Land Restoration / Reclamation Monitoring of 46 Opencast ...
185
Land Restoration / Reclamation Monitoring of 46 Opencast projects, 09 Cluster of mines and 05 Underground mines of CIL producing less than 5 m.c.m. (Coal+OB) based on Satellite Data for the Year 2020 Submitted to Coal India Limited Khasmahal OC
-
Upload
khangminh22 -
Category
Documents
-
view
4 -
download
0
Transcript of Land Restoration / Reclamation Monitoring of 46 Opencast ...

Land Restoration / Reclamation Monitoring of 46 Opencast projects, 09 Cluster of mines and 05 Underground mines of CIL producing less
than 5 m.c.m. (Coal+OB) based on Satellite Data for the Year 2020
Submitted to
Coal India Limited
Khasmahal OC
CMPDI
Job No 561410027 1
Land Restoration / Reclamation Monitoring of 46 Opencast Projects, 09 Cluster of mines and 05 Underground mines of CIL producing less than
5 m.c.m. (Coal+OB) based on Satellite Data for the Year 2020
March- 2021
Remote Sensing Cell Geomatics Division
CMPDI, Ranchi

CMPDI
Job No 561410027 2
CONTENTS
Executive Summary 3 1.0 Background 9 2.0 Objective 11 3.0 Methodology 11 4.0 Work plan 14 5.0 Land Reclamation in WCL 16 6.0 Land Reclamation in SECL 54
7.0 Land Reclamation in CCL 79 8.0 Land Reclamation in BCCL 111 9.0 Land Reclamation in ECL 128
10.0 Land Reclamation in MCL 147 11.0 Land Reclamation in NEC 168
CMPDI
Job No 561410027 3
Executive Summary
1.0 Project Land restoration/ reclamation monitoring of 60 projects consisting of 46 opencast coal mines, 9 clusters of (OC+UG) mines and 5 Underground mines of different subsidiaries of Coal India Ltd. (CIL) producing less than 5 million cubic meter (Coal+OB) annually, based on satellite data regularly at an interval of three years.
2.0 Objective Objective of the land restoration / reclamation monitoring is to
assess the area of backfilled, plantation, social forestry, active mining area, green cover, water bodies, and distribution of wasteland, agricultural land and forest in the leasehold area of these projects. This will help in assessing the progressive status of mined land reclamation and to take up remedial measures, if any, required for environmental protection.
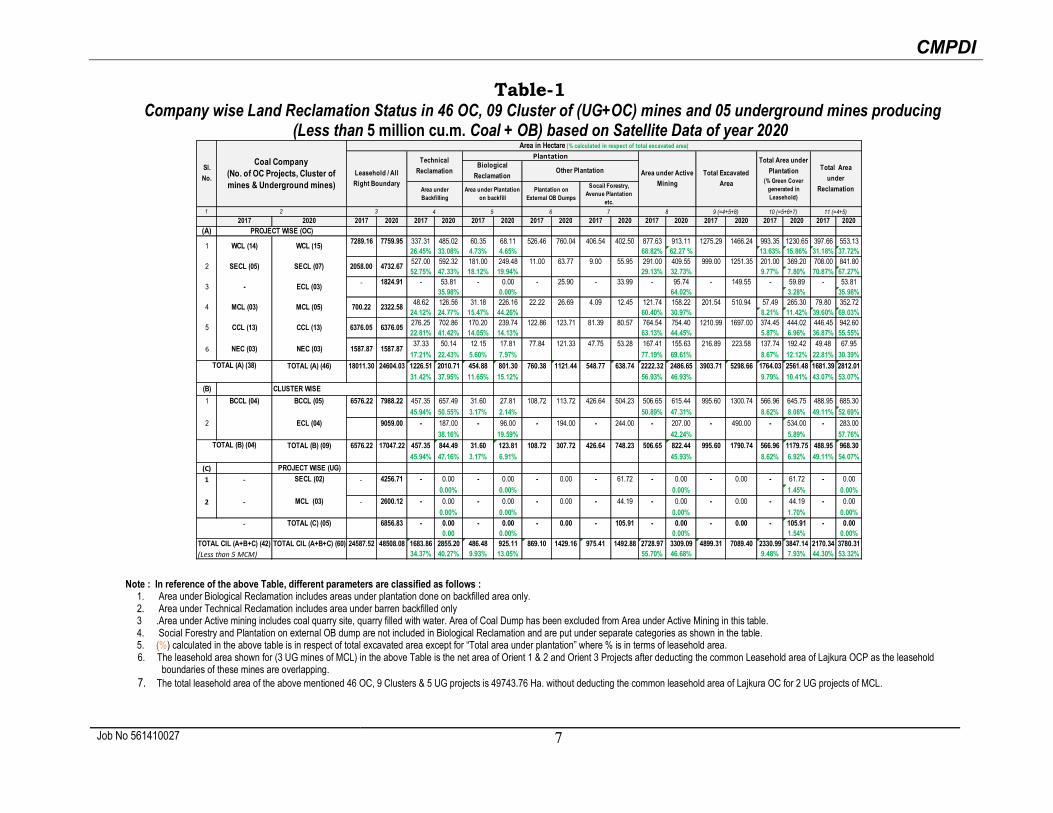
3.0 Salient Findings Out of the total mine leasehold area of 49743.76 Hectares of the
60 projects combine with 46 opencast coal mines, 9 cluster of (OC+UG) mines and 5 Underground mines producing less than 5 mcm (Coal +OB) considered for monitoring during 2020-21; total excavated area is only 7089.40 hectares out of which 925.11
hectares (13.05%) has been planted (Biologically Reclaimed), 2855.20 hectares (40.27%) area is been under backfilling (Technically Reclaimed) and 3309.09 hectares (46.68%) area is under active mining. It is evident from the analysis that 3780.31 hectares (53.32%) area of the 60 projects taken for study for the year 2020-21 is under reclamation and balance 3309.09 hectares
(46.68%) area is under active mining. Company wise details are given in Table-1 & Fig-1.
The Projects selected for land reclamation monitoring in the year
2020-21 are subdivided into three groups viz (A) 46 opencast projects belonging to WCL, SECL, CCL, ECL, MCL & NEC, (B) 09 Cluster of mines of BCCL & ECL and (C) 05 Underground mines of SECL & MCL.
For 46 nos. of Opencast mines which is indicated as Group (A),
in Table – 1, out of total mine leasehold area 24604.03 hectare of 46 OC projects of WCL, SECL, ECL, MCL, CCL & NEC producing less than 5 mcm (Coal+OB) annually considered for

CMPDI
Job No 561410027 4
monitoring during 2020-21; total excavated area is 5298.66 hectares, out of which 801.30 hectares (15.12%) area has been planted (Biologically Reclaimed), 2010.71 hectares (37.95%) area is under backfilling (Technical Reclamation) and balance 2486.65 hectares (46.93%) area is under active mining. Company wise details of land reclamation of above 46 projects is given in table - 1 (A) & Fig-1.
Comparing the status of land reclamation for 46 no. of opencast
projects in WCL, ECL, SECL, CCL, MCL & NEC monitored in the year 2020-21 with respect to previous cycle study done for the same set of OC mines in the year 2017-18 in these opencast projects of CIL’s subsidiary coal companies, it is evident from the analysis that area under land reclamation has increased from 1681.39 Hectares (43.07%) (Yr. 2017) to 2812.01 Hectares (53.07%) (Yr. 2020-21) which includes both plantation (Biological Reclamation) and areas under backfilling (Technical Reclamation). This increase of 1130.62 Hectare area under land reclamation in a period of three years is due to addition of 03 OC projects of ECL and 02 OC projects of SECL and sincere efforts made by CIL’s subsidiary companies towards land reclamation their mining area.
It has been observed that in opencast projects in WCL, SECL, CCL, MCL, ECL & NEC technical and biological reclamation has either increased in the leasehold area of opencast projects in the year 2020-21 as compared to the year 2017-18.
The 46 nos. of opencast projects in WCL, SECL, CCL, MCL, ECL
& NEC taken for study of land reclamation monitoring in the year 2020-21: the area under green cover has gone up from 1764.03 Ha (9.79%) area in the year 2017-18 to 2561.48 Ha (10.41%) area in the year 2020-21.
For 9 nos. of Clustered mines which is indicated as Group (B) in
Table –1, out of total mine leasehold of 17047.22 Hectare for total nos of 09 clusters 05 nos in BCCL and 04 nos in ECL producing less than 5 million cu.m. (Coal+OB) annually considered for monitoring during the year 2020-21; total excavated area 1790.74 Ha, out of which 123.81 Ha (6.91%) area has been planted on backfill (Biologically Reclaimed), 844.49 Ha (47.16%) area is under backfilling (Technical Reclamation) and balance 822.44 Ha (45.93%) area is under active mining.

CMPDI
Job No 561410027 5
In BCCL and ECL, cluster of mines consisting mostly opencast
mine and few underground mines have been taken into consideration for land reclamation monitoring in the year 2020-21 on request of these subsidiaries.
It is evident from Group (B) (refer table -1) that for 09 clusters
taken for monitoring of land reclamation, plantation on backfill (Biologically Reclamation) has increased from 31.60 Ha (5.57%) in the year 2017 to 123.81 Ha (6.91%) in the year 2020 and Technical Reclamation has increased from 457.35 Ha (45.94%) in the year 2017 to 844.49 Ha (47.16%) in the year 2020.
The area under green cover has gone up from 566.96 hectares
(8.62%) in the year 2017 to 1179.75 hectares (6.92%)in the year 2020. The decrease of 1.70 % in percentage of green cover in the year 2020 as compared to the year 2017 is due to increase in area of leasehold boundary this year and percentage of green cover generated has been calculated with respect to area of leasehold boundary.
Total area under reclamation in 09 nos of cluster of BCCL and
ECL has gone up from 488.95 hectares (49.11%) in 2017 to 968.30 hectares (54.07%) in 2020-21.
In Group (C ), 02 nos of underground mines of SECL and 03 nos
of Underground mines of MCL producing less than 5 million cu.m. (Coal+OB) annually are considered for the first time for land reclamation monitoring based on satellite data of the year 2020-21. Hence comparison has not been made this year however, data generated of these UG mine will be considered as base data for comparison of status of land reclamation for same set of mine during interval of three years.
From Table 1; Group (A), (B) and (C) combined, it can be seen that total area of leasehold boundary in the 60 nos of project consisting of 46 nos of OC, 09 nos of Cluster of mines and 05 nos of Underground mines of WCL, SECL, ECL, MCL, BCCL, CCL & NEC is 49743.76 Ha; total excavated area is 7089.40 Ha only, out of which 925.11 Ha (13.05%) area has been planted on backfill (Biologically Reclaimed), 2855.20 Ha (40.27%) area is under backfilling (Technical Reclamation) and balance 3309.09 Ha (46.68%) area is under active mining.

CMPDI
Job No 561410027 6
It has been observed that in all subsidiaries of CIL, biological
reclamation as well as areas under technical reclamation has increased in the leasehold boundary from 486.48 Ha (9.93%) (Yr.2017) to 925.11 Ha (13.05%) and 1683.86 Ha (34.37%) to 2855.20 Ha (40.27%) respectively.
Overall, the area under green cover has gone up from 2330.99
hectares (9.48%) in 2017-18 to 3847.14 hectares in 2020-21 as indicated in bar chart (fig-3).
Total area under reclamation in all subsidiaries of CIL has gone
up from 2170.34 hectares (44.30%) in 2017-18 to 3780.31 hectares (53.32%) in 2020-21.
CMPDI
Job No 561410027 7
Table-1 Company wise Land Reclamation Status in 46 OC, 09 Cluster of (UG+OC) mines and 05 underground mines producing
(Less than 5 million cu.m. Coal + OB) based on Satellite Data of year 2020
Note : In reference of the above Table, different parameters are classified as follows : 1. Area under Biological Reclamation includes areas under plantation done on backfilled area only. 2. Area under Technical Reclamation includes area under barren backfilled only 3 .Area under Active mining includes coal quarry site, quarry filled with water. Area of Coal Dump has been excluded from Area under Active Mining in this table. 4. Social Forestry and Plantation on external OB dump are not included in Biological Reclamation and are put under separate categories as shown in the table. 5. (%) calculated in the above table is in respect of total excavated area except for “Total area under plantation” where % is in terms of leasehold area. 6. The leasehold area shown for (3 UG mines of MCL) in the above Table is the net area of Orient 1 & 2 and Orient 3 Projects after deducting the common Leasehold area of Lajkura OCP as the leasehold
boundaries of these mines are overlapping. 7. The total leasehold area of the above mentioned 46 OC, 9 Clusters & 5 UG projects is 49743.76 Ha. without deducting the common leasehold area of Lajkura OC for 2 UG projects of MCL.
1
2017 2020 2017 2020 2017 2020 2017 2020 2017 2020 2017 2020 2017 2020 2017 2020 2017 2020 2017 2020
(A)7289.16 7759.95 337.31 485.02 60.35 68.11 526.46 760.04 406.54 402.50 877.63 913.11 1275.29 1466.24 993.35 1230.65 397.66 553.13
26.45% 33.08% 4.73% 4.65% 68.82% 62.27 % 13.63% 15.86% 31.18% 37.72%527.00 592.32 181.00 249.48 11.00 63.77 9.00 55.95 291.00 409.55 999.00 1251.35 201.00 369.20 708.00 841.8052.75% 47.33% 18.12% 19.94% 29.13% 32.73% 9.77% 7.80% 70.87% 67.27%
- 1824.91 - 53.81 - 0.00 - 25.90 - 33.99 - 95.74 - 149.55 - 59.89 - 53.8135.98% 0.00% 64.02% 3.28% 35.98%
48.62 126.56 31.18 226.16 22.22 26.69 4.09 12.45 121.74 158.22 201.54 510.94 57.49 265.30 79.80 352.7224.12% 24.77% 15.47% 44.26% 60.40% 30.97% 8.21% 11.42% 39.60% 69.03%276.25 702.86 170.20 239.74 122.86 123.71 81.39 80.57 764.54 754.40 1210.99 1697.00 374.45 444.02 446.45 942.6022.81% 41.42% 14.05% 14.13% 63.13% 44.45% 5.87% 6.96% 36.87% 55.55%37.33 50.14 12.15 17.81 77.84 121.33 47.75 53.28 167.41 155.63 216.89 223.58 137.74 192.42 49.48 67.95
17.21% 22.43% 5.60% 7.97% 77.19% 69.61% 8.67% 12.12% 22.81% 30.39%
TOTAL (A) (46) 18011.30 24604.03 1226.51 2010.71 454.88 801.30 760.38 1121.44 548.77 638.74 2222.32 2486.65 3903.71 5298.66 1764.03 2561.48 1681.39 2812.0131.42% 37.95% 11.65% 15.12% 56.93% 46.93% 21.67 21.54 9.79% 10.41% 43.07% 53.07%
(B) CLUSTER WISE
1 BCCL (04) BCCL (05) 6576.22 7988.22 457.35 657.49 31.60 27.81 108.72 113.72 426.64 504.23 506.65 615.44 995.60 1300.74 566.96 645.75 488.95 685.30
45.94% 50.55% 3.17% 2.14% 50.89% 47.31% 8.62% 8.08% 49.11% 52.69%
2 ECL (04) 9059.00 - 187.00 - 96.00 - 194.00 - 244.00 - 207.00 - 490.00 - 534.00 - 283.00
38.16% 19.59% 42.24% 5.89% 57.76%
TOTAL (B) (09) 6576.22 17047.22 457.35 844.49 31.60 123.81 108.72 307.72 426.64 748.23 506.65 822.44 995.60 1790.74 566.96 1179.75 488.95 968.30
45.94% 47.16% 3.17% 6.91% 45.93% 8.62% 6.92% 49.11% 54.07%
(C) PROJECT WISE (UG)
1 - SECL (02) - 4256.71 - 0.00 - 0.00 - 0.00 - 61.72 - 0.00 - 0.00 - 61.72 - 0.00
0.00% 0.00% 0.00% 1.45% 0.00%
2 - MCL (03) - 2600.12 - 0.00 - 0.00 - 0.00 - 44.19 - 0.00 - 0.00 - 44.19 - 0.00
0.00% 0.00% 0.00% 1.70% 0.00%
- TOTAL (C) (05) 6856.83 - 0.00 - 0.00 - 0.00 - 105.91 - 0.00 - 0.00 - 105.91 - 0.000.00 0.00% 0.00% 1.54% 0.00%
TOTAL CIL (A+B+C) (42) TOTAL CIL (A+B+C) (60) 24587.52 48508.08 1683.86 2855.20 486.48 925.11 869.10 1429.16 975.41 1492.88 2728.97 3309.09 4899.31 7089.40 2330.99 3847.14 2170.34 3780.31(Less than 5 MCM) 34.37% 40.27% 9.93% 13.05% 55.70% 46.68% 19.93 14.61 9.48% 7.93% 44.30% 53.32%
NEC (03) 1587.87 1587.876 NEC (03)
TOTAL (A) (38)
TOTAL (B) (04)
CCL (13)
3
1
2
4
5
PROJECT WISE (OC)
WCL (15)
SECL (07)
MCL (05)
CCL (13)
WCL (14)
SECL (05)
-
MCL (03)
ECL (03)
4732.67
2322.58
6376.05
3
2058.00
700.22
6376.05
Biological
ReclamationLeasehold / All
Right Boundary
Area in Hectare (% calculated in respect of total excavated area)
Total Area under
Plantation (% Green Cover
generated in Leasehold)
Area under Plantation on backfill
Technical
Reclamation Other Plantation
Plantation on External OB Dumps
Plantation
Area under Backfilling
Socail Forestry, Avenue Plantation
etc.
Coal Company (No. of OC Projects, Cluster of mines & Underground mines)
11 (=4+5)
Sl.
No.
4 5 6 7 8 9 (=4+5+8) 10 (=5+6+7)
Area under Active
Mining
Total Excavated
Area
Total Area
under
Reclamation
2

CMPDI
Job No 561410027 8
Fig. 1 : Company wise Land Reclamation Status in the Year 2020
Fig. 2 : Pie Chart indicating Land Reclamation Status in the Year 2020-21
SUBSIDIARY WISE STATUS OF LAND RECLAMATION IN THE YEAR 2020 (For projects producing less than 5 mcm (Coal+OB) annually)
STATUS OF LAND RECLAMATION IN THE LEASEHOLD OF 46 OC & 09 CLUSTERS OF MINES AND 05 UNDERGROUND MINES UNDER MONITORING IN 2020-21
For project producing Less than 5 MCM (Coal+OB) (Pie Chart indicated distribution of Total Excavated Area Only)

CMPDI
Job No 561410027 9
Figure- 3 1.0 Background
1.1 Land is the most important natural resource which embodies soil, water, flora, fauna and
total ecosystem. All human activities are based on the land which is the most scarce
natural resource in our country. Mining is a site specific industry and it could not be shifted
anywhere else from the location where mineral occurs. It is a fact that surface mining
activities do effect the land environment due to ground breaking. Therefore, there is an
urgent need to reclaim and restore the mined out land for its productive use for sustainable
development of mining. This will not only mitigate environmental degradation, but would
also help in creating a more congenial environment for land acquisition by coal companies
in future.
Keeping above in view, Coal India Ltd. (CIL) issued a work order vide letter no.
CIL/WBP/Env/2009/2428 dated 29.12.2009 to Central Mine Planning & Design Institute
(CMPDI), Ranchi, for monitoring land reclamation. status of all the opencast coal mines
having production of more than 5 million m3 per annum (Coal + OB) taken together per
CMPDI
Job No 561410027 10
annum) based on remote sensing satellite data, regularly on annual basis for sustainable
development of mining. Further, a revised work order was issued vide letter no.
CIL/WBP/Env/2011/4706 dated 12.10.2012 from Coal India Limited for the period 2012-13
to 2016-17 which was subsequently followed by another work order vide letter no.
CIL/WBP/Env/2017/DP/8477 dated 21.09.2017 from Coal India Limited for the period
2017-18 to 2021-22 for land reclamation monitoring of opencast projects and vegetation
cover monitoring of 19 major coalfields. According to this work order, all mines in CIL with
output capacity of 5 million cu. m (coal +OB) shall be monitored every year and mines
below this capacity shall be monitored at an interval of 3 years. All coalfields in CIL shall
also be monitored at an interval of 3 years as per a defined plan. The result of land
reclamation status of all such mines to be put on the website of CIL (www.coalindia.in),
CMPDI (www.cmpdi.co.in) and the concerned coal companies in public domain. Detailed
report to be submitted to Coal India and respective subsidiaries.
1.2 Land reclamation monitoring of all opencast coal mining projects would also comply the
statutory requirements of Ministry of Environment, Forest & Climate Change (MoEF &
CC). Such monitoring would not only facilitate in taking timely mitigation measures against
environmental degradation, but would also enable coal companies to utilize the reclaimed
land for larger socio-economic benefits in a planned way.
1.3 CMPDI undertook the above study and the present report is embodying the findings in
nutshell carrying out for the 60 projects including 46 opencast mines, 09 cluster of
(OC+UG) mines and 05 underground mines of different subsidiaries producing less than
5 million cubic m. (Coal +OB) in the year 2020-21 for baseline data generation / updation
of these projects so that progressive changes in the status of land reclamation could be
assessed in future.
CMPDI
Job No 561410027 11
2.0 Objective
Objective of the land reclamation/restoration monitoring is to assess the area of backfilled,
plantation, OB dumps, social forestry, active mining area, settlements and water bodies,
distribution of wasteland, agricultural land and forest land in the leasehold area of the
project. This is an important step taken up for assessing the progressive status of mined
land reclamation and for taking up remedial measures, if any, required for environmental
protection.
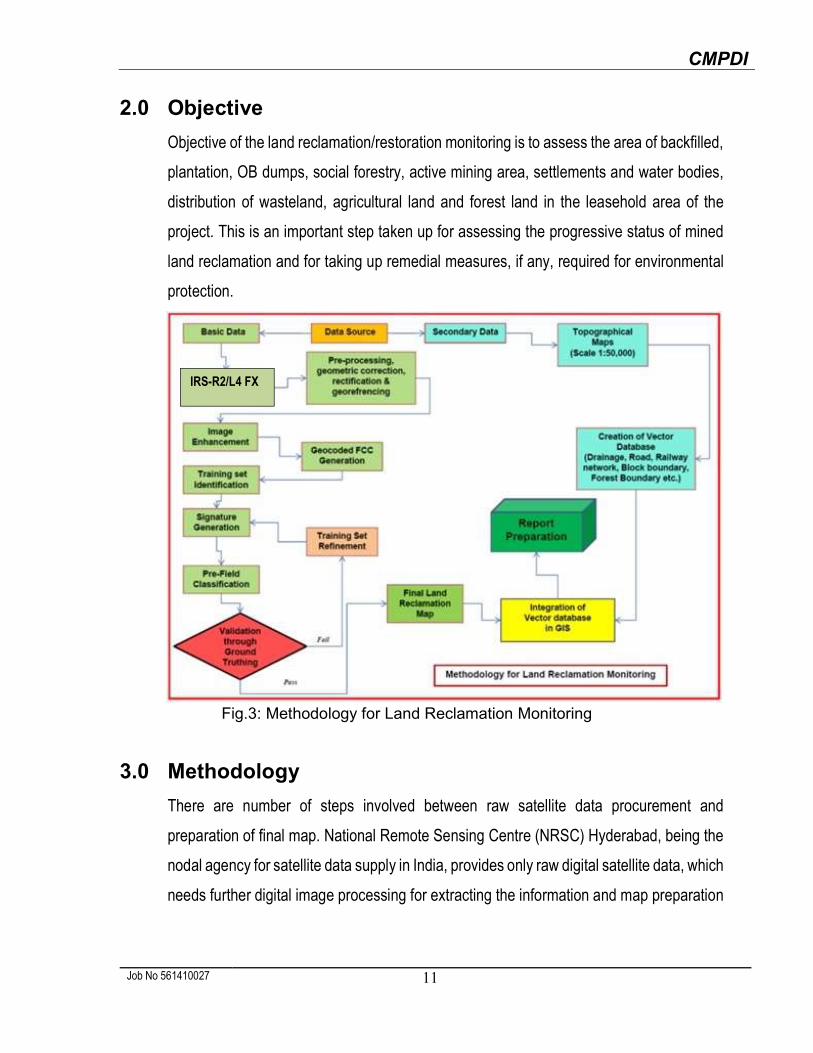
Fig.3: Methodology for Land Reclamation Monitoring
3.0 Methodology
There are number of steps involved between raw satellite data procurement and
preparation of final map. National Remote Sensing Centre (NRSC) Hyderabad, being the
nodal agency for satellite data supply in India, provides only raw digital satellite data, which
needs further digital image processing for extracting the information and map preparation
IRS-R2/L4 FX
CMPDI
Job No 561410027 12
before uploading the same in the website. Methodology for land reclamation monitoring is
given in fig 3. Following steps are involved in land reclamation /restoration monitoring:
3.1 Data Procurement: After browsing the data quality and date of pass on internet,
supply order for data is placed to NRSC. Secondary data like leasehold boundary,
topo sheets are procured for creation of vector database.
3.2 Satellite Data Processing: Satellite data are processed using ERDAS IMAGINE
v2014 s/w digital image processing s/w. Methodology involves the following major
steps:
Rectification & Georeferencing: Inaccuracies in digital imagery may occur due to
‘systematic errors’ attributed to earth curvature and rotation as well as ‘non-systematic
errors’ attributed to satellite receiving station itself. Raw digital images contain
geometric distortions, which make them unusable as maps. Therefore, geo-referencing
is required for correction of image data using ground control points (GCP) to make it
compatible to SoI-topo-sheet.
Image enhancement:
To improve the interpretability of the raw data, image enhancement is necessary. Local
operations modify the value of each pixel based on brightness value of neighbouring
pixels using ERDAS IMAGINE v 2014 s/w and enhance the image quality for
interpretation.
Training set selection
Training set requires to be selected, so that software can classify the image data
accurately. The image data are analysed based on the interpretation keys. These keys
are evolved from certain fundamental image-elements such as tone/colour, size,

CMPDI
Job No 561410027 13
shape, texture, pattern, location, association and shadow. Based on the image-
elements and other geo-technical elements like land form, drainage pattern and
physiography; training sets were selected/identified for each land use/cover class.
Field survey was carried out by taking selective traverses in order to collect the ground
information (or reference data) so that training sets are selected accurately in the
image. This was intended to serve as an aid for classification.
Classification and Accuracy assessment
Image classification is carried out using the maximum likelihood algorithm. The
classification proceeds through the following steps: (a) calculation of statistics [i.e.
signature generation] for the identified training areas, and (b) the decision boundary of
maximum probability based on the mean vector, variance, covariance and correlation
matrix of the pixels. After evaluating the statistical parameters of the training sets,
reliability test of training sets is conducted by measuring the statistical separation
between the classes that resulted from computing divergence matrix. The overall
accuracy of the classification was finally assessed with reference to ground truth data.
Area calculation
The area of each land use class in the leasehold is determined using ERDAS
IMAGINE v 2014 s/w.
Overlay of Vector data base
Vector data base created based on secondary data. Vector layer like drainage,
railway line, leasehold boundary, forest boundary etc. are superimposed on the
image as vector layer in the Arc GIS database.
Pre-field map preparation
Pre-field map is prepared for validation of the classification result

CMPDI
Job No 561410027 14
3.3 Ground Truthing:
Selective ground verification of the land use classes are carried out in the field and
necessary corrections if required, are incorporated before map finalization.
3.4 Land reclamation database on GIS:
Land reclamation database is created on GIS platform to identify the temporal
changes identified from satellite data of different cut-off dates.
4.0 Work Plan
4.1 Total 60 projects including 46 opencast coal mines, 9 cluster of (OC+UG) mines and 5
Underground mines producing less than 5 million cubic m. (Coal + OB together) were
taken up for the study during the year 2020-21 based on the R-2, L4FX satellite data, land
reclamation /mine closure monitoring was carried out using ERDAS IMAGINE 14.0 version
digital image processing s/w and Arc-Info GIS.
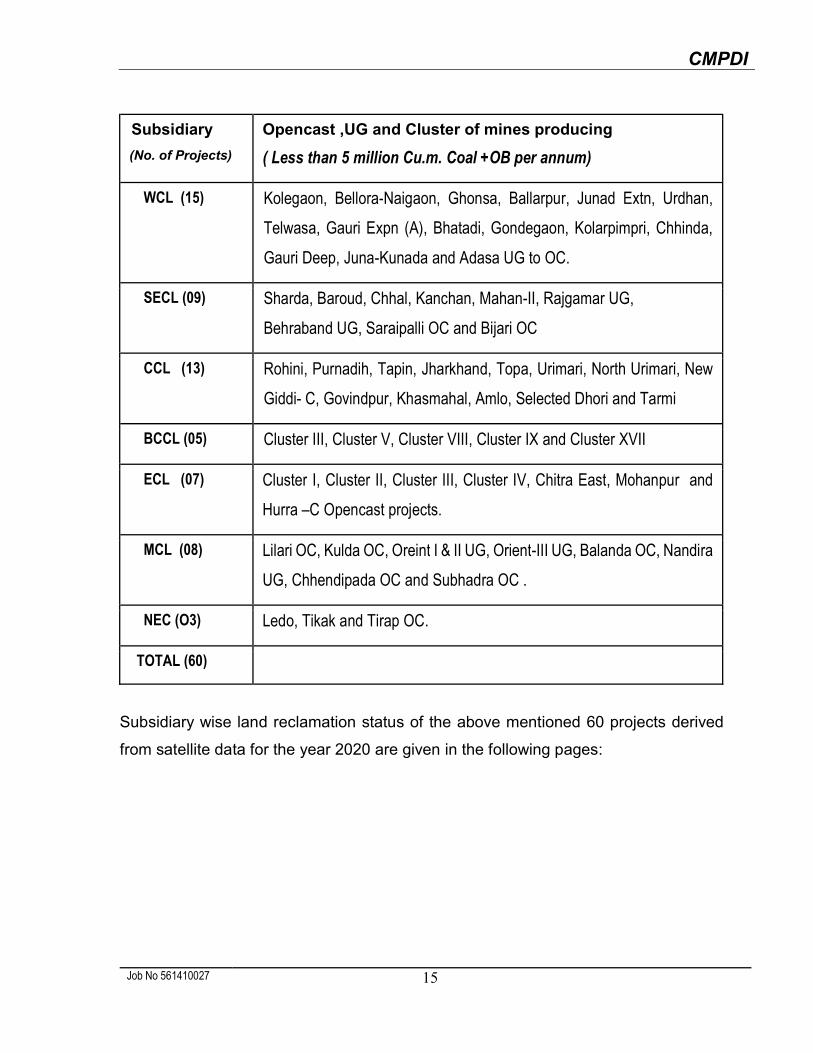
4.2 The following are the total list of subsidiary wise 60 projects combine with 05 underground,
09 cluster of (UG+OC) mines and 46 opencast mines producing less than 5 mcm (coal
and OB together) annually taken up for land reclamation monitoring based on satellite
data of year 2020-21 is given in the Table below:
CMPDI
Job No 561410027 15
Subsidiary
(No. of Projects)
Opencast ,UG and Cluster of mines producing
( Less than 5 million Cu.m. Coal +OB per annum)
WCL (15) Kolegaon, Bellora-Naigaon, Ghonsa, Ballarpur, Junad Extn, Urdhan,
Telwasa, Gauri Expn (A), Bhatadi, Gondegaon, Kolarpimpri, Chhinda,
Gauri Deep, Juna-Kunada and Adasa UG to OC.
SECL (09) Sharda, Baroud, Chhal, Kanchan, Mahan-II, Rajgamar UG,
Behraband UG, Saraipalli OC and Bijari OC
CCL (13) Rohini, Purnadih, Tapin, Jharkhand, Topa, Urimari, North Urimari, New
Giddi- C, Govindpur, Khasmahal, Amlo, Selected Dhori and Tarmi
BCCL (05) Cluster III, Cluster V, Cluster VIII, Cluster IX and Cluster XVII
ECL (07) Cluster I, Cluster II, Cluster III, Cluster IV, Chitra East, Mohanpur and
Hurra –C Opencast projects.
MCL (08) Lilari OC, Kulda OC, Oreint I & II UG, Orient-III UG, Balanda OC, Nandira
UG, Chhendipada OC and Subhadra OC .
NEC (O3) Ledo, Tikak and Tirap OC.
TOTAL (60)
Subsidiary wise land reclamation status of the above mentioned 60 projects derived
from satellite data for the year 2020 are given in the following pages:

WESTERN COALFIELDS LIMITED
CMPDI
Job No 561410027 (WCL) 17
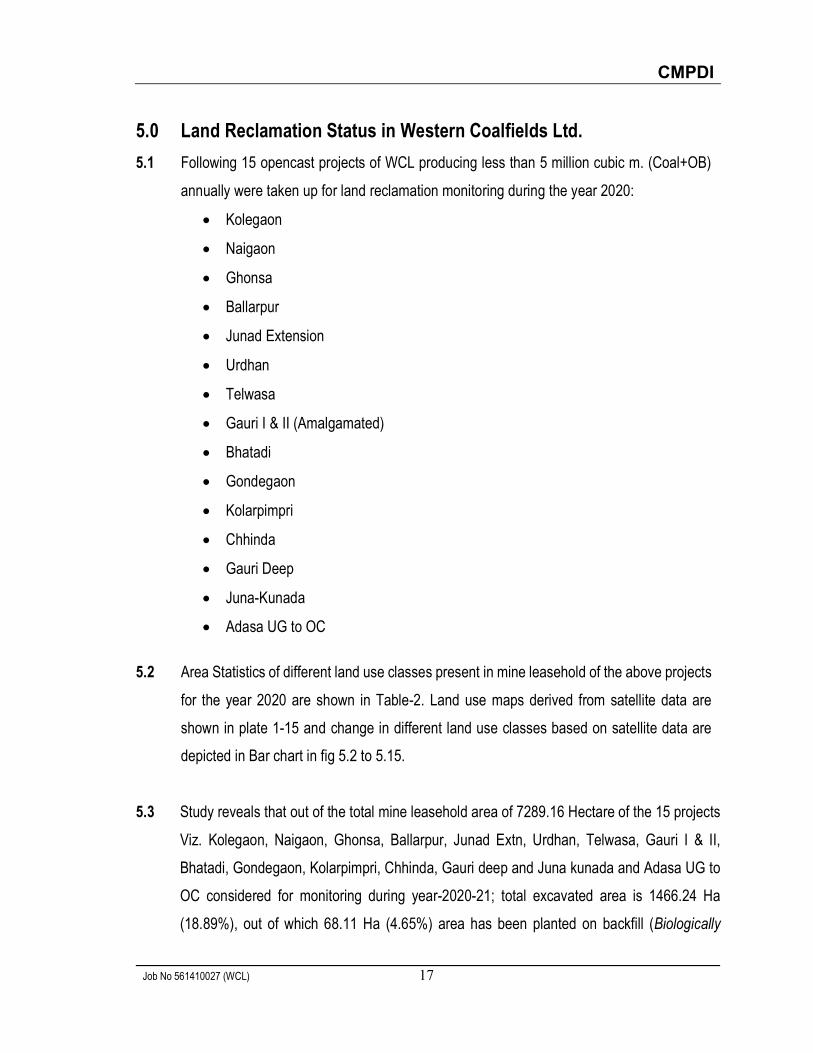
5.0 Land Reclamation Status in Western Coalfields Ltd.
5.1 Following 15 opencast projects of WCL producing less than 5 million cubic m. (Coal+OB)
annually were taken up for land reclamation monitoring during the year 2020:
Kolegaon
Naigaon
Ghonsa
Ballarpur
Junad Extension
Urdhan
Telwasa
Gauri I & II (Amalgamated)
Bhatadi
Gondegaon
Kolarpimpri
Chhinda
Gauri Deep
Juna-Kunada
Adasa UG to OC
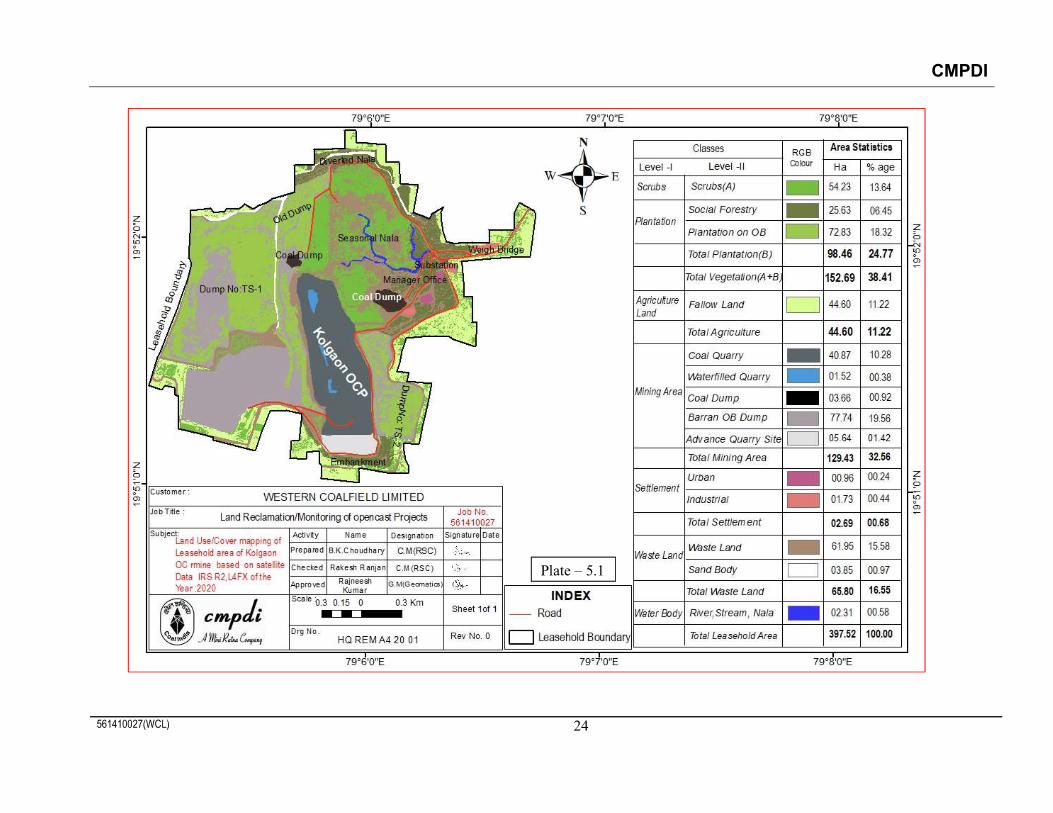
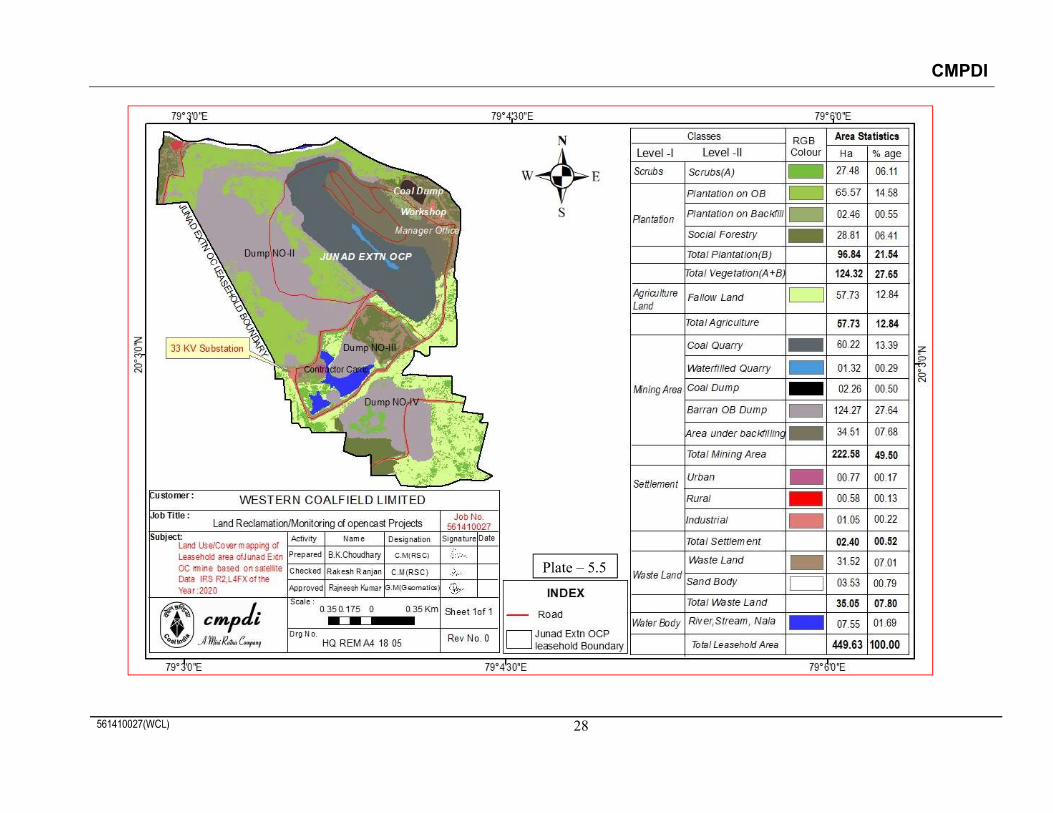
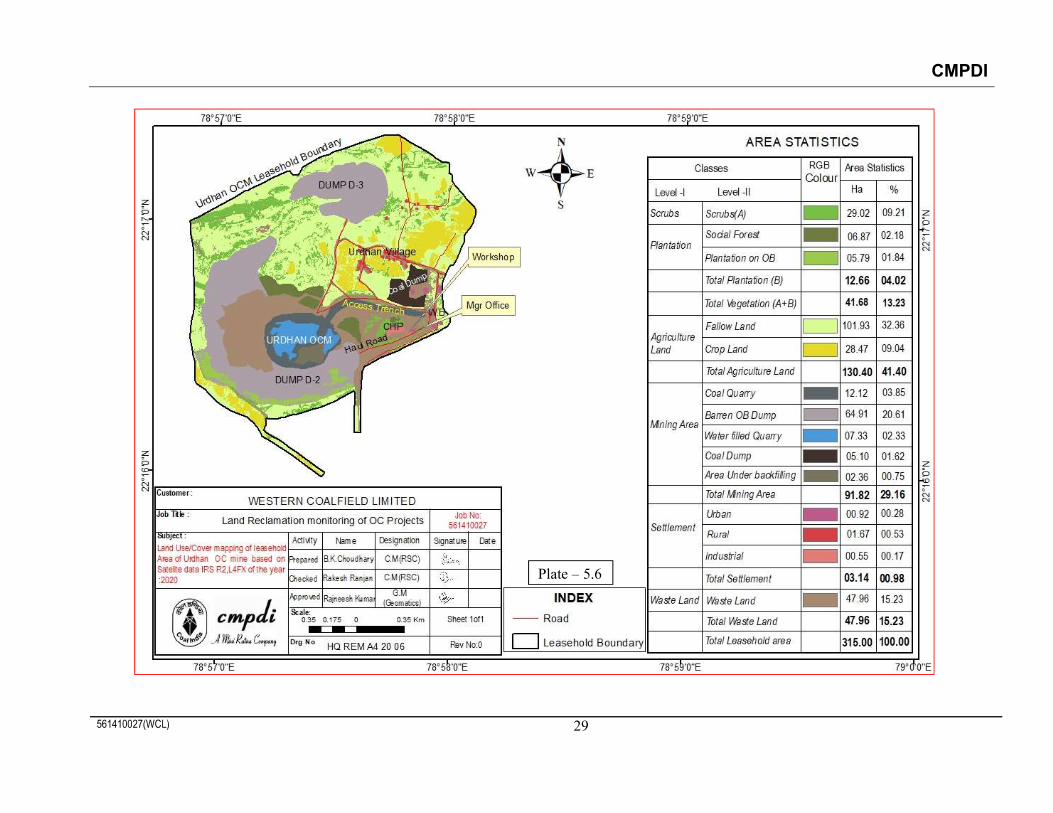
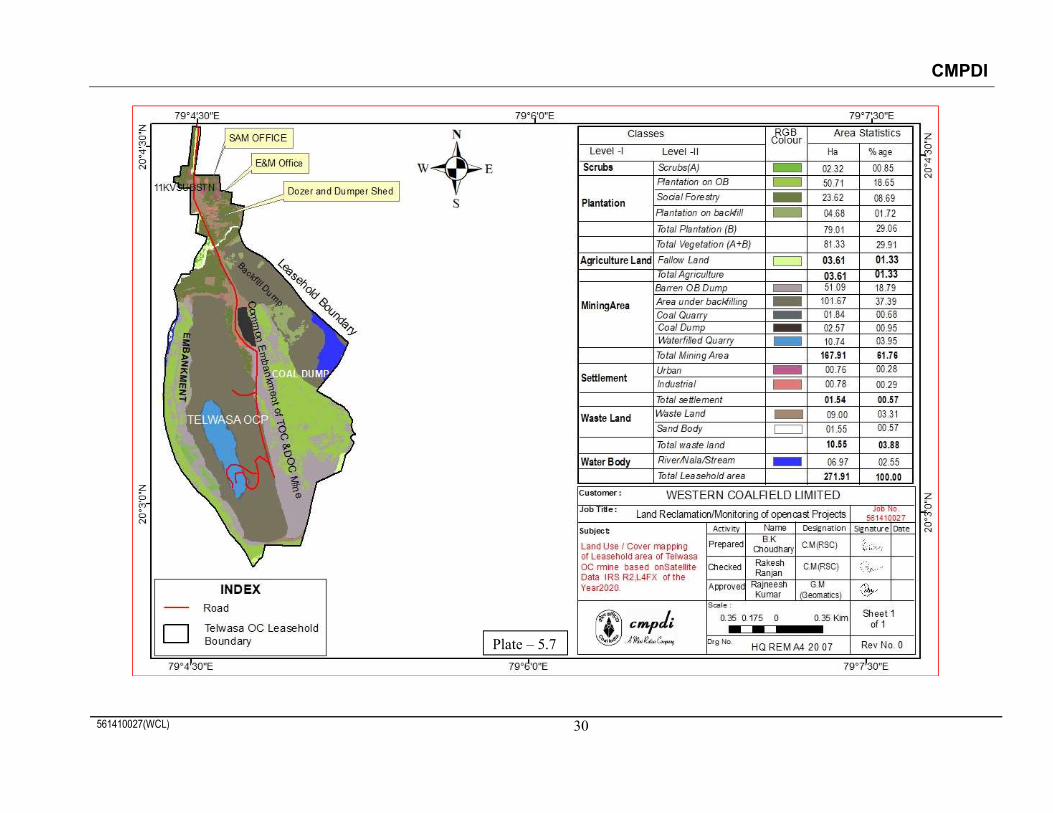
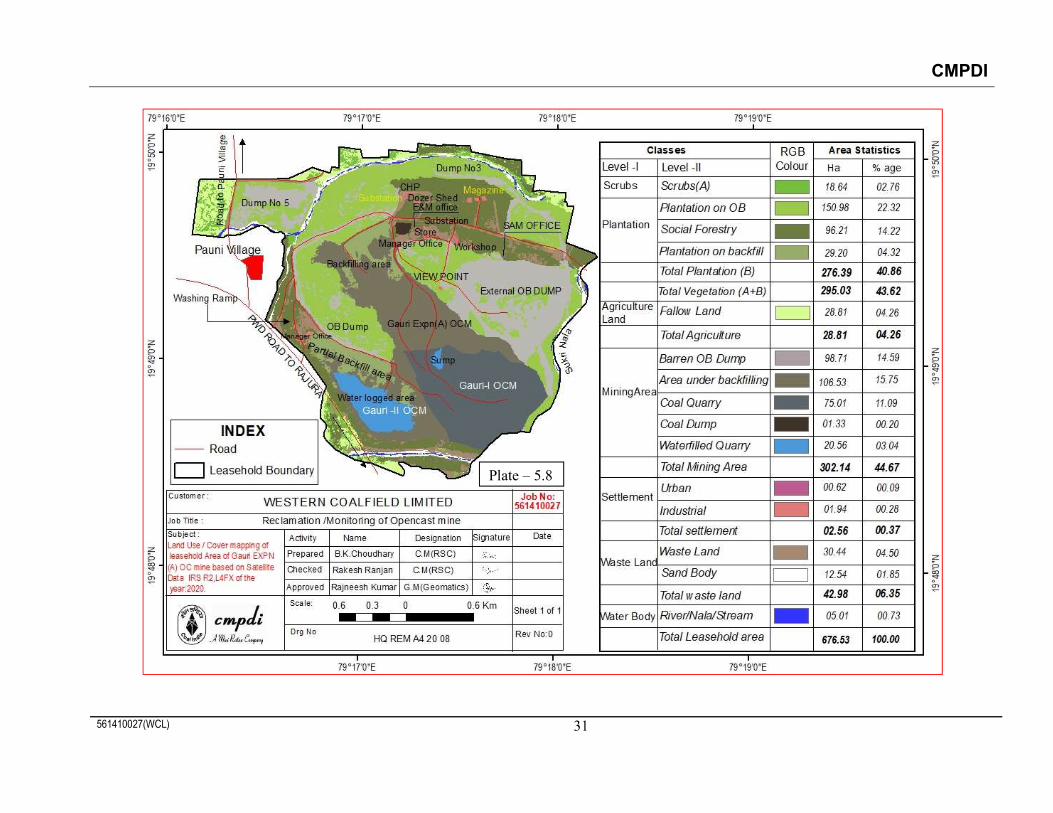
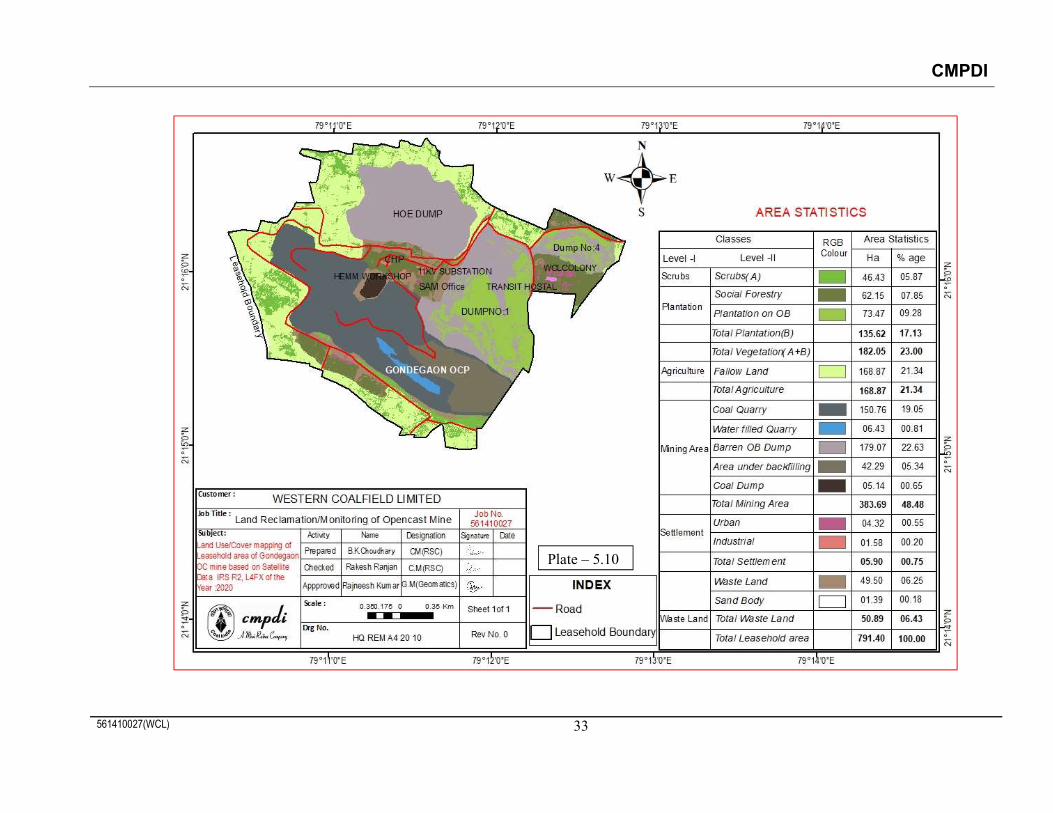
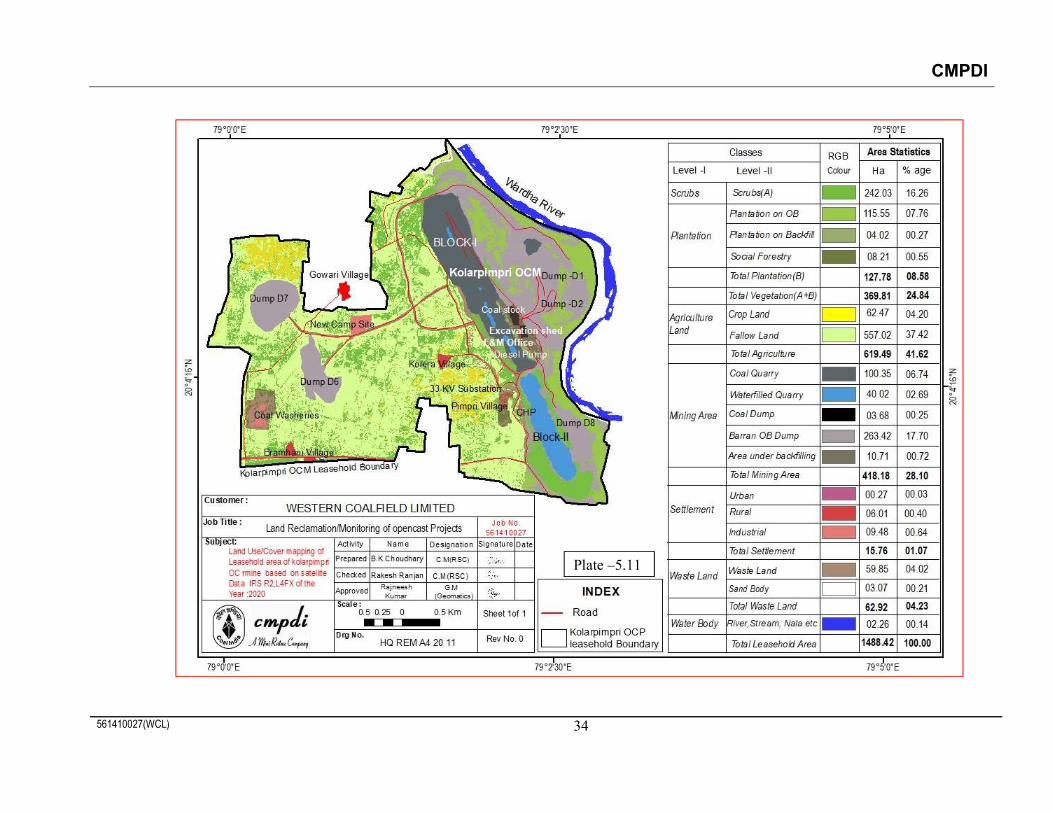
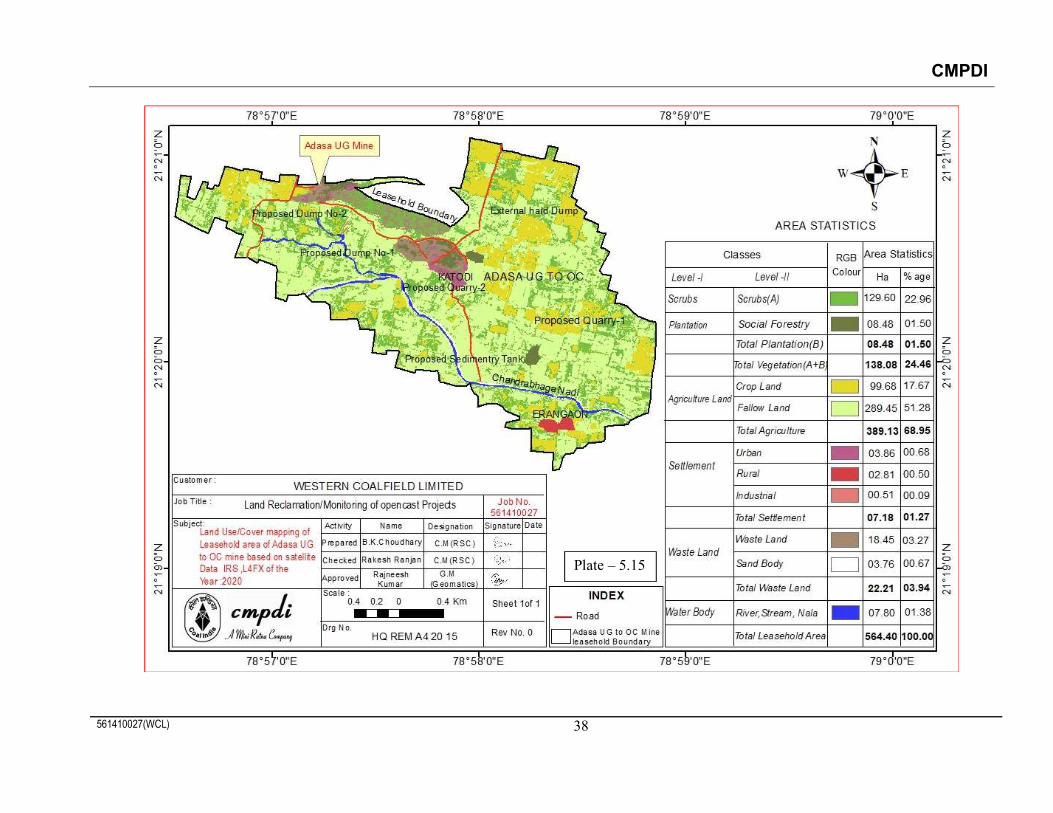
5.2 Area Statistics of different land use classes present in mine leasehold of the above projects
for the year 2020 are shown in Table-2. Land use maps derived from satellite data are
shown in plate 1-15 and change in different land use classes based on satellite data are
depicted in Bar chart in fig 5.2 to 5.15.
5.3 Study reveals that out of the total mine leasehold area of 7289.16 Hectare of the 15 projects
Viz. Kolegaon, Naigaon, Ghonsa, Ballarpur, Junad Extn, Urdhan, Telwasa, Gauri I & II,
Bhatadi, Gondegaon, Kolarpimpri, Chhinda, Gauri deep and Juna kunada and Adasa UG to
OC considered for monitoring during year-2020-21; total excavated area is 1466.24 Ha
(18.89%), out of which 68.11 Ha (4.65%) area has been planted on backfill (Biologically

CMPDI
Job No 561410027 (WCL) 18
Reclaimed) and 485.02 Ha (33.08%) area is under Backfilling (Technically Reclaimed). and
balance 913.11 Ha (62.27%) is under active mining. It is evident from the analysis that 553.13
Ha (37.72%) area of above projects is under reclamation (Biologically and Technically).
Projects wise details area given in Table 1.
5.4 On comparing the status of land reclamation for the year 2020 with respect to the year 2017
in different projects taken for reclamation in the year 2020, it is evident from the analysis
that area under land reclamation has increased from 397.66 Ha. (Yr. 2017) to 553.13 Ha
(Yr. 2020). Overall percentage increase is 6.54%. during span of three year.
5.5 From analysis it is revealed that total vegetated area ( Biological reclamation) has increased
to 68.11 Ha (4.65%) in the year 2020 as compared to 60.35 Ha (4.73%) in the Year 2017
and area under technical reclamation ( backfilling) has also increased from 337.31 Ha
(26.45%) (Yr 2017) to 485.02 Ha (Yr 2020). This increase of 147.71 Ha area in technical
reclamation during span of three year is due to major increase in area under backfilling from
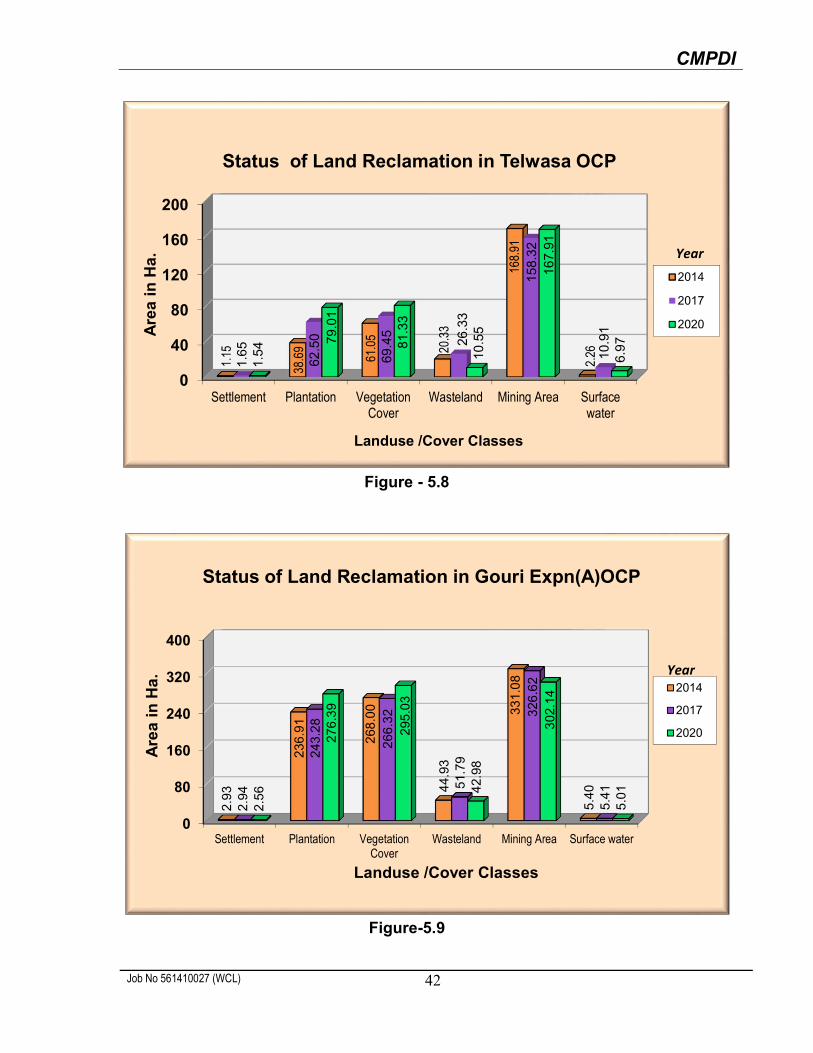
44.61 Ha (Yr2017) to 101.67 Ha (2020) in Telwasa OC.
5.6 Total leasehold area of 15 project has increased from 7289.16 Ha (Yr 2017) to 7759.95 Ha
(Yr 2020) due to major change in leasehold area of Bellora-Naigaon Ballarpur and
Gondegaon OCPs and addition of Adasa UG to OC mine.
5.7 It is observed that overall marginal decrease of 0.08% in Biological reclamation in the year
2020 as compared to year 2017 is due to overall increase in excavated area from 1275.29
Ha (Yr.2017) to 1466.24Ha( Yr.2020) as such calculation for percentage of Biological
reclamation has been carried out with respect to total excavated area.
5.8 Study indicates that overall the projects of WCL considered for this study indicate increase
or static trend in biological reclamation (Plantation on backfill) as well as area under
backfilling (Technical reclamation).
CMPDI
Job No 561410027 (WCL) 19
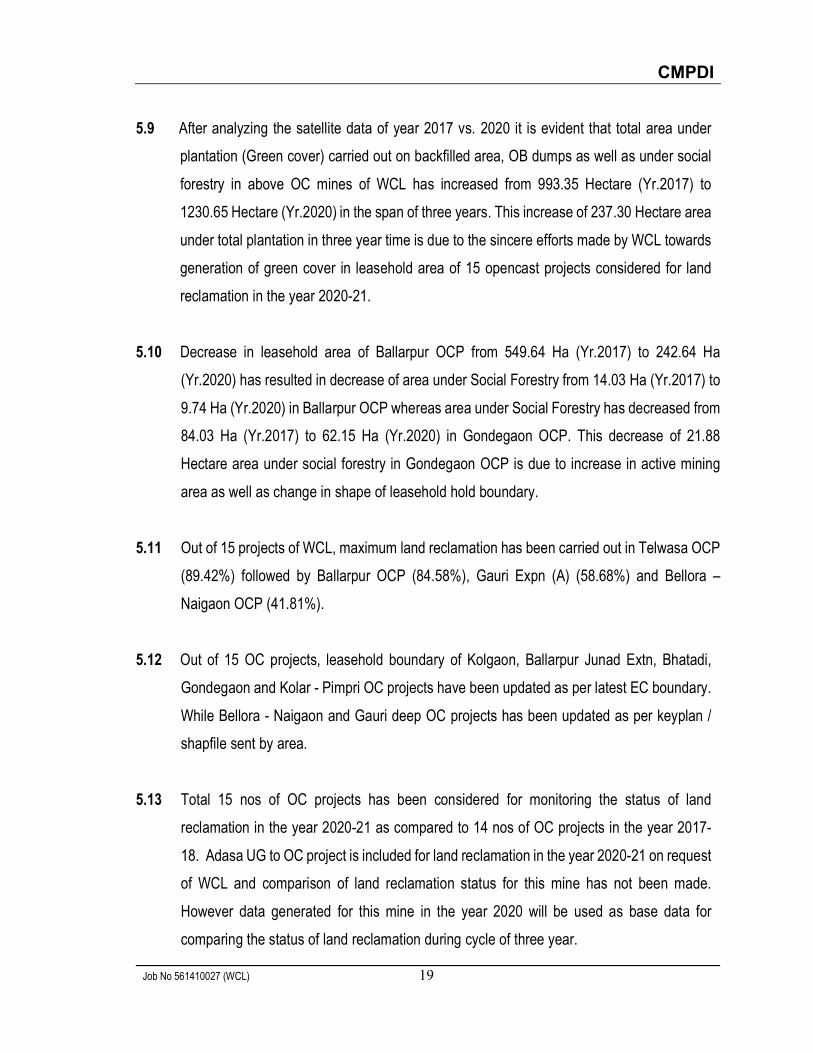
5.9 After analyzing the satellite data of year 2017 vs. 2020 it is evident that total area under
plantation (Green cover) carried out on backfilled area, OB dumps as well as under social
forestry in above OC mines of WCL has increased from 993.35 Hectare (Yr.2017) to
1230.65 Hectare (Yr.2020) in the span of three years. This increase of 237.30 Hectare area
under total plantation in three year time is due to the sincere efforts made by WCL towards
generation of green cover in leasehold area of 15 opencast projects considered for land
reclamation in the year 2020-21.
5.10 Decrease in leasehold area of Ballarpur OCP from 549.64 Ha (Yr.2017) to 242.64 Ha
(Yr.2020) has resulted in decrease of area under Social Forestry from 14.03 Ha (Yr.2017) to
9.74 Ha (Yr.2020) in Ballarpur OCP whereas area under Social Forestry has decreased from
84.03 Ha (Yr.2017) to 62.15 Ha (Yr.2020) in Gondegaon OCP. This decrease of 21.88
Hectare area under social forestry in Gondegaon OCP is due to increase in active mining
area as well as change in shape of leasehold hold boundary.
5.11 Out of 15 projects of WCL, maximum land reclamation has been carried out in Telwasa OCP
(89.42%) followed by Ballarpur OCP (84.58%), Gauri Expn (A) (58.68%) and Bellora –
Naigaon OCP (41.81%).
5.12 Out of 15 OC projects, leasehold boundary of Kolgaon, Ballarpur Junad Extn, Bhatadi,
Gondegaon and Kolar - Pimpri OC projects have been updated as per latest EC boundary.
While Bellora - Naigaon and Gauri deep OC projects has been updated as per keyplan /
shapfile sent by area.
5.13 Total 15 nos of OC projects has been considered for monitoring the status of land
reclamation in the year 2020-21 as compared to 14 nos of OC projects in the year 2017-
18. Adasa UG to OC project is included for land reclamation in the year 2020-21 on request
of WCL and comparison of land reclamation status for this mine has not been made.
However data generated for this mine in the year 2020 will be used as base data for
comparing the status of land reclamation during cycle of three year.
CMPDI
Job No 561410027 (WCL) 20
5.14 It is observed that backfilling process in Kolgaon OC project as well as Gauri deep OC could
not started till date due to its high gradient. At present Chhinda and Urdhan OC project are
not in operation. Hence minor change in area of active mining is observed as indicated in
Table-1.
5.15 This study will again be carried out at an interval of three years to assess the land
reclamation status in the above projects.

CMPDI
561410027(WCL) 21
TABLE:5.1 Project wise Land Reclamation Status in opencast Projects of WCL
Producing (Less than 5 million cu.m. of coal +OB) based on Satellite data of the year 2020
Note : In reference of the above Table, different parameters are classified as follows :
1. Area under Biological Reclamation includes areas under plantation done on backfilled area only. 2. Area under Technical Reclamation includes area under barren backfilled only 3. Area under Active mining includes coal quarry site, quarry filled with water. Area of Coal Dump has been excluded from Area under Active Mining in this table. 4. Social Forestry and Plantation on external OB dump are not included in Biological Reclamation and are put under separate categories as shown in the table. 5. (%) calculated in the above table is in respect of total excavated area except for “Total area under plantation” where % is in terms of leasehold area.
1 2
2017 2020 2017 2020 2017 2020 2017 2020 2017 2020 2017 2020 2017 2020 2017 2020 2017 20201 Kolegaon 349.00 397.52 0.00 0.00 0.00 0.00 37.41 72.83 22.23 25.63 39.26 48.03 39.26 48.03 59.64 98.46 0.00 0.00
0.00% 0.00% 0.00% 0.00% 100.00% 100.00% 17.09% 24.77% 0.00% 0.00%2 Bellora-Naigaon 398.66 664.80 8.81 53.02 9.81 12.75 21.87 35.62 28.94 28.94 122.24 91.53 140.86 157.30 60.62 77.31 18.62 65.77
6.25% 33.71% 6.96% 8.11% 86.78% 58.19% 15.21% 11.63% 13.22% 41.81%3 Ghonsa 278.68 278.68 0.00 7.28 0.00 0.00 2.10 2.55 4.65 4.65 46.87 60.29 46.87 67.57 6.75 7.20 0.00 7.28
0.00% 10.77% 0.00% 0.00% 100.00% 89.23% 2.42% 2.58% 0.00% 10.77%4 Ballarpur 549.64 242.64 67.87 80.79 12.99 15.00 67.73 69.49 14.03 9.74 30.12 17.47 110.98 113.26 94.75 94.23 80.86 95.79
61.16% 71.33% 11.70% 13.24% 27.14% 15.42% 17.24% 38.84% 72.86% 84.58%5 Junad EXTN 420.97 449.63 34.51 34.51 2.45 2.46 36.14 65.57 26.86 28.81 56.54 61.54 93.50 98.51 65.45 96.84 36.96 36.97
36.91% 35.03% 2.62% 2.50% 60.47% 62.47% 15.55% 21.54% 39.53% 37.53%6 Urdhan 315.00 315.00 0.00 2.36 0.00 0.00 3.34 5.79 0.00 6.87 21.46 19.45 21.46 21.81 3.34 12.66 0.00 2.36
0.00% 10.82% 0.00% 0.00% 100.00% 89.18% 1.06% 4.02% 0.00% 10.82%7 Telwasa 271.91 271.91 44.61 101.67 4.68 4.68 34.20 50.71 23.62 23.62 69.64 12.58 118.93 118.93 62.50 79.01 49.29 106.35
37.51% 85.49% 3.94% 3.94% 58.56% 10.58% 22.99% 29.06% 41.44% 89.42%8 Gouri Expn(A) 676.53 676.53 106.57 106.53 28.56 29.20 118.61 150.98 96.11 96.21 86.60 95.57 221.73 231.30 243.28 276.39 135.13 135.73
48.06% 46.06% 12.88% 12.62% 39.06% 41.32% 35.96% 40.85% 60.94% 58.68%9 Bhatadi 838.14 847.37 21.27 21.94 0.00 0.00 13.28 30.86 45.63 46.12 56.52 71.92 77.79 93.86 58.91 76.98 21.27 21.94
27.34% 23.38% 0.00% 0.00% 72.66% 76.62% 7.03% 9.08% 27.34% 23.38%10 Gondegaon 917.00 791.40 32.88 42.29 0.00 0.00 52.00 73.47 84.03 62.15 101.71 157.19 134.59 199.48 136.03 135.62 32.88 42.29
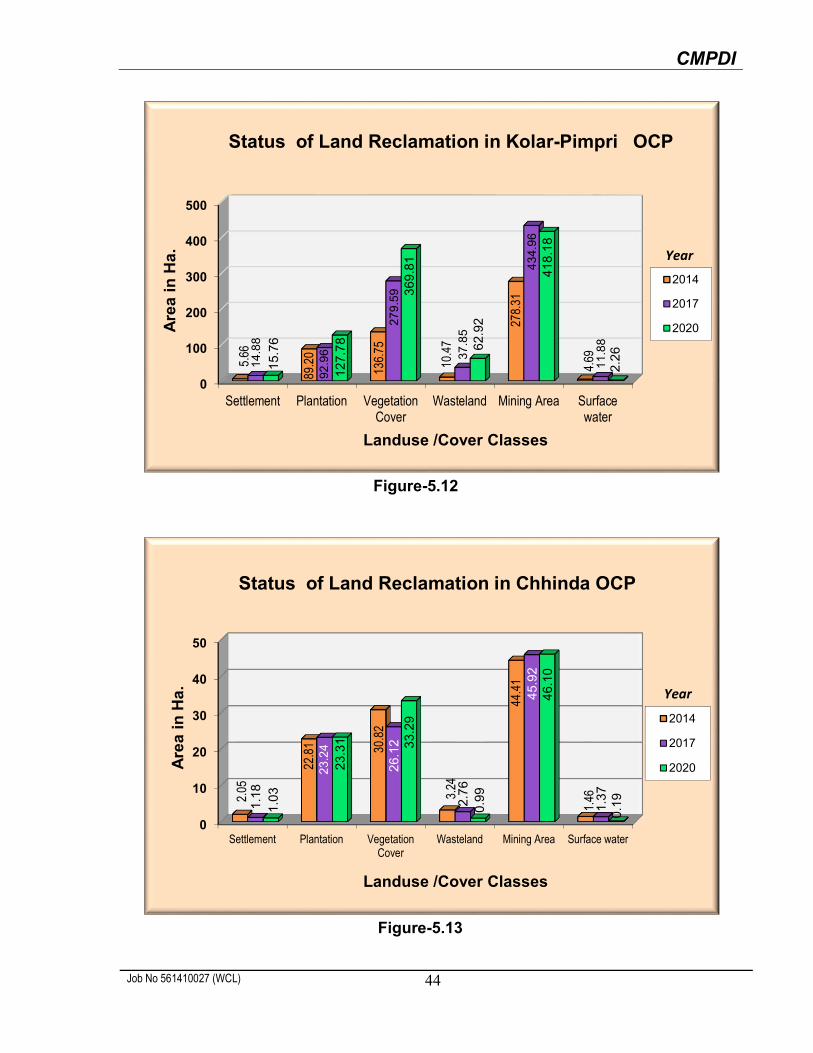
24.43% 21.20% 0.00% 0.00% 75.57% 78.80% 14.83% 17.14% 24.43% 21.20%11 Kolarpimpri 1484.97 1488.42 7.54 10.71 1.86 4.02 83.36 115.55 7.74 8.21 137.70 140.37 147.10 155.10 92.96 127.78 9.40 14.73
5.13% 6.91% 1.26% 2.59% 93.61% 90.50% 6.26% 8.58% 6.39% 9.50%12 Chhinda 106.68 106.68 0.00 0.00 0.00 0.00 20.44 20.44 2.80 2.87 22.78 23.29 22.78 23.29 23.24 23.31 0.00 0.00
0.00% 0.00% 0.00% 0.00% 100.00% 100.00% 21.78% 21.85% 0.00% 0.00%13 Gouri deep 356.11 339.10 0.00 0.00 0.00 0.00 0.00 0.00 6.19 8.00 44.29 51.04 44.29 51.04 6.19 8.00 0.00 0.00
0.00% 0.00% 0.00% 0.00% 100.00% 100.00% 1.74% 2.36% 0.00% 0.00%14 Juna-Kunada 325.87 325.87 13.25 23.92 0.00 0.00 35.98 66.18 43.71 42.20 41.90 62.84 55.15 86.76 79.69 108.38 13.25 23.92
24.03% 27.57% 0.00% 0.00% 75.97% 72.43% 24.45% 33.26% 24.03% 27.57%15 *Adasa UG to OC 564.40 0.00 0.00 0.00 0.00 0.00 0.00 0.00 8.48 0.00 0.00 0.00 0.00 0.00 8.48 0.00 0.00
0.00% 0.00% 0.00% 0.00% 0.00% 0.00% 0.00% 1.50% 0.00% 0.00%TOTAL 7289.16 7759.95 337.31 485.02 60.35 68.11 526.46 760.04 406.54 402.50 877.63 913.11 1275.29 1466.24 993.35 1230.65 397.66 553.13
26.45% 33.08% 4.73% 4.65% 68.82% 62.27% 17.50% 18.89% 13.63% 15.86% 31.18% 37.72%
5
Plantation on Excavated /
Backfilled Area
(% is calculated with respected to Excavated Area as applicable)
3 11(=4+5)10 (=5+6+7)
Area under Active Mining
Total Excavated Area
Total Area under Plantation
(% Green Cover Generated in Leasehold)
Biological Reclamation
Plantation on External Over
Burden Dumps
Total Leasehold Area
Plantation
Total Area under
Reclamation
8
Sl.No Project
Other Plantations
Social Forestry, Avanue
Plantation Etc.
9 (=4+5+8)6 7
(Area in Ha)
Area under Backfilling
Technical Reclamation
4

CMPDI
561410027(WCL) 22
Fig 5.1: Land Reclamation Status in OC projects producing less than 5mcm (Coal +OB) of WCL in the Year 2020
397.
52
664.
80
278.
68
242.
64
449.
63
315.
00
271.
91
676.
53
847.
37
791.
40
1488
.42
106.
68
339.
10
325.
87
564.
40
48.0
3 157.
30
67.5
7
113.
26
98.5
1
21.8
1 118.
93 231.
30
93.8
6 199.
48
155.
10
23.2
9
51.0
4
86.7
6
0.00
0.00 65
.77
7.28
95.7
9
36.9
7
2.36
106.
35
135.
73
21.9
4
42.2
9
14.7
3
0.00
0.00 23
.92
0.00
0
300
600
900
1200
1500
Kolgaon BelloraNaigaon
Ghonsa Ballarpur Junad Extn Urdhan Telwasa GauriExpn(A)
Bhatadi Gondegaon Kolar-Pimpri Chhinda Gouri Deep Juna Kunada Adasa UG toOC
AREA
IN H
ECTA
RE
OPENCAST PROJECTS
LEASEHOLD AREA
EXCAVATED AREA
AREA UNDERRECLAMATION
PROJECTWISE STATUS OF LAND RECLAMATION IN WCL FOR THE YEAR 2020

CMPDI
561410027(WCL) 23
TABLE 5.2 : PROJECT WISE AREA STATISTICS OF LAND USE / COVER AND LAND RECLAMATION IN OC MINES PRODUCING ((<5 MCU.M OF (COAL+OB)) OF WCL BASED ON SATELLITE DATA OF THE YEAR 2020
Area in Hectare
CMPDI
561410027(WCL) 24
Plate – 5.1

CMPDI
561410027(WCL) 25
Plate – 5.2

CMPDI
561410027(WCL) 26
Plate – 5.3

CMPDI
561410027(WCL) 27
Plate – 5.4
CMPDI
561410027(WCL) 28
Plate – 5.5
CMPDI
561410027(WCL) 29
Plate – 5.6
CMPDI
561410027(WCL) 30
Plate – 5.7
CMPDI
561410027(WCL) 31
Plate – 5.8

CMPDI
561410027(WCL) 32
Plate – 5.9 5.76
CMPDI
561410027(WCL) 33
Plate – 5.10
CMPDI
561410027(WCL) 34
Plate –5.11

CMPDI
561410027(WCL) 35
Plate –5.12

CMPDI
561410027(WCL) 36
Plate – 5.13

CMPDI
561410027(WCL) 37
Plate – 5.14 5.76
CMPDI
561410027(WCL) 38
Plate – 5.15 5.76

CMPDI
Job No 561410027 (WCL) 39
Figure-5.2
Figure-5.3
0
50
100
150
200
Settlement Plantation VegetationCover
Wasteland Mining Area Surfacewater
1.60
47.1
9
116.
42
30.5
8
157.
65
0.00
0.8
4
59.
64
118
.68
90.
99
94.
00
2.4
0
2.6
9
98.
46
152
.69
65.
80
129
.43
2.3
1
Are
a i
n H
a.
Landuse /Cover Classes
Status of Land Reclamation in Kolgaon OCP
2014
2017
2020
Year
0
50
100
150
200
250
Settlement Plantation VegetationCover
Wasteland Mining Area Surfacewater
0.14 28
.26
91.7
5
8.27
149.
95
0.00
0.16 60
.62 11
0.66
38.1
7
199.
97
0.00
0.3
3
77.
31
140
.47
22.
52
240
.86
2.1
6
Are
a in
Ha
.
Landuse /Cover Classes
Status of Land Reclamation in Bellora-Naigaon OCP
2014
2017
2020
Year

CMPDI
Job No 561410027 (WCL) 40
Figure - 5.4
Figure - 5.5
0
50
100
150
Settlement Plantation VegetationCover
Wasteland Mining Area Surfacewater
3.21
3.01
66.3
1
7.94
103.
77
0.00
0.8
7
6.7
5
78.
38
36.
98
72.
90
6.1
5
0.7
8
7.2
0
68.
20
49.
53
94.
24
0.3
1
Are
a in
Ha.
Landuse /Cover Classes
Status of Land Reclamation in Ghonsa OCP
2014
2017
2020
Year
0
50
100
150
Settlement Plantation VegetationCover
Wasteland Mining Area Surfacewater
1.70
63.9
1 77.9
5
13.1
8
99.9
8
40.1
7
1.8
6
94.
75
142
.17
64.
10
134
.32
88.
11
1.9
7
94.
23
96.
70
12.
70
125
.90
2.4
1
Are
a in
Ha.
Landuse /Cover Classes
Status of Land Reclamation in Ballarpur OCP
2014
2017
2020
Year

CMPDI
Job No 561410027 (WCL) 41
Figure - 5.6
Figure - 5.7
0
60
120
180
240
300
Settlement Plantation VegetationCover
Wasteland Mining Area Surfacewater
0.41 23
.96
30.4
0
10.7
3 114.
84
0.00
1.9
1
65.
45 102
.39
24.
50
180
.88
0.0
0
2.4
0 96.
84
124
.32
35.
05
222
.58
7.5
5
Are
a i
n H
a.
Landuse /Cover Classes
Status of Land Reclamation in Junad Extn OCP
2014
2017
2020
Year
0
50
100
150
Settlement Plantation VegetationCover
Wasteland Mining Area Surfacewater
3.55 3.90
115.
33
23.7
2 82.8
7
0.00
1.9
5
3.3
4
24
.85
47
.74
10
5.0
8
0.5
9
3.1
4
12
.66
41.6
8
47.9
6
91
.82
0.0
0
Are
a i
n H
a.
Landuse /Cover Classes
Status of Land Reclamation in Urdhan OCP
2014
2017
2020
Year
CMPDI
Job No 561410027 (WCL) 42
Figure - 5.8
Figure-5.9
0
40
80
120
160
200
Settlement Plantation VegetationCover
Wasteland Mining Area Surfacewater
1.15
38.6
9
61.0
5
20.3
3
168.
91
2.26
1.6
5
62.5
0
69.4
5
26.3
3
158.
32
10.9
1
1.5
4 79.0
1
81.3
3
10.5
5
167.
91
6.9
7
Are
a i
n H
a.
Landuse /Cover Classes
Status of Land Reclamation in Telwasa OCP
2014
2017
2020
Year
0
80
160
240
320
400
Settlement Plantation VegetationCover
Wasteland Mining Area Surface water
2.9
3
236
.91
268
.00
44.
93
331
.08
5.4
0
2.9
4
243
.28
266
.32
51.
79
326
.62
5.4
1
2.5
6
276
.39
295
.03
42.
98
302
.14
5.0
1
Are
a i
n H
a.
Landuse /Cover Classes
Status of Land Reclamation in Gouri Expn(A)OCP
2014
2017
2020
Year

CMPDI
Job No 561410027 (WCL) 43
Figure-5.10
Figure-5.11
0
50
100
150
200
250
300
Settlement Plantation VegetationCover
Wasteland Mining Area Surfacewater
4.12
50.6
4
89.5
0
30.3
1
178.
72
0.00
6.5
9
58
.91
15
6.0
0
61
.74
19
4.2
5
10
.66
6.7
8
76.
98
164
.38
79.
84
260
.07
15.
21
Are
a i
n H
a.
Landuse /Cover Classes
Status of Land Reclamation in Bhatadi OCP
2014
2017
2020
Year
0
100
200
300
400
Settlement Plantation VegetationCover
Wasteland Mining Area Surfacewater
10.4
0
122.
47
295.
78
42.6
1
263.
08
1.30
7.0
9
136.
03
215.
32
84.1
6
260.
95
0.0
0
5.9
0
135
.62
182
.05
50.
89
383
.69
0.0
0
Are
a i
n H
a.
Landuse /Cover Classes
Status of Land Reclamation in Gondegaon OCP
2014
2017
2020
Year
CMPDI
Job No 561410027 (WCL) 44
Figure-5.12
Figure-5.13
0
100
200
300
400
500
Settlement Plantation VegetationCover
Wasteland Mining Area Surfacewater
5.66
89.2
0
136.
75
10.4
7
278.
31
4.6914
.88
92.9
6
27
9.5
9
37
.85
43
4.9
6
11
.88
15.
76
127
.78
369
.81
62.
92
418
.18
2.2
6
Are
a i
n H
a.
Landuse /Cover Classes
Status of Land Reclamation in Kolar-Pimpri OCP
2014
2017
2020
Year
0
10
20
30
40
50
Settlement Plantation VegetationCover
Wasteland Mining Area Surface water
2.05
22.8
1 30.8
2
3.24
44.4
1
1.46
1.1
8
23
.24
26.
12
2.7
6
45.
92
1.3
7
1.0
3
23.
31 33.
29
0.9
9
46.
10
0.1
9
Are
a i
n H
a.
Landuse /Cover Classes
Status of Land Reclamation in Chhinda OCP
2014
2017
2020
Year

CMPDI
Job No 561410027 (WCL) 45
Figure-5.14
Figure-5.15
0
40
80
120
160
Settlement Plantation VegetationCover
Wasteland Mining Area Surfacewater
0.95 5.22
80.8
8
14.2
1 65.4
7
2.66
0.5
6
6.1
9
45.
03 15.
39
132
.35
1.9
1
1.1
9
8.0
0
47.
90
11.
22
151
.70
2.9
1
Are
a i
n H
a.
Landuse /Cover Classes
Status of Land Reclamation in Gouri Deep OCP
2014
2017
2020
Year
0
60
120
180
Settlement Plantation VegetationCover
Wasteland Mining Area Surfacewater
0.00
30.9
8
62.6
9
29.7
9
167.
99
34.8
7
2.9
3 79.
69 109
.33
83.
60
115
.38
14.
63
1.3
7
108
.38
119
.63
29.
40
166
.97
8.5
0
Are
a i
n H
a.
Landuse /Cover Classes
Status of Land Reclamation in Juna Kunada OCP
2014
2017
2020
Year
CMPDI
Job No 561410027 (WCL) 46
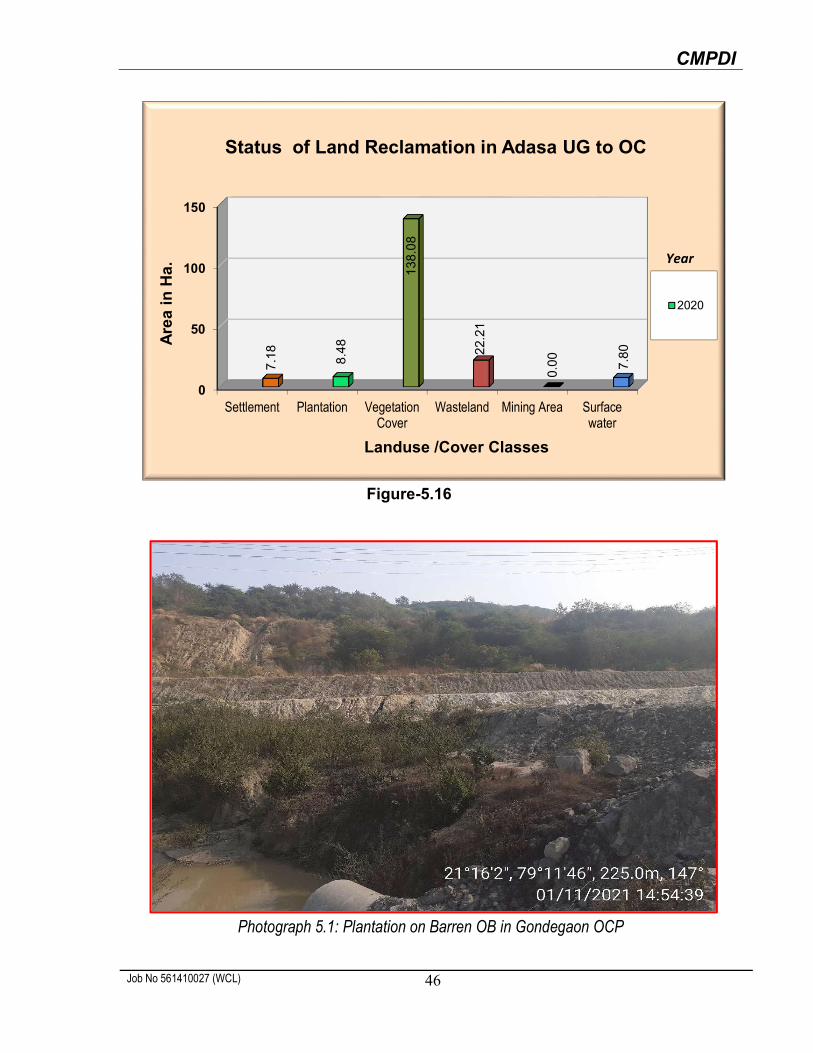
Figure-5.16
Photograph 5.1: Plantation on Barren OB in Gondegaon OCP
0
50
100
150
Settlement Plantation VegetationCover
Wasteland Mining Area Surfacewater
7.1
8
8.4
8
138
.08
22.
21
0.0
0
7.8
0Are
a i
n H
a.
Landuse /Cover Classes
Status of Land Reclamation in Adasa UG to OC
2020
Year

CMPDI
Job No 561410027 (WCL) 47
Photograph 5.2: Plantation on Barren OB in Junad Extn OCP
Photograph 5.3: Plantation on embankment in Kolgaon OCP

CMPDI
Job No 561410027 (WCL) 48
Photograph 5.4: Plantation on Barren OB dump in Kolgaon OC
Photograph 5.5: Plantation under social forestry in Bellora - Naigaon OCP

CMPDI
Job No 561410027 (WCL) 49
Photograph 5.6: Plantation on Barren OB Dump in Bellora - Naigaon OCP
Photograph 5.7: Plantation on embankment in Ballarpur OCP
CMPDI
Job No 561410027 (WCL) 50
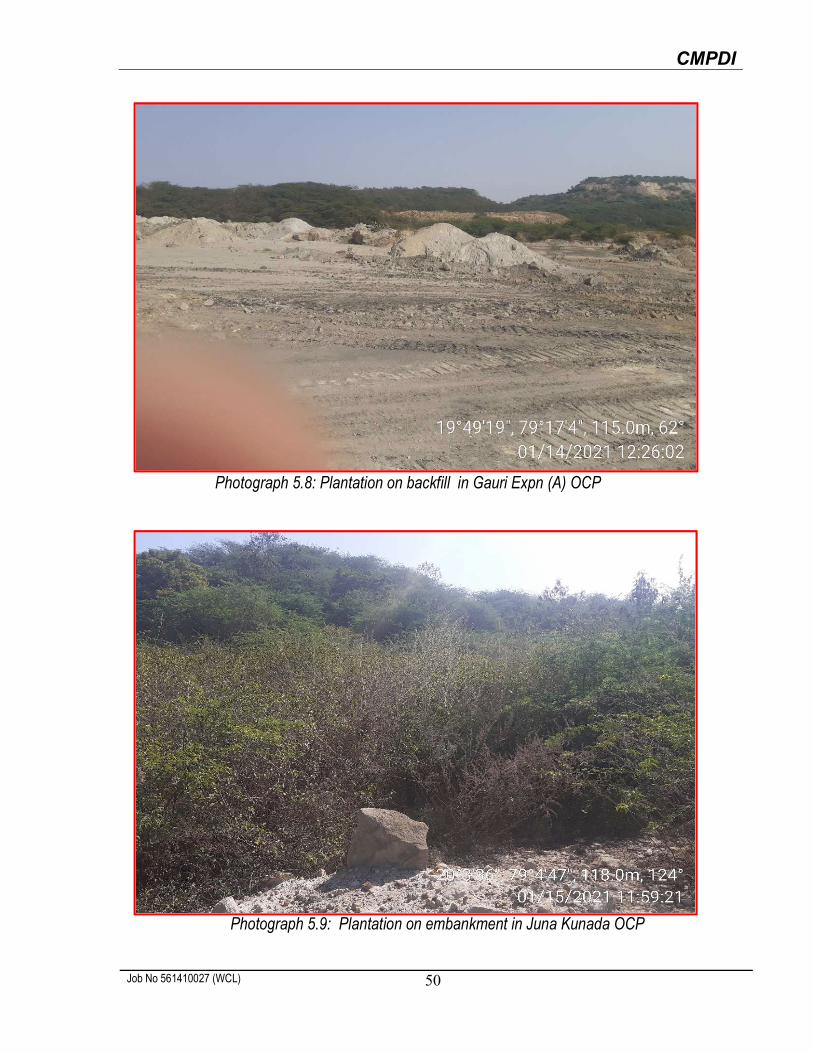
Photograph 5.8: Plantation on backfill in Gauri Expn (A) OCP
Photograph 5.9: Plantation on embankment in Juna Kunada OCP
CMPDI
Job No 561410027 (WCL) 51
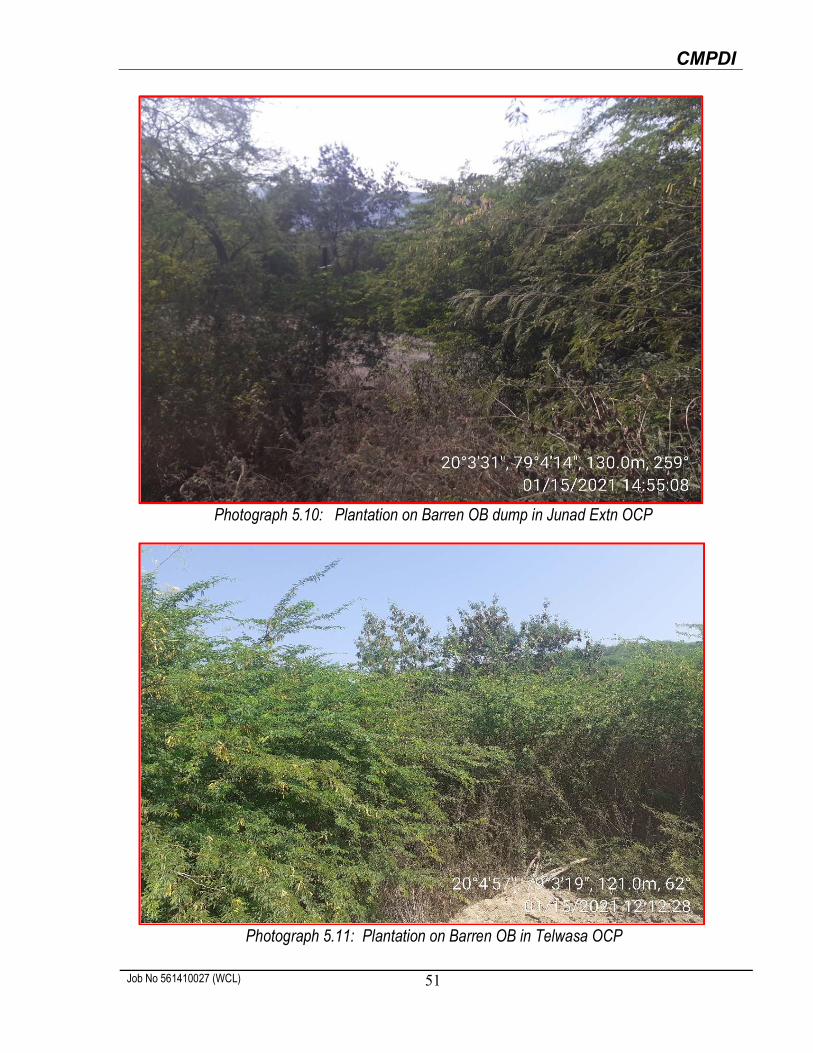
Photograph 5.10: Plantation on Barren OB dump in Junad Extn OCP
Photograph 5.11: Plantation on Barren OB in Telwasa OCP
CMPDI
Job No 561410027 (WCL) 52
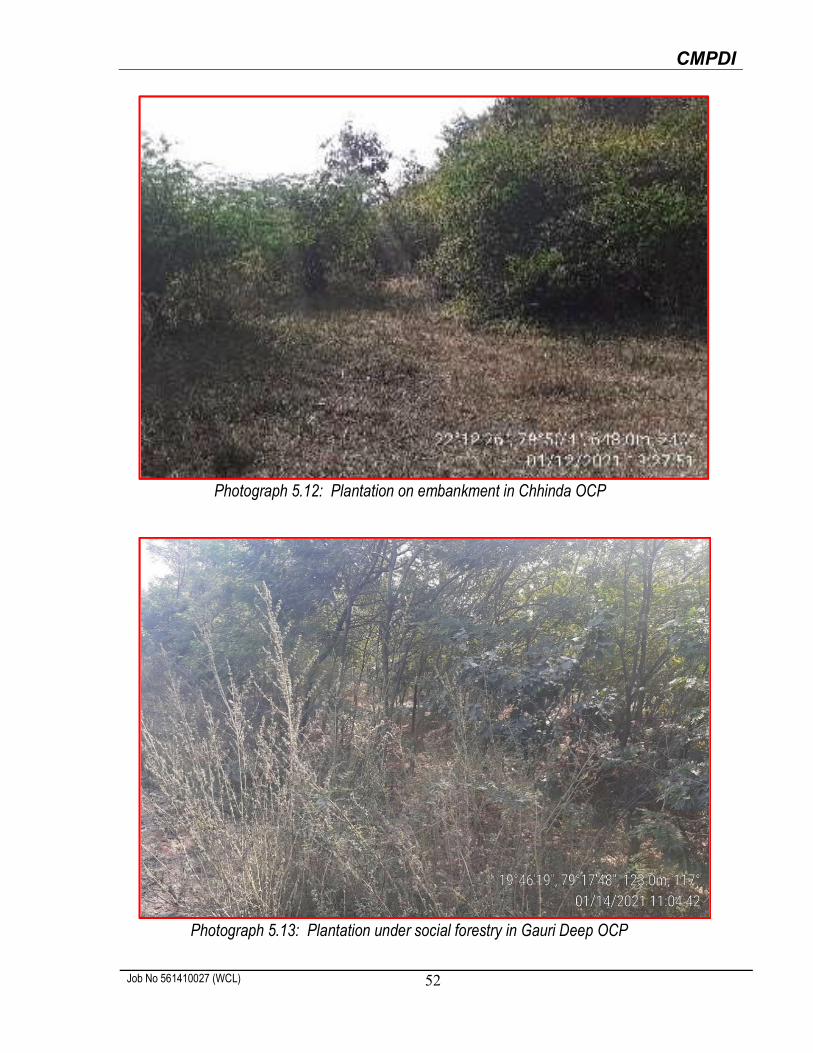
Photograph 5.12: Plantation on embankment in Chhinda OCP
Photograph 5.13: Plantation under social forestry in Gauri Deep OCP
CMPDI
Job No 561410027 (WCL) 53
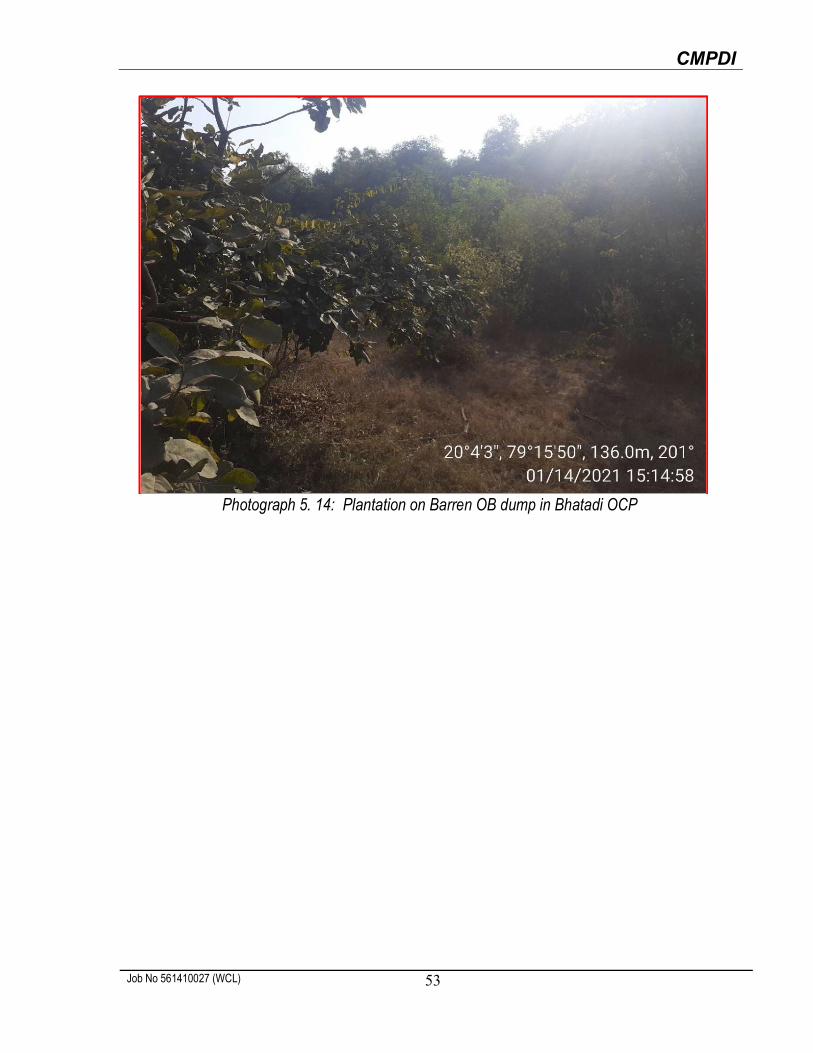
Photograph 5. 14: Plantation on Barren OB dump in Bhatadi OCP

SOUTH EASTERN COALFIELDS LIMITED

CMPDI
Job No 561410027 (SECL) 55
6.0 Land Reclamation Status in South Eastern Coalfields Limited
6.1 Following 07 opencast and 02 Underground mine of SECL producing less than 5 million
cubic m. (Coal+OB) together, have been taken up for land reclamation monitoring during
the year 2020-21 :
Sharda OC
Baroud OC
Chhal OC
Kanchan OC
Mahan II OC
Rajgamar UG
Behraband UG
Saraipali OC
Bijari OC
6.2 Project wise Land Reclamation status in SECL is given in Table 6.1 and also shown
graphically in Fig 6.1. Area statistics of different land use class present in the mine leasehold
of the above projects for the year 2020 are shown in the Table – 6.2. Land use maps derived
from satellite data are shown in Plate 6.2 - 6.10. Different land use classes based on satellite
data are depicted in Bar Charts in Fig.6.2 - 6.10.
6.3 Study reveals that out of total mine leasehold area of 8989.38 Hectares of the 07 OC and
02 UG mine of SECL mentioned above taken for this study in 2020-21; total excavated area
is 1251.35 Ha., out of which 249.48 Ha. (19.94%) has been planted (Biologically
Reclaimed), 592.32 Ha. (47.33%) is under backfilling (Technically Reclaimed) and balance
409.55 hectares (32.73%) is under active mining.
6.4 On comparing the status of land reclamation for the year 2020 with respect to the year
2017 in projects taken for land reclamation, it is evident that area of land reclamation has

CMPDI
Job No 561410027 (SECL) 56
increased from 708.00 Ha (Yr. 2017) to 841.80 Ha (Yr. 2020). This increase of 133.80 Ha
area in land reclamation includes both plantation on Backfill (Biological Reclamation) and
area under backfilling (Technical Reclamation) which are 68.48 Ha and 65.32 Ha
respectively.
6.5 After analyzing the satellite data of year 2020, it is evident that plantation carried out on
backfilled area, OB dumps as well as under social forestry in all the mines of SECL taken
up for study has reached to 430.92 Ha(4.79%) area as compared to 201.00 Ha(9.77%) in
the year 2017 within the entire leasehold area of 8989.38 Ha. Two projects (Rajgamar UG
and Behraband UG) considered during the year 2020-21 are underground mines.
Decrease of 3.6 in percentage of total area under plantation is due to increase in area of
leasehold boundary this year as percentage of Green Cover is calculated with respect to
area of leasehold boundary.
6.6 Leasehold area of Chhal OC has increased from 315 Ha (Yr 2017) to 1206.69 Ha (Yr 2020)
due to expansion of the project resulting which area under social forestry has increased to
43.15 Ha in the year 2020 as compared to 6.00 Ha in the year 2017. Whereas total area
under social forestry of all the above projects taken for land reclamation in the year 2020
has increased from 9.00 Ha to 117.67 Ha as 2 nos. each of underground and opencast
projects have been added in the year 2020.
6.7 It is revealed that area under Technical reclamation in Baroud and Sharda OCP, has
decreased from 239.00 Ha (Yr 2017) to 172.97 Ha (Yr 2020) and 84 Ha (yr 2017) to 62.00
Ha (yr 2020) respectively as more backfill area came under plantation on backfill.
6.8 Out of the 9 projects of SECL, Sharda OCP ranks on top for area under reclamation (74.58%)
followed by Baroud OCP (71.56%) and Kanchan OCP (70.69%).

CMPDI
Job No 561410027 (SECL) 57
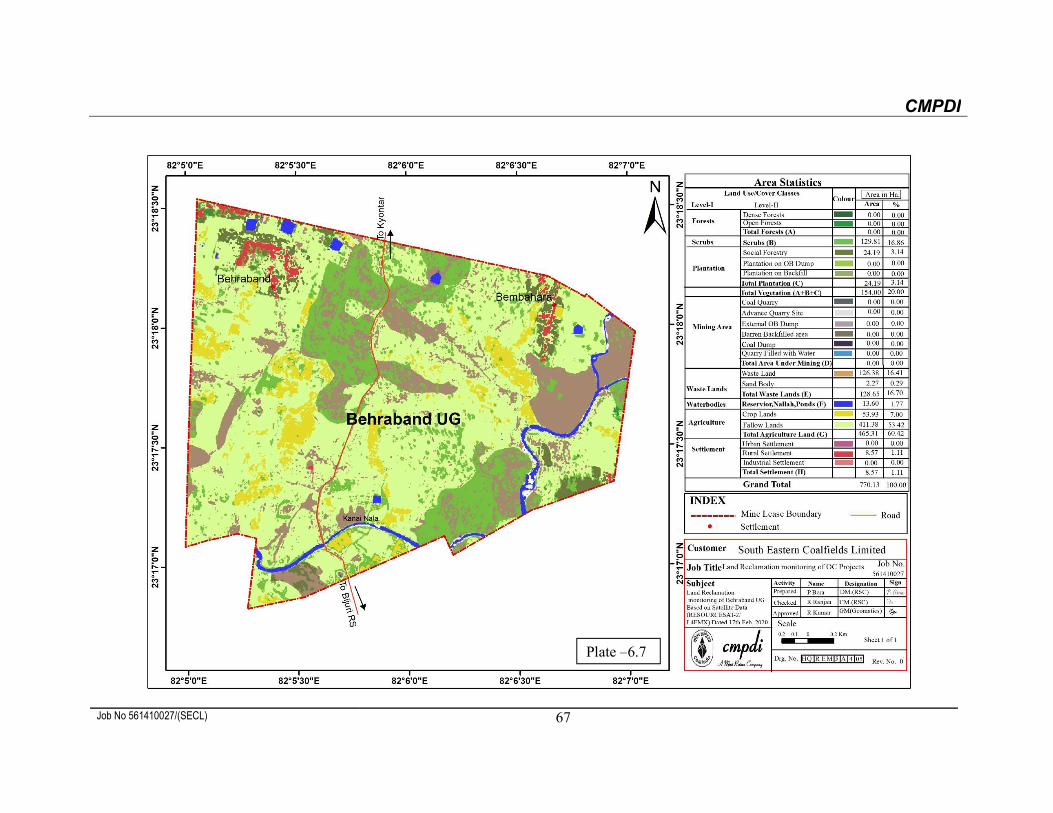
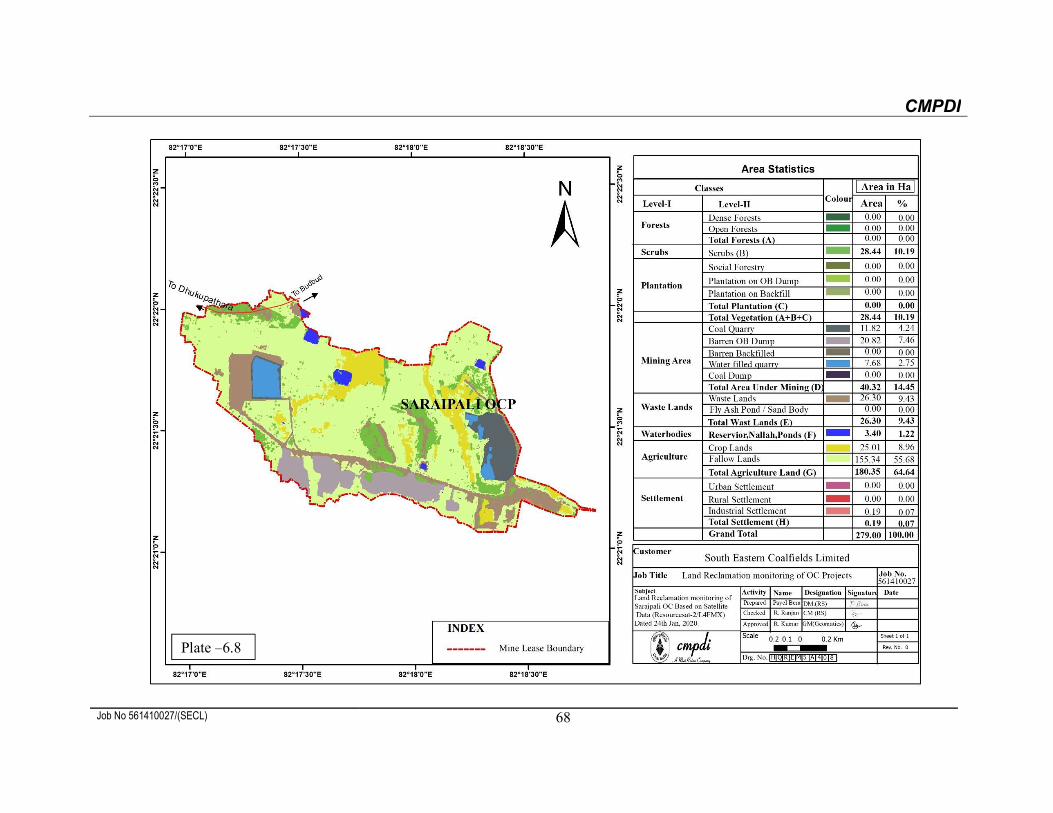
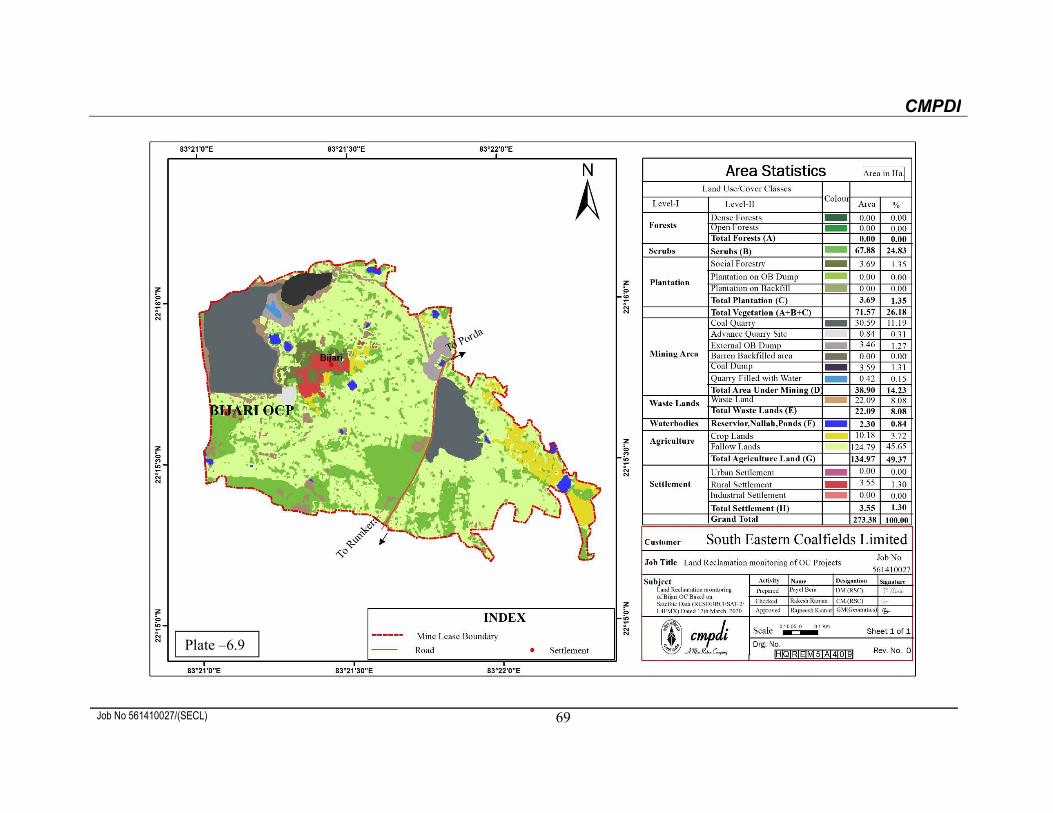
6.9 Out of the above 9 projects, 4 projects (Rajgamar UG, Behraband UG, Saraipali OC and
Bijari OC) are additional projects which have been taken up for the first time for Land
Reclamation monitoring in the year 2020-21. Updated leasehold boundary of Kanchan and
Chhal, Sharda and Baroud and leasehold boundaries of the above mentioned additional
projects were provided by SECL.

CMPDI
Job No 561410027/(SECL) 58
Table – 6.1 Project wise Land Reclamation Status in 07 Opencast Coal mines and 02 Underground mines of SECL
producing (< 5 million Cu. M. of Coal+OB) based on Satellite Data of the year 2020
1 2 3 4
2017 2020 2017 2020 2017 2020 2017 2020 2017 2020 2017 2020 2017 2020 2017 20201 Sharda OC 884.00 871.21 84.00 62.00 102.00 124.00 11.00 34.20 1.00 3.39 41.00 63.38 227.00 249.38 114.00 161.59 186.00 186.00
37.00% 24.86% 44.93% 49.72% 18.06% 25.42% 12.90% 18.55% 81.94% 74.58%2 Baroud OC 361.00 1111.40 239.00 172.97 25.00 42.20 0.00 26.72 2.00 3.00 34.00 85.53 298.00 300.70 27.00 71.92 264.00 215.17
80.20% 57.52% 8.39% 14.03% 11.41% 28.44% 7.48% 6.47% 88.59% 71.56%3 Chhal OC 315.00 1206.69 111.00 184.14 5.00 12.00 0.00 0.00 6.00 43.15 95.00 92.13 211.00 288.27 11.00 55.15 116.00 196.14
52.61% 63.88% 2.37% 4.16% 45.02% 31.96% 3.49% 4.57% 54.98% 68.04%4 Kanchan OC 201.00 693.99 33.00 67.53 22.00 37.28 0.00 0.00 0.00 0.00 50.00 43.45 105.00 148.26 22.00 37.28 55.00 104.81
31.43% 45.55% 20.95% 25.15% 47.62% 29.31% 10.95% 5.37% 52.38% 70.69%5 Mahan II OC 297.00 297.00 60.00 105.68 27.00 34.00 0.00 2.85 0.00 2.72 71.00 70.12 158.00 209.80 27.00 39.57 87.00 139.68
37.97% 50.37% 17.09% 16.21% 44.94% 33.42% 9.09% 13.32% 55.06% 66.58%6 Rajgamar UG - 3486.58 - 0.00 - 0.00 - 0.00 - 37.53 - 0.00 - 0.00 - 37.53 - 0.00
0.00% 0.00% 0.00% 0.00% 0.00% 0.00% 0.00% 1.08% 0.00% 0.00%7 Behraband UG - 770.13 - 0.00 - 0.00 - 0.00 - 24.19 - 0.00 - 0.00 - 24.19 - 0.00
0.00% 0.00% 0.00% 0.00% 0.00% 0.00% 0.00% 3.14% 0.00% 0.00%8 Saraipali OC - 279.00 - 0.00 - 0.00 - 0.00 - 0.00 - 19.50 - 19.50 - 0.00 - 0.00
0.00% 0.00% 0.00% 0.00% 0.00% 0.00% 0.00% 0.00% 0.00% 0.00%9 Bijari OC - 273.38 - 0.00 - 0.00 - 0.00 - 3.69 - 35.44 - 35.44 - 3.69 - 0.00
0.00% 0.00% 0.00% 0.00% 0.00% 0.00% 0.00% 1.35% 0.00% 0.00%
2058.00 8989.38 527.00 592.32 181.00 249.48 11.00 63.77 9.00 117.67 291.00 409.55 999.00 1251.35 201.00 430.92 708.00 841.80
52.75% 47.33% 18.12% 19.94% 29.13% 32.73% 9.77% 4.79% 70.87% 67.27%
(Area in Hectare)
Sl. No. ProjectTotal
Leasehold Area 2017
Total Leasehold Area 2020
Technical Reclamation
Plantation
Area Under Active Mining
Total Excavated Area
Total Area Under Plantation
(%Green Cover Generated in Leasehold)
Total Area Under Reclamation
Biological Reclamation
Other Plantation
Area under Backfilling
Plantation on Excavated/Backfilled
Area
Plantation on External Over Burden Dump
Social Forestry, Avenue
Plantation Etc.5 6 7 8 10(=5+6+9) 11(=6+7+8) 12(=5+6)
Total(SECL)
(% is calculated with respect to excavated area as applicable)
9
Note : In reference of the above Table, different parameters are classified as follows :
1. Area under Biological Reclamation includes areas under plantation done on backfilled area only. 2. Area under Technical Reclamation includes area under barren backfilled only 3. Area under Active mining includes coal quarry site, quarry filled with water. Area of Coal Dump has been excluded from Area under Active Mining in this table. 4. Social Forestry and Plantation on external OB dump are not included in Biological Reclamation and are put under separate categories as shown in the table. 5. (%) calculated in the above table is in respect of total excavated area except for “Total area under plantation” where % is in terms of leasehold area. 6. Rajgamar UG, Behraband UG, Saraipalli OCP and Bijari OCP have been included for land reclamation monitoring in the year 2020 for the first time.

CMPDI
Job No 561410027/(SECL) 59
Fig.6.1: Land Reclamation status in 07 OC and 02 UG mines of SECL in the year-2020
871.
21 1111
.40
1206
.99
693.
99
297.
00
3486
.85
770.
13
279.
00
273.
38
249.
38
300.
70
288.
27
148.
26
209.
80
0.00
0.00
19.5
0
35.4
4
186.
00
215.
17
196.
14
104.
81
139.
68
0.00
0.00 0.00
0.00
0
1000
2000
3000
4000
Sharda OC Baroud OC Chhal OC Kanchan OC Mahan II OC Rajgamar UG Behraband UG Saraipali OC Bijari OC
AREA
IN H
ECTA
RE
LEASEHOLD AREA
EXCAVATED AREA
AREA UNDERRECLAMATION
PROJECTWISE STATUS OF LAND RECLAMATION IN SECL FOR THE YEAR 2020
OPENCAST AND UG PROJECTS

CMPDI
Job No 561410027/(SECL) 60
Table6.2 Project wise area statistics of Land use / Cover classes and land reclamation in opencast and UG Mines producing < 5 M.C.M of (Coal + OB) of. S.E.C.L based on Satellite data of the Year 2020

CMPDI
Job No 561410027/(SECL) 61
Plate –6.1

CMPDI
Job No 561410027/(SECL) 62
Plate –6.2

CMPDI
Job No 561410027/(SECL) 63
Plate –6.3

CMPDI
Job No 561410027/(SECL) 64
Plate –6.4

CMPDI
Job No 561410027/(SECL) 65
Plate –6.5

CMPDI
Job No 561410027/(SECL) 66
Plate –6.6
CMPDI
Job No 561410027/(SECL) 67
Plate –6.7
CMPDI
Job No 561410027/(SECL) 68
Plate –6.8
CMPDI
Job No 561410027/(SECL) 69
Plate –6.9
CMPDI
Job No 561410027 (SECL) 70
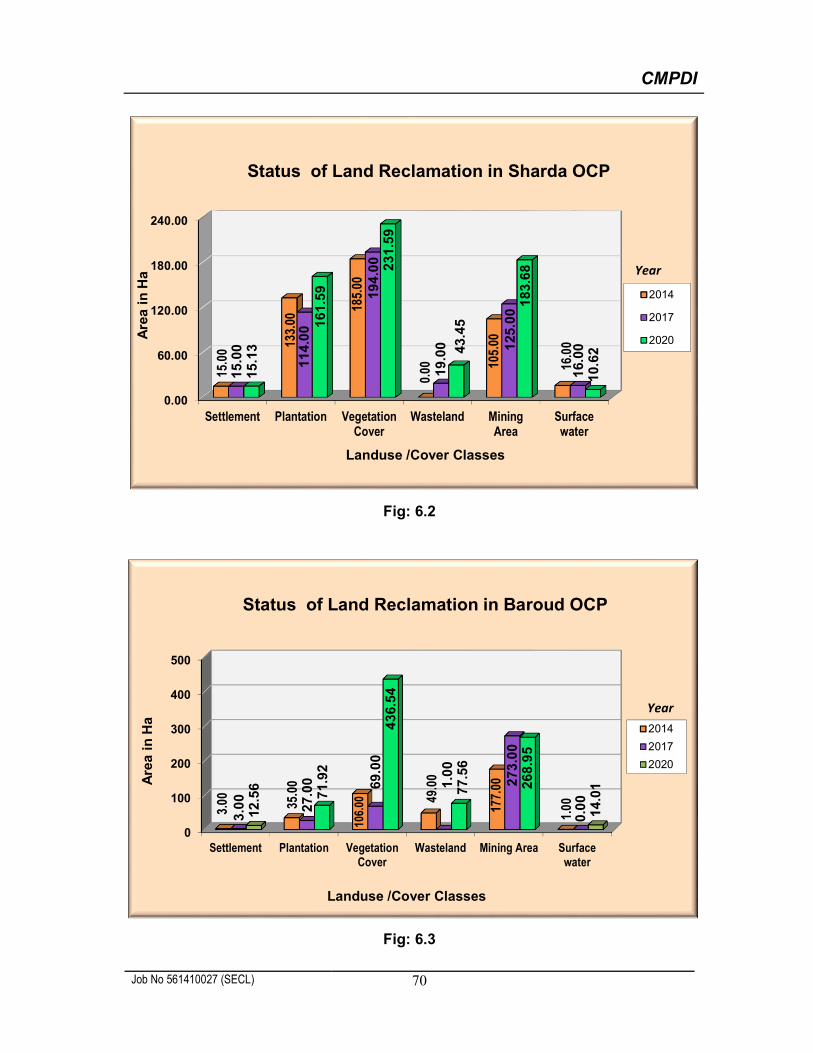
Fig: 6.2
Fig: 6.3
0.00
60.00
120.00
180.00
240.00
Settlement Plantation VegetationCover
Wasteland MiningArea
Surfacewater
15.0
0 133.
00
185.
00
0.00 10
5.00
16.0
0
15.0
0
114
.00
194
.00
19.
00 125
.00
16.
00
15.1
3
161
.59
231
.59
43.
45
183
.68
10.
62
Are
a i
n H
a
Landuse /Cover Classes
Status of Land Reclamation in Sharda OCP
2014
2017
2020
Year
0
100
200
300
400
500
Settlement Plantation VegetationCover
Wasteland Mining Area Surfacewater
3.00 35
.00
106.
00 49.0
0
177.
00
1.00
3.0
0
27.
00 69.0
0
1.0
0
273
.00
0.0
0
12.5
6
71.
92
436
.54
77.
56
268
.95
14.
01
Are
a i
n H
a
Landuse /Cover Classes
Status of Land Reclamation in Baroud OCP
2014
2017
2020
Year

CMPDI
Job No 561410027 (SECL) 71
Fig: 6.4
Fig: 6.5
0
50
100
150
200
Settlement Plantation VegetationCover
Wasteland MiningArea
Surfacewater
1.00 11.0
0
52.0
0
43.0
0
212.
00
7.00
16.7
5 55.1
5
437
.83
136.
82
283.
17
19.1
2Are
a i
n H
a
Landuse /Cover Classes
Status of Land Reclamation in Chhal OCP
2017
2020
Year
0
40
80
120
Settlement Plantation VegetationCover
Wasteland Mining Area Surfacewater
0.00
25.0
0
28.0
0
6.00
84.0
0
0.00
0.0
0
22.0
0
47.
00
6.0
0
83.0
0
1.0
09.4
3
37.2
8
118
.83
17.
47
110
.98
3.2
8
Are
a i
n H
a
Landuse /Cover Classes
Status of Land Reclamation in Kanchan OCP
2014
2017
2020
Year

CMPDI
Job No 561410027 (SECL) 72
Fig: 6.6
Fig: 6.7
0
50
100
150
200
Settlement Plantation VegetationCover
Wasteland Mining Area Surfacewater
2.00 27
.00
63.0
0
17.0
0
95.0
0
1.00
4.0
0 27.
00
75.
00
9.0
0
142
.00
1.0
0
2.2
2
39.
57
72
.89
22
.14
18
2.4
0
0.4
5
Are
a in
Ha
Landuse /Cover Classes
Status of Land Reclamation in Mahan II OC
2014
2017
2020
Year
0
1000
2000
3000
Settlement Plantation VegetationCover
Wasteland Mining Area Surfacewater
45.0
6
37.5
3
2767
.23
264.
76
0.00
28.5
5
Are
a i
n H
a
Landuse /Cover Classes
Status of Land Reclamation in Rajgamar UG
Year2020

CMPDI
Job No 561410027 (SECL) 73
Fig: 6.8
Fig: 6.9
0
50
100
150
200
Settlement Plantation VegetationCover
Wasteland Mining Area Surfacewater
8.57 24
.19
154.
00
128.
65
0.00 13
.60
Are
a i
n H
a
Landuse /Cover Classes
Status of Land Reclamation in Behraband UG
Year2020
0
10
20
30
40
Settlement Plantation VegetationCover
Wasteland MiningArea
Surfacewater
0.19
0.00
28.4
4
26.3
0
40.3
2
3.40A
rea
in
Ha
Landuse /Cover Classes
Status of Land Reclamation in Saraipali OC
Year2020

CMPDI
Job No 561410027 (SECL) 74
Fig: 6.10
Photo 6.1: Area under Backfilling in Baroud OCP
0
20
40
60
80
Settlement Plantation VegetationCover
Wasteland MiningArea
Surfacewater
3.55 3.69
71.5
7
22.0
9 38.9
0
2.30
Are
a i
n H
a
Landuse /Cover Classes
Status of Land Reclamation in Bijari OC
2020
Year

CMPDI
Job No 561410027 (SECL) 75
Photo 6.2: Plantation on Backfill in Baroud OCP
Photo 6.3: Plantation on Backfill in Baroud OCP

CMPDI
Job No 561410027 (SECL) 76
Photo 6.4: Plantation on Backfill in Sharda OCP
Photo 6.5: Plantation on Backfill in Kanchan OCP

CMPDI
Job No 561410027 (SECL) 77
Photo 6.7: OB Dump in Saraipali OCP
Photo6.8: Quarry of Saraipali OCP

CMPDI
Job No 561410027 (SECL) 78
Photo 6.9: plantation on Embankment in Chhal OCP
Photo 6.10: plantation on backfill in Chhal OCP

CENTRAL COALFIELDS LIMITED

CMPDI
Job No 561410027 (CCL) 80
7.0 Land Reclamation Status in Central Coalfields Limited
7.1 Following 13 opencast projects of CCL producing less than 5 million cubic m.
(Coal+OB) together, have been taken up for land reclamation monitoring during the
year 2020-21 :
Rohini
Purnadih
Tapin
Jharkhand
Topa
Urimari
North Urimari
New Giddi -C
Govindpur
Khasmahal
Amlo
Selected Dhori
Tarmi
7.2 Project wise Land Reclamation status in CCL is given in Table 7.1 and also shown
graphically in Fig 7.1. Area statistics of different land use class present in the mine
leasehold of the above projects for the year 2017 are shown in the Table - 7.2. Land
use maps derived from satellite data are shown in Plate 7.1 – 7.13. Different land use
classes based on satellite data are depicted in Bar Charts in Fig. 7.2 - 7.14.
7.3 Study reveals that out of total mine leasehold area of 6376.05 Hectares of the 13 OC
projects of CCL mentioned above taken for this study in 2020-21; total excavated area
is 1697.00 Hectares, out of which 239.74 Ha. (14.13%) has been planted (Biologically
Reclaimed), 702.86 Ha. (41.42%) area is under backfilling (Technically Reclaimed) and
balance 754.40 hectares (44.45%) is under active mining.

CMPDI
Job No 561410027 (CCL) 81
7.4 Total area under Land Reclamation in all projects of CCL taken for this study during the
year 2020 has increased from 446.45 Ha (36.87%) (Yr.2017) to 942.60 Ha (55.55%)
(Yr. 2020). This increase of 496.15 Hectare in area under reclamation includes both
69.54 Ha increase in plantation on backfill (Biological Reclamation) and 426.61 Ha
increase in area under backfilling (Technical reclamation).
7.5 After analyzing the satellite data of year 2020, it is evident that plantation (Green Cover)
carried out on backfilled area, OB dumps as well as under social forestry in all the 13 mines
of CCL taken up for study, has reached to 444.02 Ha (6.96%) till now as compared to
374.45 Ha (5.87%) in the Year 2017.
7.6 Study indicates that overall all the projects of CCL considered for this study indicate
increase or static trend in area under backfilling (Technical Reclamation) with respect
to the year 2017, except in Amlo OC where area under technical reclamation has
decreased from 49.50 hectare in the year 2017 to 39.51 Hectare in the year 2020
resulting which area under reclamation has decreased from 56.93 Ha to 54.09 Ha.
Whereas plantation on backfill in above project has increased from 7.43 Ha (Yr.2017)
to 14.58 Ha (Yr.2020) as more area under backfilling has come under plantation on
backfill.
7.7 After analyzing the satellite data of the year 2017 and 2020, it is evident that total area
under plantation (Green cover) carried out on backfill area, OB dumps as well as under
social forestry in all the mines of CCL has increased from 374.45 Ha to 444.02 Ha during
span of three years. This increase of 69.57 Hectare area of plantation (Green cover) in
three year is due to sincere effort of CCL towards mine land reclamation and
environment protection.
7.8 Decrease of 2.99 Hectare area under biological reclamation in Rohini OC, 3.63
Hectare in New Giddi-C OC, 0.36 Hectare in Govindpur OC and 1.93 Hectare in
Khasmahal OC in the span of three year is due to expansion of mining area. Plantation
on backfill (Biological Reclamation) in Tapin OC has not been started as yet. However,
CMPDI
Job No 561410027 (CCL) 82
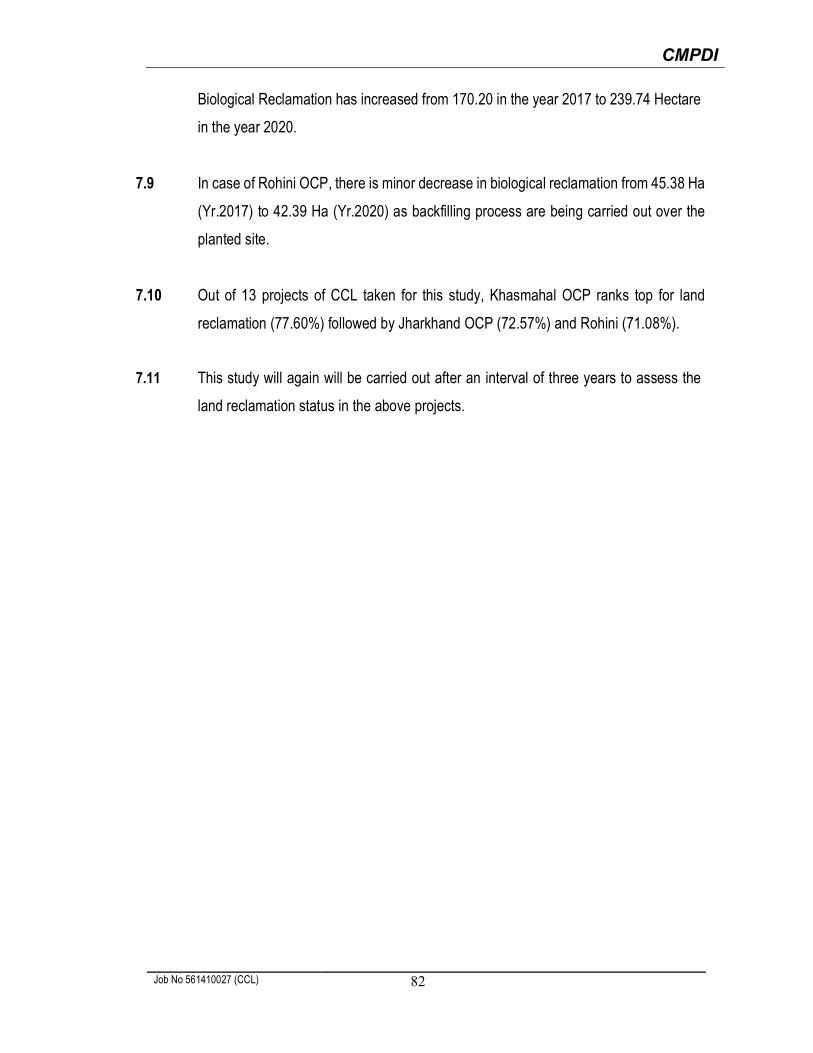
Biological Reclamation has increased from 170.20 in the year 2017 to 239.74 Hectare
in the year 2020.
7.9 In case of Rohini OCP, there is minor decrease in biological reclamation from 45.38 Ha
(Yr.2017) to 42.39 Ha (Yr.2020) as backfilling process are being carried out over the
planted site.
7.10 Out of 13 projects of CCL taken for this study, Khasmahal OCP ranks top for land
reclamation (77.60%) followed by Jharkhand OCP (72.57%) and Rohini (71.08%).
7.11 This study will again will be carried out after an interval of three years to assess the
land reclamation status in the above projects.

CMPDI
Job No 561410027 (CCL) 83
Table - 7.1
Project wise Land Reclamation Status in Opencast Projects of Central Coalfields Ltd. based on the Satellite data of the year 2020
1 22017 2020 2017 2020 2017 2020 2017 2020 2017 2020 2017 2020 2017 2020 2017 2020 2017 2020
1 Rohini 258.17 258.17 65.76 122.03 45.38 42.39 1.55 0.11 5.44 0.00 53.02 66.89 164.16 231.31 52.37 42.50 111.14 164.4240.06% 52.76% 27.64% 18.33% 32.30% 28.92% 20.29% 16.46% 67.70% 71.08%
2 Purnadih 756.00 756.00 0.00 40.71 0.00 8.58 0.06 3.01 0.15 0.15 109.40 95.40 109.40 144.69 0.21 11.74 0.00 49.290.00% 28.14% 0.00% 5.93% 100.00% 65.93% 0.03% 1.55% 0.00% 34.07%
3 Tapin 503.00 503.00 0.00 61.75 0.00 0.00 18.88 16.97 4.71 4.69 73.29 75.48 73.29 137.23 23.59 21.66 0.00 61.750.00% 45.00% 0.00% 0.00% 100.00% 55.00% 4.69% 4.31% 0.00% 45.00%
4 Jharkhand 323.88 323.88 24.73 91.21 28.85 38.25 11.34 0.33 2.48 2.48 57.13 48.93 110.71 178.39 42.67 41.06 53.58 129.4622.34% 51.13% 26.06% 21.44% 51.60% 27.43% 13.17% 12.68% 48.40% 72.57%
5 Topa 520.91 520.91 0.00 20.89 0.00 3.75 25.88 43.81 14.24 14.22 67.18 55.71 67.18 80.35 40.12 61.78 0.00 24.640.00% 26.00% 0.00% 4.67% 100.00% 69.33% 7.70% 11.86% 0.00% 30.67%
6 Urimari 1443.50 1443.50 24.16 91.58 25.03 48.80 7.56 0.06 37.59 42.67 81.97 63.74 131.16 204.12 70.18 91.53 49.19 140.3818.42% 44.87% 19.08% 23.91% 62.50% 31.23% 4.86% 6.34% 37.50% 68.77%
7 North Urimari 667.73 667.73 0.00 49.89 0.00 15.85 10.15 1.14 0.00 0.00 70.83 131.88 70.83 197.62 10.15 16.99 0.00 65.740.00% 25.25% 0.00% 8.02% 100.00% 66.73% 1.52% 2.54% 0.00% 33.27%
8 New Giddi-C 210.32 210.32 17.97 31.22 13.97 10.34 2.69 3.02 6.47 5.83 26.72 26.78 58.66 68.34 23.13 19.19 31.94 41.5630.63% 45.68% 23.82% 15.13% 45.55% 39.19% 11.00% 9.12% 54.45% 60.81%
9 Govindpur 274.95 274.95 23.36 66.56 17.86 17.50 5.16 2.03 0.00 0.22 69.50 60.02 110.72 144.08 23.02 19.75 41.22 84.0621.10% 46.20% 16.13% 12.15% 62.77% 41.66% 8.37% 7.18% 37.23% 58.34%
10 Khasmahal 280.00 280.00 26.23 33.23 23.84 21.91 6.78 8.81 7.14 7.14 15.48 15.92 65.55 71.06 37.76 37.86 50.07 55.1440.02% 46.76% 36.37% 30.83% 23.62% 22.40% 13.49% 13.52% 76.38% 77.60%
11 Amlo 247.59 247.59 49.50 39.51 7.43 14.58 15.27 15.27 1.53 1.53 26.02 39.62 82.95 93.71 24.23 31.38 56.93 54.0959.67% 42.16% 8.96% 15.56% 31.37% 42.28% 9.79% 12.67% 68.63% 57.72%
12 Selected Dhori 300.00 300.00 22.01 31.22 0.00 5.94 4.92 16.53 0.11 0.11 92.38 48.92 114.39 86.08 5.03 22.58 22.01 37.1619.24% 36.27% 0.00% 6.90% 80.76% 56.83% 1.68% 7.53% 19.24% 43.17%
13 Tarmi 590.00 590.00 22.53 23.06 7.84 11.85 12.62 12.62 1.53 1.53 21.62 25.11 51.99 60.02 21.99 26.00 30.37 34.9143.34% 38.42% 15.08% 19.74% 41.58% 41.84% 3.73% 4.41% 58.42% 58.16%
TOTAL 6376.05 6376.05 276.25 702.86 170.20 239.74 122.86 123.71 81.39 80.57 764.54 754.40 1210.99 1697.00 374.45 444.02 446.45 942.6022.81% 41.42% 14.05% 14.13% 63.13% 44.45% 5.87% 6.96% 36.87% 55.55%
Social Forestry, Avanue Plantation Etc.
10 (=5+6+7) 11(=4+5)
(% is calculated with respected to Excavated Area as applicable)
4 5 6 7 8 9 (=4+5+8)
Total Leasehold Area
3
(Area in Hectare)
Sl.No.
ProjectTechnical Reclamation
PlantationArea under Active
MiningTotal Excavated
Area
Total Area under Plantation
(% Green Cover Generated in Leasehold)
Total Area under Reclamation
Biological Reclamation Other Plantations
Area under BackfillingPlantation on Excavated /
Backfilled AreaPlantation on External
Over Burden Dumps
Note : In reference of the above Table, different parameters are classified as follows : 1. Area under Biological Reclamation includes areas under plantation done on backfilled area only. 2. Area under Technical Reclamation includes area under barren backfilled only 3. Area under Active mining includes coal quarry site, quarry filled with water etc. 4. Social Forestry and Plantation on external OB dump are not included in Biological Reclamation and are put under separate categories as shown in the table. 5. (%) calculated in the above table is in respect of total excavated area except for “Total area under plantation” where % is in terms of leasehold area.

CMPDI
Job No 561410027 (CCL) 84
Figure7.1: Land Reclamation status in OC Projects producing less than 5m.cm (Coal+OB) of CCL in the year 2020
0
200
400
600
800
1000
1200
1400
1600
Rohini Tapin Topa North Urimari Govindpur Amlo Tarmi
258.
17
756.
00
503.
00
323.
88 520.
91
1443
.50
667.
73
210.
32
274.
95
280.
00
247.
59
300.
00
590.
00
231.
31
144.
69
137.
23
178.
39
80.3
5 204.
12
197.
62
68.3
4
144.
08
71.0
6
93.7
1
86.0
8
60.0
2164.
42
49.2
9
61.7
5
129.
46
24.6
4 140.
38
65.7
4
41.5
6
84.0
6
55.1
4
54.0
9
37.1
6
34.9
1
Leasehold Area Excavated Area Area Under Reclamation (Bio+Tech)
Area
(Hec
tare
)
PROJECTWISE STATUS OF LAND RECLAMATION IN CCL FOR THE YEAR 2020
CMPDI
Job No 561410027 (CCL) 85
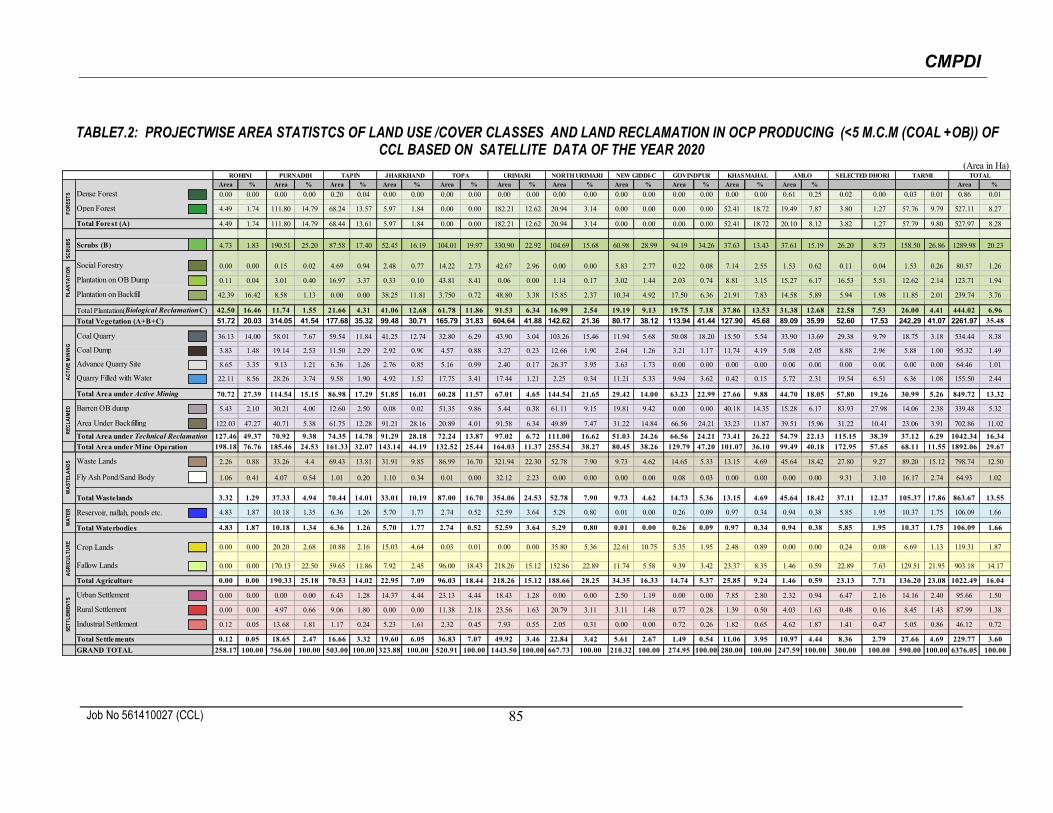
TABLE7.2: PROJECTWISE AREA STATISTCS OF LAND USE /COVER CLASSES AND LAND RECLAMATION IN OCP PRODUCING (<5 M.C.M (COAL +OB)) OF CCL BASED ON SATELLITE DATA OF THE YEAR 2020
Area % Area % Area % Area % Area % Area % Area % Area % Area % Area % Area % Area %
Dense Forest 0.00 0.00 0.00 0.00 0.20 0.04 0.00 0.00 0.00 0.00 0.00 0.00 0.00 0.00 0.00 0.00 0.00 0.00 0.00 0.00 0.61 0.25 0.02 0.00 0.03 0.01 0.86 0.01
Open Forest 4.49 1.74 111.80 14.79 68.24 13.57 5.97 1.84 0.00 0.00 182.21 12.62 20.94 3.14 0.00 0.00 0.00 0.00 52.41 18.72 19.49 7.87 3.80 1.27 57.76 9.79 527.11 8.27
Total Forest (A) 4.49 1.74 111.80 14.79 68.44 13.61 5.97 1.84 0.00 0.00 182.21 12.62 20.94 3.14 0.00 0.00 0.00 0.00 52.41 18.72 20.10 8.12 3.82 1.27 57.79 9.80 527.97 8.28
Scrubs (B) 4.73 1.83 190.51 25.20 87.58 17.40 52.45 16.19 104.01 19.97 330.90 22.92 104.69 15.68 60.98 28.99 94.19 34.26 37.63 13.43 37.61 15.19 26.20 8.73 158.50 26.86 1289.98 20.23
Social Forestry 0.00 0.00 0.15 0.02 4.69 0.94 2.48 0.77 14.22 2.73 42.67 2.96 0.00 0.00 5.83 2.77 0.22 0.08 7.14 2.55 1.53 0.62 0.11 0.04 1.53 0.26 80.57 1.26
Plantation on OB Dump 0.11 0.04 3.01 0.40 16.97 3.37 0.33 0.10 43.81 8.41 0.06 0.00 1.14 0.17 3.02 1.44 2.03 0.74 8.81 3.15 15.27 6.17 16.53 5.51 12.62 2.14 123.71 1.94
Plantation on Backfill 42.39 16.42 8.58 1.13 0.00 0.00 38.25 11.81 3.750 0.72 48.80 3.38 15.85 2.37 10.34 4.92 17.50 6.36 21.91 7.83 14.58 5.89 5.94 1.98 11.85 2.01 239.74 3.76
Total Plantation(Biological ReclamationC) 42.50 16.46 11.74 1.55 21.66 4.31 41.06 12.68 61.78 11.86 91.53 6.34 16.99 2.54 19.19 9.13 19.75 7.18 37.86 13.53 31.38 12.68 22.58 7.53 26.00 4.41 444.02 6.96
Total Vegetation (A+B+C) 51.72 20.03 314.05 41.54 177.68 35.32 99.48 30.71 165.79 31.83 604.64 41.88 142.62 21.36 80.17 38.12 113.94 41.44 127.90 45.68 89.09 35.99 52.60 17.53 242.29 41.07 2261.97 35.48
Coal Quarry 36.13 14.00 58.01 7.67 59.54 11.84 41.25 12.74 32.80 6.29 43.90 3.04 103.26 15.46 11.94 5.68 50.08 18.20 15.50 5.54 33.90 13.69 29.38 9.79 18.75 3.18 534.44 8.38
Coal Dump 3.83 1.48 19.14 2.53 11.50 2.29 2.92 0.90 4.57 0.88 3.27 0.23 12.66 1.90 2.64 1.26 3.21 1.17 11.74 4.19 5.08 2.05 8.88 2.96 5.88 1.00 95.32 1.49
Advance Quarry Site 8.65 3.35 9.13 1.21 6.36 1.26 2.76 0.85 5.16 0.99 2.40 0.17 26.37 3.95 3.63 1.73 0.00 0.00 0.00 0.00 0.00 0.00 0.00 0.00 0.00 0.00 64.46 1.01
Quarry Filled with Water 22.11 8.56 28.26 3.74 9.58 1.90 4.92 1.52 17.75 3.41 17.44 1.21 2.25 0.34 11.21 5.33 9.94 3.62 0.42 0.15 5.72 2.31 19.54 6.51 6.36 1.08 155.50 2.44
Total Area under Active Mining 70.72 27.39 114.54 15.15 86.98 17.29 51.85 16.01 60.28 11.57 67.01 4.65 144.54 21.65 29.42 14.00 63.23 22.99 27.66 9.88 44.70 18.05 57.80 19.26 30.99 5.26 849.72 13.32
Barren OB dump 5.43 2.10 30.21 4.00 12.60 2.50 0.08 0.02 51.35 9.86 5.44 0.38 61.11 9.15 19.81 9.42 0.00 0.00 40.18 14.35 15.28 6.17 83.93 27.98 14.06 2.38 339.48 5.32
Area Under Backfilling 122.03 47.27 40.71 5.38 61.75 12.28 91.21 28.16 20.89 4.01 91.58 6.34 49.89 7.47 31.22 14.84 66.56 24.21 33.23 11.87 39.51 15.96 31.22 10.41 23.06 3.91 702.86 11.02
Total Area under Technical Reclamation 127.46 49.37 70.92 9.38 74.35 14.78 91.29 28.18 72.24 13.87 97.02 6.72 111.00 16.62 51.03 24.26 66.56 24.21 73.41 26.22 54.79 22.13 115.15 38.39 37.12 6.29 1042.34 16.34
Total Area under Mine Operation 198.18 76.76 185.46 24.53 161.33 32.07 143.14 44.19 132.52 25.44 164.03 11.37 255.54 38.27 80.45 38.26 129.79 47.20 101.07 36.10 99.49 40.18 172.95 57.65 68.11 11.55 1892.06 29.67
Waste Lands 2.26 0.88 33.26 4.4 69.43 13.81 31.91 9.85 86.99 16.70 321.94 22.30 52.78 7.90 9.73 4.62 14.65 5.33 13.15 4.69 45.64 18.42 27.80 9.27 89.20 15.12 798.74 12.50
Fly Ash Pond/Sand Body 1.06 0.41 4.07 0.54 1.01 0.20 1.10 0.34 0.01 0.00 32.12 2.23 0.00 0.00 0.00 0.00 0.08 0.03 0.00 0.00 0.00 0.00 9.31 3.10 16.17 2.74 64.93 1.02
Total Wastelands 3.32 1.29 37.33 4.94 70.44 14.01 33.01 10.19 87.00 16.70 354.06 24.53 52.78 7.90 9.73 4.62 14.73 5.36 13.15 4.69 45.64 18.42 37.11 12.37 105.37 17.86 863.67 13.55
Reservoir, nallah, ponds etc. 4.83 1.87 10.18 1.35 6.36 1.26 5.70 1.77 2.74 0.52 52.59 3.64 5.29 0.80 0.01 0.00 0.26 0.09 0.97 0.34 0.94 0.38 5.85 1.95 10.37 1.75 106.09 1.66
Total Waterbodies 4.83 1.87 10.18 1.34 6.36 1.26 5.70 1.77 2.74 0.52 52.59 3.64 5.29 0.80 0.01 0.00 0.26 0.09 0.97 0.34 0.94 0.38 5.85 1.95 10.37 1.75 106.09 1.66
Crop Lands 0.00 0.00 20.20 2.68 10.88 2.16 15.03 4.64 0.03 0.01 0.00 0.00 35.80 5.36 22.61 10.75 5.35 1.95 2.48 0.89 0.00 0.00 0.24 0.08 6.69 1.13 119.31 1.87
Fallow Lands 0.00 0.00 170.13 22.50 59.65 11.86 7.92 2.45 96.00 18.43 218.26 15.12 152.86 22.89 11.74 5.58 9.39 3.42 23.37 8.35 1.46 0.59 22.89 7.63 129.51 21.95 903.18 14.17
Total Agriculture 0.00 0.00 190.33 25.18 70.53 14.02 22.95 7.09 96.03 18.44 218.26 15.12 188.66 28.25 34.35 16.33 14.74 5.37 25.85 9.24 1.46 0.59 23.13 7.71 136.20 23.08 1022.49 16.04
Urban Settlement 0.00 0.00 0.00 0.00 6.43 1.28 14.37 4.44 23.13 4.44 18.43 1.28 0.00 0.00 2.50 1.19 0.00 0.00 7.85 2.80 2.32 0.94 6.47 2.16 14.16 2.40 95.66 1.50
Rural Settlement 0.00 0.00 4.97 0.66 9.06 1.80 0.00 0.00 11.38 2.18 23.56 1.63 20.79 3.11 3.11 1.48 0.77 0.28 1.39 0.50 4.03 1.63 0.48 0.16 8.45 1.43 87.99 1.38
Industrial Settlement 0.12 0.05 13.68 1.81 1.17 0.24 5.23 1.61 2.32 0.45 7.93 0.55 2.05 0.31 0.00 0.00 0.72 0.26 1.82 0.65 4.62 1.87 1.41 0.47 5.05 0.86 46.12 0.72
Total Settlements 0.12 0.05 18.65 2.47 16.66 3.32 19.60 6.05 36.83 7.07 49.92 3.46 22.84 3.42 5.61 2.67 1.49 0.54 11.06 3.95 10.97 4.44 8.36 2.79 27.66 4.69 229.77 3.60
GRAND TOTAL 258.17 100.00 756.00 100.00 503.00 100.00 323.88 100.00 520.91 100.00 1443.50 100.00 667.73 100.00 210.32 100.00 274.95 100.00 280.00 100.00 247.59 100.00 300.00 100.00 590.00 100.00 6376.05 100.00
(Area in Ha)ROHINI PURNADIH TAPIN KHASMAHAL AMLONEW GIDDI-C GOVINDPUR TOTALSELECTED DHORI TARMI
SETT
LEM
ENTS
JHARKHAND TOPA URIMARI NORTH URIMARI
SCR
UB
SPL
AN
TATI
ON
FOR
ESTS
REC
LAIM
EDW
AST
ELA
ND
SW
ATE
RA
GR
ICU
LTU
RE
AC
TIVE
MIN
ING

CMPDI
Job No 561410027 (CCL) 86
Plate -7.1

CMPDI
Job No 561410027 (CCL) 87
Plate-7.2
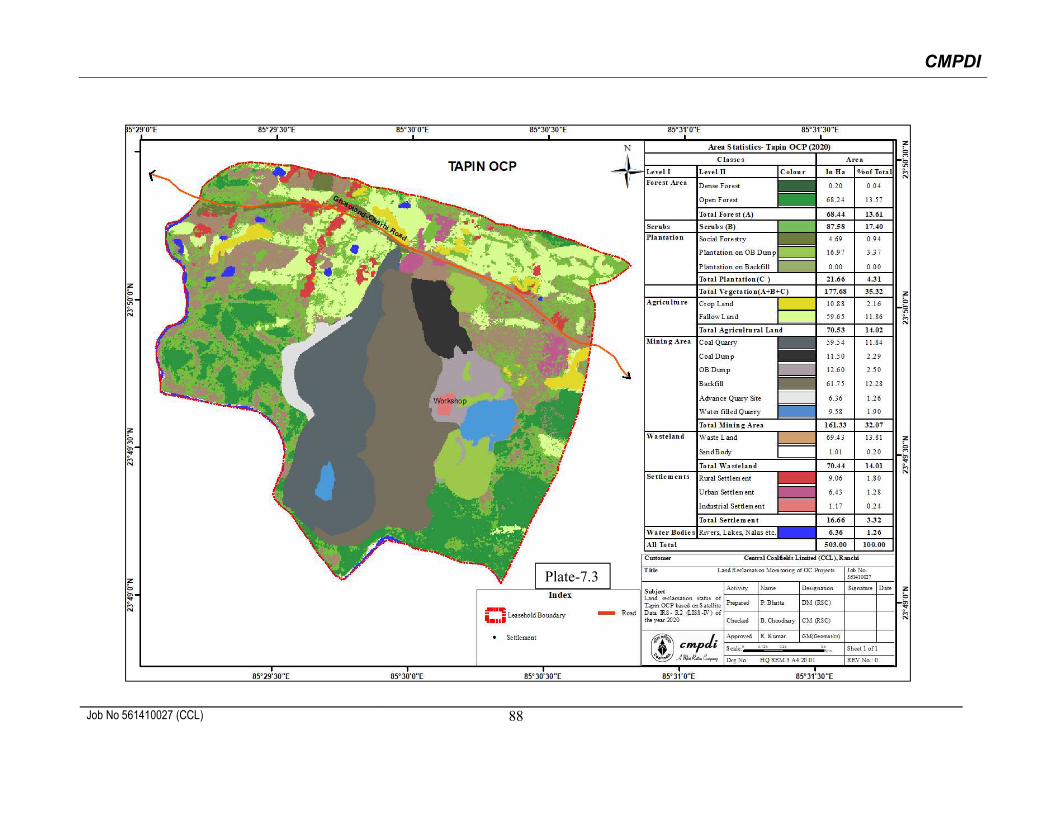
CMPDI
Job No 561410027 (CCL) 88
Plate-7.3
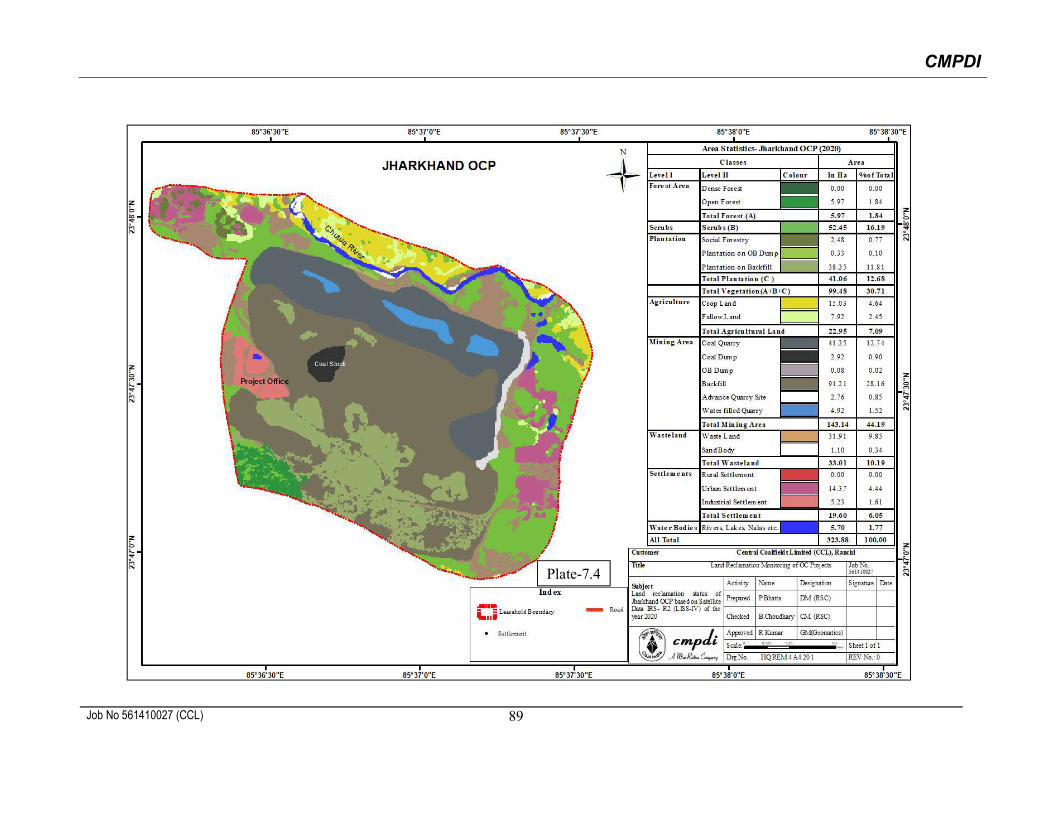
CMPDI
Job No 561410027 (CCL) 89
Plate-7.4

CMPDI
Job No 561410027 (CCL) 90
Plate-7.5

CMPDI
Job No 561410027 (CCL) 91
Plate-7.6

CMPDI
Job No 561410027 (CCL) 92
Plate -7.7

CMPDI
Job No 561410027 (CCL) 93
Plate-7.8
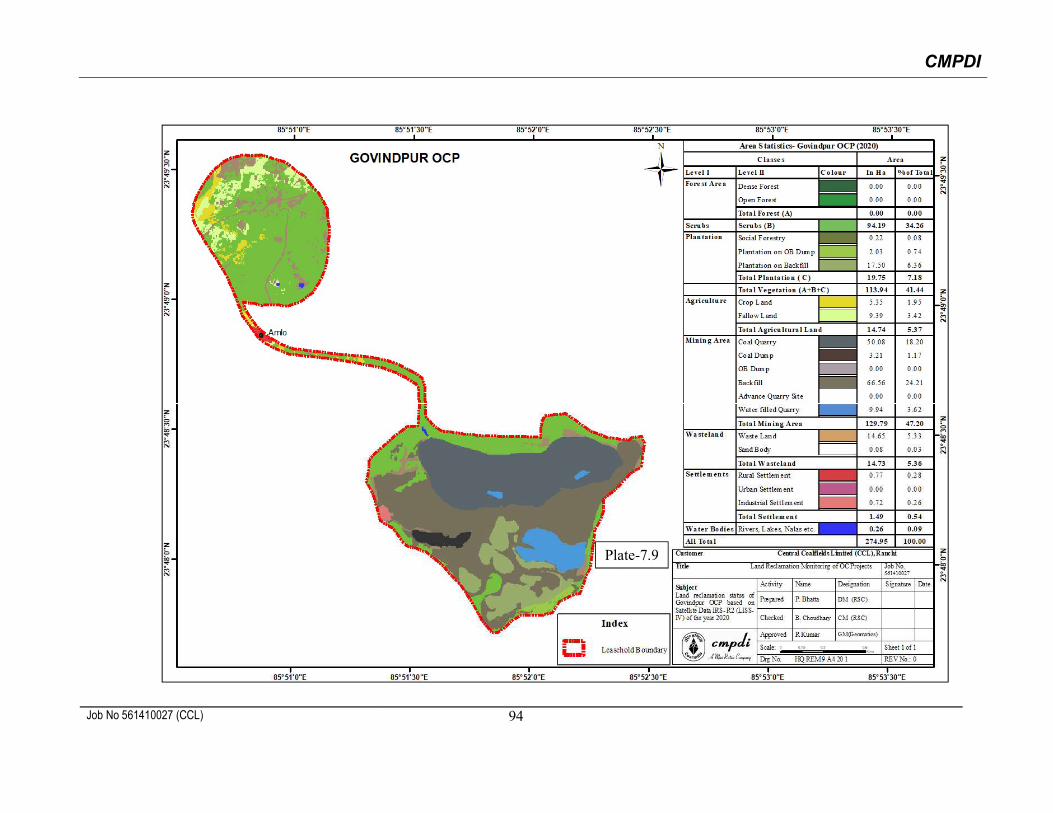
CMPDI
Job No 561410027 (CCL) 94
Plate-7.9
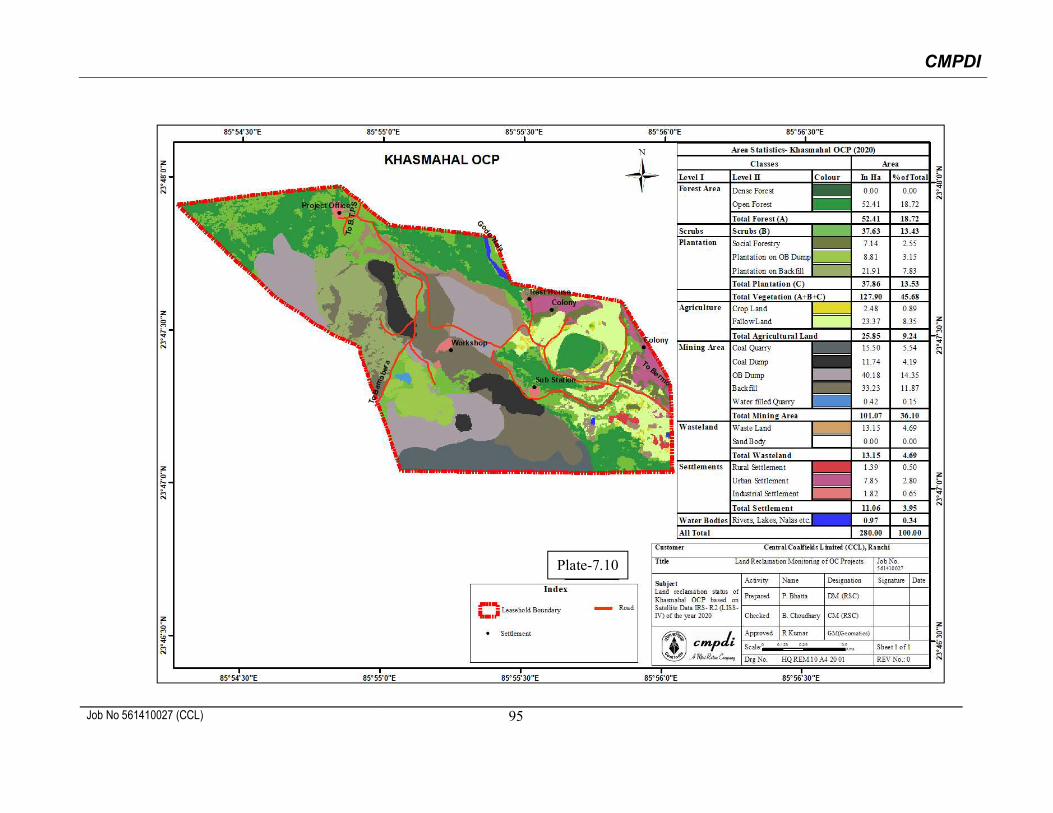
CMPDI
Job No 561410027 (CCL) 95
Plate-7.10

CMPDI
Job No 561410027 (CCL) 96
Plate-7.11
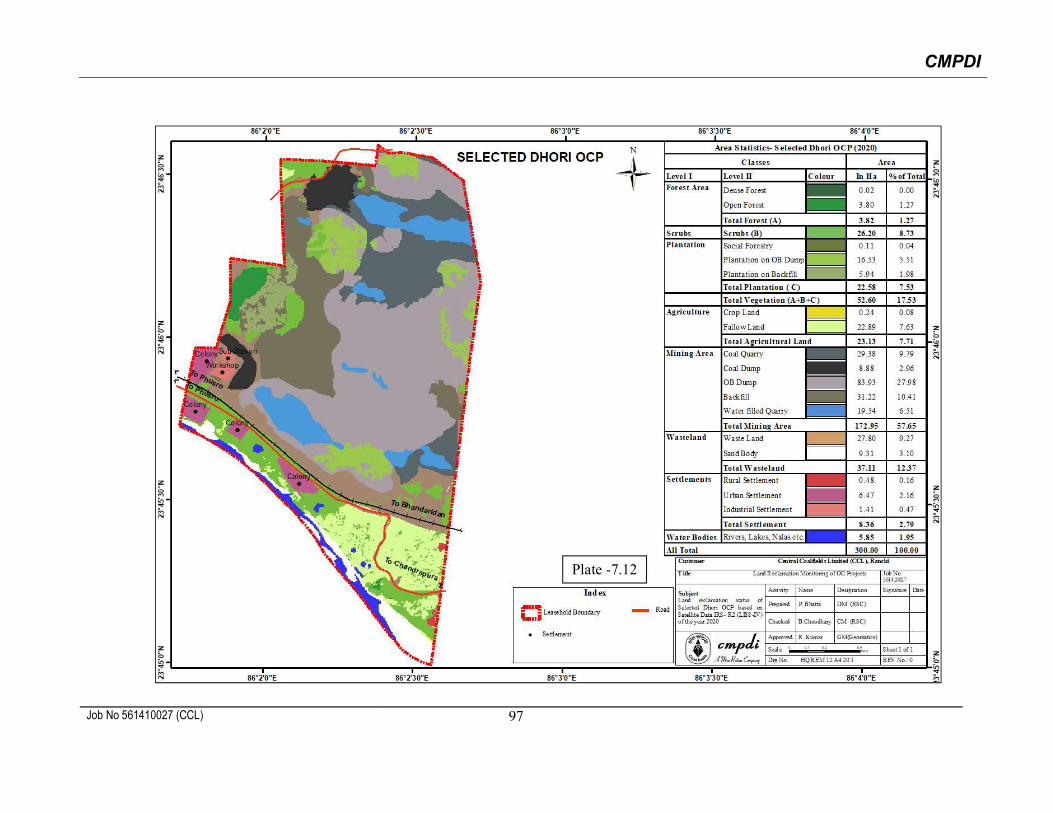
CMPDI
Job No 561410027 (CCL) 97
Plate -7.12

CMPDI
Job No 561410027 (CCL) 98
Plate -7.13

CMPDI
Job No 561410027 (CCL) 99
FIGURE – 7.2
FIGURE – 7.3
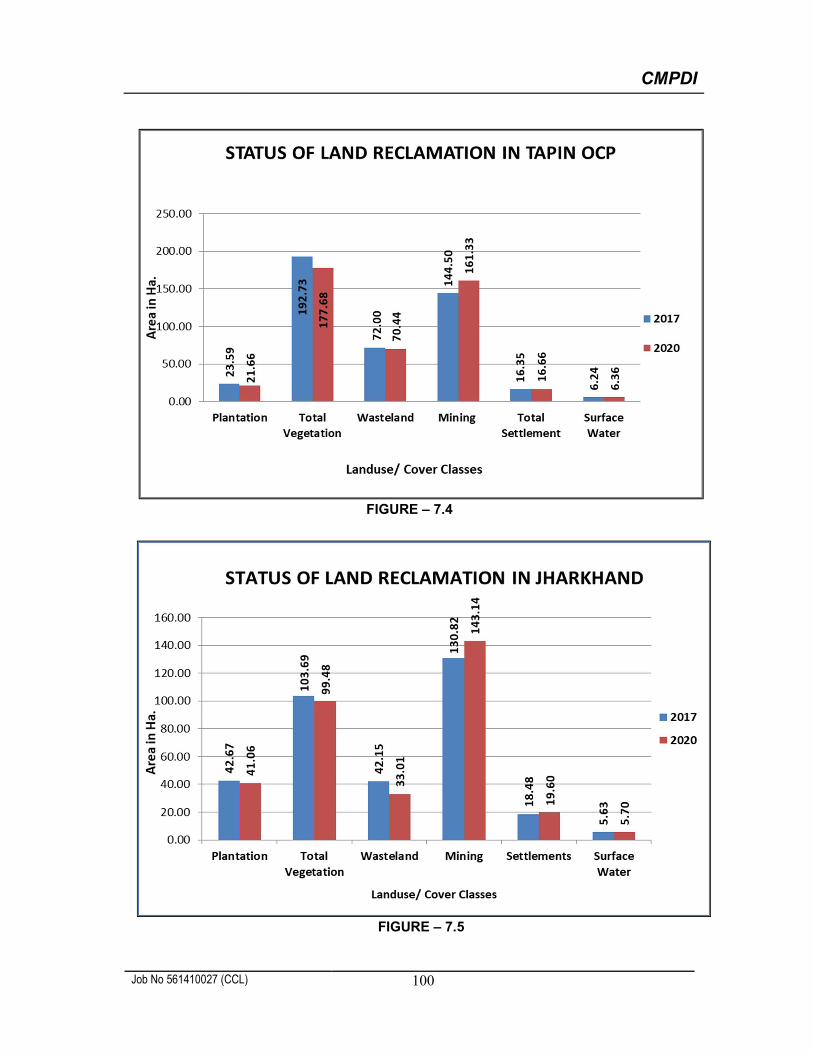
CMPDI
Job No 561410027 (CCL) 100
FIGURE – 7.4
FIGURE – 7.5
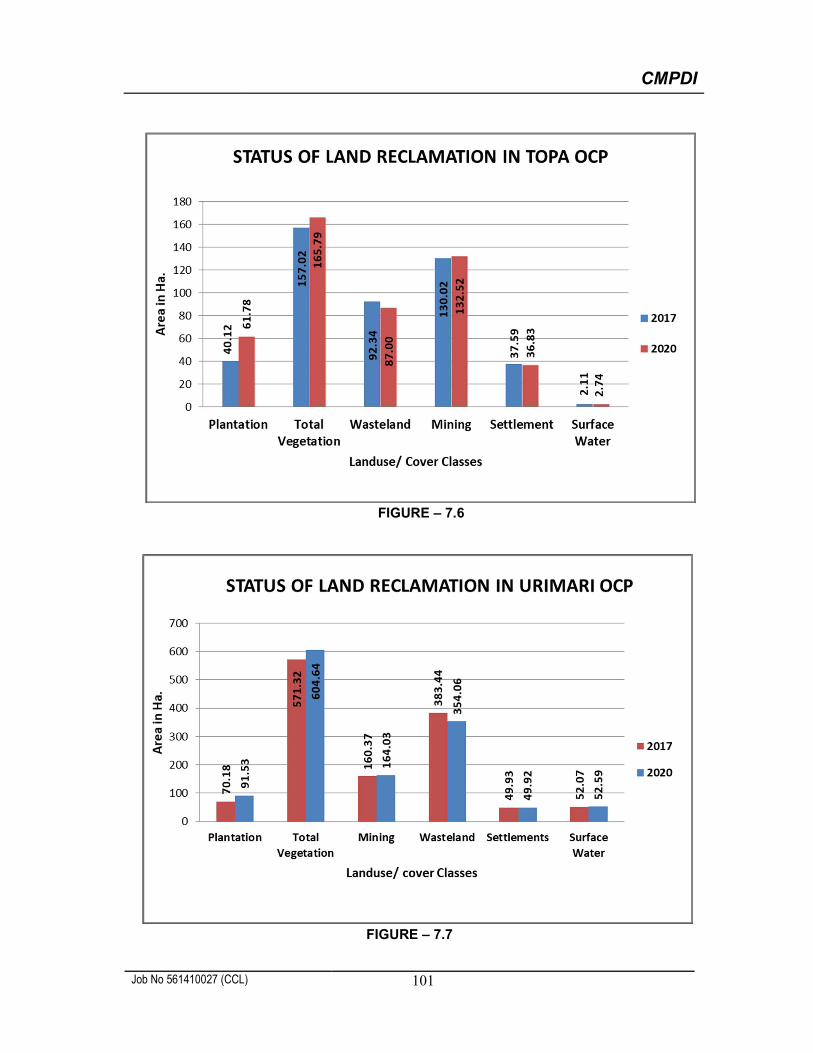
CMPDI
Job No 561410027 (CCL) 101
FIGURE – 7.6
FIGURE – 7.7
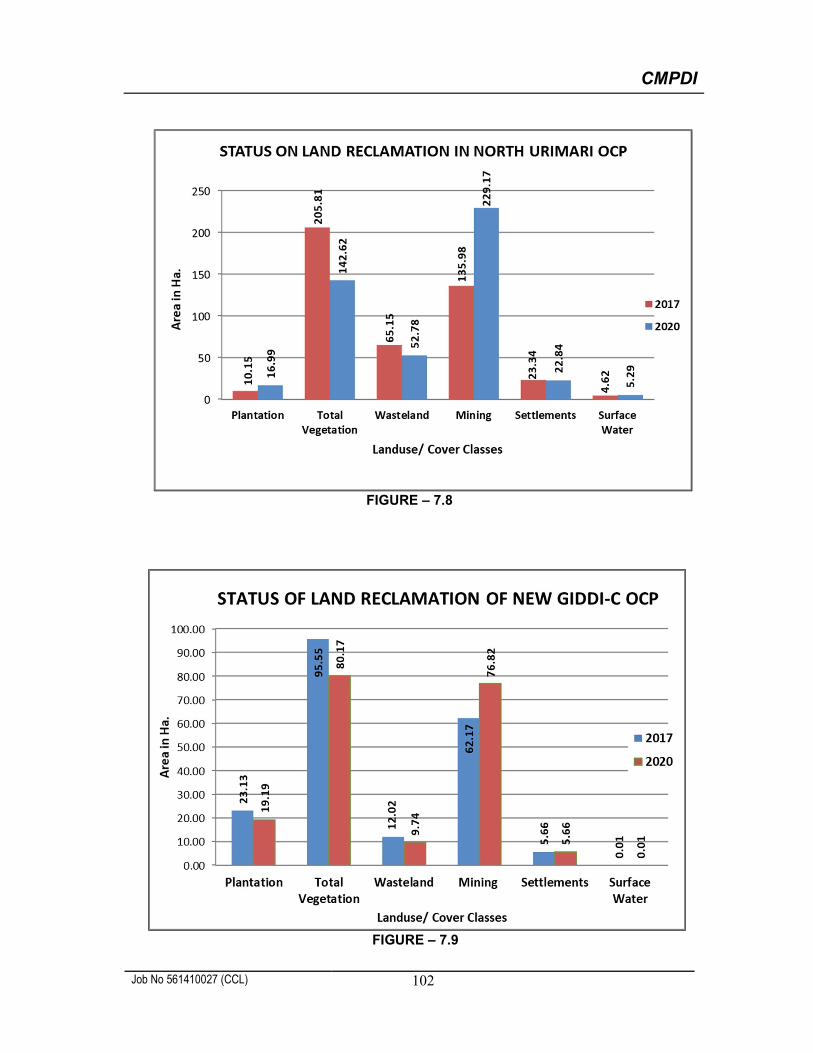
CMPDI
Job No 561410027 (CCL) 102
FIGURE – 7.8
FIGURE – 7.9
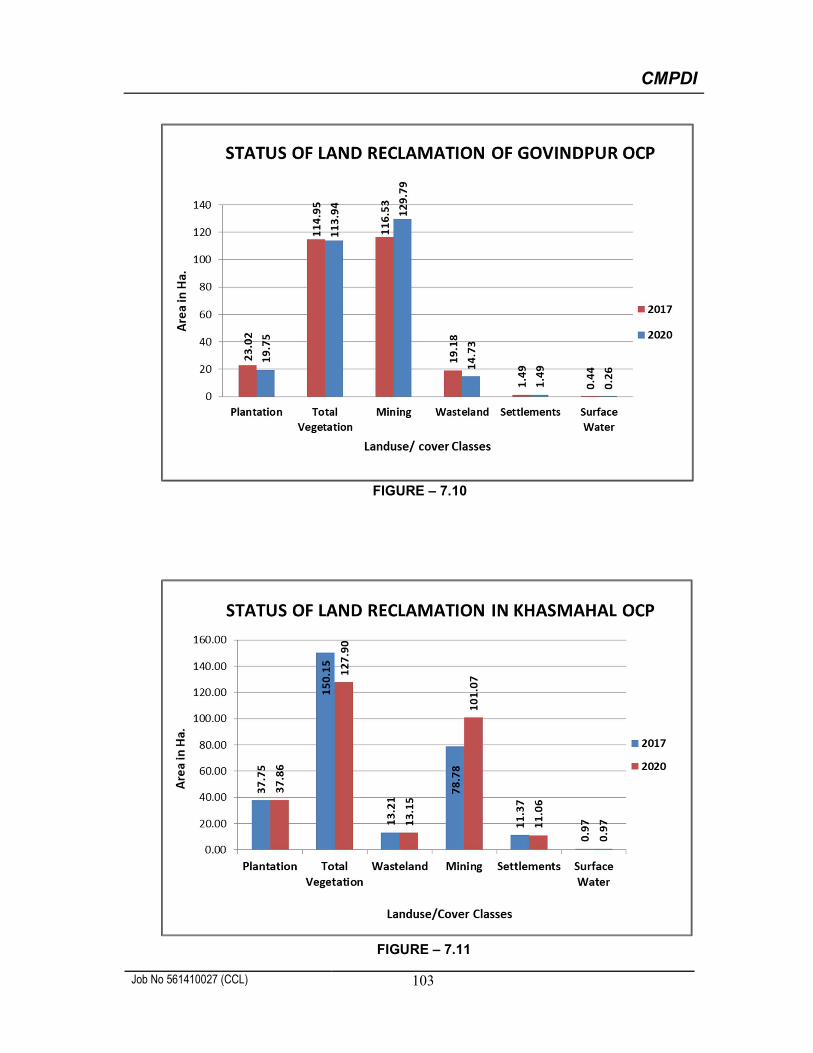
CMPDI
Job No 561410027 (CCL) 103
FIGURE – 7.10
FIGURE – 7.11
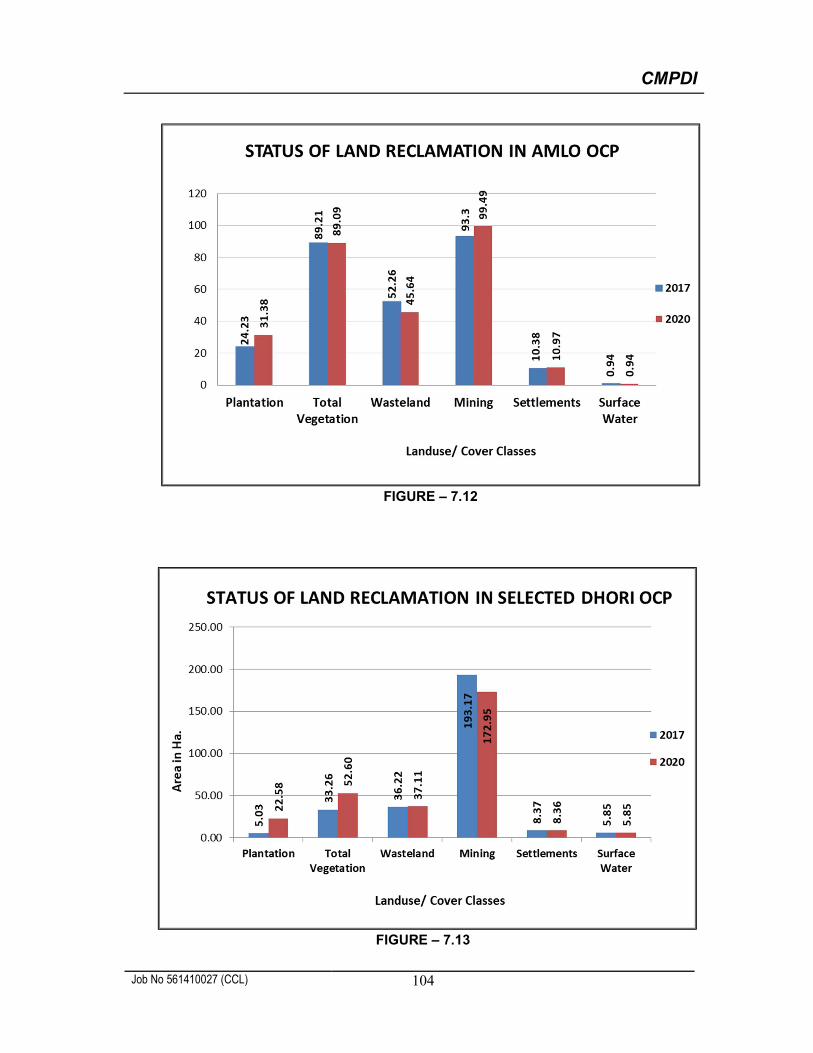
CMPDI
Job No 561410027 (CCL) 104
FIGURE – 7.12
FIGURE – 7.13

CMPDI
Job No 561410027 (CCL) 105
FIGURE – 7.14
Photo 7.1: Plantation on Backfill Dump in Rohini OCP

CMPDI
Job No 561410027 (CCL) 106
Photo7.2: Plantation on Backfill Dump in Purnadih OCP
Photo7.3: Plantation on Backfill Dump in Jharkhand OCP

CMPDI
Job No 561410027 (CCL) 107
Photo7.4: Plantation on OB Dump in Topa OCP
Photo7.5: Growing Plantation using Seed Ball Technique on Backfill in Urimari OCP

CMPDI
Job No 561410027 (CCL) 108
Photo7. 6: Plantation on Backfill Dump in Urimari OCP
Photo7.7: Plantation on External OB Dump in North Urimari OCP

CMPDI
Job No 561410027 (CCL) 109
Photo7.8: Plantation on Backfill Dump in North Urimari OCP
Photo7.9: Plantation under social forestry in Govindpur OCP
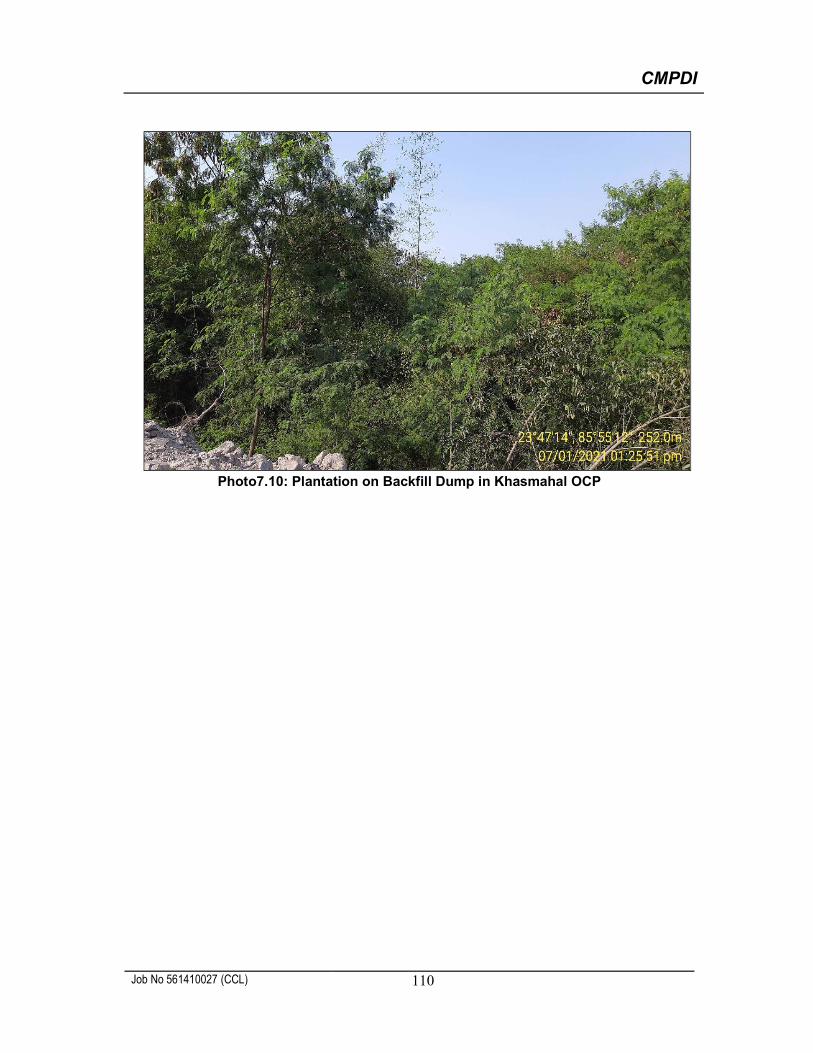
CMPDI
Job No 561410027 (CCL) 110
Photo7.10: Plantation on Backfill Dump in Khasmahal OCP
BHARAT COKING COAL LIMITED
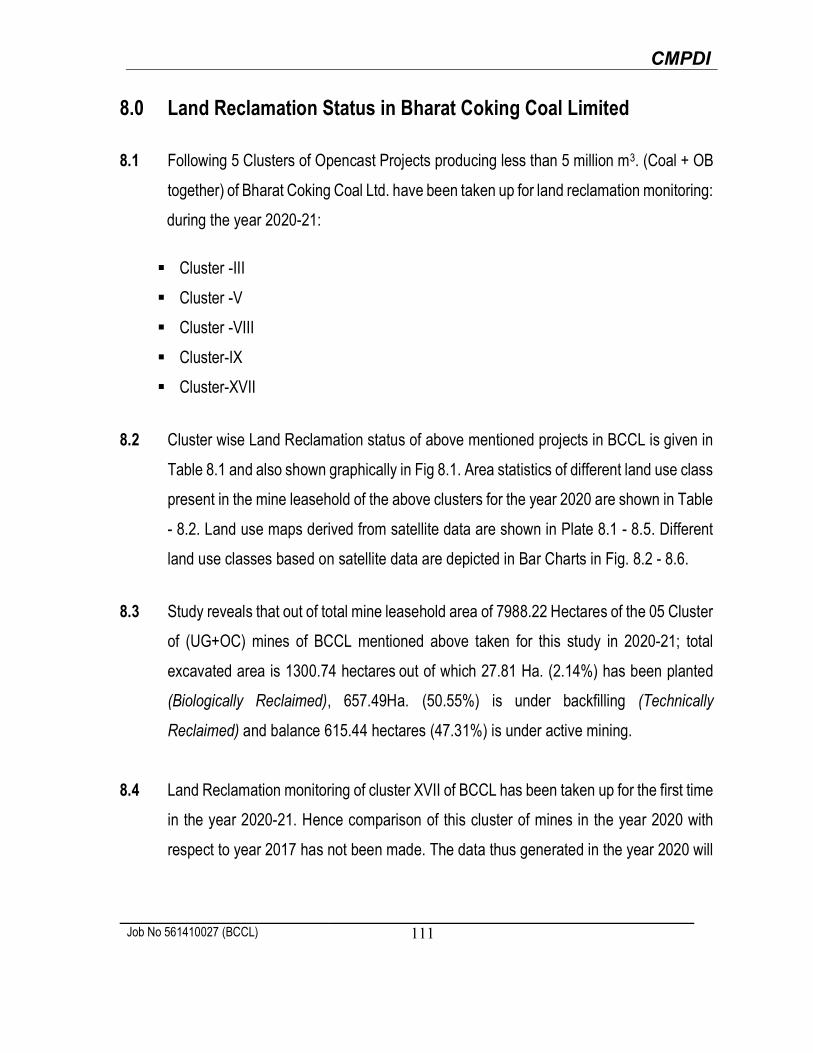
CMPDI
Job No 561410027 (BCCL) 111
8.0 Land Reclamation Status in Bharat Coking Coal Limited
8.1 Following 5 Clusters of Opencast Projects producing less than 5 million m3. (Coal + OB
together) of Bharat Coking Coal Ltd. have been taken up for land reclamation monitoring:
during the year 2020-21:
Cluster -III
Cluster -V
Cluster -VIII
Cluster-IX
Cluster-XVII
8.2 Cluster wise Land Reclamation status of above mentioned projects in BCCL is given in
Table 8.1 and also shown graphically in Fig 8.1. Area statistics of different land use class
present in the mine leasehold of the above clusters for the year 2020 are shown in Table
- 8.2. Land use maps derived from satellite data are shown in Plate 8.1 - 8.5. Different
land use classes based on satellite data are depicted in Bar Charts in Fig. 8.2 - 8.6.
8.3 Study reveals that out of total mine leasehold area of 7988.22 Hectares of the 05 Cluster
of (UG+OC) mines of BCCL mentioned above taken for this study in 2020-21; total
excavated area is 1300.74 hectares out of which 27.81 Ha. (2.14%) has been planted
(Biologically Reclaimed), 657.49Ha. (50.55%) is under backfilling (Technically
Reclaimed) and balance 615.44 hectares (47.31%) is under active mining.
8.4 Land Reclamation monitoring of cluster XVII of BCCL has been taken up for the first time
in the year 2020-21. Hence comparison of this cluster of mines in the year 2020 with
respect to year 2017 has not been made. The data thus generated in the year 2020 will

CMPDI
Job No 561410027 (BCCL) 112
be considered as base data for comparison of land reclamation of this cluster of mines
at the interval of every three years.
8.5 Study reveals that out of 5 cluster of mines of BCCL taken for land reclamation in the
year 2020, the area under total plantation (Green cover) is maximum in Cluster IX i.e
217.17 Ha followed by cluster III with 187.33 Ha, Cluster V with 136.33 Ha, cluster VIII
with 56.60 Ha, cluster XVII with 48.32 Ha.
8.6 Out of 5 cluster of mines considered for land reclamation monitoring based on satellite
data of the year 2020; cluster XVII tops with 65.67% reclamation followed by cluster V
with 65.30%, cluster VIII with 63.53%, cluster III with 38.01% and cluster IX with 27.96%.
8.7 On comparing the status of land reclamation based on satellite data of the year 2017
and 2020 for above cluster of mines, it is revealed that total area under plantation on
backfill has decreased from 31.60 Ha (Yr.2017) to 27.81 Ha (Yr.2020). This decrease of
3.79 Ha area in biological reclamation during span of three years is due to rehandling of
backfill.
8.8 Area under backfilling (Technical Reclamation) has increased from 457.35 Ha in the year
2017 to 657.49 Ha in the year 2020. This increase of 200.14 Ha area under backfilling
is mainly due to Cluster XVII which has been added in the year 2020.
8.9 After analyzing the satellite data of year 2017 and 2020, it is evident that plantation
carried out on backfilled area, OB dumps as well as under social forestry in all the
mines of BCCL taken up for study has reached to 645.75 Ha (8.08%) area as
compared to 566.96 Ha (8.62%) in the year 2017 within the entire leasehold area of
7988.22 Ha. Decrease of 0.54% in percentage of total area under plantation is due
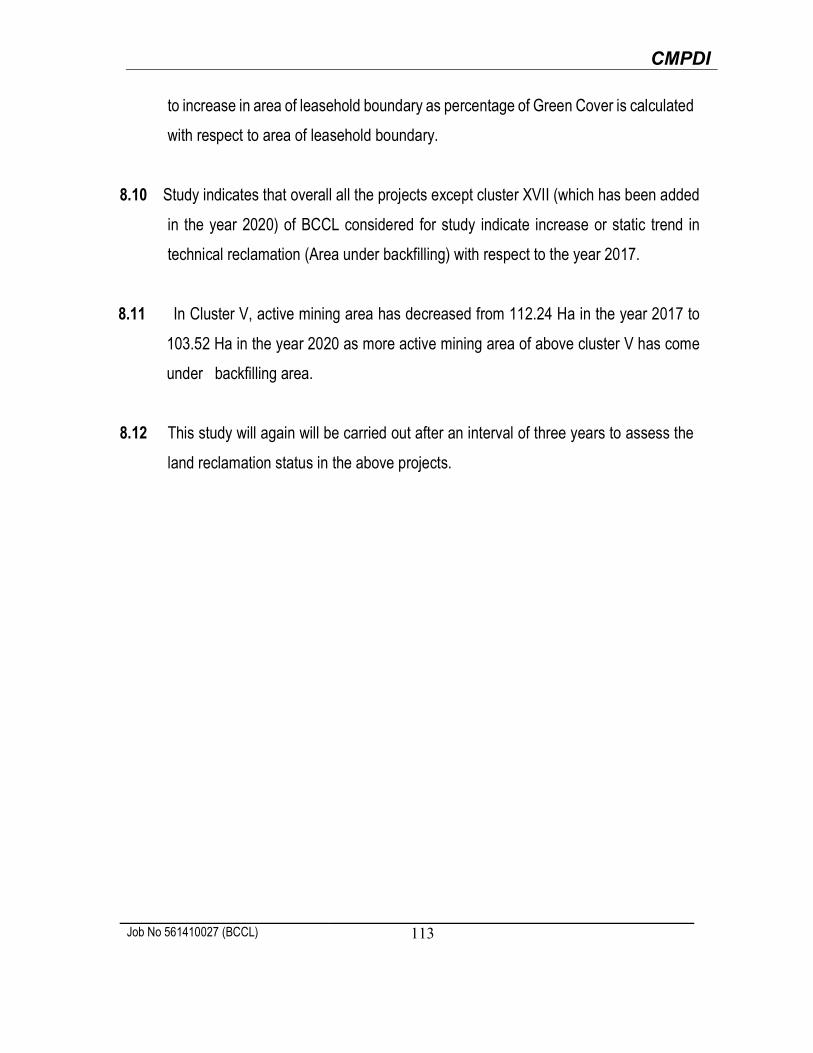
CMPDI
Job No 561410027 (BCCL) 113
to increase in area of leasehold boundary as percentage of Green Cover is calculated
with respect to area of leasehold boundary.
8.10 Study indicates that overall all the projects except cluster XVII (which has been added
in the year 2020) of BCCL considered for study indicate increase or static trend in
technical reclamation (Area under backfilling) with respect to the year 2017.
8.11 In Cluster V, active mining area has decreased from 112.24 Ha in the year 2017 to
103.52 Ha in the year 2020 as more active mining area of above cluster V has come
under backfilling area.
8.12 This study will again will be carried out after an interval of three years to assess the
land reclamation status in the above projects.
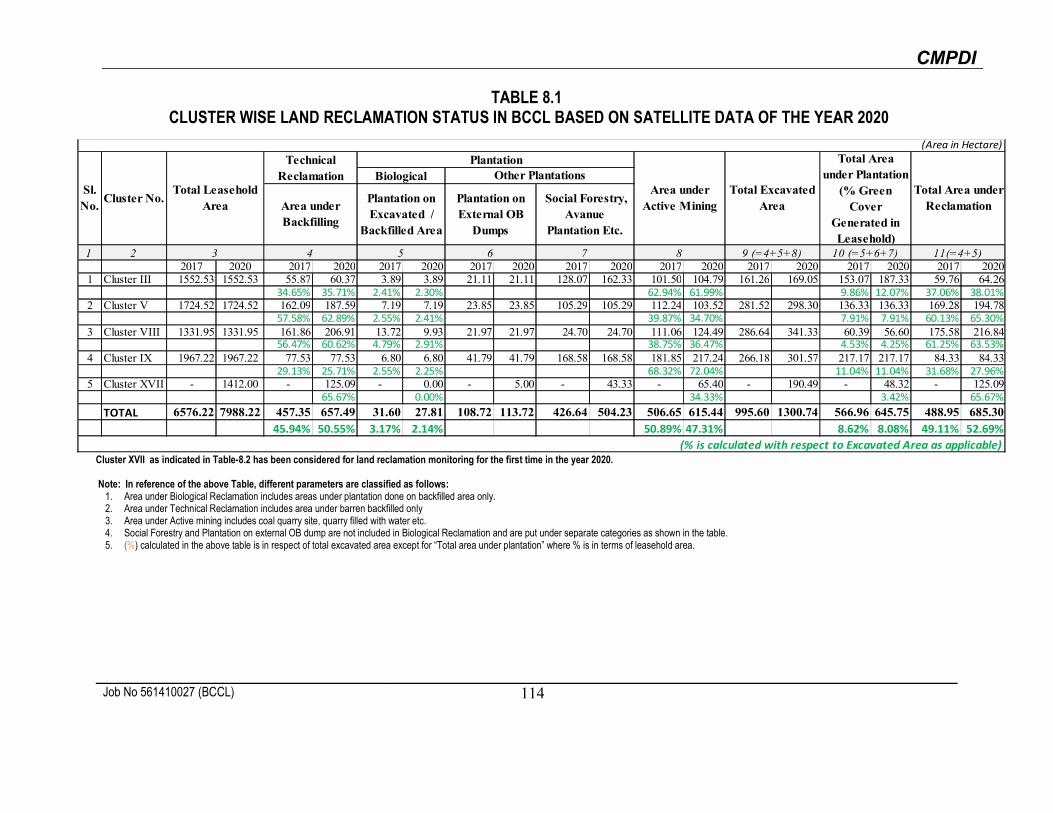
CMPDI
Job No 561410027 (BCCL) 114
TABLE 8.1 CLUSTER WISE LAND RECLAMATION STATUS IN BCCL BASED ON SATELLITE DATA OF THE YEAR 2020
1 22017 2020 2017 2020 2017 2020 2017 2020 2017 2020 2017 2020 2017 2020 2017 2020 2017 2020
1 Cluster III 1552.53 1552.53 55.87 60.37 3.89 3.89 21.11 21.11 128.07 162.33 101.50 104.79 161.26 169.05 153.07 187.33 59.76 64.2634.65% 35.71% 2.41% 2.30% 62.94% 61.99% 9.86% 12.07% 37.06% 38.01%
2 Cluster V 1724.52 1724.52 162.09 187.59 7.19 7.19 23.85 23.85 105.29 105.29 112.24 103.52 281.52 298.30 136.33 136.33 169.28 194.7857.58% 62.89% 2.55% 2.41% 39.87% 34.70% 7.91% 7.91% 60.13% 65.30%
3 Cluster VIII 1331.95 1331.95 161.86 206.91 13.72 9.93 21.97 21.97 24.70 24.70 111.06 124.49 286.64 341.33 60.39 56.60 175.58 216.8456.47% 60.62% 4.79% 2.91% 38.75% 36.47% 4.53% 4.25% 61.25% 63.53%
4 Cluster IX 1967.22 1967.22 77.53 77.53 6.80 6.80 41.79 41.79 168.58 168.58 181.85 217.24 266.18 301.57 217.17 217.17 84.33 84.3329.13% 25.71% 2.55% 2.25% 68.32% 72.04% 11.04% 11.04% 31.68% 27.96%
5 Cluster XVII - 1412.00 - 125.09 - 0.00 - 5.00 - 43.33 - 65.40 - 190.49 - 48.32 - 125.0965.67% 0.00% 34.33% 3.42% 65.67%
TOTAL 6576.22 7988.22 457.35 657.49 31.60 27.81 108.72 113.72 426.64 504.23 506.65 615.44 995.60 1300.74 566.96 645.75 488.95 685.3045.94% 50.55% 3.17% 2.14% 50.89% 47.31% 8.62% 8.08% 49.11% 52.69%
(% is calculated with respect to Excavated Area as applicable)
(Area in Hectare)
Sl.No.
Cluster No.
Technical Reclamation
Plantation
Area under Active Mining
Total Excavated Area
Total Area under Plantation
(% Green Cover
Generated in Leasehold)
4
Total Leasehold Area
3
Total Area under Reclamation
Biological Other Plantations
Area under Backfilling
Plantation on Excavated /
Backfilled Area
Plantation on External OB
Dumps
Social Forestry, Avanue
Plantation Etc.
10 (=5+6+7) 11(=4+5)5 6 7 8 9 (=4+5+8)
Cluster XVII as indicated in Table-8.2 has been considered for land reclamation monitoring for the first time in the year 2020. Note: In reference of the above Table, different parameters are classified as follows:
1. Area under Biological Reclamation includes areas under plantation done on backfilled area only. 2. Area under Technical Reclamation includes area under barren backfilled only 3. Area under Active mining includes coal quarry site, quarry filled with water etc. 4. Social Forestry and Plantation on external OB dump are not included in Biological Reclamation and are put under separate categories as shown in the table. 5. (%) calculated in the above table is in respect of total excavated area except for “Total area under plantation” where % is in terms of leasehold area.
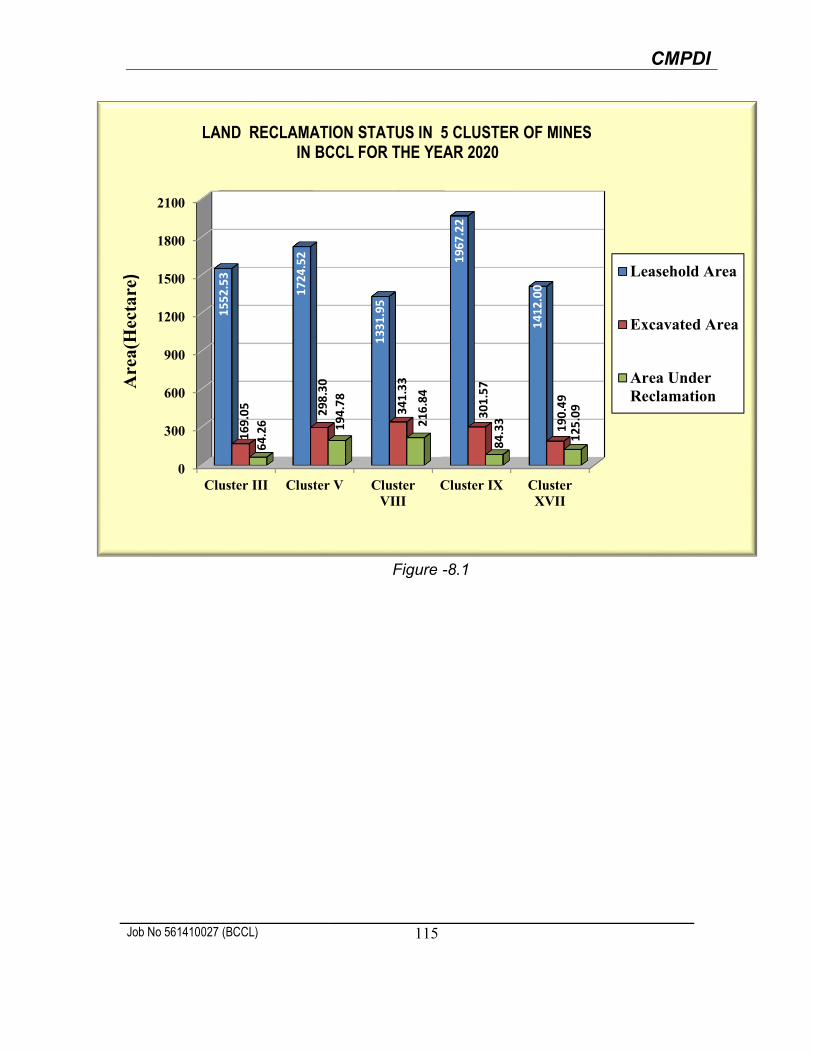
CMPDI
Job No 561410027 (BCCL) 115
Figure -8.1
0
300
600
900
1200
1500
1800
2100
Cluster III Cluster V ClusterVIII
Cluster IX ClusterXVII
1552
.53
1724
.52
1331
.95
1967
.22
1412
.00
169.
05 298.
30
341.
33
301.
57
190.
49
64.2
6 194.
78
216.
84
84.3
3
125.
09
Leasehold Area
Excavated Area
Area UnderReclamation
Are
a(H
ecta
re)
LAND RECLAMATION STATUS IN 5 CLUSTER OF MINESIN BCCL FOR THE YEAR 2020
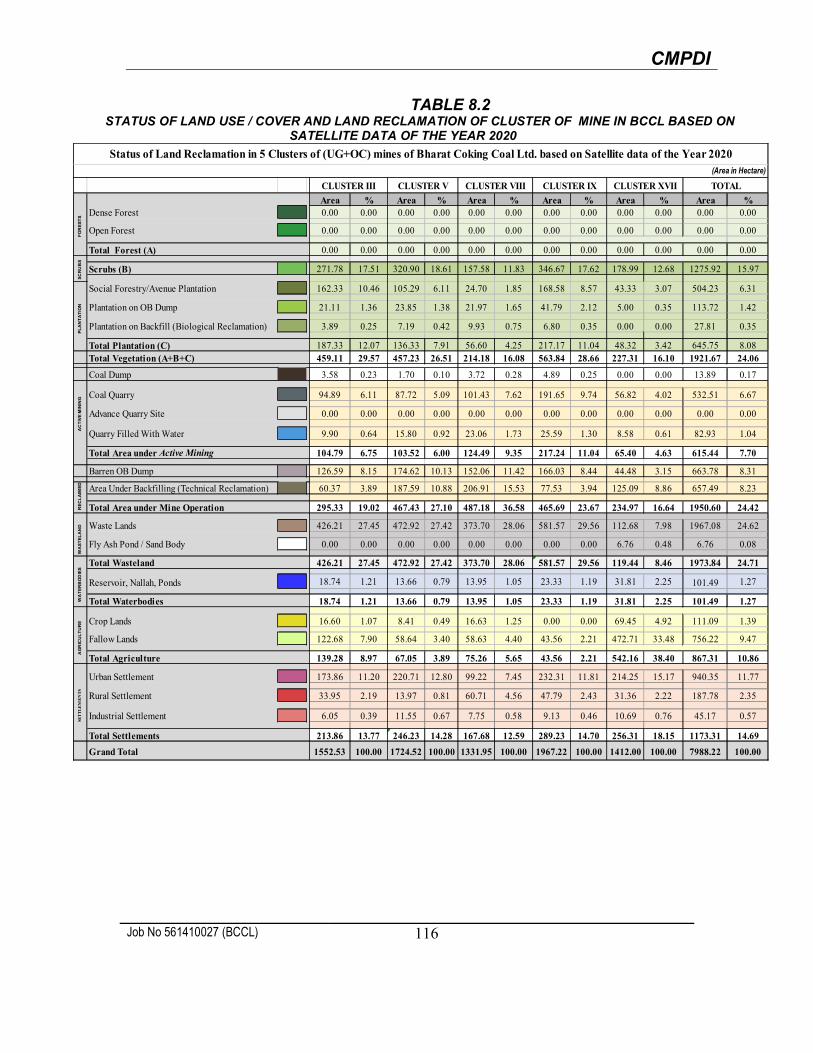
CMPDI
Job No 561410027 (BCCL) 116
TABLE 8.2 STATUS OF LAND USE / COVER AND LAND RECLAMATION OF CLUSTER OF MINE IN BCCL BASED ON
SATELLITE DATA OF THE YEAR 2020
Area % Area % Area % Area % Area % Area %Dense Forest 0.00 0.00 0.00 0.00 0.00 0.00 0.00 0.00 0.00 0.00 0.00 0.00
Open Forest 0.00 0.00 0.00 0.00 0.00 0.00 0.00 0.00 0.00 0.00 0.00 0.00
Total Forest (A) 0.00 0.00 0.00 0.00 0.00 0.00 0.00 0.00 0.00 0.00 0.00 0.00
Scrubs (B) 271.78 17.51 320.90 18.61 157.58 11.83 346.67 17.62 178.99 12.68 1275.92 15.97
Social Forestry/Avenue Plantation 162.33 10.46 105.29 6.11 24.70 1.85 168.58 8.57 43.33 3.07 504.23 6.31
Plantation on OB Dump 21.11 1.36 23.85 1.38 21.97 1.65 41.79 2.12 5.00 0.35 113.72 1.42
Plantation on Backfill (Biological Reclamation) 3.89 0.25 7.19 0.42 9.93 0.75 6.80 0.35 0.00 0.00 27.81 0.35
Total Plantation (C) 187.33 12.07 136.33 7.91 56.60 4.25 217.17 11.04 48.32 3.42 645.75 8.08Total Vegetation (A+B+C) 459.11 29.57 457.23 26.51 214.18 16.08 563.84 28.66 227.31 16.10 1921.67 24.06
Coal Dump 3.58 0.23 1.70 0.10 3.72 0.28 4.89 0.25 0.00 0.00 13.89 0.17
Coal Quarry 94.89 6.11 87.72 5.09 101.43 7.62 191.65 9.74 56.82 4.02 532.51 6.67
Advance Quarry Site 0.00 0.00 0.00 0.00 0.00 0.00 0.00 0.00 0.00 0.00 0.00 0.00
Quarry Filled With Water 9.90 0.64 15.80 0.92 23.06 1.73 25.59 1.30 8.58 0.61 82.93 1.04
Total Area under Active Mining 104.79 6.75 103.52 6.00 124.49 9.35 217.24 11.04 65.40 4.63 615.44 7.70
Barren OB Dump 126.59 8.15 174.62 10.13 152.06 11.42 166.03 8.44 44.48 3.15 663.78 8.31
Area Under Backfilling (Technical Reclamation) 60.37 3.89 187.59 10.88 206.91 15.53 77.53 3.94 125.09 8.86 657.49 8.23
Total Area under Mine Operation 295.33 19.02 467.43 27.10 487.18 36.58 465.69 23.67 234.97 16.64 1950.60 24.42
Waste Lands 426.21 27.45 472.92 27.42 373.70 28.06 581.57 29.56 112.68 7.98 1967.08 24.62
Fly Ash Pond / Sand Body 0.00 0.00 0.00 0.00 0.00 0.00 0.00 0.00 6.76 0.48 6.76 0.08
Total Wasteland 426.21 27.45 472.92 27.42 373.70 28.06 581.57 29.56 119.44 8.46 1973.84 24.71
Reservoir, Nallah, Ponds 18.74 1.21 13.66 0.79 13.95 1.05 23.33 1.19 31.81 2.25 101.49 1.27
Total Waterbodies 18.74 1.21 13.66 0.79 13.95 1.05 23.33 1.19 31.81 2.25 101.49 1.27
Crop Lands 16.60 1.07 8.41 0.49 16.63 1.25 0.00 0.00 69.45 4.92 111.09 1.39
Fallow Lands 122.68 7.90 58.64 3.40 58.63 4.40 43.56 2.21 472.71 33.48 756.22 9.47
Total Agriculture 139.28 8.97 67.05 3.89 75.26 5.65 43.56 2.21 542.16 38.40 867.31 10.86
Urban Settlement 173.86 11.20 220.71 12.80 99.22 7.45 232.31 11.81 214.25 15.17 940.35 11.77
Rural Settlement 33.95 2.19 13.97 0.81 60.71 4.56 47.79 2.43 31.36 2.22 187.78 2.35
Industrial Settlement 6.05 0.39 11.55 0.67 7.75 0.58 9.13 0.46 10.69 0.76 45.17 0.57
Total Settlements 213.86 13.77 246.23 14.28 167.68 12.59 289.23 14.70 256.31 18.15 1173.31 14.69
Grand Total 1552.53 100.00 1724.52 100.00 1331.95 100.00 1967.22 100.00 1412.00 100.00 7988.22 100.00
Status of Land Reclamation in 5 Clusters of (UG+OC) mines of Bharat Coking Coal Ltd. based on Satellite data of the Year 2020(Area in Hectare)
CLUSTER III CLUSTER V CLUSTER VIII CLUSTER IX CLUSTER XVII
WA
ST
EL
AN
DW
AT
ER
BO
DIE
SA
GR
ICU
LT
UR
ESE
TT
LE
ME
NT
S
TOTAL
FO
RE
ST
SS
CR
UB
SP
LA
NT
AT
ION
AC
TIV
E M
ININ
GR
EC
LA
IME
D

CMPDI
Job No 561410027/(NEC) 117
Plate-8.1
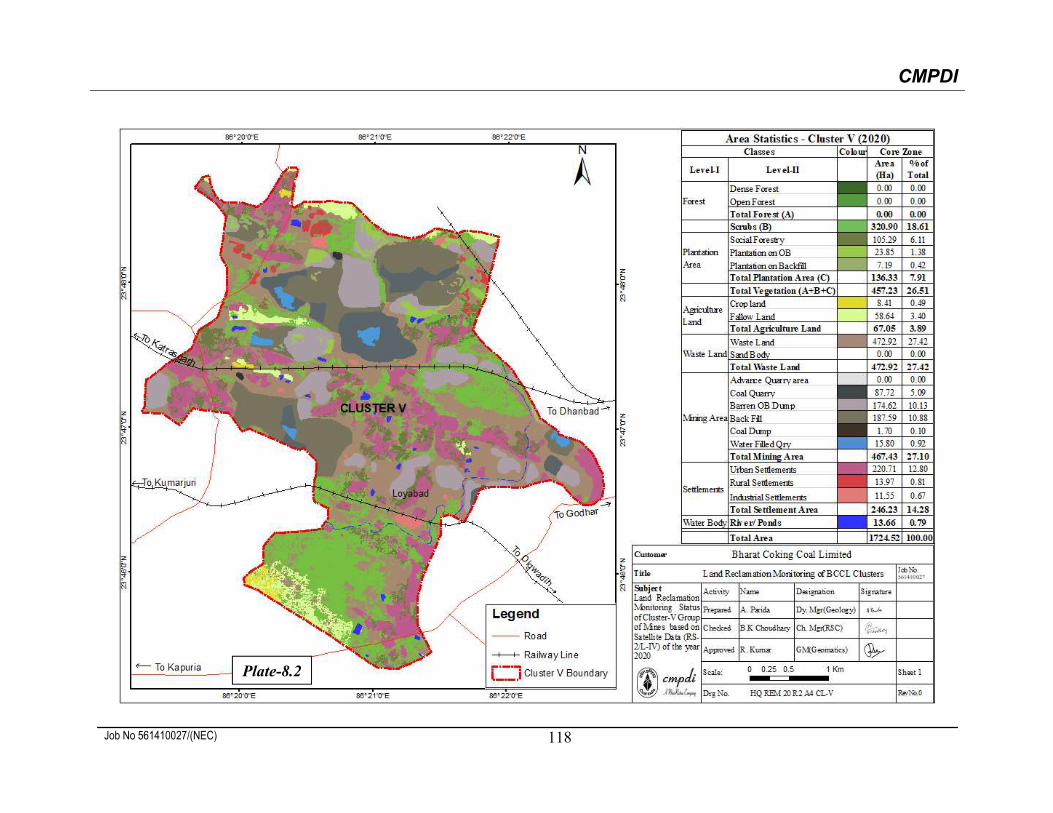
CMPDI
Job No 561410027/(NEC) 118
Plate-8.2
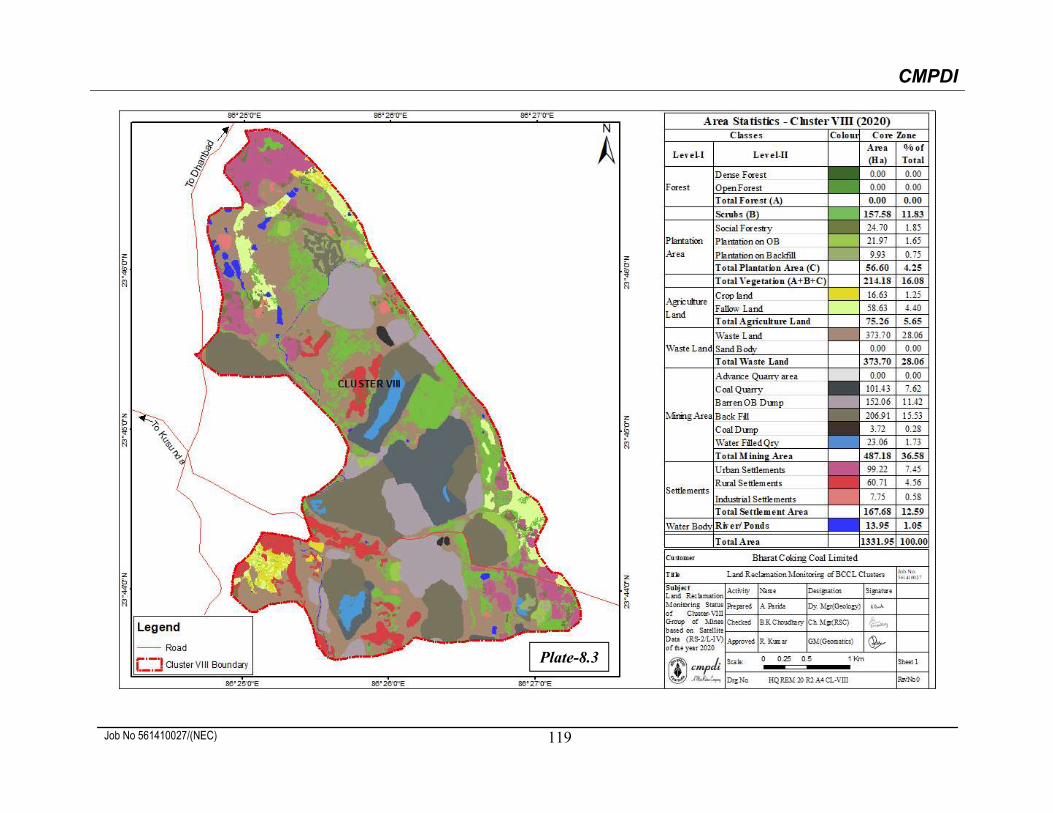
CMPDI
Job No 561410027/(NEC) 119
Plate-8.3

CMPDI
Job No 561410027/(NEC) 120
Plate-8.4

CMPDI
Job No 561410027/(NEC) 121
Plate-8.5

CMPDI
Job No 561410027 (BCCL) 122
Figure 8.2
Figure 8.3
0
50
100
150
200
250
300
350
400
450
500
Settlements VegetationCover
Mining Area Plantation Waste Land WaterBodies
201.
71
453.
12
291.
21
153.
07
461.
92
17.4
8
213.
86
459.
11
295.
33
187.
33
426.
21
18.7
4
2017
2020
Year
Land Use/Cover Classses
STATUS OF LAND RECLAMATION MONITORING IN CLUSTER III
0
100
200
300
400
500
600
Settlements VegetationCover
Mining Area Plantation Waste Land WaterBodies
241.
74
481.
11
428.
08
136.
33
517.
23
10.2
1
246.
23
457.
23
467.
43
136.
33
472.
92
13.6
6
2017
2020
Year
Land Use/Cover Classses
STATUS OF LAND RECLAMATION MONITORING IN CLUSTER V
Area
In H
ecta
re
Area
In H
ecta
re

CMPDI
Job No 561410027 (BCCL) 123
Figure 8.4
Figure 8.5
0
50
100
150
200
250
300
350
400
450
500
Settlements VegetationCover
Mining Area Plantation Waste Land WaterBodies
165.
62
203.
60
429.
93
60.3
9
443.
58
13.1
5167.
68
214.
18
487.
18
56.6
0
373.
70
13.9
5
2017
2020
Year
Land Use/Cover Classses
STATUS OF LAND RECLAMATION MONITORING IN CLUSTER VIII
0
100
200
300
400
500
600
700
Settlements VegetationCover
Mining Area Plantation Waste Land WaterBodies
289.
23
557.
03
441.
24
217.
17
614.
64
20.5
9
289.
23
563.
84
465.
69
217.
17
581.
57
23.3
3
2017
2020
Year
Land Use/Cover Classses
STATUS OF LAND RECLAMATION MONITORING IN CLUSTER IX
Are
a (H
ecta
re)
Area
In H
ecta
re

CMPDI
Job No 561410027 (BCCL) 124
Figure 8.6
Photo8.1: Plantation on OB dump in Cluster III
0
50
100
150
200
250
300
Settlements VegetationCover
Mining Area Plantation Waste Land WaterBodies
256.
31
227.
31
234.
97
48.3
2
119.
44
31.8
1
2020
Year
Land Use/Cover Classses
STATUS OF LAND RECLAMATION MONITORING IN CLUSTER XVIIAr
ea (H
ecta
re)

CMPDI
Job No 561410027 (BCCL) 125
Photo 8.2: Eco Restoration site in Cluster V
Photo 8.3: Plantation on OB Dump in Cluster V

CMPDI
Job No 561410027 (BCCL) 126
Photo8.4: Plantation on OB Dump in Cluster VIII Photo8.5: Gokul Eco Cultural Park in cluster IX

CMPDI
Job No 561410027 (BCCL) 127
Photo 8.6: Plantation under social forestry in Cluster XVII

EASTERN COALFIELDS LIMITED

CMPDI
Job No 561410027 (ECL) 129
9.0 Land Reclamation Status in Eastern Coalfields Limited
9.1 In ECL, there are a total of twelve clusters of mines. Out of which four clusters of mines
(comprising both UG and OC projects) and three OCPs (Chitra East, Mohanpur and
Hurra-C) have been taken up for land reclamation monitoring during the year 2020-21
.
1. Cluster - I (Chapapur OC, Nirsa OC, Khudiya OC and Kapasara OC)
2. Cluster - II (Rajpura OC, Kumardhubi UG & Barmuri OC)
3. Cluster - III (Bonjehamari, Sangramgarh & Dabour - all UG & OC)
4. Cluster - IV (Itapara OC, Gaurangdih & Begunia OC)
5. Chitra-East OC
6 .Mohanpur OC
7. Hurra-C OC
9.2 Project wise Land Reclamation status of four clusters of mines (UG+OC) and three
OC in ECL is given in Table 9.1 and also shown graphically in Fig 9.1. Area statistics
of different land use class present in the mine leasehold of the above projects for the
year 2020 are shown in the Table - 9.2. Land use maps derived from satellite data
are shown in Plate 9.1 - 9.7. Different land use classes based on satellite data are
depicted in Bar Charts in Fig. 9.2 - 9.8
9.3 Study reveals that out of total mine leasehold area of 10883.91 Hectares of the above
mentioned four clusters of mines (UG+OC) and 03 OC projects of ECL taken up for
this study in 2020-21; total excavated area is 639.55 hectares (5.88%) out of which
96.00Ha (15.01%) area has been planted (Biologically Reclaimed), 240.81 Ha
(37.65%) area is under backfilling (Technically Reclaimed) and balance 302.74 Ha
(47.34%) area is under active mining.

CMPDI
Job No 561410027 (ECL) 130
9.4 Land reclamation monitoring for four clusters of mines (UG+OC) and three OC in ECL
have been taken up for the first time in the year 2020 -21. The data thus generated in
the year 2020-21 will be considered as base data for comparison of status of land
reclamation for the same set of projects at the interval of three year .
9.5 Study reveals that out of four clusters of mines (UG+OC) and three OC in ECL
considered for land reclamation monitoring in the year 2020-21, area under backfilling
(Technical reclamation), plantation on backfill (Biological Reclamation), total area
under plantation (Green Cover) and total area under land reclamation is maximum in
Cluster I i.e 90 Ha (40.18%), 60.00 Ha (26.79%), 295.00 Ha (7.99%) and 150.00 Ha
(66.96%) respectively.
9.6 Since the clusters have many underground mines too, surface land has not been
affected much due to mining activities in majority of the areas, except where opencast
mines are present. Whereas, the land affected in the OC mines area has been taken
up for reclamation/ restoration activities.
9.7 It is evident from the analysis that out of four clusters of mines (UG+OC) and three OC
in ECL considered for land reclamation monitoring based on satellite data of the year
2020, cluster-II tops with 74.11% land reclamation followed by cluster-I with 66.96%
and Mohanpur OC with 55.00%.
9.8 The study will again be carried out to assess the status of land reclamation monitoring
for the same set of above mentioned four cluster of mines and 3 opencast projects
after an interval of three year.

CMPDI
Job No 561410027 (ECL) 131
Table 9.1 Project wise Land Reclamation Status in Opencast Projects of ECL
based on the Satellite data of the year 2020
Note: In reference of the above Table, different parameters are classified as follows: 1. Area under Biological Reclamation includes areas under plantation done on backfilled area only. 2. Area under Technical Reclamation includes area under barren backfilled only 3. Area under Active mining includes coal quarry site, quarry filled with water etc. 4. Social Forestry and Plantation on external OB dump are not included in Biological Reclamation and are put under separate categories 5. (%) calculated in the above table is in respect of total excavated area except for “Total area under plantation” where % is in terms of leasehold area.
1 2 3
1 Cluster I 3692.00
2 Cluster II 1018.00
3 Cluster III 1628.00
4 Cluster IV 2721.00
5 Chitra East 714.00
6 Mohanpur 164.91
7 Hurra-C 946.00
TOTAL 10883.91
112.00
52.66%
48.0049.48%
2.003.51%
336.81
150.0066.96%83.00
74.11%
0.00 0.00 0.00
109.55 42.89 31.81
37.00
5.88%
295.007.99%89.008.74%96.005.90%54.001.98%
593.895.46%
97.00
57.00
639.55
224.00
0.00 0.00
17.00
6.00
74.0033.04%29.00
25.89%49.00
50.52%55.00
96.49%
302.7447.34%
90.00
30.00
277.99
87.00
96.0015.01%
48.0049.48%
1.001.75%
240.81
23.00
219.90
22.00 0.00 11.0029.04% 0.00%
31.25%0.00
0.00%1.00
1.75%
Status of Land Reclamation in 4 Clusters and 3 OCPs of ECL based on Satellite Data of the Year 2020(Area in Hectare)
Sl.No.
Cluster / Mine
Total Leasehold
Area
Technical Reclamation
Plantation
Area under Active Mining
Total Excavated
Area
Total Area under Plantation
(% Green Cover Generated in Leasehold)
Total Area under
Reclamation
Biological Reclamation
Other Plantations
Area under Backfilling
Plantation on Excavated /
Backfilled Area
Plantation on External OB
Dumps
Social Forestry, Avanue
Plantation Etc.
148.00
10 (=5+6+7) 11(=4+5)
(% is calculated with respect to Excavated Area as applicable)
4 5 6 7 8 9 (=4+5+8)
90.0040.18%48.00
42.86%
37.65%
60.0026.79%35.00
31.81 0.00 14.90 27.99 77.7470.96% 6.01% 29.04%
6.00 18.00 40.00 17.00 22.0055.00% 0.00% 45.00% 10.31% 55.00%
0.00 0.00 0.00

CMPDI
Job No 561410027 (ECL) 132
Fig. 9.1: Project wise Land Reclamation Status in year 2020 for ECL
0
500
1000
1500
2000
2500
3000
3500
4000
Cluster I Cluster II Cluster III Cluster IV ChitraEast
Mohanpur Hurra-C
3692
.00
1018
.00 16
28.0
0
2721
.00
714.
00
164.
91
946.
00
224.
00
112.
00
97.0
0
57.0
0
109.
55
40.0
0
0.0015
0.00
83.0
0
48.0
0
2.00
31.8
1
22.0
0
0.00
LeaseholdArea
ExcavatedArea
Area UnderReclamation
Land Reclamation Status in 4 Clusters & 3 OCPs of ECL in the year 2020
Are
a (
Hec
tare
)
ECL PROJECTS

CMPDI
Job No 561410027 (ECL) 133
Table 9.2

CMPDI
Job No 561410027/(ECL) 134
Plate 9.1
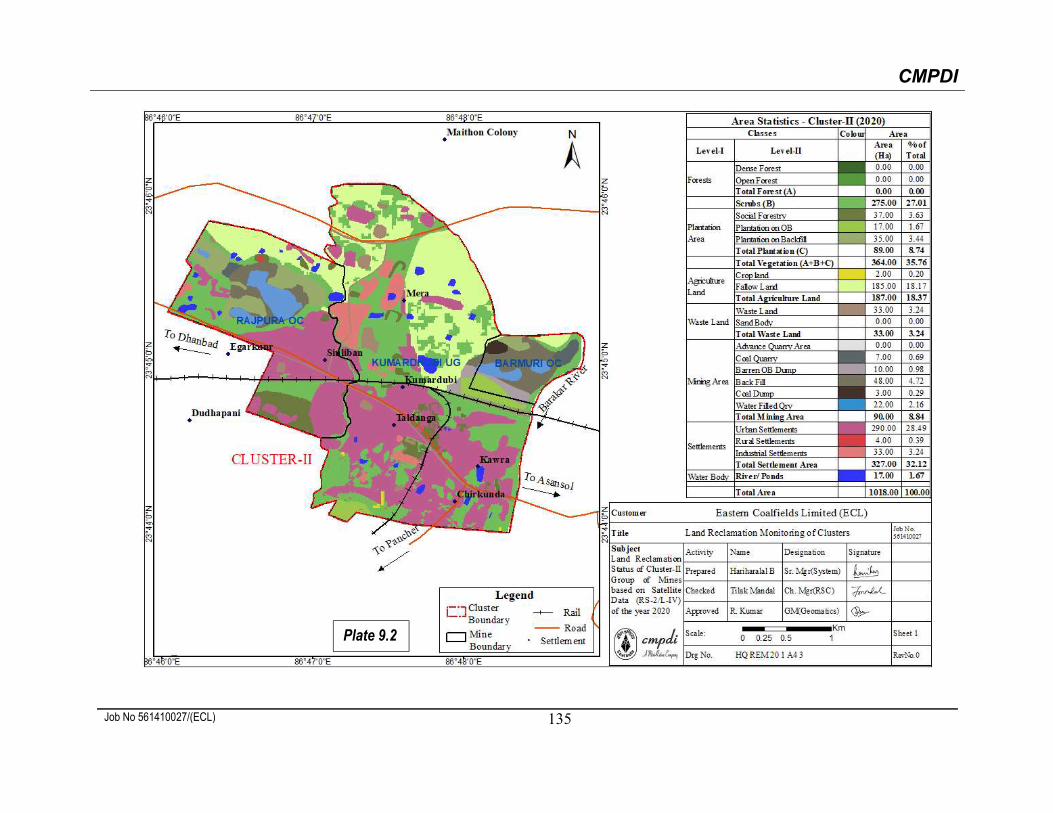
CMPDI
Job No 561410027/(ECL) 135
Plate 9.2
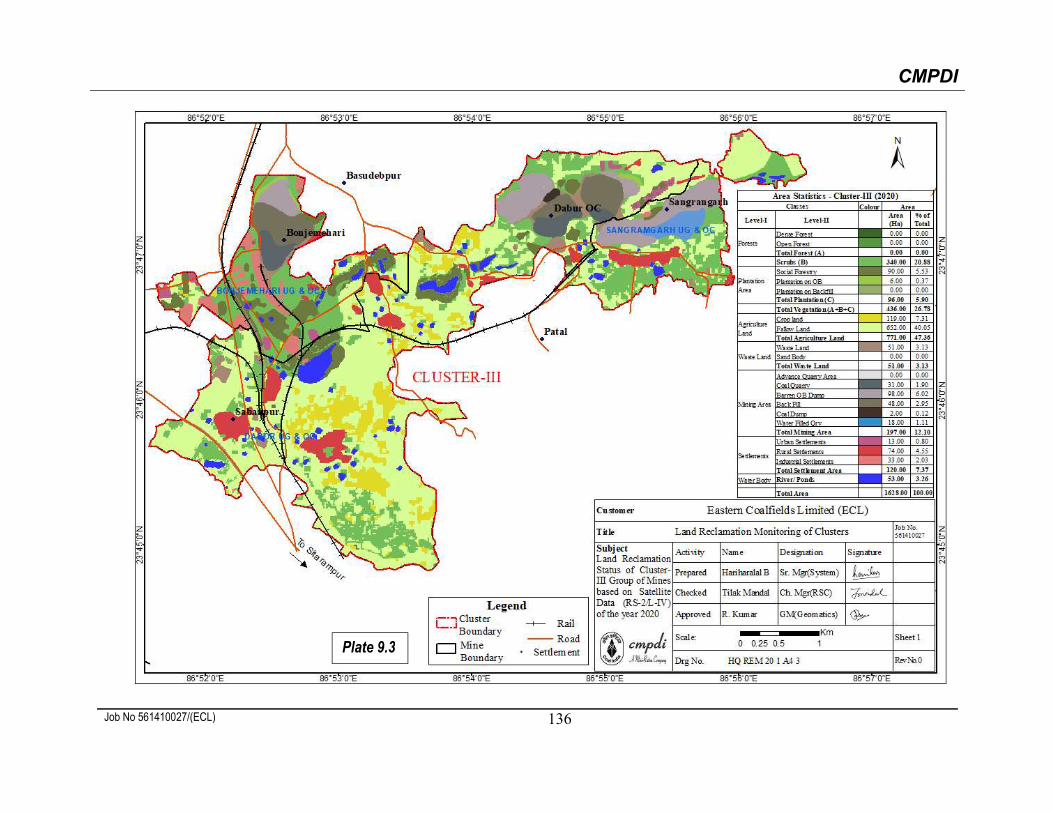
CMPDI
Job No 561410027/(ECL) 136
Plate 9.3
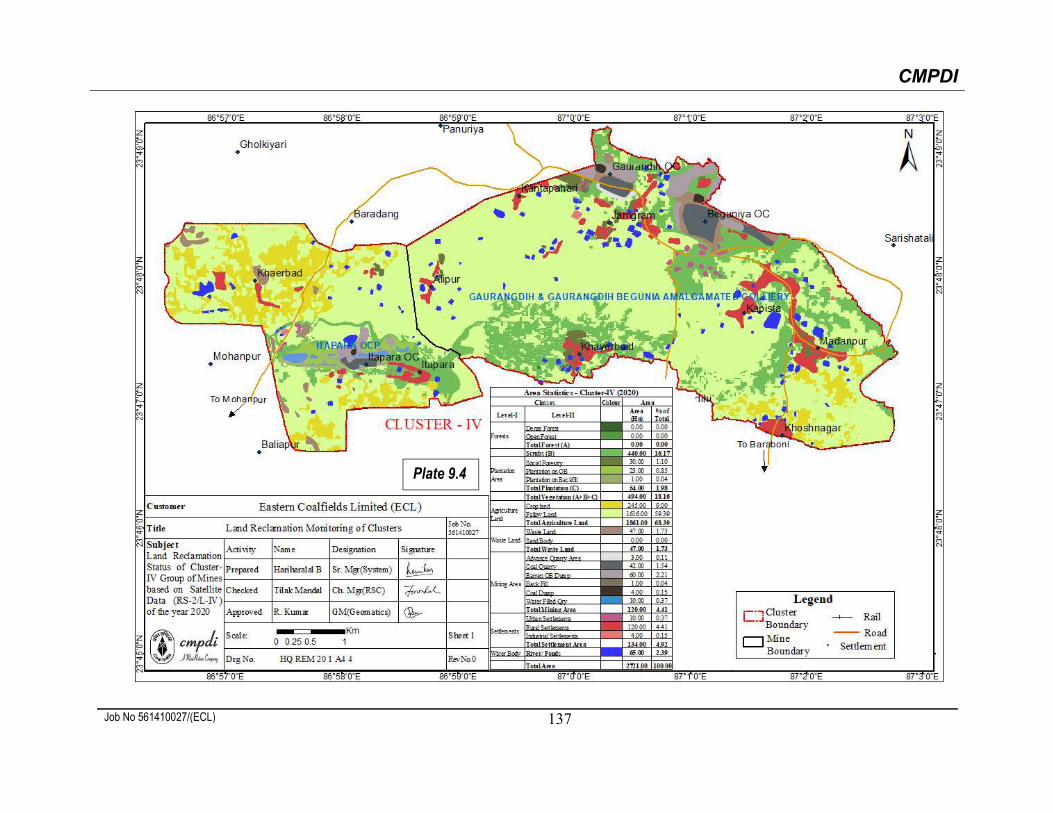
CMPDI
Job No 561410027/(ECL) 137
Plate 9.4

CMPDI
Job No 561410027/(ECL) 138
Plate 9.5
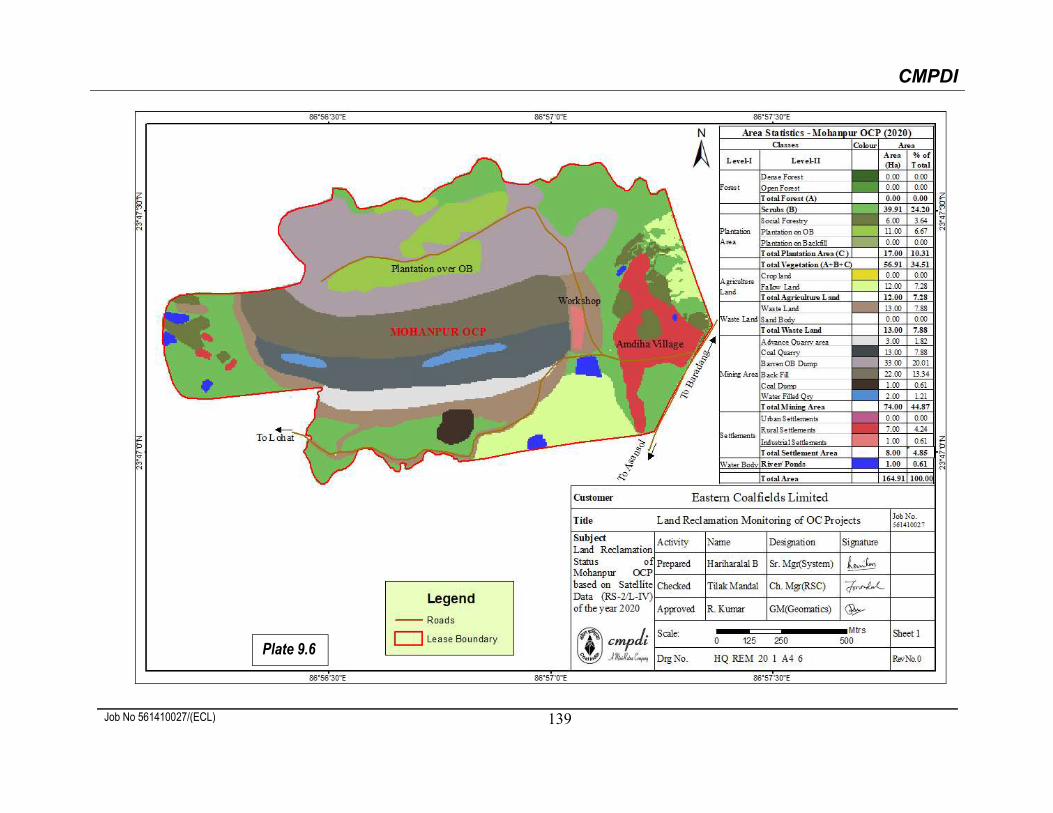
CMPDI
Job No 561410027/(ECL) 139
Plate 9.6
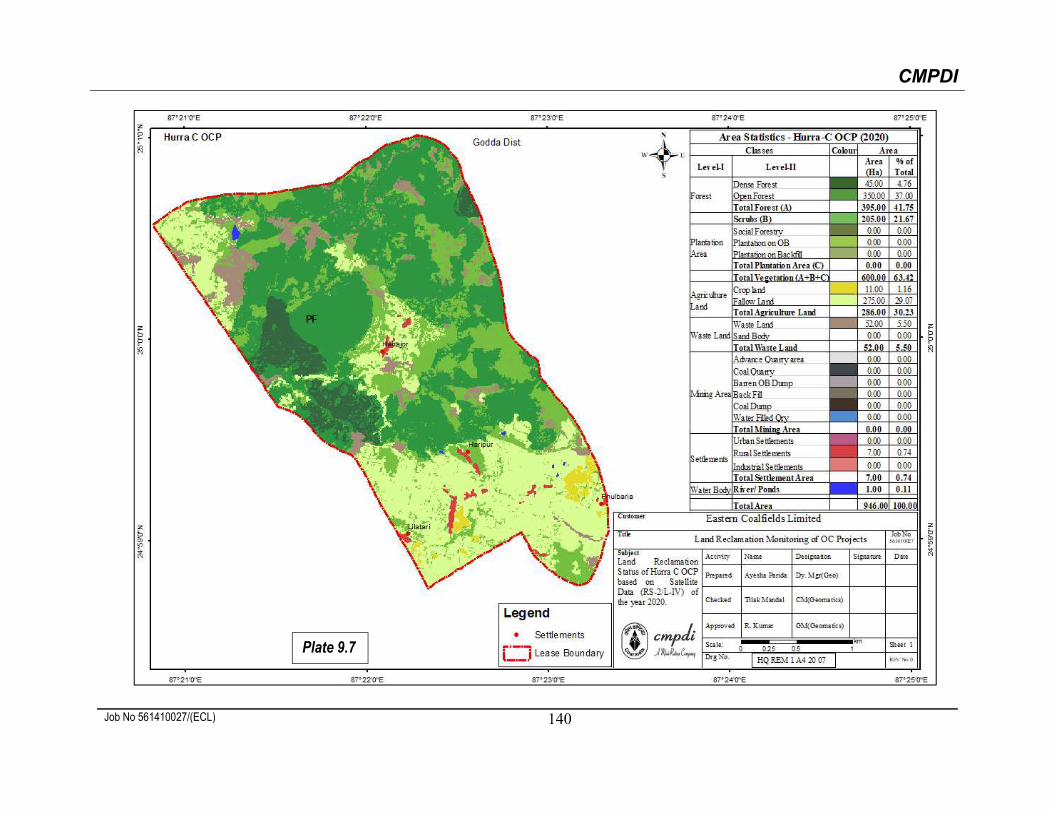
CMPDI
Job No 561410027/(ECL) 140
Plate 9.7

CMPDI
Job No 561410027 (ECL) 141
Figure-9.2
Figure-9.3
0
200
400
600
800
1,000
1,200
1,400
Settlements VegetationCover
Mining Area Plantation Waste Land WaterBodies
330.
00
1338
.00
335.
00
295.
00 160.
00
82.0
0
Year 2020
Land Use /Cover Classes
Are
a(H
ecta
re)
0
100
200
300
400
Settlements VegetationCover
Mining Area Plantation Waste Land WaterBodies
327.
00 364.
00
90.0
0
89.0
0 33.0
0
17.0
0
Year 2020
Land Use /Cover Classes
STATUS OF LAND RECLAMATION IN CLUSTER-I
STATUS OF LAND RECLAMATION IN CLUSTER-II
Are
a (H
ecta
re)
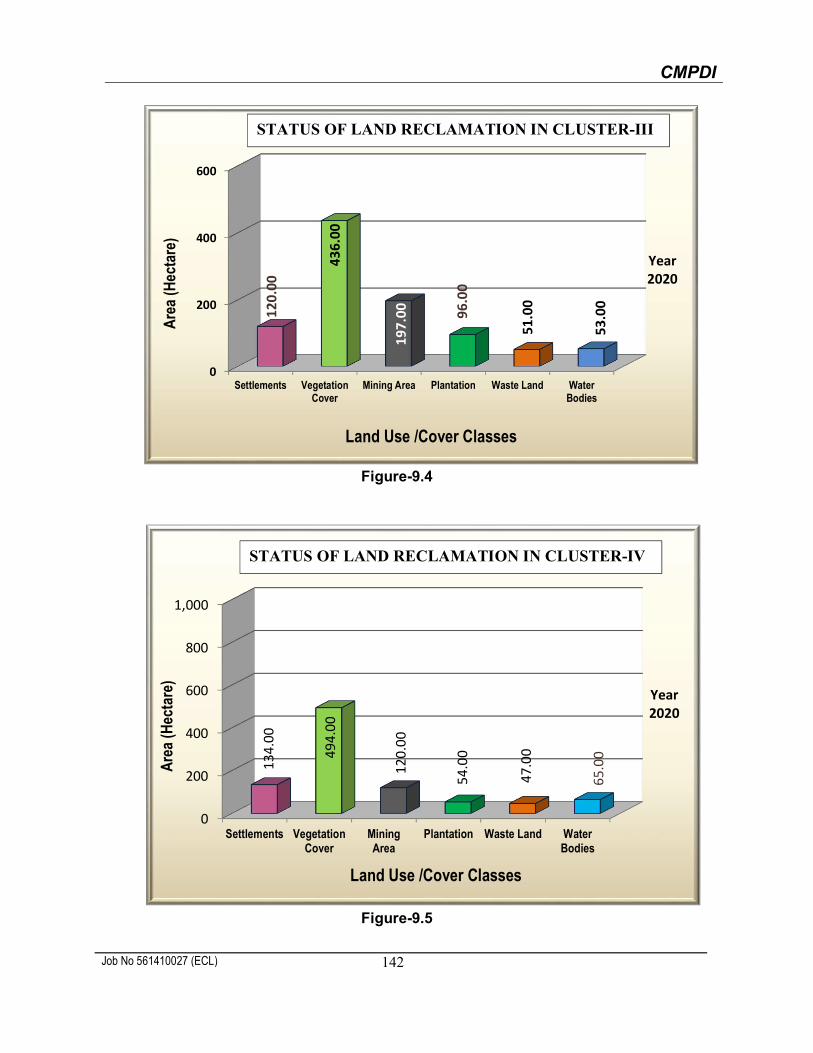
CMPDI
Job No 561410027 (ECL) 142
Figure-9.4
Figure-9.5
0
200
400
600
Settlements VegetationCover
Mining Area Plantation Waste Land WaterBodies
120.
00
436.
00
197.
00 96.0
0
51.0
0
53.0
0
Year 2020
0
200
400
600
800
1,000
Settlements VegetationCover
MiningArea
Plantation Waste Land WaterBodies
134.
00
494.
00
120.
00
54.0
0
47.0
0
65.0
0
Year 2020
STATUS OF LAND RECLAMATION IN CLUSTER-III
STATUS OF LAND RECLAMATION IN CLUSTER-IV
Land Use /Cover Classes
Land Use /Cover Classes
Are
a (H
ecta
re)
Are
a (H
ecta
re)
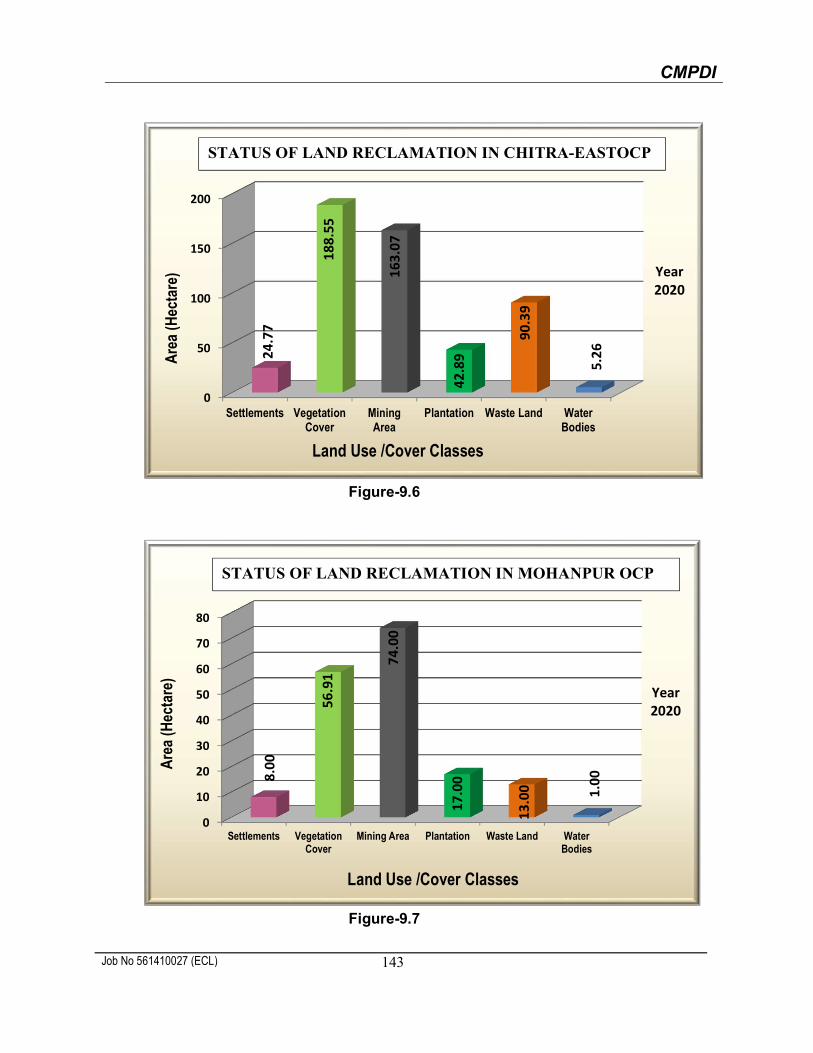
CMPDI
Job No 561410027 (ECL) 143
Figure-9.6
Figure-9.7
0
50
100
150
200
Settlements VegetationCover
MiningArea
Plantation Waste Land WaterBodies
24.7
7
188.
55
163.
07
42.8
9
90.3
9
5.26
Year 2020
0
10
20
30
40
50
60
70
80
Settlements VegetationCover
Mining Area Plantation Waste Land WaterBodies
8.00
56.9
1
74.0
0
17.0
0
13.0
0 1.00
Year 2020
STATUS OF LAND RECLAMATION IN CHITRA-EASTOCP
STATUS OF LAND RECLAMATION IN MOHANPUR OCP
Land Use /Cover Classes
Land Use /Cover Classes
Are
a (H
ecta
re)
Are
a (H
ecta
re)

CMPDI
Job No 561410027 (ECL) 144
Figure-9.8
Photo -9. 1 Plantation on OB Dump area in Dabor OCP, Cluster-III
0
100
200
300
400
500
600
Settlements VegetationCover
Mining Area Plantation Waste Land WaterBodies
7.00
600.
00
0.00
0.00 52
.00
1.00
Year 2020
STATUS OF LAND RECLAMATION IN HURRA-C OCP
Land Use /Cover Classes
Are
a (H
ecta
re)
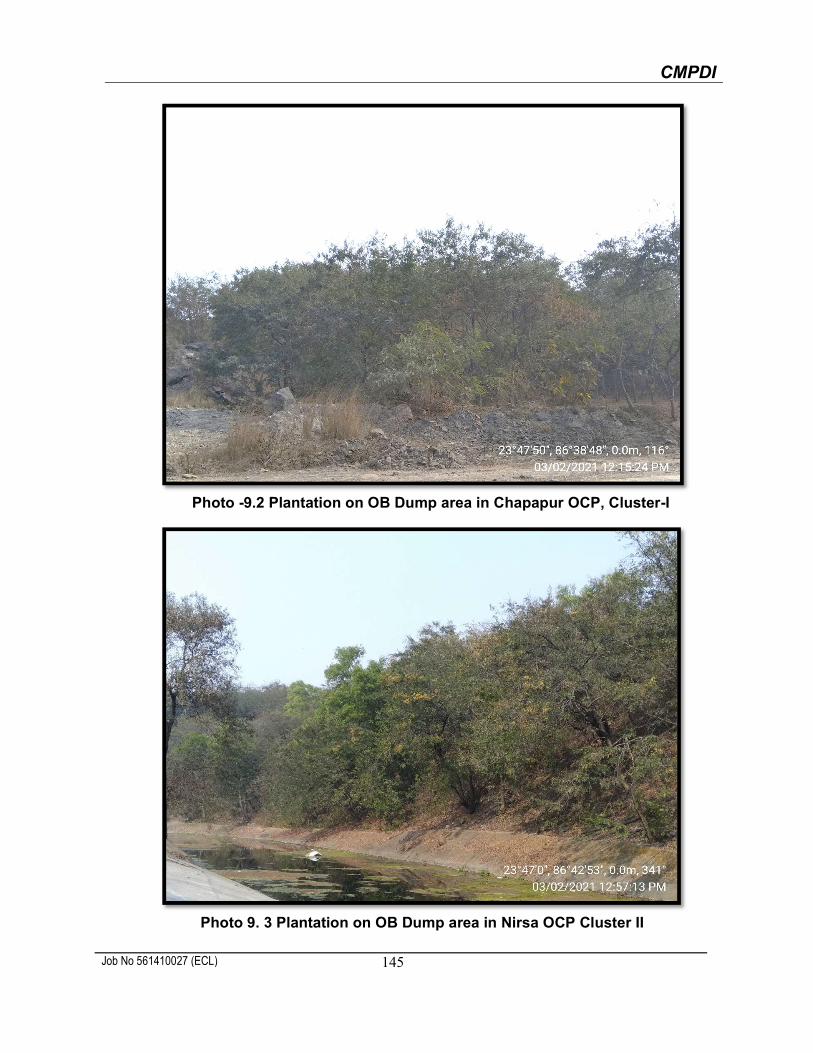
CMPDI
Job No 561410027 (ECL) 145
Photo -9.2 Plantation on OB Dump area in Chapapur OCP, Cluster-I
Photo 9. 3 Plantation on OB Dump area in Nirsa OCP Cluster II

CMPDI
Job No 561410027 (ECL) 146
Photo 9. 4 Plantation on OB Dump in Chitra East OCP
Photo -9.5 Plantation on OB Dump in Mohanpur OCP
MAHANADI COALFIELD LIMITED

CMPDI
Job No 561410027 (MCL) 148
10.0 Land Reclamation Status in Mahanadi Coalfields Limited
10.1 Following 8 projects (UG+OC) mines producing less than 5 million m3. (Coal + OB
together) of Mahanadi Coalfields Ltd. have been taken up for land reclamation monitoring
during the year 2020-21:
Lilari OCP
Kulda OCP
Orient 1 & 2 UG
Orient 3 UG
Balanda OCP
Nandira UG
Chhendipada OCP
Subhadra OCP
10.2 Project wise Land Reclamation status of above mentioned projects in MCL is given in
Table 10.1 and also shown graphically in Fig 10.1. Area statistics of different land use
class present in the mine leasehold of the above projects for the year 2020 are shown in
the Table - 10.2. Land use maps derived from satellite data are shown in Plate 10.1 - 10.8.
Different land use classes based on satellite data are depicted in Bar Charts in Fig. 10.2
– 10.9
10.3 Study reveals that out of total mine leasehold area of 6158.38 Hectares of the above
mentioned 05 OC and 03 UG mines of MCL taken up for this study in 2020-21; total
excavated area is 510.94 hectares, out of which 226.16 hectares (44.26%) has been
planted (Biologically Reclaimed), 126.56 Hectare area (24.77%) is under Backfilling
(Technically Reclaimed) and balance 158.22 Hectare (30.97%) is under active mining. It
is also evident from analysis that 352.72 Ha (69.03%) area of the 8 nos. of UG and OC
mines together is under total reclamation (Biological and Technical).

CMPDI
Job No 561410027 (MCL) 149
10.4 After analyzing the satellite data of year 2017 vs. 2020 it is evident that total area under
plantation (Green Cover) carried out on backfilled area, OB dumps as well as under social
forestry in above (OC+UG) mines of MCL has increased from 57.49 Hectare (Yr 2017) to
309.49 Hectare (Yr 2020). This increase of 252.00 Ha in plantation area in the year 2020
is due to addition of 3 UG and 2 OC projects in the year 2020.
10.5 It is revealed that excavated area and area under plantation on backfill (Biological
Reclamation) in Lilari OCP have decreased from 71.02 Ha (Yr 2017) to 66.29 Ha (Yr 2020)
and 30 Ha in the year 2017 to 24.80 Ha in the year 2020 respectively. Whereas area under
social forestry has increased from 1.80 Ha (Yr 2017) to 2.53 Ha (Yr 2020). The decrease
of 4.73 Ha in excavated area and 5.20 Ha area under plantation on backfill is due to
change in shape and area of leasehold boundary of the above project.
10.6 On comparing the status of land reclamation for the year 2017 with respect to the year
2020 in different projects. It is evident from analysis that area of land reclamation has
increased from 79.80 Ha (Yr 2017) to 352.72 Ha (Yr 2020). This increase of 272.92 Ha
area under reclamation is mainly due to increase in area under land reclamation in Lilari
and Kulda OCPs and also due to addition of Balanda and Subhadra OC projects in the
year 2020-21.
10.7 In Chhendipada OCP, total area under plantation increased from 4.40 Ha. (Yr 2017) to
9.37 Ha. (Yr 2020) which indicate that MCL is committed for reclamation of mined land
for maintaining the ecological balance in the region.
10.8 It is important to mention here that leasehold boundary of Orient 1 & 2 UG overlaps with
the leasehold boundary of Lajkura OCP and Orient 3 UG. Therefore, to avoid data
duplicity in terms surface features/classes pertaining to Lajkura OCP reflecting in the
Area Statistics of Orient 1&2 UG and Orient 3 UG, the overlapping leasehold area of
Lajkura OCP has been deducted as per request from MCL. (Refer MCL Letter No.
MCL/GM/OA/ENVT/2021/675 dtd. 31.05.2021). Furthermore, the leasehold boundaries
of Orient 1&2 and Orient 3 UG mines were also found to be overlapping. Moreover, it

CMPDI
Job No 561410027 (MCL) 150
may be noted that Land Reclamation monitoring of Lajkura OC based on Satellite Data
of year 2020 has been carried out under more than 5 mcm category.
10.9 Out of the above mentioned projects taken up for monitoring, Subhadra OC is an
upcoming project and the current status can be used as base data for comparing the
status of land reclamation monitoring during cycle of three years.
10.10 Out of the 8 projects of MCL, Balanda OCP ranks on top for land reclamation (92.60%)
followed by Lilari OCP (91.67%), Chhendipada OCP (74.04%) in the year 2020.

CMPDI
Job No 561410027 (MCL) 151
Table10.1
Project wise Land Reclamation Status in 5 OC and 3 UG mines of Mahanadi Coalfields Ltd based on Satellite data of the year 2020
Note: In reference of the above Table, different parameters are classified as follows: 1. Area under Biological Reclamation includes Areas under Plantation done on Backfilled Area Only. 2. Area under Technical Reclamation includes Area under Barren Backfilling only 3. Area under Active Mining Includes Coal Quarry, Advance Quarry Site, and Quarry filled with water etc., if any. 4. Social Forestry and Plantation on External OB Dumps are not included in Biological Reclamation and are put under separate categories as shown in the Table above. 5. (%) calculated in the above Table is in respect to Total Excavated Area except for “Total Area under Plantation” where % is in terms of “Leasehold Area”. 6. Out of 8 projects taken for Land Reclamation Monitoring in the year 2020-21, comparison has been made for only three projects like Lilari OCP, Kulda OCP and Chhendipada OCP as other 5 projects are taken up for
monitoring for the first time in the year 2020. 7. The leasehold areas of Lilari OC, Kulda OC, Orient 1&2 UG, Orient 3 UG, Nandira UG and Chhendipada OC projects are modified as per EC while Leasehold area of Balanda OC and Subhadra OC are as per map provided
by area. 8. The leasehold area shown in (Sl. 6 & 7) in the above Table is the net area of these Projects after deducting the common Leasehold area of Lajkura OCP as the leasehold boundaries of these mines are overlapping. 9. The total leasehold area of the above mentioned 8 OC & UG projects without deducting the common leasehold area of Lajkura OC is 6158.38 Ha.
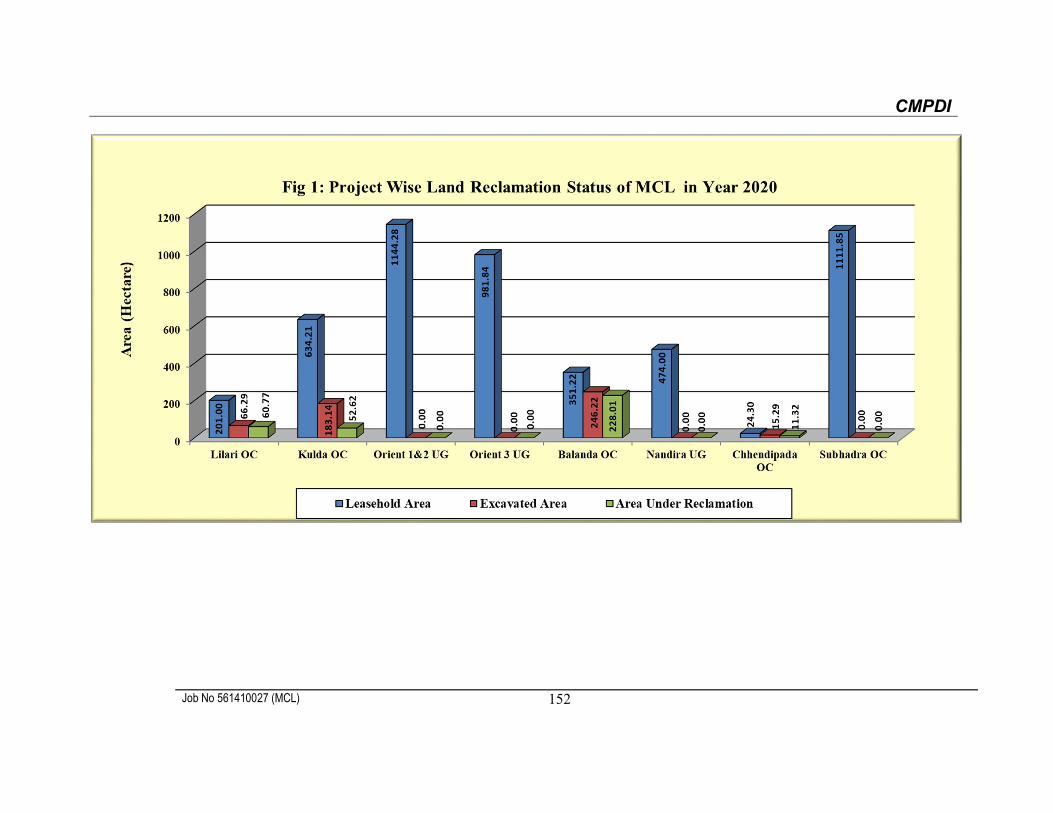
CMPDI
Job No 561410027 (MCL) 152

CMPDI
Job No 561410027 (MCL) 153
TABLE-10.2 STATUS OF LAND USE/COVER CLASSES/LAND RECLAMATION IN UG & OC MINE PRODUCING (<5 M.C.M OF COAL+OB) OF MCL BASED ON SATELLITE DATA OF THE YEAR 2020
Note: The Area of Orient 1&2* and Orient 3** indicated here is excluding the common area of Lajkura OC as the leasehold areas of Orient 1 & 2, Orient 3 UG Mines and Lajkura OC overlap with each other. Moreover, it may be noted that monitoring of Lajkura OC based on Satellite Data of 2020 has been carried out under more than 5 mcm category.

CMPDI
Job No 561410027 (MCL) 154
Plate-10.1

CMPDI
Job No 561410027 (MCL) 155
Plate-10.2
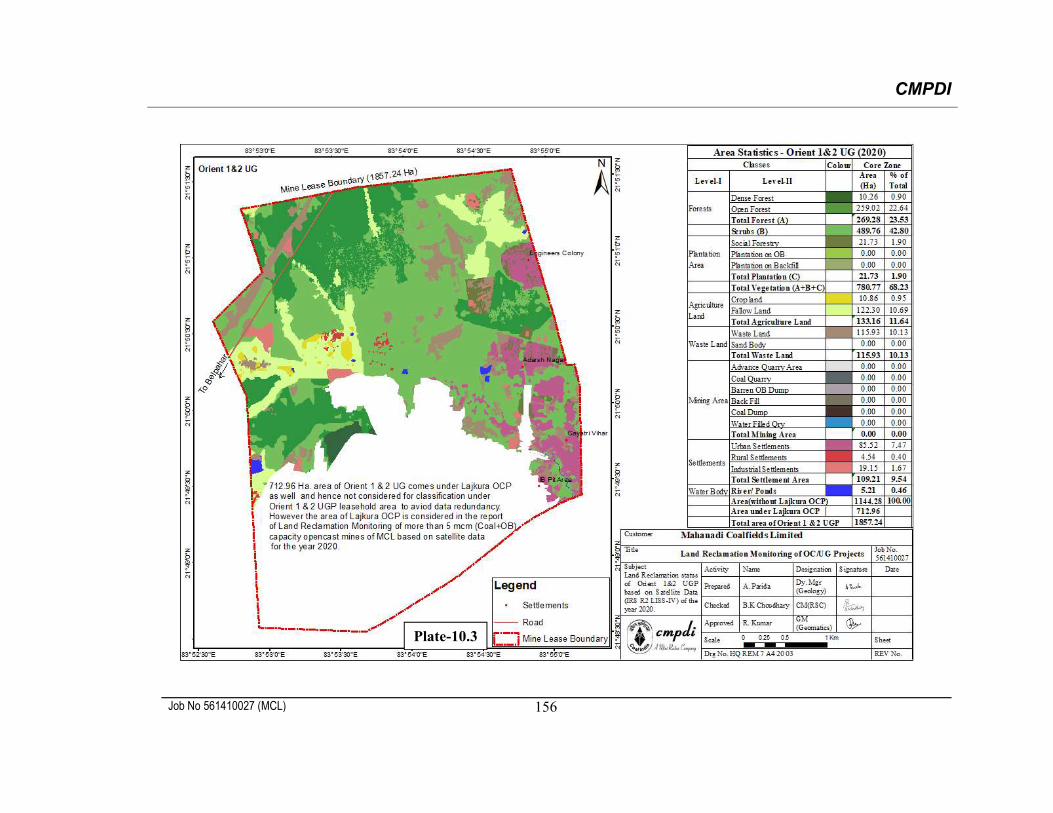
CMPDI
Job No 561410027 (MCL) 156
Plate-10.3
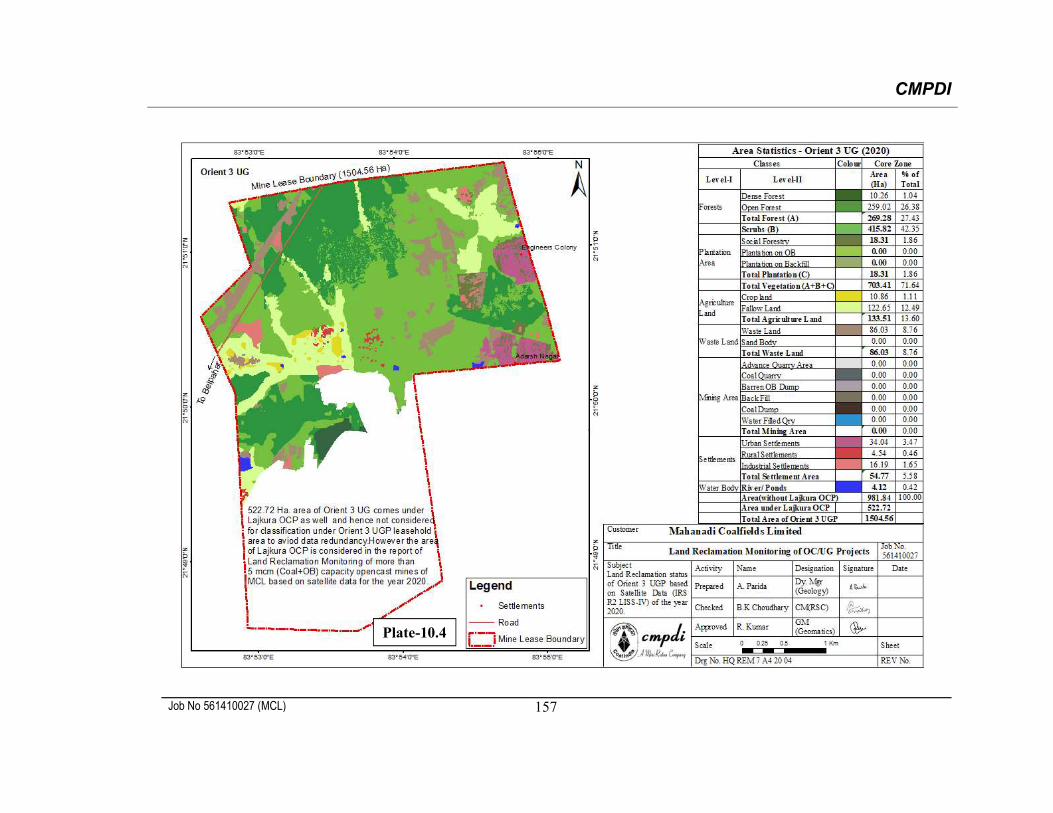
CMPDI
Job No 561410027 (MCL) 157
Plate-10.4

CMPDI
Job No 561410027 (MCL) 158
Plate-10.5
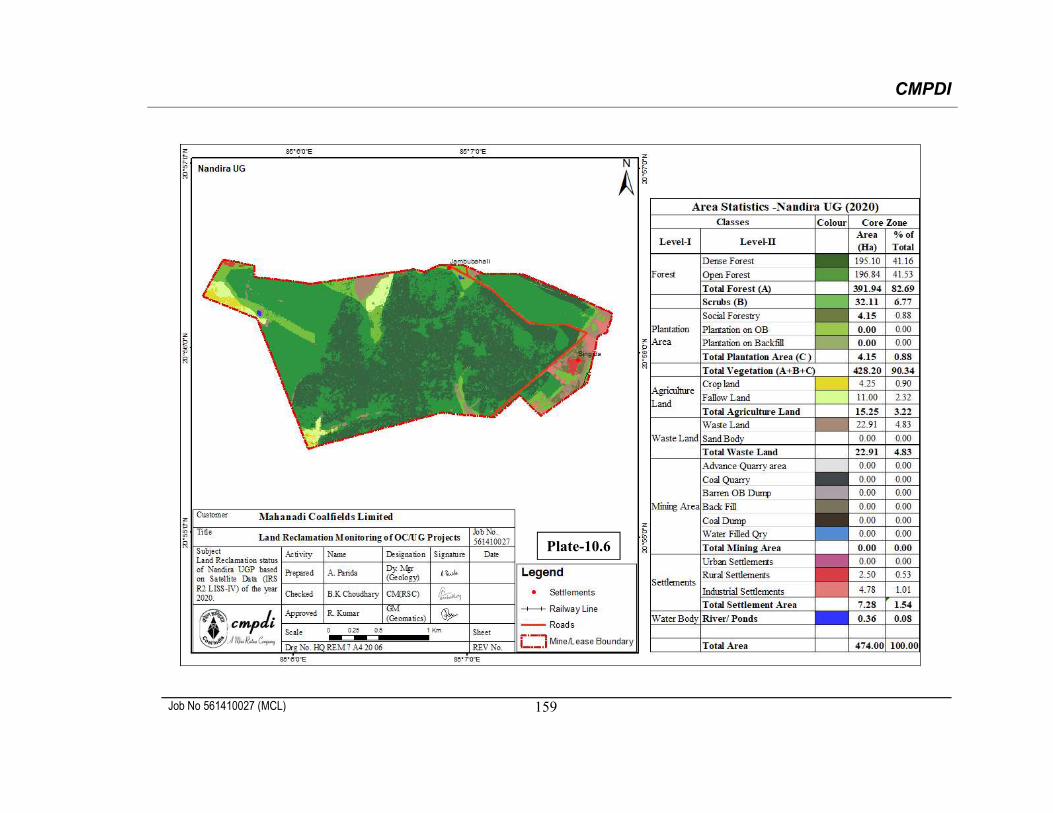
CMPDI
Job No 561410027 (MCL) 159
Plate-10.6

CMPDI
Job No 561410027 (MCL) 160
Plate-10.7
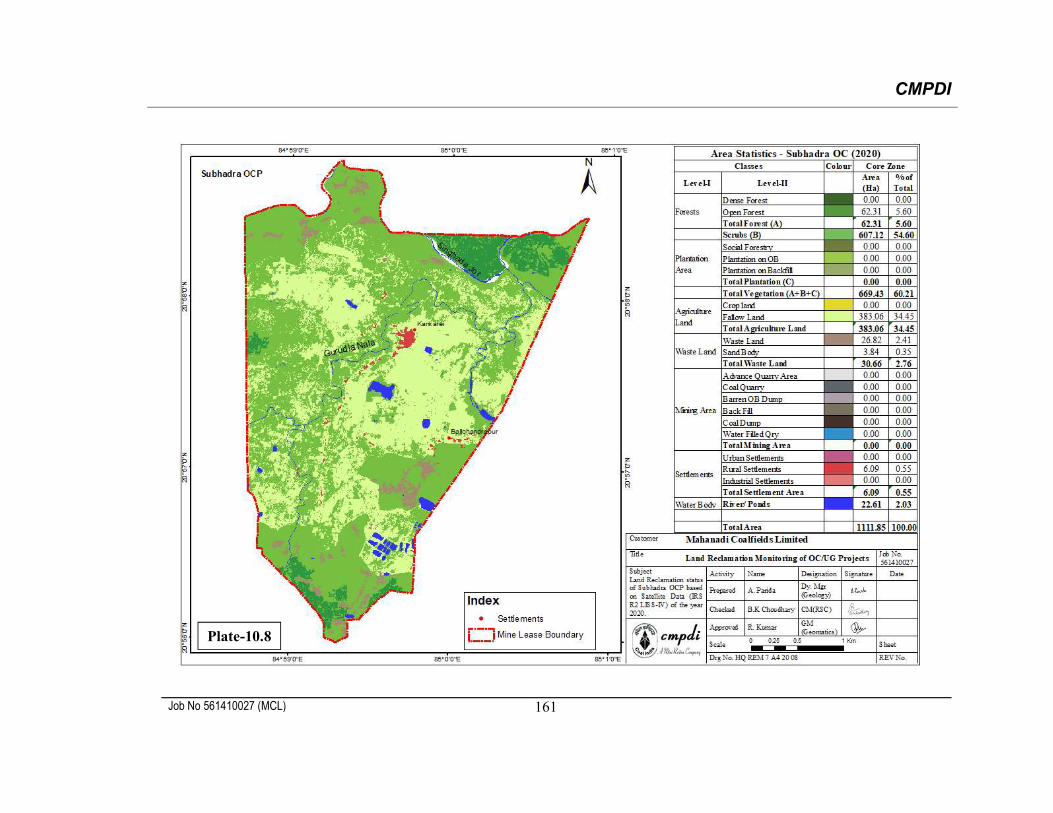
CMPDI
Job No 561410027 (MCL) 161
Plate-10.8

CMPDI
Job No 561410027 (MCL) 162
Figure – 10.2
Figure -10.3
Area
(Hec
tare
) Ar
ea (H
ecta
re)
STATUS OF LAND RECLAMATION IN LILARI OCP
STATUS OF LAND RECLAMATION IN KULDA OCP
LandUse/Cover Classes
LandUse/Cover Classes

CMPDI
Job No 561410027 (MCL) 163
Figure -10.4
Figure -10.5
STATUS OF LAND RECLAMATION IN ORIENT 1&2 UG MINE
STATUS OF LAND RECLAMATION IN ORIENT 3 UG MINE
Land Use/Cover Classes
Land Use/Cover Classes
Are
a (H
ecta
re)
Are
a (H
ecta
re)

CMPDI
Job No 561410027 (MCL) 164
Figure -10.6
Figure -10.7
0
50
100
150
200
250
Settlements VegetationCover
Mining Area Plantation Waste Land WaterBodies
0.69
212.
68
49.3
2
203.
56
88.3
9
0.14
Year 2020
0
100
200
300
400
500
Settlements VegetationCover
MiningArea
Plantation Waste Land WaterBodies
7.28
428.
20
0.00
4.15 22
.91
0.36
Year 2020
Are
a (H
ecta
re)
Are
a (H
ecta
re)
STATUS OF LAND RECLAMATION IN BALANDA OCP
STATUS OF LAND RECLAMATION IN NANDIRA UG MINE
Land Use/Cover Classes
Land Use/Cover Classes
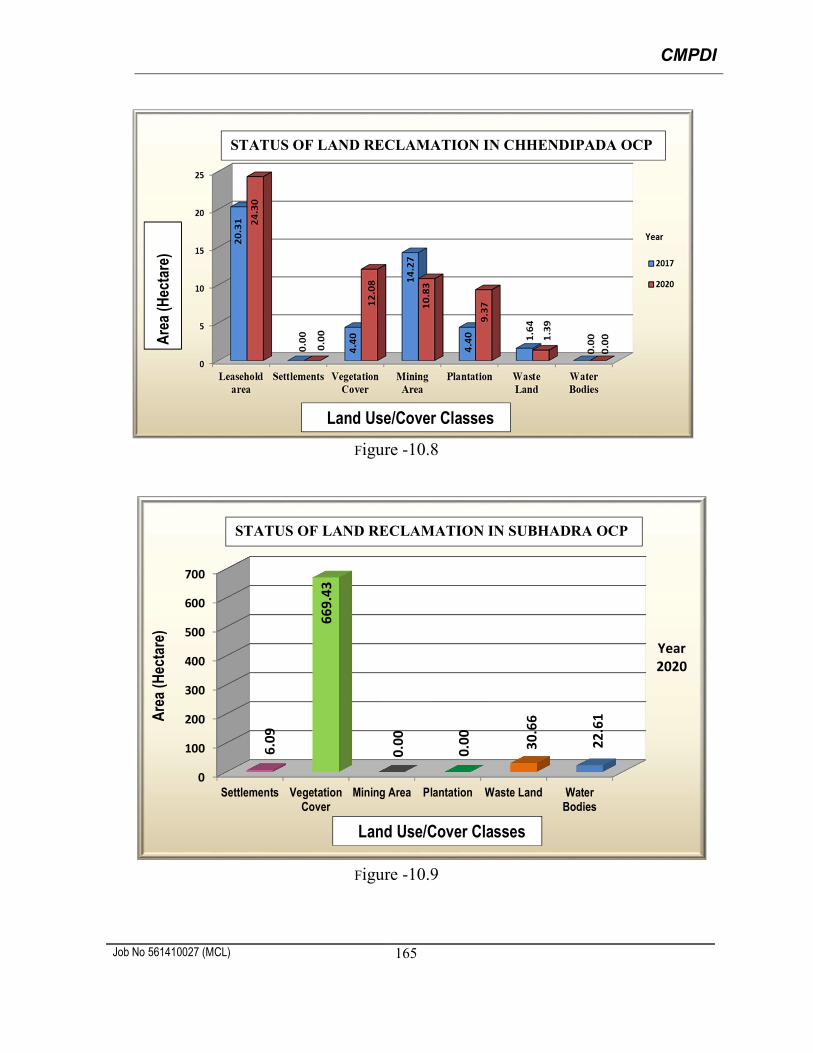
CMPDI
Job No 561410027 (MCL) 165
Figure -10.8
Figure -10.9
0
100
200
300
400
500
600
700
Settlements VegetationCover
Mining Area Plantation Waste Land WaterBodies
6.09
669.
43
0.00
0.00 30
.66
22.6
1
Year 2020
Are
a (H
ecta
re)
Are
a (H
ecta
re)
STATUS OF LAND RECLAMATION IN CHHENDIPADA OCP
STATUS OF LAND RECLAMATION IN SUBHADRA OCP
Land Use/Cover Classes
Land Use/Cover Classes

CMPDI
Job No 561410027 (MCL) 166
Photograph10.1: Plantation on backfill in Lilari OCP
Photo10.2: Plantation on internal dump in Kulda OCP

CMPDI
Job No 561410027 (MCL) 167
Photo 10.3: Plantation on backfill in Balanda OCP
Photo 10.4: Plantation on backfill in Chhendipada OCP

NORTH EASTERN COALFIELDS

CMPDI
Job No 561410027 (NEC) 169
11.0 Land Reclamation Status in North Eastern Coalfields
11.1 Following three OC projects producing less than 5 million m3 (Coal + OB together) of North Eastern
Coalfields Ltd. have been taken up for land reclamation monitoring based on satellite data of the
the year 2020-21 .
Lido OCP
Tikak OCP
Tirap OCP
11.2 Project wise Land Reclamation status of above mentioned projects in NEC is given in Table
11.1 and also shown graphically in Fig 11.1. Area statistics of different land use class present
in the mine leasehold of the above projects for the year 2020 are shown in the Table - 11.2.
Land use maps derived from satellite data are shown in Plate 11.1 -11.3 Different land use
classes based on satellite data are depicted in Bar Charts in Fig. 11.2 to 11.4.
11.3 Study reveals that out of total mine leasehold area of 1587.87 Hectares of the above mentioned
03 OC projects of NEC taken up for this study in 2020-21; total excavated area is 223.58
hectares (14.08%), out of which 17.81 Hectare (7.97%) has been planted (Biologically
Reclaimed), 50.14 Hectare (22.43%) is under backfilling (Technically Reclamation) and
balance 155.63 Hectare (69.61%) is under active mining.
11.4 On comparing the status of land reclamation for the year 2017 with respect to the year 2020 in
different projects. It is evident from analysis that area of land reclamation has increased from
49.48 Ha (22.81%) in the year Year 2017 to 67.95 Ha (30.39%) in the Year 2020.
11.5 After analyzing the satellite data of the year 2017 vs 2020 it is evident that total plantation
carried out on backfill area, OB Dumps as well as social Forestry in all the three mines of
NEC has increased from 137.74 Hectare (8.67%) (Year 2017) to 192.42 (12.12%) Hectare
(Year 2020) in the span of last three years. This increase of 54.68 Hectare area of total
plantation in three years is due to sincere effort made by NEC towards land reclamation.

CMPDI
Job No 561410027 (NEC) 170
11.6 Out of three projects in NEC, Ledo OCP tops with 22.54 Hectare (82.41%) reclamation
followed by Tirap OCP with 45.41 Hectare (33.90%) as evident from Table -11.1.
11.7 This study will be carried out again after an interval of three years to assess the land
reclamation status in the above projects.

CMPDI
Job No 561410027 (NEC) 171
Table-11.1 Projects wise Land Reclamation Status in opencast projects of NEC based on the satellite data of the year 2020
1 2
2017 2020 2017 2020 2017 2020 2017 2020 2017 2020 2017 2020 2017 2020 2017 2020 2017 2020
1 Ledo 101.00 101.00 0.00 14.35 5.82 8.19 1.31 8.05 29.21 29.99 21.51 4.81 27.33 27.35 36.34 46.23 5.82 22.54
0.00% 52.47% 21.30% 29.95% 78.70% 17.59% 35.98% 45.77% 21.30% 82.41%
2 Tikak 1191.80 1191.80 0.00 0.00 0.00 0.00 71.26 100.81 18.54 23.29 62.00 62.29 62.00 62.29 89.80 124.10 0.00 0.00
0.00% 0.00% 0.00% 0.00% 100.00% 100.00% 7.53% 10.41% 0.00% 0.00%
3 Tirap 295.07 295.07 37.33 35.79 6.33 9.62 5.27 12.47 0.00 0.00 83.90 88.53 127.56 133.94 11.60 22.09 43.66 45.4129.26% 26.72% 4.96% 7.18% 65.77% 66.10% 3.93% 7.49% 34.23% 33.90%
TOTAL 1587.87 1587.87 37.33 50.14 12.15 17.81 77.84 121.33 47.75 53.28 167.41 155.63 216.89 223.58 137.74 192.42 49.48 67.9517.21% 22.43% 5.60% 7.97% 77.19% 69.61% 8.67% 12.12% 22.81% 30.39%
9 (=4+5+8) 10 (=5+6+7) 11(=4+5)
(% is calculated with respected to Excavated Area as applicable)
3 4 5 6 7 8
Biological Reclamation Other Plantations
Area under BackfillingPlantation on Excavated
/ Backfilled Area
Plantation on External Over
Burden Dumps
Social Forestry, Avanue
Plantation Etc.
(Area in Hectare)
Sl.No.
ProjectTotal Leasehold
Area
Plantation
Area under Active Mining
Technical Reclamation
Total Excavated Area
Total Area under Plantation
(% Green Cover Generated in
Leasehold)
Total Area under Reclamation
Note: In reference of the above Table, different parameters are classified as follows: 1. Area under Biological Reclamation includes areas under plantation done on backfilled area only. 2. Area under Technical Reclamation includes area under barren backfilled only 3. Area under Active mining includes coal quarry site, quarry filled with water etc. 4. Social Forestry and Plantation on external OB dump are not included in Biological Reclamation and are put under separate categories as shown in the table. 5. (%) calculated in the above table is in respect of total excavated area except for “Total area under plantation” where % is in terms of leasehold area.
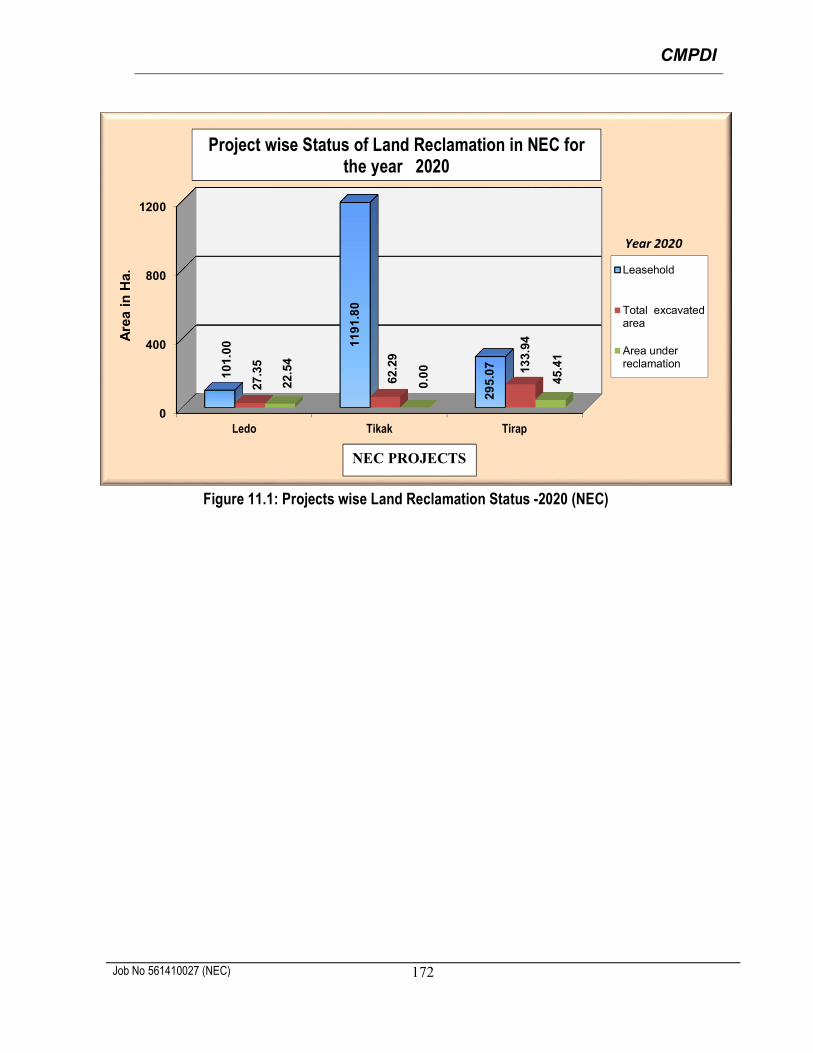
CMPDI
Job No 561410027 (NEC) 172
Figure 11.1: Projects wise Land Reclamation Status -2020 (NEC)
0
400
800
1200
Ledo Tikak Tirap
10
1.0
0 11
91.
80
29
5.0
7
27.3
5
62.2
9
133.
94
22.5
4
0.0
0
45.4
1
Are
a i
n H
a . Leasehold
Total excavatedarea
Area underreclamation
Year 2020
Project wise Status of Land Reclamation in NEC for the year 2020
NEC PROJECTS

CMPDI
Job No 561410027 (NEC) 173
TABLE-11.2 PROJECT WISE STATUS OF LAND USE / COVER / LAND RECLAMATION IN 03 OC MINE OF NEC
PRODUCING LESS THAN 5 M.C.M (COAL+OB) BASED ON SATELLITE DATA OF THE YEAR 2020
Area % Area % Area % Area %
Dense Forest/Tea 0.00 0.00 725.09 60.85 98.74 33.46 823.83 51.88
Tea Plantation 2.29 2.27 34.68 2.91 14.95 5.07 51.92 3.27
Total Forest/Tea Plantation 2.29 2.27 759.77 63.76 113.69 38.53 875.75 55.15
Scrubs 8.00 7.92 39.06 3.28 3.37 1.14 50.43 3.18
Social Forestry 29.99 29.69 23.29 1.95 0.00 0.00 53.28 3.36
Plantation on OB Dump 8.05 7.97 100.81 8.46 12.47 4.23 121.33 7.64
Plantation on Backfill (Biological Reclamation) 8.19 8.11 0.00 0.00 9.62 3.26 17.81 1.12
Total Plantation(Green Cover generated) 46.23 45.77 124.10 10.41 22.09 7.49 192.42 12.12Total Vegetation 56.52 55.96 922.93 77.45 139.15 47.16 1118.60 70.45
Active Mining Area/Coal Quarry 0.00 0.00 62.29 5.23 82.35 27.91 144.64 9.11
Coal Dump 0.00 0.00 0.00 0.00 0.01 0.00 0.01 0.00
Advance Quarry Site 0.00 0.00 0.00 0.00 0.00 0.00 0.00 0.00
Quarry Filled With Water(Sump) 4.81 4.76 0.00 0.00 6.17 2.09 10.98 0.69
Total Area under Active Mining 4.81 4.76 62.29 5.23 88.53 30.00 155.63 9.80
Barren OB Dump 4.36 4.32 104.43 8.76 7.85 2.66 116.64 7.35
Barren Backfilled Area (Technical Reclamation) 14.35 14.21 0.00 0.00 35.79 12.13 50.14 3.16
Total Area under Technical Reclamation 14.35 14.21 0.00 0.00 35.79 12.13 50.14 3.16
Waste Lands 4.63 4.58 95.28 7.99 18.02 6.11 117.93 7.43
Fly Ash Pond / Sand Body 0.00 0.00 0.00 0.00 0.00 0.00 0.00 0.00
Total Wasteland 4.63 4.58 95.28 7.99 18.02 6.11 117.93 7.43
Reservoir, nallah, ponds 0.00 0.00 5.50 0.46 4.81 1.63 10.31 0.65
Total Waterbodies 0.00 0.00 5.50 0.46 4.81 1.63 10.31 0.65
Crop Lands 0.00 0.00 0.00 0.00 0.00 0.00 0.00 0.00
Fallow Lands 0.00 0.00 0.00 0.00 0.00 0.00 0.00 0.00
Total Agriculture 0.00 0.00 0.00 0.00 0.00 0.00 0.00 0.00
Urban Settlement 16.33 16.17 0.00 0.00 0.30 0.10 16.63 1.05
Rural Settlement 0.00 0.00 1.37 0.11 0.00 0.00 1.37 0.09
Industrial Settlement 0.00 0.00 0.00 0.00 0.62 0.21 0.62 0.04
Total Settlement 16.33 16.17 1.37 0.11 0.92 0.31 18.62 1.17
Grand Total 101.00 100.00 1191.80 100.00 295.07 100.00 1587.87 100.00
PL
AN
TA
TIO
NS
ET
TL
EM
EN
TS
AC
TIV
E M
ININ
GR
EC
LA
IME
DW
AS
TE
LA
ND
SW
AT
ER
BO
DIE
SA
GR
ICU
LT
UR
ES
CR
UB
SF
OR
ES
TS
(Area in Ha.)
LedoTikak(4 miles leased area
including Namdang) Tirap TOTAL
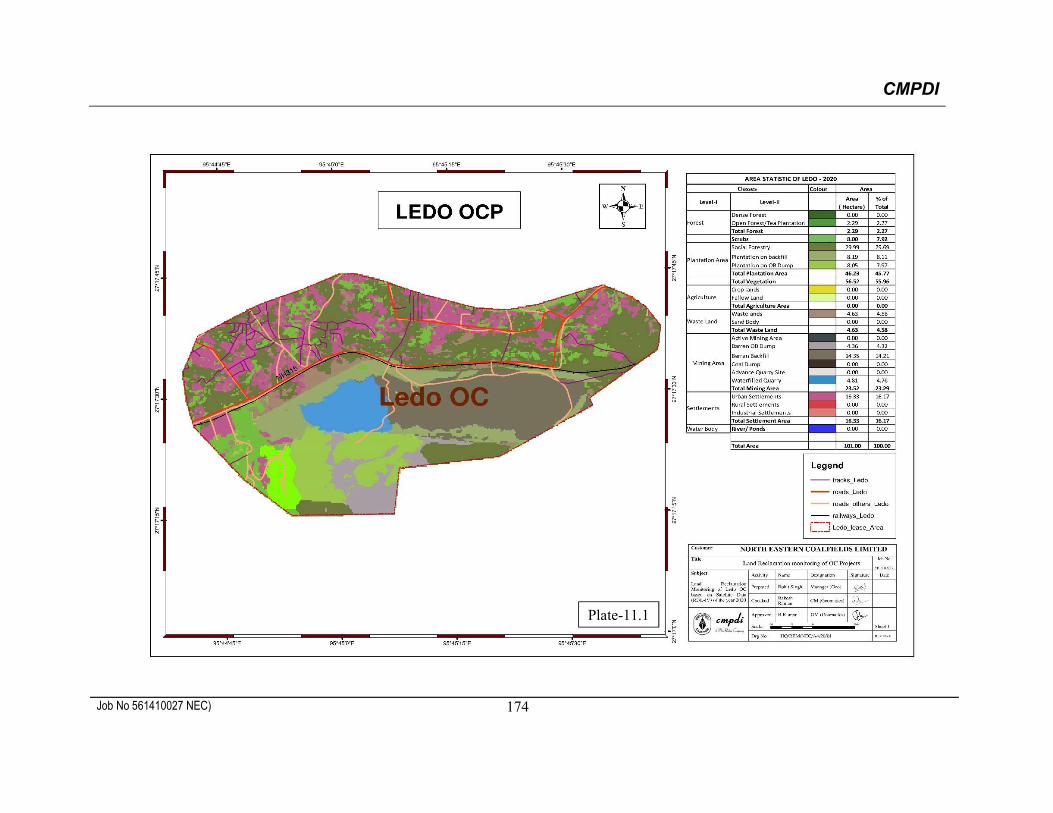
CMPDI
Job No 561410027 NEC) 174
Plate-11.1
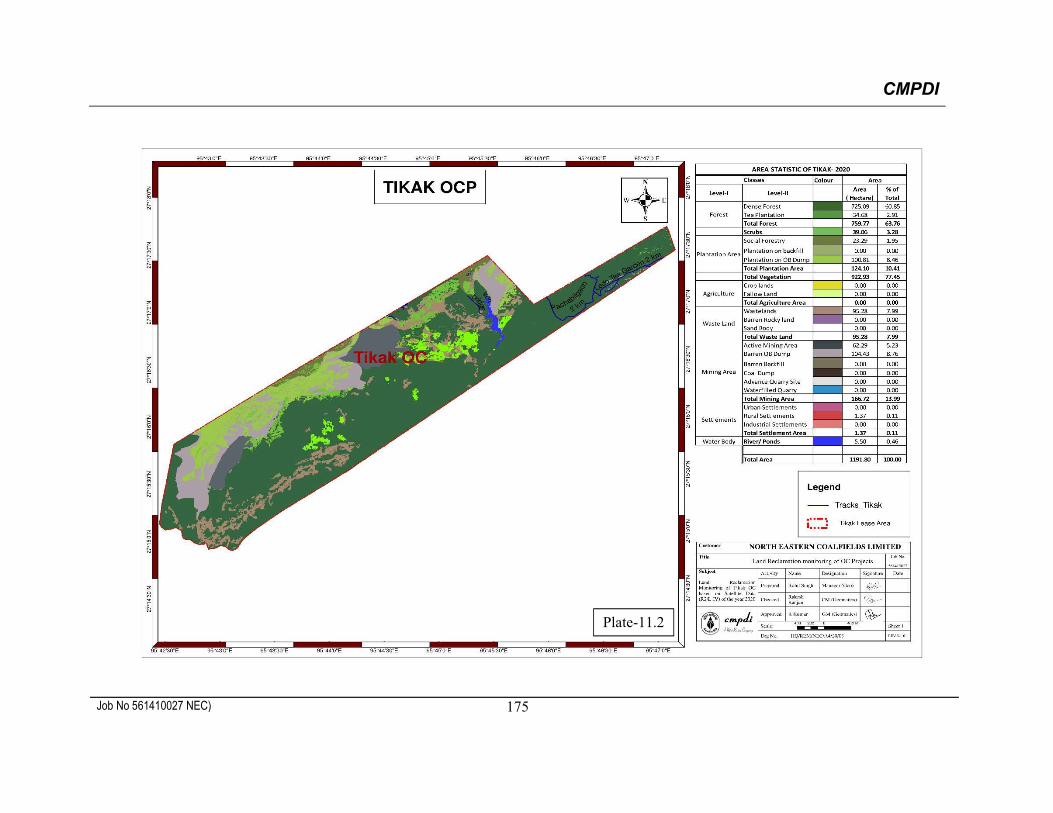
CMPDI
Job No 561410027 NEC) 175
Plate-11.2

CMPDI
Job No 561410027 NEC) 176
Plate-11.3

CMPDI
Job No 561410027 NEC) 177
Figure -11.2
Figure -11.3
0
20
40
60
80
Settlement Plantation VegetationCover
Wasteland Mining Area Surfacewater
6.00
40.4
0
56.9
3
14.8
2
23.0
5
0.208.
40 36.3
4
55.6
9
9.81
27.1
0
0.00
16.3
3
46.2
3 56.5
2
4.63 23
.52
0.00
Are
a in
Ha.
2014
2017
2020
Year
0
400
800
1200
Settlement Plantation VegetationCover
Wasteland Mining Area Surfacewater
0.00 78.0
1
949.
73
102.
20
137.
67
2.90
0.89 89
.80
879.
94
102.
57 196.
33
12.0
7
1.37
124.
10
922.
93
95.2
8
166.
72
5.50
Are
a in
Ha.
2014
2017
2020
Year
Status of Land Reclamation in Ledo OCP
Status of Land Reclamation in Tikak(4milesleased+Namdang) OCP
Land Use/Cover Classes
Land Use/Cover Classes

CMPDI
Job No 561410027 NEC) 178
Figure -11.4
Photo-11.1 Plantation on OB Dump in Ledo OCP
0
400
800
1200
Settlement Plantation VegetationCover
Wasteland Mining Area Surfacewater
0.30
11.6
0 149
.66
0.0
0 13
9.44
5.67
0.92
22
.09
139
.15
18.0
2
132.
17
4.81
Are
a in
Ha.
2017
2020
Year
Status of Land Reclamation in Tirap OCP
Land Use/Cover Classes

CMPDI
Job No 561410027 NEC) 179
Photo 11.2 Plantation on OB Dump in Ledo OCP
Photo-11.3: Plantation on OB Dump in Tikak OCP
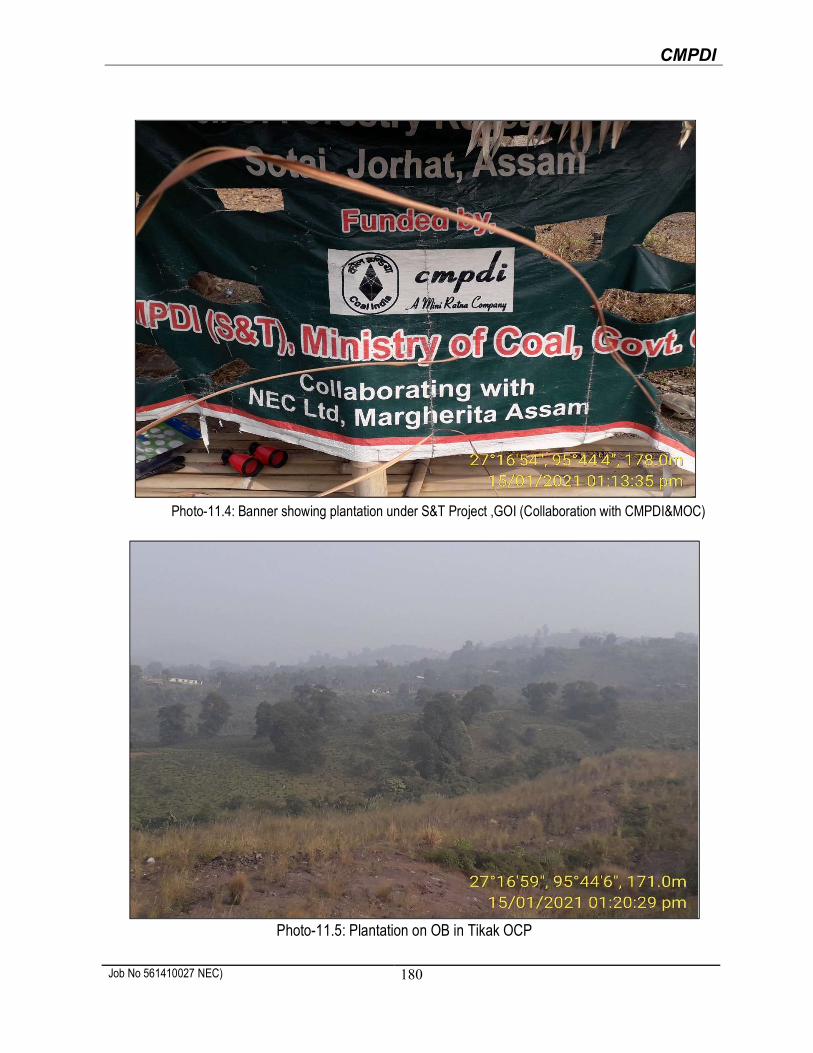
CMPDI
Job No 561410027 NEC) 180
Photo-11.4: Banner showing plantation under S&T Project ,GOI (Collaboration with CMPDI&MOC)
Photo-11.5: Plantation on OB in Tikak OCP

CMPDI
Job No 561410027 NEC) 181
Photo-11.6: Plantation on OB in Tikak OCP
Photo-11.7: Plantation on backfill in Tirap OCP

CMPDI
Job No 561410027 NEC) 182
Photo-11.8: Plantation on backfill in Tirap OCP

Central Mine Planning & Design Institute Ltd. (A Subsidiary of Coal India Ltd.)
Gondwana Place, Kanke Road, Ranchi 834031, Jharkhand Phone : (+91) 651 2230001, 2230002, 2230483, FAX (+91) 651 2231447, 2231851
Wesite : www.cmpdi.co.in, Email : [email protected]