LAKEWOOD CITY COUNCIL STUDY SESSION AGENDA
219
Persons requesting special accommodations or language interpreters should contact the City Clerk, 253-983-7705, as soon as possible in advance of the Council meeting so that an attempt to provide the special accommodations can be made. http://www.cityoflakewood.us LAKEWOOD CITY COUNCIL STUDY SESSION AGENDA Monday, September 13, 2021 7:00 P.M. City of Lakewood Council Chambers 6000 Main Street SW Lakewood, WA 98499 Residents can virtually attend City Council meetings by watching them live on the city’s YouTube channel: https://www.youtube.com/user/cityoflakewoodwa Those who do not have access to YouTube can call in to listen by telephone via Zoom: Dial +1(253) 215- 8782 and enter meeting ID: 868 7263 2373 ________________________________________________________________ Page No. CALL TO ORDER ITEMS FOR DISCUSSION: (3) 1. Review of 2 nd Quarter (2021) Financial Report. – (Memorandum) (126) 2. Review policies and priorities for allocation of American Rescue Plan Act (ARPA) funds. – (Memorandum) ITEMS TENTATIVELY SCHEDULED FOR THE SEPTEMBER 20, 2021 REGULAR CITY COUNCIL MEETING: 1. Sound Transit Access Improvement Update. – Ms. Katie Drewel and Mr. Zachary Eskenazi 2. Authorizing the execution of an amendment to the agreement with Pierce County for road and traffic maintenance services. – (Motion – Consent Agenda) 3. Reappointing J. Alan Billingsley and Vito Iacobazzi to serve on the Parks and Recreation Advisory Board through September 19, 2024. – (Motion – Consent Agenda) 4. Adopting policies and priorities concerning allocation of American Rescue Plan Act (ARPA) funds and allocating ARPA funds to certain expenditures. – (Ordinance – Regular Agenda) 5. Appointing a Representative and Alternate to the South Sound Housing Affordability Partners (SSHA 3 P) Executive Board. – (New Business – Regular Agenda)
-
Upload
khangminh22 -
Category
Documents
-
view
9 -
download
0
Transcript of LAKEWOOD CITY COUNCIL STUDY SESSION AGENDA

Persons requesting special accommodations or language interpreters should contact the City Clerk, 253-983-7705, as soon as possible in advance of the Council meeting so that an attempt to provide the
special accommodations can be made.
http://www.cityoflakewood.us
LAKEWOOD CITY COUNCIL STUDY SESSION AGENDA Monday, September 13, 2021 7:00 P.M. City of Lakewood
Council Chambers 6000 Main Street SW Lakewood, WA 98499
Residents can virtually attend City Council meetings by watching them live on the city’s YouTube channel: https://www.youtube.com/user/cityoflakewoodwa
Those who do not have access to YouTube can call in to listen by telephone via Zoom: Dial +1(253) 215- 8782 and enter meeting ID: 868 7263 2373
________________________________________________________________ Page No.
CALL TO ORDER ITEMS FOR DISCUSSION:
(3) 1. Review of 2nd Quarter (2021) Financial Report. – (Memorandum) (126) 2. Review policies and priorities for allocation of American Rescue Plan Act
(ARPA) funds. – (Memorandum)
ITEMS TENTATIVELY SCHEDULED FOR THE SEPTEMBER 20, 2021 REGULAR CITY COUNCIL MEETING:
1. Sound Transit Access Improvement Update. – Ms. Katie Drewel and Mr. Zachary Eskenazi
2. Authorizing the execution of an amendment to the agreement with Pierce
County for road and traffic maintenance services. – (Motion – Consent Agenda)
3. Reappointing J. Alan Billingsley and Vito Iacobazzi to serve on the Parks
and Recreation Advisory Board through September 19, 2024. – (Motion – Consent Agenda)
4. Adopting policies and priorities concerning allocation of American Rescue
Plan Act (ARPA) funds and allocating ARPA funds to certain expenditures. – (Ordinance – Regular Agenda)
5. Appointing a Representative and Alternate to the South Sound Housing
Affordability Partners (SSHA3P) Executive Board. – (New Business – Regular Agenda)

Lakewood City Council Agenda -2- September 13, 2021 Page No.
Persons requesting special accommodations or language interpreters should contact the City Clerk, 253-983-7705, as soon as possible in advance of the
Council meeting so that an attempt to provide the special accommodations can be made.
http://www.cityoflakewood.us
6. Review of Fireworks Display Options. – (Reports by the City Manager) REPORTS BY THE CITY MANAGER
CITY COUNCIL COMMENTS ADJOURNMENT

To: Mayor and City Councilmembers
From: Tho Kraus, Deputy City Manager
Through: John J. Caulfield, City Manager
Date: September 13, 2021
Subject: 2021 Q2 Financial Report
Introduction
The intent of the financial report is to provide an overview of activity in all funds through June 30, 2021. Additionally, performance measures and other data reporting are included at the end of this report.
Page In This Report Page In This Report
2 American Rescue Plan Act (ARPA) 45 1406 Affordable Housing Program (New‐Additional Details)
3 Consolidated Funds ‐ General/Street O&M 46 Community Development Block Grant
6 Property Tax 59 Neighborhood Stabilization Program
7 Sales & Use Tax 59 South Sound Military Partnership
13 Criminal Justice Sales Tax (New) 60 Park Sales Tax
14 Util ity Tax 61 Cost Recovery ‐ Parks Recreation
15 Gambling Tax 62 Farmers Market Financial & Metrics (New)
16 Admissions Tax 63 Human Services Program
17 Franchise & Non‐Compete Fees 64 Property Management (New‐Additional Details)
18 State Shared Revenues 65 Capital Projects ‐ Parks
19 Photo Infraction ‐ Red Light/School Zone Enforcement 66 Real Estate Excise Tax
21 Jail Services 71 Transportation Benefit District
22 Dispatch Services 76 Capital Projects ‐ Transportation
23 Animal License & Animal Control Services 77 Capital Projects ‐ Sewer
24 Alarm Permits & Fees 78 Surface Water Mangement Operations & Capital
25 Seizure Fund ‐ Narcotics (New‐Additional Details) 79 Hotel/Motel Lodging Tax
25 Seizure Fund ‐ Felony (New‐Additional Details) 81 Fleet & Equipment Fund
26 Seizure Fund ‐ Federal (New‐Additional Details) 82 Information Technology Fund (New‐Additional Details)
27 Public Safety Grants 83 Risk Management Fund
28 Municipal Court Fines & Forfeitures, Fil ings and Finances 84 Debt Service
33 Business License 86 Cash & Investments
34 Development Services Permits & Fees (New‐Additional Details) 86 By Fund Summary
41 Cost Recovery ‐ Development Services Permits & Fees 87 Financial Statements by Fund
(Combines CED & PWE Permits & Fees) 103 Performance Measures
42 Property Abatement 115 MyLakewood311 Data Report
44 Rental Housing Safety Program 120 Building Permit Activity Report
1 3

American Rescue Plan Act (ARPA) On March 12, 2021, President Biden signed the American Rescue Plan Act of 2021 (ARPA). Per Title IX Part 8 Subtitle M of the act, ARPA allocates funds to states, counties and cities for their use to mitigate the effects of COVID‐19 has had on their government’s revenue and operations as well as their citizens ARPA funds total $1.9 trillion, of which $350 billion is allocate to states and local governments. The State portion of the funding is $195 billion of which $1.25 billion minimum will be distributed equally among the 50 states and the District of Columbia. The remaining state portion will be distributed according to a formula that takes into account each state’s share of unemployed individuals. The local portion of the funding totals $130 billion which is equally divided between cities and counties. For cities, $45.5 billion of the $65 billion will be allocated to metropolitan cities (population over 50,000) utilizing a modified formula and the remaining amounts for smaller jurisdictions (population under 50,000) will be allocated according to population share but will not exceed 75% of their most recent budget. For counties, the $65 billion will be allocated based on the county share of population. Counties that are CDBG recipients will receive the larger share between the population based on CDBG formula. As a metropolitan city, Lakewood has been allocated $13.77 million in ARPA funds. Funds will be disbursed in two traunches, each 50% ($6.88M). The City received the first disbursement in August 2021 and the second disbursement is expected to occur no earlier than 12 months after (August 2022). Eligible uses include:
(A) to respond to the public health emergency with respect to the Coronavirus Disease 2019 (COVID‐19) or its negative impacts, including assistance to households, small businesses, and nonprofits, or aid to impacted industries such as tourism, travel, and hospitality;
(B) to responds to workers performing essential work during the COVID‐19 public health emergency by providing premium pay to eligible workers of the State, territory, or Tribal / local government that are performing such essential work, or by providing grants to eligible employers that have eligible workers who perform essential work;
(C) for the provision of government services to the extent of the reduction in revenues of such State, territory, or Tribal / local government due to the COVID‐19 public health emergency relative to revenues collected in the most recent full year of the State, territory, or Tribal / local government prior to the emergency; or
(D) to make necessary investments in water, sewer, or broadband infrastructure. ARPA funds are one‐time monies, and commensurate with City financial policies, should only be used for one‐time purposes versus ongoing operations. The additional administrative support needed to administer ARPA funds will depend on the scope and number of grants or programs the City Council directs to be established. At its March 27, 2021 retreat, the City Council established its initial ARPA program policy direction and discussed a number of items for potential funding. The City Council also directed the City to conduct a comprehensive engagement effort to incorporate stakeholder, partner and public input into the final decisions about how to best spend the City’s ARPA funds. On August 23, 2021, the City Council reviewed a summary of the information gathered during the community engagement process as well as updated information on guidance from the US Department of the Treasury and other various organizations. The City Council reviewed the draft ordinance establishing ARPA policies and priorities and allocation of a portion of the City’s ARPA funds, and a list of funding requests. The next steps related to ARPA Funds, subject to change are:
September 7 – Public Hearing on Draft Ordinance
September 14 – City Council Discussion
September 21 – Action to Adopt Ordinance
2 4

Consolidated Funds ‐ General/Street O&M
The funds are combined in this presentation, as these two funds are the City’s primary general governmental operating funds. In 2021, the General Fund anticipates providing an annual subsidy of $1.46M, which equates to 60% of the Street O&M Fund sources.
The following table and charts provide a comparison of operating revenues, operating expenditures and the resulting operating income/loss for the current and historical years.
The following graph illustrates the total current budgeted and historical operating revenues and expenditures.
The following graph illustrates the change in total revenues collected and expenditures compared to the prior year.
Consolidated
General & Street O&M
Funds
2015
Annual
Actual
2016
Annual
Actual
2017
Annual
Actual
2018
Annual
Actual
2019
Annual
Actual
2020
Annual
Actual
2021
Revised
Budget
Operating Revenue 36,648,190$ 37,796,664$ 40,002,901$ 41,764,092$ 43,289,960$ 41,318,153$ 39,189,596$
Operating Expenditures 34,234,619$ 35,172,853$ 36,480,054$ 38,468,132$ 39,409,137$ 35,808,185$ 39,282,154$
Operating Income / (Loss) $2,413,571 $2,623,811 3,522,847$ 3,295,960$ 3,880,823$ 5,509,968$ (92,558)$
3 5

Consolidated Funds – General and Street O&M Ending Fund Balance and Cash
In support of the City’s financial integrity, the City Council adopted on September 15, 2014, a set of financial policies including fund balance reserves totaling 12% of General/Street O&M Funds operating revenues. For the 2021 budget, this 12% equates to $4.70M as follows:
2% General Fund Contingency Reserves: The purpose of this reserve is to accommodate unexpected operational changes, legislative impacts, or other economic events affecting the City’s operations which could not have been reasonably anticipated at the time the original budget was prepared. A 2% reserve fund based on the General/Street O&M Funds operating revenues equates to $784K.
5% General Fund Ending Fund Balance Reserves: The purpose of this reserve is to provide financial stability, cash flow for operations and the assurance that the City will be able to respond to revenue shortfalls with fiscal strength. A 5% reserve fund based on the General/Street O&M Funds operating revenues equates to $1.96M.
5% Strategic Reserves: The purpose of this reserve is to provide some fiscal means for the City to respond to potential adversities such as public emergencies, natural disasters or similarly major unanticipated events. A 5% reserve fund based on the General/Street O&M Funds operating revenues equates to $1.96M.
The following table and graph below provides the current and historical General/Street O&M Funds ending balance and cash & investment.
YearTotal
Ending Fund Balance
Total
Cash
2016 7,975,155$ 5,545,118
2017 9,163,535$ 6,634,879
2018 8,847,536$ 6,986,782
2019 9,878,841$ 7,483,611
2020 13,730,802$ 10,769,320
2021 (YTD Jun) 17,376,288$ 13,679,183
4 6

2021 YTD Actual 2021 YTD Actual
vs 2020 YTD Actual vs 2021 YTD Budget
General & Street O&M Funds 2020 2021 Over / (Under) Over / (Under)
Combined Summary Annual Actual YTD Actual Revised Budget YTD Budget Actual $ Chg % Chg $ Chg % Chg
REVENUES:
Property Tax 7,259,756$ 3,933,262$ 7,412,100$ 4,014,788$ 4,093,191$ 159,929 4.1% 78,403 2.0%
Local Sales & Use Tax 11,946,044 5,548,740 10,060,000 4,831,287 7,277,365 1,728,625 31.2% 2,446,078 50.6%
Sales/Parks 671,080 307,196 575,000 275,649 382,526 75,330 24.5% 106,877 38.8%
Brokered Natural Gas Use Tax 39,494 14,134 34,000 15,837 22,078 7,944 56.2% 6,241 39.4%
Criminal Justice Sales Tax 1,213,087 550,912 1,043,000 493,361 687,122 136,209 24.7% 193,760 39.3%
Admissions Tax 96,599 80,811 200,000 106,815 63,869 (16,941) ‐21.0% (42,945) ‐40.2%
Utility Tax 5,402,943 2,852,255 5,479,100 2,876,964 2,864,862 12,607 0.4% (12,103) ‐0.4%
Leasehold Tax 6,903 3,809 4,300 2,257 3,744 (66) ‐1.7% 1,486 65.8%
Gambling Tax 1,910,429 691,602 2,452,000 1,193,112 1,721,801 1,030,199 149.0% 528,689 44.3%
Franchise Fees 4,289,904 2,081,169 4,269,000 2,063,319 2,075,896 (5,273) ‐0.3% 12,577 0.6%
Development Service Fees (CED) 2,252,765 835,769 1,755,200 803,274 1,126,993 291,224 34.8% 323,719 40.3%
Permits & Fees (PW) 147,236 94,312 106,500 58,970 98,865 4,553 4.8% 39,895 67.7%
License & Permits (BL, Alarm, Animal) 354,013 184,035 382,525 226,935 205,938 21,903 11.9% (20,997) ‐9.3%
State Shared Revenues 2,188,859 1,016,331 2,092,105 1,029,926 1,085,244 68,913 6.8% 55,318 5.4%
Intergovernmental 453,830 255,725 216,110 106,258 127,331 (128,394) ‐50.2% 21,072 19.8%
Parks & Recreation Fees 127,720 60,832 191,250 101,616 88,211 27,379 45.0% (13,405) ‐13.2%
Police Contracts, including Extra Duty 1,237,632 584,677 1,138,500 405,879 405,879 (178,798) ‐30.6% ‐ 0.0%
Other Charges for Services 18 18 1,800 1,269 2,718 2,699 14766.8% 1,449 114.2%
Fines & Forfeitures ‐ Municipal Court 608,159 376,520 663,205 376,521 320,005 (56,515) ‐15.0% (56,516) ‐15.0%
Fines & Forfeitures ‐ Camera Enforcement 665,148 441,633 700,000 366,878 476,740 35,106 7.9% 109,862 29.9%
Miscellaneous/Interest/Other 161,833 87,386 129,201 60,796 53,390 (33,996) ‐38.9% (7,406) ‐12.2%
Interfund Transfers 284,700 142,350 284,700 142,350 142,350 ‐ 0.0% ‐ 0.0%
Subtotal Operating Revenues 41,318,153$ 20,143,479$ 39,189,596$ 19,554,060$ 23,326,116$ 3,182,637$ 15.8% 3,772,056$ 19.3%
EXPENDITURES:
City Council 134,101 68,256 148,287 74,572 62,948 (5,309) ‐7.8% (11,624) ‐15.6%
City Manager 636,362 343,180 709,804 361,948 284,502 (58,678) ‐17.1% (77,445) ‐21.4%
Municipal Court 1,853,556 945,941 1,991,012 1,001,114 887,568 (58,372) ‐6.2% (113,546) ‐11.3%
Administrative Services 1,840,554 917,666 1,912,353 977,677 941,557 23,891 2.6% (36,120) ‐3.7%
Legal 1,430,939 703,548 1,624,194 791,968 696,254 (7,294) ‐1.0% (95,714) ‐12.1%
Community & Economic Development 2,188,040 948,539 2,520,827 1,119,475 1,087,437 138,899 14.6% (32,037) ‐2.9%
Parks, Recreation & Community Services 2,407,609 1,104,113 2,931,877 1,330,809 1,251,309 147,196 13.3% (79,500) ‐6.0%
Police 22,920,852 11,650,705 24,493,673 12,363,041 11,505,599 (145,106) ‐1.2% (857,442) ‐6.9%
Street Operations & Engineering 1,807,679 1,048,142 $2,328,281 1,188,202 $1,060,773 12,631 1.2% (127,430) ‐10.7%
Non‐Departmental 107,234 70,726 136,925 82,624 70,152 (575) ‐0.8% (12,473) ‐15.1%
Interfund Transfers 481,260 227,961 484,921 268,885 268,885 40,924 18.0% ‐ 0.0%
Subtotal Operating Expenditures 35,808,185$ 18,028,777$ 39,282,154$ 19,560,315$ 18,116,984$ 88,206 0.5% (1,443,332) ‐7.4%
OPERATING INCOME (LOSS) 5,509,968$ 2,114,702$ (92,558)$ (6,255)$ 5,209,133$ 3,094,431$ 146.3% 5,215,388$ ‐83374.5%
OTHER FINANCING SOURCES:
Grants, Contrib, 1‐Time Source 3,446,592 222,843 456,467 259,086 259,086 36,243 16.3% ‐ 0.0%
Transfers In ‐ ‐ ‐ ‐ ‐ ‐ n/a ‐ n/a
Subtotal Other Financing Sources 3,446,592$ 222,843$ 456,467$ 259,086$ 259,086$ 36,243$ 16.3% ‐$ 0.0%
OTHER FINANCING USES:
Capital & Other 1‐Time 4,089,922 780,934 1,415,110 468,984 468,984 (311,951) ‐39.9% ‐ 0.0%
Interfund Transfers 1,014,676 871,129 1,490,537 1,353,750 1,353,750 482,621 55.4% ‐ 0.0%
Subtotal Other Financing Uses 5,104,598$ 1,652,063$ 2,905,647$ 1,822,734$ 1,822,734$ 170,670$ 10.3% ‐$ 0.0%
Total Revenues and Other Sources 44,764,745$ 20,366,322$ 39,646,063$ 19,813,146$ 23,585,202$ 3,218,881$ 15.8% 3,772,056$ 19.0%
Total Expenditures and other Uses 40,912,783$ 19,680,841$ 42,187,801$ 21,383,049$ 19,939,717$ 258,877$ 1.3% (1,443,332)$ ‐6.7%
Beginning Fund Balance: 9,878,841$ 9,878,841$ $13,573,122 13,573,122$ 13,730,803$ 3,851,962$ 39.0% 157,681$ 1.2%
Ending Fund Balance: 13,730,803$ 10,564,322$ 11,031,384$ 12,003,219$ 17,376,288$ 6,811,966$ 64.5% 5,373,069$ 44.8%
Ending Fund Balance as a % of Oper Rev 33.2% 52.4% 28.1% 61.4% 74.5%
Reserve ‐ Total Target 12% of Oper Rev: 4,958,178$ 4,958,178$ 4,702,751$ 4,702,752$ 4,702,752$
2% Contingency Reserves 826,363$ 826,363$ 783,792$ 783,792$ 783,792$
5% General Fund Reserves 2,065,908$ 2,065,908$ 1,959,480$ 1,959,480$ 1,959,480$
5% Strategic Reserves 2,065,908$ 2,065,908$ 1,959,480$ 1,959,480$ 1,959,480$
Undesignated/Reserved for 2021‐2024 Budgets 8,772,625$ 5,606,144$ 6,328,633$ 7,300,467$ 12,673,536$
Note: Undesignated/Reserved Balances are are one‐time funds and per the city's financial policies may not be used for ongoing operations.
Additionally, 2020 ending fund balance increased by $117,220 due to additional 2020 transactions posted after publication of the 2020 year‐end financial report.
5 7

Property Tax
A property tax rate is placed on each piece of property within the City and is used for general governmental purpose. The rate is expressed in “dollars per $1,000 assessed value (AV), and is a function of the property tax levy permitted by law and adopted by the City Council. In the City of Lakewood, as in other Washington cities, the maximum regular levy cannot exceed $3.60, which includes the maximum regular levy of $3.375 plus an additional $0.225 per $1,000 AV to provide for the Firemen’s Pension Fund. Property tax is assessed on land, buildings, and residential homes, and on inventory and improvements to commercial property.
Property TaxYear‐to‐date through June
Over / (Under)2021 2021 Actual vs 2020 Actual 2021 Actual vs 2021 Budget
Month 2019 Actual 2020 Actual Budget Actual $ % $ % Jan 144,853$ 167,149$ 124,516$ 175,819$ 8,670$ 5.2% 51,303$ 41.2%
Feb 492,293 288,602 370,884 386,370 97,768 33.9% 15,486 4.2%
Mar 2,595,070 2,212,886 2,600,688 2,765,349 552,463 25.0% 164,661 6.3%
Apr 601,934 786,517 763,259 631,535 (154,982) ‐19.7% (131,724) ‐17.3%
May 32,454 412,020 121,571 68,297 (343,723) ‐83.4% (53,274) ‐43.8%
Jun 25,420 66,088 33,869 65,822 (266) ‐0.4% 31,953 94.3%
Jul 37,309 59,647 47,578 ‐ ‐ ‐ ‐ ‐
Aug 168,603 99,526 138,384 ‐ ‐ ‐ ‐ ‐
Sep 2,468,943 2,517,610 2,551,259 ‐ ‐ ‐ ‐ ‐
Oct 535,490 559,245 589,209 ‐ ‐ ‐ ‐ ‐
Nov 41,237 73,883 49,394 ‐ ‐ ‐ ‐ ‐
Dec 15,837 16,583 21,487 ‐ ‐ ‐ ‐ ‐
Total YTD 3,892,024$ 3,933,262$ 4,014,788$ 4,093,192$ 159,930$ 4.1% 78,405$ 2.0%
Total Annual 7,159,443$ 7,259,756$ 7,412,100$ n/a n/a n/a n/a n/a
5‐Year Ave Change (2016 ‐ 2020): 1.9%
Levy Rate Per $1,000 Assessed Value (AV)
Taxing District 2019 2020 2021
City of Lakewood 1.03$ 0.98$ 0.91$
Emergency Medical Services 0.44 0.50 0.49
Flood Control 0.08 0.10 0.10
Pierce County 1.13 1.05 0.98
Port of Tacoma 0.18 0.18 0.17
Rural Library 0.50 0.47 0.44
School District 2.88 3.78 3.74
Sound Transit 0.21 0.20 0.20
Washington State 2.62 3.01 2.93
West Pierce Fire District 2.48 2.81 2.67
Total Levy Rate 11.54$ 13.08$ 12.63$
Total AV ($ in billions) 6.93$ 7.46$ 8.11$
6 8

Sales & Use Tax
The City imposes a sales and use tax of 1% to fund general government programs. Of this total, 15% is provided to Pierce County per state law. The City imposes both the basic 0.5% and the optional 0.5% sales and use tax. This tax is imposed on personal and business purchases of tangible property. The retail sales tax is also assessed on some services such as repairs and construction. The City receives 1% of the sales tax rate. Of the 1%, the City receives 0.84% (Pierce County receives 15% of the 1% and the State receives 1% of the 1% leaving 0.84% to the City).
Agency Rate
State of Washington 6.50%
City of Lakewood 1.00%
Criminal Justice Sales Tax 0.10%
Pierce Transit 0.60%
Sound Transit 1.40%
Pierce County Juvenile Facilities 0.10%
Zoo‐Park Fee 0.10%
South Sound 911 0.10%
Pierce County Mental Health & Chemical Dependency 0.10%
Total Tax on Sales & Use 10.00%
Sales Tax
Year‐to‐date through June
Over / (Under)2021 2021 Actual vs 2020 Actual 2021 Actual vs 2021 Budget
Month 2019 Actual 2020 Actual Budget Actual $ % $ %
Jan 866,122$ 921,305$ 732,952$ 1,045,104 123,799$ 13.4% 312,153$ 42.6%
Feb 834,944 815,257 727,150 1,069,437 254,180 31.2% 342,287 47.1%
Mar 1,094,051 801,220 859,324 1,339,293 538,074 67.2% 479,969 55.9%
Apr 936,605 835,856 759,883 1,254,417 418,561 50.1% 494,534 65.1%
May 1,009,891 1,069,435 832,011 1,223,441 154,006 14.4% 391,430 47.0%
Jun 1,106,875 1,105,668 919,967 1,345,673 240,005 21.7% 425,706 46.3%
Jul 1,033,260 1,047,578 848,904 ‐ ‐ ‐ ‐ ‐
Aug 1,027,630 1,008,016 857,666 ‐ ‐ ‐ ‐ ‐
Sep 1,047,083 1,145,841 911,230 ‐ ‐ ‐ ‐ ‐
Oct 972,142 1,072,199 832,857 ‐ ‐ ‐ ‐ ‐
Nov 942,492 909,197 804,742 ‐ ‐ ‐ ‐ ‐
Dec 1,083,910 1,214,472 973,315 ‐ ‐ ‐ ‐ ‐
Total YTD 5,848,488$ 5,548,740$ 4,831,287$ 7,277,365$ 1,728,625$ 31.2% 2,446,078$ 50.6%Annual Total 11,955,004$ 11,946,044$ 10,060,000$ n/a n/a n/a n/a n/a
5‐Year Ave Change (2016 ‐ 2020): 6.0%
7 9

Note on Wholesale Sales Tax Classification: Sales tax applies if the buyer does not have a reseller permit or exemption certificate. Additionally, purchases made for personal or household use is not exempt from sales tax. This includes items used in a business that are not resold, such as office supplies, tools, equipment and equipment rentals.
Sales & Use Tax by Sector
Year‐to‐date through June
Over / (Under) Explanation of Variance
Actual Change from 2020 Increase / (Decrease)
Sector 2020 2021 $ % $ in Thousands
Retail Trade 2,550,253$ 3,411,044$ 860,791$ 33.8% 344$ 58% Motor Vehicle and Parts Dealers
136$ 42% Miscellaneous Store Retailers
81$ 88% Clothing and Clothing Accessories Stores
75$ 14% General Merchandise Stores
55$ 75% Furniture and Home Furnishings Stores
53$ 50% Health and Personal Care Stores
38$ 14% Building Material and Garden Equipment and Supplies
28$ 28% Sporting Goods, Hobby, Musical Instrument & Books
20$ 21% Electronics and Appliance Stores
14$ 25% Gasoline Stations
11$ 5% Food and Beverage Stores
5$ 6% Nonstore Retailers
Services 1,210,519 1,483,555 273,036 22.6% 131$ 21% Food Services and Drinking Places
48$ 24% Repair and Maintenance
32$ 17% Administrative and Support Services
23$ 46% Professional, Scientific, and Technical Services
20$ 52% Personal and Laundry Services14$ 43% Amusement, Gambling, and Recreation Industries
(3)$ ‐20% HospitalsConstruction 877,544 1,282,971 405,427 46.2% 215$ 38% Construction of Buildings
112$ 122% Heavy and Civil Engineering Construction
78$ 36% Specialty Trade Contractors
Wholesale Trade 260,725 299,040 38,314 14.7% 17$ 9% Merchant Wholesalers, Durable Goods
14$ 22% Merchant Wholesalers, Nondurable Goods
Information 248,466 249,932 1,466 0.6% 8$ 27% Other Information Services
3$ 31% Data Processing, Hosting, and Related Services
(1)$ ‐50% Broadcasting (except Internet)
(2)$ ‐1% Telecommunications
(2)$ ‐29% Motion Picture and Sound Recording Industries
(5)$ ‐17% Publishing Industries (except Internet)
Finance, Insurance, 221,284 293,523 72,239 32.6% 64$ 37% Rental and Leasing Services
Real Estate 9$ 23% Credit Intermediation and Related Activities
2$ 40% Real Estate
(0)$ ‐35% Monetary Authorities‐Central Bank
Manufacturing 75,228 105,549 30,321 40.3% 7$ 392% Wood Product Manufacturing
6$ 101% Apparel Manufacturing
4$ 141% Beverage and Tobacco Product Manufacturing
4$ 118% Machinery Manufacturing
3$ 83% Food Manufacturing
2$ 35% Miscellaneous Manufacturing
Government 67,943 107,159 39,215 57.7% 28$ 54% Administration of Economic Programs
10$ 90% Govt/Unclassifiable
Other 36,778 44,593 7,815 21.2% 5$ 40% Transit and Ground Passenger Transportation
1$ 7% Support Activities for Transportation
Total 5,548,740$ 7,277,365$ 1,728,625$ 31.2%
8 10

Retail trade, the largest economic sector, accounts for 47% of collections, followed by services and construction, which account for 20% and 18%, respectively.
The Marketplace Fairness Act, effective January 1, 2018, resulted in an increase in sales tax distributions for all cities and counties, but also eliminated the SST mitigation payments that many cities and counties have received since 2008. SST mitigation helped compensate jurisdictions for sales tax revenues that were lost when the state switched from an origin‐based to destination‐based sales tax for delivery of goods. As jurisdictions receive increased sales tax revenues from internet and remote sales, their SST mitigation payments are reduced by a corresponding amount, and all mitigation payments will cease of as October 1, 2019. The City’s SST mitigation ceased mid‐2018 since sales tax from the Marketplace Fairness Act exceeded SST mitigation.
Marketplace Fairness Act
AWC Annual Over/Under Estimate
Year Annual Est Actual $ %
2018 83,017$ 121,932$ 38,915$ 46.9%
2019 254,620$ 157,863$ (96,757)$ ‐38.0%
2020 325,104$ 268,037$ (57,067)$ ‐17.6%
2021 364,509$
2022 397,231$
2023 433,026$
Total 1,857,507$
Top 10 Taxpayers (Grouped by Sector)
Year‐to‐date through June
Over / (Under)
Change from 2020
Sector 2020 2021 $ %
General Merchandise Stores 421,086$ 423,393$ 134,985$ 138.9%
Motor Vehicle and Parts Dealers 200,500 371,273 12,625 6.6%
Miscellaneous Store Retailers 197,706 265,716 60,702 138.7%
Construction of Buildings 66,350 255,509 35,065 79.4%
Building Material and Garden Equipment a 159,500 170,091 14,315 27.6%
Heavy and Civil Engineering Construction 82,126 159,379 (2,430) ‐3.9%
Rental and Leasing Services 90,940 97,509 26,977 83.0%
Administration of Economic Programs 50,485 78,765 15,817 44.6%
Total 1,268,692$ 1,821,634$ 552,942$ 43.6%
Marketplace Fairness Act Quarterly Distributions
Chg From Prior Year
Over/(Under)
2018 2019 2020 2021 $ %
Q1 27,107$ 32,686$ 44,164$ 79,229$ 35,065$ 79.4%
Q2 28,007 36,003 69,638 83,651 14,013 20.1%
Q3 29,402 39,758 68,020
Q4 37,416 49,416 86,215
Total YTD 55,114$ 68,689$ 113,802$ 162,880$ 49,078$ 43.1%
Total Annual 121,932$ 157,863$ 268,037$ n/a n/a n/a
9 11

The following section provides a sales tax comparison by retail area and is based on UBI numbers and physical location addresses received from the Washington State Business License database, matched against UBI numbers in the City’s sales tax database. The area category title “All Other” which includes food services & drinking places, construction, and telecommunications attempts to capture: businesses that have multiple locations reporting under a single UBI number is excluded from the retail area reporting (such as Walgreens, O’Reilly’s, Starbucks, Dollar Tree, McDonald’s, etc.); businesses that do not fall under the retail area as currently defined (such food services & drinking places); or businesses that do not have a physical location in the City but are providing services within the City limits ( telecommunications and construction). Businesses are added to the sales and use tax area periodically throughout the year; therefore, amounts reported in previous periods may differ.
Area Map ID Location
Bridgeport & Steilacoom 1 Steilacoom Boulevard from John Dower Road to Lakewood Drive
Bridgeport North 2 Bridgeport Wy from Custer Rd to University Place city limit & Custer Road from Bridgeport Way to Tacoma city limit
Bridgeport South 3 Bridgeport Way from 108th Street to 59th Avenue
Central Business District 4 Lakewood Towne Center, the Colonial Center, and Lowes/Hobby Lobby Complex
International District 5 South Tacoma Way and Durango Avenue from 87th Street to the B&I
Lakewood Industrial Park 6 Lakeview Avenue from 108th Street to Steilacoom Boulevard and Lakewood Industrial Park
Pacific Highway TOC 7 Pacific Highway from 108th St SW to Bridgeport Way
Pacific Highway Ponders 8 Pacific Highway from Gravelly Lake Drive to Bridgeport Way
Springbrook 9 Springbrook Neighborhood
Steilacoom West 10 Steilacoom Drive from 87th Avenue to Phillips Road
Tillicum 11 Tillicum Neighborhood
Woodbrook 12 Woodbrook Neighborhood
Woodworth 13 112th Street & South Tacoma Way/Steel Street/Sales Road (East Lakewood)
10 12

11 13

Sales & Use Tax by AreaYear‐to‐date through June
Over / (Under) Explanation of Variance
Change from 2020 Increase / (Decrease)
Map ID/Area 2020 2021 $ % $ in Thousands
1 Bridgeport & Steilacoom 69,210$ 84,017$ 14,807$ 21.4% 9$ 24% Retail Trade6$ 19% Services(0)$ ‐22% Construction
2 Bridgeport North 325,174 318,320 (6,854) ‐2.1% (10)$ ‐3% Retail Trade3 Bridgeport South 284,104 329,817 45,713 16.1% 22$ 20% Retail Trade
9$ 9% Services5$ 18% Fin, Ins, Real Est(2)$ ‐72% Information
4 Central Business District 887,403 1,037,123 149,721 16.9% 151$ 25% Retail Trade1$ 0% Services(0)$ ‐34% Government(2)$ ‐9% Information
5 International District 357,993 484,567 126,575 35.4% 90$ 58% Retail Trade25$ 26% Services7$ 8% Fin, Ins, Real Est3$ 35% All Other Categories1$ 138% Construction0$ 57% Wholesale Trade(0)$ ‐3% Manufacturing
6 Lakewood Industrial Park 33,899 45,994 12,095 35.7% 5$ 25% Services5$ 2331% Wholesale Trade1$ 79% Manufacturing
7 Pacific Highway (TOC) 262,670 359,925 97,255 37.0% 91$ 38% Retail Trade Transit Oriented Commercial 7$ 28% Services
0$ 114% Manufacturing(0)$ ‐10% Wholesale Trade
8 Pacific Highway Ponders 94,677 116,348 21,671 22.9% 20$ 47% Retail Trade1$ ‐188% Manufacturing
9 Springbrook 7,707 3,578 (4,129) ‐53.6% 0$ 21% Services(4)$ ‐76% Fin, Ins, Real Est
10 Steilacoom West 76,435 83,318 6,884 9.0% 5$ 63% Services1$ 2% Retail Trade
11 Til l icum 60,034 65,821 5,787 9.6% 3$ 27% Retail Trade2$ 41% Manufacturing0$ 1% Services(0)$ ‐3% Construction
12 Woodbrook 3,217 1,436 (1,781) ‐55.4% (2)$ ‐58% Retail Trade13 Woodworth 10,982 9,599 (1,382) ‐12.6% (1)$ ‐11% ServicesOther: Food Services, Drinking Places 229,188 340,017 110,829 48.4% 101$ 50% Services
10$ 36% Retail Trade Construction 845,616 1,245,286 399,671 47.3% 400$ 47% Construction Telecommunications 158,804 158,052 (752) ‐0.5% All Other Categories 1,841,630 2,594,146 752,516 40.9% 477$ 51% Retail Trade
110$ 30% Services65$ 67% Fin, Ins, Real Est40$ 59% Government29$ 12% Wholesale Trade24$ 41% Manufacturing5$ 8% Information2$ 10% All Other Categories
Total 5,548,740$ 7,277,366$ 1,728,626$ 31.2%
12 14

Criminal Justice Sales Tax
Criminal Justice Sales Tax is a local option sales tax of 0.10 percent that is collected in addition to retail sales tax and use taxes by the Department of Revenue. Only counties may impose this non‐voted 0.1% sales tax for criminal justice purposes, but the county must share its revenues with all cities and towns in the county. 10% of the funds are distributed to the county in which the tax was collected. The remaining 90% of the funds is distributed to the county (for unincorporated areas) and cities within the county based on population as last determined by the Office of Financial Management. The Department of Revenue retains 1% as an administrative fee. Moneys received from this tax are restricted for criminal justice purposes. Criminal justice purposes are defined as activities that substantially assist the criminal justice system, which may include circumstances where ancillary benefit to the civil justice system occurs, and which includes domestic violence services such as those provided by domestic violence programs, community advocates, and legal advocates, as defined by RCW 70.123.020.
Criminal Justice Sales Tax
Year‐to‐date through JuneOver / (Under)
2021 2021 Actual vs 2020 Actual 2021 Actual vs 2021 Budget
Month 2019 Actual 2020 Actual Budget Actual $ % $ %
Jan 86,119$ 89,960$ 75,337$ 99,947 9,987$ 11.1% 24,610$ 32.7%
Feb 80,465 79,544 72,600 99,087 19,543 24.6% 26,487 36.5%
Mar 103,541 80,282 85,215 127,037 46,755 58.2% 41,822 49.1%
Apr 93,925 84,461 79,606 111,841 27,380 32.4% 32,235 40.5%
May 99,682 105,683 86,789 121,585 15,902 15.0% 34,796 40.1%
Jun 106,377 110,982 93,815 127,625 16,643 15.0% 33,810 36.0%
Jul 102,027 109,830 90,321 ‐ ‐ ‐ ‐ ‐
Aug 102,362 106,236 90,368 ‐ ‐ ‐ ‐ ‐
Sep 103,700 110,656 93,051 ‐ ‐ ‐ ‐ ‐
Oct 97,137 106,529 86,775 ‐ ‐ ‐ ‐ ‐
Nov 95,954 104,888 85,868 ‐ ‐ ‐ ‐ ‐
Dec 107,767 124,037 103,256 ‐ ‐ ‐ ‐ ‐
Total YTD 570,110$ 550,912$ 493,361$ 687,122$ 136,210$ 24.7% 193,761$ 39.3%
Annual Total 1,179,057$ 1,213,087$ 1,043,000$ n/a n/a n/a n/a n/a
5‐Year Ave Change (2016 ‐ 2020): 4.7%
13 15

Utility Tax
The City levies a tax on utilities provided within the city. The tax is currently 5% of gross income for electric and gas services and 6% of gross income for solid waste, cable, cellular phone, landlines and storm drainage.
Utility Tax Audit. December 2019 includes $82K received from an audit of a major phone provider for the tax period January 1, 2012 through May 31, 2018. In May 2021, the City received $73K from an audit of a major phone provider for the tax period May 2012 through December 2020.
Utility Tax by Type
Year‐to‐date through June
Over / (Under)
2021 YTD Actual 2021 Actual
2020 2021 vs 2020 YTD Actual vs 2020 YTD Budget
Type Annual Actual YTD Actual Annual Budget YTD Budget YTD Actual $ % $ %
Electricity 1,662,189$ 883,726$ 1,748,000$ 891,381$ 904,010$ 20,284$ 2.3% 12,629$ 1.4%
Natural Gas 711,112 432,348 681,000 436,093 459,550 27,202 6.3% 23,457 5.4%
Solid Waste 878,978 434,734 886,000 438,500 454,431 19,697 4.5% 15,931 3.6%
Cable 1,075,202 522,425 1,061,000 526,951 529,519 7,094 1.4% 2,568 0.5%
Phone/Cell 807,400 436,691 842,000 440,474 362,051 (74,640) ‐17.1% (78,423) ‐17.8%
SWM 268,062 142,332 261,100 143,565 155,301 12,969 9.1% 11,736 8.2%
Total 5,402,943$ 2,852,256$ 5,479,100$ 2,876,964$ 2,864,862$ 12,606$ 0.4% (12,102)$ ‐0.4%
Utility Tax
Year‐to‐date through June
Over / (Under)2021 2021 Budget vs 2020 Actual 2021 Actual vs 2021 Budget
Month 2019 Actual 2020 Actual Budget Actual $ % $ %
Jan 482,703$ 492,960$ 515,632$ 462,655$ (30,305)$ ‐6.1% (52,977)$ ‐10.3%
Feb 494,221 497,700 499,969 490,246 (7,454) ‐1.5% (9,723) ‐1.9%
Mar 513,387 515,720 509,328 496,804 (18,916) ‐3.7% (12,524) ‐2.5%
Apr 509,876 509,190 510,839 548,293 39,103 7.7% 37,454 7.3%
May 438,676 434,542 437,651 490,158 55,616 12.8% 52,507 12.0%
Jun 406,169 402,144 403,545 376,706 (25,438) ‐6.3% (26,839) ‐6.7%
Jul 378,731 384,505 388,922 ‐ ‐ ‐ ‐ ‐
Aug 383,662 377,613 390,295 ‐ ‐ ‐ ‐ ‐
Sep 394,350 375,303 392,857 ‐ ‐ ‐ ‐ ‐
Oct 490,378 480,846 466,094 ‐ ‐ ‐ ‐ ‐
Nov 504,221 445,436 455,134 ‐ ‐ ‐ ‐ ‐
Dec 578,978 486,985 508,834 ‐ ‐ ‐ ‐ ‐
Total YTD 2,845,030$ 2,852,256$ 2,876,964$ 2,864,862$ 12,606$ 0.4% (12,101)$ ‐0.4%
Total Annual 5,575,350$ 5,402,943$ 5,479,100$ n/a n/a n/a n/a n/a
5‐Year Ave Change (2016 ‐ 2020): ‐0.8%
14 16

Gambling Tax
The City levies a gambling tax on gross receipts derived by operators of gambling activities, including punchboards; pull tabs, bingo, raffles, amusement games, and social card rooms. Fund raising activities and charitable and non‐profit organizations that involve game of chance are subject to the tax. The gambling tax rates by activity are as follows: card rooms (11% of gross receipts), punch boards (3% of gross receipts), pull tabs (5% of gross receipts), bingo (5% off gross receipts less amounts paid as prizes), raffles (5% of gross receipts less amount paid as prizes); amusement games (2% of gross receipts less amount paid as prizes). Gambling tax from card rooms account for the majority of the revenues.
Gambling Tax
Year‐to‐date through June
Over / (Under)2021 2021 Actual vs 2020 Actual 2021 Actual vs 2021 Budget
Month 2019 Actual 2020 Actual Budget Actual $ % $ %
Jan 232,365$ 221,353$ 211,429$ 232,113$ 10,760$ 4.9% 20,684$ 9.8%
Feb 276,487 239,499 213,873 223,710 (15,789) ‐6.6% 9,837 4.6%
Mar 316,973 116,855 218,151 347,645 230,790 197.5% 129,494 59.4%
Apr 287,987 764 181,487 306,619 305,855 40033.4% 125,132 68.9%
May 290,634 ‐ 180,606 338,481 338,481 n/a 157,875 87.4%
Jun 248,101 113,131 187,567 273,233 160,102 141.5% 85,666 45.7%
Jul 192,822 200,210 196,178 ‐ ‐ ‐ ‐ ‐
Aug 277,725 118,950 207,948 ‐ ‐ ‐ ‐ ‐
Sep 292,664 281,165 220,497 ‐ ‐ ‐ ‐ ‐
Oct 224,158 226,662 198,830 ‐ ‐ ‐ ‐ ‐
Nov 250,787 167,453 206,954 ‐ ‐ ‐ ‐ ‐
Dec 209,109 224,388 228,481 ‐ ‐ ‐ ‐ ‐
Total YTD 1,652,547$ 691,602$ 1,193,112$ 1,721,801$ 1,030,199$ 149.0% 528,689$ 44.3%Total Annual 3,099,810$ 1,910,431$ 2,452,000$ n/a n/a n/a n/a n/a
5‐Year Ave Change (2016 ‐ 2020): ‐5.9% COVID‐19 caused closure affected March through June 2020.
Card Room Gambling Tax ‐ Major Establishments Only
Year‐to‐date through June
Over / (Under)
2019 2020 2021 YTD 2020 Actual vs YTD 2019 Actual
Major Establishment Actual Actual YTD YTD Actual $ %
Chips Casino 902,660$ 548,388$ 172,733$ 559,993$ 387,260$ 224.2%
Great American Casino 667,826 351,655 152,435 232,202 79,767 52.3%
Macau Casino 789,618 566,617 199,635 509,533 309,898 155.2%
Palace Casino 617,032 374,182 137,971 372,806 234,835 170.2%
Total 2,977,136$ 1,840,841$ 662,774$ 1,674,534$ 1,011,760$ 152.7%
Covid‐19 Restrictions closed the card rooms for mid‐March through mid‐June 2020.
15 17

Admissions Tax
The City levies an admissions tax of 5% on activities such as movie and play tickets, entrance fees and over charges to clubs. The tax is levied on the person or organization collecting the admission fee.
Admissions TaxYear‐to‐date through June
Over / (Under)2021 2021 Actual vs 2020 Actual 2021 Actual vs Budget
Month 2019 Actual 2020 Actual Budget Actual $ % $ %
Jan 40,681$ 39,325$ 18,801$ 7$ (39,318)$ ‐100.0% (18,794)$ ‐100.0%
Feb 31,915 30,115 18,877 6,301 (23,814) ‐79.1% (12,576) ‐66.6%
Mar 41,565 11,369 16,868 6,970 (4,399) ‐38.7% (9,898) ‐58.7%
Apr 54,869 ‐ 18,034 16,432 16,432 n/a (1,602) ‐8.9%
May 45,834 2 15,702 10,354 10,352 517600.0% (5,348) ‐34.1%
Jun 44,332 ‐ 18,532 23,805 23,805 n/a 5,273 28.5%
Jul 50,429 3,752 18,269 ‐ ‐ ‐ ‐ ‐
Aug 39,231 2,058 15,064 ‐ ‐ ‐ ‐ ‐
Sep 28,213 ‐ 10,015 ‐ ‐ ‐ ‐ ‐
Oct 36,870 5,339 13,693 ‐ ‐ ‐ ‐ ‐
Nov 39,323 2,105 15,532 ‐ ‐ ‐ ‐ ‐
Dec 51,618 2,535 20,612 ‐ ‐ ‐ ‐ ‐
Total YTD 259,195$ 80,812$ 106,815$ 63,869$ (16,943)$ ‐21.0% (42,946)$ ‐40.2%Total Annual 504,880$ 96,599$ 200,000$ n/a n/a n/a n/a n/a
5‐Year Ave Change (2016 ‐ 2020): ‐16.8% Decreases in 2020 and 2021 due to COVID‐19 caused closure/reduced capacity.
Admissions Tax by Payer
Year‐to‐Date through June
Over / (Under)
2019 2020 2021 YTD 2021 Actual vs YTD 2020 Actual
Major Establishment Annual YTD Actual YTD YTD Actual $ %
AMC Theatres 318,466$ 155,564$ 61,598$ 57,297$ 39,761$ (17,536)$ ‐30.6%
Déjà Vu 7,520 5,061 ‐ ‐ ‐ ‐ ‐
Grand Prix Raceway 22,137 10,908 6,455 ‐ 7,358 7,358 ‐
Oakbrook Golf Club ‐ ‐ 5,030 ‐ 10,742 10,742 ‐
Regal Cinemas 152,093 82,998 23,516 23,514 6,009 (17,505) ‐74.4%
Star Lite Swap Meet 4,663 4,663 ‐ ‐ ‐ ‐ ‐
Total 504,879$ 259,194$ 96,600$ 80,812$ 63,869$ (16,945)$ ‐21.0%
Note: Star Lite Swap Meet closed on 5/31/2019 and Déjà Vu closed in 9/18/2019.
Oakbrook Golf Club tax effective 10/1/2020. Regal Cinemas reopened May 2021.
16 18

Franchise Fees & Non‐Compete Fees
Franchise fees are charges levied on private utilities for their use of City streets and other public properties to place utility infrastructure and to recoup City costs of administering franchise agreements. The franchise fees on light, natural gas, and telephone utilities are limited by statute to the actual administrative expenses incurred by the City directly related to receiving and approving permits, licenses, or franchises. Cable TV franchise fees are governed by the Federal Cable Communications Policy Act of 1996 and are negotiated with cable companies for an amount not to exceed 5% of gross revenues.
Utility
Contract
Expiration
Util ity
Tax
Franchise
Fee
Non‐
Compete
Fee
Comcast Phone 11/02/25 6.00% ‐ ‐
Comcast Cable 12/04/25 6.00% 5.00% ‐
Integra Communications 07/27/24 6.00% ‐ ‐
Lakeview Light & Power 12/23/22 5.00% ‐ ‐
Lakewood Water District 12/22/26 ‐ ‐ 6.00%
Pierce County Sanitary Sewer 03/13/31 ‐ ‐ 6.00%
Puget Sound Energy 01/20/26 5.00% ‐ ‐
Rainier Connect (formerly Click!) 05/07/24 6.00% 5.00% ‐
TPU Light 06/01/25 ‐ ‐ 6.00%
TPU Water 11/23/21 ‐ ‐ 8.00%
Waste Connections 12/31/25 6.00% 4.00% ‐
Small Cell Wireless (fee is admin cost)
‐ AT&T Small Wireless 06/08/25 ‐ ‐ ‐
Franchise Fees/Non‐Compete Fees
Year‐to‐date through June
Over / (Under)2019 2020 2021 2021 Actual vs 2020 Actual 2021 Actual vs Budget
Month Actual Actual Budget Actual $ % $ % Jan ‐$ ‐$ ‐$ ‐$ ‐ ‐ ‐ ‐ Feb 79,748 82,474 81,677 64,436 (18,038) ‐21.9% (17,241) ‐21.1%Mar 909,401 951,080 936,254 947,940 (3,140) ‐0.3% 11,686 1.2%Apr ‐ ‐ ‐ ‐ ‐ ‐ ‐ ‐ May 78,814 86,860 82,874 86,552 (308) ‐0.4% 3,678 4.4%Jun 947,375 960,754 962,514 976,967 16,213 1.7% 14,453 1.5%Jul ‐ ‐ ‐ ‐ ‐ ‐ ‐ ‐ Aug 82,636 86,140 85,116 ‐ ‐ ‐ ‐ ‐ Sep 1,004,558 1,023,951 1,034,400 ‐ ‐ ‐ ‐ ‐ Oct ‐ ‐ ‐ ‐ ‐ ‐ ‐ ‐ Nov 77,808 72,925 78,034 ‐ ‐ ‐ ‐ ‐ Dec 964,798 1,025,718 1,008,131 ‐ ‐ ‐ ‐ ‐
Total YTD 2,015,338$ 2,081,168$ 2,063,319$ 2,075,895$ (5,273)$ ‐0.3% 12,576$ 0.6%Total Annual 4,145,138$ 4,289,902$ 4,269,000$ n/a n/a n/a n/a n/a
5‐Year Ave Change (2016 ‐ 2020): 3.7%
Franchise Fees/Non‐Compete Fees by TypeYear‐to‐date through June
Over / (Under)2020 2021 2021 Actual vs 2020 Actual 2021 Actual vs YTD Budget
Type 2019 ActualAnnual
ActualYTD Actual
Annual
Budget
YTD
Budget
YTD
Actual$ % $ %
Cable 888,488$ 898,527$ 437,008$ 901,000$ 436,384$ 440,491$ 3,483 0.8% 4,107 0.9%Water 526,830 528,130 209,731 433,000 171,236 218,094 8,363 4.0% 46,858 27.4%Sewer 961,344 999,895 498,275 1,028,000 510,145 491,980 (6,295) ‐1.3% (18,165) ‐3.6%Solid Waste 645,175 655,787 323,971 667,000 328,137 338,864 14,893 4.6% 10,727 3.3%Electric 1,123,301 1,204,366 602,183 1,240,000 617,416 586,467 (15,716) ‐2.6% (30,949) ‐5.0%Small Cell ‐ 3,200 10,000 ‐ ‐ ‐ (10,000) ‐100.0% ‐ n/a
Total 4,145,138$ 4,289,902$ 2,081,168$ 4,269,000$ 2,063,319$ 2,075,895$ (5,273)$ ‐0.3% 12,576$ 0.6%
17 19

State Shared Revenues
State‐shared revenues are from taxes and fees collected by the State and disbursed to municipalities based on population or other criteria. The source of these shared revenues include: sales tax mitigation, criminal justice, leasehold excise tax, state lodging tax sharing, liquor excise tax and liquor profits, and motor vehicle fuel tax. The following tables provides a comparison of state shared revenues, including the portion of motor vehicle fuel tax, increased gas tax and multi‐modal revenue receipted directly in the transportation capital fund.
Motor vehicle fuel tax decrease in 2020 is due to COVID‐19 stay home/work from home whereas hybrid telework/in office in 2021.
State Shared Revenue
Year‐to‐date through June
2019 2020 2021 2021 YTD Actual vs 2020 YTD Actual
Revenue Annual Annual YTD Annual YTD Over/(Under)
Actual Actual Actual Budget Actual $ % CJ‐Violent Crimes/Population 94,809$ 102,436$ 50,347$ 95,000$ 51,072$ 725$ 1.4%
CJ‐Special Programs 64,628 67,713 33,455 70,235 35,142 1,687 5.0%
CJ‐DUI Cities 8,069 9,072 4,336 8,000 4,912 576 13.3%
CJ‐High Crime 162,777 427,878 169,494 249,450 176,033 6,539 3.9%
Liquor Excise Tax 330,276 393,090 191,949 339,770 210,152 18,203 9.5%
Liquor Board Profits 483,806 478,969 239,493 474,240 237,208 (2,285) ‐1.0%
Marijuana Enforcement Profits 8 8 8 ‐ ‐ (8) ‐100.0%
Motor Vehicle Fuel Tax 841,601 709,693 327,250 855,410 370,726 43,476 13.3%Subtotal ‐ General/Street 1,985,974$ 2,188,859$ 1,016,332$ 2,092,105$ 1,085,244$ 68,912$ 6.8%
Motor Vehicle Fuel Tax 343,752 289,874 133,666 344,330 151,423 17,757 13.3%
Increase Motor Vehicle Fuel Tax 71,983 71,174 35,588 70,235 35,249 (339) ‐1.0%
Multi‐Modal 82,162 82,400 40,672 80,440 40,284 (388) ‐1.0%Subtotal ‐ Capital Projects 497,897 443,448 209,926 495,005 226,956 17,030$ 8.1%Total State Shared Revenue 2,483,872$ 2,632,307$ 1,226,258$ 2,587,110$ 1,312,200$ 85,942$ 7.0%
18 20

POLICE
Photo Infraction – Red Light/School Zone Enforcement
The City currently has eight cameras operating at five locations:
Two (2) school zone cameras located at: 5405 Steilacoom Blvd – WB and 9904 Gravelly Lake Drive – SB.
Six (6) red light cameras located at: Bridgeport Blvd SW & San Francisco Ave SW – SB & NB, Steilacoom Blvd SW & Phillips Rd SW – WB & EB; and South Tacoma Way & SR 512 – NB & SB.
Photo Infraction ‐ Red Light / School Zone EnforcementYear‐to‐Date through June
Over / (Under)
Year 2019 Year 2020 Year 2021 Net Revenue 2021 vs 2020
Month
Gross
Revenue
Vendor
Payment
Net
Revenue
Gross
Revenue
Vendor
Payment
Net
Revenue
Gross
Revenue
Vendor
Payment
Net
Revenue$ %
Jan 77,124$ 31,455$ 45,669$ 97,729$ 32,240$ 65,489$ 30,145$ 22,500$ 7,645$ (57,844)$ ‐88.3%
Feb 64,380 32,240 32,140 69,584 32,240 37,344 29,016 32,240 (3,224) (40,568) ‐108.6%
Mar 68,761 32,240 36,521 79,403 22,500 56,903 26,207 32,240 (6,033) (62,936) ‐110.6%
Apr 64,478 32,240 32,238 97,456 22,500 74,956 144,618 32,240 112,378 37,422 49.9%
May 76,632 32,240 44,392 57,712 15,000 42,712 129,806 32,240 97,566 54,854 128.4%
Jun 101,799 32,240 69,559 39,750 18,750 21,000 116,950 32,240 84,710 63,710 303.4%
Jul 76,168 32,240 43,928 34,022 22,500 11,522 ‐ ‐ ‐ ‐ ‐
Aug 71,272 32,240 39,032 33,450 22,500 10,950 ‐ ‐ ‐ ‐ ‐
Sep 64,088 32,240 31,848 45,915 22,500 23,415 ‐ ‐ ‐ ‐ ‐
Oct 64,963 32,240 32,723 42,056 22,500 19,556 ‐ ‐ ‐ ‐ ‐
Nov 108,665 32,240 76,425 36,846 23,798 13,048 ‐ ‐ ‐ ‐ ‐
Dec 111,736 32,240 79,496 31,227 22,500 8,727 ‐ ‐ ‐ ‐ ‐ Total 453,172$ 192,655$ 260,517$ 441,634$ 143,230$ 298,404$ 476,740$ 183,700$ 293,042$ (5,362)$ ‐1.8%
Total
Annual950,064$ 386,095$ 563,969$ 665,150$ 279,528$ 385,622$ n/a n/a n/a n/a n/a
19 21

COVID‐19 caused school closures and stay home/work from home affected school zone and red light camera infractions notices generated in 2020 and early 2021. The huge spike beginning in April 2021 is due to schools opening up and violations after pandemic.
# of Infraction Notices Generated
Year‐to‐date through June
BP Way & San Francisco Steilacoom & Phillips South Tacoma Way & SR512 School Zones Total
Month 2019 2020 2021 2019 2020 2021 2019 2020 2021 2019 2020 2021 2019 2020 2021
Jan 72 67 69 222 273 143 533 498 538 548 746 ‐ 1,375 1,584 750
Feb 65 49 76 278 292 207 540 587 611 409 927 1,082 1,292 1,855 1,976
Mar 53 48 78 280 244 219 736 408 778 540 554 1,892 1,609 1,254 2,967
Apr 51 53 113 278 251 243 665 282 850 604 ‐ 1,180 1,598 586 2,386
May 62 77 114 368 123 324 737 495 902 881 ‐ 1,127 2,048 695 2,467
Jun 92 101 108 422 101 361 778 673 974 369 ‐ 599 1,661 875 2,042
Jul 101 85 ‐ 415 185 ‐ 771 819 ‐ 151 ‐ ‐ 1,438 1,089 ‐
Aug 100 97 ‐ 382 248 ‐ 695 843 ‐ 149 ‐ ‐ 1,326 1,188 ‐
Sep 62 87 ‐ 347 179 ‐ 690 728 ‐ 879 ‐ ‐ 1,978 994 ‐
Oct 79 89 ‐ 344 166 ‐ 685 780 ‐ 825 ‐ ‐ 1,933 1,035 ‐
Nov 72 98 ‐ 314 121 ‐ 512 549 ‐ 913 ‐ ‐ 1,811 768 ‐
Dec 65 62 ‐ 285 157 ‐ 493 610 ‐ 556 ‐ ‐ 1,399 829 ‐
Total YTD 395 395 558 1,848 1,284 1,497 3,989 2,943 4,653 3,351 2,227 5,880 9,583 6,849 12,588
Total
Annual 874 913 n/a 3,935 2,340 1,497 7,835 7,272 4,653 6,824 2,227 n/a 19,468 12,752 n/a
20 22

Jail Services
The City contracts with various agencies to provide jail services. Current contracts are with Nisqually and Pierce County.
2021 Jail Rates
Pierce County Booking Fee $59.66 Nisqually Booking Fee $20.00
Daily Rate $90.57 Daily Rate $65.00
Escort Fee* $139.24 Major Medical Costs City Pays
Mental Health Fee $235.30
Special Identification Process $194.27
Major Medical Costs City Pays
Year 2019 Year 2020 Year 2021
Service
Period Nisqually
Pierce
County Medical
Total by
Month Nisqually
Pierce
County Medical
Total by
Month Nisqually
Pierce
County Medical
Total by
Month
Jan 65,097$ 17,695$ 5,666$ 88,458$ 32,955$ 12,167$ ‐$ 45,122$ 14,662$ 1,349$ 1,085$ 17,095$
Feb 55,820 15,059 8,036 78,914 22,685 16,085 ‐ 38,770 16,610 513 ‐ 17,123
Mar 52,065 13,109 6,659 71,833 24,310 12,645 ‐ 36,955 27,534 300 ‐ 27,834
Apr 55,426 15,713 452 71,591 13,994 7,630 ‐ 21,624 18,087 572 ‐ 18,659
May 53,300 27,369 ‐ 80,669 20,995 5,188 ‐ 26,183 17,353 2,178 ‐ 19,531
Jun 56,745 27,580 ‐ 84,325 19,305 6,808 ‐ 26,113 11,146 2,992 ‐ 14,138
Jul 53,425 14,769 1,973 70,166 18,891 9,864 208 28,963 ‐ ‐ ‐ ‐
Aug 35,620 14,360 5,558 55,538 21,522 9,740 ‐ 31,262 ‐ ‐ ‐ ‐
Sep 29,120 24,179 ‐ 53,299 28,176 9,454 ‐ 37,630 ‐ ‐ ‐ ‐
Oct 21,480 26,515 9,791 57,786 26,251 5,451 31,702 ‐ ‐ ‐ ‐
Nov 30,909 22,967 ‐ 53,876 21,965 3,694 25,659 ‐ ‐ ‐ ‐
Dec 33,235 12,209 ‐ 45,444 13,698 1,908 15,606 ‐ ‐ ‐ ‐
Annual
Total542,242$ 231,524$ 38,133$ 811,899$ 264,747$ 100,636$ 208$ 365,591$ 105,391$ 7,905$ 1,085$ 114,381$
Annual Budget 950,000$ Annual Budget 950,000$ Annual Budget * 950,000$
Annual Exp as % of Annual Budget 85.5% YTD as % of Annual Budget 38.5% YTD as % of Annual Budget 12.0%* 2021 annual budget totals $950,000 ($700,000 ongoing + $250,000 1-time).
21 23
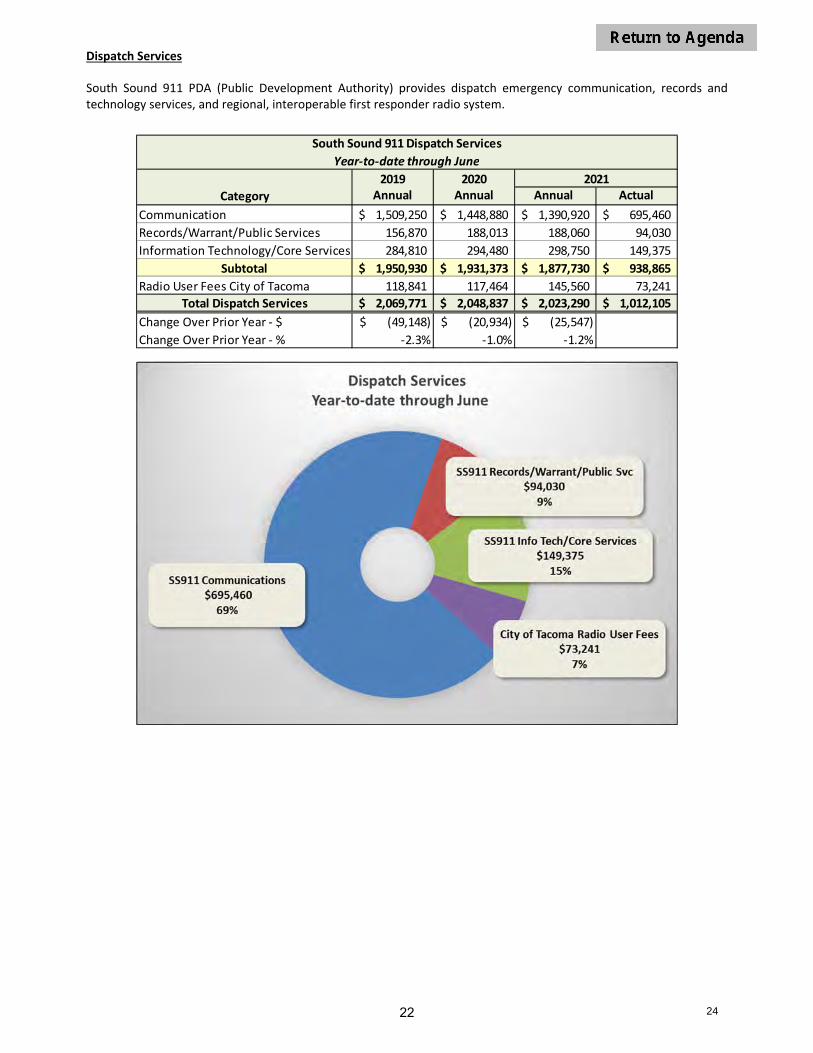
Dispatch Services
South Sound 911 PDA (Public Development Authority) provides dispatch emergency communication, records and technology services, and regional, interoperable first responder radio system.
2019 2020
Category Annual Annual Annual Actual
Communication 1,509,250$ 1,448,880$ 1,390,920$ 695,460$
Records/Warrant/Public Services 156,870 188,013 188,060 94,030
Information Technology/Core Services 284,810 294,480 298,750 149,375
Subtotal 1,950,930$ 1,931,373$ 1,877,730$ 938,865$
Radio User Fees City of Tacoma 118,841 117,464 145,560 73,241
Total Dispatch Services 2,069,771$ 2,048,837$ 2,023,290$ 1,012,105$
Change Over Prior Year ‐ $ (49,148)$ (20,934)$ (25,547)$
Change Over Prior Year ‐ % ‐2.3% ‐1.0% ‐1.2%
South Sound 911 Dispatch Services
Year‐to‐date through June
2021
22 24

Animal License
The City requires all dogs and cats over the age of eight weeks and residing in the city limits to be licensed annually. All licenses expire on December 31. Licenses not renewed by February 28 are subject to a $2 late penalty.
Animal License Fees
Fee Type Regular
Senior (65+) or
Physically Disabled
Unaltered Dogs/Cats $55.00 $30.00
Spayed/Neutered Dogs $20.00 $10.00
Spayed/Neutered Cats $12.00 $4.00
Pets Unders 6 Months Old $4.00 $4.00
Service Dogs $0.00 $0.00
Late Fee (after February 28) $2.00 $2.00
Animal LicenseYear‐to‐date through June
Over / (Under)2021 2021 Actual vs 2020 Actual 2021 Actual vs Budget
Month 2019 Actual 2020 Actual Budget Actual $ % $ %
Jan 8,561$ 1,055$ 4,903$ 6,557$ 5,502$ 521.5% 1,654$ 33.7%
Feb 250 16,839 11,608 11,271 (5,568) ‐33.1% (337) ‐2.9%
Mar 17,903 2,291 7,917 5,453 3,162 138.0% (2,464) ‐31.1%
Apr 2,394 7,986 3,718 2,927 (5,059) ‐63.3% (791) ‐21.3%
May 3,183 410 1,520 3,275 2,865 698.8% 1,755 115.4%
Jun 1,609 3,216 1,952 1,193 (2,023) ‐62.9% (759) ‐38.9%
Jul 1,063 1,049 1,177 ‐ ‐ ‐ ‐ ‐
Aug 848 943 928 ‐ ‐ ‐ ‐ ‐
Sep 714 995 705 ‐ ‐ ‐ ‐ ‐
Oct 987 370 527 ‐ ‐ ‐ ‐ ‐
Nov 700 1,011 735 ‐ ‐ ‐ ‐ ‐
Dec 626 213 310 ‐ ‐ ‐ ‐ ‐
Total YTD 33,900$ 31,797$ 31,618$ 30,676$ (1,121)$ ‐3.5% (942)$ ‐3.0%
Total Annual 38,838$ 36,378$ 36,000$ n/a n/a n/a n/a n/a
5‐Year Ave Change (2016 ‐ 2020): ‐1.8%
Animal Control
Year‐to‐date through June
Over / (Under)
Operating 2019 2020 2021 2021 Actual vs 2020 Actual
Revenues & Expenditures Annual Actual Annual Actual YTD Actual Annual Est YTD Actual $ %
Operating Revenue:
Animal License 38,838$ 36,376$ 31,797$ 36,000$ 30,676$ (1,121)$ ‐3.5%
Animal Services ‐ City of Dupont 33,252 33,917 16,959 34,514 17,298 339 2.0%
Animal Services ‐ Town of Steilacoom 18,012 15,630 5,660 16,601 7,436 1,776 31.4%
Total Operating Revenues 90,101$ 85,923$ 54,416$ 87,115$ 55,410$ 994$ 1.8%
Operating Expenditures:
Personnel 190,591 196,614 100,977 201,175 106,821 5,844 5.8%
Operating Supplies 500 569 569 2,220 500 (69) ‐12.1%
Minor Equipment 1,355 ‐ ‐ 2,120 ‐ ‐ n/a
Humane Society 132,365 121,795 72,373 150,534 75,851 3,478 4.8%
Other Services & Charges ‐ 151 ‐ 1,200 ‐ ‐ n/a
Total Operating Expenditures 324,812$ 319,129$ 173,919$ 357,249$ 183,173$ 9,254$ 5.3%
Net Program Cost (234,711)$ (233,206)$ (119,503)$ (270,134)$ (127,763)$ (8,260)$ 6.9%
Note ‐ operating expenditures do not include internal service allocations (such as vehicle repairs & maintenance, vehicle
replacement reserves, etc.) as all police internal service charges are accounted for under Command Section.
23 25

Alarm Permits and Fees
False alarms cost the City and citizens thousands of dollars per year and take officers away from actual emergencies. The false alarm ordinance includes a registration process, provides for annual alarm permit fees for residential and business alarms, and provides for fees for false alarms to encourage all alarm users to maintain the reliability of and to properly use their alarm equipment.
The number of new registrations have been trending downward from 2017 to 2019. The number of customers that have renewed each year has also trended downward and could be due to several reasons: the customer moved and did not provide notification; the customer cancelled their alarm service and did not provide notification; or the customer was not aware they had to renew the permit. The number of billable false alarms have decreased, which is a natural progression of the program. As customers become more aware of the expectations and are more diligent in the management of the alarm system, the number of false alarms decrease. Another trend PMAM is seeing throughout all of their customer base is the dollars collected have decreased due to the COVID‐19 pandemic. From March through June 2021, PMAM did not see any major impacts, but moving into the second half of the year, customers are prioritizing their finances by necessity over luxury.
The increase in June 2021 is mainly due to yearly renewal charges for a major company.
Alarm Permits and FeesYear‐to‐date through June
Over / (Under)
2019 2020 2021 2021 Actual vs 2020 Actual 2021 Actual vs 2021 Budget
Month Actual Actual Budget Actual $ % $ %
Jan 11,037$ 4,333$ 4,271$ 2,564$ (1,769)$ ‐40.8% (1,707)$ ‐40.0%
Feb 1,594 4,933 4,354 3,930 (1,003) ‐20.3% (424) ‐9.7%
Mar 3,026 1,832 4,366 2,425 593 32.4% (1,941) ‐44.5%
Apr 3,418 2,219 3,333 1,259 (960) ‐43.3% (2,074) ‐62.2%
May 2,135 2,184 6,026 3,917 1,733 79.3% (2,109) ‐35.0%
Jun 3,770 3,638 3,694 16,442 12,804 352.0% 12,748 345.2%
Jul 10,912 1,001 4,893 ‐ ‐ ‐ ‐ ‐
Aug 2,708 7,619 4,391 ‐ ‐ ‐ ‐ ‐
Sep 6,435 7,009 6,219 ‐ ‐ ‐ ‐ ‐
Oct 9,634 9,543 14,042 ‐ ‐ ‐ ‐ ‐
Nov 23,419 13,577 9,188 ‐ ‐ ‐ ‐ ‐
Dec 6,261 5,647 5,223 ‐ ‐ ‐ ‐ ‐ Total YTD 24,980$ 19,139$ 26,044$ 30,537$ 11,398$ 59.6% 4,493$ 17.3%
Total Annual 84,349$ 63,535$ 70,000$ n/a n/a n/a n/a n/a
5‐Year Ave Change (2016 ‐ 2020): ‐8.0%Note: The table reflects gross revenue and does not take into account of related
processing and other fees totaling $51,379 in 2019, $31,736 in 2020 and $7,905 YTD 2021.
24 26

Seizure Funds
Fund 180 Narcotics Seizure Fund
The purpose of this fund is for tracking assets seized as a result of involvement with the illegal sale, possession, or distribution of drugs or controlled substances, and for the purchase of controlled substances or drugs by law enforcement officers or agents, as well as other expenses to enhance and improve law enforcement activities having a close and demonstrable relationship to enforce enforcement of controlled substances. Funds may not be used to supplant existing funding sources. The 2021 original adopted budget includes $120,000 to provide for half of the cost of the new SRT vehicle. The other half of the new vehicle is funded by federal seizures. The 2020 carry forward budget adjustment added $106,196 funded by 2020 ending fund for potential eligible narcotics seizure related activity.
Fund 181 Felony Seizure Fund
The state statute authorizes the seizure of assets that have been or was actually employed as an instrumentality in the commission or in the aiding or abetting in the commission of any felony, or which was furnished or was intended to be furnished by any person in the commission of, as a result of, or as a compensation for the commission of, any felony, or which was acquired in whole or in part with the proceeds traceable to the commission of a felony. Funds shall be used exclusively by the City in the expansion and improvement of law enforcement activity; however may not be used to supplant existing funding sources. The 2020 carry forward budget adjustment added $47,837 funded by 2020 ending fund for potential eligible felony seizure related activity.
Fund 180 ‐ Narcotics Seizure
Year‐to‐date through June
2019 2020 2021
Annual Annual Annual YTD
Actual Actual Budget Actual
Sources:
Forfeitures 123,275$ 71,670$ ‐$ 15,794$
Law Enforcement Contracts 38,171 33,485 ‐ 2,217
Interest /Misc 6,098 1,197 ‐ 81
Total Sources 167,544$ 106,352$ ‐$ 18,091$
Uses:
Investigations 201,584 162,477 106,196 42,714
Capital Purchases ‐ ‐ 120,000 ‐
Total Uses 201,584$ 162,477$ 226,196$ 42,714$
Sources Over/(Under) Uses (34,040)$ (56,125)$ (226,196)$ (24,623)$
Beginning Balance 316,361$ 282,321$ 226,196$ 226,196$
Ending Balance 282,321$ 226,196$ ‐$ 201,573$
Fund 181 ‐ Felony Seizure
Year‐to‐date through June
2019 2020 2021
Annual Annual Annual YTD
Actual Actual Budget Actual
Sources:
Forfeitures 14,121$ 42,620$ ‐$ ‐$
Interest /Misc ‐ 40 ‐ 20
Total Sources 14,121$ 42,660$ ‐$ 20$
Uses:
Investigations 21,022 2,966 47,837 6,528
Total Uses 21,022$ 2,966$ 47,837$ 6,528$
Sources Over/(Under) Uses (6,901)$ 39,694$ (47,837)$ (6,508)$
Beginning Balance 15,044$ 8,143$ 47,837$ 47,837$
Ending Balance 8,143$ 47,837$ ‐$ 41,329$
25 27

Fund 182 Federal Seizure Fund
The Federal Equity Sharing Guidelines lists the following (funds shall be used to increase or supplement and not be used to replace or supplant): Permissible Uses: law enforcement investigations; law enforcement training, law enforcement and detention facilities; law enforcement equipment; law enforcement travel and transportation; law enforcement awards and memorials; drug and gang education awareness programs; matching fund for grants; pro rata funding of the law enforcement agency’s percentage of costs associated with supporting multi‐agency items or facilities; asset accounting and tracking of expenditures of federally shared funds; language assistance services in connection with law enforcement activity; transfers of cash to other law enforcement agencies; support of community‐based programs (cash transfers to community‐based programs are not permitted); and windfall situations to provide additional support to community –based programs. Impermissible Uses: Salaries and benefits of permanent law enforcement personnel, except in limited circumstances (i.e. express statutory authorization, overtime of officers and investigators, new positions and temporary or not‐to‐exceed one year appointments and salary of an officer hired to replace an officer assigned to a task force, specialized programs that generally to not involve traditional law enforcement functions); use of forfeited property by non‐law enforcement personnel; payment of education‐related costs; uses contrary to the laws of the state or local jurisdiction; non‐official government use of shared assets; personal or political use of shared assets; purchase of food and beverage (except for conference and meals during local operations); extravagant expenditures or wasteful expenditures and entertainment; cash on hand, secondary accounts, and stored value cards (such as prepaid credit cards); transfers to other law enforcement agencies; purchase of items for other law enforcement agencies; costs related to lawsuits; loans; and money laundering operations. The 2021 original adopted budget includes $120,000 to provide for half of the cost of the new SRT vehicle. The other half of the new vehicle is funded by narcotics seizures. The 2020 carry forward budget adjustment added $40,906 for purchase of replacement boat.
Fund 182 ‐ Federal Seizure
Year‐to‐date through June
2019 2020 2021
Annual Annual Annual YTD
Actual Actual Budget Actual
Sources:
Forfeitures 264,203$ 63,492$ ‐$ ‐$
Interest/Misc ‐ 1,132 ‐ 86
Total Sources 264,203$ 64,624$ ‐$ 86$
Uses:
Crime Prevention 4,374 399 40,906 ‐
Capital Purchases ‐ 163,147 120,000 ‐
Total Uses 4,374$ 163,546$ 160,906$ ‐$
Sources Over/(Under) Uses 259,829$ (98,922)$ (160,906)$ 86$
Beginning Balance ‐$ 259,829$ 160,906$ 160,907$
Ending Balance 259,829$ 160,907$ ‐$ 160,993$
26 28

Fund 195 Public Safety Grants The purpose of this fund is to account for the revenues and expenditures related to public safety grants. The following table provides a financial summary of these grants.
Year‐to‐date through June
Public Safety Grants
Beginning
Balance Revenue Expenditure
Ending
Balance
Dept. of Justice ‐ Justice Assistance Grant ‐ Bicycles ‐$ 23,419$ 23,419$ ‐$
Dept. of Justice ‐ Justice Assistance Grant ‐ COVID ‐ 24,154 24,154 ‐
Dept. of Justice ‐ Veterans Treatment Court ‐ 46,031 46,031 ‐$
Pierce County ‐ WTSC ‐ Phlebotomy Certification ‐ 148 148 ‐ Washington Auto Theft Prevention Authority (WATPA) ‐ 142,112 142,112 ‐ Washington State Parks & Recreation Boaters Safety ‐ 6,520 6,520 ‐ Washington Traffic Safety Commission (WTSC) Impaired Driving ‐ 6,626 6,626 ‐
Total ‐$ 249,010$ 249,010$ ‐$
2021
Public Safety Grants
Annual
Budget YTD Jun
Dept. of Justice ‐ JAG Bicycles 36,959$ 23,419$
Dept. of Justice ‐ JAG COVID Emergency Supplement 40,541 24,154
Dept. of Justice ‐ Veterans Treatment Court 224,819 46,031
Pierce County ‐ Phlebotomy 2,721 148
Washington Auto Theft Prevention Authority (WATPA) 124,500 142,112
Washington State Parks & Recreation Boaters Safety 11,867 6,520
Washington Traffic Safety Commission (WTSC) Impaired & Distracted Driving 7,428 6,626
Total 448,835$ 249,010$
27 29

MUNICIPAL COURT
Effective January 2015, as part of the new contracts, fines and forfeiture revenues from the Town of Steilacoom and City of University Place are no longer retained by the City, other than for past cases. Revenues from 2015 cases and forward are collected by the City and remitted on a monthly basis to the contract jurisdictions (City of DuPont, City of University Place and Town of Steilacoom).
Municipal Court Fines & Forfeitures
Year‐to‐date through June
2020 2021 Over / (Under) Over / (Under)
2019 Annual YTD Annual YTD YTD 2021 YTD Actual vs 2020 YTD Actual 2021 YTD Actual vs 2021 YTD Budget
Category Actual Actual Actual Budget Budget Actual $ % $ %
Admin, Filing, Copy, Forms, Legal 51,015$ 42,168$ 20,603$ 41,050$ 20,155$ 18,700$ (1,903)$ ‐9.2% (1,455)$ ‐7.2%
Detention & Corrrection Services 158,640 95,415 67,765 190,255 66,291 57,047 (10,718) ‐15.8% (9,244) ‐13.9%
Civil Penalties 2,720 1,740 905 1,800 885 726 (179) ‐19.8% (159) ‐18.0%
Civil Infraction Penalties 484,398 384,788 247,911 358,000 242,517 220,248 (27,663) ‐11.2% (22,269) ‐9.2%
Civil Parking Infractions 1,498 1,420 856 2,000 837 2,560 1,704 199.1% 1,723 205.7%
Criminal Traffic Misdemeanor Fines 38,272 10,961 6,736 13,000 6,589 6,127 (609) ‐9.0% (462) ‐7.0%
Criminal Non‐Traffic Fines 7,751 20,678 4,789 8,000 4,685 (9,601) (14,390) ‐300.5% (14,286) ‐304.9%
Court Cost Recoupment 16,514 18,633 8,742 18,800 8,552 10,193 1,451 16.6% 1,641 19.2%
Interest/Other/Misc 51,965 32,358 18,213 30,300 17,817 14,005 (4,208) ‐23.1% (3,812) ‐21.4%
Total 812,771$ 608,160$ 376,521$ 663,205$ 368,329$ 320,005$ (56,516)$ ‐15.0% (48,324)$ ‐13.1%
Municipal Court Fines & Forfeitures
Year‐to‐date through June
Over / (Under)2021 2021 Actual vs 2020 Actual 2021 Actual vs Budget
Month 2019 Actual 2020 Actual Budget Actual $ % $ %
Jan 76,991$ 71,738$ 60,079$ 40,542$ (31,196)$ ‐43.5% (19,537)$ ‐32.5%
Feb 78,043 70,791 63,167 40,724 (30,067) ‐42.5% (22,443) ‐35.5%
Mar 71,343 70,471 66,213 37,627 (32,844) ‐46.6% (28,586) ‐43.2%
Apr 63,866 80,802 74,797 88,547 7,745 9.6% 13,750 18.4%
May 86,843 44,622 57,472 62,056 17,434 39.1% 4,584 8.0%
Jun 52,973 38,097 46,601 50,509 12,412 32.6% 3,908 8.4%
Jul 51,449 58,687 60,182 ‐ ‐ ‐ ‐ ‐
Aug 82,274 58,214 52,929 ‐ ‐ ‐ ‐ ‐
Sep 70,292 56,595 56,696 ‐ ‐ ‐ ‐ ‐
Oct 54,188 44,210 51,366 ‐ ‐ ‐ ‐ ‐
Nov 78,483 47,094 50,666 ‐ ‐ ‐ ‐ ‐
Dec 46,026 (33,161) 23,038 ‐ ‐ ‐ ‐ ‐
Total YTD 430,059$ 376,521$ 368,329$ 320,005$ (56,516)$ ‐15.0% (48,324)$ ‐13.1%
Total Annual 812,771$ 608,160$ 663,205$ n/a n/a n/a n/a n/a
5‐Year Ave Change (2016 ‐ 2020): ‐8.2%
28 30

The following charts provides current and historical filings and fines & forfeitures for Lakewood (does not include photo infraction filings and revenues).
Municipal Court
Year‐to‐date through June
Over / (Under)
2019 2020 2021 2021 YTD Actual
Operating Annual Annual YTD Annual YTD vs 2020 YTD Actual
Revenues & Expenditures Actual Actual Actual Budget Actual $ %
Operating Revenue:
Fines & Forfeitures 812,771$ 608,160$ 376,521$ 663,205$ 320,005$ (56,517)$ ‐15.0%
Court Services ‐ City of University Place 153,321 251,187 140,142 6,000 6,000 (134,142) ‐95.7%
Court Services ‐ Town of Steilacoom 155,276 87,364 51,364 63,916 37,810 (13,554) ‐26.4%
Court Services ‐ City of DuPont 121,505 35,565 35,565 68,079 36,860 1,295 3.6%
Total Operating Revenues 1,242,873$ 982,276$ 603,592$ 801,200$ 400,675$ (202,917)$ ‐33.6%
Operating Expenditures:
Judicial Services 1,065,824 1,045,965 559,709 1,076,609 529,816 (29,893) ‐5.3%
Professional Services* 591,672 562,198 273,783 572,000 260,837 (12,946) ‐4.7%
Probation & Detention 301,019 245,393 112,449 342,403 96,915 (15,534) ‐13.8%
Total Operating Expenditures 1,958,515$ 1,853,556$ 945,941$ 1,991,012$ 887,568$ (58,373)$ ‐6.2%
Net Revenue (Cost) (715,642)$ (871,280)$ (342,349)$ (1,189,812)$ (486,893)$ (144,544)$ 42.2%
* Professional Services includes Pro‐Tem Judge , Public Defender, Jury/Witness Fees and Interpreter Services.
29 31

Fines & Forfeitures Retained by Contract Jurisdictions (Received by the City of Lakewood and Remitted to Contract Jurisdictions)
Contract Jurisdiction 2016 Annual 2017 Annual 2018 Annual 2019 Annual 2020 Annual 2021 YTD Jun
City of University Place 64,187$ 70,720$ 86,876$ 63,086$ 68,482$ 26,303$
Town of Steilacoom 69,060 90,649 104,858 99,374 65,191 38,284
City of DuPont 88,908 95,501 78,473 68,131 40,715 24,636
Total 222,155$ 256,870$ 270,208$ 230,591$ 174,388$ 89,222$
30 32

Filings and Hearings by Jurisdiction – YTD June
FILINGS HEARINGS
Total YTD Jun Infractions Criminal
Photo/
Camera
Total
Filings Infractions Criminal
Photo/
Camera
Total
Hearings
Total Filing
& Hearings
2021 1,552 875 10,331 12,758 797 4,490 112 5,399 18,157
Lakewood 1,146 763 10,331 12,240 635 3,918 112 4,665 16,905
University Place 9 5 ‐ 14 34 250 ‐ 284 298
Steilacoom 279 57 ‐ 336 80 168 ‐ 248 584
DuPont 118 50 ‐ 168 48 154 ‐ 202 370
2020 2,358 1,151 5,633 9,142 1,274 5,213 149 6,636 15,778
Lakewood 1,676 948 5,633 8,257 1,002 4,371 149 5,522 13,779
University Place 202 108 ‐ 310 119 529 ‐ 648 958
Steilacoom 307 52 ‐ 359 87 175 ‐ 262 621
DuPont 173 43 ‐ 216 66 138 ‐ 204 420
2019 2,972 1,397 7,986 12,355 1,252 7,328 171 8,751 21,106
Lakewood 2,051 1,144 7,986 11,181 910 5,855 171 6,936 18,117
University Place 207 132 ‐ 339 130 876 ‐ 1,006 1,345
Steilacoom 511 90 ‐ 601 157 335 ‐ 492 1,093
DuPont 203 31 ‐ 234 55 262 ‐ 317 551
2018 3,322 1,734 7,162 12,218 1,194 6,831 175 8,200 20,418
Lakewood 2,053 1,302 7,162 10,517 813 5,325 175 6,313 16,830
University Place 325 186 ‐ 511 108 771 ‐ 879 1,390
Steilacoom 480 107 ‐ 587 151 284 ‐ 435 1,022
DuPont 464 139 ‐ 603 122 451 ‐ 573 1,176
2017 4,383 1,486 7,264 13,133 1,318 6,653 198 8,169 21,302
Lakewood 2,991 1,047 7,264 11,302 981 5,021 198 6,200 17,502
University Place 385 228 ‐ 613 108 966 ‐ 1,074 1,687
Steilacoom 532 90 ‐ 622 90 303 ‐ 393 1,015
DuPont 475 121 ‐ 596 139 363 ‐ 502 1,098
2016 4,326 1,836 8,681 14,843 1,370 5,903 182 7,455 22,298
Lakewood 3,233 1,341 8,681 13,255 1,049 4,555 182 5,786 19,041
University Place 267 205 ‐ 472 76 704 ‐ 780 1,252
Steilacoom 317 77 ‐ 394 96 240 ‐ 336 730
DuPont 509 213 ‐ 722 149 404 ‐ 553 1,275
2015 6,454 2,235 5,458 14,147 2,556 6,200 185 8,941 23,088
Lakewood 5,299 1,765 5,458 12,522 2,426 5,413 185 8,024 20,546
University Place 198 251 ‐ 449 130 787 ‐ 917 1,366
Steilacoom 405 115 ‐ 520 ‐ ‐ ‐ ‐ 520
DuPont 552 104 ‐ 656 ‐ ‐ ‐ ‐ 656
31 33

Filings and Hearings by Jurisdiction – Annual Totals
FILINGS HEARINGS
Annual Totals Infractions Criminal
Photo/
Camera
Total
Filings Infractions Criminal
Photo/
Camera
Total
Hearings
Total Filing
& Hearings
2020 4,120 2,274 10,143 16,537 2,408 10,762 267 13,437 29,974
Lakewood 2,777 1,876 10,143 14,796 1,788 9,005 267 11,060 25,856
University Place 392 201 ‐ 593 242 1,067 ‐ 1,309 1,902
Steilacoom 633 102 ‐ 735 226 374 ‐ 600 1,335
DuPont 318 95 ‐ 413 152 316 ‐ 468 881
2019 7,638 3,050 16,644 27,332 2,710 14,346 298 17,354 44,686
Lakewood 5,678 2,481 16,644 24,803 2,070 11,598 298 13,966 38,769
University Place 419 302 ‐ 721 194 1,655 ‐ 1,849 2,570
Steilacoom 922 188 ‐ 1,110 301 596 ‐ 897 2,007
DuPont 619 79 ‐ 698 145 497 ‐ 642 1,340
2018 6,494 3,187 15,680 25,361 2,392 13,724 333 16,449 41,810
Lakewood 4,008 2,390 15,680 22,078 1,608 10,727 333 12,668 34,746
University Place 687 340 ‐ 1,027 264 1,585 ‐ 1,849 2,876
Steilacoom 1,053 234 ‐ 1,287 313 604 ‐ 917 2,204
DuPont 746 223 ‐ 969 207 808 ‐ 1,015 1,984
2017 7,910 3,097 14,413 25,420 2,615 13,055 364 16,034 41,454
Lakewood 5,303 2,235 14,413 21,951 1,890 9,898 364 12,152 34,103
University Place 629 396 ‐ 1,025 227 1,843 ‐ 2,070 3,095
Steilacoom 1,151 204 ‐ 1,355 266 583 ‐ 849 2,204
DuPont 827 262 ‐ 1,089 232 731 ‐ 963 2,052
2016 7,733 3,569 15,107 26,409 2,581 12,414 398 15,393 41,802
Lakewood 5,463 2,623 15,107 23,193 1,933 9,567 398 11,898 35,091
University Place 602 409 ‐ 1,011 199 1,583 ‐ 1,782 2,793
Steilacoom 678 162 ‐ 840 179 487 ‐ 666 1,506
DuPont 990 375 ‐ 1,365 270 777 ‐ 1,047 2,412
2015 10,453 4,197 10,761 25,411 4,806 12,322 368 17,496 42,907
Lakewood 8,204 3,308 10,761 22,273 4,569 10,784 368 15,721 37,994
University Place 316 458 ‐ 774 237 1,538 ‐ 1,775 2,549
Steilacoom 787 197 ‐ 984 ‐ ‐ ‐ ‐ 984
DuPont 1,146 234 ‐ 1,380 ‐ ‐ ‐ ‐ 1,380
32 34

COMMUNITY & ECONOMIC DEVELOPMENT
Business License
Businesses located or doing business in the City are required to obtain a local business license prior to commencing operations. Business license fees are set by the City Council and may change from time to time. Currently, the cost of a general business license is $60 for a 12‐month period. Additional fees may apply to specialty businesses. Organization exempt from taxation under 26 USC 501(C)(3) and (4) must apply and obtain a business license, but are exempt from the business license fee. The number of business licenses in a given year range between 3,800 – 4,200 with roughly 3,800 renewals annually.
General business licenses were down in 2020 due to the closure of the State Business License Services (BLS) office as a result of COVID‐19 causing delays in processing. BLS deferred the general business license expirations dates, thus less revenue from renewals. Business activity is overall is down due to the pandemic, however is picking up in 2021. Specialty licenses are down in 2021 compared to 2019 due to the closure of Déjà vu on September 18, 2019.
Business LicenseYear‐to‐date through June
Over / (Under)
2021 2021 Actual vs 2020 Actual 2021 Actual vs 2021 Budget
Month 2019 Actual 2020 Actual Budget Actual $ % $ %
Jan 34,715$ 26,180$ 48,166$ 26,370$ 190$ 0.7% (21,796)$ ‐45.3%
Feb 26,320 22,935 32,162 21,420 (1,515) ‐6.6% (10,742) ‐33.4%
Mar 38,489 26,790 33,063 34,490 7,700 28.7% 1,427 4.3%
Apr 30,280 17,625 20,722 21,490 3,865 21.9% 768 3.7%
May 20,725 17,350 17,174 18,780 1,430 8.2% 1,606 9.4%
Jun 21,715 22,220 17,988 22,175 (45) ‐0.2% 4,187 23.3%
Jul 22,940 26,814 21,345 ‐ ‐ ‐ ‐ ‐
Aug 20,650 20,090 17,339 ‐ ‐ ‐ ‐ ‐
Sep 18,935 16,815 15,199 ‐ ‐ ‐ ‐ ‐
Oct 21,395 17,240 15,942 ‐ ‐ ‐ ‐ ‐
Nov 15,100 16,775 14,307 ‐ ‐ ‐ ‐ ‐
Dec 21,225 23,270 23,119 ‐ ‐ ‐ ‐ ‐
Total YTD 172,244$ 133,100$ 169,274$ 144,725$ 11,625$ 8.7% (24,549)$ ‐14.5%
Annual Total 292,489$ 254,104$ 276,525$ n/a n/a n/a n/a n/a
5‐Year Ave Change (2016 ‐ 2020): ‐1.7%
Business License By TypeYear‐to‐date through June
Over / (Under)
2019 2020 2021Month Annual Annual YTD Budget YTD Actual $ %
General 257,545$ 239,815$ 123,575$ 240,000$ 134,150$ 10,575$ 8.6%
Specialty 34,944 14,289 9,525 36,525 10,575 1,050 11.0%
Total 292,489$ 254,104$ 133,100$ 276,525$ 144,725$ 11,625$ 8.7%
2021 YTD Actual vs
2020 YTD Actual
33 35

Development Services Permits & Fees
Development Services Permits & Fees include revenues from Community & Economic Development (Fund 001 General Fund) and Public Works Engineering Services (Fund 101 Street Engineering and Fund 401 SWM Engineering). Community and Economic Development permits and fees include building and related permits (i.e. mechanical, plumbing), plan review fees, plan check fees and zoning and development fees. Public Works Engineering permits and fees include oversize load permits, right‐of‐way permits, site development permits street vacation permits, street opening permits and engineering review services.
Total ‐ Development Services Permits & Fees
(Combined CED & PWE)
Year‐to‐date through June
Over / (Under)
2021 2021 Actual vs 2020 Actual 2021 Actual vs 2021 Budget
Month 2019 Actual 2020 Actual Budget Actual $ % $ %
Jan 81,118$ 104,008$ 172,273$ 223,911$ 119,903$ 115.3% 51,638$ 30.0%Feb 79,946 246,268 128,363 121,333 (124,935) ‐50.7% (7,030) ‐5.5%Mar 148,373 104,847 123,805 157,680 52,833 50.4% 33,875 27.4%Apr 137,095 137,944 134,660 363,968 226,024 163.9% 229,308 170.3%May 129,841 249,214 138,867 214,688 (34,526) ‐13.9% 75,821 54.6%Jun 157,651 138,946 196,467 187,746 48,800 35.1% (8,721) ‐4.4%Jul 184,624 150,805 142,477 ‐ ‐ ‐ ‐ ‐ Aug 167,992 283,230 165,442 ‐ ‐ ‐ ‐ ‐ Sep 177,340 261,246 136,666 ‐ ‐ ‐ ‐ ‐ Oct 256,594 329,860 233,961 ‐ ‐ ‐ ‐ ‐ Nov 216,659 111,357 131,635 ‐ ‐ ‐ ‐ ‐ Dec 209,356 354,208 205,587 ‐ ‐ ‐ ‐ ‐
Total YTD 734,024$ 981,227$ 894,435$ 1,269,326$ 288,099$ 29.4% 374,891$ 41.9%Total Annual 1,946,589$ 2,471,932$ 1,910,200$ n/a n/a n/a n/a n/a
5‐Year Ave Change (2016 ‐ 2020): 17.3%
34 36

35 37

CED ‐ Building Permit Fees
Year‐to‐date through June
Over / (Under)
2021 2021 Actual vs 2020 Actual 2021 Actual vs 2021 Budget
Month 2019 Actual 2020 Actual Budget Actual $ % $ %
Jan 37,664$ 50,272$ 94,941$ 87,473$ 37,201$ 74.0% (7,468)$ ‐7.9%Feb 32,461 136,871 62,857 39,191 (97,680) ‐71.4% (23,666) ‐37.7%Mar 56,949 37,180 61,121 70,527 33,347 89.7% 9,406 15.4%Apr 55,884 71,701 62,914 233,354 161,653 225.5% 170,440 270.9%May 58,981 89,589 66,940 117,693 28,104 31.4% 50,753 75.8%Jun 78,037 70,566 109,619 100,532 29,966 42.5% (9,087) ‐8.3%Jul 86,656 62,726 78,165 ‐ ‐ ‐ ‐ ‐ Aug 100,468 176,682 102,926 ‐ ‐ ‐ ‐ ‐ Sep 112,318 177,112 86,616 ‐ ‐ ‐ ‐ ‐ Oct 168,457 190,511 154,527 ‐ ‐ ‐ ‐ ‐ Nov 148,441 55,369 80,479 ‐ ‐ ‐ ‐ ‐ Dec 69,586 147,713 72,195 ‐ ‐ ‐ ‐ ‐
Total YTD 319,976$ 456,179$ 458,393$ 648,770$ 192,591$ 42.2% 190,377$ 41.5%Total Annual 1,005,902$ 1,266,291$ 1,033,300$ n/a n/a n/a n/a n/a
5‐Year Ave Change (2016 ‐ 2020): 16.4%
36 38

CED ‐ Plan Review/Plan Check Fees
Year‐to‐date through June
Over / (Under)
2021 2021 Actual vs 2020 Actual 2021 Actual vs 2021 Budget
Month 2019 Actual 2020 Actual Estimate Actual $ % $ %
Jan 20,271$ 19,758$ 51,075$ 113,615$ 93,857$ 475.0% 62,540$ 122.4%Feb 19,617 71,472 38,695 47,394 (24,078) ‐33.7% 8,699 22.5%Mar 65,985 43,523 43,663 57,098 13,575 31.2% 13,435 30.8%Apr 46,362 40,794 45,539 82,668 41,874 102.6% 37,129 81.5%May 37,242 62,631 36,694 41,850 (20,781) ‐33.2% 5,156 14.1%Jun 39,477 58,319 57,762 44,261 (14,058) ‐24.1% (13,501) ‐23.4%Jul 72,564 56,290 40,954 ‐ ‐ ‐ ‐ ‐ Aug 45,135 76,218 38,978 ‐ ‐ ‐ ‐ ‐ Sep 38,033 67,124 31,615 ‐ ‐ ‐ ‐ ‐ Oct 53,300 101,986 54,600 ‐ ‐ ‐ ‐ ‐ Nov 54,348 34,565 30,773 ‐ ‐ ‐ ‐ ‐ Dec 111,166 177,955 111,050 ‐ ‐ ‐ ‐ ‐
Total YTD 228,953$ 296,497$ 273,431$ 386,886$ 90,389$ 30.5% 113,455$ 41.5%Total Annual 603,499$ 810,634$ 581,400$ n/a n/a n/a n/a n/a
5‐Year Ave Change (2016 ‐ 2020): 23.8%
37 39

CED ‐ Zoning/Development Fees
Year‐to‐date through June
Over / (Under)
2021 2021 Actual vs 2020 Actual 2021 Actual vs 2021 Budget
Month 2019 Actual 2020 Actual Budget Actual $ % $ %
Jan 14,630$ 12,112$ 15,515$ 11,960$ (152)$ ‐1.3% (3,555)$ ‐22.9%Feb 15,961 29,024 15,437 8,472 (20,552) ‐70.8% (6,965) ‐45.1%Mar 7,370 7,118 8,479 11,295 4,177 58.7% 2,816 33.2%Apr 14,446 13,770 11,214 21,462 7,692 55.9% 10,248 91.4%May 11,801 15,459 10,019 31,379 15,920 103.0% 21,360 213.2%Jun 15,710 5,611 10,786 6,769 1,158 20.6% (4,017) ‐37.2%Jul 5,754 17,829 9,638 ‐ ‐ ‐ ‐ ‐ Aug 7,662 14,780 11,855 ‐ ‐ ‐ ‐ ‐ Sep 15,230 13,060 12,185 ‐ ‐ ‐ ‐ ‐ Oct 14,763 18,487 13,203 ‐ ‐ ‐ ‐ ‐ Nov 7,270 10,130 12,463 ‐ ‐ ‐ ‐ ‐ Dec 9,030 18,460 9,704 ‐ ‐ ‐ ‐ ‐
Total YTD 79,918$ 83,094$ 71,452$ 91,337$ 8,243$ 9.9% 19,885$ 27.8%Total Annual 139,627$ 175,840$ 140,500$ n/a n/a n/a n/a n/a
5‐Year Ave Change (2016 ‐ 2020): 13.3%
38 40

PW Street Engineering ‐ ROW Permits & Fees
Year‐to‐date through June
Over / (Under)
2021 2021 Actual vs 2020 Actual 2021 Actual vs 2021 Budget
Month 2019 Actual 2020 Actual Budget Actual $ % $ %
Jan 8,169$ 17,366$ 8,749$ 9,113$ (8,253)$ ‐47.5% 364$ 4.2%Feb 7,306 7,276 7,487 17,841 10,565 145.2% 10,354 138.3%Mar 11,739 13,526 7,886 11,865 (1,661) ‐12.3% 3,979 50.5%Apr 14,288 8,679 9,521 18,289 9,610 110.7% 8,768 92.1%May 14,805 42,492 14,037 16,846 (25,646) ‐60.4% 2,809 20.0%Jun 17,293 3,825 10,316 23,714 19,889 520.0% 13,398 129.9%Jul 15,150 9,210 8,911 ‐ ‐ ‐ ‐ ‐ Aug 11,112 10,925 8,402 ‐ ‐ ‐ ‐ ‐ Sep 10,484 3,950 5,784 ‐ ‐ ‐ ‐ ‐ Oct 15,824 10,738 8,423 ‐ ‐ ‐ ‐ ‐ Nov 5,975 7,408 6,015 ‐ ‐ ‐ ‐ ‐ Dec 18,448 8,955 9,472 ‐ ‐ ‐ ‐ ‐
Total YTD 73,600$ 93,164$ 57,995$ 97,668$ 4,504$ 4.8% 39,673$ 68.4%Total Annual 150,593$ 144,349$ 105,000$ n/a n/a n/a n/a n/a
5‐Year Ave Change (2016 ‐ 2020): 4.0%
39 41

PW SWM ‐ Permits & Fees
Year‐to‐date through June
Over / (Under)
2021 2021 Actual vs 2020 Actual 2021 Actual vs 2021 Budget
Month 2019 Actual 2020 Actual Budget Actual $ % $ %
Jan 385$ 4,500$ 1,992$ 1,750$ (2,750)$ ‐61.1% (242)$ ‐12.2%Feb 4,602 1,625 3,887 8,435 6,810 419.1% 4,548 117.0%Mar 6,330 3,500 2,656 6,895 3,395 97.0% 4,239 159.6%Apr 6,115 3,000 5,473 8,195 5,195 173.2% 2,722 49.7%May 7,012 39,043 11,177 6,920 (32,123) ‐82.3% (4,257) ‐38.1%Jun 7,133 625 7,984 12,470 11,845 1895.2% 4,486 56.2%Jul 4,500 4,750 4,809 ‐ ‐ ‐ ‐ ‐ Aug 3,615 4,625 3,280 ‐ ‐ ‐ ‐ ‐ Sep 1,275 ‐ 466 ‐ ‐ ‐ ‐ ‐ Oct 4,250 8,138 3,208 ‐ ‐ ‐ ‐ ‐ Nov 625 3,885 1,905 ‐ ‐ ‐ ‐ ‐ Dec 1,126 1,125 3,166 ‐ ‐ ‐ ‐ ‐
Total YTD 31,577$ 52,293$ 33,168$ 44,665$ (7,628)$ ‐14.6% 11,497$ 34.7%Total Annual 46,968$ 74,815$ 50,000$ n/a n/a n/a n/a n/a
5‐Year Ave Change (2016 ‐ 2020): 28.0%
40 42

Cost Recovery – Development Services
In May 2016, the City Council adopted a set of revised financial policies to include cost recovery. The following is an excerpt of the cost recovery policy as it relates specifically to target cost recovery for development review services:
Target Cost Recovery Level for Development Review Services. The cost recovery policy applies to the following development programs/services: planning (long and short plats, privately initiated re‐zonings and comprehensive plan amendments, variances, use permits); building and safety (building permits, structural plan checks, inspections); engineering (public improvement plan checks, inspections, subdivision requirements, encroachments, right‐of‐way permits); and fire plan check. Cost recovery for these services should generally be very high. In most instances, the City's cost recovery ratio goal should be 85%. The timeline to achieve the cost recovery is no later than year 2021. In setting cost recovery levels, the City shall clearly establish and articulate performance measurements to ensure that there is “value for cost.”
The table below provides historical annual and current estimated annual and actual subsidy and recovery ratio by program.
Development Services Permits & Fees(Includes Community & Economic Development, Public Works Engineering & Surface Water Management)
Year‐to‐date through June2016 2017 2018 2019 2020 2021
Annual Annual Annual Annual Annual Annual YTDActual Actual Actual Actual Actual Budget Actual
Operating Revenues: Building Related Permits 696,696 860,776 1,390,775 1,005,902 1,266,291 1,033,300 648,770 Plan Review/Plan Check Fees 370,220 661,291 625,754 603,498 810,634 581,400 386,886 Other Zoning/Development Fees 105,660 134,106 188,137 139,627 175,840 140,500 91,337 Oversize Load Permits 5,126 6,851 6,636 4,591 3,370 3,000 6,904 ROW Permits 82,318 88,026 100,148 97,035 65,164 52,000 46,098 Site Development Permits 63,753 79,678 113,246 93,936 149,632 100,000 89,330 Street Vacation Permits ‐ ‐ ‐ 2,000 1,000 ‐ ‐ Engineering Fees 50 2,754 ‐ ‐ ‐ ‐ ‐
Total Operating Revenue $1,323,823 $1,833,482 $ 2,424,696 $ 1,946,589 $ 2,471,931 $ 1,910,200 $ 1,269,325 Operating Expenditures:Current Planning 662,641 630,971 659,093 718,158 715,817 775,895 233,888 Long Range Planning 135,641 171,058 192,837 218,809 196,147 240,978 72,586 Building 909,265 1,014,891 1,035,962 1,146,618 1,135,909 1,303,025 226,499 Development Services 301,241 325,821 331,330 382,403 365,394 417,452 190,504
Total Operating Expenditures $2,008,788 $2,142,741 $ 2,219,222 $ 2,465,988 $ 2,413,267 $ 2,737,350 $ 723,477 General Fund Subsidy Amount $ 684,965 $ 309,259 $ (205,474) $ 519,399 $ (58,664) $ 827,150 $ (545,848)Recovery Ratio 66% 86% 109% 79% 102% 70% 175%
5‐Year Average Actual Recovery:General Fund Subsidy (2016 ‐ 2020) $ 249,897
Recovery Ratio (2016 ‐ 2020) 88%
Note:
‐ Expenditures do not include indirect overhead cost allocation for finance, human resources, legal, legislative and executive functions.
‐ Public Works Development Services Permits includes associated revenues and expenditures accounted for in the SWM Fund; also includes 10% overhead cost.
41 43

Fund 105 Property Abatement / Rental Housing Safety Program / 1406 Affordable Housing Program
Property Abatement
The Property Abatement portion of this fund accounts for projects that the City has identified and processed through the abatement program. All revenue and the rightful recovery of those project expenses, along with all revenues from fees, fines, and interest, and other rightful recoveries from those projects are deposited into the program for the purpose of funding additional abatement projects.
Property AbatementYear‐to‐date through June
2019 2020 2021
Operating Annual Annual Annual YTD
Revenues & Expenditures Actual Actual Budget Actual
Operating Revenue:
Abatement Charges 138,739$ 59,134$ 77,000$ 68,481$
Misc/Interest/Other 40,206 13,401 35,000 40,147
Total Operating Revenues 178,946$ 72,535$ 112,000$ 108,628$
Operating Expenditures:
Personnel Costs 46,364 31,419 48,000 18,947
Supplies 91 642 ‐ 587
Professional Services 84,315 60,513 709,386 28,773
Other Services & Charges 1,704 360 ‐ 494
Total Operating Expenditures 132,474$ 92,934$ 757,386$ 48,800$
Net Program Income (Cost) 46,472$ (20,398)$ (645,386)$ 59,828$
Other Sources / (Uses)
Transfer In From General Fund 60,000 60,000 35,000 35,000
Total Sources / (Uses) 60,000$ 60,000$ 35,000$ 35,000$
Beginning Balance 464,313$ 570,784$ 610,386$ 610,387$
Ending Balance 570,784$ 610,386$ ‐$ 705,213$
DANGEROUS BUILDING AND PUBLIC NUISANCES
As of August 30, 2021
Property AddressDangerous
Building
Public
Nuisance Other Date Started
Date
Completed
1 12616 47th Ave. SW ‐ X ‐ 9/9/2019 2/4/2020
2 5408 Steilacoom Blvd. SW ‐ X ‐ 12/3/2019 2/4/2020
3 10506 Bridgeport Way SW X ‐ ‐ 1/11/2019 12/15/2020
4 9006 Washington Blvd. SW X ‐ ‐ 8/16/2018 3/1/2020
5 5509 Boston Ave. SW X ‐ ‐ 12/3/2018 1/27/2021
6 6922 146th St. SW X ‐ ‐ 8/1/2019 4/1/2020
7 6918 146th St. SW X ‐ ‐ 8/1/2019 4/1/2020
8 14601 Woodbrook Dr. SW X ‐ ‐ 8/1/2019 4/1/2020
9 9827 American Ave SW X ‐ ‐ 10/18/2018 4/17/2020
10 2621 84th St. S (Karwan Vil lage Mobile Home Park) X ‐ ‐ 1/9/2019 In process
11 9314‐16 Bridgeport Way SW X ‐ ‐ 11/15/2018 In l itigation
12 9320‐30 Bridgeport Way SW X ‐ ‐ 11/15/2018 In l itigation
13 6112 100th St. SW X ‐ ‐ 5/16/2019 In process
14 8203 32nd Ave. Ct. S, #46 X ‐ ‐ 5/17/2019 12/15/2020
15 8602 Maple St. SW X ‐ ‐ 7/9/2017 In process
16 4824 101st St. SW X X ‐ 6/27/2019 11/4/2020
17 8410 S Tacoma Way X X ‐ 6/6/2019 In process
18 8113 Sherwood Forest St. SW X X X 7/31/2019 In process
19 6401 Wildaire Rd. SW X X ‐ 8/16/2019 1/26/2021
20 7119 Foster St. SW X X ‐ 10/30/2019 In process
21 8604 Maple St. SW ‐ X ‐ 10/24/2019 In process
22 12632 Lincoln Ave. SW X X ‐ 1/9/2020 8/3/2021
42 44

DANGEROUS BUILDING AND PUBLIC NUISANCES (continued)
As of August 30, 2021
Property AddressDangerous
Building
Public
Nuisance Other Date Started
Date
Completed
23 12314 Pacific Hwy SW ‐ ‐ X 4/9/2020 In process
24 9230 Northlake Dr. SW X X ‐ 4/9/2020 1/26/2021
25 9616 Gravelly Lake Dr. SW X X ‐ 10/26/2020 In process
26 12715 Addison St. SW X X X 5/17/2020 In process
27 573 Lake Louise Dr. SW X X X 5/14/2020 In process
28 11618 Pacific Highway SW ‐ ‐ X 8/26/2020 7/1/2021
29 8920 Gravelly Lake Drive SW ‐ ‐ X 10/29/2020 In process (UST)
30 5408 Steilacoom Blvd SW X X ‐ 10/29/2020 7/31/2020
31 9152 Gravelly Lake Drive SW ‐ ‐ X Not started Not started (UST)
32 9601 Gravelly Lake Drive SW ‐ ‐ X Not started 1/4/2021
33 10202 Gravelly Lake Drive SW ‐ ‐ X Not started Not started (UST)
34 WSH Building 45 X ‐ ‐ 7/6/2020 2/25/2021
35 WSH Building 46 X ‐ ‐ 7/6/2020 2/25/2021
36 WSH Building 48 X ‐ ‐ 7/6/2020 2/25/2021
37 WSH Building 49 X ‐ ‐ 7/6/2020 2/25/2021
38 4500‐4504 111th ST SW, Units 1‐5 ‐ ‐ X 4/13/2020 In process
39 4925 Diamond Blvd. SW ‐ ‐ X 1/27/2020 In process
40 5116 128th Street Ct. SW, Unit C ‐ ‐ X 1/29/2020 9/14/2020
41 5501 116th St. SW ‐ ‐ X 2/26/2020 In process
42 6622 146th Street SW ‐ ‐ X 1/27/2020 In process
43 7114 87th Street SW ‐ ‐ X 2/5/2020 10/14/2020
44 7563 Dowerdell Ln. W ‐ ‐ X 1/10/2020 In process
45 9315 Gravelly Lake Dr SW X ‐ ‐ 4/13/2020 4/10/2021
46 10202 Gravelly Lake Drive SW ‐ ‐ X 10/29/2020 Not started (UST)
47 9522 Bridgeport Way SW ‐ ‐ X 3/9/2020 6/23/2020
48 13020 Lincoln Avenue SW ‐ X X 2/2/2019 10/20/2020
49 14804 Portland Avenue SW ‐ ‐ X 2/18/2020 Not started
50 8129 Durango Street SW ‐ ‐ X 10/29/2020 In process
51 8311 Durango Street SW ‐ ‐ X Unknown 10/15/2020
52 7101‐7229 150th Street SW X X ‐ 8/7/2018 In process
53 12718 Gravelly Lake Drive SW ‐ ‐ X 10/7/2020 In process
54 116 Haman Lane SW ‐ ‐ X 10/29/2020 In process
55 5629 Boston Avenue ‐ X X 10/29/2020 11/13/2020
56 8906 Wadsworth St SW X X ‐ 11/30/2020 In process
57 2624 92nd Street S X ‐ X 12/3/2020 1/31/2021
58 7131 150th Street SW X X ‐ 1/19/2021 In process
59 7407‐7409 146th Street SW (APN: 0219221041) X X X 4/4/2019 In process
60 9724 South Tacoma Way ‐ ‐ X 12/22/2020 In process
61 8423 95th Street SW ‐ X ‐ 1/4/2021 In process
62 6111 88th Street SW ‐ ‐ X Unknown In process
63 2404‐2506 104th Street Court S ‐ ‐ X 1/4/2021 In process
64 15013 Union Avenue S X ‐ X 1/19/2021 7/15/2021
65 11614 Military Road SW ‐ X ‐ Unknown 8/3/2021
66 9704‐9706 121st Street SW ‐ X X 2/18/2021 In process
67 7116 146th Street SW X ‐ ‐ 3/10/2021 5/12/2021
Totals
36 23 32 67
In process ‐ 29
In litigation ‐ 2
Not started ‐ 3
Completed ‐ 31
Notes:
The category "Other" includes structures damaged by fire, major land use violations, & major RHSP violations.
Information is up‐to‐date as of March 8, 2021; however project status can change weekly.
43 45

Rental Housing Safety Program
On August 1, 2016, the Lakewood City Council approved Ordinance No. 644 creating a Rental Housing Safety Program (RHSP). The program requires all residential rental properties (apartments, single family homes, duplexes, etc.) within Lakewood city limits to be registered. The program is designed to ensure that all rental housing units comply with specific life and safety standards and are providing a safe place for tenants to live. As of October 4, 2017, all rental properties owners will be required to register their property with the City every year and have the property inspected once every five years.
Rental Housing Safety Program
Year‐to‐date through June
2019 2020 2021
Operating Annual Annual Annual YTD
Revenues & Expenditures Actual Actual Budget Actual
Operating Revenue:
Registration Program Fees 205,307$ 179,398$ 175,000$ 147,096$
Total Operating Revenues 205,307$ 179,398$ 175,000$ 147,096$
Operating Expenditures:
Personnel Costs 172,420 218,137 222,150 105,952
Supplies 738 687 ‐ 633
Professional Services 487 222 ‐ ‐
Other Services & Charges 17 329 ‐ 15
Internal Service Charges 26,179 44,345 2,850 ‐
Total Operating Expenditures 199,841$ 263,719$ 225,000$ 106,600$
Net Program Income (Cost) 5,466$ (84,321)$ (50,000)$ 40,496$
Other Sources / (Uses)
Transfer In From General Fund 25,000 25,000 74,287$ 50,000
Total Sources / (Uses) 25,000$ 25,000$ 74,287$ 50,000$
Beginning Balance 4,568$ 35,034$ (24,287)$ (24,287)$
Ending Balance 35,033$ (24,287)$ ‐$ 66,208$
Rental Housing Safety Program FeesYear‐to‐date through June
Month 2019 2020 2021
Jan 63,805$ 72,979 79,429
Feb 18,464 24,523 24,951
Mar 15,639 9,715 25,589
Apr 19,103 6,480 9,181
May 6,086 1,844 3,907
Jun 8,374 5,867 4,039
Jul 12,153 4,330 ‐
Aug 6,510 12,498 ‐
Sep 8,163 9,453 ‐
Oct 14,459 11,754 ‐
Nov 20,922 16,058 ‐
Dec 11,629 3,897 ‐
Total YTD 131,471$ 121,408$ 147,096$
Annual Total 205,307$ 179,398$ n/a
2021 Annual Estimate = 175,000$
2021 % of Revenue Collected = 84%
44 46

1406 Affordable Housing Program
On March 2, 2020, the City Council approved Ordinance 731 relating to local sales and use tax, authorizing the maximum capacity of the tax authorized under the provisions of Substitute House Bill 1406 for affordable and supporting housing. The revenue to the City is a credit of the state’s sales tax. With adoption of this ordinance, the City is able to impose the rate of 0.0073%. According to the Department of Revenue (DOR), the maximum amount the City may receive is $98K per state fiscal year for twenty years totaling an estimated $1.95M. The City notified DOR on March 13, 2020 and DOR began imposing the tax effective May 1, 2020. The City received its first full distribution amount in July 2020 with some funds trickling through in May and June due to early returns filed. The direction from the Lakewood City Council is to use the funds in conjunction with the City’s CDBG Major Home Repair Program, CDBG Major Home Repair and Sewer Loan Program, and HOME Housing Rehabilitation Loan Program given that there is a high demand for home repair and rehabilitation loans in the City. The City is presently working with two homeowners to assist with repairs not eligible to be made under the City’s CDBG housing program (deck/landing repairs and the repair of a detached garage). A third client has requested information about the program and the City is working to assist that individual as well. Loans are anticipated to be made to these homeowners in the third quarter of 2021, with work to be completed in early fall. The City is finalizing updating the CED webpage with program information.
1406 Affordable Housing Program
Year‐to‐date through June
2021
Month 2020 Budget Actual
Jan ‐$ 7,140$ 8,941
Feb ‐ 7,084 9,198
Mar ‐ 8,371 7,349
Apr 107 7,402 ‐
May 7,811 8,105 10,758
Jun 9,379 8,962 11,237
Jul 8,959 8,270 ‐
Aug 8,618 8,355 ‐
Sep 10,203 8,877 ‐
Oct 8,924 8,113 ‐
Nov 7,860 7,839 ‐
Dec 10,456 9,482 ‐
Total YTD ‐$ 47,064$ 47,483$
Annual Total 72,316$ 98,000$ 47,483$
1406 Affordable Housing Program
Year‐to‐date through June
Operating 2020 Annual YTD
Revenues & Expenditures Actual Budget Actual
Operating Revenue:
Sales & Use Tax 72,316$ 98,000$ 47,483$
Total Operating Revenues 72,316$ 98,000$ 47,483$
Operating Expenditures:
Program Costs ‐ 170,315 ‐
Total Operating Expenditures ‐$ 170,315$ ‐$
Net Program Income (Cost) 72,316$ (72,315)$ 47,483$
Other Sources / (Uses)
Transfer In From General Fund ‐ ‐ ‐
Total Sources / (Uses) ‐$ ‐$ ‐$
Beginning Balance ‐$ 72,316$ 72,316$
Ending Balance 72,316$ ‐$ 119,800$
2021
45 47

Fund 190 Community Development Block Grant
Fund 190 CDBG is predominantly comprised of U.S. Department of Housing and Urban Development funds for Community Development Block Grant Entitlements (CDBG), HOME program funding through the Lakewood and Tacoma HOME Consortium and Section 108 Loan Guarantees. There is also a grant from the Nisqually Tribe for minor home repairs and West Pierce Fire & Rescue for emergency assistance for displaced residents. Through the planning and citizen participation process CDBG and HOME spending priorities are set on an annual basis, to be broken out into funding projects for physical improvements, public service (not to exceed 15%), housing, economic development, and administration (not to exceed 20%). CDBG:
CDBG Funds may be used to fund an array of projects and activities qualifying under any of four categories:
(1) Physical/Infrastructure Improvements (2) Public Service (3) Housing (4) Economic Development
Investments made in various housing programs (Major Home Repair/Sewer Loan Program, Down Payment Assistance, and Multi‐family Housing), and economic development activities (Microenterprise Loan Program) have created multiple Revolving Loan Funds (RLF) for each of the funded activities. In addition to tracking the various CDBG grant allocation’s revenue and expenditures in Fund 190 CDBG, notes receivable for Housing Program Loans are also tracked. These are revolving loans for Major Home Repair, Major Home Repair for Sewer and Down Payment Assistance for qualifying homebuyers.
CDBG Entitlement Funding History
Program Year
Annual
Allocation$ %
2021 573,352 $ (22,563) ‐3.8%
2020 595,915 $ 32,791 5.8%
2019 563,124 1,893 0.3%
2018 561,231 76,865 15.9%
2017 484,366 17,316 3.7%
2016 467,050 (698) ‐0.1%
2015 467,748 (4,004) ‐0.8%
2014 471,752 (9,846) ‐2.0%
2013 481,598 10,703 2.3%
2012 470,895 (106,895) ‐18.5%
2011 577,790 (114,016) ‐16.5%
2010 691,806 50,755 7.9%
2009 641,051 5,749 0.9%
2008 635,302 (24,966) ‐3.8%
2007 660,268 (3,682) ‐0.6%
2006 663,950 (77,700) ‐10.5%
2005 741,650 (43,350) ‐5.5%
2004 785,000 (21,000) ‐2.6%
2003 806,000 (91,000) ‐10.1%
2002 897,000 (46,000) ‐4.9%
2001 943,000 30,000 3.3%
2000 913,000 n/a n/aTotal 14,092,848$
Change Over Prior Year
46 48

The following tables provide a summary of loans and grants for Major Home and Sewer Repair Down Payment Assistance. These are zero interest loans with 20‐year terms. Payments are revolving which dictates that the principal received is applied to current program expenditures before billing CDBG. Major Home Repairs & Sewer and Down Payment Assistance Loans and Grants:
Major Home Repairs & Sewers (MHRS) / Down Payment Assistance (DPA)
Loans and Grants
As of June 30, 2021
Program
Year
# of
Projects
Original
Amount
# of
Projects
Original
Amount
2021 4 84,500$ ‐ ‐$
2020 4 76,231$ ‐ ‐$
2019 6 174,193$ ‐ ‐$
2018 9 181,300$ ‐ ‐$
2017 4 72,325$ ‐ ‐$
2016 6 129,356$ ‐ ‐$
2015 1 37,144$ ‐ ‐$
2014 5 72,979$ 1 3,365$
2013 8 144,408$ ‐ ‐$
2012 9 106,857$ 1 2,250$
2011 8 170,407$ ‐ ‐$
2010 13 256,287$ 2 8,619$
2009 6 102,652$ 5 23,791$
2008 3 37,224$ 4 19,379$
2007 4 56,345$ 2 8,700$
2006 6 67,556$ 1 7,000$
2005 7 69,634$ ‐ ‐$
2004 4 36,058$ 3 14,901$
2003 8 49,136$ 8 35,336$
2002 3 19,999$ ‐ ‐$
2001 ‐ ‐$ 11 51,621$
2000 ‐ ‐$ 1 5,000$
Total 118 1,944,591$ 39 179,962$
MHRS DPA
47 49

Major Home Repairs & Sewer Loans Detail:
Major Home Repair & Sewer Loans (MHRS)As of June 30, 2021
Loan
ID #
Original
Loan / Grant
Amount
Principal &
Interest Paid /
Other
Loans
Receivable Closing Date
First
Payment
Date Status
Maturity
Date
Interest
Rate
Year 2002
3 = Total # Loans/Grants
0 = Total Outstanding 19,999$ 19,999$ ‐$
MHR‐001 6,000$ 6,000$ ‐$ 9/23/2002 Paid Off 0.0%
MHR‐003 5,999$ 5,999$ ‐$ 2/24/2003 Paid Off 0.0%
MHR‐004 8,000$ 8,000$ ‐$ 5/5/2003 Paid Off 0.0%Year 2003
8 = Total # Loans/Grants
1 = Total Outstanding 49,137$ 41,181$ 7,956$
MHR‐006 7,831$ 7,831$ ‐$ 7/23/2003 Paid Off 0.0%
MHR‐008 4,523$ 4,523$ ‐$ 9/8/2003 10/1/2023 Paid Off 9/8/2023 0.0%
MHR‐009 7,956$ ‐$ 7,956$ 9/16/2003 10/1/2023 9/10/2023 0.0%
MHR‐011 7,237$ 7,237$ ‐$ 10/21/2003 Paid Off 0.0%
MHR‐018 6,950$ 6,950$ ‐$ 1/28/2004 Paid Off 0.0%
MHR‐016 6,640$ 6,640$ ‐$ 3/2/2004 3/1/2024 Paid Off 2/25/2024 0.0%
MHR‐019 8,000$ 8,000$ ‐$ 5/12/2004 Paid Off 0.0%
MHR‐017 ‐$ ‐$ ‐$ 5/21/2004 Written Off 0.0%Year 2004
4 = Total # Loans/Grants
0 = Total Outstanding 36,058$ 36,058$ ‐$
MHR‐020 12,554$ 12,554$ ‐$ 9/15/2004 Paid Off 0.0%
MHR‐030 7,504$ 7,504$ ‐$ 9/23/2004 Paid Off 0.0%
MHR‐029 8,000$ 8,000$ ‐$ 11/1/2004 Written Off 0.0%
MHR‐024 8,000$ 8,000$ ‐$ 12/3/2004 Paid Off 0.0%Year 2005
7 = Total # Loans/Grants
2 = Total Outstanding 69,634$ 49,989$ 19,645$
MHR‐038 7,064$ 7,064$ ‐$ 8/29/2005 Paid Off 0.0%
MHR‐031 9,235$ 1,590$ 7,645$ 9/1/2005 4/1/2016 3/1/2026 0.0%
MHR‐032 7,302$ 7,302$ ‐$ 9/2/2005 Paid Off 0.0%
MHR‐034 7,993$ 7,993$ ‐$ 10/19/2005 Paid Off 0.0%
MHR‐036 15,840$ 15,840$ ‐$ 12/15/2005 Paid Off 0.0%
MHR‐040 10,200$ 10,200$ ‐$ 4/11/2006 Paid Off 0.0%
MHR‐047 12,000$ ‐$ 12,000$ 6/7/2006 6/1/2026 6/1/2026 0.0%Year 2006
6 = Total # Loans/Grants
2 = Total Outstanding 67,556$ 48,942$ 18,614$
MHR‐046 9,697$ 9,697$ ‐$ 7/26/2006 Paid Off 0.0%
MHR‐052 11,927$ 11,927$ ‐$ 11/14/2006 12/1/2026 Paid Off 11/8/2026 0.0%
MHR‐053 11,858$ 11,858$ ‐$ 12/20/2006 Paid Off 0.0%
MHR‐055 10,126$ 3,500$ 6,626$ 1/3/2007 1/1/2027 12/27/2026 0.0%
MHR‐056 11,960$ 11,960$ ‐$ 5/22/2007 Paid Off 0.0%
MHR‐054 11,988$ ‐$ 11,988$ 4/25/2007 5/1/2027 4/19/2027 0.0%Year 2007
4 = Total # Loans/Grants
2 = Total Outstanding 56,346$ 26,179$ 30,167$
MHR‐061 11,777$ ‐$ 11,777$ 11/8/2007 12/1/2027 11/2/2027 0.0%
MHR‐062 18,390$ ‐$ 18,390$ 11/20/2007 12/1/2027 11/14/2027 0.0%
MHR‐063 19,291$ 19,291$ ‐$ 11/20/2007 Paid Off 0.0%
MHR‐064 6,888$ 6,888$ ‐$ 2/4/2008 Paid Off 0.0%
Year 2008
3 = Total # Loans/Grants
1 = Total Outstanding 37,224$ 25,325$ 11,899$
MHR‐066 11,899$ ‐$ 11,899$ 8/21/2008 9/1/2028 8/15/2028 0.0%
MHR‐069 11,980$ 11,980$ ‐$ 12/29/2008 Written Off 0.0%
MHR‐070 13,345$ 13,345$ ‐$ 2/12/2009 Paid Off 0.0%
48 50

Major Home Repair & Sewer Loans (MHRS) ‐ continuedAs of June 30, 2021
Loan
ID #
Original
Loan / Grant
Amount
Total
Principal &
Interest Paid /
Other
Loans
Receivable Closing Date
First
Payment
Date Status
Maturity
Date
Interest
Rate
Year 2009
6 = Total # Loans/Grants
3 = Total Outstanding 102,653$ 56,581$ 46,072$
MHR‐075 14,397$ 14,397$ ‐$ 9/21/2009 9/1/2013 Paid Off 9/1/2016 0.0%
MHR‐077 12,597$ 3,377$ 9,220$ 11/13/2009 12/1/2013 11/1/2016 0.0%
MHR‐079 23,168$ 23,168$ ‐$ 11/4/2009 Paid Off 0.0%
MHR‐073 14,137$ 2,475$ 11,662$ 12/23/2009 6/1/2013 12/1/2017 0.0%
MHR‐080 13,164$ 13,164$ ‐$ 4/16/2010 Paid Off 0.0%
MHR‐082 25,190$ ‐$ 25,190$ 5/28/2010 6/1/2030 6/1/2030 0.0%
Year 2010
13 = Total # Loans/Grants
6 = Total Outstanding 256,287$ 160,225$ 96,062$
MHR‐076 25,110$ ‐$ 25,110$ 7/2/2010 7/1/2030 6/25/2013 0.0%
MHR‐087 19,930$ 4,260$ 15,670$ 9/30/2010 9/1/2030 9/23/2030 0.0%
MHR‐088 21,124$ ‐$ 21,124$ 9/30/2010 10/1/2030 9/24/2030 0.0%
MHR‐083 26,232$ 26,232$ ‐$ 10/8/2010 Paid Off 0.0%
MHR‐089 3,474$ ‐$ 3,474$ 10/29/2010 11/1/2030 10/22/2030 0.0%
MHR‐086 21,778$ 21,778$ ‐$ 11/29/2010 Paid Off 0.0%
MHR‐093 24,390$ 24,390$ ‐$ 2/28/2011 6/1/2016 Paid Off 2/18/2031 0.0%
MHR‐092 (Grant) 12,100$ 12,100$ ‐$ 2/28/2011 n/a n/a
MHR‐090 16,770$ 16,770$ ‐$ 3/14/2011 4/1/2031 Paid Off 3/8/2031 0.0%
MHR‐094 25,020$ 25,020$ ‐$ 4/4/2011 4/1/2031 Paid Off 3/29/2031 0.0%
MHR‐085 22,449$ 8,700$ 13,749$ 5/14/2014 7/1/2014 7/1/2029 0.0%
MHR‐096 (Grant) 11,120$ 11,120$ ‐$ 4/21/2011 n/a n/a
MHR‐095 26,790$ 9,855$ 16,935$ 6/28/2011 4/1/2015 4/1/2031 0.0%
Year 2011
8 = Total # Loans/Grants
4 = Total Outstanding 170,407$ 84,124$ 86,283$
MHR‐098 22,293$ ‐$ 22,293$ 7/21/2011 8/1/2031 7/13/2031 0.0%
MHR‐100 18,858$ 18,858$ ‐$ 9/20/2011 6/1/2017 Paid Off 9/14/2016 0.0%
MHR‐101 26,182$ ‐$ 26,182$ 11/9/2011 12/1/2031 11/2/2016 0.0%
MHR‐102 6,386$ 6,386$ ‐$ 12/19/2011 Paid Off 0.0%
MHR‐099 19,414$ ‐$ 19,414$ 12/30/2011 1/1/2031 12/21/2031 0.0%
MHR‐107 27,300$ 27,300$ ‐$ 1/10/2012 Short Sale 0.0%
MHR‐103 24,974$ 6,580$ 18,394$ 1/11/2012 8/1/2017 1/5/2017 0.0%
MHR‐105/to MHR‐162 25,000$ 25,000$ ‐$ 5/14/2012 6/1/2022 Sub‐Ordinated 5/8/2017 0.0%
Year 2012
9 = Total # Loans/Grants
5 = Outstanding Loans 106,857$ 27,714$ 79,143$
MHR‐106 28,913$ ‐$ 28,913$ 8/28/2012 9/1/2022 8/21/2022 0.0%
MHR‐112 12,230$ ‐$ 12,230$ 2/27/2013 3/1/2033 2/20/2033 0.0%
MHR‐113 17,850$ ‐$ 17,850$ 12/8/2012 12/1/2032 12/4/2032 0.0%
MHR‐114 (Grant) 1,696$ 1,696$ ‐$ 7/18/2012 n/a n/a
MHR‐117 10,174$ 10,174$ ‐$ 6/17/2013 Paid Off 0.0%
MHRS‐01 7,150$ 7,150$ ‐$ 9/27/2012 Paid Off 0.0%
MHRS‐05 10,022$ ‐$ 10,022$ 9/18/2012 10/1/2032 9/11/2032 0.0%
MHRS‐06 10,128$ ‐$ 10,128$ 9/27/2012 12/1/2017 9/20/2017 0.0%
MHRS‐07 8,694$ 8,694$ ‐$ 9/11/2012 12/1/2017 9/5/2017 0.0%
Year 2013
8 = Total # Loans/Grants
3 = Total Outstanding 144,408$ 86,376$ 58,032$
MHR‐118 27,921$ 27,921$ ‐$ 10/16/2013 10/10/2018 Paid Off 10/10/2018 0.0%
MHR‐119 11,969$ 11,969$ ‐$ 7/1/2013 Paid Off 0.0%
MHR‐120 15,100$ 15,100$ ‐$ 11/22/2013 1/1/2014 Paid Off 12/1/2033 0.0%
MHR‐121 (Grant) 8,457$ 8,457$ ‐$ 9/6/2013 n/a n/a
MHR‐122 (Grant) 12,597$ 12,597$ ‐$ 10/3/2013 n/a n/a
MHR‐123 24,938$ 4,338$ 20,600$ 3/6/2014 5/1/2014 5/1/2034 0.0%
MHR‐124 31,238$ 5,994$ 25,244$ 4/14/2014 8/1/2014 8/1/2034 0.0%
MHR‐091 12,188$ ‐$ 12,188$ 1/23/2014 8/17/2034 8/17/2015 0.0%
49 51

Major Home Repair & Sewer Loans (MHRS) ‐ continuedAs of June 30, 2021
Loan
ID #
Original
Loan / Grant
Amount
Total
Principal &
Interest Paid /
Other
Loans
Receivable Closing Date
First
Payment
Date Status
Maturity
Date
Interest
Rate
Year 2014
5 = Total # Loans/Grants
1 = Total Outstanding 72,979$ 62,648$ 10,331$
MHR‐126 11,140$ 11,140$ ‐$ 9/22/2014 12/1/2014 Paid Off 1/12/2034 0.0%
MHR‐127 12,558$ 12,558$ ‐$ 2/5/2015 Paid Off 0.0%
MHR‐128 14,014$ 3,683$ 10,331$ 1/14/2015 4/1/2015 3/1/2035 0.0%
MHR‐129 24,497$ 24,497$ ‐$ 12/30/2014 3/1/2015 Paid Off 3/1/2035 0.0%
MHRS‐04 10,770$ 10,770$ ‐$ 1/29/2015 4/1/2015 Paid Off 4/1/2035 0.0%
Year 2015
1 = Total # Loans/Grants
1 = Outstanding Loans 37,144$ 7,002$ 30,142$
MHR‐132 37,144$ 7,002$ 30,142$ 12/22/2015 2/1/2016 1/1/2036 0.0%
Year 2016
6 = Total # Loans/Grants
4 = Total Outstanding 129,356$ 55,045$ 74,311$
MHR‐133 25,000$ 25,000$ ‐$ 8/16/2016 8/1/2036 7/1/2036 0.0%
MHR‐135 28,303$ 4,208$ 24,095$ 12/9/2016 2/1/2017 1/1/2037 0.0%
MHR‐136 10,702$ 10,702$ ‐$ 12/5/2016 1/1/2037 Paid Off 1/1/2037 0.0%
MHRS‐09 12,724$ 2,808$ 9,916$ 12/19/2016 2/1/2017 1/1/2037 0.0%
MHRS‐10 37,761$ 12,327$ 25,434$ 12/19/2016 2/1/2017 1/1/2037 0.0%
MHR‐138 14,866$ ‐$ 14,866$ 1/20/2017 12/1/2037 12/31/2037 0.0%
Year 2017
4 = Total # Loans/Grants
2 = Total Outstanding 72,322$ 40,960$ 31,362$
MHRS‐08 8,243$ ‐$ 8,243$ 6/15/2017 6/1/2037 6/1/2037 0.0%
MHRS‐11 23,289$ 23,289$ ‐$ 6/19/2017 8/1/2017 Paid Off 7/1/2037 0.0%
MHR‐137 28,225$ 5,106$ 23,119$ 11/15/2017 12/1/2037 11/1/2037 0.0%
MHR‐145 12,565$ 12,565$ ‐$ 11/16/2017 1/1/2037 Paid Off 0.0%
Year 2018
9 = Total # Loans/Grants
7 = Total Outstanding 181,300$ 29,930$ 151,370$
MHR‐140 14,779$ 14,779$ ‐$ 1/29/2018 1/1/2038 Paid Off 1/29/2038 0.0%
MHR‐142 9,405$ ‐$ 9,405$ 1/29/2018 1/1/2038 1/29/2038 0.0%
MHR‐146 23,625$ ‐$ 23,625$ 2/16/2018 2/1/2038 2/16/2038 0.0%
MHR‐149 5,201$ ‐$ 5,201$ 2/6/2018 2/1/2038 2/1/2038 0.0%
MHR‐150 5,201$ ‐$ 5,201$ 1/11/2018 1/1/2038 1/11/2038 1.0%
MHR‐151 12,686$ 12,686$ ‐$ 2/16/2018 3/1/2018 Paid Off 3/1/2038 1.0%
MHR‐147 15,000$ 1,715$ 13,285$ 7/28/2018 7/1/2038 7/28/2038 0.0%
MHR‐154 70,203$ 750$ 69,453$ 11/29/2018 11/1/2038 11/29/2038 0.0%
MHR‐162/MHR‐105 25,200$ ‐$ 25,200$ 12/6/2018 12/1/2038 12/6/2038 0.0%
Year 2019
6 = Total # Loans/Grants
5 = Total Outstanding 174,193$ 55,550$ 118,643$
MHR‐155 22,442$ 2,417$ 20,025$ 2/28/2019 6/1/2019 5/1/2039 1.0%
MHR‐158 44,800$ 309$ 44,491$ 5/15/2019 8/1/2019 6/1/2039 1.0%
MHR‐160 36,736$ 36,736$ ‐$ 4/26/2019 6/1/2019 Paid Off 5/1/2039 1.0%
MHR‐161 43,000$ 9,904$ 33,096$ 5/8/2019 6/30/2019 6/1/2039 1.0%
MHR‐164 12,215$ ‐$ 12,215$ 2/13/2020 1/1/2039 1/1/2039 1.0%
MHR‐165 15,000$ 6,184$ 8,816$ 8/1/2019 8/1/2019 7/1/2039 1.0%
Year 2020
4 = Total # Loans/Grants
4 = Total Outstanding 76,231$ 667$ 75,564$
MHR‐163 23,791$ 667$ 23,124$ 3/12/2020 3/1/2040 3/1/2040 1.0%
MHR‐168 30,500$ ‐$ 30,500$ 2/6/2020 2/1/2040 2/1/2040 0.0%
MHR‐173 3,440$ ‐$ 3,440$ 5/26/2020 5/26/2040 5/26/2040 0.0%
MHR‐177 18,500$ ‐$ 18,500$ 11/20/2020 11/1/2040 11/1/2040 1.0%
Year 2021
4 = Total # Loans/Grants
4 = Total Outstanding 84,500$ 162$ 84,338$
MHR‐172 42,000$ ‐$ 42,000$ 3/8/2021 3/1/2041 3/1/2041 0.0%
MHR‐175 13,500$ 162$ 13,338$ 1/14/2021 1/1/2041 1/1/2041 1.0%
MHR‐178 9,000$ ‐$ 9,000$ 3/8/2021 3/1/2041 3/1/2041 0.0%
MHR‐180 20,000$ ‐$ 20,000$ 3/8/2021 3/1/2041 3/1/2041 0.0%Life‐to‐Date Total
118 = Total # Loans/Grants
57 = Total Outstanding 1,944,591$ 914,657$ 1,029,934$
50 52

Down Payment Assistance Loans & Grants Detail:
Loan
ID #
Original
Loan/Grant Amount
Principal
Payments &
Other
Loans
Receivable
Closing
Date
First
Payment Date Status
Maturity
Date
Interest
Rate
Year 2000
1 = Total # Loans/Grants
0 = Total Outstanding 5,000$ 5,000$ ‐$
DPA‐001 5,000$ 5,000$ ‐$ 12/5/2001 Paid Off 0.0%Year 2001
11 = Total # Loans/Grants
1 = Total Outstanding 51,622$ 51,142$ 480$
DPA‐002 5,000$ 5,000$ ‐$ 7/2/2001 Paid Off 0.0%
DPA‐004 3,366$ 3,366$ ‐$ 8/28/2001 Paid Off 0.0%
DPA‐005 5,000$ 5,000$ ‐$ 9/4/2001 Paid Off 0.0%
DPA‐006 5,000$ 5,000$ ‐$ 9/20/2001 Paid Off 0.0%
DPA‐007 5,000$ 5,000$ ‐$ 9/21/2001 Written Off 0.0%
DPA‐008 4,425$ 4,425$ ‐$ 10/18/2001 Paid Off 0.0%
DPA‐009 3,973$ 3,973$ ‐$ 12/5/2001 10/26/2021 Paid Off 10/26/2021 0.0%
DPA‐012 5,000$ 5,000$ ‐$ 1/25/2002 Paid Off 0.0%
DPA‐011 5,000$ 5,000$ ‐$ 1/31/2002 Paid Off 0.0%
DPA‐013 4,778$ 4,778$ ‐$ 2/28/2002 Paid Off 0.0%
DPA‐014 5,080$ 4,600$ 480$ 3/21/2002 9/1/2017 2/1/2022 0.0%Year 2003
8 = Total # Loans/Grants
0 = Total Outstanding 35,336$ 35,336$ ‐$
DPA‐015 5,000$ 5,000$ ‐$ 8/1/2003 Paid Off 0.0%
DPA‐016 2,167$ 2,167$ ‐$ 8/20/2003 Paid Off 0.0%
DPA‐017 (Grant) 5,000$ 5,000$ n/a 12/3/2003 n/a n/a
DPA‐018 (Grant) 5,000$ 5,000$ n/a 1/22/2004 n/a n/a
DPA‐020 (Grant) 3,169$ 3,169$ n/a 2/17/2004 n/a n/a
DPA‐022 (Grant) 5,000$ 5,000$ n/a 4/22/2004 n/a n/a
DPA‐021 (Grant) 5,000$ 5,000$ n/a 4/29/2004 n/a n/a
DPA‐023 (Grant) 5,000$ 5,000$ n/a 6/30/2004 n/a n/aYear 2004
3 = Total # Loans/Grants
0 = Total Outstanding 14,901$ 14,901$ ‐$
DPA‐024 5,000$ 5,000$ ‐$ 9/2/2004 Paid Off 0.0%
DPA‐025 4,901$ 4,901$ ‐$ 9/28/2004 Paid Off 0.0%
DPA‐026 5,000$ 5,000$ ‐$ 5/2/2005 Paid Off 0.0%Year 2006
1 = Total # Loans/Grants
1 = Total Outstanding 7,000$ 234$ 6,766$
DPA‐027 7,000$ 234$ 6,766$ 7/26/2006 7/17/2026 7/17/2026 0.0%Year 2007
2 = Total # Loans/Grants
1 = Total Outstanding 8,700$ 3,500$ 5,200$
DPA‐029 5,200$ ‐$ 5,200$ 2/28/2008 2/27/2028 2/27/2028 0.0%
DPA‐030 3,500$ 3,500$ ‐$ Written Off 0.0%Year 2008
4 = Total # Loans/Grants
0 = Total Outstanding 19,379$ 19,379$ ‐$
DPA‐032 6,959$ 6,959$ ‐$ 11/21/2008 Written Off 0.0%
DPA‐033 2,550$ 2,550$ ‐$ 12/22/2008 2/18/2028 Paid Off 12/18/2028 0.0%
DPA‐034 6,995$ 6,995$ ‐$ Short Sale Written Off 0.0%
DPA‐035 2,875$ 2,875$ ‐$ 5/11/2009 4/27/2029 Paid Off 4/27/2029 0.0%Year 2009
5 = Total # Loans/Grants
1 = Total Outstanding 23,791$ 16,791$ 7,000$
DPA‐041 7,000$ 7,000$ ‐$ 9/30/2009 Paid Off 0.0%
DPA‐042 4,410$ 4,410$ ‐$ 10/9/2009 10/7/2029 Paid Off 10/7/2029 0.0%
DPA‐044 2,091$ 2,091$ ‐$ 11/30/2009 Paid Off 0.0%
DPA‐046 7,000$ ‐$ 7,000$ 5/12/2010 5/5/2030 5/5/2030 0.0%
DPA‐055 3,290$ 3,290$ ‐$ 6/18/2010 Paid Off 0.0%
Down Payment Assistance ‐ Loans & GrantsAs of June 30, 2021
51 53

CDBG Loan Detail: The City of Lakewood note receivable from Living Access Support Alliance (LASA) of $250,000 is for partial funding of the Client Services Center project. This is a 20 year deferred loan at zero interest.
Loan
ID #
Original
Loan/Grant Amount
Principal
Payments &
Other
Loans
Receivable
Closing
Date
First
Payment Date Status
Maturity
Date
Interest
Rate
Year 2010
1 = Total # Loans/Grants
2 = Total Outstanding 8,619$ 7,000$ 1,619$
DPA‐048 1,619$ ‐$ 1,619$ 11/18/2010 10/29/2030 10/29/2030 0.0%
DPA‐049 7,000$ 7,000$ ‐$ 5/25/2011 5/16/2031 Paid Off 5/16/2031 0.0%Year 2012
1 = Total # Loans/Grants
1 = Total Outstanding 2,250$ ‐$ 2,250$
DPA‐050 2,250$ ‐$ 2,250$ 10/24/2012 10/16/2032 10/16/2032 0.0%Year 2014
1 = Total # Loans/Grants
1 = Total Outstanding 3,364$ 3,364$ ‐$
DPA‐051 3,364$ 3,364$ ‐$ 9/30/2014 Paid Off 0.0%Life‐to‐Date Total
39 = Total # Loans/Grant
6 = Total Outstanding 179,962$ 156,647$ 23,315$
Down Payment Assistance ‐ Loans & Grants (continued)As of June 30, 2021
CDBG Entitlement Loan ‐ Living Access Support Alliance Loan (LASA)As of June 30, 2021
Loan
ID #
Original
Loan/Grant
Amount
Total
Principal Paid
Loans
Receivable
Closing
Date
First
Payment Date
Maturity
Date
Interest
Rate
2013‐01 250,000$ ‐$ 250,000$ 6/2/2014 7/23/2023 6/2/2034 0.0%Life‐to‐Date Total
1 = Total # Loans
1 = Outstanding 250,000$ ‐$ 250,000$
52 54

HOME: In accordance with HOME federal regulations, expenditures for the HOME program have primarily focused investment in the creation of, maintenance of, or acquisition of affordable housing for low and moderate income individuals. Programs funded include the Housing Rehabilitation Program (single‐family homeowner rehabilitation), Down Payment Assistance, and the Affordable Housing Fund (investments primarily with Habitat for Humanity and various non‐profit housing providers). The Housing Rehabilitation, Down Payment, and Affordable Housing Funds all have corresponding Revolving Loan Funds (RLF) established in accordance with HUD regulations, which allow for the recapture and reuse of loan funds for similar housing activities. The HOME program is funded annually through the Lakewood and Tacoma HOME Consortium. The Consortium reimburses expenditures for the City of Lakewood’s projects/programs, which include Housing Rehabilitation, Affordable Housing, and Home Down Payment Loans, to the City of Lakewood. The notes on these loans are held and tracked by the Lakewood and Tacoma HOME Consortium in Tacoma, and are not accounted for in Fund 190 CDBG.
Program Year
# of
Projects
Original
Amount
2021 ‐ ‐$
2020 ‐ ‐$
2019 ‐ ‐$
2018 1 82,718$
2017 1 37,432$
2016 1 74,611$
2015 2 88,697$
2014 ‐ ‐$
2013 1 36,258$
2012 4 201,175$
2011 2 131,300$
2010 3 178,130$
2009 6 412,750$
2008 7 289,765$
2007 3 179,546$
2006 7 379,452$
2005 7 286,313$
2004 10 390,697$
2003 11 363,099$
2002 5 155,471$
2001 3 126,899$
2000 1 40,000$
Total 75 3,454,313$
HOME Housing Rehabilitation Loans
As of June 30, 2021
53 55

HOME Housing Rehabilitation Loan Detail:
HOME Housing Rehabilitation LoansAs of June 30, 2021
Loan
ID #
Original
Loan Amount
Loan
Reduction
Net
Loan Amount
Principal
Paid & Write
Offs
Loans
Receivable Closing Date
First Payment
Date Status
Maturity
Date
Interest
Rate
Year 2000
1 = Total # Loans 40,000$ ‐$ 40,000$ 40,000$ ‐$
LHR‐001 40,000$ ‐$ 40,000$ 40,000$ ‐$ 9/23/2002 Paid Off 0.0%
Year 2001
3 = Total # Loans 126,899$ ‐$ 126,899$ 126,899$ ‐$
LHR‐002 49,979$ ‐$ 49,979$ 49,979$ ‐$ 7/23/2003 Paid Off 0.0%
LHR‐004 40,000$ ‐$ 40,000$ 40,000$ ‐$ 9/8/2003 Paid Off 0.0%
LHR‐005 36,920$ ‐$ 36,920$ 36,920$ ‐$ 9/16/2003 Paid Off 0.0%
Year 2002
5 = Total # Loans 155,471$ 361$ 155,110$ 139,663$ 15,447$
LHR‐003 39,028$ ‐$ 39,028$ 39,028$ ‐$ 9/15/2004 Paid Off 0.0%
LHR‐006 50,000$ ‐$ 50,000$ 50,000$ ‐$ 7/22/2002 Paid Off 0.0%
LHR‐007 30,735$ ‐$ 30,735$ 30,735$ ‐$ 9/23/2004 Paid Off 0.0%
LHR‐008 15,808$ 361$ 15,447$ ‐$ 15,447$ 2/28/2003 2/1/2023 2/28/2023 0.0%
LHR‐011 19,900$ ‐$ 19,900$ 19,900$ ‐$ 12/3/2004 Paid Off 0.0%
Year 2003
11 = Total # Loans 363,099$ 6,806$ 356,293$ 222,299$ 133,994$
LHR‐009 40,000$ ‐$ 40,000$ ‐$ 40,000$ 7/31/2003 4/1/2023 8/23/2025 0.0%
LHR‐013 35,328$ ‐$ 35,328$ 35,328$ ‐$ 9/1/2005 Paid Off 0.0%
LHR‐020 18,744$ ‐$ 18,744$ 15,608$ 3,136$ 11/13/2003 11/1/2023 11/13/2023 0.0%
LHR‐012 68,321$ ‐$ 68,321$ 68,321$ ‐$ 10/19/2005 Paid Off 0.0%
LHR‐019 23,344$ 2,100$ 21,244$ ‐$ 21,244$ 12/18/2003 12/18/2023 12/18/2023 0.0%
LHR‐016 42,304$ ‐$ 42,304$ 42,304$ ‐$ 4/11/2006 Paid Off 0.0%
LHR‐012B 23,145$ ‐$ 23,145$ 23,145$ ‐$ 5/14/2004 Paid Off 0.0%
LHR‐026 28,760$ 4,702$ 24,058$ ‐$ 24,058$ 5/4/2004 5/1/2024 5/4/2024 0.0%
LHR‐032 13,473$ ‐$ 13,473$ 13,473$ ‐$ 6/21/2004 Paid Off 0.0%
LHR‐014 45,560$ 4$ 45,556$ ‐$ 45,556$ 6/1/2024 6/1/2024 0.0%
LHR‐022 24,120$ ‐$ 24,120$ 24,120$ ‐$ 6/7/2006 Paid Off 0.0%
Year 2004
10 = Total # Loans 390,697$ 1,849$ 388,848$ 287,690$ 101,158$
LHR‐021 34,100$ 111$ 33,989$ ‐$ 33,989$ 7/28/2004 7/1/2024 7/28/2024 0.0%
LHR‐018/099X 44,153$ ‐$ 44,153$ 44,153$ ‐$ 11/14/2006 Paid Off 0.0%
LHR‐031 13,072$ ‐$ 13,072$ 13,072$ ‐$ 12/20/2006 Paid Off 0.0%
LHR‐025R 54,015$ 918$ 53,097$ 53,097$ ‐$ 10/11/2004 Paid Off 10/11/2024 0.0%
LHR‐030 48,000$ ‐$ 48,000$ 48,000$ ‐$ 12/16/2004 Paid Off 0.0%
LHR‐039 38,704$ 489$ 38,215$ 38,215$ ‐$ 3/30/2005 3/30/2025 Paid Off 3/30/2025 0.0%
LHR‐027 47,838$ ‐$ 47,838$ 47,838$ ‐$ 4/2/2005 Paid Off 0.0%
LHR‐019B 19,500$ 214$ 19,286$ ‐$ 19,286$ 4/29/2005 4/29/2025 12/27/2026 0.0%
LHR‐041 43,315$ ‐$ 43,315$ 43,315$ ‐$ 5/22/2007 Paid Off 0.0%
LHR‐028 48,000$ 117$ 47,883$ ‐$ 47,883$ 6/6/2005 6/6/2025 6/6/2025 0.0%
Year 2005
7 = Total # Loans 286,313$ 248$ 286,065$ 163,696$ 122,369$
LHR‐043 41,480$ ‐$ 41,480$ 41,480$ ‐$ 11/8/2007 Paid Off 0.0%
LHR‐033 33,752$ ‐$ 33,752$ 33,752$ ‐$ 8/29/2005 Paid Off 0.0%
LHR‐034 52,577$ 109$ 52,468$ 20,599$ 31,869$ 8/23/2005 8/23/2025 8/23/2025 0.0%
LHR‐038 26,504$ ‐$ 26,504$ 26,504$ ‐$ 2/14/2006 Paid Off 0.0%
LHR‐049 65,000$ ‐$ 65,000$ ‐$ 65,000$ 6/1/2006 6/1/2026 6/1/2026 0.0%
LHR‐047 25,500$ ‐$ 25,500$ ‐$ 25,500$ 6/8/2006 6/8/2026 6/8/2026 0.0%
LHR‐052 41,500$ 139$ 41,361$ 41,361$ ‐$ 6/23/2006 6/23/2026 Paid Off 6/23/2026 0.0%
Year 2006
7 = Total # Loans 379,452$ 256$ 379,196$ 245,302$ 133,894$
LHR‐050 52,000$ ‐$ 52,000$ 52,000$ ‐$ 8/23/2006 1/1/2013 Paid Off 8/23/2026 0.0%
LHR‐040 42,420$ ‐$ 42,420$ 42,420$ ‐$ 10/4/2006 Paid Off 0.0%
LHR‐053 73,910$ ‐$ 73,910$ 73,910$ ‐$ 10/24/2006 Written Off 0.0%
LHR‐054 47,570$ ‐$ 47,570$ 47,570$ ‐$ 1/31/2007 8/1/2017 Paid Off 1/31/2027 0.0%
LHR‐055 69,150$ 17$ 69,133$ ‐$ 69,133$ 1/31/2007 1/31/2026 1/31/2027 0.0%
LHR‐057 65,000$ 239$ 64,761$ ‐$ 64,761$ 3/29/2007 3/29/2027 3/29/2027 0.0%
LHR‐060 29,402$ ‐$ 29,402$ 29,402$ ‐$ 2/12/2009 Written Off 0.0%
HOME Housing Rehabilitation LoansAs of June 30, 2021
54 56

HOME Housing Rehabilitation LoansAs of June 30, 2021
Loan
ID #
Original
Loan Amount
Loan
Reduction
Net
Loan Amount
Principal
Paid & Write
Offs
Loans
Receivable Closing Date
First Payment
Date Status
Maturity
Date
Interest
Rate
Year 2007
3 = Total # Loans 179,546$ 176$ 179,370$ 57,060$ 122,310$
LHR‐062 57,060$ ‐$ 57,060$ 57,060$ ‐$ 12/23/2009 Paid Off 0.0%
LHR‐058/087 56,886$ 39$ 56,847$ ‐$ 56,847$ 8/17/2007 8/17/2018 8/17/2027 0.0%
LHR‐063 65,600$ 137$ 65,463$ ‐$ 65,463$ 1/31/2008 2/1/2028 1/31/2028 0.0%
Year 2008
7 = Total # Loans 289,765$ 1,409$ 288,356$ 151,073$ 137,284$
LHR‐066 36,915$ ‐$ 36,915$ 36,915$ ‐$ 7/2/2010 Paid Off 0.0%
LHR‐068 49,085$ 248$ 48,837$ ‐$ 48,838$ 10/10/2008 10/10/2028 10/10/2028 0.0%
LHR‐071 62,845$ 668$ 62,177$ ‐$ 62,177$ 10/10/2008 10/10/2028 10/10/2028 0.0%
LHR‐070 38,050$ ‐$ 38,050$ 38,050$ ‐$ 10/10/2008 Paid Off 0.0%
LHR‐072 50,070$ ‐$ 50,070$ 50,070$ ‐$ 9/30/2010 Paid Off 0.0%
LHR‐069 26,450$ 181$ 26,269$ ‐$ 26,269$ 2/24/2009 12/19/2028 2/24/2029 0.0%
LHR‐073 26,350$ 312$ 26,038$ 26,038$ ‐$ 4/10/2009 4/10/2029 Paid Off 4/10/2029 0.0%
Year 2009
6 = Total # Loans 412,750$ 6,127$ 406,623$ 225,857$ 180,766$
LHR‐078 65,000$ 1,383$ 63,617$ 63,617$ ‐$ 9/15/2009 9/15/2029 Paid Off 9/15/2029 0.0%
LHR‐074 59,525$ 3,243$ 56,282$ ‐$ 56,282$ 10/2/2009 10/2/2029 10/2/2029 0.0%
LHR‐077 83,100$ ‐$ 83,100$ 83,100$ ‐$ 11/9/2011 Paid Off 0.0%
LHR‐076 64,200$ 307$ 63,893$ ‐$ 63,893$ 11/6/2009 11/1/2029 11/6/2029 0.0%
LHR‐080 61,685$ 1,094$ 60,591$ ‐$ 60,591$ 12/17/2009 12/31/2029 12/17/2029 0.0%
LHR‐082 79,240$ 100$ 79,140$ 79,140$ ‐$ 2/16/2010 2/16/2030 Paid Off 0.0%
Year 2010
3 = Total # Loans 178,130$ 4,873$ 173,257$ 58,519$ 114,738$
LHR‐081 59,150$ 1,631$ 57,519$ 57,519$ ‐$ 1/31/2011 12/28/2030 Paid Off 1/31/2031 0.0%
LHR‐085 52,200$ 3,242$ 48,958$ 1,000$ 47,958$ 2/2/2011 2/18/2031 2/2/2031 0.0%
LHR‐086 66,780$ ‐$ 66,780$ ‐$ 66,780$ 5/5/2011 5/5/2031 5/5/2031 0.0%
Year 2011
2 = Total # Loans 131,300$ 3,854$ 127,446$ ‐$ 127,446$
LHR‐090 47,500$ 3,617$ 43,883$ ‐$ 43,883$ 4/5/2012 4/5/2032 4/5/2032 0.0%
LHR‐091 83,800$ 237$ 83,563$ ‐$ 83,563$ 5/8/2012 5/8/2032 5/8/2032 0.0%
Year 2012
4 = Total # Loans 201,175$ 3,693$ 197,484$ 72,542$ 124,939$
LHR‐094 34,500$ 3,133$ 31,367$ 31,367$ ‐$ 9/28/2012 9/28/2032 Paid Off 9/28/2032 0.0%
LHR‐096 50,000$ 560$ 49,442$ ‐$ 49,439$ 1/23/2013 1/29/2018 1/23/2033 0.0%
LHR‐097 75,500$ ‐$ 75,500$ ‐$ 75,500$ 2/20/2013 2/20/2033 4/20/2033 0.0%
LHR‐095 41,175$ ‐$ 41,175$ 41,175$ ‐$ 12/30/2014 Paid Off 0.0%
Year 2013
1 = Total # Loans 36,258$ ‐$ 36,258$ 18,185$ 18,073$
LHR‐066R 36,258$ ‐$ 36,258$ 18,185$ 18,073$ 8/27/2013 10/1/2013 8/27/2033 0.0%
Year 2015
2 = Total # Loans 88,697$ ‐$ 88,697$ 36,997$ 51,700$
LHR‐099X/018 15,947$ ‐$ 15,947$ 15,947$ ‐$ 12/29/2015 1/1/2016 12/29/2035 0.0%
LHR‐100 72,750$ ‐$ 72,750$ 21,050$ 51,700$ 9/28/2015 11/1/2015 9/28/2035 0.0%
Year 2016
1 = Total # Loans 74,611$ ‐$ 74,611$ 74,611$ ‐$
LHR‐101 74,611$ ‐$ 74,611$ 74,611$ ‐$ 8/26/2016 8/26/2036 Paid Off 7/1/2036 0.0%
Year 2017
1 = Total # Loans 37,432$ ‐$ 37,432$ 37,432$ ‐$
LHR‐103 37,432$ ‐$ 37,432$ 37,432$ ‐$ 1/3/2018 3/1/2018 2/1/2038 0.0%
Year 2018
1 = Total # Loans 82,718$ 7,718$ 75,000$ ‐$ 75,000$
LHR‐104 82,718$ 7,718$ 75,000$ ‐$ 75,000$ 7/28/2018 8/1/2038 8/1/2038 0.0%Year 2021
0 = Total # Loans ‐$ ‐$ ‐$ ‐$ ‐$
Life‐to‐Date Total
75 = Total # Loans 3,454,313$ 37,370$ 3,416,945$ 1,957,825$ 1,459,118$
55 57

Section 108:
The Section 108 program funds are used to fund large‐scale, capital intensive economic development, housing, public facilities, and infrastructure and community development projects throughout Lakewood. This funding source most closely mirrors CDBG program regulations and requirements, in that, it must meet the national objective of serving low and moderate income individuals (primarily through the creation or retention of jobs for low and moderate income persons). Funding is to be awarded to qualifying projects as “gap funding” and is typically the final piece of the financing puzzle required to complete a project’s budget. Funds are to be provided as loans with terms up to 20 years and carry standard underwriting and collateralization requirements. Section 108 loans require borrower (jurisdiction) to pledge current and future CDBG allocations as principal security for the loan guarantee with additional collateral security being provided to the City by the final borrower (business or end use). In 2012, the City of Lakewood was awarded $2,888,000 from HUD for Section 108 Loan Guarantee funds. To be eligible for continuation of this loan program, the City must reapply every five years, which the City did not. If the City were to reapply, the City may be eligible for $1.9M (as of end of March 2021). Changes in underwriting requirements and complexity, along with lower borrowing rates were some of the determining factors to not reapply and pursue this financing source only as last resort.
Section 108 LoansAs of June 30, 2021
Loan
ID #
Original
Loan/Grant
Amount
Total
Principal Paid
Total
Interest Paid Loan Balance
Closing
Date
First
Payment
Date
Maturity
Date
Interest
Rate
Year 2014
1 = Total # Loans
1 = Total Outstanding 700,000$ 160,000$ 122,815$ 540,000$
Curbside Motors 700,000$ 160,000$ 122,815$ 540,000$ 12/5/2014 8/1/2015 8/1/2034 4.25%Year 2015
1 = Total # Loans
1 = Total Outstanding 310,000$ 15,000$ 64,302$ 295,000$
Living Access
Support All iance
(LASA) 310,000$ 15,000$ 64,302$ 295,000$ 8/1/2015 8/1/2020 8/1/2034 4.25%
Year 2017
1 = Total # Loans
0 = Total Outstanding 141,000$ 141,000$ 6,349$ ‐$
City of Lakewood
108th Street 141,000$ 141,000$ 6,349$ ‐$ 8/31/2017 8/1/2018 8/31/2020
1.5%
variableLife‐to‐Date Total
3 = Total # Loans
2 = Total Outstanding 1,151,000$ 316,000$ 193,466$ 835,000$
the City. The outstanding combined principal balance as of June 30, 2021 of $835,000 is being repaid by a third party
and, therefore, is not recognizable as debt on the City’s long‐term debt schedule or City's financials.
in 2015 for Living Access Support Alliance by the United States Department of Housing and Urban Development (HUD) to
On August 31, 2017, the City entered into a Contract Loan Guarantee with Housing Urban Development for the overlay
project 108th Street. The loan amount is $141,000 to be paid with three years of CDBG entitlement funds. This was approved
in the annual action plan and the note application. The security pledge is the City’s full faith and credit. The interest rate is
variable and is set by LIBOR. As of 9/30/2020 the outstanding principal balance for this loan is zero.
A Section 108 Loan in the amount of $700,000 was issued in 2014 for Curbside Motors Incorporated and another for $310,000
56 58

Loan Repayment by Program
The following table provides a schedule of loan repayments by program.
The schedule of loan repayments above reflects estimated amounts as of 12/31/2020.
Loan Repayment by Program 2021 2022 2023 2024 2025‐2029 2030‐2060
Major Home Repairs & Sewers 12,546$ 21,337$ 22,419$ 22,736$ 115,983$ 834,914$
Down Payment Assistance 1,182 1,404 1,404 1,404 2,427 15,494
CDBG LASA Entitlement Loan ‐ ‐ ‐ ‐ ‐ 250,000
Home Housing Rehab Loans 7,714 10,964 13,725 18,428 181,793 1,226,494
Section 108 47,000 49,000 50,000 53,000 300,000 336,000
Total 68,442$ 82,705$ 87,548$ 95,568$ 600,203$ 2,662,902$
Average Annual Years 2025‐2029 100,034$
Average Annual Years 2030‐2060 88,763$
57 59

CDBG Fund Summary
The following tables provide the fund’s financial information.
Fund 190 CDBG
Balance Sheet
As of June 30, 2021
Assets:
Cash (45,226)$
Due From Other Governments 105,327
Notes/Loan Receivable ‐ CDBG Down Payment Assistance 23,315
Notes/Loan Receivable ‐ CDBG Major Home & Sewer Repairs 1,029,934
Notes/Loan Receivable ‐ CDBG LASA 250,000
Notes/Loan Receivable ‐ Nisqually Tribe Contribution 1,379
Total Assets 1,364,729$
Liabilities:
Accounts Payable ‐$
Retainage Payable 4,362
Payroll Payable 15,888
Interfund Loan Payable 33,777
HUD DPA Checking Interest 101
Total Liabilities 54,128$
Fund Balance (Restricted) 1,310,601$
Total Liabilities & Fund Balance 1,364,729$
Fund 190 CDBG Summary Beginning Balance Revenue Expenditure Fund Balance
CDBG 1,374,976$ 356,806$ 427,934$ 1,303,848$
HOME ‐ 105,359 105,359 ‐
Nisqually Tribal 6,747 6 ‐ 6,753 Total 1,381,723$ 462,171$ 533,293$ 1,310,601$
CDBG 1,374,976$ 356,806$ 427,934$ 1,303,848$
Administration ‐ 67,939 96,720 (28,781)
Administration ‐ FFY 2020 ‐ 35,912 35,912 ‐
Administration ‐ Revolving Program Income ‐ ‐ 28,781 (28,781)
Administration ‐ CARES CVD 1 & CVD 3 ‐ 32,027 32,027 ‐
Physical Improvements ‐ 5,040 ‐ 5,040
Sidewalks ‐ Phill ips Rd. (1) ‐ 5,040 ‐ 5,040
Housing Programs 1,124,976 34,283 81,670 1,077,589
Major Home Repair/Sewer (2) 1,124,976 7,859 12,220 1,120,615
Emergency Assistance Displaced Resident ‐ 2,236 2,236 ‐
Admin of HOME Programs ‐ 20,012 20,012 ‐
Major/DPA Revolving Loans, Interest, Fees ‐ 4,176 47,202 (43,026)
Affordable Housing 250,000 ‐ ‐ 250,000
CDBG Loan 250,000 ‐ ‐ 250,000
CARES ‐ CVD 1 & CVD 3 Programs 249,544 249,544 ‐
Program ‐ Economic Development ‐ 32,500 32,500 ‐
Program ‐ Mortgage Assistance 217,044 217,044 ‐
HOME ‐$ 105,359$ 105,359$ ‐$ Housing Rehabilitation ‐ 111 111 ‐
Affordable Housing ‐ TBRA & Other ‐ 105,248 105,248 ‐
NISQUALLY & OTHER 6,747$ 6$ ‐$ 6,753$
Emergency Assist Displaced Residents 441 ‐ ‐ 441
Emergency Assist Displaced Residents 441 ‐ ‐ 441
Minor Home Repairs 6,306 6 ‐ 6,312 Minor Home Repairs 6,306 6 ‐ 6,312
Total 1,381,723$ 462,171$ 533,293$ 1,310,601$
(1) Project funding applied from cancelled Low Income Street Lighting
(2) Retainage $4,361.60 MHR‐170 Ellco Construction
Year‐to‐date through June 30, 2021
58 60

Fund 191 Neighborhood Stabilization Program
The purpose of this fund is to account for the revenues and expenditures associated with the Federal Neighborhood Stabilization Program. The NSP was established for the purpose of stabilizing communities that have suffered from foreclosures and abandonment. The NSP1 program provides funds to purchase and redevelop foreclosed and abandoned homes and residential properties. The NSP3 program provides a third round of neighborhood stabilization grants to all states and select governments on a formula basis. NSP 3 program funds have been spent. The following table provides a financial summary of the NSP program.
Fund 192 South Sound Military Communities Partnership
The purpose of this fund is to account for the revenues and expenditures associated with the Federal Office of Economic Adjustment Grant Program, which provides grants to assist communities with the alleviation of socioeconomic effects that may result from military base closures and realignments. This fund also accounts for all activity associated with the South Sound Military Communities Partnership (SSMCP). The following table provides a financial summary of the SSMCP and associated programs (OLDCC Office of Local Defense Community Cooperation, formerly Office of Economic Adjustment).
Year‐to‐date through June 30, 2021
Neighborhood Stabilization Program
Beginning
Balance Revenue Expenditure
Ending
Balance
Neighborhood Stabilization Program 1 197,609$ 52,182$ 48,959$ 200,833$
Neighborhood Stabilization Program 3 57,505 ‐ ‐ 57,505
Total 255,114$ 52,182$ 48,959$ 258,338$
Year‐to‐date through June 30, 2021Beg Bal Revenue Expenditure Ending
SSMCP 18,018$ 230,500$ 99,392$ 149,125$
Dept. of Defense /OLDCC ‐ Growth Management ‐ 97,938 97,938 ‐$
Dept. of Defense /Tactical Tailor ‐ 17,258 17,258 ‐$
Total 18,018$ 345,696$ 214,588$ 149,125$
South Sound Military Communities Partnership
59 61

PARKS, RECREATION & COMMUNITY SERVICES
Parks Sales Tax On September 19, 2000, Pierce County voters approved the ballot measure to increase local sales taxes by one‐tenth of 1 percent. A sales and use tax equal to one‐tenth of one percent (0.001%) within Pierce County provides funds to acquire, improve, rehabilitate, maintain, or develop regional and local parks; to improve, rehabilitate, maintain or expand accredited zoo, aquarium and wildlife preserves pursuant to RCW 82.14.400(6); for community‐based housing; and to implement the creation of a zoo and aquarium advisory authority. The tax was proposed as a funding mechanism for Tacoma Metro Park District (the zoo). The money collected is shared 50‐50 between the Parks District and the cities not contained in the District and the county.
Parks Sales Tax
Year‐to‐date through June
Over / (Under)
2021 2021 Actual vs 2020 Actual 2021 Actual vs 2021 Budget
Month 2019 Actual 2020 Actual Budget Actual $ % $ %
Jan 62,678$ 60,456$ 54,053$ 69,579$ 9,123$ 15.1% 15,526$ 28.7%
Feb 48,314 50,467 41,798 56,065 5,598 11.1% 14,267 34.1%
Mar 45,140 44,623 40,278 55,579 10,956 24.6% 15,301 38.0%
Apr 58,086 45,035 47,277 71,262 26,227 58.2% 23,985 50.7%
May 52,692 47,381 44,163 61,925 14,544 30.7% 17,762 40.2%
Jun 55,907 59,234 48,080 68,116 8,882 15.0% 20,036 41.7%
Jul 59,742 62,205 51,987 ‐ ‐ ‐ ‐ ‐
Aug 57,222 61,563 50,039 ‐ ‐ ‐ ‐ ‐
Sep 57,409 59,547 50,067 ‐ ‐ ‐ ‐ ‐
Oct 58,156 62,021 51,547 ‐ ‐ ‐ ‐ ‐
Nov 54,478 59,711 48,074 ‐ ‐ ‐ ‐ ‐
Dec 53,831 58,837 47,637 ‐ ‐ ‐ ‐ ‐
Total YTD 322,817$ 307,196$ 275,649$ 382,526$ 75,330$ 24.5% 106,877$ 38.8%
Total Annual 663,655$ 671,080$ 575,000$ n/a n/a n/a n/a n/a
5‐Year Ave Change (2016 ‐ 2020): 4.6%
60 62

Cost Recovery – Parks, Recreation & Community Services
In May 2016, the City Council adopted a set of revised financial policies to include cost recovery. The following is an excerpt of the cost recovery policy as it relates specifically to target cost recovery for parks programs/services:
Target Cost Recovery Level for Parks Programs/Services. The cost recovery policy applies to the following parks and recreation programs/services: recreation services; special events and community gathering; senior services; and all parks. The following should be considered when determining pricing levels: The higher the community benefit, the higher the General Fund subsidy level and the higher the individual benefit, the lower the General Fund subsidy level. The overall cost recovery goal for all parks programs and services should be 45%.
Included in the revenues is the parks sales tax, which is allocated to the various parks programs/functions based on prorated share of expenditures. The growth in parks sales tax has helped reduce the general fund subsidy amount. The table below provides historical annual and current budgeted annual and actual subsidy and recovery ratio by program.
Parks, Recreation & Community ServicesYear‐to‐Date through June
2016 2017 2018 2019 2020 2021Annual Annual Annual Annual Annual Annual YTD
Program Actual Actual Actual Actual Actual Budget ActualRecreation:
Revenues $ 216,547 $ 261,919 $ 259,786 $ 273,458 $ 152,314 $ 298,579 $ 120,171 Expenditures $ 416,464 $ 465,267 $ 405,448 $ 467,173 $ 297,314 $ 479,387 $ 149,043 General Fund Subsidy $ 199,917 $ 203,347 $ 145,662 $ 193,715 $ 145,000 $ 180,808 $ 28,872 Recovery Ratio 52% 56% 64% 59% 51% 62% 81%
Senior Services:Revenues $ 128,002 $ 146,667 $ 135,302 $ 164,863 $ 120,842 $ 101,827 $ 41,130 Expenditures $ 221,579 $ 222,371 $ 236,627 $ 246,535 $ 180,325 $ 243,300 $ 75,044 General Fund Subsidy $ 93,576 $ 75,703 $ 101,325 $ 81,672 $ 59,483 $ 141,473 $ 33,914 Recovery Ratio 58% 66% 57% 67% 67% 42% 55%
Parks Facilities:Revenues $ 189,650 $ 196,875 $ 207,559 $ 216,183 $ 211,344 $ 168,650 $ 130,721 Expenditures $ 475,050 $ 465,075 $ 500,484 $ 544,466 $ 424,886 $ 445,093 $ 263,710 General Fund Subsidy $ 285,400 $ 268,200 $ 292,925 $ 328,283 $ 213,542 $ 276,443 $ 132,989 Recovery Ratio 40% 42% 41% 40% 50% 38% 50%
Fort Steilacoom Park:Revenues $ 222,616 $ 229,551 $ 282,142 $ 298,997 $ 245,841 $ 247,989 $ 164,751 Expenditures $ 604,482 $ 588,850 $ 672,444 $ 733,560 $ 619,238 $ 790,180 $ 364,119 General Fund Subsidy $ 381,866 $ 359,299 $ 390,302 $ 434,563 $ 373,397 $ 542,191 $ 199,368 Recovery Ratio 37% 39% 42% 41% 40% 31% 45%
Subtotal Direct Cost:Revenues $ 756,815 $ 835,013 $ 884,789 $ 953,501 $ 730,341 $ 817,045 $ 456,773 Expenditures $ 1,717,575 $ 1,741,562 $ 1,815,003 $ 1,991,734 $ 1,521,763 $ 1,957,960 $ 851,916 General Fund Subsidy $ 960,760 $ 906,549 $ 930,214 $ 1,038,233 $ 791,422 $ 1,140,915 $ 395,143 Recovery Ratio 44% 48% 49% 48% 48% 42% 54%
Administration (Indirect Cost):Revenues $ 79,621 $ 87,032 $ 89,860 $ 94,133 $ 122,958 $ 79,455 $ 73,797 Expenditures $ 293,036 $ 304,327 $ 301,174 $ 329,201 $ 341,371 $ 313,935 $ 203,637 General Fund Subsidy $ 213,415 $ 217,295 $ 211,314 $ 235,068 $ 218,413 $ 234,480 $ 129,840 Recovery Ratio 27% 29% 30% 29% 36% 25% 36%
Total Direct & Indirect Cost:Revenues $ 836,436 $ 922,045 $ 974,649 $ 1,047,634 $ 853,299 $ 896,500 $ 530,570 Expenditures $ 2,010,611 $ 2,045,889 $ 2,116,177 $ 2,320,935 $ 1,863,134 $ 2,271,895 $ 1,055,553 General Fund Subsidy $ 1,174,175 $ 1,123,844 $ 1,141,528 $ 1,273,301 $ 1,009,835 $ 1,375,395 $ 524,983 Recovery Ratio 42% 45% 46% 45% 46% 39% 50%
5‐Year Average General Fund Subsidy (2016 ‐ 2020) $ 1,144,537 5‐Year Average Recovery Ratio (2016 ‐ 2020) 45%
COVID‐19 caused closure/event cancellation and participant capacity limitations in 2020 and 2021.
61 63

Farmers Market In 2020, State pandemic restrictions forced the City to move its traditional “Night Market” to Fort Steilacoom Park, which is more wide‐open and suitable to social distancing guidelines. With this move, the event experienced increased vendor sales as local demand for fresh produce in a safe environment was stimulated during the lockdown. The market is open on Fridays, May 21 through September 24, from 2:00pm ‐6:30pm. Future plans are to add more days to the schedule to accommodate the public interest. The market features food trucks and local wine and beer in addition to local produce and handcraft. The following tables provide farmers market financial information at activity through second quarter for 2020 and 2021.
Note: Estimated attendance assumes average sales of $35 per person and each person is accompanied by two other people, for a family or group of three.
Farmers Market Activity
Year‐to‐date through June
2020
Financial Information Revised Budget YTD Actual
Sources:
Vendor Fees 15,000$ 17,673$
Sponsorships & Donations 11,000 11,000
Total Sources 26,000 28,673
Uses:
Temporary Personnel ‐ ‐
Office & Operating Supplies 4,100 284
Professional Services 23,000 1,885
Advertising 15,400 3,170
Memberships & Dues 350 ‐
Total Uses 42,850 5,339
Sources Over/(Under) Uses (16,850) 23,334
Market Sales and Attendance
Market 2021 vs 2020 Estimated
Sales Over/(Under) Attendance
Week Month 2020 2021 $ % 2021 2021
Week 1 May 23,197$ 48,184$ 24,987$ 107.7% 1,988 4,130
Week 2 May 26,116$ 50,352$ 24,236$ 92.8% 2,239 4,316
Week 3 Jun 29,549$ 46,726$ 17,177$ 58.1% 2,533 4,005
Week 4 Jun 32,649$ 23,439$ (9,210)$ ‐28.2% 2,798 2,009
Week 5 Jun 33,475$ 47,606$ 14,131$ 42.2% 2,869 4,081
Week 6 Jun 31,958$ 28,545$ (3,413)$ ‐10.7% 2,739 2,447
Total ‐ YTD 176,944$ 244,852$ 67,908$ 38.4% 15,167 20,987
62 64

Human Services Program
Since incorporation, the City has dedicated 1% of General Fund in for human services programs that support our most vulnerable populations and create conditions that enable people in need to access resources and support services which foster healthy and functional individuals and families where children thrive and achieve their full potential.
Agency Program
2017
Actual
2018
Actual
2019
Actual
2020
Actual
2021
Allocation
Total
2017‐2020
Total 337,441$ 344,707$ 353,356$ 329,605$ 380,000$ 1,365,109$
Access to Health & Behavior Health $ 59,000 $ 42,500 $ 59,000 $ 54,005 $ 41,500 $ 214,505
Communities In Schools Lakewood School‐Wide Support 22,500 ‐ ‐ ‐ ‐ 22,500
Community Healthcare Primary Medical Care ‐ ‐ 20,000 15,000 14,000 35,000
Community Healthcare Uncompensated Medical Care for ESL 5,000 ‐ ‐ ‐ ‐ 5,000
Franciscan Health System Children's Immunization ‐ ‐ ‐ ‐ ‐ ‐
Lindquist Dental Clinic for Children Dental Care for Children 12,000 17,000 14,000 14,005 15,000 57,005
Pierce County Aids Foundation Case Management 7,500 8,500 12,500 12,500 ‐ 41,000
Pierce County Project Access Donated Care Program 12,000 17,000 12,500 12,500 12,500 54,000
Emotional Supports and Youth Programming 59,016$ 88,923$ 86,903$ 85,973$ 125,000$ 320,815$
Asian Pacific Cultural Center Promised Leaders of Tomorrow ‐ ‐ ‐ ‐ 20,000 ‐
Centerforce Inclusion for Adult with Disabilities ‐ ‐ 10,000 10,000 ‐ 20,000
Communities In Schools After School Program ‐ 24,000 17,500 17,500 25,000 59,000
Lakewood Boys & Girls Club After School Program 12,500 12,500 20,000 20,000 20,000 65,000
Pierce College Computer Clubhouse 11,626 14,000 ‐ ‐ ‐ 25,626
Pierce College / City of Lakewood (*) Lakewood's Promise 17,390 19,923 21,403 25,664 25,000 84,380
Pierce County Aids Foundation Oasis Youth Center 7,500 8,500 10,000 10,000 15,000 36,000
YMCA of Pierce & Kitsap Counties Late Night Youth Programs 10,000 10,000 8,000 2,809 20,000 30,809
Housing Assistance and Homelessness Prevention 40,988$ 41,000$ 25,953$ 29,000$ 40,000$ 136,941$
Catholic Community Services Family Housing Network 15,988 16,000 11,953 15,000 14,000 58,941
Rebuilding Together South Rebuilding Day & Year‐Round Services 10,000 10,000 14,000 14,000 14,000 48,000
Tacoma Rescue Mission Adams Street Family Shelter 15,000 15,000 ‐ ‐ 12,000 30,000
Crisis Stabilization and Advocacy 113,837$ 107,284$ 106,500$ 85,627$ 68,000$ 413,248$
Caring for Kids Ready to Learn Fair & School Supplies 5,000 4,997 ‐ ‐ ‐ 9,997
Greater Lakes Mental Health Emergency Assistance 25,000 25,000 25,000 25,000 25,000 100,000
Lakewood Area Shelter Association
(LASA)
Client Services Center 22,500 22,500 18,750 3,555 ‐ 67,305
Rebuilding Hope Sexual Assault Center Therapy & Advocacy Programs 14,893 16,000 14,000 14,000 12,500 58,893
South Sound Outreach Services Connection Center Utility Assistance 9,444 1,287 ‐ ‐ ‐ 10,731
Springbrook Connections Direct Services & Resouce Connections ‐ ‐ ‐ ‐ 12,500 ‐
Tacoma Community House Victims of Crime Advocacy Program 12,000 12,500 18,750 13,072 ‐ 56,322
TACID HELP & ACCESS Programs ‐ ‐ ‐ ‐ ‐ ‐
YWCA Pierce County Domestic Violence Services 25,000 25,000 30,000 30,000 18,000 110,000
Access to Food 64,600$ 65,000$ 75,000$ 75,000$ 105,500$ 279,600$
Emergency Food Network Food Distribution 25,000 25,000 25,000 25,000 25,000 100,000
Making a Difference Foundation Eloise's Cooking Pot Food Delivery ‐ ‐ ‐ ‐ 15,500 ‐
Nourish Pierce Co (Fish Food Banks of
Pierce Co)
Food Bank 25,000 25,000 20,000 20,000 25,000 90,000
St. Leo Food Connection Children's Feeding Program 5,600 6,000 ‐ ‐ ‐ 11,600
St. Leo Food Connection Springbrook Mobile Food Bank 9,000 9,000 30,000 30,000 25,000 78,000
Tillicum Community Center Emergency Services ‐ Food ‐ ‐ ‐ ‐ 15,000 ‐
63 65

Fund 502 Property Management
The table below provides the operating costs of maintaining City Hall, Police Station and Sounder Station and 1‐time
property management expenditures.
Property Management Operating Expenditures
Year‐to‐date through June
2021
2019 Actual 2020 Actual Annual Budget YTD Actual
Sources:
M&O Revenue 683,461$ 702,611$ 695,603$ 361,618$
Interest Earnings/Misc 14,728 2,278 ‐ 258
Replacement Reserves Collections 100,000 100,000 ‐ ‐
1‐Time M&O/Capital Contributions ‐ 56,178 40,000 ‐
Total Sources 798,189$ 861,067$ 735,603$ 361,876$
Operating Exp:
City Hall Facility 369,872$ 374,899$ 381,034$ 193,137$
Personnel 121,578 122,649 125,534 60,451
Supplies 32,199 21,762 35,810 10,950
Services 109,081 127,510 80,400 76,084
Utilities 107,014 102,978 139,290 45,651
Police Station 266,904$ 275,469$ 245,052$ 148,740$
Personnel 62,438 66,397 61,832 29,523
Supplies 12,466 12,654 25,700 16,503
Services 80,244 82,857 66,390 44,979
Utilities 111,757 113,561 91,130 57,735
Sounder Station * 61,413$ 54,521$ 69,517$ 19,999$
Personnel 12,487 13,279 12,367 6,159
Supplies 3,278 2,085 5,000 779
Services 39,531 33,156 52,150 11,418
Utilities 6,116 6,001 ‐ 1,643
Subtotal ‐ Operating Exp 698,189$ 704,887$ 695,603$ 361,875$
Capital & Other 1‐Time:
Caretaker House Repairs ‐ ‐ 10,000 ‐
CH Water Pump Repair 9,899 ‐ ‐ ‐
City Hall Boiler Repair & Replacement 37,456 ‐ ‐ ‐
City Hall Exterior Beam Painting ‐ ‐ 75,000 ‐
City Hall Parking Lot Improvements ‐ ‐ 5,000 ‐
City Hall Space Evaluation ‐ ‐ 30,000 ‐
Exhaust fan repair 2,410 ‐ ‐ ‐
Gate repair 2,160 ‐ ‐ ‐
Generator repair 3,700 ‐ ‐ ‐
HVAC & Security System 11,741 ‐ ‐ ‐
Light Bulb & Battery Replacement Program 2,346 757 ‐ ‐
Parks Facil ities Secure Access 6,400 ‐ ‐ ‐
Parks O&M Facil ity HVAC Replacement 141 ‐ ‐ ‐
Parks O&M Facil ity LED Lighting 4,963 ‐ ‐ ‐
Paving of Washdown Station & Perim O&M ‐ ‐ 10,000 ‐
Police Station Battery Backup Upgrade/Repair ‐ ‐ 150,000 ‐
Police Salt Bin Cover ‐ ‐ 10,000 ‐
Police Firearms Range Equipment ‐ ‐ 45,000 9,822
Police Parking Lot Improvements ‐ ‐ 20,000 ‐
Police Station Sprinkler in 25,865 ‐ ‐ ‐
Police Station Window Security Film ‐ 7,178 ‐ ‐
To Parks CIP ‐ FSP Angle Lane Parking 50,000 ‐ ‐ ‐
Subtotal 1‐Time/Capital 157,080$ 7,934$ 355,000$ 9,822$
Total Uses 855,270$ 712,822$ 1,050,603$ 371,697$
Sources Over/(Under) Uses (57,081)$ 148,245$ (315,000)$ (9,821)$
Beginning Balance 493,139$ 436,058$ 584,300$ 584,300$
Ending Balance 436,058$ 584,303$ 269,300$ 574,479$
* Reflects Sounder Station operating expenditures accounted for in Fund 502 Property Management.
64 66

Fund 301 – Parks CIP
The Parks Capital Project Fund accounts for the receipts and disbursements related to the acquisition or construction of major park capital facilities with the exception of those facilities financed by proprietary and trust funds.
Fund 301 Parks CIP ‐ As of March 31, 2021 2021 Budget 2021 Actual
Revenues:
Grants 332,000$ 254,498$
Contributions/Donations ‐ 13,540
Interest/Other ‐ 436
Transfer In ‐ Fund 001 General 80,000 80,000
Transfer In ‐ Fund 102 REET 158,000 ‐
Transfer In ‐ MVET ‐ 986
Total Revenues 570,000$ 349,460$
Expenditures:
301.0003 Harry Todd Playground Replacement ‐ 312,929
301.0006 Gateways ‐ 64,611
301.0014 Ft Steilacoom Park/South Angle Lane Parking & Elwood Fencing ‐ 94,691
301.0016 Park Equipment Replacement 20,000 5,344
301.0017 Park Playground Resurfacing 10,000 7,078
301.0018 Project Support 50,000 3,730
301.0019 Edgewater Dock ‐ 375
301.0020 Wards Lake Improvements 200,000 ‐
301.0025 Fort Steilacoom Park ADA/Sensorty All Abilities Playground ‐ 70,345
301.0027 American Lake Improvement (ADA, Playground) 200,000 ‐
301.0032 Springbrook Park Expansion V ‐ 8,345
301.0034 Kiwanis Park Playground Replacement 90,000 ‐
301.0035 Fort Steilacoom Park Pavilion Restroom Improvements ‐ 31,541
301.0036 Service Club Sign ‐ 12,827
Total Expenditures 570,000$ 611,813$
Beginning Fund Balance ‐$ 2,605,500$
Ending Fund Balance ‐$ 2,343,146$
65 67

Fund 102 Real Estate Excise Tax Prior to January 1, 2020, the State of Washington levied a flat 1.28% real estate excise tax (REET) upon all sales of real estate under chapter 82.45 RCW. Beginning January 1, 2020 the state implemented a graduated tax scale based on the selling price ranging from 1.1% for the portion of sale that is $500,000 and less to 3.0% on the portion that is greater than $3M. The selling price thresholds listed above will be reviewed and adjusted every fourth year beginning July 1, 2022 based on the growth of the Consumer Price Index (CPI) for shelter of 5.0%, whichever is less, rounded to the nearest $1,000. If the CPI growth is negative, the thresholds will remain unchanged. This graduated scale applies only to the state portion of real estate excise tax. The locally imposed REET remains unchanged. Chapter 82.46 RCW authorizes cities and towns to impose local real estate excise taxes on top of the state rate. The tax is calculated based on the full selling price, including the amount of any liens, mortgages and other debts given to secure the purchase. The City of Lakewood is planning under the Growth Management Act (GMA) and enacted both the first ¼% and second ¼% tax, for a total of 0.50%. Real estate excise taxes are typically the responsibility of the seller of the property, not the buyer, although the buyer is liable if the tax is not paid. However, sometimes the buyer pays some or all of the tax as part of the negotiated sale agreement. The Pierce County Treasurer collects the real estate excise tax and remits to the City on a monthly basis.
Real Estate Excise Tax
Year‐to‐date through June
Over / (Under)2021 2021 Actual vs 2020 Actual 2021 Actual vs 2021 Budget
Month 2019 2020 Budget Actual $ % $ %
Jan 177,064$ 170,333$ 107,981 219,089$ 48,756$ 28.6% 111,108$ 102.9%
Feb 73,074 187,573 97,087 176,802 (10,771) ‐5.7% 79,715 82.1%
Mar 281,814 166,651 117,056 231,280 64,629 38.8% 114,224 97.6%
Apr 385,709 169,105 130,276 314,889 145,784 86.2% 184,613 141.7%
May 237,058 133,477 133,009 285,528 152,051 113.9% 152,519 114.7%
Jun 307,045 206,539 135,539 364,278 157,739 76.4% 228,739 168.8%
Jul 202,258 254,238 142,778 ‐ ‐ ‐ ‐ ‐
Aug 158,917 201,397 122,702 ‐ ‐ ‐ ‐ ‐
Sep 222,439 243,682 147,046 ‐ ‐ ‐ ‐ ‐
Oct 293,584 454,960 216,264 ‐ ‐ ‐ ‐ ‐
Nov 154,694 814,336 196,270 ‐ ‐ ‐ ‐ ‐
Dec 500,975 640,825 253,992 ‐ ‐ ‐ ‐ ‐
Total YTD 1,461,764$ 1,033,678$ 720,948$ 1,591,866$ 558,187$ 54.0% 870,918$ 120.8%
Total Annual 2,994,631$ 3,643,120$ 1,800,000$ n/a n/a n/a n/a n/a
5‐Year Ave Change (2016 ‐ 2020): 14.5%
66 68

The following tables summarize by month, the number of taxable and exempt real estate transactions, and lists major
transactions (sales price of $1M and greater).
Transactions that are exempt from REET include (WAC 458‐61A):
Gifts;
Inheritance of devise;
Community property, dissolution of marriage or domestic partnership, legal separation, decree of invalidity;
Tenants in common and joint tenants;
Governmental transfers*;
Condemnation proceedings;
Bankruptcy;
Transfers pursuant to deeds of trusts, foreclosure proceedings, executions of judgment, deeds in lieu of foreclosure, and contract forfeiture;
Rescission of sale;
Irrevocable trusts;
Mere change in identity or form – family corporations and partnerships;
Transfers where gain is not recognized under the Internal Revenue Code;
IRS “tax deferred” exchange;
Nominee;
Clearing or exiting title, and additions to title;
Mortgage insurers;
Rerecord;
Low income housing; and
Developmentally disabled person‐Housing‐Transfers and Improvements. * The transfer from a governmental is not subject to the tax. However, transfers to a governmental entity is generally subject to the tax, unless otherwise exempted (condemnation not subject to tax). Transfers to a governmental entity for a public purpose in connection with the development of real property by a developer when the transfer is required for plat approval are not subject to the real estate excise tax (example – a developer who deeds property to the city for streets and utilities).
67 69

Transaction Type # of Major Transactions ‐ 2021
Month Exempt Taxable Total Parcels Description Sales Price Net Tax
Jan 54 81 135 143 Single Family Residence 128 Country Club Circle SW $1,120,000 $5,544
Condo 13140 Country Club Drive SW Unit 403 $1,425,000 $7,054
Vacant Commercial Land & Improvements 7907 Washington Blvd SW $1,500,000 $7,425
Bridgeport Plaza 11001 to 10017 Bridgeport Way $2,500,000 $12,375
Americas Best Value Inn 4215 Sharondale St $4,200,000 $20,790
Industrial Land & Land Improvements 10720 26th Ave S $5,553,000 $27,487
Feb 65 98 163 171 Woodbrook Food Center 14421 Woodbrook SW $1,030,000 $5,099
Dirk's Truck Repair 2421 110th St S $1,200,000 $5,940
Single Family Residence 8921 North Thorne Lane SW $1,500,000 $7,425
New Apartment Complex 14607 ‐ 14619 Murray Rd SW $1,750,000 $8,663
NewDuplexes 8113 to 8133 John Dower Road SW $1,760,500 $8,714
Vacant Industrial Land 7402 150th St SW $3,390,017 $16,781
Mar 56 99 155 158 Apartments 14405 to 14417 Union Ave SW $1,521,440 $7,531
Single Family Residence 12785 Gravelly Lake Drive SW $1,680,000 $8,316
Single Family Residence 7235 Interlaaken Drive SW $1,999,000 $9,895
Herfy's Texaco Minimart & Laundry 12706 Bridgeport Way SW $2,840,000 $14,058
Apr 56 121 177 189 Single Family Residence 6803 75th St W $1,010,000 $5,000
Darrelyn Apartments 3409 88th St S $1,050,000 $5,198
Single Family Residence 7817 Walnut St SW $1,150,000 $5,693
Single Family Residence 12230 Gravelly Lake Dr SW $1,200,000 $5,940
The Fairy Store Cinema Plaza Pad "D" 2202 84th St S $1,350,000 $6,683
Flett Creek Plaza Condo 7602 Bridgeport Way W Unit 1A $1,658,800 $8,211
Foothil ls Family Property 3612 100th St SW $1,700,000 $8,415
Single Family Residence 8019 N Thorne Ln SW $2,229,000 $11,034
Days Inn 9325 S Tacoma Way $5,770,000 $28,562
May 74 116 190 202 Kentucky Fried Chcken 15116 Union Ave South $1,500,000 $7,425
Single Family Residence 13006 Avenue DuBois SW $1,850,000 $9,158
Single Family Residence 108 County Club Cir SW $2,000,000 $9,900
Single Family Residence 8201 North Thorne Lane SW $2,650,000 $13,118
Monta Vista Court Apts 3407 to 3411 92nd St S $2,750,000 $13,613
Jun 50 120 170 181 Single Family Residence 31 Country Club Drive SW $1,130,000 $5,594
Single Family Residence 10501 Brook Lane SW $1,149,000 $5,688
Single Family Residence 7420 North St SW $1,164,795 $5,766
Westland Apts 6124 88th St SW $1,305,000 $6,460
Single Family Residence 12629 Gravelly Lake Drive SW $1,350,000 $6,683
Single Family Residence 10311 Interlaaken Drive SW $1,370,000 $6,782
Condo 13140 Country Club Drive SW Unit 304 $1,450,000 $7,178
Heritage Bank 8801 South Tacoma Way $1,490,000 $7,376
Maple Creek Retirement Home 10420 Gravelly Lake Drive $3,181,260 $15,747
Single Family Residence 11407 Gravelly Lake Drive $3,550,000 $17,573
Oak Terrace Apts 42 Thunderbird Parkway SW $10,500,000 $51,975
Total YTD June 355 635 990 1,044 $90,476,812 $447,860
68 70

Transaction Type # of Major Transactions ‐ 2020
Month Exempt Taxable Total Parcels Description Sales Price Net Tax
Jan 60 67 127 142 Apartment Complex 14405 to 14417 Untion Ave SW $1,198,400 $5,932
Crest Apartments 3276 South 92nd St $1,199,000 $5,935
Washington Oaks Apartments 15308 Washington Ave SW $1,700,000 $8,415
Carlyle Apartments 12721 47th Ave SW $1,700,000 $8,415
Clover Creek Apartments 12502 Addison St SW $1,750,000 $8,663
Eden Plaza 9312 South Tacoma Way $3,280,000 $16,236
Steilacoom Square 3865 Steilacoom Blvd SW $4,612,500 $22,832
Feb 42 70 112 124 Auto Repair Services 4046 100th St SW $1,400,000 $6,930
Entertainment Bars 8920 South Tacoma Way $1,890,000 $9,356
Single Family Residence 7708 Walnut Street SW $2,000,000 $9,900
Gas Station Mini Mart 15408 Union Ave SW $2,500,000 $12,375
Western Inn 9920 South Tacoma Way $7,170,000 $35,492
Mar 53 82 135 143 Single Family Residence 12746 Gravelly Lake Drive SW $1,625,000 $8,044
Malibu Apts 4120 109th St SW $2,093,000 $10,360
Grand Cedars Apts 5226 to 5230 Chicago Ave SW $2,820,000 $13,959
Amber Court Apts 12809 Lincoln Ave SW $3,080,000 $15,246
Apr 38 73 111 174 Land & Land Improvements 5400 Chicago Ave SW $2,472,600 $12,239
Single Family Residences 124xx ‐ 125xx Springbrook Lane $7,417,400 $36,716
May 40 72 112 118 Vincent Apartments 3313 to 3317 92nd St South $1,200,000 $5,940
Single Family Residence 11702 Madera Drive SW $1,236,000 $6,118
Single Family Residence 8904 Frances Folsom St SW $1,403,000 $6,945
Jun 43 100 143 153 Vacant Undeveloped Land 8109 North Thorne Lane SW $1,000,000 $4,950
Single Family Residence 8911 North Thorne Lane SW $1,010,000 $5,000
Medical Office 5605 100th St SW STE A‐D $1,100,000 $5,445
Islander Apts 10417 to 10423 112th St SW $1,175,000 $5,816
Apt 5810 to 5816 77th St West $1,300,000 $6,435
Single Family Residence 11507 Gravelly Lake Drive SW $1,872,500 $9,269
$2,514,998 $12,449
Jul 59 103 162 174 Single Family Residence 11420 Gravelly Lake Drive SW $1,150,000 $5,693
Single Family Residence 8925 Lake Steilacoom Point Road SW $1,225,000 $6,064
Vacant Industrial Land 7301 150th Street SW $1,300,000 $6,435
Apt Condo High Rise 13140 Country Club Drive SW Unit 303 $1,300,000 $6,435
Auto Parking XXX 36th Ave Court SW $2,500,000 $12,375
Bell Garden Apartments 8810 John Dower Road SW $2,644,000 $13,088
Vacant Undeveloped Residential Land XXX Moreland Ave SW $2,700,000 $13,365
Boral Roofing 10920 Steele St S $6,100,000 $30,195
Aug 41 95 136 138 Single Family Residence 9705 Lake Seilacoom Drive SW $1,000,000 $4,950
Single Family Residence 15 Lagoon Ln N $1,150,000 $5,693
Single Family Residence 8812 Frances Folsom St SW $1,334,000 $6,603
Single Family Residence 7308 Norh St S $1,650,000 $8,168
Sep 53 98 151 165 Single Family Residence 7233 Interlaaken Drive SW $1,050,000 $5,198
Retail Trade 12612 Pacific Highway SW $1,100,000 $5,445
Single Family Residence 10807 Evergreen Terrace SW $1,280,000 $6,336
Single Family Residence 10007 Lake Steilacoom Drive SW $1,300,000 $6,435
Single Family Residence 9104 116th St SW $1,300,000 $6,435
Gas Station Mini Mart 7718 Bridgeport Way W $1,500,000 $7,425
Multi‐Family Apts 110 Country Club Lane $2,190,000 $10,841
Duplex 8102 Sherwood Forest St SW $2,348,400 $11,625
Gas Station Mini Mart 8306 Tacoma Mall Boulevard $5,250,000 $25,988
Oct 61 98 159 164 Single Family Residence 12617 Gravelly Lake Drive SW $1,000,000 $4,950
General Warehousing Storange 3003 107th St South $1,100,000 $5,445
Multi‐Family Apts 6415 Steilacom Blvd SW $1,317,500 $6,522
Multi‐Family Apts 11216 to 11230 Kline St SW $1,450,000 $7,178
Single Family Residence 8420 Woodholme Rd SW $2,038,200 $10,089
Professional Svcs Building 5712 Main St SW $11,350,000 $56,183
Vacant Industrial Land 3451 84th St South $39,500,000 $195,525
Nov 48 91 139 153 Single Family Residence 48 Loch Lane SW $1,025,000 $5,074
Jack In the Box 8814 South Tacoma Way $1,400,000 $6,930
Precision Countertops 8201 Durango St SW $1,630,000 $8,069
Clover Meadows Apartments 12517 47th Ave SW $3,272,250 $16,198
Warehouse Condo 2624 112th St S $5,550,000 $27,473
Village at Seeley Lake Apts 9221 57th Ave S $119,000,000 $589,050
Dec 66 119 185 217 Single Family Residence 10313 Interlaaken Drive SW $1,000,000 $4,950
General Warehousing Storage 3727 112th St SW $2,600,000 $12,870
General Merchandise Retail Trade 8016 Durango St SW $2,950,000 $14,603
Governmental Services 12811 Pacific Highway SW (DHS) $5,573,000 $27,586
Business Park 10029 South Tacoma Way $18,231,250 $90,245
Beaumont Apts 8609 82nd St SW $62,116,500 $307,477
Total YTD June 276 464 740 854 $63,719,398 $315,411
Total Annual 604 1,068 1,672 1,865 $387,194,498 $1,916,613
Residential 6922 & 6918 146th St SW and
14714, 14704, 14601 Woodbrook Dr SW
69 71

Transaction Type # of Major Transactions ‐ 2019
Month Exempt Taxable Total Parcels Description Sales Price Net Tax
Jan 60 90 150 159 Commercia/Retail 5221 100th St SW $1,850,000 $9,158
Commercial/Retail (Custer Square) 4102 to 7406 Custer Rd W $2,550,000 $12,623
Apartment Complex 12802 True Lane SW $5,293,600 $26,203
Feb 39 54 93 98 Single Family Residence 6718 76th St W $1,050,000 $5,198
Mar 61 90 151 198 Universal Tires & Wheels 9210 South Tacoma Way $1,000,000 $4,950
Single Family Residence 14 Country Club Drive SW $1,650,000 $8,168
General Warehousing 3401 96th St South $27,200,000 $134,640
Apr 65 101 166 178 Single Family Residence 8921 North Thorne Lane SW $1,100,000 $5,445
Commercial Retail Trade 10506 Bridgeport Way SW $1,200,000 $5,940
Apartment Complex 5314 San Francisco Ave SW $1,877,500 $9,294
Beaumont Apartments 8609 82nd St SW $46,393,200 $229,646
May 58 107 165 196 Single Family Residence 25 Forest Glen Ln SW $1,175,000 $5,816
Commercial Land & Improvements 11329 Pacific Hwy SW $1,600,000 $7,920
Commercial Land & Improvements 9530 Front St South $5,000,000 $24,750
Commercial Land & Improvements 9522 to 9537 Gravelly Lake Drive $7,865,000 $38,932
Jun 51 116 167 185 Single Family Residence 11901 Greendale Drive SW $1,072,500 $5,309
RV Storage Yard XXX Steilacoom Blvd SW $1,200,000 $5,940
General Warehousing Storage/Farmers Coffee 9412 Front St S $1,225,000 $6,064
Walgreens 9505 Bridgeport Way SW $4,327,714 $21,422
Bridgeport Professional/Medical Svcs Bldg 7424 Bridgeport Wy $7,250,000 $35,888
Star Lite Market Place 8327 S Tacoma Way $11,700,000 $57,915
Jul 53 99 152 167 Single Family Residence 11914 Nyanza Rd SW $1,200,000 $5,940
Aug 54 101 155 170 No major transactions ($1M+) n/a n/a
Sep 53 106 159 189 76 Union Gas Station Mini Mart 7718 Bridgeport Way West $1,500,000 $7,425
Til l icum Manor Mobile Park 23 Spaces 2 Duplexes 15317 WA Ave SW $1,618,000 $8,009
Single Family Residence 7 Country Club Drive West $1,795,000 $8,885
Commercial General Merchandise Retail Trade 10408 South Tac Way $2,425,000 $12,004
Commerical 9314 to 9316 Bridgeport Way SW $2,500,000 $12,375
Commercial Lakewood Square 6010 Mt Tacoma Drive SW $4,466,000 $22,107
Oct 55 109 164 181 Single Family Residence 12404 Gravelly Lake Drive SW $1,140,000 $5,643
Lake Center Apt 5925 99th St SW $1,150,000 $5,693
Les Schwab xxx Durango St SW $1,218,000 $6,029
Klauser Building 3625 Perkins Ln $1,450,000 $7,178
Single Family Residence 12753 Gravelly Lake Drive SW $1,775,000 $8,786
Mt Tahoma Square Phase One 9505 South Tacoma Wy $2,100,000 $10,395
Butler House 4901 115th St Ct SW $3,197,100 $15,826
Macau Casino Restaurant 9811 South Tacoma Wy $6,000,000 $29,700
CVS Pharmacy 9332 to 9400 Bridgeport Way SW $8,505,300 $42,101
Nov 42 83 125 136 Meadow Park Trlr Ct & Computer Repair 7416 Custer Road W $1,000,000 $4,950
Professional Office Building 9881 Bridgeport Way LLC $1,120,000 $5,544
New Construction Multi Family Apts 15001 Woodbrook Dr SW $1,350,000 $6,683
Single Family Residence 12718 Gravelly Lake Dr SW $1,940,000 $9,603
Single Family Residence 23 Country Dr SW $2,000,000 $9,900
Dutch Brothers Coffee 6229 Lake Grove St W $2,095,000 $10,370
Dec 69 91 160 Single Family Residence 57 Country Club Road SW $1,002,000 $4,960
Single Family Residence 10502 Brook Lane SW $1,021,000 $5,054
Single Family Residence 7117 Interlaaken Drive SW $1,450,000 $7,178
Freeport Apts 10211 47th Ave SW $1,751,500 $8,670
Medical Office 11203 Bridgeport Way SW $2,160,000 $10,692
Single Family Residence 6820 150th St SW $5,000,000 $24,750
Oakridge Condos 8008 83rd Ave SW $20,169,600 $99,840
Royal Oaks Apts 8008 to 8248 Bridgeport Way SW $25,154,000 $124,512
Total YTD Jun 387 657 1,044 1,181 $134,779,514 $667,159
Total Annual 660 1,147 1,807 1,857 $242,832,014 $1,202,019
70 72

Fund 103 Transportation Benefit District
On August 6, 2012, the Lakewood City Council adopted Ordinance #550, creating a transportation benefit district (TBD) in the City of Lakewood, referred to as the Lakewood TBD. The TBD is a quasi‐municipal corporation and independent taxing district created for the sole purpose of acquiring, constructing, improving, providing and funding transportation improvement within the city limits of Lakewood. It has the authority to impose certain taxes and fees, either through the vote of the people of board action, for transportation purposes. The TBD is governed by the members of the Lakewood City Council as the District’s Board of Directors and the Mayor services as Chair of the Board. The Transportation Benefit District authority automatically expires on 12:01 am on July 16, 2032, unless dissolved sooner.
On September 15, 2014, the Lakewood TBD adopted Ordinance #TBD‐01, authorizing an annual $20 vehicle licensing fee for the TBD. The TBD Board found this fee is the best way to preserve, maintain, operate, construct, or reconstruct the transportation infrastructure of the City of Lakewood and fund transportation improvements within the District that are consistent with existing state, regional or local transportation plans necessitated by existing or reasonably foreseeable congestion levels.
The fees are effective for tabs due beginning April 1, 2015. The Washington State Department of Licensing (DOL) collects the fees and distributes the net proceeds to the City on a monthly basis. DOL automatically deducts one percent (1%) of the $20 fee at the time of collection for administration and collections expenses incurred. The 1% administration fee is the maximum amount permitted by RCW 82.80.140.
$20 Vehicle Licensing Fee
Year‐to‐date through June
Over / (Under)
2021 2021 Actual vs 2020 Actual 2021 Actual vs 2021 Budget
Month 2019 Actual 2020 Actual Budget Actual $ % $ %
Jan 60,311$ 57,938$ 58,575$ 70,902 12,964$ 22.4% 12,327$ 21.0%
Feb 65,498 78,329 66,287 70,983 (7,346) ‐9.4% 4,696 7.1%
Mar 52,470 66,865 62,769 64,192 (2,673) ‐4.0% 1,422 2.3%
Apr 80,200 82,118 81,706 88,760 6,642 8.1% 7,054 8.6%
May 86,823 75,953 77,556 86,863 10,910 14.4% 9,307 12.0%
Jun 76,931 73,676 74,450 73,042 (634) ‐0.9% (1,408) ‐1.9%
Jul 69,201 77,463 76,602 ‐ ‐ ‐ ‐ ‐
Aug 70,290 66,960 64,823 ‐ ‐ ‐ ‐ ‐
Sep 83,477 86,194 81,964 ‐ ‐ ‐ ‐ ‐
Oct 66,370 79,594 67,768 ‐ ‐ ‐ ‐ ‐
Nov 73,750 74,686 67,644 ‐ ‐ ‐ ‐ ‐
Dec 45,363 62,073 54,854 ‐ ‐ ‐ ‐ ‐
Total YTD 422,233$ 434,878$ 421,344$ 454,742$ 19,863$ 4.6% 33,398$ 7.9%
Annual Total 830,685$ 881,849$ 835,000$ n/a n/a n/a n/a n/a
5‐Year Ave Chg (2016 ‐ 2020): 2.6%
71 73

On July 1, 2015 the Washington State Legislature enacted Second Engrossed Substitute Bill 5987 (SESSB 5987), which authorizes the City to assume the rights, powers, functions, and obligation of the TBD. On November 22, 2016, the City Council declared its intent to conduct a public hearing to consider the proposed assumption of the rights, powers, function, and obligations of the existing City of Lakewood TBD. The City Council conducted the public hearing on December 5, 2016. On December 12, 2016, the City Council adopted the ordinance to assume the TBD. On May 6, 2019, the Lakewood TBD adopted Ordinance # 708, authorizing two additional eligible projects and identified completed TBD projects as follows (to be updated in 2021, see discussion in following section):
Completed Projects
Steilacoom Boulevard – Lakewood Drive to West of South Tacoma Way
Lakewood Drive – 100th to Steilacoom Boulevard
Main Street – Gravelly Lake Drive to 108th St
59th – Main Street to 100th
108th – Bridgeport to Pacific Highway
108th – Main Street to Bridgeport
Current Eligible Projects
Pacific Highway – 108th to SR 512
100th – Lakeview to South Tacoma Way
New LED Street Lights
Signal Projects
Minor Capital Projects
Neighborhood Traffic Safety
Personnel, Engineering, Professional Services
Chip Seal Program – Local Access Roads
Lakewood Drive – Flett Creek to North City Limits
59th – 100th to Bridgeport
Custer – Steilacoom to John Dower
88th – Steilacoom to Custer
100th – 59th to Lakeview
Non‐Motorized Trail: Gravelly Lake Drive – Washington Blvd to Nyanza Road SW (added 5/6/2019)
Overlay & Sidewalk Fill‐In: Custer Road – John Dower to 500’ West of Bridgeport Way (added 5/6/2019) The $20 vehicle license fee is estimated to generate $835,000 annually, however, has increased to over $880,000 in 2020. This revenue source along with General Fund contributions, real estate excise tax, motor vehicle fuel tax and grants will provide funding for needed improvements to city streets and roads. Initiative I‐976 / Supreme Court Decision / City Next Steps In November 2019, voters approved I‐976 (known as the “$30 car tab initiative”) effective December 5, 2019. The initiative makes significant changes to many other aspects of the State’s transportation system, including repeal of the authority for transportation benefit districts to impose fees. The initiative would: Limit motor vehicle license fees to $30 per year; repeal or reduce certain motor vehicle weight fees; repeal the authority for TBDs to impose vehicle license fees; reduce electric vehicle fees to $30 per year; repeal the 0.3% tax on motor vehicle retail sales; require local motor vehicle excise taxes (MVETs) to be calculated using the Kelley Blue Book base value of the vehicle; conditionally repeal the Sound Transit 0.8% MVET; and require the retirement or refinancing of Sound Transit‐related bonds. There would also be reductions in many of the state accounts associated with transportation funding, including the Multimodal Transportation Account (including state grants and local programs funded by these resources), the Motor Vehicle Account, State Patrol Highway Account, and the Transportation Partnership Account. In addition to the $835,000/year from the $20 VLF, the City receives multimodal funding and motor vehicle excise tax of approximately $82,000/year and $1,285,000/year, respectively, which could be impacted if reductions occur as the state level.
72 74

The Transportation Benefit District authority automatically expires on 12:01 am on July 16, 2032, unless dissolved sooner. The City did not anticipate dissolving the TBD earlier than this date since Ordinance 550 authorizes the City to establish TBDs within the boundaries of the City of Lakewood. I‐976 affects the $20 VLF (car tabs) option but does not eliminate other funding options, such as a voter‐approved sales tax.
The State Department of Licensing (DOL) is responsible for collecting vehicle licensing fees and taxes. Once collected, DOL sends the revenue to the Washington State Treasurer. The Treasurer distributes funds to the City. In 2020 through September, the City deposited the revenues in a liability account pending the outcome of I‐976. DOL was responsible for taking necessary and appropriate action to refund any collected fees or taxes and communicate accordingly with customers pending instructions from the court as the case moved forward.
In July 2020, State Supreme Court heard oral arguments about the constitutionality of the initiative to lower the cost of car tabs that voters passed last year. The injunction on I‐976 remained in place until the Washington State Supreme Court can rule on appeal. On April 29, the Washington State Supreme Court accepted expedited direct review and granted the motion to stay the injunction pending the appeal. This meant that the injunction preventing I‐976 from taking effect would stay in place until the Supreme Court’s decision on the appeal.
In October 2020, the Washington State Supreme Court ruled on the constitutionality of I‐976 and struck down the initiative because it contained multiple subjects and a misleading ballot title. Now that the court has ruled, the 2020 vehicle license fees that the City has been receiving from the State Department of Licensing (DOL) is recognized as revenue. Since the State Supreme Court finds that the voter‐approved I‐976 is unconstitutional, the Lakewood City Council has a few options. One option is to rescind the $20 vehicle license fee or second move forward with using the monies to continue investing in transportation infrastructure projects. City’s $20 vehicle license fee could be used to leverage the issuance of bonds in support of transportation projects totaling approximately $11 million that would be repaid over 20 years.
The City will update the list of eligible and completed TBD funded projects following City Council discussion and decision in 2021.
73 75

Vehicles Subject to the Vehicle Licensing Fee
The annual vehicle fee is due for each vehicle subject to license tab fees and for each vehicle subject to gross weight fees with an unladen (scale) weight of 6,000 pounds or less as described in table below. Vehicles with non‐expiring registration, such as Disabled American Veteran and Collector Vehicles, are exempt from the tax. The annual vehicle licensing fee applies only when renewing a vehicle registration, and is effective upon the registration renewal date as provided by the Department of Licensing.
The following vehicles are subject to the vehicle licensing fee under RCW 82.80.140:
Vehicles Subject to the VLF
Use Type Description Authority
CAB Taxicab RCW 46.17.350
CMB Combination RCW 46.17.355 if scale weight is 6000 pounds or less
CMB (non‐powered) Trailers RCW 46.16A.450(b)
COM Commercial vehicle RCW 46.17.350if scale weight is 6000 pounds or less
COM non powered Commercial RCW 46.16A.450
CYC Motorcycle RCW 46.17.350
FIX Fixed Load vehicle RCW 46.17.355if scale weight is 6000 pounds or less
FRH, 6 seats or less For Hire RCW 46.17.350
FRH, 7 seats or more For Hire RCW 46.17.355if scale weight is 6000 pounds or less
HDL House Moving Dolly RCW 46.17.350
LOG (powered) Used Exclusively for hauling logs RCW 46.17.355 if scale weight is 6000 pounds or less
LOG (non‐powered) Used exclusively for hauling logs RCW 46.17.355
MHM Motor home RCW 46.17.350
MOB Mobile Home RCW 46.17.350 (if actually licensed)
PAS Passenger vehicle RCW 46.17.350
STA, 6 seats or less Stage RCW 46.17.350
STA, 7 seats or more Stage RCW 46.17.355if scale weight is 6000 pounds or less
TLR Private –use trailer (if over 2000 pounds scale weight)
RCW 46.17.350
TOW Tow truck RCW 46.17.350
TRK Truck RCW 46.17.355if scale weight is 6000 pounds or less
TVL Travel trailer RCW 46.17.350
NEP Neighborhood electric passenger vehicle RCW 46.17.350
NET Neighborhood electric truck RCW 46.17.355if scale weight is 6000 pounds or less
MEP Medium‐speed electric passenger vehicle RCW 46.17.350
MET Medium‐speed electric truck RCW 46.17.355 if scale weight is 6000 pounds or less
74 76

Vehicles Exempt from the Vehicle Licensing Fee
The following vehicles are specifically exempted from the vehicle licensing fee:
a. Campers, as defined in RCW 46.04.085; b. Farm tractors or farm vehicles as defined in RCW 46.04.180 and 46.04.181; c. Mopeds, as defined in RCW 46.04.304; d. Off‐road and non‐highway vehicles as defined in RCW 46.04.365; e. Private use single‐axle trailer, as defined in RCW 46.04.422; f. Snowmobiles as defined in RCW 46.04.546; and g. Vehicles registered under chapter 46.87 RCW and the international registration plan.
The following vehicles are not subject to the vehicle fee under RCW 82.80.140:
Vehicles Exempt from VLF
Use Type Description Reasoning
ATQ Antique Vehicle (any vehicle 30 years old) Not subject to license fees
ATV Motorized Non highway vehicle Not subject to RCW 82.80.140
CGR Converter Gear Not subject to license fees
CMP Campers Exempt under RCW 82.80.140
GOV State, County, City, Tribal Not subject to license fees
FAR Farm Exempt under RCW 82.80.140
FCB Farm Combination Exempt under RCW 82.80.140
FED Federally Owned Not subject to license fees
FEX Farm Exempt Not subject to license fees
FMC Federal Motorcycle Trailer Not subject to license fees
ORV Off Road Vehicles Exempt under RCW 82.80.140
PED Moped Exempt under RCW 82.80.140
ATQ Restored and Collector Vehicles Not subject to license fees
SCH Private School Not subject to license fees
SNO, SNV Snowmobiles Exempt under RCW 82.80.140
SNV Vintage snowmobiles Exempt under RCW 82.80.140
SNX State, County, City owned snowmobiles Exempt under RCW 82.80.140
TLR Personal use trailers, single axle (less than 2,000 pounds scale weight)
Exempt under RCW 82.80.140
75 77

Fund 302 – Transportation CIP
The Transportation Capital Projects Fund accounts for receipts and disbursements related to acquisition, design, construction and any other related street capital project expenditures. Revenues supporting this fund’s activities include motor vehicle fuel tax; direct and indirect federal grants; state grants; GO bond proceeds; transfers in from the Real Estate Excise Tax Fund; contribution from General Fund, Community Development Block Grant, and the councilmanic $20 vehicle licensing fees from the Transportation Benefit District Fund.
Fund 302 Transportation CIP ‐ As of June 30, 2021 2021 Budget 2021 Actual
Revenues:
Motor Vehicle Excise Tax 344,330$ 149,230$
Increased Motor Vehicle Excise Tax 70,235 35,249
Multi‐Modal Distribution 80,440 40,284
Grants 8,480,468 1,627,115
Contributions From Utilities/Developers/Partners 150,302 ‐
Pavement Degradation ‐ 21,263
Interest/Other ‐ 1,982
GO Bond Proceeds 6,600,000 ‐
Transfer In ‐ Fund 001 General 700,000 700,000
Transfer In ‐ Fund 102 REET 818,295 ‐
Transfer In ‐ Fund 190 CDBG 294,960 (5,040)
Transfer In ‐ Fund 401 SWM 4,316,155 779,458
Total Revenues 21,855,185$ 3,349,540$
Expenditures:
302.0000 Unallocated ‐ 10,380
302.0001 Personnel, Engineering & Professional Svcs 587,000 228,474
302.0002 New LED Streetlights 340,836 130,711
302.0003 Neighborhood Traffic Safety 50,248 465
302.0004 Minor Capital 320,113 18,689
302.0005 Chip Seal Program 380,000 16,554
302.0015 112th/111th Bridgeport Way to Kendrick 1,316,132 761,083
302.0024 Steilacoom Blvd ‐ Farwest to Phillips 365,668 96,478
302.0060 Signal Projects 875,001 156,415
302.0068 Overlay: Pac Hw to 112th St SW 37,861 2,667
302.0071 Safety: SRTS ‐ Phillips Rd Sidewalks & Bike Lanes (Steilacoom to Onyx)‐P 452,000 ‐
302.0074 Streets: S Tacoma Way ‐ 88th to 80th St 521,685 2,378
302.0077 Gravelly Lake Dr. ‐ WA Blvd to Nyanza Rd SW ‐ Non‐Motorized Trail ‐ 38,266
302.0080 Overlay: 108th Street – Bridgeport Way to Pacific Highway 703,619 368,820
302.0119 Sidewalks: Lakewood Drive ‐ Steilacoom Blvd. to Flett Creek 993,933 847,053
302.0133 Street & Sidewalks: Steilacoom Blvd (Farwest to Weller) ROW Acquisitio 1,100,000 ‐
302.0134 Veterans Dr ‐ GL Dr to Amer Lake Park 1,998,341 1,533,602
302.0135 Building, Street & Park Improvements 9,735,977 103,895
302.0137 Streets: Steilacoom Blvd/88th (Weller to Custer Rd.) 3,991,565 43,813
302.0138 Sidewalks: Onyx Dr SW ‐ 89th to 97th 786,622 20,709
302.0144 146th St ‐ Woodbrook to Murray 221,620 4,416
302.0164 Sidewalks: Farwest Dr, 112th to Lakes HS, 100th St Ct SW to Stcm Blvd 1,475,000 ‐
Total Expenditures 26,253,222$ 4,384,867$
Beginning Fund Balance 4,869,918$ 4,869,918$
Ending Fund Balance 471,881$ 3,834,590$
76 78

Sewer CIP Funds
The Sewer Capital Project CI Fund accounts for the construction and expansion of a sewer system and related costs to maintain and operate the fund. The City Council also adopted Resolution 2018‐19, which supports continuing the sewer surcharge and expanding the geographical area to include the entire city and identifies that the surcharge are to be used for design, construction and other costs associated with sewer projects beyond paying for debt service. This will allow the City to use surcharge revenue to pay for sewer projects both inside and outside of Tillicum and Woodbrook.
Fund 311 Sewer Capital Project ‐ As of June 30, 2021 2021 Budget 2021 Actual
Revenues:
Interest/Other ‐$ 3,437$
Grant 75,000 ‐
Sewer Availability charges 165,000 123,970
Transfer In ‐ Fund 204 Sewer Project Debt (4.75% Surcharge) 190,000 ‐
Total Revenues 430,000$ 127,407$
Expenditures:
311.0000 Unallocated 35,000 9,784
311.0002 Side Sewer CIPS 250,419 ‐
311.0005 Maple St Sewer Extension 1,231,042 33,562
311.0013 Fort Steilacoom Park Sewer Extension 227,000 ‐
Total Expenditures 1,743,461$ 43,346$
Beginning Fund Balance 1,531,918$ 1,531,918$
Ending Fund Balance 218,457$ 1,615,979$
77 79

Fund 401 – Surface Water Management Operations & CIP
The Surface Water Management Fund accounts for activities that provide storm water collection and disposal services to the City. Activities include administration, engineering, construction, operation, maintenance, and repairs, which are primarily supported by user fees. The fees are billed by Pierce County and are included in the semi‐annual property taxes, and remitted by the County to the City.
Fund 401 Surface Water Management ‐ As of June 30, 2021 2021 Budget 2021 Actual
Revenues:
Storm Drainage Fees & Charges 4,351,500$ 2,588,348$
Site Development Permits 50,000 44,665
Special Assessment 33,285 9,710
GO Bond Proceeds 1,000,000 ‐
Flood Control Services ‐ ‐
Interest Earnings / Other 15,600 2,684
Transfer In ‐ Fund 302 Public Works ‐ ‐
Grants/Contributions 3,435 21,398
Total Revenues 5,453,820$ 2,666,805$
Expenditures:
401.0000 Operations & Maintenance 3,172,765 1,046,142
401.0000 Transfers to Parks CIP 206,277 ‐
401.0000 Transfers to Transportation CIP 4,316,155 779,458
401.0000 Debt Service Payment 60,566 ‐
401.0008 Outfall Retrofit 124,184 467
401.0012 Outfall Retrofit Feasibility Project 60,000 ‐
401.0014 Water Quality Improvements 45,000 ‐
401.0015 Oakbrook Outfall Retrofits 219,577 ‐
401.0016 112th St Drainage Improvements 40,000 7,781
401.0018 Waughop Lake Treatment 20,000 8
401.0020 2022 Drainage Pipe Repair Project 35,000 9,912
401.0021 American Lake Treatment Project 61,121 2,246
401.0023 Clover Creek Flood Risk Reduction Study 125,000 ‐
401.9999 IT Maintenance & Operations 20,787 21,552
Total Expenditures 8,506,432$ 1,867,566$
Beginning Fund Balance 5,821,019$ 5,821,019$
Ending Fund Balance 2,768,407$ 6,620,258$
78 80

ADMINISTRATIVE SERVICES
Fund 104 Hotel/Motel Lodging Tax
There is an excise tax of 7% on the sale of or charge made for the furnishing of lodging by a hotel, rooming house, tourist court, motel, trailer camp and the granting of similar license to use real property. The hotel/motel taxes generated from the rental of rooms are restricted to the promotion of tourism in the City.
The City’s Lodging Tax Advisory Committee makes recommendations to the City Council in regards to how the taxes
are to be used.
The 2018 overall increase is due primarily to new hotel, increased activity and additional revenue resulting from an excise tax audit performed by the state.
Hotel/Motel Lodging Tax
Year‐to‐date through June
Over / (Under)
2021 2021 Actual vs 2020 Actual 2021 Actual vs 2021 Budget
Month 2019 Actual 2020 Actual Budget Actual $ % $ %
Jan 52,821$ 80,098$ 50,812$ 78,567$ (1,531)$ ‐1.9% 27,755$ 54.6%
Feb 65,824 58,654 54,749 61,859 3,205 5.5% 7,110 13.0%
Mar 84,328 51,444 66,525 99,524 48,080 93.5% 32,999 49.6%
Apr 82,032 53,538 58,386 88,869 35,331 66.0% 30,484 52.2%
May 97,918 72,138 66,854 111,327 39,189 54.3% 44,473 66.5%
Jun 111,782 79,755 79,193 140,640 60,885 76.3% 61,447 77.6%
Jul 121,053 87,560 86,624 ‐ ‐ ‐ ‐
Aug 122,802 97,783 89,296 ‐ ‐ ‐ ‐
Sep 109,087 81,284 74,959 ‐ ‐ ‐ ‐
Oct 94,968 81,553 69,704 ‐ ‐ ‐ ‐
Nov 80,038 63,713 54,833 ‐ ‐ ‐ ‐
Dec 69,300 59,791 48,065 ‐ ‐ ‐ ‐
Total YTD 494,705$ 395,627$ 376,519$ 580,786$ 185,159$ 46.8% 204,268$ 54.3%
Annual Total 1,091,953$ 867,311$ 800,000$ n/a n/a n/a n/a n/a
5‐Year Ave Change (2016 ‐ 2020): 2.9% Decreases in 2020 due to COVID‐19 caused closure/cancellation of events.
79 81

The following table provides details of the hotel/motel lodging tax allocations for year‐to‐date June 30, 2021.
2021
Hotel/Motel Lodging Tax Summary Annual Budget Actual YTD Jun
4% Revenue:
Special Hotel/Motel Tax (2%) 228,571$ 165,937$
Transient Rental Income (2%) 228,571 165,942
Subtotal 457,142 331,879
3% Revenue:
Special Hotel/Motel Tax (3%) 342,857 248,906
Subtotal 342,857 248,906
Interest ‐ 722
Total Revenue 800,000 581,508
4% Expenditure:
Asia Pacific Cultural Center 15,000 ‐
City of Lakewood Communications ‐ Imaging Promotion 40,000 24,744
City of Lakewood ‐ Concert Series 20,000 ‐
City of Lakewood ‐ PRCS ‐ Farmers Market 35,000 29,685
City of Lakewood ‐ PRCS ‐ SummerFEST 80,000 1,700
Historic Fort Steilacoom Association 12,000 ‐
Lakewold Gardens 50,000 11,936
Lakewood Arts Festival Association 19,500 2,165
Lakewood Chamber of Commerce 90,000 24,876
Lakewood Chamber of Commerce ‐ Nights of Lights 25,000 ‐
Lakewood Historical Society & Museum 35,000 14,334
Lakewood Playhouse 25,000 1,739
Lakewood Sister Cities Association ‐ Gimhae 16,350 ‐
Travel Tacoma ‐ Mt. Rainier Tourism and Sports 7,550 759
Tacoma Regional Convention + Visitor Bureau & Tacoma Sound Sports Commission 100,000 30,081
Subtotal 570,400 142,019
3% Expenditure:
City of Lakewood ‐ PRCS ‐ Gateways 140,941 68,050
CPTC McGavick Center Payment 101,850 101,850
Subtotal 242,791 169,900
‐
Total Expenditures 813,191$ 311,917$
Beginning Balance 1,659,033$ 1,659,033$
Ending Balance 1,645,842$ 1,928,624$
80 82

Fund 501 Fleet & Equipment
The Fleet and Equipment Replacement Fund accounts for all costs associated with operating, maintaining and replacing the City’s vehicles and other motorized equipment. This fund owns and depreciates all non‐proprietary fund assets of this nature. Fleet and equipment user charges are allocated to the operating funds based on usage.
Fund 501 ‐ Fleet & Equipment Fund
Year‐to‐date through June
2019 2020 2021
Annual Annual Annual YTD
Actual Actual Budget Actual
Sources:
M&O Revenue 763,367$ 617,408$ 740,720$ 268,986$
Interest Earnings/Misc 71,013 19,472 15,000 1,883
Interfund Loan Proceeds ‐ 880,204 ‐ ‐
Replacement Reserves Collections 805,481 ‐ ‐ ‐
Capital Contributions ‐ 25,807 ‐ ‐
Proceeds from Sale of Assets 13,339 11,716 24,900 24,660
Transfer In from Insurance Recovery 81,184 64,851 ‐ ‐
Total Sources 1,734,384$ 1,619,458$ 780,620$ 295,528$
Operating Exp:
Fuel/Gasoline 323,206 255,476 424,150 131,198
Other Supplies 18,655 11,720 3,990 9,432
Repairs & Maintenance 499,389 380,884 327,580 130,112
Other Services & Charges 6,468 516 ‐ 126
Subtotal ‐ Operating Exp 847,718$ 648,596$ 755,720$ 270,868$
Capital & Other 1‐Time:
Fleet & Equipment Replacement 941,993 490,005 687,552 211,055
Subtotal ‐ Capital & Other 1‐Time Exp 941,993$ 490,005$ 687,552$ 211,055$
Total Uses 1,789,711$ 1,138,601$ 1,443,272$ 481,923$
Sources Over/(Under) Uses (55,327)$ 480,857$ (662,652)$ (186,395)$
Beginning Balance 3,835,778$ 3,780,451$ 3,940,779$ 4,261,308$
Ending Balance 3,780,451$ 4,261,308$ 3,278,127$ 4,074,913$
81 83

Fund 503 Information Technology
The Information Technology Fund accounts for all costs and services associated with the City’s Information Technology needs. This fund supports all internal systems such as the City’s Geographical Information Systems (GIS) needs, Internal & External Web Resources (WWW, Intranet & FTP), E‐Mail Systems, business continuity needs, infrastructure resources, applications and overall support. In addition, the fund leverages emerging technologies to reduce cost, limit growth in the workforce, and improve services to citizens and employees; and to provide the most innovative and cost effective technology services for managing the City of Lakewood. Information technology costs are allocated to the operating funds based on a combination of FTEs and usage.
Fund 503 ‐ Information Technology
Year‐to‐date through June
2019 2020 2021
Annual Annual Annual YTD
Actual Actual Budget Actual
Sources:
M&O Revenue 1,202,671$ 1,337,482$ 1,891,129$ 755,573$
Interest Earnings/Misc 2,201 2,826 ‐ 89
Replacement Reserves Collections 48,678 66,845 ‐ ‐
Capital Contributions/Grants 593,944 305,350 525,655 185,951
Total Sources 1,847,494$ 1,712,503$ 2,416,784$ 941,613$
Operating Exp:
Personnel 562,728 524,535 588,699 293,341
Supplies 40,330 60,796 179,520 33,630
Other Services & Charges 601,814 754,976 1,122,910 367,854
Subtotal ‐ Operating Exp 1,204,872$ 1,340,307$ 1,891,129$ 694,825$
Capital & Other 1‐Time:
Website Update/Redesign 4,726 520 7,499 520
Disaster Recover/Co‐Location Police 26,800 ‐ ‐ ‐
Computer Replacement 131,682 142,264 138,750 40,360
Vulnerability & Penetration Testing 33,255 ‐ ‐ ‐
Security Enhancements 1,869 ‐ ‐ ‐
Server/Hardware Upgrades 28,963 ‐ 30,000 ‐
Legal Workflow System 3,209 ‐ ‐ ‐
In Car Video System 131,949 121,333 ‐ ‐
Police SANS Storage Implementation 113,506 ‐ ‐ ‐
O&M Facility Fiber Installation 18,134 ‐ ‐ ‐
Cloud Enabled Backup Storage 37,612 ‐ ‐ ‐
Cybersecurity 62,239 ‐ ‐ ‐
Fiber Optic Connection FSP ‐ 36,860 ‐ ‐
Document Management System ‐ 3,594 296,406 185,951
CED+ / PALS Permit System ‐ 779 20,000 19,957
Video Surveillance ‐ ‐ 3,000 ‐
Disaster Recover/Co‐Location Police ‐ ‐ 10,000 ‐
Redundant Voice/Data at Police Station ‐ ‐ 20,000 ‐
Subtotal ‐ Capital & Other 1‐Time Exp 593,944$ 305,350$ 525,655$ 246,788$
Total Uses 1,798,816$ 1,645,657$ 2,416,784$ 941,613$
Sources Over/(Under) Uses 48,678$ 66,846$ ‐$ 0$
Beginning Balance 90,000$ 138,678$ 205,522$ 205,522$
Ending Balance 138,678$ 205,522$ 205,522$ 205,522$
82 84

Fund 504 Risk Management
The Risk Management Fund accounts for the financial administration of the City’s comprehensive risk management program. The Fund assures that the revenues and assets of the City are protected through an established risk control and risk finance program including risk management goals and objectives, a formalized risk assessment process and methodology for reviewing and monitoring of the effectiveness of the risk management program. Risk management functions include property, casualty and general liability and similar functions. Risk management provides departments with information and assistance about recommended insurance requirements for various City contracts. Through the safety program, information and training is provided on how to reduce the risk of injury to employees, the general public and the City owned and leased property. This fund is funded primarily through user charges allocated to the operating funds based on a combination of FTEs and usage.
Fund 504 ‐ Risk Management
Year‐to‐date through June
2019 2020 2021
Annual Annual Annual YTD
Actual Actual Budget Actual
Sources:
M&O Revenue 1,561,705$ 1,289,027$ 1,406,350$ 1,465,350$
AWC Retro Refund ‐ 128,938 ‐ ‐
Insurance Proceeds/3rd Party Recoveries 285,680 371,383 200,000 83,259
Total Sources 1,847,385$ 1,789,348$ 1,606,350$ 1,548,609$
Uses:
Safety Program 2,782 2,474 13,850 1,309
AWC Retro Program 35,792 37,356 37,500 33,945
WCIA Assessment 1,411,230 1,438,931 1,355,000 1,364,838
Claims/Judgments & Settlements 316,397 245,735 200,000 148,516
Transfer Insurance Proceeds to Fleet & Equipment 81,184 64,851 ‐ ‐
Total Uses 1,847,385$ 1,789,348$ 1,606,350$ 1,548,609$
Sources Over/(Under) Uses ‐$ ‐$ ‐$ (0)$
Beginning Balance ‐$ ‐$ ‐$ ‐$
Ending Balance ‐$ ‐$ ‐$ (0)$
83 85

Debt Service
Under RCW 39.36.020(2), the public may vote to approve bond issues for general government in an amount not to exceed 2.5% of the value of all taxable property within the City. Within the 2.5% limit, the City Council may approve bond issues not to exceed 1.5% of the City’s assessed valuation. Prior to the passage of new legislation in 1994, the statutory limit on councilmanic (non‐voted) debt for general government purposes was 0.75% of assessed valuation. Another 0.75% of councilmanic debt was available only for lease‐purchase contracts (RCW 35.43.200). These two components are combined and can be used for any municipal purpose, including using the entire 1.5% for bonds. Therefore, the City’s remaining debt capacity without voter approval is $108.7M and an additional $81.1M may be accessed with voter approval. The voter‐approved capacity is generally referred to as unlimited tax general obligation debt, which requires 60% voter approval and the election must have a voter turnout of at least 40% of those who voted in the last State general election. With this vote, the voter approves additional property tax be levied above and beyond the constitutional and statutory caps on property tax. In addition to this general purpose debt capacity, RCW 39.36.030(4) also allows voter approval of park facilities and utility bond issues, each limited to 2.5% of the City’s assessed valuation. Therefore, legally the City can issue up to a total of 7.5% of the City’s assessed valuation in bonds for $595.4M. The tables below show the City’s available debt capacity and outstanding debt as of June 30, 2021.
Computation of Limitation of IndebtednessAs of June 30, 2021
General Purpose Excess Levy Excess Levy Total
Councilmanic Excess Levy Open Space & Park Util ity Purposes Debt
Description (Limited GO) (with a vote) (voted) (voted) Capacity
AV = $8,111,198,629 (A)
1.50% 121,667,979$ (121,667,979)$ ‐$
2.50% 202,779,966$ 202,779,966$ 202,779,966$ 608,339,897$
Add: Cash on Hand for Redemption (B) ‐$ ‐$
Less: Bonds Outstanding (12,940,941)$ ‐$ ‐$ ‐$ (12,940,941)$
Remaining Debt Capacity $108,727,039 $81,111,986 $202,779,966 $202,779,966 $595,398,956
General Capacity (C) $189,839,025
(A) Final Assessed Valuation for 2021 Property Tax Collection
(B) Debt Service Prefunding (the City currently does not prefund debt service)
(C) Combined Total for Councilmanic and Excess Levy Capacities
84 86

Compensated absences are an unfunded liability comprised of all outstanding vacation pay and accrued compensatory time that is recorded as an expenditure when paid. This occurs when an employee is paid out for unused vacation or compensatory time when an employee leaves the City. The calculation is made on an annual basis. As of December 31, 2020, this unfunded liability totals $3.28M.
Summary of Outstanding Debt
As of June 30, 2021
Average
Description Purpose
Issue
Date
Final
Maturity
Interest
Rate %
Amount
Issued
Outstanding
Debt
Annual
Payment
Funding
Source
2020 Limited Tax
General Oblgiation
Bonds (LTGO)
Transportation
Projects
12/9/2020 12/1/2035 2.00% 3,029,885$ 3,029,885$ 183,000$ REET
2019 Limited Tax
General Oblgiation
Bonds (LTGO)
Transportation
Projects
5/8/2019 12/1/2038 3.0 ‐ 5% 7,460,000$ 7,200,000$ 270,000$ REET
2016 Limited Tax
General Obligation
Bonds (LTGO)
Refunding 2009
LTGO
4/19/2016 12/1/2028 1.40 ‐ 2.41% 1,884,032$ 1,536,314$ 210,000$ General Fund
LOCAL Financing LED Streetlight
Retrofit
3/24/2015 12/1/2027 2.33% 1,460,000$ 960,000$ 156,000$ General Fund
59th Avenue
Promissory Note
Right‐of‐Way /
Roadway
in Lakewood
Towne Center
4/30/2005 4/30/2024 3.74% 1,071,000$ 214,742$ 77,000$ General Fund
Subtotal 14,904,917$ 12,940,941$ 896,000$
PWTFL
04‐691‐PRE‐132
American Lake
Gardens/
Till icum Sewer
7/7/2005 7/7/2024 1.00% 593,864$ 89,145$ 31,000$ Assessments on
all Lakewood
Sewer Accounts
PWTFL
06‐962‐022
American Lake
Gardens/
Till icum Sewer
9/18/2006 9/18/2026 0.50% 5,000,000$ 1,472,410$ 302,000$ Assessments on
all Lakewood
Sewer Accounts
PWTFL
08‐951‐025
American Lake
Gardens/
Till icum Sewer
3/1/2008 7/1/2028 0.50% 1,840,000$ 728,183$ 107,000$ Assessments on
all Lakewood
Sewer Accounts
PWTFL
12‐951‐025
American Lake
Gardens/
Till icum Sewer
6/1/2012 6/1/2031 0.50% 500,000$ 357,143$ 37,000$ Assessments on
all Lakewood
Sewer Accounts
Subtotal 7,933,864$ 2,646,882$ 477,000$
Combined Local
Improve District
(CLID) 1101/1103
Street
Improvements
12/1/2006 12/1/2026 3.75 ‐ 4.65% 2,824,704$ 210,000$ 210,000$ Assessment on
Eight Property
Owners
Local Improvement
District (LID) 1108
Street
Improvements
1/1/2008 12/1/2027 4.22 ‐ 5.3% 880,000$ 122,460$ 56,000$ Assessment on
Single Business
Local Improvement
District (LID) 1109
Street
Improvements
3/2/2020 3/1/2033 2.76 ‐ 3.47% 922,757$ 852,000$ 71,000$ Assessment on
Single Business
Subtotal 4,627,461$ 1,184,460$ 337,000$
Total 27,466,242$ 16,772,283$ 1,757,000$
Legacy Cost
December 31, 2020
Group FTE Total Liability
Non‐Rep 33.00 525,929$
AFSCME 86.00 664,352$
LPMG 4.00 222,861$
LPIG 92.00 1,845,670$
Teamsters 4.00 22,168$
Total 219.00 3,280,980$
85 87

Cash & Investments
The City currently maintains cash in its bank account to earn earnings credit, which offsets banking service fees. The remainder is invested with the Local Government Investment Pool (LGIP). As of June 30, 2021, the total invested with the LGIP is $33.3M with net earnings of 0.08% compared to the average yield on the 6‐month Treasury Bill of 0.04%. By Fund Summary The following table provides a summary of each fund’s activity as of June 30, 2021.
Beginning Revenue Ending
Fund Balance YTD Activity Over/(Under) Fund Balance Cash Balance (3)
Fund 1/1/2021 Revenues (1)
Expenditures (2) Expenditures 6/30/2021 6/30/2021
Total All Funds 42,083,192$ 77,074,371$ 76,976,588$ 97,783$ 42,180,976$ 40,643,268$
001General Fund 13,613,583$ 40,226,201$ 40,457,651$ (231,450)$ 13,382,134$ 13,769,040$
1XX Special Revenue Funds 7,502,008$ 7,455,707$ 7,751,807$ (296,100)$ 7,205,909$ 7,540,897$
101 Street Operations & Maintenance ‐ 2,399,379 2,399,379 ‐ ‐ (89,857)
102 Real Estate Excise Tax 2,271,511 1,800,000 2,491,100 (691,100) 1,580,410 3,051,394
103 Transportation Benefit District 687,753 835,000 640,000 195,000 882,753 1,142,854
104 Hotel/Motel Lodging Tax 1,659,031 1,000,000 800,000 200,000 1,859,034 1,676,656
105 Property Abatement/RHSP/1406 Funds 658,414 409,500 409,500 ‐ 658,414 874,221
106 Public Art 135,500 15,000 15,000 ‐ 135,499 135,562
180 Narcotics Seizure 226,196 ‐ ‐ ‐ 226,198 204,064
181 Felony Seizure 47,837 ‐ ‐ ‐ 47,837 41,329
182 Federal Seizure 160,906 ‐ ‐ ‐ 160,906 160,992
190 CDBG 1,381,724 595,000 595,000 ‐ 1,381,723 (45,226)
191 Neighborhood Stabilization Program 255,114 42,000 42,000 ‐ 255,115 258,367
192 South Sound Military Partnership 18,018 227,500 227,500 ‐ 18,018 76,572
195 Public Safety Grants ‐ 132,328 132,328 ‐ ‐ 53,969
2XX Debt Service Fund 988,318$ 2,771,970$ 2,465,330$ 306,640$ 1,294,954$ 800,939$
201 General Obligation Bond Debt Service ‐ 1,689,938 1,689,938 ‐ ‐ ‐
202 Local Improvement District Debt Service 248,038 247,774 247,774 ‐ 248,038 150,735
204 Sewer Project Debt Service 607,313 834,258 527,618 306,640 913,949 517,177
251 Local Improvement District Guaranty 132,968 ‐ ‐ ‐ 132,968 133,027
3XX Capital Project Funds 9,007,335$ 13,716,198$ 13,271,998$ 444,200$ 9,451,536$ 6,854,280$
301 Parks CIP 2,605,498 3,430,000 3,430,000 ‐ 2,605,499 1,928,956
302 Transportation CIP 4,869,919 10,036,198 9,711,998 324,200 5,194,119 3,303,298
311 Sewer Project CIP 1,531,918 250,000 130,000 120,000 1,651,918 1,622,027
4XX Enterprise Funds 5,821,019$ 7,565,476$ 7,601,032$ (35,556)$ 5,785,464$ 6,624,646$
401 Surface Water Management 5,821,019 $7,565,476 7,601,032 (35,556) 5,785,463 6,624,646
5XX Internal Service Funds 5,051,129$ 5,338,526$ 5,428,770$ (90,244)$ 4,960,887$ 4,953,375$
501 Vehicle & Equipment Replacement 4,261,308 755,720 1,007,720 (252,000) 4,009,309 4,074,912
502 City Hall Facility Services 584,300 798,917 703,917 95,000 679,301 596,625
503 Information Technology 205,523 2,177,539 2,110,783 66,756 272,279 279,606
504 Risk Management ‐ 1,606,350 1,606,350 ‐ ‐ 2,231
6XX Fiduciary Funds 99,799$ 293$ ‐$ 293$ 100,092$ 100,092$
631 Custodial Funds 99,799 293 ‐ 293 100,092 100,092
(1)Revenues includes all sources, ongoing and one‐time.
(2) Expenditures includes all uses, ongoing and one‐time.
(3) Negative cash balance due to timing of grant reimbursements and/or revenue collection.
86 88

2019
Annual Actual
2020
Annual Actual
2020
Actual YTD Jun
2021
Original
Budget
2021
Current
Revised
2021
Actual
YTD Jun
(001) GENERAL FUNDREVENUES:
Taxes $30,197,457 $28,546,334 $13,982,722 $27,259,500 $27,259,500 $17,116,557
Property Tax 7,159,443 7,259,756 3,933,262 7,412,100 7,412,100 4,093,191
Local Sales & Use Tax 11,955,004 11,946,044 5,548,740 10,060,000 10,060,000 7,277,365
Sales/Parks 663,655 671,080 307,196 575,000 575,000 382,526
Brokered Natural Gas Use Tax 50,477 39,494 14,134 34,000 34,000 22,078
Criminal Justice Sales Tax 1,179,058 1,213,087 550,912 1,043,000 1,043,000 687,122
Admissions Tax 504,879 96,599 80,811 200,000 200,000 63,869
Utility Tax 5,575,351 5,402,943 2,852,255 5,479,100 5,479,100 2,864,862
Leasehold Tax 9,779 6,903 3,809 4,300 4,300 3,744
Gambling Tax 3,099,813 1,910,429 691,602 2,452,000 2,452,000 1,721,801
Franchise Fees 4,145,138 4,289,904 2,081,169 4,269,000 4,269,000 2,075,896
Cable, Water, Sewer, Solid Waste 3,021,837 3,082,339 1,468,986 3,029,000 3,029,000 1,489,429
Tacoma Power 1,123,301 1,204,366 602,183 1,240,000 1,240,000 586,467
Small Cell ‐ 3,200 10,000 ‐ ‐ ‐
Development Service Fees 1,749,026 2,252,765 835,769 1,755,200 1,755,200 1,126,993
Building Permits 690,016 992,686 300,874 735,600 735,600 557,987
Other Building Permit Fees 315,885 273,605 155,304 297,700 297,700 90,783
Plan Review/Plan Check Fees 603,498 810,634 296,497 581,400 581,400 386,886
Other Zoning/Development Fees 139,627 175,840 83,095 140,500 140,500 91,337
Licenses & Permits 415,674 354,013 184,035 382,525 382,525 205,938
Business License 292,489 254,104 133,100 276,525 276,525 144,725
Alarm Permits & Fees 84,348 63,533 19,139 70,000 70,000 30,538
Animal Licenses 38,838 36,376 31,796 36,000 36,000 30,676
State Shared Revenues 1,144,373 1,479,167 689,082 1,236,695 1,236,695 714,518
Criminal Justice 167,506 179,221 88,138 173,235 173,235 91,126
Criminal Justice High Crime 162,777 427,878 169,494 249,450 249,450 176,033
Liquor Excise Tax 330,276 393,090 191,949 339,770 339,770 210,152
Liquor Board Profits 483,806 478,969 239,493 474,240 474,240 237,208
Marijuana Enforcement/Excise Tax 8 8 8 ‐ ‐ ‐
Intergovernmental 528,086 453,830 255,725 288,665 216,110 127,331
Police FBI & Other Misc 14,080 12,870 ‐ 12,000 12,000 12,960
Police‐Animal Svcs‐Steilacoom 18,012 15,630 5,660 16,601 16,601 7,436
Police‐Animal Svcs‐Dupont 33,252 33,917 16,959 34,514 34,514 17,298
Police‐South Sound 911 Background Investigations 32,640 17,298 6,035 15,000 15,000 8,968
Muni Court‐University Place Contract 153,321 251,187 140,142 20,000 6,000 6,000
Muni Court‐Town of Steilacoom Contract 155,276 87,364 51,364 103,000 63,916 37,810
Muni Court‐City of Dupont 121,505 35,565 35,565 87,550 68,079 36,860
87 89

2019
Annual Actual
2020
Annual Actual
2020
Actual YTD Jun
2021
Original
Budget
2021
Current
Revised
2021
Actual
YTD Jun
(001) GENERAL FUND‐continuedCharges for Services & Fees 1,648,838 1,365,370 645,527 1,331,550 1,331,550 496,808
Parks & Recreation Fees 279,541 127,720 60,832 191,250 191,250 88,211
Police ‐ Various Contracts 19,943 3,851 1,650 4,000 4,000 1,455
Police ‐ Towing Impound Fees 10,000 3,000 3,000 4,000 4,000 ‐
Police ‐ Extra Duty 978,470 875,281 401,776 775,000 775,000 226,674
Police ‐ Western State Hospital Community Policing 355,500 355,500 178,250 355,500 355,500 177,750
Other 5,384 18 18 1,800 1,800 2,718
Fines & Forfeitures 1,762,837 1,273,308 818,153 1,363,205 1,363,205 796,745
Municipal Court 812,773 608,159 376,520 663,205 663,205 320,005
Photo Infraction 950,064 665,148 441,633 700,000 700,000 476,740
Miscellaneous/Interest/Other 417,942 161,833 87,386 129,201 129,201 53,390
Interest Earnings 160,388 52,458 39,255 67,930 67,930 9,928
Penalties & Interest ‐ Taxes 167,569 34,294 18,748 7,500 7,500 10,276
Miscellaneous/Other 89,985 75,081 29,382 53,771 53,771 33,185
Interfund Transfers 284,700 284,700 142,350 284,700 284,700 142,350
Transfers In ‐ Fund 401 SWM 284,700 284,700 142,350 284,700 284,700 142,350
Subtotal Operating Revenues $42,294,072 $40,461,225 $19,721,917 $38,300,241 $38,227,686 $22,856,525
EXPENDITURES:
City Council 135,995 134,101 68,256 148,287 148,287 62,948
Legislative 133,874 134,101 68,256 144,837 144,837 62,948
Sister City 2,121 ‐ ‐ 3,450 3,450 ‐
City Manager 722,760 636,362 343,180 709,664 709,804 284,502
Executive 567,347 551,617 273,780 590,909 591,049 249,716
Communications 155,413 84,745 69,400 118,755 118,755 34,787
Municipal Court 1,958,515 1,853,556 945,941 1,990,524 1,991,012 887,568
Judicial Services 1,065,824 1,045,965 559,709 1,076,121 1,076,609 529,816
Professional Services 591,672 562,198 273,783 572,000 572,000 260,837
Probation & Detention 301,019 245,393 112,449 342,403 342,403 96,915
Administrative Services 1,775,396 1,840,554 917,666 1,911,795 1,912,353 941,557
Finance 1,193,231 1,265,348 619,269 1,285,342 1,285,714 642,912
Human Resources 582,165 575,206 298,397 626,453 626,639 298,645
Legal 1,706,817 1,430,939 703,548 1,623,752 1,624,194 696,254
Civil Legal Services 1,124,353 956,930 503,498 1,024,671 1,025,066 493,273
Criminal Prosecution Services 232,724 164,818 86,092 220,030 220,030 107,579
City Clerk 204,178 217,889 113,958 224,051 224,098 95,403
Election 145,562 91,302 ‐ 155,000 155,000 ‐
88 90

2019
Annual Actual
2020
Annual Actual
2020
Actual YTD Jun
2021
Original
Budget
2021
Current
Revised
2021
Actual
YTD Jun
(001) GENERAL FUND‐continuedCommunity & Economic Development 2,266,964 2,188,040 948,539 2,519,919 2,520,827 1,087,437
Current Planning 718,158 715,817 356,866 775,895 776,337 425,756
Long Range Planning 218,809 196,147 109,791 240,978 241,118 124,222
Building 1,146,618 1,135,909 416,705 1,303,025 1,303,304 448,221
Eonomic Development 183,379 140,167 65,177 200,021 200,068 89,238
Parks, Recreation & Community Services 2,903,440 2,407,609 1,104,113 2,930,296 2,931,877 1,251,309
Human Services 403,779 370,123 80,346 482,039 482,039 89,528
Administration 329,201 341,371 188,948 312,761 313,935 203,637
Recreation 467,173 297,314 122,938 479,387 479,387 149,043
Senior Services 246,535 180,325 90,898 243,300 243,300 75,044
Parks Facilities 544,466 424,886 244,628 444,965 445,093 263,710
Fort Steilacoom Park 733,560 619,238 288,538 789,994 790,180 364,119
Street Landscape Maintenance 178,727 174,352 87,818 177,850 177,943 106,228
Police 24,953,309 22,920,852 11,650,705 24,460,328 24,493,673 11,505,599
Command 4,084,467 3,413,795 2,055,191 3,840,266 3,845,611 1,995,519
Jail Service 811,899 365,591 194,768 700,000 700,000 114,381
Dispatch Services/SS911 2,069,771 2,048,834 1,024,370 1,995,290 2,023,290 1,012,105
Investigations 3,935,607 3,898,138 1,887,500 4,326,224 4,326,224 1,902,314
Patrol 7,730,510 7,522,202 3,620,249 7,743,477 7,743,477 3,782,155
Special Units 373,704 291,102 120,963 268,573 268,573 126,693
SWAT/Special Response Team 148,476 37,322 5,769 70,730 70,730 53,350
Neighborhood Policing Unit (Formerly Crime Prevention) 1,195,099 1,287,326 644,643 1,328,064 1,328,064 638,253
Contracted Services (Extra Duty, offset by Revenue) 1,033,057 900,942 500,620 775,000 775,000 368,749
Community Safety Resource Team (CSRT) 403,968 370,379 198,475 478,116 478,116 180,659
Training 843,556 749,949 390,754 812,777 812,777 375,651
Traffic Policing 928,309 883,041 439,293 955,384 955,384 331,381
Property Room 276,447 229,129 116,829 314,888 314,888 114,639
Reimbursements 356,392 276,459 132,302 64,650 64,650 142,879
Emergency Management 51,141 47,987 1,832 39,640 39,640 ‐
Animal Control 324,810 319,129 173,920 357,249 357,249 183,171
Road & Street/Camera Enforcement 386,095 279,528 143,230 390,000 390,000 183,700
Non‐Departmental 121,530 107,234 70,726 136,925 136,925 70,152
Citywide 121,530 107,234 70,726 136,925 136,925 70,152
Interfund Transfers 1,983,711 1,462,408 881,624 1,866,823 1,851,291 875,787
Transfer to Fund 101 Street O&M 1,512,108 981,149 653,664 1,381,902 1,366,370 606,902
Transfer to Fund 105/190 Abatement Program 35,000 35,000 ‐ 35,000 35,000 35,000
Transfer to Fund 201 GO Bond Debt Service 436,603 446,260 227,961 449,921 449,921 233,885
Subtotal Operating Expenditures $38,528,437 $34,981,655 $17,634,299 38,298,313 38,320,243 17,663,113
2019
Annual Actual
2020
Annual Actual
2020
Actual YTD Jun
2021
Original
Budget
2021
Current
Revised
2021
Actual
YTD Jun
OPERATING INCOME (LOSS) 3,765,635 5,479,570 2,087,619 1,928 (92,557) 5,193,413
As a % of Operating Expenditures 9.8% 15.7% 11.8% 0.01% ‐0.24% 29.40%
89 91

2019
Annual Actual
2020
Annual Actual
2020
Actual YTD Jun
2021
Original
Budget
2021
Current
Revised
2021
Actual
YTD Jun
(001) GENERAL FUND‐continuedOTHER FINANCING SOURCES:
Grants, Donations/Contrib, 1‐Time 544,035 3,434,273 222,524 100,250 456,467 256,225
Contibutions/Donations/Other 97,102 58,319 15,996 100,250 155,696 51,793
Grants 446,933 3,375,954 206,528 ‐ 300,771 204,432
Subtotal Other Financing Sources $544,035 $3,434,273 $222,524 $100,250 $456,467 $256,225
OTHER FINANCING USES:
Capital & Other 1‐Time 1,620,058 4,042,415 748,743 185,656 1,323,222 450,402
Municipal Court 94,366 76,136 29,436 8,800 79,621 38,869
City Council ‐ ‐ ‐ ‐ ‐ ‐
City Manager 25,796 1,666 590 17,131 59,472 14,416
Administrative Services 32,136 5,447 3,227 8,190 27,557 14,786
City‐Wide COVID‐19 Grants ‐ 2,877,860 ‐ ‐ 2,689 570
Legal/Clerk 57,002 34,302 18,108 8,825 54,470 26,109
Community & Economic Development 600,928 293,575 143,964 14,663 295,189 76,236
Parks, Recreation & Community Services 102,495 156,355 88,774 40,262 187,178 102,815
Police 707,335 597,075 464,645 87,785 617,045 176,600
Interfund Transfers 1,663,097 1,014,676 871,129 880,000 1,582,425 1,353,750
Transfer Out ‐ Fund 101 Street ‐ ‐ ‐ ‐ 91,888 ‐
Transfer Out ‐ Fund 105 Property Abatement/RHSP 50,000 50,000 ‐ 50,000 50,000 50,000
Transfer Out ‐ Fund 106 Public Art 100,000 ‐ ‐ ‐ 22,500 ‐
Transfer Out ‐ Fund 192 SSMCP 50,000 50,000 50,000 50,000 50,000 50,000
Transfer Out ‐ Fund 301 Parks CIP 479,300 494,129 282,129 80,000 668,037 553,750
Transfer Out ‐ Fund 302 Transportation CIP 983,797 393,547 512,000 700,000 700,000 700,000
Transfer Out ‐ Fund 311 Sewer ‐ 27,000 27,000 ‐ ‐ ‐
Subtotal Other Financing Uses $3,283,155 $5,057,091 $1,619,872 $1,065,657 $2,905,647 $1,804,152
Total Revenues and Other Sources $42,838,107 $43,895,498 $19,944,441 $38,400,491 $38,684,153 $23,112,750
Total Expenditures and other Uses $41,811,592 $40,038,746 $19,254,171 39,363,970 $41,225,890 $19,467,265
Beginning Fund Balance: $8,847,534 $9,874,049 $9,874,049 $5,767,631 $13,573,122 $13,730,801
Ending Fund Balance: $9,874,049 $13,730,801 $10,564,319 $4,804,152 $11,031,385 $17,376,286
Ending Fund Balance as a % of Gen/Street Operating Rev 22.8% 33.2% 52.4% 12.2% 28.1% 74.5%
Reserve ‐ Total Target 12% of Gen/Street Operating Rev $5,194,795 $4,958,178 $4,958,178 $4,711,458 $4,702,752 $4,702,752
2% Contingency Reserves $865,799 $826,363 $826,363 $785,243 $783,792 $783,792
5% General Fund Reserves $2,164,498 $2,065,908 $2,065,908 $1,963,108 $1,959,480 $1,959,480
5% Strategic Reserves $2,164,498 $2,065,908 $2,065,908 $1,963,108 $1,959,480 $1,959,480
Unreserved / (12% Adopted Reserves Shortfall): $4,679,253 $8,772,622 $5,606,141 $92,695 $6,328,635 $12,673,535
90 92

2019
Annual Actual
2020
Annual Actual
2020
Actual YTD Jun
2021
Original
Budget
2021
Current
Revised
2021
Actual
YTD Jun
FUND 101 STREET OPERATIONS & MAINTENANCEREVENUES:
Permits 154,287 147,196 94,272 106,500 106,500 98,865
Engineering Review Fees ‐ 40 40 ‐ ‐ ‐
Motor Vehicle Fuel Tax 841,601 709,693 327,250 855,410 855,410 370,726
Subtotal Operating Revenues 995,888$ 856,929$ 421,562$ 961,910$ 961,910$ 469,591$
EXPENDITURES:
Emergency Services
Street Lighting 367,112 353,182 144,459 337,210 337,210 132,424
Traffic Control Devices 386,439 235,746 104,093 430,523 430,523 120,493
Snow & Ice Response 5,446 28,747 28,521 45,500 45,500 33,667
Road & Street Preservation 1,633,811 1,190,004 771,069 1,514,151 1,515,048 774,188
Subtotal Operating Expenditures $2,392,808 $1,807,679 $1,048,142 $2,327,384 $2,328,281 $1,060,773
OPERATING INCOME (LOSS) ($1,396,920) ($950,750) ($626,580) ($1,365,474) ($1,366,371) ($591,182)
OTHER FINANCING SOURCES:
Grants 12,000 ‐ ‐ ‐ ‐
Judgments, Settlements/Miscellaneous 589 319 319 ‐ ‐ 2,861
Transfer In From General Fund 1,512,108 981,149 653,664 1,381,902 1,458,258 606,902
Subtotal Other Financing Sources $1,512,697 $993,467 $653,982 $1,381,902 1,458,258 609,763
OTHER FINANCING USES:
Building, Vehicles, Equipment &Other 1‐Time 110,987 47,507 32,191 16,428 91,888 18,581
Subtotal Other Financing Uses $110,987 $47,507 $32,191 $16,428 $91,888 $18,581
Total Revenues and Other Sources $2,508,585 $1,850,396 $1,075,544 $2,343,812 $2,420,168 $1,079,354
Total Expenditures and other Uses $2,503,796 $1,855,185 $1,080,333 $2,343,812 $2,420,168 $1,079,354
Beginning Fund Balance: $0 $4,789 $4,789 $0 $0 $0
Ending Fund Balance: $4,789 $0 $0 $0 $0 $0
91 93

2019
Annual Actual
2020
Annual Actual
2020
Actual YTD Jun
2021
Original
Budget
2021
Current
Revised
2021
Actual
YTD Jun
FUND 102 REAL ESTATE EXCISE TAXREVENUES:
Real Estate Excise Tax 2,994,634 3,643,117 1,033,678 1,800,000 1,800,000 1,592,505
Interest Earnings 7,380 2,413 1,880 ‐ ‐ 725
Transfer In ‐ Fund 301 Parks CIP ‐ 100,000 ‐ ‐ ‐ ‐
Total Revenue $3,002,014 $3,745,530 $1,035,559 $1,800,000 $1,800,000 $1,593,230
EXPENDITURES:
Transfer Out ‐ Fund 201 GO Bond Debt Service 164,000 535,296 140,450 1,240,900 1,240,900 162,902
Transfer Out ‐ Fund 301 Parks CIP 1,443,130 519,589 519,589 158,000 158,000 ‐
Transfer Out ‐ Fund 302 Transportation CIP 1,304,031 1,219,403 ‐ 679,295 818,295 ‐
Total Expenditures $2,911,161 $2,274,288 $660,039 $2,078,195 $2,217,195 $162,902
Beginning Fund Balance: $709,416 $800,269 $800,269 $540,095 $2,271,510 $2,271,510
Ending Fund Balance: $800,270 $2,271,510 $1,175,789 $261,900 $1,854,315 $3,701,838
2019
Annual Actual
2020
Annual Actual
2020
Actual YTD Jun
2021
Original
Budget
2021
Current
Revised
2021
Actual
YTD Jun
FUND 103 LAKEWOOD TRANSPORTATION BENEFIT DISTRICTREVENUES:
$20 Vehicle License Fee (Net of State Admin Fee) 830,684 881,849 434,879 835,000 835,000 454,742
Interest Earnings 3,447 904 604 ‐ ‐ 359
Total Revenue $834,131 $882,753 $435,483 $835,000 835,000 455,101
EXPENDITURES:
Transfer to Fund 302 Transportation Capital 923,000 247,457 52,457 ‐ ‐ ‐
Total Expenditures $923,000 $247,457 $52,457 $0 $0 $0
Beginning Fund Balance: $141,325 $52,457 $52,457 $640,000 $687,753 $687,753
Ending Fund Balance: $52,457 $687,753 $435,483 $1,475,000 $1,522,753 $1,142,854
2019
Annual Actual
2020
Annual Actual
2020
Actual YTD Jun
2021
Original
Budget
2021
Current
Revised
2021
Actual
YTD Jun
FUND 104 HOTEL/MOTEL LODGING TAXREVENUES:
Special Hotel/Motel Lodging Tax (5%) $774,671 $619,508 $282,591 $571,429 $571,429 $414,844
Transient Rental income Tax (2%) 317,282 247,803 113,036 228,571 228,571 165,942
Interest Earnings 22,666 7,693 6,290 ‐ ‐ 722
Total Revenues $1,114,619 $875,005 $401,917 $800,000 $800,000 $581,508
EXPENDITURES:
Lodging Tax Programs 540,352 456,515 224,808 672,250 672,250 243,868
Lodging Tax Programs‐Transfer Out to Fund 301 Parks CIP 178,836 320,093 ‐ ‐ 140,941 68,049
Total Expenditures $719,189 $776,609 $224,808 $672,250 $813,191 $311,917
Beginning Fund Balance: $1,165,206 $1,560,637 $1,560,637 $1,247,353 $1,659,033 $1,659,033
Ending Fund Balance (earmarked for next year's grant awards) $1,560,637 $1,659,033 $1,737,747 $1,375,103 $1,645,842 $1,928,624
92 94

2019
Annual Actual
2020
Annual Actual
2020
Actual YTD Jun
2021
Original
Budget
2021
Current
Revised
2021
Actual
YTD Jun
FUND 105 PROPERTY ABATEMENT & RENTAL HOUSING SAFETY PROGRAMREVENUES:
Abatement Program: 238,946 132,535 34,679 147,000 147,000 143,628
Abatement Charges 138,739 59,134 30,819 77,000 77,000 68,481
Interest Earnings 36,581 13,401 3,860 35,000 35,000 40,147
Judgments & Settlements/Other Misc 3,625 ‐ ‐ ‐ ‐ ‐
Transfer In ‐ Fund 001 General 60,000 60,000 ‐ 35,000 35,000 35,000
Rental Housing Safety Program: 230,307 204,398 121,408 225,000 249,287 197,096
Transfer In ‐ Fund 001 General 25,000 25,000 ‐ 50,000 74,287 50,000
Rental Housing Safety Program Fees 205,307 179,398 121,408 175,000 175,000 147,096
1406 Affordable Housing Program: ‐ 72,316 17,297 98,000 98,000 47,483
Sales Tax ‐ 72,316 17,297 98,000 98,000 47,483
Total Revenues $469,253 $409,250 $173,384 $470,000 $494,287 $388,207
EXPENDITURES:
Abatement 132,474 92,934 26,089 147,000 757,386 48,800
Rental Housing Safety Program 199,841 263,719 117,235 225,000 225,000 106,600
1406 Affordable Housing Program ‐ ‐ ‐ 98,000 170,315 ‐
Total Expenditures $332,315 $356,653 $143,324 $470,000 $1,152,701 $155,400
Beginning Fund Balance: $468,879 $605,817 $605,817 $0 $658,414 $658,414
Ending Fund Balance: $605,817 $658,414 $635,877 $0 $0 $891,221
Abatement Program $570,784 $610,386 $579,374 $0 $0 $705,213
Rental Housing Safety Program $35,033 ($24,288) $39,206 $0 $0 $66,208
1406 Affordable Housing Program $0 $72,316 $17,297 $0 $0 $119,800
2019
Annual Actual
2020
Annual Actual
2020
Actual YTD Jun
2021
Original
Budget
2021
Current
Revised
2021
Actual
YTD Jun
FUND 106 PUBLIC ARTREVENUES:
Interest Earnings 893 722 597 ‐ ‐ 62
Facility Rentals 21,000 (3,000) 1,500 7,500 7,500 ‐
Transfer In ‐ Fund 001 General 100,000 ‐ ‐ ‐ 22,500
Total Revenues $121,893 ($2,278) $2,097 $7,500 $30,000 $62
EXPENDITURES:
Arts Commission Programs ‐ ‐ ‐ 2,000 10,000 ‐
Public Art 4,000 5,000 5,000 5,500 155,500 ‐
Total Expenditures $4,000 $5,000 $5,000 $7,500 $165,500 $0
Beginning Fund Balance: $24,885 $142,778 $142,778 $0 $135,500 $135,500
Ending Fund Balance: $142,778 $135,500 $139,875 $0 $0 $135,562
93 95

2019
Annual Actual
2020
Annual Actual
2020
Actual YTD Jun
2021
Original
Budget
2021
Current
Revised
2021
Actual
YTD Jun
FUND 180 NARCOTICS SEIZUREREVENUES:
Forfeitures 123,275 71,670 16,383 ‐ ‐ 15,794
Law Enforcement Contracts 38,171 33,485 11,630 ‐ ‐ 2,217
Interest Earnings 6,098 1,197 997 ‐ ‐ 81
Total Revenues $167,544 $106,352 $29,010 $0 $0 $18,091
EXPENDITURES:
Investigations /Predictive Policing 201,584 162,477 87,273 ‐ 106,196 42,714
Capital Purchases ‐ ‐ ‐ 120,000 120,000 ‐
Total Expenditures $201,584 $162,477 $87,273 $120,000 $226,196 $42,714
Beginning Fund Balance: $316,361 $282,321 $282,321 $120,000 $226,196 $226,196
Ending Fund Balance: $282,321 $226,196 $224,058 $0 $0 $201,573
2019
Annual Actual
2020
Annual Actual
2020
Actual YTD Jun
2021
Original
Budget
2021
Current
Revised
2021
Actual
YTD Jun
FUND 181 FELONY SEIZUREREVENUES:
Forfeitures/Misc/Interest 14,121 42,660 5,401 ‐ ‐ 20
Total Revenues $14,121 $42,660 $5,401 $0 $0 $20
EXPENDITURES:
Investigations/Predictive Policing 21,022 2,966 1,424 ‐ 47,837 6,528
Total Expenditures $21,022 $2,966 $1,424 $0 $47,837 $6,528
Beginning Fund Balance: $15,044 $8,143 $8,143 $0 $47,837 $47,837
Ending Fund Balance: $8,143 $47,837 $12,121 $0 $0 $41,329
2019
Annual Actual
2020
Annual Actual
2020
Actual YTD Jun
2021
Original
Budget
2021
Current
Revised
2021
Actual
YTD Jun
FUND 182 FEDERAL SEIZUREREVENUES:
Forfeitures 264,203 63,492 63,492 ‐ ‐ ‐
Interest Earnings ‐ 1,132 881 ‐ ‐ 86
Total Revenues $264,203 $64,624 $64,373 $0 $0 $86
EXPENDITURES:
Crime Prevention 4,374 399 ‐ ‐ 40,906 ‐
Capital ‐ 163,147 ‐ 120,000 120,000 ‐
Total Expenditures $4,374 $163,546 $0 $120,000 $160,906 $0
Beginning Fund Balance: $0 $259,829 $259,829 $120,000 $160,907 $160,907
Ending Fund Balance: $259,829 $160,907 $324,202 $0 $0 $160,993
94 96

2019
Annual Actual
2020
Annual Actual
2020
Actual YTD Jun
2021
Original
Budget
2021
Current
Revised
2021
Actual
YTD Jun
FUND 190 CDBGREVENUES:
Grants 843,178 385,342 223,055 595,000 4,328,614 458,754
Section 108 Loan Proceeds ‐ ‐ ‐ ‐ ‐ ‐
Interest Earnings 6 16 9 ‐ ‐ 6
Miscellaneous/Contributions 1,309 3,411 408 ‐ ‐ 3,411
Total Revenues $844,493 $388,769 $223,472 $595,000 $4,328,614 $462,171
EXPENDITURES:
Grants 348,605 402,213 254,390 595,000 4,328,614 533,295
Transfer Out ‐ Fund 302 Transportation 486,445 8,056 3,016 ‐ ‐ ‐
Total Expenditures $835,050 $410,269 $257,406 $595,000 $4,328,614 $533,295
Beginning Fund Balance: $1,393,781 $1,403,224 $1,403,224 $0 $1,381,724 $1,381,724
Ending Fund Balance: $1,403,224 $1,381,724 $1,369,289 $0 $1,381,724 $1,310,600
2019
Annual Actual
2020
Annual Actual
2020
Actual YTD Jun
2021
Original
Budget
2021
Current
Revised
2021
Actual
YTD Jun
FUND 191 NEIGHBORHOOD STABLILIZATION PROGRAMREVENUES:
Grant‐NSP 1 55,697 43,741 ‐ ‐ 42,000 46,093
Grant‐NSP 3 ‐ 57,505 57,505 ‐ ‐ ‐
Abatement Charges ‐ ‐ ‐ 63,000 ‐ ‐
Abatement Interest 1,766 12,257 12,257 15,000 ‐ 6,090
Total Revenues $57,462 $113,503 $69,763 $78,000 $42,000 $52,182
EXPENDITURES:
Grant‐NSP 1 3,662 822 652 78,000 297,114 5,601
Grant‐NSP 3 ‐ ‐ ‐ ‐ ‐ 43,357
Total Expenditures $3,662 $822 $652 $78,000 $297,114 $48,959
Beginning Fund Balance: $88,632 $142,433 $142,433 $0 $255,115 $255,115
Ending Fund Balance: $142,433 $255,115 $211,543 $0 $0 $258,339
2019
Annual Actual
2020
Annual Actual
2020
Actual YTD Jun
2021
Original
Budget
2021
Current
Revised
2021
Actual
YTD Jun
FUND 192 SSMCP (SOUTH SOUND MILITARY COMMUNITIES PARTNERSHIP)REVENUES:
Grants 241,825 461,015 217,757 ‐ 7,509,228 115,196
Partner Participation 182,400 186,000 184,100 177,500 186,000 180,500
Misc/Other 1 500 500 ‐ ‐ ‐
Transfer In From Fund 001 General 50,000 50,000 50,000 50,000 50,000 50,000
Total Revenues $474,227 $697,515 $452,357 $227,500 $7,745,228 $345,696
EXPENDITURES:
OEA/SSMCP 494,496 732,928 404,043 227,500 7,763,073 214,588
Total Expenditures $494,496 $732,928 $404,043 $227,500 $7,763,073 $214,588
Beginning Fund Balance: $73,700 $53,431 $53,431 $0 $18,018 $18,018
Ending Fund Balance: $53,431 $18,018 $101,744 $0 $173 $149,125
95 97
2019
Annual Actual
2020
Annual Actual
2020
Actual YTD Jun
2021
Original
Budget
2021
Current
Revised
2021
Actual
YTD Jun
FUND 195 PUBLIC SAFETY GRANTSREVENUES:
Grants 317,474 535,656 193,236 132,328 518,076 249,010
Total Revenues $317,474 $535,656 $193,236 $132,328 $518,076 $249,010
EXPENDITURES:
Grants 317,473 535,656 193,236 132,328 518,076 249,010
Total Expenditures $317,473 $535,656 $193,236 $132,328 $518,076 $249,010
Beginning Fund Balance: $0 $0 $0 $0 $0 $0
Ending Fund Balance: $0 $0 $0 $0 $0 $0
2019
Annual Actual
2020
Annual Actual
2020
Actual YTD Jun
2021
Original
Budget
2021
Current
Revised
2021
Actual
YTD Jun
FUND 201 GENERAL OBLIGATION BOND DEBT SERVICEREVENUES:
Transfer‐In From Fund 001 General 436,603 446,260 233,564 449,921 449,921 233,885
Transfer‐In From Fund 102 REET 164,000 535,296 134,846 1,240,900 1,240,900 162,902
Total Revenues $600,603 $981,556 $368,411 $1,690,821 $1,690,821 $396,787
EXPENDITURES:
Principal & Interest ‐ 59th Avenue 77,000 77,000 77,000 77,000 77,000 77,000
Principal & Interest ‐ Police Station ‐ 2009/2016 210,181 209,006 17,261 212,594 212,594 15,935
Principal & Interest ‐ LOCAL LED Streetlight 155,025 154,650 133,700 160,327 160,327 140,950
Principle & Interest ‐ Transportation Bond ‐ 2019 LTGO 158,396 540,900 140,450 1,004,950 1,004,950 133,950
Principle & Interest ‐ Transportation Bond ‐ 2020 LTGO ‐ ‐ 235,950 235,950 28,952
Total Expenditures $600,603 981,556 368,411 1,690,821 1,690,821 396,787
Beginning Fund Balance: $0 $0 $0 $0 $0 $0
Ending Fund Balance: $0 $0 $0 $0 $0 $0
2019
Annual Actual
2020
Annual Actual
2020
Actual YTD Jun
2021
Original
Budget
2021
Current
Revised
2021
Actual
YTD Jun
FUND 202 LOCAL IMPROVEMENT DISTRICT (LID) DEBT SERVICEREVENUES:
Interest 1,876 1,407 1,129 ‐ ‐ 108
Assessments 201,429 270,724 ‐ 268,920 268,920 ‐
LID 1109 Bond Proceeds for Admin Fees (Fund 302) ‐ 17,730 17,300 ‐ ‐ ‐
Total Revenues $203,305 $289,861 $18,429 $268,920 $268,920 $108
EXPENDITURES:
Combined LID 1101/1103 167,641 10,800 512 109,833 247,002 665
LID 1108 68,293 65,521 ‐ 62,749 62,749 182
LID 1109 ‐ 600 600 96,338 207,207 96,564
Total Expenditures 235,934 76,921 1,112 268,920 516,958 97,411
Beginning Fund Balance: $67,726 $35,097 $35,097 $0 $248,038 $248,038
Ending Fund Balance: $35,097 $248,038 $52,414 $0 $0 $150,735
96 98

2019
Annual Actual
2020
Annual Actual
2020
Actual YTD Jun
2021
Original
Budget
2021
Current
Revised
2021
Actual
YTD Jun
FUND 204 SEWER PROJECT DEBT SERVICEREVENUES:
Sewer Charges (4.75% Sewer Surcharge) 822,295 791,007 392,315 785,000 785,000 383,888
Interest Earnings/Other 20,829 4,127 2,553 6,600 6,600 409
Sanitary Side Sewer Connection Home Loan Repayment 7,767 30,413 4,190 8,881 8,881 5,649
Total Revenues $850,891 $825,547 $399,057 $800,481 $800,481 $389,946
EXPENDITURES:
Principal & Interest 485,023 482,554 482,554 480,086 480,086 480,086
Transfer To Fund 311 Sewer Capital 987,000 55,000 55,000 190,000 190,000 ‐
Total Expenditures 1,472,023 $537,554 $537,554 $670,086 $670,086 $480,086
Beginning Fund Balance: $940,452 $319,321 $319,321 $578,288 $607,313 $607,313
Ending Fund Balance: $319,321 $607,313 $180,824 $708,683 $737,708 $517,173
2019
Annual Actual
2020
Annual Actual
2020
Actual YTD Jun
2021
Original
Budget
2021
Current
Revised
2021
Actual
YTD Jun
FUND 251 LOCAL IMPROVEMENT DISTRICT (LID) GUARANTY DEBT SERVICEREVENUES:
Interest Earnings 2,606 674 556 ‐ ‐ 59
Total Revenues $2,606 $674 $556 $0 $0 $59
EXPENDITURES:
Transfer Out ‐ Fund 001 General ‐ ‐ ‐ ‐ ‐ ‐
Total Expenditures $0 $0 $0 $0 $0 $0
Beginning Fund Balance: $129,688 $132,294 $132,294 $132,294 $132,968 $132,968
Ending Fund Balance: $132,294 $132,968 $132,850 $132,294 $132,968 $133,028
2019
Annual Actual
2020
Annual Actual
2020
Actual YTD Jun
2021
Original
Budget
2021
Current
Revised
2021
Actual
YTD Jun
FUND 301 PARKS CAPITAL REVENUES:
Grants 714,360 2,112,047 151,817 332,000 2,609,549 336,070
Motor Vehicle Excise Tax for Paths & Trails 4,978 4,198 1,936 ‐ ‐ 2,193
Interest Earnings 33,800 12,768 10,611 ‐ ‐ 721
Contributions/Donations/Utility & Developers 208,974 5,023 50 ‐ 10,000 13,540
Transfer In From Fund 001 General 479,300 494,129 282,129 80,000 643,750 553,750
Transfer In From Fund 102 REET 1,443,130 519,589 519,589 158,000 158,000 ‐
Transfer In From Fund 104 Hotel/Motel Lodging Tax 178,836 320,093 ‐ ‐ 140,941 68,049
Transfer In From Fund 302 Transportation CIP 5,087 ‐ ‐ ‐ ‐ ‐
Transfer In From Fund 401 Surface Water Mgmt 131,537 ‐ ‐ ‐ 206,277 ‐
Transfer In ‐ Fund 502 Property Management 50,000 ‐ ‐ ‐ ‐ ‐
Total Revenues $3,250,004 $3,467,848 $966,132 $570,000 $3,768,517 $974,323
EXPENDITURES:
Capital 2,025,972 3,478,905 223,231 570,000 6,349,899 1,729,969
Transfer to Fund 102 REET ‐ 100,000 ‐ ‐ ‐ ‐
Total Expenditures $2,025,972 $3,578,905 $223,231 $570,000 $6,349,899 $1,729,969
Beginning Fund Balance: $1,492,525 $2,716,557 $2,716,557 $0 $2,605,500 $2,605,500
Ending Fund Balance: $2,716,557 $2,605,500 $3,459,458 $0 $24,118 $1,849,853
97 99

2019
Annual Actual
2020
Annual Actual
2020
Actual YTD Jun
2021
Original
Budget
2021
Current
Revised
2021
Actual
YTD Jun
FUND 302 TRANSPORATION CAPITAL PROJECTREVENUES:
Motor Vehicle Excise Tax 338,774 285,676 131,730 344,330 344,330 149,230
State Transportation Package ‐ Multi‐Modal Distribution 82,162 81,341 40,672 80,440 80,440 40,284
State Transportation Package ‐ Increased Gas Tax (MVET) 71,893 71,174 35,588 70,235 70,235 35,249
Traffic Mitigation Fees 103,505 ‐ ‐ ‐ ‐ ‐
Pavement Degradation Fees 52,741 28,135 17,423 ‐ ‐ 21,263
Grants 1,421,106 2,192,897 625,525 4,786,400 8,480,468 1,627,115
Contributions from Utilities/Developers/Partners 179,351 150,126 ‐ 150,302 150,302 ‐
LID Financing ‐ 922,757 922,757 ‐ ‐ ‐
Proceeds from Sale of Asset/Street Vacation 200,000 65,203 37,800 ‐ ‐ ‐
Interest/Other 136,879 57,861 50,035 ‐ ‐ 1,982
GO Bond Proceeds 8,055,905 3,029,885 ‐ 6,600,000 6,600,000 ‐
Transfer In ‐ Fund 001 General 983,797 512,000 512,000 700,000 700,000 700,000
Transfer In ‐ Fund 102 REET 1,304,031 1,100,950 ‐ 679,295 818,295 ‐
Transfer In ‐ Fund 103 TBD 923,000 247,457 52,457 ‐ ‐ ‐
Transfer In ‐ Fund 190 CDBG 486,445 8,056 3,016 ‐ 294,960 (5,040)
Transfer In ‐ Fund 401 SWM 788,275 492,901 278,657 1,575,000 4,316,155 779,458
Total Revenues $15,127,864 $9,246,420 $2,707,659 $14,986,002 $21,855,185 $3,349,540
EXPENDITURES:
Capital Projects 7,256,185 14,571,364 4,285,493 15,732,002 26,253,222 4,374,487
Debt Issue Cost 55,881 19,500 ‐ ‐ ‐ 10,380
Transfer Out ‐ Fund 301 Parks CIP 5,087 ‐ ‐ ‐ ‐
Transfer Out ‐ Fund 201 GO Bond Debt Service ‐ 17,730 17,300 ‐ ‐ ‐
Transfer Out ‐ Fund 401 SWM ‐ 241,840 241,840 ‐ ‐ ‐
Intefund Loan Repayment ‐ 880,204 880,204 ‐ ‐ ‐
Total Expenditures $7,317,153 $15,730,638 $5,424,837 $15,732,002 $26,253,222 $4,384,867
Beginning Fund Balance: $3,543,426 $11,354,136 $11,354,136 $927,246 $4,869,918 $4,869,918
Ending Fund Balance: $11,354,136 $4,869,918 $8,636,959 $181,246 $471,881 $3,834,590
2019
Annual Actual
2020
Annual Actual
2020
Actual YTD Jun
2021
Original
Budget
2021
Current
Revised
2021
Actual
YTD Jun
FUND 311 SEWER CAPITAL PROJECTREVENUES:
Grants 450,000 ‐ ‐ ‐ 75,000 ‐
Sewer Availability Charge 245,401 297,919 146,531 165,000 165,000 125,914
Interest Earnings 18,382 5,381 4,322 ‐ ‐ 868
Proceeds from Lien 1,474 1,543 632 ‐ ‐ 625
Transfer In Fund 001 General ‐ 27,000 27,000 ‐ ‐ ‐
Transfer In From Fund 401 Surface Water Mgmt ‐ 8,000 ‐ ‐ ‐ ‐
Transfer In Fund 204 Sewer Debt (Sewer Surcharge 4.75%) 987,000 55,000 55,000 190,000 190,000 ‐
Transfer In Fund 312 Sanitary Sewer Connection Capital 815,483 ‐ ‐ ‐ ‐ ‐
Total Revenues $2,517,741 $394,844 $233,485 $355,000 $430,000 $127,407
EXPENDITURES:
Capital/Administration 1,390,145 108,745 44,795 795,000 1,743,461 43,346
Total Expenditures $1,390,145 $108,745 $44,795 $795,000 1,743,461 43,346
Beginning Fund Balance: $118,225 $1,245,820 $1,245,820 $465,586 $1,531,919 $1,531,919
Ending Fund Balance: $1,245,820 $1,531,919 $1,434,510 $25,586 $218,458 $1,615,980
98 100

2019
Annual Actual
2020
Annual Actual
2020
Actual YTD Jun
2021
Original
Budget
2021
Current
Revised
2021
Actual
YTD Jun
FUND 401 SURFACE WATER MANAGEMENTREVENUES:
Storm Drainage Fees & Charges 4,256,773 4,480,680 2,372,193 4,351,500 4,351,500 2,588,348
Site Development Permit Fee 46,968 74,816 52,293 50,000 50,000 44,665
Interest Earnings & Misc 79,984 22,701 18,408 15,600 15,600 2,684
Subtotal Operating Revenues $4,383,724 $4,578,197 $2,442,893 $4,417,100 $4,417,100 $2,635,698
EXPENDITURES:
Engineering Services and Operations & Maintenance ‐ ‐ ‐ ‐ ‐ ‐
Engineering Services 1,431,957 1,430,305 746,049 1,860,808 1,861,215 807,724
Operations & Maintenance 810,393 623,702 229,188 961,416 961,416 96,068
Revenue Bonds ‐ Debt Service (15‐Year Life, 4%) ‐ 126,000 126,000 ‐
Transfer to Fund 001 General Admin Support 284,700 284,700 142,350 284,700 284,700 142,350
Subtotal Operating Expenditures $2,527,049 $2,338,707 $1,117,587 $3,232,924 $3,233,331 $1,046,142
OPERATING INCOME (LOSS) $1,856,675 $2,239,490 $1,325,306 $1,184,176 $1,183,769 $1,589,555
As a % of Operating Expenditures 73.5% 95.8% 118.6% 36.6% 36.6% 151.9%
OTHER FINANCING SOURCES:
Grants/Contributions ‐ 120,168 7,376 ‐ 3,435 21,398
American Lake Management District 119,313 32,337 21,506 33,285 33,285 9,710
Flood Control Opportunity Fund ‐ 300,202 148,488 ‐ ‐ ‐
Revenue Bonds ‐ Bond Proceeds ‐ ‐ ‐ 1,000,000 1,000,000 ‐
Transfer In From Fund 302 Transportation Capital ‐ 241,840 241,840 ‐ ‐ ‐
Subtotal Other Financing Sources $119,313 $694,546 $419,209 $1,033,285 $1,036,720 $31,108
OTHER FINANCING USES:
Capital/1‐Time 225,438 903,821 226,568 231,665 689,548 39,720
American Lake Management District 124,619 14,584 4,128 29,886 61,121 2,246
Transfer to Fund 301 Parks CIP 133,958 ‐ ‐ ‐ 206,277 ‐
Transfer to Fund 302 Transportation Capital 785,855 492,901 278,657 1,575,000 4,316,155 779,458
Transfer To Fund 311 Sewer Capital ‐ 8,000 ‐ ‐ ‐ ‐
Subtotal Other Financing Uses $1,269,870 $1,419,305 $509,353 $1,836,551 $5,273,101 $821,424
Total Revenues and Other Sources $4,503,037 $5,272,743 $2,862,102 $5,450,385 $5,453,820 $2,666,805
Total Expenditures and other Uses $3,796,920 $3,758,013 $1,626,941 $5,069,475 $8,506,432 $1,867,566
Beginning Fund Balance: $3,600,172 $4,306,289 $4,306,289 $1,500,405 $5,821,019 $5,821,019
Ending Fund Balance: $4,306,289 $5,821,019 $5,541,451 $1,881,315 $2,768,407 $6,620,258
Ending Fund Balance as a % of Operating Rev/Exp 98.2% 127.1% 226.8% 42.6% 62.7% 251.2%
17% Operating Reserves (of operating revenues) $0 $0 $0 $0 $0 $0
33% Operating Reserves (of operating expenditures) $833,926 $771,773 $368,804 $1,066,865 $1,066,999 $1,066,999
1% Capital Reserves $458,330 $453,795 $453,795 $490,130 $490,130 $490,130
American Lake Management District $16,571 $31,237 $31,518 $31,549 $314 $35,614
Unreserved / (Shortfall): $2,997,462 $4,564,214 $4,687,334 $292,771 $1,210,964 $5,027,515
99 101

2019
Annual Actual
2020
Annual Actual
2020
Actual YTD Jun
2021
Original
Budget
2021
Current
Revised
2021
Actual
YTD Jun
FUND 501 FLEET & EQUIPMENTOPERATING REVENUES:
M&O Revenue 763,367 617,408 275,170 740,720 740,720 268,986
Interest Earnings 71,013 19,472 15,857 15,000 15,000 1,883
Total Revenues $834,380 $636,880 $291,026 $755,720 $755,720 $270,868
OPERATING EXPENDITURES:
Fuel/Gasoline 323,206 255,476 108,340 424,150 424,150 131,198
Other Supplies 18,655 11,720 6,529 3,990 3,990 9,432
Repairs & Maintenance 499,389 380,884 184,912 327,580 327,580 130,112
Other Services & Charges 6,468 516 462 ‐ ‐ 126
Total Expenditures $847,719 $648,597 $300,243 $755,720 $755,720 $270,868
Operating Revenue Over/(Under) Expenditures ($13,339) ($11,716) ($9,216) $0 $0 $0
OTHER FINANCING SOURCES:
Interfund Loan (Fund 302 LID Interim Financing) ‐ 880,204 880,204 ‐ ‐ ‐
Replacement Reserves Collections 805,481 ‐ ‐ ‐ ‐ ‐
Capital Contribution ‐ 25,807 ‐ ‐ 24,900 ‐
Proceeds From Sale of Assets 13,339 11,716 9,216 ‐ ‐ 24,660
Transfer In From Fund 504 Risk Management 81,184 64,851 58,574 ‐ ‐ ‐
Total Other Financing Sources $900,004 $982,578 $947,994 $0 $24,900 $24,660
OTHER FINANCING USES:
Fleet & Equipment New & Replacement 941,993 490,005 59,058 484,000 687,552 211,055
Total Other Financing Uses $941,993 $490,005 $59,058 $484,000 $687,552 $211,055
Total Revenues $1,734,384 $1,619,459 $1,239,020 $755,720 $780,620 $295,528
Total Expenditures $1,789,712 $1,138,602 $359,300 $1,239,720 $1,443,272 $481,923
Beginning Fund Balance: $3,835,778 $3,780,451 $3,780,451 $3,940,779 $4,261,308 $4,261,308
Ending Fund Balance: $3,780,451 $4,261,308 $4,660,171 $3,456,779 $3,598,656 $4,074,913
2019
Annual Actual
2020
Annual Actual
2020
Actual YTD Jun
2021
Original
Budget
2021
Current
Revised
2021
Actual
YTD Jun
FUND 502 PROPERTY MANAGEMENTOPERATING REVENUES:
M&O Revenue 683,461 702,611 312,249 695,603 695,603 361,618
Interest Earnings 14,728 2,278 1,831 ‐ ‐ 258
Total Operating Revenues 698,189$ 704,888$ 314,080$ 695,603$ 695,603$ 361,876$
OPERATING EXPENDITURES:
City Hall Facility 369,872 374,899 167,098 381,034 381,034 193,137
Police Station 266,905 275,469 125,889 245,052 245,052 148,740
Parking Facilities/Light Rail 61,413 54,521 21,093 69,517 69,517 19,999
Total Operating Expenditures 698,189$ 704,888$ 314,080$ 695,603$ 695,603$ 361,876$
Operating Revenue Over/(Under) Expenditures (0)$ ‐$ ‐$ ‐$ ‐$ ‐$
OTHER FINANCING SOURCES:
Replacement Reserve Collections / Other 1‐Time 100,000 156,178 66,333 ‐ 40,000 ‐
Total Other Financing Sources 100,000$ 156,178$ 66,333$ ‐$ 40,000$ ‐$
OTHER FINANCING USES:
Capital/1‐Time/6‐Year Property Management Plan 157,082 7,934 757 230,000 355,000 9,822
Total Other Financing Uses 157,082$ 7,934$ 757$ 230,000$ 355,000$ 9,822$
Total Revenues 798,188$ 861,066$ 380,414$ 695,603$ 735,603$ 361,876$
Total Expenditures 855,271$ 712,823$ 314,837$ 925,603$ 1,050,603$ 371,698$
Beginning Fund Balance: $493,139 $436,057 $436,057 $389,124 $584,300 $584,300
Ending Fund Balance: $436,057 $584,300 $501,634 $159,124 $269,300 $574,479
100 102

2019
Annual Actual
2020
Annual Actual
2020
Actual YTD Jun
2021
Original
Budget
2021
Current
Revised
2021
Actual
YTD Jun
FUND 503 INFORMATION TECHNOLOGYREVENUES:
M&O Revenue 1,202,671 1,337,482 697,270 1,891,129 1,891,129 694,736
Misc/Interest/Other 2,201 2,826 2,655 ‐ ‐ 89
Total Operating Revenues 1,204,872$ 1,340,308$ 699,925$ 1,891,129$ 1,891,129$ 694,825$
EXPENDITURES:
Personnel 562,728 524,535 259,555 588,699 588,699 293,341
Supplies 40,330 60,796 48,127 179,520 179,520 33,630
Services & Charges 601,814 754,976 392,243 1,122,910 1,122,910 367,854
Total Operating Expenditures $1,204,872 $1,340,308 $699,925 $1,891,129 $1,891,129 $694,825
Operating Revenue Over/(Under) Expenditures $0 $0 $0 $0 $0 $0
OTHER FINANCING SOURCES:
Replacement Reserve Collection 48,678 66,845 22,282 ‐ ‐ ‐
Capital Contrib & Other 1‐Time /6‐Year Strategic Plan 593,944 305,350 203,334 168,750 525,655 246,788
Total Other Financing Sources $642,622 $372,195 $225,616 $168,750 $525,655 $246,788
OTHER FINANCING USES:
One‐Time/Capital 593,944 305,350 203,334 168,750 525,655 246,788
Total Other Financing Uses $593,944 $305,350 $203,334 $168,750 $525,655 $246,788
Total Revenues $1,847,494 $1,712,503 $925,541 $2,059,879 $2,416,784 $941,612
Total Expenditures $1,798,816 $1,645,658 $903,259 $2,059,879 $2,416,784 $941,612
Beginning Fund Balance: $90,000 $138,678 $138,678 $205,522 $205,522 $205,523
Ending Fund Balance: $138,678 $205,523 $160,960 $205,522 $205,522 $205,523
101 103

2019
Annual Actual
2020
Annual Actual
2020
Actual YTD Jun
2021
Original
Budget
2021
Current
Revised
2021
Actual
YTD Jun
FUND 504 RISK MANAGEMENTREVENUES:
M&O Revenue 1,561,705 1,289,027 1,494,012 1,396,480 1,406,350 1,465,350
AWC Retro Refund ‐ 128,938 51,655 ‐ ‐ ‐
Insurance Proceeds/3rd Party Recoveries 285,680 371,383 105,694 200,000 200,000 83,259
Total Revenues $1,847,386 $1,789,348 $1,651,361 $1,596,480 $1,606,350 $1,548,609
EXPENDITURES:
Safety Program 2,782 2,474 1,013 3,980 3,980 1,310
AWC Retro Program 35,792 37,356 37,356 37,500 37,500 33,945
WCIA Assessment 1,411,230 1,438,931 1,438,931 1,355,000 1,364,870 1,364,838
Claims/Judgments & Settlements 316,397 245,735 115,486 200,000 200,000 148,516
Total Expenditures $1,766,202 $1,724,497 $1,592,787 $1,596,480 $1,606,350 $1,548,609
OTHER FINANCING SOURCES:
Capital Contribution/1‐Time M&O ‐ ‐ ‐ ‐ ‐ ‐
Total Other Financing Sources $0 $0 $0 $0 $0 $0
OTHER FINANCING USES:
Transfer To Fund 501 Fleet & Equipment 81,184 64,851 58,574 ‐ ‐ ‐
Total Other Financing Uses $81,184 $64,851 $58,574 $0 $0 $0
Total Revenues $1,847,386 $1,789,348 $1,651,361 $1,596,480 $1,606,350 $1,548,609
Total Expenditures $1,847,386 $1,789,348 $1,651,361 $1,596,480 $1,606,350 $1,548,609
Beginning Fund Balance: $0 $0 $0 $0 $0 $0
Ending Fund Balance: $0 $0 $0 $0 $0 $0
102 104

City Council
Performance Measure Target Quarter 1 Quarter 2
# of City Council retreats 2 times per year 1 1
# of City Council sponsored/supported events 20 per year 2 4
MLK Jr. Celebration
APCC Asia Pacific New Year Celebration
Community Clean‐Up Event
2021 Kids’ Fest and Children’s Museum at JBLM Ribbon Cutting Ceremony
Lancer Field Dedicatoin Ceremony
Rotary Club of Lakewood Sportsmans Dinner & Auction
103 105

City Manager
Performance Measure Target Quarter 1 Quarter 2
Average # of items on study session agendas < 6 items 3.3 4
# of presentations of State of the City 10 3 3
# of new followers: City Twitter 45 per quarter data not available 2,480
# of new followers: LPD Twitter 45 per quarter data not available 7,955
#of new likes: City FB 45 per quarter 6 8,942
#of new likes: LPD FB 45 per quarter data not available
16,385
#of new likes: Parks FB 45 per quarter data not available
1,495
#of new likes: Senior Ctr FB 45 per quarter data not available
494
# of posts: City Instagram 45 per quarter 11 36
# of multimedia items produced ‐ video 3 per quarter 0 15
104 106

Finance
Performance Measure Target Quarter 1 Quarter 2Type/Description‐ Finance
# of invoices paid annually n/a 1699 1875
% of invoices paid within 30 days of invoice date (1) 95% 87.0% 88.1%
% of accounts receivable aged balances over 60 days versus annual billing 5% 0.66% 1.76%
GFOA Award Received for the Annual Comprehensive Financial Report (ACFR) for 2013‐2019 (2) Yes FY2020 Pending Review
GFOA Award Received for the Poplular Annual Financial Report (PAFR) for 2016‐2019 (2) Yes FY2020 Pending Review
GFOA Award Received for Distinguished Budget Presentation for the
2021‐2022 Biennium's Budget Document (2) Yes n/a n/a
Clean Audit for Prior Fiscal Year Yes Pending Yes
Bond Rating Per Standard & Poor's AA AA AA
(1) Requires coordination with departments to ensure Accounts Payable receives invoices timely.
(2) Received Triple Crown Medallion Award which signifies government has received all three GFOA awards (the Certificate of Achievement for Excellence in Financial
Reporting Award, the Distinguished Budget Presentation Award, and the Popular annual Financial Report for fiscal year 2019).
105 107

Information Technology
Performance Measure Target Quarter 1 Quarter 2
# of new systems implemented n/a 0 0
# of users served n/a 259 259
# of personal computers maintained n/a 444 444
# of applications maintained n/a 139 139
# of servers maintained (LAN/WAN) n/a 81 81
# of Hot Spots & In‐Car Cradlepoint cellular devices maintained n/a 130 130
# of Cell Phones/maintained n/a 205 205
# of Shoretel phones operated and maintained n/a 290 290
# of radios maintained n/a N/A N/A
% of IT system up‐time during normal business hours 100% 100% 100%
% of communications up‐time during normal business hours 100% 100% 100%
Overall Phish‐Prone Percentage (Cyber Phishing) (Current Industry is 29%) 29% 4% 4%
Number of help desk requests receivedn/a 371 393
Help desk requests resolved: Total requests resolvedn/a 519 324
Total # of Blocked incoming email messages n/a 11,848 Unavailable
Total # of Allowed incoming email messages n/a 256,755 Unavailable
Total # of Blocked outgoing email messages n/a 3,751 Unavailable
Total # of Allowed outgoing email messages n/a 76,522 Unavailable
Total # of Blocked Website pages (via policy) n/a 9,572 Unavailable
Total # of Blocked Website pages (via Spyware/Infected) n/a 335 Unavailable
Total # of Allowed Website hits n/a 68,396,074 Unavailable
Note: Items listed as "n/a" do not have a set threshhold that is met. Totals are exact numbers provided to show activity in these areas
based on overall use and submission from staff (i.e. helpdesk requests).
"Unavailable" = unavailable at time of publication of this report.
106 108

Human Resources
Performance Measure Target Quarter 1 Quarter 2
Measures‐ Human Resources
Number of current (unexpired) Collective Bargaining Agreements as of EOQ 4 3 3
Voluntary Employee Turnover Rate (not reported cumulatively) <12% 1.98% 2.43%
Average number of recruitments/analyst n/a 4.5 2.5
Average number of applications received/position n/a 20 18
Percentage of employees hired during the quarter last year and still employed 100% 100% 100%
Average number of days to complete external recruitment (excluding Police Officers) <45 52 39.8
Average number of FTEs filled City‐wide 220 202 205.45
Percentage of performance evaluations due during quarter completed 100% 38% 33%
Percentage of City Leadership Team who have achieved WCIA Supervisor credential 100% 36%
Number of categories (out of 112) where workforce underutilization is 3% or greater 0 16
Measures‐ Risk Management
Percentage of employees in compliance with quarterly mandatory training 100% 71
Percentage of employees who participate in monthly safety training promotions 100% n/a n/a
Percentage Stay at Work applications of total medical releases to light duty 70% 33%
Percentage workers comp developed claim expense of total annual premium cost = Loss
Ratio% (reported cumulative YTD)<70% 5.8%
Worker's Compensation Experience Factor <1.0 0.8908 0.8908
Percentage of vehicle incidents that were preventable by the City employee 0% 100.00%
107
17
27%
n/a
n/a
n/a
n/a
n/a = information not available/provided at time of publication of the quarterly financial report.
109

Community Economic Development
Performance Measure Target Quarter 1 Quarter 2
Measure‐ CDBG
# of persons with new or improved access to public facility or infrastructure 5,115 0 0
# of owner‐occupied units rehabilitated 12 3 4
# of new affordable housing units constructed 3 0 0
# persons assisted with emergency HOME tenant‐based rental assistance 100 56 52
# persons assised with emergency CDBG‐CV assistance payments for rental
and mortgage assistance
150 0 73
# persons with access to affordable housing through fair housing activities 50 0 0
# units assisted that are occupied by the elderly tbd 0 5‐Major/ 21 Rental
Assistance
$ program income received (CDBG & NSP) tbd $58,329
Measure ‐ Nuisances and Abatements**
#of dangerous building abatements completed annually 30 7 0
#of dangerous building abatements pending 19 19
#of public nuisances completed annually 3 0 4
#of public nuisances pending 4 2
Measure‐ RHSP
# rental properties registered 3,732 1,624 210
# rental units registered 13,915 9,811 1,045
# rental properties inspected annually 913 72 75
# rental units inspected annually 2,451 90 95
Measure‐ Economic Development
$ investment created through economic dev efforts $320,000,000 $75,907,000 $99,777,787
# of business retention/expansion of interviews conducted 80 21 33
# of new market rate, owner‐occupied housing units constructed annually 40 10 31
# of projects where permit assistance was provided 40 24 15
# of special projects completed 50 28 14
# of economic development inquiries received 200 82 68
# of participant attending forums, focus groups, or special events 500 0 0
# of new companies located in Lakewood 20 243 133
# of new development projects assisted 30 8 11
Measure‐ Building Permit
# of permits issued tbd 380 414
# of plan reviews performed tbd 30 49
# of inspections performed tbd 1,564 1,643
Measure‐ Long Range Planning
# of privately initiated land use amendments 4 4 0
# of city initiated land use amendments 6 6 9
Adoption of the Lakewood Station District Subarea Plan 2nd qtr In‐process In‐process
2021 comprehensive plan & zoning code amendments (includes energy &
climate change chapter)
3rd qtrIn‐process
9
Review of 2020 shoreline restoration report 1st qtr Completed N/A
Buildable Lands Report 4th qtr In‐process; dates subject
to change
In‐process; dates subject to
change; report to city
council September 7, 2021
2022 Comprehensive Plan Docket 4th qtr Not started In‐process
Annual zoning development regulations update (follows close of legislative
session)
3rd/4th qtrs Not started In‐process
ARPA administration Annual In‐process In‐process
Lakewood VISION 2050 population allocations Special In‐process In‐process; tied to
Buildable Lands Report
Update Pierce County‐Wide Planning Policies 4th qtr In‐process In‐process
Complete annual assignments ‐ capital facilities plan update, tracking housing
date, and prepare multi‐family tax credit report
Annual Housing report completed Not started
108 110

Quarter 1 Quarter 2
Permit Type‐ Current
Planning
Target
# of Days
Total
Permits
Average
Days
% w/in
Target?
# Outside
Target
Target
# of Days
Total
Permits
Average
Days
% w/in
Target?
# Outside
Target
Zoning Certification 30 10 19.00 80% 2 30 11 25.54 100% 0
Conditional use 120 0 n/a n/a n/a 120 1 28 100% 0
Administrative use 120 n/a n/a n/a n/a 120 n/a n/a n/a n/a
Preliminary plat 120 0 n/a n/a n/a 120 0 n/a n/a n/a
Preliminary short plat 90 2 29.00 100% 0 90 5 24.8 100% 0
Sign permit 20 9 3.50 100% 0 20 13 10 100% 0
Site development permit 90 n/a n/a n/a n/a 90 n/a n/a n/a n/a
Building Permit 20 92 18.11 100% 0 20 78 12.8 100% 0
Shoreline permit 180 4 31.75 100% 0 180 6 24.33 100% 0
Permit Type
Target
# of Days
Total
Permits
Average
Days
% w/in
Target?
# Outside
Target
Target
# of Days
Residential model homes
(basic) 30 0 30 0 0 0 0.00
New single family
residential
30 23 29.5 74% 6 30 13 17 69% 4
Residential additions 30 4 27.0 75% 1 30 11 32 73% 3
New multi‐family 30 30 0 0 0% 0
New commercial buildings 30 3 41.3 33% 2 30 4 5 100% 100
Commercial tenant
improvements
‐ major (change of use)
30 13 16.6 85% 2 30 21 21 81% 4
109 111

Parks and Recreation
Performance Measure Target Quarter 1 Quarter 2Measure‐ Admin
Cost Recovery % Target ‐ 45% for parks and recreation services * 45 % 44% 50%Measure‐ Human Services
Monthly average attendance at Lakewood Community Collaboration
Meetings
40 each
month 22 28# of human services contracts Managed 25 25 25Measure‐ Recreation$ vendor sales generated from Farmers Market $140,000 na $245,000 # of partners at SummerFEST 50 na na$ vendor fees generated from SummerFest $17,000 na na$ sponsorship, grants and in‐kind service $70,000 $33,150 $17,500 Math Relay School/participants 8/240 Postponed Postponed# of registered participants at SummerFEST Triathlon 200 na naMeasure‐ Senior Center# of unduplicated seniors served 1,400 276 184
$ revenue generated from grants, fees, donations & in‐kind support $80,000$7,578 $8,562
# of volunteer hours 1,300 219.05 126.1Measure‐ Park Facilities# of special use permits generated at park site (not FSP) 160 4 30Boat Launch Revenue $50,000 $7,556 $26,636 # of returning customers 20 2 12Measure‐ Fort Steilacoom
# of acres of open space to maintain 500 500 500
# of special use permits for park use 230 18 109
# of returning customers 25 9 26Measure‐ Landscape# of sites maintained 38 46 47
# of special projects completed outside of regular maintenance
schedule
10 3 6
Measure‐ Property Management
# of square feet of coverage per building maintenance employee 158,615 158,615 158,615
# of unscheduled system failures 0 Fire Alarm Testing @ CH &
LPD, Test fire Sprinkler system
at CH, LPD, & ST, LNI elevator
inspections
LPD HVAC Shutdown (heat) &
maintenance, HVAC3 at CH
reset, LPD Gate & Door Entry
(Heat)
# of service requests 400 92 236SWM Operations & Maintenance# of City street curb miles swept 3,600 1,103 737# of catch basins cleaned or inspected 3,400 97 1533# of hours of storm drain pipe video inspections recorded 900 11.5 592.5# of linear feet of storm drain pipe cleaned 30,000 0 185# of tons of sweeping and vactor waste disposed of 2,000 146.5 251.5# of gallons of sweeping and vactor liquid waste disposed of 100,000 1,500 3,500Measure‐ Street Operations and Maintenance# of MyLakewood311 service requests regarding street maintenance NA 436 529% of completed MyLakewood311 requests 100% 98% 96%# of potholes responded to <275 72 42# of reported downed signs <400 88 87# of traffic signal major equipment failures <2 0 0# of after hour call outs <250 38 20
110 112

Public Works
Performance Measure Target Quarter 1 Quarter 2
Measure‐ Transportation Capital
# of traffic signals operated and maintained 69 69 68
# of City maintained street lights 2,500 2,525 2,525
Annual transportation capital funds administered N/A $1,431,615 $2,953,253
Amount of transportation grant funds awarded N/A $1,500,000 $2,875,000
Measure‐ Surface Water Management
# of businesses/properties inspected for SWM compliance 400/yr 15 72
# of volunteer hours for water quality sampling 150/yr 17 49.5
Average turnaround time for 1st review ‐ Site Development Permits 30 days 30 30
Average turnaround time for Right of Way Permits 5 days 5 5
111 113

Legal
Performance Measure Target Quarter 1 Quarter 2
# of days on average to review/process a contract 3 3.3 2.64
% of cases disposed of in accordance with departmental standards n/a 100 100%
# of criminal citation cases filed 475 386
# of days on average for PRA response 30 15 17.65
Provide discovery within 14 calendar days of a request in 90% or more of the cases in which discovery
is authorized/requested/required
90% 100% 100%
Make In Custody charging decisions within 8 hours of receipt of the report(s) in 90% or more of the
cases
90% 100% 100%
Review all felony In Custody NCF cases from Pierce County within 8 hours of receipt of the report(s) in
95% or more of the cases
95% 100% 100%
Review incidents for charging decision within 30 days of receipt 90% 100% 100%
112 114

Municipal Court
Performance Measure Target Quarter 1 Quarter 2
# of community group road tours 8 5 3
# of incidents with offenders involving risk management 0 0 0
# of work crew hours performed in lieu of jail 0 312 120
Cost saved by using alternative sentencing 0 $10,201 $5,857
Cost saved from reduced number of court transports * $35,000 $8,750 $6,836
Number of Veteran's Court participants 18 6 8
Number of Veteran's Court graduates ‐ 3 2*Cost savings regarding court transports will be down due to vacant position.
113 115

Police
Performance Measure Target Quarter 1 Quarter 2Measure‐ Specialty Units# of traffic stops 9,000 1,287 715Property Room Audits 1 0 0Animal Complaints 2,600 225 238# of captures by K9 25 7 7Marine Service Hours 90 12 56SRT Mission/Callout 10 2 4SRT Training Days 31 6 11Civil Disturbance missions 0 0 0Civil Disturbance Team Training Days 13 2 1Vehicle Collisions (Fatality) 0 1 1Vehicle Collisions (Injury) 250 50 56Vehicle Collisions (Non‐Injury) 2,100 212 213Measure‐ Criminal InvestigationsCases assigned for follow up 1,000 330 589Cases cleared by investigation 700 213 513
Amount of narcotics seized (lbs) 30 8 442# of findings during Special Operations quarterly audits 0 0 0Measure‐ Patrol# of arrests 2,500 409 446# of self‐initiated calls for service 2,200 3,143 2194# of minutes to respond to call for service 12 18 20.81
Top Priority calls: Average time from receipt to dispatch (in minutes) 3 2.65 2.9
Top Priority calls: Average time from dispatch to arrival on scene (in minutes) 3.5 3.72 4.38
Total calls for service 55,000 11,286 11,933Measure‐ Professional Standards
% of officers meeting state requirements for annual training hours 100 100 100# of training hours provided 8,080 1,575 2,906Successful WASPC accreditation Yes na na# of internal investigations conducted 8 3 3Use of force as percent of arrests 0.03 0.08% 0.05%Uses of force as percent of calls for service 0.10% 0.003% 0.002%
Pursuits 35 11 1
Pursuit Terminations 15% 5 0
Promotional processes completed 2 1 0
Hiring processes completed 4 1 0
Measure ‐ CSRT
Total number of code enforcement complaints received 600 143 175
Average calendar days: Code complaint to first investigation 7 2 4
Total code enforcement cases initiated during the reporting period 500 140 163
Code enforcement cases resolved through voluntary compliance 300 49 49
Code enforcement cases resolved through forced compliance 0 22 23
Code enforcement: Average calendar days, Inspection to Forced Compliance 60 4 2
Code enforcement: Average calendar days, Inspection to Voluntary Compliance 14 10 2Community Meetings Attended 120 24 32
114 116

MyLakewood311 # of Requests by Type
YTD June
Type
2018
YTD
2018
Total
2019
YTD
2019
Total
2020
YTD
2020
Total
2021
YTD
Abandon/Vacant Property 21 47 28 55 22 53 34
Abandoned Vehicles 77 131 81 178 73 180 129
Animal‐Related Calls 29 53 27 77 35 56 47
Compliments 6 11 6 13 5 10 5
Drug Activity/House 8 14 10 16 11 27 20
Flooding 23 47 17 75 34 95 28
Gang Activity 0 3 2 8 2 11 5
Garbage‐Related Calls 455 893 531 1187 399 861 501
General Questions 68 151 47 110 78 115 44
Graffiti/Vandalism 31 78 102 192 100 192 53
Hazardous Materials 7 16 2 8 1 4 0
Hazardous Weather/Road Conditions 0 0 36 52 25 46 23
Homeless Concerns 0 0 0 0 52 141 78
Illegal Auto Activity 7 13 22 44 20 38 30
Illegal Dumping 0 0 0 0 3 6 118
Noise/Nuisance 24 35 12 26 33 90 61
Other Police Requests 10 24 30 54 11 34 51
Parking Commercial Vehicle Private Property 4 9 8 18 10 30 18
Patrol Response 4 7 11 31 20 24 7
Play Equipment 3 3 3 7 4 11 3
Pothole 294 371 161 263 231 294 118
Restroom 1 2 0 2 1 2 1
Signs 183 394 216 392 212 401 192
Speed Complaint 10 18 21 47 26 47 21
Street Light 30 65 51 83 20 54 33
Street Sweeper Requests 0 0 0 0 10 26 20
Traffic 4 11 7 17 8 24 11
Traffic Signal 31 71 33 86 14 39 18
Unpermitted/Prohibited Signs 9 17 7 80 64 127 67
Unsafe Power Lines 4 7 5 5 ‐ 8 1
Vegetation‐Related calls 59 139 85 162 72 148 84
Other Requests 125 267 16
Total 1,429 2,685 1,612 3,406 1,721 3,461 1,837
115 117

116 118

117 119

MyLakewood311 # of Requests by Type
Year 2018
Type Jan Feb Mar Apr May Jun Jul Aug Sep Oct Nov Dec YTD June
Total
Annual
Abandon/Vacant Property 1 3 1 8 3 5 2 8 7 3 4 2 21 47
Abandoned Vehicles 5 10 19 11 17 15 8 8 7 15 7 9 77 131
Animal‐Related Calls 2 3 5 4 4 11 3 8 4 4 4 1 29 53
Compliments 5 ‐ ‐ 1 ‐ ‐ 1 1 ‐ 1 ‐ 2 6 11
Crime Tips 1 ‐ ‐ 1 1 2 2 1 1 2 4 ‐ 5 15
Drug Activity/House ‐ 1 3 ‐ 2 2 1 1 ‐ 1 2 1 8 14
Flooding 10 6 4 1 1 1 2 2 3 1 5 11 23 47
Gang Activity ‐ ‐ ‐ ‐ ‐ ‐ 2 ‐ ‐ ‐ 1 ‐ ‐ 3
Garbage‐Related Calls 63 67 99 63 83 80 82 86 80 67 58 65 455 893
General Questions 4 9 20 6 13 16 22 20 10 13 12 6 68 151
Graffiti/Vandalism 3 2 2 2 15 7 9 11 6 5 11 5 31 78
Hazardous Materials 1 2 ‐ 2 ‐ 2 1 1 ‐ ‐ 4 3 7 16
Hazardous Weather/Road Conditions ‐ ‐ ‐ ‐ ‐ ‐ ‐ ‐ ‐ ‐ ‐ ‐ ‐ ‐
Homeless Concerns ‐ ‐ ‐ ‐ ‐ ‐ ‐ ‐ ‐ ‐ ‐ ‐ ‐ ‐
Homeless Encampment ‐ 3 9 2 5 3 1 8 5 1 2 1 22 40
Illegal Auto Activity ‐ 1 1 1 2 2 1 2 ‐ 3 ‐ ‐ 7 13
Illegal Dumping ‐ ‐ ‐ ‐ ‐ ‐ ‐ ‐ ‐ ‐ ‐ ‐ ‐ ‐
Noise/Nuisance 3 3 2 5 4 7 3 ‐ 4 2 1 1 24 35
Other Police Requests ‐ ‐ 2 2 5 1 6 2 3 ‐ 1 2 10 24
Parking Commercial Vehicle Private ‐ ‐ ‐ ‐ 3 1 ‐ ‐ 4 ‐ 1 ‐ 4 9
Patrol Response ‐ ‐ 1 ‐ 1 2 1 1 1 ‐ ‐ ‐ 4 7
Play Equipment ‐ ‐ 1 ‐ 1 1 ‐ ‐ ‐ ‐ ‐ ‐ 3 3
Pothole 117 52 46 51 12 16 10 12 9 16 6 24 294 371
Restroom ‐ 1 ‐ ‐ ‐ ‐ 1 ‐ ‐ ‐ ‐ ‐ 1 2
Signs 30 38 44 25 20 26 25 29 47 29 32 49 183 394
Speed Complaint 1 2 1 ‐ 4 2 2 2 3 1 ‐ ‐ 10 18
Street Light 9 3 4 7 2 5 3 6 7 5 5 9 30 65
Street Sweeper Request ‐ ‐ ‐ ‐ ‐ ‐ ‐ ‐ ‐ ‐ ‐ ‐ ‐ ‐
Traffic ‐ ‐ 3 ‐ 1 ‐ 1 1 2 2 1 ‐ 4 11
Traffic Signal 5 5 6 4 6 5 5 6 4 8 11 6 31 71
Unpermitted/Prohibited Signs 1 ‐ ‐ 1 6 1 2 3 1 2 ‐ ‐ 9 17
Unsafe Power Lines 2 2 ‐ ‐ ‐ ‐ 1 ‐ 2 ‐ ‐ ‐ 4 7
Vegetation‐Related calls 4 7 5 5 16 22 18 24 5 4 6 23 59 139
Other Requests ‐ ‐ ‐ ‐ ‐ ‐ ‐ ‐ ‐ ‐ ‐ ‐ ‐ ‐ Total 267 220 278 202 227 235 215 243 215 185 178 220 1,429 2,685
118 120

MyLakewood311 # of Requests by Type
Year 2019
Type Jan Feb Mar Apr May Jun Jul Aug Sep Oct Nov Dec YTD June
Total
Annual
Abandon/Vacant Property 3 2 9 1 8 5 5 8 4 3 5 2 28 55
Abandoned Vehicles 11 16 13 17 8 16 30 13 21 10 11 12 81 178
Animal‐Related Calls 3 1 3 3 4 13 8 17 6 12 2 5 27 77
Compliments 2 1 ‐ ‐ ‐ 3 1 2 1 2 ‐ 1 6 13
Crime Tips 1 1 2 2 2 3 2 ‐ ‐ ‐ ‐ ‐ 11 13
Drug Activity/House ‐ 2 1 2 3 2 1 1 1 1 ‐ 2 10 16
Flooding 7 6 1 1 2 3 5 9 1 40 17 75
Gang Activity 1 1 ‐ ‐ ‐ ‐ 1 ‐ ‐ ‐ 4 1 2 8
Garbage‐Related Calls 72 53 100 106 95 105 158 132 93 103 90 80 531 1,187
General Questions 11 7 7 1 8 13 8 12 8 15 10 10 47 110
Graffiti/Vandalism 9 19 19 8 30 17 17 17 11 16 8 21 102 192
Hazardous Materials 2 ‐ ‐ ‐ ‐ 1 2 2 ‐ 1 ‐ 2 8
Hazardous Weather/Road Conditions 29 ‐ 2 3 2 ‐ 1 2 2 7 2 2 36 52
Homeless Concerns ‐ ‐ ‐ ‐ ‐ ‐ ‐ ‐ ‐ ‐ ‐ ‐ ‐ ‐
Homeless Encampment 5 ‐ 5 11 7 12 15 15 10 2 14 9 40 105
Illegal Auto Activity 2 2 1 1 5 11 4 6 4 2 3 3 22 44
Illegal Dumping ‐ ‐ ‐ ‐ ‐ ‐ ‐ ‐ ‐ ‐ ‐ ‐ ‐ ‐
Noise/Nuisance 3 1 1 4 ‐ 3 1 6 4 2 1 ‐ 12 26
Other Police Requests 4 4 5 3 5 9 13 2 1 6 2 ‐ 30 54
Parking Commercial Vehicle Private 1 2 2 2 ‐ 1 3 2 2 1 2 8 18
Patrol Response 2 ‐ ‐ 4 2 3 6 4 1 5 2 2 11 31
Play Equipment ‐ ‐ ‐ 1 2 1 1 1 1 ‐ 3 7
Pothole 23 36 30 30 23 19 13 14 12 21 16 26 161 263
Restroom ‐ ‐ ‐ ‐ ‐ ‐ ‐ ‐ 2 ‐ 2
Signs 75 38 20 27 31 25 27 31 34 38 18 28 216 392
Speed Complaint 1 1 7 11 1 8 5 9 2 ‐ 2 21 47
Street Light 17 8 13 4 3 6 6 1 6 10 2 7 51 83
Street Sweeper Request ‐ ‐ ‐ ‐ ‐ ‐ ‐ ‐ ‐ ‐ ‐ ‐ ‐ ‐
Traffic ‐ 1 ‐ 2 1 3 3 3 2 2 ‐ ‐ 7 17
Traffic Signal 10 5 4 2 5 7 9 6 9 7 13 9 33 86
Unpermitted/Prohibited Signs 2 3 ‐ 1 1 ‐ 11 8 9 14 14 17 7 80
Unsafe Power Lines 3 2 ‐ ‐ ‐ ‐ ‐ ‐ 5 5
Vegetation‐Related calls 18 11 8 6 21 21 18 13 13 19 11 3 85 162 Other Requests ‐ ‐ ‐ ‐ ‐ ‐ ‐ ‐ ‐ ‐ ‐ ‐ ‐
Total 317 223 246 248 276 302 371 323 271 311 232 286 1,612 3,406
119 121

MyLakewood311 # of Requests by TypeYear 2020
Type Jan Feb Mar Apr May Jun Jul Aug Sep Oct Nov Dec
YTD
June
Total
Annual
Abandon/Vacant Property 3 7 5 1 5 1 4 7 11 3 3 3 22 53 Abandoned Vehicles 8 11 11 6 21 16 22 18 17 24 12 14 73 180 Animal‐Related Calls 10 11 8 5 1 1 5 12 3 35 56 Compliments 1 1 1 2 1 1 2 1 5 10 Drug Activity/House 1 1 ‐ 4 1 4 9 1 5 1 11 27 Flooding 25 1 4 ‐ 1 3 1 1 31 13 10 5 34 95 Gang Activity 2 3 4 1 1 2 11 Garbage‐Related Calls 65 74 68 63 58 71 70 123 93 64 54 58 399 861 General Questions 8 9 12 20 16 13 11 4 3 5 6 8 78 115 Graffiti/Vandalism 25 17 23 11 16 8 12 10 9 24 24 13 100 192 Hazardous Materials 1 2 1 1 4 Hazardous Weather/Road
Conditions 6 5 3 6 5 4 4 1 5 1 6 25 46 Homeless Concerns 12 11 6 7 4 12 15 18 18 19 7 12 52 141 Illegal Auto Activity 4 1 2 8 4 1 3 1 7 2 3 2 20 38 Illegal Dumping 3 3 3 6 Noise/Nuisance 2 3 2 3 10 13 9 13 6 5 11 13 33 90 Other Police Requests 1 4 4 1 1 3 3 8 5 2 2 11 34 Parking Commercial Vehicle
Private Property 1 3 1 3 2 7 6 3 1 3 10 30 Patrol Response 2 1 4 7 6 2 1 1 20 24 Play Equipment 1 2 1 4 2 1 4 11 Pothole 65 74 26 33 4 29 5 15 12 4 14 13 231 294 Restroom 1 1 1 2 Signs 63 53 29 28 21 18 23 38 24 52 38 14 212 401 Speed Complaint 5 3 4 3 9 2 7 5 3 3 2 1 26 47 Street Light 2 7 5 2 2 2 5 3 2 9 6 9 20 54 Street Sweeper Requests 3 3 4 2 1 1 5 3 4 10 26 Traffic 2 1 3 2 3 5 3 4 1 8 24 Traffic Signal 6 2 3 1 2 5 7 4 4 3 2 14 39
Unpermitted/Prohibited Signs 9 15 6 2 9 23 7 20 12 14 8 2 64 127 Unsafe Power Lines ‐ ‐ ‐ ‐ ‐ ‐ 6 2 ‐ ‐ ‐ ‐ ‐ 8 Vegetation‐Related calls 13 15 6 8 17 13 16 25 3 16 10 6 72 148 Other Requests 2 9 17 14 37 46 29 16 20 25 24 28 125 267
Total 342 337 253 236 252 301 289 354 305 320 248 224 1,721 3,461
120 122

MyLakewood311 # of Requests by Type
Year 2021
Type Jan Feb Mar Apr May Jun Jul Aug Sep Oct Nov Dec YTD June
Total
Annual
Abandon/Vacant Property ‐ 3 2 13 9 7 34 34
Abandoned Vehicles 22 15 20 22 28 22 129 129
Animal‐Related Calls 5 2 9 7 14 10 47 47
Compliments 2 1 1 ‐ 1 ‐ 5 5
Drug Activity/House 6 2 2 4 2 4 20 20
Flooding 21 3 ‐ ‐ ‐ 4 28 28
Gang Activity ‐ ‐ 1 ‐ 2 2 5 5
Garbage‐Related Calls 71 53 67 126 109 75 501 501
General Questions 5 5 9 12 3 10 44 44
Graffiti/Vandalism 15 3 7 13 10 5 53 53
Hazardous Materials ‐ ‐ ‐ ‐ ‐ ‐ ‐ ‐
Hazardous Weather/Road Conditions 17 5 ‐ ‐ ‐ 1 23 23
Homeless Concerns 6 7 15 25 14 11 78 78
Illegal Auto Activity 2 6 4 6 7 5 30 30
Illegal Dumping 16 16 19 29 23 15 118 118
Noise/Nuisance 9 8 12 11 14 7 61 61
Other Police Requests 2 7 7 10 11 14 51 51
Parking Commercial Vehicle Private Property ‐ 2 3 1 9 3 18 18
Patrol Response 2 1 1 1 ‐ 2 7 7
Play Equipment ‐ ‐ ‐ ‐ 2 1 3 3
Pothole 28 27 17 16 17 13 118 118
Restroom ‐ ‐ ‐ 1 ‐ ‐ 1 1
Signs 43 22 27 32 38 30 192 192
Speed Complaint 2 1 3 3 6 6 21 21
Street Light 5 11 9 4 4 ‐ 33 33
Street Sweeper Requests 1 ‐ 1 8 ‐ 10 20 20
Traffic 3 2 ‐ 2 3 1 11 11
Traffic Signal 3 ‐ 4 5 5 1 18 18
Unpermitted/Prohibited Signs 7 6 13 7 9 25 67 67
Unsafe Power Lines ‐ ‐ ‐ ‐ ‐ 1 1 1
Vegetation‐Related calls 11 4 9 17 17 26 84 84
Other Requests 1 2 1 3 4 5 16 16 Total 305 214 263 378 361 316 ‐ ‐ ‐ ‐ ‐ ‐ 1,837 1,837
121 123

Building Permit Activity Report
2021 Change over 2020
Total 2020 ‐ YTD Jun Total 2021 ‐ YTD Jun Increase/(Decrease)
Permit Type Description # of
Permits
Permit Fees Valuation # of
Permits
Permit Fees Valuation # of
Permits Permit Fees Valuation
Commercial 243 511,514$ 27,729,946$ 178 563,656$ 38,345,899$ (65) ‐27% 52,142$ 10% 10,615,953$ 38%
Commercial Addition 3 2,281$ 78,000$ 2 3,568$ 233,000$ (1) ‐33% 1,287$ 56% 155,000$ 199%
Commercial Carport 1 499$ 8,800$ ‐ ‐$ 8,800$ (1) ‐100% (499)$ ‐100% ‐$ 0%
Commercial Deck 1 901$ 17,981$ ‐ ‐$ 17,981$ (1) ‐100% (901)$ ‐100% ‐$ 0%
Commercial Demolition Permit 12 3,360$ 532,000$ 8 2,036$ 600,500$ (4) ‐33% (1,324)$ ‐39% 68,500$ 13%
Commercial Gate 3 2,388$ 48,628$ 1 1,337$ 78,628$ (2) ‐67% (1,051)$ ‐44% 30,000$ 62%
Commercial Mechanical 42 85,894$ ‐$ 36 14,475$ ‐$ (6) ‐14% (71,419)$ ‐83% ‐$ n/a
Comm Over‐the‐Counter Mechanical 5 542$ ‐$ 9 1,859$ ‐$ 4 80% 1,317$ 243% ‐$ n/a
Solar ‐ Comm/Non‐prescriptive Res ‐ ‐$ ‐$ ‐ ‐$ ‐$ 0 n/a ‐$ n/a ‐$ n/a
New Commercial Building 6 116,834$ 12,932,641$ 12 165,671$ 14,985,641$ 6 100% 48,838$ 42% 2,053,000$ 16%
New Commercial Bldg ‐ Multi‐Family 4 66,984$ 4,973,332$ ‐ ‐$ 4,973,332$ (4) ‐100% (66,984)$ ‐100% ‐$ 0%
Commercial Plumbing 37 64,187$ ‐$ 31 10,142$ ‐$ (6) ‐16% (54,045)$ ‐84% ‐$ n/a
Commercial Swimming Pool/Spa ‐ ‐$ ‐$ ‐ ‐$ ‐$ 0 n/a ‐$ n/a ‐$ n/a
Comm over‐the‐counter plumbing 5 693$ ‐$ 5 879$ ‐$ 0 0% 186$ 27% ‐$ n/a
Commercial Retaining Wall ‐ ‐$ ‐$ 1 3,573$ 172,000$ 1 n/a 3,573$ n/a 172,000$ n/a
Commercial Remodel 66 137,359$ 7,756,992$ 46 329,683$ 15,647,767$ (20) ‐30% 192,324$ 140% 7,890,775$ 102%
Commercial Re‐roof 4 5,109$ 221,615$ 7 14,376$ 328,290$ 3 75% 9,267$ 181% 106,675$ 48%
Comm re‐roof over‐the‐counter 13 6,676$ 337,061$ 16 15,746$ 474,703$ 3 23% 9,070$ 136% 137,642$ 41%
Commercial Window Replacement 1 3,211$ 190,000$ ‐ ‐$ 190,000$ (1) ‐100% (3,211)$ ‐100% ‐$ 0%
Comm Window replacement OTC 40 14,597$ 632,895$ 4 311$ 635,256$ (36) ‐90% (14,285)$ ‐98% 2,361$ 0%
Residential 510 290,173$ 12,961,417$ 574 502,302$ 29,117,303$ 64 13% 212,130$ 73% 16,155,886$ 125%
Residential Accessory Structure 7 10,544$ 440,807$ 11 15,354$ 799,938$ 4 57% 4,810$ 46% 359,131$ 81%
Residential Addition 15 25,664$ 1,019,752$ 15 26,000$ 1,415,011$ 0 0% 336$ 1% 395,259$ 39%
Residential Accessory Dwelling Unit 1 1,678$ 24,875$ 2 6,287$ 24,875$ 1 100% 4,609$ 275% ‐$ 0%
Residential Demolition Permit 15 2,750$ 315,775$ 12 1,914$ 595,275$ (3) ‐20% (836)$ ‐30% 279,500$ 89%
Residential Gate ‐ ‐$ ‐$ ‐ ‐$ ‐$ 0 n/a ‐$ n/a ‐$ n/a
Residential Mechanical ‐ ‐$ ‐$ 1 115$ ‐$ 1 n/a 115$ n/a ‐$ n/a
Res over‐the‐counter mechanical 225 16,436$ ‐$ 263 20,096$ ‐$ 38 17% 3,660$ 22% ‐$ n/a
New Single Family Residence 23 115,507$ 6,814,207$ 47 318,183$ 13,601,146$ 24 104% 202,676$ 175% 6,786,939$ 100%
Residential Plumbing 7 468$ ‐$ 10 748$ ‐$ 3 43% 280$ 60% ‐$ n/a
Res over‐the‐counter plumbing 57 9,812$ 346,202$ 24 1,407$ 346,202$ (33) ‐58% (8,406)$ ‐86% ‐$ 0%
Residential Re‐roof ‐ ‐$ ‐$ ‐ ‐$ ‐$ 0 n/a ‐$ n/a ‐$ n/a
Res re‐roof over‐the‐counter 30 10,231$ 431,645$ 31 11,427$ 571,456$ 1 3% 1,196$ 12% 139,811$ 32%
Residential Remodel/Repair 84 88,429$ 3,234,042$ 72 82,677$ 4,985,106$ (12) ‐14% (5,752)$ ‐7% 1,751,063$ 54%
Solar ‐ Residential Prescriptive OTC 1 424$ 19,800$ 3 1,146$ 19,800$ 2 200% 722$ 170% ‐$ 0%
Residential Window Replacement 1 624$ 18,000$ ‐ ‐$ 18,000$ (1) ‐100% (624)$ ‐100% ‐$ 0%
Res Window replacement OTC 44 7,606$ 296,312$ 83 16,949$ 6,740,495$ 39 89% 9,343$ 123% 6,444,183$ 2175%
WEB Residential Furnace ‐ ‐$ ‐$ ‐ ‐$ ‐$ 0 n/a ‐$ n/a ‐$ n/a
WEB Residential Water Heater ‐ ‐$ ‐$ ‐ ‐$ ‐$ 0 n/a ‐$ n/a ‐$ n/a
Manufactured Home 5 5,039$ 193,276$ 10 8,262$ 319,176$ 5 100% 3,222$ 64% 125,900$ 65%
Manufactured Home ‐ residential lot 2 3,704$ 160,000$ ‐ ‐$ 160,000$ (2) ‐100% (3,704)$ ‐100% ‐$ 0%
Manufactured Home ‐ MH Park ‐ ‐$ ‐$ ‐ ‐$ ‐$ 0 n/a ‐$ n/a ‐$ n/a
Monument Sign 3 1,336$ 33,276$ 10 8,262$ 159,176$ 7 233% 6,926$ 518% 125,900$ 378%
Other 34 6,670$ 48,030$ 32 10,641$ 163,095$ (2) ‐6% 3,971$ 60% 115,065$ 240%
Change of Use 10 1,840$ ‐$ 1 184$ ‐$ (9) ‐90% (1,656)$ ‐90% ‐$ n/a
Day Care 2 350$ 3,000$ ‐ ‐$ 3,000$ (2) ‐100% (350)$ ‐100% ‐$ 0%
Pole Sign 1 380$ 9,000$ 2 1,499$ 47,690$ 1 100% 1,119$ 294% 38,690$ 430%
Wall Sign 10 2,334$ 36,030$ 18 6,935$ 112,405$ 8 80% 4,601$ 197% 76,375$ 212%
Adult Family Home 11 1,767$ ‐$ 11 2,024$ ‐$ 0 0% 258$ 15% ‐$ n/a
Universal Base Plan ‐ ‐$ ‐$ ‐ ‐$ ‐$ 0 n/a ‐$ n/a ‐$ n/a
792 813,396$ 40,932,668$ 794 1,084,862$ 67,945,472$ 2 0% 271,466$ 33% 27,012,804$ 66%
Note:
‐ Reports generated in the permits module are based either on application date range or issued date range and are meant to show activity.
‐ At application a portion of the fees are collected with the balance being collected at issuance which could fall in two different reporting periods.
‐ The report is not intended to be a revenue report, rather it is intended to show the number and types of permits and information on what those permits generated
overall in permit fees and valuation.
‐ The Building Permit Report only reflects the building division and does not include planning and public works.
‐ The revenue reported on this spreadsheet is based on issued permits and will never match the financial revenue report as it does not include monies collected
on permits that have not yet been issued.
122 124

Chart Data
Annual Totals 2020 # Permits 2021 # Permits 2020 Permit Fees 2021 Permit Fees 2020 Valuation 2021 ValuationCommercial 243 178 511,514$ 563,656$ 27,729,946$ 38,345,899$ Residential 510 574 290,173$ 502,302$ 12,961,417$ 29,117,303$ Manufactured & Other 39 42 11,709$ 18,903$ 241,306$ 482,271$ Total 792 794 813,396$ 1,084,862$ 40,932,668$ 67,945,472$
2020 Permit Fees, $290,173
2020 Permit Fees, $11,709
2021 Permit Fees, $18,903
2020 Valuation, $27,729,946
2020 Valuation, $12,961,417
2020 Valuation, $241,306
2021 Valuation, $38,345,899
2021 Valuation, $29,117,303
2021 Valuation, $482,271
$0
$50,000
$100,000
$150,000
$200,000
$250,000
$300,000
$‐
$10,000,000
$20,000,000
$30,000,000
$40,000,000
Commercial Residential Manufactured & Other
Building Permit ActivityYear‐to‐date June 30, 2021
2020 Permit Fees 2021 Permit Fees 2020 Valuation 2021 Valuation
Valuation Permit Fee
123 125

TO: City Council
FROM: Tiffany Speir, Long Range & Strategic Planning Manager
THROUGH: John Caulfield, City Manager
DATE: September 13, 2021
SUBJECT: Lakewood American Rescue Plan Act (ARPA) Program
ATTACHMENTS: Proposed Ordinance (Attachment A); Details regarding Expenditures (Attachment B); Powerpoint Presentation (subject to change) (Attachment C)
BACKGROUND After a study session held on August 23, the City Council held a public hearing on September 7 regarding the proposed Ordinance (Attachment A) establishing policies, priorities, allocation of funds and initial expenditures under the City’s American Rescue Plan Act (ARPA) Program. Comments were submitted by organizations seeking ARPA support and from members of the public.
The City Council is scheduled to consider the proposed Ordinance on September 20.
RECOMMENDATIONS It is recommended that the City Council adopt the proposed Ordinance, with or without amendment, identifying policies and priorities of use of Lakewood’s $13,766,236 in ARPA funds, allocating a percentage of funds into each of the seven expenditure categories (ECs) identified by the Department of Treasury, and approving initial expenditures.
It is also recommended that prior to, or contemporarily with, action on the proposed Ordinance, the City Council consider and provide direction regarding expenditures identified within the City Lost Revenue/Revenue Replacement category.
Third, it is recommended that the City Council provide direction regarding whether to commit all ARPA funds prior to resolution of any discussion of collaborations with other governments or organizations.
Fourth, it is recommended that prior to, or contemporarily with, action on the proposed Ordinance, the City Council consider and provide direction regarding external expenditures identified during the community engagement process.
DISCUSSION The proposed Ordinance (Attachment A) sets out policies and priorities of use for the City’s ARPA funds that would serve to guide Lakewood’s distribution and use of the funds.
126

As recommended, the funds are allocated as follows into the seven categories established in Department of Treasury Guidance:
ARPA Expenditure Categories* Recommended ARPA
Share in Dollars Recommended ARPA
Share in Percentages
A: Public Health + 5% Direct Admin Costs $105,000.00 0.8% B: Negative Economic Impacts + 5% Direct Admin Costs $3,688,311.80 26.8%
C: Services to Disproportionately Impacted Communities + 5% Direct Admin Costs $3,987,207.40 29.0%
D: Premium Pay + 5% Direct Admin Costs $0 0.0%
E: Infrastructure + 5% Direct Admin Costs $1,500,000.00 10.9% F: Revenue Replacement + 5% Direct Admin Costs $3,797,405.00 27.6%
G: General Administrative Costs (5% Indirect) $688,311.80 5.0%
TOTAL $13,766,236.00 100% *All costs are preliminary and subject to change.
A Public Health 1%
B Neg Econ Impacts27%
C Disprop. Impacted Comm 29%
E Infrastructure 11%
F Revenue Replacement 27%
G General Admin 5%
ARPA FUND ALLOCATION PERCENTAGESA Public Health B Neg Econ Impacts C Disprop. Impacted CommD Premium Pay E Infrastructure F Revenue ReplacementG General Admin
127

ARPA Program Administration Once the City Council takes action directing how the City will expend its ARPA funds, The City will pursue hiring the needed Finance and other City staff who will be dedicated to ARPA administration. The City will then conduct a fund application process that complies with requirements and guidance from the Department of the Treasury. The City will establish a time frame for the application process and for the distribution of funds to subrecipients.
Lakewood has received the first tranche of ARPA funds ($6,883,118) and the second will be available to Lakewood in mid-August, 2022. However, the distributions made by the City to subrecipients and expenditures on City Revenue Replacement items will not be constrained by that timeline (for instance, some of the allocations included in the proposed Ordinance are for multiple years, and not all of the first tranche would have to be used on those allocations.)
Expenditure Review Included below are tables identifying recommended initial expenditures, community engagement external requests, and identified City lost revenue expenditures. Additional regarding expenditures details are included in Attachment B.
City Council Discussion on September 13 It is requested that the City Council discuss and address the following questions on September 13:
1) Does the City Council approve of Policies, Priorities of Use, Fund Allocations, and Initial Expenditures included in the proposed Ordinance?
2) Does the City Council have direction regarding expenditures identified within the City Lost Revenue/Revenue Replacement category?
3) Does the City Council have direction regarding whether to commit all ARPA funds prior to resolution of any discussion of collaborations with other governments or organizations?
4) Does the City Council have direction regarding external expenditures identified during the community engagement process?
128

ATTACHMENT A ORDINANCE NO. 7XX
AN ORDINANCE OF THE CITY COUNCIL OF THE CITY OF LAKEWOOD, WASHINGTON ADOPTING POLICIES AND PRIORITIES OF USE CONCERNING ALLOCATION AND EXPENDITURE OF AMERICAN RESCUE PLAN ACT (ARPA) FUNDS AND ALLOCATING ARPA FUNDS TO CERTAIN INITIAL EXPENDITURES
FINDINGS
WHEREAS, COVID-19 is a contagious and potentially deadly virus that has been
declared a pandemic event by the World Health Organization; and
WHEREAS, in 2020, President Biden, Governor Inslee, and Pierce County Executive
Dammeier and Lakewood City Manager John Caulfield each declared states of emergency within
their respective jurisdictions; and
WHEREAS, actions taken to mitigate the spread of COVID-19 have resulted in
widespread and continuing social and economic disruption throughout the City of Lakewood;
and
WHEREAS, the COVID-19 Delta Variant has resulted in some of the highest
hospitalization rates throughout the pandemic, with no end of its effects yet seen; and
WHEREAS, on March 11, 2021, the federal government enacted the American Rescue
Plan Act (ARPA) that is expected to provide $13,766,236 to the City of Lakewood, which is
considered a Metropolitan City under the Act; and
WHEREAS, the United States Department of the Treasury will allocate funding to the
City of Lakewood in two equal tranches, with the first tranche of an estimated $6,883,118
expected to be received in 2021, and the second equal tranche in 2022; and
129

WHEREAS, the ARPA specifies eligible expenditures that include responding to the
public health emergency with respect to the Coronavirus Disease 2019 (COVID-19), its negative
economic impacts, and necessary investments in water, sewer, or broadband infrastructure; and
WHEREAS, time is of the essence due to the duration of the pandemic and the ongoing
negative impact on public health and the economy upon which the public depend; and
WHEREAS, on March 27, 2021 the City of Lakewood City Council established four
initial policies regarding the City’s ARPA allocation, namely, that: ARPA funds would be
subject to a one percent (1%) set-a-side for human services; ARPA funds would generally be
used for one-time costs, although the Council would consider making exceptions for certain
programs or pilot programs; Lakewood’s ARPA funds would be used to “fill the gaps” versus
duplicating services and resources available from federal, state or county sources; and the City
would conduct a robust community engagement effort with businesses, residents, human service
providers and other non-profits, and other community stakeholders to seek input and
recommendations concerning community needs that could be funded with the ARPA funds; and
WHEREAS, community engagement was conducted between April and August, 2021
through: discussions at the City’s boards and commissions and two community stakeholder
summits; personal outreach to neighborhood associations, cultural organizations, municipal
partners such as utilities, special districts, and economic development organizations; City
publications; Coffee with the Mayor; and an online public survey; and
WHEREAS, Lakewood residents and businesses continue to experience physical and
mental health stress and economic stress due to the ongoing pandemic and its effects; and
WHEREAS, on September 7, 2021, the City Council held a duly noticed public hearing
on the proposed policies and allocations of the ARPA funds; and
130

WHEREAS, the City Council completed its consideration of public input and its
deliberations regarding policies and allocations of the ARPA funds on September 20, 2021;
NOW, THEREFORE, THE CITY COUNCIL OF THE CITY OF LAKEWOOD, WASHINGTON, DO ORDAIN AS FOLLOWS: Section 1. Adoption of City Council Findings.
The Findings of the City Council are adopted as part of this Ordinance.
Section 2. Adoption of ARPA Allocation Policies and Priorities of Use.
The policies and priorities of use included in Exhibit A to this Ordinance are
adopted as part of this Ordinance.
Section 3. Adoption of ARPA Allocations.
The allocations of ARPA funds as described in Exhibit B to this Ordinance are
adopted as part of this Ordinance.
Section 4. Approval of Initial ARPA Expenditures.
The initial ARPA expenditures identified in Exhibit C to this Ordinance are hereby
approved.
Section 5. Authorization for City Manager to Implement.
The City Manager is authorized to implement a program to administer the City of
Lakewood’s ARPA fund program consistent with the policies and priorities of use hereby
adopted. The City Manager shall provide the City Council regular reports (no less than
quarterly) regarding how the funds have been expended and what results have occurred from
their use.
Section 6. Emergency.
131

This Emergency Ordinance is necessary for the immediate preservation of the public
peace, health, safety, or support of the City of Lakewood government and its existing institutions
to provide relief to its citizens and businesses during the Coronavirus pandemic.
Section 7. Severability.
If any portion of this Ordinance or its application to any person or circumstances is held
invalid, the remainder of the Ordinance or the application of the provision to other persons or
circumstances shall not be affected.
Section 8. Effective Date.
This Emergency Ordinance shall be in full force and effect immediately after final
passage.
ADOPTED by the City Council of the City of Lakewood this 20th day of September, 2021.
CITY OF LAKEWOOD _______________________________ Don Anderson, Mayor
Attest: _______________________________ Briana Schumacher, City Clerk Approved as to Form: _______________________________ Heidi Ann Wachter, City Attorney
132

EXHIBIT A POLICIES AND PRIORITIES FOR USE OF
AMERICAN RESCUE PLAN ACT (ARPA) FUNDS
Policies in addition to those adopted as part of this Ordinance per its Findings: 1. Provide ARPA and other COVID-19 related resource navigation services to Lakewood residents and businesses. 2. Provide support to people living in, and agencies, organizations and businesses operating in, Lakewood’s “hardest hit communities” as defined in Department of the Treasury guidance. 3. Improve infrastructure in Lakewood to mitigate historical inequality and health issues in “hardest hit communities” as defined by the Department of the Treasury as well as to spur economic recovery. 4. Improve Lakewood’s delivery of municipal services to its residents and businesses in light of COVID (i.e. facility, communications and operations improvements)
Priorities for Use (not listed in order of importance): 1. Responding to Public Health Emergency
- Support COVID-19 vaccination efforts, including providing financial incentives
2. Assistance to households, small businesses, and nonprofits, or aid to impacted industries: - Partner with United Way and other service providers, Pierce County, and other
cities to provide ARPA and COVID-19 resource navigation services to Lakewood residents.
- Partner with Pierce County and other jurisdictions to provide ARPA and COVID- 19 resource navigation services to the City’s businesses with an emphasis on BIPOC and small businesses.
- Provide financial assistance to non-profits and human services organizations operating in Lakewood and providing ARPA-eligible services.
- Support efforts to maintain existing, and to create new, affordable housing capacity in Lakewood.
- Support the creation of emergency shelter housing units. 3. Provision of government services:
- Coordinate with public partners such as power utilities (TPU, PSE, LL&P), West Pierce Fire & Rescue, Pierce County Library Services District, Lakewood Water District, Pierce County Sewer, and others to support facility improvements,
133

infrastructure improvements, payment arrears forgiveness programs, and other ARPA-eligible program expenditures.
- Address and backfill City revenue shortfalls caused by the COVID-19 pandemic per ARPA criteria and Department of Treasury guidance. - Improve remote access to City services to accommodate post-COVID-19 resident and business needs. - Capital and non-capital improvements to City facilities related to COVID-19 and post-COVID-19 operations. - Maintain a supply of non-capital ARPA-eligible supplies, including PPE for City employees and the public attending City meetings and events.
4. Providing grants to eligible employers that have eligible workers who perform essential work:
- $0
134

EXHIBIT B AMERICAN RESCUE PLAN ACT (ARPA)
EXPENDITURE CATEGORIES
ARPA Expenditure Categories* Recommended ARPA Share in Dollars
Recommended ARPA Share in Percentages
A: Public Health + 5% Direct Admin Costs $105,000.00 0.8%
B: Negative Economic Impacts + 5% Direct Admin Costs $3,688,311.80 26.8%
C: Services to Disproportionately Impacted Communities + 5% Direct Admin Costs $3,987,207.40
29.0% D: Premium Pay + 5% Direct Admin Costs $0 0.0% E: Infrastructure + 5% Direct Admin Costs $1,500,000.00 10.9% F: Revenue Replacement** + 5% Direct Admin Costs $3,797,405.00 27.6% G: General Administrative Costs (5% Indirect) $688,311.80 5.0% TOTAL $13,766,236.00 100%
*Amounts are preliminary estimate and subject to change. **Lost Revenue can be used for items identified as ARPA expenditures or for other eligible government service as
described in the Dept. of the Treasury Interim Final Rule..
135

EXHIBIT C INITIAL ARPA EXPENDITURES
Proposed Initial ARPA Expenditures* Amount Category Comfort Inn + 5% Direct Admin Costs (Purchase & Emergency Shelter Operation for 2 yrs) $1,050,000 Negative Economic Impacts
Lakewood Community Services Advisory Board 1% of Funds in 2022 and 2023 + 5% Direct Admin Costs (2 yrs) $144,543
Services to Disproportionately Impacted Communities
2021 Warriors of Change + 5% Direct Admin Costs (Clover Park High School) $71,872.50
Services to Disproportionately Impacted Communities
City of Lakewood Police Body Cameras + 5% Direct Admin Costs (Purchase & Program Operations 5 yrs) $2,071,258.35 Revenue Replacement Pierce County BIPOC Business Accelerator Contribution + 5% Direct Admin Costs (Launch Sept. ’21, 200 businesses in 8 cohorts by May ‘22) $525,000.00
Services to Disproportionately Impacted Communities
Vaccination Incentives + 5% Direct Admin Costs $105,000.00 Public Health
LPD Retention Bonus: $7,500 lump sum payment per officer (85 officers = $637,500 maximum) in exchange for a commitment to remain with the department for three years + 5% Direct Admin Costs $669,375 Revenue Replacement
Housing Safety Crisis Response: Lakewood Eviction Defense & Prevention Project + 5% Admin Costs (1 year) $236,250 Negative Economic Impacts
ARPA Program Administration Indirect Costs (5 yrs) (Two Finance 0.5 FTEs, 1 FTE ARPA Coordinator (including residential navigation services), Tracking & Reporting Resources, Other City Staff %) $688,311.80 Administrative Costs
SUBTOTAL $5,561,612 Remaining ARPA funds after Initial Allocations $8,204,624
*Amounts are preliminary and subject to change.
136

ARPA Expenditures*
NOTE: Table does not include potential collaboration expenditures
Expenditure Category
Amount
Allocated to
ARPA
Category
Amount in
Recommended
Initial
Expenditures
including 5%
Direct Admin
Remaining
Amount after
Initial
Expenditures
including 5%
Direct Admin
Community
Engagement
(CE)
External
Requests
Received**
Remaining
Amount after
Initial
Expenditures
and CE External
Requests**
Identified
Revenue
Replacement
Expenditures
Remaining
Amount after
Revenue
Replacement
Expenditures
A: Public Health + 5%
Direct Admin Costs $105,000.00 $105,000 $0 $0 $0 $0 $0
B: Negative Economic
Impacts + 5% Direct
Admin Costs $3,688,311.80 $1,286,250 $2,402,061.80 $6,026,000 -$3,323,938.20 $0 -$3,323,938.20
C: Services to
Disproportionately
Impacted Communities +
5% Direct Admin Costs $3,987,207.40 $741,416 $3,245,791.40 $3,864,500 -$618,708.60 $0 -$618,708.60
D: Premium Pay + 5%
Direct Admin Costs $0 $0 $0 $0 $0 $0 $0
E: Infrastructure + 5%
Direct Admin Costs $1,500,000.00 $0 $1,500,000.00 $1,500,000 $0 $0 $0
F: Revenue
Replacement** + 5%
Direct Admin Costs $3,797,405.00 $2,740,634 $1,056,771.00 $243,331 $813,440 $2,046,798 -$1,233,358
G: General Administrative
Costs (5% Indirect) $688,311.80 $688,312 $0 $0 $0 $0 $0
TOTAL $13,766,236 $5,561,612 $8,204,624 $11,633,831 -$3,129,207 $2,046,798 -$5,176,005 * All amounts preliminary and subject to change.
**5% Direct administrative costs must be accounted for within total listed
137

Recommended Initial ARPA Expenditures* Category Amount
Comfort Inn + 5% Direct Admin Costs (Purchase & Emergency Shelter Operation for 2 yrs) B. Negative Economic Impacts $1,050,000
Lakewood Community Services Advisory Board 1% of Funds in 2022 and 2023 +
5% Direct Admin Costs (2 yrs) C. Services to Disproportionately
Impacted Communities $144,543
2021 Warriors of Change + 5% Direct Admin Costs (Clover Park High School) C. Services to Disproportionately
Impacted Communities $71,872.50
City of Lakewood Police Body Cameras + 5% Direct Admin Costs (Purchase & Program Operations 5 yrs) F. Revenue Replacement $2,071,258.35
Vaccination Incentives + 5% Direct Admin Costs A. Public Health $105,000.00
Housing Safety Crisis Response: Lakewood Eviction Defense & Prevention
Project + 5% Admin Costs (1 year) B. Negative Economic Impacts $236,250.00
Pierce County BIPOC Business Accelerator Contribution + 5% Direct Admin
Costs (Launch Sept. ’21, 200 businesses in 8 cohorts by May ‘22) C. Services to Disproportionately
Impacted Communities $525,000.00
LPD Retention Bonus: $7,500 lump sum payment per officer (85 officers = $637,500 maximum) in exchange for a commitment to remain with the department
for three years + 5% Direct Admin Costs F. Revenue Replacement $669,375.00
ARPA Program Administration Indirect Costs* (5 yrs) (Two Finance 0.5 FTEs, 1 FTE ARPA Coordinator (including residential navigation services), Tracking & Reporting Resources, Other City Staff %) G. Administrative Costs $688,311.80
TOTAL including 5% direct admin costs $5,561,612 * All amounts preliminary and subject to change
138

Community Engagement (CE) External Requests* Category Amount
Boys & Girls Club ( 5 years) B. Negative Economic Impacts $226,000
Violent Crime Victim Services Staff and Program Support B. Negative Economic Impacts $250,000
Home Ownership Center of Tacoma (2 years) B. Negative Economic Impacts $500,000
Living Access Support Alliance (LASA) Housing Project B. Negative Economic Impacts $4,750,000
Lakewold Gardens Carriage House B. Negative Economic Impacts $300,000
Pierce County Library (Lakewood) 24/7 Lockers C. Services to Disproportionately Impacted Communities $70,000
LASA Hygiene Center (3.5 years) C. Services to Disproportionately Impacted Communities $87,500
United Way Center for Strong Families (3 years) C. Services to Disproportionately Impacted Communities $150,000
Habitat for Humanity Boat Street Project (utilities and road improvements for 12 unit project) C. Services to Disproportionately Impacted Communities $242,000
Workforce Central C. Services to Disproportionately Impacted Communities $295,000
Rebuilding Together South Sound (5 years) C. Services to Disproportionately Impacted Communities $325,000
YMCA ($339,000 per year for 5 years) C. Services to Disproportionately Impacted Communities $1,695,000
Springbrook Connections Community Building Purchase ($4.75M total w/ partners) C. Services to Disproportionately Impacted Communities
$1,000,000
Lakewood Water District New Well at St. Clare Hospital E. Infrastructure $1,500,000
Emergency Services Alert & Warning System (Partnership with UP, Steilacoom, WPFR) F. Revenue Replacement $13,331
West Pierce Fire & Rescue F. Revenue Replacement $230,000
Pierce Co. Business Navigator Program TBD
Cohen Clinic (Veterans’ services) TBD
ARPA Collaboration w County and Cities TBD
SSHA3P Affordable Housing Collaboration TBD
Tacoma ProBono Eviction Prevention Services beyond Year 1 TBD
Subtotal plus 5% admin costs and without TBDs $11,633,831
* All amounts preliminary and subject to change
No commitments were made regarding the external expenditures identified above, and there will be a formal call for
applications consistent with ARPA rules and guidance once the City Council has taken action on the proposed Ordinance.
139

Identified Revenue Replacement Expenditures* Category Amount
Emergency Services Alert & Warning System (Partnership with UP, Steilacoom, WPFR) F. Revenue Replacement $13,331
West Pierce Fire & Rescue F. Revenue Replacement $230,000
South Sound Alliance – Future of Labor in the South Sound Study F. Revenue Replacement $10,000
City Website Multilingual Services and Redesign F. Revenue Replacement $35,000
Handwashing Facilities at City Parks without bathrooms (Oakbrook, Active, Washington, Edgewater, and Wards Lake) F. Revenue Replacement $75,000
City Hall Space Reorganization to 1st & 2nd Floors Schematic Design only (Not
including $520,000 cost for permitting/construction documents or $100 - $150/sq ft. x 35K
sq. ft. = $3.5M - $5.25M cost of building reconfiguration/construction) F. Revenue Replacement $105,000
City Council Chambers (dais expansion for social distancing) F. Revenue Replacement $125,000
Court Chambers (IT for hybrid proceedings) F. Revenue Replacement $133,000
Human Resources Technology to handle hybrid workplace (purchase & 3 years operation) F. Revenue Replacement $151,000
Youth Employment Program ($84,000 per year for 3 yrs.) F. Revenue Replacement $252,000
City Reader Boards (2 @ $160K each) F. Revenue Replacement $320,000
HVAC Cooler System Replacement at City Hall with Bipolar Ionization F. Revenue Replacement $500,000
Subtotal plus 5% direct admin costs $2,046,798 * All amounts preliminary and subject to change
140

ATTACHMENT A
ORDINANCE NO. 7XX
AN ORDINANCE OF THE CITY COUNCIL OF THE CITY OF
LAKEWOOD, WASHINGTON ADOPTING POLICIES AND PRIORITIES
OF USE CONCERNING ALLOCATION AND EXPENDITURE OF
AMERICAN RESCUE PLAN ACT (ARPA) FUNDS AND ALLOCATING
ARPA FUNDS TO CERTAIN INITIAL EXPENDITURES
FINDINGS
WHEREAS, COVID-19 is a contagious and potentially deadly virus that has been
declared a pandemic event by the World Health Organization; and
WHEREAS, in 2020, President Biden, Governor Inslee, and Pierce County Executive
Dammeier and Lakewood City Manager John Caulfield each declared states of emergency within
their respective jurisdictions; and
WHEREAS, actions taken to mitigate the spread of COVID-19 have resulted in
widespread and continuing social and economic disruption throughout the City of Lakewood;
and
WHEREAS, the COVID-19 Delta Variant has resulted in some of the highest
hospitalization rates throughout the pandemic, with no end of its effects yet seen; and
WHEREAS, on March 11, 2021, the federal government enacted the American Rescue
Plan Act (ARPA) that is expected to provide $13,766,236 to the City of Lakewood, which is
considered a Metropolitan City under the Act; and
WHEREAS, the United States Department of the Treasury will allocate funding to the
City of Lakewood in two equal tranches, with the first tranche of an estimated $6,883,118
expected to be received in 2021, and the second equal tranche in 2022; and
141

WHEREAS, the ARPA specifies eligible expenditures that include responding to the
public health emergency with respect to the Coronavirus Disease 2019 (COVID-19), its negative
economic impacts, and necessary investments in water, sewer, or broadband infrastructure; and
WHEREAS, time is of the essence due to the duration of the pandemic and the ongoing
negative impact on public health and the economy upon which the public depend; and
WHEREAS, on March 27, 2021 the City of Lakewood City Council established four
initial policies regarding the City’s ARPA allocation, namely, that: ARPA funds would be
subject to a one percent (1%) set-a-side for human services; ARPA funds would generally be
used for one-time costs, although the Council would consider making exceptions for certain
programs or pilot programs; Lakewood’s ARPA funds would be used to “fill the gaps” versus
duplicating services and resources available from federal, state or county sources; and the City
would conduct a robust community engagement effort with businesses, residents, human service
providers and other non-profits, and other community stakeholders to seek input and
recommendations concerning community needs that could be funded with the ARPA funds; and
WHEREAS, community engagement was conducted between April and August, 2021
through: discussions at the City’s boards and commissions and two community stakeholder
summits; personal outreach to neighborhood associations, cultural organizations, municipal
partners such as utilities, special districts, and economic development organizations; City
publications; Coffee with the Mayor; and an online public survey; and
WHEREAS, Lakewood residents and businesses continue to experience physical and
mental health stress and economic stress due to the ongoing pandemic and its effects; and
WHEREAS, on September 7, 2021, the City Council held a duly noticed public hearing
on the proposed policies and allocations of the ARPA funds; and
142

WHEREAS, the City Council completed its consideration of public input and its
deliberations regarding policies and allocations of the ARPA funds on September 20, 2021;
NOW, THEREFORE, THE CITY COUNCIL OF THE CITY OF LAKEWOOD,
WASHINGTON, DO ORDAIN AS FOLLOWS:
Section 1. Adoption of City Council Findings.
The Findings of the City Council are adopted as part of this Ordinance.
Section 2. Adoption of ARPA Allocation Policies and Priorities of Use.
The policies and priorities of use included in Exhibit A to this Ordinance are
adopted as part of this Ordinance.
Section 3. Adoption of ARPA Allocations.
The allocations of ARPA funds as described in Exhibit B to this Ordinance are
adopted as part of this Ordinance.
Section 4. Approval of Initial ARPA Expenditures.
The initial ARPA expenditures identified in Exhibit C to this Ordinance are hereby
approved.
Section 5. Authorization for City Manager to Implement.
The City Manager is authorized to implement a program to administer the City of
Lakewood’s ARPA fund program consistent with the policies and priorities of use hereby
adopted. The City Manager shall provide the City Council regular reports (no less than
quarterly) regarding how the funds have been expended and what results have occurred from
their use.
Section 6. Emergency.
143

This Emergency Ordinance is necessary for the immediate preservation of the public
peace, health, safety, or support of the City of Lakewood government and its existing institutions
to provide relief to its citizens and businesses during the Coronavirus pandemic.
Section 7. Severability.
If any portion of this Ordinance or its application to any person or circumstances is held
invalid, the remainder of the Ordinance or the application of the provision to other persons or
circumstances shall not be affected.
Section 8. Effective Date.
This Emergency Ordinance shall be in full force and effect immediately after final
passage.
ADOPTED by the City Council of the City of Lakewood this 20th day of September, 2021.
CITY OF LAKEWOOD _______________________________ Don Anderson, Mayor
Attest: _______________________________ Briana Schumacher, City Clerk Approved as to Form: _______________________________ Heidi Ann Wachter, City Attorney
144

EXHIBIT A
POLICIES AND PRIORITIES FOR USE OF
AMERICAN RESCUE PLAN ACT (ARPA) FUNDS
Policies in addition to those adopted as part of this Ordinance per its Findings:
1. Provide ARPA and other COVID-19 related resource navigation services to Lakewood residents and businesses. 2. Provide support to people living in, and agencies, organizations and businesses operating in, Lakewood’s “hardest hit communities” as defined in Department of the Treasury guidance. 3. Improve infrastructure in Lakewood to mitigate historical inequality and health issues in “hardest hit communities” as defined by the Department of the Treasury as well as to spur economic recovery. 4. Improve Lakewood’s delivery of municipal services to its residents and businesses in light of COVID (i.e. facility, communications and operations improvements)
Priorities for Use (not listed in order of importance):
1. Responding to Public Health Emergency
- Support COVID-19 vaccination efforts, including providing financial incentives
2. Assistance to households, small businesses, and nonprofits, or aid to impacted
industries: - Partner with United Way and other service providers, Pierce County, and other
cities to provide ARPA and COVID-19 resource navigation services to Lakewood residents.
- Partner with Pierce County and other jurisdictions to provide ARPA and COVID- 19 resource navigation services to the City’s businesses with an emphasis on BIPOC and small businesses.
- Provide financial assistance to non-profits and human services organizations operating in Lakewood and providing ARPA-eligible services.
- Support efforts to maintain existing, and to create new, affordable housing capacity in Lakewood.
- Support the creation of emergency shelter housing units.
3. Provision of government services: - Coordinate with public partners such as power utilities (TPU, PSE, LL&P), West
Pierce Fire & Rescue, Pierce County Library Services District, Lakewood Water District, Pierce County Sewer, and others to support facility improvements,
145

infrastructure improvements, payment arrears forgiveness programs, and other ARPA-eligible program expenditures.
- Address and backfill City revenue shortfalls caused by the COVID-19 pandemic per ARPA criteria and Department of Treasury guidance. - Improve remote access to City services to accommodate post-COVID-19 resident and business needs. - Capital and non-capital improvements to City facilities related to COVID-19 and post-COVID-19 operations. - Maintain a supply of non-capital ARPA-eligible supplies, including PPE for City employees and the public attending City meetings and events.
4. Providing grants to eligible employers that have eligible workers who perform
essential work:
- $0
146

EXHIBIT B
AMERICAN RESCUE PLAN ACT (ARPA)
EXPENDITURE CATEGORIES
ARPA Expenditure Categories* Recommended ARPA
Share in Dollars Recommended ARPA
Share in Percentages A: Public Health + 5% Direct Admin Costs $105,000.00 0.8%
B: Negative Economic Impacts + 5% Direct Admin Costs $3,688,311.80 26.8%
C: Services to Disproportionately Impacted Communities +
5% Direct Admin Costs $3,987,207.40 29.0%
D: Premium Pay + 5% Direct Admin Costs $0 0.0% E: Infrastructure + 5% Direct Admin Costs $1,500,000.00 10.9% F: Revenue Replacement** + 5% Direct Admin Costs $3,797,405.00 27.6% G: General Administrative Costs (5% Indirect) $688,311.80 5.0% TOTAL $13,766,236.00 100%
*Amounts are preliminary estimate and subject to change.
**Lost Revenue can be used for items identified as ARPA expenditures or for other eligible government service as
described in the Dept. of the Treasury Interim Final Rule..
147

EXHIBIT C
INITIAL ARPA EXPENDITURES
Proposed Initial ARPA Expenditures* Amount Category Comfort Inn + 5% Direct Admin Costs (Purchase & Emergency Shelter Operation for 2 yrs) $1,050,000 Negative Economic Impacts
Lakewood Community Services Advisory Board 1% of Funds
in 2022 and 2023 + 5% Direct Admin Costs (2 yrs) $144,543 Services to Disproportionately
Impacted Communities 2021 Warriors of Change + 5% Direct Admin Costs (Clover Park High School) $71,872.50
Services to Disproportionately Impacted Communities
City of Lakewood Police Body Cameras + 5% Direct Admin
Costs (Purchase & Program Operations 5 yrs) $2,071,258.35 Revenue Replacement Pierce County BIPOC Business Accelerator Contribution +
5% Direct Admin Costs (Launch Sept. ’21, 200 businesses in 8 cohorts by May ‘22) $525,000.00
Services to Disproportionately Impacted Communities
Vaccination Incentives + 5% Direct Admin Costs $105,000.00 Public Health
LPD Retention Bonus: $7,500 lump sum payment per officer
(85 officers = $637,500 maximum) in exchange for a commitment to remain with the department for three years + 5% Direct
Admin Costs $669,375 Revenue Replacement
Housing Safety Crisis Response: Lakewood Eviction Defense
& Prevention Project + 5% Admin Costs (1 year) $236,250 Negative Economic Impacts
ARPA Program Administration Indirect Costs (5 yrs) (Two Finance 0.5 FTEs, 1 FTE ARPA Coordinator (including residential navigation services), Tracking & Reporting Resources, Other City Staff %) $688,311.80 Administrative Costs
SUBTOTAL $5,561,612 Remaining ARPA funds after Initial Allocations $8,204,624
*Amounts are preliminary and subject to change.
148

ATTACHMENT BARPA Expenditure Ideas*,**
(*Formal applications and requests for proposals will be issued after the City Council adopts ARPA policies, priorities, and any initial fund expenditures.
**All costs are preliminary and subject to change.)
Purchase of Hotel for Emergency Housing Shelter
West Pierce Fire & Rescue request Lakewood Police Department Emergency Management request Pierce County Library Foundation request Future of Work in the South Sound Analysis request Pierce County BIPOC Business Assistance Program request Lakewood Water New Well at District’s Ponders Site
Lakewood Light & Power utility payment arrears Lakewood Water District utility payment arrears Pierce Co. Sewer utility payment arrears PSE utility payment arrears
Lakewood Parks & Recreation Department Youth Employment Program YMCA request Cohen Veterans Clinic potential request Rebuilding Together South Sound (RTSS) request Workforce Central request United Way/Clover Park Technical College Center for Strong Families request Home Ownership Center Northwest request Habitat for Humanity request Springbrook Connections request Boys & Girls Club request Violent Crime Victim Services request Clover Park High School 2021 Warriors of Change requestLASA requestTacomaProBono request
96149

6000 Main Street SW Lakewood, WA 98499-5027 (253) 589-2489 www.cityoflakewood.us
August 4, 2021
Sharon Lee, Executive Director Low Income Housing Institute (LIHI) 1253 S. Jackson St. Seattle, WA 98144
Dear Ms. Lee:
This letter is to communicate the City of Lakewood’s conditional commitment of capital and operational support for the Low Income Housing Institute (LIHI’s) purchase of the Comfort Inn (Project), located at 8620 S. Hosmer St, Tacoma, parcel #0320315002.
The City of Lakewood agrees to provide conditional funding of $1 million dollars in capital funds, to be used in combination with funds from the City of Tacoma and Pierce County, by LIHI to purchase the building and pay associated closing costs. $700,000 will be conditionally committed as an acquisition bridge loan, and $300,000 will be committed as a deferred loan as permanent financing. The City understands that LIHI is seeking to leverage State Dept. of Commerce funding through their Rapid Capital Housing Acquisition program in the amount of $7,000,000. A portion of these funds will be used to repay the City’s bridge loan.
The use and conversion of the Comfort Inn building will happen in two phases. The first phase will include 120 enhanced shelter beds for homeless people and the second phase, anticipated to begin in 2024, will include approximately 80 units of permanent supportive housing (PSH). During the first phase, the City will provide $163,000 in annual operating and services funding for two years (or through December 2023) from sources such as its ARPA, CARES and document recording fee (DRF) revenues.
The City’s funding amount is subject to change based on final Project capital and operating costs. If there are decreases in development costs or increases in other projected capital revenue sources, the City of Lakewood and other public funders explicitly reserve the right to decrease the final subsidy award to the minimum level needed. The projected sources of the City of Lakewood capital funding are federal ARPA dollars appropriated by the City of Lakewood City Council specifically for the acquisition of the Project.
This letter will serve as an award of funds, subject to: 1. The reservation of 12 emergency shelter beds for Lakewood individuals;2. Approval of the final Project development and operations budgets;
Don Anderson Mayor
Jason Whalen Deputy Mayor
Mary Moss Councilmember
Michael D. Brandstetter Councilmember
Patti Belle Councilmember
Linda Farmer Councilmember
Paul Bocchi Councilmember
John J. Caulfield City Manager
As of 9/13/21, final conditions and negotiations are underway regarding purchase of the Comfort Inn
97150

6000 Main Street SW Lakewood, WA 98499-5027 (253) 589-2489 www.cityoflakewood.us
3. Consistency with the City of Lakewood 5 Year 2020-2024 Consolidated Plan and FY 2021 Consolidated Annual Action Plan (already approved) as developed by the Tacoma-Lakewood HOME Consortium;
4. Income and affordability levels in the Multi-Family Lending Term Sheet; and 5. Additional City of Lakewood requirements that will be identified as further details
become available regarding the Project’s construction costs, operational costs, and timelines for conversion from an enhanced shelter to permanent supportive housing.
This letter does not cover all federal, state and local requirements, nor all the terms that will be included in loan documents including legal rights and obligations. Please read this letter carefully and return a signed copy of the acknowledgement at the bottom to Tiffany Speir, City of Lakewood ARPA Manager. Thank you,
Tiffany Speir, ARPA Program Manager 253.983.7702 / [email protected]
98151

From: Hallie McCurdy [mailto:[email protected]] Sent: Monday, July 26, 2021 5:03 PM To: Tiffany Speir <[email protected]> Subject: City of Lakewood ARPA Fund Request
Dear Tiffany,
Thank you for including West Pierce Fire & Rescue as a stakeholder to help determine how the City of
Lakewood should spend their America Rescue Plan Act (ARPA) funds. West Pierce Fire & Rescue would
like to request funds to improve our Emergency Management program. There are two items we believe
will help us to be better prepared for the next major emergency, disaster, or pandemic.
The first item is to update our Department Operations Center (DOC) and backup DOCs to better
communicate with the city and other stakeholders during times of emergency or disaster. One thing the
COVID-19 Pandemic brought to light is the fact that we need to consider how to accomplish tasks when
we are not in the same location. Our primary DOC and backup locations have some basic technology
but holding virtual meetings has been incredibly challenging because we don’t have appropriate camera
and audio capabilities for remote meetings. West Pierce has navigated the pandemic using laptop
cameras to bring in people from other locations; sometimes the technology works and other times it
does not. This is the format we have used to conduct emergency management trainings and meetings,
but we believe it could be improved by adding some dedicated hardware such as cameras and audio
capabilities. The estimated cost of these upgrades at four fire stations is $200,000.
Another improvement to our DOC would be to add HAM radios. The City of Lakewood has a great setup
with HAM radios; the fire district should have a similar level of capabilities so we can communicate
seamlessly if phone and internet fail during an emergency. The estimated cost for this project is $10,000
The second item we would like to consider is translation of our basic emergency messages into
additional languages to better serve our community. The fire district would like to take the lead on this
project for the West Pierce Emergency Management Coalition as many of the messages would be
released jointly. We estimate the costs to translate emergency messages into the top four languages
utilized in the fire district would be approximately $20,000.
In total, West Pierce is asking for $230,000 from these ARPA funds. If you have any questions
regarding this proposal, please feel free to contact me at 253-377-3163. Thank you for your
consideration!
Sincerely,
Hallie McCurdy
West Pierce Fire & Rescue
99152

From: John Unfred Sent: Tuesday, July 20, 2021 9:44 AM To: Tiffany Speir <[email protected]> Subject: RE: Latest FAQs re ARPA qualified expenditures and processes and Request for Your Ideas Hi, Tiffany, Thank you for all of your work on this. I have a question about eligibility for something I’m working on for Emergency Management. As you might recall, Lakewood is now part of a coalition providing EM services to Lakewood, U.P., and West Pierce Fire & Rescue. Steilacoom will be joining us in January. One of the things we are evaluating is our own alert and warning system. This is a system that would allow us to send emergency messages via reverse 911 to landlines, and/or to any cell phone within the alert boundary. It also allows for residents to subscribe for routine messages from the City. The question is whether this is something that ARPA funds might be used for? I understand ARPA is one-time funds and this would be an annual subscription, but it would at least get us off the ground with it. Thanks! John From: Tiffany Speir Sent: Monday, July 19, 2021 2:41 PM To: Executive Leadership Team <[email protected]> Cc: Jim Kopriva <[email protected]>; Becky Newton <[email protected]>; Brian Humphreys <[email protected]>; Ted Thelin <[email protected]>; Jeff Gumm <[email protected]>; Martha Larkin <[email protected]> Subject: Latest FAQs re ARPA qualified expenditures and processes and Request for Your Ideas Hello all: Attached please find the latest FAQs sheet from Treasury re the American Rescue Plan Act (ARPA) expenditures and processes as well as other ARPA background and explanatory documents. As you recall, ARPA is intended to assist people, businesses and local governments recover from the COVID-19 pandemic. The City Council will hold a study session on August 23 to review the collected feedback from community outreach efforts and internal discussions and a Resolution recommending the use of ARPA funds on a list of items. Please send me any ideas for expenditures relevant to your department that you think would be ARPA eligible no later than August 13 – I am happy to meet with you/your staff to discuss in more detail as needed. Thank you in advance, _______________________________________________________
100153

PIERCE COUNTY LIBRARY SYSEM
Responsive, Innovative Service: Installation of Library Lockers
Case for Support
Since March of 2020, PCLS has significantly expanded online services, online programs and the e-book
collection as a response to the COVID pandemic and the statewide closure of library buildings. As PCLS
has modified its service approach as a result of the pandemic, the public’s desire to safely and easily
access our physical materials collection without entering their local library is an opportunity that PCLS
seeks to address. As a result, PCLS seeks to address the following:
1. To quickly find safe protocols and modes of exchange of books and materials for patrons
2. To expand the available hours that books and materials can be delivered to patrons
3. To improve the ability of the patrons to self-serve with respect to pick-up of books and materials
4. To bridge the equity divide for patrons who do not have access to digital material
Solution
In City of Lakewood’s case, we would strategically locate either one or two lockers in an area of need
(Springbrook, Tillicum, Woodbrook, for example), depending on funding. The locker model is also
scalable if the pilot installations are successful.
1. A bank of lockers are installed in the community with easy proximity to parking and drive-up
2. Patrons place holds via the library catalog and designate a locker pick-up location
3. Library staff load the lockers with the books and materials
4. Patrons may pick up materials via self-service kiosk, 24/7
Budget
Project components Units Estimated budget
Materials for exterior data/network/power retrofitting on lockers 2 $10,000
Self-Service Holds Kiosk – 32 lockers per unit, one return bin per unit 2 $60,000
TOTAL 2 $70,000
Reference
The King County Public Library installed lockers at several
locations and reports full-capacity utilization by patrons with high
satisfaction.
101154

Project: The future of work in the South Sound Region
COVID-19 has provided us with an interesting opportunity to assess the future of work and consider
whether we are finally ready to abandon, albeit partially, the industrial age practice of commuting to
work.
COVID-19 created a condition that forced American employers and employees to use technology, to the
extent possible, to maintain employment and our economy.
Background
Pre-COVID-19
Nationally, nearly 120 million Americans commuted by driving alone to work (76% of
commuters).
King County, only 60% of were commuters.
Pierce 77% drove alone to work (334,000 commuters).
Nearly half of Pierce County commuters drove to workplaces outside the county.
Similar patterns can be observed in South King County cities, from Federal Way to Maple Valley.
Only 5% of American workers were telecommuting
During COVID-19
By mid-August 2020, national commuter trips declined by 34.4% as compared to August 2019.
WA state reduction was at 46.3% for the same time period.
In King County, nearly 2 million trips of over 5 miles disappeared from the roads.
In Pierce County, over 400,000 trips had been eliminated.
The number of people staying home in Pierce County increased by nearly 70,000.
What does this mean for the South Sound Region (South King County and Pierce County), post-
pandemic?
Will the future of the region involve a higher level of reliance on technology (compared to
2019)?
Are resident workers (by occupation and skills) and our infrastructure ready for a larger
proportion of the working population pivoting toward performing their jobs entirely or partially
at home (or a local work center)?
Is the current labor force trained and prepared to address the changes created by work-related
technological growth?
With the growth of ICT (Information, Communication, and Technology), is the region ready to
grow its economy in related sectors?
Are there enough resident skilled workers to become attractive to firms seeking to establish,
move, or grow their new headquarters in the small and mid-size cities of larger metro regions?
102155

The Center for Applied Urban Research at University of Washington Tacoma has the capacity to help
South Sound communities understand the characteristics of the region’s labor force and identify what
information might be useful in order to prepare for the post-pandemic economy. It can provide the
necessary insight for jurisdictions to respond to the stated questions and help prepare for the region’s
economic future.
The proposed analysis will be performed in four phases for participating jurisdictions:
1. Analyzing the most recent resident occupations/skills – This will offer the occupational structure
and net differential between resident workers, their skills, and local jobs (by each occupation
category).
a. We will focus on six particular tech categories (as a subset of the larger analysis):
i. Construction
ii. Biotech
iii. Energy
iv. Transportation
v. Manufacturing
vi. Information/Communication
b. We will determine the overall capacity of the region (based on its resident skills) to
attract and grow related industries.
2. We will conduct an online survey of resident workers (with announcement/recruitment from
participating jurisdictions) to identify their place of work (ZIP Code) and their occupation to
verify against economic data. This survey will be designed with input from participating
jurisdictions. Note: The final survey will be used for all jurisdictions.
3. Based on resident skills, we will provide an estimate of growth potentials for the region and in
individual participating jurisdictions.
4. Based on existing research and best estimates, we will identify the work at home potential for
various job categories and what this might mean for the totality of the labor force.
Product: The proposed research will result in a report that focuses on the entirety of Pierce County and
South King County (as a single region). Detailed data at the local level will be provided to participating
jurisdictions only.
How will this report help Pierce County and local jurisdictions?
Understand the potential for continued remote work for local residents
Identify strategies for economic development
Focus on the creation of flexible office environments
Identify potential hubs and spokes for a diversity of employment centers (at regional level)
Identify strategies to attract and support small firms and satellite offices
We will put housing cost and wages in the context of quality-of-life issues for the region. This topic will
be addressed in a chapter focusing on potential policy strategies.
Timeline: This will be a 4-to-6-month project requiring a significant amount of time and data analytics.
Ideally, we would like to start this project no later than August 1, 2021.
103156

Cost: The cost of this research is a function of the number of participating jurisdictions. Below is the cost
structure. Pierce County’s cost is listed separately, assuming that at least 5 jurisdictions are willing to
participate in this research.
1 municipality $20,000
2 municipalities $30,000
3-5 municipalities $40,000-$50,000
6-10 municipalities $60,000
Pierce County (Regional Analysis) $10,000
Who else has signed on? So far, Sumner and Federal Way
Ask to Lakewood: $10,000
104157

From: Becky Newton Sent: Monday, May 10, 2021 3:58 PM To: John Caulfield <[email protected]>; Tiffany Speir <[email protected]> Cc: David Bugher <[email protected]>; Tho Kraus <[email protected]> Subject: FW: ARPA John, and Tiffany, Please see bullet #1 below for consideration. Pierce County is requesting that Lakewood contribute $500,000 to support an Entrepreneurial & Technical Assistance program focusing on Black, Indigenous, and People of Color. Becky From: Betty Capestany [mailto:[email protected]] Sent: Monday, May 10, 2021 3:41 PM To: Becky Newton <[email protected]> Subject: RE: ARPA This email originated outside the City of Lakewood.
Use caution when following links or opening attachments as they could lead to malicious code or infected web sites. When in doubt, please contact the HelpDesk.
- [email protected] ext. 4357
Thanks Becky for your follow-up email. First, I wanted to let you know that out of the 757 qualified applications for the 2021 Business Roll-back Relief grants, 91 were from the City of Lakewood. We are working through all of the final vetting process so will get you the final award numbers in the next couple of weeks. Grants are for up to $10,000.
Partnership Opportunity: Entrepreneurial & Technical Assistance with a focus on BIPOC opportunities. The County Council has set aside $5M of ARPA towards this initiative with the caveat that we receive matching resources from Cities, Non-profits & the Business Community. Our ask is for Lakewood to contribute $500,000 towards this effort.
Background: During the CARES process we worked with thousands of businesses and saw some gaps and opportunities to grow entrepreneurism; help BIPOC communities and also to help our small and micro businesses grow their companies. Programs will have a County-wide focus and will focus on growing entrepreneurism; have a BIPOC focus; have structured cohort opportunities and also tailored individual opportunities. Resources will go to training, technical resources needed by businesses, innovation grants to help with seed money funding, financial reporting programs and mentors/navigators to help the businesses learn to use the tools. Success measures include: the number of businesses launched and also growing wealth in our communities.
105158

This will be a multi-year effort as part of the American Rescue Plan funding. The long term goal will be to have these efforts create self-sustaining programs. Participating partners will also help design these efforts.
We are in the beginning stage of this process and look forward to having Lakewood join us in creating a legacy program that leverages existing opportunities, reaches above silos and create new ways to grow entrepreneurship in Pierce County. Thanks,
Betty
Betty Capestany Director I Pierce County Economic Development 950 Pacific Avenue, Suite 525 Tacoma, Washington 98402-2100 p: 253.798.6926 l 253-389-2309 [email protected] From: Becky Newton <[email protected]> Sent: Monday, May 10, 2021 2:52 PM To: Betty Capestany <[email protected]> Subject: ARPA Betty, Could you send me some information regarding the partnership opportunity you mentioned on Friday? Becky Newton Economic Development Manager City of Lakewood 6000 Main Street SW Lakewood WA 98499 253-983-7738 (office) 253-254-1204 (cell) FB: @lakewoodwa; |Twitter: @cityoflakewood | Instagram: @cityoflakewoodwa
106159

Lakewood Water District 4 of 4 ARPA Project Options 8/11/2021
Project Name: New Well at District’s Ponders Site
Project Description: Install a third groundwater well at the
District’s Ponders well site. The
additional well would provide
improved groundwater supply to the
Springbrook area and beyond. The
well site contains the only supply
sources west of I-5 that could serve
the area if a major natural disaster
were to damage the pipelines
crossing I-5. As this area continues to develop into multi-family, high-density multi-family and industrial
land uses, water supply resiliency for consumption and fire protection will be important to the long term
planning of this area.
Project Benefits
Economic Development
o Improves water availability to City residents and businesses.
Dependable Infrastructure
o Provides an additional water source to City customers.
o Additional source at only site that directly serves this area of the City east of I-5.
Public Safety
o Provides a new water supply source east of I-5 to help support firefighting and water during
emergencies.
o Potential to combine this project with an emergency water distribution station at the nearby
Springbrook Park.
Financial Responsibility
o Reduced project cost due to leveraging existing improvements at site.
Robust & Active Community
o Potential to combine this project with an emergency water distribution station at the nearby
Springbrook Park.
New
Groundwater
Well
Project Location: Springbrook Area Project Timeline: Design - as early as 2022; Construct - 2023-2024. Project Budget: Approximately $1,000,000
107160

From: Teri MacDougall [mailto:[email protected]] Sent: Tuesday, August 10, 2021 8:01 AM To: Randy Black <[email protected]>; Tiffany Speir <[email protected]>; [email protected]; [email protected]; [email protected]; [email protected]; [email protected]; [email protected]; Marshall Meyer <[email protected]>; Ian Black <[email protected]>; Philip Mendoza <[email protected]> Subject: RE: Question re utility payment arrears in Lakewood City boundaries This email originated outside the City of Lakewood.
Use caution when following links or opening attachments as they could lead to malicious code or infected web sites. When in doubt, please contact the HelpDesk.
- [email protected] ext. 4357
Good morning Tiffany,
As of today, the amount owed by Lakewood Water customers who would be disconnected is
$81,484.62. As you can imagine this number fluctuates from day to day. Let me know if there is
any more information you need.
Sincerely,
Teri MacDougall Office Manager Lakewood Water District
253-588-4423 [email protected] www.lakewoodwater.org
From: Randy Black <[email protected]> Sent: Tuesday, August 10, 2021 6:49 AM To: Tiffany Speir <[email protected]>; [email protected]; [email protected]; [email protected]; [email protected]; [email protected]; [email protected]; Marshall Meyer <[email protected]>; Ian Black <[email protected]>; Teri MacDougall <[email protected]>; Philip Mendoza <[email protected]> Subject: RE: Question re utility payment arrears in Lakewood City boundaries Hi Teri, Would you please forward to Tiffany with the City of Lakewood our current outstanding amount from customers who have not paid their water bills owed? Thank you, Randy From: Tiffany Speir <[email protected]> Sent: Monday, August 9, 2021 5:22 PM To: [email protected]; [email protected]; [email protected]; [email protected]; [email protected];
108161

From: Tiffany Speir Sent: Monday, August 16, 2021 8:57 AM To: 'Kip Julin' <[email protected]> Cc: Maylin Clark <[email protected]>; Jen Tetatzin <[email protected]>; Jane Vandenberg <[email protected]> Subject: RE: Question re utility payment arrears in Lakewood City boundaries Thank you _______________________________________________________ Tiffany Speir*, Esq., CPM® Long Range/Strategic Planning Manager
http://cityoflakewood.us/arpa/
From: Kip Julin [mailto:[email protected]] Sent: Monday, August 16, 2021 7:03 AM To: Tiffany Speir <[email protected]> Cc: Maylin Clark <[email protected]>; Jen Tetatzin <[email protected]>; Jane Vandenberg <[email protected]> Subject: RE: Question re utility payment arrears in Lakewood City boundaries This email originated outside the City of Lakewood.
Use caution when following links or opening attachments as they could lead to malicious code or infected web sites. When in doubt, please contact the HelpDesk.
- [email protected] ext. 4357
Tiffany I have not heard that they are considering that. We have had penalty and interest relief since March 2020. That relief effort is scheduled to end September 30th. Kip From: Tiffany Speir <[email protected]> Sent: Sunday, August 15, 2021 10:51 PM To: Kip Julin <[email protected]> Cc: Maylin Clark <[email protected]>; Jen Tetatzin <[email protected]>; Jane Vandenberg <[email protected]> Subject: RE: Question re utility payment arrears in Lakewood City boundaries Thank you, Kip. Do you know if the County Council is considering utility payment forgiveness? _______________________________________________________ Tiffany Speir*, Esq., CPM® Long Range/Strategic Planning Manager
109162
http://cityoflakewood.us/arpa/
From: Kip Julin [mailto:[email protected]] Sent: Sunday, August 15, 2021 8:28 PM To: Tiffany Speir <[email protected]> Cc: Maylin Clark <[email protected]>; Jen Tetatzin <[email protected]>; Jane Vandenberg <[email protected]> Subject: RE: Question re utility payment arrears in Lakewood City boundaries This email originated outside the City of Lakewood.
Use caution when following links or opening attachments as they could lead to malicious code or infected web sites. When in doubt, please contact the HelpDesk.
- [email protected] ext. 4357
Tiffany Currently, PPW Sewer Division records indicate that 4.1 % (605 accounts) of the 14,855 Lakewood accounts are at 120+ days delinquent, another 2.4 % (362 account) between 91-120 days delinquency and 6% (883 accounts) are in 61-90 days delinquency. Any account 60 days or greater delinquent are lien eligible. The total amount delinquent is $334,883. The far majority of the accounts owe $500 or less. One hundred and forty (140) owe $500 or more. Let me know if you need any additional information.
Stuart Kip Julin Sewer Business Services Manager Planning & Public Works | Sewer Division (253) 798-4145
110163

From: Phifer, Kierra [mailto:[email protected]] Sent: Monday, August 16, 2021 10:52 AM To: Tiffany Speir <[email protected]> Subject: RE: Question re utility payment arrears in Lakewood City boundaries
Hi Tiffany – Thank you for the reminder. Also, great to see you last week! Please see the attached spreadsheet for Lakewood arrearages as of July 31, 2021. I broke this out by residential vs. commercial/industrial and then also by active/closed accounts. There are currently 2,770 customers past due with a total of $1.33MM past due with a premise ID that ties to Lakewood. There are 5 tables in the attached spreadsheet:
1. Total # customers past due 2. Total # customers past due based on their oldest balance
a. This will tell you how long customers have had outstanding balance. For example, cell K18 indicates there are 217 active residential customers in Lakewood whose oldest outstanding balance is more than a year old (they likely have more recent outstanding balances as well – but their oldest outstanding balance is greater than 365 days old).
b. 34% of the customers fall in the 1 – 30 day bucket, meaning their oldest balance is basically less than a month old. I am assuming the customers they will likely be aim at are customers who fall beyond this bucket (i.e. > 30 days past due).
3. Total $ past due 4. Energy assistance totals for customers currently past due in Lakewood for this program year 5. Energy assistance totals for customers in Lakewood (past due or not) for this program year
I hope this helps! Please let me know if you have any questions. -Kierra From: Tiffany Speir <[email protected]> Sent: Monday, August 16, 2021 10:46 AM To: Phifer, Kierra <[email protected]> Subject: RE: Question re utility payment arrears in Lakewood City boundaries Little reminder . . . Thanks,
111164

_______________________________________________________ Tiffany Speir*, Esq., CPM® Long Range/Strategic Planning Manager
http://cityoflakewood.us/arpa/
From: Tiffany Speir Sent: Monday, August 9, 2021 5:22 PM To: '[email protected]' <[email protected]>; '[email protected]' <[email protected]>; '[email protected]' <[email protected]>; '[email protected]' <[email protected]>; '[email protected]' <[email protected]>; '[email protected]' <[email protected]>; '[email protected]' <[email protected]>; '[email protected]' <[email protected]>; '[email protected]' <[email protected]> Subject: Question re utility payment arrears in Lakewood City boundaries Hello all – first, my apologies if you are not the right person from whom to request this information. Hoping you would be willing to forward along as needed. The City of Lakewood is reviewing how to allocate its American Rescue Plan Act (ARPA) funds, and one idea is to assist with covering utility payment arrears (i.e., water, sewer, power.) I am requesting any sort of estimate of the amount in arrears for residents (and businesses if that information is available) from your respective utility. The City Council is starting its review of ARPA options in August, so if there is any information you can provide by the end of day August 16, it would be MUCH appreciated. Thank you in advance and I hope you and yours are healthy and well _______________________________________________________ Tiffany Speir*, Esq., CPM® Long Range/Strategic Planning Manager
6000 Main St SW, Lakewood, WA 98499 253.983.7702 l [email protected] *Tiffany Speir does not provide legal representation for the City of Lakewood http://cityoflakewood.us/arpa/
PSE Arrearages as of July 31, 2021 for the City of Lakewood, WA
112165

TOTAL # CUSTOMERS PAST DUE AS OF JULY 31, 2021
CUSTOMER
TYPE ACCOUNT STATUS1
# CUSTOMERS
AVG. PAST DUE PER
CUSTOMER
Commercial / Industrial
Active 178 $ 1,009
Closed 25 $ 654
Residential Active 2,296 $ 459
Closed 271 $ 313
TOTAL ACTIVE ACCOUNTS: 2,474 $ 498
TOTAL: 2,770 $ 482
1Closed account indicates a customer has closed their account with PSE but still owes money on the account (e.g. a customer who moves out of a location but has yet to pay their final bill).
# OF CUSTOMERS PAST DUE BASED ON THE TIMEFRAME OF THEIR OLDEST BALANCE
CUSTOMER TYPE
ACCOUNT STATUS1
PAST_DUE _1_30
PAST_DUE _31_60
PAST_DUE _61_90
PAST_DUE_ 91_120
PAST_DUE_ 121_150
PAST_DUE_ 151_180
PAST_DUE_ 181_364
PAST_DUE_ 365_ABOVE
Commercial / Industrial
Active 79 24 17 10 9 9 11 19 Closed 11 5 1 1 4 3 Residential Active 784 427 247 182 122 94 223 217 Closed 65 37 32 26 9 6 31 65
TOTAL: 939 493 297 218 141 109 269 304
% OF TOTAL CUSTOMERS
PAST DUE: 34% 18% 11% 8% 5% 4% 10% 11% TOTAL $ PAST DUE
CUSTOMER TYPE
ACCOUNT STATUS1
PAST_DUE _1_30
PAST_DUE_ 31_60
PAST_DUE_ 61_90
PAST_DUE_ 91_120
PAST_DUE_ 121_150
PAST_DUE_ 151_180
PAST_DUE_ 181_364
PAST_DUE_ 365_ABOVE TOTAL_PAST_DUE
Commercial / Industrial
Active $ 63,993
$ 23,501
$ 10,070
$ 7,830
$ 7,259
$ 5,671
$ 17,080
$ 44,191
$ 179,595
Closed $ 8,983
$ 931
$ 745
$ 949
$ 1,575
$ 924
$ 1,977
$ 266
$ 16,350
Residential Active $ 195,912
$ 125,378
$ 112,804
$ 108,895
$ 101,914
$ 79,718
$ 187,371
$ 141,115
$ 1,053,106
113166

Closed $ 9,837
$ 6,471
$ 7,205
$ 8,392
$ 6,171
$ 5,267
$ 15,501
$ 26,068
$ 84,911
TOTAL $ PAST DUE ON
ACTIVE ACCOUNTS: $ 259,905
$ 148,879
$ 122,874
$ 116,725
$ 109,173
$ 85,389
$ 204,451
$ 185,306
$ 1,232,701
TOTAL $ PAST DUE: $ 278,725
$ 156,281
$ 130,824
$ 126,066
$ 116,919
$ 91,580
$ 221,929
$ 211,640
$ 1,333,962
% OF TOTAL $: 21% 12% 10% 9% 9% 7% 17% 16% 100%
# OF CUSTOMERS CURRENTLY PAST DUE WHO HAVE RECEIVED ENERGY ASSISTANCE THIS PROGRAM YEAR
(10/1/2020 - PRESENT)
ALL LAKEWOOD CUSTOMERS WHO HAVE RECEIVED ENERGY ASSISTANCE THIS PROGRAM YEAR
(WHETHER THEY ARE PAST DUE CURRENTLY OR NOT) (10/1/2020 - PRESENT)
TYPE OF
ASSISTANCE #
CUSTOMERS AMOUNT
RECEIVED AVG.
AMOUNT RECEIVED
TYPE OF ASSISTANCE
# CUSTOMERS
AMOUNT RECEIVED
AVG. AMOUNT
RECEIVED
CACAP 16 $ 8,133
$ 508 CACAP 49
$ 25,268
$ 516
CACAP 2 86 $ 113,357
$ 1,318 CACAP2 145
$ 172,371
$ 1,189
LIHEAP PLEDGE 36
$ 39,896
$ 1,108
LIHEAP PLEDGE 286
$ 259,349
$ 907
NON-CAP AGENCY 35
$ 16,179
$ 462
NON-CAP AGENCY 59
$ 26,113
$ 443
PSE HELP 41 $ 28,742
$ 701 PSE HELP 293
$ 167,726
$ 572
SALVATION ARMY PLEDGE 5
$ 1,989
$ 398
SALVATION ARMY PLEDGE 6
$ 2,278
$ 380
TOTAL UNIQUE
CUSTOMERS2 165 $ 208,296
$ 1,262
UNIQUE CUSTOMERS2 486
$ 653,104
$ 1,344
2Cell C43 and G43 will not match the sum of rows C37 to C42 and G37 to G42 respectively, as the same customer may have received more than one type of pledge program
114167

PR Dept Youth Employment Program Our recreation assistant starting pay is $15.00. Our recreation leader pay range is 15.50 – 18.50. Found this with a quick search: “The typical cost per participant is approximately $1,400 to $2,000” City Council requested a more traditional youth Corp work crew program for the 2022 summer season. The 12 week program would include hands on work throughout the city as well as leadership and employment readiness training. The program would involve two recreation leaders and eight youth workers and fuel and supplies. cost for the 2 rec leaders is $25,000; 8 youth crewmembers cost $57,600 with $1000 in fuel and supplies for a total of $83,600
115168

From: Jessie Palmer [mailto:[email protected]] Sent: Friday, August 13, 2021 3:14 PM To: Tiffany Speir <[email protected]> Subject: RE: Follow-up to Last Week's Stakeholder Summit Hi Tiffany,
I’ve attached estimates for the programs and services I outlined in my July 21 e-mail. I
broke it down by program, provided a general estimate of what that funding would enable us to do, how many we could serve, etc.
When I refer to ARPA priority population/targeted communities in the attached proposal, that includes those individuals/families disproportionately impacted by COVID-19; Black,
Indigenous, People of Color (BIPOC); and the three communities identified by the Council: Tillicum, Woodbrook, and Monta Vista.
I also state “free or reduced price” and that refers to the Y’s sliding scale for membership or
program assistance. We scale our pricing/fees to ensure that individuals and households can afford our services and that no one is turned away. If the City is using a certain
income/poverty threshold for the ARPA funding, we can adjust to that scale. For the
purposes of preparing this proposal, I went with 150% of poverty level/scale.
Please review and let me know if you have any questions.
Thanks,
Jessie
Jessie Palmer | Senior Association Development Director
YMCA of Pierce and Kitsap Counties Association Office | 4717 S. 19th St. Ste. 201, Tacoma, WA 98405 C 253-905-0647 The Y is for youth development, healthy living, and social responsibility.
City of Lakewood – American Recovery Plan Act Funding Proposal/Cost Estimates for YMCA COVID-19 Recovery Programs and Services Addressing educational disparities:
We have a great, existing partnership with Clover Park Schools
Currently offering before and after school child care and summer day camp in elementary schools
Currently offering summer learning academies in middle schools
A holistic approach to positive youth development: includes academic, health, and social-emotional enrichment
We are focused on closing the academic achievement gap, improving health outcomes, and strengthening the social-emotional skills so that every child is
successful Early Learning: we are serving Lakewood/Clover Park SD kids at our Early Learning
Center in University Place, but depending on the type of funding that is available, we may be able to offer Early Learning in Lakewood
116169

Program Name Scope of Services
Child Care ARPA Funding Request: $30,000/yr. Will provide free and reduced price access to YMCA Child Care for 40 children from parents/families meeting ARPA priority populations/targeted communities. YMCA Child Care is offered during the school-year, between late August through June, every school day, on school breaks/vacations, holidays, etc. Care is offered before school as early as 6 a.m. and after school as late as 6 p.m. Child Care is offered in our partner elementary schools (Clover Park SD).
Summer Day Camp ARPA Funding Request: $25,000/yr. Will provide free and reduced price access to Summer Day Camp at the Lakewood Family YMCA or at select Clover Park SD elementary schools (offered at Custer Elementary in summer 2021, TBD in summer 2022-23) for 25 children from parents/families meeting ARPA priority populations/targeted communities. Summer Day Camp is offered a minimum of 10-weeks during the summer, from the last day of school to the Friday before the first day of the new school year.
Summer Learning Academies
ARPA Funding Request: $15,000/yr. Will provide free access to local middle school youth to attend the YMCA’s Summer Learning Academy offered at Claudia Thomas MS (serving Claudia Thomas, Hudtloff, Lochburn students). We will work with our school partners to identify and recruit students who meet the ARPA priority populations/targeted communities. We project serving more than 140 middle school students in summers 2022 and 2023 (a 20% increase in participation from summer 2021).
Early Learning/Little Learners
ARPA Funding Request: $12,500/yr. Will provide free and reduced price access to 25 children from parents/families meeting ARPA priority populations/targeted communities to attend our Little Learners program offered at the Lakewood Family YMCA. Our Little Learners program and curriculum supports toddlers, ages 3-5, in preparing for either pre-school or kindergarten. Little Learners is offered from September to June of each year.
117170

Promoting healthy childhood environments: Our Lakewood YMCA Community Center: pre-COVID-19, we served thousands of
youth and teens (ages 0-18) in registered and drop-in programming including water
safety and swimming lessons, youth sports, arts classes, gymnastics, and drop-in programs like 678 Nite and Teen Late Nite.
Our Summer Day Camp programs at our Lakewood Y and at a couple of Clover Park
Schools serve hundreds of Lakewood youth This summer, in partnership with Clover Park Schools, we are offering Summer
Learning Academies for hundreds middle school aged youth All of our activities take a holistic approach to positive youth development and
include academic, health, and social-emotional enriching activities and offer positive coaching and mentoring by highly-trained adult role models.
Program Name Scope of Services
Water Safety/Swimming Lessons
ARPA Funding Request: $15,000/yr. Will provide free and reduced price water safety and swimming lessons to 250 children from parents/families meeting ARPA priority populations/targeted communities. Our water safety and swimming lessons are progressive, skill-based lessons and support swimmers at every level (beginner, intermediate, and advanced) in improving their skills and abilities to be safe in and around the water. Swim lessons are offered year round in 4-6 week sessions.
Youth Sports ARPA Funding Request: $5,000/yr. Will provide free and reduced price scholarships to 100 children and youth from parents/families meeting ARPA priority populations/targeted communities to participate in youth sports activities at the Lakewood YMCA. The Lakewood Y offers a variety of youth sports activities including indoor and outdoor soccer, flag football, basketball, t-ball, baseball, volleyball, etc. to youth ages 3-12 years. Our youth sports primarily serve children who are new to sports and focus on the fundamentals, developing techniques, teamwork, sportsmanship skills, and developing a love for the game.
Arts Classes ARPA Funding Request: $5,000/yr. Will provide free and reduced price scholarships to 50 youth and teens from parents/families meeting ARPA priority populations/targeted communities. Arts programming will be offered at the Lakewood Family YMCA or at our outreach locations (local CPSD elementary schools). We offer a variety of arts activities for children to explore including the performing arts (dance, ballet, guitar, piano), visual arts (drawing, painting), and culinary arts. Youth Arts activities are offered in 6-8 week sessions throughout the year.
Gymnastics ARPA Funding Request: $5,000/yr. Will provide free and reduced price scholarships to 20 youth and teens from parents/families meeting ARPA priority populations/targeted communities to attend the Lakewood YMCA’s Gymnastics program. The YMCA’s gymnastics program serves youth of all skill abilities (beginner, intermediate, advanced/competitive) and offers a progressive lesson plan. Gymnastics is offered in 6-8 week sessions, year-round.
Establish a youth employment program:
The Y is a leading employer of teens both locally and nationally
118171

We offer a Leader in Training (LIT) and Counselor in Training (CIT) programs that
provide teens the job skills necessary to gain employment at the YMCA Our employment opportunities are convenient for teens (evenings, holidays,
weekends, etc.) We would be interested in exploring the City’s interest in establishing a youth
employment program or how we might offer support
Program Name Scope of Services
Leaders in Training and Counselors in Training
ARPA Funding Request: $10,000/yr. Will provide 40 teens (ages 13-18) from parents/families meeting ARPA priority populations/targeted communities Leaders in Training and/or Counselors in Training at the Lakewood Family YMCA. The program and activities provides job training and coaching by highly-trained YMCA staff that will help prepare teens for the workforce through hands-on training and work experiences, while serving as a YMCA volunteer. Once teens complete the program (80 hours) and are of working age, they will be eligible for employment at the YMCA (as Youth Leaders or Camp Counselors) or elsewhere in the community.
A couple of other areas that I believe the Y may be able to help City residents in their recovery: Health and Wellness Services for Adults:
Targeting those most disproportionately impacted by COVID-19, BIPOC individuals
and families, targeted communities (e.g. Springbrook, Tillicum, etc.) Small group counseling for stress, grief, anxiety, mental health
Chronic Disease Prevention programs: Blood Pressure Self-Monitoring, Diabetes Prevention, Parkinsons Programs, Weight Loss Programs, etc.
Senior Programs: socials/gatherings, Active Older Adult Fitness, Fall Prevention, etc.
Program Name Scope of Services
Community Café – Mental Health
ARPA Funding Request: $5,500/yr. Will provide 25 adults free or reduced priced access to our virtual Community Café (Mental Health). The Community Cafés are small-group sessions, 6-10 participants, offered in 8-week sessions throughout the year. The Community Cafes and small groups are facilitated by a highly-trained counselor who specializes in grief, stress, anxiety, and mental health and incorporates coaching and therapies that have proven effective in supporting people through these experiences.
Diabetes Prevention Programming
ARPA Funding Request: $20,000/yr. Will provide 25 adults free and reduced priced access to our Diabetes Prevention Program for those referred to our program by a physician (Type II diabetes) or who are pre-diabetic and also meeting ARPA priority populations/targeted communities. Our Diabetes Prevention Program is a year-long program and offered in four cohorts throughout the year.
Parkinson’s Programs ARPA Funding Request: $10,000/yr. Will provide 10 individuals free and reduced priced access to our Parkinson’s Programs (either Pedaling for Parkinson’s or Rocksteady Boxing) for those meeting ARPA priority populations/targeted communities. Our Parkinson’s programming is offered year-round.
Weight Loss Programs ARPA Funding Request: $10,000/yr.
119172

Will provide 50 individuals free and reduced priced access to our Weight Loss Program for individuals meeting ARPA priority populations/targeted communities. Our Weight Loss Program is offered in small groups, between 6-10 participants per group, in 12-week sessions throughout the year. We are targeting to serve individuals with a Body Mass Index (BMI) greater than 30, followed by those with a BMI greater than 25.
Active Older Adult Fitness ARPA Funding Request: $20,000/yr. Will provide 25 adults free and reduced priced access to our Active Older Adult Fitness programming meeting ARPA priority populations/targeted communities. Our Active Older Adult fitness classes are designed for those ages 55 and older. Our Active Older Adult activities focus on mobility and flexibility, strengthening muscle, etc. Exercises and activities can be modified to accommodate those with different fitness and strength levels. While our Active Older Adult programs are primarily focused on fitness, there is a strong social component to the program. Participants regularly meet before and after activities for coffee, meals, or just to be in each other’s company. The bonds that form help create accountability to attend program activities, motivation to continue exercise and diet routines, strong network of support, etc.
Family Wellness:
Parenting skills or parent/family support group programs Adult Life Skills/Coaching: Making Change Stick, Journey to Freedom, Financial
Peace University, etc. Family fitness programs
Family fun programs (e.g. Family Date Night, Family Movie Nights, etc.)
120173

From: John Caulfield Sent: Friday, August 13, 2021 4:07 PM To: Tiffany Speir <[email protected]> Subject: FW: ARPA Funding Option Viable opportunity that meets the definition of using ARPA funds? Or have they reached out to us? --John John Caulfield, ICMA-CM City Manager City of Lakewood 6000 Main Street SW | Lakewood, WA 98499 Ph: 253.983.7703 https://www.cityoflakewood.us/ Like us on Facebook Follow us on Twitter -----Original Message----- From: Mike Brandstetter Sent: Thursday, August 12, 2021 3:37 PM To: Tiffany Speir <[email protected]> Cc: John Caulfield <[email protected]> Subject: ARPA Funding Option As a community behavioral health resource, the Cohen Clinic serves a targeted population of veterans and their families. When the clinic located in Lakewood with City and County encouragement, it was noted that the Cohen foundation was establishing the clinic and funding it operationally for a number of years. That operational support was intended to make way for more local support. As a valuable community partner, perhaps ARPA contribution to operational costs in 2023-2026 (Perhaps $150K per year) your would serve the community well and could be the nexus for broader community support. Support with ARPA funding by Pierce County would strengthen impact. I am not aware of the clinic formulating an ask but could we reach out to see if there is in fact a long term need to transition from total reliance on Cohen Foundation funding to keep the clinic operative in Lakewood. Mike Brandstetter
121174

From: Kim Taylor [mailto:[email protected]] Sent: Friday, August 13, 2021 5:17 PM To: Tiffany Speir <[email protected]> Subject: RE: ARPA Funds Proposal
Hi Tiffany, I just caught this as I was almost on my way out for the week – we had to do some quick moving around on staff because of a medical leave situation and I thought this had been sent to you already. My fault completely for not checking and sending so late. For the past few years, we have received $14,000 per year from the Human Services Department to complete house projects in the City of Lakewood through our Rebuilding Day and Safe at Home Programs. Our outputs for this contract amount have varied, but are typically 4 homes with 9 unduplicated residents. We would like to request an increase to our contract for a total of $25,000. For the past few years, we have processed a growing number of applications from Lakewood households, so we know that qualified projects within the City of Lakewood are there, we just typically don’t have the funds to get to all of them. We are currently working through a waiting list, due to COVID related delays, that will likely stretch into the next two years of budget. Increased funding specifically tied to projects in Lakewood would allow us to work through that list much quicker and perhaps allow us to respond to new applications submitted for services in a more timely manner. Regarding our existing proposal, ideally, we would love to operate a Rebuilding a Healthy Neighborhood (RaHN) Program for 1 to 2 years in each of the 4 neighborhoods that the City of Lakewood has identified as specific neighborhoods in need of attention with regards to safe and healthy housing (Tillicum/Woodbrook, Springbrook, Lakeview, and Monta Vista areas). Some Rebuilding Together Affiliates have had a much better success rate when they focus on one neighborhood for two consecutive years. Other Affiliates have had good results with a single year focus in a neighborhood. For estimate purposes, the cost per neighborhood per year is $65,000. The awesome thing about this program is that it is easily replicated from neighborhood to neighborhood. The challenge is usually getting community/neighborhood buy-in. That is where the two year plan in a single neighborhood can best serve the people living there. It gives the residents one year to see what we do and then with more trust in our program in our work, the second year is usually more successful with more community participation. So if the Council decided to allocate funds for this program beginning in 2022 and continuing each year through 2026, the cost would be $65,000 per year x 5 years = $325,000. A 5-year span would allow us to set up a RaHN event in either each of the 4 neighborhoods plus an additional neighborhood or select 2 neighborhoods for two-year programs and 1 neighborhood for a single-year program. We can be completely flexible with what the Council decides to prioritize. If you have any questions or need more information, please don’t hesitate to email or call me. We’re excited about possibly partnering with the City of Lakewood more in the future and look forward to hearing of the budgeting decisions made! PS – I attended the Lake City Neighborhood Association last night because I was able to connect with Larry Woods during your ARPA Zoom call – thank you very much for the introductions, we were able to connect with Larry and one other neighborhood group leader to start conversations with them about
122175

our services. Also, Councilmember Mike Brandstetter was very complimentary of you when the group discussed ARPA funds! Best Regards, Kim Taylor Operations Director
Rebuilding Together South Sound [email protected] Phone: 253.238.0977
From: Tiffany Speir <[email protected]> Sent: Wednesday, July 28, 2021 10:57 AM To: Kim Taylor <[email protected]> Subject: RE: ARPA Funds Proposal If there is a ball park number you could provide bu Aigust 13, that would be great. I am not sure whether the City Council will want to consider how to spend all of the funds at once, or if they will allocate the 1st half now and the 2nd half next year, so trying to gather as much info as I can. _______________________________________________________ Tiffany Speir*, Esq., CPM® Long Range/Strategic Planning Manager
http://cityoflakewood.us/arpa/
From: Kim Taylor [mailto:[email protected]] Sent: Wednesday, July 28, 2021 10:53 AM To: Tiffany Speir <[email protected]> Subject: RE: ARPA Funds Proposal This email originated outside the City of Lakewood.
Use caution when following links or opening attachments as they could lead to malicious code or infected web sites. When in doubt, please contact the HelpDesk.
- [email protected] ext. 4357
Thank you Tiffany! When do you need to have an answer? We’ve been planning on an expansion into serving more in Lakewood, we just need to put the Programs, Construction and Operations teams together to put together a longer range request. Kim Taylor Operations Director
Rebuilding Together South Sound [email protected] Phone: 253.238.0977
123176

Purpose- To engage, connect, and provide awareness to Lakewood residents, moving them to sustainable self-sufficiency through high wage training programs at Pierce and Clover Park Technical College and community workforce development (WFD) services. Proposed Model- If awarded funding, Career TEAM will hire a full-time Career Navigator who resides within the Lakewood targeted areas (Springbrook, Tillicum/Woodbrook, Monta Vista and Lakeview) to serve as a Peer Career Navigator (PCN). The PCN will be trained on WFD resources and strategies that support the training programs of Clover Park Technical College and Pierce College. In addition, the PCN will serve as a resource navigator who will help leverage Lakewood community organizations such as the Center for Strong Families, Springbrook Connections, and Tillicum Community Center to provide support services to residents while they are in training. Additionally, Career TEAM will leverage a more concentrated effort with Pierce County WIOA (Workforce Innovation Opportunities Act) funds and services to further support residents. Career TEAM will be partnering closely with Workforce Central who represents the Workforce Development Board to provide local data analysis on labor market information, as well as robust business engagement services. With these resources, Career TEAM and Workforce Central plans to work alongside the colleges in creating pathway opportunities for residents who will be attending training programs that lead to high wage employment. This impactful partnership will allow Career TEAM and Workforce Central to take an intentional approach in providing pathways and career coaching to Lakewood residents to help them build sustainable and self-sufficient careers.
The PCN will work with community partners to identify outreach and awareness activities in the four targeted areas identified by Lakewood (Springbrook, Tillicum/Woodbrook, Monta Vista and Lakeview) to help residents get connected and enrolled into high wage training programs (employment at $25/hour or higher) identified by Clover Park and Pierce College such as: HVAC, Cyber Security Specialist, Computer Programing, Material Tester and Low Voltage Electricians. Career TEAM will collaborate with Workforce Central to bring employers hiring for these high wage positions in the Pierce County area to the students, around program completion. Bringing these employers will help provide more opportunities such as a career boosts, paid internships, employer tours and hiring events. Each resident enrolled into a High Wage Career Training program from these efforts program will have lifetime access to Career TEAM’s Career EDGE platform which has 24/7 access to career coaching content and essential skill development, accessible by phone, tablet or computer. Career EDGE will provide assessment tools that help identify career pathways and help residents build upon career ready skills sets to make them competitive for employment after finishing their training. Career Edge will also serve as a case management system (CRM function) to track residents that the PCN will be serving.
250 State Street Unit C 2 North Haven, CT 06473 Phone (203) 407 - 8800 Fax (203) 407 - 8801 www.careerteam.com
124177

Projected Outcome Metric(s)- (over the course of 2 years)
Lakewood Residents enrolled into High Wage Career Training Programs
100
Engagement with Lakewood residents about WFD/Training Programs (counted individually)
400
Engagement and Facilitation of Outreach Activities such as Career Fairs, Career Boost, Resource Fairs, etc
40
Proposed Budget- (over the course of 2 years)
Admin/Overhead & Program (supplies, travel, outreach materials, communications)
$20,000
Staff Salaries & Benefits (1.25 Full-Time Equivalents)
$160,000
Career EDGE Platform (customer tracking and career coaching tool)
$25,000
Workforce Central (0.5 FTE Business Services)
$90,000
Total Funds $295,000
Thank you for your consideration. Sincerely, James Hughes Regional Director Career TEAM
125178

United Way/Clover Park Technical College
Center for Strong Families Data 2018 to 2021
Request consideration to support the Clover Park Center for Strong Families location - $150,000 over 3 years.
Clover Park Technical College has been as CSF site partner since 2018. LaPria Bonner, the Center for Strong Families (CSF) financial coach and site manager, is an Accredited Financial Counselor who works closely with the Workforce Development and Financial Aid offices to align her clients’ financial goals with employment opportunities and income supports. To date 258 people have participated
Client Success Story The client for this story is a single mother of one. She lives in Lakewood, WA, works two part-time jobs and has been a CSF client since 02/2020.
The client was initially curious about financial literacy for others, as she had stated she herself "knew" everything she needed about the subject to find personal success and felt she was already successful at personal finance. Client reached out by the end of February and stated she realized she did not have the proper tools, resources and accountability to move her personal goals.
Once global lock-downs went into place, client stated she was grateful she was able to obtain my services as it seemed like she would have missed her opportunity to move forward. Client was immediately hit by closures as one of her professions is a hair colorist.
Service Area Metrics Strategies
Credit Enhancement Families improve credit scores and debt-to-income ratios
• 27% of clients improve credit score• Average increase in credit score is 174 points• 21% of clients had a net worth increase• $15,081 Average increase of net worth• 49 people achieved at least one key financial
goal/outcome (homeownership, savingsaccounts, paid off debt, etc)
• Financialcounseling
• Credit counseling• Debt restructuring
Build Income Families increase their income toward their Self-Sufficiency Standard
• 135 enrolled in a degree program• 68 people achieve certifications• 60% job placement rate for job seekers in their
degree program• Certificate and degree recipients increased
earnings by average of $600/mo
• WorkforceDevelopment(hard and softskills)
• EducationCounseling
• Micro-enterpriseDevelopment
Build & Preserve Savings and Assets Families accumulate liquid assets equal to three months of living expenses
• 12% of clients are saving $400/mo regularly• $3,358 Average savings total• 21/100% of clients graduated from CSF
coaching model with an increased financialwell-being score of 13 points or higher
• Savings and IDAPrograms
• Micro-enterpriseDevelopment
• First-timeHomeownershipPrograms
126179

This client wanted to make sure she began her journey to financial capacity and success for not only herself and her 10-year-old daughter, but her the financial legacy she wanted to leave her daughter to follow as she herself stepped in to adulthood.
Client committed to weekly Financial Counseling meetings to discuss emotions around the loss of income, how she was navigating the unemployment environment, as well as debt reduction, goal setting and small business development. Client was determined to not let the pandemic hinder the plans she saw herself fulfilling.
Client began the program with nine (9) credit cards totaling a little over $20k. As of this writing, the client has successfully reduced the number of credit cards to four (4) with a total of $11k in consumer debt. During the crisis the client was able to obtain a small loan from her bank to help with business expenses that she used to make sure the booth she rents at a local salon would not go unpaid for the months of August/September 2020. In January 2021, the salon owner informed her she would not have to pay rental fees as a Thank You for making payments on time during the rough months of the pandemic! Client has also committed to consistently building an emergency savings account and is on track to launching her e-commerce business June 2021.
Background on Center for Strong Families
What is a Center for Strong Families?
A Center for Strong Families is a framework for neighborhood service delivery designed to help low-income individuals increase income, reduce debt and generate new wealth for themselves and their community.
The CWF Theory of Change The Center for Working Families model provides low to moderate income families with access to high quality one-on-one career and financial coaching as needed over an extended period of time. This bundled service delivery system changes people’s financial behavior in a way that encourages them to increase income, decrease expenses and acquire assets.
127180

What makes this model different is the integrated service model, where core services reinforce one another providing a multi-faceted approach to income and wealth building. The co-location of services means families are not navigating a fragmented system of components to economic stability.
This delivery model of combined services is a replicable and scalable economic opportunity for the Pierce County residents who significantly need those bundled services. The approach is a service delivery system via trusted local sites that have a history of social and financial services in their neighborhoods while providing culturally competent services to clients which will, indeed, move the needle on self-sufficiency.
128181

HOMEOWNERSHIP CENTER NORTHWEST 1424 South J Street, Tacoma, WA 98405 253.627.6560 office | 253.627.2421 fax http://www.hcthomes.org
HCNW 2021 Lakewood ARPA funding
Homeownership Center Northwest is pleased to provide a pre-funding proposal to Lakewood’s American Rescue Plan Act (ARPA) funding for potential allocation in the fall of 2021. We appreciate the invitation from the City of Lakewood to share our ideas of how to utilize ARPA funding to increase investment in affordable housing and economic vitality.
Homeownership Center Northwest proposes two projects that are intertwined.
1. Financial Counseling for Lakewood LMIsHCNW’s homeownership program begins with dialog and assessment of potential homebuyers housing needs andtheir understanding and application of money management and financial capacities. We have found that the kind ofinformation exchanges and counseling sessions we share with people, whether they end up buying a home thoughour program or elsewhere, are very helpful and useful in ways far beyond the initial interest in buying a home.Affordable housing units are desperately needed all across Pierce County and the greater Puget Sound region. And,that need is increasing in dramatic and alarming ways, particularly with the unprecedented challenges that continueto arise from the ongoing Covid-19 pandemic.
Fully sixty-one percent (61%) of American wealth is in home equity. Americans of color have only thirty-one percent (31%) percent of their wealth in home equity. People of color have had lower homeownership rates than whites. This is the continuing result of the legacy of discrimination and redlining, the illegal but once overtly common practice of denying mortgages, infrastructure, or other services to communities based on race, income, or location. Affordable housing is important to all Pierce County residents and communities. Stable housing offers benefits for increased family stability, improved education opportunities and career advancement, better overall health, and reduced risks of homelessness. Safe, fully functional, affordable housing is a key factor in a community's vitality, diversity, equity and continued economic stabilization and growth. HCNW will continue to partner with Pierce County in its efforts to achieve affordable and attainable homeownership options for LMI individuals and families
For almost thirty years, HCNW has focused on creating homeownership options for a diverse clientele. Financial literacy counseling and debt management planning is offered to all clients whether or not the goal is owning a home. Information about finding and keeping suitable housing and information about financial stabilization are the services
HOMEOWNERSHIP CENTER NORTHWEST
129182
HOMEOWNERSHIP CENTER NORTHWEST 1424 South J Street, Tacoma, WA 98405 253.627.6560 office | 253.627.2421 fax http://www.hcthomes.org
most requested by people contacting HCNW. We would like to offer our particular kind of “wholistic financial counseling” to a targeted number of LMI individuals and families living in Lakewood. We have seen that creating a respectful, comfortable relationship is imperative in helping clients understand how money and credit “works”. This is particularly important because many people do not seek assistance until they are facing a serious crisis.
The need for equitable affordable rental and homeownership opportunities has sharply increased. Pierce County property values continue to rise at unprecedented levels, with average home prices increasing approximately 20+% each year. Many homebuyers, including many higher wage earners, are priced out of the Seattle/King County/Snohomish County market resulting in greatly intensified pressure on affordable housing availability in Pierce County and South Puget Sound. Rates for suitable rental housing units are also rising rapidly against a backdrop of fewer and fewer available housing units. The ability for LMI individuals and families to find and secure housing is critical. HCNW counselors provide customized, in-person or online one-on-one “financial therapy” sessions with respectful and compassionate information exchanges designed to prevent crisis, plan for a secure present and bright future, and show how wealth-building actions need not be difficult, confusing, or painful.
Almost all people at some point, regardless of income level, occasionally need some assistance in navigating the complexities of financial management. This is especially true for LMI individuals and families. HCNW’s financial counseling project in Lakewood will expand existing and ongoing financial counseling programs to assist targeted LMI Lakewood residents to uncover, understand, and utilize their personal values, interests, life goals, financial strengths, and long-term objectives to create a solid plan for success. HNCW is especially interested in providing services to Lakewood individuals and families experiencing significant challenges such as serious health concerns, student loan debt, medical debt, sudden and serious change in circumstances such as loss of spouse/partner/child, loss of employment, impacted by Covid-19, and/or other acute issues. Financial counseling under this project would certainly benefit LMI folks looking to buy a home or get into higher-priced rental housing but would widely serve some of our most marginalized neighbors who are trying to figure out a way to pay off debt, get medical and/or personal care that seems out of reach, change employment, save up for a special trip, or pursue a dream.
HCNW proposes a two-year plan to work with 60 individuals and families to provide in depth, longer-term, one-on-one financial counseling on a highly individualized basis.
Cost: $180,000
130183

HOMEOWNERSHIP CENTER NORTHWEST 1424 South J Street, Tacoma, WA 98405 253.627.6560 office | 253.627.2421 fax http://www.hcthomes.org
2. Down Payment Community Investment
First-time homebuyers have struggled to buy homes in Pierce County due to skyrocketing prices, decreasing numbers of overall housing units, and competition from all-cash investors. Seventy-two percent of Washington State households is unable to qualify for mortgages adequate to purchase suitable, move-in-ready homes in desired neighborhoods. In February 2021, real estate firm Redfin confirmed what most buyers already knew about Pierce County home sales - Pierce County’s housing market was the fastest selling area in the country in January 2021, according to Redfin's analysis of sales data. Spanaway has topped the list before. The main reason for fast sales: LACK OF INVENTORY. Turnkey, affordable homes are very rare, and are almost always obtained through off-market deals. HCNW remains committed to creating and offering equitable inclusionary affordable homes. As new homeownership opportunities are developed through renovation of existing homes or new construction, the biggest barrier is availability of down payment assistance. Black, Indigenous, Asian/Pacific Island, Latinx, women, and LGBTQIA+ peoples face exclusions and have been disproportionately burdened by housing instability. Two recent studies show that Pierce County is at or near the bottom of Washington State counties in providing housing for lowand moderate-income households. [Housing Needs Assessment, Washington Department of Commerce; Out of Reach -Washington National Low-Income Housing Coalition].
Affordable housing includes a wide range of models and services. Home ownership is the lowest priority and focus of affordable housing funding and support. HCNW’s mission is challenging. Despite the continuing impact and ramifications of COVID-19, we continue to find ways to broaden awareness of the immense need for housing in our area. Striving to create equitable, affordable housing and homeownership opportunities in our Pierce County communities, HCNW is continuously looking for homes to renovate. Our Down Payment Community Investment (DPCI) program offers no interest/no payment loans that payable when the home is refinanced, sold, or after a certain number of years. This type of investment supports family stability and resilience, wealth building, community stabilization and the creation of homes that are affordable. Without this program, the acquisition of an efficiently and functionally designed, quality-built, right-sized, affordable home to a well-qualified, moderate-income first-time homebuyer is almost impossible.
With money dedicated to DPCI first-time homebuyer assistance, the funds are directly invested in the family, the home, and the community. HCNW’s DPCI assistance project supports responsible and immediately positive investment to provide housing and support the Lakewood community. DPCI loans would be fully repaid to the City of Lakewood by the first-time homebuyers.
131184

HOMEOWNERSHIP CENTER NORTHWEST 1424 South J Street, Tacoma, WA 98405 253.627.6560 office | 253.627.2421 fax http://www.hcthomes.org
HCNW proposes a two-year plan to work with four to eight (4 to 8) first-time homebuyer individuals and/or families to provide $40,000 to $80,000 in Down Payment Community Investment loans to each project participant, based on need, financial strengths, and other factors. The fully detailed plan would be finalized through a collaborative effort with City of Lakewood.
Cost: $320,000 ___________________________________________________________________________________
SUMMARY
1. Financial Counseling for Lakewood LMIs $180,0002. Down Payment Community Investment $320,000
TOTAL: $500,000
___________________________________________________________________________________
Fully sixty-one percent (61%) of American wealth is in home equity. Americans of color have only thirty-one percent (31%) percent of their wealth in home equity. People of color have had lower homeownership rates than whites. This is the continuing result of the legacy of discrimination and redlining, the illegal but once overtly common practice of denying mortgages, infrastructure, or other services to communities based on race, income, or location. Affordable housing is important to all Lakewood residents and communities. Secure, appropriate housing offers benefits for increased family stability, improved education opportunities and career advancement, better overall health, and reduced risks of homelessness. Safe, fully functional, affordable housing is a key factor in a community's vitality, diversity, equity and continued economic stabilization and growth. HCNW will continue to partner with City of Lakewood and other organization across Pierce County in its efforts to achieve affordable and attainable homeownership options for LMI individuals and families. The HCNW team responds to every inquiry about obtaining information about financial management, housing, and homeownership.
132185

HOMEOWNERSHIP CENTER NORTHWEST 1424 South J Street, Tacoma, WA 98405 253.627.6560 office | 253.627.2421 fax http://www.hcthomes.org
Homeownership Center Northwest appreciates the opportunity to provide ideas and input for the use of ARPA funds through the City of Lakewood. We value our strengthening partnership with City of Lakewood and stand ready to bring our best efforts to address the needs of the growing Lakewood community.
David Puszczewicz Executive Director
133186

From: Jason Gauthier [mailto:[email protected]] Sent: Friday, August 6, 2021 9:07 AM To: Tiffany Speir <[email protected]> Subject: [POSSIBLE SPAM] Fw: Boat Street off-sites
This email originated outside the City of Lakewood.
Use caution when following links or opening attachments as they could lead to malicious code or infected web sites. When in doubt, please contact the HelpDesk. - [email protected] ext. 4357
Tiffany - wanted to share. I know Gomer mentioned the potential of doing full street improvements if the City wanted to fund it. CM Farmer asked for this, so she'll be receiving a similar email with this info.
Jason Gauthier [He/Him] Director of Operations & Government Affairs 906-221-5382 [call/text]
This communication may contain privileged and/or confidential information. It is intended solely for the use of the addressee. If you are not the intended recipient, you are strictly prohibited from disclosing, copying, distributing or using any of this information. If you received this communication in error, please contact the sender immediately and destroy the material in its entirety, whether electronic or hard copy. This communication may contain nonpublic personal information about consumers subject to the restrictions of the Gramm-Leach-Bliley Act. You may not directly or indirectly reuse or redisclose such information for any purpose other than to provide the services for which you are receiving the information.
From: Gomer Roseman <[email protected]> Sent: Friday, August 6, 2021 6:53 AM To: Kevin Peterson <[email protected]> Cc: Jason Gauthier <[email protected]> Subject: RE: Boat Street off-sites I did manage to go out to the site yesterday to walk the ground and gather some reconnaissance. This will take a little time, but Felix and I will prepare a proposal for these three options:
A) All underground utilities with half street improvements on Boat St & 88th Ave Ct
B) All underground utilities with full street improvements on Boat St & ¾ street improvements on 88th
C) All underground utilities with full street improvements on Boat St & 88th Ave Ct
134187

After taking a closer look, Option B makes the most sense to me. There are some grading issues on the east edge of the 88th right-of-way that would involve building a retaining wall – probably not worth the effort. A possible option D would be to fully improve all of Boat St – not just our frontage. Gomer Roseman Director of Site Development & Construction
TPCHFH - LAND ACQUISITION PRO FORMA
Site - Boat St. DEVELOPMENT COSTS Number of Homes = 9 HOME CDBG SHOP Habitat Comments
LAND ACQUISITION
Environmental Assessment $900 $900
Property Appraisal $750 $750
Title Report & Closing Costs $5,300 $300
Feasability Study $9,500 $9,500
Relocation $0
Water Easement $3,000
Vacated Street Purchase $0 $5/SqFt
Land Purchase $260,000 $260,000
Land Acquisition Total $279,450 $260,000 $0 $0 $11,450
SOFT COSTS
Architect $0
Short Plat $10,370 $10,370
Civil Engineering $75,000 $75,000 Engineering+Sewer+Water Plans
Land Survey $7,800 $7,800
Geotechnical Engineering $2,000 $2,000
Site Dev. Const Staking & As-Builts $24,000 $24,000
Site Dev. Permits & Fees $9,420 $9,420 Plus Lakewood Water Fees
135188

Site Specific Re-Zone & C. Plan Amendment $9,746 $2,000
Bonds $0
Soft Costs Total $138,336 $0 $0 $0 $130,590
SITE DEVELOPMENT
Demolition & Prep
Asphalt, Curb, Gutter & Sidewalk Removal $12,500 $12,500
Building & Fence Demolition $0 $0
Cleanup & Waste Removal $1,000 $1,000
Special Mitigation - Asbestos, Lead, Oil Tanks, Etc. $0 $0
Tree & Brush Removal $5,000 $5,000
Demo. Permits & Fees $0
Demolition & Prep Subtotal $18,500 $0 $0 $18,500 $0
On-Site Construction
Mobilization $8,000 $8,000
Temp Fence $8,820 $3/unit, 70 units, 12 months
Clearing, Stockpile Soil, Haul Waste $0
T.E.S.C. $20,100 $20,100
Earthwork & Grading $7,500 $7,500
Common Utility Work $0
Site Fencing $12,000 $12,000 $24/LF-Wood ($10/LF-Chain); 500LF
Common Areas - Landscape, Lighting, Play-Spaces, Etc. $0
Storm Drainage $8,550
Private Street Work - Paving, Sidewalk, Etc. $14,765
On-Site Construciton Subtotal $79,735 $0 $0 $47,600 $0
Off-Site Construction
Sanitary Sewer Extension $81,450 $81,450
Water Main Extension & Hydrants $56,350 $56,350 RPD vs LW
Storm Drainage $37,225 $37,225
Dry Utilities (Power, Gas, Tel) $0
Joint Utility Trench $9,950 $9,950
136189

Earthwork & Grading $0
Public Street Work - Paving, Sidewalk, Traffic Control, Etc. $56,860 $56,860
Street Lighting $0
Off-Site Construction Subtotal $241,835 $184,975 $56,860 $0 $0
Site Development Total $340,070 $184,975 $56,860 $66,100 $0
HOME CONSTRUCTION
GIK $12,564
Building Permits $9,215
Utility Fees - Meters, Connection Charges, Etc. $6,850
Home Construction - Direct Labor $39,000
Home Construction - Contract Labor and Materials $72,398
Single Home Construction Total $140,026 $0 $0 $0 $0
Project Home Construction Total $1,260,237 $0 $0 $0 $0
DEVELOPMENT TOTALS
Direct Project Cost Total $
2,018,093 $
444,975 $
56,860 $
66,100 $
142,040
Contingency (10%) $201,809 $44,498 $5,686 $6,610 $14,204
Overhead (20% of Home Construction) $252,047 $0 $0 $0 $0
Full Project Cost Total $
2,471,950 $
489,473 $
62,546 $
72,710 $
156,244
Cost Per Home $274,661 $
54,386 $
6,950 $
8,079 $
17,360
137190

From: Brian Humphreys Sent: Friday, August 6, 2021 9:46 AM To: Tiffany Speir <[email protected]> Subject: Re: Business plan
Obviously the city would only be responsible for a portion of that.
From: Tiffany Speir Sent: Friday, August 6, 2021 9:37 AM To: Brian Humphreys Subject: Re: Business plan Any idea re cost for purchase?
Tiffany Speir City of Lakewood On Aug 6, 2021, at 9:02 AM, Brian Humphreys <[email protected]> wrote:
So Springbrook Connections has been meeting with the Health Department about trying to raise money to purchase the community center building from Centerforce so they can maintain it and provide a permanent facility for the community in that neighborhood. They asked me to join a phone call yesterday they had and asked my opinion. I told them I couldn't speak for the City, but if I were them I'd try to piece together some ARPA funding for the purchase, but to be attractive for ARPA funding they would need to come up with a financial plan to demonstrate how this community center would be self-sustaining after the initial purchase was made. So they wrote up the attached document yesterday and sent it to me asking if I could get it to you to see if this is something the City might be interested in leveraging ARPA dollars for. Any thoughts? Brian <Springbrook Community Center.docx>
138191

Springbrook Community Center Identity: Springbrook Community Center (Springbrook Connections) will provide a space for residents to connect with each other, where they can access resources and services that are accessible, in a way that improves their quality of life and helps them thrive.
Problem: There is NO indoor community space for residents of the Springbrook neighborhood of Lakewood to gather. There is limited transportation in this geographically isolated area. Partnering agencies have no local space in which to offer their programs and services.
Our solution: Partner with the City of Lakewood and Pierce County to purchase the building located at 5204 Solberg Drive SW Lakewood WA 98499. With this purchase we could open a community center to provide the space that residents yearn for, where multiple organizations can provide services directly to the community.
Target market: Residents of Springbrook, and neighboring communities of Tillicum and Woodbrook.
The competition: This facility would be the only community center in Springbrook. There is friendly “coop-etition” from partners like United Way’s Center for Strong Families at Clover Park Technical College, but Springbrook is largely unserved there and both facilities would serve as referrals for the other. We will learn from similar community centers and apply best practices in a process of continuous improvement. While there is significant competition for contributed income, the case statement investments are strong and with a focused, coordinated approach, we know we will thrive.
Revenue streams: Once the facility is purchased, Springbrook Connections will fund ongoing maintenance and operations. We are completing a business plan with full details, and consulting with fundraising professionals to develop a robust funding strategy. Earned income will include lease agreements with partners utilizing the center, space rental, and community revenue. Income from the public sector (additional prospects include Pierce County, State of Washington and Tacoma-Pierce County Health Department) will leverage private philanthropy (foundation grants, corporate sponsors and donors).
Marketing: Springbrook Connections will utilize existing marketing strategies which include social media platforms, partnerships with organizations such as Lorene’s Place, Lakewood Rotary and Workforce Central, and door-to-door outreach. We will also add a mass texting platform in multiple languages to engage residents in being involved and in seeking services.
Expenses: • Building purchase • Utilities • Maintenance, insurance • Staffing and program costs
Team and key roles: Springbrook Connects Board and staff: Diane Formoso – President Kinney Knauls – Vice President John Giles – Treasurer Shawnna Zimmerman- Community Outreach Yuni Medlin- Secretary Jesse Black – Director/Staff
Proposed offerings: • Resource office with hours to meet resident
needs • Community meeting space and rentals • Computer lab • Parenting, financial literacy and education classes • Clothing bank • Community meals and community garden
139192
tspeir
Highlight

Lakewood Boys & Girls Clubs Teen Engagement & Mental Health Support Needs Sep 1, 2021-June 30th, 2022
● Teen Late nights: This program is from 6:00-9:00 PM (goal is to offer 2x/month during the school year) and includes games, activities, snacks, and a meal provided by a local restaurant or prepared by our staff members. Teen Late Night encourages the development of youth in grades 6-12 by providing a safe environment, consistent adult involvement, and fun activities that foster excellence and a positive attitude. Specific activities focus on personal development including social skills, problem-solving techniques, communication skills, goal setting, and decision-making. They are designed to give young people the sense that they can achieve short- and long-term goals to lead a successful life. Health and fitness are an important part of Late Night. Activities such as sports tournaments and nutritious snacks encourage physical development and healthy life-styles. Also, through recreational activities, Late Night participants have fun while acquiring self-confidence, a sense of fair play and skills in interpersonal relationships. Examples of Late Night social recreation activities may include skits and plays, dances, movies, games, fine arts projects, and karaoke.
The following trainings will be offered to teens at the Boys & Girls Club and will be facilitated by Dianna Sullivan who serves as our Director of Family Support. Dianna is a licensed marriage and family therapist that has been leading the Trauma-Informed Approach framework for our organization.
● Mental Health Supports -teen Mental Health First Aid:
Teaches high school students how to identify, understand and respond to signs of mental illnesses and substance use disorders among their friends and peers. The training gives students the skills to have supportive conversations with their friends and get a responsible and trusted adult to take over as necessary. It is designed to be delivered in schools or community sites in three interactive classroom sessions of 90 minutes each or six sessions of 45 minutes each.
-Talk Saves Lives (suicide prevention): Talk Saves Lives is an education program that provides participants with a clear understanding of this leading cause of death, including the most up-to-date research on suicide prevention, and what they can do in their communities to save lives. Participants will learn common risk factors and warning signs associated with suicide, and how to keep themselves and others safe. -1 Youth Serving Organization including inviting Lakewood Youth City Council -3 90 minute sessions with Youth -1 Lakewood High School -3 90 minute sessions with youth -Increase access for teens by providing transportation for Schools not currently provided to Boys & Girls Clubs Total estimated cost: $45,214
140193
tspeir
Highlight

From: Lew [mailto:[email protected]] Sent: Tuesday, July 27, 2021 3:18 PM To: Tiffany Speir <[email protected]> Subject: RE: ARPA Grant! This email originated outside the City of Lakewood.
Use caution when following links or opening attachments as they could lead to malicious code or infected web sites. When in doubt, please contact the HelpDesk.
- [email protected] ext. 4357
Good afternoon Tiffany, Violent Crime Victim Services has been cut $250,000 from our VOCA (Victim Of Crime Act) budget. Our two-year reduced contract with VOCA started 07/01/2021 – June 30, 2023. Staff salaries have been reduced to half pay and hours decreased accordingly, and one victim advocate position has been eliminated. With a $250,000 ARAP grant, we would be able to bring our staffing up to the level before the budget cuts and meet the demands of the state of the current violent crime level. In terms of VOCA and its funding cuts, Congress just voted to fix the reasons behind the cuts. The President signed into law the crime bill to regulate future funding for community-based crime victim organizations. Nonetheless, it will take a couple of years to build up funding reserves to hold VOCA funding. Therefore, if VCVS is awarded $250,000 from the Lakewood grant, we would be able to sustain the level of services to crime victims before COVID-19. The Lakewood region experiences violent crime; post-2020, our office sees an increase in violent crime in Lakewood.
Sincerely yours,
Lew Cox Executive Director Violent Crime Victim Services 1501 Pacific Avenue Suite 301 Tacoma, WA 98402 [email protected] 253-383-5254 www.vcvs.org
141194

V I 0 L E N T C R I M E
VICTIM SERVICES 1501 Pacific Ave. Suite 301
Tacoma, W A 98402 253 383-5254
July 20, 2021 Tiffany Speir Long Range/Strategic Planning Manager City of Lakewood 6000 Main St SW, Lakewood, WA 98499
Violent Crime Victim Services Requesting City of Lakewood ARPA Funding
Funding Need Statement
• Spike in the murder rate is 37%. The highest since 1998. • Spike in the vehicular homicide rate. • COVID-19 is a parcel of the cause of the high murder rate. • VOCA (Victim of Crime Act) Budget cuts ($150.000) annually. • One victim advocate/researcher - Laid off due to budget cuts. • Two staff - hours and salaries reduced by half. • With the slash of hours, layoffs, and funding cuts, it is difficult for this agency to meet
the current demands for victim services plus the needs due to the increase in homicide cases.
SERVICES AND PROGRAMS TO CO-VICTIMS OF HOMICIDE INITIAL CONTACT: Prosecutor's office, homicide detectives, counselors, hospitals, police chaplains. CRISIS INTERVENTION: Providing crisis intervention to family and friends of the homicide victims, including… police investigation, the criminal justice system, victim's rights, bereavement, and Crime Victims Compensation. JUDICIAL PROCEEDINGS: Advocates accompanying co-victims to legal proceedings, pre-trial, trials, and sentencings. SUPPORT GROUPS: Peer support groups for co-victims of homicide to discuss their concerns, frustrations, grief recovery, and coping skills.
142195

REFERRALS TO: Grief counselors, civil attorneys, the faith community, and other social services. SUPPLEMENTAL INFORMATION FOR APPLYING FOR CITY OF LAKEWOOD ARPA FUNDING Violent Crime Victim Services is a community-based organization that has provided direct services in Pierce County since 1991. VCVS has been providing services to the residents of Lakewood long before Lakewood became a city. VCVS partnered with Lakewood Police Chief Bret Farrar on high-profile murder cases when he was an active homicide detective with the Pierce County Sheriff's Department. Lakewood Police Chief Bret Farrar contacted Violent Crime Victim Services after Maurice Clemmons's reign of terror act of murdering four Lakewood police officers. He asked for victim advocates from Violent Crime Victim Services to provide services to the officers' families and the Lakewood police department personnel. VCVS also provided years of bereavement services to the family of the Loomis Armored Car driver, who was robbed and murdered inside the Lakewood Walmart store. VCVS provided long-term assistance to the family of nine-year-old Cindy Allinger, who was raped and murdered in the Woodbrook area. The Allinger family had to endure a six-month death penalty. Most murder cases that take place in Lakewood are not classified as high-profile in the news. Despite that, to the victim's family, a murdered loved one is high-profile to them. No matter the classification of a murder case, VCVS provides the same level of victim services no matter the circumstances. All services are free of charge to co-victim of homicide. Sincerely yours,
Lew Cox Executive Director Violent Crime Victim Services 1501 Pacific Avenue Suite 301 Tacoma, WA 98402 [email protected] 253-383-5254 www.vcvs.org
143196

Return to Agenda
266
TO: Mayor and City Council
FROM: Mary Dodsworth, Parks, Recreation & Community Services Director
THROUGH: John Caulfield, City Manager
DATE: June 7, 2021
SUBJECT: Summer Youth Corp Program – Warriors of Change
ATTACHMENTS: Communities in Schools of Lakewood proposal
Summary: Council suggested developing a summer youth corps employment program in Lakewood. As with all successful Lakewood programs, we reached out to our community
partners to determine if other programs are already available and/or how we could help
develop or support a new program to meet the needs of local youth. Communities in
Schools of Lakewood (CIS) is working with the Clover Park School District (CPSD), the
City, local businesses and colleges to support a summer youth program for Clover Park High
School students. The program would provide academic support, project based learning, leadership opportunities, transition support after graduation, and research and community
problem solving skills as they develop solution based projects and presentations. The
program includes college student mentors so it would also support training and experience
to Clover Park High School graduates and CIS past participants who are now college
students. Funds would be used to cover the cost of student stipends, staffing and
administration. Student stipends are a major program incentive which can reduce various
barriers for students to participate in the program. Other partners include local credit unions who may help with financial literacy and transactions and various community experts who
may support the community based problem solving mentoring and panel presentations. CPSD is providing paid teachers and facility support. The City would provide program funding and community collaboration support as needed throughout the program.
The six week program is due to begin June 21. Student stipends are a large portion of the
project costs so if less students participated, program funding costs would be reduced. Also,
we will work with CIS to consider other available funding sources to offset program costs.
See attached proposal along with a cost estimate. Staff will share more details regarding the
program at the June 7 Council meeting.
144197

Return to Agenda
267
“Warriors of Change”
A Lakewood Project-Based Leadership Development Experience Request for
Summer 2021 Funding by Communities In Schools of Lakewood
Warriors of Change 2021will be the first-annual 6-week summer program that is “project-
based leadership development experience” held at Clover Park High School June 21-July
30, 2021.
Summary: Approximately 80 Clover Park High School Students who are rising seniors (2021
summer will serve graduating class 2022 etc.) will have the opportunity to be empowered leaders
by participate in community, project- based learning, leadership classes, and preparing them
for their transitions their seniors and beyond. The Warriors of Change program will take
place in the afternoon so students will also be able to participate in half-day credit-retrieval
(*as needed) with tutors and teachers supporting their completion.
Need: It is no question that this year has been challenging for the young people of
Lakewood. Warriors of Change is an opportunity for next year’s leaders (seniors) at Clover
Park High School to have an empowering leadership experience preparing them to take on
the challenges in their life and in our community.
Reducing Barriers and Increasing Participation: Providing an end-of-program cash award (of $500 per student) will reduce barriers to participation by negating some of the financial
hardship that sometimes is created by a high- school students attending summer programing
because they are often taking care of younger siblings, getting paid summer jobs or helping
their family in other ways. The cash-incentive increases the investment in their education
and future and provides opportunity for students to truly invest in themselves as leaders.
Partnership: The Warriors of Change program is facilitated in partnership with Clover
Park School District, providing school-district teachers and staff to facilitate project-based
learning and contracting with Quantum Learning to provide one-week of the “Keys to
Leadership” leadership development program. Communities In Schools of Lakewood’s
Program Coordinator is coordinating the program, with the support of a Site Coordinator
staff and MSW Inter Alvaro Lara will be providing additional support to the program.
145198

Return to Agenda
268
Additionally 8 college-students/CPHS graduates will be brought in to provide project-mentoring and support to the cohorts of high school students.
Funding Request: The Clover Park School District is providing funding for school- staff and teachers, facilitate costs, and the contract with Quantum Learning.
We request funding from the City of Lakewood for Communities In Schools of
Lakewood portion of the Warriors of Change program and the cash-incentives for the
student participants.
$40,000 Student end-of-program cash incentives ($500 each for 80 students)
8,000 Cohort-Mentor stipends ($1,000 each for 8 college-age students)
4,800 Admin costs for managing student & mentors (10%)
9,150 Summer Program Coordinator Costs for 2 months
6,500
(2 weeks planning + 6 week program)
Summer Site Coordinator Costs for 2 months
$68,450 Total Request Amount (for 2021*)
*Note: Warriors of Change 2021 is the pilot program of a 6-week leadership
development project-based learning experience for Clover Park High School rising
seniors, with the hope that the program can grow to expand and serve more students for
future years.
146199

From: Janne Hutchins [mailto:[email protected]] Sent: Monday, August 23, 2021 3:41 PM To: Tiffany Speir <[email protected]> Subject: Request This email originated outside the City of Lakewood.
Use caution when following links or opening attachments as they could lead to malicious code or infected web sites. When in doubt, please contact the HelpDesk.
- [email protected] ext. 4357
Tiffany As you know LASA is closing on a piece of property and will control 1.5 acres. Our goal is to develop this property to meet the needs of formerly homeless individuals and/or families and those who are at risk of homelessness. We expect to house approximately 50 households and anticipate this to be a $15,000,000 dollar project. Early planning calls for mixed use with some business included. REQUEST FOR FUNDS TO DEVELOP LOW INCOME /EMERGENCY/TRANSITONAL HOUSING 4.75 million for Development
1. LASA will be reaching out to the County, the State and foundations to turn this project from a dream to a reality. To get the ball rolling we are coming to you with an ask of 4.75 million dollars. We realize this is a big ask and hope that you can see that we will be leveraging money from outside our city to make the project a reality and create housing for low income Lakewood citizens for years to come. Frankly we would ask for additional funds but feel that you will be pulled in many different direction to meet all the needs of the city.
REQUEST OF FUNDS TO OPERATE HYGIENE CENTER $ 87,500 Services for 3.5 years As you know LASA is planning on expanding our Client Services Center to include a Hygiene center. This center will feature laundry and showers. While most of the funds have been raised to make the capital improvements ( thanks in no small part to the outstanding efforts of City employees. LASA is asking for a.5 fte at $23,000 per year for 3.5 years along with 2,000 for added operational costs for a total of $25,000) to oversee the hygiene Center. To cover full costs at the Hygiene Center, we will find matching funds. I can be reached on my cell should you have any questions. Thank you Janne Hutchins 253 370-0409.
200

_______________________________________________________ Tiffany Speir*, Esq., CPM® Long Range/Strategic Planning Manager
http://cityoflakewood.us/arpa/
From: Laurie Davenport [mailto:[email protected]] Sent: Sunday, September 5, 2021 3:46 PM To: Tiffany Speir <[email protected]> Cc: Brian Humphreys <[email protected]>; Carly Roberts <[email protected]> Subject: Re: Funding for eviction prevention
The budget submitted is an annual budget for the specified salaries (includes benefits) and outreach costs, using current salary figures for similar positions hired I 2021. Laurie Davenport Director of Development & Outreach Tacomaprobono Community Lawyers 621 Tacoma Avenue South, Suite 303 Tacoma, WA 98402 253.572.5134 ext. 106 http://www.tacomaprobono.org
Do you need help with a civil legal issue? Access the Tacomaprobono Online Intake Form here. Living in Tacoma or Pierce County and behind on rent? Apply for Rental Assistance here. From: Tiffany Speir <[email protected]> Date: Sunday, September 5, 2021 at 3:33 PM To: Laurie Davenport <[email protected]> Cc: Brian Humphreys <[email protected]>, Carly Roberts <[email protected]> Subject: RE: Funding for eviction prevention
How long would services to Lakewood residents be funded with $225,000? Thank you, _______________________________________________________ Tiffany Speir*, Esq., CPM®
201

Long Range/Strategic Planning Manager
http://cityoflakewood.us/arpa/
From: Laurie Davenport [mailto:[email protected]] Sent: Friday, September 3, 2021 12:12 PM To: Tiffany Speir <[email protected]> Cc: Brian Humphreys <[email protected]>; Carly Roberts <[email protected]> Subject: Re: Funding for eviction prevention This email originated outside the City of Lakewood.
Use caution when following links or opening attachments as they could lead to malicious code or infected web sites. When in doubt, please contact the HelpDesk.
- [email protected] ext. 4357
Thank you Tiffany, we appreciate your support! Laurie Davenport Tacomaprobono Community Lawyers Director of Development & Outreach 621 Tacoma Ave S, Suite 303 Tacoma, WA 98402 http://www.tacomaprobono.org Do you need help with a civil legal issue? Access the Tacomaprobono Online Intake Form here. Living in Tacoma or Pierce County and behind on rent? Apply for Rental Assistance here.
From: Tiffany Speir <[email protected]> Date: Friday, September 3, 2021 at 11:58 AM To: Laurie Davenport <[email protected]> Cc: Brian Humphreys <[email protected]>, Carly Roberts <[email protected]> Subject: RE: Funding for eviction prevention
202

Thank you Laurie – the City Council is expected to take action on an initial ordinance setting policies regarding how the City will spend ARPA funds, and then there will be a formal call for applications. I understand that this is a very time sensitive request and will present it to Council as such. _______________________________________________________ Tiffany Speir*, Esq., CPM® Long Range/Strategic Planning Manager
6000 Main St SW, Lakewood, WA 98499 253.983.7702 l [email protected] *Tiffany Speir does not provide legal representation for the City of Lakewood http://cityoflakewood.us/arpa/
From: Laurie Davenport [mailto:[email protected]] Sent: Friday, September 3, 2021 11:54 AM To: Tiffany Speir <[email protected]> Cc: Brian Humphreys <[email protected]>; Carly Roberts <[email protected]> Subject: Re: Funding for eviction prevention
- [email protected] ext. 4357
Hello Tiffany and Brian, I’m attaching a funding proposal for eviction prevention work specifically targeted for Lakewood residents -- please don’t hesitate to let us know if you have questions or need more information! Laurie Laurie Davenport Tacomaprobono Community Lawyers Director of Development & Outreach 621 Tacoma Ave S, Suite 303 Tacoma, WA 98402 http://www.tacomaprobono.org Do you need help with a civil legal issue? Access the Tacomaprobono Online Intake Form here. Living in Tacoma or Pierce County and behind on rent? Apply for Rental Assistance here.
203

2021 American Rescue Plan Act (ARPA)
Tiffany Speir, Long Range & Strategic Planning Manager
City Council Study SessionSeptember 13, 2021
ATTACHMENT C
204

Study Session Outline
1) Review of 9/7/21 Public Comments
2) Responses to 9/7/21 Council Member Questions
3) Summary review of ARPA
4) Review of Potential Fund Allocations and Expenditures
5) Council discussion and direction regarding Ordinance and Expenditures
6) Next Steps
205

Recommendations
It is recommended that the City Council adopt the proposed Ordinance, with or without amendment, identifying policies and priorities of use of Lakewood’s $13,766,236 in ARPA funds, allocating a percentage of funds into each of the seven expenditure categories (ECs) identified by the Department of Treasury, and approving initial expenditures.
It is also recommended that prior to, or contemporarily with, action on the proposedOrdinance, the City Council consider and provide direction regarding expendituresidentified within the City Lost Revenue/Revenue Replacement category.
Third, it is recommended that the City Council provide direction regarding whether tocommit all ARPA funds prior to resolution of any discussion of collaborations with other governments or organizations.
Fourth, it is recommended that prior to, or contemporarily with, action on the proposed Ordinance, the City Council consider and provide direction regarding external expenditures identified during the community engagement process.
206

September 7 Public Hearing Comments
Kim Taylor, Rebuilding Together South Sound – $325K for 5 year program
Jason Gauthier, Habitat for Humanity – $242K for Boat Street Project infrastructure
Randall Black, Lakewood Water District – $1.0 - $1.5M for new St Clare Hospital area well
Janne Hutchins, LASA – $ for increased housing capacity at property adjacent to offices
Jessie Black, Springbrook Connections - $ to purchase Centerforce Building to serve as community center for Springbrook, Tillicum & Woodbrook (purchase to be joint with County, others TBD)
Dona Poneinto, Center for Strong Families - $150K for 3 year program
Drs. Tim and Deb Villm, Clover Park Veterinary Hospital – use funds to address homeless issues in order to protect business districts
207
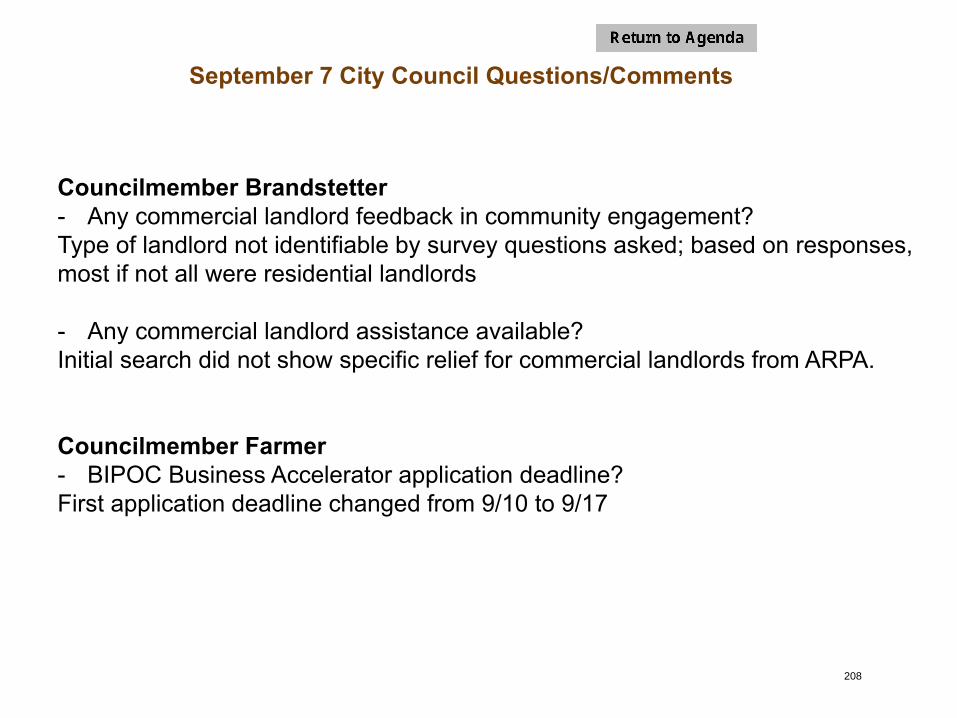
September 7 City Council Questions/Comments
Councilmember Brandstetter - Any commercial landlord feedback in community engagement? Type of landlord not identifiable by survey questions asked; based on responses, most if not all were residential landlords
- Any commercial landlord assistance available?Initial search did not show specific relief for commercial landlords from ARPA.
Councilmember Farmer- BIPOC Business Accelerator application deadline?First application deadline changed from 9/10 to 9/17
208

ARPA Funds Exhausted
ARPA Costs Incurred
ARPA Government Services Costs
ARPA Milestone Date
ARPA Community Costs
The City may use funds to provide assistance to households, businesses, and individuals within the eligible use categories for economic harms experienced by those households, businesses, and individuals prior to as well as after March 3, 2021.
12/31/2612/31/24Post-
3/3/213/3/21Pre- and
post-3/3/21
Use of funds for government services must be forward looking for costs incurred by the City after March 3, 2021.
Eligible costs must be
incurred by the City
between March 3, 2021 and December 31, 2024.
The City must exhaust funds by 12/31/26.
ARPA Expenditures209

ARPA Collaborations
1) Closing Process for Comfort Inn purchase underway; completion date TBD
2) No new information regarding collaborations with County and cities
3) No new information regarding Pierce County business navigator program (decision on SBA program application pending)
4) Pierce County BIPOC Business Accelerator Program now accepting participant applications
5) No new information regarding a possible infrastructure expenditure partnership with State
6) No new information regarding a possible SSHA3P request for ARPA funds
210

*The amounts identified in the table categories above are preliminary and subject to change.** Revenue replacement can be used for items identified as ARPA expenditures or for other government services
Expenditure Category Allocation Recommendations
ARPA Expenditure Categories*
Recommended ARPA Share in
Dollars
Recommended ARPA Share in
PercentagesA: Public Health + 5% Direct Admin Costs $105,000.00 0.8%B: Negative Economic Impacts + 5% Direct Admin Costs $3,688,311.80 26.8%C: Services to Disproportionately Impacted Communities + 5% Direct Admin Costs $3,987,207.40 29.0%D: Premium Pay + 5% Direct Admin Costs $0 0.0%E: Infrastructure + 5% Direct Admin Costs $1,500,000.00 10.9%F: Revenue Replacement** + 5% Direct Admin Costs $3,797,405.00 27.6%G: General Administrative Costs (5% Indirect) $688,311.80 5.0%TOTAL $13,766,236.00 100%
A 1%
B 27%
C 29%E 11%
F 27%
G 5%
EXPENDITURE SHARESA B C D E F G
211

212

213

214

215

ARPA Program Administration
Once the City Council takes action directing how the City will expend its ARPA funds, the City will pursue hiring the needed Finance and other City staff who will be dedicated to ARPA administration. The City will then conduct a fund application process that complies with requirements and guidance from the Department of the Treasury. The City will establish a time frame for the application process and for the distribution of funds to subrecipients.
Lakewood has received the first tranche of ARPA funds ($6,883,118) and the second will be available to Lakewood in mid-August, 2022. However, the distributions made by the City to subrecipients and expenditures on City Revenue Replacement items will not be constrained by that timeline (for instance, some of the allocations included in the proposed Ordinance are for multiple years, and not all of the first tranche would have to be used on those allocations.)
The most time sensitive issues reflected in the potential expenditures is the September 30 end of the eviction moratorium. This is addressed in the recommended initial expenditures for Tacoma ProBono eviction protection services and in the purchase of the Comfort Inn for use as an emergency shelter, and in the hiring of ARPA staff needed for the City’s administration of the program and provision of resident navigation services. 216

City Council Discussion
It is requested that the City Council discuss and address the following questions:
1) Does the City Council approve of Policies, Priorities of Use, Fund Allocations, andInitial Expenditures included in the proposed Ordinance?
2) Does the City Council have direction regarding expenditures identified within theCity Lost Revenue/Revenue Replacement category?
3) Does the City Council have direction regarding whether to commit all ARPA fundsprior to resolution of any discussion of collaborations with other governments ororganizations?
4) Does the City Council have direction regarding external expenditures identifiedduring the community engagement process?
217

City Council ARPA Program Options:
1) Take no action now (funds must be obligated by 12/31/24, exhausted by 12/31/26)
2) Adopt Policies and Priorities and Allocation Shares, but expend no funds now
3) Adopt Policies, Priorities and Allocation Shares, and set aside funds for Initial Expenditures now
4) Adopt Policies, Priorities and Allocation Shares, and set aside funds for All Expenditures now
218

Lakewood HUD “Qualified Census Tracts” 720.00 Tillicum/Woodbrook, 718.06 Springbrook, 718.05 Lakeview, and718.08 Monta Vista
219


![10 11 Session HR Session Seri Management[1]](https://static.fdokumen.com/doc/165x107/6314ba61fc260b71020fb0ee/10-11-session-hr-session-seri-management1.jpg)