Lack of detection of ampicillin resistance gene transfer from Bt176 transgenic corn to culturable...
10
Lack of detection of ampicillin resistance gene transfer from Bt176 transgenic corn to culturable bacteria under field conditions Esther Badosa, Carmen Moreno, Emilio Montesinos * Institute of Food and Agricultural Technology, CIDSAV-CeRTA, University of Girona, Avda. Lluis Santal o, s/n, Girona 17071, Spain Received 24 July 2003; received in revised form 25 September 2003; accepted 12 January 2004 First published online 13 February 2004 Abstract Population levels of total and ampicillin-resistant culturable bacteria and the putative horizontal bla gene acquirement from Bt- corn were studied in commercial fields of transgenic corn in Spain during the years 2000–2003. Commercial fields consisting of conventional corn (Dracma) and Bt176 transgenic corn (Compa CB) were located in three climatic regions. The effect of corn type, plant material, field location, stage of sampling and year of study were studied on total and ampicillin resistant bacterial population levels, on median effective dose and on the slope of the dose–response curve to ampicillin. None of the parameters measured were significantly different (P < 0:01) between transgenic and non-transgenic cornfields under the diverse conditions studied. However, in population levels of ampicillin resistant bacteria, the minimum difference between sample means to be significant with a likelihood of 80% was 8.9%. Specific detection of putative bacteria harbouring bla TEM-1 ampicillin resistance genes acquired from Bt176 corn was performed with a method based on the extraction of DNA from the culturable bacterial fraction and with PCR. Primers for PCR were targeted to the bla gene and the corresponding flanking regions present in the pUC18 cloning vector or the Bt176 construct. The culturable bacterial fraction of 144 field samples (up to 864 analysis, including ampicillin enrichments) was analysed by PCR. The estimated total number of bacteria analysed was 10 8 . The level of detection of a transfer event according to the sensitivity of the methods used was 10 6 . Four samples of transgenic and five of non-transgenic corn gave positive signals. However, the amplification products did not correspond to the ones expected from Bt176 or pUC18. The limitations of the sampling design and of the methods used are discussed. Ó 2004 Federation of European Microbiological Societies. Published by Elsevier B.V. All rights reserved. Keywords: Bt176 transgenic corn; Horizontal gene transfer; Ampicillin resistance; Commercial field monitoring 1. Introduction Since its commercialization in 1996, the world area of genetically modified crops (GM) has increased at a sustained rate [1]. The principal GM crops are soybean, corn, cotton and canola, and the two main traits intro- duced are herbicide tolerance and insect resistance [2]. Many commercial GM crops contain selectable markers under bacterial promoter control such as anti- biotic resistance genes, which are reminders of the vector used for transformation [3]. Most frequently used is the nptII gene, which encodes a neomycin phosphotrans- ferase (resistance to kanamycin) and is expressed in the plant. The bla gene, encoding a TEM-1 b-lactamase (resistance to ampicillin), is less frequent and is not ex- pressed in the plant. Bacteria have evolved mechanisms of genetic ex- change by conjugation, transformation and transduc- tion, all operating under natural conditions [4]. Acquisition of genes encoding for antibiotic resistance from transgenic plants by plant associated bacteria and subsequent transfer from these bacteria to human or animal bacterial pathogens has been one of the main concerns for the large-scale use of transgenic crops [5–7]. However, the process requires a sequence of coordinated events, involving the release and persistence of transgenic DNA in the environment, the uptake and integration in * Corresponding author. Tel.: +34-972-418427; fax: +34-972-418399. E-mail address: [email protected] (E. Montesinos). 0168-6496/$22.00 Ó 2004 Federation of European Microbiological Societies. Published by Elsevier B.V. All rights reserved. doi:10.1016/j.femsec.2004.01.005 FEMS Microbiology Ecology 48 (2004) 169–178 www.fems-microbiology.org
Transcript of Lack of detection of ampicillin resistance gene transfer from Bt176 transgenic corn to culturable...
FEMS Microbiology Ecology 48 (2004) 169–178
www.fems-microbiology.org
Lack of detection of ampicillin resistance gene transfer fromBt176 transgenic corn to culturable bacteria under field conditions
Esther Badosa, Carmen Moreno, Emilio Montesinos *
Institute of Food and Agricultural Technology, CIDSAV-CeRTA, University of Girona, Avda. Lluis Santal�o, s/n, Girona 17071, Spain
Received 24 July 2003; received in revised form 25 September 2003; accepted 12 January 2004
First published online 13 February 2004
Abstract
Population levels of total and ampicillin-resistant culturable bacteria and the putative horizontal bla gene acquirement from Bt-
corn were studied in commercial fields of transgenic corn in Spain during the years 2000–2003. Commercial fields consisting of
conventional corn (Dracma) and Bt176 transgenic corn (Compa CB) were located in three climatic regions. The effect of corn type,
plant material, field location, stage of sampling and year of study were studied on total and ampicillin resistant bacterial population
levels, on median effective dose and on the slope of the dose–response curve to ampicillin. None of the parameters measured were
significantly different (P < 0:01) between transgenic and non-transgenic cornfields under the diverse conditions studied. However, in
population levels of ampicillin resistant bacteria, the minimum difference between sample means to be significant with a likelihood of
80% was 8.9%. Specific detection of putative bacteria harbouring bla TEM-1 ampicillin resistance genes acquired from Bt176 corn
was performed with a method based on the extraction of DNA from the culturable bacterial fraction and with PCR. Primers for
PCR were targeted to the bla gene and the corresponding flanking regions present in the pUC18 cloning vector or the Bt176
construct. The culturable bacterial fraction of 144 field samples (up to 864 analysis, including ampicillin enrichments) was analysed
by PCR. The estimated total number of bacteria analysed was 108. The level of detection of a transfer event according to the
sensitivity of the methods used was 10�6. Four samples of transgenic and five of non-transgenic corn gave positive signals. However,
the amplification products did not correspond to the ones expected from Bt176 or pUC18. The limitations of the sampling design
and of the methods used are discussed.
� 2004 Federation of European Microbiological Societies. Published by Elsevier B.V. All rights reserved.
Keywords: Bt176 transgenic corn; Horizontal gene transfer; Ampicillin resistance; Commercial field monitoring
1. Introduction
Since its commercialization in 1996, the world area ofgenetically modified crops (GM) has increased at a
sustained rate [1]. The principal GM crops are soybean,
corn, cotton and canola, and the two main traits intro-
duced are herbicide tolerance and insect resistance [2].
Many commercial GM crops contain selectable
markers under bacterial promoter control such as anti-
biotic resistance genes, which are reminders of the vector
used for transformation [3]. Most frequently used is thenptII gene, which encodes a neomycin phosphotrans-
* Corresponding author. Tel.: +34-972-418427; fax: +34-972-418399.
E-mail address: [email protected] (E. Montesinos).
0168-6496/$22.00 � 2004 Federation of European Microbiological Societies
doi:10.1016/j.femsec.2004.01.005
ferase (resistance to kanamycin) and is expressed in the
plant. The bla gene, encoding a TEM-1 b-lactamase
(resistance to ampicillin), is less frequent and is not ex-pressed in the plant.
Bacteria have evolved mechanisms of genetic ex-
change by conjugation, transformation and transduc-
tion, all operating under natural conditions [4].
Acquisition of genes encoding for antibiotic resistance
from transgenic plants by plant associated bacteria and
subsequent transfer from these bacteria to human or
animal bacterial pathogens has been one of the mainconcerns for the large-scale use of transgenic crops [5–7].
However, the process requires a sequence of coordinated
events, involving the release and persistence of transgenic
DNA in the environment, the uptake and integration in
. Published by Elsevier B.V. All rights reserved.
170 E. Badosa et al. / FEMS Microbiology Ecology 48 (2004) 169–178
the genome of the recipient bacteria and the existence of
a positive selective pressure towards the transformed
bacteria [8].
Experimental evidence of gene transfer from trans-
genic plants to bacteria is very limited, and most studieshave been performed under laboratory or simulated
natural conditions. Transformation of bacteria with
transgenic plant DNA extracts was observed only when
containing regions homologous to the transforming
DNA [9–11]. Transfer of selectable antibiotic markers
was not detected in plant parts or whole plants infected
with bacterial plant pathogens [12–14]. However, gene
transfer was observed when certain barriers were absent,using a two-bacterial species transgenic tobacco com-
plex model system with transplastomic DNA and a high
degree of sequence homology [15].
Studies of gene transfer from transgenic crops to
bacteria under field conditions are rare and suffer from
methodological problems. DNA-based analysis exhibits
difficulties to prevent contamination of the bacterial
DNA by transgenic plant DNA, especially from senes-cent tissues [16]. An alternative method consists of the
extraction and analysis of DNA from the culturable
associated bacteria. In a field study with transgenic
rhizomania-resistant sugar beet plants, construct-spe-
cific sequences of nptII genes were detected by Southern
hybridization in DNA directly extracted from soil
samples and from culturable bacteria, but these signals
were unexplained [17]. However, there were no pub-lished reports on monitoring the transfer of antibiotic
resistance genes from Bt176 corn to the associated
bacterial microbiota in commercial fields.
This work was performed to study the putative im-
pact of transfer of ampicillin resistance to corn-associ-
ated bacteria using two approaches: a classical plate
count-based method and a PCR specific method.
Therefore, the aim of the present study was to: (a) assessthe impact of Bt-corn on total and ampicillin-resistant
culturable bacterial population levels and (b) develop a
suitable PCR-based method to monitor the transfer of
the b-lactamase encoding genes from Bt176 corn to as-
sociated bacteria and to study the putative horizontal
gene transfer in commercial cornfields.
2. Materials and methods
2.1. Plant material
Two corn cultivars were used in the present work:
Dracma and Compa CB (Syngenta Seeds, S.A., Barce-
lona, Spain). Dracma is the non-transgenic isogenic cul-
tivar of the transgenic Compa CB. Compa CB wasderived from line CG-00256-176 and contains the
cryIA(b) gene encoding the Bt toxin which confers re-
sistance to the European corn borer. Event 176 corn was
obtained by transformation with plasmids pCIB4431 and
pCIB3064. Plasmid pCIB4431 contains the cryIA(b)
gene, encoding for a truncated Bt toxin. Plasmid
pCIB3064 contains the bar gene, encoding phosphino-
tricin acetyltransferase. Both plasmids were derived fromthe pUC19 cloning vector, containing a TEM-1 b-lacta-mase gene confering resistance to a variety of penicillins
and cephalosporins, including ampicillin.
2.2. Commercial fields and experimental design
Commercial cornfields were located in Villamayor
(Zaragoza), Palau d’Anglesola (Lleida) and El Salobral(Albacete) in Spain. In each location, a mesoscale field
plot of approximately 1 ha was selected, containing one
half of the non-transgenic corn and the other half of the
transgenic corn. Within each half-plot, three subplots of
approximately 50 plants (25 m2) were selected randomly
and sampled. Field plots were tested for authenticity of
transgenic/non-transgenic corn. To avoid cross con-
tamination by pollen, leaf samples were collected at the9–12 vegetative leave stages before flowering. DNA was
extracted and analysed with the GMOIdent Maximizer
Bt176 Kit (GeneScan Europe, Germany). The presence
of Bt176 corn was tested with IR1-PG primers for
the flanking regions between the PEPC promoter and
the CryA(B) gene, according to the manufacturer’s
instructions.
2.3. Sampling procedures and processing of samples
Sampling and sample processing were performed ac-
cording to the recommendations of Van Elsas and Smalla
[16]. Samples were taken from each subplot and consisted
of material from five corn plants or soil samples. Samples
of soil, roots and aerial plant material were collected
during the July–August growing period and severalmonths after harvest during January. The experiment was
performed twice, during the years 2000–2001 and 2002–
2003. A total of 144 samples was processed. For each field
site and treatment (corn type), a total of 12 samples of
roots, nine samples of soil and three samples of aerial
plant material was taken. In the years 2000 (growing pe-
riod) and 2001 (postharvest), 54 samples were taken. In
the years 2002 (growing period) and 2003 (postharvest),90 samples were taken. Materials were collected in sterile
plastic bags and transported to the laboratory under re-
frigeration at 5 �C. In the laboratory, 20 g of sample
material was homogenized during 2 min with 150 ml of
phosphate buffer (pH 7.0, 100 mM) using a Stomacher
(IUL Instruments). Then, a 40-ml portion of extract was
filtered through several layers of sterile cheesecloth to
eliminate large particulate materials and the effluent wascentrifuged at 13,000g for 15 min at 4 �C. The pellet wasresuspended in 40ml of phosphate buffer and washed two
times in the same buffer.
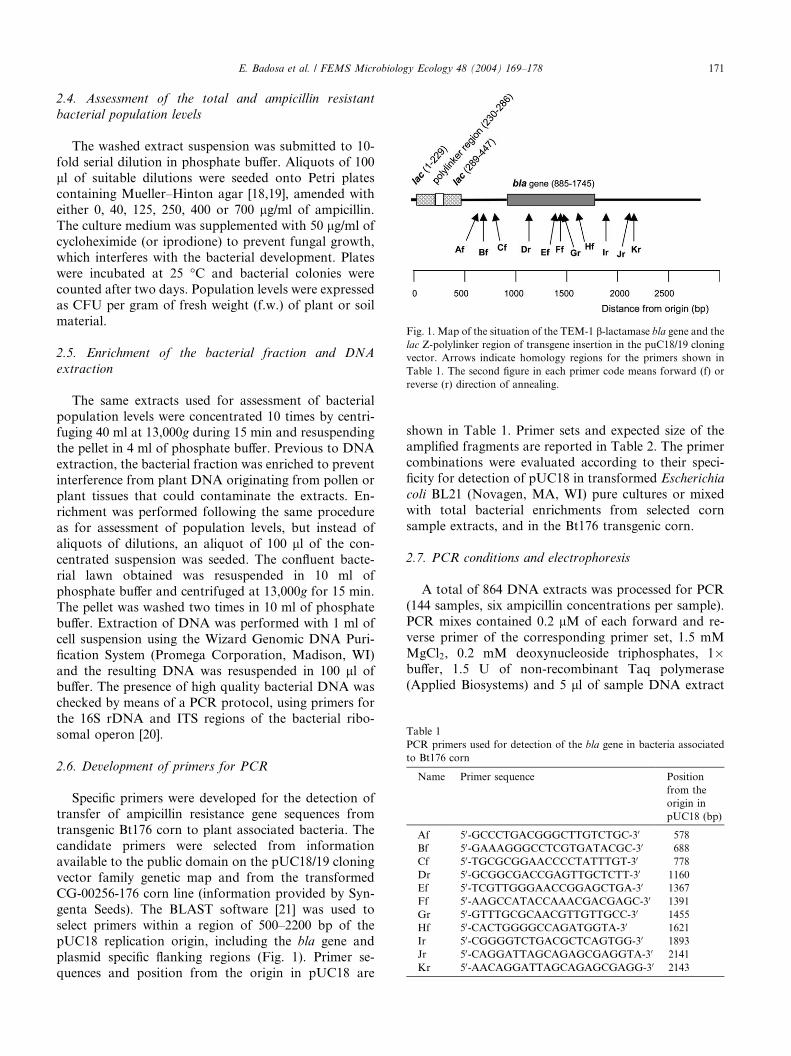
Fig. 1. Map of the situation of the TEM-1 b-lactamase bla gene and the
lac Z-polylinker region of transgene insertion in the puC18/19 cloning
vector. Arrows indicate homology regions for the primers shown in
Table 1. The second figure in each primer code means forward (f) or
reverse (r) direction of annealing.
Table 1
PCR primers used for detection of the bla gene in bacteria associated
to Bt176 corn
Name Primer sequence Position
from the
origin in
pUC18 (bp)
Af 50-GCCCTGACGGGCTTGTCTGC-30 578
Bf 50-GAAAGGGCCTCGTGATACGC-30 688
Cf 50-TGCGCGGAACCCCTATTTGT-30 778
Dr 50-GCGGCGACCGAGTTGCTCTT-30 1160
Ef 50-TCGTTGGGAACCGGAGCTGA-30 1367
Ff 50-AAGCCATACCAAACGACGAGC-30 1391
Gr 50-GTTTGCGCAACGTTGTTGCC-30 1455
Hf 50-CACTGGGGCCAGATGGTA-30 1621
Ir 50-CGGGGTCTGACGCTCAGTGG-30 1893
Jr 50-CAGGATTAGCAGAGCGAGGTA-30 2141
Kr 50-AACAGGATTAGCAGAGCGAGG-30 2143
E. Badosa et al. / FEMS Microbiology Ecology 48 (2004) 169–178 171
2.4. Assessment of the total and ampicillin resistant
bacterial population levels
The washed extract suspension was submitted to 10-
fold serial dilution in phosphate buffer. Aliquots of 100ll of suitable dilutions were seeded onto Petri plates
containing Mueller–Hinton agar [18,19], amended with
either 0, 40, 125, 250, 400 or 700 lg/ml of ampicillin.
The culture medium was supplemented with 50 lg/ml of
cycloheximide (or iprodione) to prevent fungal growth,
which interferes with the bacterial development. Plates
were incubated at 25 �C and bacterial colonies were
counted after two days. Population levels were expressedas CFU per gram of fresh weight (f.w.) of plant or soil
material.
2.5. Enrichment of the bacterial fraction and DNA
extraction
The same extracts used for assessment of bacterial
population levels were concentrated 10 times by centri-fuging 40 ml at 13,000g during 15 min and resuspending
the pellet in 4 ml of phosphate buffer. Previous to DNA
extraction, the bacterial fraction was enriched to prevent
interference from plant DNA originating from pollen or
plant tissues that could contaminate the extracts. En-
richment was performed following the same procedure
as for assessment of population levels, but instead of
aliquots of dilutions, an aliquot of 100 ll of the con-centrated suspension was seeded. The confluent bacte-
rial lawn obtained was resuspended in 10 ml of
phosphate buffer and centrifuged at 13,000g for 15 min.
The pellet was washed two times in 10 ml of phosphate
buffer. Extraction of DNA was performed with 1 ml of
cell suspension using the Wizard Genomic DNA Puri-
fication System (Promega Corporation, Madison, WI)
and the resulting DNA was resuspended in 100 ll ofbuffer. The presence of high quality bacterial DNA was
checked by means of a PCR protocol, using primers for
the 16S rDNA and ITS regions of the bacterial ribo-
somal operon [20].
2.6. Development of primers for PCR
Specific primers were developed for the detection oftransfer of ampicillin resistance gene sequences from
transgenic Bt176 corn to plant associated bacteria. The
candidate primers were selected from information
available to the public domain on the pUC18/19 cloning
vector family genetic map and from the transformed
CG-00256-176 corn line (information provided by Syn-
genta Seeds). The BLAST software [21] was used to
select primers within a region of 500–2200 bp of thepUC18 replication origin, including the bla gene and
plasmid specific flanking regions (Fig. 1). Primer se-
quences and position from the origin in pUC18 are
shown in Table 1. Primer sets and expected size of the
amplified fragments are reported in Table 2. The primer
combinations were evaluated according to their speci-
ficity for detection of pUC18 in transformed Escherichia
coli BL21 (Novagen, MA, WI) pure cultures or mixed
with total bacterial enrichments from selected corn
sample extracts, and in the Bt176 transgenic corn.
2.7. PCR conditions and electrophoresis
A total of 864 DNA extracts was processed for PCR
(144 samples, six ampicillin concentrations per sample).
PCR mixes contained 0.2 lM of each forward and re-
verse primer of the corresponding primer set, 1.5 mM
MgCl2, 0.2 mM deoxynucleoside triphosphates, 1�buffer, 1.5 U of non-recombinant Taq polymerase
(Applied Biosystems) and 5 ll of sample DNA extract
Table 2
Primer sets, size and correspondence of the amplified fragments to the
bla gene and flanking regions of the pUC18 plasmid
Primer
combination
Size (bp) Base pairs corresponding to
Plasmid bla gene
Af/Dr 582 309 273
Bf/Dr 472 199 273
Cf/Gr 677 109 568
Cf/Dr 382 109 273
Ef/Ir 526 146 380
Ff/Kr 752 396 356
Ff/Ir 502 146 356
Ff/Jr 750 394 356
Hf/Jr 520 394 126
Hf/Kr 522 396 126
172 E. Badosa et al. / FEMS Microbiology Ecology 48 (2004) 169–178
(250–400 ng) in 50 ll of total volume. Amplification was
performed in a GeneAmp PCR System 9700 (Perkin–
Elmer Applied Biosystems) thermocycler. The PCR in-
volved a 2-min denaturizing step at 94 �C and 35 cycles
consisting of 45 s at 94 �C, 30 s at 58 �C for primer
annealing and 45 s at 72 �C for primer extension, fol-
lowed by a final 7-min extension step at 72 �C. An-
nealing was performed at 55 �C for the Ff/Jr primer set.For detection of Bt176 construct in corn plants, a pre-
vious digestion of DNA with the restriction enzyme
NaeI (Roche Diagnostics) was required to improve the
accessibility of the primer annealing site.
2.8. Characterization of PCR-amplified fragments from
samples
Amplified fragments of the expected 752 bp size were
identified by means of digestion with single cleavage
sequence restriction endonucleases and DNA sequenc-
ing. For restriction analysis and sequencing, DNA
bands corresponding to 752 bp Ff/Kr-amplified frag-
ments were cut from agarose gels, extracted and cleaned
up using the QiaexII gel extraction kit (Qiagen, Hilde,
Germany).Restriction analysis was performed with BglI and
BspHI at 37 �C for 3 h. The digestion of the amplified
fragments from Bt176 and pUC18 positive controls
produces two subfragments of 594 and 158 bp with BglI
and of 450 and 302 bp with BspHI, respectively.
Sequencing was performed by PCR with an ABI
PRISM 310 (Perkin–Elmer) sequencer using the BigDye
Terminator cycle sequencing kit. Direct PCR sequencingof the Ff/Kr-amplified 752-bp fragments obtained from
either pUC18 or Bt176 corn was successful, but was not
possible for fragments from field samples showing po-
sitive signals. Therefore, fragments were cloned in E. coli
using the TOPO TA cloning kit for fast cloning of Taq-
amplified PCR products (InVitrogen Corp., CA). The
resulting amplified fragments of 890 bp (752+ 140 bp)
were submitted to direct PCR sequencing of both
strands. The nucleotide sequences obtained for the po-
sitive controls were aligned to the putative sequences
obtained from positive signals in samples using Clustaw
and MULTALIN software (ver. 5.4.1, I.N.R.A. 1996).
Then, the sequences were introduced into the BLASTsoftware to search for homologous sequences in the
database.
2.9. Data treatment and statistical analysis
Bacterial population levels were transformed to log10CFU/g f.w. before being used to normalize the distri-
bution. Population levels at the different ampicillinconcentrations were transformed to proportion of sur-
viving bacteria and were used to calculate the median
effective dose (ED50) and the slope of the dose–response
curve to ampicillin. ED50 and the slope were obtained by
linear regression from probit transformation of surviv-
ing bacteria as dependent and the log10 of ampicillin
concentration as independent variables. Analysis of
variance using a General Linear Procedure (GLM) wasperformed to test the significance of the effect of sam-
pling material, field plot, year, period of sampling and
corn type on independent variables. The SAS package
(8.2 version, SAS Institute Inc. Cary, NC) was used for
performing ANOVA and regression analysis.
Power analysis was performed according to the ex-
perimental design used in order to determine how big
the difference between compared sample means shouldbe to minimize the risk of rejecting H0 when it is true (a,error type I) and to accept H0 when it is false (b, errortype II). The following equation given by Sokal and
Rohlf [22] was used:
n6 2rd
� �2
tma½ þ t2ð1�PÞm�2 ð1Þ
where r is the standard deviation for the data, d is the
smallest difference that should be detected, m represents
the degrees of freedom for a groups of means of n rep-lications per group, a is the significance level and P is the
probability that a difference will be found to be signifi-
cant (1� P , the power of the test). The equation can be
rearranged to:
d ¼ 1:414rffiffiffin
p tma�
þ t2ð1�P Þm�2: ð2Þ
According to the experimental and sampling design,
the number of group means compared was 48 and the
number of replicated measurements was 3. Thus, con-
sidering m ¼ a ðn� 1Þ, m ¼ 48 ð3� 1Þ ¼ 96. Since r and
d can be expressed as the coefficient of variation, the
mean value of r for the three sub-samples within the 48
samples was used for each of the parameters measured(total, resistant, slope and ED50). t values were calcu-
lated from statistical tables at a ¼ 0:01 and 0.05, and
b ¼ 0:1 and 0.2.
E. Badosa et al. / FEMS Microbiology Ecology 48 (2004) 169–178 173
3. Results and discussion
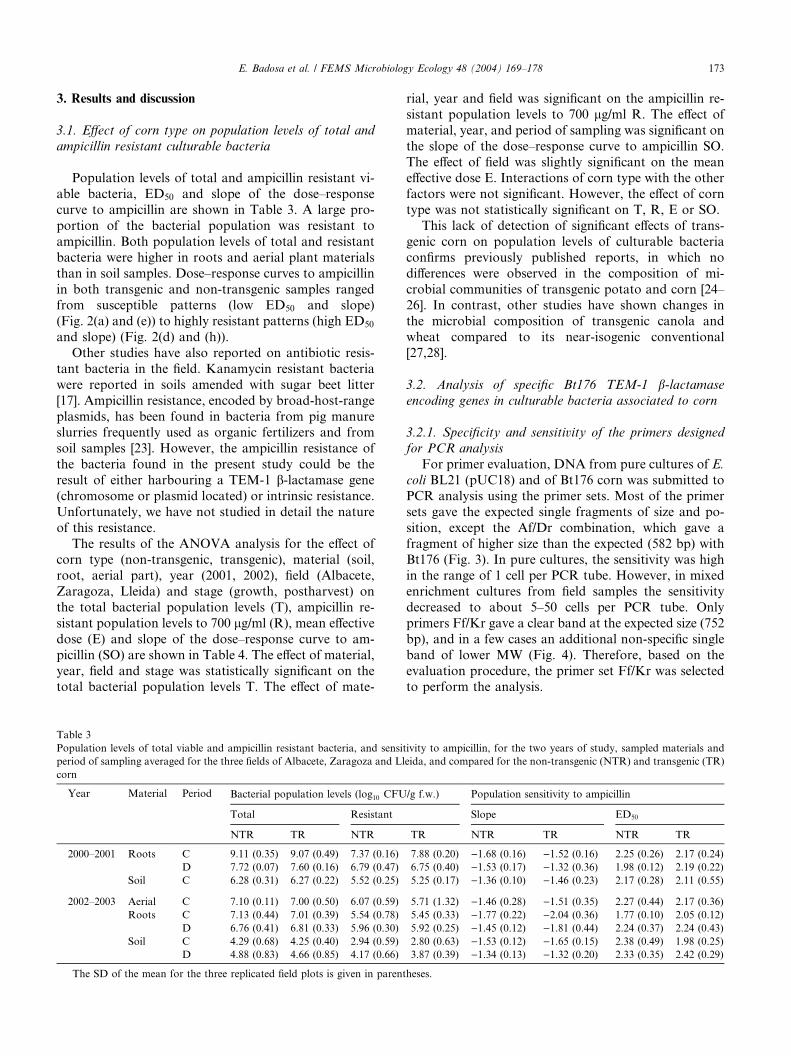
3.1. Effect of corn type on population levels of total and
ampicillin resistant culturable bacteria
Population levels of total and ampicillin resistant vi-
able bacteria, ED50 and slope of the dose–response
curve to ampicillin are shown in Table 3. A large pro-
portion of the bacterial population was resistant to
ampicillin. Both population levels of total and resistant
bacteria were higher in roots and aerial plant materials
than in soil samples. Dose–response curves to ampicillin
in both transgenic and non-transgenic samples rangedfrom susceptible patterns (low ED50 and slope)
(Fig. 2(a) and (e)) to highly resistant patterns (high ED50
and slope) (Fig. 2(d) and (h)).
Other studies have also reported on antibiotic resis-
tant bacteria in the field. Kanamycin resistant bacteria
were reported in soils amended with sugar beet litter
[17]. Ampicillin resistance, encoded by broad-host-range
plasmids, has been found in bacteria from pig manureslurries frequently used as organic fertilizers and from
soil samples [23]. However, the ampicillin resistance of
the bacteria found in the present study could be the
result of either harbouring a TEM-1 b-lactamase gene
(chromosome or plasmid located) or intrinsic resistance.
Unfortunately, we have not studied in detail the nature
of this resistance.
The results of the ANOVA analysis for the effect ofcorn type (non-transgenic, transgenic), material (soil,
root, aerial part), year (2001, 2002), field (Albacete,
Zaragoza, Lleida) and stage (growth, postharvest) on
the total bacterial population levels (T), ampicillin re-
sistant population levels to 700 lg/ml (R), mean effective
dose (E) and slope of the dose–response curve to am-
picillin (SO) are shown in Table 4. The effect of material,
year, field and stage was statistically significant on thetotal bacterial population levels T. The effect of mate-
Table 3
Population levels of total viable and ampicillin resistant bacteria, and sensit
period of sampling averaged for the three fields of Albacete, Zaragoza and Ll
corn
Year Material Period Bacterial population levels (log10 CFU
Total Resistant
NTR TR NTR
2000–2001 Roots C 9.11 (0.35) 9.07 (0.49) 7.37 (0.16)
D 7.72 (0.07) 7.60 (0.16) 6.79 (0.47)
Soil C 6.28 (0.31) 6.27 (0.22) 5.52 (0.25)
2002–2003 Aerial C 7.10 (0.11) 7.00 (0.50) 6.07 (0.59)
Roots C 7.13 (0.44) 7.01 (0.39) 5.54 (0.78)
D 6.76 (0.41) 6.81 (0.33) 5.96 (0.30)
Soil C 4.29 (0.68) 4.25 (0.40) 2.94 (0.59)
D 4.88 (0.83) 4.66 (0.85) 4.17 (0.66)
The SD of the mean for the three replicated field plots is given in parent
rial, year and field was significant on the ampicillin re-
sistant population levels to 700 lg/ml R. The effect of
material, year, and period of sampling was significant on
the slope of the dose–response curve to ampicillin SO.
The effect of field was slightly significant on the meaneffective dose E. Interactions of corn type with the other
factors were not significant. However, the effect of corn
type was not statistically significant on T, R, E or SO.
This lack of detection of significant effects of trans-
genic corn on population levels of culturable bacteria
confirms previously published reports, in which no
differences were observed in the composition of mi-
crobial communities of transgenic potato and corn [24–26]. In contrast, other studies have shown changes in
the microbial composition of transgenic canola and
wheat compared to its near-isogenic conventional
[27,28].
3.2. Analysis of specific Bt176 TEM-1 b-lactamase
encoding genes in culturable bacteria associated to corn
3.2.1. Specificity and sensitivity of the primers designed
for PCR analysis
For primer evaluation, DNA from pure cultures of E.
coli BL21 (pUC18) and of Bt176 corn was submitted to
PCR analysis using the primer sets. Most of the primer
sets gave the expected single fragments of size and po-
sition, except the Af/Dr combination, which gave a
fragment of higher size than the expected (582 bp) withBt176 (Fig. 3). In pure cultures, the sensitivity was high
in the range of 1 cell per PCR tube. However, in mixed
enrichment cultures from field samples the sensitivity
decreased to about 5–50 cells per PCR tube. Only
primers Ff/Kr gave a clear band at the expected size (752
bp), and in a few cases an additional non-specific single
band of lower MW (Fig. 4). Therefore, based on the
evaluation procedure, the primer set Ff/Kr was selectedto perform the analysis.
ivity to ampicillin, for the two years of study, sampled materials and
eida, and compared for the non-transgenic (NTR) and transgenic (TR)
/g f.w.) Population sensitivity to ampicillin
Slope ED50
TR NTR TR NTR TR
7.88 (0.20) )1.68 (0.16) )1.52 (0.16) 2.25 (0.26) 2.17 (0.24)
6.75 (0.40) )1.53 (0.17) )1.32 (0.36) 1.98 (0.12) 2.19 (0.22)
5.25 (0.17) )1.36 (0.10) )1.46 (0.23) 2.17 (0.28) 2.11 (0.55)
5.71 (1.32) )1.46 (0.28) )1.51 (0.35) 2.27 (0.44) 2.17 (0.36)
5.45 (0.33) )1.77 (0.22) )2.04 (0.36) 1.77 (0.10) 2.05 (0.12)
5.92 (0.25) )1.45 (0.12) )1.81 (0.44) 2.24 (0.37) 2.24 (0.43)
2.80 (0.63) )1.53 (0.12) )1.65 (0.15) 2.38 (0.49) 1.98 (0.25)
3.87 (0.39) )1.34 (0.13) )1.32 (0.20) 2.33 (0.35) 2.42 (0.29)
heses.
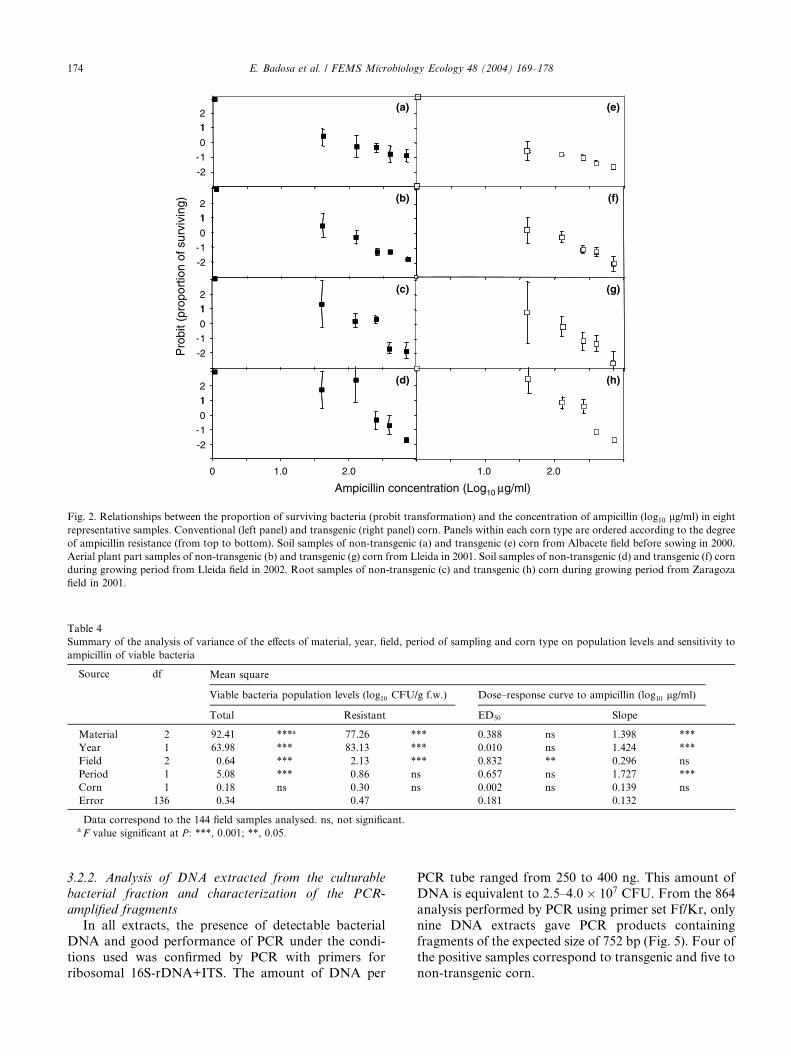
Table 4
Summary of the analysis of variance of the effects of material, year, field, period of sampling and corn type on population levels and sensitivity to
ampicillin of viable bacteria
Source df Mean square
Viable bacteria population levels (log10 CFU/g f.w.) Dose–response curve to ampicillin (log10 lg/ml)
Total Resistant ED50 Slope
Material 2 92.41 ***a 77.26 *** 0.388 ns 1.398 ***
Year 1 63.98 *** 83.13 *** 0.010 ns 1.424 ***
Field 2 0.64 *** 2.13 *** 0.832 ** 0.296 ns
Period 1 5.08 *** 0.86 ns 0.657 ns 1.727 ***
Corn 1 0.18 ns 0.30 ns 0.002 ns 0.139 ns
Error 136 0.34 0.47 0.181 0.132
Data correspond to the 144 field samples analysed. ns, not significant.aF value significant at P : ***, 0.001; **, 0.05.
-2
-1
0
1
2
1
-2
-1
0
1
2
1
-2
-1
0
1
2
1
-2
-1
0
1
2
1
Pro
bit (
prop
ortio
n of
sur
vivi
ng)
Ampicillin concentration (Log10 µg/ml)
(a)
(b)
(c)
(d)
(e)
(f)
(g)
(h)
0 1.0 2.0 1.0 2.0
Fig. 2. Relationships between the proportion of surviving bacteria (probit transformation) and the concentration of ampicillin (log10 lg/ml) in eight
representative samples. Conventional (left panel) and transgenic (right panel) corn. Panels within each corn type are ordered according to the degree
of ampicillin resistance (from top to bottom). Soil samples of non-transgenic (a) and transgenic (e) corn from Albacete field before sowing in 2000.
Aerial plant part samples of non-transgenic (b) and transgenic (g) corn from Lleida in 2001. Soil samples of non-transgenic (d) and transgenic (f) corn
during growing period from Lleida field in 2002. Root samples of non-transgenic (c) and transgenic (h) corn during growing period from Zaragoza
field in 2001.
174 E. Badosa et al. / FEMS Microbiology Ecology 48 (2004) 169–178
3.2.2. Analysis of DNA extracted from the culturable
bacterial fraction and characterization of the PCR-
amplified fragments
In all extracts, the presence of detectable bacterial
DNA and good performance of PCR under the condi-
tions used was confirmed by PCR with primers for
ribosomal 16S-rDNA+ITS. The amount of DNA per
PCR tube ranged from 250 to 400 ng. This amount of
DNA is equivalent to 2.5–4:0� 107 CFU. From the 864
analysis performed by PCR using primer set Ff/Kr, only
nine DNA extracts gave PCR products containing
fragments of the expected size of 752 bp (Fig. 5). Four of
the positive samples correspond to transgenic and five to
non-transgenic corn.
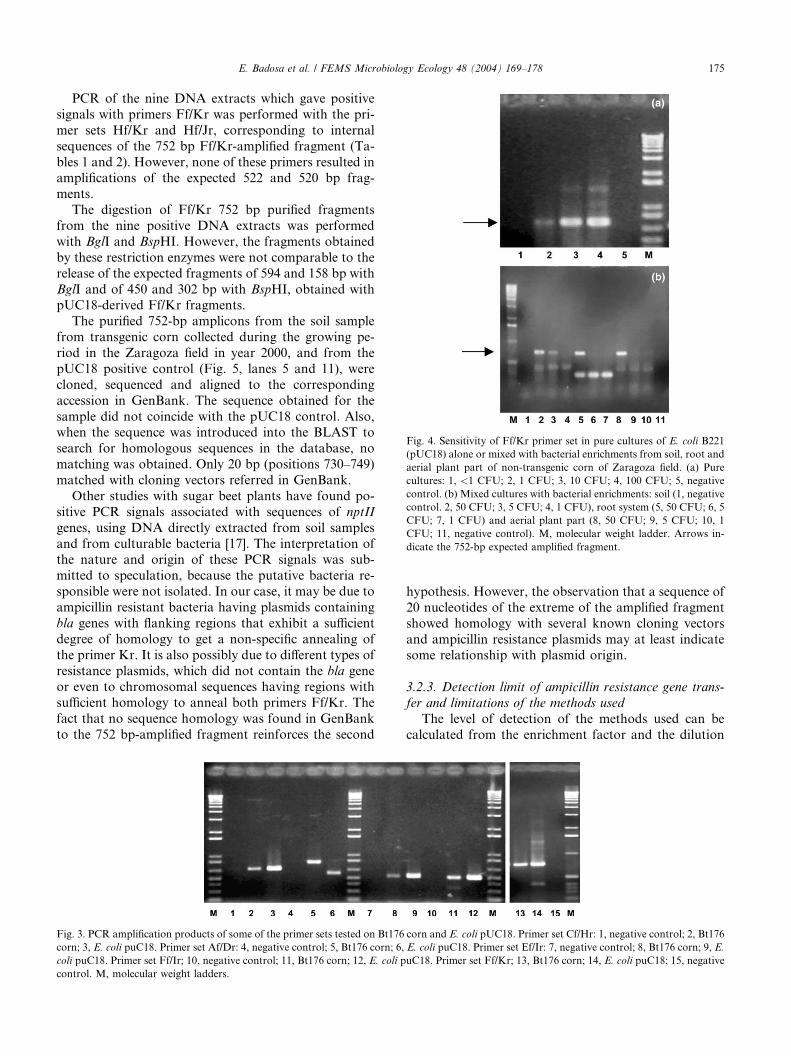
Fig. 4. Sensitivity of Ff/Kr primer set in pure cultures of E. coli B221
(pUC18) alone or mixed with bacterial enrichments from soil, root and
aerial plant part of non-transgenic corn of Zaragoza field. (a) Pure
cultures: 1, <1 CFU; 2, 1 CFU; 3, 10 CFU; 4, 100 CFU; 5, negative
control. (b) Mixed cultures with bacterial enrichments: soil (1, negative
control. 2, 50 CFU; 3, 5 CFU; 4, 1 CFU), root system (5, 50 CFU; 6, 5
CFU; 7, 1 CFU) and aerial plant part (8, 50 CFU; 9, 5 CFU; 10, 1
CFU; 11, negative control). M, molecular weight ladder. Arrows in-
dicate the 752-bp expected amplified fragment.
E. Badosa et al. / FEMS Microbiology Ecology 48 (2004) 169–178 175
PCR of the nine DNA extracts which gave positive
signals with primers Ff/Kr was performed with the pri-
mer sets Hf/Kr and Hf/Jr, corresponding to internal
sequences of the 752 bp Ff/Kr-amplified fragment (Ta-
bles 1 and 2). However, none of these primers resulted inamplifications of the expected 522 and 520 bp frag-
ments.
The digestion of Ff/Kr 752 bp purified fragments
from the nine positive DNA extracts was performed
with BglI and BspHI. However, the fragments obtained
by these restriction enzymes were not comparable to the
release of the expected fragments of 594 and 158 bp with
BglI and of 450 and 302 bp with BspHI, obtained withpUC18-derived Ff/Kr fragments.
The purified 752-bp amplicons from the soil sample
from transgenic corn collected during the growing pe-
riod in the Zaragoza field in year 2000, and from the
pUC18 positive control (Fig. 5, lanes 5 and 11), were
cloned, sequenced and aligned to the corresponding
accession in GenBank. The sequence obtained for the
sample did not coincide with the pUC18 control. Also,when the sequence was introduced into the BLAST to
search for homologous sequences in the database, no
matching was obtained. Only 20 bp (positions 730–749)
matched with cloning vectors referred in GenBank.
Other studies with sugar beet plants have found po-
sitive PCR signals associated with sequences of nptII
genes, using DNA directly extracted from soil samples
and from culturable bacteria [17]. The interpretation ofthe nature and origin of these PCR signals was sub-
mitted to speculation, because the putative bacteria re-
sponsible were not isolated. In our case, it may be due to
ampicillin resistant bacteria having plasmids containing
bla genes with flanking regions that exhibit a sufficient
degree of homology to get a non-specific annealing of
the primer Kr. It is also possibly due to different types of
resistance plasmids, which did not contain the bla geneor even to chromosomal sequences having regions with
sufficient homology to anneal both primers Ff/Kr. The
fact that no sequence homology was found in GenBank
to the 752 bp-amplified fragment reinforces the second
Fig. 3. PCR amplification products of some of the primer sets tested on Bt176
corn; 3, E. coli puC18. Primer set Af/Dr: 4, negative control; 5, Bt176 corn; 6,
coli puC18. Primer set Ff/Ir; 10, negative control; 11, Bt176 corn; 12, E. coli p
control. M, molecular weight ladders.
hypothesis. However, the observation that a sequence of
20 nucleotides of the extreme of the amplified fragment
showed homology with several known cloning vectors
and ampicillin resistance plasmids may at least indicatesome relationship with plasmid origin.
3.2.3. Detection limit of ampicillin resistance gene trans-
fer and limitations of the methods used
The level of detection of the methods used can be
calculated from the enrichment factor and the dilution
corn and E. coli pUC18. Primer set Cf/Hr: 1, negative control; 2, Bt176
E. coli puC18. Primer set Ef/Ir: 7, negative control; 8, Bt176 corn; 9, E.
uC18. Primer set Ff/Kr; 13, Bt176 corn; 14, E. coli puC18; 15, negative
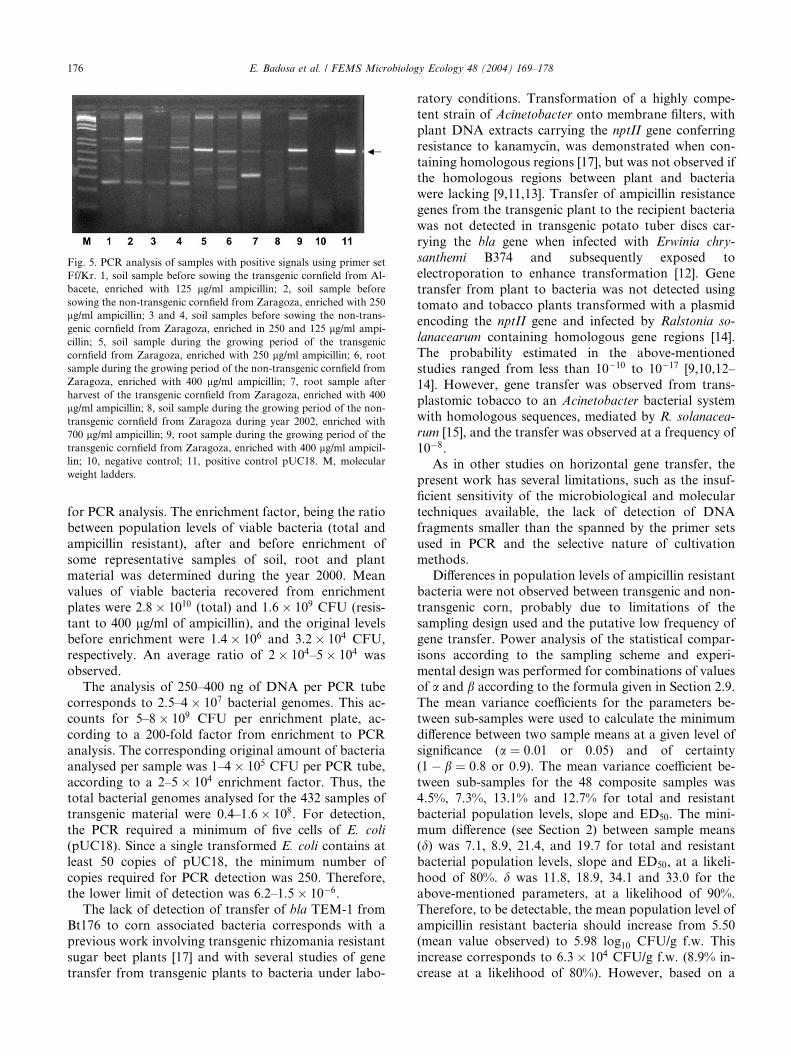
Fig. 5. PCR analysis of samples with positive signals using primer set
Ff/Kr. 1, soil sample before sowing the transgenic cornfield from Al-
bacete, enriched with 125 lg/ml ampicillin; 2, soil sample before
sowing the non-transgenic cornfield from Zaragoza, enriched with 250
lg/ml ampicillin; 3 and 4, soil samples before sowing the non-trans-
genic cornfield from Zaragoza, enriched in 250 and 125 lg/ml ampi-
cillin; 5, soil sample during the growing period of the transgenic
cornfield from Zaragoza, enriched with 250 lg/ml ampicillin; 6, root
sample during the growing period of the non-transgenic cornfield from
Zaragoza, enriched with 400 lg/ml ampicillin; 7, root sample after
harvest of the transgenic cornfield from Zaragoza, enriched with 400
lg/ml ampicillin; 8, soil sample during the growing period of the non-
transgenic cornfield from Zaragoza during year 2002, enriched with
700 lg/ml ampicillin; 9, root sample during the growing period of the
transgenic cornfield from Zaragoza, enriched with 400 lg/ml ampicil-
lin; 10, negative control; 11, positive control pUC18. M, molecular
weight ladders.
176 E. Badosa et al. / FEMS Microbiology Ecology 48 (2004) 169–178
for PCR analysis. The enrichment factor, being the ratio
between population levels of viable bacteria (total and
ampicillin resistant), after and before enrichment of
some representative samples of soil, root and plant
material was determined during the year 2000. Mean
values of viable bacteria recovered from enrichment
plates were 2:8� 1010 (total) and 1:6� 109 CFU (resis-
tant to 400 lg/ml of ampicillin), and the original levelsbefore enrichment were 1:4� 106 and 3:2� 104 CFU,
respectively. An average ratio of 2� 104–5� 104 was
observed.
The analysis of 250–400 ng of DNA per PCR tube
corresponds to 2.5–4� 107 bacterial genomes. This ac-
counts for 5–8� 109 CFU per enrichment plate, ac-
cording to a 200-fold factor from enrichment to PCR
analysis. The corresponding original amount of bacteriaanalysed per sample was 1–4� 105 CFU per PCR tube,
according to a 2–5� 104 enrichment factor. Thus, the
total bacterial genomes analysed for the 432 samples of
transgenic material were 0.4–1:6� 108. For detection,
the PCR required a minimum of five cells of E. coli
(pUC18). Since a single transformed E. coli contains at
least 50 copies of pUC18, the minimum number of
copies required for PCR detection was 250. Therefore,the lower limit of detection was 6.2–1:5� 10�6.
The lack of detection of transfer of bla TEM-1 from
Bt176 to corn associated bacteria corresponds with a
previous work involving transgenic rhizomania resistant
sugar beet plants [17] and with several studies of gene
transfer from transgenic plants to bacteria under labo-
ratory conditions. Transformation of a highly compe-
tent strain of Acinetobacter onto membrane filters, with
plant DNA extracts carrying the nptII gene conferring
resistance to kanamycin, was demonstrated when con-
taining homologous regions [17], but was not observed ifthe homologous regions between plant and bacteria
were lacking [9,11,13]. Transfer of ampicillin resistance
genes from the transgenic plant to the recipient bacteria
was not detected in transgenic potato tuber discs car-
rying the bla gene when infected with Erwinia chry-
santhemi B374 and subsequently exposed to
electroporation to enhance transformation [12]. Gene
transfer from plant to bacteria was not detected usingtomato and tobacco plants transformed with a plasmid
encoding the nptII gene and infected by Ralstonia so-
lanacearum containing homologous gene regions [14].
The probability estimated in the above-mentioned
studies ranged from less than 10�10 to 10�17 [9,10,12–
14]. However, gene transfer was observed from trans-
plastomic tobacco to an Acinetobacter bacterial system
with homologous sequences, mediated by R. solanacea-
rum [15], and the transfer was observed at a frequency of
10�8.
As in other studies on horizontal gene transfer, the
present work has several limitations, such as the insuf-
ficient sensitivity of the microbiological and molecular
techniques available, the lack of detection of DNA
fragments smaller than the spanned by the primer sets
used in PCR and the selective nature of cultivationmethods.
Differences in population levels of ampicillin resistant
bacteria were not observed between transgenic and non-
transgenic corn, probably due to limitations of the
sampling design used and the putative low frequency of
gene transfer. Power analysis of the statistical compar-
isons according to the sampling scheme and experi-
mental design was performed for combinations of valuesof a and b according to the formula given in Section 2.9.
The mean variance coefficients for the parameters be-
tween sub-samples were used to calculate the minimum
difference between two sample means at a given level of
significance (a ¼ 0:01 or 0.05) and of certainty
(1� b ¼ 0:8 or 0.9). The mean variance coefficient be-
tween sub-samples for the 48 composite samples was
4.5%, 7.3%, 13.1% and 12.7% for total and resistantbacterial population levels, slope and ED50. The mini-
mum difference (see Section 2) between sample means
(d) was 7.1, 8.9, 21.4, and 19.7 for total and resistant
bacterial population levels, slope and ED50, at a likeli-
hood of 80%. d was 11.8, 18.9, 34.1 and 33.0 for the
above-mentioned parameters, at a likelihood of 90%.
Therefore, to be detectable, the mean population level of
ampicillin resistant bacteria should increase from 5.50(mean value observed) to 5.98 log10 CFU/g f.w. This
increase corresponds to 6:3� 104 CFU/g f.w. (8.9% in-
crease at a likelihood of 80%). However, based on a
E. Badosa et al. / FEMS Microbiology Ecology 48 (2004) 169–178 177
transfer frequency of less than 10�6 (limit of detection),
a 8.9% increase in the population levels of ampicillin
resistant bacteria cannot be expected. Clearly, the pro-
cess cannot be detected by comparing population levels
using plate count methods, not even after increasingsub-sample numbers to decrease d.
Another limitation is the low number of bacteria
processed, compared to the expected low frequency.
This is a consequence of the small amount of sample
used in the plate count and the PCR methods. Alter-
native methods based on the direct extraction of bacte-
rial DNA from soil, root and plant samples result in
high numbers of bacterial genomes, but do not allow todistinguish between residual plant material and poten-
tial recombinant bacteria. With these limitations in
mind, it is impossible to establish an absolute proba-
bility level for transfer of bla genes in the field.
The methods we have used only consider culturable
bacteria, and a fraction of the bacteria either associated
to the plant or being soil inhabitants may be non-cul-
turable or may be viable but not culturable [29]. Also,the enrichment procedure used favours development of
fast growing bacteria, therefore excluding or overgrow-
ing slow growing bacteria. Thus, the fraction analysed
only represents part of the bacterial diversity present in
the sample material, because the enrichment conditions
may have further reduced the diversity examined.
However, in spite of the lack of growth, the non-
culturable bacteria present in the sample extracts mayreach the PCR tubes, submitted, however, to consider-
able dilution. Unfortunately, no data on the total bac-
teria present (culturable and not culturable) are
available to establish a threshold probability of transfer
for the non-culturable bacteria.
In conclusion, considering the high proportion of
ampicillin resistant bacteria and the low frequency
supposed for the transfer of the bla TEM-1 gene fromBt176 corn to bacteria, the potential effect of this
transgenic corn is negligible.
Acknowledgements
We are grateful to Jordi Cabrefiga, Marta Pujol and
Olga Montojo for technical assistance. This work has
been performed in part with support of the Comissi�oInterdepartamental de Recerca i Tecnologia of the
Generalitat de Catalunya (GRC-2001SGR00293) and by
Syngenta Seeds, S.A.
References
[1] James, C. (2003) Global status of commercialized transgenic
crops: 2002. ISAA Briefs no. 27. ISAA.
[2] Jenkins, J.N. (1998) Transgenic plants expressing toxins from
Bacillus thuringiensis. In: Methods in Biotechnology(Hall, F.R.
and Barry, J.W., Eds.), vol. 5, pp. 211–231 Human Press, Totowa,
NJ.
[3] Potrykus, I., Bilang, R., F€utterer, J., Stautter, C., Schrott, M. and
Spangenberg, G. (1998) Genetic engineering of crop plants. In:
Agricultural Biotechnology (Altman, A., Ed.), pp. 119–159.
Marcel Dekker, New York.
[4] In: Horizontal Gene Transfer (Syvanen, M. and Kado, C.I.,
Eds.). Chapman & Hall, London, UK.
[5] Jones, D.D. and Maryanski, J.H. (1991) Safety considerations in
the evaluation of transgenic plants for human food. In: Risk
Assessment in Genetic Engineering (Levin, M.A. and Strauss,
H.S., Eds.). McGraw-Hill, New York.
[6] WHO (1993) Health aspects of marker genes in genetically
modified plants. Report of a WHO workshop, World Health
Organization, Geneva, 32 pp.
[7] Sanders, P.R., Lee, T.C., Groth, M.E., Astwood, J.D. and Fuchs,
R.L. (1998) Safety assessment of insect-protected corn. In:
Biotechnology and Safety Assessment (Thomas, J.A., Ed.). Taylor
& Francis, Philadelphia.
[8] Nielsen, K.M., Bones, A.M., Smalla, K. and Van Elsas, J.D.
(1998) Horizontal gene transfer from transgenic plants to terres-
trial bacteria – a rare event? FEMS Microbiol. Rev. 22, 79–103.
[9] Nielsen, K.M., Gebhard, F., Bones, A.M. and Van Elsas, J.D.
(1997) Evaluation of possible horizontal gene transfer from
transgenic plants to the soil bacterium Acinetobacter calcoaceticus
BD413. Theor. Appl. Genet. 95, 815–821.
[10] Gebhard, F. and Smalla, K. (1998) Tranformation of Acineto-
bacter sp. BD413 by transgenic sugar beet DNA. Appl. Environ.
Microbiol. 64, 1550–1554.
[11] De Vries, J., Meier, P. and Wackernagel, W. (2001) The natural
transformation of the soil bacteria Pseudomonas stutzeri and
Acinetobacter sp. by transgenic plant DNA strictly depends on
homologous sequences in the recipient cells. FEMS Microbiol.
Lett. 195, 211–215.
[12] Schl€uter, K., F€utterer, J. and Potrykus, I. (1995) Horizontal gene
transfer from a transgenic potato line to a bacterial pathogen
(Erwinia chrysanthemi) occurs – if at all – at an extremely low
frequency. Biotechnology 13, 94–98.
[13] Broer, I., Dr€oge-Laser, W. and Gerke, M. (1996) Examination of
the putative horizontal gene transfer from transgenic plants to
agrobacteria. In: Transgenic Organisms and Biosafety, Horizontal
Gene Transfer, Stability of DNA and Expression of Transgenes
(Schmidt, E.R. and Hankeln, T., Eds.), pp. 67–70. Springer-
Verlag, Heidelberg, Germany.
[14] Bertolla, F., Pepin, R., Passelegue-Robe, E., Paget, E., Simkin, A.,
Nesme, X. and Simonet, P. (2000) Plant genome complexity may
be a factor limiting in situ the transfer of transgenic plant genes to
the phytopathogen Ralstonia solanacearum. Appl. Environ. Mi-
crobiol. 66, 4161–4167.
[15] Kay, E., Vogel, T.M., Bertolla, F., Nalin, R. and Simonet, P.
(2002) In situ transfer of antibiotic genes from transgenic
(transplastomic) tobacco plants to bacteria. Appl. Environ.
Microbiol. 68, 3345–3351.
[16] Van Elsas, J.D. and Smalla, K. (1997) Methods for sampling soil
microbes. In: Manual of Environmental Microbiology (Hurst,
C.Jj., Knudsen, G.R., McInerney, M.J., Stetzenbach, L.D. and
Walter, M.V., Eds.), pp. 383–390. ASM Press.
[17] Gebhard, F. and Smalla, K. (1999) Monitoring field releases of
genetically modified sugar beets for persistence of transgenic plant
DNA and horizontal gene transfer. FEMS Microbiol. Ecol. 28,
261–272.
[18] Tenover, F.C., Jorgensen, J.H. and Turnidge, J.D., Section Eds.
(1999) Antimicrobial agents and susceptibility testing. In: Manual
of Clinical Microbiology (Murray, P.R., Baron, E.J., Pfaller,
178 E. Badosa et al. / FEMS Microbiology Ecology 48 (2004) 169–178
M.A., Tenover, F.C. and Yolken, R.H., Eds.), seventh ed., pp.
1467–1662. American Society for Microbiology, Washington.
[19] Koneman, E.W., Allen, S.D., Janda, W.H., Schreckenberger, P.C.
and Winh, W.C. (1997) In: Color Atlas and Textbook of
Diagnostic Microbiology, fifth ed, p. 1432. Lippincott-Raven
Publishers.
[20] Normand, P., Cournoyer, B., Simonet, P. and Nazaret, S. (1992)
Analysis of a ribosomal RNA operon in the actinomycete Frankia.
Gene 111, 119–124.
[21] Altschul, D., Stephen, F., Madden, T.L., Sch€affer, A.A., Zhang,
J., Zhang, Z., Miller, W. and Lipman, D.J. (1997) Gapped BLAST
and PSI-BLAST: a new generation of protein database search
programs. Nucleic Acids Res. 25, 3389–3402.
[22] Sokal, R. and Rohlf, F. (1969) Biometry. W.H. Freeman.
[23] G€otz, A., Pukall, R., Smit, E., Tietze, E., Prager, R., Tsch€ape, H.,
Van Elsas, J.D. and Smalla, K. (1996) Detection and character-
ization of broad-host range plasmids in environmental bacteria by
PCR. Appl. Environ. Microbiol. 62, 2621–2628.
[24] Schmalenberger, A. and Tebbe, C.C. (2002) Bacterial community
composition in the rhizosphere of a transgenic, herbicide-resistant
maize (Zea mays) and comparison to its non-transgenic cultivar
Bosphore. FEMS Microbiol. Ecol. 40, 29–37.
[25] Lukow, T., Dunfield, P.F. and Liesack, W. (2000) Use of the T-
RFLP technique to assess spatial and temporal changes in the
bacterial community structure within an agricultural soil planted
with transgenic and non-transgenic potato plants. FEMS Micro-
biol. Ecol. 32, 241–247.
[26] Lottmann, J. and Berg, G. (2001) Phenotypic and genotypic
characterization of antagonistic bacteria associated with roots of
transgenic and non-transgenic potato plants. Microbiol. Res. 156,
75–82.
[27] Siciliano, S.D., Theoret, C.M., de Freitas, J.R., Hucl, P.J. and
Germida, J.J. (1998) Differences in the microbial communities
associated with roots of field-grown transgenic Brassica napus cv.
Quest, compared to the non-transgenic B. napus cv. Excel and B.
rapa cv. Parkland. FEMS Microbiol. Ecol. 29, 263–272.
[28] Germida, J.J., Siciliano, S.D., de Freitas, J.R. and Seib, A.M.
(1998) Diversity of root-associated bacteria associated with field
grown canola (Brassica napus L.) and wheat (Triticum aestivum
L.). FEMS Microbiol. Ecol. 26, 43–50.
[29] Wilson, M. and Lindow, S.E. (2000) Viable but nonculturable
cells in plant-associated bacterial populations. In: Nonculturable
Microorganisms in the Environment (Colwell, R.R. and Grimes,
D.J., Eds.). American Society for Microbiology, Washington, DC.