Labor Market Outcomes of Punjab TEVTA Graduates March ...
49
Report No. 52 South Asia Human Development Sector Baseline Survey: Labor Market Outcomes of Punjab TEVTA Graduates March 2012 Discussion Paper Series Public Disclosure Authorized Public Disclosure Authorized Public Disclosure Authorized Public Disclosure Authorized Public Disclosure Authorized Public Disclosure Authorized Public Disclosure Authorized Public Disclosure Authorized
-
Upload
khangminh22 -
Category
Documents
-
view
3 -
download
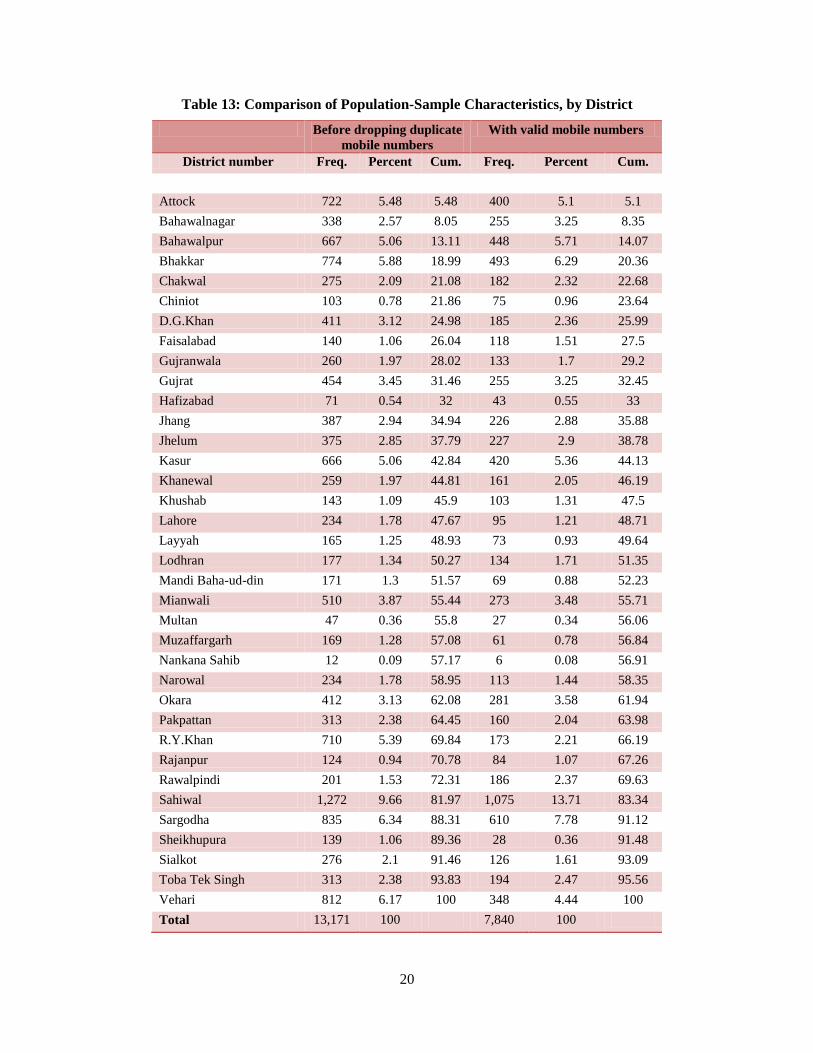
0
Transcript of Labor Market Outcomes of Punjab TEVTA Graduates March ...

Report No. 52
South Asia Human Development Sector Baseline Survey:Labor Market Outcomes of Punjab TEVTA Graduates March 2012 Discussion Paper Series
Pub
lic D
iscl
osur
e A
utho
rized
Pub
lic D
iscl
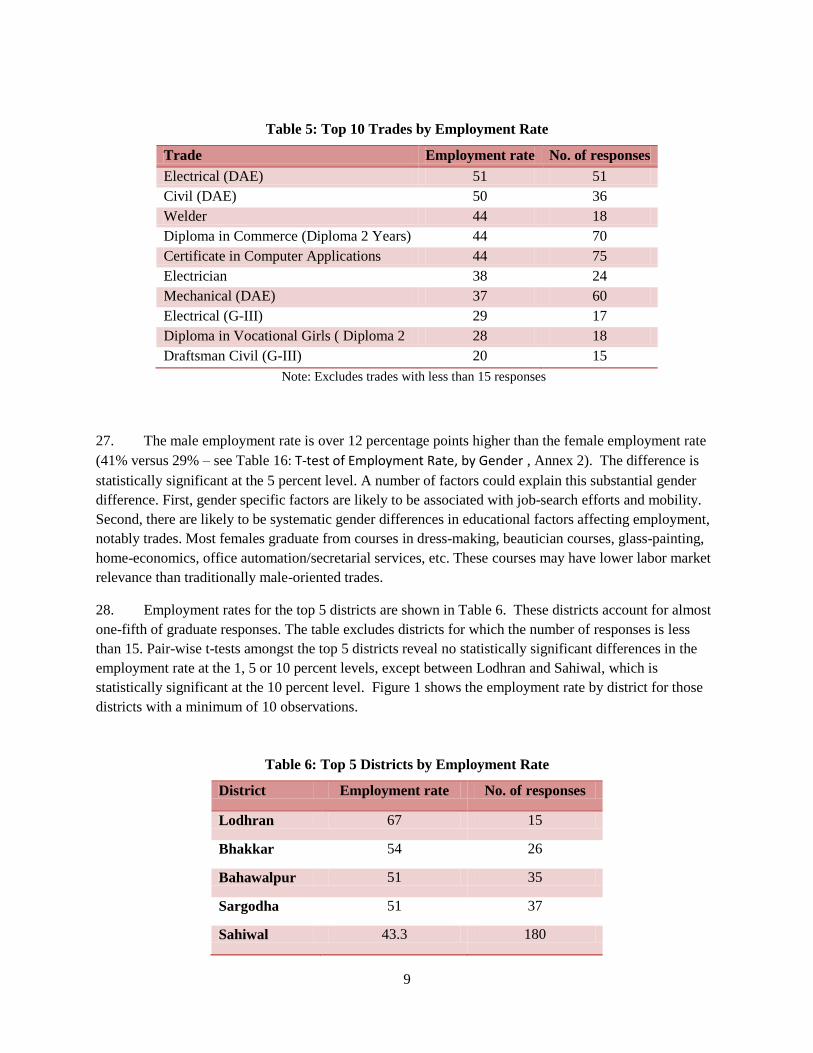
osur
e A
utho
rized
Pub
lic D
iscl
osur
e A
utho
rized
Pub
lic D
iscl
osur
e A
utho
rized
Pub
lic D
iscl
osur
e A
utho
rized
Pub
lic D
iscl
osur
e A
utho
rized
Pub
lic D
iscl
osur
e A
utho
rized
Pub
lic D
iscl
osur
e A
utho
rized
wb406484
Typewritten Text
67432

Report No. 52
South Asia Human Development Sector
Baseline Survey:
Labor Market Outcomes of Punjab TEVTA Graduates
March 2012
__________________________________________________________
Discussion Paper Series

Discussion Papers are published to communicate the results of the World Bank‟s work to the
development community with the least possible delay. The typescript manuscript of this paper therefore
has not been prepared in accordance with the procedures appropriate to formally edited texts. Some
sources cited in the paper may be informal documents that are not readily available.
The findings, interpretations, and conclusions expressed herein do not necessarily reflect the views of the
International Bank for Reconstruction and Development / The World Bank and its affiliated
organizations, or those of the Executive Directors of the World Bank or the governments they represent.
The World Bank does not guarantee the accuracy of the data included in this work. The boundaries,
colors, denominations, and other information shown on any map in this work do not imply any judgment
on the part of The World Bank concerning the legal status of any territory or the endorsement or
acceptance of such boundaries.

Abstract
Increasing employment among youth and increasing the earnings and job-stability of youth is important
for Pakistan. This study examines the labor market outcomes of graduates from training institutes run by
Punjab TEVTA, the largest technical and vocational education and training provider in the province of
Punjab, Pakistan. The study uses an SMS-based survey of 7,840 graduates from 2010. This is a promising
and inexpensive method to assess the impact of education and training in developing countries. Using
SMS is feasible, fast, and very low-cost, but it comes with a set of challenges, notably a low response
rate. We summarize lessons for future SMS-administered surveys. For the labor market outcomes, we
find that only 39 percent of graduates are employed post training with considerable variation in
employment outcomes across trades, districts, gender, and schools. We conclude that there is overall
strong need for the improvement of quality and relevance of technical education and vocational training,
and that some schools, trades, and districts are substantially better at linking to labor market demand than
others.
Acknowledgements
This discussion paper is authored by Ayesha Khan and Andreas Blom.
We are grateful to the former Chairman of Punjab TEVTA, Mr. Saeed Alvi, and the MIS team at Punjab
TEVTA, for their support. We would like to thank Abdul Rehman Naeem and Asim Fayyaz for
developing the survey platform, and Sangeeta Goyal, Huma Ali Waheed and Zubair Khursheed Bhatti for
their valuable technical input into the survey instrument and design.

CONTENTS
I. Introduction .................................................................................................................................... 1
II. Methodology ................................................................................................................................... 2
Rationale for using SMS to conduct baseline survey ...................................................................... 2
The Sample ...................................................................................................................................... 4
Questionnaire ................................................................................................................................... 5
Platform used ................................................................................................................................... 6
Process ............................................................................................................................................. 6
III. Results ............................................................................................................................................. 7
Current employment status .............................................................................................................. 7
Number of hours worked per week ................................................................................................ 11
Income earned last month .............................................................................................................. 12
Relationship between Training and Current Job ............................................................................ 12
Effect on Survey Completion and Response Rates of an Incentive to Reply ................................ 13
Lessons Learned for Future Mobile-phone Tracer Studies ............................................................ 14
IV. Conclusion .................................................................................................................................... 15
Annex 1 ......................................................................................................................................... 17
Annex 2 ......................................................................................................................................... 22
Annex 3A: Questionnaire (Phase 1) .............................................................................................. 38
Annex 3B: SMS Flowchart (Phase 1) ........................................................................................... 40
Annex 3C: Questionnaire (Phase 2) .............................................................................................. 41
Annex 3D: Questionnaire (Phase 3) .............................................................................................. 42

Tables
Table 1: Proportion of Household Members with a Mobile Phone, Punjab MICS 2007-08 ........................ 3
Table 2: Descriptive Statistics - Survey Sample ........................................................................................... 5
Table 3: Baseline Survey – All Phases ......................................................................................................... 7
Table 4: Survey Question – Current Employment Status ............................................................................. 7
Table 5: Top 10 Trades by Employment Rate .............................................................................................. 9
Table 6: Top 5 Districts by Employment Rate ............................................................................................. 9
Table 7: Survey Question: How Many Hours Do Respondents Work Each Week? .................................. 12
Table 8: Survey Question – Income Earned Last Month ............................................................................ 12
Table 9: Survey Question – Relationship between Job and Training ......................................................... 13
Table 10: Effect of an Incentive on Survey Completion Rates ................................................................... 13
Table 11: Effect of an Incentive on Survey Response Rates ...................................................................... 14
Table 12: Comparison of Population-Sample Characteristics, by Trade .................................................... 17
Table 13: Comparison of Population-Sample Characteristics, by District ................................................. 20
Table 14 Comparison of population-sample characteristics: By gender..................................................... 21
Table 15: Pair-wise T-test of Difference in Employment Rate across Top 10 Trades ............................... 22
Table 16: T-test of Employment Rate, by Gender ...................................................................................... 23
Table 17: Employment Rate and Mean Income by Trade .......................................................................... 24
Table 18: Employment Rate by Duration of Course ................................................................................... 26
Table 19: Pair-wise T-test of Difference in Employment Rate across Duration of Training ..................... 27
Table 20: Employment Rate by Level of Previous Education .................................................................... 28
Table 21: Employment Rate and Mean Income by District ........................................................................ 29
Table 22: Employment Rate and Mean Income by Gender ........................................................................ 30
Table 23: Employment Rate and Mean Income by Institution ................................................................... 32
Figures
Figure 1: Employment Rate by District ...................................................................................................... 10
Figure 2: Employment Rate by type of TVET institution (%) .................................................................... 10
Figure 3: Employment rate by sub-group of Technical Training Centre .................................................... 10
Figure 4: Employment Rate by Duration of Course ................................................................................... 11
Figure 5: Employment Rate by Duration of Course ................................................................................... 27
Figure 6: Employment Rate by Prior Education Level ............................................................................... 28
Figure 7: Employment Rate by Prior Education Level (More than 15 Observations) ................................ 29
Figure 8: Employment Rate by Institution .................................................................................................. 31

1
I. INTRODUCTION
1. One of the key indicators for measuring performance of the Technical and Vocational
Education and Training (TVET) sector is the labor market outcomes of its graduates. As part of the
Pakistan Education Sector Review that focuses on technical education and vocational training, this survey
establishes background and labor market information for a sample of trainees who graduated from public
training institutions run by the Punjab Technical Education and Vocational Training Authority (P-
TEVTA) in 2010.
2. The Government of Punjab awards high priority to the development of its TVET sector. It
boasts 456 technical education and vocational training public institutions in the province. However, these
institutions face a number of important challenges, notably relevance of training is reportedly low,
training opportunities for youth are few, investments are far in-between, infrastructure is increasingly
becoming outdated and accountability for results could be increased. The Province has taken several steps
to address some of these, the most significant being re-organization of the sector by providing autonomy
to the Punjab Technical Education and Vocational Training Authority (P-TEVTA) and giving it
administrative authority over all TVET related public activity in the province.
3. This study sets a baseline for labor market outcomes of the graduates, and is informed by
an SMS-based survey of graduates. The introduction of an incentive in the form of mobile phone credit
was also tested to investigate whether it increased survey response and completion rates.
4. The survey was administered to 7,840 graduates in 3 phases: Phase 1 marks the pilot phase; in
Phase 2 the survey was rolled out after design adjustments informed by Phase 1 and; Phase 3 was
conducted at the end to investigate the effect of an incentive in the form of mobile phone credit on the
survey response rate.
5. The overall response rate of the survey was 16 percent. This introduces a possibility that the
survey suffers from significant biases, and one should therefore be cautious in drawing conclusions from
the study. Further, the study allowed us to draw a number of lessons for future mobile phone tracer
studies.
6. The findings of the survey indicate a strong need for the improvement of quality and
relevance of technical education and vocational training. Excluding the group of graduates in further
studies, the employment percentage is 39 percent while 61 percent remain without job, almost all of
which were looking for employment. 28 percent of the respondents were engaged in further education. As
expected employment outcomes differ across trades, districts, gender, and schools. Among other things,
this variation indicates that training is substantially better linked to labor market demand in some schools,
trades, and districts. Details on the findings are presented in the rest of this paper.
7. This paper is organized as follows. After this introduction follows a section on methodology,
including data collection method (mobile phone), the questionnaire, and the sample. The third section
describes the results, while the fourth concludes and draw lessons for future tracer studies.

2
II. METHODOLOGY
Rationale for using SMS to conduct baseline survey
8. Paper-based surveys are typically expensive and require a substantial duration of time to train the
surveyors, conduct the survey, and enter the data obtained. The fact that the vocational training and
technical education trainees are literate/educated (see Table 2) presented us with an opportunity to
administer the survey via SMS without having to conduct a more traditional survey where the respondents
were interviewed, necessary had they been illiterate. Developing a simple platform to conduct the survey
was not expensive or did not take long, and graduates could be contacted directly. Given low SMS costs,
the cost of designing a platform to administer the survey was minimal and required only the services of a
consultant.1
9. As shown in a Punjab household survey from 2007-08, the Multiple Indicator Cluster Survey, the
mobile phone penetration rate in Punjab is quite high: 71 percent of households own mobile phones, and
almost 29 percent of households belonging to the lowest wealth quintile own a mobile phone. Since then,
mobile phone penetration is expected to have further increased.
1 The combined cost of the consultant‟s services and the SMS costs is Rs. 77,000, or approximately USD$865.

3
Table 1: Proportion of Household Members with a Mobile Phone, Punjab MICS 2007-08
Proportion of households with
mobiles (%)
Punjab 71.0
Area
Rural 65.0
Urban 84.3
Major city 87.8
Other urban 80.8
Education of Household head
None 57.9
Primary 73.6
Middle 79.1
Secondary 86.4
Higher 94.0
Madrassa/NSC 66.0
Missing/DK 68.2
Wealth index quintiles
Lowest 28.8
Second 60.4
Middle 79.4
Fourth 89.5
Highest 96.9
Source: Bureau of Statistics, Planning and Development Department, Government of the
Punjab – Multiple Indicator Cluster Survey, Punjab 2007–08, Lahore, Pakistan.
10. Despite the advantages of using SMS to conduct the baseline survey, the use of SMS poses
several limitations. First, the sample of graduates with mobile phones may not be representative of the
population of TVET graduates – as a matter of fact, the sample may consist of graduates from relatively
higher income quintiles. This introduces a bias in the results. Second, the response rate is expected to be
much lower than that of a paper-based/interview-based survey given that the response is dependent
wholly on the graduate‟s willingness to respond and cannot be elicited or encouraged by the physical
presence of an interviewer. Also, the graduates were not informed of the survey and thus did not expect it,
potentially further reducing the response rate. Third, the use of SMS necessarily limits the number of
questions in the survey, given that there are costs, however minimal, to the graduate to reply. There is also
a limit on the number of characters which can be sent in each SMS, thus placing constraints on the
language used, as well as the number of forced-response choices which can be sent with each question.
Fourth, a dataset with updated mobile phone numbers must be accessible. Last, the order of the questions
must be structured, so as to ensure that the most important information is obtained first in the event that
the respondent does not complete the survey. This may not be possible with all surveys.
4
The Sample
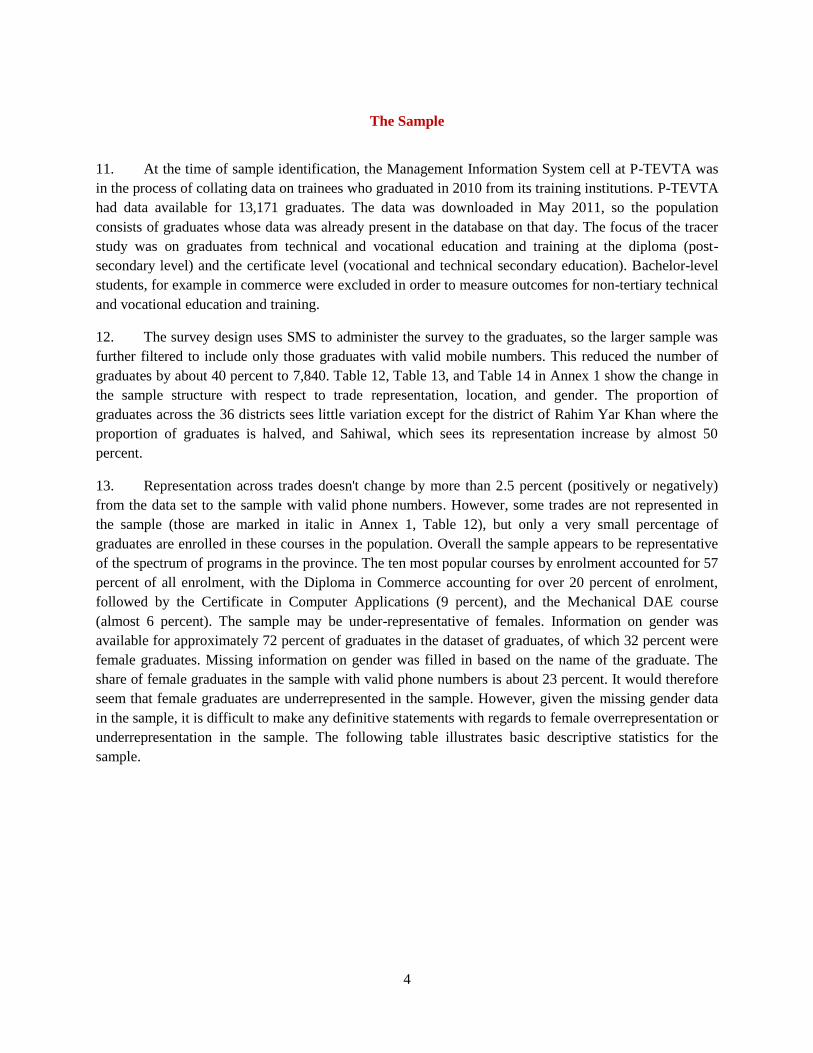
11. At the time of sample identification, the Management Information System cell at P-TEVTA was
in the process of collating data on trainees who graduated in 2010 from its training institutions. P-TEVTA
had data available for 13,171 graduates. The data was downloaded in May 2011, so the population
consists of graduates whose data was already present in the database on that day. The focus of the tracer
study was on graduates from technical and vocational education and training at the diploma (post-
secondary level) and the certificate level (vocational and technical secondary education). Bachelor-level
students, for example in commerce were excluded in order to measure outcomes for non-tertiary technical
and vocational education and training.
12. The survey design uses SMS to administer the survey to the graduates, so the larger sample was
further filtered to include only those graduates with valid mobile numbers. This reduced the number of
graduates by about 40 percent to 7,840. Table 12, Table 13, and Table 14 in Annex 1 show the change in
the sample structure with respect to trade representation, location, and gender. The proportion of
graduates across the 36 districts sees little variation except for the district of Rahim Yar Khan where the
proportion of graduates is halved, and Sahiwal, which sees its representation increase by almost 50
percent.
13. Representation across trades doesn't change by more than 2.5 percent (positively or negatively)
from the data set to the sample with valid phone numbers. However, some trades are not represented in
the sample (those are marked in italic in Annex 1, Table 12), but only a very small percentage of
graduates are enrolled in these courses in the population. Overall the sample appears to be representative
of the spectrum of programs in the province. The ten most popular courses by enrolment accounted for 57
percent of all enrolment, with the Diploma in Commerce accounting for over 20 percent of enrolment,
followed by the Certificate in Computer Applications (9 percent), and the Mechanical DAE course
(almost 6 percent). The sample may be under-representative of females. Information on gender was
available for approximately 72 percent of graduates in the dataset of graduates, of which 32 percent were
female graduates. Missing information on gender was filled in based on the name of the graduate. The
share of female graduates in the sample with valid phone numbers is about 23 percent. It would therefore
seem that female graduates are underrepresented in the sample. However, given the missing gender data
in the sample, it is difficult to make any definitive statements with regards to female overrepresentation or
underrepresentation in the sample. The following table illustrates basic descriptive statistics for the
sample.

5
Table 2: Descriptive Statistics - Survey Sample
Total number of graduates 7,840
Male 76.8%
Female 23.2%
Number of trades 104
Number of districts 36
Previous education (only available for 2,350 graduates)
Level % of
graduates
Illiterate 0.08
Primary 1.53
Middle (8 years of schooling) 25.23
Under Matric (below 10 years of schooling) 1.15
Matric (10 years of schooling) 56.63
FA FSc Icom 10.75
Undergraduate (BA BSc BCom BEd) 2.93
Master (MA MSc MCom MEd) 0.76
CCA 0.08
DCom (Diploma – post-secondary) 0.51
DAE (Diploma – post-secondary) 0.04
Religious education 0.17
Other 0.13
14. Information on previous education was limited – only available for 2,350 graduates. As seen in
the sample with information on previous education, most students would have completed either middle
school (8 years of schooling) or Matric (10 years of schooling) in order to qualify for technical and
vocational education and training.
Questionnaire
15. The survey questions sent to the graduates can be seen in Annexes 3A, 3B and 3C. The questions
are sent in roman Urdu. As can be seen, though there are minor variations in the surveys, the following
information is collected:
Current employment status
Numbers of hours worked per week
Income earned last month
Whether training was useful to current employment
16. The information received was appended to the database of graduate information downloaded
from the P-TEVTA MIS database. The database already contained information such as the graduate

6
name, gender, mobile phone number, address, name of institution and course attended, duration of the
course, district, marks obtained, and education level attained before training.
Platform used
17. Four SIM (Subscriber Identity Module) cards were used to send messages to trainees using a
modem connected to a computer, which sends and receives messages through an SMS Gateway. This was
developed using SMSLib which is a JAVA library for sending/receiving SMS. The Core Application
sends out the surveys, parses the incoming messages and generates the responses. This was developed as
a simple state machine in PHP using a PHP framework called Yii. Both parts of the application
communicate to each other using a MySQL database, which is where the data received is stored.
Process
18. The sample of graduates with valid mobile numbers was split into 3 groups: Phase 1, Phase 2 and
Phase 3.
19. Phase 1 marks the pilot of the survey, in which the survey was administered to 600 randomly
selected graduates from the sample over the course of 4 days. The survey questions sent can be seen in
Annex 3A. The 600 graduates were split into 3 further groups: Group 1 to receive no incentive, Group 2
to receive Rs. 10 (US$ 0.11) upon completion of the survey, and Group 3 to receive Rs. 30 (US$ 0.34)
upon the completion of the survey. The incentive was not offered until the respondent had confirmed
his/her identity and the name of the training institute; hence the effect of the incentive can only be seen on
the survey completion rate and not the response rate.
20. The pilot revealed certain areas of the survey which required improvement or change. Details are
provided in the “Lessons Learned” section of this working paper. Design adjustments were made to
shorten the number of questions in the survey by combining questions where possible; the order of the
questions was rearranged so that the critical questions were asked earlier during the survey; and the
incentive was revoked because of the difficulty in transferring the credit to those who completed the
survey. Also, given the lack of “credibility” of the survey illustrated by the numerous messages asking for
further identification, it was decided that instead of sending the survey on behalf of the trainee‟s
institution, it would be sent out on behalf of Punjab TEVTA.
21. In Phase 2, the survey (see Annex 3B) was sent to 6,840 graduates over a 12-day period2,
incorporating the changes described above. No incentive was offered to any of the graduates from Phase
2.
22. Phase 3 was used as to test the effect of offering an incentive (credit) at the beginning of the
survey. Two subgroups of 200 randomly chosen graduates each were sent Rs. 10 and Rs. 30 separately.
The survey from Phase 2 was used, adjusted only to provide the incentive and collect information
necessary to send the credit (see Annex 3C).
2 The rate at which the survey was sent was slowed down because some respondents tried calling the number back,
slowing the program down.
7
III. RESULTS
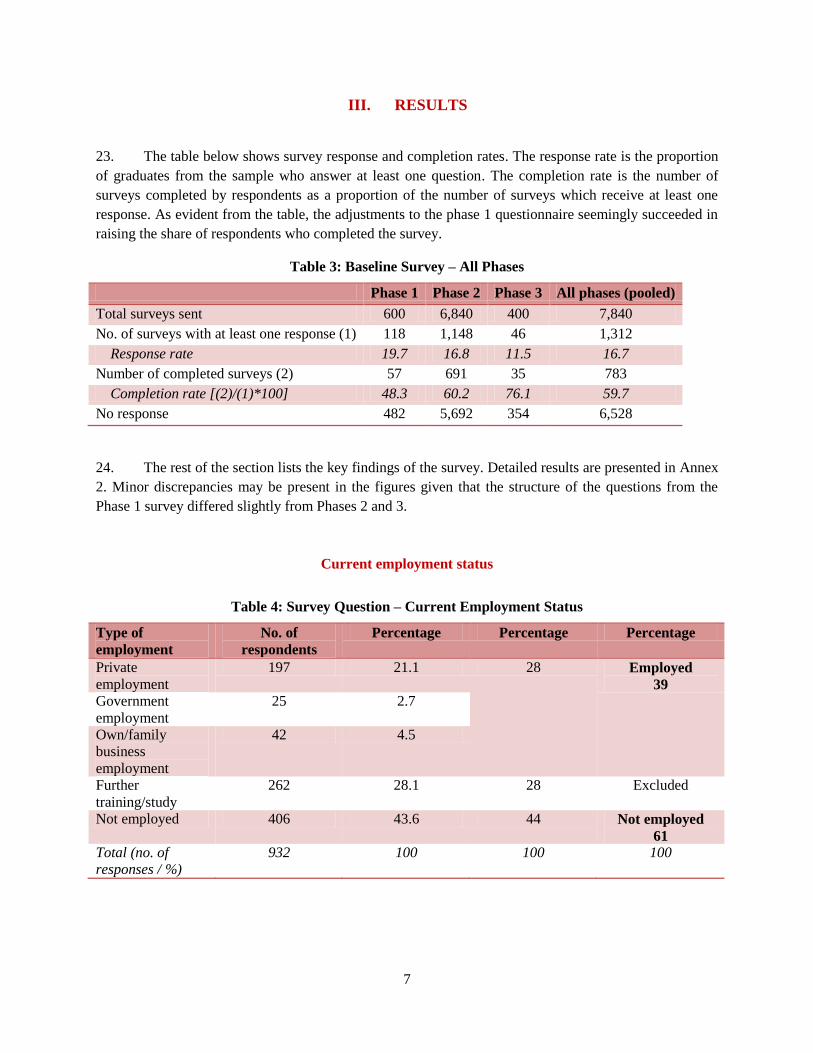
23. The table below shows survey response and completion rates. The response rate is the proportion
of graduates from the sample who answer at least one question. The completion rate is the number of
surveys completed by respondents as a proportion of the number of surveys which receive at least one
response. As evident from the table, the adjustments to the phase 1 questionnaire seemingly succeeded in
raising the share of respondents who completed the survey.
Table 3: Baseline Survey – All Phases
Phase 1 Phase 2 Phase 3 All phases (pooled)
Total surveys sent 600 6,840 400 7,840
No. of surveys with at least one response (1) 118 1,148 46 1,312
Response rate 19.7 16.8 11.5 16.7
Number of completed surveys (2) 57 691 35 783
Completion rate [(2)/(1)*100] 48.3 60.2 76.1 59.7
No response 482 5,692 354 6,528
24. The rest of the section lists the key findings of the survey. Detailed results are presented in Annex
2. Minor discrepancies may be present in the figures given that the structure of the questions from the
Phase 1 survey differed slightly from Phases 2 and 3.
Current employment status
Table 4: Survey Question – Current Employment Status
Type of
employment
No. of
respondents
Percentage Percentage Percentage
Private
employment
197 21.1 28 Employed
39 Government
employment
25 2.7
Own/family
business
employment
42 4.5
Further
training/study
262 28.1 28 Excluded
Not employed 406 43.6 44 Not employed
61 Total (no. of
responses / %)
932 100 100 100
8
25. The current employment status of the respondents to the related question is presented in the table
above for all three phases. If the respondents in further education and training are excluded, which is
standard for calculation of employment rates, the employment percent is estimated to 39%.3 More than 93
percent of the unemployed respondents were looking for a job.4 It is likely that with time, the share of
graduates with a job increases as graduates gain practical experience and become more successful in
contacting employers. Although there is no information on how long the graduates have been in the labor
market except for the year of graduation, the unemployment percentage clearly indicates that youths face
problems transitioning from TVET school to a job. This could be for several reasons: (i) low relevance
and/or quality of education, including a lack of practical skills; (ii) little job-search assistance on how to
find a job; (iii) reduced connections to employers and no assistance was provided in this regard, and (iv)
stagnant economy with few employers hire. These are reasons that are likely to vary substantial across the
trades, gender, schools, districts, and prior education. We explore this further in the next paragraphs.
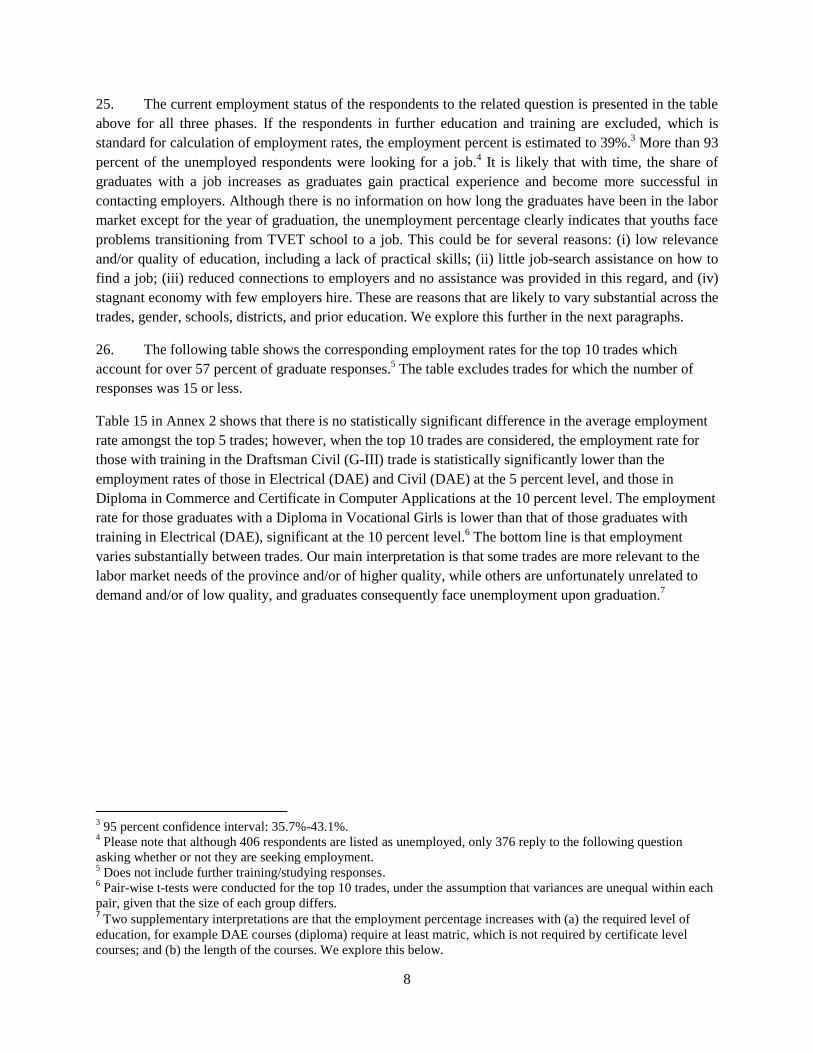
26. The following table shows the corresponding employment rates for the top 10 trades which
account for over 57 percent of graduate responses.5 The table excludes trades for which the number of
responses was 15 or less.
Table 15 in Annex 2 shows that there is no statistically significant difference in the average employment
rate amongst the top 5 trades; however, when the top 10 trades are considered, the employment rate for
those with training in the Draftsman Civil (G-III) trade is statistically significantly lower than the
employment rates of those in Electrical (DAE) and Civil (DAE) at the 5 percent level, and those in
Diploma in Commerce and Certificate in Computer Applications at the 10 percent level. The employment
rate for those graduates with a Diploma in Vocational Girls is lower than that of those graduates with
training in Electrical (DAE), significant at the 10 percent level.6 The bottom line is that employment
varies substantially between trades. Our main interpretation is that some trades are more relevant to the
labor market needs of the province and/or of higher quality, while others are unfortunately unrelated to
demand and/or of low quality, and graduates consequently face unemployment upon graduation.7
3 95 percent confidence interval: 35.7%-43.1%.
4 Please note that although 406 respondents are listed as unemployed, only 376 reply to the following question
asking whether or not they are seeking employment. 5 Does not include further training/studying responses.
6 Pair-wise t-tests were conducted for the top 10 trades, under the assumption that variances are unequal within each
pair, given that the size of each group differs. 7 Two supplementary interpretations are that the employment percentage increases with (a) the required level of
education, for example DAE courses (diploma) require at least matric, which is not required by certificate level
courses; and (b) the length of the courses. We explore this below.
9
Table 5: Top 10 Trades by Employment Rate
Trade Employment rate No. of responses
Electrical (DAE) 51 51
Civil (DAE) 50 36
Welder 44 18
Diploma in Commerce (Diploma 2 Years) 44 70
Certificate in Computer Applications 44 75
Electrician 38 24
Mechanical (DAE) 37 60
Electrical (G-III) 29 17
Diploma in Vocational Girls ( Diploma 2 28 18
Draftsman Civil (G-III) 20 15
Note: Excludes trades with less than 15 responses
27. The male employment rate is over 12 percentage points higher than the female employment rate
(41% versus 29% – see Table 16: T-test of Employment Rate, by Gender , Annex 2). The difference is
statistically significant at the 5 percent level. A number of factors could explain this substantial gender
difference. First, gender specific factors are likely to be associated with job-search efforts and mobility.
Second, there are likely to be systematic gender differences in educational factors affecting employment,
notably trades. Most females graduate from courses in dress-making, beautician courses, glass-painting,
home-economics, office automation/secretarial services, etc. These courses may have lower labor market
relevance than traditionally male-oriented trades.
28. Employment rates for the top 5 districts are shown in Table 6. These districts account for almost
one-fifth of graduate responses. The table excludes districts for which the number of responses is less
than 15. Pair-wise t-tests amongst the top 5 districts reveal no statistically significant differences in the
employment rate at the 1, 5 or 10 percent levels, except between Lodhran and Sahiwal, which is
statistically significant at the 10 percent level. Figure 1 shows the employment rate by district for those
districts with a minimum of 10 observations.
Table 6: Top 5 Districts by Employment Rate
District Employment rate No. of responses
Lodhran 67 15
Bhakkar 54 26
Bahawalpur 51 35
Sargodha 51 37
Sahiwal 43.3 180

10
Figure 1: Employment Rate by District
29. The employment rates differ substantially across the types of TVET institutions. There are
graduates from 6 types of institutions in the survey (there were no responses from graduates from the
seventh type, Agricultural Machinery Training School). Graduates from the Institutes of Commerce have
the highest employment percentage (51%), followed by graduates from colleges of commerce (46%) and
technology (43%), graduates from technical training centres (37%), technical training institutes (33%),
and graduates from vocational training centres, who have the lowest employment rate (28%). The
differences seem to signal a higher success in commerce streams than in technical streams, however,
gender differences are likely to be part of the explanation.
30. There are several sub-groups of Technical Training Centers, see below. The employment
outcomes are relatively similar across the different sub-groups, with the exception of the women Centers
where graduates have a lower employment rate (although it is above the average employment rate for
female in the total sample.
Figure 2: Employment Rate by type of TVET
institution (%)
Figure 3: Employment rate by sub-group of
Technical Training Centre
Note: Only employment percentage based upon a minimum of 10 observations are shown.
67 57 54 54 51 51 45 43 42 40 40 38 33 33 33 31 29
19 18 14 0
0
20
40
60
80
Employment rate by district (%) (Min. 10 observations)
Employment rate
46 43 51
37 33
28
0
10
20
30
40
50
60
Emp
loym
en
t ra
te in
%
37
32
42 39
33
0
5
10
15
20
25
30
35
40
45
G Tech Trg Ctr
GTTC (ABAD)
GTTC (DMTC)
GTTC (M)
GTTC (W)
Emp
loym
en
t ra
te in
%

11
31. The employment rate seems to be unrelated to the duration of the program. Interestingly, the
employment rates for those who attended courses lasting 12 months are statistically significantly lower
than for those who attended courses 3, 6, 24 or 36 months long. While the employment rate for those who
attended 3 month courses is the highest, it is not statistically significantly higher than those who attended
longer courses (the exception being 12 month courses).8
9 This is a puzzling finding, which could be
related to differences in the background of the graduates between those in short versus long duration
courses. We therefore caution against policymaking solely based upon this finding.
Figure 4: Employment Rate by Duration of Course
32. Caution is warranted when interpreting these results. The representativeness of the sample is
compromised by potential biases stemming from the fact that not all graduates have a mobile phone and
only 1 in 6 graduates answered the survey. It could be that the outcomes of those who responded
systematically differed from the total sample. However, it is not clear whether such biases increase or
decrease the employment percentage. Further, the sub-categories rely on a low number of responses to the
survey questions. Also, given the varying duration of different courses, it is difficult to estimate how long
the graduates were in the labor market before they were surveyed, as no data on graduation dates was
available. Finally, the names of trade courses are not standardized, and have been kept in their original
form for the purpose of this study. It is possible that some courses are actually the same but have been
grouped separately because of differences in spelling or notation.
Number of hours worked per week
33. Out of the 221 respondents to this question, over 60 percent worked between 20-40 hours every
week. Less than 5 percent of the respondents worked over 40 hours a week.
8 Only employment percentage based upon a minimum of 10 observations are shown.
9 See
Table 19.
51
39
24
41 43
0
10
20
30
40
50
60
0 3 6 12 24 36
Emp
loym
en
t ra
te in
%
Duration of course in months
Employment rate Linear (Employment rate)

12
Table 7: Survey Question: How Many Hours Do Respondents Work Each Week?
No. of hours worked per week No. of respondents Percentage
Less than 10 hours 53 24.0
10 - 20 hours 23 10.4
20 - 40 hours 136 61.5
More than 40 hours 9 4.1
Total no. of responses 221 100.0
Income earned last month
34. Over 77 percent of respondents reported income levels less than Rs. 10,000 (US$120). The mean
income is Rs. 7,590 (US$85), and the 95 percent confidence interval is Rs. 6,216 – Rs. 8,962 (US$70-
US$101). Seventy responses reporting income less than Rs.300 (US$3.4) were not included in the table
above as they appeared to be incorrectly reported.
Table 8: Survey Question – Income Earned Last Month
Salary range No. of respondents Percentage
Rs. 300 or greater but less than Rs. 5,000 31 33.0
Rs. 5,000 or greater but less than Rs. 10,000 42 44.7
Rs. 10,000 or greater but less than Rs. 15,000 7 7.4
Rs. 15,000 or greater but less than Rs. 20,000 7 7.4
Rs. 20,000 or greater but less than Rs. 25,000 3 3.2
Rs. 25,000 or greater but less than Rs. 30,000 3 3.2
Rs. 30,000 or greater but less than Rs. 35,000 0 0.0
Rs. 35,000 or greater 1 1.1
Total no. of responses 94 100.0
Relationship between Training and Current Job
35. Out of 158 respondents, 55 percent reported that their job was in the same field as the training
they received. In response to a follow-on question, 43 percent of respondents reported that they use the
skills obtained during training in their jobs to a large extent.

13
Table 9: Survey Question – Relationship between Job and Training
Is your job in the same field as the training you received? No. of
respondents
Percentage
Yes 87 55.1
No 71 44.9
Total no. of responses 158 100.0
To what extent do you use skills obtained during training in your job? No. of
respondents
Percentage
To a large extent 61 43.0
To some extent 57 40.1
Not at all 24 16.9
Total no. of responses 142 100.0
Effect on Survey Completion and Response Rates of an Incentive to Reply
36. In Phase 1, subsequent to the respondent confirming his/her identity and training institute in
Messages 1 and 2, an incentive is offered in the form of credit to Group 2 (Rs.10) and Group 3 (Rs.30)10
.
The amounts were determined based on an estimate of the cost of responding to the survey. Although
subscriptions to SMS “buckets” (bulk purchase of SMSs) are quite popular, the lower incentive was
calculated to be the cost of responding to the survey if the respondent had no such subscription. A higher
incentive of Rs. 30 was offered to Group 3 to explore the effect of actual benefit to the respondent (a
premium above the estimated cost of responding to the survey).
37. The table below shows that roughly the same proportion of respondents „reach‟ the incentive
message, i.e. they respond to identity confirmation questions in each group. After receiving the message,
the survey completion rates increase proportionately with the amount of credit offered.
Table 10: Effect of an Incentive on Survey Completion Rates
Phase 1 No
credit
Rs.10 Rs.30
Number of recipients 200 200 200
No. of respondents to the first SMS (and hence who
'reach' incentive message)
22 18 21
Completed surveys 17 16 20
Completed surveys as a % of respondents who reach
incentive message
77% 89% 95%
Note: Pakistan Rs. 10 and 30 is equivalent to USD 12 cents and 36 cents.
10
No credit is offered to Group 1.

14
38. Phase 3 of the baseline survey tests the impact of an incentive offered on the response rate of the
survey in the first SMS. This is different from Phase 1 where the incentives were only offered after the
respondent had confirmed her/his identity. The comparison group (no incentive) is the group of graduates
from Phase 2 as the surveys sent to Phase 2 and Phase 3 graduates are identical with the exception of the
offer of an incentive in the first message sent to graduates in Phase 3. The credit appears to have no effect
on raising the response rate of the graduates; in fact, the response rate is lower for the incentive groups
(though rises proportionately with the amount of credit offered). We have little explanation for this
finding except that this relatively small incentive seems not to be a motivating factor for responding or
not in the first place. While the phase 1 incentives seem to show that a small incentive may be effective in
incentivizing interested graduates to complete the survey.
Table 11: Effect of an Incentive on Survey Response Rates
Phase 2 Phase 3
Rs.10 Rs.30
Total no. of surveys sent 6,840 200 200
No. of responses 1,148 21 25
Response rate 16.8 10.5 12.5
Lessons Learned for Future Mobile-phone Tracer Studies
39. Overall, using SMS to administer the baseline survey is feasible and very low-cost, but it comes
with a set of challenges. This section looks at the lessons learned.
Establishing credibility with regards to the source of the survey is important. Sending the
messages from a regular mobile phone number (so-called long code) seemed to lack credibility,
judging by the large number of messages which were sent back requesting the identity of the
sender. Purchasing an “800-number/short code” would allow the sender to purchase a sending
phone number that identifies the sender with a name to all recipients. In Phase 1 of the survey, the
introductory message was sent on behalf of the respondent‟s institution; however, this did not
seem to work and was later adjusted to Punjab TEVTA for Phases 2 and 3. Neither the
respondent‟s institution name nor Punjab TEVTA (contained in the message) seemed to be
effective in establishing credibility at the onset of the survey. Since the respondents are addressed
by name, and information of a personal nature (employment status, income) is requested,
establishing credibility is key to raising the response and completion rates. This can be done by
informing the institutions (who inform their trainees) before the survey so that the respondents
expect to be surveyed a certain period after graduation, and understand the objective of the
survey.
The length of the survey must be kept in consideration. The questionnaire used in Phase 1 was
shortened and restructured because of the large number of people who “dropped out” of the
survey.

15
Not all graduates from the sample seemed familiar with responding to a forced-response/multiple-
choice question format and responded with actual text. Their answers could not be used in this
format. The method of responding to the survey questions via SMS may be explained to trainees
when they are informed about the survey by their institution.
While the offer of credit upon completion of the survey offered later on during the survey
increases the completion rate of the survey of those who do respond, it appears to be ineffective
in increasing the survey response rate. It should be noted that credit had to be sent to respondents
from a kiosk or shop where “Easy Load” facilities were available and could not be sent via the
platform. Telecom operators can be contracted to send the credit; however, this can be explored
further given the potentially high costs of such contracts, especially when offering a small credit
to respondents seemingly has no obvious effects on the initial interest in responding. However, it
may be that a larger amount or a lottery with larger prices would be more successful in soliciting
a response.
Using SMS provides an excellent opportunity to inexpensively pilot the survey and make
appropriate adjustments to the questions.
IV. CONCLUSION
40. This survey serves to set a baseline for employment, income and other indicators used to
assess the labor market outcomes of a sample of 2010 technical education and vocational training
graduates in the province of Punjab, Pakistan. Given the high rate of cell phone penetration in the
Punjab, the method of survey administration via SMS provides a low-cost, quick and feasible way to
reach out to a large sample of TVET graduates. The key drawback was a low response rate of only 17
percent of contacted graduates. The introduction of an incentive in the form of extra mobile credit offered
to respondents did not improve the respondent rate.
41. Only 39 percent of graduates are in employment. This employment excludes the graduates
engaged in further training or studies (28 percent of respondents). More than 93 percent of those
graduates who listed themselves as unemployed reported that they were seeking employment. Another 28
percent of graduates pursue further studies. The employment rate is the highest for those with an
Electrical Diploma of Associate Engineering (DAE) at 51 percent, followed by Civil DAE (50 percent),
and Welder (43 percent). The employment rate is highest for those graduates from Lodhran district (67
percent), followed by Bhakkar (54 percent) and Bahawalpur (51 percent). The male employment rate is
over 12 percentage points higher than the female employment rate (41 percent versus 29 for females).
42. Over 60 percent of employed respondents worked between 20-40 hours every week.
Seventy-seven percent of graduates earn less than Rs. 10,000. The mean income reported was
approximately Rs. 7,600. More than fifty-five percent of graduates reported that their job was in the same
field as their training.
43. Caution is advised in over-interpreting the results due to the potential statistical bias
present in the sampling itself, as well as the low number of responses to the survey questions. To
conclude, it is important to note the possible limitations of the use of SMS in administering the survey.
The sample of graduates with mobile phones may not be representative of the population of TVET

16
graduates on the basis of income, introducing a bias in the results. The use of SMS necessarily limits the
number of questions in the survey, given that there are costs, however minimal, to the graduate to reply. It
is also important to further explore ways in which the response rate can be increased.
44. The findings seem to suggest that more needs to be done to improve the employment
outcomes of trainees and meeting industry demand for skilled labor. A key step for the Government
and Punjab TEVTA is to increase employability of graduates through improvement in the labor market
relevance and quality of training, and as a second step continuously measure the employability of
graduates to see if the improvement raises employability.

17
ANNEX 1
Table 12: Comparison of Population-Sample Characteristics, by Trade
Before dropping duplicate
mobile numbers
With valid mobile numbers
Trade Freq. Percent Cum. Freq. Percent Cum.
Agriculture(DAE) 37 0.28 0.28 26 0.33 0.33
Architectural Drafting (G-II) 16 0.12 0.40 10 0.13 0.46
Auto & Diesel (DAE) 29 0.22 0.62 18 0.23 0.69
Auto & Farm Machinery 37 0.28 0.90 13 0.17 0.85
Auto & Farm Machinery(G-III) 54 0.41 1.31 25 0.32 1.17
Auto and Farm 36 0.27 3.94 21 0.27 3.84
Auto and Farm (DAE) 42 0.32 4.26 36 0.46 4.30
Auto and Farm(G-II) 30 0.23 4.49 23 0.29 4.59
Auto and Farm(G-III) 11 0.08 4.57 11 0.14 4.73
Auto Cad 39 0.30 1.61 33 0.42 1.59
Auto Electrician 24 0.18 1.79 23 0.29 1.89
Auto Electrician(G-II) 35 0.27 2.06 17 0.22 2.10
Auto Electrician(G-III) 9 0.07 2.13 9 0.11 2.22
Auto Mechanic(Diesel) 5 0.04 2.16 3 0.04 2.26
Auto Mechanic(G-II) 82 0.62 2.79 34 0.43 2.69
Auto Mechanic(G-III) 106 0.80 3.59 63 0.80 3.49
Auto Mechanic(Petrol) 9 0.07 3.66 5 0.06 3.56
Auto Mechanic(Petrol) (G-III) 1 0.01 3.67 1 0.01 3.57
Beautician 472 3.58 8.15 174 2.22 6.95
Bulldozer Operator 39 0.30 8.45 38 0.48 7.44
Carpenter 6 0.05 8.50 6 0.08 7.51
Certificate in Computer Application 59 0.45 14.47 58 0.74 12.31
Certificate in Computer Applications 1,134 8.61 23.08 717 9.15 21.45
Certificate Vocational Girls (1 Year
Certificate)
728 5.53 14.02 318 4.06 11.57
Chemical (DAE) 12 0.09 23.17 4 0.05 21.51
Civil (DAE) 449 3.41 26.58 305 3.89 25.40
Commercial Arts / Graphics (G-II) 7 0.05 26.64 2 0.03 25.42
Computer and Electronics(G-III) 11 0.08 27.85 11 0.14 26.67
Computer Information Technology
(DAE)
40 0.30 26.94 25 0.32 25.74
Computer Operator 47 0.36 27.30 38 0.48 26.22
Computer Operator(G-III) 62 0.47 27.77 24 0.31 26.53
Cooking & Baking 12 0.09 27.94 3 0.04 26.71
Decoration 6 0.05 27.99 1 0.01 26.72

18
Diploma in Business Administration
(Dip)
51 0.39 28.38 22 0.28 27.00
Diploma in Commerce (Diploma 2 Years 56 0.43 28.80 47 0.60 27.60
Diploma in Commerce (Diploma 2
Years)
2,443 18.55 47.35 1,605 20.47 48.07
Diploma in Office Management 8 0.06 47.41 3 0.04 48.11
Diploma in Vocational Girls 1 0.01 47.42 1 0.01 48.12
Diploma in Vocational Girls (Diploma 2
Years)
691 5.25 52.67 232 2.96 51.08
Diploma in Vocational Girls (Additional) 31 0.24 52.90 8 0.10 51.19
Diploma in Vocational Teacher Training 10 0.08 52.98 0 0.00 51.19
Domestic Tailoring 325 2.47 55.44 184 2.35 53.53
Draftsman Civil(G-II) 89 0.68 56.12 65 0.83 54.36
Draftsman Civil(G-III) 129 0.98 57.10 87 1.11 55.47
Draftsman Mechanical(G-II) 128 0.97 58.07 43 0.55 56.02
Draftsman Mechanical(G-III) 37 0.28 58.35 12 0.15 56.17
Dress Designing & Making (DAE) 35 0.27 58.62 12 0.15 56.33
Dress Designing & Making (G-III) 195 1.48 60.10 51 0.65 56.98
Dress Making 16 0.12 60.22 0 0.00 56.98
Dress Making (G-II) 8 0.06 60.28 8 0.10 57.08
Electrical (DAE) 340 2.58 62.86 241 3.07 60.15
Electrical Wiring Technician 29 0.22 63.08 28 0.36 60.51
Electrical(G-II) 127 0.96 64.05 83 1.06 61.57
Electrical(G-III) 332 2.52 66.57 200 2.55 64.12
Electrician 291 2.21 68.78 228 2.91 67.03
Electrician(G-II) 218 1.66 70.43 112 1.43 68.46
Electrician(G-III) 91 0.69 71.12 66 0.84 69.30
Electronics (DAE) 179 1.36 72.48 83 1.06 70.36
Electronics Application (Radio & TV) 114 0.87 73.35 60 0.77 71.12
Electronics Application (Radio & TV)(G-
III)
38 0.29 73.64 29 0.37 71.49
Electronics(G-III) 2 0.02 73.65 1 0.01 71.51
Elementary Food Preservation 27 0.21 73.86 25 0.32 71.82
Fabric Printing 52 0.39 74.25 20 0.26 72.08
Fashion Designing 21 0.16 74.41 5 0.06 72.14
Fashion Designing (G-III) 17 0.13 74.54 3 0.04 72.18
Fitter General (G-III) 31 0.24 74.78 13 0.17 72.35
Fitter General(G-II) 92 0.70 75.47 35 0.45 72.79
Food Technology (DAE) 51 0.39 75.86 47 0.60 73.39
General Mechanic(G-III) 11 0.08 75.95 9 0.11 73.51
Hand Embroidery 127 0.96 76.91 54 0.69 74.20
Handicraft 61 0.46 77.37 10 0.13 74.32
Heating Ventilation & Air Conditioning 89 0.68 78.05 71 0.91 75.23

19
Heating Ventilation Air Conditioning 20 0.15 78.32 2 0.03 75.26
Heating Ventilation Air Conditioning
(HVACR) (G-III)
16 0.12 78.17 0 0.00 75.26
Home Appliances & Repair 15 0.11 78.44 14 0.18 75.43
Industrial Electrician 15 0.11 78.55 13 0.17 75.60
Industrial Electronics(G-III) 13 0.10 78.65 0 0.00 75.60
Instrumentation (DAE) 45 0.34 78.99 39 0.50 76.10
Leather Manufacturing(G-III) 2 0.02 79.01 1 0.01 76.11
Machine Embroidery 170 1.29 80.30 95 1.21 77.32
Machine Shop(G-III) 26 0.20 80.49 17 0.22 77.54
Machinist 2 0.02 80.51 2 0.03 77.56
Machinist(G-II) 197 1.50 82.00 82 1.05 78.61
Machinist(G-III) 100 0.76 82.76 61 0.78 79.39
Mechanical (DAE) 521 3.96 86.72 434 5.54 84.92
Mobile Repairing 14 0.11 86.83 0 0.00 84.92
Motor Cycle Mechanic 73 0.55 87.38 66 0.84 85.77
Motor Winding 69 0.52 87.90 61 0.78 86.54
Motor Winding(G-III) 45 0.34 88.25 26 0.33 86.87
Office Management Assistant (G-III) 27 0.21 88.45 18 0.23 87.10
Office Secretary (G-III) 7 0.05 88.50 4 0.05 87.16
Paint Polish 7 0.05 88.56 6 0.08 87.23
Painting 2 0.02 88.57 2 0.03 87.26
Plumber 67 0.51 89.08 57 0.73 87.98
Plumber (G-II) 7 0.05 89.13 6 0.08 88.06
Refrigeration & Air Conditioning (DAE) 7 0.05 89.19 2 0.03 88.09
Refrigeration & Air Conditioning(G-II) 164 1.25 90.43 105 1.34 89.43
Refrigeration & Air Conditioning(G-III) 52 0.39 90.83 26 0.33 89.76
Tailoring 161 1.22 92.05 91 1.16 90.92
Tailoring(G-III) 42 0.32 92.37 31 0.40 91.31
Telecom(DAE) 12 0.09 92.46 6 0.08 91.39
Tractor Mechanic 1 0.01 92.47 0 0.00 91.39
Tractor Operator 115 0.87 93.34 98 1.25 92.64
Turner 92 0.70 94.04 68 0.87 93.51
Welder 220 1.67 95.71 154 1.96 95.47
Welder(G-II) 98 0.74 96.45 54 0.69 96.16
Welder(G-III) 81 0.62 97.07 61 0.78 96.94
Wireman 366 2.78 99.85 229 2.92 99.86
Wood Work 1 0.01 99.86 1 0.01 99.87
Wood Work(G-III) 19 0.14 100.00 10 0.13 100.00
Total 13,170 100 7,840 100
Note: trades not represented in the sample are marked in italic
20
Table 13: Comparison of Population-Sample Characteristics, by District
Before dropping duplicate
mobile numbers
With valid mobile numbers
District number Freq. Percent Cum. Freq. Percent Cum.
Attock 722 5.48 5.48 400 5.1 5.1
Bahawalnagar 338 2.57 8.05 255 3.25 8.35
Bahawalpur 667 5.06 13.11 448 5.71 14.07
Bhakkar 774 5.88 18.99 493 6.29 20.36
Chakwal 275 2.09 21.08 182 2.32 22.68
Chiniot 103 0.78 21.86 75 0.96 23.64
D.G.Khan 411 3.12 24.98 185 2.36 25.99
Faisalabad 140 1.06 26.04 118 1.51 27.5
Gujranwala 260 1.97 28.02 133 1.7 29.2
Gujrat 454 3.45 31.46 255 3.25 32.45
Hafizabad 71 0.54 32 43 0.55 33
Jhang 387 2.94 34.94 226 2.88 35.88
Jhelum 375 2.85 37.79 227 2.9 38.78
Kasur 666 5.06 42.84 420 5.36 44.13
Khanewal 259 1.97 44.81 161 2.05 46.19
Khushab 143 1.09 45.9 103 1.31 47.5
Lahore 234 1.78 47.67 95 1.21 48.71
Layyah 165 1.25 48.93 73 0.93 49.64
Lodhran 177 1.34 50.27 134 1.71 51.35
Mandi Baha-ud-din 171 1.3 51.57 69 0.88 52.23
Mianwali 510 3.87 55.44 273 3.48 55.71
Multan 47 0.36 55.8 27 0.34 56.06
Muzaffargarh 169 1.28 57.08 61 0.78 56.84
Nankana Sahib 12 0.09 57.17 6 0.08 56.91
Narowal 234 1.78 58.95 113 1.44 58.35
Okara 412 3.13 62.08 281 3.58 61.94
Pakpattan 313 2.38 64.45 160 2.04 63.98
R.Y.Khan 710 5.39 69.84 173 2.21 66.19
Rajanpur 124 0.94 70.78 84 1.07 67.26
Rawalpindi 201 1.53 72.31 186 2.37 69.63
Sahiwal 1,272 9.66 81.97 1,075 13.71 83.34
Sargodha 835 6.34 88.31 610 7.78 91.12
Sheikhupura 139 1.06 89.36 28 0.36 91.48
Sialkot 276 2.1 91.46 126 1.61 93.09
Toba Tek Singh 313 2.38 93.83 194 2.47 95.56
Vehari 812 6.17 100 348 4.44 100
Total 13,171 100 7,840 100

21
Table 14: Comparison of Population-Sample Characteristics, by Gender
Before dropping duplicate mobile numbers With valid mobile numbers
Gender Freq. Percent Cum. Freq. Percent Cum.
Female 2,969 31.25 31.25 1,437 22.83 22.83
Male 6,533 68.75 100 4,857 77.17 100
Total 9,502 100 6,294 100

22
ANNEX 2
Table 15: Pair-wise T-test of Difference in Employment Rate across Top 10 Trades
Trade Trade Mean (J) I - J P-value
Certificate in Computer Applications Civil DAE 0.500 -0.060 0.560
Mean, I = Diploma in Commerce 0.449 -0.009 0.973
0.44 Diploma Girls Vocational 0.278 0.162 0.198
Draftsman Civil GIII 0.200 0.240 0.0603*
Electrical DAE 0.510 -0.070 0.446
Electrical GIII 0.294 0.146 0.264
Electrician 0.375 0.065 0.579
Mechanical DAE 0.367 0.073 0.391
Welder 0.444 -0.004 0.974
Civil DAE Diploma in Commerce 0.449 0.051 0.583
Mean, I = Diploma Girls Vocational 0.278 0.222 0.115
0.500 Draftsman Civil GIII 0.200 0.300 0.035**
Electrical DAE 0.510 -0.010 0.929
Electrical GIII 0.294 0.206 0.156
Electrician 0.375 0.125 0.347
Mechanical DAE 0.367 0.133 0.209
Welder 0.444 0.056 0.708
Diploma in Commerce Diploma Girls Vocational 0.278 0.171 0.194
Mean, I = Draftsman Civil GIII 0.200 0.249 0.0591*
0.449 Electrical DAE 0.510 -0.061 0.471
Electrical GIII 0.294 0.155 0.258
Electrician 0.375 0.074 0.566
Mechanical DAE 0.367 0.082 0.381
Welder 0.444 0.005 0.991
Diploma Girls Vocational Draftsman Civil GIII 0.200 0.078 0.614
Mean, I = 0.278 Electrical DAE 0.510 -0.232 0.0828*
Electrical GIII 0.294 -0.016 0.918
Electrician 0.375 -0.097 0.516
Mechanical DAE 0.367 -0.089 0.484
Welder 0.444 -0.166 0.312
Draftsman Civil GIII Electrical DAE 0.510 -0.310 0.0225**
Mean, I = 0.200 Electrical GIII 0.294 -0.094 0.551
0.200 Electrician 0.375 -0.175 0.242

23
Mechanical DAE 0.367 -0.167 0.191
Welder 0.444 -0.244 0.139
Electrical DAE Electrical GIII 0.294 0.216 0.118
Mean, I = Electrician 0.375 0.135 0.280
0.510 Mechanical DAE 0.367 0.143 0.133
Welder 0.444 0.066 0.643
Electrical GIII Electrician 0.375 -0.081 0.598
Mean, I = Mechanical DAE 0.367 -0.073 0.582
0.294 Welder 0.444 -0.150 0.371
Electrician Mechanical DAE 0.367 0.008 0.944
Mean, I = Welder 0.444 -0.069 0.661
0.375
Mechanical DAE Welder 0.444 -0.077 0.572
Mean, I =
0.367
* Significant at the 10% level ** Significant at the 5% level *** Significant at the 1% level
Table 16: T-test of Employment Rate, by Gender
Gender Obs. Mean Std. Err. Std. Dev. [95% Conf. Interval]
Female 116 0.293 0.042 0.457 0.209 0.377
Male 554 0.415 0.021 0.493 0.374 0.456
combined 670 0.394 0.019 0.489 0.357 0.431
diff -0.122 0.047 -0.215 -0.029
diff = mean(Female) - mean(Male) t = -2.5785
Ho: diff = 0; Ha: diff not equal to 0 P-value = 0.0107

24
Table 17: Employment Rate and Mean Income by Trade
Trade Employment
rate
No. of
responses
Mean
income
No. of
responses
Electrical (DAE) 51.0 51 7,922 6
Civil (DAE) 50.0 36 7,100 5
Welder 44.4 18 15,733 3
Diploma in Commerce (Diploma 2 Years) 44.3 70 12,733 6
Certificate in Computer Applications 44.0 75 7,462 17
Electrician 37.5 24 5,440 5
Mechanical (DAE) 36.7 60 7,179 8
Electrical(G-III) 29.4 17 2,000 1
Diploma in Vocational Girls ( Diploma 2 Years) 27.8 18 3,200 2
Draftsman Civil(G-III) 20.0 15 26,200 1
Refrigeration & Air Conditioning(G-II) 69.2 13 5,875 4
Certificate Vocational Girls (1 Year Certificate) 25.0 12 10,000 1
Domestic Tailoring 27.3 11 - 0
Electrical(G-II) 10.0 10 - 0
Electronics (DAE) 20.0 10 15,000 1
Machine Embroidery 30.0 10 4,133 3
Wireman 40.0 10 3,900 2
Beautician 44.4 9 - 0
Electrician(G-II) 22.2 9 3,000 1
Machinist(G-III) 33.3 9 4,000 1
Motor Winding 44.4 9 4,000 1
Plumber 33.3 9 - 0
Certificate in Computer Application 50.0 8 6,550 2
Tailoring 50.0 8 1,000 1
Auto and Farm (DAE) 42.9 7 - 0
Draftsman Mechanical(G-II) 14.3 7 - 0
Food Technology (DAE) 71.4 7 8,000 2
Heating Ventilation & Air Conditioning 42.9 7 4,750 2
Motor Cycle Mechanic 28.6 7 - 0
Welder(G-II) 42.9 7 7,350 2
Electronics Application (Radio & TV) 50.0 6 6,000 1
Machinist(G-II) 50.0 6 13,200 1
Bulldozer Operator 20.0 5 - 0
Fitter General(G-II) 20.0 5 6,500 1
Auto Electrician(G-II) 0.0 4 - 0
Auto Mechanic(G-II) 25.0 4 - 0
Auto Mechanic(G-III) 25.0 4 6,500 1
Computer Operator(G-III) 0.0 4 - 0
Dress Designing & Making (G-III) 0.0 4 - 0
Electrician(G-III) 50.0 4 500 1

25
Auto & Farm Machinery(G-III) 66.7 3 1,000 1
Auto Cad 66.7 3 15,000 1
Auto and Farm(G-III) 33.3 3 2,000 1
Computer Operator 33.3 3 1,000 1
Diploma in Commerce (Diploma 2 Years) 66.7 3 - 0
Draftsman Civil(G-II) 33.3 3 - 0
Electronics Application (Radio & TV)(G-III) 0.0 3 - 0
Machine Shop(G-III) 33.3 3 23,000 1
Turner 66.7 3 - 0
Agriculture(DAE) 0.0 2 - 0
Commercial Arts / Graphics (G-II) 100.0 2 5,000 1
Computer Information Technology (DAE) 50.0 2 5,000 1
Diploma in Business Administration 50.0 2 15,000 1
Dress Making (G-II) 100.0 2 - 0
Elementary Food Preservation 0.0 2 - 0
Fashion Designing (G-III) 0.0 2 - 0
Home Appliances & Repair 100.0 2 8,000 1
Instrumentation (DAE) 100.0 2 7,000 1
Tailoring(G-III) 0.0 2 - 0
Auto Electrician 100.0 1 4,000 1
Computer and Electronics(G-III) 0.0 1 - 0
Cooking & Baking 0.0 1 - 0
Draftsman Mechanical(G-III) 0.0 1 - 0
Electrical Wiring Technician 0.0 1 - 0
Fabric Printing 0.0 1 - 0
General Mechanic(G-III) 0.0 1 - 0
Hand Embroidery 100.0 1 - 0
Industrial Electrician 0.0 1 - 0
Motor Winding(G-III) 100.0 1 - 0
Refrigeration & Air Conditioning(G-III) 100.0 1 8,000 1
Telecom(DAE) 0.0 1 - 0
Welder(G-III) 0.0 1 - 0
Wood Work(G-III) 0.0 1 - 0
Architectural Drafting (G-II) - 0 - 0
Auto & Diesel (DAE) - 0 - 0
Auto & Farm Machinery - 0 - 0
Auto Electrician(G-III) - 0 - 0
Auto Mechanic(Diesel) - 0 - 0
Auto Mechanic(Petrol) - 0 - 0
Auto Mechanic(Petrol) (G-III) - 0 - 0
Auto and Farm - 0 - 0
Auto and Farm(G-II) - 0 - 0
Carpenter - 0 - 0

26
Chemical (DAE) - 0 - 0
Decoration - 0 - 0
Diploma in Office Management - 0 - 0
Diploma in Vocational Girls - 0 - 0
Diploma in Vocational Girls (Additional) - 0 - 0
Dress Designing & Making (DAE) - 0 - 0
Electronics(G-III) - 0 - 0
Fashion Designing - 0 - 0
Fitter General (G-III) - 0 - 0
Handicraft - 0 - 0
Heating Ventilation Air Conditioning - 0 - 0
Leather Manufacturing(G-III) - 0 - 0
Machinist - 0 - 0
Office Management Assistant (G-III) - 0 - 0
Office Secretary (G-III) - 0 - 0
Paint Polish - 0 - 0
Painting - 0 - 0
Plumber (G-II) - 0 - 0
Refrigeration & Air Conditioning (DAE) - 0 - 0
Tractor Operator - 0 - 0
Wood Work - 0 - 0
Table 18: Employment Rate by Duration of Course
Duration in months Unemployed Employed No. of responses
3 48.8 51.2 43
6 61.3 38.7 186
12 76.4 23.6 89
18 57.1 42.9 7
24 58.6 41.4 162
36 56.6 43.4 182

27
Figure 5: Employment Rate by Duration of Course
Table 19: Pair-wise T-test of Difference in Employment Rate across Duration of Training
Duration (in months) Duration (in months) Mean (J) I - J P-value
3 6 0.387 0.125 0.148
Mean, I = 12 0.236 0.276 0.003***
0.512 24 0.414 0.098 0.260
36 0.434 0.078 0.368
6 12 0.236 0.151 0.010***
Mean, I = 24 0.414 -0.027 0.616
0.387 36 0.434 -0.047 0.361
12 24 0.414 -0.178 0.003***
Mean, I = 36 0.434 -0.198 0.001***
0.236
24 36 0.434 -0.021 0.702
Mean, I =
0.414
* Significant at the 10% level ** Significant at the 5% level *** Significant at the 1% level
0
51
39
24
41 43
0
10
20
30
40
50
60
0 3 6 12 24 36
Emp
loym
en
t ra
te in
%
Duration of course in months
Employment rate Linear (Employment rate)

28
Table 20: Employment Rate by Level of Previous Education
Previous education Unemployed Employment rate No. of responses
Middle 66.7 33.3 45
Under Matric 75.0 25.0 4
Matric 67.1 32.9 140
FA FSc ICom 54.5 45.5 33
BA BSc Bcom Bed 75.0 25.0 4
MA MSc Mcom Med 100.0 0.0 2
DCom 100.0 0.0 1
Table 20 shows the employment rate of graduates by previous education level. If only those education
levels with more than 15 observations are considered, graduates with an FA, FSc, or ICom (Grade 12)
level of education have the highest employment rate at 45 percent, and those with a Matric the lowest at
33 percent. Graduates who have completed middle school but not Matric have the same employment rate
as those with a Matric level of education. Pair-wise t-tests show that the employment rates of graduates
with Middle, Matric, and FA, FSc, ICom levels of education are not statistically different from each other.
Figure 6: Employment Rate by Prior Education Level
33
25
33
45
0
25
0 0
10
20
30
40
50
Middle Under Matric
Matric FA FSc ICom
DCom BA BSc Bcom Bed
MA MSc Mcom Med
Emp
loym
en
t ra
te in
%
Employment rate
Employment rate Linear (Employment rate)

29
Figure 7: Employment Rate by Prior Education Level (More than 15 Observations)
Table 21: Employment Rate and Mean Income by District
District Employment rate No. of responses Mean Income No. of responses
Attock 14.3 28 5,000 1
Bahawalnagar 41.7 24 8,083 6
Bahawalpur 51.4 35 5,971 7
Bhakkar 53.8 26 2,150 2
Chakwal 0.0 13 - 0
Chiniot 25.0 4 - 0
D.G.Khan 57.1 14 4,260 5
Faisalabad 33.3 9 8,000 1
Gujranwala 50.0 4 - 0
Gujrat 53.8 13 15,400 3
Hafizabad 25.0 4 - 0
Jhang 33.3 12 - 0
Jhelum 18.5 27 12,233 3
Kasur 37.8 45 2,938 4
Khanewal 17.6 17 - 0
Khushab 50.0 2 - 0
Lahore 40.0 10 5,000 1
Layyah 25.0 8 5,000 1
Lodhran 66.7 15 9,600 3
Mandi Baha-ud-din 25.0 4 5,500 1
Mianwali 29.2 24 19,860 5
Multan 0.0 4 - 0
Muzaffargarh 50.0 2 - 0
33 33
45
0
10
20
30
40
50
Middle Matric FA FSc ICom Emp
loym
en
t ra
te in
%
Employment rate (min. 15 observations)
Employment rate

30
Nankana Sahib 0 - 0
Narowal 30.8 13 - 0
Okara 33.3 18 3,000 3
Pakpattan 50.0 8 - 0
R.Y.Khan 45.5 11 6,750 2
Rajanpur 0.0 1 - 0
Rawalpindi 33.3 30 4,129 7
Sahiwal 43.3 180 7,194 24
Sargodha 51.4 37 7,570 10
Sheikhupura 0.0 2 - 0
Sialkot 75.0 4 4,600 1
Toba Tek Singh 85.7 7 - 0
Vehari 40.0 15 10,475 4
Table 21 shows the employment rate and average income by district. The top 5 districts by employment
rate account for 19 percent of graduate responses. Pair-wise t-tests amongst the top 5 districts reveal no
significant differences in the employment rate at the 1, 5 or 10 percent levels. Graduates from Lodhran
have the highest employment rate at 67 percent, while only 14 percent of respondents from Attock listed
themselves as employed11
.
Table 22: Employment Rate and Mean Income by Gender
Gender Employment rate No. of responses Mean income No. of responses
Female 29.3 116 3,142 13
Male 41.5 554 8,303 81
Table 22 shows that there is a statistically significant difference between male and female employment
rates; the employment rate for males is over 12 percent higher than that for females. The number of
observations for female income is too limited to infer the average income, but the mean income for male
graduates is Rs. 8,303.
11
Note: Highest and lowest employment rates described for those districts with 15 and above responses.

31
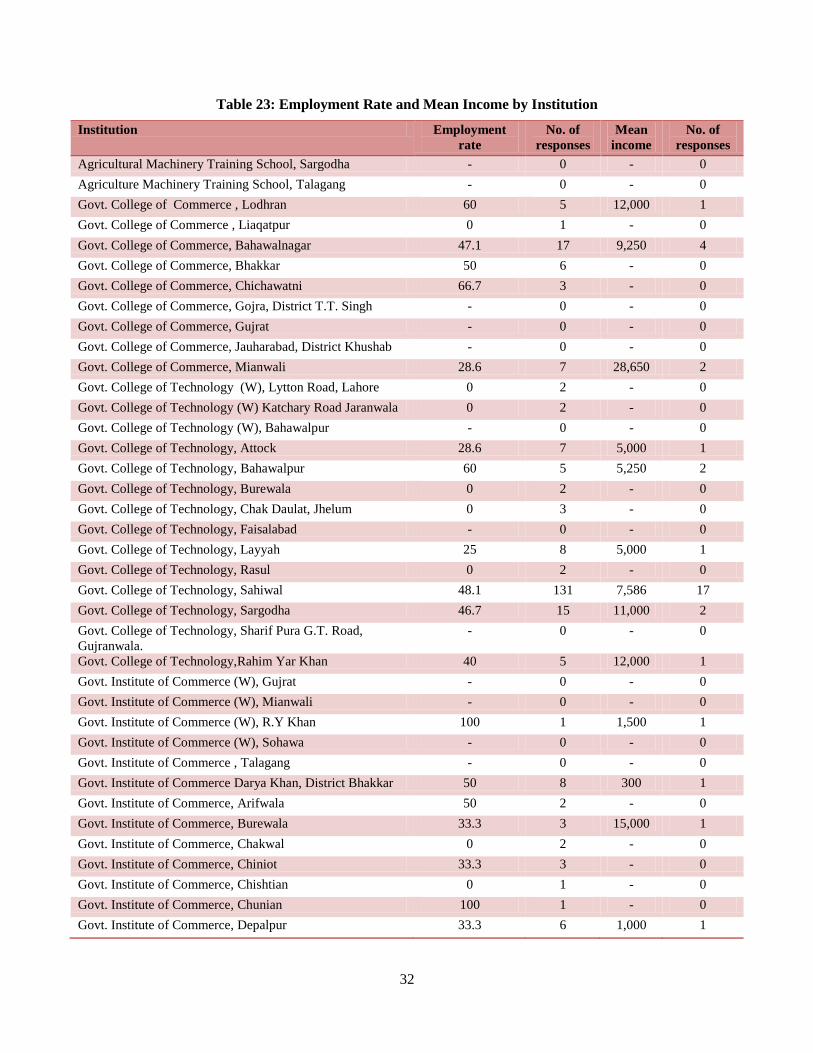
Figure 8: Employment Rate by Institution
Figure 8 shows the employment rate of graduates by institution. The Government College of
Technology, Sahiwal, has the highest employment rate at 48 percent, followed by the Government
College of Commerce, Bhawalnagar, and the Government College of Technology, Sargodha (both at 47
percent). The lowest employment rate is for graduates of Government Technical Training Institute,
Jhelum, at 21 percent.
0
10
20
30
40
50
60
Emp
loym
en
t ra
te in
%
Employment rate by institution (Min. 10 observations)
Employment rate
32
Table 23: Employment Rate and Mean Income by Institution
Institution Employment
rate
No. of
responses
Mean
income
No. of
responses
Agricultural Machinery Training School, Sargodha - 0 - 0
Agriculture Machinery Training School, Talagang - 0 - 0
Govt. College of Commerce , Lodhran 60 5 12,000 1
Govt. College of Commerce , Liaqatpur 0 1 - 0
Govt. College of Commerce, Bahawalnagar 47.1 17 9,250 4
Govt. College of Commerce, Bhakkar 50 6 - 0
Govt. College of Commerce, Chichawatni 66.7 3 - 0
Govt. College of Commerce, Gojra, District T.T. Singh - 0 - 0
Govt. College of Commerce, Gujrat - 0 - 0
Govt. College of Commerce, Jauharabad, District Khushab - 0 - 0
Govt. College of Commerce, Mianwali 28.6 7 28,650 2
Govt. College of Technology (W), Lytton Road, Lahore 0 2 - 0
Govt. College of Technology (W) Katchary Road Jaranwala 0 2 - 0
Govt. College of Technology (W), Bahawalpur - 0 - 0
Govt. College of Technology, Attock 28.6 7 5,000 1
Govt. College of Technology, Bahawalpur 60 5 5,250 2
Govt. College of Technology, Burewala 0 2 - 0
Govt. College of Technology, Chak Daulat, Jhelum 0 3 - 0
Govt. College of Technology, Faisalabad - 0 - 0
Govt. College of Technology, Layyah 25 8 5,000 1
Govt. College of Technology, Rasul 0 2 - 0
Govt. College of Technology, Sahiwal 48.1 131 7,586 17
Govt. College of Technology, Sargodha 46.7 15 11,000 2
Govt. College of Technology, Sharif Pura G.T. Road,
Gujranwala.
- 0 - 0
Govt. College of Technology,Rahim Yar Khan 40 5 12,000 1
Govt. Institute of Commerce (W), Gujrat - 0 - 0
Govt. Institute of Commerce (W), Mianwali - 0 - 0
Govt. Institute of Commerce (W), R.Y Khan 100 1 1,500 1
Govt. Institute of Commerce (W), Sohawa - 0 - 0
Govt. Institute of Commerce , Talagang - 0 - 0
Govt. Institute of Commerce Darya Khan, District Bhakkar 50 8 300 1
Govt. Institute of Commerce, Arifwala 50 2 - 0
Govt. Institute of Commerce, Burewala 33.3 3 15,000 1
Govt. Institute of Commerce, Chakwal 0 2 - 0
Govt. Institute of Commerce, Chiniot 33.3 3 - 0
Govt. Institute of Commerce, Chishtian 0 1 - 0
Govt. Institute of Commerce, Chunian 100 1 - 0
Govt. Institute of Commerce, Depalpur 33.3 6 1,000 1

33
Govt. Institute of Commerce, Gujar Khan, District
Rawalpindi
33.3 3 - 0
Govt. Institute of Commerce, Haroonabad 50 2 5,000 1
Govt. Institute of Commerce, Hasilpur 100 1 - 0
Govt. Institute of Commerce, Isakhel 50 4 16,500 2
Govt. Institute of Commerce, Jand 0 3 - 0
Govt. Institute of Commerce, Kabirwala 50 4 - 0
Govt. Institute of Commerce, Kamalia, T.T. Singh 100 3 - 0
Govt. Institute of Commerce, Kharian - 0 - 0
Govt. Institute of Commerce, Mailsi 75 4 12,750 2
Govt. Institute of Commerce, Mandi Baha-ud-Din - 0 - 0
Govt. Institute of Commerce, Minchanabad - 0 - 0
Govt. Institute of Commerce, Narowal 50 4 - 0
Govt. Institute of Commerce, Naushera, Tehsil & District
Khushab
- 0 - 0
Govt. Institute of Commerce, Pakpattan 0 1 - 0
Govt. Institute of Commerce, Pattoki 100 1 - 0
Govt. Institute of Commerce, Phalia - 0 - 0
Govt. Institute of Commerce, Pind Dadan Khan, District
Jhelum
0 1 - 0
Govt. Institute of Commerce, Pindi Gheb - 0 - 0
Govt. Institute of Commerce, Rajanpur 0 1 - 0
Govt. Institute of Commerce, Rojhan - 0 - 0
Govt. Institute of Commerce, Sadiqabad 66.7 3 - 0
Govt. Institute of Commerce, Shahpur Sadar, District
Sargodha
0 1 - 0
Govt. Institute of Commerce, Shorkot 100 2 - 0
Govt. Institute of Commerce, Sialkot 100 2 4,600 1
Govt. Institute of Commerce, Taunsa Sharif - 0 - 0
Govt. Institute of Commerce, Yazman 62.5 8 11,500 2
Govt. Techncial Training Centre, Talagang 0 3 - 0
Govt. Technical Training Centre (M), (ABAD), Kallur Kot,
Bhakkar
- 0 - 0
Govt. Technical Training Centre, Fortabbas - 0 - 0
Govt. Technical Training Center (M), Haroonabad, District
Bahawalnagar
- 0 - 0
Govt. Technical Training Center (M), Jandanwala, District
Bhakkar
50 4 4,000 1
Govt. Technical Training Center, Bahtar - 0 - 0
Govt. Technical Training Center, Sadiqabad - 0 - 0
Govt. Technical Training Centre (M), ( ABAD), Jand 0 1 - 0
Govt. Technical Training Centre (M), (ABAD), Fateh Jang - 0 - 0
Govt. Technical Training Centre (M), (ABAD), Kharian 0 1 - 0
Govt. Technical Training Centre (M), (ABAD), Jampur - 0 - 0
Govt. Technical Training Centre (M), Qila Didar Singh,
District Gujranwala
50 2 - 0

34
Govt. Technical Training Centre (Male) Piplan 33.3 6 9,000 1
Govt. Technical Training Centre (W) Sambrial 50 2 - 0
Govt. Technical Training Centre Lalian, (DMTC), Tehsil
Chiniot
0 1 - 0
Govt. Technical Training Centre, (ABAD), Bhakkar 50 4 - 0
Govt. Technical Training Centre, (ABAD), Choa Saidan
Shah
0 5 - 0
Govt. Technical Training Centre, (ABAD), Khushab 100 1 - 0
Govt. Technical Training Centre, (ABAD), Shakargarh 28.6 7 - 0
Govt. Technical Training Centre, (ABAD), Zafarwal 0 2 - 0
Govt. Technical Training Centre, (ABAD), Isakhel 0 3 - 0
Govt. Technical Training Centre, (ABAD), Jalalpur Jattan 100 1 23,000 1
Govt. Technical Training Centre, (ABAD), Kot Chutta 50 8 6,550 2
Govt. Technical Training Centre, (ABAD), Pasrur - 0 - 0
Govt. Technical Training Centre, (ABAD), Sarai Alamgir 100 1 - 0
Govt. Technical Training Centre, (AMTS), D.G.Khan 100 2 2,500 2
Govt. Technical Training Centre, (DMTC), Arifwala - 0 - 0
Govt. Technical Training Centre, (DMTC), Burewala 33.3 3 - 0
Govt. Technical Training Centre, (DMTC), Dahranwala 0 1 - 0
Govt. Technical Training Centre, (DMTC), Hafizabad 0 2 - 0
Govt. Technical Training Centre, (DMTC), Kamoki 50 2 - 0
Govt. Technical Training Centre, (DMTC), Kot Addu 50 2 - 0
Govt. Technical Training Centre, (DMTC), Pakpattan 60 5 - 0
Govt. Technical Training Centre, (DMTC), Samundri - 0 - 0
Govt. Technical Training Centre, (DMTC), Wahndo - 0 - 0
Govt. Technical Training Centre, (Male) Jehanian District
Khanewal
12.5 8 - 0
Govt. Technical Training Centre, (Male) Karor Pacca District
Lodhran
66.7 9 15,000 1
Govt. Technical Training Centre, (Male) Khairpur Tamewali
District Bahawalpur
0 1 - 0
Govt. Technical Training Centre, (Male) Malikwal, District
,Mandi Baha-ud-Din
50 2 5,500 1
Govt. Technical Training Centre, (Male) Safdarabad District
Sheikhupura
0 2 - 0
Govt. Technical Training Centre, (Male) Tribal Area (Fort
Minro) District, D.G.Khan
50 4 3,200 1
Govt. Technical Training Centre, (Male), Chak Jhumra
District, Faisalabad
66.7 3 8,000 1
Govt. Technical Training Centre, (Male), Kallar Kahar
District Chakwal
0 1 - 0
Govt. Technical Training Centre, (Male), Kallar Sydian 44.4 9 5,167 3
Govt. Technical Training Centre, (Male), Kot Momin ,
District Sargodha
45.5 11 12,400 3
Govt. Technical Training Centre, (Male), Renala Khurd,
District Okara
50 6 4,000 2
Govt. Technical Training Centre, (Male),Kot Radha Kishen,
District Kasur
29.4 17 - 0

35
Govt. Technical Training Centre, (PSIC), Khurrianwala - 0 - 0
Govt. Technical Training Centre, (PSIC), Tamman - 0 - 0
Govt. Technical Training Centre, (VTC) (PSIC) ,Shahpur,
District Sargodha
100 1 - 0
Govt. Technical Training Centre, (W) Ahmadpur Sial,
District Jhang
33.3 3 - 0
Govt. Technical Training Centre, (W) Jehanian District
Khanewal
0 1 - 0
Govt. Technical Training Centre, (W) Karor Pacca District
Lodhran
100 1 1,800 1
Govt. Technical Training Centre, (W) Khairpur Tamewali
District Bahawalpur
66.7 3 - 0
Govt. Technical Training Centre, (W), Kallar Sydian 33.3 15 3,350 4
Govt. Technical Training Centre, (W), Kot Momin , District
Sargodha
33.3 3 - 0
Govt. Technical Training Centre, (W), Phool Nagar, District
Kasur
27.3 11 1,000 1
Govt. Technical Training Centre, (W), Renala Khurd,
District Okara
16.7 6 - 0
Govt. Technical Training Centre, (W),Kot Radha Kishen,
District Kasur
30 10 2,875 2
Govt. Technical Training Institute (W) College Road,
Township, Lahore
50 8 5,000 1
Govt. Technical Training Institute (W) Kamal Gunj, Lahore - 0 - 0
Govt. Technical Training Institute Kamalia 50 2 - 0
Govt. Technical Training Institute, Ahmad Murad Road,
Sahiwal
22.7 22 5,750 4
Govt. Technical Training Institute, Attock 16.7 6 - 0
Govt. Technical Training Institute, Bahawalnagar 50 2 6,500 1
Govt. Technical Training Institute, Bahawalpur 44.4 9 500 1
Govt. Technical Training Institute, Chichawatni 57.1 7 6,250 2
Govt. Technical Training Institute, Daulat Gate, Multan 0 2 - 0
Govt. Technical Training Institute, Gujranwala - 0 - 0
Govt. Technical Training Institute, Gujrat 44.4 9 13,200 1
Govt. Technical Training Institute, Harapa Road, Sahiwal 30 10 8,200 1
Govt. Technical Training Institute, Jauharabad 0 1 - 0
Govt. Technical Training Institute, Jhang 20 5 - 0
Govt. Technical Training Institute, Jhelum 21.4 14 15,100 2
Govt. Technical Training Institute, Kasur 80 5 5,000 1
Govt. Technical Training Institute, Khanewal 0 4 - 0
Govt. Technical Training Institute, Mianwali 0 1 - 0
Govt. Technical Training Institute, Muzaffargarh - 0 - 0
Govt. Technical Training Institute, Pindi Gheb 0 6 - 0
Govt. Technical Training Institute, Sohawa 22.2 9 6,500 1
Govt. Technical Training Institute, T.T.Singh 100 2 - 0
Govt. Technical Training Institute,Sillanwali Road Sargodha 100 3 3,500 3
Govt. Vocational Training Institute (W), (RMGTC),
Rawalpindi
0 1 - 0
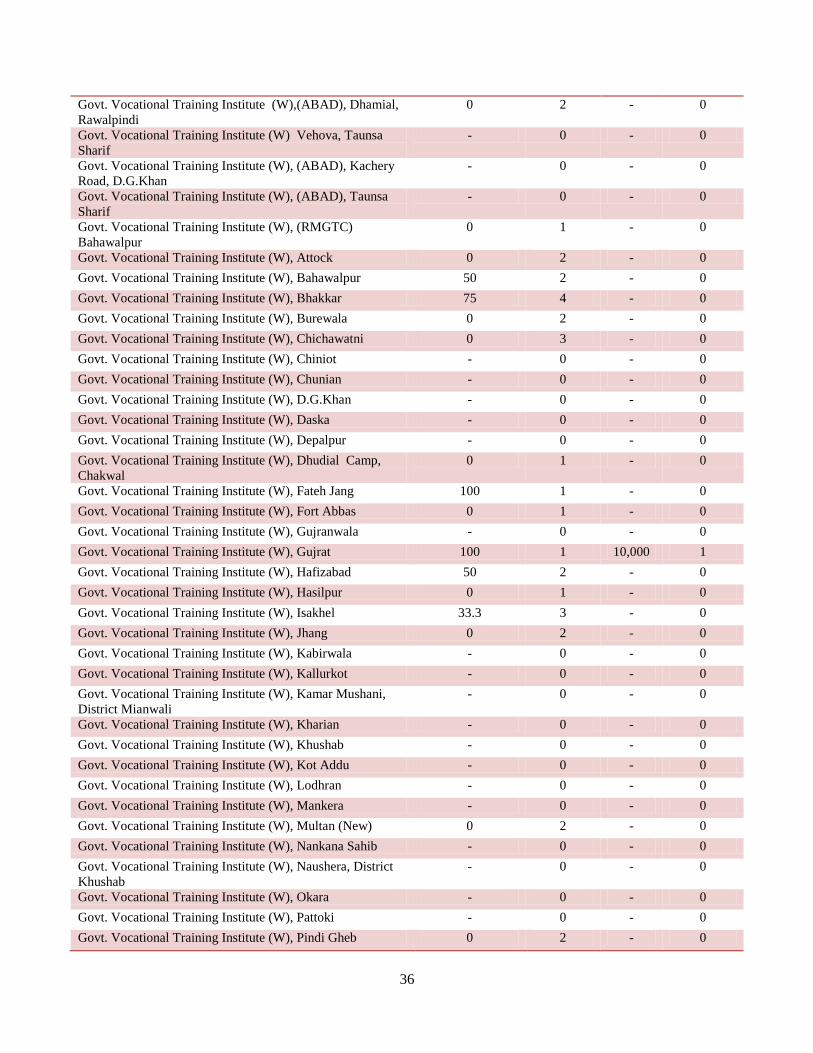
36
Govt. Vocational Training Institute (W),(ABAD), Dhamial,
Rawalpindi
0 2 - 0
Govt. Vocational Training Institute (W) Vehova, Taunsa
Sharif
- 0 - 0
Govt. Vocational Training Institute (W), (ABAD), Kachery
Road, D.G.Khan
- 0 - 0
Govt. Vocational Training Institute (W), (ABAD), Taunsa
Sharif
- 0 - 0
Govt. Vocational Training Institute (W), (RMGTC)
Bahawalpur
0 1 - 0
Govt. Vocational Training Institute (W), Attock 0 2 - 0
Govt. Vocational Training Institute (W), Bahawalpur 50 2 - 0
Govt. Vocational Training Institute (W), Bhakkar 75 4 - 0
Govt. Vocational Training Institute (W), Burewala 0 2 - 0
Govt. Vocational Training Institute (W), Chichawatni 0 3 - 0
Govt. Vocational Training Institute (W), Chiniot - 0 - 0
Govt. Vocational Training Institute (W), Chunian - 0 - 0
Govt. Vocational Training Institute (W), D.G.Khan - 0 - 0
Govt. Vocational Training Institute (W), Daska - 0 - 0
Govt. Vocational Training Institute (W), Depalpur - 0 - 0
Govt. Vocational Training Institute (W), Dhudial Camp,
Chakwal
0 1 - 0
Govt. Vocational Training Institute (W), Fateh Jang 100 1 - 0
Govt. Vocational Training Institute (W), Fort Abbas 0 1 - 0
Govt. Vocational Training Institute (W), Gujranwala - 0 - 0
Govt. Vocational Training Institute (W), Gujrat 100 1 10,000 1
Govt. Vocational Training Institute (W), Hafizabad 50 2 - 0
Govt. Vocational Training Institute (W), Hasilpur 0 1 - 0
Govt. Vocational Training Institute (W), Isakhel 33.3 3 - 0
Govt. Vocational Training Institute (W), Jhang 0 2 - 0
Govt. Vocational Training Institute (W), Kabirwala - 0 - 0
Govt. Vocational Training Institute (W), Kallurkot - 0 - 0
Govt. Vocational Training Institute (W), Kamar Mushani,
District Mianwali
- 0 - 0
Govt. Vocational Training Institute (W), Kharian - 0 - 0
Govt. Vocational Training Institute (W), Khushab - 0 - 0
Govt. Vocational Training Institute (W), Kot Addu - 0 - 0
Govt. Vocational Training Institute (W), Lodhran - 0 - 0
Govt. Vocational Training Institute (W), Mankera - 0 - 0
Govt. Vocational Training Institute (W), Multan (New) 0 2 - 0
Govt. Vocational Training Institute (W), Nankana Sahib - 0 - 0
Govt. Vocational Training Institute (W), Naushera, District
Khushab
- 0 - 0
Govt. Vocational Training Institute (W), Okara - 0 - 0
Govt. Vocational Training Institute (W), Pattoki - 0 - 0
Govt. Vocational Training Institute (W), Pindi Gheb 0 2 - 0

37
Govt. Vocational Training Institute (W), R.Y Khan 0 1 - 0
Govt. Vocational Training Institute (W), Rajanpur - 0 - 0
Govt. Vocational Training Institute (W), Sahiwal 25 4 - 0
Govt. Vocational Training Institute (W), Sammundri 25 4 - 0
Govt. Vocational Training Institute (W), Sargodha 66.7 3 3,000 2
Govt. Vocational Training Institute (W), Shorkot - 0 - 0
Govt. Vocational Training Institute (W), Talagang 0 1 - 0
Govt. Vocational Training Institute (W), Vehari 100 1 1,400 1
Govt. Vocational Training Institute (W),(ABAD), Darya
Khan, Bhakkar
- 0 - 0
Govt. Vocational Training Institute (W),(ABAD), Noorkot - 0 - 0
Govt.Technical Training Center, (DMTC) Ahmad Pur East - 0 - 0
Govt.Technical Training Center, (DMTC) Hasilpur. 0 2 - 0
Govt.Technical Training Center, (DMTC) Yazman 100 2 3,900 2
Govt.Technical Training Center, Tranda Muhammand
Pinnah
- 0 - 0
Govt.Technical Training Centre, (AMTS), Gujranwala - 0 - 0

38
ANNEX 3A: QUESTIONNAIRE (PHASE 1)12
Message 1:
This message is being sent to you from [Institution Name]. Are you [Mr./Ms.] [Name]?
1. Yes [go to Message 3]
2. No [go to Message 1]
Message 2:
Do you know [Mr./Ms.] [Name]? Please send us their mobile number so we can contact them directly. [If number
received, send Message 1]
Message 3:
[Mr./Ms.] [Name], according to our records, you received training from [Institution Name]. Is this correct?
1. Yes [go to Message 4]
2. No [go to Message 13]
Message 4:
Please answer the following questions to tell us how you have benefited from your training.
Message 5:
You will receive Rs.[Credit amount] upon answering all questions. Please choose your operator.
1. Mobilink [go to Message 6]
2. Telenor [go to Message 6]
3. Warid [go to Message 6]
4. Ufone [go to Message 6]
5. Zong [go to Message 6]
Message 6:
What are you doing these days?
1. Private employment [go to Message 9]
2. Government employment [go to Message 9]
3. Own/family business [go to Message 9]
4. Not doing anything [go to Message 7]
Message 7:
Are you searching for employment?
1. Yes [go to Message 13]
2. No [go to Message 8]
Message 8:
What are you doing these days?
1. Further studies
2. Further training
3. Housework
4. Nothing
Message 9:
12
For the subgroup which did not receive credit, Message 5 is excluded.

39
Is your job in your area of training?
1. Yes [go to Message 10]
2. No [go to Message 10]
Message 10:
To what extent do you use skills learned during training at your job?
1. To a large extent [go to Message 11]
2. To some extent [go to Message 11]
3. Not at all [go to Message 11]
Message 11:
On average, how many hours do you work every week?
1. Less than 10 hours [go to Message 12]
2. 10-20 hours [go to Message 12]
3. 20-30 hours [go to Message 12]
4. 30-40 hours [go to Message 12]
5. More than 40 hours [go to Message 12]
Message 12:
How much did you earn last month? Please type the figure.
Message 13:
Thank you

40
ANNEX 3B: SMS FLOWCHART (PHASE 1)

41
ANNEX 3C: QUESTIONNAIRE (PHASE 2)
Message 1:
This message is being to sent to you on behalf of Punjab TEVTA. Are you [Name]? Please reply by replying either
1 or 2.
1. Yes [go to Message 3]
2. No [go to Message 2]
Message 2:
Do you know [Mr./Ms.] [Name]? Please send us their mobile number so we can contact them directly. [If number
received, send Message 1]
Message 3:
The Government of Punjab would like to know how you have benefited from receiving training at [Institution
Name]. What are you doing these days?
1. Private sector employment [go to Message 5]
2. Government employment [go to Message 5]
3. Own/family business [go to Message 5]
4. Further education or training [go to Message 9]
5. Not doing anything [go to Message 4]
Message 4:
Are you searching for employment?
1. Yes [go to Message 9]
2. No [go to Message 9]
Message 5:
On average, how many hours do you work every week?
1. Less than 10 hours [go to Message 6]
2. 10-20 hours [go to Message 6]
3. 20-40 hours [go to Message 6]
4. More than 40 hours [go to Message 6]
Message 6:
How much did you earn last month? Please type the figure. [go to Message 7]
Message 7:
Is your job in your area of training?
1. Yes [go to Message 8]
2. No [go to Message 8]
Message 8:
To what extent do you use skills learned during training at your job?
1. To a large extent [go to Message 9]
2. To some extent [go to Message 9]
3. Not at all [go to Message 9]
Message 9: Thank you

42
ANNEX 3D: QUESTIONNAIRE (PHASE 3)
Message 1:
This message is being sent to you on behalf of Punjab TEVTA. Are you [Name]? Please reply by replying either 1
or 2. You will receive Rs.[Credit amount] upon completion of the survey.
1. Yes [go to Message 3]
2. No [go to Message 2]
Message 2:
Do you know [Mr./Ms.] [Name]? Please send us their mobile number so we can contact them directly. [If number
received, send Message 1]
Message 3:
The Government of Punjab would like to know how you have benefited from receiving training at [Institution
Name]. What are you doing these days?
1. Private sector employment [go to Message 5]
2. Government employment [go to Message 5]
3. Own/family business [go to Message 5]
4. Further education or training [go to Message 9]
5. Not doing anything [go to Message 4]
Message 4:
Are you searching for employment?
1. Yes [go to Message 9]
2. No [go to Message 9]
Message 5:
On average, how many hours do you work every week?
1. Less than 10 hours [go to Message 6]
2. 10-20 hours [go to Message 6]
3. 20-40 hours [go to Message 6]
4. More than 40 hours [go to Message 6]
Message 6:
How much did you earn last month? Please type the figure. [go to Message 7]
Message 7:
Is your job in your area of training?
1. Yes [go to Message 8]
2. No [go to Message 8]
Message 8:
To what extent do you use skills learned during training at your job?
1. To a large extent [go to Message 9]
2. To some extent [go to Message 9]
3. Not at all [go to Message 9]
Message 9:

43
Thank you for your cooperation. Choose your operator.
1. Mobilink
2. Telenor
3. Warid
4. Ufone
5. Zong
Message 10:
Thank you. You will receive your credit shortly.