
lab.js: A free, open, online study builder - OSF
37
lab.js: A free, open, online study builder Felix Henninger University of Mannheim University of Koblenz-Landau Yury Shevchenko University of Konstanz Central Institute of Mental Health, Mannheim Ulf K. Mertens Heidelberg University Pascal J. Kieslich University of Mannheim Benjamin E. Hilbig University of Koblenz-Landau Corresponding author Felix Henninger [email protected] Mannheimer Zentrum für Europäische Sozialforschung (mzes) a5, 6 (section a) 68159 Mannheim, Germany
-
Upload
khangminh22 -
Category
Documents
-
view
1 -
download
0
Transcript of lab.js: A free, open, online study builder - OSF

lab.js:A free, open, onlinestudy builder
Felix HenningerUniversity of Mannheim
University of Koblenz-Landau
Yury ShevchenkoUniversity of Konstanz
Central Institute of Mental Health, Mannheim
Ulf K. MertensHeidelberg University
Pascal J. KieslichUniversity of Mannheim
Benjamin E. HilbigUniversity of Koblenz-Landau
Corresponding author Felix [email protected]
Mannheimer Zentrum für
Europäische Sozialforschung (mzes)
a5, 6 (section a)
68159Mannheim, Germany
lab.js: a free, open, online study builder 2
Abstract
Web-based data collection is increasingly popular in both experimental andsurvey-based research because it is flexible, efficient and location-independent.While dedicated software for laboratory-based experimentation and online sur-veys is commonplace, researchers looking to implement experiments in thebrowser have, heretofore, often had tomanually construct their studies’ contentand logic using code. We introduce lab.js, a free, open-source experimentbuilder that makes it easy to build studies for both online and in-laboratory datacollection. Through its visual interface, stimuli can be designed and combinedinto a studywithout programming, though studies’ appearance andbehavior canbe fully customized using html, css and JavaScript code if required. Presenta-tion and response times are kept andmeasuredwith high accuracy andprecisionheretofore unmatched in browser-based studies. Experiments constructed withlab.js can be run directly on a local computer and published online with ease,with direct deployment to cloud hosting, export to web servers, and integra-tion with popular data collection platforms. Studies can also be shared in aneditable format, archived, re-used and adapted, enabling effortless, transparentreplications, and thus facilitating open, cumulative science. The software isprovided free of charge under an open-source license; further information, codeand extensive documentation are available from https://lab.js.org.
lab.js: a free, open, online study builder 3
Introduction
Themeteoric rise of the internet over the past decades (TheWorld Bank, 2016) hasprovided vast opportunities for behavioral science. Thanks to the access to larger,more diverse samples, it promises more flexible and economical research, andmorerobust findings as a result (e.g., Reips, 2007; Woods, Velasco, Levitan, Wan, &5
Spence, 2015). Because the browser is now a ubiquitous communication tool, datacollection can take place in amultitude of settings, ranging frommobile devices inthe field to the comfort of participants’ sofas, as well as themore controlled contextof established laboratories. In addition, the ease with which data can be shared overthe web holds the potential to transform science by enabling the free exchange of10
materials and data and the transparent documentation of studies (Nelson, Simmons,& Simonsohn, 2017; Nielsen, 2011).
The potential of browser-based and online data collection, despite these strongarguments in their favor, has yet to be realized to its full extent: The specializedknowledge required to construct and deploy online studies has limited their adop-15
tion— researchers had to program studies from scratch or rely on pre-made tem-plates. Technical restrictions limited the accuracy of presentation and responsetimes; proprietary tools hampered the exchange, re-use and extension of paradigms.
Our goal herein is to make available this untapped potential, and to increasethe accessibility and usefulness of browser-based and online research by provid-20
ing an open, general-purpose study builder – lab.js – in the spirit of widely usedlaboratory-based software (Mathôt, Schreij, & Theeuwes, 2012; Peirce, 2007). It isdesigned to be easy to use without prior technical knowledge, but fully customizableand extensible by advanced users. It is built to integrate with the existing ecosys-tem of tools for online research, and tomake use of the full capabilities of modern25
browsers for interactivity. It also provides excellent timing performance across sys-tems, addressing a major concern in online experimental research (Hilbig, 2016;Semmelmann&Weigelt, 2017a; de Leeuw&Motz, 2015). Our software is availablefree of charge, enabling the open archival, sharing, and replication of studies. In-deed, it is designed to facilitate and encourage the exchange and re-use of tasks and30
paradigms. Thus, we have endeavored tomeet the practical needs of researchers aswell as the requirements of a modern, open, transparent and reproducible scientificpractice.
In doing so, we extend previous work that has identified and partially addressedthese issues. In particular, libraries such as jsPsych (de Leeuw, 2014) and QRTEngine35
(Barnhoorn,Haasnoot, Bocanegra,&Steenbergen, 2015)havegreatly facilitatedman-ual coding of studies by providing programming frameworks that automate stimulusdisplay and response collection formany commonparadigms. The QRTEngine in par-ticular pioneered newmethods formore accurate experimental timing, and jsPsych
lab.js: a free, open, online study builder 4
was the first to provide a set of templates for common research scenarios, makingin-browser experimentationmuchmore accessible. All of these previous libraries,however, require programming skills. JATOS (Lange, Kühn, & Filevich, 2015) andTatool Web (von Bastian, Locher, & Ruflin, 2013) offer easy-to-use interfaces thatvastly simplify the assembly and deployment of task batteries, though the paradigms5
themselves are still constructedmanually. PsyToolkit (Stoet, 2017) presents yet an-other perspective, using a custom text-based syntax to generate questionnaires andexperiments.
Our software combines and augments these previous technical advances, provid-ing an easy-to-use graphical interface that follows familiar conventions established10
by many laboratory-based, offline study builders. Most typical paradigms can beconstructed using a what-you-see-is-what-you-get approach, without requiring pro-gramming or relying on a set of pre-made templates. At the same time, this easeof use does not place restrictions upon researchers looking to customize studies infull: The technical foundation of all studies is exposed, and can be accessed to adapt15
a study’s appearance and behavior: In principle, any content that can be includedon a website can also be used within a study. Thus, while the graphical interfaceprovides an accessiblemeans of designing studies, customizability of the underlyinglogic vastly expands its capabilities and enables arbitrarily complex stimuli andexperimental designs.20
The software is the result of our own requirements and experience, and in con-structing it, we have endeavored to meet the demands of modern experimentalresearch: lab.js is freely available, and thus accessible regardless of resources. It isopenas code, therebyamenable to inspection, customizationandextension. Becauseof its open nature, studies created with it can likewise be shared freely, re-used and25
adapted, facilitating cumulative, open science. It is flexible, in that it accommodatesthe full range of behavioral research, from psychophysical studies to questionnaires.Finally, it can be applied across contexts, in a laboratory setting as well as directly onparticipants’ devices; there need only be a browser present.
Building experiments in lab.js30
The following sections are adapted from the online reference and tutorial, which providemore in-depth information about the library as well as extensive introductory videos. Thefull documentation is available from the project homepage at https://lab.js.org/.
Studies in lab.js are assembled from components, building blocks that, together,make up a study. These can be screens that present stimuli, sequences thereof, or35
more complex blocks that combine and repeat parts of a study. The lab.js studybuilder provides a visual interface for designing individual components and combin-ing them into a larger experiment. The builder can be used in any recent browser

lab.js: a free, open, online study builder 5
without installation. It, too, is linked from the project homepage, or can be accesseddirectly by navigating to https://lab.js.org/builder.
For the purposes of this tutorial, we will focus on a variant of the classic Stroopparadigm, introducedbyStroop (1935). Themost commonversionof the taskpresentscolor words in different hues, and instructs participants to identify the hue and dis-5
regard the semantic content of the word itself (see also MacLeod, 1991; Strauss,Sherman, & Spreen, 2006, for variants andmore recent applications). The Stroopeffect refers to the stable finding that this judgment takes longer when the two stim-ulus dimensions conflict, for example when the word red is shown in the color blue.This paradigmwill serve as an example for the remainder of this tutorial, as its trial10
structure with crossed factors can readily be adapted tomany other experimentaltasks.
Using the interface
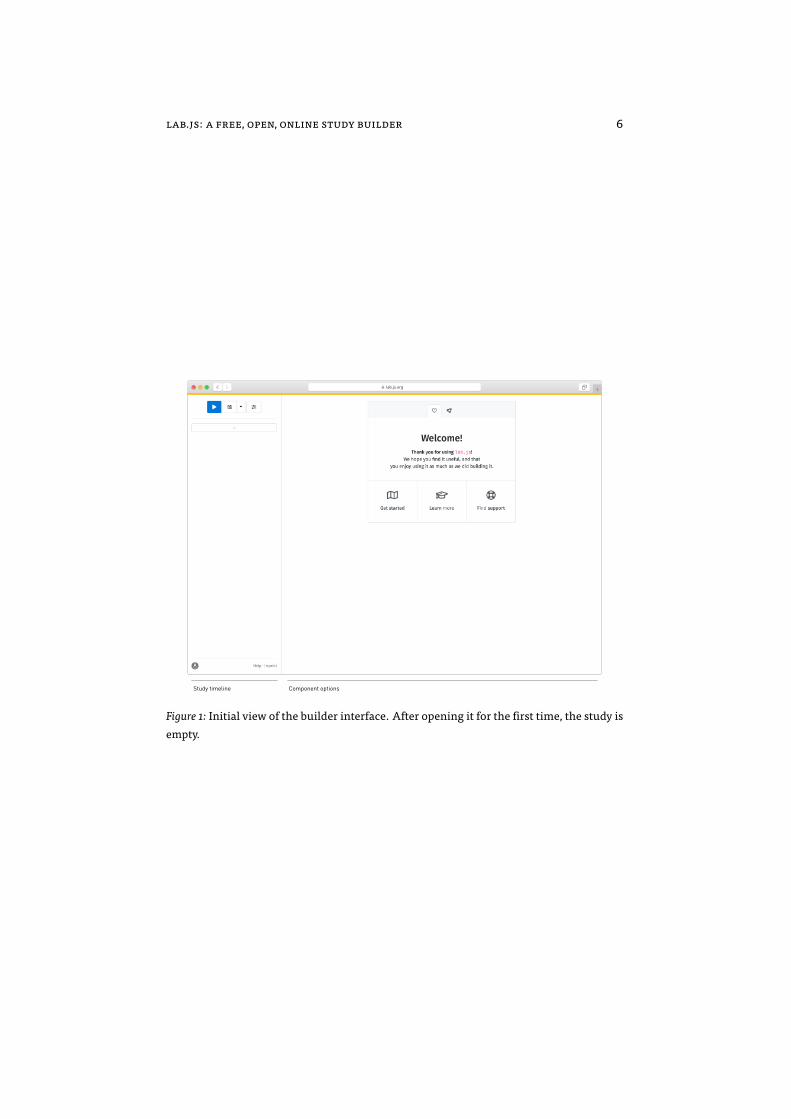
A first-time visitor to the interface will find an empty study waiting to be filled(Figure 1). The welcome screen offers a variety of examples and templates to build15
upon, which we warmly invite users to explore; for the purpose of this tutorial, wedemonstrate the construction of a study from scratch. Our first task, therefore, willbe to add the initial content to the nascent study.
The interface is divided into two panes: The pane to the left represents the study’soverall structure, providing access to the study’s constituent components, whereas20
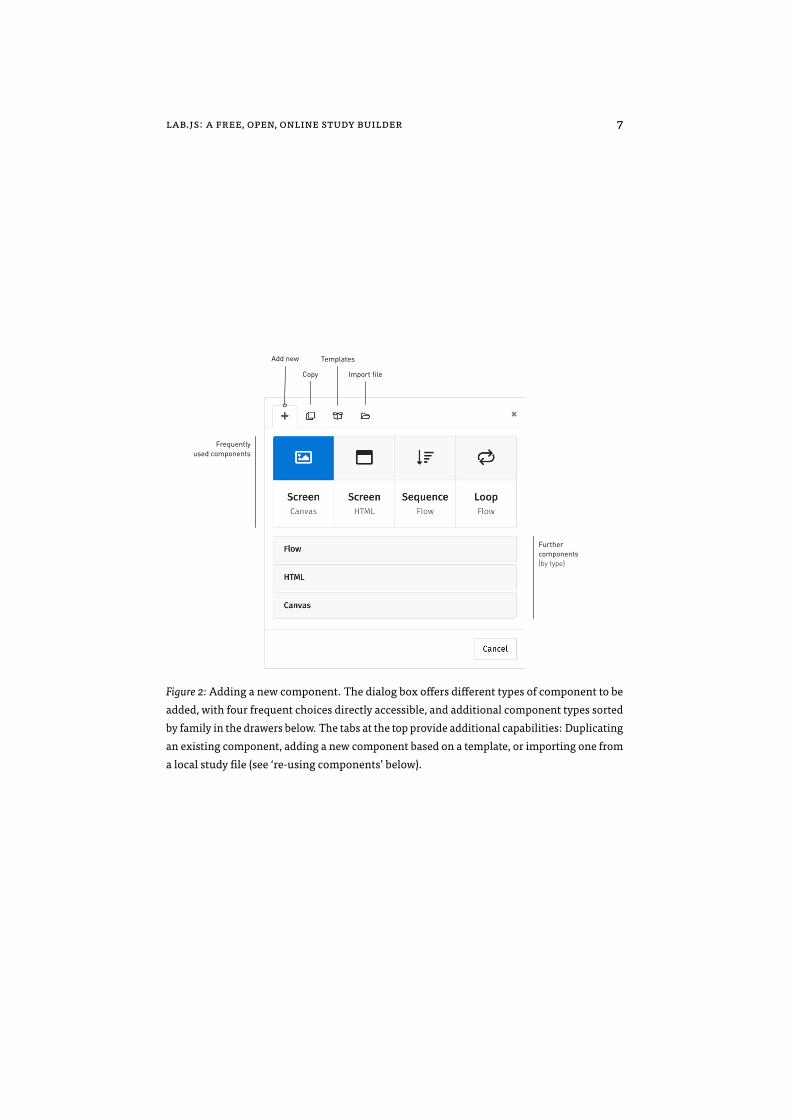
the right represents the details and settings of any selected component. New compo-nents are added to the study’s structure using the plus button on the left-hand sideof the interface. Clicking this button reveals a dialog offering a selection of variouscomponent types to add (Figure 2). We revisit the different options below; for now,our first selection will be the leftmost: A screen of the canvas type.25
Designing screens
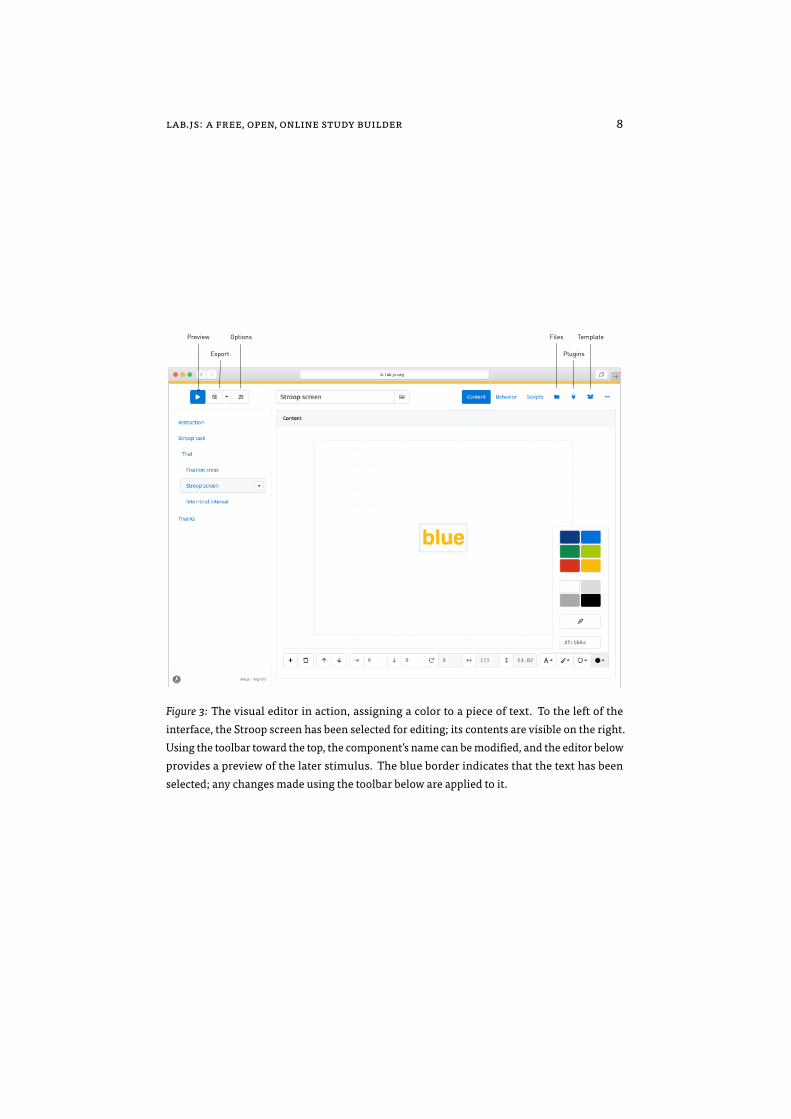
Having added the new screen component, its settings become visible on the right-hand side of the builder (Figure 3). Canvas-based screens are designed using a visualeditor that provides a direct preview of the later display. Through the toolbar belowthe editor, text, images, and other visual content can be added using the button with30
the plus symbol and thenmoved and re-sized directlywithin the preview. The toolbaralso provides access to an element’s precise location, color and (if applicable) furtheroptions. For the purpose of our Stroop task, wemight add a single word in the centerof the screen, select a color for it, and increase the font size and weight. With thisbasic screen complete, a click on the blue preview button in the top left toolbar shows35
the task as a participant will experience it, and provides a first glimpse of the studyin progress.
lab.js: a free, open, online study builder 6
Study timeline Component options
Figure 1: Initial view of the builder interface. After opening it for the first time, the study isempty.
lab.js: a free, open, online study builder 7
Frequentlyused components
Furthercomponents(by type)
Add new
Copy
Templates
Import file
Figure 2: Adding a new component. The dialog box offers different types of component to beadded, with four frequent choices directly accessible, and additional component types sortedby family in the drawers below. The tabs at the top provide additional capabilities: Duplicatingan existing component, adding a new component based on a template, or importing one froma local study file (see ‘re-using components’ below).
lab.js: a free, open, online study builder 8
Preview
Export
Options Files
Plugins
Template
Figure 3: The visual editor in action, assigning a color to a piece of text. To the left of theinterface, the Stroop screen has been selected for editing; its contents are visible on the right.Using the toolbar toward the top, the component’s name can bemodified, and the editor belowprovides a preview of the later stimulus. The blue border indicates that the text has beenselected; any changesmade using the toolbar below are applied to it.

lab.js: a free, open, online study builder 9
Working towards a single trial, our next step is to extend the study by addingfurther screens of the same type: A screen with a centered plus sign prior to theStroop screen serves as a fixation cross, and an empty inter-stimulus interval followsit. As before, new components are added to the study structure on the left-handside, where their vertical order represents the temporal succession during the study.5
Briefly hovering the cursor in the intended location of the new component, in thiscase above and below the existing screen, oncemore reveals the button for insertingcomponents. Previewing the study at this point, however, shows that the task neverprogresses beyond the initial fixation cross; clearly another change is in order.
Changing components’ behavior10
Beyond their contents, furtheroptions for any selected component canbe set throughthe different tabs listed at the top right of the interface. The behavior tab determinesits behavior during the study: Here, the topmost set of options provides a visualrepresentation of the component timeline onwhich additional events and stimulican be scheduled (e.g. sounds), as well as a timeout after which the studymoves on15
to the next component. For the fixation cross and the inter-trial interval, we wouldlike screens to disappear after a fixed amount of time (wemight choose, for example,500ms duration for the fixation cross and 1000ms for the inter-stimulus interval).For the Stroop screen itself, the participant’s response triggers the transition; there-fore, the set of permissible responsesmust be defined (Figure 4). In the responses grid,20
the first column, label, represents the qualitative meaning applied to any response.In our case, the available options are the different colors in which the wordmight beshown. The next columns request that we select between different actions that aparticipant might take tomake their response. In our study, participants indicatetheir answer by pressing one of several keys. Thus, the event that corresponds to a25
response is the keydown. This is not the only option: Mouse-based responsemodesare also available, and responses can be triggered specifically when a button or keyis pressed or released. The next column, target, would allow us to limit responsesto specific parts of the screen, for example by restrictingmouse clicks to predefinedcontent or screen areas. By leaving the field empty, we allow responses anywhere30
onscreen. The final column allows us to filter events further, in this case by key:Entering a single letter assigns the corresponding key to the response in question(multiple alternative buttons can also bemapped onto the same response, by sepa-rating the keys with commas). With timeouts and responses in place, the study nowruns through a single trial when previewed.35

lab.js: a free, open, online study builder 10
Figure 4: The possible responses available on the Stroop screen, with each color representedusing a different key. Below, the correct response has been defined using a placeholder (seetext for a detailed description).
Figure 5:Minimal settings for a loop that only counts repetitions.

lab.js: a free, open, online study builder 11
Flow control
A single trial is, of course, only the first step toward a useful study: A completeStroop experiment will containmany trials, each repeating the screens we have justbuilt while varying word and hue. We could duplicate our screens and change theircontent manually to create a longer study, however this would be an effortful and5
tiresome endeavor, and limit the study to a static order of stimuli. To more easilycreate an experimental task, flowcontrol components allowus to go beyond the linearsequence of screens we have encountered so far. Wewill use this type of component,first, to group the existing screens into one unit. The software can then repeat thisgrouped set of screens to create a recurring trial structure automatically. Our final10
task will then be to add variation between these repetitions.The most basic flow control component is the sequence, which combines a set
of successive components. A sequence is added to the study structure in the sameway the screens were (cf. Figure 2), and other components can be nested within bydrag and drop. When this is complete, a slight indentation indicates that multiple15
screens have been combined into a larger unit, in our case into a single trial (as inFigure 3). Though it is required for the next step, at this point, the grouping is forour convenience only, and invisible to participants.
A loop repeats a single component (a screen, sequence, or another loop) multipletimes. Like the sequence, it accepts nested content. Its main options concern the20
number of repetitions and the attributes that define each one. These are representedas a grid (Figure 5), with every row representing a repetition of the loop’s contents,and every columnaparameter that varies across iterations. In themost basic case, wemight nameone column repetition and assign anumber to every cycle. Previewingthe study at this point shows that the trial is repeated the requested number of25
times—but it is repeated verbatim, without variation in either color name or hue,thus lacking themanipulation at the core of the Stroop paradigm.
Defining parameters
To addmeaningful variation across loop iterations, we can define parameters thatchange between repetitions, and set their respective levels. For the Stroop task,30
these are the presented word and its color. To implement this design, we mightname two columns in the loop’s grid word and color and fill themwith the desiredcombinations (Figure 6). The plus button at the bottom of the grid can be used toadd further rows as needed, generate a larger grid from an given design, or to loadand save the entries to a csv file. Lastly, as the option below the grid indicates, the35
software will run through all repetitions in random order, though this could bechanged by limiting the number of trials or switching to one of the other availablerandomization schemes.

lab.js: a free, open, online study builder 12
Figure 6: Loop parameters for the Stroop task (abridged). In the columns, the presentedword and its hue are defined as two string variables; each row represents the set of valuesthat determine one iteration. Rows are shuffled before presentation, resulting in a randomordering during the study.

lab.js: a free, open, online study builder 13
Even with this addition, the screen remains constant: We’ll need to include thevarying parameters in the screen content so that the display and behavior reflect theexperimental manipulation.
Using placeholders
Tomark insertion points for varying content, lab.js uses placeholders, temporary5
stand-ins that are replaced by other data during the study. Placeholders are definedusing a dollar sign and curly braces, ${}, where an expression between the bracketsrepresents the data that is substituted as the component is prepared. Tomake use ofthepreviouslydefinedparameters, for example,wecan insert${ this.parameters.word
} in place of the fixed screen content, as a placeholder for the currently static word10
shown during every trial (Figure 7). Similarly, by replacing the color code in the tool-bar’s fill option with ${ this.parameters.color }, we can vary the word’s color.As a result, color and content now change dynamically across trials. At this point,we have constructed a complete within-subjects experimental paradigm, entirelywithout code. Many like it can be assembled with similar ease.15
Placeholders are central to studies in lab.js, and can be used inmost optionsthroughout thebuilder interface. For example, because thegoal of the task is tonamethe color, wemight insert ${ this.parameters.color } in the correct response fieldon the behavior tab (cf. Figure 4). Here too, the corresponding value is substituted,and the accuracy of the response coded accordingly.20
Previewing data
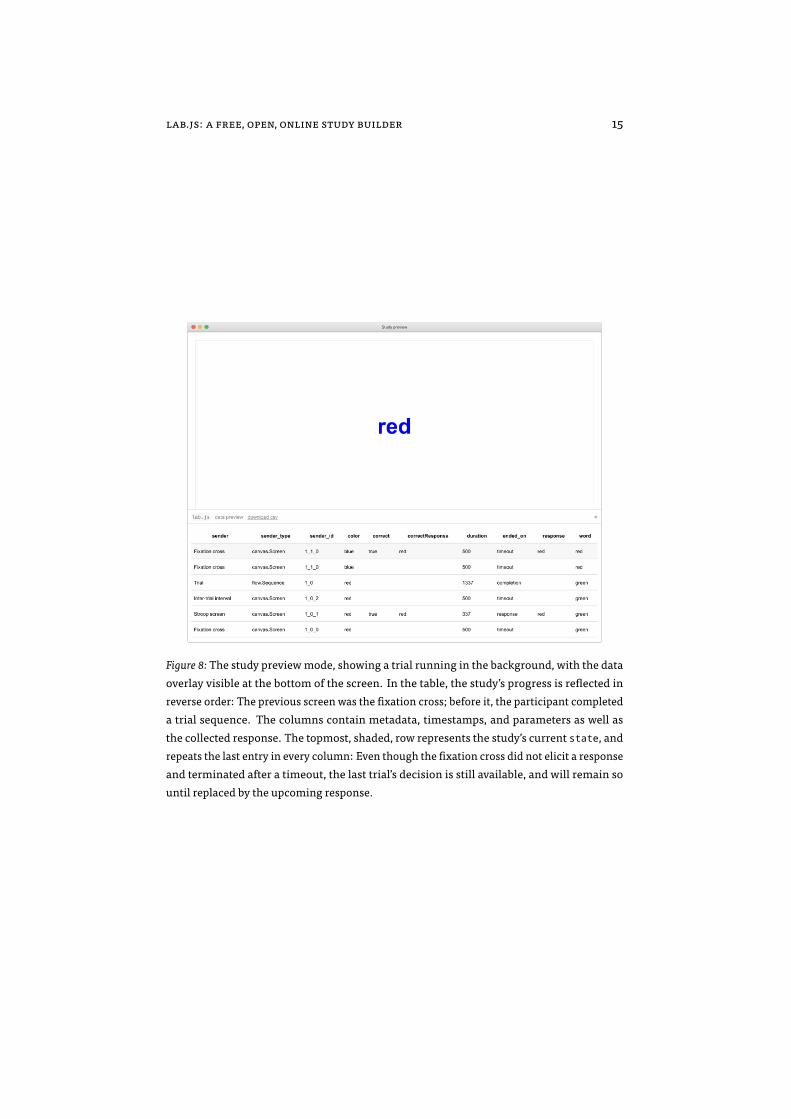
Data are collected automatically as the study progresses. In the study preview, theaccumulated data can be accessed through the small button in the lower right-handscreen corner. The button reveals a data grid (Figure 8) where different variablesare collected in columns; rows represent a single component each. Every screen,25
sequence or loop adds a line the instant a participantmoves beyond it. In the preview(but not the final dataset), the rows are reversed, so that the latest entries are addedon top, where they can be compared directly to the current screen content.
The entries in the sender column reflect the origin of the data through the nameof the corresponding component; the column sender_type indicates its type. Fur-30
ther columns include timing information, the response given by the participant,and the parameters set by the design. If a correct response has been defined, it isincluded, as is an indication of whether the recorded responsematches this standard(as a Boolean value, true or false).

lab.js: a free, open, online study builder 14
Figure 7: Final version of the Stroop screen, including placeholders in place of the text contentand hue (at the bottom of the color selector).
lab.js: a free, open, online study builder 15
Figure 8: The study previewmode, showing a trial running in the background, with the dataoverlay visible at the bottom of the screen. In the table, the study’s progress is reflected inreverse order: The previous screen was the fixation cross; before it, the participant completeda trial sequence. The columns contain metadata, timestamps, and parameters as well asthe collected response. The topmost, shaded, row represents the study’s current state, andrepeats the last entry in every column: Even though the fixation cross did not elicit a responseand terminated after a timeout, the last trial’s decision is still available, and will remain sountil replaced by the upcoming response.

lab.js: a free, open, online study builder 16
Experiment state and feedback
The topmost, shaded row in the data preview represents the latest entry in each col-umn, or the study’s current state. Through the state, data from previous componentsis accessible until overwritten by a new entry in the same column. For example,in our task, the last observed response persists until the next stimulus is shown,5
because the intervening components do not accept or store responses. This is oftenuseful, particularly when providing feedback regarding previous answers1.
The study’s state canbeusedwithinplaceholders, inamanneranalogous to thepa-rameters introducedabove. For example,wemight include${ this.state.correct
} on the inter-trial screen to show the accuracy of the last response and provide feed-10
back to participants. However, if we were to try this, the screen would remain empty.This is because lab.js attempts, in order tomaximise performance, to prepare andrender all screen content as early as possible, ideally as the page is loading2. Thus,by default, screen content is fixed entirely before participants start interacting withthe study, and data generated later is not available for inclusion in components. To15
remedy this, individual components can be set to tardymode by checking the cor-responding box on the behavior tab. Activating this option on a componentmeansthat it is prepared only just prior to its presentation, allowing it to reflect the latestcollected data, though at the expense of some further processing (and potentially aminuscule delay) during the study. Activating tardymode on the inter-trial screen20
makes the feedback visible – the screen now indicates the veracity of the responsethrough the values true and false. Admittedly, this Boolean value is not themostfriendly feedback, but thankfully, it is also not difficult to replace.
Logic in placeholders
Placeholders can contain any JavaScript expression, so that it is possible to include25
small programs directly in the screen content, or in any other option that supportsplaceholders. So far, we have retrieved values from variables and included themverbatim, but expressions give us the opportunity to perform further computationsbased on state and parameters. For our example, we might want to translate thebinary values into more helpful feedback by replacing the Boolean values with30
friendlier messages. A ternary expression helps us achieve this, by switching be-tween two outcomes based on a binary variable. It consists of three parts, a binarycriterion, and two values that are substituted depending on whether the conditionis met or not. For example, ${ this.state.correct ? 'Well done!' : 'Please
try again.' } evaluates into the message ‘Well done!’ after correct responses,35
1Earlier data can, of course, also be accessed, for example to calculate aggregateperformance. The data storage mechanism is described in the documentation athttps://labjs.readthedocs.io/en/latest/reference/data.html
2This corresponds to the prepare-run-strategy introduced byMathôt et al. (2012)
lab.js: a free, open, online study builder 17
whereas themessage ‘Please try again.’ is shown following incorrect answers.Thisuseof expressions isnot limited to substituting content; it canbeusedwithin
any placeholder. For example, wemight provide graphical feedback by switchingthe color of a circle between green and red depending on the participant’s response.Nor is accuracy the only possible switching criterion: We could similarly instruct5
participants to respond faster by comparing the value of this.state.duration toa fixed threshold. Thus, combined with expressions, placeholders provide a verygeneral and flexible mechanism for varying all of a study’s content and behavior.
Using html
Although the visual interface is undoubtedly convenient, the browser offers more10
options for defining content. Indeed, most information on the web is not definedas a fixed visual layout, but using the Hypertext Markup Language, html. Thistechnology allows studies built with lab.js to draw upon themanifold options andresources for content and interaction design available to anyweb page, which extendfar beyond the capabilities of many classical experimental tools. lab.js supports15
html-based screens through a dedicated component type (second from the left inFigure 2), and studies can combine both as required.
Defining screens using html does not fix their layout precisely as the visualeditor does; instead, screen content is represented as text, and augmented by tagsthat reflect the semantic purpose of any part of the page. To provide amore concrete20
example, <main>blue</main> indicates that themain content of a screen is thewordblue. The tags, enclosed in angle brackets, are not shown to the user. Instead, thebrowser takes into account the additional semantic information they provide, andchooses an appropriate visual representation. Content defined using html mayconsequently vary in its exact layout across different devices and browsers, adapting25
to screen sizes, zoom settings, resolutions and aspect ratios. In comparison to thevisual editor, the code-based nature of html takes a small amount of time to learn,which its flexibility quickly repays. To support users, the built-in editor completestags as they are entered, highlights potential mistakes and suggests remedies.
Screen design presents another common hurdle for beginning online experi-30
menters, since it requires formatting instructions defined in the css language. Inthis regard, too, lab.js assists researchers by providing built-in defaults for com-monly used layouts. For example, a three-tiered vertical structure can be designedquickly by adding <header>, <main> and <footer> tags to a screen and placing therespective content within them; the built-in styles will automatically provide an35
appropriate screen layout (e.g. Figure 9). To facilitate placement and alignmentof content, the library also provides a range of convenience css classes3. As an
3The documentation provides an overview at https://labjs.readthedocs.io/en/latest/

lab.js: a free, open, online study builder 18
Figure 9: Three-tiered html-based instruction screen using <header>, <main> and <footer>elements.

lab.js: a free, open, online study builder 19
example, the content-vertical-center class centers content on the vertical axis(alternatively, content canbemoved to thetop andbottom vertically, andhorizontallyto the left, right and center).
Dynamically generated content can also be embedded into the html syntaxusing placeholders. Thus, aminimal html equivalent to the graphically constructed5
screen we constructed abovemight be the following:
<main
class="
content-vertical-center
content-horizontal-center
"
style="
font-size: 4rem;
font-weight: bold;
color: ${ this.parameters.color };
"
>
${ this.parameters.word }
</main>
The free combination of html- and canvas-based screens allows researchersto mix different content types at their convenience. For example, we have foundit useful to define instructions using html so that their content can adapt to thescreen size, while designing stimuli using the canvas for maximum performance10
and consistent presentation across devices.
html forms
An additional advantage of html is its ability to represent forms and questionnaires,making lab.js useful beyond purely experimental research. This is supportedthroughform components,which capture andprocess data collected in forms4. Their15
content is also defined using html5, so that a minimal questionnaire might be rep-resented by the following snippet:
<main>
<form>
<p>Please provide the participant id</p>
<input name="participant_id" type="text" required>
reference/style.html4The idea of generic form processor goes back to Göritz and Birnbaum (2005) and Reips and Neuhaus
(2002).5A visual questionnaire builder for lab.js is currently under development

lab.js: a free, open, online study builder 20
<button type="submit">Submit</button>
</form>
</main>
The above code translates to a basic formonscreen, containing a single text-basedinput field and a button to submit the data. The form component extracts all data au-tomatically upon submission: In this case, the entry is saved in the participant_idcolumn; anyadditionalfieldswould likewisebe included in theparticipants’ datasets.
To ensure consistency of the collected information, validation logic can be ap-5
plied. In our example, the required attribute dictates that the field contain a value,and a participant will only be able tomove further after filling it. Beyond themerepresence of a value, more complex validation is possible within the html code, forexample by constraining entries to a given input type (e.g. number, email, date, etc.)or comparing them to a predefined pattern.10
Study deployment, archival, and re-use
With the construction of the study, of course, the scientific work has only just begun.Data collection and the archival of a study’s materials are further, central steps in thescientific process that lab.jsmakes easier andmore efficient.
Saving a study to disk15
As with most other experimental software, studies constructed in lab.js can besaved to a single file that contains all content, settings, stimuli and auxiliary files.This file can be downloaded using the corresponding button in the toolbar (Figure 1),and is best suited for development and public archival. Using the dropdownmenunext to the save button, an experiment file can be re-opened later for inspection and20
further modification.
Deploying a study for data collection
For a study to be truly useful, it must run beyond the confines of the builder and theexperimenter’s device, and be made accessible within a laboratory or publicly onthe internet. This, too, previously demanded specialized technical knowledge, and25
therefore presented a challenge for researchers considering online data collection.Depending on the project goals and the available infrastructure, lab.js offers awideand growing range of options for data collection, all designed to vastly simplify thepreviously complex task of hosting studies. All deployment options are likewiseavailable from the dropdownmenu next to the save button.30
Themost basic option is offline data collection, which bundles all necessary files torun the study entirely without external infrastructure. This export option results in
lab.js: a free, open, online study builder 21
a zip archive that contains the study as visible in the builder preview, pre-configuredto save all collected data as a csv file at the end of the study. Besides facilitating localtesting and data collection, this type of bundle can easily be shared in a preregistra-tion or archived alongside data and other materials, so that the exact appearanceand behavior of a study are preserved and documented.5
Data collection over the internet is the common feature of all further exportoptions. Researchers looking for an effortless hosting optionmight opt for a clouddeployment, placinghosting anddata storage in thehandsof ahighly reliable externalservice. Studies can be transferred to an external provider6 directly from the builderin amatter of seconds, and data collection can start immediately.10
Where full control over the data collection process is required, the php backendbundle can be used to install a survey onmost, if not all, commonweb servers. Thisoption produces a zip archive which, extracted on a php-enabled webspace, fullyautomates data collection: Data is continuously sent from the client and gathered ina database as participants complete the study7.15
Studies created with lab.js also integrate with external tools as part of a largerdata collection project. Another export option creates the code required for inte-gration in survey tools such as the proprietary services Qualtrics (Qualtrics, 2016) orSoSci Survey (Leiner, 2014), and open-source alternatives like the powerful surveyframeworks Formr (Arslan,Walther, & Tata, in press) or LimeSurvey (Limesurvey20
GmbH, 2018). Beyond that, the builder provides a direct export to The ExperimentFactory (Sochat et al., 2016; Sochat, 2018), which is an open-source framework forassembling and hosting batteries of tasks in fully reproducible containers, as well asjatos (Lange et al., 2015), Open Lab (Shevchenko&Henninger, 2019), and Pavlovia(https://pavlovia.org). These easy-to-use, comprehensive, open-source study25
hosting platforms not onlymake study hosting, recruitment and data collection easy,but provide further features such as (in the case of jatos) real-time interaction be-tween participants and coordination with crowdsourcing services such as Amazon’sMechanical Turk.
Through all of these deployment options, we aim to support a wide range of30
data collection scenarios, so that lab.js can be used by researchers regardless oftheir technical experience and the infrastructure at their disposal. Across all alterna-tives, we automatically implement best practices for online researchwherever possible,with the least amount of effort on part of the user. For example, cloud and serverdeployment options are configured to support the multiple site entry technique,35
through which participant populations can be distinguished by the URL throughwhich they access the study (Reips, 2002). Likewise, the software automatically
6At the time of writing, lab.js provides direct export to the Netlify hosting service(https://netlify.com).
7The idea of a generic server-side data collection script was introduced by Birnbaum (2000) and Göritzand Birnbaum (2005).
lab.js: a free, open, online study builder 22
captures information provided by external recruitment services, such as worker andtask ids generated by AmazonMechanical Turk (cf. Stewart, Chandler, & Paolacci,2017). Where external files are used, their paths are obfuscated so as not to revealthe experiment’s structure.
Re-using components directly5
Beyond the publication and re-use of entire studies, lab.js is built to facilitate therecombination, extension and exchange of individual components or larger parts ofan experiment. Screens, forms or entire tasks are designed to be self-contained andeasily transferable between studies.
Every part of an experiment can be independently exported as a stand-alone file10
and re-imported into a new study, preserving all content and settings. This option isavailable from the drop-downmenu next to any selected component in the studyoverview. The resulting file can be imported into a study from the dialog box foradding new components, or used as starting point for an entirely new project.
Creating task templates15
To facilitate the re-use of more complex paradigms, parts of a study can also bedesignated templates. This reduces a set of nested components into oneunit, creatinga single component that encapsulates an entire task, and can be easily droppedinto other studies. For example, the Stroop task we constructed earlier could, oncecompleted, be condensed into a single template component, making it much easier20
to reuse it, for example as part of a larger test battery.If a component ismarked as a template, all of its contents and options are hidden
and thereby protected from inadvertent modification. In their place, a much simplerinterface provides access to only the settings relevant to the task. For example,template authors can allow users to adapt the number of trials, response buttons,25
instruction texts, and other parameters without requiring them to delve into thedetails of the task. Any values set by users are available inside a template throughthe parameter mechanism outlined above, and can be inserted inside placeholders.
Through the template mechanism, lab.js bridges the gap betweenmanual pro-gramming, which offers control over every aspect of a study, and entirely template-30
focused tools that limit researchers to a set of predefined tasks or stimuli. Usingtemplates, more advanced users can package technically complex paradigms intoeasy-to-use units that can be reapplied without the expertise and effort that werenecessary to create them. This, however, does not hinder customization and adapta-tion—by exposing the relevant settings, a task can be adjusted tomatch the needs of35
a research project without requiring detailed knowledge of its innermost workings.Because the template setting is reversible, the accessibility of a task bundled as a

lab.js: a free, open, online study builder 23
template does not preclude in-depth inspection andmodification: Paradigms can behandled andmodified at multiple levels of abstraction or technical detail, suitingthe needs of the individual researcher.
Timing performance
A common concern of researchers considering online data collection has been the5
accuracy and precision of presentation and response timing, especially for fast-pacedexperimental paradigms. Empirical validation studies have found that browser-based stimulus display and response collection incurred lags and variability bothwithin a given browser and across different combinations of browser and operatingsystem (e.g. Reimers & Stewart, 2014). Thoughmany phenomena are demonstrably10
robust to anymeasurement inaccuracy introduced both bymoving from dedicatedexperimental software tobrowser-baseddata collectionandgatheringdataoutsideofthe controlled laboratory setting (Semmelmann&Weigelt, 2017a; de Leeuw&Motz,2015; Hilbig, 2016; Crump, McDonnell, & Gureckis, 2013; Simcox & Fiez, 2014),considerable room for improvement has remained with regard to both accuracy15
(denoting freedomfrombias or lag) andprecision (freedomfrommeasurementnoise,Plant&Turner, 2009). Withlab.js, webuildand improveuponpreviousapproachesto browser-based experimentation, reducing both lags andmeasurement noise, andfurther approaching the performance of native experimental software (see alsoHenninger &Arslan, 2019).20
The first prerequisite for precise timemeasurement is exact timekeeping. Ourframework consistently uses high-resolution timers that provide sub-millisecondprecision for all measurements, following Barnhoorn et al. (2015). This is a simple,but effective improvement over previous in-browser timingmethods that truncatetimestamps at themillisecond level by default8.25
Asecond imperative for precise timing is thatmeasurements are synchronized tothedisplay refresh. Failing todo so results in addednoise because timemeasurementmight start before or even after a stimulus has been presented. Therefore, frame syn-chronization is commonplace in dedicated, native experimental software (cf. Mathôtet al., 2012). In lab.js, all timer onsets are aligned to the browser’s animation frame30
cycle, which closely tracks the underlying graphics hardware (Barnhoorn et al., 2015).Presentation times are likewise synchronized to browser’s screen update rate: Anadaptive algorithmmonitors the current rendering performance and presents newcontentwith the frame thatmost closelymatches the intendeddisplay duration. This
8At the time of writing, some browsers add a small amount of artificial jitter—2ms in the case ofFirefox—to all timemeasurements for security reasons, limiting the potential timing precision of anybrowser-based data collection project. Having resolved the underlying security issues, the Chromedevelopers have proceeded to remove this artificial source of noise, and we expect the other browsers tofollow suit.
lab.js: a free, open, online study builder 24
provides a considerable improvement over the typically-used setTimeout function,which is prone to overshooting any specified duration and thereby adding lag.
Thefinal element tohigh-performance timing is anoptimized renderingengine thatminimizes delays in stimulus presentation. Here again, lab.js improves upon previ-ously available tools, adopting strategies formerly found only in native experimental5
software: It reduces computation during the study as much as possible, pre-loadingand preparing stimuli prior to their presentation (a prepare-run-strategy, c.f. Mathôtet al., 2012). For screens constructed using the visual editor, the canvas-based render-ing engine provides flexible, high-performance graphics capabilities by removingthe computationally expensive layout calculations required for HTML content. Users10
can furtherminimize the amount of content that the browser needs to re-render dur-ing the study through Frame components, which provide a constant frame of htmlcontent around a changing stimulus, thereby avoiding large changes to the docu-ment and the corresponding costly layout recalculations. For example, in our Strooptask, we might extract those parts of the screen that remain constant during the15
task into a frame and place the stimulus loop inside, varying only themain contentbetween screens while leaving its surroundings (e.g. instructions) in place. Thereby,only the actual stimulus is exchanged between screens instead of re-drawing theentire display with every change, howeverminor. Using the canvas.Frame compo-nent to enclose a set of canvas-based screens provides a common <canvas> element20
across all screens. This eliminates changes to the html document entirely, furtherincreasing rendering performance.
With all of these features in place, the practical performance of the library re-mains to be demonstrated empirically. To this end, we conducted a technical valida-tion study similar to that reported byMathôt et al. (2012) and Reimers and Stewart25
(2014). In particular, to capture the software’s performance in isolation, wemeasuredthe actual duration of stimuli output by the computer, and used external hardwareto simulate precisely timed responses, which we then compared to the responseinterval measured by our software. In our tests, we created a continuous series ofrapidly changing screen content, creating a load that likely exceeds the demands30
of many typical experiments (Garaizar & Vadillo, 2014). This we repeated across arange of common browsers and operating systems to evaluate the consistency ofresults (further details regarding ourmethod are provided in the Appendix).
Figures 10 and 11 summarize our validation results. In a nutshell, presentationintervals were consistently met across browsers and operating systems. Chrome35
and Safari always matched the intended stimulus duration exactly. Firefox metthis criterion in more than 98% of our measurements on Windows and mac os,with somewhat reduced performance on Linux. However, Firefox never deviatedmore than a single frame from the target interval. Internet Explorer Edge showed aconsiderable increase in single-frame deviations, and 0.3% ofmeasurements two40

lab.js: a free, open, online study builder 25
Linux Chrome 100.0%
50ms
100.0%
100ms
100.0%
250ms
100.0%
500ms
100.0%
1000ms
Firefox 97.5% 99.5% 96.0% 99.5% 63.5%
Mac OS Chrome 100.0% 100.0% 100.0% 100.0% 100.0%
Firefox 99.5% 99.5% 100.0% 100.0% 98.5%
Safari 100.0% 100.0% 100.0% 100.0% 100.0%
Windows Chrome 100.0% 100.0% 100.0% 100.0% 100.0%
Firefox 99.0% 99.5% 100.0% 99.5% 100.0%
Edge 75.0% 99.5% 73.5% 59.0% 72.5%
Figure 10: Timing validation results for stimulus presentation, in percent of target frames hitacross simulated durations, browsers, and systems. The green areas represent the proportionof exact matches, orange areas are one frame to early or to late, and red areas two frames ormore (only the case for Internet Explorer Edge, in less than 1% of the two longest presentationintervals). See also https://lab.js.org/performance for themost recent timing results.
Linux Chrome
50ms 100ms 250ms 500ms 1000ms
Firefox
Mac OS Chrome
Firefox
Safari
Windows Chrome
Firefox
Edge
-1 0 +1 +2
Figure 11: Timing validation results for response time measurement across browsersand systems. Dots represent the mean difference between simulated and cap-tured response times in frames, and bars the observed standard deviation. See alsohttps://lab.js.org/performance for themost recent timing results.
lab.js: a free, open, online study builder 26
ormore frames off the preset duration. However, the excellent performance acrossall other browsers demonstrates that this is specific to IE, and one might expectthis browser to catch up with its competitors as it matures9. The overall result thusdemonstrates that lab.js offers extremely precise stimulus timing capabilities, withthe best-performing browsers approaching the level of popular native experimental5
software (Mathôt et al., 2012; Garaizar, Vadillo, López-de-Ipiña, & Matute, 2014;Garaizar & Vadillo, 2014).
Regarding response times, our results show somewhat greater variability acrossbrowsers. Most consistently overestimate response latencies by between one andtwo frames (16.7 to 33.4ms), with fairly little noise (themaximum sdwe observed10
was 7.4ms, in Internet Explorer Edge at 1000ms response latency). Chrome standsout not only for its small measurement variability across operating systems, but alsofor its consistent lag of almost exactly a frame on Linux andmac os, and around1.5ms onWindows. We fully anticipate that this result will improve further withbrowsers’ future development, and providemore detailed and up-to-date informa-15
tion at https://lab.js.org/performance.All this being said, we would like to emphasize that the standard of absolute
timing accuracy and precision applied above, while well worth pursuing, is a veryhigh one. In practice, themeasurement noise for response times we report aboveis negligible inmany common paradigms: Even for between-subject experimental20
comparisons, Reimers and Stewart (2014) show through simulations that a smallincrease in thenumber of participantsmakesup for any loss of power due to between-browser variations anda timingnoise larger than theoneweobserved (see alsoUlrich& Giray, 1989; Damian, 2010; Brand & Bradley, 2012). Similarly, within-subjectsdesigns that focus on differences in response times between conditions (which we25
intuit are already common in paradigms that rely on response times) are insensi-tive to any consistent lag introduced in timing (see also Reimers & Stewart, 2014,for an in-depth discussion). Our sole caution is that correlations between individualdifferences and absolute response timesmight bemediated by participants’ choiceof browser (Buchanan& Reips, 2001), but again, compared to common variation in30
response times, we observe only very small differences between browsers. Shouldsuch concerns, however, become pressing, studies built in lab.js also translate nat-urally to a laboratory setting, which provides the opportunity to run the study in abrowser with the desired timing characteristics, and on consistent hardware.
In sum, reviewing this pattern of results and particularly the timing performance35
that lab.js offers in combination with themost powerful browsers, we cautiouslypredict that further improvements are unlikely to stem from browser-based experi-mental software itself, but will result from browser and operating system advance-
9At the time of writing, Internet Explorer is slated for replacement by a new browser with the sametechnical foundation as Chrome

lab.js: a free, open, online study builder 27
ments. Finally, we would like to note that all of thesemeasurements are exclusivelyconcerned with, and therefore purposefully isolate, our software’s performance:Beyond any timing inaccuracy introduced by the software, common peripheral hard-ware such as off-the-shelf keyboards and displays is likely to introduce further lagsandmeasurement noise (e.g. Garaizar et al., 2014; Plant & Turner, 2009; Lincoln5
& Lane, 1980). These, however, apply not only to online data collection but alsomost laboratory settings, unless specialized response hardware is used10. Thoughthe variability of peripherals outside of the laboratory is likely to introduce a slightamount of additional variance, this is unlikely to affect qualitative findings exceptfor the smallest of effects (Hilbig, 2016; Semmelmann&Weigelt, 2017a; Brand&10
Bradley, 2012).
Technical underpinnings
Theworkhorseof stimulusdisplayanddatacollection inlab.js is a customJavaScriptframework that governs all interaction with participants. In the workflow demon-strated above, the builder interface generates a JavaScript representation of the study,15
which is read and executed by the framework within participants’ browsers. Theentire study logic thus runs on the client side, reacting immediately to participantinput and eliminating network latency which would be introduced by loading newpage content from the server between screens.
All components in a study can be customized through JavaScript code to fit20
the requirements of the scientific endeavor at hand. In the builder’s scripts tab,custom instructions can be attached to every component, to be run at specific pointsduring its lifecycle. For example, when it is prepared, a component’s optionsmightbe adjusted depending on participants’ previous performance, enabling adaptiveexperimentation. When a component is run, the presentation can be extended25
beyond the default behavior, enabling, for example, interaction patterns within asingle screen that go far beyond the standard stimulus-response pattern. In addition,code canbeexecutedwhen thepresentation comes toanend, for example to computeindices based on the collected responses. Similarly, because the library exposesthe stimulus canvas and the html document directly via standardized browser30
interfaces, any content or library that can be included on a regular web page canalso be added to an experiment built with lab.js. This ability to add custom logicduring the study, and to draw from the rich ecosystem of the web, greatly increasesthe flexibility of our tool, allowing it to cater to applications yet to be envisioned, andto complete tasks we have not foreseen or implemented directly in the interface.35
10Whenever a research question requires exact, absolute interpretation of time measurements, werecommend that the hardware and software setup be subjected to careful timing validation. Havingperformed such a validation and replicated our results, for example, a researcher might confidentlysubtract any consistent browser-specific lag from all measured response times.

lab.js: a free, open, online study builder 28
Programming studies in pure JavaScript
Researchers interested in defining studies directly in code can use the underlyinglibrary independently of the builder for maximumflexibility. It exposes the samebuilding blocks through a declarative, object-oriented interface whichmirrors thegraphical builder. To give a brief example, a basic canvas-based Stroop screen would5
be defined as follows:
const stroopScreen = new lab.canvas.Screen({
content: [
{
type: 'text',
text: '${ this.parameters.word }',
fill: '${ this.parameters.color }',
left: 0, top: 0,
fontSize: 48,
fontWeight: 'bold'
fontFamily: 'Helvetica, Arial, Sans-Serif',
}
],
responses: {
'keypress(r)': 'red',
'keypress(b)': 'blue',
/* ... */
}
})
As in the builder interface, these basic stimuli can also be combined into super-ordinate components:
const stroopTrial = new lab.flow.Sequence({
content: [
fixationCross,
stroopScreen,
interTrialInterval,
],
})
All of these components provide a consistent JavaScript interface. For example,a developer might write stroopScreen.run() to trigger the preparation and display10
of the screen defined above, which would show the stimulus and wait for one of thepredefined responses. The exact samemethod can be applied to the stroopTrial

lab.js: a free, open, online study builder 29
to present a slightly more involved sequence of events. To include custom logic,instructions can be added to any component for execution at a later point in timethrough the command stroopScreen.on('run', function() { /* ... */ })11.
On a technical level, all different components are linked through JavaScript’sinheritance mechanism, and adopt the vast majority of their behavior from the5
general-purpose lab.core.Component, extending it only as required by their specificuse. For example, the lab.html.Screen component only inserts its html contentinto the page when it is run; most other logic, including the substitution of place-holders, is provided by the library core. In a similar way, and with very little effort,new functionality can be added to the library itself by creating custom components10
that perform specific tasks. In addition, a pluginmechanism exists to attach logic toany component in a study, regardless of its type. This is, for example, used to providethe data preview for all parts of the study.
We have taken great care to follow best practices for scientific software (Wilsonet al., 2014) while developing lab.js: The code is available under an open-source15
license which allows for free extension andmodification. All changes are trackedin the project repository, and a set of automated tests run across multiple browsersare applied to every one, ensuring continued stability and compatibility. We areconfident that this infrastructure will greatly facilitate sustained development. Ex-periment files are automatically upgraded to the latest library version, incorporating20
changes and updates, while exported studies include all necessary files to supportcontinued use and long-term archival.
Discussion
lab.js provides an easy-to-use, visual interface for building browser-based studies,enabling efficient data collection both in the laboratory and online. The graphical25
builder makes the design of studies easy, while html, css and JavaScript integra-tion give researchers full control over their studies’ presentation and behavior. Itspresent focus is on experimental paradigms, for which it provides powerful, high-performance stimulus and response timingmethods, but our library supports thefull gamut of behavioral research, and canmake full use of the powerful capabilities30
of modern browsers.We believe that the advantages of a platform like lab.js are not limited tomore
efficient data collection: Because the web is an almost ubiquitous medium, andlab.js freely available, studies can easily be shared with colleagues before they areused in the field, facilitating collaboration within a project. Following publication,35
studies can be publicly archived, viewed, modified and adapted by interested re-11A full code-based Stroop task is available from our repository at
https://github.com/felixhenninger/lab.js/tree/master/tasks

lab.js: a free, open, online study builder 30
searchers, who can build upon previous efforts and customize or extend existingstudies without having to re-implement a paradigm in its entirety. Our softwaremakes it easy to export parts of studies in an editable format for sharing and re-use,facilitating collaboration and cumulative science (Nielsen, 2011; Ince, Hatton, &Graham-Cumming, 2012); completed studies can be similarly shared in archivable5
form, so that paradigms can be viewed and potentially replicated directly withoutadditional software.
Of course, some lines of research may require dedicated native experimentalsoftware, particularly if they involve specialized external hardware. That being said,browser-based experimental software supplements andmay inmany cases supplant10
native experimental software, and its capabilities are continuously expanding (for ex-ample, physiological measurements and basic eye-tracking are already possible, seeSemmelmann&Weigelt, 2017b).
Through lab.js, we have aimed tomake available the power and flexibility of-fered by dedicated laboratory-based data collection software in the browser and on15
the web. We hope that it will enable a more efficient (and, keeping with the spirit ofMathôt et al., 2012, perhaps even fun) realization of behavioral science, andwewouldbe proud to support the ingenuity and creativity of our fellow researchers. The inter-net has been themediumwith the fastest growth in the history of humanity, and itcontinues to evolve rapidly. We hope to track these developments and incorporate20
future best practices in the library, benefiting all users. As an open and freely avail-able project, we would be thrilled to serve as a foundation for future browser-basedresearch.

lab.js: a free, open, online study builder 31
AcknowledgementsThe authors would like to express their sincere gratitude to all colleagues and students whohavemade this project possible. The students and teaching assistants in the University of
Landau cognitionmodule have accompanied our software over several years and through asmany incarnations, have patiently pointed out its rough edges and provided outstanding5
feedback that has shaped its design; our tas and ras have likewise been instrumental inshaping this software: Ronja Frölich, Theresa Honervogt, Luisa Horsten, Felix Ludwig, KevinE. Tiede and VanessaWiench. Michael Kriechbaumer and Felix Ludwig worked tirelessly tobuild our repository of example tasks. Heartfelt thanks are due to Christine Blech and RobertGaschler at the FernUniversität Hagen, Sophie Scharf at the University of Mannheim, Merle10
Schuckart and Julian Keil at the University of Kiel, and themembers of the University ofLandau Cognition Lab, who bravely applied this software in their research from a very early
stage, and provided invaluable feedback. Katja Heuer and Priyanka Nag patiently andexpertly guided it into the open source world as part of theMozilla Open Leaders mentorship;Pablo Garaizar and Teon Brooks provided fantastic technical feedback; Jakob Voß counseled15
us on how to better support open science, andWikimedia Germany e.V. supported our effortsthrough an Open Science fellowship.
This work wasmade possible through the University of Mannheim’s Graduate School of
Economic and Social Sciences as well as the research-training group ‘Statistical Modeling in
Psychology’ (grk 2277), both funded by the German Research Foundation.20

lab.js: a free, open, online study builder 32
References
Arslan, R. C., Walther, M. P., & Tata, C. S. (In press). Formr: A study framework allow-ing for automated feedback generation and complex longitudinal experience-sampling studies using R. Behavior ResearchMethods. doi:10.3758/s13428-019-01236-y5
Barnhoorn, J. S., Haasnoot, E., Bocanegra, B. R., & Steenbergen, H. v. (2015). QRT-Engine: An easy solution for running online reaction time experiments usingQualtrics. Behavior ResearchMethods, 47(4), 918–929. doi:10.3758/s13428-014-0530-7
Birnbaum,M. H. (2000). SurveyWiz and FactorWiz: JavaScriptWeb pages that make10
HTML forms for research on the internet. Behavior ResearchMethods, Instruments,& Computers, 32(2), 339–346. doi:10.3758/BF03207804
Brand, A., & Bradley, M. T. (2012). Assessing the effects of technical variance onthe statistical outcomes ofWeb experimentsmeasuring response times. SocialScience Computer Review, 30(3), 350–357. doi:10.1177/089443931141560415
Buchanan, T., & Reips, U.-D. (2001). Platform-dependent biases in online research:DoMac users really think different? In K. J. Jonas, P. Breuer, B. Schauenburg, &M. Boos (Eds.), Perspectives on internet research: Concepts andmethods. RetrievedDecember 16, 2018, from http://www.uni-konstanz.de/iscience/reips/
pubs/papers/Buchanan_Reips2001.pdf20
Crump, M. J. C., McDonnell, J. V., & Gureckis, T. M. (2013). Evaluating Amazon’sMechanical Turk as a tool for experimental behavioral research. PLOSOne, 8(3),e57410. doi:10.1371/journal.pone.0057410
Damian, M. F. (2010). Does variability in human performance outweigh imprecisionin response devices such as computer keyboards? Behavior Research Methods,25
42(1), 205–211. doi:10.3758/BRM.42.1.205de Leeuw, J. R. (2014). jsPsych: A JavaScript library for creating behavioral experi-
ments in a Web browser. Behavior Research Methods, 1(47), 1–12. doi:10.3758/s13428-014-0458-y
de Leeuw, J. R., &Motz, B. A. (2015). Psychophysics in aWeb browser? Comparing30
response times collected with JavaScript and Psychophysics Toolbox in a visualsearch task. Behavior Research Methods, 48(1), 1–12. doi:10.3758/s13428-015-0567-2
Garaizar, P., &Vadillo,M. A. (2014). Accuracy and precision of visual stimulus timingin PsychoPy: No timing errors in standard usage. PLOSOne, 9(11), e112033. doi:10.35
1371/journal.pone.0112033
Garaizar, P., Vadillo, M. A., López-de-Ipiña, D., &Matute, H. (2014). Measuring soft-ware timing errors in the presentation of visual stimuli in cognitive neuroscienceexperiments. PLOSOne, 9(1), e85108. doi:10.1371/journal.pone.0085108

lab.js: a free, open, online study builder 33
Göritz, A. S., & Birnbaum,M. H. (2005). Generic HTML Form Processor: A versatilePHP script to saveWeb-collected data into aMySQL database. Behavior ResearchMethods, 37(4), 703–710. doi:10.3758/BF03192743
Henninger, F., & Arslan, R. C. (2019).Who said browser-based experiments can’t haveproper timing?Manuscript in preparation.5
Hilbig, B. E. (2016). Reaction time effects in lab- versusWeb-based research: Exper-imental evidence. Behavior Research Methods, 48(4), 1718–1724. doi:10.3758/s13428-015-0678-9
Ince, D. C., Hatton, L., & Graham-Cumming, J. (2012). The case for open computerprograms.Nature, 482, 485–488. doi:10.1038/nature1083610
Lange, K., Kühn, S., & Filevich, E. (2015). Just another tool for online studies (JATOS):An easy solution for setup andmanagement of web servers supporting onlinestudies. PLOSOne, 10(6), e0130834. doi:10.1371/journal.pone.0130834
Leiner, D. J. (2014). SoSci Survey. Retrieved from https://www.soscisurvey.com
Limesurvey GmbH. (2018). LimeSurvey: An open source survey tool. Retrieved from15
http://www.limesurvey.org
Lincoln, C. E., & Lane, D. M. (1980). Reaction time measurement errors resultingfrom the use of CRT displays. Behavior ResearchMethods & Instrumentation, 12(1),55–57. doi:10.3758/BF03208326
MacLeod, C. M. (1991). Half a century of research on the Stroop effect: An integrative20
review. Psychological Bulletin, 109(2), 163–203. doi:10.1037/0033-2909.109.2.163
Mathôt, S., Schreij, D.,&Theeuwes, J. (2012).OpenSesame:Anopen-source, graphicalexperiment builder for the social sciences. Behavior ResearchMethods, 44(2), 314–324. doi:10.3758/s13428-011-0168-725
Nelson, L. D., Simmons, J., & Simonsohn, U. (2017). Psychology’s renaissance.AnnualReview of Psychology. doi:10.1146/annurev-psych-122216-011836
Nielsen, M. (2011). Reinventing discovery. Princeton: University Press.Peirce, J. W. (2007). PsychoPy—Psychophysics software in Python. Journal of Neuro-
scienceMethods, 162(1–2), 8–13. doi:10.1016/j.jneumeth.2006.11.01730
Plant, R. R., & Turner, G. (2009). Millisecond precision psychological research in aworld of commodity computers:Newhardware, newproblems?BehaviorResearchMethods, 41(3), 598–614. doi:10.3758/BRM.41.3.598
Qualtrics. (2016). Qualtrics. Provo, Utah: Qualtrics. Retrieved from https://www.
qualtrics.com35
Reimers, S., & Stewart, N. (2014). Presentation and response timing accuracy inAdobe Flash andHTML5/JavaScriptWebexperiments.BehaviorResearchMethods,47(2), 309–327. doi:10.3758/s13428-014-0471-1
Reips, U.-D. (2002). Internet-based psychological experimenting: Five dos and fivedon’ts.SocialScienceComputerReview,20(3), 241–249.doi:10.1177/08944393020200030240

lab.js: a free, open, online study builder 34
Reips,U.-D. (2007). Themethodologyof internet-based experiments. InA.N. Joinson,K. Y. A.McKenna, T. Postmes, &U.-D. Reips (Eds.), TheOxfordHandbook of InternetPsychology (pp. 373–390). Oxford: University Press.
Reips, U.-D., & Neuhaus, C. (2002). WEXTOR: AWeb-based tool for generating andvisualizing experimental designs and procedures. Behavior Research Methods,5
Instruments, & Computers, 34(2), 234–240. doi:10.3758/BF03195449Semmelmann, K., &Weigelt, S. (2017a). Online psychophysics: Reaction time effects
in cognitive experiments. Behavior ResearchMethods, 49(4), 1241–1260. doi:10.3758/s13428-016-0783-4
Semmelmann, K., &Weigelt, S. (2017b). Online webcam-based eye tracking in cogni-10
tive science: A first look. Behavior ResearchMethods, 1–15. doi:10.3758/s13428-017-0913-7
Shevchenko, Y., & Henninger, F. (2019).Open Lab: AWeb application for running andsharing online experiments. Manuscript in preparation.
Simcox, T., & Fiez, J. A. (2014). Collecting response times using AmazonMechanical15
Turk and Adobe Flash. Behavior Research Methods, 46(1), 95–111. doi:10.3758/s13428-013-0345-y
Sochat, V. V. (2018). The Experiment Factory: Reproducible experiment containers.The Journal of Open Source Software. doi:10.21105/joss.00521
Sochat, V. V., Eisenberg, I. W., Enkavi, A. Z., Li, J., Bissett, P. G., & Poldrack, R. A.20
(2016). The Experiment Factory: Standardizing behavioral experiments. Frontiersin Psychology, 7. doi:10.3389/fpsyg.2016.00610
Stewart, N., Chandler, J., & Paolacci, G. (2017). Crowdsourcing samples in cognitivescience. Trends in Cognitive Sciences, 21(10), 736–748. doi:10.1016/j.tics.2017.06.00725
Stoet, G. (2017). PsyToolkit: A novel Web-based method for running online ques-tionnaires and reaction-time experiments. Teaching of Psychology, 44(1), 24–31.doi:10.1177/0098628316677643
Strauss, E., Sherman, E. M. S., & Spreen, O. (2006).A compendium of neuropsychologi-cal tests: Administration, norms, and commentary. Oxford: University Press.30
Stroop, J. R. (1935). Studies of interference in serial verbal reactions. Journal of Experi-mental Psychology, 18(6), 643–662. doi:10.1037/h0054651
TheWorld Bank. (2016). Individuals using the internet. Data retrieved fromWorldDevelopment Indicators, https://data.worldbank.org/indicator/IT.NET.USER.ZS.35
Ulrich, R., & Giray, M. (1989). Time resolution of clocks: Effects on reaction timemeasurement—Good news for bad clocks. British Journal of Mathematical andStatistical Psychology, 42(1), 1–12. doi:10.1111/j.2044-8317.1989.tb01111.x
lab.js: a free, open, online study builder 35
von Bastian, C. C., Locher, A., & Ruflin, M. (2013). Tatool: A Java-based open-sourceprogramming framework for psychological studies. Behavior ResearchMethods,45(1), 108–115. doi:10.3758/s13428-012-0224-y
Wilson, G., Aruliah, D. A., Brown, C. T., Hong, N. P. C., Davis, M., Guy, R. T., …, &Wilson, P. (2014). Best practices for scientific computing. PLOS Biology, 12(1),5
e1001745. doi:10.1371/journal.pbio.1001745Woods, A. T., Velasco, C., Levitan, C. A., Wan, X., & Spence, C. (2015). Conducting
perception research over the internet: A tutorial review. PeerJ, 3, e1058. doi:10.7717/peerj.1058

lab.js: a free, open, online study builder 36
Appendix: Validation studymethods
Formany experimental paradigms, the accuracy of stimulus’ presentation durationsand the measurement of response times is paramount. To rigorously assess theperformance of lab.js, we therefore captured the generated stimulus durations andsimulated response times of different lengths precisely using external hardware.5
A simple experiment alternated screens of dark and light stimuli. To test displaydurations, 100 stimuli of either brightnesswere shown in succession, set to a timeoutof either 50, 100, 250, 500 or 1000ms. For response time validation, we conducteda second experiment with the same setup that waited for keyboard input on everyscreen, and we simulated a keypress after each of the aforementioned intervals.10
We ran this experiment through all presentation and response durations acrossthe most recent versions of all major browsers (Firefox, Chrome, Safari, InternetExplorer Edge) and operating systems (Windows, Ubuntu Linux,Mac OS), onmodesthardware (Table 1).
Specialized video analysis hardware (Nexys Video; Digilent Inc.) decoded the15
screen content as output by the computer via its HDMI port. We monitored andrecorded thebrightnessof the centerpixel, aswell as theonset of every frame (verticalsync). To generate responses, a USB development board (Teensy 3.5; PJRC) connectedto the computer simulated key presses following an increase in brightness. To verifythe software’s frame synchronization, response intervals were timed starting from20
the frame onset. We captured screen content, frame onsets, and USB data using alogic analyzer (Logic Pro 8; Saleae, Inc.) sampling every 20ns (50MHz sampling rate).The complete data and analysis scripts are available via

lab.js: a free, open, online study builder 37
Table 1: Hardware used in the timing validation study
pc mac
Processor Intel Core i3 Intel Core i5
Clock frequency 3.5 GHz 2.7 GHz
Memory 8GB 16GB
Graphics adapter Intel Iris Graphics
Screen resolution 1280 x 720, 60Hz refresh rate
Operating System Windows 10Ubuntu 18.10
Mac os 10.14