LAB Reports for - Materials Science - WordPress.com
55
Materials Science LAB Reports for Materials Science
-
Upload
khangminh22 -
Category
Documents
-
view
0 -
download
0
Transcript of LAB Reports for - Materials Science - WordPress.com

Materials Science LAB Reports for
Materials Science

1
German – Jordanian University (GJU) Material Science Laboratory
IE 2210 Summer Semester 2008‐2009
i i
Experiment 1
Tensile Testing of Metals
Mahmood Hisham Shubbak
Title MarkObjective /10 Introduction /15 Method /15 Result /30 Discussion and Conclusion /20 Report Neatness /10 Total Mark /100

2
Objective:
To determine the followings: 1. The relation between the engineering stress and engineering strain according to the
results obtained from the tensile test. 2. The yield stress and offset yield (proof) stress. 3. Modulus of elasticity or Young's modulus. 4. Tensile strength or ultimate tensile strength. 5. Percentage elongation and percentage reduction in area. 6. Indications to understand some important properties of material , such as ductility
brittleness and toughness.
Introduction:
Strength is the resistance of a material to a tensile load applied to a specimen, and this is the principle of the Tensile Test.
The tensile test specimen differs in shape, size and kind of material according to final product we want.
There are two main kinds of test pieces: 1. Full section specimens. 2. Machined specimens.
In this experiment we have studied the relation between the tensile force acting on a piece of metal [N] and the extension of it [mm].
In order to get rid of size we study the relation between stress and strain.
Stress (σ): the force acting per unit area.
[MPa]
Strain (ε): the measure of the elongation or contraction of a line segment in the body. ∆
In Engineering Stress and Strain we use the original section area (A0) and the extension of length (∆L).
But in True Stress and Strain we use the instantaneous area (Ai) and instantaneous gauge length (Li).
Method:
The first step is measuring the cross section dimensions (width; thickness or reduced diameter) by micrometer and slide caliper if needed.
The next step is scribing the gauge length L0 on the piece by two soft marks of symmetrical distance from both ends; After scribing the gauge length it should be measured accurately by using slide caliper; and this gauge will be the reference for obtaining the percentage elongation.
Next we install the appropriate grips of the convenient size on the tensile testing machine; and put the chart of load-extension diagram on the plotter attached to the testing machine; which its vertical Y ordinate axes gives the force in a factor of mm according to the chosen force-scale; and its horizontal X axes moves in a magnified scale with the displacement of the moving head of the tensile machine.

3
We choose the force scale of the machine, fix the piece on the grips and start the operation until fracture.
Then we remove the specimen from the machine, measure all parameters that we have measured earlier. And analyze the results.
Results:
Applying the experiment method we got the graph shown on page (5).
The initial properties for the piece were: Diameter D0 = 12.3 mm → Area A0 = 118.82 mm2 Length L0 = 50.0 mm
The final properties are: Diameter Df = 10.2 mm → Area Af = 81.7 mm2 Length Lf = 58.3 mm
From the graph we can calculate these values as follows:
101.6 118.82
106.4 118.82 .
% ∆
100% . %
% ∆
100% . %
∆∆ 185,240
Discussion and Conclusion:
In this experiment we learned about tensile testing of metals. Applying this test we can study the behavior of any material under tensile conditions. According to the graph on page (5) we can recognize an elastic region (from A to B)
where the material can recover its initial shape and dimensions after removing the effect.
In the graph the region of elasticity is linear, which has a slope (Modulus of elasticity). Here it equals to 185 GPa.
Elastic region can determine by drawing the proof line from 0.2% of L0 parallel to the stress function, the intersection point with it is the proof stress (here we got 855MPa).
After the elastic region, any change on shape or dimensions becomes permanent and this region is called plastic region (After point B).
The engineering stress increase to a maximum value (Tensile Strength; here we got 895.5 MPa).

4
After that it decreases a little until the fracture. During this process the dimensions of specimen changes as follows:
o The length increases (with %elongation here = 16.6%). o The section area decreases (with % area reduction here = 31.2%).
Note: the graph on page (5) describes the force as a function of extension, from this graph we can easily get the engineering stress-strain diagram using the initial properties which are explained in the results part of this report.

1
German – Jordanian University (GJU) Material Science Laboratory
IE 2210 Summer Semester 2008‐2009
i i
Experiment 2
Hardness Test
Mahmood Hisham Shubbak
Title MarkObjective /10 Introduction /15 Method /15 Result /30 Discussion and Conclusion /20 Report Neatness /10 Total Mark /100

2
Objective:
1. To understand the meaning of hardness, and to be able to distinguish between its values given for different materials.
2. To become familiar with the basic methods and machines used to measure hardness.
3. To be able to relate hardness to other properties of materials.
Introduction:
Hardness is the resistance of a material to a permanent indentation; the values of hardness give general indication of the strength of the material and its resistance to wear and scratches.
There are several methods to measure hardness, the most commonly used tests are shown in the following figure:
In this experiment we have seen the Vickers, Rockwell and Brinell tests using Universal Hardness Testing Machine.
1. Rockwell Test: This method is widely used in industry because it is quick, simple and direct reading although it is not reliable and inaccurate.
With this system, a hardness number is determined by the difference in depth of penetration resulting from the application of an initial minor load followed by a larger major load; utilization of a minor load enhances test accuracy.
2. Vickers Test: In this method a very small diamond indenter having pyramidal geometry is forced into the surface of the specimen. [Applied loads are much smaller

3
than for Rockwell and Brinell] ranging (between 1 and 1000g).The resulting impression is observed under a microscope and measured; this measurement is then converted into a hardness number using the formula as shown in the following figure:
3. Brinell test: In Brinell tests, as in Rockwell measurements, a hard, spherical indenter is forced into the surface of the metal to be tested. The diameter of the hardened steel (or tungsten carbide) indenter is 10.00 mm (0.394 in.). Standard loads range between 500 and 3000 kg in 500‐kg increments; during a test, the load is maintained constant for a specified time (between 10 and 30 s). Harder materials require greater applied loads. The Brinell hardness number, HB, is a function of both the magnitude of the load and the diameter of the resulting indentation.
2

4
Method:
Take 3‐4 specimens of various materials. Grind and polish the surfaces (the material surface must be polished and not painted).
Fix the specimen on the Universal Hardness Tester, focus the surface and start the operation.
After the impression of the indenter is created, measure its dimensions. Get the value of Hardness automatically from the machine. Apply each law for each test using the measured values to check the hardness value.
Note: With Rockwell test the hardness number can be read easily without any calculations.
Results:
Applying the experiment method we got the following results:
1. The Vickers Test: Load force = 30 kg The Impression Shape is Diamond. Its diagonals (measured):
d1 = 0.5555 mm d2 = 0.5342 mm Average d = 0.5449 mm
The Hardness value got from machine = 187.3 Calculated HV = (1.854 * 30) / (0.5449)2 = 187.33
2. The Brinell Test: Load force = 187.5 kg The Indenter shape is Sphere with D = 2.5 mm The Impression Shape is Circle. Its diameter (measured):
d1 = 1.1068 mm d2 = 1.1073 mm Average d = 1.1071 mm
The Hardness value got from machine = 184.7
Calculated . . . . .
.

5
3. The Rockwell Test: Rockwell Type: T The Indenter shape is 1/16 in. Sphere. Load force:
o Minimum = 10 kg o Maximum = 30 kg
The Hardness value got from machine: o 1st trial HRT = 73.8 o 2nd trial HRT = 76.2
4. Micro Vickers: In this method we used a very accurate machine that gives the HV and converts it automatically into HRC.
Maximum Load force 2000 g. d1 = 99.49 mm d2 = 99.21 mm
The Hardness value got from machine: o 193 μHV o 9.2 μHRC
Discussion and Conclusion:
In this experiment we learned about hardness testing of materials. Applying this test we can study the behavior of any material under compression conditions (press or scratch).
Hardness can be defined as the resistance of the permanent indentation. There are many common methods and scales to measure hardness. In this experiment we learned about 3 important methods; Vickers, Rockwell and Brinell.
The main idea behind all these methods is using a particular indenter to be forced into the surface of the specimen and measuring the dimensions of its impression to calculate the hardness value.
Each test has its own merits. Vickers test is accurate, Brinells is widely common in manufacturing, and Rockwell is automated it does not need too much human interaction.
The hardness and strength are proportionally related; when the hardness increase the strength increases.

1
German – Jordanian University (GJU) Material Science Laboratory
IE 2210 Summer Semester 2008‐2009
i i
Experiment 3
The Impact Test
Mahmood Hisham Shubbak
Title MarkObjective /10 Introduction /15 Method /15 Result /30 Discussion and Conclusion /20 Report Neatness /10 Total Mark /100

2
Objective:
1. To determine the toughness of metals by an impact testing machine. 2. To observe the behavior of metals under high strain rate loading (impact
loading).
Introduction:
Toughness is a measure of the amount of energy required to cause an item to fracture and fail. The more energy that is required then the tougher the material.
Recall that ductility is a measure of how much something deforms plastically before fracture, but just because a material is ductile does not make it tough. The key to toughness is a good combination of strength and ductility. A material with high strength and high ductility will have more toughness than a material with low strength and high ductility. Therefore, one way to measure toughness is by calculating the aarreeaa uunnddeerr tthhee ssttrreessss ssttrraaiinn ccuurrvvee ffrroomm aa tteennssiillee tteesstt. This value is simply called “material toughness” and it has units of energy per volume. Material toughness equates to a slow absorption of energy by the material.
In order to determine the impact toughness of a material there are two types of Impact Test methods differs in specimens' specifications and methods of holding the specimens. These two types are:

3
1. Izod Test:
The specimen is tested in cantilever mode.
The specimen is firmly clamped in a vice with the prepared notch levels with the edge of the vice.
The impact blow is delivered on the same side as the notch.
2. Charpy Test:
The specimen is tested as a simply supported beam.
The edge of the pendulum strikes at mid‐span directly behind the milled notch.
The standard Charpy‐V specimen, illustrated in Fig.1. is 55mm long, 10mm square and has a 2mm deep notch with a tip radius of 0.25mm machined on one face.
Fig.2. Standard Charpy‐V notch specimen
For both tests, the specimen is broken by a single overload event due to the impact of the pendulum. A stop pointer is used to record how far the pendulum swings back up after fracturing the specimen. The impact toughness of a metal is determined by measuring the energy absorbed in the fracture of the specimen. This is simply obtained by noting the height at which the pendulum is released and the height to which the pendulum swings after it has struck the specimen . The height of the pendulum times the weight of the pendulum produces the potential energy and the difference in potential energy of the pendulum at the start and the end of the test is equal to the absorbed energy.

4
Note: The notch is important to make fracturing easier, so that it machined on the extended surface; the side of strike in Izod test, and the other side in Charpy test. Method:
Take a specimen of the standard [BS EN 10045‐1] and the shape shown in fig.2. Using an accurate microscope measure the specimen dimensions and check whether they satisfy the specific standard.
Fix the specimen on the Impact Test machine in Charpy holding method. Raise the pendulum hammer of the impact machine to its initial upper height and fix it.
Put the pointer of the absorbed energy scale at its initial position. Release the pendulum to strike the specimen and rise to another high, and notice the reading of the absorbed energy scale.
This reading is in kgforce.m unit, in order to get the toughness in Joules multiply by g (= 9.8 m\s2).
Notice the fracture appearance of the specimen and the shear fracture area.
Results:
Applying the experiment method we got the following results:
1. The Specimen Dimensions: Angle = 44.46 o Width = 9.971 mm. Length = 54.868 mm. Height = 9.957 mm. L/2 left = 27.49 mm. Radius of the notch = 0.259 mm. Height below notch = 7.927 mm.
All these dimensions are approximately among the standard range (see page 7 )
2. The Impact Toughness Test: Applying the experiment procedure we got the following absorbed energy reading:
o Toughness = 14.8 kgforce.m Converting this value to Joules:
o . . .

Dis
3. The Fr The shsurfacemateriastructu
Brittlegranuladeformshows fcompleheld at
cussion a
In this eimpact
Applyinto abso
There aholding
In figuretwo me
In this e In ordespecime
The toudeterm
The Impmetals,
racture Suhape of the differs fromal to anothere.
e fracture shar structure ation, whilefibrous struete .sometimlow tempe
nd Conclu
experiment test). ng this test worb energy iare two comg method; Ize.4 (on the ethods and texperiment r to get theen with theughness is pmined by thepact test is and this is
urface: e fracture anm specimener dependin
hows a cleawith little e ductile fracture. In thmes due to trature.
usion:
we learned
we can studn the procemmon methzod and Chanext page)the proceduwe learned true resulte specificatioproportionae area undevery importnecessary w
nd its n ng on its
an
acture e very ductthe very hig
d about tou
dy the abilitess before frods to applarpy methoyou can recure of Impad specificallts from the ons shown lly related tr the stresstant methowhen desig
tile materialgh ductility
ghness test
ty of a metaracture. y impact teds. cognize theact test. y about Chaimpact macin fig.2 [Stato hardness strain diagd to determning machin
ls the fractuof a materi
ting of mate
al to deform
est differs in
e difference
arpy methochine you mndard BS Es and strengram. mine the tounes …etc.
ures will notal the test i
erials (the
m plastically
n specimen
s between t
od. must use a N 10045‐1]gth; it can b
ughness of
5
t is
and
the
. e

6
Figure 4

1
German – Jordanian University (GJU) Material Science Laboratory
IE 2210 Summer Semester 2008‐2009
i i
Experiment 4
Bending Test
Mahmood Hisham Shubbak
Title MarkObjective /10 Introduction /15 Method /15 Result /30 Discussion and Conclusion /20 Report Neatness /10 Total Mark /100

Obj
Intr
Dbrea
Tevaloadsimleng Uequforcare eacforc Ininteof sdrawdiag Tsurfdete
Wcom Th(com
jective:
1. Undersmomen
2. Calculatmomen
3. Obtaini4. Unders
differen5. Perform
standar
roduction
Ductility is thaking.
he bend tesluating ducd (P) at the ply supportgth (L).
Using the equilibrium weces on the bnormal andh. (There arces acting).
n order to dernal forces ections fromw the sheargrams as fo
he stress atface of the sermined by
While acting mpression fo
he Neutral Ampression a
tanding thent and sheation of bendnt of inertia ng the Modtanding thence betweeming practicrds to test t
n:
he ability of
st is a methtility by appmidpoint oted beam w
uations of e can find thbeam at supd equal to Pre no more
determine twe use them which wer and momellows:
t any point ospecimen cy this formu
with a forceorce while t
Axis N.A andand tension
e free‐body r diagrams ding stress of differendulus of Elase concept ofn layers in ccal bending he ductility
f a material
od for plying a f a
with
hat the pports P/2 on external
the e method e can ent
on the an be la
e (P), the hithe lower su
d Neutral Pln) where the
diagrams Ffor simply sand deflectt cross‐sectsticity fromf Neutral Axcompressiotest on a spy of it.
to withstan
igher surfacurface is con
lane are somere is neithe
FBD for bendsupported btion caused tions.
m deflection xis N.A and on and tensipecimen acc
nd permane
ce of the spenfronted w
mewhere ber tension n
ding and drbeam. by the load
formula. Neutral Plaion in bendcording to s
ent deforma
ecimen is coith tension
etween thenor compre
rawing the
d, and the
ane and theing. specific
ation witho
onfronted wforce.
e two layersssion.
2
out
with
s

3
Calculating the stress at the higher surface we find that it is negative (compression) while the stress at the lower one is positive (tension).
Theoretically the stress at the Neutral Plane must be zero.
When we apply the load (P) some deflection (δ) will occur in the beam, this can be determined by the following formula:
48
Where E: is the Modulus of elasticity. P: is the applying load. L: the Length. I: the moment of inertia of the cross section.
We can get the value of E (Modulus of Elasticity) of the specimen using this formula.
In this experiment we are interested in deflecting the specimen from its mid‐point by 180o and seeing if it will fracture or not (whatever the necessary load is). Then we can determine if the specimen is ductile enough or not.
At the end of the bend test we can calculate the length of the specimen using this formula:
2 2
(t: clearance = (5‐10) mm) Method:
The test is held on a Deformed Carbon‐Steel Concrete reinforcement of 10 mm outside diameter according to standards.
The specimen will be cut so it is adapted to the machine. Choose a mandrel of dimensions; D= 4 x d = 4 x 10 = 40 mm. Install the mandrel in the plunger. Calculate the length between supports which equals to: L = 50 + 40 + 20 + 10 = 120 mm.
Adjust the supports to this distance. Put the specimen on the supports, then turn the machine on and let the mandrel move to bend the specimen at a U shape with the specified angel 180o.
If the specimen holds up it then it complies with the standard requirements and it is accepted.
Otherwise any crack occurs the specimen doesn’t follow the requirements and it is rejected.
Res
Ap
Dis
sults:
pplying the
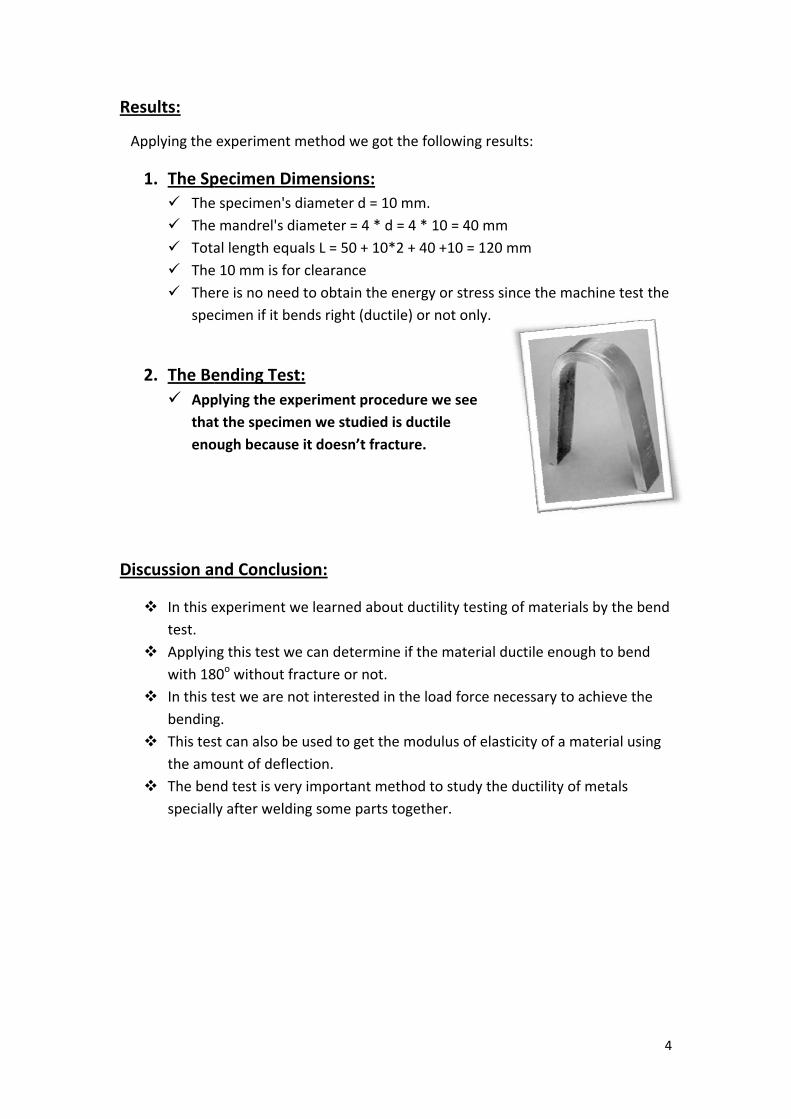
1. The Sp The The Tota The Thespe
2. The Be Appthateno
cussion a
In this etest.
Applyinwith 18
In this tbending
This testhe amo
The benspeciall
experiment
pecimen De specimen'se mandrel's al length eqe 10 mm is fere is no neecimen if it b
ending Teplying the et the specimough becaus
nd Conclu
experiment
ng this test w80o without test we are g. st can also bount of defnd test is vely after weld
t method w
Dimensions diameter diameter =quals L = 50 for clearanced to obtainbends right
st: experiment men we stuse it doesn’
usion:
we learned
we can detefracture ornot interes
be used to glection. ery importading some p
we got the fo
ns: d = 10 mm. 4 * d = 4 * + 10*2 + 40
ce n the energy(ductile) or
procedure udied is duc’t fracture.
d about duc
ermine if thr not. ted in the lo
get the mod
nt method parts togeth
ollowing res
. 10 = 40 mm0 +10 = 120
y or stress sr not only.
we see ctile
ctility testin
e material d
oad force n
dulus of elas
to study thher.
sults:
m 0 mm
since the m
g of materia
ductile eno
ecessary to
sticity of a m
e ductility o
achine test
als by the b
ugh to bend
o achieve th
material usi
of metals
4
the
bend
d
he
ing

1
German – Jordanian University (GJU) Material Science Laboratory
IE 2210 Summer Semester 2008‐2009
i i
Experiment 5
Preparation of Specimen for Micro‐Examination
Mahmood Hisham Shubbak
Title MarkObjective /10 Introduction /15 Method /15 Result /30 Discussion and Conclusion /20 Report Neatness /10 Total Mark /100

Obj
Pr
Intr
In whi Sele Bplac
If of tmussomstruinco Grin Aobtaachwiththe
Etch Afis a Etchto s
jective:
reparation a1. Grindin2. Etching
structu3. Using th4. Examin
roduction
preparing ach is flat, an
ecting the Sut first whece, to make
f there was he deformast be awareme cases‐ it ucture of theorrect concl
nding & PolAfter selectinain a reasonieved by grh water andpaper.
hing: fter the spelast proceshing. This prhow the cry
a specimen ng and polisg the polishere. he metalluring the stru
n:
a specimennd scratch f
Specimen: en selecting the specim
some sort oation, not pee of overheawill result ie specimenlusion.
lishing: ng the specnably surfacinding, and d rotated th
cimen is gos that it shorocess is imystal structu
for micro‐ehing the speed mirror‐fi
rgical microucture of th
for micro‐efree.
g the specimmen more re
of deformaterpendiculaating the spn deformat, and as a r
imen, it is nce with mirthen it sho
hrough 90° a
Afscramuspolibe u(Marangsuspmouheld
one throughould go thromportant to ure.
examinationecimen. nished surf
scope. e specimen
examination
men for the epresentativ
tion, the spear to it. Alsopecimen, betion in the result, givin
necessary toror finish, tould be cleaat each cha
fter the speatches that ast be removshing powdused are Aluagnesium Oxges from .5 pension in cunted on a fd against th
h the grindinough, in ordproduce a d
n by carryin
face of a spe
n under the
n, it must h
test, it musve for the a
ecimen muo when cuttcause if the
ng
o his is ned nge of
cimen is griappeared frved by polisders. The poumina (alumxide) or diato 3mm). Tconjunctionflat rotatingis rotating d
ng and the pder to be readeformatio
g out the fo
ecimen to r
microscope
ave a surfac
st be cut froims of the t
st be cut in ting the speere was ove
inded, thererom the grinhing the suolishing powminum oxidemond dust They are use with a polig disc, and tdisc under l
polishing prady for testn free layer
ollowing ste
reveal its
e.
ce produce
om a certaintest.
the directiocimen, we erheating –
e are some nding, theyrface with twders that me) or Magne(the particled in water shing cloth the specimeight pressu
rocesses, thting, it is ther of metal, a
2
eps:
d,
n
on
in
fine the may esia les
en is re.
here e and

It stru
EtsolusolutimeuseSomand(likeexpspeto mswa
Affor emicand
Me
is Etched byuctural char
tching can bution, or by ution, and he required fd matter, ame alloys cad some reque cast iron weriment). Acimen mustmove away abbed with
fter cleaningexaminatioroscope. Thd normal to
ethod:
Bringof no
Grinding GrindThe send ogrind
Washand dgrindstep.
Polishing Polishmachnecesthe p
Washthe a
At thi
y a suitableacteristics o
be done by iswabbing t
handled withfor etching nd etching n be etcheduires as mucwhich is stuAfter the etct be washedthe etchingalcohol, and
g the specimn under thehe surface othe axis of t
g representat more than
g d the specimspecimen shof the sand ing from a p
h the groundry it with aing particle
g h the grounhine, a constssary; to keolishing op
h the specimir dryer.
is point the
e reagent (Eof a metal a
immersion the surface h a nickel tovaries with reagents ofd in a few sech as thirty died in thisching proced under rung reagent, ad then dried
men, it’s bee metallurgof the specimthe microsc
ative specimn 12 mm.
men minimuhould be wapaper, to ppaper to th
nd surface on air dryer,es from bein
d surface otant drip ofep the clotheration.
men with w
surface of
tchant). Thiare not evid
the surfacewith a piecongs. The the type off course. econds, minutes
ss, the nning waternd then d.
een taken ical men must bcope tube.
men with a d
um form 12ashed in warevent the e next finge
of the specim in order tong carried o
of the specimf suspendedh covering t
water and cl
the specim
is reagent isent in the a
e of the spece of cotton
f
r,
be parallel t
diameter of
0 grit, 400 tter and rotcarry‐over oer grade san
men with wo prevent anver to the p
men using td polishing pthe disc wet
ean it with
en must be
s used to reas‐polished
cimen in thesoaked wit
to the surfa
f 20 mm, an
then 1000 gated througof relativelynd paper.
water, clean ny dirt or copolishing clo
the rotatingpowder in wtted thorou
alcohol, the
e like a mirro
eveal particucondition.
e etching th the etchi
ce, of the st
nd a thickne
grit gradualgh 90° at eay coarse
it with alcoontaminatiooth in the n
g disc polishwater is ughly, durin
en dry it wit
or‐surface.
3
ular
ng
tage
ess
ly. ach
ohol, on or ext
ing
g
th

4
Etching Wash the flat, polished finished surface with running tap water, shake the specimen to remove the water, and then wash it with alcohol, and then put it to dry, to remove all the oil, grease or other things that may’ve been there on the surface, to ensure that the surface to be absolutely clean, and NEVER touch the specimen with your hands.
Prepare the proper etching solution according to the metal of the specimen.
Use proper method to apply the etching solution to the prepared surface of the specimen, and apply it.
After etching, quickly wash the surface with running tap water, then swab it with alcohol and dry it.
Using Microscope
Put the specimen under the objective lens of the metallurgical microscope and use the proper magnification power.
Sketch the micro‐structure of the etched surface of the specimen, as it is observed through the eye‐piece lens of the metallurgical microscope.
Results:
Applying the experiment method we got the following results:
1. Grinding and Polishing:
The sand papers were rotating in a 300 speed.
2. Etching:
The etching solution we used was Nitric Acid.
3. Microscope:
The microscope power was 0.8*16*16 = 204.8 (times)
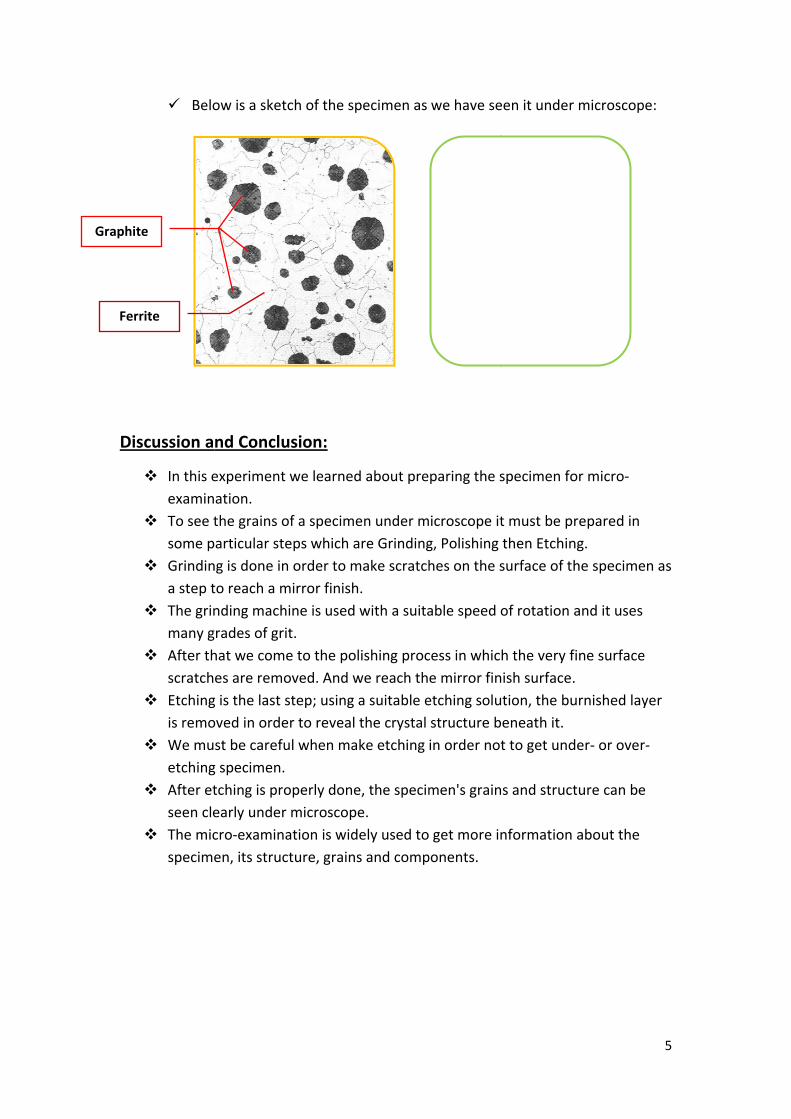
The specimen we have studied was cast iron.
According to what we have seen by the microscope, the specimen contained only carbon graphite and ferrite.
Dis
Graphite
Ferr
Belo
cussion a
In this eexamin
To see tsome p
Grindina step t
The grinmany g
After thscratch
Etchingis remo
We muetching
After etseen cle
The micspecime
e
rite
ow is a sket
nd Conclu
experiment ation. the grains oarticular steng is done into reach a mnding machrades of grihat we comes are remog is the last soved in ordest be carefug specimen. tching is proearly undercro‐examinaen, its struc
tch of the sp
usion:
we learned
of a specimeeps which an order to mmirror finishhine is used it. e to the pooved. And wstep; using er to reveal ul when ma
operly doner microscopation is widcture, grains
pecimen as
d about pre
en under mare Grindingmake scratchh. with a suita
lishing procwe reach tha suitable ethe crystal ke etching
e, the specime. ely used tos and comp
we have se
paring the s
icroscope itg, Polishing hes on the s
able speed
cess in whice mirror finetching solustructure bin order no
men's grain
get more inponents.
een it under
specimen fo
t must be pthen Etchinsurface of t
of rotation
h the very fnish surfaceution, the bubeneath it. t to get und
ns and struc
nformation
r microscop
or micro‐
prepared in ng. he specime
and it uses
fine surface. urnished lay
der‐ or over
ture can be
about the
5
pe:
en as
e
yer
r‐
e

1
German – Jordanian University (GJU) Material Science Laboratory
IE 2210 Summer Semester 2008‐2009
i i
Experiment 6
Scanning Electron Microscope
Mahmood Hisham Shubbak
Title MarkObjective /10 Introduction /15 Method /15 Result /30 Discussion and Conclusion /20 Report Neatness /10 Total Mark /100

Obj
Intr
Thof li Prep In exathes
How
1.
jective:
1. Get fam2. Study S3. Notice s
roduction
he Scanningght to form
paring the sorder to gemination, tse main ste1. Removi
could v2. Firmly m3. Non‐m
ceramicelectric
4. Metallic
w does a SE
. A beam ogun (a filTungsten
miliar with SSEM's operasome SEM's
n:
g Electron Mm extremely
specimen foet clear andhe specimeps: ing all wateaporize durmount all th
metallic samcs, should bcally conducc samples c
EM work?
of electronsament madn hairpin gu
Scanning Eleating princips applicatio
Microscope y larger with
or SEM exad accurate reen should be
r, solvents ring the opehe samples.ples, such abe coated wctive. can be place
s is producede of varioun.
ectron Micrple. ons.
is a microsch high resolu
amination:esults frome prepared
or other maeration. . as those of bwith some m
ed directly i
ed at the tops types of m
oscope.
cope that usution image
this following
aterials that
biology or metals (usua
nto the SEM
p of the micmaterials, th
ses electrones.
t
lly gold) so
M.
croscope byhe most com
n beam inst
they becom
y an electrommon is the
2
tead
me
n e

2.
3.
4.
5.
6.
7.
8.
9.10
. The elecheld withof this is by gas filreactionssource.
. The beamelectromwhich foctoward t
. The beamscan coilsvarying tthousandscan genmagneticbeam ba
. The varyiray tube
. Once thefrom the
. These eledetector,
. The ampthe spot
. The imag0. From thethe mate
ctron beam hin a vacuumto avoid insled, and to s with the e
m travels thmagnetic fielcus the beahe sample. m goes aftes which arehe voltage ds volts) proerator, andc field whichck. ing voltage CRT. e beam hits sample.
ectrons are , convertedlified voltagof light to cge consists oe secondaryerial and see
follows a vem; the reasstability cauavoid any electron
rough ds and lensam down
r that throu energized (25‐30 oduced by a create a h deflects th
is also appl
the sample
collected b to voltage ge is appliedchange. of thousandy electrons ae it with larg
A
ertical pathon used
ses,
ugh by
a
he
ied to the c
e, secondary
by a secondaand amplifd to the grid
ds of varyingand x‐ray wge magnific
An Image of h
through th
coils around
y electrons
ary detectoied. d of the CRT
g intensity swe can detercation powe
human blood
he microsco
d the neck o
and X‐rays
or or a backs
T causes the
spots. rmine the cer reaches 3
d cells under
pe, which is
of the Catho
are ejected
scatter
e intensity o
omposition300,000 tim
r SEM.
3
s
ode‐
d
of
n of mes.

Me
Res
Ap
Dis
ethod:
Seleccoin)
Use Sadjus
Deterspeci
sults:
pplying the
1. Magni The15 t
2. Chemi
The Theit co
cussion a
In this e SEM is wspecime
SEM ha Anotheto get t
SEM is wchemicmedica
SEM ha
ct specimen.
SEM to see tsting it to th
rmine the cmen.
experiment
ification Pe magnificatto 20 times.
ical Comp
e 5‐Piasters ere was somonsists main
nd Conclu
experiment widely usedens, Non‐mas more power importanhe composwidely usedal componel needles. as a large m
to be exam
the writing he suitable m
hemical com
t method w
Power: tion power w.
position
coin consisme dirt on itsnly of Calciu
usion:
we learnedd to see a clmetallic specwer than opnt advantagition of thed in biologyents of mate
agnification
mined (in th
on its surfamagnificatio
mposition o
we got the fo
we used to
ts mainly ofs surface wum (Ca).
d about usinlear with higcimens can ptical microse of SEM isspecimen.to study orerials, and t
n power rea
is experime
ace by on power.
of the select
ollowing res
see the wr
f Nickel (Ni)e analyze it
ng the Scangh resolutioalso be seescopes. its ability to
rganisms, itthe shape o
aches 300,0
ent we used
ted
sults:
itings clearl
). t chemically
ning Electroon images fon with som
o make che
is also usedof some too
000 times.
d a 5‐Piastre
ly was almo
y and saw th
on Microscoor metallic e preparati
emical analy
d to study ls such as
4
es
ost
hat
ope.
on.
ysis

1
German – Jordanian University (GJU) Material Science Laboratory
IE 2210 Summer Semester 2008‐2009
i i
Experiment 7
Corrosion
Mahmood Hisham Shubbak
Title MarkObjective /10 Introduction /15 Method /15 Result /30 Discussion and Conclusion /20 Report Neatness /10 Total Mark /100

Obj
Intr
Cwith T
Codirecomeffic Thcorrcorr Noby s Th
Thloss und Thtemthen Thior in
Whe
jective:
1. Identify2. Define f3. Calculat
roduction
orrosion is h the enviro
There are m1. Temper2. The hyd3. Time. 4. Temper
orrosion cauct; where we
mponents, or ciency).
here are manrosion such arosion resista
on‐metallic malvation or c
here are man General Corrosio Galvani Cavitati
he most commethod; byer the actua
he main idea perature, pHn calculate th
is corrosion rn [g/m2.day]
ere : WL: weigD: DensitA: Area (T: Time (
y metal corrfactors affete corrosion
n:
the processonment.
many factorsrature. drogen‐ion
rature Cycli
ses a lot of ee need to reindirect (los
ny methods tas painting, pance alloys.
materials arechemical rea
ny types of col corrosion. on fatigue. c corrosion. on corrosion
monly used y using this ml or simulate
behind this H … ‐exactly he loss of its
rate can be eby using the
ght loss (mg). ty (g/cm3). cm2). hr).
rosion. ecting corron rate.
s in which m
s affecting c
concentrat
ng.
economical lplace the coss of product
to prevent mprotective co
e affected byction causing
orrosion, like
n.
method to dmethod we caed conditions
method is tolike the actuweight.
expressed inese formulas
.
sion and co
metal deteri
corrosion ra
ion pH (hyd
osses either rroded tion and lowe
metals from oating or usin
corrosion alg softening,
e:
determine than calculate s.
o let the specual condition
[mils per ye:
orrosion rate
iorates thro
ate such as:
drogen pow
er
ng
lso. Plastics, swelling and
he corrosion the corrosio
cimen go unns in the field
ear (mpy)], [m
e.
ough a chem
wer).
for exampled ultimate fa
rate for meton rate for an
der particulad‐ for a spec
millimeters p
mical reactio
e, are attackeilure.
tals is the weny specimen
ar conditionscific time, an
per year (mm
2
on
ed
eight
s of d
m/y)]
Whe
Me
ere: WL: we A: Area T: Time
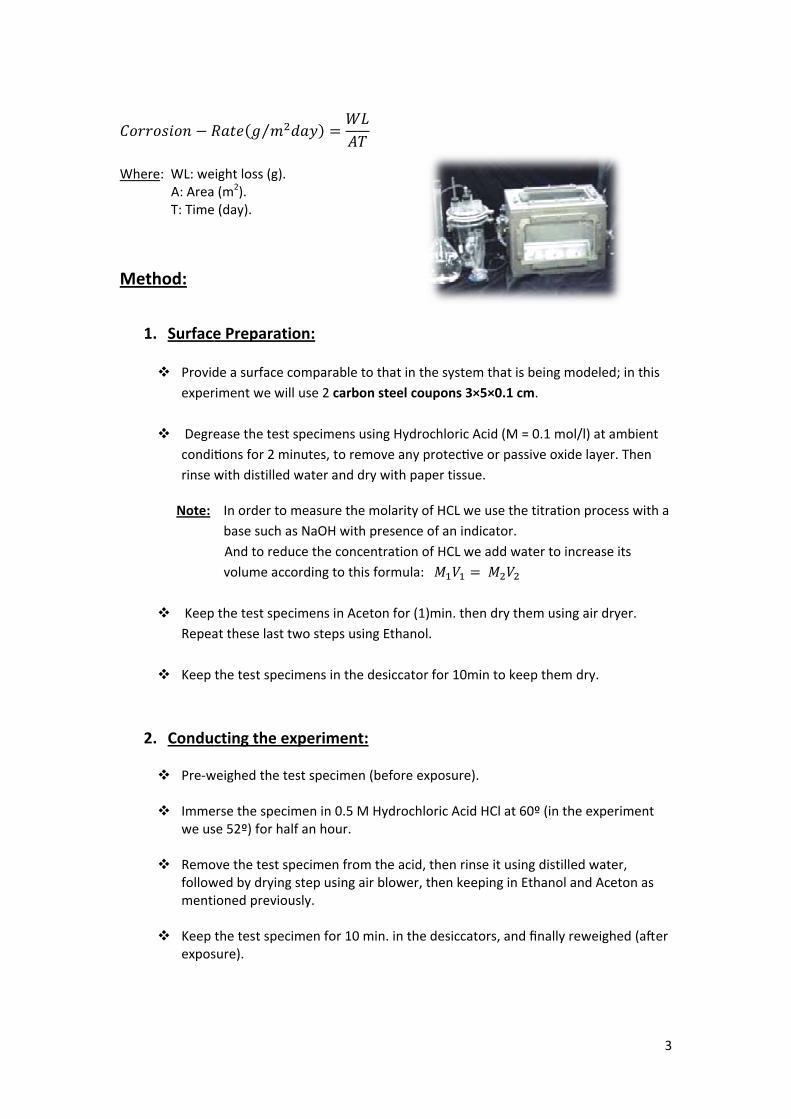
ethod:
1. Surface Providexper
Degreconditirinse w
Note:
Keep Repea
Keep
2. Condu Pre‐w
Immewe us
Remofollowmenti
Keep expos
⁄
ight loss (g).(m2). (day).
e Preparat
de a surface riment we wi
ease the testtions for 2 mwith distilled
In order tobase such a
And to red volume acc
the test speat these last
the test spec
cting the e
weighed the t
erse the specse 52º) for ha
ove the test swed by dryingioned previo
the test specsure).
tion:
comparableill use 2 carb
t specimensminutes, to red water and
o measure thas NaOH witduce the conccording to th
ecimens in Actwo steps us
cimens in the
experimen
test specime
cimen in 0.5 alf an hour.
specimen frog step using ously.
cimen for 10
to that in thbon steel cou
using Hydroemove any pdry with pap
e molarity oth presence ocentration ohis formula:
ceton for (1)sing Ethanol
e desiccator
t:
n (before ex
M Hydrochlo
om the acid, air blower, t
0 min. in the
he system thupons 3×5×0
chloric Acid protective or per tissue.
f HCL we useof an indicatf HCL we add
min. then dr.
for 10min to
xposure).
oric Acid HCl
then rinse itthen keeping
desiccators,
at is being m0.1 cm.
(M = 0.1 mopassive oxid
e the titratioor. d water to in
ry them usin
o keep them
at 60º (in th
using distilleg in Ethanol a
and finally r
modeled; in t
ol/l) at ambiede layer. The
on process w
ncrease its
g air dryer.
dry.
he experimen
ed water, and Aceton a
reweighed (a
3
his
ent n
ith a
nt
as
after

4
Results:
Applying the experiment method we got the following results:
1. Experiment conditions: Temperature = 52 o C. Solution: Acidic. Kind of solution: HCl. Solution composition: M= 0.5 mol/l. Solution movement: Stagnant. Type of Metal: Carbon Steel.
2. Experiment Readings: We ran the experiment for two specimens and got the following readings:
Specimen A Specimen B
Initial weight Trial(1) = 18.1801 g Trial(2) = 18.1799 g Avg = 18.1800 g
Trial(1) = 18.1818 g Trial(2) = 18.1819 g Avg = 18.18185 g
Final weight Trial(1) = 18.1389 g Trial(2) = 18.1392 g Avg = 18.13905 g
Trial(1) = 18.1510 g Trial(2) = 18.1510 g Avg = 18.1510 g
Weight Loss (g) 0.04095 0.03085 Sample area* (m2) 3.16 x 10‐3 Exposure Time (day) 30min = 0.0208 day Corrosion rate** (g/m2.day) 622.025 468.608 Corrosion rate*** (mm/y) 187.326 141.120 *Sample Area= 2x3x5 + 2x3x0.1 + 2x5x0.1 = 31.6 cm2 = 3.16 x 10‐3 m2 **Corrosion rate= WL/AT Specimen Density: D1=12.12 g/cm
3 , D2=12.1212 g/cm3
***Corrosion rate (mm/y) = 87.6WL/DAT
Discussion and Conclusion:
In this experiment we learned about Corrosion. Corrosion is big problem facing most the metallic parts and pieces in machines, and it occurs because of the reaction between the metals and the environment (water, temperature cycling and pH…)
There are many types of corrosion as well as many methods to prevent it. Weight loss method is very common method to determine the corrosion rate depending on the loss of the specimen's weight due to corrosion.
In this experiment we have calculated this rate for 2‐Carbon steel‐specimens and it was different (almost 622 g/m2.day for the 1st one and 469 for the 2nd)
Corrosion Rate Test or weight loss test is very important to specify how long the metal can stand in the field of operation, and this can be used when designing machines.

1
German – Jordanian University (GJU) Material Science Laboratory
IE 2210 Summer Semester 2008‐2009
i i
Experiment 8
Hardening Steel Using Different Quenching Media
Mahmood Hisham Shubbak
Title MarkObjective /10 Introduction /15 Method /15 Result /30 Discussion and Conclusion /20 Report Neatness /10 Total Mark /100

2
Objective: 1. Heating steel to appropriate temperature, and then quenching it using
different quenching media. 2. Measuring the hardness after quenching by different media. 3. Study the changes in hardness of steel due to the changes of the quenching
media.
Introduction: Plain carbon steels and alloy steels are among relatively few engineering materials, which can be usefully heat‐treated in order to vary their mechanical properties. Steels are heat treated, because of the structural changes that can take place within solid iron carbon alloys. The various heat‐treatment process appropriate to plain carbon steels are:
1. Full annealing. 2. Normalizing. 3. Process annealing. 4. Hardening. 5. Tempering.
In all above process the steel is heated slowly to the appropriate temperature according to its carbon content and then cooled.
It is the rate of cooling which determines the ultimate structure and properties that the steel will have at the end of each of the pre‐mentioned heat treatment process.

Ttemaboadvandtheitem If ferrcalleAus Th
In carbwat
Me
he process mperature inove their upantage in hd in practiceir lower crit
mperature h
f the steel isrite or Pearled Martensstenite.
he most coma. Compreb. Oil. c. Water. d. 10% Bri
this Experibon steel ester and insid
ethod:
1. Specim a) Brin
fromb) Hea
becoperc Thordesand
c) Leav
2. Quenc a) Leav
ordeb) Take
it in c) Take
unti
of hardeninnto quenchiper critical eating hypee; the hardetical temperelps to prev
s cooled quiite and Cemsite. This is d
mmonly useessed air bla
ine (water +
ment we stspecially its de the furna
men Heatin
ng three specm steel contat the furnaceome totally acentage of cahen put the ter to protectd inside a steve the specim
hing in diff
ve one specier to cool it we the secondthe air (large the third spl it becomes
ng involves ing media. Htemperaturer‐eutectoidning temperature. Quevent crackin
ickly, there mentite, butdue to the a
ed quenchinast.
+ 10% salt).
tudied the ehardness. Wace.
ng:
cimens with aining more te to the hardaustenite), tharbon of thehree specimt them from eel cast iron mens inside t
ferent Me
men inside twith small cod specimen oer cooling rapecimen outs cold. (the la
rapidly queHypereutecre prior to qd steels aboerature normenching hypng and disto
will be no tt into a newallotropic tr
ng media ar
effect of heaWe used th
similar dimethan 0.3% C dening temphe hardening steel bar us
mens close tooxidization, container. the furnace f
dia:
the furnace fooling rate.out from the ate). t, and quenchargest coolin
enching the ctoid steels quenching. ove their Ac
mally used ereutectoidortion.
transformatw harder, buransformati
re:
at treatmenree quench
ensions bars. erature of thg temperatued. each other it is recomm
for 30– 60 m
for a long tim
furnace usin
h it using theg rate).
steel from are heated There is nom when haris just 30‐50d steels from
tion into Peut less duction of the fa
nt on the prhing media w
he specimenre usually de
inside the hemended to co
minutes.
me (6 hours o
ng nickel ton
e water med
appropriateup to 30‐50 particular dening them0˚ C above m this lowe
arlite and ile structureace‐centere
roperties of which are a
(until they epends on th
eated furnacover them wi
or more); in
gs, and quen
ia with stirri
3
e 0˚ C
m,
r
e ed
ir,
he
ce. In ith
nch
ng

Res
Ap
Dis
3. Hardne a) Grinb) Mea
macc) Com
on t
sults:
pplying the
The Speci1. The
2. The
3. The
cussion a
In this equench
ess Measu
nd the surfacasure the hachine, do 3 trmpare betwethe hardness
experiment
imens Hare 1st SpecimQuenching Vickers Har
1st tria2nd tria3rd tria
e 2nd SpecimQuenching Vickers Har
1st tria2nd tria3rd tria
e 3rd SpecimQuenching Vickers Har
1st tria2nd tria3rd tria
nd Conclu
experiment hing media.
ring:
ce of each sprdness for earials for eacheen the resuls of the speci
t method w
rdness: men: Media: Insrdness:
l l l
men: Media: airrdness:
l l l
men: Media: wardness:
l l l
usion:
we learned
pecimen propach one of thh specimen.ts, and discuimen.
we got the fo
ide the furn
d1 0.5388 0.5471 0.5546
(medium c
d1 0.4754 0.4565 0.4518
ter (rapid c
d1 0.3908 0.4124 0.4077
d about Har
perly to prephe specimen
uss the effect
ollowing res
nace (slow c
d0.50.50.54
ooling rate)
d0.440.40.4
cooling)
d0.30.40.4
rdening Stee
pare it for thes using the V
t of each que
sults:
cooling)
d2 270 583 416
)
d2 456 518 628
d2 938 009 064
el using diff
e hardness teVickers testin
enching med
HV 195.8 182.1 187.9
188.6 HV
HV 262.3 269.9 266.0
266.1 HV
HV 361.4 336.3 341.0
346.2 HV
ferent
4
est. ng
dium
V
V
V

5
Heat treatment is very effective method to hardening carbon steel; the idea behind all the heat treatments is to change the structure of the alloy material in order to change its properties.
In all heat treatment processes we heat the specimen to some high temperature then we cool it with some cooling rate.
From the results we got in this experiment we can notice that the larger cooling rate we applied, the harder steel we got.
When we use the water media (the most rapid cooling) we got very hard and brittle steel. (something like Martensite)
While using the furnace cooling media, we got steel with least hardness and most ductility. (something like Pearlite)
And using the air media, the output we got was something like Bainite with medium hardness and ductility (almost highest toughness).
The heat treatment process (or the quenching media we used) depends always on the final product we need and its applications; for example we can use the rapid cooling process to get very hard iron and use it in gears or other high hardness needed applications.

1
German – Jordanian University (GJU) Material Science Laboratory
IE 2210 Summer Semester 2008‐2009
i i
Experiment 9
Hardenability and Jominy Test
Mahmood Hisham Shubbak
Title MarkObjective /10 Introduction /15 Method /15 Result /30 Discussion and Conclusion /20 Report Neatness /10 Total Mark /100
2
Objective:
1. Distinguish between hardness and hardenability. 2. Understand the concept of mass effect and ruling section. 3. Perform Jominy test as a method to indicate hardenability.
Introduction:
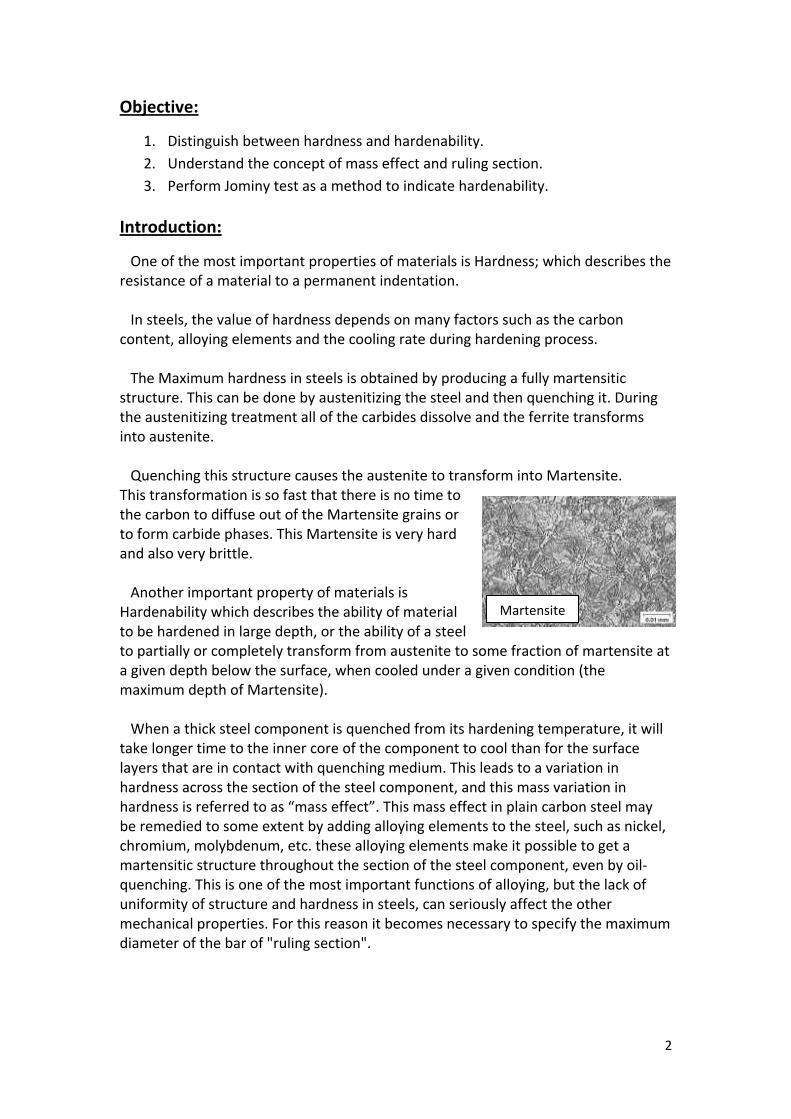
One of the most important properties of materials is Hardness; which describes the resistance of a material to a permanent indentation. In steels, the value of hardness depends on many factors such as the carbon content, alloying elements and the cooling rate during hardening process. The Maximum hardness in steels is obtained by producing a fully martensitic structure. This can be done by austenitizing the steel and then quenching it. During the austenitizing treatment all of the carbides dissolve and the ferrite transforms into austenite. Quenching this structure causes the austenite to transform into Martensite. This transformation is so fast that there is no time to the carbon to diffuse out of the Martensite grains or to form carbide phases. This Martensite is very hard and also very brittle. Another important property of materials is Hardenability which describes the ability of material to be hardened in large depth, or the ability of a steel to partially or completely transform from austenite to some fraction of martensite at a given depth below the surface, when cooled under a given condition (the maximum depth of Martensite). When a thick steel component is quenched from its hardening temperature, it will take longer time to the inner core of the component to cool than for the surface layers that are in contact with quenching medium. This leads to a variation in hardness across the section of the steel component, and this mass variation in hardness is referred to as “mass effect”. This mass effect in plain carbon steel may be remedied to some extent by adding alloying elements to the steel, such as nickel, chromium, molybdenum, etc. these alloying elements make it possible to get a martensitic structure throughout the section of the steel component, even by oil‐quenching. This is one of the most important functions of alloying, but the lack of uniformity of structure and hardness in steels, can seriously affect the other mechanical properties. For this reason it becomes necessary to specify the maximum diameter of the bar of "ruling section".
Martensite

ThTestframendprogalonque
Me
Res Ap
1 In tused
he hardenabt; in which ame, and qued. The standgressively leng the side enched end.
ethod:
1. Specim
a) ChostanmadStee
b) Hea
2. Jominy
c) Drotest
d) End
3. Hardne
e) Grinf) Mea
bar wor
g) Plotthe
h) Com
sults: pplying the
the standard Jd Vickers inste
bility of mata heated spenched by sdard specimess rapidly tof the spec.
men Heatin
ose two typendard dimensde from plainel). t each of the
y Test Mac
p each bar indevice. quenches ea
ess Measu
nd a flat alonasure the hausing Vickerrld). t the hardnesdistance fro
mpare the ha
experiment
Jominy test Roead.
terials can bpecimen of sspraying a pen cools vetowards theimen and it
ng:
es of steel basions of the n carbon stee
ese two bars
chine:
nto its prope
ach bar with
ring:
ng the side ofrdness everys1 hardness t
ss measuredm quenchedrdenability o
t method w
ockwell C Har
be studied bsteel (austepre‐set stanery rapidly ae opposite ets hardness
ars with propJominy test el and the ot
s up to its aus
er position of
h tap water fo
f each specimy 3 mm formtesting mach
(HV) of eachd end (mm) oof the two ob
we got the fo
rdness must b
by a particuenite) is drodard jet of wat the quencend. When is measure
per dimensiospecimen. Other is from a
stenite temp
f the frame o
or about 15m
men. m the quenchhine (the old
h bar with thon the same btained curv
ollowing res
e used, but he
ular test callpped into pwater againched end ancold, a flat d every 3m
ons to be maOne of these alloy steel (h
perature.
of the Jominy
mins.
ed side of thest one in th
he relation tograph paperves.
sults:
ere in this exp
led Jominy position in anst its lowernd is grounded
mm form the
achined to thsteel bars is here we used
y
he he
o r.
periment we h
3
a r
d e
he
d d2
have

Distance d1 d2 avg HVg3 0.3 0.3 0.3 618 Specimen Type: Plain Carbon Steel 10456 0.29 0.29 0.29 661.35559 0.3 0.3 0.3 618 Load (kg) 30
12 0.3 0.3 0.3 61815 0.31 0.31 0.31 578.772115 0.31 0.31 0.31 578.772118 0.31 0.28 0.295 639.126721 0.29 0.3 0.295 639.126724 0.31 0.29 0.3 61827 0.3 0.29 0.295 639.126730 0.28 0.28 0.28 709.4388
700
800
)
Hardenability for Plain Carbon Steel [1045]
30 0.28 0.28 0.28 709.438833 0.31 0.32 0.315 560.544236 0.31 0.3 0.305 597.903839 0.32 0.33 0.325 526.579942 0.34 0.3 0.32 543.164145 0.34 0.35 0.345 467.2968 300
400
500
600
rs Hardn
ess (HV)
HV
45(أ 0.34 0.35 0.345 467.296848 0.33 0.34 0.335 495.611551 0.38 0.37 0.375 395.5254 0.36 0.37 0.365 417.489257 0.39 0.37 0.38 385.180160 0.4 0.39 0.395 356.4813
0
100
200
0 20 40 60 80 100
Vickeأسي) .HV)
60 0.4 0.39 0.395 356.481363 0.39 0.38 0.385 375.240366 0.38 0.39 0.385 375.240369 0.37 0.4 0.385 375.240372 0.39 0.4 0.395 356.481375 0 37 0 39 0 38 385 1801
0 20 40 60 80 100
Distance from quenched end (mm)
75 0.37 0.39 0.38 385.180178 0.37 0.38 0.375 395.5281 0.38 0.4 0.39 365.680584 0.38 0.4 0.39 365.680587 0.37 0.39 0.38 385.180190 0 4 0 42 0 41 330 874590 0.4 0.42 0.41 330.8745

Distance HV3 736 Specimen Type: d2 Steel6 626.19 561
12 662.115 598.5 Hardenability for d2 Steel15 598.518 579.121 561.124 598.127 561.130 579.1 600
700
800
900
s (HV)
Hardenability for d2 Steel
30 579.133 579.136 662.439 765.442 736.145 708.5 200
300
400
500
600
Vickers Hardn
ess
HV
(HV. (أسي45 708.548 712.151 700.454 666.857 66060 653.3
0
100
200
0 20 40 60 80 100V
Distance from quenched end (mm)60 653.363 634.766 612.469 559.472 541.875 504 1
q ( )
75 504.178 478.981 480.384 423.187 410.190 628 590 628.5
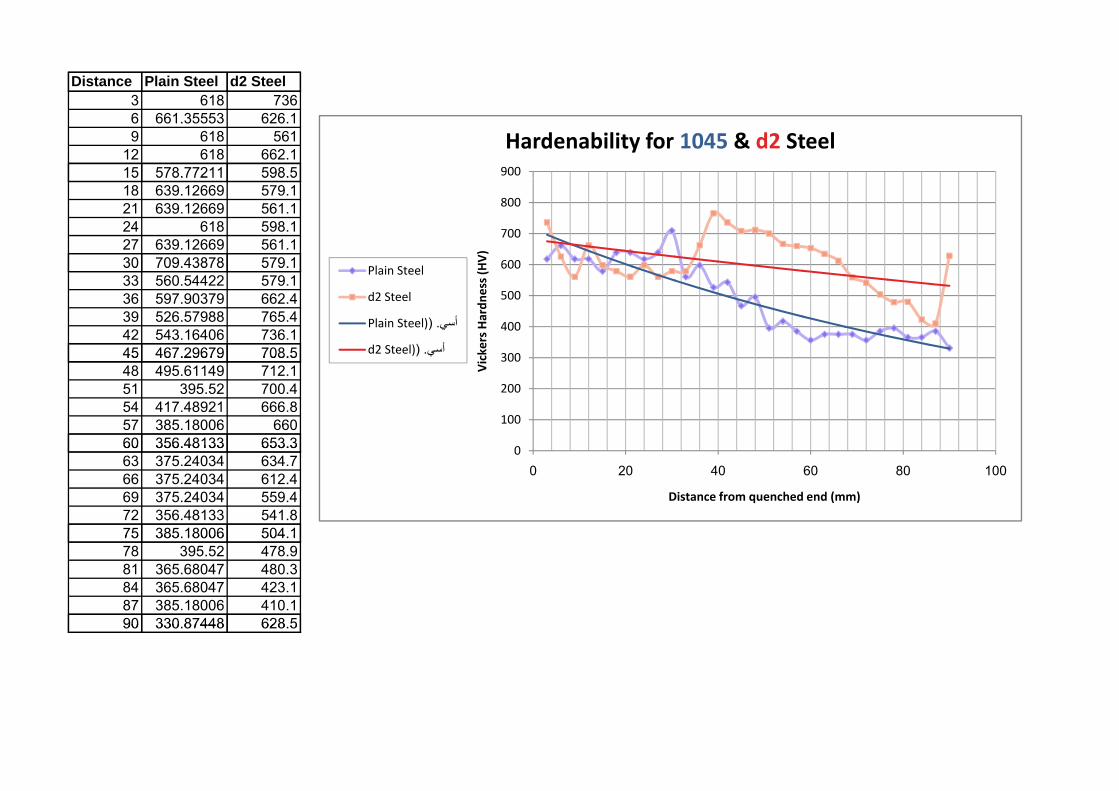
Distance Plain Steel d2 Steel3 618 7366 661.35553 626.19 618 561
12 618 662.115 578.77211 598.5 900
Hardenability for 1045 & d2 Steel15 578.77211 598.518 639.12669 579.121 639.12669 561.124 618 598.127 639.12669 561.130 709.43878 579.1 600
700
800
HV)
Pl i St l30 709.43878 579.133 560.54422 579.136 597.90379 662.439 526.57988 765.442 543.16406 736.145 467.29679 708.5 300
400
500
600
ckers Hardn
ess (HPlain Steel
d2 Steel
(Plain Steel. (أسي
d2 Steel)45. (أسي 467.29679 708.548 495.61149 712.151 395.52 700.454 417.48921 666.857 385.18006 66060 356.48133 653.3 0
100
200
300
Vic
60 356.48133 653.363 375.24034 634.766 375.24034 612.469 375.24034 559.472 356.48133 541.875 385.18006 504.1
0
0 20 40 60 80 100
Distance from quenched end (mm)
75 385.18006 504.178 395.52 478.981 365.68047 480.384 365.68047 423.187 385.18006 410.190 330.87448 628.590 330.87448 628.5

7
Discussion and Conclusion:
In this experiment we learned about the Hardenability of Steels. Hardenability is an important property of material (especially steels) that describes the capacity of the steel to harden in depth under a given set of conditions.
Jominy test is an effective method to measure Hardenability of steels; by quenching one end of a specimen to generate Martensite along its depth, then measuring the hardness at different distances from this end, and determine the ability of this steel specimen to generate Martensite with depth.
As we have studied (and also noticed in the lab) adding some alloys to steel make it more hardenable. The following graph explains this:
When we applied the Jominy test on the two specimens in this experiment we found the following: 1. The 1st specimen's (Plain Steel 1045) curve was approximately similar to
our expectations except some out‐of‐range points –as you can see in the results part of this report‐.
2. The 2nd specimen's (D2 Steel) curve was almost strange; since the first 12 points are less hard than the next part of the curve, and this doesn’t make sense (because these 1st points have more cooling rate i.e. more opportunity to form Martensite).
3. But in general we can notice from the third graph (the comparison one) the effect of alloying in increasing hardenability. This unexpected curve2 (of D2 steel) can be due to some factors such as: a. Some inhomogeneousity in the specimen.
2 Notice: this part of experiment for D2 steel has done by the other group of students, and I actually don’t know the way or conditions in which they made it. So all the reasons I mentioned are just expectations.

8
b. Mistakes in applying Jominy test (especially in the rate of cooling along distance).
c. Mistakes in measuring hardness. I think that the third reason is the most expected because they have changed the hardness testing machine (from the manual one to the automatic one) between the 12th and 13th points, and their mistakes could be either in measuring d1 & d2 of the impression, or in calculating the Vickers hardness.
Alloying usually increases the hardenability of steels because it increases the time needed to form martensite (decreases the critical cooling rate).
From this experiment we can conclude that the plain carbon steel 1045 has less hardenability than D2 steel.
This property (hardenability) can help in choosing suitable metals for more effective heat treatment and performance in industrial applications.

1
German – Jordanian University (GJU) Material Science Laboratory
IE 2210 Summer Semester 2008‐2009
i i
Experiment 10
Tensile Testing of Plastics
Mahmood Hisham Shubbak
Title MarkObjective /10 Introduction /15 Method /15 Result /30 Discussion and Conclusion /20 Report Neatness /10 Total Mark /100

2
Objective:
1. To investigate the tensile behavior of polymers. 2. To determine the following properties:
a. The relationship between tensile stress and strain. b. Modulus of elasticity. c. The tensile strength. d. Percentage of elongation.
Introduction:
Strength can be defined as the ability of a material to resist applied forces without yielding or fracturing.
The strength of materials can be determined using some kind of tests called Tensile Test, in which a tensile load (force) is applied to a specimen of the material and its extension is measured with respect to this load, i.e. Tensile test is used to measure the force required to break a specimen and the extent to which the specimen stretches or elongates to that breaking point.
Applying this test, the Stress‐Strain Diagram is produced, and we can investigate the tensile behavior of the material and its properties from this diagram.
Stress (σ): the force acting per unit area.
[MPa]
Strain (ε): the measure of the elongation or contraction of a line segment in the body. ∆
In this experiment we are studying the tensile behavior of some polymers (Plastics) under specific conditions (such as temperature, initial geometry and speed of testing .etc.)
The testing speed: is the rate of separation of the grips of the testing machine during the test (expressed in [mm/min]).

3
The tensile behavior of polymers depends on many factors rather than the composition and structure; it depends also on the temperature T and the strain rate (testing speed).
Increasing the temperature results in decreasing of modulus of elasticity (E) and Tensile strength TS but increasing in Ductility (%EL).
The effect of strain rate is completely the opposite of T; while the strain rate of testing increases the ductility of the material decreases and it seems stronger. Method:
1. Test Atmosphere:
a. Conduct the test in the same atmosphere used for conditioning the test specimen. (the conditions we used in this experiment were: T = 23 oC (+/‐ 2) Humidity = 50% (+/‐ 5)
2. Dimensions of test specimen1:
e. Define the gauge marks on the test specimen; these shall be approximately equidistance from the midpoint.
f. Measure the width (b) and the thickness (h) at the center of each end of each specimen and within 5 mm of each end of the gauge length (4 readings for each).
g. Calculate the arithmetic means for the width and thickness of each specimen, which shall be used for calculation purposes.
3. Clamping: place the test specimen in the grips.
4. Prestresses: the specimen shall not be stressed substantially
prior to test.
5. Adjustment of the Camera: after balancing the prestresses, set and adjust the camera to be centered to the gauge length of the test specimen.
6. Testing speed: set the speed of testing in accordance with the appropriate for the material concerned.
7. Recording of data: record the force and the corresponding values of increase of the gauge length and the distance between grips during the test using the automatic recording system of the tester.
1 In this experiment we have tested three specimens; 2 PVC (Poly Vinyl Chloride) specimens (with different testing rate) and 1 HDPE (High Density Polyethylene) specimen.

4
Results: Applying the experiment method we got the following results:
1. Dimensions of test specimens:
Material Thickness (mm) Width (mm) Gauge Length (mm) Testing Speed HDPE 3.06 6.12 25 100 mm/min PVC1 3.3325 3.175 50 5 mm/min PVC2 3.4 11.72 50 15 mm/min
2. Stress‐Strain2 Diagrams: The stress strain diagram for each specimen was drawn by the automatic recording system of the tester and you can see them in the next pages.
Material Tensile Strength (MPa) Yield Stress YP (MPa) Ductility %EL HDPE 25.6061 21.4127 640% PVC1 50.3081 1.4514 150% PVC2 50.7984 ‐ 63%
Discussion and Conclusion:
In this experiment we learned about the tensile testing of Polymers. This test is carried out to study the tensile behavior of polymers (under tensile load).
There are many properties related to this test such as strength, Ductility toughness, stiffness and so on.
Polymers differ widely in their tensile behaviors.
2 The diagrams on Pages(7‐9) are force‐extension diagrams, that we can turn into Stress‐Strain using the two equations of Stress and Strain (in the introduction part of this report).

5
The main aim of tensile test is to measure the strength of materials in term of Tensile (Max) or Yield strength (stress).
The main difference between metals and polymers tensile behavior is that polymers' depends on temperature and strain rate.
Another important difference is in ductility; since polymers (in general) are much more ductile than metals.
Metals have more strength than polymers. Here we have tested two types of polymers; HDPE and PVC, and we got the following results:
o HDPE is more ductile than PVC. o HDPE has less tensile strength than PVC.
Applying the tensile test on PVC specimens with different strain rate (5 and 15 mm/min), we got the following:
o By increasing the strain rate, the strength of polymer increases (here the TS increased from 50.3081 MPa to 50.7984 MPa).
o By increasing the strain rate, the ductility of the polymer decreases (here from %EL 150% to 63%). And these results meet the theoretical information mentioned in the introduction part of this report.
The PVC specimen with high strain rate has no yield strength i.e. it directly deforms plastically without plastic deformation, because of the high testing speed.
Tensile test is very important to check if the specimen meets the standards or not.

1
German – Jordanian University (GJU) Material Science Laboratory
IE 2210 Summer Semester 2008‐2009
i i
Experiment 11
Melt Mass Flow Rate (MFR) Of Thermoplastics
Mahmood Hisham Shubbak
Title MarkObjective /10 Introduction /15 Method /15 Result /30 Discussion and Conclusion /20 Report Neatness /10 Total Mark /100

2
Objective: 1. To determine the melt mass flow rate MFR of thermoplastics materials under
specified conditions of temperature and load. 2. Compare between raw and manufactured material in MFR.
Introduction: One of materials' properties is the melt mass flow rate which describes the viscosity of the polymer in the melt phase. . It is defined as the mass of polymer in grams flowing per 10 minutes through a capillary of specific diameter and length by a pressure applied via a range of standard weights at specified temperature.
MFR is a simple and quick test of the polymer viscosity, carried out using some Apparatus (Extrusion Plastometer) consists of the following essential parts:
1. Cylinder: manufactured from a material resistant to wear and corrosion up to a maximum temperature of the heating system, and the finish, properties and dimensions of its surface shall not be affected by the material being tested. The cylinder shall have a length between 115 mm and 180 mm and an internal diameter of 9.550 ± 0.025 mm.
2. Piston: also manufactured from a material resistant to wear and corrosion up to a maximum temperature of the heating system, and the finish, properties and dimensions of its surface shall not be affected by the material being tested. The piston shall have a head 6.35 mm ± 0.10 mm in length. The diameter of the head shall be less that the internal diameter of cylinder by 0.075 mm ± 0.010 mm.
3. Temperature control system: between 10 mm and 75 mm above the top of the die. And it shall allow the test temperature to be set in steps of 0.2ºC or less.
4. Die: made of tungsten carbide or hardened steel, 8.000 mm ± 0.025 mm in length. The die shall have ends that are flat, perpendicular to the axis of the bore and free from visible machining marks.
5. Means of setting of maintaining the cylinder truly vertical: a two‐directional bubble level, set normal to the cylinder axis, and adjustable supports for the apparatus are suitable for the purpose.
6. Load: a set of removable weights, which may be adjusted so that the combined mass of the weights and the piston gives the selected nominal load to an accuracy of ± 0.5 % are mounted on top of the piston.
Using this machine, we get some cut‐offs of the specimen in specified time (taking other conditions such as temperature, load and dimensions into consideration), then we can calculate the MFR using this equation:
, 600
Where: T is the test temperature [oC]. mnom is the nominal load [kg]. m is the average mass [g] of the cut‐offs. T is the cut‐off time‐interval [sec]. 600 is the factor used to convert g/sec into g/10 min (600s).

3
In this experiment we have studied the melt mass flow rate of raw material and manufactured HDPE (High Density Polyethylene). Method:
1. Selection of temperature and load: The material standard takes precedence over the international standard. If no material standard exits, use an appropriate set of conditions based on knowledge of the melting point of the material or the processing conditions recommended by manufacturing. Here we used two specimens (raw material and manufactured HDPE) with temperature and load as fixed in Standards.
2. Cleaning: The apparatus should be cleaned thoroughly after each determination. The cylinder may be cleaned with cloth patches and the piston with a cotton cloth (while it’s hot) and the die is cleaned with a closely fitting brass reamer.
3. Selection of sample mass and charging cylinder: Charge the cylinder with 3‐5 g of the sample. During the charging, compress the material with the packing rod, using hand pressure. Complete the charging process <1 min. The preheat time of 5 min begins after the charging is complete. At the end of the 5 min preheating put the desired load.
4. Measurements: Place the selected weight on the piston. When the lower reference mark has reached the top edge of the cylinder, start timing, simultaneously cut off the extrudate with the cutting tool.
Collect the successive cut‐offs in order to measure the extrusion rate at a given time interval. Choose a time interval1 so that the length is not less than 10 mm and preferably between 10 & 20 mm.
Stop cutting when the upper mark reaches the edge of the cylinder. After cooling, weigh individually, to the nearest 1mg, preferably three or more2, and calculate their average mass.
The time between the end of charging the cylinder and the last measurement shall not exceed 25min for any material. For some materials, this time may need to be reduced to prevent degradation or cross‐linking of the material during the test.
5. Expression of results: Calculate the melt mass flow rate in term of g/10 min using the equation placed in the introduction part of this report. Then compare the MFR values of raw material and manufactured HDPE.
1 Here we have chosen 240 seconds as a time interval for cutting. 2 In this experiment we have done the test only one time for each specimen.

4
Results:
Applying the experiment method we got the following results:
Material Test
Temperature (0C)
Load (kgforce)
Time interval for cutting
(sec)
The Cut Mass (kg)
MFR (g/10 min)
Manufactured HDPE
190 oC 5 kg 240 sec 0.1026 g 0.2565
Raw material HDPE
190 oC 5 kg 240 sec 0.1060 g 0.2650
% Difference 3.21%
Discussion and Conclusion:
In this experiment we learned about the melt mass flow rate MFR of thermoplastics.
MFR test is carried out to study the viscosity of the polymer in the melt phase which is important to determine the suitable manufacturing processes for it.
This test is usually done using some Apparatus (Extrusion Plastometer) that melt the specimen in specific conditions of temperature and load, let this melt extrude for an interval of time and then cut it off.
By measuring the mass of the cut piece, (with known interval time) we can calculate the MFR.
Here we have tested two HDPE specimens, raw material and manufactured, and we noticed the following:
o MFR for the two specimens are not the same. There was some difference.
o MFR for Raw‐material is more than its value for manufactured specimens from the same material (HDPE).
o Here we got 0.265g/10min as MFR for the raw material HDPE while 0.2565g/10min for manufactured HDPE, with %difference of 3.21%.
o This difference might be because that during manufacturing process the structure of the material may be slightly changed, or some other types of materials might be added.
MFR test of polymers is very important to check if some manufacturing processes and conditions are suitable for the specimen or not.