7552_all.pdf - Ministerio para la Transición Ecológica y el ...

Vol. 9(16), pp. 1252-1264, 17 April, 2014 DOI: 10.5897/AJAR2013.7782 Article Number: F38153043963 ISSN 1991-637X Copyright © 2014 Author(s) retain the copyright of this article http://www.academicjournals.org/AJAR
African Journal of Agricultural Research
Full Length Research Paper
Genetic variability among traits associated with grain yield of rice (Oryza sativa L.) exposed to drought at
flowering stage
Alok Singh1, Ashok Kumar Singh1*, Vikrant Singh2, Nivedita Singh3, Vijay Narayan Singh1, Md. Shamim4, Prashant Vikram4 and Sanjay Singh5
1Department of Crop Physiology, N.D. University of Agriculture and Technology, Kumarganj, Faizabad, India.
2Department of Genetics Plant Breeding, G.B. Pant University of Agriculture and Technology, Pantnagar, Uttarakhand, India.
3NBPGR, IARI, Pusa, New Delhi-110012, India. 4Department of Plant Molecular Biology and Genetic Engineering, N.D. University of Technology, Kumarganj,
Faizabad, 224 229, India. 5Division of Genetics, IARI, Pusa, New Delhi-110012, India.
Received 7 August, 2013; Accepted 21 March, 2014
Morphometric and biochemical characterization of eighteen rainfed upland rice genotypes were studied under drought stress situation. Relation of the studied traits was also observed with grain yield under drought stress situation. A significant variation among the rice genotypes were observed and a significant genotype × environment interaction for all the traits was seen indicating better scope for drought tolerance and improvement in yield. The different biochemical parameter that is, shoot starch at maturity, leaf’s starch, upper root’s and lower root’s carbohydrate under both the conditions were positively increased. However, proline in irrigated condition was the only trait which possessed very high estimates of phenotypic and genotypic coefficient of variation, heritability (h2
b) and genetic advance (Ga). Traits like, chlorophyll a, nitrate reductase activity, carbohydrate at flowering, starch at maturity, leaf’s carbohydrate, leaf’s starch and lower root’s starch showed positively high (desired) genotypic correlation as well as direct effect on grain yield. SDS-PAGE profiling in control and drought condition was conducted and 25 kDa proteins was found to be induced in resistance rice genotypes. Drought tolerance of well-known cultivars- Vandana, NDR-359, Azucena, Moroberekan, P-0326 and TN-1 (DSI<1 & DTE>75%) was validated through biochemical as well as physiological characterization in the study. These traits showed a promise for selection parameters for the drought stress situation. Key words: Correlation, drought susceptibility index, drought tolerance efficiency, path coefficient, genetic advance, upland rice and variance.
INTRODUCTION Rice is the most important food crop for more than one third of world's population. To meet the needs of the
growing population, the present annual rice production of 560 million tons must be increased to 850 million tons by
*Corresponding author. E- mail: [email protected]; Tel: 0091-9415720338. Author(s) agree that this article remain permanently open access under the terms of the Creative Commons Attribution License 4.0 International License

2025 (Khush, 1997). Rice is probably the most diversely cultivated crop under varied environments including: (i) irrigated, (ii) rainfed sloping uplands, (iii) rainfed plain upland, and (iv) rainfed lowland to deepwater conditions. Among various abiotic stresses, drought is one of the basic factors for restricting crops production (Vallivodan and Nguyen, 2006; Sinclair, 2011). As being semi-aquatic plant, it consumes huge amount of water for its life cycle that is, two to three times more water than other food crops such as wheat or maize (Barker et al., 2003). According to an estimate, approximately 3000 to 5000 l of water are required to produce one kg of rice. Irrigated rice is the most common rice ecosystem by occupying 55% of the total 158 Mha of cultivated rice area, while rainfed lowland rice harbours (34%) 54 Mha, rainfed upland (9%) 14 Mha and flood-prone rice areas (7%) 11 Mha (Bouman et al., 2007). Rainfed rice occupies 40% area of the total rice area in Asia. South Asia alone holds 37% of the world’s rice area, 50% of which is rainfed (Dawe et al., 2010). The upland ecosystem presents 12% of global rice area, which is the lowest yielding rice ecosystem (Khush, 1997). Rainfed rice accounts for 84% of total rice area in Sub-Saharan Africa (Gauchan and Pandey, 2011).
The recent scenario of global climate change and unpredictable rainfall patterns lead to severe drought spells in rain-fed areas. Even though water occupies almost 70% of our planet, freshwater resources are limited. According to an estimate, amount of crop water consumption will increase by 70 to 90% in 2050 and will reach 12,050 to 13,500 cubic kilometers from the present 7,130 cubic kilometres (de Fraiture et al., 2007). Therefore, it is highly likely that in the future, rainfed rice-growing areas will face severe spells of drought stress, consequently with high yield decline. To ensure the food security and reduce the water requirement for crop growth, development of drought tolerant and water-saving rice varieties has become increasingly important particularly to upland conditions in African as well as Asian countries (Levitt, 1980 and Graff, 1980). Plant water status has a major impact on plant function and adaptive processes under water limited environments. Several studies of past have reported that the major control of plant water status to crop plants subject to drought is exerted mainly by constitutive traits (Blum, 2005). These traits may help to maintain high relative water content and tend to retain higher leaf area and low leaf rolling. Multidisciplinary approach involving genetics, biochemistry, biotechnology, physiology, plant breeding and crop science will be appropriate to assess the complicated and integrated responses of plants to drought and to evolve superior drought resistant genotypes (Mitra, 2001).
It is reported that biochemical and physiological changes occur in response to low water condition in different plants. There is increase in several biochemical components like increase of free proline occurs in decrease in water supply (Zhang et al., 2006). The
Singh et al. 1253 amount of proline in rice (Oryza sativa L.) was also increased steadily in salt stress using 24-epibassinolide which causes proline gene expression (Ozdemir et al., 2004). Although plant resistant mechanisms are not known clearly, new proteins accumulation and stress genes expression that code biosynthetic enzymes against osmotic stress were investigated (Vallivodan and Nguyen, 2006). Generally, drought stress reduces growth (Levitt, 1980) and yield of various crops (Dhillon et al., 1995) by decreasing chlorophyll pigments and photosynthetic rate, and stomatal conductance as well as transpiration rates. Drought stress reduces the nutrient uptake in plants (Kamran et al., 2009).
To improve rice production under water stress productivity, it is necessary to understand the mechanism and changes in the biochemical and molecular component of plant responses to drought conditions. Furthermore, the functional significance of the physiological and biochemical traits and their relationship to sustain grain yield are still not clearly established in rice. Therefore, present study was undertaken to analyze the biochemical traits which confer grain yield of rain fed lowland rice genotypes under irrigated as well as drought exposed at flowering stages in order to identify drought tolerant genotypes as well as their genotypic and phenotypic inter-relationships with grain yield. MATERIALS AND METHODS Experimental sites, genotypes and years of screen The present investigation was carried out in wet season under normal (E1) as well as flowering stage drought (E2) condition during 2005 to 2006 and 2006 to 2007 at the instructional farm of Department of Crop Physiology, N. D. University of Agriculture and Technology, Faizabad (U.P.), India. The eighteen genotypes of upland rice from different geographical regions were screened for drought tolerance (Table 1). Experimental design The genotypes were seeded in dry beds and one seedling per hill transplanting was done at 21 days after seeding in randomized block design with three replications in 20 × 15 cm spacing of 3 m row length. All recommended agronomic practices were followed for a good crop at optimum level. Water management The experiments were conducted with well defined protocol for water management under two environmental conditions (E1 and E2) in the wet season as follows: Irrigated (E1) The experimental field was left uncovered to receive natural rainfall as well as also irrigated with normal water, as and when required, to maintain appropriate moisture levels as recommended for irrigated rice.

1254 Afr. J. Agric. Res. Table 1. The place of origin and salient features of genotypes.
S/No. Cultivar Group Salient feature
1 Morobereken Japonica Upland cultivar, coarse grain, high grain yielder, broad leaf, selection landraces
2 Azucena Japonica Highly green broad leaf, drought tolerant, coarse grain
3 TN-1 Japonica Susceptible for multi disease and insect dwarf plant, low grain yield, short gold grain
4 IR-64 Indica Highly susceptible for drought, tiny fine grain semi dwarf 5 Vandana Indica Upland cultivar, tall plant and drought tolerant 6 NDR-359 Indica Irrigated (ecology) long gold high grain yielder semi dwarf plant
7 NDR-97 Indica Upland cultivar, dwarf plant, short duration, drought tolerant (escaping fine grain, eating quality good)
8 Saita Indica Highly susceptible for drought and sheath blight, semi dwarf plant, land races 9 DGI-21 Indica × Japonica Double haploid
10 DGI-75 Indica × Japonica Double haploid 11 DGI-138 Indica × Japonica Double haploid 12 DGI-152 Indica × Japonica Double haploid 13 DGI-379 Indica × Japonica Double haploid 14 DSU-18-6 Indica × Japonica Double haploid 15 P 0088 IR64 introgression line Introgression line 16 P 0090 IR64 introgression line Introgression line 17 P 0326 IR64 introgression line Introgression line 18 P 0397 IR64 introgression line Introgression line
Reproductive stage drought stress (E2) The experiments were laid out in rainout shelter at a height of 10 to 12 feet using polythene sheets to exclude any possibility of natural rainfall falling in the experimental plots with proper drainage channel. Care was taken to check the inflow or seepage of water from the adjoining areas by making adequate bunds around the experiment and covered with polythene in drought condition. The heading stage drought was created with holding the irrigation for 15 days up to 80 K Pa at 0 to 15 cm soil profile and 60 K Pa at 30 cm soil depth. Soil moisture content (SMC) during stress period was monitored through fabricated soil tensio meter, periodically. Observation and evaluation Observations were recorded on five competitive plants of the middle row of each plot for 18 biochemical traits and grain yield on the basis of plot grain yield (gram m-2). The biochemical traits that is, chlorophyll content (mg g-1 fresh weight), protein content (mg g-1 fresh weight), carbohydrate content (mg g-1 dry weight), starch content (mg g-1 dry weight), proline content (mg g-1 fresh weight), nitrate reductase activity (µmol NO2
- g-1 fresh weight h-1 ) and α-amylase activity (Unit g-1 fresh weight h-1) were estimated according to Arnon (1949), Lowery et al. (1951), Yemm and Willis (1954), Mc Cready et al. (1950), Bates et al. (1973), Asada et al. (1974), Jowarski (1971) and Chance and Maechly (1955), respectively. The total protein was isolated in sodium phosphate buffer (0.5 M, pH 7.0) and protein was separated 12% SDS-PAGE as method described by Laemmli (1970).
The pooled data of two year under E1 and E2 were analyzed by appropriate statistical analysis (Gomez and Gomez, 1984) using Crop Stat 7.2 (IRRI, 2009) programme. Phenotypic (PCV) and genotypic (GCV) coefficient of variation, path coefficient, heritability (broad sense) and genetic advance in percent of mean were
analysed according to Singh and Chaudhary (1985). Drought tolerance efficiency [DTE (%) = (Grain yield under stress/Grain yield under non-stress) x 100] and drought susceptibility index (DSI) was computed according to Fischer and Wood (1981) and Fischer and Maurer (1978) to identify the promising genotypes for limited irrigation, respectively.
RESULTS Analysis of variance (ANOVA) Significant differences were observed among the genotypes and also among the G × E (Genotypes × Environments) interactions for all the traits under both the conditions. The results of analysis of variance have been presented in Table 2. Means and range of biochemical traits under observations The grand mean of all traits for two environments over the seasons showed lower value under E2 compared to E1 except proline and α-amylase which represents the sensitivity of these traits to the stress. However, differences in mean values of all the characters were higher except carbohydrate and chlorophyll, which showed marginal differences between the two environments (Table 3).

Singh et al. 1255
Table 2. Analysis of variance (ANOVA) for 18+1 traits in upland rice under irrigated (E1) as well as flowering stage drought (E2) environment (E).
Source of variation d.f E Chl a Chl b Proline NR α Amylase
CHO at 50% F
Starch at 50% F CHO at M
Starch at M
Leaf’s CHO
Leaf’s starch
Upper root’s CHO
Lower root’s CHO
Lower root’s starch
Grain yield
Environments (Years) 1
E1 0.007 0.00126 7.92 2966.25* 584.00 42.50 11.50 44.25 151.7 83.56 7.78 0.0004 0.0018 0.0000008 0.0007 E2 0.000005 0.0009 1.39 1776.37** 3512.00 36.75 8.87 228.25 20.43 34.43 5.78 0.00003 0.000001 0.00001 0.0001
Replications (R) 2
E1 0.00002 0.00002 0.0117 9.00 8.00 45.00 31.87 7.75 84.37 2.68 106.25 0.00008 0.0001 0.00006 0.0004 E2 0.00003 0.00006 0.171 28.25 30.00 88.12 7.12 10.37 129.00 16.78 45.44* 0.000008 0.00001 0.00004 0.00004
E x R 2 E1 0.0001 0.000008 0.0351 15.62 3.00 1.500 20.62 6.12 0.812 5.34 2.48 0.000008 0.00002 0.00001 0.0001 E2 0.00001 0.00002 0.0703 7.12 10.00 28.00 44.50 9.78 2015 24.17 3.37 0.000001 0.000003 0.000006 0.00001
Genotypes (G) 17 E1 0.0133** 0.0216** 173.86** 597.39 14437.76** 3068.30** 3149.95** 4636.74** 8124.90** 666.16** 835.64** 0.01** 0.008** 0.0109** 0.00285** E2 0.0635** 0.0164** 59.38** 1530.07** 10614.98** 9814.20** 6475.24** 4965.41** 10261.33** 875.91** 519.49** 0.0039** 0.005** 0.00291** 0.00318**
G x E 17 E1 0.00300** 0.00290** 1.88** 441.65** 1365.64** 200.24** 78.15** 560.03** 94.85** 35.32** 30.53* 0.00009 0.00028** 0.0000120 0.0004** E2 0.00187** 0.00148** 1.20** 207.95** 1885.01** 209.29** 40.13** 505.76** 42.57** 13.92** 13.27** 0.0001** 0.0001** 0.000015* 0.00008**
Error 68 E1 0.00009 0.00002 0.033 328.34 13.79 6.73 19.23 8.00 9.05 8.82 5.65 0.00001 0.0006 0.000019 0.00043 E2 0.00004 0.00002 0.105 12.19 16.47 19.62 6.68 6.38 6.32 6.52 5.21 0.000006 0.00002 0.000007 0.000005
* Significant at 5% level, ** Significant at 1% level, Chl a = Chlorophyll a, Chl b = Chlorophyll b, NR = Nitrate reductase, CHO = Carbohydrate, F = Flowering stage, M = Maturity stage, d.f = degree of freedom. Phenotypic (PCV) and genotypic (GCV) coefficient of variation The phenotypic and genotypic coefficients of variations for all biochemical and physiological traits observed in this study have been presented in Table 3. Differences, between PCV and GCV were quite low for all the characters except nitrate reductase activity, upper and lower root’s starch under E1 (Table 3). Heritability (h2
b) and genetic advance (Ga) High heritability coupled with high genetic advance (determining scale from Johnson et al., 1955a) were estimated for chlorophyll b, proline,
carbohydrate and starch at flowering, carbohydrate and starch at maturity, leaf’s carbohydrate and starch, upper and lower root’s carbohydrate under both the conditions. Simultaneously, upper root’s starch, nitrate reductase and grain yield under E1 and lower root’s starch and chlorophyll a under E2 showed high heritability (>75.0) and genetic advance (>30.0) while rest traits exhibited indefinite combinations (Table 3). Drought tolerance parameters There was the wide range of corresponding variations of “drought susceptible index (DSI) with drought tolerant efficiency (DTE) in all the
genotypes for all the traits e.g. from 0.42 (Vandana) to 1.99 (Saita) of DSI while correspondingly from 46.49 (Saita) to 88.66 (Vandana) of DTE for grain yield. Out of 18 genotypes; six, eleven and one genotype (s) showed below average (ADSI<1), above average (ADSI>1) and average (ADSI~1) to drought susceptibility for grain yield, respectively (Table 6). Drought susceptible index with high grain yield potential can be used to identify parents to improve the performance of rice under variable moisture conditions (Ouk et al., 2006). The genotypes with high DTE and low DSI recorded minimum grain yield reduction (Bahar and Yildirim, 2010 and Parameshwarappa et al., 2010). Drought tolerant parameters- DTE and DSI have been presented in Table 4a,b.

1256 Afr. J. Agric. Res.
Table 3. Estimates of grand mean, range, phenotypic (PCV) and genotypic (GCV) coefficients of variation, heritability in broad sense (h2b) and
genetic advance in per cent of mean (Ga) for 18+1 characters in rice germplasm lines under irrigated (E1) and flowering stage drought (E2) conditions.
Characters Environments Grand mean Range Coefficient of
Variation h2b (%)
Ga (in % of mean)
PCV GCV
Chlorophyll a Irrigated 0.783 ±0.025 0.73-0.87 5.45 5.30 94.60 10.21 Drought 0.521 ±0.024 0.25-0.66 19.51 19.47 99.60 40.30
Chlorophyll b Irrigated 0.259 ±0.023 0.21-0.45 18.97 18.91 99.30 42.47 Drought 0.209 ±0.010 0.13-0.35 24.02 23.91 99.10 47.84
Proline Irrigated 23.03 ±2.11 17-34 23.26 23.25 99.90 47.85 Drought 33.68 ±1.62 27-38 9.30 9.25 98.90 18.44
Nitrate reductase Irrigated 168.00 ±5.78 148-181 14.87 14.48 94.80 30.03 Drought 102.52 ±4.22 76-128 4.56 3.03 44.20 4.14
α Amylase Irrigated 512.2±17.10 410-581 9.14 9.11 99.40 18.70 Drought 655.82 ±22.22 568-735 5.85 5.82 98.90 11.99
Carbohydrate at 50% flowering
Irrigated 210.11 ±6.48 166-245 10.95 10.87 98.60 21.28 Drought 145.31 ±3.77 78-218 27.70 27.54 98.80 56.37
Starch at 50% flowering Irrigated 151.60 ±3.12 113-192 15.20 14.93 96.40 30.18 Drought 112.10 ±2.09 60-158 29.31 29.22 99.40 60.00
Carbohydrate at maturity Irrigated 140.62 ±2.66 119-214 18.65 18.54 98.80 37.96 Drought 94.31 ±1.53 38-140 29.03 28.91 99.10 59.29
Starch at maturity Irrigated 131.24 ±3.26 83-195 27.97 27.87 99.30 57.23 Drought 88.88 ±2.09 33-180 46.52 46.43 99.60 75.47
Leaf’s Carbohydrate Irrigated 68.63 ±2.66 43-85 15.55 14.94 92.30 29.56 Drought 48.00 ±1.53 35-71 25.53 24.97 95.70 50.30
Leaf’s starch Irrigated 46.95 ±3.54 32-74 25.19 24.67 96.00 49.79 Drought 34.14 ±2.25 23-53 27.72 26.91 94.20 53.78
Upper root’s Carbohydrate
Irrigated 0.175 ±0.018 0.12-0.24 25.15 25.06 99.30 51.42 Drought 0.123 ±0.016 0.09-0.19 20.55 20.45 99.00 40.75
Upper root’s Starch Irrigated 0.214 ±0.007 0.14-0.32 23.72 23.37 97.10 49.18 Drought 0.122 ±0.004 0.05-0.21 21.26 17.57 68.30 28.03
Lower root’s Carbohydrate
Irrigated 0.129 ±0.008 0.06-0.21 33.26 33.12 99.00 69.76 Drought 0.079 ±0.006 0.03-0.11 27.84 27.61 98.40 50.63
Lower root’s Starch Irrigated 0.104 ±0.009 0.08-0.16 27.91 19.32 47.90 28.84 Drought 0.068 ±0.005 0.04-0.11 33.81 33.64 99.00 73.83
Grain yield Irrigated 520.69 ±7.12 390-664 16.70 16.69 99.90 34.36 Drought 371.57 ±6.68 228-550 25.37 25.35 99.90 52.19

Singh et al. 1257
Table 4(a). Drought tolerance parameters [i.e. drought susceptible index (DSI), drought tolerance efficiency (DTE) as well as per cent increase in α-amylase, proline and leaf water potential (LWP)] of 18 upland rice genotypes including Azucena (DT Check) and IR 64 (DS Check) under flowering stage drought condition.
Genotypes Proline Chlorophyll a Chlorophyll b α Amylase
Upper root starch
Lower root starch
Upper root sugar
Lower root sugar
Leaf starch Shoot starch
DSI DTE %
DSI DTE
% DSI
DTE %
DSI DTE %
DSI DTE
% DSI DTE % DSI DTE % DSI DTE% DSI DTE% DSI DTE%
Azucena 0.38 114.0 0.69 76.74 0.78 76.67 0.41 109.6 0.34 85.71 0.67 76.92 0.33 89.47 0.51 80.95 0.51 85.76 0.45 85.77 DGI-138 0.82 130.7 1.00 66.23 0.79 76.19 1.76 141.0 0.69 70.59 1.28 56.25 0.45 85.71 0.67 75.00 0.41 88.39 0.80 74.40 DGI-152 1.61 159.9 0.98 67.09 1.18 64.71 1.09 125.5 1.18 50.00 1.22 58.33 1.33 58.33 0.89 66.67 1.28 63.95 1.49 52.59 DGI-21 1.83 168.4 0.75 74.67 0.73 78.26 1.77 141.5 1.01 57.14 0.32 88.89 0.21 93.33 1.23 53.85 1.29 63.75 1.34 57.40 DGI-379 0.64 123.7 1.13 62.07 0.90 72.97 0.07 101.6 1.30 45.00 1.25 57.14 0.68 78.57 0.97 63.64 1.03 70.97 1.88 39.96 DGI-75 1.73 164.5 1.27 57.14 0.90 73.08 1.49 134.9 0.82 65.00 1.86 36.36 1.43 55.00 1.33 50.00 1.39 61.05 0.94 70.12 DSU-18-6 1.50 156.1 1.29 56.58 0.64 80.77 1.99 146.6 1.02 56.52 0.65 77.78 1.51 52.63 0.41 84.62 0.91 74.31 0.69 77.95 IR-64 2.20 182.0 1.56 47.67 1.73 48.15 1.49 134.9 0.74 68.42 0.67 76.92 1.36 57.14 1.40 47.62 1.52 57.36 2.13 32.16 Moroberekan 0.31 111.4 0.59 80.00 0.56 83.33 0.87 120.2 0.96 59.09 1.62 44.44 0.91 71.43 0.82 69.23 1.13 68.22 0.31 90.22 NDR-359 1.79 166.6 0.63 78.95 0.92 72.41 0.99 123.1 1.74 26.32 0.37 87.50 0.53 83.33 0.59 77.78 0.90 74.72 0.40 87.34 NDR-97 0.33 112.3 0.52 82.67 0.76 77.14 0.93 121.7 0.50 78.57 0.27 90.91 0.49 84.62 1.23 53.85 0.84 76.31 0.23 92.55 P-0088 0.18 106.7 1.25 58.11 1.04 68.97 1.52 135.5 0.74 68.42 0.80 72.73 1.12 64.71 0.24 90.91 0.77 78.47 0.85 72.82 P-0090 0.57 121.3 1.21 59.26 1.36 59.26 1.15 126.8 0.81 65.63 1.62 44.44 1.36 57.14 0.67 75.00 0.43 87.85 1.40 55.43 P-0326 0.55 120.6 0.70 76.39 0.74 77.78 0.47 111.0 0.45 80.95 0.65 77.78 0.49 84.62 0.44 83.33 0.89 75.01 0.48 84.87 P-0397 2.34 187.3 1.13 62.03 1.84 44.83 1.13 126.5 1.18 50.00 1.62 44.44 0.93 70.83 1.33 50.00 1.73 51.46 0.79 74.88 Saita 2.22 182.9 1.97 33.78 1.23 63.16 1.88 144.1 1.27 46.15 1.62 44.44 0.80 75.00 1.14 57.14 0.87 75.56 1.81 42.43 TN-1 2.18 181.3 0.71 76.19 1.03 69.23 0.58 113.6 1.01 57.14 0.97 66.67 1.46 54.17 1.33 50.00 1.18 66.75 1.36 56.60 Vandana 0.37 113.7 0.58 80.52 0.74 77.78 0.75 117.5 0.90 61.90 0.29 90.00 1.59 50.00 0.59 77.78 0.55 84.45 0.40 87.35 Genotypic correlation coefficients under irrigated (rgE1) and flowering stage drought (rgE2) condition Amongst various component traits, the traits namely chlorophyll A, chlorophyll B, nitrate reductase activity, carbohydrate at flowering stage and leaf’s carbohydrate exhibited significant positive association with grain yield. While, some other traits namely starch at flowering, carbohydrate at maturity, starch at maturity, upper root’s carbohydrate and lower root’s starch exhibited significant positive association with above mentioned traits other than grain yield. Results of the genetic correlations have been presented in Table 4.
Direct and indirect effects under irrigated (E1) and flowering stage drought (E2) condition The traits namely chlorophyll A, proline content, carbohydrate at flowering, starch at maturity, leaf’s carbohydrate and lower’s root starch showed low to high (determined from the scale of Lenka and Mishra, 1973) positive direct effect on grain yield under both environment. All the traits exhibited somehow indirect effect on grain yield through other traits (Table 5). Plant water status and proline accumulation Strong positive regression coefficient were
obtained between grain yield and RWC (r = 0.52) and almost all the genotypes recorded low DSI for RWC in present investigation. Grain yield was also positively and significantly correlated (r = 0.78) with proline under water stress situation. Leaf water potential (LWP) was positively associated with accumulation of proline and grain yield under drought stress. Similarly, we found strong negative correlation between RWC vs. sterility and LWP vs. sterility. Protien profiling SDS-PAGE analysis revealed differences between the protein patterns of drought stressed

1258 Afr. J. Agric. Res.
Table 4(b). Drought tolerance parameters that is, drought susceptible index (DSI), drought tolerance efficiency (DTE) as well as per cent increase in α-amylase, proline and leaf water potential (LWP)] of 18 upland rice genotypes including Azucena (DT Check) and IR 64 (DS Check) under flowering stage drought condition.
Genotypes Nitrate reductase Leaf carbohydrate Shoot carbohydrate RWC Biomass Harvest index Test Weight Grain Yield Per cent increase
DSI DTE% DSI DTE% DSI DTE% DSI DTE% DSI DTE% DSI DTE% DSI DTE% DSI DTE% αAmylase Proline LWP
Azucena 0.35 86.07 0.41 87.78 0.19 91.64 1.05 79.47 0.84 75.77 0.83 82.42 0.58 91.42 0.55 85.08 20.26 11.46 66.10 DGI-138 1.18 52.91 0.70 78.84 0.56 74.74 1.24 75.85 0.53 84.93 1.12 76.35 1.01 84.90 1.17 68.61 41.08 30.78 27.94 DGI-152 1.17 53.43 1.61 51.70 1.21 45.65 0.75 85.30 1.43 58.95 1.00 78.80 1.19 82.28 1.50 59.58 25.49 59.94 23.36 DGI-21 0.54 78.68 0.95 71.46 0.55 75.38 1.39 72.86 1.11 68.18 0.88 81.49 0.62 90.69 1.34 63.99 41.54 68.49 15.73 DGI-379 0.77 69.52 1.52 54.33 0.96 56.89 0.08 98.51 1.10 68.36 0.74 84.30 1.26 81.17 1.45 60.90 5.60 23.73 47.83 DGI-75 0.84 66.48 1.51 54.72 1.43 35.44 1.21 76.46 0.87 74.99 0.97 79.60 0.41 93.96 1.46 60.61 34.98 64.56 79.31 DSU-18-6 1.11 55.81 0.86 74.29 0.27 87.75 0.90 82.51 0.92 73.48 0.88 81.47 0.92 86.26 1.09 70.72 46.68 56.17 31.34 IR-64 0.98 61.12 1.26 62.10 1.16 47.67 0.30 94.08 1.44 58.58 1.41 70.18 1.09 83.78 1.27 65.74 34.96 82.00 73.91 Moroberekan 0.82 67.24 0.62 81.41 0.84 62.08 0.79 84.56 0.41 88.10 0.46 90.34 0.81 87.86 0.60 83.88 9.66 55.00 12.16 NDR-359 0.63 75.03 0.51 84.71 0.29 86.75 0.95 81.47 0.47 86.49 0.70 85.22 1.23 81.61 0.47 88.45 23.16 66.67 25.42 NDR-97 0.60 76.09 0.59 82.28 0.20 91.01 0.63 87.69 1.38 60.27 1.19 74.89 0.71 89.38 1.28 60.38 21.75 12.31 19.57 P-0088 1.38 44.94 1.19 64.30 1.70 23.40 1.79 65.07 1.48 57.48 1.30 72.51 1.21 81.96 1.47 60.38 35.52 6.72 87.67 P-0090 1.74 30.90 1.37 58.77 0.44 79.98 0.64 87.57 0.89 74.44 0.89 81.25 0.95 85.85 1.41 62.11 26.81 21.38 28.79 P-0326 1.00 60.02 0.49 85.38 0.36 84.00 1.14 77.69 1.14 67.17 0.70 85.14 0.50 92.50 0.74 80.10 10.99 20.69 23.77 P-0397 1.12 55.48 1.45 56.44 1.98 11.00 1.33 74.10 1.14 67.31 1.23 74.08 1.20 82.09 1.36 63.40 26.53 87.32 80.30 Saita 1.34 46.75 1.83 44.94 1.75 21.20 1.67 67.50 1.63 53.16 1.53 67.65 2.72 59.52 1.99 46.49 44.10 82.99 92.65 TN-1 1.26 49.95 0.59 82.30 0.32 85.71 1.85 63.88 0.30 91.43 1.25 73.60 1.17 82.61 0.81 78.26 1.91 81.30 16.88 Vandana 0.67 73.16 0.34 89.80 0.19 91.50 0.33 93.66 0.59 82.97 0.93 80.46 0.24 96.47 0.42 88.66 17.52 43.74 17.86
and controlled condition’s rice leaves proteins (Figure 1). A protein band of 25+2 kDa molecular weight was observed under control as well as drought stressed environment; while, this particular protein band was not observed in susceptible rice varieties exposed to drought stress. A specific protein band of 25+2 kDa was found in the stressed condition in NDR-97 and NDR-359, this protein was not observed in the controlled condition. Drought tolerant variety Vandana, showed constitutive expression of this particular protein in control as well as stress condition. However, this novel protein band was not present in the susceptible rice variety IR-64 in
both control and drought condition. DISCUSSION The high and significant differences among genotypes as well as G × E reveals the existence of sufficient variability among the genotypes and over whelming effect of environment on genetic performance, respectively (Table 2). A significant range of variation was observed for the biochemical traits observed among different genotypes. However, widest range of variability was recorded for proline, nitrate reductase, α-
amylase, carbohydrate and starch at flowering and maturity under E1 and Chlorophyll B under E2
(Table 3). The low difference between GCV and PCV of the traits except nitrate reductase activity, upper and lower root’s starch indicates towards true genetic variability and this is also supported by higher values of heritability (Table 3). Therefore, selection on the basis of phenotype alone can be effective for the improvement of these traits. Girish et al. (2006) have also reported the influence of environment on the characters if the PCV is higher than GCV. Blum (1988) also reported the reduction in genetic variance under severe stress condition.

Singh et al. 1259 Table 5. Genotypic correlation coefficient among 15+1 traits in upland rice grown under irrigated (upper diagonal) as well as flowering stage drought (lower diagonal) condition.
Traits 1 2 3 4 5 6 7 8 9 10 11 12 13 14 15 16
1 rgE1 0.115 -0.079 0.402 0.206 0.376 0.610* -0.245 -0.344 0.164 0.144 0.480 0.012 0.414 0.255 -0.085 rgE2
2 0.291 0.280 0.319 0.211 -0.237 -0.017 -0.159 -0.267 0.416 0.017 0.073 0.033 -0.014 -0.241 0.061 3 -0.330 0.065 -0.284 0.243 0.239 0.221 0.003 -0.008 0.162 -0.240 -0.301 -0.033 -0.121 -0.251 0.249 4 0.627* 0.473 0.060 -0.168 0.903** 0.493 0.444 -0.145 0.006 0.014 0.865 0.465 0.130 0.642** -0.120 5 -0.096 0.164 0.358 -0.011 0.286 0.495 0.074 0.146 0.237 -0.274 -0.125 -0.284 0.510 0.147 -0.107 6 0.604* 0.165 0.111 0.432 -0.222 0.742** 0.131 0.005 0.246 0.310 0.551* 0.433 0.083 0.307 0.061 7 0.579* -0.055 0.127 0.430 -0.285 0.844** 0.036 -0.016 0.234 0.204 0.328 0.227 0.172 -0.068 -0.375 8 0.356 -0.007 -0.032 0.234 -0.167 0.453 0.612* 0.712** 0.028 -0.156 0.221 -0.249 0.110 0.152 -0.253 9 0.355 0.121 -0.024 0.258 0.324 0.459 0.525* 0.827** -0.228 -0.087 0.086 -0.360 0.234 -0.052 0.003
10 0.752** 0.432 0.000 0.818** 0.102 0.624* 0.627* 0.655** 0.486 0.387 0.089 -0.019 -0.106 -0.014 0.094 11 0.242 0.197 -0.188 0.116 -0.434 0.394 0.432 0.407 0.041 0.356 0.703** 0.348 -0.333 0.014 0.171 12 0.038 -0.535* 0.016 0.134 -0.303 -0.128 0.037 0.109 -0.098 -0.041 -0.157 0.361 -0.083 0.319 0.107 13 -0.250 -0.214 0.244 -0.497 -0.235 0.064 0.118 0.099 -0.137 -0.194 0.471 0.047 -0.152 -0.332 -0.318 14 -0.029 -0.157 0.267 -0.191 0.344 0.072 0.099 0.113 0.102 0.014 -0.239 0.026 0.174 0.226 -0.405 15 0.411 0.200 -0.097 0.463 0.010 0.191 0.173 0.448 0.282 0.594* 0.088 0.419 -0.170 0.222 0.333 16 0.726** 0.546* -0.163 0.669** -0.135 0.559* 0.333 .413 0.512 0.741** 0.207 -0.180 -0.252 -0.133 0.513
1=Chlorophyll a; 2= Chlorophyll b; 3=Proline; 4=Nitrate reductase; 5= α Amylase; 6=Carbohydrate at 50% flowering; 7=Starch at 50% flowering; 8=Carbohydrate at maturity; 9=Starch at maturity; 10=Leaf’s carbohydrate; 11=Leaf’s starch; 12=Upper root’s carbohydrate; 13=Upper root’s starch; 14= Lower root’s carbohydrate; 15=Lower root’s starch; 16=Grain yield; * and ** Significant at 5% and 1% level [i.e. 0.514 and 0.641 r value from Fisher & Yates (1963)], respectively; rgE2 = Genotypic coefficient under irrigated condition; rgE2 = Genotypic coefficient under drought condition. Heritability of some of the physiological, biochemical and root related traits were higher in present analysis as revealed in Table 3. In general, the character that shows high heritability with high genetic advance is controlled by additive gene action and selection is always effective only for that trait (Warkad et al., 2008). Starch at maturity, leaf’s starch, upper root and lower root’s carbohydrate in both the environments while proline in E1 were the only traits which possessed very high estimates of phenotypic (PCV) and genotypic (GCV) coefficient of variation, heritability (h2
b) and genetic advance (Ga) (Table 3). These characters could be considered as preferred selection criteria for irrigated and
drought condition. Further, characters showing high heritability along with moderate or low genetic advance can be improved by inter mating superior genotypes of population developed from combination breeding (Samadia, 2005).
A close agreement between genotypic and phenotypic correlation in almost all the traits (data not presented in this paper) were found, which indicates least environment influence on the degree of association. Henceforth, reference is being made only to genotypic correlation (rgE2). rgE2 were, in general, similar in nature and higher than the corresponding rgE1; which reveals true genetical correlation of the traits with each other. The significant and positive correlation of
chlorophyll a, chlorophyll b, nitrate reductase activity, carbohydrate at flowering stage and leaf’s carbohydrate with grain yield was observed. Interestingly a significant positive correlation of above mentioned traits (starch at flowering, carbohydrate and starch at maturity, upper root’s carbohydrate and lower root’s starch) was observed with chlorophyll A, chlorophyll B, nitrate reductase activity, carbohydrate at flowering stage and leaf’s carbohydrate indicating that grain yield and these traits has the same biochemical/genetical basis for their expression (Table 4). Since chlorophyll a, proline and carbohydrate content at flowering, starch at maturity, leaf’s carbohydrate and lower’s root

1260 Afr. J. Agric. Res. Table 6. Genotypic direct and indirect effects of biochemical traits on grain yield under irrigated (E1) as well as flowering stage drought (E2) condition.
Traits 1 2 3 4 5 6 7 8 9 10 11 12 13 14 15
1 E1 E2
1.123 -0.031 -0.021 -0.202 0.046 0.028 -0.609 0.289 -0.617 0.147 -0.18 0.27 0.011 -0.594 0.253 0.697 -0.138 -0.248 -0.085 0.071 -0.068 -0.816 -0.549 0.398 1.349 0.214 -0.005 0.079 -0.005 0.045
2 E1 E2
0.129 -0.266 0.074 -0.160 0.047 -0.018 0.017 0.188 -0.478 0.373 -0.022 0.041 0.029 0.344 -0.239 0.203 -0.475 0.049 -0.064 -0.123 -0.018 0.077 0.012 0.135 0.774 0.174 0.074 0.068 -0.027 0.022
3 E1 E2
-0.088 -0.074 0.264 0.143 0.054 0.018 -0.220 -0.003 -0.015 0.146 0.299 -0.170 -0.029 0.173 -0.249 -0.230 -0.031 0.750 -0.008 -0.267 -0.012 -0.180 0.049 -0.027 0.001 -0.166 -0.002 -0.077 0.046 -0.011
4 E1 E2
0.452 -0.085 -0.075 -0.503 -0.037 0.067 -0.492 -0.524 -0.260 0.005 -0.018 0.488 0.413 -0.186 0.636 0.437 -0.225 0.045 0.135 0.008 0.048 -0.607 -0.360 0.289 1.467 0.102 -0.019 0.157 -0.033 0.051
5 E1 E2
0.231 -0.056 0.064 0.085 0.222 0.021 -0.494 -0.087 0.262 0.212 0.341 -0.070 -0.252 -0.732 0.146 -0.067 -0.078 0.269 0.001 -0.745 0.025 0.402 0.258 -0.363 0.183 -0.384 0.042 0.074 0.060 0.001
6 E1 E2
0.422 0.063 0.063 -0.454 0.064 0.074 -0.740 -0.155 0.010 0.221 -0.387 0.311 0.385 -0.120 0.304 0.428 -0.078 0.083 -0.058 0.166 0.111 -1.190 -0.698 0.514 1.119 0.348 0.018 -0.020 0.013 0.021
7 E1 E2
0.686 0.004 0.058 -0.248 0.110 0.055 -0.998 -0.004 -0.028 0.210 -0.254 0.185 0.202 -0.247 -0.067 0.403 0.026 0.096 -0.058 0.212 -0.093 -1.411 -0.944 0.588 1.124 0.382 -0.005 -0.037 0.017 0.019
8 E1 E2
-0.275 0.042 0.001 -0.223 0.016 0.010 -0.036 -1.181 1.278 0.025 0.195 0.125 -0.221 -0.158 0.150 -0.248 0.004 -0.024 -0.032 0.125 -0.050 -0.864 -1.541 0.927 1.175 0.359 -0.015 -0.031 0.020 0.049
9 E1 E2
-0.386 0.071 -0.002 0.073 0.032 0.000 0.016 -0.841 1.794 -0.205 0.109 0.049 -0.320 -0.336 -0.052 0.247 -0.057 -0.018 -0.035 0.245 -0.051 -0.740 -1.275 1.120 0.871 0.037 0.014 0.043 0.018 0.031
10 E1 E2
0.184 -0.111 0.043 -0.003 0.053 0.018 -0.234 -0.033 -0.410 0.897 -0.482 0.050 -0.017 0.152 -0.014 0.524 -0.205 0.000 -0.110 -0.076 -0.069 -0.885 -1.009 0.544 1.793 0.315 0.006 0.061 0.003 0.065
11 E1 E2
0.164 -0.005 -0.063 -0.007 -0.061 0.023 -0.203 0.184 -0.157 0.347 -1.247 0.396 0.309 0.478 0.014 0.169 -0.094 -0.141 -0.016 0.324 -0.044 -0.609 -0.626 0.046 0.638 0.884 0.022 -0.148 -0.041 0.010
12 E1 E2
0.539 -0.019 -0.079 -0.435 -0.028 0.041 -0.327 -0.261 0.155 0.079 -0.877 0.564 0.321 0.119 0.316 0.026 0.254 0.012 -0.018 0.226 0.014 -0.052 -0.167 -0.110 -0.074 -0.139 -0.039 -0.015 0.004 0.046
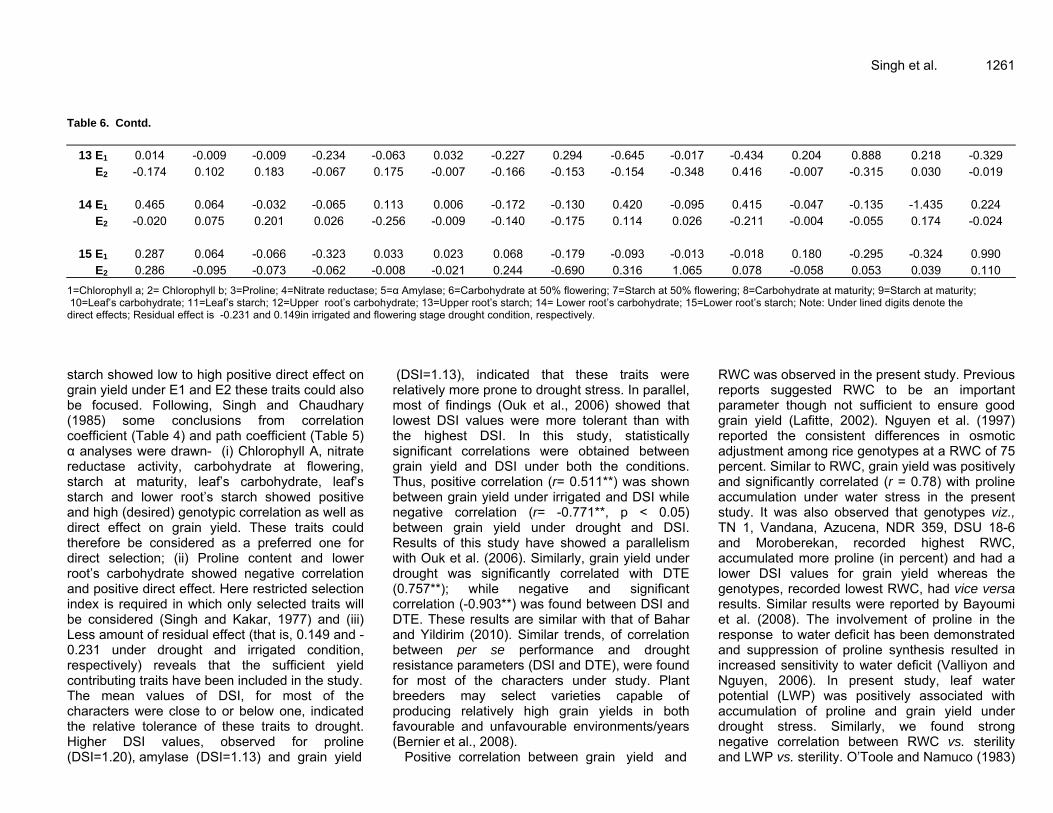
Singh et al. 1261 Table 6. Contd.
13 E1 E2
0.014 -0.009 -0.009 -0.234 -0.063 0.032 -0.227 0.294 -0.645 -0.017 -0.434 0.204 0.888 0.218 -0.329 -0.174 0.102 0.183 -0.067 0.175 -0.007 -0.166 -0.153 -0.154 -0.348 0.416 -0.007 -0.315 0.030 -0.019
14 E1 E2
0.465 0.064 -0.032 -0.065 0.113 0.006 -0.172 -0.130 0.420 -0.095 0.415 -0.047 -0.135 -1.435 0.224 -0.020 0.075 0.201 0.026 -0.256 -0.009 -0.140 -0.175 0.114 0.026 -0.211 -0.004 -0.055 0.174 -0.024
15 E1 E2
0.287 0.064 -0.066 -0.323 0.033 0.023 0.068 -0.179 -0.093 -0.013 -0.018 0.180 -0.295 -0.324 0.990 0.286 -0.095 -0.073 -0.062 -0.008 -0.021 0.244 -0.690 0.316 1.065 0.078 -0.058 0.053 0.039 0.110
1=Chlorophyll a; 2= Chlorophyll b; 3=Proline; 4=Nitrate reductase; 5=α Amylase; 6=Carbohydrate at 50% flowering; 7=Starch at 50% flowering; 8=Carbohydrate at maturity; 9=Starch at maturity; 10=Leaf’s carbohydrate; 11=Leaf’s starch; 12=Upper root’s carbohydrate; 13=Upper root’s starch; 14= Lower root’s carbohydrate; 15=Lower root’s starch; Note: Under lined digits denote the direct effects; Residual effect is -0.231 and 0.149in irrigated and flowering stage drought condition, respectively. starch showed low to high positive direct effect on grain yield under E1 and E2 these traits could also be focused. Following, Singh and Chaudhary (1985) some conclusions from correlation coefficient (Table 4) and path coefficient (Table 5) α analyses were drawn- (i) Chlorophyll A, nitrate reductase activity, carbohydrate at flowering, starch at maturity, leaf’s carbohydrate, leaf’s starch and lower root’s starch showed positive and high (desired) genotypic correlation as well as direct effect on grain yield. These traits could therefore be considered as a preferred one for direct selection; (ii) Proline content and lower root’s carbohydrate showed negative correlation and positive direct effect. Here restricted selection index is required in which only selected traits will be considered (Singh and Kakar, 1977) and (iii) Less amount of residual effect (that is, 0.149 and -0.231 under drought and irrigated condition, respectively) reveals that the sufficient yield contributing traits have been included in the study. The mean values of DSI, for most of the characters were close to or below one, indicated the relative tolerance of these traits to drought. Higher DSI values, observed for proline (DSI=1.20), amylase (DSI=1.13) and grain yield
(DSI=1.13), indicated that these traits were relatively more prone to drought stress. In parallel, most of findings (Ouk et al., 2006) showed that lowest DSI values were more tolerant than with the highest DSI. In this study, statistically significant correlations were obtained between grain yield and DSI under both the conditions. Thus, positive correlation (r= 0.511**) was shown between grain yield under irrigated and DSI while negative correlation (r= -0.771**, p < 0.05) between grain yield under drought and DSI. Results of this study have showed a parallelism with Ouk et al. (2006). Similarly, grain yield under drought was significantly correlated with DTE (0.757**); while negative and significant correlation (-0.903**) was found between DSI and DTE. These results are similar with that of Bahar and Yildirim (2010). Similar trends, of correlation between per se performance and drought resistance parameters (DSI and DTE), were found for most of the characters under study. Plant breeders may select varieties capable of producing relatively high grain yields in both favourable and unfavourable environments/years (Bernier et al., 2008).
Positive correlation between grain yield and
RWC was observed in the present study. Previous reports suggested RWC to be an important parameter though not sufficient to ensure good grain yield (Lafitte, 2002). Nguyen et al. (1997) reported the consistent differences in osmotic adjustment among rice genotypes at a RWC of 75 percent. Similar to RWC, grain yield was positively and significantly correlated (r = 0.78) with proline accumulation under water stress in the present study. It was also observed that genotypes viz., TN 1, Vandana, Azucena, NDR 359, DSU 18-6 and Moroberekan, recorded highest RWC, accumulated more proline (in percent) and had a lower DSI values for grain yield whereas the genotypes, recorded lowest RWC, had vice versa results. Similar results were reported by Bayoumi et al. (2008). The involvement of proline in the response to water deficit has been demonstrated and suppression of proline synthesis resulted in increased sensitivity to water deficit (Valliyon and Nguyen, 2006). In present study, leaf water potential (LWP) was positively associated with accumulation of proline and grain yield under drought stress. Similarly, we found strong negative correlation between RWC vs. sterility and LWP vs. sterility. O’Toole and Namuco (1983)

1262 Afr. J. Agric. Res.
Figure 1. SDS-PAGE profiling of the susceptible(IR64), and drought resistance rice varieties (NDR97, NDR-359 and Vandana) in control (c) and drought (D) condition.
found that panicle exertion rate was decreased linearly with decrease in water potential and subsequently grain yield also. However, genotypic differences in proline accumulation may be simply a reflection of respective differences in leaf water potential (Dingkuhn et al., 1991). Thus, studies indicated that capacity to maintain high LWP is promising traits for selection to improve tolerance against late season drought in rainfed upland rice. In above view, genotypes selected as drought resistance for grain yield viz., NDR 359, DSU 18-6, Vandana and Moroberekan were considered as best among the top genotypes with low DSI (<1) for all other biochemical and physiological traits under study.
The presence of protein band of 25+2 kDa in drought tolerant cultivars- NDR-97, NDR-359 and Vandana and its absence in IR64 can be due to induction of specific proteins involved in stress tolerance/response in the resistance rice varieties. Beside their specific functions, proteins which are accumulated in the plants by stress exposure may provide a storage form of nitrogen that is reutilized when stress is over and probably play a role in osmotic adjustment (Niknam et al., 2006; Ahmad et al., 2007). The disappearance of a protein band/expression under waters stress seems to be due to ionic component which is a conserved response among different rice cultivars. The observed difference between the intensity of a protein band suggests a probable role of this protein in drought tolerance. Also, the induction of some protein
bands under stress treatments, which exclusively occurred in NDR 369, may play a role in higher osmotic stress tolerance of NDR357 compared to IR64.
The establishment of managed drought conditions by rainout shelter allows rice research workers to select drought tolerant genotypes by following drought susceptibility index and drought tolerance efficiency as the important parameters. A comprehensive screening of physiological and biochemical traits during drought stress will advance our fundamental understanding of these traits and provide direction for future strategies for drought tolerance in rice. Breeding procedures like pureline selection, pedigree breeding method would be effective for development of drought tolerant genotypes. Vandana, as drought tolerant cultivar (Bernier et al., 2008 and Acuna et al., 2008), is grown in drought prone upland of eastern India. Thus, improvement in it’s per se performance and drought tolerance could be of significant for food security under target environments. Saita, as displaying concerned opposite traits, must be used to develop mapping population. Complex nature of upland drought suggested that multi environment testing and selection is necessary for NDR 359, DSU 18-6, Vandana and Moroberekan to develop high yield potential with drought tolerance. Abbreviations: DTE, Drought tolerance efficiency; DSI, drought susceptibility index; GCV, genotypic coefficient of

variation; G × E, Genotypes × Environments; PCV, phenotypic coefficient of variation; RWC, relative water content; SDS-PAGE: sodium dodecyl sulphate poly acrylamide gel electrophoresis; SMC, soil moisture content. ACKNOWLEDGEMENT Author’s acknowledge Rockefeller foundation USA for the financial support to perform these experiments. REFERENCES Acuna BTL, Lafitte HR, Wade LJ (2008). Genotype × environment
interactions for grain yield of upland rice backcross lines in diverse hydrological environments. Field Crop Res. 108:117-125.http://dx.doi.org/10.1016/j.fcr.2008.04.003
Ahmad MSA, Javed F, Ashraf M (2007). Iso-osmotic effect of NaCl and PEG on growth, cations and free proline accumulation in callus tissue of two indica rice (Oryza sativa L.) genotypes. Plant Growth Regul. 53:53-63.http://dx.doi.org/10.1007/s10725-007-9204-0
Arnon DI (1949). Copper enzyme in isolated chloroplast: Polyphenol oxidase in Beta vulgaris. Plant Phyisol. 24:1-15. http://dx.doi.org/10.1104/pp.24.1.1 PMid:16654194 PMCid:PMC437905
Asada K, Takahasi SM, Nagate M (1974). Assay and inhibition of spinach superoxide dismutase. Agric. Biol. Chem. 38(2):171-173. http://dx.doi.org/10.1271/bbb1961.38.471
Bahar B, Yildirim M (2010). Heat and drought resistance criteria in spring bread wheat: Drought resistance parameters. Sci. Res. Essays 5:1742-1745.
Barker R, Dawe D, Inocencio A (2003). Economics of water productivity in managing water for agriculture. In: Kijne JW, Barker, R, Molden M (eds). Water productivity in agriculture: limits and opportunities for improvement. CABI Publishing, UK. P. 332.http://dx.doi.org/10.1079/9780851996691.0019
Bates LS, Warden RP, Teare ID (1973). Rapid determination of free proline for water stress studies. Plant. Soil 39:205-207.http://dx.doi.org/10.1007/BF00018060
Bayoumi TY, Eid MH, Metwali EM (2008). Application of physiological and biochemical indices as a screening technique for drought tolerance in wheat genotypes. AfrI J. Biotechnol. 7:2341-2352.
Bernier J, Atlin GN, Rachid S, Kumar A, Spaner D (2008). Breeding upland rice for drought resistance. J. Sci. Food Agric. 8:927-939.http://dx.doi.org/10.1002/jsfa.3153
Bouman BAM, Lampayan RM, Tuong TP (2007). Water management in irrigated rice: coping with water scarcity. International Rice Research Institute: Los Banos, Philippines. http://dx.doi.org/10.1016/j.agwat.2006.10.005
Blum A (1988). Plant Breeding for Stress Environments. CRC Press, Boca Raton, FL.
Blum A (2005). Drought resistance, water-use efficiency, and yield potential-are they compatible, dissonant, or mutually exclusive? Aust. J. Agric. Res. 56:1159-1168.http://dx.doi.org/10.1071/AR05069
Chance B, Maechly AC (1955). Assay of catalase and peroxidase, In: S.P. Colowick and N.O. Kaplan (eds.), Methods in Enzymology 76-Academic Press, New York.
Dawe D, Pandey S, Nelson A (2010). Emerging trends and spatial patterns of rice production. In: Pandey S, Byerlee D, Dawe D, Dobermann A, Mohanty S, Rozelle S, Hardy B, editors. Rice in the global economy: strategic research and policy issues for food security. Los Banos (Philippines): International Rice Research Institute. pp. 15-35.PMid:20822326 PMCid:PMC3317381
de Fraiture C, Wichelns D, Kemp BE, Rockstrom J (2007). Scenarios on water for food and environment. InWater for Food, Water for Life: A Comprehensive Assessment of Water Management in Agriculture, Chapter 3, Earthscan,London and International Water Management
Singh et al. 1263
Institute, Colombo. Dhillon RS, Thind HS, Saseena UK, Sharma RK, Malhi NS (1995).
Tolerance to excess water stress and its association with other traits in maize. Crop Imp. 22:22-28.
Dingkuhn M, Cruz RT, O'Toole JC, Turner NC, Doerfflin K (1991) Responses of seven diverse rice cultivars to water deficits. III. Accumulation of abscisic acid and proline in relation to leaf water potential and osmotic adjustment. Field Crop Res. 27:103-117.http://dx.doi.org/10.1016/0378-4290(91)90025-Q
Fischer RA, Maurer R (1978). Drought resistance in spring wheat cultivars. 1. Grain yield responses. Aust. J. Agric Sci. 29:892-912.http://dx.doi.org/10.1071/AR9780897
Fischer RA, Wood G (1981). Breeding and selection for drought tolerance in tropical maize. In: KS Fischer, EC Johnso GO Edmonds (eds). (1981). Proceedings of symposium on 'Principles and methods in crop improvement for drought resistance with Emphasis on Rice, IRRI, Philippines, May, Gauchan D, Pandey S (2011). Socio-economic analyses of farmer livelihoods, modern variety adoption and economics of rice production in stress-prone rainfed areas of Nepal. IRRI, Phillipines.
Girish TN, Gireesha TM, Vaishali MG, Hanamareddy BG, Hittalmani S (2006). Response of new IR 50/ Morobereken recombinant inbred population of rice (Oryza sativa L.) from an indica x japonica cross for growth and grain yield traits under arobic condition. Euphytica 152:149-161.http://dx.doi.org/10.1007/s10681-006-9190-8
Gomez KA, Gomez AA (1984). Statistical Procedures for Agricultural Research (2nd Edition). New York (USA) John Wiley & Sons. Inc. P. 680.
Graff DF (1980). Adaptation of Plants to Water and High Temperature Stress (eds Turner, N. C. and Kramer, P. J.), Wiley, New York, pp. 207–230.
I.R.R.I. (2009). CropStat 7.2 for Windows. Crop Research Informatics Laboratory, International Rice Research Institute, Los Banos, Philippines.
Johnson HW, Robinson HF, Comstock RE (1955). Estimates of genetic and environmental variability in soybean. Agron. J. 47:314-318.http://dx.doi.org/10.2134/agronj1955.00021962004700070009x
Jowarski K (1971). Nitrate reductase assay for nitrite reductase in barley aleurone layer. Plant Physiol. 47:790-794. http://dx.doi.org/10.1104/pp.47.6.790
Kamran M, Shahbaz M, Ashraf M, Akram NA (2009). Alleviation of drought-induced adverse effects in spring wheat (Triticum aestivum L.) using proline as a pre-sowing seed treatment. Pak. J. Bot. 41:621-632.
Khush GS (1997). Origin, dispersal, cultivation and variation of rice. Plant. Mol. Biol. 35:25-34.http://dx.doi.org/10.1023/A:1005810616885PMid:9291957
Laemmli UK (1970). Cleavage of structural proteins during the assembly of the head of bacteriophage T4. Nature 227:680-665.http://dx.doi.org/10.1038/227680a0PMid:5432063
Lafitte HR (2002). Relationship between leaf relative water content during reproductive stage water deficit and grain formation in rice. Field Crop Res. 76:165-174.http://dx.doi.org/10.1016/S0378-4290(02)00037-0
Lenka D, Mishra B (1973). Path coefficient analysis of yield in rice varieties. Indin J. Agric Sci. 43:376-379.
Levitt J (1980). Responses of plants to environmental stresses. 2nd ed. Academic Press, New York.
Lowery OH, Rosenbrough NJ, Farr AL, Randal RJ (1951). Protein measurement with folin phenol reagent. J. Biol Chem. 193:265-275.
Mc Cready RM, Guggols J, Silviers V, Owen HS (1950). Determination of starch and amylase in vegetables. Ann. Chem. 22:1156-1158.http://dx.doi.org/10.1021/ac60045a016
Mitra J (2001). Genetics and genetic improvement of drought resistance in crop plants. Curr. Sci. 80:758-763.
Nguyen HT, Babu RC, Blum A (1997). Breeding for drought resistance in rice: physiology and molecular genetics considerations. Crop Sci. 37:1426-1434. http://dx.doi.org/10.2135/cropsci1997.0011183X003700050002x
Niknam V, Razavi H, Ebrahimzadeh H, Sharifizadeh B (2006). Effect of NaCl on biomass, protein and proline contents, and antioxidant enzymes in seedlings and calli of two Trigonella species. Biol. Plant.

1264 Afr. J. Agric. Res.
50(4):591-596. http://dx.doi.org/10.1007/s10535-006-0093-2 O'Toole JC, Namuco OS (1983). Role of panicle exertion in water stress
induced sterility. Crop Sci. 23:1093-1097. http://dx.doi.org/10.2135/cropsci1983.0011183X002300060017x
Ouk M, Basnayake J, Tsubo M, Fukai S, Fischer KS, Cooper M, Nesbitt H (2006). Use of drought response index for identification of drought tolerant genotypes in rainfed lowland rice. Field Crop Res. 99:48-58.http://dx.doi.org/10.1016/j.fcr.2006.03.003
Ozdemir F, Bor M, Demiral T, Turkan I (2004). Effect of 24-epibrassinolide on seed germination, seedling growth, lipid peroxidation, proline content and antioxidant system of rice (Oryza sativa L.) under salinity stress. Plant Growth Regul. 41:203-211. http://dx.doi.org/10.1023/B:GROW.0000026509.25995.13
Parameshwarappa SG, Salimath PM, Upadhyaya HD, Patil SS, Kajjidoni ST, Patil BC (2010). Characterization of drought tolerant accessions identified from the minicore of chickpea (Cicer arietinum L.). Indian J. Genet. 70:125-131.
Samadia DK (2005). Genetic variability studies in Lasora (Cordia myxa Roxb.). Indian J. Plant Genet Res. 18:236-240.
Sinclair TR (2011). Challenges in breeding for yield increase for drought. Trends in Plant Sci. 16:289-293. http://dx.doi.org/10.1016/j.tplants.2011.02.008 PMid:21419688
Singh RK, Chaudhary BD (1985). Biometrical methods in quantitative genetic analysis. Kalyani Publishers, New Delhi, India.
Singh RK, Kakar SN (1977). Control of individual trait means during index selection. Proc. Third Congr. SABRAO (Canberra), 3(d):22-25.
Vallivodan B, Nguyen HT (2006). Understanding regulatory networks and engineering for enhanced drought tolerance in plants. Curr. Opin. Plant Biol. 9:189-195. http://dx.doi.org/10.1016/j.pbi.2006.01.019PMid:16483835
Warkad YN, Potdukhe NR, Dethe AM, Kahate PA, Kotgire RR (2008). Genetic variability, heritability and genetic advance for quantitative traits in sorghum germplasm. Agric. Sci Digest. 28:202-205.
Yemm EW, Willis AJ (1954). The estimation of carbohydrates in plant extracts by anthrone. Biochem J. 57:508-514. PMid:13181867 PMCid:PMC1269789
Zhang J, Jia W, Yang J, Ismail M. (2006). Role of ABA in integrating plant response to drought and salt stresses. Field Crops Res. 97:111-119. http://dx.doi.org/10.1016/j.fcr.2005.08.018
Copyright © 2022 FDOKUMEN