L E A D T H E - CSE
146
JOHN KEELLS PLC ANNUAL REPORT 2021 | 2022 LEAD THE
-
Upload
khangminh22 -
Category
Documents
-
view
2 -
download
0
Transcript of L E A D T H E - CSE

JOHN KEELLS PLCANNUAL REPORT 2021 | 2022
L E A D T H E


1
l e a d t h e c h a n g e
John Keells PLC has a clearly defined vision for the future; one designed to withstand change and challenge alike. Our
legacy is built on thriving through changes that have defined the course of Sri Lanka’s history and the fortunes of Ceylon Tea. As we position ourselves to embrace the opportunities
of the present and the potential of tomorrow, we have strengthened our capabilities and our partnerships to extend sustained value in ways that matter. We are evolving to lead
the change.

2
JOHN KEELLS PLCAnnual Report 2021/22
About Us
pg04Management Discussion and Analysis
pg14
Corporate Governance
pg36
Financial Information
pg65
ABOUT US
About Us 04Introduction to the Report 05Group Structure 06 Senior Management Team 06Performance Highlights 07Milestones 8Chairman’s Statement 10
MANAGEMENT DISCUSSION AND ANALYSIS
Management Discussion & Analysis 14Financial Review 23Human Resources & CSR 28
STEWARDSHIP
The Board of Directors 34Corporate Governance 36Enterprise Risk Management 51Report of the Board Audit Committee
55 Report of the Related Party
Transactions Review Committee 58Annual Report of the Board of
Directors 59Statement of Directors’ Responsibility
64
FINANCIAL INFORMATION
Financial Calendar 66Independent Auditor’s Report 67Income Statement 70Statement of Comprehensive Income
71Statement of Financial Position 72Statement of Changes in Equity 73Cash Flow Statement 75Index to the Notes 77Notes to the Financial Statements 78Information to Shareholders and
Investors 129Key Ratios & Information 131Five year Summary 132Glossary of Financial Terms 134
Corporate Information Inner Back Cover
Contents
3
L I G H T T H E
A B O U T U S
About Us | Introduction to the Report | Group Structure | Senior Management Team | Performance Highlights | Milestones | Chairman’s Statement
4
JOHN KEELLS PLCAnnual Report 2021/22
About Us
John Keells PLC has streamlined its operations to welcome challenges and adapt to change while moving with the times in a fast-changing world. Today we have become a paradigm of innovation prospering through 150 years of experience and market leadership while setting a benchmark of quality, brand excellence, and good governance.
This report analyses the responsive strategies and resources that have enabled us to thrive, transform, and remain pertinent to our stakeholders, enabling them to pursue the future and what it holds.
Resilience is our greatest source of confidence through turbulent times and economies. Our Annual Report demonstrates how we have moved with the times and performed exceptionally across a range of indicators by maintaining our long-term vision both now and into the years ahead.
Vision
To be internationally recognised as the best Produce Broker in the world.
Mission
To retain the pre-eminent position as Sri Lanka’s leading Tea and Rubber broker; To uphold the traditions and ethics of the Tea and Rubber trades; To ensure superior customer service through a dedicated and motivated workforce.
Values
We are committed to the highest level of integrity and ethical conduct in all our business activities. We will look towards exceeding shareholder and customer expectations by achieving excellence in all areas of operations. We recognise the right of every individual to be treated with fairness, dignity and respect and assist our employees to improve their skills and reward their accomplishments. We will focus on corporate social responsibility and look to protect and safeguard the environment.
5
Introduction to the Report
It is with pleasure the Board of Directors together with the Management of John Keells PLC present the Annual Report for the financial year, 2021/22. As a company, we at John Keells PLC (herein referred to as the “Company”) are devoted in ensuring all stakeholders are well-informed in our business activities. This Report includes fundamental aspects of the company that enhances the value creating ability of the Company and its subsidiaries, John Keells Warehousing (Pvt) Ltd (JKW) and John Keells Stock Brokers (Pvt) Ltd (JKSB) (herein referred to as the “Group”) in the short, medium and long term.
This Annual Report comprises the financial statements, other reports and statements, which are prepared in compliance with local and international regulations and guidelines on Financial and Non-Financial reporting. Further, this report discloses specific information to better serve our diverse stakeholders’ information requirements. The foundations of preparing this Annual Report would be beneficial when reading and comprehending this report, hence it is described as follows.
Reporting Scope and BoundariesThe Annual report 2021/2022 of John Keells PLC covers the operations of the Company and the Group for the reporting period 1st April 2021 to 31st March 2022. Any material event after this reporting period, up to the date of sign-off by the Board of Directors on 23rd May 2022, have been disclosed in Note 37 to this report ensuring relevance and reporting accuracy. Our latest report is for the financial year ending 31st March 2021, and it is available on our website www.johnkeellstea.com.
The Consolidated Financial Statements of the Group presented on pages 70 to 76 provides information on financial reporting of the Group. Management discussion and analysis appearing on pages 14 to 32 identifies the activities of the Group. This report also covers risks, opportunities and outcomes that could materially affect the organization’s ability to create value. There were no significant changes to the Group’s size, structure, shareholding, or supply chain during the period under review. There were no material re-statements of information from the previous reporting period.
Corporate GovernanceIn developing and maintaining healthy relationships in our business engagements, good governance plays a chief role, which is why it is valued and advocated for, across the Group. The section on Corporate Governance given on pages 36 to 50 of this report elaborates on how we have initiated and executed corporate governance practices in the Company and the Group. The section also comprises information on the mandatory and voluntary compliances that have been placed in accordance with corporate governance provisions laid out in the Code of Best Practice on Corporate Governance jointly issued by the Institute of Chartered Accountants of Sri Lanka (CA Sri Lanka) and Securities and Exchange Commission of Sri Lanka (SEC).
Disclaimer for the Publication of Forecast DataThe report contains information about the plans and strategies of the Group for the medium and long term and represent the group view of the management. The plans are forward looking in nature and their feasibility depends on a number of economic, environmental, political and legal factors which are outside the influence of the Group and Company such as global and domestic financial, economic and political situations, the situation of key markets, changes in tax, environmental legislation, weather patterns and so forth. Given this, the actual performance indicators in future years may differ from the forward-looking statements published in this Report.
Information VerificationThe information contained in this Report has been reviewed as applicable by:
• The Board of Directors • Audit Committee of the Company • An independent auditor confirming the
accuracy of the annual financial statements • The Management Committee
STANDARDS AND PRINCIPLESGovernance, Risk Management and Operations• Laws and Regulations of the Companies Act No. 7 of 2007
• Listing Rules of the Colombo Stock Exchange (CSE) and subsequent revisions to date
• Code of Best Practice on Corporate Governance jointly advocated by the Securities and Exchange Commission of Sri Lanka (SEC) and the Institute of Chartered Accountants of Sri Lanka (CA Sri Lanka)
• Code of Best Practices on Related Party Transactions (2013)
Financial Reporting• Sri Lanka Accounting Standards (SLFRSs / LKASs) issued by the Institute of Chartered
Accountants of Sri Lanka (CA Sri Lanka)
Contact PersonFor any inquiries and feedback with reference to this report please contact
Devika Weerasinghe, Chief Financial OfficerJohn Keells PLC, No. 186, Vauxhall Street, Colombo 02.
E-mail: [email protected]

6
JOHN KEELLS PLCAnnual Report 2021/22
Group Structure
Senior Management Team
Transportation
Financial Services
Property
Information Technology
Produce Broking - Tea & Rubber
Produce Warehousing - Tea
Stock Broking
Leisure Sector
Consumer Foods and Retail
Tea Smallholders Factories PLC
86.90%
37.62%
John Keells Warehousing (Pvt) Ltd
John Keells Stock Brokers (Pvt) Ltd
John Keells PLC
100%
76%
John Keells Holdings PLC (Parent Company)
JOHN KEELLS PLC [INC 1960]• Hishantha De Mel – Chief Executive officer / Vice President John Keells
Holdings PLC
• Ravin Vannitamby – Head of Operations / Assistant Vice President John Keells Holdings PLC
• Deshan Bandaranayake – Head of Marketing / Assistant Vice President John Keells Holdings PLC
• Janith De Silva – Manager Tea
• Kaveesha Hettiarachchi – Manager Tea
• Nishika Thadani – Head of Finance
• Samantha Siriwardene – Head of Processes and Systems
JOHN KEELLS WAREHOUSING (PVT) LTD [INC 2001]• Lakshman Kannangara – Manager Warehousing
JOHN KEELLS STOCK BROKERS (PVT) LTD [INC 1979]• Tivanka Ratnayake – Chief Executive Officer / Vice President John Keells
Holdings PLC
• Sherin Cader – Chief Financial Officer, Financial Services Sector / Executive Vice President John Keells Holdings PLC
• Akmal Mashoor – Head of Sales / Assistant Vice President John Keells Holdings PLC
• Navin Ratnayake – Head of Research / Assistant Vice President John Keells Holdings PLC
• Dishan Leo – Manager Research
• Harsha Senanayake – Head of Business Systems, Financial Services Sector / Vice President John Keells Holdings PLC
• Samantha Siriwardene – Head of Processes and Systems
• Marinus Fernando – Manager IT
• Chryshanthi Manuel – Compliance Officer
• Vanitha Saravana – Head of Documentation
Plantation Services
7
Performance Highlights
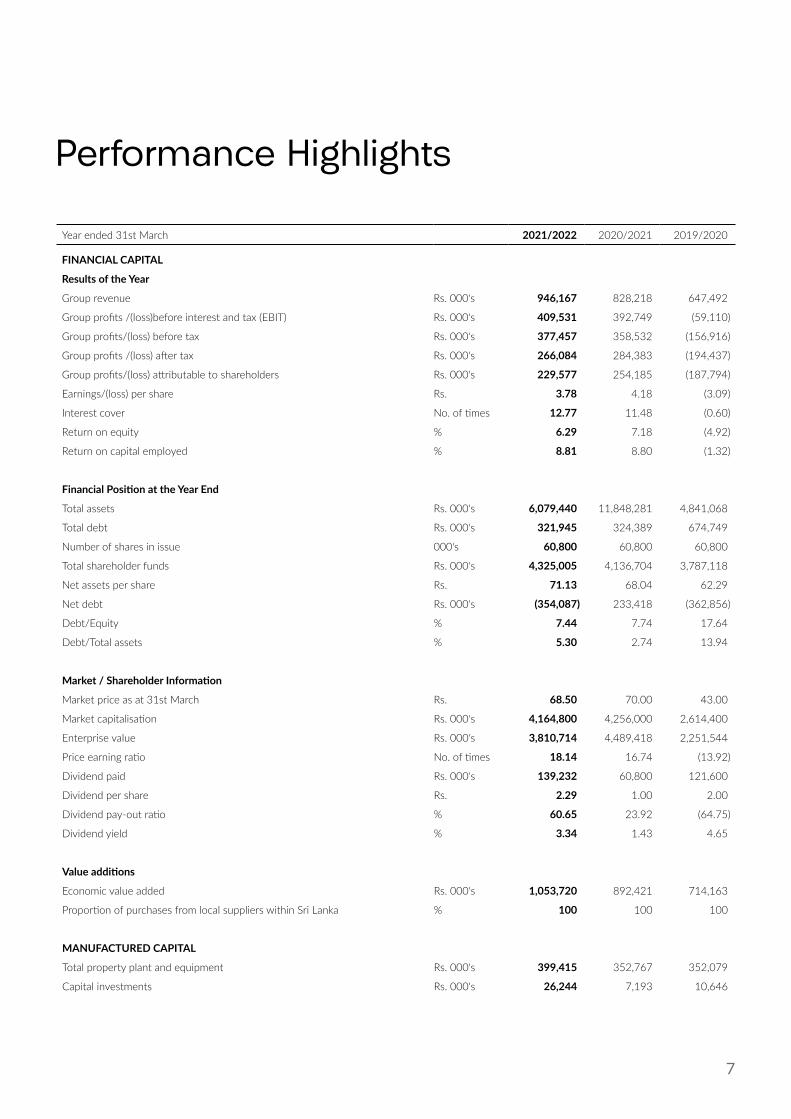
Year ended 31st March 2021/2022 2020/2021 2019/2020
FINANCIAL CAPITAL
Results of the Year
Group revenue Rs. 000's 946,167 828,218 647,492
Group profits /(loss)before interest and tax (EBIT) Rs. 000's 409,531 392,749 (59,110)
Group profits/(loss) before tax Rs. 000's 377,457 358,532 (156,916)
Group profits /(loss) after tax Rs. 000's 266,084 284,383 (194,437)
Group profits/(loss) attributable to shareholders Rs. 000's 229,577 254,185 (187,794)
Earnings/(loss) per share Rs. 3.78 4.18 (3.09)
Interest cover No. of times 12.77 11.48 (0.60)
Return on equity % 6.29 7.18 (4.92)
Return on capital employed % 8.81 8.80 (1.32)
Financial Position at the Year End
Total assets Rs. 000's 6,079,440 11,848,281 4,841,068
Total debt Rs. 000's 321,945 324,389 674,749
Number of shares in issue 000's 60,800 60,800 60,800
Total shareholder funds Rs. 000's 4,325,005 4,136,704 3,787,118
Net assets per share Rs. 71.13 68.04 62.29
Net debt Rs. 000's (354,087) 233,418 (362,856)
Debt/Equity % 7.44 7.74 17.64
Debt/Total assets % 5.30 2.74 13.94
Market / Shareholder Information
Market price as at 31st March Rs. 68.50 70.00 43.00
Market capitalisation Rs. 000's 4,164,800 4,256,000 2,614,400
Enterprise value Rs. 000's 3,810,714 4,489,418 2,251,544
Price earning ratio No. of times 18.14 16.74 (13.92)
Dividend paid Rs. 000's 139,232 60,800 121,600
Dividend per share Rs. 2.29 1.00 2.00
Dividend pay-out ratio % 60.65 23.92 (64.75)
Dividend yield % 3.34 1.43 4.65
Value additions
Economic value added Rs. 000's 1,053,720 892,421 714,163
Proportion of purchases from local suppliers within Sri Lanka % 100 100 100
MANUFACTURED CAPITAL
Total property plant and equipment Rs. 000's 399,415 352,767 352,079
Capital investments Rs. 000's 26,244 7,193 10,646

8
JOHN KEELLS PLCAnnual Report 2021/22
Milestones
1870 Edwin John came to Ceylon, as the Island was then called, to join his brother George. Together, they established themselves as Produce and Exchange Brokers.
1876 A partnership styled “John Brothers and Company” was formed with offices situated in Colombo and Kandy.
1878 This partnership was dissolved and Edwin John started an establishment of his own titled “E. John” and carried on the business of produce and exchange broking. The first decade of business of E. John was one of low activity. Villers records this period thus, “Business in those days was very limited. Coffee had all but gone out, Tea had not expanded sufficiently and the little business in Chinchona was not enough to go around.” During this period, Reginald, son of Edwin John, joined his father in Ceylon.
1890 Prospects began to improve rapidly with the approaching tea business.
1895 Reginald John was taken into the partnership of E. John and Co. By this time, business was growing quite rapidly in tea, shares, oil and exchange.
1948 E. John and Co., amalgamated with two London Tea Broking firms, William Jas and Hy Thompson and Co. and Geo White and Co. The firm was then incorporated as a private limited liability company and the name was changed to E. John, Thompson, White and Co. Ltd.
1960 E. John, Thompson, White and Co. Ltd., amalgamated with Keells and Waldock Ltd. The name was changed to John Keells Thompson White Ltd. This Company had its office in the National Mutual Insurance Company building in Chatham Street. The first Chairman of the Company was Douglas Armitage and on his retirement he was succeeded by A.G.R. Willis. The Company acquired its Glennie Street premises from Dodwell and Company which were initially used as a warehouse.
1962 The firm moved to the sixth floor of the then newly constructed Ceylinco House.
1966 The initial step towards diversification of the activities of the Company was taken with the acquisition of Ceylon Mineral Waters Ltd.
1970 M.C. Bostock was elected Chairman of the Company.
1971 John Keells PLC., moved its offices to Glennie Street, Slave Island.
1976 John Keells PLC., became a People’s Company.
1986 John Keells Holdings PLC, acquired the controlling interest of John Keells PLC., M.C. Bostock retired and D.J.M. Blackler took over as the Chairman of the Company.
1990 K. Balendra took over as Chairman, the first Sri Lankan to hold this position. John Keells PLC., acquired controlling interests in John Keells Stock Brokers (Pvt) Ltd.
1993 Financial Statements of the associates Keells Realtors Ltd., and International Tourists and Hoteliers Ltd. were incorporated to the Consolidated Accounts.
2000 K. Balendra retired as Chairman on 31st December, 2000.
2001 V. Lintotawela took over as Chairman on 1st January, 2001. John Keells PLC., incorporated John Keells Warehousing (Pvt) Ltd., a fully owned subsidiary with B.O.I. status.

9
2003 The state-of-the-art warehouse of John Keells Warehousing (Pvt) Ltd., which is the largest hi-tech tea warehouse in this part of the region was commissioned for storing pre-auctioned produce.
2004 The Company disposed its Investment in International Tourists and Hoteliers Ltd.
2005 V. Lintotawela retired as Chairman on 31st December 2005 and S. Ratnayake took over as Chairman on 01st January 2006.
2007 The name of the Company was changed to John Keells PLC which is a new requirement of the Companies Act No. 7 of 2007.
2010 The Board of Directors at a meeting held on 20th July 2010 resolved to increase the number of shares by way of share sub – division in the ratio of one (1) share for every one (1) share held. Consequently, the no of shares after the sub – division increased to 30,400,000 shares from the current 15,200,000 shares.
2011 The Board of Directors at a meeting held on 11th May 2011 resolved to increase the number of shares by way of a share sub -division in the ratio of one (1) share for every one (1) share held. Consequently, the number of shares after the sub – division increased to 60,800,000 shares from the previous 30,400,000 shares.
2013 The Company disposed of its land at 130, Glennie Street Colombo 2.
2015 In Compliance to the new Securities Exchange Commission directive which came in to effect from 1st January 2016 the shares of the company which was listed on the Main Board was transferred to the Diri Savi Board of the Colombo Stock Exchange.
2016 In compliance to the Capital Adequacy Requirement implemented by The Colombo Stock Exchange on stock broking firms, JKPLC increased its investment in its subsidiary John Keells Stock Brokers (Pvt) Ltd by accepting the rights for 570,000 shares.
2018 Mr. K. N. J. Balendra and Mr. J. G. A. Cooray appointed as the new directors of John Keells PLC (w.e.f. 01st January 2018) with the retirement of Mr. A. D. Gunewardene and Mr. J. R. F. Peiris
2019 Mr. K. N. J. Balendra was appointed as the new Chairman of John Keells Holding PLC (w.e.f. 01st January 2019) with the retirement of Mr. S. Ratnayake.
2020 John Keells PLC Celebrates 150 years of association with Ceylon Tea.
2021 The first online tea auction was conducted on Saturday, April 04th, 2020.

10
JOHN KEELLS PLCAnnual Report 2021/22
Chairman’s Statement
On behalf of the Board of Directors, I am pleased to present the Annual Report and Financial Statements of John Keells PLC (JK PLC) for the year ended 31st March 2022. The Group demonstrated agility and resilience amidst unprecedented challenges and volatility experienced in the segments it operates in, while fulfilling its commitments to internal and external stakeholders.
Sri Lankan Macroeconomic Environment OverviewThe COVID-19 pandemic continued to be of concern for the country and the Group during the year under review. As new variants of the virus spread globally, economies continued to slowdown and the Sri Lankan Government also implemented intermittent lockdowns during the first half of FY 2021/22 as a measure to curtail the spread of the virus within the Country. The successful vaccination drive, together with the health and safety protocols enabled the re-opening of the economy during the latter part of the year. However, the last quarter of the financial year was characterised by significant macro-economic challenges, including the steep depreciation of the Sri Lankan Rupee, high inflation levels, and depleting foreign currency reserves.
In this backdrop, the Sri Lankan economy grew in real terms by 3.7 percent compared to the 3.6 percent contraction recorded in 2020. The agriculture, forestry and fishing sector recorded a 2 percent growth compared to the 2.9 percent contraction recorded in 2020, the industry sector grew by 5.3 percent compared
to the 7.3 percent contraction experienced in the previous calendar year, and the services sector grew by 3 percent compared to the decline of 1.9 percent in 2020.
Financial Performance HighlightsThe Group’s consolidated revenue for the year under review recorded a 14 percent growth to Rs. 946.17 million compared to Rs. 828.22 million earned in the previous financial year. The Group’s profit after tax recorded for the financial year ended 31st March 2022 was Rs. 266.08 million, compared to Rs. 284.38 million earned in the previous financial year. The drop in profitability despite the revenue growth, was due to provision made on account of doubtful recoveries of tea loans and advances. The Group was able to sustain its performance during the year under review by focusing on cost control initiatives, process improvements, offering personalised services to producers, and value-added services to buyers.
From a segmental perspective, the top two contributors to the Group’s consolidated revenues were the tea segment and the share broking segment, contributing 38 percent and 49 percent, respectively. The warehousing segment contributed 14 percent to total revenues.
Tea Segment PerformanceThe Company’s tea segment performance recorded a growth in the year under review, increasing market share to 14 percent. This is despite Sri Lanka’s tea industry recording a decline in production for the financial year. Total production declined by 3 percent to 288 million kilograms for the financial year 2021/22 compared to 298 million kilograms recorded in the financial year 2020/21. The total export volumes increased marginally by 1.4 percent to 280 million kilograms in 2021/22 compared to the 276 million kilograms exported in 2020/21.
The Sri Lankan tea industry performed well in the first half of the financial year 2021/22, with crop production increasing across all elevations supported by the conducive weather patterns. The second half of the financial year was a challenge for the tea industry as, a ban on inorganic fertiliser imports, rising wage rates, trade union actions, and the slower than expected macroeconomic recovery increased
costs of production and caused difficulties in importing supplemental items for the smooth operations of the industry.
JK PLC’s tea segment performance for the financial year 2021/22 was marginally better than that recorded in the previous financial year. The segment recorded a revenue of Rs. 355.4 million compared to the Rs. 354.67 million earned in the previous financial year. The total tea sold amounted to 39.04 million kilograms in the financial year ended 31st March 2022 compared to 36.9 million kilograms sold during the financial year ended 31st March 2021. As a result of the higher volumes sold by the Company, income from brokerage increased by 5 percent during the financial year. The Company adopted a more prudent policy in lending to their clients and the income from sellers’ interest declined by 15 percent during the financial year. The Company was able to obtain good tea prices in line with the prices prevailing in the industry for most of 2021 enabling JK PLC to achieve 16 all-time-record prices for teas sold. However, quality issues due to sporadic fertiliser application remained a concern in quarters two and three of the financial year resulting in auction price declines. Due to less availability of tea at the auction, coupled with the devaluation of the Sri Lankan rupee, tea prices increased substantially in quarter four.
Rubber Segment PerformanceThe Sri Lankan rubber industry performance improved in 2021 in terms of pricing, as lockdowns eased and the focused efforts by the Export Development Board (EDB) to increase the national rubber export quantities yielded positive results. For the first time in the country’s history, the total rubber export revenue surpassed USD 1 billion, supported by the production of high-quality crepe and other types of rubber as well as the superior quality of manufactured rubber products leading to increasing demand. However, the unfavourable weather conditions experienced during the year resulted in declining volumes with rubber production declining by 1.7 percent to 76.9 million kilograms compared to the 4.6 percent production growth achieved in 2020.
The Company’s rubber segment also performed significantly better than in the previous financial year despite the continuing reduction
39.04 Mn KgTea quantity sold
13.58%Market share
11
in rubber production in the country. While total rubber sales for the year declined by 18.6 percent to 2.29 million kilograms compared to the 2.82 million kilograms sold during 2021, auction averages were significantly higher in comparison to the previous year. As a result, the segment’s revenues increased by 22 percent to Rs. 12.1 million and segmental profit before tax increased year on year to Rs. 6.1 million. The higher price for natural rubber in global markets had a positive impact on local rubber prices which recorded an upward trend during 2021 with higher auction prices for both Ribbed Smoked Sheet No.1 (RSS1) rubber and Latex Crepe rubber.
Warehousing Segment PerformanceThe performance of the Company’s warehousing segment was commendable amidst the challenges faced during the year under review. The focus on increasing utilisation through strategic partnerships proved to be successful with capacity utilisation increasing to 90 percent in FY 2021/22 compared to the 70 percent recorded in the previous financial year. JKW also invested in machinery and other equipment required to facilitate this increased capacity utilisation and ensure the smooth running of the warehousing operations. As such, segment revenue increased by 40 percent year on year, while the profit before tax increased by 58 percent to Rs. 56.35 million, despite the increase in operating expenses from Rs. 8.62 million in the FY 2020/21 to Rs. 11.40 million in the year under review.
Stock Broking Segment PerformanceThe Colombo Stock Exchange (CSE) experienced an extremely volatile year with the All-Share Price Index (ASPI) moving up 89 percent from 1st April 2021 up to January 2022 and then dropping sharply for the rest of the financial year reversing most of the gains achieved in the first nine months, to close with an overall gain of 25 percent at the end of the FY 2021/22. Much of this volatility stemmed from a weakening macroeconomic environment with Sri Lanka’s foreign currency reserves continuing to decline throughout the period. Foreign activity was minimal, approximating at around 5 percent with an overall net outflow. The daily average turnover for the financial year amounted to Rs. 4,798 million.
The overall market capitalisation of the CSE was Rs.3,826 billion at the end of the financial year compared to Rs. 3,111 billion at the end of the previous year, recording an overall increase of 23 percent.
Pursuing Sustainable Business OperationsThe Group, in alignment with the John Keells Group, continued to focus on integrating sustainable business practices within our operations. Despite the prevailing challenges in the macroeconomic environment, the Group remained true to this premise in the year under review. A noteworthy development was the upgrade of the roadway leading to the warehouse using the plastic asphalt which contributed positively to the environment. The road construction used 400 kilograms of plastic waste, thus ensuring it did not end up in our landfills or waterways and enabled the Group to reduce volatile organic compounds (VOC) and carbon monoxide (CO) emissions by 1,400 kilograms. The success of this project will pave the way for future sustainable initiatives as the Group continues to be vigilant in adopting sustainable alternatives, as part of our business operations.
Focusing on Our PeopleThe Group continued its commitment towards our employees by prioritising their health and safety in the pandemic operating environment. Professional development, succession planning, and transition were focal points in the year under review, as several senior employees retired after having completed 25 plus years of service, being key contributors to the success of the Group. The Group had sought out a new generation of individuals with the right mindset and passion for our business to continue its growth momentum and to maintain an effective management and leadership pipeline.
Being a Responsible Corporate CitizenThe Group continues to remain resolute in applying the Code of Business Conduct and Ethics of the Code of Best Practice of Corporate Governance, jointly advocated by the Securities and Exchange Commission of Sri Lanka and the Institute of Chartered Accountants of Sri Lanka in business operations. We also continue to be committed to upholding the John Keells Group policies and the Code of Conduct of the John Keells Group and are mindful that our business operations are conducted ethically, consider all legal and regulatory requirements, have zero tolerance for corruption and bribery, and dissuade any form of workplace harassment or discrimination.
Outlook 2022 and BeyondThe Group begins the new financial year on a positive note despite the prevailing macroeconomic challenges and remains steadfast in pursuing business growth by increasing volumes and capturing a larger share of the tea and rubber export markets. While we expect rising prices of goods and services to have an impact on our costs, the prospect of higher demand for tea and rubber, high-quality production of tea and rubber, and the depreciating Sri Lankan rupee is expected to have a positive influence on JK PLC’s performance in the forthcoming financial year. The rising cost of fertiliser however, will have an impact on the cost of production and with less applications, it is envisaged that the overall tea production will be lower in the ensuing year.
To manage the increasing costs of production, JK PLC has identified strategies for improved cost efficiencies within our business processes, which will be cascaded across the segments and become the responsibility of every
“The Company was able to sustain its performance during the year under review by focusing on cost control initiatives, process improvements, offering personalised services to producers, and value-added services to buyers.”

12
JOHN KEELLS PLCAnnual Report 2021/22
Chairman’s Message
employee of the Company. Furthermore, the Company will closely monitor rising costs of finance and put in place prudent measures for the management of same. The emerging economic challenges also call for the Company to re-evaluate and prudently manage business risks while executing strategies that support business growth.
The Company’s tea segment is expected to continue its improved performance in the FY 2022/23 supported by the positive industry outlook. However, increasing costs remain a key concern for the Sri Lankan tea industry and the Company, as this could have a long-lasting impact on the competitiveness of Ceylon Tea in the global tea market. Unpredictable weather patterns also remain a concern as this has a direct impact on the quality of tea production impacting both volumes and auction prices. Improving production efficiencies and implementing innovative production methodologies and employing prudent cost control measures remain the primary methods to overcome these challenges.
The Ceylon Tea Roadmap 2030 which has achieved some progress in the financial year under review is also expected to bring greater stability in terms of quality and efficiencies to the industry and support the industry’s efforts to remain competitive within the global tea industry.
The Company remains optimistic about growing the rubber segment business in the medium to longer terms if the Sri Lankan rubber industry’s potential for exponential
growth is given the impetus for growth and development by the authorities in the coming years. There is a significant opportunity to increase rubber production and manufacture a larger range of high-quality rubber products by pursuing productivity improvement, innovations in production and manufacturing methods, and focusing on new developments through targeted research.
The approach to managing the growth of the warehousing segment through strategic partnerships will continue to support segmental growth in terms of revenue and profitability in the coming year. The Company will pursue sustainable business operations and invest in equipment to improve efficient warehousing operations to optimise costs, while increasing efficiencies.
With regard to stock broking, we expect that fiscal reforms will lead to higher taxation and that interest rates will remain elevated over the course of FY2022/23 relative to the last two years. Uncertainty over the economy will lead to continued volatility in the equity market and we expect that retail interest will decline from the levels we saw over the last two years, with corporate earnings also expected to moderate. However, we have started to see modest net foreign inflows into the market which can be viewed as a positive. Conditions at the CSE are likely to remain uncertain for the forthcoming year and we expect lower overall trading activity.
Remaining cognisant of the dynamic changes in the industry operating environment, and
the prevailing uncertainties which abound in the country’s macroeconomic environment, the Group will closely monitor external developments and maintain a flexible approach to managing our business strategies to ensure prudent and sustainable business growth. We will remain mindful of stakeholder expectations and work with our business partners to create value for the business and our stakeholders in the coming year and beyond.
Appreciations and AcknowledgmentsI take this opportunity to thank the Board of Directors for their continued support and their leadership in guiding the Group in challenging times. I would also like to thank all our employees and the management who remained dedicated to the Group and persisted in ensuring growth in a demanding operating environment. Finally, I thank our business partners, shareholders, regulators and all other stakeholders for their continued trust and loyalty.
K N J BalendraChairman23rd May 2022

13
S E T T H E
M A N A G E M E N T D I S C U S S I O N& A N A L Y S I S
Management Discussion & Analysis | Financial Review | Human Resources & CSR

14
JOHN KEELLS PLCAnnual Report 2021/22
Management Discussion & Analysis
As one of Sri Lanka’s leading tea brokering businesses, with over 150 years of handling aromatic Ceylon Tea, JK PLC strives to be ahead of the competition while creating a distinguished position in the market place with our continued efforts to offer high-quality teas with value-added services to our clients.
6%YOY GrowthTea quantity sold
3.9%YOY GrowthBrokerage Income
Today, we have a significant market share of Sri Lanka’s tea business, approximating 13.58%.
Tea Brokering Segment
Total Tea Quantity Sold By JK PLCTotal Trade Tea Quantity Sold
0
50
100
150
200
250
300
Tea Quantity Sold - Trade/ Company
2021/22 2020/21 2019/20 2018/19 2017/18
15
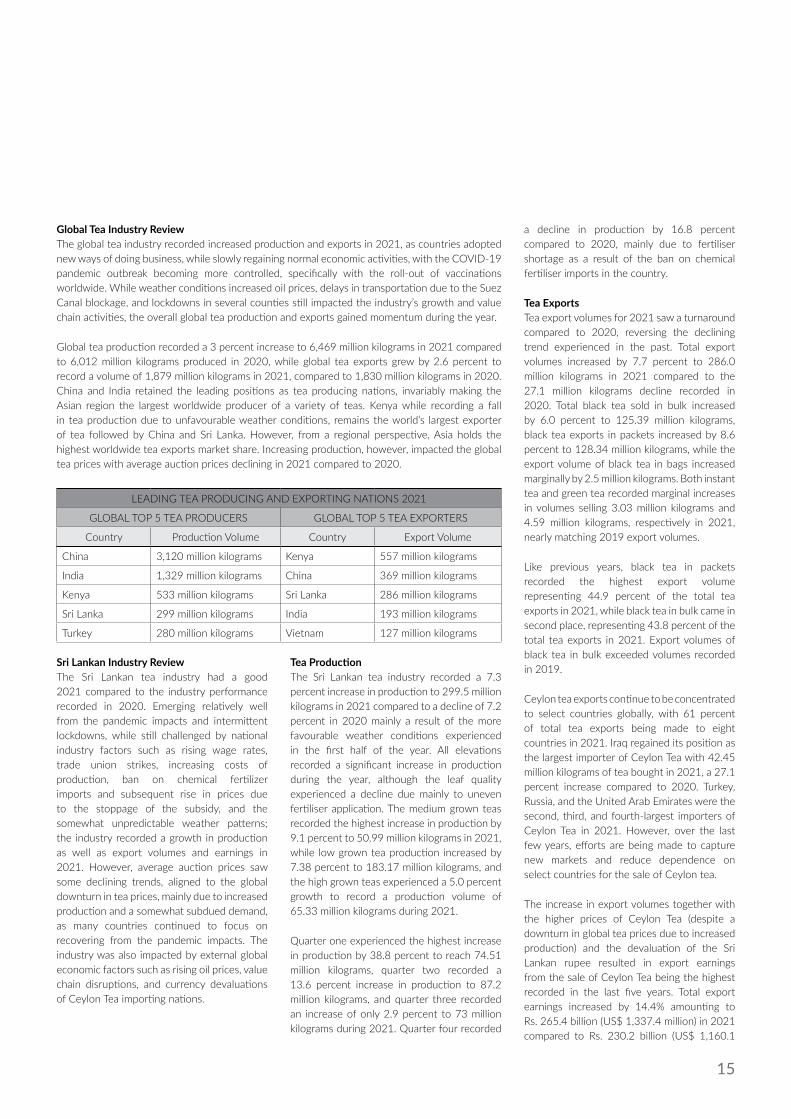
Global Tea Industry ReviewThe global tea industry recorded increased production and exports in 2021, as countries adopted new ways of doing business, while slowly regaining normal economic activities, with the COVID-19 pandemic outbreak becoming more controlled, specifically with the roll-out of vaccinations worldwide. While weather conditions increased oil prices, delays in transportation due to the Suez Canal blockage, and lockdowns in several counties still impacted the industry’s growth and value chain activities, the overall global tea production and exports gained momentum during the year.
Global tea production recorded a 3 percent increase to 6,469 million kilograms in 2021 compared to 6,012 million kilograms produced in 2020, while global tea exports grew by 2.6 percent to record a volume of 1,879 million kilograms in 2021, compared to 1,830 million kilograms in 2020. China and India retained the leading positions as tea producing nations, invariably making the Asian region the largest worldwide producer of a variety of teas. Kenya while recording a fall in tea production due to unfavourable weather conditions, remains the world’s largest exporter of tea followed by China and Sri Lanka. However, from a regional perspective, Asia holds the highest worldwide tea exports market share. Increasing production, however, impacted the global tea prices with average auction prices declining in 2021 compared to 2020.
LEADING TEA PRODUCING AND EXPORTING NATIONS 2021
GLOBAL TOP 5 TEA PRODUCERS GLOBAL TOP 5 TEA EXPORTERS
Country Production Volume Country Export Volume
China 3,120 million kilograms Kenya 557 million kilograms
India 1,329 million kilograms China 369 million kilograms
Kenya 533 million kilograms Sri Lanka 286 million kilograms
Sri Lanka 299 million kilograms India 193 million kilograms
Turkey 280 million kilograms Vietnam 127 million kilograms
Sri Lankan Industry ReviewThe Sri Lankan tea industry had a good 2021 compared to the industry performance recorded in 2020. Emerging relatively well from the pandemic impacts and intermittent lockdowns, while still challenged by national industry factors such as rising wage rates, trade union strikes, increasing costs of production, ban on chemical fertilizer imports and subsequent rise in prices due to the stoppage of the subsidy, and the somewhat unpredictable weather patterns; the industry recorded a growth in production as well as export volumes and earnings in 2021. However, average auction prices saw some declining trends, aligned to the global downturn in tea prices, mainly due to increased production and a somewhat subdued demand, as many countries continued to focus on recovering from the pandemic impacts. The industry was also impacted by external global economic factors such as rising oil prices, value chain disruptions, and currency devaluations of Ceylon Tea importing nations.
Tea ProductionThe Sri Lankan tea industry recorded a 7.3 percent increase in production to 299.5 million kilograms in 2021 compared to a decline of 7.2 percent in 2020 mainly a result of the more favourable weather conditions experienced in the first half of the year. All elevations recorded a significant increase in production during the year, although the leaf quality experienced a decline due mainly to uneven fertiliser application. The medium grown teas recorded the highest increase in production by 9.1 percent to 50.99 million kilograms in 2021, while low grown tea production increased by 7.38 percent to 183.17 million kilograms, and the high grown teas experienced a 5.0 percent growth to record a production volume of 65.33 million kilograms during 2021.
Quarter one experienced the highest increase in production by 38.8 percent to reach 74.51 million kilograms, quarter two recorded a 13.6 percent increase in production to 87.2 million kilograms, and quarter three recorded an increase of only 2.9 percent to 73 million kilograms during 2021. Quarter four recorded
a decline in production by 16.8 percent compared to 2020, mainly due to fertiliser shortage as a result of the ban on chemical fertiliser imports in the country.
Tea ExportsTea export volumes for 2021 saw a turnaround compared to 2020, reversing the declining trend experienced in the past. Total export volumes increased by 7.7 percent to 286.0 million kilograms in 2021 compared to the 27.1 million kilograms decline recorded in 2020. Total black tea sold in bulk increased by 6.0 percent to 125.39 million kilograms, black tea exports in packets increased by 8.6 percent to 128.34 million kilograms, while the export volume of black tea in bags increased marginally by 2.5 million kilograms. Both instant tea and green tea recorded marginal increases in volumes selling 3.03 million kilograms and 4.59 million kilograms, respectively in 2021, nearly matching 2019 export volumes.
Like previous years, black tea in packets recorded the highest export volume representing 44.9 percent of the total tea exports in 2021, while black tea in bulk came in second place, representing 43.8 percent of the total tea exports in 2021. Export volumes of black tea in bulk exceeded volumes recorded in 2019.
Ceylon tea exports continue to be concentrated to select countries globally, with 61 percent of total tea exports being made to eight countries in 2021. Iraq regained its position as the largest importer of Ceylon Tea with 42.45 million kilograms of tea bought in 2021, a 27.1 percent increase compared to 2020. Turkey, Russia, and the United Arab Emirates were the second, third, and fourth-largest importers of Ceylon Tea in 2021. However, over the last few years, efforts are being made to capture new markets and reduce dependence on select countries for the sale of Ceylon tea.
The increase in export volumes together with the higher prices of Ceylon Tea (despite a downturn in global tea prices due to increased production) and the devaluation of the Sri Lankan rupee resulted in export earnings from the sale of Ceylon Tea being the highest recorded in the last five years. Total export earnings increased by 14.4% amounting to Rs. 265.4 billion (US$ 1,337.4 million) in 2021 compared to Rs. 230.2 billion (US$ 1,160.1

16
JOHN KEELLS PLCAnnual Report 2021/22
Management Discussion & Analysis
million) in 2020. The average export price (FOB) of tea increased by 6.2 percent in 2021 compared to the 1.6 percent increase recorded in 2020. The average FOB price per kilogram amounted to Rs. 920.76 (US$ 4.64).
8 CEYLON TEA IMPORTING TOP NATIONS 2021
Country Export Volume Year-on-Year Increase (+)/Decline (-)
Iraq 42.45 million kilograms + 27.1 percent +9.1 million kilograms
Turkey 29.7 million kilograms - 23.7 percent -9.2 million kilograms
Russia 27.4 million kilograms - 7.4 percent -2.2 million kilograms
United Arab Emirates 23.1 million kilograms + 165.5 percent +14.4 million kilograms
Iran 15.8 million kilograms + 4.6 percent +0.7 million kilograms
China 14.2 million kilograms + 0.7 percent +0.1 million kilograms
Libya 12.3 million kilograms + 57.7 percent +4.5 million kilograms
Azerbaijan 10.59 million kilograms + 2.8 percent +0.3 million kilograms
levels enabled stakeholders to release healthy volumes for sale at auction supporting increased export volumes for the year under review. Thus, the Company’s revenues marginally decreased from Rs. 344.73 million recorded in the financial year ended 2020/21 to Rs. 343.31 million in the financial year under review, a decline of 0.41 percent.
From a sales volume perspective, the first six months from April to September 2021 were the most lucrative, as increased production levels resulted in increased sale volumes by 13.8 percent for this period compared to the same period in the previous financial year. However, the tea prices were lower during this period as an industry, due to the increased supply available for sale. As the year progressed, a reversal was recorded in tea production volumes seen in the first half of the year. The government policy to ban the import and sale of non-organic fertilisers had a long-reaching impact with tea production quality and volumes declining in the second half of the financial year. While the ban was lifted in November 2021, the stoppage of the fertilizer subsidy continued to impact the industry as prices exponentially increased. As such, tea production volumes from October 2021 to March 2022 recorded a declining trend, with November 2021 recording an all-time low production volume of only 20 million kilograms of tea produced, in nearly two decades. This similar trend continued in December 2021 which also recorded the lowest production since 2008 when world economies experienced the global economic
crisis and the Sri Lankan tea industry artificially controlled production to overcome drastically falling prices. The lower production impacted the volumes available for sale at auctions and over the last six months, auction volumes declined, closing the year under review with as low as 5 million kilograms of tea for sale.
Tea auction prices which were low in the first half of the financial year, recorded increases as production volumes fell in the second half of the year. This resulted in tea auction prices increasing during the period October 2021 to March 2022. Furthermore, the devaluation of the Sri Lankan rupee also contributed to increase in auction prices, especially in the last quarter of the financial year under review. As a result, the Company experienced some of the highest-priced sales from January 2022 to March 2022.
Thus, the segment’s total sales volumes increased to 39.04 million kilograms in the financial year ended 31st March 2022 compared to 36.9 million kilograms recorded in the previous financial year-end. JK PLC recorded a marginal 0.3 percent decline in the average sale price to Rs. 621.58 per kilogram for the year ended 31st March 2022 compared to Rs. 623.29 per kilogram recorded in the previous financial year, driven by rising prices in the latter half of the year. The increased revenues for the financial year contributed to increased brokerage income and other related tea sales revenue which increased by 3.9 percent to Rs. 275.61 million in 2021/22 compared to Rs. 265.36 million earned in
Tea AuctionsGlobal tea auctions continued to operate in the virtual mode with more auctions converting to e-auctions throughout 2021. The Sri Lankan e-Auction platform continued its successful operations but changed vendors to OKLO Private Ltd from sale number 37 in September 2021, after 18 months in operation by the previous vendor. The change of vendor facilitated a new auction interface with distinct new features such as faster analysis of prices, trends, and other related parameters to enhance the overall virtual auction experience.
The Colombo Tea Auction showed a positive trend at the start of 2021, with average prices increasing in the first three months compared to the same period in 2020. However, average prices started falling from April 2021 with this trend continuing till the end of the year. Thus, average auction prices showed an overall declining trend in 2021, recording a 2.0 percent decline from Rs. 628.21 (US$ 3.39) per kilogram in 2020 to Rs. 615.44 (US$ 3.10) per kilogram in 2021. Despite the fall in prices, cumulative auction sales volumes increased by 9.11 percent in 2021 to 280.38 million kilograms compared to 256.96 million kilograms sold in 2020.
The Year Under ReviewJK PLC’s tea brokering business recorded a volume growth of 5.6 percent in the financial year 2021/22, propelled by increasing export volumes supported by increased production, rising tea prices, and the devaluation of the Sri Lankan rupee. The increasing production
National Production - Mn Kgs.National Average Price - Rs /KgNational Average Price - US $ /Kg
0
100
200
300
400
500
600
700
800
National Averages
2021 2020 2019 2018 20170.0
0.9
1.8
2.7
3.6
4.5
17
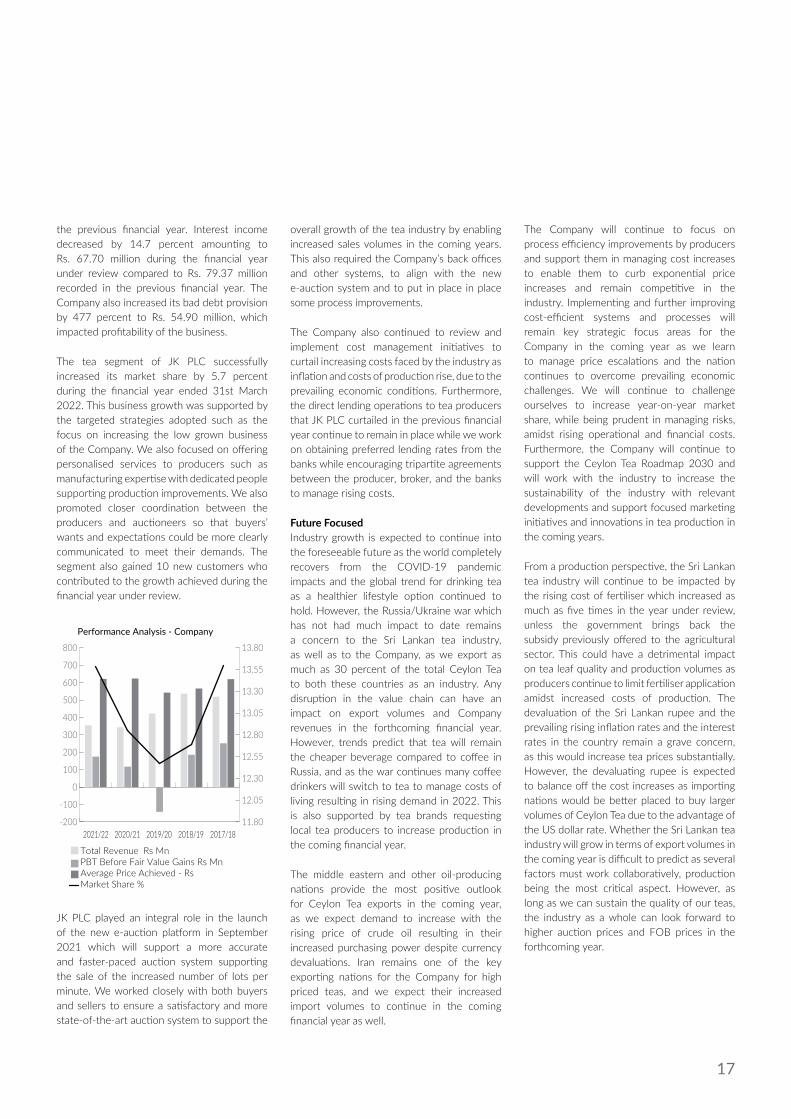
the previous financial year. Interest income decreased by 14.7 percent amounting to Rs. 67.70 million during the financial year under review compared to Rs. 79.37 million recorded in the previous financial year. The Company also increased its bad debt provision by 477 percent to Rs. 54.90 million, which impacted profitability of the business.
The tea segment of JK PLC successfully increased its market share by 5.7 percent during the financial year ended 31st March 2022. This business growth was supported by the targeted strategies adopted such as the focus on increasing the low grown business of the Company. We also focused on offering personalised services to producers such as manufacturing expertise with dedicated people supporting production improvements. We also promoted closer coordination between the producers and auctioneers so that buyers’ wants and expectations could be more clearly communicated to meet their demands. The segment also gained 10 new customers who contributed to the growth achieved during the financial year under review.
overall growth of the tea industry by enabling increased sales volumes in the coming years. This also required the Company’s back offices and other systems, to align with the new e-auction system and to put in place in place some process improvements.
The Company also continued to review and implement cost management initiatives to curtail increasing costs faced by the industry as inflation and costs of production rise, due to the prevailing economic conditions. Furthermore, the direct lending operations to tea producers that JK PLC curtailed in the previous financial year continue to remain in place while we work on obtaining preferred lending rates from the banks while encouraging tripartite agreements between the producer, broker, and the banks to manage rising costs.
Future FocusedIndustry growth is expected to continue into the foreseeable future as the world completely recovers from the COVID-19 pandemic impacts and the global trend for drinking tea as a healthier lifestyle option continued to hold. However, the Russia/Ukraine war which has not had much impact to date remains a concern to the Sri Lankan tea industry, as well as to the Company, as we export as much as 30 percent of the total Ceylon Tea to both these countries as an industry. Any disruption in the value chain can have an impact on export volumes and Company revenues in the forthcoming financial year. However, trends predict that tea will remain the cheaper beverage compared to coffee in Russia, and as the war continues many coffee drinkers will switch to tea to manage costs of living resulting in rising demand in 2022. This is also supported by tea brands requesting local tea producers to increase production in the coming financial year.
The middle eastern and other oil-producing nations provide the most positive outlook for Ceylon Tea exports in the coming year, as we expect demand to increase with the rising price of crude oil resulting in their increased purchasing power despite currency devaluations. Iran remains one of the key exporting nations for the Company for high priced teas, and we expect their increased import volumes to continue in the coming financial year as well.
The Company will continue to focus on process efficiency improvements by producers and support them in managing cost increases to enable them to curb exponential price increases and remain competitive in the industry. Implementing and further improving cost-efficient systems and processes will remain key strategic focus areas for the Company in the coming year as we learn to manage price escalations and the nation continues to overcome prevailing economic challenges. We will continue to challenge ourselves to increase year-on-year market share, while being prudent in managing risks, amidst rising operational and financial costs. Furthermore, the Company will continue to support the Ceylon Tea Roadmap 2030 and will work with the industry to increase the sustainability of the industry with relevant developments and support focused marketing initiatives and innovations in tea production in the coming years.
From a production perspective, the Sri Lankan tea industry will continue to be impacted by the rising cost of fertiliser which increased as much as five times in the year under review, unless the government brings back the subsidy previously offered to the agricultural sector. This could have a detrimental impact on tea leaf quality and production volumes as producers continue to limit fertiliser application amidst increased costs of production. The devaluation of the Sri Lankan rupee and the prevailing rising inflation rates and the interest rates in the country remain a grave concern, as this would increase tea prices substantially. However, the devaluating rupee is expected to balance off the cost increases as importing nations would be better placed to buy larger volumes of Ceylon Tea due to the advantage of the US dollar rate. Whether the Sri Lankan tea industry will grow in terms of export volumes in the coming year is difficult to predict as several factors must work collaboratively, production being the most critical aspect. However, as long as we can sustain the quality of our teas, the industry as a whole can look forward to higher auction prices and FOB prices in the forthcoming year.
JK PLC played an integral role in the launch of the new e-auction platform in September 2021 which will support a more accurate and faster-paced auction system supporting the sale of the increased number of lots per minute. We worked closely with both buyers and sellers to ensure a satisfactory and more state-of-the-art auction system to support the
Total Revenue Rs MnPBT Before Fair Value Gains Rs MnAverage Price Achieved - RsMarket Share %
-200
-100
0
100
200
300
400
500
600
700
800
Performance Analysis - Company
11.80
12.05
12.30
12.55
12.80
13.05
13.30
13.55
13.80
2021/22 2020/21 2019/20 2018/19 2017/18
18
JOHN KEELLS PLCAnnual Report 2021/22
Management Discussion & Analysis
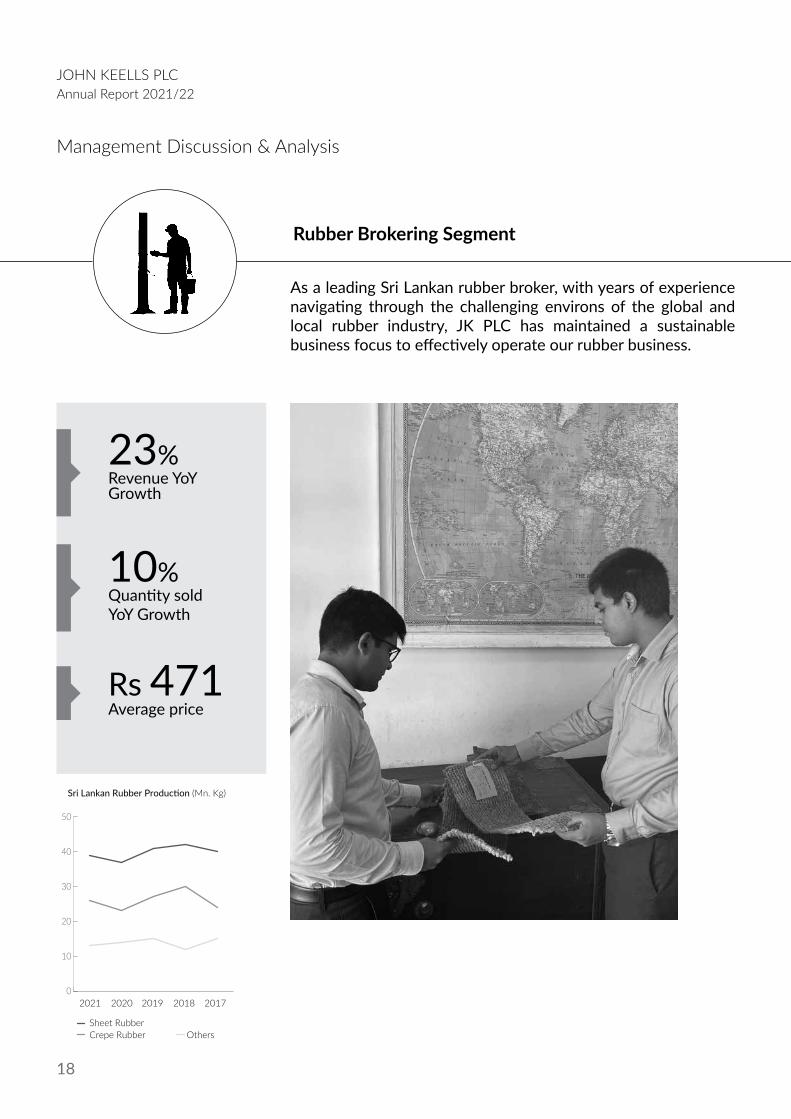
As a leading Sri Lankan rubber broker, with years of experience navigating through the challenging environs of the global and local rubber industry, JK PLC has maintained a sustainable business focus to effectively operate our rubber business.
Rubber Brokering Segment
23%Revenue YoY Growth
10%Quantity soldYoY Growth
Rs 471Average price
Sheet RubberCrepe Rubber Others
Sri Lankan Rubber Production (Mn. Kg)
2021 2020 2019 2018 20170
10
20
30
40
50

19
Global Rubber Industry Review The industry continued to be impacted by the ongoing COVID-19 pandemic outbreak of new variants of the virus in major natural rubber producing countries. The resulting intermittent lockdowns interrupted farming activities and restrictions placed on people’s movements reduced the supply of natural rubber. Despite the challenges, industry experienced growth in 2021 compared to the decline recorded in 2020. However, natural rubber production realised a slower recovery.
According to the Malaysian Rubber Council, global rubber production increased by 7.4 percent to 29.4 million tonnes in the calendar year 2021 compared to 27.4 million tonnes recorded in 2020. The ratio of natural rubber to synthetic rubber produced in 2021 was 47:53.
Countries identified as major natural rubber producing nations are Thailand, Malaysia, Indonesia, the Philippines, Vietnam, India, and African countries.
The demand for rubber increased at a higher rate than production in 2021, a trend that has been in place over the last few years. The recovery of the automotive industry was a key driver of the rising demand for natural rubber in 2021, as this increased demand for tyres, which is the largest application of rubber globally. Thus, total global consumption of rubber increased by 10.4 percent to 29.7 million tonnes compared to 26.9 million tonnes recorded in 2020. The Asia Pacific region remains the largest producer and consumer of natural rubber and this trend is expected to continue in the future. China which consumes around 40 percent of the total global output is the largest importer and consumer of natural rubber globally.
The top 10 rubber consuming countries in 2021 were China, the USA, India, Thailand, Japan, Malaysia, Indonesia, Brazil, Russia, and Vietnam.
Sri Lankan Rubber Industry ReviewThe Sri Lankan rubber industry continued to experience declining natural rubber production levels, mainly due to unfavourable weather conditions with rains interrupting the smooth operations of rubber tapping and fungal disease affecting the health of rubber trees. The increasing prices of fertiliser also impacted rubber production levels as planters were unable to maintain a steady fertiliser application regime. As a result, rubber yield recorded a 1.7 percent decline to 76.9 million kilograms in 2021 compared to 78.2 million kilograms in 2020. The lower total production is mainly attributed to a higher number of rainy days in the second half of the year, as opposed to the rising production recorded at the start of 2021.
Rubber consumption in the domestic market increased by 19.4 percent to 133.9 million kilograms in 2021, supported by rising demand as the country slowly emerged from extended lockdowns and low economic activity, leading to the recovery of the industry sector.
The declining rubber production impacted rubber exports which experienced a 1.7 percent decline to 15.5 million kilograms in 2021, compared to the increase of 21.3 percent to 15.8 million kilograms recorded in 2020. However, the increasing price of rubber in the global markets, mainly as demand outstripped supply, resulted in the total value of rubber exports increasing by 44 percent to USD 42 million in 2020 compared to USD 29 million earned in 2021. The average Colombo Auction price of rubber soared, increasing by 31 percent to Rs. 460.78 per kilogram compared to Rs. 351.46 per kilogram recorded in 2020.
The Year Under ReviewJK PLC’s rubber brokering business performance recorded a significant improvement in the financial year under review compared to the lacklustre performance
recorded in the previous financial year. The higher production of rubber resulted in the availability of larger quantities for sale and the Company’s sales volumes increased by 10 percent to 2.2 million kilograms compared to the previous financial year. The segment also recorded increasing revenue earnings as rubber prices considerably increased during the year under review. The total revenue earned by the segment increased by 23 percent to Rs. 11.92 million, compared to the 10 percent increase to Rs. 9.9 million in the previous financial year. The segment’s profit recorded an increase of 30 percent to Rs. 12.12 million despite the challenges faced. The average auction price recorded by JK PLC for the financial year ended 31st March 2022 was Rs. 471 per kilogram compared to Rs. 336 per kilogram recorded in the previous financial year.
The continued year-on-year growth of the JK PLC rubber segment was possible due to effective strategic management processes and the long-standing relationships built with our suppliers over the years.
Future FocusedThe Company’s rubber broking business continues to be dependent on the industry performance. The proactive initiatives by the Rubber Development Department (RDD) and the Rubber Research Institute (RRI) to improve the productivity of natural rubber are a boon to the industry that has a lot of potential as the global demand for natural rubber continues to rise year-on-year.

20
JOHN KEELLS PLCAnnual Report 2021/22
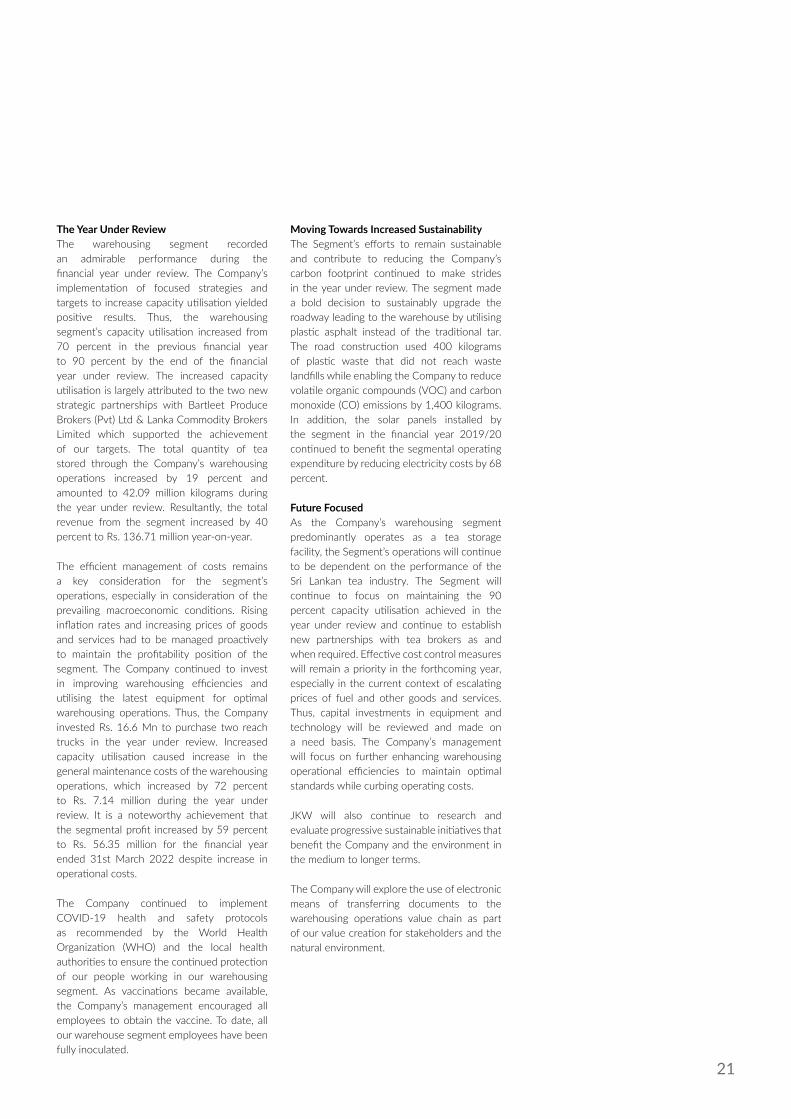
JKW successfully recorded 90 percent capacity utilisation throughout the financial year under review. The Company’s warehousing segment operates at high standards to ensure state-of-the-art facilities for use by our select clientele.
Warehousing Segment
Tea Quantity Stored - Mn KgsTea Store rent Recovered - Mn Rs.
0
20
40
60
80
100
120
Warehousing Operations -Quantity Handled / Value
2021/22 2020/21 2019/20 2018/19 2017/18
90%Capacity Utilisation
Rs.16MnInvestment
40%YOY revenue growth
21
The Year Under ReviewThe warehousing segment recorded an admirable performance during the financial year under review. The Company’s implementation of focused strategies and targets to increase capacity utilisation yielded positive results. Thus, the warehousing segment’s capacity utilisation increased from 70 percent in the previous financial year to 90 percent by the end of the financial year under review. The increased capacity utilisation is largely attributed to the two new strategic partnerships with Bartleet Produce Brokers (Pvt) Ltd & Lanka Commodity Brokers Limited which supported the achievement of our targets. The total quantity of tea stored through the Company’s warehousing operations increased by 19 percent and amounted to 42.09 million kilograms during the year under review. Resultantly, the total revenue from the segment increased by 40 percent to Rs. 136.71 million year-on-year.
The efficient management of costs remains a key consideration for the segment’s operations, especially in consideration of the prevailing macroeconomic conditions. Rising inflation rates and increasing prices of goods and services had to be managed proactively to maintain the profitability position of the segment. The Company continued to invest in improving warehousing efficiencies and utilising the latest equipment for optimal warehousing operations. Thus, the Company invested Rs. 16.6 Mn to purchase two reach trucks in the year under review. Increased capacity utilisation caused increase in the general maintenance costs of the warehousing operations, which increased by 72 percent to Rs. 7.14 million during the year under review. It is a noteworthy achievement that the segmental profit increased by 59 percent to Rs. 56.35 million for the financial year ended 31st March 2022 despite increase in operational costs.
The Company continued to implement COVID-19 health and safety protocols as recommended by the World Health Organization (WHO) and the local health authorities to ensure the continued protection of our people working in our warehousing segment. As vaccinations became available, the Company’s management encouraged all employees to obtain the vaccine. To date, all our warehouse segment employees have been fully inoculated.
Moving Towards Increased SustainabilityThe Segment’s efforts to remain sustainable and contribute to reducing the Company’s carbon footprint continued to make strides in the year under review. The segment made a bold decision to sustainably upgrade the roadway leading to the warehouse by utilising plastic asphalt instead of the traditional tar. The road construction used 400 kilograms of plastic waste that did not reach waste landfills while enabling the Company to reduce volatile organic compounds (VOC) and carbon monoxide (CO) emissions by 1,400 kilograms. In addition, the solar panels installed by the segment in the financial year 2019/20 continued to benefit the segmental operating expenditure by reducing electricity costs by 68 percent.
Future FocusedAs the Company’s warehousing segment predominantly operates as a tea storage facility, the Segment’s operations will continue to be dependent on the performance of the Sri Lankan tea industry. The Segment will continue to focus on maintaining the 90 percent capacity utilisation achieved in the year under review and continue to establish new partnerships with tea brokers as and when required. Effective cost control measures will remain a priority in the forthcoming year, especially in the current context of escalating prices of fuel and other goods and services. Thus, capital investments in equipment and technology will be reviewed and made on a need basis. The Company’s management will focus on further enhancing warehousing operational efficiencies to maintain optimal standards while curbing operating costs.
JKW will also continue to research and evaluate progressive sustainable initiatives that benefit the Company and the environment in the medium to longer terms.
The Company will explore the use of electronic means of transferring documents to the warehousing operations value chain as part of our value creation for stakeholders and the natural environment.
22
JOHN KEELLS PLCAnnual Report 2021/22
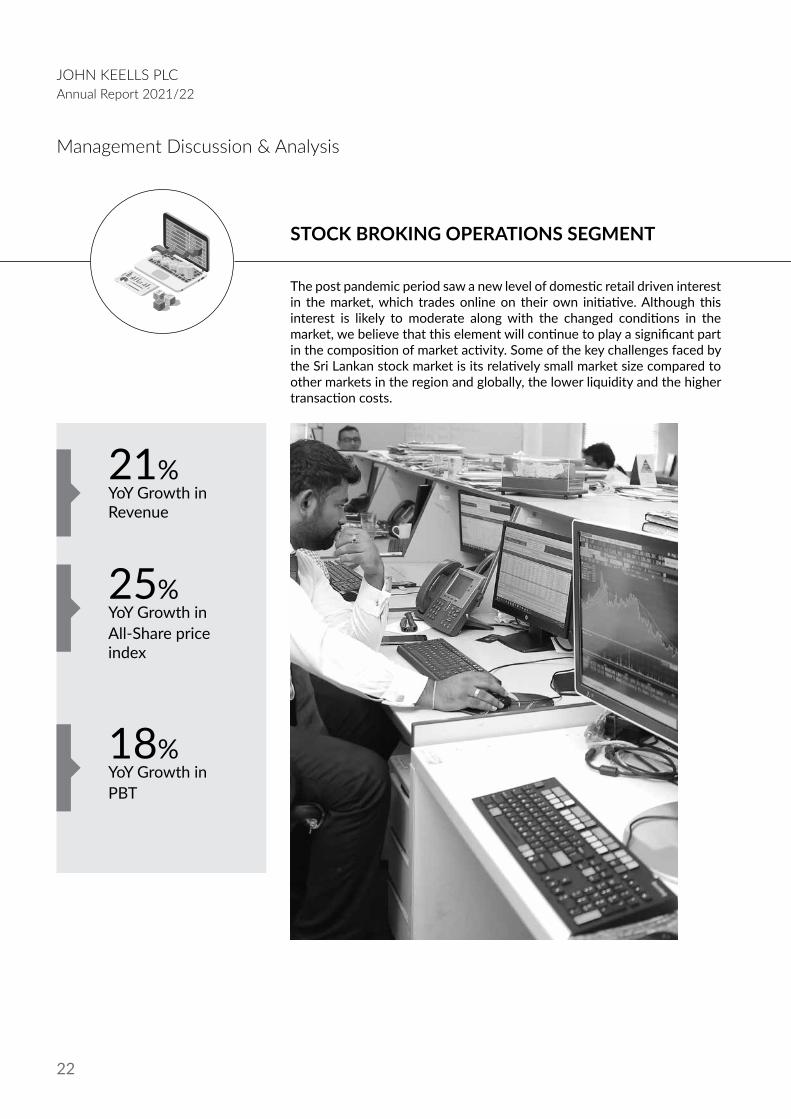
The post pandemic period saw a new level of domestic retail driven interest in the market, which trades online on their own initiative. Although this interest is likely to moderate along with the changed conditions in the market, we believe that this element will continue to play a significant part in the composition of market activity. Some of the key challenges faced by the Sri Lankan stock market is its relatively small market size compared to other markets in the region and globally, the lower liquidity and the higher transaction costs.
21%YoY Growth in Revenue
25%YoY Growth inAll-Share price index
18%YoY Growth inPBT
STOCK BROKING OPERATIONS SEGMENT
Management Discussion & Analysis
23
Financial Review
Financial ReviewThe Company has in place strict internal controls and governance processes which validate our revenue generation and cost control models, while proactive risk management measures safeguards unexpected external developments. In addition, strategic planning and resource allocation are an integral part of managing financial capital which ensures that adequate resources are allocated for the proper functioning of other capitals while contributing to the Company’s economic value generation capacity. Key financial capital indicators and their progress during the year under review is discussed herewith.
RevenueThe Group recorded a consolidated revenue of Rs. 946 million for the year under review, a 14 percent increase compared to the Rs. 828 million recorded during the previous financial year. This increase is mainly attributed to the 40 percent increase in revenue of John Keells Warehousing (Pvt) Ltd (JKW) and to the 21 percent increase in revenue of John Keells Stock Brokers (Pvt) Ltd. Produce Broking segment contributed a 0.22 percent marginal increase compared to the previous financial year. The performance of JKW was mainly realised as a result of the extended duration of storage and the increased revenue earning from external client volumes. John Keells Stock Brokers (Pvt) Ltd revenue increase is mainly attributed to higher trading activity at the Colombo Stock Exchange. The increase in brokerage income earned was negated by the drop in interest earned from producer clients on monies lent as advances.
Composition of RevenueThe Company’s revenue composition during the year under review remained the same as in the previous financial year in terms of highest contributor segments to revenue. However, actual percentages saw a marginal shift with Produce Broking contributing 38 percent, Share Broking contributing 48 percent and the Warehousing operation contributing 14 percent to total revenue during the year under review compared to 42 percent, 46 percent and 12 percent respectively in the previous financial year.
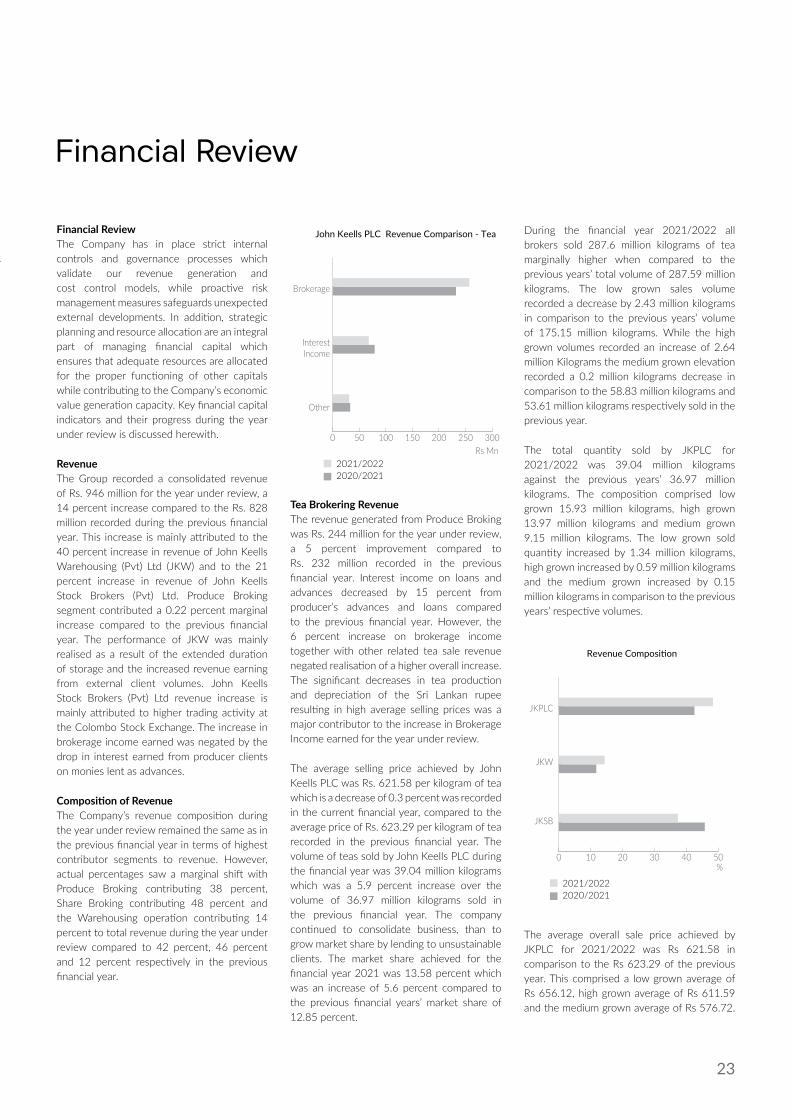
Tea Brokering RevenueThe revenue generated from Produce Broking was Rs. 244 million for the year under review, a 5 percent improvement compared to Rs. 232 million recorded in the previous financial year. Interest income on loans and advances decreased by 15 percent from producer’s advances and loans compared to the previous financial year. However, the 6 percent increase on brokerage income together with other related tea sale revenue negated realisation of a higher overall increase. The significant decreases in tea production and depreciation of the Sri Lankan rupee resulting in high average selling prices was a major contributor to the increase in Brokerage Income earned for the year under review.
The average selling price achieved by John Keells PLC was Rs. 621.58 per kilogram of tea which is a decrease of 0.3 percent was recorded in the current financial year, compared to the average price of Rs. 623.29 per kilogram of tea recorded in the previous financial year. The volume of teas sold by John Keells PLC during the financial year was 39.04 million kilograms which was a 5.9 percent increase over the volume of 36.97 million kilograms sold in the previous financial year. The company continued to consolidate business, than to grow market share by lending to unsustainable clients. The market share achieved for the financial year 2021 was 13.58 percent which was an increase of 5.6 percent compared to the previous financial years’ market share of 12.85 percent.
During the financial year 2021/2022 all brokers sold 287.6 million kilograms of tea marginally higher when compared to the previous years’ total volume of 287.59 million kilograms. The low grown sales volume recorded a decrease by 2.43 million kilograms in comparison to the previous years’ volume of 175.15 million kilograms. While the high grown volumes recorded an increase of 2.64 million Kilograms the medium grown elevation recorded a 0.2 million kilograms decrease in comparison to the 58.83 million kilograms and 53.61 million kilograms respectively sold in the previous year.
The total quantity sold by JKPLC for 2021/2022 was 39.04 million kilograms against the previous years’ 36.97 million kilograms. The composition comprised low grown 15.93 million kilograms, high grown 13.97 million kilograms and medium grown 9.15 million kilograms. The low grown sold quantity increased by 1.34 million kilograms, high grown increased by 0.59 million kilograms and the medium grown increased by 0.15 million kilograms in comparison to the previous years’ respective volumes.
2021/20222020/2021
0 10 20 30 40 50
Revenue Composition
JKPLC
JKW
JKSB
%
2021/20222020/2021
0 50 100 150 200 250 300
John Keells PLC Revenue Comparison - Tea
Brokerage
InterestIncome
Other
Rs Mn
The average overall sale price achieved by JKPLC for 2021/2022 was Rs 621.58 in comparison to the Rs 623.29 of the previous year. This comprised a low grown average of Rs 656.12, high grown average of Rs 611.59 and the medium grown average of Rs 576.72.
24
JOHN KEELLS PLCAnnual Report 2021/22
Financial Review
The low, high, and medium grown averages were Rs 16.68 and Rs 4.21 below the previous year’s low and medium grown respective elevation averages. The high grown average achieved by JKPLC is Rs. 13.80 above last year. In the current financial year high and medium grown elevation average was Rs. 4.63 and Rs 19.89 higher than the overall trade average of Rs 606.96 and Rs 556.10, respectively. The low grown average achieved by JKPLC for the current year was Rs. 10.16 lower than the overall trade average of Rs 666.28.
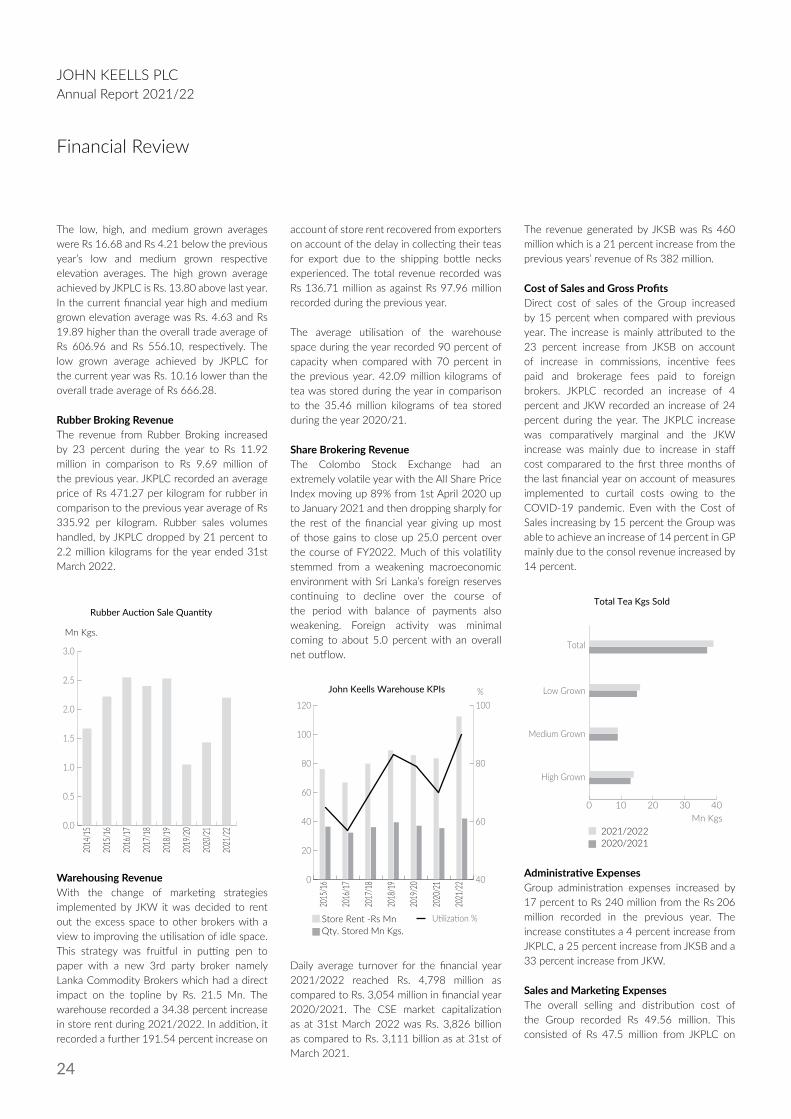
Rubber Broking RevenueThe revenue from Rubber Broking increased by 23 percent during the year to Rs 11.92 million in comparison to Rs 9.69 million of the previous year. JKPLC recorded an average price of Rs 471.27 per kilogram for rubber in comparison to the previous year average of Rs 335.92 per kilogram. Rubber sales volumes handled, by JKPLC dropped by 21 percent to 2.2 million kilograms for the year ended 31st March 2022.
account of store rent recovered from exporters on account of the delay in collecting their teas for export due to the shipping bottle necks experienced. The total revenue recorded was Rs 136.71 million as against Rs 97.96 million recorded during the previous year.
The average utilisation of the warehouse space during the year recorded 90 percent of capacity when compared with 70 percent in the previous year. 42.09 million kilograms of tea was stored during the year in comparison to the 35.46 million kilograms of tea stored during the year 2020/21.
Share Brokering RevenueThe Colombo Stock Exchange had an extremely volatile year with the All Share Price Index moving up 89% from 1st April 2020 up to January 2021 and then dropping sharply for the rest of the financial year giving up most of those gains to close up 25.0 percent over the course of FY2022. Much of this volatility stemmed from a weakening macroeconomic environment with Sri Lanka’s foreign reserves continuing to decline over the course of the period with balance of payments also weakening. Foreign activity was minimal coming to about 5.0 percent with an overall net outflow.
The revenue generated by JKSB was Rs 460 million which is a 21 percent increase from the previous years’ revenue of Rs 382 million.
Cost of Sales and Gross ProfitsDirect cost of sales of the Group increased by 15 percent when compared with previous year. The increase is mainly attributed to the 23 percent increase from JKSB on account of increase in commissions, incentive fees paid and brokerage fees paid to foreign brokers. JKPLC recorded an increase of 4 percent and JKW recorded an increase of 24 percent during the year. The JKPLC increase was comparatively marginal and the JKW increase was mainly due to increase in staff cost comparared to the first three months of the last financial year on account of measures implemented to curtail costs owing to the COVID-19 pandemic. Even with the Cost of Sales increasing by 15 percent the Group was able to achieve an increase of 14 percent in GP mainly due to the consol revenue increased by 14 percent.
0.0
0.5
1.0
1.5
2.0
2.5
3.0
Rubber Auction Sale Quantity
2014
/15
2015
/16
2016
/17
2017
/18
2018
/19
2019
/20
2020
/21
2021
/22
Mn Kgs.
Warehousing RevenueWith the change of marketing strategies implemented by JKW it was decided to rent out the excess space to other brokers with a view to improving the utilisation of idle space. This strategy was fruitful in putting pen to paper with a new 3rd party broker namely Lanka Commodity Brokers which had a direct impact on the topline by Rs. 21.5 Mn. The warehouse recorded a 34.38 percent increase in store rent during 2021/2022. In addition, it recorded a further 191.54 percent increase on
Store Rent -Rs MnQty. Stored Mn Kgs.
0
20
40
60
80
100
120
John Keells Warehouse KPIs
2015
/16
2016
/17
2017
/18
2018
/19
2019
/20
2020
/21
2021
/22 40
60
80
100
Utilization %
%
Daily average turnover for the financial year 2021/2022 reached Rs. 4,798 million as compared to Rs. 3,054 million in financial year 2020/2021. The CSE market capitalization as at 31st March 2022 was Rs. 3,826 billion as compared to Rs. 3,111 billion as at 31st of March 2021.
2021/20222020/2021
0 10 20 30 40
Total Tea Kgs Sold
Total
Low Grown
Medium Grown
High Grown
Mn Kgs
Administrative ExpensesGroup administration expenses increased by 17 percent to Rs 240 million from the Rs 206 million recorded in the previous year. The increase constitutes a 4 percent increase from JKPLC, a 25 percent increase from JKSB and a 33 percent increase from JKW.
Sales and Marketing Expenses The overall selling and distribution cost of the Group recorded Rs 49.56 million. This consisted of Rs 47.5 million from JKPLC on

25
account of bad debt recovered (Net), Rs 0.56 million expenses on account of JKW and a Rs 1.12 million expenses for JKSB. The Group has already initiated legal action against clients who had unsettled amounts in previous years for which provision had been made. With regards to cases which have been already initiated, the Group is confident that these cases would be resolved in favour of JKPLC.
of Rs 34.2 million. The 38 percent increase in overall finance income along with the 6 percent decrease in the finance expenses resulted in the net finance expense decreasing by 167 percent to Rs 31.19 million when compared with the previous year’s expenses of Rs 11.68 million. The interest cover for the year was 12.77 when compared with previous year’s 11.48. The increase is mainly attributed to the current year increase profit before tax in comparison to the previous year.
ProfitabilityThe Group profit before tax increased by 5 percent to a profit of Rs. 377 million for the year compared to Rs 358 million recorded in the previous year. The current year’s PBT includes a Rs 30.1 million fair value adjustment of investment properties in comparison to Rs 15.1 million in the previous year. The tea average price per kilogram during the last quarter of the current year recorded a significant increase. This had a positive impact on the brokerage income earned by JKPLC in comparison to the previous year. The reduced lending to tea producers had a negative impact on the interest earned from sellers. The lower interest rate charged on the lower lending also contributed to the drop in interest earned. The increase in selling and distribution expenses on account of provisioning for bad debts had a negative impact on the profitability of JKPLC in comparison to the previous year.
The pivotal reasons for the positive impact on the profitability for the year was mainly due to the increased store rent income generated due to the surge in space utilisation throughout the financial year by means of renting out warehousing space to a new 3rd party broker, Lanka Commodity Brokers Limited and the increase in revenue generated from extra store rent income on account of the delay by Exporters in collecting their teas for export due to the shipping bottle necks, enabled JKW to record an extremely satisfactory profit of Rs 56.33 million in comparison to the Rs 35.61 million recorded in the previous year.
JKSB recorded Rs 202 million profit in comparison to the previous years’ profit before tax of Rs 170 million.
Change in Fair Value of Investment PropertyThe Investment properties were valued by Mr P B Kalugalagedera using open market value
method of valuation as at 31st December 2021. The change in value was a positive Rs 30.1 million during the current year as against Rs 15.1 million during the previous year.
TaxationAs per the tax regulations that prevailed during the financial year, produce brokering, warehousing and stock brokering, income was subject to a tax of 24 percent. Increase in profits had a direct impact on the amount of taxes paid to the government during the year.
2021/20222020/2021
0 2 4 6 8
Leverage and Capital Structure = Group
ShareholdersFunds
Non- controllinginterest
Non- CurrentLiabilities
CurrentLiabilities
Rs. Bn.
2021/20222020/2021
0 25 50 75 100
Share Performance
Highest MarketPrice
Lowest MarketPrice
Closing MarketPrice
EPS
DPS
NAP
P/E - Times
Rs
Finance IncomeThe Group’s interest income from investments in Treasury Bills and other short-term Investments increased by 38 percent during the year when compared to the previous year. JKPLC and JKSB recorded an increase of 38 percent and 54 percent respectively in comparison to the last year, whereas JKW 41 percent decrease in comparison to the last year. The finance income of the Group also includes the dividends received from Keells Food Products PLC. The dividend income received from Keells Food Products PLC recorded a 36 percent increase in comparison to the previous year. This increase contributed to the overall increase recording only a 38 percent increase in finance income during the year.
Finance Expenses (Net)The Group’s finance expenses decreased by 6 percent during the year. The decrease in use of overdraft facilities by JKPLC due to lower advances to tea producers along with the decreased rates on borrowings was the main contributory factor for the decrease when compared to the previous year’s cost
Statement of Financial PositionRevenue ReserveThe Group revenue reserve increased by 3 percent to Rs 2,872 million from Rs 2,797 million recorded in the previous year. This was on account of Rs 266 million profit recorded for the current year and a payout of Rs 139.23 million as a final dividend for 2020/2021.
Fair value Reserves of Financial AssetsThe Fair value Reserves of Financial Assets balance increased by 7 percent to Rs 936 million from the Rs 875 million recorded in the previous year. This was mainly due to the Fair Value increase of investments held in Keells Food Products PLC and Waterfront Properties (Pvt) Ltd by Rs 60.28 million during the year.
Non- Controlling InterestThe Non- controlling interest increased by 21 percent to Rs 36.50 million from the Rs 30.19 million in the previous year on account of the increased profit registered by JKSB during the

26
JOHN KEELLS PLCAnnual Report 2021/22
Financial Review
year. The Non – controlling interest in JKSB is 24 percent.
Cashflow The net movement in cash and cash equivalents for the year under review was an inflow of Rs 114 million compared to the cash inflow of Rs 606 million recorded in the previous year. The increase in outflow of Rs 492 million comprises a drop in cash generated from operations by Rs 374 million, drop in cash inflow from investing activities by Rs 16.6 million and a decrease in cash outflows for financing activities by Rs 100.0 million. The decrease in cash outflow for financing activities is mainly on account of reduced payout of dividends during the year.
The Group’s current liabilities have dropped by Rs 5,976 million mainly on account of trade and other payables dropping by Rs 5,951 million, income tax payable dropping by Rs 6 million and bank borrowing increasing by Rs 2 million. The increase in trade and other payables of JKPLC by Rs 122 million is mainly due to increase in average price this year in comparison to last year. The drop in JKSB of Rs 6,078 million is due to drop in share trade volumes as at end March.
Share Price and Market CapitalisationJKPLC’s shares lost 2 percent of its value during the year with the highest trading price of Rs 80.50 per share recorded on 13th January 2022.
During the year Earnings per Share (EPS) decreased by 10 percent to Rs 3.78 from the Rs 4.18 per share the previous year. The Price earnings ratio (PER) for the year under review was 18.14 times, this was an increase from the previous year’s value of 16.74 times. Net Assets per share increased by 14.8 percent to Rs 71.13 per share from the Rs 68.04 per share reported the previous year.
DividendThe dividend policy of the Group seeks to ensure a dividend payout correlated with profits while ensuring sufficient funds are retained for future developments while delivering sustainable value to shareholders in the short, medium and long term.
During the year under review the Group paid a dividend of Rs 2.29 per share resulting in a total cash outflow of Rs 139 million. The dividend payout ratio stood at a 86 percent whilst the dividend yield was at 30.
Economic value statementThe economic value addition statement depicts the generation of wealth and its distribution among the stakeholders in all business/social activities throughout the entire value chain. It also reveals the amounts reinvested for the replacement of assets and retained for the growth and development of operations.
Subsequent EventsThere are no further matters or circumstances arising since 31 March 2022, not otherwise dealt with in the financial statements that would materially affect the operations or results of the Group.
2021/20222020/2021
0 100 200 300 400 500 600 700
Sale average achieved by trade
Total JKL Ave.
Total Trade Ave.
Low GrownJKL Ave.
Low GrownTrade Ave.
Medium GrownJKL Ave.
Medium GrownTrade Ave.
High GrownJKL Ave.
High GrownTrade Ave.
Rs.
Working Capital/LiquidityNet working capital of the Group increased by Rs 141 million to Rs 349 million as at 31st March 2022 from Rs 207 million in 2020/2021. The Group’s current assets dropped by 75 percent to Rs 1,853 million in comparison to the previous year’s Rs 7,686 million. The Groups current liabilities also dropped by 80 percent to Rs 1,505 million in comparison to the previous year’s Rs 7,480 million. The Group current assets have dropped by Rs 5,833 million on account of trade and other receivables dropping by Rs 5,987 million and short-term investments and cash and bank balances increasing by Rs 118 million. The decrease in trade and other receivables consist of Rs 123 million increase in JKPLC, Rs 6,112 million drop in JKSB and Rs 1.3 million in JKW.
2021/20222020/2021
0 5 10 15 20 25
Market Share
Total
Low Grown
Medium Grown
High Grown
%
The total shares issued by JKPLC is 60.8 million. The total Market Capitalisation as at 31st March 2022 was Rs 4,164 million, an increase of 8.38 percent from the previous year’s Market Capitalisation of Rs 4,256 million as at 31st March 2021.
Dividend Yeild -%Dividend payout ratio -%Market Capitalisation - Rs Mn.
0
1,000
2,000
3,000
4,000
5,000
2021/22 2020/21
Dividend ratio andMarket Capitalization Ratio
0
14
28
42
56
70%Rs. Mn.

27
Human Resources and CSR
Human Resources The employees of JK PLC are an integral part of the business and the company considers the development of the skills, talent and productivity of the employees as a pre-requisite to achieving success.
Management ApproachTaking into account the importance of our employees, the main objective of our human development strategy is the enhancement of the mutually beneficial relationship that exists between the company and the employees. Not only attracting but also retaining the right people with the necessary experience and attitude to each role is considered important. The company ensures that it rewards its employees not only in terms of compensation but also with opportunities for professional advancement and career growth. As such, the company continues to be committed to the following fundamental principles:
1. Equality and diversity at all stages of the employment process including recruitment, selection, evaluation, promotion and training and development.
2. Competitive compensation and benefits in line with industry standards including compliance with statutory laws of the country.
3. Evaluation of performance of all employees to identify their potential within the Company, thereby enabling the identification of training requirements if any.
4. Providing training and development to ensure the employees acquire the skills and competencies needed to optimize their capacity whilst also aligning them with the JKH Group behavioural competencies framework (referred to as roof competencies)
5. A communicative and open culture to enable employees to give and receive feedback freely to their colleagues, supervisors and senior managers.
6. Recognition of leadership qualities in employees to inspire them to reach greater heights.
7. Opportunities for employee engagement and team building whilst also volunteering for CSR activities.
8. Maintenance of a work-life balance by providing opportunities to all employees to use the flexible working hours policy, work-from-home policy, agile working policy and paternity leave.
9. Strictly implementing an equal opportunity principle to include people representing both genders, multiple social, religious and ethnic backgrounds and age groups.
10. Strict policy of disallowing child labour
Overview of Employee CadreAs at the end of the financial year 2021 / 2022, JK PLC had an employee cadre of 50 people, 11 of whom were recruited in the year under review. The company continuously maintains a diversity not only in terms of age groups but also gender wise. This we believe assists us to remain relevant in this advanced operating environment. The hands-on experience showcased by our older and experienced members coupled with the latest knowledge and techniques brought in by the younger generation, plays a pivotal role to the sustainability of the business. The company takes pride of the fact that over 45% of our employees have been with the company for over 10 years, proving our success as an employer of choice.
The Human Resource Information System (HRIS)The Group’s state-of-the-art HRIS has enabled the connection and automation of end-to-end HR processes. This system has not only provided the facility of undertaking all processes on one platform but has also increased the efficiency as well as the effectiveness, especially taking into account the mobile enabled option. This system is also aligned to enable the processes to be undertaken in a paperless manner whilst ensuring that the storing and retrieval of information is handled in a more secured environment.
The mobile application allows the real-time engagement between employees keeping in line with modern trends.
Talent ManagementThe Company continues to follow the concept of a “Talent Pool” where the identification of talent commences subsequent to the Career Committee Meetings on a recommendation from the Profit Centre Manager (PCM) for Assistant Managers and Executives. The concurrence of the Sector Head / President is obtained for Manager grade employees. This pool which is finalized and updated in the system by 31st May annually enables the retention of the most qualified employees by ensuring they are trained and developed towards reaching their career aspirations within the Company. The selection of employees to the “Talent Pool” is aligned with the pre-set criteria set by the JKH Group. During the year under review, 1 employee of JK PLC was successfully included in the “Talent Pool”.
Performance Appraisal ProcessJK PLC’s performance management cycle ensures that all employees of the Company undergo regular appraisals. Formal feedback is provided on a bi-annual basis to the executive cadre and once a year to all others, whilst continuous feedback is encouraged. The process, which is underpinned by the need to firstly live the Values of the Group, enables identification of high potentials and successors, and also helps identify and enhance required skills of individuals needing support to achieve business outcomes. It is also noteworthy that the appraisal process encourages employees to contribute to the Group at large, as opposed to the business unit or functional unit they belong to.
Competency Assessment ToolThe Competency Assessment Tool was developed to assist the employees as well as the Company to identify gaps and areas for development. Here too a self and supervisor evaluation is undertaken after which a one on one meeting is held to discuss and agree on the competencies for development.
This assessment is completed prior to the commencement of the year end performance appraisal as the outcome would be useful thereto as well.
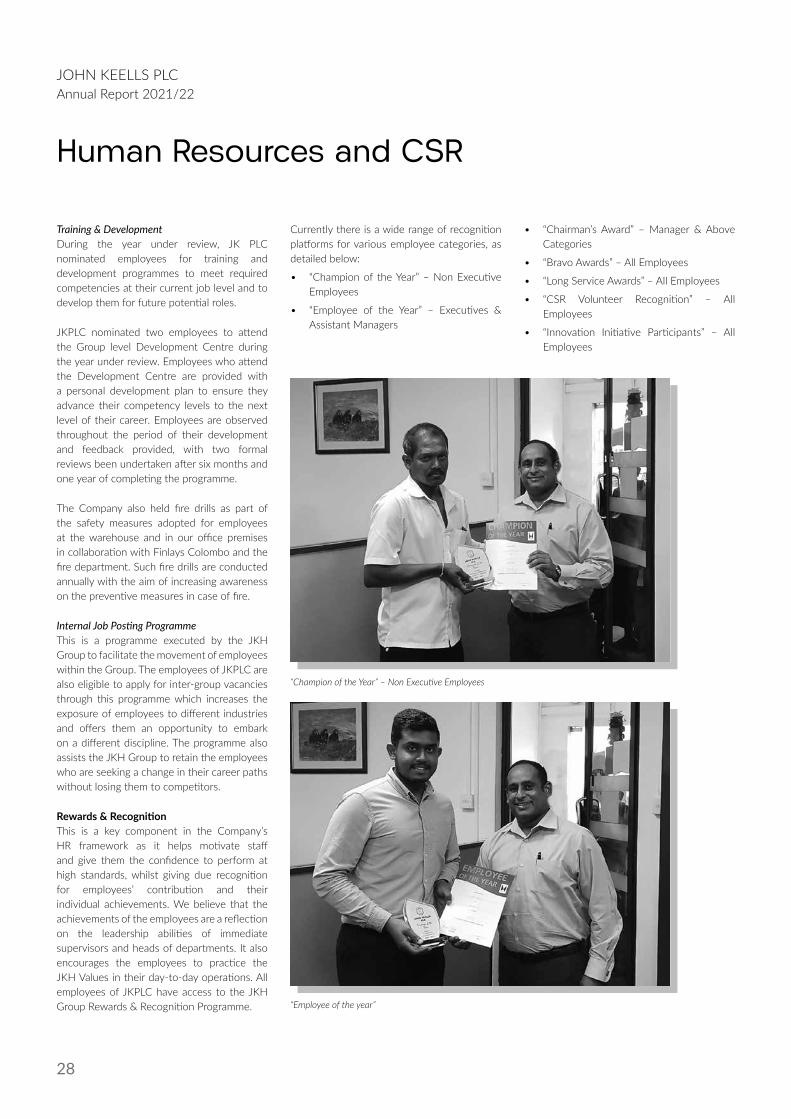
28
JOHN KEELLS PLCAnnual Report 2021/22
Human Resources and CSR
Training & DevelopmentDuring the year under review, JK PLC nominated employees for training and development programmes to meet required competencies at their current job level and to develop them for future potential roles.
JKPLC nominated two employees to attend the Group level Development Centre during the year under review. Employees who attend the Development Centre are provided with a personal development plan to ensure they advance their competency levels to the next level of their career. Employees are observed throughout the period of their development and feedback provided, with two formal reviews been undertaken after six months and one year of completing the programme.
The Company also held fire drills as part of the safety measures adopted for employees at the warehouse and in our office premises in collaboration with Finlays Colombo and the fire department. Such fire drills are conducted annually with the aim of increasing awareness on the preventive measures in case of fire.
Internal Job Posting ProgrammeThis is a programme executed by the JKH Group to facilitate the movement of employees within the Group. The employees of JKPLC are also eligible to apply for inter-group vacancies through this programme which increases the exposure of employees to different industries and offers them an opportunity to embark on a different discipline. The programme also assists the JKH Group to retain the employees who are seeking a change in their career paths without losing them to competitors.
Rewards & RecognitionThis is a key component in the Company’s HR framework as it helps motivate staff and give them the confidence to perform at high standards, whilst giving due recognition for employees’ contribution and their individual achievements. We believe that the achievements of the employees are a reflection on the leadership abilities of immediate supervisors and heads of departments. It also encourages the employees to practice the JKH Values in their day-to-day operations. All employees of JKPLC have access to the JKH Group Rewards & Recognition Programme.
Currently there is a wide range of recognition platforms for various employee categories, as detailed below:
• “Champion of the Year” – Non Executive Employees
• “Employee of the Year” – Executives & Assistant Managers
• “Chairman’s Award” – Manager & Above Categories
• “Bravo Awards” – All Employees
• “Long Service Awards” – All Employees
• “CSR Volunteer Recognition” – All Employees
• “Innovation Initiative Participants” – All Employees
“Champion of the Year” – Non Executive Employees
“Employee of the year”

29
“Long Service Awards” – All Employees
Communicative & Open CultureJKPLC strongly believes in an open and communicative culture where employees are encouraged to provide feedback on all business activities and developments. The following mechanisms are currently in place:
Skip Level MeetingsThese meetings enable employees to skip their immediate supervisor and reach out to the next level in terms of seniority. Such meetings enable the senior management to build trust with junior level employees; assess junior employees on a one-on-one basis, solicit new ideas, solutions and/or process improvements; and promote an open-door culture. In turn, junior employees are given an opportunity to gain additional awareness of business strategies and initiatives and receive guidance/coaching/mentoring from the senior management.
Peer & Upward Survey (Manager & Above Category)This is an e-based feedback tool conducted annually where an employees’ peers and direct reports are asked to provide feedback in a confidential manner. The feedback received is then compared to the self-assessment form completed by the employee in line with the JKH Group’s roof competencies.
Joint Consultative Committee (JCC) MeetingsOne non-executive level employee representing each department is given the opportunity to meet the CEO and the Head of HR of JKPLC regularly to raise concerns, make suggestions and discuss areas for improvement.
Staff MeetingsStaff meetings are organized to share financial information and other pertinent Company developments with the employees. The employees are also given the opportunity to share their ideas and opinions.
Great Place to Work (GPTW) SurveyThis survey was undertaken in the financial year 2019/ 2020 in order to obtain feedback from the employees on areas such as Credibility, Respect, Fairness, Pride & Camaraderie. Areas for development are being addressed through the action plan in place.
Engagement ForumThis is a JKH Group initiative aimed at promoting bottom-up and top-down communication.
The employees are given the opportunity to meet the JKH Group Chairman and the Head of Group HR for an informal discussion. JKPLC
continues to have three staff members in the categories of Executive, Assistant Manager and Manager as representatives at this forum.
Employee EngagementIn order to ensure a work-life balance and to enable the employees to build personal relationships with colleagues, the Company sponsors several events and activities. During the year under review, the Company had a celebration for all female employees on Women’s Day.
Diversity and InclusionIn 2020/21, the John Keells Group concluded its initiatives under the commitments of the IFC

30
JOHN KEELLS PLCAnnual Report 2021/22
SheWorks Sri Lanka partnership, which focused on implementing gender smart solutions with the objective of increasing female participation in the workforce. Maintaining this momentum, the Group joined ‘Target Gender Equality’, the UN Global Compact’s accelerated programme towards increasing women’s representation and leadership in business.
To visually consolidate the Group’s work in diversity and inclusion, the brand ‘ONE JKH’ was launched in September 2020 and the logo is now incorporated into vacancy advertisements to reinforce the Group’s position on non-discrimination and equal opportunity.
On International Women’s Day - 8th March 2021, the Group announced its commitment to increase female participation to 40% by the end of the 2025/26 with annual interim goals set for each industry group. To meet this goal, along with other Group companies John Keells PLC has committed to increasing the participation of women by 2% this date, setting out initiatives and interventions to breaking gender stereotypes and increasing women in non-traditional roles.
The Group formalized its Agile Workplace Policy into a more practical and accessible methodology, which was implemented during the transition period of the new normal. This assisted greatly in maintaining a work-life balance.
Human Resources and CSR
“Innovation Initiative Participants” – All Employees
Womens day celebration
“Employee of the Year” – Executives & Assistant Managers
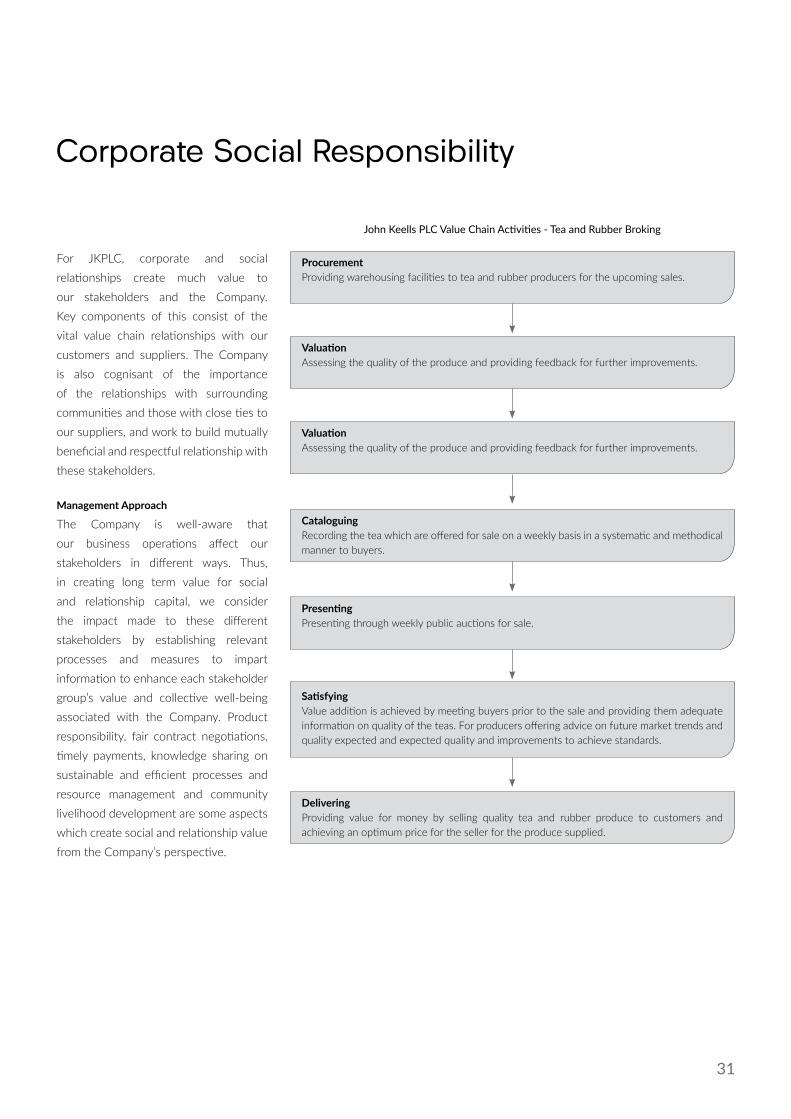
31
Corporate Social Responsibility
For JKPLC, corporate and social relationships create much value to our stakeholders and the Company. Key components of this consist of the vital value chain relationships with our customers and suppliers. The Company is also cognisant of the importance of the relationships with surrounding communities and those with close ties to our suppliers, and work to build mutually beneficial and respectful relationship with these stakeholders.
Management Approach
The Company is well-aware that our business operations affect our stakeholders in different ways. Thus, in creating long term value for social and relationship capital, we consider the impact made to these different stakeholders by establishing relevant processes and measures to impart information to enhance each stakeholder group’s value and collective well-being associated with the Company. Product responsibility, fair contract negotiations, timely payments, knowledge sharing on sustainable and efficient processes and resource management and community livelihood development are some aspects which create social and relationship value from the Company’s perspective.
John Keells PLC Value Chain Activities - Tea and Rubber Broking
ProcurementProviding warehousing facilities to tea and rubber producers for the upcoming sales.
ValuationAssessing the quality of the produce and providing feedback for further improvements.
ValuationAssessing the quality of the produce and providing feedback for further improvements.
CataloguingRecording the tea which are offered for sale on a weekly basis in a systematic and methodical manner to buyers.
PresentingPresenting through weekly public auctions for sale.
Delivering Providing value for money by selling quality tea and rubber produce to customers and achieving an optimum price for the seller for the produce supplied.
SatisfyingValue addition is achieved by meeting buyers prior to the sale and providing them adequate information on quality of the teas. For producers offering advice on future market trends and quality expected and expected quality and improvements to achieve standards.

32
JOHN KEELLS PLCAnnual Report 2021/22
Corporate Social Responsibility
Creating Value for Customers As part of JKPLC’s commitment to serve our customers (buyers) efficiently and in the most convenient manner, the Company engages in continuous one-on-one interactions to better understand their requirements which in turn enables the effectiveness of our business actions and processes.
Being a part of the tea brokering business, the Company’s weekly Tea Market Report is a critical tool to share information with our customers. The report includes latest developments in the global and Sri Lankan tea industry. To further strengthen relationships across the value chain, JKPLC also facilitates interaction between our two key stakeholders – our buyers and our suppliers, by arranging visits to the factories and production facilities.
In addition, the Company’s emphasis on quality warehousing practices ensures that customers who purchase products stored in our warehouse receive products which are not degraded or adversely affected due to storage issues.
The increasing customer base of the Company is testimony of the trust placed in our brand and the quality of our services.
Creating Value for SuppliersOur tea and rubber suppliers are the critical link in our value chain, as the success of JKPLC’s business depends heavily on reliable and sustainable supply chain partners. As such, the Company remains fully committed to work towards building trust with our suppliers and offering increasingly comprehensive supplier integration within the Company’s business operations through a range of value-added services. As such, over the years, JKPLC has built processes and systems which enable us to provide financial assistance to factory owners (suppliers) to manage their working capital requirements and pursue extension plans, sharing of knowledge and best practices, sharing of latest industry developments and challenges, and one-on-one interaction with our customers for greater understanding of their needs.
In addition, the Company’s emphasis on efficient warehousing practices and quality standards ensures that suppliers’ produce is stored in optimal conditions without affecting quality, thereby increasing their ability to obtain higher prices at the marketplace.
Supply Chain – Commodity Broking
Creating Value for the CommunityBeing a responsible and conscientious business organisation, JKPLC practices good corporate citizenship by assisting and developing communities which surround our business operations and those of our suppliers. Focus areas include health and well-being and the improvement of living standards.
Community activities are generally carried out with the support of our employees who are encouraged to volunteer their time in organising and participating at these programmes.
In addition, the Company makes an annual contribution to the John Keells Foundation through which, all of the John Keells Group’s corporate social responsibility activities are carried out.
Tea / Rubber Small holders
Corporative Societies/ Trusts
Partnerships / Agents of
Estates
Private Tea/Rubber Factory
Owners/ Managing Agent of Tea/Rubber
Factories
Commodity Brokers
Buyers – Exporters/Local Purchases
Final Consumer
Warehouses – Brokers/Plantation Companies/Third party logistics
providers
Regional Plantation Companies

33
S P E A R H E A D T H E
S T E W A R D S H I P
The Board of Directors | Corporate Governance | Enterprise Risk Managemente | Report of the Board Audit Committee |Report of the Related Party Transactions Review Committee | Annual Report of the Board of Directors |
Statement of Directors’ Responsibility

34
JOHN KEELLS PLCAnnual Report 2021/22
The Board of Directors
KRISHAN BALENDRACHAIRMAN/NON-INDEPENDENT - NON-EXECUTIVE DIRECTOR
Appointed to Board 2018% Shares held 0 %
Board CommitteesMember – Nominations CommitteeMember – Related Party Transactions Review Committee
Skills and ExpertiseKrishan Balendra is the Chairman of John Keells Holdings PLC. He is the Deputy Vice Chairman of the Ceylon Chamber of Commerce and the Hon. Consul General of the Republic of Poland in Sri Lanka. He is a former Chairman of Nations Trust Bank and the Colombo Stock Exchange. Krishan started his career at UBS Warburg, Hong Kong, in investment banking, focusing primarily on equity capital markets. He joined JKH in 2002. Krishan holds a law degree (LLB) from the University of London and an MBA from INSEAD.
Positions held in Other CompaniesFormer Chairman of Nations Trust Bank PLC and Colombo Stock Exchange.
Other Current AppointmentsChairman of John Keells Holdings PLC and serves as a Director of the Ceylon Chamber of Commerce and the Hon. Consul General of the Republic of Poland in Sri Lanka.
GIHAN COORAYNON-INDEPENDENT - NON-EXECUTIVE DIRECTOR
Appointed to Board 2018% Shares held 0 %
Board CommitteesNone
Skills and ExpertiseMr Cooray has overall responsibility for the Group’s Finance and Accounting, Taxation, Corporate Finance and Strategy, Treasury, Information Technology function and Corporate Communications. He is a Director of several companies in the John Keells Group. Mr Cooray holds an MBA from the Jesse H. Jones Graduate School of Management at Rice University, Houston, Texas. He is a Fellow member of the Chartered Institute of Management Accountants,
UK, a certified management accountant of the Institute of Certified Management Accountants, Australia and has a Diploma in Marketing from the Chartered Institute of Marketing, UK.
Other Current AppointmentsDeputy Chairman & Group Finance Director of John Keells Holdings PLC, Chairman of Nations Trust Bank and serves as a committee member of the Ceylon Chamber of Commerce.
ZAFIR HASHIMNON-INDEPENDENT - NON-EXECUTIVE DIRECTOR
Appointed to Board 2021% Shares held 0 %
Board CommitteesNone
Skills and ExpertiseMr Zafir Hashim has been in the group for 18 years. He has an MSc in Chemical Engi-neering from the University of Birmingham (UK).
Positions held in Other CompaniesHe joined the JKH Group in 2003, seconded to Lanka Marine Services, where he served as the CEO from 2005-2015. He has also served as a member of the Transportation Sector Committee from 2005. During the last 18 years he has held the position of CEO at John Keells Logistics Lanka Ltd. for a short time, and Mackinnons Macken-zie Shipping Co. Ltd, Mack International Freight Ltd and Mackinnons Travels Ltd.
Other Current AppointmentsHead of Transportation and Plantation sectors within the John Keells Group.
DEVIKA WEERASINGHENON-INDEPENDENT - NON-EXECUTIVE DIRECTOR
Appointed to Board 2021% Shares held 0 %
Board CommitteesNone
Skills and ExpertiseMs Devika Weerasinghe is an Associate member of the Chartered Institute of Man-agement Accountants UK. She also holds a Bachelor’s Degree in Business Administration, from the University of Sri Jayewardenepura. She serves as the CFO of the Plantations Services Sector of the John Keells Group.
Positions held in Other CompaniesMs Weerasinghe previously held the position of Sector Financial Controller of the Transportation sector. She also served as the Sector Financial Controller of the Air-lines SBU of the Transportation sector during the period 1998-2004.
Other Current AppointmentsShe is the CFO of the Transportations Industry group and the Information Technology sector of the John Keells Group.
35
CHARITHA NISSANKA WIJEWARDANEINDEPENDENT NON-EXECUTIVE DIRECTOR
Appointed to Board 2016% Shares held 0 %
Board CommitteesMember - Board Audit Committee
Skills and ExpertiseMr Charitha Wijewardane graduated from the University of HULL, UK with BSc Honours Degree in Digital Electronics and Communications, and is an Engineer by profession.
He also worked at IBMs Asia Pacific Group Headquarters in Hong Kong, where he was in-charge of Mass Marketing Programmes in all of Asia Pacific for IBMs AS/400 series.
He headed the Marketing Team in IBM Sri Lanka and he was also managing the AS/400 Mass Marketing Programme for IBM ASEAN Operations out of Singapore. He served at Lexmark Internationals Asia Pacific Operations based in Sydney, Australia. He is recognized for setting up effective channels operations in diverse cultures and sub cultures.
Positions held in Other CompaniesHe served at IBM as a Country General Manager for IBM World Trade Corporation. At Lexmark he worked as a Regional Manager spearheading distribution and service operations for Lexmark Products in Pakistan, India, Bangladesh, Sri Lanka, Myanmar, Maldives, New Zealand and Western Australia. He also served as an Independent Non-Executive Director of Bank of Ceylon. Served in the BOC RISK Committee as Chairperson, and as a member of the Audit committee of Bank of Ceylon. He was a Board member of MBSL, MBSL INSURANCE, BOC
TRAVELS. He was also the Chairman Hotels Colombo (1963) Owning company of Grand Oriental Hotel. He also served as an Independent Non-Executive Director of the National Lotteries Board and is a member of the Audit committee of the Lotteries Board.
ANANDHIY K. GUNAWARDHANAINDEPENDENT NON-EXECUTIVE DIRECTOR
Appointed to Board 2016 % Shares held 0 %
Board CommitteesMember - Board Audit Committee
Skills and ExpertiseAttorney-at-Law and a partner of Julius & Creasy, Attorneys-at-Law and Notaries Public. Graduated from the University of Colombo’s Faculty of Law in 1995 with Second Class (Upper Division) Honours and also secured First Class Honours at the Attorneys at Law (Final) Examination in 1996, conducted by the Sri Lanka Law College. She is a Fulbright Scholar and was awarded the Master of Laws (LL.M. with Distinction) by Georgetown University, Washington DC, in May 2000 and, thereafter, served a 7-month internship with the International Monetary Fund’s Legal Department in Washington D.C. She was called to the Bar in June 1997 and was duly enrolled as an Attorney at Law of the Supreme Court of Sri Lanka. Having joined Julius & Creasy in August 1996 as an apprentice, she was made a professional associate in July 1997 and admitted as a Partner in 2005. Her areas of specialization are Capital Markets, Corporate and Commercial Law and Mergers & Acquisitions.
Positions held in Other CompaniesNone.
BODIYABADUGE ARUNDATHI INDIRA RAJAKARIERINDEPENDENT NON-EXECUTIVE DIRECTOR
Appointed to Board 2016% Shares held 0 %
Board CommitteesChairperson - Board Audit Committee
Skills and ExpertiseShe has over 25 years working experience as a finance professional. She is a Fellow member of the Institute of Chartered Accountants, Sri Lanka. She is a founder Director of SheConsults (Pvt) Ltd., a financial consulting company. She has also been a Consultant to World Bank and other institutions on various assignments. She was trained at Ernst & Young where she served as Senior Manager in both auditing, consultancy, and training.
Positions held in Other CompaniesShe serves on the Board of Morison Ltd in the capacity of an Independent Non-Executive Director and the Chairperson of the Audit Committee and Related Party Transactions Review committees. She serves on the Council of Sri Lanka Institute of Directors. She served as the Founder Chairperson of the Women’s Empowerment & Leadership Committee of the Institute of Chartered Accountants of Sri Lanka. She served as the Country Manager for ACCA Sri Lanka and Maldives, at NDB Bank in senior roles covering Corporate Banking, Merchant Banking and Consultancy and Internal Audit; and as Finance Director of Lanka Cellular Services (Pvt) Ltd. She served on the Board of NCAP as an Independent Non- Executive Director and was the Chair-person of the Audit, Risk and Compliance Committee and the Remuneration Committee and a member of the Investment Committee. She also served on the Board of NDB Securities (Pvt) Ltd., a subsidiary of NCAP as a Non-Executive Director.
36
JOHN KEELLS PLCAnnual Report 2021/22
Corporate Governance
John Keells PLC values good governance, as we believe that it’s a core strength we possess in building and maintaining sustainable business relationships, which has helped us stand strong and resilient over our existence of over 150 years in the industry. John Keells PLC (herein referred to as “The Company”), along with its subsidiary and associate companies (collectively termed as “JKL Group”) has its own set of internal benchmarks, processes and structures towards meeting accepted best practices in governance, in addition to the compliance with mandatory regulatory requirements. The JKL Group has been structured and controlled internally through a process of continuous review in facilitating the adoption of the key principles of corporate governance.
Ethical conduct and good governance are embedded within the Company culture and are instilled in the core values of the organization. The Code of Conduct of John Keells Holdings PLC, the parent company (JKH), which can be accessed through the following link https://www.keells.com/governance, applies to all the employees of the Company, senior management, and the Board, provides guidance on embracing this philosophy while carrying out their official duties. The performance management system monitors the adherence to the JKH Code of Conduct and encourages and rewards the employees who exhibit these core values and become exemplary characters within and outside the organization.
Highlights of the 74th AGM held on 23rd June 2021
• Mr. C N Wijewardane, who retired in terms of Article 83 of the Articles of Association of the Company was re-elected as a Director of the Company
• Ms. K D Weerasinghe , who retired in terms of Article 90 of the Articles of Association of the Company was re-elected as a Director of the Company
• Mr. A Z Hashim, who retired in terms of Article 90 of the Articles of Association of the Company was re-elected as a Director of the Company
• Re-appointment of Auditors Messrs. Ernst & Young, Chartered Accountants, as the External Auditors of the Company and determination of their remuneration
The JKL Group is committed to upholding the highest levels of ethical business conduct and good governance practices, and always focuses on achieving high level of transparency in all its reporting aspects. The Corporate Governance philosophy practiced at the Company and JKL Group, is in compliance with the following, and where necessary, any deviations as permitted by the relevant rules and regulations have been explained. This report lays out the practices of Corporate Governance framework, adhered to by your Company and the JKL Group for the financial year 2021/2022.
Compliance Summary Regulatory Benchmarks• The Companies Act No.7 of 2007 and
regulations (Mandatory provisions) - fully compliant
• Listing Rules of the Colombo Stock Exchange (CSE) (Mandatory provisions) - fully compliant
• Securities and Exchange Commission of Sri Lanka Act No. 19 of 2021, including directives and circulars (Mandatory provisions) - fully compliant
• Code of Best Practices on Related Party Transactions (2013) advocated by the Securities and Exchange Commission of Sri Lanka (SEC) (Mandatory provisions) - fully compliant
• Code of Best Practice on Corporate Governance (2013) jointly advocated by the Securities and Exchange Commission of Sri Lanka (SEC) and the Institute of Chartered Accountants of Sri Lanka (CA Sri Lanka) (Voluntary provisions) - fully compliant
• UK Corporate Governance Code (formerly known as the Combined Code of 2010) (Voluntary provisions) - compliant, as applicable to JKL
• Code of Best Practice on Corporate Governance (2017) issued by CA Sri Lanka (Voluntary provisions) - compliant with almost the full 2017 Code, to the extent of business exigency and as required by the JKL Group Key Internal Benchmarks
• Articles of Association of the Company
• Recruitment and selection policies
• Learning and development policies
• Policies on equal opportunities, career management and promotions
• Rewards and recognition policy
• Leave, flexi-hours and tele-working policies including health and safety enhancements and protocols
• Code of conduct which also includes policies on gifts, entertainment, facilitation payments, proprietary and confidential information
• Policy against sexual harassment
• Policies against forced, compulsory and child labour and child protection
• Disciplinary procedure
• Policies on diversity, equity and inclusion including gender
• Policy on grievance handling
• Policies on anti-fraud, anti-corruption, and anti-money laundering and countering the financing of terrorism
• Policy on communications and ethical advertising

37
• Ombudsperson policy
• Whistleblower policy
• Group accounting procedures and policies
• Policies on enterprise risk management
• Policies on fund management and foreign exchange risk mitigation
• IT policies and procedures, including data protection, classification and security
• Group environmental and economic policies
• Policies on energy, emissions, water and waste management
• Policies on products and services
Note: The above highlights some of the key policies within the John Keells Group which are adhered to by the JKL Group.
Detailed Account of Compliance with the Code of Best Practice on Corporate Governance
JKL Group’s corporate governance framework is developed based on the sections laid out in the Code of Best Practice on Corporate Governance issued jointly by Securities and Exchange Commission of Sri Lanka (SEC) and the Institute of Chartered Accountants of Sri Lanka (CA Sri Lanka). Below is a snapshot of the model adapted by the JKL Group, which will help in navigating through this section on Corporate Governance.
Code of Best Practice on Corporate Governance
The Company
B. Directors’ Remuneration
D. Accountability and Audit
F. Other Investors
H. Environment, Society and Governance (ESG)
A. The Board of Directors
C. Shareholder Relations
E. Institutional Investors
G. Internet of Things and Cybersecurity
The Shareholders
Internal Audit
Board of DirectorsNominations Committee
Human Resources and Compensation
Committee
Related Party Transactions Review
Committee
Project Risk Assessment Committee
Board of Directors
Board Audit Committee
Chief Executive
OfficerEmployees
John Keells PLC
Management Committee of the
Company
Group Management Committee -
Plantation Servies Sector
John Keells Holdings PLC (Parent Company)
A. Board of Directors1. An Efficient Board

38
JOHN KEELLS PLCAnnual Report 2021/22
Corporate Governance
The Board meets regularly to discuss all matters relevant to the operation and governance of the Company and the minutes of all Board meetings are documented by the Company Secretaries, Keells Consultants (Private) Limited.
Certain functions of the Board have been delegated to the Board Sub-Committees, with the Board retaining final decision rights. This allows more specialized knowledge to be brought into the overall decision-making process, by having the members of these Sub-Committees focus on their area of expertise.
As permitted by the listing rules of the Colombo Stock Exchange (CSE), the Nominations, Human Resources and Compensation and Related Party Transactions Review committees,
together with the Project Risk Assessment committee of the parent company, JKH, function on behalf of the Company.
The Company has its own Board Audit Committee composed solely of NED/ID.
The reports of the below sub committees are given within this Annual Report on the pages specified herein.
• Board Audit Committee (BAC) – (reference page 44)
• Nominations Committee (of Parent Company JKH) – (reference pages 41 to 42)
• Human Resources and Compensation Committee (of Parent Company JKH) – (reference page 42)
• Related Party Transactions Review Committee (of Parent Company JKH) – (reference page 44)
• Project Risk Assessment Committee (of Parent Company JKH) – (reference pages 44 to 45)
The Company’s governance model, indicating the Board, its sub-committees and the overall hierarchy are shown above in Page 37.
1.1. Attendance at Board Meetings The Board meets at least once every quarter or more frequently in the event circumstances require. Any absences are excused in advance and duly recorded in the minutes. The absent Board members are immediately briefed on the discussions and actions taken during the meeting.
The dates and attendance of Directors at the quarterly Board meetings held during the financial year is as follows;
Name of Director Board meeting attendance
23-April-21 22-Jul-21 21-Oct-21 24-Jan-22 Eligible no. of meetings
Attended
Mr. K N J Balendra (Chairman) NED/NID 4 4
Mr. J G A Cooray NED/NID 4 4
Mr. C N Wijewardene NED/ID 4 4
Ms. A K Gunawardhana NED/ID 4 4
Ms. B A I Rajakarier NED/ID 4 4
Ms K D Weerasinghe NED/NID 4 4
Mr A Z Hashim NED/NID 4 4
AbbreviationsNED/NID – Non-Executive, Non-Independent DirectorNED/ID – Non-Executive, Independent Director
A typical Board meeting agenda in financial year 2021/22 contained:
- Confirmation of minutes of previous meeting - Ratification of capital expenditure, disposal of fixed assets and donations
- Matters arising from the previous minutes - Ratification of the use of the Company seal and share certificates issued
- Status updates of major projects - Ratification of circular resolutions and new resolutions
- Review of performance in summary and in detail, including high level commentary on actuals and outlook
- Report on corporate social responsibility
- Summation of strategic issues discussed at pre-Board meetings - Review of risks, sustainability development, HR practices/updates, etc.
- Approval of quarterly and annual financial statements, and quarterly financial and operational compliance statements
-
-
Board sub-committee reports and other matters exclusive to the Board
Any other business of which due notice has been given
1.2. Roles and Responsibilities of the BoardIn carrying out its responsibilities, the Board promotes a culture of openness and productive dialogue with a view to creating value to all stakeholders. In executing its role, the Board of Directors is collectively responsible for the below key matters, as per the John Keells Group Corporate Governance Framework:
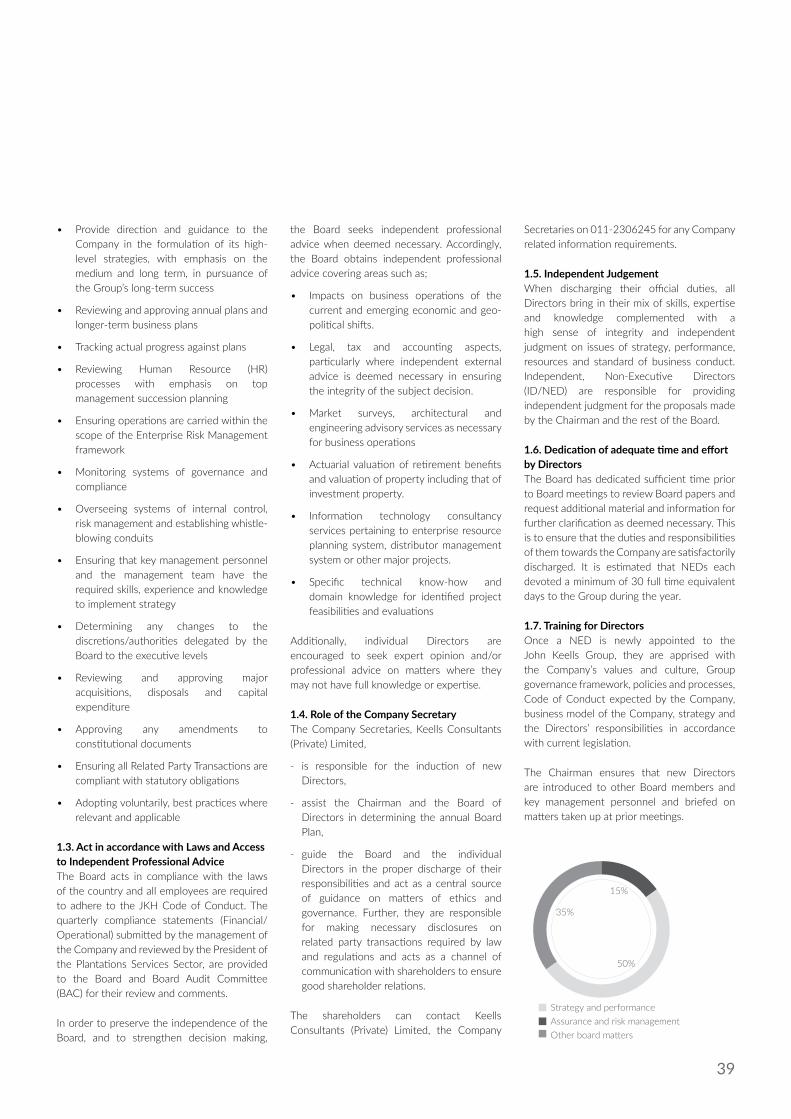
39
• Provide direction and guidance to the Company in the formulation of its high-level strategies, with emphasis on the medium and long term, in pursuance of the Group’s long-term success
• Reviewing and approving annual plans and longer-term business plans
• Tracking actual progress against plans
• Reviewing Human Resource (HR) processes with emphasis on top management succession planning
• Ensuring operations are carried within the scope of the Enterprise Risk Management framework
• Monitoring systems of governance and compliance
• Overseeing systems of internal control, risk management and establishing whistle-blowing conduits
• Ensuring that key management personnel and the management team have the required skills, experience and knowledge to implement strategy
• Determining any changes to the discretions/authorities delegated by the Board to the executive levels
• Reviewing and approving major acquisitions, disposals and capital expenditure
• Approving any amendments to constitutional documents
• Ensuring all Related Party Transactions are compliant with statutory obligations
• Adopting voluntarily, best practices where relevant and applicable
1.3. Act in accordance with Laws and Access to Independent Professional AdviceThe Board acts in compliance with the laws of the country and all employees are required to adhere to the JKH Code of Conduct. The quarterly compliance statements (Financial/Operational) submitted by the management of the Company and reviewed by the President of the Plantations Services Sector, are provided to the Board and Board Audit Committee (BAC) for their review and comments.
In order to preserve the independence of the Board, and to strengthen decision making,
the Board seeks independent professional advice when deemed necessary. Accordingly, the Board obtains independent professional advice covering areas such as;
• Impacts on business operations of the current and emerging economic and geo-political shifts.
• Legal, tax and accounting aspects, particularly where independent external advice is deemed necessary in ensuring the integrity of the subject decision.
• Market surveys, architectural and engineering advisory services as necessary for business operations
• Actuarial valuation of retirement benefits and valuation of property including that of investment property.
• Information technology consultancy services pertaining to enterprise resource planning system, distributor management system or other major projects.
• Specific technical know-how and domain knowledge for identified project feasibilities and evaluations
Additionally, individual Directors are encouraged to seek expert opinion and/or professional advice on matters where they may not have full knowledge or expertise.
1.4. Role of the Company SecretaryThe Company Secretaries, Keells Consultants (Private) Limited,
- is responsible for the induction of new Directors,
- assist the Chairman and the Board of Directors in determining the annual Board Plan,
- guide the Board and the individual Directors in the proper discharge of their responsibilities and act as a central source of guidance on matters of ethics and governance. Further, they are responsible for making necessary disclosures on related party transactions required by law and regulations and acts as a channel of communication with shareholders to ensure good shareholder relations.
The shareholders can contact Keells Consultants (Private) Limited, the Company
Secretaries on 011-2306245 for any Company related information requirements.
1.5. Independent JudgementWhen discharging their official duties, all Directors bring in their mix of skills, expertise and knowledge complemented with a high sense of integrity and independent judgment on issues of strategy, performance, resources and standard of business conduct. Independent, Non-Executive Directors (ID/NED) are responsible for providing independent judgment for the proposals made by the Chairman and the rest of the Board.
1.6. Dedication of adequate time and effort by DirectorsThe Board has dedicated sufficient time prior to Board meetings to review Board papers and request additional material and information for further clarification as deemed necessary. This is to ensure that the duties and responsibilities of them towards the Company are satisfactorily discharged. It is estimated that NEDs each devoted a minimum of 30 full time equivalent days to the Group during the year.
1.7. Training for DirectorsOnce a NED is newly appointed to the John Keells Group, they are apprised with the Company’s values and culture, Group governance framework, policies and processes, Code of Conduct expected by the Company, business model of the Company, strategy and the Directors’ responsibilities in accordance with current legislation.
The Chairman ensures that new Directors are introduced to other Board members and key management personnel and briefed on matters taken up at prior meetings.
Strategy and performanceAssurance and risk managementOther board matters
50%
15%
35%

40
JOHN KEELLS PLCAnnual Report 2021/22
Corporate Governance
Directors are encouraged to update their skills and knowledge on a continuous basis, and this is facilitated through the following activities.
• Access to External and Internal Auditors
• Periodic reports on performance
• Updates on topics that range from proposed / new regulations to industry best practices
• Opportunities to meet Senior Management of the Managing Agents in a structured setting
• Access to industry experts and other external professional advisory services
• Access to the Centre Legal, Tax and Finance Divisions of the John Keells Group of which the Company is a member
• The services of the Company Secretary
The Directors also have the opportunity of gaining further insight into the Company’s business by undertaking business visits. As laid out in Section 1.6. above, the Directors devote sufficient time and make every effort to ensure that in proportion with their knowledge and experience, they discharge their responsibilities to the Company.
2. Chairman & the Chief Executive Officer (CEO)The roles of Chairman and CEO have been segregated in the Company. The purpose and role of both these officers summarized below:
Role of Chairman Role of CEO
• To provide leadership to the Board whilst inculcating good governance and ensuring effectiveness of the Board
• Execute strategies and policies of the Board
• Ensure constructive working relations are maintained between the Executive and Non-Executive members of the Board
• Ensure the efficient management of all businesses
• Ensure with the assistance of the Board Secretary that:
• Board procedures are followed
• Information is disseminated in a timely manner to the Board
• Guide and supervise Executive Directors towards striking a balance between their Board and Executive responsibilities
• Ensure the operating model of the Group is aligned with short and long-term strategies of the Group
• Ensure succession at the very senior levels is planned
Prior to Appointment Once Appointed During Board Meetings
• Nominees are requested to make known their various interests
• Directors obtain Board clearance prior to:
• Accepting a new position
• Engaging in any transaction that could create or potentially create a conflict of interest
• All NEDs are required to notify the Chairman-CEO of any changes to their current Board representations or interests and a new declaration is made annually.
• Directors who have an interest in a matter under discussion:
• Excuse themselves from deliberations on the subject matter
• Abstain from voting on the subject matter (abstentation from decisions are duly minuted)
3. Role of Chairman The main responsibility of the Chairman is to lead and manage the Board and its Committees so that they can function effectively. He sets the tone at the top for the governance and ethical framework of the Group, facilitates and encourages the expression of differing views, and by keeping in touch with local and global industry developments, ensures that the Board is alert to its obligations to the Company’s shareholders and other stakeholders. He
represents the Company externally and is the focal point of contact for shareholders on all aspects of corporate governance.
4. Financial Acumen Mr. J G A Cooray, Ms. B A I Rajakarier and Ms. K D Weerasinghe who are members of the Board are also members of professional accounting bodies who are able to offer sound financial guidance through their specialized knowledge on the subject of finance.
5. Managing ConflictsThe JKL Group takes necessary steps to ensure that Directors avoid situations in which they have, or could have, a direct or indirect interest which conflicts with, or might possibly conflict with, the interests of the JKL Group.
In order to avoid such potential conflicts or biases, the Directors make a general disclosure of interests, as illustrated below, at appointment, at the beginning of every

41
financial year and during the year as required. Such potential conflicts are reviewed by the Board from time to time to ensure the integrity of the Board’s independence. Details of companies in which Board members hold Board or Board Committee membership are available with the Company Secretary for inspection by shareholders, on request.
By following the JKH Group’s Diversity, Equity and Inclusion (DE&I) policy, the Board acknowledges the need to have gender diversity among the Directors. As a percentage, the female participation in the Board stands at 42.8%.
7. Supply of InformationInformation to be tabled at the Board meetings are provided to the Directors well in advance (at least one week prior to the Board meeting) in order to facilitate more informed decision making. Board packs supplied to the Directors prior to the Board meeting includes, but not limited to; Board Resolutions and other information on functional areas such as tax, human resources, treasury and corporate social responsibility.
8. Appointments to the Board Directors’ appointment to the Board is under the purview of the Nominations Committee of the parent Company, JKH. All NED/IDs are appointed for an initial period of three years and are eligible for re-election by the shareholders, subject to the age limit as per statutory provisions at the time of re-appointment. NED/IDs can serve up to a maximum of three successive terms unless an extended Board tenure is necessitated by the requirements of the JKL Group. Details of new Directors are disclosed to shareholders at the time of their appointment through a public announcement made to the CSE. Details of such appointments are also carried in the respective Interim Release and the Annual Report. Directors are required to report any substantial change in their professional responsibilities and business associations to the Nominations Committee, which will examine the facts and circumstances and make recommendations to the Board accordingly. Casual vacancies are filled by the Board following a similar rigorous process of selecting nominees.
0 1 2 3 4 5 6 7 8
NED/ID NED/NID
2021/22
2020/21
Independence of NED/IDs were assessed based on the following criteria:
i. No shareholding in the Company
ii. Not being employed by the Company, its subsidiaries or Parent during the period of two years immediately preceding appointment as a Director
iii. Not holding a Directorship at another company in which a majority of the other Directors of the Company are employed, or are Directors, or have a significant shareholding, or have a material business relationship
iv. No close family member being a Director, CEO or a Key Management Personnel
v. Continuous service on the Board for a period not exceeding nine years from the date of the first appointment
vi. Is neither employed nor has a material business relationship and/or significant shareholding in other companies in which a majority of the other Directors of the Company are employed, or are Directors, or have a significant shareholding, or have a material business relationship
Based on above criteria, the independence of Directors Mr. C N Wijewardene, Ms. A K Gunawardhana and Ms. B A I Rajakarier, was established. All three NED’s of the Company have submitted signed declarations of their independence.
The Company is conscious of the need to maintain an appropriate mix of skills and experience in the Board through a regular review of its composition in ensuring that the skills representation is in sync with current and future needs.
Name of Director Shareholding (i) Employed (ii) Director / Management (iii)
Family member a Director or CEO
or KMP (iv)
Continuous Service for more than 9 years (v)
Material Business Relationship (vi)
Mr. C N Wijewardene No No No No No No
Ms. A K Gunawardhana No No No No No No
Ms. B A I Rajakarier No No No No No No
6. Board Balance The Board of Directors of the Company comprises solely of NED’s with four (4) NED/NIDs and three (3) NED/IDs. Further details on the Directors are given under Directors Profile section in pages 34 to 35.

42
JOHN KEELLS PLCAnnual Report 2021/22
Corporate Governance
Composition of the Nominations Committee of JKH and Committee Attendance
Name 24/May/2021 14/June/2021 29/July/2021
Mr. M A Omar (Chairman)
Mr. K N J Balendra
Dr. S S H Wijayasuriya
Ms. M P Perera
Composition of the Human Resources and Compensation Committee of JKH and Meeting Attendance
As permitted by the listing rules of the CSE, the Human Resources and Compensation Committee of JKH, acts as the Human Resources and Compensation Committee for the Company.
Name05/July/
202128/July/
2021
Mr. D A Cabraal (Chairman)
Dr. S S H Wijayasuriya*
Mr. M A Omar*
By Invitation
Mr. K N J Balendra
Mr. J G A Cooray
* Member
2. Level and Make Up of RemunerationNon-Executive Director RemunerationCompensation of NEDs is determined in reference to fees paid to other NEDs of comparable companies and is adjusted where necessary in keeping with the complexity of the JKL Group. The fees received by NEDs are determined by the Board and reviewed annually. NEDs do not receive any performance /incentive payments and are not eligible to participate in any of the John Keells Group’s ESOPs. NEDs fees are not subject to time spent or defined by a maximum/minimum number of hours committed to the JKL Group per annum, and hence are not subject to additional/lower fees for additional/lesser time devoted. Directors fees applicable to NEDs nominated by JKH are paid directly to JKH and not to individuals.
Total aggregate of NED remuneration for the financial year 2021/22 was Rs. 6 million (2020/21 - Rs. 7.46 million.)
Compensation for Early TerminationIn the event of an early termination of a Director, there are no compensation commitments other than for NED’s accrued fees payable, if any, as per the terms of their contract.
9. Re-electionAt each Annual General Meeting (AGM) one third of the Directors, except the Chairman, are subject to retirement by rotation in accordance with the Articles of Association of the Company and are eligible for re-election. The Directors who retire are those who have been longest in office since their appointment / re-appointment. In addition, any new Director who was appointed to the Board during the year is required to stand for re-election at the next Annual General Meeting in terms of the Articles of Association of the Company. Annually, the Board discusses the possibilities of any impairment of Directors independence due to extended Board tenures, and collectively evaluates the re-election of such Board members.
Proposals for the re-election of Directors are set out in the Annual Report of the Board of Directors on pages 59 to 63 and in the Notice of Meeting on page 135 of this Report.
10. Appraisal of Board Performance The performance appraisal of the Board is conducted annually by the Board itself. Each member of the Board will self-appraise on an anonymous basis, the performance of the Board, using a detailed checklist / questionnaire, under the areas of;
• Role clarity and effective discharge of responsibilities
• People mix and structures
• Systems and procedures
• Quality of participation
• Board image
The results of this exercise are analyzed and discussed among the Board members to understand the level of effectiveness of the Board, and areas which require further strengthening.
11. Disclosure of Information in respect of Directors As per the Code of Best Practice on Corporate Governance (2013), the below details have been disclosed in this annual report, with respect to the Directors;
• Name, qualifications, expertise, material business interests and brief profiles on pages 34 to 35.
• Membership of Sub-Committees and attendance at Board Meetings and Sub-Committee meetings on pages 36 to 50.
• Related party transactions in Note 35 to the Financial Statements.
12. Appraisal of CEO The appraisal of the CEO is carried out annually, at a parent level and is based on pre-agreed performance criteria.
B. Directors’ Remuneration1. Remuneration ProcedureJKH Group remuneration policies apply to Directors of the Company. This procedure is independently performed upon the recommendations of the Human Resources and Compensation Committee of JKH, and no Director is involved in determining his/her own remuneration.
43
C. Shareholder Relations1. Constructive use of AGM and General MeetingsThe AGM is a main mode of communication of the Company with its shareholders. Information is provided to the Shareholders prior to the AGM to give them an opportunity to exercise the prerogative to raise any issues relating to the businesses of the JKL Group. Shareholders are provided with the Annual Report in electronic form. Shareholders may at any time elect to receive an Annual Report from JKL in printed form, which is provided free of charge.
The Company makes use of the AGMs constructively to promote better shareholder relations and to enhance shareholder inclusiveness in the businesses concerned. To facilitate this, below procedures are followed;
• Notice of the AGM and related documents, are sent to shareholders along with the Annual Report within the specified period
• Summary of procedures governing voting at General Meetings are clearly communicated
• All the Directors are available to answer queries
• The Chairman ensures that the relevant Senior Managers are available at the AGM to answer specific queries
• Separate resolutions are proposed for each item
• Proxy votes are counted
2. Communications with ShareholdersThe primary modes of communication between the Company and the shareholders are through the announcements made to the CSE, Annual and Quarterly Reports and the AGM.
The Board of Directors, in conjunction with the Board Audit Committee (BAC), is responsible for ensuring the accuracy and timeliness of published information and for presenting an honest and balanced assessment of results in the quarterly and annual Financial Statements for the year ended 31st March 2022.
All other material and price sensitive information about the Company is promptly communicated to the CSE, where the shares of
the Company are listed, and such information is also released to the employees, press and shareholders.
3. Major and Material TransactionsShareholders are advised of any instance where the contemplated value of a transaction would be in excess of half of the assets of the Company (“Major transactions”). There were no major transactions as defined under Section 185 of the Companies Act No. 07 of 2007 (Companies Act), during the year under review.
D. Accountability and Audit1. Financial and Business ReportingThe Financial Statements included in this Annual Report are prepared and presented in accordance with the Sri Lanka Accounting Standards (SLFRS/LKAS).
The following specialized information requirements are also included in this Annual Report:
• The Annual Report of the Board of Directors on the Affairs of the Company - pages 59 to 63
• The Statement of Directors’ Responsibility - page 64
• The Directors’ Statement on Internal Controls - pages 55 to 57
• The Independent Auditors’ Report - pages 67 to 69
• The Management Discussion and Analysis - pages 14 to 32
• Related Party transactions - pages 126 to 127
2. Risk Management and Internal Control2.1. Internal Control The parent company, JKH, extends the services of its Group Business Process Review (BPR) division to the Company, to oversee systems designed to safeguard the Company’s assets, maintain proper accounting records and provide management information. The risk review program, covering the Internal Audit of the Company is outsourced and coordinated by the John Keells Group BPR division on behalf of the Company.
Reports arising out of such audits, are first considered and discussed at the Company level, and reviewed by the President.
An Executive Summary including appropriate management action prepared by the John Keells Group BPR division is forwarded to the relevant Board Audit Committee (BAC), through the Group Finance Director, on a quarterly basis. Further, the Board Audit Committee assesses the effectiveness of the risk review process and systems of internal control periodically.
The role of Internal Audit is given higher value within the Company as it adds value to the systems and processes in place to enhance value creation of the business. The audit findings form an integral input in modifying and improving internal processes.
2.2. Internal Compliance StatementsThe JKL Group requires each business unit to produce a self-completion checklist with regards to Operational and Financial compliances adhered to during the year under review. This program requires the Sector Head of the Plantation Services Sector of JKH and the CEO of the Company to confirm compliance with statutory and other regulatory procedures, and also to identify any significant deviations from the expected norms. The Sector Head of the Plantation Services Sector of JKH and the CEO of the Company are required to confirm operational compliance with statutory and other regulations and key control procedures, and also identify any significant deviations from the expected norms.
2.3 Risk ReviewThe JKL Group’s Risk Management initiatives focus on wider sustainability development, to identify, evaluate and manage significant risks and to stress-test various risk scenarios. These initiatives ensure that the operations are effectively managed with a view to creating, enhancing and preserving shareholder and stakeholder value.
The steps taken towards promoting the Integrated Risk Management process are:
• Integrating and aligning activities and processes related to planning, policies / procedures, culture, competency, financial

44
JOHN KEELLS PLCAnnual Report 2021/22
Corporate Governance
management, monitoring and reporting with risk management.
• Supporting executives / managers in moving the organization forward in a cohesive integrated and aligned manner to improve performance, while operating effectively, efficiently, ethically and legally within the established limits for risk taking.
The Enterprise Risk Management section to this Annual Report set out on pages 51 to 54 provides a detailed account on the risk management initiatives of the Company.
3. Board Audit Committee (BAC)The Board Audit Committee (BAC) solely comprises NED/IDs and conforms to the
requirements of the Listing Rules of the CSE. Details on the composition of the Board Audit Committee, and attendance at meetings is provided in the Audit Committee Report on pages 55 to 57. It is governed by a Charter, which inter alia, covers the reviewing of policies and procedures of internal control, business risk management, compliance with laws and JKL Group policies and independent audit function.
The Committee is responsible for the consideration and recommendation of the appointment of External Auditors, the maintenance of a professional relationship with them, reviewing the accounting principles, policies and practices adopted in the preparation of published financial information
and examining all documents representing the final Financial Statements.
The quarterly self-compliance exercises performed by the JKL Group have significantly aided the committee in its efforts in ensuring correct financial reporting and effective internal control and risk management.
CEOs of the Company and John Keells Stock Brokers (Private) Limited (JKSB), the Chief Financial Officer (CFO), the Head of Finance and other operational heads are invited to the meetings of the Board Audit Committee. The detailed Board Audit Committee report including areas reviewed during the financial year 2021/22 is given on pages 55 to 57 of the Annual Report.
Composition and Meeting Attendance of the Board Audit Committee of the Company
Name 18/May/2021 22/July/2021 14/Oct/2021 21/Oct/2021 24/Jan/2022
Ms. B A I Rajakarier (Chairperson)
Mr. A K Gunawardhana
Mr. C N Wijewardene
4. Related Party Transactions Review CommitteeAs permitted by the listing rules of the CSE, the Related Party Transactions Review Committee of JKH, the Parent Company, functions as the Related Party Transactions Review Committee of the Company.
The Board ensures that no related party transactions (RPT) which would provide ‘more favorable treatment’ to the related parties, occur within the business setup. The Related Party Transactions Review Committee aids in ensuring the same, by assessing if all RPT are executed in line with the provisions laid out in LKAS 24 – Related Party Disclosures.
Composition and Meeting Attendance of the Related Party Transactions Review Committee of JKH
Name 20/May/2021 26/07/2021 01/11/2021 25/01/2022
Ms. M P Perera (Chairperson)
Mr. D A Cabraal*
Mr. A N Fonseka *
By Invitation
Mr. K N J Balendra
Mr. J G A Cooray
*Member
The Related Party Transactions Review Committee report for the financial year 2021/22 is given on page 58.
5. Project Risk Assessment Committee The Project Risk Assessment Committee was established to further augment the John Keells Group’s Investment Evaluation Framework. The committee provides the Board of John Keells Holdings PLC (JKH) with enhanced illumination of risk perspectives with respect to large-scale new investments, and assess the potential impact of risks associated with such investments. Investments which are referred to the committee are those which exceed a Board-agreed threshold in terms of quantum of investment and/or potential impact to the John Keells Group. Accordingly, the committee provides early-stage recommendations to the Board with regard to the extent of risk and adequacy of mitigation strategies.
Whilst the sub-committee convened once during the year under review to discuss other investments of the John Keells Group, no meetings were convened in relation to investments made by John Keells PLC.

45
Given the impact of the pandemic on Group businesses and the challenging macroeconomic uncertainties and volatilities during the latter part of the year, the JKH Board held frequent discussions affording the opportunity for matters pertaining to Group investments and risk assessments to be deliberated by all Board members.
6. Code of Business Conduct & EthicsThe Company follows the JKH Code of Conduct. (figure x) The objectives of the Code of Conduct are further affirmed by a strong set of corporate values which are well institutionalized at all levels within the Company through structured communication. Adherence to the Code of Conduct is linked to reward and recognition schemes, to promote greater conformity among employees with the Company Code of Ethics and enhance ethical business practices.
6.1. OmbudspersonThe ombudsperson has been appointed by the Company’s parent company, JKH, for any employee (or group of employees) who feel that an alleged violation has not been addressed satisfactorily using the available/existing procedures and processes. The Ombudsperson’s duty ceases upon the confidential written communication of the findings of the Ombudsperson and recommendations to the Chairman or the Senior Independent Director of JKH, as the case may be.
The Chairman or the Senior Independent Director of JKH, as the case may be, will place before the Board.
• The decision and the recommendations of the Ombudsperson
• The action taken based on the recommendations
• The areas of disagreement and the reasons adduced in instances where the Chairman or the Senior Independent Director disagrees with any or all findings and/ or recommendations. In such cases, the Board shall consider the areas of disagreement and determine the way forward.
It is important to note that the Chairman or the Senior Independent Director takes steps necessary to ensure that the complainant is not victimized for having invoked this process. The organization’s open-door policies facilitate such constant dialogue, communication, transparency and ultimately employee confidence, which would help retain existing talent whilst attracting new.
6.2. Whistleblower policyThe employees can report to the Chairman through a communication link named “Chairman Direct”, on any concerns about unethical behavior and any violation of the John Keells Group values. Employees reporting such incidents are guaranteed
complete confidentiality and such complaints are investigated and addressed via a selected committee under the direction of the Chairman.
6.3. Securities trading policyThe JKL Group’s securities trading policy prohibits all employees and agents engaged by the Company who are in possession of unpublished price sensitive information from trading in the Company shares or other companies in which the Company has a business interest. The Group has a zero-tolerance policy against any employee who is found to be in violation of the same.
6.4. Employee ParticipationHuman Resource unit is designed in a manner that enables high accessibility by any employee to every level of management. Structured ‘skip level’ meetings are held where employees are given the opportunity to discuss matters of concern with superiors who are at a level higher than their own immediate supervisor in an open but confidential environment. Through the participation of 360 Degree surveys and Voice of Employee (VOE) surveys which are conducted annually, employees are able to voice their opinion about the Company and their respective superiors. The employees also have the opportunity to take part in the Great Place To Work (GPTW) survey conducted by JKH once every four years giving them the opportunity to voice their opinion on the overall work environment.
7. Corporate Governance DisclosuresThe Board, through the support and guidance provided by JKH Legal division, strives to ensure that the Company complies with the laws and regulations of the country.
The Board of Directors have also taken all reasonable steps in ensuring that all financial statements are prepared in accordance with the Sri Lanka Accounting Standards / Sri Lanka Financial Reporting Standards (LKAS / SLFRS) issued by the CA Sri Lanka and the requirements of the CSE and other relevant regulatory authorities. Statement of Directors’ Responsibility given on page 64 elaborates on how financial reporting compliance is ensured, as required by the statutes. Details on corporate governance disclosures are set out on pages 36 to 50. In any case, where the Company has not adopted any best
Exercise of professionalism
and integrity in all business and ‘public’
personal transactions
Conduct all businesses in an
ethical manner at all times in keeping with acceptable
business practice
Allegiance to the Company and the Group
Compliance with rules and regulations applying in the territories that the Group operates in
46
JOHN KEELLS PLCAnnual Report 2021/22
Corporate Governance
practice, the rationale for such non adoption is articulated.
E. & F. Institutional & Other Investors1. Shareholder votingShareholders are provided sufficient financial information and other relevant information on the website of the Company to enable them to take decisions regarding their investments. Annual Reports and Interim Financial Statements are circulated to all registered shareholders within prescribed timelines. All shareholders are encouraged to participate at the Annual General Meeting and vote on matters set before the shareholders which are detailed on page 38.
2. Other investorsIndividual investors directly investing in the Company are encouraged to seek advice in their investment/divestment decisions. The Company facilitates this to the best of their ability by making available their Annual and Interim Financial Statements on public platforms such as the CSE website and by
inviting individual shareholders to their General Meetings to exercise their voting rights.
G. Digital Oversight, Cybersecurity, Data Protection, Information Management and AdoptionThe IT Governance framework used by the Parent Company, provides guidance on best practices and industry leading models such as CObIT (Control Objectives for Information and Relate Technology), ISO 35800, ISO 27001, ISO 9000:2008, COSO (Committee of Sponsoring Organizations of the Treadway Commission)/BCP (Business Continuity Planning), ITIL (Information Technology Infrastructure Library) in providing a best of breed framework.
Below are the primary objectives upon which the IT Governance framework is built;
• Leverage IT as a Strategic Asset
• Ensuring agility, in a fast-moving environment
• Create better alignment between business and IT
• Create greater business value with our investments in IT
• Create a strong IT governance and regulatory framework through a coherent set of policies, processes and adoption of best practices in line with world-class organizations
The integration of operations with technological processes has led the Group to be vulnerable to cyber threats. In such a background, there is a significant increase in the organisation’s reliance on technology, and Cyber security continues to be a regular item on the agenda of Risk Management and Audit Committees and is periodically discussed at the Board level.
The Board accepts that the risk of a security breach needs to be continually managed, and the need to be well aware of where the vulnerabilities lie.
Upon the emergence of regulations such as European Union General Data Protection Regulation (GDPR) and the Sri Lankan Personal Data Protection Act, No. 9 of 2022, data security, integrity and information management has become pivotal. JKL Group continues to strengthen its focus on data governance to ensure ownership, accountability and execution of clearly articulated data governance policies, processes and data quality standards.
H. Environment, Society and Governance (ESG)The Company, through its risk management model, identifies its ESG risks and opportunities. Once recognized, these are then measured, managed and reported on. The Enterprise Risk Management Report on pages 51 to 54 further elaborates these measures.
The Company recognises that emphasis should not only be on maximising long term shareholder value, but it should also place emphasis on the rights and appropriate claims of many non-shareholder groups such as employees, consumers, clients, suppliers, lenders, environmentalists, host communities and governments. A detailed description of the Company’s CSR activities can be found on the Management Discussion and Analysis section of this Annual Report on pages 31 to 32.
Statements of Compliance1. Statement of compliance under Section 7.10 of the Rules of the Colombo Stock Exchange (CSE) on Corporate Governance (Mandatory provisions – Fully Complied)
Rule No. Subject Applicable requirement Reference within the Report
a./b./c. Compliance with Corporate Governance Rules
The Company is in compliance with the Corporate Governance Rules and any deviations are explained where applicable
Corporate Governance
a./b./c. Non-Executive Directors (NED)
2 or at least 1/3 of the total number (whichever is higher) of Directors should be NEDs
Corporate Governance
a. Independent Directors (ID) 2 or 1/3 of NEDs, whichever is higher, should be independent Corporate Governance
b. Independent Directors Each NED should submit a signed and dated declaration of his/her independence or non-independence
Available with the Secretaries for review
a./b. Disclosure relating to Directors
The Board shall annually determine the independence or otherwise of the NEDs
Corporate Governance
47
Rule No. Subject Applicable requirement Reference within the Report
c. Disclosure relating to Directors
A brief resume of each Director should be included in the Annual Report (AR) including the Directors’ areas of expertise.
Board of Directors section
d. Disclosure relating to Directors
Provide a brief resume of new Directors appointed to the Board along with details to CSE for dissemination to the public
Corporate Governance
a. - h. Determination of Independence
Requirements for meeting criteria to be an Independent Director Corporate Governance
7.10.5 Remuneration Committee (RC)
The Human Resources and Compensation Committee (equivalent of the RC with a wider scope) of the listed parent company may function as the RC
Corporate Governance
a. Composition of RC • Shall comprise NEDs, a majority of whom will be independent
• One NED shall be appointed as Chairman of the Committee by the Board of Directors
Corporate Governance
b. Functions of RC The RC shall recommend the remuneration of the CEO Corporate Governance
c. Disclosure in the Annual Report relating to RC
• Names of Directors comprising the RC
• Statement of Remuneration Policy
• Aggregated remuneration paid to ED’s and NED’s
Corporate Governance, Corporate Governance of Holding Company and Notes to the Financial Statements
a. Composition of Board Audit Committee (BAC)
• Shall comprise of NEDs a majority of whom should be Independent
• A NED shall be appointed as the Chairman of the Committee
• CEO and Financial Controller should attend BAC meetings, unless otherwise determined by the BAC
• The Chairman of BAC or one member should be a member of a recognised professional accounting body
Corporate Governance and the Board Committee Reports
b. BAC Functions • Overseeing the;
• preparation, presentation and adequacy of disclosures in the financial statements in accordance with Sri Lanka Accounting Standards (SLFRS/LKAS)
• compliance with financial reporting requirements, information requirements of the Companies Act and related regulations and requirements
• process to ensure the internal and risk management controls are adequate to meet the requirements of the SLFRS/LKAS
• assessment of the independence and performance of the entity’s External Auditors
and
• Make recommendations to the Board pertaining to appointment, re-appointment and removal of External Auditors, and approve the remuneration and terms of engagement of the External Auditor
Corporate Governance and the Board Committee Reports

48
JOHN KEELLS PLCAnnual Report 2021/22
Corporate Governance
Rule No. Subject Applicable requirement Reference within the Report
c. Disclosure in Annual Report (AR) relating to BAC
• Names of Directors comprising the BAC
• The BAC shall determine the independence of the Auditors and disclose the basis for such determination
• The AR shall contain a Report of the BAC
• setting out its functions and the manner of compliance with their functions
Corporate Governance and the Board Committee Reports
2. Statement of Compliance under Section 7.6 of the Rules of the Colombo Stock Exchange (CSE) on Corporate Governance (Mandatory provisions – Fully Complied)
Sub-section Compliance status Reference within the Report
(i) Names of persons who were Directors of the Entity during the financial year Complied Pages 34 to 35
(ii) Principal activities of the Entity and its subsidiaries during the year, and any changes therein
Complied Page 78
(iii) The names and the number of shares held by the 20 largest holders of voting and non-voting shares and the percentage of such shares held
Complied Page 130
(iv) The float adjusted market capitalisation, public holding percentage (%), number of public shareholders and under which option the Listed Entity complies with the Minimum Public Holding requirement
Complied Page 129
(v) A statement of each Director’s holding and Chief Executive Officer’s holding in shares of the Entity at the beginning and end of each financial year
Complied Page 62
(vi) Information pertaining to material foreseeable risk factors of the Entity Complied Pages 51 to 54
(vii) Details of material issues pertaining to employees and industrial relations of the Entity
During the year 2021/22, there were no material issues pertaining to employees and industrial relations of the Company
N/A
(viii) Extents, locations, valuations and the number of buildings of the Entity’s land holdings and investment properties
Complied Pages 110 to 113
(ix) Number of shares representing the Entity’s stated capital Complied Page 121
(x) A distribution schedule of the number of holders in each class of equity securities, and the percentage of their total holdings
Complied Page 129
(xi) Financial ratios and market price information Complied Page 131
(xii) Significant changes in the Company’s or its subsidiaries’ fixed assets, and the market value of land, if the value differs substantially from the book value as at the end of the year
Complied Pages 106 to 110
(xiii) Details of funds raised through a public issue, rights issue and a private placement during the year
N/A N/A
(xiv) Information in respect of Employee Share Ownership or Stock Option Schemes Complied Pages 122 to 123
49
Sub-section Compliance status Reference within the Report
(xv) Disclosures pertaining to corporate governance practices in terms of Rules 7.10.3, 7.10.5 c. and 7.10.6 c. of Section 7 of the Listing Rules
Complied Pages 46 to 50
(xvi) Related party transactions exceeding 10 percent of the equity or 5 percent of the total assets of the Entity as per audited financial statements, whichever is lower
Complied Page 126
1. Statement of Compliance under Section 9.3.2 of the Listing Rules of the CSE on Corporate Governance (Mandatory provisions – Fully Complied)
Sub-section Compliance Status Reference within the Report
(a) Details pertaining to Non-Recurrent Related Party Transactions (RPT)
Complied Notes to the Financial Statements (page 126)
(b) Details pertaining to RPT Complied Notes to the Financial Statements (pages 126 to 127)
(c) Report of the Related Party Transactions Review Committee
Complied Report of the Related Party Transaction Review Committee (page 58)
(d) Declaration by the Board of Directors as an affirmative statement of compliance with the rules pertaining to RPT, or a negative statement otherwise
Complied Annual Report of the Board of Directors (pages 59 to 63)
2. Statement of Compliance under Section 168 of the Companies Act No. 7 of 2007 (Mandatory provisions – Fully Complied)
Sub-section Compliance Status Reference within the Report
(1) (a) The nature of the business of the Group and the Company together with any change thereof during the accounting period
Complied Page 78
(1) (b) Signed financial statements of the Group and the Company for the accounting period completed Complied Pages 70 to 128
(1) (c) Auditors’ Report on financial statements of the Group and the Company Complied Pages 67 to 69
(1) (d) Accounting policies and any changes thereto Complied Page 80
(1) (e) Particulars of the entries made in the Interests Register during the accounting period Complied Page 62
(1) (f) Remuneration and other benefits paid to Directors of the Company during the accounting period
Complied Page 100
(1) (g) Corporate donations made by the Company during the accounting period Complied Page 100
(1) (h) Information on the Directorate of the Company and its subsidiaries during and at the end of the accounting period
Complied Page 62
(1) (i) Amounts paid/payable to the External Auditor as audit fees and fees for other services rendered during the accounting period
Complied Page 100
(1) (j) Auditors’ relationship or any interest with the Company and its subsidiaries Complied Pages 55 to 57
(1) (k) Acknowledgement of the contents of this Report and signatures on behalf of the Board Complied Pages 59 to 63

50
JOHN KEELLS PLCAnnual Report 2021/22
Corporate Governance
3. Code of Best Practice of Corporate Governance 2013 Issued Jointly by the Securities and Exchange Commission of Sri Lanka and the Institute of Chartered Accountants of Sri Lanka (Voluntary provisions – Fully Complied)
Sub-Section Compliance Summary
Directors - The Company is directed, controlled and lead by an effective Board that possess the skills, experience and knowledge and thus all Directors bring independent judgement on various subjects, particularly financial acumen.
- Roles of Chairman and CEO are separate. Their performances are appraised annually. Board Balance is maintained as the Code stipulates.
- Whilst there is a transparent procedure for Board Appointments, election and re-election, subject to shareholder approval, takes place at regular intervals.
Directors’ Remuneration - The Human Resource and Compensation Committee of JKH, consisting of exclusively NEDs is responsible for determining the remuneration of Chairman, CEO and NEDs.
- Compensation commitments in the event of early termination, determination of NED remuneration, remuneration policy and aggregate remuneration paid is disclosed under Page 62 and is in line with the Code.
Relationship with Shareholders - There is constructive use of the AGM, as per Code. Notice of Meeting, with adequate details, is circulated to shareholders as per statute.
- The Group has in place multiple channels to reach shareholders as discussed under Page 43.
Accountability and Audit - Interim and other price sensitive and statutorily mandated reports are disclosed to Regulators. As evident from the Annual Report of the Board of Directors, the company carried out all business in accordance with regulations and applicable laws, equitably and fairly.
- The Company continues to be a going concern and remedial action for any material events is in place. All related party transactions are reported under the Notes to the Financial Statements.
- There is an annual review of effectiveness of Internal Control which ensures the maintenance of a sound system of internal control.
- The Internal Audit function and the Board Audit Committee, functions as stipulated by the Code.
Institutional Investors - The Company conducts regular and structured dialogue with shareholders based on a mutual understanding of objectives. This is done via the Investor Relations team and through the AGM.
Other Investors - Individual shareholders investing directly in shares of the Company are encouraged to carry out adequate analysis and seek independent advice in all investing and/or divesting decisions. They are encouraged to participate at the AGM and exercise their voting rights and seek clarity, whenever required.
Sustainability Reporting - The JKH Group places emphasis on sustainable development and value creation. The JKH Group’s Sustainability Management Framework includes strategies for entrenchment of sustainability through awareness creation, monitoring and sustainability assurance.
4. Code of Best Practice on Corporate Governance (2017) issued by CA Sri LankaThe Company is compliant with almost the full 2017 Code of Best Practice on Corporate Governance issued by the CA Sri Lanka to the extent of business exigency and as required by the JKL Group.
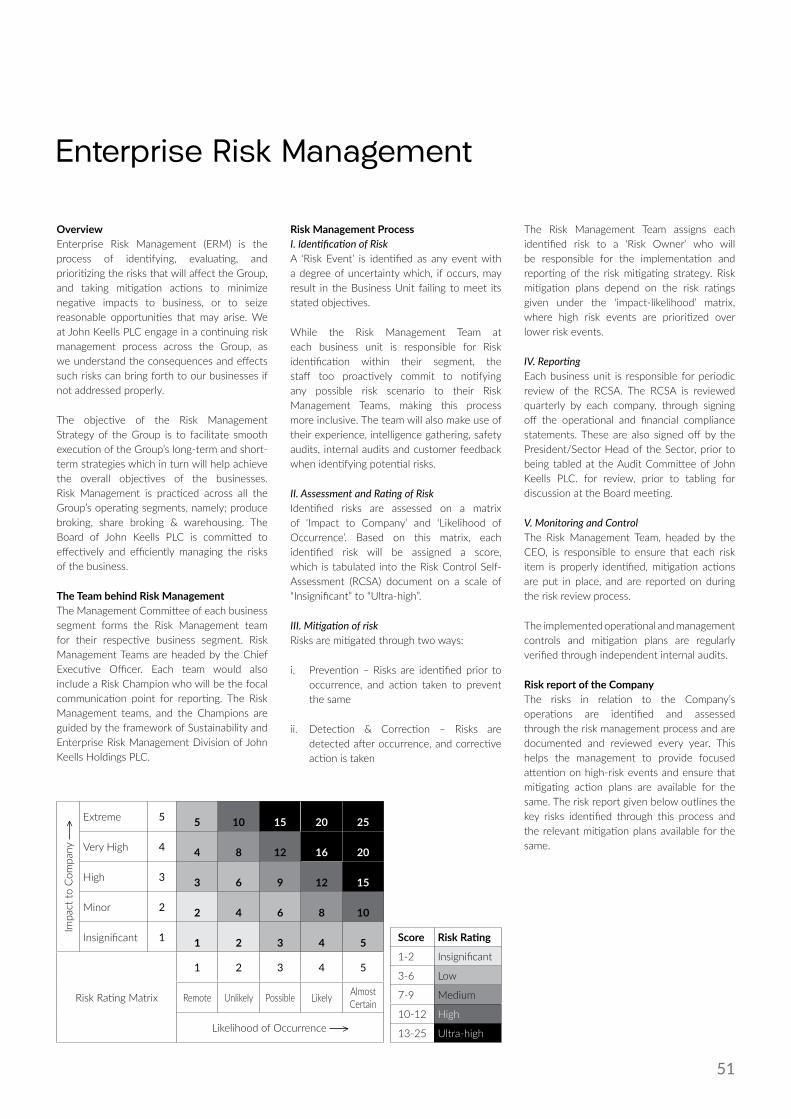
51
Enterprise Risk Management
OverviewEnterprise Risk Management (ERM) is the process of identifying, evaluating, and prioritizing the risks that will affect the Group, and taking mitigation actions to minimize negative impacts to business, or to seize reasonable opportunities that may arise. We at John Keells PLC engage in a continuing risk management process across the Group, as we understand the consequences and effects such risks can bring forth to our businesses if not addressed properly.
The objective of the Risk Management Strategy of the Group is to facilitate smooth execution of the Group’s long-term and short-term strategies which in turn will help achieve the overall objectives of the businesses. Risk Management is practiced across all the Group’s operating segments, namely; produce broking, share broking & warehousing. The Board of John Keells PLC is committed to effectively and efficiently managing the risks of the business.
The Team behind Risk ManagementThe Management Committee of each business segment forms the Risk Management team for their respective business segment. Risk Management Teams are headed by the Chief Executive Officer. Each team would also include a Risk Champion who will be the focal communication point for reporting. The Risk Management teams, and the Champions are guided by the framework of Sustainability and Enterprise Risk Management Division of John Keells Holdings PLC.
Risk Management ProcessI. Identification of RiskA ‘Risk Event’ is identified as any event with a degree of uncertainty which, if occurs, may result in the Business Unit failing to meet its stated objectives.
While the Risk Management Team at each business unit is responsible for Risk identification within their segment, the staff too proactively commit to notifying any possible risk scenario to their Risk Management Teams, making this process more inclusive. The team will also make use of their experience, intelligence gathering, safety audits, internal audits and customer feedback when identifying potential risks.
II. Assessment and Rating of RiskIdentified risks are assessed on a matrix of ‘Impact to Company’ and ‘Likelihood of Occurrence’. Based on this matrix, each identified risk will be assigned a score, which is tabulated into the Risk Control Self-Assessment (RCSA) document on a scale of “Insignificant” to “Ultra-high”.
III. Mitigation of riskRisks are mitigated through two ways:
i. Prevention – Risks are identified prior to occurrence, and action taken to prevent the same
ii. Detection & Correction – Risks are detected after occurrence, and corrective action is taken
The Risk Management Team assigns each identified risk to a ‘Risk Owner’ who will be responsible for the implementation and reporting of the risk mitigating strategy. Risk mitigation plans depend on the risk ratings given under the ‘impact-likelihood’ matrix, where high risk events are prioritized over lower risk events.
IV. ReportingEach business unit is responsible for periodic review of the RCSA. The RCSA is reviewed quarterly by each company, through signing off the operational and financial compliance statements. These are also signed off by the President/Sector Head of the Sector, prior to being tabled at the Audit Committee of John Keells PLC. for review, prior to tabling for discussion at the Board meeting.
V. Monitoring and ControlThe Risk Management Team, headed by the CEO, is responsible to ensure that each risk item is properly identified, mitigation actions are put in place, and are reported on during the risk review process.
The implemented operational and management controls and mitigation plans are regularly verified through independent internal audits.
Risk report of the CompanyThe risks in relation to the Company’s operations are identified and assessed through the risk management process and are documented and reviewed every year. This helps the management to provide focused attention on high-risk events and ensure that mitigating action plans are available for the same. The risk report given below outlines the key risks identified through this process and the relevant mitigation plans available for the same.
Impa
ct to
Com
pany
Extreme 5 5 10 15 20 25
Very High 4 4 8 12 16 20
High 3 3 6 9 12 15
Minor 2 2 4 6 8 10
Insignificant 1 1 2 3 4 5
Risk Rating Matrix
1 2 3 4 5
Remote Unlikely Possible Likely Almost Certain
Likelihood of Occurrence
Score Risk Rating
1-2 Insignificant
3-6 Low
7-9 Medium
10-12 High
13-25 Ultra-high

52
JOHN KEELLS PLCAnnual Report 2021/22
Enterprise Risk Management
Risk Description and Rating Mitigation Plan(s)
Information Technology (IT) related risks
Dependence on outsourced IT vendors for system support create vulnerability for the Company in case of system breakdowns. External vendor may not meet the expected service quality levels.
Risk Rating – Low
• John Keells PLC invested in a security infrastructure appropriate for its size and scale of operations & security procedures are constantly updated to take account of the latest knowledge and technical enhancements. Security regulations cover technical aspects as well as organizational measures including staff training, end user computer policies etc. The Company has a fully-fledged disaster recovery location in place and recovery plan is tested periodically and found to be satisfactory.
• Conducting IT internal audits, management supervision & legal contractual obligations from both parties are in place to mitigate risk.
Unauthorized access to critical assets
Compromising of delivery orders being issued prior to buyers making payments.
Risk Rating – Low
• John Keells PLC being a part of John Keells Holdings Group, follows the Group IT policies as set out by Group IT. We have a disaster recovery plan in place, in the case of a perpetration to our IT systems.
• We have implemented a new system for releasing electronic delivery orders.
• There are Internal audits and manual checks carried out periodically to ensure that the internal control system is up to date and relevant.
Health and safety of warehouse staff
Lack of attention to health and safety may result in injuries, fatalities, unnecessary costs to the Company and may also cause bad reputation for the Company.
Risk Rating – Low
• The staff members, especially at our warehouse are under good supervision of the Management and their health and safety needs are given prompt attention.
• OHSAS are in place, and third-party health and safety audits are carried out.
Other Brokers not adhering to byelaws
Not adhering to industry byelaws will result in loss of business.
Risk Rating – Low
• Canvassing to strengthen the Colombo Brokers Association (CBA) audit by extending it to cataloging and warehousing of tea.
• John Keells PLC checks other brokers’ stores and catalogues after the sale.
Fire at warehouseThis will cause loss of stocks, owned property and may lead to loss of brand reputation and customer base.
Risk Rating – Low
• We make sure that a Business Continuity Plan is in place and reviewed on a quarterly basis.
• John Keells Warehousing has installed fire smoke detectors and carries out annual compliance audits. Further, the Company has obtained OHSAS & HACCP certification to ensure up to date adherence to safety requirements.
• Covering all possible risks through an insurance policy.
Acts of terrorism
Will cause disruption to business operations.
Risk Rating – Low
• We maintain an agile working policy which allows staff to work from home.
• Teas are stored at multiple warehouses.
Skilled staff recruitment and retention
Lack of skilled staff and difficulty in retaining skilled staff may cause adverse impact on efficiency of operations and loss of competitive advantage.
Risk Rating – Low
• The Company attempts to mitigate this risk by encouraging continuous education, providing relevant training and development opportunities, and fostering a culture where all employees, regardless of rank, can actively contribute to the business.

53
Risk Description and Rating Mitigation Plan(s)
Natural Disasters
Disastrous events of nature will cause loss of productivity, damage to critical assets such as stocks, machinery & equipment and may even cause harm to HR.
Risk Rating – Low
• JK PLC has a Business Continuity Plan (BCP) in place, which is reviewed and updated quarterly.
• We ensure that our assets are adequately covered through insurance.
Fraud & Corruption
Any frauds and corruption within the business will result in loss of revenue and will hinder the business reputation which has been built over the years.
Risk Rating – Low
• We carefully monitor and review Forestpin analyses in collaboration with Group Business Process Review.
• There is constant management supervision and internal audits conducted to oversee and investigate any frauds/deviations to internal control systems. Strict disciplinary action is taken towards any frauds identified.
Increase in interest rates
This leads to increases in the Company’s overall borrowing cost.
Risk Rating – Medium
• We maintain constant communication with Group Treasury & CBA on minimum lending rates.
• We regularly review the Average Weighted Prime Lending Rate (AWPLR) and revise the interest rate charged to clients.
Loss of business due to factories closing down
All the key stakeholders in the industry work as a closely-knit system. Therefore, any closing down of factories directly affects the supply chain of the industry and causes loss of business and financial losses to the Company.
Risk Rating – Medium
• The Company closely monitors the green leaf intakes to the factories, and the catalogued quantities.
Inadequate power supply/lack of fuel
Not being able to charge the batteries on reach trucks, disruption to warehouse operations.
Disruption to operations directly affects the supply chain of the industry and causes loss of business and financial losses to the Company.
Risk Rating – Medium
• Maintain fuel stocks at adequate levels at all times.
• Increase storage capacity.
Labour wage increases/unrests
Day to day operations getting interrupted due to strikes etc.
Risk Rating – Medium
• Discussion with man power suppliers to maintain adequate supply of manpower.

54
JOHN KEELLS PLCAnnual Report 2021/22
Enterprise Risk Management
Risk Description and Rating Mitigation Plan(s)
Macro-economic environment of exporting countries
This includes currency fluctuation and drop in oil prices, which may result in increased operational cost & potential loss of revenue.
Risk Rating – Medium
• Monitoring of the macro-environment changes.
• We maintain extra space in the warehouses in the short run to accommodate any short-term fluctuations of quantities.
Pandemic impacting business operations
Due to the current pandemic, employees may not be able to attend work as usual. The sample distribution process may be hampered.
Risk Rating – Medium
• With the introduction of the new e-platform for conducting the tea auctions online, the Company has been able to introduce an agile working policy. This allows our staff to continue most of their usual work without travelling to office.
Exposure on lending
Providing advances over and above the stock values will reduce cash flows and profitability.
Exposure to probable losses due to delayed or non-settlement.
Risk Rating – Medium
• The Company deals mostly with recognized, credit-worthy clients who are private tea factory owners & plantation companies. Credit risks are minimized as we advance funds based on the inventory available in our warehouse, valued based on historical as well as potential market trends.
• Over advances are made available only for those clients who have a good track record and are monitored closely, but as a norm we minimize over advancing and adhere to the policy manual and processes in place.
• Advances are released following an automated approval grid procedure.
• Legal action would be taken on clients who fail to adhere to the commitment they made.
Responsibility of the Board of Directors on Risk ManagementThe responsibility of maintaining an effective system of internal control and risk management lies with the Board. The Audit Committee, on behalf of the Board, reviews the Risk Management process adopted and reported by the Group prior to discussion by the Board.
The Board confirms that a process for identifying, evaluating, and managing significant risks that compromise the achievement of the strategic objectives of John Keells PLC has been in place throughout the year in accordance with the guidelines set out by the Institute of Chartered Accountants of Sri Lanka and industry best practice. In compliance with the Sri Lanka Accounting Standards (SLFRS), potential Financial Risk is disclosed on pages 84 to 89 under notes to the Financial Statements.
55
Report of the Board Audit Committee
IntroductionThe Board Audit Committee (Committee) of the Company is a formally constituted Sub- Committee of the Board of Directors which assists in the areas of financial reporting, internal audit, internal controls, external audit, and corporate risk. This report focuses on the activities of the Committee for the year under review.
Role of the Board Audit CommitteeThe terms of reference of the Committee are defined in the Audit Committee Charter. The Audit Committee Charter is periodically reviewed and revised with the concurrence of the Board of Directors to ensure that new developments relating to the function of the Committee are adopted. The Charter of the Committee was last reviewed and approved by the Board in January 2022.
The Committee assists the Board in fulfilling its oversight and responsibilities with regard to;
> Ensuring the integrity of the financial statements of the Company in accordance with the Accounting Standards as defined by The Institute of Chartered Accountants of Sri Lanka, applicable local laws, and regulations and the requirements of the Listing Rules of the Colombo Stock Exchange (CSE) to provide accurate, appropriate and timely information to management, regulatory authorities, shareholders, and other stakeholders.
> Ensuring that high standards of Corporate Governance are in place by adopting and adhering to policies and procedures of the Company.
> Ensuring compliance with laws, regulations, policies of the Group and Company.
> Evaluating and reviewing the independence of the External Auditors and outsourced Internal Auditors and follow up on their findings and recommendations.
> Ensuring the efficiency, effectiveness and adequacy of the Company’s internal controls, risk management measures and processes to accept, avoid, transfer, or mitigate current and unforeseen risks.
> Assessing the Company’s ability to continue as a going concern in the foreseeable future.
Composition of the Board AuditCommittee and MeetingsThe Board Audit Committee (Committee) of John Keells PLC is appointed by and accountable to the Board of Directors and is formally constituted as a Sub Committee of the Board of Directors and in accordance with the requirements of the Listing Rules of the CSE. The members of the Board Audit Committee comprised three Independent Non-Executive Directors for the financial year 2021/2022 whose detailed profiles are given on pages 34 to 35 of this report. The Committee is chaired by Ms. Aruni Rajakarier, Fellow Member of the Institute of Chartered Accountants of Sri Lanka. The Chief Financial Officer of the Plantation Services Sector of the John Keells Group serves as the Secretary to the Committee.
The Committee convened five times during the financial year 2021/2022 and the attendance of its members at these meetings are illustrated at the end of this report.
The Committee comprises of the Non-Independent Non-Executive, Directors of John Keells PLC (JKPLC). The Chief Executive Officer of JKPLC, Head of Operations of JKPLC, Chief Executive Officer of John Keells Stock Brokers (Pvt) Ltd (JKSB), Finance Manager of JKSB, Chief Financial Officer of the Financial Services Sector and Head of Group Business Process Review (Group BPR) of John Keells Holdings PLC attend the meetings of the Committee by invitation. The External Auditors, Outsourced Internal Auditors and other officials attend the meetings on a need basis. The Chairman and members of the Committee were in regular contact with the management of the Company through numerous meetings and communications to oversee the risks and control aspects in the Company.
The activities and views of the Committee were communicated to the Board of Directors on a quarterly basis through verbal briefings and by tabling the minutes of the Committee’s meetings.
Financial ReportingThe Committee reviews the financial reporting system adopted in the preparation of its quarterly and annual Financial Statements to ensure reliability of the processes and consistency of the accounting policies and methods adopted and their compliance with the Sri Lanka Financial Reporting Standards. The methodology included obtaining statements of compliance from the Chief Financial Officer. The Committee recommended the Financial Statements to the Board for its deliberations and issuance.
The Committee, in its evaluation of the financial reporting system also recognized the adequacy of the content and quality of routine management information reports forwarded to its members. The Committee is satisfied that all relevant matters have been considered in the preparation of the financial statements through discussion regarding the operations of the Company both during the financial year and its future outlook with the management.
The Committee continues to monitor compliance in accordance with the financial reporting standards of The Institute of Chartered Accountants of Sri Lanka, Companies Act No. 7 of 2007, The Sri Lanka Accounting and Auditing Standards and the Continuing Listing Rules of the Colombo Stock Exchange.
Internal Audit and Control AssessmentThe Internal Audit plan and scope of work were formulated in consultation with the Group BPR Division and the Outsourced Internal Auditors (BDO Partners), which was then approved by the Committee.
The main focus of the Internal Audit was to provide independent assurance on the overall system of internal controls, risk management and governance, by evaluating the adequacy and efficacy of internal controls, and compliance with laws, regulations and established policies and procedures of the Company. The Committee reviewed the process to assess the effectiveness of the Internal Financial Controls that have been designed to provide reasonable assurance to the Directors that assets are safeguarded, and that the financial reporting system can be relied upon in preparation

56
JOHN KEELLS PLCAnnual Report 2021/22
Report of the Board Audit Committee
and presentation of Financial Statements. During the year a renewed approach was institutionalized to Internal Audits & process reviews. This approach focuses on identifying opportunities for continuous improvement, to determine the degree of alignment between processes, technologies, and people, in optimally facilitating each business strategy and associated predominant use cases, to handle consequent transactional events, for better outcomes. The internal audit reports were presented to the Committee by the Outsourced Internal Auditors, which were reviewed and discussed along with the management and the Group BPR Division. Findings and recommendations of internal investigations have been given due attention and followed up for implementation.
External AuditThe Committee along with the External Auditors and the management, reviewed and discussed the External Auditor’s letter of engagement, audit plan, scope of the audit prior to the commencement of the audit.
The External Auditors kept the Committee advised on an ongoing basis regarding matters of significance that were pending resolution.
Before the conclusion of the audit, the Committee met with the External Auditors to discuss all audit issues and agreed on their treatment. The Committee also met the External Auditors, without the management present, prior to the finalization of the financial statements to obtain their input on specific issues and to ascertain whether they had any areas of concern relating to their work.
No matters other than those already discussed with management were raised by the External Auditors.
The External Auditors’ Management Letter for the year 2021/22, together with management’s responses was discussed with management and the auditors.
The Committee is satisfied that the independence and objectivity of the External Auditors are safeguarded and has not been impaired by any event or service that gives rise to a conflict of interest. The assigned audit and non-audit work were reviewed by the
Committee and due consideration has been given to the level of audit and non-audit fees received by the External Auditors.
The performance of the External Auditors has been evaluated and discussed with the senior management of the Company.
Representations have been provided by Messrs. Ernst & Young to the Committee, confirming the compliance on its independence criteria as given in the Code of Ethics of the Institute of Chartered Accountants of Sri Lanka.
Based on the evaluation of the scope, delivery of audit resources and the quality of the assurance initiatives taken during the year, the Committee recommended to the Board that Messrs. Ernst & Young, be re-appointed as the External Auditors of John Keells PLC for the financial year ending 31st March 2023, subject to approval of the shareholders at the next Annual General Meeting.
Risk AssessmentThe Audit Committee has also reviewed the processes for the identification, evaluation, and management of all significant operational risks faced by the Company. The management and the Sustainability and Enterprise Risk Management Division of the John Keells Group review the notable risks and the measures taken to mitigate those identified risks. The key risks that could impact operations have been identified and appropriate actions have been taken to mitigate their impact.
Formal confirmations and assurances have been received quarterly from senior management regarding the efficacy and status of the internal control systems, risk management systems, and compliance with applicable laws and regulations.
Information Technology and Risk AssessmentThe IT services are made use of by the Company to enhance the efficiency and the effectiveness of the internal processes and to provide value added services to it’s customers. When utilizing IT services, conformity is drawn from the Head of IT Plantation Services Sector, Group IT and the Group Business Process Re-engineering (BPR) division as well as the outsourced Internal Auditors, Messrs BDO Partners.
In the context of enhanced health and safety measures, remote working arrangements and a higher level of digital transactions that became necessary during the year under review due to the COVID-19 pandemic, the Committee paid special attention to the risk mitigation measures introduced by management and obtained management assurances in this regard.
Ethics, Governance and WhistleblowingThe continuous emphasis by the Committee on sustaining the ethical values of the employees through the Whistleblowing policy ensured the achievement of highest standards of Corporate Governance and adherence to the Code of Ethics of the Company.
The Company has an established mechanism for employees to report to the Chairman of John Keells Holdings PLC through a communication link named “Chairman Direct” with regard to any unethical behavior, any violation of group values or other improprieties. All appropriate procedures are in place to conduct independent investigations into incidents reported through Whistleblowing or identified through other means. The Whistleblowing Policy guarantees strict confidentiality of the identity of the Whistleblower.
Professional AdviceIt is within the power of the Committee to seek external professional advice as and when it requires on any relevant subject area. During the year under review, the Committee has drawn comfort from the services rendered by Actuarial & Management Consultants (Pvt) Ltd, Mr P. B. Kalugalgedera Chartered Valuer and Mr K. T. D. Tissera Chartered Valuer alongside the services of Messrs. Ernst & Young and Messrs. BDO Partners.
Compliance of the Board Audit CommitteeThe scope and the functions of the Committee are in compliance with the requirements of the Code of Best Practice on Audit Committee. The Committee has conducted its affairs in accordance with the requirements of the code of best practice on Corporate Governance and the Corporate Governance Rules as per section 7.10 of the Listing Rules of the Colombo Stock Exchange.
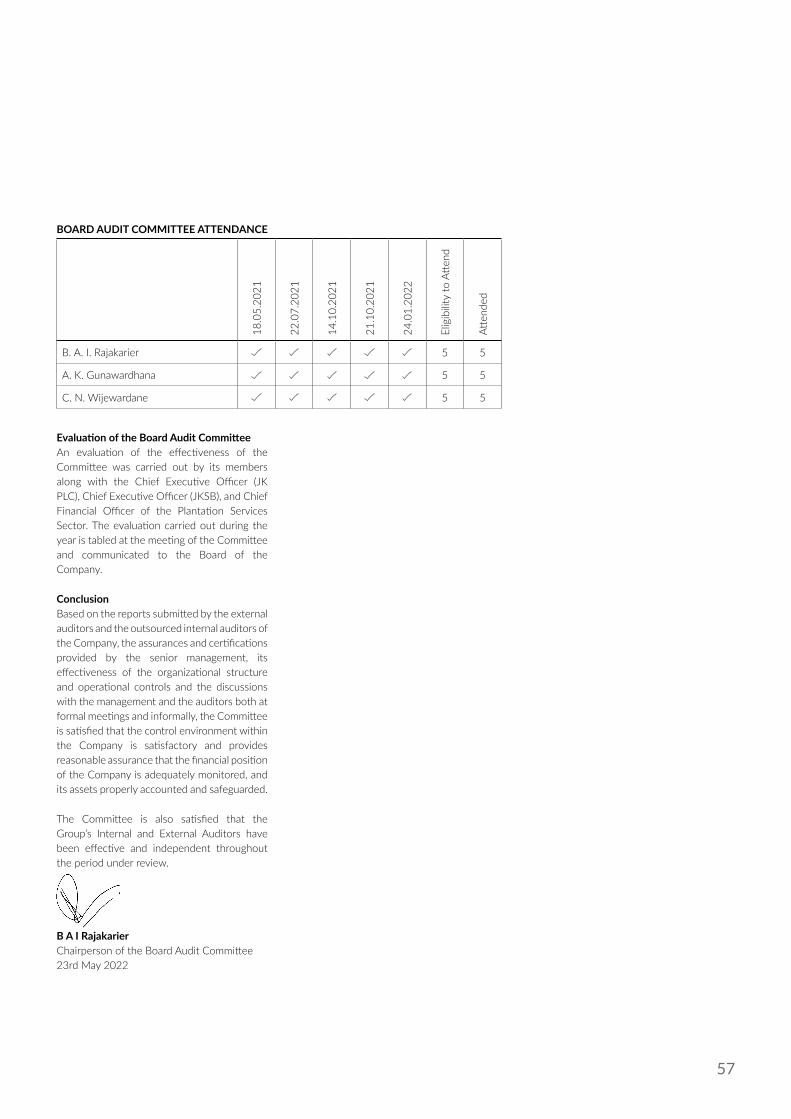
57
BOARD AUDIT COMMITTEE ATTENDANCE
18.0
5.20
21
22.0
7.20
21
14.1
0.20
21
21.1
0.20
21
24.0
1.20
22
Elig
ibili
ty to
Atte
nd
Atten
ded
B. A. I. Rajakarier 5 5
A. K. Gunawardhana 5 5
C. N. Wijewardane 5 5
Evaluation of the Board Audit CommitteeAn evaluation of the effectiveness of the Committee was carried out by its members along with the Chief Executive Officer (JK PLC), Chief Executive Officer (JKSB), and Chief Financial Officer of the Plantation Services Sector. The evaluation carried out during the year is tabled at the meeting of the Committee and communicated to the Board of the Company.
ConclusionBased on the reports submitted by the external auditors and the outsourced internal auditors of the Company, the assurances and certifications provided by the senior management, its effectiveness of the organizational structure and operational controls and the discussions with the management and the auditors both at formal meetings and informally, the Committee is satisfied that the control environment within the Company is satisfactory and provides reasonable assurance that the financial position of the Company is adequately monitored, and its assets properly accounted and safeguarded.
The Committee is also satisfied that the Group’s Internal and External Auditors have been effective and independent throughout the period under review.
B A I RajakarierChairperson of the Board Audit Committee23rd May 2022

58
JOHN KEELLS PLCAnnual Report 2021/22
Report of the Related Party transactions Review CommitteeThe following Directors served as members of the Committee during the financial year: P Perera N Fonseka A Cabraal
The Chairman-CEO, Deputy Chairman/Group Finance Director, and Group Financial Controller attended meetings by invitation. The Head of Group Business Process Review served as the Secretary to the Committee.
The objective of the Committee is to exercise oversight on behalf of the Board of John Keells Holdings PLC and its listed Subsidiaries, to ensure compliance with the Code on Related Party Transactions, as issued by the Securities and Exchange Commission of Sri Lanka (“The Code”) and with the Listing Rules of the Colombo Stock Exchange (CSE). The Committee has also adopted best practices as recommended by the Institute of Chartered Accountants of Sri Lanka.
The Committee in discharging its functions primarily relied on processes that were validated from time to time and periodic reporting by the relevant entities and Key Management Personnel (KMP) with a view to ensuring that:
• there is compliance with “the Code“and the Listing Rules of the CSE
• shareholder interests are protected; and
• fairness and transparency are maintained.
The Committee reviewed and pre-approved all proposed non-recurrent Related Party Transactions (RPTs) of the parent, John Keells Holdings PLC, and all its listed subsidiaries, namely: John Keells PLC, Tea Smallholder Factories PLC, Asian Hotels and Properties PLC, Trans Asia Hotels PLC, John Keells Hotels PLC, Ceylon Cold Stores PLC, Keells Food Products PLC, and Union Assurance PLC.
Recurrent RPTs as well as the disclosures & assurances provided by the senior management of the listed companies in the Group in relation to such transactions, in terms of formulated guidelines so as to validate compliance with sec 9.5(a) of the listing rules and thus exclusion from the mandate for review & pre-approval by the Committee, were reviewed annually by the Committee.
Other significant transactions of non-listed subsidiaries were presented to the Committee for information.
In addition to the Directors, all Presidents, Executive Vice Presidents, Chief Executive Officers, Chief Financial Officers and Financial Controllers of respective companies/sectors have been designated as KMPs in order to increase transparency and enhance good governance. Annual disclosures from all KMPs setting out any RPTs they were associated with, if any, were obtained and reviewed by the Committee.
The Committee held four meetings during the financial year. Information on the attendance at these meetings by the members of the Committee is given below.
The activities and views of the Committee have been communicated to the Board of Directors, quarterly, through verbal briefings, and by tabling the minutes of the Committee’s meetings.
P Perera Chairperson of the Related Party Transaction Review Committee 20th May 2022

59
Annual Report of the Board of Directors
The Directors have pleasure in presenting the 75th Annual Report together with the Audited Financial Statements of John Keells PLC (‘the Company or JKL’), and the Audited Consolidated Financial Statements of the JKL Group for the year ended 31st March, 2022.
GeneralThis report also considers the requirements of the Companies Act No. 07 of 2007 (Companies Act), the relevant listing rules of the Colombo Stock Exchange (CSE) and recommended best reporting practices, such as the rules on Corporate Governance (2013) jointly issued by the Securities and Exchange Commission of Sri Lanka (SEC) and the Institute of Chartered Accountants of Sri Lanka (CA Sri Lanka) and are also guided by recommended best accounting practices.
The Company was incorporated on 01st April 1960 as a Public Limited Liability Company and the issued shares of the Company are listed on the CSE. Pursuant to the requirements of the Companies Act, the Company obtained a new Company registration No. PQ11 on 15th June 2007.
Principal ActivitiesCompanyThe principal activities of the Company remain unchanged as produce broking services.
SubsidiariesJohn Keells Stock Brokers (Private) Limited continues to provide stock broking services.
John Keells Warehousing (Private) Limited continues to provide warehousing facilities.
Business ReviewA review of the Company and its subsidiaries (JKL Group’s) performance during the financial year is given in the Chairman’s Statement and in the Management Discussion and Analysis. These reports form an integral part of the Directors Report and provide a fair review of
the performance of the JKL Group during the financial year ended 31st March 2022.
Financial StatementsThe Financial Statements of the Company and the JKL Group are set out on pages 70 to 128 of the Annual Report.
Auditor’s ReportThe Auditor’s Report on the Financial Statements are given on pages 67 to 69 of the Annual Report.
Significant Accounting PoliciesThe Accounting Policies adopted in the preparation of the Financial Statements are given on pages 80 to 82 of the Annual Report.
Going ConcernThe Company and JKL Group have prepared the financial statements for the year ended 31st March 2022 on the basis that it will continue to operate as a going concern.
In determining the basis of preparing the financial statements for the year ended 31st March 2022, based on available information, the management has assessed the prevailing macroeconomic conditions and its effect on the Company and JKL Group and the appropriateness of the use of the going concern basis.
It is the view of the management that there are no material uncertainties that may cast significant doubt on the Company and Group’s ability to continue to operate as a going concern. The Group’s businesses recorded strong improvement in profitability compared to the previous year on the back of a fast recovery momentum with most of the businesses reaching pre COVID-19 levels of operations post the easing of restrictions. The management has formed judgment that the Company, its subsidiaries, associates have adequate resources to continue in operational existence for the foreseeable future driven
by the continuous operationalisation of risk mitigation initiatives and monitoring of business continuity and response plans at each business unit level along with the financial strength of the Group.
In determining the above significant management judgements, estimates and assumptions, the impact of the macroeconomic uncertainties, including supply chain disruptions, power interruptions and distribution challenges on account of the prevailing foreign exchange market limitations, and the COVID-19 pandemic have been considered as of the reporting date and specific considerations have been disclosed under the notes, as relevant.
Financial Statements are prepared based on the “Going Concern Concept”.
Stated CapitalThe total stated capital of the Company as at 31st March 2022 was Rs.152 million (2021- Rs. 152 million).
RevenueRevenue generated by the Company amounted to Rs. 355 million (2021 - Rs. 355 million), whilst JKL Group revenue amounted to Rs. 946 million (2021 - Rs. 828 million). Contribution to JKL Group revenue, from the different business segments is provided in Note 6.1 to the Financial Statements on page 83.
Results and AppropriationsThe profit/(loss) after tax of the Company was Rs 161 million (2021 - Rs.179 million) whilst the JKL Group profit /(loss) attributable to equity holders of the Parent Company for the year was Rs. 230 million (2021 - Rs.254 million).
Results of the Company and of the JKL Group are given in the Income Statement on page 70.

60
JOHN KEELLS PLCAnnual Report 2021/22
Annual Report of the Board of Directors
Detailed description of the results and appropriations are given below.
Group Company
Profits 2021 /2022Rs 000’s
2020 /2021Rs 000’s
2021 /2022Rs 000’s
2020 /2021Rs 000’s
After making provision for bad and doubtful debts and for all known liabilities and after providing for depreciation on fixed assets, the profit/(loss) earned was
377,456 358,532 205,358 221,327
From which has to be (deducted) the provision for taxation of (111,373) (74,149) (44,010) (42,456)
Leaving a net profit/(loss) on ordinary activities after taxation of 266,084 284,383 161,349 178,871
From which the amount attributable to minority Interest was (deducted)/added (36,507) (30,198) - -
To which Other Comprehensive Income was added/(deducted) 92,023 149,964 59,607 140,053
To which share Based payment Expenses is added 5,933 6,238 2,550 2,589
And after the balance brought forward from the previous year was added 4,136,705 3,787,118 3,701,517 3,440,804
The amount available for appropriation was 4,464,239 4,197,505 3,925,023 3,762,317
Appropriations
An interim dividend of Rs. 1.00 per share paid for 2020/21 on 29th March 2021 (First and Final Dividend of Rs. 2.00 per share paid for 2018/19)
(139,232) (60,800) (139,232) (60,800)
Leaving a balance to be carried forward to the next year of 4,325,006 4,136,705 3,785,791 3,701,517
4,325,006 4,136,705 3,785,791 3,701,517
DonationsDuring the year under review the Company has not made any donations. (2021 – Nil).
The John Keells Foundation, which operates with funds contributed by each of the companies in the John Keells Group, handles most of the JKL Group’s CSR initiatives and activities. The foundation manages a range of programs that underpin its key principle of acting responsibly in all areas of business to bring about sustainable development.
The Company’s contribution to John Keells Foundation was Rs. 0.53 million (2021 - Rs. 0.87 million) and the Group’s contribution was Rs. 1.74 million (2021 - Rs. 1.66 million) respectively.
Property, Plant and EquipmentThe book value of property, plant and equipment as at the Reporting date amounted to Rs. 10 million (2021 - Rs. 12 million) and Rs. 399 million (2021 - Rs. 353 million) for the Company and Group respectively.
Capital expenditure for the Company and JKL Group amounted to Rs. 1.7 million (2021 - Rs. 0.9 million) and Rs. 26 million (2021 - Rs. 7.2 million), respectively. Details
of property, plant and equipment and their movements are given in Note 18 to the Financial Statements on pages 106 to 110.
Market Value of PropertiesAll properties classified as investment property were valued in accordance with the requirements of SLAS40 (2005) Investment Property. The carrying value of Investment Property of the Company and JKL Group amounted to Rs. 424 million (2021-Rs. 394 million) and Rs. 424 million (2021 - Rs. 394 million) respectively. The investment, property was revalued by Mr.P.B. Kalugalagedara, Associated Chartered Valuer as at 31st December 2021.
Details of the valuation of Investment property is provided in Note 20 to the Financial Statements on pages 112 to 113.
The real estate portfolio of the JKL Group as at 31st March 2022 is disclosed on page 112.
InvestmentInvestments of the Company and the JKL Group and other external investments amounted to Rs. 3,171 million (2021 - Rs. 3,105 million) respectively.
Investment in Waterfront Properties (Pvt) LtdDuring the year, the Company’s shareholding in Waterfront Properties (Pvt) Ltd was diluted to 2.68 percent from 3.31 percent as a result of the direct equity infusion in Waterfront Properties (Pvt) Ltd by the Parent Company, John Keells Holdings PLC (JKH) as envisaged at the outset of the project.
Detailed description of the long term investments held as at 31st March 2022, are given in Note 24 to the Financial statements on pages 117 to 119.
ReservesTotal reserves as at 31st March 2022 of the Company and JKL Group amounted to Rs. 3,634 million (2021 - Rs. 3,549 million) and Rs. 4,173 million (2021 - Rs. 3,985 million), respectively.
The movement and composition of the Capital and Revenue reserves is disclosed in the Statement of Changes in Equity on pages 73 to 74.
Events Occurring After the Reporting DateThere have been no events subsequent to the Reporting date, which would have any material

61
effect on the Company or on the JKL Group other than those disclosed in Note 37 to the Financial Statements on page 128.
Contingent Liabilities and Capital CommitmentsThere have been no commitments or contingent liabilities other than those stated in Note 37 on page 128 of this Annual Report.
Human ResourcesThe number of persons employed by the Company and JKL Group as at 31st March 2022 was 50 (2021 - 48) and 76 (2021 - 70), respectively.
The JKL Group is committed to pursuing various Human Resources (HR) initiatives that ensure the individual development of all our teams as well as facilitating the creation of value for themselves, the Company and all other stakeholders.
There were no material issues pertaining to employees and industrial relations in the year under review.
Corporate GovernanceCorporate Governance practices and principles with respect to the Management and operations of the Company are set out on pages 36 to 50 of this Report. The Directors confirm that the Company is in compliance with the relevant rules on Corporate Governance contained in the listing rules of the CSE.
The Directors declare that:
a) The Company has not engaged in any activities, which contravene laws and regulations.
and
b) The Directors have declared all material interest in contracts involving the Company and refrained from voting on matters in which they were materially interested; and
c) The Company has made all endeavors to ensure the equitable treatment of shareholders; and
d) The business is a Going Concern with supporting assumptions or qualifications as necessary; and
e) The Directors have conducted a review of internal controls covering financial operational and compliance controls and risk management and have obtained a reasonable assurance of their effectiveness and successful adherence herewith.
Risk Management and Internal ControlThe Board confirms that there is an ongoing process for identifying, evaluating and managing any significant risks faced by the JKL Group. Risk assessment and evaluation for each business unit takes place as an integral part of the annual strategic planning cycle and the principle risks and mitigating actions in place are reviewed regularly by the Board and the Audit Committee. The Board, through the involvement of the risk review and control division takes steps to gain assurance on the effectiveness of control systems in place. The Audit Committee receives reports on the results of internal control reviews and the Head of the John Keells Group risk review and control division has direct access to the Chairman of the Audit Committee.
Audit CommitteeThe following Independent Non-Executive, Directors of the Board served on the Audit Committee of the Company.Ms. B.A.I. Rajakarier –ChairpersonMr. C.N.WijewardaneMs A.K.Gunawardhana
The report of the Audit Committee is given on pages 55 to 57 of the Annual Report.
Human Resources and Compensation CommitteeAs permitted by the listing rules of the CSE, the Human Resources and Compensation Committee of JKH ,the Parent Company functions as the Human resources and Compensation Committee of the Company. The Human Resources and Compensation Committee of JKH comprises of three independent Directors.Mr. D A Cabraal - ChairmanMr. M A OmarDr. S.S.H.Wijayasuriya
The remuneration policy of the Company and its subsidiaries is detailed in the Corporate Governance report on page 42 of the Annual Report.
Nomination CommitteeAs permitted by the listing rules of the CSE, the Nomination Committee of JKH, the Parent Company, functions as the Nomination Committee of the Company, The Committee comprises of three Independent Non-Executive Directors and one Non Independent Executive Director.Mr. M A Omar - ChairmanDr. S S H.WijayasuriyaMs. P PereraMr. K N J Balendra
Related Party Transactions Review CommitteeAs permitted by the listing rules of the CSE, the Related Party Transactions Review Committee of JKH, the Parent Company, functions as the Related Party Transactions Review Committee of the Company. The Committee comprises of three Independent Non-Executive Directors.Ms. M P Perera – ChairpersonMr. A N FonsekaMr. D A Cabraal
Project Risk Assessment CommitteeProject Risk Assessment Committee of JKH, the parent of the Company, functions as the Project Risk Assessment Committee of the Company and its subsidiaries. The Project Risk Assessment committee members of the parent company are as follows;Dr. S S H Wijayasuriya - ChairmanMs. M P PereraMr. K N J BalendraMr. J G A Cooray
Stock Market InformationAn ordinary share of the Company was quoted on the CSE at Rs. 68.50 as at 31st March 2022 (31st March 2021 - Rs. 70.00). Information relating to public holding, earnings, dividend, net assets, market value per share and share trading is given in Key Ratios and Information on page 131 and in the Shareholders Information section on pages 129 to 130.
The Company endeavors at all times to ensure equitable treatment to all shareholders.
Substantial ShareholdingsThe names of the twenty largest shareholders, the number of shares held, and the percentages held are given on page 130 of the Annual Report. The distribution schedule of the shareholders and public holdings are disclosed on page 129 of the Annual Report.

62
JOHN KEELLS PLCAnnual Report 2021/22
Annual Report of the Board of Directors
DirectorateAs at 31st March 2022 the Board of Directors of the Company consisted of seven Directors with wide commercial, academic knowledge and experience. The Directors profile is given on pages 34 and 35 of this Annual Report.
The Board of Directors of the Company and its subsidiaries as at 31st March 2022 are listed below.
Name of the Director John Keells PLC John Keells Stock Brokers (Private)
Limited
John Keells Warehousing
(Private) Limited
Mr. K N J Balendra Chairman - -
Mr. J. G. A. Cooray - -
Ms. K D Weerasinghe* -
Ms. B. A. I. Rajakarier - -
Mr. C. N. Wijewardane - -
Ms. A. K. Gunawardhana - -
Mr. D P Gamlath - -
Ms. R S Cader - -
Mr. S Rajendra - -
Mr. K C Subasinghe - -
Mr. A Z Hashim* -
RETIREMENT OF DIRECTORS BY ROTATION AND RE-ELECTIONIn accordance with the Article 83 of the Article of Association of the Company Ms. B A I Rajakarier and Ms. A K Gunawardhana who are retiring by rotation and being eligible, will offer themselves for re-election at the next Annual General Meeting.
Directors’ RemunerationDetails of the remuneration and other benefits received by the Directors are set out on page 100 of the Financial Statements.
Directors’ and CEO’s Shareholdings
Number of shares
Name of Director / CEO As at 31st March 2022 As at 31st March 2021
Mr. K N J Balendra-Chairman Nil Nil
Mr. J. G. A. Cooray Nil Nil
Mr. A Z Hashim Nil Nil
Ms. B. A. I. Rajakarier Nil Nil
Ms. K D Weerasinghe Nil Nil
Mr. C. N. Wijewardane Nil Nil
Ms. A. K. Gunawardhana Nil Nil
Mr. H. G. R. De Mel (CEO) Nil Nil
Related Party TransactionsThe Company’s transactions with related parties , given in Note 35 to the Financial Statements have complied with the listing Rule 9.3.2 of the Colombo Stock Exchange and the Code of Best Practices on Related Party Transactions under the Securities and Exchange Commission Directive issued under Section 13(c) of the Securities and Exchange Commission Act.
INTEREST REGISTERThe Company maintains an Interests Register as required by the Companies Act and entries have been made therein.
As both subsidiaries of the Company are private companies which have dispensed with the requirement to maintain an Interest Register, this Annual Report does not contain particulars of entries made in the Interest Registers of subsidiaries.
Particulars of Entries in the Interests Register
a) Interests In Contracts - The Directors have all made a general disclosure to the Board of Directors as permitted by Section 192 (2) of the Companies Act No. 7 of 2007 and no additional interests have been disclosed by any Director.
b) There have been no disclosures of share dealings during the financial year ended 31st March 2022.
c) Indemnities and Remuneration
SUPPLIER POLICYThe JKL Group applies an overall policy of agreeing and clearly communicating terms of payment as part of the commercial agreements negotiated with suppliers, and endeavors to pay for all items properly charged in accordance with these agreed terms. As at 31st March 2022 the trade and other payables of the Company and JKL Group amounted Rs. 663 million (2021 - Rs. 542 million) and Rs. 1,133 million (2021 - Rs. 7,084 million) respectively.
ENVIRONMENTAL PROTECTIONThe JKL Group complies with the relevant environmental laws, regulations and endeavors to comply with best practices applicable in the country of operation.
STATUTORY PAYMENTSThe Directors confirm that to the best of their knowledge, all taxes, duties and levies payable by the Company and its subsidiaries, all contributions, levies and taxes payable on behalf of, and in respect of the employees of the Company and its subsidiaries, and all other known statutory dues as were due and payable by the Company and its subsidiaries as
63
at the Reporting date have been paid or, where relevant provided for, except as specified in Note 36 to the Financial statements on page 128, covering Contingent liabilities.
AuditorsMessrs. Ernst & Young, Chartered Accountants, have intimated their willingness to continue as Auditors of the Company, and a resolution to re-appoint them as Auditor and authorising the Directors to fix their remuneration will be proposed at the Annual General Meeting.
The Audit Committee reviews the appointment of the Auditor, its effectiveness and its relationship with the Group, including the level of audit and non-audit fees paid to the Auditor.
Details of Audit fees are set out in Note 14 of the Financial Statement. The Auditors, do not have any relationship (other than that of an Auditor) with the Company or any of its subsidiaries.
Further details on the work of the Auditor and the Audit Committee are set out in the Audit Committee Report on page 55.
Annual ReportThe Board of Directors approved the Company and Consolidated Financial Statements on 23rd May 2022. The appropriate number of copies of this report will be submitted to the CSE and to the Sri Lanka Accounting and Auditing Standards Monitoring Board.
Annual General MeetingThe Annual General Meeting of the Company will be held on 23rd June 2022.
This Annual Report is signed for and on behalf of the Board of Directors.
Chairman
Director
Keells Consultants (Private) Limited.Secretaries23rd May 2022

64
JOHN KEELLS PLCAnnual Report 2021/22
Statement of Directors’ Responsibility
The responsibility of the Directors, in relation to the financial statements, is set out in the following statement. The responsibility of the auditors, in relation to the financial statements prepared in accordance with the provisions of the Companies Act No. 07 of 2007, is set out in the Independent Auditors Report.
The financial statements comprise of:
• income statement and statement of comprehensive income of the Company and its subsidiaries, which present a true and fair view of the financial performance of the Company and its subsidiaries for the financial year; and
• a statement of financial position, which presents a true and fair view of the state of affairs of the Company and its subsidiaries as at the end of the financial year.
• The Directors are required to confirm that the financial statements have been prepared:
• using appropriate accounting policies which have been selected and applied in a consistent manner, and material departures, if any, have been disclosed and explained; and
• in accordance with the Sri Lanka Accounting Standards (SLFRS/LKAS); and that reasonable and prudent judgments and estimates have been made so that the form and substance of transactions are properly reflected; and
• provide the information required by the Companies Act and the Listing Rules of the Colombo Stock Exchange and requirements of any other regulatory authority as applicable to the Company.
The Directors are also required to ensure that the Company has adequate resources to continue in operation to justify applying the going concern basis in preparing these financial statements.
Further, the Directors have a responsibility to ensure that the Company maintains sufficient accounting records to disclose, with reasonable accuracy, the financial position of the Company and of the Group.
The Directors are also responsible for taking reasonable steps to safeguard the assets of the Company and of the Group and in this regard to consider the establishment of appropriate internal control systems, with a view to preventing and detecting fraud and other irregularities.
The Directors are required to prepare the financial statements and to provide the auditors with every opportunity to take whatever steps and undertake whatever inspections that may be considered being appropriate to enable them to give their audit opinion.
The Directors are of the view that they have discharged their responsibilities as set out in this statement.
Compliance ReportThe Directors confirm that to the best of their knowledge, all taxes, duties and levies payable by the Company and its subsidiaries, all contributions, levies and taxes payable on behalf of and in respect the employees of the Company and its subsidiaries, and all other known statutory dues as were due and payable by the Company and its subsidiaries as at the reporting date have been paid, or where relevant provided for, except as specified in note 36 to the financial statements covering contingent liabilities.
By order of the Board
Keells Consultants (Pvt) Ltd.Secretaries23rd May 2022

65
G E A R E D F O R
F I N A N C I A L I N F O R M A T I O N
Financial Calendar | Independent Auditor’s ReportFinancial Calendar | Independent Auditor’s Report | Income Statement | Statement of Comprehensive Income | Statement of Financial Position | Statement of Changes in Equity | Cash Flow Statement |
Index to the Notes | Notes to the Financial Statements | Information to Shareholders and Investors | Key Ratios & Information | Five year Summary | Glossary of Financial Terms | Corporate Information Inner Back CoverIncome Statement | Statement of Comprehensive Income |
Statement of Financial Position | Statement of Changes in Equity | Cash Flow Statement | Index to the Notes | Notes to the Financial Statements | Information to Shareholders and Investors | Key Ratios & Information | Five year Summary | Glossary of Financial Terms | Corporate Information

66
JOHN KEELLS PLCAnnual Report 2021/22
Financial Calendar
INTERIM FINANCIAL STATEMENTS WILL BE PUBLISHED AS PER RULE 7.4 OF THE COLOMBO STOCK EXCHANGE
1st Quarter – 22nd July 20212nd Quarter – 21st October 20213rd Quarter – 24th January 20224th Quarter – 23rd May 2022
Annual Reports2021/2022 (Annual Report) – 23rd May 20222020/2021 (Annual Report) – 21st May 2021
Meetings 75th Annual General Meeting – 23rd June 202274th Annual General Meeting – 23rd June 2021

67
Independent Auditors’ Report
TO THE SHAREHOLDERS OF JOHN KEELLS PLC
Report on the audit of the Financial Statements
Opinion We have audited the financial statements of John Keells PLC (‘’the Company”), and the consolidated financial statements of the Company and its subsidiaries (‘’the Group”), which comprise the statement of financial position as at 31 March 2022, and the income statement and the statement of comprehensive income, statement of changes in equity and statement of cash flows for the year then ended, and notes to the financial statements, including a summary of significant accounting policies.
In our opinion, the accompanying financial statements of the Company and the Group give a true and fair view of the financial position of the Company and the Group
as at 31 March 2022, and of their financial performance and cash flows for the year then ended in accordance with Sri Lanka Accounting Standards.
Basis for OpinionWe conducted our audit in accordance with Sri Lanka Auditing Standards (SLAuSs). Our responsibilities under those standards are further described in the auditor’s responsibilities for the audit of the financial statements section of our report. We are independent of the Group in accordance with the Code of Ethics issued by CA Sri Lanka (Code of Ethics) and we have fulfilled our other ethical responsibilities in accordance with the Code of Ethics. We believe that the audit evidence we have obtained is sufficient and appropriate to provide a basis for our opinion.
Key Audit MattersKey audit matters are those matters that, in our professional judgment, were of most
significance in our audit of the financial statements of the current period. These matters were addressed in the context of our audit of the financial statements as a whole, and in forming our opinion thereon, and we do not provide a separate opinion on these matters. For each matter below, our description of how our audit addressed the matter is provided in that context.
We have fulfilled the responsibilities described in the Auditor’s responsibilities for the audit of the financial statements section of our report, including in relation to these matters. Accordingly, our audit included the performance of procedures designed to respond to our assessment of the risks of material misstatement of the financial statements. The results of our audit procedures, including the procedures performed to address the matters below, provide the basis for our audit opinion on the accompanying financial statements.
Key Audit Matter How our audit addressed the Key Audit Matter
Valuation of unquoted financial assets classified as Fair Value through Other Comprehensive Income (FVOCI)
As further detailed in Note 24, Non-current financial assets consist of an unquoted equity investment in Waterfront Properties (Pvt) Ltd. The fair value is determined based on the discounted cash flow approach, which is derived based on the projected cash flows of Waterfront Properties (Pvt) Ltd.
This was a key audit matter due to;
• Materiality of the reported unquoted investment balances which amounted to LKR 2,560 Mn and represents 42% of the total assets.
• The degree of assumptions, judgements and estimates associated with deriving the estimated future cashflows used for unquoted equity investment valuation considering current economic conditions.
Key areas of significant management judgements, estimates and assumptions used in the valuation of unquoted equity investments included the use of valuation techniques and unobservable inputs such as revenue and EBITDA margins, discount rate, etc. as further disclosed in notes 8.3 and 24.2 in the financial statements.
Our audit procedures focused on the valuation of the fair value of the investment performed by the management, and included the following;
• We assessed the appropriateness of the cash flow forecast and revenue growth rates based on the best available information up to the date of our audit report. Our evaluation involved the use of comparable market data considering the impacts of the current economic conditions prevailing in the country on those forecasts.
• We evaluated the appropriateness and completeness of the information included in the value in use calculation.
• We assessed the appropriateness of the valuation techniques and reasonableness of assumptions used by the management to ascertain the fair value of the unquoted equity investments.
Further, we evaluated the adequacy of the related disclosures in notes 8.3 and 24.2 to the financial statements.

68
JOHN KEELLS PLCAnnual Report 2021/22
Independent Auditors’ Report
Key Audit Matter How our audit addressed the Key Audit Matter
Provision for Impairment allowance for Loans and Advances given to Tea sellers
As at 31 March 2022, the Group loans and advances given to Tea sellers, as detailed in notes 26, 24.3 and 7.1.1.3.1 amounted to LKR 927 Mn with an impairment provision of LKR 468 Mn and represent 7.5% of total assets of the Group.
This was a key audit matter due to:
• Materiality of the reported loans and advances given to Tea sellers.
• The degree of assumptions, judgements and estimates associated with evaluating the recoverability and the increased risk over collection of loans and advances considering the current economic condition.
The key areas of significant judgments, estimates and assumptions included the following:
• The increased risk over collection of loans and recovery of advances.
• The value and the realisability of the collateral obtained against the loans and advances.
Our audit procedures included the following:
• Checked that the credit limit assessment has been appropriately completed and authorization of credit limit had been in accordance with the standard operating procedures for granting credit to Tea sellers.
• Obtained an understanding of the process for impairment assessment for loans and advances given to Tea sellers, including:
evaluating the reasonableness of the recoverable amounts of receivables by comparing the most recent trading prices of tea as at the reporting date.
assessed the value and the realisability of the collateral obtained against the loans and advances by evaluating the recent settlement trends and recovery actions.
We also assessed the adequacy of the disclosures in notes 7.1.1.3.1 and 26 in the financial statements regarding impairment for loans and advances given to Tea sellers.
Fair value assessment of Land and Buildings
Property, Plant and Equipment and Investment Property include land and buildings carried at fair value as detailed in note 8.2. The fair values of land and buildings were determined by an external valuer engaged by the Group.
This was a key audit matter due to:
• Materiality of the reported land and buildings balances which amounted to LKR 784 Mn and represent 13% of the total assets.
• the degree of assumptions, judgements and estimation uncertainties associated with fair valuation of land and buildings such as reliance on comparable market transactions, and current market conditions.
Key areas of significant judgments, estimates and assumptions used in the valuation of the land and buildings included the following:
• estimate of per perch value of the land
• estimate of the per square foot value of the buildings
Our audit procedures focused on the valuations performed by the external valuer engaged by the Group, and included the following:
• We assessed the competency, capability and objectivity of the external valuer engaged by the Group.
• We read the external valuer’s report and understood the key estimates made and the approach taken by the valuer in determining the valuation of each land and building.
• We assessed the reasonableness of the significant judgements made by the valuer and valuation techniques, per perch price and value per square foot used by the valuer in the valuation of each land and building.
We have also assessed the adequacy of the disclosures made in notes 8.2, 18.9 and 20 to the financial statements relating to the significant judgements, valuation techniques and estimates used by the external valuer.
Other information included in the Group’s 2021/2022 Annual ReportOther information consists of the information included in the Annual Report, other than the financial statements and our auditor’s report thereon. The Management is responsible for the other information.
Our opinion on the financial statements does not cover the other information and we do not express any form of assurance conclusion thereon.
In connection with our audit of the financial statements, our responsibility is to read the other information identified above when it becomes available and, in doing so, consider whether the other information is materially inconsistent with the financial statements or our knowledge obtained in the audit or otherwise appears to be materially misstated. If, based on the work we have performed, we conclude that there is a material misstatement of this other information, we are required to report that fact. We have nothing to report in this regard.
Responsibilities of management and those charged with governance Management is responsible for the preparation of financial statements that give a true and fair view in accordance with Sri Lanka Accounting Standards, and for such internal control as management determines is necessary to enable the preparation of financial statements that are free from material misstatement, whether due to fraud or error.

69
In preparing the financial statements, management is responsible for assessing the Group’s ability to continue as a going concern, disclosing, as applicable, matters related to going concern and using the going concern basis of accounting unless management either intends to liquidate the Group or to cease operations, or has no realistic alternative but to do so.
Those charged with governance are responsible for overseeing the Company’s and the Group’s financial reporting process.
Auditors’ responsibilities for the audit of the Financial StatementsOur objectives are to obtain reasonable assurance about whether the financial statements as a whole are free from material misstatement, whether due to fraud or error, and to issue an auditor’s report that includes our opinion. Reasonable assurance is a high level of assurance, but is not a guarantee that an audit conducted in accordance with SLAuSs will always detect a material misstatement when it exists. Misstatements can arise from fraud or error and are considered material if, individually or in the aggregate, they could reasonably be expected to influence the economic decisions of users taken on the basis of these financial statements
As part of an audit in accordance with SLAuSs, we exercise professional judgment and maintain professional skepticism throughout the audit. We also:
• Identify and assess the risks of material misstatement of the financial statements, whether due to fraud or error, design and perform audit procedures responsive to those risks, and obtain audit evidence that is sufficient and appropriate to provide a basis for our opinion. The risk of not detecting a material misstatement resulting from fraud is higher than for one resulting from error, as fraud may involve collusion, forgery, intentional omissions, misrepresentations, or the override of internal control.
• Obtain an understanding of internal control relevant to the audit in order to design audit procedures that are appropriate in the circumstances, but not for the purpose of expressing an opinion on the effectiveness of the internal controls of the Company and the Group.
• Evaluate the appropriateness of accounting policies used and the reasonableness of accounting estimates and related disclosures made by management.
• Conclude on the appropriateness of management’s use of the going concern basis of accounting and, based on the audit evidence obtained, whether a material uncertainty exists related to events or conditions that may cast significant doubt on the Group’s ability to continue as a going concern. If we conclude that a material uncertainty exists, we are required to draw attention in our auditor’s report to the related disclosures in the financial statements or, if such disclosures are inadequate, to modify our opinion. Our conclusions are based on the audit evidence obtained up to the date of our auditor’s report. However, future events or conditions may cause the Group to cease to continue as a going concern.
• Evaluate the overall presentation, structure and content of the financial statements, including the disclosures, and whether the financial statements represent the underlying transactions and events in a manner that achieves fair presentation.
• Obtain sufficient appropriate audit evidence regarding the financial information of the entities or business activities within the Group to express an opinion on the consolidated financial statements. We are responsible for the direction, supervision and performance of the group audit. We remain solely responsible for our audit opinion.
We communicate with those charged with governance regarding, among other matters, the planned scope and timing of the audit and significant audit findings, including any significant deficiencies in internal control that we identify during our audit.
We also provide those charged with governance with a statement that we have complied with ethical requirements in accordance with the Code of Ethics regarding independence, and to communicate with them all relationships and other matters that may reasonably be thought to bear on our independence, and where applicable, related safeguards.
From the matters communicated with those charged with governance, we determine those matters that were of most significance in the audit of the financial statements of the current period and are therefore the key audit matters. We describe these matters in our auditor’s report unless law or regulation precludes public disclosure about the matter or when, in extremely rare circumstances, we determine that a matter should not be communicated in our report because the adverse consequences of doing so would reasonably be expected to outweigh the public interest benefits of such communication.
Report on Other Legal and Regulatory RequirementsAs required by section 163 (2) of the Companies Act No. 07 of 2007, we have obtained all the information and explanations that were required for the audit and, as far as appears from our examination, proper accounting records have been kept by the Company.
CA Sri Lanka membership number of the engagement partner responsible for signing this independent auditors’ report is 2097.
23rd May 2022Colombo

70
JOHN KEELLS PLCAnnual Report 2021/22
Income Statement
Group Company
For the Year Ended 31st March Note 2022 2021 2022 2021
Rs 000's Rs 000's Rs 000's Rs 000's
Continuing operations
Services transferred over time 10 946,167 828,218 355,435 354,666
Revenue from contracts with customers 946,167 828,218 355,435 354,666
Cost of sales (354,208) (308,638) (149,761) (144,226)
Gross profit 591,959 519,580 205,674 210,440
Dividend income 11 - - 96,960 69,280
Other operating income 12.1 3,198 2,094 1,406 617
Selling and distribution expenses (49,556) 14,512 (47,500) 15,828
Administrative Expenses (240,425) (205,711) (85,216) (81,869)
Results from operating activities 305,176 330,475 171,324 214,296
Finance expenses 13.4 (32,074) (34,217) (32,052) (33,966)
Finance income 13.3 63,264 45,897 35,892 25,912
Net finance income/(expenses) 31,190 11,680 3,840 (8,054)
Changes in fair value of investment properties 30,195 15,085 30,195 15,085
Share of results of associate 10,896 1,292 - -
Profit before tax 14 377,457 358,532 205,359 221,327
Tax expense 17.1 (111,373) (74,149) (44,010) (42,456)
Profit for the Year 266,084 284,383 161,349 178,871
Attributable to:
Equity holders of the parent 229,577 254,185
Non-controlling interests 36,507 30,198
266,084 284,383
Rs. Rs. Rs. Rs.
Earnings per share
Basic 15 3.78 4.18 2.65 2.94
Dividend per share 16 2.29 1.00 2.29 1.00
Figures in brackets indicate deductions.The Accounting Policies and Notes as set out on pages 78 to 128 form an integral part of these Financial Statements.
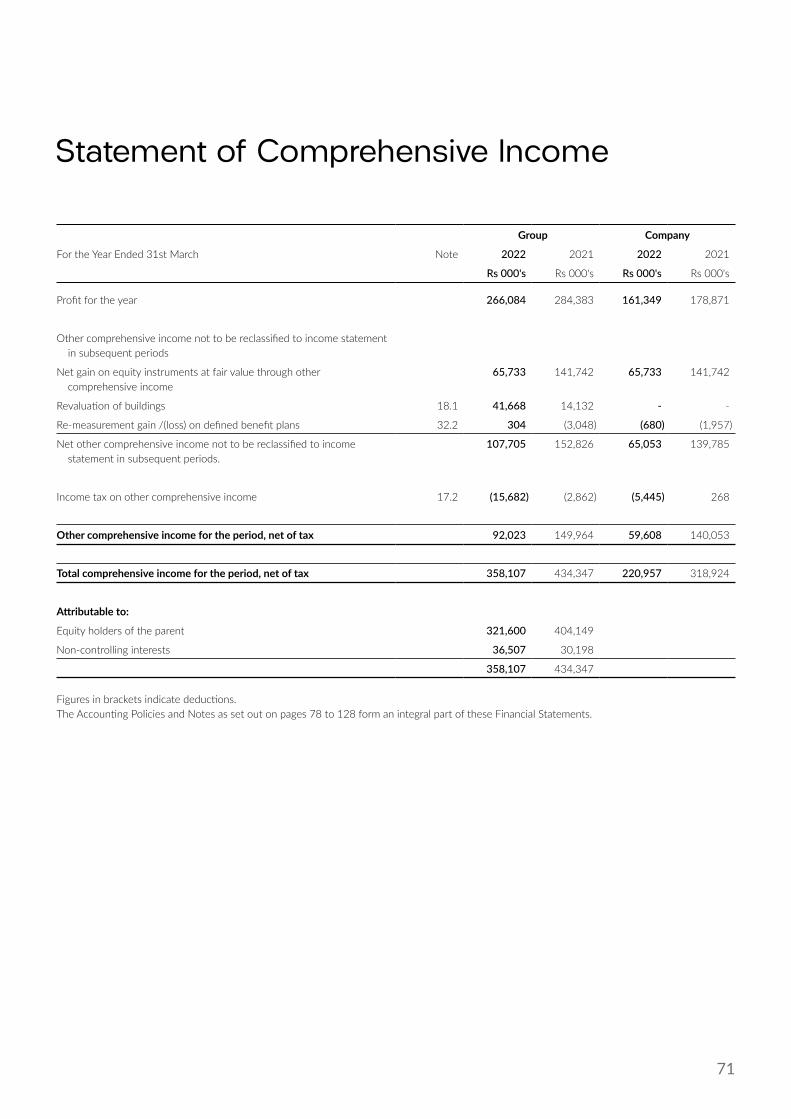
71
Statement of Comprehensive Income
Group Company
For the Year Ended 31st March Note 2022 2021 2022 2021
Rs 000's Rs 000's Rs 000's Rs 000's
Profit for the year 266,084 284,383 161,349 178,871
Other comprehensive income not to be reclassified to income statement in subsequent periods
Net gain on equity instruments at fair value through other comprehensive income
65,733 141,742 65,733 141,742
Revaluation of buildings 18.1 41,668 14,132 - -
Re-measurement gain /(loss) on defined benefit plans 32.2 304 (3,048) (680) (1,957)
Net other comprehensive income not to be reclassified to income statement in subsequent periods.
107,705 152,826 65,053 139,785
Income tax on other comprehensive income 17.2 (15,682) (2,862) (5,445) 268
Other comprehensive income for the period, net of tax 92,023 149,964 59,608 140,053
Total comprehensive income for the period, net of tax 358,107 434,347 220,957 318,924
Attributable to:
Equity holders of the parent 321,600 404,149
Non-controlling interests 36,507 30,198
358,107 434,347
Figures in brackets indicate deductions.The Accounting Policies and Notes as set out on pages 78 to 128 form an integral part of these Financial Statements.
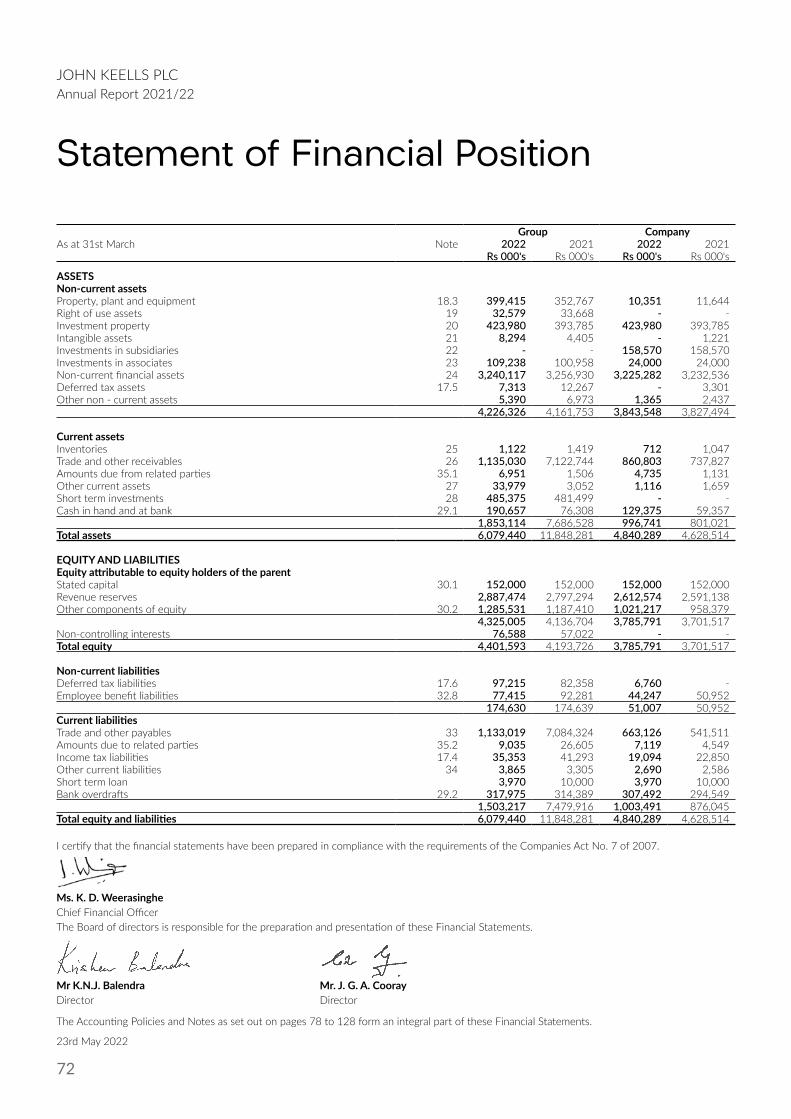
72
JOHN KEELLS PLCAnnual Report 2021/22
Statement of Financial Position
Group CompanyAs at 31st March Note 2022 2021 2022 2021 Rs 000's Rs 000's Rs 000's Rs 000's
ASSETSNon-current assetsProperty, plant and equipment 18.3 399,415 352,767 10,351 11,644 Right of use assets 19 32,579 33,668 - - Investment property 20 423,980 393,785 423,980 393,785 Intangible assets 21 8,294 4,405 - 1,221 Investments in subsidiaries 22 - - 158,570 158,570 Investments in associates 23 109,238 100,958 24,000 24,000 Non-current financial assets 24 3,240,117 3,256,930 3,225,282 3,232,536 Deferred tax assets 17.5 7,313 12,267 - 3,301 Other non - current assets 5,390 6,973 1,365 2,437
4,226,326 4,161,753 3,843,548 3,827,494
Current assets Inventories 25 1,122 1,419 712 1,047 Trade and other receivables 26 1,135,030 7,122,744 860,803 737,827 Amounts due from related parties 35.1 6,951 1,506 4,735 1,131 Other current assets 27 33,979 3,052 1,116 1,659 Short term investments 28 485,375 481,499 - - Cash in hand and at bank 29.1 190,657 76,308 129,375 59,357
1,853,114 7,686,528 996,741 801,021 Total assets 6,079,440 11,848,281 4,840,289 4,628,514
EQUITY AND LIABILITIESEquity attributable to equity holders of the parent Stated capital 30.1 152,000 152,000 152,000 152,000 Revenue reserves 2,887,474 2,797,294 2,612,574 2,591,138 Other components of equity 30.2 1,285,531 1,187,410 1,021,217 958,379
4,325,005 4,136,704 3,785,791 3,701,517 Non-controlling interests 76,588 57,022 - - Total equity 4,401,593 4,193,726 3,785,791 3,701,517
Non-current liabilitiesDeferred tax liabilities 17.6 97,215 82,358 6,760 - Employee benefit liabilities 32.8 77,415 92,281 44,247 50,952
174,630 174,639 51,007 50,952 Current liabilitiesTrade and other payables 33 1,133,019 7,084,324 663,126 541,511 Amounts due to related parties 35.2 9,035 26,605 7,119 4,549 Income tax liabilities 17.4 35,353 41,293 19,094 22,850 Other current liabilities 34 3,865 3,305 2,690 2,586 Short term loan 3,970 10,000 3,970 10,000 Bank overdrafts 29.2 317,975 314,389 307,492 294,549
1,503,217 7,479,916 1,003,491 876,045 Total equity and liabilities 6,079,440 11,848,281 4,840,289 4,628,514
I certify that the financial statements have been prepared in compliance with the requirements of the Companies Act No. 7 of 2007.
Ms. K. D. WeerasingheChief Financial OfficerThe Board of directors is responsible for the preparation and presentation of these Financial Statements.
Mr K.N.J. Balendra Mr. J. G. A. CoorayDirector Director
The Accounting Policies and Notes as set out on pages 78 to 128 form an integral part of these Financial Statements.
23rd May 2022

73
Statement of Changes in Equity
Group Attributable to equity holders of the parent
Other components of equity
Note Stated capital
Revaluationreserves
Fair valuereserve
of financialassets
at FVOCI
Othercapital
reserves
Revenue reserves
Total NonControlling
interest
TotalEquity
Rs 000’s Rs 000’s Rs 000’s Rs 000’s Rs 000’s Rs 000’s Rs 000’s Rs 000’s
As at 01st April 2020 152,000 161,722 734,069 133,102 2,606,225 3,787,118 37,690 3,824,808
Profit for the year - - - - 254,185 254,185 30,198 284,383
Other comprehensive income net of tax - 10,739 141,540 - (2,316) 149,964 - 149,964
Total comprehensive income net of tax - 10,739 141,540 - 251,869 404,149 30,198 434,347
Share based payment expenses 31 - - - 6,238 - 6,238 1,134 7,372
1st Interim dividend paid - 2020/21 16 - - - - (60,800) (60,800) - (60,800)
Subsidiary dividend to Non-controlling interest
- - - - - - (12,000) (12,000)
As at 31 March 2021 152,000 172,461 875,609 139,340 2,797,294 4,136,705 57,022 4,193,727
Profit for the year - - - - 229,577 229,577 36,507 266,084
Other comprehensive income net of tax - 41,972 50,216 - (165) 92,023 - 92,023
Total comprehensive income net of tax - 41,972 50,216 - 229,412 321,600 36,507 358,107
Share based payment expenses 31 - - - 5,933 - 5,933 1,060 6,993
Final dividend paid - 2020/21 16 - - - - (139,232) (139,232) - (139,232)
Subsidiary dividend to non-controlling interest
- - - - - - (18,000) (18,000)
As at 31 March 2022 152,000 214,433 925,825 145,273 2,887,474 4,325,005 76,588 4,401,593
Figures in brackets indicate deductions.The Accounting Policies and Notes as set out on pages 78 to 128 form an integral part of these Financial Statements.
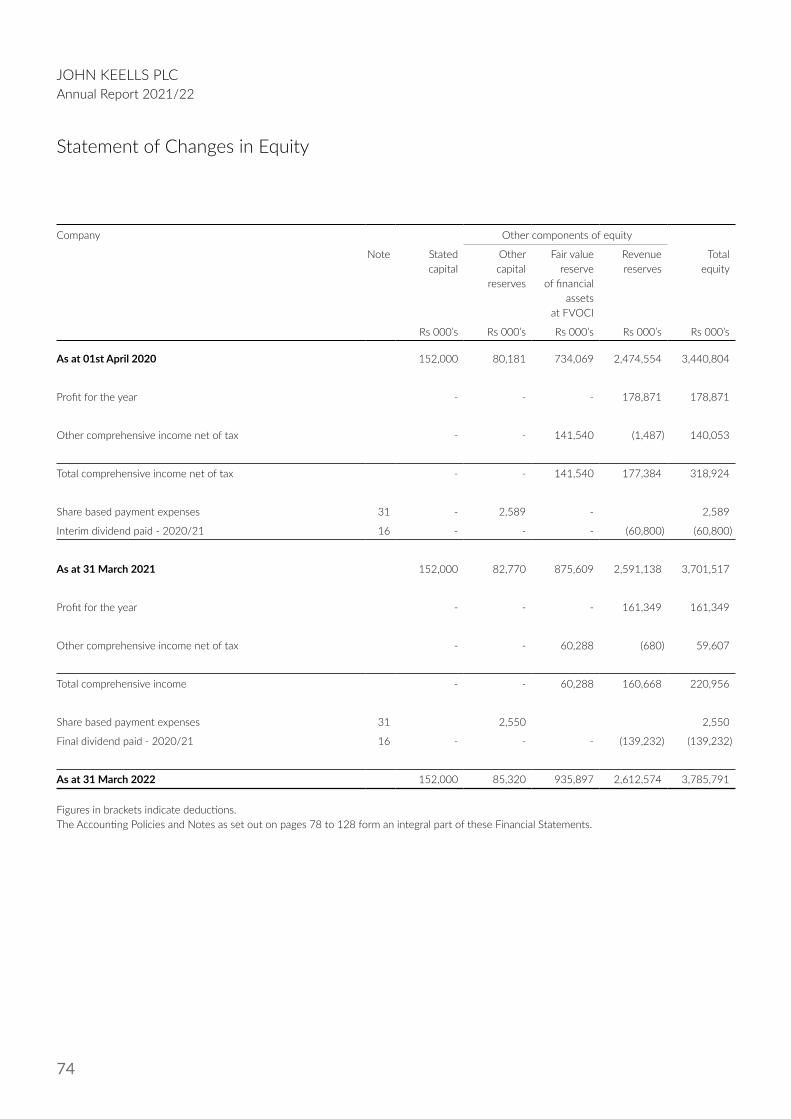
74
JOHN KEELLS PLCAnnual Report 2021/22
Statement of Changes in Equity
Company Other components of equity
Note Stated capital
Othercapital
reserves
Fair valuereserve
of financialassets
at FVOCI
Revenue reserves
Totalequity
Rs 000’s Rs 000’s Rs 000’s Rs 000’s Rs 000’s
As at 01st April 2020 152,000 80,181 734,069 2,474,554 3,440,804
Profit for the year - - - 178,871 178,871
Other comprehensive income net of tax - - 141,540 (1,487) 140,053
Total comprehensive income net of tax - - 141,540 177,384 318,924
Share based payment expenses 31 - 2,589 - 2,589
Interim dividend paid - 2020/21 16 - - - (60,800) (60,800)
As at 31 March 2021 152,000 82,770 875,609 2,591,138 3,701,517
Profit for the year - - - 161,349 161,349
Other comprehensive income net of tax - - 60,288 (680) 59,607
Total comprehensive income - - 60,288 160,668 220,956
Share based payment expenses 31 2,550 2,550
Final dividend paid - 2020/21 16 - - - (139,232) (139,232)
As at 31 March 2022 152,000 85,320 935,897 2,612,574 3,785,791
Figures in brackets indicate deductions.The Accounting Policies and Notes as set out on pages 78 to 128 form an integral part of these Financial Statements.

75
Statement of Cash Flow
Group Company
For the Year Ended 31st March Note 2022 2021 2022 2021
Rs 000's Rs 000's Rs 000's Rs 000's
CASH FLOW FROM OPERATING ACTIVITIES
Profit before tax 377,457 358,532 205,359 221,327
Adjustments to reconcile profit before tax to net cash flows:
Associate companies share of profit 23.2 (10,896) (1,292) - -
Interest income 13.3 (38,818) (27,885) (11,446) (7,900)
Dividend income- FVOCI financial assets 13.3 (24,446) (18,012) (24,446) (18,012)
Dividend income-subsidiaries - - (96,960) (69,280)
Finance expenses 11 32,074 34,217 32,052 33,966
Change in fair value of investment properties 20 (30,195) (15,085) (30,195) (15,085)
Depreciation of property, plant and equipment 14 21,262 20,634 2,995 2,956
Amortisation expense of right-of-use assets 19.1 1,089 1,089 - -
Amortisation of Intangible assets 21.2 2,519 2,058 1,221 1,421
Provision for Impairment allowance for loans and advances given to tea sellers.
44,447 (17,938) 44,447 (17,938)
Amotisation of prepaid staff cost 196 1,803 2,007 -
(Profit) / loss on sale of property, plant and equipment - (165) - -
Share based payment expenses 31 6,993 7,372 2,550 2,589
Gratuity provision and related costs 32.3 10,162 12,038 5,833 6,348
Other long term employee benefits 3,335 3,464 2,762 3,464
Operating profit before working capital changes 395,180 360,830 136,181 143,856
Working capital adjustments :
Decrease / (increase) in Inventories 297 102 335 126
Decrease / (increase) in trade and other receivables 5,943,267 (6,466,248) (167,423) (128,807)
Decrease / (increase) in other non-current assets 84,357 (129,774) 73,047 (129,418)
Decrease / (increase) in amounts due from related parties (5,445) 4,440 (3,604) 3,315
Decrease / (increase) in other current assets (30,927) 589 542 (253)
Increase / (decrease) in trade and other payables (5,951,305) 6,930,409 121,615 488,285
Increase / (decrease) in amounts due to related parties (17,571) 22,413 2,570 (2,021)
Increase / (decrease) in other current liabilities 560 2,501 104 1,919
Cash generated from operations 418,414 725,262 163,367 377,002
Interest received 13.3 38,818 27,885 11,446 7,900
Finance expenses paid 13.4 (32,074) (34,217) (32,052) (33,966)
Dividend income - subsidiaries 11 - - 96,960 69,280
Income tax paid and setoff 17.4 (111,931) (55,948) (44,511) (27,521)
Gratuity paid/transfers (net) 32.2 (27,119) (2,353) (15,614) (1,642)
Net cash flow from operating activities 286,108 660,629 179,594 391,053
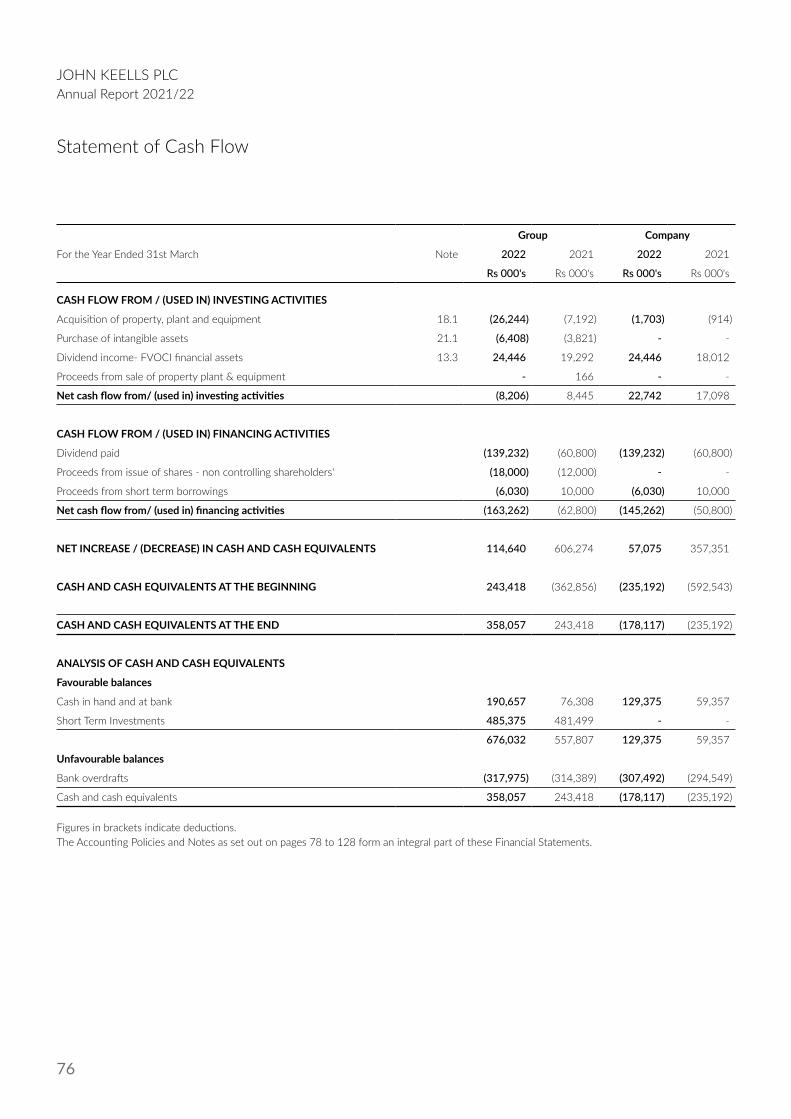
76
JOHN KEELLS PLCAnnual Report 2021/22
Statement of Cash Flow
Group Company
For the Year Ended 31st March Note 2022 2021 2022 2021
Rs 000's Rs 000's Rs 000's Rs 000's
CASH FLOW FROM / (USED IN) INVESTING ACTIVITIES
Acquisition of property, plant and equipment 18.1 (26,244) (7,192) (1,703) (914)
Purchase of intangible assets 21.1 (6,408) (3,821) - -
Dividend income- FVOCI financial assets 13.3 24,446 19,292 24,446 18,012
Proceeds from sale of property plant & equipment - 166 - -
Net cash flow from/ (used in) investing activities (8,206) 8,445 22,742 17,098
CASH FLOW FROM / (USED IN) FINANCING ACTIVITIES
Dividend paid (139,232) (60,800) (139,232) (60,800)
Proceeds from issue of shares - non controlling shareholders' (18,000) (12,000) - -
Proceeds from short term borrowings (6,030) 10,000 (6,030) 10,000
Net cash flow from/ (used in) financing activities (163,262) (62,800) (145,262) (50,800)
NET INCREASE / (DECREASE) IN CASH AND CASH EQUIVALENTS 114,640 606,274 57,075 357,351
CASH AND CASH EQUIVALENTS AT THE BEGINNING 243,418 (362,856) (235,192) (592,543)
CASH AND CASH EQUIVALENTS AT THE END 358,057 243,418 (178,117) (235,192)
ANALYSIS OF CASH AND CASH EQUIVALENTS
Favourable balances
Cash in hand and at bank 190,657 76,308 129,375 59,357
Short Term Investments 485,375 481,499 - -
676,032 557,807 129,375 59,357
Unfavourable balances
Bank overdrafts (317,975) (314,389) (307,492) (294,549)
Cash and cash equivalents 358,057 243,418 (178,117) (235,192)
Figures in brackets indicate deductions.The Accounting Policies and Notes as set out on pages 78 to 128 form an integral part of these Financial Statements.

77
Index to the Notes
Note No. Section Page noCorporate and Group information
1 Corporate information 78
Basis of preparation and other significant accounting policies2 Basis of preparation 78-793 Basis of consolidations 79-804 Significant accounting judgements, estimates and assumptions 805 Summary of significant accounting policies 80-82
Group business, operations & management6 Operating Segment information 82-837 Financial risk management objectives and policies 84-898 Fair value measurement and related fair value disclosures 90-939 Financial instruments and related policies 93-97
Notes to the income statement, statement of comprehensive income and statement of financial position10 Revenue 9811 Dividend income 9812 Other operating income 98-9913 Net Finance income 9914 Profit before tax 10015 Earnings per share 10116 Dividend per share 10117 Taxes 101-10618 Property, plant and equipment 106-11019 Leases 110-11120 Investment property 112-11321 Intangible assets 113-11422 Investment in subsidiaries 114-11523 Investment in associate 115-11624 Non current financial assets 117-11925 Inventories 11926 Trade and other receivables 12027 Other current assets 12028 Short term investments 12029 Cash in hand and at bank 120-12130 Stated capital and other components of equity 12131 Share-based payment plans 122-12332 Employee benefit liabilities and other long term employee benefits 123-125
33 Trade and other payables 12634 Other current liabilities 12635 Related party transactions 126-128
Commitments and Contingencies 36 Commitments and Contingent liabilities 12837 Events after the reporting period 128

78
JOHN KEELLS PLCAnnual Report 2021/22
Notes to the Financial Statements
CORPORATE AND GROUP INFORMATION1 CORPORATE INFORMATION Reporting Entity John Keells PLC is a public limited liability company incorporated and domiciled in Sri Lanka and listed on the Colombo Stock Exchange. The
registered office of the company is located at 117, Sir Chittampalam A Gardiner Mawatha, Colombo 02 and the principal place of business of the company is located at 186, Vauxhall Street, Colombo 02.
Ordinary shares of the company are listed on the Colombo Stock Exchange.
Consolidated financial statements The financial statements for the year ended 31 March 2022, comprise “the Company” referring to John Keells PLC. as the holding Company and
“the Group” referring to the companies that have been consolidated therein.
Approval of Financial Statements The Financial statements for the year ended 31 March 2022 were authorized for issue by the directors’ on 23rd May 2022.
Principal Activities and Nature of Operations Holding Company The principal activities of the Group’s holding Company is Commodity broking.
Subsidiaries and Associate The companies within the Group and its business activities are disclosed in the Group Structure on note 6 of the Annual Report. There were no
other significant changes in the nature of the principal activities of the Company and the Group during the financial year under review.
Parent Entity and Ultimate Parent Entity The Company’s parent entity is John Keells Holdings PLC in the opinion of the directors, which is incorporated in Sri Lanka.
Responsibility for Financial Statements The responsibility of the Directors in relation to the financial statements is set out in ‘The statement of directors’ responsibility on Page 64 in
the Annual report.
Statement of compliance The financial statements which comprise the statement of financial position, the statement of income, the statement of comprehensive income,
the statement of changes in equity and the statement of cash flows, together with the accounting policies and notes (the “financial statements”) have been prepared in accordance with Sri Lanka Accounting Standards (SLFRS/LKAS) as issued by the Institute of Chartered Accountants of Sri Lanka (ICASL) and the requirement of the Companies Act No. 7 of 2007.
2 BASIS OF PREPARATION Going Concern The Group has prepared the financial statements for the year ended 31 March 2022 on the basis that it will continue to operate as a going
concern. In determining the basis of preparing the financial statements for the year ended 31 March 2022, based on available information, the management has assessed the prevailing macroeconomic conditions and its effect on the Group companies and the appropriateness of the use of the going concern basis.
It is the view of the management that there are no material uncertainties that may cast significant doubt on the Group’s ability to continue to operate as a going concern. The Group’s businesses recorded strong improvement in profitability compared to the previous year on the back of a fast recovery momentum with most of the businesses reaching pre COVID-19 levels of operations post the easing of restrictions. The management has formed judgment that the Company, its subsidiaries, associates and joint ventures have adequate resources to continue in operational existence for the foreseeable future driven by the continuous operationalisation of risk mitigation initiatives and monitoring of business continuity and response plans at each business unit level along with the financial strength of the Group.
In determining the above significant management judgements, estimates and assumptions, the impact of the macroeconomic uncertainties, including supply chain disruptions, power interruptions and distribution challenges on account of the prevailing foreign exchange market limitations, and the COVID-19 pandemic have been considered as of the reporting date and specific considerations have been disclosed under the notes, as relevant.

79
Basis of Preparation The Company’s financial statements have been prepared on an accrual basis and under the historical cost convention except for investment
properties and available-for-sale financial assets designated at FVOCI that have been measured at fair value.
Presentation and Functional Currency The consolidated financial statements are presented in Sri Lankan Rupees (Rs.), the Group’s functional and presentation currency, which is the
primary economic environment in which the Holding Company operates. Each entity in the Group uses the currency of the primary economic environment in which they operate as their functional currency.
All values are rounded to the nearest rupees thousand (Rs. ’000) except when otherwise indicated.
The significant accounting policies are discussed with relevant individual notes.
3 BASIS OF CONSOLIDATION The consolidated financial statements comprise the financial statements of the Group and its subsidiaries as at 31 March 2022. Control is
achieved when the Group is exposed, or has rights, to variable returns from its involvement with the investee and has the ability to affect those returns through its power over the investee. Specifically, the Group controls an investee if, and only if, the Group has:
• Power over the investee (i.e., existing rights that give it the current ability to direct the relevant activities of the investee)
• Exposure, or rights, to variable returns from its involvement with the investee
• The ability to use its power over the investee to affect its returns
Generally, there is a presumption that a majority of voting rights result in control. To support this presumption and when the Group has less than a majority of the voting or similar rights of an investee, the Group considers all relevant facts and circumstances in assessing whether it has power over an investee, including:
• The contractual arrangement with the other vote holders of the investee;
• Rights arising from other contractual arrangements; and
• The Group’s voting rights and potential voting rights
The Group re-assesses whether or not it controls an investee if facts and circumstances indicate that there are changes to one or more of the three elements of control. Consolidation of a subsidiary begins when the Group obtains control over the subsidiary and ceases when the Group loses control of the subsidiary. Assets, liabilities, income and expenses of a subsidiary acquired or disposed of during the year are included in the consolidated financial statements from the date the Group gains control until the date the Group ceases to control the subsidiary.
Profit or loss and each component of other comprehensive income (OCI) are attributed to the equity holders of the parent of the Group and to the non-controlling interests, even if this results in the non-controlling interests having a deficit balance. When necessary, adjustments are made to the financial statements of subsidiaries to bring their accounting policies into line with the Group’s accounting policies.
Loss of control If the Group loses control over a subsidiary, it derecognises the related assets (including goodwill), liabilities, non-controlling interest and other
components of equity while any resultant gain or loss is recognised in the income statement. Any investment retained is recognised at fair value.
The total profits and losses for the year of the Company and of its subsidiaries included in consolidation are shown in the consolidated income statement and consolidated statement of comprehensive income and all assets and liabilities of the Company and of its subsidiaries included in consolidation are shown in the consolidated statement of financial position.
Non-controlling interest (NCI) Non-controlling interest which represents the portion of profit or loss and net assets not held by the Group, are shown as a component of profit
for the year in the consolidated income statement and statement of comprehensive income and as a component of equity in the consolidated statement of financial position, separately from equity attributable to the shareholders of the parent. The consolidated statement of cash flow includes the cash flows of the Company and its subsidiaries.
Transactions eliminated on consolidation All intra-group assets, liabilities, equity, income, expenses and cash flows relating to transactions between members of the Group are eliminated
in full on consolidation. A change in the ownership interest of a subsidiary, without a loss of control, is accounted for as an equity transaction.
80
JOHN KEELLS PLCAnnual Report 2021/22
Notes to the Financial Statements
4 SIGNIFICANT ACCOUNTING JUDGEMENT, ESTIMATES AND ASSUMPTIONS The preparation of the financial statements of the company require the management to make judgments, estimates and assumptions, which may
affect the amounts of income, expenditure, assets, liabilities and the disclosure of contingent liabilities, at the end of the reporting period.
Uncertainty about these assumptions and estimates could result in outcomes that require a material adjustment to the carrying amount of assets or liabilities affected in future periods. In the process of applying the Group’s accounting policies, management has made various judgements. Those which management has assessed to have the most significant effect on the amounts recognised in the consolidated financial statements have been discussed in the individual notes of the related financial statement line items.
The key assumptions concerning the future and other key sources of estimation uncertainty at the reporting date, that have a significant risk of causing a material adjustment to the carrying amounts of assets and liabilities within the next financial year, are also described in the individual notes to the financial statements. The Group based its assumptions and estimates on parameters available when the financial statements were prepared. Existing circumstances and assumptions about future developments, however, may change due to market changes or circumstances arising that are beyond the control of the Group. Such changes are reflected in the assumptions when they occur.
The line items which have most significant effect on accounting, judgements, estimate and assumptions are as follows;
a) Valuation of property, plant and equipment and investment property.
b) Impairment of non-financial assets
c) Share based payments
d) Taxes
e) Employee benefit liability
f) Provision for Impairment allowance for Loans and Advances given to Tea Sellers
5 SUMMARY OF SIGNIFICANT ACCOUNTING POLICIES ACCOUNTING POLICIES The accounting policies adopted by the Group are consistent with those used in the previous year.
Changes in accounting standards The Group applied for the first time certain standards and amendments, which are effective for annual periods beginning on or after 1 January
2021.
The following amendments and improvements did not have a significant impact on the Group’s Financial Statements.
• Amendments to SLFRS 16: COVID-19 Related Rent Concessions beyond 30th June 2021
The amendments provide relief to lessees from applying SLFRS 16 guidance on lease modification accounting for rent concessions arising as a direct consequence of the COVID-19 pandemic. As a practical expedient, a lessee may elect not to assess whether a COVID-19 related rent concession from a lessor is a lease modification.
A lessee that makes this election accounts for any change in lease payments resulting from the COVID-19 related rent concession the same way it would account for the change under SLFRS 16, if the change were not a lease modification. The Group has applied practical expedient for COVID-19 related rent concessions which have been extended up to June 2022.
• Amendments to SLFRS 3 : Definition of a Business
• Amendments to SLFRS 7 and SLFRS 9 : Interest Rate Benchmark Reform
• Amendments to LKAS 1 and LKAS 8 : Definition of Material
• Conceptual Framework for Financial Reporting
Standards issued but not yet effective The following amendments and improvements are not expected to have a significant impact on the Group’s financial statements. Amendments to LKAS 1 : Classification of liabilities as Current or Noncurrent.

81
Amendments to SLFRS 3: Reference to the Conceptual Framework. Amendments to LKAS 16 : Property, Plant & Equipment - Proceeds before Intended Use Amendments to LKAS 37 : Onerous Contracts - Cost of Fulfilling a Contract. Amendments to SLFRS 1: Subsidiary as a first-time adopter Amendments to SLFRS 9: Fees in the ’10 percent’ test for derecognition of financial liabilities
Comparative information The presentation and classification of the financial statements of the previous years have been amended, where relevant for better presentation
and to be comparable with those of the current year.
5.1 Business combinations & goodwill Acquisitions of subsidiaries are accounted for using the acquisition method of accounting. The Group measures goodwill at the acquisition date
as the fair value of the consideration transferred including the recognized amount of any non-controlling interests in the acquiree, less the net recognized amount (generally fair value) of the identifiable assets acquired and liabilities assumed, all measured as of the acquisition date. When the excess is negative, a bargain purchase gain is recognized immediately in the income statement.
The Group selects on a transaction by transaction basis whether to measure non-controlling interests at fair value, or at their proportionate share of the recognized amount of the identifiable net assets, at the acquisition date. Transaction costs, other than those associated with the issue of debt or equity securities, that the Group incurs in connection with a business combination are expensed as incurred. When the Group acquires a business, it assesses the financial assets and liabilities assumed for appropriate classification and designation in accordance with the contractual terms, economic circumstances and pertinent conditions as at the acquisition date. This includes the separation of embedded derivatives in host contracts by the acquiree.
If the business combination is achieved in stages, the acquisition date fair value of the acquirer’s previously held equity interest in the acquiree is remeasured to fair value at the acquisition date through profit or loss.
Any contingent consideration to be transferred by the acquirer will be recognized at fair value at the acquisition date. Contingent consideration which is deemed to be an asset or liability, which is a financial instrument and within the scope of LKAS 39, is measured at fair value with changes in fair value either in profit or loss or as a change to other comprehensive income. If the contingent consideration is classified as equity, it will not be remeasured. Subsequent settlement is accounted for within equity. In instances where the contingent consideration does not fall within the scope of LKAS 39, it is measured in accordance with the appropriate SLFRS/LKAS.
Goodwill is initially measured at cost being the excess of the consideration transferred over the Group’s net identifiable assets acquired and liabilities assumed. If this consideration is lower than the fair value of the net assets of the subsidiary acquired the difference is recognized in the income statement.
After initial recognition, goodwill is measured at cost less any accumulated impairment losses. Goodwill is reviewed for impairment, annually or more frequently if events or changes in circumstances indicate that the carrying value maybe impaired. For the purpose of impairment testing, goodwill acquired in a business combination is, from the acquisition date, allocated to each of the Group’s cash generating units that are expected to benefit from the combination, irrespective of whether other assets or liabilities of the acquiree are assigned to those units.
Impairment is determined by assessing the recoverable amount of the cash generating unit to which the goodwill relates. Where the recoverable amount of the cash generating unit is less than the carrying amount, an impairment loss is recognized. The impairment loss is allocated first to reduce the carrying amount of any goodwill allocated to the unit and then to the other assets pro-rata to the carrying amount of each asset in the unit.
Goodwill and fair value adjustments arising on the acquisition of a foreign operation are treated as assets and liabilities of the foreign operation and translated at the closing rate.
Where goodwill forms part of a cash generating unit and part of the operation within that unit is disposed of, the goodwill associated with the operation disposed of is included in the carrying amount of the operation when determining the gain or loss on disposal of the operation. Goodwill disposed in this circumstance is measured based on the relative values of the operation disposed of and the portion of the cash-generating unit retained.
Other significant accounting policies not covered with individual notes.

82
JOHN KEELLS PLCAnnual Report 2021/22
Notes to the Financial Statements
Following accounting policies which have been applied consistently by the Group, are considered to be significant but are not covered in any other sections.
5.2 Current versus non-current classification The Group presents assets and liabilities in statement of financial position based on current/non-current classification. An asset is classified as
current when it is: * Expected to be realised or intended to be sold or consumed in normal operating cycle * Held primarily for the purpose of trading * Expected to be realised within twelve months after the reporting period, or * Cash or cash equivalent unless restricted from being exchanged or used to settle a liability for at least twelve months after the reporting period.
All other assets are classified as non-current.
A liability is current when: * It is expected to be settled in normal operating cycle * It is held primarily for the purpose of trading * It is due to be settled within twelve months after the reporting period, or * There is no unconditional right to defer the settlement of the liability for at least twelve months after the reporting period
The Group classifies all other liabilities as non-current. Deferred tax assets and liabilities are classified as non-current assets and liabilities.
6 OPERATING SEGMENT INFORMATION Accounting Policy The Group internal organisation and management is structured based on individual services which are similar in nature and process and where
the risk and returns are similar. The operating segments represent the Group’s business structure.
The activities of each of the operating businesses of the Group are detailed in the Group structure of the Annual report.
The Group’s operating business segments are as follows
Produce Broking provision of tea and rubber broking services.
Warehousing provision of warehousing of tea services.
Share Broking provision of stock broking services.
Segment information has been prepared in conformity with the accounting policies adopted for preparing and presenting the consolidated financial statements of the Group.
No operating segments have been aggregated to form the above reportable operating segments. An individual segment manager is determined for each operating segment and the results are regularly reviewed by the Board of Directors. The Board of Directors monitors the operating results of its business units separately for the purpose of making decisions about resource allocation and performance assessment. Segment performance is evaluated based on operating profit or loss which in certain respects, as explained in the operating segments information, is measured differently from operating profit or loss in the consolidated financial statements. Transfer prices between operating segments are carried out in the ordinary course of business. The Income taxes are managed on Group basis and are not allocated to operating segments.
Transfer prices between operating segments are on an arm’s -length basis in a manner similar to transactions with third parties.
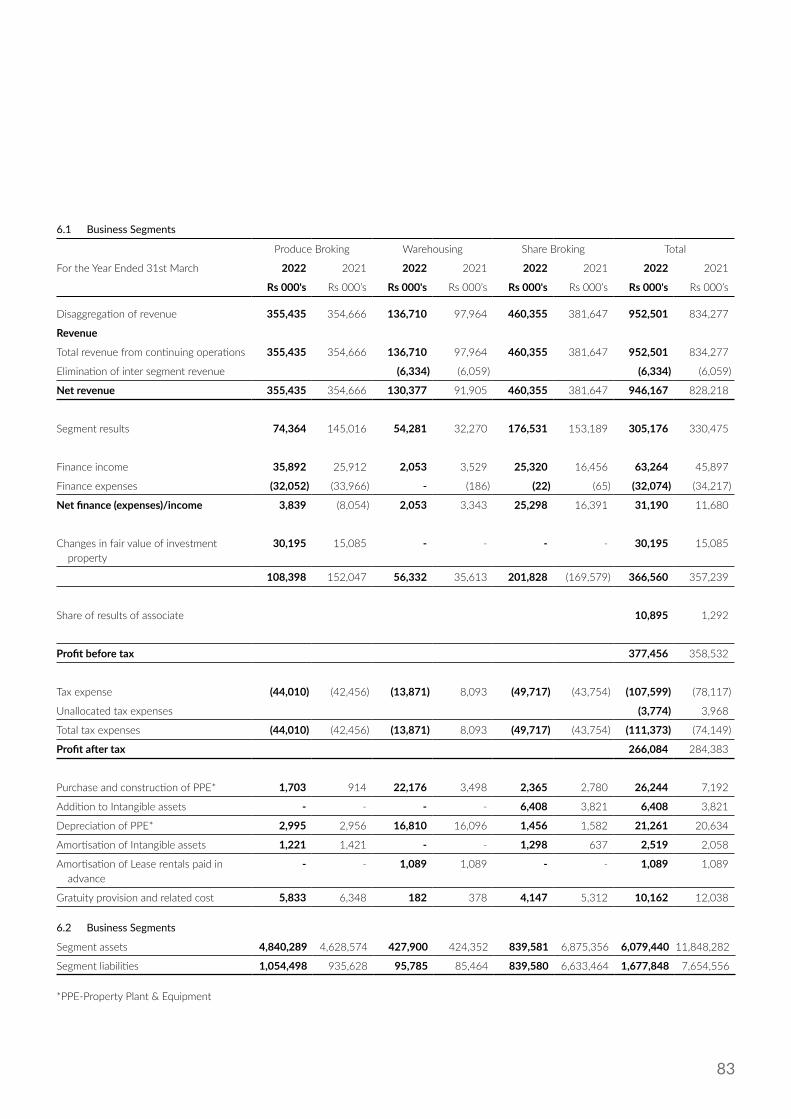
83
6.1 Business Segments
Produce Broking Warehousing Share Broking Total
For the Year Ended 31st March 2022 2021 2022 2021 2022 2021 2022 2021
Rs 000's Rs 000’s Rs 000's Rs 000’s Rs 000's Rs 000’s Rs 000's Rs 000’s
Disaggregation of revenue 355,435 354,666 136,710 97,964 460,355 381,647 952,501 834,277
Revenue
Total revenue from continuing operations 355,435 354,666 136,710 97,964 460,355 381,647 952,501 834,277
Elimination of inter segment revenue (6,334) (6,059) (6,334) (6,059)
Net revenue 355,435 354,666 130,377 91,905 460,355 381,647 946,167 828,218
Segment results 74,364 145,016 54,281 32,270 176,531 153,189 305,176 330,475
Finance income 35,892 25,912 2,053 3,529 25,320 16,456 63,264 45,897
Finance expenses (32,052) (33,966) - (186) (22) (65) (32,074) (34,217)
Net finance (expenses)/income 3,839 (8,054) 2,053 3,343 25,298 16,391 31,190 11,680
Changes in fair value of investment property
30,195 15,085 - - - - 30,195 15,085
108,398 152,047 56,332 35,613 201,828 (169,579) 366,560 357,239
Share of results of associate 10,895 1,292
Profit before tax 377,456 358,532
Tax expense (44,010) (42,456) (13,871) 8,093 (49,717) (43,754) (107,599) (78,117)
Unallocated tax expenses (3,774) 3,968
Total tax expenses (44,010) (42,456) (13,871) 8,093 (49,717) (43,754) (111,373) (74,149)
Profit after tax 266,084 284,383
Purchase and construction of PPE* 1,703 914 22,176 3,498 2,365 2,780 26,244 7,192
Addition to Intangible assets - - - - 6,408 3,821 6,408 3,821
Depreciation of PPE* 2,995 2,956 16,810 16,096 1,456 1,582 21,261 20,634
Amortisation of Intangible assets 1,221 1,421 - - 1,298 637 2,519 2,058
Amortisation of Lease rentals paid in advance
- - 1,089 1,089 - - 1,089 1,089
Gratuity provision and related cost 5,833 6,348 182 378 4,147 5,312 10,162 12,038
6.2 Business Segments
Segment assets 4,840,289 4,628,574 427,900 424,352 839,581 6,875,356 6,079,440 11,848,282
Segment liabilities 1,054,498 935,628 95,785 85,464 839,580 6,633,464 1,677,848 7,654,556
*PPE-Property Plant & Equipment
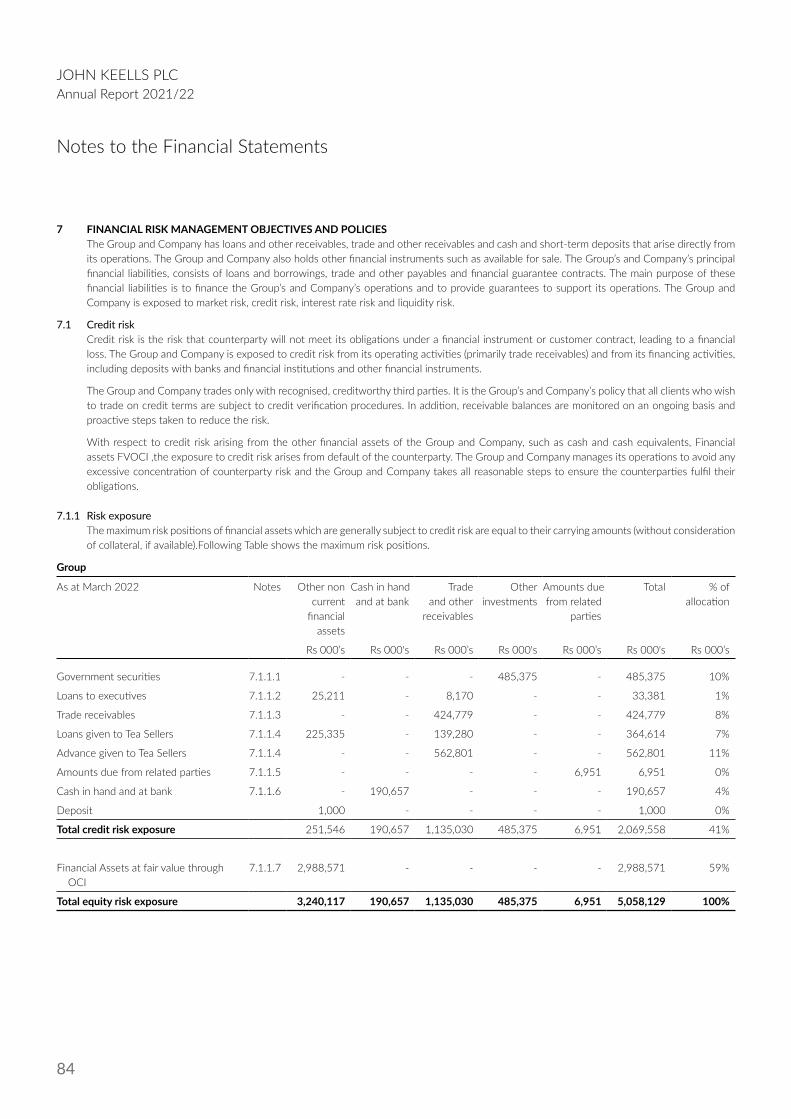
84
JOHN KEELLS PLCAnnual Report 2021/22
Notes to the Financial Statements
7 FINANCIAL RISK MANAGEMENT OBJECTIVES AND POLICIES The Group and Company has loans and other receivables, trade and other receivables and cash and short-term deposits that arise directly from
its operations. The Group and Company also holds other financial instruments such as available for sale. The Group’s and Company’s principal financial liabilities, consists of loans and borrowings, trade and other payables and financial guarantee contracts. The main purpose of these financial liabilities is to finance the Group’s and Company’s operations and to provide guarantees to support its operations. The Group and Company is exposed to market risk, credit risk, interest rate risk and liquidity risk.
7.1 Credit risk Credit risk is the risk that counterparty will not meet its obligations under a financial instrument or customer contract, leading to a financial
loss. The Group and Company is exposed to credit risk from its operating activities (primarily trade receivables) and from its financing activities, including deposits with banks and financial institutions and other financial instruments.
The Group and Company trades only with recognised, creditworthy third parties. It is the Group’s and Company’s policy that all clients who wish to trade on credit terms are subject to credit verification procedures. In addition, receivable balances are monitored on an ongoing basis and proactive steps taken to reduce the risk.
With respect to credit risk arising from the other financial assets of the Group and Company, such as cash and cash equivalents, Financial assets FVOCI ,the exposure to credit risk arises from default of the counterparty. The Group and Company manages its operations to avoid any excessive concentration of counterparty risk and the Group and Company takes all reasonable steps to ensure the counterparties fulfil their obligations.
7.1.1 Risk exposure The maximum risk positions of financial assets which are generally subject to credit risk are equal to their carrying amounts (without consideration
of collateral, if available).Following Table shows the maximum risk positions.
Group
As at March 2022 Notes Other non current
financial assets
Cash in hand and at bank
Trade and other
receivables
Other investments
Amounts due from related
parties
Total % of allocation
Rs 000’s Rs 000's Rs 000’s Rs 000's Rs 000’s Rs 000's Rs 000’s
Government securities 7.1.1.1 - - - 485,375 - 485,375 10%
Loans to executives 7.1.1.2 25,211 - 8,170 - - 33,381 1%
Trade receivables 7.1.1.3 - - 424,779 - - 424,779 8%
Loans given to Tea Sellers 7.1.1.4 225,335 - 139,280 - - 364,614 7%
Advance given to Tea Sellers 7.1.1.4 - - 562,801 - - 562,801 11%
Amounts due from related parties 7.1.1.5 - - - - 6,951 6,951 0%
Cash in hand and at bank 7.1.1.6 - 190,657 - - - 190,657 4%
Deposit 1,000 - - - - 1,000 0%
Total credit risk exposure 251,546 190,657 1,135,030 485,375 6,951 2,069,558 41%
Financial Assets at fair value through OCI
7.1.1.7 2,988,571 - - - - 2,988,571 59%
Total equity risk exposure 3,240,117 190,657 1,135,030 485,375 6,951 5,058,129 100%
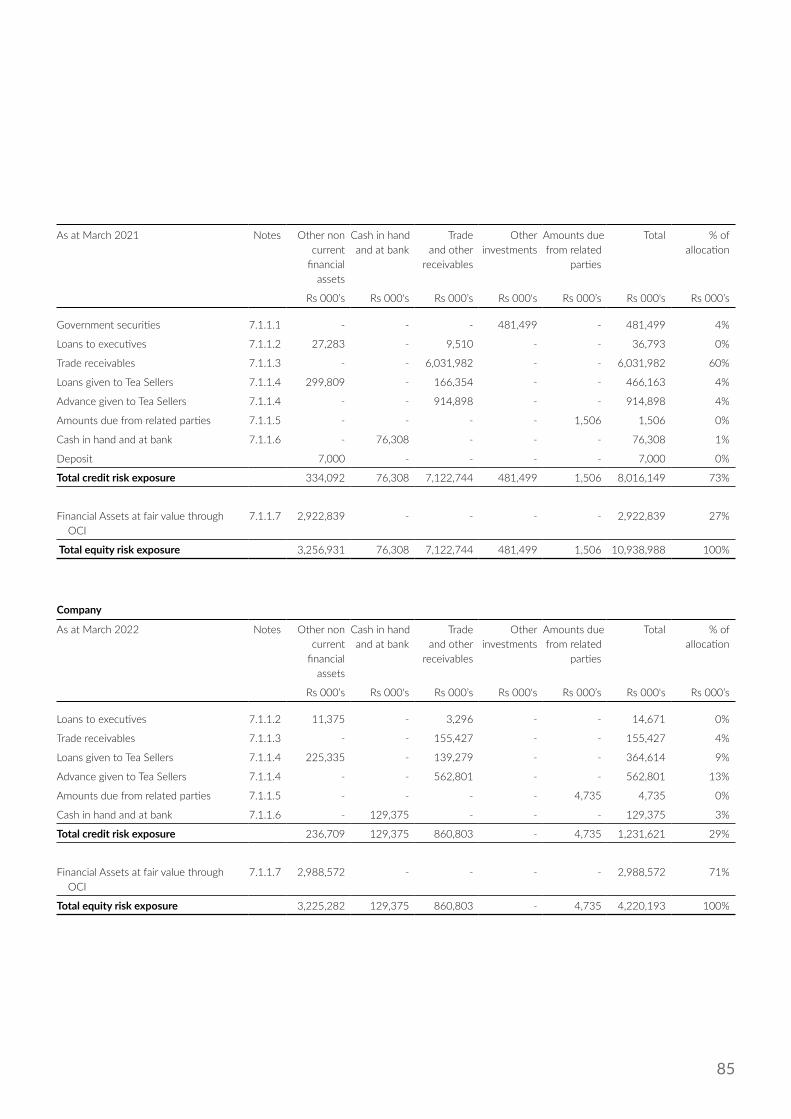
85
As at March 2021 Notes Other non current
financial assets
Cash in hand and at bank
Trade and other
receivables
Other investments
Amounts due from related
parties
Total % of allocation
Rs 000’s Rs 000's Rs 000’s Rs 000's Rs 000’s Rs 000's Rs 000’s
Government securities 7.1.1.1 - - - 481,499 - 481,499 4%
Loans to executives 7.1.1.2 27,283 - 9,510 - - 36,793 0%
Trade receivables 7.1.1.3 - - 6,031,982 - - 6,031,982 60%
Loans given to Tea Sellers 7.1.1.4 299,809 - 166,354 - - 466,163 4%
Advance given to Tea Sellers 7.1.1.4 - - 914,898 - - 914,898 4%
Amounts due from related parties 7.1.1.5 - - - - 1,506 1,506 0%
Cash in hand and at bank 7.1.1.6 - 76,308 - - - 76,308 1%
Deposit 7,000 - - - - 7,000 0%
Total credit risk exposure 334,092 76,308 7,122,744 481,499 1,506 8,016,149 73%
Financial Assets at fair value through OCI
7.1.1.7 2,922,839 - - - - 2,922,839 27%
Total equity risk exposure 3,256,931 76,308 7,122,744 481,499 1,506 10,938,988 100%
Company
As at March 2022 Notes Other non current
financial assets
Cash in hand and at bank
Trade and other
receivables
Other investments
Amounts due from related
parties
Total % of allocation
Rs 000’s Rs 000's Rs 000’s Rs 000's Rs 000’s Rs 000's Rs 000’s
Loans to executives 7.1.1.2 11,375 - 3,296 - - 14,671 0%
Trade receivables 7.1.1.3 - - 155,427 - - 155,427 4%
Loans given to Tea Sellers 7.1.1.4 225,335 - 139,279 - - 364,614 9%
Advance given to Tea Sellers 7.1.1.4 - - 562,801 - - 562,801 13%
Amounts due from related parties 7.1.1.5 - - - - 4,735 4,735 0%
Cash in hand and at bank 7.1.1.6 - 129,375 - - - 129,375 3%
Total credit risk exposure 236,709 129,375 860,803 - 4,735 1,231,621 29%
Financial Assets at fair value through OCI
7.1.1.7 2,988,572 - - - - 2,988,572 71%
Total equity risk exposure 3,225,282 129,375 860,803 - 4,735 4,220,193 100%

86
JOHN KEELLS PLCAnnual Report 2021/22
Notes to the Financial Statements
7 FINANCIAL RISK MANAGEMENT OBJECTIVES AND POLICIES (Contd.)7.1.1 Risk exposure (Contd.)
As at March 2021 Notes Other non current
financial assets
Cash in hand and at bank
Trade and other
receivables
Other investments
Amounts due from related
parties
Total % of allocation
Rs 000’s Rs 000's Rs 000’s Rs 000's Rs 000’s Rs 000's Rs 000’s
Loans to executives 7.1.1.2 9,888 - 4,284 - - 14,172 0%
Trade receivables 7.1.1.3 - - 186,635 - - 186,635 5%
Loans given to Tea Sellers 7.1.1.4 299,809 - 163,550 - - 463,359 11%
Advance given to Tea Sellers 7.1.1.4 - - 383,628 - - 383,628 10%
Amounts due from related parties 7.1.1.5 - - - - 1,131 1,131 0%
Cash in hand and at bank 7.1.1.6 - 59,357 - - - 59,357 1%
Total credit risk exposure 309,697 59,357 738,827 - 1,131 1,108,012 27%
Financial Assets at fair value through OCI
7.1.1.7 2,922,839 - - - - 2,922,839 73%
Total equity risk exposure 3,232,536 59,357 738,827 - 1,131 4,031,851 100%
7.1.1.1 Government securities As at March 2022 as shown in table above 10% (2021 - 4%) of debt securities comprises investment in government securities consist of
treasury bills and reverse repo investments.
Government securities are usually referred to as risk free due to sovereign nature of the instrument.
7.1.1.2 Loans to executives Loans to executive portfolio is largely made up of vehicle loans which are given to staff at assistant manager level and above. The respective
business units have obtained the necessary Power of Attorney/promissory notes as collateral for the loans granted.
7.1.1.3 Trade and other receivables
Group Company
For the Year Ended 31st March 2022 2021 2022 2021
Rs 000's Rs 000's Rs 000's Rs 000's
Neither past due nor impaired 421,393 6,558,759 176,318 194,868
Past due but not impaired
0–30 days 228,209 235,767 199,260 215,111
31–60 days 906 2,067 732 1,814
61–90 days 188 17 179 -
> 91 days 952,599 813,307 952,579 813,207
Gross carrying value 1,603,295 7,609,917 1,329,068 1,225,000
Less: impairment provision
Individually assessed impairment provision (Note 7.1.1.3.1) (468,265) (487,173) (468,265) (487,173)
Total 1,135,030 7,122,744 860,803 737,827
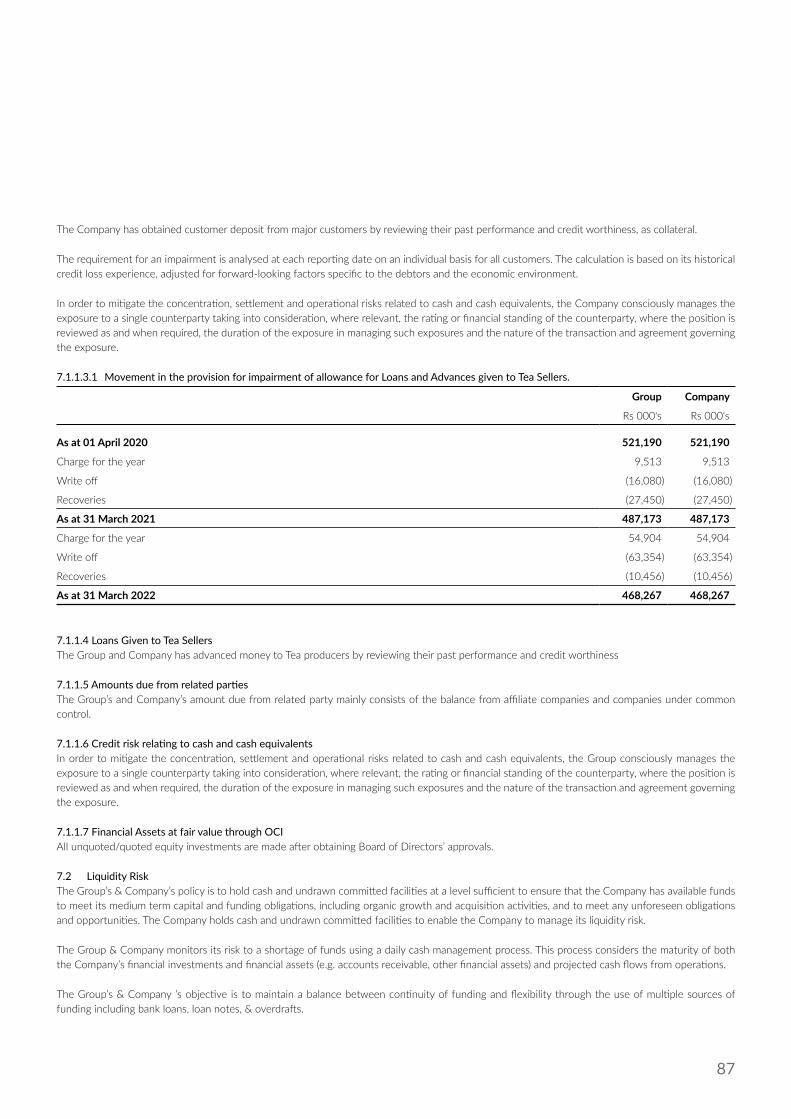
87
The Company has obtained customer deposit from major customers by reviewing their past performance and credit worthiness, as collateral.
The requirement for an impairment is analysed at each reporting date on an individual basis for all customers. The calculation is based on its historical credit loss experience, adjusted for forward-looking factors specific to the debtors and the economic environment.
In order to mitigate the concentration, settlement and operational risks related to cash and cash equivalents, the Company consciously manages the exposure to a single counterparty taking into consideration, where relevant, the rating or financial standing of the counterparty, where the position is reviewed as and when required, the duration of the exposure in managing such exposures and the nature of the transaction and agreement governing the exposure.
7.1.1.3.1 Movement in the provision for impairment of allowance for Loans and Advances given to Tea Sellers.
Group Company
Rs 000's Rs 000's
As at 01 April 2020 521,190 521,190
Charge for the year 9,513 9,513
Write off (16,080) (16,080)
Recoveries (27,450) (27,450)
As at 31 March 2021 487,173 487,173
Charge for the year 54,904 54,904
Write off (63,354) (63,354)
Recoveries (10,456) (10,456)
As at 31 March 2022 468,267 468,267
7.1.1.4 Loans Given to Tea SellersThe Group and Company has advanced money to Tea producers by reviewing their past performance and credit worthiness
7.1.1.5 Amounts due from related partiesThe Group’s and Company’s amount due from related party mainly consists of the balance from affiliate companies and companies under common control.
7.1.1.6 Credit risk relating to cash and cash equivalentsIn order to mitigate the concentration, settlement and operational risks related to cash and cash equivalents, the Group consciously manages the exposure to a single counterparty taking into consideration, where relevant, the rating or financial standing of the counterparty, where the position is reviewed as and when required, the duration of the exposure in managing such exposures and the nature of the transaction and agreement governing the exposure.
7.1.1.7 Financial Assets at fair value through OCIAll unquoted/quoted equity investments are made after obtaining Board of Directors’ approvals.
7.2 Liquidity RiskThe Group’s & Company’s policy is to hold cash and undrawn committed facilities at a level sufficient to ensure that the Company has available funds to meet its medium term capital and funding obligations, including organic growth and acquisition activities, and to meet any unforeseen obligations and opportunities. The Company holds cash and undrawn committed facilities to enable the Company to manage its liquidity risk.
The Group & Company monitors its risk to a shortage of funds using a daily cash management process. This process considers the maturity of both the Company’s financial investments and financial assets (e.g. accounts receivable, other financial assets) and projected cash flows from operations.
The Group’s & Company ’s objective is to maintain a balance between continuity of funding and flexibility through the use of multiple sources of funding including bank loans, loan notes, & overdrafts.
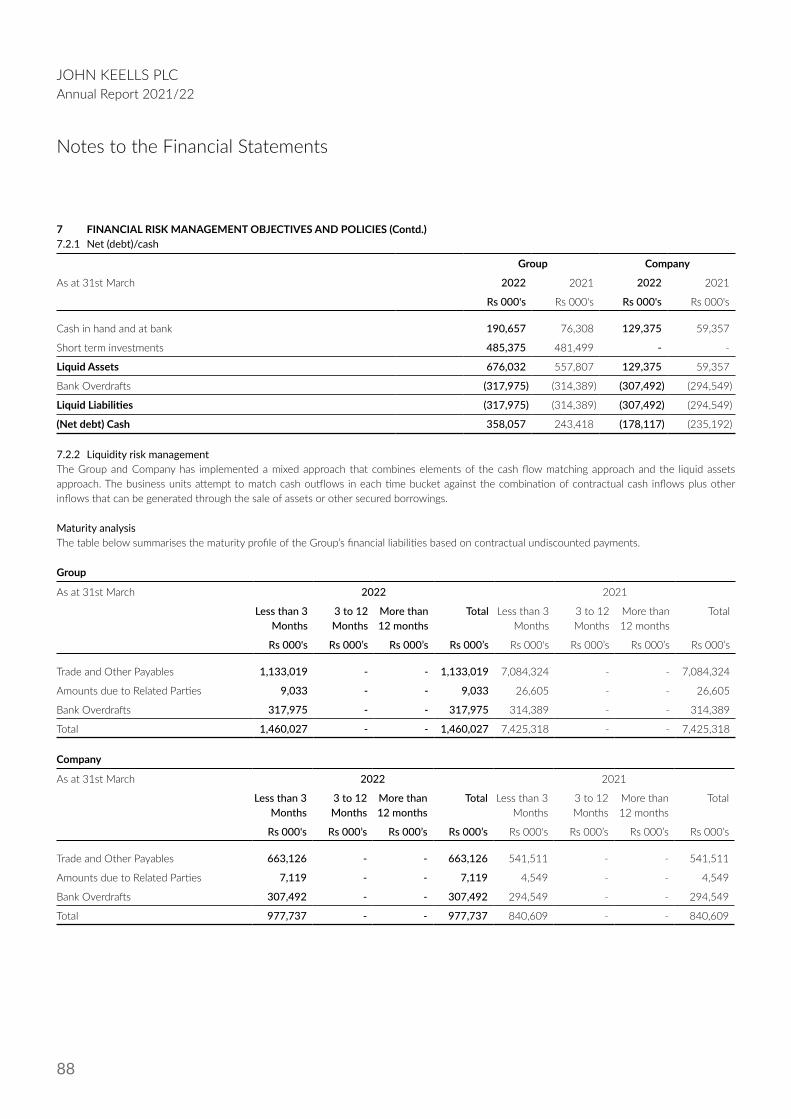
88
JOHN KEELLS PLCAnnual Report 2021/22
Notes to the Financial Statements
7 FINANCIAL RISK MANAGEMENT OBJECTIVES AND POLICIES (Contd.)7.2.1 Net (debt)/cash
Group Company
As at 31st March 2022 2021 2022 2021
Rs 000's Rs 000's Rs 000's Rs 000's
Cash in hand and at bank 190,657 76,308 129,375 59,357
Short term investments 485,375 481,499 - -
Liquid Assets 676,032 557,807 129,375 59,357
Bank Overdrafts (317,975) (314,389) (307,492) (294,549)
Liquid Liabilities (317,975) (314,389) (307,492) (294,549)
(Net debt) Cash 358,057 243,418 (178,117) (235,192)
7.2.2 Liquidity risk managementThe Group and Company has implemented a mixed approach that combines elements of the cash flow matching approach and the liquid assets approach. The business units attempt to match cash outflows in each time bucket against the combination of contractual cash inflows plus other inflows that can be generated through the sale of assets or other secured borrowings.
Maturity analysisThe table below summarises the maturity profile of the Group’s financial liabilities based on contractual undiscounted payments.
Group
As at 31st March 2022 2021
Less than 3Months
3 to 12 Months
More than12 months
Total Less than 3Months
3 to 12 Months
More than12 months
Total
Rs 000's Rs 000’s Rs 000’s Rs 000’s Rs 000's Rs 000’s Rs 000’s Rs 000’s
Trade and Other Payables 1,133,019 - - 1,133,019 7,084,324 - - 7,084,324
Amounts due to Related Parties 9,033 - - 9,033 26,605 - - 26,605
Bank Overdrafts 317,975 - - 317,975 314,389 - - 314,389
Total 1,460,027 - - 1,460,027 7,425,318 - - 7,425,318
Company
As at 31st March 2022 2021
Less than 3Months
3 to 12 Months
More than12 months
Total Less than 3Months
3 to 12 Months
More than12 months
Total
Rs 000's Rs 000’s Rs 000’s Rs 000’s Rs 000's Rs 000’s Rs 000’s Rs 000’s
Trade and Other Payables 663,126 - - 663,126 541,511 - - 541,511
Amounts due to Related Parties 7,119 - - 7,119 4,549 - - 4,549
Bank Overdrafts 307,492 - - 307,492 294,549 - - 294,549
Total 977,737 - - 977,737 840,609 - - 840,609

89
7.3 Market riskThe objective of market risk management is to manage and control market risk exposures within acceptable parameters, while optimizing the return.
Market risk is the risk that the fair value of future cash flows of a financial instrument will fluctuate because of changes in market prices. Market prices comprise four types of risk: interest rate risk, currency risk, commodity price risk and other price risk, such as equity price risk. The financial instruments affected by the Company is Financial Assets designated at FVOCI which include equity securities.
The Central Bank of Sri Lanka adopted a tightening monetary policy stance during the latter half of the financial year, resulting in an upward trend in interest rates. Elevated pressures on inflation on account of many factors including increases in global commodity prices, food supply and the sharp depreciation of the currency in March 2022 have resulted in strong policy actions by the CBSL on monetary policy post the end of the reporting period. Such actions have raised monetary policy rates significantly and helped bridge the gap between policy and market interest rates.
7.3.1 Equity price riskThe Company’s listed and unlisted equity securities are susceptible to market price risk arising from uncertainties about future values of the investment securities.
7.3.2 Financial Assets designated at FVCOIAll quoted equity and unquoted equity investments are made after obtaining Board of Directors’ approval.
7.3.3 Sensitivity analysisThe following table demonstrates the sensitivity to a reasonably possible change in the market index, with all other variables held constant, of the Group’s and Company’s profit before tax & equity due to changes in the fair value of the listed equity securities.
As at 31st March Change in year end market price index
Effect on profit before tax
Effect on equity
Rs 000’s
Group
2022 10% 42,779
-10% (42,779)
2021 10% 41,814
-10% (41,814)
Company
2022 10% 42,779
-10% (42,779)
2021 10% 41.814
-10% (41.814)
7.4 Capital managementThe primary objective of the Company’s capital management is to ensure that it maintains a strong financial position and healthy capital ratios to support its business and maximise shareholder value.
The Company manages its capital structure, and makes adjustments to it, in the light of changes in economic conditions. To maintain or adjust the capital structure, the Company may issue new shares, have a rights issue or buy back of shares.
Group Company
As at 31st March 2022 2021 2022 2021
Rs 000's Rs 000's Rs 000's Rs 000's
Debt/Equity 7.36% 7.60% 8.13% 7.96%
90
JOHN KEELLS PLCAnnual Report 2021/22
Notes to the Financial Statements
8 FAIR VALUE MEASUREMENT AND RELATED FAIR VALUE DISCLOSURESFair value measurementFair value related disclosures for financial instruments and non-financial assets that are measured at fair value or where fair values are only, disclosed are reflected in this note. Aside from this note, additional fair value related disclosures, including the valuation methods, significant estimates and assumptions are also provided in:
· Investment in unquoted equity shares Note 24.2
· Property, plant and equipment under revaluation model Note 18.8
· Investment properties Note 20
· Financial Instruments (including those carried at amortised cost) Note 9
Accounting policy
Fair value is the price that would be received to sell an asset or paid to transfer a liability in an orderly transaction between market participants at the measurement date. The fair value measurement is based on the presumption that the transaction to sell the asset or transfer the liability takes place either:· In the principal market for the asset or liability, or · In the absence of a principal market, in the most advantageous market for the asset or liability
The principal or the most advantageous market must be accessible by the Group.
The fair value of an asset or a liability is measured using the assumptions that market participants would use when pricing the asset or liability, assuming that market participants act in their economic best interest.
A fair value measurement of a non-financial asset takes into account a market participant’s ability to generate economic benefits by using the asset in its highest and best use or by selling it to another market participant that would use the asset in its highest and best use.
The Group uses valuation techniques that are appropriate in the circumstances and for which sufficient data are available to measure fair value, maximising the use of relevant observable inputs and minimising the use of unobservable inputs.
All assets and liabilities for which fair value is measured or disclosed in the financial statements are categorized within the fair value hierarchy, described as follows, based on the lowest level input that is significant to the fair value measurement as a whole:· Level 1 — Quoted (unadjusted) market prices in active markets for identical assets or liabilities.· Level 2 — Valuation techniques for which the lowest level input that is significant to the fair value measurement is directly or indirectly observable.· Level 3 — Valuation techniques for which the lowest level input that is significant to the fair value measurement is unobservable.
For assets and liabilities that are recognised in the financial statements on a recurring basis, the Group determines whether transfers have occurred between levels in the hierarchy by reassessing categorisation (based on the lowest level input that is significant to the fair value measurement as a whole) at the end of each reporting period. The Group determines the policies and procedures for both recurring fair value measurement, such as investment properties and unquoted equity instruments, and for non-recurring measurement, such as assets held for sale in discontinued operations. External valuers are involved for valuation of significant assets, such as land and building and investment properties, and significant liabilities, such as insurance contracts. Selection criteria for external valuers include market knowledge, reputation, independence and whether professional standards are maintained. The Group decides, after discussion with the external valuers, which valuation techniques and inputs to use for individual assets and liabilities. For the purpose of fair value disclosures, the Group has determined classes of assets and liabilities on the basis of the nature, characteristics and risk of the asset or liability and the level of the fair value hierarchy as explained above.

91
8.1 Financial Assets by Fair Value HierarchyThe Company held the following financial instruments carried at fair value in the statement of financial position.
Financial AssetsGroup Date of valuation Level 1 Level 2 Level 3As at 31st March 2022 2021 2022 2021 2022 2021 Rs 000’s Rs 000’s Rs 000’s Rs 000's Rs 000’s Rs 000’s
Non-listed equity investments
Waterfront Properties (Pvt) Ltd 31.03.2022 - - - - 2,560,777 2,504,695
Listed equity investments
Keells Food Products PLC 31.03.2022 427,794 418,144 - - - -
Total 427,794 418,144 - - 2,560,777 2,504,695
Financial AssetsCompany Date of valuation Level 1 Level 2 Level 3As at 31st March 2022 2021 2022 2021 2022 2021 Rs 000’s Rs 000’s Rs 000’s Rs 000's Rs 000’s Rs 000’s
Non-listed equity investments
Waterfront Properties (Pvt) Ltd 31.03.2022 - - - - 2,560,777 2,504,695
Listed equity investments
Keells Food Products PLC 31.03.2022 427,794 418,144 - - - -
Total 427,794 418,144 - - 2,560,777 2,504,695
During the reporting period ended 31 March 2022, there were no transfers between Level 1 and Level 2 fair value measurements.
8.2 Non - Financial Assets by Fair Value HierarchyNon Financial Assets -Group
Date of valuation Level 1 Level 2 Level 3As at 31st March 2022 2021 2022 2021 2022 2021 Rs 000’s Rs 000’s Rs 000’s Rs 000's Rs 000’s Rs 000’s
Fair Value Hierarchy Non Financial Assets
Assets Measured at fair value
Investment Property 31.12.2021 - - - - 423,980 393,785
Buildings on Leasehold land 31.12.2021 - - - - 360,000 325,000
Non Financial Assets- CompanyDate of valuation Level 1 Level 2 Level 3
As at 31st March 2022 2021 2022 2021 2022 2021 Rs 000’s Rs 000’s Rs 000’s Rs 000's Rs 000’s Rs 000’s
Fair Value Hierarchy Non Financial Assets
Assets Measured at fair value
Investment Property 31.12.2021 - - - - 423,980 393,785
In determining the fair value, highest and best use of the property has been considered including the current condition of the properties , future usability and associated redevelopment requirements have been considered. Also the valuers have made reference to market evidence of the transaction prices for similar properties, with appropriate adjustments for the size and location . The appraised fair value are rounded within the range of values.
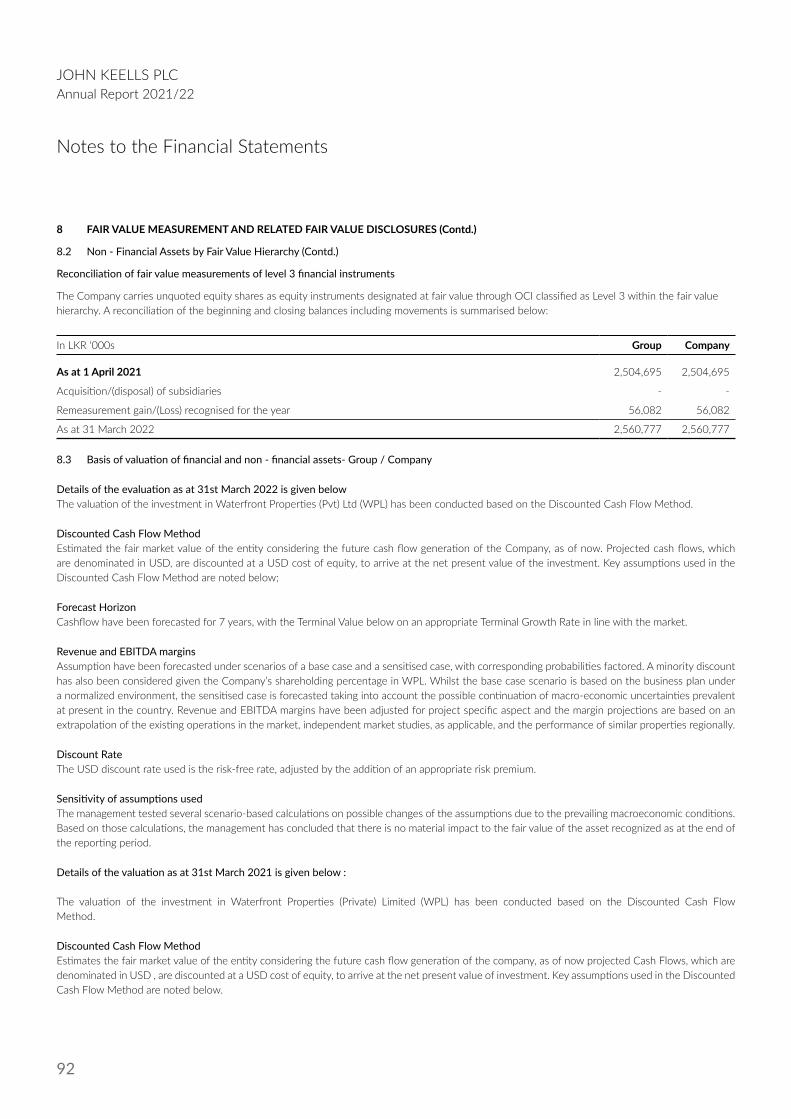
92
JOHN KEELLS PLCAnnual Report 2021/22
Notes to the Financial Statements
8 FAIR VALUE MEASUREMENT AND RELATED FAIR VALUE DISCLOSURES (Contd.)
8.2 Non - Financial Assets by Fair Value Hierarchy (Contd.)
Reconciliation of fair value measurements of level 3 financial instruments
The Company carries unquoted equity shares as equity instruments designated at fair value through OCI classified as Level 3 within the fair value hierarchy. A reconciliation of the beginning and closing balances including movements is summarised below:
In LKR ‘000s Group Company
As at 1 April 2021 2,504,695 2,504,695
Acquisition/(disposal) of subsidiaries - -
Remeasurement gain/(Loss) recognised for the year 56,082 56,082
As at 31 March 2022 2,560,777 2,560,777
8.3 Basis of valuation of financial and non - financial assets- Group / Company
Details of the evaluation as at 31st March 2022 is given belowThe valuation of the investment in Waterfront Properties (Pvt) Ltd (WPL) has been conducted based on the Discounted Cash Flow Method.
Discounted Cash Flow Method Estimated the fair market value of the entity considering the future cash flow generation of the Company, as of now. Projected cash flows, which are denominated in USD, are discounted at a USD cost of equity, to arrive at the net present value of the investment. Key assumptions used in the Discounted Cash Flow Method are noted below;
Forecast HorizonCashflow have been forecasted for 7 years, with the Terminal Value below on an appropriate Terminal Growth Rate in line with the market.
Revenue and EBITDA marginsAssumption have been forecasted under scenarios of a base case and a sensitised case, with corresponding probabilities factored. A minority discount has also been considered given the Company’s shareholding percentage in WPL. Whilst the base case scenario is based on the business plan under a normalized environment, the sensitised case is forecasted taking into account the possible continuation of macro-economic uncertainties prevalent at present in the country. Revenue and EBITDA margins have been adjusted for project specific aspect and the margin projections are based on an extrapolation of the existing operations in the market, independent market studies, as applicable, and the performance of similar properties regionally.
Discount Rate The USD discount rate used is the risk-free rate, adjusted by the addition of an appropriate risk premium.
Sensitivity of assumptions usedThe management tested several scenario-based calculations on possible changes of the assumptions due to the prevailing macroeconomic conditions. Based on those calculations, the management has concluded that there is no material impact to the fair value of the asset recognized as at the end of the reporting period.
Details of the valuation as at 31st March 2021 is given below :
The valuation of the investment in Waterfront Properties (Private) Limited (WPL) has been conducted based on the Discounted Cash Flow Method.
Discounted Cash Flow MethodEstimates the fair market value of the entity considering the future cash flow generation of the company, as of now projected Cash Flows, which are denominated in USD , are discounted at a USD cost of equity, to arrive at the net present value of investment. Key assumptions used in the Discounted Cash Flow Method are noted below.
93
9 FINANCIAL INSTRUMENTSAccounting policyi) Financial instruments- Initial recognition and subsequent measurementFinancial assets within the scope of SLFRS 9 are classified as amortised cost, fair value through other comprehensive income (OCI), and fair value through profit or loss.
The classification of financial assets at initial recognition depends on the financial asset’s contractual cash flow characteristics and the Company’s business model for managing them. This assessment is referred to as the SPPI test and is performed at an instrument level. The business model determines whether cash flows will result from collecting contractual cash flows, selling the financial assets, or both. With the exception of trade receivables that do not contain a significant financing component or for which the Company has applied the practical expedient are measured at the transaction price.
At initial recognition, the Group measures a financial asset at its fair value plus, in the case of a financial asset not at fair value through profit or loss (FVPL), transaction costs that are directly attributable to the acquisition of the financial asset. Transaction costs of financial assets carried at FVPL are expensed in profit or loss.
The Group’s financial assets include cash and short-term deposits, trade and other receivables, loans and other receivables, quoted and unquoted financial instruments and derivative financial instruments.
Subsequent measurement For purposes of subsequent measurement, financial assets are classified in four categories
· Financial assets at amortised cost
· Financial assets at fair value through OCI with recycling of cumulative gains and losses
· Financial assets designated at fair value through OCI with no recycling of cumulative gains and losses upon derecognition
· Financial assets at fair value through profit or loss
Debt instrumentsFinancial assets at amortised costAssets that are held for collection of contractual cash flows where those cash flows represent solely payments of principal and interest are measured at amortised cost. The Group measures financial assets at amortised cost if both of the following conditions are met:
• The financial asset is held within a business model with the objective to hold financial assets in order to collect contractual cashflows and
• The contractual terms of the financial asset give rise on specified dates to cash flows that are solely payments of principal and interest on the principal amount outstanding
Probability Weighted ScenariosAssumptions have been forecasted under scenarios of a base case and a sensitised case , with corresponding probabilities factored. Whilst the base case scenario is based on the current Business plan , the sensitised case takes into account the uncertainties prevalent at present and possible disruptions to the commencement and ramp up of operations in the event the current situation in the country and the region continues for a prolonged period of time.
Forecast HorizonCashflows have been forecasted for 7 years, with the terminal value based on an appropriate Terminal Growth Rate in line with the Market.
Revenue and EBITDA marginsRevenue and EBITDA margins have been projected based on the existing operations in the market, independent market studies, as applicable and the performance of similar properties regionally, which has been adjusted for project specific aspects.
Discount RateA 9% USD Cost of equity based on the risk-free rate post adjustments for appropriate risk premiums.

94
JOHN KEELLS PLCAnnual Report 2021/22
Notes to the Financial Statements
Financial assets at amortised cost are subsequently measured using the effective interest (EIR) method and are subject to impairment. Gains and losses are recognised in profit or loss when the asset is derecognised, modified or impaired.
Impairment of financial assetsThe Group recognises an allowance for expected credit losses (ECLs) for all debt instruments not held at fair value through profit or loss. ECLs are based on the difference between the contractual cash flows due in accordance with the contract and all the cash flows that the Group expects to receive, discounted at the Group’s effective interest rate.
For trade receivables, the Group applies the simplified approach permitted by SLFRS 9, which requires expected lifetime losses to be recognised from initial recognition of the receivables. The Group has established a provision matrix that is based on its historical credit loss experience, adjusted for forward-looking factors specific to the debtors and the economic environment.
Financial assets at fair value through OCIAssets that are held for collection of contractual cash flows and for selling the financial assets, where the assets’ cash flows represent solely payments of principal and interest, are measured at FVOCI. The Group measures debt instruments at fair value through OCI if both of the following conditions are met:
• The financial asset is held within a business model with the objective of both holding to collect contractual cashflows and selling and;
• The contractual terms of the financial asset give rise on specified dates to cash flows that are solely payments of principal and interest on the principal amount outstanding
Movements in the carrying amount are taken through OCI, expect for the recognition of impairment gains or losses, interest income and foreign exchange gains and losses which are recognised in profit or loss. When the financial assets is derecognised, the cumulative gain or loss previously recognized in OCI is reclassified from equity to profit or loss and recognized in other gains/(losses). Interest income from these financial assets is included in finance income using the effective interest rate method. Foreign exchange gains and losses are presented in other gains/(losses) and impairment expenses are presented as separate line item in the income statement.
The Group does not have debt instruments at fair value through OCI.
Equity Instruments Financial assets designated at fair value through OCI Upon initial recognition, the Company can elect to classify irrevocably its equity investments as equity instruments designated at fair value through OCI when they meet the definition of equity under IAS 32 Financial Instruments: Presentation and are not held for trading. The classification is determined on an instrument-by-instrument basis.
Gains and losses on these financial assets are never recycled to profit or loss. Dividends are recognised as other income in the statement of profit or loss when the right of payment has been established, except when the Company benefits from such proceeds as a recovery of part of the cost of the financial asset, in which case, such gains are recorded in OCI. Equity instruments designated at fair value through OCI are not subject to impairment assessment.
The Group does not have financial assets at fair value through profits or loss.
Financial assets - derecognition Financial assets are derecognised when the rights to receive cash flows from the financial assets have expired or have been transferred and the Group has transferred substantially all the risks and rewards of ownership.
Impairment of financial assetsFrom 1 April 2018, the group assesses on a forward looking basis the expected credit losses associated with its debt instruments carried at amortised cost and FVOCI. The impairment methodology applied depends on whether there has been a significant increase in credit risk.
For trade receivables, the group applies the simplified approach permitted by SLFRS 9, which requires expected lifetime losses to be recognised from initial recognition of the receivables. The Group has established a provision matrix that is based on its historical credit loss experience, adjusted for forward-looking factors specific to the debtors and the economic environment.
9 FINANCIAL INSTRUMENTS (Contd.)
95
Financial liabilities Initial recognition and measurement Financial liabilities are classified, at initial recognition, as financial liabilities at fair value through profit or loss, loans and borrowings, payables, or as derivatives designated as hedging instruments in an effective hedge, as appropriate.
All financial liabilities are recognised initially at fair value and, in the case of loans and borrowings, carried at amortised cost. This includes directly attributable transaction costs.
The Group’s financial liabilities include trade and other payables, bank overdrafts, loans and borrowings.
Subsequent measurement The measurement of financial liabilities depends on their classification, as described below:
Financial liabilities at fair value through profit or lossThe Group does not have financial liabilities at fair value through profits or loss.
Loans and borrowingsThis is the category most relevant to the Group. After initial recognition, interest-bearing loans and borrowings are subsequently measured at amortised cost using the EIR method. Gains and losses are recognised in profit or loss when the liabilities are derecognised as well as through the EIR amortisation process.
Amortised cost is calculated by taking into account any discount or premium on acquisition and fees or costs that are an integral part of the EIR. The EIR amortisation is included as finance costs in the statement of profit or loss.
Derecognition A financial liability is derecognised when the obligation under the liability is discharged or cancelled or expires. When an existing financial liability is replaced by another from the same lender on substantially different terms, or the terms of an existing liability are substantially modified, such an exchange or modification is treated as the derecognition of the original liability and the recognition of a new liability. The difference in the respective carrying amounts is recognised in the statement of profit or loss.
Offsetting of financial instrumentsFinancial assets and financial liabilities are offset and the net amount is reported in the consolidated statement of financial position if there is a currently enforceable legal right to offset the recognised amounts and there is an intention to settle on a net basis, to realise the assets and settle the liabilities simultaneously.
Fair Value of financial InstrumentsThe fair value of financial instruments that are traded in active markets at each reporting date is determined by reference to quoted market prices or dealer price quotations.(bid prices for long position and ask price for short positions), without any deductions for transaction costs. For instrumnents not traded in an active market , the fair value is determined using appropriate valuation techniques. Such techniques may include using recent arm’s length market transactions; reference to the current fair value of another instrument that is subsequent that is substantially the same; a discounted cash flow analysis or other valuation models. An analysis of fair values of financial instruments and further details as to how they are measured are provided in Note 9.
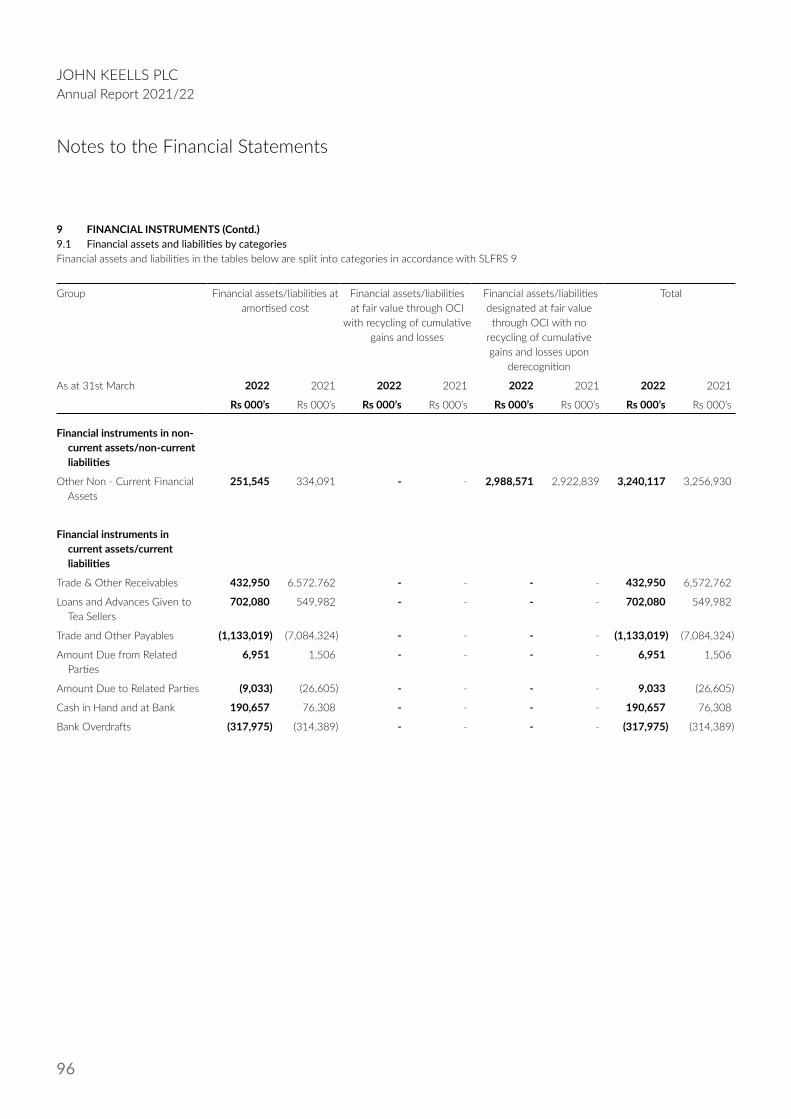
96
JOHN KEELLS PLCAnnual Report 2021/22
Notes to the Financial Statements
9 FINANCIAL INSTRUMENTS (Contd.)9.1 Financial assets and liabilities by categoriesFinancial assets and liabilities in the tables below are split into categories in accordance with SLFRS 9
Group Financial assets/liabilities at amortised cost
Financial assets/liabilities at fair value through OCI
with recycling of cumulative gains and losses
Financial assets/liabilities designated at fair value through OCI with no
recycling of cumulative gains and losses upon
derecognition
Total
As at 31st March 2022 2021 2022 2021 2022 2021 2022 2021
Rs 000’s Rs 000’s Rs 000’s Rs 000’s Rs 000’s Rs 000’s Rs 000’s Rs 000’s
Financial instruments in non-current assets/non-current liabilities
Other Non - Current Financial Assets
251,545 334,091 - - 2,988,571 2,922,839 3,240,117 3,256,930
Financial instruments in current assets/current liabilities
Trade & Other Receivables 432,950 6.572.762 - - - - 432,950 6,572,762
Loans and Advances Given to Tea Sellers
702,080 549,982 - - - - 702,080 549,982
Trade and Other Payables (1,133,019) (7,084,324) - - - - (1,133,019) (7,084,324)
Amount Due from Related Parties
6,951 1,506 - - - - 6,951 1,506
Amount Due to Related Parties (9,033) (26,605) - - - - 9,033 (26,605)
Cash in Hand and at Bank 190,657 76,308 - - - - 190,657 76,308
Bank Overdrafts (317,975) (314,389) - - - - (317,975) (314,389)

97
Company Financial assets/liabilities at amortised cost
Financial assets/liabilities at fair value through OCI
with recycling of cumulative gains and losses
Financial assets/liabilities designated at fair value through OCI with no
recycling of cumulative gains and losses upon
derecognition
Total
As at 31st March 2022 2021 2022 2021 2022 2021 2022 2021
Rs 000’s Rs 000’s Rs 000’s Rs 000’s Rs 000’s Rs 000’s Rs 000’s Rs 000’s
Financial instruments in non-current assets/non-current liabilities
Other Non - Current Financial Assets
236,709 309,697 - - 2,988,572 2,922,839 3,225,282 3,232,536
Financial instruments in current assets/current liabilities
Trade & Other Receivables 158,723 192,792 - - - - 158,723 192,792
Loans and Advances Given to Tea Sellers
702,080 545,035 - - - - 702,080 545,035
Trade and Other Payables (663,126) (541,511) - - - - (663,126) (541,511)
Amount Due from Related Parties
4,735 1,131 - - - - 4,735 1,131
Amount Due to Related Parties (7,119) (4,549) - - - - - (4,549)
Cash in Hand and at Bank 129,375 59,357 - - - - 129,375 59,357
Bank Overdrafts (307,492) (294,549) - - - - (307,492) (294,549)
The fair value of loans and receivables is not significantly different from the value based on amortised cost methodology.
The management assessed that, cash and short-term deposits, trade receivables, trade payables, loans and advances given to Tea Sellers, bank overdrafts and other current financial liabilities approximate their carrying amounts largely due to the short-term maturities of these instruments.
Fair value is the price that would be received to sell an asset or paid to transfer a liability in an orderly transaction between market participants at the measurement date.
The following methods and assumptions were used to estimate the fair values:Fair value of quoted equities, debentures and bonds is based on price quotations in an active market at the reporting date

98
JOHN KEELLS PLCAnnual Report 2021/22
Notes to the Financial Statements
10 REVENUEAccounting policyContracts with customersRevenue from contracts with Group is recognised when control of the services are transferred to the customer at an amount that reflects the consideration to which the Group expects to be entitled in exchange for those services.
Services transferred point of timeUnder SLFRS 15, the Group determines at contract inception whether it satisfies the performance obligation at a point in time. For each performance obligation satisfied overtime, the Group recognises the revenue over time by measuring the progress towards complete satisfaction of that performance obligation.
10.1 Disaggregation of revenue
Group Company
2022 2021 2022 2021
Rs 000's Rs 000's Rs 000's Rs 000's
Brokerage Fee 716,876 623,257 256,520 241,610
Warehousing income 136,710 97,963 - -
Other 29,325 31,789 29,325 31,789
Total Revenue from Contract with Customers 882,911 753,009 285,845 273,399
Interest Earned on Loans and Advances 67,870 79,581 67,870 79,581
Rental income earned 1,720 1,685 1,720 1,685
Inter Segement Revenue (6,334) (6,058) - -
Total Revenue 946,167 828,218 355,435 354,666
10.2 Reconciliation of revenueReconciliation between Revenue from contracts with customers and revenue information that is disclosed for each reportable segments has been provided in the operating segments information section.
11 DIVIDEND INCOMEAccounting policyDividend income is recognised when the Company’s right to receive the payment is established.
Group Company
For the year ended 31st March 2022 2021 2022 2021
Rs 000's Rs 000's Rs 000's Rs 000's
Income from investments in related parties - - 96,960 69,280
- - 96,960 69,280
12 OTHER OPERATING INCOMEAccounting policyGains and lossesNet gains and losses of a revenue nature arising from the disposal of property, plant and equipment and other non-current assets, including investments, are accounted for in the income statement, after deducting from the proceeds on disposal, the carrying amount of such assets and the related selling expenses.
Gains and losses arising from activities incidental to the main revenue generating activities and those arising from a group of similar transactions, which are not material are aggregated, reported and presented on a net basis.
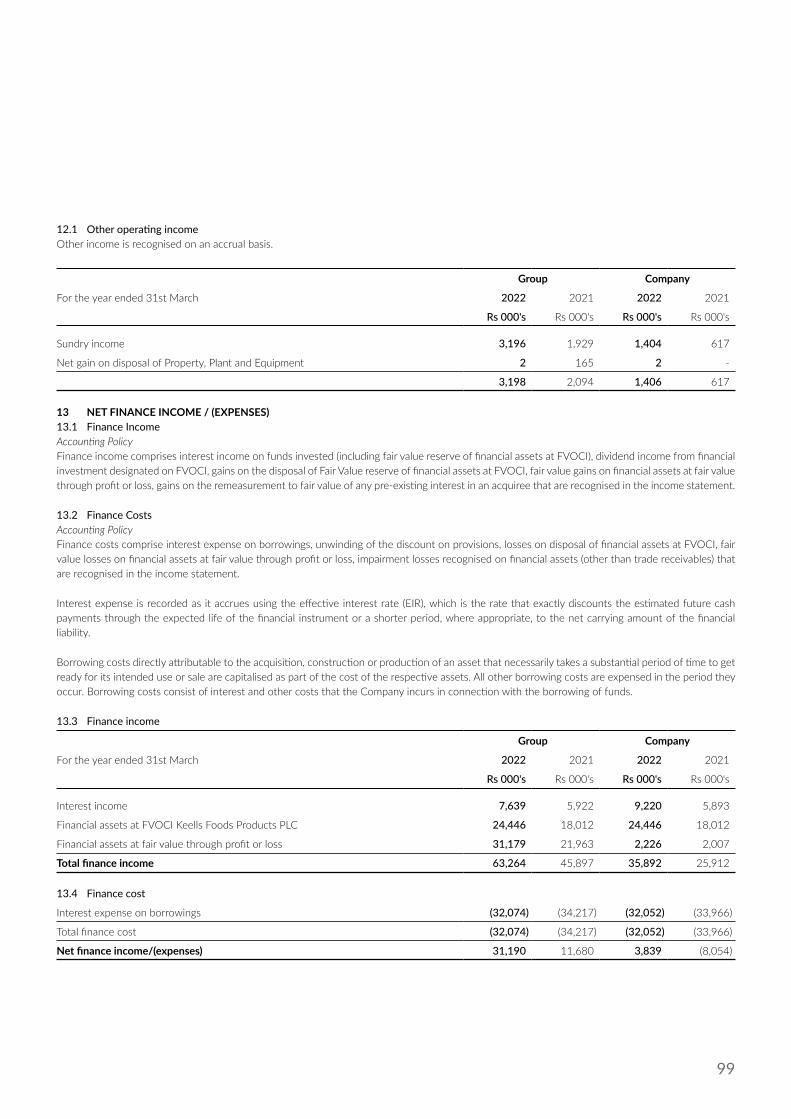
99
12.1 Other operating incomeOther income is recognised on an accrual basis.
Group Company
For the year ended 31st March 2022 2021 2022 2021
Rs 000's Rs 000's Rs 000's Rs 000's
Sundry income 3,196 1,929 1,404 617
Net gain on disposal of Property, Plant and Equipment 2 165 2 -
3,198 2,094 1,406 617
13 NET FINANCE INCOME / (EXPENSES)13.1 Finance IncomeAccounting PolicyFinance income comprises interest income on funds invested (including fair value reserve of financial assets at FVOCI), dividend income from financial investment designated on FVOCI, gains on the disposal of Fair Value reserve of financial assets at FVOCI, fair value gains on financial assets at fair value through profit or loss, gains on the remeasurement to fair value of any pre-existing interest in an acquiree that are recognised in the income statement.
13.2 Finance CostsAccounting PolicyFinance costs comprise interest expense on borrowings, unwinding of the discount on provisions, losses on disposal of financial assets at FVOCI, fair value losses on financial assets at fair value through profit or loss, impairment losses recognised on financial assets (other than trade receivables) that are recognised in the income statement.
Interest expense is recorded as it accrues using the effective interest rate (EIR), which is the rate that exactly discounts the estimated future cash payments through the expected life of the financial instrument or a shorter period, where appropriate, to the net carrying amount of the financial liability.
Borrowing costs directly attributable to the acquisition, construction or production of an asset that necessarily takes a substantial period of time to get ready for its intended use or sale are capitalised as part of the cost of the respective assets. All other borrowing costs are expensed in the period they occur. Borrowing costs consist of interest and other costs that the Company incurs in connection with the borrowing of funds.
13.3 Finance income
Group Company
For the year ended 31st March 2022 2021 2022 2021
Rs 000's Rs 000's Rs 000's Rs 000's
Interest income 7,639 5,922 9,220 5,893
Financial assets at FVOCI Keells Foods Products PLC 24,446 18,012 24,446 18,012
Financial assets at fair value through profit or loss 31,179 21,963 2,226 2,007
Total finance income 63,264 45,897 35,892 25,912
13.4 Finance cost
Interest expense on borrowings (32,074) (34,217) (32,052) (33,966)
Total finance cost (32,074) (34,217) (32,052) (33,966)
Net finance income/(expenses) 31,190 11,680 3,839 (8,054)

100
JOHN KEELLS PLCAnnual Report 2021/22
Notes to the Financial Statements
14 PROFIT BEFORE TAXAccounting PolicyExpenditure recognitionExpenses are recognised in the income statement on the basis of a direct association between the cost incurred and the earning of specific items of income. All expenditure incurred in the running of the business and in maintaining the property, plant and equipment in a state of efficiency has been charged to the income statement.
For the purpose of presentation of the income statement, the “function of expenses” method has been adopted, on the basis that it presents fairly the elements of the Group’s and Company performance.
Group Company
For the year ended 31st March 2022 2021 2022 2021
Rs 000's Rs 000's Rs 000's Rs 000's
PROFIT BEFORE TAX
Profit before tax is stated after charging all expenses including the following;
Administration Expenses
Remuneration to Non Executive Directors 7,997 7,457 6,000 5,460
Audit Fees 2,476 2,164 1,475 1,158
Amortisation of Right of Use Assets - Lease hold properties 1,089 1,089 - -
Personnel costs includes
Defined Benefit Plan Cost 10,162 12,038 5,833 6,348
Defined Contribution Plan Cost - EPF and ETF 30,865 30,198 13,590 12,924
Other Staff Cost 313,846 267,858 112,652 108,470
Depreciation of Property, Plant and Equipment 21,262 20,634 2,995 2,956
Amortization of Intangible Assets 2,519 2,058 1,221 1,421
Other long term employee benefits cost 7,205 3,434 2,762 3,464
Donations 1,737 1,301 528 878
Selling and Distribution Expenses
Impairment (Recoveries) of Trade Receivables 44,447 (17,938) 44,447 (17,938)

101
15 EARNINGS PER SHAREAccounting PolicyBasic EPS is calculated by dividing the profit for the year attributable to ordinary equity holders of the parent by the weighted average number of ordinary shares outstanding during the year.
Group Company
For the year ended 31st March 2022 2021 2022 2021
Rs 000's Rs 000's Rs 000's Rs 000's
Basic earnings per share
Profit attributable to equity holders of the parent 229,577 254,185 161,349 178,871
Weighted average number of ordinary shares (In 000's) 60,800 60,800 60,800 60,800
Rs Rs Rs Rs
Basic earnings per share 3.78 4.18 2.65 2.94
Amount used as denominator
Ordinary shares at the beginning of the year (In 000's) 60,800 60,800 60,800 60,800
Ordinary shares at the end of the year (In 000's) 60,800 60,800 60,800 60,800
16 DIVIDEND PER SHARE
Company
For the Year Ended 31st March 2022 2021
Rs Rs 000's Rs Rs 000's
Equity dividend on ordinary shares
Declared and paid during the year
Out of Dividends received - Free of tax 1.13 68,425 1.00 60,800
Out of Profits -Liable for tax 1.16 70,807 - -
Total dividend 2.29 139,232 1.00 60,800
17 TAXAccounting PolicyCurrent taxCurrent tax assets and liabilities for the current and prior periods are measured at the amount expected to be recovered from or paid to the taxation authorities. The tax rates and tax laws used to compute the amount are those that are enacted or substantively enacted, at the reporting date in the country where the Group operates and generates taxable income.
Current income tax relating to items recognized directly in equity is recognized in equity and for items recognized in other comprehensive income shall be recognized in other comprehensive income not in the income statement. Management periodically evaluates positions taken in the tax returns with respect to situations in which applicable tax regulations are subject to interpretation and establishes provisions where appropriate.
Current taxDeferred tax assets are recognized for all deductible temporary differences, and unused tax credits and tax losses carried forward, to the extent that it is probable that taxable profit will be available against which the deductible temporary differences and the unused tax credits and tax losses carried forward can be utilized except:
· Where the deferred income tax asset relating to the deductible temporary difference arises from the initial recognition of an asset or liability in a transaction that is not a business combination and, at the time of the transaction, affects neither the accounting profit nor taxable profit or loss; and·

102
JOHN KEELLS PLCAnnual Report 2021/22
Notes to the Financial Statements
17 TAX (Contd.)
· in respect of deductible temporary differences associated with investments in subsidiaries and associates, deferred tax assets are recognized only to the extent that it is probable that the temporary differences will reverse in the foreseeable future and taxable profit will be available against which the temporary differences can be utilized.
The carrying amount of deferred tax assets is reviewed at each reporting date and reduced to the extent that it is no longer probable that sufficient taxable profit will be available to allow all or part of the deferred tax asset to be utilized. Unrecognised deferred tax assets are reassessed at each reporting date and are recognised to the extent that it has become probable that future taxable profit will allow the deferred tax asset to be recovered.
Deferred tax assets and liabilities are measured at tax rates that are expected to apply to the year when the asset is realised or liability is settled, based on the tax rates and tax laws that have been enacted or substantively enacted as at the reporting date.
Deferred tax relating to items recognised outside profit or loss is recognised outside profit or loss. Deferred tax items are recognised in correlation to the underlying transaction either in other comprehensive income or directly in equity.
Deferred tax assets and deferred tax liabilities are offset, if a legally enforceable right exists to set off current tax assets against current tax liabilities and when the deferred taxes relate to the same taxable entity and the same taxation authority.
Sales taxRevenues, expenses and assets are recognised net of the amount of sales tax except:
· Where the sales tax incurred on a purchase of a assets or services is not recoverable from the taxation authority, in which case the sales tax is recognised as part of the cost of acquisition of the asset or as part of the expense item as applicable; and
· Receivables and payables that are stated with the amount of sales tax included.
The net amount of sales tax recoverable from, or payable to, the taxation authority is included as part of receivables or payables in the statement of financial position.
Surcharge TaxSurcharge Tax Act No. 14 of 2022 was enacted on 8th April 2022 and is applicable to the John Keells Group as the collective taxable income of companies belonging to the Group, calculated in accordance with the provisions of the Inland Revenue Act No. 24 of 2017, exceeds Rs. 2,000 million, for the year of assessment 2020/2021. The liability is computed at the rate of 25 percent on the taxable income of the individual Group companies, net of dividends from subsidiaries.
As the Act was certified by the Speaker of Parliament after the financial reporting date, no liability has been recognized in FY 2021/2022 on account of the one-off Surcharge Tax as the law had not been enacted as at 31st March 2022.
Total Surcharge Tax liability of Rs. 80.38 Mn and Rs. 30.51 Mn will be recognized in the financial statements of FY 2022/2023 for the Group and the Company respectively as an adjustment to the 1st April 2021 retained earnings in the statement of Changes in Equity as per the Statement of Alternative Treatment (SoAT) issued by The Institute of Chartered Accountants of Sri Lanka.
On 20th April 2022, the Group and the Company paid Rs. 40.19 Mn and Rs. 15.25 Mn respectively on account of the first instalment of the Surcharge Tax liability with the balance payable on 20th July 2022.
17.1 Tax Expense
Group Company
For the year ended 31st March 2022 2021 2022 2021
Rs 000's Rs 000's Rs 000's Rs 000's
Current income tax 109,255 84,443 41,404 41,514
Adjustments in respect of current income tax of Previous Year (2,008) - (2,008) -
Deferred income tax
Relating to origination and reversal of temporary differences 17.2 4,126 (10,294) 4,615 942
111,373 74,149 44,010 42,456
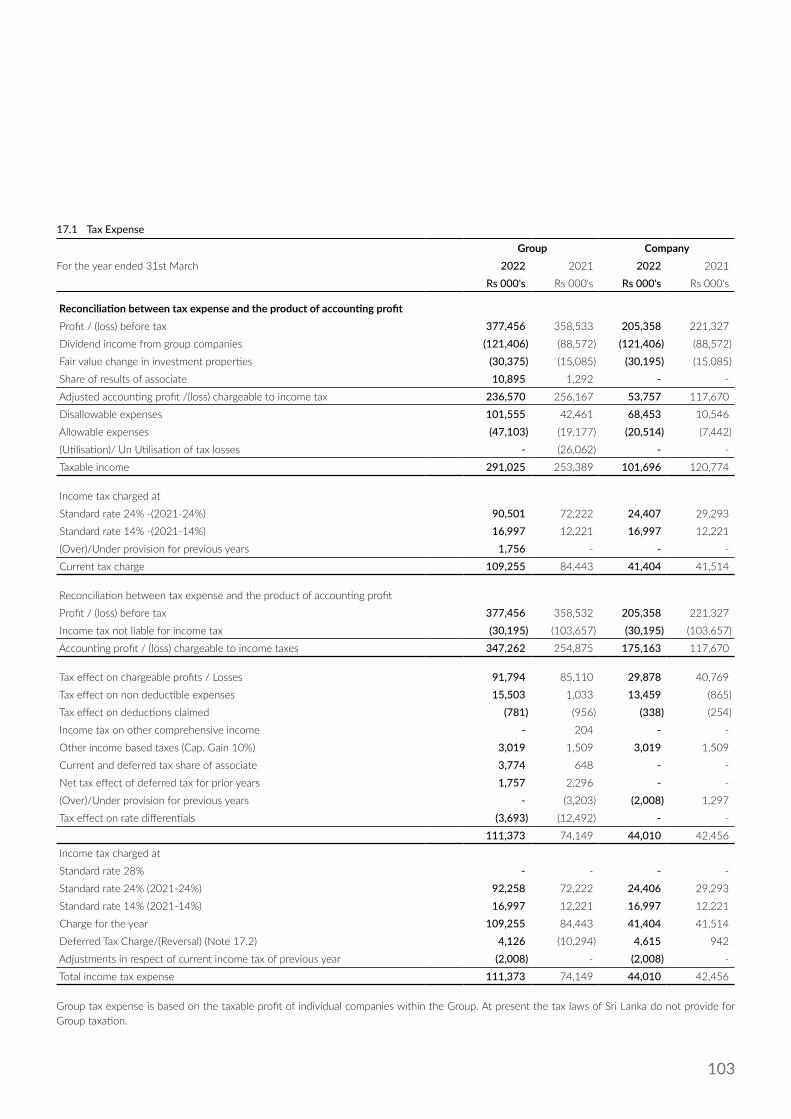
103
17.1 Tax Expense
Group CompanyFor the year ended 31st March 2022 2021 2022 2021
Rs 000's Rs 000's Rs 000's Rs 000's
Reconciliation between tax expense and the product of accounting profit Profit / (loss) before tax 377,456 358,533 205,358 221,327
Dividend income from group companies (121,406) (88,572) (121,406) (88,572)
Fair value change in investment properties (30,375) (15,085) (30,195) (15,085)
Share of results of associate 10,895 1,292 - -
Adjusted accounting profit /(loss) chargeable to income tax 236,570 256,167 53,757 117,670
Disallowable expenses 101,555 42,461 68,453 10,546
Allowable expenses (47,103) (19,177) (20,514) (7,442)
(Utilisation)/ Un Utilisation of tax losses - (26,062) - -
Taxable income 291,025 253,389 101,696 120,774
Income tax charged at
Standard rate 24% -(2021-24%) 90,501 72,222 24,407 29,293
Standard rate 14% -(2021-14%) 16,997 12,221 16,997 12,221
(Over)/Under provision for previous years 1,756 - - -
Current tax charge 109,255 84,443 41,404 41,514
Reconciliation between tax expense and the product of accounting profit
Profit / (loss) before tax 377,456 358,532 205,358 221,327
Income tax not liable for income tax (30,195) (103,657) (30,195) (103,657)
Accounting profit / (loss) chargeable to income taxes 347,262 254,875 175,163 117,670
Tax effect on chargeable profits / Losses 91,794 85,110 29,878 40,769
Tax effect on non deductible expenses 15,503 1,033 13,459 (865)
Tax effect on deductions claimed (781) (956) (338) (254)
Income tax on other comprehensive income - 204 - -
Other income based taxes (Cap. Gain 10%) 3,019 1,509 3,019 1,509
Current and deferred tax share of associate 3,774 648 - -
Net tax effect of deferred tax for prior years 1,757 2,296 - -
(Over)/Under provision for previous years - (3,203) (2,008) 1,297
Tax effect on rate differentials (3,693) (12,492) - -
111,373 74,149 44,010 42,456
Income tax charged at
Standard rate 28% - - - -
Standard rate 24% (2021-24%) 92,258 72,222 24,406 29,293
Standard rate 14% (2021-14%) 16,997 12,221 16,997 12,221
Charge for the year 109,255 84,443 41,404 41,514
Deferred Tax Charge/(Reversal) (Note 17.2) 4,126 (10,294) 4,615 942
Adjustments in respect of current income tax of previous year (2,008) - (2,008) -
Total income tax expense 111,373 74,149 44,010 42,456
Group tax expense is based on the taxable profit of individual companies within the Group. At present the tax laws of Sri Lanka do not provide for Group taxation.
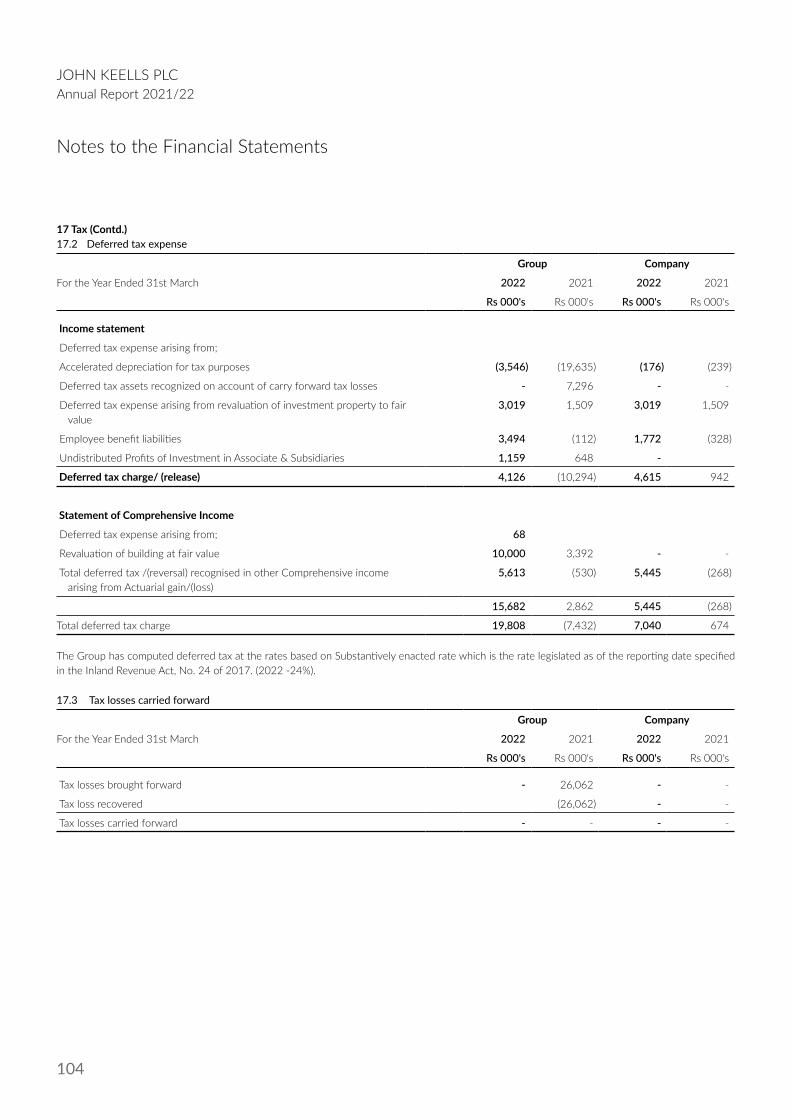
104
JOHN KEELLS PLCAnnual Report 2021/22
Notes to the Financial Statements
17 Tax (Contd.)17.2 Deferred tax expense
Group Company
For the Year Ended 31st March 2022 2021 2022 2021
Rs 000's Rs 000's Rs 000's Rs 000's
Income statement
Deferred tax expense arising from;
Accelerated depreciation for tax purposes (3,546) (19,635) (176) (239)
Deferred tax assets recognized on account of carry forward tax losses - 7,296 - -
Deferred tax expense arising from revaluation of investment property to fair value
3,019 1,509 3,019 1,509
Employee benefit liabilities 3,494 (112) 1,772 (328)
Undistributed Profits of Investment in Associate & Subsidiaries 1,159 648 -
Deferred tax charge/ (release) 4,126 (10,294) 4,615 942
Statement of Comprehensive Income
Deferred tax expense arising from; 68
Revaluation of building at fair value 10,000 3,392 - -
Total deferred tax /(reversal) recognised in other Comprehensive income arising from Actuarial gain/(loss)
5,613 (530) 5,445 (268)
15,682 2,862 5,445 (268)
Total deferred tax charge 19,808 (7,432) 7,040 674
The Group has computed deferred tax at the rates based on Substantively enacted rate which is the rate legislated as of the reporting date specified in the Inland Revenue Act, No. 24 of 2017. (2022 -24%).
17.3 Tax losses carried forward
Group Company
For the Year Ended 31st March 2022 2021 2022 2021
Rs 000's Rs 000's Rs 000's Rs 000's
Tax losses brought forward - 26,062 - -
Tax loss recovered (26,062) - -
Tax losses carried forward - - - -

105
17.4 Income Tax Liabilities/Refunds
Group Company
For the Year Ended 31st March 2022 2021 2022 2021
Rs 000's Rs 000's Rs 000's Rs 000's
At the beginning of the year 41,293 8,405 22,850 8,535
Charge for the year 104,632 89,058 41,403 41,514
(Over)/ Under Provision of current tax of previous Years 1,359 322 (648) 322
WHT Set off against Payments - (544) - -
Payments and set off against refunds (111,931) (55,948) (44,511) (27,521)
At the end of the year 35,353 41,293 19,094 22,850
Income tax refund - - - -
Income tax liability 35,353 41,293 19,094 22,850
17.5 Deferred Tax Asset
Group Company
For the year ended 31st March 2022 2021 2022 2021
Rs 000's Rs 000's Rs 000's Rs 000's
At the beginning of the year 8,966 20,049 - 3,975
(Charge) and release (1,485) (8,254) - (942)
(Charge) and release Other - Comprehensive Income (168) 674 - 470
Deferred tax on other unquoted equity investments - (202) - (202)
At the end of the year 7,313 12,267 - 3,301
The closing deferred tax asset balances relate to the following;
Tax effect on gain on remeasurement of FVOCI Financial Assets - 3,752 - 3,752
Accelerated depreciation for tax purposes (441) (2,408) - (2,112)
Revaluation of investment property to fair value 7,754 (10,569) - (10,569)
Employee retirement benefit liability - 21,492 - 12,230
7,313 12,267 - 3,301
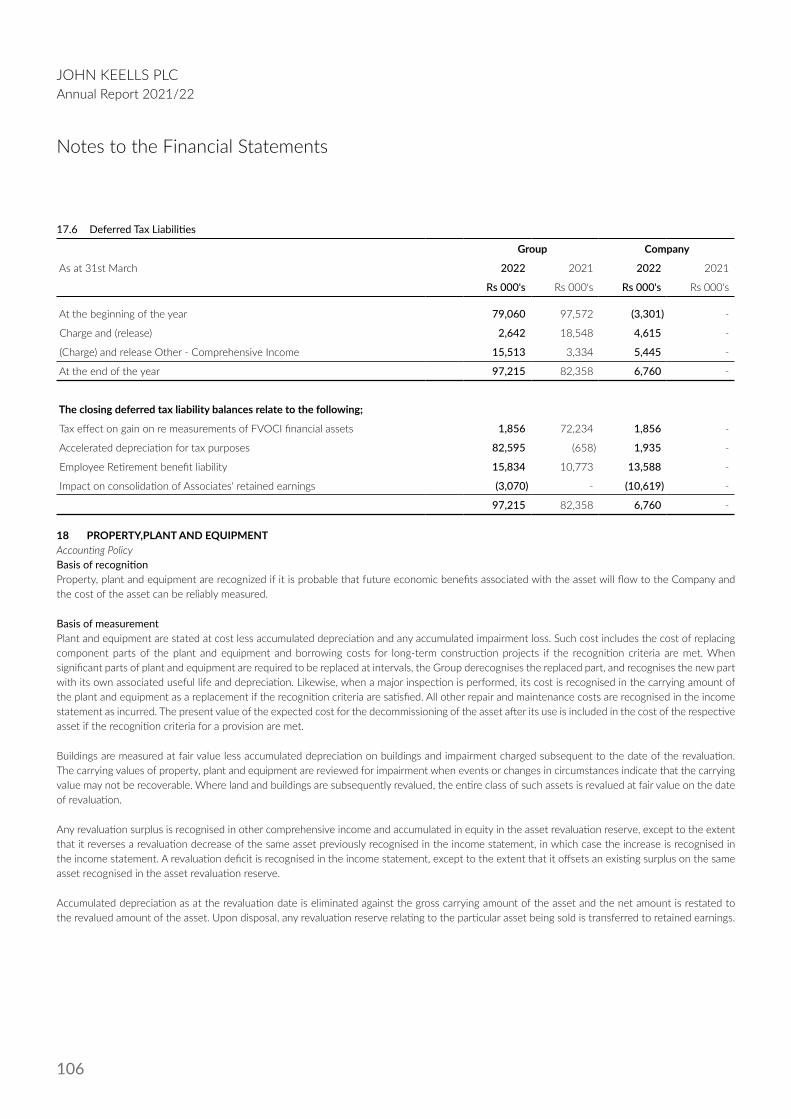
106
JOHN KEELLS PLCAnnual Report 2021/22
Notes to the Financial Statements
17.6 Deferred Tax Liabilities
Group Company
As at 31st March 2022 2021 2022 2021
Rs 000's Rs 000's Rs 000's Rs 000's
At the beginning of the year 79,060 97,572 (3,301) -
Charge and (release) 2,642 18,548 4,615 -
(Charge) and release Other - Comprehensive Income 15,513 3,334 5,445 -
At the end of the year 97,215 82,358 6,760 -
The closing deferred tax liability balances relate to the following;
Tax effect on gain on re measurements of FVOCI financial assets 1,856 72,234 1,856 -
Accelerated depreciation for tax purposes 82,595 (658) 1,935 -
Employee Retirement benefit liability 15,834 10,773 13,588 -
Impact on consolidation of Associates' retained earnings (3,070) - (10,619) -
97,215 82,358 6,760 -
18 PROPERTY,PLANT AND EQUIPMENTAccounting PolicyBasis of recognitionProperty, plant and equipment are recognized if it is probable that future economic benefits associated with the asset will flow to the Company and the cost of the asset can be reliably measured.
Basis of measurementPlant and equipment are stated at cost less accumulated depreciation and any accumulated impairment loss. Such cost includes the cost of replacing component parts of the plant and equipment and borrowing costs for long-term construction projects if the recognition criteria are met. When significant parts of plant and equipment are required to be replaced at intervals, the Group derecognises the replaced part, and recognises the new part with its own associated useful life and depreciation. Likewise, when a major inspection is performed, its cost is recognised in the carrying amount of the plant and equipment as a replacement if the recognition criteria are satisfied. All other repair and maintenance costs are recognised in the income statement as incurred. The present value of the expected cost for the decommissioning of the asset after its use is included in the cost of the respective asset if the recognition criteria for a provision are met.
Buildings are measured at fair value less accumulated depreciation on buildings and impairment charged subsequent to the date of the revaluation. The carrying values of property, plant and equipment are reviewed for impairment when events or changes in circumstances indicate that the carrying value may not be recoverable. Where land and buildings are subsequently revalued, the entire class of such assets is revalued at fair value on the date of revaluation.
Any revaluation surplus is recognised in other comprehensive income and accumulated in equity in the asset revaluation reserve, except to the extent that it reverses a revaluation decrease of the same asset previously recognised in the income statement, in which case the increase is recognised in the income statement. A revaluation deficit is recognised in the income statement, except to the extent that it offsets an existing surplus on the same asset recognised in the asset revaluation reserve.
Accumulated depreciation as at the revaluation date is eliminated against the gross carrying amount of the asset and the net amount is restated to the revalued amount of the asset. Upon disposal, any revaluation reserve relating to the particular asset being sold is transferred to retained earnings.

107
DerecognitionAn item of property, plant and equipment are derecognised upon replacement, disposal or when no future economic benefits are expected from its use. Any gain or loss arising on derecognition of the asset is included in the income statement in the year the asset is derecognised.
DepreciationDepreciation is calculated by using a straight-line method on the cost or valuation of all property, plant and equipment, other than freehold land, in order to write off such amounts over the estimated useful economic life of such assets.
The estimated useful life of assets is as follows:
Assets Years
Buildings on leasehold land over the Lease period
Plant and machinery 2-10
Equipment 6-8
Furniture and fittings 8
Motor vehicles 5
Computer Equipment 5
Other 5
The asset’s residual values and useful lives are reviewed, and adjusted if appropriate, at each financial year end.

108
JOHN KEELLS PLCAnnual Report 2021/22
Notes to the Financial Statements
18
PRO
PERT
Y,PL
AN
T A
ND
EQ
UIP
MEN
T (C
ontd
.)
Gro
upBu
ildin
gs o
nLe
aseh
old
Lan
d
Pla
nt a
n m
achi
nery
F
urni
tur
and
fitti
ngs
Mot
or v
ehic
les
Com
pute
r e
quip
men
t O
ffice
e
quip
men
t O
ther
s To
tal
2022
Tot
al
2021
R
s 00
0's
Rs
000'
s R
s 00
0’s
Rs
000'
s R
s 00
0's
Rs
000'
s R
s 00
0’s
Rs 0
00’s
Rs
000'
s
18.1
Co
st/V
alua
tion
At th
e be
ginn
ing
of th
e ye
ar 3
25,0
00
35,
211
90,2
72 2
9,18
1 23
,391
11,1
561.
670
515
,880
4
96,0
77
Addi
tions
3,9
08
16,
317
2,3
55
- 3
,422
2
40
- 2
6,24
4 7
,193
Reva
luati
on 4
1,66
8 -
- -
- -
- 4
1,66
8 1
4,13
2
Disp
osal
s -
- -
- -
- -
- (2
,334
)
Tran
sfer
s (1
0,57
6)-
--
- -
- (1
0,57
6) (1
0,01
0)
At th
e en
d of
the
year
360
,000
5
1,52
8 9
2,62
7 2
9,18
1 2
6,81
3 1
1,39
6 1
,670
5
73,2
15
505
,058
18.2
Ac
cum
ulat
ed d
epre
ciati
on a
nd im
pairm
ent
At th
e be
ginn
ing
of th
e ye
ar (2
,621
) (2
9,34
3) (8
6,57
7) (1
9,73
9) (1
8,27
6) (4
,903
) (1
,655
) (1
63,1
14)
(143
,998
)
Cha
rge
for t
he y
ear
(11,
013)
(2,7
40)
(2,1
12)
(2,0
54)
(1,7
54)
(1,5
31)
(58)
(21,
262)
(20,
634)
Disp
osal
s-
--
--
--
- 2
,331
Tran
sfer
of a
ccum
ulat
ed d
epre
ciati
on o
n as
set
reva
luati
on 1
0,57
6 -
--
--
- 1
0,57
6 1
0,01
0
At th
e en
d of
the
year
(3,0
58)
(32,
083)
(88,
690)
(21,
793)
(20,
030)
(6,4
34)
(1,7
13)
(173
,801
) (1
52,2
91)
18.3
Ca
rryi
ng v
alue
As a
t 31
Mar
ch 2
022
356
,942
1
9,44
5 3
,938
7
,387
6,7
85
4,9
62
43 3
99,4
15
-
As a
t 31
Mar
ch 2
021
322
,379
5
,868
3
,696
9
,445
5
,115
6
,253
1
5 -
352
,767
Dur
ing
the
finan
cial
yea
r, th
e G
roup
acq
uire
d Pl
ant
and
Equi
pmen
t to
the
agg
rega
te v
alue
of
Rs 2
6.24
Mn
(202
1 -
Rs 7
.19
Mn)
Cas
h pa
ymen
ts a
mou
nting
to
Rs 2
6.24
Mn
(202
1 - R
s 7.
19 M
n) w
as p
aid
durin
g th
e ye
ar fo
r the
acq
uisiti
on o
f Pla
nt a
nd E
quip
men
t.

109
Company Plant an machinery
Furniture and fittings
Motor vehicles
Computer equipment
Office equipment
Others Total 2022
Total 2021
Rs 000's Rs 000’s Rs 000's Rs 000's Rs 000's Rs 000’s Rs 000’s Rs 000's
18.4 Cost
At the beginning of the year 744 22,483 29,180 11,474 719 1,183 65,783 64,869
Additions 139 73 - 1,492 - - 1,703 914
At the end of the year 883 22,556 29,180 12,966 719 1,183 67,486 65,783
18.5 Accumulated depreciation and impairment
At the beginning of the year (229) (22,379) (19,738) (9,994) (632) (1,168) (54,139) (51,183)
Charge for the year (108) (66) (2,053) (699) (52) (15) (2,996) (2,956)
At the end of the year (338) (22,444) (21,793) (10,694) (685) (1,183) (57,135) (54,139)
18.6 Carrying value
As at 31 March 2022 543 113 7,387 2,272 34 0 10,351 -
As at 31 March 2021 515 104 9,442 1,480 87 15 - 11,644
During the financial year, the Company acquired Plant and Equipment to the aggregate value of Rs 1.70 Mn (2021 Rs 0.94Mn) Cash payments amounting to Rs 1.70 Mn (2021 Rs 0.94Mn) was paid during the year for the acquisition of Plant and Equipment.
18.7 Carrying value of Property, Plant and Equipment
Group Company
As at 31st March 2022 2021 2022 2021
Rs 000's Rs 000's Rs 000's Rs 000's
At Cost 42,475 30,386 10,351 11,644
At valuation 356,941 322,380 - -
399,417 352,766 10,351 11,644
18.8 Revaluation of land and buildingsAccounting judgements, estimates and assumptionsThe Group uses the revaluation model of measurement of land and buildings. The Group engaged independent expert valuers to determine the fair value of its land and buildings. Fair value is determined by reference to market-based evidence of transaction prices for similar properties. Valuations are based on open market prices, adjusted for any difference in the nature, location, or condition of the specific property. These valuation techniques that are appropriate in the circumstances and for which sufficient data is available to measure fair value, maximizing the use of relevant observable inputs and minimizing the use of unobservable inputs. The most recent revaluation was carried out on 31 December 2021.
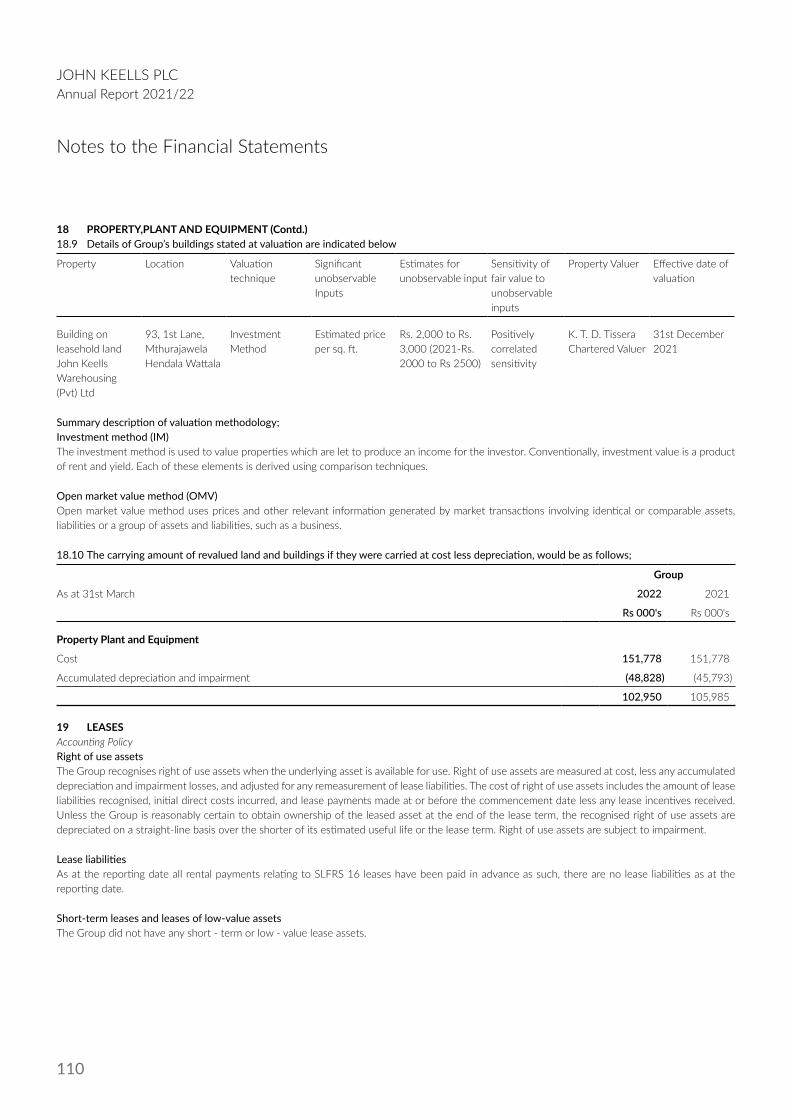
110
JOHN KEELLS PLCAnnual Report 2021/22
Notes to the Financial Statements
18 PROPERTY,PLANT AND EQUIPMENT (Contd.)18.9 Details of Group’s buildings stated at valuation are indicated below
Property Location Valuation technique
Significant unobservable Inputs
Estimates for unobservable input
Sensitivity of fair value to unobservable inputs
Property Valuer Effective date of valuation
Building on leasehold land John Keells Warehousing (Pvt) Ltd
93, 1st Lane, Mthurajawela Hendala Wattala
Investment Method
Estimated price per sq. ft.
Rs. 2,000 to Rs. 3,000 (2021-Rs. 2000 to Rs 2500)
Positively correlated sensitivity
K. T. D. Tissera Chartered Valuer
31st December 2021
Summary description of valuation methodology;Investment method (IM)The investment method is used to value properties which are let to produce an income for the investor. Conventionally, investment value is a product of rent and yield. Each of these elements is derived using comparison techniques.
Open market value method (OMV)Open market value method uses prices and other relevant information generated by market transactions involving identical or comparable assets, liabilities or a group of assets and liabilities, such as a business.
18.10 The carrying amount of revalued land and buildings if they were carried at cost less depreciation, would be as follows;
Group
As at 31st March 2022 2021
Rs 000's Rs 000's
Property Plant and Equipment
Cost 151,778 151,778
Accumulated depreciation and impairment (48,828) (45,793)
102,950 105,985
19 LEASESAccounting PolicyRight of use assetsThe Group recognises right of use assets when the underlying asset is available for use. Right of use assets are measured at cost, less any accumulated depreciation and impairment losses, and adjusted for any remeasurement of lease liabilities. The cost of right of use assets includes the amount of lease liabilities recognised, initial direct costs incurred, and lease payments made at or before the commencement date less any lease incentives received. Unless the Group is reasonably certain to obtain ownership of the leased asset at the end of the lease term, the recognised right of use assets are depreciated on a straight-line basis over the shorter of its estimated useful life or the lease term. Right of use assets are subject to impairment.
Lease liabilitiesAs at the reporting date all rental payments relating to SLFRS 16 leases have been paid in advance as such, there are no lease liabilities as at the reporting date.
Short-term leases and leases of low-value assetsThe Group did not have any short - term or low - value lease assets.

111
19.1 Amounts recognised in the statement of financial position and income statementSet out below, are the carrying amounts of the Group’s right of use assets and the movements for the period ended 31 March 2022.
As at 31st March Group 2022
Company2022
Rs 000's Rs 000’s
Right of Use Assets - Lease hold properties
Cost
At the beginning of the year 35,846 -
Additions - -
Transfers from Lease rentals paid in advance - -
At the end of the year 35,846 -
Accumulated amortisation and impairment
At the beginning of the year 2,178 -
Amortisation 1,089 -
Transfers - -
At the end of the year 3,267 -
Carrying value 32,579 -
The following are the amounts recognised in profit or loss:
Right of use assets
For the year ended 31st MarchGroup 2022
Company2022
Rs 000's Rs 000’s
Amortisation expense of right-of-use assets 1,089 -
Total amount recognised in profit or loss 1,089 -
No expenses relating to short term leases and leases of low value assets has recognized in profit or loss.
19.2 PropertyDetails of Right of Use Assets
As at 31st March Land extent Lease period 2022 2021
In Rs. ‘000s In Rs. ‘000s
Land - Muthurajawela A - 6 and P - 30 50 years from 1 March 2002 32,579 33,668
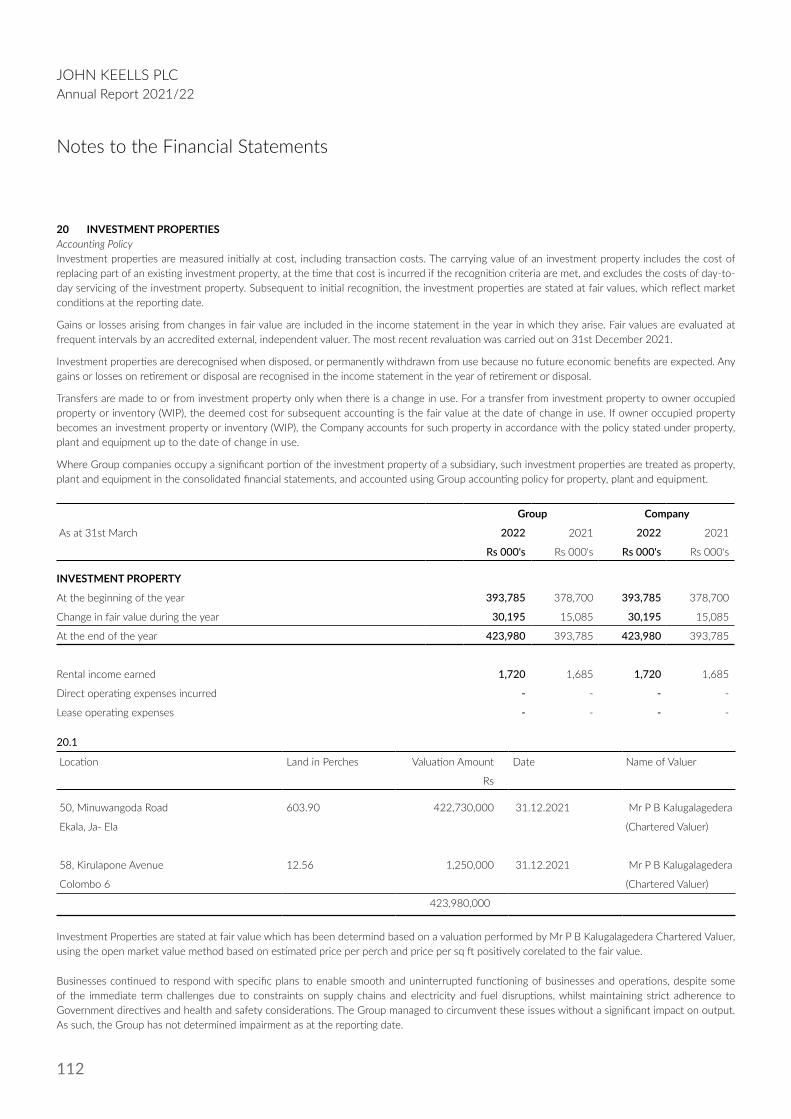
112
JOHN KEELLS PLCAnnual Report 2021/22
Notes to the Financial Statements
20 INVESTMENT PROPERTIESAccounting PolicyInvestment properties are measured initially at cost, including transaction costs. The carrying value of an investment property includes the cost of replacing part of an existing investment property, at the time that cost is incurred if the recognition criteria are met, and excludes the costs of day-to-day servicing of the investment property. Subsequent to initial recognition, the investment properties are stated at fair values, which reflect market conditions at the reporting date.
Gains or losses arising from changes in fair value are included in the income statement in the year in which they arise. Fair values are evaluated at frequent intervals by an accredited external, independent valuer. The most recent revaluation was carried out on 31st December 2021.
Investment properties are derecognised when disposed, or permanently withdrawn from use because no future economic benefits are expected. Any gains or losses on retirement or disposal are recognised in the income statement in the year of retirement or disposal.
Transfers are made to or from investment property only when there is a change in use. For a transfer from investment property to owner occupied property or inventory (WIP), the deemed cost for subsequent accounting is the fair value at the date of change in use. If owner occupied property becomes an investment property or inventory (WIP), the Company accounts for such property in accordance with the policy stated under property, plant and equipment up to the date of change in use.
Where Group companies occupy a significant portion of the investment property of a subsidiary, such investment properties are treated as property, plant and equipment in the consolidated financial statements, and accounted using Group accounting policy for property, plant and equipment.
Group Company
As at 31st March 2022 2021 2022 2021
Rs 000's Rs 000's Rs 000's Rs 000's
INVESTMENT PROPERTY
At the beginning of the year 393,785 378,700 393,785 378,700
Change in fair value during the year 30,195 15,085 30,195 15,085
At the end of the year 423,980 393,785 423,980 393,785
Rental income earned 1,720 1,685 1,720 1,685
Direct operating expenses incurred - - - -
Lease operating expenses - - - -
20.1
Location Land in Perches Valuation Amount Date Name of Valuer
Rs
50, Minuwangoda Road 603.90 422,730,000 31.12.2021 Mr P B Kalugalagedera
Ekala, Ja- Ela (Chartered Valuer)
58, Kirulapone Avenue 12.56 1,250,000 31.12.2021 Mr P B Kalugalagedera
Colombo 6 (Chartered Valuer)
423,980,000
Investment Properties are stated at fair value which has been determind based on a valuation performed by Mr P B Kalugalagedera Chartered Valuer, using the open market value method based on estimated price per perch and price per sq ft positively corelated to the fair value.
Businesses continued to respond with specific plans to enable smooth and uninterrupted functioning of businesses and operations, despite some of the immediate term challenges due to constraints on supply chains and electricity and fuel disruptions, whilst maintaining strict adherence to Government directives and health and safety considerations. The Group managed to circumvent these issues without a significant impact on output. As such, the Group has not determined impairment as at the reporting date.

113
Location Valuation technique Significant unobservable inputs
Estimates for unobservable inputs
Sensitivity of fair value to un observable inputs
50, Minuwangoda Road, Ekala, Ja- Ela Market comparable Method Estimated price per perch
Rs 700,000 Positively correlated sensitivity
58, Kirulapone Avenue, Colombo 6 Book value maintained until the vacant possession of the land is obtained
Estimated price per perch
Rs 100,000 Zero correlated
Real Esate Portfolio
Owning company and location No of buildings Buildingsin (Sq. Ft)
Land in acres Net book value at valuation
Freehold Leasehold 2022 In Rs. ‘000s
2021 In Rs. ‘000s
PROPERTIES IN COLOMBO
56/1, 58, 58 1/1 Kirulapone Avenue, Colombo 5.
1 1,200 12.56 Perches - 1,250 1,250
PROPERTIES OUTSIDE COLOMBO
17/1, Temple Road, Ekala, Ja-Ela. - - 603.9 Perches - 422,730 392,535
93, First Avenue, Muthurajawela, Hendala, Wattala
3 146,743 - A-6 and P-30 360,000 320,000
21 INTANGIBLE ASSETSAccounting PolicyBasis of recognitionAn Intangible asset is recognised if it is probable that future economic benefits associated with the asset will flow to the Company and the cost of the asset can be reliably measured.
Basis of measurementIntangible assets acquired separately are measured on initial recognition at cost.
Following initial recognition, intangible assets are carried at cost less any accumulated amortisation and any accumulated impairment losses.
Internally generated intangible assets, excluding capitalised development costs, are not capitalised, and expenditure is charged against income statement in the year in which the expenditure is incurred.
Useful economic lives, amortization and impairment The useful lives of intangible assets are assessed as either finite or indefinite lives. Intangible assets with finite lives are amortised over the useful economic life and assessed for impairment whenever there is an indication that the intangible asset may be impaired. The amortisation period and the amortisation method for an intangible asset with a finite useful life is reviewed at least at each financial year-end and such changes are treated as accounting estimates. The amortisation expense on intangible assets with finite lives is recognised in the income statement.
Intangible assets with indefinite useful lives are not amortized but tested for impairment annually, or more frequently when an indication of impairment exists either individually or at the cash-generating unit level. The useful life of an intangible asset with an indefinite life is reviewed annually to determine whether indefinite life assessment continues to be supportable. If not, the change in the useful life assessment from indefinite to finite is made on a prospective basis.
Software licenseSoftware license costs are recognised as an intangible asset and amortised over the period of expected future usage of related ERP systems.
Gains or losses arising from de recognition of an intangible asset are measured as the difference between the net disposal proceeds and the carrying amount of the asset and are recognised in the income statement when the asset is derecognised.
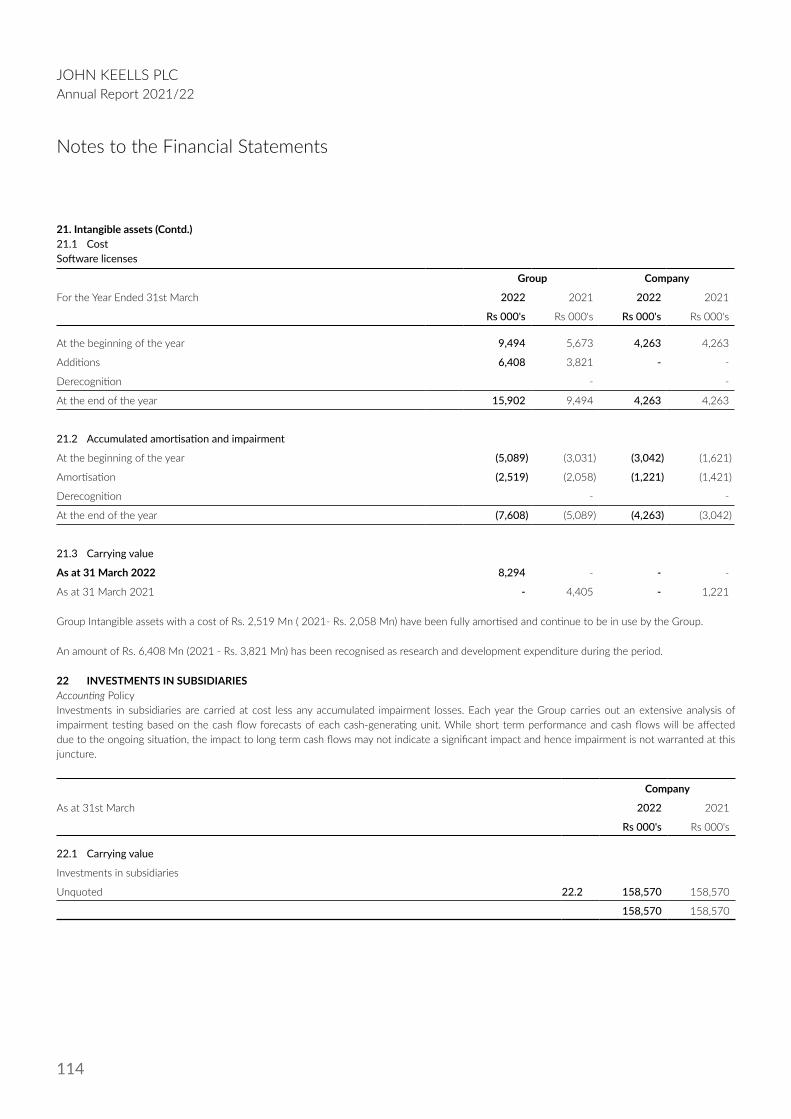
114
JOHN KEELLS PLCAnnual Report 2021/22
Notes to the Financial Statements
21. Intangible assets (Contd.)21.1 CostSoftware licenses
Group Company
For the Year Ended 31st March 2022 2021 2022 2021
Rs 000's Rs 000's Rs 000's Rs 000's
At the beginning of the year 9,494 5,673 4,263 4,263
Additions 6,408 3,821 - -
Derecognition - -
At the end of the year 15,902 9,494 4,263 4,263
21.2 Accumulated amortisation and impairment
At the beginning of the year (5,089) (3,031) (3,042) (1,621)
Amortisation (2,519) (2,058) (1,221) (1,421)
Derecognition - -
At the end of the year (7,608) (5,089) (4,263) (3,042)
21.3 Carrying value
As at 31 March 2022 8,294 - - -
As at 31 March 2021 - 4,405 - 1,221
Group Intangible assets with a cost of Rs. 2,519 Mn ( 2021- Rs. 2,058 Mn) have been fully amortised and continue to be in use by the Group.
An amount of Rs. 6,408 Mn (2021 - Rs. 3,821 Mn) has been recognised as research and development expenditure during the period.
22 INVESTMENTS IN SUBSIDIARIES Accounting PolicyInvestments in subsidiaries are carried at cost less any accumulated impairment losses. Each year the Group carries out an extensive analysis of impairment testing based on the cash flow forecasts of each cash-generating unit. While short term performance and cash flows will be affected due to the ongoing situation, the impact to long term cash flows may not indicate a significant impact and hence impairment is not warranted at this juncture.
Company
As at 31st March 2022 2021
Rs 000's Rs 000's
22.1 Carrying value
Investments in subsidiaries
Unquoted 22.2 158,570 158,570
158,570 158,570
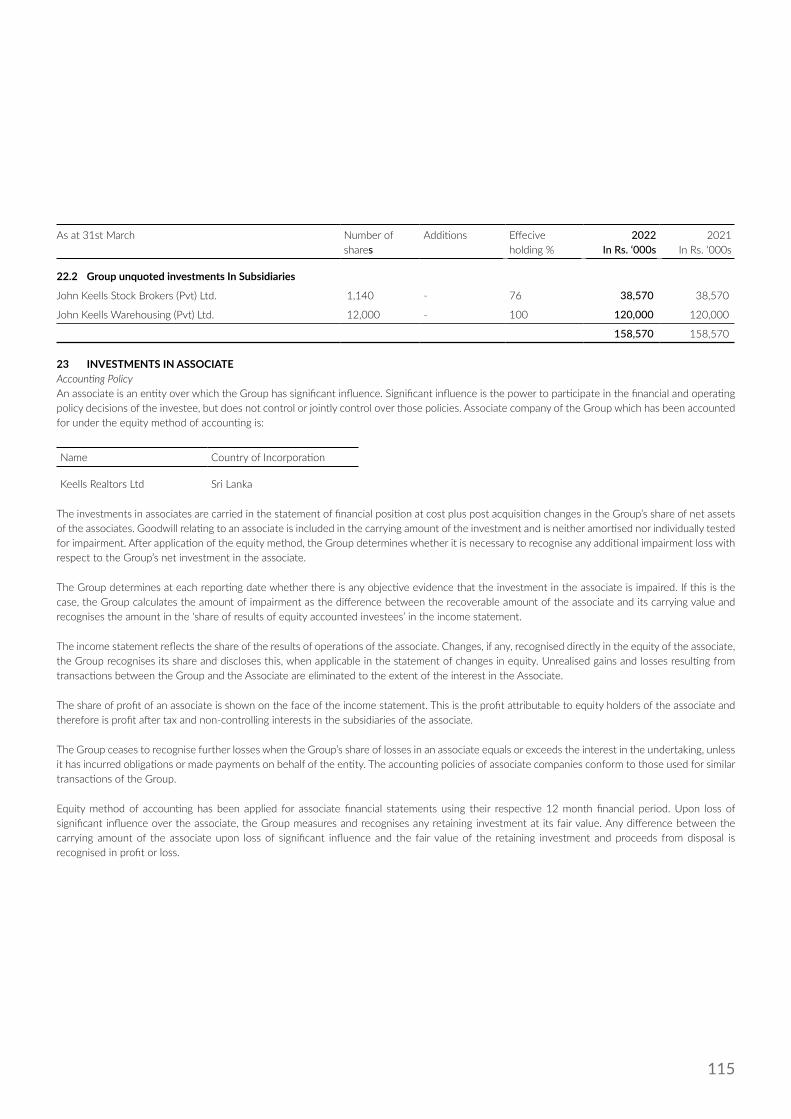
115
As at 31st March Number of shares
Additions Effecive holding %
2022 In Rs. ‘000s
2021 In Rs. ‘000s
22.2 Group unquoted investments In Subsidiaries
John Keells Stock Brokers (Pvt) Ltd. 1,140 - 76 38,570 38,570
John Keells Warehousing (Pvt) Ltd. 12,000 - 100 120,000 120,000
158,570 158,570
23 INVESTMENTS IN ASSOCIATEAccounting PolicyAn associate is an entity over which the Group has significant influence. Significant influence is the power to participate in the financial and operating policy decisions of the investee, but does not control or jointly control over those policies. Associate company of the Group which has been accounted for under the equity method of accounting is:
Name Country of Incorporation
Keells Realtors Ltd Sri Lanka
The investments in associates are carried in the statement of financial position at cost plus post acquisition changes in the Group’s share of net assets of the associates. Goodwill relating to an associate is included in the carrying amount of the investment and is neither amortised nor individually tested for impairment. After application of the equity method, the Group determines whether it is necessary to recognise any additional impairment loss with respect to the Group’s net investment in the associate.
The Group determines at each reporting date whether there is any objective evidence that the investment in the associate is impaired. If this is the case, the Group calculates the amount of impairment as the difference between the recoverable amount of the associate and its carrying value and recognises the amount in the ‘share of results of equity accounted investees’ in the income statement.
The income statement reflects the share of the results of operations of the associate. Changes, if any, recognised directly in the equity of the associate, the Group recognises its share and discloses this, when applicable in the statement of changes in equity. Unrealised gains and losses resulting from transactions between the Group and the Associate are eliminated to the extent of the interest in the Associate.
The share of profit of an associate is shown on the face of the income statement. This is the profit attributable to equity holders of the associate and therefore is profit after tax and non-controlling interests in the subsidiaries of the associate.
The Group ceases to recognise further losses when the Group’s share of losses in an associate equals or exceeds the interest in the undertaking, unless it has incurred obligations or made payments on behalf of the entity. The accounting policies of associate companies conform to those used for similar transactions of the Group.
Equity method of accounting has been applied for associate financial statements using their respective 12 month financial period. Upon loss of significant influence over the associate, the Group measures and recognises any retaining investment at its fair value. Any difference between the carrying amount of the associate upon loss of significant influence and the fair value of the retaining investment and proceeds from disposal is recognised in profit or loss.

116
JOHN KEELLS PLCAnnual Report 2021/22
Notes to the Financial Statements
23 INVESTMENTS IN ASSOCIATE (Contd.)
Group Company
As at 31st March Number of shares Holding 2022 2021 2022 2021
(000’s) % Rs 000's Rs 000's Rs 000's Rs 000's
23.1 Carrying value
Unquoted ordinary shares
Keells Realtors Ltd 2,400 32 24,000 24,000 24,000 24,000
Share of Profit as at the beginning of the year 76,958 72,331 - -
Cumulative profit/(Loss) accruing to the group net of dividend
8,280 4,627 - -
Net of Dividend 85,238 76,958 - -
Net Assets at the end of the year 109,238 100,958 24,000 24,000
Company
As at 31st March 2022 2021
Rs 000's Rs 000's
23.2 Summarised financial information of Associate
Revenue 5,085 7,670
Cost of sales (1,590) (684)
Gross Profit 3,495 6,986
Total Operating Expenses (3,094) (3,072)
Financial Income 59 122
Change in fair value of Investment Property 33,588 -
Income Tax Expenses (8,171) 14,423
Profit for the year 25,877 18,459
Group share of profit for the year 10,895 1,292
Group share of other comprehensive income - -
Share of results of equity accounted investee 10,895 1,292
Non - Current Assets 439,389 405,060
Current Assets 3,767 3,330
Total Assets 443,155 408,390
Non - Current Liabilities (100,499) (92,438)
Current Liabilities (1,285) (455)
Net Assets 341,370 315,497
Group Share of net Assets 109,238 100,958
Each year the Group carries out an extensive analysis of impairment testing based on cash flow forecast of each cash-generating unit. While short term performance and cash flows will be affected due to the ongoing situation, the impact to long term cash flows may not indicate a significant impact and hence impairment is not warranted at this juncture.

117
24 NON CURRENT FINANCIAL ASSETS
Group Company
As at 31st March Note 2022 2021 2022 2021
Rs 000's Rs 000's Rs 000's Rs 000's
Other quoted equity investments 24.1 427,794 418,144 427,794 418,144
Other unquoted equity investments 24.2 2,560,777 2,504,695 2,560,778 2,504,695
Loans to executives 24.4 25,211 27,283 11,374 9,888
Loans given to Tea Sellers 24.3 225,335 299,809 225,335 299,809
Deposits with Colombo Stock Exchange 1,000 7,000 - -
3,240,117 3,256,930 3,225,282 3,232,536
24.1 Other quoted equity investments
Group Company
As at 31st March Number ofshares
Holding 2022 2021 2022 2021
000’s % Rs 000's Rs 000's Rs 000's Rs 000's
Keells Food Products PLC
At the beginning of the year 134,599 134,599 134,599 134,599
At the end of the year 2,573 10.09 134,599 134,599 134,599 134,599
Market Value
Keells Food Products PLC 427,794 418,144 427,794 418,144
427,794 418,144 427,794 418,144
The market value of quoted investments amounts to Rs. 427 Mn (2021 - Rs. 418 Mn).
24.2 Other unquoted equity investments
Group Company
As at 31st March 2022Number of
shares
2021Number of
shares
2022 2021 2022 2021
000’s 000’s Rs 000's Rs 000's Rs 000's Rs 000's
Ceylon Cold Stores PLC - Preference Share 1 1 1 1 1 1
Waterfront Properties (Pvt) Ltd 191,638 191,638
At the beginning of the year 2,504,694 2,502,676 2,504,694 2,502,676
Remeasurement gain recognised for the year 56,083 2,018 56,083 2,018
2,560,777 2,504,694 2,560,777 2,504,694
The Company’s shareholding in Waterfront Properties (Pvt) Ltd diluted to 2.68% as at 31.03.2022 from 3.31% as at end of the last financial year as a result of the direct investment in stated capital of Waterfront Properties (Pvt) Ltd by John Keells Holdings PLC.
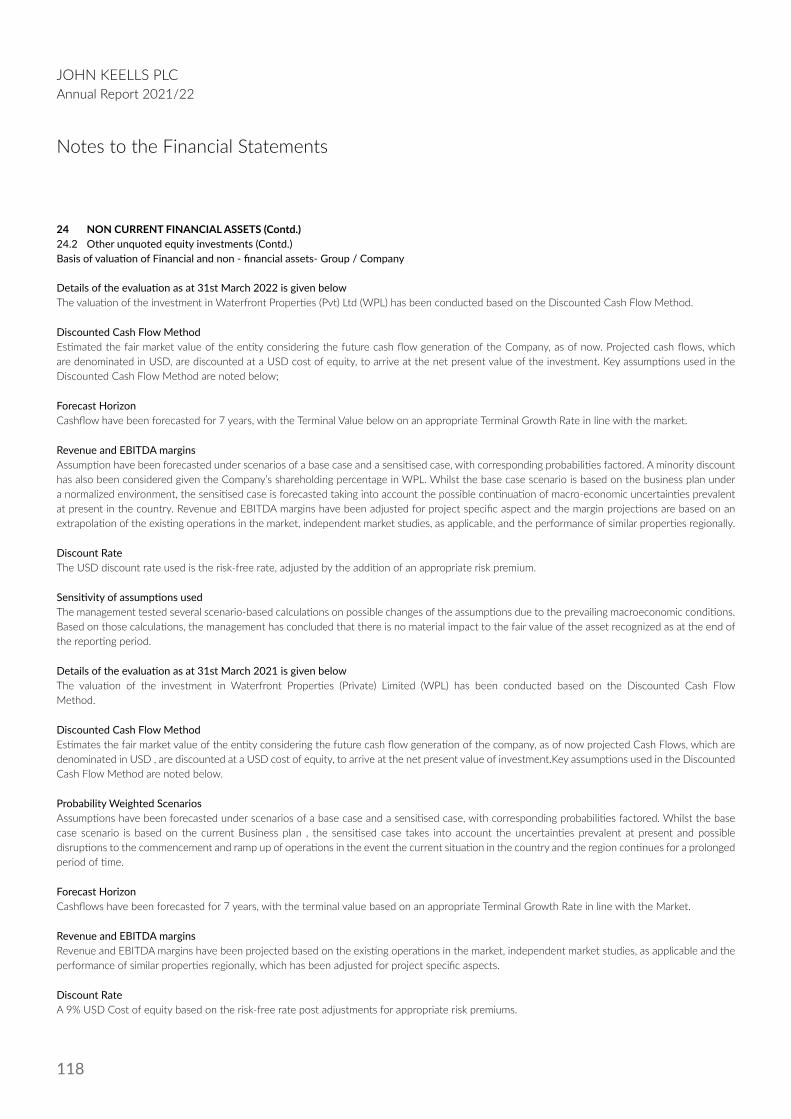
118
JOHN KEELLS PLCAnnual Report 2021/22
Notes to the Financial Statements
24 NON CURRENT FINANCIAL ASSETS (Contd.)24.2 Other unquoted equity investments (Contd.)Basis of valuation of Financial and non - financial assets- Group / Company
Details of the evaluation as at 31st March 2022 is given belowThe valuation of the investment in Waterfront Properties (Pvt) Ltd (WPL) has been conducted based on the Discounted Cash Flow Method.
Discounted Cash Flow Method Estimated the fair market value of the entity considering the future cash flow generation of the Company, as of now. Projected cash flows, which are denominated in USD, are discounted at a USD cost of equity, to arrive at the net present value of the investment. Key assumptions used in the Discounted Cash Flow Method are noted below;
Forecast HorizonCashflow have been forecasted for 7 years, with the Terminal Value below on an appropriate Terminal Growth Rate in line with the market.
Revenue and EBITDA marginsAssumption have been forecasted under scenarios of a base case and a sensitised case, with corresponding probabilities factored. A minority discount has also been considered given the Company’s shareholding percentage in WPL. Whilst the base case scenario is based on the business plan under a normalized environment, the sensitised case is forecasted taking into account the possible continuation of macro-economic uncertainties prevalent at present in the country. Revenue and EBITDA margins have been adjusted for project specific aspect and the margin projections are based on an extrapolation of the existing operations in the market, independent market studies, as applicable, and the performance of similar properties regionally.
Discount Rate The USD discount rate used is the risk-free rate, adjusted by the addition of an appropriate risk premium.
Sensitivity of assumptions usedThe management tested several scenario-based calculations on possible changes of the assumptions due to the prevailing macroeconomic conditions. Based on those calculations, the management has concluded that there is no material impact to the fair value of the asset recognized as at the end of the reporting period.
Details of the evaluation as at 31st March 2021 is given belowThe valuation of the investment in Waterfront Properties (Private) Limited (WPL) has been conducted based on the Discounted Cash Flow Method.
Discounted Cash Flow MethodEstimates the fair market value of the entity considering the future cash flow generation of the company, as of now projected Cash Flows, which are denominated in USD , are discounted at a USD cost of equity, to arrive at the net present value of investment.Key assumptions used in the Discounted Cash Flow Method are noted below.
Probability Weighted ScenariosAssumptions have been forecasted under scenarios of a base case and a sensitised case, with corresponding probabilities factored. Whilst the base case scenario is based on the current Business plan , the sensitised case takes into account the uncertainties prevalent at present and possible disruptions to the commencement and ramp up of operations in the event the current situation in the country and the region continues for a prolonged period of time.
Forecast HorizonCashflows have been forecasted for 7 years, with the terminal value based on an appropriate Terminal Growth Rate in line with the Market.
Revenue and EBITDA marginsRevenue and EBITDA margins have been projected based on the existing operations in the market, independent market studies, as applicable and the performance of similar properties regionally, which has been adjusted for project specific aspects.
Discount RateA 9% USD Cost of equity based on the risk-free rate post adjustments for appropriate risk premiums.
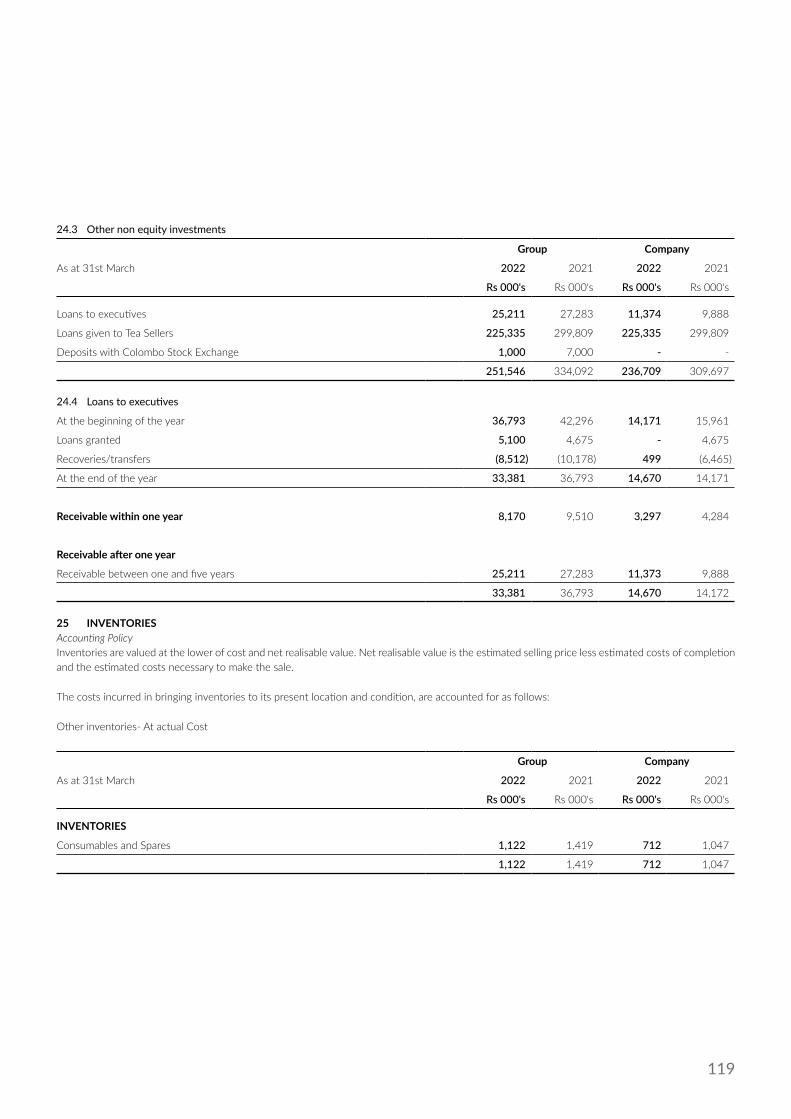
119
24.3 Other non equity investments
Group Company
As at 31st March 2022 2021 2022 2021
Rs 000's Rs 000's Rs 000's Rs 000's
Loans to executives 25,211 27,283 11,374 9,888
Loans given to Tea Sellers 225,335 299,809 225,335 299,809
Deposits with Colombo Stock Exchange 1,000 7,000 - -
251,546 334,092 236,709 309,697
24.4 Loans to executives
At the beginning of the year 36,793 42,296 14,171 15,961
Loans granted 5,100 4,675 - 4,675
Recoveries/transfers (8,512) (10,178) 499 (6,465)
At the end of the year 33,381 36,793 14,670 14,171
Receivable within one year 8,170 9,510 3,297 4,284
Receivable after one year
Receivable between one and five years 25,211 27,283 11,373 9,888
33,381 36,793 14,670 14,172
25 INVENTORIESAccounting PolicyInventories are valued at the lower of cost and net realisable value. Net realisable value is the estimated selling price less estimated costs of completion and the estimated costs necessary to make the sale.
The costs incurred in bringing inventories to its present location and condition, are accounted for as follows:
Other inventories- At actual Cost
Group Company
As at 31st March 2022 2021 2022 2021
Rs 000's Rs 000's Rs 000's Rs 000's
INVENTORIES
Consumables and Spares 1,122 1,419 712 1,047
1,122 1,419 712 1,047

120
JOHN KEELLS PLCAnnual Report 2021/22
Notes to the Financial Statements
26 TRADE AND OTHER RECEIVABLESA receivable represents the Group’s right to an amount of consideration that is unconditional. Trade receivables are on no interest bearing and are generally on the term of 30 to 90 days. In 2022, Rs. 468 million was recognized as provision for allowance for loans and advances given to tea sellers.
The Group’s exposure to credit risk is influenced by the individual characteristics of each customer. The individual receivable balances were re-assessed, specific provisions were made wherever necessary, existing practice on the provisioning of trade receivables were re-visited and adjusted to reflect the different rearrangement of homogeneous groups. Receivable balances are monitored on an ongoing basis to minimise bad debt risk and to ensure default rates are kept very low, whilst the improved operating environment resulted in improved collections during the financial year although there could be stresses in the ensuing year on account of the macroeconomic uncertainty and related impacts to our customers on account of elevated inflation and interest rates and the possible impact on consumer discretionary spend.
Group Company
As at 31st March 2022 2021 2022 2021
Rs 000's Rs 000's Rs 000's Rs 000's
Trade receivables 838,166 6,512,132 623,613 135,245
Advances and loans given to Tea sellers 702,080 1,081,252 702,080 1,081,252
Less: allowance for loans and advances given to Tea Sellers (468,265) (487,173) (468,265) (487,173)
Other Receivables 54,879 7,023 78 4,219
Loans to Executives 24.4 8,170 9,510 3,297 4,284
1,135,030 7,122,744 860,803 737,827
Significant judgements on advances and loans given to Tea sellersThe measurement of provision for impairment allowance requires judgement, in particular, the amount and timing of future cash flows and collateral values when determining impairment losses. Elements that are considered accounting judgements mainly include the length of business relationship between the Tea Sellers and Company and the global demand and anticipated production of Tea.
27 OTHER CURRENT ASSETS
Group Company
As at 31st March 2022 2021 2022 2021
Rs 000's Rs 000's Rs 000's Rs 000's
Prepayments and non cash receivable 33,979 3,052 1,116 1,659
33,979 3,052 1,116 1,659
28 SHORT TERM INVESTMENTSShort-term investments are liquid assets or cash, which are being held for a short period of time, with the primary purpose of controlling the tactical asset allocation.
Group Company
As at 31st March 2022 2021 2022 2021
Rs 000's Rs 000's Rs 000's Rs 000's
Government Securities (less than 3 months) 485,375 481,499 - -
485,375 481,499 - -
29 CASH IN HAND AND AT BANK Accounting PolicyCash and short-term deposits in the statement of financial position comprise cash at banks and on hand and short-term deposits with a maturity of three months or less. For the purpose of the cash flow statement, cash and cash equivalents consist of cash and short-term deposits as defined above, net of outstanding bank overdrafts.

121
29.1 Favourable cash and bank balances
Group Company
As at 31st March 2022 2021 2022 2021
Rs 000's Rs 000's Rs 000's Rs 000's
Cash in hand and at bank 190,657 76,308 129,375 59,357
190,657 76,308 129,375 59,357
29.2 Unfavourable cash and bank balances
Bank Overdrafts 317,975 314,389 307,492 294,549
317,975 314,389 307,492 294,549
Net Cash & Cash Equivalents (127,318) (238,081) (178,117) (235,192)
30 STATED CAPITAL AND OTHER COMPONENTS OF EQUITYAccounting PolicyThe ordinary shares of John Keells PLC are quoted in the Colombo Stock Exchange. Holders of ordinary shares are entitled to receive dividends as declared from time to time, and are eligible to one vote per share at the General Meeting of the Company.
Fair Value reserve of finacial assets at FVOCI included changes of fair value of equity instruments.
Revaluation reserve consist of the net surplus on the revaluation of property, plant and equipment and equipment and present value of acquired in - force business (PVIB)
The other capital reserve is used to recognise the value of equity -settled share based payments provided to employees, including key management personnel, as part of their remuneration.
30.1 Stated Capital
2022 2021
As at 31st March Number ofshares
Value ofshares
Number ofshares
Value ofshares
000’s Rs 000’s 000’s Rs 000’s
Fully paid ordinary shares
At the beginning of the year 60,800 152,000 60,800 152,000
At the end of the year 60,800 152,000 60,800 152,000
30.2 Other Components of Equity
Group Company
As at 31st March 2022 2021 2022 2021
Rs 000's Rs 000's Rs 000's Rs 000's
Fair Value reserve of financial assets at FVOCI 925,825 875,609 935,897 875,609
Revaluation Reserve 214,433 172,461 - -
Other Capital reserves 145,273 139,340 85,320 82,770
1,285,531 1,187,410 1,021,217 958,379

122
JOHN KEELLS PLCAnnual Report 2021/22
Notes to the Financial Statements
31 SHARE BASE PAYMENT PLANSAccounting PolicyEmployees of the Company receive remuneration in the form of share based payment transactions, whereby employees render services as consideration for equity instruments (equity-settled transactions). The Company applied SLFRS 02 Share Based Payments in accounting for employee remuneration in the form of shares from 2013/14 financial year onwards.
Equity-settled transactionsThe cost of equity-settled transactions is recognised, together with a corresponding increase in other capital reserves in equity, over the period in which the performance and service conditions are fulfilled. The cumulative expense recognised for equity-settled transactions at each reporting date until the vesting date reflects the extent to which the vesting period has expired and the Group’s best estimate of the number of equity instruments that will ultimately vest. The income statement expense or credit for a period represents the movement in cumulative expense recognised as at the beginning and end of that period and is recognised in the share based payment plan note.
No expense is recognised for awards that do not ultimately vest, except for equity-settled transactions where vesting is conditional upon a market or non-vesting condition, which are treated as vesting irrespective of whether or not the market or non-vesting condition is satisfied, provided that all other performance and service conditions are satisfied.
Where the terms of an equity-settled transaction award are modified, the minimum expense recognised is the expense as if the terms had not been modified, if the original terms of the award are met. An additional expense is recognised for any modification that increases the total fair value of the share-based payment transaction, or is otherwise beneficial to the employee as measured at the date of modification.
Where an equity-settled award is cancelled, it is treated as if it vested on the date of cancellation, and any expense not yet recognised for the award is recognised immediately. This includes any award where non-vesting conditions within the control of either the entity or the employee are not met. However, if a new award is substituted for the cancelled award, and designated as a replacement award on the date that it is granted, the cancelled award and the new award are treated as if they were a modification of the original award, as described in the previous paragraph.
Share Based Payments- Employee Share Option SchemeUnder the John Keells Group’s Employees share option scheme (ESOP), share options of the parent are granted to senior executives of the Company with more than 12 months of service. The exercise price of the share options is equal to the 30 day volume weighted average market price of the underlying shares on the date of grant. The share options vest over a period of four years and is dependent on a performance critera and a service criteria. The performance criteria being a minimum performance achievement of “Met Expectations” and service criteria being that the employee has to be in employment at the time the share options vest. The fair value of the share options is estimated at the grant date using a binomial option pricing model, taking into account the terms and conditions upon which the share options were granted.
The contractual term for each option granted is five years. There are no cash settlement alternatives. The Group does not have a past practice of cash settlement for these share options.
The expense recognised for employee services received during the year is shown in the following table:
Group Company
As at 31st March 2022 2021 2022 2021
Rs 000's Rs 000's Rs 000's Rs 000's
Expense arising from equity-settled share-based payment transactions 6,993 7,372 2,550 2,589
Total expense arising from share-based payment transactions 6,993 7,372 2,550 2,589
Movements in the yearThe following table illustrates the number (No.) and weighted average exercise prices (WAEP) of, and movements in, share options during the year:

123
Group Company
As at 31st March 2022 2021 2022 2021
No. WAEP No. WAEP No. WAEP No. WAEP
Rs Rs Rs Rs
Outstanding at the beginning of the year 1,200,334 151.71 1,432,982 153.16 448,446 152.86 692,606 152.86
Granted during the year 189,700 136.64 190,000 132.86 51,700 136.64 55,000 132.86
Exercised during the year (32,000) 133.76 - - - - - -
Adjusted -Sub division
Adjusted -Warrants
Lapsed/Forfeited during the year (259,846) 144.60 (422,648) 149.84 (89,219) 142.83 (299,160) 149.84
Transfers in /(out) during the year - - - - - - - -
Outstanding at the end of the year 1,098,188 150.71 1,200,334 151.71 410,927 152.53 448,446 152.86
Exercisable at the end of the year 657,535 158.97 673,432 155.75 264,871 160.15 264,782 156.30
Fair value of the share option and assumptionsThe fair value of the share options is estimated at the grant date using a binomial option pricing model, taking into account the terms and conditions upon which the share options were granted.
The valuation takes into account factors such as stock price, expected time to maturity, exercise price, expected volatility of share price, expected dividend yield and risk free interest rate.
32 EMPLOYEE BENEFIT LIABILITIESAccounting Policy
32.1 Employee Contribution Plan - EPF/ETFEmployees are eligible for Employees’ Provident Fund contributions and Employees’ Trust Fund contributions in line with respective statutes and regulations. The companies contribute the defined percentages of gross emoluments of employees to an approved Employees’ Provident Fund and to the Employees’ Trust Fund respectively, which are externally funded.
32.2 Employee Defined Benefit Plan- GratuityThe liability recognised in the statement of financial position is the present value of the defined benefit obligation at the reporting date using the projected unit credit method. Any actuarial gains or losses arising are recognised immediately in statement of other comprehensive income statement.
Group Company
As at 31st March 2022 2021 2022 2021
Rs 000's Rs 000's Rs 000's Rs 000's
EMPLOYEE BENEFIT LIABILITIES
At the beginning of the year 83,419 70,687 42,091 35,428
Current service cost 5,095 4,594 2,045 2,451
Past service cost 1,536 - (367) -
Transfers 92 - 92 -
Interest cost on benefit obligation 3,383 7,444 3,788 3,897
Payments (27,212) (2,353) (15,707) (1,642)
(Gain)/Loss arising from changes in assumptions or due to (over)/under provision in the previous year
(304) 3,048 680 1,957
At the end of the year 65,791 83,420 32,623 42,091

124
JOHN KEELLS PLCAnnual Report 2021/22
Notes to the Financial Statements
32 EMPLOYEE BENEFIT LIABILITIES (Contd.)32.3 The expenses are recognised in the income statement in the following line items;
Group Company
As at 31st March 2022 2021 2022 2021
Rs 000's Rs 000's Rs 000's Rs 000's
Cost of Sales 6,398 6,362 4,359 5,157
Administrative Expenses 3,325 5,635 1,036 1,150
Cost reimbursement for shared employees 439 41 439 41
10,162 12,038 5,833 6,348
The employee benefit liability of listed company and the Group is based on the actuarial valuations carried out by Messrs. Actuarial & Management Consultants (Pvt) Ltd., actuaries.
32.4 The principal assumptions used in determining the cost of employee benefits were:
Group Company
As at 31st March 2022 2021 2022 2021
Discount rate 9.0% 9.0% 9.0% 9.00%
Future salary increases 8.0% 8.0% 8.0% 8.00%
Retirement Age;Executive staff and sales representatives As of 17th November 2021, employees who have attained the age of;
Group Company
2022 2021 2022 2021
Less than 52 years 60 years 55 years 60 years 55 years
53 years 59 years 55 years 59 years 55 years
54 years 58 years 55 years 58 years 55 years
55 years 57 years 55 years 57 years 55 years
The Management tested several scenario based calculations on possible changes of the assumptions due to the prevailing macro-economic conditions. Based on those calculations, the management has concluded that there is no material impact to retirement benefit obligations liability of the Group and the Company.
32.5 Sensitivity of assumptions usedA one percentage change in the assumptions would have the following effects:
Group Company
As at 31st March Discount rate Salary increment Discount rate Salary increment
2022 2021 2022 2021 2022 2021 2022 2021
Rs 000’s Rs 000’s Rs 000’s Rs 000’s Rs 000’s Rs 000’s Rs 000’s Rs 000’s
Effect on the defined benefit obligation liability
Increase by one percentage point (2,999) (3,249) 3,139 3,977 (1,423) (2,227) 1,269 2,573
Decrease by one percentage point 3,076 3,839 (3,098) (3,618) 1,335 2,538 (1,377) (2,298)
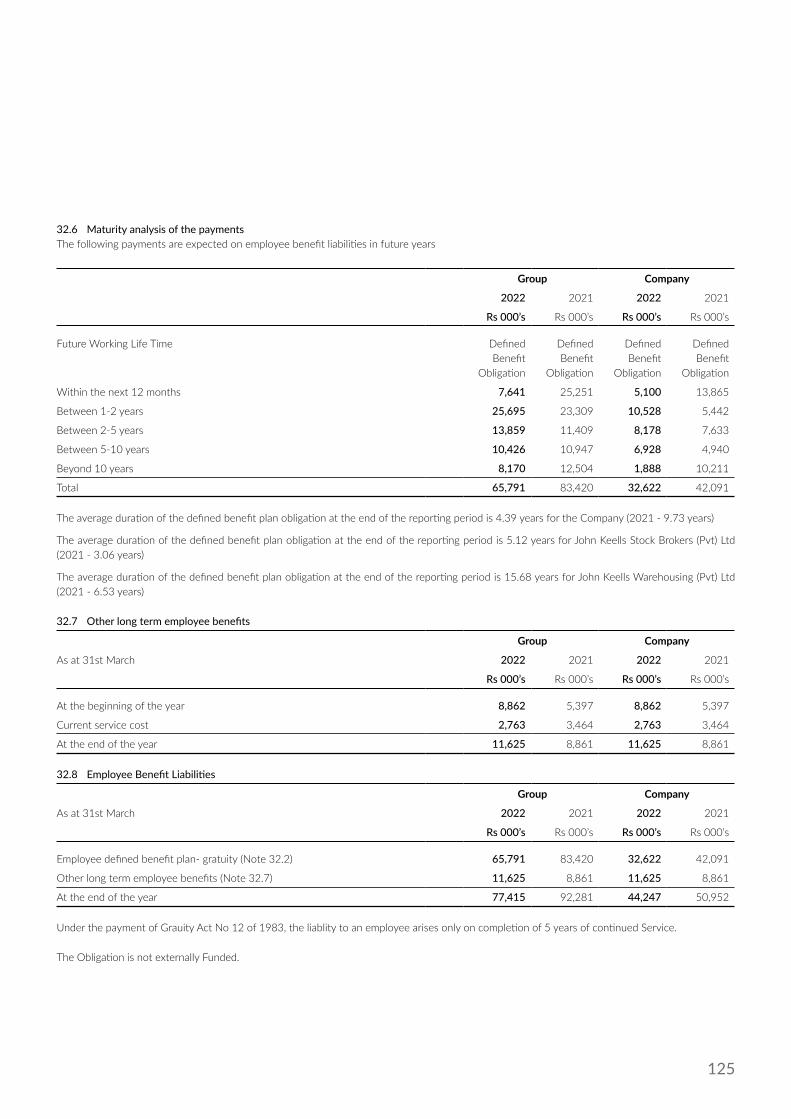
125
32.6 Maturity analysis of the paymentsThe following payments are expected on employee benefit liabilities in future years
Group Company
2022 2021 2022 2021
Rs 000’s Rs 000’s Rs 000’s Rs 000’s
Future Working Life Time Defined Benefit
Obligation
Defined Benefit
Obligation
Defined Benefit
Obligation
Defined Benefit
Obligation
Within the next 12 months 7,641 25,251 5,100 13,865
Between 1-2 years 25,695 23,309 10,528 5,442
Between 2-5 years 13,859 11,409 8,178 7,633
Between 5-10 years 10,426 10,947 6,928 4,940
Beyond 10 years 8,170 12,504 1,888 10,211
Total 65,791 83,420 32,622 42,091
The average duration of the defined benefit plan obligation at the end of the reporting period is 4.39 years for the Company (2021 - 9.73 years)
The average duration of the defined benefit plan obligation at the end of the reporting period is 5.12 years for John Keells Stock Brokers (Pvt) Ltd (2021 - 3.06 years)
The average duration of the defined benefit plan obligation at the end of the reporting period is 15.68 years for John Keells Warehousing (Pvt) Ltd (2021 - 6.53 years)
32.7 Other long term employee benefits
Group Company
As at 31st March 2022 2021 2022 2021
Rs 000’s Rs 000’s Rs 000’s Rs 000’s
At the beginning of the year 8,862 5,397 8,862 5,397
Current service cost 2,763 3,464 2,763 3,464
At the end of the year 11,625 8,861 11,625 8,861
32.8 Employee Benefit Liabilities
Group Company
As at 31st March 2022 2021 2022 2021
Rs 000’s Rs 000’s Rs 000’s Rs 000’s
Employee defined benefit plan- gratuity (Note 32.2) 65,791 83,420 32,622 42,091
Other long term employee benefits (Note 32.7) 11,625 8,861 11,625 8,861
At the end of the year 77,415 92,281 44,247 50,952
Under the payment of Grauity Act No 12 of 1983, the liablity to an employee arises only on completion of 5 years of continued Service.
The Obligation is not externally Funded.

126
JOHN KEELLS PLCAnnual Report 2021/22
Notes to the Financial Statements
33 TRADE AND OTHER PAYABLESAccounting PolicyTrade payables are the aggregate amount of obligations to pay for goods and services, that have been acquired in the ordinary course of business.
Group Company
As at 31st March 2022 2021 2022 2021
Rs 000’s Rs 000’s Rs 000’s Rs 000’s
Trade payables 1,067,049 7,009,007 633,790 500,908
Sundry creditors including accrued expenses 65,970 75,317 29,336 40,603
1,133,019 7,084,324 663,126 541,511
Trade and other payables are normally non- interest bearing and settled within one year.
34 OTHER CURRENT LIABILITIES Accounting Policy Group classifies all non financial current liabilities under other current liabilities.
These include non refundable deposits and other tax payables. These liabilities are recorded at amounts expected to be set off at the reporting date.
Group Company
As at 31st March 2022 2021 2022 2021
Rs 000’s Rs 000’s Rs 000’s Rs 000’s
OTHER CURRENT LIABILITIES
Other tax payables 3,865 3,305 2,690 2,586
3,865 3,305 2,690 2,586
35 RELATED PARTY TRANSACTIONSTerms and conditions of transactions with related parties.
Transactions with related parties are carried out in the ordinary course of business. Outstanding current account balances at year end are unsecured, interest free and settlement occurs in cash.
The sales to and purchases from related parties are made on terms equivalent to those that prevail in arm’s length transactions.
Non- recurrent related party transactionsThere were no non -recurrent related party transactions which in aggregate value exceeds 10% of equity or 5% of total assets which ever is lower of the Company as per 31st March 2022 audited financial statements, which required additional disclosure in the 2021/2022 Annual Report under Colombo Stock Exchange listing rule 9.3.2 and Code of Best Practice on Related Party Transactions under the Securities and Exchange Commission Directive issued under Section 13 (c ) of the Securities and Exchange Commission Act.
Recurrent related party transactionsThere were no recurrent related party transactions which in aggregate value exceeds 10% of the consolidated revenue of the Group as per 31st March 2022 audited financial statements, which required additional disclosure in the 2021/2022 Annual Report under Colombo Stock Exchange listing rule 9.3.2 and Code of Best Practice on Related Party Transactions under the Securities and Exchange Commission Directive issued under Section 13 (c ) of the Securities and Exchange Commission Act.

127
35.1 Amounts due from related parties
Group Company
As at 31st March 2022 2021 2022 2021
Rs 000’s Rs 000’s Rs 000’s Rs 000’s
Ultimate Parent 3,545 590 3,545 590
Companies Under Common Control 1,792 916 1,190 541
Key management personnel 1,614 - - -
Close family members of KMP - - - -
6,951 1,506 4,735 1,131
35.2 Amounts due to related parties
Ultimate Parent 1,468 1,993 870 1,670
Companies Under Common Control 6,379 859 6,249 2,879
Key management personnel 1,188 18,597 - -
Close family members of KMP - 5,156 - -
9,035 26,605 7,119 4,549
Group Company
For the year ended 31st March 2022 2021 2022 2021
Rs 000’s Rs 000’s Rs 000’s Rs 000’s
35.3 Transactions with related parties
Ultimate Parent - John Keells Holdings PLC
Receiving of Services for which fees are paid 33,923 29,585 18,343 16,588
Companies under Common Control
Purchase of goods for a fee 2,180 687 439 377
Receiving of Services for which fees are paid 27,821 10,205 7,920 7,075
Lending Money for which interest is received 16,586 (1,685) - -
Renting of office space for which rent is received (3,300) (30,753) (1,720) (1,685)
Providing of Services for which fees are received (28,567) 12,904 (21,210) (32,544)
Subsidiaries
Renting of stores space for which rent is paid - - 6,001 6,058
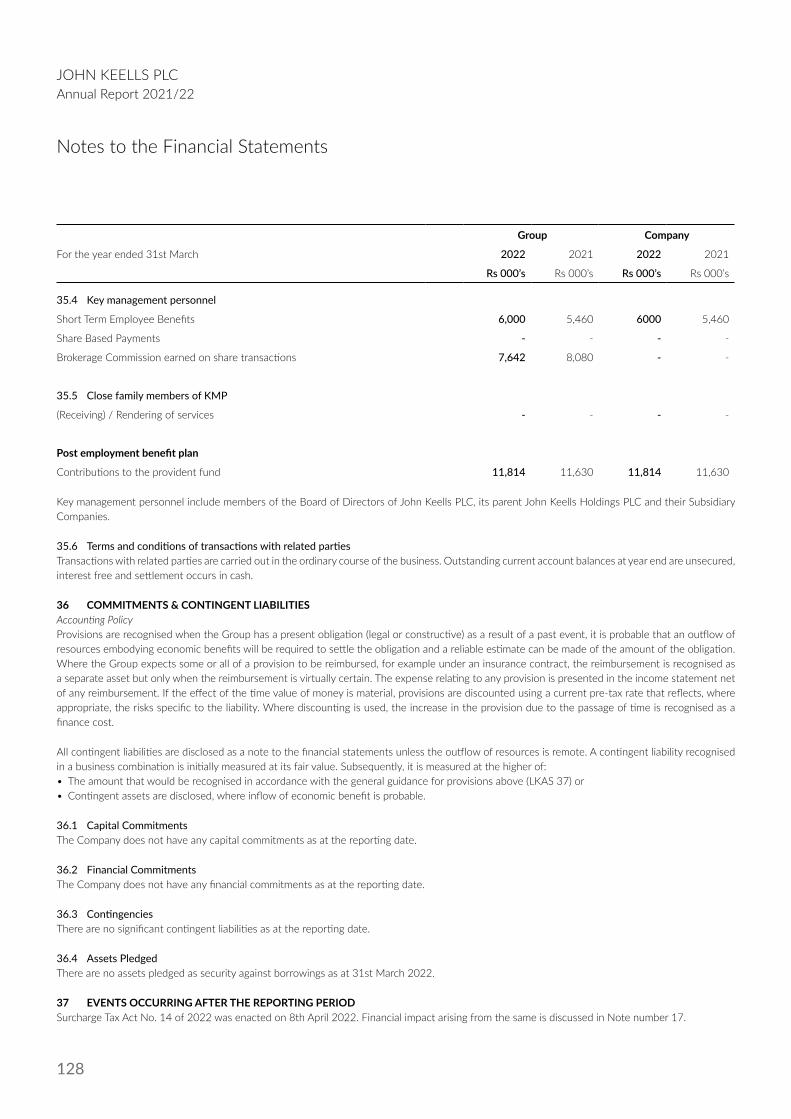
128
JOHN KEELLS PLCAnnual Report 2021/22
Notes to the Financial Statements
Group Company
For the year ended 31st March 2022 2021 2022 2021
Rs 000’s Rs 000’s Rs 000’s Rs 000’s
35.4 Key management personnel
Short Term Employee Benefits 6,000 5,460 6000 5,460
Share Based Payments - - - -
Brokerage Commission earned on share transactions 7,642 8,080 - -
35.5 Close family members of KMP
(Receiving) / Rendering of services - - - -
Post employment benefit plan
Contributions to the provident fund 11,814 11,630 11,814 11,630
Key management personnel include members of the Board of Directors of John Keells PLC, its parent John Keells Holdings PLC and their Subsidiary Companies.
35.6 Terms and conditions of transactions with related partiesTransactions with related parties are carried out in the ordinary course of the business. Outstanding current account balances at year end are unsecured, interest free and settlement occurs in cash.
36 COMMITMENTS & CONTINGENT LIABILITIESAccounting PolicyProvisions are recognised when the Group has a present obligation (legal or constructive) as a result of a past event, it is probable that an outflow of resources embodying economic benefits will be required to settle the obligation and a reliable estimate can be made of the amount of the obligation. Where the Group expects some or all of a provision to be reimbursed, for example under an insurance contract, the reimbursement is recognised as a separate asset but only when the reimbursement is virtually certain. The expense relating to any provision is presented in the income statement net of any reimbursement. If the effect of the time value of money is material, provisions are discounted using a current pre-tax rate that reflects, where appropriate, the risks specific to the liability. Where discounting is used, the increase in the provision due to the passage of time is recognised as a finance cost.
All contingent liabilities are disclosed as a note to the financial statements unless the outflow of resources is remote. A contingent liability recognised in a business combination is initially measured at its fair value. Subsequently, it is measured at the higher of:• The amount that would be recognised in accordance with the general guidance for provisions above (LKAS 37) or• Contingent assets are disclosed, where inflow of economic benefit is probable.
36.1 Capital CommitmentsThe Company does not have any capital commitments as at the reporting date.
36.2 Financial CommitmentsThe Company does not have any financial commitments as at the reporting date.
36.3 ContingenciesThere are no significant contingent liabilities as at the reporting date.
36.4 Assets PledgedThere are no assets pledged as security against borrowings as at 31st March 2022.
37 EVENTS OCCURRING AFTER THE REPORTING PERIODSurcharge Tax Act No. 14 of 2022 was enacted on 8th April 2022. Financial impact arising from the same is discussed in Note number 17.
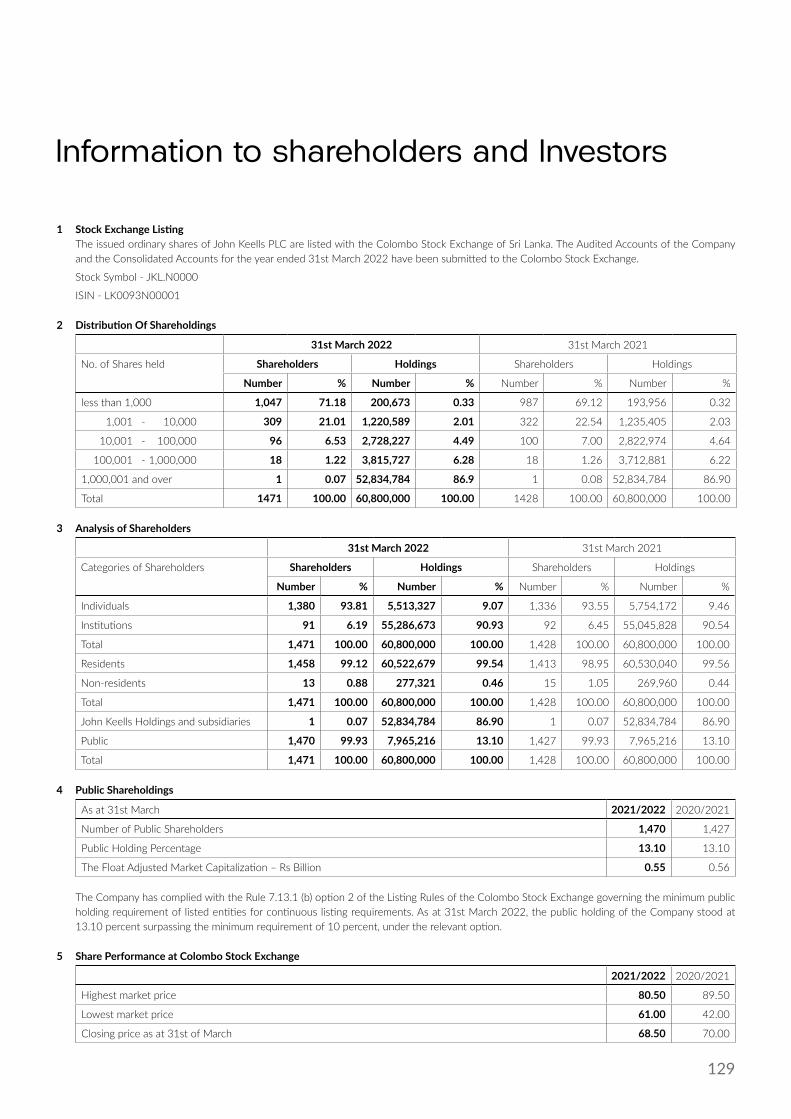
129
Information to shareholders and Investors
1 Stock Exchange Listing The issued ordinary shares of John Keells PLC are listed with the Colombo Stock Exchange of Sri Lanka. The Audited Accounts of the Company
and the Consolidated Accounts for the year ended 31st March 2022 have been submitted to the Colombo Stock Exchange.
Stock Symbol - JKL.N0000
ISIN - LK0093N00001
2 Distribution Of Shareholdings
31st March 2022 31st March 2021
No. of Shares held Shareholders Holdings Shareholders Holdings
Number % Number % Number % Number %
less than 1,000 1,047 71.18 200,673 0.33 987 69.12 193,956 0.32
1,001 - 10,000 309 21.01 1,220,589 2.01 322 22.54 1,235,405 2.03
10,001 - 100,000 96 6.53 2,728,227 4.49 100 7.00 2,822,974 4.64
100,001 - 1,000,000 18 1.22 3,815,727 6.28 18 1.26 3,712,881 6.22
1,000,001 and over 1 0.07 52,834,784 86.9 1 0.08 52,834,784 86.90
Total 1471 100.00 60,800,000 100.00 1428 100.00 60,800,000 100.00
3 Analysis of Shareholders
31st March 2022 31st March 2021
Categories of Shareholders Shareholders Holdings Shareholders Holdings
Number % Number % Number % Number %
Individuals 1,380 93.81 5,513,327 9.07 1,336 93.55 5,754,172 9.46
Institutions 91 6.19 55,286,673 90.93 92 6.45 55,045,828 90.54
Total 1,471 100.00 60,800,000 100.00 1,428 100.00 60,800,000 100.00
Residents 1,458 99.12 60,522,679 99.54 1,413 98.95 60,530,040 99.56
Non-residents 13 0.88 277,321 0.46 15 1.05 269,960 0.44
Total 1,471 100.00 60,800,000 100.00 1,428 100.00 60,800,000 100.00
John Keells Holdings and subsidiaries 1 0.07 52,834,784 86.90 1 0.07 52,834,784 86.90
Public 1,470 99.93 7,965,216 13.10 1,427 99.93 7,965,216 13.10
Total 1,471 100.00 60,800,000 100.00 1,428 100.00 60,800,000 100.00
4 Public Shareholdings
As at 31st March 2021/2022 2020/2021
Number of Public Shareholders 1,470 1,427
Public Holding Percentage 13.10 13.10
The Float Adjusted Market Capitalization – Rs Billion 0.55 0.56
The Company has complied with the Rule 7.13.1 (b) option 2 of the Listing Rules of the Colombo Stock Exchange governing the minimum public holding requirement of listed entities for continuous listing requirements. As at 31st March 2022, the public holding of the Company stood at 13.10 percent surpassing the minimum requirement of 10 percent, under the relevant option.
5 Share Performance at Colombo Stock Exchange
2021/2022 2020/2021
Highest market price 80.50 89.50
Lowest market price 61.00 42.00
Closing price as at 31st of March 68.50 70.00

130
JOHN KEELLS PLCAnnual Report 2021/22
Information to shareholders and Investors
6 Twenty Largest Shareholders
31st March 2022 31st March 2021
NAME OF SHAREHOLDERS No. of Shares Holding % No. of Shares Holding %
1 John Keells Holdings PLC 52,834,784 86.90 52,834,784 86.90
2 Dr. H.S.D.Soysa & Mrs. G. Soysa 625,611 1.03 625,611 1.03
3 People’s Leasing & Finance PLC/Dr.H.S.D. Soysa & Mrs.G. Soysa 384,552 0.63 314,327 0.52
4 People’s Leasing & Finance PLC/L.P. Hapangama 380,840 0.63 242,563 0.40
5 Bank Of Ceylon No. 1 Account 250,200 0.41 250,200 0.41
6 Mrs. H.G.S. Ansell & Mrs. A.P. Ansell 240,000 0.39 0 0.00
7 Est Of Late M. Radhakrishnan (Deceased) 232,800 0.38 232,800 0.38
8 Mrs. M.L. De Silva 207,872 0.34 207,872 0.34
9 Mr. A.M. Weerasinghe 179,792 0.30 179,792 0.30
10 Catholic Bishops Conference In Sri Lanka 171,416 0.28 171,416 0.28
11 Employees Trust Fund Board 169,988 0.28 169,988 0.28
12 People’s Leasing & Finance PLC/L.H.L.M.P. Haradasa 157,041 0.26 84,652 0.14
13 Miss N.S. De Mel 137,115 0.23 137,115 0.23
14 Mrs. N. Tirimanne 133,580 0.22 133,580 0.22
15 Sisira Investors Limited 114,272 0.19 114,272 0.19
16 Colombo Fort Investments PLC 112,800 0.19 112,000 0.18
17 Mr. A.J.M. Jinadasa 110,000 0.18 60,000 0.10
18 Mrs. G. Soysa & Dr. H.S.D. Soysa 105,000 0.17 105,000 0.17
19 Colombo Investment Trust PLC 102,848 0.17 102,000 0.17
20 Mr. H.P.N. Soysa & Mrs. S.N. Jayewardene 100,000 0.16 100,000 0.16
56,750,511 93.34 56,177,972 92.40
7 Market Information on Ordinary Shares of the Company
2021/2022 Q4 Q3 Q2 Q1 2020/2021
Share Information
High 80.50 80.50 76.00 69.90 77.80 89.50
Low 61.00 63.20 65.00 61.00 62.80 42.00
Close 68.50 68.50 71.90 64.40 66.70 70.00
Trading Statistics of John Keells PLC
Number of transactions 2,533 674 709 701 449 3,189
Number of Shares traded 1,039,978 343,581 212,198 384,044 100,155 1,751,163
Value of the Shares traded (Rs. Mn) 72.54 25.72 14.93 25.02 6.87 116.25
Market Capitalisation (Rs. Mn) 4,164.80 4,164.80 4,371.52 3,915.52 4.055.36 4,256.00
No shares were held by the Directors and Chief Executive Officer as at the end of the financial year.

131
Key Ratios and Information
Group Company
For the year ended 31st March 2022 2021 2020 2019 2018 2022 2021 2020 2019 2018
KEY INDICATORS
(A) Profitability & Return to Shareholders
Annual Turnover Growth (%) 14.24 27.91 (22.28) 4.24 30.47 0.22 (16.02) (21.16) 3.21 22.65
Net Profit Ratio (%) 28.12 34.34 (30.03) 24.30 29.75 45.39 50.43 (38.73) 37.11 46.63
Earnings per share (Rs.) * 3.78 4.18 (3.09) 3.32 3.86 2.65 2.94 (2.69) 3.27 3.98
Returns on Shareholders' Funds (%) 6.29 7.18 (4.92) 5.35 6.93 4.31 5.01 (4.75) 5.30 7.77
Return on Capital Employed (%) 8.82 8.82 (1.32) 7.92 9.81 5.80 6.39 (0.73) 7.79 10.30
Dividend per share (Rs.)* 2.29 1.00 2.00 2.30 2.00 2.29 1.00 2.00 2.30 2.00
Debt Equity Ratio (%) 7.35 7.60 17.82 27.98 20.61 8.12 7.96 18.98 30.23 22.07
(B) Liquidity
Current Ratio (No. of Times) 1.23 1.03 1.14 1.22 1.38 0.99 0.91 0.91 1.12 1.29
Interest Cover (No. of Times) 12.77 11.48 (0.60) 3.48 5.10 7.41 7.52 (0.31) 3.19 4.91
(C) Investor Ratio
Net Assets per share at year end (Rs.)*
71.13 68.04 62.29 67.58 56.83 62.27 60.88 56.59 61.75 51.27
Price Earning Ratio (Times)* 18.14 16.74 (13.92) 14.46 15.31 25.81 23.81 (15.99) 14.68 14.85
Enterprise Value (Rs. 000's) 4,518,887 4,489,418 2,251,544 2,219,044 3,350,365 3,982,713 4,010,808 2,021,857 1,961,643 3,058,627
Dividends (Rs. 000's) 139,232 60,800 121,600 139,840 121,600 139,232 60,800 121,600 139,840 121,600
Dividend Cover (Times)* 1.91 4.68 (1.60) 1.45 1.95 1.16 2.94 (1.34) 1.42 1.99
(D) Share Valuation
Market price per share (Rs.) 68.50 70.00 43.00 48.00 59.10 68.50 70.00 43.00 48.00 59.10
Market Capitalisation (Rs. 000's) 4,164,800 4,256,000 2,614,400 2,918,400 3,593,280 4,164,800 4,256,000 2,614,400 2,918,400 3,593,280
(E) Other Information
Number of Employees** 76 70 78 81 85 50 44 49 54 61
Turnover per employee (Rs.000's) 12,450 11,832 8,301 10,285 9,403 7,109 8,061 8,619 9,920 8,509
Value Added per Employee (Rs. 000's)
13,823 12,749 9,156 12,103 10,612 8,231 9,006 9,424 11,813 9,934
Note:*Earnings per share, Dividends per share & Net Assets per share is based on 60,800,000 number of shares in issue as at 31st March 2022.** Excluding contract Employees

132
JOHN KEELLS PLCAnnual Report 2021/22
Five Year Summary
Group CompanyFor the year ended 31st March 2022
Rs.000’s2021
Rs.000’s2020
Rs.000’s2019
Rs.000’s2018
Rs.000’s2022
Rs.000’s2021
Rs.000’s2020
Rs.000’s2019
Rs.000’s2018
Rs.000’s
OPERATING RESULTS
Gross Revenue 946,167 828,218 647,492 833,119 799,267 355,435 354,666 422,317 535,675 519,029
Operating Profit/(loss) 301,979 328,381 (125,781) 269,043 306,440 72,958 144,399 (101,220) 241,824 279,229
Other Income 3,198 2,094 1,456 493 8,759 1,406 617 1,279 288 5,699
Dividend Income - - - - - 96,960 69,280 31,920 36,602 25,902
Changes in Fair Value of Investment Property 30,195 15,085 15,100 75,500 60,350 30,195 15,085 15,100 75,500 60,350
Finance Charges (32,074) (34,217) (97,806) (119,439) (80,164) (32,052) (33,966) (97,785) (119,438) (79,819)
Finance Income 63,264 45,897 47,200 51,770 47,254 35,892 25,912 23,061 26,464 20,909
Share of Results of Associate 10,895 1,292 2,915 19,433 (13,652) - - - - -
Profit before Taxation 377,457 358,532 (156,916) 296,800 328,987 205,358 221,327 (127,645) 261,240 312,271
Taxation based thereon (111,373) (74,149) (37,521) (94,345) (91,224) (44,010) (42,456) (35,898) (62,434) (70,229)
Profit after Taxation 266,084 284,383 (194,437) 202,455 237,763 161,348 178,871 (163,543) 198,806 242,042
Non-controlling interests (36,507) (30,198) 6,643 (667) (3,004) - - - - -
Profit/(loss) attributable to John Keells PLC 229,577 254,185 (187,794) 201,788 234,759 161,348 178,871 (163,543) 198,806 242,042
CAPITAL EMPLOYEDStated Capital 152,000 152,000 152,000 152,000 152,000 152,000 152,000 152,000 152,000 152,000
Revenue Reserves 2,871,957 2,797,294 2,606,225 2,910,954 2,847,937 2,612,574 2,591,138 2,474,554 2,757,474 2,697,374
Other components of equity 1,301,048 1,187,410 1,028,893 1,045,869 455,260 1,021,217 958,379 814,250 844,885 267,577
4,325,005 4,136,704 3,787,118 4,108,823 3,455,197 3,785,791 3,701,517 3,440,804 3,754,359 3,116,951
Non-controlling interests 76,588 57,022 37,690 42,591 39,535 - - - - -
Total Equity 4,401,593 4,193,726 3,824,808 4,151,414 3,494,732 3,785,791 3,701,517 3,440,804 3,754,359 3,116,951
Total Debt - - - - - - - - - -
4,401,593 4,193,726 3,824,808 4,151,414 3,494,732 3,785,791 3,701,517 3,440,804 3,754,359 3,116,951
ASSETS EMPLOYEDCurrent Assets 1,853,115 7,686,528 962,099 2,241,507 2,019,755 996,741 801,021 658,675 1,765,214 1,573,039
Current Liabilities (1,503,216) (7,479,916) (842,604) (1,843,101) (1,458,683) (1,003,491) (876,045) (722,111) (1,575,562) (1,222,008)
Net Current Assets/(Liabilities) 349,899 206,614 119,495 398,406 561,073 (6,749) (75,023) (63,436) 189,652 351,031
Fixed Assets and Investments 4,226,325 4,161,752 3,878,969 3,928,413 3,093,378 3,843,551 3,827,493 3,545,064 3,604,912 2,802,987
Long Term Liabilities - - - - - - - -
Non-current liabilities (174,630) (174,640) (173,656) (175,405) (159,718) (51,007) (50,953) (40,825) (40,205) (37,067)
4,401,586 4,193,724 3,824,808 4,151,414 3,494,733 3,785,795 3,701,517 3,701,517 3,440,803 3,754,359
CASH FOLWNet cash flows from / (used in) operating activities 286,107 660,629 453,797 (317,924) 192,945 179,592 471,383 (294,560) 97,201 110,761
Net cash flows from / (used in) investing activities (8,205) 8,445 4,303 1,322 (36,946) 22,742 14,431 12,295 3,481 (1,303)
Net cash flows from / (used in) financing activities (163,262) (62,800) (121,600) (139,840) (121,600) (145,262) (121,600) (139,840) (121,600) (60,800)
Net increase / (decrease) in cash and cash equivalents 114,640 606,274 336,500 (456,442) 34,399 57,070 364,214 (422,105) (20,918) 48,658
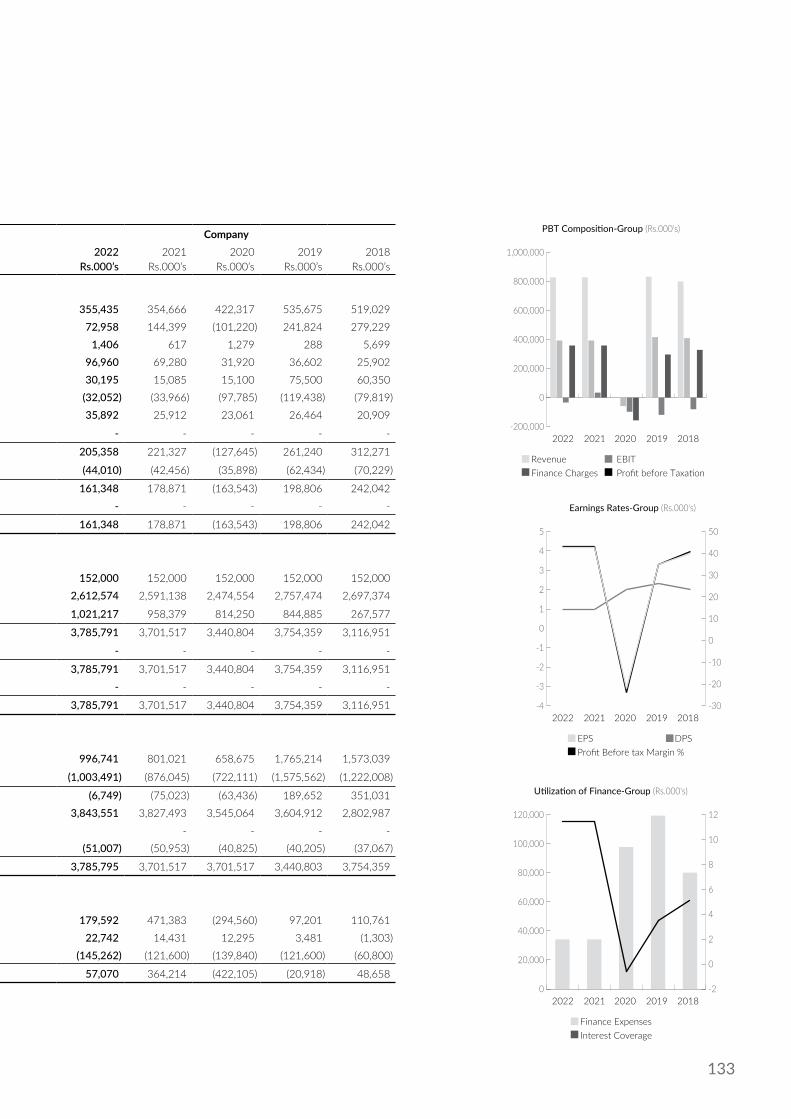
133
Group CompanyFor the year ended 31st March 2022
Rs.000’s2021
Rs.000’s2020
Rs.000’s2019
Rs.000’s2018
Rs.000’s2022
Rs.000’s2021
Rs.000’s2020
Rs.000’s2019
Rs.000’s2018
Rs.000’s
OPERATING RESULTS
Gross Revenue 946,167 828,218 647,492 833,119 799,267 355,435 354,666 422,317 535,675 519,029
Operating Profit/(loss) 301,979 328,381 (125,781) 269,043 306,440 72,958 144,399 (101,220) 241,824 279,229
Other Income 3,198 2,094 1,456 493 8,759 1,406 617 1,279 288 5,699
Dividend Income - - - - - 96,960 69,280 31,920 36,602 25,902
Changes in Fair Value of Investment Property 30,195 15,085 15,100 75,500 60,350 30,195 15,085 15,100 75,500 60,350
Finance Charges (32,074) (34,217) (97,806) (119,439) (80,164) (32,052) (33,966) (97,785) (119,438) (79,819)
Finance Income 63,264 45,897 47,200 51,770 47,254 35,892 25,912 23,061 26,464 20,909
Share of Results of Associate 10,895 1,292 2,915 19,433 (13,652) - - - - -
Profit before Taxation 377,457 358,532 (156,916) 296,800 328,987 205,358 221,327 (127,645) 261,240 312,271
Taxation based thereon (111,373) (74,149) (37,521) (94,345) (91,224) (44,010) (42,456) (35,898) (62,434) (70,229)
Profit after Taxation 266,084 284,383 (194,437) 202,455 237,763 161,348 178,871 (163,543) 198,806 242,042
Non-controlling interests (36,507) (30,198) 6,643 (667) (3,004) - - - - -
Profit/(loss) attributable to John Keells PLC 229,577 254,185 (187,794) 201,788 234,759 161,348 178,871 (163,543) 198,806 242,042
CAPITAL EMPLOYEDStated Capital 152,000 152,000 152,000 152,000 152,000 152,000 152,000 152,000 152,000 152,000
Revenue Reserves 2,871,957 2,797,294 2,606,225 2,910,954 2,847,937 2,612,574 2,591,138 2,474,554 2,757,474 2,697,374
Other components of equity 1,301,048 1,187,410 1,028,893 1,045,869 455,260 1,021,217 958,379 814,250 844,885 267,577
4,325,005 4,136,704 3,787,118 4,108,823 3,455,197 3,785,791 3,701,517 3,440,804 3,754,359 3,116,951
Non-controlling interests 76,588 57,022 37,690 42,591 39,535 - - - - -
Total Equity 4,401,593 4,193,726 3,824,808 4,151,414 3,494,732 3,785,791 3,701,517 3,440,804 3,754,359 3,116,951
Total Debt - - - - - - - - - -
4,401,593 4,193,726 3,824,808 4,151,414 3,494,732 3,785,791 3,701,517 3,440,804 3,754,359 3,116,951
ASSETS EMPLOYEDCurrent Assets 1,853,115 7,686,528 962,099 2,241,507 2,019,755 996,741 801,021 658,675 1,765,214 1,573,039
Current Liabilities (1,503,216) (7,479,916) (842,604) (1,843,101) (1,458,683) (1,003,491) (876,045) (722,111) (1,575,562) (1,222,008)
Net Current Assets/(Liabilities) 349,899 206,614 119,495 398,406 561,073 (6,749) (75,023) (63,436) 189,652 351,031
Fixed Assets and Investments 4,226,325 4,161,752 3,878,969 3,928,413 3,093,378 3,843,551 3,827,493 3,545,064 3,604,912 2,802,987
Long Term Liabilities - - - - - - - -
Non-current liabilities (174,630) (174,640) (173,656) (175,405) (159,718) (51,007) (50,953) (40,825) (40,205) (37,067)
4,401,586 4,193,724 3,824,808 4,151,414 3,494,733 3,785,795 3,701,517 3,701,517 3,440,803 3,754,359
CASH FOLWNet cash flows from / (used in) operating activities 286,107 660,629 453,797 (317,924) 192,945 179,592 471,383 (294,560) 97,201 110,761
Net cash flows from / (used in) investing activities (8,205) 8,445 4,303 1,322 (36,946) 22,742 14,431 12,295 3,481 (1,303)
Net cash flows from / (used in) financing activities (163,262) (62,800) (121,600) (139,840) (121,600) (145,262) (121,600) (139,840) (121,600) (60,800)
Net increase / (decrease) in cash and cash equivalents 114,640 606,274 336,500 (456,442) 34,399 57,070 364,214 (422,105) (20,918) 48,658
-30
-20
-10
0
10
20
30
40
50
-4
-3
-2
-1
0
1
2
3
4
5
Earnings Rates-Group (Rs.000's)
EPS DPSProfit Before tax Margin %
2022 2021 2020 2019 2018
Revenue EBITFinance Charges Profit before Taxation
-200,000
0
200,000
400,000
600,000
800,000
1,000,000
PBT Composition-Group (Rs.000's)
2022 2021 2020 2019 2018
Finance ExpensesInterest Coverage
0
20,000
40,000
60,000
80,000
100,000
120,000
Utilization of Finance-Group (Rs.000's)
2022 2021 2020 2019 2018-2
0
2
4
6
8
10
12
134
JOHN KEELLS PLCAnnual Report 2021/22
Glossary of Financial Terms
ACCRUAL BASISRecording Revenues and Expenses in the period in which they are earned or incurred regardless of whether cash is received or disbursed in that period.
CAPITAL EMPLOYEDShareholders’ funds plus non-controlling interests and debt including lease liabilities.
CONTINGENT LIABILITIESA condition or situation existing at the Balance Sheet date due to past events, where the financial effect is not recognized because:
1. The obligation is crystallized by the occurrence or non-occurrence of one or more future events or,
2. A probable outflow of economic resources is not expected or,
3. It is unable to be measured with sufficient reliability
CURRENT RATIOCurrent assets divided by current liabilities.
DEBT/EQUITY RATIODebt as a percentage of Shareholders’ Funds
DIVIDEND COVEREarnings per share over dividends per share
DIVIDEND PAYOUT RATIODividend paid as a percentage of Company Profits.
DIVIDEND YIELDDividends adjusted for changes in number of shares in issue as a percentage of the share price (diluted) at the end of the period.
EARNINGS PER SHARE (EPS)Profit after Tax attributable to ordinary shareholding over weighted average number of shares in issue during the period.
EARNINGS YIELDEarnings per share as a percentage of Market price per Share at the end of the period.
EARNINGS BEFORE INTEREST AND TAX (EBIT)Earnings before interest and tax (includes other operating income)
EFFECTIVE RATE OF TAXATIONIncome Tax, (including deferred tax) over Profit before Tax
ENTERPRISE VALUE (EV)Market capitalisation plus net debt/(net cash).
INTEREST COVERConsolidated profit before interest and tax over interest expense.
MARKET CAPITALISATIONNumber of Shares in issue at the end of the period multiplied by the market price at end of period
NET ASSETSTotal assets minus current liabilities, long-term liabilities, and non-controlling interests.
NET ASSET PER SHARENet assets as at a particular financial year end divided by the number of shares in issue as at the current financial year end.
NET DEBTTotal debt minus cash equivalents (cash in hand and at bank plus short-term deposits).
NET TURNOVER PER EMPLOYEENet turnover over average number of employees
PRICE EARNINGS RATIOMarket Price per Share over earnings per share
QUICK RATIOCash plus short-term investments plus receivables, divided by current liabilities.
RETURN ON ASSETSProfit after Tax over average total assets
RETURN ON EQUITYProfit attributable to shareholders as a percentage of average shareholders’ funds.
RETURN ON CAPITAL EMPLOYEDEBIT as a percentage of average capital employed.
SHAREHOLDERS’ FUNDSStated capital plus other components of equity plus revenue reserves
TOTAL ASSETSFixed Assets plus Investments plus Non-Current Assets plus Current Assets
TOTAL DEBTLong Term Loans plus Short Term Loans and Overdrafts
TOTAL EQUITYShareholders’ funds plus non-controlling interest
TOTAL VALUE ADDEDThe difference between revenue (including other income) andexpenses, cost of materials and services purchased from externalsources
WORKING CAPITALCapital required to finance the day-to-day operations (Current Assets minus Current Liabilities)

135
Notice of Meeting
Notice is hereby given that the Seventy Fifth Annual General Meeting (AGM) of John Keells PLC will be held as a virtual meeting on 23rd June 2022 at 10:00 a.m.
The business to be brought before the Meeting will be to:
1. read the Notice convening the Meeting.
2. receive and consider the Annual Report and Financial Statements for the Financial Year ended 31st March 2022 with the Report of the Auditors thereon.
3. to re-elect as Director, Ms. B A I Rajakarier who retires in terms of Article 83 of the Articles of Association of the Company. A brief profile of Ms. B A I Rajakarier is contained in the Board of Directors Section on page 35 of the Annual Report.
4. to re-elect as Director, Ms. A K Gunawardhana who retires in terms of Article 83 of the Articles of Association of the Company. A brief profile of Ms. A K Gunawardhana is contained in the Board of Directors section on page 35 of the Annual Report.
5. re-appoint the Auditors and to authorise the Directors to determine their remuneration.
6. consider any other business of which due notice has been given in terms of the relevant laws and regulations.
The Annual Report of John Keells PLC for 2021/2022, is available on the:
(1) Corporate Website – https://www.johnkeellstea.com
(2) The Colombo Stock Exchange - https://www.cse.lk
For clarifications on how to download and/or access the Annual Report and Financial Statements, please contact Umasha Perera on +94 11 71 669 9686 during normal office hours (8.30 a.m. to 4.30 p.m.) or email [email protected].
Should Members wish to obtain a hard copy of the Annual Report, they may send a written request to the registered office of the Company or fax to 011- 2446223 by filling the request form attached to the Form of Proxy. A printed copy of the Annual Report will be forwarded by the Company within eight (8) market days from the date of receipt of the request.
By Order of the BoardJOHN KEELLS PLC
Keells Consultants (Private) LimitedSecretaries
23rd May 2022
Notes:i. A Member unable to attend is entitled to
appoint a Proxy to attend and vote in his/her place.
ii. A Proxy need not be a member of the Company.
iii. A Member wishing to vote by Proxy at the Meeting may use the Form of Proxy enclosed herein.
iv. Members are encouraged to vote by Proxy through the appointment of a member of the Board of Directors to vote on their behalf and to include their voting preferences on the resolutions to be taken up at the Meeting in the Form of Proxy
v. In order to be valid, the completed Form of Proxy must be lodged at the Registered Office of the Company or forwarded to the email address: [email protected] or Fax No.011 2439037 not less than 48 hours before the meeting.
vi. A vote can be taken on a show of hands or by a poll. If a poll is demanded, each share is entitled to one vote. Votes can be cast in person, by proxy or corporate representatives. In the event an individual member and his/her proxy holder are both present at the meeting, only the member’s vote is counted. If the proxy holder’s appointor has indicated the manner of voting, only the appointor’s indication of the manner to vote will be used.
vii. Instructions as to attending the virtual meeting are attached.

136
JOHN KEELLS PLCAnnual Report 2021/22
137
Form of Proxy
I/We .......................................................................................................................................................................................................................................................... of
..................................................................................................................................................... being a Member/Members of John Keells PLC hereby appoint
.......................................................................................................................................................................................................................................................................
of ................................................................................................................................................................................................................................. or, failing him/her
Mr. Krishan Niraj Jayasekara Balendra or, failing him
Mr. Joseph Gihan Adisha Cooray or, failing him
Mr. Ahamed Zafir Hashim or, failing him
Ms. Kamini Devika Weerasinghe or, failing her
Ms. Anandhiy Krisnajina Gunawardhana or, failing her
Mr. Charitha Nissanka Wijewardane or, failing him
Ms. Bodiyabaduge Arundathi Indira Rajakarier
as my/our proxy to represent me/us and vote on my/our behalf at the Seventy Fifth Annual General Meeting of the Company to be held on Wednesday, 23rd June 2022 at 10.00 a.m. and at any adjournment thereof, and at every poll which may be taken on consequence thereof.
I/We, the undersigned, hereby direct my/our proxy to vote for me/us and on my/our behalf on the specified Resolution as indicated by the letter “X” in the appropriate cage:
FOR AGAINST
To re-elect as Director, Ms. B A I Rajakarier who retires in terms of Article 83 of the Articles of Association of the Company.
To re-elect as Director, Ms. A K Gunawardhana who retires in terms of Article 83 of the Articles of Association of the Company.
To re-appoint the Auditors and to authorize the Directors to determine their remuneration.
Signed this ……..………………….. day of …………………... Two Thousand and Twenty Two.
Signature/s of Shareholder/s
NOTE: INSTRUCTIONS AS TO THE COMPLETION OF THIS FORM OF PROXY ARE NOTED ON THE REVERSE.

138
JOHN KEELLS PLCAnnual Report 2021/22
INSTRUCTIONS AS TO COMPLETION OF PROXY
1. Please perfect the Form of Proxy by filling in legibly your full name and address, signing in the space provided and filling in the date of signature.
2. The completed Form of Proxy should be deposited at the Registered Office of the Company at No. 117, Sir Chittampalam A. Gardiner Mawatha, Colombo 2 or forwarded to the email address: [email protected] or Fax No.011 2439037, no later than 48 hours before the time appointed for the holding of the Meeting.
3. If the Form of Proxy is signed by an Attorney, the relevant Power of Attorney should accompany the completed Form of Proxy for registration, if such Power of Attorney has not already been registered with the Company.
4. If the appointor is a company or corporation, the Form of Proxy should be executed under its Common Seal or by a duly authorised officer of the company or corporation in accordance with its Articles of Association or Constitution.
5. If this Form of Proxy is returned without any indication of how the person appointed as Proxy shall vote, then the Proxy shall exercise his/her discretion as to how he/she votes or, whether or not he/she abstains from voting.
Please fill in the following details:
Name : ....................................................................................................................................
Address : ....................................................................................................................................
....................................................................................................................................
....................................................................................................................................
Jointly with : ....................................................................................................................................
Share Folio No. : ....................................................................................................................................

139
INSTRUCTIONS FOR REGISTRATION AND PARTICIPATION OF SHAREHOLDERS AT THE VIRTUAL ANNUAL GENERAL MEETING OF THE COMPANY HELD THROUGH AUDIO/VISUAL MEANS ON 23RD JUNE 2022
Dear Shareholder,
The Board of Directors of the Company, having taken into consideration the guidelines issued by Colombo Stock Exchange (“CSE”) on holding virtual shareholder meetings through audio/visual means and in conformity with the regulatory provisions of the Articles of Associations of the Company, have decided to hold the Annual General Meeting (“AGM”) of the Company as a virtual meeting through audio/visual means using an online platform in the manner set forth below.
1. Shareholders who wish to participate in the AGM through the online platform are required to complete and forward the “Shareholder/Proxyholder Registration Form” annexed to this document as Annexure 1 together with a copy of the National identity Card or passport of the Shareholder/Proxyholder (if a Proxy is appointed) by registered post to the registered office of the Company, email it to [email protected] or forward it by fax to 011 -2439037 not less than 48 hours before the holding of the AGM. Shareholders are required to mandatorily provide their email address (or the email address of the Proxyholder) in the space provided in Annexure 1 in order to forward the web link if they wish to participate in the AGM through the online platform. The registered Shareholders/Proxyholders are requested to join the AGM only on the digital platform through the weblink sent by the Company.
2. Shareholders who wish to submit proxies can duly complete the proxies as per the instructions given on the reverse of the Form of Proxy and send same by registered post to the registered office of the Company or forward it by fax to 011-2439037 or by email to [email protected] not less than 48 hours before the holding of the AGM.
3. Shareholders who wish to appoint a member of the Board of Directors as his/her Proxy to represent them at the AGM may do so by completing the Form of Proxy with their voting preferences marked against each resolution to be taken up at the AGM.
4. It is recommended that Shareholders/Proxyholders join the AGM at least fifteen (15) minutes before the start of the AGM. The digital platform will be active thirty (30) minutes before the start of the AGM.
5. Voting on items listed on the Agenda will be registered by using an online platform. Shareholders/Proxyholders will be briefed on the procedure for voting prior to the commencement of the AGM.
6. All Shareholders/Proxyholders speaking at the AGM to vote, seek clarification or make a comment relevant to the AGM are required to identify themselves when speaking at the AGM.
7. Any Shareholder can forward his/her queries and clarifications relevant to the AGM, by registered post to the registered office of the Company, email to [email protected] or forward it by fax to No.011- 2446223 not less than three (3) days before the holding of the AGM. Responses in respect of such queries and clarifications may be made before or during the course of the meeting.
8. The date fixed for the AGM will not be affected even if a public holiday or curfew declared on such date as the AGM is to be held virtually. In the event, if any further action is required to be taken by the Company in relation to the AGM notification of such change would be by way of an announcement to the Colombo Stock Exchange and by way of publication on the Company website https://www.johnkeellstea.com
9. This Document together with the Notice of Meeting, Shareholder/Proxyholder Registration Form (Annexure 1), Form of Proxy and Form of Request for the printed version of the annual report will also be published on the Company’s website (https://www.johnkeellstea.com) and on the website of the CSE https://www.cse.lk/Search Company - John Keells PLC
By order of the Board JOHN KEELLS PLC
KEELLS CONSULTANTS (PRIVATE) LIMITEDSecretaries23rd May 2022

140
JOHN KEELLS PLCAnnual Report 2021/22

141
Annexure 1
JOHN KEELLS PLC75th ANNUAL GENERAL MEETING- 23rd June 2022
REGISTRATION FORM
To: JOHN KEELLS PLC No. 117, Sir Chithampalam A. Gardiner Mawatha, Colombo 02
Full Name of the Shareholder : ......................................................................................................................................................................................................................
Shareholder’s Address : .................................................................................................................................................................................................................................... ................................................................................................................................................................................................................................................................................
................................................................................................................................................................................................................................................................................
Shareholder’s NIC No./Passport No./Co. Reg. No. : .................................................................................................................................................................................
Shareholder’s Contact Nos: Residence : ...................................................................... Mobile : ...........................................................................................................
Shareholder’s E mail address : .........................................................................................................................................................................................................................
IF PROXY IS APPOINTED
Full name of Proxyholder : ..............................................................................................................................................................................................................................
Proxyholder’s NIC No./Passport No : ...........................................................................................................................................................................................................
Telephone Number: Residence : .................................................................................... Mobile : ...........................................................................................................
Email address : ...................................................................................................................................................................................................................................................
........................................... ...........................................Shareholder’s signature Date
Notes: • Please perfect the Registration Form by filling in legibly your full name, address, email, contact number, signing in the space provided and filling in
the date of signature.
• If the Registration Form is signed by an Attorney, the relevant Power of Attorney should accompany the completed Registration Form, if such Power of Attorney has not already been registered with the Company.
• If the Shareholder is a company or corporation, the Form should be executed under its Common Seal or by a duly authorised officer of the company or corporation in accordance with its Articles of Association or Constitution.

142
JOHN KEELLS PLCAnnual Report 2021/22

Designed & produced by
Name of Company John Keells PLC
Company Registration NumberPQ 11
Name of Subsidiaries John Keells Stock Brokers (Pvt) LimitedJohn Keells Warehousing (Pvt) Limited
Name of Associate Company Keells Realtors Limited
Legal Form:Public Limited Liability Company listed on the Colombo Stock Exchange(Incorporated in Sri Lanka in 1960)
Registered OfficeNo. 117, Sir Chittampalam A. Gardiner Mawatha Colombo 2, Sri LankaTel: 0094 11 2306000Telefax: 0094 11 2342456E-mail: [email protected]
Business AddressNo. 186, Vauxhall Street,Colombo 2.
Directors Mr. K.N.J. BalendraMr. J.G.A. CoorayMr. A.Z. HashimMs. K.D. WeerasingheMr. B.A.I. RajakarierMr. C.N. WijewardaneMr. A.K. Gunawardhana
Secretaries & Registrars Keells Consultants (Pvt) LimitedNo. 117, Sir Chittampalam A. Gardiner Mawatha Colombo 2.
Auditors Messrs. Ernst & YoungChartered AccountantsP.O. Box 101, Colombo.
Principal Bankers (in alphabetical order)Bank of CeylonCommercial Bank of Ceylon PLCDeutsche BankDFCC Vardhana BankHatton National BankHongkong & Shanghai Banking Corporation Ltd.Nation’s Trust BankNational Development Bank PLCPeople’s BankSampath Bank PLCSeylan Bank PLCStandard Chartered Bank
Corporate Information
Printed by Printel (Pvt) Ltd

John Keells PLCNo. 117, Sir Chittampalam A. Gardiner Mawatha
Colombo 2, Sri LankaTel: [email protected]