Lezaun& Calvillo. In the Political Laboratory: Kurt Lewin's Atmospheres
Upload
khangminh22Category
view
3download
0
Greater OKC Chamber
One of the nation’s largest chambers!
More than 5,000 Members
American Chamber of Commerce Executives
Best of Show in 2012
Consistently rated Top 10 Chamber
A Look Ahead At 2014 And Lessons From 2013
CREC February 20, 2014

ECONOMIC FORECAST & DATA TOOLS
GREATER OKLAHOMA CITY

2.4% 2.6% 2.3%
-4%
-3%
-2%
-1%
0%
1%
2%
3%
0
100
200
300
400
500
600
700
2000 2001 2002 2003 2004 2005 2006 2007 2008 2009 2010 2011 2012 2013 2014 2015
Ann
ual P
erce
nt C
hang
e
MSA
Employ
men
t, Tho
usan
ds
OKC MSA Nonfarm and Private Employment
Percent Change, YOY OKC Nonfarm OKC Private

0.5% 2.2%
4.1%
6.7
21.0
-20%
-15%
-10%
-5%
0%
5%
10%
15%
20%
25%
0
5
10
15
20
25
2000 2001 2002 2003 2004 2005 2006 2007 2008 2009 2010 2011 2012 2013 2014 2015
Anu
ual P
erce
nt Cha
nge
Mining Em
ploy
men
t, Tho
usan
ds
OKC MSA Mining Employment
Percent Change, YOY OKC Mining Employment

-‐12.1%
-‐4.6%
2.5% 1.8% 2.6%
-15%
-10%
-5%
0%
5%
10%
0
10
20
30
40
50
60
Ann
ual P
erce
nt Cha
nge
Man
ufac
turing
Employ
men
t, Tho
usan
ds
OKC MSA Manufacturing Employment
Percent Change, YOY OKC Manufacturing Employment

1.1%
3.6% 3.1%
-‐8.0%
-‐6.0%
-‐4.0%
-‐2.0%
0.0%
2.0%
4.0%
6.0%
0
10
20
30
40
50
60
70
80
90
2000 2001 2002 2003 2004 2005 2006 2007 2008 2009 2010 2011 2012 2013 2014 2015
Ann
ual P
erce
nt Cha
nge
PBS Em
ploy
men
t, Tho
usan
ds
OKC MSA Professional and Business Employment
Percent Change, YOY OKC Professional and Business Employment
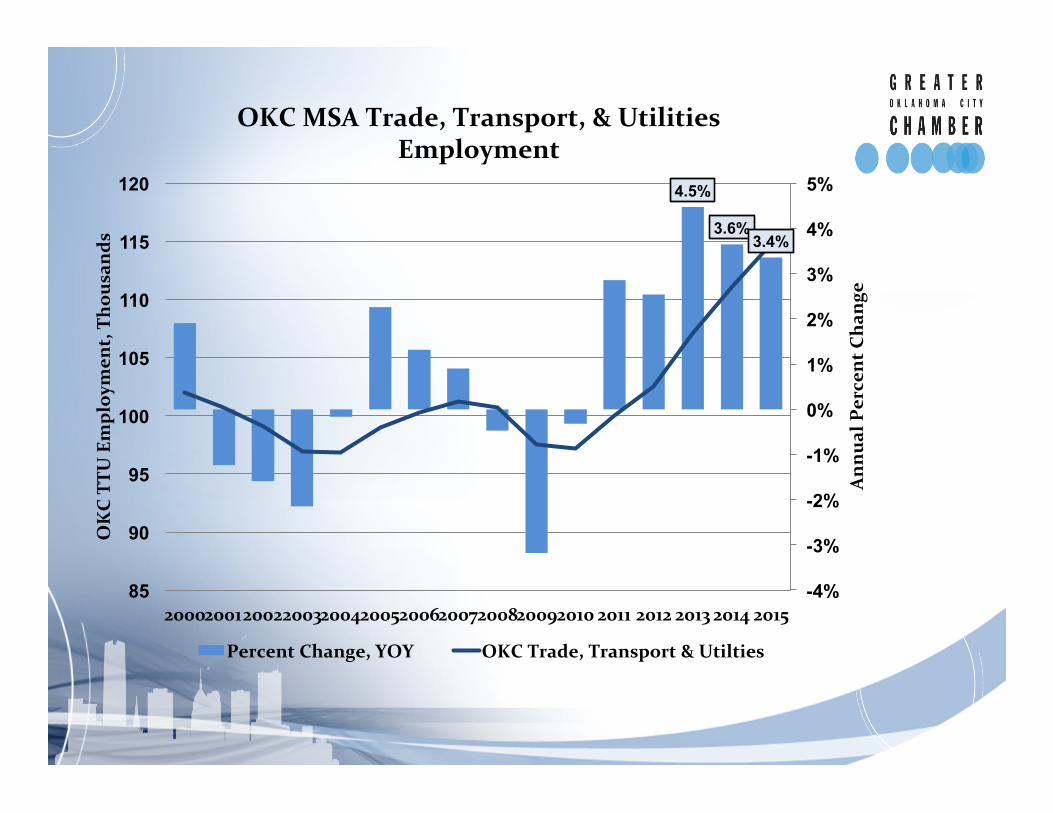
4.5%
3.6% 3.4%
-4%
-3%
-2%
-1%
0%
1%
2%
3%
4%
5%
85
90
95
100
105
110
115
120
2000 2001 2002 2003 2004 2005 2006 2007 2008 2009 2010 2011 2012 2013 2014 2015
Ann
ual P
erce
nt Cha
nge
OKC TTU
Employ
men
t, Tho
usan
ds
OKC MSA Trade, Transport, & Utilities Employment
Percent Change, YOY OKC Trade, Transport & Utilties

4.0%
4.6%
-10%
-5%
0%
5%
10%
15%
0
10,000
20,000
30,000
40,000
50,000
60,000
1990
19
91
1992
19
93
1994
19
95
1996
19
97
1998
19
99
2000
20
01
2002
20
03
2004
20
05
2006
20
07
2008
20
09
2010
20
11
2012
20
13
2014
20
15
Ann
ual G
rowth
, %
Per Cap
ita Perso
nal Inc
ome ($)
OKC MSA Per Capita Personal Income
Annual Growth OKC Per Capita Personal Income

1.7% 1.6%
-2%
-1%
0%
1%
2%
3%
4%
5%
0
200,000
400,000
600,000
800,000
1,000,000
1,200,000
1,400,000
1,600,000
1970
19
72
1974
19
76
1978
19
80
1982
19
84
1986
19
88
1990
19
92
1994
19
96
1998
20
00
2002
20
04
2006
20
08
2010
20
12
2014
Ann
ual G
rowth
, %
MSA
Pop
ulation
OKC MSA Population
Annual Growth OKC MSA Population
-‐6%
-‐4%
-‐2%
0%
2%
4%
6%
8%
10%
0
100
200
300
400
500
600
700
800
900
Jan-
91
Sep-
91
May
-92
Jan-
93
Sep-
93
May
-94
Jan-
95
Sep-
95
May
-96
Jan-
97
Sep-
97
May
-98
Jan-
99
Sep-
99
May
-00
Jan-
01
Sep-
01
May
-02
Jan-
03
Sep-
03
May
-04
Jan-
05
Sep-
05
May
-06
Jan-
07
Sep-
07
May
-08
Jan-
09
Sep-
09
May
-10
Jan-
11
Sep-
11
NF Em
ploy
men
t, Tho
usan
ds
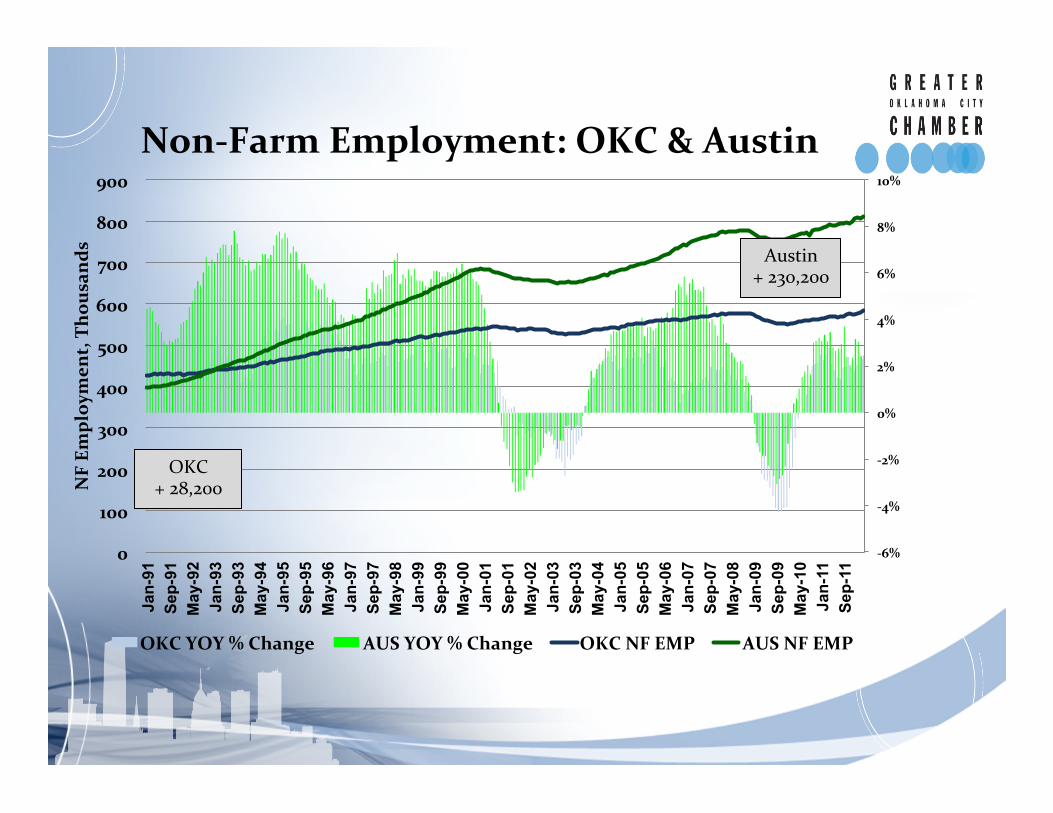
Non-‐Farm Employment: OKC & Austin
OKC YOY % Change AUS YOY % Change OKC NF EMP AUS NF EMP
OKC + 28,200
Austin + 230,200

OESC Employer Locator 193,000 business records with contact info for Oklahoma companies
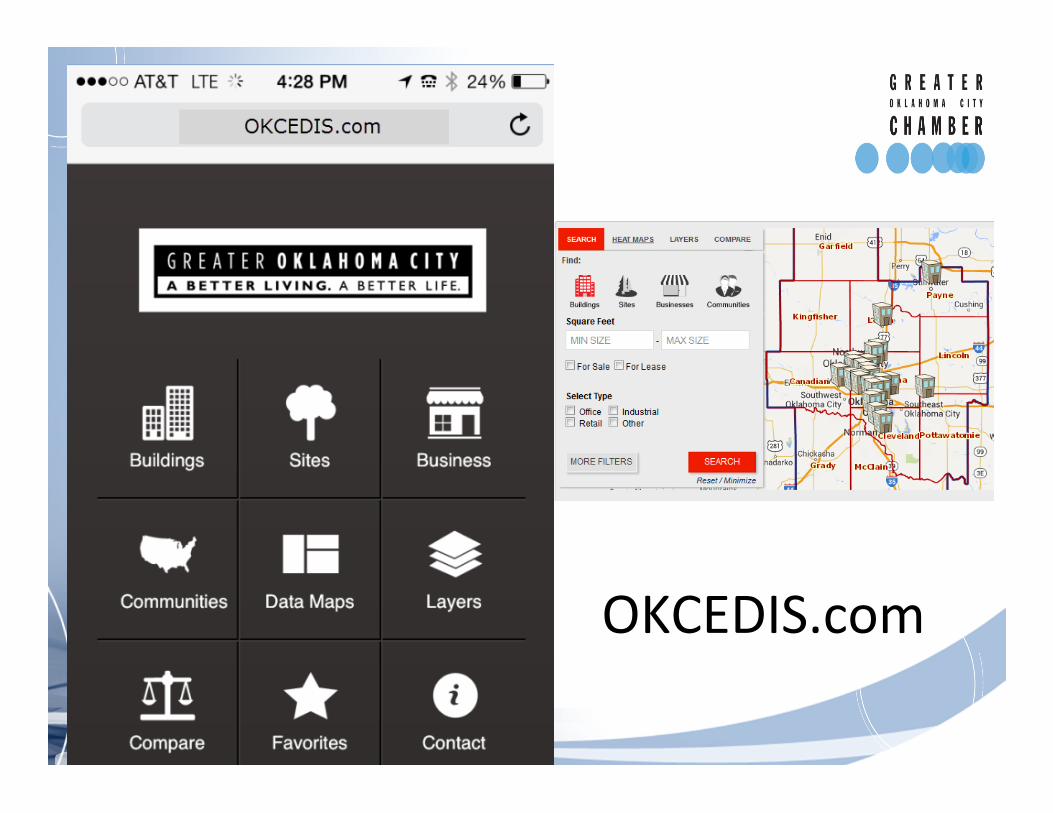
OKCEDIS.com
www.greateroklahomacity.com/OKCLBI
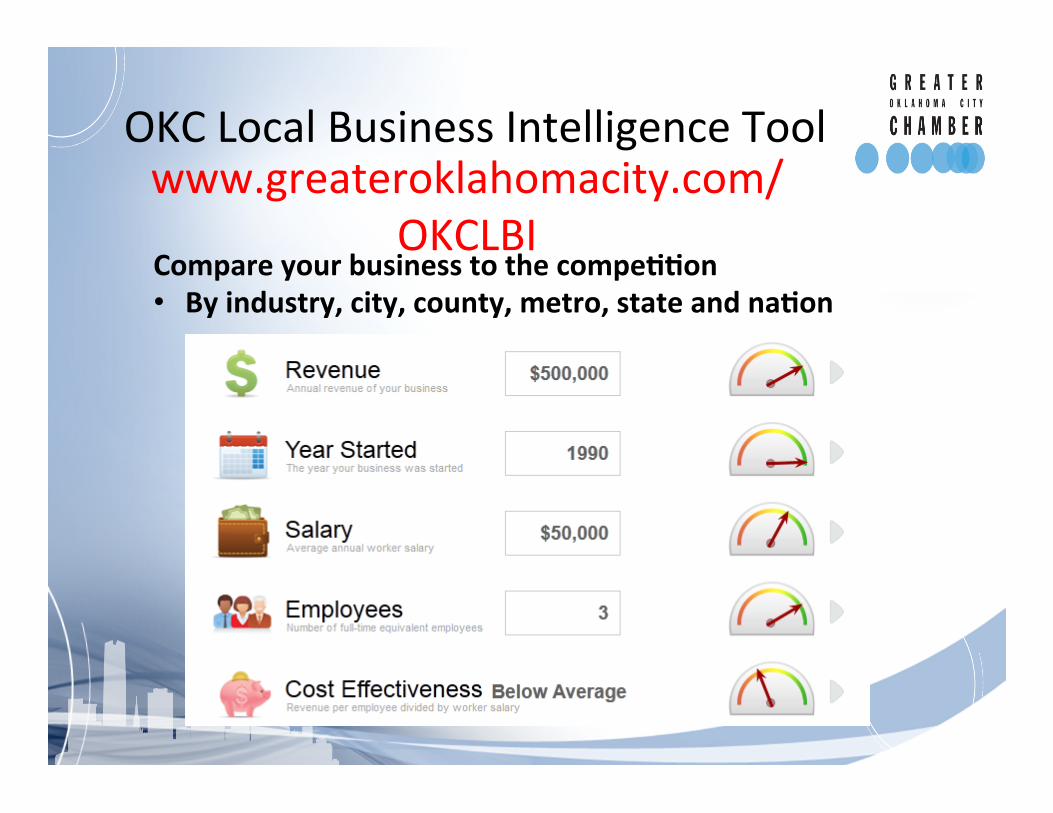
OKC Local Business Intelligence Tool
Compare your business to the compe??on • By industry, city, county, metro, state and na?on
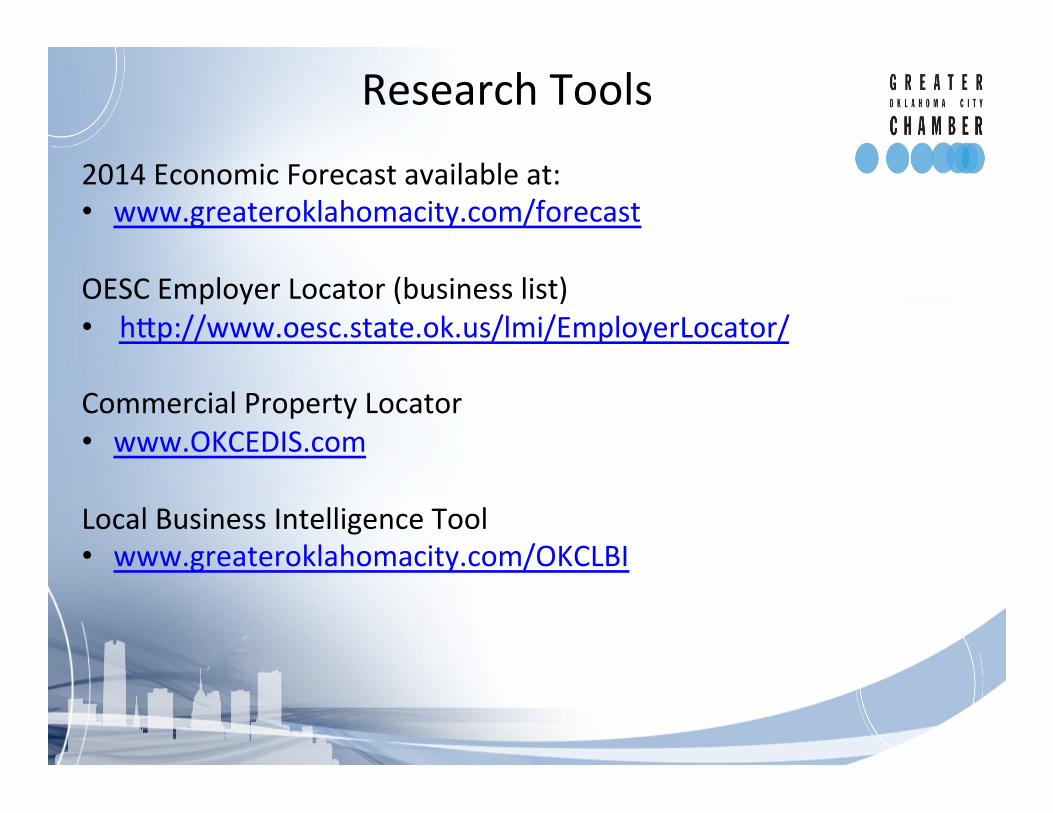
Research Tools 2014 Economic Forecast available at: • www.greateroklahomacity.com/forecast
OESC Employer Locator (business list) • hUp://www.oesc.state.ok.us/lmi/EmployerLocator/ Commercial Property Locator • www.OKCEDIS.com
Local Business Intelligence Tool • www.greateroklahomacity.com/OKCLBI

2013 RESULTS AND PIPELINE ACTIVITY
GREATER OKLAHOMA CITY

2013 Actuals 2013 Goals Campaign
Actuals 5-‐Year Goals**
Jobs 6,561 4,000 – 5,000 15,110 20,000 – 25,000
Average Salary*** $43,533 $45,453 -‐-‐
$47,430 $54,736 $45,453 -‐ $47,430
Capital Investment $501,709,800 $180M -‐
$200M $1,297,219,330 $900M -‐ $1Billion
Local Tax Revenue* $13,058,477 $10M -‐ $11M $33,736,788 $50M -‐ $55M
Forward OKC IV Results

January 2014 Project Pipeline
*Note: Not all projects provide the key pieces of information listed above.
13,625 jobs $399 million payroll
$555 million capital investment
3.6 million Sq. Ft.
28 Ac?ve Projects
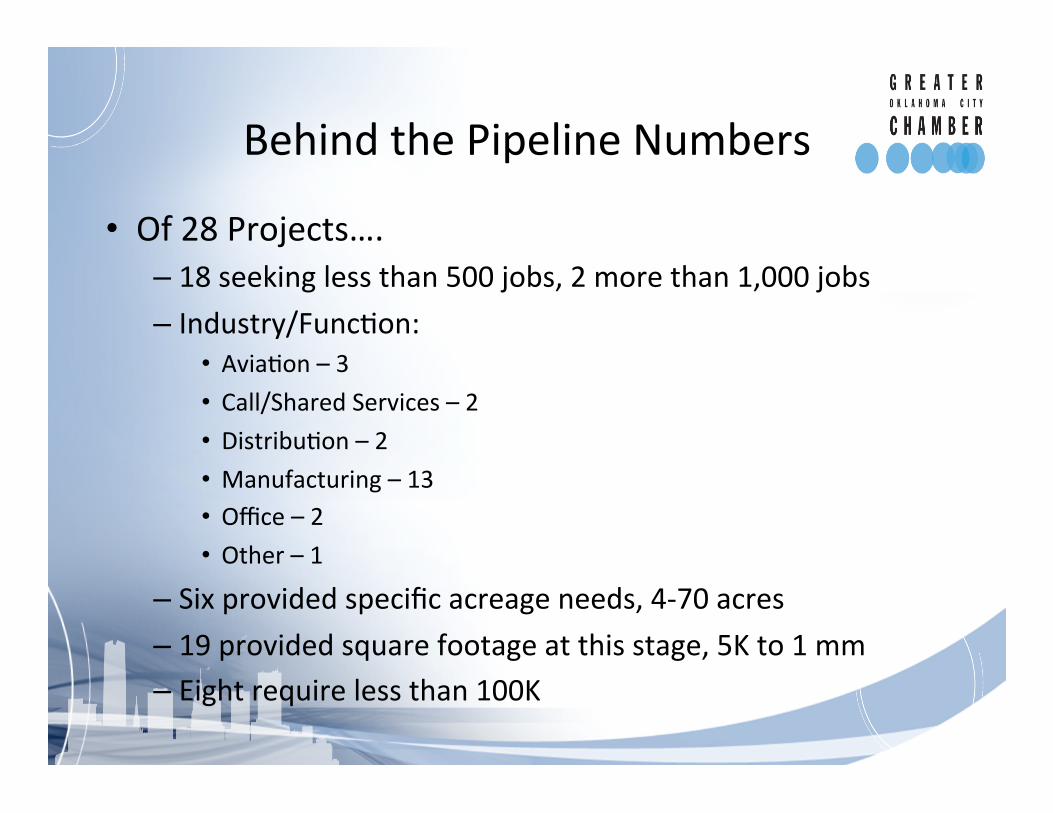
Behind the Pipeline Numbers
• Of 28 Projects…. – 18 seeking less than 500 jobs, 2 more than 1,000 jobs – Industry/Func^on:
• Avia^on – 3 • Call/Shared Services – 2 • Distribu^on – 2 • Manufacturing – 13 • Office – 2 • Other – 1
– Six provided specific acreage needs, 4-‐70 acres – 19 provided square footage at this stage, 5K to 1 mm – Eight require less than 100K

2013 Projects
10
15
20
25
30
35
40
Total Projetcs

2013 Jobs
0
4,000
8,000
12,000
16,000
20,000
*Note: Not all projects provide the key pieces of information listed above.

2013 Total Annual Payroll
$0
$50,000,000
$100,000,000
$150,000,000
$200,000,000
$250,000,000
$300,000,000
$350,000,000
$400,000,000
$450,000,000
*Note: Not all projects provide the key pieces of information listed above.
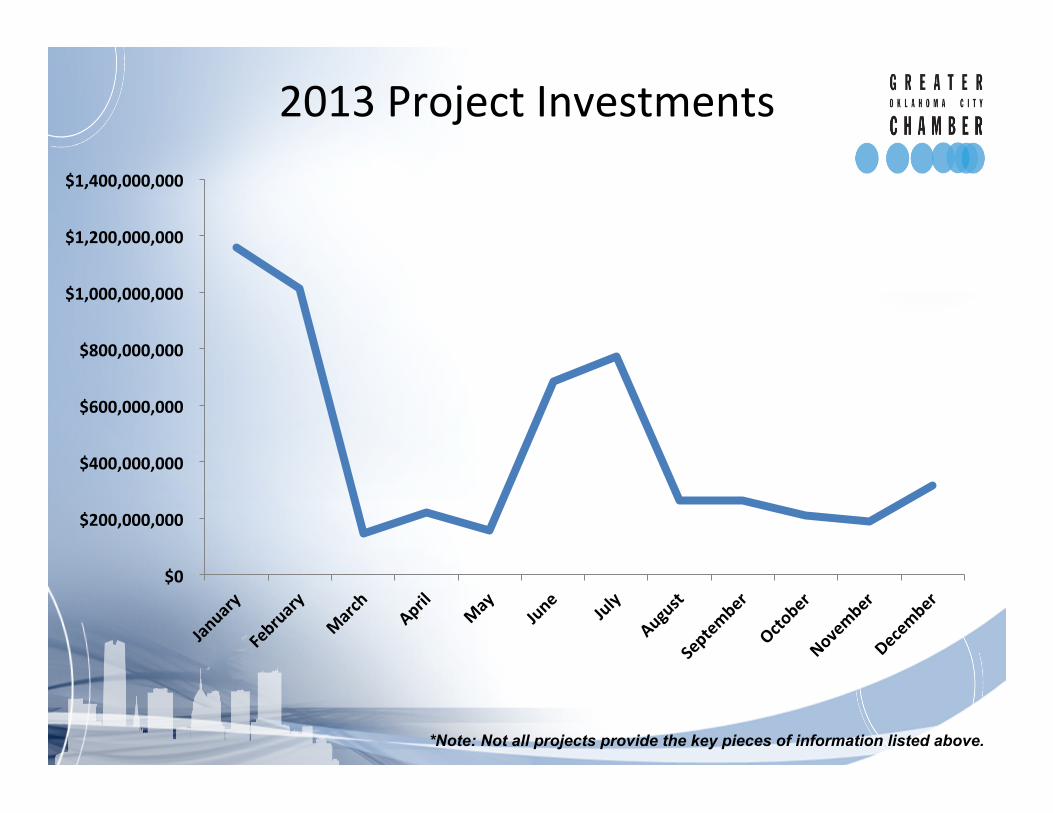
2013 Project Investments
$0
$200,000,000
$400,000,000
$600,000,000
$800,000,000
$1,000,000,000
$1,200,000,000
$1,400,000,000
*Note: Not all projects provide the key pieces of information listed above.
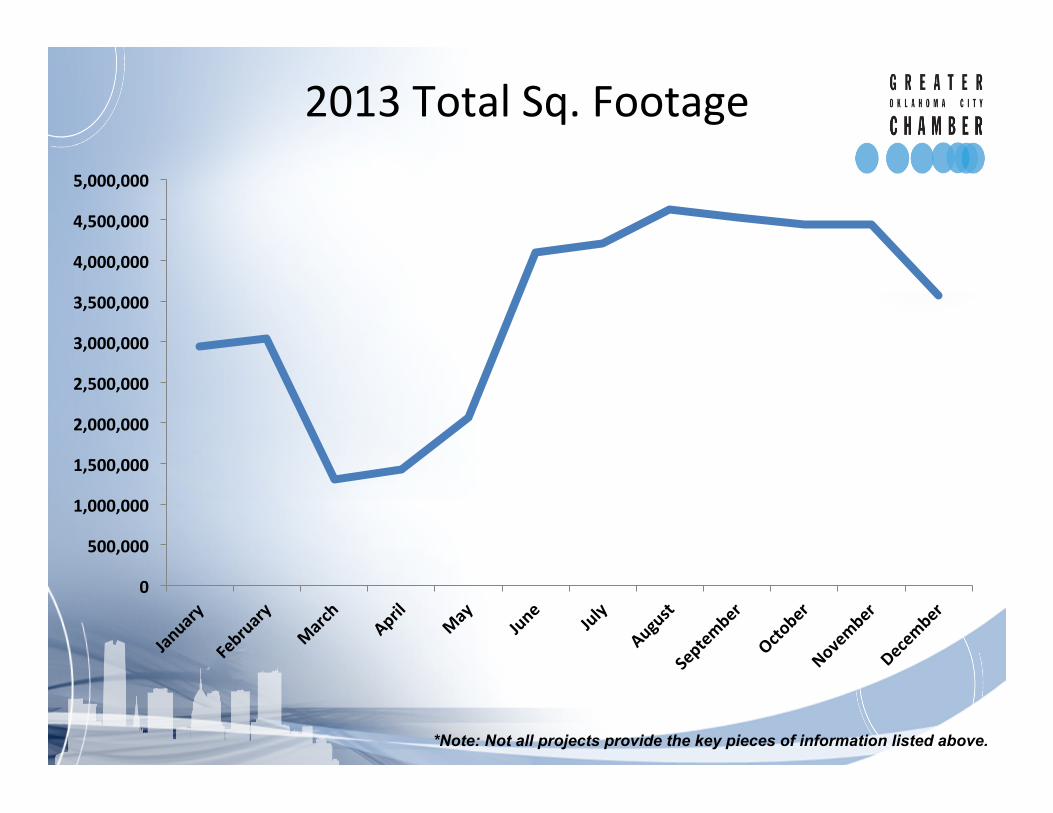
2013 Total Sq. Footage
0
500,000
1,000,000
1,500,000
2,000,000
2,500,000
3,000,000
3,500,000
4,000,000
4,500,000
5,000,000
*Note: Not all projects provide the key pieces of information listed above.

Retail Efforts: Results and Impacts • More than 40 site visits in OKC in 2013
– OKC con^nues to be on the radar of retailers recognizing OKC’s poten^al
• Moving from “Top of Low Priority List” to “Top of List” for 2014-‐15.
• Snapshot of Announcements in 2013 (All First Oklahoma Loca^ons) – Nordstrom Rack – Top Golf – Von Maur – Microsok
• Development and Redevelopment Opportuni^es Underway

Key Opportunity: Underserved Markets
• Why focus on these areas? – Tradi^onal market data and analysis may be inaccurate or misrepresent the economic poten^al and purchasing power
– Seeking to establish a healthier retail presence through public-‐private partnerships in underes^mated, primarily urban inner city markets
– Bring OKC prosperity to more por^ons of the City over ^me
Highligh^ng Underserved Markets • Held Program on Poten^al of Underserved Markets
– Partnered with Interna^onal Council of Shopping Centers (ICSC), City of OKC, Alliance for Economic Development, Urban Land Ins^tute (ULI) & Black Chamber
• Follow-‐up Underway with key interest groups • Community (residents, community based organiza^ons) • Government (elected officials and professional staff) • Developers • Retailers
• Working with exis^ng retailer, Alliance and City on a site in NE OKC to increase store footprint size and add further development
• Con^nue dialogue with retailers and developers about various underserved sites in OKC

Project Golden Fox
• Interna^onal company seeking new North American manufacturing loca^on
• Investment: $800 MM, 750 employees (avg. wage $53K+) • Need: 160 acre site • Outcome: OKC region dropped • Challenge: had only one site that was poten^ally a fit really.
School Lands site, requiring public bid process and had challenges on site too (easements, etc.)
Project Domino
• Petro Chemical plant • Investment: $550 MM, 80 employees (avg. wage $76K+) • Need: 60 acre site, rail served and 2 million gallons of water/
day plus lots of natural gas (60,000 MMBtu/day) • Outcome: OKC region dropped • Challenge: water requirement just not workable AND would
have been largest natural gas user in state
Project Lewis & Clark
• Fulfillment Center/distribu^on • Investment: 400-‐600 employees • Need: 300-‐500,000 sf building with 32 foot clear height and
very ^ght ^meframe (needed opera^onal in 12 months) • Outcome: OKC region dropped • Challenge: no exis^ng buildings; only built to suit op^ons.
Company was too nervous to have it work in their ^meframe

Project Delta
• Shared Service center (HR/IT/Finance) • Investment: 1,100 employees (avg. wage $39K+) • Need: Exis^ng 100,000 sf building • Outcome: OKC region dropped in finals, Nashville chosen • Challenge: two poten^al buildings. one was downtown,
second refiUed industrial building. Parking issues downtown and other challenges at second facility. Nashville, more op^ons for real estate, same ^me zone as HQ

Poten^al Take-‐Aways
• Challenges of Success are evident across most of MSA/region • Lack of product straining ability to capture some opportuni^es
– Lease rate expecta^ons and reali^es geung closer but not completely there yet
• Pressure by other uses on “good places” for employment opportuni^es con^nues to create challenges
• Need to determine ways to balance lessons learned in 1980s with expecta^ons/ interests of today’s prospects – Staying financially wise while crea^ng enough product

THANK YOU Eric Long Research Economist [email protected] 405-‐297-‐8976
Kurt Foreman EVP Economic Development [email protected] (405) 297-‐8945
Copyright © 2022 FDOKUMEN