Knowledge Networks as a Source of Knowledge Initiatives and Innovation Activity in Small and Medium...
8
Knowledge Networks as a Source of Knowledge Initiatives and Innovation Activity in Small and Medium Enterprises Regression Analysis for EU 27 Countries Ján Papula, Jana Volná and Jaroslav Huľvej Faculty of Management, Comenius University, Odbojárov 10, Bratislava, Slovak Republic {jana.volna, jan.papula, jaroslav.hulvej}@fm.uniba.sk Keywords: Knowledge Networks, Intellectual Capital, Core Competences, Innovation Activity, Clusters, Small and Medium Enterprises. Abstract: Building-up the knowledge society through human capital and innovation activities, particularly generated through SMEs are generally the driving force of economic development, are developing options for future competitiveness in the form of new knowledge, and are increasing the efficiency of the economy and its ability to act. Since countries like Finland, Germany, Denmark and Sweden reach highest innovation performance among all EU countries, there are countries like Latvia, Lithuania, Romania, Bulgaria, Poland or Slovakia which drag behind other European countries and rank among the countries with the weakest innovative performance. The aim of this paper is to identify the enablers of innovation in European SMEs by using the concept of intellectual capital. Through statistical analysis we have investigated how knowledge networks, which can be considered as the source of knowledge initiatives in SMEs, contribute to their innovation activities. According to conclusions of our analysis, creating knowledge network, which secure knowledge circulation and spilling over partners consisting of universities, state or local governments and SMEs, will increase knowledge base of the economy of a country, i.e. will grow the innovation activity of enterprises, improve the quality of human resources, research and technology, which are considered as key factors of European competitiveness. 1 INTRODUCTION Innovation has become a major driver for economic growth through the creation, use, and diffusion of knowledge (OECD, 2002). As drafted in figure 1, countries like Finland, Germany, Denmark and Sweden reach highest innovation performance among all EU countries. Figure 1: EU Member States’ Innovation Performance (European Commission, 2011). On the other side, there are countries like Latvia, Lithuania, Romania, Bulgaria, Poland or Slovakia which drag behind other European countries and rank among the countries with the weakest innovative performance. It is apparent, that states with lowest innovation performance are all post-communist countries entering the EU after 2004, of which the main competitive advantage is the existing comparative competitive advantage of low cost (low wages, low taxes). In terms of the global economy, these strategies are not further sustainable for mentioned countries in the future. The growing competition of countries having even cheaper labor quickly devalues these temporary competitive advantages. Based on the above, it is therefore clear that mentioned countries must start focusing on value added, knowledge-based resource advantages instead of advantages originated from low cost. The resource-based advantages are represented in the knowledge base of the economy, specifically growing innovation potential of enterprises, the quality of human resources, research and 389 Papula, Ján – Volná, Jana – Huľvej, Jaroslav (2013) “Knowledge networks as a source of knowledge initiatives and innovation activity in small and medium enterprises“, Proceedings of International Conference KDIR 2013 and KMIS 2013 Algarve: Scitepress, ISBN 978-989-8565-75-4. pp. 389-396
Transcript of Knowledge Networks as a Source of Knowledge Initiatives and Innovation Activity in Small and Medium...

Knowledge Networks as a Source of Knowledge Initiatives and Innovation Activity in Small and Medium Enterprises
Regression Analysis for EU 27 Countries
Ján Papula, Jana Volná and Jaroslav Huľvej Faculty of Management, Comenius University, Odbojárov 10, Bratislava, Slovak Republic
{jana.volna, jan.papula, jaroslav.hulvej}@fm.uniba.sk
Keywords: Knowledge Networks, Intellectual Capital, Core Competences, Innovation Activity, Clusters, Small and Medium Enterprises.
Abstract: Building-up the knowledge society through human capital and innovation activities, particularly generated through SMEs are generally the driving force of economic development, are developing options for future competitiveness in the form of new knowledge, and are increasing the efficiency of the economy and its ability to act. Since countries like Finland, Germany, Denmark and Sweden reach highest innovation performance among all EU countries, there are countries like Latvia, Lithuania, Romania, Bulgaria, Poland or Slovakia which drag behind other European countries and rank among the countries with the weakest innovative performance. The aim of this paper is to identify the enablers of innovation in European SMEs by using the concept of intellectual capital. Through statistical analysis we have investigated how knowledge networks, which can be considered as the source of knowledge initiatives in SMEs, contribute to their innovation activities. According to conclusions of our analysis, creating knowledge network, which secure knowledge circulation and spilling over partners consisting of universities, state or local governments and SMEs, will increase knowledge base of the economy of a country, i.e. will grow the innovation activity of enterprises, improve the quality of human resources, research and technology, which are considered as key factors of European competitiveness.
1 INTRODUCTION
Innovation has become a major driver for economic growth through the creation, use, and diffusion of knowledge (OECD, 2002). As drafted in figure 1, countries like Finland, Germany, Denmark and Sweden reach highest innovation performance among all EU countries.
Figure 1: EU Member States’ Innovation Performance (European Commission, 2011).
On the other side, there are countries like Latvia,
Lithuania, Romania, Bulgaria, Poland or Slovakia which drag behind other European countries and rank among the countries with the weakest innovative performance.
It is apparent, that states with lowest innovation performance are all post-communist countries entering the EU after 2004, of which the main competitive advantage is the existing comparative competitive advantage of low cost (low wages, low taxes). In terms of the global economy, these strategies are not further sustainable for mentioned countries in the future. The growing competition of countries having even cheaper labor quickly devalues these temporary competitive advantages. Based on the above, it is therefore clear that mentioned countries must start focusing on value added, knowledge-based resource advantages instead of advantages originated from low cost. The resource-based advantages are represented in the knowledge base of the economy, specifically growing innovation potential of enterprises, the quality of human resources, research and
389
Papula, Ján – Volná, Jana – Huľvej, Jaroslav (2013) “Knowledge networks as a source of knowledge initiatives and innovation activity in small and medium enterprises“, Proceedings of International Conference KDIR 2013 and KMIS 2013 Algarve: Scitepress, ISBN 978-989-8565-75-4. pp. 389-396
reference
Papula, Ján - Volná, Jana - Huľvej, Jaroslav (2013) “Knowledge networks as a source of knowledge initiatives and innovation activity in small and medium enterprises“, Proceedings of International Conference KDIR 2013 and KMIS 2013 Algarve: Scitepress, ISBN 978-989-8565-75-4. pp. 389-396

technology, which are considered as key factors of European competitiveness.
In order to increase the innovation activity in the lowest ranked countries according to their innovation performance (Pilková et al., 2012), the focus has to be put on identification of the enablers of the creation, use, and diffusion of knowledge especially within SMEs. One possibility to provide the identification of these enablers is to use the concept of intellectual capital of an organization identifying and quantifying the knowledge, skills, relationships, business processes, innovation and other components of intangible assets in the organization which together aim to build and strengthen the organization's competitive advantage and also which aim to activate and enhance their innovation potential. The outcome of effective management of intellectual capital in organizations is their increased innovation activity through the creation of new products and services with high added value for the customers.
The business sector, especially by SMEs, is generally considered to be the innovation holder. To fulfill this task requires professionally trained, educated and creative human resources. The priority therefore has to be put on creating innovative companies with creative human capital and effective internal and external communication, which are able to add value for customer by using their knowledge based resources (intellectual capital).
2 KNOWLEDGE AS A STRATEGIC TOOL OF COMPETITIVENESS AND INNOVATION ACTIVITY OF SMALL AND MEDIUM ENTERPRISES
2.1 Importance of Knowledge Management
In companies based on knowledge, managing human resources concentrates on increasing the so-called organization intelligence and developing potential of workers by means such as learning, participation, co-operation and initiative. To know is an advantage, to learn is necessity. This has always been acknowledged. But these attributes are gradually becoming the main comparative advantage in a knowledge company now and they are the basis for creating wealth.
Knowledge management is a term, which has been currently appearing more and more often in relation with the ambition of businesses to succeed in the challenging competitive environment. Knowledge management can be generally understood as an effort to make know-how available in an organization to those who need it, to where it is needed, at the right time and in a form in which it is needed in order to increase human and organization performance. The main activities of knowledge management are: Acquiring knowledge and skills in the
organization; Processing knowledge and skills within
organization; Sharing knowledge and skills within organization; Enhancement of knowledge and skills within
organization.
2.2 Intellectual Capital as Value Adding Element of Knowledge Management
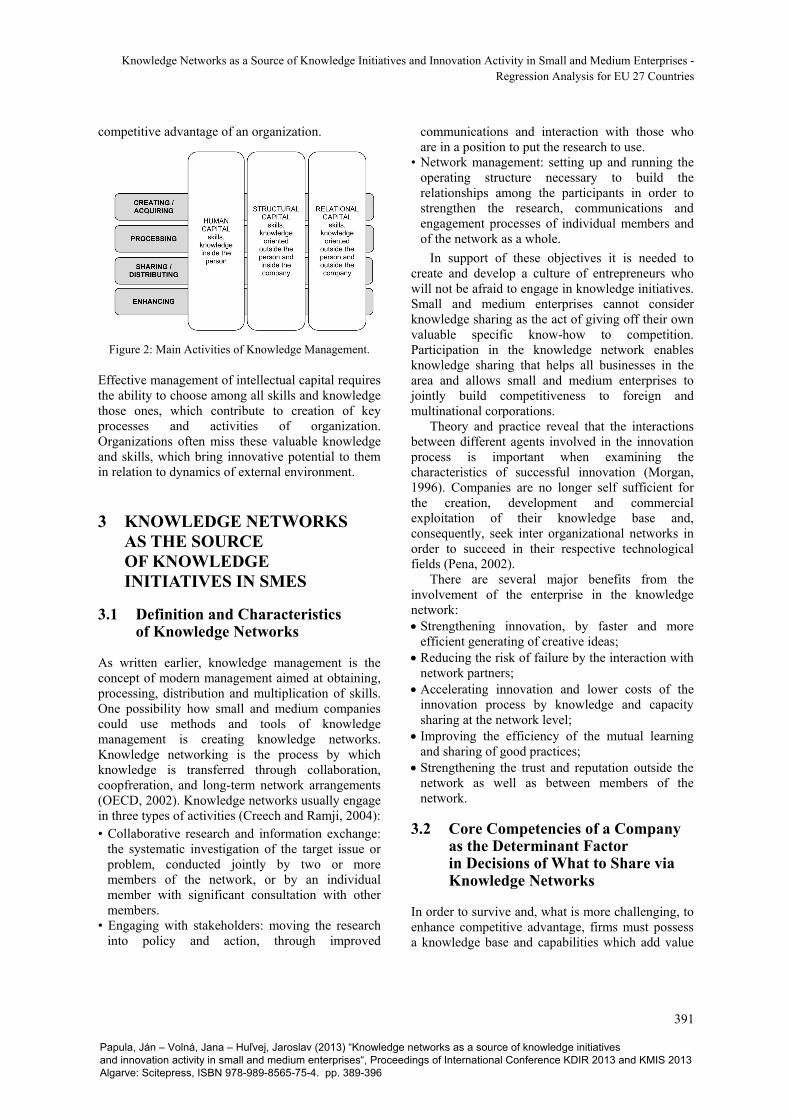
In contrast to first understandings of knowledge management which had been focused on knowledge distribution among creative individuals in the company, later evolution of knowledge management understands the employees (human capital of the company) in the context of other elements of intellectual capital (structural and relational capital) and the knowledge management is understood as management of intellectual capital of the particular company (figure 2). The idea is, that in reality it is not possible to separate employees from the company's internal and external relations. Individual items of knowledge are always oriented towards something outside the person and therefore the object of knowledge management has been broadened to all parts of intellectual capital (Mouritsen and Larsen, 2005).
The aim is to justify the interaction of skills and knowledge of employees among each other, with technologies and processes as well as with customers, resp. with external environment of a company.
Intellectual capital, which incorporates skills and knowledge at all levels of an organization, has become the most important economic resource and is replacing financial and physical capitals as the most important source in the new economy. Knowledge management including knowledge-based activities, which build any of the components of intellectual capital in the company, are nowadays considered as the driving motor of sustainable
KMIS�2013�-�International�Conference�on�Knowledge�Management�and�Information�Sharing
390
Papula, Ján – Volná, Jana – Huľvej, Jaroslav (2013) “Knowledge networks as a source of knowledge initiatives and innovation activity in small and medium enterprises“, Proceedings of International Conference KDIR 2013 and KMIS 2013 Algarve: Scitepress, ISBN 978-989-8565-75-4. pp. 389-396
competitive advantage of an organization.
Figure 2: Main Activities of Knowledge Management.
Effective management of intellectual capital requires the ability to choose among all skills and knowledge those ones, which contribute to creation of key processes and activities of organization. Organizations often miss these valuable knowledge and skills, which bring innovative potential to them in relation to dynamics of external environment.
3 KNOWLEDGE NETWORKS AS THE SOURCE OF KNOWLEDGE INITIATIVES IN SMES
3.1 Definition and Characteristics of Knowledge Networks
As written earlier, knowledge management is the concept of modern management aimed at obtaining, processing, distribution and multiplication of skills. One possibility how small and medium companies could use methods and tools of knowledge management is creating knowledge networks. Knowledge networking is the process by which knowledge is transferred through collaboration, coopfreration, and long-term network arrangements (OECD, 2002). Knowledge networks usually engage in three types of activities (Creech and Ramji, 2004): • Collaborative research and information exchange:
the systematic investigation of the target issue or problem, conducted jointly by two or more members of the network, or by an individual member with significant consultation with other members.
• Engaging with stakeholders: moving the research into policy and action, through improved
communications and interaction with those who are in a position to put the research to use.
• Network management: setting up and running the operating structure necessary to build the relationships among the participants in order to strengthen the research, communications and engagement processes of individual members and of the network as a whole.
In support of these objectives it is needed to create and develop a culture of entrepreneurs who will not be afraid to engage in knowledge initiatives. Small and medium enterprises cannot consider knowledge sharing as the act of giving off their own valuable specific know-how to competition. Participation in the knowledge network enables knowledge sharing that helps all businesses in the area and allows small and medium enterprises to jointly build competitiveness to foreign and multinational corporations.
Theory and practice reveal that the interactions between different agents involved in the innovation process is important when examining the characteristics of successful innovation (Morgan, 1996). Companies are no longer self sufficient for the creation, development and commercial exploitation of their knowledge base and, consequently, seek inter organizational networks in order to succeed in their respective technological fields (Pena, 2002).
There are several major benefits from the involvement of the enterprise in the knowledge network: Strengthening innovation, by faster and more
efficient generating of creative ideas; Reducing the risk of failure by the interaction with
network partners; Accelerating innovation and lower costs of the
innovation process by knowledge and capacity sharing at the network level;
Improving the efficiency of the mutual learning and sharing of good practices;
Strengthening the trust and reputation outside the network as well as between members of the network.
3.2 Core Competencies of a Company as the Determinant Factor in Decisions of What to Share via Knowledge Networks
In order to survive and, what is more challenging, to enhance competitive advantage, firms must possess a knowledge base and capabilities which add value
Knowledge�Networks�as�a�Source�of�Knowledge�Initiatives�and�Innovation�Activity�in�Small�and�Medium�Enterprises�-Regression�Analysis�for�EU�27�Countries
391
Papula, Ján – Volná, Jana – Huľvej, Jaroslav (2013) “Knowledge networks as a source of knowledge initiatives and innovation activity in small and medium enterprises“, Proceedings of International Conference KDIR 2013 and KMIS 2013 Algarve: Scitepress, ISBN 978-989-8565-75-4. pp. 389-396
to the firm; resources which are inimitable, no substitutable and scarce (Pena, 2002). As early as in 1990, the authors C. K. Prahald and G. Hamel in their article “The Core Competence of the Corporation” developed the concept of Core Competence of an organization. Key competencies are only those skills that meet these following criteria (Ireland et al., 2009): 1. They are valuable, so they contribute to value
creation for customers by exploiting new opportunities or neutralizing threats.
2. They must be rare, so they are held by few if any competitors.
3. It must be difficult to imitate them. They are difficult to re-create because intangible resources or their specific contribution to the capability cannot be easily identified.
4. They should be no substitutable. No resources / capabilities should exist that can complete the tasks and provide the same value to customers.
If today a firm is basing its competitive advantage on one single product innovation or on the use of other material or on the purchase of the new technology, it will be quickly realized and imitate by others, especially if the change is effective. Therefore now it is important to prepare competitive advantages that are hard to detect and hard to imitate (Papulova, 2012).
According to this concept, the key capabilities - or core competencies of the company are the main source of its competitive advantage and they allow the organization to create a new level of products and services. To create core competencies in a company, the organization must possess abilities which can be used to create something valuable for the customer and which other organizations do not have. At the same time it has to be difficult to imitate and unable to substitute. Knowledge and company resources, which form valuable, unique, not imitable as well as irrecoverable abilities are those, which should not be therefore managed through knowledge networks. For all other knowledge – or components of intellectual capital of the company, knowledge networks may be beneficial.
An integrated knowledge management approach should mix together firm internal core competencies with inter organizational extensions to absorb and transfer knowledge beyond the boundaries of a firm (Pena, 2002).
3.3 Clusters as a Form of Knowledge Networks
A cluster can be characterized as a network of interdependent firms, knowledge-producing institutions (e.g., universities, research institutes, and technology-providing firms), bridging institutions, and customers, linked to each other in a value-adding production chain (Roelandt et al.,, 1999). A cluster is a form of network that occurs within a geographic location, in which the proximity of firms and institutions ensures certain forms of commonality and increases the frequency and impact of interactions (Porter, 1998). There exist several research studies with evidence that actors in clusters tend to be more innovative than those that are not in clusters (Baptista, 2000).
4 RESEARCH METHODOLOGY
4.1 Research Setting
The present paper examines how knowledge networks, which can be considered as the source of knowledge initiatives in SMEs, contribute to their innovation activities. In this paper we employ regression analysis to estimate the quantitative effect of an indicator reflecting the level of existing and operating knowledge networks in particular EU 27 countries as the independent variable upon the indicator reflecting innovation activity of SMEs in these countries as dependent variable.
4.2 Definition of Measures and Data Sources
Data have been collected from two different sources, using the Innovation Union Scoreboard 2011 (European Commission, 2011) as the source of innovation activity of EU 27 countries data and Star Clusters reports (European Commission, 2011) as the source of cluster involvement in specific EU 27 states.
4.2.1 Independent Variable
As an independent variable, we have been looking for an indicator reflecting the level of knowledge networks existing and operating in particular EU 27 countries. As a source for data collection we have used Star Cluster reports (European Commission, 2011), which describe regional clusters in 30 European countries. According to Star Cluster
KMIS�2013�-�International�Conference�on�Knowledge�Management�and�Information�Sharing
392
Papula, Ján – Volná, Jana – Huľvej, Jaroslav (2013) “Knowledge networks as a source of knowledge initiatives and innovation activity in small and medium enterprises“, Proceedings of International Conference KDIR 2013 and KMIS 2013 Algarve: Scitepress, ISBN 978-989-8565-75-4. pp. 389-396
reports (European Commission, 2011), the amount and quality of knowledge circulating and spilling over between firms, located in a cluster, is dependent upon 3 characteristics: 1. The cluster's size; 2. The degree to which it is specialized; 3. The extent to which the locality (the region) is
focused upon production in the relevant industries comprising the cluster. The European Cluster Observatory shows the
extent to which clusters have achieved this specialized critical mass by employing measures of these three factors as described below, and assigning each cluster 0, 1, 2 or 3 stars depending on how many of the below criteria are met. For our analysis we have used data about clusters, which received at least one star (also 1, 2 or 3 stars) in this assessment. Deeper insight into methodology of star apportioning is described below (European Commission, 2011): 1. A cluster has received the “size star”, if
employment reaches a sufficient share of total European employment, it is more likely that meaningful economic effects of clusters will be present. The size measure shows whether a cluster is in the top 10% of all clusters in Europe within the same cluster category in terms of the number of employees.
2. A cluster has received the “specialization star”, if a region is more specialized in a specific cluster category than the overall economy across all regions. This is likely to be an indication that the economic effects of the regional cluster have been strong enough to attract related economic activity from other regions to this location, and that spillovers and linkages will be stronger. The specialization measure compares the proportion of employment in a cluster category in a region over the total employment in the same region, to the proportion of total European employment in that cluster category over total European employment. The measure needs to be at least 2 to receive a star.
3. A cluster has received the “focus star”, if a cluster accounts for a larger share of a region's overall employment, it is more likely that spill-over effects and linkages will actually occur instead of being drowned in the economic interaction of other parts of the regional economy. The focus measure shows the extent to which the regional economy is focused upon the industries comprising the cluster category and relates employment in the cluster to total employment in the region. The top 10% of
clusters, which account for the largest proportion of their region's total employment, receive a star.
National statistical offices of participating EU countries have been picked up as data sources for Star cluster reports and data in these reports reflect the situation in years 2001 – 2008, where in majority of countries with reference year 2008. For the purposes of our analysis, we have calculated indicator consisting of Nr. of people employed in clusters that had received at least one star through Star Cluster assessment, divided with the Nr. of inhabitants for every EU 27 country (later in text marked as % CLU). The values of % CLU indicator for EU 27 countries are shown in table 1. European Countries are divided in the table into two groups, first group consisting of 15 member countries in the European Union prior to the accession of ten candidate countries on 1st May, 2004 (labeled as EU15) and countries entering into EU after 1st May, 2004 (labeled as EU new).
Table 1: Values of % CLU indicator for EU 27 countries divided into EU 15 and EU new.
EU 15 EU new Belgium BE 7.5 Bulgaria BG 10 Denmark DK 14.5 Czech Rep. CZ 9.9 Germany DE 8.1 Estonia EE 10.1 Ireland IE 8.6 Cyprus CY 9.3 Greece GR 8.3 Latvia LV 6.7 Spain ES 10.4 Lithuania LT 7.3 France FR 6.9 Hungary HU 7.7 Italy IT 10.6 Malta MT 11.7 Luxembourg LU 16 Poland PL 5.5 Netherlands NL 7.3 Romania RO 10.0 Austria AT 11.7 Slovenia SI 10.9 Portugal PT 10.7 Slovakia SK 7.9 Finland FI 8.5 Sweden SE 8 UK 7.8
4.2.2 Dependent Variables
As a dependent variable, we have been looking for an indicator reflecting the level of innovation activity of SMEs in EU 27 countries. For the purposes of our analysis we have decided to use the Innovation Union Scoreboard 2011 (European Commission, 2011) as a source. Specifically, we have used two indicators from this report:
1. The indicator 3.1.1 - SMEs introducing product or process innovations as % of SMEs (later in text labeled as % PPI), since technological innovation, as measured by the introduction of new products (goods or services) and processes,
Knowledge�Networks�as�a�Source�of�Knowledge�Initiatives�and�Innovation�Activity�in�Small�and�Medium�Enterprises�-Regression�Analysis�for�EU�27�Countries
393
Papula, Ján – Volná, Jana – Huľvej, Jaroslav (2013) “Knowledge networks as a source of knowledge initiatives and innovation activity in small and medium enterprises“, Proceedings of International Conference KDIR 2013 and KMIS 2013 Algarve: Scitepress, ISBN 978-989-8565-75-4. pp. 389-396

is a key ingredient to innovation in manufacturing activities and higher shares of technological innovators should reflect a higher level of innovation activities (European Commission, 2011).
2. The indicator 3.1.2 - SMEs introducing marketing or organizational innovations as % of SMEs (later in text labeled as % MOI), as the indicator of non-technological innovation activity of EU 27 countries. Both indicators have used the statistics from
Eurostat from the reference year 2008 as the data source. Values for these two indicators are shown in table 2.
Table 2: Values of % PPI and % MOI indicator for EU 27 countries divided into EU 15 and EU new.
EU 15 EU newState % PPI % MOI State % PPI % MOI BE 44.0 44.1 BG 20.7 17.3 DK 37.6 40.0 CZ 34.9 45.9 DE 53.6 62.6 EE 43.9 34.1 IE 27.3 41.6 CY 42.2 47.3 GR 37.3 51.3 LV 17.2 14.0 ES 27.5 30.4 LT 21.9 21.4 FR 32.1 38.5 HU 16.8 20.5 IT 36.9 40.6 MT 25.9 25.6 LU 41.5 53.0 PL 17.6 18.7 NL 31.6 28.6 RO 18.0 25.8 AT 39.6 42.8 SI 31.0 39.4 PT 47.7 43.8 SK 19.0 28.3 FI 41.8 31.5
SE 40.6 36.7
UK 25.1 31.1
4.3 Data Analysis
Data in this paper are presented and analyzed through descriptive statistics using histograms, box and whisker plots, and statistics summaries such as average, median, standard deviation, and kurtosis and skewness. Then, normality tests have been provided. After that, we have continued with correlation and regression analysis and analysis of variance, which have allowed us to analyze the relationships among selected data. Data have been executed in Microsoft Excel and Statgraphics Plus software programs.
5 RESULTS
The main statistics summaries for all three variables, %PPI, %MOI and %CLU are presented in table 3.
As seen in the table, all statistics summaries are very similar for both, %PPI and %MOI. Figure 3 shows the results of fitting a linear model to describe the relationship between %MOI and %PPI. The equation of the fitted model is:
%MOI = 4.76719 + 0.945769*%PPI (1)
Since the P-value is less than 0.01, there is a statistically significant relationship between %MOI and %PPI at the 99% confidence level. The R-Squared statistic indicates that the model as fitted explains 69.83% of the variability in %MOI. The correlation coefficient equals 0.84, indicating a moderately strong relationship between the variables.
All these facts mean that the portion of SMEs introducing product or process innovations in a country is similar to the portion of SMEs introducing marketing or organizational innovations. Both, average and median is slightly higher for %MOI reflecting the marketing or organizational innovations than for %PPI reflecting product or process innovations.
Table 3: Statistics summaries.
Indicator % PPI % MOI % CLU
Average 32.35 35.37 9.35
Median 32.09 36.73 8.60
St. Deviation 10.54 11.93 2.36
Kurtosis -1.03 -0.35 1.52
Skewness 0.03 0.14 1.07
Minimum 16.82 13.95 5.50
Maximum 53.61 62.63 16.00
Figure 3: Correlation Analysis for %MOI and %PPI.
As seen in table 3 describing main statistics summaries, minimum and maximum value for %CLU reflecting the level of knowledge networks existing and operating in European Union countries
KMIS�2013�-�International�Conference�on�Knowledge�Management�and�Information�Sharing
394
Papula, Ján – Volná, Jana – Huľvej, Jaroslav (2013) “Knowledge networks as a source of knowledge initiatives and innovation activity in small and medium enterprises“, Proceedings of International Conference KDIR 2013 and KMIS 2013 Algarve: Scitepress, ISBN 978-989-8565-75-4. pp. 389-396

is 5.5 as minimum and 16 as maximum. It is very interesting, that the portion of knowledge networks is so similar for all EU27 countries and the data range is only 10.5 points (where the maximum of 16% represents Luxembourg, which is a country with the lowest population and higher percentage of cross-border workers, thus it is feasible that the %CLU indicator is affected by this fact). Figure 4 shows the box and whisker plot for %CLU data divided into two groups, EU 15 and the rest countries, entering the EU since 2004 (EU new).
Figure 4: Box and Whisker Plot for %CLU Data for EU 15 and EU New States.
To describe the relationship between the level of knowledge networks operating in EU27 countries and the innovation activity of SMEs in them, regression analysis has been provided between these variables. Figure 5 shows the results of fitting a multiplicative model describing the relationship between %CLU and %MOI. The equation of the fitted model is:
%CLU = 3.66701*%MOI^0.259078 (2)
Figure 5: Relationship between %CLU and %MOI.
Since the P-value in the analysis of variance table is less than 0.05, there is a statistically significant relationship between %CLU and %MOI at the 95% confidence level. The R-Squared statistic indicates
that the model as fitted explains 16.11% of the variability in %CLU after transforming to a logarithmic scale to linearize the model. The correlation coefficient equals 0.40, indicating a relationship between these variables.
Figure 6: Relationship between %CLU and %PPI.
Figure 6 shows the results of fitting a multiplicative model to describe the relationship between %CLU and %PPI. The equation of the fitted model is:
%CLU = 3.76108*%PPI^0.258029 (3)
Since the P-value is less than 0.10, there is a statistically significant relationship between %CLU and %PPI at the 90% confidence level. The R-Squared statistic indicates that the model as fitted explains 14.35% of the variability in %CLU after transforming to a logarithmic scale to linearize the model. The correlation coefficient equals 0.38, indicating a relationship between the variables.
6 DISCUSSION AND CONCLUSIONS
The activity of SMEs within EU27 countries in knowledge networks or clusters is a clear demonstration of their efforts to strengthen competitiveness. At the country level, there is the clear evidence of the relationship between the level of existing and operating knowledge networks and the innovation activity of SMEs in EU countries.
This should be a motivating factor for businesses to seek and engage in knowledge networks or clusters. This is important especially for small and medium-sized enterprises, where the ability to multiply and enhance knowledge by their own is strictly limited. For new knowledge needed to support innovation, they must also search in the external environment. Maintaining the pace of innovation requires to find the right partners to
5 7 9 11 13 15 17
D
D 15
Knowledge�Networks�as�a�Source�of�Knowledge�Initiatives�and�Innovation�Activity�in�Small�and�Medium�Enterprises�-Regression�Analysis�for�EU�27�Countries
395
Papula, Ján – Volná, Jana – Huľvej, Jaroslav (2013) “Knowledge networks as a source of knowledge initiatives and innovation activity in small and medium enterprises“, Proceedings of International Conference KDIR 2013 and KMIS 2013 Algarve: Scitepress, ISBN 978-989-8565-75-4. pp. 389-396
achieve the appropriate synergies through joint action in the knowledge network, but also to focus on correct settings in the internal environment.
Without adequate organizational culture, internal processes and support of employee development towards the search and usage of knowledge, the involvement to the knowledge network could be ineffective and without the desired results.
To ensure a sustainable competitive strategy, there is necessary to activate the processes of knowledge management by effective inclusion of own knowledge-based resources (intellectual capital) of company. Here occurs the importance of intellectual capital management point of view to secure the necessary enablers to support knowledge management activities at the level of knowledge networks. The concept of intellectual capital allows managers to align resources and activities with regard to the strategic objectives of the organization, but also to measure and evaluate the activities leading to the effective participation in knowledge networks or clusters.
Regular monitoring and evaluation can help to maintain activities and thus to promote a sustainable innovation capability of enterprises. This is relevant especially for countries that today do not achieve the desired results in innovation activity (Latvia, Lithuania, Romania, Bulgaria, Poland or Slovakia). These countries should focus on comprehensive management of activities, not just the obvious process of knowledge management, but also at building enablers consisting of the sources of intellectual capital.
Limitations of our research: The research is focused on analyzing the relationship between engagement in knowledge networks represented by clusters and innovation activity of companies, especially small and medium enterprises. We didn't analyze the level of activity within knowledge networks or clusters, neither to analyze the structure of intellectual capital with regard to the effective usage of the possibilities of knowledge networks or clusters. On these areas we plan to focus in our future research.
ACKNOWLEDGEMENTS
This paper has been funded by project Vega 1/0920/11.
REFERENCES
Baptista R. 2000. Do innovations diffuse faster within geographical clusters? In International Journal of Industrial Organization Elsevier Science 18, 3. pp.515–35
Creech, H. – Ramji, A. 2004. Knowledge Networks: Guidelines for Assessment. International Institute for Sustainable Development.
European Commission, Innovation Union Scoreboard 2011, European Union.
Ireland, R. D. – Hoskisson, R. E. – Hitt, M. A. 2009. Understanding Business Strategy: Concepts and Cases.South-Western, 2nd Edition
Mouritsen, J. – Larsen, L. T. 2005. The 2nd wave of knowledge management: The management control of knowledge resources through intellectual capital information. In Management Accounting Research. Frederiksberg, Denmark: Elsevier. pp. 371–394
Morgan K. 1996. Learning-by-interacting: inter-firm networks and enterprise support. In: OECD, editor. Networks of enterprises and local development. Paris: OECD. p. 53–66.
OECD. 2002. Dynamising national innovation systems. Paris: OECD
Papulova, Z. 2012. Strategické analýzy s podporou strategického myslenia. Aktuálny trend v strategickom manažmente. Kartprint. Bratislava
Pena, I., 2002. Knowledge networks as part of an integrated knowledge management approach. In: Journal of Knowledge management. Vol. 6, N. 5, pp. 469-478.
Pilková, A. – Kovačičová, Z., Holienka, M., Rehák, J. 2012. Podnikanie na Slovensku: vysoká aktivita, nízke rozvojové ašpirácie. Univerzita Komenského v Bratislave.
Porter, M. E.,1998. Clusters And The New Economics Of Competition .In Harvard Business Review, November–December, pp. 77–90.
Prahald, C. K. – Hamel.G. 1990. The Core Competence of the Corporation, Harvard Business Review. Maj-Jun
Roelandt T. J. A. , den Hertog P., van Sinderen J., van den Hove N. 1999. Cluster analysis and cluster-based policy in the Netherlands. In: OECD, editor. Boosting innovation: the cluster approach. Paris: OECD. p. 9–26.
European Cluster Observatory. Star Cluster reports. online:http://www.clusterobservatory.eu/index.html#!view=scoreboard;url=/scoreboard/
KMIS�2013�-�International�Conference�on�Knowledge�Management�and�Information�Sharing
396
Papula, Ján – Volná, Jana – Huľvej, Jaroslav (2013) “Knowledge networks as a source of knowledge initiatives and innovation activity in small and medium enterprises“, Proceedings of International Conference KDIR 2013 and KMIS 2013 Algarve: Scitepress, ISBN 978-989-8565-75-4. pp. 389-396