KMF Quarterly Commentary & Performance Data: Q1'22
7
Kayne Anderson NextGen Energy & Inastructure, Inc. KMF Quarterly Commentary & Performance Data: Q2’22 July 5, 2022
-
Upload
khangminh22 -
Category
Documents
-
view
3 -
download
0
Transcript of KMF Quarterly Commentary & Performance Data: Q1'22
Kayne AndersonNextGen Energy & In�astructure, Inc.
KMF Quarterly Commentary & Performance Data: Q2’22
July 5, 2022
July 5, 2022
Dear Fellow Stockholders:
We hope this letter finds you and your families well. Though summer is upon us, there is no lack of news flow regarding the state of the global economy. Investors are on edge, with financial assets reacting violently as market sentiment shifts. In our last quarterly update, we pointed to the many factors driving volatility in financial markets, including “concerns about inflation, rising interest rates, and the potential for a slower global recovery.” Many of these challenges have only become more pronounced, with inflation hovering at 40-year highs and central banks rapidly increasing interest rates to rein in inflation expectations. Energy prices are featured prominently in the inflation discussion, and energy security remains squarely in focus as geopolitical events roil global energy and power markets. Despite the nearer-term headwinds facing equity valuations, we believe the long-term investment case for energy infrastructure equities is even more compelling, and we believe KMF is ideally suited to give investors exposure to the Energy Transition as a result of its emphasis on investing in NextGen Companies.(1) Our portfolio of equity and debt investments in high-quality, well-capitalized energy and infrastructure companies should generate attractive returns across a range of economic conditions while contributing to global decarbonization goals. This quarter’s relative performance is an excellent case study highlighting this point.
In this letter, we discuss the energy infrastructure markets, KMF’s portfolio positioning, and the Fund’s strong quarterly performance. In summary:
• KMF had another impressive quarter performance-wise, generating a Net Asset Return of 10.3%;(2) • We achieved this return while maintaining conservative leverage levels with ample “downside cushion”
given the overall market volatility;(3) and • Announced a quarterly distribution of $0.16 per share.
Market Conditions
The S&P 500 declined 5.2% during KMF's fiscal second quarter (ended May 31st) and was down 8.8% during the first six months of fiscal 2022.(4) Volatility remained stubbornly high as the market assessed accelerating and widespread inflation amidst skepticism about the Federal Reserve’s ability to engineer a “soft landing.” As the Fed and other Central Banks rapidly increased interest rates to quell inflation expectations, the prospects for a global recession have increased. Bond yields continued to increase at an extraordinary pace during the quarter, with the 10-year U.S. Treasury bond yield up 101 basis points (bps) to 2.8% – double the rate at the start of fiscal 2022. Against a backdrop of heightened uncertainty, we expect continued periods of above-average volatility in equity markets.
Energy commodity prices remained strong (but volatile) during the fiscal quarter, as WTI crude oil prices ended the quarter at a 14-year high of $114 per barrel (up 19% during fiscal Q2). Global crude oil and refined product inventories were tight even before Russia’s invasion of Ukraine, and we are now witnessing a delicate global balancing act. Global demand is still growing materially, but at a slower rate due to high prices. Meanwhile, unprecedented strategic petroleum reserve releases are helping offset lower Russian exports. Despite this, oil prices remain high as the market weighs the prospects of lower Russian supply by the end of this year and limited alternatives to offset this decline. Domestically, capital discipline by U.S. upstream companies and supply chain/labor constraints continue to act as meaningful governors on domestic supply growth. Barring a severe global recession, we anticipate robust demand growth and believe oil prices will remain above “mid-cycle” levels, as there is no quick fix to today’s supply constraints.
Natural gas and LNG (liquified natural gas) prices remain in focus, given that Russia (pre-war) supplied roughly 40% of the natural gas consumed by Europe. During the quarter, U.S. natural gas prices approached levels not experienced in well over a decade, averaging $6.46 per million British thermal units (MMBtu) and ended
(1) We consider NextGen companies to be energy companies and infrastructure companies that are meaningfully participating in, or benefiting from, the Energy Transition.
For these purposes, we include renewable infrastructure companies, natural gas & LNG infrastructure companies, and certain utility companies. (2) Net Asset Return is defined as the change in net asset value per share plus cash distributions paid during the period (assuming reinvestment through our dividend
reinvestment plan). (3) Downside cushion reflects the decrease in total asset value that could be sustained while maintaining compliance with 1940 Act leverage levels and KMF’s financial
covenants. (4) Performance metrics in this letter represent total returns unless specifically noted otherwise.
the period at $8.46/MMBtu. As stunning as these price levels are for American consumers, prices in Europe averaged $31/MMBtu during the same period. It is hard to overstate the importance of access to cheap and abundant natural gas to global manufacturing and power generation, and consumers are bearing the brunt of this dramatic price increase in the form of higher prices for finished goods and unprecedented utility bills. This dynamic has created additional near-term and long-term demand for sources of renewable energy while simultaneously accelerating the sanctioning and development of additional LNG import/export infrastructure. The recent emphasis on newbuild energy infrastructure, combined with a corporate and political mandate for lower-carbon energy sources, provides an extremely attractive commercial backdrop for our natural gas and renewable infrastructure investments. Policymakers and investors alike have a heightened awareness of the importance of cheap, reliable energy to modern life, driving incremental investor interest in companies throughout our portfolio.
The parallel themes of energy security and Energy Transition continue to resonate globally as countries struggle to reconcile their acute need for inexpensive sources of non-Russian energy today with longer-term climate commitments. The myriad geopolitical and economic crises have become something of an energy Rorschach test, in which the subjects’ perception of events is informed by their respective pre-crisis political and business agendas. Global leaders and management teams throughout our investable universe have articulated seemingly divergent energy takeaways in recent months, and there is no shortage of pundits offering a “silver bullet” solution for global energy supply woes.
Our view is that there is no universal solution to the systemic challenges we face today; countries will require energy infrastructure tailored to their respective economic, geographic, and political constraints. To reiterate our long-held belief: The quest for energy security does not conflict with the Energy Transition. We believe that responsibly produced, low-carbon intensity hydrocarbons will be part of the global mix for decades to come, complementing growing renewable energy sources and providing raw materials necessary to manufacture consumer and medical products that are fundamental to daily life in modern society. KMF is designed to provide direct and curated exposure to the durable megatrends of decarbonization and energy security.
Portfolio and Performance
Returns across KMF's three energy infrastructure sectors – midstream, U.S. utilities, and renewable infrastructure – were mixed during the second fiscal quarter of 2022.
• Midstream energy had another outstanding quarter, with the Alerian Midstream Energy Index (AMNA) up 11.4%, outperforming the S&P 500 by approximately 1,700 bps.
• U.S. utilities were up meaningfully for the quarter as investors searched for relative safety amid a volatile backdrop, with the Utilities Select Sector SPDR Fund (XLU) returning 10.2% – the sector’s best quarterly performance in the last year.
• Renewable infrastructure returns were down slightly, at negative 1.9%.(5)
We should also note that post quarter-end, each of these sectors declined during June along with many other financial assets as investors weigh the prospect of slowing economic growth and the potential for recession. During June, the AMNA, XLU, and our renewable infrastructure composite declined 12.2%, 4.9%, and 9.3%, respectively. While unsettling, we recognize that these corrections occur from time to time. KMF’s diversified portfolio of liquid investments and conservative leverage allow us to navigate these corrections efficiently so that we can focus on generating attractive long-term returns.
Over the last 24 months (June 2020 to May 2022), the AMNA returned 86%, which is approximately 4,600 bps greater than the S&P 500's return of 40% over the same time period. U.S. utilities returned 32% over this period, and renewable infrastructure was up 24%. While renewable infrastructure and utilities have lagged the midstream sector over this two-year period, it is important to recall both sectors’ outstanding returns in 2019 and 2020 when midstream investments performed poorly. As we emphasized in past letters, the diversity among these returns is expected, and we believe this portfolio diversification reduces KMF’s overall risk without unduly sacrificing returns. We continue to believe each sector’s fundamental long-term prospects are very favorable, and our team actively monitors near-term prospects for each in pursuit of maximizing total returns.
(5) Based on a composite total return for 38 domestic and international renewable infrastructure and utility companies (calculated on a market-cap weighted basis with
individual constituents capped at a 10% weighting).
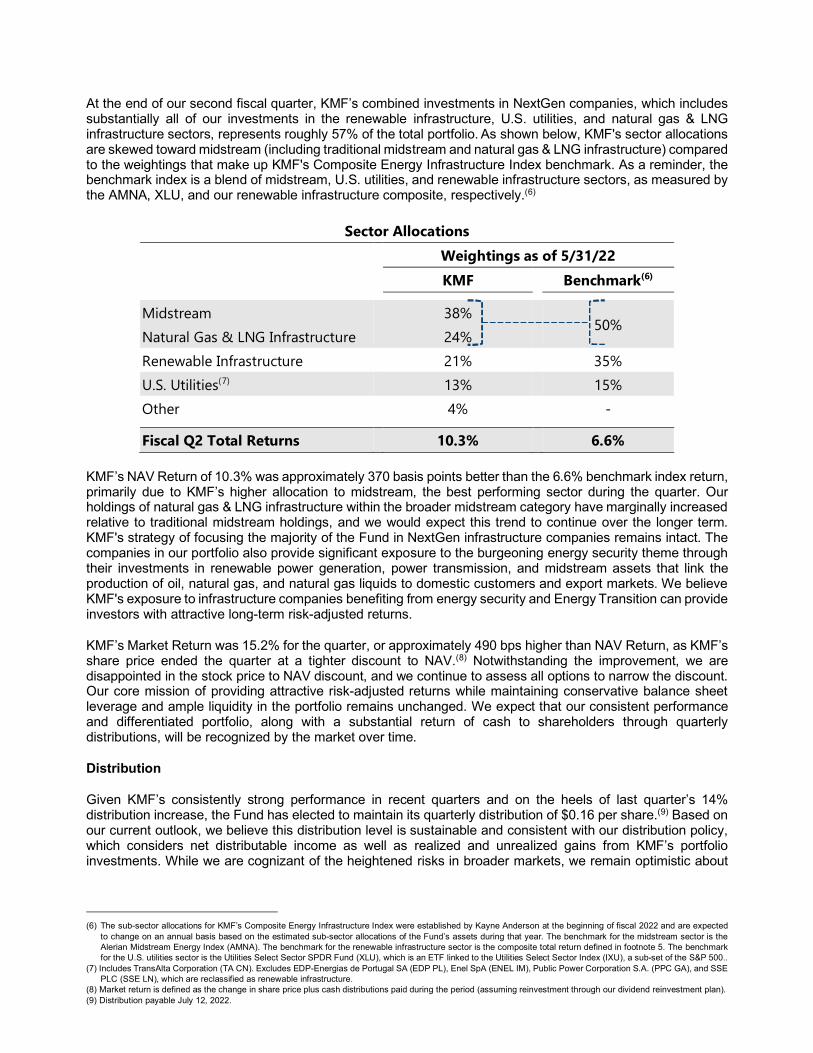
At the end of our second fiscal quarter, KMF’s combined investments in NextGen companies, which includes substantially all of our investments in the renewable infrastructure, U.S. utilities, and natural gas & LNG infrastructure sectors, represents roughly 57% of the total portfolio. As shown below, KMF's sector allocations are skewed toward midstream (including traditional midstream and natural gas & LNG infrastructure) compared to the weightings that make up KMF's Composite Energy Infrastructure Index benchmark. As a reminder, the benchmark index is a blend of midstream, U.S. utilities, and renewable infrastructure sectors, as measured by the AMNA, XLU, and our renewable infrastructure composite, respectively.(6)
Sector Allocations Weightings as of 5/31/22
KMF Benchmark(6)
Midstream 38%
50%
Natural Gas & LNG Infrastructure 24%
Renewable Infrastructure 21%
35%
U.S. Utilities(7) 13%
15%
Other 4%
-
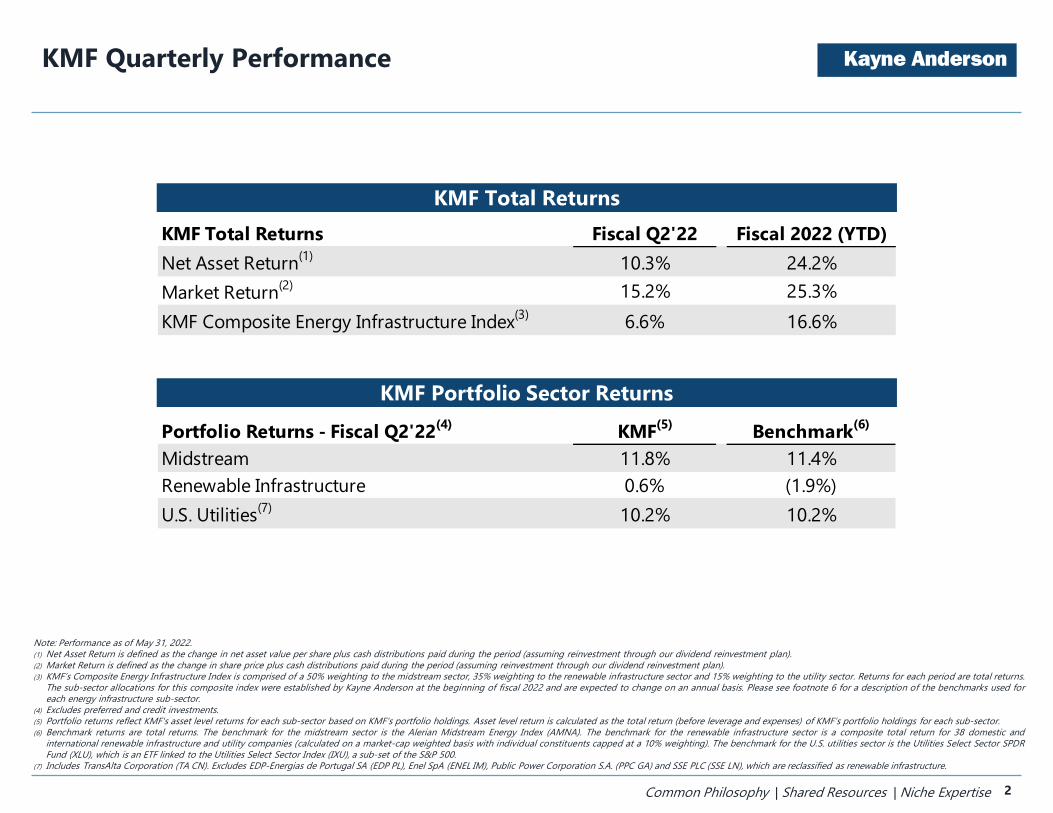
Fiscal Q2 Total Returns 10.3% 6.6%
KMF’s NAV Return of 10.3% was approximately 370 basis points better than the 6.6% benchmark index return, primarily due to KMF’s higher allocation to midstream, the best performing sector during the quarter. Our holdings of natural gas & LNG infrastructure within the broader midstream category have marginally increased relative to traditional midstream holdings, and we would expect this trend to continue over the longer term. KMF's strategy of focusing the majority of the Fund in NextGen infrastructure companies remains intact. The companies in our portfolio also provide significant exposure to the burgeoning energy security theme through their investments in renewable power generation, power transmission, and midstream assets that link the production of oil, natural gas, and natural gas liquids to domestic customers and export markets. We believe KMF's exposure to infrastructure companies benefiting from energy security and Energy Transition can provide investors with attractive long-term risk-adjusted returns.
KMF’s Market Return was 15.2% for the quarter, or approximately 490 bps higher than NAV Return, as KMF’s share price ended the quarter at a tighter discount to NAV.(8) Notwithstanding the improvement, we are disappointed in the stock price to NAV discount, and we continue to assess all options to narrow the discount. Our core mission of providing attractive risk-adjusted returns while maintaining conservative balance sheet leverage and ample liquidity in the portfolio remains unchanged. We expect that our consistent performance and differentiated portfolio, along with a substantial return of cash to shareholders through quarterly distributions, will be recognized by the market over time.
Distribution
Given KMF’s consistently strong performance in recent quarters and on the heels of last quarter’s 14% distribution increase, the Fund has elected to maintain its quarterly distribution of $0.16 per share.(9) Based on our current outlook, we believe this distribution level is sustainable and consistent with our distribution policy, which considers net distributable income as well as realized and unrealized gains from KMF’s portfolio investments. While we are cognizant of the heightened risks in broader markets, we remain optimistic about
(6) The sub-sector allocations for KMF’s Composite Energy Infrastructure Index were established by Kayne Anderson at the beginning of fiscal 2022 and are expected
to change on an annual basis based on the estimated sub-sector allocations of the Fund’s assets during that year. The benchmark for the midstream sector is the Alerian Midstream Energy Index (AMNA). The benchmark for the renewable infrastructure sector is the composite total return defined in footnote 5. The benchmark for the U.S. utilities sector is the Utilities Select Sector SPDR Fund (XLU), which is an ETF linked to the Utilities Select Sector Index (IXU), a sub-set of the S&P 500..
(7) Includes TransAlta Corporation (TA CN). Excludes EDP-Energias de Portugal SA (EDP PL), Enel SpA (ENEL IM), Public Power Corporation S.A. (PPC GA), and SSE PLC (SSE LN), which are reclassified as renewable infrastructure.
(8) Market return is defined as the change in share price plus cash distributions paid during the period (assuming reinvestment through our dividend reinvestment plan). (9) Distribution payable July 12, 2022.

the long-term outlook for NextGen Companies and their role in the Energy Transition and in facilitating increased energy security for our allies across the globe.
We encourage investors to visit our website at kaynefunds.com for more information about the Fund, including the podcasts posted on the "Insights" page that discuss performance and key industry trends. For more details on KMF’s performance, please refer to the “Quarterly Performance” section of our website at kaynefunds.com/kmf. We appreciate your investment in KMF and look forward to providing future updates.
KA Fund Advisors, LLC
2Common Philosophy | Shared Resources | Niche Expertise
Kayne Anderson
Portfolio Returns - Fiscal Q2'22(4) KMF(5) Benchmark(6)
Midstream 11.8% 11.4%Renewable Infrastructure 0.6% (1.9%)U.S. Utilities(7) 10.2% 10.2%
KMF Quarterly Performance
KMF Total Returns
KMF Portfolio Sector Returns
Note: Performance as of May 31, 2022.(1) Net Asset Return is defined as the change in net asset value per share plus cash distributions paid during the period (assuming reinvestment through our dividend reinvestment plan).(2) Market Return is defined as the change in share price plus cash distributions paid during the period (assuming reinvestment through our dividend reinvestment plan).(3) KMF’s Composite Energy Infrastructure Index is comprised of a 50% weighting to the midstream sector, 35% weighting to the renewable infrastructure sector and 15% weighting to the utility sector. Returns for each period are total returns.
The sub-sector allocations for this composite index were established by Kayne Anderson at the beginning of fiscal 2022 and are expected to change on an annual basis. Please see footnote 6 for a description of the benchmarks used foreach energy infrastructure sub-sector.
(4) Excludes preferred and credit investments.(5) Portfolio returns reflect KMF's asset level returns for each sub-sector based on KMF's portfolio holdings. Asset level return is calculated as the total return (before leverage and expenses) of KMF’s portfolio holdings for each sub-sector.(6) Benchmark returns are total returns. The benchmark for the midstream sector is the Alerian Midstream Energy Index (AMNA). The benchmark for the renewable infrastructure sector is a composite total return for 38 domestic and
international renewable infrastructure and utility companies (calculated on a market-cap weighted basis with individual constituents capped at a 10% weighting). The benchmark for the U.S. utilities sector is the Utilities Select Sector SPDRFund (XLU), which is an ETF linked to the Utilities Select Sector Index (IXU), a sub-set of the S&P 500.
(7) Includes TransAlta Corporation (TA CN). Excludes EDP-Energias de Portugal SA (EDP PL), Enel SpA (ENEL IM), Public Power Corporation S.A. (PPC GA) and SSE PLC (SSE LN), which are reclassified as renewable infrastructure.
KMF Total Returns Fiscal Q2'22 Fiscal 2022 (YTD)Net Asset Return(1) 10.3% 24.2%Market Return(2) 15.2% 25.3%KMF Composite Energy Infrastructure Index(3) 6.6% 16.6%
All investments involve risk, including possible loss of principal. An investment in the fund could suffer loss. Closed-end funds, unlike open-end funds, are not continuously offered. After the initial public offering, shares are sold on the open market through a stock exchange. As with any other stock, total return and market value will fluctuate so that an investment, when sold, may be worth more or less than its original cost. Shares of closed-end funds frequently trade at a market price that is below their net asset value.
Kayne Anderson NextGen Energy & Infrastructure, Inc. (NYSE: KMF) is a non-diversified, closed-end management investment company registered under the Investment Company Act of 1940, as amended, whose common stock is traded on the NYSE. The fund's investment objective is to provide a high level of total return with an emphasis on making cash distributions to its stockholders. The fund seeks to achieve its investment objective by investing at least 80% of its total assets in securities of Energy Companies and Infrastructure Companies. The fund anticipates that the majority of its investments will consist of investments in "NextGen" companies, which we define as Energy Companies and Infrastructure Companies that are meaningfully participating in, or benefiting from, the Energy Transition. See Glossary of Key Terms in the fund’s most recent quarterly report for a description of these investment categories and the meaning of capitalized terms.
This communication contains statements reflecting assumptions, expectations, projections, intentions, or beliefs about future events. These and other statements not relating strictly to historical or current facts constitute forward-looking statements as defined under the U.S. federal securities laws. Forward-looking statements involve a variety of risks and uncertainties. These risks include, but are not limited to, changes in economic and political conditions; regulatory and legal changes; energy industry risk; leverage risk; valuation risk; interest rate risk; tax risk; and other risks discussed in detail in the Company’s filings with the Securities and Exchange Commission (“SEC”), available at www.kaynefunds.com or www.sec.gov. Actual events could differ materially from these statements or from our present expectations or projections. You should not place undue reliance on forward-looking statements, which speak only as of the date they are made. Kayne Anderson undertakes no obligation to publicly update or revise any forward-looking statements made herein. There is no assurance that the Company’s investment objectives will be attained.
This commentary is provided for informational purposes only and is not intended for trading purposes. This commentary shall not constitute an offer to sell or a solicitation to buy, nor shall there be any sale of any securities in any jurisdiction in which such offer or sale is not permitted. Performance data quoted represent past performance and are for the stated time period only, Past performance is not a guarantee of future results. Current performance may be lower or higher than that shown based on market fluctuations from the end of the reported period. The Fund may also hold positions in other types of securities issued by the companies listed. Fund holdings are subject to change at any time and are not recommendations to buy or sell any security. Current and future holdings are subject to risk.


![n ÷df]a fOn kmf]gl/k]o / 6]lSgl;og](https://static.fdokumen.com/doc/165x107/6322d0c7aa6c954bc707daa6/n-dfa-fon-kmfglko-6lsglog.jpg)