Kirkpatrick, Sandra L. New Perspectives on Student Mobility.
172
DOCUMENT RESUME ED 322 608 EA 022 122 AUTHOR TITLE Lash, Andrea A.; Kirkpatrick, Sandra L. New Perspectives on Student Mobility. Final Report. SPONS AGENCY Office of Educational Research and Improvement (ED), Washington, DC. PUB DATE 30 Mar 90 NOTE 173p.; Report prepared in collaboration with the OfficP of Curriculum and Instructional Services, Sacramento County Office of Education, California. PUB TYPE Reports - Research/Technical (143) -- Tests/Evaluation Instruments (160) -- Statistic:a Data (110) EDRS PRICE MF01/PC07 Plus Postage. DESCRIPTORS Adjustment (to Environment); Attendance; Decision Making; Educational Mobility; Elementary Secondary Education; Enrollment; Enrollment Trends; Institutional Characteristics; Instructional Development; Integrated Activities; Migrant Youth; *Migration; *Migration Patterns; Needs Assessment; Orientation; Principals; School Demography; Social Integration; Special Needs Students; Stopouts: Student Characteristics; Student Evaluation; *Student Mobility; Student Participation; Teacher Attitudes; Teaching Methods; Transfer Policy; Transfer Students ABSTRACT A basic assumption about school enrollment is that classrooms.are stable over the school year. Patterns of student mobility, teacher strategies for student orientation, teacher perceptions of mobile students, the effects of student mobility on principals' decision making, and the relationship between principals' decisions and student population type are described in this paper. Eight Sacramento area schools serving four different student populations--agricultural, military, urban, and stable--were studied. Findings indicate that a significant number of students move frequently enough to impact students, teachers, and schools. Unlike research on migrant students, little acknowledgment of student mobility and its effect on the educational system exists in current literature. Problems related to student mobility are inconsistent curricula, difficulty of student needs assessment, and the primary assignment of responsibility to teachers. Unlike migrant student research, little acknowledgment of student mobility and its effect on 4.:le educational system exists. Recommendations are made concerning patterns of student mobility, classroom strategies, teacher perceptions, and effects of student mobiiity on principals' decision making. Figures and tables highlight the research results. An extensive bibliography and appendices containing the survey and interview instruments are included. (LMI)
-
Upload
khangminh22 -
Category
Documents
-
view
4 -
download
0
Transcript of Kirkpatrick, Sandra L. New Perspectives on Student Mobility.

DOCUMENT RESUME
ED 322 608 EA 022 122
AUTHORTITLE
Lash, Andrea A.; Kirkpatrick, Sandra L.New Perspectives on Student Mobility. FinalReport.
SPONS AGENCY Office of Educational Research and Improvement (ED),Washington, DC.
PUB DATE 30 Mar 90NOTE 173p.; Report prepared in collaboration with the
OfficP of Curriculum and Instructional Services,Sacramento County Office of Education, California.
PUB TYPE Reports - Research/Technical (143) --Tests/Evaluation Instruments (160) -- Statistic:aData (110)
EDRS PRICE MF01/PC07 Plus Postage.DESCRIPTORS Adjustment (to Environment); Attendance; Decision
Making; Educational Mobility; Elementary SecondaryEducation; Enrollment; Enrollment Trends;Institutional Characteristics; InstructionalDevelopment; Integrated Activities; Migrant Youth;*Migration; *Migration Patterns; Needs Assessment;Orientation; Principals; School Demography; SocialIntegration; Special Needs Students; Stopouts:Student Characteristics; Student Evaluation; *StudentMobility; Student Participation; Teacher Attitudes;Teaching Methods; Transfer Policy; TransferStudents
ABSTRACT
A basic assumption about school enrollment is thatclassrooms.are stable over the school year. Patterns of studentmobility, teacher strategies for student orientation, teacherperceptions of mobile students, the effects of student mobility onprincipals' decision making, and the relationship between principals'decisions and student population type are described in this paper.Eight Sacramento area schools serving four different studentpopulations--agricultural, military, urban, and stable--were studied.Findings indicate that a significant number of students movefrequently enough to impact students, teachers, and schools. Unlikeresearch on migrant students, little acknowledgment of studentmobility and its effect on the educational system exists in currentliterature. Problems related to student mobility are inconsistentcurricula, difficulty of student needs assessment, and the primaryassignment of responsibility to teachers. Unlike migrant studentresearch, little acknowledgment of student mobility and its effect on4.:le educational system exists. Recommendations are made concerningpatterns of student mobility, classroom strategies, teacherperceptions, and effects of student mobiiity on principals' decisionmaking. Figures and tables highlight the research results. Anextensive bibliography and appendices containing the survey andinterview instruments are included. (LMI)

NEW PERSPECTIVES ON STUDENT MOBILITY
bYAndrea A. Lash /it t :
Sandra L Kirkpatrick
in collaboration with
The Sacramento County Office of EducationOffice of Curriculum and Instructional Services
March 30, 1990
Final Report submitted toOffice of Educational Research and Information
U.S. Department of EducationR117E80041
Address Correspondence to the authors at555 Liberty Street
San Francisco CA 94114
r
C
0
AiLhdLE

Admowledgements
We would like to acknowledge the support we have received from many colleagues during the
course of this project, in particular, the suggestions and recommndations of our Advisory Board:
Alice Furry, Douglas Mitchell, Susan Traiman and David Berliner. Our thanks also go to Linda
Mural and Sherry Arnold of the Office of Curriculum and Instructional Services of the
Sacramento County Office of Education for their work gathering information for school
selection and for the many hours spent at the computer processing enmllment data.
3

Executive Summary
chapter 1: New Perspectives on Student Mobility
* 19% of school-aged children move during a single year, and that number is as high as 23% forprimary grade children.
* Not all moves made by students occur at convenient points in the academic year.
* Migrant students have been studied for 20 years. Their education cannot be provided easilyat a single school site within a standard academic calendar. Solutions to problemsassociated with such movement have been offered: a computerized system to provide anefficient exchange of student records; extra staff, teachers and aides to supplement theregular program when migrant students are in attendance; instructional programs proviledover the summer.
* With the exception of migrant students, there are no special educational services orschool programs for students who move. The major responsibility for working withthese students rests with teachers.
* Teachers have the challenge of integrating newcomers into established ciasses. Newstudents need to become part of a class that already has built a history, including acommon understanding of rules and routines and a shared knowledge base. Complicatingthis is the fact that a newcomer's educational history may not match that of the class.
* Student mobility may challenge principals also. Because principal decisions help toestablish a context for classroom instruction, it is important to understand howprincipals consider student mobility in their decision making.
* The research reported here was designed to address six questions:
1. What mobility patterns describe the enrollment and withdrawal of students fromelementary schools?
2. What strategies do teachers use to integrate new students into a class so that (a) thestudent understands clpssroom rules and routines and (b) the student's instructionalneeds are being met?
3. How do strategies for orienting new students to class rules and curricula compare withthose used to orient a class of students at the beginning of the year?
4. What are teacher perceptions of working with students who move?
5. How is principal decisionmaking influenced by student mobility?
6. Are teacher strategies, perceptions and principal decisions related to the type ofstudent population served?
Chapter 2: Study Populations and Research Methods
* The teachers and principals from eight schools in the greater Sacramento, CA area tookpart in this study.

O The schools served four different student populations or mobility types that weredefined according to the reason for the move:
1. Agricultural, in which moves are determined by harvest seasons;
2. Military, in which moves are determined by the personnel needs of a largeorganization;
3. Urban, in which moves often are determined by changes in family statusand employment; and
4. Stable, a contrast population in which moves are infrequent.
O The study was designed to maximize the opportunity to observe differences in mobilitypatterns. Schools were selected to meet specific criteria established for the study. Fourtypes of data were gathered to address the research questions.
1. Student enrollment and withdrawal information was collected. The dates ofenrollment and withdrawal were obtained for every student who attended a studyschool during the study year.
solo2. A sample of four teachersAwas interviewed twice during the study year. The fall
interview was used to establish teachers' instructional and organizational styles.The spring interview was used to discover how teachers worked with students whoenrolled during the school year.
3. The full faculty of each school was surveyed by questionnaire to examine generaltrends in teacher perceptions of student mobility.
4. Principals were interviewed to obtain information about school level responses tostudents moving into and out of the school.
Chapter_3: Characteristks of Student Mobility in Four Types of Schools
Mobility Characteristks of Student Populations
O The percentage of students who moved during the study year varied across schools anddiffered by mobility type. In one urban school, 50% of the students moved during thestudy year, and in the other about 40%. In one agricultural school 50% of the studentsmoved and in the other 22% moved. In each military school about one-third of thestudent population moved during the study year. In stable schools 25% and 17% of thepopulation moved.
O Mobility characteristics of the student populations distinguished the four mobilitytypes. As anticipated, schools selected because they served stable communities hadiower percentages of students move during the study year than other schools.
O Enrollment changes that occurred in the urban and stable populations were more likelyto be late enrollments than they were to be early withdrawals of students who hadstarted at the school at the beginning of the year.
O Only in agricultural communities did a large percentage of students re-enroll afterwithdrawing from the school during the study year.
-limaieimmin5

O Within each pair of schools, the schools serving stable, military, and urbancommunities displayed distributions of enrollment duration similar to each other. Instable ommunities school enrollments were for longer periods of time, as expected, andin urban communities Uwe were more short-term enrollments.
O The schools that served agricultural populations were less similar to each other thanschools in the other pairs. The percentage of mobile students was higher and typicallengths of enrollment shorter at one school. There are reasons for these differences.
Patterns in Enrollment Change Over Time.
O Except in schools serving stable communities, teacher descriptions of mobility generallymatched the patterns documented by enrollment data.
O Teachers in all types of schools reported that enrollment changes occurred near holidayvacation time, a trend confirmed by the plots of enrollment data.
O There were distinct patters to enrollment change in schools serving agriculturalcommunities. The large numbers of fall withdrawals and spring enrollments were adirect result of the harvest and planting cycles in the fields surrounding the schools. Toa lesser degree, these schools experienced another duster of withdrawals later in thefall and another cluster of new enrollments in January.
O Like the teachers there, principals in agricultural schools described a pattern ofenrollment, withdrawal, and re-enrollment for students whose families moved withthe farming seasons. In military and urban schools, principals were less dear about thepatterns of mobility in their schools, but were very knowledgeable about the eventsthat caused them. In both types of schools, very few students remained throughouttheir elementary years. No students re-enrolled in military schools; though some didre-enroll in urban schools, the principals were unable to provide exact figures.
Teacher Comparisons Among Mobility Patterns
O Teachers in military, urban, and stable communities agreed that a pattrn ofindividualistic moves, in which students enroll and withdraw one at a time during theacademic year, best described the mobility in their classes. To a lesser extent they alsoagreed that it described the pattern that was most disruptive to classrooms.
O Teachers from all schools agreed that the individualistic pattern would be mostdisruptive to teachers' instructional planning.
O Teachers reported a discrepancy between their experiences and their training forworking with students who move. Teachers in . 1 types of schools reported that theirtraining prepared them to teach in classes where moves occurred only betweensemesters, a pattern that they believed was not disruptive, or that they were trainedto teach in classes where moves were individualistic. Their reports did not differacross the four types of populations.
i iir6

Chapter 4: Teaching Mobile Student Populations
Instructional Planning
No more than half the teachers interviewed from military and urban schools0
considered student mobility in their planning. As anticipated, student mobility was nota major factor in instructional planning for teachers in stable schools.
Teachers reported that they could not plan for mobility because student movement was0
too unpredictable and because they could not know in advance the abilities and needs ofthe individuals who would arrive.
Teachers in agricultural schools considered the timing of student moves and the movers'0
levels of English language skill when they planned instruction. They delayed sometopics until the migrant students returned to their classes, and they scheduled somesmall-class activities for the intervals when migrant students were away.
Teachers in migrant, military, and urban schools preferred teaching methods that0
facilitated student interactions and the movement of the whole class, as a group,through the curriculum. They recommended organizing students into mixed-abilitygroups, all of which worked on a single class assignment, and they recommendedsupporting newcomers through peer tutoring and coopentive group arrangements.
Assessing gssitclliews2mrs
0 It was rare for teachers to receive information about new students before the studentsjoined their classes. Not only did teachers fail to receive information about newcomersbefore students arrived, but it was rare for teachers to receive advance notice of newstudents.
0 The primary source of information that teachers had about new students' knowledge,skills, and previous experiences were the students themselves.
0 Teachers typically assessed how well a new student would fit into the class curriculumby examining a student's work on current assipments. They also obtained informationby asking students directly to describe their skills and previous education.
It was rare for teachers to receive or seek information from newcomers' parents,0
guardians or previous teachers. Information provided in students' official files, thecumulative records, arrived too late to aid placement decisions.
A substantial percentage of teachers reported that they would adapt their strategies0
for teaching newcomers if they had informadon about the student's previous curriculum.However, this information generally was not available to them and they did not seeki t.
0 Teachers estimated that they needed a week on average to learn abouta new student'sinstructional needs. There was less agreement among teachers on the amount of timeneeded to understand the needs of a class of students at the start of the year. Onaverage, they estimated two weeks, but their estimates ranged widely.
i v 7

Orienting New Students To Oasstoonameratt
o All study teachers taught classroom rules and routines to students at the start of theschool year; most teachers also introduced classes to math and reading curricula earlyin the year.
o Teachers deegated to other students the responsibility of teaching newcomers thedassroom rules and routines.
O In many classes teachers did not orient newcomers to curricula.
Monitoring the Progress of Iniggratign
Nearly all teachers looked to see if newcomers were making friends as a clue towhether they were making the transition to their new classes. Teachers also looked atstudent emotions and whether they were successful academically.
O Teachers said that a new student's personality was a primary factor affecting theamount of time it took for the student to become part of a new class.
Teacher Recommendations
O About one-third of the teachers would recommend to school administrators that moreand better information about the new students who enter their classes be provided tothem. Teachers suggested a variety of methods to convey this information.
O Teachers also made suggestions for program and staff support
Chapter 5: Teacher Perceptions of Student Mobility
O The analyses of teacher (N=166) responses to a questionnaire survey indicated that itwas possible to measure teacher perceptions of student mobility, that teachers differedin their perceptions, and that those differences related to the type of mobilepopulation they taught. Further, findings from the survey questionnaire generallywere consistent with information provided in teacher interviews.
O Factor analyses of responses supported seven opinion scales. Four scales concernteachers' opinions about their work with students who move: satisfaction with thiswork, benefits of working with mobile populations, responsibility for students at theirschool, and the importance of the educational history of students. Three scales centeredon school characteristics: the importance of student mobility as an issue in the school,administrative supports for teaching, and parent support for teaching students whomove.
As expected, student mobility was not an issue for teachers in stable schools. Studentmobility was important to teachers in urban schools, who also reported the leastamount of benefit from and satisfaction in working with students who move.
O The opinions of teachers in urban schools may be due to a perceived or actual lack ofsupport for their work. Teachers in military schools reported high levels of parentsupport, and teachers in agricultural schools high levels of administrative support.Teachers in urban schools reported lower levels of support from both parents and schooladministration.

There was a clear limit to teacher responsibility for students in transition between0
classes that related to school boundaries. Teachers reported significantly lessresponsibility for students who transferred out of their classes to move to other schoolsthan for students who moved to other classes in the same school. They reportedsignificantly less responsibility for learning about the instructional experiences of newstudents if the students transferred into their classes from other schools as opposed totransferring from other classes in the same school.
Outer 6: School Level Responses to Student Mobility
0 Seven of the eight principals agreed that student mobility did affect their jobs. Even instable schools, principals said student mobility would make their jobs more difficult.
Principals from all four types of schools agreed that there were three areas in which0
student mobility would make the job of principal more difficult: extra burdens inclerical and administrative work, extra effort in getting to know students, andadditional time required in getting to know new families. Principals in urban schoolsdescribed the added task of coordinating the services provided by outside social andwelfare agencies.
0 Principals in stable schools said that newcomers brought valuable experiences to theschool. Principals in agricultural and military schools said that moving createdproblems for movers related to a lack of continuity in their education. Both principalsof urban schools agreed that student mobility was disruptive in classrooms for moversand norunovers alike, focussing teacher attention toward newcomers for a day or twowhile stable students are put on hold.
Student Mobility and Principal Decisionmaking
Student mobility did influence the planning decisions principals made, and there were0
differences among principals about how that factor affected their decisions
0 Budget decisions were problematic for principals in schools with lots of studentmobility because they were often made far in advance of actual enrollment. Adequatestaffing to the number of students served in highly mobile schools was diffiat becauseclass sizes fluctuated duriog the year and students who left were not always replacedby students at the same grade level. Shortages of classroom materials often occurrea inschools that over the course of a year served more students than there were seats.Principals in military and urban schools made changes to the school calendar as a resultof mobility, and prindpals in agricultural schools were creative in the way they usedspace.
Some principals solved planning problems at a school level through educational0
program choices or a flexible attitude toward space. Other principals determined thatthe best place to solve problems related to student mobility was in the classroom.
Instructional Leadership
Student rrzbility did not affect a principal's curricular decisions.0
v i S

O Student mobility did affect class assignment processes, and hence the makeup ofclassrooms.
O Typically, principals in schools with more mobility used more avenues to communicateinformation to both students and parents than did stable schools.
Chapter 7: Discussion and Recommendations
O A basic assumption of most research on classroom instruction and management is thatclassrooms are stable over the school year. This assumption of stability isinappropriate for many schools. The magnitude of student movement documented inthis study, and its potential impact on students, teachers, classrooms, and schools arguethat student mobility deserves more attention from eduastors and policymakers alike.
5elected Recommendations
O School level personnel should examine and graph the mobility patterns of their schoolsover the school year. This documentation would serve several purposes.
0 Class size, or the maximum number of students to be enrolled in a classroom at a singlepoint in time, is not a useful figure to indicate a teacher*0 workload during the year inschools with high levels of student mobility. A more realistic figure would be thenumber of students who pass through the classroom in a given year.
O Teacher training programs should examine the skills needed by teachers in classroomswith high levels of student mobility. Specifically, organizational and diagnosticskills are described by teachers and principals alike as essential.
O Educators could make a priority of developing a common language about learning thatwould be used by students and teachers alike. Teachers rely on students to explain whatthey know and what type of curriculum they have studied. A shared, precise languagewould help students convey this information to teachers.
O Policymakers may need to address the question of where the responsibility for acomprehensive view of a child's education lies. The federal government has assumedthat responsibility for migrant students only.
c There appears to be less support for teachers who work with the least predictable andhighest amount of student mobility. A review of migrant education programs may offerurban educators methods to support teachers who work with urban students.
O Districts that have some schools with highly mobile stub:lent populations mightconsider a different formula for allocating resources in aavance of student enrollments.That allocation might he based on the number of students served by a school in a sint,leyear, or a time trend showing how enrollments change, rather than the average dailyattendance.
O In regions where students typically move from one school to another within a welldefined, geographic area it might be useful for a single authority to coordinateadministrative and curricular policies. For instance, a county office of education couldfacilitate the curricular alignment between districts that share many students.

TABLE OF COM.. ENTS
Page
Executive Summary i
List of Figures x
List of Tables x i
Chapter 1: New Perspectives on Student Mobility 1.1
A Classroom Perspective 1.3A School Level Perspective 1.4Research Questions 1.6
Chapter 2: Study Populations and Research Methods 2.1
School Sample 2.1Teacher and Principal Samples 2.4Research Methods 2.6
Chapter 3: Characteristics of Student Mobilityin Four Types of Schools 3.1
Mobility Characteristics of Student Populations 3.2Patterns in Enrollment Change Over Time 3.6Teacher Comparisons Among Mobility Patterns 3.13
Chapter 4: Teaching Mobile Student Populations 4.1
Instructional Planning 4.1Assessing Instructional Needs of Newcomers 4.6Orienting New Students to Classroom Processes 4.15Monitoring the Progress of Integration 4.18Teacher Recommendations 4.21
Chapter 5: Teacher Perceptions of Student Mobility 5.1
Opinions About Working With Students Who Move 5.1School Characteristics and Resources 5.5Comparison of Teacher Perceptions AmongFour Types of Schools 5.8Summary of Teacher Perceptions 5.11
Chapter 6: School Level Responses to Student Mobility 6.1
Student Mobility and the Principal's Job 6.1Student Mobility and Principal Decisionmaking 6.3Discussion 6.11
. viii 1 1

Chapter 7: Discussion and Conclusions 7.1
Patterns of Student Mobility 7.1A Classroom Perspective on Teaching Students Who Move 7.4Teacher Perceptions of Student Mobility 7.7Principals and Student Mobility 7.8Sununary 7.11
Reerences R.1
Appendix
Fall Teacher Interview A.1Spring Teacher Intenriew A.7Teachn Questionnaire A.12Principal Interview A.17
Figures F.1
Tables T.1
( 2
ix

UST OF FIGURES
Figure Page
3.1 Distributions of Length of Enrollmentfor Eight School Populations F.1
3.2 Enrollment Patterns for Agricultural Schools F.23.3 Enrollment Patterns for Military Schools F.33.4 Enrollment Patterns for Urban Schools F.43.5 Enrollment Patterns for Stable Schools F.55.1 Teacher Perceptions of Responsibility
Students in Transition F.6
3

LIST OF TABLES
Page
Chapter 2: Study Populations and Research Methods
2.1 Demographic Desaiptions of Four Types of Schools T.12.2 Description of School Contexts T.22.3 Grade Level and Teaching Experience
of Teachers Interviewed T.52.4 Experience of Teachers in the Questionnaire Sample T.62.5 Number of Years Experience as Principal and Teacher
for Study Pendpals T.7
rt_ et 41 t ofS I ki I I _ _ i 6,4t. S 6,4
3.1 Size and Stability of Student Populations in Eight Schools T.83.2 Descriptive Statistics for the Number of Enrollment Changes
in Half-Month Periods for Four Types of Schools T.93.3 Teacher Descriptions of Mobility i tterns
at Their Schools T.103.4 Principal Knowledge of Mobility in the School T.113.5 Principal Knowledge of Students Leaving School T.123.6 Teacher Reports on Mobility Patterns T.13
Chapter 4: Teaching Mobile Student Populations
4.1 Effects of Mobility on Instructional Plans T.154.2 The Advance Notice Teachers Receive about
New Enrollments in Four Types of Schools T.164.3 Teachers Choice of Methods for Assessing
New Students in Math and Reading T.174.4 Teachers' Reasons for Adapting or not Adapting
Instructional Methods to AccommodateNewcomers' Previous Experiences T.18
4.5 Number of School Days Needed to UnderstandInstructional Needs of Students in Four Types of Schools T.19
4.6 Teacher Methods for Conveying Classroom Rulesto an Entire Class at the Start of the Year andto New Students During the Year T.20
4.7 Frequencies of Teachers Reporting Fall and NewcomerOrientations in Reading and Math Curricula T.21
4.8 Indicators of Student Integration Into a Class Usedby Teachers from Four Types of Schools T.22
4.9 Factors Affecting Newcomers' Integration into Classesin Eight Schools T.23
4.10 Frequencies of Teacher Recommendations to AdministratorsAbout Working with Students Who Move T.24
xi

c kt &
5.1 Teacher Opinions about Working with Mobile Students:Four-Factor Solution. T.25
5.2 Teacher Opinions About School Characteristics:Four-Factor Solution. T.26
5.3 Mean Scores on Opinion Scales for Teachersin Four Mobility Groups T.27
nses II LI _
6.1 Principal Perceptions of the Impact of SW:lent Mobilityon the Principal's job T.28
6.2 Principal Perceptions of the Impact of Student Mobility onStudents T.296.3 Effects of Student Mobility on Principal
Planning Decisions T.306.4 Student Mobility and School-Wide Programs T.3163 Student Mobility and School Administration T.326.6 Student Mobility and School-wide Management T.336.7 Principal Perceptions of Teacher Skills Needed and Evaluated
in Work with Mobile Students T.346.8 Resources Available to Teachers Who Work
with Mobile Students T.356.9 Principal's Focus in Providing Services T.36
i5

Chapter 1: New Perspectives on Student Mobility
A conventioval image of schooling is one of a system serving a stable group of students
who begin school in the fall, study with their classmates until June, and return to their schools
following a summer vacation. However, school populations are dynamic, continually changing
as new students enroll and others withdraw. Nationwide, 19% of school-aged children move in
a single year. Younger children are even more mobile with 23% of the primary-grade children
relocating each year (US. Department of Commerce, 1987).
Not 311 of these moves occur at convenient pciods in the academic year, such as over
.the semester or summer breaks, and their timing depends in part on the reasons for the move.
Seasonal jobs require employees to move their families when schools are in session. Migrant
farm workers come to mind immediately, but fishing, timber, tourism, and consfruction are also
seasonal industries, and many people who engage in this work move themselves and their
families in accordance with their work schedules. Job and military transfers require families to
relocate at times convenient to the employer but not necessarily to the family. Fmally, changes
within the family which can occur at any time of the year, such as divorce and financial
instability, may result in children relocating to new homes and schools.
For more than 20 years educators have recognized that certain relocations that occur
during the academic year can disrupt schooling and the education of the children who move
(e.g., Nance, 1961). These disruptions, and methods designed to reduce their impact, have been
studied almost exclusively for migrant students, the children of workers in the migrant
agricultural and fishing industries.
Migrant students education cannot be provided easily in a manner consistent with the
conventional image of schooling at a single school site within a standard academic calendar.
These students move across school boundaries in accordance with a seasonal calendar; about
half of them change schools at least once during an academic year (Cameron, 1981; Office of the
Inspector General, 1987). Because school changes often mean changed educational requirements,
behavioral expectations, and curricula, migration can disrupt students' education. In a national
study of migrant education programs, Trotter (1988) learned how differences between schools
can affect students:
1 rIA

Many migrant children feel like ping pong balls as they are bounced from one curriculumto another, often going up or down a grade by taking a different standardized test.Migrant children, since the timing of subjects differs from xhool district to schooldistrict, often get half a subject every time they change schools. (p. 9)
Special programs have been designed to aid migrant students in their transitions
between schools (See Exotech Systems, Inc., 1974; Harrington, 1987; Johnson, 1987; Marks, 1987).
As one example, the Office of Migrant Education established a computerirad system to provide
rapid exchange of student records from one school to the next This system was needed because
the students' cumulative files, the primary source of information about a student's education,
typically are exchanged by school through the mail and arrive too late to be used by teachers
for assessment and placement (cf., Applied Systems Institute, 1988). Second, schools that r.rve
large numbers of migrant students often hire extra staff, teachers and aides to supplement the
regular program when migrant students are in attendance. A wide variety of such programs
exist; in some the extra staff work in the regular curriculum teamed with the classroom teacher,
while in others they offer separate instruction. Additionally, in some locations, instructional
programs are provided between June and September.
The special programs and services provided to migrant students are supported by
federal funds set aside by Congress under Title I of the Elementary and Secondary Education
Act. With the exception of specifically identified migrants, students who move do not receive
special educational services routinely, nor do most schools have in place programs to aid mobile
students (Bayer, 1982; Cornille, Bayer & Smith, 1983).
In the absence of school programs, the major responsibility for working with children
who move rests in the classroom with the teacher. The primary focus of the study reported
here is on teachers' methods for assisting students in transition between schools. Additionally,
the study examines the nature of student mobility in four types of schools, teacher perceptions
of their work with mobile students, and principal strategies for serving a mobile student
population.
1.2

A Classroom Perspective
Teachers who work with mobile students have the challenge of integrating newcomers
into established classes. New students need to become part of a class that already has built a
history, including a sense of purpose, a common understanding of the rules and mutines that
govern activities, and a shared knowledge base acquired from previous instruction and required
for subsequent learning. The challenge is complicated because new students bring educational
histories and a knowledge of subject matter that do not match the shared experiences of the
classes they enter. Moreover, integrating new students needs to be accomplished in ways that
maintain continuity in learning for both the newcomer and the class.
Three things must be accomplished before successful integration of a new student into a
class can occur. The newcomer must learn the behavior accepted and expected in class, as well
as the expectations for learning. The newcomer's instructional needs must be identified and met.
In addition to learning needs that existed before the student moved, these instructional needs
include those resulting from the mismatch between curricula used at the two schools and any
instruction the student may have missed due to the the move. It is also necessary for newcomers
to adapt socially, but social integration is outside the scope of the present study.
Research that examines how teachers communicate their behavioral expectations to a
class, how they orient the class to the curriculum, and how they assess learning needs, has
examined the teaching of stable classes. Although there is a substantial empirical literature
that describes the classroom instructional and managerial processes employed by more effective
teachers (e.g., Brophy & Good, 1986; Doyle, 1986), this literature treats student mobility as a
problem of missing data or sample attrition rather than as a managerial and instructional
challenge to teachers that deserves examination. As a result, the recommendations derived
from this literature may have limited value in classrooms with high levels of student
mobility. For example, it is well documentei that more effective teachers establish a system of
rules, expectations, and routines during the first few weeks of school (e.g., Everton, Emmer,
Clements, Sanford, & Worsham, 1984). What is not known is how they maintain those systems
throughout a school year when many students in attendance during the critical first weeks
leave and others later enroll.
6
1.3

Fitting a new student into an ongoing class presents a challenge to teachers as they bring
the newcomer up to speed without losing monwntum for the rest of the class. Balancing the
competing needs of the newcomer and the class requires teachers to make choices about the time
they will spend with the newcomer, the instructional methods to employ and what changes
they will make if the newcomer dm not make the transition easily. The choices teachers
make about how they will work with newcomers may vary with the amount and pattern of
student mobility in their classes. For instance, teachers who are able to predict student
movement throughout the year might organize students in such a way that the change will
cause minimal disruption to the part of the class that remains or delay teaching a particular
topic until the change occurs. Preparation could also include class assignments that would
allow the teacher time to work individually with new students so as to ease their transition
into the class. Teachers who experience one or two new students per year may use different
methods from teachers who experience one or two new students each month.
The primary focus of this study is on how teachers respond to student mobility.
However, teachers do not operate in a vacuum. Classroom practices can be influenced by actions
taken at a school level. These actions could affect instructional and management systems in the
classroom and the integration of new students. School level decisions establish the context or
boundaries for classroom instructional and management systems. Since principals are
responsible for decisions made at the school level, and for the day-to-day operation of the
schools, it is important to find out how mobility affects the choices principals made.
The principal's role in the school is to initiate school level policies, instructional and
administrative, and to implement district and state level policies. An example of how
principal dedsionmaking can influence the classroom is provided by the assignment of students
to classes. New students do not enroll in classrooms directly. They enroll in schools and are
assigned by the front office to classes. Principals can choose from a variety of methods a process
for assigning students to classes (Monk, 1987), and the assignment method will affect the class
composition (Beckerman and Good, 1981) and thus how classes are organized by teachers for
instruction (Barr and Dreeben, 1983).
1

The manner in which principals exercise their decisionmaking authority over teachers
and students varies. First, principals directly control the allocation of resources available
within the school. These resources can be physical, such as classroom space and location, or
material, such as enrichment programs and classroom aides. Second, principals more subtly
control the environment for students and teachers through decisions they make in such areas as
daily, weekly asid annual schedules, allocation of students to classrooms, and the articulation
of school curricula across classroom boundaries (Firestone & Wilson, 1985). Least tangibly,
principals affect school climate in the ways that they develop attitudes and skills in teachers,
foster expectations for achievement and represent the school in the community.
The decisions principals make about how best to exercise authority the strategies
they use to achieve particular goals are not understood, particularly as there appears to be no
single style of leadership that would assure educational excellence (Brophy and Good, 1986;
Hall, Hord, Huling, Rutherford & Stiegelbauer, 1983). Reviews of literature that suggest
principals are crucial to school effectiveness, particularly in the areas of school climate,
curricula and instruction, provide little description of how principal actions differ in various
settings (Bridges, 1982; Brophy & Good, 1986). Yet those decisions are likely to affect
classrooms dramatically, as the example of assigning students to classes demonstrates. The
decision rules that determine where a new student will be placed can filter or alter the effects
on classrooms of the school's mobility pattern. Further, the timing of the placement and the
steps the school might take toward integrating the new student into a classroom are apt to be
important to teachers, and would be weighed in the strategies teachers might employ.
The particular needs of a school population can affect the principal's decisions as well.
In their case studies, Dwyer, Lee, Rowan and Bossert (1982) imply that institutional context
both limits and provides opportunities for principals to react differently to the same issue. A
model of the principal's role in instructional management shows the multitude of contextual
factors that affect principal deciskuunaldng on a daily basis, including student transiency
(Barnett, 1985; Bossert, Dwyer, Rowan & Lee, 1982). However, little is known about how those
factors influence the decisions principals make.
2 0
1.5

Research Ouestions
The research reported here was designed to address six research questions:
1. What mobility patterns describe the enrollment and withdrawal of students fromelementary schools?
2. What strategies do teachers use to integrate new students into a class so that
(a) the student understands classroom rules and routines and(b) the student's
instructional needs are being met?
3. How do strategies for orienting new students to class rules and curricula compare
with those used to orient a class of students at the beginning of the school year?
4. What are teacher perceptions of working with students who move?
5. How does student mobility affect the decisions typically made by principals?
6. Are teacher strategies, perceptions and principal decisions related to the type ofstudent population served?
Chapter 2 discusses the research design, samples and methods of data collection.
Chapter 3 describes the student mobility that occurred in the study schools during the study
year. Chapter 4 examines teacher strategies for working with students who movz into and outof their classrooms, based on data collected froma sample of teachers through interviews.
Chapter 5 explores teacher perceptions of student mobility at their school and its impacts ontheir work. The information comes primarily from a survey of all teachers in the eight study
schools. Chapter 6 looks at school level strategies for working with students who move, and isbased on data collected in interviews -vith the principals. A discussion of the findings arepresented in Chapter 7 along with recommendaions for practice.
2 .1
1.6

Chapter 2: Study Populations and Research Methods
The teachers and principals from eight schools in the greater Sacramento, CA, area
took part in this study. The schools served four different student populations or mobility types
that are defined according to the reason for the move: migrant, in which moves are determined
by harvest seasons; military, in which moves are aetennined by the personnel needs of a large
organization; urban, in which moves often are determined by changes in family status and
employment; and stable, a contrast population in which moves are infrequent. A variety of
data were gathered. The principal and four teachers from each school took part in an in-depth
interview study, and all teachers were surveyed by questionnaire. School records provided the
dates of enrollment and withdrawal for every student who attended the study schools. The
following sections outline the sample identification and selection process for schools and
teachers, describe the study samples, and introduce the data collection methods.
&hool Saii1 e
Eight srhools, two of each mobility type, were identified for participation in this
study from a review of over 200 schools in the greater Sacramento, CA, area. The goal in
constructing this sample was to include four pairs of schoo_s that differed as much as possible in
the type of mobile population they served, but were as similar as possible in their ethnic
distribution, size, and history serving the student poimlation, or mobility type, for which they
were selected. Individual schools were not selected to represent a particular population of
schools. Rather, the collection of eight schools was built to meet the following criteria in an
attempt to maximize the contrasts among mobility types and minimize the effects of potential
confounding variables:
1. Each school should serve the specified population type as purely as possible.
We did not want an urban school that also served children of migrant
agricultural workers, for example.
2. The schools should have enough enrollment to support 10 classrooms acmss
grades 1 - 6. We wanted enough teachers in the school to give us some selection
for the interviews and at least 10 respondents to teacher questionnaires.
n riL. 4..
2.1

3. The schools should be as similar to each other as possible in terms of ethnic
distribution. We controlled ethnic distribution because we could not vary it
systematically nor did we wish to confound it with mobility type.
4. The pair of schools within a mobility type should not be part of the same
school district. We did not wish to confound district-level practices andmobility characteristics.
5. For each school, the mobility and economic characteristics of the student
population should not have changed in the last few years and they should notbe expected to change during th e. study year. We wanted schools that had ahistory of working with the type of mobility for which they were selected, andthat would enroll students with that type of mobility during the study year.
School Identification
School selection took place in three stages. First, a collection of schools was identifiedas potential study chools for each mobility type. This was a complex process because eachtype required slightly different information and methods for identification, as the paragraphsbelow describe.
Agricultural Schools. Migrant education in California is organized by geographicregions which differ from county boundaries. The migrant education coordinators in the tworegions that include or surround Sacramento County identified the 21 schools having migranteducation programs in the area. We called the larger schools for information about the numberand type of migrant students enrolled. There are three classes of migrants in California, andonly one class actively moves. Of the eight schools that met our enrollment criteria, threeserved a mixture of mobile populations. From the five schools that remained, we identified thethree that served actively migrant students. In this report, the terms "agricultural" and"migrant" school are used interchangeably.
Military Schools. Administrators at schools located near the two military bases inSacramento County were asked to identify schools that served children from military families.The secretaries of those schools were called and asked to provide information about the
2.2
2 3

parcentage of students in the school whose parents worked for the military. Five schools were
identified.
Urban Schools. This category contains urban schools that report high degrees of
mobility and poverty. They were identified by analysis of school mobility and poverty data
obtained from the California State Department of Education, California Assessment Progam.
The index of mobility is the percent of third graders present for Spring, 1987 achievement tests
who were new to the school that year. The poverty index is the percent of students who
received Aid for Dependent Children (AFDC) funds. We examined the joint distribution of
these two indices for the population of 200 elementary schools in Sacramento County. Schools
that fell in the top quartile for both indices were identified, and their loca'on within the
county determined. Using information from the Sacramento Area Council of Government and
the Sacramento County Office of Education, we confirmed that these schools were located in
densely populated areas, in or surrounding the city of Sacramento. Seventeen schools wereidentified.
Stable Schools. This category includes schools with low mobility and low poverty.
They were selected in much the same way as the urban schools. From the joint distribution of
mobility and poverty, we identified schools in the lowest quartile on each index. Twenty-four
schools were identified.
Further Delineation. Once a group of candidate schools was determined, information
was gathered for each about enrollment, grades served, characteristics of the surrounding
community, and school programs that could alter the populations served. For example, it was
important to identify magnet schools likely to have a mixture of mobility types because they
draw students from a wide geographic area. A variety of information sources were used in this
process. The Sacramento Area Council of Governments provided information about economic
growth and population change in various parts of the region. Statistical reports and computer
data tapes from the California State Department of Education provided student demographic
and economic characteristics, and 1980 census data described housing in target school tracts.
Personnel from the Sacramento County Office of Education shared their knowledge of the
county schools and communities and also called school principals and secretaries when currentdata or future projections were needed.
...
4 1-A:
2.3

In the third and final stage of school selection, specific exclusion criteria were
established to balance the ethnic distributions of the schools in the four categories. Schools
were excluded where: (a) one ethnic minority made up more than 40% of the population, or
(b) Cauctisian students comprised more than 75% of the student body. Since the number of
military and migrant schools were low, they defined the ethnic make-up of the study schools to
a large degree.
sample Description
The eight schools selected as our top choices agreed to take part in the study. The
schools were selected to meet specific criteria for study; we do not consider them to be
representative samples from specified populations. One advantage of the selectionprocess is
that it identifies how the study schools may differ from other schools of the same mobility
type that were considered for this study. The agricultural schools in this study are larger than
most schools having migrant education programs in the communities around Sacramento County.
One of them has a larger percentage of migrant students than all other migrant educatien
schools. One of the study military schools is located on an Air Force base, which may not be
typical of other military schools. Finally, stable schools in this study are in urban and small
town settings; most suburban schools were excluded from the sample because their student
populations were not ethnically mixed.
Table 2.1 summarizes the demographic characteristics of the schools. All but one
school served students in grades 1-6. It was necessary to accept a migrant school serving only
grades 3-5. The schools ranged in size from 442 to 712 students. With the exception of the
migrant schools, the student populations were predominantly white with a mix of minority
students. Table 2.2 provides narrative descriptions of the schools, their communities, andschool wide instructional programs.
Teacher and Frincipal_Samples
Teacher Interview Sample
For the in-depth interview study, we sought four teachers at each school. Our goal was
to find a teacher group that (a) had experience working with the type of mobile students for
2.4

which their school was selected, (b) would teach for the entire study year and thus be
available for the spring interview, and (c) included primary and upper elementary teachers.
We gave the following criteria to principals who took one of two approaches to recruiting
teachers. Either they asked for volunteers and then selected the volunteer teachers who met
most closely the criteria, or they identified specific teachers who met the criteria and asked
them to participate.
1. Teachers should not be first-year teachers in the 1988 - 1989 school year.
2. There should be no reason to believe that the teacher would leave the school
before the end of the school year (e.g., for maternity leave).
3. In the group of four teachers one should teach Grade 1, one Grade 3, one Grade 4,
and one Grade 6.
Table 2.3. shows the grade levels and teaching experience of the study teachers. The
teachers had at least two years of experience at their schoois; half had five years or more. All
teachers had at least three years of teaching experience; half had been tea."hing for more Ihan
10 years. It was not possible to meet the criteria in all schools, end the first selection rule to be
relaxed was #3, concerning grade levels. Still, both primary and upper elementary grades are
represented in each school. Additionally, at one agricultural school (Appleton), not all
teachers worked with migrant students: we specified that two interview teachers come from
the mignuit education program. Because of this additional requirement we had to relax
criteria #2 and accept a pregnant teacher at Appleton who returned to school in spring for her
interview.
Although this teacher sample was experienced working with a particular type of
mobility, the teachers did not have formal training for this work. Teachers were asked
directly whether they had any training to work with students who moved. Only six teachers,
five of them from agricultural schools, described any training. In particular, teachers
mentioned the taining they received as part of their bilingual certification (4 teachers). That
training emphasized a multiculttral approach in the classroom, and specific strategies for
working with migrants. The fifth teacher at an agricultural school had participated in some
inservice training provided by her school's bilingual teacher. Finally, one teacher at a stable
1,- u
2.5

school had taken extra coursework in reading instruction in order to better remediate students in
a highly mobile school where she had worked previously. The remaining 80% of teachers said
they had no training that prepared them to work with students who moved.
Teacher Survey Sample
The entire faculty at each school was surveyed by questionnaire. Table 2.4 describes
the teachers who responded to the questionnaire. The 166 teachers who responded were
distributed about equally across the four mobility types. The teacher sample ranged widely in
terms of total years of teaching experience (from less than one year up to 42 years) and years
teaching at the study school (from less than one year up to 31 years). On average, the total
sample had 11.4 years of teaching experience with 6.4 years at the study school. On average,
military teachers had been teaching longer, but this difference was not statistically significant
(F = 2.39, df = 3, p < .07). Differences in tenure at the study school differed reliably by type of
school, however (F = 67.0, df = 3, p < .001). Teachers in the stable and urban schools had less
tenure at their school on average than the teachers in agricultural and military schools.
ryincipal Sample
The sample consists of the principals (n = 8) of all the study schools. All were female
with experience ranging from two to 13 years (see Table. 7.E:. Stable schools had the oldest,
most experienced principals. Agricultural and urban scht,..As had first time principals in theirfourth year on the job. In urban schools, printipals had the fewest number of years prior
teaching experience in the sample.
Elltqrati.M.gibzia
This study was designed to maximize the opportunity to observe differences in mobility
patterns. Four types of data were used to answer the research questions. Student enrollment andwithdrawal information was collected, a sample of teachers was interviewed twice during thestudy year, all teachers at the study schools were surveyed by questionnaire, and all principals
were interviewed once. Copies of all instruments appear in the Appendix.
2 7
2.6

Enrollment Data
The dates of enrollment and withdrawal were recorded for every student who attended
the study schools. In most cases the dates came from the class attendance books maintained by
teachers and used by schools to document average daily attendance. In four schools, the dates
were obtained from office records that listed the names of students who entered and withdrew
each month along with the date of the enrollment transaction. The data were gathered by a
member of the research team who visited the schools and photocopied the records periodically
during the study year. A computer file of these data was created for each school, using
D-BASEIII software, which contained an identification number, teacher identification, grade,
dates of enrollment(s) and withdrawal(s) for each student who attended the school during the
1988 - 1989 school year. Chapter 3 summarizes the analyses and fmdings from the enrollment
data set.
Teacher Interviews
Two structured interviews were conducted with teachers, one in late October and one in
May. Interviewers met with teachers at their schools while a specially hired substitute
covered their classes. The 40-minute interview was taped for later transcription, and the
interviewer took field notes. The fall interview was used to establish teachers' instructional
and organizational styles. The interview was structured to obtain information about the
instructional and management decisions teachers made. In particular, teachers were asked how
they oriented the entire class to the school and classroom rules, routines and expectations, and
how the teachers learned their students' instructional needs. The spring interview was used to
discover how teachers learned the instructional needs of students who enrolled during the
school year. In particular, teachers were asked what kinds of adjustments they made in their
instruction and management to accommodate new students, how long it took for new students to
become integrated into the curriculum, and the impact of new students on the classroom,
curriculum and job of teaching. Chapters 4 and 5 present the findings from the interview study.
Teacher Questionnaire
The teacher questionnaire contained closed-response questions about classroom
teaching. It was structured to capture teacher attitudes about student mobility, sources of
2.7

support for working with students who moved, the limits of te ',cher responsibility, and
whether teachers could describe the enrollment and withdrawal patterns in their schools. Theinformation from the questionnaire would allow us to propose some generalizable results thatwould not be possible from an interview of a small sample of teachers. The specifics of the
analyses of the questionnaire and its results are included in specially marked sections inChapters 3 and 5.
Principal Interview
Principals were interviewed in their offices in May 1989. The purpose of the principalinterview was to obtain information about school level responses to students moving into and outof the school. These school-level responses would provide us with some context in which tounderstand teacher responses. In addition, we wanted to know how student mobility affected
the principal-teacher relationship. The principal also is tha school's link to the larger systemof schooling the district office. The decisions made by principals, and how those decisionswere affected by student mobility, could provideus with clues about the responsiveness of theschool system per se to the issue of student mobility. The principal interview also provided acheck on the teacher interviews and questionnaire in the area of resources available toteachers. Chapter 6 summarizes information learned from the principal interview.
n 0t."-. I 1
2.8

Chapter 3: Characteristics of Student Mobility in Four Types of Schools
Although it is possible to document that nearly one in every five school-aged children
moves each year in this country, it is clifficult to discover who those children are, and any
pattern there might be in their edumtional needs. Every year the US. Census documents
geographic mobility, providing an overall picture of mobility trends by region and age of
movers. Educational organizations report on mobility also. Typically, mobility is assessed by
different indices that are not easy to interpret, and do not capture characteristics important to
instruction.
As part of its annual assessment program, the California State Department of
Education asks schools to document mobility of students in certain grades. The index of mobility
is the grade at which a student first enrolied in the school. In Spring 1987, for example, 24% of
the third graders were new to their school that academic year (California Assessment
Program, 1987). The percenge of new third gra, lers ranged widely in the 4321 schools
reporting. The median response of the schools was that 22% of the third graders were new.
School districts also derive indices of student mobility. As an example, the Sacramento City
Unified School District describes student mobility for a school year as the number of student
transactions (enrollments plus withdrawals), expressed as a percentage of the average monthly
attendance.
These indicators of mobility summarize in a single number the movement that occurs
over the course of a calendar or academic year. They provide a "snapshot" taken at a single
point in time of movement that is continuous during the year. The indicators do not capture well
characteristics of student mobility that impact the educational process. In addition to the
simple number of movers, these characteristics might include whether the movement is due to
new students enrolling, students leaving, or both; how long students typically remain enrolled in
that school; whether or not students return after leaving; and whether there are times in a
school year when the number of enrollment changes is greater. It is also likely that the
predictability of that movement whether it is random, monthly, seasonal, or in some other
way cyclical will affect the instructional process.
3 03.1

This chapter examines characteristics of mobility in the eight study schools, and
teacher and principal perceptions of that movement. The primarysource of data for student
mobility was the selool's documentation used io calculate average daily attendance. Fromthese records, the dates of enrollment and withdrawal were gathered for every student who
attended the eight study schools during the 19884989 school year. Perceptions of teachers and
principals were gathered by questionnaire and interview.
Mobility Characteristics of Student Populations
There are two segments of the student population in each of the study schools. Students
are part of either a stable scignent that rt..-rnaius enrolled from the beginning to the end of the
school year, or a mobile segment that includes those who enroll after the first weekend of the
school year, withdraw before the last day of school, or enroll late and withdraw early. Theanalyses of enrollment data describe the relative size of these sub-populations, and the lengthof time students were enrolled in the study schools.
Population Segments
The percentage of students who moved during the study year varied across schools from
17% at Creekside to 50% at Ninth Street and Elm Schools (Table 3.1). With one exception, the
schools selected for the study because they served mobile populations had higher percentagesof movers during the study year than both schools that were selected because they served stable
communities. At Appleton, selected because it served an agricultural population, 22% of the
students were mobile during the study year. This was lower than the percentage at Fairview, a
stable school, where 25% of the students moved".
For the remaining schools that served mobile populations, substantial segments of thestudent populations were comprised of students who moved. At NinthStreet, which servedurban students, and at Elm, which served agricultural students, half of the student populations
were enrolled for less than the full school year. Slightly more than a third of the urban
3.1 Because the sample size for student enrollment change was so large (N=4939), Chi-squaretests of frequency differences between groups reached statistical significance even for smallabsolute differences. This chapter summarizes the data and discusses practical significance,since statistical significance was achieved readily.
3.2 31.

students (38%) at Broadway moved during the study year. In the schools that served military
families, movers comprised a:nut a third of the school population (31% at Doolittle and 33%atMcArthur).
The mobile portion of the student population can be partitioned further. Some movers
were enrolled at the beginning of the school year and then withdrew before the end of school.
Other movers arrived late and joined classes during the school year, and some of these students
also withdrew before the end of school. Finally, students who withdrew sometimes re-
enrolled. The schools differed in the type of enrollment changes that occurred during the study
year as Table 3.1 summarizes. Urban and stable schools experienced similar enrollment
changes: Movers were more likely to arrive during the school year than they were to withdraw
after starting the year at the school. As compared with agricultural and military schools, the
urban and stable schools had lower percentages of movers enrolled at the start of the school
year. (The percentages of movers enrolled in school at year's start were 53% for military, 51%
for agriculture, 35% for urban and 29% for stable.) Student mobility in agricultural schools had
a special characteristic Many of the students who withdrew later re-enrolled. Half of the
students who left Elm and 40% who left Appleton returned before the end of the school year.
Duration of Enrollment
A teacher's opportunity to instruct a student and a student's opportunity to adjust to a
new class and school are limited by the number of days a student is enrolled in the school. The
length of enrollments may vary even between schools having similar percentages of mobile
student& The duration of enrollment was computed for each student in the eightstudy schools.
The computation counted weekdays between a student's date of enrollment and date of
withdrawal, excluding the days allocated for Thanksgiving, Christmas, and spring vacations.
For students who withdrew and later re-enrolled, the duration includes all periods of
enrollment.
Depending on the study school, the academic year was 183 to 186 days. The median
duration of enrollment was the full school year for all but two study schools. In Elm and Ninth
Street, where close to half of the student populations were mobile, the median enrollment
period was 181 and 180 days, respectively.
3.3
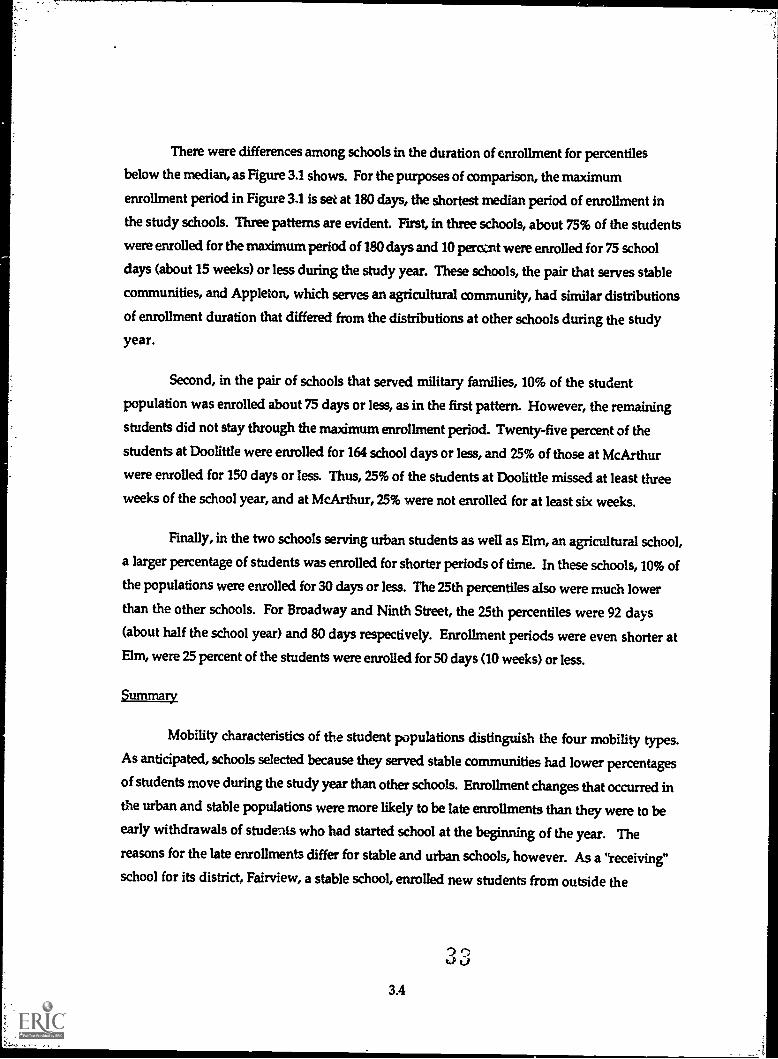
There were differences among schools in the duration of enrollment for percentiles
below the median, as Figure 3.1 shows. For the purposes of comparison, the maximum
enrollment period in Figure 3,1 is set at 180 days, the shortest median period of enrollment in
the study schools. Three patterns are evident Fffst, in three schools, about 75% of the students
were enrolled for the maximum period of 180 days and 10 percent were enrolled for 75 school
days (about 15 weeks) or less during the study year. These schools, the pair that serves stable
communities, and Appleton, which serves an agricultural community, had similar distributions
of enrollment duration that differed from the distributions at other schools during the study
year.
Second, in the pair of schools that served military families, 10% of the student
population was enrolled about 75 days or less, as in the first pattern. However, the remaining
students did not stay through the maximum enrollment period. Twenty-five percent of the
students at Doolittle were enrolled for 164 school days or less, and 25% of thoseat McArthur
were enrolled for 150 days or less. Thus, 25% of the students at Doolittle missed at least three
weeks of the school year, and at McArthur, 25% were not enrolled for at least six weeks.
Finally, in the two schools serving urban students as well as Elm, an agricultural school,
a larger percentage of students was enrolled for shorter periods of time. In these schools, 10% of
the populations were enrolled for 30 days or less. The 25th percentiles alsowere much lower
than the other schools. For Broadway and Ninth Street, the 25th percentiles were 92 days
(about half the school year) and 80 days respectively. Enrollment periods were even shorter atElm, were 25 percent of the students were enrolled for 50 days (10 weeks) or less.
Summary
Mobility characteristics of the student populations distinguish the four mobility types.As anticipated, schools selected because they served stable communities had lower percentages
of students move during the study year than other schools. Enrollment changes that occurred inthe urban and stable populations were more likely to be late enrollments than they were to beearly withdrawals of students who had started school at the beginning of the year. Thereasons for the late enrollments differ for stable and urban schools, however. As a "receiving"
school for its district. Fairview, a stable school, enrolled new students from outside the
3.4

from neighboring schools were enrolled at Fairview, the 2istrict did not transfer them back
until the following school year. This may explain why Fairview had a higher percentage of
movers than Creekside, the other stable school, and why 78% of Fairview's movers were late
enrollments. In urban schools and in Creekside, the decision to move was made by students,
parents or guardians and not by the district.
Only in agricultural communities did a large percentage of students re-enroll after
withdrawing from the school during the study year. The agricultural industry in the areas
surrounding Appleton and Elm employed migrant workers from spring planting through fall
harvest times. The high percentage of re-enrollments in these schools reflects this cycle.
Students attended school in the fall until the harvest was completed; they withdrew to move
with their parents for work elsewhere; when their parents returned to the area for spring
planting the students re-enrolled. In addition, teachers reported in interviews that some
students withdrew during the Thanksgiving and Christmas holiday season and re-enrolled in
the first months of the new year.
Within each pair, the schools serving stable, military, and urban communities
displayed distributions of enrollment duration similar to each other. In stable communities,
school enrollments were for longer periods of time, as expected, and in urban communities there
were more short-term enrollments.
The schools that served agricultural populafions were less similar to each other than
schools in the other pairs. The student population at Elm had a higher percentage of mobile
students, and typical lengths of enrollment were shorter than at Appleton. Appleton's
population was more similar to the stable populations in terms of the percentage of mobile
students and the durafion of enrollment in the school. There are some explanations for this
difference. While Appleton did serve a migrant populafion during the study year, that
population was a small percentage of the total number of students in this large school. Further,
independent study programs allowed some migrant students to be enrolled officially when they
were not in attendance at Appleton School. As a result, the enrolbnent records at Appleton
underestimate the number of movers.
3.5

Patterns in Enrollment Change over Time
The mobility characteristics of a student population are useful for describing the
general level of mobility in a school and the length of time students remainat a school. Thoughthis information describes a population generally, it cannot help teachers predict when
changes will occur. In order for a teacher to accommodate enrollment changes, knowledge ofwhen students are more likely to enroll or withdraw would be useful for preparation and
planning. The examination of time trends of students mobility drew on three sources of data:
the dates of enrollment and withdrawal for each student, the teacher responses to the spring
interview, and principal interview responses. The analysis describes trends that occurred
during the study year in the four type of schools and examined teacher and principalperceptions of those trends.
Study-Year Trends in Enrollment Data
The analysis of time trends partitioned the school year into 18 haif-month periods andexamined the number of new enrollments and withdrawals that occurred in each period. Thefirst 15 days of a month were included in the first period, and remaining days in the secondperiod for a month. The analysis presented here summarizes trends for the four types of
mobility, pooling the data for the two schools within each type. In these analyses themobility, particularly in agricultural communities, may be underestimated because theanalyses do not count the first withdrawal or second enrollment of students who leave and re-enroll during a single school year.
Table 3.2 summarizes the distributions of enrollmentchanges for the four types ofschools. In all mobility types, at least one new student enrolled and one student withdrew eachperiod of the year. In a typical half-month period, the pair of schools serving agriculturalcommunities had 6 new enrollments and 4 withdrawals, the pair serving military communitieshad 6 new enrollments and 12 withdrawals, the pair serving urban students had 21 newenrollments and 16 withdrawals, and the pair serving stable communities had 9 newenrollments and 4 withdrawals. The average number of enrollment changes during a half-month period differed significantly across the four types of schools both for enrollments
(F = 3.65; df = 3, 68; p 5 .02) and for withdrawals (F = 8.95; df = 3, 68; p .0001). While urban
3.6

schools experienced the greatest change on average acmss periods, schools serving agricultural
communities experienced the greatest number of changes in a single period. In one period 70 new
students enrolled in that pair of schools. Also in a single period 38 students withdrew.
Enrollment trends across the academic year for the four types of schools are displayed
in Figures 3.2 to 3.5. Each figure graphs new enrollments and withdrawals, standardized
separately over the 18 periods. Within mobility type, frequencies of enrollment changes were
standardized by subtracting the average over half-months and dividing by the standard
deviation over half-months. Standard scores were used so that the differences in the absolute
number of enrollment changes and the variability in the number that occurred each period
would not mask pattern differences among the mobility types. In all figures, zero represents the
average number of new enrollments and new withdrawals, and a scale unit equals one standard
deviation.
Agicultural. The number of withdrawals peaked dramatically in the last half of
October, and the number of new enrollments in the first half of May in schools serving
agricultural communities (Figure 3.2). The number of withdrawals was elevated in December,
before the Christmas holiday vacation, as was the number of new enrollments in January,
following the vacation. Relative to these highs, there were few differences in enrollment
changes from one period to the next.
Military. During the fall months, until the second half of November, the number of
new enrollments was above average for the year in the pair of schools serving military
communities (Figure 3.3). After a drop just before the Christmas vacation, new enrollments
increased in January, peaking in the first half of the month. For the remainder of the school
year the number of new enrollments was below average with one exception: The number of new
enrollments was above average in the second half of March, the period that contains the week
of spring vacation. The number of withdrawals increased from September to mid-February, and
then declined to below average until June, when the largest number of withdrawals occurred.
Urbm. In urban schools, the number of new enrollments and withdrawals followed
similar patterns during the fall (Figure 3A). Both increased during September and remained
above average for the year until the second half of November. Beginning in December the
patterns diverged. The number of withdrawals reached a high point in the first half of
3.7

December and then fell below average during the first three periods of the new calendar year.In contrast, the number of new enrollmentswas lower than average in December and above
average during the first three periods of the new year, peaking in the first half of January.During March and April the patterns converged again; the numbers of new enrollments and
withdrawals were above average at the beginning of March and declined through April.While the number of new enrollments continued to decline during the last six weeks of the
school year, the number of withdrawals increased but remained below the average for the year.
Stable. In the pair of schools serving stable communities, the number of new enrollments
was higher than average from mid-October to mid-February (Figure 3.5). Enrollments peakedin January, during the second half of the month, and then declined over the remainder of the
year with a small increase during the first half of April, the period following spring vacation.The number of withdrawals was below average daring October and November, when new
enrollments were high. The number of withdrawals increased in December and peaked at thebeginning of January. Withdrawals then declined, remaining at or below average with twoexceptions the latter part of March, in the period containing spring break, and the last periodof the school year.
Teacher Reports of Enrollment Trends
During the spring interviews, four teachers at each school responded to the question: Inyour experience at this school, is there a systematic pattern to the times new students enroll andothers withdraw? Teachers who had experienced patterns of mobility were asked to describethe pattern (Table 3.3).
In all schools teachers reported that enrollment changes could occur throughout theschool year, but most teachers (26 teachers) identified periods of the year when enrollmentchanges were more frequent. Looking over all schools, the most common period for enrollment
change was after holiday vacation time (14 teachers). As one fifth grade teacher described:
3 7
3.8

It seems [the heavier times occur] after major holiday periods, like Easter orChristmas, because that's the time when the family has time to move. Andsome parents are cvncerned about the kids missing school, so they will waituntil the child is out of school for a big block of time. We have a week at Easterand two weeks at Christmas. WN5)32
The aecond most common pattern was reported only by teachers in agricultural
communities (7 teachers). This pattern coincides with the planting and harvest seasons:
students who migrated with their families withdrew in October after the harvest was
completed and enrolled in May at the start of spring planting. The third most frequently
mentioned pattern was enrollment change that took place in the fall during the first few weeks
of school (5 teachers). New students enrolled late in the fall at Fairview, the stable school
that served as an "overflow" school for its district, and both enrollments and withdrawals
occurred in the fall according to teachers at the urban school. The remaining pattern mentioned
by teachers from more than one type of school was spring enrollment changes. Two teachers in
military schools and one at Creekside, a stable school, described this pattern but did not
provide a rationale for it.
Teachers' descriptions of the mobility patterns at their schools varied by type of
school. Teachers in stable schools did not identify a pattern, primarily because so few students
transferred into and out of their schools. In military and urban schools the most frequent
response described moves that occurred around holiday vacations, while in agricultural schools
the moves followed the planting and harvest cycles. In agricultural and urban schools, patterns
were described that were unique to the type of school. Two of the four teachers at Appleton, an
agricultural school, explained that students withdrew in late fall and re-enrolled in January or
later. This pattern was not described for any other type of mobility or in fact, for any other
school.
We have two patterns. We have the migrant farm worker that really[follows] the crops. We have other kids, some of them are classified migrantbut they're really residents. They stay here but they do take off during thosemonths where there's not much work going on here and then they go back toMexico. So they'll be gone from one to two months, some of them. (AA3b)
3.2 Codes in parentheses following quotations in this report identify the source of a quotation.The first letter indicates the type of community served by the teacher's school, A=Agricultural,M=Military, U=Urban, and S=Stable. The second letter in the code is the first letter of theschool name. The number indicates the grade level of the teacher.
..1 r)4 % .-..,
3.9

There is an additional pattern too that is our Hispanic students who leave forChristmas. They might leave in November or December and come backanywhere between January and April. I started with 28 [students] about five[left in October] and then in January at one point I had 17. Then they startcoming back. (AA5)
Two teachers of urban students, one from each school, mentioned a monthly cycle to
moves in which enrollment changes occurred around the beginning of the month. The teachers
reported that the timing of these changes may be related to the terms of rental agreements
because many of their students lived in rental housing.
Principal Reports of enrollment Trends
Principals in the study also were knowledgeable about student mobility at their
schools. A cluster of questions asked principals about patterns to student mobility, and reasons
there might be for that pattern, how long the pattern had odsted, and the average amount of
time a student enrolled in the study school. Another cluster of questions asked where students
went when they withdrew from the study school, and how often re-enrollments occurred.
Like the teachers, principals at both agricultural schools described a long-established
pattern of enrollment, withdrawal and re-enrrillment that coincided with the availability of
farmwork in the region (Table 3.4). They reported that the average amount of time a migrant
student enrolled was 13-14 weeks during the year, and many of the migrant students who left
school in the fall re-enrolled the following spring. From Appleton, those students typically
went to Mexico or where farmwork was next available (Table 3.5). At Elm, students left and
went to other farm communities in California or to Texas. However, during the time they were
not enrolled at the two study schools, these students were not necessarily enrolled in any school.
At Appleton, students were encouraged to take work to complete independently during the time
between enrollments there. Both rural schools also had communities of stable students, some
whose families had been there for generations and others attracted by the availability of
inexpensive housing.
Principals at schools serving military families described enrollment patterns that were
less clear than those in agricultural schools. The moves were dependent on military decisions
about a parent's posting, and at one of them the availability of on-base housing. Students could
9 nLfi 0
3.10

remain for as little as four or five months while a parent was Ln a training program, but more
often, the average stay was three years. One principal found that out of all the sixth grade
students the previous year, only four had been enrolled from kindergarten through sixth gade.
Students who left these schools could go anyplace in the world, and they seldom, if ever,
returned to the study schools to re-enmll.
Student mobility in schools serving urban populations was continuous and random,
according to the principals. This appeared to be at least partly a result of the many reasons
principals cited for student mobility, including financial instability, divorce, apartment
condemnation and legal difficulties. The principal at Broadway did not know how long
students typically stayed enrolled at her school, but she had asked her faculty to identify how
many students stayed in the school throughout the reading mastery curriculum. She said that
only six students were identified who had remained from Kindergarten through the third
grade, the duration of the curriculum. The other principal guessed it might be about two or
three years.
nincipals fr. 1:oth schools serving stable communities described very little mobility,
and what little that did occur was random and unpredictable. At Creekside, the principal
attributed the stability of the school population to that of the neighborhood. The principal at
Fairview described the first two weeks of the school year as filled with commotion, until the
district redistributed students to balance enrollments. From that point on, very few students
enrolled or withdrew. When students left stable schools, they generally transferred to other
schools within the district, particularly magnet schools.
Summary and Discussion
Except in schools serving stable communities where there were few enrollment changes,
teacher descriptions of mobility generally matched the patterns documented by enrollment
data. Teachers in all types of schools reported that enrollment changes occurred near holiday
vacation time, a trend confirmed by the plots of enrollment data. There was a high number of
enrollment changes near the Christmas holiday vacation in all four types of schools, and near
spring vacation in all but the urban communifies. Though many enrollment changes occurred in
December and January in all types of schools, there were some differences in the timing of the
moves. In urban, military, and agricultural communities the numbers of withdrawals were
relatively high, if not the highest, early in December before the holiday vacation, and the
numbers of new enrollments were highest in the first period of the new year, following the
34 fi

Christmas vacation. In stable conununities, however, the moves were delayed by one half-
month period. Withdrawals peaked at the beginning of the new year and enrollments peaked
the second half of January in schools serving stable communities. While the reason for this
difference is not known, one possible explanation relates to the academic calendar. The first
semester of the school year ends in January, after the start of the new calendar year. It may bethat in stable communities, a greater percentage of families can time their moving to coincidewith the school calendar.
There were distinct patterns to enzollment change in schools serving agricultural
communities, making it easy to identify peak periods. The large numbers of fall withdrawalsand spring enrollments were a direct result of the harvest and planting cycles in the fields
surrounding the schools. To a lesser degree, these schools experiencedanother cluster of
withdrawals later in the fall and another cluster of new enrollments in January. These changeswere identified by teachers as well.
Two urban teachers reported that enrollment changes frequently occurred at thebeginning and end of calendar months. To examine this trend,we computed the percentage of
enrollment changes that occurred mid-month, and compared that number with the number ofchanges that occurred on the remaining 15 days, the period spanning the completion of onemonth and the beginning of the next. The differences were negligible; close to half the changes
occurred mid-month: 47.1% of new enrollments occurred during the middle of a month, and48.3% of withdrawals.
Principals were knowledgeable about student mobility in their schools, and respondedto our questions with a great deal of contextual information. Like the teachers there, principalsin agricultural schools described a pattern of enrollment, withdrawal and re-enrollment forstudents whose families moved with the farming seasons. The principals described wheremigrant students went when they left, knew something of their schooling elsewhere before theyreturned, and prepared for the re-enrollment of many students over the years. These principalsalso described the stable populations of students served by their schools.
Principals in military schools were less clear about the patterns of mobility in theirschools, but were very knowledgeable about the events that caused it. These included thetiming of postings, of training programs offered at the base, availability of on-base housing and
3.1241

other family plans. Upon leaving these schools, students seldom, if ever, re-enrolled. In urban
schools, principals cited an impressive list of reasons for student mobility, which was
continuous and random. Though students sometimes re-enrolled, the number of enrollments and
withdrawals was so &eat that principals were unable to provide exact figures. At both
military and urban schools, there were very few students who remained at the study schools
throughout their elementary years.
Principals in stable schools described little studmt mobEity over the years. The
exception, at Fairview, involved student movement betwegm schools in the district during the
first two weeks of school.
Teacher Comparisons among Mobility Patterns
There may be periods of the year, such as semester break, when it is easier for teachers
and students to adjust to enrollment change; and for some year-long patterns it may be easier for
teachers to plan for and accommodate enrollment change. Teacher perceptions of student
mobility patterns were gathered by questionnaire survey of the faculties of the study schools
(N = 166). The questionnaire asked teachers to identify the patterns that described their
classes and then to identify patterns that described classes they were trained to teach. In
addition, it asked for patterns that disrupted classroom processes and complicated instructional
planning. Teachers responded by selecting one of four patterns:
(A) Students enrolled and withdrew only between semesters,
(B ) students enrolled and withdrew individually throughout the year,
(C) students enrolled and withdrew during a single month in the spring, and
(D) students withdrew as a group in the fall and re-enrolled together in the spring.
The four patterns describe key characteristics of the patterns we had expected to find in the
stable, urban, military, and agricultural schools, respectively. 33
3.3 As the questionnaire was developed before enrollment data were gathered and analyzed,the pattern descriptions do not describe the actual trends that occurred during the study year.In particular, the description of a pattern for military school enrollment which was inferredfrom a report that military transfers occurred in spring was not an accurate description of themobility trend during tht study year. Though military transfers are announced in spring, somefamilies do not withdraw their children and move to the next base until summer. Those who do
3.13 4 2

First, looking over all schools, teacher responses highlighted a discrepancy betweentheir experiences and their training for working with students who move (Table 3.6). Teachersagreed overwhelmingly that there was no pattern to the student mobility that occurred in theirclasses. Over all schools, 81% of the teachers said the pattern that best described their classwas B: students enrolled and withdrew individually throughout the school year. Most of theremaining teachers (13%) selected the agricultural pattern (D), and very few selected thestable (4%) or military (2%) pattern (A or C). Although the teachers agreed on the patternthat described their classrooms, they did not agree this was the pattern that described theclasses they were trained to teach (x2 = 650, df = 3, p .001). The teacher sample was splitabout evenly between training for pattern A, students enrolled and withdrew only betweensemesters, and pattern B, the individualistic pattern that described most of the classes (eachpattern was selected by 43% of the teachers). Most of the remaining teachers (11%) selectedthe agricultural pattern.
Teachers agreed that student transfers that occurred between semesters caused littledifficulty in their classrooms relative to the other mobility patterns. Teachers identifiedpatterns that made it difficult to integrate movers into the classroom activities, thatcomplicated instructional planning, that disrupted the education of students who move, thatdisrupted the education of other students in the class who do not move, and that disruptedclassroom management. Few teachers (6% or less) selected the between-semester pattern inresponse to these questions (x2 = 77, df = 1, p .001). For each disruption, pattern B,individualistic moves, was selected consistently by about half of the teachers. The remainingteachers split, with more selecting the agricultural pattern (27% to 34%, depending on thedisruption) than the spring or military pattern (13% to 18%).
Responses to the questionnaire items varied among teachers from different types ofschools. The pattern that best described their classes varied by mobility tYPe (x2 = 623, df 9,p .001). As expected, a higher percentage of teachers in school's that served agriculturalcommunities selected the agricultural pattern to describe their classes (45% of the agricultural,3% of stable, and no urban or military teachers selected this pattern). The stable, between-
move often leave for their new base in spring, travel and take vacation between assignmentsand enroll their children in a new school the following fall.
3.144 3

semester pattern (A) was selected slightly more often by teachers in stable communities (11%)
than by teachers in other communities (5% military, 3% urban, and 0% agricultural).
Teacher responses differed significantly among the four types of schools for three other
questions also. There were systematic differences on the mobility pattern that most disrupts
the education of students who move (x2 = 27.03, df = 9, p < .001), which corresponded to the
patterns that existed in the schools. Pattern A, the between-semesters pattern, was selected
most often by teachers of stable school communities, pattern B, the individualistic pattern,
most often by teachers of urban students, and pattern D, the migrant pattern, most often by
teachers of schools in agricultural communities. Teachers differed reliably in the pattern they
believed most disrupted the education of students in the class who do not move (x2 = 21.05,
df = 9, 12 5 .01). In schools that served agricultural communities, 60 percent of the teachers
believed the agricultural pattern was most disruptive, while only about 25 percent of the
teachers in other types of schools selected this pattern. In other schools, teachers were more
likely to select pattern B, the individualistic pattern. Finally, differences were found across
school types in the pattern teachers believed most disrupted classroom management (X = 325,
df=9, p < .001). Again, teachers in agricultural schools more frequently selected the
agricultural pattern (pattern D) as being the most disruptive, while teachers in other types of
schools more frequently selected the pattern of individual moves (pattern B). Teachers in
schools serving stable and military communities also selected pattern C, the spring pattern.
There were no statistically significant differences among the four types of schools in the
patterns teachers selected to describe (a) the classes they were trained to teach (x2 = 14.27,
df=9, p < .11), (b) the pattern that makes it most difficult to integrate movers into the ongoing
classroom activities (x2 = 15.77, df = 9, p < .07), and (c) the pattern for which instructional
planning is most difficult (x2 = 8.8, df = 9, p .45).
Summary
There were differences among teacher comparisons of mobility patterns that varied
systematically with the type of mobility they experienced and with the question asked.
Teachers in military, urban, and stable communities agreed that the individualistic pattern(B) best described mobility in their classes, and to a lessv extent that it alsu described the
pattern that was most disruptive to classrooms. In contest, almost half the teachers in
agricultural communities selected the agricultural pattern (D) as best describing their class,
315's

and with one exception this pattern was selected most frequently as the most disruptive pattern
by teachers in agricultural communities. The exception was that when considering instructional
planning, teachers in schools serving agricultural communities tended to agree with teachers in
other schools that the individualistic pattern would be most disruptive. Teachers in all types
of schools reported that their trahting prepared them to teach in classes wheremoves occurred
only between semesters (pattern A), a pattern that teachers believed was not disruptive, orthat they were trained to teach in classes where moves were individualistic (Pattern 13).
Apparently teachers received similar training, as the reports of their preparation did notdiffer significantly across the four types of populations.
4
3.16
5

Chapter 4: Teaching Mobile Student Populations
The major responsibility for working with children who move rests in the classroom
with the teacher. This chapter examines teacher strategies for worldng with mobile student
populations. We look first at instructional planning to learn how teachers prepare to instruct
classes that change composition during the school year. Then we examine how teachers work
with individuals: how teachers evaluate instructional needs, orient newcomers to their classes,
and monitor the integration process of new students in their classes. Finally, we report teacher
recommendations for working with students who move.
Instructional Planning
One strategy for teaching in a highly mobile population would be to plan instruction to
accommodate that mobility. We asked teachers how they took student mobility into account
when they prepared for the school year, when they set out their curricula, including the
selection, sequencing and timing of topics, and when they chose instructional techniques,
including methods for organizing students for lessons. Table 4.1 summarizes teacher responses to
this series of questions.
Year-Long Planning
At the start of the school year, when they designed their curriculum and classroom
organization, about half of the teachers (47%) planned for a stable class of students, even
though they may have worked in schools with mobile student populations. As a third-grade
teacher described, " Basically, I just plan my curriculum throughout the year ... I have the same
expectations and I just go through the curriculum as if it was the same class." (UN3)
We asked teachers how they planned for the patterns of enrollment and withdrawal
that occurred at their schools and the percentage of teachers who planned for stable classes
differed significantly across the three types of mobile populations (X2 = 6.4, df = 2, p < .04). In
urban schools, 75% prepared to teach a class that would not change composition during the
school year; in military schools 50% of the teachers prepared fora stable class; and in
agricultural schools 12% of the teachers assumed a stable class for planning purposes. Teachers
in schools with high levels of student mobility said they planned for a stable class because
611

they could not predict the changes that would occur, or the individual needs of the students
who would move into or out of their classes.
I don't make any special plans for that ... because it's so unpredictable as towhen it's going to happen and how many it's going to happen to. (UB1)
I don't think I really consider that in my overall planning ... Even if you knowthey are leaving, sometimes their plans change. They might plan to leave inNovember and not get away until January. (MD3)
In schools serving agricultural communities, teachers did consider mobility when they
planned their year-long program. First, they considered students' language abilities when
they decided how they would organize students for instruction (3 teachers). Because many
migrant students spoke Spanish only, or had weak oral or written English language skills,
teachers planned to pair or group migrant students with bilingual classmates more proficient in
English. One teacher prepared a detailed instructional routine that her students followed each
day. This teacher believed that it was easier to integrate newcomers when the class followed
a well-developed routine because the students in the class could teach the routine to the
newcomers themselves. Another migrant tacher planned the sequence of her curriculum to
accommodate the seasonal movements of the migrant students.
Other types of plans were reported by teachers in stable, urban, and military schools.
Five teachers prepared for newcomers by stocking extra books, materials and supplies for
newcomers. Two teachers planned instruction to meet individual needs of students whether
they started the year with the class or not. One teacher in a military school chose to follow a
standard curriculum and common teaching methods so that the instructional activities in her
classroom would be familiar to newcomers.
Curricular Planning
The percentage of teachers who considered student mobility when they planned their
curricula differed across the four types of schools (X2 = 10.5, df = 3, p < .02). With only three
exceptions, teachers in schools serving military, urban, and stable communities did not consider
student mobility when they planned the content and sequencing of their curricula. The three
exceptions were a teacher in a military school who did not begin major projects after April
because military families often moved in late spring; a teacher in an urban school who taught
4 74.2

basic skills after major holidays, periods when new enrollments were common; and a teacher in
a stable school who did not introduce new material until the second month of school, after new
enrollments sent from other schools filled her class.
In agricultural schools, teachers planned curricula to accommodate student mobility.
Half of the teachers sequenced instruction to include migrant students in activities or delayed
the start of a new project that the migrant students could not complete before leaving the
school:
I go two ways, I guess. I say at Christmas time, when there's fewer kids there,you can do things that you might not do with larger numbers. On the otherhand, if it's something that's really fun, then I might save it, and think "Gee,only 12 of my kids are going to be able to do this instead of 30." It's certainlysomething you always keep in mind. You think, "If I teach it now, are too manypeople going to miss it?" (AA5)
I try to save the last part of the year [when migrant students are in attendance]as a review, so those who do come in...can practice, especially in math. Thatway you can pick up, for example, fracdons. (AA4)
Teachers in migrant schools reported they altered some curricular topics to make them
more relevant to their school communities (2 teachers) and that they altered instructional
activities to support the migrant students (2 teachers).
I by to cover Mexico, which isn't even in our social studies curriculum, and talkabout the indigenous people more and the influence and the contribution thatthey have given ... so that we're not always studying mmething real obscure.(AA3a)
I keep [mobility] in mind ... Only in preparation does it affect me because I know"Aha, if I'm getting ready for the insect unit in May I'm going to need toincorporate some things that are going to involve new students." Normally ... Ihave step-by-step drawing lessons with my science units. I'll keep in mind that[for] the insect unit I'm going to have a lot of kids who aren't used to doing step-by-step drawing lessons. (AE1)
Teaching Methods
The instructional methods and classroom organization that teachers recommended as
useful for working with mobile populations had two characteristics in common: (a) they
fostered interactions among the students, and (b) they allowed a teacher to move an entire class
through the curriculum as a single poup. Teachers recommended grouping students
f4E3
4.3

heterogeneously with respect to ability levels into cooperative learning groups, peer tutoringarrangements, pairs, triads, and other small groups There were no reliable differences amongthe four types of schools in the percentage of teachers maldng this recommendation (%2 = 1.3,df = 3, p < .71).
Classroom organizations that encouraged interacfions among students were preferredbecause teachers relied on their students to help integrate newcomers into the class routines andcurriculum
A lot of the time you'll find that students who move around a lot are lower in alot of academic areas than other students. They're somewhat behind the class,so it doesn't make any sense for me to go back and teach for them ... I have mystudents working in groups of fouror five. I will buddy that person up withsomebody who cannot only show them around the school and help them withsome of the rules ... but also help with their work. (UM)
Additionally, when students worked cooperatively in groups, it was possible to involve anewcomer quickly in classroom activities:
I've been doing a lot more with cooperative groups, and I've found that thathelps [new students] ... They've got a support system built right in to the lessonsto bring them up where they might not have the skills that we have beenworking on. [New students can contribute] the things that they do know. Ifthey don't know, the whole assignment is not ruined. (UN3)
I do a lot of cooperative learning and that makes it a little bit easier to dealwith children who go in and out ... because they're not swimming alone, becausethey are part of a group and they have a job within that group. You can tailorthe job to give [the newcomer] some time to get caught up. For instance, if theydon't speak English but they can tell time, they can be the time keeper for thegroup. And they're there taking part in what's happening, but they are not onthe spot to do the writing. (AE4)
Teachers recommended organizing students into mixed-ability gro7ips for instruction andthey discouraged individualized instruction and grouping by ability levels for two reasons.First, with mixed-ability groups, classmates could help teach new students. Second, teachersbelieved that mixed-ability groups allowed them to meet individual needs of students withoutthe need to tailor instruction fornumerous student groups. In schools with mobile students,teachers reported it was difficult to tailor instruction because they worked with a large numberof students and a wide ability range.
4 94.4

[The size of my class this year] has been between 30 and 35 kids, and with a lotof them coming in and out, it's really hard for me to individualize and catchthem up ... so I just get other people to help them and I try to help them. (U/11)
I could group my class in 20 different [ability] groups and that's reallyfrustrating and really hard to do, so I try not to do that grouping so much. Iteach to the whole class, and we do do projects and work together in thecooperative groups. (AA3)
Last year I used self-paced instruction in math, with the mastery type ofapproach, and this year I'm whole-group. I'd like to find the middle groundbetween them. I think that will actually help a lot of the problems [due tomobility]. What I think I'm going to do is go back to self-paced within a unitframework, ... That way everybody's exposed to [the same material]. (AE5)
$ummary
As anticipated, student mobility was not a major factor in instructional planning for
teachers in stable schools. However, it was also the case that no more than half the teachers
in military and urban schools considered student mobility when planning instruction,
particularly when they selected and sequenced topics in their curricula. Teacher responses
provided some insight into the reasons they did not plan for mobility. Some teachers reported
that they could not plan because student movement was too unpredictable and becausethey
could not know in advance the abilities and needs of the individuals who would arrive. In
contrast, teachers in agricultural schools considered the timing of student moves and the
movers' likely levels of English language skill when they planned instruction. Migrant
teachers delayed some topics until the migrant students returned to their classes, and they
scheduled some small-class activities for the intervals when migrant students were away.
Teachers in migrant, military, and urban schools generally agreed on instxuctional
methods well suited for teaching mobile student populations. These teachers planned methods
to facilitate student interactions and the movement of the whole class, as a group, through the
curriculum. They wanted to maximize their flerdbility for placing and meeting the needs of a
newcomer. They also wanted to minimize the number of different lessons that would need to be
taught during a single day. Teachers recommended organizing students into mixed-ability
groups, all of which worked on a single class assignment, and they recommended supporting
newcomers through peer tutoring and cooperative group arrangements.

ANNIara a. A
Asimsing Instnictio
In most classmoms there is an assessment and adjustment period at the start of the
school year when teachers learn about the academic skills and abilities of the students in their
classes. As they come to understand their students, teachers may adjust their curricula and
instructional plans to accommodate ).te range of student experiences and ability levels in their
classes. With newcomers who arrive ai ie.: the start o;' the school year, there is a period of
assessment and adjustment as well. During this time te.lchers may gather and examine
information about the student in order to place a flew(emer in their curriculum, they may
monitor the newcomer's progress, and they may adjust the level or type of instruction provided
to the newcomer. We asked teachers a series of questions about this adjustment period to learn
what information teachers sought about new students, and how they obtained and used thatinformation.
Inf_curi_koniet. sgimulaefor.s,
Teachers rarely received information about newcomers before students joined theirclasses. In fact, teachers in the four types of schools rarely had advance notice of newcomer
arrivals (See Table 4.2). Of the 32 teachers interviewed, only two described situations wherethey received information about a student and more than a few days notice of the student's
arrival. In both cases an adult relative of the student visited the school about two weeks beforeenrolling the student. At an agricultural school, one teacher was visited by a stepmother who
wanted to discuss her child's emotional problems before the child started at the school. At astable school, a parent observed a teacher's class before deciding whether to enroll her child.
In military and urban schools teachers typically learned about a newcomer on the daythe student arrived in their classes. They were never notified more than one day in advance of
the newcomer's arrival "Usually I just get a message over the intercom ... saying send a studentdown to pick up a new studeat." (UN5)
Because the lack of notice disrupted classes, the faculty and administration atBroadway, an urban school, had designed an enrollment procedure that would provide teachers
a one-day notice of new enrollments. Unless new students arrived before the school day began,they were to complete their enrollment papers and begin school the following day. The school
4.6 5 1

secretary would notify teachers of students who would jc;n their classes by leaving a note in
their mailboxes. The note would include basic information about the student, such as the
newcomer's name, address, birthdate, and social worker, if any. However teachers reported
that frequently the procedure could not be followed, and as a result they often did not learn
about newcomers in advance of their arrival:
I had one kid come into my class and his cousin say "He's in your c1Rss now."The cousin brought him in. I went to the office and asked "Is it true?" ... [thecousin] might have been wrong. Who knows? [the office hadn't gotten] thepaperwork done yet, so I didn't have any idea. (UB3)
In agricultural and stable schools, teachers sometimes received notice that a student
would enroll, but rarely did they receive any information about the student (Table 4.2).
Teachers in agricultural schools knew that enrollments of migrant students would increase near
the opening date that the migrant labor camps nearby. Although they knew the timing of
enrollments, they could not know which students would join their classes until the students
arrived at the school. In the fall at Fairview, a stable school that serves as an overflow or
receiving school for its district, teachers sometimes learned a few days in advance of plans to
bus new students to their school, but they did not learn about the individuals who would be
placed in their school.
Information for Curricular Placement
To place students in the math and reading curricula, teachers needed information about
newcomers' knowledge in these topics. While all teachers4.1 reported that they needed
information about newcomers' skill levels or abilities in these areas, only six teachers
identified other information they would like to have in order to place students in their
curricula. Five teachers would have liked information about the new student's previous
curriculum (AA3, AA4, MM1, UB6, and UN6). These teachers would like to have known the
textbook series that the newcomer had used and how far the student had progressed in the
series. One of these teachers also would like to have known the type of instruction, whole class
4.1 With the exception of a teacher in a stable school, all teachers interviewed had received anew student in their classes during the study year. The Chapter 4 analyses from this pointforward are based on the 31 teachers who had experience with newcomers during the studyyear.

or individualized for example, that the student experienced. The sixth teacher (AE5) wanted
to know about students' oral language skills.
In most cases, teachers gathered the information they needed from the newcomers
themselves (Table 4.3) and their methods of choice differed for math and reading placement
(x2 = 23, clf = 5, p .001). More than half of the teachers (18 teachers) used the current
classroom assignment to assess a newcomer, and this practice occurred more frequently in math
(15 teachers) than in reading (3 teachers).
I usually give them the paper we're doing that day and explain it to them alittle extra if they need it. Some kids have been able to just pick up a penciland know just what to do. Others are dumfounded, and I just try to give themthat extra help. I say 'Do you know how to add? " If they know the word andthey say "Yes" then you're probably okay. But if they just look at you blank ...they haven't even had the word yet ... [so then you back up] "Do you knowplusses? " or "Do you know how to count?". (MD1)
... they're just immediately part of our group. Whatever we're doing, that'swhat they do, and that's how I assess them. (AA5)
A second common practice was simply to ask the new student about previous work (18
teachers), and teachers used this practice in math (10 teachers) about as often as they did in
reading (8 teachers).
I try to ask them what book they're in, and then if they don't know the book,I'll just straight out ask them, "Well, what kind of reader are you, what kindof group were you in?" (SC5)
You ask the child..."What color was your reading book?" ...And then we mayhave a variety of books and I can show them books and they (say] "Oh, yeah, itwas that blue book." (A.A3)
We ask them, "What did you do at your other school?" And they pretty muchknow by fourth grade. "I was doing long division, or I was doing this," and thenyou ask then "Do you remember the book you were reading?" (AA4)
TeLchers also assessed newcomers by asking them to complete chapter tests, quizzes, or
other informal written tests (15 teach?rs), or by questioning the student ina one-to-one session
with the teacher (14 students). Teachers used written assessments more often for math
placement (10 teachers) than for reading (5 teachers), and they conducted individual oral
assessments more frequently for reading (10 teachers) than for math (4 teachers).

I start with an easy level reader and ask them te read a little bit to me. And Iask them questions about what they've read ... and in math it's an informal test... sometimes I use flashcards, sometimes I just sit down with them and write afew problems on the chalkboard or on paper. (MM3/4)
Parents and previous teachers were used infrequently as sources of information about a
newcomer's academic skills. One teacher each in an urban and a stable school reported
receiving information from parents, and two teachers in urban schools reported calling
newcomers' previous teachers for information. Communications between teachers via students'
cumulative folders were rarely useful for placement decisions because the folder arrived weeks
after the student.
The methods teachers used to gather information did not vary by grade level taught
(x2 = 3.6, df = 5, p .61) or by mobilitY tYPe (x2 = 19.8, df 15, p .18). Placement practices for
reading varied by school, however. In three schools, Doolittle, Ninth Street, and Fairview, a
reading specialist or the principal tested new students and assigned them to classes, in part, on
the basis of their reading levels. In those schools, classroom teachers were relieved of the
responsibility of reading placement, though they could change it.
There was a trend in teachers' reports that suggested their need for information about
individuals depended on the type of curriculum they taught. Teachers reported that w'
class and heterogeneous groups required less detailed information than teaching to abi
groups or in individualized programs.
I ask them what they've been doihg and hope it's the same thing we've beendoing. When I had self-paced, I always gave them a placement-type test.This year [for the new student] it's jump into the whole-group instruction andhope you don't repeat and hope you have enough background to get it. (AE5)
They just come in and either sink or swim. I don't do a placement test in mathbecause there wouldn't be a whole lot of variations I could make in theprogram. (UBD
This year I've pretty much done whole-class instruction [in reading] becausewe're working with the Core Literature books ... So wh9n a student comes in, itreally doesn't matter what the reading level is, they can fit into the classinstruction. (MD4)

Information About Newcomers' Educational Flistories
If teachers do not have information about a newcomer's previous educational
experiences, they are limited in their ability to help new students in the transition betweenclasses. Without knowing about the topics covered and the teaching methods used in anewcomer's previous class, teachers cannot link new and previous instruction easily. This limitstheir ability to help students see connections between the knowledge they have and newinformation to be learned.
When we asked teachers what information they needed to determine instructionalneeds of students, only five teachers in the sample mentioned information about the educationalexperiences of new students. To probe further, we asked teachers specifically if their strategiesfor working with newcomers would depend on a student's previous curricula. We posed twohypothetical situations, one for math and one for reading, and for each we asked teachers iftheir strategies for working with the newcomers would differ. The situations were:
1. Suppose two new students enrolled. One student previously studied in acurriculum that taught basic arithmetic skills through drill and practice inthose skills. The other student had studied a curriculum that developed anunderstanding of math concepts through use of manipulatives and a problem-sol ving approach.
2. Now suppose two new students enrolled who had different experiences in
reading. One student previously studied in a curriculum that taught basic
decoding and word-attack skills primarily through a basal textbook. Theother student previously had studied ina curriculum that took a whole-language approach to teaching reading through children's literature.
Mathematics Curjiculum. For the situation involving mathematics instruction, 53% ofthe 30 teachers who were queried (16 teachers) reported that their methods for working withthe two newcomers would not differ (Table 4.4). Response frequencies were similar across thefour types of schools (z2 = 1.78, df = 3, p S .62). Eleven of these teachers believed their mathprograms would accommodate both new students because the programs included problem-soivingand drill and practice components.
4.10

Both [students] would blend in pretty well because we do both [approa, !hes] inthe dassroom. So they both would have their needs met because we teach inboth modes. We have a couple of days when we do centers, [using]manipulatives, and then we do group instruction and we have some drills. Sothey're going to find their own little mode, I think. (MM1)
Five other teachers said they would not deviate from their own program, as one teacher
expiained: "I've gotten away from the drill-and-practice approach and I'm not going to go back
to it." (UB4).
Thirteen teachers, or 43% of those asked, said their approaches to working with the
two students would differ depending on the students' math background. Five of these teachers
predicted they would heed to devote time to working on manipulatives and problem-solving
strategies with any newcomer whose previous curriculum took a drill and practice approach.
Our program now is pretty much a problem-solving focus. I do a lot of that asopposed to drill and practice. So somebody that's coming in from the drill andpractice approach ... I'm going to need to nurse them a little bit until they get afeel for the problem solving. In that case I will have somebody hook up withthem, along with me spending a couple of extra minutes here, a couple of extraminutes there ... just getting them to understand the strategies of problemsolving. (UB6)
Three other teachers, whose curricula had components of each approach, said they would work
with newcomers on whichever approach the students were missing, and three other teachers
said they would wait and see where the stt: _Lents were having difficulty and then address
individual needs.
If the student coming in with the drill and practice experience was havingdifficulty with the concepts, I would concentrate more on giving themexperience with manipulatives and problem solving. I might adjust myprogram for just a little while and incorporate more of that into my program.The student who had the mauipulatives and problem solving ... again, if theyhad difficulty with the drill, I might incorporate a little more of that for thewhole dass [and] work with them a little bit on an individual basis to givethem the automaticity that my kids had. (SF112)
Reading Curriculum. For the situation concerning reading instruction, responses did not
differ across the four types of schools (x2 = 2.4, df = 3, p 5 .50). Of the teachers queried, 48% (14
of 29 teachers) reported that they would not alter their approach to teaching students who had
had different reading curricula, and all of them explained why they would not. Six teachers
4.11

reported that the curricular differences would not create difficulties for the newcomers. Two ofthese teachers, both from schools serving stable communities, taught at the fourth or fifthgrade level and reported that by the time students reached those grades the students hadalready developed basic skills such as decoding and phonics. A student's previous curriculum
was not cause for concern for the four other teachers because theirown curricula couldaccommodate a variety of past experiences, as one first grade teacher described:
Since my program right now is more whole literature and whole languageapproach, the person who comes in froma strictly phonic -based readingprogram might originally have a tough time adapting to my program because ...I have a group reading book thaton normal terms, as far as Ginn or levels wouldtell you, is above their reading ability. But we do the book so many times, andwe repeat it and chart it, that they've got it memorized. (AEI)
Two other rationales were given by the remaining teachers who predicted they woulduse the same approach :or working with two newcomers whose experiences differed. Four of theteachers reported that their curricula incorporated both approaches, so newcomers familiarwith either approach should be comfortable. The other four teachers reported that theirmethods would not change because they followed a particular curriculum, usually onerecommended by their school or district.
Ten teachers, or 34% of those queried, would work with newcomers differentlydepending on the students' previous curricula, andall but one of these teachers described why orhow they would alter their methods. Five teachers identified differences between the twoapproaches to reading instruction that could cause students problems, and they believed theywould need somehow to link the two approaches for the students.
I think you use different strategies just in thebridging stages, in terms of lettingthem see the difference between the two programs. But I think if you're goingfrom decoding basal into literature, it's a much easier bridge because it's fundoing litelature and analyzing stories and rewriting stories and making puppethat go with the stories and all the things that come with the package. Ifyou're going from literature into basal, which is a lot of the drill and practiceworkbook pages, if it were not that I'm open-minded, I would think that itwould be very frustrating fora student. (SF2)
None of the five teachers who identified program differences described how they would alteror design instructional activities to bridge theprograms for newcomers. Two teachers reported
4.12

they would by to relate the cunicula by explaining to newcomers the differences between them,
and one teacher said she would teach whichever type of material the newcomer was missing.
The remaining four teachers who predicted they would use different methods for the
two newcomers reported that they would call on other adults to assist them. These teachers
would ask special reading teachers, compensatory education teachers or parents to help
students learn phonics and decoding skills necessary to participate in the classwork.
Five of the 29 teachers queried (17%) did not respond to the question concerning reading
instruction. Four of these teachers described their own curriculum but did not offer information
about how they would help a newcomer understand that curriculum. One other teacher, who
also did not respond to the question about math instruction, said she could not answer because
she would never be in the situation of knowing about a student's previous curriculum.
Time Required to Understand Instructional Needs
We wondered how long were the periods of adjustment when teachers assessed students'
learning needs and adapted instruction if necessary. In the fall interviews, teachers estimatedthe number of days it took before they understood the instructional needsof the class of students
who started school with them in September. In the spring interviews, they estimated thenumber of days it took, on average, to understand the instructional needsof a new student who
entered their classes during the school year. Table 4.5 summarizes their answers.
A typical teacher spent a period of two weeks at the start of the school year learningabout the class of students who started school in the fall and a period half that long for each
new student who enrolled during the school year. To understand the needs ofa class of studentsin the fall, some teachers estimated they required as few as 3 days, others required as many as
120 days. The median response was 10 school days, or two weeks. The variability in teachers'
estimates was not explained by the type of school in which they taught (p < .49). There was
greater agreement among teachers on the amount of time necessary to understand a newcomer's
instructional needs. Looking over all schools, teachers estimated 1 to 12 dayswere needed. Themedian response was 5 school days, or one week. There were no systematic differences between
estimates given by teachers from different types of schools (p < .58). Also, the difference
4.13

between the amount of time needed for an entire class and for each newcomer did not vary
systematically across the four types of schools (p < .44).
Summary
Since they did not know the experiences and instructional needs of newcomers in
advance of their arrival, teachers could not make preparations to accommodate particular
individuals who would join their classes. It was rare for a teacher in this study to receive
information about a new student before the student arrived. Moreover, it wasrare for teachers
to receive advance notice of the arrival. Typically a teacher learned about a new student when
called by the office to meet the student or when the student appeared at the classroom door. In
schools serving agricultural communities and at Fairview, a stable school that served as an
"overflow" school for its district, teachers familiar with the enrollment patterns at theirschools could predict periods of the year when new students were more likely to join their class.
SO, they received no advance notice about class assignments or advance information aboutnewcomers.
The primary source of information that teachers had about new students' knowledge,
skills, and previous experiences were the students themselves. To evaluate reading and mathachievement, teachers relied on information obtained from the new students. Teachers
typically assessed how well a new student would fit into the class curriculum by examining a
student's work on current assignments. Teachers also obtained information by directly asking
students to describe the topics they had studied and their skill levels. It was rare for teachersto receive or seek information 4rom newcomers' parents, guardians, or previous teachers.
Information provided in students' official files, the cumulative records, arrived too late to aidplacement decisions.
Although the teachers in this study typically did not seek or receive information about
new students previous curricula, a substantial percentage reported they would adapt strategies
for worldng with newcomers if they had such information. The adaptations would be designed
to bridge the curricula of the newconer's current and previous class, teaching students how to usemanipulatives in math lessons or explaining why there were no workbooks in a literature-based
reading program, for example. Most teachers who would not tailor their strategies to theprevious curricula of newcomers reported that curricular differences, at least those addressed in
4.14

the study, were unimportant. These teachers believed their own curricula were varied enough
to contain some content and methods familiar to any new student. A small number of teachers
refused to tailor their methods for working with newcomers because that would cause them to
deviate from their instructional programs.
Teachers estimated that it took a week on average for them to learn about a new
student's instructional needs. There was less agreement among teachers on the amount of time
needed to understand the needs of a class of students at the start of the school year. On average,
they estimated two weeks were needed at the start of school, but their estimates ranged
widely.
Orienting New Students to aassrwm Processes
During the first few weeks of the school year, effective elementary school teachers
convey to students their behavioral and academic expectations. They teach students
instructional routines, such as when and how to work cooperatively in groups, administrative
procedures, such as steps to turn in completed assignments, and classroom rules of behavior.
They also may convey what they expect students to learn, and what they will look for in
students' work when they evaluate learning. Students who arrive during the school year also
need to learn the behavioral norms and academic standards of their new classes in order to
function successfully as class members and in order not to disrupt classroom processes.
The methods teachers use to orient new students may differ from the methods used toorient an entire class at the start of the year. In the fall interview we asked teachys how they
taught their classes the class rules and what they told them about their reading and math
programs. In the sprin& we asked teachers, in a parallel set of questions, to describe how they
conveyed their expectations to newcomers.
Methods for Conveying Classroom Rules
Teachers used a variety of methods to teach classroom rules to their classes at the startof the school year (Table ,*.6). All teachers posted a list of rules, and 94% held a class
discussion about classroom rules. Other common methods were for teachers to tell students the
rules (88%) and to prepare a handout for students that listed rules (81%). Some teachers (42%)
gave students an assignmml concerning the rules of the class.
6 CI
4.15

Teachers took a different approach to conveying classroom rules to new students whoenrolled during the year. With the exception of the posted list of rules, the most commonmethod was to assign to another student the task of teaching rules to a newcomer (77%).Teachers delegated this responsibility to classroom officers or to students they asked to serve asbuddies, hosts, or special friends to new students. Less frequently, teachers explained the rulesto new students themselves (55%), gave handouts listing rules to newcomers (48%), and heldclass discussions about the rules when new students enrolled (45%).
A teacher's use of a particular method in the fall to orient an entire class did notpredict that teacher's use of the method during the year to orient new students. For none of themethods was there a statistically significant relationship between use for the entire class anduse for new students. A teacher's use of handouts listing rules was the method for informingnewcomers that was best predicted by fall use (x2 = 2.99, df = 1, p < .08).
hit u *n t-t_offig_dm_qi2ktc0_urrilum
During fall interviews, most teachers reported that they oriented their classes to mathand reading curricula at the start of the school year. Teachers informed classes about the topicsthey would study and the procedures they would follow, for example forming small groups forreading instruction. Some teachers also described their teaching approach. In math, teachersdescribed problem-solving approaches and the use of manipulatives in math class. In reading,teachers who wed a literature-based approach explained to their classes how the readingbooks and activities would differ from the standard, basal-text approach. In all, 79% of theteachers interviewed in the fall reported that they oriented their classes in some manner to thereading curricula, anc: 73% to the math curricula. These percentages did not differ significantlyamong the four types of schools either for reading curricula (x2 = .70, df = 3, p 5 .87) or for mathcurricula (x2= 3.34, df=3, p < .34).
Fewer teachers oriented new students whoenrolled during the year to their curricula.,Over all schools, 62% of the teachers wported that they introduced their reading curricula tonewcomers and only 40% introduced the math curricula to newcomers. There were no reliabledifferences among the four types of schools m the percentage orienting newcomers to the readingcurricula (x2 = 3.34, df = 3, p < .34) ) or to the math curricula (x2 = .40, df = 3, p < .94 ). The type
fa4.16

of information teachers provided new students varied from simple descriptions of topics or
procedures to more detailed descriptions of teacher expectations and the type of curricula that
would be used. The quotes below preseht two of the most detailed orientations reported by
teachers.
There'i going to be a lot of problem solving and I need to know how muchproblem solving you've done. And maybe I need to talk about word problems orwhatever [the newcomer] called it. I tell them that it's important to know yourbasic facts, and I need to know [if they do]. I have a little timed test of basicfacts. And [I tell them] that in our book, Open Court, that it's a different kindof a book than they might have been familiar with, and so-and-so in your groupis a good helper in math, and he or she is willing to sit with you and talk withyou and help you during our group math time. If you're confused by whatthey're saying, get with me ... and in the meantime I'm checking all this out,kind of over-the-shoulder type of thing. (PB6)
I show them the book, and I kind of introduce them to the book as a whole. Letthem flip through a little bit, make sure they know where the table of contentsis, because the things we use a lot I want to make sure that they know, and ifthey don't I orient them to that. I tell them we do the reading and we talkabout the stories and we'll be doing some testing and some workbook pages, andin addition we do some literature. (SF112)
Teachers who reported orienting dasses in the fall were more likely to report orienting
newcomers during the year (Table 4.7). All of the teachers who described their math curricula
to newcomers also had oriented their classes in the fall, and )4% who described their reading
curricula to newcomers had done so for their classes at the start of the school year. Teacher
reports of fall and newcomer orientations were related significantly for reading curricula
(x2 = 6.6, df = 1, p .5..01) and for math curricula (x2 = 7.3, df = 1, p < .002).
Some of the teachers who did not orient newcomers explained why they did not.
Teachers zeported that students learned about the curricula on their own:
They can pick up a lot just by looking around and seeing what other people aredoing and then what the expectations are. (UB3)
For some teachers, there was no time to orient students:
Well, usually they come in when school's already started, and you don't havemuch time to tell them anything. "Sit here, here's a book." ... and when you getto the lesson, you're delivering the lesson to the whole class, and that's why Isit the new student with someone who speaks Spanish, and I tell that child"You're this person's buddy, and I want you to help explain what we're doing."
4.17

... They're coming in after the bell has rung. You've already started your day,and here's this child. You quickly say, "Here's a chair, here's a seat, oh hownice to see you. and here's some books." and thenyou're off. (AE3)
A few others did not believe students would be interested in learning about the curriculum.
I really don't tell them anything. Kids are flexible enough ... I think in thefourth gade even if I told them ... it would be water off their backs. They'dhave no idea what we were talking about. (UB4).
All of the study teachers reported that they taught classroom rules and routines tostudents at the start of the school year, and most teachers reported that they also introducedclasses to the math and reading curricula early in the year. In contrast, newcomers typicallywere taught class rules and routines by other students designated by teachers to complete thistask. In many classes, newcomers did not receive information about curricula. Sixty percent ofthe teachers did not provide information to newcomers about math curricula and 38% did notprovide information about reading curricula. Withoutorientations, students were left todiscover on their own what they were to learn, how they were to go about learning, and how
their new curricula related to curricula they had studied previously.
Monitoring the Progress of Integration
Teachers monitor newcomers during their first weeks in a class to learn if the studentsare becoming integrated into the class academically and socially. Teachers in this study used avariety of indicators to assess integration (Table 4.8), but most were signs of social integration.The most frequent clue to integration was whether a newcomer was establishing relationshipswith peers, with 90% of the interviewed teachers mentioning it.
rd see if they had made friends, if they look like they're happy, see how thekids are treating them when they go out of the room and enter back in the room,how they're doing at recess. (AA3a)
It's how they interact with the other students. If they're crabby or if they'refriendly and willing to share. So that's, you know, just by observing theirinteraction. (AA4)
.1 r)f ,1 t.I
4.18

The next most frequently cited clue to social adjustment was the expression on a newcomer's face.
A majority of the teachers (53%) observed students to learn their feelings: happy, bewildered,
nervous, anxious, frustrated, or comfortable.
Whether the child is smiling and if they seem happy and content, I thinkthat's a pretty good indication. If they're morose and not enjoying themselvesor enjoying their classmates, something is not going [well], so I judge it just byhow content they seem in the classroom. (PB1)
Other dues to social integration were the student's behavior in class (mentioned by 27% of the
teachers), the class reaction to the newcomer (17%), and whether the teacher and the
newcomer were establishing a working rapport (13%).
Most teachers (53%) also looked to see if newcomers were successful in their school
work. This was described variously as success with assignments, academic progress, and
satisfactory test scores. Other academic areas teachers watched 'Acluded whether the
newcomers could follow classroom rules and routines (23%), whether they volunteered or shared
something in class (17%), whether they followed instructions (13%), and whether they turned
in class assignments in a timely fashion (13%).
Only in military schools did academic adjustment equal social adjustment in value, in
the teacher's estimation, as a signal of student's integration into a class. In migrant, stable, and
urban schools, not more than a third of the indicators mentioned by teachers centered on
academic performance. However, this difference between types of schools was not statistically
significant (x2 = 3.06, df = 3, p .38).
Time Required for Integration
We asked teachers to estimate the amount of time it took before new students began to
function in the class as if they had been part of it from the start of the school year. This was
not an easy question for the teachers to answer. Of the 28 teachers queried, only 9 (31%)
provided a precise answer, and their answers ranged from 2 days to 2 weeks. Fourteen teachers
(50%) answered with a time interval that spanned at least a week and at most a month, and
five teachers (18%) could not provide an estimate because they believed the amount of fime
needed depended on the student who enrolled.
4.19

For the 23 teachers who answered with a time estimate, 52% (12 teachers) reported
that newcomers become integrated within two weeks from the time or their enrollments. There
was a pattern to teacher responses that varied with the type of mobile students they taught,
but the differences were not statistically significant (x,2 = 3.9, df = 3, p 5 .27). The percentage of
teachers who believed newcomers were integrated into a class within two weeks we , ;0% for
stable schools, 67% for military schools, 40% for agricultural schools, and only 29% for urban
schools.
EardorsAffesting_the_Integratigainsen
From teachers' perspectives, there were a number of factors that contributed to how
much time new students needed before becoming integrated into classes (Table 4.9). The type of
factors that teachers believed were important did not differ systematically among the four
types of schools (x,2 = 13.3, df = 12, p 5 .34). The most common factor reported by 61% of the
teachers queried was the new student's personality or attitude. Teachers said whether
newcomers were shy or aggressive and whether they had positive or poor attitudes toward
school or toward moving influenced their integration into classes. Eleven teachers (38%)
identified as key the newcomer's social ability, including the abilities to make friends and getalong with classmates.
How shy the child is is a major factor too. Moving is very hard on some kids, and forothers it's just a matter of course and they can handle the changes easily and makefriends very quickly. The quieter kids have a harder time because they're moreisolated. (PB1)
Eight teachers (28% of respondents) said the academic abilities of newcomers were
important to the time it took for integration in the classroom. By academic abilities, teachers
included issues of placement, whether the student's abilities and theclass work were closely
matched, and the severity of any learning problems.
If their [math] facts are real weak, it takes them a lot longer to move into the conceptareas ... whether you're a strong reader or an extremely weak reader ... whether yourproblem is decoding or whether your problem is you never learned any kind of phonicsand you're just kind of memorizing every word you see and try to remember it, or, youknow, that kind of thing takes longer. (AE4)
If everything's different and you're not real quick at catching on to something new andeverything you're presented with is something new, then it's tough- (MD5)
F',: 5
4.20

If we had some kind of assessment device for all of our subjects. We do haveassessment for reading, but if we could assess them in all theareas, byspecialists or somebody who has the time and is not in the classroom, thatwould save a lot of time too. (PN3)
Propam and staff supports were strong recommendations. Thirty-one percent of the
teachers recommended extra aides, counselors, resource personnel and spctialized programs as
ways to support teachers who work with students who move.
I see lots of kids who could .a.se just some counseling time, just some private timethat I can't give them ... Jura a lot of hurting things that if I could say, "Whydon't we make an appointment for you to talk to the counselor? I think you'llfeel better." I think that would help. (AEI)
The support people that I work with at the school are really terrific thoughThey're real fledble. Usually [we have a Compensatory Education person] andusually a reading person. So those are people I can usually count on, and they'rereal supportive. (PM)
Except in agricultural schools, teachers (29%) wanted more notice in advance of student
enrollment. Teachers did not ask for much notice; learning about a newcomer the day before the
student's arrival would be helpful.
I would like for them to register the child whenever the parents show up andthen have the child come the next morning so that at night I could get thethings ready and I wouldn't be so scatter-brained the next morning trying toimmediately, as soon as the child gets there, to deal with all this stuff. Andthat would save a lot of stress. (MM3)
Other recommendations were made but only bya few teachers each. Four teachers
(14%) recommended that students carry academic information with them to a new teacher.
This information could be in various forms: the aunulative record itself, a note from the
previous teacher, a form that could be filled out providing the name of textbooks used and page
numbers completed, or a form with state curricular guidelines listed as a checklist. The extra
forms suggested by teachers would be temporary but immediate: the information they would
contain would be confirmed by the arrival of the official cumulative record some weeks later.Four teachers (14%) suggested administrators limit new enrollments in the classrooms either bylimiting class sizes or eliminating district programs that moved students from school to school.
Three teachers (10%) suggested changes in the curriculum so that there were fewer curricular
differences across the state or between neighboring districts.
CI- 7
4.22

Chapter 5: Teacher Perceptions of Student Mobility
The teacher interviews summarized in Chapter 4 provided detailed information about
the work and perceptions of a sample of teachers. To gather data more representative of the
teachers in the study schools, we surveyed by questionnaire all of the teachers in the eight
schools. The purpose of the survey was to learn if student mobility was an issue for teachers,
and if it was a greater issue for teachers in schools serving mobile populations than in schools
serving stable populations. In addition, the survey was designed to gather teacher opinions
about working with students who move and about the supports they have for their work. The.
first two sections of this chapter describe the development and validation of Ile opinion scales.
Much was learned about teacher perceptions from the validafion study. The third section,
which may be read first without loss of continuity, uses the scales that result from the
questionnaire to examine the opinions of the teachers at the four types of schools.
Opinions About Working With Students Who Move
Twenty-three questionnaire items described opinions about teaching 3tudents who
transfer to a new school during an academic year. Teachers rated their level of agreement with
each opinion. Three measurement scales, each comprised of seven or eight items, were built into
the questionnaire to assess : (a) teacher attitudes about student mobility, (b) teacher
satisfaction with sources of information about newcomers, and (c) teacher perceptions of their
responsibility for the education of students who move. Using factor analysis, we examined how
teachers responded to the items and whether the relationships among their responses
supported the clustering of items into three separate scales. The analysis (a principle
component analysis) resulted in four orthogonal factors that accounted for 46% of the
variability in responses. While this analysis parHally supported the three-scale design, it
suggested that four scales, corresponding to the four factors, would provide a more valid
summary of teacher opinions.
Teacher Satisfaction and Benefits f
Eight items were designed originally to assess teacher attitudes toward student
mobility. The items reflect positive or negative opinions teachers had expressed at a school
5.1

serving a highly mobile population in a single-school, pilot study of student mobility (Lash &Kirkpatrick, in press). The eight items were:
Positive attitudes.
The variety of experiences brought to theclassroom by mobile students can be used as aresource for instruction.
New students provide me with ideas about 1-.ow other teachers do things.
Working with mobile students is exciting.
I am satisfied with my approach to worlemg with children who move.
Working with new students is no different from worl ing with students who started theyear in my class.
Negative attitudes.
I would ratFer not work with students who move.
Student mobility complicates the job of teaching
It is difficult to meet the needs of both a newcomer and the rest of the class at the sametime.
When teacher responses to the 23 items were factor analyzed, the items from theattitude scale clustered into two factors, as opposed to clustering together to form one bipolaropinion scale. The first three positive items formed a factor, along with one other item fromthe information scale (Table 5.1). Items in that factor describe benefits to working withindividuals who relocate and an appreciation for the contributions newcomers can make to aclass. The remaining five items formed a factor, along with two information items, that
described teacher satisfaction in working with students who move. High scores on this factorindicate mobility is not a problem and teachers are satisfied with their approaches to workingwith mobile students. Low scores on this factor are consistent with the opinion that mobilitycomplicates the job of teaching.
Responsibility for Educating Students Whp Move
Eight questionnaire items were written ti described teacher responsibility for aidingstudents in making the transition between instructional settings. The items varied the nature of
95.2

the transition: transferring between schools, transferring between classes within the same
school, or returning to a class after a lengthy absence. Also varied was the responsibility of the
teacher: to assess student abilities, to learn about the student's previous instruction, and to help
the student adjust to the new situation.
EgN_rn fitmlogihylkstence.
?fri2-L6-.C:satgl.; elk..When a student returns to my class from an absence of a month ormore, it is my responsibility to find out what instruction wasprovided the student, if any.
Adiustment: When a student is absent from my class for a month or more, Iam responsible for the student's adjustment upon reentry.
II. Transfer between classef insme_sthool.
Assessment: When a student transfers to my class from another class in theschool, it is my responsibiity to find out what the studentknows and is able to do.
Past Instruction: When a student transfers to my class from another class in thisschool, it is my responsibility to find out about the instructionprovided in the previous class.
Adiustment: When a student from my class transfers to another teacher'sclass in this school, 1 share responsibility for the student'sadjustment to the new class.
III. Transfer between schools.
Assessment: When a student from another school enrolls in my class, it is myresponsibility to find out what the student knows and is able todo.
Past Instruction: When a student from another school enrolls in my class, it is myresponsibility to find out about the curriculum and instructionprovided at the student's previous school.
Adjustment: When a student from my class transfers to another school, Ishare responsibility for the student's adjustment to the newclass.
A responribility scale, containing six of the eight items, was supix rted by the factor
analysis (Table 5.1). The resulting scale describes teacher responsibility for students in their
5.3

school. The two items that did not correlate with the responsibility factor, and thus were not
part of the resulting scale, described transfers between schools. Teachers did not perceive the
responsibility for a student's adjustment to a class in another school or the responsibility for
learning about the curriculum of another school to relate to the other six responsibilities. From
the teachers' perspective, however, the responsibility for assessing new students from other
schools was related to the responsibilities for transitions that occur within their school.
IrnRo_dance ofaudents' Educational Histories
Seven questionnaire items were constructed that describe opinions about the type of
information teachers receive about new students and information they need to assess student
learning needs. They were intended to form a scale about teacher satisfaction with informationsources
It is important to know if a new student's previous math instruction followed a basicskills approach or a problem-solving approach.
It is important for me to know if a new student's previous reading instruction followed awhole-language approach or a basic skills approach.
I by not to re2d a newcomer's cumulative folder.
It is not important for me to know about the curricular approach used ina new student'sprevious school.
The cumulative folder provides sufficient information for me to place newcomers in mycurriculunt
Most students can accurately describe what they have studied in a subject area.
Placement tests that accompany my textbooks provide the information I need to place astudent in the curriculum.
In the analysis of teacher responses, the first five items clustered together in a factoralong with the two items about teacher responsibility that did not correlate with the
responsibility factor. High scores on this factor indicate teacher interest in the educationalhistories of their students, including past curricula, the information contained in cumulative
folders, and student adjustment to future classes.
5.4

The two remaining items clustered with other factors, but there are no dear
explanations as to why this occurred. The item concerning the accuracy of students' self-
assessment loaded most strongly, and positively, with the factor that described teacher
satisfaction. Apparently teachers who are satisfied with their approaches to working with
mobile students also perceive student self-reports of previous instruction as accurate. The item
about placement tests loaded most strongly, and negatively, with the items that describe
benefits to working with mobile students. Teachers who report learning valuable information
from the new students in th: classes apparently do not believe they obtain sufficient
information about students from the tests provided by their textbooks.
$chool Characteristics and Resources
A second portion of the questionnaire contained 22 items grouped into three scales
designed to assess (a) the importance of student mobility to the faculty and administration of a
school, (b) the amount of sapport teachers perceived from their principals, and (c) the amount
of support they perceived from the parents of students who move. Again, teachers responded by
rating their level of agreement with the statements. A principal component analysis of these
data resulted in four orthogonal factors, accounting for 45% of the variability in responses.
Mobility As An Issue for the School
A ten-item scale was designed to assess how important student mobility was as an issue
for the faculty and administration at the school. The items stated opinions about student
mobility in the school, described faculties that worked together to solve problems created by
student mobility, and described school programs established to accommodate student mobility.
Strdent mobility in the school.
Anyone considering a teaching position at this school should be told how many of ourstudent- move during the school year.
Working with students who move is a key aspect of my job as d teacher.
Student mobility is not an issue at this mhool.
5.5

Faculties working together.
As a faculty, we share ideas about working with students who move.
As a faculty, we share books and materials in oider to meet the needs of children whomove.
It would be unusual for teachers at this school to talk about student mobility.
At faculty meetings we frequently discuss topics related to student mobility.
School programs.
Our school provides special orientation materials to newcomers and their parents.
Our school has established procedures to help teachers work with newcomers.
Our school has enough books and supplies to serve the students who enroll during theyear.
In the factor analysis of the 22 questionnaire items, not all of these ten items clustered
together to form a factor (Table 5.2). The first six items, however, formed a factor of their own.
The factor contained the three statements about student mobility at the school and :he first
three statements about the school faculty. The statement concerning faculty meetings and all
statements about school programs related more highly to other items than to this factor. The
measurement scale resulting from this analysis assessed teachers' perceptions of the importanceof student mobility to the teachers at the school. High scores indicated mobility was
important It was discussed among teachers and was a key aspect of their jobs as teachers.
School-Level Teaching Support
Six items were written to assess teachers views of how strongly principals respondec! to
student mobility. The first three statements describe situations in which principals allocatedresources to support teachers' work with mobile student, the fourth describes a task often
shared between principals and teachers, and the remaining two items concern the supervisoryrole of the principal:
The principal has identified student mobility as a tcpic for inservice training.
The principal has hired extra staff to help teachers work with students who ,nove.
5.6

The principal routinely visits my class to see how newcomers are adjusting.
I am able to influence the assigmnent of new students tomy class.
The way I work with new students is a factor in my performance evaluations.
The principal recogrizes that student mobility is an important factor affecting my job asa teacher.
The first four of these items formed a factor that also contained two of the items
originally written for the "issue" factor: (a) At faculty meetings we frequently discuss topics
related to student mobility, and (b) Our school has enough books and supplies to serve the
students who enroll during the year. It is important to note that all but the last item, concerning
books and supplies, related positively to this factor. Apparmtly, in schools where principalsprovide resources such as inservice training and extra staff to help teachers work with mobile
students, the amount of books and supplies are insufficient toserve the number of students who
enroll. It is interesting that the question about faculty meetings related more strongly to the
principal items than to the other items about faculty interactions. It may be that teachers
distinguished informal conversations among teachers from discussions that occurred at faculty
meetings, associating the latter with the principai who typically leads the meetings. Thefactor that resulted may be interpreted to measure perceptions of the amount of administrative
support for working with mobile populations that is provided by the school. Higher scoresindicate greater support.
Parent Support
The six questionnaire items designed to assess teacher perceptions of the supportprovided by parents to students who move were highly intercorrelated, and they formed a
factor of their own. High scores on this factor indicate teachers view parents as activeparticipants in the education of the mobile students.
Newt.3mers' parents tell me their children's strengths and weaknesses.
Newcomer's parents bring information to me from the previous school.
Before students move to another school, their parents ask me for information to take tothe teacher.
Parents of new students are willing to work with me to catch the student up to the class.
5.7

Parents accompany new students to my class on their first day.
Most parents of newcomers could do more to help their children adjust to a new school.
Specialized School Programs
A fourth factor resulted from the analysis of teacher responses. It contained three items
that originally were written for other scales but that did not correlate with those scales. Twohad been designed to assess the importance of mobtlity as an issue to the school; they were the
final two items describing school programs. One of these items defined this facton "Our schoolprovides special orientation materials to newcomers and their parents." The second item also
related moderately with the other factors: "Our school has established procedures to helpteachers work with newcomers." The third item that correlated more highly with this factorthan with others was: "The principal recognizes that student mobility is an important factor
affecting my job as a teacher." With only three items, this factor is not easily interpreted andfor that reason further analyses exclude this factor.
Comparison of Teacher Perceptions Among Four Types of Schools
Are teacher perceptions of student mobility related to the type of student populationserved by their schools? To address this question, teacher ratings on seven opinion scales were
examined. The seven scales were identified from factor analyses of teacher responses to 45
questionnaire items. Four scales assess teacher perceptions about working with mobile students,and the three others assess perceptions about school characteristics. Using analysis ofvariance, the scales were examined for effects of mobility typeagricultural, military, urban,or stableand effects for schools nested within type (Table 5.3). In this discussion, quotationsfrom teacher interviews are used to enhance the meaning of the survey results.
Teacher Perceptions About Working with Mobile Students
Teachers from all four populations held similar views about their responsibility foreducating the students in their schools. Differences existed between schools serving the samepopulation, however, indicating that teacher perceptions of responsibility may be influencedby school characteristics in addition to the type of mobile populaEon served.
5.8
iiiiiimmsmr.

The remaining three scales displayed systematic differences among the four types of
student mobility, but not between schools of the same type. Urban school teachers reported less
satisfaction with their experiences in teaching mobile students than did teachers in other types
of schools. One urban teacher from the interview sample explained mobility complicated her
job in this way:
It's easier to have kids throughout the whole year because you get to knowthem and they get to know you, so everybody knows where we are. [With] thenew student I have to go through that learning process again, and it's time-consuming ... It's not that I mind doing that. I like doing that, but when you getthe ball rolling and then students leave and some other students come in, youhave to go through that again ... It takes time away from something else.(UB6)
Teachers in urban schools also perceived less benefit to working with mobile students than did
teachers in other schools. Teachers in migrant and military schools had the highest ratings for
benefits of the teachers who responded to the questionnaire. In the interview sample, no
teachers from urban schools provided examples of positive impacts of student mobility, but
teachers in migrant and military schools did describe benefits.
Often students that move around have wonderful experiences from wherethey've lived, so you have a lot of cultural things they bring to the classroom.When we study about Japan or we study about Mexico, some of them will say,"Oh, I've been there." (MM1)
The students get to see people coming from different places ... It gives kids afeeling "oh, there are kids who move, "orlook, you've come from a differentplace," and we talk about where they come from. (AE1).
I think there's a friendship established. I get a kick out of these kids comingback and I'm sure a ?ot of the kids do too. You know, "Myra's back in town."There are some positive things here. You make some cultural things and,sometimes a kid comes in and they've already had the fractions and they'rethe whiz and ,hey're showing people how to do it. A lot of them brir 3 a good,positive attitude towards school (AE5)
On the third scale, the importance of the educational history of students, military
teachers' ratings were lower, indicating that a students' educafional history was less important
to them than to teachers at other types of schools. Because students from military families
travel and attend schools throughout the world, their teachers may feel they have fewer

opportunities or less reason to gather this information or to prepare students to move to other
schools.
Although some teachers in the questionnaire survey, particularly in military schools,
did not rate the educational history of students as important to them, teachers who were
interviewed did recognize that relocatio, disrupts the continuity of a student's education.
It fragments their education, because where I am in May may not be where theteacher they go to is in May. They may have catching up to do,or they may befar ahead and not stimulated in the time it takes for that other class to catchup. (AE1)
And sometimes too, there may be gaps. Maybe I've already covered verbs, forinstance, and adjectives by the time that a new studentcomes in, and theyhaven c had it, and so then they don't really get it in fourth grade. (MD4)
Since school districts don't ... necessarily use the same [reading] programs ... theconsistency isn't there for them. Especially if they move from a look-seeprogram to a phonetic-based program (PIM
It may be that teachers recognize a problem exists but, perhaps for practical reasons, they areunable to solve that problem or accept responsibility for finding a solution.
School Characteristics and Support
There were systematic differences among teachers from the four types of schools on the
three scales related to school characteristics and support. Reliable differences between schoolsof the same type existed also. Thus teacher opinions about school characteristics and supports
were related to the type of mobile population served and also to other school-level variables
not measured in this study.
Student mobility varied in importance as an issue in schools. As expected, mobility wasleast important in stable schools. Among the three mobile populations, teachers in urban
schools perceived mobility to be a greater issue than did teachers in migrant and militaryschools.
Urban school teachers reported the lowest levels of parent support, while teachers inmilitary schools reported the highest levels. This finding based on the questionnaire survey isconsistent with the interview data. Teachers in military schools reported they routinely

delegated to parents the task of tutoring or drilling students so that they could catch up with
the rest of the class. It was also the case that parents in the military learned relocation dates
several weeks in advance of their move, and thus they were able to inform teachers and request
information to take to the next school.
Administrative supports for teaching mobile students were rated highest by teachers in
migrant schools. This finding also is consistent with reports obtained in interviews. The
agricultural schools had special funds and programs designed specifically to help them teach
migrant students. Appleton had established a core program where migrant students worked
with a bilingual teacher for a portion of the day, and there were teacher aides from migrant
education programs in the classrooms of Elm School. None of the other schools had programs
sPecifically to assist teachers who worked with mobile students.
Summary of Teacher Perceptions
The analyses of teacher responses to the survey questionnaire indicated that it was
possible to measure teacher perceptions of student mobility, that teachers differed in their
perceptions, and that those differences related to the type of mobile population they taught.
Further, findings from the survey questionnaire generally were consistent with information
provided in teacher interviews.
The factor analyses supported the development of four opinion scales about working
with students who move and three scales about school characteristics. Of the four concerning
students, one scale assessed teachers' satisfaction in their work with mobile populations. High
scores indicated student mobility was not perceived as a problem by teachers. A second scale
summarized benefits to working with mobile students. High scores on this sca!ewere consistent
with the belief that newcomers brought valuable ideas and experiences to a class. A third
scale assessed teachers' views of their responsibility for instructing students in their schools.
Teachers who received high scores on this scale perceived thenselves as responsible for
assessing learning needs of new students, for learning about instruction students received while
away from their classes, and for helping students adjust to other classes in their schools. A
fourth scale measured teacher perceptions of the importance of the educational history of
newcomers. Teachers who scored high on this scale valued information obtained from and about
5.11

other schools, including information about a new student's previous instruction and information
about a former student's adjustment to a new class.
The three scales about school characteristics summarized teacher opinions of the
importance of student mobility as an issue in the schools and the level of support provided by
parents of movers and the school administration for working with mobile students. Teachers
scoring high on the issue scale reported that student mobility was an important characteristic
of their schools, and it was a topic discussed among the faculty. Highscores on the scale of
parent support indicated teachers viewed parents as active partners with teachers in the
education of students who move. Parents brought information about their children to teachers
and were willing to work with teachers to integrate new students into classes. Administative
supports, provided primarily by principals, comprised the final scale. Higher scores indicated
teachers perceived greater support.
There were two unexpected findings from the factor analyses, both of which resulted
from analysis of teacher opinions about working with mobile students. First, benefits to
working with mobile students did not correlate highly with the factor describing teacher
satisfaction. Instead, the items formed a second, orthogonal factor. This finding suggests that
teacher perceptions about the ease or difficulty of working with mobile students was not
related to beliefs about the worth of the experiences and information newcomers brought to
their classes. For some teachers there may have been few probletrs and few benefits to working
with mobile students. It is not inconsistent for teachers who were unsatisfied or who believed
mobility complicated their jobs to recognize benefits of working with mobile students.
The second unexpected result was the formation of a factor which we interpreted as the
importance teachers place on information about the educational histories of students. Thatfactor was unrelated to teacher perceptions of their responsibility for educating the students intheir schools. The level of responsibility teachers accepted for students enrolled in theirschools was not related to the interest they took in the pastor future education of those same
students, if the education occurred at other schools. There was a limit to teacher responsibility
that became clear on inspection 3f responses to the eight items in the original responsibility
scale. Figure 5.1 positions the items along a portion of the four-point rating scale at the
average rating given by the 166 teachers in the study. Standard errors for theaverage arenoted in the figure. Teachers reported significantly lower levels of responsibility for the
5.12

situations that might require them to gather information from sources outside their schools
than for situations that required information available in their schools. To a lesser extent,
classroom boundarieS litrdted teacher responsibility also. As compared with situations that
occurred in their classrooms, such as assessing students, teachers reported feeling less
responsibility for the situations that rnight require them to look outside their own classrooms,
such as learning about the instruction another teacher in the school provideda student.
There are important implications raised by the separation of teacher perceptions about
the importance of a student's educational history and about their own responsibility for
educating students in their schools. Even teachers who accepted a high degree of responsibility
for the students in their schools may not have accepted that the education of their students is a
process that spans a number of years and perhaps a number of schools. Teachers who did not
believe it was important to learn about the educational history of a student could not build on
that history in any systematic way. They limit their ow.., ability to help a student make
connections between material that was already learned and new information.
Teacher perceptions varied systematically with the type of student population they
taught. As expected, student mobility was not an important issue in schools serving stable
communities. Mobility was reported to be an important issue by teachers in urban schools, who
also reported the least amount of benefit from and satisfaction in working with students whomove. The opinions of the teachers in urban schools may be due to a perceived or actual lack of
support for their work with mobile students. Teachers in military schools reported high levels
of parent support, and teachers in agricultural schools high levels of administrative support.
Teachers in urban schools reported lower levels of support from both parents and whool
administration. Teacher perceptions of support were consistent with descriptions ofprograms
and practices that a smaller sample of teachers had provided in interviews.
8 05.13

Chapter 6: School Level Responses to Student Mobility
The primary focus of this study was on how teachers responded to sttdent mobility.
Since school level decisions establish the context or boundaries for classroom instructional and
management systems, it is important to understand the context within wi :ch teachers make
management and instructional decisions. Further, a knowledge of school level practices for
placing new students is necessary, because those practices might alter the effects of student
mobility in the classroom. This information was acquired in interviews with the principals at
the study schools.
Student mobility also serves as a practical dilemma confronted by principals in six of
the eight study schools. That context of mobility, and how principals understand the
educational needs it engenders, affects their decisionmaking. An underlying assumption is that
the goal for these principals is to act so as to best promote and sustain productive learning
outcomes for all the students in their schools, stable as well as mobile. Two questions guided our
thinking in this study of principals:
1. Are the strategies used by principals in mobile schools different from those of
principals in stable schools? e.g., how does student mobility affect the
decisions typically made by principals?
2. What commitments do principals make in order to provide services to students
who move vs. those who are stable? e.g., how does the principal organize her
world to provide education to all students?
Student Mobility and the Principal's lob
In order to first determine if principals believed that student mobility affected their
jobs, we asked four questions. Two of those questions focussed on the principal and two questions
required the principal to describe how mobility affected the students themselves.
principal Focus
Seven principals agreed that student mobility did affect their jobs (Table 6.1); even in
stable schools, principals said student mobility would make their jobs more difficult. The
6.1

single exception, the principal of a military school, said mobility didn't affect her job. She
then proceeded to describe the things she did that were a direct response to student mobility.
Principals from all four types of schools agreed that there were three areas in which student
mobility would make the job of principal more difficult: extra burdens in clerical and
administrative work, extra effort in getting to know students, and additional time required in
getting to know new families. Further, principals in the urban schools described the added task
of coordinating the services provided by outside social and welfare agencies. Principals in
agricultural schools said that curricular adjustments and finding money to support those
adjustments added to the complexity of their jobs. There was one principal, at a military-
school, who mentioned that student mobility was hard on the teachers.
When asked what advice should be provided a new principal in a school with lots of
student mobility, the responses of principals in mobile schools had more to do with personal
characteristics than with strategies for solving problems. Five principals, all from mobile
schools, said that new principals should be advised to have patience and flexibility. More
concrete suggestions included adjusting the curriculum, adjusting the staff, and adjusting
administrative routines (two mobile school principals for each suggestion). One urban school
principal suggested calling on someone with experience and learning from them.
Student Focus
Responses to questions about how mobility affected the education of students who did ordid not move appeared to vary by the degree of student mobility principals expetienced in their
own schools (Table 6.2). Principals in stable schools said that newcomers brought valuable
experiences to the stable students in their schools. One principal said mobility might be hard
on the mover, but the other thoug: ': moving enhanced a student's own education.
Principals in military schools said that moving had no impact on the stable students,
but admitted that they had very few students who had not moved. They both agreed that theproblems for movers related to a lack of continuity in their education, that they were requiredto make so many transitions among many different curricula.
One agricultural school principal said that moving was a problem for both the moversand the stable students. First, moving impacted the education of mobilestudents because they
.. nc . 4,,,
6.2

missed large blocks of time in school but still had to compete with students who tad been
enrolled for the entire year. For stable students, newcomers required that a teacher's attention
be taken away from them for a period of erne, impacting the pace of their learning.
One urban school principal felt "very badly about the mobility," while the other saw
movers as less likely to attend school immediately after moving, developing a poor attitude
toward school, and more likely to finally drop out of school. Both principals of urban schools
agreed that student mobility was disruptive in classrooms for movers and nonmovers alike,
focussing teacher attention toward newcomers for a day or two whi e the "other kids have to
usually be put on hold."
Student Mobility and Principal Decisionntaking
We categorized typical principal responsibilities into three broad areas:
1. Planning, including budgeting, staffing, materials, scheduling, and logistics.
2. Instructional Leadership, including school-wide corricular and management
programs, administradve support, and parent participation.
3. Supervision of Teacher Wm k, including resources, training and evaluation.
Eirl_gin
Data collection was organized around the planning dimension by asking principals how
student mobility affected their decisions about staff, budget, caleniar, and about tradeoffs they
made in their decisions. We were particularly interested in how principals accommodated
changing school populations in the decisiuns they were required to make. Since the decisions
principals make about providing services to students are constrained by state education code and
diatrict policy, we believed that this area of questioning would also provide clues about how
responsive schools could be to student mobility (Table 6.3).
Principals in schools with mobile student populations faced planning challenges that
were not evident in stable schools, primarily because needs were continually changing. The
issues raised by mobililty had effects on budgeting, staffing, materials, space, and the programs
6.3

aad services a school provided. Principals of schools with high student mobility had differing
strategies for resolving issues brought on by student mobility within the given constraints.
Budgeting. Decisions about budgets were problematic for principals in schools with lots
of student mobility for several reasons. First, the budget was generally prepared a year in
advance. Often line item allocations were based on student enrollment at a given point during
the previous school year or on an assumption of maximum enrollment.
We're given an allocation in our budget, and it goes according to the CBEDS, which isthe enrollment from the previous October. And then when I'm given that allocation,that's the money that I have to work with. So, since I had a hundred less students thisyear at this school, my budget was cut accordingly. (McArthur).
Second, specialized funding for particular needs was often controlled at the district
level, and authority for supervising and directing that work lay outside the school itself.
Within the school budget, the principal's authority to make tradeoff decisions occurred at thevery heart of the educational enterprise purchasing a copy machine rather than enrichment
programs, relinquishing a compensatory education teacher for a counselor, and searching for
ways to provide needed services free.
Staffing. Adequate staffing to the number of students served in schools with highstudent mobility was a big issue. Except in stable schools, principals were unable to determine
how many students needed to be sei ved at each grade level until they arrived. In the studyschools, hiring a new full-time teacher was a district responsibility. Principals typically had
to negotiate with the district for the number I" teachers needed based on an enroi3ment figure at
a given point in time. "I basically fight for the -.amblr of tea& -rs I have, and if the districtdecides that [it sees] our numbers differently than I do, they [at the district] decide"
(Ninth Street). In urban and agricultural schools, federal resources were available through
Chapter 1 and Migrant Education provisions to hire extra personnel to work with sps.cifically
designated children, whether they moved or not. At least in the case of migrant funding,
principals had no authority over their work, supervision, or evaluation, which wasaccomplished by a regional Office of Migrant Education.
Not only did dass sizes fluctuate during the year, but students who left were not alwaysreplaced by students at the same grade level. Principlls in mobile schools were continually
adjusting classes to distribute students evenly. For instance, classsizes in migrant schools were
6.4

set so that fall classes met district requirements. When migrant students left, class sizes fell to
around 20 students. When the migralts returned, some classes could get no new students and
others could get 20 new students. Moreover, because of their relatively isolated locations, there
were no other schools in the area that could enroll excess stuuents at a given grade level.
Principals at military and urban schools solved the problems created by an uneven distribution
of students by sending excess students to another school, by combining grade levels within
classes, or by moving students from one class to another during the yearas enrollments changed.
Classroom Materials. Shortages of classroom materials often occurred in schools that
served more students than there were seats. Principal strategies for resolving this issue
included providing teachers with their own budgets for consumables and allowing them to
purchase supplies as needed, having students reuse workbooks, and purchasing a copy machine
to make extra copies of workbooks. One principal commented, "Teachers understand if we have
a shortage of supplies. They're very good about it and very understanding." (McArthur)
The School Calendar. Another area where principals in schools with highly mobile
student populations made changes was in the school calendar. Generally, the district
determined the calendar for the entire school year, often in nertiation with the teacher union,
and, at least in the case of one agricultural school, tied to particular needs in the community.
However, two principals said they had successfully lobbied to have state testing scheduled for
a later part of the school year in their schools. 'We try to get ECTBS testing] done early in
May, before most of the kids start to leave." (Doolittle) 'Why would you test midyear at aschool like this? It just doesn't make sense. The later the better, till everybody's in and settled
and keeps coming in." (Broadway) At a school serving military students, the prindpal had toestablish a promotion date: if a student left the school before that date, she would not
recommend promotion to the next grade.
Space. Accommodating changing student populations was a problem only in
agricultural schools. Once urban and miiiry schools reached maximum enrollment at a given
grade, evess students were transferred to another xhool in the district. In the rural areasserved by the two agricultural schools, there were no other schools where excess numbers of
students could be sent. Principals in these two schools had strategies for metting space
demands, but confessed to the difficulty of meeting needs adequatity. "I have no control over
that. I'm allocated no funds for room, so wherever I can put those poor children, that is where
,S
6.'5. ")

they go. It's very difficult." (Appletoa). "Space is a real problem at this point. We don't
have a space left in the school. We've converted closets, we've converted bathrooms. There isno space left." (Elm).
5ummary. Student mobility did influence the planning decisions principkxis made, and
there were differences among principals about how that factor affected their decisions. Thenumber of ways that student mobility affected planning decisions was greater in agricultural
and urban schools than in military schools. There were also differences in the strategies that
principals used to confront issues raised by student mobility. Some principals solved planningproblems at a school level through educational progam choices or a flexible attitude toward
space. Other principals determined that the best place to solve problems related to student
mobility was in the classroom; they delegated authority for supply budgets to teachers andhired specialized personnel to help teachers as they worked with mobile students.
Instructional Leadership
Data collection was organized around the instructional leadership dimension by askingprincipals how student mobility affected their decisions and activities in the areas of
curriculum, administration, school rules and routines, and parent involvement. Since this is an
area where principals have a great deal of autonomy, we looked for consistent differer ..es in
the way stPdents who move were treated vis a vis their stable peers.
Curriculum. There appear to be no systematic differences in curricular decisions madeby principals in stable schools from those in schools with high student mobility (Table 6.4).Classroom teachers generally assessed new students' reading and math ability with support,particularly in urban schools, from reading specialists. Where they existed, instructional
programs that crossed classroom boundaries were put in place in order to provide moreindividual attention to students, not as a response to mobility Far se. Indeed, even when asked,
principals in schools with the highest student mobility had ambivalent opinions as towhether such programs made it easier or 'rare difficult for teachers to work with mobile
students: "I would like to believe it makes it easier. I don't know what th z. teachers would say.Basically they're the ones initiating this." (Broadway). "I don't know. I think they [thetea 2hers] think it makes it easier." (Ninth Street). In three schools with mobile students,including both military schools, principals said that mobility would not be a factor in the
6.6

decision to adopt a new curriculum. In one urban school, the principal said that the self-esteem
of the many low achievers in her school would be the most important element in selecting a new
curriculum. In another mobile school, the district selected the curriculum, and one principal of
an agricultural school was not asked.
Administration. With one exception, new students in the study schools were placed in
their classrooms the same day they registered (Table 6.5), though the number of reasons why
that wasn't always possible was greater in schools with mobile students:
It depends on when they get here. If they're here at 100, we ask them to wait unfil thenext day. If they're here first thing in the morning, yes, they are placed. But it alsodepends upon a number of things. We always check their heads for lice. If they havelice, they go home. If they don't have the information to enroll, we don't enroll them.(Ninth Street)
One urban s:hool had a policy of placing students in class the day following
reOtration, allowing teachers 24 hours to prepare. The other schools provided very little or
no notice to teachers of a new arrival. Nor was there any systematic difference in the basis used
to place students in classrooms: the majority of principals placed students where there were
empty seats at that grade level, balancing the student load per teacher. Where possible, they
also tried to balance classrooms by sex, behavior problems and/or special needs. Three schools
placed students according to their reading or ability level. This process differed from that u
to make up new classes in the fall, which genera'ly involved teachers in the decision. Again,
there were no systematic differences bAween stable and mobile schools.
$chool Routines. Stable schools did not provide a formal orientation intended to convey
school rules and routines to new students; half of the schools serving mobile students did (Table
6.6). In stable schools, information about rules and routines was generally provided directly to
the students, though newsletters were intended for parent consumption as well. Typically-
principals in schools serving mobile populations sought multiple avenues for informing and
orienting new students. All but one school se.-ving mobile students used handbooks to provide
informtion about school rules and routines, primarily for parents. In schools withmore
mobility, principals typically used separate strategies to get information to the parents and
their children, fn addition to newsletters and notices meant for both audiences.
6.7

Though all study schools had some sort of school-wide management system in place,
information about how it worked was conveyed to students differently in mobile and stableschools. In stable schools, that information was conveyed directly to the new student by
classroom buddies and either the office staff or the teacher. Classmates were not the primary
source of information about the management systems in mobile schools. In half of these schools,
a handbook described the system to both students and their parents. In half the mobile schools,there were regular, formal reviews of the rules, including assemblies conducted by theprincipal.
Parents and Transitions. A parent handbook, or parent/student handbook was providedto parents in seven of the study schools, including all of those serving mobile studentpopulations. Typically this handbook described school routines hours for class, special
programs and rules governing student behavior and homework. There were differencesthough, in how principals perceived parental support for their students. In stable and militaryschools, principals described parents as supportive either at home or as volunteers in the
classroom, or both. One nigitary school principal described parental support as "... thepreparation that they do before they get here." (McArthur). Another military schoolprincipal described a unique resource that helpedher provide services to students themilitary itself:
The dad's real mad because he was supposed to go remote to Korea for the year, andbecause there were lots of problems involved with this child, I called Major G whohappens to be the head of ... Family Services. And they called [the boy] in and Dad ...we called to make sure that [the boy] needed help right away. And so then the dad'sorders were canceled...and so what I do with that is, before I go to the SARB [StudentAttendance Review Board], I'll call the First Sergeant and say ... "This is the pattern,and we may have to go to SARB over it." And usually it doesn't happen again.(Doolittle).
Principals in migrant and urban schools described little direct contact with parents.Concerns about students were channeled to parents through a migrant liaison in one agriculturalschool.
They're out working in the fields most of them, and their person that they count .an is ...the migrant aide, paid for out of migrant funds, who's on our site. She visits the camp,she tells them what's going on, she meets with them, she does home visits, and she istheir person that they rely on for information. But we very rarely see them. They'rebusy all the time. (Appleton).
6.8

Principals in urban schools said that parents of mobile students did not help .....se the
transition of their children to a new school. Often, the school did not know a student was
leaving and so could not provide any materials that would ease the transition.
We ask that they let us know. I ask in newsletters and I ask in the parent handbook,that if they're going to leave, to let us know ... I ask again if they move during thesummer to please call us, but very often we're dealing with so many disconnects, even if Icall them during the summer I'll never find out because they're disconnected So wemay be saying a kid is unexcused in his absence for two weeks, and all of a sudden wefigure out they really moved. (Ninth Street).
To ease the transition when students leave for another school, most schools updated the
student's cumulative record so that it was ready when the new school requested it. Agricultural
and military schools did other things as well. Report cards, notes from teachers, transcripts
and current progress reports were often prepared, and military schools typically handed the
cumulative file over to the moving families to carry to the next school if it was abroad or out-
of-state.
summary. Though student mobility did not affect a principal's curricular decisions, it
did affect class assignment processes, and hence the makeup of classrooms. Administratively,
some principals used strategies to relieve teachers of some of the burden of integrating new
students into the classroom by providing assessment and orientation through the front office.
Typically, principals in schools with more mobility used more avenues to communicate
information to both students and parents than did stable schools. As in stable schools, parents
were a considerable resource to military school principaL. That was not so in agricultural and
urban schools.
Supervision of Teachers
The effects of student mobility are experienced in the classroom, challenging teachers
both instructionally and manar;erially. It is reasonable to assume that mobility would have an
impact on the decisions principals make in their supervision of teachers. Data collection was
organized around this dimension by asking principals about the skills needed by teachers to
work in mobile settings, whether those skills were formally evaluated, and how student
mobility affected principal decisions about the support and resources made available to
teachers.
6.9

Skills. The principals in all study schools agreed on the qualities possessed by a
teacher particularly effective in working with mobile students (Table 6.7). However, mobile
school principals evaluated teachers on specific skills that would best serve the students in
their schools. Five of the six principals at mobile schools described personal characteristics
possessed by successful teachers in those settings, including flexibility, an acceptance and
understanding of individual differences, patience, and a sense of caring. Other skills mentioned
by principals included diagnosing student learning needs, adjusting the curriculum
appropriately to individual needs, planning and organization, and a variety of teaching
techniques. Mobile school principals, particularly those in urban schools, emphasized that
highly skilled teachers were a priority for them. They explained that such teachers were able
to work successfully with an entire class, never knowing who was going to move. These
principals evaluated teachers primarily on technical skill in teaching, especially in schools
serving military populations, and diagnosis, particularly in the agricultural schools.
Resources. Five of the six principals in mobile schools found many ways to support
teachers as they worked with mobile students, despite constraints (Table 6.8). Principals in
schools serving mo:lile student populations were unable to provide teachers extra time for
planning because of district policy or union contracts. However, two did provide extra
preparation time for teachers, one thanks to lottery funding and the other by not convening
school meetings on district scheduled minimum days. Half the principals in mobile schools had
found inservice training programs that were useful for working with students who moved, and
supported their teachers in those programs. These included skills for integrating new students
provided in ESL training, teachers own "metacognition" gained as they evaluated themselves
teaching on videotape, and idea fairs on mofivation and methodology for working with highrisk children. Though all principals claimed they were a resource for teachers having
difficulty working with sfr-lents who moved, there were also specialized staff available to
help, including bilingual teachers, resource specialists, reading specialists, a psychologist, a
counselor and the grade team of which the te?er was a member. One principal cited 10
individuals or resources available to teachers in her school for help in working with mobilestudents.
5urnma. Student mobility did affect the decisions principals made as they
supervised teachers. Particular skills and techniques were valued, and opportunities were
6.10

provided for tea:hers to acquire them. Specialized permnnel were generally made available
to help teachers work with students who moved.
Discussion
In this study of eight principals, student mobility was a factor that affected the
decisions principals made as they structured school environments. Student mobility affected
long and short term planning, administrative processes, communication strategies, and the
support and supervision of teachers. Student mobility was not a factor in the curricular
decisions made by principals.
Though there were areas where principals had limited authority to respond, there
were differences in how principals structured school environments in schools with different
types of student mobility. Those differences might be reflected in the way that resources closest
at hand were used. For instance, military school principals were able to include parents as a
resource for teachers, even if pressure from military authorities was required, to help students
overcome the difficulties caused by changing curricula. Principals in urban and agricultural
schools did not rely on parents, but had access to grants, specialized funding and personnel, ane
could use those resources to help teachers work with students who moved. Other differences
might have to do with decisions about how to best meet individual student needs. For instance,
one principal regularly moved students from classroom to classroom in order to provide them
appropriately targeted instruction; another provided separate instruction for migrant students
during part of the school day.
The strategies used by these principals to accommodate changing school populations
were different in each school type. In planning decisions, principals in military schools sought
solutions to problems of student mobility primarily at the school level. Principals in
agricultural and urban schools sought solutions to planning problems at both the classroom and
the school level. Principals in agricultural and military schools tended to defer decisions about
curricular issues to classroom teachers, while urban school principals were most likely to seek
school level solutions. Urban school principals were more likely than those in other schools to
treat new student placement as a school /evel problem, rather than a classroom problem.
Principals in schools with student mobility were more likely to use multiple avenues of
communication to both students and families than were stable schools.
rg.ii

Principals recognized the extra effort student mobility requ:red of classroom teachers.
They reported that teachers were provided with resources, such as time, training and
specialized personnel, to help them with students who moved into their classrooms. If that
support was not readily available through district resources, principals searched for ways to
provide it, sometimes by way of volunteered services and sometimes at the expense of other
school priorities. Principals in schools with student mobility emphasized particular skills in
teacher evaluations rather than personal characteristics, especially in agricultural schools.
How responsive are schools to student mobility? In this study, it appears that the
response is limited. The reasons for this seem to lie outside the school itself, primarily with
the long term planning accomplished at the district level, and the constraints on principal
autonomy that came from funding formulae, lines of authority, and union negotiations.
Examples include a budget based on enrollment at a previous point in time or a maximum
enrollment for the school; staff litres based on district primities; staff supervised by another
authority; and union-negotiated preparation time.
When principals had developed ways to respond to issues raised by mobility, it was
generally at the expense of other students in the school, a tradeoff veral did not want made
common knowledge. Oilier principals simply said they could not plan for mobility and
operated their schools as though it did not occur. Their strategy was to plan for maximum
enrollment at all times:
We can't plan for what might be. We only plan for what we have right now. Andthat's basically how I plan. I look at what we have right now. I promote everybodyup, and I pray that they all come back. (Ninth Street).
Some patterns emerged in the different strategies principals used when confronting the
problem of student mobility. Examining the answers principals gave about decisions they
made, or the reasons for their decisions, we could see that some planned for mobility by
thinking of the number of seats in the school that were always filled with students, no matter
who those studcncs were. Others planned for the large number of individual students who
passed through the school during the year.
Principals who thought in terms of the number of seats in the school tended to took
toward school level solutions: planning, budget tradeoffs and calendar issues were confronted at
2
6.12

the school rather than class level, new students were placed in empty seats in ways that kctclass enrollments numerically even, and the school office was involved in conveying rules and
routines to new students.
So you still can't have more than that number [specified by the state] of students, so youonly have that amount of books, and you have that amount paper and pencils and whathave you ... Kids, the population in your classroom can change, but the desks will sfillbe 34, and the books will still be the same, and the paper will still be the same, becauseit's just ',different students]. (Doolittle).
Principals who thought in terms of the individual students who passed through the
school tended to provide teachers with the autonomy to make adjustments in the classroom:
classroom budgets allowed teachers to make tradeoffs as needed within each class, instruction
that crossed classroom boundaries was arranged by teachers and confined to grade level or
subject matter, new students were placed with some thought given to balancing the classroom
composition, and conveying school rules and routines was delegated to the teacher and other
students in the class.
We've put a tremendous amount of money into the copy machine. I mean, those thingsare astronomical. [It costs a great deal] to service the thing and to feed it, not countingpaper, just all the other stuff. And I think that's one of the areas we've put a lot ofmoney into because of mobility...Trying to duplicate materials rather than having, youknow st 20 pk.-es of a workbook used or something like that. (Elm).
Reviewers went back to the transcripts of the principal interviews and read them
through. Then reviewers rated the principals to whether they responded to student mobility
as if it were an issue of provkling services to individual students or to seats in classrooms. A 1-5
scale was used, where one represented an individual student approach and five represented a
seat approach. When we compared approaches across school types (Table 6.9), it was possible
to see a relationship between the type of student mobility and the degree of student or seat
focussed response to the dilemma. Principals in urban and agricultural schools were the most
seat focussed and principals in stable schools were the most student focussed. While this is not
conclusive, it suggests that student mobility might influence principal decisionmaking towardschool-level solutions.
6.13

Chapter 7: Discussion and Reownmendations
Students do move, and enough of them move frequently enough to present educators with
some important educational challenges in schools serving mobile populations, as much as 50%
of the student body is enrolled for less than a school year. Teachers and principals alike say
the effects of student mobility on their jobs are substantial. Who those students are and the
pattern of their educational needs have been examined only for the children of seasonal
agricultural workers.
The issues confronted by those who work with migrant students, documented by 20 years
of research, are no less salient for other students who move. As with migrants, students who
move cannot be provided education in a manner consistent with the convent;onal image of
schooling, at a single school site within a standard calendar. As with migrants, information
about the special needs of students who move and their educational histories is difficult to
obtain in time to help teachers address students' needs in a timely fashion. As with migrants,
the primary responsibility for meeting the needs of students who move lies in the dassroom
with the teacher.
However, unlike migrants, most students whc move do not have a protective arm of the
federal government overseeing their needs. Special programs and services are not available to
the majority of students who move. Teachers are not trained to understand the particular needs
of movers, or to work in classrooms where student mobility is high. Indeed, except for migrants,
there is very little acknowledgement that students do move except in the many schools and
classrooms all over the country affected by that mobility.
Patterns of Student Mobility
Teachers and principals in the study schools were generally knowledgeable about
student mobility in their own schools throughout the academic year. That knowledge did not
come, nor was it conveyed by, the indices used by the district and the state to compute student
transiency. Rather, that knowledge came from an understanding of the cycle of student
movement over time, its rhythms through the year and the factors that caused mobility among
the students and families served by the schools.
7.1

In this study, we documented those patterns of student movement throughout the school
year. The dearest pattern was in schools serving students whose families were migrant
agricultural workers. The students were enrolled for a predictable amount of time in the fall
and then withdrew. At a predictable time in the spring, many of those who had withdrawn re-
enrolled, along with some new students, and remained until the end of the school year.
In military, urban and stable schools, enrollment change occurred most often near thetime of major school holidays Christmas or spring breaks; new enrollments were somewhat
delayed after the new year in stable schools to coincide with the new semester that begins in
late January. The major difference among these three types of schools was the volume of
students who enrolled and withdrew. More students moved in urban schools than in the other
two types. Student mobility in urban communities was also greater than mobility in
agricultural communities.
Teachers in military, urban and stable communities agreed that individualistic moves
throughout the year, like what they had in their own classrooms, were the most disruptive to
the educational process. Teachers in agricultural school: agreed with their colleagues in otherschools that the many individual mow-- throughout the year would make instructional
planning most difficult more so than the agricultural pattern. Teachers in all types of schools
reported either that their training prepared them to teach in classes where moves occurred
only between semesters, a pattern that they believed was not disruptive, or that they were
trained to teach in classes where moves were individualistic.
This study of student mobility in different school types has three implications for
educators. First, there are student mobility patterns other than the migrantpattern. If school-level personnel can document a pattern to moves, they can relate that pattern to instructionalplanning.
Second, the volume of students who move is different at different schools. The greaterthe number of students who move during the year, the less opportunity there may be for
teachers to understand and meet individual learning needs. Further, the more moves that occur,the less time students are enrolled. Knowing how many students are served throughout the
year, and the average amount of time those students spend at a school, would provide better
7.2

information about the simple need for things like supplies, texts, and furniture. It would also
provide principals with the information they need to determine and justify extra staffing
needs, training recommendations, and administrative change.
Finally; teachers are not prepared to teach classes that change composition frequently
and continuously throughout the year. Except for teachers in agricultural schools, teachers in
schools serving mobile populati' ts had no training for teaching in thne special communities.
Nevertheless teachers from all school types agreed that this type of movement would disrupt
education of movers and non-movers alike was and was most difficult to plan for
instructionally.
Recomm2nclations
School-level personnel, perhaps the principal, should examine and graph the mobility
patterns of their schools during the school year. This documentation would serve several
purPoses.
1. A graphed mobility pattern would validate teachi: and prindpal perceptions
of the student mobility at their schools, and eliminate misconceptions.
2. The duration of student enrollment in schools should be calculated and
compared with the pattern.
3. By comparing the enrollment and withdrawal patterns, and the duration of
enrollment with other school events, such as testing, principals and teachers
will have better information to make administrafive, instructional and
planning decisions. Some study principals had lobbied to change state testing
dates, but there are other areas that could be examined as well. Curricular
questions, such as "Which among a group of texts is most suited to the
enrollment pattern?" or "Is it smart to have a curriculum remarkably different
from other schools in the area if student mobility is great?" might be asked.
Choices among various inservice training programs might be dearer with this
information. Such a picture of enrollment is also a powerful tool for prindpals
to use to demonstrate to district personnel and the school board the specific
needs of a particular sthool population.

A Classroom Perspective on Teaching Students Who Move
With the exception of teachers in agricultural schools, not more than half the teachers
in mobile schools considered mobility in their curricular and instructional planning. Teachers
said they did not plan because student movement was unpredictable and the needs of h Aividual
students were unknown before their enrollment. Nor did teachers have particular strategies
that were developed specifically for worldng with students who moved.
Teachers had developed some ways to ease the transitions of new students into their
classrooms. Teachers in mobile schools placed newcomers in small heterogeneous groups
specifically to foster interaction among students. This method served two purposes. First,
students already in the group were assigned to help the new student learn class routines and
complete tasks. Second, mixed ability groups allowed teachers to continu: to move the entire
class through a single curriculum together.
Teachers relied heavily on students throughout the transition process. Teachers
obtained information about educational needs from the newcomers themselves. Teachers asked
newcomers directly about their previous education. Information from parents, previous
teachers, and official school records rarely was available and teachers did not seek it out.
Further, many teachers delegated to other students in their classes the job of orienting new
students to the classroom rules and routines. Newcomers often had to learn about the curricula
and teacher expectations on their own.
Though a substantial percentage of teachers said they would tailor their strategies for
teaching newcomers if they had information about students' previous curricula, it was rare for
teachers to seek such information. In general, teachers felt that what students had learned
elsewhere and how they learned it could be accommodated by their own instructional methods.
Indeed, even when asked, about half of the teachers would make no changes in their curricular
approaches to students with different educational histories.
Teachers were able to identify many factors that affected how successfully newcomers
made the transition into their classrooms. However, most of those factors pertained to the
students, and did not involve actions or adaptations that teachers could make. Teachers
typically evaluated newcomers' transition into the class by their social adjustment, and they
7.4

reported that 1ewcomers' personalities and attitudes were the primary factors affecting their
transition.
This study of how teachers cope with student mobility in the classroom has several
implications. Teacher training programs are not providing teachers with the skills to work
successfully with students who move. There are two areas in particular on which to focus.
Teachers whose students continually change need outstanding organizational skills. These
skills can be simple and practical, such as having folders of previous assignments ready in
anticipation of new enrollments and rationing school supplies. More complex organizational
skills might involve long term curricular planning in anticipation of high and low enrollment
periods or fall-back plans for student assessment In other organizations, individuals who
supervise the work of 30-50 people coming and going in the space of nine months would be
expected to have explicit and elaborate preparations to orient the new workers. Lacking these
organizational skills, teachers must either invent them individually, or admit defeat in
planning.
A second area in which teacher training programs could better prepare teachers to work
with students who move is that of diag.losing learning needs. Teachers need to thoroughly
understand their own curricula. They must be knowledgeable about the subject matter, use
appropriate methods for conveying the information, be prepared to answer typical questions,
and able to pace learning adequately for the students in a classroom. In order to properly assess
a newcomer's learning and place that student appropriately, teachers must also understand
different curricula and alternative teaching methods as thoroughly as their own. Without the
scope of such knowledge, teachers risk overlooking learning gaps, misdiagnosis of special
learning needs, and loss of additional learning time for a student who has already lost learning
time to a move. This is particularly true when student assessment is based almost entirely on a
student's completion of current class assignments.
It is unclear who is responsible for a student's complete education. Teachers do not
assume responsibility for the education a student has had before enrollment in the class, or
after the student leaves. Information about a studenes learning elsewhere is not usually
available to teachers in time to help with academic assessment and placement. For migrant
students, this problem was addressed by a computerized record transfer system established and
operated by the Office of Migrant Education. Unfortunately, it too is delayed in providing
C87.5

teachers with relevant information (Applied Systems Institute, 1988). Traditionally, theschool assumed responsibility fcr the completeness of a student's education across grades in a
single school. However, that responsibility ended when the student left one school and went to
another, except through the formality of transferring official records.
The only other place where that responsibility could reside is with the studentsthemselves, and their families. Military schools give families the official cumulative file to
convey to out-of-state schools and when teachers ask students or their parents directly abouttheir educational histories, they are tacitly assuming that that is where the responsibilitylies. However, it is not clear that students or their families are aware that they must oversea
the educational flow over time, keep track of what has and has not been learned, be aware ofand conversant about learning problems, and able to describe what instructional methods are
most effective. Most likely, that responsibility has fallen between the cracks and there is noauthority concerned with or responsible for the completeness of a given student's education.
Recornmendations.
1. Class size, or the maximum number of students to be enrolled in a classroom at a
single point in time, is not a useful figure to indicate a teacher's workload
during the year, particularly in schools with high levels of student mobility.
A more realistic figure to represent the amount of preparation time a teacher
needs, the case load of students who must be served, andany added stress would
be the number of students who pass through the classroom in a given year.
2. Teacher training programs should re-examine the skills needed by teachers in
classrooms, particularly those with high levels of student mobility. Specificskills particularly effective in such classes should be part of the training
program for all teachers, not just to those who will be teaching inmigrantprograms. Specifically, organizational and diagnostic skills are described byteachers and principals alike as essential.
3. Educators could make a priority of developing a common language about
learning that would be used k lents and teachers alike. References to textscould be by the publisher or title, rather than the generic "reading book"
7.6

reference. Students should be able to say whether they have experienced a
problem-solving approach to mathematics instruction, and how much success
they had with it. Such information would be more helpful to teachers than
what color the reading book was. It would lead to more accurate assessment of
where the student is in a given curriculum, and lessen the likelihood of
misdiagnosis and inappropriate placement.
4. Policymakers may need to address the question of where the responsibility for
a comprehensive view of a child's education lies. The federal government has
assumed that responsibility for migrant stedents only.
Teacher Perceptions of Student Mobility
Student mobility was an issue in schools that served mobile populations. Teachers
reported that they discussed student mobility among themselves, shared ideas for solving
common problems they faced, and believed it was an important identifying characteristic of
their schools. Nevertheless there were differences in the satisfaction teachers felt working in
these schools, in the support that they perceived from parents and the school administration,
and the benefits they enjoyed from working with students who move. Those differences related
to the type of mobile population they served.
Teachers in urban schools were the least satisfied and reported the fewest benefits of
working with students who move. Among schools serving mobile populations, urban school
teachers perceived the least support. Teachers in military schools believed they could turn to
parents as a resource in educating mobile students, and teachers in agricultural schools could
turn to special programs in their schools. Teachers in military and agricultural schools also
perceived benefits to working with students who move. It is reasonable to expect that the
perceived lack of support for teachers in urban schools contributed to their dissatisfaction. Also
teachers in urban schools experienced the most amount of student movement. The obvious
implication is that teachers in urban schools suffer most from student mobility.
Recommendation
Like migrant students, all students who move present challenges to teachers. In the
absence of school or parental support, those challenges can be overwhelming. Urban educators
1 0 07.7

might consider the models from migrant education programs in designing supports for urbanschool teachers.
Erindpak and Student Mobility
Not only does student mobility affect the lives of teachers and students daily, it affectsthe principal as well. Though the principal is responsible for setting school level policies and
implementing district, state and federal policies, that responsibility is highly constrained by
competing authorities, calendars dictated by other concerns, and the resources available. To
promote and sustain productive learning outcomes for movers and non-movers alike requires
principals to push the boundaries of their authority, bend resources to different purposes, and beaggressively imaginative in finding ways to meet clear but untargeted needs.
Principals are the key source of information about the school for the teachers, for otherlevels in the school system, and for the communities they serve. Describing student mobility byusing an index computed at a single point in time does not convey the educational complexity
resulfing from student mobility. Easily documented statements such as, "Typically, each
teacher in the school is responsible for the education of 40 students per year, even though there
are only 30 seats in the class", or "A quarter of the students in this school enroll for less thanhalf the academic year", are far more descriptive and effective in conveying how studentmobility can affect classroom processes.
Principals am in a unique position to make those statements and be heard. Theliterature on student mobility is generally confined to discussions of migrant students. It is not inthe mainstream of thinking about classroom processes, the job of teaching, or impacts onlearning. District personnel would have no reason to understand the classroom implications of
student mobility unless they can be made to imagine what it would be like to work in an
environment where such change continually occumed. In addition to district staff, with whomprincipals plan budgets and calendars, the school beard comprised of citizens who set school
policy should understand the impacts of student mobility. Finally, teachers also need to knowwhat the picture of mobility is like in the whole school in order to understand how similar ordifferent their own classes are.
101.
7.8

Without that information, it will continue to be difficult for principals to lobby for the
resources they need to serve the students who enroll in and then leave their schools. Those
needs can be straightforward, like changing the date for state testing so it will not coincide
with periods of high enrollments or withdrawals. More annplicated needs might involve extra
staff counselors or social workers located on site to help students and their families make the
transition more smoothly, or a different time line to make decisions about staffing and space
allocafions. Such actions could expand the choices available to principals as they seek to
improve their schools' overall effectiveness in meeting a specific population's needs.
Principals supervise teachers. Nevertheless, principals in mobile schools were not very
specific about the skills teachers needed in order to confront the classroom complexity presented
by students coming and going continually. Though they did not describe them as wade skills,
most of the principals in mobile schools reported that they did evaluate teachers on their
teaching methods and how well they could diagnose student learning needs; only one evaluated
teachers on their knowledge of the curriculum, and another on organiutional and planning
skills. That evaluafion that rewards skilled teachers and highlights areas for improvement
occurs in the absence of a clear idea of what skills are best suited for the environment.
Principals are also responsible for selecting new teachers. An explicit understanding of the
skills that are best suited for working with mobile student populations would allow principals
to hire in a more directed manner, building a faculty focussed on the unique needs of the students
in that school. In turn, that value for serving mobile students is likely to '5e reflected in the
school climate.
It is reasonable that, since teachers must struggle to find ways to work successfully with
high numbers of mobile students, principals hesitate to be terribly critical. Yet, the pooled
knowledge of teachers and principals would be useful within their own schools, and shared
with the teacher training programs that typically -supply new teachers for the area, lead to
improved service for the students in that school.
Finally, this study demonstrates how one practical dilemma, student mobility, affects
the decisions principals make in order to achieve particular goals. The decisions typkally
made in all schools before the school year begins are made by principals in schools with lots of
student mobility throughout the school year as w-1. The information used to make decisions
10 27.9

during the year is likely to be different from the process used before students enroll. A single
case we studied is the assignment of students to classes. Though the planning of classes prior to
the start of school was accomplished with teachers involved and influenced by the needs of the
students themselves, those considerations and the time spent on them could not support
dedsion-making once school started. In this instance, principals used different processes to
make similar decisions at different points in the year. It may also be true for other kinds of
decisions. Those who seek to improve principal training might look for other critical issues
that confront principals who work with highly mobile student populations to better understand
how these factors affect daily decisions.
Recommendations
There are three recommendations that come from this discussion:
1. The skills needed by teachers to work successfully in classrooms of continually
changing students should be clarified. Principals can help in that task by
virtue of their position as evaluators of teachers in their schools. Educators
from local teacher training programs can be enlisted to help, thereby providing
feedback to the kind of teacher a given school seeks to hire.
2. Districts that have some schools with highly mobile student populations
might consider a different formula for allocating funds made so far in advance
of student enrollments. That allocation might be based on the number of
students served by the school in a single year, or a time trend showing how
enrollments change during the year, rather than the average daily attendance.
3. In retdons where students typically move from one school to another withina
geogrdphic area, it might be useful for a single authority to coordinate
administrative and curricular policies. For instance, a county office of
education could facilitate the curricular alignment between districts that share
many students.
7.10

Summau
A basic assumption of most of the research on classroom instruction and management is
that classrooms are stable over the school year. We believe that this assumption of stability is
inappropriate for many schools. The magnitude of student movement documented in this study,
and its potential impact on students, teachers, classrooms and schools argue that student
mobility deserves more attention from educators and policymakers alike. We believe that
examining patterns of student mobility will enlighten the issues that all educators must
confront. We believe also, that by examining how educators respond to different types of
student mobility, we will learn more about meeting the needs of all students, movers and non-
movers alike.
In this study, two types of informants, teachers and principals, provided information
about student mobility and its impacts on classrooms, teachers, and schools. However, one
important informant group has not provided insight to this discussion students. Neither
students who move nor those who do not move have described how mobility affects their
education, whether or not it is a hardship, and what in their views might ameliorate any
undesirable impacts. Another group of individuals who have not contributed to this discussion
is the parents of students who move and who don't move. These are promising areas for future
research.
i1rt 11
i 1 q
7.11

References
Applied Systems Institute, Inc. (1988). Synthesis of available research and databases on the
migrant education program: Volume II. The migant student record transfer system.
Washington, D.C.: Author.
Barnett, B.G. (1985). Peer-assisted leadership: Using research to improve practice. UrbanReview, 1Z, 47-64.
Barr, R. and Dreeben, R. (1983). How Schools Work. Chicago: University of Chicago Press.
Bayer, A. E. (1982). A school transfer typology: Implicationsior new theory revised research
delioansLmfs2oked_Kholmlicylacbgackg. Paper presented at the annual meeting
of the American Educational Research Association, New York.
Beckerman, T. and Good, T. (1981). The classroom ratio of high and low aptitude students andits effects on achievement. American Educational Research Iournal, a 317-328.
Bossert, S. T., Dwyer, D. C., Rowan, B., and Lee, G. V. (1982). The instructional mahagementrole of the principal. Educatitmal Administration Ouarterly, la, (3), 34-64.
Bridges, E. M. (1982). Research on the school administrator: The state of the art, 1967-1980.
Educational A Ingini_s_tatu_(Ngter_lx,1 IL 12-33.
Brophy, J. and Good, T. L. (1986). Teacher behavior and student achievement. In Wittrock, M.
C. (Ed.), Handbook of Research on Teaching. New York: Macmillan Publishing Co.,328-375.
California Assessment Program (1987). Grade three summary [machine-readable data file].
Sacramento: California State Department of Education.
Cameron, B (1981). Comprehensive summary: Study of tbilagAittlg_u_a_ni anteducation
program. (Report No. RTI/1235/46-54 F). Research Triangle Park, North Carolina:Center for Educational Research and Evaluation, Research Triangle Institute.

Comilla, T. A., Bayer, A. E., and Smyth, C. K. (1983). Schools and newcomers: A nationalsurvey of innovative programs. J'ersonrtel apd Guidance Journal, 621 229-236.
Doyle, W. (1986). Classroom organization and management. In Wittrock, M. C. (Ed.),Handbook of Research on Teaching. New York: Macmillan Publishing Co., 392-431.
Dwyer, D. C., Lee, G. V., Rowan, B. andBossert, S. T. (1982). The principal's role in
instructional management Five participant observation studies of principals in action.San Francisco: Far West Laboratory.
Evanson, C. M., Emrner, E. T., Clements, B. S., Sanford, J. P., and Worsham, M. E. (1984).
Classroom management for elementary teachers. Englewood Cliffs, NJ: Prentice-Hall,Inc.
Exotech Systems, Inc. (1974). E .1u . .n .f th a .1 E EA Titl I r. ams for migrantchildren of migrant agricultural workers. Volume I: Executive summary. Falls Church,VA: Author.
Firesbne, W. A. and Wilson, B. L. (1985). Using bureaucratic and cultural linkages to improveinstruction: The principal's contribution. Educational Administration Quarterly, 21,(2), 7-30.
Hall, G. E., Hord, S. M., Huling, L. L., Rutherford, W. L. and Stiegelbauer, S. M. (1983).J..eadership variables associated with successful school improvement. Paper presentedat the annual meeting, American Educational Research Association, Montreal.
Harrington, S. (Nov./Dec. 1987). Children of the road. Instructor, 36-39.
Johnson, D. M. (1987). The organization of instruction in migrant education: Assistance forchildren and youth at risk. TESOL Quarterly, , ( 3 ) , 437-459.
Lash, A. A. and Kirkpatrick, S. L. (in press). A classroom perspective on student mobility.Elementary School Journal.
R.2

Marks, E. L. (1987). Case studies of the migrant education program. Washington, D.C.: Policy
Studies Associates, Inc. for the US. Department of Educ lion.
Monk, D. H. (1987). Assigning elementary pupils to their teachers. The Elementarlool
journal, fg, 167-187.
Nance, A. D. (1%1). Migrant education in California schools. Sacramento: California State
Department of Education.
Office of Inspector General, Office of Audit (1987). gbanggIneesJed in allocating migrant
education program funds (Audit Control No. 0940004). Washington, D.C.: U.S.
Department of Education.
Trotter, R. T. (April, 1988). An ethnographic study of migrant farmworker educational
opportunities. Paper presented at the annual meeting of the American Educational
Research Association, New Orleans, LA.
U.S. Department of Commerce (1987). Geographic mobility: 1985. (Current Population Reports,
Series P20, No. 420). Washington, D.C.: US. Government Printing Office.

APPENDIX
1.
1

Teacher Interview
Fall
School Teacher
Tape Interviewer Date
In this first interview I would like to learn about the class and curriculum you are working with
this year.
1. What grade level are you teaching?
The Beginning of the School Year
I'm interested in knowing how you get to know your students at the beginning of the school year.
1. How soon before school starts do you know who is in your class?
2. What would you like to know about your class BEFORE school begins?
Prube: What questions do you have about your students?
3. How do you get the information you want?
4. There are a number of ways to get information about students that may be useful for ylannim
instruction. I'm going to read a list of 4. At the beginning of the year do you
look at the cumulative files?
talk to their previous teachers?
interview students?
talk with students' families?
5. Is there any other information you use in order to plan instruction?
6. Do you examine this information to understand the general trend in your class or to get
specific information about individual students?
class as a whole inidividuals
7. How does that type of information help you?
Probe: Why do you need information about the general trend or individuals?
8. How long before you understand your students' instructional needs?
9. At the beginning of the school year how do you orient students to the physical layout of the
school? (e.g., bathrooms)

Reading Instruction
T.-...1. next set of questions asks about reading instruction.
1. ihat are the main features of your reading program?
2. Does your program emphasize development of basic skills or comprehension?
basic skills = decoding, phonics, basal readers
comprehension = whole-language approach, literature-based
both
3. Is this program used throughout the school?
If no, which other teachers use it?
4. At the beginning of the year, what do you tell students about the reading program and theapproach that it takes?
5. Does it matter if a student's previous reading instruction followed a program different fromyours?
If yes, in what way?
If no, why?
6. Do you use a rPading series?
If yes, which one?
Do you supplement the series with any other inaterials?
If yes, for what purpose? remedial enrichment other emphasis7. Is your reading instruction primarily whole-class small-group
individualized instructionIF WHOLE CLASS:
1. What are your reasons for using whole class instruction for reading?
2. At the start of the year, how do you decide where to begin in your reading program?
Probe: How do you assess students' reading levels and match them to thecurriculum?
IF SMALL GROUP:
1. On what basis do you group students at the beginning of the year?
by reading ability
other ability_other:
If by ability, how do you determine ability?
2. What are your reasons for using small group instruction?
IF INDIVIDUALIZED:
1. What are your reasons for using individualized instruction?
A-2

2. At the start of the year, how do you decide where a student should begin in the
program?
8. Please describe a typical reading lesson for your class. ( If small group, what do others do?)
Probe: What is the first activity in your reading period? Then what?
9. To your lolowledge, is this type of lesson typical of other teachers' reading instrucfion?
Yes Probably Yes
No Probably No
Don't know
If No or Probably No, in what way is it different?
10. Suppose while reading aloud to you a student subsfitutes a word with another that is
appropriate in the context of the story. What do you do?
11. When you ask students to read aloud, do you tell them what you hope to learn?
[What type of errors are teachers seeking
Math Instruction
Now I have a similar set of questions about your Math instruction.
1. What are the main features of your Math program?
2. Does your program emphasize development of basic skills or arithmetic concepts?
basic skills = computation
concepts = knowing fraction as part of whole/base 10/place values/
set theory
both
3. Is this program used throughout the school?
If no, what other teachers used it?
4. At the beginning of the year, what do you tell students about the math program and the
approach that it takes?
5. Does it matter if a student's previous Math instruction followed a program different from
yours?
If yes, in what way?
If no, why?
6. Do you use a Math textbook?
If yes, which one?
Do you supplement the text with any other materials?
If yes, for what purpose? remedial enrichment
other emphasis7. Is your Math instruction primarily
whole-class small-group individualized instruction
AV1 I

IF WHOLE CLASS:
1. What are your reasons for using whole-class instruction for Math?
2. At the start of the year, how doyou decide where to begin in your Math program?
Probe: How do you assess students Math levels and match them to thecurriculum?
IF SMALL GROUP:
1. On what basis do you group students at the beginning of theyear?
by Math ability
other ability
otherIf by ability, how do you detmnine ability?
2. What are your reasons for using small group instruction?IF INDIVIDUALIZED:
1. What are your reasons for using individualized instruction?
2. At the start If the year, how do you decide where a student should begin in theprogram?
8. Please describe a typical Math lesson for your class
Probe: What is the first activity in your Math period? Then what?9. To your knowledge, is this type of lesson typical of other teachers' Math instruction?
Yes Probably Yes
No Probably No
Don't Know
If No, or Probably No, in what way is it different?
10. Suppose when solving a story or word problem a student =Iles a computation error thatleads to an incorrect answer. However, you can tell from the student's work that his reasoningis sound. What do you do?
11. When you give a math assignment doyou tell students what you will look for when youcorrect it?
Talking in Class
Now Fa like to focus on a specific type of student behaviorstudents talking in Lhe classroom.I. In your class, when may a student talk with other students?
Probe: When can't they talk with other students?
2. When may a student makea contribution to a lesson?
Probe: Can they make unsolicited contributions?
3. What rules govern HOW they make that contribution?
A-4

; -
4. To whom should a student turn first for help in your class?
If "it depends", on what does it depend? (based on answer, ask #4 for specifics)
5. How do you teach students the rules for talking in your class?
Probe: How do students learn the rules?
Seat Assignments
I have three questions to ask about how students are organized in your classroom.
1. How do you determine seat assignments in this class?
2. How do you assign seats on the first day of school?
3. Are students arranged in different groups in different parts of the day?
If yes, how do they know where and when to go?
Classroom Rules & Routines
Next I'm going to ask about your classroom rules and routines.
1. Most classes have rules for student behavior. Please describe 2 or 3 rules from your class.
2. Who determined the rules for behavior in your class? Teacher Student Both
3. There are a number of ways teachers could present rules to students at the start of the school
year. I'm going to read a list of 5 methods. Tell me, at the start of the year did you:
post the rules in the room?
tell the students the list of rules?
give each student a handout listing the rules?
give an assignment about rules?
have a class discussion about rules?
4. Did you use any other method to present rules?
If yes, what was that?
5. Did you determine some rules before the start of school?
If yes, do those rules still hold?
6. Do you review class rules during the year?
If yes, when?
7. Do you develop new rules during the year?
8. Are the rules in your class typical of the kinds of rules found in other classrooms?
If no, how do they differ? (Please give an example)
9. For routine administrative tasks, such as turrdng in assignments, teachers often develop
procedures for students to follow. Do you have such procedures? If no, go to #10.
9A. Of the procedures you have in place now, were the majority determined
before the start of school?
9B. Are your procedures typical of the kinds found in other classes?
If no, how do they differ (please give an example)
' A-5

9C. I'm going to read a list of methods teachers could use to establish classroom
procedures. Tell me, have you:
explained the procedure to students?
posted instructions for the procedure in the room?
given students a handout that describes the procedures?
practiced the procedures with the class?
reminded students who forget to follow the procedures?
9D. Did you use any other method to establish procedures?
If yes, what was it?
10. How long after the start of the school year is it before your class is functioning the way you
want it to be? Please provide a time estimatein units of hours, days, weeks,or months.Student Mobility
Now, I would like you to describe the amount of student turnover that you expect will occur inyour class.
1. Estimate the number of students this year who will enroll in your class after the end ofSeptember.
2. When are they most likely to enroll?
3. About what percentage of the students enrolled before October will remain until June?
4. If they leave before June, when will they leave?
Teaching Experience
The final set of questions is about your teaching experience.
1. How long have you been teaching?
2. How long have you taught in this school?
3. What degrees do you hold?
4. What teaching or administrative credentials do you hold?
1 '; Z7.A-6

Teacher Interview
Spring
School Teacher
Tape Interviewer Date
The first iime you were interviewed for this study you described how you organized your class
at the start of the school year. During this interview I would like to talk with you about
working with students who change schools during the school year.
Pattern
In your experience at this school, is there a systematic pattern to the times new students enroll
and others withdraw? For example, is there more change in the Spring than in the Fall?
If Yes, what is the pattern?
If No, we'll call that a random pattern.
Has this year differed markedly from other years?
If Yes, in what ways?
FOR AGRICULTURAL ONLY:
I understand that at this school there are some students who leave the school in October and
then they return in May.
1. Is that the main pattern of enrollment changes that occurred in your class?
If No, what other pattern did you have?
2. Of the students who enroll in May, were most with you in the Fall?
3. Do they attend school between October and May? Where?
Planning
I'd like to learn how teachers plan instruction when their pattern of enrollment is like theone
you have.
1. At the start of the year, when you're designing your curriculum and the way you will
organize your class, how do you plan for the fact that students will be enrolling and
withdrawing (throughout the year) (as they do)?
2. What methods of teaching and organizing students for instruction work best foryou given
that some students are not here for all of the year?

3. Are there teaching methods and classroom organizations that do not work well for this
pattern?
Probe: Are there methods you recommend others not try?
4. In what ways does the enrollment pattern iruluence your decisions about what topics to teach
or when to teach them?
Probe: How do you take the pattern into account when you decide on the sequence or
schedule of topics? (Get an example of how it affects planning. Try for a general rule,
e.g., leave the difficult topics until May.)
5. Some teachers have told me it can be difficult to meet the needs of students who move while
maintaining instruction for the other students in the class. How do you handle these competingdemands?
Probe: To whom do you direct instruction?
Working with Individual Students
Let's talk about your interactions with individual students who move.
STABLE ONLY: Did any new students enroll in your class after the start of the school year? Ifno, go to Leavers.
1. Do you receive advance notice that a student is going to join your class?
If Yes, how?
How much notice?
2. What information about the student do you receive BEFORE the student arrives?
Now we'll focus on teaching the new student mathematics and reading.
I. What information do you need in order to place the student in your math and readingprograms?
2. How do you get that information? (Get information for MATH and for READING)
2a. How long before you understand the new student's instructional needs?
3. When a new student arrives, your class may be working at a level or place in the curriculum
that is not the same as the student's previous class.
a. How frequently does this happen?
b. How do you know when this type of "mismatch" ocurrs? What are the signs?(Get some for MATH and READING if possible)
1 ? 6
A-8

4. When there is not a good match between the instructional history of your class and that of
the new student do you try to
(a) integrate the student into the curriculum of your class, or
(b) provide instruction that more closely matches the student's previous
curriculum?
5. How do you do that?
6. Suppose two new students enrolled.
One student previously studied in a curriculum that taught basic arithmetic skills through
drill. and-practice in those skills. The other student had studied a curriculum that developed
an understanding of math concepts through the use of manipulatives and a problem-solving
approach.
Would you use different strategies in working with these students?
Probe: Which student would have the easier time adjusting to your curriculum? Wir.,1
Now what about the other student?
If yes, in what way? Why?
If no, why?
7. What do you tell new students about your math program and the approach that it takes?
8. Now suppose two new students enrolled who had different experiences in reading.
One student previously studied in a curriculum that tauzht basic decoding and word-attack
skills primarily through a basal textbook. The other student previously studied in a curriculum
that took a whole-language approach to teaching reading through children's literature.
Would you use different strategies in working with these students?
Probe: Which student would have the easier time adjusting to your curriculum? Why?
Now what about the other student?
If yes, in what way? Why
If no, why?
9. What do you tell new students about your reading program and the approach that it takes?
Integration into the Class
Now I'd like to talk about new students becoming integrated into the classwhen they finally
reach the point that they are no longer "new", but are worldng in the curriculum and the
classroom as if they had been with the class since the start of the school year.
A-9
117

1. During the first week that a new student is in your class, what do you look for to determine ifthe student is adjusting to your class socially and academically? (Be sure to get responses forboth socially and academically)
2. How do you use that informafion?
Probe: Do you adjust your methods of working with the student based on his progressthe first week? How?
3. Now thinking about all of the new studerft you've hae *his year.
a. Would you say that most became integrated into the class?
b. On average, how long does it take?
c. What factors affect the amount of time that it takes?
Leavers
I have a few questions about students who withdraw from your class.
FOR STABLE ONLY: This year, did any students withdraw from your class?If no, go to next section.
1. Do you receive advance nofice that a stv dent is going to withdraw from you class?
If yes, how?
How much?
2. Typically, what information, if any, do you pr,z=v;de the students or their parents to take totheir next school?
The Impact of Moving on Participants
Next, I have a few questions about how moving affects your job and the education of children.1. What is the biggest impact that moving has on the education of students who move?la. What is the biggest impact that student mobility has on the education of students in yourclass who do not move?
2. What is the biggest impact that student mobili4P has on your job as a teacher?3. What changes would you recommend to school and district administrators that would helpyou work with mobile students?
4. Have you had any special training for working with students who move?To your knowledge, does any exist?
5. In this school, is it typical to move students from one class (or teacher) to another during theschool year? e.g., their class assignment changes.
If yes, in what ways is working with students who change classes within a srhooldifferent from working with students who change schools?
?A-10

Classroom Management
This last set of questions asks about teaching new students classroom routines and rules.
1. I'm going to read a list of 5 methods for teaching class rules and routines. Tell me which of
these methods you use to teach rules and routines to new students:
assign another student to inform the new student?
a list posted in the classroom?
the teacher telling the student the rules?
a handout that you eve to the student?
an assignment given to the new student?
a class discussion or review of rules?
model rules and routines
Anything else?
2. How do you convey to the new student when it is appropriate for students to talk in class?
3. How does the new student learn who to turn to for help in classwork?
4. If students change seats or rooms during the day, how does the new student learn where to go
and when?
FOR STABLE SCHOOLS ONLY: In some schools, students enroll and withdraw individually
and unpredictably in large numbers throughout the school year. For example, in one school I've
studied, a typical class has 20 students who remain from fall to summer. The other 10 seats in
the class are filled by a constantly changing group of students.
a. How would you feel about teaching in a school like that?
b. If you taught in a school like that, what if anything would you change about your
teaching?
Probe: Would you organize your class differently? Use different teaching methods?
Organize the curriculum differently?
A-11
119

SACRAMENTO AREA STUDY OF STUDENT MOBILITY*
Nationwide, nearly one out of every five school-aged children moves each year, but there are fewresources to help educators who work with mobile students. Your school is one of eight partici-pating in a study of student mobility in the greatar Sacramento area. The purpose of the study isto learn how teachers work with students who change schools during the school year.
Your personal experiences working with mobile students are extremely valuable to the study andto other teachers. Please take a few minutes to tell us about your expenance by completing thisquestionnaire. Your responses, which are anonymous, will be used to describe what it is like towork with students who change schools and how these changes affect the work of teachers.
First, please tell us about yourseff:
What grade do you teach?
How long have you taught at this school?
How long have you been teaching*?
As you answer the questions on the following pages, please remember they refer to studentswho change schools during the school year, as opposed to students who move over thesummer months.
*The study is funded by the U.S. Office of Education through a grant to the Sacramento CountyOffice of Education.
A.12
1.20

For each statement below, decide if you agree with the statement or not. Then circle the number tothe !fat?t a the item that best describes your opinion about the statement. Use this scale:
1 4: Strongly Disagree (SD)2 = Disagree (0)3 = Agree (A)4 = Strongly Agree (SA)? = Don't Know (DK)
SCHOOL CHARACTERISTICS 212._p A SA DX
1 . Working with students who move is a key aspect of my job as ateacher.
2. As a faculty, we share books and materials in order to meet the needsof children who move.
3. Our school provides special orientation materials to newcomers andtheir parents.
4. Student mobility Is not an issue at this school.
5. At faculty meetings we frequently discuss topics related to studentmobility.
6. Anyone considering a teaching position at this school should be toldhow many of our students move during the school year.
7. As a faculty, we share ideas about working with students who move.
8. Our school has established procedures to help teachers work withnewcomers.
9. It would be unusual for teachers at this school to talk about studentmobility.
10. The principal routinely visits my class to see how newcomers areadjusting.
11. Our school has enough books and supplies to serve the studentswho enroll during the year.
12. The principal recognizes that student mobirrty is an important factoraffecting my job as a teacher.
13. I am able to influence the assignment of new students to my class.
14. The way I work ih.th new students is a factor in my performanceevaluations.
15. The principal has hired extra staff to help teachers work with studentswho move.
16. The principal has identified student mobilty as a topic for in-servicetraining.
17. Parents accompany new students to my class on their first day.
18. Newcomers' parents tell me their children's strengths andweaknesses.
19. Newccmers' parents bring information to me from the previousschool.
A.13 121
1 2 3 4 ?
1 2 3 4 ?
1 2 3 4 ?
1 .L 3 4 ?
1 2 3 4 ?
1 2 3 4 ?
1 2 3 4 ?
1 2 3 4 ?
1 2 3 4 ?
1 2 3 4 ?
1 2 3 4 ?
1 2 3 4 ?
1 2 3 4 ?
1 2 3 4 ?
1 2 3 4 ?
1 2 3 4 ?
1 2 3 4 ?
1 2 3 4 ?
1 2 3 4 ?

20. Parents of new students are willing to work with me to catch thestudent up to the class.
21. Before students move to another school, their parents ask me forInformation to take to the new teacher.
22. Most parents of newcomers could do more te help their childrenadjust to a new school.
WORKING WITH CHILDREN WHO move
23. The variety of experiences brought to the classroom by mobilestudents can be used as a resource for Instruction.
24. It is difficult to meet the needs of both a newcomer and the rest of theclass at the same time.
25. New students provide me with ideas about how other teachers dothings.
26. I am satisfied with my approach to working with children who move.
27. Working with new students is no different from working with studentswho started the year in my class.
28. Student mobility complicates the job of teaching.
29. Working with mobile students is exciting.
30. I would rather not work with students who move.
31. It is Important for me to know if a new student's previous readinginstruction followed a whole language approach or a basic skillsapproach.
32. The cumulative folder supplies sufficient informati-n for me to placenewcomers in my curriculum.
33. Most students can describe accurately what they've studied in asubject area.
34. It is rigg important for me to know about the curricular approach usedIn a new student's previous school.
35. Placement tests that accompany my textbooks provide theInformation I need to place a student in the curriculum.
36. I try not to read newcomers' cumulative folders.
37. It Is Important for me to know If a new student's previous mathInstruction followed a basic skills approach or a problem-solvingapproach.
38. When a student from another school enrolls in my class, it is myresponsibility to find out what the student knows and is able to do.
39. When a student from another school enrolls in my class, it is myresponsibility to find out about the curriculum and Instructionprovided at the student's previous school.
40. When a student from my class transfers to another school, I shareresponsibility for the student's adjustment to the new class.
A.I41.22
,
SD D k SA DK1 2 3 4 ?
1 2 3 4 ?
1 2 3 4 7
1 2 3 4 ?
1 2 3 4 ?
1 2 3 4 ?
1 2 3 4 't
1 2 3 4 ?
1 2 3 4 ?
1 2 3 4 ?
1 2 3 4 ?
1 2 3 4 ?
1 2 3 4 ?
1 2 3 4 ?
1 2 3 4 ?
1 2 3 4 ?
1 2 3 4 ?
1 2 3 4 ?
1 2 3 4 ?
1 2 3 4 ?
1 2 3 4 ?

41. When a student returns to my class from an absence of a month ormore, it is my responsibility to find out what instruction was providedthe student, if any.
42. When a student is absent from my class for a month or more, I amresponsible for the student's adjustment to my class upon reentry.
43. When a student transfers to my class from another class in thisschool, it is my responsibility to find out about the instructionprovided in the previous class.
44. When a student transfers to my class from another class in theschool, it is my responsibility to find out what the student knows andis able to do.
45. When a student from my class transfers to another teacher's class inthis school, I share responsibility for the student's adjustment to thenew class.
IEAQam_sigEB2
SD D A SA DK
1 2 3 4 ?
1 2 3 4 ?
1 2 3 4 ?
1 2 3 4 ?
1 2 3 4 ?
Worning in schools can sometimes be stressful, and some sdiool events and activities are morestressful than others. For each item below, circle the level on the four-point scale that indicates howstressful the activity is for you.
1 = Not At All Stressful (NS)2 = Slightly Stressful (SS)3 = Stressful (S)4 = Extremely Stressful (ES)
NS SS S ES
1. Adopting a new textbook. 1 2 3 4
2. Talking to parents about their child's problems. 1 2 3 4
3. Teaching in an overcrowded classroom. 1 2 3 44. Learning that a new student will enroll in your class. 1 2 3 45. Suffering verbal abuse from a student. 1 2 3 4
6. Teaching du ing the first week of the school year. 1 3 47. Learning that a student withdrew from your class. 1 2 3 4
8. Managing disruptive children. 1 2 3 4
9. Maintaining student records. 1 2 3 4
10. Having a new student arrive ckiring a lesson. 1 2 3 411. Developing daily lesson plans. 1 2 3 412. Teaching without enough texts and supplies. 1 2 3 413. Grading students. 1 2 3 414. Scheduling instruction to accommodate school
programs.1 2 3 4
15. Having a student become ill during a lesson. 1 2 3 416. Viuit:n with a new student on his/her first day in
class.1 2 3 4
A.15
IM111

TIME FOR INTEGRATION
It takes time to integrate a new student into a class of students. For each item below, circle thenumber of weeks that it takes to achieve the goal described in the Item. For goals that require lessthan one week, circle "0", and for goals that require more than four weeks, circle
1
On average, how long does it take before: Weeks
1. New students participate in classroom activities. 0 1 2 3 4 +2. New students understand the class nfies. 0 1 2 3 4 +3. Other children treat newcomers as regular members
of the class.0 1 2 3 4 +
4. New students understand how the class functions. 0 1 2 3 4 +5. You know the learning needs of newcomers. 0 1 2 3 4 +6. Newcomers are no longer new. 0 1 2 3 4 +7. Newcomers work in the curriculum as if they had
been with the class from the start of the year.0 1 2 3 4 +
8. You know newcomers as well as you know thestudents who started the year in your class.
0 1 2 3 4 +
PATTERNS. OF ENROLLMENT
Suppose during the school year five students enrolled in your class and five withdrew. The pattern ofthis enrollment change could differ from one class to another even though the number of studentsmoving remains the same. Use these four patterns to answer the next set of questions:
Pattern A: The students enrolled and withdrew onLy between semesters.
Pattern 13: The students enrolled and withdrew individualOf throughout the year.
Pattern C: The students ensolled and withdrew guring a single month in the spring.
Pattern D: The students withdrew as a group in the fall and reenrolled together inthe spring.
1. Which pattern comes closest to describing the class you have this year? ABCD2. Their training best prepares teachers to work with which pattern? ABCD3. Which pattern makes it most difficult to integrate movers into the ongoing
classroom activities?ABCD
4. For which pattern would instructional planning be most difficutt? ABCD5. Which pattern most disrupts the education of students who move? ABCD6. Which pattern most disrupts the education of the other students in the class? ABCD7. Which pattern most disrupts classroom management? ABCD8. For which patterns is whole-zlass instruction well suited (circle all that apply)? ABCD9. For which patterns is instruction by cooperative groups well suited (circle all that
aPPIA?
ABCDA.16
124Thank you for your Mel

Principal School
Tape Interviewer Date
Principal Interview
We would like to know how you and your faculty work with students who change schools during
the sthool year, whether the number of students who move in and out of this school has caused
you to establish specific policies and procedures, and how mobility affects what you do as a
principal.
First, please tell us a little about yourself.
How long have you been a principal?
How long have you been principal at this school?
How many years did you teach before becoming a principal?
Students Coming and Going
This first group of questions are about the administrative routines your school follows before
placing new students in classrooms and when they withdraw.
1. In this school, is there a pattern to when students enroll and withdraw? If ym, please
describe it. If no, we will call it a random pattern.
2. What do you believe are the reasons for this pattern?
3. How long has this pattern vcisted for your school?
4. What is the average amount of time a student is enrolled in this school?
Class Assignment and.Orientation
1. Are new students placed in classrooms the same day they enroll?
Why do you do it that way?
2. Typically, how much notke do teachers have of a new student's placement in their classes?
3. What procedure is used to assign a new student to a classroom and teacher?
Probe: Who assigns students to classes? On what basis is the assignment made?
4. Is this procedure different from the way in which students are assigned to classes at the
beginning of the year?
Probe: Is this routine in place spedfically as a way to ease the transition for the new
student or for the teacher?
If yes, how is it different?
5. Is there an orientation for new students at this school?
If yes, what does it include?

6. How are school routines conveyed to the new student?
e.g., time school begins, when there are short days, bus schedules
7. Is there a school-wide behavior management program at this school?
If yes, please describe how it funcfions.
8. How is this school-wide behavior management program conveyed to new students?
9. Is there an orientation for parents of new students at this school?
If yes, what does it include?
Placement and Curriculum
I. In this school, who is responsible for assessing the newcomer's reading level?
Teacher Resource Specialist Other
2. In this school, who is responsible for assessing tile newcomer's mathematics level?
Teacher Resource Specialist Other ,
3. Are there instructional programs at this school that require students to combine differently
across classroom boundaries?
If No, go to #6.
If yes, who determines placement for a new student?
On what basis is that placement made?
Can teachers change that placement?
4. What are the reasons for these school-wide instructional programs at this school?
5. Do school-wide programs make it easier or more difficult for teachers to work with mobile
students?
(Please explain your answer)
6. How do parents work with you and with teachers to ease the transition of their children toanew school?
Leavers
1. When students withdraw from your school, is there a general trend to where they go? Ifyes,
what is it?
2. How frequently do students reenroll in your school? Generally, how long have they been
away? (Don't ask migrant)
3. Typically, what information, if any, do you provide students or their parents to take to theirnext school?
Probe: Does the school (principal) have any responsibility for the student's tansition
to the new school?
A-18 f c

School Level FunctIons
This next group of questions focus on how mobility might affect how your school operates.
1. When you plan and project your needs for the entire school year, how does mobility affect
the decisions you mike in such areas as
Staffing (number and/or particular qualification)
Faculty
Aide3
Classifid personnel (e.g., clerks, janitorial)
Resource personnel (e.g , specialists, counselors)
Materials:
Texts and workbooks
Paper, pencils, scissors etc.
rquipment for science, P.E. or social studies
Space:
Number of classes
Class size
Other?
2. Often, budget decisions call for trade-offs: e.g., In order to do this, we will not be able to do
that. What trade-offs must you make to meet the demands of student mobility at this school?
Planning
1. When you plan the calendar for the entire school year, how does mobility affect the
decisions you make in such areas as:
Daily Schedule (begin, end of day)
Grading periods
Achievement tests
Teacher inservice days
SIP days
Other
2. Suppose you and your faculty were planning to adopt a new curriculum. How might the
mobility at this school be a factor in your decision?

Teaching
From your perspedi,,e as principal, you are able to evaluate teaching across the school. This
next group of questions fozus on what you think about student mobility and how it affectsteaching.
1. Are there particular skills that enable teachers to work more effectively with a mobilestudent population?
If yes, what are they?
If no, go to #3.
2. When you evaluate a teacher's performance, do you look for these skills?
3. Is it necessary to provide teachers at this school with extra planning time in order that theymay better work with students who move?
If yes, how much and how often?
4. Is there any inservice training you have found that particularly helps teachers better workwith students who move? Please describe.
5. If a teacher needs help working with a student who moves, to whom should he or she turn forhelp?
Pezsonal Opinion
The final series of questions are intended to discover your thoughts about mobility in thisschool, and how that affects your job as principal.
I. How does mobility affect the education of the students in your school who move?
2. How does mobility affect the education of the students in your school who do not move? (whoare stable)
3. How does mobility affect your job as principal?
4. What advice would you offer a new principal in a school with a lot of mobility?5. Is there anything else you think we should know about mobility that we have not asked?That is the end of this interview. Thank you for your time.
Miscellaneous Questions
1. In this school, is it typical for students to be moved from one class to another during theschool year?
If Yes: In your view, are the issues of moving students from classroom to cla %roomdifferent from those of students who move from. school to school? Please describe the difference.2. What is the largest number of new students in a year that you are able to handle?
Probe: How many studen:s are too many?
A-20 I

3. FOR STABLE: How would your job be different if half your students moved each year?
4. FOR MILITARY: How many of your students are from military families?
School Secretary
1. Is the magnitude of student movement at this school the same this year as it was last year?
2. Please describe the registTation and enrollment routines for a student who emolls during the
school year.
3. Would you please describe the withdrawal procedure or routine at this school?
?V


SCHOOL
AgriculturalAppleton
Elm
Military
Doolittle
McArthur
UrbanBroadway
Ninth St.
StableCreekside
Fairview
:',::",:?..'::::::... . . , . . ,
:7'4..::::' ',.:.:.:0
,';'.
.: .k...:',:..,:"::'.:,., .... ... . -,.:x-,:..)':!::".;.:, I
iiimmilmimi.7777.77.77.77777.,. ...,, . -;.:E_ ....._,...,-- <%.,:
-..z.4-y. ..--,
0 10 20 30 40 50 60 70 80 90 100 110 120 130 140 150 160 170 180
Length of EnroHment (Days)
MI to 10th. percentile EMI 10th.to 25th. percentiles II 25th. to 50th. percentiles
Figure 3.1 Distributions of Length of Enrollment for Eight School Populations
131

iOF STUDENTS
(STANDARDIZED)

ra.)
OF STUDENTS (STANDARDIZED)
I3

IOF STUDENTS (STANDARDIZED)

When a student from another school enrolls in my class,it is my responsibility to find out what the student knowsand is abk to do.
When a student transfers to my class from another class inthis school, it is my responsibility to fInd out about the --II--Instruction provided in the previous class.
When a student is absent from my class for a month or more.I am responsible km the student's adjustment to my class upon --IPre-mby.
When a student from my arse transfers to another teacher'sclass in this school. 1 share rtsponsibility for the student%adjustment to the new ckss.
When a student returns to my class from an absence of a monthor more. it I. my responsibility to ilnd out what instruction -"-was provided the student, if any.
When a student transfers to my class from another class fnthis school. it Is my responsibility to find out about theinstruction provided the student in the previous class.
When a student from my class transfers to another school.I share responsibility for the student's adjustment to the ---111new class.
al
When a student from another school enrolls in my class,it is my responsibility to ilnd out about the curriculum andInstruction provided at the student's previous school.
0-- Mean Rating (NolG6)± 1 standard error
--II-
111
..1110...
2.5 2.6 2.7 2.8 2.9 3.0 3.1 3.2 3.3 3.4 3.5
Scale of Agreement(2.0 . Disagree, 3.0 = Agree)
Figure 5.1. Teacher Perceptions of Responsiblity for Students in Transition
1. 3 5

TABLES

Table 2.1
Demographic Descriptions of Four Types of Schools
"Mobility Type:
School Name:
Agriculturala
Appleton Elm
Militaryb
Doolittle McArthur
Urban
Broadway Ninth St.
Stable
Creekside Fairview
,Mobility Index 31 22 33 32 42 35 14 13
: Grades Served 3-5 K - 8 1 - 6 K - 6 K - 6 K - 6 K - 6 K - 6
ft Students 647 557 712 506 448 442 499 514
% AFDC 7.7 15 1.7 0.4 76 59 10 1
"%LEP 16.1 18 0 0 6 11 5.8 1.9
Ethnic Distribution
% Asian 1 0 5 7 2 10 16 4
% Filipino 0 0 4 1 0 0 1 4
% Hispanic 30 43 7 7 14 18 11 9
% Black 10 1 16 17 24 12 5 7
% White 66 54 66 68 58 59 66 75
Note Information about school size and grades served was obtained from the California School Directory. Ethnic distributions were obtained fromthe 1987 CBEDS data summary for Sacramento County Schools, and by report from the school secretary for the two migrant schools outside
!bacramento County. All other data were collected in Spring, 1987, by the California Assessment Program.16 AFDC = Percent of students receiving Aid for Dependent Children.
LEP = Percent of students having limited English Proficiency.Mobility Index = Percent of third graders present for 1987 Spring achievement tests who were new to the school that year.
Elm, 1/3 of the students were classified as migrant education students.bDoolittle school is located adjacent to off-base, military housing. The principal estimates 70% of the students are from military families.
l'McArthur school is located on an air force base and 100% of the students are from military families.

Table 2.2
Description of School Contexts
GeographicDescription
Economic Base
PertinentSchoolDescription
ReadingCurriculum
MathematicsCuniculum
SpecialPmgrams
Agricultural Schools
Appleton Elm
In small Solano Co. town (pop. 10,000), 25 mi.W of Sacramento.
County is nearly 70% agricultural. Seasonalwork harvesting corn, pears, safflowers,sheep. Also tomato processing andslaughterhouse.
Grades K - 2 served in another town. Bustransportation for schooling is regional.
Literature based reading, including bilingual.No school wide text.
Silver Burdett.
8:30 - 11:30 AM: "Core" program for migrantstudents who lived at labor camp. Onlyoffered when migrants enrolled, about 14weeks. English speaking ability basis ofplacement. Staffed by certified teacher andone ESL aide. Supervised by district'sDirector of Instruction. Individual studyprogram for group of students who leave for 8weeks around Christmas for Mexico.
In tiny Yolo Co. town (pop. 2,000), 25mi. NW of Sacramento.
County is nearly 90% agricultural.Seasonal work harvesting grains,nuts, tree fruit, field fruit &vegetables. Also tomato processing.Inexpensive housing attributed toincreasing number of studentsreceiving AFDC.
Large attendance area. Schoolschedule staggered to accommodatetypically long bus rides.
No school wide text.
Addison Wesley: new during studyyear.
1. :3 8
T.2

Table 2.2 (con't.)
GeographicDescription
Economic Base
PertinentSchoolDescription
ReadingCurriculum
MathematicsCurriculum
Military Schools
Doolittle McArthur
Adjacent to an off-base, military residentialcomplex, E of Sacramento, in county.
Aircraft repair: Principal estimates that70% of students have one or both parentsemployed by military.
School shares fenced boundary with base ontwo sides.
Harcourt Brace Jovanovich with coreliterature program.
Heath: new during study year.
On a Strategic Air Command (SAC)Air Force Base, N of Sacramento,adjacent to another incorporated city.
Base provides navigation and pilottraining to US, SAC and NATOforces.
On base: those from off-base needclearance at guardpost.
Ginn.
Holt-Rinehart: new during studyyear.
GeographicDescription
Economic Base
ReadingCurriculum
MathematicsCurriculum
Urban Schools
Broadway Ninth St.
In Sacramento, just N of city center.
Neighborhood of older homes mixed withopen space and shops.
K, 1, 2 use DISTAR. Grades 2 - 6 use HoughtonMifflin.
K, 1, 2 use Math Their Way. Grades 3 - 6 useOpen Court.
In Sacramento, just N of city center.
Neighborhood of homes andapartment units, small shops.
Houghton Mifflin.
Harcourt Bface Jovanovich.
11.4 0....1. I.; t /

Table 2.2 (con't.)
Stable Schools
Creekside Fairview
Geographic In Sacramento, older neighborhood of nice In unincorporated area outside ofDescription homes, local shops. Nearby city park along Sacramento. Older small town now
river with a zoo and community college. surrounded by tracts of new housing,less than 10 years old.
Pertinent Bussing for desegregation. School is less than 10 years old.School Attendance bounr:aries changed atDescription beginning of study year to include
students from several new housingdevelopments.
Reading MacMillan. Scott Forseman. Great BooksCurriculum literature program.
Mathematics New text during study year. Open Court.Curriculum
SpecialPrograms
Receiving school for districtenrolling students whose ownneighborhood schools were full.

Table 2.3
Grade Level and Teaching Experience of Teachers Interviewed
School Teacher GradeYears
Teaching
Years atStudySchool
Trainingfor
Mobility
AgriculturalAppleton 1 3 9 3 Yes
2 3 19 10 Yes3 4 13 5 Yes4 5 12 12 Yes
Elm 1 1 3 3 No2 3 7 4 No3 4 14 3 No4 5 3 3 Yes
MilitaryDoolittle 1 1 25 18 No
2 3 19 12 No3 4 12 5 No4 5 13 13 No
McArthur 1 1 8 8 No2 3 7 4 No3 3 & 4 26 26 No4 5 & 6 41 28 No
UrbanBroadway 1 1 13 3 No
2 3 3 3 No3 4 3 3 No4 6 5 5 No
Ninth St. I 1 10 4 No2 5 3 3 No3 5 3 3 No4 6 23 8 No
5tableCreekside 1 2 21 4 Yes
2 3 18 2 No3 4 15 5 No4 5 12 4 No
Fairview 1 1 & 2 8 2 No2 2 10 8 No3 4 & 5 6 6 No4 6 36 8 No

Table 2.4
Experience of Teachers in the Questionnaire Sample
School N
Years Teaching Years at Study School
Min Max Mean SD Min Max Mean SD
Agricultural 43 1 28 11.0 7.4 1 26 7.8 6.5
Appleton 22 1 20 10.2 5.8 1 19 7.8 5.9Elm 21 2 28 11.8 8.9 1 26 7.8 7.2
Mil lazy 40 1 42 14.4 9.9 1 26 8.8 7.9
Doolittle 26 1 29 13.3 8.6 1 25 7.0 6.6McArthur 14 2 42 16.4 11.9 2 26 12.3 9.0
Urban 41 0 34 10.2 8.2 0 31 4.9 5.4
Broadway 18 1 26 8.7 7.3 0 10 3.8 3.0Ninth St. 23 0 34 11.4 8.8 0 31 5.8 6.7
Stable 42 1 36 10.1 9.0 1 20 4.0 4.1
Creekside 17 3 25 15.0 7.5 1 20 6.0 5.4Fairview 25 1 36 6.8 8.6 1 8 2.6 2.1
T.igo1 .A

Table 2.5
um A-r f Y ar x n n a Prin al an h r f
Years Principal atSchool Study School Years Principal
AgriculturalAppletonElm
MilitaryDoolittleMcArthur
inBroadwayNorth St.
StableCreeksideFairview
5 52 2
2 22 2
4 43 3
4 128 13

Table 3.1
Size and Stability of Student PQpulations in Eight Schools
SchoolNo. of
Students
Percent of movers who:
%Leavers
WhoReturn
% WhoMove
EnrollLate &Stay
EnrollLate &LeaveEarly
Enroll onTime &LeaveEarly
Agricultural 1274 33 40 9 51 45
Appleton 752 22 29 8 63 40Elm 522 50 47 10 43 50
Military 1227 32 37 10 53 5
Doolittle 738 31 42 8 50 8McArthur 489 33 31 12 57 0
aim 1241 44 42 23 35 7
Broadway 614 38 43 18 39 9Ninth St. 627 50 42 26 32 6
stable 1197 22 55 17 29 3
Creekside 541 17 43 18 39 6Fairview 656 25 62 16 22 0
T.1.4 4

Table 3.2
Descriptive Statistics for the Number of Enrollment Changes in Half-Month Periods
for Four Types of Schools
Enrollment Change Min Median Max Mean SD
New EnrollmentsAgricultural 1 6 70 11.6 15.8Military 2 6 29 10.8 7.3Urban 2 21 36 19.8 9.2Stable 1 9 23 10.3 5.5
WithdrawalsAgricultural 1 4 38 8.0 8.7Military 1 12 32 13.0 7.3Urban 8 16 26 16.6 4.8Stable 2 4 17 6.4 4.7
T.9

Table 3.3
Teacher Descriptions of Mobility Patterns at Their Rhools
SchoolNo
PatternAround
Holidays In Fall In Spring MonthlyCrop
SeasonExtendedVacation
Agricultural o 2 0 0 o 7 2
AppletonElm
oo
2o
oo
oo
oo
34
2o
Military 2 4 1 2 o o o
Doolittle 1 2 o 1 o o oMcArthur 1 2 1 1 o o o
vrim 1 6 2 o 2 o o
Broadway o 3 2 o 1 o oNinth St. 1 3 o 0 1 o o
Stable 3 2 2 1 o 0 o
Creekside 2 1 o 1 o o oFairview 1 1 2 o o o o
Note. Four teachers were interviewed at each school. Table entries are frequencies of response.Some teachers provided more than one response.
1 t
T.10

Table 3.4
Princi al I_ Cnowlecthe School
School1.
Enrollment Pattern2.
Reasons for Moves3.
History of Pattern4.
Average Enrollment Length
Agricultural (Ag)Appleton Yes Ag work Always 6wks+8wks=14wksElm Yes Ag work Always ag 8 wks + 5 wks = 13 wks (Ag)
Cheap housing Housing = 8 years 1 - 2 years (Others)Christmas in Mexico
Mkt=Doolittle Yes Base housing 30 years 3 yearsMcArthur No Military decision Since school built 4 -5months to3-5 yrs
UrbanBroadway No Unstable homes Forever Does not knowNinth St. No Unstable homes At least 3 years 2 - 3 yrs
Condemned housing%gig
Creekside No Stable community Since school built 7 years for over 50%Fairview No Overload from other
schoolsNot asked 1 year
Note. Interview questions:1. Is there a pattern to when students enroll and withdraw?2. What do you believe are the reasons for this pattern?3. How long has this pattern existed for your school?4. What is the average amount of time a student is enrolled at this school?
1.47
_

Table 3.5
Principal Knowledge of Students Leaving School
1. 2.School Where Students Go Re-enroll
gr. loglwiliAppleton Mexico Not askedElm Some to BrownsviLe, DC; some to Not asked
Arbuckle, Fresno, and San Jose, CAMilitary
Doolittle No pattern Not at allMcArthur All over the world Not often
UrbanBroadway Within the district VariesNinth St. Within the district or to neighboring Often
districtstable
Creekside Magnet programs Very small numberFairview Own neighborhood school Very small number
Note. Interview questions:1. When students withdraw from your school, is there a general trend f , where they go?2. How frequently do students re-enroll in your school?
1.48
T.12

Table 3.6
Teacheriiteports on Mobility Patterns
Percent of Teachers Selecting:
A
Which pattern comes closest to describing the class you have this year?
Overall schools 4 81 2 13
Agricultural 11 83 3 3
Military 0 55 0 45
Urban 5 95 0 0Stable 3 92 5 0
Their training prepares teachers to work with which pattern?
Overall schools 43 43 2 11
Agricultural 47 44 0 8
Military 50 26 3 21
Urban 36 54 0 11
Stable 38 53 6 3
Which pattern makes it most difficult to integrate movers into the ongoingclassroom activities?
Overall schools 6 53 15 27
Agricultural 2 54 17 27
Military 2 44 7 46
Urban 8 54 19 19
Stable 11 60 16 14
For which pattern would instructional planning be most difficult?
Overall schools 2 52 17 28
Agricultural 2 49 24 24
Military 2 48 14 36
Urban so 21 29
Stable 5 65 8 22
T.13
149

Table 3.6 (con't.)
Which pattern most disrupts the education of students who move?
Overall schools 3 52 13 32
Agricultural 10 44 22 24Military 2 37 7 54Urban 0 57 14 30Stable 0 74 9 17
Which pattern most disrupts the education of the other students in the class?
Overall schools 1 48 17 34
0 52 22 257 29 10 600 63 14 23
50 22 25
AgriculturalMilitaryUrbanStable 3
Which pattern most disrupts classroom management?
Overall schools 1 54 18 28
Agricultural 2 52 32 15Military 2 34 7 56Urban 0 69 20 11
Stable 0 63 11 25
Note. Cell entries are percentages; rows may not add to 100 due to rounding. Thefollowing instructions were given to teachers: Suppose during the school year fivestudents enrolled in your class and five withdrew. The pattern of this enrollmentchange could differ from one class to another even though the number of studentsmoving remains the same. Use these four patterns to answer the next sei ofquestions:Pattern A = The students enrolled and withdrew only between semesters.Pattern B = The students enrolled and withdrew individually throughout the year.Pattern C = The students enrolled and withdrew during a single month in the spring.Pattern D = The students withdrew as a group in the fan and reenrolled together in
the spring.
T.14
150

Table 4.1
effects of Mobility on Instructional Plans
School
Year-Long Planninga Curriculumb Methods'
NoEffect Materials Other
NoEffect
Timing/Content Groups Other None
Agricultural 1 0 7 2 6 6 2 0
Appleton 0 0 4 1 3 4 0 0Elm 1 0 3 1 3 2 2 0
Military 4 1 3 6 1 4 1 3
Doolittle 3 0 1 3 0 1 0 3McArthur 1 1 2 3 1 3 1 0
Urban 6 2 0 7 1 4 2 1
Broadway 3 1 0 4 0 1 1 1Ninth St. 3 1 0 3 1 3 1 0
Stable 4 2 2 6 1 2 2 4
Creekside 3 1 0 4 0 1 0 3Fairview 1 1 2 2 1 1 2 1
Note. Four teachers were interviewed at each school. Entries are the number of teachers giving theresponse. When the total responses for a school is three, the question was not asked of one teacher inthe school.aAt the start of the year, when you are designing your curriculum and the way you will organize yourclass, how do you plan for the fact that students will be enrolling and withdrawing as they do?bin what ways does the enrollment pattern influence your decisions about what topics to teach orwhen to teach them?CWhat methods of teaching P.:-....1 organizing students for instruction work best for you given that somestudents are not here for all of the year?
T.15 i r .3I t 41 i

Table 42
The Advance Notice Teachers Receive about New Enrollments in Four Types of Schools
School
Receives Notice
Yes NoSome-times
AgriculturalAppleton 3 1 0
Elm 0 4 0
MilitaryDoolittle 0 3 1
McArthur 1 3 0
UrbanBrc.adway 0 1 3
Ninth St. 0 4 0
StableCreekside 1 1
Fairview 2 1 1
Method Length of Notice
L-tforrnation ReceivedBefore Student Arrives
None Some (spacify)
RelativeMemo in mailbox fivmofficeKnow date nigrantsarrive
(Although date knownwhen migrant eampopens, students mayarrive earlier or later)
Reading specialist
School office staff
Depends, 0-14 daysAt least one dayArrival date ofmigrants the sameyear to year
Less than one day
One day
Notice in mailbox from One dayschool office
ParentSchool office staff
School office staff
Parent - 2 weeksOffice - 1 to 2 days
Orte dayA couple of days
3 1 an case ofrelative:learne demotionalproblems)
4 0
3 1 (Reading level,info providedby parent)
4 0
0 4 (From notice:name, parent,address, birthdate, # ofsiblings, socialworker)
4 0
1 2 (From theoffice: infoprovided bythe parent)
1 (Name, gradelevel)
1 (If interdistrictmay receivecume folder)
Note. Numerical entries indicate the number of teachers who responded as indicated to the interview question.With one exception, N = 4 for each school. At Creekside, N = 3 because one teacher had not had a student enroll in herclass during the study year.
T.16
.1 5 2

Table 4.3
Teachers' Choice of Methods for Assessing New Students in Math and Reading
Grade: 1-3 4 - 6
Typea: A MU S A M U S
Math
Current assignment
One-to-one with teacher
Quiz or test
Ask student
School places student
Other
itsacb_gl
Current assignment
One-to-one with teacher
Quiz or test
Ask student
School places student
Other
1 2 3 2 3 2 1 1
1 1 0 0 0 2 0 0
1 2 0 1 0 0 3 3
1 1 2 0 1 2 1 2
0 0 0 0 0 0 0 0
0 0 2 1 0 0 2 1
0 0 0 0 2 0 1
3 2 1 0 1 2 0 1
1 0 1 1 0 0 2 0
2 0 0 0 1 0 2 3
0 1 3 2 0 1 2 1
0 1 0 1 2 1 2 2
Note. Cell entries are the number of teachers who reported the method. Four teachers for each grade-by-mobility classification were interviewed except for the stable-primary grades where N = 3.a A = Agricultural, M = Military, U = Urban, S = Stable.
T.17
1 3

Tale 4.4Teachers' Reasons for Adapting or Not Adapting Instructional Methods to Accommodate Newcomers' Previous
experiences
School Initial
Teacher Response A E DMBN C F
MATH INSTRUCTION
Would NOT use different methods 2 1 4 1 3 2 2 1
1. Curriculum has both approaches already 2 1 3 1 1 2 1 02. I follow my own program 0 0 1 0 2 0 1 1
Would use different methods 2 2 0 2 1 2 1 3
1 Teach use of manipulatives and p.s strategies 0 1 0 1 1 1 1 02. Teach whichever approach the student is
missing1 0 0 1 0 0 0 1
3. Wait and see where the student has difficulty 0 1 0 0 0 1 0 1
4. Other 1 0 0 0 0 0 0 1
No response given 0 0 0 1 0 0 0 0
READING INSTRUCTION
Would NOT use different methods 3 2 1 1 2 2 3 0
1. Curriculum has both approaches already 2 0 0 1 0 0 1 02. I follow my own program 1 0 1 0 0 2 0 03. Differences between approaches are not a
problem0 2 0 0 2 0 2 0
Would use different methods 1 0 2 0 1 2 0 4
1. Ask other to teach basic skills 0 0 2 0 0 1 0 1
2. Make links between current and pastcurriculum
1 0 0 0 1 1 0 2
_I. No reason given 0 0 0 0 0 0 0 1
No response given 0 0 1 3 1 0 0 0
Note. Teachers were asked to consider two hypothetical situations, one concerning mathematics instructionand the other reading instruction. In both situations, two new students arrived, one having had previousinstruction that focused on basic skills while the other student's instruction took a different approach.Teachers were asked if their methods for working with these two new students would differ, and if so, in whatways. Thirty teachers were queried about the mathematics situation. One teacher at Creekside was not askedbecause she had had no new students during the study year and one at Elm because time did not permit it. Inaddition to these teachers, one teacher at Elm was not asked about the reading situation because time did Lotpermit it.
T.18
1. 5 4

Table 4.5
Number of School Days Needed to Understand Instructional Needs of Students in Four Types of Schools
School Type
Instructional Needs
Agricultural Military Urban Stable
K-Wa pN Min Mid Max N Min Mid Max N Min Mid Max N Min Mid Max
Of class in fall 7 5 20 120 7 5 10 47 8 7 15 12 8 3 10 30 2.42 .49
Of newcomers duringyear 7 1 5 12 7 2 10 10 8 2 6 12 7 2 5 7 1.94 .58
Difference in time forclass and newccmer 6 0 25 108 7 2 5 37 8 -3 13 18 7 1 5 27 2.71 .44
a K-W = Kruskal-Wallis Test of the hypothesis that differences exist among the four types of schools.

Table 4.6
Teacher Methods for ConveAng aassroom Rules to an Entire Class at the Start of the Year
And to New Students During the Year
Percent of Teachers Using for
Method Class Newcomer Chi-Square (prob.)
Post a list of rules 100 94
Discuss rules with the class 94 45 1.8 (.18)
Tell students the rules 88 55 0.04 (.83)Prepare a handout listing rules 81 48 2.99 (.08)
Give an assignment about the rules 42 3 0.7 (.39)
Assign a student to teach rules 0 77
Note. Time did not permit one teacher at Ninth Street to complete the spring interviewquestionsabout rules, and thus the percentages are based on N = 31. The Chi-Square tests the researchhypothesis that there is a relation6h:p between teachers use of the method in the fall and springagainst the null hypothesis that there is no relationship between fall and spring use. Each test isbased on N = 31, df = 1. When there was no variability in response, the test could not be computed.
1:37
T.20

Table 4.7
frequencies of Teachers Reporting Fall and Newcomer Orientations in
iteading and Math Curricula
Fall Orientation
Newcomer Orientation
Yes No
Reading Curriculum
17 6Orier.9 class
No oriemation 1 5
Math Curriculum
Orients Class 12 10
No orientation 0 8
158T.21
"--1',

Table 4.8
Jndicators of Stident Integration Into a Class liwd by Teachers from Four Types of Schools
Indicator
Agricultural MilitaryI Urban Stable
A E DMBNC F
Social Adjustment 10 6 6 10 6 8 8 5
Relations with peers 4 3 3 4 4 4 3 2Student feelings 4 2 0 4 1 2 1 2Relationship with teacher 0 0 0 1 0 0 2 1Class behavior 1 1 1 2 1 1 1 0Class reaction to newcomer 1 0 2 0 0 1 1 0
Academic Adjustment 5 3 8 8 2 4 2 4
Successful school work 2 2 4 2 1 2 1 2Follows instructions 1 0 1 1 0 0 1 0Timelines 0 0 1 1 1 0 0 1Follows rules, routines 1 0 2 2 0 2 0 0Volunteers in class 1 1 0 2 0 0 0 1
Note. Entries are frequencies of response. Column headings are school initials. Four teacherswere interviewed at each school, except at Elm, where one teacher was not asked, andCreekside, where one teacher had no new students.
T.22

Table 4.9
Factors Affecting Newcomers' Integration into Classes in Eight Schools
School Initial
Factor: A EDMBNC F
Teacher 0 1 2 0 0 0 0 1
Newcomer's Academic Skill 1 2 1,i 0 0 3 0
Newcorner's Personality 4 2 3 1 3 3 0 1
Newcomer's Social Skill 1 1 2 2 1 0 1 3
Newcomer's Home Life 1 0 3 1 1 1 0 1
Other 2 1 0 1 0 1 0 1
Note. Entries are frequencies of response. N = 4 at all schools except Appleton, Ninth Street, andCreekside, where N = 3.
160
T.23

,..
Table 4.10
Entquencies of Teacher Recommendations to Administrators About Working with Students
hia.M2YC
Recommendation
School1.
Info.2.
Support3.
Notice4.
Student5.
Texts6.
Class7.
Other
Agricultural
Appleton 1 2 0 1 0 0 1
Elm 1 2 0 0 0 0 0
Military
Doolittle 2 1 2 0 0 1 1
McArthur 1 0 2 0 0 0 2
Urban
Broadway 1 0 1 1 1 0 3
Ninth St. 1 2 0 1 0 1 1
Stable
Creekside 1 2 1 1 1 2 0
Fairview 2 0 2 0 1 0 0
Note. Entries are frequencies o resse. Four teachers were interviewed at each schoolexcept Elm, Ninth Street, and Creekside, where one teacher each was not asked the question.1. Provide more academic information on newcomers.2. Provide program or staff supports for teachers.3. Provide more advanced notice of new students,.4. Establish procedure where students bring information with them.5. Align curricula of nearby schools.6. Limit ciass enrollment.7. Other responses including don't know and teachers should adjust.
T 21 6 1

Table 5.1
Teacherthi I ,
Factor Loading
Questionnaire Item
Responsibility
I. When a otudent is absent from my dam foe a month or mort,1 amresponeible for the student's adjustment upon reentry. .76
2. When a student transfers to my class from another clan in thisschool, it is my responsibility to find out About the instructionprovided in the previous clasa. .73
3. When a student tranders to my class from another clam in theschool, it is my responsibility to find out what the student knowsand is able to do. .71
4. When a student returns to my class from an absence of a mcnth ormore, it is my responsibility to find out what instruction wasprovided the student, if any. .70
5. When a student from my dass transfers to another teacher's classin this school, I share responsibility for the student's adjustment tothe new class. .63
6. When a student from another school enrolls in my class, it is myresponsibility to find out what the student knows and is able to do. .58
Mobility Complicates Teaching
7. Working with new students is no different from working withstudents who started the year in my class. -.07
8. Most students can describe accurately what they have studied in asubject area. .24
9. The cumulative folder supplies sufficient information for me toplace newcomers in my curriculum. -.07
10. I am satisfied with my approach to working with children whomove. -.08
11. I would rather not work with students who move. -.27
12. Student mobility complicates the job of teaching. -.00
13. It is difficult to meet the needs of both a newcomer and the rest ofthe class at the same time. -.04
Educational History of Newcomers Is Important
14. It is important for me to know if a new student's previous mathinstruction followed a basic skills approach or a problem-solvingapproach. -.10
15. It is important for me to know if a new student's previous readinginstruction followed a whole language approach or a basic skillsapproach. .08
16. When a student from another school enrolls in my class, it is myresponsibility to find out about the curriculum and inkructionprovided at the student's previous school. .28
17. When a student from my class transfers to another school, I shareresponsibility for the student's adjustment to the new class. .17
18. I by not to read newcomer's cumulative folders. -.08
19. It is not important for me to know about the curricular approachused in a new student's previous school. -.02
Benefits to Working With Mobile Students
20. The variety of experiences brought to the classroom by mobileAudents can be used as a resource for instruction. .20
21. New students ptovide me with ideas about how other teachers dothings. -.20
22. Working with mobile students is exciting. .21
23. Placement tests that accompany my textbooks provide theinformation I need to place a student in the curriculum. -.05
11 III IV
-.05 .03 .02
.14 .22 -.01
.07 .01 -.32
.05 .02 .23
-.09 .16 -.02
.07 .00 .19
.62 -.11 .15
.57 -.00 -.20
.49 .45 -.16
.53 .00 .01
-.48 .09 -.20
-.69 .10 -.09
-.72 .02 -.08
.05 .75 -.07
-.14 .70 -.02
.04 .56 .16
.11 .46 .16
.15 -.35 .18
.33 -.63 -.23
.12 .04 .58
.14 .20 .55
.42 .10 .46
.32 .26 -.51
T.25
162

Table 5.2
Teacher Opinions about School Characteristicr Four-Factor Solution
Facta Loading
Questionnaire Item I II III IV
Parent Support for Teaches
1. Newcomers parents tell me their children's strength andweaknesses.
2. Newcomer's parents bring information to me from the previousschool.
3. Before students move to another school, their parents ask me forinforrnation to take to the new teacher.
4. Parents of new students are willing to week with me to ouch thestudent up to the dam
5. Parents accompany new students to my den an their first day.
6. Most parents of newcomers could do more to help their childrsenadjust to a new school.
Mobility as an lame for the School
7. Anyone considering a teaching position at this school should betold how many d our students move duzing the school year.
8. Working with students who move is 3 key upect of my job as ateacher.
9. As a faculty, we share ideas about working with students whomove.
10. As a faculty, we share books and materials in order to meet theneeds of children who move.
11. The way I week with new students is a factor in my performanceevaluations.
12. It would be unusual for teachers at this school to talk about studentmobility.
13. Student mobility is not an issue at this school.
School Support for Teaching
14. The principal has identified student mobility as a topic for in-service training.
15. The principal has hired extra staff to help teachers work withstudents who move.
16. The principal routinely visits my class to tee how newcomers SITadjusting.
17. At faculty meetings we frequently discuss topics related to studentmobility.
18. I am able to influence the assignment of new students to my class.
19. Our school has enough books and supplies to save the studertbwho enroll during the year.
Specialized School Programs
20. Our school provides special orientation materials to newcomersand their parents.
21. The principal recognizes that student mobility is an impatantfactc: affecting my icb as a teacher.
22. Our schal has established procedures to help teachers week withnewcanas
.81 -.05 .12 -.05
.73 -.13 .10 .00
.72 -.09 -.06 .10
.70 -.10 .06 .29
.57 .05 .13 -.25
-.43 .00 .05 -.32
-.14 .71 .02 -.04
-.06 .70 -.09 .17
.14 .52 .38 .14
.01 .34 .02 .06
.09 .26 .23 .25
.14 -39 .04 -.11
.22 -.66 -.07 .30
.11 .09 .72 .11
.11 -.04 .67 -.07
.14 .04 .60 .35
.20 .38 .57 -.00
-.15 -22 .44 .21
.32 -.00 -.44 .19
.12 .07 .01 .76
-.23 .13 .32 .50
.35 .38 .23 .47
T.261 6 3
--.

Table 5.3
Mean Scores on Opinion Scales for Teachers in Four Mobility Se214151
Factor
Mobility Pattern p-valuea
Migrant Military Urban Stable Mobility School
Satisfaction -.11 .21 -.43 .34 .002 .36
Benefits .24 .21 -.46 .00 .004 .11
History .09 -.64 .30 .23 .0001 .39
Responsibility .14 .03 -.23 .05 .35 .03
Issue -.16 .14 .40 -.36 .002 .02
Parent Support -.05 .41 -.62 .26 .001 .002
Teaching Support .49 -.64 .05 .06 .0001 .0002
ap-values derived from ANOVAs
T.27 1 4

Table 6.1
Principal Perwtions of the Impact of Student Mobility on the Principal's lob
Agricultural Military Urban SableAppleton Elm Doolittle McArthur Broadway Ninth St. Creekside Fairview
How does mobility affect your job as principal?
Extraclerical/admin.work
Extra time to knowstudents X X X X
Extra time to knowfamilies X X X X X
Extra time to workwith agencies
Extra cost
Changes tocurriculum
What adv,ze would you offer a new principal in a school with a lot of mobility?
Patience &flexibility
Adjust curriculum X X
Adjust staff X
Adjust admin. X
Parent contract
Call on experience
High expectations
Ignore mobile

Table 6.2
Principal Perceptions of the Impact of Student Mobility on Students
111.
1. 2.Impact on Students
School Impact on Students Who Move Who Do Not Move
AgriculturalAppleton An extra burden in life; competing with
students enrolled for 10 months; missingdramatic amounts of school; do not learnEnglish as quickly
Elm Not asked
Teacher time goes to newcomers;away from stable students
Not asked
MilitaryDoolittle Negative; too many different curricula; No impact
frequent transitions hard on students;social & emotional problems; neverbelonging, feeling insecure
McArthur Dismptive; lack of continuity in curricula The longer they stay the better
UrbanBroadway Feels badly DisruptiveNinth St. Difficult; low retention or not in srhool; Disrupts class for 1-2 days;
attitude that school not important other kids put on hold
StableCreekside Self-worth affected; using energy to learn Positive; new experience
new people/schoolFairview Enhances their education Social life only, not education
Note. Interview questions:1. How does mobility affect the education of the students in your school who move?2. How does mobility affect the education of the students in your school who do not move?
T.29 1 -C

Table 6.3
Effects of Student Mobility on Principal Planning Decisions
School1.
Effects on Planning2.
Budget Trade-offs3.
Effects on School Calendar
Agricultural1) Funding Space Not affectedAppleton2) Redirect staff time3) Coordinate space
Elm 1) Redirect staff time Curriculum Community/families2) Convert space3) Manipulate class size4) Inservice training5) Move desks & chairs
Military1) Assume maximum enrollment,
students inteithangeableNot affected; multi ethnic
students = positive1) State testing2) Promotion date
Doolittle
McArthur 1) Budget based on previous year'senrollment
Shortages of supplies & materials Not affected
Broadway 1) Manipulate class size Not affected; seek free services State testing2) School program excellence3) Maximum use of facilities
Ninth St. 1) Delegate $ for materials toteachers
Resource staff Not affected
2) Bght for status quo faculty3) Add resource staff
StableCreekside Not affected Not affected Not affectedFairview 1) Aides hired for class overloads Not affected Not affected
Note. Interview questions:1. When you plan and project your needs for the entire school year, how does mobility affect the decisions you make?2. Often, budget decisions call for trade-offs. What trade-offs must you make to meet the demands of student mobility at this school?3. When you plan the calendar for the entire school year, how does mobility affect the decisions you make?
17

Table 6.4
Student Mobility & School-wide Programs
School
1.Reading
Placement
2.Ma th
Placement
3.School-wide
Programs
4.
Reasons
5.Effect of School
Programs
6.Effect on New
Curriculum
AgriculturalTeacher Teacher Yes Teacher initiated to
integrate non-Englishspeakers
Easier Mobility = NoLanguage =Yes
Appleton
Elm Teacher Tevtior No Not applicable Not applicable No
MiUntyDoolittle Reading Teacher No Not applicable Not applicable No
Specialist NoMcArthur Teacher Teacher Yes 1) Teacher expertise Easier
2) Meet individual needsUrban
Broadway Teacher Teacher Yes Self-esteem of students Don't know District selects textsNinth St. Reading
SpecialistTeacher Yes In place before principal
took jobDon't know Self-esteem of low-
achievers = moreimportant
StableCreekside Teacher Teacher Yes Meet individual student Easier Uncodeable responseFairview Principal Teacher Yes needs Doesn't matter District selects texts
Skills-based reading
Note. Interview questions:1. Who is responsible for assessing the newcomer's reading level?2. Who is responsible for assessing the newcomer's math level?3. Are there instructional programs that require students to combine differently across classroom boundaries?4. What are the reasons for these school-wide instructional programs?5. Do school-wide programs make it easier or more difficult for teachers to work with mobile students?6. Suppose you and your faculty were planning to adopt a new curriculum, how might mobility be a factor in your decision?
1 F38

Table 6.5
Student Mobility & School Administration
School
1.Same DayPlacement
2.
Notice Given
3.
Who Assigns
4.
Based On
5.Differentfrom Fall
AgriculturalAppleton Yes < 1 hr 1) Principal 1) Empty seat Yes
2) Need for bilingual servicesElm Yes > 1 mo for
migrants1) Principal2) Teacher
1) Balance heterogenous class ability2) Balance sex
Yes
MilitaryDoolittle Depends < 1 hr 1) Reading 1) Primary by reading ability Yes
Specialist 2) Upper by empty seatMcArthur Depends < 1 hr 1) Front office 1) Empty seat No
i.0NI
2) Balance sex3) Special needs
UrbanBroadway No 24 hours 1) Principal 1) Empty seat Yes
2) Balance sex3) Match student's needs & teacher4) Student ability/special needs
Ninth St. Depends < 1 hr 1) Secretary 1) Empty seat Yes2) Principal3) Bus schedule
StableCreekside Yes < 1 hr 1) Secretary 1) Empty sea. Yes
21 Principal 2) Balance special needsFairview Yes < 1 hr 1) Principal 1) Balance heterogenous reading level No
2) B.LInce sex
.
Note. Interview questions:1. Are new students placed in classrooms the same day they enroll?2. Typically, how much notice do teachers have of a new student's placement in their classes?3. Who assigns students to classes?4. On what basis is the assignment made?5. Is this procedure different from the way in which students are assigned to classes at the beginning of the year?

Table 6.6
Student Mobility & School-wide Management
School
I.
Student Orientation
2.
Who Conveys Rules & Routines
3.School-wideManagement
4.
Who Conveys School-wide
AgriculturalAppleton No I) Teacher Yes I) Handbook
2) Parent handbook 2) Fall assembly3) Bus schedule 3) Teacher
Elm No 1) Parent Yes 1) Folder to student and parents2) Secretary3) Newsletters/notices4) Binder in office
MilitaryDoolittle Yes, student coundl
mini-presentationI) Parent handbook2) Newsletters/notices
Yes 1) Regular review through year2) Individual review3) Teacher4) Handbook
'.-35) Classmates
coco McArthur No 1) Office staff Yes I ) Handbook
2) Parent/student handbook 2) Teacher3) Fall orientation
UrbanBroadway No 1) Principe to parents Yes 1) Teacher
2) Bus schedule 2) Classmates3) Parent 3) Rules posted4) Newsletter/notices5) Teacher
Ninth St. Yes, Fall assembly 1) Office staff Yes I) Teacher2) Teacher 2) Rules posted3) Parent handbook
StableCreeksi :4e No, handbook to student I) Secretary Yes 1) Office staff
2) Newsletters/notices 2) Clan buddy3) Maps for buses
Fairview No 1) Teacher Yes 1) Teacher2) Class buddy 2) Class buddy
Note. Interview questions:I. Is there an orientation for new students at this school?2. How are school routines conveyed to the new student?3. Is there a school-wide behavior management program at this school?4. How is the school-wide behavior management program conveyed to new students?
1 70

Table 6.7
Principal Perceptions of Teacher Skills Needed & Evaluated in Work with Mobile Students
Agricultural
Appleton Elm
Military Urban Stable
Doolittle McArthur Broadway Ninth St. Creekside Fairview
Personal N NCharacteristics N N E N N N E
Knowledge of NCurriculum E N N
Diagnosing NStudent Needs E E E N v N E
Organization & NPlanning E N
Teaching NTechniques E E F. E
Note. Interview questions:1. Are there particular skills that enable teachers to work more effectively with a mobile student
population? (N = skill needed)2. When you evaluate a teacher's performance, do you look for these skills? (E = skill evaluated)
I)
T.34
1 7 .1

Table 6.8
Resources Available to Teachers Who Work with Mobile Students
School1.
Time2.
Training3.
Help
AgriculturalNo Yes 1) PrincipalAppleton
2) Bilingual Title VIIproject director
Elm Question not asked Question not asked Question not asked
MilitaryYes Yes 1) Resource specialistDooli ttle
2) STC teacher3) ESL teacher4,5) Two reading spedalists6) Psychologist7) Speech8) Language9) Principal10) Vice Principal
McArthur No No 1) Principal
UrbanYes Yes 1) Reading specialistBroadway
2) Grade team3) Principal4) Special education
Ninth St. No No 1) Peer2) Principal
StableNo Yes 1) Resource specialistCreekside
2) PrincipalFairview No Yes 1) Principal
2) R.:source specialist
Note. Interview Questions:1. Is it necessary to provide teachers at this school with extra planning time in order that
they may better work with students who move?2. Is there any inservice training you have found that particularly helps teachers better work
with students who move?3. If a teacher needs help working with a student who moves, bp whom should he or she turn
for help?
T.35
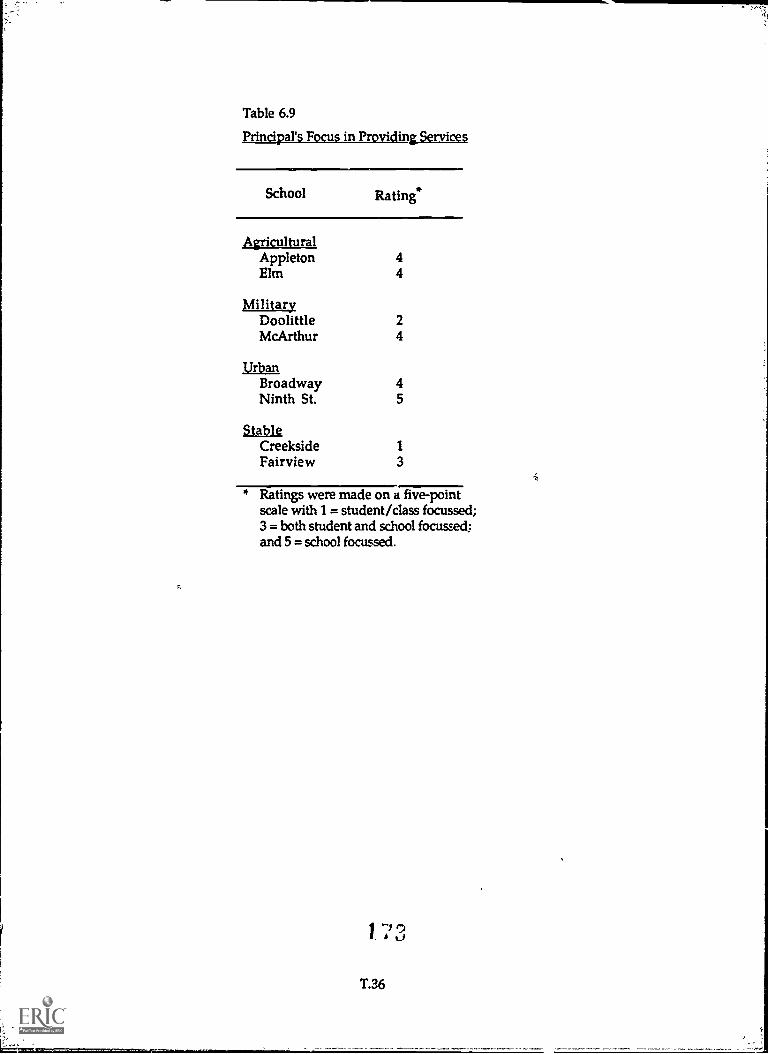
Table 6.9
Principal's Focus in Providing Services
School Rating*
AgriculturalAppleton 4Elm 4
MilitaryDoolittle 2McArthur 4
UrbanBroadway 4Ninth St. 5
StableCreekside 1
Fairview 3
* Ratings were made on a five-pointscale with 1 = student/class focussed;3 = both student and school focus..ed;and 5 = school focussed.
1 73
1.36