gareth.jones Section name Deregulation and productivity growth: a study of Indian commercial banking
Upload
khangminh22Category
view
0download
0
KILLEEN GROWTH STUDY
KILLEEN, TEXAS
Prepared by:
RKG Associates, Inc. Economic, Planning and Real Estate Consultants
300 Montgomery Street
Suite 203
Alexandria, VA 22314
Tel: (703) 739-0965
www.rkgassociates.com
October 2019
Killeen Growth Study Killeen, Texas
October 2019
Prepared for:
One Santa Fe Plaza
Killeen, TX 76541
Contact: Jennifer Hetzel [email protected] Tel: 254.526.9551 killeenchamber.com
Special Thanks:
Prepared by:
Economic, Planning and Real Estate Consultants
300 Montgomery Street, Suite 203
Alexandria, VA 22314
Tel: 703.739.0965
rkgassociates.com
i
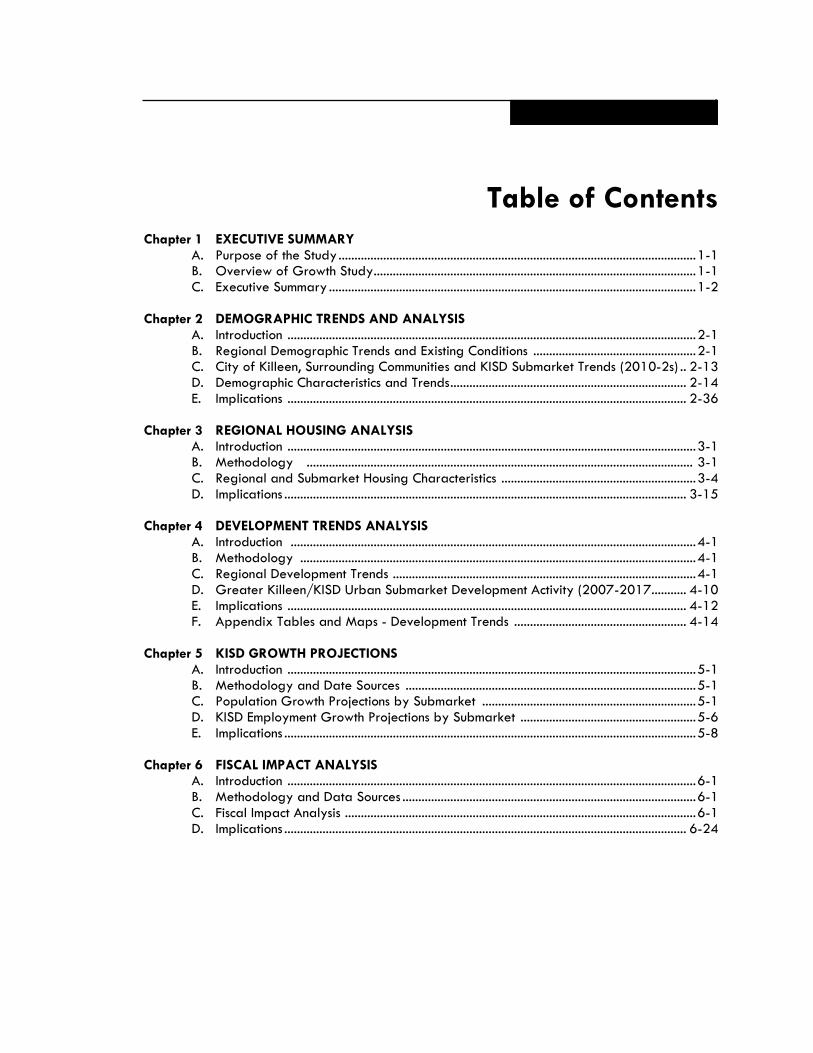
Table of Contents
Chapter 1 EXECUTIVE SUMMARY
A. Purpose of the Study ................................................................................................................ 1-1 B. Overview of Growth Study ..................................................................................................... 1-1 C. Executive Summary ................................................................................................................... 1-2
Chapter 2 DEMOGRAPHIC TRENDS AND ANALYSIS A. Introduction ................................................................................................................................ 2-1 B. Regional Demographic Trends and Existing Conditions ................................................... 2-1 C. City of Killeen, Surrounding Communities and KISD Submarket Trends (2010-2s) .. 2-13 D. Demographic Characteristics and Trends .......................................................................... 2-14 E. Implications ............................................................................................................................. 2-36
Chapter 3 REGIONAL HOUSING ANALYSIS A. Introduction ................................................................................................................................ 3-1 B. Methodology ......................................................................................................................... 3-1 C. Regional and Submarket Housing Characteristics ............................................................. 3-4 D. Implications .............................................................................................................................. 3-15
Chapter 4 DEVELOPMENT TRENDS ANALYSIS A. Introduction ............................................................................................................................... 4-1 B. Methodology ............................................................................................................................ 4-1 C. Regional Development Trends ............................................................................................... 4-1 D. Greater Killeen/KISD Urban Submarket Development Activity (2007-2017........... 4-10 E. Implications ............................................................................................................................. 4-12 F. Appendix Tables and Maps - Development Trends ...................................................... 4-14 Chapter 5 KISD GROWTH PROJECTIONS A. Introduction ................................................................................................................................ 5-1 B. Methodology and Date Sources ........................................................................................... 5-1 C. Population Growth Projections by Submarket ................................................................... 5-1 D. KISD Employment Growth Projections by Submarket ....................................................... 5-6 E. Implications ................................................................................................................................. 5-8 Chapter 6 FISCAL IMPACT ANALYSIS A. Introduction ................................................................................................................................ 6-1 B. Methodology and Data Sources ............................................................................................ 6-1 C. Fiscal Impact Analysis .............................................................................................................. 6-1 D. Implications .............................................................................................................................. 6-24
Killeen Growth Study City of Killeen, TX October 2019
Page 1-1
1 EXECUTIVE SUMMARY
A. PURPOSE OF THE STUDY The Killeen Growth Study was commissioned by the Greater Killeen Chamber of Commerce, in cooperation with the Killeen Independent School District and the City of Killeen. This study was originally conceived in order to understand demographic and growth characteristics of the region in order to better plan for the education and municipal service needs of the community in the face of rapid population growth. Since the year 2000, the soldier population at Fort Hood has ranged from 41,250 in 2000 to a peak of 53,831 in 2008 and then dropped to 37,053 in 2019 – a decline of 16,778 Soldiers since 2008 and 3,293 since 2000. During the same period of time, overall total population for the Killeen-Temple-Fort Hood Metropolitan Statistical Area (MSA), which includes Bell, Coryell, and Lampasas Counties, increased substantially but at varying rates. There is some evidence that this runs counter to historical trends. Historically, enrollments in the Killeen Independent School District have been closely proportionate to the number of active duty Soldiers assigned to Fort Hood. In recent years, the number of enrollments in KISD has continued to increase while the number of active duty Soldiers has decreased. This means that the recent population growth is not directly attributable to the military population as shown in the data over this period. Communities geographically closest to Fort Hood traditionally experienced growth rates comparable to the military population of Fort Hood. However, the local communities recently have grown while the military population has dropped. The Greater Killeen Chamber of Commerce (GKCC) sought the services of a professional economic consultant to facilitate the development of a Growth Analysis that will guide the GKCC and partner entities. GKCC represents a collaboration between the Chamber and Killeen Economic Development Corporation, City of Killeen, Killeen Independent School District, Heart of Texas Defense Alliance and Workforce Solutions of Central Texas. These organizations were focused on obtaining a better understanding of these regional dynamics in order to assist local leaders with short-and-long-term strategic planning and policy implementation.
B. OVERVIEW OF GROWTH STUDY This report provides a detailed understanding of the demographic and market factors that have shaped growth in the City of Killeen and the Killeen Independent School District over the past several decades. The chapters are arranged in the following order:
Chapter 1 – Introduction Chapter 2 – Demographic Trends Analysis Chapter 3 – Regional Housing Analysis Chapter 4 – Development Trend Analysis Chapter 5 – KISD Growth Projections Chapter 6 – Fiscal Impact Analysis
Killeen Growth Study City of Killeen, TX October 2019
Page 1-2
C. EXECUTIVE SUMMARY 1. Demographic Trends Analysis a) Regional Overview RKG analyzed the demographic trends and conditions for both the region and the Greater/KISD study area. This analysis focused mainly on the population trends, indicators, and conditions for the 50-year period between 1970-2017. To complete the population trend analysis, RKG used data obtained from Woods & Poole Economics, Inc and ESRI. Between 2000-2010, all three counties in the Killeen-Temple-Fort Hood MSA experienced population growth. Additionally, since 2010, the age group with the largest growth rate in all three counties was seniors (65+ years old). This is part of a national trend of the country getting older as “Baby Boomers” hit retirement age. Also, due to immigrants migrating to the region since 1970, the MSA has experienced a 12% annual increase in the Hispanic population. Part of the region population increase can be attributed to a disproportionate rate of natural births over deaths, which far outpace the state average. In fact, natural population change resulted in nearly 30,000 net new population in Bell County between 2011 and 2017. This is a significant driver of population change, which is evidence in the area’s younger population base and increased enrollment trends in the KISD school district. In addition, movements of military personnel and their families from other locations of the country, and their desire to remain in the region after separating or retiring from the military has resulted in population increases. Finally, over the past 15 years, the rising cost of living in California has made Texas a popular destination for Californians looking for both housing affordability and employment. Based on migration data, it can be shown that the state continues to attract large numbers of people from higher cost regions of the Country. With the US entering conflicts in both Iraq and Afghanistan in the early 2000s, Bell County experienced population growth in the 0-14 age group, young adult population (19-34 years old), and older adult population (45-54-year-old). The older adult population could be attributable to family members of soldiers moving to the region to support military spouses and children left behind. Even though annual growth has slowed down slightly as Fort Hood’s solider levels have decreased, Bell County has remained an attractive place for both soldiers and young adults that want to establish their family. Coryell County experienced much of its population growth during the 1970-1980 period. Similar to Bell County, Coryell experienced population growth during the early 2000s. Since then, it has experienced a decline in school age population. This decline is likely due to the families migrating to Killeen and other communities within the region. Lampasas County is the smallest county by population and has the largest percentage of seniors. The county has struggled to attract young families, which can be reflected in the fact that it has the oldest workforce of any county in the region. Additionally, Lampasas County has a large concentration of senior care facilities. The City of Killeen has experienced the most population, growth compared to the other surrounding communities in the region. Killeen experienced rapid population growth between 2000-2010, which slowed slightly after 2010 but still outpaced any other surrounding community. While Killeen experienced changes in its population it also experienced changes in the age of its residents. During the study period (2000-2017), the senior population grew enough for the median age of the population to rise. However, Killeen still has the youngest population within the region. Killeen was able to maintain a comparable young population due to its growth in the 0-14 and 34-44 age cohorts. Growth in these age cohorts shows the large concentration of young families and
Killeen Growth Study City of Killeen, TX October 2019
Page 1-3
school aged children. This is likely due to Killeen’s affordable and diverse housing market compared to other communities. Temple is the second largest population center in the region and the most diverse economically. The population of Temple is the oldest within the region, primarily made up of the 45-64 and 65+ age cohorts. Because of this aging population, Temple is home to many 1-person households and senior care facilities. Temple’s economy is built upon a high concentration of both least-educated and most-educated persons. This can be reflected in Temple’s housing market, which has a mix of both high-value and low-value homes. Fort Hood, unsurprisingly, is most directly affected by changes at the post. Fort Hood is home to both the youngest population and highest concentration of person in group quarters within the region. This community’s education levels reflect a military installation with a large percentage of residents that have achieved mid-level educational attainment. b) KISD As the region has grown in population, the Roy J Smith and Patterson-Liberty Hill submarkets have been the recipients of most of this new population. The growth in these two submarkets reflects the demand from families seeking the best educational offerings. Also, these areas are attractive to recently separated and retired military, who want to stay in the region and are looking for places to raise their families. This is directly reflected in the large increases in school-aged children within these two submarkets. Both submarkets now share an educated workforce, as compared to other parts of the study area. Because of the pace of growth in these two submarkets, the demand for municipal services, commercial offerings and basic infrastructure has put fiscal stress on City, KISD and County. Previously developed submarkets like Bellaire-Reeces Creek and Manor-Rancier experienced slight population growth during the study period. Both areas are aging at a slower pace, due to their lack of senior living options. These submarkets also have low educational attainment levels, which also reflects in lower median household incomes. The other submarkets - Harker Heights, Nolanville, and Killeen/Fort Hood Regional Airport – exhibit their own unique characteristics. Harker Heights has a higher than average median household income, which matches its higher valued housing market and the population’s higher education attainment levels. Nolanville did not experience growth in children or young adult cohorts because of the lack of job opportunities and affordable housing. The Killeen/Fort Hood Regional Airport submarket has a higher than average household income levels, while having below average educational attainment levels. In the future, this submarket is positioned to grow rapidly. 2. Regional Housing Analysis RKG analyzed the residential market for both the region and the Greater/KISD study area. This analysis focused mainly on the market trends, indicators, and conditions for both for-sale and for-rent housing markets for the 10-year period between 2007-2017. RKG utilized Killeen Independent School District (KISD), U.S. Census, and the 2011-2015 American Community Survey data for this analysis. The City of Killeen and Temple have the largest inventory of housing within the region. The City of Killeen’s population has grown rapidly, this has allowed for significant new housing to be built. This population growth is reflected by the fact that 33% of all housing was built in the city between the years of 2000 and 2009. Since Fort Hood’s most recent expansion phase did not include the construction of housing units, areas outside the installation took on much of the housing demand. Compared to Temple, Killeen has a larger concentration of lower value housing units for ownership and rent. Furthermore, residents of Killeen more often carry mortgage debt and spend over 50%
Killeen Growth Study City of Killeen, TX October 2019
Page 1-4
of their household income on housing. This often indicates that residents are experiencing housing affordability issues, despite its comparatively affordable housing market. All submarkets within the Greater Killeen Study Area have a housing stock that is a majority single family detached homes. Housing demand is concentrated within the submarkets that make up the City of Killeen (submarkets 1-4) due to the services offered in the city and their proximity to Fort Hood. These submarkets are more diverse both in type and price compared to the rest of the study area. The population growth that occurred between 2000 and 2009 in the submarkets of Patterson-Liberty Hill and Roy J Smith, allowed for much of the new housing units to be developed there. Most of Patterson-Liberty Hill’s resident population moved into their homes after 2000, whereas Roy J Smith, with its more diverse rent level and housing stock have a much larger percentage of long-term residents. Over the past two decades, the region has shifted from owner-occupied centric to renter-occupied. This has increased the level of moving activity within the study area. Of the 32,000-total renter-occupied units, approximately 80% of renters moved in 2010 or later. a) Owner Occupied Within the Greater Killeen Study Area’s owner-occupied housing market, 75% of homes are valued under $200,000. These houses are mainly concentrated in the Bellaire-Reeces Creek, Manor-Rancier, and Roy J Smith submarkets. Conversely, areas with large lots and suburban features like Patterson-Liberty Hill and Harker Heights submarkets have higher concentrations of homes values above $300,000. Harker Heights has been able to attract new high income-households by building large custom-built homes and rental units. Additionally, as seniors downsize, they have looked at this submarket to rent because of the vibrant long-established neighborhoods. Compared to the metro area, homeowners within the study area spend more of their household income on housing. This is most evident in submarkets like Roy J Smith, Manor-Rancier, and Nolanville, which have significant homeowners spending over 50% of their incomes on housing. In areas such as Bellaire-Reece Creek which have older houses and longer resident tenures, homeowners do not experience the same housing cost burden because they have likely paid off their mortgages. b) Renter-Occupied As the study area has grown over the past 20 years, it has experienced an increase in the amount of rental housing in all submarkets. Within the study area, 48% of units are renter occupied. This rental population is mostly concentrated in the Bellaire-Reeces Creek and Manor-Rancier submarkets, which now account for 60% of multi-family unit inventory. This is consistent with the makeup of the population moving into these areas which are dominated by 1-person and 2-person households. Patterson-Liberty Hill, Roy J Smith, and Fort Hood have the most expensive rental markets, with gross rents near $1000 per month. This is likely due to the new multifamily developments happening in those submarkets. Bellaire-Reece Creek and Manor-Rancier with their older rental housing stock have the most affordable rental housing. These submarkets offer gross rents closer to $500 or below. 3. Development Trend Analysis RKG analyzed the residential and non-residential development activity for both the region and the Greater/KISD study area. This analysis focused mainly on the development trends for the 10-year period between 2007-2017. RKG utilized assessment records for each county analyzed in this study. a) Regional Trends- Residential Bell County’s residential market accounts for 72% of all land acreage within the county. The county’s housing mix is dominated by single family housing. Due to the population growth between 2007 and 2011, Bell County added 10,938 parcels or 20.3 Million SF of residential housing. Additionally,
Killeen Growth Study City of Killeen, TX October 2019
Page 1-5
since 2011, the county has exceeded that growth with 18,669 new parcels and 35.9 million SF of residential housing. The 2007-2011 development phased produced larger square footages and higher square feet building value compared to the 2012-2017 phase for both single family and multi-family housing, which reflects a higher demand for less expensive housing. Copperas Cove is a low-density, rural community located in Coryell County. This community has not experienced the same population growth as other areas in the study area. Because of this, 85% of all single-family homes were built before 2007. The development that has occurred over the study period (2007-2017) has been focused on single family housing. These new are substantially larger and of higher value than those built previously in this community. This displays a demand for higher-end housing compared to previous development phases. As the City of Killeen has experienced robust population growth, its residential development market produced different types of housing choices. Between 2007 and 2011, developers invested heavily in the city’s single-family housing market. Because much of the population growth came from families with children, duplexes were not a housing type that developers focused on during this period. Additionally, the city did see a large buildup of multi-family inventory. Since 2011, 20% of the city’s multi-family properties were built, as more non-family households came to the region. b) KISD Trends- Residential Due to the significant population growth in both Patterson-Liberty Hill and Roy J Smith, these submarkets have been the most active from a residential development perspective. Patterson-Liberty Hill added 4,216 residential properties between 2007 and 2017. Roy J Smith saw growth in the multi-family segment of the residential market. Additionally, both submarkets saw demand for higher-end housing increase, evident by the larger average residential unit square footage. The submarkets of Bellaire-Reeces Creek and Manor-Rancier have not experienced the same residential development due to their lack of developable land. However, because of the proximity to the Fort Hood military post, Bellaire-Reeces Creek has experienced modest residential development of both single family and multi-family buildings. The Fort Hood submarket has only seen residential growth in mobile homes during the study period, which coincides with the lack of population of growth. Killeen-Fort Hood Regional Airport submarket has experienced strong demand for large single-family house since 2007, as homeowners have used this submarket to build high-value housing. c) Non-Residential Within Bell County, only 3% of all non-residential land is currently occupied by commercial properties. Most of the non-residential land within the county is vacant or farmland. In terms of development, the non-residential market has not kept pace with the residential market during the study period. With the large increase in population and a significant amount of vacant land, non-residential developments should be viable to meet commercial and public service needs. The City of Killeen non-residential market has also not kept pace with its residential market. The City of Killeen’s non-residential market added an additional 3 million SF of commercial space during the study period. The city also has a large amount of vacant commercial lots, that could be assembled to eventually meet the commercial needs of a now larger population. Within the Greater Killeen/KISD study area, most of the non-residential properties are in older submarkets like Bellaire-Reeces Creek and Manor-Rancier. These two submarkets attract workers, shoppers, and patrons from other surrounding submarkets because of their concentrated downtowns. Though Bellaire-Reeces Creek has experienced population growth, it has not experienced commiserate growth in non-residential development. Because of that many, needs for both commercial and public services within this submarket are not being met. As the residential population
Killeen Growth Study City of Killeen, TX October 2019
Page 1-6
has grown in the Patterson-Liberty Hill and Roy J Smith submarkets, new non-residential properties have begun to be developed to support these new population centers. As the population is expected to continue to grow in these two submarkets, government officials and developers should focus their attention on making sure the commercial and public services needs are being addressed. 4. KISD Growth Projections This section details the results of a growth analysis that projected population and employment growth from 2018 to 2035. RKG Associate focused their analysis on the Killeen Independent School District (KISD) study area. a) Population The major shift in the region over the past 20 years is the lessening of dependence on the Fort Hood soldier population. Fort Hood’s population peaked in 2008, yet the Killeen-Temple-Fort Hood Metropolitan area (MSA) continued to grow its population at 1.9% annually. Additionally, as the military population has deceased, student enrollment within the KISD increased during this time period. A majority of this growth will occur in the Patterson-Liberty Hill and Roy J Smith submarkets. This will be a continuation of the population growth that both submarkets have experienced over recent years. Over the next 17 years, Bell County is projected to have an annual population growth rate of 1.4%. Based on these projections, the population of people between the ages of 20-54 is expected to grow by 54% over this period. This is critical to the region, as these ages contribute significantly to both the labor force and family-forming households. Additionally, like the national trend, the county is expected to see significant annual increases in the number of people aged 75 and older. b) Employment RKG projected the employment makeup of the KISD study area from 2018 to 2035 by using the 2018 employment figures for each submarket. Total employment is projected to increase at 0.9% annually, which is slower than the projected population growth. This new employment will cluster in the fast-growing and traditional employment hubs that have the infrastructure and population needed to support them. Since 2010, 80% of commercial development within the KISD happened in the City of Killeen. Traditional employment hubs such as Bellaire-Reeces Creek and Manor-Rancier will continue to be attractive to employers. Additionally, areas south of I-14 like Patterson-Liberty Hill and Roy J Smith, which have experienced significant population and employment growth this decade will also continue to be attractive to employers and commercial developers. 5. Fiscal Impact Analysis This chapter analyzes the fiscal impact of the growth projections detailed in Chapter 5-KISD Growth Projections. The purpose of this chapter is to give insight to both the City of Killeen and KISD on how the expected growth will impact their financial operations over the next 17 years. a) General Government Fiscal Impact As the City of Killeen has grown, its taxable property value experienced a 58% increase. However, the value of tax-exempt properties that are located within the city increased by 214%. In real terms, the City has lost nearly $5.9 million in ad valorem tax revenues in the current fiscal year. Within the City, disabled veterans take up the largest share of tax-exempt property value. This number has continued to increase even as Fort Hood’s force strength has declined. This reflects the rapid increase in veterans retiring within the region. The City of Killeen has experienced the most substantial growth in veteran population regionally. Military veterans and retirees from other parts
Killeen Growth Study City of Killeen, TX October 2019
Page 1-7
of the country are moving to this region because of the quality of life, affordable housing, and military benefits. As the region is expected to grow in population over the next 17 years, it will need to build new residential and non-residential properties to accommodate that growth. Based on a model created by RKG, Bell County is expected to add an additional $1.7 billion (2018 dollars) in new residential assessed value during this study period. The largest portion of this growth will occur during the 2020-2025 period. Fast-growing submarkets such as Patterson-Liberty Hill and Roy J Smith will be the areas that have the largest residential property value growth. On the non-residential side, with estimated job growth of less than 1% each year, the KISD study area is projected to add 3.6 million SF of new building space to accommodate over 7,000 new jobs. Due to the new development within both the KISD and the City of Killeen, both entities are expected to annually average an additional $12 million and $5 million respectively, in new property tax revenues. The City of Killeen, over the 17-year projection period, with the new retail and hotel offerings, would collect $28.4 million in new sales tax and $5.8 million in hotel occupancy tax. This money will help offset the new expenditures needed to accommodate this growth. RKG created a model to investigate the impact of municipal expenditures based on the expected growth in each submarket. Based on growth projections, an additional $4.5 million dollars will be spent in 2035 on municipal expenditures. As Patterson-Liberty Hill and Roy J. Smith are expected to account for much of the growth within the city, the model allocates most of the future expenditure changes to those submarkets. b) KISD RKG obtained detailed school attendance data for all schools within the KISD to project future school facility needs for each submarket. Overall, from 2019 to 2035, the KISD is projected to add 25% more students based on the 2019 enrollment figures. A majority of these new students will be enrolled in elementary schools. Most of this growth will occur in the submarkets of Patterson-Liberty Hill, Roy J Smith, and Harker Heights. It will be necessary for KISD to monitor these expected growth submarkets closely to have time to plan for the services needed. Taking into account the already planned new school construction and consolidations, RKG projects the following building additions to the school district:
• Year 2028 – New elementary school in the fast-growing Patterson-Liberty Hill submarket
• Year 2030 – New middle schools for Patterson-Liberty Hill and Roy J. Smith submarkets
• Year 2031- Robert J. Shoemaker High School is projected to exceed its capacity. New High school (No. 5) would pool students from Robert Shoemaker, Ellison, and Harker Heights attendance zones.
• Year 2033- Ellison High School is projected to exceed its capacity. New High School (No. 6) is projected to be needed to accommodate this growth.
These projected new schools based on recent school construction in Texas could exceed $250 million in today’s dollars. Additionally, based on these projections, KISD will have to hire roughly 775 new teachers (or 45 new staff per year) to accommodate this growth. Finally, KISD receives up to $50 million in Federal Impact Aid because of its high population of federally-connected students. As the number of federally-connected students has dropped over the past 10 years, KISD is expected to go below the federal threshold to receive this aid. Going below the federal threshold could be detrimental to KISD as they could lose up to $20 million from its operating budget.
Killeen Growth Study City of Killeen, TX October 2019
Page 2-1
2 DEMOGRAPHIC TRENDS ANALYSIS
A. INTRODUCTION The City of Killeen is in Bell County, which is the principal city in the Killeen-Temple-Fort Hood Metropolitan Statistical Area (MSA). Additionally, Killeen is directly adjacent to Fort Hood, one of the country’s largest military installations. The city and region’s economy are largely dependent on the activities of Fort Hood, with its 36,000 military personnel and their dependents. Over the past seventeen years, Fort Hood’s population has experienced significant fluctuations depending on the nation’s war-fighting posture around the world. During the same period, the total population of the Killeen-Temple-Fort Hood MSA, which includes Bell, Coryell, and Lampasas Counties, increased substantially but at varying rates of growth. However, there is some evidence that this runs counter to historical trends. Historically, regional population changes have mirrored changes at Fort Hood, however, since 2010 there has been a divergence from historical trends. Primarily, the region’s population has continued to rise while Fort Hood’s population behind the fence has declined. Likewise, student enrollment in the Killeen Independent School District (KISD) has also risen sharply outside the installation while student enrollment has declined on post. The Greater Killeen Chamber of Commerce (GKCC) retained RKG Associates, Inc. to provide a regional demographic and economic analysis to better understand the drivers of population, school enrollment and development growth in the region; particularly in the City of Killeen and the KISD region. It is hoped that the results of this analysis will help local leaders and elected officials plan for this new and emerging future. In order to complete this analysis, RKG examined a variety of housing/development activity, economic and demographic factors shaping the surrounding Killeen-Temple-Fort Hood MSA, the City of Killeen and the KISD study area. To identify local population and development trends, RKG broke the KISD service area into eight separate submarkets. Four of the eight submarkets comprise the City of Killeen’s municipal boundaries. The other four submarkets comprise the smaller towns and suburban areas that are located within the Killeen Independent School District (KISD) boundaries. The results of this analysis are essential for understanding the future growth opportunities that exist in the KISD area.
B. REGIONAL DEMOGRAPHIC TRENDS & EXISTING CONDITIONS
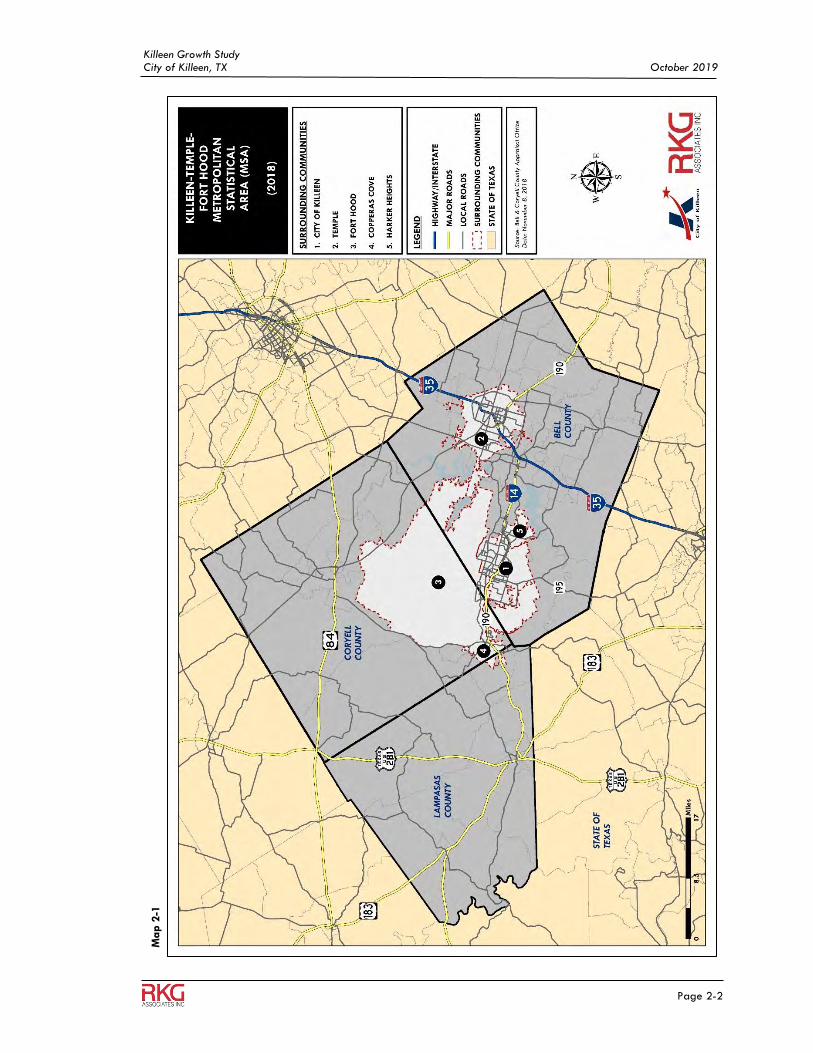
1. Methodology and Data Sources This section quantifies and compares the counties within the Killeen-Temple-Fort Hood MSA that compete against the City of Killeen for new residents and jobs. RKG analyzed nearly 50-year population trends (1970-2017) for the following counties that comprise the Killeen-Temple-Fort Hood MSA, which include: (1) Bell County, (2) Coryell County, (3) Lampasas County (Map 2-1). To complete the population trend analysis the consultant used data obtained from Woods & Poole Economics, Inc., a national data analytics firm.
Killeen Growth Study City of Killeen, TX October 2019
Page 2-2
Ma
p 2
-1
Killeen Growth Study City of Killeen, TX October 2019
Page 2-3
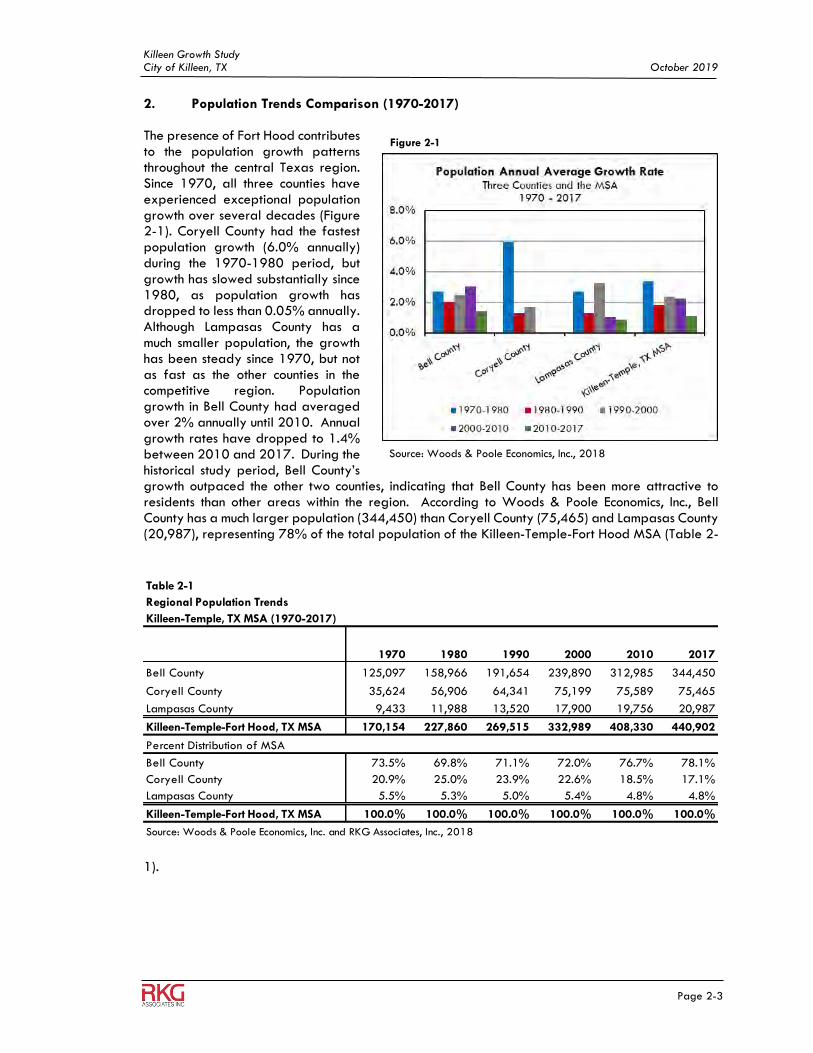
2. Population Trends Comparison (1970-2017) The presence of Fort Hood contributes to the population growth patterns throughout the central Texas region. Since 1970, all three counties have experienced exceptional population growth over several decades (Figure 2-1). Coryell County had the fastest population growth (6.0% annually) during the 1970-1980 period, but growth has slowed substantially since 1980, as population growth has dropped to less than 0.05% annually. Although Lampasas County has a much smaller population, the growth has been steady since 1970, but not as fast as the other counties in the competitive region. Population growth in Bell County had averaged over 2% annually until 2010. Annual growth rates have dropped to 1.4% between 2010 and 2017. During the historical study period, Bell County’s growth outpaced the other two counties, indicating that Bell County has been more attractive to residents than other areas within the region. According to Woods & Poole Economics, Inc., Bell County has a much larger population (344,450) than Coryell County (75,465) and Lampasas County (20,987), representing 78% of the total population of the Killeen-Temple-Fort Hood MSA (Table 2-
1).
Figure 2-1
Source: Woods & Poole Economics, Inc., 2018
Table 2-1
Regional Population Trends
Killeen-Temple, TX MSA (1970-2017)
1970 1980 1990 2000 2010 2017
Bell County 125,097 158,966 191,654 239,890 312,985 344,450
Coryell County 35,624 56,906 64,341 75,199 75,589 75,465
Lampasas County 9,433 11,988 13,520 17,900 19,756 20,987
Killeen-Temple-Fort Hood, TX MSA 170,154 227,860 269,515 332,989 408,330 440,902
Percent Distribution of MSA
Bell County 73.5% 69.8% 71.1% 72.0% 76.7% 78.1%
Coryell County 20.9% 25.0% 23.9% 22.6% 18.5% 17.1%
Lampasas County 5.5% 5.3% 5.0% 5.4% 4.8% 4.8%
Killeen-Temple-Fort Hood, TX MSA 100.0% 100.0% 100.0% 100.0% 100.0% 100.0%
Source: Woods & Poole Economics, Inc. and RKG Associates, Inc., 2018
Killeen Growth Study City of Killeen, TX October 2019
Page 2-4
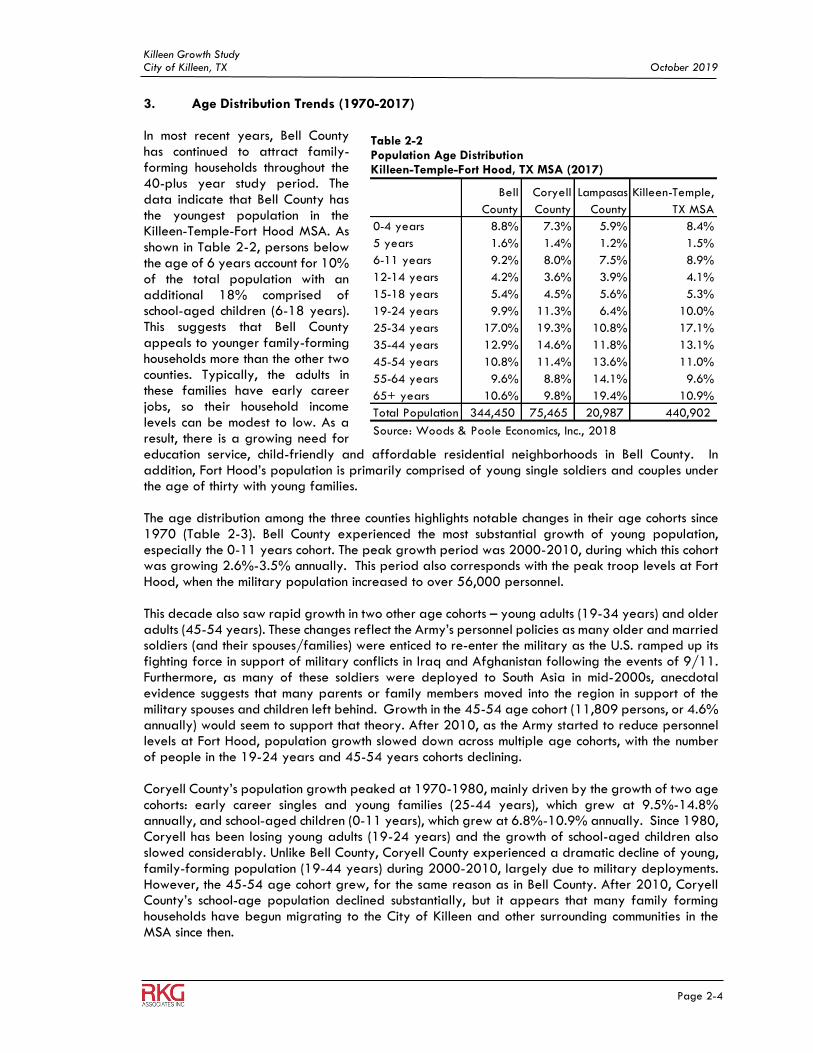
3. Age Distribution Trends (1970-2017) In most recent years, Bell County has continued to attract family-forming households throughout the 40-plus year study period. The data indicate that Bell County has the youngest population in the Killeen-Temple-Fort Hood MSA. As shown in Table 2-2, persons below the age of 6 years account for 10% of the total population with an additional 18% comprised of school-aged children (6-18 years). This suggests that Bell County appeals to younger family-forming households more than the other two counties. Typically, the adults in these families have early career jobs, so their household income levels can be modest to low. As a result, there is a growing need for education service, child-friendly and affordable residential neighborhoods in Bell County. In addition, Fort Hood’s population is primarily comprised of young single soldiers and couples under the age of thirty with young families. The age distribution among the three counties highlights notable changes in their age cohorts since 1970 (Table 2-3). Bell County experienced the most substantial growth of young population, especially the 0-11 years cohort. The peak growth period was 2000-2010, during which this cohort was growing 2.6%-3.5% annually. This period also corresponds with the peak troop levels at Fort Hood, when the military population increased to over 56,000 personnel. This decade also saw rapid growth in two other age cohorts – young adults (19-34 years) and older adults (45-54 years). These changes reflect the Army’s personnel policies as many older and married soldiers (and their spouses/families) were enticed to re-enter the military as the U.S. ramped up its fighting force in support of military conflicts in Iraq and Afghanistan following the events of 9/11. Furthermore, as many of these soldiers were deployed to South Asia in mid-2000s, anecdotal evidence suggests that many parents or family members moved into the region in support of the military spouses and children left behind. Growth in the 45-54 age cohort (11,809 persons, or 4.6% annually) would seem to support that theory. After 2010, as the Army started to reduce personnel levels at Fort Hood, population growth slowed down across multiple age cohorts, with the number of people in the 19-24 years and 45-54 years cohorts declining. Coryell County’s population growth peaked at 1970-1980, mainly driven by the growth of two age cohorts: early career singles and young families (25-44 years), which grew at 9.5%-14.8% annually, and school-aged children (0-11 years), which grew at 6.8%-10.9% annually. Since 1980, Coryell has been losing young adults (19-24 years) and the growth of school-aged children also slowed considerably. Unlike Bell County, Coryell County experienced a dramatic decline of young, family-forming population (19-44 years) during 2000-2010, largely due to military deployments. However, the 45-54 age cohort grew, for the same reason as in Bell County. After 2010, Coryell County’s school-age population declined substantially, but it appears that many family forming households have begun migrating to the City of Killeen and other surrounding communities in the MSA since then.
Table 2-2 Population Age Distribution Killeen-Temple-Fort Hood, TX MSA (2017)
Bell
County
Coryell
County
Lampasas
County
Killeen-Temple,
TX MSA
0-4 years 8.8% 7.3% 5.9% 8.4%
5 years 1.6% 1.4% 1.2% 1.5%
6-11 years 9.2% 8.0% 7.5% 8.9%
12-14 years 4.2% 3.6% 3.9% 4.1%
15-18 years 5.4% 4.5% 5.6% 5.3%
19-24 years 9.9% 11.3% 6.4% 10.0%
25-34 years 17.0% 19.3% 10.8% 17.1%
35-44 years 12.9% 14.6% 11.8% 13.1%
45-54 years 10.8% 11.4% 13.6% 11.0%
55-64 years 9.6% 8.8% 14.1% 9.6%
65+ years 10.6% 9.8% 19.4% 10.9%
Total Population 344,450 75,465 20,987 440,902
Source: Woods & Poole Economics, Inc., 2018
Killeen Growth Study City of Killeen, TX October 2019
Page 2-5
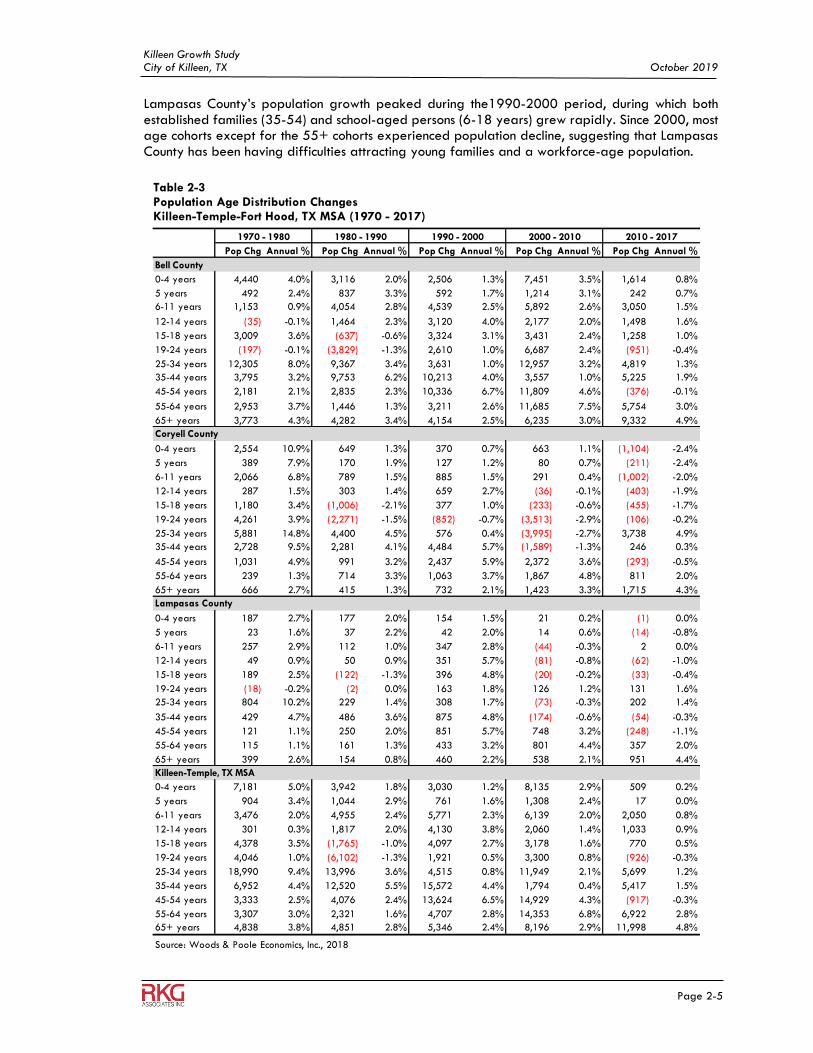
Lampasas County’s population growth peaked during the1990-2000 period, during which both established families (35-54) and school-aged persons (6-18 years) grew rapidly. Since 2000, most age cohorts except for the 55+ cohorts experienced population decline, suggesting that Lampasas County has been having difficulties attracting young families and a workforce-age population.
Table 2-3 Population Age Distribution Changes Killeen-Temple-Fort Hood, TX MSA (1970 - 2017)
Pop Chg Annual % Pop Chg Annual % Pop Chg Annual % Pop Chg Annual % Pop Chg Annual %
Bell County
0-4 years 4,440 4.0% 3,116 2.0% 2,506 1.3% 7,451 3.5% 1,614 0.8%
5 years 492 2.4% 837 3.3% 592 1.7% 1,214 3.1% 242 0.7%
6-11 years 1,153 0.9% 4,054 2.8% 4,539 2.5% 5,892 2.6% 3,050 1.5%
12-14 years (35) -0.1% 1,464 2.3% 3,120 4.0% 2,177 2.0% 1,498 1.6%
15-18 years 3,009 3.6% (637) -0.6% 3,324 3.1% 3,431 2.4% 1,258 1.0%
19-24 years (197) -0.1% (3,829) -1.3% 2,610 1.0% 6,687 2.4% (951) -0.4%
25-34 years 12,305 8.0% 9,367 3.4% 3,631 1.0% 12,957 3.2% 4,819 1.3%
35-44 years 3,795 3.2% 9,753 6.2% 10,213 4.0% 3,557 1.0% 5,225 1.9%
45-54 years 2,181 2.1% 2,835 2.3% 10,336 6.7% 11,809 4.6% (376) -0.1%
55-64 years 2,953 3.7% 1,446 1.3% 3,211 2.6% 11,685 7.5% 5,754 3.0%
65+ years 3,773 4.3% 4,282 3.4% 4,154 2.5% 6,235 3.0% 9,332 4.9%
Coryell County
0-4 years 2,554 10.9% 649 1.3% 370 0.7% 663 1.1% (1,104) -2.4%
5 years 389 7.9% 170 1.9% 127 1.2% 80 0.7% (211) -2.4%
6-11 years 2,066 6.8% 789 1.5% 885 1.5% 291 0.4% (1,002) -2.0%
12-14 years 287 1.5% 303 1.4% 659 2.7% (36) -0.1% (403) -1.9%
15-18 years 1,180 3.4% (1,006) -2.1% 377 1.0% (233) -0.6% (455) -1.7%
19-24 years 4,261 3.9% (2,271) -1.5% (852) -0.7% (3,513) -2.9% (106) -0.2%
25-34 years 5,881 14.8% 4,400 4.5% 576 0.4% (3,995) -2.7% 3,738 4.9%
35-44 years 2,728 9.5% 2,281 4.1% 4,484 5.7% (1,589) -1.3% 246 0.3%
45-54 years 1,031 4.9% 991 3.2% 2,437 5.9% 2,372 3.6% (293) -0.5%
55-64 years 239 1.3% 714 3.3% 1,063 3.7% 1,867 4.8% 811 2.0%
65+ years 666 2.7% 415 1.3% 732 2.1% 1,423 3.3% 1,715 4.3%
Lampasas County
0-4 years 187 2.7% 177 2.0% 154 1.5% 21 0.2% (1) 0.0%
5 years 23 1.6% 37 2.2% 42 2.0% 14 0.6% (14) -0.8%
6-11 years 257 2.9% 112 1.0% 347 2.8% (44) -0.3% 2 0.0%
12-14 years 49 0.9% 50 0.9% 351 5.7% (81) -0.8% (62) -1.0%
15-18 years 189 2.5% (122) -1.3% 396 4.8% (20) -0.2% (33) -0.4%
19-24 years (18) -0.2% (2) 0.0% 163 1.8% 126 1.2% 131 1.6%
25-34 years 804 10.2% 229 1.4% 308 1.7% (73) -0.3% 202 1.4%
35-44 years 429 4.7% 486 3.6% 875 4.8% (174) -0.6% (54) -0.3%
45-54 years 121 1.1% 250 2.0% 851 5.7% 748 3.2% (248) -1.1%
55-64 years 115 1.1% 161 1.3% 433 3.2% 801 4.4% 357 2.0%
65+ years 399 2.6% 154 0.8% 460 2.2% 538 2.1% 951 4.4%
Killeen-Temple, TX MSA
0-4 years 7,181 5.0% 3,942 1.8% 3,030 1.2% 8,135 2.9% 509 0.2%
5 years 904 3.4% 1,044 2.9% 761 1.6% 1,308 2.4% 17 0.0%
6-11 years 3,476 2.0% 4,955 2.4% 5,771 2.3% 6,139 2.0% 2,050 0.8%
12-14 years 301 0.3% 1,817 2.0% 4,130 3.8% 2,060 1.4% 1,033 0.9%
15-18 years 4,378 3.5% (1,765) -1.0% 4,097 2.7% 3,178 1.6% 770 0.5%
19-24 years 4,046 1.0% (6,102) -1.3% 1,921 0.5% 3,300 0.8% (926) -0.3%
25-34 years 18,990 9.4% 13,996 3.6% 4,515 0.8% 11,949 2.1% 5,699 1.2%
35-44 years 6,952 4.4% 12,520 5.5% 15,572 4.4% 1,794 0.4% 5,417 1.5%
45-54 years 3,333 2.5% 4,076 2.4% 13,624 6.5% 14,929 4.3% (917) -0.3%
55-64 years 3,307 3.0% 2,321 1.6% 4,707 2.8% 14,353 6.8% 6,922 2.8%
65+ years 4,838 3.8% 4,851 2.8% 5,346 2.4% 8,196 2.9% 11,998 4.8%
Source: Woods & Poole Economics, Inc., 2018
1990 - 2000 2000 - 2010 2010 - 20171970 - 1980 1980 - 1990
Killeen Growth Study City of Killeen, TX October 2019
Page 2-6
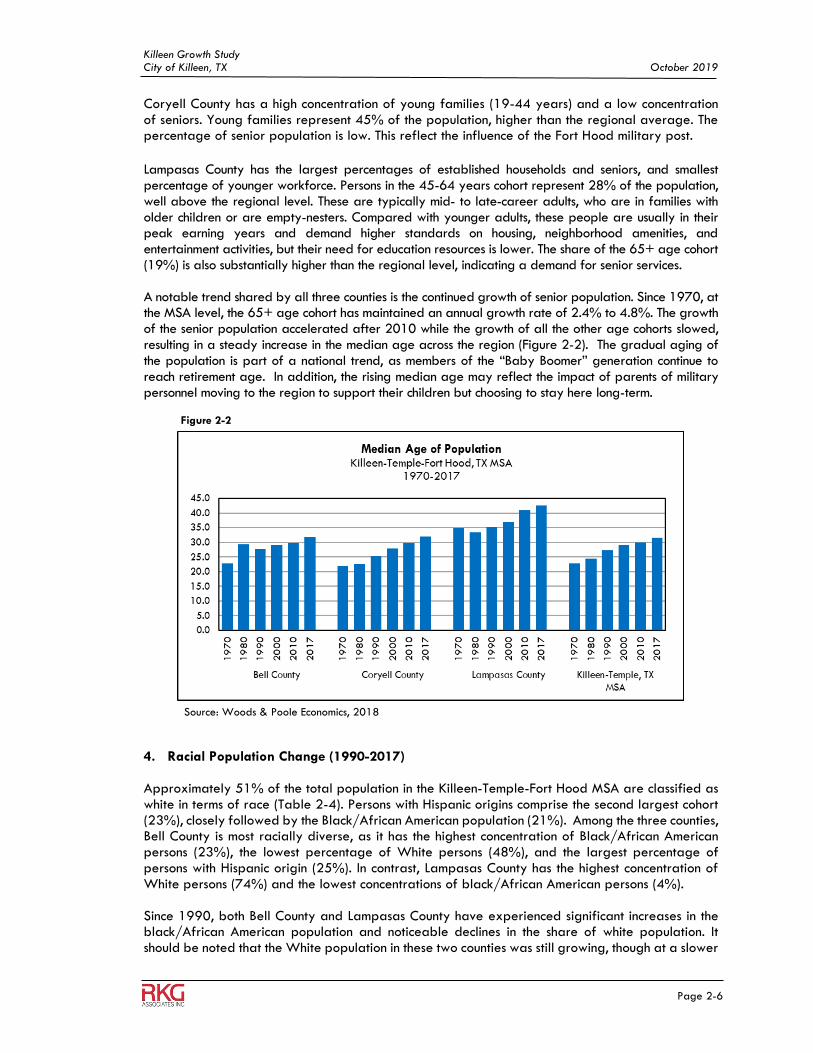
Coryell County has a high concentration of young families (19-44 years) and a low concentration of seniors. Young families represent 45% of the population, higher than the regional average. The percentage of senior population is low. This reflect the influence of the Fort Hood military post. Lampasas County has the largest percentages of established households and seniors, and smallest percentage of younger workforce. Persons in the 45-64 years cohort represent 28% of the population, well above the regional level. These are typically mid- to late-career adults, who are in families with older children or are empty-nesters. Compared with younger adults, these people are usually in their peak earning years and demand higher standards on housing, neighborhood amenities, and entertainment activities, but their need for education resources is lower. The share of the 65+ age cohort (19%) is also substantially higher than the regional level, indicating a demand for senior services. A notable trend shared by all three counties is the continued growth of senior population. Since 1970, at the MSA level, the 65+ age cohort has maintained an annual growth rate of 2.4% to 4.8%. The growth of the senior population accelerated after 2010 while the growth of all the other age cohorts slowed, resulting in a steady increase in the median age across the region (Figure 2-2). The gradual aging of the population is part of a national trend, as members of the “Baby Boomer” generation continue to reach retirement age. In addition, the rising median age may reflect the impact of parents of military personnel moving to the region to support their children but choosing to stay here long-term.
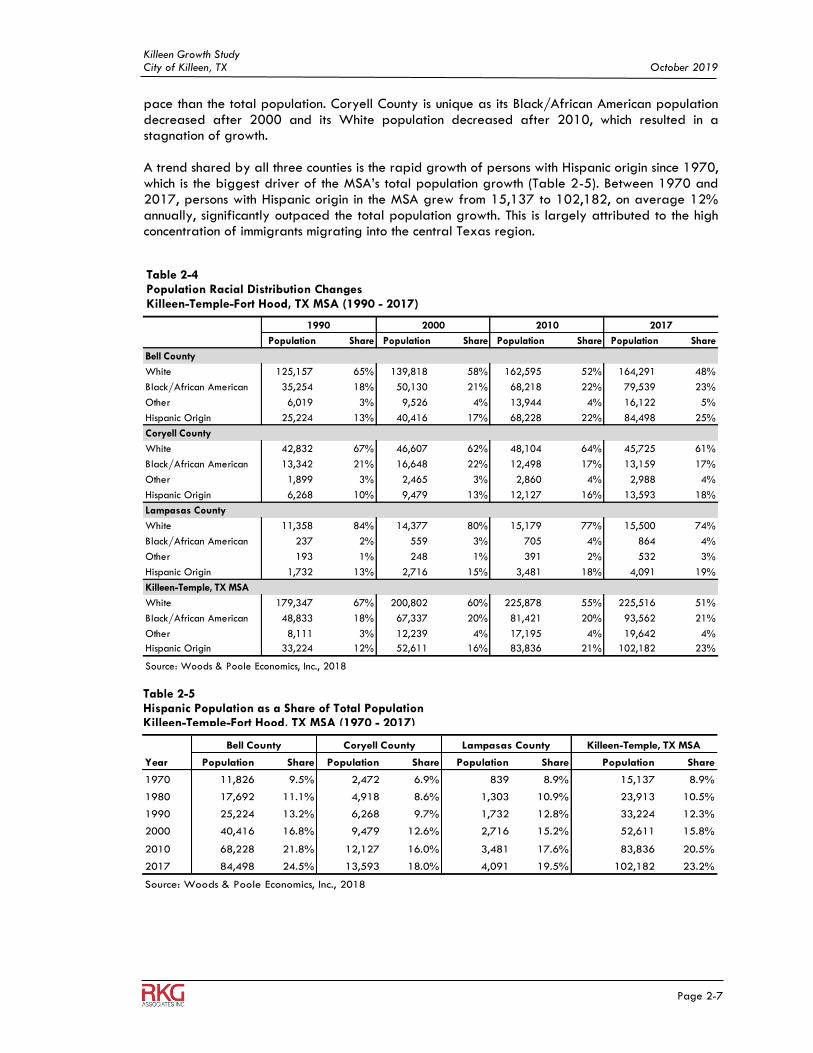
4. Racial Population Change (1990-2017) Approximately 51% of the total population in the Killeen-Temple-Fort Hood MSA are classified as white in terms of race (Table 2-4). Persons with Hispanic origins comprise the second largest cohort (23%), closely followed by the Black/African American population (21%). Among the three counties, Bell County is most racially diverse, as it has the highest concentration of Black/African American persons (23%), the lowest percentage of White persons (48%), and the largest percentage of persons with Hispanic origin (25%). In contrast, Lampasas County has the highest concentration of White persons (74%) and the lowest concentrations of black/African American persons (4%). Since 1990, both Bell County and Lampasas County have experienced significant increases in the black/African American population and noticeable declines in the share of white population. It should be noted that the White population in these two counties was still growing, though at a slower
Figure 2-2
Source: Woods & Poole Economics, 2018
Killeen Growth Study City of Killeen, TX October 2019
Page 2-7
pace than the total population. Coryell County is unique as its Black/African American population decreased after 2000 and its White population decreased after 2010, which resulted in a stagnation of growth. A trend shared by all three counties is the rapid growth of persons with Hispanic origin since 1970, which is the biggest driver of the MSA’s total population growth (Table 2-5). Between 1970 and 2017, persons with Hispanic origin in the MSA grew from 15,137 to 102,182, on average 12% annually, significantly outpaced the total population growth. This is largely attributed to the high concentration of immigrants migrating into the central Texas region.
Table 2-4 Population Racial Distribution Changes Killeen-Temple-Fort Hood, TX MSA (1990 - 2017)
Population Share Population Share Population Share Population Share
Bell County
White 125,157 65% 139,818 58% 162,595 52% 164,291 48%
Black/African American 35,254 18% 50,130 21% 68,218 22% 79,539 23%
Other 6,019 3% 9,526 4% 13,944 4% 16,122 5%
Hispanic Origin 25,224 13% 40,416 17% 68,228 22% 84,498 25%
Coryell County
White 42,832 67% 46,607 62% 48,104 64% 45,725 61%
Black/African American 13,342 21% 16,648 22% 12,498 17% 13,159 17%
Other 1,899 3% 2,465 3% 2,860 4% 2,988 4%
Hispanic Origin 6,268 10% 9,479 13% 12,127 16% 13,593 18%
Lampasas County
White 11,358 84% 14,377 80% 15,179 77% 15,500 74%
Black/African American 237 2% 559 3% 705 4% 864 4%
Other 193 1% 248 1% 391 2% 532 3%
Hispanic Origin 1,732 13% 2,716 15% 3,481 18% 4,091 19%
Killeen-Temple, TX MSA
White 179,347 67% 200,802 60% 225,878 55% 225,516 51%
Black/African American 48,833 18% 67,337 20% 81,421 20% 93,562 21%
Other 8,111 3% 12,239 4% 17,195 4% 19,642 4%
Hispanic Origin 33,224 12% 52,611 16% 83,836 21% 102,182 23%
Source: Woods & Poole Economics, Inc., 2018
1990 2000 2010 2017
Table 2-5 Hispanic Population as a Share of Total Population Killeen-Temple-Fort Hood, TX MSA (1970 - 2017)
Year Population Share Population Share Population Share Population Share
1970 11,826 9.5% 2,472 6.9% 839 8.9% 15,137 8.9%
1980 17,692 11.1% 4,918 8.6% 1,303 10.9% 23,913 10.5%
1990 25,224 13.2% 6,268 9.7% 1,732 12.8% 33,224 12.3%
2000 40,416 16.8% 9,479 12.6% 2,716 15.2% 52,611 15.8%
2010 68,228 21.8% 12,127 16.0% 3,481 17.6% 83,836 20.5%
2017 84,498 24.5% 13,593 18.0% 4,091 19.5% 102,182 23.2%
Source: Woods & Poole Economics, Inc., 2018
Coryell County Lampasas County Killeen-Temple, TX MSABell County
Killeen Growth Study City of Killeen, TX October 2019
Page 2-8
5. Population Gender Change (1970-2017) Over the past several decades, as the Department of Defense has allowed women to assume different roles in the military, including combat roles, both Bell County and Coryell County experienced faster female population growth, resulting in a substantial shift in population gender composition in both counties (Table 2-6 and 2-7). In addition, the population at Fort Hood has changed from predominantly single soldiers to the re-enlistment of older soldiers with spouses and families. In Bell County, the percentage of females increased from 45.2% in 1970 to 50.5% in 2010. The more rapid growth between 2000 and 2010 shows the increase in married soldiers and their spouses re-entering the military and being stationed at Fort Hood. The long-term shift in Coryell County was more dramatic going from 35.4% female in 1970 to 50.9% in 2010. This was due to the exceptional growth in female population during the 1970-1980 period and the decline in male population during the 2000-2010 period when soldiers were deployed at higher numbers. Since 2010, the growth of the female population has slowed in both counties. In Lampasas County where the impact of Fort Hood is less pronounced, the female population has been growing slower than the male population since 1970, resulting in a decrease of the share of females from 52% to 50.6% in 2010.
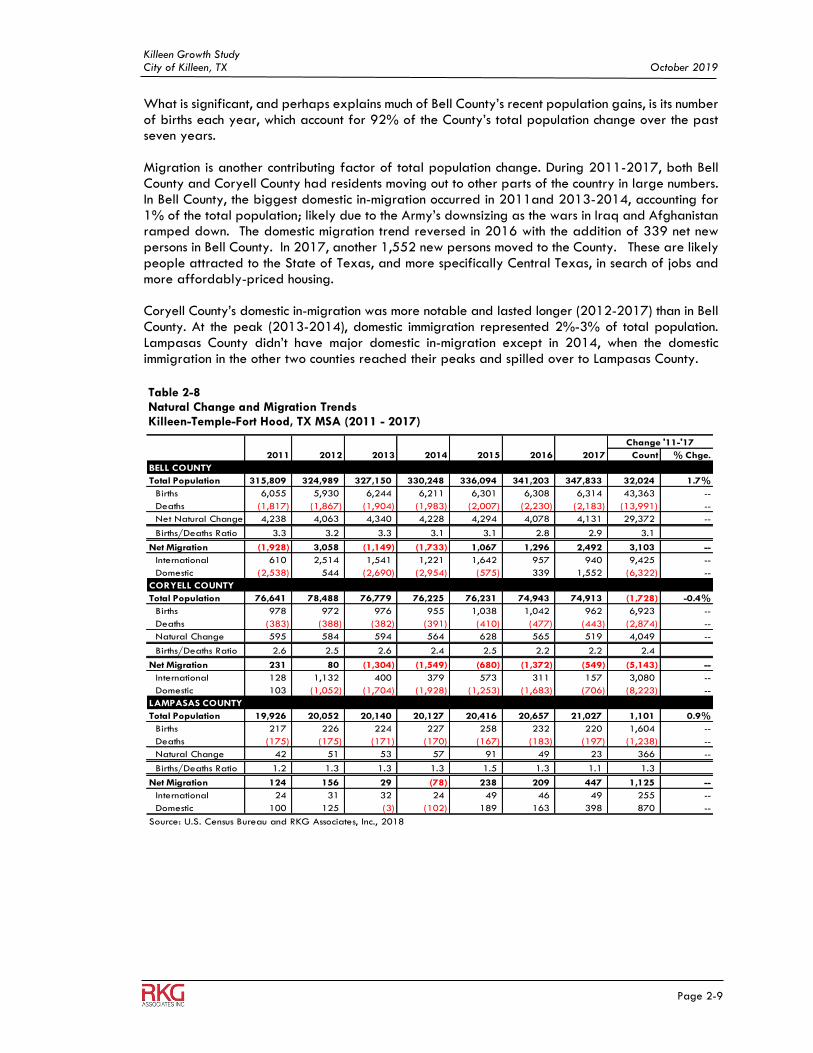
6. Natural Population Change and Migration (2011-2017) One expected result of a younger population is more pronounced natural population growth. Since 2011, births have far exceeded deaths in all three counties. Bell County has an average birth/death ratio of 3.1, with the average number of births per year (6,195) being three times greater than deaths (1,999). Coryell County’s births were more than twice the number of deaths (2.4) during the 2011-2017 study period (Table 2-8). Lampasas County has a similar but less significant pattern.
Table 2-6 Population Gender Composition Trends Killeen-Temple-Fort Hood, TX MSA (1970 - 2017)
Male Female Male Female Male Female Male Female
1970 54.8% 45.2% 64.6% 35.4% 48.0% 52.0% 56.5% 43.5%
1980 52.2% 47.8% 59.0% 41.0% 48.3% 51.7% 53.7% 46.3%
1990 50.9% 49.1% 56.4% 43.6% 48.4% 51.6% 52.1% 47.9%
2000 50.2% 49.8% 51.3% 48.7% 49.0% 51.0% 50.4% 49.6%
2010 49.5% 50.5% 49.1% 50.9% 49.4% 50.6% 49.4% 50.6%
2017 49.8% 50.2% 49.5% 50.5% 49.2% 50.8% 49.7% 50.3%
Source: Woods & Poole Economics, Inc., 2018
Bell County Coryell County Lampasas County Killeen-Temple, TX MSA
Male Female Male Female Male Female Male Female
'70 - '80 2.1% 3.4% 4.6% 8.5% 2.8% 2.6% 2.7% 4.2%
'80 - '90 1.8% 2.4% 0.8% 2.0% 1.3% 1.3% 1.5% 2.2%
'90 - '00 2.3% 2.7% 0.6% 3.1% 3.4% 3.1% 1.9% 2.8%
'00 - '10 2.9% 3.2% -0.4% 0.5% 1.1% 1.0% 2.0% 2.5%
'10 - '17 1.5% 1.4% 0.1% -0.1% 0.8% 0.9% 1.2% 1.1%
Source: Woods & Poole Economics, Inc., 2018
Bell County Coryell County Lampasas County Killeen-Temple, TX MSA
Table 2-7 Annual Population Growth Rate by Gender Killeen-Temple-Fort Hood, TX MSA (1970 - 2017)
Killeen Growth Study City of Killeen, TX October 2019
Page 2-9
What is significant, and perhaps explains much of Bell County’s recent population gains, is its number of births each year, which account for 92% of the County’s total population change over the past seven years. Migration is another contributing factor of total population change. During 2011-2017, both Bell County and Coryell County had residents moving out to other parts of the country in large numbers. In Bell County, the biggest domestic in-migration occurred in 2011and 2013-2014, accounting for 1% of the total population; likely due to the Army’s downsizing as the wars in Iraq and Afghanistan ramped down. The domestic migration trend reversed in 2016 with the addition of 339 net new persons in Bell County. In 2017, another 1,552 new persons moved to the County. These are likely people attracted to the State of Texas, and more specifically Central Texas, in search of jobs and more affordably-priced housing. Coryell County’s domestic in-migration was more notable and lasted longer (2012-2017) than in Bell County. At the peak (2013-2014), domestic immigration represented 2%-3% of total population. Lampasas County didn’t have major domestic in-migration except in 2014, when the domestic immigration in the other two counties reached their peaks and spilled over to Lampasas County.
Table 2-8 Natural Change and Migration Trends Killeen-Temple-Fort Hood, TX MSA (2011 - 2017)
2011 2012 2013 2014 2015 2016 2017 Count % Chge.
BELL COUNTY
Total Population 315,809 324,989 327,150 330,248 336,094 341,203 347,833 32,024 1.7%
Births 6,055 5,930 6,244 6,211 6,301 6,308 6,314 43,363 --
Deaths (1,817) (1,867) (1,904) (1,983) (2,007) (2,230) (2,183) (13,991) --
Net Natural Change 4,238 4,063 4,340 4,228 4,294 4,078 4,131 29,372 --
Births/Deaths Ratio 3.3 3.2 3.3 3.1 3.1 2.8 2.9 3.1
Net Migration (1,928) 3,058 (1,149) (1,733) 1,067 1,296 2,492 3,103 --
International 610 2,514 1,541 1,221 1,642 957 940 9,425 --
Domestic (2,538) 544 (2,690) (2,954) (575) 339 1,552 (6,322) --
CORYELL COUNTY
Total Population 76,641 78,488 76,779 76,225 76,231 74,943 74,913 (1,728) -0.4%
Births 978 972 976 955 1,038 1,042 962 6,923 --
Deaths (383) (388) (382) (391) (410) (477) (443) (2,874) --
Natural Change 595 584 594 564 628 565 519 4,049 --
Births/Deaths Ratio 2.6 2.5 2.6 2.4 2.5 2.2 2.2 2.4
Net Migration 231 80 (1,304) (1,549) (680) (1,372) (549) (5,143) --
International 128 1,132 400 379 573 311 157 3,080 --
Domestic 103 (1,052) (1,704) (1,928) (1,253) (1,683) (706) (8,223) --
LAMPASAS COUNTY
Total Population 19,926 20,052 20,140 20,127 20,416 20,657 21,027 1,101 0.9%
Births 217 226 224 227 258 232 220 1,604 --
Deaths (175) (175) (171) (170) (167) (183) (197) (1,238) --
Natural Change 42 51 53 57 91 49 23 366 --
Births/Deaths Ratio 1.2 1.3 1.3 1.3 1.5 1.3 1.1 1.3
Net Migration 124 156 29 (78) 238 209 447 1,125 --
International 24 31 32 24 49 46 49 255 --
Domestic 100 125 (3) (102) 189 163 398 870 --
Source: U.S. Census Bureau and RKG Associates, Inc., 2018
Change '11-'17
Killeen Growth Study City of Killeen, TX October 2019
Page 2-10
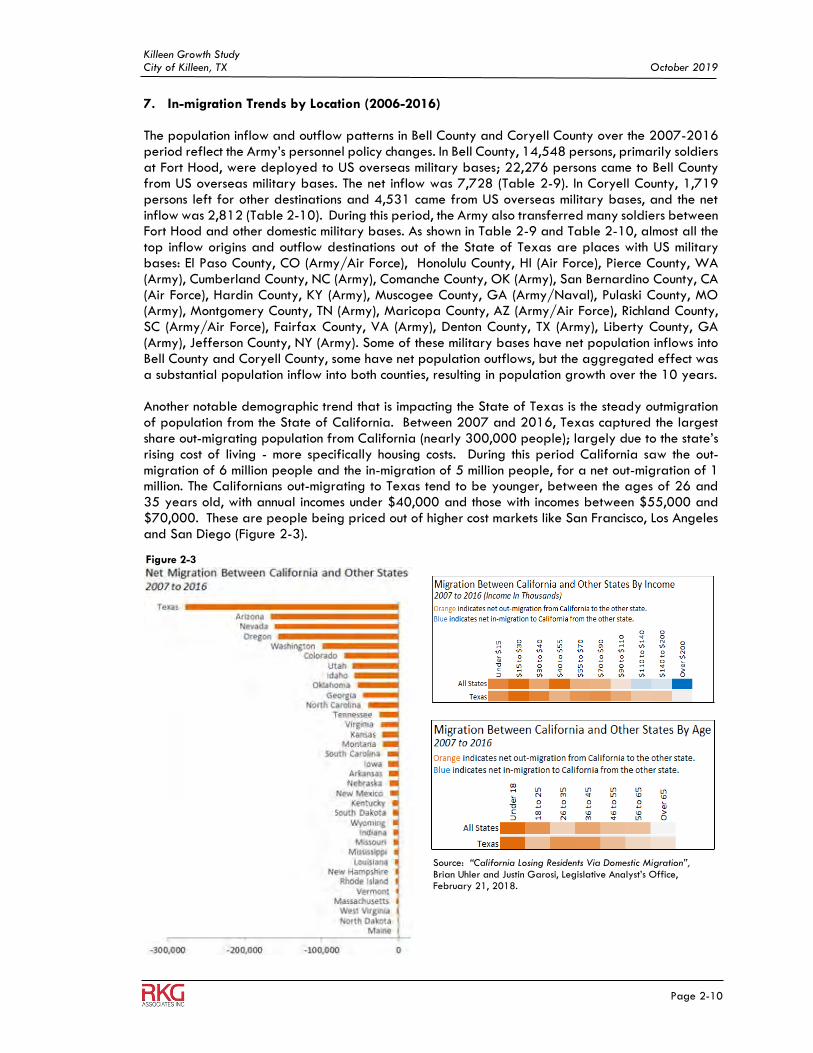
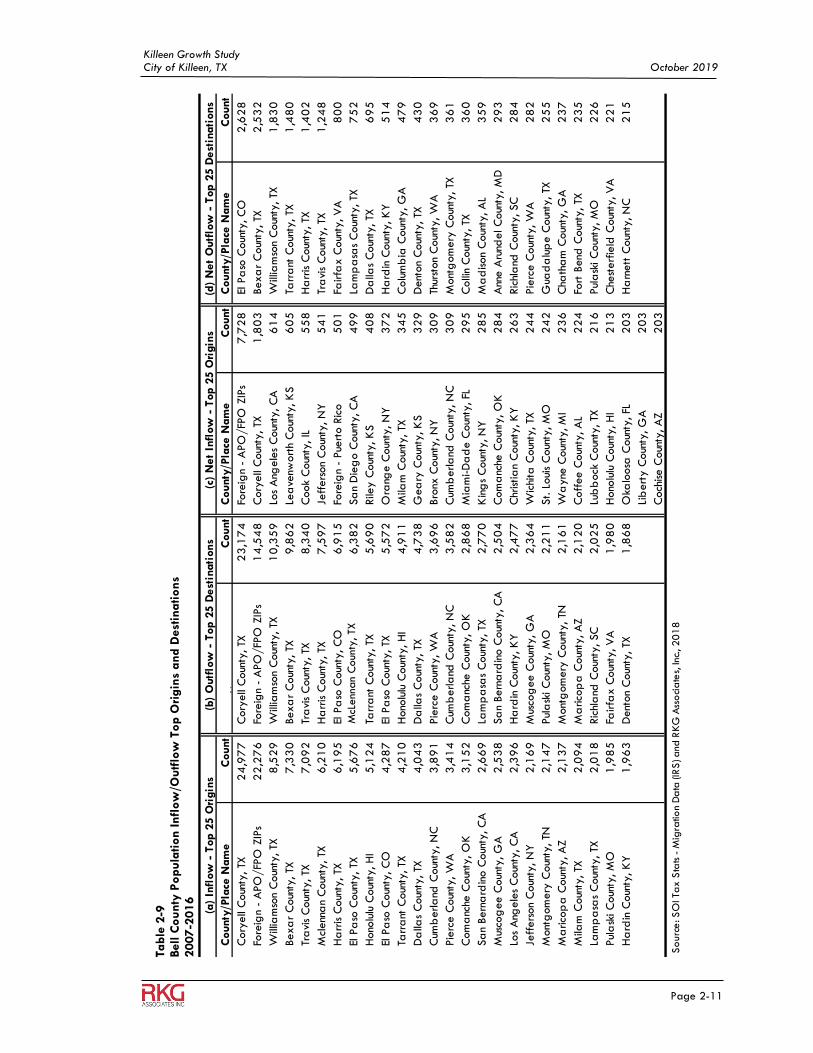
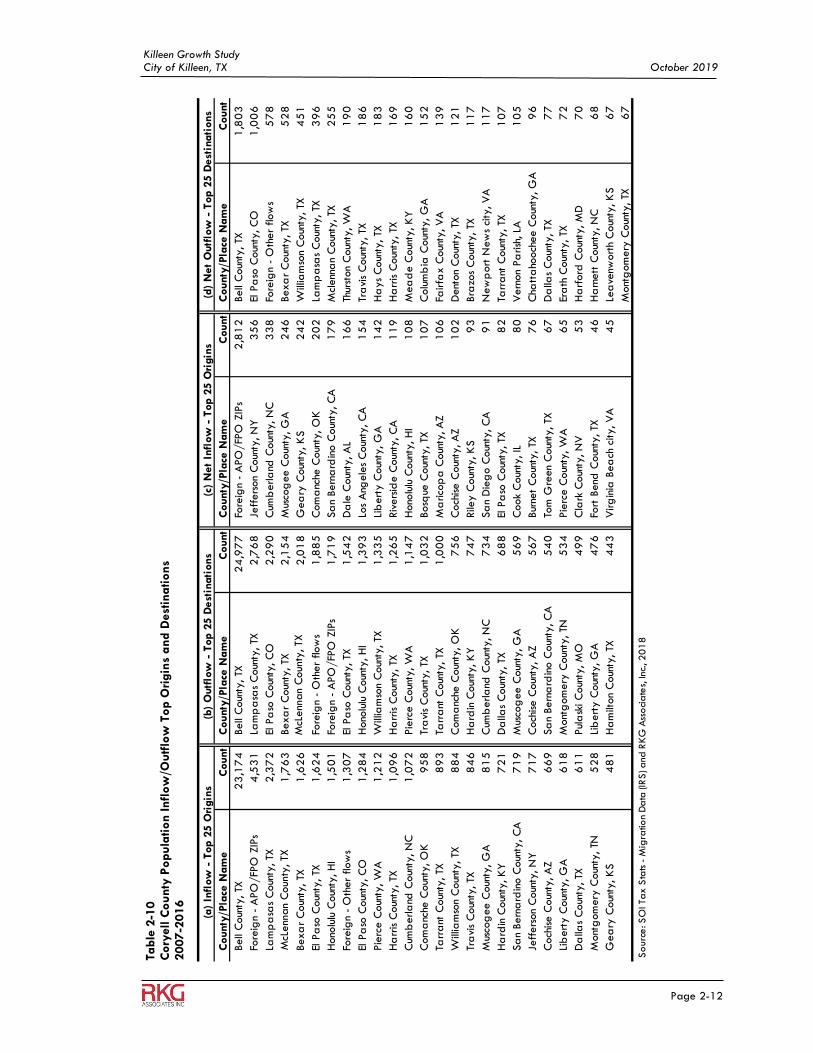
7. In-migration Trends by Location (2006-2016) The population inflow and outflow patterns in Bell County and Coryell County over the 2007-2016 period reflect the Army’s personnel policy changes. In Bell County, 14,548 persons, primarily soldiers at Fort Hood, were deployed to US overseas military bases; 22,276 persons came to Bell County from US overseas military bases. The net inflow was 7,728 (Table 2-9). In Coryell County, 1,719 persons left for other destinations and 4,531 came from US overseas military bases, and the net inflow was 2,812 (Table 2-10). During this period, the Army also transferred many soldiers between Fort Hood and other domestic military bases. As shown in Table 2-9 and Table 2-10, almost all the top inflow origins and outflow destinations out of the State of Texas are places with US military bases: El Paso County, CO (Army/Air Force), Honolulu County, HI (Air Force), Pierce County, WA (Army), Cumberland County, NC (Army), Comanche County, OK (Army), San Bernardino County, CA (Air Force), Hardin County, KY (Army), Muscogee County, GA (Army/Naval), Pulaski County, MO (Army), Montgomery County, TN (Army), Maricopa County, AZ (Army/Air Force), Richland County, SC (Army/Air Force), Fairfax County, VA (Army), Denton County, TX (Army), Liberty County, GA (Army), Jefferson County, NY (Army). Some of these military bases have net population inflows into Bell County and Coryell County, some have net population outflows, but the aggregated effect was a substantial population inflow into both counties, resulting in population growth over the 10 years. Another notable demographic trend that is impacting the State of Texas is the steady outmigration of population from the State of California. Between 2007 and 2016, Texas captured the largest share out-migrating population from California (nearly 300,000 people); largely due to the state’s rising cost of living - more specifically housing costs. During this period California saw the out-migration of 6 million people and the in-migration of 5 million people, for a net out-migration of 1 million. The Californians out-migrating to Texas tend to be younger, between the ages of 26 and 35 years old, with annual incomes under $40,000 and those with incomes between $55,000 and $70,000. These are people being priced out of higher cost markets like San Francisco, Los Angeles and San Diego (Figure 2-3).
Source: “California Losing Residents Via Domestic Migration”, Brian Uhler and Justin Garosi, Legislative Analyst’s Office, February 21, 2018.
Figure 2-3
Killeen Growth Study City of Killeen, TX October 2019
Page 2-11
T
able
2-9
Bell C
ounty
Po
pula
tion I
nfl
ow
/Outf
low
To
p O
rigin
s and D
est
inations
2007-2
016
County
/Pla
ce N
am
eC
ount
County
/Pla
ce N
am
eC
ount
County
/Pla
ce N
am
eC
ount
County
/Pla
ce N
am
eC
ount
Cory
ell
Coun
ty, TX
24
,97
7
Cory
ell
Coun
ty, TX
23
,17
4
Fore
ign
- A
PO
/FP
O Z
IPs
7,7
28
El P
aso
Coun
ty, C
O2
,62
8
Fore
ign
- A
PO
/FP
O Z
IPs
22
,27
6
Fore
ign
- A
PO
/FP
O Z
IPs
14
,54
8
Cory
ell
Coun
ty, TX
1,8
03
Bexa
r C
oun
ty, TX
2,5
32
Will
iam
son
Coun
ty, TX
8,5
29
Will
iam
son
Coun
ty, TX
10
,35
9
Los
Ang
ele
s C
oun
ty, C
A6
14
W
illia
mso
n C
oun
ty, TX
1,8
30
Bexa
r C
oun
ty, TX
7,3
30
Bexa
r C
oun
ty, TX
9,8
62
Lea
venw
ort
h C
oun
ty, K
S6
05
Ta
rra
nt C
oun
ty, TX
1,4
80
Tra
vis
Coun
ty, TX
7,0
92
Tra
vis
Coun
ty, TX
8,3
40
Cook
Coun
ty, IL
55
8
Ha
rris C
oun
ty, TX
1,4
02
Mcl
enn
an
Coun
ty, TX
6,2
10
Ha
rris C
oun
ty, TX
7,5
97
Jeff
ers
on
Coun
ty, N
Y5
41
Tr
avi
s C
oun
ty, TX
1,2
48
Ha
rris C
oun
ty, TX
6,1
95
El P
aso
Coun
ty, C
O6
,91
5
Fo
reig
n -
Pue
rto R
ico
50
1
Fairfa
x C
oun
ty, V
A8
00
El P
aso
Coun
ty, TX
5,6
76
Mcl
enn
an
Coun
ty, TX
6,3
82
Sa
n D
ieg
o C
oun
ty, C
A4
99
La
mp
asa
s C
oun
ty, TX
75
2
Hono
lulu
Coun
ty, H
I5
,12
4
Ta
rra
nt C
oun
ty, TX
5,6
90
Rile
y C
oun
ty, K
S4
08
D
alla
s C
oun
ty, TX
69
5
El P
aso
Coun
ty, C
O4
,28
7
El
Pa
so C
oun
ty, TX
5,5
72
Ora
nge C
oun
ty, N
Y3
72
H
ard
in C
oun
ty, K
Y5
14
Tarr
ant
Coun
ty, TX
4,2
10
Hono
lulu
Coun
ty, H
I4
,91
1
M
ilam
Coun
ty, TX
34
5
Colu
mb
ia C
oun
ty, G
A4
79
Da
llas
Coun
ty, TX
4,0
43
Da
llas
Coun
ty, TX
4,7
38
Gea
ry C
oun
ty, K
S3
29
D
ent
on
Coun
ty, TX
43
0
Cum
berla
nd C
oun
ty, N
C3
,89
1
Pie
rce C
oun
ty, W
A3
,69
6
Bro
nx C
oun
ty, N
Y3
09
Th
urst
on
Coun
ty, W
A3
69
Pie
rce C
oun
ty, W
A3
,41
4
C
umb
erla
nd C
oun
ty, N
C3
,58
2
C
umb
erla
nd C
oun
ty, N
C3
09
M
ont
gom
ery
Coun
ty, TX
36
1
Com
anc
he C
oun
ty, O
K3
,15
2
C
om
anc
he C
oun
ty, O
K2
,86
8
M
iam
i-D
ad
e C
oun
ty, FL
29
5
Colli
n C
oun
ty, TX
36
0
Sa
n Bern
ard
ino C
oun
ty, C
A2
,66
9
La
mp
asa
s C
oun
ty, TX
2,7
70
Kin
gs
Coun
ty, N
Y2
85
M
ad
ison
Coun
ty, A
L3
59
Mus
cog
ee C
oun
ty, G
A2
,53
8
Sa
n Bern
ard
ino C
oun
ty, C
A2
,50
4
C
om
anc
he C
oun
ty, O
K2
84
A
nne A
rund
el C
oun
ty, M
D2
93
Los
Ang
ele
s C
oun
ty, C
A2
,39
6
H
ard
in C
oun
ty, K
Y2
,47
7
C
hristia
n C
oun
ty, K
Y2
63
Ric
hla
nd C
oun
ty, SC
28
4
Jeff
ers
on
Coun
ty, N
Y2
,16
9
M
usco
gee C
oun
ty, G
A2
,36
4
W
ichi
ta C
oun
ty, TX
24
4
Pie
rce C
oun
ty, W
A2
82
Mont
gom
ery
Coun
ty, TN
2,1
47
Pul
ask
i C
oun
ty, M
O2
,21
1
St. L
oui
s C
oun
ty, M
O2
42
G
uad
alu
pe C
oun
ty, TX
25
5
Ma
rico
pa
Coun
ty, A
Z2
,13
7
M
ont
gom
ery
Coun
ty, TN
2,1
61
Wa
yne
Coun
ty, M
I2
36
C
hath
am
Coun
ty, G
A2
37
Mila
m C
oun
ty, TX
2,0
94
Ma
rico
pa
Coun
ty, A
Z2
,12
0
C
off
ee C
oun
ty, A
L2
24
Fo
rt B
end
Coun
ty, TX
23
5
Lam
pa
sas
Coun
ty, TX
2,0
18
Ric
hla
nd C
oun
ty, SC
2,0
25
Lub
bock
Coun
ty, TX
21
6
Pul
ask
i C
oun
ty, M
O2
26
Pul
ask
i C
oun
ty, M
O1
,98
5
Fa
irfa
x C
oun
ty, V
A1
,98
0
H
ono
lulu
Coun
ty, H
I2
13
C
hest
erf
ield
Coun
ty, V
A2
21
Ha
rdin
Coun
ty, K
Y1
,96
3
D
ent
on
Coun
ty, TX
1,8
68
Oka
loosa
Coun
ty, FL
20
3
Ha
rnett
Coun
ty, N
C2
15
Lib
ert
y C
oun
ty, G
A2
03
Coch
ise C
oun
ty, A
Z2
03
Sourc
e: SO
I Tax S
tats -
Mig
ration D
ata
(IR
S) a
nd
RK
G A
ssoci
ate
s, Inc., 20
18
(a)
Infl
ow
- T
op 2
5 O
rigin
s(b
) O
utf
low
- T
op 2
5 D
est
inati
ons
(c)
Net
Infl
ow
- T
op 2
5 O
rigin
s(d
) N
et
Outf
low
- T
op 2
5 D
est
inati
ons
McL
enn
an
Coun
ty, TX
Killeen Growth Study City of Killeen, TX October 2019
Page 2-12
Table
2-1
0
Cory
ell C
ounty
Po
pula
tion Infl
ow
/Outf
low
To
p O
rigin
s an
d D
est
inations
2007-2
016
County
/Pla
ce N
am
eC
ount
County
/Pla
ce N
am
eC
ount
County
/Pla
ce N
am
eC
ount
County
/Pla
ce N
am
eC
ount
Bell
Coun
ty, TX
23
,17
4
Bell
Coun
ty, TX
24
,97
7
Fo
reig
n -
APO
/FP
O Z
IPs
2,8
12
Bell
Coun
ty, TX
1,8
03
Fore
ign
- A
PO
/FP
O Z
IPs
4,5
31
La
mp
asa
s C
oun
ty, TX
2,7
68
Je
ffers
on
Coun
ty, N
Y3
56
El
Pa
so C
oun
ty, C
O1
,00
6
Lam
pa
sas
Coun
ty, TX
2,3
72
El
Pa
so C
oun
ty, C
O2
,29
0
Cum
berla
nd C
oun
ty, N
C3
38
Fo
reig
n -
Oth
er
flow
s5
78
Mcl
enn
an
Coun
ty, TX
1,7
63
Bexa
r C
oun
ty, TX
2,1
54
M
usco
gee C
oun
ty, G
A2
46
Bexa
r C
oun
ty, TX
52
8
Bexa
r C
oun
ty, TX
1,6
26
M
clenn
an
Coun
ty, TX
2,0
18
G
ea
ry C
oun
ty, K
S2
42
W
illia
mso
n C
oun
ty, TX
45
1
El P
aso
Coun
ty, TX
1,6
24
Fo
reig
n -
Oth
er
flow
s1
,88
5
Com
anc
he C
oun
ty, O
K2
02
La
mp
asa
s C
oun
ty, TX
39
6
Hono
lulu
Coun
ty, H
I1
,50
1
Fore
ign
- A
PO
/FP
O Z
IPs
1,7
19
Sa
n Bern
ard
ino C
oun
ty, C
A1
79
M
clenn
an
Coun
ty, TX
25
5
Fore
ign
- O
ther
flow
s1
,30
7
El P
aso
Coun
ty, TX
1,5
42
D
ale
Coun
ty, A
L1
66
Th
urst
on
Coun
ty, W
A1
90
El P
aso
Coun
ty, C
O1
,28
4
Hono
lulu
Coun
ty, H
I1
,39
3
Los
Ang
ele
s C
oun
ty, C
A1
54
Tr
avi
s C
oun
ty, TX
18
6
Pie
rce C
oun
ty, W
A1
,21
2
Will
iam
son
Coun
ty, TX
1,3
35
Li
bert
y C
oun
ty, G
A1
42
H
ays
Coun
ty, TX
18
3
Ha
rris C
oun
ty, TX
1,0
96
H
arr
is C
oun
ty, TX
1,2
65
Riv
ers
ide C
oun
ty, C
A1
19
H
arr
is C
oun
ty, TX
16
9
Cum
berla
nd C
oun
ty, N
C1
,07
2
Pie
rce C
oun
ty, W
A1
,14
7
Hono
lulu
Coun
ty, H
I1
08
M
ea
de C
oun
ty, K
Y1
60
Com
anc
he C
oun
ty, O
K9
58
Tr
avi
s C
oun
ty, TX
1,0
32
Bosq
ue C
oun
ty, TX
10
7
Colu
mb
ia C
oun
ty, G
A1
52
Tarr
ant
Coun
ty, TX
89
3
Tarr
ant
Coun
ty, TX
1,0
00
M
arico
pa
Coun
ty, A
Z1
06
Fa
irfa
x C
oun
ty, V
A1
39
Will
iam
son
Coun
ty, TX
88
4
Com
anc
he C
oun
ty, O
K7
56
C
och
ise C
oun
ty, A
Z1
02
D
ent
on
Coun
ty, TX
12
1
Tra
vis
Coun
ty, TX
84
6
Ha
rdin
Coun
ty, K
Y7
47
Rile
y C
oun
ty, K
S9
3
Bra
zos
Coun
ty, TX
11
7
Mus
cog
ee C
oun
ty, G
A8
15
C
umb
erla
nd C
oun
ty, N
C7
34
Sa
n D
ieg
o C
oun
ty, C
A9
1
N
ew
port
New
s ci
ty, V
A1
17
Ha
rdin
Coun
ty, K
Y7
21
D
alla
s C
oun
ty, TX
68
8
El P
aso
Coun
ty, TX
82
Tarr
ant
Coun
ty, TX
10
7
Sa
n Bern
ard
ino C
oun
ty, C
A7
19
M
usco
gee C
oun
ty, G
A5
69
C
ook
Coun
ty, IL
80
Vern
on
Pa
rish
, LA
10
5
Jeff
ers
on
Coun
ty, N
Y7
17
C
och
ise C
oun
ty, A
Z5
67
Bur
net
Coun
ty, TX
76
Cha
tta
hooch
ee C
oun
ty, G
A9
6
Coch
ise C
oun
ty, A
Z6
69
Sa
n Bern
ard
ino C
oun
ty, C
A5
40
To
m G
reen
Coun
ty, TX
67
Da
llas
Coun
ty, TX
77
Lib
ert
y C
oun
ty, G
A6
18
M
ont
gom
ery
Coun
ty, TN
53
4
Pie
rce C
oun
ty, W
A6
5
Er
ath
Coun
ty, TX
72
Da
llas
Coun
ty, TX
61
1
Pul
ask
i C
oun
ty, M
O4
99
C
lark
Coun
ty, N
V5
3
H
arf
ord
Coun
ty, M
D7
0
Mont
gom
ery
Coun
ty, TN
52
8
Lib
ert
y C
oun
ty, G
A4
76
Fo
rt B
end
Coun
ty, TX
46
Ha
rnett
Coun
ty, N
C6
8
Gea
ry C
oun
ty, K
S4
81
H
am
ilton
Coun
ty, TX
44
3
Virg
inia
Bea
ch c
ity, V
A4
5
Le
ave
nwort
h C
oun
ty, K
S6
7
Mont
gom
ery
Coun
ty, TX
67
Sourc
e: SO
I Tax S
tats -
Mig
ration D
ata
(IR
S) a
nd
RK
G A
ssoci
ate
s, Inc., 20
18
(a)
Infl
ow
- T
op 2
5 O
rigin
s(b
) O
utf
low
- T
op 2
5 D
est
inati
ons
(c)
Net
Infl
ow
- T
op 2
5 O
rigin
s(d
) N
et
Outf
low
- T
op 2
5 D
est
inati
ons
McL
enn
an
Coun
ty, TX
McL
enn
an
Coun
ty, TX
Killeen Growth Study City of Killeen, TX October 2019
Page 2-13
8. Implication of Regional Population Trends In the Killeen-Temple-Fort Hood MSA region, all the three counties have experienced rapid population growth since 1970. However, the differences between the three counties reflect the impacts of the Army’s changing force structure. Bell County, which has the largest population, has maintained the most consistent pace of growth, suggesting that it has been attractive to residents and still relatively affordable for middle income households. The percentage of school-aged children is particularly high, indicating a strong demand for education resources and family-oriented neighborhood amenities. Still, the changes in the population’s age cohorts and gender composition reflect the influence of the military post. The population of children, young adults and older adults grew substantially between 1990 and 2000, as many married soldiers and their spouses entered the military and were stationed at Fort Hood. The increase of older adults continued into mid- to late-2000s, when the parents of some soldiers who were deployed overseas moved here to support their children. Since 1970, as the Army allowed women to assume expanded roles in the military, the share of female population started to increase. Coryell County has a smaller population than Bell County, but since most of Fort Hood’s land area falls into Coryell County, the impacts of the Army appeared to be more direct. First, the expansion of the military post between 1970 and 1980 led to 6% annually population growth. In the mid- and late-2000s, as soldiers were deployed overseas in large numbers, the total population stagnated, and the population of young adults and middle-aged adults declined substantially. However, the population of older adults increased, for the same reason as in Bell County. After 2010, as the Army downsized, Coryell County’s total population declined. The shift in the population’s gender composition has been more dramatic in Coryell County than in Bell County: between 1970 and 2017, Coryell County changed from 34.4% female to 50.5% female. During the 2007-2016 period, both Bell County and Coryell County had substantial population migrations to and from US domestic and overseas military bases. The net effect was an inflow of population, which contributed to increased population gains in both counties. Lampasas County has the smallest population and has been less affected by the Army than the other two counties. Its population is older than the MSA average, with a lower percentage of school-aged children, a higher percentage of persons in senior career facilities and in established households, and a higher percentage of seniors/retirees. This suggests that the housing and neighborhood qualities as well as home values in Lampasas are higher than in Bell County and Coryell County. Senior facilities are also more available in Lampasas. Despite the differences, the three counties share two common demographic trends in terms of median age and racial diversity in population. The diversification in population is largely attributed to affordable living options that have surfaced throughout the Killeen-Temple-Fort Hood MSA., which will be discussed in detail in the next chapter.
C. CITY OF KILLEEN, SURROUNDING COMMUNITIES AND KISD SUBMARKET TRENDS (2000-2022)
1. City of Killeen and Surrounding Communities
As shown in Map 2-1, RKG analyzed the demographic characteristics and trends within the surrounding communities in the metropolitan statistical area. However, the following analysis examines the City of Killeen, the adjacent communities and the eight submarket areas that comprise the Killeen Independent School District boundaries, including the Fort Hood military post. The other surrounding communities include, Temple; Fort Hood; Copperas Cove and Harker Heights.
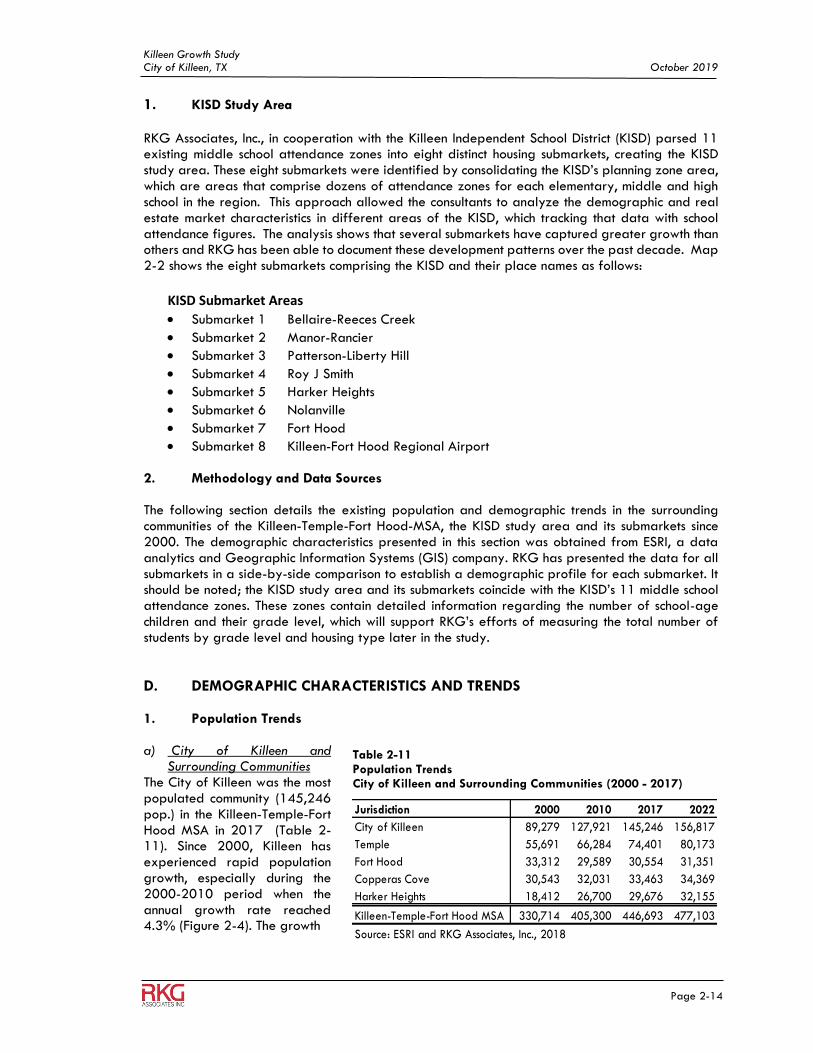
Killeen Growth Study City of Killeen, TX October 2019
Page 2-14
1. KISD Study Area RKG Associates, Inc., in cooperation with the Killeen Independent School District (KISD) parsed 11 existing middle school attendance zones into eight distinct housing submarkets, creating the KISD study area. These eight submarkets were identified by consolidating the KISD’s planning zone area, which are areas that comprise dozens of attendance zones for each elementary, middle and high school in the region. This approach allowed the consultants to analyze the demographic and real estate market characteristics in different areas of the KISD, which tracking that data with school attendance figures. The analysis shows that several submarkets have captured greater growth than others and RKG has been able to document these development patterns over the past decade. Map 2-2 shows the eight submarkets comprising the KISD and their place names as follows:
KISD Submarket Areas
• Submarket 1 Bellaire-Reeces Creek
• Submarket 2 Manor-Rancier
• Submarket 3 Patterson-Liberty Hill
• Submarket 4 Roy J Smith
• Submarket 5 Harker Heights
• Submarket 6 Nolanville
• Submarket 7 Fort Hood
• Submarket 8 Killeen-Fort Hood Regional Airport 2. Methodology and Data Sources The following section details the existing population and demographic trends in the surrounding communities of the Killeen-Temple-Fort Hood-MSA, the KISD study area and its submarkets since 2000. The demographic characteristics presented in this section was obtained from ESRI, a data analytics and Geographic Information Systems (GIS) company. RKG has presented the data for all submarkets in a side-by-side comparison to establish a demographic profile for each submarket. It should be noted; the KISD study area and its submarkets coincide with the KISD’s 11 middle school attendance zones. These zones contain detailed information regarding the number of school-age children and their grade level, which will support RKG’s efforts of measuring the total number of students by grade level and housing type later in the study.
D. DEMOGRAPHIC CHARACTERISTICS AND TRENDS 1. Population Trends
a) City of Killeen and
Surrounding Communities The City of Killeen was the most populated community (145,246 pop.) in the Killeen-Temple-Fort Hood MSA in 2017 (Table 2-11). Since 2000, Killeen has experienced rapid population growth, especially during the 2000-2010 period when the annual growth rate reached 4.3% (Figure 2-4). The growth
Table 2-11 Population Trends City of Killeen and Surrounding Communities (2000 - 2017)
Jurisdiction 2000 2010 2017 2022
City of Killeen 89,279 127,921 145,246 156,817
Temple 55,691 66,284 74,401 80,173
Fort Hood 33,312 29,589 30,554 31,351
Copperas Cove 30,543 32,031 33,463 34,369
Harker Heights 18,412 26,700 29,676 32,155
Killeen-Temple-Fort Hood MSA 330,714 405,300 446,693 477,103
Source: ESRI and RKG Associates, Inc., 2018
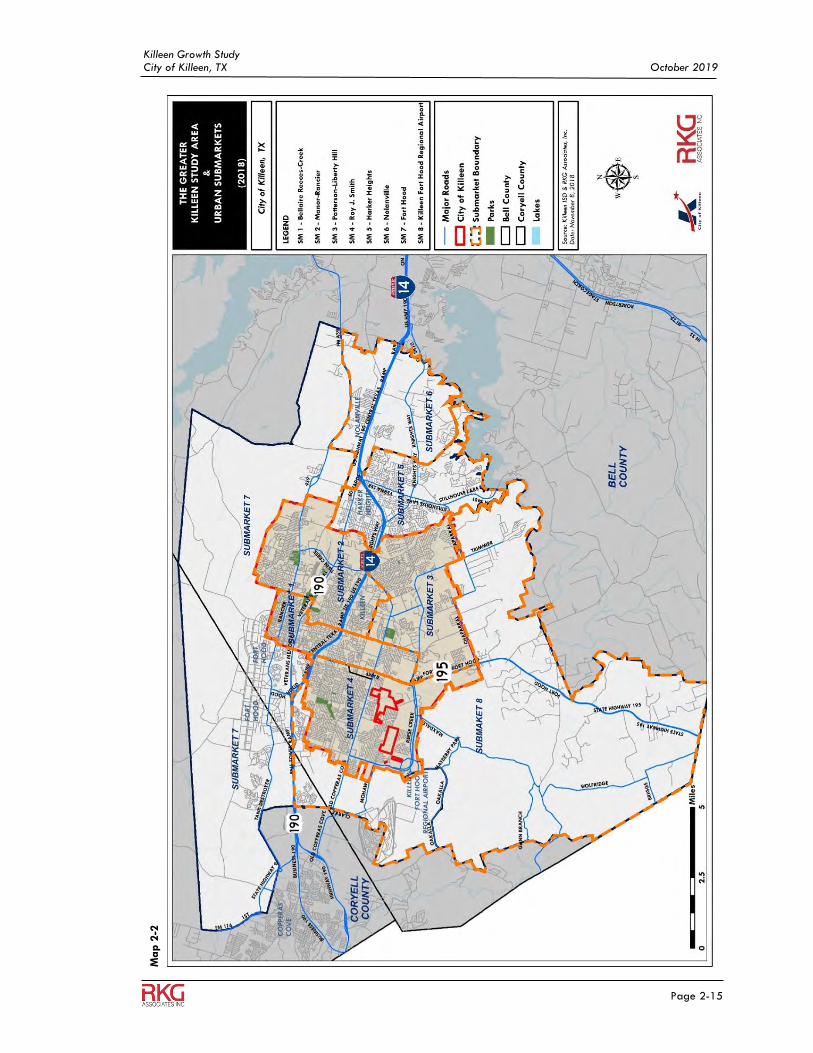
Killeen Growth Study City of Killeen, TX October 2019
Page 2-15
Ma
p 2
-2
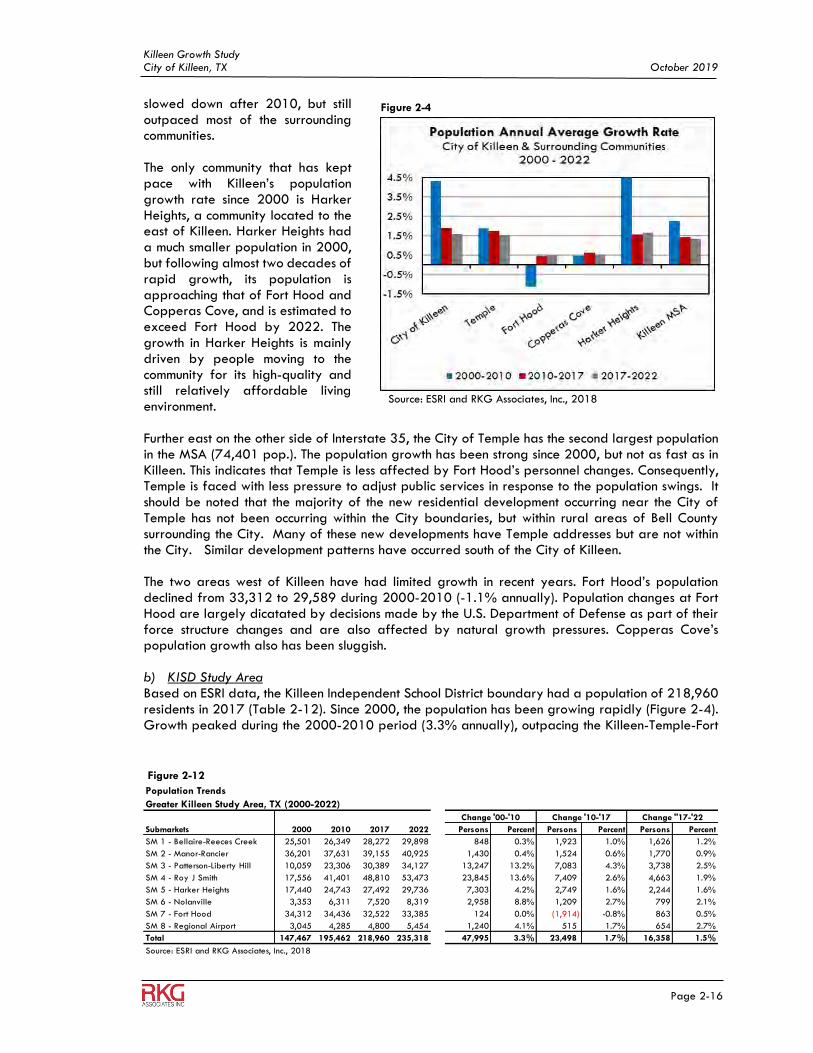
Killeen Growth Study City of Killeen, TX October 2019
Page 2-16
slowed down after 2010, but still outpaced most of the surrounding communities. The only community that has kept pace with Killeen’s population growth rate since 2000 is Harker Heights, a community located to the east of Killeen. Harker Heights had a much smaller population in 2000, but following almost two decades of rapid growth, its population is approaching that of Fort Hood and Copperas Cove, and is estimated to exceed Fort Hood by 2022. The growth in Harker Heights is mainly driven by people moving to the community for its high-quality and still relatively affordable living environment. Further east on the other side of Interstate 35, the City of Temple has the second largest population in the MSA (74,401 pop.). The population growth has been strong since 2000, but not as fast as in Killeen. This indicates that Temple is less affected by Fort Hood’s personnel changes. Consequently, Temple is faced with less pressure to adjust public services in response to the population swings. It should be noted that the majority of the new residential development occurring near the City of Temple has not been occurring within the City boundaries, but within rural areas of Bell County surrounding the City. Many of these new developments have Temple addresses but are not within the City. Similar development patterns have occurred south of the City of Killeen. The two areas west of Killeen have had limited growth in recent years. Fort Hood’s population declined from 33,312 to 29,589 during 2000-2010 (-1.1% annually). Population changes at Fort Hood are largely dicatated by decisions made by the U.S. Department of Defense as part of their force structure changes and are also affected by natural growth pressures. Copperas Cove’s population growth also has been sluggish. b) KISD Study Area Based on ESRI data, the Killeen Independent School District boundary had a population of 218,960 residents in 2017 (Table 2-12). Since 2000, the population has been growing rapidly (Figure 2-4). Growth peaked during the 2000-2010 period (3.3% annually), outpacing the Killeen-Temple-Fort
Figure 2-4
Source: ESRI and RKG Associates, Inc., 2018
Figure 2-12
Population Trends
Greater Killeen Study Area, TX (2000-2022)
Submarkets 2000 2010 2017 2022 Persons Percent Persons Percent Persons Percent
SM 1 - Bellaire-Reeces Creek 25,501 26,349 28,272 29,898 848 0.3% 1,923 1.0% 1,626 1.2%
SM 2 - Manor-Rancier 36,201 37,631 39,155 40,925 1,430 0.4% 1,524 0.6% 1,770 0.9%
SM 3 - Patterson-Liberty Hill 10,059 23,306 30,389 34,127 13,247 13.2% 7,083 4.3% 3,738 2.5%
SM 4 - Roy J Smith 17,556 41,401 48,810 53,473 23,845 13.6% 7,409 2.6% 4,663 1.9%
SM 5 - Harker Heights 17,440 24,743 27,492 29,736 7,303 4.2% 2,749 1.6% 2,244 1.6%
SM 6 - Nolanville 3,353 6,311 7,520 8,319 2,958 8.8% 1,209 2.7% 799 2.1%
SM 7 - Fort Hood 34,312 34,436 32,522 33,385 124 0.0% (1,914) -0.8% 863 0.5%
SM 8 - Regional Airport 3,045 4,285 4,800 5,454 1,240 4.1% 515 1.7% 654 2.7%
Total 147,467 195,462 218,960 235,318 47,995 3.3% 23,498 1.7% 16,358 1.5%
Source: ESRI and RKG Associates, Inc., 2018
Change '00-'10 Change '10-'17 Change "17-'22
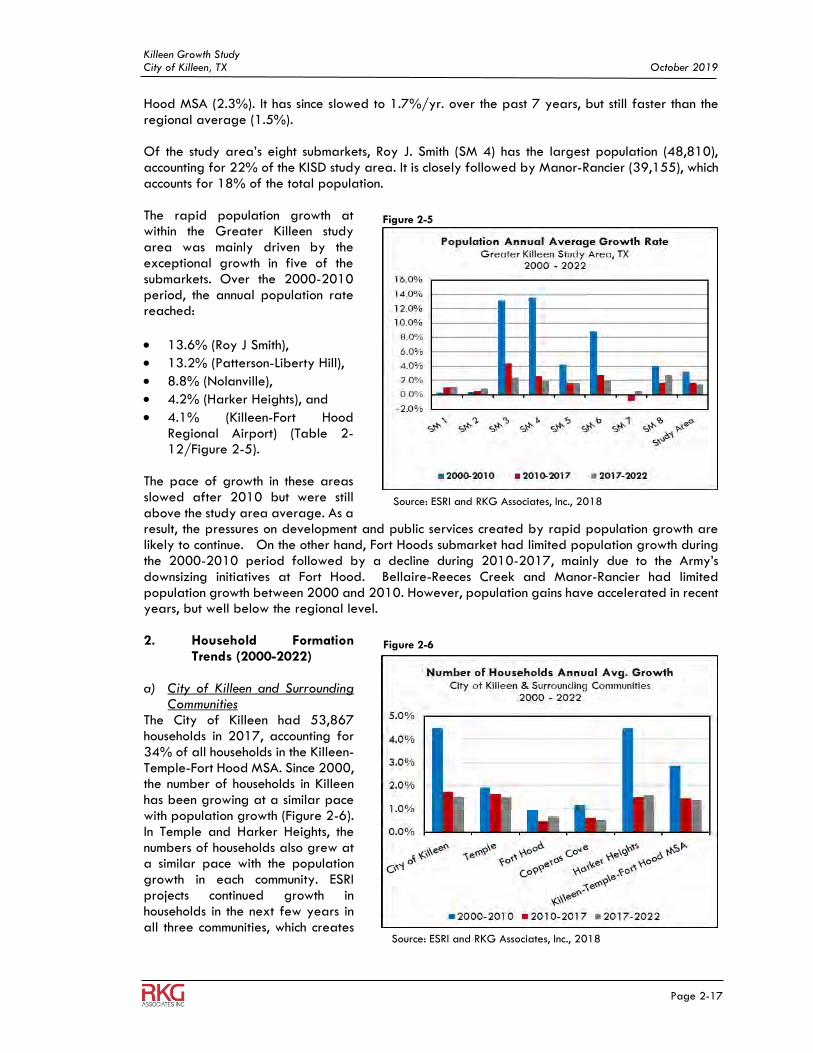
Killeen Growth Study City of Killeen, TX October 2019
Page 2-17
Hood MSA (2.3%). It has since slowed to 1.7%/yr. over the past 7 years, but still faster than the regional average (1.5%). Of the study area’s eight submarkets, Roy J. Smith (SM 4) has the largest population (48,810), accounting for 22% of the KISD study area. It is closely followed by Manor-Rancier (39,155), which accounts for 18% of the total population.
The rapid population growth at within the Greater Killeen study area was mainly driven by the exceptional growth in five of the submarkets. Over the 2000-2010 period, the annual population rate reached:
• 13.6% (Roy J Smith),
• 13.2% (Patterson-Liberty Hill),
• 8.8% (Nolanville),
• 4.2% (Harker Heights), and
• 4.1% (Killeen-Fort Hood Regional Airport) (Table 2-12/Figure 2-5).
The pace of growth in these areas slowed after 2010 but were still above the study area average. As a result, the pressures on development and public services created by rapid population growth are likely to continue. On the other hand, Fort Hoods submarket had limited population growth during the 2000-2010 period followed by a decline during 2010-2017, mainly due to the Army’s downsizing initiatives at Fort Hood. Bellaire-Reeces Creek and Manor-Rancier had limited population growth between 2000 and 2010. However, population gains have accelerated in recent years, but well below the regional level. 2. Household Formation
Trends (2000-2022)
a) City of Killeen and Surrounding Communities
The City of Killeen had 53,867 households in 2017, accounting for 34% of all households in the Killeen-Temple-Fort Hood MSA. Since 2000, the number of households in Killeen has been growing at a similar pace with population growth (Figure 2-6). In Temple and Harker Heights, the numbers of households also grew at a similar pace with the population growth in each community. ESRI projects continued growth in households in the next few years in all three communities, which creates
Figure 2-5
Source: ESRI and RKG Associates, Inc., 2018
Figure 2-6
Source: ESRI and RKG Associates, Inc., 2018
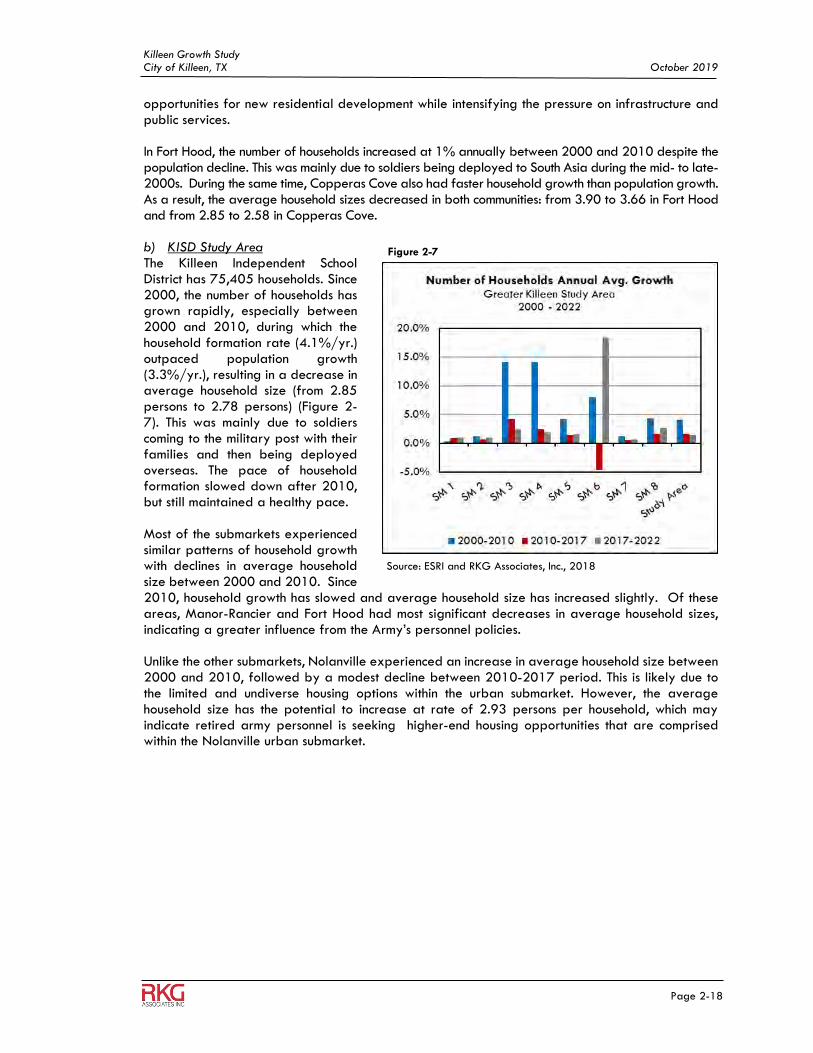
Killeen Growth Study City of Killeen, TX October 2019
Page 2-18
opportunities for new residential development while intensifying the pressure on infrastructure and public services. In Fort Hood, the number of households increased at 1% annually between 2000 and 2010 despite the population decline. This was mainly due to soldiers being deployed to South Asia during the mid- to late- 2000s. During the same time, Copperas Cove also had faster household growth than population growth. As a result, the average household sizes decreased in both communities: from 3.90 to 3.66 in Fort Hood and from 2.85 to 2.58 in Copperas Cove. b) KISD Study Area The Killeen Independent School District has 75,405 households. Since 2000, the number of households has grown rapidly, especially between 2000 and 2010, during which the household formation rate (4.1%/yr.) outpaced population growth (3.3%/yr.), resulting in a decrease in average household size (from 2.85 persons to 2.78 persons) (Figure 2-7). This was mainly due to soldiers coming to the military post with their families and then being deployed overseas. The pace of household formation slowed down after 2010, but still maintained a healthy pace. Most of the submarkets experienced similar patterns of household growth with declines in average household size between 2000 and 2010. Since 2010, household growth has slowed and average household size has increased slightly. Of these areas, Manor-Rancier and Fort Hood had most significant decreases in average household sizes, indicating a greater influence from the Army’s personnel policies.
Unlike the other submarkets, Nolanville experienced an increase in average household size between 2000 and 2010, followed by a modest decline between 2010-2017 period. This is likely due to the limited and undiverse housing options within the urban submarket. However, the average household size has the potential to increase at rate of 2.93 persons per household, which may indicate retired army personnel is seeking higher-end housing opportunities that are comprised within the Nolanville urban submarket.
Figure 2-7
Source: ESRI and RKG Associates, Inc., 2018
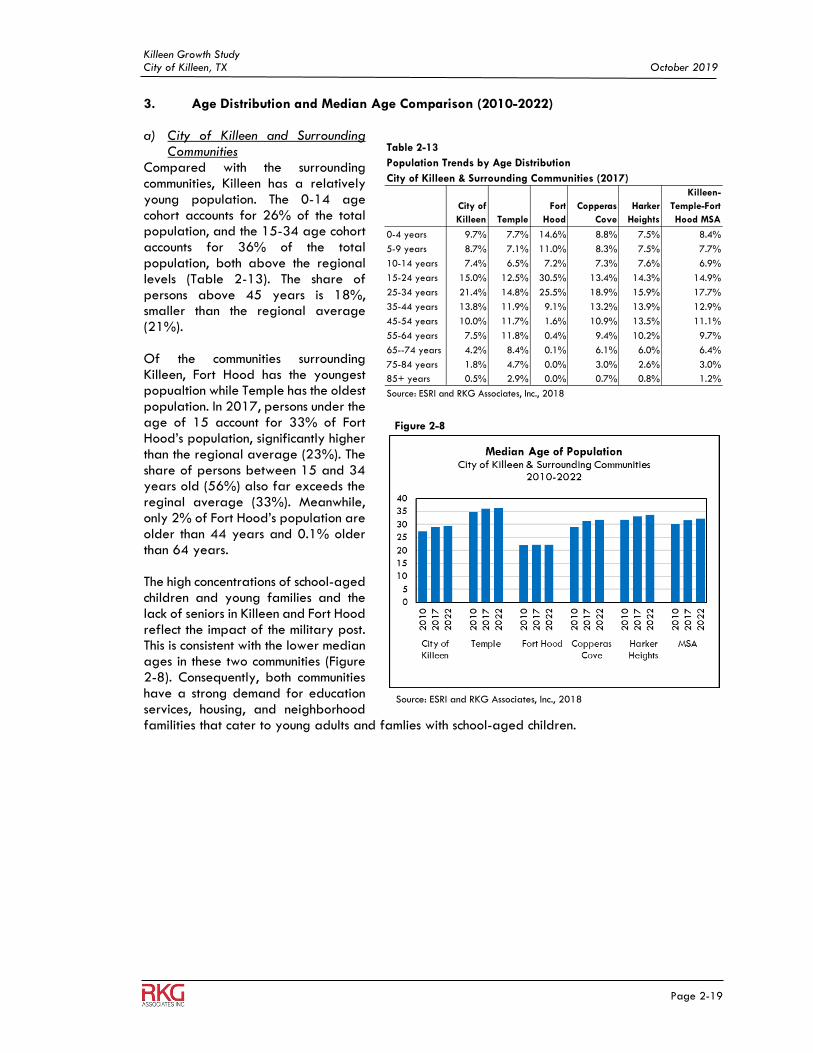
Killeen Growth Study City of Killeen, TX October 2019
Page 2-19
3. Age Distribution and Median Age Comparison (2010-2022) a) City of Killeen and Surrounding
Communities Compared with the surrounding communities, Killeen has a relatively young population. The 0-14 age cohort accounts for 26% of the total population, and the 15-34 age cohort accounts for 36% of the total population, both above the regional levels (Table 2-13). The share of persons above 45 years is 18%, smaller than the regional average (21%). Of the communities surrounding Killeen, Fort Hood has the youngest popualtion while Temple has the oldest population. In 2017, persons under the age of 15 account for 33% of Fort Hood’s population, significantly higher than the regional average (23%). The share of persons between 15 and 34 years old (56%) also far exceeds the reginal average (33%). Meanwhile, only 2% of Fort Hood’s population are older than 44 years and 0.1% older than 64 years. The high concentrations of school-aged children and young families and the lack of seniors in Killeen and Fort Hood reflect the impact of the military post. This is consistent with the lower median ages in these two communities (Figure 2-8). Consequently, both communities have a strong demand for education services, housing, and neighborhood familities that cater to young adults and famlies with school-aged children.
Table 2-13
Population Trends by Age Distribution
City of Killeen & Surrounding Communities (2017)
City of
Killeen Temple
Fort
Hood
Copperas
Cove
Harker
Heights
Killeen-
Temple-Fort
Hood MSA
0-4 years 9.7% 7.7% 14.6% 8.8% 7.5% 8.4%
5-9 years 8.7% 7.1% 11.0% 8.3% 7.5% 7.7%
10-14 years 7.4% 6.5% 7.2% 7.3% 7.6% 6.9%
15-24 years 15.0% 12.5% 30.5% 13.4% 14.3% 14.9%
25-34 years 21.4% 14.8% 25.5% 18.9% 15.9% 17.7%
35-44 years 13.8% 11.9% 9.1% 13.2% 13.9% 12.9%
45-54 years 10.0% 11.7% 1.6% 10.9% 13.5% 11.1%
55-64 years 7.5% 11.8% 0.4% 9.4% 10.2% 9.7%
65--74 years 4.2% 8.4% 0.1% 6.1% 6.0% 6.4%
75-84 years 1.8% 4.7% 0.0% 3.0% 2.6% 3.0%
85+ years 0.5% 2.9% 0.0% 0.7% 0.8% 1.2%
Source: ESRI and RKG Associates, Inc., 2018
Figure 2-8
Source: ESRI and RKG Associates, Inc., 2018
Killeen Growth Study City of Killeen, TX October 2019
Page 2-20
In Temple, 40% of the population clusters in the 45-64 and 65+ age cohorts, well above the regional level of 31%, resulting in a relatively high median household age. As previously explained, the 45-64 cohort represents established households that typically are looking for higher-quality housing choices and other services; the 65+ cohort indicates a demand for senior services.
Between 2010 and 2017, all communities except for Fort Hood experienced rapid growth in senior population (4.2% to 6.4% annually), causing an overall aging of the region’s population (Table 2-14). The share of the 15-24 age cohort decreased, especially in Killeen and Copperas Cove. This coincides with the downsizing of the military population at Fort Hood as the wars in Iraq and Afghanistan ramped down during the period. In most communities, the growth of young population (0-14 years) was slower than other age cohorts. This suggests that the region doesn’t have adequate education resources to attract families with school-aged children which coincides with the rapid population growth in the City of Killeen. b) KISD Study Area The KISD study area has a younger population than the Killeen-Temple-Fort Hood MSA average (Table 2-15). The population under the age of 15 years accounts for 26.2% of the total population, similar to the percentage in the City of Killeen (26%), but higher than the MSA avarege (23%). Persons above the age of 65 years account for 6.3% of the total population, well below the regional level (10.6%). Further, the study area also has a higher percentage of persons in the 15-44 age cohort (51.1%) and lower percentage of persons in the 45-64 age cohort (16.5%). As previously explained, a younger population with more school-aged children and young families suggests that the Greater Killeen study area and KISD schools are faced with greater pressure to provide
Table 2-14 Annual Population Change by Age Cohort City of Killeen and Surrounding Communities (2010 - 2017)
City of
Killeen Temple
Fort
Hood
Copperas
Cove
Harker
Heights
Killeen-
Temple-Fort
Hood MSA
0-14 Years 1.7% 0.8% 0.1% 0.3% 0.1% 0.8%
15-24 Years -1.0% 1.1% 0.4% -2.4% 1.0% -0.1%
24-35 Years 2.5% 1.6% 1.3% 1.7% 2.9% 2.2%
35-44 Years 3.2% 2.0% 0.1% 1.2% -0.7% 1.5%
45-64 Years 2.5% 1.4% 0.5% 0.8% 2.9% 1.4%
65+ Years 6.0% 4.2% 0.5% 4.5% 6.4% 4.5%
Source: ESRI and RKG Associates, Inc., 2018
Table 2-15
Population Age Distribution
Greater Killeen Study Area (2017)
Age Cohort
Bellaire-
Reeces
Creek
Manor-
Rancier
Patterson-
Liberty Hill
Roy J
Smith
Harker
Heights Nolanville
Fort
Hood Airport
Study
Area
0-4 years 10.1% 9.2% 8.2% 10.9% 7.5% 8.4% 14.3% 6.0% 10.0%
5-9 years 8.6% 8.0% 8.1% 9.6% 7.5% 8.5% 10.8% 6.6% 8.8%
10-14 years 6.8% 6.6% 8.2% 7.9% 7.6% 8.2% 7.2% 6.7% 7.4%
15-24 years 15.1% 15.5% 13.9% 15.2% 14.3% 12.2% 30.2% 10.8% 17.0%
25-34 years 20.8% 23.0% 16.5% 23.3% 16.1% 15.4% 25.2% 12.9% 20.9%
35-44 years 12.8% 12.1% 16.2% 14.6% 13.8% 15.1% 9.2% 12.6% 13.2%
45-54 years 9.5% 9.0% 13.6% 8.9% 13.5% 12.5% 1.9% 13.6% 9.4%
55-64 years 8.1% 8.4% 8.9% 5.5% 10.2% 10.5% 0.8% 15.4% 7.1%
65--74 years 5.1% 5.2% 4.3% 2.7% 6.0% 6.6% 0.3% 10.6% 4.1%
75-84 years 2.3% 2.3% 1.6% 1.1% 2.6% 2.1% 0.1% 3.9% 1.7%
85+ years 0.7% 0.7% 0.5% 0.2% 0.8% 0.5% 0.0% 0.9% 0.5%
Source: ESRI and RKG Associates, Inc., 2018
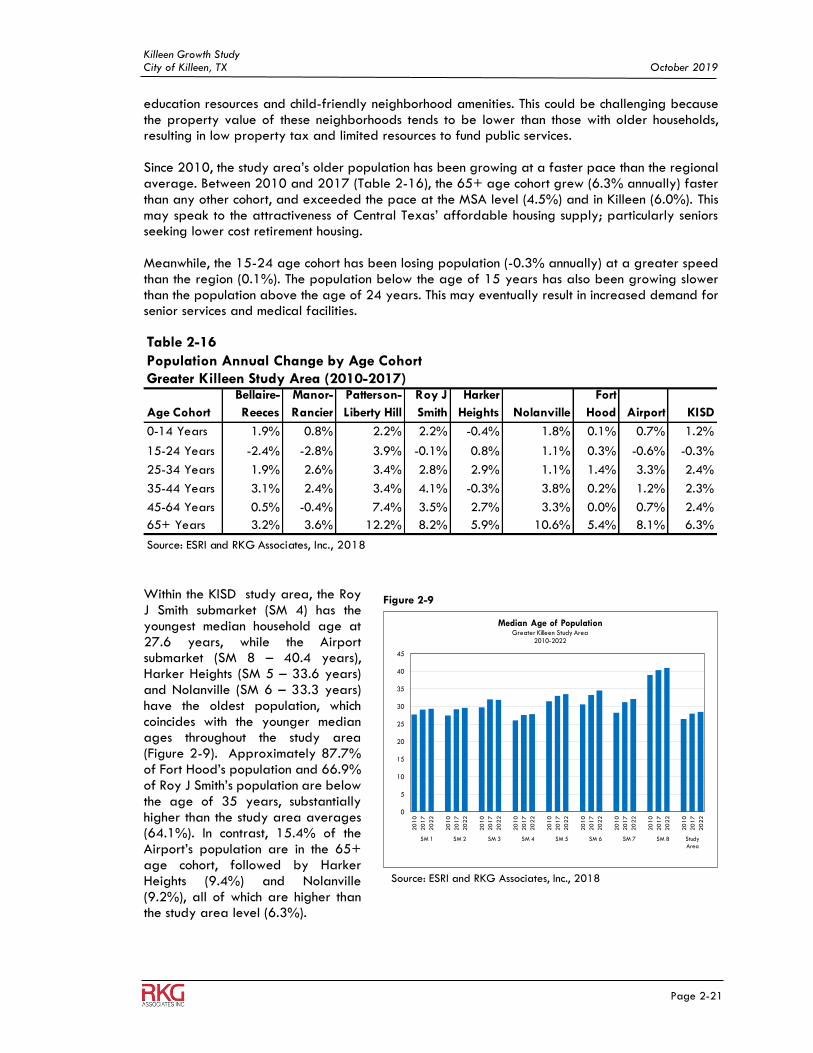
Killeen Growth Study City of Killeen, TX October 2019
Page 2-21
education resources and child-friendly neighborhood amenities. This could be challenging because the property value of these neighborhoods tends to be lower than those with older households, resulting in low property tax and limited resources to fund public services. Since 2010, the study area’s older population has been growing at a faster pace than the regional average. Between 2010 and 2017 (Table 2-16), the 65+ age cohort grew (6.3% annually) faster than any other cohort, and exceeded the pace at the MSA level (4.5%) and in Killeen (6.0%). This may speak to the attractiveness of Central Texas’ affordable housing supply; particularly seniors seeking lower cost retirement housing. Meanwhile, the 15-24 age cohort has been losing population (-0.3% annually) at a greater speed than the region (0.1%). The population below the age of 15 years has also been growing slower than the population above the age of 24 years. This may eventually result in increased demand for senior services and medical facilities.
Within the KISD study area, the Roy J Smith submarket (SM 4) has the youngest median household age at 27.6 years, while the Airport submarket (SM 8 – 40.4 years), Harker Heights (SM 5 – 33.6 years) and Nolanville (SM 6 – 33.3 years) have the oldest population, which coincides with the younger median ages throughout the study area (Figure 2-9). Approximately 87.7% of Fort Hood’s population and 66.9% of Roy J Smith’s population are below the age of 35 years, substantially higher than the study area averages (64.1%). In contrast, 15.4% of the Airport’s population are in the 65+ age cohort, followed by Harker Heights (9.4%) and Nolanville (9.2%), all of which are higher than the study area level (6.3%).
Figure 2-9
Source: ESRI and RKG Associates, Inc., 2018
0
5
10
15
20
25
30
35
40
45
20
10
20
17
20
22
20
10
20
17
20
22
20
10
20
17
20
22
20
10
20
17
20
22
20
10
20
17
20
22
20
10
20
17
20
22
20
10
20
17
20
22
20
10
20
17
20
22
20
10
20
17
20
22
SM 1 SM 2 SM 3 SM 4 SM 5 SM 6 SM 7 SM 8 StudyArea
Median Age of PopulationGreater Killeen Study Area
2010-2022
Table 2-16
Population Annual Change by Age Cohort
Greater Killeen Study Area (2010-2017)
Age Cohort
Bellaire-
Reeces
Manor-
Rancier
Patterson-
Liberty Hill
Roy J
Smith
Harker
Heights Nolanville
Fort
Hood Airport KISD
0-14 Years 1.9% 0.8% 2.2% 2.2% -0.4% 1.8% 0.1% 0.7% 1.2%
15-24 Years -2.4% -2.8% 3.9% -0.1% 0.8% 1.1% 0.3% -0.6% -0.3%
25-34 Years 1.9% 2.6% 3.4% 2.8% 2.9% 1.1% 1.4% 3.3% 2.4%
35-44 Years 3.1% 2.4% 3.4% 4.1% -0.3% 3.8% 0.2% 1.2% 2.3%
45-64 Years 0.5% -0.4% 7.4% 3.5% 2.7% 3.3% 0.0% 0.7% 2.4%
65+ Years 3.2% 3.6% 12.2% 8.2% 5.9% 10.6% 5.4% 8.1% 6.3%
Source: ESRI and RKG Associates, Inc., 2018
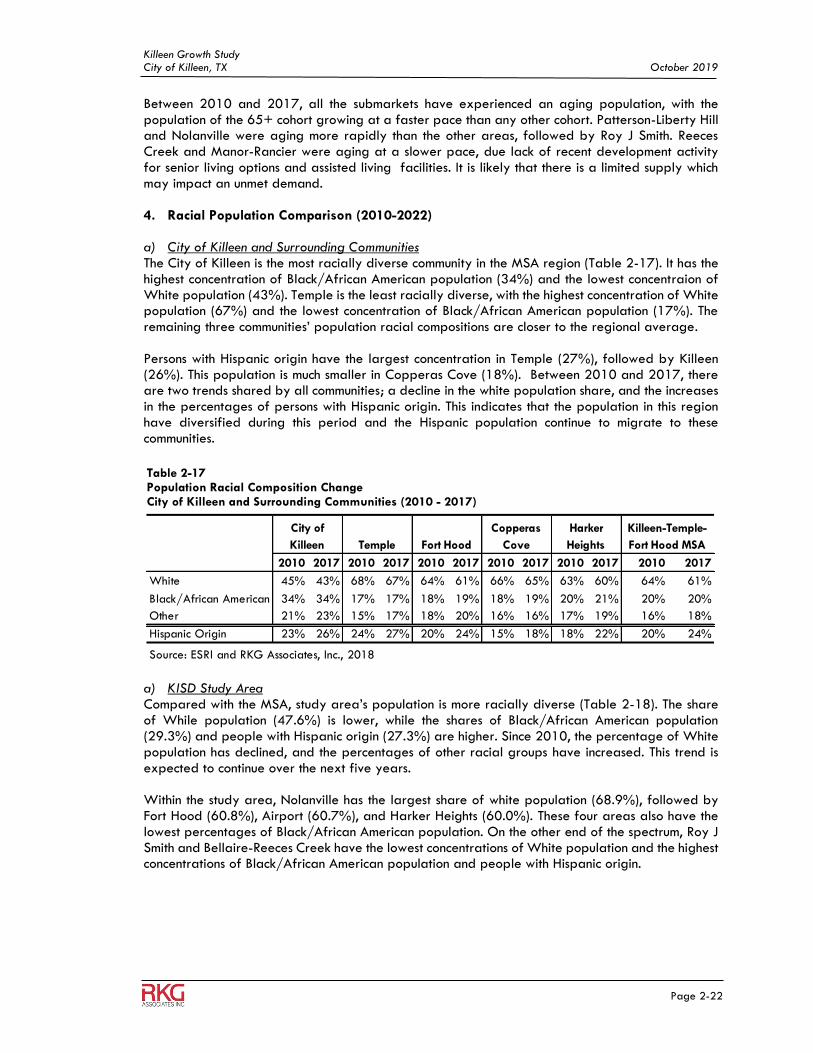
Killeen Growth Study City of Killeen, TX October 2019
Page 2-22
Between 2010 and 2017, all the submarkets have experienced an aging population, with the population of the 65+ cohort growing at a faster pace than any other cohort. Patterson-Liberty Hill and Nolanville were aging more rapidly than the other areas, followed by Roy J Smith. Reeces Creek and Manor-Rancier were aging at a slower pace, due lack of recent development activity for senior living options and assisted living facilities. It is likely that there is a limited supply which may impact an unmet demand.
4. Racial Population Comparison (2010-2022)
a) City of Killeen and Surrounding Communities The City of Killeen is the most racially diverse community in the MSA region (Table 2-17). It has the highest concentration of Black/African American population (34%) and the lowest concentraion of White population (43%). Temple is the least racially diverse, with the highest concentration of White population (67%) and the lowest concentration of Black/African American population (17%). The remaining three communities’ population racial compositions are closer to the regional average.
Persons with Hispanic origin have the largest concentration in Temple (27%), followed by Killeen (26%). This population is much smaller in Copperas Cove (18%). Between 2010 and 2017, there are two trends shared by all communities; a decline in the white population share, and the increases in the percentages of persons with Hispanic origin. This indicates that the population in this region have diversified during this period and the Hispanic population continue to migrate to these communities.
a) KISD Study Area Compared with the MSA, study area’s population is more racially diverse (Table 2-18). The share of While population (47.6%) is lower, while the shares of Black/African American population (29.3%) and people with Hispanic origin (27.3%) are higher. Since 2010, the percentage of White population has declined, and the percentages of other racial groups have increased. This trend is expected to continue over the next five years. Within the study area, Nolanville has the largest share of white population (68.9%), followed by Fort Hood (60.8%), Airport (60.7%), and Harker Heights (60.0%). These four areas also have the lowest percentages of Black/African American population. On the other end of the spectrum, Roy J Smith and Bellaire-Reeces Creek have the lowest concentrations of White population and the highest concentrations of Black/African American population and people with Hispanic origin.
Table 2-17 Population Racial Composition Change City of Killeen and Surrounding Communities (2010 - 2017)
2010 2017 2010 2017 2010 2017 2010 2017 2010 2017 2010 2017
White 45% 43% 68% 67% 64% 61% 66% 65% 63% 60% 64% 61%
Black/African American 34% 34% 17% 17% 18% 19% 18% 19% 20% 21% 20% 20%
Other 21% 23% 15% 17% 18% 20% 16% 16% 17% 19% 16% 18%
Hispanic Origin 23% 26% 24% 27% 20% 24% 15% 18% 18% 22% 20% 24%
Source: ESRI and RKG Associates, Inc., 2018
City of
Killeen Temple Fort Hood
Killeen-Temple-
Fort Hood MSA
Copperas
Cove
Harker
Heights
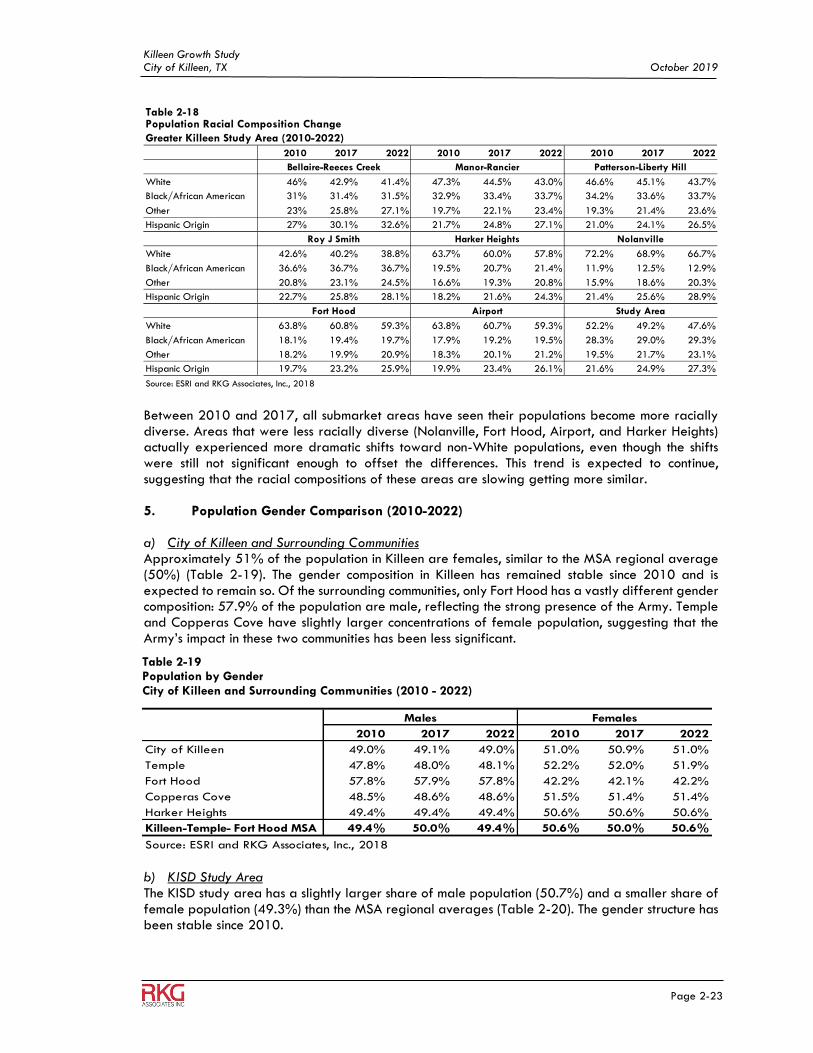
Killeen Growth Study City of Killeen, TX October 2019
Page 2-23
Between 2010 and 2017, all submarket areas have seen their populations become more racially diverse. Areas that were less racially diverse (Nolanville, Fort Hood, Airport, and Harker Heights) actually experienced more dramatic shifts toward non-White populations, even though the shifts were still not significant enough to offset the differences. This trend is expected to continue, suggesting that the racial compositions of these areas are slowing getting more similar.
5. Population Gender Comparison (2010-2022)
a) City of Killeen and Surrounding Communities Approximately 51% of the population in Killeen are females, similar to the MSA regional average (50%) (Table 2-19). The gender composition in Killeen has remained stable since 2010 and is expected to remain so. Of the surrounding communities, only Fort Hood has a vastly different gender composition: 57.9% of the population are male, reflecting the strong presence of the Army. Temple and Copperas Cove have slightly larger concentrations of female population, suggesting that the Army’s impact in these two communities has been less significant.
b) KISD Study Area The KISD study area has a slightly larger share of male population (50.7%) and a smaller share of female population (49.3%) than the MSA regional averages (Table 2-20). The gender structure has been stable since 2010.
Table 2-18Population Racial Composition Change
Greater Killeen Study Area (2010-2022)
2010 2017 2022 2010 2017 2022 2010 2017 2022
White 46% 42.9% 41.4% 47.3% 44.5% 43.0% 46.6% 45.1% 43.7%
Black/African American 31% 31.4% 31.5% 32.9% 33.4% 33.7% 34.2% 33.6% 33.7%
Other 23% 25.8% 27.1% 19.7% 22.1% 23.4% 19.3% 21.4% 23.6%
Hispanic Origin 27% 30.1% 32.6% 21.7% 24.8% 27.1% 21.0% 24.1% 26.5%
White 42.6% 40.2% 38.8% 63.7% 60.0% 57.8% 72.2% 68.9% 66.7%
Black/African American 36.6% 36.7% 36.7% 19.5% 20.7% 21.4% 11.9% 12.5% 12.9%
Other 20.8% 23.1% 24.5% 16.6% 19.3% 20.8% 15.9% 18.6% 20.3%
Hispanic Origin 22.7% 25.8% 28.1% 18.2% 21.6% 24.3% 21.4% 25.6% 28.9%
White 63.8% 60.8% 59.3% 63.8% 60.7% 59.3% 52.2% 49.2% 47.6%
Black/African American 18.1% 19.4% 19.7% 17.9% 19.2% 19.5% 28.3% 29.0% 29.3%
Other 18.2% 19.9% 20.9% 18.3% 20.1% 21.2% 19.5% 21.7% 23.1%
Hispanic Origin 19.7% 23.2% 25.9% 19.9% 23.4% 26.1% 21.6% 24.9% 27.3%
Source: ESRI and RKG Associates, Inc., 2018
Patterson-Liberty HillManor-RancierBellaire-Reeces Creek
Fort Hood Airport Study Area
Roy J Smith Harker Heights Nolanville
Table 2-19 Population by Gender City of Killeen and Surrounding Communities (2010 - 2022)
2010 2017 2022 2010 2017 2022
City of Killeen 49.0% 49.1% 49.0% 51.0% 50.9% 51.0%
Temple 47.8% 48.0% 48.1% 52.2% 52.0% 51.9%
Fort Hood 57.8% 57.9% 57.8% 42.2% 42.1% 42.2%
Copperas Cove 48.5% 48.6% 48.6% 51.5% 51.4% 51.4%
Harker Heights 49.4% 49.4% 49.4% 50.6% 50.6% 50.6%
Killeen-Temple- Fort Hood MSA 49.4% 50.0% 49.4% 50.6% 50.0% 50.6%
Source: ESRI and RKG Associates, Inc., 2018
Males Females
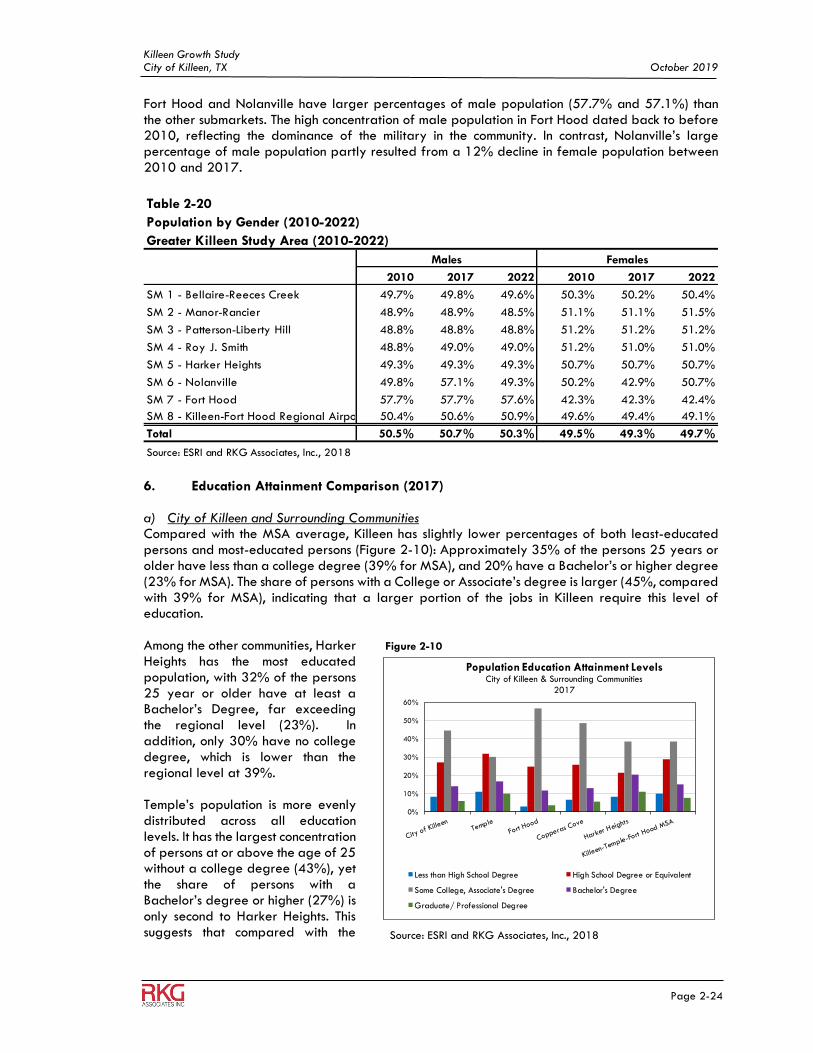
Killeen Growth Study City of Killeen, TX October 2019
Page 2-24
Fort Hood and Nolanville have larger percentages of male population (57.7% and 57.1%) than the other submarkets. The high concentration of male population in Fort Hood dated back to before 2010, reflecting the dominance of the military in the community. In contrast, Nolanville’s large percentage of male population partly resulted from a 12% decline in female population between 2010 and 2017.
6. Education Attainment Comparison (2017)
a) City of Killeen and Surrounding Communities Compared with the MSA average, Killeen has slightly lower percentages of both least-educated persons and most-educated persons (Figure 2-10): Approximately 35% of the persons 25 years or older have less than a college degree (39% for MSA), and 20% have a Bachelor’s or higher degree (23% for MSA). The share of persons with a College or Associate’s degree is larger (45%, compared with 39% for MSA), indicating that a larger portion of the jobs in Killeen require this level of education. Among the other communities, Harker Heights has the most educated population, with 32% of the persons 25 year or older have at least a Bachelor’s Degree, far exceeding the regional level (23%). In addition, only 30% have no college degree, which is lower than the regional level at 39%. Temple’s population is more evenly distributed across all education levels. It has the largest concentration of persons at or above the age of 25 without a college degree (43%), yet the share of persons with a Bachelor’s degree or higher (27%) is only second to Harker Heights. This suggests that compared with the
Figure 2-10
Source: ESRI and RKG Associates, Inc., 2018
0%
10%
20%
30%
40%
50%
60%
Population Education Attainment LevelsCity of Killeen & Surrounding Communities
2017
Less than High School Degree High School Degree or Equivalent
Some College, Associate's Degree Bachelor's Degree
Graduate/ Professional Degree
Table 2-20
Population by Gender (2010-2022)
Greater Killeen Study Area (2010-2022)
2010 2017 2022 2010 2017 2022
SM 1 - Bellaire-Reeces Creek 49.7% 49.8% 49.6% 50.3% 50.2% 50.4%
SM 2 - Manor-Rancier 48.9% 48.9% 48.5% 51.1% 51.1% 51.5%
SM 3 - Patterson-Liberty Hill 48.8% 48.8% 48.8% 51.2% 51.2% 51.2%
SM 4 - Roy J. Smith 48.8% 49.0% 49.0% 51.2% 51.0% 51.0%
SM 5 - Harker Heights 49.3% 49.3% 49.3% 50.7% 50.7% 50.7%
SM 6 - Nolanville 49.8% 57.1% 49.3% 50.2% 42.9% 50.7%
SM 7 - Fort Hood 57.7% 57.7% 57.6% 42.3% 42.3% 42.4%
SM 8 - Killeen-Fort Hood Regional Airport 50.4% 50.6% 50.9% 49.6% 49.4% 49.1%
Total 50.5% 50.7% 50.3% 49.5% 49.3% 49.7%
Source: ESRI and RKG Associates, Inc., 2018
FemalesMales
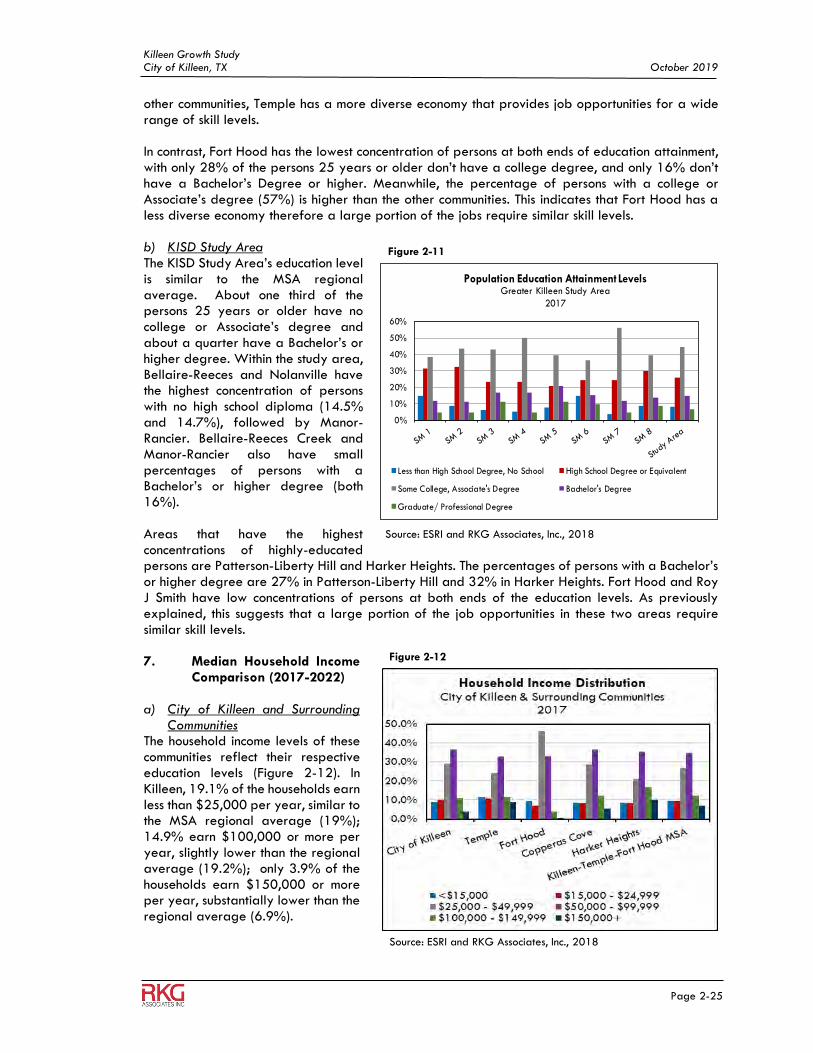
Killeen Growth Study City of Killeen, TX October 2019
Page 2-25
other communities, Temple has a more diverse economy that provides job opportunities for a wide range of skill levels. In contrast, Fort Hood has the lowest concentration of persons at both ends of education attainment, with only 28% of the persons 25 years or older don’t have a college degree, and only 16% don’t have a Bachelor’s Degree or higher. Meanwhile, the percentage of persons with a college or Associate’s degree (57%) is higher than the other communities. This indicates that Fort Hood has a less diverse economy therefore a large portion of the jobs require similar skill levels. b) KISD Study Area The KISD Study Area’s education level is similar to the MSA regional average. About one third of the persons 25 years or older have no college or Associate’s degree and about a quarter have a Bachelor’s or higher degree. Within the study area, Bellaire-Reeces and Nolanville have the highest concentration of persons with no high school diploma (14.5% and 14.7%), followed by Manor-Rancier. Bellaire-Reeces Creek and Manor-Rancier also have small percentages of persons with a Bachelor’s or higher degree (both 16%). Areas that have the highest concentrations of highly-educated persons are Patterson-Liberty Hill and Harker Heights. The percentages of persons with a Bachelor’s or higher degree are 27% in Patterson-Liberty Hill and 32% in Harker Heights. Fort Hood and Roy J Smith have low concentrations of persons at both ends of the education levels. As previously explained, this suggests that a large portion of the job opportunities in these two areas require similar skill levels. 7. Median Household Income
Comparison (2017-2022)
a) City of Killeen and Surrounding Communities
The household income levels of these communities reflect their respective education levels (Figure 2-12). In Killeen, 19.1% of the households earn less than $25,000 per year, similar to the MSA regional average (19%); 14.9% earn $100,000 or more per year, slightly lower than the regional average (19.2%); only 3.9% of the households earn $150,000 or more per year, substantially lower than the regional average (6.9%).
Figure 2-12
Source: ESRI and RKG Associates, Inc., 2018
Figure 2-11
Source: ESRI and RKG Associates, Inc., 2018
0%
10%
20%
30%
40%
50%
60%
Population Education Attainment LevelsGreater Killeen Study Area
2017
Less than High School Degree, No School High School Degree or Equivalent
Some College, Associate's Degree Bachelor's Degree
Graduate/ Professional Degree
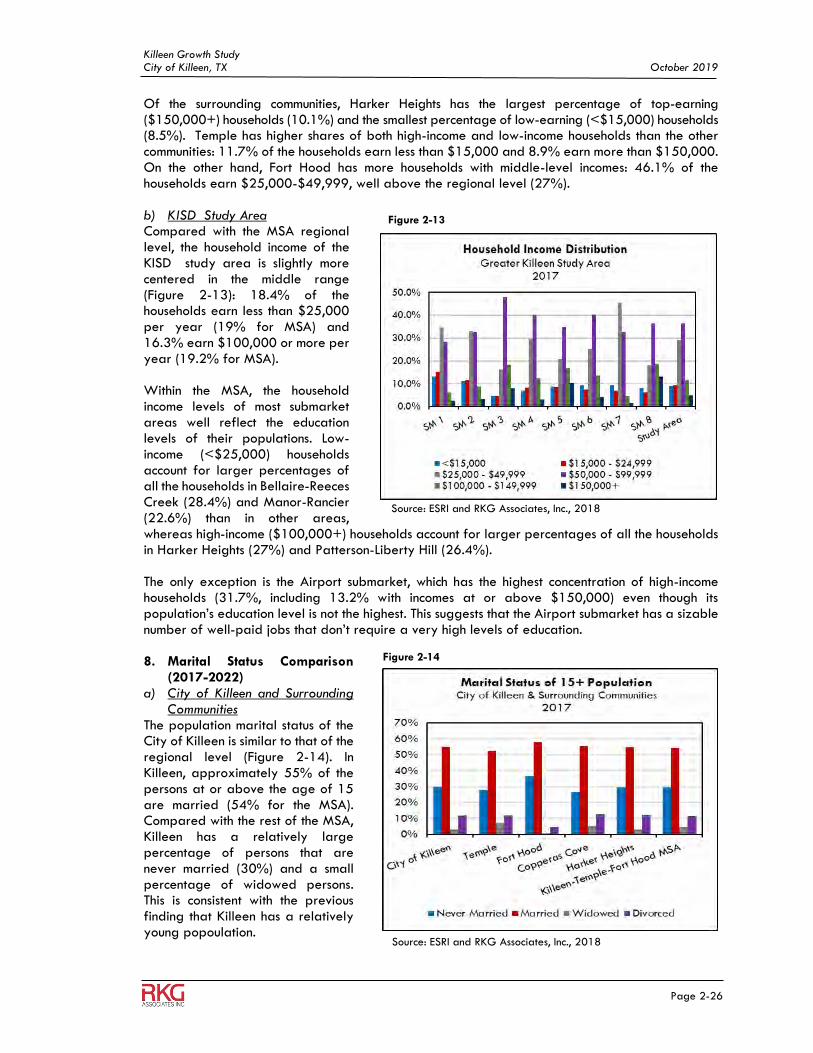
Killeen Growth Study City of Killeen, TX October 2019
Page 2-26
Of the surrounding communities, Harker Heights has the largest percentage of top-earning ($150,000+) households (10.1%) and the smallest percentage of low-earning (<$15,000) households (8.5%). Temple has higher shares of both high-income and low-income households than the other communities: 11.7% of the households earn less than $15,000 and 8.9% earn more than $150,000. On the other hand, Fort Hood has more households with middle-level incomes: 46.1% of the households earn $25,000-$49,999, well above the regional level (27%). b) KISD Study Area Compared with the MSA regional level, the household income of the KISD study area is slightly more centered in the middle range (Figure 2-13): 18.4% of the households earn less than $25,000 per year (19% for MSA) and 16.3% earn $100,000 or more per year (19.2% for MSA). Within the MSA, the household income levels of most submarket areas well reflect the education levels of their populations. Low-income (<$25,000) households account for larger percentages of all the households in Bellaire-Reeces Creek (28.4%) and Manor-Rancier (22.6%) than in other areas, whereas high-income ($100,000+) households account for larger percentages of all the households in Harker Heights (27%) and Patterson-Liberty Hill (26.4%). The only exception is the Airport submarket, which has the highest concentration of high-income households (31.7%, including 13.2% with incomes at or above $150,000) even though its population’s education level is not the highest. This suggests that the Airport submarket has a sizable number of well-paid jobs that don’t require a very high levels of education. 8. Marital Status Comparison
(2017-2022) a) City of Killeen and Surrounding
Communities The population marital status of the City of Killeen is similar to that of the regional level (Figure 2-14). In Killeen, approximately 55% of the persons at or above the age of 15 are married (54% for the MSA). Compared with the rest of the MSA, Killeen has a relatively large percentage of persons that are never married (30%) and a small percentage of widowed persons. This is consistent with the previous finding that Killeen has a relatively young popoulation.
Figure 2-13
Source: ESRI and RKG Associates, Inc., 2018
Figure 2-14
Source: ESRI and RKG Associates, Inc., 2018
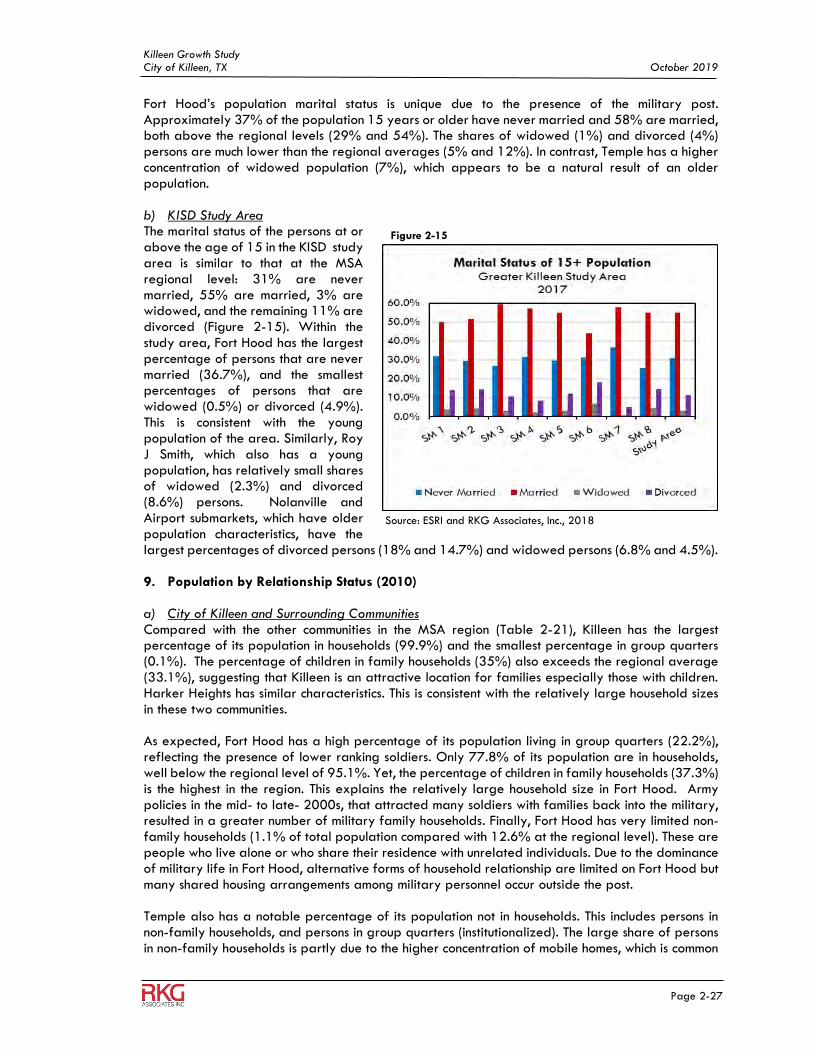
Killeen Growth Study City of Killeen, TX October 2019
Page 2-27
Fort Hood’s population marital status is unique due to the presence of the military post. Approximately 37% of the population 15 years or older have never married and 58% are married, both above the regional levels (29% and 54%). The shares of widowed (1%) and divorced (4%) persons are much lower than the regional averages (5% and 12%). In contrast, Temple has a higher concentration of widowed population (7%), which appears to be a natural result of an older population. b) KISD Study Area The marital status of the persons at or above the age of 15 in the KISD study area is similar to that at the MSA regional level: 31% are never married, 55% are married, 3% are widowed, and the remaining 11% are divorced (Figure 2-15). Within the study area, Fort Hood has the largest percentage of persons that are never married (36.7%), and the smallest percentages of persons that are widowed (0.5%) or divorced (4.9%). This is consistent with the young population of the area. Similarly, Roy J Smith, which also has a young population, has relatively small shares of widowed (2.3%) and divorced (8.6%) persons. Nolanville and Airport submarkets, which have older population characteristics, have the largest percentages of divorced persons (18% and 14.7%) and widowed persons (6.8% and 4.5%).
9. Population by Relationship Status (2010)
a) City of Killeen and Surrounding Communities Compared with the other communities in the MSA region (Table 2-21), Killeen has the largest percentage of its population in households (99.9%) and the smallest percentage in group quarters (0.1%). The percentage of children in family households (35%) also exceeds the regional average (33.1%), suggesting that Killeen is an attractive location for families especially those with children. Harker Heights has similar characteristics. This is consistent with the relatively large household sizes in these two communities. As expected, Fort Hood has a high percentage of its population living in group quarters (22.2%), reflecting the presence of lower ranking soldiers. Only 77.8% of its population are in households, well below the regional level of 95.1%. Yet, the percentage of children in family households (37.3%) is the highest in the region. This explains the relatively large household size in Fort Hood. Army policies in the mid- to late- 2000s, that attracted many soldiers with families back into the military, resulted in a greater number of military family households. Finally, Fort Hood has very limited non-family households (1.1% of total population compared with 12.6% at the regional level). These are people who live alone or who share their residence with unrelated individuals. Due to the dominance of military life in Fort Hood, alternative forms of household relationship are limited on Fort Hood but many shared housing arrangements among military personnel occur outside the post. Temple also has a notable percentage of its population not in households. This includes persons in non-family households, and persons in group quarters (institutionalized). The large share of persons in non-family households is partly due to the higher concentration of mobile homes, which is common
Figure 2-15
Source: ESRI and RKG Associates, Inc., 2018
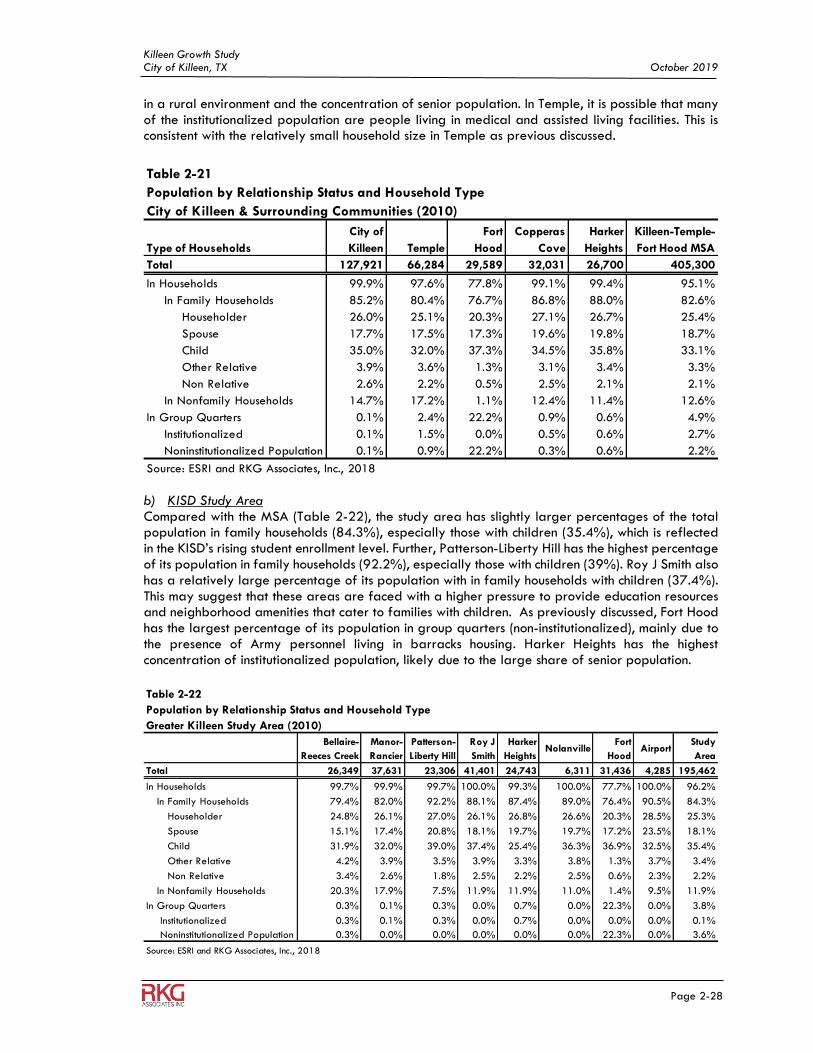
Killeen Growth Study City of Killeen, TX October 2019
Page 2-28
in a rural environment and the concentration of senior population. In Temple, it is possible that many of the institutionalized population are people living in medical and assisted living facilities. This is consistent with the relatively small household size in Temple as previous discussed.
b) KISD Study Area Compared with the MSA (Table 2-22), the study area has slightly larger percentages of the total population in family households (84.3%), especially those with children (35.4%), which is reflected in the KISD’s rising student enrollment level. Further, Patterson-Liberty Hill has the highest percentage of its population in family households (92.2%), especially those with children (39%). Roy J Smith also has a relatively large percentage of its population with in family households with children (37.4%). This may suggest that these areas are faced with a higher pressure to provide education resources and neighborhood amenities that cater to families with children. As previously discussed, Fort Hood has the largest percentage of its population in group quarters (non-institutionalized), mainly due to the presence of Army personnel living in barracks housing. Harker Heights has the highest concentration of institutionalized population, likely due to the large share of senior population.
Table 2-21
Population by Relationship Status and Household Type
City of Killeen & Surrounding Communities (2010)
Type of Households
City of
Killeen Temple
Fort
Hood
Copperas
Cove
Harker
Heights
Killeen-Temple-
Fort Hood MSA
Total 127,921 66,284 29,589 32,031 26,700 405,300
In Households 99.9% 97.6% 77.8% 99.1% 99.4% 95.1%
In Family Households 85.2% 80.4% 76.7% 86.8% 88.0% 82.6%
Householder 26.0% 25.1% 20.3% 27.1% 26.7% 25.4%
Spouse 17.7% 17.5% 17.3% 19.6% 19.8% 18.7%
Child 35.0% 32.0% 37.3% 34.5% 35.8% 33.1%
Other Relative 3.9% 3.6% 1.3% 3.1% 3.4% 3.3%
Non Relative 2.6% 2.2% 0.5% 2.5% 2.1% 2.1%
In Nonfamily Households 14.7% 17.2% 1.1% 12.4% 11.4% 12.6%
In Group Quarters 0.1% 2.4% 22.2% 0.9% 0.6% 4.9%
Institutionalized 0.1% 1.5% 0.0% 0.5% 0.6% 2.7%
Noninstitutionalized Population 0.1% 0.9% 22.2% 0.3% 0.6% 2.2%
Source: ESRI and RKG Associates, Inc., 2018
Table 2-22
Population by Relationship Status and Household Type
Greater Killeen Study Area (2010)
Bellaire-
Reeces Creek
Manor-
Rancier
Patterson-
Liberty Hill
Roy J
Smith
Harker
HeightsNolanville
Fort
HoodAirport
Study
Area
Total 26,349 37,631 23,306 41,401 24,743 6,311 31,436 4,285 195,462
In Households 99.7% 99.9% 99.7% 100.0% 99.3% 100.0% 77.7% 100.0% 96.2%
In Family Households 79.4% 82.0% 92.2% 88.1% 87.4% 89.0% 76.4% 90.5% 84.3%
Householder 24.8% 26.1% 27.0% 26.1% 26.8% 26.6% 20.3% 28.5% 25.3%
Spouse 15.1% 17.4% 20.8% 18.1% 19.7% 19.7% 17.2% 23.5% 18.1%
Child 31.9% 32.0% 39.0% 37.4% 25.4% 36.3% 36.9% 32.5% 35.4%
Other Relative 4.2% 3.9% 3.5% 3.9% 3.3% 3.8% 1.3% 3.7% 3.4%
Non Relative 3.4% 2.6% 1.8% 2.5% 2.2% 2.5% 0.6% 2.3% 2.2%
In Nonfamily Households 20.3% 17.9% 7.5% 11.9% 11.9% 11.0% 1.4% 9.5% 11.9%
In Group Quarters 0.3% 0.1% 0.3% 0.0% 0.7% 0.0% 22.3% 0.0% 3.8%
Institutionalized 0.3% 0.1% 0.3% 0.0% 0.7% 0.0% 0.0% 0.0% 0.1%
Noninstitutionalized Population 0.3% 0.0% 0.0% 0.0% 0.0% 0.0% 22.3% 0.0% 3.6%
Source: ESRI and RKG Associates, Inc., 2018
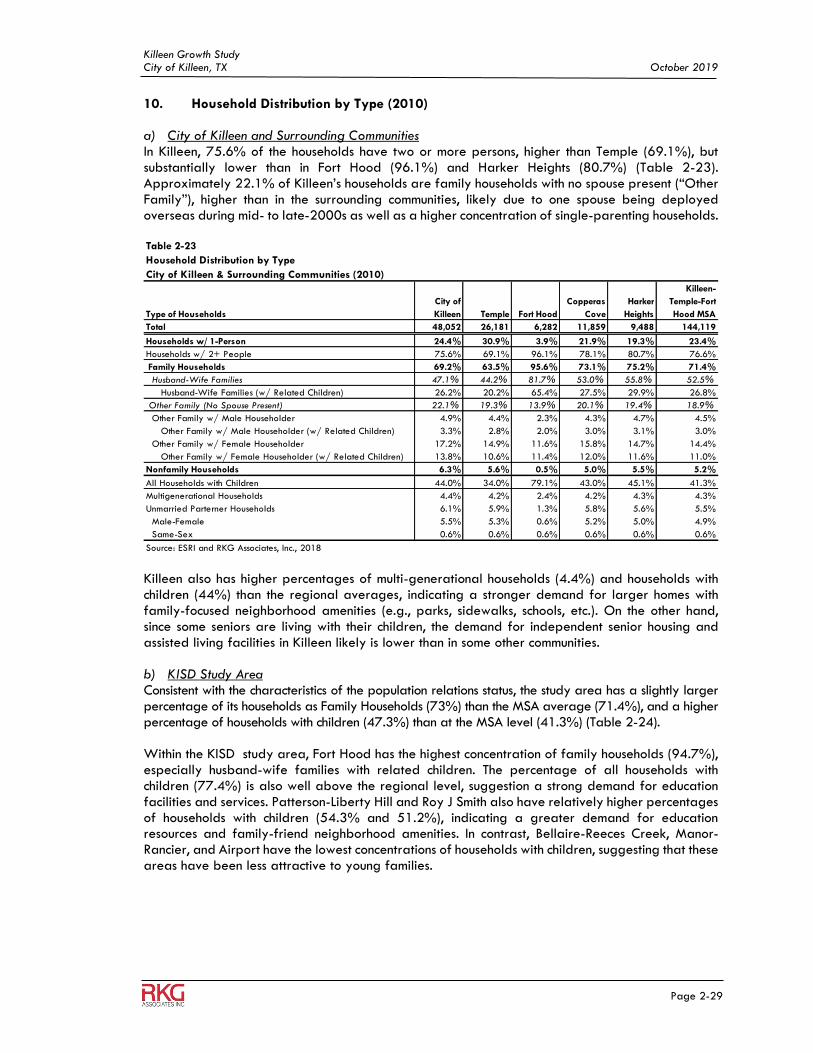
Killeen Growth Study City of Killeen, TX October 2019
Page 2-29
10. Household Distribution by Type (2010) a) City of Killeen and Surrounding Communities In Killeen, 75.6% of the households have two or more persons, higher than Temple (69.1%), but substantially lower than in Fort Hood (96.1%) and Harker Heights (80.7%) (Table 2-23). Approximately 22.1% of Killeen’s households are family households with no spouse present (“Other Family”), higher than in the surrounding communities, likely due to one spouse being deployed overseas during mid- to late-2000s as well as a higher concentration of single-parenting households.
Killeen also has higher percentages of multi-generational households (4.4%) and households with children (44%) than the regional averages, indicating a stronger demand for larger homes with family-focused neighborhood amenities (e.g., parks, sidewalks, schools, etc.). On the other hand, since some seniors are living with their children, the demand for independent senior housing and assisted living facilities in Killeen likely is lower than in some other communities. b) KISD Study Area Consistent with the characteristics of the population relations status, the study area has a slightly larger percentage of its households as Family Households (73%) than the MSA average (71.4%), and a higher percentage of households with children (47.3%) than at the MSA level (41.3%) (Table 2-24). Within the KISD study area, Fort Hood has the highest concentration of family households (94.7%), especially husband-wife families with related children. The percentage of all households with children (77.4%) is also well above the regional level, suggestion a strong demand for education facilities and services. Patterson-Liberty Hill and Roy J Smith also have relatively higher percentages of households with children (54.3% and 51.2%), indicating a greater demand for education resources and family-friend neighborhood amenities. In contrast, Bellaire-Reeces Creek, Manor-Rancier, and Airport have the lowest concentrations of households with children, suggesting that these areas have been less attractive to young families.
Table 2-23
Household Distribution by Type
City of Killeen & Surrounding Communities (2010)
Type of Households
City of
Killeen Temple Fort Hood
Copperas
Cove
Harker
Heights
Killeen-
Temple-Fort
Hood MSA
Total 48,052 26,181 6,282 11,859 9,488 144,119
Households w/ 1-Person 24.4% 30.9% 3.9% 21.9% 19.3% 23.4%
Households w/ 2+ People 75.6% 69.1% 96.1% 78.1% 80.7% 76.6%
Family Households 69.2% 63.5% 95.6% 73.1% 75.2% 71.4%
Husband-Wife Families 47.1% 44.2% 81.7% 53.0% 55.8% 52.5%
Husband-Wife Families (w/ Related Children) 26.2% 20.2% 65.4% 27.5% 29.9% 26.8%
Other Family (No Spouse Present) 22.1% 19.3% 13.9% 20.1% 19.4% 18.9%
Other Family w/ Male Householder 4.9% 4.4% 2.3% 4.3% 4.7% 4.5%
Other Family w/ Male Householder (w/ Related Children) 3.3% 2.8% 2.0% 3.0% 3.1% 3.0%
Other Family w/ Female Householder 17.2% 14.9% 11.6% 15.8% 14.7% 14.4%
Other Family w/ Female Householder (w/ Related Children) 13.8% 10.6% 11.4% 12.0% 11.6% 11.0%
Nonfamily Households 6.3% 5.6% 0.5% 5.0% 5.5% 5.2%
All Households with Children 44.0% 34.0% 79.1% 43.0% 45.1% 41.3%
Multigenerational Households 4.4% 4.2% 2.4% 4.2% 4.3% 4.3%
Unmarried Parterner Households 6.1% 5.9% 1.3% 5.8% 5.6% 5.5%
Male-Female 5.5% 5.3% 0.6% 5.2% 5.0% 4.9%
Same-Sex 0.6% 0.6% 0.6% 0.6% 0.6% 0.6%
Source: ESRI and RKG Associates, Inc., 2018
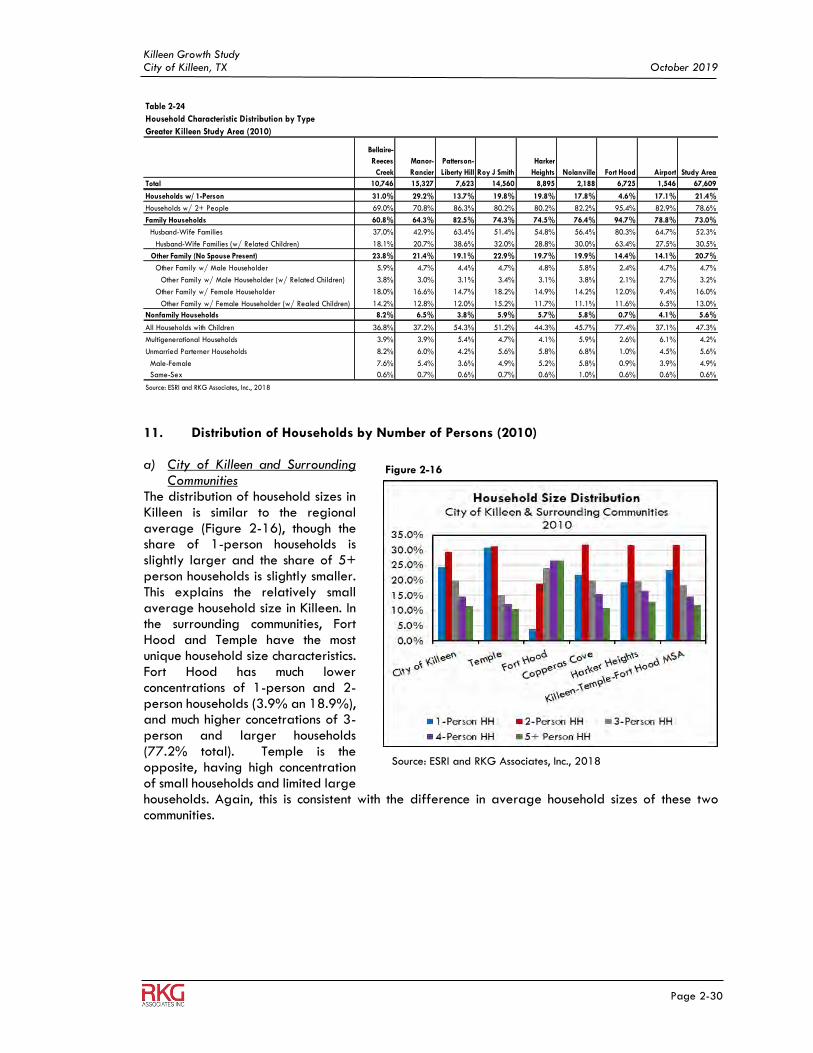
Killeen Growth Study City of Killeen, TX October 2019
Page 2-30
11. Distribution of Households by Number of Persons (2010) a) City of Killeen and Surrounding
Communities The distribution of household sizes in Killeen is similar to the regional average (Figure 2-16), though the share of 1-person households is slightly larger and the share of 5+ person households is slightly smaller. This explains the relatively small average household size in Killeen. In the surrounding communities, Fort Hood and Temple have the most unique household size characteristics. Fort Hood has much lower concentrations of 1-person and 2-person households (3.9% an 18.9%), and much higher concetrations of 3-person and larger households (77.2% total). Temple is the opposite, having high concentration of small households and limited large households. Again, this is consistent with the difference in average household sizes of these two communities.
Figure 2-16
Source: ESRI and RKG Associates, Inc., 2018
Table 2-24
Household Characteristic Distribution by Type
Greater Killeen Study Area (2010)
Bellaire-
Reeces
Creek
Manor-
Rancier
Patterson-
Liberty Hill Roy J Smith
Harker
Heights Nolanville Fort Hood Airport Study Area
Total 10,746 15,327 7,623 14,560 8,895 2,188 6,725 1,546 67,609
Households w/ 1-Person 31.0% 29.2% 13.7% 19.8% 19.8% 17.8% 4.6% 17.1% 21.4%
Households w/ 2+ People 69.0% 70.8% 86.3% 80.2% 80.2% 82.2% 95.4% 82.9% 78.6%
Family Households 60.8% 64.3% 82.5% 74.3% 74.5% 76.4% 94.7% 78.8% 73.0%
Husband-Wife Families 37.0% 42.9% 63.4% 51.4% 54.8% 56.4% 80.3% 64.7% 52.3%
Husband-Wife Families (w/ Related Children) 18.1% 20.7% 38.6% 32.0% 28.8% 30.0% 63.4% 27.5% 30.5%
Other Family (No Spouse Present) 23.8% 21.4% 19.1% 22.9% 19.7% 19.9% 14.4% 14.1% 20.7%
Other Family w/ Male Householder 5.9% 4.7% 4.4% 4.7% 4.8% 5.8% 2.4% 4.7% 4.7%
Other Family w/ Male Householder (w/ Related Children) 3.8% 3.0% 3.1% 3.4% 3.1% 3.8% 2.1% 2.7% 3.2%
Other Family w/ Female Householder 18.0% 16.6% 14.7% 18.2% 14.9% 14.2% 12.0% 9.4% 16.0%
Other Family w/ Female Householder (w/ Realed Children) 14.2% 12.8% 12.0% 15.2% 11.7% 11.1% 11.6% 6.5% 13.0%
Nonfamily Households 8.2% 6.5% 3.8% 5.9% 5.7% 5.8% 0.7% 4.1% 5.6%
All Households with Children 36.8% 37.2% 54.3% 51.2% 44.3% 45.7% 77.4% 37.1% 47.3%
Multigenerational Households 3.9% 3.9% 5.4% 4.7% 4.1% 5.9% 2.6% 6.1% 4.2%
Unmarried Parterner Households 8.2% 6.0% 4.2% 5.6% 5.8% 6.8% 1.0% 4.5% 5.6%
Male-Female 7.6% 5.4% 3.6% 4.9% 5.2% 5.8% 0.9% 3.9% 4.9%
Same-Sex 0.6% 0.7% 0.6% 0.7% 0.6% 1.0% 0.6% 0.6% 0.6%
Source: ESRI and RKG Associates, Inc., 2018
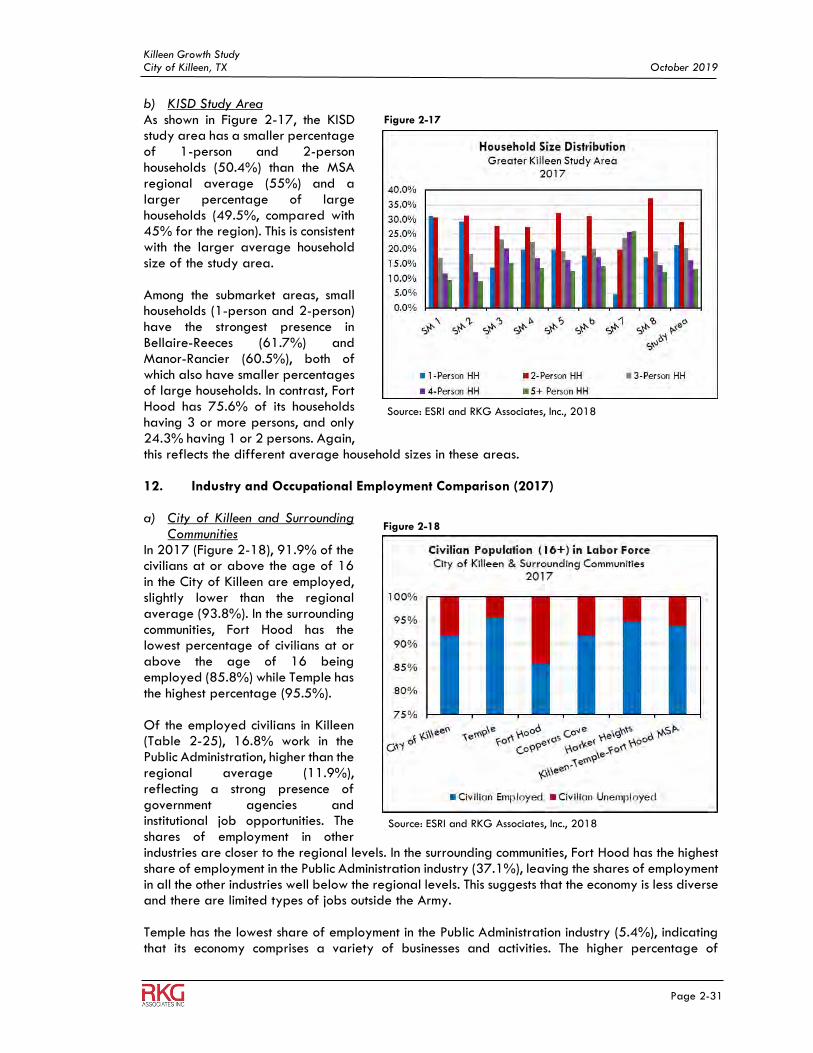
Killeen Growth Study City of Killeen, TX October 2019
Page 2-31
b) KISD Study Area As shown in Figure 2-17, the KISD study area has a smaller percentage of 1-person and 2-person households (50.4%) than the MSA regional average (55%) and a larger percentage of large households (49.5%, compared with 45% for the region). This is consistent with the larger average household size of the study area. Among the submarket areas, small households (1-person and 2-person) have the strongest presence in Bellaire-Reeces (61.7%) and Manor-Rancier (60.5%), both of which also have smaller percentages of large households. In contrast, Fort Hood has 75.6% of its households having 3 or more persons, and only 24.3% having 1 or 2 persons. Again, this reflects the different average household sizes in these areas. 12. Industry and Occupational Employment Comparison (2017)
a) City of Killeen and Surrounding
Communities In 2017 (Figure 2-18), 91.9% of the civilians at or above the age of 16 in the City of Killeen are employed, slightly lower than the regional average (93.8%). In the surrounding communities, Fort Hood has the lowest percentage of civilians at or above the age of 16 being employed (85.8%) while Temple has the highest percentage (95.5%). Of the employed civilians in Killeen (Table 2-25), 16.8% work in the Public Administration, higher than the regional average (11.9%), reflecting a strong presence of government agencies and institutional job opportunities. The shares of employment in other industries are closer to the regional levels. In the surrounding communities, Fort Hood has the highest share of employment in the Public Administration industry (37.1%), leaving the shares of employment in all the other industries well below the regional levels. This suggests that the economy is less diverse and there are limited types of jobs outside the Army. Temple has the lowest share of employment in the Public Administration industry (5.4%), indicating that its economy comprises a variety of businesses and activities. The higher percentage of
Figure 2-17
Source: ESRI and RKG Associates, Inc., 2018
Figure 2-18
Source: ESRI and RKG Associates, Inc., 2018
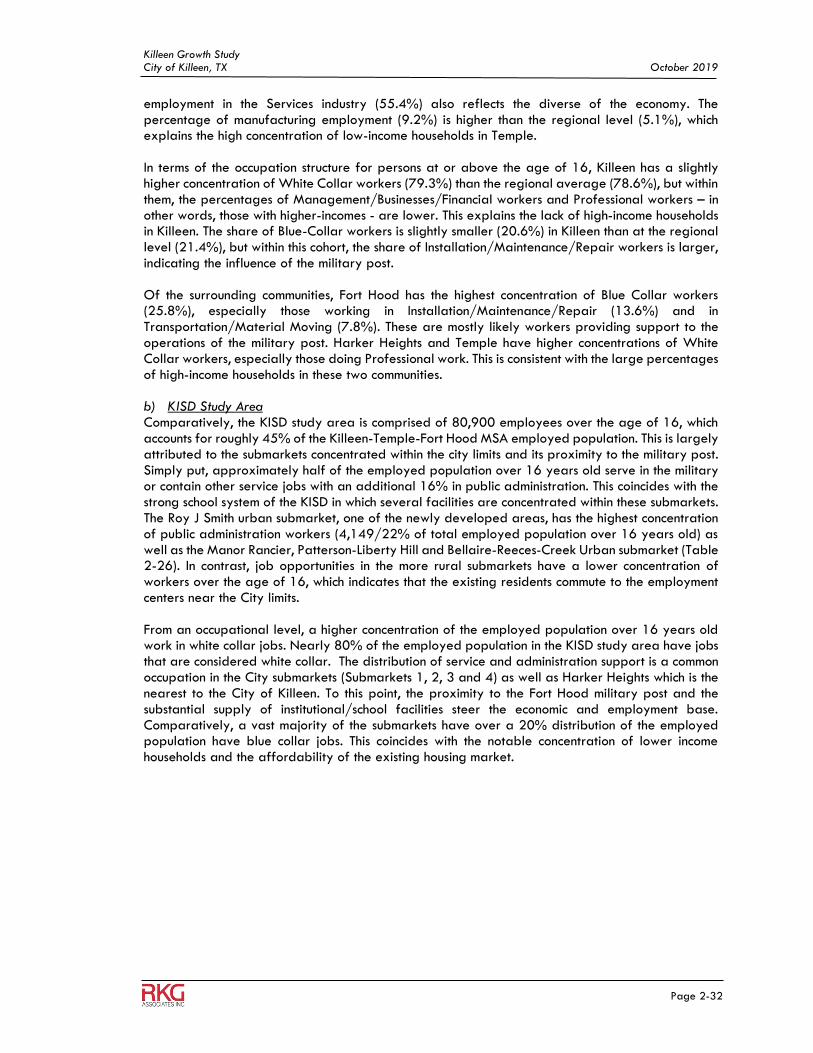
Killeen Growth Study City of Killeen, TX October 2019
Page 2-32
employment in the Services industry (55.4%) also reflects the diverse of the economy. The percentage of manufacturing employment (9.2%) is higher than the regional level (5.1%), which explains the high concentration of low-income households in Temple. In terms of the occupation structure for persons at or above the age of 16, Killeen has a slightly higher concentration of White Collar workers (79.3%) than the regional average (78.6%), but within them, the percentages of Management/Businesses/Financial workers and Professional workers – in other words, those with higher-incomes - are lower. This explains the lack of high-income households in Killeen. The share of Blue-Collar workers is slightly smaller (20.6%) in Killeen than at the regional level (21.4%), but within this cohort, the share of Installation/Maintenance/Repair workers is larger, indicating the influence of the military post. Of the surrounding communities, Fort Hood has the highest concentration of Blue Collar workers (25.8%), especially those working in Installation/Maintenance/Repair (13.6%) and in Transportation/Material Moving (7.8%). These are mostly likely workers providing support to the operations of the military post. Harker Heights and Temple have higher concentrations of White Collar workers, especially those doing Professional work. This is consistent with the large percentages of high-income households in these two communities. b) KISD Study Area Comparatively, the KISD study area is comprised of 80,900 employees over the age of 16, which accounts for roughly 45% of the Killeen-Temple-Fort Hood MSA employed population. This is largely attributed to the submarkets concentrated within the city limits and its proximity to the military post. Simply put, approximately half of the employed population over 16 years old serve in the military or contain other service jobs with an additional 16% in public administration. This coincides with the strong school system of the KISD in which several facilities are concentrated within these submarkets. The Roy J Smith urban submarket, one of the newly developed areas, has the highest concentration of public administration workers (4,149/22% of total employed population over 16 years old) as well as the Manor Rancier, Patterson-Liberty Hill and Bellaire-Reeces-Creek Urban submarket (Table 2-26). In contrast, job opportunities in the more rural submarkets have a lower concentration of workers over the age of 16, which indicates that the existing residents commute to the employment centers near the City limits. From an occupational level, a higher concentration of the employed population over 16 years old work in white collar jobs. Nearly 80% of the employed population in the KISD study area have jobs that are considered white collar. The distribution of service and administration support is a common occupation in the City submarkets (Submarkets 1, 2, 3 and 4) as well as Harker Heights which is the nearest to the City of Killeen. To this point, the proximity to the Fort Hood military post and the substantial supply of institutional/school facilities steer the economic and employment base. Comparatively, a vast majority of the submarkets have over a 20% distribution of the employed population have blue collar jobs. This coincides with the notable concentration of lower income households and the affordability of the existing housing market.
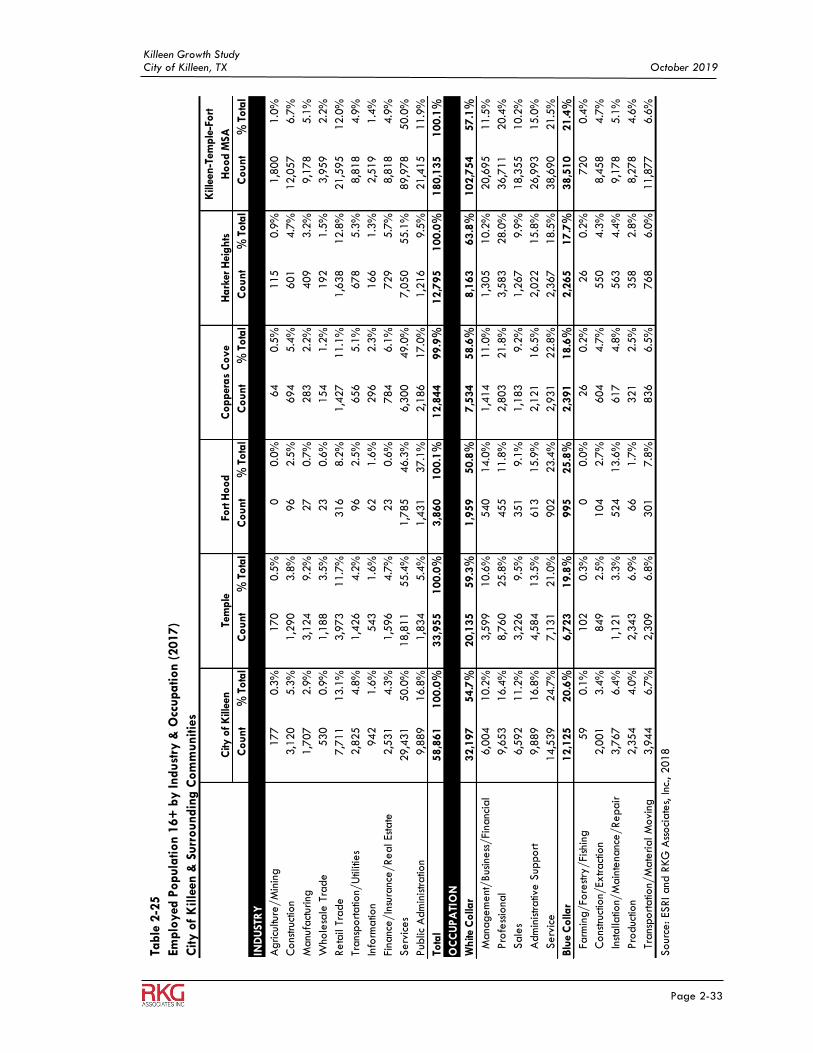
Killeen Growth Study City of Killeen, TX October 2019
Page 2-33
Table
2-2
5
Emplo
yed
Po
pula
tion 1
6+
by I
ndu
stry
& O
ccupa
tion (
201
7)
City o
f K
ille
en &
Surr
oun
din
g C
om
munit
ies
Co
un
t%
To
tal
Co
un
t%
To
tal
Co
un
t%
To
tal
Co
un
t%
To
tal
Co
un
t%
To
tal
Co
un
t%
To
tal
IND
UST
RY
Agricu
lture
/M
inin
g177
0.3
%170
0.5
%0
0.0
%64
0.5
%115
0.9
%1,8
00
1.0
%
Cons
truc
tion
3,1
20
5.3
%1,2
90
3.8
%96
2.5
%694
5.4
%601
4.7
%12,0
57
6.7
%
Manu
fact
urin
g1,7
07
2.9
%3,1
24
9.2
%27
0.7
%283
2.2
%409
3.2
%9,1
78
5.1
%
Who
lesa
le T
rade
530
0.9
%1,1
88
3.5
%23
0.6
%154
1.2
%192
1.5
%3,9
59
2.2
%
Reta
il Tr
ade
7,7
11
13.1
%3,9
73
11.7
%316
8.2
%1,4
27
11.1
%1,6
38
12.8
%21,5
95
12.0
%
Trans
portatio
n/U
tiliti
es
2,8
25
4.8
%1,4
26
4.2
%96
2.5
%656
5.1
%678
5.3
%8,8
18
4.9
%
Info
rmatio
n942
1.6
%543
1.6
%62
1.6
%296
2.3
%166
1.3
%2,5
19
1.4
%
Fina
nce/In
sura
nce/Real Es
tate
2,5
31
4.3
%1,5
96
4.7
%23
0.6
%784
6.1
%729
5.7
%8,8
18
4.9
%
Serv
ices
29,4
31
50.0
%18,8
11
55.4
%1,7
85
46.3
%6,3
00
49.0
%7,0
50
55.1
%89,9
78
50.0
%
Pub
lic A
dm
inistratio
n9,8
89
16.8
%1,8
34
5.4
%1,4
31
37.1
%2,1
86
17.0
%1,2
16
9.5
%21,4
15
11.9
%
Tota
l5
8,8
61
10
0.0
%3
3,9
55
10
0.0
%3
,86
01
00
.1%
12
,84
49
9.9
%1
2,7
95
10
0.0
%1
80
,13
51
00
.1%
OC
CU
PA
TIO
N
Wh
ite C
olla
r3
2,1
97
54
.7%
20
,13
55
9.3
%1
,95
95
0.8
%7
,53
45
8.6
%8
,16
36
3.8
%1
02
,75
45
7.1
%
M
ana
gem
ent
/Bus
iness
/Fi
nanc
ial
6,0
04
10.2
%3,5
99
10.6
%540
14.0
%1,4
14
11.0
%1,3
05
10.2
%20,6
95
11.5
%
Pro
fess
iona
l9,6
53
16.4
%8,7
60
25.8
%455
11.8
%2,8
03
21.8
%3,5
83
28.0
%36,7
11
20.4
%
Sale
s6,5
92
11.2
%3,2
26
9.5
%351
9.1
%1,1
83
9.2
%1,2
67
9.9
%18,3
55
10.2
%
A
dm
inistrativ
e S
upport
9,8
89
16.8
%4,5
84
13.5
%613
15.9
%2,1
21
16.5
%2,0
22
15.8
%26,9
93
15.0
%
Serv
ice
14,5
39
24.7
%7,1
31
21.0
%902
23.4
%2,9
31
22.8
%2,3
67
18.5
%38,6
90
21.5
%
Blu
e C
olla
r1
2,1
25
20
.6%
6,7
23
19
.8%
99
52
5.8
%2
,39
11
8.6
%2
,26
51
7.7
%3
8,5
10
21
.4%
Fa
rmin
g/Fo
restry
/Fi
shin
g59
0.1
%102
0.3
%0
0.0
%26
0.2
%26
0.2
%720
0.4
%
C
ons
truc
tion/
Extract
ion
2,0
01
3.4
%849
2.5
%104
2.7
%604
4.7
%550
4.3
%8,4
58
4.7
%
In
stalla
tion/
Main
tena
nce/Repair
3,7
67
6.4
%1,1
21
3.3
%524
13.6
%617
4.8
%563
4.4
%9,1
78
5.1
%
Pro
duc
tion
2,3
54
4.0
%2,3
43
6.9
%66
1.7
%321
2.5
%358
2.8
%8,2
78
4.6
%
Tr
ans
portatio
n/M
ate
rial M
ovi
ng3,9
44
6.7
%2,3
09
6.8
%301
7.8
%836
6.5
%768
6.0
%11,8
77
6.6
%
Sour
ce: ES
RI and
RKG
Ass
oci
ate
s, Inc
., 2018
Kill
een
-Tem
ple
-Fo
rt
Ho
od
MSA
City
of
Kill
een
Tem
ple
Fort
Ho
od
C
op
per
as
Co
ve
Ha
rker
Hei
gh
ts
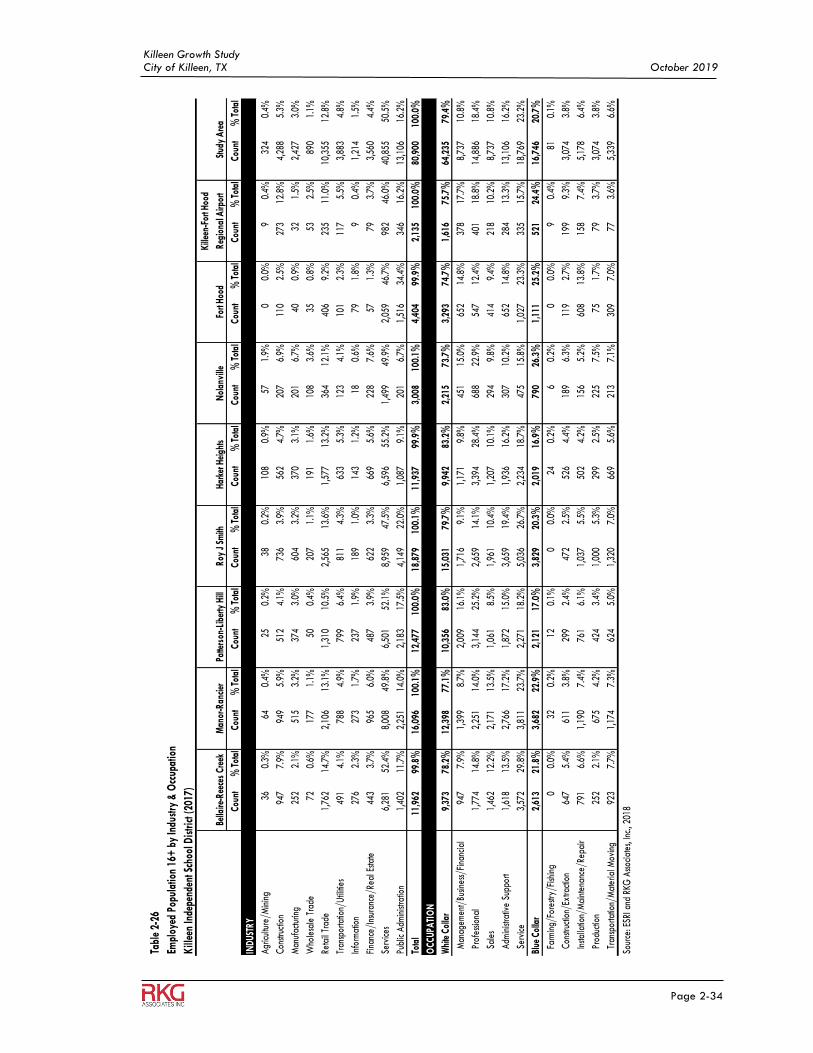
Killeen Growth Study City of Killeen, TX October 2019
Page 2-34
Tabl
e 2-
26
Empl
oyed
Pop
ulat
ion
16+
by
Indu
stry
& O
ccup
atio
n
Kill
een
Inde
pend
ent S
choo
l Dis
trict
(201
7)
Cou
nt%
Tot
alC
ount
% T
otal
Cou
nt%
Tot
alC
ount
% T
otal
Cou
nt%
Tot
alC
ount
% T
otal
Cou
nt%
Tot
alC
ount
% T
otal
Cou
nt%
Tot
al
IND
UST
RY
Agr
icul
ture
/Min
ing
360.
3%64
0.4%
250.
2%38
0.2%
108
0.9%
571.
9%0
0.0%
90.
4%32
40.
4%
Con
struc
tion
947
7.9%
949
5.9%
512
4.1%
736
3.9%
562
4.7%
207
6.9%
110
2.5%
273
12.8
%4,
288
5.3%
Man
ufac
turin
g25
22.
1%51
53.
2%37
43.
0%60
43.
2%37
03.
1%20
16.
7%40
0.9%
321.
5%2,
427
3.0%
Who
lesa
le T
rade
720.
6%17
71.
1%50
0.4%
207
1.1%
191
1.6%
108
3.6%
350.
8%53
2.5%
890
1.1%
Reta
il Tr
ade
1,76
214
.7%
2,10
613
.1%
1,31
010
.5%
2,56
513
.6%
1,57
713
.2%
364
12.1
%40
69.
2%23
511
.0%
10,3
5512
.8%
Tran
spor
tatio
n/U
tiliti
es49
14.
1%78
84.
9%79
96.
4%81
14.
3%63
35.
3%12
34.
1%10
12.
3%11
75.
5%3,
883
4.8%
Info
rmat
ion
276
2.3%
273
1.7%
237
1.9%
189
1.0%
143
1.2%
180.
6%79
1.8%
90.
4%1,
214
1.5%
Fina
nce/
Insu
ranc
e/Re
al E
state
443
3.7%
965
6.0%
487
3.9%
622
3.3%
669
5.6%
228
7.6%
571.
3%79
3.7%
3,56
04.
4%
Serv
ices
6,28
152
.4%
8,00
849
.8%
6,50
152
.1%
8,95
947
.5%
6,59
655
.2%
1,49
949
.9%
2,05
946
.7%
982
46.0
%40
,855
50.5
%
Publ
ic A
dmin
istra
tion
1,40
211
.7%
2,25
114
.0%
2,18
317
.5%
4,14
922
.0%
1,08
79.
1%20
16.
7%1,
516
34.4
%34
616
.2%
13,1
0616
.2%
Tota
l11
,962
99.8
%16
,096
100.
1%12
,477
100.
0%18
,879
100.
1%11
,937
99.9
%3,
008
100.
1%4,
404
99.9
%2,
135
100.
0%80
,900
100.
0%
OC
CU
PATI
ON
Whi
te C
olla
r9,
373
78.2
%12
,398
77.1
%10
,356
83.0
%15
,031
79.7
%9,
942
83.2
%2,
215
73.7
%3,
293
74.7
%1,
616
75.7
%64
,235
79.4
%
M
anag
emen
t/Bu
sines
s/Fi
nanc
ial
947
7.9%
1,39
98.
7%2,
009
16.1
%1,
716
9.1%
1,17
19.
8%45
115
.0%
652
14.8
%37
817
.7%
8,73
710
.8%
Pr
ofes
siona
l1,
774
14.8
%2,
251
14.0
%3,
144
25.2
%2,
659
14.1
%3,
394
28.4
%68
822
.9%
547
12.4
%40
118
.8%
14,8
8618
.4%
Sa
les
1,46
212
.2%
2,17
113
.5%
1,06
18.
5%1,
961
10.4
%1,
207
10.1
%29
49.
8%41
49.
4%21
810
.2%
8,73
710
.8%
A
dmin
istra
tive
Supp
ort
1,61
813
.5%
2,76
617
.2%
1,87
215
.0%
3,65
919
.4%
1,93
616
.2%
307
10.2
%65
214
.8%
284
13.3
%13
,106
16.2
%
Se
rvic
e 3,
572
29.8
%3,
811
23.7
%2,
271
18.2
%5,
036
26.7
%2,
234
18.7
%47
515
.8%
1,02
723
.3%
335
15.7
%18
,769
23.2
%
Blue
Col
lar
2,61
321
.8%
3,68
222
.9%
2,12
117
.0%
3,82
920
.3%
2,01
916
.9%
790
26.3
%1,
111
25.2
%52
124
.4%
16,7
4620
.7%
Fa
rmin
g/Fo
restr
y/Fi
shin
g0
0.0%
320.
2%12
0.1%
00.
0%24
0.2%
60.
2%0
0.0%
90.
4%81
0.1%
C
onstr
uctio
n/Ex
tract
ion
647
5.4%
611
3.8%
299
2.4%
472
2.5%
526
4.4%
189
6.3%
119
2.7%
199
9.3%
3,07
43.
8%
In
stalla
tion/
Mai
nten
ance
/Rep
air
791
6.6%
1,19
07.
4%76
16.
1%1,
037
5.5%
502
4.2%
156
5.2%
608
13.8
%15
87.
4%5,
178
6.4%
Pr
oduc
tion
252
2.1%
675
4.2%
424
3.4%
1,00
05.
3%29
92.
5%22
57.
5%75
1.7%
793.
7%3,
074
3.8%
Tr
ansp
orta
tion/
Mat
eria
l Mov
ing
923
7.7%
1,17
47.
3%62
45.
0%1,
320
7.0%
669
5.6%
213
7.1%
309
7.0%
773.
6%5,
339
6.6%
Sour
ce: E
SRI a
nd R
KG A
ssoc
iate
s, In
c., 2
018
Fort
Hoo
d
Kill
een-
Fort
Hoo
d
Reg
iona
l Airp
ort
Stud
y A
rea
Bella
ire-R
eece
s C
reek
Man
or-R
anci
erPa
tters
on-L
iber
ty H
illR
oy J
Sm
ithH
arke
r Hei
ghts
Nol
anvi
lle
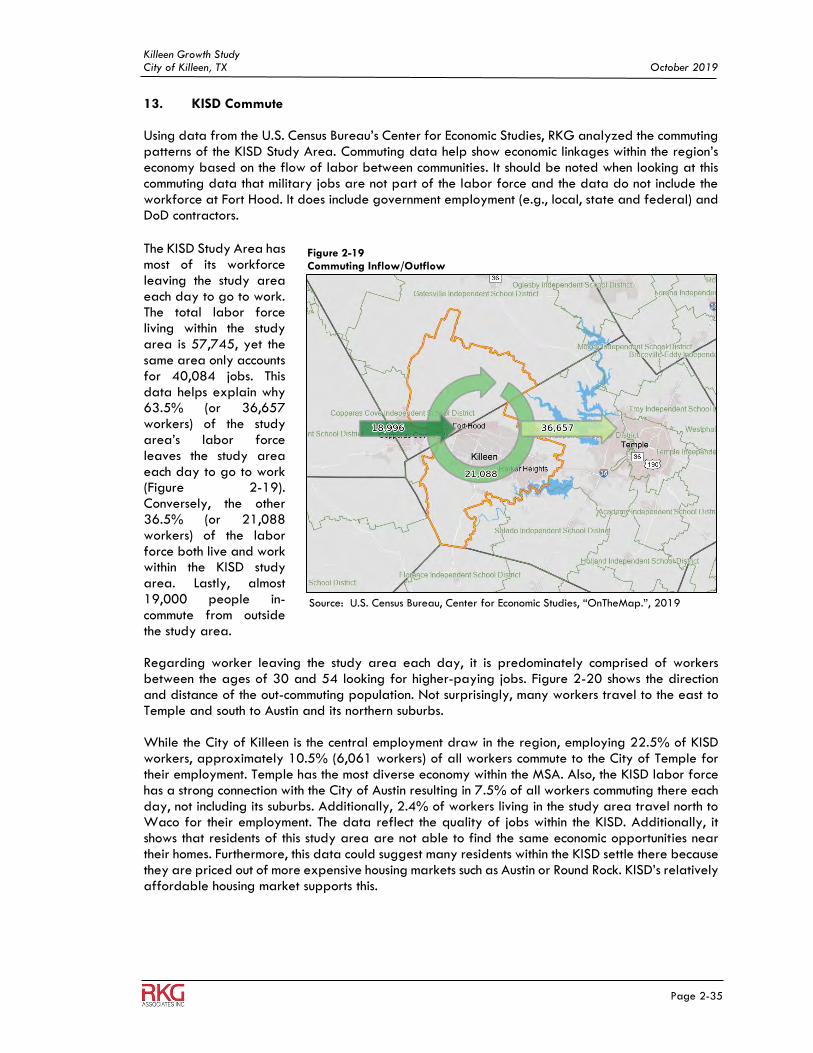
Killeen Growth Study City of Killeen, TX October 2019
Page 2-35
13. KISD Commute Using data from the U.S. Census Bureau’s Center for Economic Studies, RKG analyzed the commuting patterns of the KISD Study Area. Commuting data help show economic linkages within the region’s economy based on the flow of labor between communities. It should be noted when looking at this commuting data that military jobs are not part of the labor force and the data do not include the workforce at Fort Hood. It does include government employment (e.g., local, state and federal) and DoD contractors.
The KISD Study Area has most of its workforce leaving the study area each day to go to work. The total labor force living within the study area is 57,745, yet the same area only accounts for 40,084 jobs. This data helps explain why 63.5% (or 36,657 workers) of the study area’s labor force leaves the study area each day to go to work (Figure 2-19). Conversely, the other 36.5% (or 21,088 workers) of the labor force both live and work within the KISD study area. Lastly, almost 19,000 people in-commute from outside the study area. Regarding worker leaving the study area each day, it is predominately comprised of workers between the ages of 30 and 54 looking for higher-paying jobs. Figure 2-20 shows the direction and distance of the out-commuting population. Not surprisingly, many workers travel to the east to Temple and south to Austin and its northern suburbs. While the City of Killeen is the central employment draw in the region, employing 22.5% of KISD workers, approximately 10.5% (6,061 workers) of all workers commute to the City of Temple for their employment. Temple has the most diverse economy within the MSA. Also, the KISD labor force has a strong connection with the City of Austin resulting in 7.5% of all workers commuting there each day, not including its suburbs. Additionally, 2.4% of workers living in the study area travel north to Waco for their employment. The data reflect the quality of jobs within the KISD. Additionally, it shows that residents of this study area are not able to find the same economic opportunities near their homes. Furthermore, this data could suggest many residents within the KISD settle there because they are priced out of more expensive housing markets such as Austin or Round Rock. KISD’s relatively affordable housing market supports this.
Figure 2-19 Commuting Inflow/Outflow
Source: U.S. Census Bureau, Center for Economic Studies, “OnTheMap.”, 2019
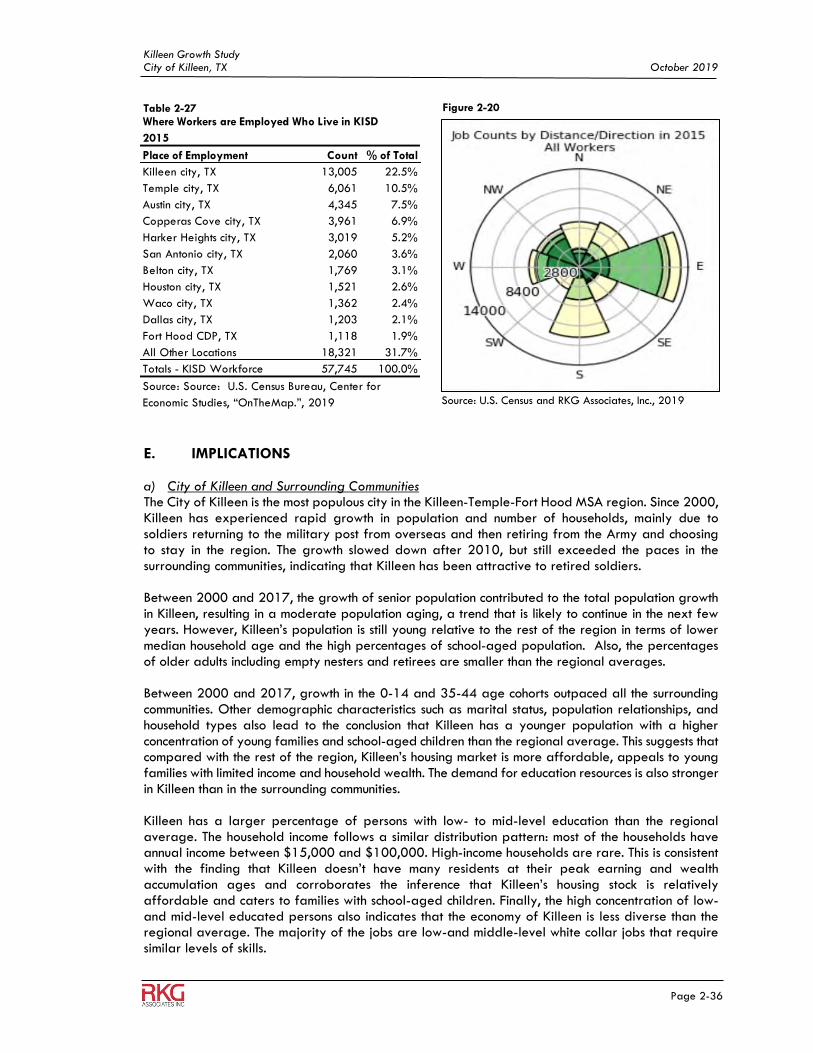
Killeen Growth Study City of Killeen, TX October 2019
Page 2-36
E. IMPLICATIONS a) City of Killeen and Surrounding Communities The City of Killeen is the most populous city in the Killeen-Temple-Fort Hood MSA region. Since 2000, Killeen has experienced rapid growth in population and number of households, mainly due to soldiers returning to the military post from overseas and then retiring from the Army and choosing to stay in the region. The growth slowed down after 2010, but still exceeded the paces in the surrounding communities, indicating that Killeen has been attractive to retired soldiers. Between 2000 and 2017, the growth of senior population contributed to the total population growth in Killeen, resulting in a moderate population aging, a trend that is likely to continue in the next few years. However, Killeen’s population is still young relative to the rest of the region in terms of lower median household age and the high percentages of school-aged population. Also, the percentages of older adults including empty nesters and retirees are smaller than the regional averages. Between 2000 and 2017, growth in the 0-14 and 35-44 age cohorts outpaced all the surrounding communities. Other demographic characteristics such as marital status, population relationships, and household types also lead to the conclusion that Killeen has a younger population with a higher concentration of young families and school-aged children than the regional average. This suggests that compared with the rest of the region, Killeen’s housing market is more affordable, appeals to young families with limited income and household wealth. The demand for education resources is also stronger in Killeen than in the surrounding communities. Killeen has a larger percentage of persons with low- to mid-level education than the regional average. The household income follows a similar distribution pattern: most of the households have annual income between $15,000 and $100,000. High-income households are rare. This is consistent with the finding that Killeen doesn’t have many residents at their peak earning and wealth accumulation ages and corroborates the inference that Killeen’s housing stock is relatively affordable and caters to families with school-aged children. Finally, the high concentration of low- and mid-level educated persons also indicates that the economy of Killeen is less diverse than the regional average. The majority of the jobs are low-and middle-level white collar jobs that require similar levels of skills.
Where Workers are Employed Who Live in KISD
2015
Place of Employment Count % of Total
Killeen city, TX 13,005 22.5%
Temple city, TX 6,061 10.5%
Austin city, TX 4,345 7.5%
Copperas Cove city, TX 3,961 6.9%
Harker Heights city, TX 3,019 5.2%
San Antonio city, TX 2,060 3.6%
Belton city, TX 1,769 3.1%
Houston city, TX 1,521 2.6%
Waco city, TX 1,362 2.4%
Dallas city, TX 1,203 2.1%
Fort Hood CDP, TX 1,118 1.9%
All Other Locations 18,321 31.7%
Totals - KISD Workforce 57,745 100.0%
Source: Source: U.S. Census Bureau, Center for
Economic Studies, “OnTheMap.”, 2019
Table 2-27 Figure 2-20
Source: U.S. Census and RKG Associates, Inc., 2019
Killeen Growth Study City of Killeen, TX October 2019
Page 2-37
Of all the communities in the Killeen-Temple-Fort Hood MSA region, Fort Hood has been most directly affected by changes at the installation. It has the youngest population, the highest share of male population, and an exceptionally higher percentage of persons in group quarters - young soldiers living in barracks-style housing, all of which are typical features of a military base. Even though only a smaller percentage of Fort Hood’s population are in households, the majority of these are husband-wife families with children (more than 2 persons). These are typically senior soldiers with spouses and children, many of which came to the military post in the 1990s. As a result, Fort Hood’s average household size is well above the regional average. The characteristics of Fort Hood’s population education level, household income, and civilian employment situation also demonstrate the influence of the military post. Fort Hood has a limited number of persons with very low- and very high-level education, and a small percentage of its households with very high and low household incomes. Compared with the other communities, Fort Hood has a much higher percentage of its civilian population unemployed. Most of them are family members of the soldiers in the military post where their job opportunities outside the Army are limited. Of the civilians that are employed, a large share of them are blue collar workers with installation/maintenance/repair and transportation/material moving jobs, providing support to the operation of the military post. On the east side of Killeen and farther away from the military post, Temple has the second largest population and the most diverse economy of the region. The population growth since 2000 has been consistently strong, indicating that Temple has been attracting residents with its diverse job opportunities and well-developed infrastructure and public services. Temple has the oldest population in the region. The percentage of persons in the 45-64 age cohort is higher than in the other communities, indicating that Temple has high-quality housing and neighborhoods that appeal to people with greater financial capabilities. The percentage of seniors (65+ years) is also the highest in the region, which is consistent with the high concentration of 1-person households. Finally, Temple has the highest percentage of persons in institutionalized group quarters, many of which are senior facilities. Compared with the other communities, Temple has higher percentages of least-educated and most-educated persons, which is consistent with the larger shares of households with the lowest incomes and highest incomes. This indicates that Temple’s diverse economy provides a wide variety of job opportunities that require different education and skill levels. It also suggests that Temple has a mixed housing market that can meet with the needs of people at all income levels. The other two communities – Harker Heights and Copperas Cove – are much smaller and more upscale. They attract high-income individuals and households that demand high-quality housing and neighborhood amenities. The local job market is small.
b) Greater Killeen Study Area Among the eight submarket areas of the Killeen Independent School District, Roy J Smith has the largest population, followed by Manor-Rancier, Fort Hood, and Patterson-Liberty Hill. This is different from the situation in 2000, when Roy J Smith and Patterson-Liberty Hill both had much smaller populations. The notable population growth in these two submarkets was largely due to the demand from family forming households who are seeking the best educational programs for their children. Additionally, a large number of soldiers separating from the Army appear to be choosing to stay within the region. They chose this area because it had plenty of undeveloped land especially in the southern part, and it is close to the military post and Interstate 14. As a result, new development and public services in these two submarkets have been struggling to keep pace with the population growth. In contrast, Fort Hood’s population declined between 2000 and 2017 as soldiers leaving the military post. To the east of Fort Hood, Bellaire-Reeces Creek and Manor-Rancier also had limited population growth since 2000. Both submarkets were developed earlier, so most neighborhoods are older and less attractive to the retired soldiers.
Killeen Growth Study City of Killeen, TX October 2019
Page 2-38
The population’s age and household relationship characteristics also reflect the influence of the military post. Fort Hood has the youngest population, with high concentrations of school-aged children and young adults, and very few persons above the age of 54. The three adjacent submarkets – Roy J Smith, Bellaire-Reeces Creek, and Manor-Rancier – also have larger percentages of school-aged persons and smaller percentages of seniors than the average at the study area level. On the other hand, many of the retired soldiers that chose to stay nearby had their spouse, children and sometimes parents living with them. As they relocated to Roy J Smith and Patterson-Liberty Hill, these two areas experienced rapid growth of school-aged children, middle-aged and older adults, and seniors. Both areas also have relatively large percentages of persons in family households especially as children. As previously explained, this suggests that the demand for education resources and family-oriented housing and neighborhood amenities is stronger in these two submarkets. Since 2000, they have been under greater pressure to provide such resources than other submarkets in the KISD study area.
Despite the similarities in military influence, the four submarkets closest to the military post have different workforces, job markets, and household income levels. Patterson-Liberty Hill has one of the most educated workforce populations in the study area, which is consistent with the high concentration of upper-middle-class households and small percentage of low-income households. Roy J Smith’s workforce education level and household income level are also above the study area averages. In contrast, Bellaire-Reeces Creek’s workforce population is the least educated throughout the study area, resulting in a high concentration of low-income households. Manor-Rancier’s workforce education level and household income level are slightly higher but still below the study area averages. A lack of high-paying jobs in Bellaire-Reeces Creek and Manor-Rancier partly explained the stagnation of population and household growth. The rest of the submarkets – Harker Heights, Nolanville, and Airport – are farther away from the military post and have been less affected by the Army’s policies. Compared with the KIDS averages, the populations in these submarkets are older and more educated, and the household income levels are higher. Since 2000, all three submarkets have experienced strong population growth, especially in the 65+ year age cohort, indicating that these areas have attracted retirees with high-quality senior facilities and services. Nolanville and Harker Heights have seen less growth of school-aged children and young adults than other age cohorts. This is due to the lack of job opportunities and affordable housing in these areas. In the Airport submarket, the growth of the young-adult population has been strong, indicating a growing job market.
Killeen Growth Study City of Killeen, TX October 2019
Page 3-1
3 REGIONAL HOUSING ANALYSIS
A. INTRODUCTION
The following section examines the residential market climate in the Killeen-Temple-Fort Hood Metropolitan Statistical Area (MSA) and its surrounding communities in addition to submarkets that comprise the KISD Independent School District (KISD) study area. Further, the chapter provides context detailing market trends, indicators, and conditions related to the overall health and performance for-rent and for-sale housing markets. The City of Killeen’s proximity to Fort Hood has translated into consistent demand and residential market growth. These market forces have been driven by population changes and economic growth throughout the City, however, the surrounding communities and various submarket areas have not always produced the same results.
B. METHODOLOGY RKG Associates analyzed housing characteristics from a regional perspective, including those counties comprising the Killeen-Temple-Fort Hood MSA (Map 3-1). In addition, the analysis consolidated 11 existing attendance zones within the Killeen Independent School Districts (KISD) into eight submarkets representing the KISD study area. Both terms are used interchangeably in this analysis. The KISD housing analysis includes the following submarket areas:
KISD Submarket Areas
• Submarket 1 Bellaire-Reeces Creek
• Submarket 2 Manor-Rancier
• Submarket 3 Patterson-Liberty Hill
• Submarket 4 Roy J Smith
• Submarket 5 Harker Heights
• Submarket 6 Nolanville
• Submarket 7 Fort Hood
• Submarket 8 Killeen-Fort Hood Regional Airport (Map 3-2) The school attendance zones contain detailed information regarding the number of school-age children by grade level and allow RKG to measure the total number of students by grade level and housing type later in the study. The U.S. Census and 2011-2015 American Community Survey estimates were used for the housing inventory data regarding the distribution and age of housing stock, tenure and value of owner-occupied/renter-occupied housing units as well as other indicators of the housing market.
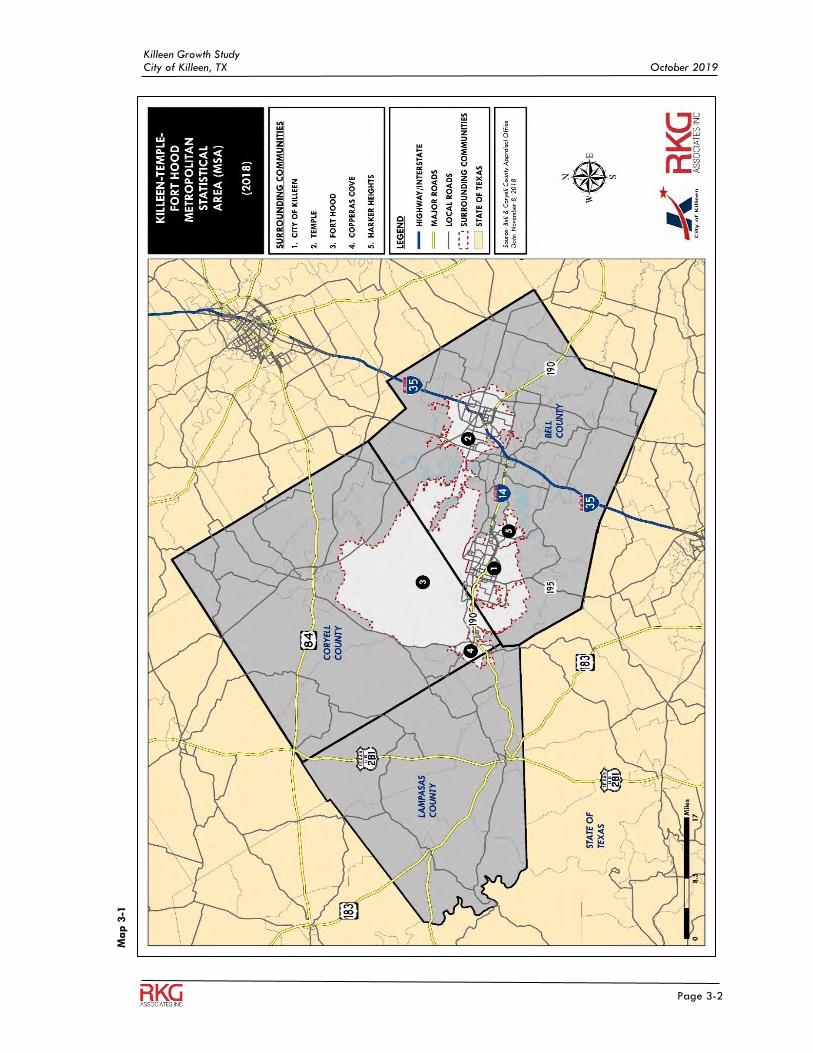
Killeen Growth Study City of Killeen, TX October 2019
Page 3-2
Ma
p 3
-1

Killeen Growth Study City of Killeen, TX October 2019
Page 3-3
Ma
p 3
-2
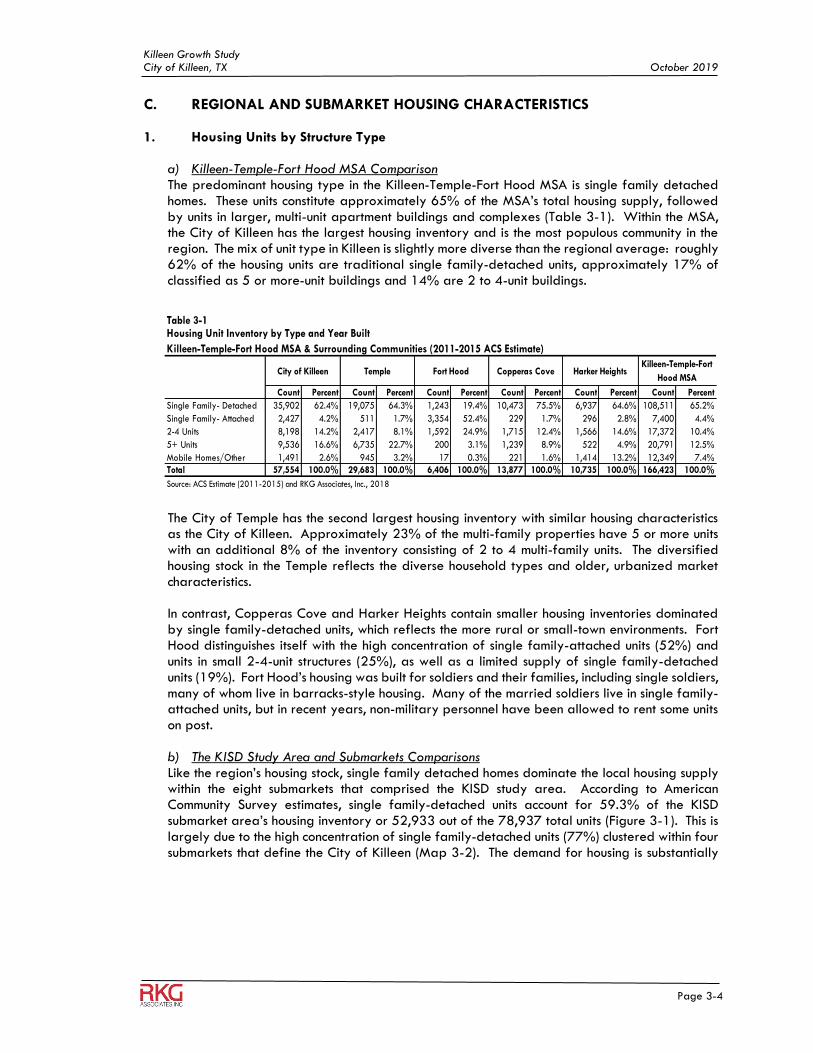
Killeen Growth Study City of Killeen, TX October 2019
Page 3-4
C. REGIONAL AND SUBMARKET HOUSING CHARACTERISTICS 1. Housing Units by Structure Type
a) Killeen-Temple-Fort Hood MSA Comparison The predominant housing type in the Killeen-Temple-Fort Hood MSA is single family detached homes. These units constitute approximately 65% of the MSA’s total housing supply, followed by units in larger, multi-unit apartment buildings and complexes (Table 3-1). Within the MSA, the City of Killeen has the largest housing inventory and is the most populous community in the region. The mix of unit type in Killeen is slightly more diverse than the regional average: roughly 62% of the housing units are traditional single family-detached units, approximately 17% of classified as 5 or more-unit buildings and 14% are 2 to 4-unit buildings.
The City of Temple has the second largest housing inventory with similar housing characteristics as the City of Killeen. Approximately 23% of the multi-family properties have 5 or more units with an additional 8% of the inventory consisting of 2 to 4 multi-family units. The diversified housing stock in the Temple reflects the diverse household types and older, urbanized market characteristics. In contrast, Copperas Cove and Harker Heights contain smaller housing inventories dominated by single family-detached units, which reflects the more rural or small-town environments. Fort Hood distinguishes itself with the high concentration of single family-attached units (52%) and units in small 2-4-unit structures (25%), as well as a limited supply of single family-detached units (19%). Fort Hood’s housing was built for soldiers and their families, including single soldiers, many of whom live in barracks-style housing. Many of the married soldiers live in single family-attached units, but in recent years, non-military personnel have been allowed to rent some units on post. b) The KISD Study Area and Submarkets Comparisons Like the region’s housing stock, single family detached homes dominate the local housing supply within the eight submarkets that comprised the KISD study area. According to American Community Survey estimates, single family-detached units account for 59.3% of the KISD submarket area’s housing inventory or 52,933 out of the 78,937 total units (Figure 3-1). This is largely due to the high concentration of single family-detached units (77%) clustered within four submarkets that define the City of Killeen (Map 3-2). The demand for housing is substantially
Table 3-1Housing Unit Inventory by Type and Year Built
Killeen-Temple-Fort Hood MSA & Surrounding Communities (2011-2015 ACS Estimate)
Count Percent Count Percent Count Percent Count Percent Count Percent Count Percent
Single Family- Detached 35,902 62.4% 19,075 64.3% 1,243 19.4% 10,473 75.5% 6,937 64.6% 108,511 65.2%
Single Family- Attached 2,427 4.2% 511 1.7% 3,354 52.4% 229 1.7% 296 2.8% 7,400 4.4%
2-4 Units 8,198 14.2% 2,417 8.1% 1,592 24.9% 1,715 12.4% 1,566 14.6% 17,372 10.4%
5+ Units 9,536 16.6% 6,735 22.7% 200 3.1% 1,239 8.9% 522 4.9% 20,791 12.5%
Mobile Homes/Other 1,491 2.6% 945 3.2% 17 0.3% 221 1.6% 1,414 13.2% 12,349 7.4%
Total 57,554 100.0% 29,683 100.0% 6,406 100.0% 13,877 100.0% 10,735 100.0% 166,423 100.0%
Source: ACS Estimate (2011-2015) and RKG Associates, Inc., 2018
Killeen-Temple-Fort
Hood MSACity of Killeen Temple Fort Hood Copperas Cove Harker Heights
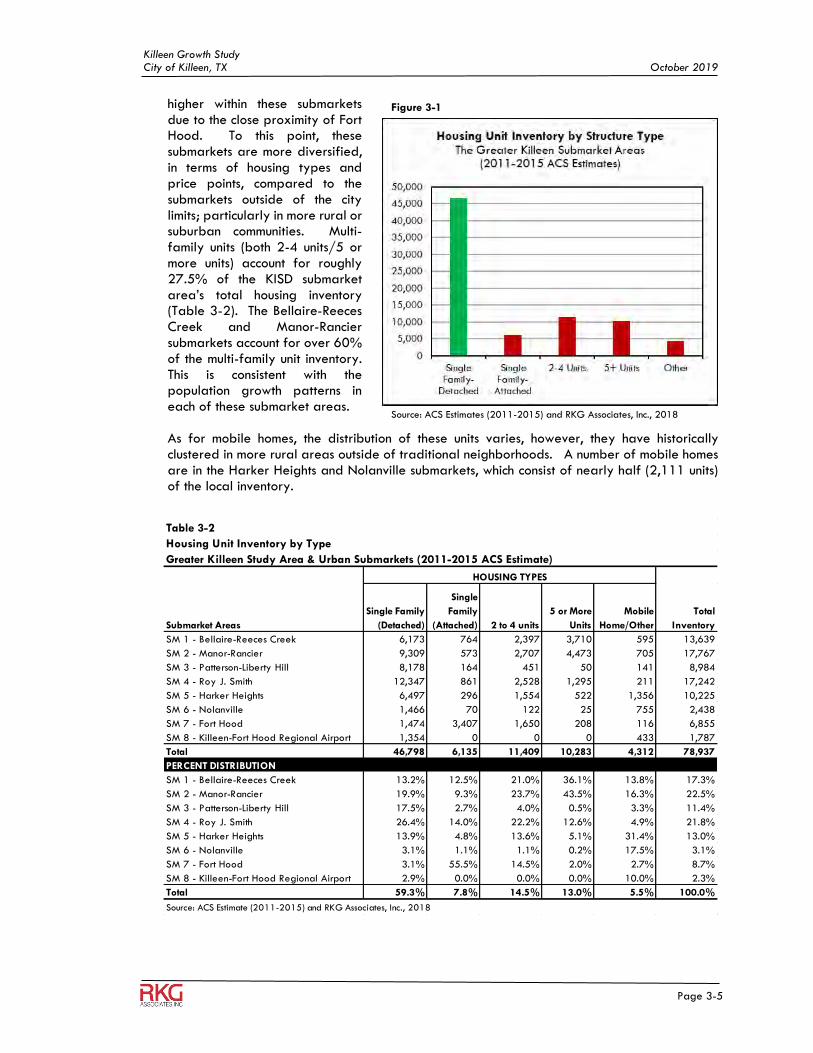
Killeen Growth Study City of Killeen, TX October 2019
Page 3-5
higher within these submarkets due to the close proximity of Fort Hood. To this point, these submarkets are more diversified, in terms of housing types and price points, compared to the submarkets outside of the city limits; particularly in more rural or suburban communities. Multi-family units (both 2-4 units/5 or more units) account for roughly 27.5% of the KISD submarket area’s total housing inventory (Table 3-2). The Bellaire-Reeces Creek and Manor-Rancier submarkets account for over 60% of the multi-family unit inventory. This is consistent with the population growth patterns in each of these submarket areas. As for mobile homes, the distribution of these units varies, however, they have historically clustered in more rural areas outside of traditional neighborhoods. A number of mobile homes are in the Harker Heights and Nolanville submarkets, which consist of nearly half (2,111 units) of the local inventory.
Table 3-2
Housing Unit Inventory by Type
Greater Killeen Study Area & Urban Submarkets (2011-2015 ACS Estimate)
Submarket Areas
Single Family
(Detached)
Single
Family
(Attached) 2 to 4 units
5 or More
Units
Mobile
Home/Other
SM 1 - Bellaire-Reeces Creek 6,173 764 2,397 3,710 595 13,639
SM 2 - Manor-Rancier 9,309 573 2,707 4,473 705 17,767
SM 3 - Patterson-Liberty Hill 8,178 164 451 50 141 8,984
SM 4 - Roy J. Smith 12,347 861 2,528 1,295 211 17,242
SM 5 - Harker Heights 6,497 296 1,554 522 1,356 10,225
SM 6 - Nolanville 1,466 70 122 25 755 2,438
SM 7 - Fort Hood 1,474 3,407 1,650 208 116 6,855
SM 8 - Killeen-Fort Hood Regional Airport 1,354 0 0 0 433 1,787
Total 46,798 6,135 11,409 10,283 4,312 78,937
PERCENT DISTRIBUTION
SM 1 - Bellaire-Reeces Creek 13.2% 12.5% 21.0% 36.1% 13.8% 17.3%
SM 2 - Manor-Rancier 19.9% 9.3% 23.7% 43.5% 16.3% 22.5%
SM 3 - Patterson-Liberty Hill 17.5% 2.7% 4.0% 0.5% 3.3% 11.4%
SM 4 - Roy J. Smith 26.4% 14.0% 22.2% 12.6% 4.9% 21.8%
SM 5 - Harker Heights 13.9% 4.8% 13.6% 5.1% 31.4% 13.0%
SM 6 - Nolanville 3.1% 1.1% 1.1% 0.2% 17.5% 3.1%
SM 7 - Fort Hood 3.1% 55.5% 14.5% 2.0% 2.7% 8.7%
SM 8 - Killeen-Fort Hood Regional Airport 2.9% 0.0% 0.0% 0.0% 10.0% 2.3%
Total 59.3% 7.8% 14.5% 13.0% 5.5% 100.0%
Source: ACS Estimate (2011-2015) and RKG Associates, Inc., 2018
HOUSING TYPES
Total
Inventory
Figure 3-1
Source: ACS Estimates (2011-2015) and RKG Associates, Inc., 2018
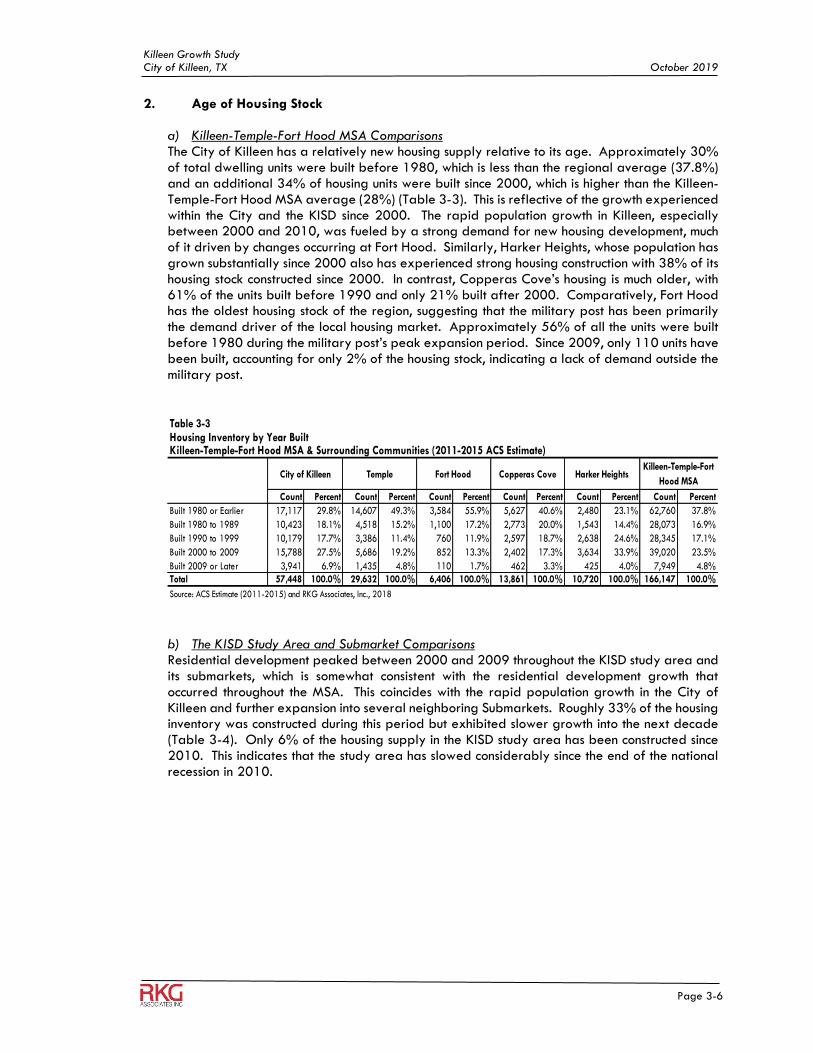
Killeen Growth Study City of Killeen, TX October 2019
Page 3-6
2. Age of Housing Stock
a) Killeen-Temple-Fort Hood MSA Comparisons The City of Killeen has a relatively new housing supply relative to its age. Approximately 30% of total dwelling units were built before 1980, which is less than the regional average (37.8%) and an additional 34% of housing units were built since 2000, which is higher than the Killeen-Temple-Fort Hood MSA average (28%) (Table 3-3). This is reflective of the growth experienced within the City and the KISD since 2000. The rapid population growth in Killeen, especially between 2000 and 2010, was fueled by a strong demand for new housing development, much of it driven by changes occurring at Fort Hood. Similarly, Harker Heights, whose population has grown substantially since 2000 also has experienced strong housing construction with 38% of its housing stock constructed since 2000. In contrast, Copperas Cove’s housing is much older, with 61% of the units built before 1990 and only 21% built after 2000. Comparatively, Fort Hood has the oldest housing stock of the region, suggesting that the military post has been primarily the demand driver of the local housing market. Approximately 56% of all the units were built before 1980 during the military post’s peak expansion period. Since 2009, only 110 units have been built, accounting for only 2% of the housing stock, indicating a lack of demand outside the military post.
b) The KISD Study Area and Submarket Comparisons Residential development peaked between 2000 and 2009 throughout the KISD study area and its submarkets, which is somewhat consistent with the residential development growth that occurred throughout the MSA. This coincides with the rapid population growth in the City of Killeen and further expansion into several neighboring Submarkets. Roughly 33% of the housing inventory was constructed during this period but exhibited slower growth into the next decade (Table 3-4). Only 6% of the housing supply in the KISD study area has been constructed since 2010. This indicates that the study area has slowed considerably since the end of the national recession in 2010.
Table 3-3Housing Inventory by Year BuiltKilleen-Temple-Fort Hood MSA & Surrounding Communities (2011-2015 ACS Estimate)
Count Percent Count Percent Count Percent Count Percent Count Percent Count Percent
Built 1980 or Earlier 17,117 29.8% 14,607 49.3% 3,584 55.9% 5,627 40.6% 2,480 23.1% 62,760 37.8%
Built 1980 to 1989 10,423 18.1% 4,518 15.2% 1,100 17.2% 2,773 20.0% 1,543 14.4% 28,073 16.9%
Built 1990 to 1999 10,179 17.7% 3,386 11.4% 760 11.9% 2,597 18.7% 2,638 24.6% 28,345 17.1%
Built 2000 to 2009 15,788 27.5% 5,686 19.2% 852 13.3% 2,402 17.3% 3,634 33.9% 39,020 23.5%
Built 2009 or Later 3,941 6.9% 1,435 4.8% 110 1.7% 462 3.3% 425 4.0% 7,949 4.8%
Total 57,448 100.0% 29,632 100.0% 6,406 100.0% 13,861 100.0% 10,720 100.0% 166,147 100.0%
Source: ACS Estimate (2011-2015) and RKG Associates, Inc., 2018
Killeen-Temple-Fort
Hood MSACity of Killeen Temple Fort Hood Copperas Cove Harker Heights
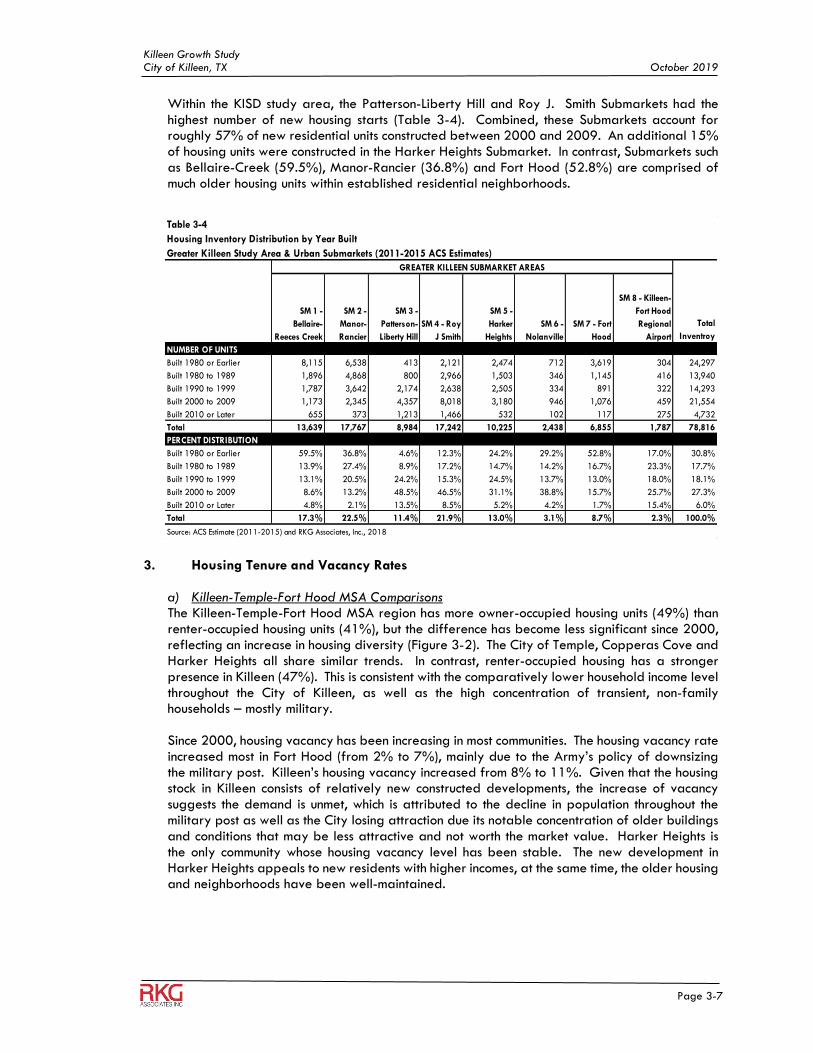
Killeen Growth Study City of Killeen, TX October 2019
Page 3-7
Within the KISD study area, the Patterson-Liberty Hill and Roy J. Smith Submarkets had the highest number of new housing starts (Table 3-4). Combined, these Submarkets account for roughly 57% of new residential units constructed between 2000 and 2009. An additional 15% of housing units were constructed in the Harker Heights Submarket. In contrast, Submarkets such as Bellaire-Creek (59.5%), Manor-Rancier (36.8%) and Fort Hood (52.8%) are comprised of much older housing units within established residential neighborhoods.
3. Housing Tenure and Vacancy Rates
a) Killeen-Temple-Fort Hood MSA Comparisons The Killeen-Temple-Fort Hood MSA region has more owner-occupied housing units (49%) than renter-occupied housing units (41%), but the difference has become less significant since 2000, reflecting an increase in housing diversity (Figure 3-2). The City of Temple, Copperas Cove and Harker Heights all share similar trends. In contrast, renter-occupied housing has a stronger presence in Killeen (47%). This is consistent with the comparatively lower household income level throughout the City of Killeen, as well as the high concentration of transient, non-family households – mostly military. Since 2000, housing vacancy has been increasing in most communities. The housing vacancy rate increased most in Fort Hood (from 2% to 7%), mainly due to the Army’s policy of downsizing the military post. Killeen’s housing vacancy increased from 8% to 11%. Given that the housing stock in Killeen consists of relatively new constructed developments, the increase of vacancy suggests the demand is unmet, which is attributed to the decline in population throughout the military post as well as the City losing attraction due its notable concentration of older buildings and conditions that may be less attractive and not worth the market value. Harker Heights is the only community whose housing vacancy level has been stable. The new development in Harker Heights appeals to new residents with higher incomes, at the same time, the older housing and neighborhoods have been well-maintained.
Table 3-4
Housing Inventory Distribution by Year Built
Greater Killeen Study Area & Urban Submarkets (2011-2015 ACS Estimates)
SM 1 -
Bellaire-
Reeces Creek
SM 2 -
Manor-
Rancier
SM 3 -
Patterson-
Liberty Hill
SM 4 - Roy
J Smith
SM 5 -
Harker
Heights
SM 6 -
Nolanville
SM 7 - Fort
Hood
SM 8 - Killeen-
Fort Hood
Regional
Airport
NUMBER OF UNITS
Built 1980 or Earlier 8,115 6,538 413 2,121 2,474 712 3,619 304 24,297
Built 1980 to 1989 1,896 4,868 800 2,966 1,503 346 1,145 416 13,940
Built 1990 to 1999 1,787 3,642 2,174 2,638 2,505 334 891 322 14,293
Built 2000 to 2009 1,173 2,345 4,357 8,018 3,180 946 1,076 459 21,554
Built 2010 or Later 655 373 1,213 1,466 532 102 117 275 4,732
Total 13,639 17,767 8,984 17,242 10,225 2,438 6,855 1,787 78,816
PERCENT DISTRIBUTION
Built 1980 or Earlier 59.5% 36.8% 4.6% 12.3% 24.2% 29.2% 52.8% 17.0% 30.8%
Built 1980 to 1989 13.9% 27.4% 8.9% 17.2% 14.7% 14.2% 16.7% 23.3% 17.7%
Built 1990 to 1999 13.1% 20.5% 24.2% 15.3% 24.5% 13.7% 13.0% 18.0% 18.1%
Built 2000 to 2009 8.6% 13.2% 48.5% 46.5% 31.1% 38.8% 15.7% 25.7% 27.3%
Built 2010 or Later 4.8% 2.1% 13.5% 8.5% 5.2% 4.2% 1.7% 15.4% 6.0%
Total 17.3% 22.5% 11.4% 21.9% 13.0% 3.1% 8.7% 2.3% 100.0%
Source: ACS Estimate (2011-2015) and RKG Associates, Inc., 2018
GREATER KILLEEN SUBMARKET AREAS
Total
Inventroy
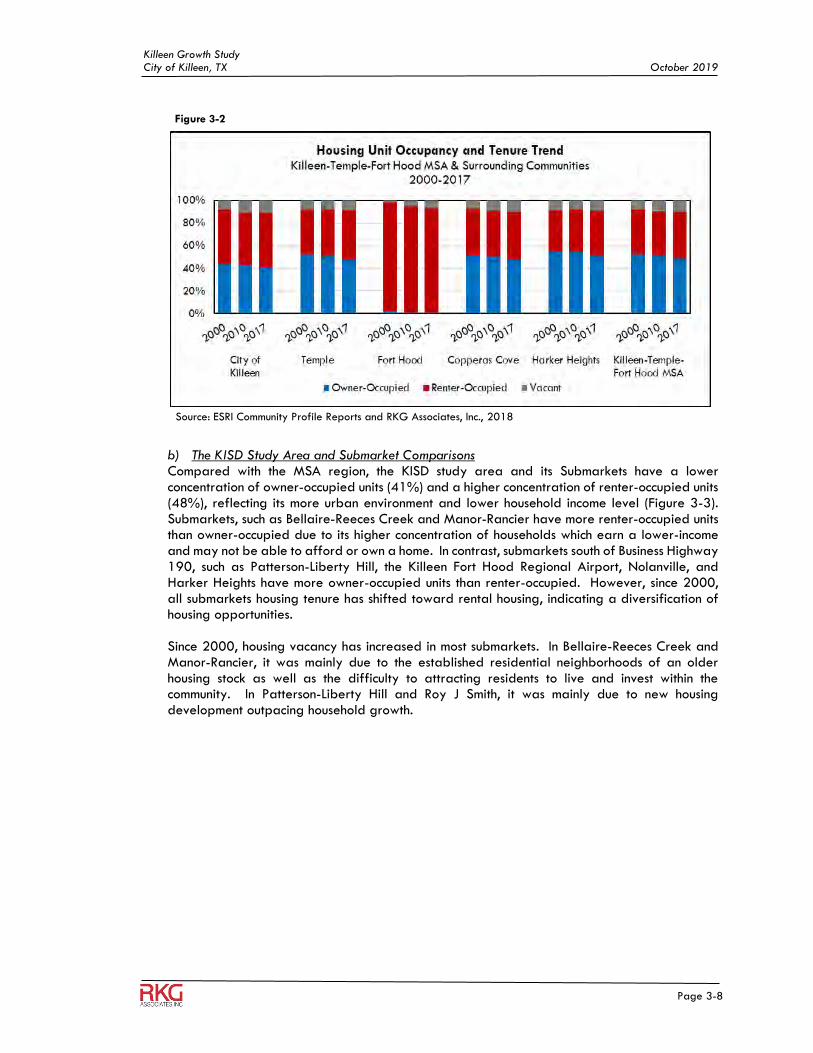
Killeen Growth Study City of Killeen, TX October 2019
Page 3-8
b) The KISD Study Area and Submarket Comparisons Compared with the MSA region, the KISD study area and its Submarkets have a lower concentration of owner-occupied units (41%) and a higher concentration of renter-occupied units (48%), reflecting its more urban environment and lower household income level (Figure 3-3). Submarkets, such as Bellaire-Reeces Creek and Manor-Rancier have more renter-occupied units than owner-occupied due to its higher concentration of households which earn a lower-income and may not be able to afford or own a home. In contrast, submarkets south of Business Highway 190, such as Patterson-Liberty Hill, the Killeen Fort Hood Regional Airport, Nolanville, and Harker Heights have more owner-occupied units than renter-occupied. However, since 2000, all submarkets housing tenure has shifted toward rental housing, indicating a diversification of housing opportunities. Since 2000, housing vacancy has increased in most submarkets. In Bellaire-Reeces Creek and Manor-Rancier, it was mainly due to the established residential neighborhoods of an older housing stock as well as the difficulty to attracting residents to live and invest within the community. In Patterson-Liberty Hill and Roy J Smith, it was mainly due to new housing development outpacing household growth.
Figure 3-2
Source: ESRI Community Profile Reports and RKG Associates, Inc., 2018
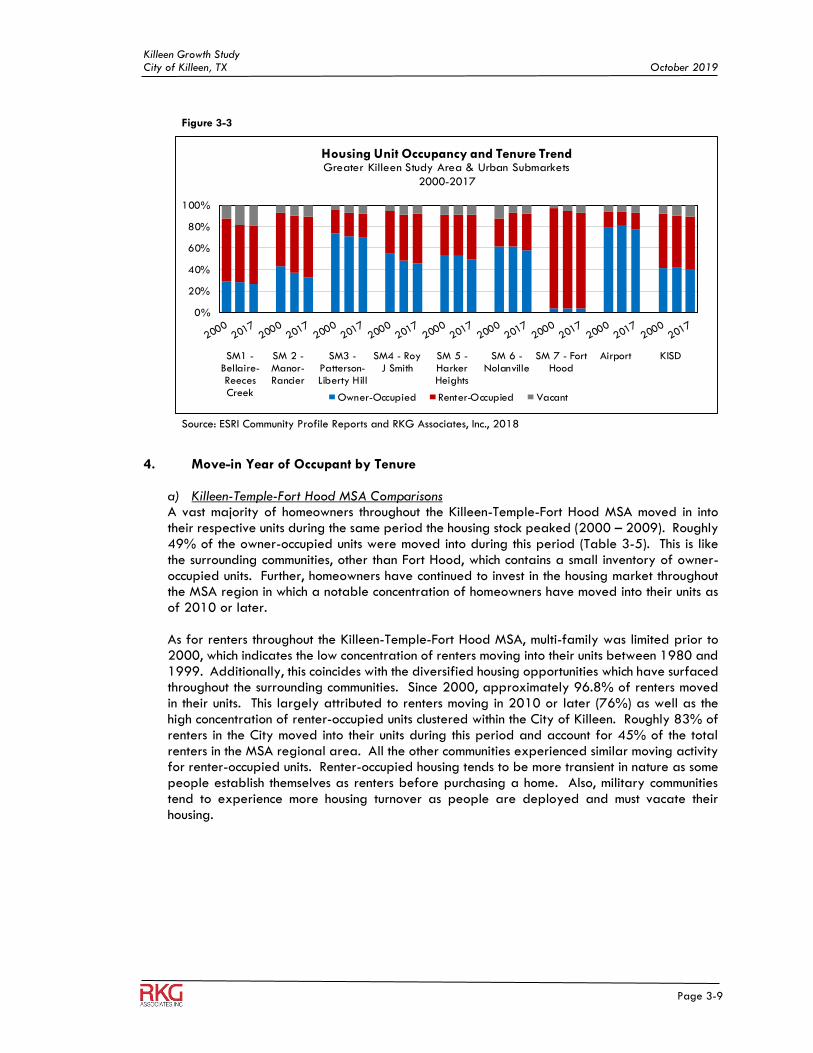
Killeen Growth Study City of Killeen, TX October 2019
Page 3-9
4. Move-in Year of Occupant by Tenure
a) Killeen-Temple-Fort Hood MSA Comparisons A vast majority of homeowners throughout the Killeen-Temple-Fort Hood MSA moved in into their respective units during the same period the housing stock peaked (2000 – 2009). Roughly 49% of the owner-occupied units were moved into during this period (Table 3-5). This is like the surrounding communities, other than Fort Hood, which contains a small inventory of owner-occupied units. Further, homeowners have continued to invest in the housing market throughout the MSA region in which a notable concentration of homeowners have moved into their units as of 2010 or later. As for renters throughout the Killeen-Temple-Fort Hood MSA, multi-family was limited prior to 2000, which indicates the low concentration of renters moving into their units between 1980 and 1999. Additionally, this coincides with the diversified housing opportunities which have surfaced throughout the surrounding communities. Since 2000, approximately 96.8% of renters moved in their units. This largely attributed to renters moving in 2010 or later (76%) as well as the high concentration of renter-occupied units clustered within the City of Killeen. Roughly 83% of renters in the City moved into their units during this period and account for 45% of the total renters in the MSA regional area. All the other communities experienced similar moving activity for renter-occupied units. Renter-occupied housing tends to be more transient in nature as some people establish themselves as renters before purchasing a home. Also, military communities tend to experience more housing turnover as people are deployed and must vacate their housing.
0%
20%
40%
60%
80%
100%
SM1 -Bellaire-ReecesCreek
SM 2 -Manor-Rancier
SM3 -Patterson-Liberty Hill
SM4 - RoyJ Smith
SM 5 -HarkerHeights
SM 6 -Nolanville
SM 7 - FortHood
Airport KISD
Housing Unit Occupancy and Tenure TrendGreater Killeen Study Area & Urban Submarkets
2000-2017
Owner-Occupied Renter-Occupied Vacant
Figure 3-3
Source: ESRI Community Profile Reports and RKG Associates, Inc., 2018
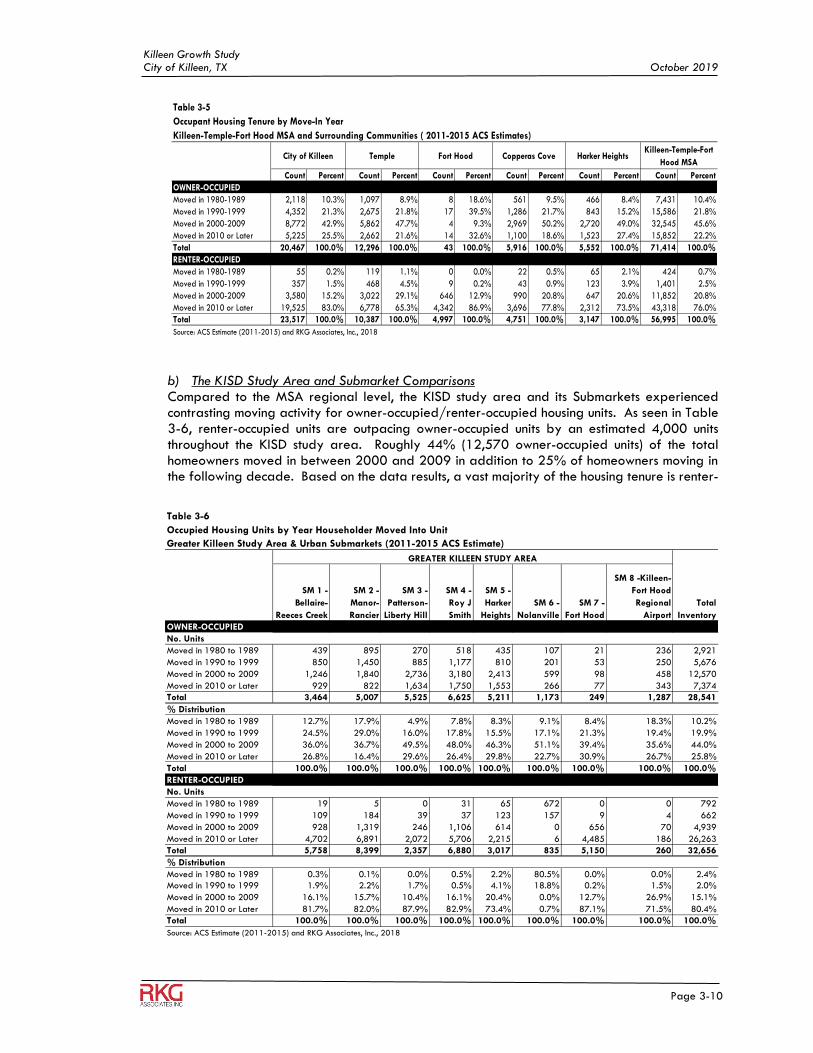
Killeen Growth Study City of Killeen, TX October 2019
Page 3-10
b) The KISD Study Area and Submarket Comparisons Compared to the MSA regional level, the KISD study area and its Submarkets experienced contrasting moving activity for owner-occupied/renter-occupied housing units. As seen in Table 3-6, renter-occupied units are outpacing owner-occupied units by an estimated 4,000 units throughout the KISD study area. Roughly 44% (12,570 owner-occupied units) of the total homeowners moved in between 2000 and 2009 in addition to 25% of homeowners moving in the following decade. Based on the data results, a vast majority of the housing tenure is renter-
Table 3-5
Occupant Housing Tenure by Move-In Year
Killeen-Temple-Fort Hood MSA and Surrounding Communities ( 2011-2015 ACS Estimates)
Count Percent Count Percent Count Percent Count Percent Count Percent Count Percent
OWNER-OCCUPIED
Moved in 1980-1989 2,118 10.3% 1,097 8.9% 8 18.6% 561 9.5% 466 8.4% 7,431 10.4%
Moved in 1990-1999 4,352 21.3% 2,675 21.8% 17 39.5% 1,286 21.7% 843 15.2% 15,586 21.8%
Moved in 2000-2009 8,772 42.9% 5,862 47.7% 4 9.3% 2,969 50.2% 2,720 49.0% 32,545 45.6%
Moved in 2010 or Later 5,225 25.5% 2,662 21.6% 14 32.6% 1,100 18.6% 1,523 27.4% 15,852 22.2%
Total 20,467 100.0% 12,296 100.0% 43 100.0% 5,916 100.0% 5,552 100.0% 71,414 100.0%
RENTER-OCCUPIED 0.0% 0.0% 0.0% 0.0% 0.0% 0.0%
Moved in 1980-1989 55 0.2% 119 1.1% 0 0.0% 22 0.5% 65 2.1% 424 0.7%
Moved in 1990-1999 357 1.5% 468 4.5% 9 0.2% 43 0.9% 123 3.9% 1,401 2.5%
Moved in 2000-2009 3,580 15.2% 3,022 29.1% 646 12.9% 990 20.8% 647 20.6% 11,852 20.8%
Moved in 2010 or Later 19,525 83.0% 6,778 65.3% 4,342 86.9% 3,696 77.8% 2,312 73.5% 43,318 76.0%
Total 23,517 100.0% 10,387 100.0% 4,997 100.0% 4,751 100.0% 3,147 100.0% 56,995 100.0%
Source: ACS Estimate (2011-2015) and RKG Associates, Inc., 2018
Killeen-Temple-Fort
Hood MSACity of Killeen Temple Fort Hood Copperas Cove Harker Heights
Table 3-6
Occupied Housing Units by Year Householder Moved Into Unit
Greater Killeen Study Area & Urban Submarkets (2011-2015 ACS Estimate)
SM 1 -
Bellaire-
Reeces Creek
SM 2 -
Manor-
Rancier
SM 3 -
Patterson-
Liberty Hill
SM 4 -
Roy J
Smith
SM 5 -
Harker
Heights
SM 6 -
Nolanville
SM 7 -
Fort Hood
SM 8 -Killeen-
Fort Hood
Regional
Airport
OWNER-OCCUPIED
No. Units
Moved in 1980 to 1989 439 895 270 518 435 107 21 236 2,921
Moved in 1990 to 1999 850 1,450 885 1,177 810 201 53 250 5,676
Moved in 2000 to 2009 1,246 1,840 2,736 3,180 2,413 599 98 458 12,570
Moved in 2010 or Later 929 822 1,634 1,750 1,553 266 77 343 7,374
Total 3,464 5,007 5,525 6,625 5,211 1,173 249 1,287 28,541
% Distribution
Moved in 1980 to 1989 12.7% 17.9% 4.9% 7.8% 8.3% 9.1% 8.4% 18.3% 10.2%
Moved in 1990 to 1999 24.5% 29.0% 16.0% 17.8% 15.5% 17.1% 21.3% 19.4% 19.9%
Moved in 2000 to 2009 36.0% 36.7% 49.5% 48.0% 46.3% 51.1% 39.4% 35.6% 44.0%
Moved in 2010 or Later 26.8% 16.4% 29.6% 26.4% 29.8% 22.7% 30.9% 26.7% 25.8%
Total 100.0% 100.0% 100.0% 100.0% 100.0% 100.0% 100.0% 100.0% 100.0%
RENTER-OCCUPIED
No. Units
Moved in 1980 to 1989 19 5 0 31 65 672 0 0 792
Moved in 1990 to 1999 109 184 39 37 123 157 9 4 662
Moved in 2000 to 2009 928 1,319 246 1,106 614 0 656 70 4,939
Moved in 2010 or Later 4,702 6,891 2,072 5,706 2,215 6 4,485 186 26,263
Total 5,758 8,399 2,357 6,880 3,017 835 5,150 260 32,656
% Distribution
Moved in 1980 to 1989 0.3% 0.1% 0.0% 0.5% 2.2% 80.5% 0.0% 0.0% 2.4%
Moved in 1990 to 1999 1.9% 2.2% 1.7% 0.5% 4.1% 18.8% 0.2% 1.5% 2.0%
Moved in 2000 to 2009 16.1% 15.7% 10.4% 16.1% 20.4% 0.0% 12.7% 26.9% 15.1%
Moved in 2010 or Later 81.7% 82.0% 87.9% 82.9% 73.4% 0.7% 87.1% 71.5% 80.4%
Total 100.0% 100.0% 100.0% 100.0% 100.0% 100.0% 100.0% 100.0% 100.0%
Source: ACS Estimate (2011-2015) and RKG Associates, Inc., 2018
GREATER KILLEEN STUDY AREA
Total
Inventory
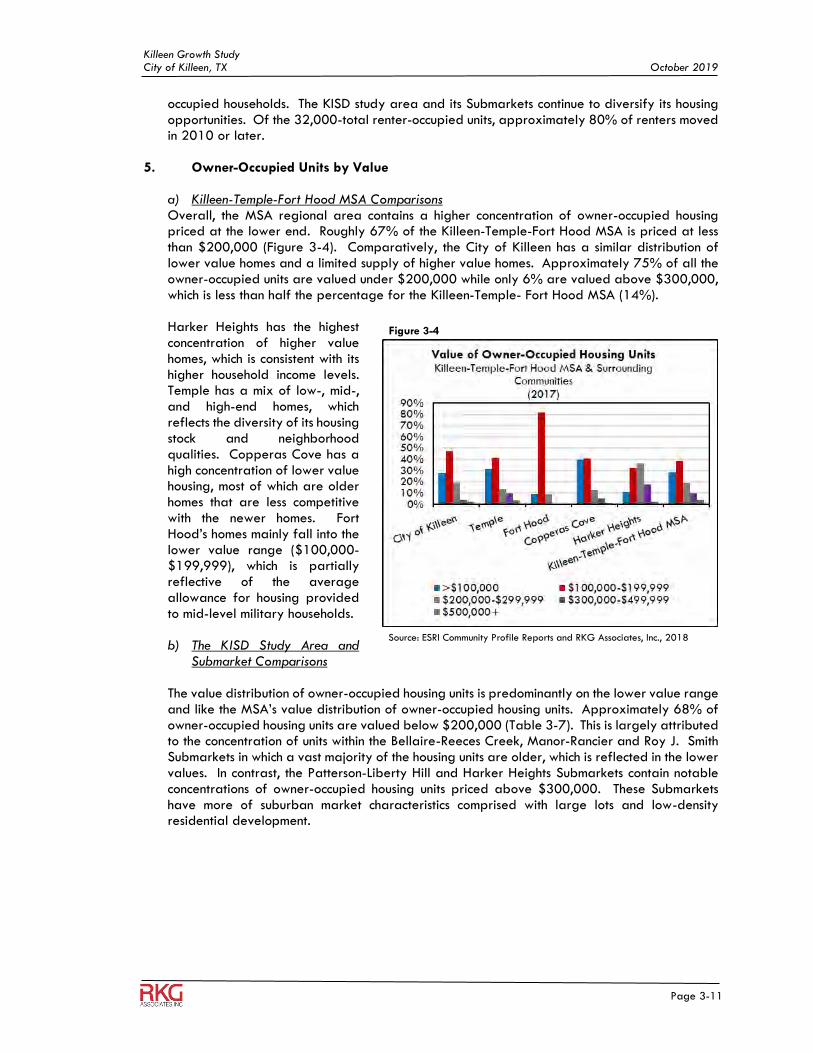
Killeen Growth Study City of Killeen, TX October 2019
Page 3-11
occupied households. The KISD study area and its Submarkets continue to diversify its housing opportunities. Of the 32,000-total renter-occupied units, approximately 80% of renters moved in 2010 or later.
5. Owner-Occupied Units by Value
a) Killeen-Temple-Fort Hood MSA Comparisons Overall, the MSA regional area contains a higher concentration of owner-occupied housing priced at the lower end. Roughly 67% of the Killeen-Temple-Fort Hood MSA is priced at less than $200,000 (Figure 3-4). Comparatively, the City of Killeen has a similar distribution of lower value homes and a limited supply of higher value homes. Approximately 75% of all the owner-occupied units are valued under $200,000 while only 6% are valued above $300,000, which is less than half the percentage for the Killeen-Temple- Fort Hood MSA (14%). Harker Heights has the highest concentration of higher value homes, which is consistent with its higher household income levels. Temple has a mix of low-, mid-, and high-end homes, which reflects the diversity of its housing stock and neighborhood qualities. Copperas Cove has a high concentration of lower value housing, most of which are older homes that are less competitive with the newer homes. Fort Hood’s homes mainly fall into the lower value range ($100,000-$199,999), which is partially reflective of the average allowance for housing provided to mid-level military households.
b) The KISD Study Area and
Submarket Comparisons
The value distribution of owner-occupied housing units is predominantly on the lower value range and like the MSA’s value distribution of owner-occupied housing units. Approximately 68% of owner-occupied housing units are valued below $200,000 (Table 3-7). This is largely attributed to the concentration of units within the Bellaire-Reeces Creek, Manor-Rancier and Roy J. Smith Submarkets in which a vast majority of the housing units are older, which is reflected in the lower values. In contrast, the Patterson-Liberty Hill and Harker Heights Submarkets contain notable concentrations of owner-occupied housing units priced above $300,000. These Submarkets have more of suburban market characteristics comprised with large lots and low-density residential development.
Figure 3-4
Source: ESRI Community Profile Reports and RKG Associates, Inc., 2018
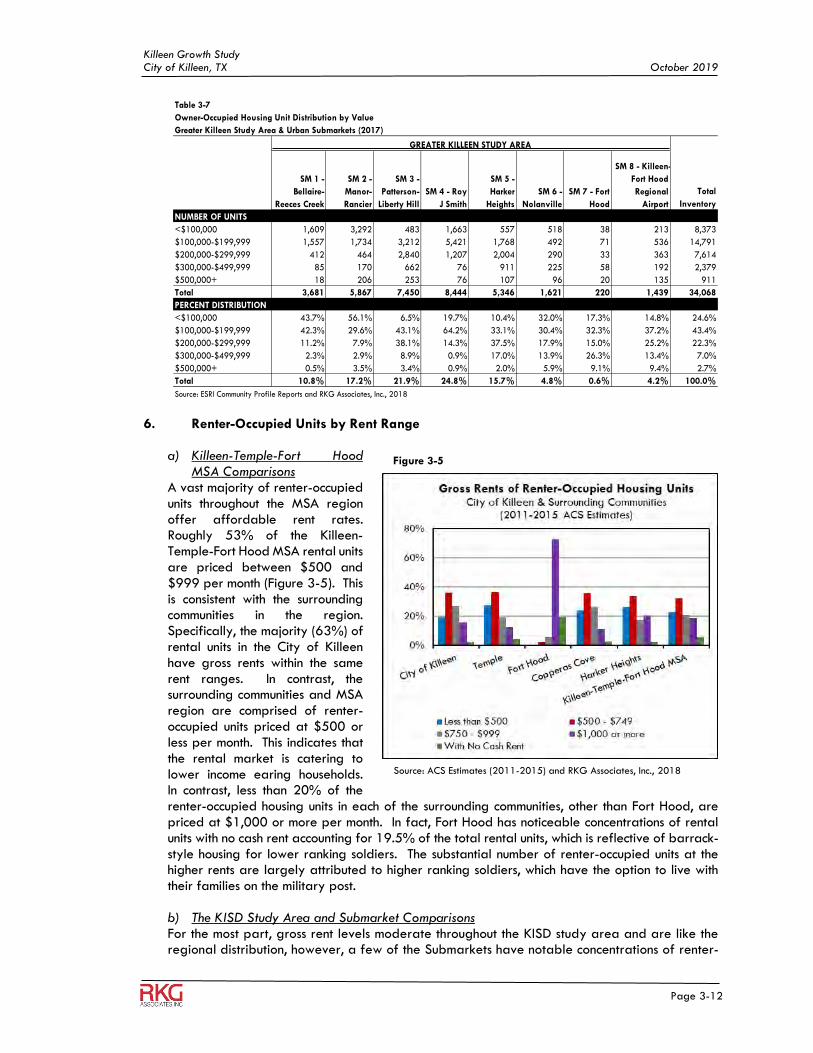
Killeen Growth Study City of Killeen, TX October 2019
Page 3-12
6. Renter-Occupied Units by Rent Range
a) Killeen-Temple-Fort Hood
MSA Comparisons A vast majority of renter-occupied units throughout the MSA region offer affordable rent rates. Roughly 53% of the Killeen-Temple-Fort Hood MSA rental units are priced between $500 and $999 per month (Figure 3-5). This is consistent with the surrounding communities in the region. Specifically, the majority (63%) of rental units in the City of Killeen have gross rents within the same rent ranges. In contrast, the surrounding communities and MSA region are comprised of renter-occupied units priced at $500 or less per month. This indicates that the rental market is catering to lower income earing households. In contrast, less than 20% of the renter-occupied housing units in each of the surrounding communities, other than Fort Hood, are priced at $1,000 or more per month. In fact, Fort Hood has noticeable concentrations of rental units with no cash rent accounting for 19.5% of the total rental units, which is reflective of barrack-style housing for lower ranking soldiers. The substantial number of renter-occupied units at the higher rents are largely attributed to higher ranking soldiers, which have the option to live with their families on the military post. b) The KISD Study Area and Submarket Comparisons For the most part, gross rent levels moderate throughout the KISD study area and are like the regional distribution, however, a few of the Submarkets have notable concentrations of renter-
Figure 3-5
Source: ACS Estimates (2011-2015) and RKG Associates, Inc., 2018
Table 3-7
Owner-Occupied Housing Unit Distribution by Value
Greater Killeen Study Area & Urban Submarkets (2017)
SM 1 -
Bellaire-
Reeces Creek
SM 2 -
Manor-
Rancier
SM 3 -
Patterson-
Liberty Hill
SM 4 - Roy
J Smith
SM 5 -
Harker
Heights
SM 6 -
Nolanville
SM 7 - Fort
Hood
SM 8 - Killeen-
Fort Hood
Regional
Airport
NUMBER OF UNITS
<$100,000 1,609 3,292 483 1,663 557 518 38 213 8,373
$100,000-$199,999 1,557 1,734 3,212 5,421 1,768 492 71 536 14,791
$200,000-$299,999 412 464 2,840 1,207 2,004 290 33 363 7,614
$300,000-$499,999 85 170 662 76 911 225 58 192 2,379
$500,000+ 18 206 253 76 107 96 20 135 911
Total 3,681 5,867 7,450 8,444 5,346 1,621 220 1,439 34,068
PERCENT DISTRIBUTION
<$100,000 43.7% 56.1% 6.5% 19.7% 10.4% 32.0% 17.3% 14.8% 24.6%
$100,000-$199,999 42.3% 29.6% 43.1% 64.2% 33.1% 30.4% 32.3% 37.2% 43.4%
$200,000-$299,999 11.2% 7.9% 38.1% 14.3% 37.5% 17.9% 15.0% 25.2% 22.3%
$300,000-$499,999 2.3% 2.9% 8.9% 0.9% 17.0% 13.9% 26.3% 13.4% 7.0%
$500,000+ 0.5% 3.5% 3.4% 0.9% 2.0% 5.9% 9.1% 9.4% 2.7%
Total 10.8% 17.2% 21.9% 24.8% 15.7% 4.8% 0.6% 4.2% 100.0%
Source: ESRI Community Profile Reports and RKG Associates, Inc., 2018
Total
Inventory
GREATER KILLEEN STUDY AREA
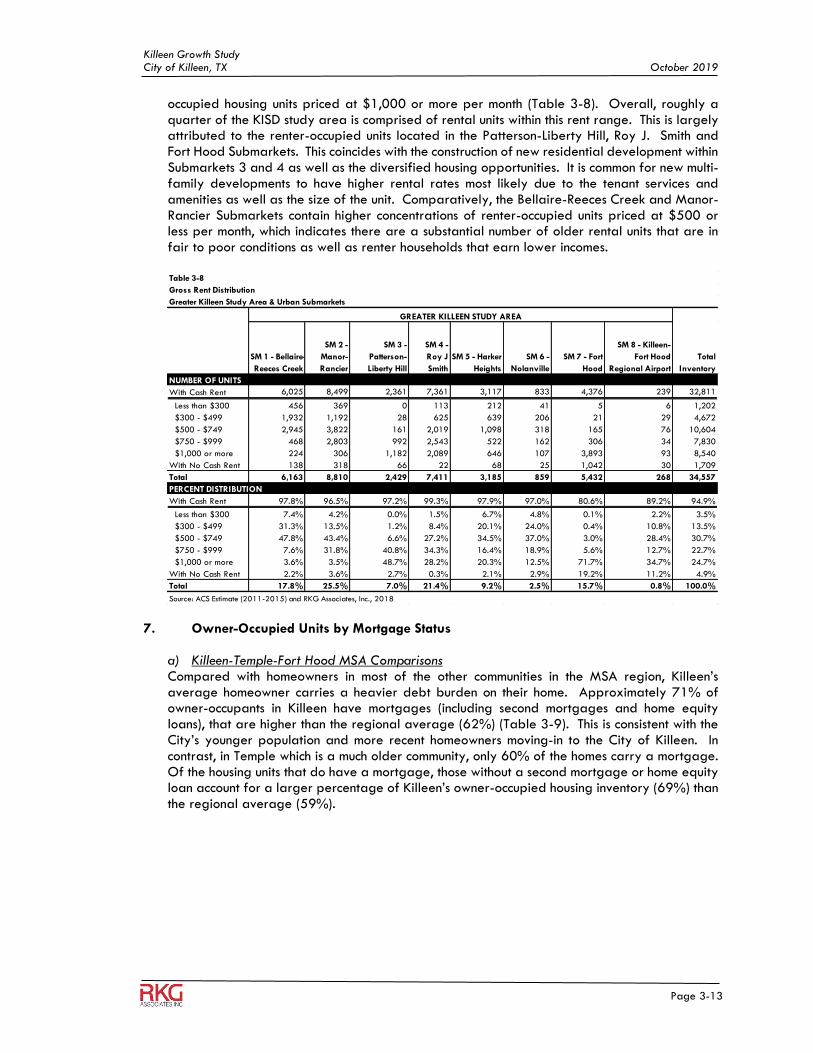
Killeen Growth Study City of Killeen, TX October 2019
Page 3-13
occupied housing units priced at $1,000 or more per month (Table 3-8). Overall, roughly a quarter of the KISD study area is comprised of rental units within this rent range. This is largely attributed to the renter-occupied units located in the Patterson-Liberty Hill, Roy J. Smith and Fort Hood Submarkets. This coincides with the construction of new residential development within Submarkets 3 and 4 as well as the diversified housing opportunities. It is common for new multi-family developments to have higher rental rates most likely due to the tenant services and amenities as well as the size of the unit. Comparatively, the Bellaire-Reeces Creek and Manor-Rancier Submarkets contain higher concentrations of renter-occupied units priced at $500 or less per month, which indicates there are a substantial number of older rental units that are in fair to poor conditions as well as renter households that earn lower incomes.
7. Owner-Occupied Units by Mortgage Status
a) Killeen-Temple-Fort Hood MSA Comparisons Compared with homeowners in most of the other communities in the MSA region, Killeen’s average homeowner carries a heavier debt burden on their home. Approximately 71% of owner-occupants in Killeen have mortgages (including second mortgages and home equity loans), that are higher than the regional average (62%) (Table 3-9). This is consistent with the City’s younger population and more recent homeowners moving-in to the City of Killeen. In contrast, in Temple which is a much older community, only 60% of the homes carry a mortgage. Of the housing units that do have a mortgage, those without a second mortgage or home equity loan account for a larger percentage of Killeen’s owner-occupied housing inventory (69%) than the regional average (59%).
Table 3-8
Gross Rent Distribution
Greater Killeen Study Area & Urban Submarkets
SM 1 - Bellaire-
Reeces Creek
SM 2 -
Manor-
Rancier
SM 3 -
Patterson-
Liberty Hill
SM 4 -
Roy J
Smith
SM 5 - Harker
Heights
SM 6 -
Nolanville
SM 7 - Fort
Hood
SM 8 - Killeen-
Fort Hood
Regional Airport
NUMBER OF UNITS
With Cash Rent 6,025 8,499 2,361 7,361 3,117 833 4,376 239 32,811
Less than $300 456 369 0 113 212 41 5 6 1,202
$300 - $499 1,932 1,192 28 625 639 206 21 29 4,672
$500 - $749 2,945 3,822 161 2,019 1,098 318 165 76 10,604
$750 - $999 468 2,803 992 2,543 522 162 306 34 7,830
$1,000 or more 224 306 1,182 2,089 646 107 3,893 93 8,540
With No Cash Rent 138 318 66 22 68 25 1,042 30 1,709
Total 6,163 8,810 2,429 7,411 3,185 859 5,432 268 34,557
PERCENT DISTRIBUTION
With Cash Rent 97.8% 96.5% 97.2% 99.3% 97.9% 97.0% 80.6% 89.2% 94.9%
Less than $300 7.4% 4.2% 0.0% 1.5% 6.7% 4.8% 0.1% 2.2% 3.5%
$300 - $499 31.3% 13.5% 1.2% 8.4% 20.1% 24.0% 0.4% 10.8% 13.5%
$500 - $749 47.8% 43.4% 6.6% 27.2% 34.5% 37.0% 3.0% 28.4% 30.7%
$750 - $999 7.6% 31.8% 40.8% 34.3% 16.4% 18.9% 5.6% 12.7% 22.7%
$1,000 or more 3.6% 3.5% 48.7% 28.2% 20.3% 12.5% 71.7% 34.7% 24.7%
With No Cash Rent 2.2% 3.6% 2.7% 0.3% 2.1% 2.9% 19.2% 11.2% 4.9%
Total 17.8% 25.5% 7.0% 21.4% 9.2% 2.5% 15.7% 0.8% 100.0%
Source: ACS Estimate (2011-2015) and RKG Associates, Inc., 2018
GREATER KILLEEN STUDY AREA
Total
Inventory
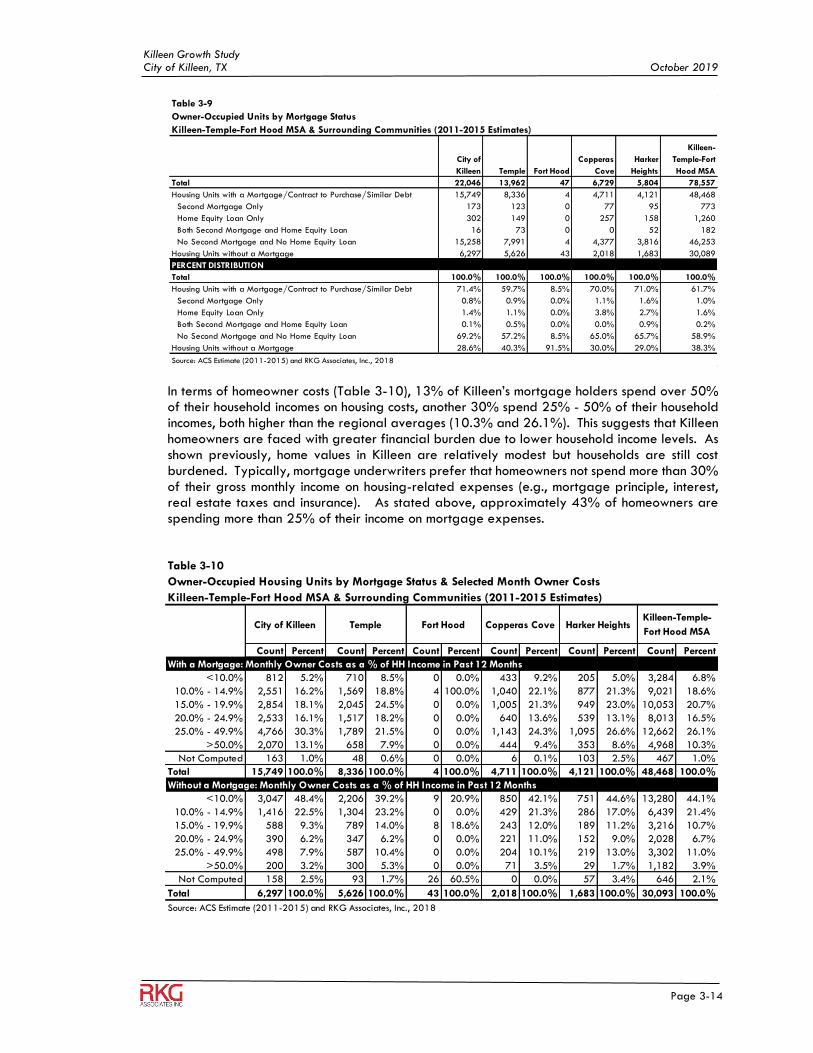
Killeen Growth Study City of Killeen, TX October 2019
Page 3-14
In terms of homeowner costs (Table 3-10), 13% of Killeen’s mortgage holders spend over 50% of their household incomes on housing costs, another 30% spend 25% - 50% of their household incomes, both higher than the regional averages (10.3% and 26.1%). This suggests that Killeen homeowners are faced with greater financial burden due to lower household income levels. As shown previously, home values in Killeen are relatively modest but households are still cost burdened. Typically, mortgage underwriters prefer that homeowners not spend more than 30% of their gross monthly income on housing-related expenses (e.g., mortgage principle, interest, real estate taxes and insurance). As stated above, approximately 43% of homeowners are spending more than 25% of their income on mortgage expenses.
Table 3-9
Owner-Occupied Units by Mortgage Status
Killeen-Temple-Fort Hood MSA & Surrounding Communities (2011-2015 Estimates)
City of
Killeen Temple Fort Hood
Copperas
Cove
Harker
Heights
Killeen-
Temple-Fort
Hood MSA
Total 22,046 13,962 47 6,729 5,804 78,557
Housing Units with a Mortgage/Contract to Purchase/Similar Debt 15,749 8,336 4 4,711 4,121 48,468
Second Mortgage Only 173 123 0 77 95 773
Home Equity Loan Only 302 149 0 257 158 1,260
Both Second Mortgage and Home Equity Loan 16 73 0 0 52 182
No Second Mortgage and No Home Equity Loan 15,258 7,991 4 4,377 3,816 46,253
Housing Units without a Mortgage 6,297 5,626 43 2,018 1,683 30,089
PERCENT DISTRIBUTION
Total 100.0% 100.0% 100.0% 100.0% 100.0% 100.0%
Housing Units with a Mortgage/Contract to Purchase/Similar Debt 71.4% 59.7% 8.5% 70.0% 71.0% 61.7%
Second Mortgage Only 0.8% 0.9% 0.0% 1.1% 1.6% 1.0%
Home Equity Loan Only 1.4% 1.1% 0.0% 3.8% 2.7% 1.6%
Both Second Mortgage and Home Equity Loan 0.1% 0.5% 0.0% 0.0% 0.9% 0.2%
No Second Mortgage and No Home Equity Loan 69.2% 57.2% 8.5% 65.0% 65.7% 58.9%
Housing Units without a Mortgage 28.6% 40.3% 91.5% 30.0% 29.0% 38.3%
Source: ACS Estimate (2011-2015) and RKG Associates, Inc., 2018
Table 3-10
Owner-Occupied Housing Units by Mortgage Status & Selected Month Owner Costs
Killeen-Temple-Fort Hood MSA & Surrounding Communities (2011-2015 Estimates)
Count Percent Count Percent Count Percent Count Percent Count Percent Count Percent
With a Mortgage: Monthly Owner Costs as a % of HH Income in Past 12 Months
<10.0% 812 5.2% 710 8.5% 0 0.0% 433 9.2% 205 5.0% 3,284 6.8%
10.0% - 14.9% 2,551 16.2% 1,569 18.8% 4 100.0% 1,040 22.1% 877 21.3% 9,021 18.6%
15.0% - 19.9% 2,854 18.1% 2,045 24.5% 0 0.0% 1,005 21.3% 949 23.0% 10,053 20.7%
20.0% - 24.9% 2,533 16.1% 1,517 18.2% 0 0.0% 640 13.6% 539 13.1% 8,013 16.5%
25.0% - 49.9% 4,766 30.3% 1,789 21.5% 0 0.0% 1,143 24.3% 1,095 26.6% 12,662 26.1%
>50.0% 2,070 13.1% 658 7.9% 0 0.0% 444 9.4% 353 8.6% 4,968 10.3%
Not Computed 163 1.0% 48 0.6% 0 0.0% 6 0.1% 103 2.5% 467 1.0%
Total 15,749 100.0% 8,336 100.0% 4 100.0% 4,711 100.0% 4,121 100.0% 48,468 100.0%
Without a Mortgage: Monthly Owner Costs as a % of HH Income in Past 12 Months
<10.0% 3,047 48.4% 2,206 39.2% 9 20.9% 850 42.1% 751 44.6% 13,280 44.1%
10.0% - 14.9% 1,416 22.5% 1,304 23.2% 0 0.0% 429 21.3% 286 17.0% 6,439 21.4%
15.0% - 19.9% 588 9.3% 789 14.0% 8 18.6% 243 12.0% 189 11.2% 3,216 10.7%
20.0% - 24.9% 390 6.2% 347 6.2% 0 0.0% 221 11.0% 152 9.0% 2,028 6.7%
25.0% - 49.9% 498 7.9% 587 10.4% 0 0.0% 204 10.1% 219 13.0% 3,302 11.0%
>50.0% 200 3.2% 300 5.3% 0 0.0% 71 3.5% 29 1.7% 1,182 3.9%
Not Computed 158 2.5% 93 1.7% 26 60.5% 0 0.0% 57 3.4% 646 2.1%
Total 6,297 100.0% 5,626 100.0% 43 100.0% 2,018 100.0% 1,683 100.0% 30,093 100.0%
Source: ACS Estimate (2011-2015) and RKG Associates, Inc., 2018
Killeen-Temple-
Fort Hood MSACity of Killeen Temple Fort Hood Copperas Cove Harker Heights
Killeen Growth Study City of Killeen, TX October 2019
Page 3-15
Of homeowners with no mortgage obligation, 11% spend 25% or more of their household incomes on their homes, lower than in most surrounding communities, suggesting that Killeen has a higher concentration of low-value homes. b) The KISD Study Area and Submarket Comparisons In the KISD study area and Submarkets, 71% of the owner-occupied units carry no mortgage, which is higher than the MSA regional average of 62% (Table 3-11). Among the submarkets, Bellaire-Reeces Creek, Manor Rancier, and the Killeen Regional Airport have relatively large percentages of owner-occupied units with no mortgage. This is consistent with the finding that these submarkets have more homeowners who have lived at their current residence for a longer period, and presumably have paid off their mortgage obligation. In the Patterson-Liberty Hill and Roy J Smith Submarkets, where homeowners have moved-in more recently, a larger percentage of the owner-occupied housing units carry a mortgage. Table 3-12 shows the financial burden of owning a home in the KISD study area and Submarkets. Of homeowners with mortgage obligations, 12% of homeowners spend over 50% of their household income on housing (including mortgage payment), 30% spend 25%-50% of their household income on housing, both slightly higher than the MSA regional level; the percentage of homeowners that spend less than 15% of their household income on housing is smaller than the MSA level. This suggests that KISD study area’s homeowners carry a heavier financial burden owning their homes. For homes with no mortgage, the owners in KISD on average spend less of their household income on housing than the regional average, suggesting the homes in KISD have lower value. Within KISD, Nolanville, Roy J Smith, and Manor-Rancier have the largest percentage of mortgage-carrying homeowners that spend over 50% of their household incomes on housing, indicating a greater demand for affordable housing.
D. IMPLICATIONS The City of Killeen has the largest housing inventory in the Killeen-Temple-Fort Hood MSA region. Compared with the regional level, Killeen’s housing stock is newer, and the residents on average moved into their current residences more recently. This is consistent with the rapid population growth that Killeen has experienced in recent years. When measured by physical characteristics and tenure, Killeen’s housing stock is more diverse than the regional average, which reflects Killeen’s more urban and diverse neighborhoods. The financial characteristics of Killeen’s housing market are consistent with the finding from the previous chapter about Killeen’s household income level. Compared with the regional average, Killeen has a higher concentration of lower value housing units for ownership and rent, and a lower concentration of higher value housing units for ownership and rent. Killeen’s homeowners on average are also carrying a heavier financial burden in owning their homes than the regional average. A larger percentage of homeowners in Killeen carry mortgage debt, and a larger percentage spend over 50% of their household incomes on housing. This indicates that Killeen households may be experiencing housing affordability issues, despite the City’s lower-priced housing stock.
Like the City of Killeen, the KISD study area and its Submarkets have a younger and more diverse housing inventory when compared with the MSA region. Within the study area, Bellaire-Reeces Creek has the oldest housing stock. The stock is also most diverse within the study area, with a large percentage of rental units and multi-family units. This reflects the older and more urban setting of this submarket. Consistent with the low household income level of this area, the housing stock is dominated by low-value and low-rent units. Since most of the homeowners have lived in the same house for a long time and have paid off their mortgages, the financial burden of owning a home in Bellaire-Reeces Creek is not as heavy as in more expensive or newer submarkets.
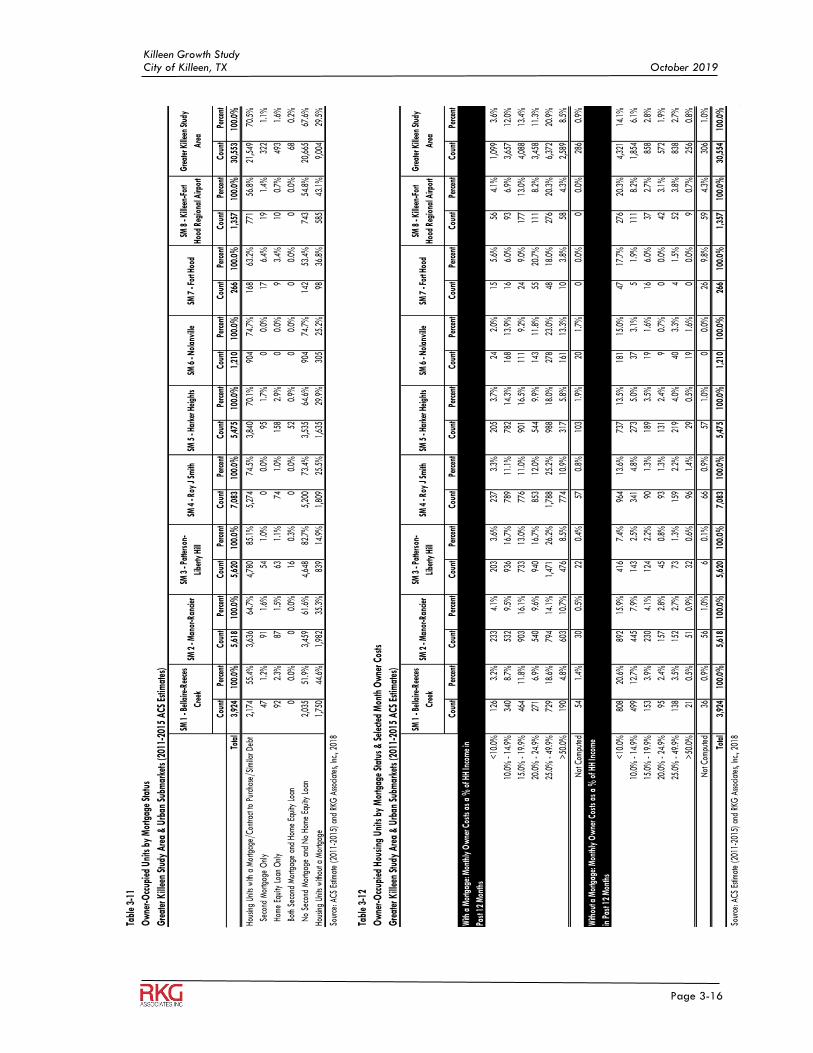
Killeen Growth Study City of Killeen, TX October 2019
Page 3-16
Tabl
e 3-
11
Ow
ner-
Occ
upie
d U
nits
by
Mor
tgag
e St
atus
Gre
ater
Kill
een
Stud
y A
rea
& U
rban
Sub
mar
kets
(201
1-20
15 A
CS E
stim
ates
)
Coun
tPe
rcen
tCo
unt
Perc
ent
Coun
tPe
rcen
tCo
unt
Perc
ent
Coun
tPe
rcen
tCo
unt
Perc
ent
Coun
tPe
rcen
tCo
unt
Perc
ent
Coun
tPe
rcen
t
Tota
l3,
924
100.
0%5,
618
100.
0%5,
620
100.
0%7,
083
100.
0%5,
475
100.
0%1,
210
100.
0%26
610
0.0%
1,35
710
0.0%
30,5
5310
0.0%
Hous
ing
Units
with
a M
ortg
age/
Cont
ract
to P
urch
ase/
Sim
ilar D
ebt
2,17
455
.4%
3,63
664
.7%
4,78
085
.1%
5,27
474
.5%
3,84
070
.1%
904
74.7
%16
863
.2%
771
56.8
%21
,549
70.5
%
Sec
ond
Mor
tgag
e O
nly
471.
2%91
1.6%
541.
0%0
0.0%
951.
7%0
0.0%
176.
4%19
1.4%
322
1.1%
Hom
e Eq
uity
Loa
n O
nly
922.
3%87
1.5%
631.
1%74
1.0%
158
2.9%
00.
0%9
3.4%
100.
7%49
31.
6%
Bot
h Se
cond
Mor
tgag
e an
d Ho
me
Equi
ty L
oan
00.
0%0
0.0%
160.
3%0
0.0%
520.
9%0
0.0%
00.
0%0
0.0%
680.
2%
No
Seco
nd M
ortg
age
and
No
Hom
e Eq
uity
Loa
n2,
035
51.9
%3,
459
61.6
%4,
648
82.7
%5,
200
73.4
%3,
535
64.6
%90
474
.7%
142
53.4
%74
354
.8%
20,6
6567
.6%
Hous
ing
Units
with
out a
Mor
tgag
e1,
750
44.6
%1,
982
35.3
%83
914
.9%
1,80
925
.5%
1,63
529
.9%
305
25.2
%98
36.8
%58
543
.1%
9,00
429
.5%
Sour
ce: A
CS E
stim
ate
(201
1-20
15) a
nd R
KG A
ssocia
tes,
Inc.,
201
8
Tabl
e 3-
12
Ow
ner-
Occ
upie
d H
ousi
ng U
nits
by
Mor
tgag
e St
atus
& S
elec
ted
Mon
th O
wne
r Cos
ts
Gre
ater
Kill
een
Stud
y A
rea
& U
rban
Sub
mar
kets
(201
1-20
15 A
CS E
stim
ates
)
Coun
tPe
rcen
tCo
unt
Perc
ent
Coun
tPe
rcen
tCo
unt
Perc
ent
Coun
tPe
rcen
tCo
unt
Perc
ent
Coun
tPe
rcen
tCo
unt
Perc
ent
Coun
tPe
rcen
t
With
a M
ortg
age:
Mon
thly
Ow
ner C
osts
as
a %
of H
H In
com
e in
Past
12
Mon
ths
<10
.0%
126
3.2%
233
4.1%
203
3.6%
237
3.3%
205
3.7%
242.
0%15
5.6%
564.
1%1,
099
3.6%
10.0
% -
14.9
%34
08.
7%53
29.
5%93
616
.7%
789
11.1
%78
214
.3%
168
13.9
%16
6.0%
936.
9%3,
657
12.0
%
15.0
% -
19.9
%46
411
.8%
903
16.1
%73
313
.0%
776
11.0
%90
116
.5%
111
9.2%
249.
0%17
713
.0%
4,08
813
.4%
20.0
% -
24.9
%27
16.
9%54
09.
6%94
016
.7%
853
12.0
%54
49.
9%14
311
.8%
5520
.7%
111
8.2%
3,45
811
.3%
25.0
% -
49.9
%72
918
.6%
794
14.1
%1,
471
26.2
%1,
788
25.2
%98
818
.0%
278
23.0
%48
18.0
%27
620
.3%
6,37
220
.9%
>50
.0%
190
4.8%
603
10.7
%47
68.
5%77
410
.9%
317
5.8%
161
13.3
%10
3.8%
584.
3%2,
589
8.5%
Not
Com
pute
d54
1.4%
300.
5%22
0.4%
570.
8%10
31.
9%20
1.7%
00.
0%0
0.0%
286
0.9%
With
out a
Mor
tgag
e: M
onth
ly O
wne
r Cos
ts a
s a
% o
f HH
Inco
me
in P
ast 1
2 M
onth
s
<10
.0%
808
20.6
%89
215
.9%
416
7.4%
964
13.6
%73
713
.5%
181
15.0
%47
17.7
%27
620
.3%
4,32
114
.1%
10.0
% -
14.9
%49
912
.7%
445
7.9%
143
2.5%
341
4.8%
273
5.0%
373.
1%5
1.9%
111
8.2%
1,85
46.
1%
15.0
% -
19.9
%15
33.
9%23
04.
1%12
42.
2%90
1.3%
189
3.5%
191.
6%16
6.0%
372.
7%85
82.
8%
20.0
% -
24.9
%95
2.4%
157
2.8%
450.
8%93
1.3%
131
2.4%
90.
7%0
0.0%
423.
1%57
21.
9%
25.0
% -
49.9
%13
83.
5%15
22.
7%73
1.3%
159
2.2%
219
4.0%
403.
3%4
1.5%
523.
8%83
82.
7%
>50
.0%
210.
5%51
0.9%
320.
6%96
1.4%
290.
5%19
1.6%
00.
0%9
0.7%
256
0.8%
Not
Com
pute
d36
0.9%
561.
0%6
0.1%
660.
9%57
1.0%
00.
0%26
9.8%
594.
3%30
61.
0%
Tota
l3,
924
100.
0%5,
618
100.
0%5,
620
100.
0%7,
083
100.
0%5,
475
100.
0%1,
210
100.
0%26
610
0.0%
1,35
710
0.0%
30,5
5410
0.0%
Sour
ce: A
CS E
stim
ate
(201
1-20
15) a
nd R
KG A
ssocia
tes,
Inc.,
201
8
SM 6
- N
olan
ville
SM 7
- Fo
rt Ho
od
SM 1
- Be
llaire
-Ree
ces
Cree
kSM
2 -
Man
or-R
ancie
rSM
3 -
Patte
rson
-
Libe
rty H
illSM
4 -
Roy
J Sm
ithSM
5 -
Hark
er H
eigh
tsSM
6 -
Nol
anvi
lle
SM 1
- Be
llaire
-Ree
ces
Cree
kSM
2 -
Man
or-R
ancie
rSM
3 -
Patte
rson
-
Libe
rty H
illSM
4 -
Roy
J Sm
ithSM
5 -
Hark
er H
eigh
tsSM
8 -
Kille
en-F
ort
Hood
Reg
iona
l Airp
ort
Gre
ater
Kill
een
Stud
y
Are
a
SM 7
- Fo
rt Ho
odSM
8 -
Kille
en-F
ort
Hood
Reg
iona
l Airp
ort
Gre
ater
Kill
een
Stud
y
Are
a
Killeen Growth Study City of Killeen, TX October 2019
Page 3-17
Manor-Rancier’s housing stock bears many similarities to Bellaire-Reeces Creek’s, though it’s not that old, and is less diverse, which are consistent with the more suburban setting of Manor-Rancier. Manor-Rancier has a mix of high-end and low-end housing units, indicating that the housing and neighborhood qualities vary from neighborhood to neighborhood within the submarket. Still, the household income level of Manor-Rancier is low, resulting in a larger percentage of homeowners spending over 50% of their household incomes on housing. Patterson-Liberty Hill and Roy J Smith have the youngest housing stocks, which is consistent with the rapid population growth in these two areas since 1980. Patterson-Liberty Hill is more dominated by single-family detached housing and owner-occupied homes, which reflects its more suburban setting. In addition, Patterson-Liberty Hill’s housing inventory is more centered in the middle-value or middle-rent range, indicating a less varied housing and neighborhood quality level across the submarket. Most the residents moved into their current residences after 2000. This suggests that most of the submarket was developed through rapid, homogeneous subdivision development within a short period of time to accommodate population growth. In contrast, Roy J Smith’s housing stock is more diverse when measured by physical characteristics, tenure, and value and rent levels. Roy J Smith also has a much larger percentage of long-term residents than Patterson-Liberty Hill does. Fort Hood’s housing inventory is predominately rental, which is typical of most federal installations. A relatively large percentage of the housing stock are single family-attached units and units in small (2-4 Units) multi-family buildings, which are typical of military post housing. Most of the renters moved into their current rental housing after 2010, the percentage of homeowners who moved in after 2010 is also larger than in all the other submarkets. This reflects that fact that Fort Hood housing is predominantly occupied by active-duty military and their families. However, as confirmed by the post command, a small percentage of on-post housing is occupied by local civilians. Harker Heights has a higher value housing stock, with a higher concentration of larger custom-built homes and rental units. The ownership housing inventory comprises both older and newer units, suggesting that Harker Heights has been able to attract new high-income households while maintaining the qualities of long-established neighborhoods. Most of the rental units were built in recent years, indicating an emerging demand for empty nesters and the population of older age cohorts looking to downsize for living purposes.
Killeen Growth Study Killeen, Texas October 2019
Page 4-1
4 DEVELOPMENT TREND ANALYSIS
A. INTRODUCTION The following section analyzes residential and non-residential development activity throughout the region (Bell County- City of Killeen and Coryell County-Copperas Cove) as well as the Greater Killeen study area, also known as the KISD study area. KISD study area has eight distinct submarkets. Both the residential and non-residential analyses document a 10-year period of development trends between 2007-2017. The study area and its submarkets were derived in consultation with the Greater Killeen Chamber of Commerce and the Killeen Independent School Districts (KISD). Each district is broken down by “planning zones” which provides detailed information regarding the number of students as well as their current grade level. As much as possible, the existing attendance zones were closely aligned with census block group boundaries, which allowed the consultants to sync the school attendance data with demographic, housing and development-related trend data. This approach allowed RKG to be more precise in its analysis of the study area and its submarkets and will support the consultant’s efforts customizing growth projections based on the market positioning and development trends in each submarket. Map 4-1 displays the boundaries and location of the KISD study area and submarkets.
B. METHODOLOGY To understand the real estate development trends over the last 10 years, RKG Associates analyzed data obtained from the Bell and Coryell County real property appraisal offices, which included real property assessment records maintained by each County within the central Texas region. As stated previously, the data was segmented by various residential and non-residential land use types and tracked over last decade from 2007 to 2017; the latest data available. RKG parsed hundreds of thousands of real property records regionally and grouped them by their submarket boundaries for the KISD study area. The consultants then analyzed development by each structure’s “year-built” to determine the year in which new development activity occurred. C. REGIONAL DEVELOPMENT TREINDS 1. Bell County
a) Residential Bell County is dominated by residential development with a total inventory of over 110,000 residential properties. This accounts for 72% of all land acreages as well as 74% of the total building SF within the County. This is consistent with the property value distribution estimated at 77% of the total value of real property (including land). This is largely attributed to single-family development (88%) and smaller percentages of duplex, multi-family and mobile home properties (Table 4-1).

Killeen Growth Study Killeen, Texas October 2019
Page 4-2
Ma
p 4
-1
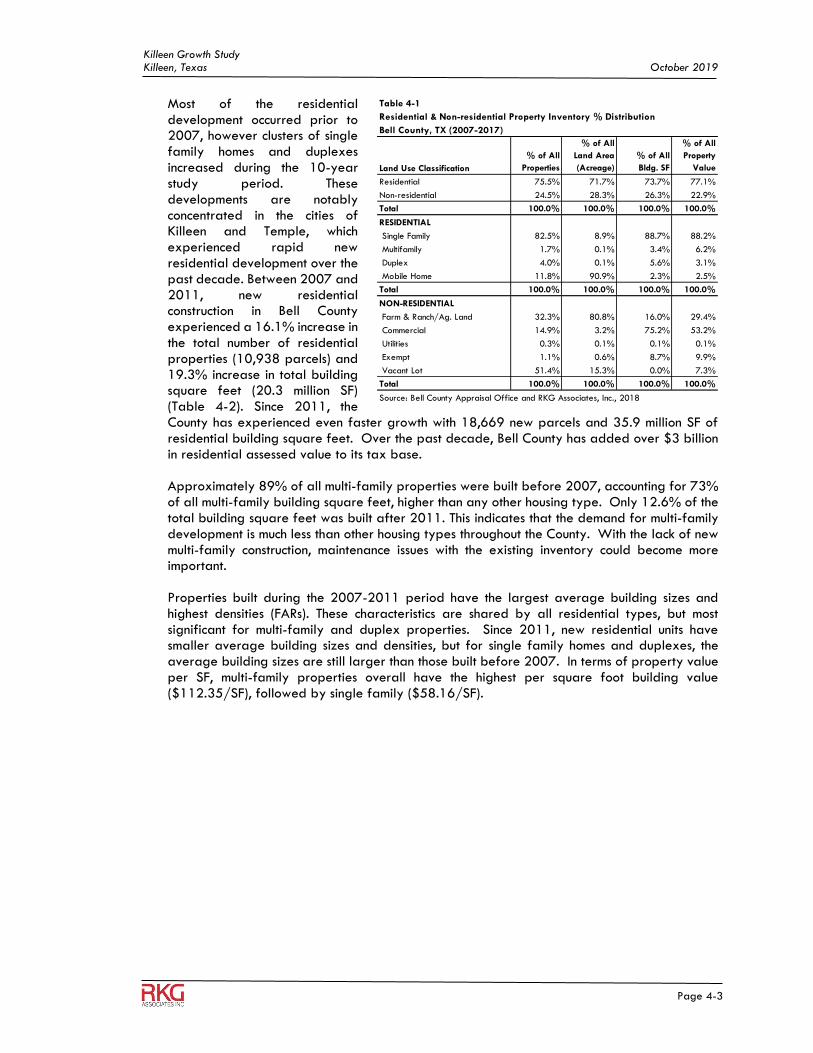
Killeen Growth Study Killeen, Texas October 2019
Page 4-3
Most of the residential development occurred prior to 2007, however clusters of single family homes and duplexes increased during the 10-year study period. These developments are notably concentrated in the cities of Killeen and Temple, which experienced rapid new residential development over the past decade. Between 2007 and 2011, new residential construction in Bell County experienced a 16.1% increase in the total number of residential properties (10,938 parcels) and 19.3% increase in total building square feet (20.3 million SF) (Table 4-2). Since 2011, the County has experienced even faster growth with 18,669 new parcels and 35.9 million SF of residential building square feet. Over the past decade, Bell County has added over $3 billion in residential assessed value to its tax base. Approximately 89% of all multi-family properties were built before 2007, accounting for 73% of all multi-family building square feet, higher than any other housing type. Only 12.6% of the total building square feet was built after 2011. This indicates that the demand for multi-family development is much less than other housing types throughout the County. With the lack of new multi-family construction, maintenance issues with the existing inventory could become more important. Properties built during the 2007-2011 period have the largest average building sizes and highest densities (FARs). These characteristics are shared by all residential types, but most significant for multi-family and duplex properties. Since 2011, new residential units have smaller average building sizes and densities, but for single family homes and duplexes, the average building sizes are still larger than those built before 2007. In terms of property value per SF, multi-family properties overall have the highest per square foot building value ($112.35/SF), followed by single family ($58.16/SF).
Table 4-1
Residential & Non-residential Property Inventory % Distribution
Bell County, TX (2007-2017)
Land Use Classification
% of All
Properties
% of All
Land Area
(Acreage)
% of All
Bldg. SF
% of All
Property
Value
Residential 75.5% 71.7% 73.7% 77.1%
Non-residential 24.5% 28.3% 26.3% 22.9%
Total 100.0% 100.0% 100.0% 100.0%
RESIDENTIAL
Single Family 82.5% 8.9% 88.7% 88.2%
Multifamily 1.7% 0.1% 3.4% 6.2%
Duplex 4.0% 0.1% 5.6% 3.1%
Mobile Home 11.8% 90.9% 2.3% 2.5%
Total 100.0% 100.0% 100.0% 100.0%
NON-RESIDENTIAL
Farm & Ranch/Ag. Land 32.3% 80.8% 16.0% 29.4%
Commercial 14.9% 3.2% 75.2% 53.2%
Utilities 0.3% 0.1% 0.1% 0.1%
Exempt 1.1% 0.6% 8.7% 9.9%
Vacant Lot 51.4% 15.3% 0.0% 7.3%
Total 100.0% 100.0% 100.0% 100.0%
Source: Bell County Appraisal Office and RKG Associates, Inc., 2018
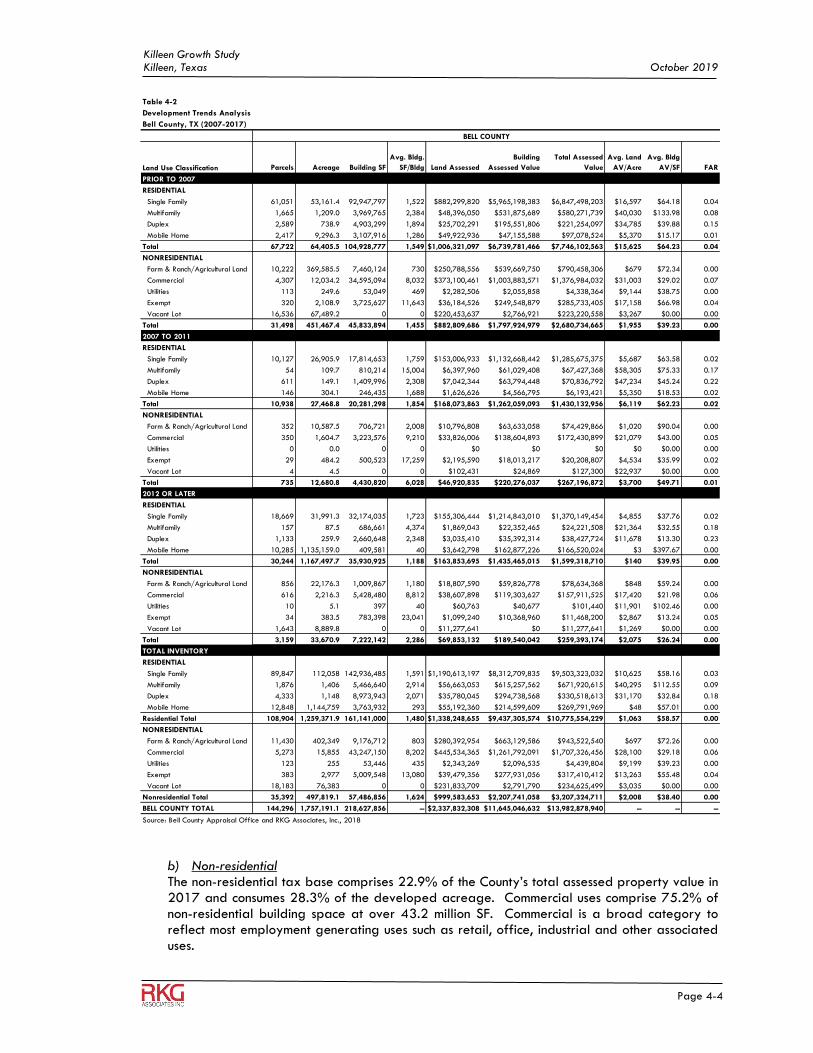
Killeen Growth Study Killeen, Texas October 2019
Page 4-4
b) Non-residential The non-residential tax base comprises 22.9% of the County’s total assessed property value in 2017 and consumes 28.3% of the developed acreage. Commercial uses comprise 75.2% of non-residential building space at over 43.2 million SF. Commercial is a broad category to reflect most employment generating uses such as retail, office, industrial and other associated uses.
Table 4-2
Development Trends Analysis
Bell County, TX (2007-2017)
Land Use Classification Parcels Acreage Building SF
Avg. Bldg.
SF/Bldg Land Assessed
Building
Assessed Value
Total Assessed
Value
Avg. Land
AV/Acre
Avg. Bldg
AV/SF FAR
PRIOR TO 2007
RESIDENTIAL
Single Family 61,051 53,161.4 92,947,797 1,522 $882,299,820 $5,965,198,383 $6,847,498,203 $16,597 $64.18 0.04
Multifamily 1,665 1,209.0 3,969,765 2,384 $48,396,050 $531,875,689 $580,271,739 $40,030 $133.98 0.08
Duplex 2,589 738.9 4,903,299 1,894 $25,702,291 $195,551,806 $221,254,097 $34,785 $39.88 0.15
Mobile Home 2,417 9,296.3 3,107,916 1,286 $49,922,936 $47,155,588 $97,078,524 $5,370 $15.17 0.01
Total 67,722 64,405.5 104,928,777 1,549 $1,006,321,097 $6,739,781,466 $7,746,102,563 $15,625 $64.23 0.04
NONRESIDENTIAL
Farm & Ranch/Agricultural Land 10,222 369,585.5 7,460,124 730 $250,788,556 $539,669,750 $790,458,306 $679 $72.34 0.00
Commercial 4,307 12,034.2 34,595,094 8,032 $373,100,461 $1,003,883,571 $1,376,984,032 $31,003 $29.02 0.07
Utilities 113 249.6 53,049 469 $2,282,506 $2,055,858 $4,338,364 $9,144 $38.75 0.00
Exempt 320 2,108.9 3,725,627 11,643 $36,184,526 $249,548,879 $285,733,405 $17,158 $66.98 0.04
Vacant Lot 16,536 67,489.2 0 0 $220,453,637 $2,766,921 $223,220,558 $3,267 $0.00 0.00
Total 31,498 451,467.4 45,833,894 1,455 $882,809,686 $1,797,924,979 $2,680,734,665 $1,955 $39.23 0.00
2007 TO 2011
RESIDENTIAL
Single Family 10,127 26,905.9 17,814,653 1,759 $153,006,933 $1,132,668,442 $1,285,675,375 $5,687 $63.58 0.02
Multifamily 54 109.7 810,214 15,004 $6,397,960 $61,029,408 $67,427,368 $58,305 $75.33 0.17
Duplex 611 149.1 1,409,996 2,308 $7,042,344 $63,794,448 $70,836,792 $47,234 $45.24 0.22
Mobile Home 146 304.1 246,435 1,688 $1,626,626 $4,566,795 $6,193,421 $5,350 $18.53 0.02
Total 10,938 27,468.8 20,281,298 1,854 $168,073,863 $1,262,059,093 $1,430,132,956 $6,119 $62.23 0.02
NONRESIDENTIAL
Farm & Ranch/Agricultural Land 352 10,587.5 706,721 2,008 $10,796,808 $63,633,058 $74,429,866 $1,020 $90.04 0.00
Commercial 350 1,604.7 3,223,576 9,210 $33,826,006 $138,604,893 $172,430,899 $21,079 $43.00 0.05
Utilities 0 0.0 0 0 $0 $0 $0 $0 $0.00 0.00
Exempt 29 484.2 500,523 17,259 $2,195,590 $18,013,217 $20,208,807 $4,534 $35.99 0.02
Vacant Lot 4 4.5 0 0 $102,431 $24,869 $127,300 $22,937 $0.00 0.00
Total 735 12,680.8 4,430,820 6,028 $46,920,835 $220,276,037 $267,196,872 $3,700 $49.71 0.01
2012 OR LATER
RESIDENTIAL
Single Family 18,669 31,991.3 32,174,035 1,723 $155,306,444 $1,214,843,010 $1,370,149,454 $4,855 $37.76 0.02
Multifamily 157 87.5 686,661 4,374 $1,869,043 $22,352,465 $24,221,508 $21,364 $32.55 0.18
Duplex 1,133 259.9 2,660,648 2,348 $3,035,410 $35,392,314 $38,427,724 $11,678 $13.30 0.23
Mobile Home 10,285 1,135,159.0 409,581 40 $3,642,798 $162,877,226 $166,520,024 $3 $397.67 0.00
Total 30,244 1,167,497.7 35,930,925 1,188 $163,853,695 $1,435,465,015 $1,599,318,710 $140 $39.95 0.00
NONRESIDENTIAL
Farm & Ranch/Agricultural Land 856 22,176.3 1,009,867 1,180 $18,807,590 $59,826,778 $78,634,368 $848 $59.24 0.00
Commercial 616 2,216.3 5,428,480 8,812 $38,607,898 $119,303,627 $157,911,525 $17,420 $21.98 0.06
Utilities 10 5.1 397 40 $60,763 $40,677 $101,440 $11,901 $102.46 0.00
Exempt 34 383.5 783,398 23,041 $1,099,240 $10,368,960 $11,468,200 $2,867 $13.24 0.05
Vacant Lot 1,643 8,889.8 0 0 $11,277,641 $0 $11,277,641 $1,269 $0.00 0.00
Total 3,159 33,670.9 7,222,142 2,286 $69,853,132 $189,540,042 $259,393,174 $2,075 $26.24 0.00
TOTAL INVENTORY
RESIDENTIAL
Single Family 89,847 112,058 142,936,485 1,591 $1,190,613,197 $8,312,709,835 $9,503,323,032 $10,625 $58.16 0.03
Multifamily 1,876 1,406 5,466,640 2,914 $56,663,053 $615,257,562 $671,920,615 $40,295 $112.55 0.09
Duplex 4,333 1,148 8,973,943 2,071 $35,780,045 $294,738,568 $330,518,613 $31,170 $32.84 0.18
Mobile Home 12,848 1,144,759 3,763,932 293 $55,192,360 $214,599,609 $269,791,969 $48 $57.01 0.00
Residential Total 108,904 1,259,371.9 161,141,000 1,480 $1,338,248,655 $9,437,305,574 $10,775,554,229 $1,063 $58.57 0.00
NONRESIDENTIAL
Farm & Ranch/Agricultural Land 11,430 402,349 9,176,712 803 $280,392,954 $663,129,586 $943,522,540 $697 $72.26 0.00
Commercial 5,273 15,855 43,247,150 8,202 $445,534,365 $1,261,792,091 $1,707,326,456 $28,100 $29.18 0.06
Utilities 123 255 53,446 435 $2,343,269 $2,096,535 $4,439,804 $9,199 $39.23 0.00
Exempt 383 2,977 5,009,548 13,080 $39,479,356 $277,931,056 $317,410,412 $13,263 $55.48 0.04
Vacant Lot 18,183 76,383 0 0 $231,833,709 $2,791,790 $234,625,499 $3,035 $0.00 0.00
Nonresidential Total 35,392 497,819.1 57,486,856 1,624 $999,583,653 $2,207,741,058 $3,207,324,711 $2,008 $38.40 0.00
BELL COUNTY TOTAL 144,296 1,757,191.1 218,627,856 -- $2,337,832,308 $11,645,046,632 $13,982,878,940 -- -- --
Source: Bell County Appraisal Office and RKG Associates, Inc., 2018
BELL COUNTY
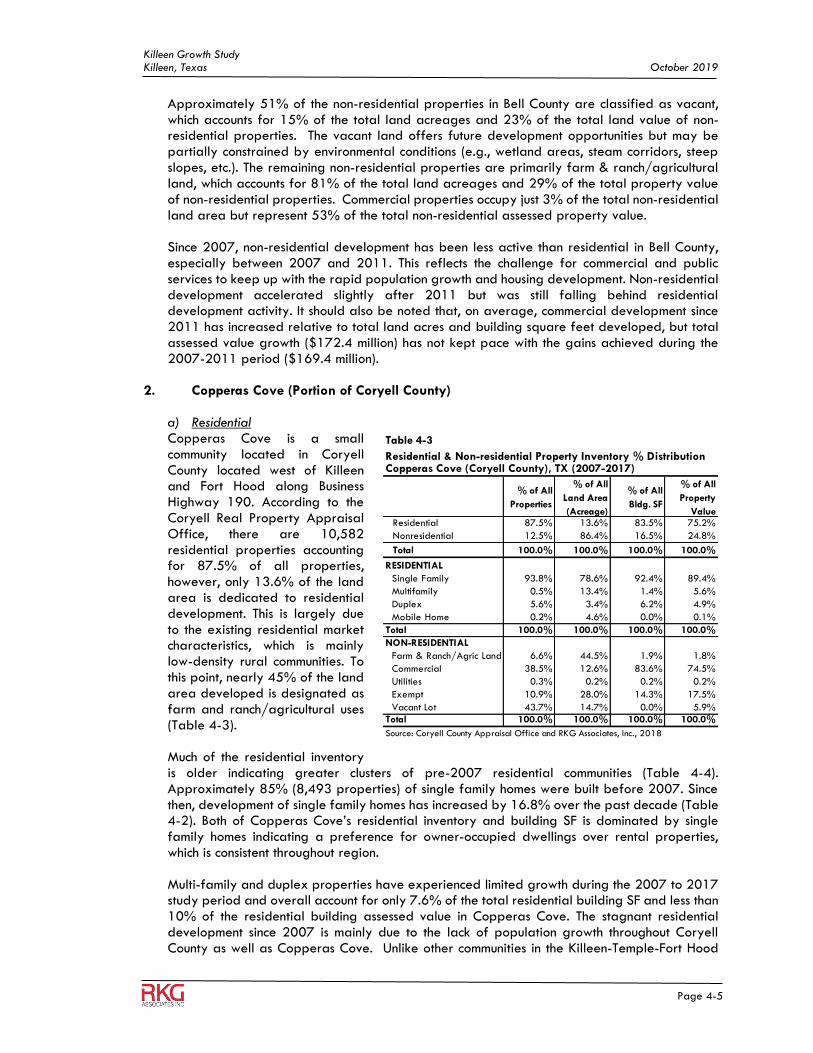
Killeen Growth Study Killeen, Texas October 2019
Page 4-5
Approximately 51% of the non-residential properties in Bell County are classified as vacant, which accounts for 15% of the total land acreages and 23% of the total land value of non-residential properties. The vacant land offers future development opportunities but may be partially constrained by environmental conditions (e.g., wetland areas, steam corridors, steep slopes, etc.). The remaining non-residential properties are primarily farm & ranch/agricultural land, which accounts for 81% of the total land acreages and 29% of the total property value of non-residential properties. Commercial properties occupy just 3% of the total non-residential land area but represent 53% of the total non-residential assessed property value. Since 2007, non-residential development has been less active than residential in Bell County, especially between 2007 and 2011. This reflects the challenge for commercial and public services to keep up with the rapid population growth and housing development. Non-residential development accelerated slightly after 2011 but was still falling behind residential development activity. It should also be noted that, on average, commercial development since 2011 has increased relative to total land acres and building square feet developed, but total assessed value growth ($172.4 million) has not kept pace with the gains achieved during the 2007-2011 period ($169.4 million).
2. Copperas Cove (Portion of Coryell County)
a) Residential Copperas Cove is a small community located in Coryell County located west of Killeen and Fort Hood along Business Highway 190. According to the Coryell Real Property Appraisal Office, there are 10,582 residential properties accounting for 87.5% of all properties, however, only 13.6% of the land area is dedicated to residential development. This is largely due to the existing residential market characteristics, which is mainly low-density rural communities. To this point, nearly 45% of the land area developed is designated as farm and ranch/agricultural uses (Table 4-3). Much of the residential inventory is older indicating greater clusters of pre-2007 residential communities (Table 4-4). Approximately 85% (8,493 properties) of single family homes were built before 2007. Since then, development of single family homes has increased by 16.8% over the past decade (Table 4-2). Both of Copperas Cove’s residential inventory and building SF is dominated by single family homes indicating a preference for owner-occupied dwellings over rental properties, which is consistent throughout region. Multi-family and duplex properties have experienced limited growth during the 2007 to 2017 study period and overall account for only 7.6% of the total residential building SF and less than 10% of the residential building assessed value in Copperas Cove. The stagnant residential development since 2007 is mainly due to the lack of population growth throughout Coryell County as well as Copperas Cove. Unlike other communities in the Killeen-Temple-Fort Hood
Table 4-3
Residential & Non-residential Property Inventory % DistributionCopperas Cove (Coryell County), TX (2007-2017)
% of All
Properties
% of All
Land Area
(Acreage)
% of All
Bldg. SF
% of All
Property
ValueResidential 87.5% 13.6% 83.5% 75.2%
Nonresidential 12.5% 86.4% 16.5% 24.8%
Total 100.0% 100.0% 100.0% 100.0%
RESIDENTIAL
Single Family 93.8% 78.6% 92.4% 89.4%
Multifamily 0.5% 13.4% 1.4% 5.6%
Duplex 5.6% 3.4% 6.2% 4.9%
Mobile Home 0.2% 4.6% 0.0% 0.1%
Total 100.0% 100.0% 100.0% 100.0%
NON-RESIDENTIAL
Farm & Ranch/Agric Land 6.6% 44.5% 1.9% 1.8%
Commercial 38.5% 12.6% 83.6% 74.5%
Utilities 0.3% 0.2% 0.2% 0.2%
Exempt 10.9% 28.0% 14.3% 17.5%
Vacant Lot 43.7% 14.7% 0.0% 5.9%
Total 100.0% 100.0% 100.0% 100.0%
Source: Coryell County Appraisal Office and RKG Associates, Inc., 2018
Killeen Growth Study Killeen, Texas October 2019
Page 4-6
MSA, Copperas Cove has experienced an average annual population growth rate of less than 1% between 2000 and 2017. Much of the residential demand occurred prior to 2000 and largely attributed to the rapid growth rate between1970 and 1980. Historically, residential development in Copperas Cove was notably smaller in terms of building size. However, despite the limited residential development activity since 2007, Copperas Cove’s single-family homes and duplexes have increased in size over the past ten years (Table 4-4). The average size of single family homes in Copperas Cove (1,720 SF) since 2012, are similar size to those in the City of Killeen (1,756 SF). In fact, Copperas Cove experienced higher concentration of duplex development than Killeen. Coryell County’s single-family homes and duplexes built after 2007 are substantially larger than those built prior. However, Copperas Cove’s residential market appeals to people interested in a rural, small town environment. The average building value per SF for single family homes peaked at $91.86/SF during this period in Copperas Cove, which is greater than the average value per SF in the City of Killeen and Bell County.
b) Non-residential Most of the land area for non-residential development is dedicated to farm and ranch/agricultural lands, which is consistent with the higher concentration of low-density residential development in Copperas Cove (Table 4-3). Approximately 86% of Copperas Cove’s land supply is designated in non-residential development in which 2,080 acres of land (45%) is classified as farm & ranch/agricultural land. Additionally, the higher concentration of non-residential development coincides with Copperas Cove’s limited residential development activity and notable supply of vacant land. Copperas Cove has a total of 735.5 acres of developed residential land developed while approximately 688.1 acres of vacant land. As seen in Table 4-3, a vast majority of commercial use and services are concentrated along Business Highway 190. Copperas Cove has a total of 2.5 million SF of commercial development in which nearly 75% of building SF was constructed prior to 2007. Since then, 647,751 building SF of new commercial space has been constructed in this area.
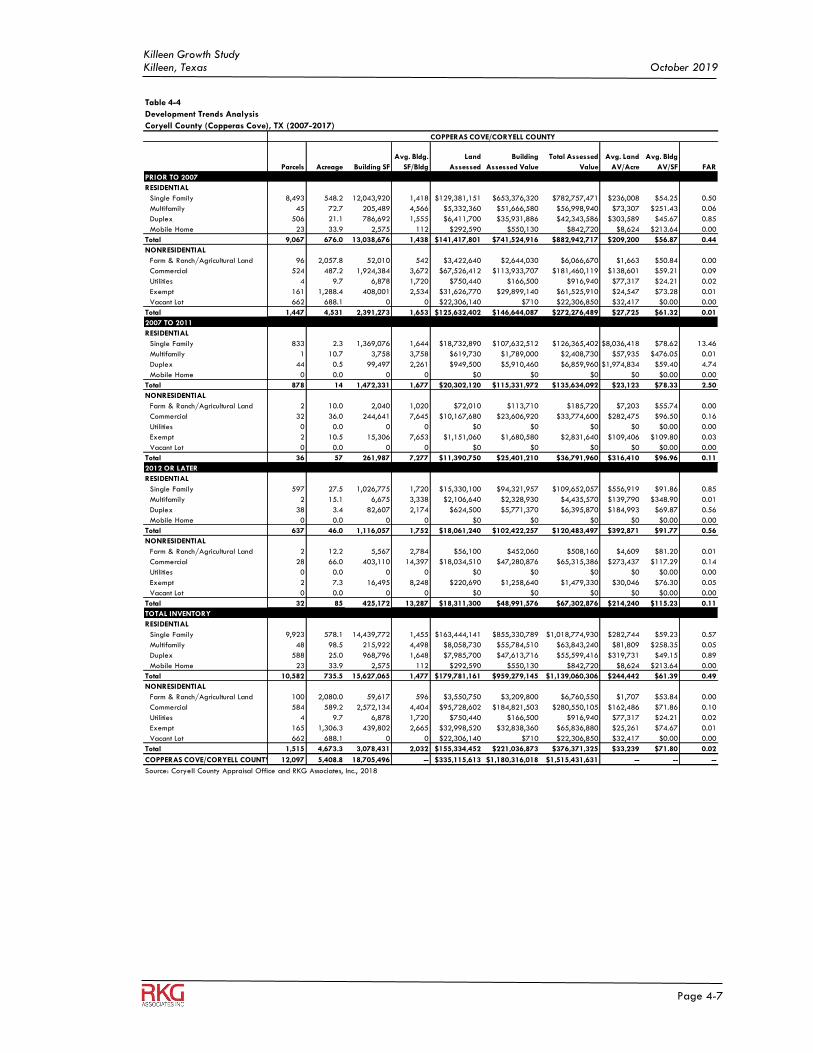
Killeen Growth Study Killeen, Texas October 2019
Page 4-7
Table 4-4
Development Trends Analysis
Coryell County (Copperas Cove), TX (2007-2017)
Parcels Acreage Building SF
Avg. Bldg.
SF/Bldg
Land
Assessed
Building
Assessed Value
Total Assessed
Value
Avg. Land
AV/Acre
Avg. Bldg
AV/SF FAR
PRIOR TO 2007
RESIDENTIAL
Single Family 8,493 548.2 12,043,920 1,418 $129,381,151 $653,376,320 $782,757,471 $236,008 $54.25 0.50
Multifamily 45 72.7 205,489 4,566 $5,332,360 $51,666,580 $56,998,940 $73,307 $251.43 0.06
Duplex 506 21.1 786,692 1,555 $6,411,700 $35,931,886 $42,343,586 $303,589 $45.67 0.85
Mobile Home 23 33.9 2,575 112 $292,590 $550,130 $842,720 $8,624 $213.64 0.00
Total 9,067 676.0 13,038,676 1,438 $141,417,801 $741,524,916 $882,942,717 $209,200 $56.87 0.44
NONRESIDENTIAL
Farm & Ranch/Agricultural Land 96 2,057.8 52,010 542 $3,422,640 $2,644,030 $6,066,670 $1,663 $50.84 0.00
Commercial 524 487.2 1,924,384 3,672 $67,526,412 $113,933,707 $181,460,119 $138,601 $59.21 0.09
Utilities 4 9.7 6,878 1,720 $750,440 $166,500 $916,940 $77,317 $24.21 0.02
Exempt 161 1,288.4 408,001 2,534 $31,626,770 $29,899,140 $61,525,910 $24,547 $73.28 0.01
Vacant Lot 662 688.1 0 0 $22,306,140 $710 $22,306,850 $32,417 $0.00 0.00
Total 1,447 4,531 2,391,273 1,653 $125,632,402 $146,644,087 $272,276,489 $27,725 $61.32 0.01
2007 TO 2011
RESIDENTIAL
Single Family 833 2.3 1,369,076 1,644 $18,732,890 $107,632,512 $126,365,402 $8,036,418 $78.62 13.46
Multifamily 1 10.7 3,758 3,758 $619,730 $1,789,000 $2,408,730 $57,935 $476.05 0.01
Duplex 44 0.5 99,497 2,261 $949,500 $5,910,460 $6,859,960 $1,974,834 $59.40 4.74
Mobile Home 0 0.0 0 0 $0 $0 $0 $0 $0.00 0.00
Total 878 14 1,472,331 1,677 $20,302,120 $115,331,972 $135,634,092 $23,123 $78.33 2.50
NONRESIDENTIAL
Farm & Ranch/Agricultural Land 2 10.0 2,040 1,020 $72,010 $113,710 $185,720 $7,203 $55.74 0.00
Commercial 32 36.0 244,641 7,645 $10,167,680 $23,606,920 $33,774,600 $282,475 $96.50 0.16
Utilities 0 0.0 0 0 $0 $0 $0 $0 $0.00 0.00
Exempt 2 10.5 15,306 7,653 $1,151,060 $1,680,580 $2,831,640 $109,406 $109.80 0.03
Vacant Lot 0 0.0 0 0 $0 $0 $0 $0 $0.00 0.00
Total 36 57 261,987 7,277 $11,390,750 $25,401,210 $36,791,960 $316,410 $96.96 0.11
2012 OR LATER
RESIDENTIAL
Single Family 597 27.5 1,026,775 1,720 $15,330,100 $94,321,957 $109,652,057 $556,919 $91.86 0.85
Multifamily 2 15.1 6,675 3,338 $2,106,640 $2,328,930 $4,435,570 $139,790 $348.90 0.01
Duplex 38 3.4 82,607 2,174 $624,500 $5,771,370 $6,395,870 $184,993 $69.87 0.56
Mobile Home 0 0.0 0 0 $0 $0 $0 $0 $0.00 0.00
Total 637 46.0 1,116,057 1,752 $18,061,240 $102,422,257 $120,483,497 $392,871 $91.77 0.56
NONRESIDENTIAL
Farm & Ranch/Agricultural Land 2 12.2 5,567 2,784 $56,100 $452,060 $508,160 $4,609 $81.20 0.01
Commercial 28 66.0 403,110 14,397 $18,034,510 $47,280,876 $65,315,386 $273,437 $117.29 0.14
Utilities 0 0.0 0 0 $0 $0 $0 $0 $0.00 0.00
Exempt 2 7.3 16,495 8,248 $220,690 $1,258,640 $1,479,330 $30,046 $76.30 0.05
Vacant Lot 0 0.0 0 0 $0 $0 $0 $0 $0.00 0.00
Total 32 85 425,172 13,287 $18,311,300 $48,991,576 $67,302,876 $214,240 $115.23 0.11
TOTAL INVENTORY
RESIDENTIAL
Single Family 9,923 578.1 14,439,772 1,455 $163,444,141 $855,330,789 $1,018,774,930 $282,744 $59.23 0.57
Multifamily 48 98.5 215,922 4,498 $8,058,730 $55,784,510 $63,843,240 $81,809 $258.35 0.05
Duplex 588 25.0 968,796 1,648 $7,985,700 $47,613,716 $55,599,416 $319,731 $49.15 0.89
Mobile Home 23 33.9 2,575 112 $292,590 $550,130 $842,720 $8,624 $213.64 0.00
Total 10,582 735.5 15,627,065 1,477 $179,781,161 $959,279,145 $1,139,060,306 $244,442 $61.39 0.49
NONRESIDENTIAL
Farm & Ranch/Agricultural Land 100 2,080.0 59,617 596 $3,550,750 $3,209,800 $6,760,550 $1,707 $53.84 0.00
Commercial 584 589.2 2,572,134 4,404 $95,728,602 $184,821,503 $280,550,105 $162,486 $71.86 0.10
Utilities 4 9.7 6,878 1,720 $750,440 $166,500 $916,940 $77,317 $24.21 0.02
Exempt 165 1,306.3 439,802 2,665 $32,998,520 $32,838,360 $65,836,880 $25,261 $74.67 0.01
Vacant Lot 662 688.1 0 0 $22,306,140 $710 $22,306,850 $32,417 $0.00 0.00
Total 1,515 4,673.3 3,078,431 2,032 $155,334,452 $221,036,873 $376,371,325 $33,239 $71.80 0.02
COPPERAS COVE/CORYELL COUNTY TOTAL12,097 5,408.8 18,705,496 -- $335,115,613 $1,180,316,018 $1,515,431,631 -- -- --
Source: Coryell County Appraisal Office and RKG Associates, Inc., 2018
COPPERAS COVE/CORYELL COUNTY
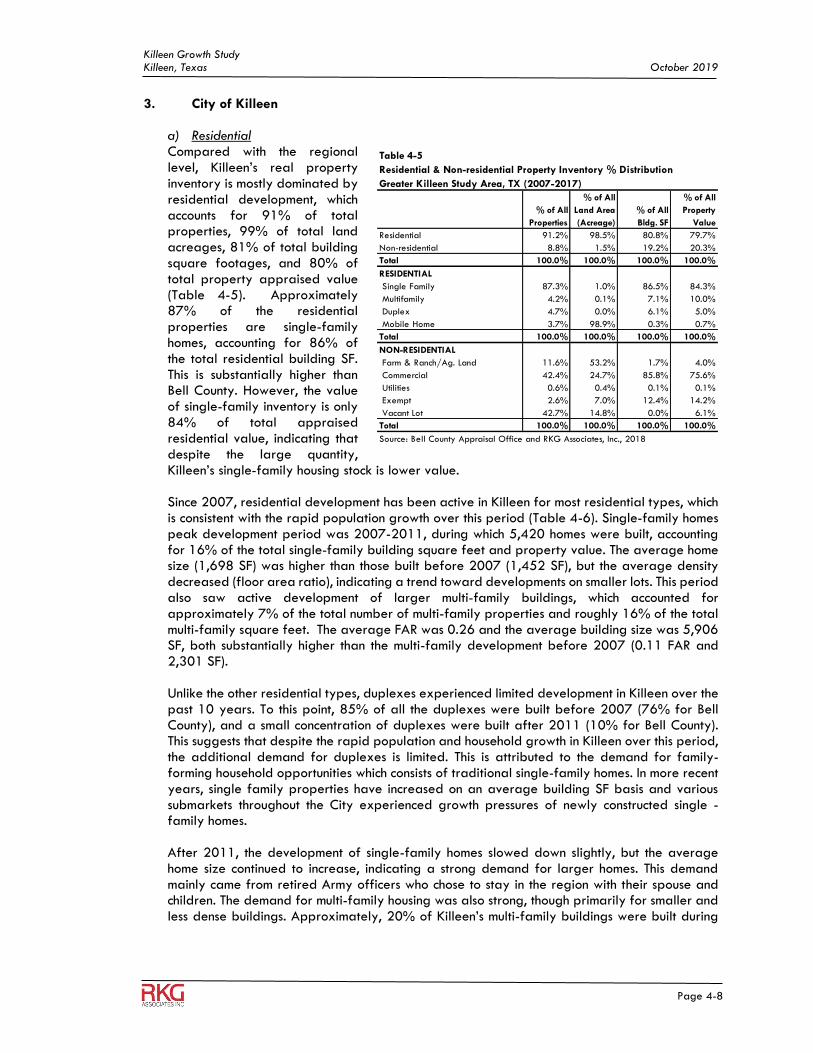
Killeen Growth Study Killeen, Texas October 2019
Page 4-8
3. City of Killeen
a) Residential Compared with the regional level, Killeen’s real property inventory is mostly dominated by residential development, which accounts for 91% of total properties, 99% of total land acreages, 81% of total building square footages, and 80% of total property appraised value (Table 4-5). Approximately 87% of the residential properties are single-family homes, accounting for 86% of the total residential building SF. This is substantially higher than Bell County. However, the value of single-family inventory is only 84% of total appraised residential value, indicating that despite the large quantity, Killeen’s single-family housing stock is lower value. Since 2007, residential development has been active in Killeen for most residential types, which is consistent with the rapid population growth over this period (Table 4-6). Single-family homes peak development period was 2007-2011, during which 5,420 homes were built, accounting for 16% of the total single-family building square feet and property value. The average home size (1,698 SF) was higher than those built before 2007 (1,452 SF), but the average density decreased (floor area ratio), indicating a trend toward developments on smaller lots. This period also saw active development of larger multi-family buildings, which accounted for approximately 7% of the total number of multi-family properties and roughly 16% of the total multi-family square feet. The average FAR was 0.26 and the average building size was 5,906 SF, both substantially higher than the multi-family development before 2007 (0.11 FAR and 2,301 SF). Unlike the other residential types, duplexes experienced limited development in Killeen over the past 10 years. To this point, 85% of all the duplexes were built before 2007 (76% for Bell County), and a small concentration of duplexes were built after 2011 (10% for Bell County). This suggests that despite the rapid population and household growth in Killeen over this period, the additional demand for duplexes is limited. This is attributed to the demand for family-forming household opportunities which consists of traditional single-family homes. In more recent years, single family properties have increased on an average building SF basis and various submarkets throughout the City experienced growth pressures of newly constructed single -family homes. After 2011, the development of single-family homes slowed down slightly, but the average home size continued to increase, indicating a strong demand for larger homes. This demand mainly came from retired Army officers who chose to stay in the region with their spouse and children. The demand for multi-family housing was also strong, though primarily for smaller and less dense buildings. Approximately, 20% of Killeen’s multi-family buildings were built during
Table 4-5
Residential & Non-residential Property Inventory % Distribution
Greater Killeen Study Area, TX (2007-2017)
% of All
Properties
% of All
Land Area
(Acreage)
% of All
Bldg. SF
% of All
Property
Value
Residential 91.2% 98.5% 80.8% 79.7%
Non-residential 8.8% 1.5% 19.2% 20.3%
Total 100.0% 100.0% 100.0% 100.0%
RESIDENTIAL
Single Family 87.3% 1.0% 86.5% 84.3%
Multifamily 4.2% 0.1% 7.1% 10.0%
Duplex 4.7% 0.0% 6.1% 5.0%
Mobile Home 3.7% 98.9% 0.3% 0.7%
Total 100.0% 100.0% 100.0% 100.0%
NON-RESIDENTIAL
Farm & Ranch/Ag. Land 11.6% 53.2% 1.7% 4.0%
Commercial 42.4% 24.7% 85.8% 75.6%
Utilities 0.6% 0.4% 0.1% 0.1%
Exempt 2.6% 7.0% 12.4% 14.2%
Vacant Lot 42.7% 14.8% 0.0% 6.1%
Total 100.0% 100.0% 100.0% 100.0%
Source: Bell County Appraisal Office and RKG Associates, Inc., 2018
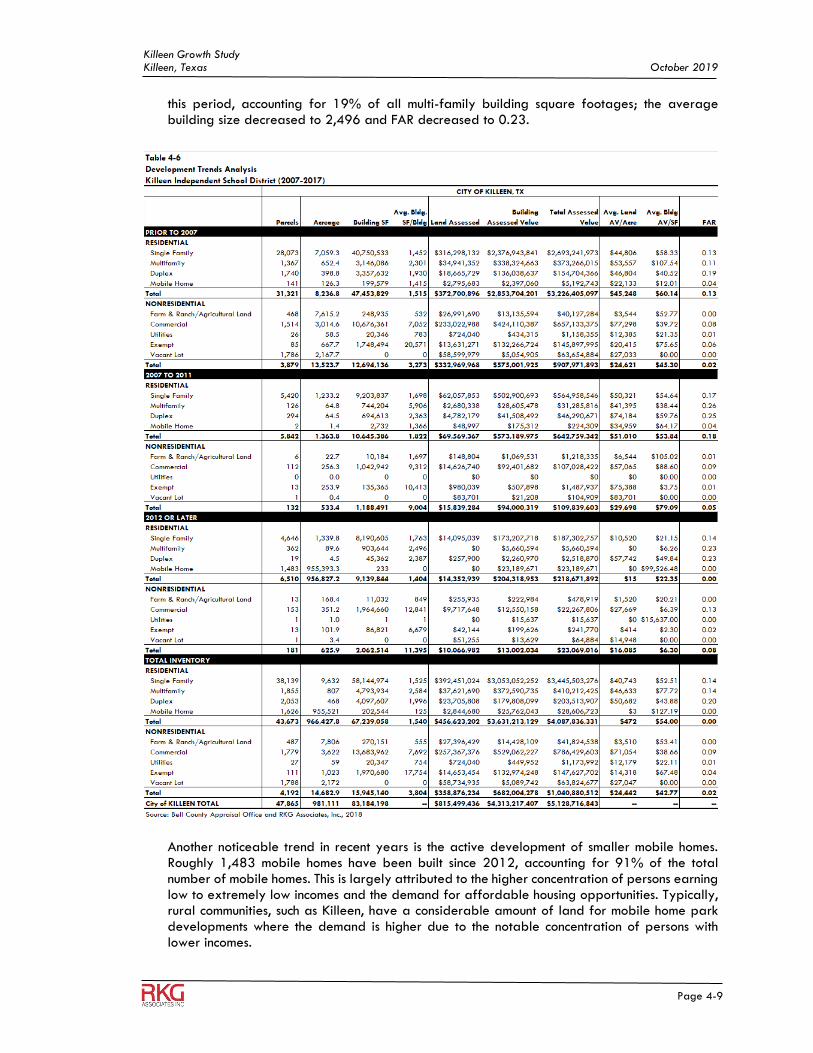
Killeen Growth Study Killeen, Texas October 2019
Page 4-9
this period, accounting for 19% of all multi-family building square footages; the average building size decreased to 2,496 and FAR decreased to 0.23.
Another noticeable trend in recent years is the active development of smaller mobile homes. Roughly 1,483 mobile homes have been built since 2012, accounting for 91% of the total number of mobile homes. This is largely attributed to the higher concentration of persons earning low to extremely low incomes and the demand for affordable housing opportunities. Typically, rural communities, such as Killeen, have a considerable amount of land for mobile home park developments where the demand is higher due to the notable concentration of persons with lower incomes.
Killeen Growth Study Killeen, Texas October 2019
Page 4-10
b) Non-residential Compared with the Bell County average, a larger percentage of Killeen’s non-residential property inventory is commercial or exempt services, and a smaller percentage is farm & ranch/agricultural land. As previously explained, this is consistent with the more densely developed environment within the city limits while communities outside of Killeen have more of a rural attributes and higher concentrations of farm & ranch/agricultural land. Like the trend at the reginal level, Killeen’s non-residential development overall has been less active than residential development, measured either by the number of new properties or by the built square footages. During the study period, the City of Killeen’s commercial development has expanded by a total of 265 properties while adding roughly 3 million SF of commercial space. In fact, vacant lots are nearly outpacing the total commercial property inventory which may indicate a high concentration of vacant commercial space and lots.
D. KISD URBAN SUBMARKET DEVELOPMENT ACTIVITY (2007-2017)
This section contains an analysis of development activity for both residential and non-residential properties during the 2007 - 2017 period in the KISD’s eight submarkets. The development trends in each of these submarkets exhibit somewhat similar growth pressures in terms of size, scale, character and pace. To locate where these clusters and patterns of new development have occurred, RKG completed a geospatial analysis for each submarket assessing the area’s development profile by residential development over the last decade between (2007-2017). The development totals for both residential and non-residential development can be found in the Appendix tables (1-9) at the end of this chapter as well as the urban submarket residential development activity maps. The data results indicate that a vast majority of residential development occurred prior to 2007 as well as the non-residential development, however, non-residential development is substantially smaller in comparison to residential growth (Appendix Table 4-9). Overall, nearly 87% of the KISD’s study area and submarkets are predominantly comprised of residential development, however, several submarkets display different market characteristics of when development activity occurred and where recent clusters of residential development are concentrated. Comparatively, non-residential development only accounts for roughly 13% of the property inventory and less than 6% of the total building SF of the KISD study area (Table 4-7). To this point, each of the submarkets have made it a priority to increase residential development due to the notable growth pressures in population in most recent years. 1. Residential Development
As seen in Appendix Maps 3 and 4, the Patterson-Liberty Hill and Roy J Smith submarkets have experienced the newest residential development within the KISD study area. This is largely attributed to the construction of single-family properties. During the study period, single family development peaked between 2007 and 2011 adding approximately 2,375 properties and development continued into 2012 and later years with another 1,841 properties. Comparatively, Roy J Smith experienced similar residential development trends, however, this submarket contains a higher concentration of diverse housing opportunities. Between 2012 and 2017, multi-family development accounted for 8% of the submarkets total residential inventory while only accounting for 3% between 2007 and 2011. Additionally, these residential development trends coincide with the notable population growth pressures. Both submarkets were recently developed and have increased substantially in both population and real estate development.
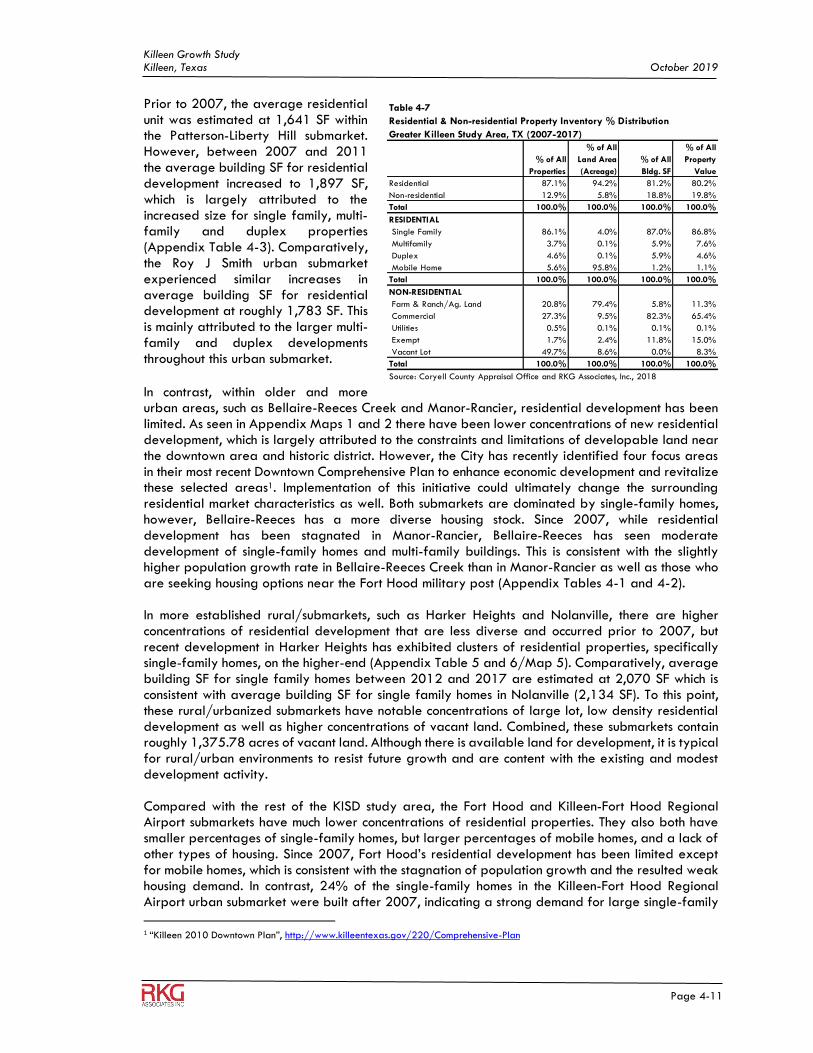
Killeen Growth Study Killeen, Texas October 2019
Page 4-11
Prior to 2007, the average residential unit was estimated at 1,641 SF within the Patterson-Liberty Hill submarket. However, between 2007 and 2011 the average building SF for residential development increased to 1,897 SF, which is largely attributed to the increased size for single family, multi-family and duplex properties (Appendix Table 4-3). Comparatively, the Roy J Smith urban submarket experienced similar increases in average building SF for residential development at roughly 1,783 SF. This is mainly attributed to the larger multi-family and duplex developments throughout this urban submarket.
In contrast, within older and more urban areas, such as Bellaire-Reeces Creek and Manor-Rancier, residential development has been limited. As seen in Appendix Maps 1 and 2 there have been lower concentrations of new residential development, which is largely attributed to the constraints and limitations of developable land near the downtown area and historic district. However, the City has recently identified four focus areas in their most recent Downtown Comprehensive Plan to enhance economic development and revitalize these selected areas1. Implementation of this initiative could ultimately change the surrounding residential market characteristics as well. Both submarkets are dominated by single-family homes, however, Bellaire-Reeces has a more diverse housing stock. Since 2007, while residential development has been stagnated in Manor-Rancier, Bellaire-Reeces has seen moderate development of single-family homes and multi-family buildings. This is consistent with the slightly higher population growth rate in Bellaire-Reeces Creek than in Manor-Rancier as well as those who are seeking housing options near the Fort Hood military post (Appendix Tables 4-1 and 4-2). In more established rural/submarkets, such as Harker Heights and Nolanville, there are higher concentrations of residential development that are less diverse and occurred prior to 2007, but recent development in Harker Heights has exhibited clusters of residential properties, specifically single-family homes, on the higher-end (Appendix Table 5 and 6/Map 5). Comparatively, average building SF for single family homes between 2012 and 2017 are estimated at 2,070 SF which is consistent with average building SF for single family homes in Nolanville (2,134 SF). To this point, these rural/urbanized submarkets have notable concentrations of large lot, low density residential development as well as higher concentrations of vacant land. Combined, these submarkets contain roughly 1,375.78 acres of vacant land. Although there is available land for development, it is typical for rural/urban environments to resist future growth and are content with the existing and modest development activity. Compared with the rest of the KISD study area, the Fort Hood and Killeen-Fort Hood Regional Airport submarkets have much lower concentrations of residential properties. They also both have smaller percentages of single-family homes, but larger percentages of mobile homes, and a lack of other types of housing. Since 2007, Fort Hood’s residential development has been limited except for mobile homes, which is consistent with the stagnation of population growth and the resulted weak housing demand. In contrast, 24% of the single-family homes in the Killeen-Fort Hood Regional Airport urban submarket were built after 2007, indicating a strong demand for large single-family
1 “Killeen 2010 Downtown Plan”, http://www.killeentexas.gov/220/Comprehensive-Plan
Table 4-7
Residential & Non-residential Property Inventory % Distribution
Greater Killeen Study Area, TX (2007-2017)
% of All
Properties
% of All
Land Area
(Acreage)
% of All
Bldg. SF
% of All
Property
Value
Residential 87.1% 94.2% 81.2% 80.2%
Non-residential 12.9% 5.8% 18.8% 19.8%
Total 100.0% 100.0% 100.0% 100.0%
RESIDENTIAL
Single Family 86.1% 4.0% 87.0% 86.8%
Multifamily 3.7% 0.1% 5.9% 7.6%
Duplex 4.6% 0.1% 5.9% 4.6%
Mobile Home 5.6% 95.8% 1.2% 1.1%
Total 100.0% 100.0% 100.0% 100.0%
NON-RESIDENTIAL
Farm & Ranch/Ag. Land 20.8% 79.4% 5.8% 11.3%
Commercial 27.3% 9.5% 82.3% 65.4%
Utilities 0.5% 0.1% 0.1% 0.1%
Exempt 1.7% 2.4% 11.8% 15.0%
Vacant Lot 49.7% 8.6% 0.0% 8.3%
Total 100.0% 100.0% 100.0% 100.0%
Source: Coryell County Appraisal Office and RKG Associates, Inc., 2018
Killeen Growth Study Killeen, Texas October 2019
Page 4-12
homes in rural areas. This also explains the presence of high-value housing in this submarket as illustrated in the previous chapter. 2. Non-residential Development
From a non-residential development perspective, commercial (17 million SF) and exempt (2.4 million SF) properties account for a vast majority of the building SF for non-residential development in the KISD study area’s non-residential property inventory. This reflects the more diverse neighborhoods in the KISD study area. To this point, commercial and exempt properties are mainly located in older, more submarkets such as Bellaire-Reeces Creek and Manor-Rancier where the main downtown area and historical district is concentrated. The higher concentration of commercial development in these two submarkets cater to the surrounding areas established such as Harker Heights, Nolanville, Fort Hood and the Killeen-Fort Hood Regional Airport submarkets. Additionally, there are several small commercial corridors that serve as urban shopping centers throughout the study area along Business Highway 190 and Interstate 14. Additionally, the KISD study area is known for its higher concentration of institutional facilities and schools. In contrast, each of the submarkets contain concentrations of farm & ranch/agricultural land but is more substantial in rural areas (Table 4-7). Among the submarkets, older, and more urban areas such as Bellaire-Reeces Creek and Manor-Rancier have the highest concentration of building SF for commercial and exempt use. This is largely due to the substantial number of schools throughout the Killeen Independent School District. Along with the recent rapid population growth patterns, the KISD study area has started to display newly constructed exempt properties, especially in the Patterson-Liberty Hill and Roy J Smith submarkets, which is commensurate to the notable concentration of residential development. A vast majority of rural & farm/agricultural land is concentrated within the rural submarkets, such as the Killeen-Fort Hood Regional Airport urban submarket. Simply put, approximately 93% of the non-residential land is comprised of farm & ranch/agricultural land. This is the highest concentration among the other submarkets, however, Nolanville and Fort Hood have notable concentrations as well. This coincides with the limited residential development in more recent years throughout these submarkets, which already contain established residential neighborhoods. E. IMPLICATIONS Approximately 76% of Bell County’s development inventory is residential properties. Single-family is the most common residential property type, followed by mobile homes. Driven by rapid population growth, Bell County has seen active residential development since 2007. Duplex development was most active during 2007-2011, while single-family development was most active after 2011, indicating a shift of demand in recent years. A large part of the demand came from retired soldiers, many of whom are senior officers with a larger family. Nevertheless, the single-family homes and duplexes built after 2011 on average have smaller square footages and lower per square feet building value than those built during 2007-2011, reflecting a greater demand for less expensive housing. Smaller-sized multi-family development was also active in recent years, reflecting the demand from young adults and young-families that yet to have the financial capability to purchase a home. Compared with residential development, the non-residential development in Bell County has been less active since 2007. As a result, the residents in Bell County’s newly developed neighborhoods are underserved by commercial and public services. Coryell County’s real property inventory is dominated by residential properties, which reflects the more rural setting. Compared with Bell County, Coryell County has an older housing stock with limited new development since 2007. This is consistent with the finding from the previous chapter that Coryell County’s population grew substantially between 1970 and 2000, but since 2000, the population growth has been stagnated. The non-residential inventory mainly comprises commercial and exempt
Killeen Growth Study Killeen, Texas October 2019
Page 4-13
properties, suggesting that the non-residential development in Coryell County is primarily driven by the demand of local residents. Over the past 10 years, despite the overall stagnation of non-residential development, a sizeable number of larger, and more upscale commercial properties have been developed, indicating a strong demand for higher-end commercial services. Killeen’s real property inventory is more dominated by residential properties, especially low- to middle-end single-family housing than at the Bell County level. Over the past 10 years, the rapid population growth has created a strong housing demand, resulting in active residential development in Killeen. The construction of single-family homes and large multi-family buildings peaked during 2007-2011, when the average density of new development also reached the peak. This reflects the pressure to house the rapidly growing population and households on limited developable land and with limited capital investment. Residential development slowed down after 2011, but the housing inventory continues to grow steadily as the population continues to increase. Meanwhile, the average size of new single-family development increased, smaller and lower-density multi-family development became more popular. This coincides with the affordability of owner-occupied units throughout the City. A higher concentration of households earns moderate to lower incomes while the surrounding communities are comprised of owner-occupied units on the higher-end. The mobile home inventory also grew substantially after 2011 leading to clusters of land dedicated to mobile home parks. Consistent with the more urban setting of Killeen, commercial and exempt properties account for a larger percentage of Killeen’s non-residential property inventory than at the Bell County level. Over the past 10 years, the development of commercial and exempt properties has been the main driver of Killeen’s non-residential development. However, the growth of commercial and exempt properties was still falling behind residential development, suggesting that at least some new residents in Killeen don’t have access to adequate commercial services and public amenities. The KISD study area and its urban submarket’s real property inventory is slightly more diverse than Killeen’s, which reflects the greater diversity of the neighborhoods in the study. Like in Killeen, the rapid population growth in Greater Study Area/KISD since 2007 has resulted in a substantial increase in the inventory of single-family and multi-family properties. Nevertheless, different submarkets experienced different levels of residential development over this period. The development was most active in Patterson-Liberty Hill and Roy J Smith, which was consistent with the exceptional population growth in these two submarkets. But unlike Patterson-Liberty Hill whose residential development was predominantly single-family, Roy J Smith had more multi-family and duplex development. This indicates that the older, and more urban environment of Roy J Smith created more varied housing demand and developable sites. In contrast, Patterson-Liberty Hill comprises mainly suburban divisions which were built in large quantity within a relatively short period of time to house the newly added residents. Over the same period, the two submarkets have also experienced the region’s most active development of commercial and exempt properties, which was primarily driven by the demand of the new residents. Bellaire-Reeces Creek’s diverse housing inventory reflects its older and more urban environment. Over the past 10 years, Bellaire-Reeces Creek has experienced moderate growth of both single-family and multi-family inventories, which is consistent with the steady population growth over the same period. However, non-residential development has been stagnated except for exempt properties. This was mainly due to a lack of interest to invest in the neighborhoods rather than a lack of demand. As a result, the needs for commercial and public services of Bellaire-Reeces Creek’s new residents have been underserved.
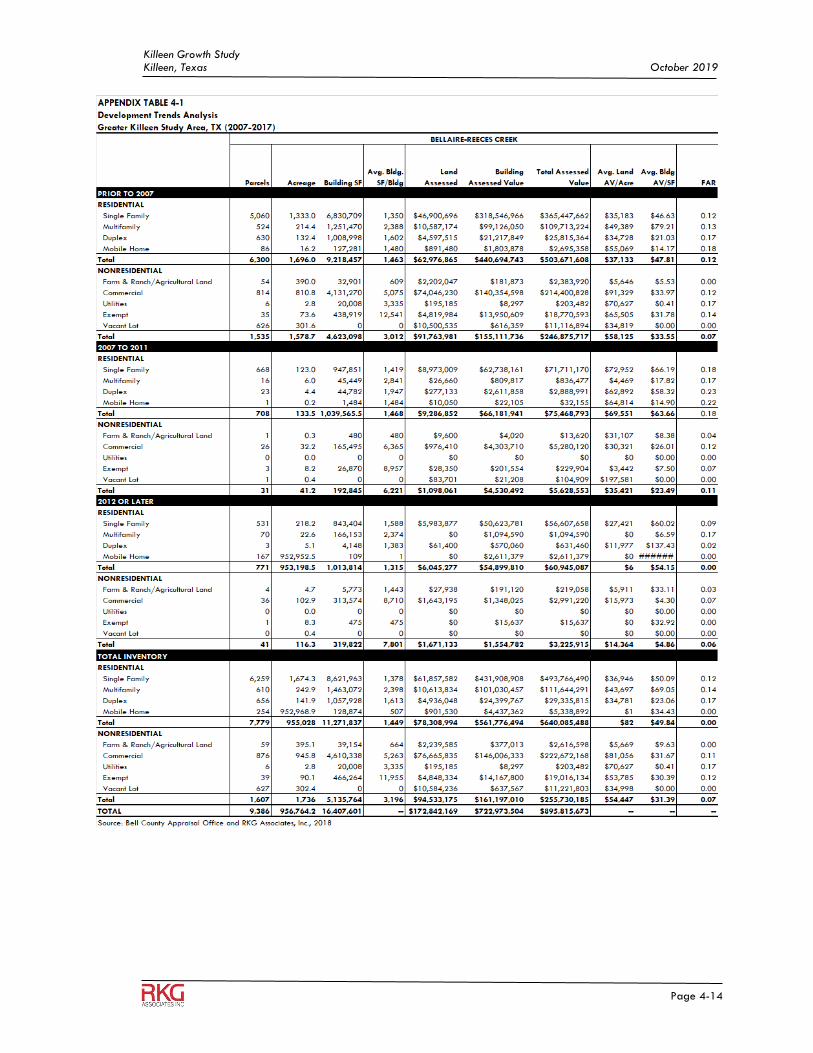
Killeen Growth Study Killeen, Texas October 2019
Page 4-14
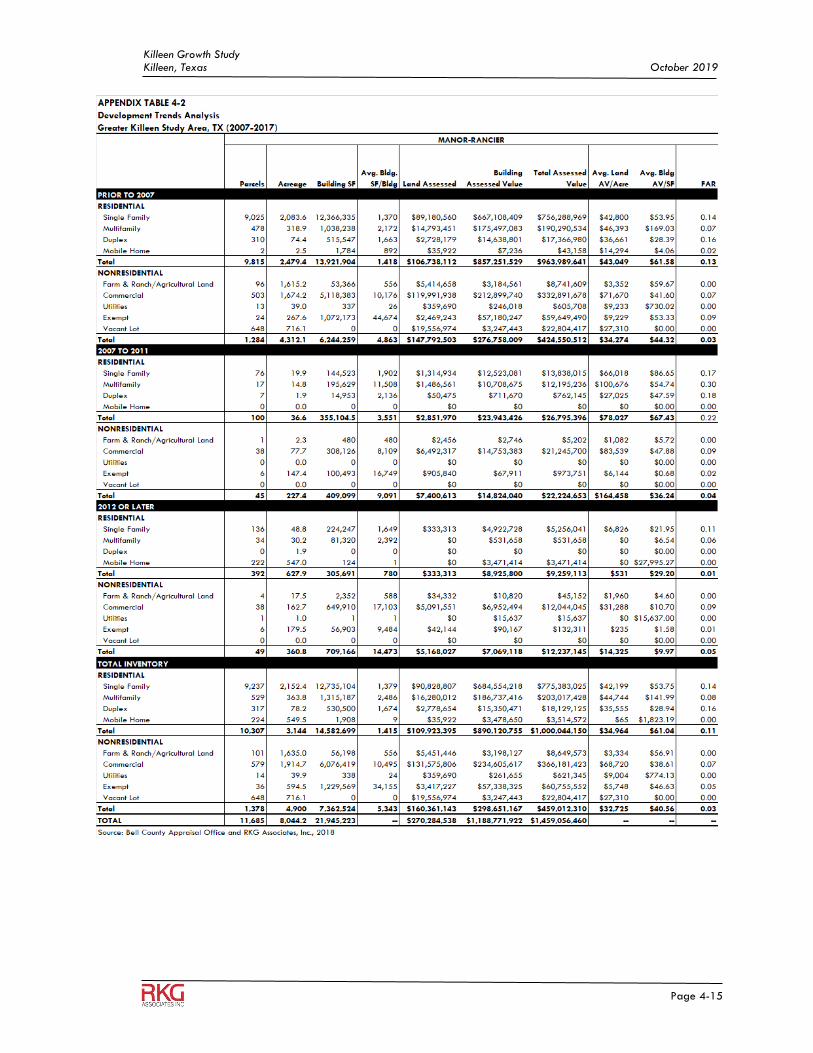
Killeen Growth Study Killeen, Texas October 2019
Page 4-15
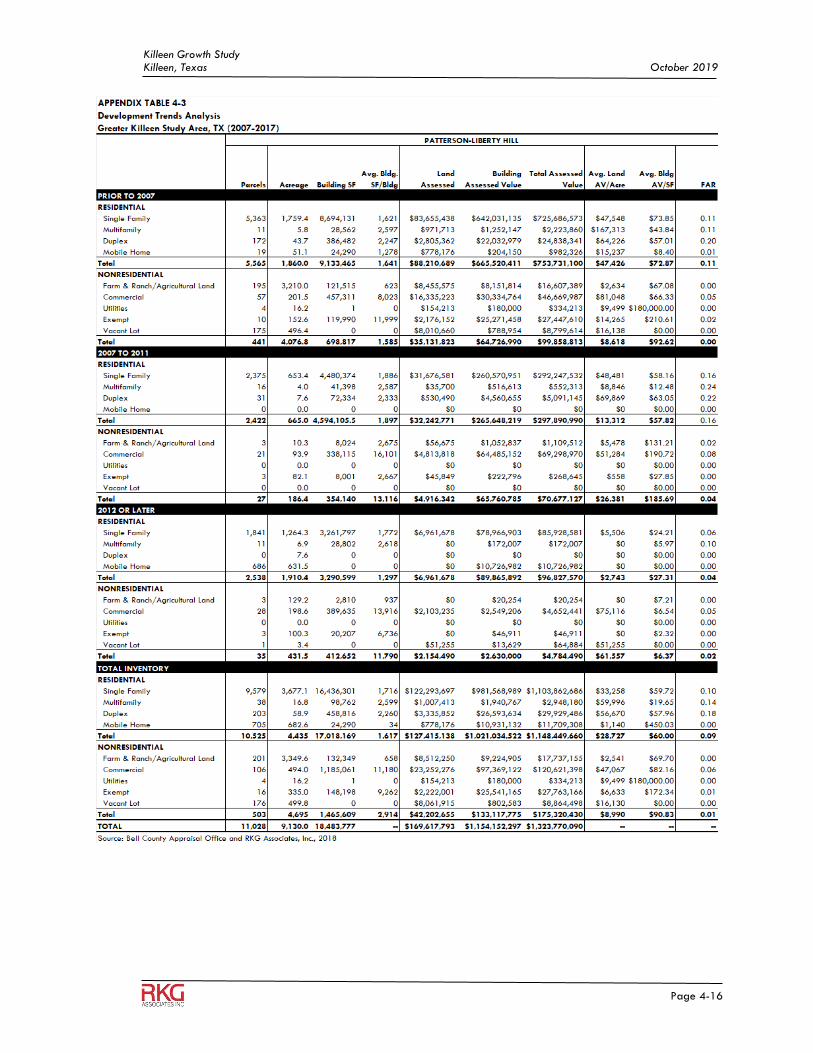
Killeen Growth Study Killeen, Texas October 2019
Page 4-16
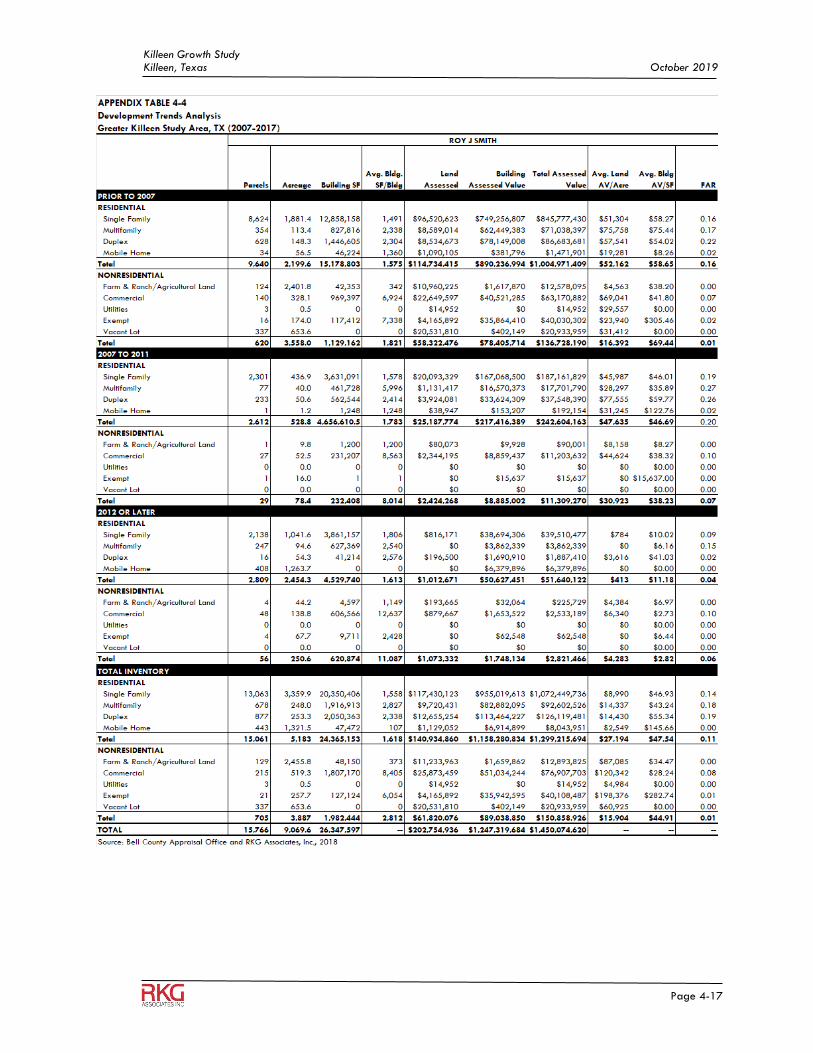
Killeen Growth Study Killeen, Texas October 2019
Page 4-17
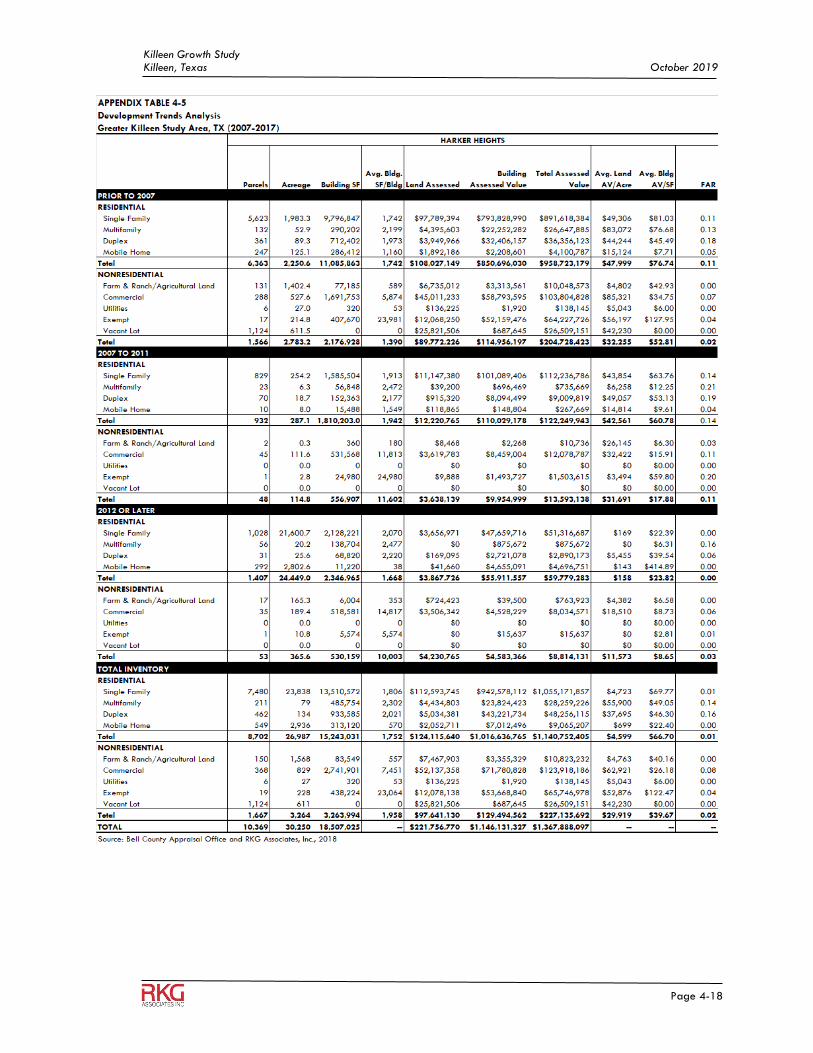
Killeen Growth Study Killeen, Texas October 2019
Page 4-18
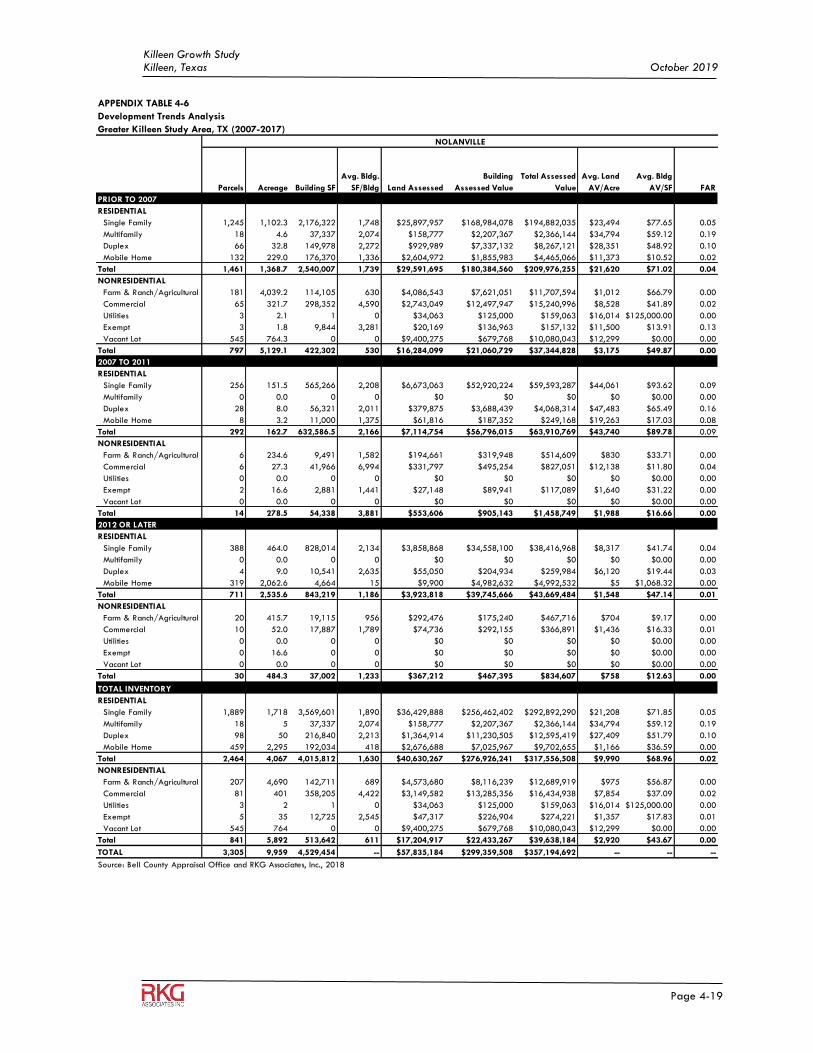
Killeen Growth Study Killeen, Texas October 2019
Page 4-19
APPENDIX TABLE 4-6
Development Trends Analysis
Greater Killeen Study Area, TX (2007-2017)
Parcels Acreage Building SF
Avg. Bldg.
SF/Bldg Land Assessed
Building
Assessed Value
Total Assessed
Value
Avg. Land
AV/Acre
Avg. Bldg
AV/SF FAR
PRIOR TO 2007
RESIDENTIAL
Single Family 1,245 1,102.3 2,176,322 1,748 $25,897,957 $168,984,078 $194,882,035 $23,494 $77.65 0.05
Multifamily 18 4.6 37,337 2,074 $158,777 $2,207,367 $2,366,144 $34,794 $59.12 0.19
Duplex 66 32.8 149,978 2,272 $929,989 $7,337,132 $8,267,121 $28,351 $48.92 0.10
Mobile Home 132 229.0 176,370 1,336 $2,604,972 $1,855,983 $4,465,066 $11,373 $10.52 0.02
Total 1,461 1,368.7 2,540,007 1,739 $29,591,695 $180,384,560 $209,976,255 $21,620 $71.02 0.04
NONRESIDENTIAL
Farm & Ranch/Agricultural Land 181 4,039.2 114,105 630 $4,086,543 $7,621,051 $11,707,594 $1,012 $66.79 0.00
Commercial 65 321.7 298,352 4,590 $2,743,049 $12,497,947 $15,240,996 $8,528 $41.89 0.02
Utilities 3 2.1 1 0 $34,063 $125,000 $159,063 $16,014 $125,000.00 0.00
Exempt 3 1.8 9,844 3,281 $20,169 $136,963 $157,132 $11,500 $13.91 0.13
Vacant Lot 545 764.3 0 0 $9,400,275 $679,768 $10,080,043 $12,299 $0.00 0.00
Total 797 5,129.1 422,302 530 $16,284,099 $21,060,729 $37,344,828 $3,175 $49.87 0.00
2007 TO 2011
RESIDENTIAL
Single Family 256 151.5 565,266 2,208 $6,673,063 $52,920,224 $59,593,287 $44,061 $93.62 0.09
Multifamily 0 0.0 0 0 $0 $0 $0 $0 $0.00 0.00
Duplex 28 8.0 56,321 2,011 $379,875 $3,688,439 $4,068,314 $47,483 $65.49 0.16
Mobile Home 8 3.2 11,000 1,375 $61,816 $187,352 $249,168 $19,263 $17.03 0.08
Total 292 162.7 632,586.5 2,166 $7,114,754 $56,796,015 $63,910,769 $43,740 $89.78 0.09
NONRESIDENTIAL
Farm & Ranch/Agricultural Land 6 234.6 9,491 1,582 $194,661 $319,948 $514,609 $830 $33.71 0.00
Commercial 6 27.3 41,966 6,994 $331,797 $495,254 $827,051 $12,138 $11.80 0.04
Utilities 0 0.0 0 0 $0 $0 $0 $0 $0.00 0.00
Exempt 2 16.6 2,881 1,441 $27,148 $89,941 $117,089 $1,640 $31.22 0.00
Vacant Lot 0 0.0 0 0 $0 $0 $0 $0 $0.00 0.00
Total 14 278.5 54,338 3,881 $553,606 $905,143 $1,458,749 $1,988 $16.66 0.00
2012 OR LATER
RESIDENTIAL
Single Family 388 464.0 828,014 2,134 $3,858,868 $34,558,100 $38,416,968 $8,317 $41.74 0.04
Multifamily 0 0.0 0 0 $0 $0 $0 $0 $0.00 0.00
Duplex 4 9.0 10,541 2,635 $55,050 $204,934 $259,984 $6,120 $19.44 0.03
Mobile Home 319 2,062.6 4,664 15 $9,900 $4,982,632 $4,992,532 $5 $1,068.32 0.00
Total 711 2,535.6 843,219 1,186 $3,923,818 $39,745,666 $43,669,484 $1,548 $47.14 0.01
NONRESIDENTIAL
Farm & Ranch/Agricultural Land 20 415.7 19,115 956 $292,476 $175,240 $467,716 $704 $9.17 0.00
Commercial 10 52.0 17,887 1,789 $74,736 $292,155 $366,891 $1,436 $16.33 0.01
Utilities 0 0.0 0 0 $0 $0 $0 $0 $0.00 0.00
Exempt 0 16.6 0 0 $0 $0 $0 $0 $0.00 0.00
Vacant Lot 0 0.0 0 0 $0 $0 $0 $0 $0.00 0.00
Total 30 484.3 37,002 1,233 $367,212 $467,395 $834,607 $758 $12.63 0.00
TOTAL INVENTORY
RESIDENTIAL
Single Family 1,889 1,718 3,569,601 1,890 $36,429,888 $256,462,402 $292,892,290 $21,208 $71.85 0.05
Multifamily 18 5 37,337 2,074 $158,777 $2,207,367 $2,366,144 $34,794 $59.12 0.19
Duplex 98 50 216,840 2,213 $1,364,914 $11,230,505 $12,595,419 $27,409 $51.79 0.10
Mobile Home 459 2,295 192,034 418 $2,676,688 $7,025,967 $9,702,655 $1,166 $36.59 0.00
Total 2,464 4,067 4,015,812 1,630 $40,630,267 $276,926,241 $317,556,508 $9,990 $68.96 0.02
NONRESIDENTIAL
Farm & Ranch/Agricultural Land 207 4,690 142,711 689 $4,573,680 $8,116,239 $12,689,919 $975 $56.87 0.00
Commercial 81 401 358,205 4,422 $3,149,582 $13,285,356 $16,434,938 $7,854 $37.09 0.02
Utilities 3 2 1 0 $34,063 $125,000 $159,063 $16,014 $125,000.00 0.00
Exempt 5 35 12,725 2,545 $47,317 $226,904 $274,221 $1,357 $17.83 0.01
Vacant Lot 545 764 0 0 $9,400,275 $679,768 $10,080,043 $12,299 $0.00 0.00
Total 841 5,892 513,642 611 $17,204,917 $22,433,267 $39,638,184 $2,920 $43.67 0.00
TOTAL 3,305 9,959 4,529,454 -- $57,835,184 $299,359,508 $357,194,692 -- -- --
Source: Bell County Appraisal Office and RKG Associates, Inc., 2018
NOLANVILLE
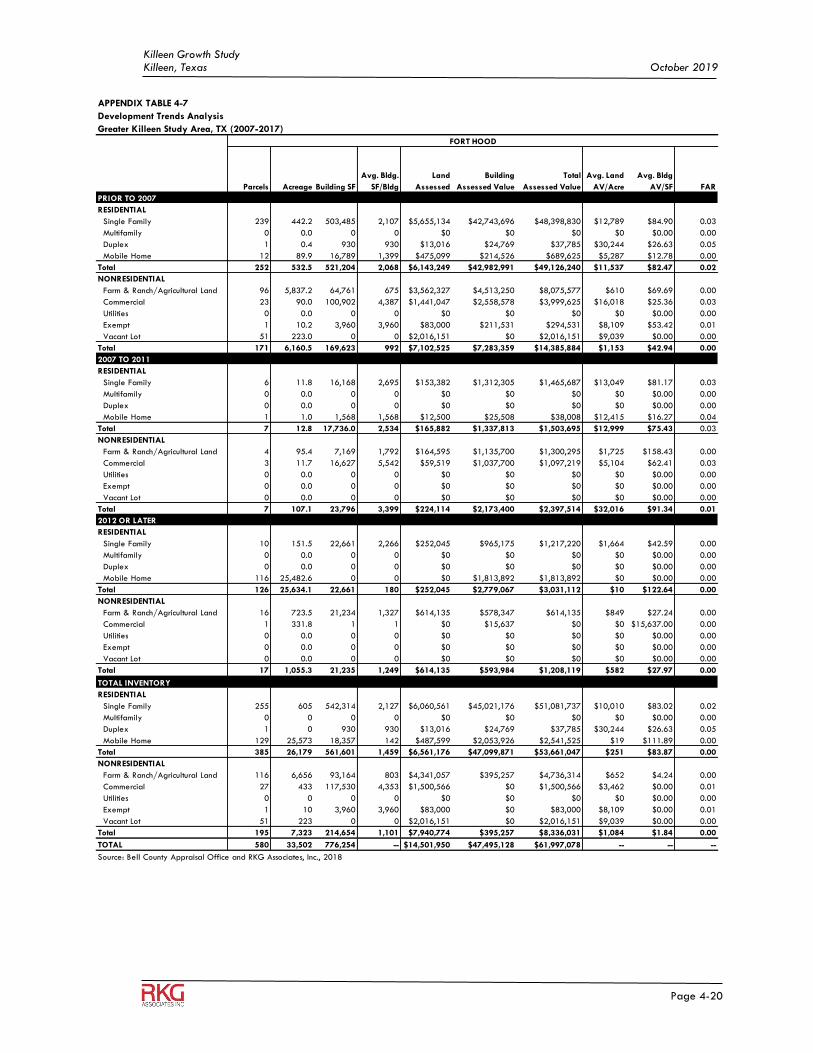
Killeen Growth Study Killeen, Texas October 2019
Page 4-20
APPENDIX TABLE 4-7
Development Trends Analysis
Greater Killeen Study Area, TX (2007-2017)
Parcels Acreage Building SF
Avg. Bldg.
SF/Bldg
Land
Assessed
Building
Assessed Value
Total
Assessed Value
Avg. Land
AV/Acre
Avg. Bldg
AV/SF FAR
PRIOR TO 2007
RESIDENTIAL
Single Family 239 442.2 503,485 2,107 $5,655,134 $42,743,696 $48,398,830 $12,789 $84.90 0.03
Multifamily 0 0.0 0 0 $0 $0 $0 $0 $0.00 0.00
Duplex 1 0.4 930 930 $13,016 $24,769 $37,785 $30,244 $26.63 0.05
Mobile Home 12 89.9 16,789 1,399 $475,099 $214,526 $689,625 $5,287 $12.78 0.00
Total 252 532.5 521,204 2,068 $6,143,249 $42,982,991 $49,126,240 $11,537 $82.47 0.02
NONRESIDENTIAL
Farm & Ranch/Agricultural Land 96 5,837.2 64,761 675 $3,562,327 $4,513,250 $8,075,577 $610 $69.69 0.00
Commercial 23 90.0 100,902 4,387 $1,441,047 $2,558,578 $3,999,625 $16,018 $25.36 0.03
Utilities 0 0.0 0 0 $0 $0 $0 $0 $0.00 0.00
Exempt 1 10.2 3,960 3,960 $83,000 $211,531 $294,531 $8,109 $53.42 0.01
Vacant Lot 51 223.0 0 0 $2,016,151 $0 $2,016,151 $9,039 $0.00 0.00
Total 171 6,160.5 169,623 992 $7,102,525 $7,283,359 $14,385,884 $1,153 $42.94 0.00
2007 TO 2011
RESIDENTIAL
Single Family 6 11.8 16,168 2,695 $153,382 $1,312,305 $1,465,687 $13,049 $81.17 0.03
Multifamily 0 0.0 0 0 $0 $0 $0 $0 $0.00 0.00
Duplex 0 0.0 0 0 $0 $0 $0 $0 $0.00 0.00
Mobile Home 1 1.0 1,568 1,568 $12,500 $25,508 $38,008 $12,415 $16.27 0.04
Total 7 12.8 17,736.0 2,534 $165,882 $1,337,813 $1,503,695 $12,999 $75.43 0.03
NONRESIDENTIAL
Farm & Ranch/Agricultural Land 4 95.4 7,169 1,792 $164,595 $1,135,700 $1,300,295 $1,725 $158.43 0.00
Commercial 3 11.7 16,627 5,542 $59,519 $1,037,700 $1,097,219 $5,104 $62.41 0.03
Utilities 0 0.0 0 0 $0 $0 $0 $0 $0.00 0.00
Exempt 0 0.0 0 0 $0 $0 $0 $0 $0.00 0.00
Vacant Lot 0 0.0 0 0 $0 $0 $0 $0 $0.00 0.00
Total 7 107.1 23,796 3,399 $224,114 $2,173,400 $2,397,514 $32,016 $91.34 0.01
2012 OR LATER
RESIDENTIAL
Single Family 10 151.5 22,661 2,266 $252,045 $965,175 $1,217,220 $1,664 $42.59 0.00
Multifamily 0 0.0 0 0 $0 $0 $0 $0 $0.00 0.00
Duplex 0 0.0 0 0 $0 $0 $0 $0 $0.00 0.00
Mobile Home 116 25,482.6 0 0 $0 $1,813,892 $1,813,892 $0 $0.00 0.00
Total 126 25,634.1 22,661 180 $252,045 $2,779,067 $3,031,112 $10 $122.64 0.00
NONRESIDENTIAL
Farm & Ranch/Agricultural Land 16 723.5 21,234 1,327 $614,135 $578,347 $614,135 $849 $27.24 0.00
Commercial 1 331.8 1 1 $0 $15,637 $0 $0 $15,637.00 0.00
Utilities 0 0.0 0 0 $0 $0 $0 $0 $0.00 0.00
Exempt 0 0.0 0 0 $0 $0 $0 $0 $0.00 0.00
Vacant Lot 0 0.0 0 0 $0 $0 $0 $0 $0.00 0.00
Total 17 1,055.3 21,235 1,249 $614,135 $593,984 $1,208,119 $582 $27.97 0.00
TOTAL INVENTORY
RESIDENTIAL
Single Family 255 605 542,314 2,127 $6,060,561 $45,021,176 $51,081,737 $10,010 $83.02 0.02
Multifamily 0 0 0 0 $0 $0 $0 $0 $0.00 0.00
Duplex 1 0 930 930 $13,016 $24,769 $37,785 $30,244 $26.63 0.05
Mobile Home 129 25,573 18,357 142 $487,599 $2,053,926 $2,541,525 $19 $111.89 0.00
Total 385 26,179 561,601 1,459 $6,561,176 $47,099,871 $53,661,047 $251 $83.87 0.00
NONRESIDENTIAL
Farm & Ranch/Agricultural Land 116 6,656 93,164 803 $4,341,057 $395,257 $4,736,314 $652 $4.24 0.00
Commercial 27 433 117,530 4,353 $1,500,566 $0 $1,500,566 $3,462 $0.00 0.01
Utilities 0 0 0 0 $0 $0 $0 $0 $0.00 0.00
Exempt 1 10 3,960 3,960 $83,000 $0 $83,000 $8,109 $0.00 0.01
Vacant Lot 51 223 0 0 $2,016,151 $0 $2,016,151 $9,039 $0.00 0.00
Total 195 7,323 214,654 1,101 $7,940,774 $395,257 $8,336,031 $1,084 $1.84 0.00
TOTAL 580 33,502 776,254 -- $14,501,950 $47,495,128 $61,997,078 -- -- --
Source: Bell County Appraisal Office and RKG Associates, Inc., 2018
FORT HOOD
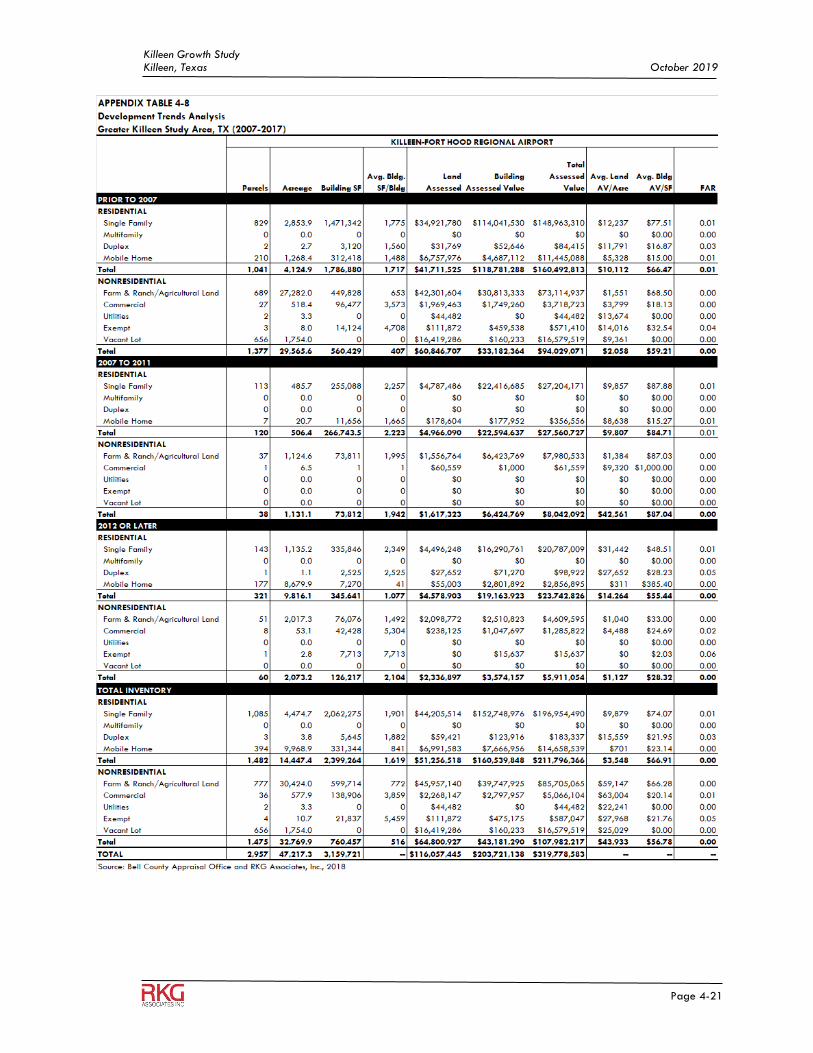
Killeen Growth Study Killeen, Texas October 2019
Page 4-21
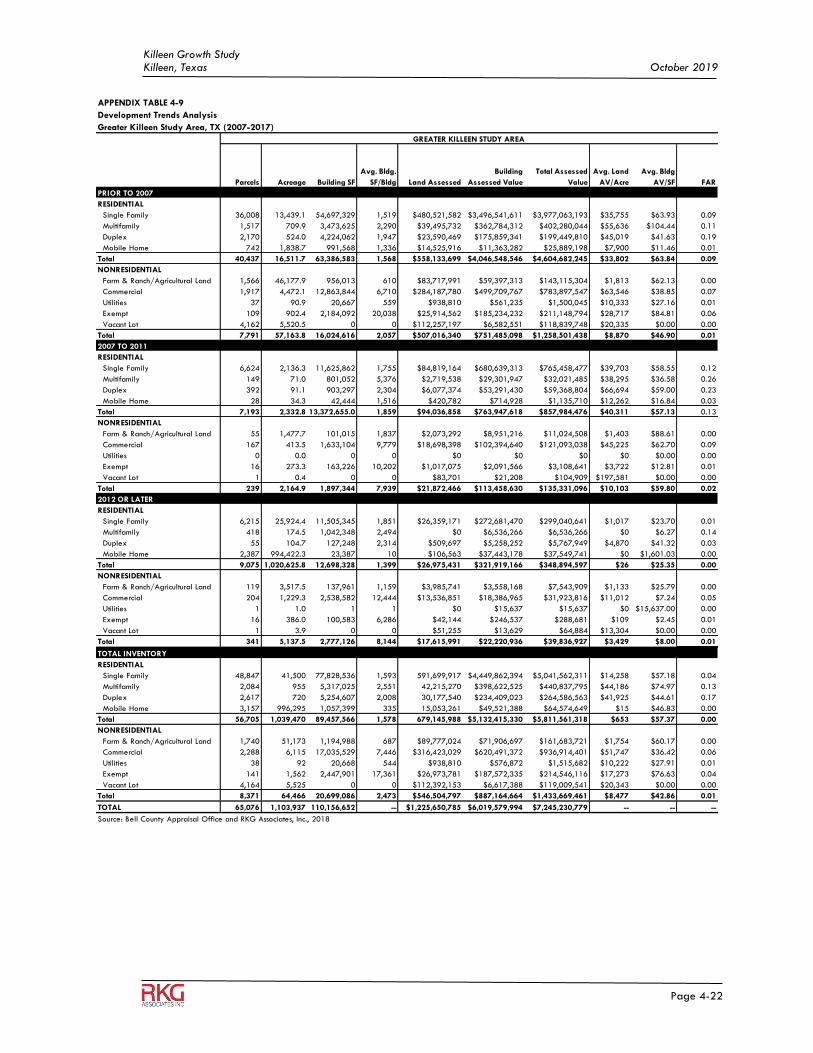
Killeen Growth Study Killeen, Texas October 2019
Page 4-22
APPENDIX TABLE 4-9
Development Trends Analysis
Greater Killeen Study Area, TX (2007-2017)
Parcels Acreage Building SF
Avg. Bldg.
SF/Bldg Land Assessed
Building
Assessed Value
Total Assessed
Value
Avg. Land
AV/Acre
Avg. Bldg
AV/SF FAR
PRIOR TO 2007
RESIDENTIAL
Single Family 36,008 13,439.1 54,697,329 1,519 $480,521,582 $3,496,541,611 $3,977,063,193 $35,755 $63.93 0.09
Multifamily 1,517 709.9 3,473,625 2,290 $39,495,732 $362,784,312 $402,280,044 $55,636 $104.44 0.11
Duplex 2,170 524.0 4,224,062 1,947 $23,590,469 $175,859,341 $199,449,810 $45,019 $41.63 0.19
Mobile Home 742 1,838.7 991,568 1,336 $14,525,916 $11,363,282 $25,889,198 $7,900 $11.46 0.01
Total 40,437 16,511.7 63,386,583 1,568 $558,133,699 $4,046,548,546 $4,604,682,245 $33,802 $63.84 0.09
NONRESIDENTIAL
Farm & Ranch/Agricultural Land 1,566 46,177.9 956,013 610 $83,717,991 $59,397,313 $143,115,304 $1,813 $62.13 0.00
Commercial 1,917 4,472.1 12,863,844 6,710 $284,187,780 $499,709,767 $783,897,547 $63,546 $38.85 0.07
Utilities 37 90.9 20,667 559 $938,810 $561,235 $1,500,045 $10,333 $27.16 0.01
Exempt 109 902.4 2,184,092 20,038 $25,914,562 $185,234,232 $211,148,794 $28,717 $84.81 0.06
Vacant Lot 4,162 5,520.5 0 0 $112,257,197 $6,582,551 $118,839,748 $20,335 $0.00 0.00
Total 7,791 57,163.8 16,024,616 2,057 $507,016,340 $751,485,098 $1,258,501,438 $8,870 $46.90 0.01
2007 TO 2011
RESIDENTIAL
Single Family 6,624 2,136.3 11,625,862 1,755 $84,819,164 $680,639,313 $765,458,477 $39,703 $58.55 0.12
Multifamily 149 71.0 801,052 5,376 $2,719,538 $29,301,947 $32,021,485 $38,295 $36.58 0.26
Duplex 392 91.1 903,297 2,304 $6,077,374 $53,291,430 $59,368,804 $66,694 $59.00 0.23
Mobile Home 28 34.3 42,444 1,516 $420,782 $714,928 $1,135,710 $12,262 $16.84 0.03
Total 7,193 2,332.8 13,372,655.0 1,859 $94,036,858 $763,947,618 $857,984,476 $40,311 $57.13 0.13
NONRESIDENTIAL
Farm & Ranch/Agricultural Land 55 1,477.7 101,015 1,837 $2,073,292 $8,951,216 $11,024,508 $1,403 $88.61 0.00
Commercial 167 413.5 1,633,104 9,779 $18,698,398 $102,394,640 $121,093,038 $45,225 $62.70 0.09
Utilities 0 0.0 0 0 $0 $0 $0 $0 $0.00 0.00
Exempt 16 273.3 163,226 10,202 $1,017,075 $2,091,566 $3,108,641 $3,722 $12.81 0.01
Vacant Lot 1 0.4 0 0 $83,701 $21,208 $104,909 $197,581 $0.00 0.00
Total 239 2,164.9 1,897,344 7,939 $21,872,466 $113,458,630 $135,331,096 $10,103 $59.80 0.02
2012 OR LATER
RESIDENTIAL
Single Family 6,215 25,924.4 11,505,345 1,851 $26,359,171 $272,681,470 $299,040,641 $1,017 $23.70 0.01
Multifamily 418 174.5 1,042,348 2,494 $0 $6,536,266 $6,536,266 $0 $6.27 0.14
Duplex 55 104.7 127,248 2,314 $509,697 $5,258,252 $5,767,949 $4,870 $41.32 0.03
Mobile Home 2,387 994,422.3 23,387 10 $106,563 $37,443,178 $37,549,741 $0 $1,601.03 0.00
Total 9,075 1,020,625.8 12,698,328 1,399 $26,975,431 $321,919,166 $348,894,597 $26 $25.35 0.00
NONRESIDENTIAL
Farm & Ranch/Agricultural Land 119 3,517.5 137,961 1,159 $3,985,741 $3,558,168 $7,543,909 $1,133 $25.79 0.00
Commercial 204 1,229.3 2,538,582 12,444 $13,536,851 $18,386,965 $31,923,816 $11,012 $7.24 0.05
Utilities 1 1.0 1 1 $0 $15,637 $15,637 $0 $15,637.00 0.00
Exempt 16 386.0 100,583 6,286 $42,144 $246,537 $288,681 $109 $2.45 0.01
Vacant Lot 1 3.9 0 0 $51,255 $13,629 $64,884 $13,304 $0.00 0.00
Total 341 5,137.5 2,777,126 8,144 $17,615,991 $22,220,936 $39,836,927 $3,429 $8.00 0.01
TOTAL INVENTORY
RESIDENTIAL
Single Family 48,847 41,500 77,828,536 1,593 591,699,917 $4,449,862,394 $5,041,562,311 $14,258 $57.18 0.04
Multifamily 2,084 955 5,317,025 2,551 42,215,270 $398,622,525 $440,837,795 $44,186 $74.97 0.13
Duplex 2,617 720 5,254,607 2,008 30,177,540 $234,409,023 $264,586,563 $41,925 $44.61 0.17
Mobile Home 3,157 996,295 1,057,399 335 15,053,261 $49,521,388 $64,574,649 $15 $46.83 0.00
Total 56,705 1,039,470 89,457,566 1,578 679,145,988 $5,132,415,330 $5,811,561,318 $653 $57.37 0.00
NONRESIDENTIAL
Farm & Ranch/Agricultural Land 1,740 51,173 1,194,988 687 $89,777,024 $71,906,697 $161,683,721 $1,754 $60.17 0.00
Commercial 2,288 6,115 17,035,529 7,446 $316,423,029 $620,491,372 $936,914,401 $51,747 $36.42 0.06
Utilities 38 92 20,668 544 $938,810 $576,872 $1,515,682 $10,222 $27.91 0.01
Exempt 141 1,562 2,447,901 17,361 $26,973,781 $187,572,335 $214,546,116 $17,273 $76.63 0.04
Vacant Lot 4,164 5,525 0 0 $112,392,153 $6,617,388 $119,009,541 $20,343 $0.00 0.00
Total 8,371 64,466 20,699,086 2,473 $546,504,797 $887,164,664 $1,433,669,461 $8,477 $42.86 0.01
TOTAL 65,076 1,103,937 110,156,652 -- $1,225,650,785 $6,019,579,994 $7,245,230,779 -- -- --
Source: Bell County Appraisal Office and RKG Associates, Inc., 2018
GREATER KILLEEN STUDY AREA
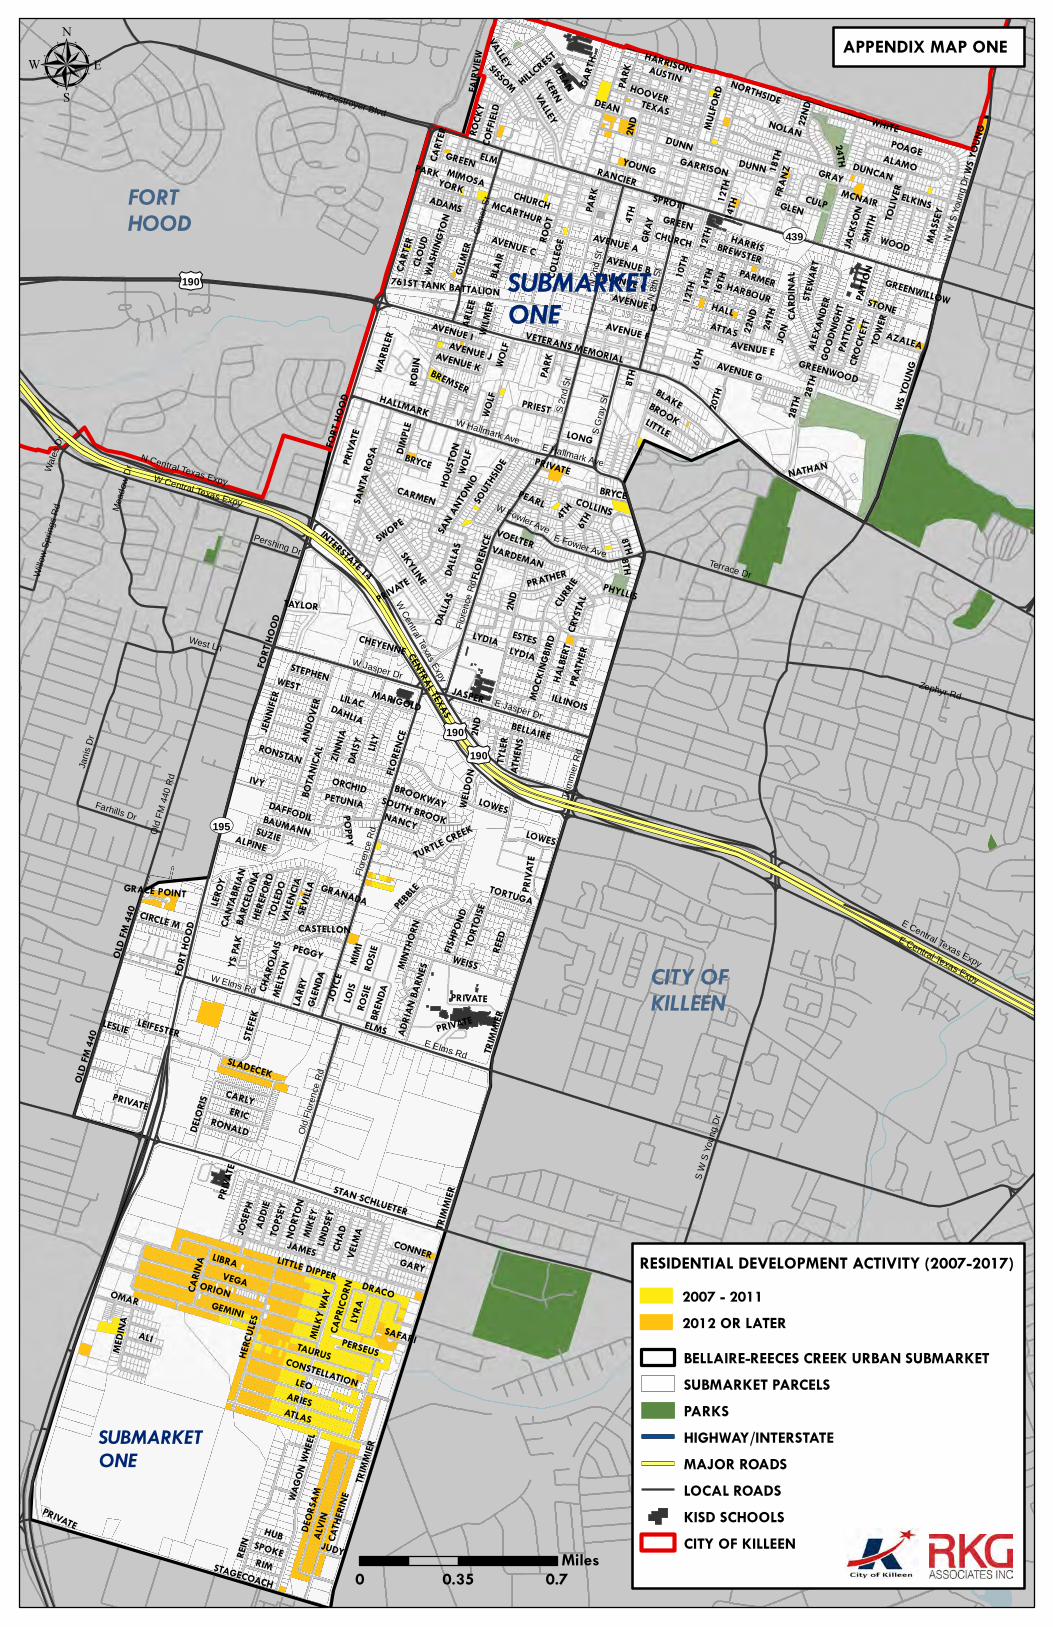
£¤190£¤190
£¤190
UV3470
UV195
UV439
E Elms Rd
Tri
mm
ier
Rd
S W
S Y
ou
ng D
r
Old
FM
440
Rd
E Central Texas Expy
Flo
ren
ce R
d
N W
S Y
oun
g D
r
Zephyr Rd
W Central Texas Expy
N 8
th S
t
Jan
is D
r
N 2
nd
St
Gilm
er
St
W Jasper Dr
Mead
ow
Dr
Terrace Dr
Tank Destroyer Blvd
N Central Texas Expy
E Jasper Dr
W Hallmark Ave
West Ln
S G
ray S
t
Old
Flo
ren
ce R
d
S 2
nd S
t
W Elms Rd
Farhills Dr
E Fowler Ave
Will
ow
Spri
ngs R
d
E Hallmark Ave
Pershing Dr
W Fowler Ave
Wale
s D
r
W C
entra
l Texa
s Exp
y
E Central Texas Expy
Flo
ren
ce R
d
2ND
10TH
GRAY
ELMS
RANCIER
JASPER
TRIM
MIER
LIBRA
DEAN
COLLE
GE
VEGAORION
REIN
LEO
AVENUE G
DUNCAN
GILME
R
18TH
GEMINI
ROOT
16TH
INTERSTATE 14
HALLMARK
FLORE
NCE
ATLAS
ALVIN
WHITE
FORT
HOOD
CENTRAL TEXAS
JAMES
6TH
GREEN
ARIES
DAISY
14TH
VALLEY
HOUS
TON
ANDO
VER
ADAMSSPROTT
WEISS
STAN SCHLUETER
LOWES
STAGECOACH
HALLVETERANS MEMORIAL
KERN GART
H
SKYLINE
BRYCE
28TH
LILYJEN
NIFER
POAGE
WS YO
UNG
TAURUS
BLAKE
HERC
ULES
ALEX
ANDE
R
TEXAS
HARRIS
STONE
ERIC
MINT
HORN
BELLAIRE
ATTAS
STEF
EKAVENUE B
BOTA
NICA
L
PARMER
AVENUE A
VARDEMAN
IVY
YOUNG
ELKINS
MASSE
Y
MILK
Y WAY
AUSTIN
ILLINOIS
DEOR
SAM
YORK
WEST
CULP
ORCHID
AVENUE D
HERE
FORD
CROC
KETT
PARK
ALI
WOOD
SANT
A ROS
A
DELO
RIS
MIKE
Y
4TH
DAFFODIL
24TH
WAGO
N WH
EEL
22ND
8TH
HOOVER
PRAT
HER
HALB
ERT
ALAMO
LITTLE
PRIEST
ELM
OLD F
M 44
0
REED
RIM
BREN
DA
SWOPE
LOIS
RONALD
OMAR
AVENUE C
WOLF
DRACO
JOSE
PH
COLLINS
BROOK
TOLIV
ER
20TH
VELM
A
12TH
HUB
CHAD
CATH
ERIN
E
CONSTELLATION
HARBOUR
BREWSTERAD
DIE
PRIVATE
FAIRV
IEW
CARLY
HARRISON
CART
ER
MEDIN
A
AVENUE I
CHURCH
VOELTER
CARMEN
ALPINEPA
TTON
TOLED
O
NOLAN
TOWE
R
LARR
Y
AVENUE F
SISSOM
DALLA
S
MIMI TO
RTOI
SE
GARY
LYRA
CARD
INAL
SOUT
HSIDE
AVENUE J
CARIN
A
HILLCREST
PEBBLE
LYDIA
GREENWOODRO
SIE
TOPS
EYSEV
ILLA
MULFO
RD
JOYC
E
LONG
761ST TANK BATTALION
CIRCLE M VALEN
CIA
DUNN
STEW
ART
LINDS
EY
DIMPL
E
SLADECEK
TYLER
MOCK
INGBIR
D
FISHP
OND
NATHAN
MELTO
N
MARIGOLD
TURTLE CREEKJA
CKSO
NMCARTHUR
GOOD
NIGHT
BLAIR
NORT
ON
BREMSER
BAUMANN
WASH
INGT
ON
SPOKE
SMITH
ROCK
Y
CONNER
BROOKWAY
PERSEUS
LEROY
ESTES
CANT
ABRIA
N
CURR
IE
SOUTH BROOKNANCY
ATHE
NS
ADRIA
N BA
RNES
AZALEA
RONSTAN
SUZIE
AVENUE K
PHYLLIS
NORTHSIDE
STEPHEN
JUDY
LESLIE
LITTLE DIPPER
GLEN
DA
COFF
IELD
PETUNIA
TORTUGA
CLOU
D
AVENUE E
ARLEE
BARC
ELONA
TAYLOR
PEARL
WELD
ON
WARB
LER
CASTELLON
YS PA
K
SAN A
NTON
IO
ZINNI
A
FRAN
Z
WILM
ER
CAPR
ICORN
CHEYENNE
LEIFESTER
PEGGY
CHAR
OLAIS
ROBIN
CRYS
TAL
GRANADA
SAFARI
GREENWILLOW
LILAC
GARRISON
DAHLIA
MIMOSA
GRACE POINT
MCNAIR
JON
GLEN
POPPY
PRATHERVALLEY
CHURCH
8TH
2ND
PRIVATE
FLORE
NCE
DUNN
TRIM
MIER
WS YO
UNG
LYDIA
12TH
24TH
WOLF
DEAN
PATTO
N
CART
ER
TRIM
MIER
PRIVA
TE
8TH
PARK
PRIVA
TE
PRIVATE
28TH
LOWES
AVENUE C
2ND
PARK
FORT
HOOD
PRIVATE
GRAY
12TH
PRIVATE
PRIVATE
DALLA
S
4TH
ROSIE
FORT
HOOD
PRIVA
TE
14TH
PARK
22ND
16TH
WOLF
OLD F
M 44
0
GREEN
BRYCE
0 0.35 0.7Miles
SUBMARKETONE
SUBMARKETONE
CITY OFKILLEEN
FORTHOOD
µ
RESIDENTIAL DEVELOPMENT ACTIVITY (2007-2017)2007 - 20112012 OR LATERBELLAIRE-REECES CREEK URBAN SUBMARKETSUBMARKET PARCELSPARKSHIGHWAY/INTERSTATEMAJOR ROADSLOCAL ROADSKISD SCHOOLSCITY OF KILLEEN
APPENDIX MAP ONE
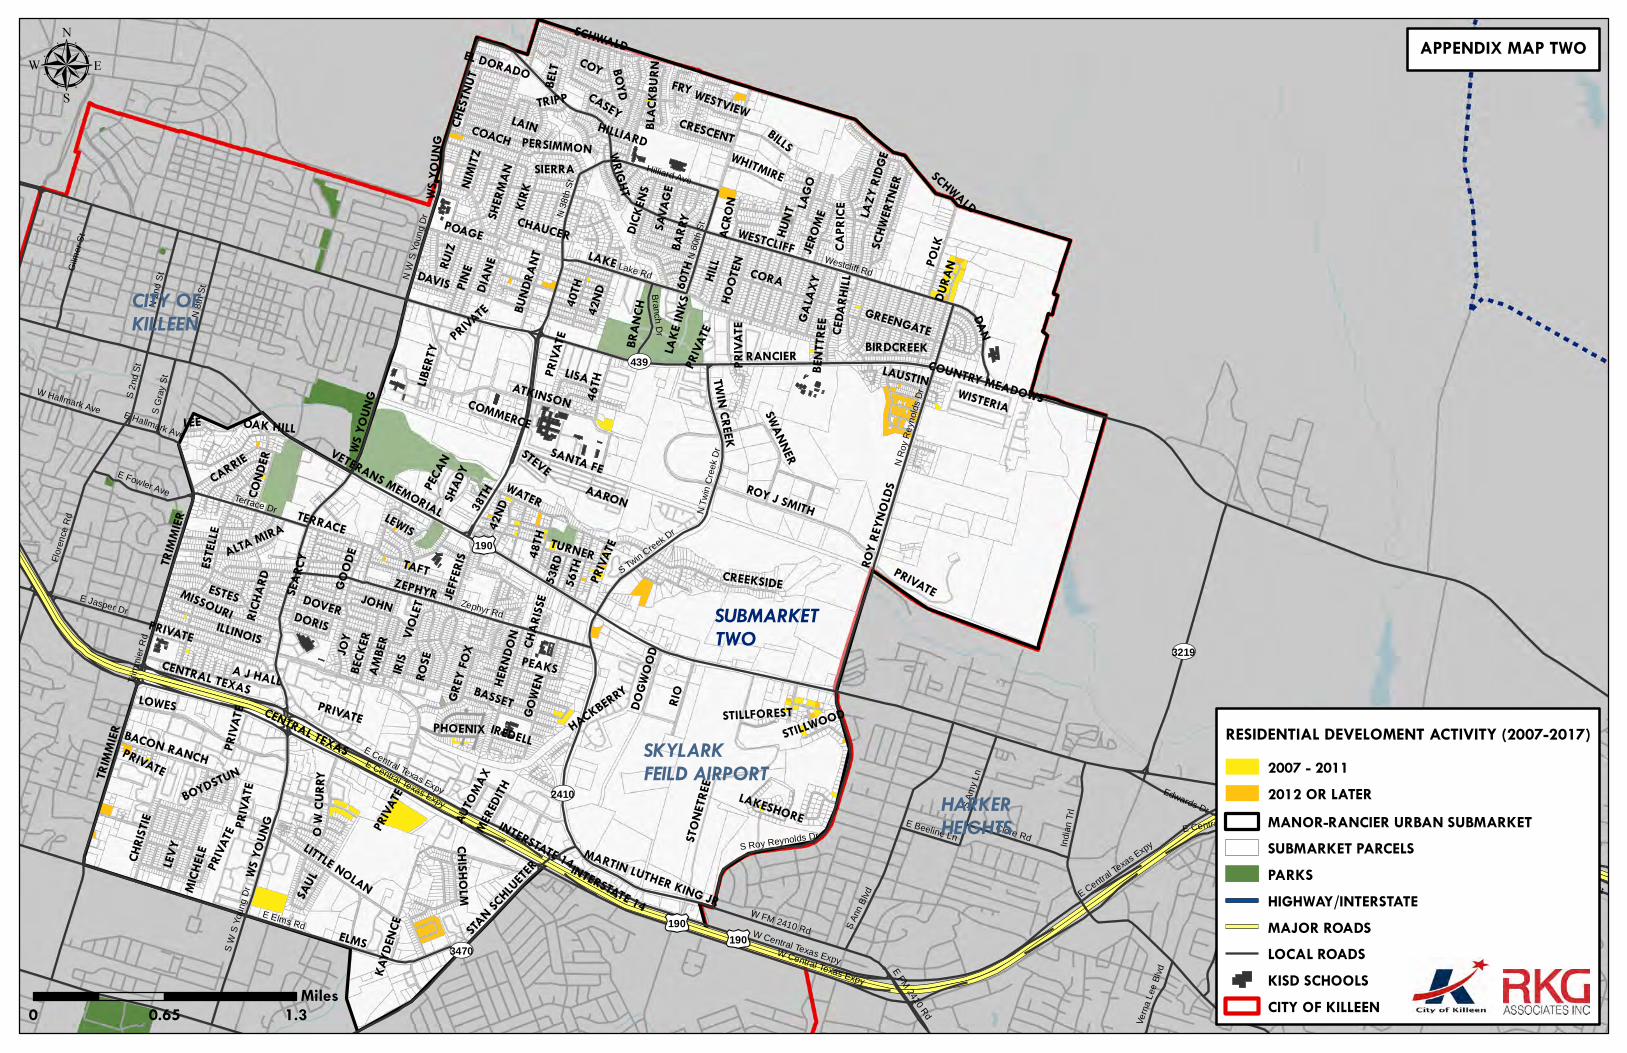
£¤190£¤190
£¤190
UV439
UV2410
UV3470
UV3219
UV190UV190 UV190
Westcliff Rd
Tri
mm
ier
Rd
E Elms Rd
S W
S Y
ou
ng D
r
E Central Texas Expy
India
n T
rl
Zephyr Rd
S A
nn B
lvd
N W
S Y
oun
g D
r
N R
oy R
eyn
old
s D
r
N 3
8th
St
Old Nolanville Rd
Lake Rd
Flo
ren
ce R
d
N 8
th S
t
N 2
nd
St
Nola
Ruth
Blv
d
Gilm
er
St
S Roy Reynolds DrClore Rd
S A
my
Ln
N 6
0th
St
Terrace Dr
Hilliard Ave
S Twin
Cre
ek Dr
W FM 2410 Rd
E Jasper Dr
W Central Texas Expy
N T
win
Cre
ek D
r
Edwards Dr
Bra
nch D
r
S G
ray S
t
S 2
nd S
t
W Hallmark Ave
E Fowler Ave
E F
M 241
0 Rd
Vern
a L
ee B
lvd
E Beeline Ln
S Main St
E Hallmark Ave
E Centra
l Texa
s Expy
E Central Texas Expy
W Central Texas Expy
E Central Texas Expy
38TH
LAKE
RANCIER
WESTCLIFF
ZEPHYR
INTERSTATE 14
60TH
WS YO
UNG
CENTRAL TEXAS
ILLINOIS
ELMS
RUIZ
ESTE
LLE
WATER
VETERANS MEMORIAL
ROY R
EYNO
LDS
LEVY
TERRACE
LOWES
CORA
TWIN CREEK
ATKINSON
JOHN
RIOST
ONET
REE
COND
ER
TAFT
KIRK
ROSE
TRIM
MIER
JEFFE
RIS
HILL
GOOD
E
POLK
PINE
GOWE
N
56TH
ESTES
LITTLE NOLAN
BOYD
ROY J SMITH
HOOT
EN
SHER
MAN
46TH
BASSET
COACH
HERN
DON
BECK
ER
SEAR
CY
DICKE
NS
48TH
BUND
RANT
SANTA FE
MARTIN LUTHER KING JR
HILLIARD
CREEKSIDE
CAPR
ICE
BILLS
LISA
SCHWALD
CARRIE
OAK HILL
GREENGATE
LAGO
POAGE
MISSOURI
LIBER
TY
DAN
PRIVATE
CHISHOLM
42ND
LAZY
RIDG
E
ALTA MIRA
CHRIS
TIE
VIOLET
BRAN
CH
O W
CURR
Y
IRIS
TURNER
COY
SAUL
JOY
SCHW
ERTN
ER
GALA
XY
GREY
FOX PEAKS
SWANNERCE
DARH
ILLDIANE
SHAD
Y
JEROM
E
DAVIS
40TH
DOVER
WRIGHTNIMI
TZ
BACON RANCHHU
NT
WISTERIA
CHES
TNUT
53RD
DOGW
OOD
PHOENIX
DORIS
BIRDCREEK
LEE
MICH
ELE
WHITMIRE
LEWIS
CRESCENT
STEVE
ACRO
N
DURA
N
COMMERCE
STAN SC
HLUETER
LAKE
INKS
SAVA
GE
LAINTRIPP
SIERRA
HACKBERRY
PERSIMMON
AARON
A J HALL
IREDELL
BLAC
KBUR
N
BENT
TREE
CHAUCER
WESTVIEW
PECAN
BELT
CASEY
EL DORADO
RICHA
RD
LAUSTIN
STILLWOOD
AMBE
R
MERE
DITH
AUTO
MAX
STILLFOREST
LAKESHORE
COUNTRY MEADOWS
FRY
BARR
Y
KAYD
ENCE
BOYDSTUN
CHAR
ISSE
TRIM
MIER
PRIVA
TE
PRIVATE
PRIVA
TE
INTERSTATE 14
CENTRAL TEXAS
PRIVA
TE
PRIVA
TEPRIVATE
SCHWALD
PRIVATE
WS YO
UNG
PRIVA
TEPR
IVATE
PRIVATE
PRIVA
TE
42ND
WS YO
UNG
PRIVA
TE
µ
0 0.65 1.3Miles
SUBMARKETTWO
HARKERHEIGHTS
CITY OFKILLEEN
SKYLARKFEILD AIRPORT
APPENDIX MAP TWO
RESIDENTIAL DEVELOMENT ACTIVITY (2007-2017)2007 - 20112012 OR LATERMANOR-RANCIER URBAN SUBMARKETSUBMARKET PARCELSPARKSHIGHWAY/INTERSTATEMAJOR ROADSLOCAL ROADSKISD SCHOOLSCITY OF KILLEEN
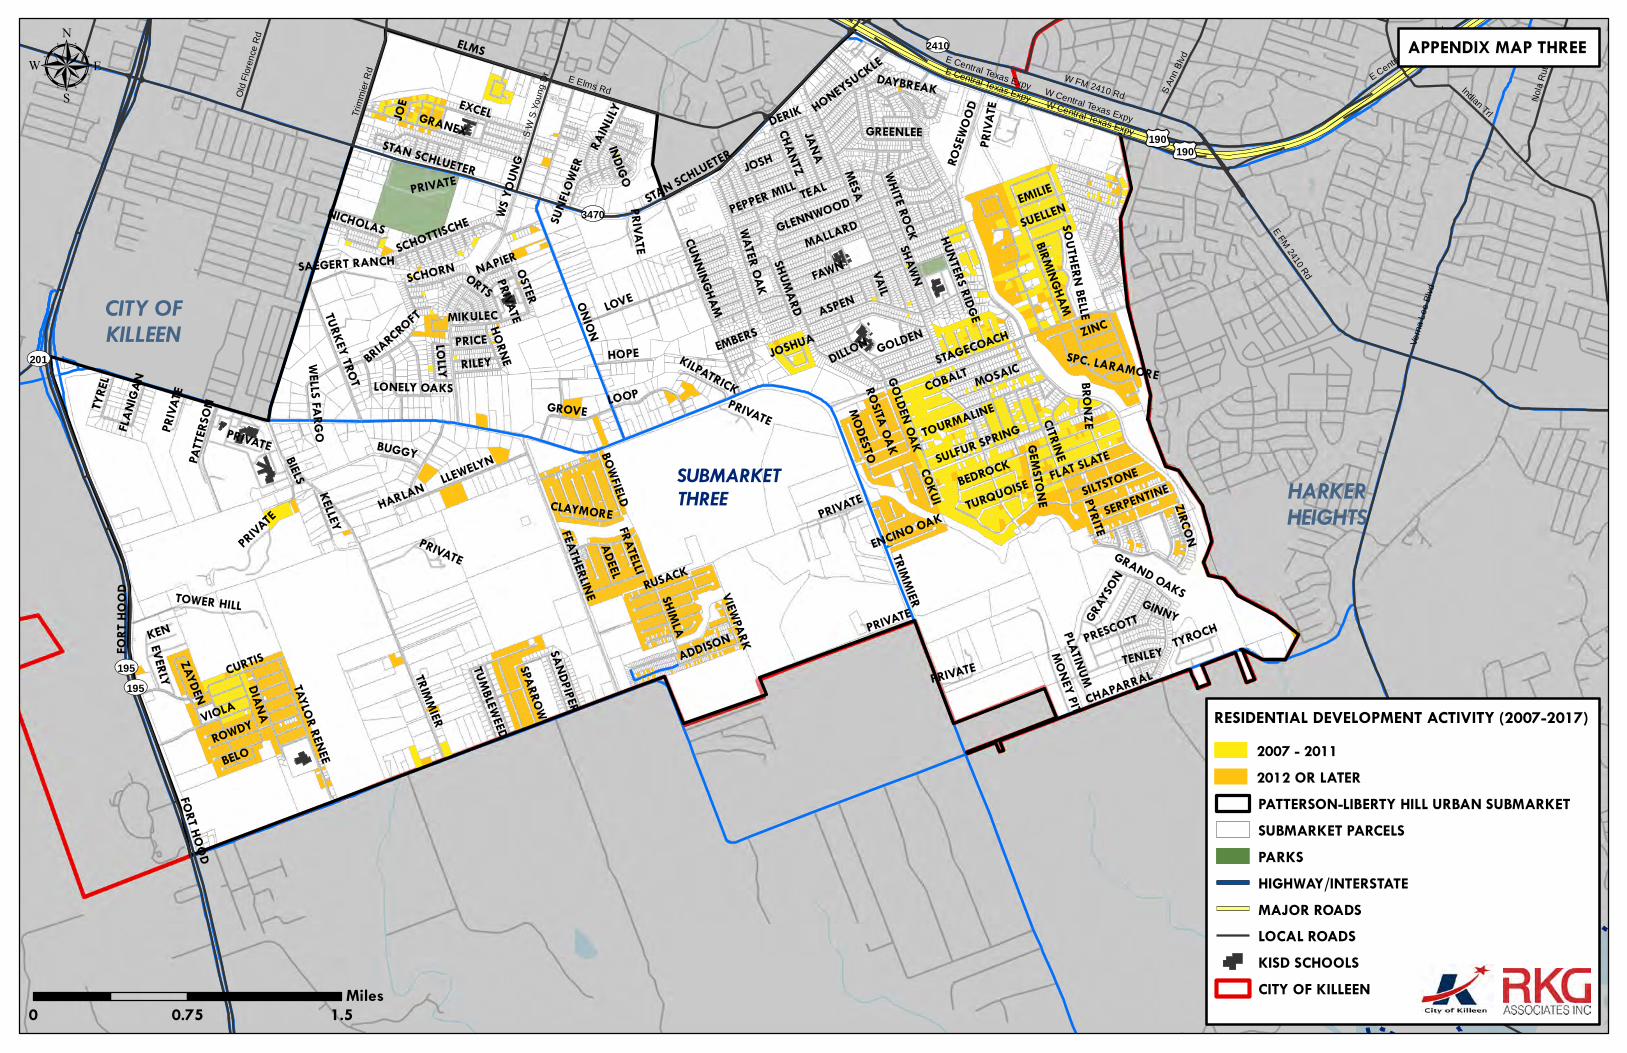
£¤190£¤190
UV3481
UV3470
UV195
UV2410
UV201
UV195
E Elms Rd Indian Trl
E F
M 241
0 Rd
Ve
rna L
ee B
lvd
E Centra
l Texa
s Expy
S W
S Y
ou
ng D
r
Tri
mm
ier
Rd
Nola
Ruth
Blv
d
S A
nn B
lvd
W FM 2410 RdW Central Texas Expy
Old
Flo
ren
ce R
d
E Central Texas Expy
E Central Texas ExpyW Central Texas Expy
STAGECOACH
ONION
FAWN
ELMS
SHAWN
MESA
ROSE
WOOD
TEAL
TRIMMIER
CHANTZ
WS YO
UNG
ASPEN
EXCEL
FEATHERLINE
CHAPARRAL
PYRITE
STAN SCHLUETER
GRANEX
CUNNINGHAM
SILTSTONE
CITRINE
PEPPER MILL
SHIMLA
SULFUR SPRING
VIOLA
JOSH
LOVE
MOSAICCOBALT
GLENNWOOD
LOOP
DIANA
ROWDY
GREENLEE
WATER OAK
WHITE ROCK
ADDISON
JANA
SCHORN
CURTIS
TOWER HILL
MALLARD
GROVE
TURKEY TROT
PRIVATE
TAYLOR RENEE
HOPE
MONEY PIT
RUSACK
FLAT SLATE
EMBERS
PATT
ERSO
N
LLEWELYN
SCHOTTISCHE
MIKULEC
RAINL
ILYPRESCOTT
RILEY
ZAYDEN
SUNF
LOWE
R
EVERLY
ORTS
ZINC
OSTER
KEN
ZIRCON
SHUMARD
SERPENTINE
GOLDEN
KELLEY
SPARROW
BELO
TYRE
L
PRICE
BEDROCK
GRAND OAKS
ADEELBOWFIELD
BRIARCROFT HORNE
EMILIE
BIRMINGHAMPLATINUM
DERIK
LOLLY
GRAY
SON
VAIL
BUGGY
GOLDEN OAK
HONEYSUCKLE
TUMBLEWEED
CLAYMORE
SANDPIPER
SOUTHERN BELLE
BIELS
SPC. LARAMOREJO
E
SUELLEN
COKUI
KILPATRICK
WELLS FARGO
GEMSTONE
TYROCH
SAEGERT RANCH NAPIER
LONELY OAKS
TURQUOISE
MODESTO
FLANI
GAN
ENCINO OAK
VIEWPARK
HUNTERS RIDGETENLEY
FORT HOOD
NICHOLAS
DAYBREAK
DILLON
FRATELLIINDIGO
JOSHUA
HARLAN
GINNY
TOURMALINE
BRONZE
ROSITA OAK
PRIVATE
PRIVATE
PRIVATE
PRIVATE
FORT
HOO
D
PRIVATE
PRIVATE
PRIVA
TE
STAN SCHLUETER
TRIMMIER
PRIVA
TE
PRIVATE
PRIVATE
PRIVATE
µ
0 0.75 1.5Miles
SUBMARKETTHREE
CITY OFKILLEEN
HARKERHEIGHTS
APPENDIX MAP THREE
RESIDENTIAL DEVELOPMENT ACTIVITY (2007-2017)2007 - 20112012 OR LATERPATTERSON-LIBERTY HILL URBAN SUBMARKETSUBMARKET PARCELSPARKSHIGHWAY/INTERSTATEMAJOR ROADSLOCAL ROADSKISD SCHOOLSCITY OF KILLEEN
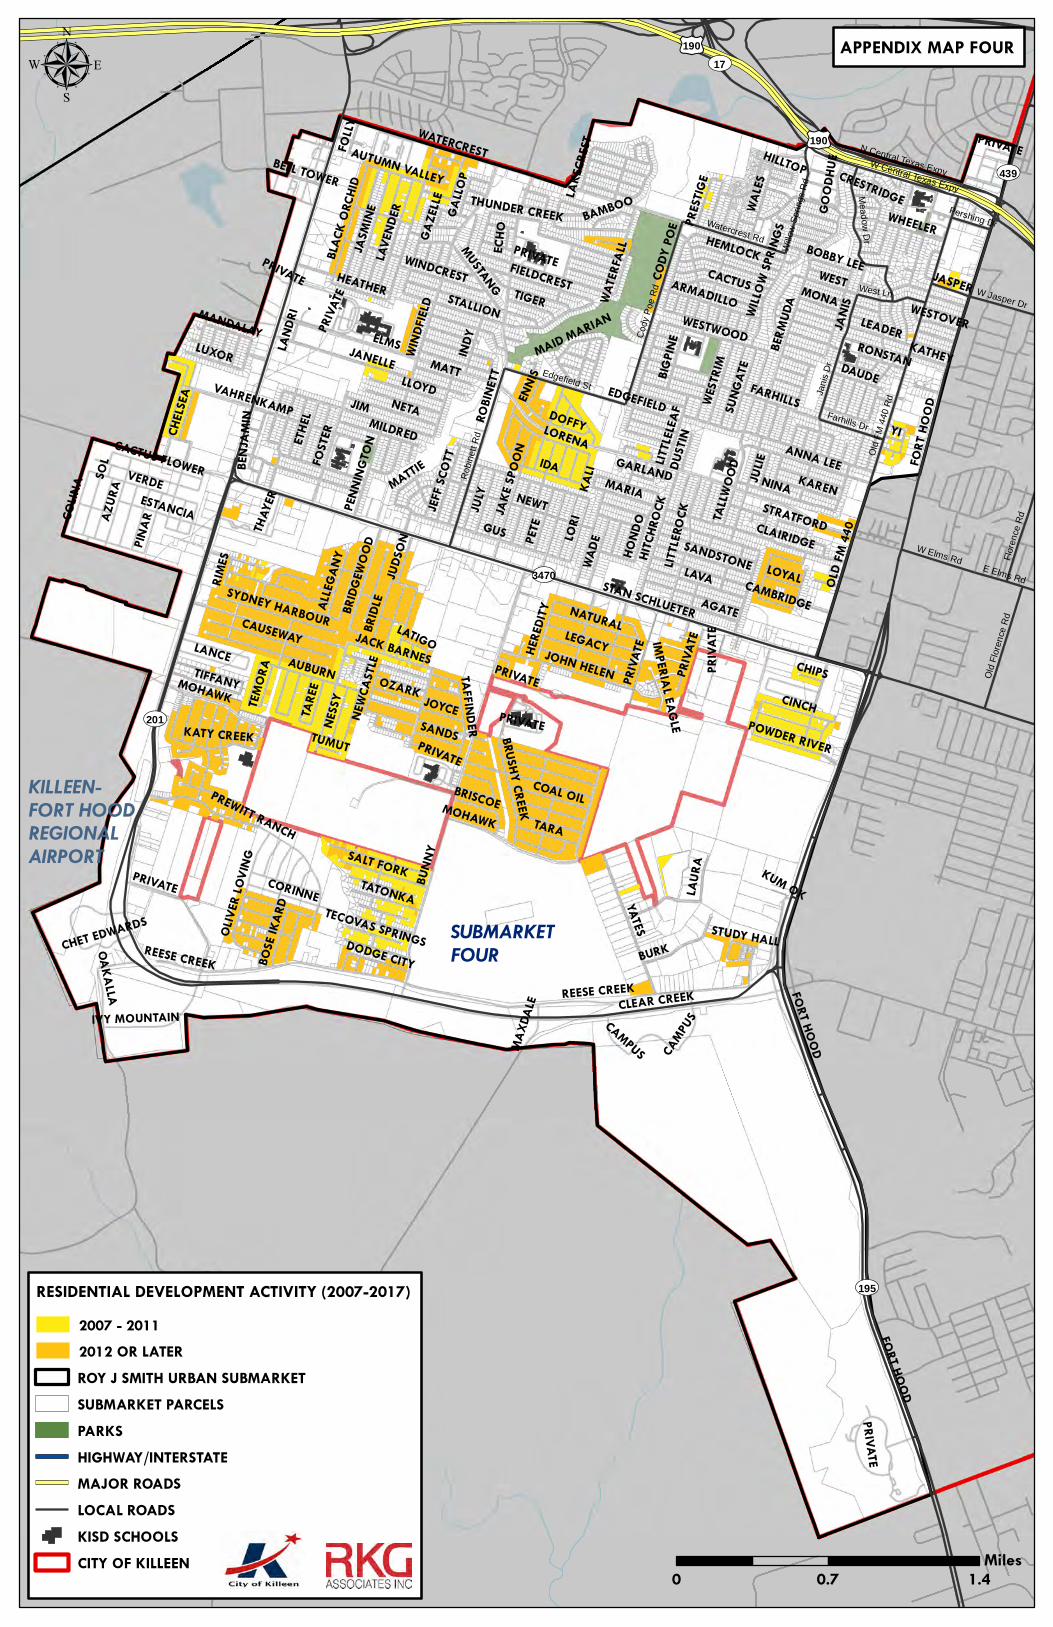
£¤190
£¤190
UV195
UV3470
UV201
UV439
UV17
Old
FM
440
Rd
Jan
is D
r
Robin
ett
Rd
Cody P
oe R
d
W Central Texas ExpyM
ead
ow
Dr
N Central Texas Expy
Edgefield St
W Jasper Dr
West Ln
Old
Flo
ren
ce R
d
Watercrest Rd
Flo
ren
ce R
d
W Elms Rd
Farhills Dr
E Elms Rd
Will
ow
Spri
ngs R
d
Pershing Dr
ELMS
FORT HOOD
BUNN
Y
CLEAR CREEK
JIM
GUS
STAN SCHLUETER
JANI
S
ROBIN
ETT
IDA
YATESWI
NDFIE
LD
JANELLE
WEST
NEWT
REESE CREEK
STALLION
LAVA
FARHILLS
NINA
BERM
UDA
CODY
POE
NETA
CLAIRIDGE
EDGEFIELD
VERDE
WATERCREST
FIELDCREST
LEADER
INDY
TALLW
OOD
WALES
FOST
ER
LAUR
A
BURK
MUSTANG
PETE
MOHAWK
JASM
INE
VAHRENKAMP
JULY
LORI
WESTWOOD
WHEELER
WILLO
W SP
RINGS
ANNA LEE
PRIVA
TE
AZUR
A
WADE
LLOYD
PREWITT RANCH
LITTLE
ROCK
HITCH
ROCK
DOFFY
CACTUS
AUBURN
TARA
LEGACY
CINCH
CAUSEWAYHO
NDO
LAVE
NDER
JOHN HELEN
MATTBR
IDLE
LANCE
ETHE
L
AGATE
LORENA
JAKE
SPOO
NBRUSHY CREEK
ESTANCIA
CORINNE
PINAR
YIMILDRED
NATURAL
WEST
RIM
KAREN
HEMLOCK
MARIA
SUNG
ATE
TIGER
LUXOR
THUNDER CREEK
COAL OIL
TIFFANY
ARMADILLONE
SSY
THAY
ER
SALT FORK
LITTLE
LEAF
SANDSTONE
BRIDG
EWOO
D
TAFFINDERWA
TERF
ALL
BIGPIN
E
COLIN
A
WINDCREST
BLAC
K ORC
HID
OLIVE
R LOV
ING
TARE
E
TATONKA
IVY MOUNTAIN
JULIE
PENN
INGT
ON
SANDS
JOYCE
JEFF S
COTT
OZARK
KATY CREEK
LAKE
CRES
TSYDNEY HARBOUR
POWDER RIVER
HEATHER
JACK BARNES HERE
DITYAL
LEGAN
Y
MONA
OAKALLA
RIMES LOYAL
CHELS
EA
JUDS
ON
BENJ
AMIN
CACTUS FLOWER
FOLLY
RONSTAN
MATTIE
JASPER
PRES
TIGE
DUST
INCA
MPUS
GALLO
P
DODGE CITY
DAUDE
BRISCOE
KATHEY
WESTOVER
TEMO
RABO
SE IK
ARD
CAMBRIDGE
ENNIS
MAXD
ALE
LATIGO
BAMBOO GOOD
HUE
NEWC
ASTLE CHIPS
MANDALAY
BOBBY LEE
AUTUMN VALLEY CRESTRIDGE
ECHO
CHET EDWARDS
OLD F
M 44
0
MAID MARIAN
TUMUT
SOL
TECOVAS SPRINGS
BELL TOWERHILLTOP
LAND
RI
STRATFORD
IMPERIAL EAGLE
KALI GARLAND
GAZE
LLE
STUDY HALL
KUM OK
PRIVATE
REESE CREEK
PRIVATE
PRIVA
TE
CAMPUS
PRIVATE
PRIVATE
PRIVA
TE
FORT
HOOD
PRIVA
TE
FORT HOOD
MOHAWK
PRIVATE
PRIVATE
PRIVATE
PRIVATE
0 0.7 1.4Miles
µ
SUBMARKETFOUR
KILLEEN-FORT HOODREGIONALAIRPORT
APPENDIX MAP FOUR
RESIDENTIAL DEVELOPMENT ACTIVITY (2007-2017)2007 - 20112012 OR LATERROY J SMITH URBAN SUBMARKETSUBMARKET PARCELSPARKSHIGHWAY/INTERSTATEMAJOR ROADSLOCAL ROADSKISD SCHOOLSCITY OF KILLEEN
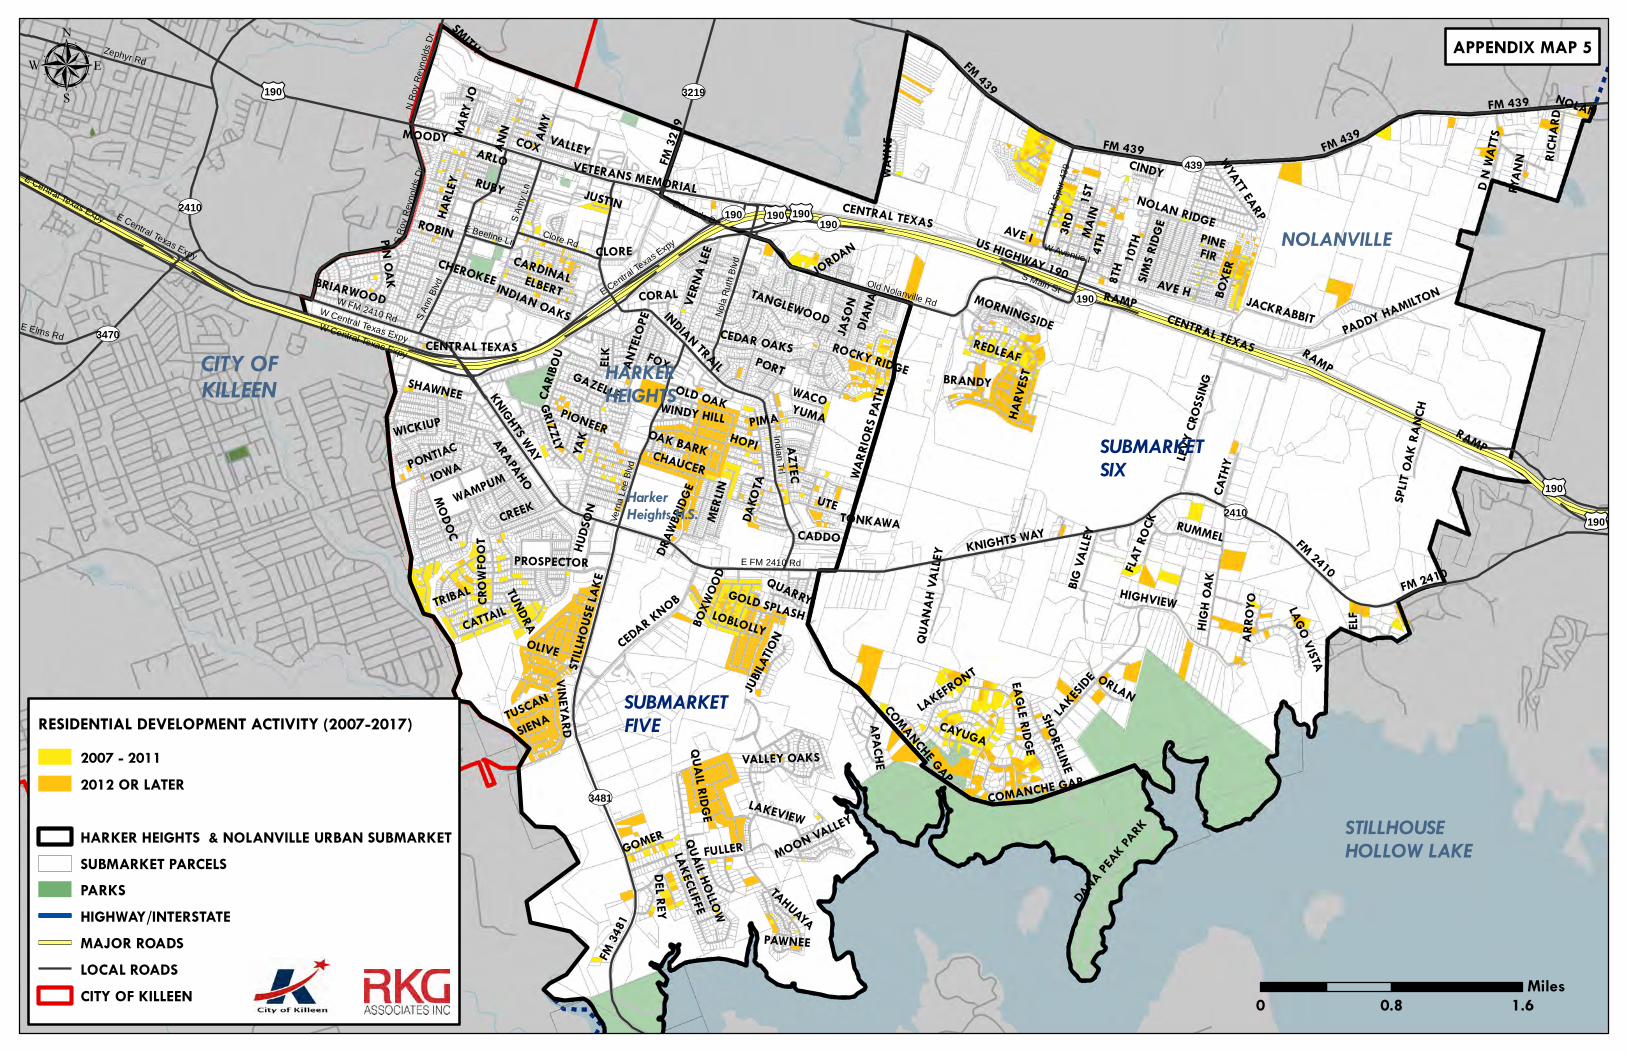
£¤190
£¤190
£¤190
£¤190
£¤190UV2410
UV439
UV3481
UV3470
UV3219
UV190UV2410 UV190
UV190
India
n T
rl
E FM 2410 Rd
Zephyr Rd
S A
nn B
lvd
E Central Texas Expy
Old Nolanville Rd
Ve
rna L
ee B
lvd
Nola
Ruth
Blv
d
S R
oy
Reynold
s D
r
Clore Rd
S A
my
Ln
E Elms Rd
FM
Spur
43
9
W FM 2410 RdW Central Texas Expy
S Main St
Edwards Dr
N R
oy R
eyn
old
s D
r
W Avenue I
E Beeline Ln
W Central Texas Expy
E Central Texas Expy
E Centra
l Texa
s Expy
ANN AM
Y
KNIGHTS WAY
FULLER
INDIAN TRAIL
IOWA
ELK
VERN
A LEE
CENTRAL TEXAS
HARL
EY
MODOC
UTE
STILL
HOUS
E LAK
E
AZTEC
CLORE
VALLEYARLOCOX
YAK
CHEROKEE
FM 34
81
RUBY
ANTE
LOPE
ELBERT
VETERANS MEMORIAL
WARR
IORS
PATH
PIONEER
CEDAR KNOB
PROSPECTOR
ROBIN
CREEK
FOX
GRIZZLY
INDIAN OAKS
ARAPAHO
LOBLOLLY
MERL
IN
JASO
N
WACO
QUAIL HOLLOW
GAZELLE
CHAUCER
HOPI
CATTAIL
CROW
FOOT
DAKO
TA
PAWNEE
VINEYARD
DIANA
PIN OAK
TANGLEWOOD
OLD OAK
CEDAR OAKS
OLIVE
WAMPUM
SMITH
COMANCHE GAP
CARIB
OU
DANA PE
AK PARK
SHAWNEE
CARDINAL
WINDY HILL
GOMER
WICKIUP
CADDO
YUMAPIMA
HUDS
ON
LAKECLIFFE
BRIARWOOD
VALLEY OAKS
TAHUAYA
LAKEVIEW
MARY
JO
TUNDRA
TUSCAN JUBIL
ATIO
N
QUARRY
PORT
TRIBAL
DEL REY
DRAW
BRIDG
E
SIENA APACHE
BOXW
OOD
GOLD SPLASH
CORAL
QUAIL RIDGE
JUSTIN
ROCKY RIDGE
OAK BARK
MOON VALLEY
MOODY
PONTIAC
COMANCHE GAP
CENTRAL TEXAS
KNIGHTS WAY
MAIN
AVE H
1ST
10TH
AVE IUS HIGHWAY 190
FM 2410
4TH
LAKESIDE
3RD
FM 439
JACKRABBIT
HIGH
OAK
CAYUGA
HIGHVIEW
HARV
EST
PADDY HAMILTON
8TH
ELF
EAGLE RIDGE
LEVY C
ROSS
ING
RUMMEL
SHORELINE
BOXE
R
FIR
RAMP
CATH
Y
REDLEAF
BIG VA
LLEY
ORLANLAKEFRONT
SIMS R
IDGE
D N W
ATTS
NOLAN RIDGE
WYATT EARP
LAGO VISTA
PINE
RICHA
RD
WAYN
E
NOLAN
QUAN
AH VA
LLEY
TONKAWA
RYAN
NCINDY
BRANDY
FLAT R
OCK
MORNINGSIDE
ARRO
YO
SPLIT
OAK
RANC
H
FM 32
19
JORDAN
CENTRAL TEXAS
RAMP
RAMP
FM 439
FM 2410
FM 439
FM 439µ
SUBMARKETFIVE
SUBMARKETSIX
0 0.8 1.6Miles
CITY OFKILLEEN
STILLHOUSEHOLLOW LAKE
HARKERHEIGHTS
NOLANVILLE
HarkerHeights H.S.
APPENDIX MAP 5
RESIDENTIAL DEVELOPMENT ACTIVITY (2007-2017)2007 - 20112012 OR LATER
HARKER HEIGHTS & NOLANVILLE URBAN SUBMARKETSUBMARKET PARCELSPARKSHIGHWAY/INTERSTATEMAJOR ROADSLOCAL ROADSCITY OF KILLEEN
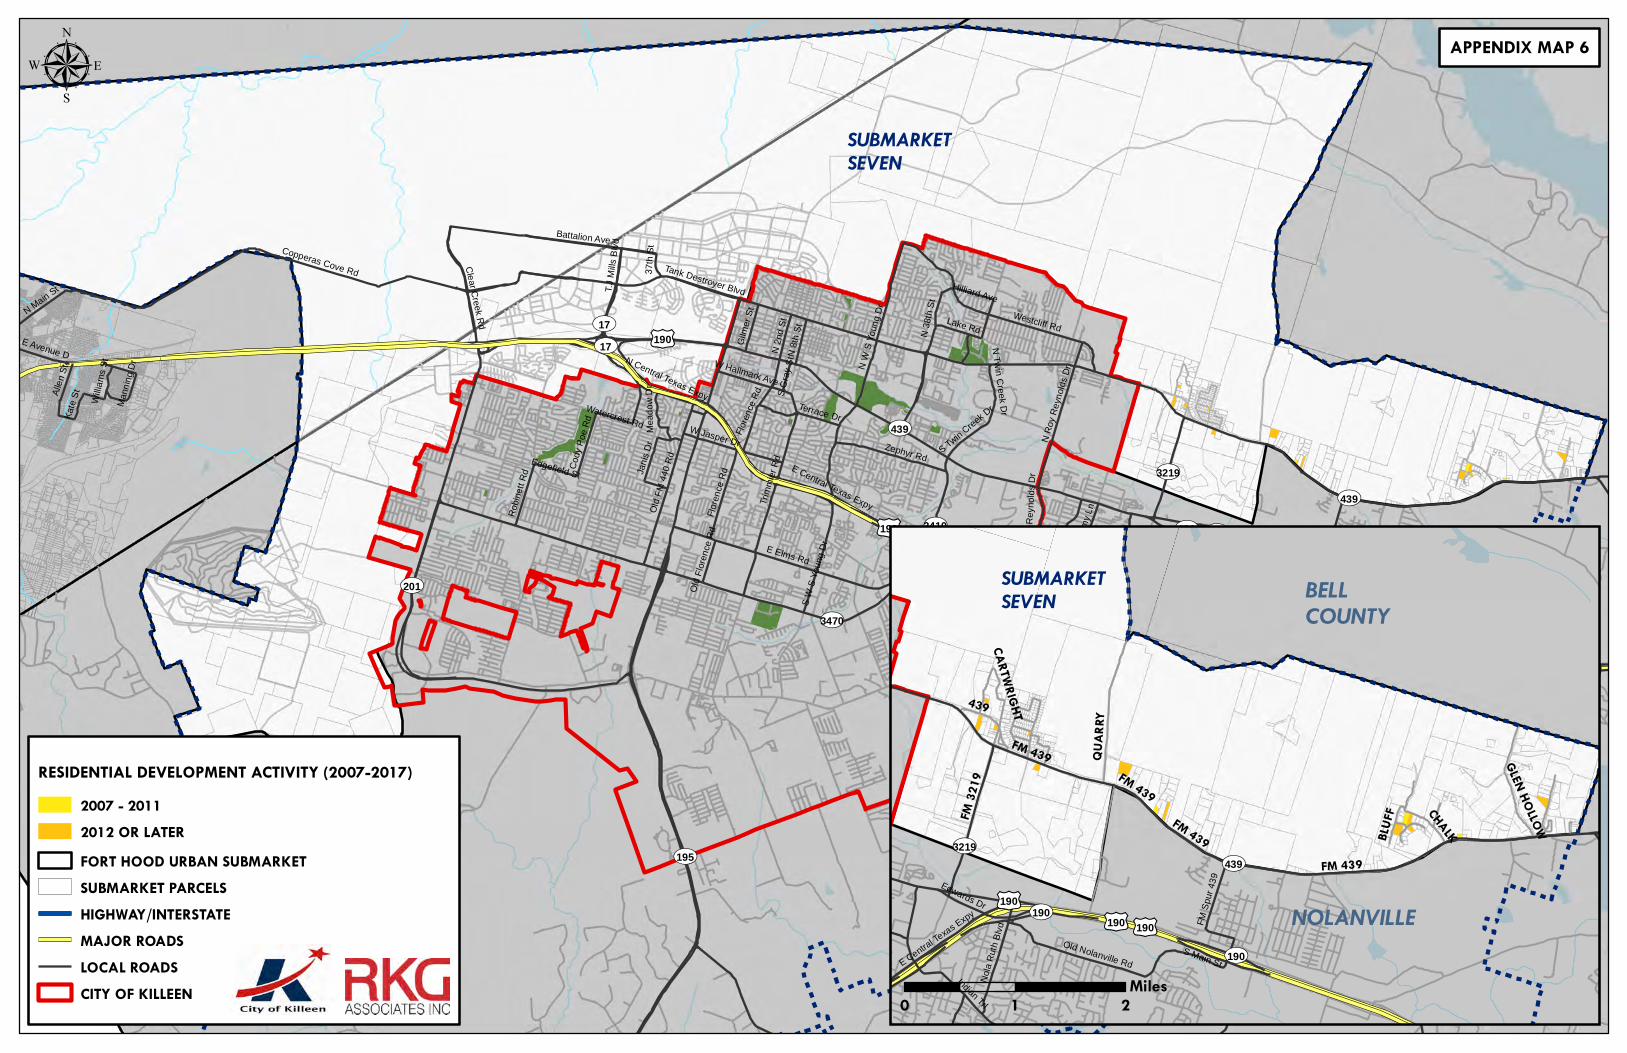
£¤190
£¤190
£¤190
UV439
UV2410
UV3481UV195
UV2484
UV3470
UV201
UV3219
UV17
UV190UV190UV2410
UV17
UV190
UV439
Indian Trl
Copperas Cove Rd
Westcliff Rd
E Elms Rd
Tri
mm
ier
Rd
S W
S Y
ou
ng D
r
E Central Texas Expy
E FM 2410 Rd
Old
FM
440
Rd
Zephyr Rd
Battalion Ave
S A
nn B
lvd
N W
S Y
oun
g D
r
Tank Destroyer Blvd
N R
oy R
eyn
old
s D
r
Flo
ren
ce R
d
N 3
8th
St
Cle
ar C
reek R
d
Alle
n S
t
Old Nolanville Rd
N Main S
t
Vern
a L
ee B
lvd
Lake Rd
N 8
th S
t
Jan
is D
r
Robin
ett
Rd
N 2
nd
St
Gilm
er
St
Cody P
oe R
d
W Jasper Dr
S R
oy R
eynold
s D
r
Clore RdS A
my
Ln
E Avenue D
Mead
ow
Dr
Terrace DrKate
St
N Central Texas Expy
Hilliard Ave
Edgefield St
S Twin
Cre
ek Dr
W Hallmark Ave
N T
win
Cre
ek D
r
37th
St
Will
iam
s S
t
Mann
ing D
r
S G
ray S
t
T.J
Mill
s B
lvd
Old
Flo
ren
ce R
d
Watercrest Rd
W Avenue I
E Centra
l Texa
s Expy
Flo
rence
Rd
E Central Texas Expy
FM 439 QUAR
RY
439
FM 32
19
CHALK
GLEN HOLLOWBLUF
F
CARTWRIGHT
FM 439FM 439
FM 439
£¤190£¤190£¤190
UV439UV3219
UV190
UV190Indian Trl
Old Nolanville Rd
Nola
Ruth
Blv
d FM
Spur
43
9
E Centra
l Texa
s Expy
S Main St
Edwards Dr
SUBMARKETSEVEN
SUBMARKETSEVEN
BELLCOUNTY
NOLANVILLE
µ
0 1 2Miles
APPENDIX MAP 6
RESIDENTIAL DEVELOPMENT ACTIVITY (2007-2017)2007 - 20112012 OR LATERFORT HOOD URBAN SUBMARKETSUBMARKET PARCELSHIGHWAY/INTERSTATEMAJOR ROADSLOCAL ROADSCITY OF KILLEEN
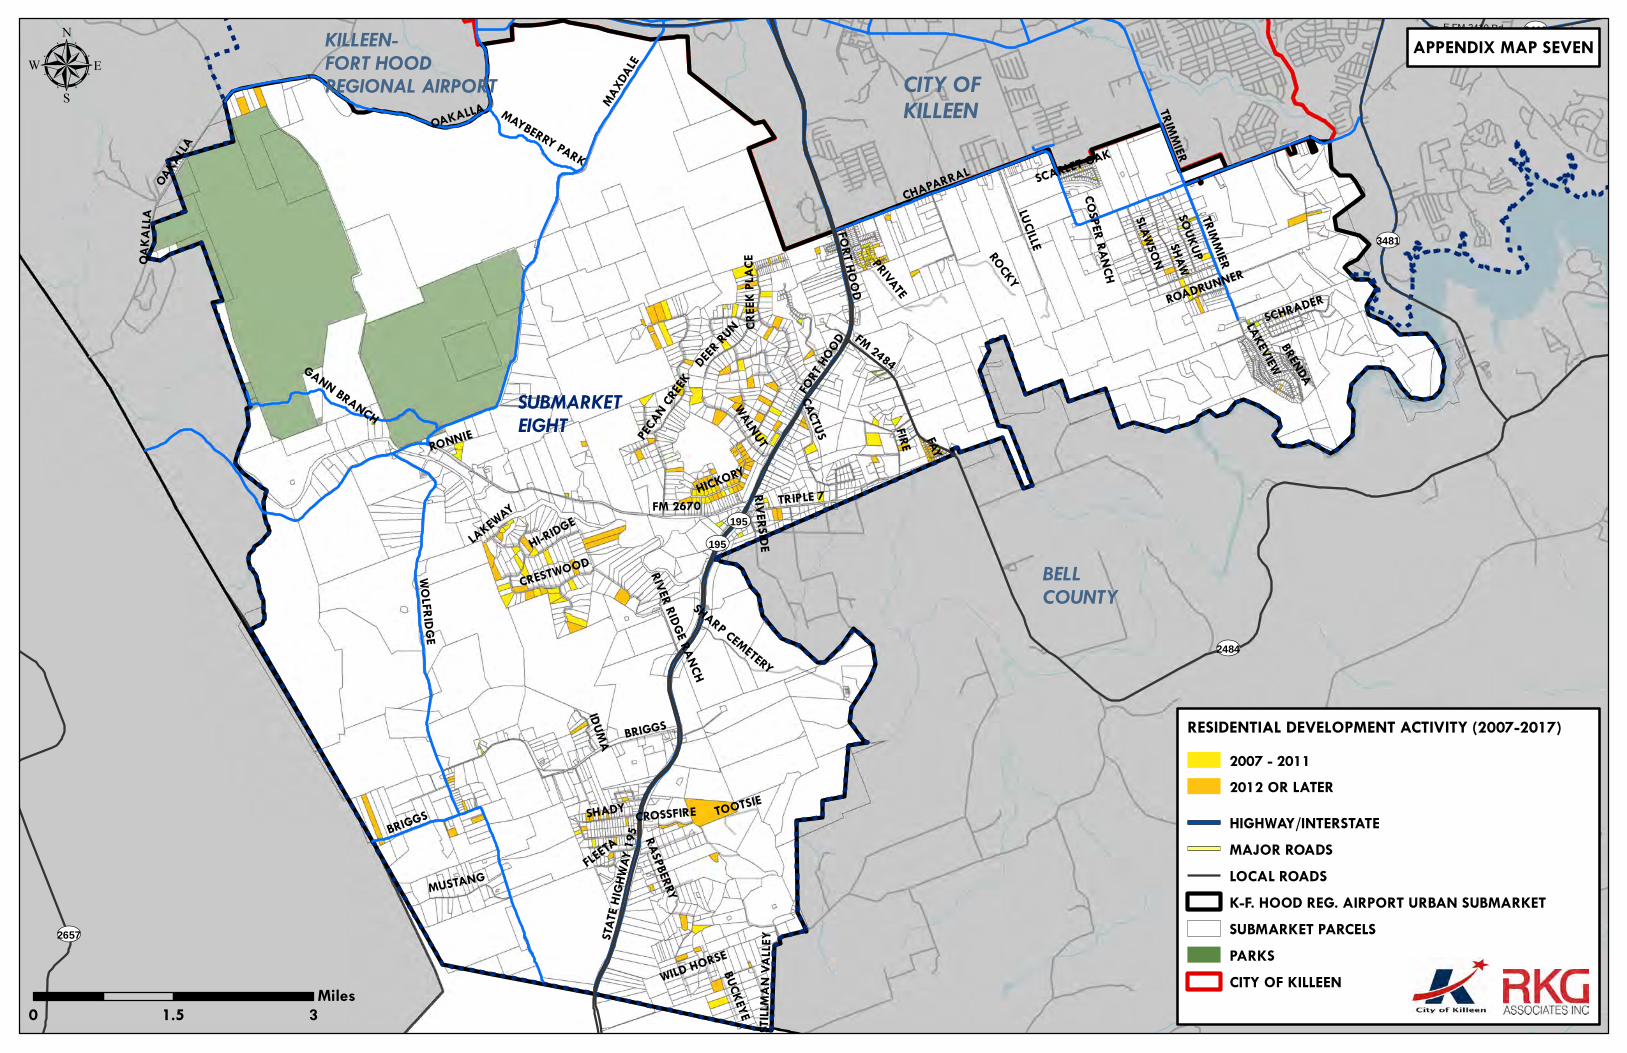
UV2484
UV195
UV3481
UV2657
UV2410
UV195
E FM 2410 Rd
MAXDA
LE
WOLFRIDGE
FORT HOOD
FM 2670
BRIGGS
CHAPARRAL
LUCILLE
FM 2484
FIRE
TRIMMIER
STATE
HIG
HWAY
195
SHAW
PECAN CR
EEK
GANN BRANCH
TRIPLE 7SLAWSON
WALNUT
CACTUS
ROCKY
HI-RIDGE
SOUKUP
CREE
K PL
ACE
CROSSFIRE
SHARP CEMETERY
SHADY
DEER RU
N
MUSTANG
LAKEVIEW
RIVER RIDGE RANCH
HICKORY
CRESTWOOD
FAY
BRENDA
MAYBERRY PARK
SCHRADER
PRIVATE
OAKALLA
IDUMA
STILL
MAN
VALLE
Y
BUCKEYE
TOOTSIE
RASPBERRY
FLEETA
RIVERSIDELAKEWAY
SCARLET OAK
ROADRUNNER
COSPER RANCH
RONNIE
WILD HORSE
OAKA
LLA
TRIMMIER
BRIGGS
OAKA
LLA
FORT
HOOD
µ
0 1.5 3Miles
SUBMARKETEIGHT
BELLCOUNTY
CITY OFKILLEEN
KILLEEN-FORT HOODREGIONAL AIRPORT
APPENDIX MAP SEVEN
RESIDENTIAL DEVELOPMENT ACTIVITY (2007-2017)2007 - 20112012 OR LATER
HIGHWAY/INTERSTATEMAJOR ROADSLOCAL ROADSK-F. HOOD REG. AIRPORT URBAN SUBMARKETSUBMARKET PARCELSPARKSCITY OF KILLEEN
Killeen Growth Study Killeen, Texas October 2019
Page 5-1
5 KISD GROWTH PROJECTIONS A. INTRODUCTION The following section details the results of a growth analysis that projected population, household formations and employment growth for the period of 2018 to 2035. The purpose of this analysis was to project the development and growth impacts on the City of Killeen and the Killeen Independent School District (KISD), based on a set of future growth projections. The analysis was prepared using conservative assumptions and based on the best available information provided by the City of Killeen, Fort Hood and the KISD. B. METHODOLOGY AND DATA SOURCES RKG Associates used several data sources, both primary and secondary, dependent on the type of projections made. To document historical population, household and household size trends, the consultants relied on ESRI Community Profile data at the KISD submarket-level. For County-level population numbers, RKG relied on both Woods & Poole Economics, Inc. (W&P) and 2018 Texas Population Projections Data Tool for 2018-2035 population projections. However, RKG used W&P because it provided more detail relative to future changes in the number of households, average household size and person living in group quarters. Both ESRI and W&P are national demographic and economic analytics firms, often used for such analyses. In addition, employment projections at the county-level were obtained from EMSI, which is a data analytics firm specializing in employment, labor force and economic impact analysis data. C. POPULATION GROWTH PROJECTIONS BY SUBMARKET 1. Population Projections RKG Associates impact model is driven by changes in population, which is largely a function of new household formations and changes in average household size. Each new household will incrementally drive the demand for municipal services (e.g., police, fire, parks, etc.), as well as educational services. Depending on the pattern of growth, population often requires the construction of new facilities such as fire stations, schools and other capital improvements (e.g., water, sewer, storm drainage, roads, etc.) to support the outward expansion of development.
a. Fort Hood Population Trends Historically, personnel changes at Fort Hood have driven population growth and contraction within the KISD service area. This was largely due to the disproportionate size of Fort Hood’s population compared to the population of the immediate region and the flow of Army personnel into and out of the region during periods of deployment. The installation is the largest single-site employer in the State of Texas. The last Economic Impact Analysis, conducted by the Texas Comptroller of Public Accounts, indicated that the economic impact of the installation on the state was more than $24.7 billion in total economic output.
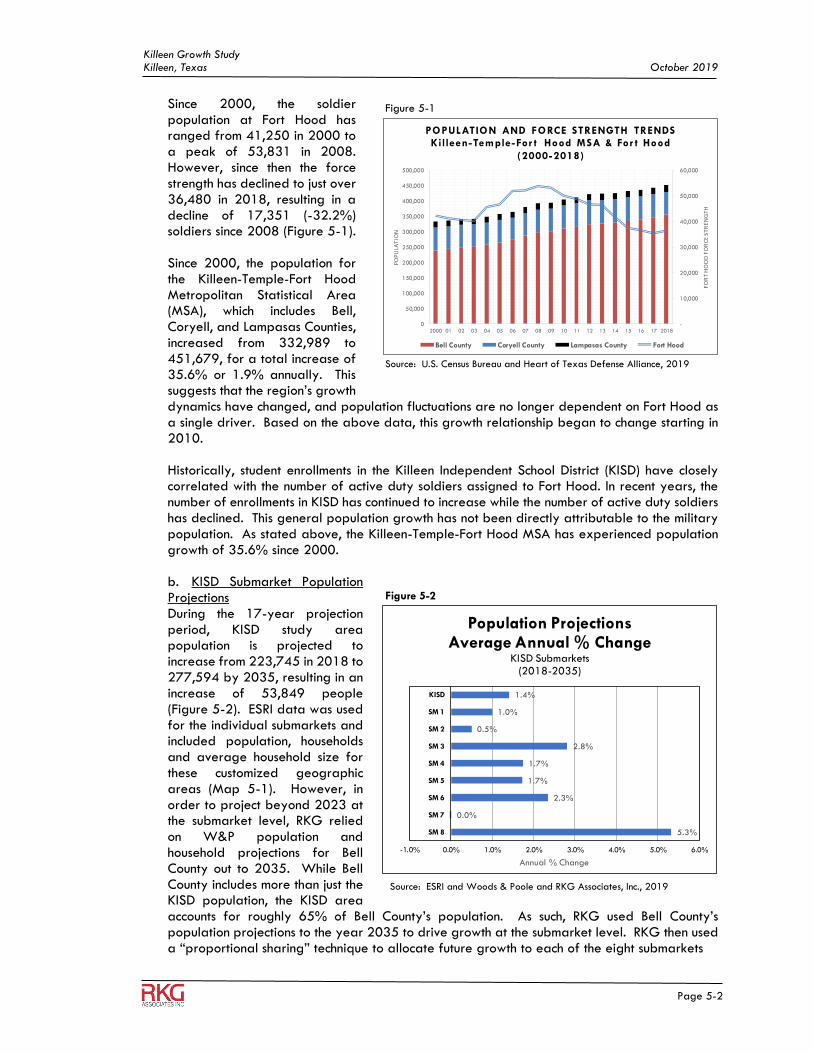
Killeen Growth Study Killeen, Texas October 2019
Page 5-2
Since 2000, the soldier population at Fort Hood has ranged from 41,250 in 2000 to a peak of 53,831 in 2008. However, since then the force strength has declined to just over 36,480 in 2018, resulting in a decline of 17,351 (-32.2%) soldiers since 2008 (Figure 5-1).
Since 2000, the population for the Killeen-Temple-Fort Hood Metropolitan Statistical Area (MSA), which includes Bell, Coryell, and Lampasas Counties, increased from 332,989 to 451,679, for a total increase of 35.6% or 1.9% annually. This suggests that the region’s growth dynamics have changed, and population fluctuations are no longer dependent on Fort Hood as a single driver. Based on the above data, this growth relationship began to change starting in 2010. Historically, student enrollments in the Killeen Independent School District (KISD) have closely correlated with the number of active duty soldiers assigned to Fort Hood. In recent years, the number of enrollments in KISD has continued to increase while the number of active duty soldiers has declined. This general population growth has not been directly attributable to the military population. As stated above, the Killeen-Temple-Fort Hood MSA has experienced population growth of 35.6% since 2000. b. KISD Submarket Population Projections During the 17-year projection period, KISD study area population is projected to increase from 223,745 in 2018 to 277,594 by 2035, resulting in an increase of 53,849 people (Figure 5-2). ESRI data was used for the individual submarkets and included population, households and average household size for these customized geographic areas (Map 5-1). However, in order to project beyond 2023 at the submarket level, RKG relied on W&P population and household projections for Bell County out to 2035. While Bell County includes more than just the KISD population, the KISD area accounts for roughly 65% of Bell County’s population. As such, RKG used Bell County’s population projections to the year 2035 to drive growth at the submarket level. RKG then used a “proportional sharing” technique to allocate future growth to each of the eight submarkets
Figure 5-1
Source: U.S. Census Bureau and Heart of Texas Defense Alliance, 2019
-
10,000
20,000
30,000
40,000
50,000
60,000
0
50,000
100,000
150,000
200,000
250,000
300,000
350,000
400,000
450,000
500,000
2000 01 02 03 04 05 06 07 08 09 10 11 12 13 14 15 16 17 2018
FO
RT
HO
OD
FO
RC
E S
TR
EN
GT
H
PO
PU
LAT
ION
POPULATION AND FORCE STRENGTH TRENDSKilleen-Temple-For t Hood MSA & For t Hood
(2000-2018)
Bell County Coryell County Lampasas County Fort Hood
Source: ESRI and Woods & Poole and RKG Associates, Inc., 2019
5.3%
0.0%
2.3%
1.7%
1.7%
2.8%
0.5%
1.0%
1.4%
-1.0% 0.0% 1.0% 2.0% 3.0% 4.0% 5.0% 6.0%
SM 8
SM 7
SM 6
SM 5
SM 4
SM 3
SM 2
SM 1
KISD
Annual % Change
Population ProjectionsAverage Annual % Change
KISD Submarkets(2018-2035)
Figure 5-2
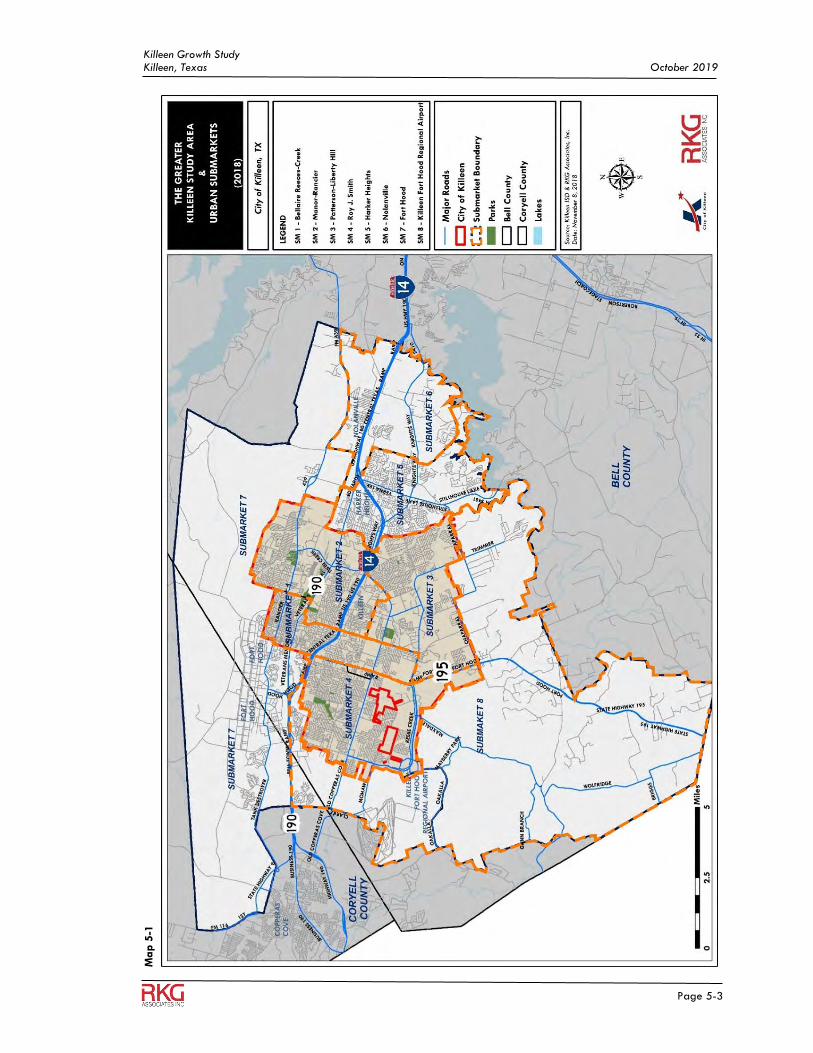
Killeen Growth Study Killeen, Texas October 2019
Page 5-3
Ma
p 5
-1
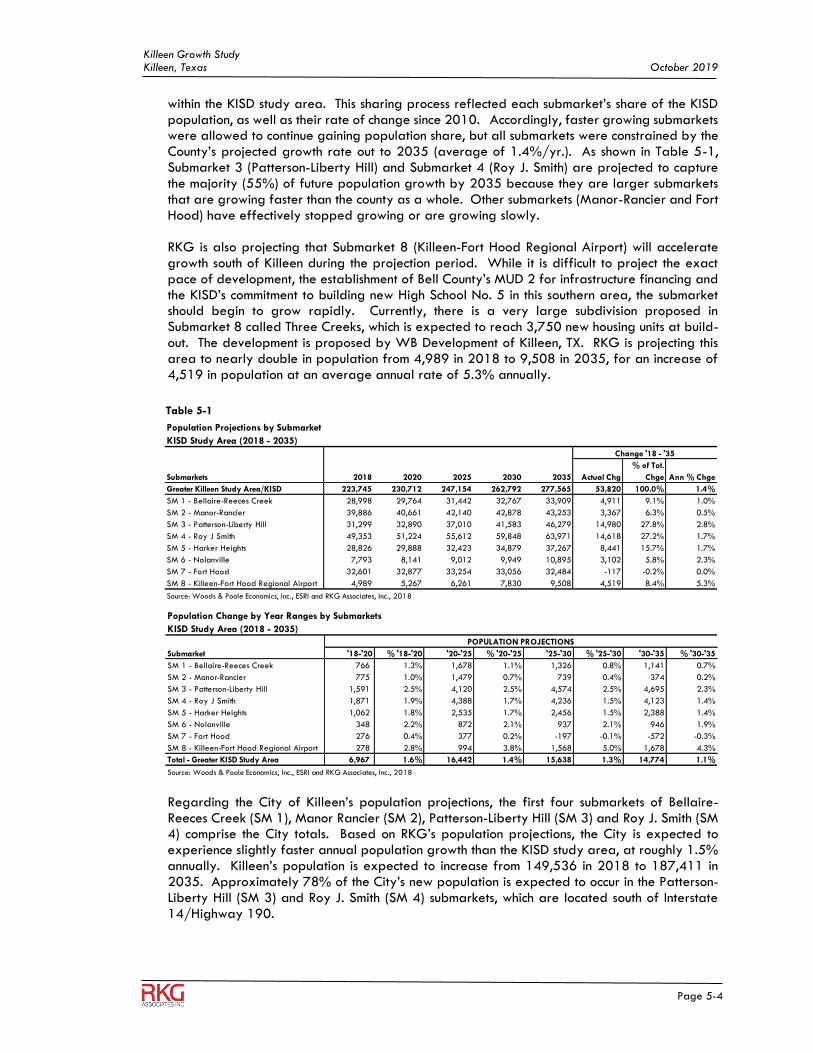
Killeen Growth Study Killeen, Texas October 2019
Page 5-4
within the KISD study area. This sharing process reflected each submarket’s share of the KISD population, as well as their rate of change since 2010. Accordingly, faster growing submarkets were allowed to continue gaining population share, but all submarkets were constrained by the County’s projected growth rate out to 2035 (average of 1.4%/yr.). As shown in Table 5-1, Submarket 3 (Patterson-Liberty Hill) and Submarket 4 (Roy J. Smith) are projected to capture the majority (55%) of future population growth by 2035 because they are larger submarkets that are growing faster than the county as a whole. Other submarkets (Manor-Rancier and Fort Hood) have effectively stopped growing or are growing slowly.
RKG is also projecting that Submarket 8 (Killeen-Fort Hood Regional Airport) will accelerate growth south of Killeen during the projection period. While it is difficult to project the exact pace of development, the establishment of Bell County’s MUD 2 for infrastructure financing and the KISD’s commitment to building new High School No. 5 in this southern area, the submarket should begin to grow rapidly. Currently, there is a very large subdivision proposed in Submarket 8 called Three Creeks, which is expected to reach 3,750 new housing units at build-out. The development is proposed by WB Development of Killeen, TX. RKG is projecting this area to nearly double in population from 4,989 in 2018 to 9,508 in 2035, for an increase of 4,519 in population at an average annual rate of 5.3% annually.
Regarding the City of Killeen’s population projections, the first four submarkets of Bellaire-Reeces Creek (SM 1), Manor Rancier (SM 2), Patterson-Liberty Hill (SM 3) and Roy J. Smith (SM 4) comprise the City totals. Based on RKG’s population projections, the City is expected to experience slightly faster annual population growth than the KISD study area, at roughly 1.5% annually. Killeen’s population is expected to increase from 149,536 in 2018 to 187,411 in 2035. Approximately 78% of the City’s new population is expected to occur in the Patterson-Liberty Hill (SM 3) and Roy J. Smith (SM 4) submarkets, which are located south of Interstate 14/Highway 190.
Population Projections by Submarket
KISD Study Area (2018 - 2035)
Submarkets 2018 2020 2025 2030 2035 Actual Chg
% of Tot.
Chge Ann % Chge
Greater Killeen Study Area/KISD 223,745 230,712 247,154 262,792 277,565 53,820 100.0% 1.4%
SM 1 - Bellaire-Reeces Creek 28,998 29,764 31,442 32,767 33,909 4,911 9.1% 1.0%
SM 2 - Manor-Rancier 39,886 40,661 42,140 42,878 43,253 3,367 6.3% 0.5%
SM 3 - Patterson-Liberty Hill 31,299 32,890 37,010 41,583 46,279 14,980 27.8% 2.8%
SM 4 - Roy J Smith 49,353 51,224 55,612 59,848 63,971 14,618 27.2% 1.7%
SM 5 - Harker Heights 28,826 29,888 32,423 34,879 37,267 8,441 15.7% 1.7%
SM 6 - Nolanville 7,793 8,141 9,012 9,949 10,895 3,102 5.8% 2.3%
SM 7 - Fort Hood 32,601 32,877 33,254 33,056 32,484 -117 -0.2% 0.0%
SM 8 - Killeen-Fort Hood Regional Airport 4,989 5,267 6,261 7,830 9,508 4,519 8.4% 5.3%
Source: Woods & Poole Economics, Inc., ESRI and RKG Associates, Inc., 2018
Change '18 - '35
Population Change by Year Ranges by Submarkets
KISD Study Area (2018 - 2035)
Submarket '18-'20 % '18-'20 '20-'25 % '20-'25 '25-'30 % '25-'30 '30-'35 % '30-'35
SM 1 - Bellaire-Reeces Creek 766 1.3% 1,678 1.1% 1,326 0.8% 1,141 0.7%
SM 2 - Manor-Rancier 775 1.0% 1,479 0.7% 739 0.4% 374 0.2%
SM 3 - Patterson-Liberty Hill 1,591 2.5% 4,120 2.5% 4,574 2.5% 4,695 2.3%
SM 4 - Roy J Smith 1,871 1.9% 4,388 1.7% 4,236 1.5% 4,123 1.4%
SM 5 - Harker Heights 1,062 1.8% 2,535 1.7% 2,456 1.5% 2,388 1.4%
SM 6 - Nolanville 348 2.2% 872 2.1% 937 2.1% 946 1.9%
SM 7 - Fort Hood 276 0.4% 377 0.2% -197 -0.1% -572 -0.3%
SM 8 - Killeen-Fort Hood Regional Airport 278 2.8% 994 3.8% 1,568 5.0% 1,678 4.3%
Total - Greater KISD Study Area 6,967 1.6% 16,442 1.4% 15,638 1.3% 14,774 1.1%
Source: Woods & Poole Economics, Inc., ESRI and RKG Associates, Inc., 2018
POPULATION PROJECTIONS
Table 5-1
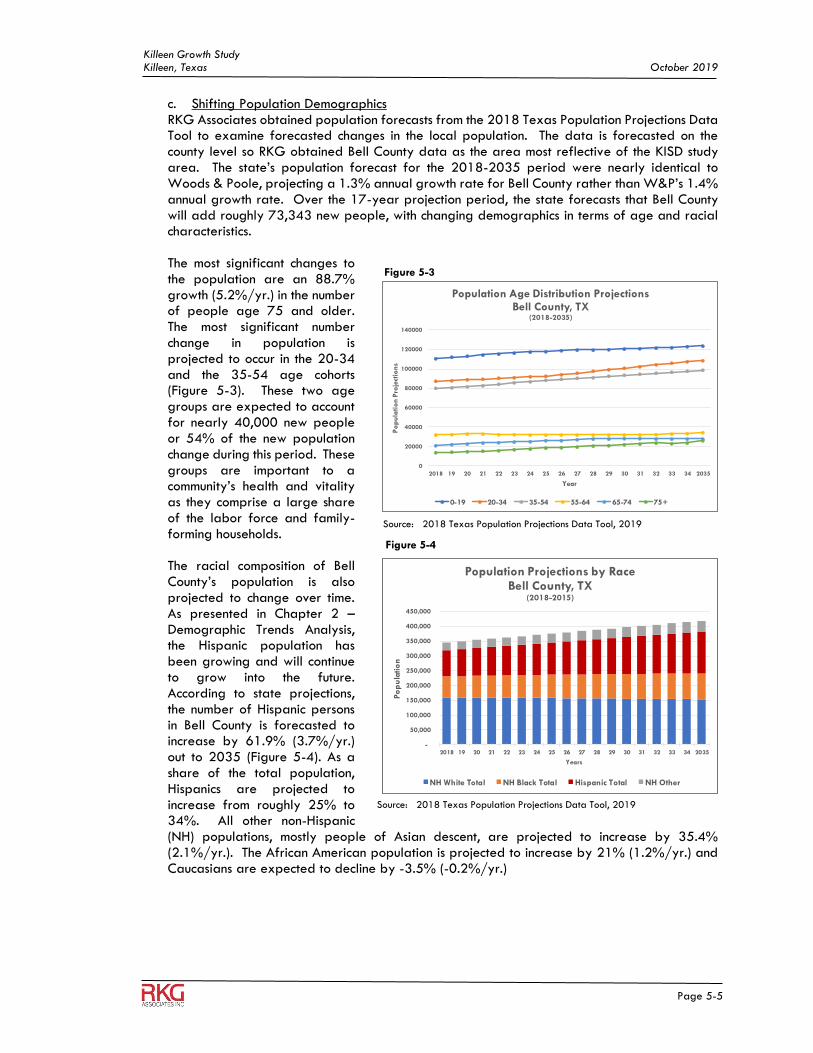
Killeen Growth Study Killeen, Texas October 2019
Page 5-5
c. Shifting Population Demographics RKG Associates obtained population forecasts from the 2018 Texas Population Projections Data Tool to examine forecasted changes in the local population. The data is forecasted on the county level so RKG obtained Bell County data as the area most reflective of the KISD study area. The state’s population forecast for the 2018-2035 period were nearly identical to Woods & Poole, projecting a 1.3% annual growth rate for Bell County rather than W&P’s 1.4% annual growth rate. Over the 17-year projection period, the state forecasts that Bell County will add roughly 73,343 new people, with changing demographics in terms of age and racial characteristics. The most significant changes to the population are an 88.7% growth (5.2%/yr.) in the number of people age 75 and older. The most significant number change in population is projected to occur in the 20-34 and the 35-54 age cohorts (Figure 5-3). These two age groups are expected to account for nearly 40,000 new people or 54% of the new population change during this period. These groups are important to a community’s health and vitality as they comprise a large share of the labor force and family-forming households.
The racial composition of Bell County’s population is also projected to change over time. As presented in Chapter 2 – Demographic Trends Analysis, the Hispanic population has been growing and will continue to grow into the future. According to state projections, the number of Hispanic persons in Bell County is forecasted to increase by 61.9% (3.7%/yr.) out to 2035 (Figure 5-4). As a share of the total population, Hispanics are projected to increase from roughly 25% to 34%. All other non-Hispanic (NH) populations, mostly people of Asian descent, are projected to increase by 35.4% (2.1%/yr.). The African American population is projected to increase by 21% (1.2%/yr.) and Caucasians are expected to decline by -3.5% (-0.2%/yr.)
Figure 5-3
Source: 2018 Texas Population Projections Data Tool, 2019
0
20000
40000
60000
80000
100000
120000
140000
2018 19 20 21 22 23 24 25 26 27 28 29 30 31 32 33 34 2035
Po
pu
latio
n P
roje
ctio
ns
Year
Population Age Distribution ProjectionsBell County, TX
(2018-2035)
0-19 20-34 35-54 55-64 65-74 75+
Figure 5-4
Source: 2018 Texas Population Projections Data Tool, 2019
-
50,000
100,000
150,000
200,000
250,000
300,000
350,000
400,000
450,000
2018 19 20 21 22 23 24 25 26 27 28 29 30 31 32 33 34 2035
Po
pu
latio
n
Years
Population Projections by RaceBell County, TX
(2018-2015)
NH White Total NH Black Total Hispanic Total NH Other
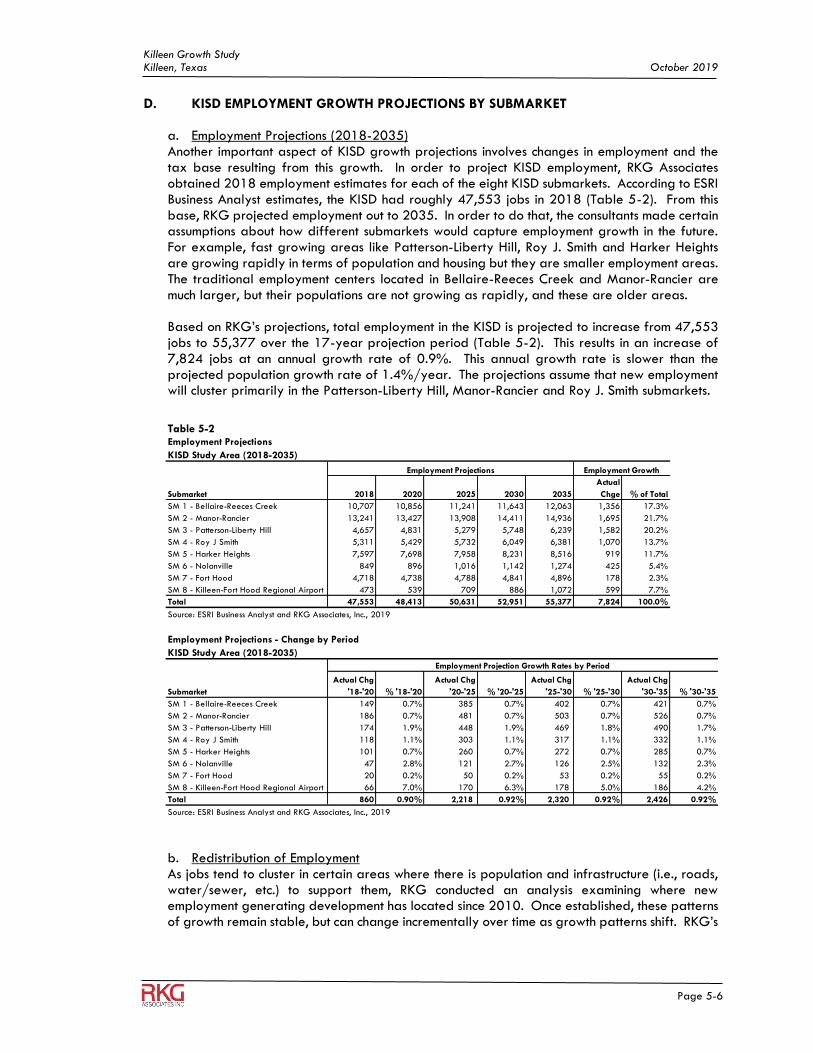
Killeen Growth Study Killeen, Texas October 2019
Page 5-6
D. KISD EMPLOYMENT GROWTH PROJECTIONS BY SUBMARKET
a. Employment Projections (2018-2035) Another important aspect of KISD growth projections involves changes in employment and the tax base resulting from this growth. In order to project KISD employment, RKG Associates obtained 2018 employment estimates for each of the eight KISD submarkets. According to ESRI Business Analyst estimates, the KISD had roughly 47,553 jobs in 2018 (Table 5-2). From this base, RKG projected employment out to 2035. In order to do that, the consultants made certain assumptions about how different submarkets would capture employment growth in the future. For example, fast growing areas like Patterson-Liberty Hill, Roy J. Smith and Harker Heights are growing rapidly in terms of population and housing but they are smaller employment areas. The traditional employment centers located in Bellaire-Reeces Creek and Manor-Rancier are much larger, but their populations are not growing as rapidly, and these are older areas. Based on RKG’s projections, total employment in the KISD is projected to increase from 47,553 jobs to 55,377 over the 17-year projection period (Table 5-2). This results in an increase of 7,824 jobs at an annual growth rate of 0.9%. This annual growth rate is slower than the projected population growth rate of 1.4%/year. The projections assume that new employment will cluster primarily in the Patterson-Liberty Hill, Manor-Rancier and Roy J. Smith submarkets.
b. Redistribution of Employment As jobs tend to cluster in certain areas where there is population and infrastructure (i.e., roads, water/sewer, etc.) to support them, RKG conducted an analysis examining where new employment generating development has located since 2010. Once established, these patterns of growth remain stable, but can change incrementally over time as growth patterns shift. RKG’s
Table 5-2 Employment Projections
KISD Study Area (2018-2035)
Submarket 2018 2020 2025 2030 2035
Actual
Chge % of Total
SM 1 - Bellaire-Reeces Creek 10,707 10,856 11,241 11,643 12,063 1,356 17.3%
SM 2 - Manor-Rancier 13,241 13,427 13,908 14,411 14,936 1,695 21.7%
SM 3 - Patterson-Liberty Hill 4,657 4,831 5,279 5,748 6,239 1,582 20.2%
SM 4 - Roy J Smith 5,311 5,429 5,732 6,049 6,381 1,070 13.7%
SM 5 - Harker Heights 7,597 7,698 7,958 8,231 8,516 919 11.7%
SM 6 - Nolanville 849 896 1,016 1,142 1,274 425 5.4%
SM 7 - Fort Hood 4,718 4,738 4,788 4,841 4,896 178 2.3%
SM 8 - Killeen-Fort Hood Regional Airport 473 539 709 886 1,072 599 7.7%
Total 47,553 48,413 50,631 52,951 55,377 7,824 100.0%
Source: ESRI Business Analyst and RKG Associates, Inc., 2019
Employment Projections - Change by Period
KISD Study Area (2018-2035)
Submarket
Actual Chg
'18-'20 % '18-'20
Actual Chg
'20-'25 % '20-'25
Actual Chg
'25-'30 % '25-'30
Actual Chg
'30-'35 % '30-'35
SM 1 - Bellaire-Reeces Creek 149 0.7% 385 0.7% 402 0.7% 421 0.7%
SM 2 - Manor-Rancier 186 0.7% 481 0.7% 503 0.7% 526 0.7%
SM 3 - Patterson-Liberty Hill 174 1.9% 448 1.9% 469 1.8% 490 1.7%
SM 4 - Roy J Smith 118 1.1% 303 1.1% 317 1.1% 332 1.1%
SM 5 - Harker Heights 101 0.7% 260 0.7% 272 0.7% 285 0.7%
SM 6 - Nolanville 47 2.8% 121 2.7% 126 2.5% 132 2.3%
SM 7 - Fort Hood 20 0.2% 50 0.2% 53 0.2% 55 0.2%
SM 8 - Killeen-Fort Hood Regional Airport 66 7.0% 170 6.3% 178 5.0% 186 4.2%
Total 860 0.90% 2,218 0.92% 2,320 0.92% 2,426 0.92%
Source: ESRI Business Analyst and RKG Associates, Inc., 2019
Employment Projections
Employment Projection Growth Rates by Period
Employment Growth
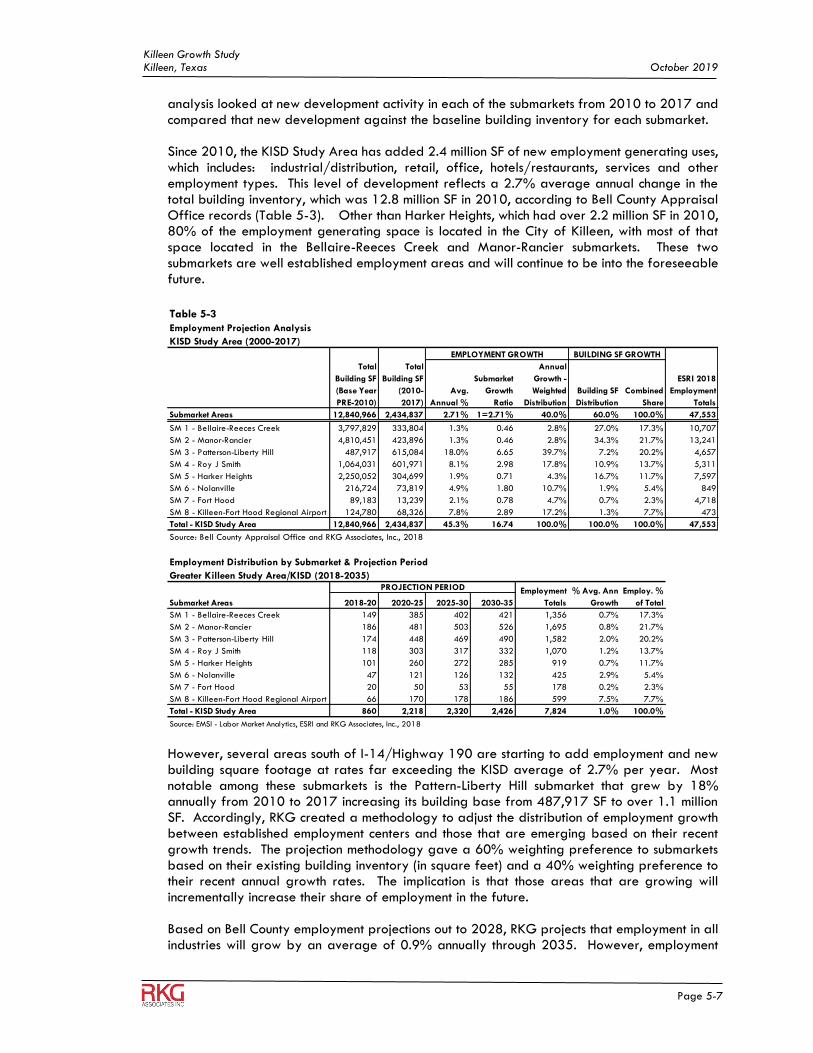
Killeen Growth Study Killeen, Texas October 2019
Page 5-7
analysis looked at new development activity in each of the submarkets from 2010 to 2017 and compared that new development against the baseline building inventory for each submarket. Since 2010, the KISD Study Area has added 2.4 million SF of new employment generating uses, which includes: industrial/distribution, retail, office, hotels/restaurants, services and other employment types. This level of development reflects a 2.7% average annual change in the total building inventory, which was 12.8 million SF in 2010, according to Bell County Appraisal Office records (Table 5-3). Other than Harker Heights, which had over 2.2 million SF in 2010, 80% of the employment generating space is located in the City of Killeen, with most of that space located in the Bellaire-Reeces Creek and Manor-Rancier submarkets. These two submarkets are well established employment areas and will continue to be into the foreseeable future.
However, several areas south of I-14/Highway 190 are starting to add employment and new building square footage at rates far exceeding the KISD average of 2.7% per year. Most notable among these submarkets is the Pattern-Liberty Hill submarket that grew by 18% annually from 2010 to 2017 increasing its building base from 487,917 SF to over 1.1 million SF. Accordingly, RKG created a methodology to adjust the distribution of employment growth between established employment centers and those that are emerging based on their recent growth trends. The projection methodology gave a 60% weighting preference to submarkets based on their existing building inventory (in square feet) and a 40% weighting preference to their recent annual growth rates. The implication is that those areas that are growing will incrementally increase their share of employment in the future. Based on Bell County employment projections out to 2028, RKG projects that employment in all industries will grow by an average of 0.9% annually through 2035. However, employment
Employment Projection Analysis
KISD Study Area (2000-2017)
Total
Building SF
(Base Year
PRE-2010)
Total
Building SF
(2010-
2017)
Avg.
Annual %
Submarket
Growth
Ratio
Annual
Growth -
Weighted
Distribution
Building SF
Distribution
Combined
Share
Submarket Areas 12,840,966 2,434,837 2.71% 1=2.71% 40.0% 60.0% 100.0% 47,553
SM 1 - Bellaire-Reeces Creek 3,797,829 333,804 1.3% 0.46 2.8% 27.0% 17.3% 10,707
SM 2 - Manor-Rancier 4,810,451 423,896 1.3% 0.46 2.8% 34.3% 21.7% 13,241
SM 3 - Patterson-Liberty Hill 487,917 615,084 18.0% 6.65 39.7% 7.2% 20.2% 4,657
SM 4 - Roy J Smith 1,064,031 601,971 8.1% 2.98 17.8% 10.9% 13.7% 5,311
SM 5 - Harker Heights 2,250,052 304,699 1.9% 0.71 4.3% 16.7% 11.7% 7,597
SM 6 - Nolanville 216,724 73,819 4.9% 1.80 10.7% 1.9% 5.4% 849
SM 7 - Fort Hood 89,183 13,239 2.1% 0.78 4.7% 0.7% 2.3% 4,718
SM 8 - Killeen-Fort Hood Regional Airport 124,780 68,326 7.8% 2.89 17.2% 1.3% 7.7% 473
Total - KISD Study Area 12,840,966 2,434,837 45.3% 16.74 100.0% 100.0% 100.0% 47,553
Source: Bell County Appraisal Office and RKG Associates, Inc., 2018
Employment Distribution by Submarket & Projection Period
Greater Killeen Study Area/KISD (2018-2035)
Submarket Areas 2018-20 2020-25 2025-30 2030-35
SM 1 - Bellaire-Reeces Creek 149 385 402 421 1,356 0.7% 17.3%
SM 2 - Manor-Rancier 186 481 503 526 1,695 0.8% 21.7%
SM 3 - Patterson-Liberty Hill 174 448 469 490 1,582 2.0% 20.2%
SM 4 - Roy J Smith 118 303 317 332 1,070 1.2% 13.7%
SM 5 - Harker Heights 101 260 272 285 919 0.7% 11.7%
SM 6 - Nolanville 47 121 126 132 425 2.9% 5.4%
SM 7 - Fort Hood 20 50 53 55 178 0.2% 2.3%
SM 8 - Killeen-Fort Hood Regional Airport 66 170 178 186 599 7.5% 7.7%
Total - KISD Study Area 860 2,218 2,320 2,426 7,824 1.0% 100.0%
Source: EMSI - Labor Market Analytics, ESRI and RKG Associates, Inc., 2018
EMPLOYMENT GROWTH BUILDING SF GROWTH
ESRI 2018
Employment
Totals
PROJECTION PERIOD Employment
Totals
% Avg. Ann
Growth
Employ. %
of Total
Table 5-3
Killeen Growth Study Killeen, Texas October 2019
Page 5-8
growth varies by submarket, with areas like Killeen-Fort Hood Regional Airport (7.5%), Nolanville (2.9%), Patterson-Liberty Hill (2%) growing faster over the projection period. It is important to note that some areas with few jobs may grow at a faster rate on a percentage basis but are not likely to capture a large number of new jobs.
E. IMPLICATIONS While RKG Associates is projecting a slowing the of the KISD’s population growth, those areas south of Interstate 14/Highway 190 will continue to grow at above average rates during the projection period. This will continue to challenge Bell County, the City of Killeen and the KISD to provide services to areas that are just beginning to develop. Submarket 8 (Killeen-Fort Hood Regional Airport) is one area that is poised to grow rapidly over the next 10 years, baring a major slow-down in the financial services, housing or mortgage lending markets. The growth prospects for the Central Texas Region are not solely driven by local housing demand. The region, and Texas in general, is seen as a pro-growth state with robust employment growth and affordably-priced housing. Consequently, many people from other parts of the country are discovering Killeen as a viable place to live. As a retirement location, the City is starting to be recognized as an affordable retirement location and the proximity to the Austin–Round Rock–San Marcos MSA is a draw to people who would be inclined to commute to Austin for higher paying employment, while maintaining their housing affordability in the KISD communities.
Killeen Growth Study Killeen, Texas October 2019
Page 6-1
6 FISCAL IMPACT ANALYSIS A. INTRODUCTION The following section details the results of fiscal impacts associated with the growth projections described in Chapter 5 – KISD Growth Projections. The purpose of this analysis was to project the fiscal impacts related to development and growth impacts on the City of Killeen and the Killeen Independent School District (KISD), based on a set of future growth projections. The analysis was prepared using conservative assumptions and focused on the primary impacts. The consultants based the analysis on the best available information obtained from the City of Killeen and the KISD. During 2018, RKG interviewed several senior staff to better understand the fiscal issues posing challenges to the City and the independent school district. B. METHODOLOGY AND DATA SOURCES KISD school attendance zone data was obtained from the KISD school planning and attendance projection office. The data cover hundreds of individual attendance zones covering the entire KISD service area. The data contain current the number of housing units, school-age children by grade and school and the ratio of children per household enrolled in elementary, middle and high school for each zone. This data were used to create a student attendance projection model, which grouped school attendance zones into the submarket boundaries presented in Chapter 2 of this study. Other data regarding annual revenues and expenditures were obtained from the City of Killeen’s Comprehensive Annual Financial Report (CAFR) and the KISD Comprehensive Financial Report. Military veteran’s data was obtained from the American Community Survey and the Heart of Texas Defense Alliance.
C. FISCAL IMPACT ANALYSIS 1. KISD School-Age Children Projections In order to project school-age population for the KISD study area, RKG obtained detailed school attendance zone data for all elementary, middle and high schools in the KISD. The data were plotted geographically and grouped into the eight submarket areas illustrated in Map 5-1 in Chapter 5 – KISD Growth Projections. The school department’s demographer responsible for student and school projections updates this data annually and tracks the number of students attending each school at various grade levels. These student figures are compared against the number of housing units to come up with multipliers for the number of elementary, middle and high school students per housing unit.
a. Student Enrollment Multipliers The data indicate that in 2018 67,914 housing units produced 44,073 students attending KISD
schools. On average, that equated to 0.65 school-age children per housing unit (HU), when viewed
across the entire KISD. However, as shown in Table 6-1, some submarkets produce more school-age
children than the school district average. The Fort Hood (0.84 students/HU) and Killeen/Fort Hood
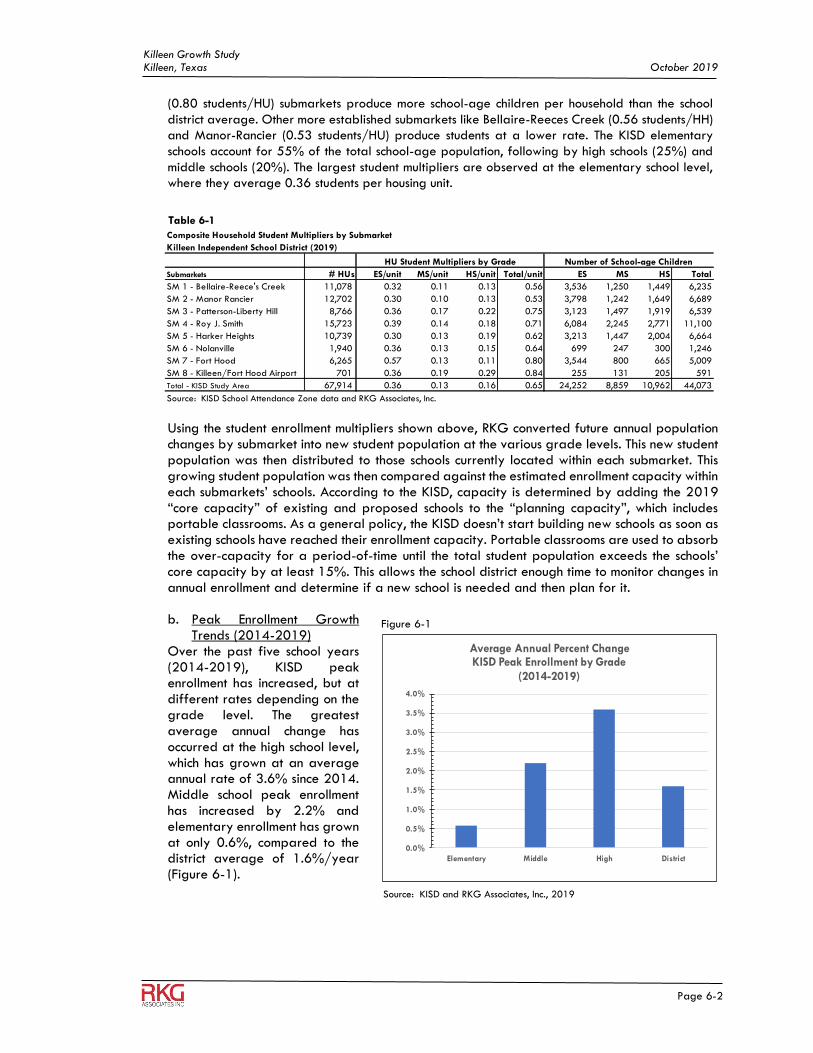
Killeen Growth Study Killeen, Texas October 2019
Page 6-2
(0.80 students/HU) submarkets produce more school-age children per household than the school
district average. Other more established submarkets like Bellaire-Reeces Creek (0.56 students/HH)
and Manor-Rancier (0.53 students/HU) produce students at a lower rate. The KISD elementary
schools account for 55% of the total school-age population, following by high schools (25%) and
middle schools (20%). The largest student multipliers are observed at the elementary school level,
where they average 0.36 students per housing unit.
Using the student enrollment multipliers shown above, RKG converted future annual population changes by submarket into new student population at the various grade levels. This new student population was then distributed to those schools currently located within each submarket. This growing student population was then compared against the estimated enrollment capacity within each submarkets’ schools. According to the KISD, capacity is determined by adding the 2019 “core capacity” of existing and proposed schools to the “planning capacity”, which includes portable classrooms. As a general policy, the KISD doesn’t start building new schools as soon as existing schools have reached their enrollment capacity. Portable classrooms are used to absorb the over-capacity for a period-of-time until the total student population exceeds the schools’ core capacity by at least 15%. This allows the school district enough time to monitor changes in annual enrollment and determine if a new school is needed and then plan for it. b. Peak Enrollment Growth
Trends (2014-2019) Over the past five school years (2014-2019), KISD peak enrollment has increased, but at different rates depending on the grade level. The greatest average annual change has occurred at the high school level, which has grown at an average annual rate of 3.6% since 2014. Middle school peak enrollment has increased by 2.2% and elementary enrollment has grown at only 0.6%, compared to the district average of 1.6%/year (Figure 6-1).
Figure 6-1
Source: KISD and RKG Associates, Inc., 2019
0.0%
0.5%
1.0%
1.5%
2.0%
2.5%
3.0%
3.5%
4.0%
Elementary Middle High District
Average Annual Percent ChangeKISD Peak Enrollment by Grade
(2014-2019)
Composite Household Student Multipliers by Submarket
Killeen Independent School District (2019)
Submarkets # HUs ES/unit MS/unit HS/unit Total/unit ES MS HS Total
SM 1 - Bellaire-Reece's Creek 11,078 0.32 0.11 0.13 0.56 3,536 1,250 1,449 6,235
SM 2 - Manor Rancier 12,702 0.30 0.10 0.13 0.53 3,798 1,242 1,649 6,689
SM 3 - Patterson-Liberty Hill 8,766 0.36 0.17 0.22 0.75 3,123 1,497 1,919 6,539
SM 4 - Roy J. Smith 15,723 0.39 0.14 0.18 0.71 6,084 2,245 2,771 11,100
SM 5 - Harker Heights 10,739 0.30 0.13 0.19 0.62 3,213 1,447 2,004 6,664
SM 6 - Nolanville 1,940 0.36 0.13 0.15 0.64 699 247 300 1,246
SM 7 - Fort Hood 6,265 0.57 0.13 0.11 0.80 3,544 800 665 5,009
SM 8 - Killeen/Fort Hood Airport 701 0.36 0.19 0.29 0.84 255 131 205 591
Total - KISD Study Area 67,914 0.36 0.13 0.16 0.65 24,252 8,859 10,962 44,073
Source: KISD School Attendance Zone data and RKG Associates, Inc.
HU Student Multipliers by Grade Number of School-age Children
Table 6-1
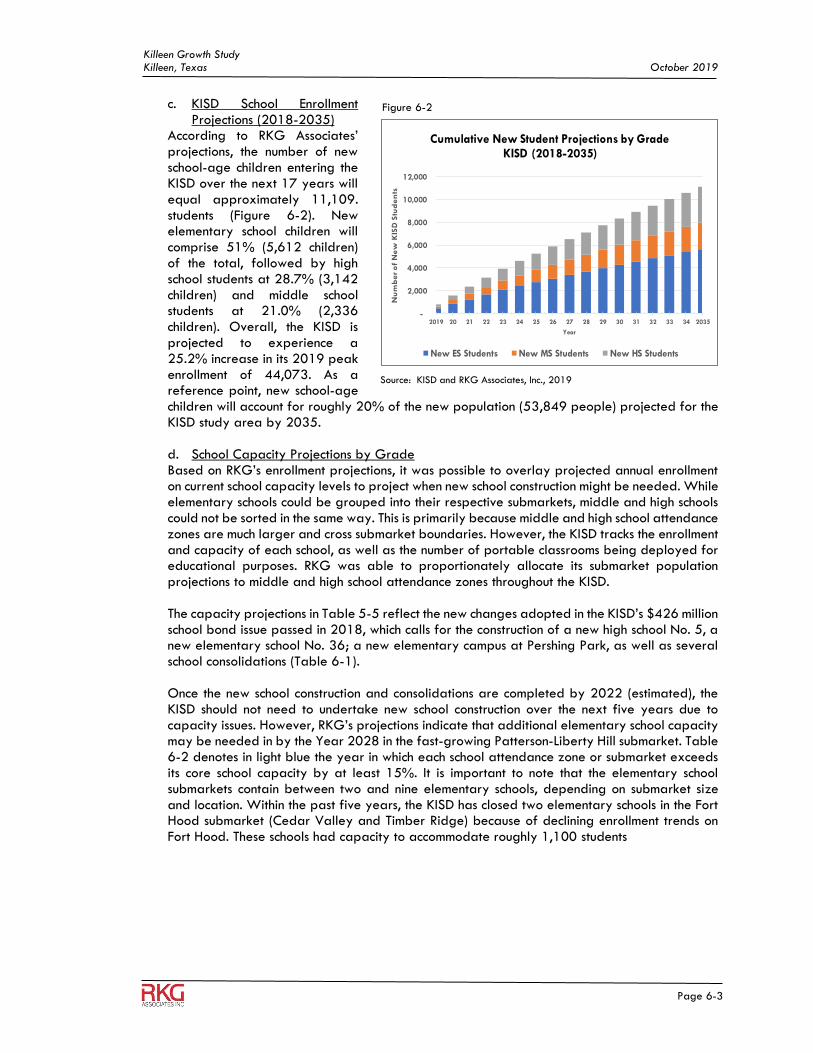
Killeen Growth Study Killeen, Texas October 2019
Page 6-3
c. KISD School Enrollment Projections (2018-2035)
According to RKG Associates’ projections, the number of new school-age children entering the KISD over the next 17 years will equal approximately 11,109. students (Figure 6-2). New elementary school children will comprise 51% (5,612 children) of the total, followed by high school students at 28.7% (3,142 children) and middle school students at 21.0% (2,336 children). Overall, the KISD is projected to experience a 25.2% increase in its 2019 peak enrollment of 44,073. As a reference point, new school-age children will account for roughly 20% of the new population (53,849 people) projected for the KISD study area by 2035. d. School Capacity Projections by Grade Based on RKG’s enrollment projections, it was possible to overlay projected annual enrollment on current school capacity levels to project when new school construction might be needed. While elementary schools could be grouped into their respective submarkets, middle and high schools could not be sorted in the same way. This is primarily because middle and high school attendance zones are much larger and cross submarket boundaries. However, the KISD tracks the enrollment and capacity of each school, as well as the number of portable classrooms being deployed for educational purposes. RKG was able to proportionately allocate its submarket population projections to middle and high school attendance zones throughout the KISD. The capacity projections in Table 5-5 reflect the new changes adopted in the KISD’s $426 million school bond issue passed in 2018, which calls for the construction of a new high school No. 5, a new elementary school No. 36; a new elementary campus at Pershing Park, as well as several school consolidations (Table 6-1). Once the new school construction and consolidations are completed by 2022 (estimated), the KISD should not need to undertake new school construction over the next five years due to capacity issues. However, RKG’s projections indicate that additional elementary school capacity may be needed in by the Year 2028 in the fast-growing Patterson-Liberty Hill submarket. Table 6-2 denotes in light blue the year in which each school attendance zone or submarket exceeds its core school capacity by at least 15%. It is important to note that the elementary school submarkets contain between two and nine elementary schools, depending on submarket size and location. Within the past five years, the KISD has closed two elementary schools in the Fort Hood submarket (Cedar Valley and Timber Ridge) because of declining enrollment trends on Fort Hood. These schools had capacity to accommodate roughly 1,100 students
Figure 6-2
Source: KISD and RKG Associates, Inc., 2019
-
2,000
4,000
6,000
8,000
10,000
12,000
2019 20 21 22 23 24 25 26 27 28 29 30 31 32 33 34 2035
Nu
mb
er o
f N
ew
KIS
D S
tud
en
ts
Year
Cumulative New Student Projections by GradeKISD (2018-2035)
New ES Students New MS Students New HS Students
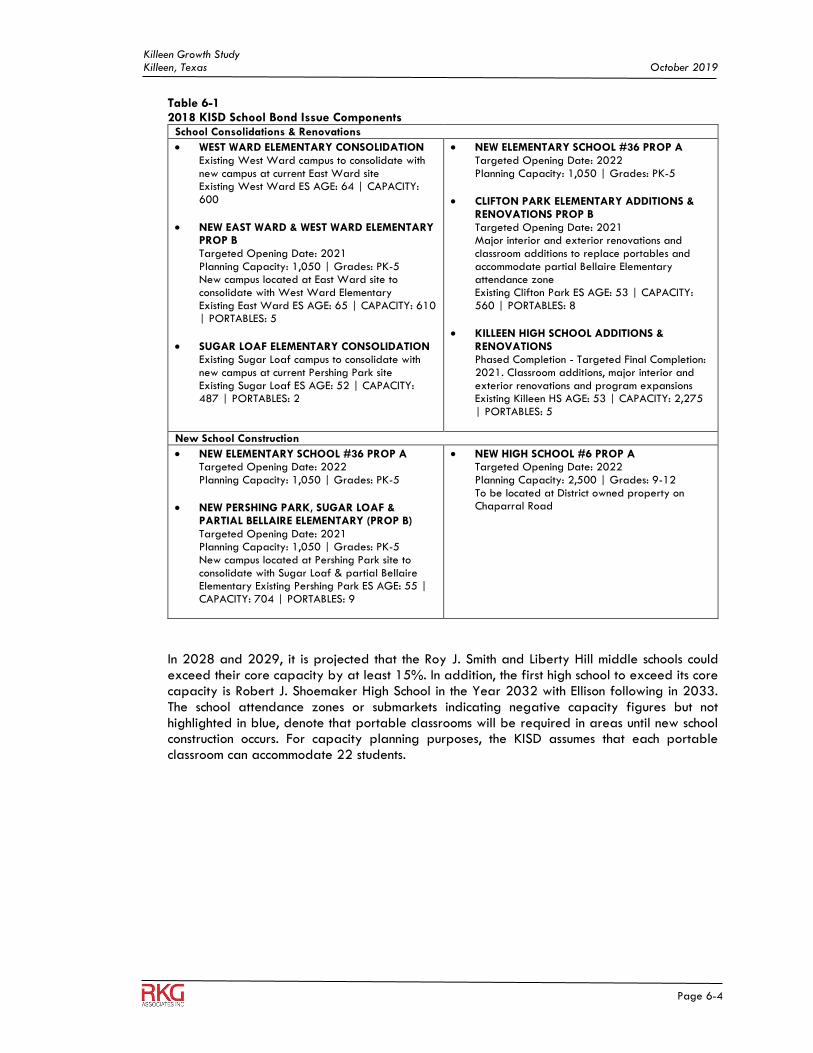
Killeen Growth Study Killeen, Texas October 2019
Page 6-4
Table 6-1 2018 KISD School Bond Issue Components
School Consolidations & Renovations
• WEST WARD ELEMENTARY CONSOLIDATION Existing West Ward campus to consolidate with new campus at current East Ward site Existing West Ward ES AGE: 64 | CAPACITY: 600
• NEW EAST WARD & WEST WARD ELEMENTARY PROP B Targeted Opening Date: 2021 Planning Capacity: 1,050 | Grades: PK-5 New campus located at East Ward site to consolidate with West Ward Elementary Existing East Ward ES AGE: 65 | CAPACITY: 610 | PORTABLES: 5
• SUGAR LOAF ELEMENTARY CONSOLIDATION Existing Sugar Loaf campus to consolidate with new campus at current Pershing Park site Existing Sugar Loaf ES AGE: 52 | CAPACITY: 487 | PORTABLES: 2
• NEW ELEMENTARY SCHOOL #36 PROP A Targeted Opening Date: 2022 Planning Capacity: 1,050 | Grades: PK-5
• CLIFTON PARK ELEMENTARY ADDITIONS & RENOVATIONS PROP B Targeted Opening Date: 2021 Major interior and exterior renovations and classroom additions to replace portables and accommodate partial Bellaire Elementary attendance zone Existing Clifton Park ES AGE: 53 | CAPACITY: 560 | PORTABLES: 8
• KILLEEN HIGH SCHOOL ADDITIONS & RENOVATIONS Phased Completion - Targeted Final Completion: 2021. Classroom additions, major interior and exterior renovations and program expansions Existing Killeen HS AGE: 53 | CAPACITY: 2,275 | PORTABLES: 5
New School Construction
• NEW ELEMENTARY SCHOOL #36 PROP A Targeted Opening Date: 2022 Planning Capacity: 1,050 | Grades: PK-5
• NEW PERSHING PARK, SUGAR LOAF & PARTIAL BELLAIRE ELEMENTARY (PROP B) Targeted Opening Date: 2021 Planning Capacity: 1,050 | Grades: PK-5 New campus located at Pershing Park site to consolidate with Sugar Loaf & partial Bellaire Elementary Existing Pershing Park ES AGE: 55 | CAPACITY: 704 | PORTABLES: 9
• NEW HIGH SCHOOL #6 PROP A Targeted Opening Date: 2022 Planning Capacity: 2,500 | Grades: 9-12 To be located at District owned property on Chaparral Road
In 2028 and 2029, it is projected that the Roy J. Smith and Liberty Hill middle schools could exceed their core capacity by at least 15%. In addition, the first high school to exceed its core capacity is Robert J. Shoemaker High School in the Year 2032 with Ellison following in 2033. The school attendance zones or submarkets indicating negative capacity figures but not highlighted in blue, denote that portable classrooms will be required in areas until new school construction occurs. For capacity planning purposes, the KISD assumes that each portable classroom can accommodate 22 students.
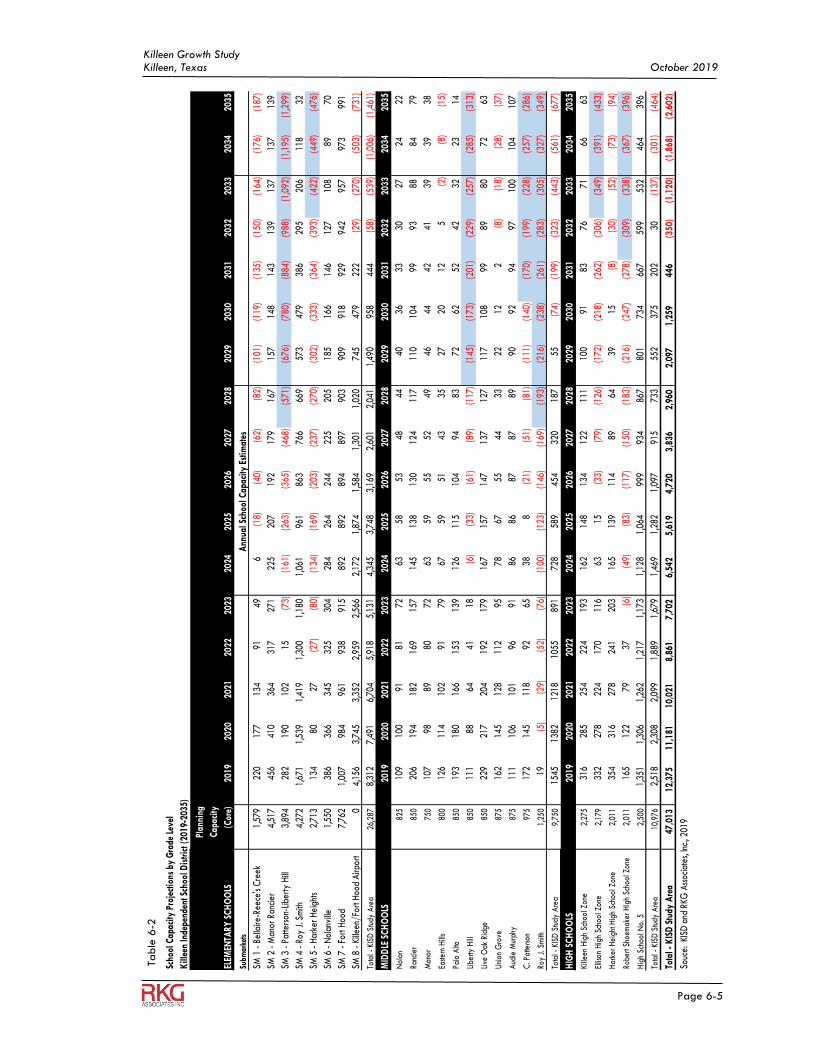
Killeen Growth Study Killeen, Texas October 2019
Page 6-5
Table
6-2
Scho
ol C
apac
ity P
roje
ctio
ns b
y G
rade
Lev
el
Kill
een
Inde
pend
ent S
choo
l Dis
tric
t (20
19-2
035)
ELEM
ENTA
RY
SC
HO
OLS
2019
Plan
ning
Cap
acity
(Cor
e)20
1920
2020
2120
2220
2320
2420
2520
2620
2720
2820
2920
3020
3120
3220
3320
3420
35
Subm
arke
tsA
nnua
l Sch
ool C
apac
ity E
stim
ates
SM 1
- B
ella
ire-R
eece
's C
reek
1,57
922
017
713
491
496
(18)
(40)
(62)
(82)
(101
)(1
19)
(135
)(1
50)
(164
)(1
76)
(187
)
SM 2
- M
anor
Ran
cier
4,51
745
641
036
431
727
122
520
719
217
916
715
714
814
313
913
713
713
9
SM 3
- P
atte
rson
-Lib
erty
Hill
3,89
428
219
010
215
(73)
(161
)(2
63)
(365
)(4
68)
(571
)(6
76)
(780
)(8
84)
(988
)(1
,092
)(1
,195
)(1
,299
)
SM 4
- R
oy J
. Sm
ith4,
272
1,67
11,
539
1,41
91,
300
1,18
01,
061
961
863
766
669
573
479
386
295
206
118
32
SM 5
- H
arke
r H
eigh
ts2,
713
134
8027
(27)
(80)
(134
)(1
69)
(203
)(2
37)
(270
)(3
02)
(333
)(3
64)
(393
)(4
22)
(449
)(4
76)
SM 6
- N
olan
ville
1,55
038
636
634
532
530
428
426
424
422
520
518
516
614
612
710
889
70
SM 7
- F
ort H
ood
7,76
21,
007
984
961
938
915
892
892
894
897
903
909
918
929
942
957
973
991
SM 8
- K
illee
n/Fo
rt H
ood
Airp
ort
04,
156
3,74
53,
352
2,95
92,
566
2,17
21,
874
1,58
41,
301
1,02
074
547
922
2(2
9)(2
70)
(503
)(7
31)
Tota
l - K
ISD
Stu
dy A
rea
26,2
878,
312
7,49
16,
704
5,91
85,
131
4,34
53,
748
3,16
92,
601
2,04
11,
490
958
444
(58)
(539
)(1
,006
)(1
,461
)
MID
DLE
SC
HO
OLS
2019
2020
2021
2022
2023
2024
2025
2026
2027
2028
2029
2030
2031
2032
2033
2034
2035
Nol
an
825
109
100
9181
7263
5853
4844
4036
3330
2724
22
Ranc
ier
850
206
194
182
169
157
145
138
130
124
117
110
104
9993
8884
79
Man
or75
0
10
798
8980
7263
5955
5249
4644
4241
3939
38
Easte
rn H
ills
800
126
114
102
9179
6759
5143
3527
2012
5(2
)(8
)(1
5)
Palo
Alto
850
193
180
166
153
139
126
115
104
9483
7262
5242
3223
14
Libe
rty H
ill85
0
11
188
6441
18(6
)(3
3)(6
1)(8
9)(1
17)
(145
)(1
73)
(201
)(2
29)
(257
)(2
85)
(313
)
Live
Oak
Rid
ge85
0
22
921
720
419
217
916
715
714
713
712
711
710
899
8980
7263
Uni
on G
rove
875
162
145
128
112
9578
6755
4433
2212
2(8
)(1
8)(2
8)(3
7)
Aud
ie M
urph
y87
5
11
110
610
196
9186
8687
8789
9092
9497
100
104
107
C. P
atte
rson
975
172
145
118
9265
388
(21)
(51)
(81)
(111
)(1
40)
(170
)(1
99)
(228
)(2
57)
(286
)
Roy
J. S
mith
1,25
0
19(5
)(2
9)(5
2)(7
6)(1
00)
(123
)(1
46)
(169
)(1
93)
(216
)(2
38)
(261
)(2
83)
(305
)(3
27)
(349
)
Tota
l - K
ISD
Stu
dy A
rea
9,75
0
1545
1382
1218
1055
891
728
589
454
320
187
55(7
4)(1
99)
(323
)(4
43)
(561
)(6
77)
HIG
H S
CH
OO
LS20
1920
2020
2120
2220
2320
2420
2520
2620
2720
2820
2920
3020
3120
3220
3320
3420
35
Kille
en H
igh
Scho
ol Z
one
2,27
5
316
285
254
224
193
162
148
134
122
111
100
9183
7671
6663
Ellis
on H
igh
Scho
ol Z
one
2,17
9
332
278
224
170
116
6315
(33)
(79)
(126
)(1
72)
(218
)(2
62)
(306
)(3
49)
(391
)(4
33)
Har
ker
Hei
ght H
igh
Scho
ol Z
one
2,01
1
354
316
278
241
203
165
139
114
8964
3915
(8)
(30)
(52)
(73)
(94)
Robe
rt Sh
oem
aker
Hig
h Sc
hool
Zon
e2,
011
16
512
279
37(6
)(4
9)(8
3)(1
17)
(150
)(1
83)
(216
)(2
47)
(278
)(3
09)
(338
)(3
67)
(396
)
Hig
h Sc
hool
No.
52,
500
1,
351
1,30
61,
262
1,21
71,
173
1,12
81,
064
999
934
867
801
734
667
599
532
464
396
Tota
l - K
ISD
Stu
dy A
rea
10,9
76
2,
518
2,30
82,
099
1,88
91,
679
1,46
91,
282
1,09
791
573
355
237
520
230
(137
)(3
01)
(464
)
Tota
l - K
ISD
Stu
dy A
rea
47,0
1312
,375
11,1
8110
,021
8,86
17,
702
6,54
25,
619
4,72
03,
836
2,96
02,
097
1,25
944
6(3
50)
(1,1
20)
(1,8
68)
(2,6
02)
Souc
e: K
ISD
and
RKG
Ass
ocia
tes,
Inc.
, 201
9
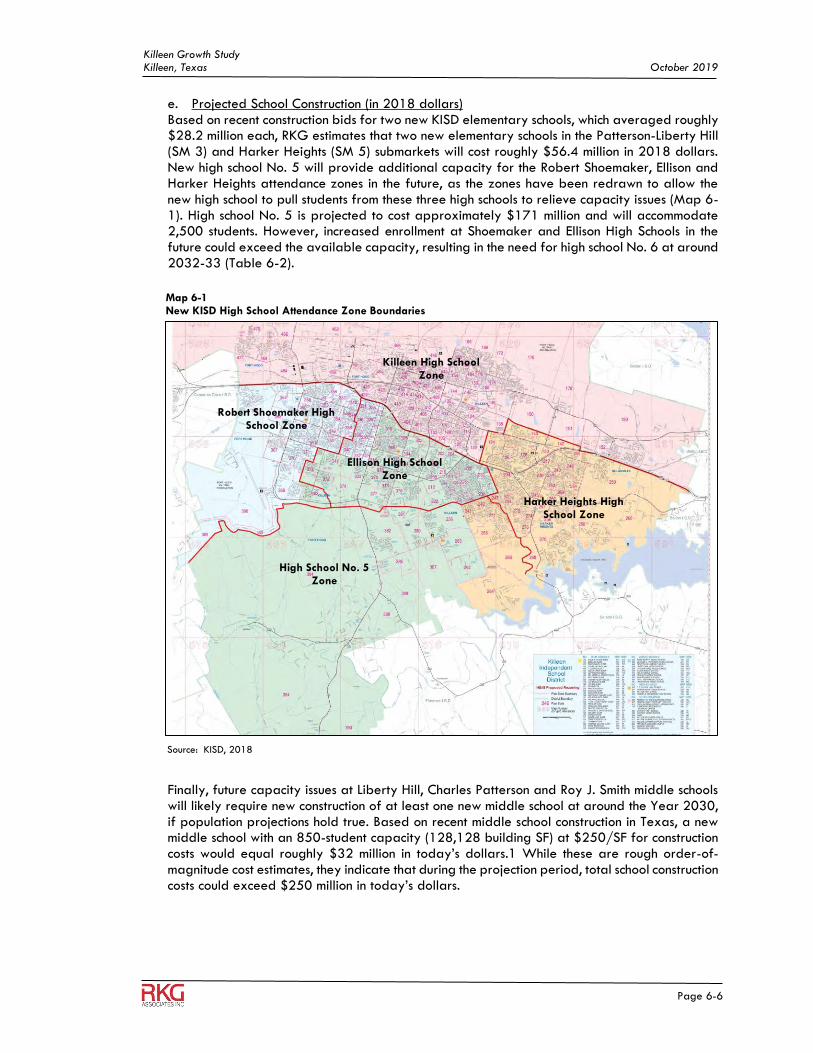
Killeen Growth Study Killeen, Texas October 2019
Page 6-6
e. Projected School Construction (in 2018 dollars) Based on recent construction bids for two new KISD elementary schools, which averaged roughly $28.2 million each, RKG estimates that two new elementary schools in the Patterson-Liberty Hill (SM 3) and Harker Heights (SM 5) submarkets will cost roughly $56.4 million in 2018 dollars. New high school No. 5 will provide additional capacity for the Robert Shoemaker, Ellison and Harker Heights attendance zones in the future, as the zones have been redrawn to allow the new high school to pull students from these three high schools to relieve capacity issues (Map 6-1). High school No. 5 is projected to cost approximately $171 million and will accommodate 2,500 students. However, increased enrollment at Shoemaker and Ellison High Schools in the future could exceed the available capacity, resulting in the need for high school No. 6 at around 2032-33 (Table 6-2).
Finally, future capacity issues at Liberty Hill, Charles Patterson and Roy J. Smith middle schools will likely require new construction of at least one new middle school at around the Year 2030, if population projections hold true. Based on recent middle school construction in Texas, a new middle school with an 850-student capacity (128,128 building SF) at $250/SF for construction costs would equal roughly $32 million in today’s dollars.1 While these are rough order-of-magnitude cost estimates, they indicate that during the projection period, total school construction costs could exceed $250 million in today’s dollars.
Killeen High School Zone
High School No. 5 Zone
Harker Heights High School Zone
Ellison High School Zone
Robert Shoemaker High School Zone
Map 6-1 New KISD High School Attendance Zone Boundaries
Source: KISD, 2018
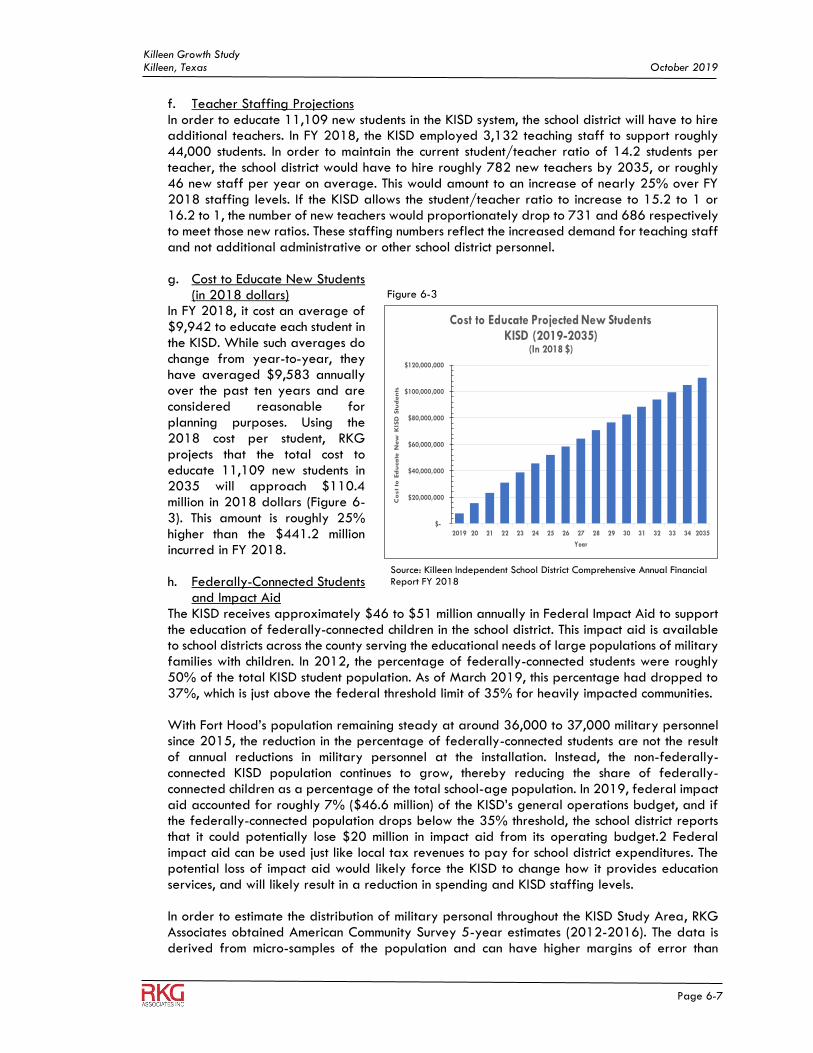
Killeen Growth Study Killeen, Texas October 2019
Page 6-7
f. Teacher Staffing Projections In order to educate 11,109 new students in the KISD system, the school district will have to hire additional teachers. In FY 2018, the KISD employed 3,132 teaching staff to support roughly 44,000 students. In order to maintain the current student/teacher ratio of 14.2 students per teacher, the school district would have to hire roughly 782 new teachers by 2035, or roughly 46 new staff per year on average. This would amount to an increase of nearly 25% over FY 2018 staffing levels. If the KISD allows the student/teacher ratio to increase to 15.2 to 1 or 16.2 to 1, the number of new teachers would proportionately drop to 731 and 686 respectively to meet those new ratios. These staffing numbers reflect the increased demand for teaching staff and not additional administrative or other school district personnel. g. Cost to Educate New Students
(in 2018 dollars) In FY 2018, it cost an average of $9,942 to educate each student in the KISD. While such averages do change from year-to-year, they have averaged $9,583 annually over the past ten years and are considered reasonable for planning purposes. Using the 2018 cost per student, RKG projects that the total cost to educate 11,109 new students in 2035 will approach $110.4 million in 2018 dollars (Figure 6-3). This amount is roughly 25% higher than the $441.2 million incurred in FY 2018. h. Federally-Connected Students
and Impact Aid The KISD receives approximately $46 to $51 million annually in Federal Impact Aid to support the education of federally-connected children in the school district. This impact aid is available to school districts across the county serving the educational needs of large populations of military families with children. In 2012, the percentage of federally-connected students were roughly 50% of the total KISD student population. As of March 2019, this percentage had dropped to 37%, which is just above the federal threshold limit of 35% for heavily impacted communities. With Fort Hood’s population remaining steady at around 36,000 to 37,000 military personnel since 2015, the reduction in the percentage of federally-connected students are not the result of annual reductions in military personnel at the installation. Instead, the non-federally-connected KISD population continues to grow, thereby reducing the share of federally-connected children as a percentage of the total school-age population. In 2019, federal impact aid accounted for roughly 7% ($46.6 million) of the KISD’s general operations budget, and if the federally-connected population drops below the 35% threshold, the school district reports that it could potentially lose $20 million in impact aid from its operating budget.2 Federal impact aid can be used just like local tax revenues to pay for school district expenditures. The potential loss of impact aid would likely force the KISD to change how it provides education services, and will likely result in a reduction in spending and KISD staffing levels. In order to estimate the distribution of military personal throughout the KISD Study Area, RKG Associates obtained American Community Survey 5-year estimates (2012-2016). The data is derived from micro-samples of the population and can have higher margins of error than
Figure 6-3
Source: Killeen Independent School District Comprehensive Annual Financial Report FY 2018
$-
$20,000,000
$40,000,000
$60,000,000
$80,000,000
$100,000,000
$120,000,000
2019 20 21 22 23 24 25 26 27 28 29 30 31 32 33 34 2035
Co
st
to E
du
ca
te N
ew
K
ISD
Stu
den
ts
Year
Cost to Educate Projected New StudentsKISD (2019-2035)
(In 2018 $)
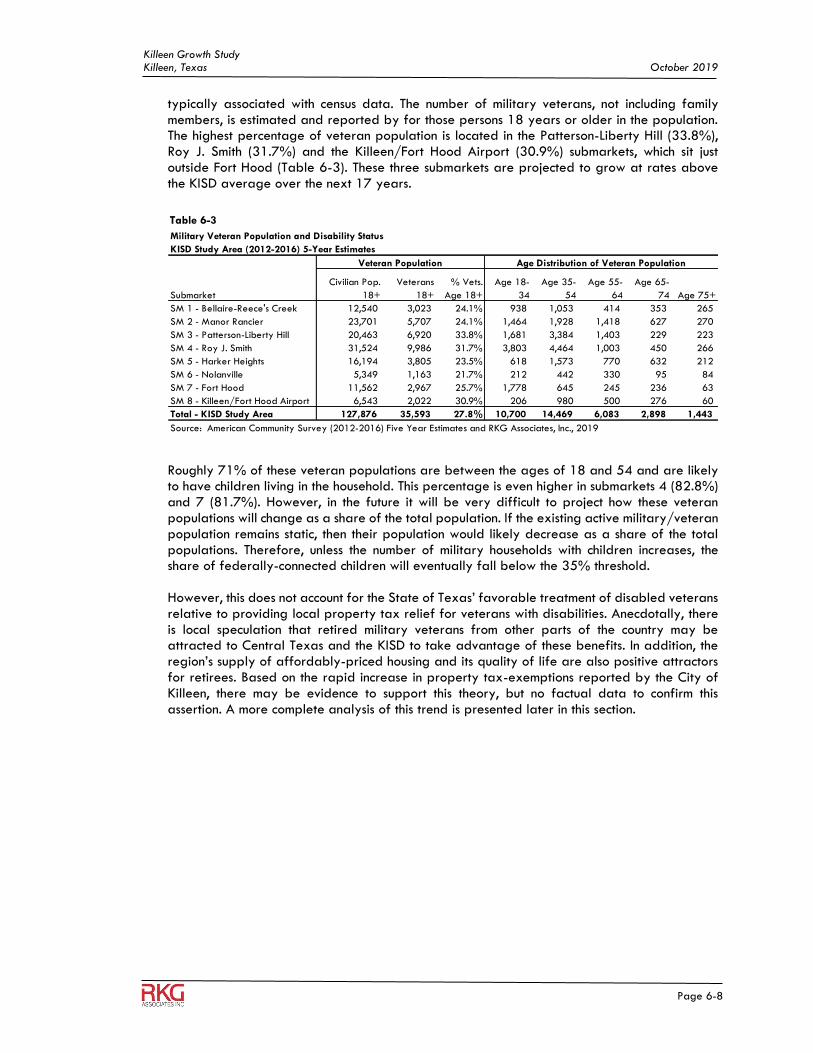
Killeen Growth Study Killeen, Texas October 2019
Page 6-8
typically associated with census data. The number of military veterans, not including family members, is estimated and reported by for those persons 18 years or older in the population. The highest percentage of veteran population is located in the Patterson-Liberty Hill (33.8%), Roy J. Smith (31.7%) and the Killeen/Fort Hood Airport (30.9%) submarkets, which sit just outside Fort Hood (Table 6-3). These three submarkets are projected to grow at rates above the KISD average over the next 17 years.
Roughly 71% of these veteran populations are between the ages of 18 and 54 and are likely to have children living in the household. This percentage is even higher in submarkets 4 (82.8%) and 7 (81.7%). However, in the future it will be very difficult to project how these veteran populations will change as a share of the total population. If the existing active military/veteran population remains static, then their population would likely decrease as a share of the total populations. Therefore, unless the number of military households with children increases, the share of federally-connected children will eventually fall below the 35% threshold. However, this does not account for the State of Texas’ favorable treatment of disabled veterans relative to providing local property tax relief for veterans with disabilities. Anecdotally, there is local speculation that retired military veterans from other parts of the country may be attracted to Central Texas and the KISD to take advantage of these benefits. In addition, the region’s supply of affordably-priced housing and its quality of life are also positive attractors for retirees. Based on the rapid increase in property tax-exemptions reported by the City of Killeen, there may be evidence to support this theory, but no factual data to confirm this assertion. A more complete analysis of this trend is presented later in this section.
Table 6-3
Military Veteran Population and Disability Status
KISD Study Area (2012-2016) 5-Year Estimates
Submarket
Civilian Pop.
18+
Veterans
18+
% Vets.
Age 18+
Age 18-
34
Age 35-
54
Age 55-
64
Age 65-
74 Age 75+
SM 1 - Bellaire-Reece's Creek 12,540 3,023 24.1% 938 1,053 414 353 265
SM 2 - Manor Rancier 23,701 5,707 24.1% 1,464 1,928 1,418 627 270
SM 3 - Patterson-Liberty Hill 20,463 6,920 33.8% 1,681 3,384 1,403 229 223
SM 4 - Roy J. Smith 31,524 9,986 31.7% 3,803 4,464 1,003 450 266
SM 5 - Harker Heights 16,194 3,805 23.5% 618 1,573 770 632 212
SM 6 - Nolanville 5,349 1,163 21.7% 212 442 330 95 84
SM 7 - Fort Hood 11,562 2,967 25.7% 1,778 645 245 236 63
SM 8 - Killeen/Fort Hood Airport 6,543 2,022 30.9% 206 980 500 276 60
Total - KISD Study Area 127,876 35,593 27.8% 10,700 14,469 6,083 2,898 1,443
Source: American Community Survey (2012-2016) Five Year Estimates and RKG Associates, Inc., 2019
Age Distribution of Veteran PopulationVeteran Population
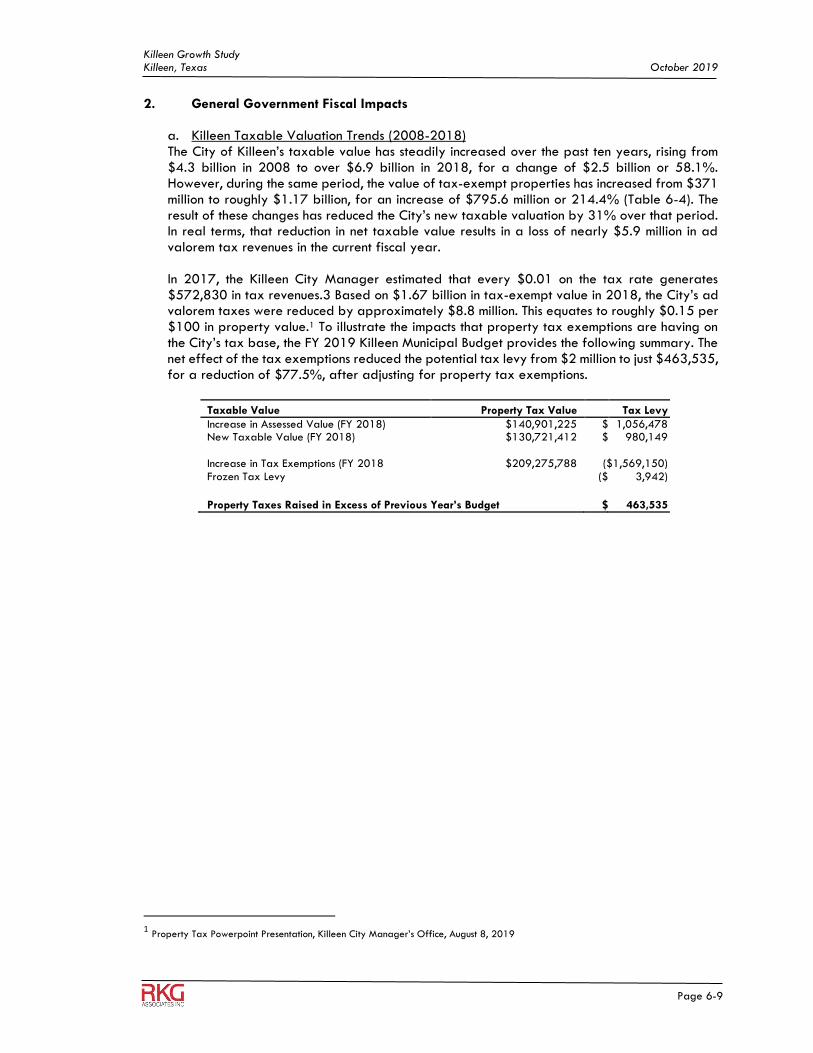
Killeen Growth Study Killeen, Texas October 2019
Page 6-9
2. General Government Fiscal Impacts
a. Killeen Taxable Valuation Trends (2008-2018) The City of Killeen’s taxable value has steadily increased over the past ten years, rising from $4.3 billion in 2008 to over $6.9 billion in 2018, for a change of $2.5 billion or 58.1%. However, during the same period, the value of tax-exempt properties has increased from $371 million to roughly $1.17 billion, for an increase of $795.6 million or 214.4% (Table 6-4). The result of these changes has reduced the City’s new taxable valuation by 31% over that period. In real terms, that reduction in net taxable value results in a loss of nearly $5.9 million in ad valorem tax revenues in the current fiscal year. In 2017, the Killeen City Manager estimated that every $0.01 on the tax rate generates $572,830 in tax revenues.3 Based on $1.67 billion in tax-exempt value in 2018, the City’s ad valorem taxes were reduced by approximately $8.8 million. This equates to roughly $0.15 per $100 in property value.1 To illustrate the impacts that property tax exemptions are having on the City’s tax base, the FY 2019 Killeen Municipal Budget provides the following summary. The net effect of the tax exemptions reduced the potential tax levy from $2 million to just $463,535, for a reduction of $77.5%, after adjusting for property tax exemptions.
1 Property Tax Powerpoint Presentation, Killeen City Manager’s Office, August 8, 2019
Taxable Value Property Tax Value Tax Levy Increase in Assessed Value (FY 2018) $140,901,225 $ 1,056,478 New Taxable Value (FY 2018) $130,721,412 $ 980,149
Increase in Tax Exemptions (FY 2018 $209,275,788 ($1,569,150) Frozen Tax Levy ($ 3,942)
Property Taxes Raised in Excess of Previous Year’s Budget $ 463,535
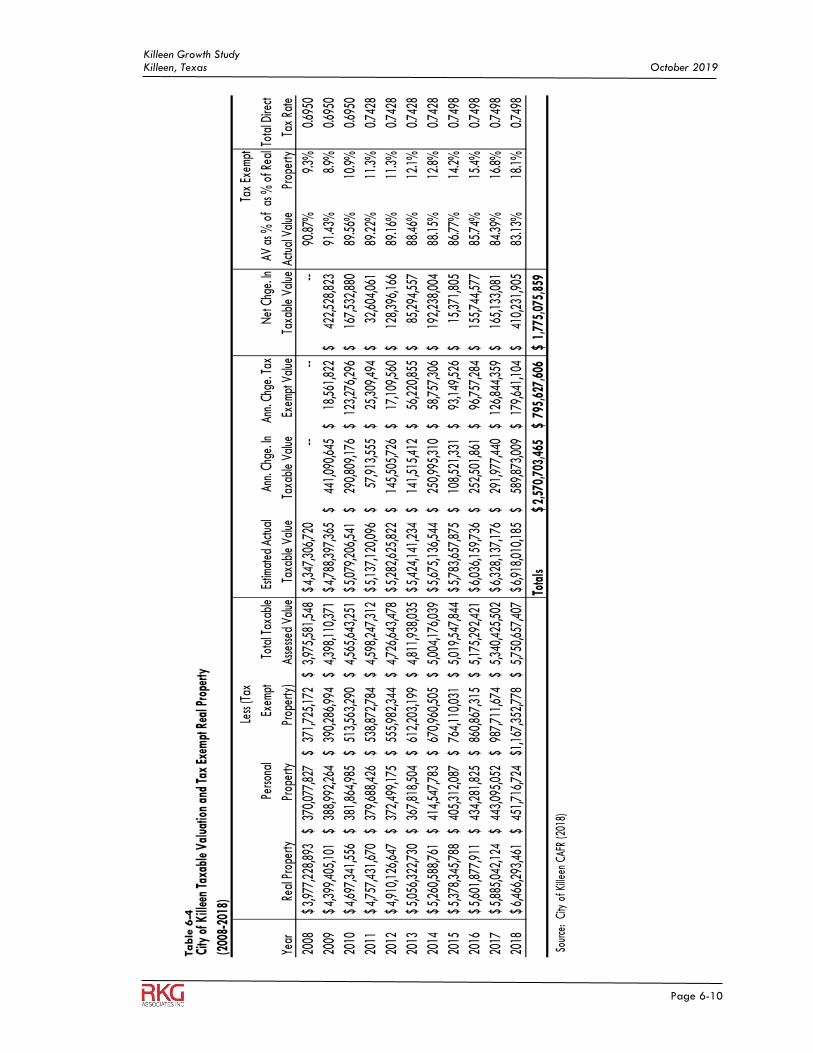
Killeen Growth Study Killeen, Texas October 2019
Page 6-10
Ta
ble
6-4
City
of K
illee
n Ta
xabl
e Va
luat
ion
and
Tax
Exem
pt R
eal P
rope
rty
(200
8-20
18)
Year
Rea
l Pro
perty
Per
sona
l
Prop
erty
Less
(Tax
Exem
pt
Prop
erty
)
Tot
al T
axab
le
Asse
ssed
Value
Esti
mate
d Ac
tual
Taxa
ble
Value
Ann
. Chg
e. In
Taxa
ble
Value
Ann.
Chge
. Tax
Exem
pt V
alue
Net
Chg
e. In
Taxa
ble
Value
AV a
s % o
f
Actu
al V
alue
Tax
Exem
pt
as %
of R
eal
Prop
erty
Tota
l Dire
ct
Tax
Rate
2008
3,97
7,22
8,89
3$
370,
077,
827
$
371,
725,
172
$
3,97
5,58
1,54
8$
4,
347,
306,
720
$ --
----
90.8
7%9.
3%0.
6950
2009
4,39
9,40
5,10
1$
388,
992,
264
$
390,
286,
994
$
4,39
8,11
0,37
1$
4,
788,
397,
365
$ 44
1,09
0,64
5$
18,5
61,8
22$
422,
528,
823
$
91
.43%
8.9%
0.69
50
2010
4,69
7,34
1,55
6$
381,
864,
985
$
513,
563,
290
$
4,56
5,64
3,25
1$
5,
079,
206,
541
$ 29
0,80
9,17
6$
123,
276,
296
$
167,
532,
880
$
89
.56%
10.9
%0.
6950
2011
4,75
7,43
1,67
0$
379,
688,
426
$
538,
872,
784
$
4,59
8,24
7,31
2$
5,
137,
120,
096
$ 57
,913
,555
$
25
,309
,494
$
32
,604
,061
$
89.2
2%11
.3%
0.74
28
2012
4,91
0,12
6,64
7$
372,
499,
175
$
555,
982,
344
$
4,72
6,64
3,47
8$
5,
282,
625,
822
$ 14
5,50
5,72
6$
17,1
09,5
60$
128,
396,
166
$
89
.16%
11.3
%0.
7428
2013
5,05
6,32
2,73
0$
367,
818,
504
$
612,
203,
199
$
4,81
1,93
8,03
5$
5,
424,
141,
234
$ 14
1,51
5,41
2$
56,2
20,8
55$
85,2
94,5
57$
88
.46%
12.1
%0.
7428
2014
5,26
0,58
8,76
1$
414,
547,
783
$
670,
960,
505
$
5,00
4,17
6,03
9$
5,
675,
136,
544
$ 25
0,99
5,31
0$
58,7
57,3
06$
192,
238,
004
$
88
.15%
12.8
%0.
7428
2015
5,37
8,34
5,78
8$
405,
312,
087
$
764,
110,
031
$
5,01
9,54
7,84
4$
5,
783,
657,
875
$ 10
8,52
1,33
1$
93,1
49,5
26$
15,3
71,8
05$
86
.77%
14.2
%0.
7498
2016
5,60
1,87
7,91
1$
434,
281,
825
$
860,
867,
315
$
5,17
5,29
2,42
1$
6,
036,
159,
736
$ 25
2,50
1,86
1$
96,7
57,2
84$
155,
744,
577
$
85
.74%
15.4
%0.
7498
2017
5,88
5,04
2,12
4$
443,
095,
052
$
987,
711,
674
$
5,34
0,42
5,50
2$
6,
328,
137,
176
$ 29
1,97
7,44
0$
126,
844,
359
$
165,
133,
081
$
84
.39%
16.8
%0.
7498
2018
6,46
6,29
3,46
1$
451,
716,
724
$
1,16
7,35
2,77
8$
5,75
0,65
7,40
7$
6,
918,
010,
185
$ 58
9,87
3,00
9$
179,
641,
104
$
410,
231,
905
$
83
.13%
18.1
%0.
7498
Tota
ls2,
570,
703,
465
$ 79
5,62
7,60
6$
1,
775,
075,
859
$
Sour
ce:
City
of K
illee
n CA
FR (2
018)
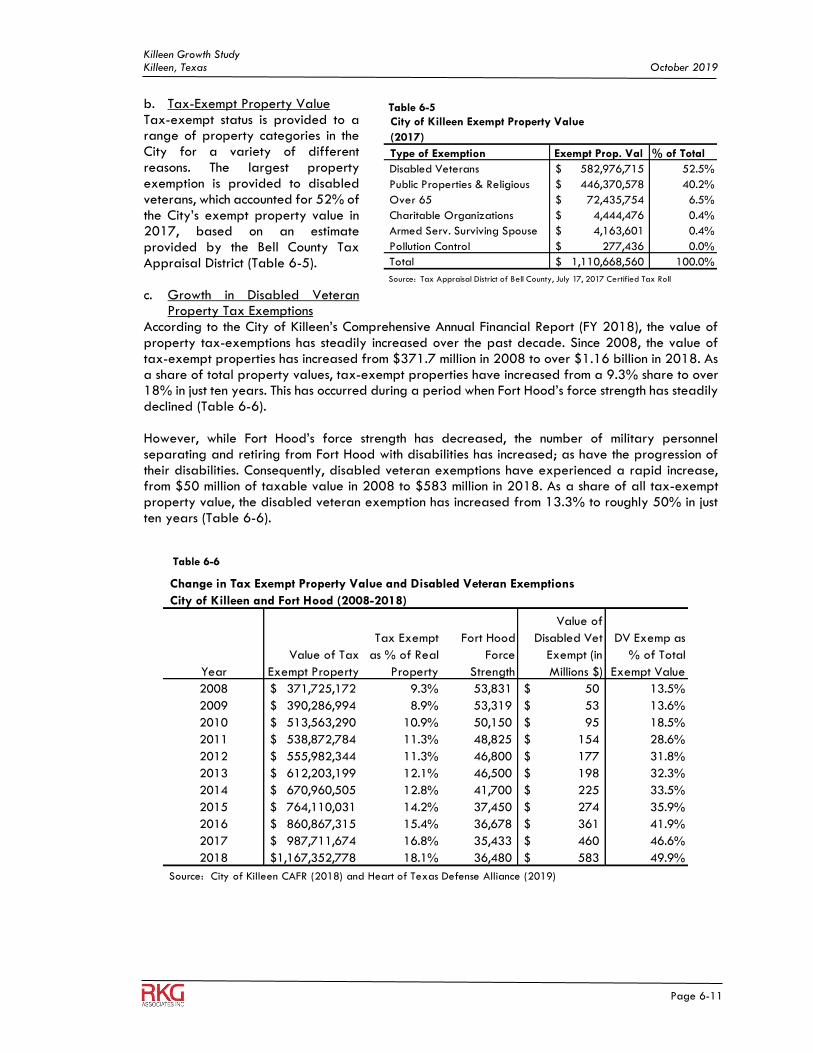
Killeen Growth Study Killeen, Texas October 2019
Page 6-11
b. Tax-Exempt Property Value Tax-exempt status is provided to a range of property categories in the City for a variety of different reasons. The largest property exemption is provided to disabled veterans, which accounted for 52% of the City’s exempt property value in 2017, based on an estimate provided by the Bell County Tax Appraisal District (Table 6-5). c. Growth in Disabled Veteran
Property Tax Exemptions According to the City of Killeen’s Comprehensive Annual Financial Report (FY 2018), the value of property tax-exemptions has steadily increased over the past decade. Since 2008, the value of tax-exempt properties has increased from $371.7 million in 2008 to over $1.16 billion in 2018. As a share of total property values, tax-exempt properties have increased from a 9.3% share to over 18% in just ten years. This has occurred during a period when Fort Hood’s force strength has steadily declined (Table 6-6). However, while Fort Hood’s force strength has decreased, the number of military personnel separating and retiring from Fort Hood with disabilities has increased; as have the progression of their disabilities. Consequently, disabled veteran exemptions have experienced a rapid increase, from $50 million of taxable value in 2008 to $583 million in 2018. As a share of all tax-exempt property value, the disabled veteran exemption has increased from 13.3% to roughly 50% in just ten years (Table 6-6).
Table 6-5
City of Killeen Exempt Property Value
(2017)
Type of Exemption Exempt Prop. Val % of Total
Disabled Veterans 582,976,715$ 52.5%
Public Properties & Religious 446,370,578$ 40.2%
Over 65 72,435,754$ 6.5%
Charitable Organizations 4,444,476$ 0.4%
Armed Serv. Surviving Spouse 4,163,601$ 0.4%
Pollution Control 277,436$ 0.0%
Total 1,110,668,560$ 100.0%
Source: Tax Appraisal District of Bell County, July 17, 2017 Certified Tax Roll
Table 6-6
Change in Tax Exempt Property Value and Disabled Veteran Exemptions
City of Killeen and Fort Hood (2008-2018)
Year
Value of Tax
Exempt Property
Tax Exempt
as % of Real
Property
Fort Hood
Force
Strength
Value of
Disabled Vet
Exempt (in
Millions $)
DV Exemp as
% of Total
Exempt Value
2008 371,725,172$ 9.3% 53,831 50$ 13.5%
2009 390,286,994$ 8.9% 53,319 53$ 13.6%
2010 513,563,290$ 10.9% 50,150 95$ 18.5%
2011 538,872,784$ 11.3% 48,825 154$ 28.6%
2012 555,982,344$ 11.3% 46,800 177$ 31.8%
2013 612,203,199$ 12.1% 46,500 198$ 32.3%
2014 670,960,505$ 12.8% 41,700 225$ 33.5%
2015 764,110,031$ 14.2% 37,450 274$ 35.9%
2016 860,867,315$ 15.4% 36,678 361$ 41.9%
2017 987,711,674$ 16.8% 35,433 460$ 46.6%
2018 1,167,352,778$ 18.1% 36,480 583$ 49.9%
Source: City of Killeen CAFR (2018) and Heart of Texas Defense Alliance (2019)
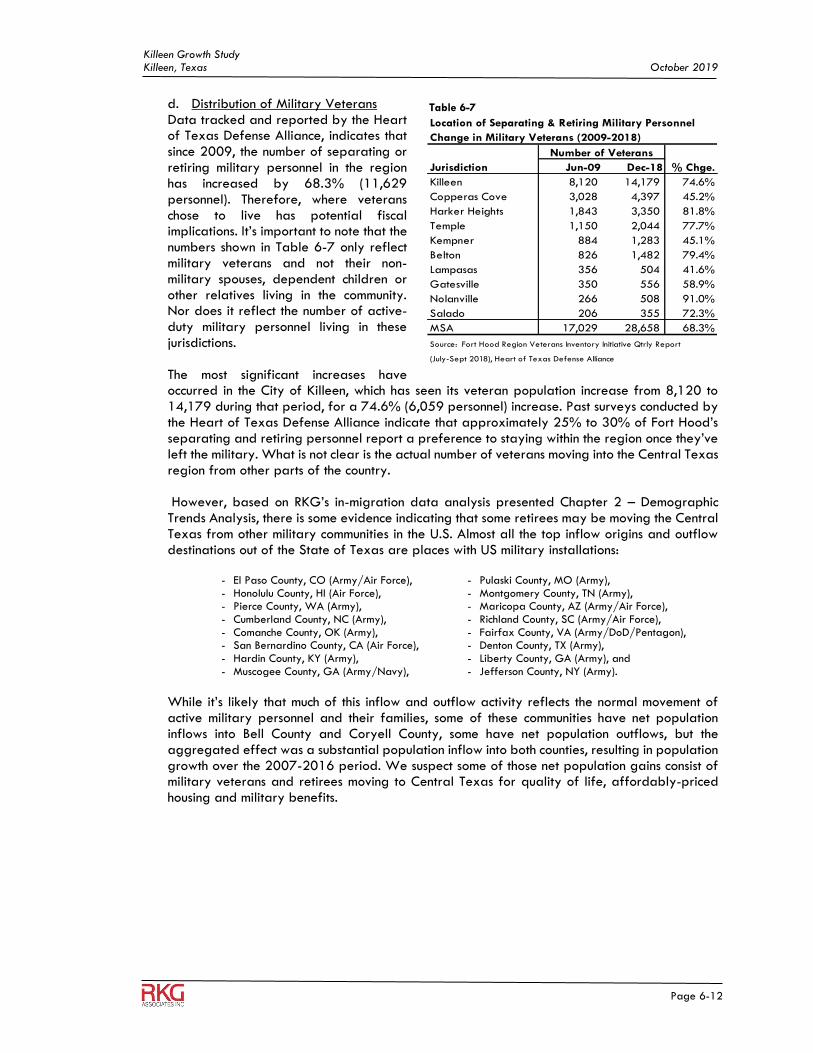
Killeen Growth Study Killeen, Texas October 2019
Page 6-12
d. Distribution of Military Veterans Data tracked and reported by the Heart of Texas Defense Alliance, indicates that since 2009, the number of separating or retiring military personnel in the region has increased by 68.3% (11,629 personnel). Therefore, where veterans chose to live has potential fiscal implications. It’s important to note that the numbers shown in Table 6-7 only reflect military veterans and not their non-military spouses, dependent children or other relatives living in the community. Nor does it reflect the number of active-duty military personnel living in these jurisdictions. The most significant increases have occurred in the City of Killeen, which has seen its veteran population increase from 8,120 to 14,179 during that period, for a 74.6% (6,059 personnel) increase. Past surveys conducted by the Heart of Texas Defense Alliance indicate that approximately 25% to 30% of Fort Hood’s separating and retiring personnel report a preference to staying within the region once they’ve left the military. What is not clear is the actual number of veterans moving into the Central Texas region from other parts of the country. However, based on RKG’s in-migration data analysis presented Chapter 2 – Demographic Trends Analysis, there is some evidence indicating that some retirees may be moving the Central Texas from other military communities in the U.S. Almost all the top inflow origins and outflow destinations out of the State of Texas are places with US military installations:
- El Paso County, CO (Army/Air Force), - Honolulu County, HI (Air Force), - Pierce County, WA (Army), - Cumberland County, NC (Army), - Comanche County, OK (Army), - San Bernardino County, CA (Air Force), - Hardin County, KY (Army), - Muscogee County, GA (Army/Navy),
- Pulaski County, MO (Army), - Montgomery County, TN (Army), - Maricopa County, AZ (Army/Air Force), - Richland County, SC (Army/Air Force), - Fairfax County, VA (Army/DoD/Pentagon), - Denton County, TX (Army), - Liberty County, GA (Army), and - Jefferson County, NY (Army).
While it’s likely that much of this inflow and outflow activity reflects the normal movement of active military personnel and their families, some of these communities have net population inflows into Bell County and Coryell County, some have net population outflows, but the aggregated effect was a substantial population inflow into both counties, resulting in population growth over the 2007-2016 period. We suspect some of those net population gains consist of military veterans and retirees moving to Central Texas for quality of life, affordably-priced housing and military benefits.
Table 6-7
Location of Separating & Retiring Military Personnel
Change in Military Veterans (2009-2018)
Jurisdiction Jun-09 Dec-18 % Chge.
Killeen 8,120 14,179 74.6%
Copperas Cove 3,028 4,397 45.2%
Harker Heights 1,843 3,350 81.8%
Temple 1,150 2,044 77.7%
Kempner 884 1,283 45.1%
Belton 826 1,482 79.4%
Lampasas 356 504 41.6%
Gatesville 350 556 58.9%
Nolanville 266 508 91.0%
Salado 206 355 72.3%
MSA 17,029 28,658 68.3%
Source: Fort Hood Region Veterans Inventory Initiative Qtrly Report
(July-Sept 2018), Heart of Texas Defense Alliance
Number of Veterans
Killeen Growth Study Killeen, Texas October 2019
Page 6-13
KILLEEN, Texas - A City in Central Texas has Won the Title of a Top Retirement Destination in the Country
Where to Retire Magazine's January/February 2019 issue focuses on cities where taxes are low and residents can get the most bang for their buck. Killeen made the cut along with seven other U.S. cities. After looking at income, property, and other taxes, it made the list since Texas doesn't impose a state income tax. It also came out on top because Killeen businesses often offer discounts to the military and their families. After living in 18 different places, a military couple featured in the article says they wanted to retire close to their favorite military base where they could continue to contribute to the community.
"Being able to stay in the military community again- it's what both of us have known our entire lives,” says Ken Cox, who retired as a Deputy Commanding General for III Corps after 36 years in the military. “It gave to us for the first 58, 59 years of our lives, so this is a chance to stay connected to our roots.”
“But Fort Hood is not just another post,” adds his wife Anna Marie. “Fort Hood is very special because of the communities that surround Fort Hood and the support. It's been incredible- we just love it!”
The couple actually resides in Harker Heights which has a slightly lower tax rate than Killeen. However, they both continue to work on Fort Hood. Ken helps veterans find jobs through Workforce Solutions and Anna Marie is the manager of the Heart of Hood, a non-profit gift shop. The couple originally planned to retire near the Dallas area, but are glad they didn’t.
“If you are considering coming someplace where the community absolutely rises up to take care of soldiers, any military member, whether they are active duty or retired veterans, it’s just the place to be,” says Ken. “If somebody is living in some other military installation outside the state of Texas, I would strongly encourage them to come here because the people just absolutely love their military families.” He also adds that for the price, they couldn't get their more than three-thousand square-foot house with views overlooking the city anywhere else.
Although Anna Marie prefers to stay home, the couple also enjoys the access they have to a variety of activities.
“There's just so many opportunities here, and it's not just right outside the gates of Fort Hood, but within a one-hour drive north, south, east, west,” adds Ken. “There's just so many places to eat and visit, so that's another reason why staying here in Central Texas was just so wonderful.”
Other cities that made the list include Clearwater, Florida and Clemson, South Carolina.
Source: Where to Retire Magazine, January/February, 2019
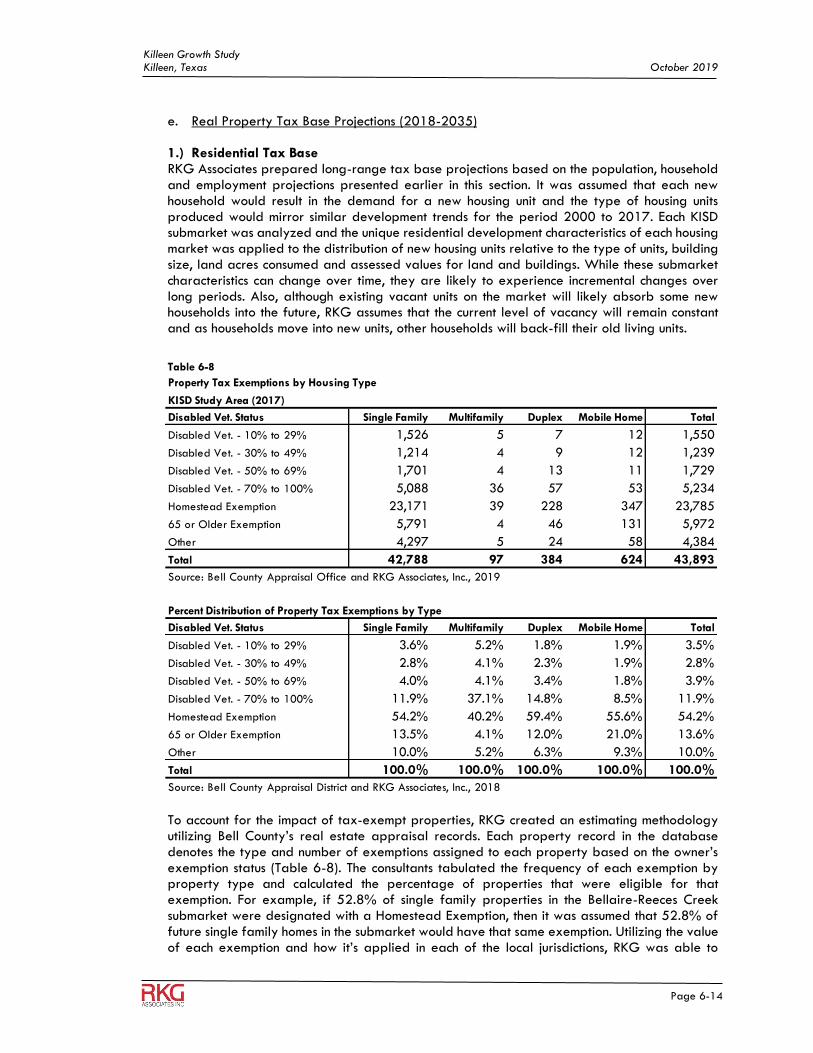
Killeen Growth Study Killeen, Texas October 2019
Page 6-14
e. Real Property Tax Base Projections (2018-2035) 1.) Residential Tax Base RKG Associates prepared long-range tax base projections based on the population, household and employment projections presented earlier in this section. It was assumed that each new household would result in the demand for a new housing unit and the type of housing units produced would mirror similar development trends for the period 2000 to 2017. Each KISD submarket was analyzed and the unique residential development characteristics of each housing market was applied to the distribution of new housing units relative to the type of units, building size, land acres consumed and assessed values for land and buildings. While these submarket characteristics can change over time, they are likely to experience incremental changes over long periods. Also, although existing vacant units on the market will likely absorb some new households into the future, RKG assumes that the current level of vacancy will remain constant and as households move into new units, other households will back-fill their old living units.
To account for the impact of tax-exempt properties, RKG created an estimating methodology utilizing Bell County’s real estate appraisal records. Each property record in the database denotes the type and number of exemptions assigned to each property based on the owner’s exemption status (Table 6-8). The consultants tabulated the frequency of each exemption by property type and calculated the percentage of properties that were eligible for that exemption. For example, if 52.8% of single family properties in the Bellaire-Reeces Creek submarket were designated with a Homestead Exemption, then it was assumed that 52.8% of future single family homes in the submarket would have that same exemption. Utilizing the value of each exemption and how it’s applied in each of the local jurisdictions, RKG was able to
Table 6-8
Property Tax Exemptions by Housing Type
KISD Study Area (2017)
Disabled Vet. Status Single Family Multifamily Duplex Mobile Home Total
Disabled Vet. - 10% to 29% 1,526 5 7 12 1,550
Disabled Vet. - 30% to 49% 1,214 4 9 12 1,239
Disabled Vet. - 50% to 69% 1,701 4 13 11 1,729
Disabled Vet. - 70% to 100% 5,088 36 57 53 5,234
Homestead Exemption 23,171 39 228 347 23,785
65 or Older Exemption 5,791 4 46 131 5,972
Other 4,297 5 24 58 4,384
Total 42,788 97 384 624 43,893
Source: Bell County Appraisal Office and RKG Associates, Inc., 2019
Percent Distribution of Property Tax Exemptions by Type
Disabled Vet. Status Single Family Multifamily Duplex Mobile Home Total
Disabled Vet. - 10% to 29% 3.6% 5.2% 1.8% 1.9% 3.5%
Disabled Vet. - 30% to 49% 2.8% 4.1% 2.3% 1.9% 2.8%
Disabled Vet. - 50% to 69% 4.0% 4.1% 3.4% 1.8% 3.9%
Disabled Vet. - 70% to 100% 11.9% 37.1% 14.8% 8.5% 11.9%
Homestead Exemption 54.2% 40.2% 59.4% 55.6% 54.2%
65 or Older Exemption 13.5% 4.1% 12.0% 21.0% 13.6%
Other 10.0% 5.2% 6.3% 9.3% 10.0%
Total 100.0% 100.0% 100.0% 100.0% 100.0%
Source: Bell County Appraisal District and RKG Associates, Inc., 2018
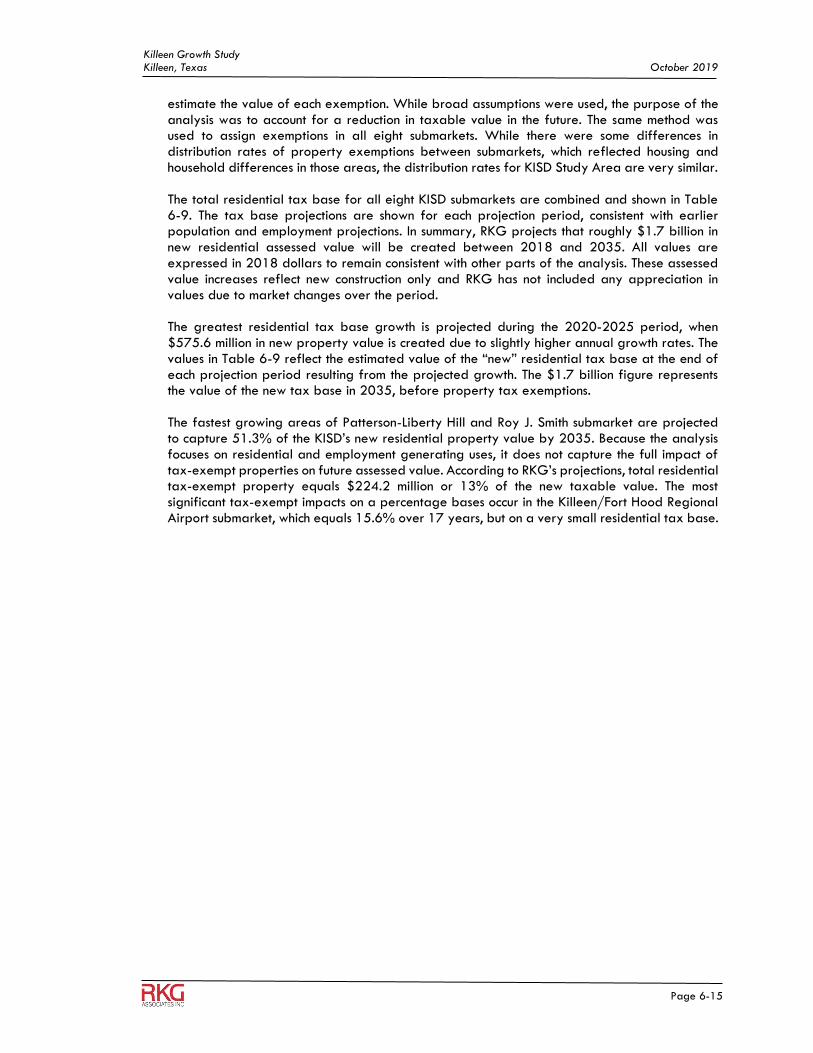
Killeen Growth Study Killeen, Texas October 2019
Page 6-15
estimate the value of each exemption. While broad assumptions were used, the purpose of the analysis was to account for a reduction in taxable value in the future. The same method was used to assign exemptions in all eight submarkets. While there were some differences in distribution rates of property exemptions between submarkets, which reflected housing and household differences in those areas, the distribution rates for KISD Study Area are very similar. The total residential tax base for all eight KISD submarkets are combined and shown in Table 6-9. The tax base projections are shown for each projection period, consistent with earlier population and employment projections. In summary, RKG projects that roughly $1.7 billion in new residential assessed value will be created between 2018 and 2035. All values are expressed in 2018 dollars to remain consistent with other parts of the analysis. These assessed value increases reflect new construction only and RKG has not included any appreciation in values due to market changes over the period. The greatest residential tax base growth is projected during the 2020-2025 period, when $575.6 million in new property value is created due to slightly higher annual growth rates. The values in Table 6-9 reflect the estimated value of the “new” residential tax base at the end of each projection period resulting from the projected growth. The $1.7 billion figure represents the value of the new tax base in 2035, before property tax exemptions. The fastest growing areas of Patterson-Liberty Hill and Roy J. Smith submarket are projected to capture 51.3% of the KISD’s new residential property value by 2035. Because the analysis focuses on residential and employment generating uses, it does not capture the full impact of tax-exempt properties on future assessed value. According to RKG’s projections, total residential tax-exempt property equals $224.2 million or 13% of the new taxable value. The most significant tax-exempt impacts on a percentage bases occur in the Killeen/Fort Hood Regional Airport submarket, which equals 15.6% over 17 years, but on a very small residential tax base.
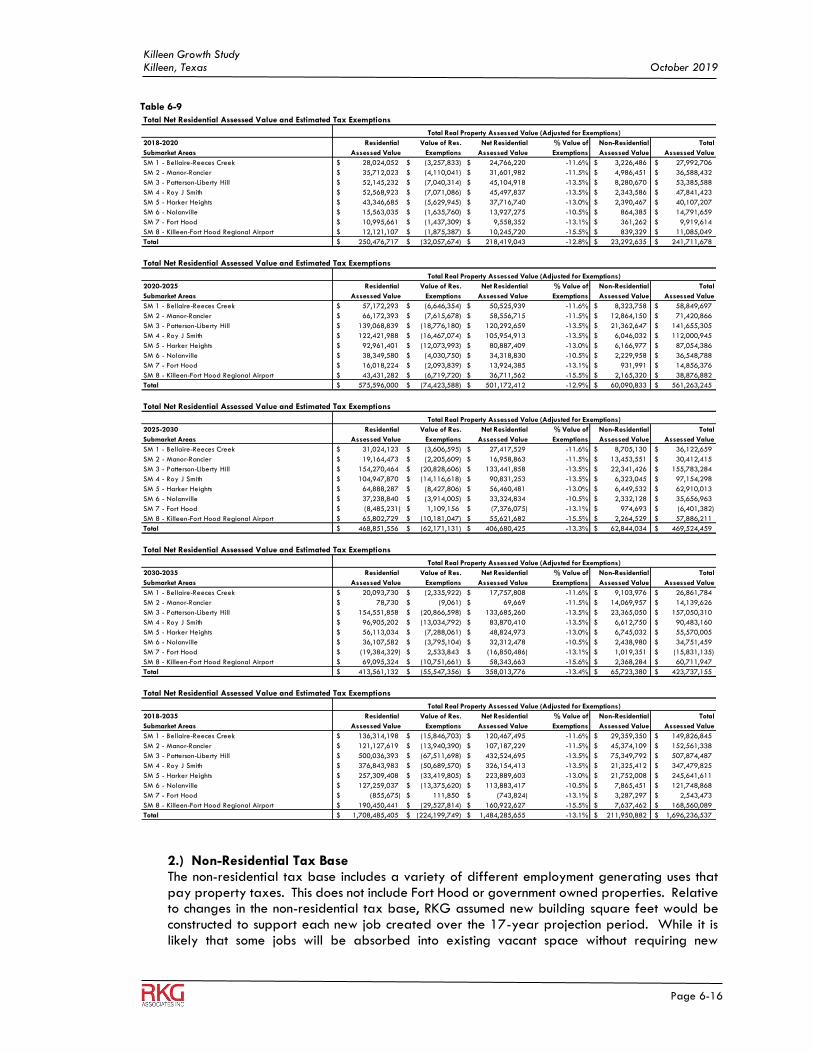
Killeen Growth Study Killeen, Texas October 2019
Page 6-16
2.) Non-Residential Tax Base The non-residential tax base includes a variety of different employment generating uses that pay property taxes. This does not include Fort Hood or government owned properties. Relative to changes in the non-residential tax base, RKG assumed new building square feet would be constructed to support each new job created over the 17-year projection period. While it is likely that some jobs will be absorbed into existing vacant space without requiring new
Table 6-9
Total Net Residential Assessed Value and Estimated Tax Exemptions
2018-2020 Residential Value of Res. Net Residential % Value of Non-Residential Total
Submarket Areas Assessed Value Exemptions Assessed Value Exemptions Assessed Value Assessed Value
SM 1 - Bellaire-Reeces Creek 28,024,052$ (3,257,833)$ 24,766,220$ -11.6% 3,226,486$ 27,992,706$
SM 2 - Manor-Rancier 35,712,023$ (4,110,041)$ 31,601,982$ -11.5% 4,986,451$ 36,588,432$
SM 3 - Patterson-Liberty Hill 52,145,232$ (7,040,314)$ 45,104,918$ -13.5% 8,280,670$ 53,385,588$
SM 4 - Roy J Smith 52,568,923$ (7,071,086)$ 45,497,837$ -13.5% 2,343,586$ 47,841,423$
SM 5 - Harker Heights 43,346,685$ (5,629,945)$ 37,716,740$ -13.0% 2,390,467$ 40,107,207$
SM 6 - Nolanville 15,563,035$ (1,635,760)$ 13,927,275$ -10.5% 864,385$ 14,791,659$
SM 7 - Fort Hood 10,995,661$ (1,437,309)$ 9,558,352$ -13.1% 361,262$ 9,919,614$
SM 8 - Killeen-Fort Hood Regional Airport 12,121,107$ (1,875,387)$ 10,245,720$ -15.5% 839,329$ 11,085,049$
Total 250,476,717$ (32,057,674)$ 218,419,043$ -12.8% 23,292,635$ 241,711,678$
Total Net Residential Assessed Value and Estimated Tax Exemptions
2020-2025 Residential Value of Res. Net Residential % Value of Non-Residential Total
Submarket Areas Assessed Value Exemptions Assessed Value Exemptions Assessed Value Assessed Value
SM 1 - Bellaire-Reeces Creek 57,172,293$ (6,646,354)$ 50,525,939$ -11.6% 8,323,758$ 58,849,697$
SM 2 - Manor-Rancier 66,172,393$ (7,615,678)$ 58,556,715$ -11.5% 12,864,150$ 71,420,866$
SM 3 - Patterson-Liberty Hill 139,068,839$ (18,776,180)$ 120,292,659$ -13.5% 21,362,647$ 141,655,305$
SM 4 - Roy J Smith 122,421,988$ (16,467,074)$ 105,954,913$ -13.5% 6,046,032$ 112,000,945$
SM 5 - Harker Heights 92,961,401$ (12,073,993)$ 80,887,409$ -13.0% 6,166,977$ 87,054,386$
SM 6 - Nolanville 38,349,580$ (4,030,750)$ 34,318,830$ -10.5% 2,229,958$ 36,548,788$
SM 7 - Fort Hood 16,018,224$ (2,093,839)$ 13,924,385$ -13.1% 931,991$ 14,856,376$
SM 8 - Killeen-Fort Hood Regional Airport 43,431,282$ (6,719,720)$ 36,711,562$ -15.5% 2,165,320$ 38,876,882$
Total 575,596,000$ (74,423,588)$ 501,172,412$ -12.9% 60,090,833$ 561,263,245$
Total Net Residential Assessed Value and Estimated Tax Exemptions
2025-2030 Residential Value of Res. Net Residential % Value of Non-Residential Total
Submarket Areas Assessed Value Exemptions Assessed Value Exemptions Assessed Value Assessed Value
SM 1 - Bellaire-Reeces Creek 31,024,123$ (3,606,595)$ 27,417,529$ -11.6% 8,705,130$ 36,122,659$
SM 2 - Manor-Rancier 19,164,473$ (2,205,609)$ 16,958,863$ -11.5% 13,453,551$ 30,412,415$
SM 3 - Patterson-Liberty Hill 154,270,464$ (20,828,606)$ 133,441,858$ -13.5% 22,341,426$ 155,783,284$
SM 4 - Roy J Smith 104,947,870$ (14,116,618)$ 90,831,253$ -13.5% 6,323,045$ 97,154,298$
SM 5 - Harker Heights 64,888,287$ (8,427,806)$ 56,460,481$ -13.0% 6,449,532$ 62,910,013$
SM 6 - Nolanville 37,238,840$ (3,914,005)$ 33,324,834$ -10.5% 2,332,128$ 35,656,963$
SM 7 - Fort Hood (8,485,231)$ 1,109,156$ (7,376,075)$ -13.1% 974,693$ (6,401,382)$
SM 8 - Killeen-Fort Hood Regional Airport 65,802,729$ (10,181,047)$ 55,621,682$ -15.5% 2,264,529$ 57,886,211$
Total 468,851,556$ (62,171,131)$ 406,680,425$ -13.3% 62,844,034$ 469,524,459$
Total Net Residential Assessed Value and Estimated Tax Exemptions
2030-2035 Residential Value of Res. Net Residential % Value of Non-Residential Total
Submarket Areas Assessed Value Exemptions Assessed Value Exemptions Assessed Value Assessed Value
SM 1 - Bellaire-Reeces Creek 20,093,730$ (2,335,922)$ 17,757,808$ -11.6% 9,103,976$ 26,861,784$
SM 2 - Manor-Rancier 78,730$ (9,061)$ 69,669$ -11.5% 14,069,957$ 14,139,626$
SM 3 - Patterson-Liberty Hill 154,551,858$ (20,866,598)$ 133,685,260$ -13.5% 23,365,050$ 157,050,310$
SM 4 - Roy J Smith 96,905,202$ (13,034,792)$ 83,870,410$ -13.5% 6,612,750$ 90,483,160$
SM 5 - Harker Heights 56,113,034$ (7,288,061)$ 48,824,973$ -13.0% 6,745,032$ 55,570,005$
SM 6 - Nolanville 36,107,582$ (3,795,104)$ 32,312,478$ -10.5% 2,438,980$ 34,751,459$
SM 7 - Fort Hood (19,384,329)$ 2,533,843$ (16,850,486)$ -13.1% 1,019,351$ (15,831,135)$
SM 8 - Killeen-Fort Hood Regional Airport 69,095,324$ (10,751,661)$ 58,343,663$ -15.6% 2,368,284$ 60,711,947$
Total 413,561,132$ (55,547,356)$ 358,013,776$ -13.4% 65,723,380$ 423,737,155$
Total Net Residential Assessed Value and Estimated Tax Exemptions
2018-2035 Residential Value of Res. Net Residential % Value of Non-Residential Total
Submarket Areas Assessed Value Exemptions Assessed Value Exemptions Assessed Value Assessed Value
SM 1 - Bellaire-Reeces Creek 136,314,198$ (15,846,703)$ 120,467,495$ -11.6% 29,359,350$ 149,826,845$
SM 2 - Manor-Rancier 121,127,619$ (13,940,390)$ 107,187,229$ -11.5% 45,374,109$ 152,561,338$
SM 3 - Patterson-Liberty Hill 500,036,393$ (67,511,698)$ 432,524,695$ -13.5% 75,349,792$ 507,874,487$
SM 4 - Roy J Smith 376,843,983$ (50,689,570)$ 326,154,413$ -13.5% 21,325,412$ 347,479,825$
SM 5 - Harker Heights 257,309,408$ (33,419,805)$ 223,889,603$ -13.0% 21,752,008$ 245,641,611$
SM 6 - Nolanville 127,259,037$ (13,375,620)$ 113,883,417$ -10.5% 7,865,451$ 121,748,868$
SM 7 - Fort Hood (855,675)$ 111,850$ (743,824)$ -13.1% 3,287,297$ 2,543,473$
SM 8 - Killeen-Fort Hood Regional Airport 190,450,441$ (29,527,814)$ 160,922,627$ -15.5% 7,637,462$ 168,560,089$
Total 1,708,485,405$ (224,199,749)$ 1,484,285,655$ -13.1% 211,950,882$ 1,696,236,537$
Total Real Property Assessed Value (Adjusted for Exemptions)
Total Real Property Assessed Value (Adjusted for Exemptions)
Total Real Property Assessed Value (Adjusted for Exemptions)
Total Real Property Assessed Value (Adjusted for Exemptions)
Total Real Property Assessed Value (Adjusted for Exemptions)
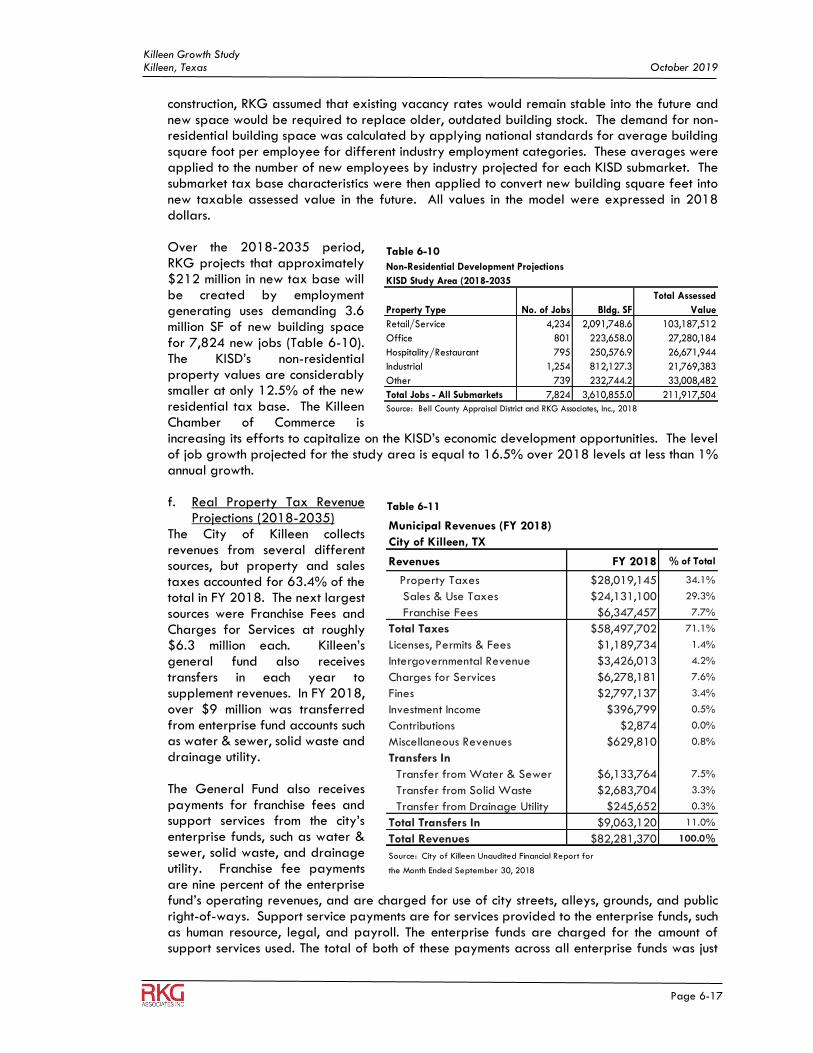
Killeen Growth Study Killeen, Texas October 2019
Page 6-17
construction, RKG assumed that existing vacancy rates would remain stable into the future and new space would be required to replace older, outdated building stock. The demand for non-residential building space was calculated by applying national standards for average building square foot per employee for different industry employment categories. These averages were applied to the number of new employees by industry projected for each KISD submarket. The submarket tax base characteristics were then applied to convert new building square feet into new taxable assessed value in the future. All values in the model were expressed in 2018 dollars. Over the 2018-2035 period, RKG projects that approximately $212 million in new tax base will be created by employment generating uses demanding 3.6 million SF of new building space for 7,824 new jobs (Table 6-10). The KISD’s non-residential property values are considerably smaller at only 12.5% of the new residential tax base. The Killeen Chamber of Commerce is increasing its efforts to capitalize on the KISD’s economic development opportunities. The level of job growth projected for the study area is equal to 16.5% over 2018 levels at less than 1% annual growth. f. Real Property Tax Revenue
Projections (2018-2035) The City of Killeen collects revenues from several different sources, but property and sales taxes accounted for 63.4% of the total in FY 2018. The next largest sources were Franchise Fees and Charges for Services at roughly $6.3 million each. Killeen’s general fund also receives transfers in each year to supplement revenues. In FY 2018, over $9 million was transferred from enterprise fund accounts such as water & sewer, solid waste and drainage utility. The General Fund also receives payments for franchise fees and support services from the city’s enterprise funds, such as water & sewer, solid waste, and drainage utility. Franchise fee payments are nine percent of the enterprise fund’s operating revenues, and are charged for use of city streets, alleys, grounds, and public right-of-ways. Support service payments are for services provided to the enterprise funds, such as human resource, legal, and payroll. The enterprise funds are charged for the amount of support services used. The total of both of these payments across all enterprise funds was just
Non-Residential Development Projections
KISD Study Area (2018-2035
Property Type No. of Jobs Bldg. SF
Total Assessed
Value
Retail/Service 4,234 2,091,748.6 103,187,512
Office 801 223,658.0 27,280,184
Hospitality/Restaurant 795 250,576.9 26,671,944
Industrial 1,254 812,127.3 21,769,383
Other 739 232,744.2 33,008,482
Total Jobs - All Submarkets 7,824 3,610,855.0 211,917,504
Source: Bell County Appraisal District and RKG Associates, Inc., 2018
Table 6-10
Table 6-11
Municipal Revenues (FY 2018)
City of Killeen, TX
Revenues FY 2018 % of Total
Property Taxes $28,019,145 34.1%
Sales & Use Taxes $24,131,100 29.3%
Franchise Fees $6,347,457 7.7%
Total Taxes $58,497,702 71.1%
Licenses, Permits & Fees $1,189,734 1.4%
Intergovernmental Revenue $3,426,013 4.2%
Charges for Services $6,278,181 7.6%
Fines $2,797,137 3.4%
Investment Income $396,799 0.5%
Contributions $2,874 0.0%
Miscellaneous Revenues $629,810 0.8%
Transfers In
Transfer from Water & Sewer $6,133,764 7.5%
Transfer from Solid Waste $2,683,704 3.3%
Transfer from Drainage Utility $245,652 0.3%
Total Transfers In $9,063,120 11.0%
Total Revenues $82,281,370 100.0%
Source: City of Killeen Unaudited Financial Report for
the Month Ended September 30, 2018
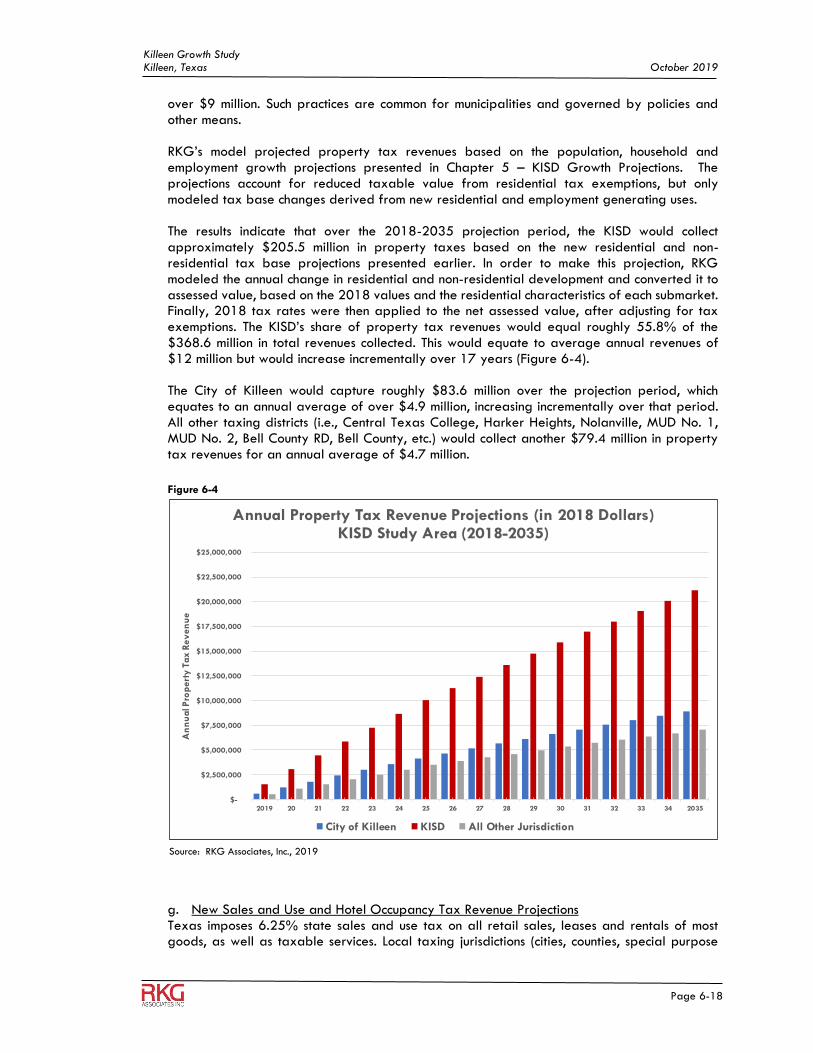
Killeen Growth Study Killeen, Texas October 2019
Page 6-18
over $9 million. Such practices are common for municipalities and governed by policies and other means. RKG’s model projected property tax revenues based on the population, household and employment growth projections presented in Chapter 5 – KISD Growth Projections. The projections account for reduced taxable value from residential tax exemptions, but only modeled tax base changes derived from new residential and employment generating uses. The results indicate that over the 2018-2035 projection period, the KISD would collect approximately $205.5 million in property taxes based on the new residential and non-residential tax base projections presented earlier. In order to make this projection, RKG modeled the annual change in residential and non-residential development and converted it to assessed value, based on the 2018 values and the residential characteristics of each submarket. Finally, 2018 tax rates were then applied to the net assessed value, after adjusting for tax exemptions. The KISD’s share of property tax revenues would equal roughly 55.8% of the $368.6 million in total revenues collected. This would equate to average annual revenues of $12 million but would increase incrementally over 17 years (Figure 6-4). The City of Killeen would capture roughly $83.6 million over the projection period, which equates to an annual average of over $4.9 million, increasing incrementally over that period. All other taxing districts (i.e., Central Texas College, Harker Heights, Nolanville, MUD No. 1, MUD No. 2, Bell County RD, Bell County, etc.) would collect another $79.4 million in property tax revenues for an annual average of $4.7 million.
g. New Sales and Use and Hotel Occupancy Tax Revenue Projections Texas imposes 6.25% state sales and use tax on all retail sales, leases and rentals of most goods, as well as taxable services. Local taxing jurisdictions (cities, counties, special purpose
Figure 6-4
Source: RKG Associates, Inc., 2019
$-
$2,500,000
$5,000,000
$7,500,000
$10,000,000
$12,500,000
$15,000,000
$17,500,000
$20,000,000
$22,500,000
$25,000,000
2019 20 21 22 23 24 25 26 27 28 29 30 31 32 33 34 2035
An
nu
al P
rop
ert
y T
ax
Rev
en
ue
Annual Property Tax Revenue Projections (in 2018 Dollars)KISD Study Area (2018-2035)
City of Killeen KISD All Other Jurisdiction
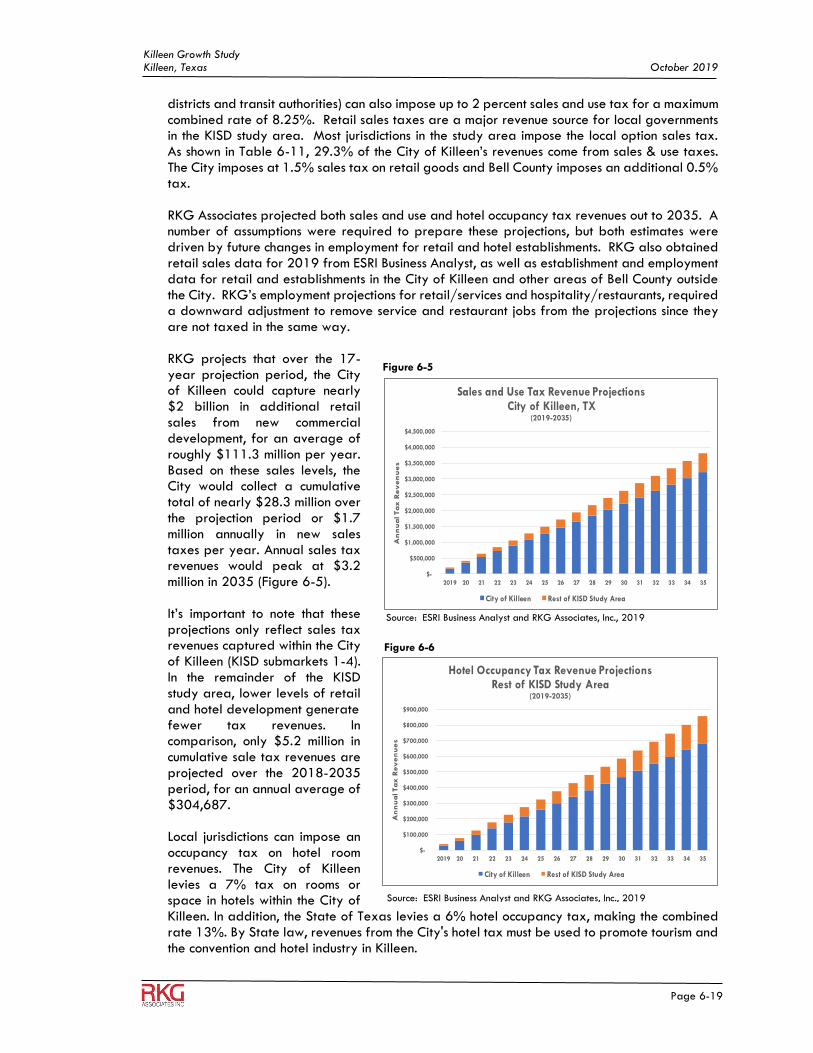
Killeen Growth Study Killeen, Texas October 2019
Page 6-19
districts and transit authorities) can also impose up to 2 percent sales and use tax for a maximum combined rate of 8.25%. Retail sales taxes are a major revenue source for local governments in the KISD study area. Most jurisdictions in the study area impose the local option sales tax. As shown in Table 6-11, 29.3% of the City of Killeen’s revenues come from sales & use taxes. The City imposes at 1.5% sales tax on retail goods and Bell County imposes an additional 0.5% tax. RKG Associates projected both sales and use and hotel occupancy tax revenues out to 2035. A number of assumptions were required to prepare these projections, but both estimates were driven by future changes in employment for retail and hotel establishments. RKG also obtained retail sales data for 2019 from ESRI Business Analyst, as well as establishment and employment data for retail and establishments in the City of Killeen and other areas of Bell County outside the City. RKG’s employment projections for retail/services and hospitality/restaurants, required a downward adjustment to remove service and restaurant jobs from the projections since they are not taxed in the same way. RKG projects that over the 17-year projection period, the City of Killeen could capture nearly $2 billion in additional retail sales from new commercial development, for an average of roughly $111.3 million per year. Based on these sales levels, the City would collect a cumulative total of nearly $28.3 million over the projection period or $1.7 million annually in new sales taxes per year. Annual sales tax revenues would peak at $3.2 million in 2035 (Figure 6-5). It’s important to note that these projections only reflect sales tax revenues captured within the City of Killeen (KISD submarkets 1-4). In the remainder of the KISD study area, lower levels of retail and hotel development generate fewer tax revenues. In comparison, only $5.2 million in cumulative sale tax revenues are projected over the 2018-2035 period, for an annual average of $304,687. Local jurisdictions can impose an occupancy tax on hotel room revenues. The City of Killeen levies a 7% tax on rooms or space in hotels within the City of Killeen. In addition, the State of Texas levies a 6% hotel occupancy tax, making the combined rate 13%. By State law, revenues from the City's hotel tax must be used to promote tourism and the convention and hotel industry in Killeen.
$-
$500,000
$1,000,000
$1,500,000
$2,000,000
$2,500,000
$3,000,000
$3,500,000
$4,000,000
$4,500,000
2019 20 21 22 23 24 25 26 27 28 29 30 31 32 33 34 35
An
nu
al Tax
Rev
en
ues
Sales and Use Tax Revenue ProjectionsCity of Killeen, TX
(2019-2035)
City of Killeen Rest of KISD Study Area
Source: ESRI Business Analyst and RKG Associates, Inc., 2019
Figure 6-5
Figure 6-6
Source: ESRI Business Analyst and RKG Associates, Inc., 2019
$-
$100,000
$200,000
$300,000
$400,000
$500,000
$600,000
$700,000
$800,000
$900,000
2019 20 21 22 23 24 25 26 27 28 29 30 31 32 33 34 35
An
nu
al Tax
Rev
en
ues
Hotel Occupancy Tax Revenue ProjectionsRest of KISD Study Area
(2019-2035)
City of Killeen Rest of KISD Study Area
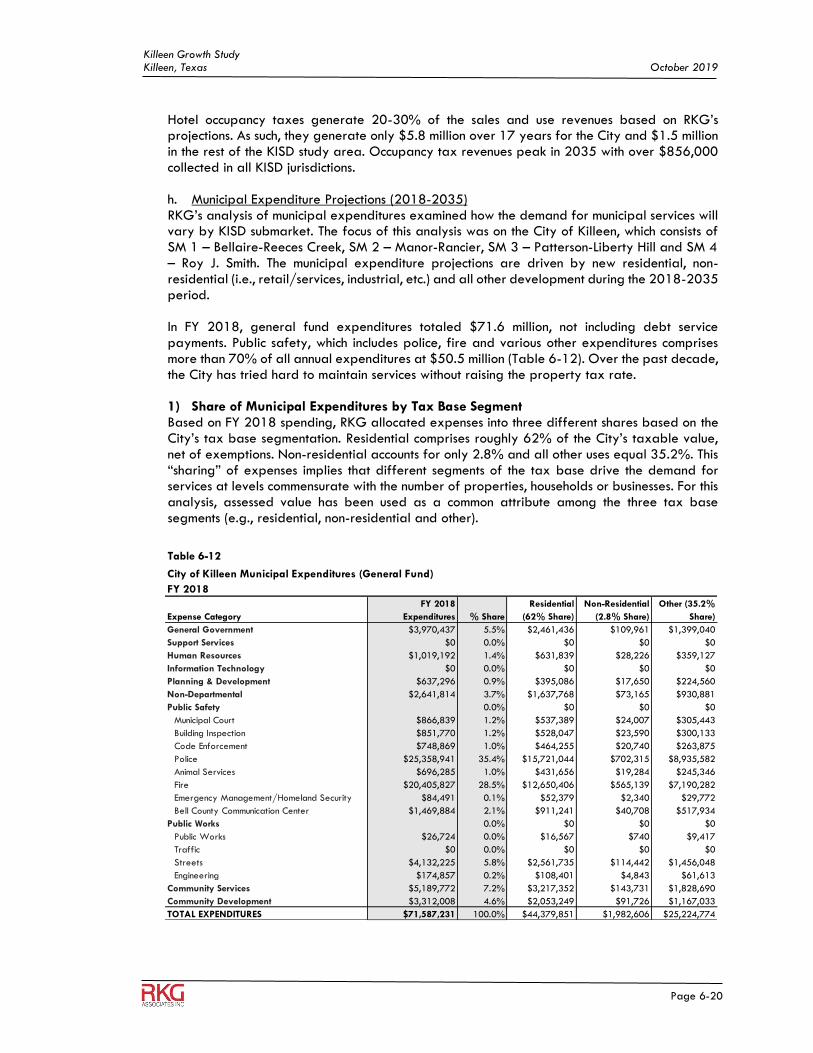
Killeen Growth Study Killeen, Texas October 2019
Page 6-20
Hotel occupancy taxes generate 20-30% of the sales and use revenues based on RKG’s projections. As such, they generate only $5.8 million over 17 years for the City and $1.5 million in the rest of the KISD study area. Occupancy tax revenues peak in 2035 with over $856,000 collected in all KISD jurisdictions. h. Municipal Expenditure Projections (2018-2035) RKG’s analysis of municipal expenditures examined how the demand for municipal services will vary by KISD submarket. The focus of this analysis was on the City of Killeen, which consists of SM 1 – Bellaire-Reeces Creek, SM 2 – Manor-Rancier, SM 3 – Patterson-Liberty Hill and SM 4 – Roy J. Smith. The municipal expenditure projections are driven by new residential, non-residential (i.e., retail/services, industrial, etc.) and all other development during the 2018-2035 period. In FY 2018, general fund expenditures totaled $71.6 million, not including debt service payments. Public safety, which includes police, fire and various other expenditures comprises more than 70% of all annual expenditures at $50.5 million (Table 6-12). Over the past decade, the City has tried hard to maintain services without raising the property tax rate. 1) Share of Municipal Expenditures by Tax Base Segment Based on FY 2018 spending, RKG allocated expenses into three different shares based on the City’s tax base segmentation. Residential comprises roughly 62% of the City’s taxable value, net of exemptions. Non-residential accounts for only 2.8% and all other uses equal 35.2%. This “sharing” of expenses implies that different segments of the tax base drive the demand for services at levels commensurate with the number of properties, households or businesses. For this analysis, assessed value has been used as a common attribute among the three tax base segments (e.g., residential, non-residential and other).
Table 6-12
City of Killeen Municipal Expenditures (General Fund)
FY 2018
Expense Category
FY 2018
Expenditures % Share
Residential
(62% Share)
Non-Residential
(2.8% Share)
Other (35.2%
Share)
General Government $3,970,437 5.5% $2,461,436 $109,961 $1,399,040
Support Services $0 0.0% $0 $0 $0
Human Resources $1,019,192 1.4% $631,839 $28,226 $359,127
Information Technology $0 0.0% $0 $0 $0
Planning & Development $637,296 0.9% $395,086 $17,650 $224,560
Non-Departmental $2,641,814 3.7% $1,637,768 $73,165 $930,881
Public Safety 0.0% $0 $0 $0
Municipal Court $866,839 1.2% $537,389 $24,007 $305,443
Building Inspection $851,770 1.2% $528,047 $23,590 $300,133
Code Enforcement $748,869 1.0% $464,255 $20,740 $263,875
Police $25,358,941 35.4% $15,721,044 $702,315 $8,935,582
Animal Services $696,285 1.0% $431,656 $19,284 $245,346
Fire $20,405,827 28.5% $12,650,406 $565,139 $7,190,282
Emergency Management/Homeland Security $84,491 0.1% $52,379 $2,340 $29,772
Bell County Communication Center $1,469,884 2.1% $911,241 $40,708 $517,934
Public Works 0.0% $0 $0 $0
Public Works $26,724 0.0% $16,567 $740 $9,417
Traffic $0 0.0% $0 $0 $0
Streets $4,132,225 5.8% $2,561,735 $114,442 $1,456,048
Engineering $174,857 0.2% $108,401 $4,843 $61,613
Community Services $5,189,772 7.2% $3,217,352 $143,731 $1,828,690
Community Development $3,312,008 4.6% $2,053,249 $91,726 $1,167,033
TOTAL EXPENDITURES $71,587,231 100.0% $44,379,851 $1,982,606 $25,224,774
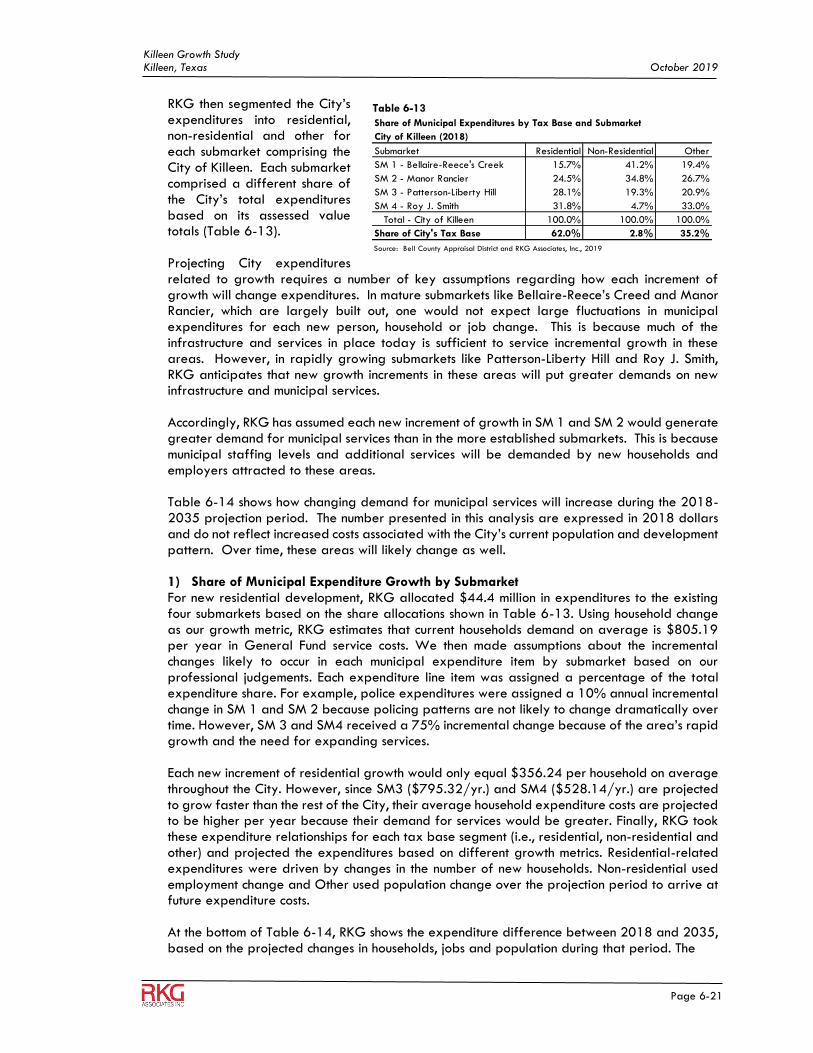
Killeen Growth Study Killeen, Texas October 2019
Page 6-21
RKG then segmented the City’s expenditures into residential, non-residential and other for each submarket comprising the City of Killeen. Each submarket comprised a different share of the City’s total expenditures based on its assessed value totals (Table 6-13). Projecting City expenditures related to growth requires a number of key assumptions regarding how each increment of growth will change expenditures. In mature submarkets like Bellaire-Reece’s Creed and Manor Rancier, which are largely built out, one would not expect large fluctuations in municipal expenditures for each new person, household or job change. This is because much of the infrastructure and services in place today is sufficient to service incremental growth in these areas. However, in rapidly growing submarkets like Patterson-Liberty Hill and Roy J. Smith, RKG anticipates that new growth increments in these areas will put greater demands on new infrastructure and municipal services. Accordingly, RKG has assumed each new increment of growth in SM 1 and SM 2 would generate greater demand for municipal services than in the more established submarkets. This is because municipal staffing levels and additional services will be demanded by new households and employers attracted to these areas. Table 6-14 shows how changing demand for municipal services will increase during the 2018-2035 projection period. The number presented in this analysis are expressed in 2018 dollars and do not reflect increased costs associated with the City’s current population and development pattern. Over time, these areas will likely change as well. 1) Share of Municipal Expenditure Growth by Submarket For new residential development, RKG allocated $44.4 million in expenditures to the existing four submarkets based on the share allocations shown in Table 6-13. Using household change as our growth metric, RKG estimates that current households demand on average is $805.19 per year in General Fund service costs. We then made assumptions about the incremental changes likely to occur in each municipal expenditure item by submarket based on our professional judgements. Each expenditure line item was assigned a percentage of the total expenditure share. For example, police expenditures were assigned a 10% annual incremental change in SM 1 and SM 2 because policing patterns are not likely to change dramatically over time. However, SM 3 and SM4 received a 75% incremental change because of the area’s rapid growth and the need for expanding services. Each new increment of residential growth would only equal $356.24 per household on average throughout the City. However, since SM3 ($795.32/yr.) and SM4 ($528.14/yr.) are projected to grow faster than the rest of the City, their average household expenditure costs are projected to be higher per year because their demand for services would be greater. Finally, RKG took these expenditure relationships for each tax base segment (i.e., residential, non-residential and other) and projected the expenditures based on different growth metrics. Residential-related expenditures were driven by changes in the number of new households. Non-residential used employment change and Other used population change over the projection period to arrive at future expenditure costs. At the bottom of Table 6-14, RKG shows the expenditure difference between 2018 and 2035, based on the projected changes in households, jobs and population during that period. The
Table 6-13
Share of Municipal Expenditures by Tax Base and Submarket
City of Killeen (2018)
Submarket Residential Non-Residential Other
SM 1 - Bellaire-Reece's Creek 15.7% 41.2% 19.4%
SM 2 - Manor Rancier 24.5% 34.8% 26.7%
SM 3 - Patterson-Liberty Hill 28.1% 19.3% 20.9%
SM 4 - Roy J. Smith 31.8% 4.7% 33.0%
Total - City of Killeen 100.0% 100.0% 100.0%
Share of City's Tax Base 62.0% 2.8% 35.2%
Source: Bell County Appraisal District and RKG Associates, Inc., 2019
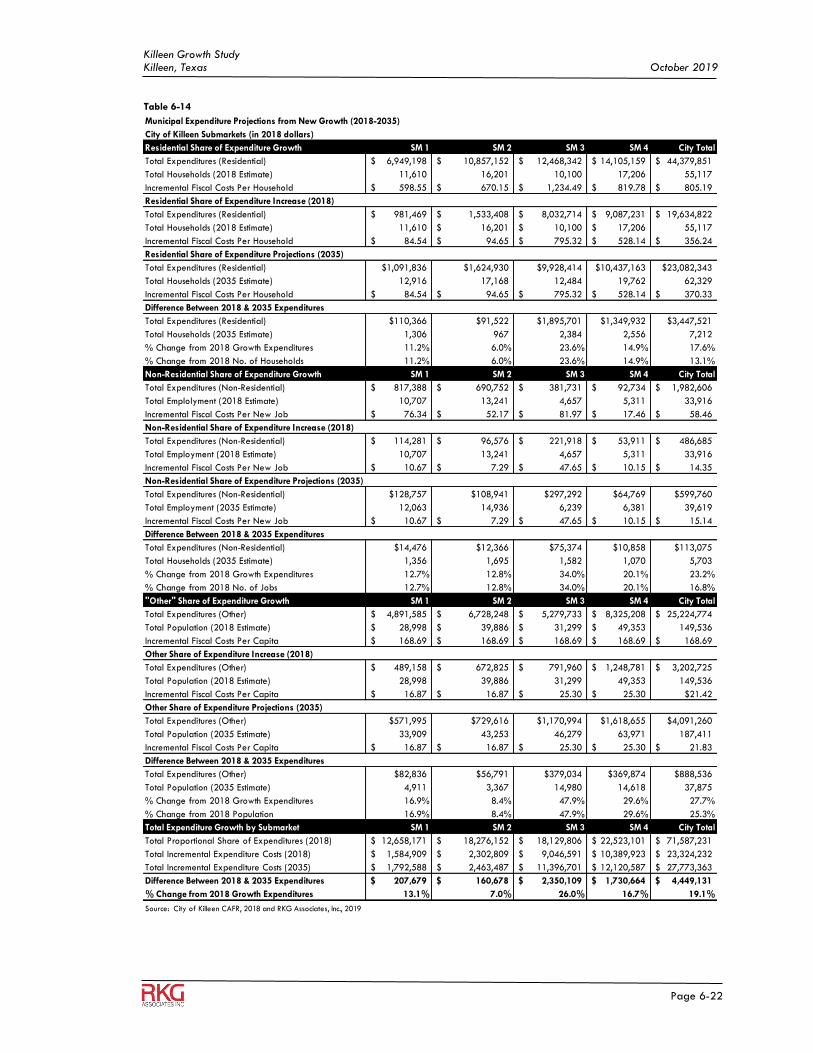
Killeen Growth Study Killeen, Texas October 2019
Page 6-22
Table 6-14
Municipal Expenditure Projections from New Growth (2018-2035)
City of Killeen Submarkets (in 2018 dollars)
Residential Share of Expenditure Growth SM 1 SM 2 SM 3 SM 4 City Total
Total Expenditures (Residential) 6,949,198$ 10,857,152$ 12,468,342$ 14,105,159$ 44,379,851$
Total Households (2018 Estimate) 11,610 16,201 10,100 17,206 55,117
Incremental Fiscal Costs Per Household 598.55$ 670.15$ 1,234.49$ 819.78$ 805.19$
Residential Share of Expenditure Increase (2018)
Total Expenditures (Residential) 981,469$ 1,533,408$ 8,032,714$ 9,087,231$ 19,634,822$
Total Households (2018 Estimate) 11,610 16,201$ 10,100$ 17,206$ 55,117
Incremental Fiscal Costs Per Household 84.54$ 94.65$ 795.32$ 528.14$ 356.24$
Residential Share of Expenditure Projections (2035)
Total Expenditures (Residential) $1,091,836 $1,624,930 $9,928,414 $10,437,163 $23,082,343
Total Households (2035 Estimate) 12,916 17,168 12,484 19,762 62,329
Incremental Fiscal Costs Per Household 84.54$ 94.65$ 795.32$ 528.14$ 370.33$
Difference Between 2018 & 2035 Expenditures
Total Expenditures (Residential) $110,366 $91,522 $1,895,701 $1,349,932 $3,447,521
Total Households (2035 Estimate) 1,306 967 2,384 2,556 7,212
% Change from 2018 Growth Expenditures 11.2% 6.0% 23.6% 14.9% 17.6%
% Change from 2018 No. of Households 11.2% 6.0% 23.6% 14.9% 13.1%
Non-Residential Share of Expenditure Growth SM 1 SM 2 SM 3 SM 4 City Total
Total Expenditures (Non-Residential) 817,388$ 690,752$ 381,731$ 92,734$ 1,982,606$
Total Emplolyment (2018 Estimate) 10,707 13,241 4,657 5,311 33,916
Incremental Fiscal Costs Per New Job 76.34$ 52.17$ 81.97$ 17.46$ 58.46$
Non-Residential Share of Expenditure Increase (2018)
Total Expenditures (Non-Residential) 114,281$ 96,576$ 221,918$ 53,911$ 486,685$
Total Employment (2018 Estimate) 10,707 13,241 4,657 5,311 33,916
Incremental Fiscal Costs Per New Job 10.67$ 7.29$ 47.65$ 10.15$ 14.35$
Non-Residential Share of Expenditure Projections (2035)
Total Expenditures (Non-Residential) $128,757 $108,941 $297,292 $64,769 $599,760
Total Employment (2035 Estimate) 12,063 14,936 6,239 6,381 39,619
Incremental Fiscal Costs Per New Job 10.67$ 7.29$ 47.65$ 10.15$ 15.14$
Difference Between 2018 & 2035 Expenditures
Total Expenditures (Non-Residential) $14,476 $12,366 $75,374 $10,858 $113,075
Total Households (2035 Estimate) 1,356 1,695 1,582 1,070 5,703
% Change from 2018 Growth Expenditures 12.7% 12.8% 34.0% 20.1% 23.2%
% Change from 2018 No. of Jobs 12.7% 12.8% 34.0% 20.1% 16.8%
"Other" Share of Expenditure Growth SM 1 SM 2 SM 3 SM 4 City Total
Total Expenditures (Other) 4,891,585$ 6,728,248$ 5,279,733$ 8,325,208$ 25,224,774$
Total Population (2018 Estimate) 28,998$ 39,886$ 31,299$ 49,353$ 149,536
Incremental Fiscal Costs Per Capita 168.69$ 168.69$ 168.69$ 168.69$ 168.69$
Other Share of Expenditure Increase (2018)
Total Expenditures (Other) 489,158$ 672,825$ 791,960$ 1,248,781$ 3,202,725$
Total Population (2018 Estimate) 28,998 39,886 31,299 49,353 149,536
Incremental Fiscal Costs Per Capita 16.87$ 16.87$ 25.30$ 25.30$ $21.42
Other Share of Expenditure Projections (2035)
Total Expenditures (Other) $571,995 $729,616 $1,170,994 $1,618,655 $4,091,260
Total Population (2035 Estimate) 33,909 43,253 46,279 63,971 187,411
Incremental Fiscal Costs Per Capita 16.87$ 16.87$ 25.30$ 25.30$ 21.83$
Difference Between 2018 & 2035 Expenditures
Total Expenditures (Other) $82,836 $56,791 $379,034 $369,874 $888,536
Total Population (2035 Estimate) 4,911 3,367 14,980 14,618 37,875
% Change from 2018 Growth Expenditures 16.9% 8.4% 47.9% 29.6% 27.7%
% Change from 2018 Population 16.9% 8.4% 47.9% 29.6% 25.3%
Total Expenditure Growth by Submarket SM 1 SM 2 SM 3 SM 4 City Total
Total Proportional Share of Expenditures (2018) 12,658,171$ 18,276,152$ 18,129,806$ 22,523,101$ 71,587,231$
Total Incremental Expenditure Costs (2018) 1,584,909$ 2,302,809$ 9,046,591$ 10,389,923$ 23,324,232$
Total Incremental Expenditure Costs (2035) 1,792,588$ 2,463,487$ 11,396,701$ 12,120,587$ 27,773,363$
Difference Between 2018 & 2035 Expenditures 207,679$ 160,678$ 2,350,109$ 1,730,664$ 4,449,131$
% Change from 2018 Growth Expenditures 13.1% 7.0% 26.0% 16.7% 19.1%
Source: City of Killeen CAFR, 2018 and RKG Associates, Inc., 2019
Killeen Growth Study Killeen, Texas October 2019
Page 6-23
projections indicate that municipal expenditures will have increased by $4.4 million over 2018 levels as a result of RKG’s growth projections. This dollar change is directly related to each new increment of growth out to the year 2035 (in 2018 dollars) and does not reflect any service cost differences due to inflationary influences. On a citywide basis, this reflects a 19.1% change in expenditures over 2018 levels. Each submarket’s share of municipal expenditure growth will vary based on its growth projections. For example, the Patterson-Liberty Hill (SM 3) submarket is projected to increase by 26% during the projection period, while Manor-Rancier would only experience a 7% change. As a percentage of total expenditure change from new growth, the Patterson Liberty Hill and Roy J. Smith submarkets are projected to account for nearly 92% of future expenditure changes in the City. 2) Municipal Staffing Issues Maintaining proper staffing levels to provide services to a growing population base will continue to be a challenge for the City of Killeen in the future. Over the past 10 years, the City has been able to limit staffing increases to a modest rate by looking for ways to get more productivity out of existing staff and cutting positions where necessary. During the 2015-2018 period, the City has had to cut both General Fund and Enterprise Fund employees. The most severe General Fund employee losses have occurred in the in the Police Department (-14 FTEs) and the Information Technology office (-19 FTEs). However, it will be difficult to sustain additional reductions in Police staffing levels as new development moves further from the center of Killeen. Over the past three years, the General Fund departments have experienced the loss of 21.3 FTEs for a force reduction of 2%. Over the entire 2009-2018 period, General Fund staffing levels have increased by 48.2 FTEs or 6% (Table 6-15). That’s largely due to staffing increases in the Fire Department, which has increased its FTEs from 201 to 237 during the 10-year period. Fire Department staffing is particularly sensitive to growth patterns due to station response time requirements, which means that new fire stations and equipment must be positioned to serve new growth areas as they move further out. Enterprise Fund departments (e.g., Solid Waste, Water/Sewer, etc.) have experienced similar staff losses in most departments, but due to staff increases in Internal Service Funds, which did not exist in 2015, FTEs have increased by 1.8. Since 2009, staffing levels have increased by 130.8 FTEs or 42%. This is largely due to staff increases in the Drainage Utility Fund (198 new FTEs) and Internal Services (53 new FTEs). Over the past 10 years, total staffing has increased by 10% or 113.6 FTEs, but recent trends have seen a reduction in staffing 20.4 FTEs or 2%. Regarding future municipal staff changes, it is not possible to project those changes based on future expenditure increases or decreases. All the Enterprise Fund departments will be highly sensitive to growth related pressures and increased demands for service. On the General Fund side, Fire, Police, Planning and Public Works are likely to experience increasing service demands due to population, transportation and development growth. Community development related services, particularly neighborhood our housing revitalization services, could experience increased demand in older established neighborhoods. While their growth projections are modest, their overall condition may require public intervention to revitalize areas in decline.
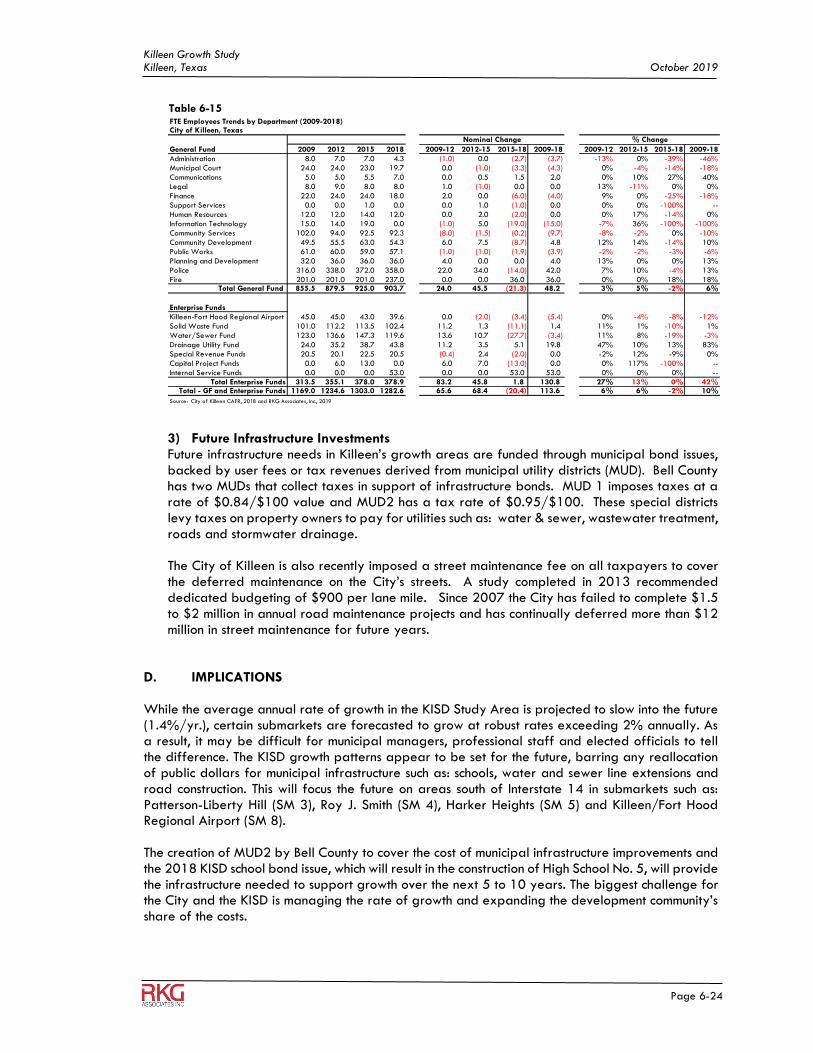
Killeen Growth Study Killeen, Texas October 2019
Page 6-24
3) Future Infrastructure Investments Future infrastructure needs in Killeen’s growth areas are funded through municipal bond issues, backed by user fees or tax revenues derived from municipal utility districts (MUD). Bell County has two MUDs that collect taxes in support of infrastructure bonds. MUD 1 imposes taxes at a rate of $0.84/$100 value and MUD2 has a tax rate of $0.95/$100. These special districts levy taxes on property owners to pay for utilities such as: water & sewer, wastewater treatment, roads and stormwater drainage. The City of Killeen is also recently imposed a street maintenance fee on all taxpayers to cover the deferred maintenance on the City’s streets. A study completed in 2013 recommended dedicated budgeting of $900 per lane mile. Since 2007 the City has failed to complete $1.5 to $2 million in annual road maintenance projects and has continually deferred more than $12 million in street maintenance for future years.
D. IMPLICATIONS
While the average annual rate of growth in the KISD Study Area is projected to slow into the future (1.4%/yr.), certain submarkets are forecasted to grow at robust rates exceeding 2% annually. As a result, it may be difficult for municipal managers, professional staff and elected officials to tell the difference. The KISD growth patterns appear to be set for the future, barring any reallocation of public dollars for municipal infrastructure such as: schools, water and sewer line extensions and road construction. This will focus the future on areas south of Interstate 14 in submarkets such as: Patterson-Liberty Hill (SM 3), Roy J. Smith (SM 4), Harker Heights (SM 5) and Killeen/Fort Hood Regional Airport (SM 8). The creation of MUD2 by Bell County to cover the cost of municipal infrastructure improvements and the 2018 KISD school bond issue, which will result in the construction of High School No. 5, will provide the infrastructure needed to support growth over the next 5 to 10 years. The biggest challenge for the City and the KISD is managing the rate of growth and expanding the development community’s share of the costs.
FTE Employees Trends by Department (2009-2018)City of Killeen, Texas
General Fund 2009 2012 2015 2018 2009-12 2012-15 2015-18 2009-18 2009-12 2012-15 2015-18 2009-18
Administration 8.0 7.0 7.0 4.3 (1.0) 0.0 (2.7) (3.7) -13% 0% -39% -46%
Municipal Court 24.0 24.0 23.0 19.7 0.0 (1.0) (3.3) (4.3) 0% -4% -14% -18%
Communications 5.0 5.0 5.5 7.0 0.0 0.5 1.5 2.0 0% 10% 27% 40%
Legal 8.0 9.0 8.0 8.0 1.0 (1.0) 0.0 0.0 13% -11% 0% 0%
Finance 22.0 24.0 24.0 18.0 2.0 0.0 (6.0) (4.0) 9% 0% -25% -18%
Support Services 0.0 0.0 1.0 0.0 0.0 1.0 (1.0) 0.0 0% 0% -100% --
Human Resources 12.0 12.0 14.0 12.0 0.0 2.0 (2.0) 0.0 0% 17% -14% 0%
Information Technology 15.0 14.0 19.0 0.0 (1.0) 5.0 (19.0) (15.0) -7% 36% -100% -100%
Community Services 102.0 94.0 92.5 92.3 (8.0) (1.5) (0.2) (9.7) -8% -2% 0% -10%
Community Development 49.5 55.5 63.0 54.3 6.0 7.5 (8.7) 4.8 12% 14% -14% 10%
Public Works 61.0 60.0 59.0 57.1 (1.0) (1.0) (1.9) (3.9) -2% -2% -3% -6%
Planning and Development 32.0 36.0 36.0 36.0 4.0 0.0 0.0 4.0 13% 0% 0% 13%
Police 316.0 338.0 372.0 358.0 22.0 34.0 (14.0) 42.0 7% 10% -4% 13%
Fire 201.0 201.0 201.0 237.0 0.0 0.0 36.0 36.0 0% 0% 18% 18%Total General Fund 855.5 879.5 925.0 903.7 24.0 45.5 (21.3) 48.2 3% 5% -2% 6%
Enterprise Funds
Killeen-Fort Hood Regional Airport 45.0 45.0 43.0 39.6 0.0 (2.0) (3.4) (5.4) 0% -4% -8% -12%
Solid Waste Fund 101.0 112.2 113.5 102.4 11.2 1.3 (11.1) 1.4 11% 1% -10% 1%
Water/Sewer Fund 123.0 136.6 147.3 119.6 13.6 10.7 (27.7) (3.4) 11% 8% -19% -3%
Drainage Utility Fund 24.0 35.2 38.7 43.8 11.2 3.5 5.1 19.8 47% 10% 13% 83%
Special Revenue Funds 20.5 20.1 22.5 20.5 (0.4) 2.4 (2.0) 0.0 -2% 12% -9% 0%
Capital Project Funds 0.0 6.0 13.0 0.0 6.0 7.0 (13.0) 0.0 0% 117% -100% --
Internal Service Funds 0.0 0.0 0.0 53.0 0.0 0.0 53.0 53.0 0% 0% 0% --
Total Enterprise Funds 313.5 355.1 378.0 378.9 83.2 45.8 1.8 130.8 27% 13% 0% 42%Total - GF and Enterprise Funds 1169.0 1234.6 1303.0 1282.6 65.6 68.4 (20.4) 113.6 6% 6% -2% 10%
Source: City of Killeen CAFR, 2018 and RKG Associates, Inc., 2019
% ChangeNominal Change
Table 6-15
Copyright © 2022 FDOKUMEN