Khorshid, Motaz, Ahmed Kamaly, Heba El-Laithy, and Soheir ...
31
Khorshid, Motaz, Ahmed Kamaly, Heba El-Laithy, and Soheir Abou El-Enein. "Egypt." Financing Human Development in Africa, Asia and the Middle East. Ed. Marco V. Sánchez and Rob Vos. London: Bloomsbury Academic, 2013. 31–60. The United Nations Series on Development. Bloomsbury Collections. Web. 28 May 2022. <http://dx.doi.org/10.5040/9781472544551.ch-002>. Downloaded from Bloomsbury Collections, www.bloomsburycollections.com, 28 May 2022, 23:00 UTC. Copyright © United Nations 2013. You may share this work for non-commercial purposes only, provided you give attribution to the copyright holder and the publisher, and provide a link to the Creative Commons licence.
-
Upload
khangminh22 -
Category
Documents
-
view
0 -
download
0
Transcript of Khorshid, Motaz, Ahmed Kamaly, Heba El-Laithy, and Soheir ...

Khorshid, Motaz, Ahmed Kamaly, Heba El-Laithy, and Soheir Abou El-Enein. "Egypt." FinancingHuman Development in Africa, Asia and the Middle East. Ed. Marco V. Sánchez and Rob Vos.London: Bloomsbury Academic, 2013. 31–60. The United Nations Series on Development.Bloomsbury Collections. Web. 28 May 2022. <http://dx.doi.org/10.5040/9781472544551.ch-002>.
Downloaded from Bloomsbury Collections, www.bloomsburycollections.com, 28 May 2022,23:00 UTC.
Copyright © United Nations 2013. You may share this work for non-commercial purposes only,provided you give attribution to the copyright holder and the publisher, and provide a link to theCreative Commons licence.

Chapter 2 Egypt
Motaz Khorshid, Ahmed Kamaly, Heba El-Laithy and Soheir Abou El-Enein
Introduction
Prior to the Lotus Revolution in 2011, Egypt was one of the few countries in the Arab region that seemed to be on track to achieve most of the millennium development goals (MDGs). Progress made in the 1990s reflected Egypt’s relatively stable socio-economic situation despite significant structural problems beneath the surface. Indeed, human development goals have been central to the aspirations expressed by the Egyptian people during and in the aftermath of the Revolution.
The purpose of this chapter is to assess strategies to achieve the MDGs in Egypt through the application of a macro-micro modelling approach. A set of policy scenarios is generated to explore alternative ways to finance strategies to meet the goals in primary education (MDG 2), child and maternal mortality (MDGs 4 and 5) and drinking water and basic sanitation (MDGs 7a and 7b). The results of the policy scenario analysis help to form an idea about the requirements in terms of additional public spending and financing needs to achieve the MDGs under alternative reference growth conditions. These requirements represent a minimum benchmark against which further efforts towards the development goals need to be assessed, in particular once the Revolution’s effects on the economy and the MDGs are fully understood.
At the core of the modelling approach is the economy-wide framework known as MAMS. This model shares the characteristics of most standard dynamic-recursive general equilibrium (CGE) models, but it has the atypical feature of adding a module for the “production” of MDG-related
32 • Financing Human Development in Africa, Asia and the Middle East
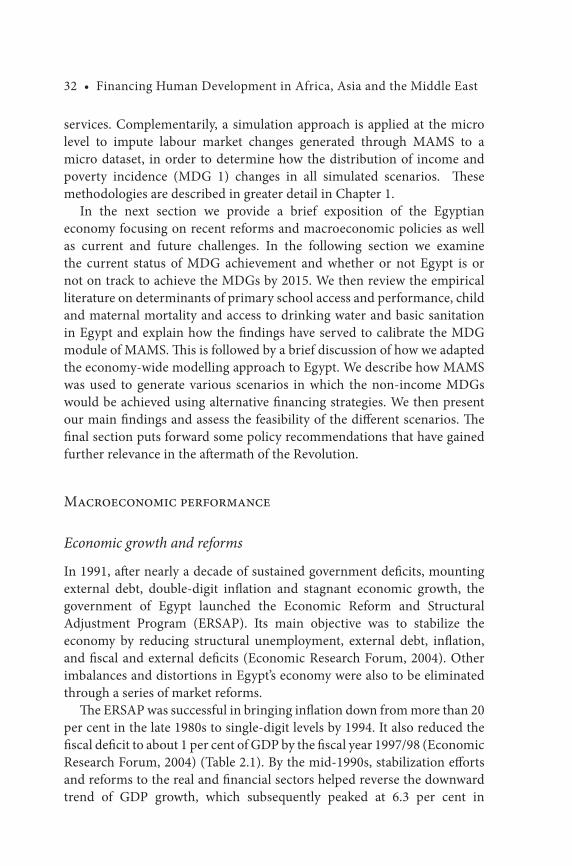
services. Complementarily, a simulation approach is applied at the micro level to impute labour market changes generated through MAMS to a micro dataset, in order to determine how the distribution of income and poverty incidence (MDG 1) changes in all simulated scenarios. These methodologies are described in greater detail in Chapter 1.
In the next section we provide a brief exposition of the Egyptian economy focusing on recent reforms and macroeconomic policies as well as current and future challenges. In the following section we examine the current status of MDG achievement and whether or not Egypt is or not on track to achieve the MDGs by 2015. We then review the empirical literature on determinants of primary school access and performance, child and maternal mortality and access to drinking water and basic sanitation in Egypt and explain how the findings have served to calibrate the MDG module of MAMS. This is followed by a brief discussion of how we adapted the economy-wide modelling approach to Egypt. We describe how MAMS was used to generate various scenarios in which the non-income MDGs would be achieved using alternative financing strategies. We then present our main findings and assess the feasibility of the different scenarios. The final section puts forward some policy recommendations that have gained further relevance in the aftermath of the Revolution.
Macroeconomic performance
Economic growth and reforms
In 1991, after nearly a decade of sustained government deficits, mounting external debt, double-digit inflation and stagnant economic growth, the government of Egypt launched the Economic Reform and Structural Adjustment Program (ERSAP). Its main objective was to stabilize the economy by reducing structural unemployment, external debt, inflation, and fiscal and external deficits (Economic Research Forum, 2004). Other imbalances and distortions in Egypt’s economy were also to be eliminated through a series of market reforms.
The ERSAP was successful in bringing inflation down from more than 20 per cent in the late 1980s to single-digit levels by 1994. It also reduced the fiscal deficit to about 1 per cent of GDP by the fiscal year 1997/98 (Economic Research Forum, 2004) (Table 2.1). By the mid-1990s, stabilization efforts and reforms to the real and financial sectors helped reverse the downward trend of GDP growth, which subsequently peaked at 6.3 per cent in

Egypt • 33
1998/99 (OECD, 2002). However, as typical of most exchange rate-based stabilization programs, the expenditure-switching effects were short-lived and were accompanied by a sufficiently strong supply response. Three major external shocks acted as catalysts to the subsequent bust: the East Asian crisis (1997-1998), the Luxor massacre (November 1997) and a sharp decline in oil prices (January 1998). As a result of the poor policy response to these shocks and the global economic deceleration following the events of September 11, 2001, economic growth continued to slow to 3 per cent in 2001/02 (Economic Research Forum, 2004). The slowdown continued until 2003 and was accompanied by rising inflation, high unemployment, a widening fiscal deficit and growing domestic debt. Moreover, economic activity was further constrained by generally low productivity levels and a severe shortage of foreign exchange, which culminated in a quasi-currency crisis in 2003. Real GDP growth stayed in a range of 2-3 per cent per year, which is below potential (Table 2.1).
A new cabinet was appointed in 2004 to turn around the feeble economic performance through a series of reforms aimed at revitalizing the supply side of the economy. The economy started to recover, with GDP growth reaching 5.1 per cent in 2004/05 and 7.1 per cent in 2006/07. The emergence of the global financial crisis derailed the growth momentum and GDP growth decelerated to 4.7 per cent in 2008/09. Main factors leading to the economic slowdown include the downturns in tourism, Suez Canal earnings, foreign direct investment (FDI), investment, exports, and, to a lesser extent, private consumption.
Table 2.1Egypt: Main macroeconomic indicators, 1990-2009
Government deficit (per cent
of GDP)
Investment(per cent of
GDP)
Trade deficit (per cent of
GDP)Inflation
(per cent)
Real GDP growth
(per cent)
1990-1994 8.6 20.1 6.9 14.1 3.0
1995-1999 1.7 19.7 7.2 6.9 3.8
2000-2004 8.9 17.9 4.0 4.7 4.8
2005-2009 7.5 19.8 4.8 10.4 6.8
Source: International Monetary Fund (IMF), International Financial Statistics (IFS).

34 • Financing Human Development in Africa, Asia and the Middle East
In spite of the global financial crisis and its effects on the Egyptian economy, GDP growth averaged a respectable 7 per cent per year during 2005-2009 (Table 2.1). But this growth did not trickle down to improve the welfare of the average Egyptian citizen in any notable way. The trend of declining poverty since the early 1990s was reversed in the second half of the 2000s.
Fiscal policy
The ERSAP also envisaged putting public finances back in order by ending deficit financing policies. As mentioned, this helped putting inflation under control and reducing external public indebtedness. The first wave of reforms broadened the tax base through the introduction of a sales tax, shifting towards bond financing and rationalizing expenditure. These measures reduced the deficit to 3.9 per cent of GDP by 1999/2000, down from 17.2 per cent in 1991. The subsequent wave of reforms came with the appointment of the new cabinet in 2004, in response to high fiscal deficits that had reached more than 10 per cent of GDP by 2002/03. The government reduced tax rates, but also implemented administrative reforms to the income tax system to enhance revenue collection. With these reforms, tax receipts came to account for more than half of total government revenue and around 14 per cent of GDP. This helped cut the government deficit from 9.5 per cent of GDP in 2003/04 to 6.6 per cent in 2008/09, but nonetheless averaged more than 7 per cent of GDP in 2005-2009 (Table 2.1). There seems still to be ample room to increase tax income, in particular by expanding the property tax. Currently, property tax revenues hover around a mere 0.03 per cent of GDP, which is negligible compared to countries at similar levels of development.
The level of total public debt peaked at more than 100 per cent of GDP in 2002/03. It decreased to 71 per cent in 2008/09, due to a declining reliance on external debt, which during the same period fell from 42.5 per cent of GDP to 17 per cent in 2008/09, a trend that continued. To manage the debt level and reduce potential exchange rate risk, stringent restrictions were put on external borrowing. Domestic borrowing increased further as a result, but at a lesser pace than GDP growth such that, together with domestic inflation of around 10 per cent per year, the public debt to GDP ratio fell during the 2000s.
In response to the global financial crisis, the government adopted a stimulus package amounting to 14.4 billion Egyptian pounds. The aim

Egypt • 35
was to spur domestic demand by increasing government expenditure. This widened the budget deficit to 8.5 per cent of GDP in 2010/11.
Monetary policy and inflation
Egypt relied heavily on seigniorage before the launching of the ERSAP, as a result of which there were continuous inflationary pressures. The ERSAP succeeded in curbing inflation by using the nominal exchange rate as an anchor and containing the budget deficit. Inflation fell from 15.7 per cent in 1995 to below 5 per cent by the second half of the 1990s (see also Table 2.1).
Despite the positive inflation differential between Egypt and its major trading partners throughout the second half of the 1990s, the nominal exchange was kept fixed. As a result, the real exchange rate appreciated, stimulating import demand. A number of external shocks added to the chronic shortage of foreign exchange, ultimately forcing the government to engage in a succession of devaluations of the Egyptian pound during 2000-2003, until letting it float in January 2003.
A surge of private capital inflows led to renewed pressures for the real exchange rate to appreciate between 2005 and 2008. Even so, adverse effects of the avian influenza, the spillover effect of a 30 per cent increase in oil prices, and increased aggregate demand fuelled by tax cuts in 2006, caused inflation to climb to double-digit rates by 2008 (Table 2.1). In response to the inflation hike, the Central Bank of Egypt (CBE) raised the overnight lending and deposit facility interest rates twice in late 2006. The drop in food prices in 2008 contributed to ease inflationary pressures, too, but inflation remained in double digits, reaching 11.7 and 16.2 per cent in 2008 and 2009, respectively. In efforts to cut inflation, the CBE reduced the overnight lending and deposit facility interest rates by 25 basis points in September 2009. For three years, starting in 2008, the Egyptian economy has witnessed persistently high inflation rates. After peaking at 13.6 per cent in January 2010, inflation remained at around 10-12 per cent until June 2011.
External sector
Egypt opted to open up its economy and promote exports but these changes have not yielded strong export-led growth. In fact, the trade deficit widened, representing on average, just below 5 per cent of GDP for 2005-2009, but up from that registered during the first half of the 2000s (Table 2.1). This deficit has been financed by a surplus of foreign exchange earnings accruing

36 • Financing Human Development in Africa, Asia and the Middle East
from tourism, Suez Canal proceeds and workers’ remittances as well as by the increasing influx of capital flows, mainly in the form of foreign direct investment (FDI) attracted by new policy incentives and a positive outlook of major macroeconomic indicators.
The woes of the global financial crisis were transmitted to the Egyptian economy via the external sector as seen in a drop in exports, tourism and Suez Canal earnings. Workers’ remittances decreased as a large number of expatriate workers lost their jobs. Finally, FDI flows dropped to US$6.7 billion in 2009.
Post-revolution economic outlook
The Revolution that unfolded on January 25, 2011 represents a paradigm shift. Yet the massive public support and hopes for a better future brought on by the Revolution do not make the short-run macroeconomic challenges the country faces less daunting. First, domestic private absorption and exports are expected to remain stagnant given the climate of uncertainty and a prolonged disruption in various economic activities. The demand deficiency is expected to decelerate economic growth to a mere 2 per cent in 2010/11 in the best-case scenario. Second, the budget deficit is expected to widen to around 10 per cent of GDP in 2010/11 as a result of a drop in tax revenues, including custom receipts, and mounting public pressure on the fiscal authority to increase wages and subsidies and to engage in expansionary fiscal policy to reactivate the economy. Third, inflationary pressures due to rising prices of food and oil imports are putting additional strains on the government budget because of higher demands for subsidies. Inflation expectations are expected to increase, keeping the inflation rate in the double digits. Fourth, the current account deficit will likely widen with fewer earnings from tourism and exports. The capital account surplus is expected to dwindle with the reversal in portfolio investment and short-term flows as well as the expected major drop in FDI flows. Fifth, monetary authorities face daunting dilemmas. There will be a strong pressure on the currency to depreciate as the balance of payment deteriorates. At the beginning of the revolution the CBE used reserves to defend the pound, but this policy is no longer sustainable. On the other hand, leaving the pound to depreciate freely would reinforce inflationary pressures through the pass-through effect and threaten economic stability.
All of these challenges may disrupt the course of Egypt to achieve the MDGs. The widening government deficit will squeeze the fiscal space,

Egypt • 37
reducing the ability of the government to direct funds to education, health and sanitation. In addition, the slowdown in the level of economic activity will adversely affect household income, thus curtailing private consumption of MDG-related services and slowing poverty reduction. On a more optimistic note, the Revolution carries the seeds of a better Egypt if the result is that the nation’s resources are better allocated to improve welfare and shared more equally across society—and if institutional reforms are put in place to guarantee and protect the political, social and economic freedoms of all citizens and to enhance accountability in public action.
Progress towards the MDGs
Egypt is unlikely to face major problems in achieving the MDGs given past progress. However, this progress has not been even: it has been swift and sustained in health and sanitation goals, acceptable in education and poverty reduction, and slow in women’s empowerment and environmental protection. Reports and existing statistics also point to worrying gaps in income levels and living standards between Lower and Upper Egypt. Population growth is also seen as one of the main challenges to meeting the MDGs.
Poverty
In 2005, Egypt met the internationally set target of halving the proportion of its population living in extreme poverty. According to data from the Household Income, Expenditure and Consumption Survey 2008-2009 (HIECS), 3.5 per cent of Egyptians live on less than $1.25 per day (measured at purchasing power parity), compared to 7 per cent in 1995. However, when using other poverty lines, poverty trends oscillated from 1990 to 2008. For example, 44.0 per cent of Egyptians lived on $2.50 or less a day in 2008/09 compared with 43.7 per cent in 1999/2000 and 57.0 per cent in 1990/91 (Table 2.2). Poverty is more widespread in the rural areas. If one considers the period 1990-2009, poverty declined significantly by all measures and regardless of the poverty line chosen. But in 2008/09, poverty increased relative to levels observed in the mid-2000s, likely as a result of the global economic crisis, which led to higher unemployment and a reduction in labour incomes. As this study was being completed, it was not yet clear how the disruption of economic activity resulting from the Revolution would affect poverty.

38 • Financing Human Development in Africa, Asia and the Middle East
In any case, the reduction in poverty can in part be explained by an improvement in the distribution of income. Measured by the Gini coefficient for household income per capita, income inequality declined from 0.446 to 0.301 between 1990/91 and 2008/09. A decomposition of the change in the incidence of poverty further confirms that, in addition to growth, improved distribution may also have contributed (see Khorshid and others, 2011).
Education
In the early 1990s, Egypt embarked on a comprehensive educational reform program. The number of basic education schools increased to nearly 11,000 and the total number of students enrolled in pre-university education climbed to 15.5 million in 2003/04 from 12.1 million in 1990/91. Net enrolment rates in primary education rose by 8 per cent between 1995 and 2005, reaching 96 per cent in 2008/09. Furthermore, the number of children (aged 6-12) attending schools increased from 83 per cent in 1995 to 90 per cent in 2008. By these numbers, Egypt would appear to be on track to achieve MDG 2 (universal primary education). Progress has been uneven across regions, however. Educational policies should be more clearly defined and the quality of education needs to be improved in order to ensure adequate educational outcomes.
Table 2.2 Egypt: Incidence of poverty and Gini coefficient for per capita income, 1990/91-2008/09 and target for 2015
1990/91 1999/00 2004/05 2008/09Target for
2015
Poverty incidence (per cent of the population)
National extreme poverty line 24.2 16.7 19.6 21.6 12.1
National moderate poverty line 51.4 42.6 40.5 41.7 25.7
$1.25 per day (PPP) 7.0 3.4 3.4 3.5 3.5
$2.50 per day (PPP) 57.0 43.7 42.8 44.0 28.5
Gini coefficient 0.446 0.362 0.320 0.301
Source: Kheir El-Din and El-Laithy (2006) for 1990/91-2004/05 and authors’ estimates based on the HIECS for 2008/09.

Egypt • 39
Reducing the wide gender and regional disparities in education remains challenging. Official data sources have not been able to identify the reasons for these disparities. For example, urban governorates achieved universal primary education whereas in other governorates such as Souhag and South and North Sinai, where there is also a rural population, enrolment rates are below 80 per cent (Ministry of Economic Development, 2010). The Girl Education Initiative and the Food-for-Education program have been launched to, respectively, close the gender gap in education and encourage the most vulnerable and poor children to attend school. However, as a result of the global financial crisis, funds for enhancing access to education and improving the quality of learning have been limited. Announced measures to promote education present good intentions, but in practice seem to be falling short of what is needed to redress the perceived deterioration in the quality of education.
Gender equality
Significant progress in school enrollment has been driven in part by a notable increase in female access to education. Nonetheless, a significant gender gap in access to education remains. By the mid-2000s, 93 per cent of girls in primary school age were enrolled, 3 percentage points less than that of boys. The gap is projected to diminish, however, as female literacy is expected to reach 95.8 per cent by 2015, up from 86 per cent in 2010 (Ministry of Economic Development, 2010).
Improved access to education for females has also facilitated greater participation of women in the labour force. Their share in the total labour force increased from 7.3 to 15.3 per cent between 1976 and 1996. Women have been encouraged to seek employment in the public sector, attracted by higher wages, as labour laws promoting equality between men and women are more strictly applied in the public than in the private sector. Yet, even as it has increased to 22 per cent, the female participation rate still lagged well behind that for males, which stood at 77 per cent in 2005 (Hassan and Sassanpour, 2008). Unemployment is also higher for women, reaching 22.6 per cent in 2001 compared to 5.6 per cent for men. The unemployment rate of females remained high over the past few years, increasing to 22.9 per cent, 4.3 times higher than the jobless rate among men in 2009. The global financial crisis did not seem to have a strong gender bias, but women were particularly vulnerable to job losses in textile companies (Jansen and von Uexkull, 2010).

40 • Financing Human Development in Africa, Asia and the Middle East
Gender inequality tracks income levels, and is high among the poor. In addition to traditions and cultural factors, poverty plays an important role, with girls dropping out at higher rates than boys.
Health
Egypt is expected to achieve the target of cutting the under-five child mortality rate (MDG 4) to 12.2 per 1,000 live births by 2015, considering that it succeeded in reducing this rate from 91 in 1990 to 32 in 2008. Given its level of development and income, child mortality in Egypt should be considered relatively low (Boone and Zhan, 2006).
Significant progress also has been achieved towards the target of reducing maternal mortality by three quarters between 1990 and 2015. The maternal mortality rate was reduced by 52 per cent between 1992 and 2000, according to data from the Ministry of Economic Development (2008).1 This reduction in maternal mortality primarily has been the result of the adoption of an integrated maternity care system and the improvement of service delivery in health care units. There has been a steady increase in the percentage of deliveries attended by health personnel which at the national level went up from 40.7 per cent in 1992 to 74.2 per cent in 2005. Also, the percentage of girls who gave birth at the age of 18 or younger dropped from 23.7 to 15.8 per cent in the same period. As a result of this progress, Egypt was expected to reach MDG 5 by 2015 before the global financial crisis occurred. Because of the crisis, however, national funds allocated for health care were reduced, affecting in particular resources available for training and medical equipment. Total health expenditure fell from 6.4 per cent of GDP in 2008 to 3.5 per cent in 2009 (World Health Organization, 2010).
Maternal mortality rates vary greatly across regions, among other things owing to the lack of availability of health personnel (Anand and Bärnighausen, 2004) and the higher prevalence of adolescence marriage and pregnancy in some parts of the country, especially in rural areas of Upper Egypt. The 2008 Demographic and Health Survey (EDHS) reported lower coverage rates of maternity services among rural women, particularly in rural Upper Egypt. Health personnel attend only 54.8 per cent of deliveries in rural Upper Egypt (Ministry of Economic Development, 2010). Also, 26.8 per cent of women in rural Upper Egypt conceived their first child before reaching the age of 18 compared to the national average of 12.3 per cent.

Egypt • 41
Meeting MDG 5 would not only require that health expenditures return to pre-crisis levels, but that measures be taken to improve the social status of women, increase female school enrolment and protect young women from early marriage. In addition, the government should invest more to train more qualified health providers and create incentives for physicians to work in remote areas so as to ensure a more balanced geographical distribution of health services.
Though it is not part of the modelling analysis performed in this chapter, it is worth mentioning that Egypt has also made strides in other health goals. Malaria has been well controlled as it declined from four cases to near zero per one thousand between 1990 and 2000. Tuberculosis is regressing as evidenced by studies showing that treatment envisaged by the Directly Observed Treatment Short Course (DOTS) has been cost-effective (see, for example, Vassall and others, 2002). HIV does not pose a serious health threat but it is nevertheless prevalent among the most productive segment of the population, with 84.3 per cent of infected Egyptians falling in the age category of 15-49 years (Ministry of Economic Development, 2010). Half of the HIV-infected cases are in urban areas with even more cases found among women. Egypt is facing an epidemic of Hepatitis C, with 7 to 9 per cent of the population being carriers of this disease. Reducing the prevalence of Hepatitis C and reversing its spread requires coordinated efforts from different governmental entities.
Access to drinking water and basic sanitation
In 2006, 98 per cent of the population had access to safe water, according to census data. This means that Egypt has already surpassed the target for MDG 7a set at 97 per cent, despite some setbacks in the mid-2000s when the volume of public investment stagnated (Kamaly and Eldin, 2009). More efforts are needed to achieve the target of providing 75 per cent of the population with access to improved sanitation (MDG 7b). In 2006, coverage was 66 per cent, up from 50 per cent in 1990. In spite of this progress, some governorates have witnessed a decline in access to improved sanitation, dropping to the coverage levels of 1996. Given the current percentage of buildings in urban areas that have improved sanitation (62.6 per cent), MDG 7b is more likely to be achieved in urban areas. Without changes in policies that increase basic sanitation delivery in the rural areas it will not be possible to meet the target for MDG 7b by 2015.

42 • Financing Human Development in Africa, Asia and the Middle East
Determinants of MDG outcomes
A review of the empirical literature was undertaken to identify the factors determining human development outcomes and the types of interventions that could accelerate progress in achieving the goals for primary education (MDG 2), child and maternal mortality (MDGs 4 and 5), and drinking water and sanitation (MDGs 7a and 7b) in Egypt. Many of these factors have been mentioned in the previous section, but here we provide additional empirical evidence. This evidence was critical for the parameter calibration of the MDG module of MAMS for Egypt, as described in more detail in Khorshid and others (2011).
Universal primary education (MDG 2)
Similar to other countries, the most important determinant of education attainment in Egypt is family wealth and income. Roushdy and Namoro (2007) have found that family wealth has a strong positive effect on education attainment. Dancer and Rammohan (2007) confirm this with their finding that the higher the level of per capita household expenditure, the higher the probability of school enrolment of family members in primary school. Data from the 2003 EDHS show that net primary school enrolment was 94.5 per cent for the richest quintile, but 75.9 per cent for the poorest quintile. The dropout rate among the richest quintile was as low as 0.2 per cent, compared with 2.2 per cent for the poorest quintile. In MAMS for Egypt, the level of household consumption per capita features among the key determinants of primary school outcomes (see Chapter 1).
The literature identifies other important factors that affect education indicators, such as parental education; infrastructure, especially the availability of paved roads; and the quality of education. Although empirical studies did not consider all of these factors as part of the same econometric model estimation, Roushdy and Namoro (2007) and Hanushek and others (2008) provide evidence of the importance of, respectively, parents’ educational level and the quality of schools in determining enrolment and dropout in primary education. Although these determinants are not explicitly quantified as part of MAMS for Egypt, the empirical findings are used as a basis for the definition of the elasticities related to the determinants of education outcomes in the MDG module of MAMS for Egypt. Family wealth and income—as proxied by per capita consumption capacity—is one of the key factors affecting entry and promotion in primary education as
Egypt • 43
well as continuation to secondary education. Other possible determinants specified in the MDG module of MAMS, such as MDG 4 (as a proxy of the health status of the population at entry age) and the quality of education (measured by the provision of services by student) may have less marked effects on entry and pass rates in the primary cycle. The quality of education is be expected to affect promotion rates because in Egypt the emphasis is on transferring the children from one grade to another with little attention paid to their actual educational performance, which, even according to officials, is deteriorating. In MAMS, though, as said, the quality of education is proxied by service delivery per student and, as further indicated below, additional spending will be required to underpin any strategy aiming to achieve that all children complete primary education without repeating a grade. Student behaviour defining the primary completion rate in MAMS for Egypt has been defined to respond moderately to changes in service delivery per student (with elasticities being 0.2 and 0.87 for entry and pass rates, respectively). The existence of supporting infrastructure such as paved roads has become relatively less important for educational outcomes given the government’s efforts to increase the number of schools. Based on this, in MAMS for Egypt, student behaviour barely responds to improvements in public infrastructure that is not directly associated with the education sector. The exception is continuation rates to tertiary education for students who graduate from secondary education for which an elasticity of 0.1 has been used for public infrastructure.
By and large, for the calibration of MAMS for Egypt it has also been assumed that the choice of continuing to the tertiary cycle also responds more quickly to changes in per capita household income, the quality of education, and the wage premium on higher education, which is not seen for the lower education cycles. The opportunity cost of continuing to tertiary education is relatively high, especially for low-income households.
Reduction of child mortality (MDG 4)
Studies on the determinants of child mortality in Egypt tend to come up with ambiguous results, which are probably attributable to the poor quality of data. Casterline and others (1989) and more recently Boone and Zhan (2006) find per capita household income to be the main determinant of a lower probability of early child death. The latter study shows that a one standard deviation increase in household wealth would lead to 30 per cent decline in the probability of child mortality.

44 • Financing Human Development in Africa, Asia and the Middle East
Government policies to achieve MDG 4 include a nationwide program of vaccination against diseases with immunization coverage that exceeds 97 per cent with little disparity across regions (Ministry of Economic Development, 2008). Other programs that aim to reduce infant and child mortality include the National Diarrhoeal Control Program and the Healthy Mother–Healthy Child program. All of these efforts are captured in MAMS by the level of delivery of health services per inhabitant.2
MAMS also accounts for the synergy effects of increased access to drinking water (MDG 7a) and sanitation (MDG 7b). Aly and Grabowski (1990) have shown that access to clean water has a significant effect on reducing child mortality, whereas Boone and Zhan (2006) have found evidence of such a synergy, but could not estimate a statistically significant quantitative relationship. Both studies concur, however, that appropriate sanitation is an important factor in reducing child mortality. Based on this empirical evidence, MAMS for Egypt assumes that improving access to sanitation has a significant impact on reducing child mortality, more so than improving access to clean water given the already near universal coverage of the latter.
Reduction of maternal mortality (MDG 5)
There is very little quantitative empirical evidence about the determinants of maternal mortality in Egypt. Anand and Bärnighausen (2004) identified factors such as the availability of medical personnel, especially physicians, and female education as key determinants of maternal mortality, whereas Fay and others (2005) add infrastructure to the list. Considering the available evidence, the level health spending per capita (reflecting the availability and quality of health services) is assumed to be the main determinant of maternal mortality in Egypt, followed by general infrastructure (determining the geographical accessibility of services) and per capita income (determining the affordability of health services and also reflecting, indirectly, education levels of mothers).
More access to safe water and improved sanitation (MDGs 7a and 7b)
Access to safe water and improved sanitation depends primarily on how much the government spends on infrastructure as well as the level of household income. Based on recent developments, the elasticity with respect to expenditure on infrastructure should be relatively higher for access to sanitation. In the case of access to safe drinking water, the already

Egypt • 45
high coverage means that the main issue is not the level of spending on water supply infrastructure. Instead, improvements in household income are considered to be the main factor in ensuring universal access.
Analysis of MDG achievement under growth and financing scenarios
Overview of MAMS implementation
In order to implement MAMS for Egypt, a social accounting matrix (SAM) was constructed using the following data for 2006/07: national income accounts and input-output tables from the Ministry of Economic Development (MOED), the balance of payments account from the CBE, the population census, the labour market survey and the set of industrial and services censuses developed by the Central Agency for Public Mobilization and Statistics (CAPMAS). Some of the less common features of this SAM—to make it suitable for MAMS—include a full breakdown of MDG-related social services (education by cycle, health, and water and sanitation) and further, where appropriate, by public and private delivery of those services. Furthermore, each institution has a capital account and, in addition to investment by sector of origin (the usual treatment), the model accounts for investment by sector of destination.
Second, time series data, previous modelling studies on Egypt (Khorshid 2003 and 2008) and international indicators of similar countries (see, for instance, country cases presented in Sánchez and others, 2010) were used to estimate the parameters and technical coefficients needed to run MAMS for Egypt. Third, after running the model, further fine-tuning helped validate the results and generate the so-called reference path (or baseline scenario) for 2007-2015 based on the recent economic performance of the Egyptian economy for 2007-10, several analytical studies (Khorshid 2003; World Bank 2006 and 2009) and indicators of the five-year socioeconomic development plans—which do not consider the effect of the Revolution on the Egyptian economy.
Fourth, two baseline scenarios served as reference points (or benchmarks) against which results of new MDG-achieving scenarios were compared. The second baseline scenario was generated to account for the uncertainties in the growth prospects in light of the 2008/09 global financial crises and other domestic socioeconomic problems. Although the effects of the recent

46 • Financing Human Development in Africa, Asia and the Middle East
Revolution were not taken into account, this baseline is conservative in terms of the future economic growth prospects. Moreover, the benchmark and scenario comparisons provide findings that will be useful in planning how to offset the impact of the Revolution on the economy—and on meeting the MDGs—once such effects are fully understood.
Finally, labour market results from all MAMS scenarios were used in the application of a microsimulation approach by means of which changes in income distribution and poverty were estimated for such scenarios. The Household Income, Expenditure and Consumption Survey (HIECS) for 2008/09 was used for these purposes.
Reference path scenario
In a first step, the model is used to generate a reference path for 2007–2015 that is regarded as a baseline or business-as-usual (BAU) scenario. This BAU run reproduces the observed functioning of the economy during 2007-2010 and it projects the medium-term economy-wide indicators up to 2015—although it does not account for the effects of the Revolution. A key underlying assumption is that the government continues to rely on various policy measures and strategic trends applied since the 1990s.
The other fundamental assumptions are associated with the closure rules of the model. Government final consumption is assumed to be fixed in real terms and follows an exogenous growth rate to ensure continuation of spending policies and to prevent government spending from responding pro-cyclically to economic growth fluctuations. Tax rates are assumed to be fixed and the level of domestic borrowing is used to clear the budget. All other components of budget financing in MAMS (that is, borrowing from the monetary system, foreign borrowing and foreign grant aid) are treated as fixed shares of GDP. A flexible real exchange rate clears the foreign exchange market, which is a realistic assumption for generating medium-term projections in developing countries (Lofgren, 2008). Household investment spending is an exogenous share of GDP, which is kept fixed. The savings rate adjusts endogenously to balance aggregate savings and investment. Finally, in the factors market, demand and supply of non-labour factors of production (capital and natural resources) equilibrate through changes in the rate of return for a given fixed rate of underutilization. As for labour, adjustments in the level of employment equilibrate the various labour market segments when the unemployment rate is above or equal to a minimum rate. When unemployment drops to the minimum rate, the markets clear through adjustments in the real consumption wage.

Egypt • 47
The main results of the reference path scenario are summarized in Table 2.3. To account for uncertainties in the growth prospects of the Egyptian economy and the impact of the recent global financial crisis, both an optimistic and a moderate growth path were generated. The former assumes that Egypt will resume its pre-crisis GDP performance before 2015. The second assumes a slow recovery from the global financial crisis. In these two scenarios, real GDP grows on average by 5.7 and 4.9 per cent per year, respectively.
The optimistic growth scenario assumes that real government consumption expenditures grow on average by 4.5 per cent per year, slightly more than in the moderate scenario, where government spending faces more financing constraints due to less tax revenue. According to the CBE database, government domestic borrowing—including treasury bills and loans from the monetary system—was expected to grow by 2 per cent per year up to 2015 before the Revolution unfolded. Public investment grows slightly less than government consumption in order to generate an adequate level of capital stock needed by the government to deliver the desired level of social services. The key question to answer is whether this amount of government spending is adequate to meet the MDGs for primary education, health and water and sanitation.
In the reference scenarios, GDP growth is mostly driven by private final demand for both intermediate and final goods and services. Given its
Table 2.3Egypt: Macroeconomic indicators and assumptions of the two baseline scenarios, 2007 and 2010-2015
2007 (million Egyptian pounds)
2010-2015 (Percentage annual growth rate)
Moderate growth scenario
Optimistic growth scenario
GDP 715,530 4.9 5.7
Household consumption 850,153 6.5 7.4
Government consumption 19,777 4.0 4.5
Investment spending:
Private 130,133 5.7 6.1
Public 25,167 3.2 3.9
Exports of goods and services 230,600 3.5 3.9
Imports of goods and services 254,600 7.9 8.4
Source: Authors’ estimates based on application of MAMS for Egypt.

48 • Financing Human Development in Africa, Asia and the Middle East
importance in aggregate demand, the volume of imports increased annually more than any expenditure component presented in Table 2.3. Export growth is much less, presumably because of a lack of export promotion measures and an ensuing real exchange rate appreciation under the two baseline trends. As a result, exports as a share of GDP decline in the simulation period, resulting in a reduction in gross domestic savings as a percentage of GDP. Assuming the government’s continued reliance on domestic debt to finance its budget, the share of domestic debt to GDP increases from 95.4 per cent in the base year to about 106 and 100 per cent in 2015 in the moderate and optimistic scenarios. Consistent with this trend, the ratio of foreign debt to GDP declines from 23 per cent in the base year to 15 per cent in 2015 under the moderate baseline scenario, but the results are not dissimilar in the optimistic growth scenario.
Under both reference scenarios, the targets for reducing child and maternal mortality rates and enhancing coverage of drinking water would be achieved—or even overachieved (see Table 2.4). The target for improving access to safe water (MDG 7a) was achieved in 2006, as indicated above. In contrast, Egypt would fall short of the targets for primary education and for coverage of basic sanitation. For MDG 2, MAMS uses the strict target of reaching almost 100 per cent of on-time primary completion, which can only be achieved if entry is at the right age and students do not drop
Table 2.4Egypt: MDG progress and achievement under the baseline scenarios, 2007 and 20151
IndicatorBase year
(2007)Target (2015)
Baseline scenarios
Moderate growth
Optimistic growth
MDG 2: primary completion rate (per cent of cohort at primary age) 75.1 99.0 91.8 (2015) 91.8 (2015)
MDG 4: under-five child mortality (per 1,000 live births) 33.0 30.3 30.0 (2013) 30.0 (2013)
MDG 5: maternal mortality (per 100,000 live births) 84.0 40.4 40.0 (2014) 40.2 (2013)
MDG 7a: drinking water (percentage of population) 98.0 98.0 98.0 (2007) 98.0 (2007)
MDG 7b: basic sanitation (percentage of population) 66.0 83.3 79.4 (2015) 80.8 (2015)
1 In parentheses, year in which MDG is achieved, or last year of simulation period if not achieved. Source: Authors’ estimates based on application of MAMS for Egypt.

Egypt • 49
out or repeat grades. For this reason, even though the targets would not be met, progress towards MDGs 2 and 7b is fairly satisfactory under the baseline scenarios, as can be seen in Table 2.4. Greater policy efforts would be needed to fully meet these targets. (MDG 1, the poverty goal, will be analysed below, based on the results from the microsimulations).
Scenarios of alternative MDG strategies
A new set of MDG-achieving scenarios was generated to gauge the new requirements of public spending in order to meet MDGs 2 and 7b while consolidating the achievements on other fronts. Unlike the baseline scenarios, these new scenarios assume that public spending is fully endogenous and can be scaled up to the extent needed to meet exogenously imposed MDG targets. In these scenarios, spending is scaled up to meet the MDG targets individually or all simultaneously and alternative sources of financing for the additional public spending are assessed. These financing options include: domestic borrowing (db), foreign current transfers to the government or grants (ft) and foreign borrowing (fb). When one of these financing mechanisms is used, it is implicitly assumed that this is the variable that clears the budget. By implication, the closure rule of the budget changes when either foreign borrowing or transfers are used relative to what it is assumed for the baseline scenario. MAMS also allows for adjusting tax rates as an alternative financing mechanism. This option is not considered in the present analysis because despite the relatively low tax burden, increasing tax rates is extremely unpopular because of the general sentiment that the government has failed to deliver quality services. It remains to be seen whether the tax financing option might gain feasibility in the aftermath after the Revolution and if confidence in government increases.
The five MDG-achieving scenarios analyzed below include:• mdg-db: targeting the achievement of MDGs 2 and 7b using domestic
borrowing• mdg-ft: targeting the achievement of MDGs 2 and 7b using foreign
transfers• mdg-fb: targeting the achievement of MDGs 2 and 7b using foreign
borrowing• mdg2-db: targeting the achievement of MDG 2 using domestic
borrowing• mdg7b-db: targeting the achievement of MDG 7b using domestic
borrowing

50 • Financing Human Development in Africa, Asia and the Middle East
Not surprisingly, the required spending efforts would be less if initial GDP growth is higher, that is when using the optimistic growth reference path scenario as the benchmark. Additional public spending to achieve MDGs 2 and 7b simultaneously would range from 0.26-0.27 per cent to 0.37-0.39 per cent of GDP per year, depending on the financing scenario and whether the optimistic or moderate growth scenario serves as the reference (Table 2.5). In spite of the fact that domestic borrowing crowds out private spending that needs to be compensated by more public spending, there is little difference across the financing scenarios in terms of additional annual public spending requirements. This is largely because the gaps to be closed in order to meet the education and sanitation goals under the baseline scenarios are very small. MAMS for Egypt also allows for the effects of synergies: the better the provisioning of basic sanitation, the more progress in reducing child and maternal mortality. Also, children’s improved health status has a positive effect on school enrolment. These synergies should make it less costly to achieve the two MDGs simultaneously, however the elasticities that have been used to define the correlations between the MDGs are rather low. As a consequence, the synergy effects are barely visible in Table 2.5—requiring the use of two decimals—as the additional annual public spending required to achieve MDGs 2 and 7b is fairly modest and because of some macroeconomic trade-offs, as explained below.
Table 2.5: Egypt: Additional annual public spending required to achieve MDGs 2 and 7b in simulated financing scenarios,1 2007-2015
Deviation from baseline
mdg-ft mdg-db mdg-fb mdg2-db mdg7b-db
Moderate growth scenario
current 0.23 0.24 0.23 0.13 0.10
capital 0.14 0.15 0.14 0.11 0.03
total 0.37 0.39 0.37 0.25 0.14
Optimistic growth scenario
current 0.14 0.15 0.14 0.06 0.08
capital 0.12 0.13 0.12 0.10 0.02
total 0.26 0.27 0.26 0.17 0.11
1 The summation of the last two columns provides the additional annual public spending required to achieve MDGs 2 and 7b separately. The resulting total minus any other of the previous three columns provides the synergy effect which in most cases is not visible using two decimals. Source: Authors’ estimates based on application of MAMS for Egypt.

Egypt • 51
The most costly scenario involves financing the additional public spending required to achieve MDGs 2 and 7b through domestic borrowing. In this case, government debt would increase by 4 percentage points of GDP to 110.2 per cent by 2015, compared to the moderate growth baseline scenario (Table 2.6). In the case of foreign borrowing, the increase in total government debt would be half, that is, 2 percentage points. The main reason for this is the crowding-out effect on private investment of increased public borrowing on domestic capital markets. This slows growth and enhances the costs relative to GDP.
The economy-wide impact of the simulated financing strategies is modest. This is not surprising considering that most of the MDGs are either achieved or almost achieved under reference path scenarios. The economy’s GDP growth remains by and large unaffected. But there are some changes in production structure (Table 2.7). The share of most government services increases when MDGs 2 and 7b are targeted, in part due to the above-discussed synergy effects. Though relatively small, the additional MDG-related spending induces a small real exchange rate appreciation that affects export competitiveness. This effect is stronger under the foreign financing scenario: the share of agriculture and industry in total GDP shrinks and private services gain importance.
Table 2.6Egypt: Domestic and foreign government debt in simulated scenarios, 2015
Per cent of GDP
Baseline scenario mdg-ft mdg-db mdg-fb mdg2-db mdg7b-db
Moderate growth scenario
domestic government debt 106.2 106.1 110.2 106.1 108.8 107.9
foreign government debt 14.9 14.9 14.9 16.9 14.9 14.8
Optimistic growth scenario
domestic government debt 100.0 99.9 102.4 99.9 101.4 101.3
foreign government debt 14.3 14.4 14.3 15.6 14.3 14.2
Source: Authors’ estimates based on application of MAMS for Egypt.

52 • Financing Human Development in Africa, Asia and the Middle East
Analysis of poverty and inequality
As mentioned above, labour market results generated through MAMS were imposed on 2008/09 HIECS data to perform microsimulations for the above-analyzed scenarios. This procedure was justified to the extent that MAMS includes no MDG-achieving scenarios that target MDG 1 and for other methodological reasons explained in Chapter 1. Poverty is treated as an outcome of economy-wide effects channelled through the labour market. For each scenario, labour market results are translated into a new income distribution at the household level. On this basis, changes in poverty and inequality are estimated using the Foster, Greer and Thorbecke (1984) family of decomposable indices for different poverty lines and the Gini coefficient for household income per capita.
One can safely argue that poverty levels are closely associated with the labour market in Egypt. Employment characteristics of the poor point to strong relation between poverty and sector and type of employment. HIECS data show that: a) the poor are mostly unskilled and non-wage workers; b) the unemployed rate is higher for the poor; c) most poor are forced to migrate to the “outside establishment” (that is, workers with no
Table 2.7 Egypt: Sector structure of GDP in the base year and in 2015 in the MDG-achieving scenarios1
Per cent
Base year mdg-ft mdg-db mdg-fb mdg2-db mdg7b-db
Agriculture 12.5 10.5 10.5 10.5 10.6 10.4
Industry 42.5 36.7 36.6 36.7 36.7 36.5
Productive services2 27.1 30.2 30.2 30.2 30.2 30.0
Other private services 5.2 6.0 6.0 6.0 6.0 6.0
Governmental services
education 3.9 5.0 5.0 5.0 5.0 5.4
health 0.9 1.2 1.2 1.2 1.2 1.2
water and sanitation 0.5 0.8 0.8 0.8 0.7 0.8
infrastructure 2.9 3.7 3.7 3.7 3.7 3.7
other government 4.5 5.9 6.0 5.9 5.9 5.9
Total 100.0 100.0 100.0 100.0 100.0 100.0
1 Modest growth baseline scenario taken as the benchmark. 2 Transportation, Suez Canal, trade, finance, insurance, tourism, hotels, and restaurants. Source: Authors’ estimates based on application of MAMS for Egypt.

Egypt • 53
specific work place); and d) about two thirds (63 per cent) of the rural poor are employed in agriculture.
The present analysis uses both international poverty measures ($1.25 and $2.50 per day evaluated at PPP) and moderate and extreme poverty indicators measured with national poverty lines. The latter are generally more in the order of $2.00 a day, and thus define a poverty challenge of much larger magnitude compared to the more typical $1.25 per day poverty line. Since the microsimulation approach derives poverty rates by comparing household income with an income poverty line, and the Egyptian official national poverty lines are estimated based on the minimum consumption level required to satisfy basic needs, consumption-based poverty lines were adjusted in order to use them as income-based poverty lines.
The main microsimulation results are presented in Table 2.8. All simulated scenarios show that mean income growth translates into less poverty—especially for the higher poverty line—but not proportionally given inequality in the distribution of income increases. The optimistic growth scenarios yield higher per capita income growth and hence greater poverty reduction than under the scenarios of moderate growth. The difference is more than 1.5 percentage points for the higher poverty lines.
Targets for MDG 1 are met in the baseline scenarios for poverty incidence only when this is calculated using the $1.25 and $2.50 per day poverty lines (compare results for 2015 in Table 2.8 with targets set in Table 2.2). In fact, extreme poverty as measured by the $1.25 per day poverty line had already been achieved in 2005 and what the baselines’ results show is further reduction.
Poverty falls in the baseline scenarios as a result of higher employment rates for unskilled workers (it increases by 2.8 per cent for unskilled labour compared with the average of 1.8 per cent for all workers) and agricultural income growth (which reaches 12.9 per cent compared with 6.5 per cent for all sectors). Income inequality rises nonetheless because wages of unskilled workers increase to a lesser degree than that for semi-skilled and skilled workers.
Scaling up public spending to achieve MDGs 2 and 7b, as simulated under the MDG-achieving scenarios, yields modest reductions in poverty incidence compared to the baselines. Only very marginal reductions in income inequality are observed and these are mostly explained by a rise in wages for unskilled labour, which becomes relatively scarce as more boys and girls enrol in and complete primary school. However, the targets for poverty incidence calculated with the national poverty lines are still not met. Poverty reduction is only modest because enhanced skills and related shifts in the composition of the labour force likely only start paying off in

54 • Financing Human Development in Africa, Asia and the Middle East
terms of higher productivity and growth in the medium to long run, that is, beyond 2015.
Results differ only slightly across the MDG scenarios. Most of the poverty reduction is explained as a result of the strategy that targets MDG 2 and results in higher wages for unskilled workers, as explained above. This, in turn, results in a modest reduction of income inequality, as measured by the Gini coefficient (see Table 2.8). When MDGs 2 and 7b are targeted simultaneously, poverty falls slightly more with respect to the baseline outcomes when the additional public spending is financed with foreign resources. This is because the labour market is not affected by the small crowding-out effect on private spending that is seen when resources are mobilized domestically.
Table 2.8 Egypt: Poverty incidence and Gini coefficient under different scenarios, 2007 and 2015
Per cent
Poverty incidence (percentage of population)Gini coefficient for per capita
income$1.25 per day $2.5 per dayNational
moderate lineNational
extreme line
2007 2015 2007 2015 2007 2015 2007 2015 2007 2015
Moderate growth
Base 1.89 1.68 29.65 23.12 40.93 29.68 20.87 17.89 0.331 0.380
mdg2-db 1.89 1.61 29.65 23.01 40.93 29.62 20.87 17.81 0.331 0.378
mdg7b-ftr 1.89 1.69 29.65 23.02 40.93 29.58 20.87 17.84 0.331 0.381
mdg7-db 1.89 1.68 29.65 23.03 40.93 29.59 20.87 17.83 0.331 0.380
mdg-db 1.89 1.61 29.65 22.97 40.93 29.55 20.87 17.76 0.331 0.378
mdg-fb 1.89 1.60 29.65 22.96 40.93 29.52 20.87 17.74 0.331 0.378
mdg-ftr 1.89 1.60 29.65 22.96 40.93 29.52 20.87 17.74 0.331 0.378
Optimistic growth
Base 1.89 1.43 29.65 21.53 40.93 27.49 20.75 16.33 0.331 0.384
mdg2-db 1.89 1.37 29.65 21.39 40.93 27.38 20.75 16.20 0.331 0.378
mdg7b-ftr 1.89 1.43 29.65 21.51 40.93 27.41 20.75 16.31 0.331 0.384
mdg7-db 1.89 1.43 29.65 21.50 40.93 27.40 20.75 16.30 0.331 0.384
mdg-db 1.89 1.37 29.65 21.38 40.93 27.34 20.75 16.20 0.331 0.377
mdg-fb 1.89 1.33 29.65 21.33 40.93 27.32 20.75 16.06 0.331 0.376
mdg-ftr 1.89 1.33 29.65 21.33 40.93 27.32 20.75 16.06 0.331 0.376
Source: Authors’ estimates based on application of MAMS for Egypt and microsimulation approach using the HIECS for 2008/09.

Egypt • 55
Conclusions and policy recommendations
This study has presented an assessment of financing strategies to achieve the MDGs in Egypt, the results of which have been generated after applying a macro-micro modelling framework. In view of past progress in most of the MDGs, Egypt is unlikely to face major problems toward the achievement of these goals at the national level. Progress towards the various MDGs has been variable, though: it has been fast and sustained in terms of reducing child and maternal mortality and enhancing drinking water coverage, acceptable in terms of improving basic sanitation coverage, primary school completion rates and reducing poverty, and rather slow in terms of empowering women and protecting the environment. The challenges are also greater for most goals when regional disparities are taken into consideration.
The modelling exercise presented here confirms that before the Revolution, Egypt was on track to achieve most of the MDGs, provided that the level of public policy effort seen before the Revolution would be sustained. However, any additional MDG financing available should target the achievement of primary completion (MDG 2) and basic sanitation (MDG 7b) targets—while keeping an eye on the other goals. Since additional public spending required to achieve MDGs 2 and 7b has been found to be a mere 0.26–0.39 per cent of GDP per year, the choice of financing would only pose minor macroeconomic challenges. Should Egypt opt to finance the newly required MDG spending through domestic borrowing, government debt would rise to nearly 110 per cent of GDP by 2015 (slightly up from already high levels). The cost of financing the education and sanitation goals would be less under the optimistic economic growth scenario. There is fiscal space to finance these goals through tax revenue, given it represents only around 15 per cent of GDP, but the cost associated with increasing tax rates are thought to outweigh the expected benefits.3 Financing through foreign borrowing is usually not recommended due to the exchange rate risk, especially given current conditions, which have the potential of raising the interest spread. Finally, financing through international development assistance is unlikely because Egypt is a middle-income country and as such is not a priority recipient, though international aid has been pledged for the post-conflict nation-building process.
A continuation of growth and public policies seen before the Revolution would ensure that targets of halving poverty by 2015 from the 1990 level would be met when the poverty incidence is measured by international poverty lines. Given that additional public spending required to achieve the MDGs in primary education, mortality rates, and water and sanitation

56 • Financing Human Development in Africa, Asia and the Middle East
would be less than 0.5 per cent of GDP per year, they would provide little direct stimulus to economic activity and employment. Hence, further reductions in poverty would be modest. The enhanced skills and labour-market shifts resulting from meeting the education goal would pay off in higher productivity and growth only in the long term, beyond 2015. The poverty reduction goal would not be achieved if incidence is measured using national poverty lines, unless additional policies are put in place to strengthen job creation and income growth for the poor. Such policies should be oriented at employment and income-generating activities that ensure the participation of the poor in the labour market, allocating soft loans to small-scale enterprises, as well as increasing their access to markets, and providing financial subsidies to the poor through cash transfers and subsidized goods and services.
Egypt is currently facing the challenge of a political transition that will likely slow progress towards the MDGs. Political unrest and increasing uncertainty have disrupted economic activity, triggering a series of undesired effects. Incomes have decreased at the same time that the unemployment problems have been magnified, all of which is putting more strain on the government budget. Inasmuch as this compromises poverty reduction efforts and the government’s ability to invest in social sectors, this chapter’s results may underestimate the actual additional MDG spending needed to meet the goals by 2015. Nonetheless, our estimates of additional public spending and financing needs can be used as a benchmark against which further efforts towards the development goals can be assessed once the effects of the Revolution are fully understood and taken into consideration. The fiscal space to finance social spending through taxation may also become a more feasible option after the Revolution.

Egypt • 57
Notes1 A study conducted by WHO, UNICEF, UNFPA and the World Bank (World Health
Organization and others, 2007) shows that this rate had been reduced by 25 percent during the same period.
2 MAMS captures a synergy between reductions in child mortality and improved education outcomes—but the latter do not affect the former. The evidence on causality for these two variables remains ambiguous. Marcotte and Casterline (1990) and Aly and Grabowski (1990) have found that parents’ education attainment has no significant effect on child mortality. A one standard deviation rise of mothers’ and fathers’ education would predict 14 and 11 percent declines in the probability of child mortality, respectively, according to a study by Boone and Zhan (2006).
3 There is a vast array of costs associated with increasing tax rates such as the administrative cost and the general discontent from increasing taxes, especially as taxes in Egypt are flat and therefore tend to be biased against low-income groups. In addition, raising taxes in the near future would be infeasible from a political point of view, given the depressed state of the economy in light of the recent political turmoil.
References
Aly, Hassan Y., and Richard Grabowski (1990). Education and Child Mortality in Egypt. World Development, Vol. 18, No. 5, pp. 733-742.
Anand, Sudhir and Till Bärnighausen (2004). Human Resources and Health Outcomes: Cross-country Econometric Study. The Lancet, Vol. 364, No. 9445, pp. 1603-1609.
Boone, Peter and Zhaoguo Zhan (2006). Lowering Child Mortality in Poor Countries: The Power of Knowledgeable Parents. Discussion Paper No. 751. Centre for Economic Performance, London School of Economics and Political Science. Available from http://eprints.lse.ac.uk/19799/.
Casterline, John B., Elizabeth C. Cooksey and Abdel Fattah E. Ismail (1989). Household Income and Child Survival in Egypt. Demography. Vol. 26, No. 1, pp. 15-35.
Dancer, Diane, and Anu Rammohan (2007). Determinants of Schooling in Egypt: The Role of Gender and Rural/Urban Residence. Oxford Development Studies, Vol. 35, No. 2, pp. 171-195.
Economic Research Forum (2004). Egypt Country Profile: The Road Ahead for Egypt. Cairo.
Fay, Marianne, Danny Leipziger, Quentin Wodon, and Tito Yepes (2005). Achieving the Millennium Development Goals: The Role of Infrastructure. World Development, Vol. 33, No. 8, pp. 1267-1284.
Foster, James, Joel Greer, and Erik Thorbecke (1984). A class of decomposable poverty measures. Econometrica, Vol. 52, No. 3, pp. 761-765.
Hanushek, Eric A., Victor Lavy, and Kohtaro Hitomi (2008). Do Students Care about School Quality? Determinants of Dropout Behavior in Developing Countries. Journal of Human Capital, Vol. 2, No. 1, pp. 69-105.

58 • Financing Human Development in Africa, Asia and the Middle East
Hassan, Mohamed, and Cyrus Sassanpour (2008). Labor Market Pressure in Egypt: Why is the Unemployment Rate Stubbornly High? Safat, Kuwait: Arab Planning Institute. Available from http://www.ilo.org/dyn/travail/docs/437/Hassan and Sassanpour 2008 ‘Labor Market Pressures in Egypt’ API.pdf.
Jansen, Marion, and Erik von Uexkull (2010). Trade and Employment in the Global Crisis. Geneva: International Labor Office. Available from http://www.ilo.org/wcmsp5/groups/public/@dgreports/@dcomm/@publ/documents/publication/wcms_141911.pdf.
Kamaly, Ahmed, with Ziad Bahaa Eldin (2009). The Egyptian Report for Investment: Toward a Fair Distribution of Growth, 2008. In Arabic. Cairo: Board of Trustees of the General Authority for Investment and Free Zones.
Kheir El-Din, Hanaa and Heba El-Laithy (2006). An Assessment of Growth, Distribution and Poverty in Egypt: 1990/91–2004/2005, Working Paper No. 115. Cairo: Egyptian Center for Economic Studies.
Khorshid, Motaz, Ahmed Kamaly, Heba El-Laithy and Soheir Abou El-Enein (2011). Assessing Development Strategies to Achieve the Millennium Development Goals in the Arab Republic of Egypt, Project Final Report. UNDP-RBAS,UN-DESA and World Bank. Available from http://www.un.org/en/development/desa/policy/capacity/output_studies.shtml.
Khorshid, Motaz (2003). Alternative Socioeconomic Development Scenarios for Egypt: Results from an Economy-Wide Simulation Model, Conference Paper. Cairo: Economic Research Forum.
Khorshid, Motaz (2008). Social Accounting Matrices for Modeling and Policy Analysis-Development Issues from the Middle East. Proceedings of the International Conference on Policy Modeling, Berlin, Germany, July 2-4.
Lofgren, Hans (2008). MAMS–A Guide for Users. Unpublished Technical Report, Regional Project for Assessing Development Strategies to Achieve the Millennium Development Goals in the Arab Region, UNDP, UN-DESA and World Bank.
Marcotte, John, and John B. Casterline (1990). Interrelations Among Child Mortality, Breastfeeding, and Fertility in Egypt, 1975-80. Population and Human Resources Department, WPS 478. Washington, D.C.: World Bank.
Ministry of Economic Development (2008). Egypt: A Midpoint Assessment Achieving the Millennium Development Goals.
Ministry of Economic Development (2010). Egypt’s Progress Towards Achieving the Millennium Development Goals.
OECD (2002). African Economic Outlook, Egypt Country Profile. Retrieved from http://www.oecd.org/dataoecd/34/15/1824627.pdf.
Roushdy, Rania, and Soiliou Namoro (2007). Intrahousehold Resource Allocation in Egypt: Effect of Power Distribution within the Household on Child Work and Schooling. Paper funded by Global Development Network.
Sánchez, Marco V., Rob Vos, Enrique Ganuza, Hans Lofgren, and Carolina Díaz-Bonilla, eds. (2010). Public Policies for Human Development: Achieving the Millennium Development Goals in Latin America. Basingstoke, U.K.: Palgrave Macmillan.

Egypt • 59
Vassall, Anna, Samiha Bagdadi, Hyam Bashour, Hanem Zaher, and P. V. Maaren (2002). Cost-effectiveness of different treatment strategies for tuberculosis in Egypt and Syria. International Journal of Tuberculosis and Lung Disease, Vol. 6, No. 12, pp. 1,083-1,090.
World Bank (2006). Egypt: Economic Monitoring Report. Social and Economic Development Group and the World Bank Office in Cairo, Middle East and North Africa Region.
World Bank (2009). Economic Growth, Inequality and Poverty: Social Mobility in Egypt between 2005 and 2008. Report No. 47699. Washington, D.C.: World Bank.
World Health Organization (2010). Egypt Country Profile. Retrieved from http: http://www.emro.who.int/emrinfo/.
World Health Organization, UNICEF, UNFPA, The World Bank (2007). Maternal mortality in 2005. Estimates developed by WHO, UNICEF, UNFPA and The World Bank. Geneva: World Health Organization.