Kızıldeniz'de Osmanlı Hakimiyeti Özdemiroğlu Osman Paşa'nın Habeşistan Beylerbeyliği (1561-1567)
Upload
khangminh22Category
view
1download
0
بسم الله الرحمن الرحيم
AL Neelain UniversityGraduate College
Effect of low Electrical voltages on the viable counting of
Escherechia coli and Staphylococcus aureus
A Complimentary Research Submitted inPartial Fulfillment of the Requirement for the
Degree of Master of Science (M.Sc.) in
Molecular Microbioloy
By
Muzdalifa Omer Adam Abd Arraheem
SupervisorProfessor: Sanaa Osman Yagoub Ahmed
April 2020
1

بسم الله الرحمن الرحيم
جامعة النيلين�كلية الدراسات العليا
أثر الجهد الكهربائي المنخفض على العد�
الحيوي لبكتيريا� اإلشريكية� القولونية�
والمكورة العنقودية� الذهبية�
بحث تكميلي لنيل درجه الماجستير في األحياء الدقيقة الجزيئية
:إعدادمزدلفة عمر آدم عبدS الرحيم
:إشرافأ.د سناء عثمان يعقوب
2020أبريل
2

اآلية الكريمة
قال تعالى:ذي تشربون ءأنتم68))أفرأيتم الماء ال
نشاء لو69نحن المنزلون أم المزن من أنزلتموه) (70تشكرون أجاجا فلوال جعلناه
صدق الله العظيمسورة الواقعة
Dedication
I

I dedicate this work to :
My mother
My aunt
My uncles
My grand mother
My brothers
My sisters
My friends
&
To all precious people with endless love
Acknowledgement
II

First of all I would like to express my deep gratitude to Allah for assisting me to complete this work.
Deep thanks to my supervisor Prof. Sanaa Osman Yagoub for her profound guidance.
I also would like to extend my thanks and appreciation for the people who helped me throughout the
research.
Particular thanks are also to Dr ibn aouf, Head of the Department of Microbiology and Molecular
Biology, Dr. Elfadil , Dr. Rabea, Miss. Amira, Mr. abdul hadi and Mr. abd assakhi who provided me
with whatever facilities needed during the course of study. My thanks also extend to my brighter
colleagues, and to everyone who participated in this research or helped me . Deep appreciations to the
faculty staff for the support provided throughout the study.
Last but not least I thank my great family for their aid and continuous support specially my uncles
who encouraged me during my study and making every thing in my life possible.
Abstract
III

Safe drinking water is necessary for human health all over the world. Being a universal solvent, water
is a major source of infection. According to world health organization (WHO) 80% of diseases are
water borne. 3.1% of deaths occur due to the unhygienic and poor quality of water. The direct current
(DC) effects on bacterial cells have been studied for several decades, viability studies have
concentrated on the use of pulsed high voltage for inactivation or moderate voltage for many hours or
many days. This study aimed to determine the effect of Alternating current on growth of E.coli and
Staphylococcus aureus at different voltages. Using a carbon wire, five, ten , fifteen, twenty , twenty-
five and fifty voltage alternating current (AC) current were adjusted in a voltmeter and electricity
was conducted for 10 minutes to each tube of 1×10 -1 to 10 -5 serially diluted E.coli and
Staphylococcus aureus and immediately cultured in plate count agar (PCA) medim; two plates for
each dilution, this dilution culture considered as after-electrical current treatment. The plates were
incubated at 37ºC for 24 hours, the bacterial colony were counted using colony counter. Statistical
analysis showed that both voltage and dilution of S. aureus and E. coli has clear effect on the
inhibition of the bacterial viable count. The difference in mean of data pre electrical current and after
electrical current treatment indicates that the electrical current has an effect on bacterial count. At 20
voltages above results showed that there was a complete inhibition of the growth of both tested
bacteria at 10 -4 and 10 -5 dilutions. This study encourage introduction of electric current for drinking
water treatment as alternatives for chemical disinfectants which has negative effect on human health.
IV

ملخ
ص البحث
تعتبر المياه الصالحة للشرب مهمة لص�حة االنس�ان في جمي�ع انح�اء الع�الم. ولم�ا ك�ان
% من االم��راض تنتق��ل80الماء مذيب عام فهو يعتبر مصدر رئيس للعدوى ل��ذلك ف��إن
% من الوفيات تحدث3.1عن طريق الماء وذلك حسب تقرير منظمة الصحة العالمية و
نتيجة تلوث المياه. لقد تمت دراسة اثر التيار المباش��ر على الخالي��ا البكتيري��ة من��ذ ع��دة
عقود ودرست فيها حيوية الخاليا بالتركيز على استخدام اما نبضات جهد كهرب��ائي ع��الي
لتثبيط النمو او جهد متوسط لعدة ساعات او ايام. هدفت هذه الدراس��ة الى تحدي��د أث��ر
التيار الكهربائي المتردد على نمو بكتريا االشريكية القولونية والمكورة العنقودية الذهبية
،15،� 10،� 5باستخدام عدة فروق جهد منخفضة . باستخدام سلك الكربون، و تم ضبط
10 فولت من التيار المتردد على جهاز الفولتميتر وتم توصيل التيار لمدة 50، و25،� 20
.10-� 5 الى 10-� 1دقائق النابيب اختبار تحتوي على البكتيريا مخففة تخفيفا عشريا من
بعد توصيل التيار مباشرة تم تزريع البكتيريا في بيئة اآلج��ار للع��د البكت��يري ؛ تم ال��تزريع
في طبقين لكل تخفيف ألخذ متوسط العد ليعتبر ذلك عدد البكتيريا بعد مرور التيار. وتم
ساعة واستخدم في الع��د جه��از ع��داد24م لمدة 37ºتحضين االطباق في درجة حرارة
المستعمرات. واثبتت التحاليل اإلحصائية ان هناك أثر إلختالف الجه��د و ترك��يز البكتيري��ا
على تثبيط العد الحيوي لبكتيريا االشريكية القولونية والمكورة العنقودية الذهبية ويت��بين
هذا األثر في الفرق بين متوسطات اعداد البكتيريا قبل م��رور التي��ار وبع��د م��رور التي��ار.
. 5- 10و 4- 10 فولت فاكثر حدث تثبيط تام للبكتيريا عند التخفيفين 20عند استخدام
هذه الدراسة تش��جع على اس��تخدام التي��ار الكهرب��ائي كطريق��ة لمعالج��ة مي��اه الش��رب
كبدائل للمعالجة الكيميائية والتي لها أثر واضح على صحة االنسان.
V

Table of Contents
Number Subject Page
Holy Quran I
Dedication II
Acknowledgement III
Abstract (English) IV
Abstract (Arabic) V
Table of contents VI
List of Tables X
List of Plates XI
List of Figures XII
List of Appendices XII
Chapter One : Introduction and Literature Review
1.1 Introduction 1
Problem statements 1
Objectives 2
1.2 Literature Review 2
1.2.1 Water pollution 2
1.2.1.1 Microbial pollution of water 3
VI

1.2.1.2 Chemical water pollution 3
1.2.2 Sources of water pollution 4
1.2.2.1 Point sources of pollution 4
1.2.2.2 Non-point sources of pollution 4
1.2.3 Water-borne diseases 5
1.2.3.1 Historical perspective of water-borne diseases
5
1.2.3.2 Bacterial water-borne diseases 5
1.2.3.3 Viral dater-borne diseases 6
1.2.4 Water Treatments 7
1.2.4.1 Traditional Treatment Methods 7
1.2.4.2 Advanced Methods of Treatments 8
1.2.5 Effect of Electrical Current on Bacteria 9
1.2.6 Test Organisms 9
1.2.6.1 Escherichia coli 9
1.2.6.2 Staphylococcus aureus 10
Chapter Two: Materials and Methods
2 Materials and Methods 13
2.1 Preparation of culture media 13
2.1.1 Nutrient agar 13
2.1.2 Eosine Methylene blue agar 13
2.1.3 MacConkey agar 13
2.1.4 Plate count agar 13
VII

2.1.5 Manitol salt agar 13
2.1.6 DNA agar 13
2.1.7 M R-Vp medium 14
2.1.8 Pepton water 14
2.2 Preparation of test organismos 14
2.3 Confirmation of bacterial isolates 14
2.3.1 Gram stain 14
2.3.2 Biochemical tests and culture 14
2.3.2.1 Culture in EMB and MacConkey agar media 14
2.3.2.2 Indol test 15
2.3.2.3 Methyl Red ( MR ) test 15
2.3.2.4 Voges Proskauer ( VP ) reaction 15
2.3.2.5 Motility test 15
2.3.2.6 Catalase test 15
2.3.2.7 Coagulase test 16
2.3.2.8 Oxidase test 16
2.3.2.9 Culture in manitol salt agar ( MSA ) 16
2.3.2.10 DNAse test 16
2.4 Preparation of water sample 17
VIII

2.5 Inoculation of water sample and bacterial count
17
2.6 Effect of AC current on S. aureus and E. coli
17
2.6.1 Conduction and application of current 17
2.6.2 Bacterial count 18
Chapter Three: Results
3 Results 20
3.1 Identification of bacterial isolates 20
3.2 Effect of 5 volt current on different dilutions of bacteria 20
3.3 Effect of 10 volt current on different dilutions of bacteria 25
3.4 Effect of 15 volt current on different dilutions of bacteria 26
3.5 Effect of 20 volt current on different dilutions of bacteria 29
3.6 Effect of 25 volt current on different dilutions of bacteria 30
3.7 Effect of 50 volt current on different dilutions of bacteria 32
3.8 Statistical analysis 33
3.8.1 Effect of electrical treatment on viable count of S. aureus 33
3.8.2 Effect of electrical current treatment on viable count of E. coli
35
Chapter Four: Discussion, Conclusion & Recommendations
4.1 Discussion 39
4.2 Conclusion 41
4.3 Recommendations 41
IX

References 43
Appendices 51
List of tables
Table 1 Characterization of S. aureus. 20Table 2 Characterization of E. coli. 20Table 3 S. aureus count before and after 5 volt treatment. 21Table 4 E. coli count before and after 5 volt treatment. 21Table 5 S. aureus count before and after 10 volt treatment. 25Table 6 E. coli count before and after 10 volt treatment. 25Table 7 S. aureus count before and after 15 volt treatment. 26Table 8 E. coli count before and after 15 volt treatment. 26Table 9 S. aureus count before and after 20 volt treatment. 29Table 10 E. coli count before and after 20 volt treatment. 29Table 11 S. aureus count before and after 25 volt treatment. 30Table 12 E. coli count before and after 25 volt treatment. 30
X

Table 13 S. aureus count before and after 50 volt treatment. 32Table 14 E. coli count before and after 50 volt treatment. 32Table 15 Statistical analysis for S. aureus numbers before and after treatment. 33Table 16 Paired sample t test of S. aureus before and after treatment. 33Table 17 S. aureus count (mean, medium, standard deviation) before and after current 34Table 18 Statistical analysis for E. coli numbers before and after treatment. 35Table 19 paired sample t test of E. coli before and after treatment. 36Table 20 E. coli viable count (mean, medium, STD) before and after current. 37
List of Plates
Plate 1 Steps of treatment using volts 18
Plate 1 S. aureus count before and after treatment with 5 volt electricity 22
Plate 3 S. aureus viable cell count of 10-4 dilution before treatment with 5 volt. 23
Plate 4S S. aureus viable cell count of 10-4 dilution after treatment with 5 volt. 23
Plate 5 S. aureus viable cell count of 10-5 dilution before treatment with 5 volt. 24
Plate 6 S aureus viable cell count of 10-5 dilution tube after treatment with 5 volt. 24
Plate 7 E. coli viable cell count of 10-1 dilution treated with 15 volt 27
Plate 8 E. coli cell count of 10-2dilution before and after treatment with 15v. 27
Plate 9 E. coli cell count of 10-3dilution before and after treatment with 15v. 28
Plate 10 E. coli 10-4 dilution before and after 15v treatment. 28
Plate 11 E. coli 10-4 dilution before and after 25v treatment. 31
Plate 12 E. coli 10-2 dilution before and after 25v treatment. 31
XI

List of Figures
Figure 1 Effect of voltage and dilution on S. aureus count. 34Figure 2 Effect of voltage and dilution on E. coli viable count 36
List of appendices
Appendix 1descriptive statistic of S. aureus count result pre- and after current passage. 51
Appendix 2descriptive statistic of E. coli count result pre- and after current passage. 56
Appendix 3Statistical analysis of S. aureus data shows dilution effect. 61
Appendix 4Statistical analysis of S. aureus data shows paired sample differences64
Appendix 5Statistical analysis of E. coli data shows paired sample differences 64
XII

CHAPTER ONE
INTRODUCTION AND LITRATURE REVIEW
XIII

XIV

CHAPTER ONE
INTRODUCTION AND LITRATURE REVIEW
1.1 Introduction:
Since along time, water has been recognized as important as shown “By means of water God gives life
to every living thing”, (Islam: Quran 21:30). “Whoever believes in me, stream of living water will pour
from within him” (Christianity: John 7:38), it is the main dietary components and drinking water has to
be visually acceptable, being clear, colorless and without disagreeable taste or odor. Many
pathogens can be transmitted through water and cause diseases to humans and animals. Possible
pathogens include viruses, bacteria, including Salmonella, Vebrio cholerae, Campylobacter and
Shigella, and protozoa, including, Giardia lamblia and other Cryptosporidia (Berrin, 2008).
Water treatment is any process that improve the quality of water to make it more acceptable for a
specific end-use. however the use of different forms of chlorine for drinking water disinfection was a
major public health breakthrough to avoid outbreaks of waterborne diseases, but their use can lead to the
formation of unwanted disinfection by-products (DBPs), of which some are bioactive and genotoxic
(Richardson et al., 2007; Li and Mitch, 2018). In epidemiological studies, exposure to DBPs in
chlorinated drinking water has been associated with various human health effects, such as bladder
cancer, miscarriage and birth defects (Villanueva et al., 2015; Bove et al., 2002). There are numerous
conventional water treatment technologies available in rural areas of developing countries. Traditional
water purification methods include boiling, filtration, sedimentation and solar radiation (Sadhana and
Ashok , 2016 ). an innovative water treatment process, including suspended ion exchange, ozonation, in-
line coagulation, ceramic microfiltration, and granular activated carbon were developed(Johan et
al.,2019).
Problem Statement:
Despite the vital importance of water, the citizen of the Khartoum state has been suffered from the
scarcity of safe and potable drinking water, lack of sufficient amount of water as well as Lack of
sanitary measures to protect water plants. Otherwise an epidemic water-borne diseases have been
reported in some areas in Khartoum state, this necessitate to conduct periodic water researches to solve
problems and provide sufficient amount of water to meet all needs of increasing population ( WHO/
UNICEF, 2017).
1
Objectives:
This work aimed to:
- Examine the effect of low voltages alternative current on growth of E.coli and Staphylococcus aureus .
- Examine the activity of different voltages toward different concentration of bacterial cells.
-Determine electric power efficiency in removing bacterial contamination of water and improve new
treatment technologies that are more safe and cost- effective to solve consumers complains towards
the quality of water and consumers acceptance.
1.2 Litrature review:
1.2.1 Water pollution
Water pollution occurs when unwanted materials enter into water (e.g. lakes, rivers, oceans, aquifers)
and contaminate the water. This form of degradation occurs when pollutants are directly discharged into
water bodies without adequate remove of harmful compounds. This is harmful to environment and
human health. Water pollution affects the biosphere of plants and organisms living in these as well as
organisms and plants that might be exposed to the water. In almost all cases the effect is damaging not
only to individual species and populations, but also to the natural biological communities (Wikipedia,
2018).
According to a 2007 World Health Organization (WHO) report, 1.1billion people lack access to an
improved drinking water supply; 88% of the 4 billion annual cases of diarrheal disease are attributed to
unsafe water and inadequate sanitation and hygiene, while 1.8 million people die from diarrheal disease
each year. The WHO estimates that 94% of these diarrheal disease cases are preventable through
modifications to the environment, including access to safe water.
The specific contaminants leading to pollution in water include a wide spectrum of chemicals,
pathogens, physical contaminants … etc. Discharge of domestic and industrial effluent wastes, leakage
from water tanks, marine dumping, radioactive waste and atmospheric deposition are major causes of
water pollution. Water pollutants are killing sea weeds, mollusks, marine birds, fishes, crustaceans and
other sea organisms that serve as food for human. Mishra (2010) points several reasons of water
pollution in Delhi such as sewage and waste water, dumping of solid wastes and litters in water bodies,
industrial waste, acid rain, global warming, eutrophication.
2

1.2.1.1 Microbial pollution of water:
The world health organization (2006) in its" guideline for drinking water quality" publication
highlighted at least seventeen different and major genus of bacteria that may be found in tap water
which are seriously affecting human health .
Biofilm in distribution system may provide a favorable condition for opportunistic pathogens (e.g.
Legionella spp., Pseudomonas aeruginosa and Mycobacterium avim ) to colonize and may harbor
pathogens such as Salmonella enterica serovar typhimurium, which can enter the distribution System
(Berry et al., 2006 ; Parsek and Singh , 2003). In general, the greatest microbial risks are associated
with ingestion of water that is contaminated with human or animal feaces. Wastewater discharges in
fresh waters and costal seawaters are the major source of fecal microorganisms, including
pathogens (Grabow, 1996 ; WHO, 2008). Polluted water causes infectious diseases, like cholera,
typhoid fever and other diseases like gastroenteritis, diarrhea, vomiting, skin and kidney problems (Owa,
2013). Wastewater discharges in fresh waters and costal seawaters are the major source of fecal
microorganisms, including pathogens (Grabow, 1996 and WHO, 2008).
1.2.1.2 Chemical water pollution:
Heavy metals, industrial waste and toxins in industrial waste are the major cause of immune
suppression, reproductive failure and acute poisoning. Dhote et al. (2001) argue that the toxic chemicals
used in making the idols tend to cause serious problems of water pollution and also pose a serious threat
to the underwater ecological system. When immersed, these colors and chemical dissolve slowly leading
to significant alteration in the water quality. Kaur et al. (2013) study on assessment of idol immersion on
physio-chemical characteristics of river Yamuna in Delhi stretch revealed that idol immersion activity
has negative impact on water quality of river Yamuna. The composed data was analyzed for the year
2011, to understand deterioration in the water quality of the river due to idol immersion practices.
According to the results, the value of DO, BOD, Total Solids and COD were found to vary from 6.0-7.5
mg/L; 3.3-38 mg/L; 430-1268 mg/L; 28- 136 mg/L respectively. The low levels of DO and high BOD
and Total solids levels at different sites indicate the poor water quality due to idol immersions. .
Insecticides like DDT concentration is increasing along the food chain, These insecticides are harmful
for humans (Owa, 2013).
3

1. 2.2 sources of water pollution:
The most significant sources of water pollution are Sewage ( Waste Water ), Agricultural
Pollution, Oil Pollution, Radioactive Substances, River dumping and Marine Dumping. Pollution is the
result of the cumulative effect over time. All plants and organisms living in or being exposed to
polluted water bodies can be impacted. The effects can damage individual species and impact the
natural biological communities (wikipedia, 2019).
The causes of water pollution include a wide range of chemicals and pathogens as well as physical
parameters. Contaminants may include organic and inorganic substances. Elevated temperatures can
also lead to polluted water. A common cause of thermal pollution is the use of water as a coolant by
power plants and industrial manufacturers. Elevated water temperatures decrease oxygen levels, which
can kill fish and alter food chain composition, reduce species biodiversity, and foster invasion by new
thermophilic species.( Goel, 2006; Edward, 2018). Sources of water pollution are either point sources or
non-point sources.
1.2.2.1 Point source of pollution
Point source of pollution refers to discharges that enter surface waters through a pipe, ditch or other well
defined point of discharge. The term applies to wastewater and storm water discharges from a variety of
sources. Point sources have one identifiable cause of the pollution, such as a storm drain, wastewater
treatment plant or stream ( Brian, 2008).
1.2.2.2 Non point source of pollution (NPS) :
NPS pollution generally results from land runoff, precipitation, atmospheric deposition, drainage,
seepage or hydrologic modification. NPS pollution, unlike pollution from industrial and sewage
treatment plants, comes from many diffuse sources. NPS pollution is caused by rainfall or snowmelt
moving over and through the ground. As the runoff moves, it picks up and carries away natural and
human-made pollutants, finally depositing them into lakes, rivers, wetlands, coastal waters and ground
waters (EPA, 2019).
4
1.2.3 Water-borne diseases:
1.2.3.1 Historical perspective of water-borne diseases
Safe drinking water is necessary for human health all over the world. Being a universal solvent, water is
a major source of infection. According to world health organization (WHO) 80% of the diseases are
water borne. 3.1% of deaths occur due to the unhygienic and poor quality of water (Pawari and
Gawande, 2015). The Pollution across rivers have been causing acute water-borne diseases and health
problems that are affecting the human population which needs to be treated and also poses an economic
cost on people (Shahid and Saba, 2018). The same authors added that in a study published by John
Hopkins states that Pneumonia and Diarrhoea claimed lives of 1.5 million child under the age of five.
This prevails disproportionately in a few countries as 72 percent of these two diseases among children
deaths occur in just 15 countries and that In India, 296,279 children under the age of five died due to
Pneumonia & Diarrhoea in 2016.
Diarrhoeal disease alone amounts to an estimated 3.6 % of the total DALY global burden of disease
and is responsible for the deaths of 1.5 million people every year. It estimated that 58% of that burden,
or 842 000 deaths per year, is attributable to unsafe water supply, sanitation and hygiene and includes
361 000 deaths of children under age of five, mostly in low-income countries(WHO, 2019).
Although water-associated diseases in developing countries are prevalent, they are also a serious
challenge in developed countries. A study by Arnone and Walling (2007), who compiled data of
outbreaks in the U.S. (1986 – 2000), reported 5,905 cases and 95 outbreaks associated with recreational
water. Drinking water supplies in United States are among the safest in the world. However, even in the
U.S., drinking water sources can become contaminated, causing sickness and disease from
waterborne germs, such as Cryptosporidium, E. coli, Hepatitis A , Giardia intestinalis , and other
pathogens.
1.2.3.2 Bacterial water- borne diseases :
Gastrointestinal Illness (GI) caused by variety of different microbes and germs, which causes
symptoms, such as diarrhea, nausea, vomiting, fever, abdominal pain, was responsible for about 29.53%
cases. More than 27% of cases were caused by Shigella spp. Nearly 21% of the outbreaks were caused
5

by Shigella spp, In addition, 12.63% of the outbreaks were caused by E. coli 0157:H7. Besides acute
gastroenteritis, major etiological agents such as E. coli 0157:H7, V. cholera, and Salmonella were the
agents responsible for many outbreaks (Craun et al., 2006).
Although cholera infections have not been reported in recent years in developed countries mainly due to
improved sanitation, millions of people each year continue to get infected by Vibrio cholera in
developing countries (Nelson et al., 2009). A work by Edge et al. (2010) detected water-borne E. coli in
80% of water samples with E. coli levels of less than 100 CFU/100 ml. Another study by Wade et al.
(2006) reported significant positive trends between increased GI illness and indicator organisms at the
Lake Michigan beach, and a positive trend with indicators such as E. coli at a Lake Erie beach. Recently,
the use of indicator organisms (e.g., fecal coliforms, E. coli) for assessing pathogen levels has been
debated more often than ever; however, the use of indicator organisms is likely to continue for assessing
pathogen levels in water resources potentially because of the lack of an alternative reliable solution.
1.2.3.3 Viral water-borne disease:
Water-transmitted viral pathogens that are classified as having a moderate to high health significance by
the World Health Organization (WHO) include adenovirus, astrovirus, hepatitis A and E viruses,
rotavirus, norovirus and other caliciviruses, and enteroviruses, including coxsackieviruses and
polioviruses (WHO, 2011). Also, viruses that are excreted through urine like polyomaviruses ( WHO,
2011) and cytomegalovirus (Cannon et al., 2011) can potentially be spread through water. Other
viruses, such as influenza and coronaviruses, have been suggested as organisms that can be transmitted
through drinking water, but evidence is inconclusive. Most of the above viruses are most commonly
associated with gastroenteritis, which can cause diarrhea as well as other symptoms including abdominal
cramping, vomiting, and fever. It should be noted that some of these viruses could also cause more
severe illnesses including encephalitis, meningitis, myocarditis (enteroviruses), cancer (polyomavirus),
and hepatitis (hepatitis A and E viruses). Hepatitis E virus can also cause a mortality rate of up to 25%
in pregnant women. Viral infections are usually self-limiting in healthy individuals. They can cause
greater morbidity in children under the age of five, the elderly, immune-compromised people, and
pregnant women. Waterborne virus-based diseases may be higher in developing regions, where there is
widespread malnutrition and large populations of HIV-positive people. Regardless, there are few broad
spectrum anti-viral drugs to treat these diseases ( WHO, 2011). Several of these viruses have extremely
low infectious doses; the probability of infection from exposure to one rotavirus particle is 31%
6

( Reynolds et al., 2008). Viruses are shed in faeces in very high numbers even asymptomatically. For
example, up to 1011 norovirus particles can be present per gram of stool (Hall, 2012). In addition, non-
enveloped viruses can persist in water for long periods of time. When considering these characteristics,
inadequate disinfection of feacally contaminated drinking water could easily lead to outbreaks of viral
gastroenteritis from ingestion. Notably, drinking water can also transmit viruses via inhalation (e.g.,
showering) or contact with skin and eyes (e.g., swimming) causing respiratory and ocular infections.
( Fong and Lipp , 2005).
1.2.4 Water Treatments:
Access to safe water is fundamental human need and a basic human right declared Kofi Annan former
United Nations Secretary. General and Economically a country is pulled back when drinking water
supply is not proper (WHO, 2003), hence, Recognizing an economic and easily accessible system for
improving water quality remains as essential for a community especially when it is isolated from
mainland.
1.2.4.1 traditional treatment methods:
UN and UNICEF (2005) promote household water treatment and safe storage. Some places community
may have their own simple purification method. If such traditional knowledge made available will be
useful to others in own country as well as in other countries. Babu and Chaudhry (2005) reported a
filtration method using natural coagulant. This method could be preferred by rural people. WHO (2003)
had elaborated simple filtration method by using fabric mesh of stainless steel or polyester (aperture 50-
45 um), which was sufficient for removing algae cells and large protozoa. Chlorine is commonly used as
a disinfectant. Probably these two measures would be easily adopted by villagers. This could be supplied
to public by government with minimum financial expenditure. However, the purity of drinking water
from this process alone is not sufficient (Lechevailler and Keung, 2004).
an Ayurveda classic had written water purification method for drinking purpose by using following
flowers ,Utpala (Nelumbo nucifera), Naga (Mesua ferrea), Champaka (Michelia champaca) and
Patala (Stereospermum suaveolens) . Among different communities this is stated as an accepted method
for purifying water. According to the method, keep one of these flowers in water to be purified and after
a period of time decant for portability. However, a standard measure for this is not known. The flowers
mentioned are being regularly used by people in different countries. However, it is not known whether
7

water is fully purified by this simple procedure ( Skandhan et al., 2011). Hackett and Kingrey (2006)
invented a treatment system for treating fresh water in a cost effective manner to mix the disinfectant
with water. The invention includes a water storage tank connected to a water source, a chlorination
device connected to the water storage tank, a media filter partially contained within the water storage
tank and a pump connecting the media filter vessel with the water storage tank. Flow through the
chlorination device is regulated to provide adequate amounts of disinfectant to be released in tablet
form.
1.2.4.2 Advanced methods of treatment:
New biotechnological tools helps environmental sustainability and Innovative drinking water treatment
techniques reduce the disinfection-induced oxidative stress and genotoxic activity (Johan et al., 2019).
Enhanced biological phosphorus removal (EBPR) is an important biological process in wastewater
treatment where P can be removed without addition of chemicals ( Blackall et al., 2002 ; Melia et al.,
2017). EBPR exploits the capability of certain microorganisms, termed polyphosphate (poly-P)
accumulating organisms (PAO), to store large quantities of orthophosphate (ortho-P) intracellularly
as poly-P. This P-enriched biomass can be removed from the treated wastewater as surplus sludge
and used directly as fertilizer or for recovery of P. A new water purification techniques including
Boiling, Distillation, Reverse osmosis, Desalination, and In Situ Chemical Oxidation are invented and
used a form of advanced water treatment in addition to Bioremediation which is a technique that uses
microorganisms in order to remove or extract certain waste products from a contaminated area. About
filtration systems, Baird (2007) disclosed a water purification system consisting of a two-stages reverse-
osmosis (RO) filtration process utilizing a carbon block pre-filter and RO filter using an annular design.
Yoon et al. ( 2005) developed nanofiltration membrane based water purifier without the need for a
storage tank. The water purifier uses a nanofiltration membrane filter as the main filtering section and
does not require a storage tank for containment of the purified water. Tonelli et al. (2001) disclosed a
method for producing high purity water using dealkalization and a double pass reverse osmosis
membrane system with enhanced membrane life. The treatment method involves coagulant addition,
membrane filtration, ion exchange for dealkalization, decarbontation, and pH adjustment. Archer (2007)
developed a drinking water filter which can remove major contaminates from tap water and other
drinking water sources, and adjust pH. The water filter contains a cylindrical cartridge with sponge
filters used as dividers between different layers of filtration material and along a length of the cartridge.
8

The same author added that beside those there are other techniques as ion exchange systems, in which
Ion exchange resins used for water softening divided into two categories as cationic and anionic resins.
1.2.5 Effect of electrical current on bacteria:
The direct current (DC) effects on bacterial cells have been studied for several decades (Pareilleux and
Sicard,1970 ; Rosenberg et al., 1965) and the studies have focused mainly on the viability, metabolism,
and transport of the cells. In particular, viability studies have concentrated on the use of pulsed high
voltage for inactivation ( Dreesa et al., 2003) or moderate voltage for many hours or many days in some
cases (Valle et al., 2007). Even in bacterial biofilms; surface-adhering bacteria that form colonies
characterized by the production of an exopolysaccharide matrix in which they reside ( Hall-Stoodley et
al., 2004), the bioelectric phenomenon is a synergy between a relatively weak DC and the antibiotic
used to eradicate the biofilm bacteria ( Sandvik et al., 2013). There are limitations for the use of DC
currents, including weak currents, for the killing of vegetative bacteria Alternatively, new trials using
AC instead of DC have been conducted. Very high electric field strength ( Smith et al., 2009) or
moderate electric field strength for longer time was used to exert heating effect ( Lee et al., 2012). The
electrochemical method for the oxidation of organic pollutants for waste water treatment has attracted a
great deal of attention recently, mainly due to the development of new effective anode material (Mericas
and Wagoner, 1994) .In fact it has been found that the oxidation of organics takes place always with
simultaneous oxygen evolution, this has allow to search new anode material with high oxygen evolution
over potential in order to favor the reaction of organics oxidation over the side reaction of oxygen
evolution ( Errami et al., 2011 ; Bouya et al., 2012 ; Id El Mouden et al., 2012).
1.2.6 Test organisms:
1.2.6.1 Escherichia coli:
E. coli is a Gram-negative, facultative anaerobic, rod-shaped, coliform bacterium of the genus
Escherichia that is commonly found in the lower intestine of warm-blooded organisms (endotherms)
(Tenaillon, 2010). Most of the E. coli strains are harmless, but some serotypes can cause serious food
poisoning in their hosts, and are occasionally responsible for product recalls due to food contamination
(Vogt and Dippold, 2005 ; CDC, 2012). The harmless strains are part of the normal microbiota of the
9

gut, and can benefit their hosts by producing vitamin K2, and preventing colonization of the intestine
with pathogenic bacteria, having a symbiotic relationship (Wikipedia, 2019).
Escherichia coli remain one of the most frequent causes of several common bacterial infections in
humans and animals. E. coli is the prominent cause of enteritis, urinary tract infection, septicaemia and
other clinical infections, such as neonatal meningitis. E. coli is also prominently associated with
diarrhoea in pet and farm animals ( Nerino et al., 2013). As a commensal it lives in a mutually
beneficial association with hosts, and rarely causes disease. It is, however, also one of the most common
human and animal pathogens as it is responsible for a broad spectrum of diseases. The peculiar
characteristics of the E. coli such as ease of handling, availability of the complete genome sequence and
its ability to grow under both aerobic and anaerobic condition, makes it an important host organism in
biotechnology. E. coli is used in a wide variety of applications both in the industrial and medical areas
and it is the most used microorganism in the field of recombinant DNA technology (Yoo et al., 2009).
Antimicrobial resistance is a major and increasing global healthcare problem (WHO, 2012). It was also
observed in animals, where the antimicrobials are used for therapy and prophylaxis of infectious
diseases (Szmolka and Nagy, 2013). As it present in the intestine of men and animals and are released
into the environment in faecal material. faecal matter is the main source for disease causing agents in
water and faecal bacteria are widely used as indicators of contamination which can affect rivers, sea
beaches, lakes, ground water, surface water, recreational water and the many diverse activities
associated with these (Ishi and Sadowsky, 2008).
1.2.6.2 Staphylococcus aureus:
Staphylococcus aureus is Gram-positive bacteria that are cocci-shaped and tend to be arranged in
clusters that are described as “grape-like.” On media, these organisms can grow in up to 10% salt,
and colonies are often golden or yellow. These organisms can grow aerobically or anaerobically
(facultative) and at temperatures between 18° C and 40° C. Typical biochemical identification
tests include catalase positive (all pathogenic Staphylococcus species) , coagulase positive (to
distinguish Staphylococcus aureus from other Staphylococcus species), novobiocin sensitive (to
distinguish from Staphylococcus saprophyticus), and mannitol fermentation positive (to distinguish
from Staphylococcus epidermidis) ( Rasigade and Vandenesch, 2014).
10

Infections are common both in community-acquired as well as hospital-acquired settings and treatment
remains challenging to manage due to the emergence of multi-drug resistant strains such as Methicillin-
Resistant Staphylococcus aureus ( Boucher and Corey, 2008).
Transmission is typically from direct contact. However, some infections involve other transmission
methods ( Rasigade and Vandenesch , 2014). Health-care-associated infections represent a major health
concern with a substantial impact on morbidity and mortality. The prevalence of nosocomial infections
is especially high in intensive care units (ICUs), where the occurrence of multidrug-resistant pathogens
is highest in the hospital ( Vincent et al., 2009). Staphylococcus aureus is a major agent of health-care-
associated infections that causes a wide range of diseases from mild to life-threatening conditions. It is
one of the most prevalent causes of nosocomial bacteraemia, hospital-acquired pneumonia, and surgical
site infections ( Vincent et al., 2009; Weiner et al., 2016 ).
11

CHAPTER TWO
MATERIALS AND METHODS
12

CHAPTER TWO
MATERIALS AND METHODS
2.1 Preparation of culture media:
All used media were prepared according to the manufacture instructions
2.1.1 Nutrient agar:
Twenty-eight grams of powder weighted using sensitive balance, added to flask of 1L of D.W. , mixed
and heated in water bath, sterilized by autoclave at 121°C for 15 minutes, and then poured (15ml /plates)
into Petri dishes that pre-sterilized in an oven and allowed to solidify .
2.1.2 EMB :
Prepared by added 35.9 gm of powder to 1L of D.W., mixed , heated in water bath, autoclaved at 121°C
for 15 minutes, then poured into sterile plates and allowed to solidify.
2.1.3 Macconkey agar:
Prepared by suspended 51.53 grams of powder in one liter of D.W. , boiled untill agar is dissolved
completely. Sterilized by autoclave at 15 Ibs pressure 121°C for 15 minutes, cooled to 45°C , poured
aseptically in sterile plates.
2.1.4 Plate count agar:
Prepared by dissolved 17.5 grams of powder in 1000ml of D.W., heated to be dissolved, autoclaved at
121°C for 15 minutes, poured aseptically in sterile plates.
2.1. 5 Manitol salt agar:
Prepared by dissolving 111.2 grams of media in 1000 ml of D.W., Boiled in water bath, sterilized in
autoclave at 121°C for 15 minutes, allowed to be cool and poured aseptically in sterile plates.
2.1.6 DNA agar medium:
Prepared by dissolving 42 grams of the medium in 1000 ml of D.W. , boiled in water bath, autoclaved
13

at 121°C for 15 minutes, allowed to cool to 45- 50 °C and then poured into plates.
2.1.7 MR –VP medium:
Prepared by adding 17.0 gms of powder to1liter of D.W, mixed well, distributed into test tubes and
Autoclaved at 121°C for 15 minutes.
2:1:8 Peptone water:
Prepared by adding 15 gms of powder to one liter of D.W , well-shacked , and distributed in test tubes
as 2 ml in each tube and sterilized by autoclaving at 121°C for 15 minutes .
2.2 preparation of test organisms:
E. coli and S. aureus isolates were obtained from National Center For Research, Khartoum, Sudan.
Single colony of each of E.coli and S. aureus was inoculated into nutrient agar medium to be confirmed.
2. 3 Confirmations of bacterial isolates:
2. 3. 1 Gram stain:
A drop of D.W was taken on a clean dry glass slide, a part of colony was taken using a sterile loop and
smear was made, allowed to dry in air, fixed using a flame, crystal violet was flooded on smear, allowed
to stay for 1 minute, washed by D.w, then the smears were flooded by logols iodine for 1 minute,
washed by D.W., de-stained by applying alcohol for 10 seconds, at last saffranin was applied for 2
minutes as counter stain, washed, allowed to dry, and then a drop of immersing oil was added and
examined in an oil immersion microscope lens. Gram positive organisms were purple, while gram
negative ones appeared as red- colored organisms.
.
2.3.2. Biochemical tests and culture:
Identification tests performed according to Monica Cheesbrough, (2008).
2.3.2.1 Culture in EMB and MacConkey agar media :
Using a loop, under aseptic condition, a part of single colony of bacterial culture was taken and
14

streaked in EMB medium, from the same colony a part was streaked into MacConkey agar medium,
cultured plates were incubated overnight at 37°C.
2.3.2.2 Indol test:
The test organisms were cultured in peptone water medium which contained tryptophan amino acid, the
inoculated cultures were incubated at 37 C° for 24 hours. Indol production was detected by kovac's
reagent, reddening of strip indicated positive test.
2.3.2.3 Methyl red (MR) Test
Glucose phosphate medium was inoculated with test organisms and incubated for 48 hours at 37 C°, two
drops of methyl red solution were added and the tube was shaken. Red color indicated positive reaction
and an orange color indicated negative reaction.
2.3.2.4 Voges Proskauer (V/P) Reaction:
The tested organism was inoculated in glucose phosphate medium and incubated for 48 hours at 37° C.
0.6 mL of 5% α-naphthol and 0.2 mL of 40% aqueous solution of potassium hydroxide were added, the
tube was well shaken and examined after 15 minutes and after one hour. A positive reaction was
indicated by appearance of strong red color.
2.3.2.5 Motility test:
A drop of the bacterial suspension was placed in the center of slides and covered with a cover glass
avoiding the trapping of air bubbles, using the corner of the heated slide, a drop of molten Vaseline was
placed on each corner of the cover glass. The slide was examined for motile bacteria using the 40X
objective lens.
2.3.2.6 Catalase Test:
A drop of 3% aqueous solution of hydrogen peroxide was placed on a clean glass slide, a small part of
the bacterial colonies was then placed in the hydrogen peroxide drop using a glass rod. Production of gas
bubbles indicated catalase expression.
15

2.3.2.7 Coagulase Test:
To detect bound Coagulase (clumping factor) a drop of physiological saline was placed on each two
slides. A small part of the bacterial colonies was emulsified in each slide to make two thick suspensions.
A drop of undiluted human’s plasma was added to one of the suspensions and mixed gently. Clumping
of the organisms within 10 seconds was considered as a positive reaction compared with the other slide
that was control.
2.3.2.8 Oxidase Test:
The organism was grown on nutrient agar, A piece of filter paper- approximately 2 cm, in diameter was
placed in Petri dish and drops of Tetramethyle 1-p Phenylene Diamine Di-hydrochloride were added,
small part of the colonies of the test organisms were streaked in the filter paper using non steel loop and
rubbed on the filter paper, dark purple color that developed within 5 to10 seconds was considered
positive result.
2.3.2.9 Culture in Manitol salt agar:
a single colony from N.A culture was taken and streaked into manitol salts agar ( MSA) medium,
Cultured plate was incubated overnight at 37c. Yellow colored colonies were noticed and confirmed as
S. aureus
2.3.2.10 DNAse test:
This was done for identification of Staphylococcus aureus , which hydrolyzed the DNA, a colony of
Staphylococcus aureus under test was inoculated onto small area in the middle of the DNA medium,
then the plates were incubated aerobically at 37°C for 18 to 24 hours and flooded with a few milliliters
of 1 mol/litter (3.6%) hydrochloric acid to be examined against a dark background, unhydrolyzed DNA
was precipitated and produced a white opacity or cloudiness in the Agar DNA , positive cultures were
surrounded by clear, unclouded zones.
16
2.4 preparation of water sample:
Nine ml of a tap water was collected in 5 clean, dry test tubes of 10 ml capacity and covered well using
a cotton and aluminum foil. Another water sample was taken in a clean, dry bottle of 250 capacities with
screw cap. All water samples were autoclaved at 121 ºC, 15psi for 15 minutes.
2. 5 Inoculation of water sample and bacterial count:
Under aseptic condition , from 18 hours E. coli culture plate, a loopfull was taken and diluted into a 250
ml capacity bottle containg sterile tap water to achieve a turbidity equivalent to 0.5 McFarland standard
(approximately 1.5 × 10⁸CFU/ml). One ml of bacterial diluents (0.5 McFarland standard) was taken into
a tube of 9 ml sterile tap water and serial 10 fold dilutions was performed until 10−5. Then 100µ of each
dilution was taken into plates of plate count agar ( PCA) medium and speeded (two plates for each
dilution) , the plates were then incubated at 37ºC for 24 hours and this culture is considered as pre-
electrical current application culture.
2.6 Effect of AC current on S. aureus and E. coli:
Electrical current thoroughly affected bacterial cells resulted on cell death due to electrical shock. This
identified by decrease in numbers of bacteria (CFU) which demonstrated by viable cell count.
Electrical current applied for 10 minutes and cells was counted before and after
current application. Different electrical voltages used )5v, 10v, 15v, 20v, 25v and
50v( with different dilutions )10^-1 to 10^-5( to determine the effect of voltage
and if the density of cells can negatively or positively affect treatment process.
Normal drinking water used with its natural salts to identify true result regarding
natural conductivity of water.
2.6.1 Conduction and application of current:
Using carbon wire, 5volt current was adjusted in voltmeter and electricity was conducted for 10 minutes
to each tube of serial dilution immediately after culturing in PCA media. After this, another 100 µ was
taken immediately and distributed in PCA agar, two plates for each dilution was cultured. This culture
considered as after-electrical current culture. The plates were incubated overnight at 37ºC. This
procedure was applied using 10, 15, 20, 25 and 50 voltage electrical current for E. coli and S. aureus
bacteria separately.
17

2. 6.2 Bacterial count:
After incubation, the bacterial colonies were counted using colony counter, the mean of the two plates
for each dilution is counted and result was recorded.
18

Plate 1: Steps of water treatment using volts
CHAPTER THREE
RESULTS
19

CHAPTER THREE
RESULTS
3:1 Identification of bacterial isolates:
Bacteria were identified according to their morphological appearance, cultural characteristics and
biochemical reactions as S. aureus ( Table 1) and E. coli (Table 2 ).
Table 1: Characterization of S. aureus
Test ResultGram stain +ve cocciCulture in MSA agar +ve (manitol fermenter)
DNAse test +veCatalase test +veCoagulase test +veMotility test -ve
+ve: positive result, -ve: negative result
Table 2: Characterization of E. coli
Test ResultGram stain -ve rodsCulture in EMB agar Metalic green colonies ( metachromatic propertyCulture in MaCconkey agar Pink colonies (lactose fermenter)MR test +veVP test -veIndol test +veMotility test +ve
3.2 Effect of 5 volt current on different dilutions of bacteria:
It was clear that the activity of current was strong with the higher dilutions of tested bacteria. At 103,
104 and 105 , the numbers of S. aureus were dramatically reduced ( Table 3). At 103 and 104 , the numbers
of Staphylococcus aureus reduced from uncountable to 2120 and 350 CFU/100µl , respectively ,
while at dilution of 105 the number was reduced from47900 to only 480 CFU/ml ( Plates 2,3,4,5 and6).
Similarly in the same table the numbers of E. coli was reduced, at dilutions 103, 104 and 105 , E coli
numbers was reduced from uncountable numbers to 20000 and 5000 at dilutions of 103and 104
respectively. At dilutions of 105 E. coli number was reduced from 64000 CFU/ml to only 420 CFU/ml
(Table 4).
20

Table 3: S aureus count before and after 5 volt treatment for ten minutes:
Dilution Bacterial count pre-electrical current ) CFU/100 µl )
Bacterial count after-electricalcurrent treatment ) CFU/100 µl )
10-1 Uncountable Uncountable 10-2 Uncountable Uncountable10-3 Uncountable 2120
10-4 Uncountable 350
10-5 4790 48
Table 4: E coli count before and after 5 volt treatment for ten minutes:
Dilution Bacterial count pre-electricalcurrent ) CFU/100 µl )
Bacterial count after-electricalcurrent ) CFU/100 µl )
10-1 Uncountable Uncountable 10-2 Uncountable Uncountable10-3 Uncountable 200010-4 Uncountable 50010-5 6400 42
Generally , 5 volt current is very low voltage and it was found to affect the numbers of Staphylococcus
aureus and E. coli moderately when compared to high voltages . the results showed that the higher
dilutions (10-3 , 10-4 and 10-5) which contained low numbers of bacterial cells were affected more than
low dilutions ( 10-1 and 10-2) as it contains uncountable numbers )1×10⁸ CFU/ml and 1×10⁷ CFU/ml),
respectively which is considered as a very high bacterial cell numbers.
21

Plate 2: S. aureus count befor and after treatment with 5 volt electricity, Up: before treatment; down:
after treatment starting from low dilution leftmost and abstractly to high dilution rightmost.
22

Plate 3 : S. aureus viable cell count of 10-4 dilution before treatment with 5 volt.
Plate 4 : S. aureus viable cell count of 10-4 dilution after treatment with 5 volt.
23

Plate 5: S. aureus viable cell count of 10-5 dilution before treatment with 5 volt.
Plate 6: S. aureus viable cell count of 10-5 dilution tube after treatment with 5 volt.
24

3.3. Effect of 10 volt current on different dilutions of bacteria:
On the different dilutions of the bacteria at ten volt current treatment the activity was more strong than 5
volt current against the same bacteria. S. aureus numbers at 10-3 and 10-4 dilutions is reduced from
uncountable numbers to 15600 and 2800 CFU/ml respectively, while dilution of 10 -5 showed reduction
of bacterial number from 50000 to 300 ( Table 5 ). On the other hand E. coli numbers was not affected
at low dilutions ( 10-1 and 10-2 ) while at higher dilutions ( 10-3 and 10-4) that contained uncountable
numbers, they reduced respectively to 3120 and 1000 CFU/ml. At 10-5 dilution E. coli was reduced
sharply from 59000 to only 100 CFU/ml (Table 6). From the two tables (Table 5 and 6) It appeared that
the ten voltage of current was more active against E. coli than Staphylococcus aureus
Table 5: S. aureus count before and after 10 volt treatment for ten minutes:
Dilution Bacterial count pre-electricalcurrent (CFU/100µl)
Bacterial count after-electrical currenttreatment (CFU/100µl)
10-1 Uncountable Uncountable10-2 Uncountable Uncountable10-3 Uncountable 156010-4 Uncountable 280 10-5 5000 30
Table 6: E. coli count before and after 10 volt treatment for ten minutes:
Dilution Bacterial count pre-electricalcurrent (CFU/100µl)
Bacterial count after-electrical currenttreatment (CFU/100µl)
10-1 Uncountable Uncountable10-2 Uncountable Uncountable10-3 Uncountable 31210-4 Uncountable 100 10-5 5900 10
3.4 Effect of 15 volt current on different dilutions of bacteria:
25

Similar to 5v and 10v, when 15 volt electrical current used, Staphylococcus aureus numbers showed no
apparent effect at 10-1 and 10-2 dilutions. At 10-3 and 10-4 dilutions the numbers of Staphylococcus
aureus was reduced from uncountable numbers to 7480 and 1000 CFU/ml respectively whereas at 10 -5
the count was reduced from 49500 to only 100 CFU/ml ( Table 7). At same voltage of current at 10 -3 and
10-4 dilutions the numbers of E. coli were reduced from uncountable to 5000 and 800 CFU/ml,
respectively. At 10-5 dilution the numbers were reduced from 65000 to 40 CFU/ml ( Table 8, Plates 7,8
and 9).
Table 7: S. aureus count before and after 15 volt treatment for ten minutes:
Dilution Bacterial count pre-electricalcurrent (CFU/100µl)
Bacterial count after-electrical currenttreatment (CFU/100µl)
10-1 Uncountable Uncountable10-2 Uncountable Uncountable10-3 Uncountable 74810-4 Uncountable 10010-5 4950 10
Table 8: E. coli count before and after 15 volt treatment for ten minutes:
Dilution Bacterial count pre-electricalcurrent (CFU/100µl)
Bacterial count after-electrical currenttreatment (CFU/100µl)
10-1 Uncountable Uncountable10-2 Uncountable Uncountable10-3 Uncountable 50010-4 Uncountable 8010-5 6500 4
26

Plate 7: E. coli viable cell count of 10-1 dilution treated with 15 volt, left: before treatment ; right:
after treatment.
Plate 8: E. coli cell count of 10-2dilution before and after treatment with 15v. left: before treatment;
right: after treatment
27

Plate 9: E. coli cell count of 10-3dilution before and after treatment with 15v. left plate: before
treatment; right 2 plates: after treatment
Plate 10: E. coli 10-4 dilution before and after 15v treatment, left: before treatment; right: after
treatment
28

3.5 Effect of 20 volt current on different dilutions of bacteria:
As shown in Table 9 the 20 volt current has strong activity against all dilutions, the numbrs of
Staphylococcus aureus were reduced from uncountable to 860 , 170, 40 and zero CFU/ml at
dilution of 10-1, 10-2, 10-3 and 10-4 respectively. At 10 -5 dilution the numbr of Staphylococcus aureus
was reduced from 40000 to zero CFU/ml . Similar results were obtained with E coli bacteria
where it reduced from uncountable numbers to 500, 30, 40 and 10 CFU/ml at dilutions of 10 - 1,
10-2,10-3 and 10-4 respectively, and at dilution of 10-5 the E. coli count was reduced from 48800
to zero CFU/ml (Table 10) .
Table 9: Staphylococcus aureus count before and after 20 volt treatment for ten minutes:
Dilution Bacterial count pre-electricalcurrent (CFU/100µl)
Bacterial count after-electrical currenttreatment (CFU/100µl)
10-1 Uncountable 8610-2 Uncountable 1710-3 Uncountable 410-4 Uncountable 010-5 4000 0
Table 10: E. coli count before and after 20 volt treatment for ten minutes:
Dilution Bacterial count pre-electricalcurrent (CFU/100µl)
Bacterial count after-electrical currenttreatment (CFU/100µl)
10-1 Uncountable 5010-2 Uncountable 310-3 Uncountable 410-4 Uncountable 110-5 4880 0
3.6 Effect of 25 volt current on different dilutions of bacteria:
It is clear that the high voltage current has stronger activity against the bacteria. The number of
Staphylococcus aureus ( Table 11) were reduced from uncountable to 330 , 10 , 10 and zero
CFU/ml at dilutions of 10-1 ,10-.2, 10-3 and 10-4 , respectively, while E. coli numbers were reduced
29

to 300 , 10 , 20 and zero CFU/ml at the same last dilutions ( Table 12, Plate 11 and 12). At 10 -5
dilution the numbers of Staphylococcus aureus were reduced from 51000 to zero while the numbers
of E. coli were reduced from 58000 to zero in the same manner.
Table 11: Staphylococcus aureus count before and after 25 volt treatment for ten minutes:
Dilution Bacterial count pre-electricalcurrent (CFU/100µl)
Bacterial count after-electrical currenttreatment (CFU/100µl)
10-1 Uncountable 3310-2 Uncountable 110-3 Uncountable 110-4 Uncountable 010-5 5100 0
Table 12: E coli count before and after 25 volt treatment for ten minutes:
Dilution Bacterial count pre-electricalcurrent (CFU/100µl)
Bacterial count after-electrical currenttreatment (CFU/100µl)
10-1 Uncountable 3010-2 Uncountable 110-3 Uncountable 210-4 Uncountable 010-5 5800 0
30

Plate 11: E. coli 10-4 dilution before and after 25v treatment, left: before treatment; right: after
treatment
Plate 12 : E. coli 10-2 dilution before and after 25v treatment, down: before treatment; up: after
treatment
31

3.7 Effect of 50 volt current on different dilutions of bacteria:
Staphylococcus aureus was reduced from uncountable numbers to 20 , 30 , 20 and 10 at dilutions 10-1 ,
10-2, 10-3 and 10-4 respectively. At 10-5 the numbers of Staphylococcus aureus was reduced from
48000 to zero CFU/ml ( Table 13) . Similarly E coli showed reduction of the count from uncountable
numbers to 20, 10 , 10 and zero at dilutions of 10-1 ,10-.2, 10-3 and 10-4 respectively, while dilution of
10-5 showed reduction of E. coli number from 50000 to zero CFU/ml ( Table 14).
Table 13: Staphylococcus aureus count before and after 50 volt treatment for ten minutes:
Dilution Bacterial count pre-electricalcurrent (CFU/100µl)
Bacterial count after-electrical currenttreatment (CFU/100µl)
10-1 Uncountable 210-2 Uncountable 310-3 Uncountable 210-4 Uncountable 110-5 4800 0
Table 14: E. coli count before and after 50 volt treatment for ten minutes:
Dilution Bacterial count pre-electricalcurrent (CFU/100µl)
Bacterial count after-electrical current(CFU/100µl)
10-1 Uncountable 2
10-2 Uncountable 110-3 Uncountable 110-4 Uncountable 010-5 5000 1
3.8 Statistical analysis
SPSS v21 is used for analysis
32

Table 15: Statistical analysis for S. aureus numbers before and after electrical current treatment.
Mean N Std. Deviation Std. Error Mean
Pair 1
pre elect 2230954.60 30 3968672.078 724577.074
after elec
1479.87 30 2606.427 475.866
3.8.1 Effect of electrical current treatment on viable count of S. aureus :
Table 15 showed that there was difference in mean of data which was changed from 2230954.60
before electrical current treatment which revealed 1479.87 after electrical current treatment, this high
change indicate that the electrical current has an effect on bacterial count. Statistical result were
illustrated and explained at tables 15, 16 and 17 and Fig 13
Table 16 : paired sample t test of S. aureus before and after current treatment.
Paired Samples Test
Paired Differences t df Sig. (2-tailed)
95% Confidence Intervalof the Difference
Upper
Pair 1pre elect - after elec
3710977.565 3.078 29 .005
The sig.(2-tailed) column displays the probability of obtaining a t statistic whose absolute value is equal
to or greater than the obtained statistic. Since the significance value for change in 0.05, we concluded
that the average loss of 2229474.733 ( see appendix no4) is not due to chance variation, and can be
attributed to the passage of voltage and change in dilution.
33

Figure 1: Effect of both voltage and dilution on S aureus count.
Vertical axis represent numbers of bacterial cells.
Table 17: S aureus data (mean, medium, standard deviation) before and after electrical powerapplication .
voltag
e
Mean)befo
re
current(
Mean)aft
er
current(
median)befo
re(
Median-
after
STD)befor
e (
STD.after
5 volt 22311449.20
3108.40 100000.00 2000.00 4362407.5 3199.25
10 volt 22311449.20
2684.40 100000.00 312.00 4362407.5 3502
15 volt 22311449.20
2716.8 100000.00 500 4362407.5 3476.7
20 volt 22311449.20
11.6 100000.00 3 4362407.5 21
25 volt 22311449.20
6.6 100000.00 1 4362407.5 13.107
50 volt 22311449 1.8 100000.00 1 4362407.5 .707
34

.20
Constant value of 22311449.20 obtained as a mean for all five dilutions before electrical current
application while when numbers of viable cell count analyzed after electrical treatment they were
3108.40 , 2684.40, 2716.8, 11.6, 6.6 and 1.8 for 10 -1 , 10-2 , 10-3 ,10-4 and 10-5 respectively with also
fixed value of mediums that was 100000.00 for all five dilutions before electrical current versus
2000.00 , 312.00 , 500 , 3 , 1 and 1 for 10-1 , 10-2 , 10-3 ,10-4 and 10-5 after current treatment
respectively . This constant values of means obtained before current indicate that no significant effect on
data. The mean value decreased gradually from 3108.40 to 2684.40, 2716.8, 11.6, 6.6 and 1.8 and the
numbers are inversely proportion to the voltage used. This proportioning appeared in median and STD
values too. All changes occurred indicate how voltage and dilutions affected living S aureus cells.
3.8.2 Effect of electrical treatment on viable count of E. coli:
Statistical results of the effect of the electrical current treatment were illustrated and explained at tables
18, 19 and 20 and Fig 14.
Taple 18: Statistical analysis of E coli shows the difference in mean before and after electrical
current.
Paired Samples Statistics
Mean N Std. Deviation Std. Error Mean
Pair 1
pre elect 2231149.20 30 3968559.174 724556.460
after_elect
1421.47 30 2619.569 478.266
The mean was changed from 2231149.20 to 1421.47 and the standard deviation was changed from
3968559.174 also, The difference in mean and STD of data pre electrical current and after electrical
current treatment indicate that the electrical current has an effect on bacterial count.
35

Figure 2: Effect of both voltage and dilution on E. coli viable count.
Table 19: paired sample t test of E coli before and after current treatment.
Paired Samples Test
Paired Differences t df Sig. (2-tailed)95% Confidence
Interval of theDifference
Upper
36

Pair 1pre elect - after_elect
3711177.589 3.078 29 .005
The sig.(2-tailed) column displays the probability of obtaining a t statistic whose absolute value is equal
to or greater than the obtained statistic. Since the significance value for change in 0.05, we concluded
that the average loss of 2229727.733 ( see appendix no 5) is not due to chance variation, and can be
attributed the passage of voltage and change in dilution
table 20: E coli viable count (mean, medium, standard deviation) before and after electrical power
application .
voltage Mean
)before
current(
Mean
)after
current(
Median
)before(
Median-
after
STD
)before (
STD. after
5 volt 22311449.2
0
3108.40 100000.00 2000.00 436207.57 3199.25
10 volt 22311449.2
0
2684.40 100000.00 312.00 436207.57 3502.7
15 volt 22311449.2
0
2716.8 100000.00 500.00 436207.57 3476.7
20 volt 22311449.2
0
11.60 100000.00 3.00 436207.57 21
25 volt 22311449.2
0
6.60 100000.00 1.00 436207.57 13.107
50 volt 22311449.2
0
1.00 100000.00 1.00 436207.57 0.707
E coli also showed constant value of 22311449.20 obtained as a mean for all five dilutions before
electrical current application while when numbers of viable cell count analyzed after electrical treatment
they were 3108.40 , 2684.40, 2716.8, 11.60, 6.60 and 1.00 for 10 -1 , 10-2 , 10-3 ,10-4 and 10-5
respectively. A fixed value of mediums that was 100000.00 for all five dilutions also was obtained
for data before electrical current versus 2000.00 , 312.00 , 500 , 3.00 , 1.00 and 1.00 for 10-1 ,
10-2 , 10-3 ,10-4 and 10-5 after current treatment respectively. These constant values of means obtained
before current indicate that there were no effect on data. The mean value decreased gradually from
37

3108.40 to 2684.40, 2716.8, 11.60, 6.60 and 1.00 and the numbers are inversely proportion to the
voltage used. This proportioning appeared in median and STD values that were also decreased
gradually. All changes occurred indicate effect of voltage and dilutions in E coli counts.
CHAPTER FOUR
DISCUSSION, CONCLUSIONS AND RECOMMENDATIONS
38

CHAPTER FOUR
DISCUSSION, CONCLUSIONS AND RECOMMENDATIONS
4.1 Discussion
This study considers Gram negative and Gram positive bacteria in an effort to contribute to scarce
knowledge available concerning the different effects of low intensity alternating currents on bacterial
cell counting, it focused on the effects of low electric current on the growth of E. coli and
Staphylococcus aureus. The effect of the current treatment with 5, 10 and 15 volt on 10-1 and 10-2
dilution culture of both E. coli and Staphylococcus aureus revealed no effect, whereas notable
inhibition was observed using 20, 25 and 50 volt. At dilution of 10-5 both tested bacteria showed clear
reduction of the total viable count at all tested current volt, this confirm the finding of Kekez et al.
( 1996) who reported that treatment of bacteria with high intensity current causes an irreversible loss of
membrane function. The enumeration of both bacteria was decrease with the increase of the current
strength and increase of the bacterial dilution , these might be explained by findings of Valle et al.(2007)
who found that when low voltage was used membrane damage causing permeability alteration and the
leakage of cellular contents; according to authors microbial death may be caused by the influx of toxic
substances through the disrupted cell membrane, whereas under much stronger field current, permanent
membrane disruption occurs and the death of cells occurs by mechanical causes. The lethal AC high
electric field effect mentioned in many researches is due to either the direct energy effect on high
voltage pulse on the cell membranes causing electroporation or to the release of toxic ions from the
used electrodes due to oxidation of the metal ions of the anode resulting in the dissolution of the
anode (Giladi et al, 2008).
39

In this study, E.coli seems to be more sensitive to increasing current intensity than Staphylococcus
aureus. The high sensitivity of Gram negative bacteria towards electric current was confirmed by Davis
et al. (1989) who found that both E. coli and Salmonella typhimurium were inhibited and killed by low
microamperage. The authors evidenced that the effectiveness of electric current in inhibition of growth
and mortality is directly related to increasing microamperage and inversely related to the bacterial
concentration. Bayer and Sloyer (1990) concluded that different parameters could affect behavior, like
the presence of lipopolysaccharides (in the Gram negative bacteria), capsule and surface proteins. Some
studies carried out with low voltage current investigated the effects of microamperage on the viability of
bacteria such as E. coli and Proteus sp. The results showed that even low microamperage can be
effective in reducing the number of microorganisms and inhibiting bacterial growth (Davis et al., 1989) ,
Palaniappan et al.( 1992) related the reduction of the Yeast and bacteria to the changes in the cell
morphology, with the formation of nonhomogeneous area in the cytoplasm and large concentrations of
debris in the culture depending on the voltage intensity and electric discharge frequency. Our results are
in agreement with literature data, in fact Valle et al.(2007) studied the effect of low electric current
(LEC) treatment on pure culture of E. coli and Bacillus cereus , the authors concluded that the
bacteriocidal effect depended on the current passing through the cell suspension and the bacterial death
are extremely complex and involve a number of interactions between microorganism medium and
electrode materials.
The DC effects on the bacterial cells have been studied for several decades (Pareilleux and Sicard, 1970)
and the studies have focused mainly on the viability, metabolism and transport of cells. In particular,
Viability studies have concentrated on the use of pulse high voltage for inactivation (Dreesa et al., 2003)
or moderate voltage for many hours or many days in some cases (Valle et al., 2007). Alternatively, new
trials using Ac instead of DC have been conducted. Very high electric field strength (Smith et al., 2009)
or moderate electric field strength for longer time were used to exert heating effect (Lee et al. ,2012)
both condition are still not optimum for in vivo application. Some studies have reported the effect of
the low electrical current (LEC) on yeast cells , Ranalli et al. (2002) demonstrated that LEC
intensities (10, 30 and 100 mA) could reduce the ATP content and viability of both S. cerevisae and H.
guilliermondii culture. In addition LEC treatment on S. cerevisae resulted in the loss of integrity of the
cytoplasmic membranes.
40

Many experiments in this field have been described, but the standardizing of the processes has incurred
difficulties related to the nonhomogeneous experimental conditions and the numerous parameters that
must simultaneously be taken into consideration ( voltage, current intensity, possible electrode use and
duration of the treatment).
As many industries produce wastewater containing toxic organic pollutants, there has been a notable
increase in both research and the number of businesses concerned with the treatment of such industrial
effluents, including biological, physical and chemical processes. Disinfection of drinking water using
chlorine can lead to formation of genotoxic by-products when chlorine reacts with natural organic
matter (NOM). Electric current has recently been targeted for the development and optimization of
innovative techniques to disinfect water and food, but its application is still far from being well-
established.
Studies have reported successful electric current applications on complex matrices of continuous low
intensity electrical current in the biomedical field (Stoodley et al., 1997), animal manure treatment
(Ranalli et al., 1996) and in food sector (Lustrato et al., 2006). There were some researches for using
AC on bacteria to avoid drawback of using DC (Del Pozo et al., 2009; Dzidic et al., 2008) but most of
them by using high pulsed electric fields as in case of food preservation (Lee et al., 2013).
4.2 Conclusions
Electric current can be used as a physical method to kill E. coli and S aureus . This study concluded that
the electrical current has a clear effect on both E. coli and S aureus , The difference in mean and STD of
data pre electrical current and after electrical current treatment indicate that the electrical current has an
effect on bacterial count. It was clear that the best results were obtained with 10 -4, and 10-5 dilutions
and when the treatment was carried out at 20, 25 and 50 voltage, as both bacteria showed absence of the
growth in the plates indicating that the bacteria had been inhibited , this mean that the removal rate of
bacterial cell increases with increase of applied current voltage and increasing of dilution. Hence, this
study concluded that we can use electricity power for water treatment in order to improve water quality
and make it fit for drinking and of good quality in a bacteriological parameter. It was clear that electrical
power can be used successfully with low voltage as a physical method to remove or to kill two types of
41

bacteria E. coli and S. aureus present in water. Our results contribute to a better understanding of the
effects of applying LEC to bacteria, and enhance the potential for future applications in different fields.
4.3 Recommendations
This study recommended that:
1- More studies are needed in order to check if viable E. coli and S. aureus after electrical shock
are changed their characteristics or not , aware must be taken not to provide new strains of
bacteria
which may have new dangerous characters.
2- More efforts should be devoted to a better understanding of this new technology and more
researches should be complemented with the quantification of the amount of voltage taking in
consideration the current intensity and power of electricity in order to determine the exact price of
treatment process.
3- Study the effect of the electrical current on other water borne pathogens such as Shigella,
Salmonella , Vibrio …etc.
4- Study the effect of the electrical current using waste water and sewage.
5- More studies are needed to evaluate effect of the different duration of the treatment.
6- Further research on the feasibility and cost-benefit of scaling up of this process is needed.
42

References
Archer, 2007. Whole House Water Filter System. V.L.: US20077156994.
https://www.springwellwater.com/product/water-filters/whole-house-water-filters/
Arnone R.D. and Walling J.P., 2007. Waterborne pathogens in urban watersheds. J
Water Health. ; 5(1):149–162.
Bayer, M.E. and Sloyer, J.L. 1990. The electrophoretic mobility of
gram-negative and gram-positive bacteria: an electrokinetic analysis. J Gen
Microbiol 136, 867–874.
Berry D. , Xi C. , Raskin L., 2006. Microbial ecology of drinking
water distribution
systems. Curr. Opin. , Biotechnol. 17:297-302.
Blackall LL, Crocetti GR, Saunders AM, Bond PL., 2002. A review and update of the
microbiology of enhanced biological phosphorus removal in wastewater treatment plants. A Van
Leeuw J Microb.;81:681–91 .
Berrin T, 2008. New Technologies for Water and Wastewater Treatment: A Survey of
Recent Patents. Volume 1, Number 1, 2008, pp. 17-26 (10). Florida International University, Civil
and Environmental Engineering Department, Engineering Center 3600, Miami, Florida 33174, USA.
43

Bove F., Shim Y., Zeitz P., 2002. Drinking water contaminants and adverse pregnancy
outcomes: a review. Environ. Health Perspect. 110 (Suppl. 1), 61-74.
Babu R. and Chaudhuri M., 2005; Home water treatment by direct filtration with natural
coagulant. J Water Health;3:27–30.
Bouya H., Errami M., Salghi R., Bazzi L., Zarrouk A., Al-Deyab S.S., Hammouti B., L.
Bazzi; Chakir A., 2012. Electrochemical Degradation of Cypermethrin Pesticide on a SnO2 Anode.
Int. j. electrochem.sci. 7:3453-3465 ·
Boucher HW. and Corey GR. 2008. Epidemiology of methicillin-resistant Staphylococcus
aureus. Clin. Infect. Dis. Jun 01;46 Suppl 5:S344-9.
Baird, 2007. Water purification system utilizing a carbon block pre-filter. Patents by
Inventor Michael T. Baird : US20077267769.https://patents.justia.com/inventor/michael-t-baired
Brian M. , 2008. Water Pollution by Agriculture. Phil. Trans. R. Soc. Lond. B. 363: 659–
666. doi:10.1098/rstb.2007.2176. PMC 2610176.
Craun GF, Fraun MF, Calderon RL, Beach MJ. 2006. Waterborne outbreaks reported in
the United States. J Water Health. ;4:19–30 .
Cannon MJ, Hyde TB, Schmid DS , 2011. Review of cytomegalovirus shedding in bodily
fluids and relevance to congenital cytomegalovirus infection. Rev Med Virol 21: 240–255.
pmid:21674676 .
Center for Disease Control and Prevention (CDC), 2012. National Center for Emerging
and Zoonotic Infectious Diseases. "Escherichia coli". Retrieved 2 October 2012.
https://www.cdc.gov/ecoli/
44

Davis C.P., Weinberg S., Anderson M.D., Rao G.M. and Warren M.M.
1989. Effects of microamperage, medium, and bacterial concentration on
iontophoretic killing of bacteria in fluid. Antimicrobial Agents Chemother 33,
442–447.
Delpozo J.L., Rouse M.S. Mandrekar J.N. (2009). Effect of electrical current on the
activities of antimicrobial agents against Pseudomonas aeruginosa, Staphylococcus aureus, and
Staphylococcus epidermidis biofilms, Antimicrob. Agents Chemother., 53, 35–40.
Dzidic S., Suskovic J., Kos B., 2008. Antibiotic resistance mechanisms in bacteria:
biochemical and genetic aspects, Food Technol. Biotechnol., 46, 11–21.
Deep River/ Turkey Creek Watershed Management Plan June 2002 .City of Hobart,
Indiana - Final Plan-- June 2002
Dhote S., Varghese B. And Mishra S.M. (2001). Impact of Idol Immersion on Water
Quality of Twin Lakes of Bhopal, Indian Journal Environmental Protection (IJEP), 21, 998-1005.
Dreesa, K.P., Abbaszadegan M., Maiera R.M., 2003. Comparative electrochemical
inactivation of bacteria and bacteriophage, Water Res., 37, 2291–2300.
Errami M., Salghi R., Abidi N., Bazzi L., Hammouti B., Chakir A., Roth E., Al-Deyab S.
S. ,2011. Electrooxidation of Bupirimate: A Comparative Study of SnO2 and Boron Doped Diamond
Anodes. Int. J. Electrochem. Sci., 6, 4927 – 4938.
Edge TA, Hill S, Seto P, Marsalek J. (2010). Library-dependent and library independent
microbial source tracking to identify spatial variation in faecal contamination sources along a Lake
Ontario beach (Ontario, Canada)Water Sci Technol. ;4:719–727.
Environmental Protection Agency (EPA), 2019. Polluted Runoff: Nonpoint Source (NPS)
Pollution. https://www.epa.gov/nps/basic-information-about-nonpoint-source-nps-pollution.
Fong TT and Lipp EK, 2005. Enteric viruses of humans and animals in aquatic
environments: health risks, detection, and potential water quality assessment tools. Microbiol Mol
Biol Rev 69: 357–371. pmid:15944460.
Edward A. L., 2018. Aquatic Pollution: An Introductory Text (4th ed.). Hoboken, NJ:
John Wiley & Sons. ISBN 9781119304500
45

Giladi M., Porat Y., Blatt A., (2008). Microbial growth inhibition by alternating electric
fields, Antimicrob. Agents Chemother., 52, 3517–3522.
Goel, P.K. , (2006). Water Pollution - Causes, Effects and Control. New Delhi: New Age
International. p. 179. ISBN 978-81-224-1839-2.
Grabow, W.O.K. 1996. Waterborne Diseases: Update on Water Quality Assessment and
Control. Water SA, 22, 193–202.
Hackett, T.D., Kingrey, S.P., 200. Water treatment system. US20067122116.
https://patents.google.com/patent/US7122116
Hall-Stoodley L., Costerton J.W., Stoodley P., 2004. Bacterial biofilms: from the natural
environment to infectious diseases, Nat. Rev. Microbiol., 2, 95–108.
Hall AJ , (2012). Noroviruses: the perfect human pathogens? J Infect Dis 205: 1622–1624.
pmid:22573872.
Id El Mouden O., Errami M., Salghi R., Zarrouk A., Zarrok H.and Hammouti B., 2012.
Oxidation of the Pesticide Dicofol at Boron-Doped Diamond Electrode. Journal of Chemica Acta.
1 44-48.
Ishi S. and Sadowsky MJ. 2008. Escherichia coli in the environment: Implications for
water quality and human health. Microbes Environ. 23:101-108.
Johan L, Anna A, Anders J, Elin L, Geeta M, Henrik K, David B, Agneta O., 2019.
Innovative drinking water treatment techniques reduce the disinfection-induced oxidative stress and
genotoxic activity. Journal: Water Research, Publisher: Elsevier BV,
https://www.scienceopen.com/document?vid=5d7ed670-4cec-4b55-b89f-89606c60163d
Kaur B.J., George. M.P, Mishra S. (2013). Water quality assessment of river Yamuna in
Delhi stretch during Idol immersion. Int. Journal of Environmental Sciences, Volume 3, No 6; 2122-
2129.
Kekez M.M., Savic P. and Johnson B.F. )1996(. Contribution to the
biophysics of the lethal effects of electric field on microorganisms. Biochem
Biophys Acta 1278, 79–88.
46

Lee S.Y., Ryu S., Kang D.H.,( 2013). Effect of frequency and waveform on inactivation of
Escherichia coli O157:H7 and Salmonella enterica, Serovar Typhimurium in salsa by ohmic heating,
Appl. Environ. Microbiol., 79, 10–17.
Lustrato G., Alfano G., Belli C., Grazia L., Iorizzo M. and Ranalli G.
)2006(. Scaling-up in industrial winemaking using low electric current as an
alternative to sulphur dioxide addition. J Appl Microbiol 101, 682–690.
Lechevailler MK, Keung Au K. , 2004. water treatment and pathogen control, safe
drinking water. Cornwall World Health Organization and IWA publications;
Lee S.Y., Sagongh H.G., Ryu S., Kang D.H., 2012. Effect of continuous ohmic heating to
inactivate Escherichia coli O157:H7, Salmonella Typhimurium and Listeria monocytogenes in orange
juice and tomato juice, J. Appl. Microbiol., 112, 723–731.
Li X.F. and Mitch W.A., 2018. Drinking water disinfection byproducts (DBPs) and
human health effects: multidisciplinary challenges and opportunities. Environ.Sci. Technol. 52 (4),
1681-1689.
Mericas D., and Wagoner B., 1994. Balancing safety and the environment. Water
Environmental Technology, 38 – 43.
Mishra A.K., (2010). A River About to Die: Yamuna, Journal of Water Resource and
Protection, 2, 489-500.
Monica Cheesbrough, (2008). Medical Laporatory Manual for Tropical Countries volume2:
Microbiology: second edition. Butterworth & Co.(Publishers) Ltd. Borough Green, Sevenoaks, Kent
TN15 8PH. ©Monica Cheesbrough 2008. ISBN 0 407 00406 8.
Melia P.M., Cundy A.B., Sohi S.P., Hooda P.S., Busquets R., 2017. Trends in the
recovery of phosphorus in bioavailable forms from wastewater. Chemosphere. 186:381–95.
Nerino A., Michele M., Mikhail F. A, and Carmine D., 2013. Escherichia coli in Europe.
Int J Environ Res Public Health.: An Overview 2013 Dec; 10(12): 6235–6254. PMC3881111 PMID:
24287850
47

Nelson E.J., Harris J.B., Glenn Morris J., Calderwood S.B., Camilli A., 2009. Cholera
transmission: the host, pathogen and bacteriophage dynamic. Nat Rev Microbiol.4(10):693–702.
Owa, F.D.(2013). ‘Water Pollution: Sources, Effects, Control and Management’,
Mediterranean Journal of Social Sciences(MJSS),4(8):65-8 .
Pawari, M. J and Gawande S. (2015). Ground water pollution and its consequence,
Int.j.eng.res.gen.sci., 3(4):773-76 .
Pareilleux A., Sicard N., (1970). Lethal effects of electric current on Escherichia coli,
Appl. Microbiol., 19, 421–424.
Parsek M. and Singh P., 2003. Bacterial biofilms: an emerging link to
disease pathogenesis. Annu. Rev. ,Microbiol. 57:677-701.
Palaniappan S., Sastry S.K. and Richter, E.R. )1992(. Effects of
electroconductive heat treatment and electrical pretreatment on thermal death
kinetics of selected microorganisms. Biotech Bioeng 39, 225–232.
Ranalli G., Chiumenti R., Donantoni L. and Sorlini C. , )1996(.
Electrolytic treatment of swine liquid manure in a full scale experiment.J Environ
Sci Health A 31, 1705–1721.
Ranalli G., Iorizzo M., Lustrato G., Zanardini E. and Grazia L., )2002(.
Effects of low electric treatment on yeast microflora. J Appl Microbiol 93, 877–883.
Rasigade J.P. and Vandenesch F., 2014. Staphylococcus aureus: a pathogen with still
unresolved issues. Infect. Genet. Evol. Jan;21:510-4.
Rosenberg B., Vancamp L., Krigas T., 1965. Inhibition of cell division in Escherichia
coli by electrolysis products from a platinum electrode, Nature, 205, 698–699.
Richardson S.D., Plewa M.J., Wagner E.D., Schoeny R., DeMarini D.M., 2007.
Occurrence, genotoxicity, and carcinogenicity of regulated and emerging disinfection by-products in
drinking water: a review and roadmap for research. Mutat. Res. Rev. Mutat. Res. 636 (1): 178e242.
Reynolds KA, Mena KD, Gerba CP (2008). Risk of waterborne illness via drinking water
in the United States. Rev Environ Contam Toxicol 192: 117–158. pmid:18020305.
48

Stoodley P., DeBeer D. and Lappin-Scott H.M. )1997(. Influence of
electric fields and pH on biofilm structure as related to the bioelectric effect.
Antimicrobial Agents chemother 41, 1876–1879.
Szmolka A. and Nagy B., 2013. Multidrug resistant commensal Escherichia coli in
animals and its impact for public health. Front. Microbiol, 4:258-259. doi:
10.3389/fmicb.2013.00258.
Sandvik E.L., Mcleod B.R., Parker A.E., Stewart P.S., 2013. Direct electric current
treatment under physiologic saline conditions kills Staphylococcus epidermidis biofilms via
electrolytic generation of hypochlorous acid, PLoS One, 8, 55118.
https://www.ncbi.nlm.nih.gov/pmc/articles/PMC3563656/
Smith S., Griffiths S., Macgregor S., 2009. Pulsed electric field as a potential new
method for microbial inactivation in scaffold materials for tissue engineering: the effect on collagen
as a scaffold, J. Biomed. Mater Res. A., 90, 844–851.
Shahid A. and Saba I., 2018. Water Pollution And Its Sources, Effects &
Management : A Case Study Of Delhi. IJCAR, ISSN: O: 2319-6475, ISSN: P: 2319-6505,
Available Online at www.journalijcar.org Volume 7; Issue 2(L).
Skandhan K. P., Amith S., Karunatilake L. P. A., Avni K. P. S., and Kulwant S.,
(2011) .Water purification prescribed in Ayurveda. Ayu.; 32(4): 448–450
https://www.ncbi.nlm.nih.gov/pmc/articles/PMC3361915/#ref13
Sadhana C. and Ashok T., (2016). A review on traditional water purification methods
used in Rural Area. Indian Journal of Environmental Protection 36(1):43-48 ·
Tenaillon O., Skurnik D., Picard B., Denamur E., 2010. "The population genetics of
commensal Escherichia coli". Nature Reviews. Microbiology. 8 (3): 207–17.
doi:10.1038/nrmicro2298. PMID 20157339.
49

Tonelli A.A., Harrison E., Wesno S.L., Husain H., Benedek A., 2001. High purity water
production. : 2001-07-10 Publication of US6258278B1.
https://patents.google.com/patent/US6258278B1/en
UN & UNICEF (2005). Water for life making it happen. Geneva: WHO library
cataloguing-in-publication data; 2005. UN, UNICEF .
Valle A., Zanardini E., Abbruscato P., 2007. Effects of low electric current (LEC)
treatment on pure bacterial cultures, J. Appl. Microbiol., 103, 1376–1385.
Vincent J.L. and Rello J., Marshall J., 2009. International study of the prevalence and
outcomes of infection in intensive care units. JAMA.; 302: 2323-2329.
Villanueva C.M., Cordier S., Font-Ribera L., Salas L.A., Levallois P., 2015. Overview of
disinfection by-products and associated health effects. Current Environmental Health Reports 2 (1),
107-115.
Vogt RL. and Dippold L. (2005) . "Escherichia coli O157:H7 outbreak associated with
consumption of ground beef, June–July 2002". Public Health Reports. 120 (2): 174–8.
doi:10.1177/003335490512000211. PMC 1497708. PMID 15842119.
Wikipedia, 2018. Water Pollution. https://en.wikipedia.org/wiki/Water_pollution
Wikipedia, (2019). https://en.wikipedia.org/wiki/Escherichia_coli.
WHO/ UNICEF, 2017. WHO/ UNICEF joint monitoring programme progress on drinking
water sanitation and hygiene.{ google scholar}
Wade T.J., Calderon R.L., Sams E., Beach M., Brenner K.P., Williams A.H., Dufour A.P.,
2006. Rapidly measured indicators of recreational water quality are predictive of swimming-
associated gastrointestinal illness. Environ Health Perspect ;4:24–28.
Weiner L.M., Webb A.K., Limbago B., 2016. Antimicrobial-resistant pathogens
associated with healthcare-associated infections: summary of data reported to the National Healthcare
Safety Network at the Centers for Disease Control and Prevention, 2011–2014. Infect Control Hosp
Epidemiol. 37: 1288-1301.
50

World Health Organization, 2006. Guidelines for Drinking water quality,
Volume 1: 3rd edition, WHO Press, Switzerland.
World Health Organization. 2007. Combating waterborne disease at the household level.
Part 1:9-13; ISBN 978-92-4-159522-3. WHO Press, World Health Organization, 20 Avenue Appia,
1211 Geneva 27, Switzerland.
WHO (World Health Organization) 2008. Guidelines for Drinking-water Quality.
Incorporating 1st and 2nd Addenda, Volume 1, Recommendations. 3rd ed. WHO; Geneva, Switzerland.
WHO ,2011. Guidelines for drinking-water quality -4th ed. Geneva, Switzerland: WHO
Press .
WHO, 2012. The Evolving Threat of Antimicrobial Resistance: Options for Action.
World Health Organization; Geneva, Switzerland: 2012.
WHO, 2019.water sanitation hygiene- disease-risks .https://www.who.int/water-
sanitation-health/disease-risks/en/. [Date of access 15 august 2019].
WHO, 2003. The right to water. Geneva: WHO Library Cataloguing-in-publication data;
2003. WHO.
Yoo S.H., Jeong H., Kwon S. K., Kim J.F., 2009. Genomics, Biological Features, and
Biotechnological Applications of Escherichia coli B: Is B for better. Springer; Berlin, Germany .
Yoon S.R., Kim S.S., Hyung H., Kim Y.H., 2005. Domestic nanofiltration membrane
based water purifier without storage tank. Publication of US6841068B1. Google patents.
https://patents.google.com/patent/US6841068B1/en
Appendices:
Appendix 1: descriptive statistic of S aureus count result pre- and after current passage:
Descriptives
voltage Statistic Std. Error
pre elect 5 volt Mean 2231149.20 1950927.975
95% Confidence Interval for Mean
Lower Bound
-3185495.23
Upper Bound
7647793.63
51

5% Trimmed Mean 1923179.89
Median 100000.00
Variance1903059981330
3.203
Std. Deviation 4362407.571
Minimum 5746
Maximum 1E+007
Range 9994254
Interquartile Range 5472127
Skewness 2.188 .913
Kurtosis 4.815 2.000
10 volt
Mean 2231149.20 1950927.975
95% Confidence Interval for Mean
Lower Bound
-3185495.23
Upper Bound
7647793.63
5% Trimmed Mean 1923179.89
Median 100000.00
Variance1903059981330
3.203
Std. Deviation 4362407.571
Minimum 5746
Maximum 1E+007
Range 9994254
Interquartile Range 5472127
Skewness 2.188 .913
Kurtosis 4.815 2.000
15 volt Mean 2231149.20 1950927.975
95% Confidence Interval for Mean
Lower Bound
-3185495.23
Upper Bound
7647793.63
5% Trimmed Mean 1923179.89
Median 100000.00
Variance 19030599813303.203
52

Std. Deviation 4362407.571
Minimum 5746
Maximum 1E+007
Range 9994254
Interquartile Range 5472127
Skewness 2.188 .913
Kurtosis 4.815 2.000
20 volt
Mean 2231149.20 1950927.975
95% Confidence Interval for Mean
Lower Bound
-3185495.23
Upper Bound
7647793.63
5% Trimmed Mean 1923179.89
Median 100000.00
Variance1903059981330
3.203
Std. Deviation 4362407.571
Minimum 5746
Maximum 1E+007
Range 9994254
Interquartile Range 5472127
Skewness 2.188 .913
Kurtosis 4.815 2.000
25 volt Mean 2231149.20 1950927.975
95% Confidence Interval for Mean
Lower Bound
-3185495.23
Upper Bound
7647793.63
5% Trimmed Mean 1923179.89
Median 100000.00
Variance1903059981330
3.203
Std. Deviation 4362407.571
Minimum 5746
Maximum 1E+007
Range 9994254
53

Interquartile Range 5472127
Skewness 2.188 .913
Kurtosis 4.815 2.000
50 volt
Mean 2231149.20 1950927.975
95% Confidence Interval for Mean
Lower Bound
-3185495.23
Upper Bound
7647793.63
5% Trimmed Mean 1923179.89
Median 100000.00
Variance1903059981330
3.203
Std. Deviation 4362407.571
Minimum 5746
Maximum 1E+007
Range 9994254
Interquartile Range 5472127
Skewness 2.188 .913
Kurtosis 4.815 2.000after_elect
5 volt
Mean 3108.40 1430.752
95% Confidence Interval for Mean
Lower Bound
-864.00
Upper Bound
7080.80
5% Trimmed Mean 3062.56
Median 2000.00
Variance 10235252.800
Std. Deviation 3199.258
Minimum 42
Maximum 7000
Range 6958
Interquartile Range 6229
Skewness .448 .913
Kurtosis -2.804 2.000
10 volt Mean 2684.40 1566.484
54

95% Confidence Interval for Mean
Lower Bound
-1664.86
Upper Bound
7033.66
5% Trimmed Mean 2593.22
Median 312.00
Variance 12269356.800
Std. Deviation 3502.764
Minimum 10
Maximum 7000
Range 6990
Interquartile Range 6445
Skewness .650 .913
Kurtosis -3.058 2.000
15 volt
Mean 2716.80 1554.854
95% Confidence Interval for Mean
Lower Bound
-1600.17
Upper Bound
7033.77
5% Trimmed Mean 2629.56
Median 500.00
Variance 12087851.200
Std. Deviation 3476.759
Minimum 4
Maximum 7000
Range 6996
Interquartile Range 6458
Skewness .642 .913
Kurtosis -3.043 2.000
20 volt Mean 11.60 9.626
95% Confidence Interval for Mean
Lower Bound
-15.13
Upper Bound
38.33
5% Trimmed Mean 10.11
Median 3.00
55

Variance 463.300
Std. Deviation 21.524
Minimum 0
Maximum 50
Range 50
Interquartile Range 27
Skewness 2.206 .913
Kurtosis 4.892 2.000
25 volt
Mean 6.60 5.862
95% Confidence Interval for Mean
Lower Bound
-9.67
Upper Bound
22.87
5% Trimmed Mean 5.67
Median 1.00
Variance 171.800
Std. Deviation 13.107
Minimum 0
Maximum 30
Range 30
Interquartile Range 16
Skewness 2.214 .913
Kurtosis 4.919 2.000
50 volt Mean 1.00 .316
95% Confidence Interval for Mean
Lower Bound
.12
Upper Bound
1.88
5% Trimmed Mean 1.00
Median 1.00
Variance .500
Std. Deviation .707
Minimum 0
Maximum 2
Range 2
Interquartile Range 1
56

Skewness .000 .913
Kurtosis 2.000 2.000
Appendix 2: descriptive statistic of E coli count result pre- and after current passage:
Descriptives
voltage Statistic Std. Error
pre elect5 volt
Mean 2231149.20 1950927.975
95% Confidence Interval for Mean
Lower Bound
-3185495.23
Upper Bound
7647793.63
5% Trimmed Mean 1923179.89
Median 100000.00
Variance1903059981
3303.203
Std. Deviation 4362407.571
Minimum 5746
Maximum 1E+007
Range 9994254
Interquartile Range 5472127
Skewness 2.188 .913
Kurtosis 4.815 2.000
10 volt Mean 2231149.20 1950927.975
95% Confidence Interval for Mean
Lower Bound
-3185495.23
Upper Bound
7647793.63
5% Trimmed Mean 1923179.89
Median 100000.00
Variance1903059981
3303.203
Std. Deviation 4362407.571
Minimum 5746
57

Maximum 1E+007
Range 9994254
Interquartile Range 5472127
Skewness 2.188 .913
Kurtosis 4.815 2.000
15 volt
Mean 2231149.20 1950927.975
95% Confidence Interval for Mean
Lower Bound
-3185495.23
Upper Bound
7647793.63
5% Trimmed Mean 1923179.89
Median 100000.00
Variance1903059981
3303.203
Std. Deviation 4362407.571
Minimum 5746
Maximum 1E+007
Range 9994254
Interquartile Range 5472127
Skewness 2.188 .913
Kurtosis 4.815 2.000
20 volt Mean 2231149.20 1950927.975
95% Confidence Interval for Mean
Lower Bound
-3185495.23
Upper Bound
7647793.63
5% Trimmed Mean 1923179.89
Median 100000.00
Variance1903059981
3303.203
Std. Deviation 4362407.571
Minimum 5746
Maximum 1E+007
Range 9994254
Interquartile Range 5472127
Skewness 2.188 .913
58
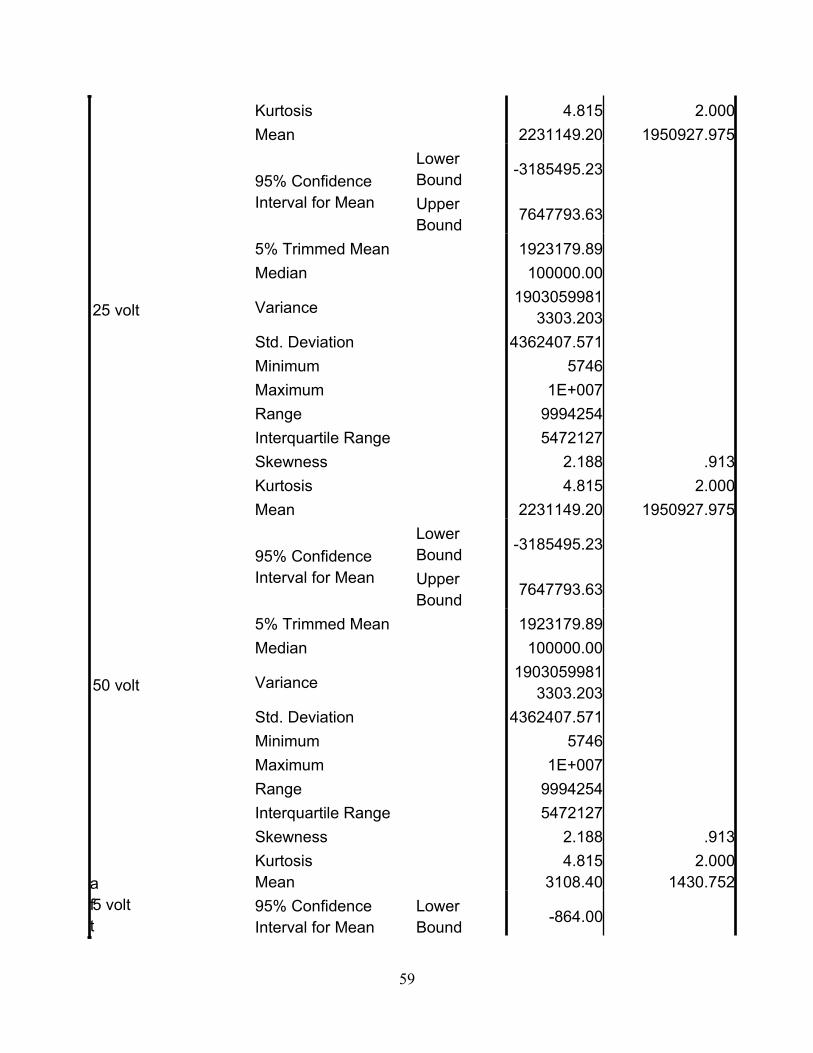
Kurtosis 4.815 2.000
25 volt
Mean 2231149.20 1950927.975
95% Confidence Interval for Mean
Lower Bound
-3185495.23
Upper Bound
7647793.63
5% Trimmed Mean 1923179.89
Median 100000.00
Variance1903059981
3303.203
Std. Deviation 4362407.571
Minimum 5746
Maximum 1E+007
Range 9994254
Interquartile Range 5472127
Skewness 2.188 .913
Kurtosis 4.815 2.000
50 volt
Mean 2231149.20 1950927.975
95% Confidence Interval for Mean
Lower Bound
-3185495.23
Upper Bound
7647793.63
5% Trimmed Mean 1923179.89
Median 100000.00
Variance1903059981
3303.203
Std. Deviation 4362407.571
Minimum 5746
Maximum 1E+007
Range 9994254
Interquartile Range 5472127
Skewness 2.188 .913
Kurtosis 4.815 2.000
aft5 volt
Mean 3108.40 1430.752
95% Confidence Interval for Mean
Lower Bound
-864.00
59

er_elect
Upper Bound
7080.80
5% Trimmed Mean 3062.56
Median 2000.00
Variance10235252.80
0
Std. Deviation 3199.258
Minimum 42
Maximum 7000
Range 6958
Interquartile Range 6229
Skewness .448 .913
Kurtosis -2.804 2.000
10 volt
Mean 2684.40 1566.484
95% Confidence Interval for Mean
Lower Bound
-1664.86
Upper Bound
7033.66
5% Trimmed Mean 2593.22
Median 312.00
Variance12269356.80
0
Std. Deviation 3502.764
Minimum 10
Maximum 7000
Range 6990
Interquartile Range 6445
Skewness .650 .913
Kurtosis -3.058 2.000
15 volt Mean 2716.80 1554.854
95% Confidence Interval for Mean
Lower Bound
-1600.17
Upper Bound
7033.77
5% Trimmed Mean 2629.56
Median 500.00
60

Variance12087851.20
0
Std. Deviation 3476.759
Minimum 4
Maximum 7000
Range 6996
Interquartile Range 6458
Skewness .642 .913
Kurtosis -3.043 2.000
20 volt
Mean 11.60 9.626
95% Confidence Interval for Mean
Lower Bound
-15.13
Upper Bound
38.33
5% Trimmed Mean 10.11
Median 3.00
Variance 463.300
Std. Deviation 21.524
Minimum 0
Maximum 50
Range 50
Interquartile Range 27
Skewness 2.206 .913
Kurtosis 4.892 2.000
25 volt Mean 6.60 5.862
95% Confidence Interval for Mean
Lower Bound
-9.67
Upper Bound
22.87
5% Trimmed Mean 5.67
Median 1.00
Variance 171.800
Std. Deviation 13.107
Minimum 0
Maximum 30
Range 30
61

Interquartile Range 16
Skewness 2.214 .913
Kurtosis 4.919 2.000
50 volt
Mean 1.00 .316
95% Confidence Interval for Mean
Lower Bound
.12
Upper Bound
1.88
5% Trimmed Mean 1.00
Median 1.00
Variance .500
Std. Deviation .707
Minimum 0
Maximum 2
Range 2
Interquartile Range 1
Skewness .000 .913
Kurtosis 2.000 2.000
Appendix 3: Statistical analysis of S aureus data shows dilution effect.
Descriptivesa,b,c,d,e
dilution Statistic Std. Error
after_elect 10^-1 Mean 3513.67 1559.148
95% Confidence Interval for Mean
Lower Bound
-494.25
Upper Bound
7521.58
5% Trimmed Mean 3515.07
Median 3525.00
Variance14585656.66
7
Std. Deviation 3819.117
62
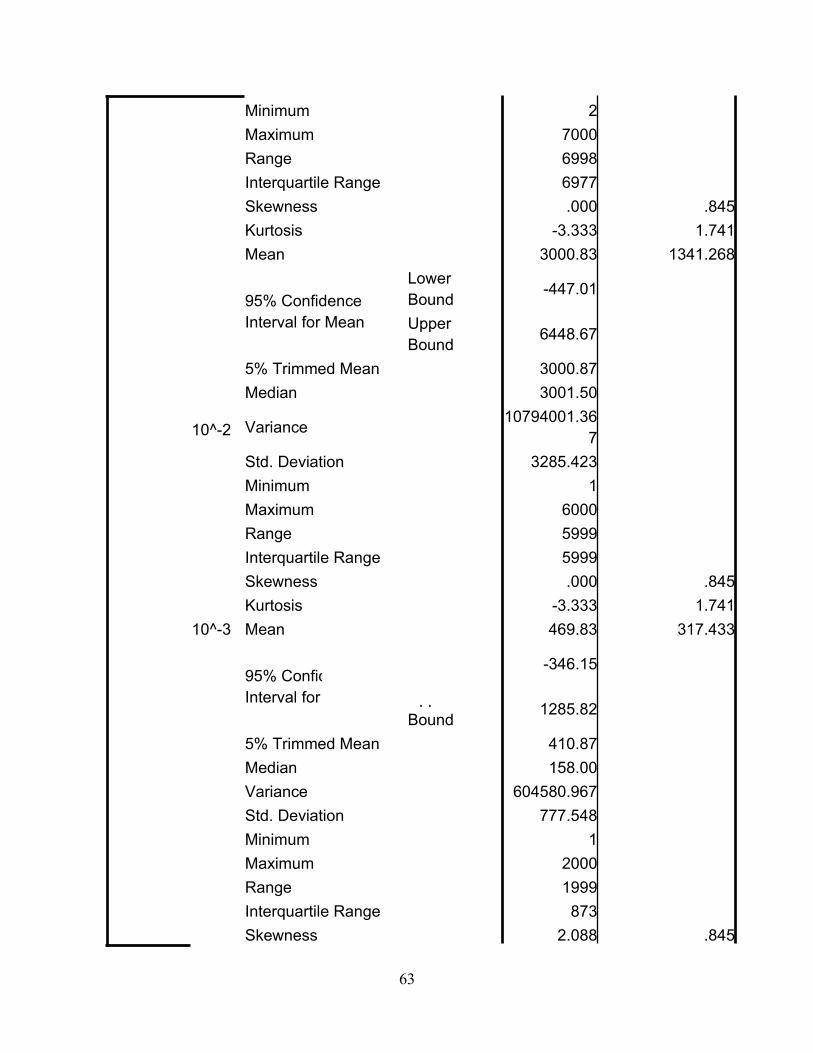
Minimum 2
Maximum 7000
Range 6998
Interquartile Range 6977
Skewness .000 .845
Kurtosis -3.333 1.741
10^-2
Mean 3000.83 1341.268
95% Confidence Interval for Mean
Lower Bound
-447.01
Upper Bound
6448.67
5% Trimmed Mean 3000.87
Median 3001.50
Variance10794001.36
7
Std. Deviation 3285.423
Minimum 1
Maximum 6000
Range 5999
Interquartile Range 5999
Skewness .000 .845
Kurtosis -3.333 1.741
10^-3 Mean 469.83 317.433
95% Confidence Interval for Mean
Lower Bound
-346.15
Upper Bound
1285.82
5% Trimmed Mean 410.87
Median 158.00
Variance 604580.967
Std. Deviation 777.548
Minimum 1
Maximum 2000
Range 1999
Interquartile Range 873
Skewness 2.088 .845
63
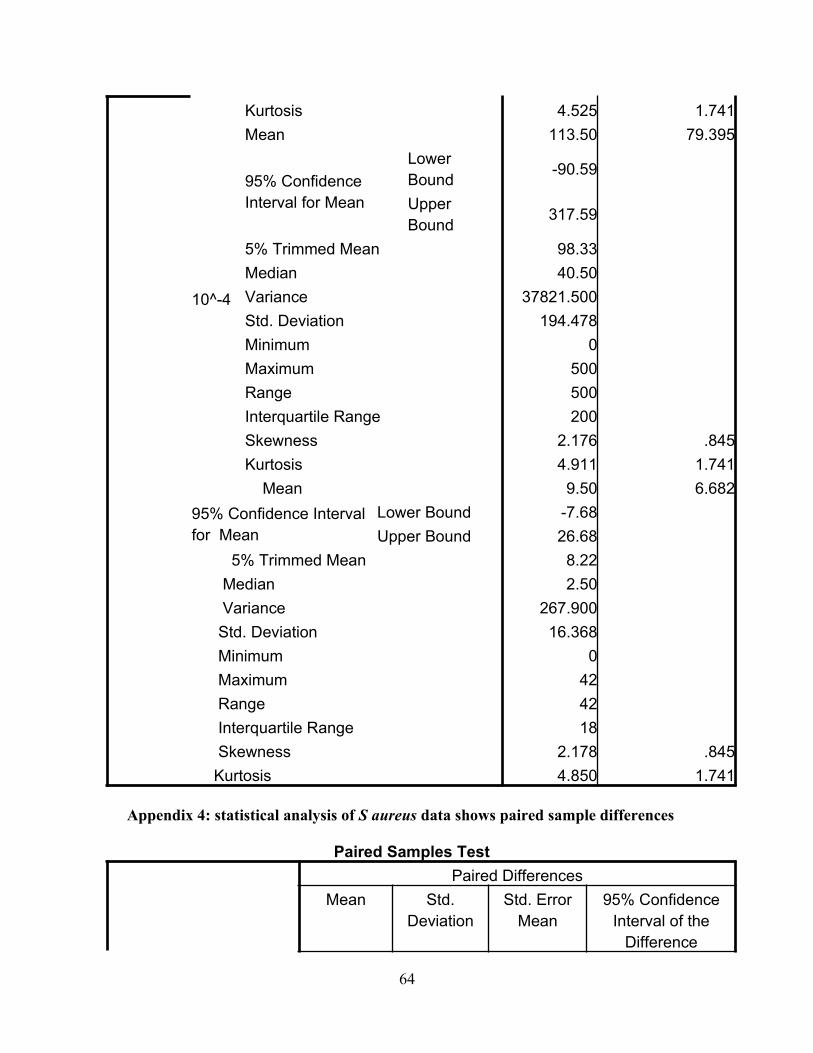
Kurtosis 4.525 1.741
10^-4
Mean 113.50 79.395
95% Confidence Interval for Mean
Lower Bound
-90.59
Upper Bound
317.59
5% Trimmed Mean 98.33
Median 40.50
Variance 37821.500
Std. Deviation 194.478
Minimum 0
Maximum 500
Range 500
Interquartile Range 200
Skewness 2.176 .845
Kurtosis 4.911 1.741
Mean 9.50 6.682
95% Confidence Interval for Mean
Lower Bound -7.68
Upper Bound 26.68
5% Trimmed Mean 8.22
Median 2.50
Variance 267.900
Std. Deviation 16.368
Minimum 0
Maximum 42
Range 42
Interquartile Range 18
Skewness 2.178 .845
Kurtosis 4.850 1.741
Appendix 4: statistical analysis of S aureus data shows paired sample differences
Paired Samples Test
Paired Differences
Mean Std.Deviation
Std. ErrorMean
95% ConfidenceInterval of the
Difference
64

Lower
Pair 1pre elect - after elec
2229474.733
3967537.449 724369.920 747971.902
Appendix 5: statistical analysis of E coli data shows paired sample differences
Paired Samples Test
Paired Differences
Mean Std.Deviation
Std. ErrorMean
95% ConfidenceInterval of the
Difference
Lower
Pair 1pre elect - after_elect
2229727.733
3967395.577 724344.017 748277.878
65
Copyright © 2022 FDOKUMEN