Х А Б А Р Л А Р Ы - Республиканская Межвузовская ...
214
ISSN 2518-170X (Online), ISSN 2224-5278 (Print) ҚАЗАҚСТАН РЕСПУБЛИКАСЫ ҰЛТТЫҚ ҒЫЛЫМ АКАДЕМИЯСЫНЫҢ Қ. И. Сəтпаев атындағы Қазақ ұлттық техникалық зерттеу университеті Х А Б А Р Л А Р Ы ИЗВЕСТИЯ НАЦИОНАЛЬНОЙ АКАДЕМИИ НАУК РЕСПУБЛИКИ КАЗАХСТАН Казахский национальный исследовательский технический университет им. К. И. Сатпаева N E W S OF THE ACADEMY OF SCIENCES OF THE REPUBLIC OF KAZAKHSTAN Kazakh national research technical university named after K. I. Satpayev ГЕОЛОГИЯ ЖƏНЕ ТЕХНИКАЛЫҚ ҒЫЛЫМДАР СЕРИЯСЫ СЕРИЯ ГЕОЛОГИИ И ТЕХНИЧЕСКИХ НАУК SERIES OF GEOLOGY AND TECHNICAL SCIENCES 4 (430) ШІЛДЕ – ТАМЫЗ 2018 ж. ИЮЛЬ – АВГУСТ 2018 г. JULY – AUGUST 2018 ЖУРНАЛ 1940 ЖЫЛДАН ШЫҒА БАСТАҒАН ЖУРНАЛ ИЗДАЕТСЯ С 1940 г . THE JOURNAL WAS FOUNDED IN 1940. ЖЫЛЫНА 6 РЕТ ШЫҒАДЫ ВЫХОДИТ 6 РАЗ В ГОД PUBLISHED 6 TIMES A YEAR АЛМАТЫ, ҚР ҰҒА АЛМАТЫ, НАН РК ALMATY, NAS RK
-
Upload
khangminh22 -
Category
Documents
-
view
1 -
download
0
Transcript of Х А Б А Р Л А Р Ы - Республиканская Межвузовская ...

ISSN 2518-170X (Online), ISSN 2224-5278 (Print)
ҚАЗАҚСТАН РЕСПУБЛИКАСЫ
ҰЛТТЫҚ ҒЫЛЫМ АКАДЕМИЯСЫНЫҢ
Қ. И. Сəтпаев атындағы Қазақ ұлттық техникалық зерттеу университеті
Х А Б А Р Л А Р Ы
ИЗВЕСТИЯ
НАЦИОНАЛЬНОЙ АКАДЕМИИ НАУК РЕСПУБЛИКИ КАЗАХСТАН Казахский национальный исследовательский технический университет им. К. И. Сатпаева
N E W S
OF THE ACADEMY OF SCIENCES OF THE REPUBLIC OF KAZAKHSTAN
Kazakh national research technical university named after K. I. Satpayev
ГЕОЛОГИЯ ЖƏНЕ ТЕХНИКАЛЫҚ ҒЫЛЫМДАР СЕРИЯСЫ
СЕРИЯ
ГЕОЛОГИИ И ТЕХНИЧЕСКИХ НАУК
SERIES OF GEOLOGY AND TECHNICAL SCIENCES
4 (430)
ШІЛДЕ – ТАМЫЗ 2018 ж. ИЮЛЬ – АВГУСТ 2018 г.
JULY – AUGUST 2018
ЖУРНАЛ 1940 ЖЫЛДАН ШЫҒА БАСТАҒАН ЖУРНАЛ ИЗДАЕТСЯ С 1940 г.
THE JOURNAL WAS FOUNDED IN 1940.
ЖЫЛЫНА 6 РЕТ ШЫҒАДЫ ВЫХОДИТ 6 РАЗ В ГОД
PUBLISHED 6 TIMES A YEAR
АЛМАТЫ, ҚР ҰҒА АЛМАТЫ, НАН РК ALMATY, NAS RK

Известия Национальной академии наук Республики Казахстан
2
NAS RK is pleased to announce that News of NAS RK. Series of geology and technical
sciences scientific journal has been accepted for indexing in the Emerging Sources Citation Index, a new edition of Web of Science. Content in this index is under consideration by Clarivate Analytics to be accepted in the Science Citation Index Expanded, the Social Sciences Citation Index, and the Arts & Humanities Citation Index. The quality and depth of content Web of Science offers to researchers, authors, publishers, and institutions sets it apart from other research databases. The inclusion of News of NAS RK. Series of geology and technical sciences in the Emerging Sources Citation Index demonstrates our dedication to providing the most relevant and influential content of geology and engineering sciences to our community.
Қазақстан Республикасы Ұлттық ғылым академиясы "ҚР ҰҒА Хабарлары. Геология жəне
техникалық ғылымдар сериясы" ғылыми журналының Web of Science-тің жаңаланған нұсқасы Emerging Sources Citation Index-те индекстелуге қабылданғанын хабарлайды. Бұл индекстелу барысында Clarivate Analytics компаниясы журналды одан əрі the Science Citation Index Expanded, the Social Sciences Citation Index жəне the Arts & Humanities Citation Index-ке қабылдау мəселесін қарастыруда. Webof Science зерттеушілер, авторлар, баспашылар мен мекемелерге контент тереңдігі мен сапасын ұсынады. ҚР ҰҒА Хабарлары. Геология жəне техникалық ғылымдар сериясы Emerging Sources Citation Index-ке енуі біздің қоғамдастық үшін ең өзекті жəне беделді геология жəне техникалық ғылымдар бойынша контентке адалдығымызды білдіреді.
НАН РК сообщает, что научный журнал «Известия НАН РК. Серия геологии и технических
наук» был принят для индексирования в Emerging Sources Citation Index, обновленной версии Web of Science. Содержание в этом индексировании находится в стадии рассмотрения компанией Clarivate Analytics для дальнейшего принятия журнала в the Science Citation Index Expanded, the Social Sciences Citation Index и the Arts & Humanities Citation Index. Web of Science предлагает качество и глубину контента для исследователей, авторов, издателей и учреждений. Включение Известия НАН РК. Серия геологии и технических наук в Emerging Sources Citation Index демонстрирует нашу приверженность к наиболее актуальному и влиятельному контенту по геологии и техническим наукам для нашего сообщества.
ISSN 2224-5278 Серия геологии и технических наук. 4. 2018
3
Б а с р е д а к т о р ы
э. ғ. д., профессор, ҚР ҰҒА академигі
И.К. Бейсембетов
Бас редакторының орынбасары
Жолтаев Г.Ж. проф., геол.-мин. ғ. докторы
Р е д а к ц и я а л қ а с ы:
Абаканов Т.Д. проф. (Қазақстан) Абишева З.С. проф., академик (Қазақстан) Агабеков В.Е. академик (Беларусь) Алиев Т. проф., академик (Əзірбайжан) Бакиров А.Б. проф., (Қырғыстан) Беспаев Х.А. проф. (Қазақстан) Бишимбаев В.К. проф., академик (Қазақстан) Буктуков Н.С. проф., академик (Қазақстан) Булат А.Ф. проф., академик (Украина) Ганиев И.Н. проф., академик (Тəжікстан) Грэвис Р.М. проф. (АҚШ) Ерғалиев Г.К. проф., академик (Қазақстан) Жуков Н.М. проф. (Қазақстан) Кенжалиев Б.К. проф. (Қазақстан) Қожахметов С.М. проф., академик (Казахстан) Конторович А.Э. проф., академик (Ресей) Курскеев А.К. проф., академик (Қазақстан) Курчавов А.М. проф., (Ресей) Медеу А.Р. проф., академик (Қазақстан) Мұхамеджанов М.А. проф., корр.-мүшесі (Қазақстан) Нигматова С.А. проф. (Қазақстан) Оздоев С.М. проф., академик (Қазақстан) Постолатий В. проф., академик (Молдова) Ракишев Б.Р. проф., академик (Қазақстан) Сейтов Н.С. проф., корр.-мүшесі (Қазақстан) Сейтмуратова Э.Ю. проф., корр.-мүшесі (Қазақстан) Степанец В.Г. проф., (Германия) Хамфери Дж.Д. проф. (АҚШ) Штейнер М. проф. (Германия)
«ҚР ҰҒА Хабарлары. Геология мен техникалық ғылымдар сериясы». ISSN 2518-170X (Online), ISSN 2224-5278 (Print) Меншіктенуші: «Қазақстан Республикасының Ұлттық ғылым академиясы» РҚБ (Алматы қ.). Қазақстан республикасының Мəдениет пен ақпарат министрлігінің Ақпарат жəне мұрағат комитетінде 30.04.2010 ж. берілген 10892-Ж мерзімдік басылым тіркеуіне қойылу туралы куəлік.
Мерзімділігі: жылына 6 рет. Тиражы: 300 дана.
Редакцияның мекенжайы: 050010, Алматы қ., Шевченко көш., 28, 219 бөл., 220, тел.: 272-13-19, 272-13-18, http://nauka-nanrk.kz /geology-technical.kz
© Қазақстан Республикасының Ұлттық ғылым академиясы, 2018
Редакцияның Қазақстан, 050010, Алматы қ., Қабанбай батыра көш., 69а. мекенжайы: Қ. И. Сəтбаев атындағы геология ғылымдар институты, 334 бөлме. Тел.: 291-59-38.
Типографияның мекенжайы: «Аруна» ЖК, Алматы қ., Муратбаева көш., 75.

Известия Национальной академии наук Республики Казахстан
4
Г л а в н ы й р е д а к т о р
д. э. н., профессор, академик НАН РК
И. К. Бейсембетов
Заместитель главного редактора
Жолтаев Г.Ж. проф., доктор геол.-мин. наук
Р е д а к ц и о н н а я к о л л е г и я:
Абаканов Т.Д. проф. (Казахстан) Абишева З.С. проф., академик (Казахстан) Агабеков В.Е. академик (Беларусь) Алиев Т. проф., академик (Азербайджан) Бакиров А.Б. проф., (Кыргызстан) Беспаев Х.А. проф. (Казахстан) Бишимбаев В.К. проф., академик (Казахстан) Буктуков Н.С. проф., академик (Казахстан) Булат А.Ф. проф., академик (Украина) Ганиев И.Н. проф., академик (Таджикистан) Грэвис Р.М. проф. (США) Ергалиев Г.К. проф., академик (Казахстан) Жуков Н.М. проф. (Казахстан) Кенжалиев Б.К. проф. (Казахстан) Кожахметов С.М. проф., академик (Казахстан) Конторович А.Э. проф., академик (Россия) Курскеев А.К. проф., академик (Казахстан) Курчавов А.М. проф., (Россия) Медеу А.Р. проф., академик (Казахстан) Мухамеджанов М.А. проф., чл.-корр. (Казахстан) Нигматова С.А. проф. (Казахстан) Оздоев С.М. проф., академик (Казахстан) Постолатий В. проф., академик (Молдова) Ракишев Б.Р. проф., академик (Казахстан) Сеитов Н.С. проф., чл.-корр. (Казахстан) Сейтмуратова Э.Ю. проф., чл.-корр. (Казахстан) Степанец В.Г. проф., (Германия) Хамфери Дж.Д. проф. (США) Штейнер М. проф. (Германия)
«Известия НАН РК. Серия геологии и технических наук». ISSN 2518-170X (Online), ISSN 2224-5278 (Print) Собственник: Республиканское общественное объединение «Национальная академия наук Республики Казахстан (г. Алматы) Свидетельство о постановке на учет периодического печатного издания в Комитете информации и архивов Министерства культуры и информации Республики Казахстан 10892-Ж, выданное 30.04.2010 г.
Периодичность: 6 раз в год Тираж: 300 экземпляров
Адрес редакции: 050010, г. Алматы, ул. Шевченко, 28, ком. 219, 220, тел.: 272-13-19, 272-13-18, http://nauka-nanrk.kz /geology-technical.kz
Национальная академия наук Республики Казахстан, 2018
Адрес редакции: Казахстан, 050010, г. Алматы, ул. Кабанбай батыра, 69а. Институт геологических наук им. К. И. Сатпаева, комната 334. Тел.: 291-59-38.
Адрес типографии: ИП «Аруна», г. Алматы, ул. Муратбаева, 75

ISSN 2224-5278 Серия геологии и технических наук. 4. 2018
5
E d i t o r i n c h i e f
doctor of Economics, professor, academician of NAS RK
I. K. Beisembetov
Deputy editor in chief
Zholtayev G.Zh. prof., dr. geol-min. sc.
E d i t o r i a l b o a r d:
Abakanov Т.D. prof. (Kazakhstan) Abisheva Z.S. prof., academician (Kazakhstan) Agabekov V.Ye. academician (Belarus) Aliyev Т. prof., academician (Azerbaijan) Bakirov А.B. prof., (Kyrgyzstan) Bespayev Kh.А. prof. (Kazakhstan) Bishimbayev V.K. prof., academician (Kazakhstan) Buktukov N.S. prof., academician (Kazakhstan) Bulat А.F. prof., academician (Ukraine) Ganiyev I.N. prof., academician (Tadjikistan) Gravis R.М. prof. (USA) Yergaliev G.K. prof., academician (Kazakhstan) Zhukov N.М. prof. (Kazakhstan) Kenzhaliyev B.K. prof. (Kazakhstan) Kozhakhmetov S.М. prof., academician (Kazakhstan) Kontorovich А.Ye. prof., academician (Russia) Kurskeyev А.K. prof., academician (Kazakhstan) Kurchavov А.М. prof., (Russia) Medeu А.R. prof., academician (Kazakhstan) Muhamedzhanov M.A. prof., corr. member. (Kazakhstan) Nigmatova S.А. prof. (Kazakhstan) Ozdoyev S.М. prof., academician (Kazakhstan) Postolatii V. prof., academician (Moldova) Rakishev B.R. prof., academician (Kazakhstan) Seitov N.S. prof., corr. member. (Kazakhstan) Seitmuratova Ye.U. prof., corr. member. (Kazakhstan) Stepanets V.G. prof., (Germany) Humphery G.D. prof. (USA) Steiner М. prof. (Germany)
News of the National Academy of Sciences of the Republic of Kazakhstan. Series of geology and technology sciences. ISSN 2518-170X (Online), ISSN 2224-5278 (Print) Owner: RPA "National Academy of Sciences of the Republic of Kazakhstan" (Almaty) The certificate of registration of a periodic printed publication in the Committee of information and archives of the Ministry of culture and information of the Republic of Kazakhstan N 10892-Ж, issued 30.04.2010
Periodicity: 6 times a year Circulation: 300 copies
Editorial address: 28, Shevchenko str., of. 219, 220, Almaty, 050010, tel. 272-13-19, 272-13-18, http://nauka-nanrk.kz/geology-technical.kz
© National Academy of Sciences of the Republic of Kazakhstan, 2018
Editorial address: Institute of Geological Sciences named after K.I. Satpayev 69a, Kabanbai batyr str., of. 334, Almaty, 050010, Kazakhstan, tel.: 291-59-38.
Address of printing house: ST "Aruna", 75, Muratbayev str, Almaty

Известия Национальной академии наук Республики Казахстан
6
N E W S OF THE NATIONAL ACADEMY OF SCIENCES OF THE REPUBLIC OF KAZAKHSTAN
SERIES OF GEOLOGY AND TECHNICAL SCIENCES
ISSN 2224-5278
Volume 3, Number 430 (2018), 6 – 17 UDC 622.276.3
A. I. Koishina1, O. G. Kirisenko2, B. N. Koilybayev1, K. K. Agayeva2
1Caspian State University of Technologies and Engineering named after Sh. Yessenov, Aktau, Kazakhstan, 2Oil and Gas Institute of Azerbaijan National Academy of Sciences, Baku, Azerbaijan.
E-mail: [email protected], [email protected], [email protected], [email protected]
DECISION-MAKING FOR CHOOSING OF GEOLOGICAL AND ENGINEERING OPERATIONS:
CURRENT STATUS AND PROSPECTS
Abstract. It is commonly known that great care is given to upgrading of the efficiency due to implementing of various new technologies and GTM during development of oil fields. Widespread introduction of GTM as well as enhanced oil recovery (EOR) and elaboration of their technologies raise the issues of relevant choice of the best methods ensuring proper technical and economical efficiency in particular conditions. Despite of the profound in-terest of the researches to the given question, major problems arise currently anyway at comparative evaluation of various types of GTM regarding particular conditions. The issue of upgrading of efficiency of GTM based on the integrated geological and physical and technological information is currently challenging and deserves relevant consideration. Deep analysis of the conditions for applying of various GTM using advanced techniques and corres-ponding software allows in its turn to give guidance to current possibilities in order to upgrade efficiency of field deposit. For many years the research focused on upgrading of the efficiency of field deposits had been conducted in various scientific and industrial organizations. The analysis of choosing and implementing of GTM at different deposits is of great interest. Review and analysis of up-to-date condition of problem of GTA choosing are illustrated in the article. Examples of application and performance evaluation of GTM are shown at different deposits. Develop-ment and upgrading of the analysis methods as well as forecasting of indicators and decision-making have been observed over the recent years. Their implementation allowed upgrading the efficiency of conducted geological and technical operations. As a result of conducted operations the researchers solved the issue of creating of integrated methodology and its mathematic, scheduled and information application for evaluating of efficiency and optimal scheduling of geological and technical operations at field deposits; structure of automated system of decision support and algorithm of its functioning have been created; by transforming the indicators characterizing the formation into the relevant factors, the equations (linear and multiplicative) were made expressing the dependence of the efficiency indicators of GTM from the formed factors; by variants calculation and analysis of comparative efficiency of any GTM in different conditions the directions were shown and the results of making decisions for choosing of the best GTM were obtained.
Key words: geological and technical measure (GTM), field development, decision-making, crude oil produc-tion, oil recovery.
Introduction. During operation of oil field well works are reported to be carried out for adjusting of its development and maintenance of crude oil production level. This range of works is called as geological and technical measures (GTM), owing to which oil producing companies provide achieving of the required indicators of field development. It goes without saying there is an operational need for assessing of methods and efficiency criteria of GTM.
It is commonly known that great care is given to upgrading of the efficiency due to implementing of various new technologies and GTM during development of oil fields. Widespread introduction of GTM as well as enhanced oil recovery (EOR) and elaboration of their technologies raises the issues of relevant choice of the best methods ensuring proper technical and economical efficiency in particular conditions. Despite of profound interest of the researches to the given issue, major problems arise currently anyway at

ISSN 2224-5278 Серия геологии и технических наук. 4. 2018
7
comparative evaluation of various types of GTM regarding particular conditions. It is linked with the lack of research allowing to give prognosis evaluation of the efficiency of GTM for those reasons where it was not applied for whatever reason. State of the art of analysis techniques of information and decision-making allows to achieve this goal upon availability of integrated geological and physical and technological information. At the same time the experience of implementing of different GTM at various fields confirms its great importance for increasing of oil production index as well as provides importance for the inves-tigation of the paths of using to the fullest extent of potential opportunities of the available information, despite of the fact that we have to face its uncertainty both statistical and non-statistical kind very fre-quently. The specified data demands applying of the methods allowing to build the relevant forecasting models of efficiency indicators and making decisions within the multicriteriality conditions based on the sort of available information.
Accordingly, the issue for the upgrading of the efficiency of GTM based on the integrated geological and physical and technological information is currently challenging and deserves relevant consideration. Deep analysis of the conditions for applying of various GTM using advanced techniques and correspon-ding software allows in its turn to give guidance to current possibilities in order to upgrade efficiency of field deposit. For many years the research focused on upgrading of the efficiency of field deposits had been conducted in various scientific and industrial organizations. The analysis of choosing and imple-menting of GTM at different deposits is of great interest.
Summary of the research related to geological and technical measures. Various types of GTM are currently used at oil deposits. They are as follows: bottom hole treatment (BTH), hydraulic fracturing of formation (HFF), extended reach drilling as well as other methods of oil well stimulation and advanced recovery methods (ARM) of geological horizons [1-3].
Various methods for calculation of the efficiency of applied GTM are offered currently [4]. In general all the measures conducted on the wells can be divided into the different types according to impact: technological, maintenance, ARM and oil production intensification, BTH.
According to the literature analysis different models are used for problem solving of oil production forecasting in order to choose the most efficient GTM. Estimated figures are defined by existing trends of oil production and efficiency of scheduled GTM. Recent research including upgrading of the existing approaches to the assessment of efficiency of GTM make possible wide implementation of new systems of programming, automation of automation process of engineering efficiency of the applied methods of the enhanced oil recovery. This includes the development of software complex EOR–Office representing modern tool designated for automation of the whole complex of tasks for experts engaged in enhanced oil recovery [5, 6]. One of the main approaches to the assessment of technological efficiency of various GTM in oil production is extrapolation. The core of extrapolation methods for the assessment of technological efficiency of various GTM consists in building of oil production base level. For this purpose actual oil production during conducting of GTM is comparing with projection data obtained during extrapolation of background. Herewith even minor mistakes in building of base oil production level as noted by experts lead to inadequate matching and planning of effective GTM [7]. In practical terms the real efficiency of GTM is assumed to assess by the methods of characteristics of water-oil displacement, i.e. by watering curves – connections of type Vн = f (Vж) and by curves of oil production variation – connections of type Vн = f (t): here Vн and Vж – are accumulated selections of oil and liquid; t –time. According to [7] the cumulative effect can be divided into the effect conditioned by changing of oil displacement nature and effect related to liquid drainage intensification. Additional quantity of produced water is calculated. Cumulative effect of GTM is defined by oil production rate decline curves – connections of type Vн = f (t).
Currently the tens of different types of displacement characteristics [8, 9] are calculated and one of the problems is a choice of such displacement characteristic which was coordinated in the best way with production history of the object and ensured the most precise extrapolation when forecasting [10]. For example work [11] shows some issues related to choosing of the most precise methods of assessment of GTM as well as connections are given for reflecting of possible cases of differentiation of technological benefit of enhanced oil recovery method. According to the author’s opinion forecasting of the effect (i.e. calculation of the estimated effect) of GTM based on the extrapolation curves of actual and base oil production using methods of characteristics cannot be always reliable. The author thinks that such circumstance appears due to the following reasons. According to his opinion, despite of the fact that

Известия Национальной академии наук Республики Казахстан
8
duration of the effect from applying of some types of GTM (for example, HFF) vary between 5-7 years, the using of watering curves for relatively long-ranged forecasts can be reliable only in case of high watering, exceeding 50-70% as a rule. In case of lower watering (at early stages) the duration of the fo-recast shall not increase 3-6 months. However many types of GTM are conducted in non-aqueous or less water-producing wells.
It is also noted in the work that upon availability of representative information on declining oil pro-duction after conducting of GTM (at least 4-6 points) the reliable extrapolation of displacement charac-teristics is possible. In such conditions the applying of forecasting methods can be viable, which are based on using of oil production decline ratios. In case if the information of oil uptake is not representative the ratios of declining of uptakes by the other wells are possible with more extended operational period after GTM. Based on the above the upgrading of the methods of displacement characteristics currently appears on the agenda and is quite up-to-date [12]. According to work [13] the object of the forecast is wells, bushes, areas, (well fields), shop, horizon, oil and gas production enterprise and etc., forecast intervals - month, quarter, year. Based on the kind and sequence of planned measures there is a possibility of con-ducting of multiple-path calculations which in its turn demands corresponding software using modern mathematical apparatus. According to this work [13] considers technology of calculations of forecast indicators implemented in integral software complex (ISC) «Baspro-analytic» (developed by CJSC «Analytical center SibINKor») and applied in practice of indicators analysis of oil deposits of the Nizhnevartovsky district. Two programmable modules are supposed to use for task solving: «Baspro-characteristics» – ensures calculation of base production under existing development system and assess-ment of impact from conducted GTM; «Baspro-forecast» – estimates anticipated oil production including intended effect from estimated GTM.
Diagrams showing the process of calculation of baseline of oil production as well as its forecasting option are illustrated in the work. Classification of indexes of technological efficiency of GTM conducting is shown. Efficiency of various GTM is installed according to the geological structure of the Ershovoe field. As the authors note, the given principle was used to the fullest extent for making of GTM and fore-casting of technological performance data of the development of the Ershovoe oil field effected by CJSC «Tyumen Oil Company». The estimate indicators for the assessment of GTM effect are defined in accor-dance with «Guidance for the assessment of technological efficiency of applying of enhanced oil recovery methods». The methods applied in the program are based on defining of displacement characteristics approximating in the best way the actual data of oil production history. Approximation is carried out in the setting of user-defined interval and belonging to history interval. Approximation error is estimated «in the least-squared sense». The effect in «Baspro-characteristics» is automatically divided into two constituents: oil production effect and intensification effect. Effect from volume reduction of produced water is calcu-lated alongside with two main effects. If characteristic of base production was already calculated and kept in the base of «anticipated production», «Baspro-characteristics» allows to calculate effect comparing this data and actual production [14].
Development of the mathematical modeling techniques and state-of-the-art instruments of computer science enables defining of technological efficiency of GTM for concerned oil and gas object by two possible ways, considers the author of harmonized calculation methods of the efficiency of GTM [9]: by ongoing multidimensional deterministic filtration model; small parameter random and statistical model on the basis of data of production history.
In the first instance creating of geological and filtration models of the object is required and presence of the relevant software describing processes in place. This approach demands relatively big time and funds costs.
In the second instance the assessment of technological efficiency is performed without involving filtration model of the object. The second approach does not demand big time and funds costs and can be used when using efficiency of GTM.
The methods provide confidence estimate of the initial data, theoretical assumptions, testing of the proposed methods as well as manual to software application. This allows increasing quality and confi-dence of the made decisions. Other authors [10] conduct analysis of currently used methodological issues on assessment of technological efficiency of GTM as well as provide the results of numerical experiments on the assessment of efficiency of GTM using software application “BASPRO-Characteristics” (methods

ISSN 2224-5278 Серия геологии и технических наук. 4. 2018
9
SibNIINP) at actual data (a range of areas of the Samotlorskoe field) and at the model characteristics estimated on idealized three-dimensional hydrodynamic model.
On the basis of three-dimensional hydrodynamic calculations of model and real sections of oil formations they conducted experimental calculations using software applications «Tempest MORE (Roxar) and Eclipse (Schlumberger), which results were compared with engineering design by the following methods of assessment of technological efficiency of GTM: methods of All-Union RDE of Oil [8, 15], SibNIINP [16], Kazakova А.А. [7, 8, 17] and Shakhverdieva А. Kh. [18]. Such approach to ap-plying of hydrodynamic models enables testing methods of assessment of technological efficiency at «synthetic» development indicators obtained in the modeling process by individual wells. Resulting from data analysis and decision support of GTM by experts from Tyumen [19] the concept of corporate knowledge bases of Tyumen Oil Company was offered designated for keeping, development, using of the experience and empirical knowledge of the experts of the company engaged in geological and technical operations (GTM) [11]. The organization of work with knowledge basis is based on Internet using. The content of the knowledge basis is structured as pairs “GTM – situation under which the operation was con-ducted”. Mathematical tool of hypergraphs is used for formalizing of representation of the situations, development of the algorithms of the situational analysis (methods of common situational approach) and search.
Situational method (situational models in corporate knowledge basis) is based on searching and using of analogies known from the real experience of the professional activity. The reality of the experience for the engineer can be more important than the results of mathematical modeling. Combination of both ap-proaches where situations – analogues will be used for choosing of the estimated parameters of GTM can be of great interest.
Work [5] describes building of database of GTM by wells recommended for production as well as corresponding criteria for GTM choosing. According to this work building of GTM database by wells by each formation the following criteria shall be chosen: current oil-filled thickness is at most 2 m; formation is not left out or by current fund non-recovery well; formation without coagulation with perforated forma-tion or non-recovery well (this criteria may not be taken into account); in radius of at least 500 m there are no wells by the current fund working on the given formation; bed shaliness is less than 6% (this criteria may not be considered, if the application of EOR (filter cake dissolving) is estimated; the formation permeability is over 0.07 μm2. Forecasting flowrates are calculated by all considered formations. Alloca-tion of chosen wells is checked according to the maps of current oil-filled thicknesses. The chosen wells are incorporated into GTM base as recommended for rendering to oil production. According to the authors` opinion the offered criteria enable performing choice of wells for building of the computer-based database with the following verification by the compiled maps which is more effective in case of big scope of information than manual well locations selection. This database building order for the development of GTM was applied upon the drawing-up recommendations by Abdrakhmanovskaya, Tchishminskaya and Eastern – Suleevskaya areas in the Romashkinkoe field [20].
Article [21] considers problem solving of creating of data base of GTM by wells recommended for production using method of fuzzy sets on the example of formation «а» of the horizon Д1 of the Eastern - Suleevskaya area of the Romashkinskoe field. Fuzzy set is here an object belonging to which can be judged only with certain volume of concern. Problem solving of well locations selection for recommen-dation for producing for each formation reduces to defining for all wells of membership functions to multitude «well recommended for rendering for production». Presence of many criteria, frequently contradictory, offers difficulties in choosing of the best solution [22]. In this regard the authors reduce the solution of multicriterion problem to one-criterion using fuzzy set theory, considering this criterion as practicability measure of conducting of provided GTM, that in their view allows effecting fast ranging of possible options of decision by degree of practicability and form the most favorite operation schedule.
The author [23] offers the following concept under assessment of efficiency of measures for in-creasing of oil production and final oil recovery.
To determine the efficiency of any additional technical measure on increasing of current production and final oil recovery two design options of development of oil deposit (production facility) shall be esti-mated: without additional action (base option); with additional measure. Regular and precise satisfactory information on the operation of producers and injectors (their flowrates of oil and liquid, water injection
Известия Национальной академии наук Республики Казахстан
10
and bottom-hole pressure) on the concerned production facilities [23, 24] is required in order to determine confidently of the initial recoverable reserves of oil and liquid actually brought into production, and their changes .
The analysis of the completed operations indicates that most of the authors consider that performance evaluation of application of methods of enhanced oil recovery (EOR) and performing forecasting for new deposit areas building of geological and filtration models is required for updating of geological conditions of distributing of current reserves of oil. In this regard methodological approach is considered relating to the development and implementation of enterprise software products, oriented at mass user and designated for operation of geological and filtration to tasks of enhanced oil recovery of formations.
Operational solving of production tasks by the authors program products was used – three-dimen-sional enterprise information system (TDEIS), developed by the employees of RDE of mathematics and mechanics named after N.G. Tchebotareva and LLC “Vensis” under active participation of experts of industrial organizations [25].
The concept of ongoing model is used within the scope of this system. Ongoing system is understood as a single computer technology representing assembly of digital integrated geological, geophysical, hyd-rodynamic information (database), 3D geological and filtration models and software tools of building and viewing of models, issuing of reporting graphical and tabular material. Description of the basic functions of programmable modules is given in the work. The estimated group consists of three modules designated for building of geological, filtration models and GTM model. Module of building of geological model is working in the presence of database by the initial indicators, filtration model modeling module (Fluid) functions under condition of built geological model (Geo), module for assessment and forecasting of efficiency of GTM uses the results of geological and filtration model for work.
In such a way almost all field-geological information is covered. Classes of oil-field tasks are detai-led. Due to GTM the estimated group of software modules consists of GTM module performing two func-tions: assessment of efficiency of GTM application; analysis of efficiency of GTM in the different geolo-gical and industrial conditions.
The review stated above represents profound interest of the researchers to the issue of assessment of efficiency of GTM, development of scientifically-based methodological approaches, analysis and choo-sing of the best options of the decisions and therefore confirms importance and applicability of decision-making on upgrading of efficiency of GTM.
As you can see from the above mentioned brief survey large number of studies has been performed, related to the assessment of technological efficiency as a separate type of GTM as well as the relevant guidance documents was developed.
This research as well as the results of GTM conducted in several districts allow to solve a number of tasks under their generalization responding several questions in particular predictive estimates of the relative efficiency of the different types of GTM on the concerned specified object, as well as determining of the object which is best suited for certain type of GTM.
Solving of these issues becomes difficult by the lack of the approach concluding in careful statistical analysis of integrated geological and geophysical and technological information, models expressing connection of efficiency indicators of any type of GTM with parameters describing the discovered object (formation). Moreover, in a number of cases the decision-making on choosing of GTM becomes very difficult by the lack or insufficient information.
Modern level of development of mathematical methods and informational technologies as well as the results of their successful using at various stages of the research works enable solving the assigned tasks in the conditions of limited information.
As you can see from the review this circumstance was considered in a number of works related to the efficiency of certain types of GTM.
All known methods for defining of technological and economical efficiency of applying of GTM are based on the comparing of certain dependencies based as a result of its implementing with base. For example, when assessing of the efficiency of the watering actual displacement correspondences are used using this method and without it. At the same time it is obvious that the main task concludes in correct approximation of the natural base process operation without using of GTM [8, 18, 26, 27].

ISSN 2224-5278 Серия геологии и технических наук. 4. 2018
11
In view of presented information alongside with the development of effective methods of evaluation of technological and economical efficiency of GTM the development of new approaches acquires par-ticular importance enabling to give technological and economical assessment to not only one particular GTM in the certain conditions but comparative efficiency of any GTM in different physical and geological and technical and geological conditions.
This allows performing reasonable matching for these or those GTM wellbores, deposits and their technologies.
Resulting from which work [26] offers calculation system of performance indicators of GTM on the basis of data of technological, physical and geological and commercial characteristics characterizing conditions of conducting of any GTM. Accordingly we performed the research pursuant to slightly simp-lified and upgraded option of a system [26]. According to the stated diagram the condition of the wells, equipment, history of conversion, the technology of conducting of GTM is characterized by technological features; physical and geological indicators – condition and features of oil deposit, namely: porosity, per-meability, hydrocarbon saturation, productivity of deposits and etc.; commercial – deposit development system, current and cumulative oil production before and after conducting of GTM, characteristics of well interaction and etc.
In such a way the chosen technological, physical and geological and commercial indicators generate information collection allowing characterizing the involved facility, technology of conduction of GTM and their impact to the results of conducted measures.
Analysis and assessment of impact of geological and technological characteristics of the object to the efficiency indicators of GTM. As a result from the analysis of the research accumulated to the present time large number of different GTM is used for upgrading the efficiency of the development of oil fields and intensification of oil production. Efficiency of their using depends on reasonable combination of large number of physical and geological, technological and industrial indicators characterizing in an integrated manner the conditions of conducting of any GTM. In practical terms, as a rule, for particular deposits choosing of GTM, their parameters as well as their technological and economical assessment, is performed in geological services of oil and gas production department on the ground of gained experience. However very often despite of experience and knowledge of geological services of oil and gas production department the choice of sites, GTM and their technology is conducted not always properly to certain geological and technological development terms. In practice there is no single approach using which we can give correct technological and economical assessment to not only separately taken GTM in certain conditions but also give predictive estimate of comparative efficiency in various physical and geological and technical and technological conditions.
Owing to recent development of the methods considering marked circumstances, there is a possibility to decide the assigned tasks on the higher level. It is intended here possibility of creating different models as well as the relevant programs based on the integrated geological and geophysical and technical and technological information and allowing making the most grounded technological decisions.
In order to create such models, data of geological and technical measures are used which is conducted on the facilities of different deposits of Kazakhstan [26, 28, 37]. The following factors serve as indicators which impact the efficiency of geological and technical measure: total thickness of formation, m (х1), oil-filled thickness, m (х2), uncovered oil-filled thickness, m (х3), net sand coefficient (х4), porosity unit fraction (х5), permeability, Кр*10-3 μm2 (х6), oil viscosity, mPa*s (formation condition) (х7), oil density t/m3 (х8), gas content, m3/t (х9), initial oil saturation, unit fraction (х10), formation temperature, Т0С (х11), wax content in oil, % (х12), sulfur content in oil, % (х13), oil flowrate to geological and technical measure, t/day (х14), liquid flowrate to geological and technical measure, t/day (х15), watering to geological and technical measure, % (х16). The following factors serve as indicators of geological and technical measure: duration of the effect, day. (Y1), additional oil production, t. (Y2), incremental oil rate, t (Y3), oil flowrate after geological and technical measure, t/day (Y4), watering after geological and technical measure, % (Y5).
Thus, initial data consist of 16 indicators and 5 efficiency indicators by each type of GTM. Further according to works [30, 32, 41], transforming of initial data is conducted in order to reduce a number of input variables.
Then correlation analysis enables installing dependencies of indicators of GTM from the marked factors and before going to correlation analysis, there is a need to ensure in dependency of data to normal
Известия Национальной академии наук Республики Казахстан
12
law of distributions which is one of the requirements. There are many different criteria for verifying of the given condition. Verification for normality is a binding procedure within conducting of measurements, control, tests, processing according to the Russian GOST. There are different criteria, but we used criteria of Shapiro-Wilk [29, 37].
The criterion of Shapiro-Wilk is based on relation of optimum linear unbiased estimate to its common estimate by the method of maximum likelihood. Statistics of criterion is as follows:
2
11
12)(
1
iin
n
iin xxa
sW , (1)
where
n
ii
n
ii x
nxxxs
1
2
1
2 1,)(
Numerator is the square of estimate of root-mean-square deviation of Lloyd [30]. Critical statistical values W() were defined according to literature data, for example, [29]. If W < W(), null hypothesis normality of distribution deviates on the level of significance .
The conducted calculations give opportunity to ground application of data at correlation analysis. In order to build the dependencies of the selected criteria from the influential factors data of con-
ditions and results of GTM were subjected to the correlation analysis. Moreover the data were subjected to the statistical processing by two ways using the program of linear regression.
1. Dependencies of the efficiency indicators from geological and technological factors by their natural values:
9
10
iii xaa
(2)
2. All the data were preliminary logarithmed, the linear dependency was made in a such way that using exponentiation transformed into multiplicative with further specification by successive appro-ximation:
· ….· (3)
Each equation represented the dependency of any efficiency indicator from the chosen factors. Such equations were made for each type of GTM.
After receiving of regression equations the degree of correspondence of calculated values of the effi-ciency indicators were installed for different GTM by actual equations. The quantitative assessment of degree of conformity is defined by identical measure according to the formula given in work [31], which values shall be changed within 0 I = 1:
I
∑ расч
∑ расч
(4)
When using integrated geological and geophysical and technical and technological information for taking of the most grounded technological decision depending on type of GTM that type of regression equation having large identity measure is chosen.
Decision-making at choosing of GTM. Results of calculations by received models are used when making decisions for choosing the best GTM for the considered conditions. This was made using efficiency indicators of GTM, adopted as criteria in such a way that the desired solution was satisfied to conditions of 5 criteria. As it is shown from the review different authors used various criteria for choosing of GTM. The whole process can be presented as a system which simplified diagram is represented on figure. When solving multicriteria tasks the difficulties arise due to the simultaneous satisfying of all the criteria, i.e. it is required to take decisions in the conditions of uncertainty.
Recently various methods are used for solving of such tasks, such as method of combining of criteria into one, generalized method of «the least concessions», positions of fuzzy set theory engineered by L.Zade. Classification of uncertainties given in works [2, 17] enables estimating the situation and choo-sing the best method for decision-making. Further when making decisions the method called “the least concessions” [32, 37] was used.

ISSN 2224-5278 Серия геологии и технических наук. 4. 2018
13
Simplified diagram for system of choosing of GTM.
When using the given method the decision of multicriteria task reduces to successive maximization (minimization) of private criteria and choosing of values of concessions. Besides qualitative analysis of the relative importance of private criteria is made first and they are numbered in order of decreasing of the importance. Then the value of the permissible reduction of the value of first importance criterion is designated and the second importance criterion is maximized provided that the value of the first criterion should not differ from maximum by more than the value of installed reduction. The recession value is redesignated but according to the second criterion and the maximum value of the third importance crite-rion is found provided that the values of the first two criteria should not differ from the previously found maximum values by more than values of the corresponding recessions. Further all the other partial criteria are used. The resulting strategies are consired optimal.
Recently the problems of management and decision-making have increasingly attracted the attention of researchers – oil industry workers. А.А. Koltun in his work [39]. Choosing of geological and technical measures uses the data of the development history (base curve method), which does not enable conside-ring hydrodynamic processes and interference of wells to the fullest extent thereby reducing the reliability of the obtained decisions. However wide development of the hydrodynamic modeling as a mean for choosing of geological and technical measures laid the groundwork for automation of their choosing [33].
The work by A. Cottini-Loureiro and М. Araujo [33, 34] using efficiency maps was suggested for choosing of well pad distribution patterns but time expenditures for building of efficiency maps drastically depend on dimension of the hydrodynamic models and is a process demanding to computing resources. When setting into operation of new wells changing of dynamics of existing wells occurs which does not allow to analyzed method to consider interference of wells in time and employ high requirements to com-puting resources.
Owing to close location of wells their arrangement diagram as shown in work by G. Santellani and В.Hansen [35], leads to difficulties of consideration of their interference it should also be noted that applying of the method stated in the given work force to stop using reputable existing well pad distribution pattern.

Известия Национальной академии наук Республики Казахстан
14
The issues of building of informational decision-making support system are considered in a number of studies when using type of geological and technical measure on the oil well for enhancing of its per-formance. In some of them choosing of options for performing of the certain type of measure is con-ducting according to the stages of the system analysis of problem situations, [36]. Describing of work of informational system is given on the example of the main software module in the given work allowing to calculate economical efficiency of the geological and technical measure such as formation fracturing [36]. Main stages of decision-making are described when choosing of GTM type. Therewith the process for choosing of wells for conducting of the certain type of GTM undergo the following stages: analysis of the situation (identification of need for conducting of GTM for the certain well); defining of goals (estimating of parameters, on which changing GTM shall be directed); producing of decisions and analysis of alter-natives (building of the list of possible types of GTM for achieving of the estimated goals, assessment of their efficiency); implementation of the decision (conducting of GTM); assessment of the results (moni-toring of condition of the well after conducting of GTM, analysis of the results). The proposed informa-tional system consists of several software modules by the number of types of GTM [36]. According to the authors` opinion such indicator as achieving of estimated incremental oil rate shall not be considered as a single criterion for assessment of the efficiency of conducting of geological and technical measures. It goes without saying that the more complete analysis requires performing additional analysis of such indicators as quantity of oil, recovered additionally due to conducting of GTM as well as duration of the effect from the measure. The results of analysis of the efficiency of GTM for the period of 2011-2014 are given in the article using the mentioned approach.
Considering significant number of fields developed by LLC «LUKOIL-PERM», all of them are conditionally divided into the groups by geographic principle [38]. The information of the conducted geological and technical measures conducted in 2011-2014 on the wells by the groups of wells for in-creasing of well efficiency such as hydraulic fracturing of formation, acid treatment, radial drilling, repeated and additional perforations are shown in the stated work.
As follows from the presented data the repeated and (or) additional perforation is conducted more often at the wells of deposits of all the groups, excluding the northern group. The authors note that the most common type of impact is hydraulic fracturing on the wells of the northern group of wells.
In such a way, the research in this direction shows the opportunity of assessment of the comparative efficiency and decision-making when choosing of GTM in various conditions.
Conclusion. Practice of the applying of GTM shows that their implementation appears ineffective. Thus conducting of comparative analysis for the assessment of the efficiency of their using is of great interest not only in conditions of their conducting but in the conditions where they were not conducted. Such assessment shall be based on the relevant models expressing the dependence of indicators of effi-ciency from the indicators characterizing geological and physical conditions of using any measure in the considered or similar conditions of the other field.
The models obtained for such purpose allow forecasting of the indicators of the efficiency of any type of GTM in new geological and physical conditions. In this regard the systems and design models were used for the purpose of forecasting of indicators for the conditions different from those where GTM were used. The results of the calculations were used when making decisions for choosing of the best GTM for considered conditions. This was performed using efficiency indicators of GTM taken as criteria of GTM adopted as criteria in such a way that the decision would satisfy all the adopted criteria.
Thus, development and upgrading of methods of the analysis, forecasting of the indicators and deci-sion-making which implementation allowed to increase the efficiency of conducted geological and technical measures have been watched recently. As a result of conducted works the researchers solved the task of creating of comprehensive methodology and its mathematical, software and information applica-tion for assessment of the efficiency and optimal planning of geological and technical measures on the oil fields; the structure of the automated system of decision support and algorithm of its functioning have been developed; by transforming the indicators characterizing the formation into the relevant factors, the equations (linear and multiplicative) were made expressing the dependence of the efficiency indicators of GTM from the formed factors; by variants calculation and analysis of comparative efficiency of any GTM in different conditions the directions were shown and the results of making decisions for choosing of the best GTM were obtained.

ISSN 2224-5278 Серия геологии и технических наук. 4. 2018
15
REFERENCES
[1] Gumersky H.H., Gorbunov A.T, Zhdanov S.A, Petrakov A.M. Enhanced oil recovery from reservoirs with the use of system technology of impact // Oil Industry. 2000. N 12. P. 12-15.
[2] Dyabin A.G., Sorokin A.Ya., Stupochenko V.E. Application of technologies for enhanced oil recovery by the Research and Production Center of JSC "RMNTK" Nefteotdacha "// Oil Industry. 2000. N 12. P. 16-18.
[3] Safonov E.N., Almaev R.H. Application of new methods enhanced oil recovery at the fields of Bashkortostan // Oil Industry. 2002. N 4. P. 38-40.
[4] Myakinik N. Enhased oil recovery - the main reserve of production increase // Journal of Oil of Russia. 2000. N 8. P. 34-39. [5] Fakhretdinov R.N., Kaledin Yu.A., Zhitkova M.V. Potential of modern information technologies in evaluating the
effectiveness of methods for enhanced oil recovery // Oil Industry. 2001. N 3. P. 54-55. [6] Hasanov M.M., Mukhamedshin R.K., Hatmullin I.F. Computer technologies for solving multicriteria tasks for
monitoring of oil deposits development // Messenger of the engineering center of YUKOS. 2001. N 2. P. 26-29. [7] Kazakov A.A. Methodological provision of unified approaches for evaluating the efficiency of EOR methods // Techno-
logy of fuel and energy complex. 2003. N 2. P. 47-53. [8] Methodical guidelines for assessing the technological effectiveness of the application of methods for increasing oil
recovery (approved). M.: Ministry of Fuel and Energy of the Russian Federation, RMNTK Nefteotdacha, VNIIneft. 1993. 130 p. [9] Shakhverdiev A.Kh., Panahov G.M., Abbasov E.M., Rasulova S.R. About possibility of regulating the viscous anomaly
in heterogeneous mixtures // Messenger of RANS. 2014. N 1. P. 28-33. [10] Syrtlanov V.R., Kadochnikova L.M., Trushnikova O.M. Methods for assessing the effectiveness of geological and
technological measures on the basis of three-dimensional hydrodynamic modeling // Oil Industry. 2002. N 6. P. 38-40. [11] Gluhih I.N., Pyankov V.N., Zabolotnov A.R. Situational models in corporate knowledge bases of geological and
technological measures // Oil Industry. 2002. N 6. P. 45-48. [12] Gomzikov V.K., Molotova N.A., Rumyantseva A.A. Investigation of the influence of basic geological and techno-
logical factors on the ultimate oil recovery of reservoirs under the water-drive regime // Works of All-Russian Scientific Research Institute. 1975. Issue 58. P. 16-30.
[13] Shpurov A.V., Pyankov V.N., Klochkov A.A., Brilliant L.S. Planning the effectiveness of geological and technical measures in forecasting oil production // Oil Industry. 2000. N 9. P. 105-108.
[14] Pyankov V.N., Filev A.I. Integral software complex "BasPro-Analytic" // Oil Industry. 2000. N 9. P. 109-114. [15] Methodological guidelines for assessing the technological effectiveness of the application of methods for enhanced oil
recovery. M.: RMNTK "Nefteotdacha", "VNIIneft", 1994. 100 p. [16] Shvetsov I.A., Manyrin V.N. Physical-chemical methods for increasing oil recovery. Analysis and design. Samara:
Russian representative office of the joint-stock company "Oil Technology Overseas Production Limited", 2000. 336 p. [17] Kazakov A.A. Development of unified methodological approaches to assess the effectiveness of geological and
technical measures to improve oil recovery and intensify oil production (In the order of discussion) // Oil Industry. 2003. N 4. P. 26-29.
[18] Shakhverdiev A.Kh., Rybitskaya L.P. Evaluation of technological efficiency when impact on hydrocarbon deposits // Oil Industry. 2003. N 4. P. 65-68.
[19] Gershtansky O.S., Sherstnev N.M., Kiinov L.K. Polymer containing surfactant compositions in oil production. JSC "VNIIOENG", 1997. 95 p.
[20] Salavatov T.Sh., Suleymanov B.A, Nuryaev A.S. Selective isolation of the inflow of hard reservoir water in production wells // Oil Industry. 2000. N 12. P. 81-83.
[21] Sarvaretdinov R.G., Gilmanova R.Kh., Khisamov R.S. and others. Formation of database for the development of geological and technical measures for optimization of oil production // Oil Industry. 2001. N 8. P. 32-35.
[22] http:/www.nitpo.ru/science/ourwor.ks/article11.html [23] Lysenko V.D. Determining the effectiveness of measures to increase oil recovery and intensify oil production // Oil In-
dustry. 2004. N 2. P. 114-118. [24] Lysenko V.D. Evaluation of the effectiveness of measures to increase oil production and final oil recovery // Oil In-
dustry. 2001. N 12. P. 49-54. [25] Bulygin D.V., Fakhretdinov R.N., Ramazanov R.G., Gerasimov A.N. Use of the TRIAS system for application of
methods of impact on the reservoir // Oil Industry. 2003. N 10. P. 86-90. [26] Abasov M.T., Efendiyev G.M., Strekov A.S. and others. Estimation of comparative efficiency of geological and
technical events on complex information // Oil Industry. 2003. N 10. P. 70-73. [27] Methodological guidelines for assessing the technological effectiveness of the application of methods to increase oil
recovery. Ufa, Yugansk: Innovative Scientific Research Engineering Center "Neftegaztechnologiya", 1997. 120 p. [28] Zhanturin Zh.K. Development of measures to intensify oil production for conducting them in various geological and
physical conditions of Kazakhstan: Ph.D. thesis of technical sciences. Atyrau, 2009. 115 p. [29] Kobzar A.I. Applied mathematical statistics. For engineers and scientists. M.: FIZMATLIT, 2006. 816 p. [30] Lloyd E. N. Least-squares estimation of location and scale parameters using order statistics // Biometrika. 1952.
Vol. 39. P. 88-95. [31] Mirzadjanzade A.Kh., Sidorov N.A., Shirinzade S.A. Analysis and forecasting of drilling performance. M.: Nedra,
1976. 237 p. [32] Podinovsky V.V., Gavrilov V.M. Optimization according to consistently applied criteria. M.: Sov. radio, 1975. 192 p. [33] Mikheev P.S. Automated decision support system for selecting parameters of geological and technical measures based
on hydrodynamic models. Ph.D. thesis. Ufa, 2006. 162 p.

Известия Национальной академии наук Республики Казахстан
16
[34] Cottini-Loureiro A., SPE, Araujo М., SPE Optimized Well Location by Combination of Multiple Realization Approach and Quality Map Methods, Imperial C., 2005. Society of Petroleum Engineers. SPE 95413.
[35] Santellani G., AGIP S.p.A., Hansen B., Norsk Agip, Herring T., an Optimised Well Location Algorithm for Reservoir Simulation, Norsk Agip , 1998 Society of Petroleum Engineers. SPE 39754.
[36] Silich V.A., Komagorov V.I., Saveliev A.O., Alekseev A.A. Construction of an information support system for deci-sion-making when choosing the type of geological and technical events at the oil production well // Reports of Tomsk State University of Control Systems and Radioelectronics, Information Technologies. December 2011. N 2(24), part 2. P. 295-299.
[37] Strekov A.S., Mamedov P.Z., Koyshina A.I. Decisions-making on the choice of geological and technical measures under uncertainty // Seventh International Conference on Soft Computing, Computing with Words and Perceptions in System Analysis, Decision and Control. Izmir, Turkey September 2-3, 2013. P. 381-384.
[38] Ilyushin P.Yu., Rakhimzyanov R.M., Soloviev D.Yu., Kolychev I.Yu. Analysis of geological and technical events to increase the productivity of production wells in the oil fields of Perm Region // Perm Journal of Petroleum and Mining Enginee-ring. 2015. N 15. P. 81-89.
[39] Koltun A.A. Assessment of efficiency and optimal planning of geological and technical measures in oil fields. Ph.D. thesis. M., 2005. 112 p.
А. И. Койшина1, О. Г. Кирисенко2, Б. Н. Койлыбаев1, К. К. Агаева2
1Ш. Есенов атындағы Каспий мемлекеттік технологиялар жəне Инжиниринг университеті,
Ақтау, Қазақстан, 2Азербайджан ұлттық ғылым академиясының мұнай жəне газ институты,
Баку, Азербайджан
ҚАЗІРГІ ЗАМАНҒЫ ЖАҒДАЙЫ ЖƏНЕ ЖЕТІСТІКТЕРІ: ГЕОЛОГО-ТЕХНИКАЛЫҚ ШАРАЛАРДЫ ТАҢДАУ БОЙЫНША
ШЕШІМНІҢ ҚАБЫЛДАНУЫ
Аннотация. Мұнай кенорындарын игеру кезінде ГТШ жəне əртүрлі жаңа технологияларды қолдану есебінен тиімділікті арттыруға көп көңіл бөлінеді. Нақты жағдайда қажетті технолого-экономикалық тиімді-лікті қамтамасыз етуде, ең жақсы əдісті дұрыс таңдауда, олардың технологияларын дамуы жəне МАƏ, соны-мен қатар ГТШ кеңінен қолдануда көптеген сұрақтар қойылады. Мұндай сұрақтарға зерттеушілердің үлкен қызығушылықтарымен қатар, қазіргі таңда нақты жағдайда əртүрлі ГТШ түрлерін салыстырмалы бағалау кезінде маңызды қиыншылықтар туындайды. Қазіргі таңда кешенді геолого-физикалық жəне технологиялық ақпараттар негізінде ГТШ тиімділіктерін арттыру мəселелері актуалды жəне сəйкесінше шешім қабылдануға ие болады. Кенорынды игерудің тиімділігін арттыру мақсатында алдымен бар мүмкіндікті дұрыс реттеу сəй-кесінше дұрыс бағыттауға мүмкіндігі бар бағдарламаларды жəне қазіргі таңдағы əдістерді қолданумен əртүр-лі ГТШ қолдану жағдайы мұқият талдау жасауға мүмкіндік береді. Көп жылдар бойы зерттеулер əртүрлі ғылыми жəне өндірістік ұйымдарда, кенорында игерудің тиімділігін арттыруға бағытталып жүргізілді. Əртүрлі кенорында ГТШ енгізу жəне таңдау тəжірибелерін талдау қызығушылықты тудырады. Мақалада ГТШ таңдаудың қазіргі таңдағы жағдайын талдау жəне жинақтар келтіріледі. Əртүрлі кенорындарда ГТШ тиімділіктерін бағалау жəне қолдану мысалдары көрсетілген. Соңғы жылдары өткізілген геолого-техникалық шаралардың тиімділігін арттыру реализациясы, шешімдер қабылдану жəне көрсеткіштер болжамдары, талдау əдістерін жетілдіру жəне дамуы байқалады. Мұнай кенорындарында геолого-техникалық шараларын тиімді жоспарлау жəне тиімділікті бағалау үшін кешенді əдістерді құру жəне олардың математикалық, бағ-дарламалық жəне ақпараттық қамтамасыз ету тапсырмалары зерттеушілердің жүргізілген жұмыстары нəти-желерінде шешілген; шешімді қабылдауды қолдаудың жəне оның алгоритмінің жұмыс істеуінің автоматтан-дырылған жүйелер құрылымы игерілген; қалыптасқан факторлардан ГТШ тиімділігінің көрсеткіштерін көр-сететін, сəйкесінше факторларға қабатты сипаттайтын, қайта құру белгілері жолымен (сызықты жəне муль-типликативтік) теңдеулер құрастырылды; ең жақсы таңдау бойынша шешім қабылдау нəтижелері алынды жəне нұсқалық есептеулер жолымен жəне салыстырмалы тиімділікті талдау əртүрлі жағдайдағы сол немесе өзге ГТШ жолдары көрсетілген.
Түйін сөздер: геолого-техникалық шаралар (ГТШ), кенорынды игеру, шешім қабылдануы, мұнайды өндіру, мұнайбергіштік.

ISSN 2224-5278 Серия геологии и технических наук. 4. 2018
17
А. И. Койшина1, О. Г. Кирисенко2, Б. Н. Койлыбаев1, К. К. Агаева2
1Каспийский государственный университет технологий и инжиниринга им. Ш. Есенова,
Актау, Казахстан, 2Институт нефти и газа Национальной академии наук Азербайджана, Баку, Азербайджан
ПРИНЯТИЕ РЕШЕНИЙ ПО ВЫБОРУ ГЕОЛОГО-ТЕХНИЧЕСКИХ МЕРОПРИЯТИЙ:
СОВРЕМЕННОЕ СОСТОЯНИЕ И ПЕРСПЕКТИВЫ Аннотация. Как известно, повышению эффективности за счет применения различных новых техноло-
гий и ГТМ уделяется большое внимание при разработке нефтяных месторождений. Широкое внедрение ГТМ, а также е МУН и развитие их технологий ставит вопросы адекватного выбора наилучших методов, обеспечивающих должную технолого-экономическую эффективность в конкретных условиях. Несмотря на большой интерес исследователей к данному вопросу, все же в настоящее время серьезные затруднения воз-никают при сравнительной оценке различных видов ГТМ применительно к конкретным условиям. Проблема повышения эффективности ГТМ на основе комплексной геолого-физической и технологической информа-ции в настоящее время является актуальной и заслуживает соответствующего внимания. Тщательный анализ условий применения различных ГТМ с использованием современных методов и соответствующего про-граммного обеспечения позволит в свою очередь правильно сориентировать имеющиеся возможности с целью повышения эффективности разработки месторождения. На протяжении многих лет исследования, направленные на повышение эффективности разработки месторождений, проводились в различных научных и производственных организациях. Представляет интерес анализ опыта выбора и внедрения ГТМ на различ-ных месторождениях. В статье приводится обзор и анализ современного состояния проблемы выбора ГТМ. Показаны примеры применения и оценки эффективности ГТМ на различных месторождениях. В последние годы наблюдается развитие и совершенствование методов анализа, прогнозирования показателей и принятия решений, реализация которых позволила повысить эффективность проводимых геолого-технических меро-приятий. В результате проведенных работ исследователями решена задача создания комплексной методики и ее математического, программного и информационного обеспечения для оценки эффективности и оптималь-ного планирования геолого-технических мероприятий на нефтяных месторождениях; разработана структура автоматизированной системы поддержки принятия решения и алгоритм ее функционирования; путем пре-образования признаков, характеризующих пласт, в соответствующие факторы, построены уравнения (линей-ное и мультипликативное), выражающие зависимость показателей эффективности ГТМ от сформированных факторов; путем вариантных расчетов и анализа сравнительной эффективности того или иного ГТМ в раз-личных условиях показаны пути и получены результаты принятия решений по выбору наилучшего ГТМ.
Ключевые слова: геолого-техническое мероприятие (ГТМ), разработка месторождений, принятие ре-шений, добыча нефти, нефтеотдача.

Известия Национальной академии наук Республики Казахстан
18
N E W S OF THE NATIONAL ACADEMY OF SCIENCES OF THE REPUBLIC OF KAZAKHSTAN
SERIES OF GEOLOGY AND TECHNICAL SCIENCES
ISSN 2224-5278
Volume 3, Number 430 (2018), 18 – 27 UDC 621.38
Ye. N. Amirgaliyev1, M. Kunelbayev1, W. Wójcik2, A.U. Kalizhanova1,3, O. A. Auelbekov1, N. S. Kataev1, A. Kh. Kozbakova1,4, A.A. Irzhanova1
1Institute Information and Computational Technologies CS MES RK, Kazakhstan,
2Lublin University of Technology, Poland, 3Al-Farabi Kazakh National University, Kazakhstan,
4Almaty University of Power Engineering and Telecommunications, Kazakhstan. E-mail: [email protected], [email protected], [email protected], [email protected],
[email protected], [email protected], [email protected]
SOLAR-DRIVEN RESOURCES OF THE REPUBLIC OF KAZAKHSTAN
Abstract. The present article considers the solar-driven resources of the Republic of Kazakhstan. To assess the
solar energy potential, falling onto the territory in any region, it is necessary to have data on the solar energy poten-tial. Based on actual observations and theoretical calculations generalizing, there exists the data: annual and lati-tudinal motion of possible monthly and annual sums of the direct solar irradiation falling onto the perpendicular sur-face under the conditions of clear sky, data on sunshine duration, daily motion of solar radiation for typical days of the year, maps of distributing the average monthly radiation sums for June and December on the territory as well as the maps of distributing «technically applicable and economically profitable solar capacity», developed criteria of defining the notion thereof. All solar systems estimates upon assessing the solar-driven resources on Kazakhstan territory are based on quantitative characteristics of the direct solar radiation onto the horizontal surface from which there might be done recalculation from the horizontal to inclined plane of any orientation. Proceeding from the results of average values of the direct, total irradiation and duration of the sunshine statistical treatment there have been differentiated five zones and compiled a histogram characterizing the possibility of introducing the solar plants onto Kazakhstan territory.
Keywords: solar energy, solar collector, solar-driven resources, solar radiation. Introduction. Upon specifying the solar plants usage feasibility at any location there conducted
preliminary calculations, taking into account the average annual, average monthly total amount of solar radiation, number of clear and dull days, duration of frostless period, cost of solar plant, their efficiency factor, etc.
At that, there was used reference data and passport data of solar stations with their technical speci-fications.
To assess the solar energy potential falling onto the territory in any region it is necessary to have the data on the solar energy potential.
In the article [1] there is analyzed the current energetic situation in Kazakhstan, including fossil ener-gy sources and renewable energy sources and have been studied political factors in the energetic sector. The main aim of the article [2] is studying the prospects of the energy renewable sources development. It has been proved, that about 18% of the world energy consumption has been received from the renewable energy sources. In the article herein [3] there were presented some offers for developing the solar industry in Kazakhstan, based on the analysis of the global solar energetic model. In the document [4] the principal attention was paid to discussing the new technological components, which might be used for developing the system of renewable sources monitoring. There are being discussed the principles and architectural technologies which can be applied to such system implementation. As well, there were considered several
ISSN 2224-5278 Серия геологии и технических наук. 4. 2018
19
examples of monitoring systems and engineering aspects behind such system. The article [5] considers different potential local resources, unrelated to fossil fuels, water power, solar power, wind, biomass and uranium, and there is being installed the structure of those resources’ priority evaluation.
Similar studies are being conducted abroad, the work [6] demonstrates the data on the average monthly, daily global and direct solar radiation in the area of Jordanian University of science and engi-neering in the North Jordan. Maximum, average and minimum values, of both global and direct radiation were given in the period of 1990-1996 proceeding from the measurement data. Offered mathematical model for computing the maximum global daily radiation has been represented as the day of year function. Other mathematical regressions for various radiation characteristics have been presented as well.
The work [7] used several linear regression models using 9 variables to define the average monthly value of global radiation in the area of Antalya (Turkey) Outcomes show, that the total solar radiation can be defined with a percentage error from –5,7 to 3,9 %, average error 2,0 % and root-mean-square –2,5 %.
The article [8] creates a long-term database of monthly solar radiation in Zimbabwe. There was taken account of meteorological data, pyranometric measurements of semi sphere radiation. Simulation based on the data has been executed by means of two methods, calculation results are failed no more than for 7%.
On the ground of the hourly data on the total solar radiation in Quetta (Pakistan) within 10 years there was carried out the stochastic simulation and obtained Markov transfer matrixes, allowing the calculation of global solar radiation for the area thereof in MJ/m2 [9].
The data on the solar radiation in Malaysia for the period of 10 years was used in the work [10] to get mathematical description. There were considered the simulation outcomes applying the models of beta distribution for 4 regions of the country with meteorological stations.
There is known the research work [11], which systematizes the latest data on solar radiation resources in Brazil. It describes geographical distribution of solar radiation in Brazil.. It demonstrates geographical distribution of solar power and those resources dependences on the local climatic conditions. Average annual level of the solar radiation in Brazil is within 182 MJ/ (m2day). Maximum monthly average level of the solar radiation is in Rio Grande state, located in the south of the country, in December and January (24 MJ/ (m2day), and minimum value of the solar radiation is in June and July in the south coast of the same state and amounts to 8 MJ/ (m2day).
The work [12] reports the outcomes of experimental researches concerning the measurement of average monthly hourly diffused solar radiation in two cities of Nigeria: Lagos, a coastal town in the south of the country and Zaire, the town, located in savanna in the north (11, 10 north latitude.) of the country. Experimental data have been compared with prognosis, obtained by means of statistical models, deve-loped for high latitudes. Comparison has shown that the models thereof are incorrect for Nigeria con-ditions.
Methods. We have offered a complex approach. Unfortunately, it does not grasp all necessary para-meters and apart from that, it is schematic, large-scale due to shortage of actinometrical stations.
Multitude of natural factors conditions the task of their correct account upon the sun power plants development. Nevertheless, the work is recommended to be fulfilled based on radiation-climatic zoning of the republic, which seems a complex process. At that, the methodological base is detecting the main cli-matic elements criteria, account and assessment of radiation regime on the territory being considered.
To use the solar power effectively in combination with other climate components for the needs of the solar heating, the criteria for zoning are the solar intensity, climate meteorological parameters (outside air temperature, wind regime and other atmospheric phenomena). As the base of all solar system factors calculations while assessing solar power resources on the territory of Kazakhstan there were accepted quantitative characteristics of direct solar radiation on the horizontal surface, from which it is possible to perform recalculation from the horizontal to inclined plane of any orientation (table 13). Proceeding from the results of statistical treatment of the direct, total radiation and sunshine duration average values in compliance with the figures 19 and 20 there were differentiated five zones and drawn up a histogram, characterizing the possibilities of introducing the solar stations along the territory of Kazakhstan. Zone 1 occupies forest-steppe zones, located in the Northern Kazakhstan with an average June totals of the direct and global radiation of 11-14 and 20-22 МJ/v2, i.e. 350-400 and 600-700 МJ/m2 a month. According to the main features the solar power usage in this region is possible for practical aims of ССТС systems, but it is limited with a climatic, meteorological factor, wind and frequent sharp decrease in temperature in spring-autumn period. Sunshine duration in the year fluctuates from 1900 to 2200 hours.

Известия Национальной академии наук Республики Казахстан
20
Zone 2 is on the territory of Turgai valley, southern suburbs of Western-Siberian lowlands. Daily there is 22-24 МJ/m2 of global radiation, but the most part of it is in the form of direct one, 13-15 МJ/m2. Monthly amount is 600-700 and 400-500 МJ/m2. The region thereof is characterized with sufficient amount of sunshine hours, i.e. 2200-2500 approximately, comparing to the Zone 1. But meteorological factors are not favorable either. In spring-autumn period there is stable cold air in Turgai lowlands, conditioning frequent, lasting ground frost.
Zone 3 is moderately-favorable for the solar power usage, which includes Precaspian lowland, Mugodzhary upland, Kazakh hummocky topography, Altai mountain uplift. Daily amount of average total radiation here is in July 23-26 МJ/m2, whereof 15-18 МJ/m2 is in the form of the direct radiation, monthly total amounts - to 700-800 and 400-550 МJ/m2. Annual sunshine duration fluctuates within 2500-2700 hours.
Zone 4 includes Kyzyl Kum, Turan lowland, plain of Balkhash-Alakol basin, Tarbagata, Junggar and Zailiisky Ala Tau mountain ranges. Daily average total solar radiation here is 23-26 МJ/m2, at that, the big amount is in the form of direct one, 15-18 МJ /m2. Thus, correspondingly the monthly solar power amount is 700-800 and 500-600 МJ/m2. Annual sum of direct radiation is higher here, especially in the mountains. Sunshine duration is 2700-2900 hours and the region is characterized as favorable for the solar power usage.
Zone 5 is the deserts Ak-Kum, Betpak-Dala with an average daily solar power intensity totals of cor-respondingly 18-22 and 25-28 МJ/ m2, and monthly sums 550-700 and 750-900 МJ/m2. The region is also favorable for using the solar power, and as we can see, in general, grasps the south of the republic. Sun-shine duration in summer is about 390 hours, annual – 2900-3200 hours at minimal amount of dull days.
As it is shown with analysis a wide range of quantitative characteristics, reflecting the solar radiation regime peculiarities, sunshine duration and cloudiness confirms that the separating having been done.
Results. Structural temporary features of the supposed days of “sunny” and "electric" solar plants heating are given for all the zones. The greatest interest from the energy point of view is the amount of days with the sun and electric water heating in the solar plants within a year. It is typical for the 1st zone to
Figure 1 – Solar power resource of the Republic of Kazakhstan

ISSN 2224-5278 Серия геологии и технических наук. 4. 2018
21
use the solar power during 180 days, the rest 180 days there is the electric heating. For the 2nd, 3rd and 4th zones the number of days when the solar energy is used grows up to 270, and amount of days while using electric water heating decreases to 94. In the 5th zone it is possible to use the solar power more efficiently within a year. Criterion for such evaluation is an average time period, when the radiation amounts to minimum 0,4 kW/m2 and exceeds 6 hours per day.
Radiation regime characteristics definition has been conducted as exemplified by Almaty hydro-meteorological station (HMS). The solar radiation is the main source for the heat conductor process in the solar station. For that purpose, firstly, it is necessary to get an average background mode of the solar radiation according to available data, many years of observation for Almaty city.
The big city’s radiation regime has Almaty HMS, situated at Zailiisky Ala Tau foothills. Along with the area’s height increase the solar radiation grows at the expense of atmosphere’s transparent zing. Usually in the summer time’s first part the atmosphere is more clear, than in the second part, which is con-nected with the atmosphere dust content increase, and convective clouds.
Solar power and meteorological zonal characteristics of Kazakhstan’s territory
Region appropriate for practical usage
Total direct irradiation onto the horizontal surface (S ), МJ/m2
days мin max winter spring summer fall year
1 7 1 7 12,1,2 3,4,5 6,7,8 9,10,11
1 2 3 4 5 6 7 8 9 10
1. Conditions, in whole, meet the requirements of the solar plants usage Kostanai, Astana)
1,2 1,4
11,2 13,5
37,7 41,9
347,7419,0
138 276
842 771
1064 1185
322 339
2367 2509
2. Conditions more or less effective for the solar plants usage Dzhanybek, Semipalatinsk )
1,2 2,3
13,9 14,5
37,7 71,2
431,6448,4
150 243
880 1018
1252 1315
440 490
2723 3067
3. Conditions secure sustainable operation of the solar plants (Atyrau, Aktobe Aktau)
1,9 1,75 1,6
17,4 15,8 15,8
58,7 54,5 50,3
540,5490,2490,2
230 197 192
1127 934 1009
1596 1446 1454
662 553 636
3616 3129 3293
4. Conditions for more effective usage of the solar stations (Aralsk Sea, Zhezkazgan, Buran)
2,7 3,1 2,9
17,9 15,9 17,0
83,8 96,4 92,2
557,3494,4528
276 297 293
1156 1043 1152
1650 1462 1546
708 632 662
3791 3435 3653
5. Conditions for the most effective usage of the solar plants (Barsa-Kelmes, Ak-Kum, Kuigan)
2,9 4,19 3,6
17,4 21,3 19,7
92,2 129,8113,1
540,5662,0611,7
272 360 347
1169 1210 1122
1713 1965 1751
699 972 825
3854 4508 4047
Table continuation
Region appropriate for practical usage
Total of global irradiation on the horizontal surface, (Q), МJ/m2
days мin max winter spring summer fall year
12,1,2 3,4,5 6,7,8 9,10,11
1 11 12 13 14 15 16 17 18 19
1. Conditions, in whole, meet the requirements of the solar plants usage Kostanai, Astana)
3,6 4,5
20,1 22
113,2138,3
624683
389 473
1520 1529
1839 1935
662 733
4412 4671
2. Conditions more or less effective for the solar plants usage Dzhanybek, Semipalatinsk )
4,0 5,3
22,6 22,8
125,7163,4
699708
414 817
1525 1730
2002 2065
775 863
4717 5191
3. Conditions secure sustainable operation of the solar plants (Atyrau, Aktobe Aktau)
5,1 5
4,19
25,5 24,5 23
159,3155
129,9
792758716
469 532 452
1780 1634 1646
2300 2191 2099
1047 905 997
5664 5262 5195
4. Conditions for more effective usage of the solar stations (Aralsk Sea, Zhezkazgan, Buran)
6,0 6,0 5,9
25,4 23,7 24,5
188,5188,5184,4
787737762
624 607 607
1872 1726 1784
2317 2149 2208
1076 993
1013
5891 5476 5614
5. Conditions for the most effective usage of the solar plants (Barsa-Kelmes, Ak-Kum, Kuigan)
5,9 7,3 7,3
24,6 27,9 26,7
184,4226,3226,3
762867829
578 695 720
1822 1851 1826
2312 2543 2384
1030 1324 1206
5744 6414 6138
Table continuation

Известия Национальной академии наук Республики Казахстан
22
Region appropriate for practical usage
Sunshine duration, hours Solar and
electric heating duration (hours)
days winter spring summer fall yr annual
1 7 12,1,2 3,4,5 6,7,8 9,10,11 solar electric
1 20 21 22 23 24 25 26 27 28
1. Conditions, in whole meet the requirements of the solar plants usage (Kostanai, Astana)
2,3 2,7
10,2 10,2
241 266
664 640
861 876
371 404
2137 2186
1900 2000
6900 6800
2. Conditions more or less effective for the solar plants usage (Dzhanybek, Semipalatinsk )
2,0 3,6
10,9 10,4
215 339
714 737
996 937
499 507
2424 2523
2200 2300
6600 6500
3. Conditions secure sustainable operation of the solar plants (Atyrau, Aktobe, Aktau)
2,4 3
2,2
11,3 11,3 11,4
249 301 257
724 712 701
1021 1032 1021
585 548 584
2579 2593 2563
2400 2400 2400
6400 6400 6400
4. Conditions for more effective usage of the solar stations (Aralsk Sea, Zhezkazgan, Buran
3,7 3,3 4,5
11,9 11,2 11,1
350 350 395
799 750 793
1090 1014 1003
624 589 587
2863 2703 2778
2700 2600 2700
6100 6200 6100
5. Conditions for the most effective usage of the solar plants (Barsa-Kelmes, Ak-Kum, Kuigan)
3,3 4,3 4,7
12,2 13 12
324 391 420
813 770 761
1132 1160 1102
648 758 695
2917 3079 2978
2800 2900 2900
6000 5900 5900
Table continuation
Region appropriate for practical usage
Cloudiness, total number
of clear and dull daysAverage daily air temperature, 0С Frostless
period duration,
days in a year
annual monthly
in points clear dull. 4 5 6 7 8 9 10
1 29 30 31 32 33 34 35 36 37 38 39
1. Conditions, in whole meet the requirements of the solar plants usage (Kostanai, Astana)
5,9 6,2
48 37
88 123
2,5 2,1
12,7 12,4
18,7 17,8
20 20
18 18
12 11
2,7 2,5
113..156 98…123
2. Conditions more or less effective for the solar plants usage (Dzhanybek, Semipalatinsk )
6 5,7
43 44
119 106
7,4 3,8
15,9 13
21,1 19
23 21
22 18
15 12
6,5 3,8
139..161 85…129
3. Conditions secure sustainable operation of the solar plants (Atyrau, Aktobe, Aktau)
5,1 5,9 5,2
68 52 65
98 110 91
8,6
10,6
17,4
17,6
22,8
22,6
25
25
24
24
16
19
7,6
12,2
190..172
126..176
4. Conditions for more effective usage of the solar stations (Aralsk Sea, Zhezkazgan, Buran
4,8 4,8 5,2
75 86 40
78 71 118
8,3 6,2 6,2
17,4 15,5 14,4
23,6 21,6 20,1
26 24 22
24 22 20
17 14 13
7,8 4,8 4,7
170…213
5. Conditions for the most effective usage of the solar plants (Barsa-Kelmes, Ak-Kum, Kuigan)
4,1 4
4,7
119 117 97
60 77 64
6,5 8,8 9,1
15,3 17,3 17,2
22 23,3 20,5
25 26 24
24 24 22
19 16 15
3,5 7,2 7,2
165…201
85…183

ISSN 2224-
We henergy usaKazakhsta
1. Ara2. Bar3. Ak4. Alm
0
1000
2000
3000
4000
5000
6000
7000
Sol
ar r
adia
tion
, MJ
/ m2
Sum
-5278
have studiedage assessm
an: aljsk Sea (Kyrsa-Kelmes (
k-Kum (Kyzymaty, GMO
Figure 3 –
1-zone, conas a whole sa
use SU
of direct radi
Figure from average
d actinometriment for the
yzyl-Orda ob(Kyzyl-Ordayl-Orda oblas(Almaty obl
Average daily
ditions atisfy to U
2condor le
ation MJ/m2
2 – Histogram values of direct
ic and climafollowing H
blast). a oblast). st). ast).
solar radiation
2-zone, the ditions are morss efficient us
of SU
The amoun
23
of the solar statt, total radiation
atic characteHydro Meteo
intensity in Kyz
re se
3-zoneconditions stable oper
nt of total radi
Серия геол
tions usage depn and duration o
eristics, usedorological St
zyl-Orda oblast
e, the to ensure
ration SU
4-zfo
iation, MJ/m2
логии и техн
pendence of the sunshine
d in the mettations, loca
t, settlement Ba
zone, conditior more efficie
use of SU
2 The durat
нических наук
thodology oated on the t
arsa-Kelmes
ons ent
5-zone, cof the mo
use o
tion of sunshin
к. 4. 2018
of the solar territory of
conditions st effective of SU
ne, hours

Известия Национальной академии наук Республики Казахстан
24
Figure 4 – Average daily solar radiation in Araljsk sea
Figure 5 – Outside air average temperature in Araljsk Sea
Figure 6 – Outside air average temperature and average intensity of the solar radiation in Almaty and Almaty oblast
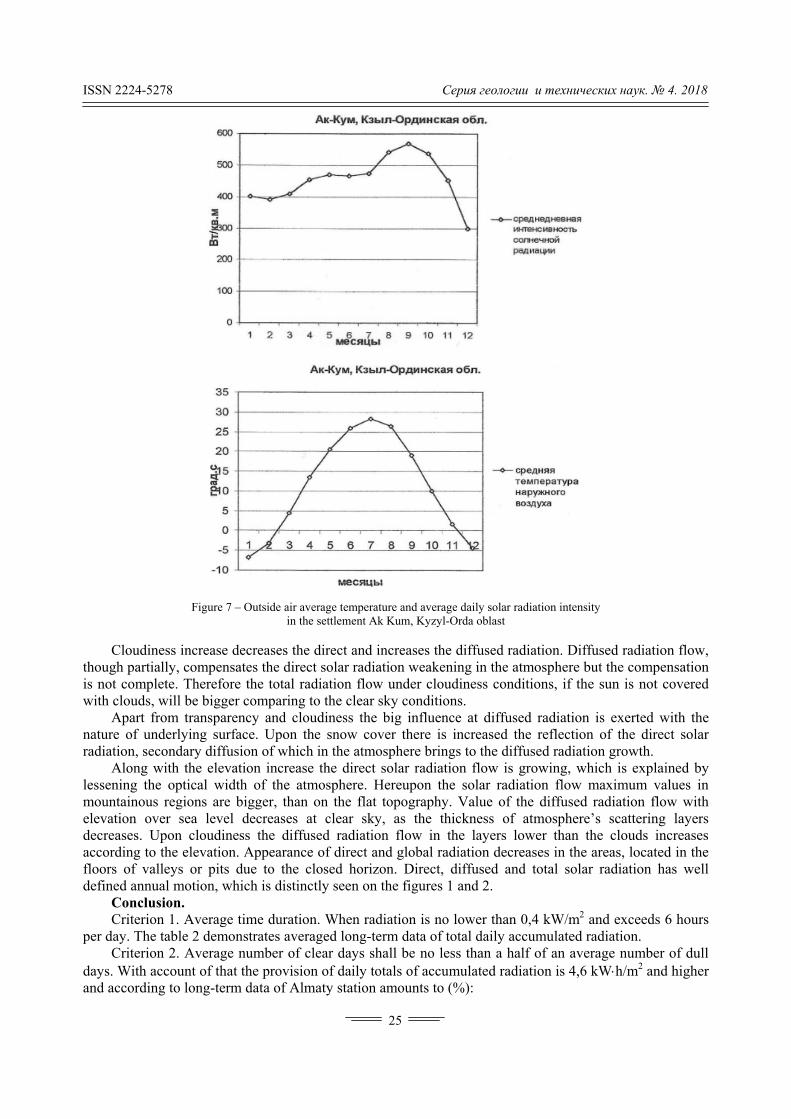
ISSN 2224-5278 Серия геологии и технических наук. 4. 2018
25
Figure 7 – Outside air average temperature and average daily solar radiation intensity in the settlement Ak Kum, Kyzyl-Orda oblast
Cloudiness increase decreases the direct and increases the diffused radiation. Diffused radiation flow,
though partially, compensates the direct solar radiation weakening in the atmosphere but the compensation is not complete. Therefore the total radiation flow under cloudiness conditions, if the sun is not covered with clouds, will be bigger comparing to the clear sky conditions.
Apart from transparency and cloudiness the big influence at diffused radiation is exerted with the nature of underlying surface. Upon the snow cover there is increased the reflection of the direct solar radiation, secondary diffusion of which in the atmosphere brings to the diffused radiation growth.
Along with the elevation increase the direct solar radiation flow is growing, which is explained by lessening the optical width of the atmosphere. Hereupon the solar radiation flow maximum values in mountainous regions are bigger, than on the flat topography. Value of the diffused radiation flow with elevation over sea level decreases at clear sky, as the thickness of atmosphere’s scattering layers decreases. Upon cloudiness the diffused radiation flow in the layers lower than the clouds increases according to the elevation. Appearance of direct and global radiation decreases in the areas, located in the floors of valleys or pits due to the closed horizon. Direct, diffused and total solar radiation has well defined annual motion, which is distinctly seen on the figures 1 and 2.
Conclusion. Criterion 1. Average time duration. When radiation is no lower than 0,4 kW/m2 and exceeds 6 hours
per day. The table 2 demonstrates averaged long-term data of total daily accumulated radiation. Criterion 2. Average number of clear days shall be no less than a half of an average number of dull
days. With account of that the provision of daily totals of accumulated radiation is 4,6 kWh/m2 and higher and according to long-term data of Almaty station amounts to (%):

Известия Национальной академии наук Республики Казахстан
26
Table 2 – Averaged daily global radiation
Month 1 2 3 4 5 6 7 8 9 10 11 12
– 8 20 50 72 83 79 60 55 40 15 –
The most favorable period to use the solar energy in Almaty is from March to November, according
to provision of daily totals of global radiation from April to September (table 2). According to the data on long term observations of the sunshine duration in compliance with the
sunshine recorder we differentiate the periods of the solar continuous shining 5,6,7, etc. At that, we exclude the time during one hour after and till the sun up. Results in Almaty city are given in the tabular form.
Table 3 – Solar station operational capacity (hour) depending
on the solar continuous shining (for 10 years period)
2 3 4 5 6 7 8 9 10 11 12
Almaty 4 4,8 7 8,2 8,4 8,3 8 6 5 4,8 4
Analysis of Table 3 demonstrates, that it is inappropriate to use the solar plants in Almaty city in
March and November, much more successfully they will operate from April to October.
REFERENCES [1] Karatayeva M., Clarke M.L. Current Energy Resources in Kazakhstan and the Future Potential of Renewables:
A Review // Energy Procedia. 2014. Vol. 59. P. 97-104. [2] Teleuyev G.B., Akulich O.V., Kadyrov M.A., Ponomarev A.A., Hasanov E.L. Problems of Legal Regulation for Use
and Development of Renewable Energy Sources in the Republic of Kazakhstan // International Journal of Energy Economics and Policy. 2017. N 7(5). P. 296-301.
[3] Nurlankyzy S., Xiong Yi., Mengliang Luo, Ke Wang. Investigation on Solar Energy Industry Development Model in Kazakhstan // Open Journal of Business and Management. 2016. Vol. 4. P. 393-400.
[4] Ravil I. Muhamedyev, Aidos Ishmanov, Andrew V. Andreev, Ilyas Alikhodzhayev, Jelena Muhamedijeva. Techno-logical preconditions of monitoring of renewable energy sources of the Republic of Kazakhstan // 2015 Twelve International Conference on Electronics Computer and Computation (ICECCO). 27-30 Sept. 2015.
[5] Ahmad S., Nadeem A., Akhanova G., Houghton T., Muhammad-Sukki F. Multi-criteria evaluation of renewable and nuclear resources for electricity generation in Kazakhstan // Energy. 15 December 2017. Vol. 141. P. 1880-1891.
[6] Al-Jamal K. Evaluation of solar radiation at JUST in Northern Jordan // Renewable Energy. 1999. Vol. 18, N 1. P. 15-23.
[7] Can E., Osman Y. Estimation of monthly average daily global radiation on horizontal sur face for Antalya (Turkey) // Renewable Energy. 1999. Vol. 17, N 1. P. 95-102.
[8] Hove T., Gottsche J. Mapping global, diffuse and beam solar radiation over Zimbabwe // Renewable Energy. 1999. Vol. 18, N 4. P. 535-556.
[9] Lalarukh K., Yasmin J., Stochastic modeling and generation of synthetic sequences of hourly global solar irradiation at Quetta, Pakistan // Renewable Energy. 1999. Vol. 18, N 4. P. 565-572.
[10] Sulaiman M. Yusof, O Hlaing W.M., Wahab Mahdi Abd, Zakaria Azmi Application of beta distribution model to Malaysian sunshine data // Renewable Energy. 1999. Vol. 18, N 4. P. 573-579.
[11] Tiba C. On the development of spatial / temporal solar radiation maps: a Brazilian case study // Et al. Renewable Energy. 1999. Vol. 18, N 3. P. 393-408.
[12] Maduekwe A.A.L., Garba B. Characteristics of the mouthly averaged hourly diffuse irradianse at Lagos and Zaria, Nigeria // Renewable Energy. 1999. Vol. 17, N 2. P. 213-225.

ISSN 2224-5278 Серия геологии и технических наук. 4. 2018
27
Е. Н. Амиргалиев1, М. Кунелбаев1, В. Вуйцик2, А. У. Калижанова1,3, О. А. Ауелбеков1, Н. С. Қатаев1, А. Х. Козбакова1,4, A. A. Иржанова1
1ҚР БҒМ ҒК Ақпараттық жəне есептеуіш технологиялар институты, Алматы, Қазақстан,
2Люблин техникалық университеті, Польша, 3Əл-Фараби атындағы Қазақ ұлттық университеті, Алматы, Қазақстан, 4Алматы энергетика жəне байланыс университеті, Алматы, Қазақстан
ҚАЗАҚСТАН РЕСПУБЛИКАСЫНЫҢ
ГЕЛИОЭНЕРГЕТИКАЛЫҚ РЕСУРСТАРЫ
Аннотация. Мақалада Қазақстан Республикасының гелиоэнергетикалық ресурстары қарастырылады. Белгілі бір аумақтағы территорияға түсетін күн энергиясының потенциалын бағалау үшін күн энергиясының потенциалы туралы деректер болу қажет. Іс жүзіндегі бақылаулар мен теориялық есептеулерді жалпылау негізінде, келесі мəліметтер алынды: ашық аспан кезінде перпендикуляр бетке түсетін тікелей күн радиа-циясының мүмкін болатын ай сайынғы жəне жыл сайынғы қосындыларының жылдық жəне ендік мөлшері, күн сəулесінің ұзақтығы туралы мағлұмат, жылдың ерекше күндеріне арналған күн радиациясының тəуліктік мөлшері, маусым жəне желтоқсан айлары үшін радиацияның орташа айлық қосындысының территория бойынша үлестіру картасы, сонымен қатар «техникалық түрде қолданылатын жəне экономикалық тиімді күн қуаттылығының» үлестірілу картасы туралы, осы тұжырымдаманы анықтау критериі əзірленді. Қазақстан-дағы күн энергетикалық ресурстарын бағалаудағы күн жүйелерінің барлық есептік көрсеткіштерінің негі-зінде, кез келген бағыттан көлденең жазықтыққа дейін қайта есептеуге болатындай, көлденең бетке тікелей күн радиациясының сандық сипаттамалары қабылданды. Күн сəулесінің тікелей, қосынды радиациясының жəне ұзақтығының орташа мəнін статистикалық өңдеу нəтижелері бойынша бес аймақ белгіленді жəне ҚР территориясы бойынша гелиоқондырғыларды енгізу мүмкіндіктерін сипаттаушы гистограмма құрылды.
Түйін сөздер: күн энергиясы, гелиоколлектор, гелиоэнергетикалық ресурстар, күн радиациясы.
Е. Н. Амиргалиев1, М. Кунелбаев1, В. Вуйцик2, А. У. Калижанова1,3, О. А. Ауелбеков1, Н. С. Катаев1, А. Х. Козбакова1,4, A. A. Иржанова1
1Институт информационных и вычислительных технологий КН МОН РК, Алматы, Казахстан,
2Люблинский технический университет, Польша, 3Казахский национальный университет им. аль-Фараби, Алматы, Казахстан,
4Алматинский университет энергетики и связи, Алматы, Казахстан
ГЕЛИОЭНЕРГЕТИЧЕСКИЕ РЕСУРСЫ РЕСПУБЛИКИ КАЗАХСТАН
Аннотация. В статье рассматривается гелиоэнергетические ресурсы Республики Казахстан. Для оценки
потенциала солнечной энергии падающей на территорию в том или ином районе необходимо иметь данные о потенциале солнечной энергии. На основе обобщения фактических наблюдении и теоретических расчетов, имеются данные: годового и широтного хода возможных месячных и годовых сумм прямой солнечной ра-диации поступающей на перпендикулярную поверхность при условиях ясного неба, сведения о продолжи-тельности солнечного сияния, суточный ход солнечной радиации для характерных дней года, карты распре-деления по территории средних месячных сумм радиации за июнь и декабрь, а также карты распределения «технически применимой и экономически выгодной солнечной мощности», разработанные им критерий определения этого понятия. В основу всех расчетных показателей гелиосистем при оценке гелиоэнергети-ческих ресурсов территории Казахстана приняты количественные характеристики прямой солнечной радиа-ции на горизонтальную поверхность, с которой можно произвести перерасчет с горизонтальной на наклон-ной плоскость любой ориентации. По результатам статистической обработки средних значении прямой, суммарной радиации и продолжительности солнечного сияния выделены пять зон и составлена гистограмма характеризующих возможности внедрения гелиоустановок по территории РК
Ключевые слова: солнечная энергия, гелиоколлектор, гелиоэнергетические ресурсы, солнечная ра-диация.
Известия Национальной академии наук Республики Казахстан
28
N E W S OF THE NATIONAL ACADEMY OF SCIENCES OF THE REPUBLIC OF KAZAKHSTAN
SERIES OF GEOLOGY AND TECHNICAL SCIENCES
ISSN 2224-5278
Volume 3, Number 430 (2018), 28 – 36 UDK 531.8
M. K. Ibatov1, F. N. Bulatbayev1, A. D. Mekhtiyev1, V. V. Yugay1, A. D. Alkina2, Y. G. Neshina2
1Karaganda state technical University, Karaganda, Kazakhstan, 2Tomsk Polytechnic University, Tomsk, Russia.
E-mail: [email protected], [email protected], [email protected], [email protected], [email protected], [email protected]
WAYS TO INCREASE OPERATIONAL EFFICIENCY OF BUSHINGS OF LEVER-HINGED MECHANISM OF MINING MACHINES
Abstract. In this article, ways to increase operational efficiency of bushings of lever-hinged mechanism of
mining machines. Reliable operation of braking device of mine elevating machines, throughout the service life, is dictated by regulatory safety requirements. The research task is to determine the presence of significant changes on the surface of the mating parts of the hinged joints under different conditions. The friction surfaces of the hinge and their physical-mechanical and tribological characteristics are compared. Using a special measuring system basic regularities of interaction elements articulation parameters for establishing the wear in the contact surfaces were studied. Research changes of the friction coefficient and wear quantity in mating parts was conducted. Research carried out for various materials and various designs Bush-finger pairs of articulation. The experimental study of stress-strain states of the various designs of hinges possible to determine the parameters of the bore inner surface of the bush with the lowest voltage in the contact zone of the sleeve and the pin. The best tribotechnical characteristics are hinges with bronze bushes. Steel bushes with a bronze coating have wear of greater than 10% compared to bronze ones. Increasing the contact area of the bush with the pin due to the conical boring reduces the wear of the hinge, allows increasing the resistance to physical wear.
Key words: mine hoisting machines, hinged mechanism, friction machine, coefficient of friction, bushing. Introduction. Rope mine elevating machines are the most important element in transport chain of
mineral resources movement from the lower horizons of mine to the surface, and also provide trans-portation of personnel and equipment. Service life of mine elevating machine, generally, is equal to the service life of the mining enterprise. At the present time, in the mining industry elevating machines are used, mostly commissioned in the 60-80s of the last century. Complete replacement of this equipment does not provided. Braking device, which performs control and protection functions, is one of the most responsible elements of mine elevating machines [1-3].
Reliable operation of braking device of mine elevating machines, throughout the service life, is dictated by regulatory safety requirements.
Operational efficiency of braking device mechanism of mine hoisting machines depends from work reliable of its main elements, particularly hinged joints. During the intensive use of elevating machine there are damages in elements of lever-hinged mechanism, which associated with the appearance of gaps due to wear of the contact surfaces of bushings [4-7]. It leads to changing of operating parameters of braking device and consequently to increasing the time of its operation.
Meanwhile, does not use possibilities of increasing hinged joints reliability due increasing the area of contact surfaces, changes in lubrication conditions, deposition on the metal surfaces of the bushes of the most durable protective coatings, which reduce their wear during operation. Based on the foregoing, establishing rational design parameters of elements hinged joints and the development of methods to increase the reliability of their work is an urgent task.

ISSN 2224-5278 Серия геологии и технических наук. 4. 2018
29
Definition of the research task. Design parameters of the different variants of the research object are established (figure 1). We perform initial diameter measurement d1; d2; d3 of lengths L2 in order to establish the parameters of conic bore. Bore depth of the inner conical surface of the sleeve is selected as a part of the total length L3, the remainder of the length L4 is bent to a cylindrical shape, provided that the inner diameter of the new hole d7 is increased to the value d2 + 2Δin (Δin is the amount of radial wear of the inner diameter of the sleeve) at a length L4, while the outer diameter of the bushing d1 remains unchanged. Finger Length Ratio: L8 is equal to L2, length L5 is the difference between L2 and L11; diameter of the larger base of the resulting truncated cone d5 is d8; diameter of the hole and smaller base of the truncated cone d7 is equal to diameter of the finger of new repair size d4 with the condition d2 + 2Δ rel.
Figure 1 – Settlement scheme of the hinge
additional lubrication channel
Main lubrication channel
additional lubrication channel
Main lubrication channel

Известия Национальной академии наук Республики Казахстан
30
1) boring angle:
51 L/tg , (1)
where 1 – bore angle:, 0; – value of increment to diameter 7d at bore, mm; L5 – the depth of the bore inner conical surface of the sleeve is HL3, mm; Х – ratio of the length of the bored part to the total length of the bushing.
2) length of the lateral line of the cone: 2
7825
26 2
ddLL
, (2)
where L6 – length of the lateral line of the cone, mm; d8 – larger inner diameter of the bushing after boring, mm; d7 – inner diameter of the bushing, mm.
3) contact surface area:
47
2
786k Ld
2
ddLS
, (3)
where Sk – contact surface area, mm; L4 – length of the lateral line of the cylinder of the non-doped part of the inner surface of the sleeve, mm.
The maximum angle of conical bore of the bushing is limited by its outer diameter and the collapsing condition. The minimum angle of conical bore is limited in accordance with GOST 8593-81 [8], GOST 25557-82 [9]. At angles of bore less than 70, grasping of the mating surfaces and jamming of the hinge may appear, since the coefficient of friction in this case may be more than one.
The research task is to determine the presence of significant changes on the surface of the mating parts of the hinged joints under different conditions. The friction surfaces of the hinge and their physical-mechanical and tribological characteristics are compared [10, 11].
Using a special measuring system (figure 2) basic regularities of interaction elements articulation parameters for establishing the wear in the contact surfaces were studied.
Research changes of the friction coefficient and wear quantity in mating parts was conducted. Research carried out for various materials and various designs Bush-finger pairs of articulation. Various lubricants and different lubrication regimes were used (GOST 9490-75) [12].
Tests were carried out on a SMC-2 friction machine with hinges of various design versions. The analysis of obtained results for further realization in the actuating mechanisms of brake device of mine hoisting machines is carried out [11].
The friction machine SMC-2 (owned by Ugleservis of JSC ArcelorMittal Temirtau) is designed for testing materials for friction and wear during rolling, rolling with slip and sliding. Tests can be carried out on three different contact patterns of samples that simulate work of parts in friction units. The samples are loaded by a spring mechanism, and the carriage is balanced by a counterweight, which makes it possible to carry out tests with loads on a pair of friction.
Figure 2 – The friction machine
Figure 2 – The friction machine consists of: - three-phase asynchronous AC motor; - worm reducer; - crank-slider mechanism with interchan-
geable eccentrics; - friction unit with mandrels for samples of
different types and sizes; - removable bath for testing in a liquid me-
dium; - two tensor beam, installed in the friction unit
of the stand and outside it (standard); - a block for recording the analog output
signal from the strain gages, consisting of a power supply, a digital oscilloscope PCS-500 and a com-puter [13].

ISSN 2224-
Techn
The oused for mvariant is important values dire
An imThe lubriccarried out
Condgroups of f
Furthanalyzed wmaterial udetermined
Deterdifferent m
The ffinger" paithis experi
The pwith differ
The fbushing isthird optiograde ST4carrying ou
The cconstructe
-5278
nical charact
Power of
Rotationa
Slippage o
Maximum
object of resmaking busha bush madcondition fo
ectly affect wmportant factcation mode t at an ambie
ducting expefriction pairser, dependenwith factors
used for mand method of rmination of materials. first stage of ir, with diffeiment is the hpurpose of thrent physicalfirst version s made of steon, when the45H18N2M, ut this experconstruction d from the ex
teristics of th
T
Technical char
the electric mot
l speed of the lo
of samples, %
m load on a frict
earch is a hhings. Bronzde of steel wor testing is twear. tor in the wedepends on
ent temperatueriments. A s with minimncies connec
such as thenufacturing fconstructingthe friction
f the experimerent slip velhinge, whichhis experimenl and mechanof the hingeeel with a coe bushing is which is use
riment is a prof the invesxperimental
he friction ma
Technical charac
racteristics
tor of the drive
ower sample, s-
tion pair P, MP
inge, which e bushes are
with an antifrthe correct c
ear of contacn type of lubure of + 22 °set of exper
mum values fcting the coe relative slfriction pairsg models usincoefficient a
ment consistsocities in the
h consists of nt is to estabnical propertie, when the boating of themade of bro
ed in all expredeterminedstigated bushresults are sh
Figure 3 –
31
achine are pr
cteristics of the
, kW -1
a
consists of
e limited in riction coatinchoice of the
ct surfaces obricant and C [14-20]. riments was
for the coeffiefficient of ip velocity s. The experng a computeas a function
in investigae interval froa bushing anblish tribotecies. bushing is me inner workonze. Inside eriments wit
d slip speed ihings is showhown in figu
Construction o
Серия геол
resented in ta
e friction machin
a bush and use because
ng. The pin e value of the
f bushes is tdesign of th
performed, cients of fricfriction andand pressurerimental dataer. of slip speed
ating the coeom 0.1 to 0.6nd a connectichnical param
made of cast king surface
the sleeve, th three variainterval fromwn in figure ure 4.
f the bushes
логии и техн
able.
ne
V
5; 8
0, 10,
pin. Gray cae of their hiis made of
e load on the
the area of mhe bush-pin
which madection, wear, rd wear valuee for the moa were proc
d when testin
efficient of fr6 m/s. The obing pin. meters of thr
iron; the seof the bushia finger is mants of bush
m 0.1 to 0.6 m3. The grap
нических наук
Value
2.2
8.3; 16.7
15, 20, 100
5
ast iron and igh cost, an steel CT45
e friction pai
mating contacpair. The stu
e it possible relative roughe were constost widely ressed by a s
ng hub bush
riction of thebject of inve
ree variants o
cond varianting with a bumade of hard
hings. The com/s. phs of the de
к. 4. 2018
bronze are alternative X18N. An ir, since its
ct surfaces. udies were
to identify hness, etc. tructed and represented statistically
hes made of
e "bushing-stigation in
of bushings
t, when the ushing; the dened steel ondition for
ependences

Известия Н
Detertesting theversions oinvestigatistalled, whvided that dependenc
Analybest tribote
Национально
F
1 – for the
rmination oe hub bushin
of hinge bushion in this ehich is madethe specifie
cies construcysis of the deechnical cha
Fig
1 – for the
ой академии н
Figure 4 – Grapwhen
e cast iron bush
of the wear ngs made ofhes made ofxperiment is
e of hardenedd range of th
cted from theependencies
aracteristics.
gure 5 – Graphson the load
e cast iron bush
наук Республи
phs of friction cn testing hub buhing; 2 – for a st
of the innef various maf different ms a hinge bud steel gradehe pressure v
e results of thin figures 4
s of changes in d when testing hhing; 2 – for a st
ики Казахста
32
coefficient variaushings made oteel bush with a
r surface ofaterials. We
materials, depush with a ce ST45H18Nvalue lies in
he experimenand 5 shows
wear of the innhinge sleeves mteel bush with a
ан
ation as a functif different matea bronze coatin
f the busheswill determi
pending on tonnecting pi
N2M. We win the range frnt are shown s that the hin
ner surface of bumade of differena bronze coatin
ion of slip speeerials: g; 3 – for the br
s as a functine the wear the applied pin. Inside thill establish trom 1 to 5 Min figure 5.
nges with bro
ushings dependnt materials: g; 3 – for the br
1
ed
ronze bush
tion of the lvalue of thre
pressure. Thhe bushing, athe value of
MPa. The gra
onze bushing
ding
ronze bush
3
load when ee different e object of a pin is in-f wear, pro-aphs of the
gs have the
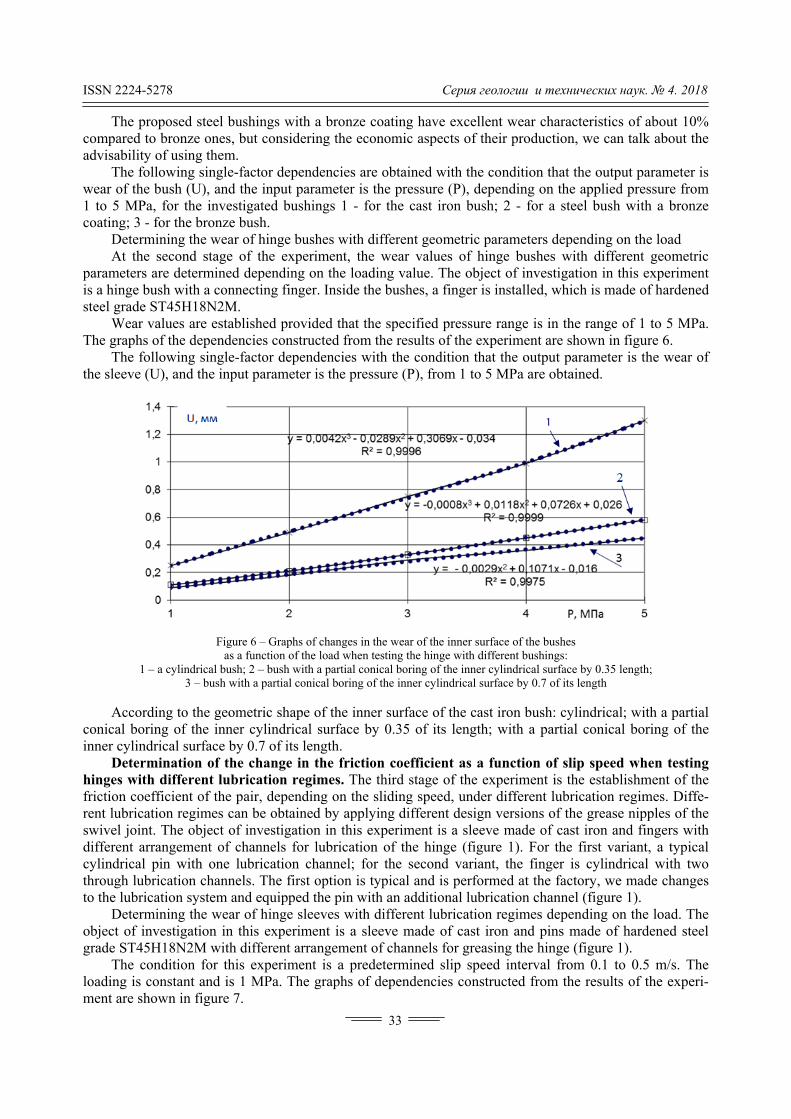
ISSN 2224-5278 Серия геологии и технических наук. 4. 2018
33
The proposed steel bushings with a bronze coating have excellent wear characteristics of about 10% compared to bronze ones, but considering the economic aspects of their production, we can talk about the advisability of using them.
The following single-factor dependencies are obtained with the condition that the output parameter is wear of the bush (U), and the input parameter is the pressure (P), depending on the applied pressure from 1 to 5 MPa, for the investigated bushings 1 - for the cast iron bush; 2 - for a steel bush with a bronze coating; 3 - for the bronze bush.
Determining the wear of hinge bushes with different geometric parameters depending on the load At the second stage of the experiment, the wear values of hinge bushes with different geometric
parameters are determined depending on the loading value. The object of investigation in this experiment is a hinge bush with a connecting finger. Inside the bushes, a finger is installed, which is made of hardened steel grade ST45H18N2M.
Wear values are established provided that the specified pressure range is in the range of 1 to 5 MPa. The graphs of the dependencies constructed from the results of the experiment are shown in figure 6.
The following single-factor dependencies with the condition that the output parameter is the wear of the sleeve (U), and the input parameter is the pressure (P), from 1 to 5 MPa are obtained.
Figure 6 – Graphs of changes in the wear of the inner surface of the bushes as a function of the load when testing the hinge with different bushings:
1 – a cylindrical bush; 2 – bush with a partial conical boring of the inner cylindrical surface by 0.35 length; 3 – bush with a partial conical boring of the inner cylindrical surface by 0.7 of its length
According to the geometric shape of the inner surface of the cast iron bush: cylindrical; with a partial
conical boring of the inner cylindrical surface by 0.35 of its length; with a partial conical boring of the inner cylindrical surface by 0.7 of its length.
Determination of the change in the friction coefficient as a function of slip speed when testing hinges with different lubrication regimes. The third stage of the experiment is the establishment of the friction coefficient of the pair, depending on the sliding speed, under different lubrication regimes. Diffe-rent lubrication regimes can be obtained by applying different design versions of the grease nipples of the swivel joint. The object of investigation in this experiment is a sleeve made of cast iron and fingers with different arrangement of channels for lubrication of the hinge (figure 1). For the first variant, a typical cylindrical pin with one lubrication channel; for the second variant, the finger is cylindrical with two through lubrication channels. The first option is typical and is performed at the factory, we made changes to the lubrication system and equipped the pin with an additional lubrication channel (figure 1).
Determining the wear of hinge sleeves with different lubrication regimes depending on the load. The object of investigation in this experiment is a sleeve made of cast iron and pins made of hardened steel grade ST45H18N2M with different arrangement of channels for greasing the hinge (figure 1).
The condition for this experiment is a predetermined slip speed interval from 0.1 to 0.5 m/s. The loading is constant and is 1 MPa. The graphs of dependencies constructed from the results of the experi-ment are shown in figure 7.

Известия Н
Analythe proposspeed, to rtribotechni
Concto determizone of thtechnical cgreater thasability of ces the weof reusingregime andof friction
[1] Gal6.
[2] Koconstruction
[3] Feo[4] Mu
Russian). [5] Mu[6] Sik
4-th All-RusRussian).
[7] Yumachinery c10.1088/175
[8] GOvzaimozame
[9] GORussia, 1982
[10] Gprovision. GOsnovnye po
[11] Gopredeleniia]
[12] G[Materialy smashine]. M
[13] SpISBN: 1317/
Национально
Figure
1 – cy
yzing the grased design chreduce the coical perform
clusions. Theine the param
he sleeve andcharacteristican 10% compf using them.ear of the hing the bush dd use of addof the matin
lkin V.I., Shesh
osilova A.G., M. Technician’s rodosjev V.I. (19ulukhov K.K.,
ulukhov K.K., Bkhimbaev M.R. ssian Scientific
urchenko A.V.,constructions s7-899X/81/1/0OST 8593-81. eniaemosti. NorOST 25557-822. (In Russian). GOST 30858-2General [Obespeolozheniia]. Mo
GOST 27674-88]. Moscow, Rus
GOST 9490-75. smazochnye zh
Moscow, Russia.pivakovskii A./БН2-20122016
ой академии н
7 – Graph of thwhen
ylindrical pin, s
aph of the dehanges of luboefficient of ance of the he experimentmeters of thed the pin. Thcs are hingespared to bro Increasing t
nge, allows indue to its boditional lubricng surfaces 3
hko E.E. (2010)
Meshjerjakov R.refernce book. M974) The resista Beslekoeva Z
Beslekoeva Z.NRecommendat
c-Practical Con
, Mekhtiyev Astrength impro12114. (in Eng.
Basic norms rmal'nye konusn. Machine tool
003. Products echenie iznosooscow, Russia, 28. Friction, wessia, 1988. (In RLiqvid lubricat
hidkie i plasti (In Russian). O., D'iachkov 6/42. (In Russia
наук Республи
he change in then testing hingessingle-channel l
ependencies bricating chafriction of th
hinges. tal study of se bore inner
he spacing ofs with bronz
onze ones. Buthe contact ancreasing thoring. Desigcation chann times.
R
) Transportnye
.K., Kalinin MMachinery Conance of materiaZ.N. (2012) G
N. (2009) Gornytions for the proference: Innov
A.D., Bulatbaevovement. IOP .). of interchang
nosti i ugly konl tapers. Basic
wear resistancstoikosti izdeli2003. (In Russi
ear and lubricatRussian). ting and plasticchnye. Metod
V.K. (1983) Tran).
ики Казахста
34
e coefficient of s with different lubricant; 2 – cy
shown in fi
annels allow he conjugate
stress-strain surface of t
f the bushingze bushes. Stut, given thearea of the bue resistance
gn changes lnel can signi
REFERENCE
mashiny. Russi
.A. (1976) Thenstruction. P. 35als. Science. P. 5Gornyy informa
yyinformatsionnojecting of a coative technolog
v F.N., Yugay conf. Publish
geabihty. Standnusov]. c dimensions [K
ce assurance. Tii. Tribotekhnician). tion. Terms an
materials. Metopredeleniia
ransporting ma
ан
f friction as a fulubrication reg
ylindrical pin, t
gure 7, we cabout more
surfaces, an
states of thethe bush witg is 0.35 to 0teel bushes we economic aush with the to physical wlubricating cficantly redu
S
ia: Izdatel'stvo
e accuracy in pr56. (In Russian)560. (In Russianatsionno-analiti
no-analiticheskiontrollable mecgies in machin
V.V. (2015) Uhing // Materia
dart rates of ta
Konusy instrum
Thribotechnicacheskie trebova
nd definitions [
thod of test for tribologicheski
achines [Transp
2
unction of slidingimes: two-channel lub
can draw thethan three ti
nd thereby sig
e various desh the lowest0.7 times its with a bronzaspects, we c
pin due to thwear, and alschannels impuce wear and
«Gornaia kniga
rocessing, bille). n). cheskiy byulle
iy byulleten. N chining attachme construction.
Using of scienals Science an
aper and cone
mental'nye. Osn
l requirementsaniia i pokazate
[Trenie, iznash
lubricating prokh kharakteris
portiruiushchie
ng speed
bricant
e following cimes, dependgnificantly in
signs of hingt voltage in length. The
e coating hacan talk abouhe conical bso opens theprove joint d reduce the
a». ISBN: 978-
et and allowanc
eten. N 5. P.
3. P. 249-257. ments (2009) Ma. Kamishin. P.
nce technologiend Engineerin
e angles [Osno
novnye razmer
s and indices. eli. Printsipy o
hivanie i smazk
operties on fourstik na chetyre
mashiny]. Mos
1
conclusion: ding on the ncrease the
ges possible the contact best tribo-
ave wear of ut the advi-oring redu- possibility lubrication coefficient
5-7418-0645-
ce in machine
253-258. (In
(In Russian). aterials of the 136-140. (In
es for mining ng, 81. DOI:
ovnye normy
ry]. Moscow,
Principles of bespecheniia.
ka. Terminy i
r ball mashine ekhsharikovoi
scow, Russia.

ISSN 2224-5278 Серия геологии и технических наук. 4. 2018
35
[14] Kartavyi A.N. (2007) Problemy primeneniia razlichnykh tipov krutonaklonnykh lentochnykh konveierov. Tiazheloe mashinostroenie. N 3. Р. 33-34.
[15] Galkin V.I., Dmitriev V.G. (2009) Trubchatye konveiery dlia gornoi promyshlennosti. Gornoe oborudovanie i elektromekhanika. N 1. Р. 39-46. (In Russian).
[16] Mehtiyev A.D., Yugay V.V. (2011) Current state and problems of operation of mine hoisting machines of the Karaganda coal basin Scientific and analytical and production magazine "Mining equipment and electromechanics". N 6. New technologies. P. 26-29.
[17] Yurchenko A., Syrjamkin V., Okhorzhina A., Kurkan N. (2015) PV effectiveness under natural conditions. IOP Conference Series: Materials Science and Engineering. Vol. 81, DOI:10.1088/1742-6596/881/1/012036.
[18] Yurchenko A.V., Bulatbaev F.N., Mekhtiyev A.D., Neshina Y.G., Alkina A.D. and Kokkoz M.M. (2017) The clearance control system of the lever-hinge mechanism of the mine winder braking device using the capacitive sensors. IOP: Journal of Physics: Conference Series, 881. DOI: 10.1088/1742-6596/881/1/012034. (In Eng.).
[19] Yurchenko A., Jakubov V., Shipilov S., Satarov R. (2015) Remote ultra-wideband tomography of nonlinear electronic components. Technical Physics. Vol. 60. P. 279-282. DOI: 10.1134/S1063784215020267 (In Eng.)
[20] Spiridonov A. A. (1981) The planning of experiments when researching technological processes. Machinery Construction. P. 184. (In Russian).
М. К. Ибатов1, Ф. Н. Булатбаев1, А. Д. Мехтиев1, В. В. Югай1 , А. Д. Алькина2, Е. Г. Нешина2
1Қарағанды мемлекеттік техникалық университеті, Қарағанды , Қазақстан,
2Томск политехникалық университеті, Томск, Ресей
ТАУ-КЕН МАШИНАЛАРЫНЫҢ ТЕЖЕГІШ-ШАРНИРЛІ МЕХАНИЗМДЕРІНІҢ ТИІМДІЛІГІН АРТТЫРУ ЖОЛДАРЫ
Аннотация. Берілген мақалада иінтіректік-топсалы механизмдегі төлкенін жұмыс істеу тиімділігін
арттыру жолдарын қарастырады. Шахтылы көтергіш машинаның тежегіш құрылғасының сенімді қолданы-луы жұмыс істеу барысы нормативтік қауіпсіздік талаптарына сай бағынады. Зерттеудің мақсаты əр түрлі шарттарда топсалы қосылыстардың бетіндегі жанасатын бөлшектердің маңызды өзгерістерін анықтау. Топ-саның үйкеліс беттерін салыстыру жəне олардың физика-механикалық жəне трибологиялық сипаттамаларын зерттеу жүргізіледі. Арнайы өлшеу кешенінің арқасында байланыс беттерінің аймағындағы тозу параметр-лерін белгілеу үшін топсаның элементтері арасындағы өзара əрекеттесу үрдісінің негізгі заңдылықтары зерт-телді. Үйкеліс коэффициентінің өзгеруін жəне жұпар бөліктеріндегі тозу мөлшерін зерттеу жүргізілді. Зерт-теу əртүрлі материалдар мен хаб-түйіспелі жұптас жұптың түрлі жобалық нұсқалары үшін жүргізілді. Əр түрлі топсалы конструкциялардың стресс-штамм күйін өткізген эксперименталдық зерттеулер төлке. пен саусақты байланыстыру аймағындағы ең төменгі кернеулі төлкенің ішкі бетінің бұрғылау параметрлерін анықтауға мүмкіндік берді. Үздік триботехникалық сипаттамалары қола бұталары бар ілмектер. Қола жабын-дысы бар болат жеңдер қоламен салыстырғанда 10% артық тозуға ие. Тұтқаны конустық бұрғылаумен бай-ланысты саусағымен байланыстыру аймағының жоғарылауы топсаның тозуын азайтады, физикалық тозуға төзімділікті арттырады.
Түйін сөздер: шахталық көтергіш машиналар, топсалы механизм, үйкеліс машинасы, үйкеліс коэффи-циенті, төлке.
М. К. Ибатов1, Ф. Н. Булатбаев1, А. Д. Мехтиев1, В. В. Югай1 , А. Д. Алькина2, Е. Г. Нешина2
1Карагандинский государственный технический университет, Караганда, Казахстан, 2Томский политехнический университет, Томск, Россия
ПУТИ ПОВЫШЕНИЯ ЭФФЕКТИВНОСТИ ЭКСПЛУАТАЦИИ ВТУЛОК
РЫЧАЖНО-ШАРНИРНОГО МЕХАНИЗМА ГОРНЫХ МАШИН Аннотация. В статье рассматриваются пути повышения эффективности эксплуатации втулок рычажно-
шарнирного механизма. Надежная эксплуатация тормозного устройства шахтных подъемных машин, на протяжении всего срока эксплуатации, диктуется нормативными требованиями безопасности. Задача иссле-дования состоит в определении наличия значимых изменений на поверхности сопрягаемых деталей шарнир-ных соединений при различных условиях. Проведено сравнение поверхностей трения шарнира и изучения их

Известия Национальной академии наук Республики Казахстан
36
физико-механических и трибологических характеристик. С помощью специального измерительного комп-лекса проведено исследование основных закономерностей процесса взаимодействия элементов шарнирного соединения для установления параметров износа в области контактных поверхностей. Было проведено ис-следование изменения коэффициента трения и величины износа в сопрягаемых деталях. Исследование проводились для различных материалов и различных конструктивных исполнений втулочно-пальцевой пары шарнирного соединения. Проведенные экспериментальные исследования напряженно-деформированного состояния различных конструкций шарниров позволили определить параметры расточки внутренней поверх-ности втулки с наименьшим напряжением в зоне контакта втулки и пальца. Наилучшими триботехническими характеристиками обладают шарниры с бронзовыми втулками. Стальные втулки с бронзовым покрытием имеют износ больший на 10% по сравнению с бронзовыми. Увеличение площади контакта втулки с пальцем за счет конической расточки уменьшает износ шарнира, позволяют повысить сопротивление физическому износу.
Ключевые слова: шахтные подъемные машины, шарнирный механизм, машина трения, коэффициент трения, втулка.
Information about authors: Ibatov Marat – Doctor of Technical Sciences, Rector of Karaganda State Technical University. Bulatbayev Felix – Candidate of Technical Sciences, Dean of the Faculty of Energy, Automation and Telecom-
munications, Karaganda State Technical University. Mekhtiyev Ali – Candidate of Technical Sciences, Head of the Department of "Communication Systems
Technologies" of the Karaganda State Technical University. Yugay Vyacheslav – Doctor PhD, Senior Lecturer of the Department of Communication Systems Technologies
of the Karaganda State Technical University. Alkina Aliya – master of engineering and technology, postgraduate student of Tomsk Polytechnic University. Neshina Yelena – master of engineering and technology, postgraduate student of Tomsk Polytechnic Uni-
versity.

ISSN 2224-5278 Серия геологии и технических наук. 4. 2018
37
N E W S OF THE NATIONAL ACADEMY OF SCIENCES OF THE REPUBLIC OF KAZAKHSTAN
SERIES OF GEOLOGY AND TECHNICAL SCIENCES
ISSN 2224-5278
Volume 3, Number 430 (2018), 37 – 45 UDC 637.525
S. E. Shukesheva1, Ya. M. Uzakov1, I. M. Chernukha2, D. E. Nurmukhanbetova1, Zh. S. Nabiyeva1, A. B. Nurtaeva3
1Almaty Technological University, Almaty, the Republic of Kazakhstan,
2V. M. Gorbatov Federal Research Center for Food Systems of RAS, Moscow, the Russian Federation, 3S. Seifullin Kazakh Agro Technical University, Astana, the Republic of Kazakhstan.
E-mail: [email protected], [email protected], [email protected], [email protected], [email protected], [email protected],
RESEARCH TO IMPROVE THE QUALITY OF FOOD PRODUCTS
Abstract. The article presents the results of research to improve the quality of food products, namely the results of the study of the restructured meat product. It is established that preliminary processing of raw materials by starter cultures promotes an increase in proteolytic activity and active accumulation of amine nitrogen, thus accelerates the ripening of meat. Adding to experimental samples raw plant materials, balanced carbohydrate and vitamin com-position, has a positive effect on the balance of the finished product and increases their biological value. The findings are promising trend in improving meats technology.
Key words: meat, beef, mutton, restructure meat product, lactic acid bacteria, propionic acid bacteria, starter cultures, grain crops, corn, proteolytic activity.
Introduction. Supplying the population with high quality meat products is one of the main and urgent task facing the processing industry. To solve this problem a great role belongs to intensification of technological processes, using modern achievements of biochemistry and meat industry, using enzyme preparations [1].
In the Republic of Kazakhstan, the production of meat and meat products is traditionally considered one of the priority. The modern conditions of production associated with the transition to low-waste processing of raw materials, the desire to reduce the cost of finished products, to define the constant expansion of the range by improving meat production technology. The solution to this problem is con-nected with control of biochemical, physical, chemical and microbiological processes in the technology of production of meat products, which are formed as a result of qualitative indicators of the finished pro- duct [2].
It is known that beef is different from meat of other species of animals by quality and technological parameters. At the same time, the process of production of beef products, characterized by a fairly rigid consistency, is long. In this regard, there is a need to find ways to intensify production and develop new recipes for beef meat products [3].
One of the promising directions of production of meat products is the creation of technologies for restructured products, the advantage of which is the ability to recreate the structure of whole-piece raw materials, by the organoleptic properties close to whole-muscle meat (i.e. compound by a variety of individual pieces of meat components into one solid, which, when cutting into slices will have a uniform shape and size) [4].
Great interest for industrial applications represents culture of propionic acid and lactic acid bacteria. It was proved that certain strains of propionic acid bacteria have a high biotechnological potential and adaptive properties, which is important when salting and maturation of meat from the intact cell structure, where the processes are associated with a high concentration of salt and low temperature [5].

Известия Национальной академии наук Республики Казахстан
38
It is proved that cultures of lactic acid bacteria have antagonistic activity against pathogenic and opportunistic pathogens of various diseases, as well as capable of forming biologically active substances (vitamins, essential amino acids, hydrolytic enzymes) regulating metabolic processes in the body. Some of their representatives in the process of vital activity produce substances that impart a specific taste and aroma to the product, promote the acceleration and stabilization of the process of its maturation, improve the sanitary and hygienic conditions of production. The available data of the using of lactic acid bacteria in the meat processing industry indicate the possibility of their using in the technology of production of meat products in order to increase production by reducing the time of the ripening process with raw material salting, as well as improving the quality of finished products and increasing their yield [6].
One of the ways to improve the quality of products and improve the structure of the population's nutrition is the introduction of new non-traditional types of plant raw materials into the diet. The products created must contain a balanced complex of proteins, lipids, minerals, vitamins, ballast substances and have high nutritional and taste properties.
One of these directions is the possibility of using cereal crops in the composition of meat products subjected to various modification methods due to their high nutritional value and functional and tech-nological properties. These cultures, being a source of dietary fiber, significantly contribute to increasing the human body's resistance to harmful environmental influences. Grain contains almost all the basic substances necessary for normal human life. Research local and foreign authors have shown promising using in the technology of combined meat products processed grain products that provide high nutritional and biological value of the product, enhance the flexibility of formulations, sustainable and uniform distribution of the ingredients, to minimize losses in the manufacturing process, which ultimately leads to create a product of stable quality.
The using of plant raw materials in meat can be considered as one of the ways to produce high-qua-lity meat products with controlled properties. For example, tocopherols contained in cereals and oilseed plants, are natural fat-soluble antioxidants possess vitamin E activity, and are widely used in the meat industry as antioxidants. To increase the amount of antioxidants in plant raw materials, the method of germination of grains [7].
Germinated grain is a useful, easily digestible product containing vitamins A, С, В1, В2, В6, РР, Е, as well as dietary fibers necessary for normal digestion. When germination in grains increases the content of certain B vitamins (for example, vitamins B, B2 and PP - an average of 1.5-2 times), vitamin E, appears in the germ and vitamin C, which does not contain in ungerminated grain. The germinated seeds are partially destroyed phytates that block the absorption of calcium, magnesium, zinc and other mineral elements. Also in the germinated grains are a lot of sugar and fiber, which in this form is easily digested [8].
Ready-made meat products are rarely considered as a basic source of vitamins, because In the process of processing most of the vitamins are destroyed, and the remaining quantities do not satisfy the physio-logical needs of the human body. In the meat there is no vitamin C, and vitamin E is contained in it in trace amounts. In the regulation of carbohydrate and fat metabolism involved vitamins: B1 (thiamine), B2 (riboflavin), B3 (pantothenic acid), H (biotin). An effective way to solve this problem is to develop affordable meat products of a functional purpose, which is expedient to carry out based on the enrichment of plant materials. The using of plant raw materials is considered very relevant and timely, because this is accompanied by enrichment of products dietary fiber, minerals, vitamins [9].
In connection with the improvement of meat production technology using bacterial starter and cereal is actual and perspective.
Materials and methods. As objects of research have been chosen lamb and beef of 1st category of fatness in the ratio of 1:1, to ensure rational using of the resources provided for the using of meat chopped germinated corn, to accelerate the ripening process and stabilization using starter cultures.
Technological process. Preparation of a control sample. Raw meat was ground on a top with a hole diameter of 25-35 mm. Further, dry salt was produced by salt at the rate of 3.0 kg of salt per 100 kg of raw material. Stirring was carried out in a minced stirrer for 5-10 min. Then the raw material was left in the refrigerator for 20 h at + 5 °C. After 20 hours, the raw materials were fed to a stirrer by adding the neces-sary spices according to the recipe. Stir until cooked for 10 minutes. Then raw meat materials are injected. The formulation of the control and experimental samples is given in table 1.
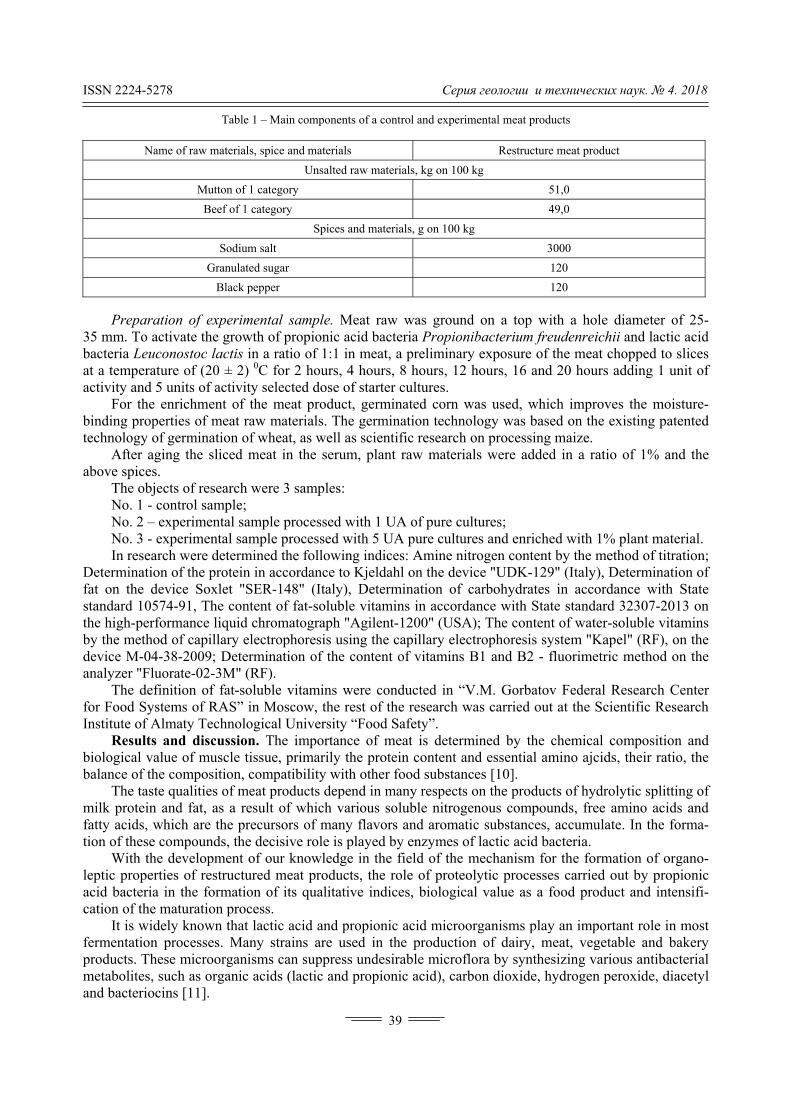
ISSN 2224-5278 Серия геологии и технических наук. 4. 2018
39
Table 1 – Main components of a control and experimental meat products
Name of raw materials, spice and materials Restructure meat product
Unsalted raw materials, kg on 100 kg
Mutton of 1 category 51,0
Beef of 1 category 49,0
Spices and materials, g on 100 kg
Sodium salt 3000
Granulated sugar 120
Black pepper 120
Preparation of experimental sample. Meat raw was ground on a top with a hole diameter of 25-
35 mm. To activate the growth of propionic acid bacteria Propionibacterium freudenreichii and lactic acid bacteria Leuconostoc lactis in a ratio of 1:1 in meat, a preliminary exposure of the meat chopped to slices at a temperature of (20 ± 2) 0С for 2 hours, 4 hours, 8 hours, 12 hours, 16 and 20 hours adding 1 unit of activity and 5 units of activity selected dose of starter cultures.
For the enrichment of the meat product, germinated corn was used, which improves the moisture-binding properties of meat raw materials. The germination technology was based on the existing patented technology of germination of wheat, as well as scientific research on processing maize.
After aging the sliced meat in the serum, plant raw materials were added in a ratio of 1% and the above spices.
The objects of research were 3 samples: No. 1 - control sample; No. 2 – experimental sample processed with 1 UA of pure cultures; No. 3 - experimental sample processed with 5 UA pure cultures and enriched with 1% plant material. In research were determined the following indices: Amine nitrogen content by the method of titration;
Determination of the protein in accordance to Kjeldahl on the device "UDK-129" (Italy), Determination of fat on the device Soxlet "SER-148" (Italy), Determination of carbohydrates in accordance with State standard 10574-91, The content of fat-soluble vitamins in accordance with State standard 32307-2013 on the high-performance liquid chromatograph "Agilent-1200" (USA); The content of water-soluble vitamins by the method of capillary electrophoresis using the capillary electrophoresis system "Kapel" (RF), on the device M-04-38-2009; Determination of the content of vitamins B1 and B2 - fluorimetric method on the analyzer "Fluorate-02-3M" (RF).
The definition of fat-soluble vitamins were conducted in “V.M. Gorbatov Federal Research Center for Food Systems of RAS” in Moscow, the rest of the research was carried out at the Scientific Research Institute of Almaty Technological University “Food Safety”.
Results and discussion. The importance of meat is determined by the chemical composition and biological value of muscle tissue, primarily the protein content and essential amino ajcids, their ratio, the balance of the composition, compatibility with other food substances [10].
The taste qualities of meat products depend in many respects on the products of hydrolytic splitting of milk protein and fat, as a result of which various soluble nitrogenous compounds, free amino acids and fatty acids, which are the precursors of many flavors and aromatic substances, accumulate. In the forma-tion of these compounds, the decisive role is played by enzymes of lactic acid bacteria.
With the development of our knowledge in the field of the mechanism for the formation of organo-leptic properties of restructured meat products, the role of proteolytic processes carried out by propionic acid bacteria in the formation of its qualitative indices, biological value as a food product and intensifi-cation of the maturation process.
It is widely known that lactic acid and propionic acid microorganisms play an important role in most fermentation processes. Many strains are used in the production of dairy, meat, vegetable and bakery products. These microorganisms can suppress undesirable microflora by synthesizing various antibacterial metabolites, such as organic acids (lactic and propionic acid), carbon dioxide, hydrogen peroxide, diacetyl and bacteriocins [11].

Известия Национальной академии наук Республики Казахстан
40
The development of biochemical processes that contribute to the maturation and tenderization of meat during fermentation can be judged from the dynamics of proteolytic processes.
The proteolytic activity is one of the most important properties of lactic and propionic acid bacteria, which characterizes their ability to break down proteins to form more simple nitrogenous compounds. However, information concerning the proteolytic enzyme system in propionic acid bacteria during cultivation in the meat substrate and the influence of various factors on their activity is extremely scarce, therefore further studies have been devoted to the study of the influence of the conditions of biotech-nological processing on the proteolytic activity of starter cultures. An informative indicator of protein proteolysis can be amine nitrogen. It is scientifically justified that the content of amine nitrogen, which contributes to the ripening of meat is 0.2 mg [5,12].
The obtained results, shown in figure 1, show that in the experimental samples a faster accumulation of amine nitrogen is observed in comparison with the control sample. Thus, in the experimental sample No. 3 the accumulation of amine nitrogen is observed 4 hours after ripening, in the experimental sample No. 2 of the same value reaches 16 hours, and in the control sample after 20 hours.
Thus, due to the introduction of starter of lactic acid and propionic acid bacteria, where the dose of the ferment is 5 units of activity, physico-chemical and biochemical processes are accelerated substantially, as a result of which the duration of salting is shortened to 16 h.
Salting duration, h
Con
tent
of
amin
e ni
trog
en, m
g/10
0g
Figure 1 – Dynamics of accumulation of amine nitrogen in the process of salting
Analysis of published data on the chemical composition showed that the processing of meat products
of bacterial starter culture and the enrichment of milled corn germ leads to increased concentrations of nutritional value, i.e. carbohydrates and vitamins. The results of the control and experimental samples are given in table 2.
Table 2 – Nutritional value of experimental samples of meat products
# Nutritional value,
%
The experimental samples
# 1 # 2 # 3
1 Mass fraction of protein 10,64±0,04 9,56±0,02 10,07±0,02
2 Mass fraction of fat 4,49±0,01 5,17±0,02 6,24±0,01
3 Mass fraction of carbohydrates It isn't revealed It isn't revealed 0,75±0,01
n=10.
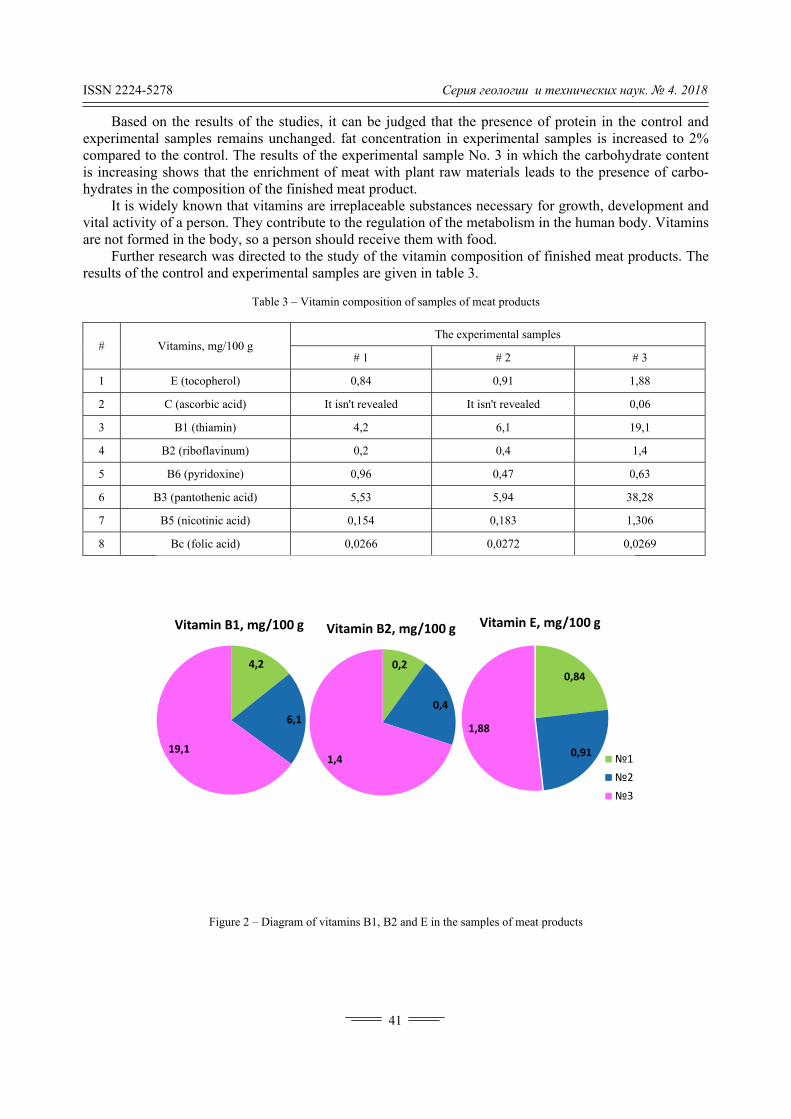
ISSN 2224-5278 Серия геологии и технических наук. 4. 2018
41
Based on the results of the studies, it can be judged that the presence of protein in the control and experimental samples remains unchanged. fat concentration in experimental samples is increased to 2% compared to the control. The results of the experimental sample No. 3 in which the carbohydrate content is increasing shows that the enrichment of meat with plant raw materials leads to the presence of carbo-hydrates in the composition of the finished meat product.
It is widely known that vitamins are irreplaceable substances necessary for growth, development and vital activity of a person. They contribute to the regulation of the metabolism in the human body. Vitamins are not formed in the body, so a person should receive them with food.
Further research was directed to the study of the vitamin composition of finished meat products. The results of the control and experimental samples are given in table 3.
Table 3 – Vitamin composition of samples of meat products
# Vitamins, mg/100 g The experimental samples
# 1 # 2 # 3
1 Е (tocopherol) 0,84 0,91 1,88
2 С (ascorbic acid) It isn't revealed It isn't revealed 0,06
3 В1 (thiamin) 4,2 6,1 19,1
4 В2 (riboflavinum) 0,2 0,4 1,4
5 В6 (pyridoxine) 0,96 0,47 0,63
6 В3 (pantothenic acid) 5,53 5,94 38,28
7 В5 (nicotinic acid) 0,154 0,183 1,306
8 Вс (folic acid) 0,0266 0,0272 0,0269
4,2
6,1
19,1
Vitamin В1, mg/100 g
0,2
0,4
1,4
Vitamin В2, mg/100 g
0,84
0,91
1,88
Vitamin Е, mg/100 g
1
2
3
Figure 2 – Diagram of vitamins B1, B2 and E in the samples of meat products

Известия Национальной академии наук Республики Казахстан
42
1514131211109
mA
U
3
2
1
0
P
yrid
oxin
e
Pan
toth
enic
aci
dd
N
icot
inic
aci
d
F
olic
aci
d
Exit time, min •P
eak
heig
ht,
Figure 3 – Chromatogram of water-soluble vitamins in the control sample meat product 1
151413121110
1
0
P
yrid
oxin
e
P
anto
then
ic a
cid
N
icot
inic
aci
d
F
olic
aci
d
•P
eak
heig
ht, mAU
Exit time, min
Figure 4 – The chromatogram of water-soluble vitamins in experimental sample meat product 2

ISSN 2224-
Accorthe presencontrol onsamples it green planexperimenhuman bodimmunity
The etimes, andvitamin B3
In experimthan in conis 1.02 tim
In adcompared an importacapillary wterol metab
The v1.4 mg/100the experim
Summcontributecultures anpositive ef
Concmaterial fohave been
-5278
Figure 5 – Th
rding to the rnce of fat-solne. If in the ct is 0.91 and nts and germntal sample ndy plays a hand disease p
experimentald in the expe3 in the contr
mental samplntrol sample
mes higher thaddition, in th
to samples ant role in thwalls, on the bolism, immvitamin B2, if0 g. Only vitmental sampmarizing the s to a slight nd 1% of cruffect on balanclusions. Basor improvingestablished:
he chromatogra
results of theluble vitamincontrol samp1.88 mg/10
minated grainumber 3 withuge role. Viprevention. data show terimental sarol sample isle 3 the co. In experiman in control
he experimen1 and 2 he oxidation-
regenerationmune biologic
f in the conttamin B6 con
ples 2 – 0.4results obtaincrease in tushed germinced vitaminsed on the stg the technolo
am of water-solu
e vitamin comn E in the exples the conc0 g. It has bin. This cauth the additioitamin E is c
that the concample 2 1.s 38.28 mg/1oncentrationental samplel sample. ntal sample in which thi
-reduction prn processes ical reactions.trol sample itncentration in47 and 3- 0ained, it can the concentrainated maizen content. tudies carrieogy of restru
43
uble vitamins in
mposition ofxperimental scentration of
been proven uses an increon of germincharacterized
centration of .4 times high00 g, in exps of vitamin
e 2 the con
3, the cos vitamin is
rocesses in thin the functio. t is 0.2 mg/1n the control0.63 mg/100be concludeation of vitame contributes
d out to impuctured meat
Серия геол
n experimental
f the studied samples is sif tocopherol that tocophe
ease in the nated corn. Td by high an
vitamin B1 her compareerimental sam
ns B5 is 8.48 ncentration o
oncentration absent. It is
he body. Asconal state of
100 g, then in sample 1 g.
ed that addinmins, and th to the enric
prove the quat products, th
логии и техн
sample of mea
meat sampleignificantly his 0.84 mg/
erol is presenconcentratio
The importanntioxidant ac
in the experied to the conmples it is 5times and B
of vitamins B
of vitamin widely know
corbic acid hthe central n
n the experimequal to 0.9
ng 1 unit acte addition 5
chment of m
ality of meahe following
нических наук
at product 3
es, it can be jhigher comp/100 g, in exnt in large qu
on of vitaminnce of tocophctivity, which
imental sampntrol. If the .53 and 5.94
Bc is 1.01 timB5 is 1.18 tim
C increasedwn that vitamhas a specificnervous syste
mental samp6 mg/100 g,
ivity of startunits activit
meat products
at used as thetechnologica
к. 4. 2018
judged that pared to the xperimental uantities in n E in the herol in the h promotes
ple 3 4.5 content of
4 mg/100 g. mes higher
mes, and Bc
by 0.06% min C plays c impact on em, choles-
ples 0.4 and whereas in
ter cultures ty of starter s and has a
e main raw al solutions

Известия Национальной академии наук Республики Казахстан
44
- Using of starter cultures in a ratio of 1: 1, with a selected dose of starter - 5 units of activity, con-tributes to the intensification of physicochemical and biochemical processes of salting, maturation of meat and creation of optimal functional and technological properties in a shorter period;
- It is proved that the enrichment of meat with cereals with 1% of crushed germinated corn, leads to the presence of carbohydrates in the finished meat product and to an increase in the concentration of such vitamins as E, C, B1, B3, B5 and Bc;
- The possibility of using of plant raw materials for the creation of restructured semi-smoked meat products has been substantiated.
Thus, revealed high biochemical activity of bacteria contributing to an increase in the proteolytic activity and the accumulation of the active amine nitrogen. It is established that preliminary processing of raw materials by the leaven of starter cultures and enrichment with crushed corn germ allows not only to intensify the salting process, but also to increase the biological and nutritional value of the finished product.
REFERENCES
[1] Ospanova D.A., Uzakov Ya.M. Research of chemical and amino-acid composition of the complex cutting of carcass //
Bulgarian Journal of Agricultural Science. 2014. 20 (N 5). Р. 1090-1093. [2] Uzakov Ya.M. Slaughter of the cattle and production of meat products on «Halal» technology. Almaty: Ewer, 2014. 268 p. [3] Uzakov Ya.M., Shukesheva S.E. (2016) Rational use of raw materials when improving the technology of meat products
of functional purpose. X Intern. science praktical conference young academic and special department of agricultural sciences "Modern approaches to the preparation and processing of agricultural products – guarantee food independence of Russia". Moscow. P. 446-448.
[4] Chernukha I.M., Uzakov Ya.M., Shukesheva S.E. (2016) Improvement the technology of restructure cooked and smoked meat products mutton and beef. The 19th international scientific and practical conference devote V. M. Gorbatov's memories "Practical and theoretical aspects of complex conversion of food staples and creation of competitive products of food – a basis of ensuring import substitution and food security of Russia of" FGBNU "of VNIIMP of V. M. Gorbatov"". Moscow. P. 81-83.
[5] Shukesheva S.E., Uzakov Ya.M., Сhernukha I.M., Nabiyeva Zh.S. The use of starter cultures in the production of restructure meat products // Bulletin of the ATU. 2017. N 4(117). P. 23-26.
[6] Mohammed Salim Ammor, Baltasar Mayo. Selection criteria for lactic acid bacteria to be used as functional starter cultures in dry sausage production: An update // Meat Science. 2007. Issue 1. P. 138-146.
[7] Uzakov Ya.M., Taeva A.M. Processing of camel meat for the production of meat products: Mon. PH "Profession", 2017. 158 p.
[8] Nabiyeva Zh., Kizatova M., Merdzhanov, P. Angelova-Romova М., Zlatanov M., Antova G., Stoyanova A., Karadzhov G. Lipid Composition during the germination of Kazakhstan maize hybrid // Bulgarian Journal of Agricultural Science, Thomson Reuters 0,136. ISSN: 1310-0351, 19 (No 4) 2013. P. 780-784.
[9] Esteve M.J., Farrе R., Frıgola A., Pilamunga C. Contents of vitamins B1, B2, B6, and B12 in pork and meat products // Meat Science. 2002. Vol. 62, Issue 1. Р. 73-78.
[10] Bulambaeva A.A., Uzakov Ya.M., Vlahova-Vangelova D.B., Dragoev S.G., Balev D.K. Development of New Func-tional Cooked Sauseges by Addition of Goji Berry and Pumpkin Powder // American Journal of Food Technology. 2014. 9(4). Р.180-189.
[11] Uzakov Ya.M. The production of meat products Halal. Profession PH, 2018. 176 p. [12] Khamagaeva I.S., Khankhalaeva I.A., Zaigrayeva L.I. Use of probiotic cultures for production of sausages. Ulan-Ude,
2006. 203 p.
С. Е. Шукешева1, Я. M. Ұзақов1, И. M. Чернуха2, Д. Е. Нұрмұханбетова1, Ж. С. Набиева1, А. Б. Нұртаева3
1Алматы технологиялық университеті, Алматы, Қазақстан,
2«В. М. Горбатов атындағы тағамдық жүйелердің федералдық ғылыми орталығы» РҒА, Мəскеу, Ресей, 3С. Сейфуллин атындағы Қазақ агротехникалық университеті, Астана, Қазақстан
ТАҒАМ ӨНІМДЕРІНІҢ САПАСЫН АРТТЫРУ БОЙЫНША ЗЕРТТЕУЛЕР
Аннотация. Мақалада тағам өнімдерінің сапасын арттыру бойынша зерттеулер нəтижесі, нақтылап
айтқанда, қайта құрылымдалған ет өнімдерінің зерттеулер нəтижесі берілген. Шикізат алдын-ала бакте-риалды старттық дақылдармен өңделсе, протеолиттік белсенділік артып, аминді азоттың белсенді жинақ-талуына себеп болады, нəтижесінде еттің жетілуін жылдамдатады. Зерттеу үлгілеріне дəрумендік жəне көмірсу құрамы бойынша байытылған өсімдік шикізатын енгізу – дайын ет өнімінің теңгерімділігіне оң əсер

ISSN 2224-5278 Серия геологии и технических наук. 4. 2018
45
беріп, биологиялық құндылығын арттырады. Болашақта алынған нəтижелерді ет технологиясын жетілдіру кезінде пайдалануға болады.
Түйін сөздер: ет, қой еті, сиыр еті, қайта құрылымдалған ет өнімі, сүтқышқылды бактериялар, пропион-қышқылды бактериялар, старттық дақылдар, дəнді дақылдар, жүгері, протеолиттік белсенділік.
С. Е. Шукешева1, Я. M. Узаков1, И. M. Чернуха2, Д. Е. Нурмуханбетова1, Ж. С. Набиева1, А. Б. Нуртаева3
1Алматинский технологический университет, Алматы, Казахстан, 2«Федеральный научный центр пищевых систем им. В. М. Горбатова» РАН, Москва, Россия,
3Казахский агротехнический университет им. С. Сейфуллина, Астана, Казахстан
ИССЛЕДОВАНИЯ ПО ПОВЫШЕНИЮ КАЧЕСТВА ПРОДУКТОВ ПИТАНИЯ
Аннотация. В статье приведены результаты исследований по повышению качества продуктов питания, а именно результаты исследования реструктурированного мясного продукта. Установлено, что предвари-тельная обработка сырья стартовыми культурами способствует увеличению протеолитической активности и активному накоплению аминного азота, соответственно ускоряет созревание мяса. Введение в опытные образцы растительного сырья, хорошо сбалансированного по углеводному и витаминному составу, оказы-вает позитивное влияние на сбалансированность готового продукта и повышает их биологическую ценность. Полученные данные являются перспективным направлением при совершенствовании технологии мяса.
Ключевые слова: мясо, говядина, баранина, реструктурированный мясной продукт, молочнокислые бактерии, пропионовокислые бактерии, стартовые культуры, зерновые культуры, кукуруза, протеолити-ческая активность.
Information about authors: Shukesheva Saule Erbolatovna – doctoral of PhD 3rd courses. Bacteriologist, Almaty Technological University,
Almaty, [email protected] Uzakov Yasin Malykovich – Doctor of technical sciences, professor, Almaty Technological University,
Almaty, [email protected] Chernukha Irina Mikhailovna – Doctor of technical sciences, professor, V. M. Gorbatov Federal Research
Center for Food Systems of RAS, Moscow, Nurmukhanbetova Dinara Erikovna – Candidate of technical sciences, a.a. docent, Technological University,
Almaty, [email protected] Nabiyeva Zhanar Serikbolovna – Doctor of PhD Head of Accredited testing laboratory Food safety, Almaty
Technological University, Almaty, [email protected] Nurtaeva Ainur Bolatbekovna – Candidate of technical sciences, senior lecturer, S. Seifullin Kazakh Agro
Technical University, Astana, [email protected]
Известия Национальной академии наук Республики Казахстан
46
N E W S OF THE NATIONAL ACADEMY OF SCIENCES OF THE REPUBLIC OF KAZAKHSTAN
SERIES OF GEOLOGY AND TECHNICAL SCIENCES
ISSN 2224-5278
Volume 3, Number 430 (2018), 46 – 50 UDC 541.128
K. М. Lakhanova1, B. Sh. Kedelbaev2, Zh. B. Makhatov2, P. Lieberzeit3, B. S. Begaliev1, G. A. Rysbayеva2, Zh. K. Ibraimova2
1Yassawi International Kazakh-Turkish University, Turkestan, Kazakhstan,
2M. Auezov South Kazakhstan state university, Shymkent, Kazakhstan, 3University of Vienna, Vienna, Austria.
E-mail: [email protected], [email protected]
DEVELOPMENT OF TECHNOLOGY FOR PRODUCING SORBITOL
FROM WHEAT STRAW CELLULOSE
Abstract. The aim of the work is to develop an enzymatic technology for processing wheat straw cellulose for the production of sorbitol by means of hydrolytic hydrogenation based on the use of a hybrid process.
Enzymatic hydrolytic hydrolysis and hydrogenation of wheat straw cellulose research have been carried out and optimal process parameters have been developed. As a result, a combined (hybrid) hydrolysis-hydrogenation process for production of sorbitol have been implemented. In this process, enzymes have been developed and tested for their activity. The influence of the process time, the temperature of the test and the pH on the conversion of cellulose and selectivity for sorbitol have been studied.
The developed technology will allow us to improve the traditional processes in terms of eliminating the nu-merous stages of purification and isolation of intermediate products. It enables the realization of a single-reactor combined (hybrid) process for the production of such a valuable chemical as sorbitol.
Key words: cellulose, wheat straw, hydrolysis, hydrogenation, polysaccharides, hydrolytic hydrogenation, glucose, sorbitol, enzyme.
Introduction. The growing interest in the use of carbohydrate-containing agricultural plant waste, rich in polysaccharides, determines the search for optimal methods for its processing [1, 2].The main criterion for processing these wastes is their cost, volume, availability and localization, as well as their chemical composition and technological properties. At the same time, the possibilities of using directly microorganisms, enzyme complexes, chemical hydrolyzing agents for effective conversion of non-food raw materials into digestible sugars [3].
The main factor restraining the processing of polysaccharides of wheat straw is the low profitability of these industries, due to shortcomings in the preparation of raw materials, highly energy inputs and low yield of the target product. This problem can be overcome when solving the problem of maximizing the use of raw materials.
At present, there are no such industries in the Republic of Kazakhstan, which makes it difficult to solve the problems of determining the prospects for introducing the scientific results obtained into production. Therefore, the development of an acceptable technology for the depolymerization of carbo-hydrate-containing plant raw materials is an extremely urgent task. Modern technologies for processing cellulose-containing raw materials are extremely diverse. They differ in the type of feedstock, processing processes, end products, and, therefore, are specific for use in different economic and regional conditions. Direct combustion is the most widely used method of processing biomass (wood and wood waste, urban solid waste, straw, etc.). It should be noted that even well-known technologies for the use of cellulosic raw materials are being improved. The authors of [7-20] investigated the process of joint hydrolysis and hydrogenation of cellulose.

ISSN 2224-5278 Серия геологии и технических наук. 4. 2018
47
According to the statistical data of the Ministry of Agriculture of the Republic of Kazakhstan, wheat is the leader among crops in terms of yield. Despite the fact that to date a number of measures developed and implemented for the processing and utilization of wheat straw, most of them are unclaimed. In most cases, it is used for feeding cattle and as litter to animals, the rest of it is plowed into the ground or burned in the fields. Thus, this waste is a large-capacity, affordable and promising secondary agricultural pro-duction resources in the Republic of Kazakhstan. The development of an integrated technology for the processing of wheat straw to produce sorbitol will not only improve the ecological situation, but also will provide raw materials and additional products for the industry.
Thus, the analysis of the literature showed that a significant increase in the number of scientific publications devoted to the one-stage processing of biomass components, especially polysaccharides over the last ten years, indicates the high relevance of the problem of its transformation into valuable chemical substances.
The goal of this work is to develop a technology for enzymatic hydrolytic hydrogenation of wheat straw pulp, in order to obtain sorbitol necessary for the food, pharmaceutical and chemical industries.
The development of such an efficient technology for processing wheat straw, with the possibility of obtaining sorbitol, is an extremely urgent task.
Materials and methods. In the present work, studied wheat straw, which formed as waste in the agricultural sector of the Republic of Kazakhstan. Previously investigated plant raw materials crushed and sorted. For chemical analyzes, raw materials were used,were fractionated through a sieve with a particle size of 2-3 mm.
The ash contents determined by burning the sample of raw materials followed by calcination in a muffle furnace at a temperature of 600°C, the content of easily and hardly hydrolysable polysaccharides determined by the method of Kiesel and Semiganovsky, lignin determined by the Koenig method in the Komarov modification using 72% sulfuric acid, pentosans - determined on the content of pentoses in hydrolysates of easily and hardly hydrolysable polysaccharides.
The analysis of the sugars carried out by the method of Bertrand and Maken-Shoorl, individual sugars were determined on a liquid chromatograph HPLC; ShimadzuLC10-ATVP, Differential Digital Detector TEST-900, Luna Column Investigation of the process of enzymatic hydrolytic hydrogenation of wheat straw in the presence of a complex enzyme preparations.
In this case, enzymatic hydrolytic hydrolysis and hydrogenation of each wheat straw cellulose sample carried out in an aqueous medium (the active acidity regulated with phosphoric acid and was within the range of 4.8-4.9 pH units).
The substrate concentration in all the experiments was 45.0 g/l. As catalysts, a composition of en-zyme preparations used, introduced in an amount of 0.03 g of enzyme per gram of substrate at the start of fermentation. To carry out the hydrogenation-hydrolysis process, the amount of wheat straw, enzymes, phosphoric acid weighed accurately on the analytical scales and the necessary amount of water placed in the fermenter. After a specified period of time, the process was terminated and analyzes were carried out for the content of sugar alcohols and the degree of conversion of cellulose was determined by means of liquid chromatography.
Results and discussion. Studies of the processes of enzymatic hydrolytic hydrogenation of wheat straw cellulose in the presence of complex enzymes carried out. Dependences of the rate of enzymatic hydrolytic hydrolysis and hydrogenation of wheat straw cellulose on the process time showed in table 1.
Table 1 – Dependence of the rate of enzymatic hydrolytic hydrolysis and hydrogenation of wheat straw cellulose
on the time of the process
#
τ, min
Conversion degree, %
Selectivity on sorbitol, %
Selectivity on mannitol, %
Total output, %
Selectivity on glucose
1 80 32.0 1.9 1.0 21.4 19.1
2 160 37.1 2.9 1.4 33.5 21.8
3 240 54.0 3.6 1.8 46.1 35.0
4 320 45.7 3.0 1.6 40.0 33.3
5 400 44.6 2.3 1.3 36.7 31.1

Известия Национальной академии наук Республики Казахстан
48
Table 1 shows the experimental data on the study of the regularities of the change in the rate of en-zymatic hydrolytic hydrolysis and the hydrogenation of wheat straw from the time of the reaction. The reaction time varied from 80 to 400 minutes. The optimal time for the process of catalytic conversion of wheat straw in the conditions chosen by us is 240 minutes. Before this moment of reaction, the conversion of wheat straw gradually increases, and after this index its values are within the margin of error. The same pattern observed with the selectivity index for sorbitol. However, the selectivity for sorbitol and mannitol is much lower than in chemical hydrolytic hydrolysis and hydrogenation. This explained by the prevalence of the rate of the hydrolysis reaction over the rate of the hydrogenation reaction. This evidenced by the high values of the selectivity on glucose (from 19.1 to 35.0%).
When studying the effect of the temperature of the process of enzymatic hydrolytic hydrolysis and hydrogenation on the conversion of wheat straw cellulose and selectivity on sorbitol and mannitol, it showed that, with an increase in temperature from 30 to 500C, the conversion of wheat straw increased from 12.7 to 42.7% (table 2). Selectivity on sorbitol with increasing temperature (30-500C) increased from 7.7 to 17.8% and decreased to 7.0% with an increase in temperature to 70°C. The decrease in selectivity for sorbitol due to the fact that at temperatures above 70°C the process of inactivation of the enzymes in use takes place.
Table 2 – Experience temperature influence on enzymatic hydrolytic hydrolysis
and hydrogenation process of wheat straw cellulose
#
Т, 0С
Conversion degree, %
Selectivity on sorbitol, %
Selectivity on mannitol, %
Total output, %
1 30 12.7 7.7 1.8 10.2
2 40 28.3 14.3 2.0 16.1
3 50 42.7 17.8 1.1 18.9
4 60 34.3 12.1 1.1 14.8
5 70 19.7 7.0 1.2 9.0
Table 2 shows the optimal temperature for experience is 500С, as soon as in this temperature we ob-
tained maximum selectivity on sorbitol and mannitol. During the study of the effect of pH (Table 3) on the process of enzymatic hydrolytic hydrolysis and
hydrogenation of wheat straw cellulose on conversion and selectivity for polyols, it was established that the highest selectivity values for sorbitol-17.8% and conversion-42.7% were observed in when using a pH value of 5.0. The change in the pH of the medium leads to a change in the degree of ionization of the acidic and basic groups as the active center of the enzyme, and the substrate itself.
Table 3 – Effect of pH on the process of enzymatic hydrolytic hydrolysis and hydrogenation of wheat straw cellulose
# Т, 0С
Conversion degree, %
Selectivity on sorbitol, %
Selectivity on mannitol, %
Total output, %
1 4.0 15.2 7.5 1.2 9.3
2 4.5 30.0 11.3 1.2 12.5
3 5.0 42.7 17.8 1.1 18.9
4 5.5 35.8 10.5 2.9 11.7
5 6.0 19.1 5.5 2.4 8.1
Consequently, a change in pH affects the affinity of the substrate to the active center of the enzyme
and to the catalytic mechanism of the reaction. The dependence of the rate of the enzymatic reaction on the pH of the medium has the form of an extremum, since for each enzyme there is an optimum pH value at which the enzyme exhibits the greatest catalytic activity (the optimum pH of the enzyme). The pH value in the optimum corresponds to the best binding of the substrate by the enzyme and the highest catalysis rate. In our case, this value is 5.0.

ISSN 2224-5278 Серия геологии и технических наук. 4. 2018
49
Thus, we determined the optimal conditions for the enzymatic hydrolytic hydrolysis and hydroge-nation of wheat straw pulp: pH 5.0, temperature 50°C, reaction time 3 hours.
Conclusion. Thus, we determined that the resource of wheat straw waste that we are interested in is quite sufficient for further implementation of the task. The effectiveness of a complex of enzymes for carrying out the process of enzymatic hydrolytic hydrogenation of cellulose of wheat straw substantiated and experimentally confirmed for the first time. The optimal conditions for the enzymatic hydrolytic hydrolysis and hydrogenation of wheat straw: pH 5.0, temperature 50°C, reaction time 3 hours are determined.
REFERENCES
[1] Huber G.W., Iborra Ѕ. Synthesis of transportation fuels from biomass: Chemistry, catalysts, and engineering // Chem.
Rev. 2006. Vol. 106. Р. 4044-4098. [2] Yang Р., Kobayashi Н., Fukuoka А. Recent Developments in the Catalytic Conversion of Cellulose into Valuable Che-
micals // Chin. Ј. Catal. 2011. Vol. 32. . [3] Kedelbaev B. Prospеcts of usage of polysaccharides depolymerization processes of the industrial and agricultural wastes
in republic of Kazakhstan. International Conference of Industrial Technologies and Engineering (ICITE 2015). Shymkent, 2015. Р. 473-476.
[4] Makhatov Zh.B., Kedelbaev B.Sh., Kaipova Zh.N. Study of the process of catalytic conversion of cellulose of wheat straw sorbitol // V Jubilee International Scientific Conference of young scientists and students' prospects for the development of biology, medicine and pharmacy. VOLUME 1 No. 4 (81), Shymkent. Republic of Kazakhstan. UKGFA 8-9 December 2017. N 12. Р. 87-89.
[5] OndaА., Ochi Т., Yanagisawa К. Selective hydrolysis of cellulose into glucose over solid acid catalysts // Green Chem. 2008. Vol. 10. Р. 1033-1037.
[6] Fukuoka А., Dhepe Р. L. Catalytic Conversion of Cellulose into Sugar Alcohols // Angew. Chem. 2006. Vol. 118. Р. 5285-5287.
[7] Palkovits R. Pentenoic acid pathways for cellulosic biofuels // Angew. Chem. Int. Ed. 2010. Vol. 49, N 26. Р. 4336-4338. [8] Palkovits R., Tajvidi К., Procelewska Ј., Ruppert А. Efficient conversion of cellulose to sugar alcohols combining acid
and hydrogenation catalysts // From Abstracts of Papers, 241st ACS National Meeting & Exposition, Anaheim, СА, United States, March 27-3 l, 2011, CELL-240.
[9] Palkovits R., Tajvidi К., Procelewska Ј., Rinaldi R. and Ruppert А. Hydrogenolysis of cellulose combining mineral acids and hydrogenation catalysts. // Green Chem. 2010. Vol. 12. Р. 972-978.
[10] GeboersЈ., Van de Vyver Ѕ., Carpentier К., Jacobs Р., Sels В. Efficient hydrolytic hydrogenation of cellulose in the presence of Ru-loaded zeolites and trace amounts of mineral acid // Chem. Commun. 2011. Vo1. 47. Р. 5590-5592.
[11]Kobayashi Н., Ito У., Komanoya Т., Hosaka У., Dhepe Р.L., Kasai К., Haraa К., Fukuoka А. Synthesis of sugaral-coholsbyhydrolytichydrogenation of cellulose over supported metal catalysts // GreenChem. 201l. 13. Р. 326-333.
[12] Huber G.W., IborraЅ., Соптіа А. Synthesis of transportation fuels from biomass: Chemistry, catalysts, and engineering // Chem. Rev. 2006. Vol. 106. Р. 4044-4098.
[13] Palkovits R., Tajvidi K., Ruppert А.М., Procelewska Ј. Heteropoly acids as efficient acid catalysts in the one-step conversion of cellulose to sugar alcohols. Chem. Commun. 201 l. Vol. 47. P. 576-578.
[14] Geboers Ј., Van de V. Stijn, Carpentier K., Blochouse K., Jacobs Р., Sels В. Reductive splitting of concentrated cellulose feeds to hexitols with heteropoly acids and Ru оп carbon // From Preprints – American Chemical Society, Division of Petroleum Cheimistry. 2011. Vol. 56. N 1. Р. 163.
[15] Tao F., Song Н., Chou L. Catalytic conversion of cellulose to chemicals in ionic liquid // Carbohydrate Research. 2011. Vol. 346, Issue l.
[16] Tian Ј., Wang Ј., Zhao Ѕ., Jiang С., Zhang Х. and Wang Х. Hydrolysis of cellulose by the heteropoly acid Н PW, O40- º/Cellulose. 2010. Vol. 17. P. 587-594.
[17] Shimizu K., Furukawa Н., Kobayashi N., Itaya У. and Satsuma А. Effects of Bronsted and Lewis acidities оп activity and selectivity of heteropolyacid- based catalyst for hydrolysis of cellobiose and cellulose // Green Chem. 2009. Vo1. 11. Р. 627-1632.
[18] Rinaldi R., Palkovits R., Schuth F. Depolymerization of cellulose by solid catalysts in ionic liquiAngew. Chem. 2008. Vol. 120. Р. 8167-8170.
[19] DE 102008014. German patent.Depolymerization of cellulose by solid catalysts in ionic liquids / Rinaldi R., Palko- vits R., Schuth F. N DE10/ 2008/014/735.42008, international publication date 12.10.2008. 16 p.
[20] WO 2012035160.International patent. Simultaneous hydrolysis and hydrogenation of cellulose / Li Ј. Makkee М., Moulijn Ј. А., O'connor Р., Rasser Ј. С., Rosheuvel А. Е. N РСТ/ЕР2О1 l/066156, priority date 17.09.2010; intemational publi-cation date 22.03. 2012. 20 p.
[21] Lail D., Deng L., Lil Ј., Liao В., Guo Q., Fu У. Hydrolysis of Cellulose into Glucose by Magnetic Solid Acid // CheinSusChem. 2011. Vol. 4, N 1. P. 55-58.

Известия Национальной академии наук Республики Казахстан
50
К. М. Лаханова1, Б. Ш. Кедельбаев2, Ж. Б. Махатов2, П. Либерцайт3, Б. С. Бегалиев1, Ғ. А. Рысбаева2, Ж. К. Ибраимова2
1Х. А. Ясауи атындағы халықаралық қазақ-түрік университеті, Түркістан, Қазақстан, 2М. Əуезов атындағы Оңтүстік Қазақстан мемлекеттік университеті, Шымкент, Қазақстан,
3Вена университеті, Вена, Австрия
БИДАЙ САБАНЫ ЦЕЛЛЮЛОЗАСЫНАН СОРБИТТІ АЛУ ТЕХНОЛОГИЯСЫН ЖАСАУ
Аннотация. Жұмыстың мақсаты – үйлестірілген (гибридті) тəсіліне негізделген бидай сабаны целлюло-засынан сорбитті гидролитикалық гидрлеуді қолдана отырып ферментативті өңдеу арқылы алу техноло-гиясын жасау. Ферментативті гидролитикалық гидрлеу жəне бидай сабаны целлюлозасын гидролитикалық гидрлеу үрдістері зерттелді, үрдістің тиімді параметрлері жасалып алынды. Нəтижесінде біз сорбитті алудың үйлестірілген (гибридті) гидролиз-гидрлеу əдісін іске асырдық. Осы үрдіс үшін ферменттер жасалды, олар-дың белсенділіктері анықталды. Үрдіске уақыттың əсері, температура жəне целлюлоза конверсиясына рН əсері, сорбит бойынша таңдама жасалынды. Біз жасап шығарған технология дəстүрлік үрдіс барысында, көптеген тазалаулар мен бөліп алуларда пайда болатын аралық өнімдерді болдырмайды. Ол біз үшін, бір реакторлы үйлестірілген (гибридті) үрдісті қолданып сорбит секілді құнды химиялық затты алуға мүмкіндік береді.
Түйін сөздер: бидай сабаны, гидролиз, целлюлоза, гидрлеу, полисахаридттер, ферментативті гидроли-тикалық гидрлеу, глюкоза, сорбит, ферменттер.
К. М. Лаханова1, Б. Ш. Кедельбаев2, Ж. Б. Махатов2,
П. Либерцайт3, Б. С. Бегалиев1, Г. А. Рысбаева2, Ж. К. Ибраимова2
1Международный казахско-турецкий университет им. Х. А. Ясауи, Туркестан, Казахстан, 2Южно-Казахстанский государственный университет М. Ауезова, Шымкент, Казахстан,
3Венский университет, Вена, Австрия
РАЗРАБОТКА ТЕХНОЛОГИИ ПОЛУЧЕНИЯ СОРБИТА ИЗ ЦЕЛЛЮЛОЗЫ СОЛОМЫ ПШЕНИЦЫ
Аннотация. Цель работы – разработка ферментативной технологии переработки целлюлозы соломы пшеницы для получения сорбита посредством гидролитического гидрирования, основанного на использо-вании совмещенного (гибридного) процесса. Проведены исследования по изучению процесса ферменттив-ного гидролитического гидролиза и гидрирования целлюлозы соломы пшеницы, разработаны оптимальные параметры процесса. В результате чего нами реализован совмещенный (гибридный) гидролиз-гидрирование процесс получения сорбита. Разработаны ферменты для данного процесса, исследована их активность. Изучено влияние времени процесса, температуры опыта и рН на конверсию целлюлозы и селективность по сорбиту. Разработанная нами технология позволит усовершенствовать традиционные процессы в плане ликвидации многочисленных стадий очистки и выделения промежуточных продуктов. Она дает возможность реализации однореакторного совмещенного (гибридного) процесса получения такого ценного химического вещества, как сорбит.
Ключевые слова: солома пшеницы, гидролиз, целлюлоза, гидрирование, полисахариды, ферментатив-ное гидролитическое гидрирование, глюкоза, сорбит, ферменты.
Information about authors: Lakhanova Kulzada Mergenbaevna – doctor of agricultural sciences, professor, International Kazakh-Turkish
University named after HA Yasaui; Department of Human Morphology and Physiology; Kedelbayev Bakhytzhan Shilmirzaevich – Doctor of Technical Sciences, Professor, M.Auezov South-Kazakh-
stan State University, Higher School "Chemical Engineering and Biotechnology", Department of "Biotechnology", [email protected];
Makhatov Zhaksylyk Baumanuly – doctoral candidate, M.Auezov South-Kazakhstan State University, Higher School "Chemical Engineering and Biotechnology", Department of "Biotechnology", [email protected];
Peter Lieberzeit – PhD doctor, Professor, University of Vienna, [email protected]; Rysbaeva Galiya Altynbekovna – Candidate of Biological Sciences, Associate Professor, M.Auezov South-
Kazakhstan State University, Higher School "Chemical Engineering and Biotechnology", Head of the Department of "Biotechnology", [email protected].
Ibraimova Zhylduz – PhD doctor, M.Auezov South-Kazakhstan State University, Higher School "Chemical Engineering and Biotechnology", Department of "Biotechnology".

ISSN 2224-5278 Серия геологии и технических наук. 4. 2018
51
N E W S OF THE NATIONAL ACADEMY OF SCIENCES OF THE REPUBLIC OF KAZAKHSTAN
SERIES OF GEOLOGY AND TECHNICAL SCIENCES
ISSN 2224-5278
Volume 3, Number 430 (2018), 51 – 61 UDC 662.415, 62-614
B. Sapargalieva1, A. Naukenova1, B. Alipova2, J. R. Illari3, Sh. Shapalov1
1M. Auezov South-Kazakhstan State University, Shymkent, Kazakhstan,
2International IT University, Almaty, Kazakhstan, 3Polytechnic University of Valencia, Valencia, Spain.
E-mail: [email protected], [email protected], [email protected], [email protected]
THE ANALYSIS OF HEAT AND MASS PROPERTIES OF THE FIRE EXTINGUISHING POWDER
IN EFFECTIVENESS CRITERIA
Abstract. The given research presents the classification of fire extinguishing and explosion suppression com-positions. The effect on the combustion reaction is possible with the help of physical and chemical methods of gas mixture components concentration reducing, cooling the combustion zone and slowing down of chain reactions with the help of a phlegmatizing or inhibiting substances, of which the most universal and perspective are powder ma-terials. In view of the high toxicity and environmental hazard of inhibitors (halides), the most promising search and development of effective powder compositions based on chlorides and substances with pronounced endothermic properties (easy-boiling, easy-decomposing, easy-melting) causing a sharp cooling of the combustion zone. The general laws of the effectiveness of extinguishing powders from their composition was considered in the scope of literature. There are proposed only some unsystematic series of dependence of the studied mineral compounds. The-refore, a necessary condition for solving the problems of developing effective flame arresters is to find common indicators and properties of substances that can become criteria for their phlegmatizing ability.
Keywords: fire extinguishing powders, explosion suppression composition, spread materials, burning reagents, efficiency of powder, heat and mass properties.
Classification of fire extinguishing and explosion suppression compositions. One of the modern
means of fires fighting and explosions are fire extinguishing and explosion suppression powders, which are finely powdered mineral salts with various additives preventing caking and balling. Powders are differed with universal actions, providing the extinguishing of even such materials that cannot be put out by water and other means.
Powders used to extinguish most of the fires classes [1, 2]. Class A - burning solids, accompanied by decay (wood, paper, textiles, coal etc.) and not followed by decay (plastic, rubber); B - burning liquids (gasoline, petroleum products, alcohols, solvents, etc.); C - combustion of gas- and vaporous substances (ammonia, methane, propane, and others.); D - burning metals and metal-containing compounds (magne-sium, aluminum, potassium, sodium, etc.); E - combustion of materials in electric installations under voltage.
Therefore, the powder can be used to extinguish of any substances and materials. Powder compo-sitions depending on the class of fire that they can extinguish, divide:
- powders of ABCE type - active main component - phosphorus-ammonium salts; powders of BCE - the main component of these powders can be sodium and potassium bicarbonate;
potassium sulfate; potassium chloride; alloy urea with salts of carbonic acid, etc.; - powders of D type - main component - potassium chloride; graphite, etc. There are distinguished powders of general and special purpose. Powders of common purpose
(ABCE, BCE types) is used to extinguish fires of ordinary (organic) easy-flammable combustible mate-rials (EF) and combustible liquids (CL), for example various liquefied gases, solid material - wood, rub-
Известия Национальной академии наук Республики Казахстан
52
ber, plastics, etc. The extinguishing of these materials is reached by creating a powder cloud that envelops the hearth burning.
The powders of special purpose are produced for the particular class of fire, for example for B. C and D classes. Cessation of combustion in this case is achieved by isolating the burning surface from the ambient air.
The advantages of powder include the possibility of their application for the deterrent and explosion suppression. In this regard, by applying powders fall into two groups: fire-extinguishing and explosion suppression. The largest group consists of extinguishing powders used for charging, manual and mobile fire extinguishers, fixed installations and special fire vehicles.
Fire extinguishing of powders ability of the general purpose is increased with rising of their dispersion (size reduction of particles), powders of a special purpose - almost does not depend on the degree of their dispersion. From literature data [3, 4] it is known that some mineral powders are active inhibitors of the chain gas-phase combustion reactions and can be used as explosion suppression agents.
So, in the USA, Germany, England, France developed and uses automatic systems of protection of curb, as a rule, commercially available fire-extinguishing powder or finely divided salts of phosphoric salts and carbonic acid.
Fire extinguishing powders properties and compositions characteristics. There are widely used various substances to prevent ignition and explosion of methane - air mixtures at mining industry at the present time. Beginning from simple deterrents (inert dust and water with the addition of 5-7% surfac-tants), the restraining effect of which is to reduce the temperature to a level at which terminates com-bustion. And finishing with the highly efficient flame retardants based on easy-decaying salts are treated with a special water-repellent additives and disintegrating, can extinguish the flame of the flash (explosion) at relatively low unit costs, about 0.01 to 0.10 kg/m3 of protected volume [5].
The extinguishing with powder method can be used to explain the physical-chemical properties of the powder (table 1) and the effect of the following factors:
- dilution of the combustible environment with gaseous products of powder decomposition or directly by a powder cloud;
- cooling of the combustion zone as a result of the heat cost for powder particles heating its partial evaporation and decomposition in flame;
- effect of fire-resistance achieved by passing the flame through the narrow channels, as if created by a powder cloud;
- inhibition of chemical reactions that lead to the development burning, gaseous products of eva-poration and powders decomposition or heterogeneous open circuits on the powders surface or solid products of their decomposition.
The working life of agents is limited to 5-10 years and depends largely on the conditions of fire extinguishing compositions service.
So, powders, working in the conditions of transport are subject to additional vibration, which leads to the seal structure, the so-called effect of “pepper”.
Standard GCST 26952-97 is spread to fire-extinguishing powders for general purposes, and estab-lishes requirements for the indicators of technical level and quality as well their test methods.
Universal fire-extinguishing powders, such as P-2АP and P-4АP are checked on quality indicators according to the TC 113-08-597-86 [6].
Powder P-2А1Т is used for filling powder fire extinguishers and installations and P-4АP for volume distant extinguishing of underground fires in coal mine workings and can be used for equipment of explosion-protection automatic machines.
Extinguishing powders are complex heterogeneous systems, so they have specific properties and characteristics which depend on their fire-extinguishing ability. Chemical composition of powders also determines their fire extinguishing action and performance properties.
There is presented information about the applied powder flame retardant compositions in the reviews [7-10].
The basis for fire extinguishing powder is phosphorus- salt (mono- and di-ammonium phosphates) such as: (NH4)2HPО4, NH4H2PО4; potassium chlorides KCl and others. In the composition of the powders also enter special additives that prevent the balling and caking.

ISSN 2224-5278 Серия геологии и технических наук. 4. 2018
53
Table 1 – Basic physical-chemical data of fire extinguishing powders
Class of fires
The combustible material The required physical-chemical properties
of powder Spread
components
А Carbon-containing (wood, coal, rubber-technical products, plastic and other)
Viscous polymer film formation at the temperature 200-250°.
Phosphorus-ammonium salt; a sodium salt of boric acid
В
Flammable liquids (gasoline, alcohol, paints, solvents and others)
The ability of the surface particles and products of its evaporation (decomposition) sharp slowdown the chain reaction of combustion; the ability of the powder substances quickly decompose at T >200°C
Phosphorus-ammonium salts; bicarbonates and chlorides of potassium (sodium)
С
Combustible gases and vapors (hydrogen, methane, ammonia, propane - butane mixture, vapours of acetone, and others)
Same
Same
D Light metals and their alloys (magnesium, aluminium, potassium, sodium)
The formation of melting film which stable at the temperatures of 2000-3000 °C
Potassium chloride (sodium); Melamine; graphite; cryolite
E
Electrical equipment and cables up to 1000-1200 V (at the latest international standards this class is absent)
The absence of electric-conductivity of powder layer and powder-air stream
From foresaid components-of all, besides graphite, but good dried (till humidity no more than 0,5%)
The powders based on bicarbonate and carbonates of alkaline materials (KHCO3, NaHCO3) are
widespread. To improve the yield and sustainability of the structure the additives of silicon organic com-pounds are entered. These powders are resistant to caking and have good performance properties.
One of the directions in solving the problem of phlegmatizing of explosive atmospheres is the use of special chemical compounds, relatively small additions of which greatly reduce the possibility of ignition from heat source. For this purpose, the authors of [11] were investigated substances: sodium bromide, sodium chloride and sodium bicarbonate with a particle size, a predominant fraction (87%) 0,2-0,5 mm.
Thus, the PSB powder made from bicarbonate of sodium has good performance properties, low-cost, and the main component of it available. Powder PSB is designed to extinguish fires of B, C and E classes. It is widely used for extinguishing liquefied gases large quantities of petroleum products (for example during an emergency landing of the aircraft), alcohols and other polar GL.
Currently available powder brand PSB-3 (TU 6-18-139-93) characterized by a higher dispersion and, consequently, increased fire-extinguishing ability.
Sodium bicarbonate and aerosol enters into powder PSB-3 as well nepheline concentrate is used to improve the fluidity.
Powder brand of PSB-3M is designed for extinguishing fires of B, C and E classes. It represents by itself a mechanical mixture of 87-90% of sodium bicarbonate (bicarbonate); 7-10% of nepheline concen-trate; 3-5% flowing additives. The rate of fire extinguishing ability when extinguishing fire of B class is no more than 0,8 kg/m2 (TU - 2149-017-19968286-95).
In addition, there are copyright certificates and patents for a number of fire extinguishing powder formulations, although not exploited commercially, but is of interest. In particular, to enhance fire-extin-guishing efficiency of the composition added salts of organic acids - sodium carbonate [A. S. 1142128 (USSR)], trilon B [us Pat. 2118834 (UK)] and other salts.
There is a tendency to apply active fire-extinguishing salts (solution) in porous media. As inorganic salts - vermiculite, aerosil, zeolite, or organic - polystyrene (patent 4226727 USA; patent 77537 NDP). Along with effective powder type "Monex" is underway on the preparation of ternary alloys of the type urea (melamine) phosphate - bicarbonate.
485742 A. S. (USSR) invited the inhibitor of ignition of combustible gases consisting of inorganic salts of potassium stearate and talc for suppression of ignition improvement and the flame of a mixture of acetylene with air extinguishing. Components: 93-96% sulfide; 3-5% of potassium stearate and talc 1-2%.

Известия Национальной академии наук Республики Казахстан
54
In a.s. 563503 (USSR) to improve the efficiency of preventing dust explosions, and the prevention of caking as the ammonium salts, the composition contains ammonium bromide (97-98%) and calcium stearate. The mixture is ground until full passage through a sieve of 0.075.
The authors of [12] were investigated the combustion of explosive substances under conditions similar to the conditions in the mine, and also the effect of various reagents added to explosives to prevent them from burning. It was established experimentally that the most effective action have inorganic compounds with a high content of water of crystallization such as:
OHSOAlOHNOAl 23422332 18)(;9)( . The authors of [13, 14] were experimentally investigated the inhibitors following the explosion of a
coal - air mixture: rock dust, crushed limestone (both calcium carbonate), a conventional composition for fire extinguisher (sodium bicarbonate), "Monex".Sevrikov and others [15] suggest to use as fire-extinguishing powder industrial dust cement plants, especially dust Bakhchisaray cement plant the extinguishing capability of which is equal to 0,7-0,8 kg/m2 (i.e. as at PSB).
To obtain fusible powders it is advisable to search among complex multi-component compositions that form a eutectic [16]. The eutectic is a thin mixture of solids, is simultaneously crystallized from the melt at a temperature lower than the melting components or other mixtures thereof. For example, in the ternary diagram of fusibility of the system CaO - SiO2 - Al2O3 used for finding low-melting compositions metallurgical slag, the melting point of pure oxide is 2570, 2040, and 1728°C, respectively, and a eutectic mixture consisting of: 24% CaO + 62% SiO2+ 14% A12O3 starts to melt already at 1170 °C.
Considering the economic aspect of the problem, effective fire extinguishing powder compositions are supposed to look for on the basis of cheap natural materials and industrial wastes, among which the perspective can be slag, the chloride technology of nonferrous metallurgy. Examples of this are the reference data that the double eutectic mixture of 35% KCl + 65% CuCl2 is melted at 150 °C, while pure KCl and CuCl2 - at 770°C and 630 °C, respectively, and the triple eutectic melting separate ZnCl2, NaCl and KCl are respectively 320 °C, 800 °C and 770 °C.
The perspective direction from an economic point of view is obtaining fire extinguishing powder based on mixtures of chlorine-containing effluents, rolling mills and iron mill scale rolling mills with the aim of iron chlorides crystal-hydrates obtaining, the effectiveness of which is conditioned by low temperature flowing of endothermic reactions decomposition and melting.
So according to I. T. Granovsky [17], FеС124H2O is decomposed at a temperature of 76 °C, FеС136Н2О melts at 37°C and boils at 285°C. Anhydrous iron (II) chloride melts at 677°C, the iron chloride (III) at 309°C and sodium chloride, which melts only at 800°C is considered as a good enough antipirogen.
Thus, the chlorides of alkali metals are one of the most effective flame arresters. They are considered most promising for the development of new powder formulations because they are low-toxic and widely available. At the same time, Baratov noted that on the basis of these salts, fire-extinguishing powders, such as PGS-M (mixture NaCl and KCl) is recommended for metals extinguishing by the method of isolation from the air, and the possibility of their application as flame retardants has not been reported.
Thus, the research [18] revealed that the most efficient inert for lignite dust is the powder of NaCl, phlegmatizing ability of which is 3,5 times is higher than in dust СаСO3.
The authors of [19] are proposed already as an inhibitor composition based on NaCl additives as a promoter of 0,1-5% FеС12.
There are claimed the ways of coal dust suppression in the mine atmosphere by blowing fine СаС12 and prevent its explosion of composite powders on the basis of chlorides (СаС12, MgCl2, NaCl) with the addition of 0,1-3% hydrophilic organic wetting agent and 0,1-2% anti-corrosion agent (chromium, silicate, phosphorus and aluminate).
In several works of [19-23] are noted effectiveness of the suppression with fine powders of chlorides, including АlС1, NaCl, KCl - explosions of methane and KCl - the hybrid mixtures of methane with coal dust.
A review of the scientific-technical and patent literature allowing to conclude that the most promising components for the manufacture of powders are phosphor-ammonium salt, sulfide- ammonium and aluminium- ammonium crystal-hydrates of alum type, chlorine and fluorine-containing compounds such

ISSN 2224-5278 Серия геологии и технических наук. 4. 2018
55
as "Monex", salts of alkali metals, salts of carbonic acid, bicarbonate and sodium or potassium carbonate. Fire-extinguishing capacity and efficiency of powders. Nowadays more and more preference is
given to powder products due to their high fire extinguishing efficiency. They are also the most cost-effective means of extinguishing based on the indicator as "the ratio of the cost of extinguishing to the area of extinguishing".
Comparing the technical data of domestic and foreign fire extinguishing powders, which are pre-sented in table 2, it can be seen that they have approximately the same fire extinguishing capacity and close in performance properties are. As the main component in fire extinguishing powders are used:
- bicarbonate and sodium and potassium carbonate; - ammophos (ammonium phosphate); - sodium and potassium chlorides; - carbamide (urea); - ammonium, potassium and sodium sulfates.
Table 2 – The characteristic of fire-explosion-danger dispersion wastes
Appellation of test-tube
Compound, % weight
Group of combustibility
Temperature, °С
Тn Тk Ignition of air
suspension
Blast furnace slag SiO2 - 36,72; СаО - 39,13; MgO - 7,51; А12O3 - 13,64
NG no No
Open-hearth slag
SiO2 - 18,72; СаО - 45,25; MgO - 9,84; Р2О5 - 1,65; А12O3 - 4,15; FeO - 12,26;
МnО - 6,98
NG No No No
Dust of open-hearth gas-cleaning
Ғе2O3 - 54,5; Са - 3,14; SiO2 - 1,9; MgO - 2,28;
S - 2,75 NG No No No
Convertor slag
SiO2 - 8,45; CaO - 44,03; А12O3 - 2,14; MgO - 5,24; MnO - 4,35; FeO - 15,34;
P2O5 - 6,34
NG No No No
Dolomite slag
CaO - 44,50; SiO2 - 3,71; MgO - 26,36; MnO - 0,25; Fe2O3 - 0,22; A12O3 - 1,74
NG
No Endo-effect
420-640 750-
Notill 1000 No
Limestone dust CaO - 81,75; SiO2 - l,20;
MgO - 0,77; A12O3 - 0,61; S - 0,02
NG Noendo-effect
430-580 720-830
Notill 1000 sparks
Graphite-containing dust of ventilation system
C - 97 TG 420 760 900
sparks
The general dependence of explosion-suppressing and fire-extinguishing powders efficiency on their chemical composition (at their identical dispersion) in the scientific and technical literature is not revealed by us. There are disclosed fragmentary according to the different composition of groups of substances. Some regularity of the effectiveness of powders with the composition of compounds present only in the last fourth and fifth cases:
1) FClBrJ (halogens, halons)
2) OHOCKNaClOCrKKClCOKClNaOCNaNaFNaHCO 242272232324223
3)
2:98:
1:99:2,0:8,44:55::
2
22
MgFlmeltingNaC
KOHNaClFeClNaClmeltingKClNaClSiO
4) Hydrates of Salts > Hydroxides >Anhydrous Salts > Oxides 5) Salts: Chlorides > Carbonated >Sulphates and moreover: FeR>MgR>CaR, where R- acid residue -
1123
24 ,, orOHClCOSO

Известия Национальной академии наук Республики Казахстан
56
The aim of our study is to find fire-extinguishing powders, in which the main part would be non-combustible (table 2) dusty metallurgical wastes of JSC "Arcelor Mittal Temirtau". The emphasis is powder flame-suppressing compositions development for the effective suppression of ignition and explosion, which would have been made from abundant raw materials by simple technology.
Therefore, the physical-chemical evaluation of metallurgical wastes by JSC “Arcelor Mittal Temirtau” is relevant both for the development of technological options for their use and for the search for new materials for the production of fire-extinguishing compositions [24, 25]. The large-tonnage dispersed waste of metallurgical plant, which have a phlegmatizing or inhibitory properties are:
- calcareous, limestone and dolomite dust of products of limestone burning shops which contains carbonates, hydroxides and calcium and magnesium oxides;
- blast furnace and steelmaking slags consisting of calcium, magnesium, aluminum, silicon and iron oxides in free state and bound in various compositions;
- neutralized acid runoff of rolling mills; - iron oxide formed during regeneration of spent etching solution. There is performed a review of scientific-technical and patent literature on the endothermic properties
of powder materials and compositions, similar in composition to waste, as explosion suppression sub-stances.
The efficiency of powder phlegmatizers can be combined into three groups [26]. The first group is substances that act as inert when heated. These include dispersed wastes consisting
mainly of oxides: - SiO2-spent foundry molding mixtures; - Fe2O3-dust generated during the regeneration of spent pickling solutions of rolling mills; - CaO, MgO, SiO2, Аl2O3 - oxides, contained in very stable silicates of CaO-SiO2, MgO-SiO2,
Al2O3-ЅіO2 in metallurgical slag. These substances do not undergo structural, mineralogical or chemical transformations when heated even above 1000°C. Fire-extinguishing properties of oxides are the weakest. The effect of phlegmatization by inertia increases with the use of substances with endothermic melting processes.
To them are related commonly magnesium, potassium, calcium and sodium chlorides, which have a melting point of 700-800°C.
The effect of oxides is due only to the physical absorption of the heat of the combustion reaction, which leads to a decrease in its thermal effect, a slowdown in the rate of combustion and an increase in the ignition temperature.
The second group is substances in which the heating occurs endothermic decomposition reaction with the transition to a substance of a different composition. These include:
- carbonates (СаСO3>MgCO3) contained in the limestone and dolomite dust, as well as calcined lime and dolomite dusts and bulk materials steel mills;
- hydroxides Ca (OH)2 and Mg (OH)2 formed upon contact with water during granulation of blast furnace slag and absorption of moisture from the air by lime and dolomite dust;
- iron hydroxides Fe(OH)2, Fe (OH)3 contained in the neutralized acid runoff of steel rolling mills; - hydrates of iron and calcium salts, containing in its composition crystal-hydrates, i.e. chemically
bound water, which are formed in acidic and neutralized effluents of steel-making shops, and are in the form of a solution or suspension, and after drying - in a dispersed state.
The third group is substances that have chemical effect on the reaction of oxidation and ignition in a combustible environment (chlorides).
Considering both efficiency, and ecological safety, search and development of compositions among substances with pronounced endothermic properties is the most perspective, i.e. preference, it is necessary to give to the materials causing sharp cooling of a zone of burning or capable to create the environment which is not supporting burning.
To these materials are related carbonates, crystal hydrates and other fusible salts. For example, as anti-pirogen are recommended the following: urea (CH4ON2), which melts at 132°C; dolomite (CaCO3MgCO3) decomposes at 350°C with the release of carbon dioxide; alum KAl(SO4)312H2O-above 100°C decomposes with the release of water vapor.

ISSN 2224-5278 Серия геологии и технических наук. 4. 2018
57
Recent studies have established [27] that one of the main factors determining the fire extinguishing capacity of powder wastes is the temperature of endothermic processes occurring in them during heating. The explosive action of powders with equal dispersion increases in a number of:
Oxides < Salt Anhydrous < Hydroxides < Hydrates Of Salts, Including Sulfates < Carbonates <
Chlorides, And CaR<MgR<FeR (R - acid residue - 1123
24 ,, orOHClCOSO ).
The authors of somescientific papers [28 noted that the efficiency of powder inhibitors is signi-ficantly influenced by the way of their spraying and delivery to the flame front. There are three ways to feed powders into a fire or explosion zone: pneumatic, explosive and combined.
Pneumatic method is carried out in several ways: - the charge and case of the fire extinguisher are constantly under pressure of the displacing inert gas
(air, nitrogen, carbon dioxide) or steam of the extinguishing agent; - presence in the fire extinguisher with powder of the spray can with the compressed or liquefied gas
located in the case of the fire extinguisher or outside; - presence in the powder container of excess pressure created by the release of gas in the course of a
chemical reaction between the components of the charge of a special pyrotechnic gas-generating element of the fire extinguisher;
- supply of extinguishing agent is carried out as a result of the thermal effect on electric current or chemical reaction products of components of a special element;
- ejection supply of fine powder in the air satellite stream (volumetric remote extinguishing powder in the mine, cable channels).
Explosive (pulse) method is implemented by placing before or in the mass of the explosive charge a detonator, the mass is selected experimentally. Explosive method has a number of advantages compared to the pneumatic method: instantaneous response, fast powder cloud formation, activation and dispersion of fire extinguishing powder by explosion energy, small inertia of the method. However, there are draw-backs: there are restrictions in the use of explosives require special accounting and storage. Burning explosives during blasting in coal mines can cause gas or coal dust explosion.
The combined (pneumatic impulse) method of feeding the powder into the fire or explosion is carried out by the energy of the gas compressed in the cylinder, the unlocking of which occurs with the help of an instantaneous micro-explosion.
The widespread use of powder-filled fire extinguishers and with an integrated pressure source, with regard to pulsed fire extinguishers and explosives is a new generation of firefighting equipment.
The successful and timely suppression of ignition and explosion of a gas-air mixture depends on the speed of introduction of an effective inhibitor into the ignition zone or flame front. For this purpose, high-speed automatic systems of active suppression [29] are used, the designs of which have recently been intensively developed. Typically, such systems include: explosion detection sensors that react to light, UV-radiation, static pressure, thermal radiation, smoke; control and amplifying device of the signal coming from the sensor and sending a command to the fuse; explosive devices, triggered by the charge of explosives and powder inhibitors, sprayed into the combustion zone or explosion.
Generators of volumetric aerosol fire extinguishing or volumetric extinguishing system (VES) are the most modern means of fire extinguishing.
They are designed to extinguish fires of flammable liquids and combustible liquids (gasoline and other oil products, organic solvents, etc.) and solid materials (wood, insulated materials, plastics, etc.) and electrical equipments (power and high voltage installations, consumer and industrial electronics, etc.)
Volumetric quenching systems (VES) are suitable for extinguishing alkaline and alkaline earth materials, as well as substances whose combustion takes place without the presence of air.
The VES generators are divided into: manual (VES-5M) and stationary (VES-1). The protected volume in case of fire by VES-5M generator up to 40m3 and VES-1 generator is up to 60 m3.
To actuate the VES-5 generator it is necessary: remove the cap from the start node, then sharply pull the cord and throw it into the burning room.
To start the VES-1 generator, special thermo-chemical or electrical start-up units are used. The use of thermo-chemical start-up units, triggered when the temperature reaches 90°C in the
protected volume, allows each generator, if there are several, to work completely autonomously. Gene-

Известия Национальной академии наук Республики Казахстан
58
rators with thermal nodes run, installed under the ceiling of the room in the area of the most likely ignition.
The use of electric start-up units allows the use of VES-1 generators at sites with fire alarms. Instal-lation of the VES-1 generator in the protected area is performed using a special bracket. The operating position of the generator is horizontal or vertical by the injector downwards. Generators with electric start node are placed at random.
VES-1 generators operate in a temperature range from minus 55°C to plus 55° and 100% humidity. In case of fire and tripping of generators, persons in this moment in a secure room need to quickly
leave it firmly closed doors and not to take any action to extinguish the fire and calling the fire brigade. Generators VES it is recommended to equip the following objects: industrial enterprises, power
installations, household enterprises, public buildings, educational institutions, research institutes and establishments, banks and offices, shopping bases and warehouses, entertainment enterprises, admini-strative and residential buildings and vehicles.
In particularly hazardous conditions using automatic systems, as in the former Soviet Union deve-loped the system explosion-suppression "Rainbow" and "Underbar", German firm "Total" designed "ACHEMA", a relatively new (2003), the Russian development of ASVP-LV explosion-suppression [30].
ASVP-LV includes: a) explosion localization device (ELD) is a device, spraying the flame retardant powder and explo-
sion creating a barrier in the form of clouds of flame retardant powder in suspension in underground mines;
b) autonomous command device (ACD) is a device that provides actuation of ELD. The explosion localization device consists of a cone-shaped hopper and an intermediate chamber
filled with flame retardant powder, inside of which is the working cavity of the device filled with compressed high-pressure air. Autonomous command device is docked with the device triggering of ELD and consists of extension rods, couplings, receiving shield and mounting nuts.
To protect the conveyor workings must be installed automatic systems ASVP-LV throughout the mine workings, at a distance apart of not more than 300 m. In the workings of the conveyor that transports only one kind, such systems are not installed.
For isolation of fire sites automatic systems of ASVP-LV are placed on all adjacent to them deve-lopments.
The systems are placed on the incoming and outgoing air streams in the production of monorail-equipped. The system by means of suspension and supports is attached to the elements of the fortress under the roof of the mining reception of acceptance board to the direction of expected spread of the shock wave front and the flame front formed as a result of the explosion of methane-air mixture and (or) coal dust. Unfortunately, this device has not been widely used.
Nowadays as we do here, and abroad, sufficient experience of creation of automatic system of ex-plosion suppression. To develop, numerous variants of the basic elements and nodes of such systems were created, and their improvement continues.
So in Germany serially produced various modifications of the complex explosion suppression BVS complex [31], this is an automatic explosion device, developed by an experienced drift Westphalia mining partnership (BVS) especially for protection from explosions in the mine degasification systems. It is already for several years is an integral part of the means of explosion-protection mine degasification sys-tems, and has justified itself in practice. According to the results of the experiments the most effective means for suppression of explosions is a powder based on ammonium phosphate sold under the brand name of tropolar.
In the [32] the powder efficiency of inhibitors was estimated by the lowest extinguishing concen-tration of powder in the detonation chamber g/l. Spraying device (suppressor) consisted of a polyethylene shell of spherical shape of the powdery inhibitor and an explosive charge. The authors noted that the effectiveness of powder inhibitors significantly affected by the method of atomization and delivery to the flame front. Testing of the restraining devices was successful.
Combustion, as is known, is a set of complex chemical and physical processes, such as chemical reactions, combustible oxidizer, diffusion, heat transfer and others. Due to the process of flame pro-pagation in the combustible gas mixture heat transfer and the diffusion of the active centers of flame (ACF). If the flame propagation velocity is significantly less than the velocity of sound propagation in a
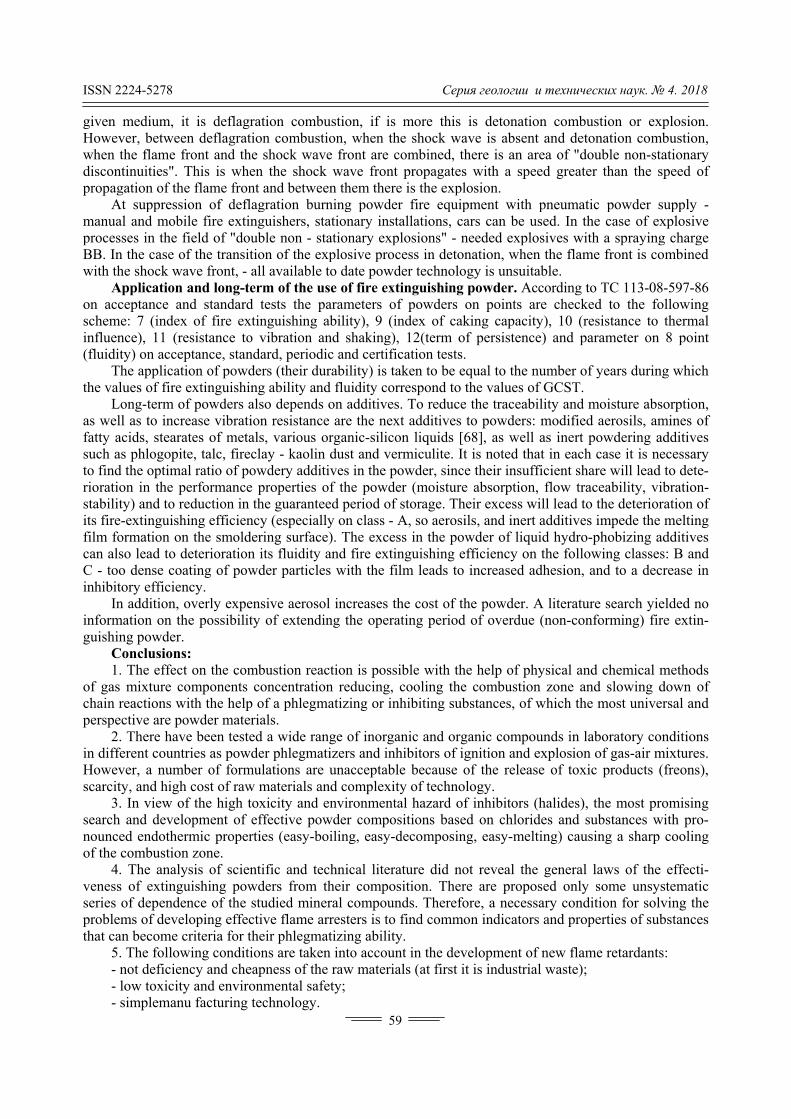
ISSN 2224-5278 Серия геологии и технических наук. 4. 2018
59
given medium, it is deflagration combustion, if is more this is detonation combustion or explosion. However, between deflagration combustion, when the shock wave is absent and detonation combustion, when the flame front and the shock wave front are combined, there is an area of "double non-stationary discontinuities". This is when the shock wave front propagates with a speed greater than the speed of propagation of the flame front and between them there is the explosion.
At suppression of deflagration burning powder fire equipment with pneumatic powder supply - manual and mobile fire extinguishers, stationary installations, cars can be used. In the case of explosive processes in the field of "double non - stationary explosions" - needed explosives with a spraying charge BB. In the case of the transition of the explosive process in detonation, when the flame front is combined with the shock wave front, - all available to date powder technology is unsuitable.
Application and long-term of the use of fire extinguishing powder. According to TC 113-08-597-86 on acceptance and standard tests the parameters of powders on points are checked to the following scheme: 7 (index of fire extinguishing ability), 9 (index of caking capacity), 10 (resistance to thermal influence), 11 (resistance to vibration and shaking), 12(term of persistence) and parameter on 8 point (fluidity) on acceptance, standard, periodic and certification tests.
The application of powders (their durability) is taken to be equal to the number of years during which the values of fire extinguishing ability and fluidity correspond to the values of GCST.
Long-term of powders also depends on additives. To reduce the traceability and moisture absorption, as well as to increase vibration resistance are the next additives to powders: modified aerosils, amines of fatty acids, stearates of metals, various organic-silicon liquids [68], as well as inert powdering additives such as phlogopite, talc, fireclay - kaolin dust and vermiculite. It is noted that in each case it is necessary to find the optimal ratio of powdery additives in the powder, since their insufficient share will lead to dete-rioration in the performance properties of the powder (moisture absorption, flow traceability, vibration-stability) and to reduction in the guaranteed period of storage. Their excess will lead to the deterioration of its fire-extinguishing efficiency (especially on class - A, so aerosils, and inert additives impede the melting film formation on the smoldering surface). The excess in the powder of liquid hydro-phobizing additives can also lead to deterioration its fluidity and fire extinguishing efficiency on the following classes: B and C - too dense coating of powder particles with the film leads to increased adhesion, and to a decrease in inhibitory efficiency.
In addition, overly expensive aerosol increases the cost of the powder. A literature search yielded no information on the possibility of extending the operating period of overdue (non-conforming) fire extin-guishing powder.
Conclusions: 1. The effect on the combustion reaction is possible with the help of physical and chemical methods
of gas mixture components concentration reducing, cooling the combustion zone and slowing down of chain reactions with the help of a phlegmatizing or inhibiting substances, of which the most universal and perspective are powder materials.
2. There have been tested a wide range of inorganic and organic compounds in laboratory conditions in different countries as powder phlegmatizers and inhibitors of ignition and explosion of gas-air mixtures. However, a number of formulations are unacceptable because of the release of toxic products (freons), scarcity, and high cost of raw materials and complexity of technology.
3. In view of the high toxicity and environmental hazard of inhibitors (halides), the most promising search and development of effective powder compositions based on chlorides and substances with pro-nounced endothermic properties (easy-boiling, easy-decomposing, easy-melting) causing a sharp cooling of the combustion zone.
4. The analysis of scientific and technical literature did not reveal the general laws of the effecti-veness of extinguishing powders from their composition. There are proposed only some unsystematic series of dependence of the studied mineral compounds. Therefore, a necessary condition for solving the problems of developing effective flame arresters is to find common indicators and properties of substances that can become criteria for their phlegmatizing ability.
5. The following conditions are taken into account in the development of new flame retardants: - not deficiency and cheapness of the raw materials (at first it is industrial waste); - low toxicity and environmental safety; - simplemanu facturing technology.

Известия Национальной академии наук Республики Казахстан
60
REFERENCES
[1] Prokhorchenko N.V. Assessment of the fire hazard of mining and metallurgical wastes and their suitability for sup-
pressing combustion and coal dust explosions and products of their processing. The author's abstract of the thesis dissertation. Karaganda, 2003. 125 p. (in Russ.).
[2] State standard 26952-97 Powders fire extinguishing. General technical requirements and test methods. Publishing house of standards (in Russ.).
[3] Glikin M.E. To the theory of the creation of non-combustible and difficult-to-combust organic materials // Chemical Industry. 1982. N 12. P. 25-27 (in Russ.).
[4] Baratov A.N., Vogman L.P. Fire extinguishing powder systems. M.: Stroyizdat, 1982. 72 p. (in Russ.). [5] Kozhushkov N.P. Powder flame suppression compositions // Chemical industry and industry for the production of mi-
neral fertilizers. Scientific Research Institute of Technical and Economic Research in the Chemical Complex. A series of safety equipment. 1984. N 10. P. 33.35 (in Russ.).
[6] Sapargaliyeva B., Naukenova A., Javier Rodrigo Illari, Aubakirova T., Ermukhanova N. The problem state of explosions of powder compositions prevention and suppression // IScience, Actual scientific research in the modern world. Collection of scientific works. 2017. Issue 11(31). Part 10. P. 52-57 (in Eng.).
[7] Sobur S.V. Fire extinguishers. Directory. M.: Special Engineering, 2001. 80 p. (in Russ.). [8] Journal of the Union Chemical Society. D.N. Mendeleyev: the number is dedicated to the problems of explosion and fire
safety of chemical industries. 1982. N 1 (in Russ.). [9] Kostrikin N.T., Krasnyansky M.E., Chekhovskikh A.M., Krasinikov A.A. Automatic system of protection "Mine-
rescuer" // Mining and rescue equipment and anti-damage protection shchaht. Sat. sciences. Tr. / Union Scientific Research Insti-tute of Mining and Rescue. Donetsk, 1988. P. 88-91 (in Russ.).
[10] Prisyatnyuk Z.P. Fire extinguishing agents and intensities of their supply of extinguishing fires in the production of acetic acid and acetic anhydride // Chemical Industry. 1990. N 1. P. 21 (in Russ.).
[11] Investigation of the process of spraying a fire extinguishing powder with charges of explosives / A.F. Nikolenko, R.M. Badanin, A.Z. Bikbaev, P.G. Malyshev // Reliability of oil pipelines: Collection of scientific works. Ufa, 1982. P. 74-79 (in Russ.).
[12] Gelfand F.M., Mamaev V.I., Ligay V.A. Inertisation of explosive atmospheres by powders of chemical compounds // Safety engineering, labor protection and mine-rescue business / Central Research Institute of Economics and Scientific and Technical Information of Coal Industry. M., 1972. N 11(65). P. 30-34 (in Russ.).
[13] Reagents that prevent the burning of explosives in coal mines. Inorganic compounds. Matsuguma K., Kunitani J., Koda V., “Kore Knakykekaucu” J. JndExplosSoe. Jap. 1972. P. 214-222 (in Eng.).
[14] Kurbatsky O.M., Isavnin N.V. Foreign experience in the study of fire extinguishing powders for extinguishing fires // Foreign Fire Engineering: Information Collection. M.: Central Research Institute of Economics and Scientific and Technical Information of the Coal Industry. 1971. N 11. P. 36-47 (in Russ.).
[15] Baratov A.N. Myshak Yu.A. New means of extinguishing in the chemical industry // Chemical Industry. 1982. N 10. P. 31-35 (in Russ.).
[16] Specifications 113-08-597-86 Fire extinguishing powders P-2AP and P-4AP. General technical requirements and test methods. Publishing house of standards (in Russ.).
[17] Report 1924130000. Scientific and Production Association "Respirator". Development of powder formulations for suppressing explosions of methane-air mixtures in the states. Donetsk, 1980. 78 p. (in Russ.).
[18] Sapargaliyeva B., Naukenova A., Javier Rodrigo Illari, Aubakirova T., Ermukhanova N. The problem state of explo-sions of powder compositions prevention and suppression // IScience, Actual scientific research in the modern world, Collection of scientific works. 2017. Issue 11(31). Part 10. P. 52-57 (in Eng.).
[19] Reagents preventing burning of explosives in coal mines // Inorganic compounds. Natsuguma K., Kunitahi J., Rjga V. Kore kuakykekaucu / J. JndExplosSoe. Jap. 1972. N 33, 214 (in Eng.).
[20] Pavel J., Hrmby V. Vlivintenichlateknavznetlivosthnedonhelnehoprachu // Zpravodaj VUHU Most. 1967. N 7-8. P. 15-32. (RZhGD – 1968 – 5В76).
[21] Prospects of using inhibitors to prevent dust and gas explosions during blasting operations in gas-bearing faces. / Gelfand F.M., Mamaev V.I., Ligay VA "Scientific works of the Karaganda territorial department of the Eastern Scientific Research Institute". 1971. P. 72-76 (in Russ.).
[22] Extinguishing methane-air diffusion flames with powdered sodium bicarbonate / Dodding R.A., Sinmons R.F., Stephens A. Combust and Flame. 1970. N 3. P. 313-315 (in Russ.).
[23] Inhibition of flame by potassium / D. Jensen, G. Jones, A. Cristopher // J. Ghem. Soc. Faraday Trans. 1979. N 10. P. 237-238 (in Eng.).
[24] Ryzhikh A.B., Makhin V.S. On the inhibition of ignition of coal dust aerospace // Physics of Combustion and Explo-sion. 1978. N 6(14). P. 60-64 (in Russ.).
[25-32] Sapargaliyeva B., Naukenova A., Javier Rodrigo Illari, Aubakirova T., Ermukhanova N. The problem state of ex-plosions of powder compositions prevention and suppression // IScience, Actual scientific research in the modern world, Collection of scientific works. 2017. Issue 11(31). Part 10. P. 52-57 (in Eng.).

ISSN 2224-5278 Серия геологии и технических наук. 4. 2018
61
Б. Сапаргалиева1, А. Наукенова1, Б. Алипова2, Х. Р. Иллари3, Ш. Шапалов1
1М. Ауезов атындағы Оңтүстік Қазақстан мемлекеттік университеті, Шымкент, Казахстан, 2Халықаралық ақпараттық технологиялар университеті, Алматы, Казахстан,
3Валенсия Политехникалық университет, Валенсия, Испания
ТИІМДІЛІК ӨЛШІМІ БОЙЫНША ӨРТСӨНДІРГІШ УНТАҚТАРДЫҢ ЖЫЛУЛЫҚ ЖƏНЕ САЛМАҚТЫҚ КАСИЕТТЕРІН ТАЛДАУ
Аннотация. Берілген зерттеу жұмысында өрт сөндіру мен жарылыс қауіпсіздігі құрамының классифи-кациясы көрсетілген. Жану реакциясына ықпалды физикалық жəне химиялық газдардың қоспалар компо-ненттерінің концентрациясын төмендету əдістері, флегматикалық жəне ингибитикалық заттар көмегімен жану аумағын азайту жəне тізбекті реакцияны баяулату арқылы жасауға болады. Флегматикалық жəне инги-битикалық заттардың ішінде ең тиімді жəне перспективтісі болып ұнтақ тəріздем материалдар болып та-былады. Уыттылығы мен экологиялық қауіпсіздігі жағынан жоғары болып келетін ингибиторлардың (гало-генидтердің) ішінде тиімді ұнтақ тəріздес композицияларды дайындау үшін жану аумағын лезде мұздатуды тудыратын эндотермиялық қаситтері айқын (оңай қайнайтын, оңай ыдырайтын, оңай балқитын) хродиттер негізінде ұнтақтар болып табылады. Əдебиет щолуында өртсөндіруші ұнтақтардың құрамына байланысты олардың тиімділігінің жалпы заңдылықтары қарастырылды. Зерттелген минералды қосылыстыр тəуелділі-гінің кейбір жүйесіздік қатарлары ұсынылды. Тиімді өртсөндіргіштерді жасап шығару үшін қажетті шарттар ретінде флекматикалық қаситтерінің критериясы бола алатын заттардың жалпы көрсеткіштері мен қасит-терін іздеу болып табылады.
Түйін сөздер: өрт сөндіргіш ұнтақтар, жарылысты төмендеткіш қабілеті, спрейлер, жаңғыш реагенттер, ұнтақ тиімділігі, жылу жəне массалық қасиеттері.
Б. Сапаргалиева1, А. Наукенова1, Б. Алипова2, Х. Р. Иллари3, Ш. Шапалов1
¹Южно-Казахстанский Государственный Университет имени М. Ауэзова, Шымкент, Казахстан, ²Международный университет информационных технологий, Алматы, Казахстан,
³Политехнический университет Валенсии, Валенсия, Испания
АНАЛИЗ ТЕПЛОВЫХ И МАССОВЫХ СВОЙСТВ ОГНЕТУШАЩИХ ПОРОШКОВ В КРИТЕРИЯХ ЭФФЕКТИВНОСТИ
Аннотация. В данном исследовании представлена классификация составов пожаротушения и взры-вобезопасности. Воздействие на реакцию горения возможно с помощью физических и химических методов снижения концентрации компонентов газовой смеси, охлаждения зоны горения и замедления цепных реакций с помощью флегматизирующих или ингибирующих веществ, из которых наиболее универсальными и перспективными являются порошкообразные материалы. Ввиду высокой токсичности и экологической опасности ингибиторов (галогенидов) наиболее перспективными для разработки эффективных порошковых композиций являются порошки на основе хлоридов и веществ с выраженными эндотермическими свойст-вами (легкокипящие, легкоразлагающиеся, легкоплавкие), вызывающие резкое охлаждение зоны горения. Общие закономерности эффективности огнетушащих порошков в зависимости от их состава были рассмот-рены в обзоре литературы. Предложены некоторые несистематические ряды зависимости изученных мине-ральных соединений. Необходимым условием для разработки эффективных пламегасителей является поиск общих показателей и свойств веществ, которые могут стать критериями их флегматизирующей способности.
Ключевые слова: огнетушащие порошки, взрывоподавляющая способность, спрей, горючие реагенты, эффективность порошка, тепловые и массовые свойства.
Information about authors: Bayan Sapargalieva – PhD student in 6D073100 “Life safety and environmental protection”, M. Auezov South-
Kazakhstan State University, Shymkent, Kazakhstan Aigul Naukenova – Candidate of Technical Sciences, Associated Professor of theDepartment “Life safety and
Environmental protection”, M. Auezov South-Kazakhstan State University, Shymkent, Kazakhstan Javier Rodrigo Ilarri – PhD, Professor of Department of Hydraulic Engineering and Environment, Polytechnic
University of Valencia, Valencia, Spain Bakhyt Alipova – Candidate of Physical and Mathematical Sciences, PhD in Applied Mathematics, Ass
Professor of theDepartment of Mathematical and Computer Modeling of International IT University, Almaty, Kazakhstan
ShermakhanShapalov – PhD of the Department “Life safety and Environmental protection”, M. Auezov South-Kazakhstan State University, Shymkent, Kazakhstan

Известия Национальной академии наук Республики Казахстан
62
N E W S OF THE NATIONAL ACADEMY OF SCIENCES OF THE REPUBLIC OF KAZAKHSTAN
SERIES OF GEOLOGY AND TECHNICAL SCIENCES
ISSN 2224-5278
Volume 3, Number 430 (2018), 62 – 68 UDC 537.523.3
B. H. Aitchanov1, Sh. A. Bakhtaev2, W. Wojcik3, A. S. Tergeusizova4, A. Zh. Toigozhinova5
1Suleyman Demirel University, Almaty, Kazakhstan, 2Almaty university of power engineering and telecommunications, Almaty, Kazakhstan,
3Lublin university of technology, Lublin, Poland, 4Kazakh national university named after al-Farabi, Almaty, Kazakhstan,
5Kazakh academy of transport and communications named after M. Tynyshpayev, Almaty, Kazakhstan. E-mail: [email protected], [email protected], [email protected], [email protected]
DEVELOPMENT OF METHODS FOR MEASURING LINEAR PARAMETERS OF MOVING DIELECTRIC FILAMENTS
Abstract. Methods and devices for contactless and continuous measurement of linear parameters (drawing
speed and diameter) of thin and ultra-thin dielectric filaments and optical fibers (10–125 microns) are developed on the basis of impulse characteristics of a unipolar corona discharge in the process of their manufacture. The developed devices differ from those known for high accuracy and reliability of measurements and are immune to changes in the electrical characteristics of discharge gaps and the state of ambient air. In both cases, the device for measuring the speed of drawing and the diameter of the dielectric thread uses the initial portion of the current-voltage characteristic of the positive corona discharge in the electrodes when the corona discharge is in the "waiting" mode, and the charging by ions of the surface of the moving dielectric filament is performed by applying additional pulses of nega-tive polarity to the electrodes.
Key words: transfer speed, fiber diameter, corona discharge, pulse corona, ions, pulse signal generators, charging, discharging, "waiting" mode.
Introduction. Thin and ultra-thin wire (5-100 microns) made of various metals and alloys (tungsten,
molybdenum, nichrome, copper, etc.) is widely used in the vacuum and electronics industries. Parameters homogeneity and the reliability of the operation of the electric and radio tubes depend on a large extent on the quality of the wire, the electrical characteristics of which, with a constant composition of the metal, are determined mainly by the geometric dimensions of its cross-section. Therefore, the development of new methods and devices for precise control of the dimensions of micro wire in production conditions is of great practical importance. In most cases, micro-wires of metals and alloys are produced by hot or cold wire drawing through diamond dies.
Equally important is the development of methods for measuring linear parameters (drawing speed and diameter) of moving dielectric filaments in the form of thin resistance wires with glass insulation of thin enamel wires and optical fiber filaments. In this case, for example, one of the main stages of the process of manufacturing optical fiber (OF) is pulling it on the drawing unit. It is established that oscilla-tion of the diameter along the length of the fiber rod, in many respects, determines the optical - physical properties of the OF (optical losses in the propagation of the signal, bandwidth, dispersion, etc.), and the scatter of the exhaust velocities of the OF also significantly affect its strength and optics - physical properties [1].
A wide variety of electrode shapes and their location relative to each other, as well as the possibility of a corona discharge in atmospheric air, created the prerequisites for the development of a whole series of new methods and corona discharge transducers designed to measure the parameters of micro wires and linear dimensions of various objects [2].

ISSN 2224-5278 Серия геологии и технических наук. 4. 2018
63
Device for measuring the speed of pulling of dielectric filaments [3]. The main purpose of deve-loping a device for measuring the speed of drawing dielectric threads is to ensure high accuracy and reliability of measurement when the indications of results are independent of changes in the electrical characteristics of the discharge gaps, the state of atmospheric air and the values of the geometric para-meters of the dielectric filaments.
Previously, a method has been developed for measuring the speed of pulling a micro wire [4], which contains two additional ring electrodes identical in shape and size located coaxially on both sides of the main electrode, and a balance circuit with an output device, containing the main ring electrode surroun-ding the monitored wire. In this device, due to the appearance of an electro-gas dynamic effect near the surface of a moving wire, processes of entrainment and the introduction of space charges into the dis-charge zones of additional electrodes arise, which ultimately allows us to judge the values of the speed of wire drawing. In this device, it is noted that the use of a balanced measurement scheme significantly re-duces the errors in measuring the speed of wire drawing with changes in electrical characteristics of discharges and geometric parameters of the corona wire. Meanwhile, due to the different location of the additional electrodes, which are essentially measuring, the changes in temperature and pressure of the ambient air can have a significant effect on the accuracy of the measurement. In addition, the proposed device also does not take into account the effect of difference in edge effects in two additional electrodes. In addition, because of the impossibility of replacing the corona wire with a dielectric thread, this device is not suitable for our purposes.
The measurement of the speed of drawing dielectric threads is based on the principles of measuring velocities by the method of marks, which are preliminarily applied to moving objects, and then the speeds of their passage through various measuring instruments are determined [5]. However, there are significant technical difficulties with marking when measuring the speed of movement of micro-objects, such as a dielectric thread or a micro wire with enamel coating (10-100 microns).
The proposed device for applying labels to a dielectric thread uses an outer corona discharge region that occurs when a sufficiently high voltage is applied between the corona wire and the outer plane-paral-lel electrode. In the outer corona discharge region, unipolar ions are usually present, which charge the surface of the dielectric filament. One of the best ways to get a clear picture of electronic labels on the surface of a dielectric filament is to supply the discharge chamber with additional clock pulses of suffi-cient magnitude with a certain duration and frequency. In this case, the dielectric filament is located paral-lel to the corona wire and in the middle of the discharge gap between the wire and the flat electrode. Next, a dielectric filament with electronic marks passes through a second measuring electrode, located some distance from the first electrode. When the filament passes through the measuring electrode, there are processes of discharge of the filament and accordingly, electric signals with a clock frequency appear on the electrode load. Now, choosing the duration of the reference signals, in other words, choosing the counting time of the clock pulses during this time, the number of pulses determines the speed of thread pulling.
To improve the accuracy of measurement and reliability of results, as well as to increase the noise immunity of the measurement to changes in the characteristics of the corona discharge and the geometric parameters of the measured dielectric filament, a positive corona discharge is used in both electrodes, its initial section of the current-voltage characteristic when the corona discharge is in the " or a small dischar-ge current flows (not more than 1 μA). The choice of a positive corona discharge is due to the fact that it has a high stability of the characteristic and there are no electron avalanche processes that form the random pulses of Trichel [6]. As clock pulses for the application of electronic tags, rectangular pulses in the form of a "meander" shape are chosen for the filament, which close the discharge gap with a positive half-wave, and in the other half-wave create pulsed discharges that charge the moving dielectric filament.
Figure 1 shows functional diagram of the device for measuring the speed of pulling the dielectric thread during its manufacturing. The device contains two identical flat-parallel electrodes 1,2 shown in figure 2(a), which coaxially surround the corona wire 3 and are located at some distance from each other. Controlled dielectric thread 4 passes through the discharge zone of the corona discharge. In our case, a high voltage power supply 5 with negative polarity at the output is used, which allows obtaining a positive corona discharge in the discharge gaps between the electrodes 1 and 2 and the wire 3. Stabilization of the corona discharge characteristics in two discharge chambers 1 and 2 and creation of the "waiting" mode
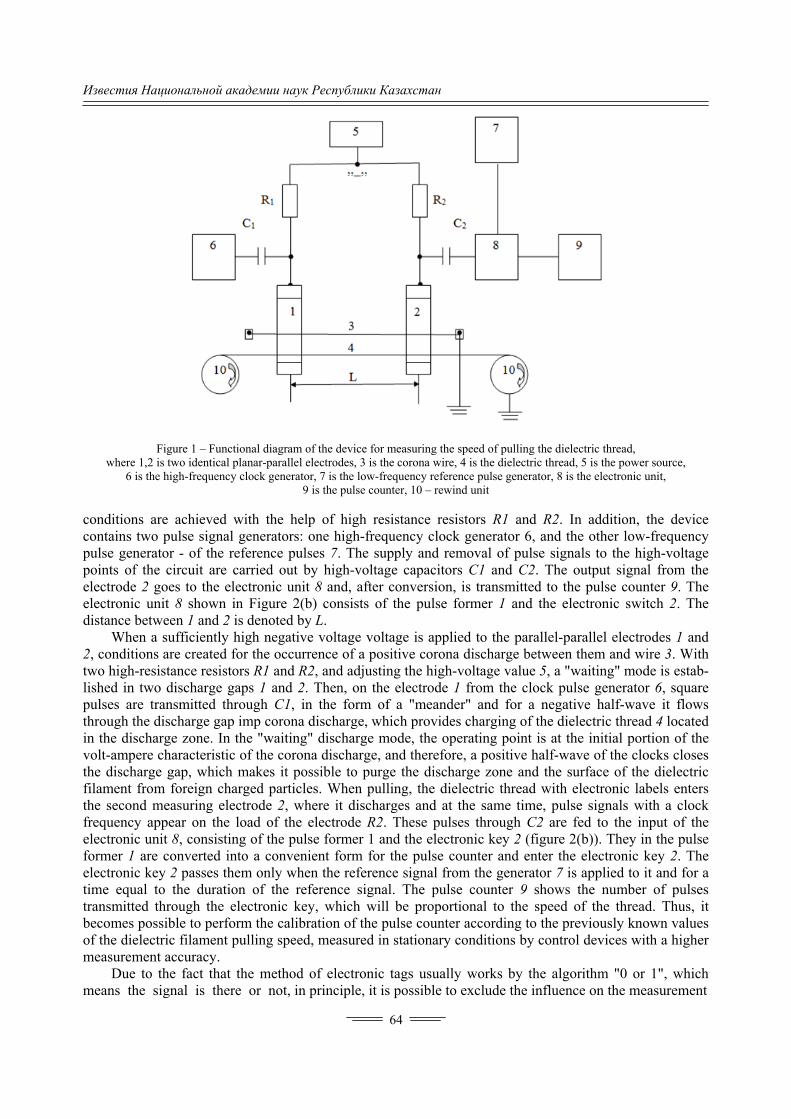
Известия Национальной академии наук Республики Казахстан
64
Figure 1 – Functional diagram of the device for measuring the speed of pulling the dielectric thread, where 1,2 is two identical planar-parallel electrodes, 3 is the corona wire, 4 is the dielectric thread, 5 is the power source,
6 is the high-frequency clock generator, 7 is the low-frequency reference pulse generator, 8 is the electronic unit, 9 is the pulse counter, 10 – rewind unit
conditions are achieved with the help of high resistance resistors R1 and R2. In addition, the device contains two pulse signal generators: one high-frequency clock generator 6, and the other low-frequency pulse generator - of the reference pulses 7. The supply and removal of pulse signals to the high-voltage points of the circuit are carried out by high-voltage capacitors C1 and C2. The output signal from the electrode 2 goes to the electronic unit 8 and, after conversion, is transmitted to the pulse counter 9. The electronic unit 8 shown in Figure 2(b) consists of the pulse former 1 and the electronic switch 2. The distance between 1 and 2 is denoted by L.
When a sufficiently high negative voltage voltage is applied to the parallel-parallel electrodes 1 and 2, conditions are created for the occurrence of a positive corona discharge between them and wire 3. With two high-resistance resistors R1 and R2, and adjusting the high-voltage value 5, a "waiting" mode is estab-lished in two discharge gaps 1 and 2. Then, on the electrode 1 from the clock pulse generator 6, square pulses are transmitted through C1, in the form of a "meander" and for a negative half-wave it flows through the discharge gap imp corona discharge, which provides charging of the dielectric thread 4 located in the discharge zone. In the "waiting" discharge mode, the operating point is at the initial portion of the volt-ampere characteristic of the corona discharge, and therefore, a positive half-wave of the clocks closes the discharge gap, which makes it possible to purge the discharge zone and the surface of the dielectric filament from foreign charged particles. When pulling, the dielectric thread with electronic labels enters the second measuring electrode 2, where it discharges and at the same time, pulse signals with a clock frequency appear on the load of the electrode R2. These pulses through C2 are fed to the input of the electronic unit 8, consisting of the pulse former 1 and the electronic key 2 (figure 2(b)). They in the pulse former 1 are converted into a convenient form for the pulse counter and enter the electronic key 2. The electronic key 2 passes them only when the reference signal from the generator 7 is applied to it and for a time equal to the duration of the reference signal. The pulse counter 9 shows the number of pulses transmitted through the electronic key, which will be proportional to the speed of the thread. Thus, it becomes possible to perform the calibration of the pulse counter according to the previously known values of the dielectric filament pulling speed, measured in stationary conditions by control devices with a higher measurement accuracy.
Due to the fact that the method of electronic tags usually works by the algorithm "0 or 1", which means the signal is there or not, in principle, it is possible to exclude the influence on the measurement

ISSN 2224-5278 Серия геологии и технических наук. 4. 2018
65
a) b)
Figure 2 – The shape of the electrodes and the electronic unit: а) form of electrodes, б) the electronic unit, where 1 – pulse shaper, 2 – electronic key
accuracy of changes in a number of parameters of the measuring device, for example, changes in the electrical characteristics of the corona discharge, The state of the ambient atmospheric air and the geometric dimensions of the controlled filament. If this methodological error of measurement is mini-mized, the rest of the measurement error will be determined by the instrumental error of the measuring instruments used in the device. Somewhat simplifies the task is that the measurement accuracy of the standard equipment used is known in advance or it is possible to select them.
The device has the following parameters: the plane-parallel electrodes have a width of 1.5 cm, the working length is 1 cm, the gap between them is L = 2 cm, the diameter of the corona wire from tungsten is 100 microns. The controlled filament is located at a distance of 0.3 cm from the surface of the outer electrode. The ballast resistances R1 and R2 were 1 mΩ, the capacitors C1 and C2 were 1 μF. A high-vol-tage voltage source of the VS-22 type was used to power the discharge chambers. The sources of the pulse signals were generators G5 - 88 (f = 1 kHz, U = 100V) and Г5-72 (f = 1Hz, U = 10V).
Experimental tests of the device were carried out on a rewinding unit 10 (figure 1) with a rate of change in the speed of winding up to 30 m/min. Copper wires with enamel coatings in the range of dia-meters of 20-100 microns have been tested as dielectric strands. Experimental measurements have shown that changes in atmospheric air pressure within ±20kPA and wire diameter by ±10 microns do not affect the accuracy of measuring the dielectric filament pulling speed, which is about 1-2% of the measured velocity. The obtained accuracy of the measurement of the speed of pulling the dielectric yarn corresponds to a calibration curve constructed from the values of the drawing speeds in the range 1-30 m/min, mea-sured under stationary conditions.
Device for measuring the diameter of moving dielectric filaments [7]. Close to the technical essence, the proposed device is a known device for controlling the inhomogeneity of moving dielectric threads [8], containing two ring electrodes concentrically surrounding the common corona wire electrode, high voltage power supplies with a constant stabilized output voltage, a load resistance and a voltmeter constant current, the controlled dielectric filament being pulled through the outer corona discharge zone, where the uniformity of the distribution volume charge is the highest. In this device, due to the presence of the discharge current stabilization effect when the two corona discharge zones are connected in series, the effect of the change in the state of atmospheric air on the accuracy of the object control will be negligible. In fact, the effects of the change in the state of atmospheric air on the discharge currents in the two elec-trodes can differ substantially. Since, at identical voltages on the electrodes, the negative corona discharge proceeds more efficiently and besides it is established that when the microelectrodes of negative polarity are corrupted there is always a pulsed discharge regime [2]. The proposed device also does not take into account the effect of the difference in the edge effects of the two electrodes. All this can greatly reduce the accuracy of measuring the device.
The main distinguishing feature of the proposed device is that in all three electrodes, the initial portion of the volt-ampere characteristic of the positive corona discharge is used, when the corona dis-charge is in the "waiting" mode, and the charging by ions of the surface of the moving dielectric filament occurs when additional pulses of negative polarity are fed to the middle electrode the form of half-waves of sinusoidal voltage. In this case, the middle electrode is covered on both sides by electrodes of similar
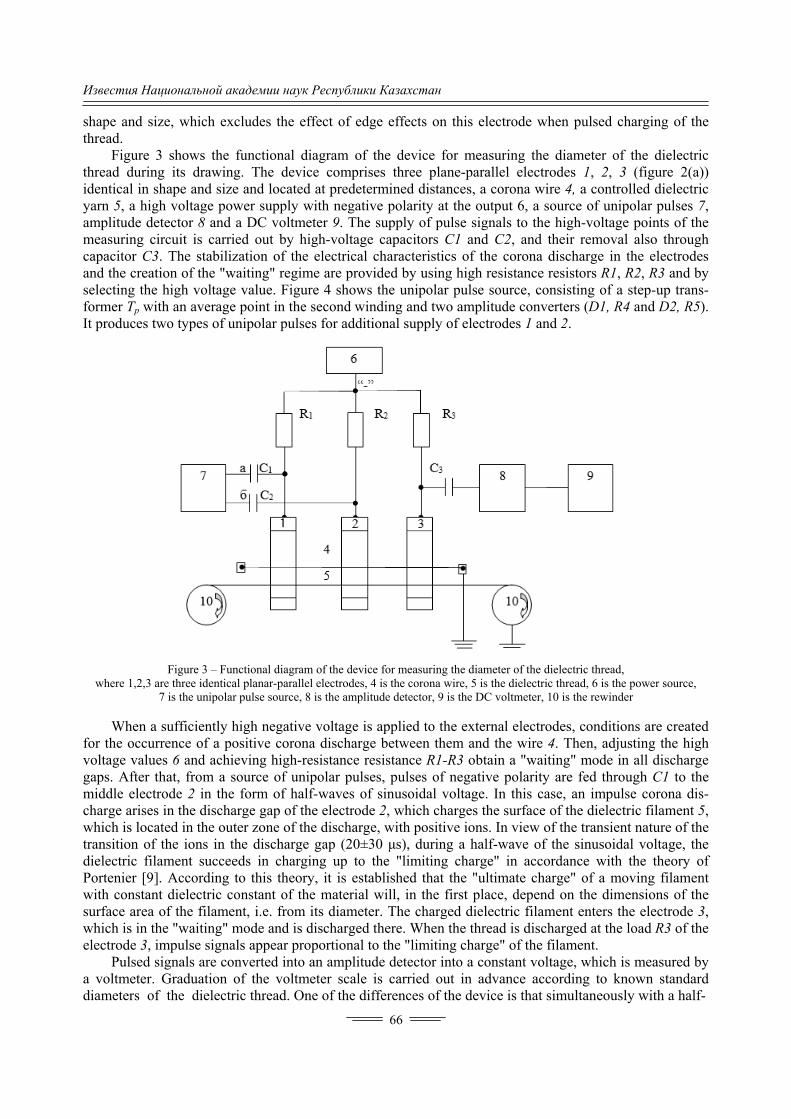
Известия Национальной академии наук Республики Казахстан
66
shape and size, which excludes the effect of edge effects on this electrode when pulsed charging of the thread.
Figure 3 shows the functional diagram of the device for measuring the diameter of the dielectric thread during its drawing. The device comprises three plane-parallel electrodes 1, 2, 3 (figure 2(a)) identical in shape and size and located at predetermined distances, a corona wire 4, a controlled dielectric yarn 5, a high voltage power supply with negative polarity at the output 6, a source of unipolar pulses 7, amplitude detector 8 and a DC voltmeter 9. The supply of pulse signals to the high-voltage points of the measuring circuit is carried out by high-voltage capacitors C1 and C2, and their removal also through capacitor C3. The stabilization of the electrical characteristics of the corona discharge in the electrodes and the creation of the "waiting" regime are provided by using high resistance resistors R1, R2, R3 and by selecting the high voltage value. Figure 4 shows the unipolar pulse source, consisting of a step-up trans-former Tp with an average point in the second winding and two amplitude converters (D1, R4 and D2, R5). It produces two types of unipolar pulses for additional supply of electrodes 1 and 2.
Figure 3 – Functional diagram of the device for measuring the diameter of the dielectric thread, where 1,2,3 are three identical planar-parallel electrodes, 4 is the corona wire, 5 is the dielectric thread, 6 is the power source,
7 is the unipolar pulse source, 8 is the amplitude detector, 9 is the DC voltmeter, 10 is the rewinder
When a sufficiently high negative voltage is applied to the external electrodes, conditions are created for the occurrence of a positive corona discharge between them and the wire 4. Then, adjusting the high voltage values 6 and achieving high-resistance resistance R1-R3 obtain a "waiting" mode in all discharge gaps. After that, from a source of unipolar pulses, pulses of negative polarity are fed through C1 to the middle electrode 2 in the form of half-waves of sinusoidal voltage. In this case, an impulse corona dis-charge arises in the discharge gap of the electrode 2, which charges the surface of the dielectric filament 5, which is located in the outer zone of the discharge, with positive ions. In view of the transient nature of the transition of the ions in the discharge gap (20±30 μs), during a half-wave of the sinusoidal voltage, the dielectric filament succeeds in charging up to the "limiting charge" in accordance with the theory of Portenier [9]. According to this theory, it is established that the "ultimate charge" of a moving filament with constant dielectric constant of the material will, in the first place, depend on the dimensions of the surface area of the filament, i.e. from its diameter. The charged dielectric filament enters the electrode 3, which is in the "waiting" mode and is discharged there. When the thread is discharged at the load R3 of the electrode 3, impulse signals appear proportional to the "limiting charge" of the filament.
Pulsed signals are converted into an amplitude detector into a constant voltage, which is measured by a voltmeter. Graduation of the voltmeter scale is carried out in advance according to known standard diameters of the dielectric thread. One of the differences of the device is that simultaneously with a half-

ISSN 2224-5278 Серия геологии и технических наук. 4. 2018
67
Figure 4 – Schematic of the source of unipolar pulses, where Tp is a step-up transformer, D1 R4 and D2 R5 are amplitude converters, a is the output of a half-wave
of a sinusoidal voltage of positive polarity, б is the output of a half-wave of a sinusoidal voltage of negative polarity
wave of negative polarity of the sinusoidal voltage applied to the electrode 2, a half-wave of positive polarity is fed to the electrode 1, while the discharge gap of the electrode 1 is closed and the filament charging by the "dark" corona discharge current in "Standby" mode.
The device has the following parameters: the plane-parallel electrodes have a width of 1.5 cm, the working length is 1 cm, the gap between them is 0.1 cm, the diameter of the corona wire from tungsten is 100 microns, the controlled filament is located at a distance of 0.3 cm from the surface of the outer electrode, the ballast resistances R1, R2, R3 were equal to 1 mΩ, capacitors C1, C2, C3 – 1 μF. As a high-voltage power source of voltage type VS-22.
Experimental measurements have shown that changes in the state of the ambient air and the speed of the moving filament do not significantly affect the accuracy of measuring the diameter of the filament, which amounted to about 1-2% of the measured diameter. The resulting accuracy in measuring the diameter of the filament corresponds to a calibration curve constructed from known standard diameters in the range 20-100 microns.
Conclusions. Methods and devices for contactless and continuous measurement of linear parameters (speed of drawing and diameter) of dielectric threads of optical fiber are developed, the application of which provides automatic control and control of the technological process of manufacturing of OB.
REFERENCES
[1] Kondratiev G.M., Dulnev G.N., Platunov E.S., Yaryshev N.A. Applied physics: Heat transfer in instrument engineering.
St. Petersburg State University of Information Technologies, Mechanics and Optics. St. Petersburg, IVA, 2003. 513 p. [2] Bakhtaev Sh.A., Bokanova A.A., Bochkareva G.V., Sydykova G.K. Physics and technology of corona discharge
devices. Almaty, 2007. 278 p. [3] Application for utility model 2018/0174.2. "Device for measuring the speed of pulling dielectric threads" / Bakhtaev
Sh.A., Tergeusizova AS, Aitchanov B.Kh., Sydykova G.K, Toigozhinova A.Zh. The NIIP conclusion on the grant of a utility model patent dated March 19, 2018.
[4] Provisional patent of the Republic of Kazakhstan 12038 IPC G01 P 3/00. “Method for measuring the speed of wire drawing” / Abishev M.A., Bakhtaev Sh.A., Bochkareva G.V., Baimakhanova Z.A., Titova T.S. Published on 16.09.2002.
[5] Ilinskiy V.М. Non-contact measurement of consumption. M.: Energia, 1970. P. 5-28. [6] Dzhuvarly Ch.M., Gorin Yu.V., Mekhtizade R.N. Corona discharge in electronegative gases. Baku: ELM, 1988. 144 p. [7] Application for utility model 2018/0175.2. "Device for measuring the diameter of moving dielectric filaments" /
Bakhtaev Sh.A., Tergesizova A.S., Aitchanov B.Kh., Sydykova G.K., Musapirova G.D. The NIIP conclusion on the grant of a utility model patent dated March 19, 2018.
[8] Provisional patent of the Republic of Kazakhstan 12030. “Method for controlling the inhomogeneities of moving die-lectric filaments” / Abishev M.A., Bakhtaev Sh.A., Bochkareva G.V., Baymakhanova Z.A., Titova T.S. Published on 16.09.2002, IPC G01 B7/12.
[9] Vereshchagin V.P. Corona discharge in devices of electron-ion technology. M.: Energoatomizdat, 1985. 159 p. [10] Bahtaev Sh.A., Kozhaspaev N.K., Kodzhabergenova A.K. Raschet jelektricheskih polej unipoljarnoj korony so
slozhnoj konfiguraciej jelektrodov // Vestnik AUJeS. 2015. N 1(28). P. 46-51. [11] Bahtaev Sh.A., Bochkareva G.V., Musapirova G.D. Metody opredelenija razmernyh parametrov chehla unipoljarnoj
korony // Vestnik KazATK. 2014. N 5(90). P. 92-97. [12] Bahtaev Sh.A., Bochkareva G., Musapirova G.D. Non-contact measurement meters of micro-sizes on coronary dis-
charge // NEWS of the National Academy of Sciences of the Republic of Kazakhstan. 2017. Vol. 4, N 424. P. 208-218.

Известия Национальной академии наук Республики Казахстан
68
Б. Х. Айтчанов1, Ш. А. Бахтаев2, В. Вуйцык3, А. С. Тергеусизова4, А. Ж. Тойгожинова5
1Сулейман Демирел университеті, Алматы, Қазақстан, 2Алматы энергетика жəне байланыс университеті, Алматы, Қазақстан,
3Люблин техникалық университеті, Люблин, Польша, 4Əл-Фараби атындағы Қазақ ұлттық университеті, Алматы, Қазақстан,
5М. Тынышбаев атындағы Қазақ көлік жəне коммуникация академиясы, Алматы, Қазақстан
ДИЭЛЕКТРЛІК ЖІПТЕРДЕ ҚОЗҒАЛАТЫН СЫЗЫҚТЫ ПАРАМЕТРЛЕРДІ ӨЛШЕУ ƏДІСТЕРІН ӨҢДЕУ
Аннотация. Дайындау процесінде, бір тасымалды тəжді (каронды) разрядтың импульсті сипаттама-сының негізінде жұқа жəне өте жұқа диэлектрлік жіптердің жəне оптикалық талшықтардың (10–125 микрон) сызықты параметрлерін (жылдамдық, тартажонғыштар жəне диаметр) үздіксіз, шексіз өлшеу əдістері мен құрылғылары өңделген. Өңделген құрылғының белгілі құрылғылардан айырмашылығы дəлдігі жоғары, өлшеудің сенімділігімен, разряд аралығындағы электр сипаттамасының өзгерісіне жəне қоршаған орта атмо-сфера ауасының өзгерісіне қарсы тұра алатындығында. Осы жəне басқа жағдайларда жіптерді тарту жылдамдығын өлшеуге жəне диэлектрикалық жіптердің диаметрі үшін электродтағы оң тəжді разрядының вольтамперлі сипаттамасының бастапқы аймағы қолданылады. Бұл жағдайда тəжді разряд «күту» режимінде болады, сонымен қатар диэлектрлік жіптердің үстінде қозғалатын иондармен зарядтау электродтарға қо-сымша теріс полярлы импульстерді беру арқылы орындалады.
Түйін сөздер: тартажонғыштар жылдамдығы, талшықты-оптикалық диаметр, тəжді разряд, импульстік тəж, иондар, импульстік сигналдардың генераторлары, зарядтау, разрядтау, «күту» режимі.
Б. Х. Айтчанов1, Ш. А. Бахтаев2, В. Вуйцык3, А. С. Тергеусизова4, А. Ж. Тойгожинова5
1Университет имени Сулеймана Демиреля, Алматы, Казахстан, 2Алматинский университет энергетики и связи, Алматы, Казахстан,
3Люблинский технический университет, Люблин, Польша, 4Казахский национальный университет имени аль-Фараби, Алматы, Казахстан,
5Казахская Академия транспорта и коммуникации имени М.Тынышпаева, Алматы, Казахстан
РАЗРАБОТКА МЕТОДОВ ДЛЯ ИЗМЕРЕНИЯ ЛИНЕЙНЫХ ПАРАМЕТРОВ ДВИЖУЩИХСЯ ДИЭЛЕКТРИЧЕСКИХ НИТЕЙ
Аннотация. На основе импульсных характеристик униполярного коронного разряда разработаны мето-ды и устройства для бесконтактного и непрерывного измерения линейных параметров (скорость протяжки и диаметр) тонких и сверхтонких диэлектрических нитей и оптических волокон (10–125 микрон) в процессе их изготовления. Разработанные устройства отличаются от известных высокой точностью и надежностью изме-рений и обладают помехоустойчивостью к изменениям электрических характеристик разрядных промежут-ков и состояния окружающего атмосферного воздуха. В том и другом случае устройство для измерения ско-рости протяжки и диаметра диэлектрической нити используется начальный участок вольтамперной харак-теристики положительного коронного разряда в электродах, когда коронный разряд находится в «ждущем» режиме, причем зарядка ионами поверхности движущейся диэлектрической нити производится подачей на электроды дополнительных импульсов отрицательной полярности.
Ключевые слова: скорость протяжки, диаметр оптоволокна, коронный разряд, импульсная корона, ионы, генераторы импульсных сигналов, зарядка, разрядка, «ждущий» режим.
Information about authors: Aitchanov Bekmurza Husainovich – dr. prof, Suleyman Demirel University, Almaty, Kazakhstan. E-mail:
[email protected] Bakhtaev Shabden Abuovich – d.t.n., Almaty University of Power Engineering and Telecommunications,
Almaty, Kazakhstan. Wojcik Waldemar – dr. prof, Lublin University of Technology, Lublin, Poland. E-mail:
[email protected] Tergeussizova Aliya Sovetjanovna – M. Eng. Kazakh National University named after al-Farabi, Almaty,
Kazakhstan. E-mail: [email protected] Toigozhinova Aynur Zhumakhanovna – doctor PhD, Kazakh Academy of Transport and Communications
named after M. Tynyshpayev, Almaty, Kazakhstan. E-mail: [email protected]

ISSN 2224-5278 Серия геологии и технических наук. 4. 2018
69
N E W S OF THE NATIONAL ACADEMY OF SCIENCES OF THE REPUBLIC OF KAZAKHSTAN
SERIES OF GEOLOGY AND TECHNICAL SCIENCES
ISSN 2224-5278
Volume 3, Number 430 (2018), 69 – 73 UDC 577.472
A. A. Ismailova1, A. K. Zhamangara2, S. K. Sagnayeva2,
G. D. Kaziyeva2, A. I. Abakumov3, S. Ya. Park3
1S. Seifullin Kazakh Agrotechnical University, Astana, Kazakhstan, 2L. N. Gumilyov Eurasian National University, Astana, Kazakhstan,
3Institute of Automation and Control Processes, FEB RAS, Vladivostok, Russia. E-mail: [email protected], [email protected], [email protected], [email protected],
[email protected], [email protected]
TECHNOLOGIES OF INFORMATION MONITORING BIOGENS
LAKES OF KAZAKHSTAN
Abstract. Data on mineral substances on basis of nitrogen and phosphorus for the years 2007-2013 were analyzed based on statistics. Dynamic characteristics and seasonal features of changes were identified in the con-centrations of substances. Seasonal factor plays a substantial role in changing nutrient concentrations. In the averaged year dynamics of substances concentrations are more diverse in the spring and early summer compared with the second half of the year. Spring effects may be related to the intensive development of phytoplankton. Autumn is also an outbreak of phytoplankton biomass, which can affect the concentrations of ammonium and phos-phorus. In general, the concentration of phosphorus compounds is more stable, which may favorably affect the life of phytoplankton species which are fond of phosphorus.
Keywords: hydrobiology, hydrochemistry, trend, statistical analysis, correlation matrix, classification of lakes. Introduction. Hydrobiological studies of the reservoirs of Kazakhstan (lakes Ashykol and Kumkol,
Burabai and Ulken Shabakty, the Ural River, etc.) were carried out by a number of scientists: Khusaino- va N. [1], Akbaeva L., Zhamangar A. [2], Maikanov B. [3], Burlibaev M. [4], Zaitsev V.F. [5] and others.
Nitrogen and phosphorus have basic value for an aquatic ecosystem functioning. They provide phytoplankton with food during photosynthesis and play an important role in the ecosystem of the reservoir. Phytoplankton is indicator of aquatic ecosystem state. We investigate a dynamics of nitrogen and phosphorus contents in two lakes of important recreational area of Kazakhstan [6].
Thanks to the enrichment of nutrients in water bodies, the productivity of not only phytoplankton increases, but also the productivity of aquatic communities, including fish, which is considered an economically advantageous process. However, in many cases spontaneous anthropogenic enrichment of reservoirs with primary nutrients occurs on a scale that overloads the water body as an ecosystem with biogens. As a result, there is a very rapid development of phytoplankton («flowering» of water), the decomposition of which leads to the release of hydrogen sulphide or other toxic substances. This leads to the death of the animal population of water
Lake Burabai and lake Ulken Shabakty are located in Shchuchinsk-Borovoye resort area. This area has great recreational and tourist value. At the same time, the ecological status of the region is quite complicated. Pollution exceeding maximum permissible concentration (MPC) is captured in a village Borovoye. Major complexes of recreation institutions, fixed on the coast lakes Burabai, Ulken Shabakty and extends along the highways. As a result of irretrievable water intake for industrial and drinking and sanitary needs, plowing on the slopes, deforestation in the catchment area pollutants and organic substances are washed away, which increases the processes of lake siltation [7].

Известия Национальной академии наук Республики Казахстан
70
Study of mineral substances on base nitrogen and phosphorus allows to identify patterns of condition and dynamics of hydrobiological indicators. This leads to an assessment of the environmental condition of the reservoir [8].
Materials and methods. Lake Burabai - located within Kokshetau Highland, at the eastern foot of Kokshe, north of Lake Shchuchye. Area of water surface is approximately 11 square kilometers. The average depth of the lake is 3.4 m, maximum depth is observed in the north and makes up to 7 m. Water surface of the lake is mostly open, only the western and north-western coasts covered with reeds and rushes.
Lake Ulken Shabakty - the largest lake among Burabai group which is located 16.5 km to the north of Schuchinks. Water surface area is about 23 square kilometers. The average depth of the lake is 11.1 m, maximum - 33.3 m. The lake is open without aquatic vegetation, which is explained by the presence of the great depths [9].
By the degree of pollution, the Lakes Burabai and Ulken Shabakty can be currently classified as between "clean" and "moderately polluted". All indicators of the lakes belonged to the "pure" in 2009 year, and in subsequent years, such parameters as dissolved oxygen, ammonia nitrogen and pH indicate some water pollution..
Results and discussion. The nitrogen is presented the nitrite compounds, nitrates and ammonium salts. Under phosphorus we mean the total phosphorus. These substances on basis nitrogen and phos-phorus we mean here as mineral substances. We have data from 2007 to2013 years for Lake Burabai and from 2008 to 2013 years for Lake Ulken Shabakty [10].
Trend analysis of mineral substances with averaging of 12 months (figure) show an increasing of pollutions in 2010 - 2011 years. These trends show interannual variability for concentration of mineral substances. The concentrations of all substances have bigger values in second half of time period. This fact is shown that the pollution in both lakes increased in this period. But the seasonal fluctuations are large enough compared to the interannual variability. Seasonal factor plays a significant role in changing
Trends(solid lines) of concentrations of total phosphorus on basis data of measures
(dashed lines). On verticalaxis is theconcentration
ofsubstanceinmg/l,on horizontal axes years are specified
Lake Burabai
Lake UlkenShabakty

ISSN 2224-5278 Серия геологии и технических наук. 4. 2018
71
mineral substances concentrations too. Trend analysis showed that seasonal oscillations of concentra- tions of substances are sufficiently large.
Data on phosphorus load presented in figure show that in 2007-2008 lakes were close to oligotrophic and in 2012-2013 have already approached the mesotrophic reservoirs. Currently, according to the classification of the content of total phosphorus, both lakes relate to mesosaprobic type [11-14].
The application of methods of statistical processing of environmental research results makes it possible to obtain quantitative characteristics of the distribution of organisms that are suitable for com-parison, to carry out the very procedure of comparison, and to establish the dependence between the individual variables characterizing the habitat [15].
Statistical data analysis was begun from test of the hypothesis about lognormal distribution for data. The presence ofthe lognormal distribution provides to use traditional criteria Student, Pearson, Fisher, etc. to analyze the data in a logarithmic scale. Data from all four substances are tested on the lognormal distribution for each lake. [16]. We use Pearson criterion for this test. Nitrate, ammonia and phosphorus have lognormal distribution with signification level 0.05. Nitrite has this distribution for Lake Ulken Shabakty but it has not for Lake Burabai.
In the averaged year dynamics of substances concentrations are more diverse in the spring and early summer compared with the second half of the year, although "outbursts" do happen in the ammonium and phosphorus in the fall and early winter. Spring effects may be associated with the arrival of melt water and intensive development of phytoplankton. Flashes also occur in autumn in the phytoplankton biomass, which can affect the concentrations of ammonium and phosphorus.
Data which are not included inthe confidence intervals were allocated. When data were reanalyzed it is revealed that there are indicators, the absolute values of which lie outside the boundaries of the confi-dence intervals. The proportion of such points varies from 0.083 to 0.286. These deviations do not have any natural character of manifestations; that is they do not depend on the season or on the reservoir in which they are recorded. Number of such points is almost always within 20%. In our view, this indicates a satisfactory quality of data collection and a good reliability.
The correlation matrixfor substances concentrations
the lakes Burabai (above the main diagonal) and Ulken Shabakty (below the main diagonal)
Nitrite nitrogen Nitrate nitrogen Ammonia nitrogen Total phosphorus
Nitrite nitrogen 1.000 0.465 0.072 0.233
Nitrate nitrogen 0.154 1.000 0.216 0.137
Ammonia nitrogen 0.116 0.157 1.000 -0.123
Total phosphorus 0.134 0.236 0.204 1.000
Rigid links between the concentrations of substances in each lake are not separately identified,
substances behave relatively independently. Only nitrates and nitrites of Burabai lake have significant connections (table). This may mean that their delivery to the lake and phytoplankton consumption are not synchronized, that is substances come from various sources and converted with independent to each other speeds.
The obtained results on trends indicate that seasonal variations are large enough compared to the interannual. Seasonal factor plays a substantial role in changing nutrient concentrations. Testing for nor-mal distribution of the substance concentration logarithms shows that the lake Burabai "lives" mainly due to natural factors or many small artificial factors. In the lake Ulken Shabakty there are probably artificial sources of nitrites and nitrates, "concealing" lognormal distribution patterns.
In the averaged year dynamics of substances concentrations are more diverse in the spring and early summer compared with the second half of the year, although there are "outbursts" in the ammonium and phosphorus which occur in the fall and early winter. Spring effects may be related to the intensive deve-lopment of phytoplankton. Autumn is also an outbreak of phytoplankton biomass, which can affect the concentrations of ammonium and phosphorus. In general, the concentration of phosphorus compounds is more stable, which may favorably affect the life of phytoplankton species which are fond of phosphorus [17, 18].

Известия Национальной академии наук Республики Казахстан
72
Refilling the database on lakes would enhance data processing, including statistical data processing. It is anticipated that there is a possibility of using a dynamic mathematical model for the joint analysis of hydrobiological and hydrochemical information [19-21]. These models give us the possibility for analysis of functioning of aquatic ecosystems in seas and lakes.
Acknowledgments. The research is made according to “Memorandum of Understanding between Federal State Autonomic Educational Institution of Higher Professional Education “Far Eastern Federal University” (Vladivostok, Russian Federation) and L.N. Gumilyov Eurasian National University (Astana, Republic of Kazakhstan). October 02, 2014”.
REFERENCES
[1] Khusainova N.Z. Biological foundations of fisheries in the reservoirs of Central Asia and Kazakhstan. Alma-Ata:
Nauka, 1966, 98-100. (In Russ.) [2] Akbaeva L.H., Kobetayeva N.K., Zhamangar A.K., Akhmetova S.B., Makhanbetova A.K. Bulletin of Science of the
Kazakh Agrotechnical University. S. Seifullin, 2014, 5, 65-74. (In Russ.). [3] Maikanov B.S., Syzdykov K.N., Aubakirova G.A. Agrarian Science to Agriculture: Materials of International Scientific
and Practical Conference. Barnaul: Altai State Agrarian University, 2008. Book 2, 423-427 (In Russ.) [4] Burlibaev M.Zh., Murtazin E.Zh. Biogenic substances in the main watercourses of Kazakhstan. Almaty: Kaganat, 2003.
723 p.( In Russ.) [5] Zaitsev V.F., Zaitsev V.F., Obukhova O.V., Sariev B.T. Bulletin of the Astrakhan State Technical University. Series:
Fishery, 2009, 1, 54-57 (In Russ.). [6] Silkin V.A., Abakumov A.I., Pautova L.A., Pakhomova S.V., Lifanchuk A.V. Aquatic Ecology, 2016, 50(2), 221-234 (in
Eng.). [7] Ismayilova A.A., Zhamankar A.K., Akbaeva L.Kh., Adamov A.A., Abakumov A.I., Tulegenov Sh.A., Muratov R.M.
Bulletin of KazNU named Al-Farabi. Biological series, 2013, 3/2 (59), 503-507 (In Russ.). [8] Savenko V.S., Savenko A.V. Geochemistry of phosphorus in the global hydrological cycle. M.: GEOS, 2007. 248 p. (In
Russ.). [9] Aytkazhy Kazbekov. Burabai on the eve of the 21st century. Astana, 1998, 238 p. (In Russ.). [10] Newsletter on a state of environment in Shchuchinsk-Borovoye resort area. For 2008 - 2013 year, Kazakhstan, 2013.
(In Russ.). [11] Tretyakov V.Yu., Shelutko V., Seleznev D.E. Bulletin of St. Petersburg University. Series 7. Geology. Geography,
2015, 3, 118-128. (In Russ.). [12] Vollenweider R.A. The scientific basis of lake and stream eutrophication, with particular reference to phosphorus and
nitrogen as eutrophication factor. Tech. Rep. OECD, Paris, 1968, 27, 1-83 (In Eng.). [13] Datsenko Yu.S. Eutrophication of aquatic basins. Hydrological and hydrochemical aspects, Moscow State Univ., Geo-
graphical Depart. M.: GEOS, 2007. 251 p. (In Russ). [14] Shitikov V.K., Rosenberg G.S., Zinchenko T.D. Quantitative hydroecology: methods of system identification.
Togliatti: IEVB RAS, 2003. 463 p. (In Russ.). [15] Schweitzer G.E., Black S.C. Environmental science & technology, 1985, 19 (11), 1026-1030. (in Eng.). [16] Vasilyeva L.A. Statistical methods in biology, medicine and. Agriculture, Novosibirsk: Institute of Cytology and
Genetics, Siberian Branch of the RAS, 2007, 124 p. (In Russ.). [17] Butterwick C., Heaney S.I., Talling J.F. Brit Phycol J., 1982, 17(1), 69-79. (in Eng.). [18] Nicholls K.H., Dillon P.J. Int. Revue ges. Hydrobiol., 1978, 63(2), 141-154 (in Eng.). [19] Abakumov A.I., Pak S.Ya., Simonov A.S. Informatics and Control Systems, 2011, 1 (27), 17-26. (in Eng.). [20] Abakumov A., Ismailova A., Adamov A. Information. An International Interdisciplinary Journal, 2014, 17(1), 209-218
(in Eng.). [21] Blenckner T. Hydrobiologia, 2008, 599, 177-182. (in Eng.).
А. А. Исмаилова1, A. K. Жамангара2, С. K. Сагнаева2, Г. Д. Казиева2, A. И. Абакумов3, С. Я. Пак3
1С. Сейфуллин атындағы Қазақ агротехникалық университеті, Астана, Қазақстан, 2Л. Н. Гумилев атындағы Еуразия ұлттық университеті, Астана, Қазақстан
3Автоматтандыру жəне басқару процестері институты РҒА ҚШБ, Владивосток, Ресей
ҚАЗАҚСТАН КӨЛДЕРІНДЕГІ БИОГЕНДЕРДІҢ АҚПАРАТТЫҚ МОНИТОРИНГ ТЕХНОЛОГИЯЛАРЫ
Аннотация. Статистикалық деректер бойынша 2007-2013 жылдарға арналған азот пен фосфорға не-
гізделген минералды заттар туралы мəліметтер талданды. Өзгерістердің динамикалық сипаттамалары мен маусымдық ерекшеліктері заттардың шоғырлануында анықталды. Маусымдық фактор қоректік заттардың

ISSN 2224-5278 Серия геологии и технических наук. 4. 2018
73
концентрациясын өзгертуде маңызды рөл атқарады. Орташа жылда заттардың шоғырлану динамикасы көктемде жəне жаздың басында жылдың екінші жартысымен салыстырғанда əртүрлі. Көктем əсерлері фитопланктонның қарқынды дамуымен байланысты болуы мүмкін. Күздегі фитопланктон биомассасының жарқылы аммоний мен фосфордың концентрациясына əсер етуі мүмкін болып табылады. Жалпы, фосфор қосылыстарының концентрациясы əлдеқайда тұрақты, бұл фосфорды жақсы көретін фитопланктон түрле-рінің өміріне жағымды əсер етуі мүмкін.
Түйін сөздер: гидробиология, гидрохимия, тренд, статистикалық талдау, корреляциялық матрица, көлдердің жіктелуі.
А. А. Исмаилова1, A. K. Жамангара2, С. K. Сагнаева2, Г. Д. Казиева2, A. И. Абакумов3, С. Я. Пак3
1Казахский агротехнический университет имени С. Сейфуллина, Астана, Казакстан,
2Евразийский национальный университет им. Л. Н. Гумилева, Астана, Казакстан, 3Институт автоматики и процессов управления ДВО РАН, Владивосток, Россия
ТЕХНОЛОГИИ ИНФОРМАЦИОННОГО МОНИТОРИНГА БИОГЕНОВ
ОЗЕР КАЗАХСТАНА
Аннотация. Данные по минеральным веществам на основе азота и фосфора на 2007-2013 годы были проанализированы на основе статистики. Динамические характеристики и сезонные особенности изменений были выявлены в концентрациях веществ. Сезонный фактор играет существенную роль в изменении кон-центрации питательных веществ. В усредненном году динамика концентраций веществ более разнообразна весной и в начале лета по сравнению со второй половиной года. Весенние эффекты могут быть связаны с ин-тенсивным развитием фитопланктона. Осень также является вспышкой биомассы фитопланктона, которая может влиять на концентрации аммония и фосфора. В общем, концентрация соединений фосфора более стабильна, что может благоприятно влиять на жизнь видов фитопланктона, которые любят фосфор.
Ключевые слова: гидробиология, гидрохимия, тренд, статистический анализ, корреляционная матрица, классификация озер.
Information about authors: Ismailova A. A. – PhD doctor in specialty 6D070300 - "Information systems", head of the department
"Information systems", Kazakh agrotechnical university named S. Seifullin, e-mail: [email protected] Zhamangar A. K. – Candidate of Biological Sciences, Associate Professor of the Department of Management
and Engineering in the field of environmental protection ENU named L. N. Gumilev, e-mail: [email protected] Sagynayeva S. K. – Candidate of Physical and Mathematical Sciences, Associate Professor of Information
Systems Department, ENU named L. N. Gumilyov, e-mail: [email protected] Kaziyeva G. D. – doctoral student of the third year of the specialty 6D070300 - "Information systems" ENU
named L.N. Gumilev, e-mail: [email protected] Abakumov A. I. – Doctor of Physics and Mathematics, Full Professor, Head of the Laboratory of Mathematical
Modeling of Biophysical Processes, Institute of Automation and Control Processes, FEB RAS, e-mail: [email protected]
Pak S. Ya. – Candidate of Technical Sciences, Junior Researcher, Laboratory of Mathematical Modeling of Biophysical Processes, Institute of Automation and Control Processes, FEB RAS, e-mail: [email protected]

Известия Национальной академии наук Республики Казахстан
74
N E W S OF THE NATIONAL ACADEMY OF SCIENCES OF THE REPUBLIC OF KAZAKHSTAN
SERIES OF GEOLOGY AND TECHNICAL SCIENCES
ISSN 2224-5278
Volume 3, Number 430 (2018), 74 – 78 UDC 631.1
O. A. Vasiliev1, V. G. Semenov1, Yu. A. Yuldashbayev2, D. A. Baimukanov3, Kh. A. Aubakirov4
1Chuvash state agricultural academy, Cheboksary, Chuvash Republic, Russian Federation,
2Russian state agricultural university – Moscow Agricultural academy named after K. A. Timiryazev, Moscow, Russian Federation,
3Kazakh Scientific Research Institute of Animal Breeding and Fodder Production, Almaty, Kazakhstan, 4Taraz State University named after M. Kh. Dulati, Taraz, Kazakhstan.
SOIL COVER OF THE "ZAOVRAZHNY" MICRO-DISTRICT, CHEBOKSARY, AND ITS ECOLOGICAL STATE
Abstract. In July-August 2017, soil and agrochemical investigations of the territory of the Zaovrazhny micro-
district in Cheboksary city were carried out. The territory of the new Zaovrazhny micro-district in Cheboksary is located to the west of the north-western
residential area of Cheboksary; it is bounded from the north by the coastal fortifications of the Cheboksary storage reservoir, and on the southern side by the M-7 highway (Cheboksary-Moscow).
Light gray forest heavy loam soils are widespread in the micro-district, in the middle and lower parts of the slope altered by water erosion. The undistorted soils are characterized by the following morphological features: a sod horizon Ad of 5-10 cm in thickness, a humus-eluvial horizon Al up to 15-20 cm. Below it, a transitional horizon AlA2 with a thickness of 5-15 cm is located. Gradually, A1A2 passes into the eluvial-illuvial horizon A2B up to 20 cm thick. Illuvial horizon B consists of several subhorizons: B1 – dark brownish-brown color with spots of humic sub-stances and pseudopodzolic siliceous powder; it gradually shades into a more clarified B2, followed by the tran-sitional horizon BC and the soil-forming rock C (loess-like loam).
The content of heavy metals in the humus horizon and soil-forming rock, oil products, radio nuclides and benzapyrene corresponds to the background values and does not exceed the MPC.
The soil cover of the Zaovrazhny micro-district and its ecological state were studied for the first time. Keywords: agrochemical properties, water erosion, humus horizon, soil-forming rocks, gray forest soils, heavy
metals. Introduction. The territory of the Zaovrazhny new micro-district in Cheboksary city is located to the
west of the north-western residential area of Cheboksary; it is bounded from the north by the coastal fortifications of the Cheboksary storage reservoir, and on the southern side by the M-7 highway (Chebok-sary-Moscow). The soil cover of the Zaovrazhny micro-district has not been studied, and its study and determination of the ecological state were studied for the first time.
Materials and methods. Soil research was carried out in accordance with GOST 17.4.2.03-86. When diagnosing the soil covering of the Zaovrazhny micro-district, the "Classification and Diagnostics of Soils of the USSR" (1977) was used. The content of labile phosphorus and exchangeable potassium was determined by the Kirsanov method, pH – ionometrically. Chemical, bacteriological, helminthological analyses of soil samples were carried out at the Federal State-Funded Budgetary Public Health Facility of the Hygienic and Epidemiological Center No 29 of the Federal Medical-Biological Agency of Russia, No. 2637, and also at the Federal State Institution of SCAS "Chuvashky".
The results of the research and their discussion. The territory of the Zaovrazhny micro-district is located in the North-Western part of Cheboksary and covers an area of 41 hectares. Until 2002, the territory of the micro-district was used as arable land.

ISSN 2224-5278 Серия геологии и технических наук. 4. 2018
75
In 2017, it was an idle field covered with sow-thistle, tansy and reed grass with young forest groups of 10-15 years of age, sometimes built up by cottages, with engineering networks (electricity, water supply) along the streets.
The site of the real surveys in geomorphological terms is confined to the right bank of the valley of the Volga river with a genetic type of surface – denudation, 300-350 m southeast of the site is the Shupashkarka river, the right feeder of the Volga river, from the northeast and partly from the southeast, the territory borders the allotment gardens, from the northwest - the forestry of the State Forest Fund.
The relief of the built-up area is gently-sloping, with a decrease to the north-east, towards the river Volga.The geological section before the studied depth of 10 m by drilling is mainly represented by Upper Permian and Middle Jurassic rocks, which are covered with quaternary sediments – loess-like loams. Covering loamy loess-like loams are heavy, hard, semisolid, hard-brown and light-brown, macroporous, with humusstains and streaks of calcification, ferruginous, with thin interlayers of sand [6].
Ground waters of a permanent aquifer are opened in the southern part of the site in boreholes at depths of 2.6-7.2 m in the upper fractured zone of Upper Permian sediments.
According to the chemical composition, groundwater is fresh (M = 0.3-0.5 g/l), hydrocarbonate, magnesium-calcium, from weakly acidic to slightly alkaline, lime, moderately hard, with pH 6.3-6.4.
As a result of the real soil studies, it was revealed that the soil cover on the territory of the Zaov-razhny micro-district in Cheboksary is represented by washed-away types (lightly washed, medium- and heavily washed) of light gray forest soil.
Not washed-away soils are characterized by the following morphological features: a sod horizon of 5-10 cm in thickness, a humus-eluvial horizon A1 of light-gray or gray color, of low thickness (up to 15-20 cm).
The transitional horizon A1A2 is light-gray in color, a finely-nutty-lumpy structure, 5-15 cm of thickness. Gradually, A1A2 passes into the eluvial-illuvial horizon A2B up to 20 cm thick, which is characterized by a finely-nutty structure, the silica powder on the faces of structural separates in combination with washing away stains of humus and other substances.
The illuvial horizon B consists of several subhorizons: B1 is a dark brownish-brown color with spots of humic substances and pseudopodzolic silica powder; it gradually transforms into a more decolorized horizon B2, followed by the transitional horizon BC and the soil-forming rock C (loess-like loam).
In the investigations, soils with upper plowed up part of the horizon A2B were attributed to light washed types; to the medium-washed ones – when a large part or the whole of the A2B horizon is involved in the plowing layer and its absence; and to heavily washed ones - soils, in the profile of which there were no horizons A2B and B1.
The morphological features of the reservoir soils are characterized by the fact that the former homogeneous arable Ap horizon was divided into two genetic horizons – A1 and A1A2, which are presented in virgin soils.
Description of the profile of light washed light-gray forest hard loamy medium-thick soil on loess-like loam (section 1), laid on a reservoir covered with birch and aspens with a thinned herb layer (brome grass, chicory, milfoil, dandelion) is shown in table. 1.
Table 1 – Description of the profile of light washed light-gray forest soil
А1 0-20 cm Wet, gray, heavy loamy, lumpy, loose. There may be roots, worm channels, earthworms, grub worm, clear transition.
А1А2 20-25 cm Wet, whitish-gray, heavy loamy, lumpy, dense, there are roots, spangles of silica, worm channels, clear transition.
А2В 25-38 cm Humidified, brownish-gray, heavy loamy, lumpy, finely-nutty, does not boil up from 10% hydro-chloric acid.
В1 38-49 cm Humidified, brownish-brownish, heavy loamy, nutty, with spanglesof silica and humus stains, does not boil up from 10% hydrochloric acid.
В2 49-91 cm Humidified, brown, heavy loamy, large-nutty, with humusstains, does not boil up from 10% hydrochloric acid.
ВС 91-130 cm Moistened, brown, with root channels, rare humus stains, heavy loamy, structureless, does not boil up from 10% hydrochloric acid.
С 130-180 cm Humidified, light-brown, heavy loamy, structureless, in the lower part slightly boil up from 10% hydrochloric acid.
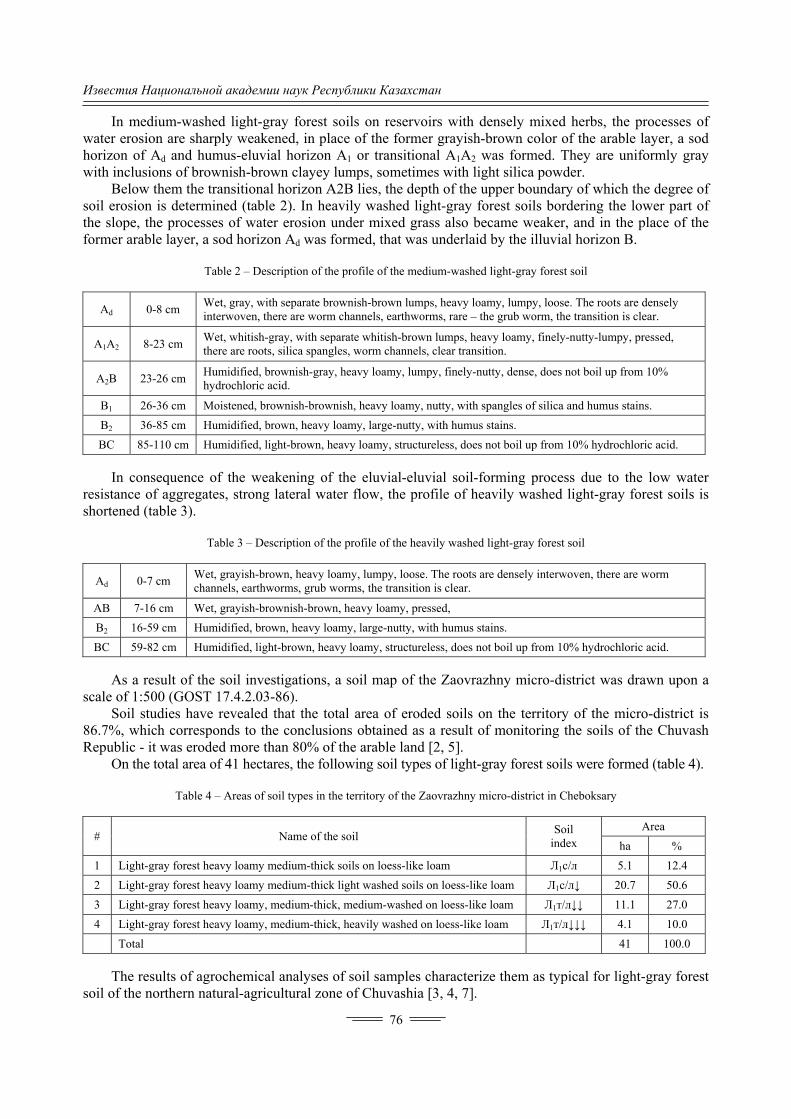
Известия Национальной академии наук Республики Казахстан
76
In medium-washed light-gray forest soils on reservoirs with densely mixed herbs, the processes of water erosion are sharply weakened, in place of the former grayish-brown color of the arable layer, a sod horizon of Ad and humus-eluvial horizon A1 or transitional A1A2 was formed. They are uniformly gray with inclusions of brownish-brown clayey lumps, sometimes with light silica powder.
Below them the transitional horizon A2B lies, the depth of the upper boundary of which the degree of soil erosion is determined (table 2). In heavily washed light-gray forest soils bordering the lower part of the slope, the processes of water erosion under mixed grass also became weaker, and in the place of the former arable layer, a sod horizon Ad was formed, that was underlaid by the illuvial horizon B.
Table 2 – Description of the profile of the medium-washed light-gray forest soil
Аd 0-8 cm Wet, gray, with separate brownish-brown lumps, heavy loamy, lumpy, loose. The roots are densely interwoven, there are worm channels, earthworms, rare – the grub worm, the transition is clear.
А1А2 8-23 cm Wet, whitish-gray, with separate whitish-brown lumps, heavy loamy, finely-nutty-lumpy, pressed, there are roots, silica spangles, worm channels, clear transition.
А2В 23-26 cm Humidified, brownish-gray, heavy loamy, lumpy, finely-nutty, dense, does not boil up from 10% hydrochloric acid.
В1 26-36 cm Moistened, brownish-brownish, heavy loamy, nutty, with spangles of silica and humus stains.
В2 36-85 cm Humidified, brown, heavy loamy, large-nutty, with humus stains.
ВС 85-110 cm Humidified, light-brown, heavy loamy, structureless, does not boil up from 10% hydrochloric acid.
In consequence of the weakening of the eluvial-eluvial soil-forming process due to the low water
resistance of aggregates, strong lateral water flow, the profile of heavily washed light-gray forest soils is shortened (table 3).
Table 3 – Description of the profile of the heavily washed light-gray forest soil
Аd 0-7 cm Wet, grayish-brown, heavy loamy, lumpy, loose. The roots are densely interwoven, there are worm channels, earthworms, grub worms, the transition is clear.
АВ 7-16 cm Wet, grayish-brownish-brown, heavy loamy, pressed,
В2 16-59 cm Humidified, brown, heavy loamy, large-nutty, with humus stains.
ВС 59-82 cm Humidified, light-brown, heavy loamy, structureless, does not boil up from 10% hydrochloric acid.
As a result of the soil investigations, a soil map of the Zaovrazhny micro-district was drawn upon a
scale of 1:500 (GOST 17.4.2.03-86). Soil studies have revealed that the total area of eroded soils on the territory of the micro-district is
86.7%, which corresponds to the conclusions obtained as a result of monitoring the soils of the Chuvash Republic - it was eroded more than 80% of the arable land [2, 5].
On the total area of 41 hectares, the following soil types of light-gray forest soils were formed (table 4).
Table 4 – Areas of soil types in the territory of the Zaovrazhny micro-district in Cheboksary
# Name of the soil Soil
index
Area
ha %
1 Light-gray forest heavy loamy medium-thick soils on loess-like loam Л1с/л 5.1 12.4
2 Light-gray forest heavy loamy medium-thick light washed soils on loess-like loam Л1с/л↓ 20.7 50.6
3 Light-gray forest heavy loamy, medium-thick, medium-washed on loess-like loam Л1т/л↓↓ 11.1 27.0
4 Light-gray forest heavy loamy, medium-thick, heavily washed on loess-like loam Л1т/л↓↓↓ 4.1 10.0
Total 41 100.0
The results of agrochemical analyses of soil samples characterize them as typical for light-gray forest
soil of the northern natural-agricultural zone of Chuvashia [3, 4, 7].

ISSN 2224-5278 Серия геологии и технических наук. 4. 2018
77
The humus content in the soils of the site is low - from 1 to 3% (very low and low). The sum of exchange bases (S) in the upper soil horizon is 16.7-21.3 mg-e / 100 g, hydrolytic acidity (Ng) – 1.03-4.43 mg-e/100 g of soil. The content of labile phosphorus and exchangeable potassium is cha-racteristic of light-gray forest soils: mainly medium and high. The saturation degree with soil bases is 82-94%. The reaction of soils varies from a medium to a neutral.
A study of the content of radionuclides (cesium-137 and strontium-90) in the upper horizon of the soil (B1) showed a low content of 8.6-12.20 and 3.3-4.4 Bq/kg, respectively.
According to the GOST 17.5.3.06-85 indices and calculations, the thickness of the fertile soil layer on the total area of the construction site with the area of 41 hectares is on average 20 cm. The total mass of the fertile soil layer with an average bulk density of 1.14 g/cm3 is 2280 tons.
The total mass of a potentially fertile layer with the thickness of 25 cm and the average bulk density of 1.25 g/cm3, located beneath the fertile layer, averages 3125 tons/ha.
Conclusion. As a result of the studies, the soil cover of the Zaovrazhny micro-district was revealed. The current state of soil quality in the micro-district area corresponds to sanitary and epidemiological requirements. The results of the research unequivocally testify to the ecological well-being of the territory of Cheboksary city of the Chuvash Republic [1], considering the new buildings located next to the ravine system.
REFERENCES
[1] Vasiliev O.A., Ilyina T.A., Chernov A.V. Ecological state of soils in the territory of the Red Square and the bay of Cheboksary // II International Scientific and Practical Conference on the Year of Ecology in Russia "Environmental, Legal and Economic Aspects of Rational Use of Land Resources" (May 04-05, 2017). Saratov, FSBEI Saratov State University named after Vavilov, 2017. P. 54-59 (in Russ.).
[2] Vasiliev O.A., Egorov V.G., Dmitrieva O.Yu., Ilyin A.N. State and prospects of the use of arable land in the Chuvash Republic // Proceedings of the XII All-Russian Scientific and Practical Conference "Youth and Innovation". Cheboksary: CSACA, 2016. P. 3-7 (in Russ.).
[3] Vasiliev O.A., Kiryanov D.P., Fadeeva N.A. The gross chemical composition of the soils of the Chuvash Republic and its influence on agrochemical properties // Proc. All-Russian scientific-practical conf. "Agro-ecological and organizational-eco-nomic aspects of the creation and effective functioning of ecologically stable territories". Cheboksary, October 5, 2017. P. 18-23 (in Russ.).
[4] Ivanova T.N., Sergeev V.S. Dynamics of agrochemical indicators of soil fertility according to the results of local monitoring // Bulletin of the Bashkir Agrarian University. 2017. N 2(42). P. 11-15 (in Russ.).
[5] Ilyina T.A., Vasiliev O.A. Ecological state of agrolandscapes and specially protected natural territories of the Chuvash Republic: Monograph. IP Sorokina A.V. "New time." Cheboksary, 2011. P. 153 (in Russ.).
[6] Technical report of JSC "ChuvashGIIZ" on engineering and geological surveys at the site: "Integrated development of the territory of the Zaovrazhny micro-district" (order 9762). 2014. 32 p. (in Russ.).
[7] Chernov A.V., Vasilyev O.A. Dynamics of Soil Fertility in the Chuvash Republic // Proceedings of the All-Russian Scientific and Practical Conference "Agroecological and Organizational-Economic Aspects of Creation and Efficient Functioning of Environmentally Sustainable Territories", October 05, 2017. Cheboksary, 2017. P. 157-163 (in Russ.).
О. А. Васильев1, В. Г. Семенов1, Ю. А. Юлдашбаев2, Д. А. Баймуканов3, Х. А. Əубəкіров4
1Чуваш мемлекеттік ауыл шаруашылық академиясы, Чебоксары қ., Чуваш Республикасы, Ресей, 2Ресей мемлекеттік аграрлық университеті – К. А. Тимирязев атындағы ауыл шаруашылық академиясы,
Москва, Ресей, 3Қазақ мал жəне мал азығы ғылыми-зерттеу институты, Алматы, Қазақстан,
4Тараз ұлттық университеті М. Х. Дулати атындағы, Тараз, Қазақстан
ЧЕБОКСАРЫ ҚАЛАСЫНЫҢ «ЗАОВРАЖНЫЙ» МӨЛТЕК АУДАНЫНДАҒЫ ТОПЫРАҚ ҚҰРАМЫ МЕН ЭКОЛОГИЯЛЫҚ ЖАҒДАЙЫ
Аннотация. 2017 жылдың шілде-тамыз айларында Чебоксары қаласындағы «Заовражный» мөлтек ауда-нындағы топырақтың агрохимиялық құрамы зерттелді.
Чебоксары қаласындағы жаңа «Заовражный» мөлтек ауданы территориясы Чебоксары қаласының солтүстік-батысында орналасқан; ол солтүстігінен Чебоксары су қоймасының жағалаулық су бекіністерімен, ал оңтүстік жағынан «М-7» көлік жолымен шектелген (Чебоксары-Москва).
Мөлтек ауданы территориясында ашық-сұр түсті орманның ауыр батпақты топырағы таралған, ал орта жəне төменгі тұстарында ол су эррозиясына ұшырап өзгерген. Сумен шайылған топырақтар келесідей мор-фологиялық белгілерімен сипатталады: Ад дерналық қабатының қалыңдығы 5-10 см, қарашірікті-элювиальды

Известия Национальной академии наук Республики Казахстан
78
А1қабаты 15-20 см дейін. Олардың астында қалыңдығы 5-15 см құрайтын А1А2өтпелі қабаты орналасқан. Біртіндеп А1А2 қалыңдығы 20 см дейін жететін А2В элювиальды-иллювиалды қабатына өтеді. В –иллю-виальды қабаты бірнеше қабат қатпарларынан тұрады: В1 – қара-қоңыр түсті қарашірікті заттардық тең-білдері бар жəне лессивировты кремни реңді себінделерден құралады; ол біртіндеп ақшыл тартқан В2 қаба-тына, содан кейін өтпелі ВС жəне топырақ құраушы С (лессогоұқсас суглинок) қабаттарына айналады.
Топырақ құраушы қарашірікті қабаты құрамындағы ауыр металдардың, мұнай өнімдерінің, радио-нуклеидтер мен бензапирендер мөлшерлері фондық мəндеріне сəйкес келеді жəне ШРК аспайды.
«Заовражный» мөлтек ауданындағы топырақ қабаты мен оның экологиялық жағдайы алғаш рет зерттелінді.
Түйін сөздер: агрохимиялық қасиеті, су эррозиясы, қарашірікті қабат, топырақ құраушы породалар, сұр түсті орман топырағы, ауыр металдар.
О. А. Васильев1, В. Г. Семенов1, Ю. А. Юлдашбаев2, Д. А. Баймуканов3, Х. А. Аубакиров4
1Чувашская государственная сельскохозяйственная академия, Чебоксары, Чувашская Республика, Россия, 2Россисйский государственный аграрный университет – Московская сельскохозяйственная академия им. К. А. Тимирязева, Москва, Россия,
3Казахский научно-исследовательский институт животноводства и кормопроизводства, Алматы, Казахстан, 4Таразский государственный университет им. М. Х. Дулати, Тараз, Казахстан
ПОЧВЕННЫЙ ПОКРОВ МИКРОРАЙОНА «ЗАОВРАЖНЫЙ» Г. ЧЕБОКСАРЫ И ИХ ЭКОЛОГИЧЕСКОЕ СОСТОЯНИЕ
Аннотация. В июле-августе 2017 г. проводились почвенно-агрохимические исследования территории микрорайона «Заовражный» г. Чебоксары.
Территория нового микрорайона «Заовражный» г. Чебоксары расположена к западу от северо-западного жилого района г. Чебоксары; она с севера ограничена береговыми укреплениями Чебоксарского водохрани-лища, а с южной стороны автотрассой «М-7» (Чебоксары-Москва).
На территории микрорайона распространены светло-серые лесные тяжелосуглинистые почвы, в средней и нижней части склона измененные водной эрозией. Несмытые почвы характеризуются следующими морфо-логическими признаками: дерновый горизонт Ад мощностью 5-10 см, гумусово-элювиальный горизонт А1 до 15-20 см. Под ним расположен переходный горизонт А1А2 мощностью 5-15 см. Постепенно А1А2 переходит в элювиально-иллювиальный горизонт А2В мощностью до 20 см. Иллювиальный горизонт В состоит из не-скольких подгоризонтов: В1 – темно-буровато-коричневой окраски с пятнами гумусовых веществ и лессиви-рованной кремнеземистой присыпки; он постепенно переходит в более осветленный В2, сменяющиеся переходным горизонтом ВС и почвообразующей породой С (лессовидный суглинок).
Содержание тяжелых металлов в гумусовом горизонте и почвообразующей породе, нефтепродуктов, радионуклеидов и бензапирена соответствует фоновым значениям и не превышают ПДК.
Почвенный покров микрорайона «Заовражный» и его экологическое состояние изучались впервые. Ключевые слова: агрохимические свойства, водная эрозия, гумусовый горизонт, почвообразующие
породы, серые лесные почвы, тяжелые металлы. About the authors: Vasiliev Oleg Aleksandrovich – Doctor of Biological Sciences, Professor of the Department of Land
Management, Cadastre and Ecology of the Chuvash State Agricultural Academy, Cheboksary, Chuvash Republic, Russia, e-mail: [email protected],
Semenov Vladimir Grigoryevich – Doctor of Biological Science, professor, honored worker of science of the Chuvash Republic, professor of Department of morphology, obstetrics and therapy of the Chuvash state agricultural academy, Cheboksary, Chuvash Republic, Russia, e-mail: [email protected]
Yuldashbayev Yusupzhan Artykovich – Doctor of Agricultural Sciences, Professor, Corresponding Member of the Russian Academy of Sciences, Dean of the Faculty of Zootechnics and Biology of the Russian State Agrarian University - Moscow Agricultural Academy named after K. A. Timiryazev, Moscow, Russia, e-mail: [email protected]
Baimukanov Dastanbek Asylbekovich – doctor of agricultural sciences, professor, corresponding member of National Academy of Sciences of the Republic of Kazakhstan, chief researcher of department of cultivation and selection of the dairy cattle of the Kazakh Scientific Research Institute of Animal Breeding and Fodder Production, Almaty, Republic of Kazakhstan.E-mail: [email protected]
Aubakirov Khamit Abilgaziyevich – Candidate of Agricultural Sciences, Associate Professor of the Department of Biotechnology, M. Kh. Dulati Taraz State University, Taraz, Kazakhstan.

ISSN 2224-5278 Серия геологии и технических наук. 4. 2018
79
N E W S OF THE NATIONAL ACADEMY OF SCIENCES OF THE REPUBLIC OF KAZAKHSTAN
SERIES OF GEOLOGY AND TECHNICAL SCIENCES
ISSN 2224-5278
Volume 3, Number 430 (2018), 79 – 86 UDC 574/075.8
A. M. Sarsenov, V. K. Bishimbayev, B. A. Kapsalyamov, K. K. Lepessov, K. M. Gapparova
“Research Centre of Salt technology” Social Fund, Astana, Kazakhstan. E-mail: [email protected] [email protected] [email protected] [email protected]
[email protected] [email protected]
INTERPHASE DISTRIBUTION OF BORIC ACID BETWEEN AQUEOUS SOLUTIONS
AND MODIFIED CELLULOSE
Abstract. Regarding the need for processing of hydromineral raw materials, many researchers have an in-creased focus on core and applied problems of producing organic sorbents based on natural materials, in particular, different kinds of cellulose modified by mercerization methods (treatment with alkali solutions) and chemical change of functional groups.
The research addresses the interfacial distribution of boric acid on a mercerized, then chemically modified crushed kernel of common apricot, Prunus armeniaca (apricot).
It was found that the sorbent material has selective properties for boric acid, extracting it from the aqueous phase and concentrating Н3ВО3 in the solid phase of the sorbent (modified cellulose). On the basis of carried out elemental chemical and mass spectrometric analyzes, along with IR spectrum of sorbents, the structure of sorbents was identified, and a mechanism for the absorption of boric acid by the phase of modified cellulose (CM) was proposed.
Keywords: boric acid; modification; interphase distribution. Nomenclature of user. In this work rational nomenclature for naming organic compounds was
applied. The extra-system units (% and the amount of the solute in a liter of solution) were used to specify the concentration and the rate of extraction. Abbreviations were spelled out in full at their first occurrence in the text.
Introduction. Spectrophotometric analysis and acid-base titration in the presence of polyhydric alcohols of mannitol, xylitol, sorbitol, etc. were applied in order to analyze the amount of boron (the relative error of the analysis is ±3.5%) [1-3].
The literature describes the use of cellulose and polyhydric alcohols as components for the synthesis of various sorbents. For example, the works [4-6] describe methods for preparing composite sorbents using cellulose fibrillated fibers together with compounds of iron and calcium to extract inorganic ions from aqueous solutions, but do not consider the extraction of boric acid.
In the invention [7], it is proposed to obtain an effective sorbent for wastewater treatment from metal ions by immobilizing finely dispersed МgCO3 and Mg(ОН)2 onto fibrillated cellulose fibers.
In the patent of the Russian Federation No. 2528696 [8] in order to extract silver and phosphorus it is proposed to obtain a sorbent by treating fibrillated cellulose fibers in a salt solution of zinc and sodium sulfide.
According to the patent of the Russian Federation No. 2520457 [9] a composite sorbent consisting of polyvinyl alcohol and nanophasic oxyhydroxide separated from waste from groundwater deironing stations is used to purify aqueous environment from arsenic.
In the work [10], carboxymethylcellulose (CMC) containing layered double hydroxides was synthesized by the ion exchange method [10]. Experiments have shown that on such CMC, the adsorption of boron increases with increasing contact time, boron concentration and pH.

Известия Национальной академии наук Республики Казахстан
80
95° С
2СН 2ОН- (СНОН) 4-СН 2ОН+3НС1
Cl-СН 2-(СНОН) 4-СН 2Cl + 2Н 2О
Cl-СН 2-(СНОН) 4-
СН 2OH+Н 2О
nСH2Cl-(CH4OH)4-СН3
К2СО3; 100-110o С
→
+
toluene
→
(I)
(II)+ nКСl +nH2O+ nCO2↑+
A study of the removal of boron from simulated and real water systems in the northern part of Chile using ultrafiltration reinforced with a polymer in water, for example, polyglycidyl methacrylate-N-methyl-D-glucamines, which was used to form complexes with boron, is presented in the work [11]. The retention capacity of the polymer membrane was maintained at a level of 2-4 mg per gram of polymer.
For producing adsorbents obtained from natural polymer [12] two forms (powder and fiber) of cellulose derivatives and N-methylglucamine [12] were synthesized. The sorption capacity of the cellulose derivatives by boron was the same as that of commercially available polystyrene resin with N-methyl-glucamine type groups. It was found that cellulose derivatives are superior to a polystyrene resin as the adsorbent for boron (III) in the processing of large amounts of wastewater.
It should be noted that the general shortage of sorbents obtained using glucomine is due to a significant biodegradation of glucomine, since the latter is a nutrient for bacteria.
Thus, there is no information in the literature on neither on chemical modification of mercerized cellulose, by "sewing" of chlorinated derivatives of polyhydric alcohols to its polymeric carbon skeleton (matrix), nor the structure and sorption properties of these compounds. Nevertheless, the interest of researchers in the study of cellulose derivatives as sorbents remains [3].
The purpose of this research was to study the redistribution of the initial boron content in the form of H3BO3 between the phases of the aqueous solution and the sorbent in time, on chemically modified cellulose (CM).
In order to achieve this goal, the following tasks were set: – chemical processing of cellulose in order to improve its operational, physical and chemical
properties; – establishment of the mechanism of the sorption process on (CM); – examination of regularities of interphase distribution of boron in the solution-solid phase system for
the development of practical recommendations. Experimental part. To improve the capacity of the CM sorbent, it was additionally modified by
chemically "sewn" molecules of hexahydrolic alcohol (sorbitol). The synthesis was carried out in two stages.
The first stage is the synthesis of 1-chloro or 1.6-dichlorosorbite. Six-atom alcohol-sorbitol is treated with hydrogen chloride at 95 °C in toluene during 6 hours.
Chlorination in reaction (I) proceeds by the mechanism of nucleophilic substitution. The reaction
product is treated with a solution of sodium carbonate until neutral, and then washed with water. After separation of the aqueous layer, the mixture of the chlorine derivatives of sorbitol is purified by distillation.
The chlorinating agent – hydrochloric acid was prepared by the known reaction of a mixture of sulfuric acid and sodium chloride when heated.
II stage – chlorinated sorbitol is "sewn" chemically to mercerized cellulose at 100-110 °C by 10% solution of К2СО3 during 5 hours:
where R is the residue of a polyhydric alcohol "sewn" to the cellulose monomer.
+

ISSN 2224-5278 Серия геологии и технических наук. 4. 2018
81
The reaction product is filtered off, washed with water, alcohol and again with water until neutral, then it is brought to an air-dry state. The composition of the substance was determined by independent IR spectroscopy, elemental chemical and mass spectrometric analyzes. A chromatography-mass spectrometer Clarus SQ 8 was used for this work.
IR spectra of absorption of reaction products are recorded on an IR-20B spectrophotometer in potassium bromide tablets in the range of 600-3800 cm-1.
The percentage of carbon and hydrogen was equal: C - 78.86%, H - 9.66%. According to these data, the calculated ratio of carbon to hydrogen atoms is 1: 1.41 and it practically coincides with their theo-retical ratio in a monomer.
The calculation was made using the well-known method for determining the formula of a chemical compound based on its percentage and element composition:
C: H = 78.85 / 12.0: 9.65 / 1.0 = 6.57: 9.65 = 1: 1.47
In figures 1 and 2, IR spectra of chlorinated sorbitol and modified cellulose are presented for com-parison.
а) b)
Figure 1 – IR spectra of a) chlorinated sorbitol, b) modified cellulose
In the IR spectra in the range of 3400-3200 cm-1, there is an intense wide band of valence vibrations ὺ that arise when intermolecular hydrogen bonds-polyassociates are formed.
In the spectra of chlorinated sorbitol, based on the significantly increasing of the intensity of the vibrational bands with the participation of the bond (C-Cl), the substitution of two primary (OH) groups for chlorine atoms can be suggested.
Sewing chlorinated sorbitol proceeds quite fully, which is proved by the minimization of the band of stretching vibrations ὺСlв in the range of 700 cm-1.
Figure 2 – The influence of time on the amount of boron sorption
a) unmodified cellulose b) modified cellulose

Известия Национальной академии наук Республики Казахстан
82
In the range of 970-900 cm-1, average low-density absorption bands characteristic of deformation vibrations of methane groups (CH) are observed.
In the 750-700 cm-1 range, intense narrow bands characteristic of the bond (C-CI) appear both in the mixture of the chlorinated derivatives of sorbitol and in the finished product.
Results and discussions. The extraction of boron from water in both types of CM is studied depen-ding on the initial boron concentration, contact time and phase ratio (S: L).
Under static conditions, in a state of equilibrium on a modified CM the degree of extraction reaches 95-97%. The modified CM is more efficient compared to the unmodified one. The sorption capacity of the CM reaches more than 6mg per gram of sorbent, which is at the level of the best existing boron selective ion exchangers. In order to obtain more information, the data of the experiments were processed using the program Excel Microsoft (figures 3, 4). Figures contain a quantitative characteristic of the influence of time and boron concentration on the degree of its sorption.
The regression equations for the dependence of the degree of boron extraction on the time factor on unmodified and modified cellulose at different initial concentrations of boron in the solution were approximated by linear dependence for computer processing (table).
Dependence of the degree of boron extraction on the initial concentration
Unmodified cellulose Modified cellulose
initial concentration of boron, g/l
y= ах+b type
of equations
coefficient of approximation R2
(correlation)
initial concentration of boron, g/l
y= ах+b type
of equations
coefficient of approximation R2
(correlation)
0.024 y = 0.8433x – 15.08 0.8845 0.024 y = 0.5437x + 38.7 0.8643
0.0406 y = 0.862x – 19.3 0.8668 0.0406 y = 0.678x + 23.2 0.9018
0.0504 y = 0.853x – 20.87 0.8524 0.0504 y = 0.5597x + 24.91 0.8884
0.0769 y = 0.853x – 20.87 0.8524 0.0769 y = 0.7453x + 0.62 0.8804
0.0938 y = 0.8363x – 22.82 0.8485 0.0938 y = 0.7173x – 4.48 0.8785
Note: a – tangent of the slope of the line to the axis of the abscissa, b – the segment cut off by the straight line along the ordinate axis.
It can be seen from the table that the coefficient of approximation achieves values greater than 0.85,
which indicates the reliability of the results obtained. Figure 3 shows the information obtained by calculation, describing the influence of the time factor on
the amount of boron sorption on two types of cellulose.
Figure 3 – The diagram of the dependence of boron sorption on the initial concentration and time of sorption on a) unmodified cellulose, b) modified cellulose

ISSN 2224-5278 Серия геологии и технических наук. 4. 2018
83
It can be seen from the graph (figure 3) that as the time and concentration increase, the degree of the extraction rate of Н3ВО3 decreases. This is due to the gradual saturation of the sorbent phase with boron, which leads to an increase in diffusion difficulties in the transportation of Н3ВО3 molecules in nano- and micro-dimensional pores of sorbents.
A sufficiently complete extraction occurs in all cases with a sorption time of more than 130 minutes, and the modified sorbent is much more efficient than the unmodified one.
Based on the Microsoft Excel program calculation a combined empirical equation is obtained, that relates the dependence of the influence of the initial boron concentration and sorption time on the extraction value:
Y = (0.86-0.3 X) τ-85.2 X + 14.7 (1)
where: Y is the boron sorption, (% of the initial content), X is the initial concentration in the solution, g / l; τ is the time of the sorption process, min.
In a graphical form, this dependence is shown in Figure 3a in the form of a diagram. As can be seen from the diagram of the combined dependence of the degree of sorption on the initial
boron concentration for different sorption times (30 to 150 min or more), the degree of increase of the target substance decreases with an increase of the initial boron concentration and a decrease of the phase contact time. As noted earlier, this type of dependence is associated with an increase in the degree of boron saturation of the sorbent phase and diffusion difficulties.
Since the obtained dependences are linear, this allows extrapolating the results of sorption to other values of the variables: the time of the process and the initial content of the extracted substance, without conducting new experiments.
Experiments were carried out using modified mercerized cellulose with "residues" of chlorine derivatives of polyhydric alcohols sewn to it (The results are given in figure 2b).
As it is shown on this figure in comparison with unmodified cellulose, the recovery of Н3ВО3 on this sorbent is also more effective.
The degree of sorption of boron on modified cellulose is described by the empirical equation, which we obtained using the above described calculation method.
Y = (2.54 X + 0.5) τ-630.2 X + 52.6 (2)
From the analysis of the diagram obtained by visualizing this equation (Figure 3b) it follows that the general pattern of the change in the magnitude of the dependence of sorption on the variable factors will remain the same as for the unmodified sorbent. However, the efficiency and speed of extraction is much higher. This is confirmed by a very significant relative increase of the tangent in the slope of the majority of straight lines (about 0.60-0.75 percent of extraction per minute). The tangent of the slope of the straight line to the abscissa axis graphically represents the speed of the process, which was used to estimate the speed of the process.
Figure 2b shows that in the case of long process duration and a large percentage of boron extraction, irrespective of its initial concentration, the straight lines converge at one point. This is obviously due to the almost complete saturation of the sorbent with boron over time. The saturation of the sorbent for all solutions occurs in this case with a shorter sorption time of about 100 minutes.
It is convenient to use the diagram (figure 3) proposed by us to determine the efficiency of sorption of a substance at given concentrations of boron and the sorption time, for example at a boron concentration of 0.2 g / l in 165 minutes 95% of the substance is extracted and 150 min less than 80% (figure 3 b). The proposed methodology for drawing up such diagrams can be used to visualize a wide range of other processes of interphase redistribution and concentration of matter in heterogeneous systems.
Thus, it can be concluded that the mercerization of the studied cellulose species and the subsequent "sewing" of chlorine derivatives of polyhydric alcohols to it led to a significant increase in the sorption capacity of cellulose.
With an increase in the background salt, the extraction of the substance is significantly improved as a result of the salting out effect. For example, it was found that, other things being equal, an increase in the NaCl concentration from 0.005 N to 1.00 N increases the coefficient of interphase distribution of boron
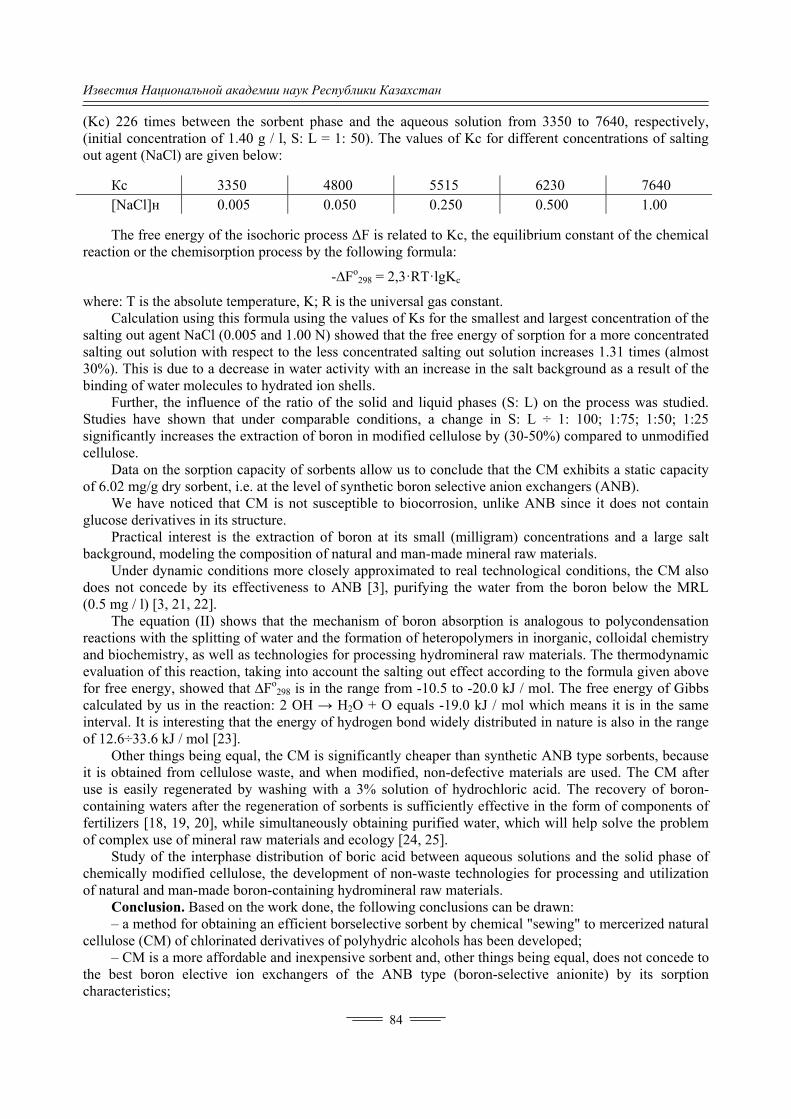
Известия Национальной академии наук Республики Казахстан
84
(Kc) 226 times between the sorbent phase and the aqueous solution from 3350 to 7640, respectively, (initial concentration of 1.40 g / l, S: L = 1: 50). The values of Kc for different concentrations of salting out agent (NaCl) are given below:
Кс 3350 4800 5515 6230 7640 [NaCl]н 0.005 0.050 0.250 0.500 1.00
The free energy of the isochoric process ΔF is related to Kc, the equilibrium constant of the chemical reaction or the chemisorption process by the following formula:
-∆Fo298 = 2,3·RT·lgKc
where: T is the absolute temperature, K; R is the universal gas constant. Calculation using this formula using the values of Ks for the smallest and largest concentration of the
salting out agent NaCl (0.005 and 1.00 N) showed that the free energy of sorption for a more concentrated salting out solution with respect to the less concentrated salting out solution increases 1.31 times (almost 30%). This is due to a decrease in water activity with an increase in the salt background as a result of the binding of water molecules to hydrated ion shells.
Further, the influence of the ratio of the solid and liquid phases (S: L) on the process was studied. Studies have shown that under comparable conditions, a change in S: L ÷ 1: 100; 1:75; 1:50; 1:25 significantly increases the extraction of boron in modified cellulose by (30-50%) compared to unmodified cellulose.
Data on the sorption capacity of sorbents allow us to conclude that the CM exhibits a static capacity of 6.02 mg/g dry sorbent, i.e. at the level of synthetic boron selective anion exchangers (ANB).
We have noticed that CM is not susceptible to biocorrosion, unlike ANB since it does not contain glucose derivatives in its structure.
Practical interest is the extraction of boron at its small (milligram) concentrations and a large salt background, modeling the composition of natural and man-made mineral raw materials.
Under dynamic conditions more closely approximated to real technological conditions, the CM also does not concede by its effectiveness to ANB [3], purifying the water from the boron below the MRL (0.5 mg / l) [3, 21, 22].
The equation (II) shows that the mechanism of boron absorption is analogous to polycondensation reactions with the splitting of water and the formation of heteropolymers in inorganic, colloidal chemistry and biochemistry, as well as technologies for processing hydromineral raw materials. The thermodynamic evaluation of this reaction, taking into account the salting out effect according to the formula given above for free energy, showed that ∆Fo
298 is in the range from -10.5 to -20.0 kJ / mol. The free energy of Gibbs calculated by us in the reaction: 2 OH → H2O + O equals -19.0 kJ / mol which means it is in the same interval. It is interesting that the energy of hydrogen bond widely distributed in nature is also in the range of 12.6÷33.6 kJ / mol [23].
Other things being equal, the CM is significantly cheaper than synthetic ANB type sorbents, because it is obtained from cellulose waste, and when modified, non-defective materials are used. The CM after use is easily regenerated by washing with a 3% solution of hydrochloric acid. The recovery of boron-containing waters after the regeneration of sorbents is sufficiently effective in the form of components of fertilizers [18, 19, 20], while simultaneously obtaining purified water, which will help solve the problem of complex use of mineral raw materials and ecology [24, 25].
Study of the interphase distribution of boric acid between aqueous solutions and the solid phase of chemically modified cellulose, the development of non-waste technologies for processing and utilization of natural and man-made boron-containing hydromineral raw materials.
Conclusion. Based on the work done, the following conclusions can be drawn: – a method for obtaining an efficient borselective sorbent by chemical "sewing" to mercerized natural
cellulose (CM) of chlorinated derivatives of polyhydric alcohols has been developed; – CM is a more affordable and inexpensive sorbent and, other things being equal, does not concede to
the best boron elective ion exchangers of the ANB type (boron-selective anionite) by its sorption characteristics;

ISSN 2224-5278 Серия геологии и технических наук. 4. 2018
85
– in heterogeneous systems it is proposed to depict data on the interphase distribution of matter in analytical (mathematical) and graphical interpretation (in the form of diagrams), taking into account three variables (time, concentration and recovery percentage), which allows obtaining results without conducting additional experiments.
Acknowledgements. The work was carried out within the framework of the Project AP05135766 "Investigation of interfacial distribution processes of components of lithium-boron-magnesium hydro-mineral raw materials of natural and technogenic origin", financed by Ministry of Science, the Republic of Kazakhstan.
REFERENCES
[1] Kazakova T.A. (2013) Spectrophotometric determination of boric acid in waters. [Spektrofotometricheskoe opredelenie
bornoj kisloty v vodah]. Abstract of diss. ... candidate of chemical sciences [Avtoreferat diss. ... k.h.n.]. (In Russian) [2] Kazakova T.A., Tyutyunnik O.A., Dedkov Yu.M. (2013) Analysis and control [Analiz i kontrol'] 1(17): 242-245. (In
Russian) [3] Sarsenov A.M. (2016) Resource saving and environmental safety in the processing of chromites and borates of Western
Kazakhstan [Resursosberezhenie i jekologicheskaja bezopasnost' pri pererabotke hromitov i boratov Zapadnogo Kazahstana]. Astana. ISBN: 9965-13-923-7 (In Russian)
[4] Mazitov L.A., Finatov A.N., Finatova I.L., Orlova A.P. (2014) A method for producing sorbents based on iron hyd-roxide and calcium sulphate on a carrier from cellulose fibers [Sposob poluchenija sorbentov na osnove gidroksida zheleza i sul'fataka l'cija na nositele iz celljuloznyh volokon]. Patent of the Russian Federation [Patent Rossiyskoy Federatsii]. (In Russian)
[5] Pastukhov A.V., Nikitin N.V., Davankov V.A. (2014) Method for the preparation of polymer-inorganic composite sorbents [Sposob poluchenija polimer-neorganicheskih kompozitnyh sorbentov]. Patent of the Russian Federation [Patent Ros-siyskoy Federatsii]. (In Russian)
[6] Mazitov L.A., Finatov A.N., Finatova I.L. (2014) A method for producing sorbents based on ferric hydroxide on a carrier of cellulose fibers [Sposob poluchenija sorbentov na osnove gidroksida trehvalentnogo zheleza na nositele iz celljuloznyh volokon]. Patent of the Russian Federation [Patent Rossiyskoy Federatsii]. (In Russian)
[7] Mazitov L.A., Finatov A.N., Finatova I.L., Druzhinina N.S. (2013) A method for producing a composite sorbent based on a carbonate and magnesium hydroxide [Sposob poluchenija kompozicionnogo sorbenta na osnove karbonata i gidroksida magnija]. Patent of the Russian Federation [Patent Rossiyskoy Federatsii]. (In Russian)
[8] Mazitov L.A., Finatov A.N., Finatova I.L., Orlova A.P. (2014) A method for the preparation of Zn(OH)2 and ZnS based sorbents on a carrier from cellulose fibers [Sposob poluchenija sorbentov na osnove Zn(OH)2 i ZnS na nositele iz celljuloznyh volokon]. Patent of the Russian Federation [Patent Rossiyskoy Federatsii]. (In Russian)
[9] Sirotkina E.E. (2014) Sorbent for cleaning water from arsenic and the way it is produced [Sorbent dlja ochistki vodnyh sred ot mysh'jaka i sposob ego poluchenija]. Patent of the Russian Federation [Patent Rossiyskoy Federatsii]. (In Russian)
[10] Chun Yan Yan, Wen Tao Yi (2013) Boron Adsorption by Cellulose Supported Layered Double Hydroxides. Advanced Materials Research, 807-809: 1380-1383. DOI: 10.4028/www.scientific.net/AMR.807-809.1380. (In Eng.)
[11] Julio Sanchez, Joanna Wolska, Eren Yörükoğlu, Bernabe L. Rivas, Marek Bryjak, Nalan Kabay (2014) Removal of boron from water through soluble polymer based on N-methyl-D-glucamine and regenerated-cellulose membrane. Desalination Water Treatment, 57(2):861-869. DOI: 10.1080/19443994.2014.979369. (In Eng.)
[12] Yoshinari Inukai, Yoshinaru Tanaka, Toshio Matsuda, Nobutake Mihara, Kouji Yamada, Nobuyoshi Nambu (2004) Removal of boron(III) by N-methylglucamine-type cellulose derivatives with higher adsorption rate. Analytica Chimica Acta, 511(2):261-265. DOI:10.1016/j.aca.2004.01.054. (In Eng.)
[13] United States Borax Chemical Corporation, ARO Plastics Development LTD (1976) Selective ion-exchangers moulding plastic articles. Patent of Great Britain.
[14] Willard D.P. (1974) Removal of boron from water Removal of boron from water. Patent of USA. [15] Leykin Y.A., Yagodin G.A., Kosaeva A.E. (1986) A method for producing a sorbent for extracting boron from aqueous
solutions [Sposob poluchenija sorbenta dlja izvlechenija bora iz vodnyh rastvorov]. Author's certificate of the USSR [Avtorskoe svidetel'stvo SSSR].(In Russian)
[16] Bishimbayev V.K., Sarsenov A.M. (1996) Bulletin of the Higher School of Kazakhstan [Vestnik Vysshej shkoly Kazahstana] 3: 15-22. (In Russian)
[17] Donald E.G. (1998) Borrates: Handbook of deposits, processing and use. AcademicPress, USA. ISBN: 978-0122760600. [18] Sarsenov A.M., Akhmetov S.M., Bazarbayeva S.M., Sarsengaliyev K.K., Serikov T.P. (2008) The composition of
boron-containing microfertilizer in the form of a solution [Sostav borsoderzhashhego mikroudobrenija v vide rastvora]. Innovation patent of the Republic of Kazakhstan [Innovacionnyj patent Respubliki Kazahstan]. (In Russian)
[19] Bazarbayeva S.M. (2008) Bulletin of Bashkir University [Vestnik Bashkirskogonuniversiteta] 13(1): 33-35. (In Russian) [20] Bazarbayeva S.M. (2009) Complex processing and utilization of industrial wastes of Western Kazakhstan [Kompleks-
naja pererabotka i utilizacija promyshlennyh othodov Zapadnogo Kazahstana]. Abstract of diss. ... Doctor of Technical Sciences [Avtoreferat diss. ... dokt. tehn. nauk]. (In Russian)
[21] Grushko Y.M. (1979) Harmful inorganic compounds in industrial wastewater [Vrednye neorganicheskie soedinenija v promyshlennyh stochnyh vodah].Chemistry, Russia. (In Russian)
[22] Landolph J.R. (1985) Cytotoxicity and negligible genotoxicity of borax and borax ores to cultured mammalian cells, American Journal of Industrial Medicine,7(1): 31-43. DOI: 10.1002/ajim.4700070105. (In Eng.)

Известия Национальной академии наук Республики Казахстан
86
[23] Soviet Encyclopedic Dictionary (1982). Great Soviet Encyclopedia, Russia. ISBN: 978-5-85270-001-8. [24] Ergozhin E.E. (2011) Reports of the National Academy of Sciences of the Republic of Kazakhstan [Doklady
Nacional'noj Akademii Nauk Respubliki Kazahstan] 6:32-41. (In Russian) [25] Taspenova G.A., Smailova Zh.P., Meshkov V.R. (2018) The Bulletin of the National Academy of Sciences of the
Republic of Kazakhstan [Vestnik Nacional'noj Akademii Nauk Respubliki Kazahstan] 2: 209-217. (In Russian)
А. М. Сарсенов, В. К. Бишимбаев, Б. А. Капсалямов, К. К. Лепесов, К. М. Гаппарова
«Тұз технологиясының ғылыми зерттеу орталығы» Қоғамдық Қоры, Астана, Қазақстан
МОДИФИКАЦИЯЛАНҒАН ЦЕЛЛЮЛОЗА МЕН СУ ЕРІТІНДЕРІНІҢ АРАСЫНДАҒЫ БОР ҚЫШҚЫЛЫНЫҢ ФАЗААРАЛЫҚ БӨЛІНУІ
Аннотация. Гидроминералды шикізатты өңдеу қажеттілігіне байланысты көптеген зерттеушілер табиғи
материалдар негізінде органикалық сорбенттерді алудың іргелі жəне қолданбалы мəселеріне, атап айтқанда, мерсеризация əдістерімен модификацияланған əртүрлі целлюлозаға (сілтілі ерітінділерімен өндеу) жəне функционалдық топтардың химиялық модификациясына қызығушылық танытады.
Бор қышқылының фазааралық бөлуді нақтылы, Prunus armeniaca (абрикос) мерсеризденген, содан кейін химиялық түрде модификацияланған ұсақталған өрік сүйегіне зерттеу жүргізілді.
Сорбент материалында бор қышқылына арналған селективті қасиеттері бар, оның су фазасынан алынып, H3BO3-ні сорбент (өзгертілген целлюлоза) қатты фазасында шоғырландыратыны анықталды. Эле-менттік химиялық жəне масс-спектрометриялық талдау жүргізілді, сорбенттердің ИК-спектрлері түсірілді, олардың негізінде құрылымдар берілді жəне бор қышқылын модификацияланған целлюлоза (МЦ) фазасы арқылы жұту механизмі ұсынылды.
Түйін сөздер: бор қышқылы; өзгерту; фазааралық таралуы.
А. М. Сарсенов, В. К. Бишимбаев, Б. А. Капсалямов, К. К. Лепесов, К. М. Гаппарова
Общественный Фонд «Научно-исследовательский центр солевых технологий», Астана, Казахстан
МЕЖФАЗОВОЕ РАСПРЕДЕЛЕНИЕ БОРНОЙ КИСЛОТЫ МЕЖДУ ВОДНЫМИ РАСТВОРАМИ И МОДИФИЦИРОВАННОЙ ЦЕЛЛЮЛОЗЫ
Аннотация. В связи с необходимостью переработки гидроминерального сырья многие исследователи
проявляют интерес к фундаментальным и прикладным проблемам получения органических сорбентов на ос-нове природных материалов, в частности к различным видам целлюлозы, модифицированной методами мерсеризации (обработкой растворами щелочей), а также химическим изменением функциональных групп.
В работе изучено межфазное распределение борной кислоты на мерсеризованной, затем химически модифицированной дробленой косточке абрикоса обыкновенного, Prunus armeniaca (урюка).
Установлено, что вещество сорбента обладает селективными свойствами к борной кислоте, извлекая ее из водной фазы и концентрируя Н3ВО3 в твердой фазе сорбента (модифицированной целлюлозе). Проведены элементный химический и масс-спектрометрический анализы, сняты ИК-спектры сорбентов, на основании которых дана их структура, а также предложен механизм поглощения борной кислоты фазой модифициро-ванной целлюлозы (ЦМ).
Ключевые слова: борная кислота; модификация; межфазовое распределение.
Information about authors: Arystan Sarsenov – Doctor of Technical Sciences, Professor, “Research Centre of Salt technology” Social
Fund, Astana, Kazakhstan. Valikhan Bishimbayev – Doctor of Technical Sciences, Professor, “Research Centre of Salt technology” Social
Fund, President, Astana, Kazakhstan. Bauyrzhan Kapsalyamov – Doctor of Technical Sciences, Vice-President, “Research Centre of Salt technology”
Social Fund, Astana, Kazakhstan. Kambar Lepessov – Candidate of Chemical Sciences, “Research Centre of Salt technology” Social Fund,
Astana, Kazakhstan. Kamila Gapparova – PhD, main specialist, “Research Centre of Salt technology” Social Fund, Astana,
Kazakhstan, [email protected].

ISSN 2224-5278 Серия геологии и технических наук. 4. 2018
87
N E W S OF THE NATIONAL ACADEMY OF SCIENCES OF THE REPUBLIC OF KAZAKHSTAN
SERIES OF GEOLOGY AND TECHNICAL SCIENCES
ISSN 2224-5278
Volume 3, Number 430 (2018), 87 – 97 IRSTI 531, 530, 532
K. A. Kabylbekov, Kh. K. Abdrakhmanova, М. N. Ermakhanov, B. А. Urmashеv, Е. Т. Jаткаnbayеv
M. Auezov South Kazakhstan state University (SKSU), Shymkent, Kazakhstan.
E-mail: [email protected], [email protected]
CALCULATION AND VISUALIZATION OF A BODY MOTION IN A GRAVITATIONAL FIELD
Abstract. The article presents the program for calculation and visualization of a material particle motion
trajectory in a gravitational field of two motionless objects M1 and M2. The system of differential equations of the particle motion is solved using the ode45 procedure of the MATLAB system. At first the m-file under the title «f=finit2(t,x)», is created and then it is connected from a command line. Experiments with change of mass of the second motionless object are made, i.e. at M1=50 for M2=0; 0.2; 1; 2; at M1=49 for M2=0; 1; 2; at M1=47 for M2=0.5; 1.0. The movement of a point in the field of one motionless object happens along an ellipse, and intro-duction of other motionless object of small mass leads to perturbation of an orbit and the trajectory isn't closed. Initial parameters are introduced as global. By changing initial parameters it is possible to get various models of the particle’s motion in the gravitational field. The results of this study can be used on theoretical mechanics classes of the higher school.
Key words: gravitational field, trajectory, perturbation, ode45 procedure. Nowadays all educational institutions of Kazakhstan are provided with computer hardware and
software, interactive boards and internet. Almost all teachers have completed language and computer courses of professional development. Hence the educational institutions have all conditions for using computer training programs and models for performing computer laboratory works. In recent years we conduct work on organization computer laboratory works on physics with use of resources of the Fizikon Company [1] and [2], developed at Al-Farabi Kazakh National University by V. V. Kashkarov and his group. Some of worksheet templates for computer laboratory works are introduced in educational process of our university and schools of the Southern Kazakhstan [3-29]. Students of the specialties 5B060400 and 5B011000-physics successfully study the discipline “Computer modeling of physical phenomena” which is the logical continuation of the disciplines “Information technologies in teaching physics” and “Use of electronic textbooks in teaching physics”. The aim of this discipline is to study and learn the program language of the MATLAB [30] system, acquaintance with its huge opportunities for the modeling and visualization of physical processes. The MATLAB system is widely applied for calculating and visua-lization of problems of applied mechanics which are studied by students of specialties 5B070600-Geology and exploration of mineral deposits, 5B071200-Mechanical engineering, 5B072900-Construction, 5B072400-Technological machines and the equipment, 5B071300-Transport, transport equipment and technologies, 5B070800-Oil and gas business, 5B090100-Organization of transportations, movement and operation of transport.
This article is devoted to calculation and visualization of a body motion in a gravitational field using MATLAB software package.
Laboratory work “Calculation and visualization of a body motion in a gravitational field of two motionless objects”.
Aim of the work: to work out the program for calculation and visualization of a body motion in a gravitational field of two motionless objects.

Известия Н
Formuobjects wit
The m
The eequation:
We su
Using
Withoequal to Gmotionlessunder the t
Listinf=finiglobaf=[x(3-M1*M2*(-M1*M2*(end
Национально
ulation of thth masses M
motion of the
equation (1)
uppose that m
g these denot
;x1 x3
x3 G
x4 G
out impact oG=1 and M1s objects aretitle finit2. ng of the m. fit2(t,x) al M1 M2 c1x3);x(4);... (x(1)-c1x)/(s
(x(1)-c2x)/(sq(x(2)-c1y)/(s
(x(2)-c2y)/(sq
ой академии н
he problem: M1 and M2 (fi
e particle wit
mR
Figure 1 –in gravitation
) is the sec
R
V
motion occur
,R x1 x
tations we re
; ;x2 x4
MG
x1 c1x
M 1
Gx1 c1x
on the solutio1=50. M2=0e c1= (5,0), c
file
x c1y c2x c2
sqrt((x(1)-c1qrt((x(1)-c2xsqrt((x(1)-c1qrt((x(1)-c2x
наук Республи
A particle ofigure 1). th mass m is
13
1
mMG
R r
– The diagram nal field of two
ond-order d
1
V
MG
R r
rs on the plan
, 1x2 r c
ewrite the equ
2
M 1 x1 c1x
x x2 c
2
1 x2 c1y
x2 c
on of the pr0 (their valuec2= (0,10). T
2y
x)^2+(x(2)-cx)^2+(x(2)-cx)^2+(x(2)-c
x)^2+(x(2)-c
ики Казахста
88
of mass m m
described by
1R r G
of a location ofmotionless obj
differential e
13
1
R rr
ne and introd
, ,c1x c1y ruation (2) as
/3 22
x
c1y
/3 22
c1y
roblem, we tes can be chThen the sys
c1y)^2))^3-.2y)^2))^3; c1y)^2))^3-.2y)^2))^3];
ан
moves in a gr
y the followin
23
2
mMG
R r
f the particle wiects with masse
equation. It
23
2
MG
R r
duce the follo
,2r c2x c2
the followin
M
x1 c2x
M 2
x1 c2x
take the valuhanged). Alsstem of the e
..
..
ravitational f
ng equation
2R r
ith mass m es M1 and M2
can be redu
23 R r
owing denota
,2 y V
ngs
2
2 x1 c2x
x x2 c
2
2 x2 c2 y
x2 c2
ue of a graviso we suppoequations ca
field of two
uced to the
ations:
,x3 x4
/ ;3 22
x
c2 y
/ ;3 22
2 y
itational conose that cooan be written
motionless
(1)
first-order
(2)
(3)
(4)
nstant to be rdinates of
n as m. file

ISSN 2224-5278 Серия геологии и технических наук. 4. 2018
89
The program of the movement of a particle of mass m in the field of one motionless object with mass M1=50. In the command line of MATLAB we write
>> global M1 M2 c1x c1y c2x c2y >> M1=50; M2=0; c1x=5; c1y=0; c2x=0; c2y=10; % input of parameters >> x0=0; y0=0; vx0=0; vy0=4.3; T1=4000; % input of parameter >> [t,h]=ode45(@finit2,[0,T1],[x0,y0,vx0,vy0]); % solution of the differential equation >> x=h(:,1); y=h(:,2); x1=c1x; y1=c1y; x2=c2x; y2=c2y; >> plot(x,y) % drawing the motion trajectory >> grid on% drawing the coordinate grid >> hold on% drawing the next element % drawing the location of motionless objects >> plot(x1,y1,'r+',x2,y2,'r*','MarkerSize',15); >> plot(x1,y1,'ro',x2,y2,'ro','MarkerSize',15); >> gtext('M1=50') % input of the notation in the figure >> gtext('M2=0') % input of the notation in the figure The result is presented in the figure 2.
Figure 2 – The trajectory of a particle motion in a gravitational field of one motionless object with mass M1
It is known that the particle in a gravitational field of one motionless object with a certain mass moves along an ellipse or a circle. In the figure 2 the line trajectory is indistinct. This is due to insufficient accuracy of the calculation. By default the accuracy of calculation of the ode45 procedure is 1e-6 which isn't enough for the considered problem. Therefore, in the ode45 procedure the calculation accuracy is taken to be 1e-9.
>> global M1 M2 c1x c1y c2x c2y >>M1=50; M2=0; c1x=5; c1y=0; c2x=0; c2y=10; % input of parameters >> x0=0; y0=0; vx0=0; vy0=4.3; T1=4000; >> tol=1e-9; >> [t,h]=ode45(@finit2,[0,T1],[x0,y0,vx0,vy0],odeset('RelTol',tol)); >>x=h(:,1); y=h(:,2); x1=c1x; y1=c1y; x2=c2x; y2=c2y; >>plot(x,y) % drawing the trajectory of the motion >> grid on >> hold on% drawing the next element % drawing the location of motionless objects >> plot(x1,y1,'r+',x2,y2,'r*','MarkerSize',15); >>plot(x1,y1,'ro',x2,y2,'ro','MarkerSize',15);
-10 0 10 20 30 40 50 60 70-20
-15
-10
-5
0
5
10
15
20
M1=50
M2=0
x
y
y(x)

Известия Национальной академии наук Республики Казахстан
90
>>gtext('M1=50') % input of the notation in the figure >> gtext('M2=0') % input of the notation in the figure The result is presented in the figure 3.
Figure 3 – The trajectory of a particle motion in a gravitational field of one motionless object with mass M1
Now we have got the perfect picture of the trajectory. The program of the movement of a particle of mass m in the field of two motionless objects with
masses M1=50 and M2=0.2. >> M1=50; M2=0.2; c1x=5; c1y=0; c2x=0; c2y=10; % input of parameters >> x0=0; y0=0; vx0=0; vy0=4.3; T1=1000; % input of parameters >> [t,h]=ode45(@finit2,[0,T1],[x0,y0,vx0,vy0]); % solution of the differential equation >> x=h(:,1); y=h(:,2); x1=c1x; y1=c1y; x2=c2x; y2=c2y; >> plot(x,y); % drawing the motion trajectory >> gtext('M2=0.2') % input of the notation in the figure >> gtext('M1=50') % input of the notation in the figure The result is presented in the figure 4. Figure 4 shows that introduction of the second motionless object with a small mass of M2=0.2 leads
to disturbance of an orbit and the orbit isn't closed.
Figure 4 – The trajectory of a particle motion in a gravitational field of two motionless objects with masses M1=50 and M2=0.2
-10 0 10 20 30 40 50 60 70-20
-15
-10
-5
0
5
10
15
20
M1=50
M2=0
x
y
y(x)
0 10 20 30 40 50 60 70-20
-15
-10
-5
0
5
10
15
20
25
M1=50
M2=0.2

ISSN 2224-5278 Серия геологии и технических наук. 4. 2018
91
The program of the movement of a particle of mass m in the field of two motionless objects with masses M1=50 and M2=1.
>> global M1 M2 c1x c1y c2x c2y >> M1=50; M1=1; c1x=5; c1y=0; c2x=0; c2y=10; % input of parameters >> x0=0; y0=0; vx0=0; vy0=4.3; T1=1000; % input of parameters >> [t,h]=ode45(@finit2,[0,T1],[x0,y0,vx0,vy0]); % solution of the differential equation >> x=h(:,1); y=h(:,2); x1=c1x; y1=c1y; x2=c2x; y2=c2y; >> plot(x,y); % drawing the motion trajectory >> grid on% drawing the coordinate grid >> hold on% drawing the next element >> % drawing the location of motionless objects >> plot(x1,y1,'r+',x2,y2,'r*','MarkerSize',15); >> plot(x1,y1,'ro',x2,y2,'ro','MarkerSize',15); >> gtext('M1=50') % input of the notation in the figure >> gtext('M2=1') % input of the notation in the figure The result is presented in the figure 5.
Figure 5 – The trajectory of a particle motion in a gravitational field of two motionless objects with masses M1=50 and M2=1
Figure 5 shows that the increase in mass of the second motionless object leads to a greater distur-bance of the orbit.
The program of the movement of a particle of mass m in the field of two motionless objects with masses M1=50 and M2=2.
>> global M1 M2 c1x c1y c2x c2y >> M1=50; M2=2; c1x=5; c1y=0; c2x=0; c2y=10; % input of parameters >> x0=0; y0=0; vx0=0; vy0=4.3; T1=1000; % input of parameters >> [t,h]=ode45(@finit2,[0,T1],[x0,y0,vx0,vy0]); % solution of the differential equation >> x=h(:,1); y=h(:,2); x1=c1x; y1=c1y; x2=c2x; y2=c2y; >> plot(x,y); % drawing the motion trajectory >> grid on% drawing the coordinate grid >> hold on% drawing the next element >> % drawing the location of motionless objects >> plot(x1,y1,'r+',x2,y2,'r*','MarkerSize',15); >> plot(x1,y1,'ro',x2,y2,'ro','MarkerSize',15); >> gtext('M1=50') % input of the notation in the figure >> gtext('M2=2') % input of the notation in the figure The result is presented in the figure 6.
0 10 20 30 40 50 60-20
-10
0
10
20
30
40
M1=50
M2=1
x
y

Известия Национальной академии наук Республики Казахстан
92
Figure 6 – The trajectory of a particle motion in a gravitational field of two motionless objects with masses M1=50 and M2=2
The program of the movement of a particle of mass m in the field of two motionless objects with masses M1=49 and M2=0.
>> global M1 M2 c1x c1y c2x c2y >> M1=49; M2=0; c1x=5; c1y=0; c2x=0; c2y=10; % input of parameters >> x0=0; y0=0; vx0=0; vy0=4.3; T1=300; % input of parameters >> [t,h]=ode45(@finit2,[0,T1],[x0,y0,vx0,vy0]); % solution of the differential equation >> x=h(:,1); y=h(:,2); x1=c1x; y1=c1y; x2=c2x; y2=c2y; >> plot(x,y); % drawing the motion trajectory >> grid on% drawing the coordinate grid >> hold on% drawing the next element % drawing the location of motionless objects >> plot(x1,y1,'r+',x2,y2,'r*','MarkerSize',15); >> plot(x1,y1,'ro',x2,y2,'ro','MarkerSize',15); >> gtext('M1=49') % input of the notation in the figure >> gtext('M2=0') % input of the notation in the figure The result is presented in the figure 7.
Figure 7 – The trajectory of a particle motion in a gravitational field of two motionless objects with masses M1=49 and M2=0
0 10 20 30 40 50 60-10
-5
0
5
10
15
20
25
30
35
40
M1=50
x
y
M2=2
0 10 20 30 40 50 60 70 80 90-25
-20
-15
-10
-5
0
5
10
15
20
25
M1=49
M2=0

ISSN 2224-5278 Серия геологии и технических наук. 4. 2018
93
The program of the movement of a particle of mass m in the field of two motionless objects with masses M1=49 and M2=1.
>> global M1 M2 c1x c1y c2x c2y >> M1=49; M2=1; c1x=5; c1y=0; c2x=0; c2y=10; % input of parameters >> x0=0; y0=0; vx0=0; vy0=4.3; T1=1000; % input of parameters >> [t,h]=ode45(@finit2,[0,T1],[x0,y0,vx0,vy0]); % solution of the differential equation >> x=h(:,1); y=h(:,2); x1=c1x; y1=c1y; x2=c2x; y2=c2y; >> plot(x,y); % drawing the motion trajectory >> grid on% drawing the coordinate grid >> hold on% drawing the next element >> % drawing the location of motionless objects >> plot(x1,y1,'r+',x2,y2,'r*','MarkerSize',15); >> plot(x1,y1,'ro',x2,y2,'ro','MarkerSize',15); >> gtext('M1=49') % input of the notation in the figure >> gtext('M2=1') % input of the notation in the figure The result is presented in the figure 8.
Figure 8 – The trajectory of a particle motion in a gravitational field of two motionless objects with masses M1=49 and M2=1
The program of the movement of a particle of mass m in the field of two motionless objects with masses M1=49 and M2=2.
>> global M1 M2 c1x c1y c2x c2y >> M1=49; M2=2; c1x=5; c1y=0; c2x=0; c2y=10; % input of parameters >> x0=0; y0=0; vx0=0; vy0=4.3; T1=1000; % input of parameters >> [t,h]=ode45(@finit2,[0,T1],[x0,y0,vx0,vy0]); % solution of the differential equation >> x=h(:,1); y=h(:,2); x1=c1x; y1=c1y; x2=c2x; y2=c2y; >> plot(x,y); % drawing the motion trajectory >> grid on% drawing the coordinate grid >> hold on% drawing the next element % drawing the location of motionless objects >> plot(x1,y1,'r+',x2,y2,'r*','MarkerSize',15); >> plot(x1,y1,'ro',x2,y2,'ro','MarkerSize',15); >> gtext('M1=49') % input of the notation in the figure >> gtext('M2=2') % input of the notation in the figure The result is presented in the figure 9. The program of the movement of a particle of mass m in the field of two motionless objects with
masses M1=47 and M2=0.5.
0 10 20 30 40 50 60 70 80-20
-10
0
10
20
30
40
50
M1=49
M2=1

Известия Национальной академии наук Республики Казахстан
94
Figure 9 – The trajectory of a particle motion in a gravitational field of two motionless objects with masses M1=49 and M2=2
>> global M1 M2 c1x c1y c2x c2y; >> M1=47; M2=0.5; c1x=5; c1y=0; c2x=0; c2y=10; % input of parameters >> x0=0; y0=0; vx0=0; vy0=4.3; T1=4000; % input of parameters >> [t,h]=ode45(@finit2,[0,T1],[x0,y0,vx0,vy0]); % solution of the differential equation >> x=h(:,1); y=h(:,2); x1=c1x; y1=c1y; x2=c2x; y2=c2y; >> plot(x,y); % drawing the motion trajectory >> grid on% drawing the coordinate grid >> hold on% drawing the next element % drawing the location of motionless objects >> plot(x1,y1,'r+',x2,y2,'r*','MarkerSize',15); >> plot(x1,y1,'ro',x2,y2,'ro','MarkerSize',15); >> gtext('M1=47') % input of the notation in the figure >> gtext('M2=0.5') % input of the notation in the figure The result is presented in the figure 10.
Figure 10 – The trajectory of a particle motion in a gravitational field of two motionless objects with masses M1=47 and M2=0.5
The program of the movement of a particle of mass m in the field of two motionless objects with masses M1=47 and M2=1.
0 10 20 30 40 50 60 70-10
0
10
20
30
40
50
M1=49
M2=2
0 50 100 150 200 250-40
-20
0
20
40
60
80
M1=47
M2=0.5

ISSN 2224-5278 Серия геологии и технических наук. 4. 2018
95
>> T1=4000; M1=47; M2=1; >> [t,h]=ode45(@finit2,[0,T1],[x0,y0,vx0,vy0]); % solution of the differential equation >> x=h(:,1); y=h(:,2); x1=c1x; y1=c1y; x2=c2x; y2=c2y; >> plot(x,y) % drawing the motion trajectory >> grid on% drawing the coordinate grid >> hold on% drawing the next element % drawing the location of motionless objects >> plot(x1,y1,'r+',x2,y2,'r*','MarkerSize',15); >> plot(x1,y1,'ro',x2,y2,'ro','MarkerSize',15); >> gtext('M1=47') % input of the notation in the figure >> gtext('M2=1') % input of the notation in the figure The result is presented in the figure 11.
Figure 11 – The trajectory of a particle motion in a gravitational field of two motionless objects with masses M1=47 and M2=1
Conclusion. The program allows performing modeling at various initial parameters: for example at M1=50 and M2=0; 0.2; 1; 2; at M1=49 and M2=0; 1; 2; at M1=47 and M2=0.5; 1.0. Students are sug-gested to simulate independently for other various initial parameters by changing calculation accuracy using the command “odeset ('RelTol', tol)”.
The use of the MATLAB language for simulation of the material particle motion in the gravitational field of two motionless objects with different masses helps greatly in study of the gravitational field influence on the particle’s motion.
The movement of the particle in the field of one motionless object happens along an ellipse, and introduction of other motionless object of small mass leads to perturbation of an orbit and the trajectory isn't closed.
REFERENCES
[1] CD of the open JSC "Phizicon". «The open hysics1.1». 2001. [2] http://elektronika.newmail.ru [3] Kabylbekov K.A., Abdrakhmanova Kh.K., Abekova Zh.A., Abdraimov R.T., Ualikhanova B.S. Calculation and
visualization of a system- an electron in a deep square potential well, with use of the software package of MATLAB. Proceeding of the III International Scientific and Practical Conference «Topical researches of the World Science» (Iune 28, 2017, Dubai, UAE). July 2017. Vol. 1, N (23). P. 7-13.
[4] Kabylbekov K., Saidullaeva N., Spabekova R., Omashova G, Tagaev N., Bitemirova A., Berdieva M. Model of a blank form for computer laboratory work on research of the speed selector // Journal of Theoretical and Applied Information Techno-logy15th July 2017. Vol. 95, N 13. P. 2999-3009. JATIT & LLS. Indexada en Scopus.
[5] Kabylbekov K., Omashova G, Spabekova R, Saidullaeva N, Saidakhmetuv P. Junusbtkova S Management and organi-zation of computer laboratory work in physics education // Espacios. Vol. 38, N 45. Año 2017. Pág. 35. Indexada en Scopus, Google Schollar.
0 20 40 60 80 100 120 140 160 180 200-20
0
20
40
60
80
100
M1=47
M2=1

Известия Национальной академии наук Республики Казахстан
96
[6] Kabylbekov K.A., Saidakhmetov P. A, Arysbaeva A.S. Worksheet template for organization the independent performance of computer laboratory works // Proceedings of the National Academy of Sciences of the Republic of Kazakhstan. Series of Physics and Mathematics. Almaty, 2013. N 6. P. 82-89.
[7] Kabylbekov K.A., Saidahmetov P. A, Baidullaeva L.E., Abduraimov R. A technique of use of computer models for photo-effect and Compton effect studying, worksheet template for organization the performance of computer laboratory works // Proceedings of the National Academy of Sciences of the Republic of Kazakhstan. Series of Physics and Mathematics. Almaty, 2013. N 6. P. 114-121.
[8] Kabylbekov K.A., Saidahmetov P.A. Тurganоvа T.K, Nurullaev M. A, Baidullaeva L.E. Model of a lesson on conver-ging and diverging lenses // Proceedings of NAN RК. Series physical-mat. Almaty, 2014, N 2. P. 286-294.
[9] Kabylbekov K.A., Ashirbaev H.A., Saidahmetov P.A., Rustemova K.Zh., Baidullaeva L.E. Worksheet template for or-ganization the performance of computer laboratory work on study the diffraction of light // Proceedings of the National Academy of Sciences of the Republic of Kazakhstan. Series of Physics and Mathematics, Almaty, 2015. N 1(299). P. 71-77.
[10] Kabylbekov K.A., Ashirbaev H.A., Takibaeva G.А., Saparbaeva E.М., Baidullaeva L.E., Adineeva Sh.I. Worksheet template for organization the performance of computer laboratory work on study the motion of charged particles in a magnetic field // Proceedings of the National Academy of Sciences of the Republic of Kazakhstan. Series of Physics and Mathematics. Almaty, 2015. N 1(299). P. 80-87.
[11] Kabylbekov K.A., Ashirbaev H.A., Saidakhmetov P.А., Baigulova Z.A., Baidullaeva L.E. Worksheet template for organization the performance of computer laboratory work on study the Newton's ringes // Proceedings of the National Academy of Sciences of the Republic of Kazakhstan. Series of Physics and Mathematics. Almaty, 2015. N 1(299). P. 14-20.
[12] Kabylbekov K.A., Ashirbaev H.A., Sabalakhova A.P., Dzhumagalieva A.I. Worksheet template for organization the performance of computer laboratory work on study the phenomenon of light interference // Proceedings of the National Academy of Sciences of the Republic of Kazakhstan. Series of Physics and Mathematics. Almaty, 2015. N 3(301). P. 131-136.
[13] Kabylbekov K.A., Ashirbaev H.A., Sabalakhova A.P., Dzhumagalieva A.I. Worksheet template for organization the performance of computer laboratory work on study the Doppler-effect // Proceedings of the National Academy of Sciences of the Republic of Kazakhstan. Series of Physics and Mathematics. Almaty, 2015. N 3(301). P. 155-160.
[14] Kabylbekov K.A., Ashirbaev H.A., Arysbaeva A.S., Dzhumagalieva A.I. Worksheet template for organization the performance of computer laboratory work on study physical phenomena // Modern high technologies. M., 2015. N 4. P. 40-43.
[15] Kabylbekov K. A., Saidakhmetov P. A., Ashirbaev Kh. A., Omashova G. Sh., Berdalieva J. Worksheet template for organization the performance of computer laboratory work on study electromagnetic oscillations // Proceedings of the National Academy of Sciences of the Republic of Kazakhstan. Series of Physics
And Mathematics. Almaty, 2016. N 1(305). P. 111-116. [16] Kabylbekov K.A., Saidakhmetov P.A., Omashova G.Sh., Berdalieva J., Dzhumagalieva A.I. Worksheet template for
organization the performance of computer laboratory work on study the interaction between two infinitely long parallel current-carrying conductors // Proceedings of the National Academy of Sciences of the Republic of Kazakhstan. Series of Physics and Mathematics. Almaty, 2016. N 1(305). P. 135-140.
[17] Kabylbekov K.A., Saidakhmetov P.А., Omashova G.Sh., Suttibaeva D.I., Kozybakova G.N. Worksheet template for organization the performance of computer laboratory work on study isobaric process // Proceedings of the National Academy of Sciences of the Republic of Kazakhstan. Series of Physics and Mathematics. Almaty, 2016. N 2. P. 92-97.
[18] Kabylbekov K.А., Omashova G.Sh., Saidakhmetov P.A., Nurullaev M.A., Artygalin N.A. Worksheet template for organization the performance of computer laboratory work on study the Carnot cycle // Proceedings of the National Academy of Sciences of the Republic of Kazakhstan. Series of Physics and Mathematics. Almaty, 2016. N 2. P. 98-103.
[19] Kabylbekov K.A., Saidakhmetov P.А., Ashirbaev H.A., Abdubaeva Ph.I., Doskanova A.E. Study of the work done by gas on computer model // The Herald of NAN РК. 2016. N 2. P. 83-88.
[20] Kabylbekov K.A., Saidakhmetov P.А., Omashova G.Sh., Serikbaeva G.S., Suyerkulova Zh.N. Worksheet template for organization the performance of computer laboratory work on study simple harmonic motions // Proceedings of the National Academy of Sciences of the Republic of Kazakhstan. Series of Physics and Mathematics. Almaty, 2016. N 2. P. 84-91.
[21] Kabylbekov K.A. Madjarov N.T., Saidakhmetov P.A. An Independent design of research assignments for computer laboratory work on thermodynamics // Proceedings of the IX International scientific-methodical conference “Teaching natural Sciences (biology, physics, chemistry), mathematics and computer science”. Tomsk, 2016. P. 93-99.
[22] Kabylbekov K.A., Saidakhmetov P.A., Omashova G.Sh. Organization of computer laboratory work on study the inductor reactance in an ac circuit // Proceedings of NAN RК. Almaty, 2017. N 1. P. 77-82.
[23] Kabylbekov K.A., Saidakhmetov P.A., Omashova G.Sh., Ashirbaev H.A., Abekova J.A. Organization of computer laboratory works on study of the isotherms of a real gas // Proceedings of the National Academy of Sciences of the Republic of Kazakhstan. Series of Physics and Mathematics. Almaty, 2017. N 1. P. 77-83.
[24] Kabylbekov K.A., Saidakhmetov P.A., Omashova G.Sh. Organization of computer laboratory works on study of the phenomenon of beats // Proceedings of the National Academy of Sciences of the Republic of Kazakhstan. Series of Physics and Mathematics. Almaty, 2017. N 2. P. 104-110.
[25] Kabylbekov K.A., Omashova G.Sh., Spabekova R.S., Saidakhmetov P.A., Serikbaeva G., Arysbaeva A.S. Worksheet template for organization the performance of computer laboratory work on study the isothermal process // Herald of the National Academy of Sciences of Kazakhstan. Almaty, 2017. N 3. P. 19-207.
[26] Kabylbekov K.A., Omashova G.Sh., Spabekova R.S., Saidakhmetov P.A., Abdrakhmanovа Kh.K., Arysbaeva A.S. Independent design of assignment for performance of a computer lab on study isochoric process // Proceedings of the National Academy of Sciences of the Republic of Kazakhstan. Series of Physics and Mathematics. Almaty, 2017. N 3. P. 127-134.
[27] Kabylbekov K.A., Omashova G.Sh., Spabekova R.S., Saidakhmetov P.A., Serikbaeva G.S., Aktureeva G. Organization of computer laboratory works on study the turn-on and turn-off current of the power supply by using MATLAB software package

ISSN 2224-5278 Серия геологии и технических наук. 4. 2018
97
// Proceedings of the National Academy of Sciences of the Republic of Kazakhstan. Series of Physics and Mathematics. Almaty, 2017. N 3. P. 139-146.
[28] Kabylbekov K.A., Omashova G.Sh., Spabekova R.S., Saidakhmetov P.A., Serikbaeva G.S., Aktureeva G. Organization of computer labs for the study the velocity and height distribution of molecules from the Earth's surface by using MATLAB software package // Herald of RK NAS. Almaty, 2017. N 3. P. 111-119.
[29] Kabylbekov K.A., Ashirbayev H.A., Abdrakhmanovа Kh.K., Dzhumagalieva A.I., Kydyrbekova J.B. Organization of laboratory work on study the electric and magnetic fields by using MATLAB software package // Proceedings of the National Academy of Sciences of the Republic of Kazakhstan. Series of Physics and Mathematics. Almaty, 2017. N 3(313). P. 206-212.
[30] Porsev S.V. Computer simulation of physical processes in the package MATLAB. M.: Hot Line-Telecom, 2003. 592 p.
К. А. Қабылбеков, Х. А. Абдрахманова,
М. Н. Ермаханов, Б. А. Урмашев, Е. Т. Жатқанбаев
М. Əуезов атындағы Оңтүстік Қазақстан мемлекеттік университеті, Шымкент, Казахстан
ДЕНЕНІҢ ГРАВИТАЦИЯЛЫҚ ӨРІСТЕ ҚОЗҒАЛЫСЫН ЕСЕПТЕУ МЕН БЕЙНЕЛЕУ
Аннотация. Екі тыныштықтағы M1 жəне M2 объектілердің гравитациялық өрісінде материялық нүктенің траекториясын есептеу мен бейнелеу ұсынылғанПредлагается программа расчета и визуализациии. Қозғалыстың дифференциалдық теңдеулер жүйесі MATLAB жүйесінде ode45 процедурасымен шешіледі. Ол үшін алдын-ала «f=finit2(t,x)» деп аталатын m-файл жазылады жəне ол MATLAB тың командалық строкасынан қосылады. Тыныштықтағы бірінші объектінің массасын өзгертпей М1=50, тыныштықтағы екінші объектінің массасын М2=0; 0.2; 1; 2 шамаларында өзгертіп эксперименттер жүргізілген;
Сонымен қатар М1=49, М2=0, 1, 2; М1=47, М1=0.5,1.0 шамалар бойынша эксперименттер қайталанған. Тыныштықтағы бір объектінің өрісінде материялық нүктенің қозғалысы эллипс бойында, ал екінші объект қосылғанда нүктенің траекториясы шамалы өзгереді де траектория тұйықталмайды. Бастапқы параметрлер глобалды деп жарияланған. Бастапқы парметрлерін өзгерту арқылы материалдық нүктенің гравитациялық өрістегі қозғалысының əр түрлі моделін алуға болады.
Зерттеу нəтижелері жоғары оқу орындарындағы теориялық механика дəрістерінде қолдануға болады. Түйін сөздер: гравитациялық өріс, траектория, өзгерту, ode45 процедурасы.
К. А. Кабылбеков, Х. А. Абдрахманова, М. Н. Ермаханов, Б. А. Урмашев, Е. Т. Жатканбаев
Южно-Казахстанский государственный университет им. М.Ауэзова, Шымкент, Казахстан
РАСЧЕТ И ВИЗУАЛИЗАЦИЯ ДВИЖЕНИЯ ТЕЛА В ГРАВИТАЦИОННОМ ПОЛЕ
Аннотация. В статье приводится расчет и визуализациия траектории движения материальной точки в гравитационном поле двух неподвижных объектов M1 и M2. Решение системы дифференциальных уравений движения проводится процедурой ode45 системы MATLAB. Сначала создается m-файл под названием «f=finit2(t,x)», который подключается с командной строки. Далее проводится моделирование с изменением массы второго неподвижного объекта при постоянной массе первого объекта: М2=0; 1; 2 при М1=50; М2=0, 1, 2 при М1=49; М1=0.5 и 1.0 при М1=47. Движение точки в поле одного неподвижного объекта происходит по эллипсу, а введение другого неподвижного объекта малой массы приводит к возмущению орбиты и траек-тория незамкнута. Исходные параметры объявлены как глобальные. Меняя исходные параметры можно получить разные модели движения материальной точки в гравитационном поле.
Результаты исследования могут быть использованы на занятиях по теоретической механике в высших учебных заведениях.
Ключевые слова: гравитационное поле, траектория, возмущение, процедура ode45. Сведения об авторах: Кабылбеков К.А. – канд. физ.-мат. наук, доцент кафедры «Физика» Абдрахманова Х.К. – канд. физ.-мат. наук, доцент кафедры «Физика» Ермаханов М.Н. – канд. техн. наук, доцент, зав.каф. «Химия» Урмашев Б.А. – канд. техн. наук, доцент кафедры «Химия» Жатқанбаев Е.Т. – канд. техн. наук, доцент кафедры «Химия»

Известия Национальной академии наук Республики Казахстан
98
N E W S OF THE NATIONAL ACADEMY OF SCIENCES OF THE REPUBLIC OF KAZAKHSTAN
SERIES OF GEOLOGY AND TECHNICAL SCIENCES
ISSN 2224-5278
Volume 3, Number 430 (2018), 98 – 109
S. A. Mashekov1, B. N. Absadykov2, А. S. Mashekova3, Е. Z. Nugman1, B. А. Bekbosynova1, E. A. Tussupkaliyeva1
1Satbayev University, Almaty, Kazakhstan, 2Institute of Chemical Sciences named after A. B. Bekturov, Almaty, Kazakhstan,
3Nazarbayev University, Astana, Kazakhstan. E-mail: [email protected], [email protected], [email protected],
[email protected], [email protected], [email protected]
INVESTIGATION OF THE KINEMATICS OF ROLLING RIBS AND PIPES
ON A CONTINUOUS RADIAL-SHIFTING MILL OF A NEW CONSTRUCTION
Abstract. When using a continuous cast piece to press bars or pipes in a new mill, the deformation must be carried out in the most efficient way, so that a better structure of the metal can be obtained. For a new continuous pressing mill, a possible solution to this problem is to use helical rolls with rational geometric dimensions of the pro-trusions and hollows. The use of helical rolls with rational sizes of protrusions and hollows will intensively deform the metal of the workpiece within the required reduction of the workpiece. In the study of kinematics of pressing, helical rolls with different sizes of protrusions and hollows were used. Their use made it possible to establish the dependence of the rate of metal yield from the deformation center on the technological regimes of deformation in helical-shaped rolls and to determine the more effective geometric dimensions of the protrusions and hollows of these rolls. It is shown that the deformation of the metal during rolling on the radial-shear mill is realized with sliding of the workpiece relative to the rolls. Slip occurs due to the discrepancy between the speed of the screw movement of the workpiece in the area of deformation of the speed of rotation of the rolls. The quality of steel products depends on the magnitude of sliding, as well as other technical and economic indicators of production. It is established that when rolling on a radial-shear mill, the speed of the workpiece movement is less than the speed of the rolls. The kinematics of the process is analyzed analytically and formulas are derived to determine the rate of roll slippage relative to the workpiece in the zones of the hollow of the workpiece.
Keywords: helical-shaped rolls, matrix, process kinematics, rod, workpiece, slippage, tangential and axial components of slip and velocities.
Introduction. Rods and pipes are widely used in all industries. They are used, both in the form of finished products, and in the form of semi-finished products for the production of a number of metal products. It should be noted that at present there is a significant interest in ponds and pipes, which has ultrafine-grained (UFG) or nanocrystalline (NC) structure. This is due to the unique physical and mecha-nical properties of such materials, which are significantly higher than the similar properties of coarser polycrystalline materials [1-6].
One of the most promising ways to obtain a UFG or NC structure in metallic materials is the use of severe plastic deformation (SPD), when a combination of nonmonotonic and intense deformation breaks down the metal structure [1-6]. When using a nonmonotonic SPD, without changing the shape and geo-metric dimensions of the workpiece, the angle between the directions of deformation is changed consequently by 90° and 180°. Such deformation leads to the development of macro-shear deformations along its cross-section, which contributes to the intensive generation of new dislocations, the evolution of the dislocation structure, and the rearrangement of the small-angle boundaries of the structure fragments into high-angle structures [7]. Particularly widely used is the method of equal-channel angular (ECA) pressing [4-6]. It should be noted that to date, none of the methods of SPD, including ECA-pressing, does

ISSN 2224-5278 Серия геологии и технических наук. 4. 2018
99
not allow obtaining industrial products that are acceptable in shape and size [7]. First of all, this concerns the possibility of structuring metal in long products, such as bars, pipes and wires.
Of the SPD methods that allow to obtain long-length products with significant changes in micro-structure and mechanical properties, it is necessary to note the cross-screw rolling, or rather its appea-rance, singled out by its authors in a separate way with the name "Radial Shear Rolling" (RSR) [8-12]. RSR is defined as a special case of stationary helical rolling in the region of large feeding angles (16– 18 deg, and more), in rolls with special calibration for deformation of continuous workpieces of constant cross-section.
At the heart of the RSR method is the trajectory control of the motion of the deformable metal [9,13]. In the focus of deformation, a helicoidal outflow of metal is created with the braking of the outer layer of the preform and the acceleration of the internal layer. In this case, in the outer layer each element under-goes compression deformation along the radius of the workpiece and the direction of flow (along the screw path). Multidirectional flows cause intensive shearing movements in the volume of rolled metal, which leads to a considerable grinding of the structural structure. The metal acquires a characteristic finely dispersed structure that is practically not available for other stationary methods of metal processing. In terms of its morphological pattern, structure and properties, the metal after the RSR becomes a material of new quality. There is a complex increase and stabilization of the physico-mechanical and service pro-perties of the metal at a level exceeding the traditional properties of the material [11].
In terms of the overall structure, the RSR mills are identical to the helical rolling mill used for the production of seamless hot-rolled pipes [13]. The main difference between these technological processes is that during the production of pipes, a "loosening" of the central zone of the circular billet (pipe piercing) is created, and during the process of the RSR, the metal of the billet is consolidated throughout the cross section. The theory, technology and equipment for the implementation of the RSR process are presented in [10-12].
The first industrial tests of radial-shear rolling technology were carried out at the Verkhne-Saldinsky metallurgical production association [11]. Using the results obtained, the RSR-130 radial shear rolling mill was designed and put into operation, designed to produce high-quality bars of titanium alloys. The design of the mill allows for reverse rolling. The working cage of the RSR-130 is made in the form of a cast die-cast frame, in cylindrical bores at which the drums with rigidly fixed roller assemblies are placed at an angle of 120°. The distance between them is changed by moving the drums into the guide rails by means of the roll setting mechanism. The rotation of the rolls to the required feed angle is achieved by rotating the drums in the cylindrical bores of the frame by the action of the rotation mechanisms of the drum. In the working position, the lid adjoins the base of the frame with support surfaces and is pressed with a tie, ensuring the integrity and high stiffness of the frame together with the hinged connection and screed.
As a way of conducting transshipment in the line of the RSR-130 mill, a scheme for changing the rolls is provided by tilting the lid of the stand with the drum in it [12]. When transshipment, the lower rollers with rolls openly located at the bottom of the frame are replaced by a crane. To replace the upper drum with the roller, a special stand is used.
It should be noted that the RSR mill consists of two stands [12]. The roughing stand works in reverse mode. It produces 9-11 passes with single draw coefficients of 1.15–1.25. Such a regime excludes the possibility of deformation heating, since the temperature range of deformation of titanium alloys is rather narrow. The maximum diameter of the blank for the roughing stand is 160, and the minimum rolling diameter after rolling is 75 mm. The design of the finishing stand is similar to roughing. It produces a single pass and ensures high accuracy of the produced bars, minimal curvature and a smooth surface. The maximum diameter of the roll for the finishing stand is 110, and the bar after rolling is 65 mm. That is, the deformation capabilities of the roughing stand in this case are not fully used.
The rod produced in the RSR-130 mill with a diameter of 75–90 mm is fed to the longitudinal rolling mill 450 and rolled onto bars of 18–65 mm in diameter [12]. The resulting bars have a homogeneous globular metal structure.
In work [12] the technical characteristics of working stands of the RSR are presented. On the largest of them, RSR-500 uses a maximum diameter 450 billet and a minimum diameter of 120 mm is rolled in a roughing mill and 150 and 90 mm respectively in a finishing stand. The rough cage is reversible, several passages are made in it, in the finishing is one pass.

Известия Национальной академии наук Республики Казахстан
100
Thus, the disadvantage of RSR mills is the impossibility of rolling bars by continuous mode, the relatively complex design of equipment and the use of a large number of passes to produce bars with precise geometric dimensions and ultrafine-grained structure.
In the present work, a new combined method for creating a stable submicrocrystal structure is proposed: intense plastic deformation by the method of radial shear rolling with a combination of pressing (figure 1) [14].
Figure 1 – Device for continuous pressing of rods: 1 - working stand, 2 and 3 - rolls; 4 - matrix; 5 - blank; 6 and 7 - are projection sand hollows of the rolls; 8 - aperture of a pressmatrix
The device for continuous pressing of rods comprises a main drive, a work stand, rolls rotating in one
direction and a die. The rolls have smooth and undulating cone-shaped gripping and crimping portions, respectively, and calibrating cylindrical portions. The protrusions or hollows of wavy cone-like sections having the same width and corresponding height or depth are made along a helical line with an angle between the tangent to the helical line and a line passing through the point of tangency along the gene-ratrix perpendicular to the base of the roll equal to 45° to 60°.
The rods are pressed in the following way. The workpiece is fed into the gap between the rolls, and is gradually deformed by the protrusions and valleys of corrugated cone-shaped areas. With this deforma-tion, the workpiece rotationally translates in the direction of rolling and extruded through the aperture of a press matrix.
The use of this method and the pressing device ensures the rolling of the bars by a continuous mode, efficient grinding of the metal structure throughout the cross section of the workpiece due to the develop-ment of shear deformations and reduction of the rolling force. Effective grinding of the structure creates the conditions for obtaining high-quality products.
The purpose of the work is to study the kinematics of the deformation process and physical and mechanical phenomena in the process of continuous pressing of rods on a new plant and to obtain new scientific knowledge about the laws of the mechanics of rolling processes in screw-like rolls, depending on the specific features of the technologies used and the design of the tool, the development of techniques for searching for effective deformation modes, ensuring the production of quality rods.
Materials and the method of the experiment. When using a continuous cast piece for pressing bars or pipes on a new mill, the deformation must be carried out in the most efficient way so that a better structure of the metal can be obtained. For a new continuous pressing mill, a possible solution to this problem is to use helical rolls with rational geometric dimensions of the protrusions and valleys. The use of helical rolls with rational sizes of protrusions and valleys will intensively deform the metal of the workpiece within the required reduction of the workpiece. To determine the effective geometric dimen-sions of the protrusions and cavities of these rolls, the kinematics of the process of pressing the rods on a new mill was investigated.

ISSN 2224-5278 Серия геологии и технических наук. 4. 2018
101
It is known [15-17] that when the circumferential speed of the circular roll stock preparation is exceeded, rolling is carried out ahead of time, therefore, η > 1, and vice versa, when the circumferential speed of the peripheral speed rolls is exceeded, the rolling stock is lagged, therefore, η < 1.
It should be noted that when rolling ahead and behind, the flow of metal along the roll surface is carried out with sliding [16,17]. In this case, the slip, appearing when rolling in screw-like rolls ahead of time, does not affect the quality of the rods. However, when rolling in screw-like rolls with a lag in the bars, surface and internal defects may appear.
In general case the slip value can be determined by the speed coefficient during rolling in helical rolls in the absence of axial movement of the workpiece [15, 16]:
,i
ii
where i - circumferential velocity of the corresponding workpiece surfaces; i – circumferential roll
speed corresponding to these surfaces. It should be emphasized that the lower the speed coefficient, the greater the slip between the
workpiece and the rolls [17]. The circumferential velocity of any point on the surface of a screw-like roll of diameter Di can be
determined from the formula [15, 16]:
,60
nDii
(1)
where n – rotational speed. When investigating the kinematics of the radial shear rolling process, it is necessary to take into
account the position of the helical rolls with respect to the rolling axis, i.e., the feed angle β. In this case, it is necessary to emphasize that the rotational-translational movement of the preform in the deformation region is divided into tangential and axial components [16-18]. The tangential components of the speed of the roll impart a rotational motion to the workpiece, the axial components are translational motion.
It has been established [16, 17] that the tangential and axial components of the slip more significantly affect the productivity of the process, the surface defects of the rods, and the intensity of the deformation effect of the rolls on the metal structure. Consequently, the tangential and axial components of the slip, respectively, influence the study of the structure of the peripheral and axial zones of the workpiece. With radial shear rolling, the tangential and axial velocity components are used to estimate the tangential and axial slip components. With the increase in these coefficients, the quality of the rod surface is increased. For the quantitative determination of the tangential and axial components of the slip in any section of the deformation center:
,i
ii
(2)
,оi
оiоi
(3)
where ητi, ηoi – coefficients of tangential and axial velocity components at different points of the workpiece surface; υʹτi, υʹоi and υτi, υoi – tangential and axial velocity components at various points of the surface of the workpiece and the roll.
When studying the kinematics of radial shear rolling, the velocity components at various points of the rod surface are usually determined by the following formulas [17]:
;cos ii (4)
.sin ioi (5)
Using the law of constancy of seconds volumes [15], we express the axial rolling speed in the helical-shaped rolls in the examined cross-section through the bar speed at the exit from the deformation center.

Известия Национальной академии наук Республики Казахстан
102
The condition of the constancy of the seconds volumes for rolling in screw-like rolls can be written in the form:
υi,0Fi,0 = υi,1Fi,2 = υi,2Fi,2 = υi,3Fi,3 = ....= υi,kFi,k, (6)
where υi,j – axial flow velocities of the workpiece metal in the depressions or protrusions of the screw-like roll; Fij - cross-sectional area of the workpiece, deformed in the corresponding sections of the screw-like roll and at the exit from the deformation center; υikFik - the axial velocity and cross-sectional area of the workpiece at the exit from the deformation center, respectively.
From (6) we obtain the following formula:
υi,j+1 = (υi,jFi,j)/Fi,j+2 = υi,j·μij,
where μij – coefficient of drawing the workpiece, deformable in the corresponding section of the screw-like roll.
It should be noted [15], that for any point lying on the surface of a helical-shaped roll and located in some section remote from one of the ends of the rolls, we can write the following equations (without gliding):
- circumferential speed of the roll: υxв = ωв · Rx, (7)
where Rx – the radius of the roll in the examined section; ωв – angular velocity of the roll (without slip);
- circumferential rotational speed of the workpiece at the feed angle β:
υτз = υxв·cosβ = ωв·Rx·cosβ; (8)
- axial billet speed at feed angle β:
υоз = ωвRx·sinβ; (9)
- the angular velocity of the billet in the considered section (without slip):
ωз = ωв·cosβ(Rx/rx), (10)
where rx − radius of workpiece in the examined section. In operation, the angle of elevation of the helical line β'of the screw-like roll was used as an addi-
tional parameter in determining the kinematic conditions of the deformation process in the mill:
,d
Stg
where S – pitch of helix; d – diameter of the workpiece. The values of S and d were determined by specifying the dimensions of the screw line on the helical-
shaped rolls. The speeds of the translational and rotational motion of the workpiece during the motion along the helical line were determined, using the relations (2) - (5) will be equal to:
;sinsin ioiоiоiвiоi (11)
,coscos iiiiвii (12)
where ηв, – coefficient of speed along the screw line of the helical roll. From relations (11) and (12), we can establish the following relationship between the angles β and β',
which can later be used to determine the tangential velocity coefficient:
tgtgi
оi
or .
tg
tgoii
(13)
In the method of continuous pressing, the extrusion of metal through the die aperture is effected by contact friction of the rotating screw-like rolls formed on the contact surface and by the deformable bar stock. In this connection, the value of the contact area of the workpiece with the tool largely determines the pressing pressure, the torque in the screw-like rolls and the power of the electric drive of the instal-

ISSN 2224-
lation, etcthe rolls dprotrusionthe momenmatrix.
Therenecessary extrusion.
As nopressure tappearancethe formatworkpiece
In ordeffective dgiven in [researched
Whenperforms trolls, the crolls 2, thatime, in thradii Rоi on
In thidetermined
The pvelocity:
-5278
. When twodue to its rotns and hollont of reachin
efore, the gto complete
oted above, to extrude the of cracks otion of defec
e. der to determdeformation [19], the kind. n the workpitranslational correspondinat are corresphe correspondn the roll, wh
Figure 2
is case, the ad by the form
points of the
o (3) rotatingtational and tws of the h
ng the forces
ripping zonly fill the pr
when presshe metal an
on the surfaccts is the sli
mine the slimode and th
nematics of t
iece is deforand rotation
g sections ofponded to theding sectionshere the linea
– Scheme for c
angular velomula:
metal of the
g rolls are gtranslationalhelical rolls of active fri
nes in the inrotrusions an
sing the barsnd the poor e of the worppage of the
ippage of thhe tool desigthe deformat
rmed and prnal motion (f the workpieese sections s of the workar velocities
calculating the k
ocities of the
i
e workpiece
вз
103
grasped by tl motion. Aft
and the groiction suffici
nitial stage nd hollows o
s, problems quality of
rkpiece. One e working su
he roll relatign at which tion process
ressed throug(figure 2). Itece 1 rotate aof the workpkpiece, thereof the workp
kinematics of th
e workpiece
,oi
i
r
1i
located in th
. вiii r
Серия геол
the bar stockfter this, the owth of theient to extrud
of deformaf the helical
may arise dthe productof the reaso
urface of the
ve to the wminimal slip
s using a new
gh the matrit is assumedat an angularpiece, have ae are circles piece and rol
he rolling proce
and rolls in
.oi
i
R
he hollow of
.ioi
вi
r
r
логии и техн
k, it is crimmetal is com
e contact arede the metal
ation shouldrolls and cr
due to the cts due to suns for the ree rolls relati
workpiece anp is observew continuou
ix by rotatind that duringr velocity ωi,an angular vewith a radiulls υi are the s
ess in helical-sh
the correspo
f the rolls ha
нических наук
mped and mompletely filleea between into the cha
d provide threate pressur
creation of iurface defecduction in prve to the co
nd to identifyed, using theus pressing d
ng rolls, the g rolling by , and the sectelocity ω1i. A
us rоi and corsame.
haped rolls
onding secti
ave the follow
к. 4. 2018
oved along ed with the them until
annel of the
he pressure re for metal
insufficient cts and the ressure and
ompressible
fy the most e procedure device was
workpiece screw-like
tions of the At the same rresponding
ons can be
(14)
wing linear
(15)

Известия Национальной академии наук Республики Казахстан
104
The points on the projecting roll surface have the following linear velocity:
.1. ioi
НiНiiiнв R
RR (16)
Slippage of the workpiece and the roll in the corresponding sections characterize the following difference in speeds:
.0
.. ioi
вi
i
Hiiвзiнвi r
r
R
RV
(17)
In this case, the relative rate of slippage in the hollows of the workpiece can be determined from formula:
.oi
вi
oi
Hi
i
ii r
r
R
RV
(18)
On the basis of the analysis of the above formulas, we found that the slippage of blanks relative to the rolls depends on the position of the radii rоiandRоi of the circles, where the velocities are the same. The position of these circles depends on the shape of the hollows of the workpiece, the friction value, the tem-perature of the workpiece and rolls, and other factors. The locations of the circles were estimated using the coefficient.
,i
ii H
hk (19)
where hi – the distance from the hollow of the workpiece to the point on the workpiece and the roll with identical speeds in the corresponding sections; Hi – the height of the workpiece protrusion in the corresponding sections.
In this case, the relative rate of slippage in the corresponding section can be determined from formula:
.вiнiiвi
нi
вiHiiHi
Нii rrkr
r
RRkR
R
(20)
Results and discussion. In the study the calculation of the relative slip velocity in the valley of the rolls was performed. At the same time, the coefficient «k» was varied in the range of 0.3–0.8. Table and figure 3 present results of the calculations.
Analysis of the results shows that the relative slippage speed of the workpiece relative to the rolls depends on the coefficient k. With an increase of k, the relative speed of slip also increases. The calculated results showed that the lower the relative slip speed, the better the conditions for extruding the metal of the workpiece and the probability of cracks and peeling on the surface of the pressed bars decreseases.
The results of calculating slip during rolling in helical rolls have shown that tangential and axial slip components are not very sensitive to the change in technological factors and mainly depend on the angle of rise of the helix line β' or the angle between the tangent to the helix and the line passing through the
Relative speed of sliding during rolling by screw-like rollers
k rв, mm rН, mm Rв, mm RН, mm r0, mm R0, mm ϑ,
0.3 15 24 71 80 17.7 73.7 0.476048
0.4 15 24 71 80 18.6 74.6 0.531868
0.5 15 24 71 80 19.5 75.5 0.580744
0.6 15 24 71 80 20.4 76.4 0.623652
0.7 15 24 71 80 21.3 77.3 0.661406
0.8 15 24 71 90 22.2 78.2 0.694684
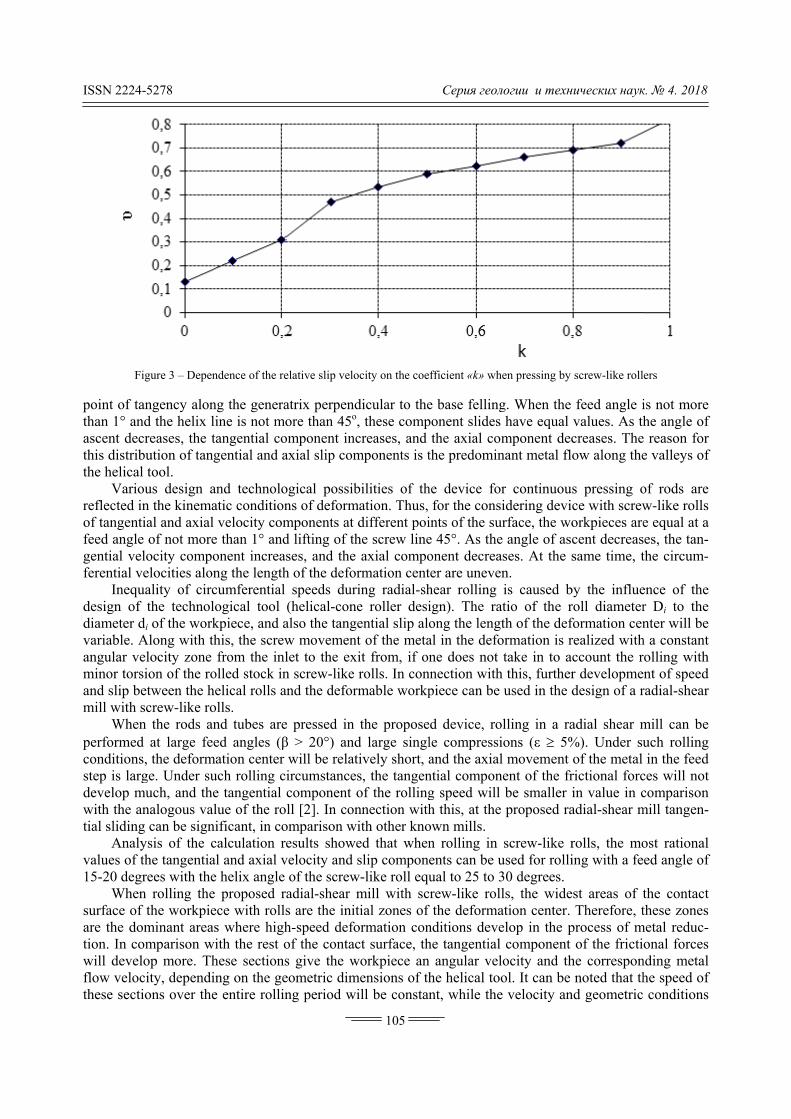
ISSN 2224-
Fi
point of tathan 1° anascent decthis distribthe helical
Varioreflected inof tangentifeed anglegential velferential v
Inequdesign of diameter dvariable. Aangular veminor torsand slip bemill with s
Whenperformedconditionsstep is largdevelop mwith the antial sliding
Analyvalues of t15-20 degr
Whensurface of are the dotion. In cowill develflow velocthese secti
-5278
igure 3 – Depen
angency alonnd the helix lcreases, the tbution of tangl tool. ous design an the kinemaial and axial
e of not morelocity compoelocities alon
uality of circthe technol
di of the workAlong with thelocity zone sion of the roetween the hscrew-like ron the rods and at large fees, the deformge. Under su
much, and thenalogous val
g can be signysis of the cthe tangentiarees with then rolling thef the workpieominant areasomparison wop more. Th
city, dependiions over the
ndence of the re
ng the generaine is not motangential cogential and a
and technoloatic conditionvelocity com
e than 1° andonent increang the lengthcumferential ogical tool kpiece, and ahis, the screwfrom the inl
olled stock inelical rolls a
olls. nd tubes areed angles (β
mation center uch rolling ce tangential lue of the ro
nificant, in cocalculation ral and axial ve helix angle e proposed rece with rollss where highith the rest ohese sectionsing on the gee entire rollin
elative slip velo
atrix perpendore than 45о,
omponent incaxial slip com
ogical possibns of deformmponents at d lifting of thses, and the h of the defor
speeds duri(helical-cone
also the tangew movementlet to the exn screw-likeand the defor
e pressed in β > 20°) andwill be relatircumstancescomponent oll [2]. In con
omparison wiesults showe
velocity and sof the screwadial-shear ms are the inith-speed defoof the contacs give the weometric dimng period wi
105
ocity on the coe
dicular to the, these compcreases, and mponents is t
bilities of thmation. Thus,
different poihe screw lineaxial compo
rmation centing radial-she roller desiential slip alot of the metait from, if onrolls. In con
rmable workp
the proposed large singltively short, as, the tangenof the rollingnnection withith other knoed that whenslip compon
w-like roll equmill with sctial zones of ormation conct surface, th
workpiece anmensions of th
ill be constan
Серия геол
fficient «k» wh
e base fellingponent slides
the axial cothe predomin
he device fofor the cons
ints of the sue 45°. As theonent decreater are unevehear rolling ign). The raong the lengal in the defone does not
nnection withpiece can be
ed device, role compressiand the axialntial compong speed will h this, at theown mills. n rolling in ents can be uual to 25 to 3
crew-like rolf the deformanditions devehe tangentialn angular velhe helical tont, while the
логии и техн
hen pressing by
g. When the have equal mponent dec
nant metal fl
or continuousidering deviurface, the woe angle of ascases. At the sen.
is caused batio of the rgth of the deformation is rtake in to a
h this, furtherused in the d
olling in a raions (ε 5%l movement
nent of the frbe smaller i
e proposed ra
screw-like rused for rolli30 degrees. ls, the wideation center. elop in the p component locity and thol. It can be
e velocity an
нических наук
screw-like roll
feed angle ivalues. As thcreases. Theow along the
s pressing oce with screworkpieces arecent decreassame time, t
by the influeroll diameterformation cenrealized withccount the rr developmedesign of a r
adial shear m%). Under suof the metal rictional forcin value in cadial-shear m
rolls, the moing with a fe
est areas of tTherefore, t
process of mof the fricti
he corresponnoted that th
nd geometric
к. 4. 2018
ers
is not more he angle of
e reason for e valleys of
of rods are w-like rolls e equal at a es, the tan-the circum-
ence of the r Di to the nter will be
h a constant rolling with nt of speed
radial-shear
mill can be uch rolling in the feed
ces will not comparison mill tangen-
ost rational ed angle of
the contact these zones
metal reduc-onal forces
nding metal he speed of conditions

Известия Национальной академии наук Республики Казахстан
106
of the metal flow will not coincide with other parts of the deformation center. For the rest of the pressed metal, the front zones of the deformation focus are the force and kinematic parameters. It should be noted that these sections adjust the velocity, geometric and other differences along the length of the deformation center to certain uniform boundary.
Thus, when rolling in a radial-shear mill with helical rolls, tangential sliding can be influenced by changing the feed angle and the angle of the helix. As the feed angle and the angle of elevation of the heli-cal line increase, the tangential velocity coefficient increases. Changes in speed, boundary, dimensional and other conditions of rolling in screw-like rolls it is possible to adjust the coefficient of tangential velocity.
It should be noted that axial slip, in contrast to tangential sliding, has a more complex dependence on the design of the helical roll and technological factors. Axial slip varies in sufficiently wide intervals with a change in the feed angle and the angle of the helix and the geometric dimensions of the screw-like swath and the array of the device. From the above, the relationship of axial slip to rolling regimes, structural fea-tures of the radial-shear mill (cage) and, in general, to pressing technology, is not quite evident. On the basis of recent data, it can be noted that, unlike tangential slip, it is promising to find ways to control axial slip. Optimization of ways to control the values of axial slip can significantly improve the quantitative and qualitative performance of the equipment.
Axial slip occurs over the entire length of the deformation center, its magnitude increases in the direction of the matrix in accordance with the growing values of the extruded workpiece. It should be noted that for rolling slip is a natural process, without which it is impossible to carry out the pressing pro-cess. However, its presence, in the case of a significant delay in the speed of rotation of the workpiece from the speed of the rolls, can reduce the quality parameters of the rod surface and reduce the produc-tivity of the installation. The results of the calculation showed that the smaller the height of the protrusion of the helical rolls, the greater the slip. However, in accordance with the law of constancy of seconds volumes, an increase in the rate of deformation in the initial sections of the workpiece will lead to an increase in the speed of axial displacement at the end of the deformation center and in the matrix.
The proposed design of the radial-shear mill allows wide variation of the value of the coefficients of tangential and axial velocities. When rolling on a radial-shear mill with screw-like rolls with a small angle of lift of the helical line, the tangential velocity coefficient is larger and the axial velocity coefficient is less than on the helical-shaped rolls with a large angle of the helix. It can be noted that when rolling in screw-like rolls with a large angle of elevation, the axial component of metal velocity predominates significantly in the kinematics of the process, rather than the tangential component, as in helical-shaped rolls with a small angle of ascent. Therefore, the process of pressing bars on the proposed device will be more dependent on factors that negatively affect the axial slip.
Analysis of the data obtained shows that tangential and axial slip are significantly influenced by factors that change the coefficient of friction at the contact surface of the metal with the tool. First of all, this refers to the roughness of the rolls and the presence of helical protrusions and depressions on their surfaces. With a smooth surface of the rolls, the axial velocity coefficient decreases, and in the presence of roughnesses or screw-like protrusions and depressions on the surface of the rolls, it increases and will be the greater, the larger the protrusions and depressions of the rolls.
According to the results of the research, it was established, in comparison with screw-like rolls, that rolls with smooth working surfaces can not provide high speed parameters of rolling. This is due to the fact that rolling in such rolls is carried out with a lag of the axial component of the speed of the rod from the speed of the rolls. The most noticeable effect on axial slip is the angle of the helix of the helical rolls. When the workpiece is deformed in screw-like rolls with a small angle of lifting of the helical line, the tangential component of the workpiece speed exceeds by two or more times the axial component of the speed of the rolls. On these rollers, with an angle of 45°, the tangential component approaches the axial component of the billet speed. When pressing rods using screw-like rolls, the productivity of the device also increases.
The presence of screw-shaped protrusions and valleys on the surface of the rolls does not allow the workpiece to rotate in the center of deformation and contributes to an increase in the pitch of the metal, and thus to its stretching by the feed step. It is known [17] that with a larger feed step, the single compres-sions increase and so do, the surface quality of the rod.

ISSN 2224-5278 Серия геологии и технических наук. 4. 2018
107
Large single compressions and metal movements along the helical line intensively deform the structure of the metal of the billet [19, 20]. Therefore, in comparison with the rollers, an even surface, the screw-like rolls at a high rolling speed will grind the metal structure well, both in the axial and peripheral zones of the rod. This is most important when pressing continuously cast billets, when the axial porosity of the rod can not be eliminated by the technological conditions of rolling due to an increase in the reduc-tion of the metal. In this case, the use of screw-like rollers, which, due to the development of intense plastic deformation, provides a good study of the structure of the metal, an increase in the productivity of the installation and an improvement in product quality are achieved.
It is found that in the proposed tool the opposite arrangement of the projections or valleys of the rolls relative to each other also allows intensively deform the metal structure.
Conclusions. 1. Formulas have derived that allow to determine the slippage speed of the roll relative to the work-
piece in the zones of the hollow of the workpiece. 2. An analysis of the results obtained showed that the low slippage speed of the workpiece relative to
the roll takes place at small values of the coefficient k. 3. It is shown that when rolling in screw-like rolls, sliding occurs due to the discrepancy between the
speed of the screw movement of the workpiece in the area of deformation of the rotation speed of the rolls. 4. It is established that the use of helical rolls with rational sizes of protrusions and valleys intensively
deforms the metal of the workpiece within the required reduction of the workpiece. 5. Using the kinematics of the rolling process in a radial-shear mill, the dependence of the velocity of
the metal exit from the deformation center on the technological deformation modes was established, and the more effective geometric dimensions of the protrusions and valleys of these rolls were defined.
REFERENCES
[1] Segal V.M., Reznikov V.I., Drobyshevsky A.E., Kopylov V.I. Plastic treatment of metals by simple shear // Izv. AN
SSSR. Metals. 1981. N 1. P. 115-123. [2] Valiev R.Z., Aleksandrov I.V. Volumetric nanostructured metal materials. M.: Academic Book, 2007. P. 397. [3] Minaev I.V., Zhgilev I.N., Shorokhov E.V. Simulation of the process of intensive plastic deformation under high-speed
metal loading // Deformation and destruction of materials. 2009. N 3. P. 17-20. [4] Valiev R.Z., Aleksandrov G.V. Nanostructured metals obtained by intense plastic deformation. M.: Logos, 2000. P. 272. [5] Khomskaya I.V., Zeldovich V.I., Shorokhov E.V. High-speed deformation of metallic materials by the method of chan-
nel-angular pressing for obtaining ultrafine-grained structure // Deformation and destruction of materials. 2009. N 2. P. 36-40. [6] Shipachev A.N., Ilyina E.V., Zelepugin S.A. Deformation of titanium samples under dynamic channel-angular pressing
// Deformation and destruction of materials. 2010. N 4. P. 20-24. [7] Lyakishev N.P., Alymov M.I. Nanomaterials of structural designation // Russian nanotechnologies. 2006. N 1. P. 71-81. [8] Patent of Russian Federation No. 2293619, IPC В21В 19/00. Method of screw rolling / Galkin S.P.; applicant and patent
holder NITU MISiS. No. 2006110612/02, apll.04/04/2006; publ. 20.02.2007. Bul. fig., 2007, No. 5. P. 46. [9] Galkin S.P. Trajectory-velocity features of radial-shear and helical rolling. "Modern problems of metallurgy"
Dnepropetrovsk // "Systems of Technology". 2008. Vol. 11. P. 26-33. [10] Galkin S.P., Mikhailov V.K., Romanenko V.P., etc. Questions of the theory of radial-shear rolling of high-quality metal //
Production of rolled metal. 2001. N 7. P. 23-28. [11] Kharitonov E.A., Rozhdestvenskii V.V., Skryabin E.A., Kurochkin L.G. The introduction of technology and equipment
for the production of rods of critical use with the use of radial-shear rolling mills // Productionofrolledmetal. 2001. N 7. P. 28-32. [12] Romantsev B.A., Mintokhanov M.A., Ryabikhin N.P., etc. The design of radial shear rolling mills // Production of rolled
products. 2001. N 7. P. 32-37. [13] Naizabekov A.B., Arbuz A.S. Influence of cross-helical rolling on the microstructure of 40X steel // Bulletin of
KazNTU. 2015. N 5. P. 249-250. [14] Patent of the RK No. 27722. S.A. Mashekov, E.Z. Nugman, A.M. Alshynova, etc. Device for continuous pressing of a
press product. Publ. 12.18.2013, bul. 12. 3 p: ill. [15] Orlov G.A. The fundamentals of the theory of rolling and drawing pipes: atextbook. Ekaterinburg: Publishinghouse
Ural. university, 2016. P. 204. [16] Potapov I.N., Polukhin P.I. The technology of screw rolling. M.: Metallurgy, 1990. 344 p. [17] Zhernovkov S.P., Kalchenko V.A., Nikulin A.N. High-speed conditions of metal deformation on a sorted mill of screw
rolling // Vestnik MSTU. N. E. Bauman // Ser. "Mechanical engineering". 2008. N. 2. P. 97-108.

Известия Национальной академии наук Республики Казахстан
108
[18] Osadchiy V.Ya., Vavilin A.S., Zimovets V.G., Kolikov A.P. Technology and equipment of pipe production: Textbook for high schools. M.: Intermet Engineering, 2001. 608 p.
[19] Zhelezkov O.S., Zhelezkov S.O. Perfection of the design of the tool for thread rolling on track screws // Steel. 2009. N 3. P. 88.
[20] Kaibyshev O.A., Utiashev F.Z. Superplasticity, grinding of structure and processing of hard-deformed alloys. M.: Nauka, 2002. 210 p.
[21] Ovid’ko I.A., Gutkin M.Yu. Physical mechanics of deformable nanostructures. Nanocrystalline materials. SPb.: Janus, 2003. Vol. 1. P. 194.
С. А. Машеков1, Б. Н. Абcадыков2, А. С. Машекова3, Е. З. Нугман1, Б. А. Бекбосынова1, Э. А. Тусупкалиева1
1Satbayev University, Алматы, Қазақстан,
2А. Б. Бектурова атындағы химия ғылымдар институты, Алматы, Қазақстан, 3Назарбаев Университеті, Астана, Қазақстан
ҚҰРЫЛЫМЫ ЖАҢА ҮЗДІКСІЗ РАДИАЛЬДЫ-ЫҒЫСТЫРУ ОРНАҒЫНДА ШЫБЫҚ ПЕН
ҚҰБЫРДЫ ИЛЕМДЕУ ПРОЦЕСІНІҢ КИНЕМАТИКАСЫН ЗЕРТТЕУ
Аннотация. Жаңа қондырғыда құбыр мен шыбықты баспақтап жасаған кезде үздіксіз дайындаманы қолдану, металл құрылымын жақсы өңдеуді қамтамасыз ететінтым нəтижелі тəсілмен деформация іске асы-руды қажет етеді. Жаңа үздіксіз баспақтау қондырғысы үшін осындай мəселені шешудің жолы болып, шы-ғынқылығы мен ойымдарында ұтымды өлшемдер бар бұрандалы пішінбіліктерді қолдану саналады. Шығын-қылығы мен ойымдарында ұтымды өлшемдер бар бұрандалы пішінбіліктерді қолдан кезде, талап етілетін жаншу шегімен дайындаманың құрылымын қарқынды деформациялауға болады. Баспақтаудың кинема-тикасын зерттеген кезде шығынқылығы мен ойымдарында əртүрлі өлшемдер бар бұрандалы пішінбіліктерді қолданылды. Осы бұрандалы пішінбіліктерді қолдану, деформациялаудың технологиялық режімдеріне бай-ланысты деформация ошағынан металдың шығу жылдамдығын жəне осы пішінбіліктердің шығынқылығы мен ойымдарының нəтижелі геометриялық өлшемдерін анықтауға мүмкіндік берді. Радиальды-ығысу орна-ғында илемдеген кезде металды деформациялау, дайындаманың пішінбілікке қатысты сырғанауымен іске асырылатындығы мақалада көрсетілді. Деформация ошағында дайындаманың бұрандалы қозғалысының жылдамдығы пішінбіліктің айналу жылдамдымен сəйкес келмеуінен сырғанау пайда болатындығы жұмыста айтылды. Сырғудың мөлшерінен өнімнің сапасы жəне тағыда басқа өндірістің техника-экономикалық көр-сеткіштерді тəуелді болатындығы мақалада анықталды. Радиальды-ығысу орнағында илемдеген кезде дайын-даманың қозғалыс жылдамдығы пішінбілік жылдамдығынан кіші болатындығы жұмыста табылды. Жұмыста, дайындаманың ойым аймағында деформацияланатын дайындамаға қатысты пішінбіліктің сырғанау жылдам-дығын анықтауға мүмкіндік беретін формулалар шығарылған.
Түйін сөздер: бұрандалы пішінбілік, ұяқалып, процестің кинематикасы, шыбық, дайындама, сырғанау, сырғанау мен жылдамдықтың тангенциалды жəне осьтік құраушылары.
С. А. Машеков1, Б. Н. Абcадыков2, А. С. Машекова3, Е. З. Нугман1, Б. А. Бекбосынова1, Э. А. Тусупкалиева1
1Satbayev University, Алматы, Казахстан,
2Институт химических наук им. А.Б. Бектурова, Алматы, Казахстан, 3Назарбаев Университет, Астана, Казахстан
ИССЛЕДОВАНИЕ КИНЕМАТИКИ ПРОЦЕССА ПРОКАТКИ ПРУТКОВ И ТРУБ
НА НЕПРЕРЫВНОМ РАДИАЛЬНО-СДВИГОВОМ СТАНЕ НОВОЙ КОНСТРУКЦИИ
Аннотация. При использовании непрерывнолитой заготовки для прессования прутков или труб на
новой установке деформация должна осуществляться наиболее эффективным способом, чтобы можно было добиться лучшей проработки структуры металла. Для новой установки непрерывного прессования возмож-ным решением такой задачи является использования винтообразных валков с рациональными геометри-ческими размерами выступов и впадин. Применение винтообразных валков с рациональными размерами

ISSN 2224-5278 Серия геологии и технических наук. 4. 2018
109
выступов и впадин, будет интенсивно деформировать металл заготовки в пределах требуемого обжатия заготовки. При исследовании кинематики прессования были использованы винтообразные валки с различ-ными размерами выступов и впадины. Их использование позволило установить зависимость скорости вы-хода металла из очага деформации от технологических режимов деформирования в винтообразных валках и определить более эффективные геометрические размеры выступов и впадин данных валков. Показано, что деформация металла при прокатке на радиально-сдвиговом стане осуществляется со скольжением заготовки относительно валков. Скольжение возникает вследствие несоответствия скорости винтового перемеще- ния заготовки в очаге деформации скорости вращения валков. От величины скольжения зависят качество металлопродукции, а также другие технико-экономические показатели производства. Установлена, что при прокатке на радиально-сдвиговом стане скорость перемещения заготовки меньше скорости валков. Аналитическим способом исследована кинематика процесса и выведены формулы, позволяющие определять скорость проскальзывания валка относительно заготовки в зонах впадины заготовки.
Ключевые слова: винтообразные валки, матрица, кинематика процесса, пруток, заготовка, скольжение, тангенциальные и осевые составляющие скольжения и скоростей.
Сведения об авторах: Машеков Серик Акимович – доктор технических наук, профессор, Казахский национальный техни-
ческий университет имени К.И. Сатпаева, кафедра «Станкостроение, материаловедение и технология маши-ностроительного производства» (СМиТМП), Алматы, [email protected]
Абсадыков Бахыт Нарикбаевич – доктор технических наук, профессор, Институт химических наук имени А.Б. Бектурова, Алматы, [email protected]
Машекова Айгерим Сериковна – доктор PhD, Назарбаев Университет, школа Инженерии, Астана, [email protected]
Нугман Ерик Зейнелович – кандидат технических наук, заместитель директора Института промыш-ленной инженерии, Казахский национальный технический университет имени К.И. Сатпаева, кафедра СМиТМП, Алматы, [email protected]
Бекбосынова Баглан Асылхановна – докторант Института промышленной инженерии, Казахский на-циональный технический университет им. К.И. Сатпаева, кафедра СМиТМП, Алматы, Bekbossynova_bagi @ mail.ru
Тусупкалиева Эльмира Адиетовна – докторант Института промышленной инженерии, Казахский на-циональный технический университет имени К.И. Сатпаева, кафедра СМиТМП, Алматы, [email protected].

Известия Национальной академии наук Республики Казахстан
110
N E W S OF THE NATIONAL ACADEMY OF SCIENCES OF THE REPUBLIC OF KAZAKHSTAN
SERIES OF GEOLOGY AND TECHNICAL SCIENCES
ISSN 2224-5278
Volume 3, Number 430 (2018), 110 – 123 UDC 536.248.2
A. T. Kalbayeva1, S. D. Kurakbayeva1, L. T. Tashimov2, V. V. Dilman 3, A. T. Kalbayeva4, G. Zh. Elbergenova1
1South Kazakhstan State university named M. O. Auezov, Shymkent, Kazakhstan, 2Representative office of the NAS of RK for the SKR, Shymkent, Kazakhstan,
3Kurnakov Institute of General and Inorganic Chemistry, Moscow, Russia, 4South Kazakhstan Pedagogical university, Shymkent, Kazakhstan. E-mail: [email protected], [email protected], [email protected],
viktor.dilman@ rambler.ru, [email protected], [email protected]
SIMULATION OF AUTOCATALYTIC SYSTEMS WITH CHEMICAL OSCILLATIONS WITH ALLOWING
FOR REACTION STAGES REVERSIBILITY
Abstract. The paper deals with the simulation of two auto-catalytic system are remarkable for chemical oscil-lations in the case of some reactions stages reversibility. The methods for engineering calculations of kinetic charac-teristics and the residence time applying to the dynamical processes of mass transfer in cascades of chemical reactors for various model environments have been studied. The preferred model schemes for describing various systems with vibrational chemical reactions have been established. For bromate systems and systems with oxidation-reduction reactions containing metal ions, it is proposed to use a Belousov-Zhabotinsky model with irreversibility kinetic sta-ges. For systems with organic reducing agents the suitable model is a model of the type of the Belousov–Zhabotinsky system, taking into account the reversibility of the reaction stages. For systems with enzymatic reactions and bioche-mical systems it is a model with autocatalysis or "Brusselator".
Grounded on the criteria equations for the known flow pattern in each of the cascade reactors, the following calculation sequence is recommended. First, the required average velocity of the phase flows in the section of the tubular reactor is calculated. Then, according to this average velocity, the diameter of the apparatus is calculated for a given consumption of the processed substance. Then, at a given degree of the conversion in the reactor and at a cer-tain average flow rate, the required residence time in the reactor is calculated according to the offered method. If the length of the reactor is specified for design reasons, the calculated residence time can be used to determine the required number of reactors in the cascade. If the length of the reactor is not specified, it can be selected by iterative calculation according to the described procedure to ensure a given degree of the conversion.
Key words: modelling of chemical reactors, recycle, two-stage reactor, Belousov-Zhabotinsky reaction, “brus-selator” system.
1. Introduction. Description of concentration wave fronts and oscillatory processes in reaction-
diffusion systems is an extremely topical scientific problem, which also has great practical significance. Many known methods for modeling chemical reactors completely ignore the possibility of forming wave fronts in physicochemical systems. At the same time, the intensity of the processes of heat and mass transfer in the presence of moving frontal sections changes significantly and cannot be correctly calculated without accounting these phenomena.
In this paper, we consider some fairly simple models that make it possible to describe the general characteristic features of propagation of wave fronts in reaction-diffusion systems.
2. Analysis of model systems. 2.1. Belousov-Zhabotinsky reaction. The Belousov-Zhabotinsky (BZ) reaction is the process of
oxidation of malonic or bromomalonic acid by bromate ions in an acidic medium, catalyzed by ions of

ISSN 2224-5278 Серия геологии и технических наук. 4. 2018
111
transition metals (cerium, iron). Under different conditions in a flow-type reactor with mixing, one can observe long-term self-oscillations, several stationary states and periodic regimes, chaotic behavior, and for distributed systems the propagating concentration waves of oxidation and restoration can be occurred. It is well-known that this reaction serves as a model for studying nonlinear phenomena in chemical kinetics. Field, Köresh and Noyes developed a detailed scheme for the mechanism of this reaction, con-sisting of eleven basic reactions between twelve components. Later, Field and Noyes proposed a simp-lified scheme, consisting of five main stages.
In our analysis, we will use the reduced scheme of Field-Noyes. Let us denote the components of the
reaction as follows: A=BrO 3 , B=BrMA, P=HOBr, X=HbrO2, Y=Br -, Z=Ce4+. The appropriate scheme of
the reaction reads
,PXYA (1)
,2PYX (2)
,22 ZXXA (3)
,2 PAX (4)
hYZB . (5)
As a rule, the known papers in mathematical models of the kinetics of individual stages do not take into account the reversibility of the reactions. However, under real conditions, many reaction stages of the Belousov-Zhabotinsky type can be reversible [1, 2]. This circumstance substantially complicates the kinetic equations and their analysis.
Further we consider the case of reversibility of the fourth stage of the reaction, i.e. decomposition of the product X.
Then the scheme of chemical equations is supplemented by the equation:
XPAk
26
. (6)
Let us assume that the components A and B are in a large excess and that their concentrations do not change noticeable on time. For the convenience of numerical experiments and the data interpretation, all reaction rate constants ki, transfer coefficients Dij and time t were dimensioned with respect to the relaxation time of the first stage 11 kτ p , i.e. the dimensionless characteristics were determined
according to the scheme:
111 , , kDDkkktkt ijijii . (7)
Then the time variation of the concentrations of the remaining components in a closed system can be described using the equations:
APkXkXYkAYkdt
dP
BZkAXkdt
dZ
BZhkXYkAYkdt
dY
APkXkAXkXYkAYkdt
dX
62
421
53
521
62
4321
22
,2
,
,22
(8)
The above balance equations do not take into account the input and output streams. Thus, it is assumed that only the Y (Br -) component is fed into the flow-type reactor with mixing, and the reaction components X X(HbrO2) and Z(Ce4+) are intermediate products arising during the reaction. The analytical solution of the obtained system (8) is impossible. Therefore, we carried out a numerical study using the Runge-Kutta method. For the numerical experiment, the following sets of control parameters were selected:

Известия Национальной академии наук Республики Казахстан
112
The first series of experiments: 21,1,1,1,1,1 654321 kkkkkk ,
The second series of experiments: 21,21,1,1,1,1 654321 kkkkkk .
Some results of the experiments are depicted in figures 1, 2.
Figure 1 – The change in the concentration of intermediate reagent X in the reactor of flow type with mixing at A = 1; B = 1,4: 1 – reversible reaction; 2 – inreversible reaction
Figure 2 – The change in the concentration of intermediate reagent Y in the reactor of flow type with mixing at A = 1; B = 1,4:1 – reversible reaction; 2 – inreversible reaction
Numerical investigation has shown that taking into account the reversibility of the reaction stages
can be important in the simulation of the considered process. In particular, it can be seen that the rever-sibility of the fourth stage alters the yield of the product Z by 25%.
0,2
0,4
0,6
0,8
1,0
0,2 0,4 0,6 0,8 1,0 1,2 1,4 1,6 1,8
X
t
1 2
Con
cent
rati
on X
Time
0,1
0,2
0,3
0,4
0,5
0,2 0,4 0,6 0,8 1,0 1,2 1,4 1,6 1,8 2,0
Y
t
1
2Con
cent
rati
on Y
Time

ISSN 2224-5278 Серия геологии и технических наук. 4. 2018
113
2.2. "Brusselator" system with accounting two reaction stages reversibility. When modeling nonli-near physical and chemical systems, a system of nonlinear kinetic equations of the "brusselator" type is of-ten used. This system simulates many real complex multi-stage reactions occurring in industrial reactors.
In accordance with this model, the starting reagents A and B are converted to reaction products D and E with the appearance of intermediates X and Y, and the kinetics of the reaction can be described by the following system of equations:
.
,32
,
,
4
3
2
1
EX
XYX
DYXB
XA
k
k
k
k
(9)
In the presented form, the system of kinetic equations is rather complicated for analytical inves-tigation. The nonlinearity of the kinetic equations leads to a multiplicity of stationary states that differ from one another in the type of stability. In addition, under real conditions, the individual reaction stages can be reversible, which stipulates the formation of feedbacks and also complicates the theoretical analysis of the dynamics of the process.
At the same time, as it has already been shown, the question of reversibility is extremely important and requires special research.
In our work, a numerical study of the solutions of the system of kinetic equations describing the dynamics of the process (9) has been carried out, taking into account the reversibility of the two reaction stages, namely corresponding to the decomposition of the substance A entering the reactor and the product of the reaction between X and the other substance B entering the reactor inlet.
In this case the system of chemical equations is supplemented as follows:
.
;6
5
XE
XBDYk
k
(10)
With a constant concentration of the initial substances A and B, and the given set of reaction rate constants, we obtain the following mathematical model of the process kinetics in the reactor:
.
,
,
,
64
52
2352
642
3521
EkXkdt
dE
YDkBXkdt
dD
YXkYDkBXkdt
dY
ЕkXkYXkYDkBXkAkdt
dX
(11)
Numerical investigation of the system (12) is carried out with the following values of reaction rate constants:
21,21,1,1,1,1 654321 kkkkkk .
Some results of the numerical experiment are presented in figures 3, 4. An analysis of the results of a numerical study shows that the reversibility of the individual stages of
the reaction can lead to a significant change in the parameters of the stationary state. This circumstance can radically change the type of stability of a stationary point. Moreover, the influence of the irrever-sibility factor increases with time and it is more significant not in the initial transition period, but in a period process stabilization corresponding to a completely irreversible system. As the rate constant of the reverse reaction increases, the influence of the reversibility factor increases too.

Известия Национальной академии наук Республики Казахстан
114
Figure 3 – The change in the concentration of intermediate reagent X in the reactor of flow type
with mixing for "brusselator" at A = 1; B = 1,4: 1 – inreversible reaction; 2 – reversibility of the one reaction stage; 3 – reversibility of two reaction stages
Figure 4 – The change in the concentration of intermediate reagent D in the reactor of flow type with mixing for "brusselator" at A = 1; B = 1,4:
1 – inreversible reaction; 2 – reversibility of the one reaction stage; 3 – reversibility of two reaction stages
0,2
0,4
0,6
0,8
1,0
0,2 0,4 0,6 0,8 1,0 1,2 1,4 1,6 1,8 2,0
X
t
1
2
Con
cent
rati
on X
Time
3
0,3
0,6
0,9
1,2
1,5
0,2 0,4 0,6 0,8 1,0 1,2 1,4 1,6 1,8 2,0
D
t
1
2
Con
cent
rati
on D
Time
3

ISSN 2224-5278 Серия геологии и технических наук. 4. 2018
115
Figure 5 – The change in the concentration of intermediate reagent E
in the reactor of flow type with mixing for "brusselator" at A = 1; B = 1,4: 1 – inreversible reaction; 2 – reversibility of the one reaction stage; 3 – reversibility of two reaction stages
Further studies should be aimed at assessing the influence of the flow structure in the reactor and of the reversibility of various stages of the "brusselator type "reactions on the kinetics of the process.
3. Methods of calculation and discussion of the results. 3.1. Simulation of a two-cascade reactor with a partially reversible reaction in the "brusselator"
system. Simulation of chemical reactors for the implementation of complex physicochemical processes requires taking into account the specific features of the kinetics of chemical transformations and the conditions for the heat and mass transfer. at the same time, the correct choice of the model system allows often for greater generality of the conclusions and the possibility to create methods for calculating a wide class of systems and reactors.
In this section, a mathematical model of two cascade reactors with a brusselator type reaction is constructed, taking into account the partial decomposition of the final product, that is, the reversibility of the last stage of the reaction:
XEk5
The numerical investigation of the developed mathematical model is carried out. The concentrations of the input substances A and B are assumed to be constant (that is, the assumption of their excess is assumed), and the reaction rate constants are assumed to be equal to the following values: k1 =1, k2 =1, k3 =1, k4=1, k5=1/2.
The structure of the streams is represented as a cascade of two fully agitated reactors with mutual mass transfer (figure 8).
0,2
0,4
0,6
0,8
1,0
0,2 0,4 0,6 0,8 1,0 1,2 1,4 1,6 1,8 2,0
E
t
1
2
Con
cent
rati
on
Time
3

Известия Национальной академии наук Республики Казахстан
116
D1 D1
D2 D2 D3 D3
a b
Figure 6 – Cascade of two fully agitated reactors with mutual mass transfer: а) – cascade with recycles; b) – stream in one direction
The corresponding systems of kinetic equations, provided that the resulting inflow and outflow of intermediate products are zero, and the concentrations of incoming components are kept constant, have the form:
),(),(
(12) ),(
),(),(
),(
213225242
212222
23222
21122522
232422212
123115141
122112
13121
12111512
131412111
EEDEkXkdt
dEYYDYXkBXk
dt
dY
XXDЕkYXkXkBXkAkdt
dX
EEDEkXkdt
dEYYDYXkBXk
dt
dY
XXDЕkYXkXkBXkAkdt
dX
Two reactors with mutual mass transfer can also be considered in the case of a stream flowing in only one direction from the reactor 1 to the reactor 2.
Then the system of equations (12) takes the form:
),(
),(
),(
,
,
,
213225242
212222
23222
21122522
232422212
15141
12
13121
1512
131412111
EEDEkXkdt
dE
YYDYXkBXkdt
dY
XXDЕkYXkXkBXkAkdt
dX
EkXkdt
dE
YXkBXkdt
dY
ЕkYXkXkBXkAkdt
dX
(13)
The analytical solution of the obtained systems (12) and (13) is impossible. Therefore, we conducted a numerical study. The reaction rate constants in the numerical experiment are assumed to be equal to the following values: A1 = 1; A2 = 1.2; D11 = 0.1; D21 = 0.1; D31 = 0.1; D12 = 0.05; D22 = 0.05; D32 = 0.05. The initial conditions can be taken for t = 0 X1 = X2 = Y1 = Y2 = E1 = E2 = 0. Some results of the numerical experiment are shown in figures 9–12.
The analysis of the data of a numerical experiment showed that the concentration of the intermediate active complex Y arising during the reaction reaches a maximum value after the start of the process, and then decreases, trending to a stable value.
1 2 1 2

ISSN 2224-5278 Серия геологии и технических наук. 4. 2018
117
а) b)
Figure 7 – The change in the concentration of intermediate reagents X- a) and Y- b) in the cascade with recycle ("brusselator"):
1 – the first reactor of the cascade; 2 – the second reactor of the cascade
1
2
3
4
5
1 2 3 4 5 6 7 8 9 10
X
t
1
2
Con
cent
rati
on
Time
0,3
0,6
0,9
1,2
1,5
1 2 3 4 5 6 7 8 9 10
Y
1 2
Con
cent
rati
on
Time
t

Известия Национальной академии наук Республики Казахстан
118
Figure 8 – The change in the concentration of the end-product E in the cascade reactors with recycle ("brusselator"): 1 – the first reactor of the cascade; 2 – the second reactor of the cascade
Figure 9 – The change in the concentration of the end-product E in the cascade reactors without recycle ("brusselator") The dependencies of the concentration of the intermediate complex X and the final product E on time
are monotonic and reach stable values after a long time. The partial decomposition of the final product in the case when the rate constant of the decomposition reaction is comparable with the constants of the other stages, can remove the oscillatory character of the concentrations of intermediate complexes characteristic to the "brusselator". A significant effect of recycling on the nature of the process was not found in the in-vestigated range of parameters.
The results of the study show the importance of taking into account the reversibility of individual reaction stages in the analysis of the kinetics in cascades of chemical reactors.
3.2. Stages of modeling and calculation of cascades of through-flowing reactors. To obtain an approximate estimation of the necessary residence time of the reactants in the cascade of reactors operating in the dynamic regimes of the traveling concentration waves, we consider separately the cases of a model medium of the "Brusselator" type and a medium with three stationary states (to this case, a reaction-diffusion medium with the Belousov-Zhabotinsky system can be attributed).
2
4
6
8
10
1 2 3 4 5 6 7 8 9 10
E
1
2
Con
cent
rati
on
Time
t
2
4
6
8
10
1 2 3 4 5 6 7 8 9 10
E
1
2
Con
cent
rati
on
Time
t
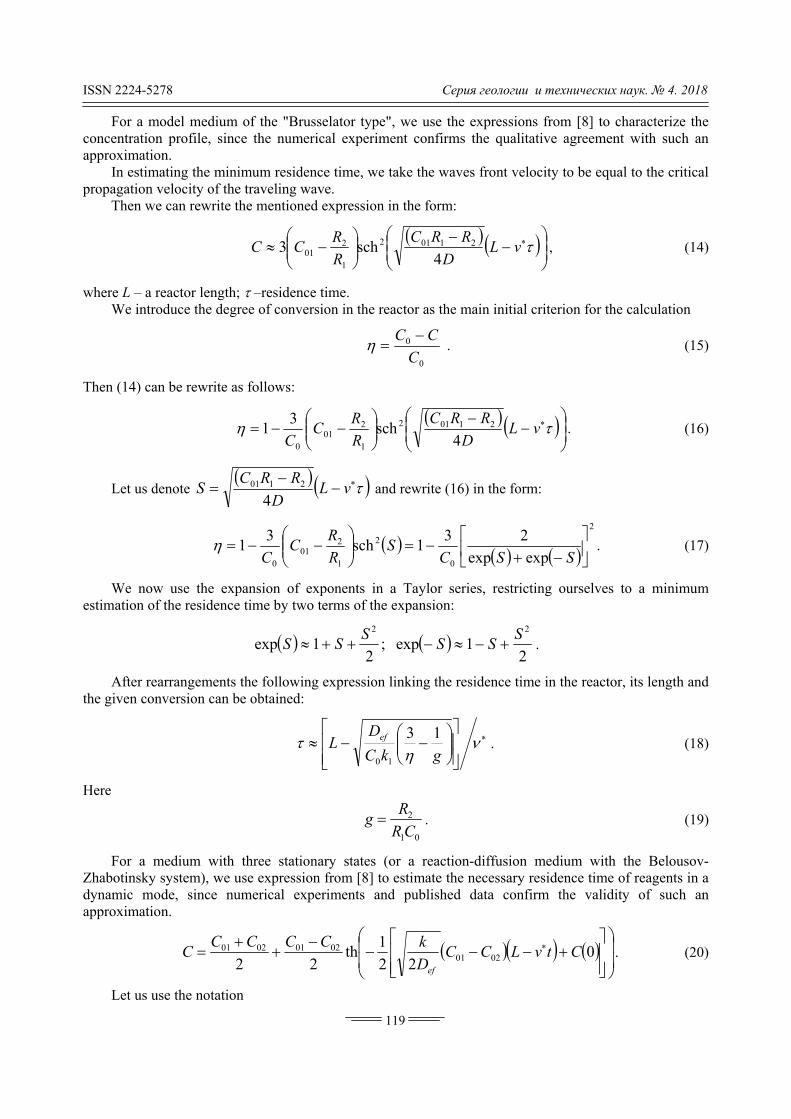
ISSN 2224-5278 Серия геологии и технических наук. 4. 2018
119
For a model medium of the "Brusselator type", we use the expressions from [8] to characterize the concentration profile, since the numerical experiment confirms the qualitative agreement with such an approximation.
In estimating the minimum residence time, we take the waves front velocity to be equal to the critical propagation velocity of the traveling wave.
Then we can rewrite the mentioned expression in the form:
vL
D
RRC
R
RCC
4sch3 21012
1
201 , (14)
where L – a reactor length; –residence time. We introduce the degree of conversion in the reactor as the main initial criterion for the calculation
0
0
С
СС . (15)
Then (14) can be rewrite as follows:
vL
D
RRC
R
RC
C 4sch
31 21012
1
201
0
. (16)
Let us denote
vL
D
RRCS
42101 and rewrite (16) in the form:
2
0
2
1
201
0 expexp
231sch
31
SSCS
R
RC
C . (17)
We now use the expansion of exponents in a Taylor series, restricting ourselves to a minimum estimation of the residence time by two terms of the expansion:
2
1exp ;2
1exp22 S
SSS
SS .
After rearrangements the following expression linking the residence time in the reactor, its length and the given conversion can be obtained:
gkC
DL ef 13
10
. (18)
Here
01
2
CR
Rg . (19)
For a medium with three stationary states (or a reaction-diffusion medium with the Belousov-Zhabotinsky system), we use expression from [8] to estimate the necessary residence time of reagents in a dynamic mode, since numerical experiments and published data confirm the validity of such an approximation.
0
22
1th
22 020102010201 СtvLCC
D
kCCCCC
ef
. (20)
Let us use the notation

Известия Национальной академии наук Республики Казахстан
120
0
22
10201 СtvLCC
D
kS
ef
. (21)
Thus from the expression for hyperbolic tangent
)exp()exp(
)exp()exp()(th
SS
SSS
. (22)
and Taylor expansions we can offer the following calculation scheme for optimal residence time:
А) Calculation of the subsidiary parameter М:
М = 12 00201 CCC . (23)
B) Calculation of the subsidiary parameter N from the equation:
0M2NNM 02012 CC . (24)
C) Obtaining the estimation of the residence time:
L
CC
C
0201
0 N2 . (25)
For the cascade of reactors, the estimations of the necessary residence time in an individual diffusion cell for different systems with a lot of stationary states and self-oscillating dynamic regimes should be used in the general system of design equations, taking into account the known structure of the flows.
Conclusions. Thus, the following general scheme of simulation and calculation is proposed: 1. Choice of the model kinetic scheme. For bromate systems and systems with oxidation-reduction reactions containing metal ions, the
optimal model is the BZ type model. For systems with organic reducing agents, the optimal model is the model of Belousov-Zhabotinsky
type with allowing for the reversibility of the reaction stages. For systems with enzymatic reactions and biochemical systems the optimal model is the model with
autocatalysis or "Brusselator" type. 2. Modelling the flows structure and defining the number of cascades. 3. Analysis of the multiplicity of stationary states for each cascade. 4. Investigation of the stability of stationary states. 5. Analysis of conditions for the formation of wave regimes of mass transfer and estimation of the
parameters of wave fronts. 6. Calculation of the conversions of reagents. The calculation sequence is the same. On the base of the criterial equations for the known flow structure in each of the cascade reactors, the
required average flow rate of the phases in the section of the tubular reactor is calculated. Then, at this average speed, the diameter of the apparatus can be determined for a given flow rate of
the processed substance. Then, at a given degree of conversion in the reactor and a certain average flow rate, the required
residence time in the reactor is calculated according to the procedure described above. If the length of the reactor is specified for design reasons or it is also specified, the calculated resi-
dence time is used to determine the required number of reactors in the cascade. If the length of the reactor is not specified, it can be selected by iterative calculation according to the
described procedure to ensure a given degree of conversion.

ISSN 2224-5278 Серия геологии и технических наук. 4. 2018
121
REFERENCES
[1] Richard J. Field, Maria Burger (1985) Oscillations and Travelling Waves in Chemical Systems. Wiley-Interscience,
United States. ISBN: 978-0471893844. [2] Sagdeev R.Z., Zaslavsky G.M.(1988) Introduction to the Nonlinear Physics. Harwood, New York. 676р. [3] Tauasarov B.R., Kalbayeva A.T., Brener A.M. (2003) Modeling of a two-stage reactor recycle autocatalytic. Search
[Poisk], series natural sciences and engineering, 4 (2): 175-179. (In Russian). [4] Kalbaeva A.T., Tauasarov B.R. (2004) Numerical research reaction-diffusion systems in the flow tube reactor. Pro-
ceedings of the International scientific conference "Science and education on the threshold of the ХХI century", dedicated to the 10th anniversary of M. Saparbayev, Shymkent, South Kazakhstan Humanitarian Institute. Vol. 2. P.81-85. (In Russian).
[5] Kalbaeva A.T., Tauasarov B.R. (2004) Numerical modeling of stationary modes autocatalytic flow reactors. Proceedings of the International scientific-theoretical conference of young scientists. Shymkent. P. 86-89. (In Russian).
[6] Kalbaeva A.T., Tauasarov B.R., Brener A.M. (2003) Numerical solution of kinetic equations for the "brusselator" system with allowing for the reversibility of two kinetic stages. Science and Education of South Kazakhstan, chapters: Chemistry, chemical technology. Processes and apparatuses. Vol. 2, N 35. Shymkent. P. 120-123. (In Russian).
[7] Kalbaeva A.T., Tauasarov B.R., Brener A.M. (2003) Simulating the kinetics of reactions of the "brusselator" type accounting to the kinetic stages reversibility. Numerical solution of kinetic equations for the "brusselator" system with allowing for the reversibility of two kinetic stages. Science and Education of South Kazakhstan, chapters: Chemistry, chemical technology. Processes and apparatuses. Vol. 2, N 35. Shymkent. P. 44-46. (In Russian).
[8] Kalbaeva A.T., Кurakbayeva S.D., Zhidebayeva A.N., Musrepova E. (2014) Modelling the Dinamical Regimes of Mass Transfer in Cascades of Through – Reactors. 17th Conference Process Integration, Modelling and Optimisation for Energy Saving and Pollution Reduction, Prague, Czech Republic. P. 1015-1020.
[9] Yunussov M.B., Kalbaeva A.T., Кurakbayeva S.D., Brener A.M. (2013) Simulating the transient regimes and concen-trate waves in through-reactors with multi-stage kinetics. Proceedings of the 7th International Conference on Computational Che-mistry (COMPUCHEM '13), Paris, France. P. 18-22.
[10] Barkanyi A., Nemeth S., Lakatos B.G. (2013) Modelling and Simulation of a Batch Poly(Vinyl Chloride) Reactor, Chemical Engineering Transactions, 32: 769-774.
[11] Carvajal, D., Jara C.C., Irrazabal M.M. (2012) Dynamic Modelling of the Reactive Absorption of CO2 in Ionic Liquids and its Effect on the Mass Transfer and Fluid Viscosity, Chemical Engineering Transactions, 29: 175-180.
[12] Dateo C.E., Orban M., De Kepper P., Epstein I.R. (1982) Systematic design of chemical oscillators. Bistability and oscillations in the autocatalytic chlorite-iodide reaction in a stirred-flow reactor, Journal of the American Chemical Society, 104(2): 504-509.
[13] Field R.J., Koros E., Noyes R.M. (1972) Oscillations in chemical systems, II. Thorough analysis of temporal oscillation in the bromate-cerium-malonic acid system, Journal of the American Chemical Society, 94(25): 8649-8664.
[14] Holodniok M., Klıc A., Kubıcek M., Marek M. (1984) Methods of Analysis of Nonlinear Dynamical Models. Academia, Prague, Czech Republic.
[15] Manenti F., Cieri S., Restelli M., Lima N.M.N., Linan L.Z., (2011) Dynamic Simulation of the Lurgi-type Reactor for Methanol Synthesis, Chemical Engineering Transactions, 24: 379-384.
[16] Baetens D., Van Keer R., Hosten L.H. (1997) Gas-liquid reaction: absorption accompanied by an instantaneous, irreversible reaction, Comp. Mech. Publ. Moving boundaries IV, Boston, p.185-190.
[17] Cussler E.L. (2009) Diffusion: mass transfer in fluid systems, International Journal of Refrigeration, Cambridge, UK, 16(4): 282-294.
[18] Bo S., Ma X., Lan Z., Chen J., Chen H. (2010) Numerical simulation on the falling film absorption process in a counter-flow absorber, Chemical Engineering Journal, 156(3): 607-612.
[19] Musabekova L.M. (2011) Method of calculation of reaction-diffusion processes taking into account non-ideal system. International scientific-technical conference NERPO 2011, MSOU, Moscow, P. 294-299. (In Russian)
[20] Musabekova L.M., Dausheeeva N.N., Jamankarayeva M.A. (2012) Methodology of calculating reaction-diffusion processes with moving boundaries of kinetic zones. 15-th Conference Process Integration, Modeling and Optimization for Energy Saving and Pollution Reduction.

Известия Национальной академии наук Республики Казахстан
122
А. Т. Қалбаева1, С. Д. Құрақбаева1, Л. Т.Ташимов2, В. В. Дильман3, А. Т. Қалбаева4, Ғ. Ж. Ельбергенова1
1М. Əуезов атындағы ОҚМУ, Шымкент, Қазақстан,
2ҚР ОҚО бойынша ҰҒА өкілдігі, Шымкент, Қазақстан, 3Н. С. Курнаков атындағы жалпы жəне бейорганикалық химия институты, Мəскеу, Ресей,
4Оңтүстік Қазақстан педагогикалық университеті, Шымкент, Қазақстан
РЕАКЦИЯНЫҢ ҚАЙТЫМЫН ЕСЕПКЕ АЛА ОТЫРЫП ХИМИЯЛЫҚ ОСЦИЛЛЯЦИЯМЕН АВТОКАТАЛИТИКАЛЫҚ ЖҮЙЕЛЕРДІ МОДЕЛЬДЕУ
Аннотация. Мақалада химиялық осцилляциямен екі автокаталитикалық жүйені модельдеу қарас-
тырылады: Белоусов–Жаботинский реакциясы жəне «брюсселятор» жүйесі, қайтымды реакция жағдайында. Түрлі моделдік орта үшін химиялық реакторлар какскадында жəне келу уақытын анықтау əдістемесі жалпы тасымалдаудың динамикалық процестері үшін кинетикалық сипаттамалардың инженерлік есептеу сұлбасы ұсынылған. Тербелмелі химиялық реакциямен түрлі жүйелерді сипаттау үшін қолайлы модельдің сұлбасы орнатылған. Ионды металы бар броматты жүйе жəне тотығу – қалпына келтіру реакциясы үшін БЖ түріндегі модельді қолдану ұсынылады. Органикалық қалпына келтіру жүйесі үшін – Белоусов–Жаботинский жүйесі түріндегі модель реакциялардың қайтымды сатыларын есепке алу. Ферментативті реакциялар мен биохи-миялық жүйелері үшін – автокатализ немесе «Брюсселятор» мен модель.
Əр каскад реакторынан белгілі ағындар құрылымында критериальды теңдеуден шығатыны келесі есеп-теу тізбегі. Бастапқыда құбырлы реактордың қимасындағы фазалар ағындарының қажетті орташа жыл-дамдығы есептеледі. Ары қарай осы орташа жылдамдықпен өңделетін субстанциялардың берілген шығыны бойынша аппарат диаметрі анықталады. Сонан соң берілген айналдыру дəрежесінде реакторды жəне жоға-рыда аталған əдіс бойынша ағындардың анықталған орташа жылдамдығымен реактордағы қажетті келу уақыты есептеледі. Егер реактор ұзындығы конструктивті тұрғыдан берілсе, онда есептелген келу уақыты каскадтағы реакторлардың қажетті санын анықтау үшін қолданылады. Егер реактор ұзындығы берілмесе, онда ол берілген айналдыру дəрежесін қамтамасыз ету үшін сипатталған əдіс бойынша итерациялық есептеу жолымен таңдала алады.
Түйін сөздер: химиялық реакторларды модельдеу, екі сатылы реактор, Белоусов–Жаботинский реак-циясы, «Брюсселятор» жүйесі.
А. Т. Калбаева1, С. Д. Куракбаева1, Л. Т.Ташимов2, В. В. Дильман3, А. Т. Калбаева4, Г. Ж. Ельбергенова1
1Южно-Казахстанский государственный университет им. М. Ауэзова, Шымкент, Казахстан,
2Представительство НАН РК по ЮКО, Шымкент, Казахстан, 3Институт общей и неорганической химии им. Н. С. Курнакова РАН, Москва, Россия,
4Южно-Казахстанский педагогический университет, Шымкент, Казахстан
МОДЕЛИРОВАНИЕ АВТОКАТАЛИТИЧЕСКИХ СИСТЕМ С ХИМИЧЕСКИМИ ОСЦИЛЛЯЦИЯМИ С УЧЕТОМ ОБРАТИМОСТИ РЕАКЦИЙ
Аннотация. В статье рассматривается моделирование двух автокаталитических систем с химическими
осцилляциями: реакция Белоусова-Жаботинского и система «брюсселятор» в случае обратимости реакций. Предложена схема инженерного расчета кинетических характеристик для динамических процессов массо-переноса в каскадах химических реакторов и методика определения времени пребывания для различных модельных сред. Установлены предпочтительные модельные схемы для описания различных систем с коле-бательными химическими реакциями. Для броматных систем и систем с окислительно-восстановительными реакциями, содержащих ионы металлов, предлагается использовать модель типа БЖ. Для систем с органи-ческими восстановителями – модель типа системы Белоусова–Жаботинского с учетом обратимости стадий реакций. Для систем с ферментативными реакциями и биохимических систем – модель с автокатализом или «Брюсселятор».
Исходя из критериальных уравнений при известной структуре потоков в каждом из реакторов каскада рекомендована следующая последовательность расчета. Вначале рассчитывается необходимая средняя ско-рость потоков фаз в сечении трубчатого реактора. Далее по этой средней скорости при заданном расходе

ISSN 2224-5278 Серия геологии и технических наук. 4. 2018
123
обрабатываемой субстанции определяется диаметр аппарата. Затем при заданной степени превращения в реакторе и определенной средней скорости потоков по описанной выше методике рассчитывается необхо-димое время пребывания в реакторе. Если длина реактора задается из конструктивных соображений, то рас-считанное время пребывания используется для определения необходимого числа реакторов в каскаде. Если же длина реактора не задана, то она может подбираться путем итерационного расчета по описанной методике для обеспечения заданной степени превращения.
Ключевые слова: моделирование химических реакторов, двухкаскадный реактор, реакция Белоусова–Жаботинского, система «брюсселятор».
Information about the authors: Kalbayeva Aizhan – Candidate of technical science, associate professor, M.Auezov South-Kazakhstan State
University, "Information Technologies and Energy" Higher School, Department of "Information Systems and Modeling"
Kurakbayeva Sevara – Candidate of technical science, associate professor, M.Auezov South-Kazakhstan State University, "Information Technologies and Energy" Higher School, Department of "Information Systems and Modeling"
Tashimov Lesbek – Doctor of Technical Sciences, Professor, Academician of the National Academy of Sciences of Kazakhstan, Representative Office of the National Academy of Sciences of the Republic of Kazakhstan for the South Kazakhstan Region.
Dilman Viktor – Doctor of Technical Sciences, Professor, Kurnakov Institute of General and Inorganic Che-mistry, Russian Academy of Sciences.
Kalbayeva Aigul – Teacher, South Kazakhstan Pedagogical university, Department of " Computer Science and Mathematics "
Elbergenova Gaziza – Master, senior lecturer, M.Auezov South-Kazakhstan State University, "Information Technologies and Energy" Higher School, Department of "Information Systems and Modeling"

Известия Национальной академии наук Республики Казахстан
124
N E W S OF THE NATIONAL ACADEMY OF SCIENCES OF THE REPUBLIC OF KAZAKHSTAN
SERIES OF GEOLOGY AND TECHNICAL SCIENCES
ISSN 2224-5278
Volume 3, Number 430 (2018), 124 – 131 UDC 004.4:004.946; 517.958:532.5
G. Z. Kaziyev1, M. B. Markosiyan2, A. A. Taurbekova3
1Almaty University of Energy and Communications, Almaty, Kazakhstan, 2Yerevan Research Institute of Communication Facilities, Yerevan, Armenia,
3PhD student KazNTU named after K.I. Satpayev, Almaty, Kazakhstan. E-mail: [email protected], [email protected], [email protected]
METHODS OF DISTRIBUTION OF DATA PROCESSING SYSTEMS TO THE NODES OF COMPUTING SYSTEMS
Abstract. A new class of discrete programming problems - block-symmetric problems is considered in this
paper. General formulation and solution of block-symmetric problems of discrete programming are presented. The features and properties of this class of problems are given. The formulation and solution of the problem of
optimal allocation of program modules and database arrays to the nodes of computing systems of a given topology is considered.
Key words: model, method, algorithm, variable, block-symmetric problem, discrete programming. Introduction. Large-scale development and implementation of information systems is carried out on
the basis of computer networks on which data processing systems are operated. By data processing systems we mean a set of application software for the implementation of various
applications and associated database arrays. With the increase in the number of applications, there is arises a problem of the optimal allocation of
the set of application software and database arrays to the nodes of the computing system of a given topology. This allocation problem also arises when a node of computing system and communication channels between nodes fail.
The existing optimization methods for solving this problem are not effective because of the small dimensionality of the problems being solved.
Therefore, there is a need to develop new productions, models and methods for solving these problems.
One of the approaches is the application of a new class of problems of setting and solving discrete programming problems for block-symmetric problems.
1. General statement of block-symmetric discrete programming problems. The problems of discrete programming are widely used in the formulation and solution of applied scientific and technical problems.
At the same time, this section of applied mathematics is conservative for a number of reasons. The main ones being the exponential computational complexity of traditional statements of discrete program-ming problems, the difficulty of constructing effective algorithms for solving problems, the inadequacy of traditional problem statements for new applied problems that arise in various fields of science and technology, in particular in the field of information technology.
Therefore, one of the research areas is the development of new classes of discrete programming problems that most fully meet the modern requirements of setting and solving applied problems.
A number of applied problems: the design of modular software and database arrays of information systems, the distribution of program modules and database arrays to the nodes of computing networks, the choice of projects in conditions of limited resources can be formulated in the form of a new class of tasks -

ISSN 2224-5278 Серия геологии и технических наук. 4. 2018
125
block-symmetric models of discrete programming. Unlike traditional models, models of this class make it possible to formulate problems with several types of variables of different nature, to decompose complex problems into blocks with a single objective function and to develop efficient algorithms having polynomial computational complexity [1,2].
Let us consider the general formulation and solution of block-symmetric problems of discrete programming.
Problem statement. Let the set of objects ; 1, and the set of objects ; 1, are given with elements of different types, and also the interrelations between the elements of these sets that are defined by matrix , 1, , 1, , whose elements are integer or Boolean. It is necessary to combine the elements of the set A into disjoint subsets , 1, , and the elements of the subset B to disjoint subsets , 1, , in such a way as to deliver the extreme of the objective function , .
For a formal formulation of the problem, we introduce the following variables. Let ‖ ‖,1, ; 1, be a Boolean matrix, where xin = 1 if the i-th element is distributed to the n-th group and
xin = 0 otherwise. Similarly, , 1, ; 1, , where yjm = 1, if the j-th element is distributed to the m-th group and yjm = 0 otherwise. In the general case of a matrix, the variables X and Y can be integer.
We define on the set A x B the function F (X, Y), depending on the distribution of the elements of the sets A and B in the subsets An and Bm. Correspondingly, on the set of the A-function , 1, , and on the set B - the functions , 1, , defining constraints on the sets A and B.
The block-symmetric discrete programming problem is formulated as follows:
, → (1.1)under constraints , 1, (1.2) , 1, (1.3)
In the set of constraints (1.2) and (1.3), depending on the statements of problems, the signs of the inequalities can be reversed.
In general, two-index matrices - the variables X and Y and a given matrix W can be integer-valued. Consider the problem under the condition that the variables X, Y and W are Boolean matrices. As
functions F (X, Y), often use a function of the form F (Z), where
(1.4)
Consider the expression (1.4), which is the product of the matrices of the variables X and Y and the given matrix Z on which the objective function is defined. Unlike traditional statements of discrete programming problems, in this formulation there are two types of variables X and Y, the variables X and Y are symmetric with respect to the given matrix W.
In the problem (1.1) - (1.3) one can select the set of constraints of the form (1.2.) that depend on the variable X, and the set of constraints of the form (1.3) that depend on the variable Y.
A functional of the form F (X, Y) can be represented as follows: , → (1.5) → (1.6) , 1, (1.7) → (1.8) , 1, (1.9)

Известия Национальной академии наук Республики Казахстан
126
In the formulation of the problem (1.5) - (1.9), we single out a block of functions (1.6) - (1.7) depending only on the variable X, and a block of functions (1.8) - (1.9) depending only on the variable Y, united by a single functional of the form (1.5). Note that in a number of problem statements there can be a constraint block of the form
, , 1, (1.10)
depending only on the variables X and Y. In this case, we can select a block of the objective functional of the form (1.5), (1.10). Thus, the problem (1.2.5-1.2.10) is called the block-symmetric discrete programming problem. In a number of problem statements, the functional F (X, Y) can be represented as a function vector. In
this case, a multicriterial block-symmetric discrete programming problem is formulated. Consider the features and properties of block-symmetric problems. 2. Analysis of features and properties of block-symmetric models. Basic algorithm for solving
block-symmetric problems. Analysis of the general statement of the block-symmetric problem showed that the model of this class differs from the known models of discrete programming.
Consider the problem under the condition that the variables X, Y and W are Boolean matrices. As functions F (X, Y), often use a function of the form F (Z), where
(2.1)
Expression (2.1) is the product of the matrices of the variables X and Y and a given matrix W on which the objective function is defined. Unlike traditional statements of discrete programming problems, in this formulation there are two types of variables X and Y, the variables X and Y are symmetric with respect to the given matrix W.
In the problem (1.1) - (1.3) one can select a set of constraints of the form (1.2) that depend on the variable X, and the set of constraints of the form (1.3) that depend on the variable Y.
We consider the expression (2.1.). It follows from this that the variables X and Y are symmetric with respect to the given matrix W, and the function (2.1) can be defined from left to right, and vice versa, i.e.
(2.2)
On the basis of the general formulation, we define the basic properties of the formulated class of problems that distinguish it from the traditional statements of problems of discrete programming.
Property 1. The presence of two types of variables X and Y of different types, represented in the form of Boolean matrices, which are defined on the given matrix W.
Property 2. The blocking of the problem consists in isolating in the formulation of individual blocks functions of the form (1.2) and (1.3), depending on the corresponding variable X and Y.
Property 3. The symmetry of the problem consists in the possibility of computing (2.1) both in the forward and backward directions.
The solution of the problem. Analysis of the features and properties of the formulated problem allows us to propose effective algorithms for solving this class of problems. Consider the solution of block-symmetric discrete programming problems, provided that X, Y and W are Boolean matrices. It is easy to prove the following statement.
Statement. The distribution of the elements of the set A to the disjoint subsets An corresponds to the logical addition of the rows of the matrix W, i ϵ n, and the distribution of the elements of the set B with respect to disjoint subsets of Bm is the logical addition of the columns of the matrix W, j ϵ m. The results of this statement allow us to simply calculate the estimates and directions of the solution search for the development of effective algorithms.
We introduce the concepts of the basis for the solution of the problem. A basis is a predefined composition of the elements of the subset An and Bm.
In the matrix W the basis is found as a certain submatrix Z whose elements are defined. This submatrix can always be determined in the upper left corner by rearranging the row and column numbers

ISSN 2224-5278 Серия геологии и технических наук. 4. 2018
127
of the matrix and their renumbering. Such a representation simplifies the procedure for calculating estimates and determining the direction of the search for a solution.
To solve the block-symmetric discrete programming problem under the condition that, X, Y and W are Boolean matrices, an effective scheme for solving the problem is developed and proposed. The solution search scheme consists of the following main steps [3]:
1. In the Boolean matrix W, we select the matrix ‖ ‖, 1, ; 1, and define it as the basis for the solution of the problem.
2. Define the matrix ‖ ‖, 1, ; 1, of the direction of the search for the solution X by the logical addition of non-linear rows of the matrix W with rows basis and calculate the values of the estimates only for the positions of the basis.
3. In accordance with the estimates obtained, we realize the distribution of the elements of the set A with respect to the subsets An. As a result, we fix the solution X and the intermediate matrix П , 1, , 1, .
4. Define the matrix , 1, ; 1, of the direction of finding the solution Y
by the logical addition of the non-spacing columns of the intermediate matrix П with columns of the basis and calculate the values of the estimates only for the positions of the basis of the matrix Π.
5. In accordance with the estimates obtained for the matrix Π, we partition the elements of the set B with respect to the subset Bm. As a result, we fix the solution Y and the target matrix Z on which the value of the objective function F (Z) is determined.
It should be noted that the search for the solution of the problem can be carried out both in the for-ward direction according to the scheme , and in the reverse direction according to the scheme .
Thus, the basic model of a new class of problems - block - symmetric discrete programming problems is developed. In the future, we will consider the application of this model to solving applied problems in the design of information systems.
3. Development of methods for distributing application software modules and database arrays to nodes of computer systems. Designing information systems is a multi-stage and labor-intensive process and depends on the scale and class of the system.
The result of the design is a variety of applied data processing and control tasks, application programs and a database for the implementation of functional tasks. At the same time, one of the stages is the task of distributing tasks, program modules and a database on nodes of computer systems.
Depending on the purpose and characteristics of computing systems (local, corporate, global), the setting of tasks can also change. For example, in the process of designing information systems based on local computer networks of a homogeneous structure, it becomes necessary to distribute software modules and a database to nodes of computer systems in such a way as to minimize the number (time) of data arrays transmitted between nodes of the network. In a number of cases, it is necessary, with the given structure of the local network, to determine user functions by optimal distribution of program modules and database arrays. There are also tasks of redistribution of software and information resources in solving new tasks, various modifications of software systems, as well as damage to data transmission channels.
The developed models can be used in the process of distributing the application software and the database to the nodes of a computational system of a given structure, the synthesis of the structure (topology) of the computing system (CS) in conditions when the CS nodes and information resources (program modules and interrelated database arrays) are given.
The dynamic development of enterprises and firms in a highly competitive environment necessitates the introduction of information systems of various classes and purposes. At the same time, radical or evolutionary changes in the structure of enterprises (modernization, new technological process, commissioning of new capacities, etc.) invariably affect the information systems. The composition and number of information resources, the systems structure, the distribution of functional tasks and application programs to the nodes of the system are changing. CS nodes are remote computer systems of computing networks or points intended for data processing.
In the design process, the composition and number of application programs, the number and composition of the database, the purpose and number of nodes of the systems can change, which leads to a redesign of the structure of an operational information system.

Известия Национальной академии наук Республики Казахстан
128
Problem statement. Let us consider the problem of distributing software modules and database
arrays to the nodes of the computer network. Let , - a set of applied programs for
solving the functional problems of information systems. - a set of database arrays
(database fragments) used in the solution of applied problems. The matrix ( if the
j-th database array is used to solve the i-th problem, otherwise ) reflects the use of database
arrays for solving application problems. The structure of a computer system or complex is specified by the
matrix where if there is a data transfer channel between nodes m
and n, if there is no communication channel between the nodes m and n.
It is necessary to distribute application programs and database arrays to nodes of the computer system in order to minimize the total number of transmitted arrays through communication channels under technological limitations. For the mathematical formulation of the problem, we introduce the following variables
1, ;0,
1, ;
0,
We also introduce auxiliary variables in the form:
1, ∑ 1
0, ∑ 0 (3.1)
The variable reflects the need to read the j-th database array by the m-th network node.
1, ∑ 1
0, ∑ 0 (3.2)
The meaning of the variable is that if the database array is located in the n-th node and it is
needed to solve the i-th problem, the latter uses the n-th network node to read the database arrays. We also define the derived variable
1, ∑ ∑ 1
0, ∑ ∑ 0 (3.3)
A variable reflects the transfer of data between m-th and the n-th nodes of the network.
The total number of transmission over the communication channels of the necessary data during the exchange of information is determined in the form
∑ ∑ (3.4)
We also introduce the following notation ti – for the processing time of the i-th application program
for the case of the same node performance in the implementation of programs, the processing time
of the i-th application program in the m-th node of the computer network for the case of different node
IiaA i ,1;
Jjbj ,1;
,ijW ,1ij
,0ij
,mngG ,,1, Mnm ,1mng
,0mng
mj
in
mnz
mi

ISSN 2224-5278 Серия геологии и технических наук. 4. 2018
129
performance, time of transfer of j-th array of data to a m-th node, the amount of memory
occupied by the i-th application program, the amount of j-th database that is sent to the m-th node.
The task of optimal allocation of software and information resources is formulated as follows
∑ ∑ ∑ ∑ → (3.5)
subject to restrictions on: duplication of tasks in nodes of computer networks
(3.6)
duplication of database arrays in nodes of computer networks
(3.7)
processing time of application programs and transfer of database arrays in the node of the computer network.
(3.8)
The amount of memory occupied by application programs and arrays of the database in the node of the computer network
(3.9)
and constraints of the form (1) - (4). The problem (3.5) - (3.9) and (3.1) - (3.4) belongs to the class of block-symmetric problems of
discrete programming [3]. To solve the formulated problem, an effective algorithm of iterative mappings is proposed [4].
Algorithm for solving the problem. 1. In the Boolean matrix, we select the submatrix ,
, and define it as the basis for the solution of the problem. The basis is defined in the form of a square matrix of the number of rows and columns, which is
equal to the number of nodes of computing systems.
2. Define the matrix , , directions of the solution search x by logical
addition of the non-linear rows of the matrix W with the rows of the basis and calculate the values of the estimates only for the positions of the basis.
3. In accordance with the estimates obtained, we can distribute the elements of the set A over sets
AN. As a result, we fix the solution X and the intermediate matrix , , .
4. Define the matrix , , , directions of the solution search Y by logical
addition of the non-basis columns of the intermediate matrix with the columns of the basis and
calculate the values of the estimates only from the positions of the basis of the matrix.
mj imjq
M
mmix
1
;1 ;,1 Ii
M
njny
1
,1 ;,1 Jj
I
i
J
jmmjmjmii Txt
1 1
, Mm ,1
I
i
J
jmmjmjmii Vqx
1 1
; Mm ,1
ijZZ
Ni ,1 Mj ,1
/midD Ii ,1\ Mm ,1
miП Mm ,1 Ii ,1
mjdD \ Jj ,1\ Mn ,1
miП
П

Известия Национальной академии наук Республики Казахстан
130
5. In accordance with the obtained estimates of the matrix we distribute the elements of the set over the set . As a result, we fix the solution and the target matrix on which the value of the
objective function is determined. The results of computational experiments showed high efficiency of the developed algorithm. Conclusion. One of the actual tasks in the design and operation of information systems of various
classes and purposes is the optimal distribution of data processing systems to the nodes of computing systems.
The problem of the optimal distribution of program modules and database arrays to the nodes of computing systems of a given topology was formulated and solved on the basis of the block-symmetric approach.
REFERENCES
[1] Sigal I.Kh., Ivanova A.P. Vvedenie v prikladnoe diskretnoe programmirovanie: modeli I vychislitelnye algoritmy.
2nd ed., Rev., and add. M.: FIZMATLIT, 2007. 304 p. [2] Sigal I.Kh. Parametrizasia priblizhennyh algoritmov reshenie nekotoryh klassov zadach diskretnoi optimizasii Bolshoi
razmernosti // Izvestiya RAN. Toeriya I sistemy upravlenia. 2002. N 6. P. 63-72. [3] Kaziev G.Z. Blochno-simmetrichnye modeli I metody postonovki I reshenia zadach diskretnogo programmorovania //
Vestnik Inzhenernoi Akademii RK. Almaty, 2000. N 2(10). P. 55-59. [4] Kaziev G.Z., Sagimbekova A.O, Nabieva G.S, Ospanov S.B. Effectivnyi algoritm reshenie blochno-simmetrichnyh
zadach // Vestnik KazNTU named after K. I. Satpaev-Almaty, 2003. N 2(37/38). P. 310-315. [5] Drozdov N.A. Algoritmy diskretnogo programmirovaniya. Tver’: Nauka, 2002. [6] Sigal I.Kh. Algoritmy resheniya zadach kommivoyajera bolshoi razmernosti // In book: «Kombinirovannye metody i
algoritmy resheniya zadach discretnoi optimizacii bol’shoi razmernosti». M.: Nauka, 2000. P. 295-317. [7] Sigal I.Kh. Vvedenie v prikladnoe diskretnoe programmirovanie. M.: FIZMATLIT, 2002. [8] Maliugin V.D. Realizaciya bulevyh funkcii arifmeticheskimi polinomami // Avtomatica I telemekhanika. 1982. N 4. P. 73. [9] Kaziev G.Z. Sintez modul’nyh blok-shem v avtomatizirovannyh sistemah upravleniya// Avtomatica I telemekhanika.
1992. N 11. P. 160-171. [10] Blochno-simmetrichnye modeli I metody postonovki I reshenia zadach diskretnogo programmorovania // Vestnik
Inzhenernoi Akademii Respublici Kazakhstan. 2003. N 2(10). P.55-59. [11] Kaziev G.Z. Model i metody razgranicheniya dostupa k informacionnym resursam // Trudy II Mezdunarodnoy
nauchno-tehnicheskoy konferencii «Informatizaciya obshestva», ENU named L. N. Gumileva. Astana, 2010. P. 419-422. [12] Uaisova M.M., Kaziev G.Z. blochno-simmetrichnyie metody razgranicheniya dostupa k informacionnym resursam //
Nauchnyi zhurnal «Vestnik kazakhskoi akademii transporta i kommunikacii imeni M. Tynyshpaeva». 2011. N 4(71). P. 31-36.
Ғ. З. Қазиев1, М. В. Маркосян2, А. Ə. Таурбекова3
1Алматы энергетика жəне байланыс университеті, Алматы, Қазақстан, 2Ереван байланыс құралдары ғылыми зерттеу институты, Ереван, Армения,
3Қ. И. Сəтпаев атындағы Қазақ ұлттық техниқалық зерттеу университеті, Алматы, Қазақстан
КОМПЬЮТЕР ЖҮЙЕСІНІҢ ЖОЛ ТОРАБЫ (ТҮЙІНДЕРІ) АРҚЫЛЫ ӨТЕТІН ДЕРЕКТЕР ҚОРЫН ӨҢДЕУ ЖҮЙЕСІН ТАРАТУ ƏДІСТЕРІ
Аннотация. Берілген жұмыста дискретті бағдарламалаудың жаңа классы – блок-симметриялық əдісі
қарастырылған, оның жалпы тұжырымдамасы (қойылымы) жасалып, оны шешу жолы келтірілген. Бұл əдістің ерекше мүмкүндіктері мен қасиеттері көрсетілген.
Компьютер желісінің берілген желі топологиясының жол торабы (түйіні) арқылы өтетін деректер қо-рының массивін жəне бағдарламалық модульдерін желі арқылы таратудың оңтайлы əдісі қарастырылып, есептің қойылымы жасалған.
Түйін сөздер: модель, əдіс. алгоритм, айнымалы, блок-симметриялық мəселе, дискретті бағдарламалау.
ПB mB Y Z
)(ZP

ISSN 2224-5278 Серия геологии и технических наук. 4. 2018
131
Г. З. Казиев1, М. В. Маркосян2, А. А. Таурбекова3
1Алматинский университет энергетики и связи, Алматы, Казахстан, 2Ереванский научно исследовательский институт средств связи, Ереван, Армения,
3Казахский национальный исследовательский технический университет им. К. И. Сатпаева, Алматы, Казахстан
МЕТОДЫ РАСПРЕДЕЛЕНИЯ СИСТЕМ ОБРАБОТКИ ДАННЫХ
ПО УЗЛАМ ВЫЧИСЛИТЕЛЬНЫХ СИСТЕМ
Аннотация. В работе рассматривается новый класс задач дискретного программирования – блочно-симметричные задачи. Приведена общая постановка и решение блочно-симметричных задач дискретного программирования.
Приведены особенности и свойства этого класса задач. Рассматривается постановка и решение задачи оптимального распределения программных модулей и массивов базы данных по узлам вычислительных систем заданной топологии.
Ключевые слова: модель, метод, алгоритм, переменная, блочно-симметричная задача, дискретное программирование.
Information about authors: Kaziyev Galym Zulharnaevich – Almaty university of energy and communications, d.t.s., professor of the
department «IT - Engineering», [email protected] Markosiyan Mger Vardkesovich – Yerevan research institute of communication facilities, d.t.s., professor, head
of the department «Informatics, computer science and automated systems», [email protected] Taurbekova Ainur Adilgazyevna – Kazakh national reserch technical university named after K.I. Satpaev, PhD
student, [email protected]

Известия Национальной академии наук Республики Казахстан
132
N E W S OF THE NATIONAL ACADEMY OF SCIENCES OF THE REPUBLIC OF KAZAKHSTAN
SERIES OF GEOLOGY AND TECHNICAL SCIENCES
ISSN 2224-5278
Volume 3, Number 430 (2018), 132 – 144 UDC 556.3.06(574)
K. M. Kanafin1, I. K. Rakhmetov2
1The Kazakh National Research Technical University after K. I. Satpaev, Almaty, Kazakhstan, 2Institute of Hydrogeology and Geoecology named after U. M. Akhmedsafin, Almaty, Kazakhstan.
E-mail: [email protected], [email protected]
ESTIMATE OF FORECAST RESOURCES OF UNDERGROUND WATER IN NARYN SANDY AREA
Abstract. To solve the problems related to water supply to rural population centers and cattle farms, irrigation
of pastures within the territory, regional hydrogeology surveys were conducted in the territory of Naryn sand massif in Northern Pre-Caspian.
Hydrogeological justification of the underground water use prospectivity is in estimating its forecast resources. With the purpose of studying the current state of surface and underground water within the territory under study, regional studies were conducted. Underground water of sandy Aeolian deposits within borders of Naryn sands is caught mainly by wells excavated and equipped manually for non-centralized drinking water supply of cattle farms and small population centers, and also for cattle watering points. Previously explored underground water fields in Aeolian deposits are not operated.
Regional hydrogeological zoning with the purpose of estimating the resources of fresh and low-mineralized water is based on general geological and hydrogeological representations, results of regional route studies. It was car-ried out with account to the following characteristics of water-bearing formations: perspective water-bearing forma-tion spread contour; underground water occurrence depth; water-bearing formation thickness; underground water mineralization.
To estimate forecast resources of Naryn sands underground water, identified were basic sources of their for-mation: natural (volumetric) reserves, natural (renewable) resources.
The estimate of forecast underground water resources was carried out using traditional and hydrodynamic methods. Methodology developed by scientists of the Institute of Hydrogeology and Geoecology named after U. M. Ahmedsafin was used as conventional estimate method.
In the process of scientific research, regional map of modules of Naryn sands underground water resources was built. Data was processed and maps were built with the use of up-to-date geoinformational software systems Geomatica 2016 and ArcGIS 10.5.
Key words: interstitial underground water, Naryn sands, Nothern Pre-Caspian, hydrogeological parameters, natural reserves, natural resources, hydrogeological zoning, hydrodynamic method, forecast useful resources.
Introduction. The most acute problem in Kazakhstan is the supplying population with quality drin-
king water. The whole number of regions, including Western Kazakhstan experiences deficit in fresh water.
Hydrogeological conditions and the status of Western Kazakhstan level of water supply is charac-terized by highly intense water resources balance. This is first of all characteristic for Pre-Caspian oblasts (Atyrau, Mangistau and south-west of half of Western Kazakhstan oblast). Due to the absence of surface water, almost the only source of all types of water supply is the underground water. Hydrogeologically, underexplored until now territory of Naryn sands (interfluve of Volga and Zhaiyk (Ural)) [1, 2] is of significant interest.
Prospectivity of a vast sandy massif is estimated not only by multiple data about presence of fresh water lenses of considerable size, large dishes and estuaries, and also the development of large confluent macrotuberous ridges and massifs of barchans type. Aeolian sand are underplayed here with water-

ISSN 2224-
permeablestitial reserunoff, dra
One osources foHydrogeolresources.
Borde1) are idenmote-senseGeomaticasoftware sy
Whensources of
Condthern Pre-Quarternarhydrologic
The mpitations aditions of within the
-5278
e formations ervoirs, creatainage and drof the most i
or water supplogical justif
ers of the terntified by hyed data (RSDa 2016 (PCI ystem ArcGI
n estimating f its formationditions for u-Caspian arery age rock ocal drug factomajor sourceand in wellheground wate
e areas of A
of Khvalynsed are favorriving of fosimportant prply, irrigationfication of t
rritory under ydrogeologicD) [5-8]. RSGeomatics).
IS 10.5 (ESRforecast re
n: natural (vundergrounde connected occurring notors [1, 2, 4-1e of ground ead areas of er resources Aeolian form
F
skiy age. Therable conditiosil saline waroblems is thn and waterithe undergro
study with tcal map haviSD processin. Maps buildRI). sources of Nolumetric) red water reso
with differt deep from t
10]. water resourivers and threplenishme
mations deve
Figure 1 – Sketc
133
ese sands haons for the f
ater, which rehe forecast oing. Such foround water u
the purpose oing scale of ng was perfoding and thei
Naryn sandseserves, natuources formrent by lithothe day surfa
urces repleniheir affluent ent and formelopment. In
ch map of Nary
Серия геол
aving relativefiltration of pesults in the fof the prosperecast must buse is in the
of undergrou1:500 000 a
ormed with tir further vis
s undergrounural (renewab
mation. Grouologic-and-faace and expo
ishment in th- surface wa
mation at accn the estuar
yn sands locatio
логии и техн
ely well filterprecipitation formation of ects of using be hydrogeoe estimate o
und water resand are adjusthe use of gesualization w
nd water, idble) resourceund (nonartesfacies compoosed to direct
he territory ater (flood ruount of precine part of M
on
нических наук
ring surfacesand absorpt
f fresh lensesundergroun
ologically subof their fore
sources estimsted with theeoinformatio
was impleme
dentified wees [9]. sian) water oosition and t impact of c
under studyun-off). Favocipitations arMal and Bol.
к. 4. 2018
s and inter-tion of land [3, 4]. d water re-bstantiated. cast useful
mate (figure e use of re-on software ented in the
ere the key
of the Nor-genesis of limatic and
y are preci-orable con-re observed Uzen river

Известия Н valleys, faprecipitatiosand sprea
In genwater [4]. explained discharge horseshoe
The ushallow oc
Field ground wasamples w
Based1. Fre
Their comsodium cat
2. Unchloride soand faintly
3. Unmade and of cattle faground wadrinking re
4. Exwere plugg
5. Redeposits bthe purpos
Hydrundergrouis based on
The zformationsrence; watto be estimpresented
Национально
avorable conons, but filtr
ad facilitate thneral, studieUndergrounby the fact tsite - Khakand embedd
underflow is ccurrence. Lo studies wer
ater of the tewere taken for
d on the resuesh undergro
mposition frotions, hardne
nderground wodium, sodiuy alkaline reanderground wequipped ma
arms and smater is taken eservoirs etc
xplored underged. sults of routoth in the fo
se of utility arogeological und water forn geological-zoning was s: contour oter-bearing fomated withinin table 1 an
ой академии н
nditions are aration of rivehe formation
es conductednd water herethat along w
ki playa, sprded into the s
discharged iocal points ore conductedrritory underr chemical an
Figure 2 –
ults of the fielound water wom bicarboness within 2-
water with mium-magnesiuaction. water of sananually. Fres
mall populatiofor cattle dr.). rground wat
te surveys coorm of lensesand drinking
zoning of trecast resour-hydrogeologcarried out
f perspectiveormation thic
n Northern Pnd figure 3.
наук Республи
also noted foer floodwaten of major red previously e is desalted
with favorablereading fromsurrounding vinto the basin
of discharge ad with the pr study (figunalysis. The
– Field route su
ld routing suwith mineralnate and bic-10 mg-eq/dmineralizationum chemical
d Aeolian fosh undergrouon centers, arinking place
ter fields of
onfirm the prs, as well as water supplythe territory rces and sepagical represet with the ae water-bearckness; undere-Caspian (
ики Казахста
134
or the underger. Such condeserves of fre
within the tthroughout te fed conditi
m north-westvalley by 10-n of the Casare shut-ins a
purpose of sture 2). Descri
total length
urveys within th
urveys, the folization of uarbonate-sul
m3, рН 6,9-8n of more thal compositio
ormations wund water is and also for ces on specifi
Aeolian dep
resence of frwater-beariny. under study
arating perspentations, resaccount to tring formatioerground wat(Naryn sands
ан
ground wateditions of gresh water. territory of Nthe full thickions, water-bt to south-ea-25 m. pian Sea, anand topograptudying the cibed were 34of routes – 1
he territory of N
ollowing canup to 1.0 g/dlphate to thr,2 (water fro
an 1,0 g/dm3
on, with hard
within Naryn used for non
cattle waterinically equipp
posits are not
resh undergrng formation
y was carriepective areasults of regionthe followinon spread; uter mineralizs) was – 30,
er formation roundwater f
Naryn sandskness of watebearing formast in the fo
nd also by evphic lows. current state4 observation1,160 km.
Naryn sands
be noted: dm3 is 58 % ree-anionic w
om neutral tohas chloride
dness of mor
sands is man-centralizedng points. Mped sites (ma
t operated. P
ound water ins perspective
d out for ths of undergronal studies.
ng characteriunderground zation. The to5 thousand k
not only at feed within th
revealed freer-bearing sa
mations have orm of sligh
vaporation in
e of surface n points, wer
of the sampwith predom weakly alka
e-sulphate anre than 10,0
ainly captured drinking w
More mineralianually or w
Previously dr
in Quarternae for develop
he further estound water s
istics of wawater depth
otal area of thkm2. Zoning
account of he areas of
esh ground and. This is a powerful
htly curved
n case of its
and under-re 26 water
pled water. mination of aline). nd sulphate-mg-eq/dm3
ed by wells ater supply ized under-
with pumps,
rilled holes
ary Aeolian pment with
timation of sources and
ater-bearing h of occur-he territory results are

ISSN 2224-
Resea
Naryn
Resea
Naryn
The asubsaline By thickn(14,53 thois estimate
Naturformula:
where Vе –decimal frformation
-5278
arch area
n sands
arch area
n sands
area of freshunderground
ness of waterousand km2 oed as 12,0 thoral reserves (
– natural (voraction; m – spread withi
Ta
to 1,0
12115
less than
3876
Figure
h underground water witr-bearing fo
or 47,6 %). Tousand km2 o(Vе) of inters
olumetric) resaverage val
in the territor
able 1 – Hydrog
А. By underg
Areas of unde
0
5
Б. По мощнос
Areas of wa
n 5,0
6
e 3 – Schematic
nd water spth mineralizrmation, pre
The territory or 39,6 %. stitial nonarte
serves of undlue of water-ry under stud
135
geological zonin
ground water m
erground water
1,0-3,0
16295
сти водоносно
ater-bearing form
5,0-10,0
14539
c map of Naryn
pread is estimzation of 1-evailing by with water-b
esian underg
Vе = µ·m·F
derground w-bearing formdy, m2.
Серия геол
ng of Naryn san
mineralization
r spread (km2) w
m
ого горизонта
mations spread
m
sands territory
mated as 12-3 g/dm3 –the area is bearing form
ground water
,
water, m3; µ –mation thick
логии и техн
nds
with mineralizat
more than 3,0
2089
а
d (km2) with thic
more than 10,0
12084
zoning
2,11 thousan16,29 thou
the value ofmation thickn
r of Naryn sa
– gravitation kness, m; F –
нических наук
tion, g/dm3
in
30
ckness, m
in
30
d km2 or 39sand km2 of less than 5ness of more
ands were ca
filtration-los– area of wa
к. 4. 2018
n all
0499
n all
0499
9,7 %, and or 53,4 %. 5,0-10,0 m
e than 10 m
alculated by
(1)
ss factor, as ater-bearing
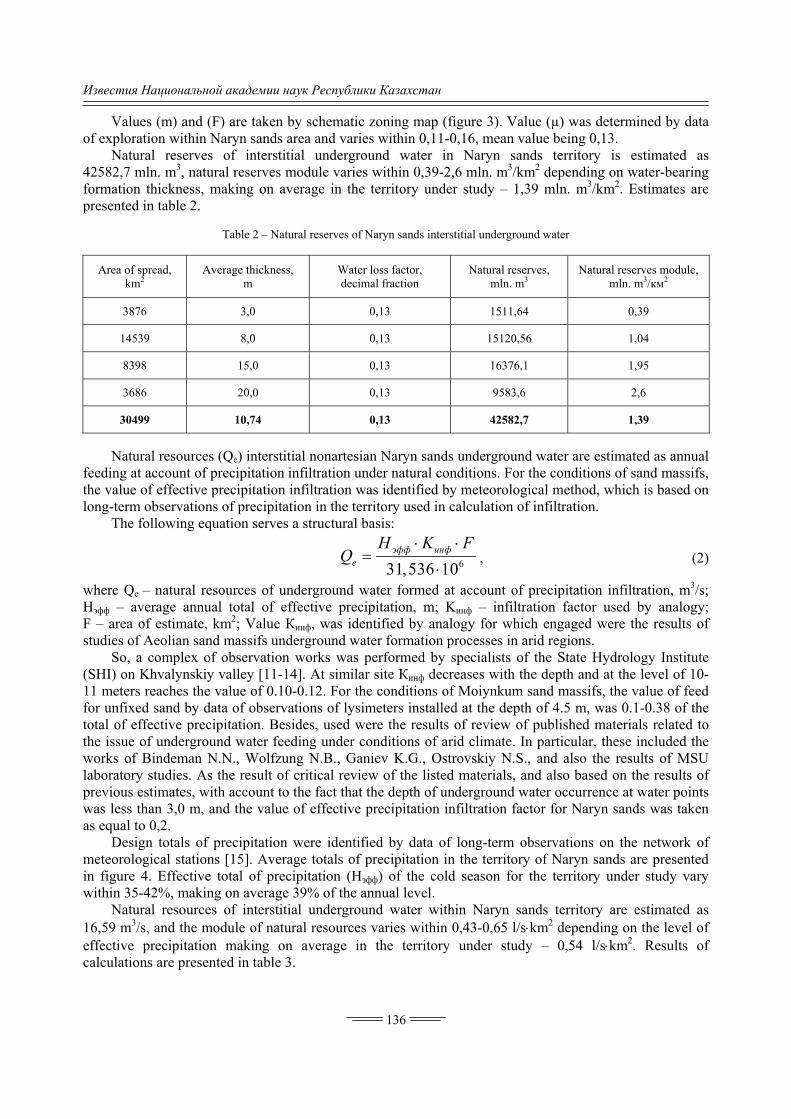
Известия Национальной академии наук Республики Казахстан
136
Values (m) and (F) are taken by schematic zoning map (figure 3). Value (µ) was determined by data of exploration within Naryn sands area and varies within 0,11-0,16, mean value being 0,13.
Natural reserves of interstitial underground water in Naryn sands territory is estimated as 42582,7 mln. m3, natural reserves module varies within 0,39-2,6 mln. m3/km2 depending on water-bearing formation thickness, making on average in the territory under study – 1,39 mln. m3/km2. Estimates are presented in table 2.
Table 2 – Natural reserves of Naryn sands interstitial underground water
Area of spread, km2
Average thickness, m
Water loss factor, decimal fraction
Natural reserves, mln. m3
Natural reserves module, mln. m3/км2
3876 3,0 0,13 1511,64 0,39
14539 8,0 0,13 15120,56 1,04
8398 15,0 0,13 16376,1 1,95
3686 20,0 0,13 9583,6 2,6
30499 10,74 0,13 42582,7 1,39
Natural resources (Qе) interstitial nonartesian Naryn sands underground water are estimated as annual
feeding at account of precipitation infiltration under natural conditions. For the conditions of sand massifs, the value of effective precipitation infiltration was identified by meteorological method, which is based on long-term observations of precipitation in the territory used in calculation of infiltration.
The following equation serves a structural basis:
631, 10536эфф инф
e
H K FQ
, (2)
where Qе – natural resources of underground water formed at account of precipitation infiltration, m3/s; Нэфф – average annual total of effective precipitation, m; Kинф – infiltration factor used by analogy; F – area of estimate, km2; Value Кинф, was identified by analogy for which engaged were the results of studies of Aeolian sand massifs underground water formation processes in arid regions.
So, a complex of observation works was performed by specialists of the State Hydrology Institute (SHI) on Khvalynskiy valley [11-14]. At similar site Кинф decreases with the depth and at the level of 10-11 meters reaches the value of 0.10-0.12. For the conditions of Moiynkum sand massifs, the value of feed for unfixed sand by data of observations of lysimeters installed at the depth of 4.5 m, was 0.1-0.38 of the total of effective precipitation. Besides, used were the results of review of published materials related to the issue of underground water feeding under conditions of arid climate. In particular, these included the works of Bindeman N.N., Wolfzung N.B., Ganiev K.G., Ostrovskiy N.S., and also the results of MSU laboratory studies. As the result of critical review of the listed materials, and also based on the results of previous estimates, with account to the fact that the depth of underground water occurrence at water points was less than 3,0 m, and the value of effective precipitation infiltration factor for Naryn sands was taken as equal to 0,2.
Design totals of precipitation were identified by data of long-term observations on the network of meteorological stations [15]. Average totals of precipitation in the territory of Naryn sands are presented in figure 4. Effective total of precipitation (Нэфф) of the cold season for the territory under study vary within 35-42%, making on average 39% of the annual level.
Natural resources of interstitial underground water within Naryn sands territory are estimated as 16,59 m3/s, and the module of natural resources varies within 0,43-0,65 l/skm2 depending on the level of effective precipitation making on average in the territory under study – 0,54 l/skm2. Results of calculations are presented in table 3.

ISSN 2224-
Area
6
7
4
3
2
3
The balance anwater form
WhenInstitute o
-5278
of spread, km2
1851
6765
7811
4888
3475
2270
1100
791
795
750
30496
estimate of nd hydrodynamation with an estimating f Hydrogeol
Figu
Table 3 – Natu
Average of preci
annual tota
175,0
185,0
195,0
205,0
215,0
225,0
235,0
245,0
255,0
265,0
220,0
f forecast reamic methodaccount to coregional forelogy and Ge
ure 4 – Average
ural resources o
annual amount ipitation, mm
al effective
68,25
72,15
76,05
79,95
83,85
87,75
91,65
95,55
99,45
103,35
85,8
esources (Qds of estimatonditions-formecast resourcoecology na
137
e amount of prec
of Naryn sands
Infiltratiodecimal
e
0,2
0,2
0,2
0,2
0,2
0,2
0,2
0,2
0,2
0,2
0,2
Qэ) of undergte on the basming factors
ces used was amed after U
Серия геол
cipitation (mm/
interstitial unde
on factor, l factor
Na
2
2
2
2
2
2
2
2
2
2
2
ground watesis of zoning s and module
the methodoU. M. Ahmed
логии и техн
/year)
erground water
atural resourcesm3/s
0,80
3,09
3,76
2,47
1,84
1,26
0,64
0,48
0,50
0,49
16,59
er was perfomap by con
es of infiltratology develodsafin, who f
нических наук
r
s, Module oresource
0,
0,
0,
0,
0,
0,
0,
0,
0,
0,
0,
ormed with nditions of untion feed. oped by scienfor more tha
к. 4. 2018
of natural s, l/skm2
43
46
48
50
53
56
58
60
63
65
54
the use of nderground
ntists of the an 50 years

Известия Н had been regularitie
where Qэ –ground wa
De18,36 m3/s
Hydrocalculationbe estimatness of wEach singlwith imperesources c
Blockfrom expre
where x –A sin
us found b
where Qэ resources, k – filtratifraction; R
Национально
dealing ws. In calculat
– forecast reater, m3; Qе –esign value s. These valuodynamic mns applicableted. Grid sizeater-bearing le water inta
ermeable boucorrespondin
Fig
k radius (Rб)ession:
– grid size, mngle water intby formula:
– capacity om3/daily;
ion factor, mRб – block rad
ой академии н
ith the studtions, used w
egional usefu– natural reso
of forecastues represent
methods of ese to the conve with accou
sediments aake structureundaries at ang to its area
а
gure 4 – Examp
), equal to c
m. take structur
of water intS – allowa
m/daily; Т –dius, m; r – r
наук Республи
dies of Kazwas the formu
2ЭQ
ul resources oources of undt regional upotential ustimating fore
ventional eveunt to geologand undergroe is conditioaccount of n (figure 4).
ples of model gr
circle radius
бR
re flow for fr
(1
Э
S
Q
take structurable level lo– design life radius of wat
ики Казахста
138
zakhstan unula proposed
100 31,53еV
of undergrouderground wuseful resouing possibiliecast resourc
en grid of weical-hydrogeound water nally schem
natural reserv
rids with block
of equal are
0,5x
ree-flow inte
2
)2
2
e
б
SQ
m
RTkm
e, m3/daily; owering, m;cycle, days
ter intake stru
ан
nderground d by U. M. A
60,
36 10
und water, mater, m3/s.
urces of Naties of the teces of undergells [19, 20] eological conmineralizatio
matized as woves included
size of 5x5 km
ea with squa
565 x ,
erstitial water
2
ln
б
б
TR
R
R
r
Qе – additi; m –water; μ – gravitaucture well,
water formAhmedsafin [
,7 eQ ,
m3/s; Ve – nat
aryn sands erritory underground watethroughout t
nditions and on was takeorking in thed into such b
b
m (а), 10x10 km
are block of
r located in t
2бR
onal feedingr-bearing foration filtratiom.
ation and d16-18]:
tural reserve
undergroundr study.
er included athe Naryn savariability o
en as 5.0 ande closed circblock, and a
m (b)
the grid is
the center of
g at accountrmation thicon-loss facto
distribution
(3)
es of under-
d water is
a method of ands area to f the thick-d 10.0 km. cular block also natural
determined
(4)
f the block,
(5)
t of natural ckness, m; or, decimal

ISSN 2224-5278 Серия геологии и технических наук. 4. 2018
139
In calculations, the following input data was used: а) additional feed coming to a block area at account of precipitation infiltration, identified by module
of natural resources from expression:
Qе = 86400Ме, (6)
where Ме – module of natural resources, l/skm2. b) the given radius of a single water intake structure is taken as equal to block radius (Rб) when
calculating by even grid and is equal with the grid size of 5 km and 10 km, 2,825 m and 5,650 m accordingly. Radius of water supply well (r), by operating experience – 0,1 m.
c) useful reserves were calculated for 50-year period of operation, or 18,250 days with two options. d) value of allowable decrease of level was identified provided natural reserves drawdown by half of
thickness of water-bearing formation (S=0.5t). e) design hydrogeologic parameters of water-bearing formations are determined by results of
development works, performed previously on underground water exploration sites. Value (µ) is taken as 0,13. Value (k) in the area of Naryn sands varies within 5,8-20,7 m/daily and for forecast calculations is - 6 m/daily.
f) total forecast useful resources of underground water were estimated for sand water-bearing formations with mineralization of up to 1 and 1-3 g/dm3 with account to the use of underground water for utility and drinking water supply and cattle drinking place, by formula:
1
n
iЭi
, (7)
where Qi – intake facilities flow rate in i-block (i = 1, 2, 3, ..., n); n – number of blocks in the area to be estimated.
Results of calculations of forecast useful resources by analytical method are presented in tables 4-7. With account to conventional even grid of wells throughout the Naryn sands area under study with grid size of 5 km, forecast useful resources of underground water were taken by the 2-nd option of calculation. Value of forecast useful resources of underground water for the Naryn sands territory to be estimated is 108,07 m3/s, including: fresh water (up to 1 g/dm3) – 54,27 m3/s, and light subsaline (1-3 g/dm3) – 53,8 m3/s.
Table 4 – Forecast resources of fresh underground water (∆x – 10 km)
Underground water
mineralization, g/dm3
Area of spread,
km2
Number of
blocks, pcs
Thickness, m
Module of natural resources,
l/skm2
Single intake facility
capacity, m3/day
Forecast useful resources Module of forecast resources,
l/s*km2
thousand m3/daily
m3/s
Fresh (to 1)
747 7 20 0,65 5412,52 37,89 0,44 0,59
757 7 20 0,63 5260,48 36,82 0,43 0,56
570 5 20 0,6 5032,42 25,16 0,29 0,51
183 1 15 0,58 3652,27 3,65 0,04 0,23
130 1 20 0,56 4728,33 4,73 0,05 0,42
417 4 15 0,56 3535,68 14,14 0,16 0,39
468 4 8 0,56 1877,36 7,51 0,09 0,19
1824 18 15 0,53 3360,78 60,49 0,70 0,38
505 5 8 0,53 1781,05 8,91 0,10 0,20
2006 20 15 0,5 3185,89 63,72 0,74 0,37
1298 12 8 0,5 1684,74 20,22 0,23 0,18
154 1 15 0,48 3069,29 3,07 0,04 0,23
1869 18 8 0,48 1620,54 29,17 0,34 0,18
122 1 3 0,48 603,05 0,60 0,01 0,06
101 1 8 0,46 1556,33 1,56 0,02 0,18
897 8 3 0,46 578,40 4,63 0,05 0,06
136 1 3 0,43 541,43 0,54 0,01 0,05
Total 12184 114 322,81 3,74 0,31

Известия Национальной академии наук Республики Казахстан
140
Table 5 – Forecast resources of subsaline underground water (∆x – 10 km)
Underground water
mineralization, g/dm3
Area of spread,
km2
Number of
blocks, pcs
Thick-ness,
m
Module of natural resources,
l/s*km2
Single intake facility
capacity, m3/day
Forecast useful resources Module of forecast resources,
l/s*km2
thousand m3 daily
m3/s
Subsaline (1 – 3)
311 3 20 0,6 5032,42 15,10 0,17 0,56
570 5 20 0,58 4880,37 24,40 0,28 0,50
100 1 15 0,58 3652,27 3,65 0,04 0,42
403 4 20 0,56 4728,33 18,91 0,22 0,54
554 5 15 0,56 3535,68 17,68 0,20 0,37
205 2 8 0,56 1877,36 3,75 0,04 0,21
182 1 15 0,53 3360,78 3,36 0,04 0,21
712 7 8 0,53 1781,05 12,47 0,14 0,20
430 4 15 0,5 3185,89 12,74 0,15 0,34
637 6 8 0,5 1684,74 10,11 0,12 0,18
1074 10 15 0,48 3069,29 30,69 0,36 0,33
4558 45 8 0,48 1620,54 72,92 0,84 0,19
464 4 15 0,46 2952,70 11,81 0,14 0,29
2451 24 8 0,46 1556,33 37,35 0,43 0,18
1821 18 3 0,46 578,40 10,41 0,12 0,07
794 7 8 0,43 1460,02 10,22 0,12 0,15
872 8 3 0,43 541,43 4,33 0,05 0,06
Total 16138 154 299,92 3,47 0,22
Table 6 – Forecast resources of fresh underground water (∆x – 5 km)
Underground water
mineralization, g/dm3
Area of spread,
km2
Number of blocks,
pcs
Thickness, m
Module of natural resources,
l/s*km2
Single intake facility
capacity, m3/day
Forecast useful resources
Module of forecast resources,
l/s*km2 thousand m3/daily
m3/s
Fresh (to 1)
747 30 20 0,65 16785,38 501,55 5,80 7,77
757 30 20 0,63 16280,93 492,99 5,71 7,54
504 20 20 0,6 15524,26 312,97 3,62 7,19
66 3 20 0,58 15019,81 39,65 0,46 6,95
183 7 15 0,58 12072,66 88,37 1,02 5,59
130 5 20 0,56 14515,37 75,48 0,87 6,72
417 17 15 0,56 11664,54 194,56 2,25 5,40
468 19 8 0,56 6925,36 129,64 1,50 3,21
1824 73 15 0,53 11052,36 806,38 9,33 5,12
505 20 8 0,53 6558,42 132,48 1,53 3,04
2006 80 15 0,5 10440,18 837,72 9,70 4,83
1298 52 8 0,5 6191,48 321,46 3,72 2,87
154 6 15 0,48 10032,06 61,80 0,72 4,64
1869 75 8 0,48 5946,86 444,59 5,15 2,75
122 5 3 0,48 2427,05 11,84 0,14 1,12
101 4 8 0,46 5702,23 23,04 0,27 2,64
897 36 3 0,46 5654,85 202,90 2,35 2,62
136 5 3 0,43 2175,45 11,83 0,14 1,01
Total 12184 487 4689,25 54,27 4,45

ISSN 2224-5278 Серия геологии и технических наук. 4. 2018
141
Table 7 – Forecast resources of subsaline underground water (∆x – 5 km)
Underground water
mineralization, g/dm3
Area of spread,
km2
Number of blocks,
pcs
Thickness, m
Module of natural resources,
l/s*km2
Single intake facility
capacity, m3/day
Forecast useful resources
Module of forecast resources,
l/s*km2 thousand m3/daily
m3/s
Subsaline (1 – 3)
37 1 20 0,63 16280,93 24,10 0,28 7,54 274 11 20 0,6 15524,26 170,15 1,97 7,19 570 23 20 0,58 15019,81 342,45 3,96 6,95 100 4 15 0,58 12072,66 48,29 0,56 5,59 403 16 20 0,56 14515,37 233,99 2,71 6,72 554 22 15 0,56 11664,54 258,49 2,99 5,40 205 8 8 0,56 6925,36 56,79 0,66 3,21 182 7 15 0,53 11052,36 80,46 0,93 5,12 712 28 8 0,53 6558,42 186,78 2,16 3,04 430 17 15 0,5 10440,18 179,57 2,08 4,83 637 25 8 0,5 6191,48 157,76 1,83 2,87
1074 43 15 0,48 10032,06 430,98 4,99 4,64 4558 182 8 0,48 5946,86 1084,23 12,55 2,75 431 17 15 0,46 9623,93 165,92 1,92 4,46
2451 98 8 0,46 5702,23 559,05 6,47 2,64 1821 73 3 0,46 5654,85 411,90 4,77 2,62 33 1 15 0,43 9011,75 11,90 0,14 4,17 794 32 8 0,43 5335,29 169,45 1,96 2,47 872 35 3 0,43 2175,45 75,88 0,88 1,01
Total 16138 646 4648,12 53,80 3,33
Figure 5 – Map of Naryn sands underground water resources

Известия Национальной академии наук Республики Казахстан
142
In the process of scientific studies, based on data of analysis of previously performed works, materials of RSD and field route surveys, regional map of Naryn sands underground water resources was made (figure 5). The map shows modules of natural resources (mln. m3/km2), natural and forecast useful resources (l/skm2) of underground water.
Conclusion: 1. Based on data of hydrogeological zoning, the area of spread of fresh underground water was
estimated as 12,11 thousand km2 or 39,7 %, By thickness of water-bearing formation, prevailing by the area is the value of less than 5,0-10,0 m (14,53 thousand km2 or 47,6 %). The territory with water-bearing formation thickness of more than 10 m is estimated as 12,0 thousand km2 or 39,6 %.
2. Field studies allowed estimation of the quality of used water resources. Fresh underground water with mineralization of up to 1,0 g/dm3 make 58% of the taken water. Their composition from bicarbonate and bicarbonate-sulphate with predomination of sodium cations, hardness within 2-10 mg-eq/dm3, рН 6.9-8.2 (water from neutral to weakly alkaline). Underground water with mineralization of more than 1,0 g/dm3 has chloride-sulphate and sulphate-chloride sodium, sodium-magnesium chemical composition, with hardness of more than 10,0 mg-eq/dm3 and faintly alkaline reaction. Results of route surveys confirm the presence of fresh underground water in Quarternary eolian deposits both in the form of lenses, as well as water-bearing formations perspective for development with the purpose of utility and drinking water supply.
3. Calculations of natural reserves of free-flow Naryn sands underground water are estimated as – 42582,7 mln. m3, natural reserves module was on average – 1,39 mln. m3/km2. Natural resources of Naryn sands underground water are estimated as 16,59 m3/s, module of natural resources – 0,54 l/skm2 on average.
4. The value of forecast useful resources of underground water for the Naryn sands territory under study is 108,07 m3/s, including: fresh water (up to 1 g/dm3) – 54,27 m3/s and light subsaline (1-3 g/dm3) – 53,8 m3/s. Major part of resources of fresh and light subsaline underground water is concentrated in the northern part of Naryn sands massif.
REFERENCES
[1] Veselov V.V., Sydykov Zh.S. Hydrogeology of Kazakhstan, 2004. 484. (in Eng.). [2] Hydrogeology of the USSR. Vol. XXXV, Western Kazakhstan. M.: Nedra, 1971. 522. (in Eng.). [3] Satpayev A.G., Kugeshev A.K. On the study of hydrogeological conditions in the Caspian region using the latest
aerospace surveys // News of the National Academy of Sciences of the Republic of Kazakhstan, Series of geology and technical sciences. 2008. Vol. 2. P. 62-65. UDC 556.3: 550.54(574.1). (in Eng.).
[4] Veselov V.V., Makhmutov T.T. and etc. Deposits of underground waters of Kazakhstan, Volume I. Western and Southern Kazakhstan: directory. Almaty, 1999. 290. (in Eng.).
[5] Kanafin K.M., Shagarova L.V. Methods of remote sensing in regional hydrogeological research on the example of Western Kazakhstan, Science today: postulates of the past and modern theories as a mechanism for effective development in a crisis, March 25-26, 2016, 14-20. (in Eng.).
[6] Kanafin K.M., Ibraimov V.M. Sattelite images interpretation using GIS in hydrogeological surveys, Bulletin of the National Academy of Sciences of the Republic of Kazakhstan. ISSN 1991-3494. Vol. 6, N 364 (2016), 27-33. (in Eng.).
[7] Tokareva O.S. Processing and interpretation of Earth remote sensing data: textbook. Tomsk: Publishing house of Tomsk Polytechnic University, 2010. 148. (in Eng.).
[8] Remote sensing аpplications тo groundwater // IHP-VI. Series on Groundwater N 16. UNESCO, 2007. (in Eng.). [9] Groundwater Studies. An international guide for hydrogeological investigations // IHP-VI. Series on groundwater N
3.UNESCO 2004. (in Eng.). [10] Sydykov Zh.S. Underground waters of the Caspian oil and gas region (formation, resources and use) // National Center
of Science and Technology Evaluation JSC. Almaty, 2001. 368 p. (in Eng.). [11] Dzhakelov A.K. Formation of underground waters of the Chu-Sarysu Artesian Basin, Almaty, 1993. 294. (in Eng.) [12] Methods for studying and calculating the water balance. L.: Gidrometeoizdat, 1981. (in Eng.). [13] Ostrovsky V.N. Underground waters of deserts and ecosystems. M.: Nedra, 1991. (in Eng.). [14] Chubarov V.N. Groundwater supply of sandy desert through aeration zone. M.: Nedra, 1972. (in Eng.). [15] A Guide to Kazakhstan's Climate, The long-term data of 1971-2000, RSE Kazhydromet. Almaty, 2004. (in Eng.) [16] Ahmedsafin U.M. Hydrogeological zoning and regional assessment of groundwater resources in Kazakhstan. Alma-
Ata: Science, 1964. 309 p. (in Eng.).

ISSN 2224-5278 Серия геологии и технических наук. 4. 2018
143
[17] Ahmedsafin U.M. Regional resources of underground waters of Kazakhstan. Alma-Ata, 1983. (in Eng.) [18] Ahmedsafin U.M. Forecast map of Kazakhstan's regional water availability with groundwater resources of 1: 2 500 000
scale. Alma-Ata, 1983. (in Eng.) [19] Bindeman N.N., Yazvin L.S. Estimation of the operational reserves of groundwater. M.: Nedra, 1970. 216. (in Eng.) [20] Borevsky B.V., Drobnokhod N.I., Yazvin L.S. Assessment of groundwater resources. 2nd ed. 1989, 407.
ISBN 5-11-001204-0. (in Eng.).
Қ. М. Канафин1, И .Қ. Рахметов2
1Қ. И. Сəтбаев атындағы Қазақ ұлттық техникалық зерттеу университеті, Алматы, Қазақстан,
2У. М. Ахмедсафин атындағы гидрогеология жəне геоэкология институты, Алматы, Қазақстан
НАРЫН ҚҰМДАРЫНЫҢ ЖЕРАСТЫ СУЛАРЫНЫҢ
БОЛЖАМДЫ РЕСУРСТАРЫН БАҒАЛАУ
Аннотация. Ауылдық елді мекендерді, мал шаруашылығын жəне жайылымдық аудандарды суару сумен қамтамасыз етуге байланысты мəселелерді шешу үшін Солтүстік Каспий маңындағы Нарын құмды массив аумағында аймақтық гидрогеологиялық зерттеулері жүргізілген.
Жерасты суларын пайдалану тиімділігін гидрогеологиялық негіздемесі олардын болжамды ресурстарын бағалауы болып келеды. Жерүсті жəне жерасты суларының қазіргі заманғы жағдайын зеттеу мақсатында осы ауданда аймақтық экспедициялық зерттеулер жүргізілген. Нарын құмдары шегінде құмды эол шөгінділерінің жерасты сулары, негізінен, мал суғару, ұсақ елді-мекендерді жəне мал шаруашылығын орталықтандырыл-маған сумен қамтамасыз ету үшін, қолмен қазылған жəне жабдықталған құдықтар қолданылады. Эолды шөгінділердің жерасты суларының бұрын зерттелген кен орындары пайдаланбайды.
Аймақтық гидрогеологиялық аудандау, тұщы жəне сəл минералданған сулардың ресурстарын бағалау мақсатында, жалпы геология-гидрогеологиялық көзқарастарға аймақтық маршруттық зерттеу нəтижелеріне негізделген. Ол келесі сулы горизонтардың сипаттамаларын есепке ала отырып орындалған: тиімді сулы го-ризонттың таралған айналасы; жерасты суыларының жату тереңдігі; сулы горизонттың қалыңдығы; жерасты суыларының минералдылығы.
Нарын құмдарының болжамдық жерасты суларының ресурстарын бағалау ушін оның басты қалыптасу дереккөздері анықталды: табиғи (сыйымдылық) қорлары, табиғи (жаңғыртылмалы) ресурстары.
Ғылыми зерттеу жүрісінде Нарын құмдарының жерасты сулар ресурстарының аймақтық модулдер картасы жасалды. Деректерді өңдеу жəне карта салуда Geomatica 2016 жəне ArcGIS 10.5 заманауи геоақпа-раттық бағдарламалық комплекстері пайдаланды.
Түйін сөздер: кеуектік жерасты суы, Нарын құмдары, Солтүстік Каспий маңы, гидрогеологиялық көрсеткіштер, табиғи қорлары, табиғи ресурстары, гидрогеологиялық аудандау, гидродинамикалық əдіс, болжамды пайдалану ресурстары.
К. М. Канафин1, И. К. Рахметов2
1Казахский национальный исследовательский технический университет им. К. И. Сатпаева,
Алматы, Казахстан, 2Институт гидрогеологии и геоэкологии им. У. М. Ахмедсафина, Алматы, Казахстан
ОЦЕНКА ПРОГНОЗНЫХ РЕСУРСОВ ПОДЗЕМНЫХ ВОД ПЕСКОВ НАРЫН
Аннотация. Для решения проблем, связанных с водоснабжением сельских населенных пунктов и жи-
вотноводческих ферм, обводнением пастбищ территории проведены региональные гидрогеологические исследования на территории песчаного массива Нарын в Северном Прикаспии.
Гидрогеологическое обоснование перспективности использования подземных вод заключается в оценке их прогнозных ресурсов. С целью изучения современного состояния поверхностных и подземных вод терри-тории исследований проведены региональные экспедиционные исследования. Подземные воды песчаных эоловых отложений в пределах песков Нарын каптируются в основном колодцами, выкопанными и обо-рудованными вручную для нецентрализованного питьевого водоснабжения животноводческих хозяйств и мелких населенных пунктов, а также водопоя скота. Ранее разведанные месторождения подземных вод эоло-вых отложений не эксплуатируются.

Известия Национальной академии наук Республики Казахстан
144
Региональное гидрогеологическое районирование с целью оценки ресурсов пресных и слабоминера-лизованных вод основано на общих геолого-гидрогеологических представлениях, результатах региональных маршрутных исследований. Оно выполнено с учетом следующих характеристик водоносных горизонтов: контур распространения перспективного водоносного горизонта; глубина залегания подземных вод; мощность водоносного горизонта; минерализация подземных вод.
Для оценки прогнозных ресурсов подземных вод песков Нарын определены основные источники их формирования: естественные (емкостные) запасы, естественные (возобновляемые) ресурсы.
Оценка прогнозных эксплуатационных ресурсов подземных вод производилась традиционным и гидро-динамическим методами. В качестве традиционных методов оценки использована методология, разрабо-танная учеными Института гидрогеологии и геоэкологии имени У. М. Ахмедсафина.
В процессе научных исследований выполнено построение региональной карты модулей ресурсов под-земных вод песков Нарын. Обработка данных и построение карт выполнено с использованием современных геоинформационных программных комплексов Geomatica 2016 и ArcGIS 10.5.
Ключевые слова: поровые подземные воды, пески Нарын, Северный Прикаспий, гидрогеологические параметры, естественные запасы, естественные ресурсы, гидрогеологическое районирование, гидродинами-ческий метод, прогнозные эксплуатационные ресурсы.
Information about authors: Kanafin K. M. – PhD Student of The Kazakh National Research Technical University after K.I. Satpaev
(KazNRTU), [email protected]. Rakhmetov I. K. – Researcher of LLС «Institute of Hydrogeology and Geoecology named after U.M. Akh-
medsafin», [email protected].

ISSN 2224-5278 Серия геологии и технических наук. 4. 2018
145
N E W S OF THE NATIONAL ACADEMY OF SCIENCES OF THE REPUBLIC OF KAZAKHSTAN
SERIES OF GEOLOGY AND TECHNICAL SCIENCES
ISSN 2224-5278
Volume 3, Number 430 (2018), 145 – 154 IRSTI 531, 530, 532
K. A. Kabylbekov1, Kh. K. Abdrakhmanova1, G. Sh. Omashova1, K.M. Lakhanova2, Zh. A. Abekova1
1M. Auezov South Kazakhstan state University (SKSU), Shymkent, Kazakhstan, 2H. A. Yassavi International Kazakh-Turkish University (IKTU), Turkistan, Kazakhstan.
E-mail: [email protected], [email protected], [email protected], [email protected]
ORGANIZATION OF COMPUTER LABORATORY WORK “CALCULATION AND VISUALIZATION OF SMALL FORCED OSCILLATIONS”
Abstract. In the article there are calculations and visualizations of forced oscillations of the system under the action of constant and variable forces: 1. F=const=F0; 2. F=at.; 3. F=F0exp(-αt); 4. F=F0exp(-t)cos(t). The graphs of dependence of the above given forces on the time are drawn in one graphic window. The programs for calculation and visualization of the forced oscillations under the action of the given forces are presented. The graphs of dependence of the one-dimensional forced oscillations on the time are submitted. Formulas (1-4), describing the laws of oscillations, are difficult for understanding the features of oscillations. Their visualization makes the nature of the system oscillations more evident and clear.
For the solution of this task the MATLAB language is used. It is known that the MATLAB language has opportunities for modeling and visualization of physical processes. MATLAB allows presenting visually the complicated formulas in the form of graphs that considerably makes easier the comprehension of the nature of the process or the phenomenon.
Aim of the work: To work out the program for calculations and visualizations of forced oscillations of the system under the action of the force F(t) if at the initial time t = 0 the system is at rest in an equilibrium state (x(t=0)=0, (t=0)=0).
The results of this study can be used on theoretical mechanics classes of the higher school. Key words: forced oscillations, visualization, oscillation graph, amplitude.
Introduction. Nowadays all educational institutions of Kazakhstan are provided with computer hardware and software, interactive boards and internet. Almost all teachers have completed language and computer courses for professional development. Hence the educational institutions have all conditions for using computer training programs and models for performing computer laboratory works. During several years we have been conducting the work on organization computer laboratory works on physics with use of resources of the Fizikon Company [1, 2] which are developed at Al-Farabi Kazakh National University by V. V. Kashkarov and his group. Some of worksheet templates for computer laboratory works are in-troduced in educational process of our university and schools of the Southern Kazakhstan [3–29]. Students of the physics specialties 5B060400 and 5B011000 successfully master the discipline “Computer modeling of physical phenomena” which is the logical continuation of the disciplines “Information technologies in teaching physics” and “Use of electronic textbooks in teaching physics”. The aim of this discipline is to study and learn the program language of the MATLAB system [30], acquaintance with its huge opportunities for modeling and visualization of physical processes. This article is devoted to organi-zation of performance of the laboratory work "Calculation and visualization of the system undergoing one-dimensional small oscillations" using the MATLAB language.
The aim of the work is to work out the program for calculations and visualizations of forced oscilla-tions of the system under the action of the force F(t) if at the initial time t = 0 the system is at rest in an

Известия Национальной академии наук Республики Казахстан
146
equilibrium state (x(t=0)=0, (t=0)=0). (The problems are taken from [31]. They were solved at practical classes on classical mechanics).
Methods. The program for calculation and visualization of forces acting on the system: >> F0=1; m=0.2; w=1; % input the parameters >> t=0:pi/10:2*pi; % input the time vector >> subplot(2,2,1);plot(t,F0,'k-') % plotting the graph in the first sub-window >> a=1; F=a.*t; % input the parameters >> subplot(2,2,2);plot(t,F,'k-') % plotting the graph in the second sub-window >> grid on% drawing the coordinate grid >> F0=1; alfa=0.5; % >> F=F0.*exp(-alfa.*t); % >> subplot(2,2,3);plot(t,F,'k-') % plotting the graph in the third sub-window >> grid on% drawing the coordinate grid >> beta=0.2;alfa=0.5; % input the parameters >> F=F0.*exp(-alfa.*t).*cos(beta.*t); % calculation of the acting force >> subplot(2,2,4);plot(t,F,'k-') % plotting the graph in the fourth sub-window >> grid on% drawing the coordinate grid Results and discussion. The result is presented in the figure 1.
Figure 1 – The graphs of acting forces versus time in one graphic window
1. F=const=F0. Under the action of a constant force the system is displaced from its equilibrium position and oscillates about this position according to the equation:
cos02
Fx 1 t
m
, (1)
where m is the mass of the system, is the oscillation frequency.
0 2 4 6 80
0.5
1
1.5
2
t,s
F0
F0=const.
0 2 4 6 80
2
4
6
8
t,s
F,N
F=at
0 2 4 6 80
0.5
1
t,s
F,
N
F=F0*exp(-alfa*t)
0 2 4 6 80
0.5
1
t,s
F,
N
F=F0.*exp(-alfa.*t).*cos(beta.*t)

ISSN 2224-5278 Серия геологии и технических наук. 4. 2018
147
The program for calculation and visualization: >> F0=1; m=0.2; w=1; % input the parameters >> t=0:pi/10:2*pi; % input the time vector >> x=F0.*(1-cos(w.*t))./m*w.^2; % >> plot(t,x) % plotting the graph >> grid on% drawing the coordinate grid The result is presented in the figure 2.
Figure 2 – The graph of displacement x versus time t
2. F = at, a = 1; The force is directly proportional to the time. Oscillation obeys the following law:
sin3
ax t t
m
(2)
The program for calculation and visualization: >> a=1; % input the parameters >> x=a.*(w*t-sin(w.*t))./m*w.^3; % calculation of the system oscillation >> plot(t,x) % plotting the graph >> grid on% drawing the coordinate grid The result is presented in the figure 3. 3. F=F0exp(-αt); The force exponentially decreases with time. Oscillation obeys the following law:
cos sint02 2
Fx e t t
m
(3)
The program for calculation and visualization: >> F0=1; alfa=0.5; % input the parameters >> F=F0.*exp(-alfa.*t); % calculation of the acting force >> plot(t,F) % plotting the graph >> grid on% drawing the coordinate grid The result is presented in the figure 4.
0 1 2 3 4 5 6 70
1
2
3
4
5
6
7
8
9
10
t
x,m
x=x(t)

Известия Национальной академии наук Республики Казахстан
148
Figure 3 – Oscillation of the system under the action of the force proportional to time
Figure 4 – The graph of the acting force versus time
>> A=F0/(m*w.^2+m*0.5.^2); % calculation of the first factor >> B=exp(-0.5.*t)-cos(w.*t)+0.5*sin(w.*t)./w; % calculation of the second factor >> x=A.*B; % calculation of the oscillation >> plot(x,t) % plotting the graph >> grid on% drawing the coordinate grid The result is presented in the figure 5.
0 1 2 3 4 5 6 70
5
10
15
20
25
30
35
t,s
x,m
x=x(t)
0 1 2 3 4 5 6 70
0.1
0.2
0.3
0.4
0.5
0.6
0.7
0.8
0.9
1
t,s
F,N
F=F(t)

ISSN 2224-5278 Серия геологии и технических наук. 4. 2018
149
Figure 5 – Oscillation of the system under the action of the force F=F0exp(-αt)
4. F=F0exp(-t)cos(t). The solution of an inhomogeneous linear differential equation describing the oscillations under the action of such driving force is very complicated to understand its nature. It is easier to realize the solution in the form of graph using the following program for calculation and visualization:
>> beta=0.2;alfa=0.5; % input the parameters >> F0=1; m=0.2; w=1; % input the parameters >> t=0:pi/10:2*pi; % input the time vector >> F=F0.*exp(-alfa.*t).*cos(beta.*t); % calculation of the acting force >> plot(t,F); % plotting the graph >> grid on% drawing the coordinate grid The result is presented in the figure 6.
Figure 6 – The graph of the acting force versus time
Oscillation under the action of the given force obeys the following equation:
cos
sin cos sin
2 2 2022 2 2 2 2
2 2 2 t 2 2 2
Fx t
m 4
t e t 2 t
(4)
-6 -4 -2 0 2 4 60
1
2
3
4
5
6
7
t,s
x,m
x=x(t)
0 1 2 3 4 5 6 70
0.1
0.2
0.3
0.4
0.5
0.6
0.7
0.8
0.9
1
t,s
F,N
F=F0.*exp(-alfa.*t).*cos(beta.*t);

Известия Национальной академии наук Республики Казахстан
150
Program for calculation and visualization: >> beta=0.2;alfa=0.5; % input the parameters >> A1=F0./m*((w.^2+alfa.^2-beta.^2).^2+4*alfa.^2*beta.^2);% calculation of factor >> B1=-(w.^2+alfa.^2-beta.^2).*cos(w.*t); % calculation of the first term >> C=alfa.*(w.^2+alfa.^2+beta.^2).*sin(w.*t); % calculation of the second term >> D=exp(-alfa.*t).*((w.^2+alfa.^2-beta.^2).*cos(beta.*t)-2*alfa*beta.*sin(beta.*t));% calculation of the third term >> x=A1.*(B1+C+D); % calculation of the product of the factor and the sum of the terms >> plot(x,t) % plotting the graph >> grid on% drawing the coordinate grid The result is presented in the figure 7.
Figure 7 – Oscillation of the system under the action of the force F=F0exp(-t)cos(t)
The graphs of oscillations of the system under the actions of forces F=F0exp (-t) and F=F0exp(-αt)cos(βt) for a longer time interval of oscillations are shown in figure 8. For comparison convenience the graphs are drawn in one graphic window. Below there is the program for calculation and visualization of oscillations in one graphic window:
>> t=0:pi/10:8*pi; input the time vector >> A=F0/(m*w.^2+m*0.5.^2); % calculation of the first term >> B=exp(-0.5.*t)-cos(w.*t)+0.5*sin(w.*t)./w; % calculation of the second term >> x=A.*B; % calculation of the oscillation >> subplot(2,2,1);plot(t,x); >> grid on >> beta=0.2;alfa=0.5; % input the parameters >> A1=F0./m*((w.^2+alfa.^2-beta.^2).^2+4*alfa.^2*beta.^2);% calculation of the factor >> B1=-(w.^2+alfa.^2-beta.^2).*cos(w.*t); % calculation of the first term >> C=alfa.*(w.^2+alfa.^2+beta.^2).*sin(w.*t); % calculation of the second term >> D=exp(-alfa.*t).*((w.^2+alfa.^2 beta.^2).*cos(beta.*t)2*alfa*beta.*sin(beta.*t));%calculation of the third term >> x=A1.*(B1+C+D); % calculation of the oscillation >> subplot(2,2,2);plot(t,x); >> grid on The result is presented in the figure 8.
-10 -8 -6 -4 -2 0 2 4 6 80
1
2
3
4
5
6
7
t,s
x,m
x=x(t)

ISSN 2224-5278 Серия геологии и технических наук. 4. 2018
151
Figure 8 – The graphs of oscillations of the system under the action of forces F=F0exp (-t) and F=F0exp(-αt)cos(βt) in one graphic window
Here is the program for calculation and visualization of forces in one graphical window: F0=1; alfa=0.5; % input the parameters F=F0.*exp(-alfa.*t); % calculation of the acting force >> plot(t,F) % plotting the graph grid on% drawing the coordinate grid >> hold on >> F=F0.*exp(-alfa.*t).*cos(beta.*t); % calculation of the acting force >> plot(t,F,'-+'); % plotting the graph The result is presented in the figure 9.
Figure 9 – The graphs of acting forces versus time
Conclusion. Formulas (1)-(4) describing the laws of oscillations are difficult for understanding the features of oscillations. Their visualization makes them more evident and clear.
Oscillations of the system under the actions of forces F=F0exp (-t) and F=F0exp(-αt)cos(βt) at first sight seem to be similar (see figures 5 and 7) since the graphs of these forces as a function of time are similar (see figures 4 and 6). However, if to draw the oscillations for a longer time (Fig. 8.), then it can be noticed that as the time goes on the oscillations begin to differ markedly from each other: under the action of the force F=F0exp(-αt) the oscillation amplitude decreases considerably during the first 12 seconds, and further it decreases not so much; under the action of the force F=F0exp(-t)cos(t) the oscillation amplitude during the first 5 seconds increases and further practically doesn't change., i.e. the oscillation stabilizes.
So, the use of the MATLAB language for calculation and visualization of small forced oscillations shows that it is an effective tool for studying the complicated oscillations.
0 10 20 30-5
0
5
10
t,s
x,m
3.x=x(t), F=F0exp(-at).
0 10 20 30-20
-10
0
10
20
t,s
x=x(
t),
4. x=x(t), F=F0exp(- t)cos( t)
0 5 10 15 20 25 30-0.2
0
0.2
0.4
0.6
0.8
1
1.2 F=F0exp(-at), F=F0exp(- t)cos( t)
t,s
F,N
F=F0exp(- t) F=F0exp(- t)cos( t)

Известия Национальной академии наук Республики Казахстан
152
REFERENCES
[1] CD of the open JSC "Phizicon" // «The open hysics1.1». 2001. [2] http://elektronika.newmail.ru [3] Kabylbekov K.A., Saidakhmetov P.A., Arysbaeva A.S. Worksheet template for organization the independent perfor-
mance of computer laboratory works // Proceedings of the National Academy of Sciences of the Republic of Kazakhstan. Series of Physics and Mathematics.Almaty, 2013. N 6. P. 82-89.
[4] Kabylbekov K.A., Saidahmetov P.A., Baidullaeva L.E., Abduraimov R. A technique of use of computer models for photo-effect and Compton effect studying, worksheet template for organization the performance of computer laboratory works // Proceedings of the National Academy of Sciences of the Republic of Kazakhstan. Series of Physics and Mathematics. Almaty, 2013. N 6. P. 114-121.
[5] Kabylbekov K.A., Saidahmetov P.A., Тurganоvа T.K., Nurullaev M.A., Baidullaeva L.E. Model of a lesson on conver-ging and diverging lenses // Proceedings of NAN RК. Series physical-mat. Almaty, 2014. N 2. P. 286-294.
[6] Kabylbekov K.A., Ashirbaev H.A., Saidahmetov P.A., Rustemova K.Zh., Baidullaeva L.E. Worksheet template for organization the performance of computer laboratory work on study the diffraction of light // Proceedings of the National Aca-demy of Sciences of the Republic of Kazakhstan. Series of Physics and Mathematics. Almaty, 2015. N 1(299). P. 71-77.
[7] Kabylbekov K.A., Ashirbaev H.A., Takibaeva G.А., Saparbaeva E.М., Baidullaeva L.E., Adineeva Sh.I. Worksheet tem-plate for organization the performance of computer laboratory work on study the motion of charged particles in a magnetic field // Proceedings of the National Academy of Sciences of the Republic of Kazakhstan. Series of Physics and Mathematics. Almaty, 2015. N 1(299). P. 80-87.
[8] Kabylbekov K.A., Ashirbaev H.A., Saidakhmetov P.А., Baigulova Z.A., Baidullaeva L.E. Worksheet template for orga-nization the performance of computer laboratory work on study the Newton's ringes // Proceedings of the National Academy of Sciences of the Republic of Kazakhstan. Series of Physics and Mathematics. Almaty, 2015. N 1(299). P. 14-20.
[9] Kabylbekov K.A., Ashirbaev H.A., Sabalakhova A.P., Dzhumagalieva A.I. Worksheet template for organization the per-formance of computer laboratory work on study the phenomenon of light interference // Proceedings of the National Academy of Sciences of the Republic of Kazakhstan. Series of Physics and Mathematics. Almaty, 2015. N 3(301). P. 131-136.
[10] Kabylbekov K.A., Ashirbaev H.A., Sabalakhova A.P., Dzhumagalieva A.I. Worksheet template for organization the performance of computer laboratory work on study the Doppler-effect // Proceedings of the National Academy of Sciences of the Republic of Kazakhstan. Series of Physics and Mathematics. Almaty, 2015. N 3(301). P. 155-160.
[11] Kabylbekov K.A., Ashirbaev H.A., Arysbaeva A.S., Dzhumagalieva A.I. Worksheet template for organization the per-formance of computer laboratory work on study physical phenomena // Modern high technologies. M., 2015. N 4. P. 40-43.
[12] Kabylbekov K.A., Saidakhmetov P.A., Ashirbaev Kh.A., Omashova G.Sh., Berdalieva J. Worksheet template for or-ganization the performance of computer laboratory work on study electromagnetic oscillations // Proceedings of the National Academy of Sciences of the Republic of Kazakhstan. Series of Physics and Mathematics. Almaty, 2016. N 1(305). P. 111-116.
[13] Kabylbekov K.A., Saidakhmetov P.A., Omashova G.Sh., Berdalieva J., Dzhumagalieva A.I. Worksheet template for organization the performance of computer laboratory work on study the interaction between two infinitely long parallel current-carrying conductors // Proceedings of the National Academy of Sciences of the Republic of Kazakhstan. Series of Physics and Mathematics. Almaty, 2016. N 1(305). P. 135-140.
[14] Kabylbekov K.A., Saidakhmetov P.А., Omashova G.Sh., Suttibaeva D.I., Kozybakova G.N. Worksheet template for organization the performance of computer laboratory work on study isobaric process // Proceedings of the National Academy of Sciences of the Republic of Kazakhstan. Series of Physics and Mathematics. Almaty, 2016. N 2. P. 92-97.
[15] Kabylbekov К.А., Omashova G.Sh., Saidakhmetov P.A., Nurullaev M.A., Artygalin N.A. Worksheet template for organization the performance of computer laboratory work on study the Carnot cycle // Proceedings of the National Academy of Sciences of the Republic of Kazakhstan. Series of Physics and Mathematics. Almaty, 2016. N 2. P. 98-103.
[16] Kabylbekov K.A., Saidakhmetov P.А., Ashirbaev H.A., Abdubaeva Ph.I., Doskanova A.E. Study of the work done by gas on computer model // The Herald of NAN РК. 2016. N 2. P. 83-88.
[17] Kabylbekov K.A., Saidakhmetov P.А., Omashova G.Sh., Serikbaeva G.S., Suyerkulova Zh.N. Worksheet template for organization the performance of computer laboratory work on study simple harmonic motions // Proceedings of the National Aca-demy of Sciences of the Republic of Kazakhstan, Series of Physics and Mathematics. Almaty, 2016. N 2. P. 84-91.
[18] Kabylbekov K.A., Madjarov N.T., Saidakhmetov P.A. An Independent design of research assignments for computer laboratory work on thermodynamics // Proceedings of the IX International scientific-methodical conference “Teaching natural Sciences (biology, physics, chemistry), mathematics and computer science”. Tomsk, 2016. P. 93-99.
[19] Kabylbekov K.A., Saidakhmetov P.A., Omashova G.Sh. Organization of computer laboratory work on study the induc-tor reactance in an ac circuit // Proceedings of NAN RК. Almaty, 2017. N 1. P. 77-82.
[20] Kabylbekov K.A., Saidakhmetov P.A., Omashova G.Sh., Ashirbaev H.A., Abekova J.A. Organization of computer laboratory works on study of the isotherms of a real gas // Proceedings of the National Academy of Sciences of the Republic of Kazakhstan, Series of Physics and Mathematics. Almaty, 2017. N 1. P. 77-83.

ISSN 2224-5278 Серия геологии и технических наук. 4. 2018
153
[21] Kabylbekov K.A., Saidakhmetov P.A., Omashova G.Sh. Organization of computer laboratory works on study of the phenomenon of beats // Proceedings of the National Academy of Sciences of the Republic of Kazakhstan. Series of Physics and Mathematics. Almaty, 2017. N 2. P. 104-110.
[22] Kabylbekov K.A., Omashova G.Sh., Spabekova R.S., Saidakhmetov P.A., Serikbaeva G., Arysbaeva A.S. Worksheet template for organization the performance of computer laboratory work on study the isothermal process // Herald of the National Academy of Sciences of Kazakhstan. Almaty, 2017. N 3. P. 119-207.
[23] Kabylbekov K.A., Omashova G.Sh., Spabekova R.S., Saidakhmetov P.A., Abdrakhmanovа Kh.K., Arysbaeva A.S. Independent design of assignment for performance of a computer lab on study isochoric process // Proceedings of the National Academy of Sciences of the Republic of Kazakhstan. Series of Physics and Mathematics. Almaty, 2017. N 3. P. 127-134.
[24] Kabylbekov K.A., Omashova G.Sh., Spabekova R.S., Saidakhmetov P.A., Serikbaeva G.S., Aktureeva G. Organization of computer laboratory works on study the turn-on and turn-off current of the power supply by using MATLAB software package // Proceedings of the National Academy of Sciences of the Republic of Kazakhstan, Series of Physics and Mathematics. Almaty, 2017. N 3. P. 139-146.
[25] Kabylbekov K.A., Omashova G.Sh., Spabekova R.S., Saidakhmetov P.A., Serikbaeva G.S., Aktureeva G. Organization of computer labs for the study the velocity and height distribution of molecules from the Earth's surface by using MATLAB software package // Herald of RK NAS. Almaty, 2017. N 3. P. 111-119.
[26] Kabylbekov K.A., Ashirbayev H.A., Abdrakhmanovа Kh.K., Dzhumagalieva A.I., Kydyrbekova J.B. Organization of laboratory work on study the electric and magnetic fields by using MATLAB software package // Proceedings of the National Academy of Sciences of the Republic of Kazakhstan. Series of Physics and Mathematics. Almaty, 2017. N 3(313). P. 206-212.
[27] Kabylbekov K.A., Ashirbaev H.A., Abdrakhmanova Kh.K., Dzhumagalieva A.I., Kadyrbekova J.B. Organization of the performance of the laboratory work "Modeling the electric field of a system consisting of a dielectric square and a long charged conductor" by using МАТLAB software package // Proceedings of the National Academy of Sciences of the Republic of Kazakhstan. Series of Physics and Mathematics. Almaty, 2017, N 4. P. 252-259.
[28] Kabylbekov K., Saidullaeva N., Spabekova R., Omashova G., Tagaev N., Bitemirova A., Berdieva M. Model of a blank form for computer laboratory work on research of the speed selector // Journal of Theoretical and Applied Information Technology 15th July 2017. Vol. 95, N 13. P. 2999-3009. JATIT & LLS. Indexada en Scopus.
[29] Kabylbekov K.A., Abdrakhmanova Kh.K., Abekova Zh.A., Abdraimov R.T., Ualikhanova B.S. Calculation and visua-lization of a system- an electron in a deep square potential well, with use of the software package of MATLAB // Proceeding of the III International Scientific and Practical Conference «Topical researches of the World Science» (Iune 28, 2017,Dubai, UAE). July 2017. Vol. 1, N (23). P.7-13.
[30] Porshnev S.V. Computer simulation of physical processes in the MATLAB package. M.: Hot Line-Telecom, 2003. 592 p.
[31] Landau L.D., Lifshits E.M. Theoretical physics. Vol. 1. Mechanics. M.: Science, 1965. P. 203.
К. А. Қабылбеков1, Х. К. Абдрахманова1, Г. Ш. Омашова1, К. М. Лаханова2, Ж. А. Абекова1
1М. Əуезов атындаңы Оңтүстік Қазақстан мемлекеттік университеті. Шымкент, Казахстан,
2Х. А. Яссауи атындағы қазақ-түрік халықаралық университиті. Түркістан, Казахстан
«АУЫТҚУЫ АЗ МƏЖБҮР ТЕРБЕЛІСТЕРДІ ЕСЕПТЕУ МЕН БЕЙНЕЛЕУГЕ» АРНАЛҒАН КОМПЬЮТЕРЛІК ЗЕРТХАНАЛЫҚ ЖҰМЫСТЫ ОРЫНДАУДЫ
ҰЙЫМДАСТЫРУ
Аннотация. Тербеліс жүйесіне тұрақты жəне айнымалы күштер əсерінен туындаған мəжбүр тербе-лістерді есептеу мен бейнелеу программалары ұсынылады: 1. F=const=F0. 2. F=at. 3. F=F0exp(-αt). 4. F=F0exp(-αt)cos(βt). Берілген күштердің уақытқа тəуелділік графиктері бір терезеде салынған. Аталған күштердің əсерінен тербелген жүйенің бірөдшемді мəжбүр тербелісін есептеу мен бейнелеудің MATLAB жүйесіндегі программалары келтірілген. Мəжбүр тербелістердің уақытқы тəуелділік графиктері салынған. Мəжбүр тербелістерді сипаттайтын формулалар физика тұрғысынан түсініксіздеу, ал оларды график арқылы бейнелегенде тербеліс сипаты айқындалып, физика тұрғысынан түсінуге болады.
Бұл мəселені шешу үшін MATLAB тілі қолданылады. Физикалық процесстерді модельдеу жəне бейне-леу барысында MATLAB тілінің орасан зор мүмкіндіктері бар екені мəлім. MATLAB күрделі формулаларды график түрінде бейнелеуге мүмкіндік береді, бұл процестің немесе құбылыстың табиғатын түсінуін айтарлықтай жеңілдетеді түседі.
Мақаланың мақсаты F(t) күштің əсерінен болған мəжбүр тербелісті есептеуге жəне бейнелеуге арналған MATLAB тілінде бағдарлама жасау. Зерттеу шарты бойынша бастапқы уақытта t = 0 жүйенің жылдамдығы тепе-теңдік күйде нольге тең деп аламыз, яғни жуйе тыныштық күйде болады ((t = 0) = 0, (t = 0) = 0).
Зерттеу нəтижелері жоғары оқу орындарындағы теориялық механика дəрістерінде қолдануға болады. Түйін сөздер: мəжбүр тербеліс, бейнелеу, тербелу уақыты, амплитуда.

Известия Национальной академии наук Республики Казахстан
154
К. А. Кабылбеков1, Х. К. Абдрахманова1, Г. Ш. Омашева1, К. М. Лаханова2, Ж. А. Абекова1
1Южно-Казахстанский государственный университет им. М. Ауезова (ЮКГУ), Шымкент, Казахстан, 2Международный Казахско-Турецкий университет им. Х. А. Яссави (МКТУ), Туркестан, Казахстан
ОРГАНИЗАЦИЯ КОМПЬЮТЕРНОЙ ЛАБОРАТОРНОЙ РАБОТЫ
«ВЫЧИСЛЕНИЕ И ВИЗУАЛИЗАЦИЯ МАЛЫХ ВЫНУЖДЕННЫХ КОЛЕБАНИЙ»
Аннотация. В статье рассматриваются вычисления и визуализации вынужденных колебаний системы под действием постоянных и переменных сил: 1. F=const=F0; 2. F=at.; 3. F=F0exp(-αt); 4. F=F0exp(-αt)cos(βt). Графики зависимости вышеупомянутых сил от времени представлены в одном графическом окне. Приве-дены программы для вычисления и визуализации вынужденных колебаний под действием данных сил. Пред-ставлены графики зависимости одномерных вынужденных колебаний от времени. Формулы (1-4), описы-вающие законы колебаний, являются трудными для понимания особенностей колебаний. Их визуализация делает природу колебаний системы более очевидной и ясной.
Для решения данной задачи использован язык MATLAB. Известно, что язык MATLAB обладает ог-ромными возможностями для моделирования и визуализации физических процессов. MATLAB позволяет наглядно представить сложные формулы в виде графиков, что значительно облегчает понимание природы процесса или явления.
Цель данной статьи разработать программу на языке MATLAB для вычислений и визуализаций вы-нужденных колебаний системы под действием силы F(t) если в начальный момент времени t = 0 система находится в покое в равновесном состоянии (x(t=0)=0, (t=0)=0).
Результаты исследования могут быть использованы на занятиях по теоретической механике в высших учебных заведениях.
Ключевые слова: вынужденные колебания, визуализация, график колебания, амплитуда. Сведения об авторах: Кабылбеков К.А. – к.ф-м.н., доцент кафедры «Физика» ЮКГУ им.М.Ауезова Абдрахманова Х.К. – к.х.н., доцент кафедры «Физика» ЮКГУ им. М. Ауезова Омашева Г.Ш. – к.ф-м.н., доцент кафедры «Физика» ЮКГУ им. М. Ауезова Лаханова К.М. – докт. c.-х. наук, профессор кафедры морфологии МКТУ им. Х. А. Ясави. Абекова Ж.А. – к.ф-м.н., доцент кафедры «Физика» ЮКГУ им. М. Ауезова

ISSN 2224-5278 Серия геологии и технических наук. 4. 2018
155
N E W S OF THE NATIONAL ACADEMY OF SCIENCES OF THE REPUBLIC OF KAZAKHSTAN
SERIES OF GEOLOGY AND TECHNICAL SCIENCES
ISSN 2224-5278
Volume 3, Number 430 (2018), 155 – 167
A. I. Koishina1, O. G. Kirisenko2, B. N. Koilybayev1, K. K. Agayeva2
1Caspian State University of Technologies and Engineering named after Sh. Yessenov,
Aktau, Kazakhstan, 2Oil and Gas Institute of Azerbaijan National Academy of Sciences,
Baku, Azerbaijan. E-mail: [email protected], [email protected], [email protected], [email protected]
DECISION-MAKING FOR CHOOSING OF GEOLOGICAL AND ENGINEERING OPERATIONS:
CURRENT STATUS AND PROSPECTS
Abstract. It is commonly known that great care is given to upgrading of the efficiency due to implementing of various new technologies and GTM during development of oil fields. Widespread introduction of GTM as well as enhanced oil recovery (EOR) and elaboration of their technologies raise the issues of relevant choice of the best methods ensuring proper technical and economical efficiency in particular conditions. Despite of the profound interest of the researches to the given question, major problems arise currently anyway at comparative evaluation of various types of GTM regarding particular conditions. The issue of upgrading of efficiency of GTM based on the integrated geological and physical and technological information is currently challenging and deserves relevant consideration. Deep analysis of the conditions for applying of various GTM using advanced techniques and corres-ponding software allows in its turn to give guidance to current possibilities in order to upgrade efficiency of field deposit. For many years the research focused on upgrading of the efficiency of field deposits had been conducted in various scientific and industrial organizations. The analysis of choosing and implementing of GTM at different deposits is of great interest. Review and analysis of up-to-date condition of problem of GTA choosing are illustrated in the article. Examples of application and performance evaluation of GTM are shown at different deposits. Deve-lopment and upgrading of the analysis methods as well as forecasting of indicators and decision-making have been observed over the recent years. Their implementation allowed upgrading the efficiency of conducted geological and technical operations. As a result of conducted operations the researchers solved the issue of creating of integrated methodology and its mathematic, scheduled and information application for evaluating of efficiency and optimal scheduling of geological and technical operations at field deposits; structure of automated system of decision support and algorithm of its functioning have been created; by transforming the indicators characterizing the formation into the relevant factors, the equations (linear and multiplicative) were made expressing the dependence of the efficiency indicators of GTM from the formed factors; by variants calculation and analysis of comparative efficiency of any GTM in different conditions the directions were shown and the results of making decisions for choosing of the best GTM were obtained.
Key words: geological and technical measure (GTM), field development, decision-making, crude oil produc-tion, oil recovery.

Известия Национальной академии наук Республики Казахстан
156
УДК 622.276.3
А. И. Койшина1, О. Г. Кирисенко2, Б. Н. Койлыбаев1, К. К. Агаева2
1Каспийский государственный университет технологий и инжиниринга им. Ш. Есенова, Актау, Казахстан, 2Институт нефти и газа Национальной академии наук Азербайджана, Баку, Азербайджан.
ПРИНЯТИЕ РЕШЕНИЙ ПО ВЫБОРУ ГЕОЛОГО-ТЕХНИЧЕСКИХ МЕРОПРИЯТИЙ:
СОВРЕМЕННОЕ СОСТОЯНИЕ И ПЕРСПЕКТИВЫ
Аннотация. Как известно, повышению эффективности за счет применения различных новых техноло-гий и ГТМ уделяется большое внимание при разработке нефтяных месторождений. Широкое внедрение ГТМ, а также е МУН и развитие их технологий ставит вопросы адекватного выбора наилучших методов, обеспечивающих должную технолого-экономическую эффективность в конкретных условиях. Несмотря на большой интерес исследователей к данному вопросу, все же в настоящее время серьезные затруднения возникают при сравнительной оценке различных видов ГТМ применительно к конкретным условиям. Проб-лема повышения эффективности ГТМ на основе комплексной геолого-физической и технологической инфор-мации в настоящее время является актуальной и заслуживает соответствующего внимания. Тщательный анализ условий применения различных ГТМ с использованием современных методов и соответствующего программного обеспечения позволит в свою очередь правильно сориентировать имеющиеся возможности с целью повышения эффективности разработки месторождения. На протяжении многих лет исследования, направленные на повышение эффективности разработки месторождений, проводились в различных научных и производственных организациях. Представляет интерес анализ опыта выбора и внедрения ГТМ на различ-ных месторождениях. В статье приводится обзор и анализ современного состояния проблемы выбора ГТМ. Показаны примеры применения и оценки эффективности ГТМ на различных месторождениях. В последние годы наблюдается развитие и совершенствование методов анализа, прогнозирования показателей и принятия решений, реализация которых позволила повысить эффективность проводимых геолого-технических меро-приятий. В результате проведенных работ исследователями решена задача создания комплексной методики и ее математического, программного и информационного обеспечения для оценки эффективности и оптималь-ного планирования геолого-технических мероприятий на нефтяных месторождениях; разработана структура автоматизированной системы поддержки принятия решения и алгоритм ее функционирования; путем пре-образования признаков, характеризующих пласт, в соответствующие факторы, построены уравнения (линей-ное и мультипликативное), выражающие зависимость показателей эффективности ГТМ от сформированных факторов; путем вариантных расчетов и анализа сравнительной эффективности того или иного ГТМ в раз-личных условиях показаны пути и получены результаты принятия решений по выбору наилучшего ГТМ.
Ключевые слова: геолого-техническое мероприятие (ГТМ), разработка месторождений, принятие решений, добыча нефти, нефтеотдача.
Введение. В период эксплуатации нефтяного месторождения, как известно, проводятся ра-
боты на скважинах с целью регулирования его разработки и поддержания уровня добычи нефти. Этот комплекс работ называют геолого-техническими мероприятиями (ГТМ), за счет проведения которых нефтедобывающие компании обеспечивают достижение необходимых показателей разработки месторождений. Естественно, имеется производственная необходимость в оценке методов и критериев эффективности ГТМ.
Как известно, повышению эффективности за счет применения различных новых технологий и ГТМ уделяется большое внимание при разработке нефтяных месторождений. Широкое внедрение ГТМ, а также е МУН и развитие их технологий ставит вопросы адекватного выбора наилучших методов, обеспечивающих должную технолого-экономическую эффективность в конкретных условиях. Несмотря на большой интерес исследователей к данному вопросу, все же в настоящее время серьезные затруднения возникают при сравнительной оценке различных видов ГТМ приме-нительно к конкретным условиям. Это связано с недостаточностью исследований, позволяющих дать прогнозную оценку эффективности ГТМ для тех условий, где по тем или иным причинам оно не применялось. Современный уровень развития методов анализа информации и принятия реше-ний позволит это сделать при наличии комплексной геолого-физической и технологической

ISSN 2224-5278 Серия геологии и технических наук. 4. 2018
157
информации. В то же время опыт внедрения различных ГТМ на различных месторождениях под-тверждает большое их значение в повышении показателей добычи нефти, а также обусловливает важность изыскания путей наиболее полного использования потенциальных возможностей имеющейся информации, хотя очень часто приходится сталкиваться с ее неопределенностью, как статистического, так и нестатистического характера. Отмеченное требует применения методов, позволяющих в зависимости от характера имеющейся информации строить соответствующие модели прогнозирования показателей эффективности и принимать решения в условиях много-критериальности.
Исходя из этого, проблема повышения эффективности ГТМ на основе комплексной геолого-физической и технологической информации в настоящее время является актуальной и заслуживает соответствующего внимания. Тщательный анализ условий применения различных ГТМ с исполь-зованием современных методов и соответствующего программного обеспечения позволит в свою очередь правильно сориентировать имеющиеся возможности с целью повышения эффективности разработки месторождения. На протяжении многих лет исследования, направленные на повышение эффективности разработки месторождений, проводились в различных научных и производствен-ных организациях. Представляет интерес анализ опыта выбора и внедрения ГТМ на различных месторождениях.
Краткий обзор исследований, посвящённых геолого-техническим мероприятиям. В настоящее время на нефтяных месторождениях используются различные виды ГТМ, в частности обработка призабойной зоны (ОПЗ), гидроразрыв пласта (ГРП), бурение горизонтальных скважин, а также другие методы интенсификации добычи нефти, а также методы увеличения нефтеотдачи (МУН) пластов [1-3].
К настоящему времени предложены различные методики расчета эффективности приме-няемых ГТМ [4]. В целом, все мероприятия, проводимые на скважинах, по виду воздействия могут быть разделены на следующие виды: технические, ремонтные, МУН и интенсификация добычи нефти, ОПЗ.
Как показывает анализ литературы, с целью выбора наиболее эффективных ГТМ применяются различные модели для решения задач прогнозирования добычи нефти. Прогнозные показатели определяются сложившимися тенденциями добычи нефти и эффективностью планируемых ГТМ. Современные исследования, в том числе совершенствования существующих подходов к оценке эффективности ГТМ, позволяют осуществлять широкое внедрение новых систем программи-рования, автоматизации процесса оценки технологической эффективности применяемых методов повышения нефтеотдачи. Сюда следует отнести разработку программного комплекса EOR–Office, который представляет современный инструмент, предназначенный для автоматизации всего комплекса задач, стоящих перед специалистами, занимающимися повышением нефтеотдачи плас-тов [5, 6]. Одним из основных подходов к оценке технологической эффективности различных ГТМ в нефтяной промышленности является экстраполяционный. Суть экстраполяционных методов оценки технологической эффективности различных ГТМ состоит в построении базового уровня добычи нефти. Для этого фактическая добыча нефти при проведении ГТМ сравнивается с прог-нозными данными, полученными при экстраполяции предыстории. При этом даже небольшие ошибки в построении базового уровня добычи, как отмечают специалисты, приведут к неадекват-ному подбору и планированию оптимальных ГТМ [7]. На практике фактическую эффективность ГТМ принято оценивать методами характеристик вытеснения нефти водой, т.е., по кривым обводнения – зависимостям типа Vн = f (Vж) и по кривым изменения добычи нефти – зависимостям типа Vн = f (t): здесь Vн и Vж – накопленные отборы соответственно нефти и жидкости; t – время. Согласно [7] общий эффект можно подразделять на эффект, обусловленный изменением характера вытеснения нефти и эффект, связанный с интенсификацией отбора жидкости. Рассчитывается дополнительное количество попутно добываемой воды. По кривым падения дебита нефти – зависимостям типа Vн = f (t) определяется общий эффект ГТМ.
В настоящее время насчитываются десятки различных типов характеристик вытеснения [8, 9] и одной из проблем является выбор такой характеристики вытеснения, которая наилучшим обра-зом согласовывалась с историей разработки объекта и обеспечивала наиболее точную экстра-поляцию при прогнозе [10]. Так, в работе [11] рассматриваются некоторые вопросы, касающиеся

Известия Национальной академии наук Республики Казахстан
158
выбора наиболее точных методов оценки ГТМ, а также приводятся зависимости, отражающие возможные случаи дифференциации технологического эффекта метода повышения нефтеотдачи. По мнению автора, прогнозирование эффекта (т.е. расчет ожидаемого эффекта) ГТМ, основанное на экстраполяции кривых фактической и базовой добычи нефти, с использованием методов харак-теристик может быть не всегда надежным. Данное обстоятельство автор связывает со следующими причинами. По его мнению, при том, как продолжительность эффекта от применения некоторых видов ГТМ (например, ГРП) колеблется в интервале 5-7 лет использование кривых обводнения для сравнительно долгосрочных прогнозов может быть надежным только при высокой обводненности, как правило, превышающей 50-70%. При более низкой обводненности (на ранних стадиях) про-должительность прогноза не должна превышать 3-6 месяцев. Однако многие виды ГТМ проводятся в безводных или малообводненных скважинах.
Также в работе отмечается, что при наличии представительной информации по падающей до-быче нефти после проведения ГТМ (не менее 4-6 точек) является возможным надежная экстра-поляция характеристик вытеснения. В этих условиях целесообразным может быть применение методов прогнозирования, основанных на использовании коэффициентов падения дебита нефти. Если информация по отборам нефти после проведения ГТМ не представительна, то можно приме-нять коэффициенты падения отборов по другим скважинам с более продолжительным периодом эксплуатации после ГТМ. Исходя из вышеизложенного совершенствование методов характеристик вытеснения и на сегодняшний день стоит на повестке дня и является вполне актуальным [12]. В работе [13] объектом прогноза являются скважины, кусты, участки, (группы скважин), цех, пласт, нефтегазодобывающее предприятие, и др., интервалы прогноза – месяц, квартал, год. В зависи-мости от характера и очередности планируемых мероприятий возникает необходимость прове-дения многовариантных расчетов, что в свою очередь требует соответствующего программного обеспечения с применением современного математического аппарата. В связи с этим в [13] рас-смотрена технология расчетов прогнозных показателей, реализованная в интегральном про-граммном комплексе (ИПК) «Баспро-аналитик» (разработка ЗАО «Аналитический центр СибИНКор») и применяемая в практике анализа показателей разработки месторождений Нижне-вартовского района. Решение задач предполагает использование двух программных модулей: «Баспро-характеристики» – обеспечивает расчет базовой добычи при сложившейся системе разработки и оценку эффекта от проведенных ГТМ; «Баспро-прогноз» – рассчитывает прогнозную добычу нефти с учетом предполагаемого эффекта от планируемых ГТМ.
В работе приводятся схемы, иллюстрирующие процесс расчета базового варианта добычи нефти, а также его прогнозного варианта. Показана классификация показателей технологической эффективности проведения ГТМ. Применительно к геологическому строению Ершового место-рождения установлена эффективность различных ГТМ. Как отмечают авторы, данный принцип был в полной мере использован для составления программы ГТМ и прогнозирования технологи-ческих показателей разработки Ершового нефтяного месторождения, осуществляемой ОАО «Тюменская нефтяная компания». Расчетные показатели оценки эффекта ГТМ определяются в соответствии с «Методическим руководством по оценке технологической эффективности приме-нения методов увеличения нефтеотдачи пластов». Используемая в программе методика основана на определении характеристик вытеснения, аппроксимирующих наилучшим образом фактические данные истории добычи нефти. Аппроксимация осуществляется на интервале настройки, зада-ваемом пользователем и принадлежащем интервалу истории. Погрешность аппроксимации оцени-вается «в смысле наименьших квадратов». Эффект в «Баспро-характеристики» автоматически разделяется на две составляющие: эффект по нефтеотдаче и эффект по интенсификации. Парал-лельно с двумя основными эффектами рассчитывается эффект от снижения объемов попутно добываемой воды. Если характеристика базовой добычи была уже рассчитана и хранится в базе «прогнозной добычи», «Баспро-характеристики» позволяет рассчитывать эффект, сопоставляя эти данные и фактическую добычу [14].
Развитие математических методов моделирования и современных средств вычислительной техники дает возможность определения технологической эффективности ГТМ для рассматри-ваемого нефтегазового объекта двумя возможными путями, считает автор унифицированной методики расчета эффективности ГТМ [9]: постоянно действующей многомерной детерминиро-

ISSN 2224-5278 Серия геологии и технических наук. 4. 2018
159
ванной моделью фильтрации; малопараметрической вероятностно-статистической моделью на основе данных истории разработки.
В первом случае требуется создание геологической и фильтрационной моделей объекта и наличие соответствующего программного обеспечения, описывающего процессы в пласте. Данный подход требует относительно больших затрат времени и средств.
Во втором случае оценка технологической эффективности выполняется без привлечения фильтрационной модели объекта. Второй подход не требует больших затрат времени и средств и может использоваться при определении эффективности ГТМ.
Методика предусматривает оценку достоверности исходных данных, теоретические пред-посылки, тестирование предлагаемой методики, а также инструкцию к программному комплексу. Это позволяет повысить качество и достоверность принимаемых решений. Другие авторы [10] проводят анализ используемых в настоящее время методических положений по оценке техноло-гической эффективности ГТМ, а также представляют результаты численных экспериментов по оценке эффективности ГТМ с использованием программного комплекса “БАСПРО-Характе-ристики” (методика СибНИИНП) на реальных данных (ряде участков Самотлорского месторож-дения) и на модельных характеристиках, рассчитанных на идеализированной трехмерной гидродинамической модели.
На основе трехмерных гидродинамических расчетов модельных и реальных участков неф-тяных пластов ими были проведены экспериментальные расчеты с использованием программных комплексов «Tempest MORE (Roxar) и Eclipse (Schlumberger), результаты которых сопоставлялись с инженерными расчетами по следующим методикам оценки технологической эффективности ГТМ: методика ВНИИнефти [8, 15], СибНИИНП [16], Казакова А.А. [7, 8, 17] и Шахвердиева А.Х. [18]. Такой подход к применению гидродинамических моделей дает возможность тестировать методики оценки технологической эффективности на «синтетических» показателях разработки, полученных в процессе моделирования по отдельным скважинам. В связи с анализом данных и поддержкой принятия решения о ГТМ тюменскими специалистами [19] предложена концепция корпоративной базы знаний ТНК, предназначенной для хранения, развития, использования опыта и эмпирических знаний специалистов компании, занимающихся геолого-технологическими меро-приятиями (ГТМ) [11]. Организация работы с базой знаний основана на использовании Интернет. Содержание базы знаний структурируется в виде пар “ГТМ – ситуация, при которой выполнялось мероприятие”. Для формализации представления ситуаций, разработки алгоритмов ситуационного анализа (методы общего ситуационного подхода) и поиска использован математический аппарат гиперграфов.
Ситуационный метод (ситуационные модели в корпоративных базах знаний) основан на поиске и использовании аналогий, известных из реального опыта профессиональной деятельности. Реальность опыта для инженера может быть более важной, чем результаты математического мо-делирования. Интерес может представлять соединение обоих подходов, при котором ситуации-аналоги будут использованы для выбора предполагаемых параметров ГТМ.
Формированию базы данных ГТМ по скважинам, рекомендуемым под добычу, а также соответствующим критериям для выбора ГТМ посвящена работа [5]. Согласно данной работе для формирования базы данных ГТМ по скважинам по каждому пласту выбираются следующие кри-терии: текущая нефтенасыщенная толщина более 2 м; пласт не перфорирован, либо по текущему фонду скважина недобывающая; пласт не имеет слияния с перфорированным пластом, либо скважина недобывающая (данный критерий может не учитываться); в радиусе менее 500 м нет добывающих по текущему фонду скважин, работающих на данный пласт; глинистость пласта менее 6% (данный критерий может не учитываться, если предполагается применение МУН (раз-глинизация); проницаемость пласта более 0,07 мкм2. По всем рассматриваемым пластам под-считываются прогнозные дебиты. Размещение выбранных скважин проверяется по картам текущих нефтенасыщенных толщин. Выбранные скважины включаются в базу ГТМ как рекомендуемые для перевода под добычу нефти. По мнению авторов, предложенные критерии позволяют проводить выбор скважин для формирования базы данных с помощью ЭВМ с последующей проверкой по построенным картам, что при большом объеме информации гораздо эффективнее, чем выбор скважин вручную. Этот порядок формирования базы данных для разработки ГТМ был применен
Известия Национальной академии наук Республики Казахстан
160
при выработке рекомендаций по Абдрахмановской, Чишминской и Восточно-Сулеевской пло-щадям Ромашкинского месторождения [20].
В статье [21] рассматривается решение задачи формирования базы данных ГТМ по сква-жинам, рекомендуемым под добычу, с использованием метода нечетких множеств на примере пласта «а» горизонта Д1 Восточно-Сулеевской площади Ромашкинского месторождения. Под нечетким множеством здесь понимается объект, о принадлежности к которому можно судить только с некоторой долей уверенности. Решение задачи выбора скважин для рекомендации под добычу для каждого пласта сводится к определению для всех скважин функций принадлежности к множеству «скважина, рекомендованная для перевода под добычу». Наличие множества кри-териев, зачастую противоречивых, создает затруднения в выборе наилучшего решения [22]. В связи с этим авторы сводят решение многокритериальной задачи к однокритериальной с помощью теории нечетких множеств, считая этот критерий как меру целесообразности проведения предус-мотренного ГТМ, что, по их мнению, позволяет осуществить быструю ранжировку возможных вариантов решения по степени целесообразности и сформировать наиболее предпочтительный график работ.
Автор [23] при оценке эффективности мероприятий по увеличению добычи нефти и конечной нефтеотдачи предлагает следующую концепцию.
Для определения эффективности какого-либо дополнительного технического мероприятия по увеличению текущей добычи и конечной нефтеотдачи следует рассчитать два варианта разработки нефтяной залежи (эксплуатационного объекта): без дополнительного мероприятия (базовый вариант); с дополнительным мероприятием. Для достоверного определения действительно введен-ных в разработку начальных извлекаемых запасов нефти и жидкости, их изменений – необходима регулярная и удовлетворительная по точности информация о работе добывающих и нагнетатель-ных скважин (их дебитах нефти и жидкости, закачке воды и забойных давлениях) по рассматри-ваемым эксплуатационным объектам [23, 24].
Анализ выполненных работ свидетельствует о том, что большинство авторов считает, что для уточнения геологических условий распределения текущих запасов нефти, оценки эффективности применения методов увеличения нефтеотдачи (МУН) и осуществления прогноза для новых участков залежи необходимо построение геолого-фильтрационных моделей. В этой связи рас-смотрен методический подход к разработке и внедрению корпоративных программных продуктов, ориентированных на массового пользователя и предназначенных для эксплуатации геолого-фильтрационных моделей, применительно к задачам повышения нефтеотдачи пластов.
Для оперативного решения производственных задач авторами была использована программ-ная продукция – трехмерная информационно-аналитическая система (ТРИАС), разработанная сотрудниками НИИ математики и механики им. Н.Г.Чеботарева и ООО «Венсис» при активном участии специалистов производственных организаций [25].
В рамках этой системы используется понятие постоянно действующей модели (ПДМ). Под ПДМ понимается единая компьютерная технология, представляющая собой совокупность циф-ровой интегрированной геологической, геофизической, гидродинамической информации (база данных), 3D геологической и фильрационной моделей и программных средств построения и просмотра моделей, выдачи отчетного графического и табличного материала. В работе дано описа-ние основных функций программных модулей. В расчетную группу входят три модуля, предна-значенных для построения геологической, фильтрационной моделей и модели ГТМ. Модуль построения геологической модели работает при наличии базы данных по первичным показателям, модуль построения фильтрационной модели (Fluid) действует при условии построенной геоло-гической модели (Geo), модуль оценки и прогноза эффективности ГТМ (GTM) использует для работы результаты построения геологической и фильтрационной моделей.
Таким образом, охватывается практически вся геолого-промысловая информация. Выделены классы нефтепромысловых задач. В связи с ГТМ в расчетной группе программных модулей имеет-ся модуль GTM, который выполняет две функции: оценку эффективности применения ГТМ; анализ эффективности ГТМ в различных геолого-промысловых условиях.
Приведенный выше обзор свидетельствует о большом интересе исследователей к вопросу оценки эффективности ГТМ, разработке научно-обоснованных методических подходов, анализу и

ISSN 2224-5278 Серия геологии и технических наук. 4. 2018
161
выбору наилучших вариантов решений, и тем самым еще раз подтверждает важность и актуаль-ность поиска решений по повышению эффективности ГТМ.
Как видно из вышеприведенного краткого обзора, выполнено большое количество исследо-ваний, посвященных оценке технологической эффективности как отдельного вида ГТМ, так и в целом, а также разработаны соответствующие руководящие документы.
Эти исследования, а также результаты проведенных в ряде районов ГТМ при их обобщении позволяют решить ряд задач, ответив на некоторые вопросы, в частности, прогнозной оценки относительной эффективности различных видов ГТМ на рассматриваемом конкретном объекте, а также установления объекта наиболее подходящего для конкретного вида ГТМ.
Решение этих вопросов затрудняется отсутствием подхода, заключающегося в тщательном статистическом анализе комплексной геолого-геофизической и технологической информации, моделей, выражающих связь показателей эффективности того или иного вида ГТМ с параметрами, характеризующими рассматриваемый объект (пласт). Кроме того, в ряде случаев принятие реше-ний по выбору ГТМ существенно затрудняется отсутствием или недостаточностью информации.
Современный уровень развития математических методов и информационных технологий, а также результаты их успешного применения на различных этапах исследовательских работ позволяют решить поставленные задачи также в условиях ограниченного объема информации.
Как видно из обзора, это обстоятельство было учтено в ряде работ, посвященных оценке эффективности отдельных видов ГТМ.
Все известные методики определения технолого-экономической эффективности применения ГТМ основаны на сравнении определенных зависимостей, полученных в результате его внедрения, с базовой. Например, при оценке эффективности заводнения используются фактические зависи-мости вытеснения при применении данного метода и без него. При этом, очевидно, что основная задача заключается в правильной аппроксимации естественного базового хода процесса без применения ГТМ [8, 18, 26, 27].
В свете изложенного наряду с разработкой эффективных методик оценки технолого-эконо-мической эффективности ГТМ особое значение приобретает разработка новых подходов, позво-ляющих дать технолого-экономическую оценку не только отдельно взятому ГТМ в конкретных условиях, но и сравнительной эффективности того или иного ГТМ в различных физико-геологи-ческих и технико-технологических условиях.
Это позволит осуществить рациональный подбор под те или иные ГТМ как скважин, залежей, так и их технологий.
В связи с этим в работе [26] предлагается система расчетов показателей эффективности ГТМ на основе данных о технологических, физико-геологических и промысловых признаках, комплекс-но характеризующих условия проведения того или иного ГТМ. С учетом этого нами выполнены исследования согласно несколько упрощенному и усовершенствованному варианту системы [26]. Согласно приведенной схеме состояние скважин, оборудования, историю освоения, технологию проведения ГТМ характеризуют технологические признаки; физико-геологические признаки – это состояние и свойства нефтяной залежи, а именно: пористость, проницаемость, нефтенасыщен-ность, продуктивность отложений и др.; промысловые – система разработки залежи, текущая и на-копленная добыча нефти до и после проведения ГТМ, особенности взаимодействия скважин и др.
Таким образом, выбранные технологические, физико-геологические и промысловые признаки формируют информационный массив, позволяющий охарактеризовать рассматриваемый объект, технологию проведения ГТМ и их влияние на результаты проводимых мероприятий.
Анализ и оценка влияния геолого-технологических характеристик объекта на показа-тели эффективности ГТМ. Как показал анализ накопленных к настоящему времени исследо-ваний, для повышения эффективности разработки нефтяных месторождений и интенсификации добычи нефти применяется большое количество различных ГТМ. Эффективность их применения зависит от рационального сочетания большого числа физико-геологических, технологических и промысловых признаков, комплексно характеризующих условия проведения того или иного ГТМ. На практике, как правило, для конкретных месторождений выбор ГТМ, их параметров, так же, как и их технологическое и экономическое обоснование, осуществляется в геологических службах НГДУ на основе приобретенного опыта. При этом очень часто, несмотря на опыт и знания геоло-

Известия Национальной академии наук Республики Казахстан
162
гических служб НГДУ, выбор участков, ГТМ и их технологии проводится не всегда адекватно конкретным геологическим и технологическим условиям разработки. Практически отсутствует единый подход, с использованием которого можно было бы дать правильную технолого-эконо-мическую оценку не только отдельно взятому ГТМ в конкретных условиях, но и прогнозную оценку сравнительной эффективности его в различных физико-геологических и технико-техно-логических условиях.
Благодаря развитию в последние годы методов, учитывающих отмеченные обстоятельства, появляется возможность решить поставленные задачи на более высоком уровне. Здесь имеется в виду возможность создания различных моделей, а также соответствующих программ, основы-вающихся на комплексной геолого-геофизической и технико-технологической информации и позволяющих принимать наиболее обоснованные технологические решения.
С целью построения таких моделей, использованы данные о геолого-технических меро-приятиях, проводимых на объектах различных месторождений Казахстана [26, 28, 37]. В качестве признаков, от которых зависит эффективность геолого-технического мероприятия, служат: общая толщина пласта, м (х1), нефтенасыщенная толщина, м (х2), вскрытая нефтенасыщенная толщина, м (х3), коэффициент песчанистости (х4), пористость д.ед. (х5), проницаемость, Кпр*10-3 мкм2 (х6), вязкость нефти, мПа*с (пластовое условие) (х7), плотность нефти т/м3 (х8), газосодержание, м
3/т (х9), начальная нефтенасыщенность, д.ед (х10), пластовая температура, Т0С (х11), содержание в нефти парафина, % (х12), содержание в нефти серы, % (х13), дебит нефти до геолого-технического мероприятия, т/сут (х14), дебит жидкости до геолого-технического мероприятия, т/сут (х15), обводненность до геолого-технического мероприятия, % (х16). В качестве показателей геолого-технического мероприятия служат: продолжительность эффекта, сут. (Y1), дополнительная добыча нефти, т. (Y2), прирост дебита нефти, т. (Y3), дебит нефти после геолого-технического мероприятия, т/сут (Y4), обводнённость после геолого-технического мероприятия, % (Y5).
Таким образом, исходные данные включают по каждому виду ГТМ 16 признаков и 5 показа-телей эффективности. Далее согласно работам [30, 32,41], проводится преобразование исходных данных с целью сокращения числа входных переменных.
Далее с помощью корреляционного анализа устанавливались зависимости показателей ГТМ от отмеченных факторов и перед тем, как перейти к корреляционному анализу, необходимо убедиться в подчинённости данных нормальному закону распределения, что является одним из требований. Существует много различных критериев для проверки данного условия. Проверка на нормальность является обязательной процедурой в ходе проведения измерений, контроля, испытаний, обработки согласно Российскому ГОСТ. Существуют различные критерии, нами использован критерии Шапиро-Уилка [29, 37].
Критерий Шапиро-Уилка основан на отношении оптимальной линейной несмещенной оценки дисперсии к ее обычной оценке методом максимального правдоподобия. Статистика критерия имеет вид:
2
11
12)(
1
iin
n
iin xxa
sW , (1)
где
n
ii
n
ii x
nxxxs
1
2
1
2 1,)(
Числитель является квадратом оценки среднеквадратического отклонения Ллойда [30]. Определялись критические значения статистики W() согласно данным литературы, например, [29]. Если W < W(), то нулевая гипотеза нормальности распределения отклоняется на уровне значимости .
Проведенные расчеты дают возможность обосновать применение данных при корреляционном анализе.
С целью построения зависимостей выбранных критериев от влияющих факторов, данные об условиях и результатах ГТМ были подвергнуты корреляционному анализу. При этом данные под-вергались статистической обработке двумя путями с применением программы линейной регрессии.

ISSN 2224-5278 Серия геологии и технических наук. 4. 2018
163
1. Строились зависимости показателей эффективности от геолого-технологических факторов по их натуральным значениям:
9
10
iii xaa
(2)
2. Все данные предварительно логарифмировались, строилась такая линейная зависимость, которая путём потенцирования превращалась в мультипликативную, с дальнейшим уточнением путём последовательного приближения:
· ….· (3)
Каждое уравнение представляло собой зависимость того или иного показателя эффективности от выбранных факторов. Такие уравнения строились для каждого вида ГТМ.
После получения уравнений регрессии была установлена степень соответствия расчетных значений показателей эффективности для различных ГТМ по уравнениям фактическим. Коли-чественная оценка степени соответствия определяется мерой идентичности согласно формуле, приведенной в работе [31], значения которой должны изменяться в пределах 0 I = 1:
I
∑ расч
∑ расч
(4)
При использовании комплексной геолого-геофизической и технико-технологической инфор-мации для принятия наиболее обоснованного технологического решения в зависимости от типа ГТМ выбирается тот вид уравнения регрессии, который имеет большую меру идентичности.
Принятие решений при выборе ГТМ. Результаты расчетов по полученным моделям исполь-зуются при принятии решений по выбору наилучшего ГТМ для рассматриваемых условий. Это осуществлялось с помощью показателей эффективности ГТМ, принятых в качестве критериев, таким образом, чтобы искомое решение должно было бы удовлетворять условиям 5 критериев. Как показывает обзор, разными авторами использовались различные критерии выбора ГТМ. Весь про-цесс можно представить в виде системы, упрощенная схема которой приведена на рисунке. При решении многокритериальных задач возникают трудности, связанные с одновременным удовлет-ворением всех критериев, т.е. приходится принимать решения в условиях неопределённости.
В последнее время для решения таких задач, успешно используются различные методы, такие, как метод объединения критериев в один, обобщённый, метод «наименьших уступок», положения теории нечетких множеств, разработанной Л. Заде. Приведённая в работах [2, 17] классификация неопределённостей позволяет оценить ситуацию и выбрать для принятия решений наиболее под-ходящий метод. Далее для принятия решений был использован метод, называемый методом «наименьших уступок» [32, 37].
При применении данного метода решение многокритериальной задачи сводится к поочеред-ной максимизации (минимизации) частных критериев и выбору величин уступок. Причем вначале производится качественный анализ относительной важности частных критериев, и они нумеруются в порядке убывания важности. Затем назначают величину допустимого снижения значения первого по важности критерия и максимизируют второй по важности критерий при условии, что значение первого критерия не должно отличаться от максимального более чем на величину установленного снижения. Снова назначают величину уступки, но уже по второму критерию и находят максимум третьего по важности критерия при условии, чтобы значения первых двух критериев не отличались от ранее найденных максимальных значений больше чем на величины соответствующих уступок. Далее таким же образом используются все остальные частные критерии. Получаемые в итоге стратегии считаются оптимальными.
В последнее время проблемы управления и принятия решений все больше стали привлекать внимание исследователей-нефтяников. Для выбора геолого-технических мероприятий в работе А. А. Колтуна [39] используются данные об истории разработки (метод базовой кривой), что не позволяет в полной мере учесть гидродинамические процессы и взаимовлияния скважин, тем самым, снижая достоверность получаемых решений. Но широкое развитие гидродинамического

Известия Национальной академии наук Республики Казахстан
164
Упрощенная схема системы выбора ГТМ
моделирования, как средства для выбора геолого-технических мероприятий создало предпосылки для автоматизации их выбора [33].
В работе A. Cottini-Loureiro и М. Araujo [33, 34] было предложено использование карт эффек-тивности для выбора схемы размещения скважин, но временные затраты на построение карт эффективности сильно зависят от размерности гидродинамической модели и являются процессом требовательным к вычислительным ресурсам. При введении в эксплуатацию новых скважин происходит изменение динамики работы существующих, что не позволяет анализируемому методу учесть взаимовлияния скважин во времени и обладает высокими требованиями к вычислительным ресурсам.
Благодаря близкому расположению скважин выбор схемы размещения их, как показано в работе G. Santellani и В. Hansen [35], приводит к затруднению учета их взаимовлияния, здесь также следует отметить, что применение метода, изложенного в данной работе, вынуждает отказаться от использования зарекомендовавших себя существующих схем размещения скважин.
В ряде исследований рассматриваются вопросы построения информационной системы под-держки принятия решений при выборе вида геолого-технического мероприятия на нефтедобы-вающей скважине для повышения ее производительности. В некоторых из них выбор вариантов на проведение определенного вида мероприятия ведется в соответствии с этапами системного анализа проблемных ситуаций [36]. В данной работе описание работы информационной системы дается на примере одного из основных программных модулей, позволяющего рассчитать экономическую эффективность геолого-технического мероприятия, такого, как гидроразрыв пласта [36]. Описаны основные этапы процесса принятия решений при выборе вида ГТМ. При этом процесс выбора скважин для проведения определенного вида ГТМ проходит следующие этапы: анализ ситуации (выявление потребности на проведение ГТМ для конкретной скважины); установление целей (определение параметров, на изменение значений которых должно быть направлено ГТМ); выра-ботка решений и анализ альтернатив (формирование перечня возможных видов ГТМ для дости-жения поставленных целей, оценка их эффективности); реализация решения (проведение ГТМ); оценка результатов (мониторинг состояния скважины после проведения ГТМ, анализ результатов).

ISSN 2224-5278 Серия геологии и технических наук. 4. 2018
165
Предлагаемая информационная система включает в себя несколько программных модулей по числу видов ГТМ [36]. Как отмечают авторы, такой показатель, как достижение запланированного прироста дебита нефти, нельзя рассматривать как единственный критерий оценки эффективности проведения геолого-технических мероприятий. Очевидно, что для более полного анализа необхо-димым является дополнительный анализ таких показателей, как количество нефти, дополнительно добытое вследствие проведения ГТМ, а также продолжительность эффекта от мероприятия. В статье приведены результаты анализа эффективности ГТМ за 2011-2014 гг. с применением ука-занного подхода.
С учетом значительного количества месторождений, разрабатываемых ООО «ЛУКОЙЛ-ПЕРМЬ», все они условно разделены на группы по географическому признаку [38]. В отмеченной работе приведены сведения о проведенных в 2011-2014 гг. геолого-технических мероприятиях на скважинах по группам месторождений, направленных на увеличение продуктивности скважин, таких, как гидроразрыв пласта, кислотные обработки, радиальное бурение, повторная и дополни-тельная перфорации.
Как следует из представленных данных, чаще других на скважинах месторождений всех групп, за исключением северной, проводится повторная и (или) дополнительная перфорация. На скважинах северной группы месторождений наиболее распространенным видом воздействия, как отмечают авторы, является гидроразрыв пласта.
Таким образом, исследованиями в этом направлении показана возможность оценки сравни-тельной эффективности и принятия решений при выборе ГТМ в различных условиях.
Заключение. Практика применения ГТМ показывает, что нередко их внедрение оказывается малоэффективным. Поэтому представляет интерес проведение сравнительного анализа с целью оценки эффективности их применения не только в условиях их проведения, но и условиях, где они не проводились. Такая оценка должна основываться на соответствующих моделях, выражающих зависимость показателей эффективности от признаков, характеризующих геолого-физические условия применения того или иного мероприятия в рассматриваемых или аналогичных условиях другого месторождения.
Полученные для этой цели модели позволяют прогнозировать показатели эффективности того или иного вида ГТМ в новых геолого-физических условиях. В связи с этим предложены системы и расчетные схемы, с помощью которых можно прогнозировать показатели для условий, отличных от тех, где применялось ГТМ. Результаты расчетов были использованы при принятии решений по выбору наилучшего ГТМ для рассматриваемых условий. Это осуществлялось с помощью показа-телей эффективности ГТМ, принятых в качестве критериев, таким образом, чтобы принятое реше-ние удовлетворяло бы всем принятым критериям.
Таким образом, в последние годы наблюдается развитие и совершенствование методов анали-за, прогнозирования показателей и принятия решений, реализация которых позволила повысить эффективность проводимых геолого-технических мероприятий. В результате проведенных работ исследователями решена задача создания комплексной методики и ее математического, программ-ного и информационного обеспечения для оценки эффективности и оптимального планирования геолого-технических мероприятий на нефтяных месторождениях; разработана структура автома-тизированной системы поддержки принятия решения и алгоритм ее функционирования; путем преобразования признаков, характеризующих пласт, в соответствующие факторы, построены урав-нения (линейное и мультипликативное), выражающие зависимость показателей эффективности ГТМ от сформированных факторов; путем вариантных расчетов и анализа сравнительной эф-фективности того или иного ГТМ в различных условиях показаны пути и получены результаты принятия решений по выбору наилучшего ГТМ.
ЛИТЕРАТУРА
[1] Гумерский Х.Х., Горбунов А.Т., Жданов С.А., Петраков А.М. Повышение нефтеотдачи пластов с применением
системной технологии воздействия // Нефтяное хозяйство. – 2000. – 12. – С. 12-15. [2] Дябин А.Г. Сорокин А.Я, Ступоченко В.Е. Применение технологий повышения нефтеотдачи научно-производ-
ственным центром ОАО «РМНТК «Нефтеотдача» // Нефтяное хозяйство. – 2000. – 12. – С. 16-18. [3] Сафонов Е.Н., Алмаев Р.Х. Применение новых методов увеличения нефтеотдачи на месторождениях Башкор-
костана // Нефтяное хозяйство. – 2002. – 4. – С. 38-40.

Известия Национальной академии наук Республики Казахстан
166
[4] Мякинник Н. Повышение нефтеотдачи – основной резерв увеличения добычи // Нефть России. – 2000. – 8. – С. 34-39.
[5] Фахретдинов Р.Н., Каледин Ю.А., Житкова М.В. Потенциал современных информационных технологий при оценке эффективности методов увеличения нефтеотдачи // Нефтяное хозяйство. – 2001. – 3. – С. 54-55.
[6] Хасанов М.М, Мухамедшин Р.К., Хатмуллин И.Ф. Компьютерные технологии решения многокритериальных задач мониторинга разработки нефтяных месторождений // Вестник инжинирингового центра ЮКОС. – 2001. 2. – С. 26-29.
[7] Казаков А.А. Методическое обеспечение единых подходов оценки эффективности методов ПНП // Технологии ТЭК. – 2003. – 2. – С. 47-53.
[8] Методическое руководство по оценке технологической эффективности применения методов увеличения нефте-отдачи пластов (утвержденное). – М.: Минтопэнерго РФ, РМНТК «Нефтеотдача», «ВНИИнефть». 1993. – 130 с.
[9] Шахвердиев А.Х., Панахов Г.М., Аббасов Э.М., Расулова С.Р. О возмож-ности регулирования вязкостной аномалии в гетерогенных смесях // Вестник РАЕН. – 2014. – 1. – С. 28-33.
[10] Сыртланов В.Р., Кадочникова Л.М., Трушникова О.М. Методики оценки эффективности геолого-технологи-ческих мероприятий на основе трехмерного гидродинамического моделирования // Нефтяное хозяйство. – 2002. – 6. – С. 38-40.
[11] Глухих И.Н., Пьянков В.Н, Заболотнов А.Р. Ситуационные модели в корпоративных базах знаний геолого-технологических мероприятий // Нефтяное хозяйство. – 2002. – 6. – С. 45-48.
[12] Гомзиков В.К., Молотова Н.А., Румянцева А.А. Исследование влияния основных геологических и техноло-гических факторов на конечную нефтеотдачу пластов при водонапорном режиме // Тр. ВНИИ. – 1975. – Вып. 58. – С. 16-30.
[13] Шпуров А. В., Пьянков В.Н., Клочков А.А., Бриллиант Л.С. Планирование эффективности геолого-техни-ческих мероприятий при прогнозировании добычи нефти // Нефтяное хозяйство. – 2000. – 9. –С. 105-108.
[14] Пьянков В.Н., Филев А.И. Интегральный программный комплекс «Баспро-аналитик» // Нефтяное хозяйство. – 2000. – 9. – С. 109-114.
[15] Методическое руководство по оценке технологической эффективности применения методов увеличения нефте-отдачи пластов. – М.: РМНТК «Нефтеотдача», «ВНИИнефть». 1994. – 100 с.
[16] Швецов И.А., Манырин В.Н. Физико-химические методы увеличения нефтеотдачи пластов. Анализ и проек-тирование. – Самара: Российское представительство акционерной компании «Ойл Техноложи Оверсиз Продакшн Лими-тед», 2000. – 336 с.
[17] Казаков А.А. Разработка единых методических подходов оценки эффективности геолого-технических меро-приятий по повышению нефтеотдачи / пластов и интенсификации добычи нефти (В порядке обсуждения) // Нефтяное хозяйство. – 2003. – 4. – С. 26-29.
[18] Шахвердиев А.Х., Рыбицкая Л.П. Оценка технологической эффективности при воздействии на залежи угле-водородов // Нефтяное хозяйство. – 2003. – 4. – С. 65-68.
[19] Герштанский О.С., Шерстнев Н.М., Киинов Л.К. и др. Полимерсодержащие композиции ПАВ в нефтедобыче. – ОАО «ВНИИОЭНГ», 1997. – 95 с.
[20] Салаватов Т.Ш., Сулейманов Б.А., Нуряев А.С. Селективная изоляция притока жестких пластовых вод в добы-вающих скважинах // Нефтяное хозяйство. – 2000. – 12. – С. 81-83.
[21] Сарваретдинов Р.Г., Гильманова Р.Х., Хисамов Р.С. и др. Формирование базы данных для разработки геолого-технических мероприятий оптимизации добычи нефти // Нефтяное хозяйство. – 2001. – 8. – С. 32-35.
[22] http:/www.nitpo.ru/science/ourwor.ks/article11.html [23] Лысенко В.Д. Определение эффективности мероприятий по увеличению нефтеотдачи и интенсификации до-
бычи нефти // Нефтяное хозяйство. – 2004. – 2. – С. 114-118. [24] Лысенко В.Д. Оценка эффективности мероприятий по увеличению добычи нефти и конечной нефтеотдачи //
Нефтяное хозяйство. – 2001. – 12. – С. 49-54. [25] Булыгин Д.В., Фахретдинов Р.Н., Рамазанов Р.Г., Герасимов А.Н. Использование системы ТРИАС для
применения методов воздействия на пласт // Нефтяное хозяйство. – 2003. – 10. – С. 86-90. [26] Абасов М.Т., Эфендиев Г.М., Стреков А.С. и др. Оценка сравнительной эффективности геолого-технических
мероприятий по комплексной информации // Нефтяное хозяйство. – 2003. – 10. – С. 70-73. [27] Методическое руководство по оценке технологической эффективности применения методов увеличения неф-
теотдачи пластов. – Уфа, Юганск: ВНИИЦ «Нефтегазтехнология», 1997. – 120 с. [28] Жантурин Ж.К. Разработка мероприятий по интенсификации добычи нефти с целью их проведения в различ-
ных геолого-физических условиях Казахстана: Диссертация канд. технических наук. – Атырау, 2009. – 115 с. [29] Кобзарь А.И. Прикладная математическая статистика. Для инженеров и научных работников. – М.:
ФИЗМАТЛИТ, 2006. – 816 с. [30] Lloyd E. N. Least-squares estimation of location and scale parameters using order statistics // Biometrika. – 1952. –
Vol. 39. – P. 88-95. [31] Мирзаджанзаде А.Х., Сидоров Н.А., Ширинзаде С.А. Анализ и прогнозирование показателей бурения. – М.:
Недра, 1976. – 237 с. [32] Подиновский В.В., Гаврилов В. М. Оптимизация по последовательно применяемым критериям. М.: Сов. радио,
1975. – 192 с. [33] Михеев П.С. Автоматизированная система поддержки принятия решения о выборе параметров геолого-техни-
ческих мероприятий на основе гидродинамических моделей: Канд. дис. – Уфа, 2006. – 162 с. [34] Cottini-Loureiro A., SPE, Araujo М., SPE Optimized Well Location by Combination of Multiple Realization Approach
and Quality Map Methods, Imperial C., 2005. Society of Petroleum Engineers. – SPE 95413.

ISSN 2224-5278 Серия геологии и технических наук. 4. 2018
167
[35] Santellani G., AGIP S.p.A., Hansen B., Norsk Agip, Herring T., an Optimised Well Location Algorithm for Reservoir Simulation, Norsk Agip, 1998. Society of Petroleum Engineers. – SPE 39754.
[36] Силич В.А., Комагоров В.И., Савельев А.О., Алексеев А.А. Построение информационной системы поддержки принятия решений при выборе вида геолого-технического мероприятия на нефтедобывающей скважине // Доклады ТУСУРа, Информационные технологии. – Декабрь, 2011. – 2(24), часть 2. – С. 295-299.
[37] Strekov A.S., Mamedov P.Z., Koyshina A.I. Decisions-making on the choice of geological and technical measures under uncertainty // Seventh International Conference on Soft Computing, Computing with Words and Perceptions in System Analysis, Decision and Control. – Izmir, Turkey September 2-3, 2013. – P. 381-384.
[38] Илюшин П.Ю., Рахимзянов Р.М., Соловьев Д.Ю., Колычев И.Ю. Анализ проведения геолого-технических мероприятий по увеличению продуктивности добывающих скважин на нефтяных месторождениях Пермского края // Вестник Пермского национального исследовательского политехнического университета. Геология, нефтегазовое и гор-ное дело. – 2015. – 15. – С. 81-89.
[39] Колтун А.А. Оценка эффективности и оптимальное планирование геолого-технических мероприятий на нефтя-ных месторождениях: Дис. канд. наук. – М., 2005. – 112 с.
А. И. Койшина1, О. Г. Кирисенко2, Б. Н. Койлыбаев1, К. К. Агаева2
1Ш. Есенов атындағы Каспий мемлекеттік технологиялар жəне Инжиниринг университеті, Ақтау, Қазақстан,
2Азербайджан ұлттық ғылым академиясының мұнай жəне газ институты, Баку, Азербайджан
ҚАЗІРГІ ЗАМАНҒЫ ЖАҒДАЙЫ ЖƏНЕ ЖЕТІСТІКТЕРІ: ГЕОЛОГО-ТЕХНИКАЛЫҚ ШАРАЛАРДЫ ТАҢДАУ БОЙЫНША
ШЕШІМНІҢ ҚАБЫЛДАНУЫ
Аннотация. Мұнай кенорындарын игеру кезінде ГТШ жəне əртүрлі жаңа технологияларды қолдану есебінен тиімділікті арттыруға көп көңіл бөлінеді. Нақты жағдайда қажетті технолого-экономикалық тиімді-лікті қамтамасыз етуде, ең жақсы əдісті дұрыс таңдауда, олардың технологияларын дамуы жəне МАƏ, соны-мен қатар ГТШ кеңінен қолдануда көптеген сұрақтар қойылады. Мұндай сұрақтарға зерттеушілердің үлкен қызығушылықтарымен қатар, қазіргі таңда нақты жағдайда əртүрлі ГТШ түрлерін салыстырмалы бағалау кезінде маңызды қиыншылықтар туындайды. Қазіргі таңда кешенді геолого-физикалық жəне технологиялық ақпараттар негізінде ГТШ тиімділіктерін арттыру мəселелері актуалды жəне сəйкесінше шешім қабылдануға ие болады. Кенорынды игерудің тиімділігін арттыру мақсатында алдымен бар мүмкіндікті дұрыс реттеу сəй-кесінше дұрыс бағыттауға мүмкіндігі бар бағдарламаларды жəне қазіргі таңдағы əдістерді қолданумен əр-түрлі ГТШ қолдану жағдайы мұқият талдау жасауға мүмкіндік береді. Көп жылдар бойы зерттеулер əртүрлі ғылыми жəне өндірістік ұйымдарда, кенорында игерудің тиімділігін арттыруға бағытталып жүргізілді. Əртүрлі кенорында ГТШ енгізу жəне таңдау тəжірибелерін талдау қызығушылықты тудырады. Мақалада ГТШ таңдаудың қазіргі таңдағы жағдайын талдау жəне жинақтар келтіріледі. Əртүрлі кенорындарда ГТШ тиімділіктерін бағалау жəне қолдану мысалдары көрсетілген. Соңғы жылдары өткізілген геолого-техникалық шаралардың тиімділігін арттыру реализациясы, шешімдер қабылдану жəне көрсеткіштер болжамдары, талдау əдістерін жетілдіру жəне дамуы байқалады. Мұнай кенорындарында геолого-техникалық шараларын тиімді жоспарлау жəне тиімділікті бағалау үшін кешенді əдістерді құру жəне олардың математикалық, бағ-дарламалық жəне ақпараттық қамтамасыз ету тапсырмалары зерттеушілердің жүргізілген жұмыстары нəти-желерінде шешілген; шешімді қабылдауды қолдаудың жəне оның алгоритмінің жұмыс істеуінің автомат-тандырылған жүйелер құрылымы игерілген; қалыптасқан факторлардан ГТШ тиімділігінің көрсеткіштерін көрсететін, сəйкесінше факторларға қабатты сипаттайтын, қайта құру белгілері жолымен (сызықты жəне мультипликативтік) теңдеулер құрастырылды; ең жақсы таңдау бойынша шешім қабылдау нəтижелері алынды жəне нұсқалық есептеулер жолымен жəне салыстырмалы тиімділікті талдау əртүрлі жағдайдағы сол немесе өзге ГТШ жолдары көрсетілген.
Түйін сөздер: геолого-техникалық шаралар (ГТШ), кенорынды игеру, шешім қабылдануы, мұнайды өндіру, мұнайбергіштік.

Известия Национальной академии наук Республики Казахстан
168
N E W S OF THE NATIONAL ACADEMY OF SCIENCES OF THE REPUBLIC OF KAZAKHSTAN
SERIES OF GEOLOGY AND TECHNICAL SCIENCES
ISSN 2224-5278
Volume 3, Number 430 (2018), 168 – 173
O. A. Vasiliev1, V. G. Semenov1, Yu. A. Yuldashbayev2, D. A. Baimukanov3, Kh. A. Aubakirov4
1Chuvash state agricultural academy, Cheboksary, Chuvash Republic, Russian Federation,
2Russian state agricultural university – Moscow Agricultural academy named after K. A. Timiryazev, Moscow, Russian Federation,
3Kazakh Scientific Research Institute of Animal Breeding and Fodder Production, Almaty, Kazakhstan, 4Taraz State University named after M. Kh. Dulati, Taraz, Kazakhstan.
SOIL COVER OF THE "ZAOVRAZHNY" MICRO-DISTRICT, CHEBOKSARY, AND ITS ECOLOGICAL STATE
Abstract. In July-August 2017, soil and agrochemical investigations of the territory of the Zaovrazhny micro-
district in Cheboksary city were carried out. The territory of the new Zaovrazhny micro-district in Cheboksary is located to the west of the north-western
residential area of Cheboksary; it is bounded from the north by the coastal fortifications of the Cheboksary storage reservoir, and on the southern side by the M-7 highway (Cheboksary-Moscow).
Light gray forest heavy loam soils are widespread in the micro-district, in the middle and lower parts of the slope altered by water erosion. The undistorted soils are characterized by the following morphological features: a sod horizon Ad of 5-10 cm in thickness, a humus-eluvial horizon Al up to 15-20 cm. Below it, a transitional horizon AlA2 with a thickness of 5-15 cm is located. Gradually, A1A2 passes into the eluvial-illuvial horizon A2B up to 20 cm thick. Illuvial horizon B consists of several subhorizons: B1 – dark brownish-brown color with spots of humic sub-stances and pseudopodzolic siliceous powder; it gradually shades into a more clarified B2, followed by the tran-sitional horizon BC and the soil-forming rock C (loess-like loam).
The content of heavy metals in the humus horizon and soil-forming rock, oil products, radio nuclides and benzapyrene corresponds to the background values and does not exceed the MPC.
The soil cover of the Zaovrazhny micro-district and its ecological state were studied for the first time. Keywords: agrochemical properties, water erosion, humus horizon, soil-forming rocks, gray forest soils, heavy
metals. УДК 631.1
О. А. Васильев1, В. Г. Семенов1, Ю. А. Юлдашбаев2, Д. А. Баймуканов3, Х. А. Аубакиров4
1Чувашская государственная сельскохозяйственная академия, Чебоксары, Чувашская Республика, Россия, 2Россисйский государственный аграрный университет – Московская сельскохозяйственная академия им. К. А. Тимирязева, Москва, Россия,
3Казахский научно-исследовательский институт животноводства и кормопроизводства, Алматы, Казахстан, 4Таразский государственный университет им. М. Х. Дулати, Тараз, Казахстан
ПОЧВЕННЫЙ ПОКРОВ МИКРОРАЙОНА «ЗАОВРАЖНЫЙ» Г. ЧЕБОКСАРЫ И ИХ ЭКОЛОГИЧЕСКОЕ СОСТОЯНИЕ
Аннотация. В июле-августе 2017 г. проводились почвенно-агрохимические исследования территории микрорайона «Заовражный» г. Чебоксары.
Территория нового микрорайона «Заовражный» г. Чебоксары расположена к западу от северо-западного жилого района г. Чебоксары; она с севера ограничена береговыми укреплениями Чебоксарского водохрани-лища, а с южной стороны автотрассой «М-7» (Чебоксары-Москва).

ISSN 2224-5278 Серия геологии и технических наук. 4. 2018
169
На территории микрорайона распространены светло-серые лесные тяжелосуглинистые почвы, в средней и нижней части склона измененные водной эрозией. Несмытые почвы характеризуются следующими морфо-логическими признаками: дерновый горизонт Ад мощностью 5-10 см, гумусово-элювиальный горизонт А1 до 15-20 см. Под ним расположен переходный горизонт А1А2 мощностью 5-15 см. Постепенно А1А2 переходит в элювиально-иллювиальный горизонт А2В мощностью до 20 см. Иллювиальный горизонт В состоит из не-скольких подгоризонтов: В1 – темно-буровато-коричневой окраски с пятнами гумусовых веществ и лессиви-рованной кремнеземистой присыпки; он постепенно переходит в более осветленный В2, сменяющиеся переходным горизонтом ВС и почвообразующей породой С (лессовидный суглинок).
Содержание тяжелых металлов в гумусовом горизонте и почвообразующей породе, нефтепродуктов, радионуклеидов и бензапирена соответствует фоновым значениям и не превышают ПДК.
Почвенный покров микрорайона «Заовражный» и его экологическое состояние изучались впервые. Ключевые слова: агрохимические свойства, водная эрозия, гумусовый горизонт, почвообразующие
породы, серые лесные почвы, тяжелые металлы. Введение. Территория нового микрорайона «Заовражный» г. Чебоксары расположена к западу
от северо-западного жилого района г. Чебоксары; она с севера ограничена береговыми укреп-лениями Чебоксарского водохранилища, а с южной стороны автотрассой «М-7» (Чебоксары-Москва). Почвенный покров микрорайона «Заовражный» не изучен, и его исследование и опре-деление экологического состояния изучалось впервые.
Материалы и методы. Почвенные исследования проводились в соответствии с ГОСТ 17.4.2.03-86. При диагностике почвенного покрова микрорайона «Заовражный» использовалась «Классификация и диагностика почв СССР» (1977 г.). Содержание подвижного фосфора и обмен-ного калия определялось методом Кирсанова, рНобм. – ионометрически. Химический, бак-териологический, гельминтологический анализы почвенных проб производились в ФГБУЗ ЦГиЭ 29ФМБА России 2637, а также в ФГУ ГЦАС «Чувашский».
Результаты исследований и их обсуждение. Территория микрорайона «Заовражный» расположена в Северо-Западной части г.Чебоксары и занимает площадь 41 га. До 2002 г. терри-тория микрорайона использовалась в качестве пашни.
В 2017 г. она представляла собой залежь, поросшую осотом, пижмой и вейником с группи-ровками молодого леса 10-15-летнего возраста, местами застроенную коттеджами, с проведенными инженерно-техническими сетями (электричество, водопровод) вдоль улиц.
Площадка настоящих изысканий в геоморфологическом отношении приурочена к право-бережному плато долины р. Волга с генетическим типом поверхности – денудационным, в 300-350 м юго-восточнее площадки протекает р. Шупашкарка, правый приток реки Волги, с северо-востока и частью с юго-востока территория граничит с дачными участками, с северо-запада – с лесным мас-сивом государственного лесного фонда.
Рельеф территории застройки полого наклонный, с понижением к северо-востоку, в сторону р. Волги.
Геологический разрез до изученной бурением глубины 10 м представлен в основном корен-ными верхнепермскими и среднеюрскими породами, которые сверху прикрыты четвертичными отложениями – лессовидными суглинками. Покровные тяжелые лессовидные суглинки – тяжелые, твердые, полутвердые, тугопластичные коричневого и светло-коричневого цвета, макропористые, с точками гумуса и прожилками известковистости, ожелезненные, с тонкими прослойками песка [6].
Подземные воды постоянного водоносного горизонта вскрыты в южной части площадки в скважинах на глубинах 2,6-7,2 м в верхней трещиноватой зоне верхнепермских отложений.
По химическому составу грунтовая вода пресная (М = 0.3-0.5 г/л), гидрокарбонатная, маг-ниево-кальциевая, от слабокислой до слабощелочной, жесткая, умеренно-жесткая, с рН 6,3-6,4.
В результате настоящих почвенных исследований выявлено, что на территории микрорайона «Заовражный» г. Чебоксары почвенный покров представлен смытыми разновидностями (слабо-смытыми, средне- и сильносмытыми) светло-серой лесной почвы.
Несмытые почвы характеризуются следующими морфологическими признаками: дерновый горизонт Ад мощностью 5-10 см, гумусово-элювиальный горизонт А1 светло-серого или серого цвета, небольшой мощности (до 15-20 см).

Известия Национальной академии наук Республики Казахстан
170
Переходный горизонт А1А2 светло-серой окраски, мелко-ореховато-комковатой структуры, мощностью 5-15 см. Постепенно А1А2 переходит в элювиально-иллювиальный горизонт А2В мощностью до 20 см, для которого характерна мелкоореховатая структура, присыпка кремнезема на гранях структурных отдельностей в сочетании с пятнами вмывания гумуса и других веществ.
Иллювиальный горизонт В состоит из нескольких подгоризонтов: В1 – темно-буровато-коричневой окраски с пятнами гумусовых веществ и лессивированной кремнеземистой присыпки; он постепенно переходит в более осветленный В2, сменяющиеся переходным горизонтом ВС и почвообразующей породой С (лессовидный суглинок).
При почвенных исследованиях к слабосмытым разновидностям относили почвы, в которых вспашкой затронута верхняя часть горизонта А2В; к среднесмытым – при вовлечении в пахотный слой большей части или всего горизонта А2В, и его отсутствии; и к сильносмытым – почвы, в профиле которых отсутствовали горизонты А2В и В1.
Особенности морфологических признаков почв залежи состоит в том, что бывший одно-родный пахотный слой Ап разделился на два генетических горизонта – А1 и А1А2, которые при-сутствуют в целинных почвах.
Описание профиля слабосмытой светло-серой лесной тяжелосуглинистой среднемощной почвы на лессовидном суглинке (разрез 1), заложенного на залежи, поросшей березами и осинами с изреженным травянистым покровом (костер, цикорий, тысячелистник, одуванчик) показано в таблице 1.
Таблица 1 – Описание профиля слабосмытой светло-серой лесной почвы
А1 0-20 см Влажный, серый, тяжелосуглинистый, комковатый, рыхлый, Встречаются корни, ходы червей, дождевые черви, личинки майского жука, переход ясный.
А1А2 20-25 см Влажный, белесо-серый, тяжелосуглинистый, комковатый, плотный, встречаются корни, блестки кремнезема, ходы червей, переход ясный.
А2В 25-38 см Увлажненный, коричневато-серый, тяжелосуглинистый, комковато-мелкоореховатый, не вскипает от 10% соляной кислоты.
В1 38-49 см Увлажненный, коричневато-буроватый, тяжелосуглинистый, ореховатый, с блестками кремнезема и пятнами гумуса, не вскипает от 10% соляной кислоты.
В2 49-91 см Увлажненный, коричневый, тяжелосуглинистый, крупно-ореховатый, с пятнами гумуса, не вскипает от 10% соляной кислоты.
ВС 91-130 см Увлажненный, коричневый, с ходами корней, редкими пятнами гумуса, тяжелосуглинистый, бесструктурный, не вскипает от 10% соляной кислоты.
С 130-180 см Увлажненный, светло-коричневый, тяжелосуглинистый, бесструктурный, в нижней части слабо вскипает от 10% соляной кислоты.
В среднесмытых светло-серых лесных почвах на залежи с густым разнотравьем процессы
водной эрозии резко ослаблены, на месте бывшего серовато-бурого цвета пахотного слоя обра-зовался дерновый горизонт Ад и гумусово-элювиальный горизонт А1 или переходный А1А2. Они равномерно серого цвета с включениями коричнево-бурых глинистых комочков, иногда со светлой кремнеземистой присыпкой.
Под ними залегает переходный горизонт А2В, по глубине верхней границы которого опре-делялась степень смытости почвы (таблица 2).
В сильносмытых светло-серых лесных почвах, окаймляющих нижнюю часть склона, процессы водной эрозии под разнотравьем также ослабились, и на месте бывшего пахотного слоя также образовался дерновый горизонт Ад, который подстилается иллювиальным горизонтом В.
Вследствие ослабленности элювиально-элювиального почвообразовательного процесса из-за низкой водопрочности агрегатов, сильного бокового стока воды профиль сильносмытых светло-серых лесных почв укорочен (таблица 3).
В результате проведенных почвенных исследований составлена почвенная карта микрорайона «Заовражный» в масштабе М 1:500 (ГОСТ 17.4.2.03-86).

ISSN 2224-5278 Серия геологии и технических наук. 4. 2018
171
Таблица 2 – Описание профиля среднесмытой светло-серой лесной почвы
Ад 0-8 см Влажный, серый, с отдельными комочками коричнево-буроватого цвета, тяжелосуглинистый, комковатый, рыхлый. Густо переплетены корни, встречаются ходы червей, дождевые черви, редко – личинки майского жука, переход ясный.
А1А2 8-23 см Влажный, белесо-серый, с отдельными комочками белесовато-бурого цвета, тяжелосуглинистый, мелкоореховато-комковатый, уплотненный, встречаются корни, блестки кремнезема, ходы червей, переход ясный.
А2В 23-26 см Увлажненный, коричневато-серый, тяжелосуглинистый, комковато-мелкоореховатый, плотный, не вскипает от 10% соляной кислоты.
В1 26-36 см Увлажненный, коричневато-буроватый, тяжелосуглинистый, ореховатый, с блестками кремнезема и пятнами гумуса.
В2 36-85 см Увлажненный, коричневый, тяжелосуглинистый, крупно-ореховатый, с пятнами гумуса.
ВС 85-110 см Увлажненный, светло-коричневый, тяжелосуглинистый, бесструктурный, не вскипает от 10% соляной кислоты.
Таблица 3 – Описание профиля сильносмытой светло-серой лесной почвы
Ад 0-7 см Влажный, серовато-бурый, тяжелосуглинистый, комковатый, рыхлый. Густо переплетены корни, встречаются ходы червей, дождевые черви, личинки майского жука, переход ясный.
АВ 7-16 см Влажный, серовато-кричневато-бурый, тяжелосуглинистый, уплотненный,
В2 16-59 см Увлажненный, коричневый, тяжелосуглинистый, крупно-ореховатый, с пятнами гумуса.
ВС 59-82 см Увлажненный, светло-коричневый, тяжелосуглинистый, бесструктурный, не вскипает от 10% соляной кислоты.
Почвенные исследования выявили, что на территории микрорайона общая площадь эроди-
рованных почв составляет 86,7%, что соответствует выводам, полученным в результате мони-торинга почв Чувашской Республики – эродированно более 80% пашни [2, 5].
На общей площади 41 га сформировались следующие почвенные разновидности светло-серых лесных почв (таблица 4).
Таблица 4 – Площади почвенных разновидностей на территории микрорайона «Заовражный» г. Чебоксары
Название почв Индекс почвы
Площадь
га %
1 Светло-серые лесные тяжелосуглинистые среднемощные почвы на лессовидном суглинке
Л1 с/л 5,1 12,4
2 Светло-серые лесные тяжелосуглинистые среднемощные слабосмытые почвы на лессовидном суглинке
Л1 с/л↓ 20,7 50,6
3 Светло-серые лесные тяжелосуглинистые, среднемощные, среднесмытые на лессовидном суглинке
Л1т/л↓↓ 11,1 27,0
4 Светло-серые лесные тяжелосуглинистые, среднемощные, сильносмытые на лессовидном суглинке
Л1т/л↓↓↓ 4,1 10,0
Всего 41 100,0
Результаты агрохимических анализов образцов почв характеризуют почвы как типичные для
светло-серой лесной почвы северной природно-сельскохозяйственной зоны Чувашии [3, 4, 7]. Содержание гумуса в почвах площадки низкое – от 1 до 3% (очень низкое и низкое). Сумма
обменных оснований (S) в верхнем горизонте почв составляет 16,7-21,3 мг-э/100 г, гидроли-тическая кислотность (Нг) – 1,03-4,43 мг-э/100 г почвы. Содержание подвижного фосфора и об-менного калия характерное для светло-серых лесных почв: в основном среднее и повышенное. Cтепень насыщенности основаниями почвы составляет 82-94%. Реакция почв колеблется от среднекислой до нейтральной.

Известия Национальной академии наук Республики Казахстан
172
Изучение содержания радионуклеидов (цезий-137 и стронций-90) в верхнем горизонте почвы (В1) показало низкое их содержание – 8,6 – 12,20 и 3,3 – 4,4 Бк/кг соответственно.
Согласно показателям ГОСТ 17.5.3.06-85 и расчетам мощность плодородного слоя почв на общей площади строительной площадки общей площадью 41 га в среднем составляет 20 см. Общая масса плодородного слоя почвы при средней плотности сложения 1,14 г/см3 составляет при этом 2280 тонн.
Общая масса потенциально плодородного слоя мощностью 25 см и средней плотностью сложения 1,25 г/см3, расположенного под плодородным слоем, составляет в среднем 3125 тонн/га.
Выводы. В результате проведенных исследований выявлен почвенный покров микрорайона «Заовражный». Современное состояние качества почв территории микрорайона соответствуют санитарно-эпидемиологическим требованиям. Результаты исследований однозначно свидетель-ствуют об экологическом благополучии территории города Чебоксары Чувашской Республики [1], учитывая расположенные рядом с овражной системой новостройки.
ЛИТЕРАТУРА
[1] Васильев. О.А., Ильина Т.А., Чернов А.В. Экологическое состояние почв территории Красной площади и залива
г. Чебоксары // II Международня научно-практическая конференция, посвященная году экологии в России "Экологи-ческие, правовые и экономические аспекты рационального использования земельных ресурсов" (04-05 мая 2017 г.). – Саратов: ФГБОУ Саратовский ГАУ им. Н. И. Вавилова, 2017. – С. 54-59.
[2] Васильев О.А., Егоров В.Г., Дмитриева О.Ю., Ильин А.Н. Состояние и перспективы использования пашни в Чувашской Республике // Материалы XII всероссийской научно-практической конференции «Молодежь и инновации». – Чебоксары: ЧГСХА, 2016. – С. 3-7.
[3] Васильев О.А., Кирьянов Д.П., Фадеева Н.А. Валовой химический состав почв Чувашской Республики и влия-ние его на агрохимические свойства // Мат. Всероссийской науч.-практ. конф. «Агроэкологические и организационно-экономические аспекты создания и эффективного функционирования экологически стабильных территорий». – Чебок-сары, 5 октября 2017. – С. 18-23.
[4] Иванова Т.Н., Сергеев В.С. Динамика агрохимических показателей плодородия почвы по результатам локаль-ного мониторинга // Вестник Башкирского аграрного университета. – 2017. – 2(42). – С. 11-15.
[5] Ильина Т.А., Васильев О.А. Экологическое состояние агроландшафтов и особо охраняемых природных террито-рий Чувашской Республики: Монография. – Чебоксары: Типография ИП Сорокина А.В. «Новое время», 2011. – С. 153.
[6] Технический отчет ОАО «ЧувашГИИЗ» об инженерно-геологических изысканиях на объекте: «Комплексное освоение территории микрорайона «Заовражный»» (заказ 9762). – 2014. – 32 с.
[7] Чернов А.В., Васильев О.А. Динамика плодородия почв Чувашской Республики // Материалы Всероссийской научно-практической конференции "Агроэкологические и организационно- экономические аспекты создания и эффек-тивного функционирования экологически стабильных территорий", 05 октября 2017. – Чебоксары, 2017. – С. 157-163.
О. А. Васильев1, В. Г. Семенов1, Ю. А. Юлдашбаев2, Д. А. Баймуканов3, Х. А. Əубəкіров4
1Чуваш мемлекеттік ауыл шаруашылық академиясы, Чебоксары қ., Чуваш Республикасы, Ресей, 2Ресей мемлекеттік аграрлық университеті – К. А. Тимирязев атындағы ауыл шаруашылық академиясы,
Москва, Ресей, 3Қазақ мал жəне мал азығы ғылыми-зерттеу институты, Алматы, Қазақстан,
4Тараз ұлттық университеті М. Х. Дулати атындағы, Тараз, Қазақстан
ЧЕБОКСАРЫ ҚАЛАСЫНЫҢ «ЗАОВРАЖНЫЙ» МӨЛТЕК АУДАНЫНДАҒЫ ТОПЫРАҚ ҚҰРАМЫ МЕН ЭКОЛОГИЯЛЫҚ ЖАҒДАЙЫ
Аннотация. 2017 жылдың шілде-тамыз айларында Чебоксары қаласындағы «Заовражный» мөлтек ауда-
нындағы топырақтың агрохимиялық құрамы зерттелді. Чебоксары қаласындағы жаңа «Заовражный» мөлтек ауданы территориясы Чебоксары қаласының
солтүстік-батысында орналасқан; ол солтүстігінен Чебоксары су қоймасының жағалаулық су бекіністерімен, ал оңтүстік жағынан «М-7» көлік жолымен шектелген (Чебоксары-Москва).
Мөлтек ауданы территориясында ашық-сұр түсті орманның ауыр батпақты топырағы таралған, ал орта жəне төменгі тұстарында ол су эррозиясына ұшырап өзгерген. Сумен шайылған топырақтар келесідей мор-фологиялық белгілерімен сипатталады: Ад дерналық қабатының қалыңдығы 5-10 см, қарашірікті-элювиальды А1қабаты 15-20 см дейін. Олардың астында қалыңдығы 5-15 см құрайтын А1А2өтпелі қабаты орналасқан. Біртіндеп А1А2 қалыңдығы 20 см дейін жететін А2В элювиальды-иллювиалды қабатына өтеді. В –иллю-виальды қабаты бірнеше қабат қатпарларынан тұрады: В1 – қара-қоңыр түсті қарашірікті заттардық тең-

ISSN 2224-5278 Серия геологии и технических наук. 4. 2018
173
білдері бар жəне лессивировты кремни реңді себінделерден құралады; ол біртіндеп ақшыл тартқан В2 қаба-тына, содан кейін өтпелі ВС жəне топырақ құраушы С (лессогоұқсас суглинок) қабаттарына айналады.
Топырақ құраушы қарашірікті қабаты құрамындағы ауыр металдардың, мұнай өнімдерінің, радио-нуклеидтер мен бензапирендер мөлшерлері фондық мəндеріне сəйкес келеді жəне ШРК аспайды.
«Заовражный» мөлтек ауданындағы топырақ қабаты мен оның экологиялық жағдайы алғаш рет зерттелінді.
Түйін сөздер: агрохимиялық қасиеті, су эррозиясы, қарашірікті қабат, топырақ құраушы породалар, сұр түсті орман топырағы, ауыр металдар.
Сведения об авторах: Васильев Олег Александрович – доктор биологических наук, профессор кафедры землеустройства, ка-
дастров и экологии Чувашской государственной сельскохозяйственной академии, г. Чебоксары, Чувашская Республика, Россия, e-mail: [email protected],
Семенов Владимир Григорьевич – доктор биологических наук, профессор, заслуженный деятель науки Чувашской Республики, профессор кафедры морфологии, акушерства и терапии Чувашской государственной сельскохозяйственной академии, г. Чебоксары, Чувашская Республика, Россия, e-mail: [email protected],
Юсупжан Артыкович Юлдашбаев – доктор сельскохозяйственных наук, профессор, член-корреспондент РАН, декан факультета зоотехния и биология Российский государственный агарный университет – Москов-ская сельскохозяйственная академия им. К. А. Тимирязева, Москва, Россия, e-mail: [email protected],
Баймуканов Дастанбек Асылбекович – доктор сельскохозяйственных наук, профессор, член-корреспон-дент Национальной академии наук Республики Казахстан, главный научный сотрудник отдела разведения и селекции молочного скота Казахского научно-исследовательского института животноводства и кормопроиз-водства, Алматы, Казахстан, e-mail: [email protected].
Аубакиров Хамит Абилгазиевич – кандидат сельскохозяйственных наук, доцент кафедры биотехнологии Таразского государственного университета им. М. Х. Дулати, Тараз, Казахстан. E-mail: [email protected]
Известия Национальной академии наук Республики Казахстан
174
N E W S OF THE NATIONAL ACADEMY OF SCIENCES OF THE REPUBLIC OF KAZAKHSTAN
SERIES OF GEOLOGY AND TECHNICAL SCIENCES
ISSN 2224-5278
Volume 3, Number 430 (2018), 174 – 185 UDC 541.13:546.23
R. N. Nasirov1, I. B. Samatov2, A. P. Slyussarev2, A. R. Nasirov1
1Atyrau state university named by Kh. Dosmukhamedov, Atyrau, Kazakhstan, 2LLP “Institute of Geological Sciences named by K. I. Satpaev”, Almaty, Kazakhstan
COMPLEX MINERALOGICAL AND LITHOLOGICAL STUDY OF SEDIMENTARY OIL AND GAS BEARING ROCKS
OF THE PRECASPIAN REGION BY EPR, IR-SPECTROSCOPY, X-RAY DIFFRACTOMETRY AND THERMAL ANALYSIS
Abstract. This article presents the results of the determination of clay minerals of the kaolinite group (kaolinite,
montmorillonite) by electron paramagnetic resonance (EPR), IR spectroscopy, X-ray diffractometry and thermal analysis in the mineralogical analysis of sedimentary rocks of the Caspian depression.
Comparison of data on the content of kaolinite in the studied rocks, which were obtained by X-ray diffractometry and thermal analysis, with intensities of the anisotropic EPR signal from kaolinite shows a good correlation. In this connection, we propose an express method for determining kaolinites in petroleum rocks, based on a linear relationship between the intensity of an anisotropic (g = 2,046 and g = 2,0028) EPR signal and the content of kaolinites in sedimentary rocks.
The developed method of processing the spectral characteristics of EPR and IR spectra, diffractometric and thermal characteristics of clay kaolinite minerals of sedimentary strata can also be used as reference and information data for identification of montmorillonite and kaolinite clays during the isolation of horizons with high screening properties.
Key words: kaolinite, montmorillonite, sedimentary rocks, clay cap rocks, smectite, mixed-layer mineral (MLM).
УДК 541.13:546.23
Р. Н. Насиров1, И. Б. Саматов2, А. П. Слюсарев2, А. Р. Насиров1
1Атырауский государственный университет им. Х. Досмухамедова, Атырау, Казахстан, 2ТОО «Институт геологических наук им. К. И. Сатпаева», Алматы, Казахстан
КОМПЛЕКНОЕ МИНЕРАЛОГИЧЕСКОЕ И ЛИТОЛОГИЧЕСКОЕ ИССЛЕДОВАНИЕ ОСАДОЧНЫХ
НЕФТЕГАЗОНОСНЫХ ПОРОД ПРИКАСПИЙСКОГО РЕГИОНА МЕТОДОМ ЭПР, ИК-СПЕКТРОСКОПИИ, РЕНТГЕНОВСКОЙ
ДИФРАКТОМЕТРИИ И ТЕРМИЧЕСКОГО АНАЛИЗА Аннотация. В статье приводятся результаты определения глинистых минералов группы каолинита
(каолинит, монтмориллонит) методами электронного парамагнитного резонанса (ЭПР), ИК-спектроскопии, рентгеновской дифрактометрии и термического анализа при минералогическом анализе осадочных пород Прикаспийской впадины.

ISSN 2224-5278 Серия геологии и технических наук. 4. 2018
175
Сравнение данных о содержании каолинита в исследуемых породах, полученных методом рентгенов-ской дифрактометрии и термического анализа с интенсивностями анизотропного сигнала ЭПР от каолинита показывает неплохую корреляцию. В этой связи предлагается экспресс-метод определения каолинитов в нефтяных породах, основанный на линейной зависимости между интенсивностью анизотропного сигнала (g2,046 = ׀׀ и g = 2,0028) ЭПР и содержанием каолинитов в осадочных породах.
Разработанная методика обработки спектральных характеристик ЭПР, ИК-спектров и дифрактомет-рических и термических характеристик глинистых каолинитовых минералов осадочных толщ, может ис-пользоваться также, в качестве справочно-информационных данных для идентификации прежде всего монт-мориллонитовых и каолинитовых глин при выделении горизонтов с высокими экранирующими свойствами.
Ключевые слова: каолинит, монтмориллонит, осадочные породы, глинистые покрышки, смектит, ССМ.
Исследование физико-химических особенностей пород, перекрывающих и имеющих скоп-ления УВ, позволяет выделять породы с выраженной тенденцией к экранированию, к прони-цаемости, к пористости и прогнозировать глинисто-карбонатные породы, как вероятные места скопления углеводородов.
Известно, что глины и глинистые породы характеризуются большим разнообразием мине-ралогического и гранулометрического составов, а следовательно, огромным набором физико-химических свойств. Так, например, присутствие в породах минералов из групп каолинита и монтмориллонита в значительной мере ухудшает диффузионную и фильтрационную их прони-цаемость, что отводят этим образованиям качества хороших покрышек [1, 2].
Рисунок 1 – Минеральный состав отложений терригенной пачки уч. Терескен
Figure 1 – Mineral composition of sediments terrigene block Teresken

Известия Национальной академии наук Республики Казахстан
176
Рентгенофазовым полуколичественным анализом изучен валовый минеральный состав образцов кернового материала, отобранного по скважинам 11 участков: Тортколь, Синельни-ковская, Урихтау, Жанатал, Кожасай, Жанажол, Тобускен, Арансай, Терескен, Кенкияк, Тортай (128 образцов и их гранулометрические фракции от 2 мм до 0,001 мм). В качестве примера, на рисунке 1 и 2 показан минеральный состав отложений терригенной пачки уч. Терескен, Тортколь, Жанатан, пл.Синельниковская.
Изучаемые осадочные породы характеризуются полиминеральным составом, включающим до 10-12 минералов. Для определения методами рентгеновской дифрактометрии кристалло-хими-ческих особенностей глинистых минералов: смектитов, хлоритов, иллитов, каолинитов, степени иллитизации смектитов, размеров кристаллитов, соотношения ширины дифракционных пиков и т.д. использовались глинистые фракции крупностью 0,001-0,005 мм и менее 0,001 мм.
Дифрактометрическое изучение кристаллохимических особенностей глинистых минералов позволяет определять ряд количественных рентгенометрических характеристик: интегральная ширина рефлекса, отношение интенсивностей базальных рефлексов разных порядков отражения, коэффициент вариации межплоскостных расстояний базальных рефлексов, состав и упоря-доченность ССМ (тип, содержание и упорядоченность слоев в смешанослойной структуре, тип чередования, гетерогенность), размер блоков (кристаллитов).
Форма профиля дифракционного отражения зависит от степени трехмерной упорядоченности структуры минерала, степени дефектности и величины области когерентного рассеяния. Присут-ствие гетерогенных минеральных образований повышает диффузность рефлексов, связанную с переменным объемным составом кристаллов.
Рисунок 2 – Минеральный состав пород:
1 – Тортколь, 2 – Жанатан,
3 – пл. Синельниковская
Figure 2 – Mineral composition of rocks:
1 – Tortkol, 2 – Zhanatan,
3 – pl. Sinelnikovskaya

ISSN 2224-5278 Серия геологии и технических наук. 4. 2018
177
В данном сообщении наряду с рентгенофазовым анализом приводятся результаты определения глинистых минералов методами электронного парамагнитного резонанса (ЭПР), ИК-спектроско-пии и термического анализа (ТА).
На рисунке 3 приведен спектр ЭПР глинистой породы месторождения Таган, взятой с глубины 515-520 м из скважины 1. Такой спектр характерен для глинистых пород многих месторождений Прикаспийского региона. Параметры анизотропного спектра близкого к параметрам так назы-ваемых «А-центров» каолинита [3]. Анизотропный сигнал полностью совпадает с сигналом от стандартного минерала каолинита Ново-Алексеевского месторождения [4]. Сигнал, названный «А-центром» был описан как результат дырочного захвата мостикового кислорода, стабилизиро-ванного двухвалентным катионом, как Mg2+ [5, 6].
Рисунок 3 – Спектры ЭПР каолинит содержащих пород: а - месторождение Таган, скв. 1
(глубина 515-520 м); б - месторождение Кемерколь, скв. 4 (глубина 1105-1110 м)
Figure 3 – EPR spectra of kaolinite rocks: a - Tagan field, borehole. 1 (depth 515-520 m); b - field Kemerkol, well. 4 (depth 1105-1110 m)
Химический состав каолинита [Al2Si2O5(OH)4]. Этот минерал содержит высокую концентра-цию алюминия, который, как известно не сменим ионами двухвалентного марганца. Это свойство каолинита очень важно при изучении его парамагнитных свойств методом электронного пара-магнитного резонанса.
Обобщаются результаты измерений ЭПР кернов, полученных из разных нефтегазовых сква-жин Прикаспия с различной глубины. Как показывает анализ спектров, методом ЭПР из большого числа элементов, определенных методом рентгенофлуоресцентного анализа (РФА) регистрируются ионы Fe3+ и Mn2+ .
Исходя из свойств и структуры минерала каолинита спектры ЭПР Fe3+ и Mn2+ исследуемой породы для обнаружения каолинита являются непригодными, так как они связаны с включениями Fe3+ и Mn2+ в другие минералы, поскольку алюминий в каолинитах менее сменимы этими ионами.
Недавние исследования авторов работы [7,8] месторождений Журавлиный Лог (Южный Урал) и Чаймат (Южный Вьетнам) методом ЭПР каолинитов также подтверждают, что наблюдаемый в ЭПР электронно-дырочный центр, локализующийся на кислороде, представляет собой комплекс O- - Mg2+, замещающий в структуре каолинита комплекс O2- - Al3+.
Необходимо отметить, что часто на сигнал с gII-фактором 2,046 «А-центр» накладываются линии двухвалентного иона марганца в осадочных породах и в этом случае определение каолинита по интенсивности данного сигнала невозможно. В этом случае его содержание определяется лишь по интенсивности сигнала с g-фактором 2,0028 «А-центр», который наблюдается между 3 и 4 ком-понентами сверхтонкой структуры от иона Mn2+. Этот случай демонстрируется на рисунке 3б. Наличие каолинита в исследуемых породах также подтверждается данными рентгеновского анализа (рисунок 4) и таблица 1.
Так, например на Молдабекском месторождении, скв. 16 залежь (218-232) экранируется покрышкой 213-216 м (ССМ 37% + каолинит 27%, а залежь месторождения Кемерколь, скв. 9 (1362-1367 м) перекрывается покрышкой из смектита (1355-1360 м). На остальных месторож-дениях наблюдается такая же закономерность.

Известия Национальной академии наук Республики Казахстан
178
Рисунок 4 – Дифрактограмма обр. пл. Молдабек, 16 , гл. 213-216м каолинит содержащей породы:
С = 27 % масс. каолинита
Figure 4 – Diffraction pattern of sample from Moldabek area, 16, depth: 213-216 m of kaolinite containing rocks: C = 27% by weight of kaolinite
Исследованные методом ЭПР-спектроскопии каолинитовые породы были также изучены методом ИК-спектроскопии.
Таблица 1 – Результаты рентгенофазового анализа пород Прикаспия
Table 1 – Results of X-ray phase analysis of the PreCaspian rocks
Месторождение, номер скважины
Интервал отбора керна, м
Глубина залегания нефти, м
Содержание минералов, %
Смектит ССМ Каолинит
Молдабек, скв. 16 207-210 отс. 20 10
скв. 16 213-216 218-232 отс. 37 27
Сазанкурак, скв. 2 476-481, низ отс. отс. 10
скв. 2 481-485, верх 485-490 отс. 3 8
Сазанкурак, скв. 7 449-460, верх 460-475 отс. 9 44
скв. 7 480-490, низ отс. 3 5
Кемерколь, скв. 9 1050-1055 отс. 23 13
скв. 9 1085-1090 1092-1100 37,4 отс. отс.
скв. 9 1350-1355 отс. отс. 14
скв. 9 1355-1360 1362-1367 отс. отс. 28
Кемерколь, скв. 20 1240-1245 1246-1250 отс. отс. 29
Котыртас, скв. 22 1203-1206 1226-1229 отс. отс. 33
Таган, скв. 1 515-520 597-601 отс. отс. 32
Ю.Камышитовый, скв. 3 256-261 отс. 27 16
скв. 3 363-369 389-400 отс. 13 22
скв. 3 396-402 отс. 22 6
Онгар, скв. 6 655-660 600-604 отс. отс. 6,5
Примечание. Cмектит – собирательное название глинистых минералов монтмориллонита. ССМ – смешанно-слойный минерал с чередующимся слоем гидрослюды и монтмориллонита.
10 20 30 40 500
100
200
300
галит
ССМ
каолинит
, хлорит
слюда
ПШ
кварц
кварц
хлорит
кварц
кварц
каолинит
, хлорит
Интенсивность
Угол 2

ISSN 2224-5278 Серия геологии и технических наук. 4. 2018
179
Инфракрасная спектроскопия – один из наиболее универсальных, информативных и чувстви-тельных методов анализа минерального состава осадочных пород. На рисунке 5 приведен полный ИК-спектр осадочной породы месторождения Онгар, скважина 6 (интервал 655-660 м). В мине-ральном составе образца преобладает каолинит - Al4[(OH)8Si4O10] – 3696, 3651, 3620, 1109, 1033, 1011, 939, 913, 799, 538, 473, 433 см-1 [9, 10], зафиксировано присутствие альбита Na[AlSi3O8] – 1164, 645, 588, 473, 433 см-1 [9] и кварца α-SiO2 – 799, 780, 696 см-1 [9, 10].
Рисунок 5 – ИК- спектр породы месторождения Онгар, скв. 6 (655-660 м)
Figure 5 – IR spectrum of the Ongar field, well #6 (655-660 m)
На рисунке 6 приведен ИК-спектр мономинерального образца каолинита Ново-Алексеевского месторождения. В высокочастотной области спектра наблюдаются четыре полосы поглощения валентных колебаний гидроксильных групп каолинита с максимумами при волновых числах 3695, 3670, 3651, 3620 см-1. В спектрах пород месторождений Южное Камышитовое и Онгар зафикси-рованы только три высокочастотных полосы 3697 (3696), 3651, 3620 см-1. Полоса поглощения при 3620 см-1, характеризующая гидроксильные группы каолинита, направленные к октаэдрическим вакансиям [11] имеет наибольшую интенсивность в обоих образцах.
Прослеживается зависимость от содержания каолинита в образце интенсивности полосы гидроксильных групп, расположенных перпендикулярно плоскости силикатного слоя между слоями в каолините, проявляющейся при 3697 (3696) см-1 [11]. При сопоставлении ИК-спектров
Рисунке 6 – ИК-спектр каолинит Ново-Алексеевское месторождение
Figure 6 – IR spectrum of kaolinite from Novo-Alekseevskoye field

Известия Н исследуемОнгар с Алексеевспоглощентовое в срсодержани
ИК-сприведеныминерала возможныминералоприменен
Рис
В данставах оса
Термдиентногосистемы Т (темперDTG (диф
Съемнагреванинавеска об
Изучеческих крзованием
Национально
мых образцоэталонным
ское в диапния каолиниравнении с ии каолинитпектры некоы на рисунк(рисунок 7
ым охарактв, входящихнии методов
унок 7 – ИК-сб – Сазанк
Figure 7 – Ib -
нной работеадочных порическая дио прокаливаF.Paulik, J.Pратурной), Dфференциальмка осущестия – динамбразца – 500ение термиривых и числсопряженны
ой академии н
ов (рисунким образцомпазоне волнита и снижеобразцом мта. оторых осадке 7. Здесь 7а) [12]. В птеризовать х в состав иЭПР, ИК-сп
пектры некотокурак, скважин
IR spectra of soSazankurak, w
е также природ Прикаспагностика мания образцPaulik, L.Er
DTA (диффеьной термогтвлялась в ический (dT0 мг., чувствческого повленных значых с ними т
наук Республи
и 5, 6) осадм мономиненовых чиселение их интместорожде
дочных порона полосу пподобных свсе полосыизучаемой ппектроскопи
орых осадочнына 2 (476-481 м
ome sedimentarwell #2 (476-481
иводятся репийского реминеральноца в диапазrdey. Термоеренциальногравиметричвоздушной
T/dt = 10 гвительностьведения порчений интентермогравим
ики Казахста
180
дочных пороеральной фл 2000-450 енсивностейния Онгар,
од, которыепоглощенияслучаях меты поглощепороды. Поии и рентген
ых пород: а – Юм); с – каолини
ry rocks: a - Sou1 m); c - kaolini
езультаты теегиона глиниого состава оне темперохимическоеой термоаналческой), й среде, в град/мин), эь весов – 100рошковой пнсивностей эметрических
ан
од месторожфракции касм-1 наблюдй в пробе мчто также
е были исслея каолинитатодом ИК-спния, котородобные задновской диф
Южное Камышит месторожден
uth Kamyshitovite from Novo-A
ермическогоистого минепород проатур 20-100е состояниелитической
диапазоне эталонное в0 мг на шкалпробы провоэндо- и экзох показаний
ждений Южаолинита мдается уменместорожденсвидетельст
едованы с па накладывапектроскопирые наблюддачи решаютфрактометри
шитовое, скважния Ново – Ал
voye, well #3 (2Alekseevskoe f
о анализа перала – каолизводилась 00°C на дере пробы оп), ТG (термо
температувещество –лу в 200 ммодилось по отермическиТG-линий.
жное Камышместорожденньшение чиния Южноетвует о бол
помощью меаются полосии не предсдаются от тся при комии.
жина 3 (219-224лексеевское
219-224 m); field
по определелинита. по результ
риватографеписывались огравиметри
ур 20-1000о
– прокаленнм. морфологиих эффектов
шитовое и ния Ново-исла полос е Камыши-лее низком
етода ЭПР, сы другого ставляется основных мплексном
4 м);
ению в со-
татам гра-е Q-1500D кривыми: ической) и
оС. Режим ный Аl2O3,
иям терми-в с исполь-

ISSN 2224-5278 Серия геологии и технических наук. 4. 2018
181
Количество указанного минерала в составе исследуемых проб (по результатам неизотерми-ческой термогравиметрии и показаний DTA-кривых) представлено в таблице 2.
Результаты анализа сравнивались с данными атласов термических кривых минералов и горных пород и сопоставлялись с описаниями термического поведения веществ, изложенных в других справочных источниках и накопленных в банке данных лаборатории, проводившей эти исследо-вания.
Из серии полученных термических проявлений (эффектов) на DTA-кривой была проведена дифференциация пиков, вызванных деструкцией каолинита.
В качестве главных термических критериев, по которым производилась диагностика указан-ного минерала, и определялось его содержание в породе, являлись эндотермическая реакция (360~700оС), обусловленная выбросом из октаэдрического слоя кристаллической решетки гид-роксильной воды и экзотермический эффект (~950оС), связанный с образованием в системе новой фазы (рисунки 9 и 10). С помощью дифференциальной термоаналитической (DTA) кривой и термо-гравиметрических показаний пробы, были определены процентные содержания каолинита в породах и определены параметры, отвечающие за степень совершенства его кристаллической структуры.
Рисунок 9 – Дериватограмма образца из площади Котыртасс. По данным термогравиметрии содержание каолинита в составе образца соответствует 23%
Figure 9 – Derivatogram of the sample from the Kotytrass area. According to thermogravimetric data, the kaolinite content in the sample corresponds to 23%
Количества указанного минерала в составах исследуемых проб (по результатам неизотер-
мической термогравиметрии и морфологии DTA-кривой) представлены в таблице 2. Данные термического анализа о процентном содержании каолинита оказались здесь несколько
ниже показаний, полученных по результатам рентгеновской дифрактометрии и ЭПР определениям, что обусловлено особенностями диагностики и расчета состава образца выполненными этими методами. Так, рентгенофазовые и ЭПР-определения выявляли количество каолинита относи-тельно окристаллизованной части минерального состава образца, тогда как термический анализ определил это содержание с учетом наличия в системе еще и аморфной ее составляющей.

Известия Национальной академии наук Республики Казахстан
182
Рисунок 10 – Дериватограмма образца из площади Таган-1. По данным термогравиметрии содержание каолинита в составе образца соответствует 22.8%
Figure 10 – Derivatogram of the sample from the Tagan-1 area. According to the thermogravimetric data, the kaolinite content in the sample corresponds to 22.8%
Таблица 2 – Результаты определения каолинита в породах Прикаспийского региона
Table 2 – Results of the determination of kaolinite in the rocks of the Caspian region
Месторождение, номер скважины
Интервал отбора,
м
Содержание каолинита, в % масс.
по рентгеновской дифрактометрии
по термическому анализу
по ЭПР
Эталонный каолинит (Ново-Алексеевское) 100 100 100
Онгар, 6 655-660 6,5 4.0 7,5
Кемерколь, 8 915-920 28,7 18.0 28,1
Кемерколь, 9 1350-1355 14 10,0 13,2
Кемерколь, 9 1355-1360 28 19,0 27,4
Кемерколь, 20 1240-1245 29 20.0 28,3
Молдабек, 16 213-216 27 18.0 25,5
Котыртас, 22 1203-1206 33 23.0 33,0
Таган, 1 515-520 32 22.8 32,1
Таким образом, процентный состав исследуемого слоистого силиката, по данным РФА и ЭПР
определениям, с одной стороны и термическим анализом – с другой, представлены относитель-ными числами. В связи с этим, результаты количественных определений каолинита, полученные указанными методами, при переводе их в одну измерительную систему, вполне сопоставимы между собой, и отражают реальное содержание их в пробах.
Сравнение данных о содержании каолинита в исследуемых породах, полученных методом рентгеновской дифрактометрии и термического анализа с интенсивностями анизотропного сигнала ЭПР от каолинита показывает неплохую корреляцию (таблица 2). В этой связи предлагается

ISSN 2224-
экспресс-ммости межосадочны
Главнмеждуречот Mn2+, иТакой спеЭПР при институтаподтверждсмектита
Рис
Fig
На рместорожмонтморимонтморибыли устэтого сп(Al1,67Mg0
KAl2[(OHCaMg[CO
-5278
метод опрежду интенсих породах. ной особеннчья Урал-Эми более узкоектр соответисследован
а [3]. Принадается дансоставляет 3
сунок 11 – Спе
gure 11 – EPR s
рисунке 12аждения, изучиллонита, соиллонита. Пановлены пектра, осно
0,33) [ (OH)2SH,F)2AlSi3O10
O3]2 – 1812, 1
Рисунок 12 – И
Figure
деления каоивностью а
ностью спемба являетсяого в слабомтствует моннии глинисадлежность нными рен37,4%, табл
ектр ЭПР монт
spectrum of a m
а приведенченный метоодержащемуПри сопоставполосы моновными по
Si4O10 ]0,33- N
0] – 3620, 101459, 883, 85
Инфракрасныйб
e 12 – Infrared
олинитов в низотропно
ектра ЭПР я наличие очм поле, сооттмориллонистых монтмсигнала ЭПтгеноструктлица 1).
тмориллонит с(гл
montmorillonite
н ИК-спектродом ЭПР. Дуся в этой пвлении распнтмориллониородообразу
Na0,33(H2O)4 –026, 472, 4252, 728 см-1.
й спектр: а - прб - монтморил
spectrum: a - sb - montmorillo
183
нефтяных ого сигнала
глинистых чень широктветствующеитовым минмориллонитоПР (рисуноктурного ан
содержащей полубина 213-216
bearing rock o
р монтмориДля более тпороде, на рположения пита и долоующими м– 3630, 10962 см-1; квар
роба Имашевсллонит Na-фор
ample of Imashonite Na-form;
Серия геол
породах, о(gII и g) ЭП
пород (риского сигналаего g = 4,3, нералам, котовых минерк 11) к миненализа иссл
ороды Молдаб6 м)
f the Moldabek
иллонитсодочного отнерисунке 12бполос этогомита. Как
минералами 6, 1026, 916, рц α-SiO2 –
ского месторожма; в - доломи
hevsky field, wev - the dolomit
логии и техн
снованный ПР и содерж
сунок 11) та, на фоне ккоторый прторые были ралов Амерералам групледуемой п
бекского место
k field, well #16
держащей песения полоприведен И
о образца и показываютявляются:
852, 647, 521171, 799, 7
ждения, скв. 1 ит
ell #1 (3416-34e
нических наук
на линейножанием као
триасовых окоторого видринадлежит обнаруженыиканского ппы монтморпороды (со
орождения, скв
6 (depth 21 -216
породы Имос спектра кИК-спектр эисследуемот результатмонтмори
24, 472 см-1;780, 695 см-
(3416-3421м.)
421 m);
к. 4. 2018
ой зависи-олинитов в
отложений дны линии иону-Fе3+. ы методом нефтяного риллонита одержание
в. 16
6 m)
ашевского к минералу эталонного ой породы, ы анализа иллонит – ; мусковит 1; доломит
;

Известия Национальной академии наук Республики Казахстан
184
Разработанная методика обработки спектральных характеристик ЭПР, ИК-спектров и ди-фрактометрических и термических характеристик глинистых каолинитовых минералов осадочных толщ, может использоваться также, в качестве справочно-информационных данных для иденти-фикации прежде всего монтмориллонитовых и каолинитовых глин при выделении горизонтов с высокими экранирующими свойствами.
Выводы. 1. Дифрактометрические оценки кристаллохимических характеристик минералов по профилю
разреза осадочных толщ позволили уточнить направление процессов их преобразования, выяснить влияние глин на формирование пород с определенными коллекторскими, фильтрационными и экранирующими свойствами, прогнозировать нефтегенерирующий потенциал изучаемых толщ.
2. Проведенные исследования позволили изучить состав и структурные особенности глинис-тых минералов выделенных литогенетических типов пород и фаций зон, наиболее перспективных для процессов нефтеобразования и нефтенакопления.
3. Результаты детального рентгенодифрактометрического изучения образцов пород и глинис-тых фракций, отобранных по разрезам изучаемых участков, стали объективной основой для разви-тия представлений об условиях формирования и преобразования отложений, палеогеографических реконструкций, оценки их перспективности на поиски месторождений нефти и газа.
4. Сравнение данных о содержании каолинита в исследуемых породах, полученных методом рентгеновской дифрактометрии и термического анализа с интенсивностями анизотропного сигнала ЭПР от каолинита показывает неплохую корреляцию. В этой связи предлагается экспресс-метод определения каолинитов в нефтяных породах, основанный на линейной зависимости между интенсивностью анизотропного сигнала (g2,046 =׀׀ и g= 2,0028) ЭПР и содержанием каолинитов в осадочных породах.
ЛИТЕРАТУРА
[1] Ермолкин В.И., Керимов В.Ю. Геология и геохимия нефти и газа. – М.: Недра, 2012. – 460 с. [2] Баженова О.К., Бурлин Ю.К., Соколов П.А., Хаин В.Е. Геология и геохимия нефти и газа. – М.: Изд.МГУ, 2004.
– 415 с. [3] Ikeya M. New Applications of Electron Spin Resonance (Dating, Dosimetry and Microscopy) World Scientific. –
Singapore, 1993. – 500 р. [4] Насиров Р., Белинский Б.Н., Берберева Н.Т., Бубнов Н.Н., Солодовников С.П. Изучение минерального состава
нефтеносных пород методом ЭПР // Нефтяное хозяйство. –1998. – 4. – С. 8-9. [5] Angel B.R., Jones J.P.E., Hall P.L. Electron spin resonance studies of doped synthetic kaolinite, I. // Clay Miner. – 1974.
– Vol. 10. – P. 247-255. [6] Muller J.P., Calas G. Tracing kaolinites through their defect centers: kaolinite paragenesis in a laterite (Cameroon) //
Economic Geol. – 1989. – Vol. 84. – P. 694-707. [7] Бортников Н.С., Минеева Р.М., Соболева С.В. Парамагнитные центры Fe3+ на поверхности частиц каолинита //
Доклады Академии наук РАН. – 2008. – Т. 422, 1. – С. 85-87. [8] Бортников Н.С., Минеева Р.М., Новиков В.М.., Горбачев Б.Ф., Сперанский А.В. Железо в каолинитах као-
линовой и бокситоноснойкор выветривания гранитов по данным ЭПР // Доклады Академии наук РАН. – 2008. – Т. 423, 6. – С. 788-791.
[9] Aldrich Condensed Phase Library Edition I (10607 spectra), 1998. [10] Moenke H. Mineralspektren, Asad. Verlag, Berlin, 1962. 394 p. [11] Литтл Л. Инфракрасные спектры адсорбированных молекул. – М.: Мир, 1969. – 515 с. [12] Плюснина И.И. Инфракрасные спектры минералов. – М.: Изд. МГУ, 1977. – 174 с.
REFERENCES
[1] Ermolkin V.I., Kerimov V.Yu. Geology and geochemistry of oil and gas. M.: Nedra, 2012. 460 p. [2] Bazhenova O.K., Burlin Yu.K., Sokolov P.A., Khain V.E. Geology and geochemistry of oil and gas. М.: Publishing
houses of Moscow State University, 2004. 415 p. [3] Ikeya M. New Applications of Electron Spin Resonance (Dating, Dosimetry and Microscopy) World Scientific.
Singapore, 1993. 500 р. [4] Nasirov R., Belinsky B.N., Berbereva N.T., Bubnov N.N., Solodovnikov S.P. A study of the mineral composition of oil-
bearing rocks by the EPR method // Oil Industry. 1998. N 4. P. 8-9. [5] Angel B.R., Jones J.P.E., Hall P.L. Electron spin resonance studies of doped synthetic kaolinite, I. // Clay Miner. 1974.
Vol. 10. P. 247-255. [6] Muller J.P., Calas G. Tracing kaolinites through their defect centers: kaolinite paragenesis in a laterite (Cameroon) //
Economic Geol. 1989. Vol. 84. P. 694-707.

ISSN 2224-5278 Серия геологии и технических наук. 4. 2018
185
[7] Bortnikov N.S., Mineeva R.M., Soboleva S.V. Paramagnetic centers of Fe3 + on the surface of kaolinite particles // Reports of the Academy of Sciences of the Russian Academy of Sciences. 2008. Vol. 422, N 1. P. 85-87.
[8] Bortnikov N.S., Mineeva R.M., Novikov V.M., Gorbachev B.F., Speransky A.V. Iron in kaolinite kaolinite and bauxite-bearing weathering of granites by EPR data // Reports of the Academy of Sciences of the Russian Academy of Sciences. 2008. Vol. 423, N 6. P. 788-791.
[9] Aldrich Condensed Phase Library Edition I (10607 spectra), 1998. [10] Moenke H. Mineralspektren, Asad. Verlag, Berlin, 1962. 394 p. [11] Littl L. Infrared spectra of adsorbed molecules. M.: Mir, 1969. 515 p. [12] Plyusnina I.I. Infrared spectra of minerals. M.: Izd. Moscow State University, 1977. 174 p.
Р. Насиров1, И. Б. Саматов2, А. П. Слюсарев2, А. Р. Насиров1
1Х. Досмұхамедов атындағы Атырау мемлекеттік университеті, Атырау, Қазақстан,
2ЖШС «Қ. И. Сəтбаев атындағы геологиялық ғылымдар институты», Алматы, Қазақстан
КАСПИЙ МАҢЫ АЙМАҒЫНДАҒЫ МҰНАЙ ОРНАЛАСҚАН ШӨГІНДІ ТАУ ЖЫНЫСТАРЫН ЭПР, ИҚ-СПЕКТРОСКОПИЯЛЫҚ, РЕНТГЕНДІК ДИФРАКТОМЕТРИЯ ЖƏНЕ ТЕРМИЯЛЫҚ ТАЛДАУ ƏДІСТЕРІМЕН КЕШЕНДІ МИНЕРАЛДЫҚ ЖƏНЕ ЛИТОЛОГИЯЛЫҚ ЗЕРТТЕУ
Аннотация. Жұмыста Каспий маңы аймағындағы тау жыныстарының минералдарынан электрондық
парамагниттік резонанс (ЭПР), ИҚ-спектроскопия, рентгенді дифрактометрия жəне термиялық талдау əдісте-рімен сазды минералдарды (каолинит, монтмориллонит) анықтау ісі қарастырылған.
Рентгенді дифрактометрия жəне термиялық талдау əдістері көмегімен зерттелген тау жыныстары ішінен каолинитті анықтап, оны ЭПР-дің анизотропты сигналының қарқындылықтарымен салыстырып, олардың арасында жақсы корреляция бары тағайындалды. Бұл жағдай ЭПР əдісін мұнай жатқан қабаттардағы као-линитті анықтау ісіне қолдануға мүмкіндік берді (g2,046 =׀׀ жəне g = 2,0028).
Ұсынылған əдіс каолинит минералдарының ЭПР, ИҚ-спектрлерінің жəне рентгенді дифрактометрия, термиялық талдау əдістерімен спектралды сипаттамаларын алуға, екінші жағынан монтмориллонитті жəне каолинитті минералдардың геологиялық қабаттардағы экрандаушы қасиеттерінен ақпаратты-анықтамалық мəліметтер алу үшін өте қажет.
Түйін сөздер: каолинит, монтмориллонит, шөгінді тау жыныстары, сазды қабат, смектит, қабатты араласқан минерал.

Известия Национальной академии наук Республики Казахстан
186
N E W S OF THE NATIONAL ACADEMY OF SCIENCES OF THE REPUBLIC OF KAZAKHSTAN
SERIES OF GEOLOGY AND TECHNICAL SCIENCES
ISSN 2224-5278
Volume 3, Number 430 (2018), 186 – 194 UDC 622.323(574)
G. Zh. Moldabayeva, G. P. Metaxa, Zh. N. Alisheva
KazNTU named after K. I. Satpayev, Almaty, Kazakhstan. E-mail: [email protected], [email protected], [email protected]
SCIENTIFIC-TECHNICAL BASICS OF VISCOSITY REDUCTION OF THE KAZAKHSTANI OILS, WHICH PROVIDE A SIGNIFICANT INCREASE OF OIL RESERVOIRS
Abstract. The aim of the work: Scientific-technical basics of viscosity reduction of the Kazakhstani oils, which provide
an essential increase of oil reservoirs. In modern economic conditions, the oil and gas industry of Kazakhstan continues to remain in the area of active
growth, along with maintaining its high investment attractiveness. The contrast of experimental results on the study of spectral responses to external pulse effects and theoretical
developments on the types of equilibrium for interplanetary cycles allows us to draw the following conclusions: 1. Obtaining information on changes in the state of the interface between phases by measuring spectral
responses provides the necessary potential for searching for cause-effect relationships in all ranges of external influences.
2. The change in the quantitative relationships in the "impact-response" system is suggested to be estimated by the formula of Smirnov A.P., which makes it possible to reflect three-stage processes in the whole variety of their manifestations.
3. It is shown that the state of water (supplier of hydrogen and oxygen) at the interface between phases affects the processes of synthesis and decomposition of hydrocarbons. The observed effect is of practical importance in the development of geotechnology to reduce viscosity under natural underground conditions.
Keywords: oil recovery, impact-response, spectral composition, interface, property management, natural occurrences.
One of the favorable factors for this is the development of the positive dynamics of the global oil and
gas industry, which determines the expanded opportunities for sales of products in foreign markets and the liquidity availability, which is available for investment in exploration and extraction. Export volumes of hydrocarbons are growing. At the same time, Kazakhstan has great prospects with the expansion of production capacity of a number of existing fields; and the oil refining sector and the sale of petroleum products in order to increase the added value of products and more complete provision of the domestic market with petroleum products [1-3].
Nowadays the scale of oil and gas production has increased significantly and is being introduced into the development of a field with complex geological-physical conditions, the most important problem of increasing the completeness of oil extraction from the subsoil is being solved, since the average value of the oil recovery coefficient is 0.3-0.4 [4-9].
Thus, the formulation of the objectives of the extraction completeness from oil reservoirs, that have reached the economic limit of operation, becomes particularly relevant in the modern oil and gas industry. However, it becomes economically unprofitable to solve such problems with the help of modern methods of increasing oil recovery, since the scientific-technical basics of hydrocarbon synthesis (UW) in the conditions of natural occurrence are insufficiently worked out. Therefore, in order to create a new geo-technology it is necessary to change the scientific paradigm, which considers the oilfield as an unchanged
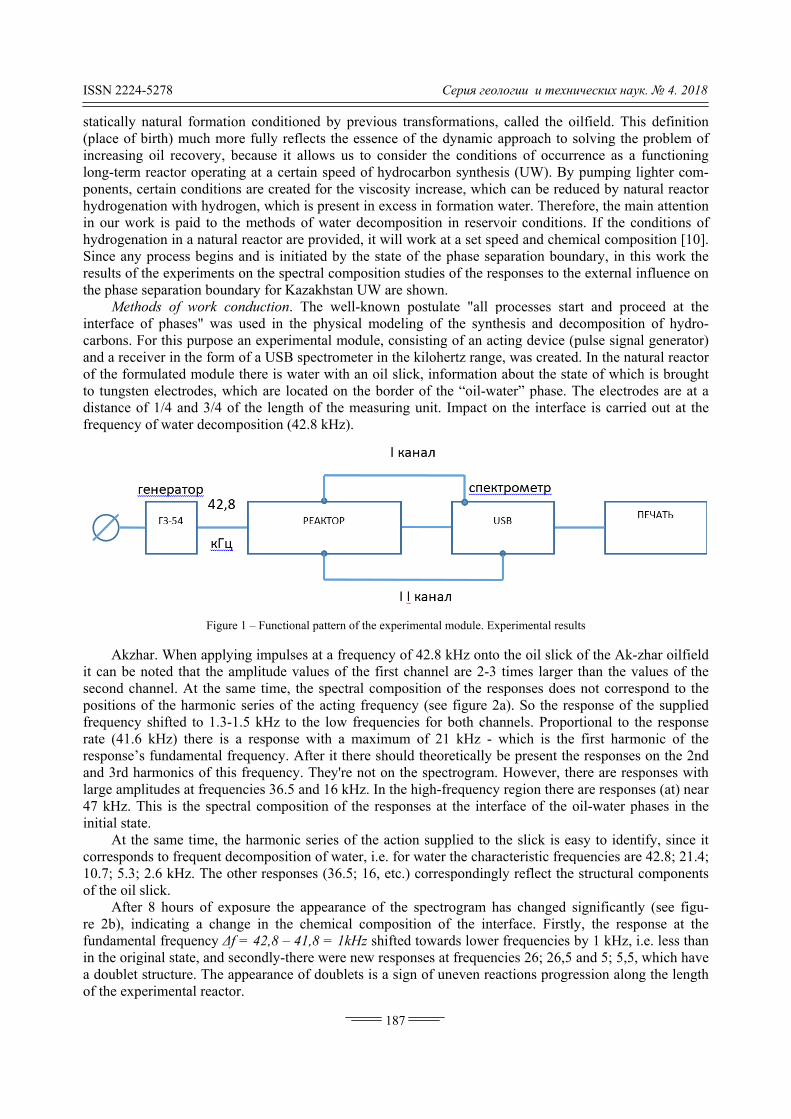
ISSN 2224-
statically n(place of bincreasinglong-term ponents, chydrogenain our worhydrogenaSince any results of tthe phase s
Methointerface ocarbons. Fand a receof the formto tungstendistance ofrequency
Akzhit can be nsecond chpositions ofrequency rate (41.6 response’sand 3rd halarge ampl47 kHz. Tinitial state
At thecorrespond10.7; 5.3; of the oil s
After re 2b), indfundamentin the origa doublet sof the expe
-5278
natural formbirth) much oil recoveryreactor operertain condit
ation with hyrk is paid to
ation in a natprocess beg
the experimeseparation boods of workof phases" w
For this purpoiver in the fomulated modn electrodes,f 1/4 and 3/of water dec
Fi
ar. When apnoted that thannel. At thof the harmoshifted to 1kHz) there
s fundamentaarmonics of litudes at fre
This is the spe. e same timeds to frequen2.6 kHz. Th
slick. 8 hours of
dicating a ctal frequency
ginal state, anstructure. Therimental rea
mation conditmore fully ry, because irating at a cetions are cre
ydrogen, whio the methodtural reactor gins and is inents on the spoundary for Kk conductionwas used in ose an experorm of a USBdule there is , which are /4 of the lengcomposition
igure 1 – Funct
plying impuhe amplitudee same timeonic series o.3-1.5 kHz tis a respon
al frequencythis frequenquencies 36.pectral comp
, the harmonnt decomposihe other resp
exposure thchange in thy Δf = 42,8 –nd secondly-the appearancactor.
tioned by prreflects the eit allows us ertain speed ated for the ch is present
ds of water dare providednitiated by thpectral compKazakhstan Un. The well-the physica
rimental modB spectrometwater with alocated on thgth of the m(42.8 kHz).
ional pattern of
ulses at a freqe values of the, the spectraof the acting to the low fr
nse with a m. After it thecy. They're n.5 and 16 kHposition of th
nic series of ition of wateonses (36.5;
he appearanche chemical – 41,8 = 1kHthere were n
ce of doublet
187
revious transessence of thto consider of hydrocarviscosity inct in excess indecompositiod, it will worhe state of thposition studUW are show-known post
al modeling dule, consistter in the kilan oil slick, ihe border of
measuring un
f the experimen
quency of 42he first chanal compositiofrequency (
frequencies fmaximum ofere should thnot on the sp
Hz. In the highe responses
f the action ser, i.e. for wa
16, etc.) cor
ce of the specomposition
Hz shifted towew responsets is a sign o
Серия геол
sformations, he dynamic a
the conditiorbon synthesicrease, whichn formation won in reservrk at a set spehe phase sepies of the reswn. tulate "all pof the synthing of an actohertz rangeinformation f the “oil-wa
nit. Impact on
ntal module. Exp
2.8 kHz onto nnel are 2-3 on of the ressee figure 2afor both chanf 21 kHz - wheoretically bpectrogram.
gh-frequency s at the inter
supplied to thater the chararrespondingl
ectrogram han of the intewards lower s at frequencf uneven rea
логии и техн
called the oapproach to ons of occuris (UW). Byh can be redwater. Thereoir conditioneed and chemparation bounsponses to th
processes stahesis and deting device (
e, was createdabout the sta
ater” phase. n the interfa
perimental resu
the oil slicktimes largersponses doesa). So the rennels. Propowhich is thebe present thHowever, thregion there
rface of the
he slick is eaacteristic freqly reflect the
as changed erface. Firstlfrequencies
cies 26; 26,5actions progr
нических наук
oilfield. Thissolving the p
rrence as a fy pumping liduced by natufore, the mains. If the comical compondary, in thi
he external in
art and procecomposition(pulse signald. In the natuate of whichThe electrod
ace is carried
ults
k of the Ak-zr than the vas not correspesponse of thortional to the first harmohe responses here are respe are responsoil-water ph
asy to identiquencies are e structural c
significantlyly, the respoby 1 kHz, i. and 5; 5,5, w
ression along
к. 4. 2018
s definition problem of functioning ghter com-ural reactor in attention
onditions of osition [10]. is work the nfluence on
ceed at the n of hydro-l generator) ural reactor
h is brought des are at a d out at the
zhar oilfield alues of the pond to the he supplied he response onic of the on the 2nd
ponses with es (at) near
hases in the
ify, since it 42.8; 21.4;
components
y (see figu- onse at the e. less than which have g the length

Известия Национальной академии наук Республики Казахстан
188
a – Theinitialslick
b – After exposure during 8 hours
c – After 3 days of aging
Figure 2 – The spectral composition of the boundary responses (Akzhar)

ISSN 2224-5278 Серия геологии и технических наук. 4. 2018
189
a – Theinitialstate
b – After exposure during 24 hours
c – After2 days of aging
Figure 3 – The spectral composition of the “oil Karabulak – water” interface response

Известия Национальной академии наук Республики Казахстан
190
The spectrogram of the responses, taken after 3 days of aging, gives an idea about the stability of new structural components (see figure 2c). Here, the spectrogram has almost no displacement of the main frequency of the action, but the amplitude response value is half less of the first harmonic (21.2 kHz), which means that the response is dominated by larger elements of the structure that are no subject to any changes (to aging). On the 2nd and 3rd harmonics their numbers are less, but they correspond to a number of the fundamental frequency.
Thus, based on the obtained results, it can be concluded that under the influence of the water decom-position frequency on the interface new structural elements appear both from the synthesis of larger struc-tures, on the basis of water, and also from the decomposition of hydrocarbon, which acquire a high-frequency response.
A similar study was given for a composition consisting of an oil slick from the Karabulak oilfield on the surface of tap water mineralization. In the initial state (figure 3a.) the spectrogram is similar to the response shown in figure 2. The main difference is the appearance of low-frequency responses near 22, 17, 14, 6 kHz, which can be considered as signs of the appearance of the structures of the main chemical composition of the researched oil.
After processing the composition during the day (figure 3b) the type of response spectrogram has changed significantly-the responses at low frequencies have disappeared. The response to 21 kHz has amplitude twice the amplitude of the original signal, which is the main sign of changes in the chemical
a – The initial state (reactor orientation: East-West)
b – After exposure during 24 hours (reactor orientation: North-South)
Figure 4 – The spectrogram of the response of the composition "oil Zhanatan - water"
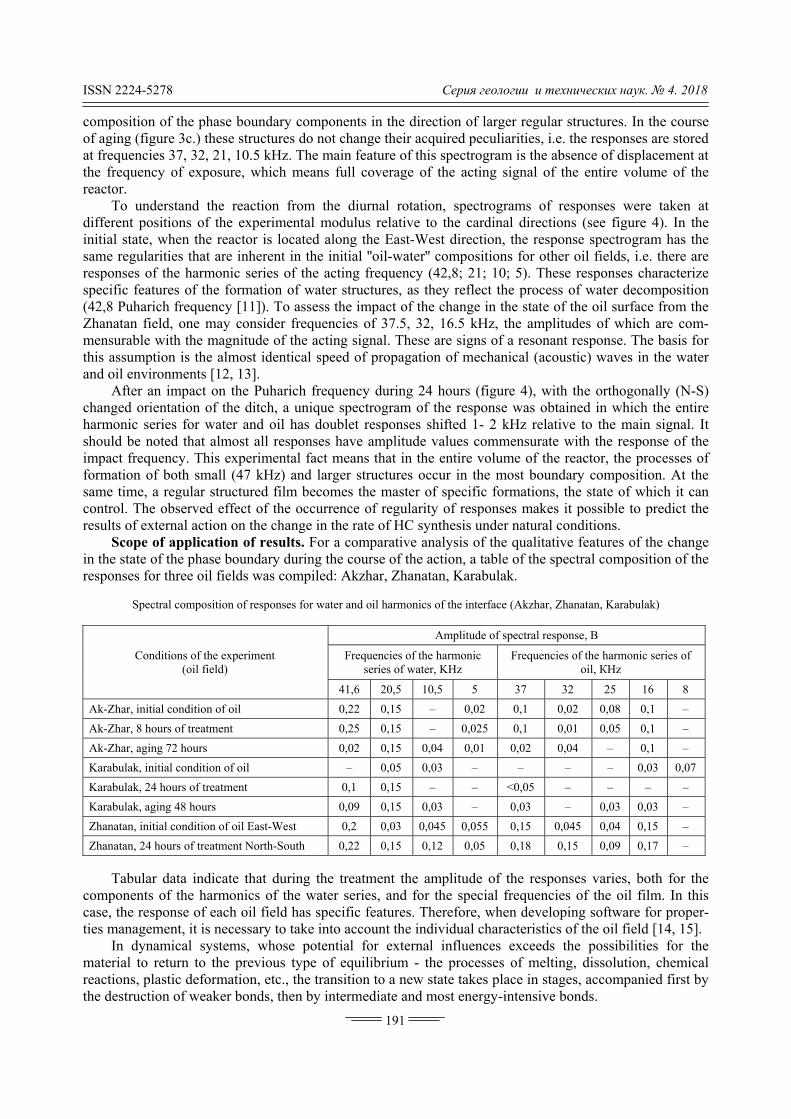
ISSN 2224-5278 Серия геологии и технических наук. 4. 2018
191
composition of the phase boundary components in the direction of larger regular structures. In the course of aging (figure 3c.) these structures do not change their acquired peculiarities, i.e. the responses are stored at frequencies 37, 32, 21, 10.5 kHz. The main feature of this spectrogram is the absence of displacement at the frequency of exposure, which means full coverage of the acting signal of the entire volume of the reactor.
To understand the reaction from the diurnal rotation, spectrograms of responses were taken at different positions of the experimental modulus relative to the cardinal directions (see figure 4). In the initial state, when the reactor is located along the East-West direction, the response spectrogram has the same regularities that are inherent in the initial ''oil-water'' compositions for other oil fields, i.e. there are responses of the harmonic series of the acting frequency (42,8; 21; 10; 5). These responses characterize specific features of the formation of water structures, as they reflect the process of water decomposition (42,8 Puharich frequency [11]). To assess the impact of the change in the state of the oil surface from the Zhanatan field, one may consider frequencies of 37.5, 32, 16.5 kHz, the amplitudes of which are com-mensurable with the magnitude of the acting signal. These are signs of a resonant response. The basis for this assumption is the almost identical speed of propagation of mechanical (acoustic) waves in the water and oil environments [12, 13].
After an impact on the Puharich frequency during 24 hours (figure 4), with the orthogonally (N-S) changed orientation of the ditch, a unique spectrogram of the response was obtained in which the entire harmonic series for water and oil has doublet responses shifted 1- 2 kHz relative to the main signal. It should be noted that almost all responses have amplitude values commensurate with the response of the impact frequency. This experimental fact means that in the entire volume of the reactor, the processes of formation of both small (47 kHz) and larger structures occur in the most boundary composition. At the same time, a regular structured film becomes the master of specific formations, the state of which it can control. The observed effect of the occurrence of regularity of responses makes it possible to predict the results of external action on the change in the rate of HC synthesis under natural conditions.
Scope of application of results. For a comparative analysis of the qualitative features of the change in the state of the phase boundary during the course of the action, a table of the spectral composition of the responses for three oil fields was compiled: Akzhar, Zhanatan, Karabulak.
Spectral composition of responses for water and oil harmonics of the interface (Akzhar, Zhanatan, Karabulak)
Conditions of the experiment (oil field)
Amplitude of spectral response, В
Frequencies of the harmonic series of water, KHz
Frequencies of the harmonic series of oil, КHz
41,6 20,5 10,5 5 37 32 25 16 8
Ak-Zhar, initial condition of oil 0,22 0,15 – 0,02 0,1 0,02 0,08 0,1 –
Ak-Zhar, 8 hours of treatment 0,25 0,15 – 0,025 0,1 0,01 0,05 0,1 –
Ak-Zhar, aging 72 hours 0,02 0,15 0,04 0,01 0,02 0,04 – 0,1 –
Karabulak, initial condition of oil – 0,05 0,03 – – – – 0,03 0,07
Karabulak, 24 hours of treatment 0,1 0,15 – – <0,05 – – – –
Karabulak, aging 48 hours 0,09 0,15 0,03 – 0,03 – 0,03 0,03 –
Zhanatan, initial condition of oil East-West 0,2 0,03 0,045 0,055 0,15 0,045 0,04 0,15 –
Zhanatan, 24 hours of treatment North-South 0,22 0,15 0,12 0,05 0,18 0,15 0,09 0,17 –
Tabular data indicate that during the treatment the amplitude of the responses varies, both for the
components of the harmonics of the water series, and for the special frequencies of the oil film. In this case, the response of each oil field has specific features. Therefore, when developing software for proper-ties management, it is necessary to take into account the individual characteristics of the oil field [14, 15].
In dynamical systems, whose potential for external influences exceeds the possibilities for the material to return to the previous type of equilibrium - the processes of melting, dissolution, chemical reactions, plastic deformation, etc., the transition to a new state takes place in stages, accompanied first by the destruction of weaker bonds, then by intermediate and most energy-intensive bonds.

Известия Национальной академии наук Республики Казахстан
192
The quantitative relations in the multistage process of the phase transition fit well in the equation of Smirnov A. P. [17]:
lnη/(1-η)-lnηi/(1-ηi3)=εi((D-Di)/Di)n .
This relationship establishes the link of the energy necessary for the transition to another state of the multiparticle system in the condition of a change in the fraction of particles in the excited state from ηi to η (the left side of the equation). The right-hand side of the equation of equilibrium characterizes the energy of the change in the measure of action on the system from Di to D (D can be temperature, magnetic field, pressure, frequency, density, velocity and other parameters changing under the action of external forces).
Analysis of the systemic bonds [17] in a solid, carried out for four levels of consideration, showed that the value of εi can be equal to 1, 10, 100, 1000 depending on the type of energy conversion during the interaction process. For example, in the process of decomposition of water by energy storage substances, three types of resonance interactions were identified, in which εi has values of 10, 100, 1000.
Thus, this equation can characterize several types of equilibrium in which the quantitative relations between the excited and unexcited elements of the structure are balanced by changing the physical properties of the substance. If this relationship has the force of law, then in already existing types of equi-librium, inter phase and intra-phase - these relationships must be satisfied. The left side of the equation gives a quantitative representation of the changes in the reacting system, and the right reflects all the varieties of responses to the external action mathematically described by the value of the power-law dependence of n. The physical meaning of this indicator reflects the change in properties in the A, 2D, 3D dimensions.
Experimentally observed values of the degree n:
n = 1; n = 1/2; n = 3/2.
An exponent n = 1 is characterized by changes in properties, which are described by linear relation-ships, for example, frequency, refractive index, diffusion, and others. We used this relation with n = 1 to determine the interaction frequency for environments moving with different velocities. The well-known formula of Krasilnikov V.A. [12] is a particular case of this law. In the matrices of systemic relationships that we have developed, the exponent equal to one is used for processes and states of level 1 of conside-ration.
The exponent n = 1/2 (square root) can be used for the second level of consideration (2D processes), where changes in states associated with the transformation of electromagnetic energy into mechanical one and vice versa prevail. In our case, these are processes and states of the second level of consideration (exponent relations).
Responses for 3D levels of consideration include processes associated with the impact of the dynamic effect of daily rotation of the planet, where the space-time parameters are determined by Kepler's third law [18-21].
Comparison of experimental results on the study of spectral responses to external impulse actions and theoretical developments based on the types of equilibrium for intraplanetary cycles allows us to draw the following conclusions:
1. Obtaining information on changes in the state of the interface between phases by measuring spectral responses provides the necessary potential for searching for cause-effect relationships in all ranges of external influences.
2. The change in the quantitative relationships in the "impact-response" system is suggested to be estimated by the formula of Smirnov A.P., which makes it possible to reflect three-stage processes in the whole variety of their manifestations.
3. It is shown that the state of water (supplier of hydrogen and oxygen) at the interface between phases affects the processes of synthesis and decomposition of hydrocarbons. The observed effect is of practical importance in the development of technology to reduce viscosity under natural underground conditions.
The results of the work were obtained during the implementation of the topic AP05130483 "Scien-tific and technical basis for reducing the viscosity of Kazakhstani oils, which provide a significant increase in oil recovery from oil fields" (2018-2020).

ISSN 2224-5278 Серия геологии и технических наук. 4. 2018
193
REFERENCES
[1] http://mirznanii.com/a/24190/povyshenie-nefteotdachi-plastov [2] Pezron E., Leibler, Ricard A. Audebert. Reversible Gel-formation Induced by Ion Complexation. 2. Phase Diagrams //
Macromolecules. 1988. Vol. 21, N 4. P. 1126-1131. [3] Tam K.C., Tiu G. Role of ionic species and valency of the steady shear behavior of partially hydrolyzed polyacrylamide
solutions // Colloid and polym. sci. 1990. Vol. 268, N 10. P. 911-920. [4] Mishchenko I.T, Bravicheva T.B., Ermolaev A.I. Selection of the method of operation of wells with hard-to-recover
reserves. M.: Publisher ''Oil and Gas'' of Gubkin RSUOG, 2005. 448 p. [5] Metaxa G.P. Development of theoretical bases of an estimation and the forecast of a condition of rocks at
electromechanical influences: the Author's abstract. Doct. dis. on spec. 25.00.20. 2006. 44 p. [6] Guliy G.A. Scientific bases of discharge-impulse technologies; resp. ed. B.Y. Mazurovsky; Academy of Sciences of
Ukraine. Design Bureau of Electrohydraulic. Kiev: Naukova Dumka, 1990. 208 p. [7] Reference book on oil extraction / Ed. Dr. Tech. HI.K. Gimatudinov. M.: Subsoil, 1974. 704 p. [8] Curtis C. Heavy oil reservoirs / S. Curtis, R. Kopper, E. Decoster, A. Guzman-Garcia, C. Huggins, L. Knauer,
M. Minner, N. Kupsch, LM Linares, H. Rough , M. Waite // Oilfield Rev. 2002. Autumn. P. 30-51. [9] Jabour C. Oil Recovery by Steam Injection: Three-phase Flow Effects / C. Jabbour, M. Quintard, H. Bertin, M. Robin //
J. of Pet. Science and Engineering. 1996. Vol. 16. P. 109-130. [10] Goncalves S. Absorbance and Fluorescence Spectroscopy on the Aggregation Behavior of Asphaltene-Toluene
Solutions / S. Goncalves, J. Castillo, A. Fernandez, J. Hung // Fuel. 2004. N 83. P. 1823-1828. [11] Zotov B.C., Alnabuda A.C.D. et al. The method of gas-impulse processing of wells. SPb.: "Galea Print", 2004. 200 p. [12] Krasilnikov V.A. Acoustics, Sound and ultrasonic waves in air, water and solids / 3rd ed. M., 1960. [13] Merkulov A.A., Nazin S.S. Impulse and acoustic technologies of oil production intensification and apparatus for recor-
ding the parameters of the process of impact // International technological symposium "Intensification of oil and gas production". M., 2003.
[14] Basniev K.S., Dmitriev N.M., Rosenberg G.D. Oil and gas hydromechanics: Textbook for higher education institutions. M.–Izhevsk: Institute for Computer Research, 2005. 544 p.
[15] Moldabayeva G.Z. Determination of the variability of the properties of aqueous solutions and hydrocarbons under electrophysical influence and the development of a method for reducing viscosity: Abstract of Cand. dis. Almaty, 2004. on the headings: Processing of oil and oil gases. Production of petroleum products. BBK 35.514 (5Kaz).
[16] Howard E. Johnson. Pulse generator for oil well and method of stimulating the flow of liquid: Pat No. 5836393, USA (published on 17.11.1998).
[17] Smirnov A.P. General laws governing the development of phase transitions. LGU. Riga. 1978. P. 3-28. [18] Yavorsky B.M., Detlaf A.A. Handbook of Physics. M.: High school, 1989. 608 p. [19] Metaxa G.P., Buktukov N.S. Types of equilibrium for interplanetary cycles (nano-level of consideration). LAP
LAMBERT Academic Publishing. Germany, 2016. P. 75. [20] Sarmurzina R.G., Karabalin U.S., Metaxa G.P. The way of influence on fluid-containing systems. Patent of the Repub-
lic of Kazakhstan. No. 26482 of December 14, 2012. [21] The generator with adjustable pressure pulse PGRI-100. Technical description and user manual PGRI-100.000 TO /
Malakhovsky branch of ANPF "Geophysics". M., 1994. 22 p.
Г. Ж. Молдабаева, Г. П. Метакса, Ж. Н. Алишева
Қ. И. Сатпаев ат. ҚазҰТЗУ, Алматы, Қазақстан
ҚАБАТТЫҢ МҰНАЙ БЕРГІШТІГІН АЙТАРЛЫҚТАЙ АРТТЫРУ МАҚСАТЫНДА ҚАЗАҚСТАНДЫҚ МҰНАЙ ТҰТҚЫРЛЫҒЫН ТӨМЕНДЕТУДІҢ
ҒЫЛЫМИ-ТЕХНИКАЛЫҚ НЕГІЗДЕРІ Аннотация. Жұмыстың мақсаты: Мұнай қабаттарының мұнай беругіштігін айтарлықтай арттыру мақсатында
қазақстандық мұнайдың тұтқырлығын азайту үшін ғылыми-техникалық негізізде құру. Қазіргі экономикалық жағдай барысында Қазақстанның мұнайгаз саласы оның жоғары инвестициялық
тартымдылығын сақтай отырып, белсенді өсу аймағында болуды жалғастыруда. Сыртқы импульстік əсер етуіге спектрлік жауап (жаңғырық)жəне теориялық əзірлемелер түрлері бойын-
ша эксперименттік нəтижелерінсалыстыру барысында тепе-теңдік үшін планета ішілік зерделеу бойынша цикл мынадай қорытындылар жасауға мүмкіндік береді:
1. Қазақстандық мұнайдың тұтқырлығын азайту процесінпрограммалық қамтамасыз ету міндеті бары-сында, əр кенорнында əртүрлі болғандықтан, анықталған əсер етудің жауабының (жаңғырықтың) спектрлік құрамын зерттеу үшін физикалық үлгілеу жүргізу керек болды.

Известия Национальной академии наук Республики Казахстан
194
2. Спектрлік жауапты өлшеу жолымен фазаның бөліну шекарасының өзгеруі жайлы ақпарат алу – барлық сыртқы əсер ету диапазондарының себеп-салдарлық өзара байланысының қажетті қуатын издеу болып табылады.
3. «Əсер ету-жауап алу» жүйесінде сандық қатынастардың өзгеруін үш стадиалық процестің көптүрлік пайда болуын көрсетуге мүмкіндік беретін А.П.Смирновтың формуласымен бағалау ұсынылды.
Түйін сөздер: мұнай бергіштік, əсерге жауап беру, спектрлік құрам, бөліну шекарасы, қасиеттерді басқару, тау жыныстарының табиғи орны.
Г. Ж. Молдабаева, Г. П. Метакса, Ж. Н. Алишева
КазНИТУ им. К. И. Сатпаева, Алматы, Казахстан
НАУЧНО-ТЕХНИЧЕСКИЕ ОСНОВЫ СНИЖЕНИЯ ВЯЗКОСТИ КАЗАХСТАНСКИХ НЕФТЕЙ, ОБЕСПЕЧИВАЮЩИХ СУЩЕСТВЕННОЕ ПОВЫШЕНИЕ НЕФТЕОТДАЧИ ПЛАСТОВ
Аннотация. Цель работы: Разработка научно-технических основ снижения вязкости казахстанских нефтей, обес-
печивающих существенное повышение нефтеотдачи пластов. В современных экономических условиях нефтегазовая отрасль Казахстана продолжает находиться в
зоне активного роста, наряду с сохранением ее высокой инвестиционной привлекательности. Сопоставление экспериментальных результатов по изучению спектральных откликов на внешние им-
пульсные воздействия и теоретических разработок по видам равновесия для внутрипланетных циклов позво-ляет сделать следующие выводы:
1. Получение информации об изменениях химического состава границы раздела фаз путем измерения спектральных откликов обеспечивает необходимый потенциал поиска причинно-следственных взаимосвязей во всех диапазонах внешних воздействий.
2. Изменение количественных соотношений в системе «воздействие-отклик» предложено оценивать по формуле Смирнова А.П., дающей возможность отражать трехстадийные процессы во всем многообразии их проявлений.
3. Показано, что состояние воды (поставщика водорода и кислорода) на границе раздела фаз влияет на процессы синтеза и разложения углеводородов. Обнаруженный эффект имеет практическое значение при разработке технологии снижения вязкости в условиях природного залегания.
Ключевые слова: нефтеотдача, воздействие-отклик, спектральный состав, граница раздела, управление свойствами, природные залегания.

ISSN 2224-5278 Серия геологии и технических наук. 4. 2018
195
N E W S OF THE NATIONAL ACADEMY OF SCIENCES OF THE REPUBLIC OF KAZAKHSTAN
SERIES OF GEOLOGY AND TECHNICAL SCIENCES
ISSN 2224-5278
Volume 3, Number 430 (2018), 195 – 200 UDK 546.78+621.793+541.52
E. S. Musina1, A. S. Musina2, G. U. Baitasheva2, G. A. Kalmenova2, Zh. Kuanysheva2
1K. I. Satpayev Institute of Geological Sciences, Almaty, Kazakhstan, 2The Kazakh State Women's Teacher Training University, Almaty, Kazakhstan.
E-mail: [email protected]
CONTROL OF TRACE QUANTITIES OF METALS IN THE ENVIRONMENTAL SAMPLES,
USING MERCURY-FILM INDICATIVE MICROELECTRODES
Abstract. Theoretical bases for the determination of trace quantities in the environmental samples by the method of stripping voltammetry, whose accuracy and reproducibility is associated with the use of the proposed mercury-film tungsten electrode, have been developed. The methods for the formation of a stable mercury film on a substrate of this material have been developed; the factors effecting the sensitivity and resolution of the film electrode have been studied.
Perspectiveness of using the electrochemical methods of analysis, in particular, stripping voltammetry, for exercising a control over toxic and heavy metals in technology-related and mineral raw materials of Kazakhstan has been demonstrated.
Key words: indicative electrode, mercury-film electrode, tungsten, stripping voltammetry, amalgamation. Nowadays, the transformation of any technology process into a recycling waste-free production is
one of the most important tasks. In this connection special attention should be paid to monitoring and regulation of the technology process itself and the determination of the content of toxic substances in industrial waste dumps and industrial wastewaters.
In connection with the accumulation of a large amount of secondary raw materials, containing harmful impurities, including heavy metals, the task of their detection and quantitative determination remains topical up till now. Only the data of analytical control may provide the people with a thread for managing the environmental purity and indicate the moment of necessary intervention for its protection from the accumulation of toxic substances and ecological poisons, whereto heavy metals are directly related. Passing into the human organism through air and water, including the chain: soil → water → animal, they cause various diseases.
The developed indicative microelectrodes on a substrate of the iron family metals and alloys on the basis of such metals, as well as a carbon-containing material, carbon-fiber reinforced plastic, which can be safely related to new means of controlling toxic substances have been earlier proposed as the means for exercising control over toxic and heavy metals [1].
Physical and chemical characteristics of these electrodes and the mechanism of the processes, proceeding at the electrode-solution interface have been studied at the stages of preparation of their surface and subsequent amalgamation. Optimal parameters of their functioning have been determined. A design of a rotating electrode has been developed, which has allowed the metrological characteristics to be improved and analytical signals of toxic elements, such as mercury, zinc, cadmium, lead and copper, to be detected when they are jointly present in the analyzed samples.
While carrying out an electrochemical analysis of the toxic metal compounds a large effect upon the cathode-anode processes is produced by the nature of the indicative electrode matrix, background composition and the presence of other components. The impurities, possessing the same or close values of

Известия Национальной академии наук Республики Казахстан
196
potentials, as well as the impurities, forming intermetallic compounds with the analyzed metals, especially hinder the registration of analytical signals. The indicated circumstances determine a necessity to solve a complex problem of development of electrodes, using inexpensive and available materials with the valuable physicochemical and electrochemical properties.
The creation of a mercury-film electrode (MFE) is one of the greatest achievements in the inversion methods of electroanalysis. MFE combines the advantages of a solid and mercury electrodes: it has a wide operating interval of potentials, sufficiently reproducible surface; it does not display, as a rule, any inter-metallic interactions of the deposited metals. MFE is obtained by applying mercury to an inert electro-conductive substrate [2, 3].
Upon the creation of new indicative electrodes special requirements are set forth for increasing their corrosion resistance, sensitivity, selectivity, expansion of the range of operating potentials, etc. The most promising in this respect are the mercury-film electrodes with an inert substrate, which make it possible to work within a very wide range of potentials, thereby expanding the analytical capabilities.
Graphite and glass carbon are usually used as a substrate. However, the use of such substrates does not ensure the formation of a uniform film due to the presence of microdefects (microscratches, chips, cracks) on the surface. Such material requires an additional treatment, involving certain physical and material costs. This may be excluded by using metal substrates.
It is known that mercury is isolated in the form of a uniform film only on amalgam-forming metals 4,5. The drawbacks of mercury-film electrodes (MFE) on metal substrates are an instability of the thick-ness and composition of a mercury film as a result of the deep penetration of mercury into the metal and the formation of amalgams of different concentrations, as well as possible interactions of the analyzed metals, isolated on the electrode, with the substrate metal. These circumstances indicate an important role of a substrate in the electrode functioning.
Precious metals are usually used as metal substrates for mercury, which are inert to mercury and adhere well thereto 6, 7.
Method of procedure. Measurements by the method of stripping voltammetry were carried out with the help of PI-50-1.1 potentiostat and СВА-1 system, using molybdenum and tungsten as an electro-chemical sensor, MB-50 alloy with the visible surface area of 0.2cm2. Electrochemical regeneration of the electrode surface was carried out after each measurement, holding an electrode at the positive potential of 0.7 V and mechanical regeneration was carried out by grinding the working surface with a special paste (or Аl203 powder), then by filter paper. A silver chloride (Ag+/AgCl) electrode (s.c.e.), whose potential in relation to a normal hydrogen electrode of 0.1 М КС1 is equal to +0.222 V at 20°С, was used as a refe-rence; a platinum wire was used as an auxiliary electrode. Voltammograms were registered on GTDA-1 two-dimensional recording potentiometer in the mode of anode stripping voltammetry with a potential sweep rate of 0.1 V/s.
Experimental. A mercury-film electrode (MFE) combines the advantages of a solid and mercury electrodes: it has a wide operating interval of potentials, sufficiently reproducible surface; it does not display, as a rule, any intermetallic interactions of the deposited metals. MFE is obtained by applying mercury to an inert electro-conductive substrate [1-4].
It is known that mercury is isolated in the form of a uniform film only on amalgam-forming metals 4, 5. The drawbacks of mercury-film electrodes (MFE) on metal substrates are an instability of the thickness and composition of a mercury film as a result of the deep penetration of mercury into the metal and the formation of amalgams of different concentrations, as well as possible interactions of the analyzed metals, isolated on the electrode, with the substrate metal. These circumstances indicate an important role of a substrate in the electrode functioning, which should ensure good adhesion with mercury and be inert thereto. With this purpose mainly precious metals are used [2-5]. Mercury-film electrodes on an iridium substrate allow one to determine the presence of Cd and Рb within the range of contents of 0.1–5 mg/l [3]. A mercury-film electrode of platinum with electrochemical regeneration of a mercury film has been studied in detail in situ in the presence of cadmium ions (С < 2-10" mol/l), providing good adhesion of mercury to a platinum substrate [6].
It has been shown that the electrochemical properties of the obtained MFE remain constant with the thickness of a mercury film of ~10 d= 0.14 mm) and ~25 μm (d- 0.45 mm). It is assumed, that with an increase of the diameter d of Pt-film an edge effect becomes more pronounced. This requires an increase

ISSN 2224-5278 Серия геологии и технических наук. 4. 2018
197
of the film thickness. When using an immobile MFE at the background of 0.1 М НС104 strong signals of cadmium and indium (III) reduction have been recorded in the presence of complexonates, causing their ligand-induced adsorption.
Precious metals are mainly used as metal substrates for mercury, which have good adhesion to mercury and are inert in relation thereto 3-6, 9.
The material, proposed by us as a substrate, tungsten, possesses such physical properties as strength, hardness and elasticity, and has an obvious advantage over the precious metals by its cost (much more inexpensive as compared with them), being, therefore, an available constructional material. Besides, it is practically insoluble in mercury (L= 6.8·10-20 at.%) 10, which affords us ground to assume that MFE on its basis should correspond by its properties more to the mercury electrodes and mercury.
The mercury potential depends, to a large extent, on the nature of anions, which is connected with the tendency of ions of mercury (I) and (II) to form salts of low solubility and complex ions (table).
Standard mercury potentials in the solutions under study [9]
Electrode reaction Е0,V (n.h.e.) E0, V (s.c.e.)
Hg + 2OH- = HgO + H2O 0.929 0.689
2Hg + SO42-= Hg2 SO4 + 2e 0.615 0.378
2Hg + 2Cl- = Hg2Cl2 + 2e 0.268 0.031
2Hg + 4Cl- = HgCl42- + 2e 0.48 0.243
2Hg + 2SCN- = Hg2(SCN)2 +2e 0.22 -0.017
2Hg + 2OH- = Hg2O + H2O +2e 0.123 -0.114
In the non-complex-forming medium the standard mercury potential is shifted to the positive values
up to ~ +0.4 ÷ +0.7 V. If any substance, forming an insoluble compound or complex with mercury ions, is present in the solution, the potential shifts to the less positive and even negative values the stronger the less soluble the precipitate is, the more stable the complex is, and the higher the concentration of the substance, forming the precipitate or complex, is. It is known that the precipitates with mercury are formed in the presence of ions of Cl-, Br-, I-, N3
-, OH-, SH-, S2- etc., the complexes are formed with SСN-, CN-, SO3
2-, S2O32-, EDTA, etc. [3].
Figure 1 – Potential-time dependences of RPWE (1-6),
RE (1'-6 '), RPSUE (1 "-3") in 0.1N solutions of electrolytes
1-1" – H2SO4; 2-2'' – KSCN; 3-3" – KCl; 4, 4' – HCl;
5, 5' – H3 PO4; 6, 6 ' – H2SO4 + 1.6810-2 N HgSO4

Известия Национальной академии наук Республики Казахстан
198
In this connection, for the identification of the peculiarities of the mercury-film electrodes on the basis of tungsten (RPWE), the stationary potentials (Eс) of the mercury-film samples based on W have been compared with the mercury pool and RPSUE in 0.1 N solutions of various electrolytes (figure 1).
As it follows from the obtained results, Eс of the mercury-film samples on the basis of tungsten is close to Eс of the above mercury electrodes. A certain difference in the values of the steady-state potentials seems to be explained by an interaction between mercury and the substrate metal. We guess that in the surface layer of a metal substrate, upon mercury deposition, the formation of tungsten bronzes (НgхWО3) is possible, whereupon a mercury coating is formed.
Upon adding of Hg2+ ions to 0.1 NH2SO4 solution the recorded potential Eс for all electrodes has the same values. This is due to the fact, that since Hg on all electrodes is present as metal, in the elemental state, its activity is equal to 1 and mercury ions are potential-defining in the indifferent H2SO4, solution, containing 1.6810-2 NHg2+.
The study of the steady-state potentials of the mercury-film samples in different media shows not only the defining role of mercury on their surface, but also an effect of the substrate metal upon the elec-trochemical characteristics of the electrode. It has been established, that the behavior of the electrode with a tungsten substrate somehow differs from that of the pure mercury electrodes [2, 11, 12].
Alongside with the potentiometric measurements, which have made it possible to study the electrodes without the imposition of external polarization, the cathode-anode processes proceeding on the electrode have been studied and the range of the operating potentials has been established for the evaluation of the effect of the substrate metal upon the functional characteristics of the electrode by way of recording cyclic voltammetric curves.
Voltammograms of pure mercury, represented by the mercury pool (RE) and mercury-film samples of tungsten and platinum in the sulfuric medium, have been taken for comparison (figure 2).
The comparison of the polarization curves shows that in case of RPWE a current horizontal area is narrower than that of a mercury electrode, since the field of potentials of the curve kinetic site is wider.
Figure 2 – Comparison of the working region of the potentials of RPWE (1), RPPRtE (2) and RE (3) in 1M H2SO4
-1.2 -0.6 0 Е, В
25 μm
1 2 3
ISSN 2224-5278 Серия геологии и технических наук. 4. 2018
199
This seems to be explained by an interaction between mercury and tungsten, and results in decrea-sing of hydrogen overpotential (down to the value of –0.8 V), in comparison with the mercury electrode (1В) [1].
Probably, the shift of the reduction potential of Н+-ions to the positive side occurs due to the change of the nature of the surface substrate layer. The horizontal curve area and ranges of operating potentials (figure 2) show an identity of polarization curves for RPWE and RPRtE(curves1, 2) and similarity of the characteristics of these electrodes to RE (curve 3).
Thus, the established similarity of the electrochemical properties of the mercury-film electrodes on a metal substrate (RPWE and RPRtE) affords us ground to conclude that the functional characteristics of the electrodes are mainly determined by the nature of the substrate metal.
A possibility of evaluating the quality of coating has been shown by the method of cyclic voltammet-ry, and the correctness of such an estimate has been established when using new materials as indicative electrodes in the method of stripping voltammetry. The conditions ensuring selectivity of their deter-mination have been revealed using the example of Pb and Tl.
The regularities of the electrochemical behavior of Pb, Hg, Tl, Cu and Au have been studied in indif-ferent and complex-forming electrolytes on the new microelectrodes. The new electrodes have been ap-probated for the first time in the analysis of waters and gold-containing products. Persepectiveness of their using as indicative electrodes for electroanalysis has been demonstrated.
A conclusion has been drawn that one of the criteria for choosing electrode materials is their solu-bility in mercury and corrosion resistance in the working electrolytes, which, in its turn, is determined by the composition and structure of their crystalline lattice, physical and chemical properties of the oxide films, formed on the sample surface and solid reaction products.
Conclusions. Thus, the established similarity of the electrochemical properties of the mercury-film electrodes on a metal substrate (RPWE and RPRtE) affords us ground to make a conclusion of a possibi-lity to use a mercury-film tungsten indicative microelectrode for exercising control over the trace quan-tities of metals in the environmental samples.
REFERENCES
[1] Mussina А.S., Bukhman S.P. On the behavior of metals of low solubility in mercury. Almaty: School of the 21st century,
2004. 184 p. [2] Vydra F., Shtulik K., Yulakova E. Stripping voltammetry. М., 1980. 278 p. [3] Brainina Kh.Z., Neiman Ye.Ya., Slepushkin V.V. Stripping electroanalytical methods. М., 1988/ 239 p. [4] Mussina А.S., Lange А.А., Bukhman S.P. Cathodic amalgamations of the iron family metals // Zashchita metallov.
1989. Vol. 25, N 5. P. 806-810. [5] Mussina А.S., Bukhman S.P., Komutbayeva G.А. Method of amalgamation of metals and alloys // RK Patent No. 141,
1993. B.I. No. 2. [6] LeDrogoff В., El. Khakani M.А. The effect of geometry of a microelectrode upon the diffusion process and electro-
chemical behavior of an iridium microelectrode, electrochemically coated with mercury // Electroanalysis. 2001. 13, N 18. P. 1491-1496.
[7] Yosypchuk В., Novotny L. The application of silver solid amalgam electrodes for the determination use of iodates // Electroanalysis. 2002. 14, N 15-16. P. 1138-1142.
[8] Maksashkina L.М., Loskutova Ye.Ye., Dorofeyeva V.V. Stripping-voltammetric determination of micro-impurities of lead, cadmium and copper in thioglycolic acid // Zav. lab. 1996. 62, N 5. P. 17-18.
[9] Gladyshev V.P., Levitskaya S.А., Filippova L.М. Analytic Chemistry of Elements. М.: Mercury, 1974. 228 p. [10] Kozin L.F. Physical and chemical bases of amalgam metallurgy. Alma-Ata, 1964. P. 40-42. [11] Khosroyeva D.А., Turyan Ya.I., Strizhov N.K. Voltammetry of an electrode with electrochemical regeneration of a mer-
cury film // Journal of Analytical Chemistry. 1992. Vol. 47, issue 7. P. 1289-1292. [12] Kaminskaya О.V., Dessyatov V.А., Zakharova V.А., Slepchenko G.B. Comparative study of voltammetric behavior of
microquantities of Zn, Cd, Pb and Cu on the vibrating and rotating mercury-film electrodes // Zav. lab. 2003. N 9. P. 18-20.

Известия Национальной академии наук Республики Казахстан
200
Э. С. Мусина1, А. С. Мусина2, Г. У. Байташева2, Г. А. Кальменова2, Ж. Куанышева2
1Институт геологических наук им. К. И. Сатпаева, Алматы, Казахстан, 2Женский государственный педагогический университет, Алматы, Казахстан
КОНТРОЛЬ СЛЕДОВЫХ КОЛИЧЕСТВ МЕТАЛЛОВ В ОБЪЕКТАХ ОКРУЖАЮЩЕЙ СРЕДЫ С ИСПОЛЬЗОВАНИЕМ
РТУТНО-ПЛЕНОЧНЫХ ИНДИКАТОРНЫХ МИКРОЭЛЕКТРОДОВ
Аннотация. Разработаны теоретические основы определения следовых количеств металлов в объектах окружающей среды методом инверсионной вольтамперометрии, точность и воспроизводимость которых свя-зана с использованием предлагаемого ртутно-пленочного вольфрамового электрода. Разработаны методы формирования устойчивой ртутной пленки на подложке из этого материала; исследованы факторы, влияю-щие на чувствительность и разрешающую способность пленочного электрода.
Показана перспективность использования электрохимических методов анализа, в частности, метода инверсионной вольтамперометрии, для осуществления контроля токсичных и тяжелых металлов в техно-генном и минеральном сырье Казахстана.
Ключевые слова: индикаторный электрод, ртутно-пленочный электрод, вольфрам, инверсионная вольтамперометрия, амальгамирование.
Э. С. Мусина1, А. С. Мусина2, Г. У. Байташева2, Г. А. Кальменова2, Ж. Куанышева2
1Қ. И. Сəтбаев атындағы геологиялық ғылымдар институты ҚР, Алматы, Қазақстан, 2Қыздар мемлекеттік педагогикалық университеті, Алматы, Қазақстан
ҚОРШАҒАН ОРТА ОБЪЕКТІЛЕРІНДЕ СЫНАП-ПЛЕНКАЛЫ ИНДИКАТОРЛАР
МИКРОЭЛЕКТРОДТАРДЫ ПАЙДАЛАНА ОТЫРЫП МЕТАЛДАРДЫҢ ӨТЕ АЗМӨЛШЕРІН БАҚЫЛАУ
Аннотация. Инверсті вольтамперометрия тəсілін қолданып қоршаған орта объектілерінде металдардың
өте аз мөлшерінің теориялық негіздерін анықтау, жаңадан өндірілуі жəне дəлдігі ұсынылатын сынап-плен-калы вольфрамды электродты пайдаланумен байланысты. Осы материалдан тұрақты сынап пленкасын қалыптастыру əдістері əзірленді; пленкалы электродтың əсер етуші факторларға сезімталдығы мен рұқсат беретін қабілеті зерттелді.
Электрохимиялық талдау əдістерін пайдалану болашағы көрсетілген, атап айтқанда, вольтамперометрия инверсті əдісін жүзеге асыру үшін ҚР техногенді жəне минералды шикізаттарда уытты жəне ауыр металдар-дың мөлшерін бақылау.
Түйін сөздер: индикаторлық электрод, сынап-пленкалы электрод, вольфрам, инверсті вольтамперо-метрия, амальгамирлену.

ISSN 2224-5278 Серия геологии и технических наук. 4. 2018
201
N E W S OF THE NATIONAL ACADEMY OF SCIENCES OF THE REPUBLIC OF KAZAKHSTAN
SERIES OF GEOLOGY AND TECHNICAL SCIENCES
ISSN 2224-5278
Volume 3, Number 430 (2018), 201 – 207
S. K. Abildinova1, R. A. Musabekov1, A. S. Rasmukhametova1, B. Ongar1, I. Zh. Yessengabylov2, А. О. Aldabergenova2, G. B. Issayeva3
1Almaty University of Power Engineering & Telecommunications (AUPET), Almaty, Kazakhstan, 2Zhetysu State University named after I. Zhansugurov, Taldykorgan, Kazakhstan,
3Caspian University, Almaty, Kazakhstan. E-mail: [email protected], [email protected], [email protected], [email protected], [email protected]
THE EFFICIENCY OF DISTRICT HEATING SYSTEMS IN CONDITIONS OF JOINT USE OF HEAT PUMPS
Abstract. The article describes the main problems of traditional heat supply in the Republic of Kazakhstan,
discusses possible solutions to this problem. Development of practical examples of the implementation of heat pump technology at specific sites of a heat supply leads to the improvement of technical and economic parameters of the heating system. The development is aimed at the concept of using nontraditional sources of heat for the transition of heating systems to a new level of heat.
By analyzing existing examples of implementation in the work of heating systems with alternative heat sources and the results of the study determined the effectiveness of the installation of heat pumps in the Central heating station that uses the independent scheme of connection of consumers of heat. The use of a heat pump reverse system water to the evaporator as a source of low potential energy leads to a reduction in consumption of direct network of water from combined heat and power CHP heating unit quarterly network and consequently will decrease the flow rate of fuel combusted at the CHP.
Keywords: central heating; heat pump; mains water; teploelektrocentral; heating network; energy efficiency; low-grade heat.
In Kazakhstan, centralized heat supply based on combined heat and power generation at central
heating plants (CHP) has been most widely developed and is currently the dominant system. In the period from 1990-2005 the commissioning of new capacities at the CHP was carried out on a
limited scale in connection with the economic downturn in the years of perestroyka. The key problem in all operating links of the district heating system is the moral and physical wear and tear of fixed assets. Low demand for thermal energy has led to deterioration in the technical and economic performance of heat supply systems. This led to an increase in the cost of production of heat and electricity.
Increasing the energy efficiency of district heating should be carried out in accordance with the program "Energy Saving-2020", adopted by the Decree of the Government of the Republic of Kazakhstan dated August 29, 2013, No. 904 [1]. The program pays much attention to the selection of the main heat sources, as this is the most important task in the design of energy-efficient heat supply systems for housing and communal services.
The program "Energy Saving 2020" determines not only the creation of technical, technological, legal, economic and organizational bases and measures to stimulate the efficiency of heat supply systems, but also their mutual coordination aimed at reducing the amount of resources used, in particular fuel resources for heat supply, while maintaining the appropriate useful effect from their use.
For effective resource and energy saving in the centralized heat supply systems of the Republic of Kazakhstan, the following main problems must be solved.
When talking about resource saving or reducing energy losses, they do not mean a quantitative expression, since it is automatically controlled by the first law of thermodynamics, but implies a quali-tative characteristic of the energy itself. In the general case, the conservation of energy of heat is, in essen-ce, the preservation of its quality.

Известия Национальной академии наук Республики Казахстан
202
The task of energy efficient heat supply depends on a number of problems that depend on the geographic location of the heat supply facility, the duration of the heating period, taking into account the average ambient temperature.
The cost of heat supply depends on the climatic conditions of Kazakhstan. According to the official source of information [2], the average January temperature in the Republic of Kazakhstan (2015) -11,00С (table 1).
Table 1 – Average temperature of January in different regions of the Republic of Kazakhstan
Region Тemperature, 0С
Akmola - 16,8
Aktobe - 14,9
Almaty - 6,5
Atyrau - 9,6
East_Kazakhstania - 16,5
Zhambyl - 5,0
West Kazakhstan -13,5
Karaganda -14,5
Kyzylorda -9,1
Kostanay -17,0
Mangystau -2,9
Pavlodar -17,6
North-Kazakhstan -18,1
South Kazakhstan -2,0
Before the design of the heating system of buildings and the selection of the source of heat, the heat
balance is calculated, which takes into account: - the number of emissions from heat sources that operate on natural fuels; - rational use of traditional natural resources, the influence of the "greenhouse effect" due to the
release of harmful substances into the atmosphere; - thermal density of the built-up area; - deficiency of generation of thermal energy; kind of available local fuel; -washing of existing engineering systems and heat networks; -it is impossible to lay new heating mains. The drawbacks of traditional heat sources are their low energy, economic and environmental
efficiency (in the case of small boiler houses), since the burning of organic fuel pollutes the environment. Plus, the constantly rising tariffs for released thermal energy, aggravated by transportation costs in the production and distribution of energy. Hence, a low exergetic ECE, characterizing the maximum work that occurs when the thermodynamic system with a specified parameter is reversed into equilibrium with the surrounding medium.
In addition, there is an unreasonably high cost of building and maintaining heat networks, which are the most unreliable element of central heating systems.
At present, the heat networks of the Republic of Kazakhstan are characterized by a high degree of wear, about 70-80%, high accidents, and losses in heating networks are much higher than world indices.
The most effective and obvious option for solving energy saving problems in heat networks is the use of rational process flow sheets with heat pumps. The prospects for the use of heat pumps TN in the Republic of Kazakhstan are determined by the technological demand and the tendency to increase prices for fuel, heat and electricity.
Overcoming with the help of factors TN that reduce the efficiency of heat supply from the CHP is fully possible only in newly constructed district heating systems (DHS) and in new construction of residential and industrial buildings.

ISSN 2224-5278 Серия геологии и технических наук. 4. 2018
203
The new projects provide for increased requirements for thermal and sound insulation. For windows, double-glazed windows of increased tightness are used. Inside the premises, there is a mandatory installation of heat metering and air temperature control devices, heating devices with more intensive heat transfer from the network water (finned-surface finned radiators, "warm floors", etc.), which help to re-duce both the temperature of direct supply water and reduce the temperature of the return network water due to intensive heat extraction.
So for "warm floors" the temperature of direct and reverse network water can lie in the range of 45÷30оС Under these conditions, a radical change in the temperature graph of direct and reverse water is possible-a reduction in these temperatures to a level sufficient for heating the premises and favorable for work TN with a high conversion factor. Under these conditions, a complete transition of the district heating systems DHS to the TN (CHP + TN system) is possible.
Currently, the network water is returned to the CHP plant at a temperature of 45 ÷ 70 °C. To achieve higher values of the TN conversion factor, this temperature should be reduced to 25-30 °C. This is possib-le not only by improving the design of buildings and their heating system, which was mentioned above. In addition to these solutions, it is possible (and appropriate) to lower the temperature of the return network water by installing heat pumps at central heating points (CHP). For TN, the source of low-potential heat will be the reverse network water.
In work [2] the system of heat supply of an apartment house with heat sources heat pump - thermal networks where the heat pump provides from 50 to 70% of heat demand is developed. The total duration of the operation of heat pumps depends on the value of the outside air temperature at the bivalent point on the heat load graph, determined by means of climatic data (Table 1).
In [3, 4], the idea of using low-potential heat concentrated on GRES-CHP by means of heat pump plants, which can be placed in centralized and individual heat points (CHS, IHP), which are part of the DHS, was proposed for the first time.
It is known that in DHS heat supply from CHP, as well as from the district boiler house, is carried out by a dependent and independent scheme for connecting external heat consumers. This circumstance, in turn, predetermines the appearance of a variety of schemes and methods for connecting heat pumps to the heat supply system, with the placement of TN both at the central heating point CHS and in close proximity to consumers.
All the listed shortcomings of traditional heat supply in conditions of energy saving and minimal harm to the environment, urgently require a different approach to solving the problem of heat supply for newly constructed housing. A possible solution to this problem is the beneficial use of low-temperature natural heat (+ 4 ... + +40° C) or waste industrial heat for heat supply with the help of heat pumps.
Figure 1 is a schematic diagram of the connection of heat pump plants to the heating and hot water supply system at the central heating station (CHS). The flow of direct network water (DNW) from the CHP enters the traditional heat exchangers 1 of heating the return quarterly water of the heating circuit, in which part of the flow of return quarterly water (flow G1k) is heated. Another part of Gtn of reverse quar-terly water enters the condenser of the heat pump system and heats up at Δt = 15° C. In the evaporators of the HPP, part of the flow of the reverse network water G2к= G1 – ΔG is sloughed, after which it is dis-charged into the main collector of the reverse network water and then returned to the CHP.
After the mixer 3, the heating water from the district heating circuit through the internal distribution heating networks is supplied to the heating of the objects of the quarterly network, after which it returns to heating in the TN and TO-1 according to the scheme described above.
By slackening the return flow network of the SS, the direct water supply from the TPS is reduced in proportion to the amount of heat collected from the SS in the evaporator TN. It is the amount of low-potential heat (LPH) from the SS that lowers LPH in the cold source at the CHP, which ultimately leads to a reduction in fuel consumption directly to the CHP and, at the same time, to a reduction in heat con-sumption from the CHP to CHS at the central heating network of the quarterly network. This ensures a reduction in the price paid by consumers of this quarter of the city for heat supply.
To discuss the results of the calculation, as an example, the costs and temperatures of the network water are taken in the conditions of the CHS: Σ G2к = 70 m3 / h. ΣGТН = 25 m3 / h. T1 rep = 50° C; T2 right = 65° C.

Известия Национальной академии наук Республики Казахстан
204
Figure 1 – Thermal diagram of the CHS with a TN with an independent heating circuit: 1 - water-water heat exchanger for the heating circuit (plate), 2-mixer, 2 - heat pump (TN), SS, HWS - external heat consumers of the heating and hot water supply system; G1 - direct grid flow to the CHS from the CHP; G2к - the return flow of return water
returned to the CHP after TN; Gтн - the return water flow rate of the quarterly heating circuit, supplied for heating in ТN; G1к - return water flow rate of the quarterly heating circuit, supplied for heating to the water-to-water heat exchanger (WWHE)
of the traditional heat supply scheme; ΔG is the unused amount of return network water after the heat exchanger, returned to the CHP plant or for other purposes.
Heat output of the heat pump is determined by the formula (1)
),( 12 обрпрямВВТН ТТСGQ
(1)
for the condition of the example in question, Q = 436 kW = 0.375 Gcal / h. Taking into account this heat load, one HT-300 water-to-water heat pump is chosen. The characteristics of the manufacturer for HT-300 are given in [5]. The HT-300 water-to-water heat pump operates on R-134 A refrigerant with a maximum condensation temperature of 600С.
With the duration of the heating season in Almaty in 2015-16, equal to 4248 hours (177 days) and the operation of one TN-300, the expected annual heat production with HPP will be 1593 Gcal, the electric power consumption for the drive will be TN - 382.6 MWh. With the adopted tariffs for thermal (3890.72 tenge per 1 Gcal.) And electric energy (7.5 tenge per 1 kWh for energy-producing enterprises) for residential objects: proceeds from the sale of heat supply will be 6.2 million KZT, electricity costs - 2.87 million KZT.
One of the important advantages of such a thermal scheme is the lowering of the temperature of the return water, which makes it possible to increase the combined generation of electric power by the CHP on thermal consumption. This is all the more topical because the temperature of the return network water returned to the CHP is constantly overestimated, which has many different causes, and not only technical ones. The practice of the operation of heat networks in different cities of the Republic of Kazakhstan shows that the water temperature in the return line of the heat supply systems in excess of the normative thermal schedule is exceeded by 5-8 °C in winter.
The capacity for hot water TN-300 is GТН = 25 m3/h. At the same time, water is taken from the low-potential source (return water of heating systems) to the evaporator TH-300 - G2к = 50 m3/h. Here it should be noted that with the same independent heating scheme without the installation of heat pumps, the flow of network water to the water-to-water heat exchangers of the heating circuit (plate) was G1 = 70 m3/h. If one TH-300 is installed, this flow rate will be G2к = 50 m3/h, i.e., ΔG= G1 - G2к = 20 m3/h will be less.

ISSN 2224-
Thus,the heat ex
By staproportionfor this mo
Figurheat pump
The t
evaporator
ration procusing para
The c
where Qк –which is ac
Conc1. The
along withsource - C
2. Inswho have
3. Thproviding
4. Caslackeningin proporti
5. Ththe efficien
-5278
, the installatxchangers. alling the flo
n to the amouode of operatre 2 shows thp HT-300.
Figure
temperature
r - = 45° C
cess 1-4. Theameters of thecoefficient of
– heat outpucceptable fro
clusions. e use of heat
h traditional HP. stallation of an independ
he thermal sheat to consu
alculations og of the returion to the am
he value of thncy of using
tion of heat p
ow of SS (retunt of heat tation of the TNhe p-H diag
2 – Thermodyn
of the work
C. In the p-H
e coefficient e constructedf conversion
ut of the heatom the point
t pumps in thheat sources
heat pumps ent scheme fcheme of thumers of thef the heat o
rn water flowmount of heathe coefficiena heat pump
pumps make
turn networkaken away fN is from
gram of the t
namic cycle of awith R-134A r
king agent R
H diagram, t
of thermal ed thermodynof thermal e
t pump; Ne -of view of th
he conditionss can signific
in the centrfor connectinhe central hee quarterly heutput of the
w in the evapt extracted frnt of conversp in the opera
205
es it possible
k water), the from the SS i
=500С to thermodynam
a single-stage srefrigerant in th
-134A in the
the process o
energy convenamic cycle (energy by a h
е
к
N
Q ,
the electric he efficiency
s of operationcantly reduce
ral heat stationg heating syeat point of eating and hoe heat pump porator TN, throm it. sion of thermation of the C
Серия геол
to reduce th
direct water in the HPP e
=400, =mic cycle of
team-compresshe p-H diagram
e heat pump
of condensat
ersion by the(Figure 2). heat pump is
power of they of the heat
n of the centre the cost of
on allows raystems. f the central ot water supp
installed in he direct wat
mal energy bCHS of heati
логии и техн
he flow of th
supply fromevaporator. C=100C. f a single-sta
sion heat pump m
p condenser
ion correspo
e TH-300 hea
determined b
e compressorpump applic
ral heating pdirect netwo
ationally prov
heating statply system ha
the CHS shter supply fr
by the heat ping networks
нических наук
e heating wa
m the CHP is Cooling of re
age steam-co
HT-300
is - = 60
onds to line 2
at pump was
by the formu
r drive and ication.
point of heatiork water fro
vide heat to
tion with a as been devehow that as rom the CHP
pump TH-30s.
к. 4. 2018
ater flow to
reduced in eturn water
ompression
° C, in the
2-3, evapo-
s calculated
ula
(2)
is μ = 4.84,
ing systems om the heat
consumers
heat pump eloped. a result of
P is reduced
00 confirms

Известия Национальной академии наук Республики Казахстан
206
REFERENCES
[1] The Law Of The Republic Of Kazakhstan. On energy saving and energy efficiency // access Mode: http: //adilet.zan.kz
free (date accessed:10.02.2017). [2] SNiP RK 2.04-01-2001. Building climatology. Astana: Committee for construction Affairs MI I T of RK, 2005. 114 p. [3] Abildinova S.K., Muhiddinov D.N. Analysis of the operating modes of the heat pump in dual mode heating system //
Proceedings of the Seventh All-Russian scientific and technical international conference "Energy: management, quality and efficient use of energy". Russia, Blagoveshchensk, Amur gos. Universitet, 2013. P. 430-436.
[4] Zakirov D.G., Rybin A.A. The use of low-grade teploty. AM: RUSAYNS, 2015. 154 p. [5] Nikolaev Yu.Ye, Baksheev A.Y. Determination of the efficiency of heat pumps using heat return water CHP // Industrial
power. 2007. N 9. P. 14-17. [6] Loganina V.I., Fedoseev A.A., Khristolyubov V.G. Statistical methods of product quality management. [7] Schor J.B. Statistical methods of analysis and quality control and reliability. [8] Adamov V.E. Statistical study of rhythm of industrial production. M.: Statistics, 2011. 188 p. [9] Aldokhin I. P. Modeling of production systems. Kharkiv: High school. Publishing house of Kharkov. UN-TA, 2008.
145 p. [10] Astafiev V.E., Povolotskaya L.J., Chaikin V.P. Economic mechanism of the acceleration of scientific-technical
progress/experience of industry. M.: Economics, 2012. 231 p. [11] Aunapu F.F. Improvement of management of industrial enterprises: Abstract. dis. ... doctor. steward. sciences'. Bar-
naul, 2010. [12] Bartashov L.V. Technical and organizational level of production: definition, economic evaluation, analysis. Kyiv:
Naukova Dumka, 2011. [13] Barlow R., Proshan F. Mathematical theory of reliability. M.: Soviet radio, 2009. P. 488. [14] Buslenko N.P. Mathematical modeling of production processes on a digital computer. M.: Science, 2010. [15] Valtukh K.K. Intensive complex and intensification of production // EKO. 2012. N 3. [16] Varlamov I.A. foster the creation and implementation of new technology. M.: Profizdat, 2011. 79 p. [17] Varlamov I.A., Sedlov P.A. Financial incentives for the creation of a new technology. M.: Ekonomika, 2012. 64 p. [18] Vlasov B.V. choice of rational forms of organization of production. M.: Mechanical engineering, 2010. 240 p. [19] Garlovsky N.In. Financial incentives for intensification of production / problems of theory, methodology and practice.
M.: Finance, 2012. 319 p. [20] Ginzburg E.G. Economics of production processes. Yaroslavl, yagu, 2011. [21] Ginzburg E.G., Katz I.Ya. Theoretical bases of production organization. Yaroslavl, 2012. 92 p. [22] Glukhov A.A., Eitingon V.N. Industrial production management. Issue I. Theoretical bases of management of socialist
production. Voronezh, 2011. [23] Gnedenko B.V., Belyaev Yu.K., Solovyov A. D. Mathematical methods of reliability theory. M.: Nauka, 2010. 524 p. [24] Golovlev E.S. Comprehensive analysis of the technical and economic level. production in mechanical engineering.
M., 2010. [25] Gruznov I.I. Mastering the release of new products. M.: Mechanical engineering, 2012. 133 p. [26] Dzhavadov G.A. Management of scientific and technical progress. M.: Znanie, 2012. 64 p. [27] Druzhinin G.V. Classification of redundant systems // Telecommunications, 2010. N 7. [28] Dumachev A. P. an Efficient system of production organization and management. M.: Ekonomika, 2011 - 142 C. [29] Sutin A.A. improving the organization of production. M.: Economy, 2010. P. 79. [30] Efimov V.V., Bart T.V. Statistical methods in product quality management.
Р. А. Мусабеков1, С. К. Абильдинова1, А. С. Расмухамедова1, Б. Онгар1, І. Ж. Есенғабылов2, А. О. Алдабергенова2, Г. Б. Исаева3
1Алматы энергетика жəне байланыс университеті, Алматы, Қазақстан,
2І. Жансугуров атындағы Жетісу мемлекеттік университеті, Талдықорған, Қазақстан, 3Каспий Университеті, Алматы, Қазақстан
ЖЫЛУ СОРҒЫЛАРЫН БІРЛЕСІП ҚОЛДАНУ ЖАҒДАЙЫНДАҒЫ
ОРТАЛЫҚТАНДЫРЫЛҒАН ЖЫЛУМЕН ҚАМТУ ЖҮЙЕЛЕРІНІҢ ТИІМДІЛІГІ
Аннотация. Мақалада Қазақстан Республикасының жылумен қамдаудың дəстүрлі жүйесінің негізгі мəселелері сипатталып, мəселені шешудің мүмкін болатын жолдары қарастырылған. Нақты объектілерде жылу сорғыларға негізделген технологияларды енгізу жылумен қамтамасыз ету жүйелердің техникалық-эко-номикалық көрсеткіштерінің жақсаруына əкеледі. Əзірленген тұжырымдама дəстүрлі емес жылу көздерін пайдалану арқылы жылумен қамтамасыз ету жүйелері жұмысын жаңа деңгейге ауыстыруға бағытталған. Баламалы жылу көздерін жылу желінің жұмысына енгізудің қолданыстағы мысалдарын қарастыру жəне зерттеу нəтижелерін талдау арқылы жылуды тұтынушыларды желіге тəуелсіз қосу схемасын пайдаланатын
ISSN 2224-5278 Серия геологии и технических наук. 4. 2018
207
орталық жылу пунктінде жылу сорғыларын пайдалану тиімділігі анықталды. Жылу сорғысы орталық жылу пунктінде кері желілік суды буландырғышта төменгі қуатты жылу көзі ретінде пайдаланып, нəтижесінде жылуэлектр орталығынан берілетін жүйелік су шығынын қысқартады жəне оның салдарынан ЖЭО-да жағы-латын отын шығыны төмендейді.
Түйін сөздер: орталықтандырылған жылумен қамдау, жылу сорғысы, жүйелік су, жылуэлектр орталығы, жылуды тұтыну, энергия тиімділігі, төменгі қайратты жылу.
Р. А. Мусабеков1, С. К. Абильдинова1, А. С. Расмухамедова1, Б. Онгар1, І. Ж. Есенғабылов2, А. О. Алдабергенова2, Г. Б. Исаева3
1Алматинский университет энергетики и связи, Алматы, Казахстан, 2Жетысуский государственный университет им. И. Жансугурова, Талдыкорган, Казахстан,
3Каспийский Университет, Алматы, Казахстан
ЭФФЕКТИВНОСТЬ РАЙОННЫХ ОТОПИТЕЛЬНЫХ СИСТЕМ В УСЛОВИЯХ СОВМЕСТНОГО ИСПОЛЬЗОВАНИЯ ТЕПЛОВЫХ НАСОСОВ
Аннотация. В статье описываются основные проблемы традиционного теплоснабжения в Республике
Казахстан, рассматриваются возможные пути решения этой проблемы. Разработка практических примеров внедрения технологии тепловых насосов на конкретных участках теплоснабжения приводит к улучшению технических и экономических параметров системы отопления. Разработка нацелена на концепцию исполь-зования нетрадиционных источников тепла для перехода отопительных систем на новый уровень тепла.
Проанализировав существующие примеры внедрения в работе отопительных систем с альтернативными источниками тепла, и результаты исследования определили эффективность установки тепловых насосов в Центральной тепловой станции, которая использует независимую схему подключения потребителей тепла. Использование системы обратной воды системы теплового насоса для испарителя в качестве источника с низкой потенциальной энергией приводит к снижению потребления прямой сети воды из комбинированной тепловой и тепловой электростанции ТЭЦ, ежеквартальной сети и, следовательно, будет уменьшать расход топлива, сжигаемого на ТЭЦ.
Ключевые слова: центральное отопление; Тепловой насос; вода в сети; teploelektrocentral; тепловая сеть; энергоэффективность; низкосортная теплота.
Information about authors: Issayeva G. B. – Caspian University, Head of the Automation and Computer Engineering Department,
Candidate of Pedagogical Sciences, [email protected] Abildinova S. A. – Almaty University of Energy and Communication, Ph.D., [email protected] Musabekov R. A. – Almaty University of Energy and Communications, Ph.D., Associate Professor,
[email protected] Rasmuhametova A. S. – Almaty University of Power Engineering and Communications, doctoral student of the
department of PTE, [email protected] Ohar B. – Almaty University of Power Engineering and Communications, senior lecturer of the department TE,
doctoral candidate of the Department of Thermal Power Engineering, [email protected] Esengabylov I. Zh. – Zhetysu State University named after I. Zhansugurov, Ph.D., [email protected], Aldabergenova A. O. – Zhetysu State University named after I. Zhansugurov, Ph.D., [email protected]

Известия Национальной академии наук Республики Казахстан
208
МАЗМҰНЫ
Койшина А.И., Кирисенко О.Г., Койлыбаев Б.Н., Агаева К.К. Қазіргі заманғы жағдайы жəне жетістіктері:
геолого-техникалық шараларды таңдау бойынша шешімнің қабылдануы (ағылшын тілінде)............................................ 6 Amirgaliyev Ye.N., Kunelbayev M., Wójcik W., Kalizhanova A.U., Auelbekov O.A., Kataev N.S., Kozbakova A.Kh.,
Irzhanova A.A. Solar-driven resources of the Republic of Kazakhstan.......................................................................................... 18 Ибатов М.К., Булатбаев Ф.Н., Мехтиев А.Д., Югай В.В., Алькина А.Д., Нешина Е.Г.
Тау-кен машиналарының тежегіш-шарнирлі механизмдерінің тиімділігін арттыру жолдары........................... 28 Шукешева С.Е., Ұзақов Я.M., Чернуха И.M., Нұрмұханбетова Д.Е., Набиева Ж.С., Нұртаева А.Б.
Тағам өнімдерінің сапасын арттыру бойынша зерттеулер........................................................................................................ 37 Лаханова К.М., Кедельбаев Б.Ш., Махатов Ж.Б., Либерцайт П., Бегалиев Б.С., Рысбаева Ғ.А.,
Ибраимова Ж.К. Бидай сабаны целлюлозасынан сорбитті алу технологиясын жасау.......................................................... 46 Сапаргалиева Б., Наукенова А., Алипова Б., Иллари Х.Р., Шапалов Ш. Тиімділік өлшімі бойынша
өртсөндіргіш унтақтардың жылулық жəне салмақтық касиеттерін талдау............................................................................ 51 Айтчанов Б.Х., Бахтаев Ш.А., Вуйцык В., Тергеусизова А.С., Тойгожинова А.Ж. Диэлектрлік жіптерде
қозғалатын сызықты параметрлерді өлшеу əдістерін өңдеу..................................................................................................... 62 Исмаилова А.А., Жамангара A.K., Сагнаева С.K., Казиева Г.Д., Абакумов A.И., Пак С.Я.
Қазақстан көлдеріндегі биогендердің ақпараттық мониторинг технологиялары................................................................... 69 Васильев О.А., Семенов В.Г., Юлдашбаев Ю.А., Баймуканов Д.А., Əубəкіров Х.А. Чебоксары қаласының
«Заовражный» мөлтек ауданындағы топырақ құрамы мен экологиялық жағдайы (ағылшын тілшінде)............................ 74 Сарсенов А.М., Бишимбаев В.К., Капсалямов Б.А., Лепесов К.К., Гаппарова К.М. Модификацияланған
целлюлоза мен су ерітіндерінің арасындағы бор қышқылының фазааралық бөлінуі............................................................ 79 Кабылбеков К.А., Абдрахманова Х.А., Ермаханов М.Н., Урмашев Б.А., Жатканбаев Е.Т.
Дененің гравитациялық өрісте қозғалысын есептеу мен бейнелеу.......................................................................................... 87 Машеков С.А., Абcадыков Б.Н., Машекова А.С., Нугман Е.З., Бекбосынова Б.А.,, Тусупкалиева Э.А.
Құрылымы жаңа үздіксіз радиальды-ығыстыру орнағында шыбық пен құбырды илемдеу процесінің кинематикасын зерттеу................................................................................................................................................................. 98
Қалбаева А.Т., Құрақбаева С.Д., Ташимов Л.Т., Дильман В.В., Қалбаева А.Т., Ельбергенова Ғ.Ж. Реакцияның қайтымын есепке ала отырып химиялық осцилляциямен автокаталитикалық жүйелерді модельдеу........... 110
Қазиев Ғ.З., Маркосян М.В., Таурбекова А.Ə. Компьютер жүйесінің жол торабы (түйіндері) арқылы өтетін деректер қорын өңдеу жүйесін тарату əдістері............................................................................................................... 124
Канафин Қ.М., Рахметов И.Қ. Нарын құмдарының жерасты суларының болжамды ресурстарын бағалау............. 132 Қабылбеков К.А., Абдрахманова Х.К., Омашова Г.Ш., Лаханова К.М., Абекова Ж.А. «Ауытқуы аз мəжбүр
тербелістерді есептеу мен бейнелеуге» арналған компьютерлік зертханалық жұмысты орындауды ұйымдастыру......... 145 Койшина А.И., Кирисенко О.Г., Койлыбаев Б.Н., Агаева К.К. Қазіргі заманғы жағдайы жəне жетістіктері:
геолого-техникалық шараларды таңдау бойынша шешімнің қабылдануы (орыс тілінде).................................................... 155 Васильев О.А., Семенов В.Г., Юлдашбаев Ю.А., Баймуканов Д.А., Əубəкіров Х.А. Чебоксары қаласының
«Заовражный» мөлтек ауданындағы топырақ құрамы мен экологиялық жағдайы (орыс тілшінде).................................... 168 Насиров Р.Н., Саматов И.Б., Слюсарев А.П., Насиров А.Р. Каспий маңы аймағындағы мұнай орналасқан
шөгінді тау жыныстарын ЭПР, ИҚ-спектроскопиялық, рентгендік дифрактометрия жəне термиялық талдау əдістерімен кешенді минералдық жəне литологиялық зерттеу................................................................................................ 174
Молдабаева Г.Ж., Метакса Г.П., Алишева Ж.Н. Қабаттың мұнай бергіштігін айтарлықтай арттыру мақсатында қазақстандық мұнай тұтқырлығын төмендетудің ғылыми-техникалық негіздері.............................. 186
Мусина Э.С., Мусина А.С., Байташева Г.У., Кальменова Г.А., Куанышева Ж. Қоршаған орта объектілерінде сынап-пленкалы индикаторлар микроэлектродтарды пайдалана отырып металдардың өте азмөлшерін бақылау............ 195
Мусабеков Р.А., Абильдинова С.К., Расмухамедова А.С., Онгар Б., Есенғабылов І.Ж., Алдабергенова А.О., Исаева Г.Б. Жылу сорғыларын бірлесіп қолдану жағдайындағы орталықтандырылған жылумен қамту жүйелерінің тиімділігі......................................................................................................................................................................................... 201

ISSN 2224-5278 Серия геологии и технических наук. 4. 2018
209
СОДЕРЖАНИЕ
Койшина А.И., Кирисенко О.Г., Койлыбаев Б.Н., Агаева К.К. Принятие решений по выбору
геолого-технических мероприятий: современное состояние и перспективы (на английском языке).................................. 6 Амиргалиев Е.Н., Кунелбаев М., Вуйцик В., Калижанова А.У., Ауелбеков О.А., Қатаев Н.С., Козбакова А.Х.,
Иржанова A.A. Қазақстан Республикасының гелиоэнергетикалық ресурстары.................................................................... 18 Ибатов М.К., Булатбаев Ф.Н., Мехтиев А.Д., Югай В.В., Алькина А.Д., Нешина Е.Г. Пути повышения
эффективности эксплуатации втулок рычажно-шарнирного механизма горных машин...................................................... 28 Шукешева С.Е., Узаков Я.M., Чернуха И.M., Нурмуханбетова Д.Е., Набиева Ж.С., Нуртаева А.Б.
Исследования по повышению качества продуктов питания..................................................................................................... 37 Лаханова К.М., Кедельбаев Б.Ш., Махатов Ж.Б., Либерцайт П., Бегалиев Б.С., Рысбаева Г.А.,
Ибраимова Ж.К. Разработка технологии получения сорбита из целлюлозы соломы пшеницы........................................... 46 Сапаргалиева Б., Наукенова А., Алипова Б., Иллари Х.Р., Шапалов Ш. Анализ тепловых и массовых свойств
огнетушащих порошков в критериях эффективности............................................................................................................... 51 Айтчанов Б.Х., Бахтаев Ш.А., Вуйцык В., Тергеусизова А.С., Тойгожинова А.Ж. Разработка методов
для измерения линейных параметров движущихся диэлектрических нитей.......................................................................... 62 Исмаилова А.А., Жамангара A.K., Сагнаева С.K., Казиева Г.Д., Абакумов A.И., Пак С.Я.
Технологии информационного мониторинга биогенов озер Казахстана................................................................................ 69 Васильев О.А., Семенов В.Г., Юлдашбаев Ю.А., Баймуканов Д.А., Аубакиров Х.А. Почвенный покров
микрорайона «Заовражный» г. Чебоксары и их экологическое состояние (на английском языке)...................................... 74 Сарсенов А.М., Бишимбаев В.К., Капсалямов Б.А., Лепесов К.К., Гаппарова К.М. Межфазовое распределение
борной кислоты между водными растворами и модифицированной целлюлозы................................................................... 79 Кабылбеков К.А., Абдрахманова Х.А., Ермаханов М.Н., Урмашев Б.А., Жатканбаев Е.Т.
Расчет и визуализация движения тела в гравитационном поле................................................................................................ 87 Машеков С.А., Абcадыков Б.Н., Машекова А.С., Нугман Е.З., Бекбосынова Б.А.,, Тусупкалиева Э.А.
Исследование кинематики процесса прокатки прутков и труб на непрерывном радиально-сдвиговом стане новой конструкции........................................................................................................................................................................ 98
Калбаева А.Т., Куракбаева С.Д., Ташимов Л.Т., Дильман В.В., Калбаева А.Т., Ельбергенова Г.Ж. Моделирование автокаталитических систем с химическими осцилляциями с учетом обратимости реакций.................... 110
Казиев Г.З., Маркосян М.В., Таурбекова А.А. Методы распределения систем обработки данных по узлам вычислительных систем................................................................................................................................................ 124
Канафин К.М., Рахметов И.К. Оценка прогнозных ресурсов подземных вод песков Нарын..................................... 132 Кабылбеков К.А., Абдрахманова Х.К., Омашева Г.Ш., Лаханова К.М., Абекова Ж.А. Организация
компьютерной лабораторной работы «Вычисление и визуализация малых вынужденных колебаний»............................. 145 Койшина А.И., Кирисенко О.Г., Койлыбаев Б.Н., Агаева К.К. Принятие решений по выбору
геолого-технических мероприятий: современное состояние и перспективы (на русском языке)........................................ 155 Васильев О.А., Семенов В.Г., Юлдашбаев Ю.А., Баймуканов Д.А., Аубакиров Х.А. Почвенный покров
микрорайона «Заовражный» г. Чебоксары и их экологическое состояние (на русском языке)............................................ 168 Насиров Р.Н., Саматов И.Б., Слюсарев А.П., Насиров А.Р. Комплекное минералогическое и литологическое
исследование осадочных нефтегазоносных пород Прикаспийского региона методом ЭПР, ИК-спектроскопии, рентгеновской дифрактометрии и термического анализа......................................................................................................... 174
Молдабаева Г.Ж., Метакса Г.П., Алишева Ж.Н. Научно-технические основы снижения вязкости казахстанских нефтей, обеспечивающих существенное повышение нефтеотдачи пластов................................................. 186
Мусина Э.С., Мусина А.С., Байташева Г.У., Кальменова Г.А., Куанышева Ж. Контроль следовых количеств металлов в объектах окружающей среды с использованием ртутно-пленочных индикаторных микроэлектродов........... 195
Мусабеков Р.А., Абильдинова С.К., Расмухамедова А.С., Онгар Б., Есенғабылов І.Ж., Алдабергенова А.О., Исаева Г.Б. Эффективность районных отопительных систем в условиях совместного использования тепловых насосов............................................................................................................................................................................................ 201

Известия Национальной академии наук Республики Казахстан
210
CONTENTS
Koishina A.I., Kirisenko O.G., Koilybayev B.N., Agayeva K.K. Decision-making for choosing
of geological and engineering operations: current status and prospects (in English)..................................................................... 6 Амиргалиев Е.Н., Кунелбаев М., Вуйцик В., Калижанова А.У., Ауелбеков О.А., Катаев Н.С., Козбакова А.Х.,
Иржанова A.A. Гелиоэнергетические ресурсы Республики Казахстан................................................................................... 18 Ibatov M.K., Bulatbayev F.N., Mekhtiyev A.D., Yugay V.V., Alkina A.D., Neshina Y.G. Ways to increase operational
efficiency of bushings of lever-hinged mechanism of mining machines........................................................................................ 28 Shukesheva S.E., Uzakov Ya.M., Chernukha I.M., Nurmukhanbetova D.E., Nabiyeva Zh.S., Nurtaeva A.B.
Research to improve the quality of food products........................................................................................................................... 37 Lakhanova K.М., Kedelbaev B.Sh., Makhatov Zh.B., Lieberzeit P., Begaliev B.S., Rysbayеva G.A.,
Ibraimova Zh.K. Development of technology for producing sorbitol from wheat straw cellulose................................................. 46 Sapargalieva B., Naukenova A., Alipova B., Illari J.R., Shapalov Sh. The analysis of heat and mass properties
of the fire extinguishing powder in effectiveness criteria............................................................................................................... 51 Aitchanov B.H., Bakhtaev Sh.A., Wojcik W., Tergeusizova A.S., Toigozhinova A.Zh. Development of methods
for measuring linear parameters of moving dielectric filaments..................................................................................................... 62 Ismailova A.A., Zhamangara A.K., Sagnayeva S.K., Kaziyeva G.D., Abakumov A.I., Park S.Ya.
Technologies of information monitoring biogens lakes of Kazakhstan.......................................................................................... 69 Vasiliev O.A., Semenov V.G., Yuldashbayev Yu.A., Baimukanov D.A., Aubakirov Kh.A. Soil cover
of the "Zaovrazhny" micro-district, Cheboksary, and its ecological state (in English).................................................................. 74 Sarsenov A.M., Bishimbayev V.K., Kapsalyamov B.A., Lepessov K.K., Gapparova K.M. Interphase distribution
of boric acid between aqueous solutions and modified cellulose.................................................................................................... 79 Kabylbekov K.A., Abdrakhmanova Kh.K., Ermakhanov М.N., Urmashеv B.А., Jаткаnbayеv Е.Т.
Calculation and visualization of a body motion in a gravitational field.......................................................................................... 87 Mashekov, S.A., Absadykov, B.N., Mashekova А.S., Nugman Е.Z., Bekbosynova B.А., Tussupkaliyeva E.A.
Investigation of the kinematics of rolling ribs and pipes on a continuous radial-shifting mill of a new construction................... 98 Kalbayeva A.T., Kurakbayeva S.D., Tashimov L.T., Dilman V.V., Kalbayeva A.T., Elbergenova G.Zh.
Simulation of autocatalytic systems with chemical oscillations with allowing for reaction stages reversibility............................ 110 Kaziyev G.Z., Markosiyan M.B., Taurbekova A.A. Methods of distribution of data processing systems
to the nodes of computing systems.................................................................................................................................................. 124 Kanafin K.M., Rakhmetov I.K. Estimate of forecast resources of underground water in Naryn sandy area......................... 132 Kabylbekov K.A., Abdrakhmanova Kh.K., Omashova G.Sh., Lakhanova K.M., Abekova Zh.A. Organization
of computer laboratory work “Calculation and visualization of small forced oscillations”........................................................... 145 Koishina A.I., Kirisenko O.G., Koilybayev B.N., Agayeva K.K. Decision-making for choosing
of geological and engineering operations: current status and prospects (in Russian)..................................................................... 155 Vasiliev O.A., Semenov V.G., Yuldashbayev Yu.A., Baimukanov D.A., Aubakirov Kh.A. Soil cover
of the "Zaovrazhny" micro-district, Cheboksary, and its ecological state (in Russian).................................................................. 168 Nasirov R.N., Samatov I.B., Slyussarev A.P., Nasirov A.R. Complex mineralogical and lithological study
of sedimentary oil and gas bearing rocks of the Precaspian region by EPR, IR-spectroscopy, X-ray diffractometry and thermal analysis........................................................................................................................................................................ 174
Moldabayeva G.Zh., Metaxa G.P., Alisheva Zh.N. Scientific-technical basics of viscosity reduction of the Kazakhstani oils, which provide a significant increase of oil reservoirs.............................................................................. 186
Musina E.S., Musina A.S., Baitasheva G.U., Kalmenova G.A., Kuanysheva Zh. Control of trace quantities of metals in the environmental samples, using mercury-film indicative microelectrodes.............................................................................. 195
Abildinova S.K., Musabekov R.A., Rasmukhametova A.S., Ongar B., Yessengabylov I.Zh., Aldabergenova А.О., Issayeva G.B. The efficiency of district heating systems in conditions of joint use of heat pumps............................................... 201

ISSN 2224-5278 Серия геологии и технических наук. 4. 2018
211
Требования для авторов журнала НАН РК Cерия геологии и технических наук
Уважаемые авторы!
Прошло более семидесятипяти лет, как издается журнал «Известия НАН РК. Серия геоло-
гическая», а с 2011 г. «Серия геологии и технических наук». За период существования журнал завоевал широкий круг читателей и стал известен не только в Казахстане, но и в странах ближнего и дальнего зарубежья.
В журнале на русском, казахском, английском языках публикуются статьи о результатах исследований по актуальным проблемам обширной геологической науки (региональной геологии, минерагении, нефти и газа, геофизики, сейсмологии, гидрогеологии, экологии, географии), а так же статьи методического характера.
Все эти годы журнал служит источником оперативной информации о новейших достижениях геологической науки Казахстана и призван способствовать повышению эффективности научных исследований.
Авторы несут ответственность за достоверность и значимость научных результатов и актуальность научного содержания работ. Не допускается плагиат.
1. Представленные для опубликования материалы должны удовлетворять следующим требованиям.
Статья сопровождается разрешением на опубликование от учреждения, в котором выполнено исследование и представляется рецензия.
Статья представляется в одном экземпляре. Размер статьи не должен превышать 15 страниц включая аннотацию в начале статьи перед основным текстом, которая должна отражать цель работы, метод или методологию проведения работы, результаты работы, область применения результатов, выводы (аннотация не мене 15 предложений – 1/4 стр. (на английском языке) через 1 компьютерный интервал), таблицы, рисунки, список литературы (через 1 компьютерный интер-вал), напечатанных в редакторе Word, шрифтом Times New Roman, поля – верхнее и нижнее – 2 см, левое – 3 см, правое – 1,5 см. Количество рисунков не более 10. Название рисунков и подрисуноч-ная подпись, а также название таблиц печатается на русском и английском языках.
СТАТЬЯ НАЧИНАЕТСЯ на английском языке. В начале, посередине страницы, идет назва-ние статьи прописными жирными буквами, далее на следующей строчке – инициалы и фамилии авторов обычным жирным шрифтом, затем на следующей строчке – название организации(ий), в которой выполнена работа, город, страна, затем на новой строчке – адреса E-mail авторов. С крас-ной строки идут ключевые слова (Key words), и с новой строчке – сама аннотация (Abstract – не мене 150 слов).
Далее, после отбивки одной строки, начинается на русском языке. В начале статьи вверху слева следует указать индекс УДК. Затем, посередине страницы,
пишется: 1) название статьи; 2) авторы; 3) название организации; с красной строки – Ключевые слова, затем – Аннотация ( оформление шрифтов, как на английском языке ).
Отбиваем одну строку и начинается сама статья. Следом за статьей идет список Литературы. Ссылки на литературные источники даются цифрами в прямых скобках по мере упоминания ( не менее 20). Список литературы оформляется следующим образом:
[1] Иванов А.А. Процессы протаивания грунта // Известия НАН РК. Серия геологии и техни-ческих наук. – 2007. – 1. – С. 16-19.
На сайте http://www.translit.ru/ можно бесплатно воспользоваться программой транслитерации Русского текста в латиницу, используя различные системы. Программа очень простая, ее легко использовать для готовых ссылок. К примеру, выбрав вариант системы Библиотеки Конгресса США (LC), мы получаем изображение всех буквенных соответствий. Вставляем в специальное поле весь текст библиографии на русском языке и
1) убираем транслитерацию заглавия статьи;

Известия Национальной академии наук Республики Казахстан
212
2) убираем специальные разделители между полями (“//”, “-”); 3) выделяем курсивом название источника; 4) выделяем год полужирным шрифтом; 5) указываем язык статьи (in Russ.). Пример: [1] White S.R., Sottos N.R., Geubelle P.H., Moore J.S., Kessler M.R., Sriram S.R., Brown E.N.,
Viswanathan S. Nature, 2001, 409, 794-797 ( in Eng.). [2] Soldatenkov N.M., Koljadina I.V., Shendrik A.T. Fundamentals of organic chemistry of
medicinal substances. M.: Himija, 2001. 192 p. ( in Russ.). В конце статьи дается резюме на казахском языке. Оформляется аналагично русскому ва-
рианту. Посередине страницы пишется: 1) название статьи; 2) авторы; 3) название организации; с красной строки – Түйін сөздер, после – Аннотация.
Последняя страница подписывается всеми авторами, ставится дата. Прилагается электронный вариант на CD – диске.
2. В случае переработки статьи по просьбе редакционной коллегии журнала датой поступ-ления считается дата получения редакцией окончательного варианта. Если статья отклонена, редакция сохраняет за собой право не вести дискуссию по мотивам отклонения.
Просьба к авторам статьей представлять весь материал в одном документе (одном файле) и точно следовать правилам при оформлении статьи.
Мы приглашем к сотрудничеству всех зайнтересованных лиц, желающих поделиться своими идеями, мыслями и фактическими материалами на страницах нашего журнала. Пишите нам, звоните или присилайте по электронной почте.
Наш адрес: Республика Казахстан, 050010, г. Алматы, ул. Кабанбай батыра, 69а. Институт геологических наук им.К.И.Сатпаева, ком.334. Контактный телефон: 8 (727) 291-59-38 Факс: 8 (727) 291-56-79 Электронная почта: [email protected]
Статьи отправлять на электронную почту: [email protected]
Уважаемые авторы!
В настоящее время около 250 казахстанских вузов и научных организаций имеют доступ к информационным ресурсам авторитетных международных компаний таких как Thompson Reuters и Springer. За последние четыре года обращений казахстанских подписчиков, согласно статистике использования ресурса Web of Scince Core Collection компании Thompson Reuters, увеличилось в 4 раза. Доступ к мировым базам научных знаний был определен президентом Нурсултаном Назарбаевым как один из приоритетных инструментов развития науки на Первом форуме ученых в декабре 2011 года.
Публикации казахстанских ученых входят в 1% самых высокоцитируемых статьей в мире. При цитировании опирайтесь на более современные данные, собственные труды по возмож-
ности указывать в меньшем количестве, использовать поиск источников информации междуна-родных ресурсов.

ISSN 2224-5278 Серия геологии и технических наук. 4. 2018
213
Publication Ethics and Publication Malpractice in the journals of the National Academy of Sciences of the Republic of Kazakhstan
For information on Ethics in publishing and Ethical guidelines for journal publication see http://www.elsevier.com/publishingethics and http://www.elsevier.com/journal-authors/ethics.
Submission of an article to the National Academy of Sciences of the Republic of Kazakhstan implies that the described work has not been published previously (except in the form of an abstract or as part of a published lecture or academic thesis or as an electronic preprint, see http://www.elsevier.com/postingpolicy), that it is not under consideration for publication elsewhere, that its publication is approved by all authors and tacitly or explicitly by the responsible authorities where the work was carried out, and that, if accepted, it will not be published elsewhere in the same form, in English or in any other language, including electronically without the written consent of the copyright-holder. In particular, translations into English of papers already published in another language are not accepted.
No other forms of scientific misconduct are allowed, such as plagiarism, falsification, fraudulent data, incorrect interpretation of other works, incorrect citations, etc. The National Academy of Sciences of the Republic of Kazakhstan follows the Code of Conduct of the Committee on Publication Ethics (COPE), and follows the COPE Flowcharts for Resolving Cases of Suspected Misconduct (http://publicationethics.org/files/u2/New_Code.pdf). To verify originality, your article may be checked by the Cross Check originality detection service http://www.elsevier.com/editors/plagdetect.
The authors are obliged to participate in peer review process and be ready to provide corrections, clarifications, retractions and apologies when needed. All authors of a paper should have significantly contributed to the research.
The reviewers should provide objective judgments and should point out relevant published works which are not yet cited. Reviewed articles should be treated confidentially. The reviewers will be chosen in such a way that there is no conflict of interests with respect to the research, the authors and/or the research funders.
The editors have complete responsibility and authority to reject or accept a paper, and they will only accept a paper when reasonably certain. They will preserve anonymity of reviewers and promote publication of corrections, clarifications, retractions and apologies when needed. The acceptance of a paper automatically implies the copyright transfer to the National Academy of Sciences of the Republic of Kazakhstan.
The Editorial Board of the National Academy of Sciences of the Republic of Kazakhstan will monitor and safeguard publishing ethics.

Известия Национальной академии наук Республики Казахстан
214
Правила оформления статьи для публикации в журнале смотреть на сайте:
www:nauka-nanrk.kz
ISSN 2518-170X (Online), ISSN 2224-5278 (Print)
http://geolog-technical.kz/index.php/kz/
Верстка Д. Н. Калкабековой
Подписано в печать 30.07.2018. Формат 70х881/8. Бумага офсетная. Печать – ризограф.
13,4 п.л. Тираж 300. Заказ 4.
Национальная академия наук РК 050010, Алматы, ул. Шевченко 28, т. 272-13-19, 272-13-18