KEY VARIABLES IN COST-DRIVEN DECISIONS ON INSTALLING MICRO-CHP IN HOUSEHOLDS
22
KEY VARIABLES IN COST-DRIVEN DECISIONS ON INSTALLING MICRO-CHP IN HOUSEHOLDS Ton Monasso, Michiel Houwing, Ivo Bouwmans Faculty of Technology, Policy and Management Delft University of Technology Jaffalaan 5, 2600 GA Delft, The Netherlands Phone (31) (0)615694251, Fax (31) (0)152783422 E-mail: [email protected] Keywords: distributed generation, investment decision modelling, micro cogenera- tion, technology adoption ABSTRACT Much has been written about the theoretical advantages and disadvantages of com- bined heat and power (CHP) systems at the household level (micro-CHP). How- ever, little research has been carried out on the parameters affecting the potential of mass adoption of micro-CHP. An important step in arriving at reliable predictions is the study of the relevant variables that should be included in a model of house- hold investment decision-making. In this paper, the sensitivity of mass adoption to a broad range of variables, includ- ing technical parameter values, economic data and household characteristics, is being researched. Sensitive variables are the heat-to-power ratio and the total ener- getic efficiency of the micro-CHP units, the initial market price, the feed-in remu- neration scheme and the choice between fixed or variable electricity transport costs.
Transcript of KEY VARIABLES IN COST-DRIVEN DECISIONS ON INSTALLING MICRO-CHP IN HOUSEHOLDS
KEY VARIABLES IN COST-DRIVEN DECISIONS ON INSTALLING MICRO-CHP IN HOUSEHOLDS
Ton Monasso, Michiel Houwing, Ivo Bouwmans Faculty of Technology, Policy and Management
Delft University of Technology Jaffalaan 5, 2600 GA Delft, The Netherlands
Phone (31) (0)615694251, Fax (31) (0)152783422 E-mail: [email protected]
Keywords: distributed generation, investment decision modelling, micro cogenera-tion, technology adoption
ABSTRACT
Much has been written about the theoretical advantages and disadvantages of com-bined heat and power (CHP) systems at the household level (micro-CHP). How-ever, little research has been carried out on the parameters affecting the potential of mass adoption of micro-CHP. An important step in arriving at reliable predictions is the study of the relevant variables that should be included in a model of house-hold investment decision-making.
In this paper, the sensitivity of mass adoption to a broad range of variables, includ-ing technical parameter values, economic data and household characteristics, is being researched. Sensitive variables are the heat-to-power ratio and the total ener-getic efficiency of the micro-CHP units, the initial market price, the feed-in remu-neration scheme and the choice between fixed or variable electricity transport costs.
1 INTRODUCTION Distributed generation of electricity by means of micro combined heat and power systems (micro-CHP) arouses much interest from electric utilities, network opera-tors, consumers, fitters and suppliers of heating systems, as well as the government. Large-scale micro-CHP market introduction is imminent in the Netherlands, as the country has an extensive gas infrastructure. The Dutch Smart Power Foundation – a consortium of Dutch energy companies and research bodies focussing on the introduction of micro-CHP in the Dutch electricity system - predicts two to four million micro-CHP units in the year 2030 [1]. When micro-CHP systems turn out to become a real alternative for conventional heating systems in households, this can have a huge impact on the design and operation of electricity distribution net-works, the fuel mix of the overall electricity production market and the different economic roles in the electricity value chain. However, a thorough quantitative basis to estimate the possible potential of micro-CHP adoption is still lacking. For these estimations, insight into the structure of the decision-making by the actual decision-makers (households) is needed.
The goal of this paper is to identify the key variables that determine the replace-ment of conventional domestic heating systems by micro-CHP. Micro-CHP is a novel heating technology that competes with other residential heating technologies such as condensing boilers, heat pumps, solar boilers and district heating networks. The core of our approach is the modelling of the cost comparison between micro-CHP and conventional systems, for a variety of households. We do this by simulat-ing domestic investment decision-making in which households compare – ceteris paribus – the costs of three different options:
1. retaining their current conventional system;
2. replacement by a new conventional (but high-efficiency and, depending on the age of their current system, sometimes higher-efficiency) system;
3. replacement by a micro-CHP system.
By ‘conventional heating system’ a high-efficiency condensing boiler is meant. For the micro-CHP prime mover technology a Stirling engine is assumed, as this is the first technology to enter the market [1]. Both the conventional system and the mi-cro-CHP are assumed to operate in conjunction with a hot water storage and they provide both space heating and domestic hot water.
This paper is limited to comparing investments in conventional systems or micro-CHP systems. Choosing from a broader set of heating technologies by households is not looked into. Therefore the simulation outcomes in terms of micro-CHP mar-ket penetration are not fully realistic. As said before, our objective is the determi-nation of the relevant variables that drive the cost comparison. All variables in-cluded in this paper should be considered as hypotheses. By testing the sensitivity of the simulation outcomes (i.e. micro-CHP market penetration) to changes in the
values of the variables, we distinguish between sensitive variables – that need to be included in simulation models aimed at detailed market predictions or policy analysis – and insensitive variables – those that hardly result in different outcomes and therefore add unnecessary complexity to the model. The result of this study is an overview of these variables, to assist the choice of variables to be included in models on micro-CHP market penetration.
We acknowledge that, besides economic viability (lowest cost), there are more factors that determine a household’s decision to invest in a micro-CHP system. To explain real-world decisions about technology investment, additional aspects such as institutional context, actor cooperation, and intrinsic motivation and strategic attitudes should also be considered [2-4]. Still, economic barriers are amongst the most important impediments to micro-CHP uptake by individual consumers or energy companies [4]. Investment decisions are assumed to be made solely by households themselves. Leasing arrangements, in which energy companies invest in micro-CHP and households subsequently lease the systems, are not considered here. This study thus aims to get in-depth knowledge of the structure of the demand side of the market with regard to households that make decisions purely on the basis of rational economic analysis and intrinsic risk attitude. Integrating the results of this model into a bigger picture would require additional research into the other contributing factors and perspectives from other actors.
The modelling work focuses on Dutch households. In The Netherlands, an exten-sive natural gas distribution system for domestic heating purposes is already in place, owing to the gas finds in the 1960s. Therefore, we will confine our study to micro-CHP systems that are driven by natural gas and not include other domestic heating options such as wood. Because many variables will become uncertain in the medium term, we limit the period for which can be forecasted. Therefore, a reasonable but arbitrary cut at 10 years is used.
The research question of this paper is, therefore: Which variables are the key driv-ers in the adoption of natural-gas-fired micro-CHP systems in the Netherlands within ten years after market introduction?
To answer this question, a simulation model was developed, in which the individ-ual investment decisions of households form the basis. These households are as-sumed to regularly make a decision about whether they should replace their con-ventional heating system by a micro-CHP system. We assume that the triggers for investment are uniformly distributed over time and model this as if each household makes a decision annually. By aggregating the household decisions and using the household characteristics, it is also possible to calculate the contribution of micro-CHP to the total electricity production.
In Section 2 we give an overview of earlier research on predicting the potential of micro-CHP in several countries. Then, in Section 3, we move to the model concep-tualisation, followed by the simulation results in Section 4. Section 5 presents the conclusions and suggestions for further research.
2 EARLIER RESEARCH This section presents a brief overview of relevant earlier research. The Micro Map study [5] carried out a simulation on the micro-CHP potential for 27 European countries. However, the study is private and only a summary was publicly dis-closed. A Dutch study was undertaken to compare system costs of both conven-tional heating and micro-CHP systems from an overall perspective [6], but no variation in household characteristics was used. Ruijg and van der Laag [7] focused their research on cost savings of micro-CHP for different housing types. However, their results were not scaled up to create a picture of the overall degree of adoption by households. Also, the calculations were not time-dependent, so no insight in the product life cycle (increasing efficiency, decreasing prices) could be gathered. Strachan et al. [8] included path dependency in their system optimisation model for the states of New York and Florida. Their research took the ‘overall’ systems viewpoint as perspective, thereby neglecting the cost structure and incentives for individual decision makers in the energy system. For the German situation, a cost calculation from both the societal and systems operator perspective was carried out [9]. The results were not aggregated to the national level, so no overall develop-ment can be extracted. Newborough [10] conducted a very thorough study on the UK potential, but again no country-wide scaling up was applied. The Future Co-Gen Study [11] used the EU-model SAFIRE to determine the European market potential for micro-CHP under different market and technology factors and policy responses. Regrettably, they published only very general results. Moreover, the results should be updated for changed circumstances and should be adapted for the Dutch situation. Whereas most studies find at least some cost advantages of micro-CHP systems over traditional alternatives, for the Italian situation it was found that for households a switch may well be disadvantageous from an economic viewpoint, even if measures are taken to internalise external benefits [12]. This study aimed at calculating the social benefits using aggregate data or averages and not accounting for differences between individual households. The Berkeley-developed DER-CAM model, adapted for the inclusion of CHP systems by Siddiqui et al. [13], provides a thorough cost analysis. However, no applications of the model for the European situation have been found, and again, no aggregation to the national level is given. In Magnus Maribu et al. [14] the report of a study on the potential for US commercial buildings is given. Here, the results are scaled up to show the total market potential, but the scale of the systems is incomparable with micro-CHP for households. As stated in the introduction, the Dutch Smart Power Foundation pre-dicts two to four million micro-CHP units in the year 2030. Their research was based on expert opinions and was independent of conversion technology adopted. Stirling engines, fuel cells and gas engines were considered [15]. An extensive model for estimating domestic market potential was developed by the trade asso-ciation of the UK onshore gas industry [16,17]. In the model a distinction was made between economic factors and factors relating to attitudes and perception. It is expected that 30% of all new boiler installations will be a micro-CHP in 2015. The underlying calculations yet remain unclear. Ben Maalla and Kunsch (2008)
developed a system dynamics model to predict Stirling micro-CHP diffusion in the UK market with a time period of twenty years. Their diffusion model incorporates imitation rates and advertisement of the attractiveness of the new product and fu-ture cost reductions due to learning effects. They further consider differences in residential energy consumption and feed-back pricing regimes [2]. They did, how-ever, not look into the sensitivity of technical characteristics of the micro-CHP system as efficiencies and the export share of produced electricity. We do consider these sensitivities as explained later in this paper. Colijn [18] uses the replacement rate as a natural limit on the speed of transformation to micro-CHP. A little more than 300,000 boilers are replaced annually, of the 385,000 newly installed boilers in total. He concludes that “The Netherlands offer a well developed gas supply infrastructure and the potential to replace about 50,000 traditional boilers by micro cogeneration units per year. If implemented at this rate, about 5% of all homes would be equipped in about 10 years time.” [18].
The general picture that arises from reviewing earlier research is that no model has been used to predict the potential of micro-CHP that uses calculations at the indi-vidual customer level with the aim of presenting aggregate data (a true “bottom-up” approach). Therefore, not only does the value of this paper lie in presenting results for the Dutch setting, but it also presents a new methodology that can be used for modelling micro-CHP adoption. Further, a thorough analysis of the influ-ence of variables determining the domestic investment decisions is lacking in the literature. Such a sensitivity analysis is shown in this work, however. The basic structure of our model can be used irrespective of the country, although it should be tailored to local circumstances such as policy measures, taxes and other cost elements.
3 MODEL CONCEPTUALISATION In this section, the conceptual choices regarding the model are described. First, the operational mode of the micro-CHP system is dealt with, and the scope of the model is sharpened. Then, the different exogenous variables are identified. Also, the household characteristics that are entered into the calculation are described. After that, the calculations that have to be made for each household are outlined. This section concludes with some details of the chosen modelling method.
3.1 Micro-CHP Model This study is confined to Dutch households that already have a connection to the gas grid, which is about 94% of all households [19]. This equals a total of 6.2 mil-lion connections in 2000 [19]. Not all of these households will make use of indi-vidual, gas-fired, heating systems; some may use district heating or electric boilers, for example. In [15] it is stated that 5.2 million households use individual, gas-fired, heating systems. These are all the households that could potentially install a micro-CHP system. Their present gas-fired systems are medium- to high-efficiency condensing boilers.
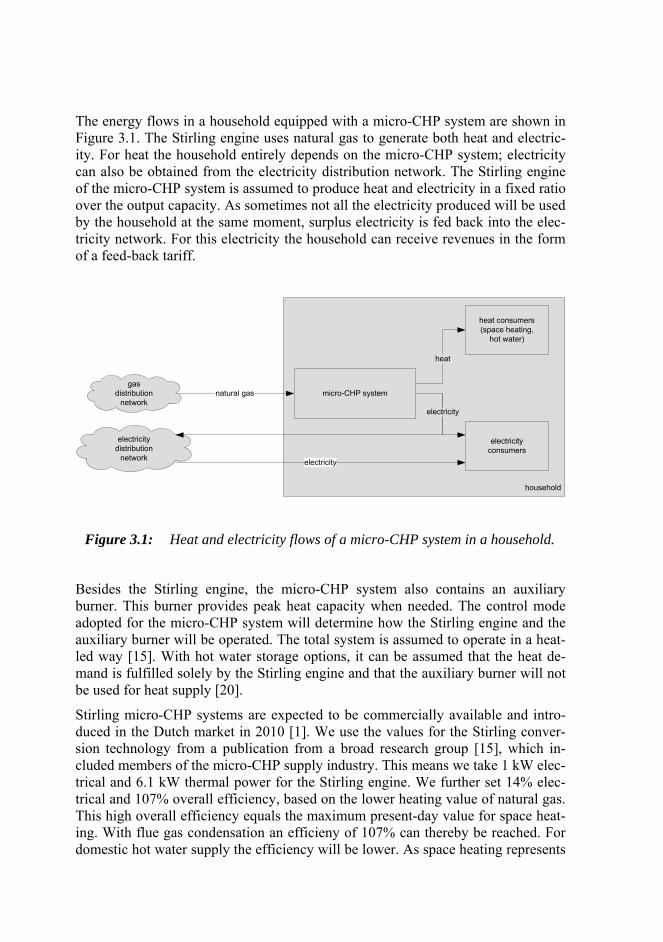
The energy flows in a household equipped with a micro-CHP system are shown in Figure 3.1. The Stirling engine uses natural gas to generate both heat and electric-ity. For heat the household entirely depends on the micro-CHP system; electricity can also be obtained from the electricity distribution network. The Stirling engine of the micro-CHP system is assumed to produce heat and electricity in a fixed ratio over the output capacity. As sometimes not all the electricity produced will be used by the household at the same moment, surplus electricity is fed back into the elec-tricity network. For this electricity the household can receive revenues in the form of a feed-back tariff.
electricitydistribution
network
household
micro-CHP system
heat consumers(space heating,
hot water)
electricityconsumers
natural gas
heat
electricity
electricity
gasdistribution
network
Figure 3.1: Heat and electricity flows of a micro-CHP system in a household.
Besides the Stirling engine, the micro-CHP system also contains an auxiliary burner. This burner provides peak heat capacity when needed. The control mode adopted for the micro-CHP system will determine how the Stirling engine and the auxiliary burner will be operated. The total system is assumed to operate in a heat-led way [15]. With hot water storage options, it can be assumed that the heat de-mand is fulfilled solely by the Stirling engine and that the auxiliary burner will not be used for heat supply [20].
Stirling micro-CHP systems are expected to be commercially available and intro-duced in the Dutch market in 2010 [1]. We use the values for the Stirling conver-sion technology from a publication from a broad research group [15], which in-cluded members of the micro-CHP supply industry. This means we take 1 kW elec-trical and 6.1 kW thermal power for the Stirling engine. We further set 14% elec-trical and 107% overall efficiency, based on the lower heating value of natural gas. This high overall efficiency equals the maximum present-day value for space heat-ing. With flue gas condensation an efficieny of 107% can thereby be reached. For domestic hot water supply the efficiency will be lower. As space heating represents
a much larger share of total heat demand than domestic hot water, we assume 107% total efficiency. In this study we further assume that from the onset, different types of micro-CHP systems will be available, characterised by different power outputs and different consumer prices. Just as for conventional heating systems, the investment costs for micro-CHP systems is assumed to increase with higher ther-mal capacities of the Stirling engine. This is explained further on.
In the model structure it is important to add a variable representing the electricity export share. This is the share of the electricity that is produced in-house in a cer-tain amount of time, but is not consumed by the house and is exported to the grid. Exported electricity might be remunerated by a feed-back tariff, and different op-tions exist on how high this tariff might be. The feed-back tariff could be equal to the electricity import tariff, or, at the other extreme, no remuneration could be given. In the Netherlands it is still unclear how exported electricity from micro-CHP will be remunerated. As a start for the model, the feed-back tariff is set equal to the consumer electricity price including taxes and transport fees (this situation is also referred to as ‘net-metering’). Later on we investigate the sensitivity of the model for this assumption, which turns out to be quite high. However, as this con-cerns an instrumental variable, the sensitivity is more interesting than the - rather arbitrary - starting value. In determining the share of produced electricity that will be fed back into the electricity network, it is necessary to look at the heat and elec-tricity demand profiles in the course of a day and the operational mode of the mi-cro-CHP unit. Houwing and Bouwmans [21] calculate an export share of 0.29 to 0.42 under various micro-CHP control modes. In this research we work with a heat-led control mode and assume an export share of 0.35, meaning that of the produced electricity 35% is being exported to the grid. With net-metering, how-ever, the export share is not relevant in the cost analysis, since the value of a unit of exported electricity is equal to that of a unit produced and consumed in-house (i.e. avoided import).
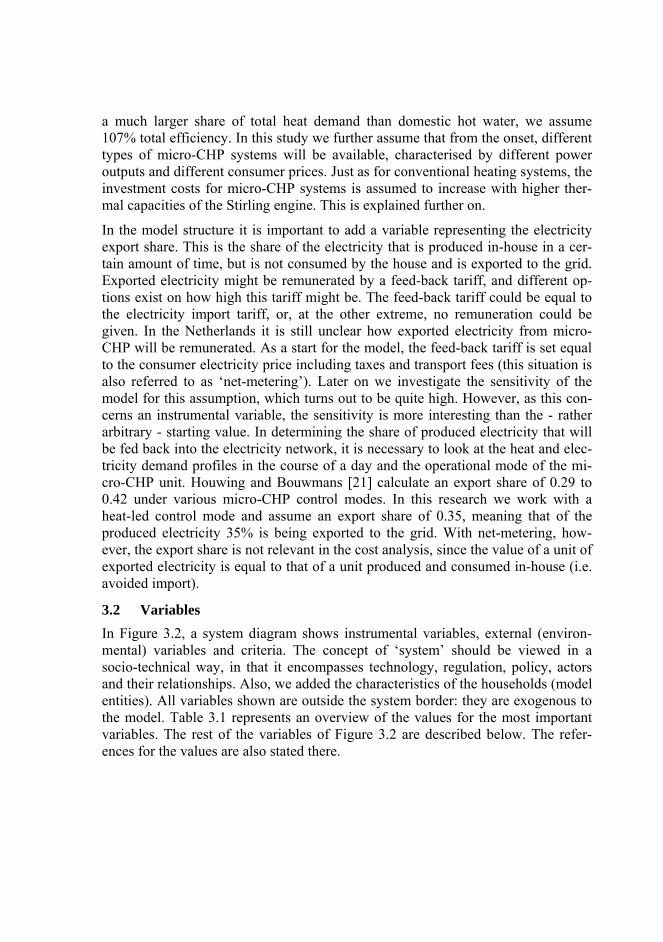
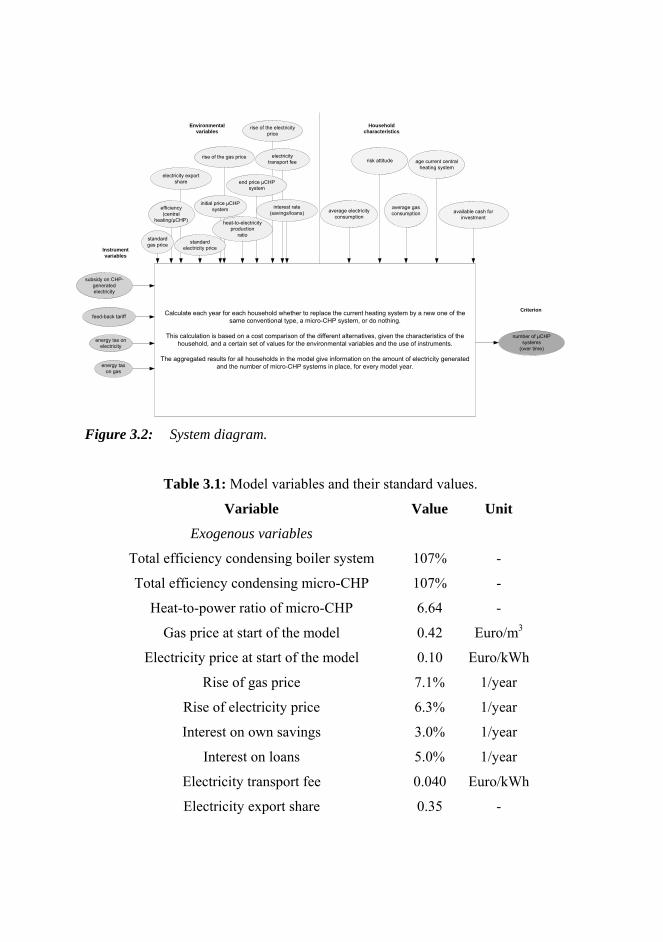
3.2 Variables In Figure 3.2, a system diagram shows instrumental variables, external (environ-mental) variables and criteria. The concept of ‘system’ should be viewed in a socio-technical way, in that it encompasses technology, regulation, policy, actors and their relationships. Also, we added the characteristics of the households (model entities). All variables shown are outside the system border: they are exogenous to the model. Table 3.1 represents an overview of the values for the most important variables. The rest of the variables of Figure 3.2 are described below. The refer-ences for the values are also stated there.
Environmentalvariables
Instrumentvariables
CriterionCalculate each year for each household whether to replace the current heating system by a new one of the same conventional type, a micro-CHP system, or do nothing.
This calculation is based on a cost comparison of the different alternatives, given the characteristics of the household, and a certain set of values for the environmental variables and the use of instruments.
The aggregated results for all households in the model give information on the amount of electricity generated and the number of micro-CHP systems in place, for every model year.
Householdcharacteristics
feed-back tariff
energy tax on electricity
energy tax on gas
efficiency (central
heating/μCHP)
average gas consumptionaverage electricity
consumption
age current central heating system
available cash for investment
risk attitude
standard electricity price
rise of the electricity price
electricity transport fee
end price μCHP system
rise of the gas price
heat-to-electricity production
ratio
initial price μCHP system
standard gas price
number of μCHP systems
(over time)
subsidy on CHP-generated electricity
electricity export share
interest rate (savings/loans)
Figure 3.2: System diagram.
Table 3.1: Model variables and their standard values.
Variable Value Unit
Exogenous variables
Total efficiency condensing boiler system 107% -
Total efficiency condensing micro-CHP 107% -
Heat-to-power ratio of micro-CHP 6.64 -
Gas price at start of the model 0.42 Euro/m3
Electricity price at start of the model 0.10 Euro/kWh
Rise of gas price 7.1% 1/year
Rise of electricity price 6.3% 1/year
Interest on own savings 3.0% 1/year
Interest on loans 5.0% 1/year
Electricity transport fee 0.040 Euro/kWh
Electricity export share 0.35 -
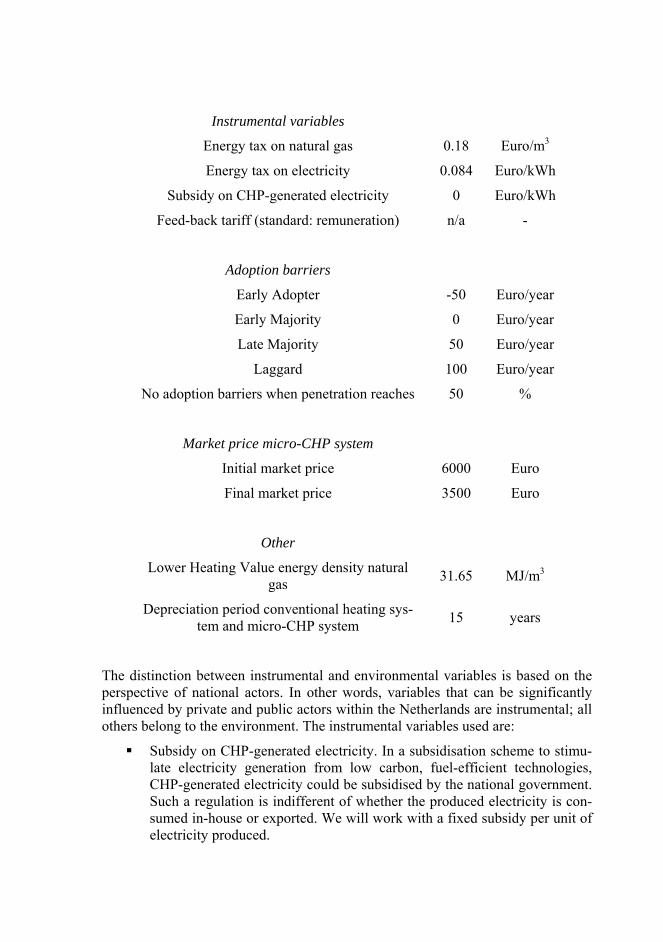
Instrumental variables
Energy tax on natural gas 0.18 Euro/m3
Energy tax on electricity 0.084 Euro/kWh
Subsidy on CHP-generated electricity 0 Euro/kWh
Feed-back tariff (standard: remuneration) n/a -
Adoption barriers
Early Adopter -50 Euro/year
Early Majority 0 Euro/year
Late Majority 50 Euro/year
Laggard 100 Euro/year
No adoption barriers when penetration reaches 50 %
Market price micro-CHP system
Initial market price 6000 Euro
Final market price 3500 Euro
Other
Lower Heating Value energy density natural gas 31.65 MJ/m3
Depreciation period conventional heating sys-tem and micro-CHP system 15 years
The distinction between instrumental and environmental variables is based on the perspective of national actors. In other words, variables that can be significantly influenced by private and public actors within the Netherlands are instrumental; all others belong to the environment. The instrumental variables used are:
Subsidy on CHP-generated electricity. In a subsidisation scheme to stimu-late electricity generation from low carbon, fuel-efficient technologies, CHP-generated electricity could be subsidised by the national government. Such a regulation is indifferent of whether the produced electricity is con-sumed in-house or exported. We will work with a fixed subsidy per unit of electricity produced.
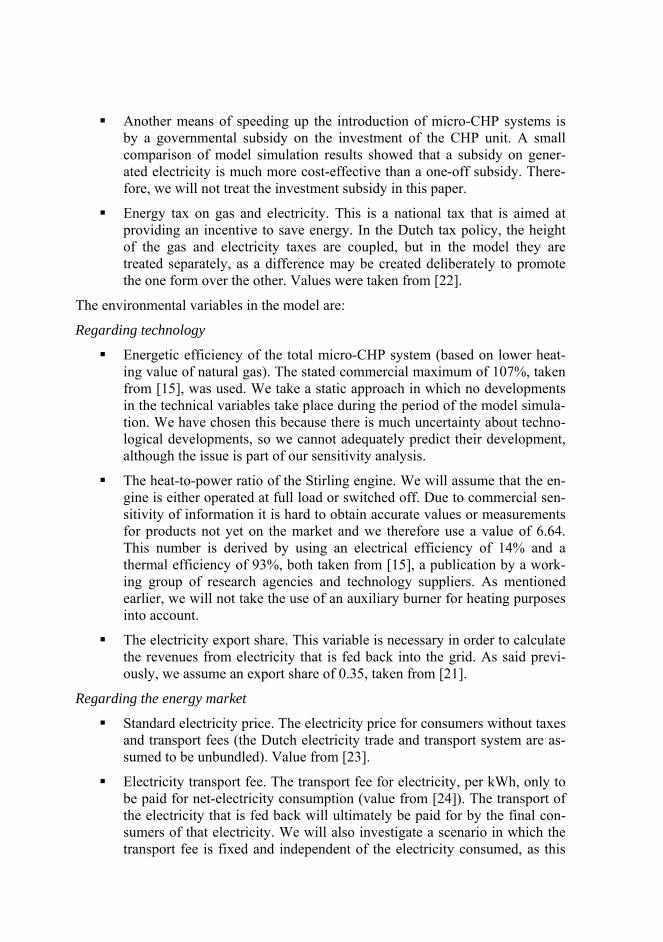
Another means of speeding up the introduction of micro-CHP systems is by a governmental subsidy on the investment of the CHP unit. A small comparison of model simulation results showed that a subsidy on gener-ated electricity is much more cost-effective than a one-off subsidy. There-fore, we will not treat the investment subsidy in this paper.
Energy tax on gas and electricity. This is a national tax that is aimed at providing an incentive to save energy. In the Dutch tax policy, the height of the gas and electricity taxes are coupled, but in the model they are treated separately, as a difference may be created deliberately to promote the one form over the other. Values were taken from [22].
The environmental variables in the model are:
Regarding technology
Energetic efficiency of the total micro-CHP system (based on lower heat-ing value of natural gas). The stated commercial maximum of 107%, taken from [15], was used. We take a static approach in which no developments in the technical variables take place during the period of the model simula-tion. We have chosen this because there is much uncertainty about techno-logical developments, so we cannot adequately predict their development, although the issue is part of our sensitivity analysis.
The heat-to-power ratio of the Stirling engine. We will assume that the en-gine is either operated at full load or switched off. Due to commercial sen-sitivity of information it is hard to obtain accurate values or measurements for products not yet on the market and we therefore use a value of 6.64. This number is derived by using an electrical efficiency of 14% and a thermal efficiency of 93%, both taken from [15], a publication by a work-ing group of research agencies and technology suppliers. As mentioned earlier, we will not take the use of an auxiliary burner for heating purposes into account.
The electricity export share. This variable is necessary in order to calculate the revenues from electricity that is fed back into the grid. As said previ-ously, we assume an export share of 0.35, taken from [21].
Regarding the energy market
Standard electricity price. The electricity price for consumers without taxes and transport fees (the Dutch electricity trade and transport system are as-sumed to be unbundled). Value from [23].
Electricity transport fee. The transport fee for electricity, per kWh, only to be paid for net-electricity consumption (value from [24]). The transport of the electricity that is fed back will ultimately be paid for by the final con-sumers of that electricity. We will also investigate a scenario in which the transport fee is fixed and independent of the electricity consumed, as this
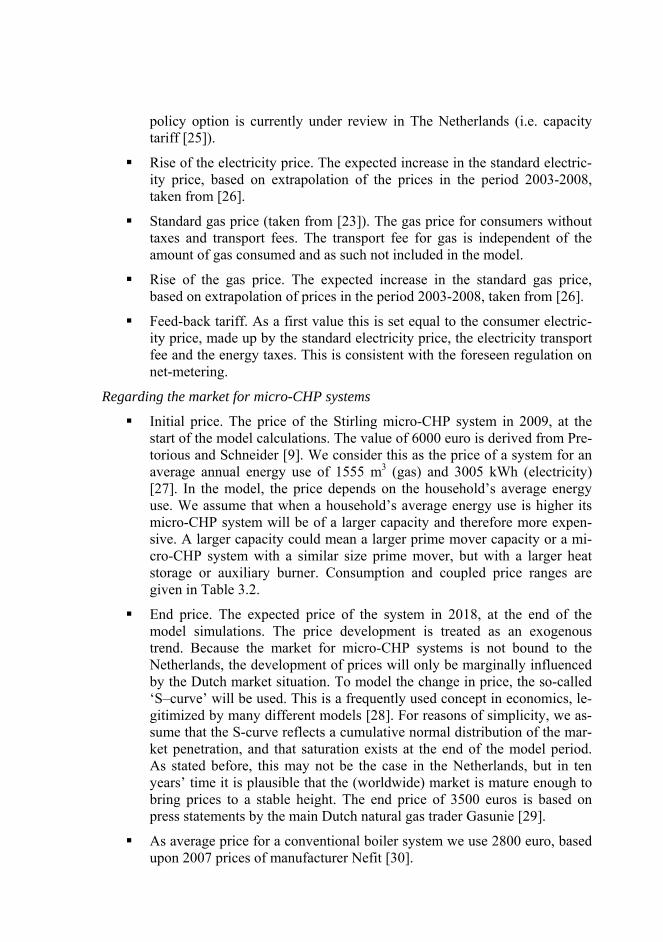
policy option is currently under review in The Netherlands (i.e. capacity tariff [25]).
Rise of the electricity price. The expected increase in the standard electric-ity price, based on extrapolation of the prices in the period 2003-2008, taken from [26].
Standard gas price (taken from [23]). The gas price for consumers without taxes and transport fees. The transport fee for gas is independent of the amount of gas consumed and as such not included in the model.
Rise of the gas price. The expected increase in the standard gas price, based on extrapolation of prices in the period 2003-2008, taken from [26].
Feed-back tariff. As a first value this is set equal to the consumer electric-ity price, made up by the standard electricity price, the electricity transport fee and the energy taxes. This is consistent with the foreseen regulation on net-metering.
Regarding the market for micro-CHP systems
Initial price. The price of the Stirling micro-CHP system in 2009, at the start of the model calculations. The value of 6000 euro is derived from Pre-torious and Schneider [9]. We consider this as the price of a system for an average annual energy use of 1555 m3 (gas) and 3005 kWh (electricity) [27]. In the model, the price depends on the household’s average energy use. We assume that when a household’s average energy use is higher its micro-CHP system will be of a larger capacity and therefore more expen-sive. A larger capacity could mean a larger prime mover capacity or a mi-cro-CHP system with a similar size prime mover, but with a larger heat storage or auxiliary burner. Consumption and coupled price ranges are given in Table 3.2.
End price. The expected price of the system in 2018, at the end of the model simulations. The price development is treated as an exogenous trend. Because the market for micro-CHP systems is not bound to the Netherlands, the development of prices will only be marginally influenced by the Dutch market situation. To model the change in price, the so-called ‘S–curve’ will be used. This is a frequently used concept in economics, le-gitimized by many different models [28]. For reasons of simplicity, we as-sume that the S-curve reflects a cumulative normal distribution of the mar-ket penetration, and that saturation exists at the end of the model period. As stated before, this may not be the case in the Netherlands, but in ten years’ time it is plausible that the (worldwide) market is mature enough to bring prices to a stable height. The end price of 3500 euros is based on press statements by the main Dutch natural gas trader Gasunie [29].
As average price for a conventional boiler system we use 2800 euro, based upon 2007 prices of manufacturer Nefit [30].
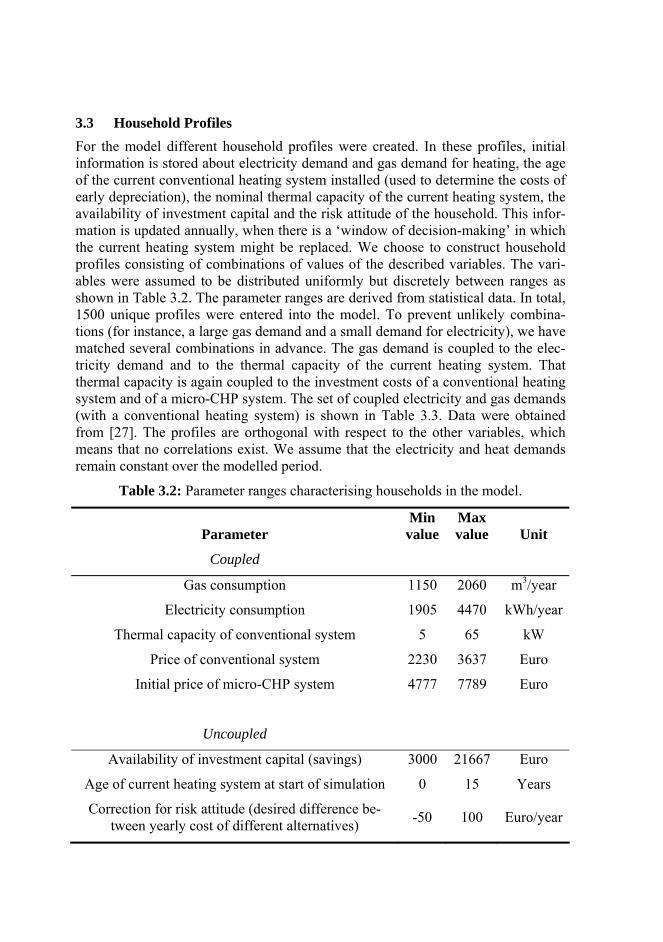
3.3 Household Profiles For the model different household profiles were created. In these profiles, initial information is stored about electricity demand and gas demand for heating, the age of the current conventional heating system installed (used to determine the costs of early depreciation), the nominal thermal capacity of the current heating system, the availability of investment capital and the risk attitude of the household. This infor-mation is updated annually, when there is a ‘window of decision-making’ in which the current heating system might be replaced. We choose to construct household profiles consisting of combinations of values of the described variables. The vari-ables were assumed to be distributed uniformly but discretely between ranges as shown in Table 3.2. The parameter ranges are derived from statistical data. In total, 1500 unique profiles were entered into the model. To prevent unlikely combina-tions (for instance, a large gas demand and a small demand for electricity), we have matched several combinations in advance. The gas demand is coupled to the elec-tricity demand and to the thermal capacity of the current heating system. That thermal capacity is again coupled to the investment costs of a conventional heating system and of a micro-CHP system. The set of coupled electricity and gas demands (with a conventional heating system) is shown in Table 3.3. Data were obtained from [27]. The profiles are orthogonal with respect to the other variables, which means that no correlations exist. We assume that the electricity and heat demands remain constant over the modelled period.
Table 3.2: Parameter ranges characterising households in the model.
Parameter Min
valueMax value Unit
Coupled
Gas consumption 1150 2060 m3/year
Electricity consumption 1905 4470 kWh/year
Thermal capacity of conventional system 5 65 kW
Price of conventional system 2230 3637 Euro
Initial price of micro-CHP system 4777 7789 Euro
Uncoupled
Availability of investment capital (savings) 3000 21667 Euro
Age of current heating system at start of simulation 0 15 Years
Correction for risk attitude (desired difference be-tween yearly cost of different alternatives) -50 100 Euro/year
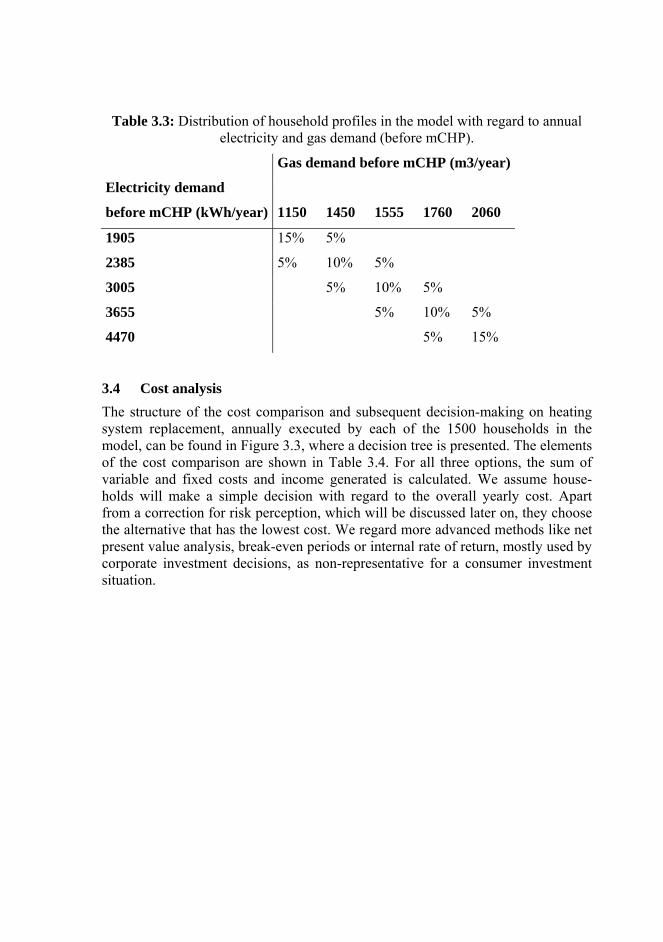
Table 3.3: Distribution of household profiles in the model with regard to annual electricity and gas demand (before mCHP).
Gas demand before mCHP (m3/year)
Electricity demand
before mCHP (kWh/year) 1150 1450 1555 1760 2060
1905 15% 5%
2385 5% 10% 5%
3005 5% 10% 5%
3655 5% 10% 5%
4470 5% 15%
3.4 Cost analysis The structure of the cost comparison and subsequent decision-making on heating system replacement, annually executed by each of the 1500 households in the model, can be found in Figure 3.3, where a decision tree is presented. The elements of the cost comparison are shown in Table 3.4. For all three options, the sum of variable and fixed costs and income generated is calculated. We assume house-holds will make a simple decision with regard to the overall yearly cost. Apart from a correction for risk perception, which will be discussed later on, they choose the alternative that has the lowest cost. We regard more advanced methods like net present value analysis, break-even periods or internal rate of return, mostly used by corporate investment decisions, as non-representative for a consumer investment situation.
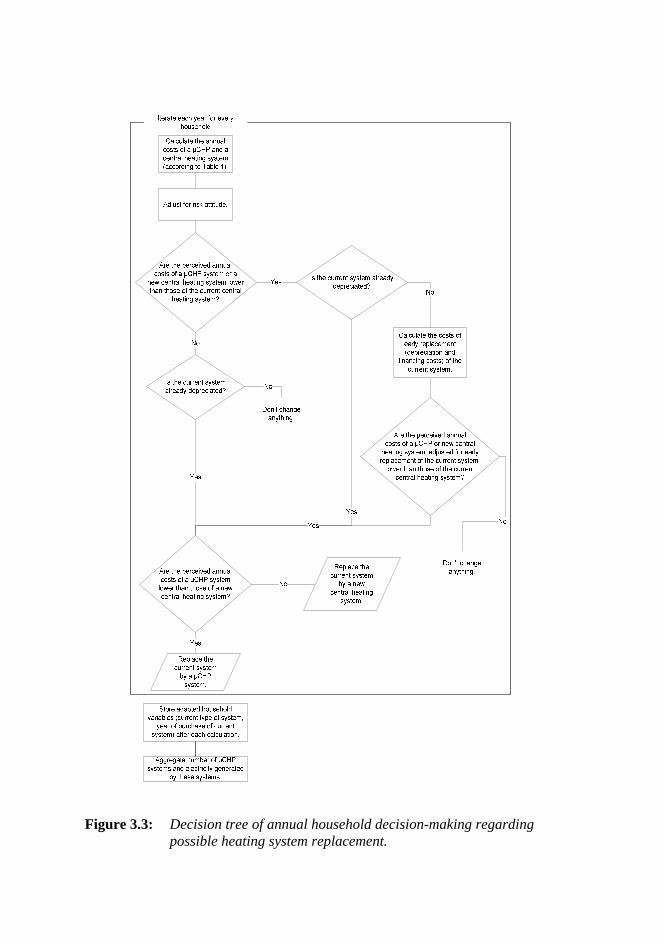
Figure 3.3: Decision tree of annual household decision-making regarding possible heating system replacement.
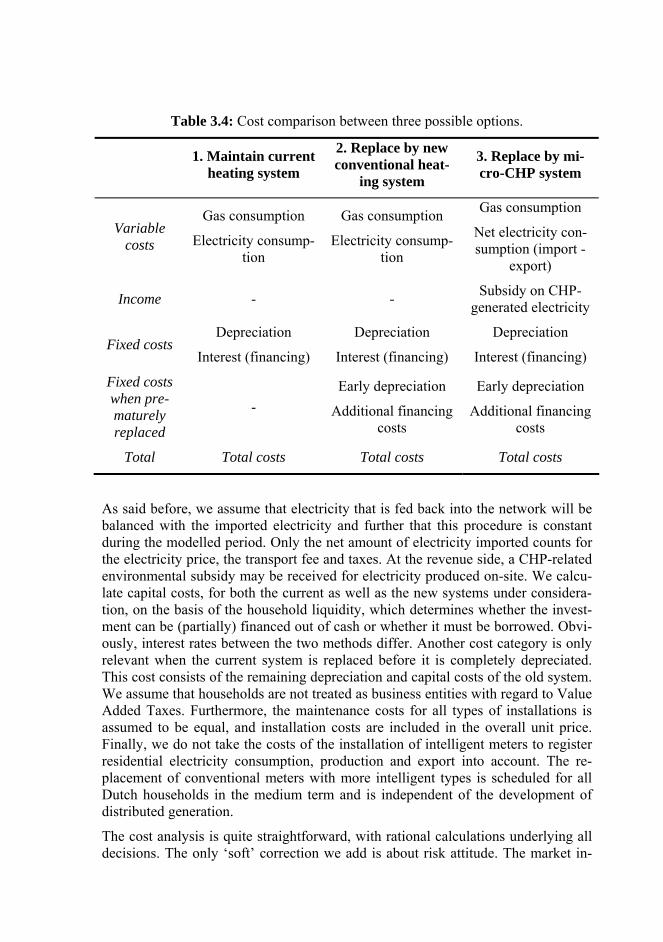
Table 3.4: Cost comparison between three possible options.
1. Maintain current heating system
2. Replace by new conventional heat-
ing system
3. Replace by mi-cro-CHP system
Variable costs
Gas consumption
Electricity consump-tion
Gas consumption
Electricity consump-tion
Gas consumption
Net electricity con-sumption (import -
export)
Income - - Subsidy on CHP-generated electricity
Fixed costs Depreciation
Interest (financing)
Depreciation
Interest (financing)
Depreciation
Interest (financing)
Fixed costs when pre-maturely replaced
- Early depreciation
Additional financing costs
Early depreciation
Additional financing costs
Total Total costs Total costs Total costs
As said before, we assume that electricity that is fed back into the network will be balanced with the imported electricity and further that this procedure is constant during the modelled period. Only the net amount of electricity imported counts for the electricity price, the transport fee and taxes. At the revenue side, a CHP-related environmental subsidy may be received for electricity produced on-site. We calcu-late capital costs, for both the current as well as the new systems under considera-tion, on the basis of the household liquidity, which determines whether the invest-ment can be (partially) financed out of cash or whether it must be borrowed. Obvi-ously, interest rates between the two methods differ. Another cost category is only relevant when the current system is replaced before it is completely depreciated. This cost consists of the remaining depreciation and capital costs of the old system. We assume that households are not treated as business entities with regard to Value Added Taxes. Furthermore, the maintenance costs for all types of installations is assumed to be equal, and installation costs are included in the overall unit price. Finally, we do not take the costs of the installation of intelligent meters to register residential electricity consumption, production and export into account. The re-placement of conventional meters with more intelligent types is scheduled for all Dutch households in the medium term and is independent of the development of distributed generation.
The cost analysis is quite straightforward, with rational calculations underlying all decisions. The only ‘soft’ correction we add is about risk attitude. The market in-
troduction of a product depends not only on rational decisions of potential consum-ers, but also on their perception of the risk involved in adopting a new technology. Roger and Scott [31] identified five types of people in this respect: innovators, early adopters, early majority, late majority and late adopters. These groups differ in their degree of innovativeness, defined as “the degree to which an individual or other unit of adoption is relatively earlier in adopting new ideas than other mem-bers of a social system”. Because the innovators only account for 2.5%, we merged this category with the early adopters. Then, the four groups can be projected on a normal distribution (16-34-34-16). In order to be able to insert this attitude into a cost calculation, we introduce a (arbitrary) cost advantage barrier that has to be overcome before one chooses for micro-CHP. Early adopters choose a micro-CHP even if it has a cost disadvantage of only up to 50 euros per year, because they are interested in the new technology, care about the environment or believe in the sys-tem’s long-term cost potential. For the early majority, the micro-CHP should at least have the same financial performance as a conventional heating system. People belonging to the category of the late majority need to see a cost advantage of 50 euros a year, and the late adopters are only convinced when the financial advantage exceeds 100 euros per year. It is important to recognise that these factors are only relevant in the early stages of micro-CHP introduction. Once the product is getting common, the idea of having a micro-CHP is not new anymore. Of course, this is not a step function; the impact of the attitude of people will gradually diminish as micro-CHP systems are getting more ground. We assume that when 50% of all households have a micro-CHP system, attitude will play no role at all anymore. This is an arbitrary value, though sensitivity tests show that it does only have a minor impact on the model results, so there is no reason to investigate this variable in more depth.
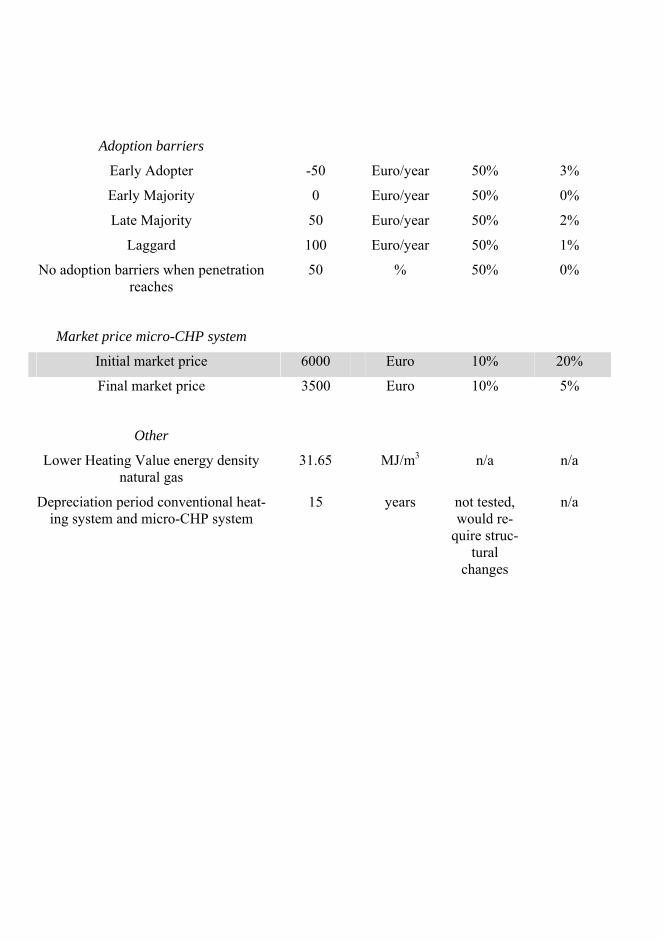
4 SIMULATION RESULTS We ran a sensitivity analysis on all variables depicted in Table 3.1, following a ceteris paribus approach. We changed the value of the variable with an arbitrary amount and looked at the change in the ultimate ‘result’ of the model: the degree of adoption of micro-CHP systems. Most variables are relatively insensitive, meaning that a change in their value does not lead to a disproportional change in the model outcomes. Several, however, do have a significant effect, as shown in the sensitiv-ity analysis results in Table 4.1.
Note that the adoption rates have no absolute meaning. The relatively high adop-tion rates can be explained because the model only incorporates demand-side char-acteristics and does not take the supply side of the market into account. Therefore, it is only about latent demand, not about real purchases of systems, since the sys-tems are hardly available at this moment and will not be mass-produced in the first years of the modelled period.
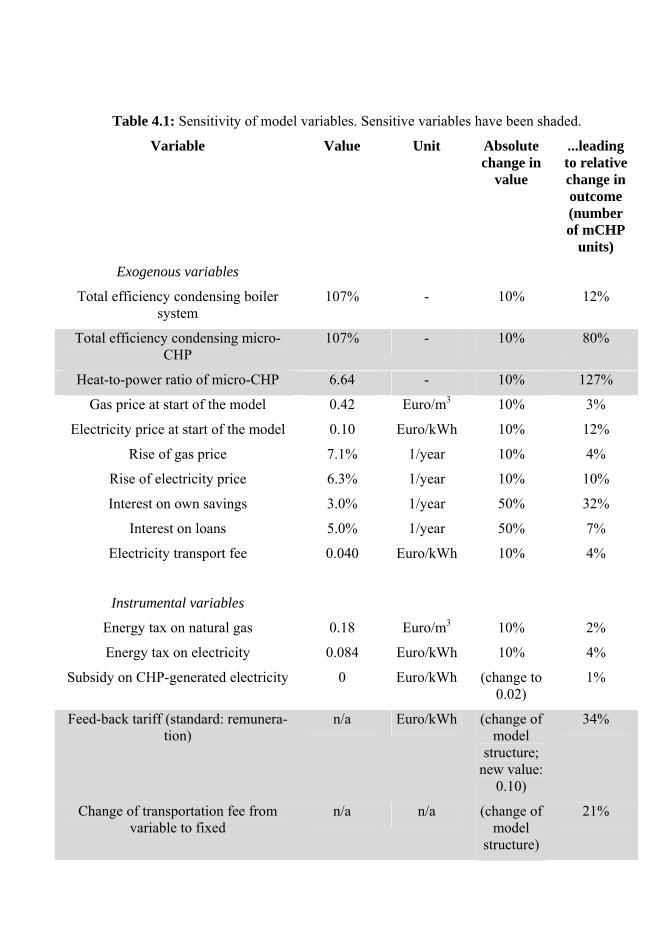
Table 4.1: Sensitivity of model variables. Sensitive variables have been shaded.
Variable Value Unit Absolute change in
value
...leading to relative change in outcome (number of mCHP
units)
Exogenous variables
Total efficiency condensing boiler system
107% - 10% 12%
Total efficiency condensing micro-CHP
107% - 10% 80%
Heat-to-power ratio of micro-CHP 6.64 - 10% 127%
Gas price at start of the model 0.42 Euro/m3 10% 3%
Electricity price at start of the model 0.10 Euro/kWh 10% 12%
Rise of gas price 7.1% 1/year 10% 4%
Rise of electricity price 6.3% 1/year 10% 10%
Interest on own savings 3.0% 1/year 50% 32%
Interest on loans 5.0% 1/year 50% 7%
Electricity transport fee 0.040 Euro/kWh 10% 4%
Instrumental variables
Energy tax on natural gas 0.18 Euro/m3 10% 2%
Energy tax on electricity 0.084 Euro/kWh 10% 4%
Subsidy on CHP-generated electricity 0 Euro/kWh (change to 0.02)
1%
Feed-back tariff (standard: remunera-tion)
n/a Euro/kWh (change of model
structure; new value:
0.10)
34%
Change of transportation fee from variable to fixed
n/a n/a (change of model
structure)
21%
Adoption barriers
Early Adopter -50 Euro/year 50% 3%
Early Majority 0 Euro/year 50% 0%
Late Majority 50 Euro/year 50% 2%
Laggard 100 Euro/year 50% 1%
No adoption barriers when penetration reaches
50 % 50% 0%
Market price micro-CHP system
Initial market price 6000 Euro 10% 20%
Final market price 3500 Euro 10% 5%
Other
Lower Heating Value energy density natural gas
31.65 MJ/m3 n/a n/a
Depreciation period conventional heat-ing system and micro-CHP system
15 years not tested, would re-
quire struc-tural
changes
n/a
The total efficiency (heat and electricity) of the micro-CHP unit proves to have a strong impact on the penetration. Although the aim of micro-CHP developers is to deliver the same efficiency as a conventional high efficiency condensing boiler, the model shows that a slight deviation can have significant impact on the overall penetration. An even more important technical parameter is the heat-to-power ratio. A small upward change in the electric efficiency, at the expense of thermal effi-ciency, has a positive effect. Most current systems use the Stirling design, which places the electrical power share at a current technical limit of around 15% (14% was used in this model, based on [15], which hardly deviates from the specifica-tions of Microgen [32].) It is expected that in the future the Stirling technology can possibly deliver 20 to 30% electrical efficiency [15]. Other technologies, among which are fuel cells, can increase this value even further.
The electricity export share does not play any role when net-metering is used for remunerating the exported electricity and when time-invariant tariffs are used (i.e. the tariffs are constant over the day; no real-time pricing). As the experiences with micro-CHP systems in The Netherlands are limited, it is hard to obtain reliable empirical measurements.
The initial market price of the systems has quite a significant impact. The changes investigated, of 1000 euro, represent the actual uncertainty, as different press statements about market introductions mention prices that differ around the same amount.
The existence of a fixed or variable scheme for transportation fees and the presence of net-metering are key policy variables, the effect of which is much bigger than that of small changes in fees related to the amount of produced electricity.
The model is relatively insensitive to the variables that describe the risk attitude. This suggests uncertainties in the way the corrections for risk aversion are calcu-lated – see the description above – do not have too many implications for the end result. Now this has been determinded, it could be considered to leave this part out of the model altogether.
5 CONCLUSIONS The penetration level is particularly sensitive to changes in the technical parame-ters (system efficiency and heat-to-power ratio) and the initial market price. System efficiency and heat-to-power ratio can, to a certain extent, be influenced by manu-facturers.
We looked at the current Dutch subsidisation scheme, which does not discriminate between own consumption and production for ‘export’. Net-metering of electricity imports and exports is very supportive of micro-CHP development. Because this way of remunerating exported electricity can be captured in regulation, it is clear that the government could have an important role in stimulating the market, al-
though the social legitimacy for this (i.e. opportunity costs) is beyond the scope of this study. A second beneficial factor is the variable transport fee for electricity. However, this is a more indirect instrument, since the consideration whether to switch to a fixed fee based on capacity will be impacted by many different perspec-tives as it is not only about micro-CHP.
The sensitivity of the above-mentioned variables suggests that modellers should pay particular attention to these and should try to find reliable empirical data. The variables that are less sensitive can be dealt with in three ways. Some variables cannot be omitted from a model (such as the gas price), but their low sensitivity suggests that there is a certain tolerance for error in empirical data. Considering that it is often hard to get reliable data, this knowledge may be very helpful in de-ciding about data collection priorities. Other variables (such as risk adoption barri-ers and probably interest rates as well) may be omitted since they hardly effected the results of our model. This leads to a structural simplification of the model.
A noteworthy characteristic of our developed model is that it mostly consists of discrete structures. The simulated households make decisions based on absolute thresholds, whereas in reality the outcome of decisions will be better described by a statistical function around this ‘absolute’ mean. Normally, this does not cause problems when the law of large numbers comes in. However, with the limited sample size (1500 artificial household profiles) it may be that the hard thresholds have introduced some error.
A second caution we need to give is that the sensitivity to household characteristics is not tested. They would require fundamental changes to the model, which are outside the scope of this study. Nevertheless, in every model construction these characteristics play a role and their relevance and sensitivity need to be researched as well.
6 FURTHER RESEARCH Further research should concentrate on three issues. First, based on the results of the sensitivity analysis, the model may be detailed with respect to the sensitive variables, and can be simplified for the insensitive ones.
Secondly, the model could incorporate more residential heating systems (e.g. solar boilers, heat pumps), that the households could choose when wanting to replace their current system.
Third, when the model structure itself is improved, it should be run with empirical data so that demand-side predictions can be made. Such a model could also be used to predict the effectiveness of policy measures. When aiming at realistic predic-tions, the model assumptions should be clearly tested. Tax regimes outside The Netherlands are different and the set of relevant alternatives for heating systems is different.
7 REFERENCES [1] De Jong A, Bakker EJ, Dam J, Van Wolferen H. Technisch energie- en
CO2-besparingspotentieel van micro-wkk in Nederland (2010-2030) (in Dutch). Werkgroep Decentraal, onderdeel van Platform Nieuw Gas, 2006.
[2] Ben Maallaa EM, Kunsch PL. Simulation of micro-CHP diffusion by means of System Dynamics. Energy Policy 2008;36:2308 - 2319.
[3] Pehnt M, Cames M, Fischer C, Praetorius B, Schneider L, Schumacher K, Vob J. Micro Cogeneration: Towards Decentralized Energy Systems. Springer: Berlin,2006.
[4] Watson J, Sauter R, Bahaj B, James P, Myers L, Wing R. Domestic micro-generation: Economic, regulatory and policy issues for the UK. Energy Policy 2008;36:3085 - 3096.
[5] Micro-Map. Mini and Micro CHP – market assessment and development plan - Summary report. 2002.
[6] Ossebaard ME, Van Wijk AJM, Van Wees MT. Heat supply in The Neth-erlands: A systems analysis of costs, exergy efficiency, CO2 and NO(x) emissions. Energy 1997;22:1087-1098.
[7] Ruijg GJ, van der Laag PC. Rentabiliteit van micro warmtekrachtsystemen. Energieonderzoek Centrum Nederland: Petten, 2003.
[8] Strachan N, Zerriffi H, Dowlatabadi H. System Implications of Distributed Generation. In: Thissen WAH, Herder PM, editors. Critical Infrastructures: State of the Art in Research and Application. Kluwer Academic Publish-ers: Norwell, Massachusetts, USA, 2003: pp. 39 -76.
[9] Pretorius B, Schneider L. Micro Cogeneration: Towards a decentralized and sustainable German energy system? 29th IAEE International Confer-ence: Potsdam, 2006.
[10] Coll-Mayor D. State of the art of the virtual utility: the smart distributed generation network. International Journal Of Energy Research 2004;28:65-80.
[11] Future CoGen. The future of CHP in the European market – The European cogeneration study. 2001.
[12] Gulli F. Small distributed generation versus centralised supply: a social cost–benefit analysis in the residential and service sectors. Energy Policy 2006;34:804-832.
[13] Siddiqui AS, Firestone RM, Ghosh S, Stadler M, Edwards JL, Marnay C. Distributed energy resources customer adoption modeling with combined heat and power applications. Lawrence Berkeley National Laboratory, 2003.
[14] Magnus Maribu K, Firestone R, Marnay C, Siddiqui AS. Distributed En-ergy Resources Market Diffusion Model. LBNL-60590. Ernest Orlando Lwarence Berkeley National Laboratory: Berkeley, 2006.
[15] de Jong A, Bakker E-J, Dam J, van Wolferen H. Technisch energie- en CO2-besparingspotentieel van micro-wkk in Nederland. Platform Nieuw Gas: Sittard, 2006.
[16] SBGI. MicroCHP - delivering a low carbon future. SBGI: Warwickshire, 2003.
[17] SBGI. Updated market projections. SBGI: Warwickshire, 2006. [18] Colijn M. Micro Cogeneration in the Netherlands. In: Pehnt M, Cames M,
Fischer C, Praetorius B, Schneider L, Schumacher K, Voβ J-P, editors. Mi-cro Cogeneration, towards decentralized energy systems. Springer: Berlin, 2006: 277-289.
[19] Energiened. Energie Informatiebank - Number of connections gas grid. 2004.
[20] Houwing M, Bouwmans I. Agent-Based Modeling of Residential Energy Generation with Micro-CHP. 2nd International Conference on Integration of Renewable and Distributed Energy Resources: Napa, CA, USA, 2006.
[21] Houwing M, Bouwmans I. Agent-Based Modeling of Residential Energy Generation with Micro-CHP. 2nd International Conference on Integration of Renewable and Distributed Energy Resources: Napa, CA, USA, 2006.
[22] www.kiesenergie.nl. Energy website (in Dutch). consulted in 2007. [23] www.nuon.nl. Dutch energy trading company. consulted in 2007. [24] www.continuon.nl. Dutch network company. consulted in 2007. [25] Van der Hoeven MJA. Liberalisering energiemarkten - brief van de minis-
ter van economische zaken aan de Tweede Kamer. 28 982, nr. 63. Den Haag: Tweede Kamer der Staten Generaal, 2008.
[26] www.energiened.nl. Association of Dutch energy producers, retailers and traders. consulted in 2007.
[27] www.cbs.nl. Dutch Central Bureau of Statistics (CBS). 2007. [28] Geroski PA. Models of technology diffusion. Research Policy
2000;29:603-625. [29] http://www.eecare.nl. Gasunie lanceert micro-WKK voor huishoudens (in
Dutch). retrieved 2006. [30] www.nefit.com. Dutch boiler manufacturer. consulted in 2006. [31] Roger EM, Scott KL. The Diffusion of Innovations Model and Outreach
from the National Network of Libraries of Medicine to Native American Communities. 1997.
[32] Microgen. Indicative product specification. 2006.