
Kansas State University Human Nutrition (FNDH 400) Flexbook
540
Kansas State University Libraries New Prairie Press NPP eBooks Monographs 2018 Kansas State University Human Nutrition (FNDH 400) Flexbook Brian Lindshield Kansas State University, [email protected] Follow this and additional works at: hps://newprairiepress.org/ebooks Part of the Higher Education Commons , and the Human and Clinical Nutrition Commons is Book is brought to you for free and open access by the Monographs at New Prairie Press. It has been accepted for inclusion in NPP eBooks by an authorized administrator of New Prairie Press. For more information, please contact [email protected]. Recommended Citation Lindshield, Brian, "Kansas State University Human Nutrition (FNDH 400) Flexbook" (2018). NPP eBooks. 19. hps://newprairiepress.org/ebooks/19
-
Upload
khangminh22 -
Category
Documents
-
view
1 -
download
0
Transcript of Kansas State University Human Nutrition (FNDH 400) Flexbook
Kansas State University LibrariesNew Prairie Press
NPP eBooks Monographs
2018
Kansas State University Human Nutrition (FNDH400) FlexbookBrian LindshieldKansas State University, [email protected]
Follow this and additional works at: https://newprairiepress.org/ebooks
Part of the Higher Education Commons, and the Human and Clinical Nutrition Commons
This Book is brought to you for free and open access by the Monographs at New Prairie Press. It has been accepted for inclusion in NPP eBooks by anauthorized administrator of New Prairie Press. For more information, please contact [email protected].
Recommended CitationLindshield, Brian, "Kansas State University Human Nutrition (FNDH 400) Flexbook" (2018). NPP eBooks. 19.https://newprairiepress.org/ebooks/19


Kansas State University Human Nutrition (FNDH 400) Flexbook
Brian Lindshield
About the Flexbook
The CK-12 foundation defines a flexbook as a “free and open source textbook platform where
one can build and edit collaborative textbooks 1.” The FNDH 400 (formerly HN 400, department
changed its name from Human Nutrition to Food, Nutrition, Dietetics and Health) Flexbook fits
this definition, but I felt the name was particularly accurate due to the flexibility of Google Docs
that it was built on.
The flexbook is divided into 13 chapters with sections and subsections. These are numbered in
such a way that the first number represents the chapter. A period separates the chapter from
the section number, and another period is followed by the subsection number. The figures are
non-copyrighted figures or I have made them myself in PowerPoint. The flexbook also contains
links to articles, videos, and animations in Web Link boxes. These can be clicked to open the
link, and urls for these resources are also provided at the end of the section or subsection.
I am happy to share the flexbook and PowerPoint slides that I use for class with other
instructors teaching similar courses. Please email me and we can get something arranged.
Brian Lindshield allows others to distribute, remix, tweak, and build upon this work, even
commercially, as long as attribute this resource.
Here’s a citation to use for this purpose, but if this doesn’t work for your purpose, please cite
the url which is also provided below.
Citation:
Lindshield, B. L. Kansas State University Human Nutrition (FNDH 400) Flexbook (2018). NPP
eBooks. 19. http://newprairiepress.org/ebooks/19
Shortened URL: goo.gl/vOAnR
A version of the flexbook is available on the Top Hat Textbook platform, but is currently only
available to students enrolled in the course.
The flexbook was a finalist for the 2012 Education-Portal.com People’s Choice Award for the
Most Open Resource (note Education-Portal.com is now Study.com).

About the Course
FNDH 400 is a 3-hour, intermediate-level, nutrition course at Kansas State University taught on
campus every spring semester, and all 3 semesters (fall, spring, summer) via the Division of
Continuing Education. Ideally on-campus students take the course during the spring semester
of their sophomore year. Most on-campus students in the class are majoring in Nutritional
Sciences, Nutrition and Health (previously Public Health Nutrition), Nutrition and Kinesiology,
Athletic Training, or Dietetics. There is an increasing number of Biology, Life Sciences and other
majors taking the course. Online, more students are nontraditional and a little more than half
are distance dietetics students (K-State offers a distance dietetics degree).
About the Author/Instructor
Brian Lindshield, Ph.D. is an Associate Professor in the Department of Food, Nutrition, Dietetics
and Health. He received an A.S. from Pratt Community College in ’01, a B.S. in Human Nutrition
from Kansas State University in ’03, and Ph.D. in Nutritional Sciences from the University of
Illinois at Urbana-Champaign in ’08.
Peer-reviewed flexbook/OER journal articles
Lindshield, B.L., Adhikari, K. Campus and Online U.S. College Students’ Attitudes Toward an
Open Educational Resource Course Fee. Int J High Educ. 2(4): 42-51, 2013.
doi:10.5430/ijhe.v2n4p42
http://www.sciedu.ca/journal/index.php/ijhe/article/view/3312/2003
Lindshield, B.L., Adhikari, K. Online and Campus College Students Like Using an Open
Educational Resource Instead of a Traditional Textbook. Journal of Online Learning and
Teaching. 9(1): 26-38, 2013. http://jolt.merlot.org/vol9no1/lindshield_0313.htm

Lindshield, B.L., Adhikari, K. The Kansas State University Human Nutrition (HN 400) Flexbook.
Educause Quarterly. 34(4), 2011.
http://www.educause.edu/ero/article/kansas-state-university-human-nutrition-hn-400-flexboo
k
Flexbook Presentations
3/5/13 Innovations in Teaching & Learning Showcase
“Open Educational Resources, Textbook Replacements?”
3/4/13 Innovations in Teaching & Learning Workshop Panel
“Take 5: Teaching Technologies that Work”
9/27/12 IDT Roundtable
“E-textbooks and Beyond”
One of 3 speakers at session.
http://id.ome.ksu.edu/roundtable/e-textbooks-and-beyond/
3/16/12 Teaching, Learning, and Technology Showcase 2012
-“Using Flexbooks to Supplement/Replace the Traditional Textbook”
9/28/11 Axio Learning Conference 2011
-Peer Showcase: “Using flexbooks to supplement/replace the traditional textbook”
7/25/11 Society for Nutrition Education and Behavior Oral Presentation
-“Kansas State University Human Nutrition (HN 400) Flexbook”
9/29/10 Axio Learning Conference 2010
-“Flexbooks”
1/12/10 7th annual K-State Teaching Retreat
-“Flexbooks: Better than Textbooks?”
Media Stories about the Flexbook
9/26/13 K-State Today
K-State faculty receive funding to develop open alternative textbooks
http://www.k-state.edu/today/announcement.php?id=10136&category=kudos&referredBy=email
1/29/13 Kansas State Collegian
Open-sourced ‘flexbook’ earns K-State educator national acclaim http://www.kstatecollegian.com/2013/01/29/open-sourced-flexbook-earns-k-state-educator-national-acclaim/
9/19/12 College Human Ecology Press Release
Lindshield’s flexbook nominated for national people’s choice award http://www.he.k-state.edu/news/2012/09/19/lindshields-flexbook-nominated-for-national-peoples-choice-award/
9/12/12 Partnership for Technology Innovation
Providing an Open Resource, Lowering the Financial Burden http://partnership4techinnovation.org/providing-an-open-resource-lowering-the-financial-burden/
8/24/12 Kansas City Star
K-State professor develops textbook flexibility http://www.kansascity.com/2012/08/24/3777552/k-state-professor-develops-textbook.html
Other media outlets where article was published:
Chicago Tribune: http://www.chicagotribune.com/business/yourmoney/sns-201208271800--tms--kidmoneyctnsr-a20120827-20120827,0,77297.story McClatchy Wire Sacramento Bee Sun Herald (Biloxi-Gulfport and Mississippi Gulf Coast Lexington Herald-Leader The Telegraph (Georgia) The South Carolina State The Olympian (Olympia, Washington) The Bradenton Herald (Florida) Bellingham Herald (Washington) News Observer (Raleigh, North Carolina) The Modesto Bee (Modesto, California) The Idaho Statesman (Boise, Idaho) Civic Plus (Blog) The Stockton Record (Stockton, California):
The Detroit News
8/16/12 Up to Date KCUR 89.3 (Kansas City NPR station)
The 'Flexbook': A Textbook Replacement http://kcur.org/post/flexbook-textbook-replacement
8/13/12 Kansas State University Press Release
From textbook to flexbook: Professor uses new collaborative tool in the classroom http://www.k-state.edu/media/newsreleases/aug12/flexbook81312.html
Other media outlets that published the release:

Campus Technology: http://campustechnology.com/articles/2012/08/13/ksu-professor-creates-flexbook.aspx
Phys.org: http://phys.org/news/2012-08-textbook-flexbook-professor-collaborative-tool.html
News Medical:
http://www.news-medical.net/news/20120814/Flexbook-helps-students-save-money-on-course-materials.aspx
Kansas City infoZine: http://www.infozine.com/news/stories/op/storiesView/sid/52822/
8/13/12 K-State Today
Professor's collaborative flexbook nominated for national people's choice award http://www.k-state.edu/today/announcement.php?id=4284&category=kudos&referredBy=email
2/22/12 Just In Blog
Lindshield flexes his flexbook muscle and tells how you can, too http://updatejustin.wordpress.com/2012/02/22/lindshield-flexes-his-flexbook-muscle-and-tells-how-you-can-too/
12/15/10 Issue 16 Axio Quarterly
Flexbooks: What Can They Do For You? http://axiolearning.org/news/2010/dec/15/flexbooks-what-can-they-do-you/
Contact Information
Brian Lindshield Ph.D.
Associate Professor
Department of Food, Nutrition, Dietetics and Health
Kansas State University
208 Justin Hall
Manhattan, KS 66506-1407
@brianlindshield on Twitter
Acknowledgement
Thanks to former Kansas State University student Russ Wolters for his input and feedback on
the flexbook design and revision. Thanks to Erin Ward for her assistance in the development
and implementation of the Top Hat version of the flexbook. Feedback from FNDH 400 students
over the years has also been extremely important in improving the flexbook.
Reference 1. http://creativecommons.org/weblog/entry/9378

Table of Contents
Chapter 1: Nutrition Basics
1.1 The Basics
1.11 Calories (Food Energy)
1.12 Phytochemicals, Zoochemicals & Functional Foods
1.13 The Scientific Method
1.2 Epidemiology
1.3 In Vitro & Animal Studies
1.4 Human Intervention Studies/Clinical Trials
1.5 Nutrition Research Statistics
1.6 Publishing Research
1.7 Interpreting Research
Chapter 2: Macronutrient Structures
2.1 Carbohydrates
2.11 Simple Carbohydrates
2.12 Sugar Alcohols (Polyols, Sugar Replacers)
2.13 Alternative Sweeteners
2.132 Other Alternative Sweeteners
2.14 Oligosaccharides
2.15 Polysaccharides
2.151 Starch
2.152 Glycogen
2.153 Fiber
2.2 Protein
2.21 Amino Acids
2.22 Protein Synthesis
2.23 Protein Structure
2.24 Protein Functions
2.25 Types of Amino Acids
2.26 Amino Acid Structures
2.27 Protein Quality
2.28 Protein-Energy Malnutrition
2.3 Lipids
2.31 How Does Fat Differ From Lipids?

2.32 Fatty Acids
2.33 Fatty Acid Naming & Food Sources
2.34 Essential Fatty Acids & Eicosanoids
2.35 Triglycerides
2.36 Phospholipids
2.37 Sterols
Chapter 3: Macronutrient Digestion
3.1 Digestion at a Glance
3.2 Mouth to the Stomach
3.3 Stomach
3.4 Small Intestine
3.41 Digestive Hormones, Accessory Organs & Secretions
3.42 Carbohydrate Digestion in the Small Intestine
3.43 Protein Digestion in the Small Intestine
3.44 Lipid Digestion in the Small Intestine
3.5 Macronutrient Digestion Review
3.6 Large Intestine
3.61 Microbiota
Chapter 4: Macronutrient Uptake, Absorption, & Transport
4.1 Crypts of Lieberkuhn & Enterocyte Maturation
4.2 Absorptive Lineup & Cell Membranes
4.3 Types of Cell Uptake/Transport
4.31 Passive Uptake/Transport
4.32 Active Uptake/Transport
4.4 Carbohydrate Uptake, Absorption, Transport & Liver Uptake
4.5 Glycemic Response, Insulin, & Glucagon
4.51 Diabetes
4.52 Glycemic Index
4.53 Glycemic Load
4.6 Protein Uptake, Absorption, Transport & Liver Uptake
4.7 Lipid Uptake, Absorption & Transport
4.71 Lipoproteins

Chapter 5: Common Digestive Problems
5.1 Peptic Ulcers
5.2 Gallstones
5.3 Irritable Bowel Syndrome
5.4 Inflammatory Bowel Syndrome
5.5 Celiac Disease & Gluten
5.6 Diverticulosis and Diverticulitis
5.7 Hemorrhoids
Chapter 6: Macronutrient Metabolism
6.1 Metabolism Basics
6.11 Cofactors
6.2 Carbohydrate Metabolism
6.21 Monosaccharide Metabolism
6.22 Glycogenesis & Glycogenolysis
6.23 Glycolysis
6.24 Transition Reaction
6.25 Citric Acid Cycle
6.26 Electron Transport Chain
6.27 Aerobic Glucose Metabolism Totals
6.28 Anaerobic Respiration
6.3 Lipid Metabolism
6.31 Lipolysis (Triglyceride Breakdown)
6.32 Fatty Acid Oxidation (Beta-Oxidation)
6.33 De novo Lipogenesis (Fatty Acid Synthesis)
6.34 Ketone Body Synthesis
6.35 Cholesterol Synthesis
6.4 Protein Metabolism
6.41 Transamination, Deamination & Ammonia Removal as Urea
6.42 Gluconeogenesis
6.43 Protein Turnover/Degradation
6.5 Alcohol Metabolism

Chapter 7: Integration of Macronutrient Metabolism
7.1 Integration of Macronutrient Metabolism
7.2 Liver Macronutrient Metabolism
7.3 Extrahepatic Macronutrient Metabolism
7.31 Muscle Macronutrient Metabolism
7.32 Adipose Macronutrient Metabolism
7.33 Brain Macronutrient Metabolism
7.34 Red Blood Cell Macronutrient Metabolism
7.4 Metabolic Conditions
7.41 Fed State
7.42 Fasting
7.43 Atkins Diet
7.44 Ornish/Pritikin Diet
7.45 Condition Summary Table
Chapter 8: Micronutrients Overview & Dietary Reference Intakes (DRIs)
8.1 Vitamins
8.2 Minerals
8.3 Vitamins & Minerals Functional Categories
8.4 Dietary Reference Intakes (DRIs)
Chapter 9: Antioxidant Micronutrients
9.1 Antioxidants
9.11 Free Radicals & Oxidative Stress
9.12 What is an Antioxidant?
9.13 Meaningful Antioxidant(s)
9.14 Too Much of a Good Thing? Antioxidants as Pro-oxidants
9.2 Vitamin E
9.21 Alpha-Tocopherol: Natural vs. Synthetic
9.22 Vitamin E Absorption, Metabolism, & Excretion
9.23 Dietary Vitamin E & Amounts Found in Body
9.24 Vitamin E Deficiency & Toxicity
9.25 Vitamin E DRI & IUs
9.3 Vitamin C
9.31 Vitamin C Absorption & Tissue Accumulation

9.32 Enzymatic Functions
9.33 Vitamin C Deficiency (Scurvy)
9.34 Vitamin C Toxicity, Linus Pauling & the Common Cold
9.4 Selenium
9.41 Selenoproteins
9.42 Selenium Absorption, Excretion, Toxicity & Its Questionable Deficiency
Chapter 10: Macronutrient Metabolism Micronutrients
10.1 Iodine
10.11 Thyroid Hormone
10.12 Iodine Deficiency & Toxicity
10.2 Manganese
10.3 Thiamin
10.31 Thiamin Functions
10.32 Thiamin Deficiency & Toxicity
10.4 Riboflavin
10.41 Riboflavin Functions
10.42 Riboflavin Deficiency & Toxicity
10.5 Niacin
10.51 Niacin Functions
10.52 Niacin Deficiency & Toxicity
10.6 Pantothenic Acid
10.7 Vitamin B6 10.71 Vitamin B6 Functions
10.72 Vitamin B6 Deficiency & Toxicity
10.8 Biotin
10.81 Biotin Functions
10.82 Epigenetics
10.83 Biotin Deficiency & Toxicity
Chapter 11: One-Carbon Metabolism Micronutrients
11.1 Folate & Folic Acid
11.11 Folate Functions
11.12 Folate Deficiency & Toxicity
11.2 Vitamin B12
11.21 Vitamin B12 Functions

11.22 Vitamin B12 Deficiency & Toxicity
11.3 B Vitamins, Homocysteine & Cardiovascular Disease
Chapter 12: Blood, Bones & Teeth Micronutrients
12.1 Vitamin D
12.11Environmental Factors that Impact Vitamin D3 Synthesis
12.12 Dietary or Supplemental Vitamin D
12.13 Response to Low Blood Calcium
12.14 Response to High Blood Calcium
12.15 Vitamin D Receptor
12.16 Vitamin D Deficiency, Toxicity, & Insufficiency
12.2 Calcium
12.21 Calcium Absorption
12.22 Calcium Bioavailability
12.23 Calcium Functions
12.24 Calcium Deficiency & Toxicity
12.3 Phosphorus
12.31 Phosphorus Functions
12.4 Fluoride
12.5 Vitamin K
12.51 Vitamin K Functions
12.52 Vitamin K Deficiency & Toxicity
12.6 Vitamin A
12.61 Carotenoids
12.62 Vitamin A Uptake, Absorption, Transport & Storage
12.63 Vitamin A Nuclear Receptors
12.64 Vitamin A Functions
12.65 Vitamin A Deficiency & Toxicity
12.7 Iron
12.71 Iron Uptake & Absorption
12.72 Iron Transport & Storage
12.73 Iron Functions
12.74 Iron Deficiency & Toxicity
12.8 Zinc
12.81 Zinc Functions
12.82 Zinc Deficiency & Toxicity
12.9 Copper
12.91 Copper Functions

12.92 Copper Deficiency & Toxicity
12.93 How High Zinc Intake Can Lead to Copper & Iron Deficiencies
Chapter 13: Electrolyte Micronutrients
13.1 Electrolytes
13.2 Sodium
13.3 Chloride
13.4 Potassium
13.5 Magnesium
13.6 Hypertension, Salt-Sensitivity & the DASH Diet
Contact Information
Brian Lindshield Ph.D.
Associate Professor
Department of Food, Nutrition, Dietetics and Health
Kansas State University
208 Justin Hall
Manhattan, KS 66506-1407
Phone 785-532-7848 Fax 785-532-3132
@brianlindshield on Twitter

1 Nutrition Basics
The field of nutrition is dynamic. This means that our understanding and practices are
constantly changing and being updated. Some of nutrition’s dynamic nature may be due to the
fact that nutrition, as a discipline, is relatively young (many vitamins weren't isolated until the
1930s) compared to many other scientific fields. New research is always being conducted and
the findings are continuously being reported to the public. With so much information,
discernment must be exercised. In order to interpret these new findings, you need to
understand how the research was conducted and the nutrition research hierarchy. Everyone
eats, so people are going to face nutrition choices and questions on a daily basis. This section
will provide you with an integrated understanding of the different forms of nutrition research
and how to evaluate them relative to one another.
Sections:
1.1 The Basics
1.2 Epidemiology
1.3 In vitro/Animal Studies
1.4 Human Intervention Studies/Clinical Trials
1.5 Nutrition Research Statistics
1.6 Publishing Research
1.7 Interpreting Research

1.1 The Basics
Nutrition can be defined as the science of the action of food, beverages, and their components
in biological systems. A nutrient is a compound that provides a needed function in the body.
Nutrients can be further classified based on the amount needed in the body.
Macronutrients: nutrients needed in larger amounts
Micronutrients: nutrients needed in smaller amounts (but still important)
The following table lists the different macronutrients and micronutrients.
Table 1.11 Macronutrients and Micronutrients
Macronutrients Micronutrients
Carbohydrates Vitamins
Proteins Minerals
Lipids
Water
Carbohydrates
The name carbohydrate means "hydrated carbon", or carbon with water. Thus, it isn't a
surprise that carbohydrates are made up of carbon, hydrogen, and oxygen. Sucrose (table
sugar) is an example of a commonly consumed carbohydrate. Some dietary examples of
carbohydrates are whole-wheat bread, oatmeal, rice, sugary snacks/drinks, and pasta.
Proteins
Proteins are also made up of carbon, hydrogen, and oxygen, but they also contain nitrogen.
Several dietary sources of proteins include nuts, beans/legumes, skim milk, egg whites, and
meat.
Lipids
Lipids consist of fatty acids, triglycerides, phospholipids, and sterols (i.e. cholesterol). Lipids are
also composed of carbon, hydrogen, and oxygen. Some dietary sources of lipids include oils,
butter, and egg yolks.
Brian Lindshield
1

Water
Water is made up of hydrogen and oxygen (H 2O) and is the only macronutrient that doesn't
provide energy.
Vitamins
Compounds that are essential for normal physiologic processes in the body.
Minerals
Elements (think periodic table) that are essential for normal physiological processes in the
body.
No References
Kansas State University Human Nutrition Textbook
2

1.11 Calories (Food Energy)
Food energy is measured in kilocalories (kcals), commonly referred to as calories by the general
public. The general public “calorie” term is incorrect (most do not know or understand the
difference between the kilocalorie and calorie terms), but it is important to understand how
what the term calorie represents when it is used in this way. A kilocalorie is the amount of
energy needed to raise 1 kilogram of water 1 degree Celsius. A food’s kilocalories are
determined by putting the food into a bomb calorimeter and determining the energy output
(energy = heat produced). The first link below is to an image of a bomb calorimeter and the
second link is to a video showing how one is used.
Web Links
Bomb Calorimeter
Video: Bomb Calorimetry (2:19)
Among the nutrients, the amount of kilocalories per gram that each provide are shown below.
Energy (kcal/g) No Energy
Carbohydrates (4) Vitamins
Proteins (4) Minerals
Lipids (9) Water
As can be seen, only carbohydrates, proteins, and lipids provide energy. However, there is
another energy source in the diet that is not a nutrient…...alcohol. Just to re-emphasize,
alcohol is NOT a nutrient! But it does provide energy.
Below is a list of energy sources in the diet from lowest calories per gram to the highest calories
per gram. Knowing these numbers allows a person to calculate/estimate the amount of calories
the food contains if you know the grams of the different energy sources.
Energy Sources (kcal/g)
Carbohydrates 4
Protein 4
Alcohol 7
Lipids 9
Links Bomb Calorimeter - https://www.learner.org/courses/chemistry/text/text.html?dis=U&num=Ym5WdElUQS9PQ289&sec=YzJWaklUQS9OeW89
Brian Lindshield
3

Bomb Calorimetry - http://www.youtube.com/watch?v=ohyA9amFfsc
Kansas State University Human Nutrition Textbook
4

1.12 Phytochemicals, Zoochemicals & Functional Foods
Beyond macronutrients and micronutrients, there is a lot of interest in non-nutritive
compounds found in foods that may be either beneficial or detrimental to health.
Phytochemicals
Phytochemicals are compounds in plants (phyto) that are believed to provide healthy benefits
beyond the traditional nutrients. One example is lycopene in tomatoes, which is thought to
potentially decrease the risk of some cancers (in particular prostate cancer). Diets rich in fruits
and vegetables have been associated with decreased risk of chronic diseases. Many fruits and
vegetables are rich in phytochemicals, leading some to hypothesize that phytochemicals are
responsible for the decreased risk of chronic diseases. The role that phytochemicals play in
health is still in the early stages of research, relative to other areas of nutrition such as
micronutrients. The following link contain good information on phytonutrients if you are
interested in learning more about them.
Web Link
Linus Pauling Institute: Phytochemicals
Zoochemicals
Zoochemicals are the animal equivalent of phytochemicals in plants. They are compounds in
animals that are believed to provide health benefits beyond the traditional nutrients that food
contains. Hopefully the name is pretty easy to remember because you can find animals at a zoo.
Some compounds can be both phytochemicals and zoochemicals. An example of compounds
that can be classified as both are the yellow carotenoids lutein and zeaxanthin. Kale, spinach,
and corn contain phytochemicals and are good sources of lutein and zeaxanthin. Whereas egg
yolks contain zoochemicals and are also a good source of these carotenoids.
Functional Foods
There are a number of definitions of functional foods. Functional foods are generally
understood to be a food, or a food ingredient, that may provide a health benefit beyond the
traditional nutrients (macronutrients and micronutrients) it contains . Functional foods are
often a rich source of a phytochemical or zoochemical, or contain more of a certain nutrient
than a normal food.
Brian Lindshield
5

Links Linus Pauling Institute: Phytochemicals - http://lpi.oregonstate.edu/infocenter/phytochemicals.html
Kansas State University Human Nutrition Textbook
6

1.13 The Scientific Method
The basis of what we know about nutrition is derived from research and the scientific method
underlies how research is conducted. The following figure shows the steps in the scientific
method.
Figure 1.131 The scientific method
Steps in the Scientific Method
1. The first step is to come up with a scientific or research question that you are interested in
investigating.
2. Based on your research question, a hypothesis or an educated guess is formulated.
3. The next step is to design and conduct the experiment. A good design should take into
account what has been done previously. Thus, a thorough review of methods and results
published previously should be undertaken. This will help prevent making the same mistakes
and save a lot of time conducting the research.
4. Perform the experiment/research and collect results and draw conclusions.
Brian Lindshield
7

5. If the hypothesis is not supported, then a new hypothesis/research question should be
created and a new experiment be conducted.
6. Ultimately, researchers hope to publish their research in peer-reviewed journals.
No References
Kansas State University Human Nutrition Textbook
8

1.2 Epidemiology
Epidemiology is defined as the study of human populations. These studies often investigate the
relationship between dietary consumption and disease development. There are three main
types of epidemiological studies: cross-sectional, case-control, and prospective cohort studies.
Figure 1.21 Types of epidemiology1
1. Cross-Sectional Studies
Cross-sectional studies compare different populations at the same point in time. It is as if you
take a snapshot of the two different populations to compare them to one another. An example
of a cross-sectional study led to a phenomenon known as the "French Paradox." Cholesterol
and saturated fat intake were associated with increased risk of coronary heart disease across a
wide variety of countries. However, within the study they noticed a surprising result. European
countries with very similar cholesterol-saturated fat intakes had hugely different death rates
from coronary heart disease deaths, as shown below.
Brian Lindshield
9

Figure 1.22 An example of a cross-sectional study, "The "French Paradox". The x-axis shows four
different European countries with similar cholesterol-saturated fat intakes 2 (the numbers
shown within the bars), and the y-axis represents coronary heart disease rate.
The French had a 5-fold lower risk of dying from coronary heart disease than the Finns, despite
having similar cholesterol-saturated fat intakes2. A paradox means something contradictory,
which this finding seemed to be. The "French Paradox" has led to research on red wine, and
one of its active components, resveratrol, because the French consume a lot of this alcoholic
beverage. Cross-sectional studies are considered the weakest type of epidemiology because
they are based only on group outcomes. This may lead people to believe that members of the
group have characteristics, which as individuals they do not. This is known as ecologic (another
name that is used to refer to this type of study) fallacy, and is a limitation of cross-sectional
studies3.
2. Case-Control Studies
Case-control studies look at a group of cases (e.g. people with a disease) vs. controls (e.g.
people without the disease). Most case-control studies are retrospective (looking back in time,
or looking at the past). These studies try to determine if there were differences in the diets of
the cases compared to controls in the past. Cases and controls are matched on characteristics
such as age, sex, BMI, history of disease, and many others. This means researchers try to
choose a control that has similar characteristics to the case. The researchers then compare the
exposure levels between the cases and controls, as shown below. In this example a greater
proportion of diseased (cases) individuals than disease-free individuals (controls) were exposed
to something.
Figure 1.23 An example of a case-control study in which the diseased were more likely to have
been exposed than those who were disease-free. Cases are represented by the red box on the
Kansas State University Human Nutrition Textbook
10

left, and the controls are the green box on the right3.
Using trans-fat intake as the exposure, and cardiovascular disease as the disease, the figure
would be expected to look like this:
Figure 1.24 An example of a case-control study that indicates that more cases had high trans-fat
intake compared to the controls
To determine people's intakes of foods and food components, food frequency questionnaires
are commonly used. As the name suggests, a food frequency questionnaire is a series of
questions that determines how frequently you consume a certain food. An example of a
question on a food frequency questionnaire is shown below:
"Over the past 12 months, how often did you drink milk?"
Never
1 time/month less 1 time/day
2-3 times/month 2-3 times/day
1-2 times/week 4-5 times/day
3-4 times/week 6 or more times/day
5-6 times/week
An example of a food frequency questionnaire is shown in the link below.
Web Link
NHANES Food Frequency Questionnaire
Brian Lindshield
11

3. Prospective Cohort Studies
A cohort is "a group of subjects." Most cohort studies are prospective. Initial information is
collected (usually by food frequency questionnaires) on the intake of a cohort of people at
baseline, or the beginning. This cohort is then followed over time (normally many years) to
quantify health outcomes of the individual within it. Cohort studies are normally considered to
be more robust than case-control studies, because these studies do not start with diseased
people and normally do not require people to remember their dietary habits in the distant past
or before they developed a disease. An example of a prospective cohort study would be if you
filled out a questionnaire on your current dietary habits and are then followed into the future
to see if you develop osteoporosis. As shown below, instead of separating based on disease
versus disease-free, individuals are separated based on exposure. In this example, those who
are exposed are more likely to be diseased than those who were not exposed.
Figure 1.25 An example of cohort study in which those exposed are more likely to develop the
disease3
Using trans-fat intake again as the exposure and cardiovascular disease as the disease, the
figure would be expected to look like this:
Kansas State University Human Nutrition Textbook
12

Figure 1.26 An example of a cohort study where higher trans-fat intake is associated with a
higher incidence of cardiovascular disease
There are several well known examples of prospective cohorts’ studies:
Framingham Heart Study
The Framingham Heart Study started in 1948 and has been following the residents of
Framingham, Massachusetts to identify risk factors for heart disease. This cohort has been very
fruitful in finding a number of important factors associated with coronary heart disease. In
2002, a third generation of participants was enrolled to be followed. The following links show
more about the Framingham Heart Study.
Web Links
Framingham Heart Study History
Framingham Heart Study Research Milestones
Nurses Health Study
The Nurses’ Health Study started in 1976 and enrolled 122,000 female nurses. Every 4 years
they received a food frequency questionnaire to assess their dietary habits.
Web Link
The Nurses’ Health Study
Health Professionals Follow-Up Study
The Health Professionals Follow-Up Study started in 1986 and enrolled 51,529 male health
professionals (dentists, pharmacists, optometrists, osteopathic physicians, podiatrists, and
Brian Lindshield
13
veterinarians). Every 4 years they received a food frequency questionnaire to assess their
dietary habits.
Web Link
Health Professionals Follow-up Study
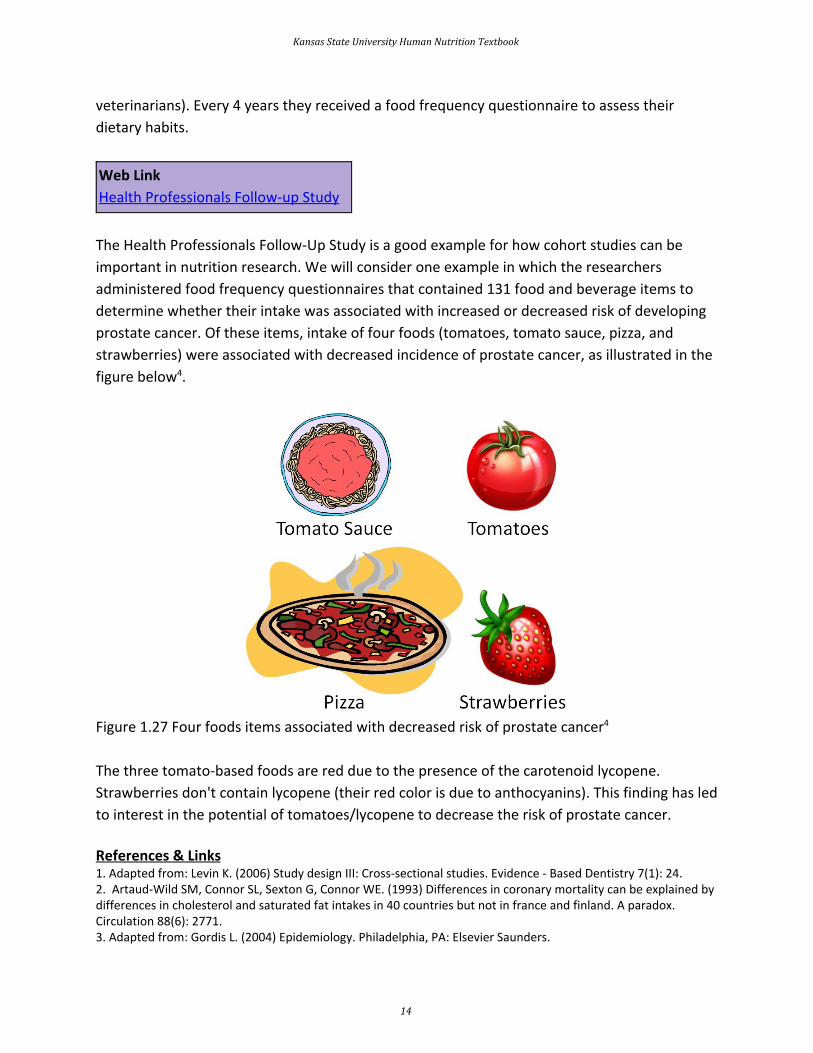
The Health Professionals Follow-Up Study is a good example for how cohort studies can be
important in nutrition research. We will consider one example in which the researchers
administered food frequency questionnaires that contained 131 food and beverage items to
determine whether their intake was associated with increased or decreased risk of developing
prostate cancer. Of these items, intake of four foods (tomatoes, tomato sauce, pizza, and
strawberries) were associated with decreased incidence of prostate cancer, as illustrated in the
figure below 4.
Figure 1.27 Four foods items associated with decreased risk of prostate cancer 4
The three tomato-based foods are red due to the presence of the carotenoid lycopene.
Strawberries don't contain lycopene (their red color is due to anthocyanins). This finding has led
to interest in the potential of tomatoes/lycopene to decrease the risk of prostate cancer.
References & Links 1. Adapted from: Levin K. (2006) Study design III: Cross-sectional studies. Evidence - Based Dentistry 7(1): 24. 2. Artaud-Wild SM, Connor SL, Sexton G, Connor WE. (1993) Differences in coronary mortality can be explained by differences in cholesterol and saturated fat intakes in 40 countries but not in france and finland. A paradox. Circulation 88(6): 2771. 3. Adapted from: Gordis L. (2004) Epidemiology. Philadelphia, PA: Elsevier Saunders.
Kansas State University Human Nutrition Textbook
14

4. Giovannucci E, Ascherio A, Rimm EB, Stampfer MJ, Colditz GA, et al. (1995) Intake of carotenoids and retinol in relation to risk of prostate cancer. J Natl Cancer Inst 87(23):1767-1776.
Links NHANES Food Frequency Questionnaire - http://appliedresearch.cancer.gov/diet/usualintakes/ffq.html Framingham Heart Study History - http://www.framinghamheartstudy.org/about-fhs/history.php Framingham Heart Study Research Milestones - http://www.framinghamheartstudy.org/about-fhs/research-milestones.php The Nurses Health Study - http://www.channing.harvard.edu/nhs/?page_id=70 Health Professionals Follow-Up Study - http://www.hsph.harvard.edu/hpfs/
Brian Lindshield
15

1.3 In Vitro & Animal Studies
The simplest form of nutrition research is an in vitro study. In vitro means "within glass", so
these methods are performed within flasks, dishes, plates, and test tubes, although most of
these are no longer glass (mostly plastic now). These studies are performed outside of a living
organism, so the results need to be interpreted with this fact in mind.
One common form of in vitro research is cell culture. This involves growing cells in flasks and
dishes. In order for cells to grow they need a nutrient source. For cell culture the nutrient
source is referred to as media. Media supplies nutrients to the cells in vitro similarly to how
blood performs this function within the body. Most cells adhere to the bottom of the flask and
are so small that a microscope is needed to see them.
Cells are only handled inside a biosafety cabinet (aka cell culture hood). The hood is sterile and
protects the cells from the outside environment. The cells need to be protected because they
do not have human skin as a barrier to keep microorganisms, etc., from contaminating them.
Figure 1.32 Flask containing media and cells (left); biosafety cabinet (cell culture hood, right)
Cells are grown inside an incubator, which is a device that provides the optimal temperature,
humidity, and carbon dioxide (CO 2) concentrations for cells and microorganisms. By imitating
the body's temperature and CO2 levels (37 degrees Celsius, 5% CO2), the incubator allows cells
to grow even though they are outside the body.
A limitation of in vitro research compared to in vivo research is that it typically does not take
into digestion or bioavailability into account. This means that the concentration used might not
be physiologically possible (it might be much higher) and that digestion and metabolism of
what is being provided to cells may not be taken into account. Cell-based in vitro research is not
as complex of a biological system as animals or people that have tissues, organs, etc. working
Kansas State University Human Nutrition Textbook
16

together as well.
Figure 1.33 Outside and inside of an incubator
Animal Studies
Animal studies are one form of in vivo research, which translates to "within the living". Rats and
mice are the most common animals used in nutrition research.
Why do animal research?
Animals can be used in research that would be unethical to conduct in humans. Researchers
can make sure that a certain regimen is safe before it is researched in humans. One advantage
of animal dietary studies is that researchers can control exactly what the animals eat. In human
studies, researchers can tell subjects what to eat and provide them with the food, but that does
not necessarily mean that they are going to consume exactly what they are supposed to. Also
people are not great at estimating, recording, or reporting how much or what they eat/ate.
Animal studies are also, normally, far less expensive than human studies.
There are some important factors to keep in mind when interpreting animal research. First, an
animal’s metabolism and physiology is different than humans. As a result, animals' absorption
and bioavailability of compounds can differ from humans. Furthermore, animal models of
disease (cancer, cardiovascular disease, etc.), although similar, are different from the human
disease. So these factors have to be considered when interpreting results from this type of
research. Nevertheless, animal studies have been, and continue to be, important for nutrition
research.
No References
Brian Lindshield
17

1.4 Human Intervention Studies/Clinical Trials
There are a variety of human intervention study designs in nutrition research, but the most
common, especially in pharmaceutical/medical research, is the clinical trial. A clinical trial is a
scientifically controlled study using consenting people to find the safety and effectiveness of
different items/regimens. Clinical trials are the "gold standard" research method. Their findings
carry the most weight when making decisions about a certain research area because they are
the most rigorous scientific studies. Every pharmaceutical must go through a series of clinical
trials before being approved for the market by the FDA (specifically the randomized,
double-blind, placebo-controlled experiments). As shown in the figure below, human
intervention studies/clinical trials are normally prospective. By the end of this section you
should have an understanding of what randomized, double-blind, and placebo-controlled
means.
Figure 1.41 Clinical trials are prospective1
Placebo and The Placebo Effect
A placebo is a fake pill or treatment that serves as a comparison to an active treatment. Some example placebo pills are shown below.
Kansas State University Human Nutrition Textbook
18

Figure 1.42 Placebo pills2
The use of a placebo is necessary in medical research because of a phenomenon known as the
"placebo effect". The placebo effect results from a subject's belief in a treatment, even though
there is actually no treatment being administered. An example would be an athlete who
consumes a sports drink and runs the 100 meter dash in 11.00 seconds. The athlete then, under
the exact same conditions, drinks what he is told is "Super Duper Sports Drink" and runs the
100 meter dash in 10.50 seconds. But what the athlete didn't know was that Super Duper
Sports Drink was the Sports Drink + Food Coloring. There was nothing different between the
drinks, but the athlete believed that the "Super Duper Sports Drink" was going to help him run
faster, so he did. This improvement is due to the placebo effect.
Figure 1.43 Placebo effect example
Ironically, a study similar to the example given above has been conducted and its results
support that there is a “placebo effect.”
Web Link
A Placebo Can Make You Run Faster
Brian Lindshield
19

Randomization
Randomization is the process of randomly assigning subjects to groups to decrease bias. Bias,
according to the Merriam-Webster dictionary, is "a systematic error introduced into sampling
or testing by selecting or encouraging one outcome or answer over others3". Bias can occur in
assigning subjects to groups in a way that will influence the results. An example of bias in a
study of an antidepressant drug is shown below. In this nonrandomized antidepressant drug
example, researchers (who know what the subjects are receiving) put depressed subjects into
the placebo group, while "less depressed" subjects are put into the antidepressant drug group.
As a result, even if the drug isn't effective, the group assignment may make the drug appear
effective, thus biasing the results as shown below.
Figure 1.44 Non-randomized antidepressant drug example
This is a bit of an extreme example, but even if the researchers are trying to prevent bias,
sometimes bias can still occur. However, if the subjects are randomized, the sick and the
healthy people will ideally be equally distributed between the groups. Thus, the trial will be
unbiased and a true test of whether or not the drug is effective.
Kansas State University Human Nutrition Textbook
20

Figure 1.45 Randomized antidepressant drug example
Blinding
Blinding is a technique to prevent bias in human intervention studies. A study without blinding
is referred to as "open label" because both the subject and the researchers know what
treatment the subject is receiving (i.e. placebo or drug). This can lead to bias, so these types of
trials are used less frequently.
Figure 1.46 In an open-label study, both the subject and researcher know what treatment the
subject is receiving.
In a single-blind study, the researcher knows what treatment the subject is receiving, but the
subject does not. If the subjects are randomized, these types of trials should produce robust
results, but it is still possible that the researcher can bias the results.
Brian Lindshield
21

Figure 1.47 In a single-blind study, the researcher knows what treatment the subject is
receiving, but the subject does not.
Finally there is the double-blind study, where neither the researcher nor the subject know what
treatment the subject is receiving. A separate board reviews the collected results and decides
the fate of the trial. This is the "gold standard" because it prevents observer bias from
occurring.
Figure 1.48 In a double-blind study, neither the subject nor the researcher know what
treatment the subject is receiving.
The following video does a nice job explaining and illustrating how double-blind randomized
trials are performed.
Kansas State University Human Nutrition Textbook
22

Web Link
Video: Double-blind clinical trial (1:40)*
*The above video does not contain captioning, and is posted in a way that we cannot add it to
it. Below is the transcript for what is said in the video.
To conduct a randomized controlled trial a statistician will select a sample size large enough to produce a
significant result.
Care must be taken that test subjects are properly representative of the target population and not
tainted by selection biases that might skew the results.
The subjects are blinded knowing as little as possible about what is being tested.
They are randomly and blindly assigned to one of several groups.
There may be a group that will receive the treatment being studied, a group receiving an established
treatment and always at least one control group receiving a control or placebo treatment.
Test administrators are also blinded.
This is called double blinding.
Such as that they don’t know what group each subject is assigned to and whenever possible they don’t
know what the treatment is they are administering.
Everything is coded to avoid experimenter bias and to cancel out any effects like patients trying to
respond the way experimenters want them to.
The trial lasts long enough to satisfy the statisticians and the scientist.
Finally, when the results are tabulated by a blinded statistician, this is called triple blinding.
We get the results.
The cloaks of anonymity are whisked aside and we finally learn with statistical certainty which
treatments are effective and which are not.
When this process shows significant benefits for a new treatment and the trial can be repeated by other
experimenters and yields similar results, then and only then do scientist say that this is a product that
works and is supported by evidence.
References & Links 1. Adapted from: Levin K. (2006) Study design III: Cross-sectional studies. Evidence - Based Dentistry 7(1): 24. 2. http://en.wikipedia.org/wiki/File:Cebocap.jpg 3. http://www.merriam-webster.com/dictionary/bias
Link A placebo can make you run faster - http://well.blogs.nytimes.com/2015/10/14/a-placebo-can-make-you-run-faster/
Video How double-blind randomized controlled trials are done - http://www.dailymotion.com/video/x12igoz_double-blind-clinical-trials_news
Brian Lindshield
23

1.5 Nutrition Research Statistics
One important aspect in being able to interpret research is to have a basic understanding of
statistical significance. Statistical significance means that there is sufficient statistical evidence
to suggest that the results are most likely not due to chance.
Statistical significance is represented by p-values in most research. The p-value is an estimate of
whether the difference is a statistical accident or due to random chance. A p-value of less than
0.05 (commonly written p-value <0.05 or p <0.05) is used in most cases to indicate statistical
significance. This value means that 5% of the time the statistical results are accidental or not
true. Researchers accept this level of uncertainty. The figure below demonstrates how to
interpret p-values in a humorous way.
Figure 1.51 p-value interpretation1
Epidemiological research usually uses different statistics to analyze their results.
Epidemiological results are commonly reported as odds ratios (ORs), relative risks (RRs), or
hazard ratios (HRs). These values can be interpreted similarly regardless of which is used. For
example, the odds ratio represents the odds of a certain event occurring (often a disease) in
response to a certain exposure (in nutrition this is often a food or dietary compound). In a
paper it is common to see one of these measures in this form: OR = 2.0. What does this mean?
As shown below, an OR, RR, or HR of 1 means that exposure is associated with neither
Kansas State University Human Nutrition Textbook
24

increased nor decreased risk (neutral). If an OR, RR or HR is less than 1, that exposure is
associated with a decreased risk. If an OR, RR, or HR is greater than 1, that exposure is
associated with an increased risk. An OR,RR, or HR of 2 means there is twice the risk, while an
OR, RR, or HR of 0.5 means there is half the risk of the exposure versus the comparison group.
Figure 1.52 Risk in relation to exposure for OR, RR, or HR
To determine whether OR, RR, and HR are significantly different for a given exposure, most
epidemiological research uses 95% confidence intervals. Confidence intervals indicate the
estimated range that the measure is calculated to include. They go below and above the OR,
RR, and HR itself. It is a calculation of how confident the researchers are that the OR, RR, and
HR value is correct. Thus:
Large Confidence Intervals = Less Confidence in Value
Small Confidence Intervals = More Confidence in Value
Thus, 95% confidence intervals indicate that researchers are 95% confident that the true value
is within the confidence intervals. A confidence interval is normally written in parenthesis
following the OR, RR, or HR or represented as bars in a figure as shown below.
Brian Lindshield
25

Figure 1.53 Confidence Intervals for OR, RR, or HRs in text form (left) and figure form (right)
Most of the time, the OR, RR, or HR will be found in the middle of the 95% confidence interval,
but not necessarily all of the time. For instance, there could be much greater confidence that
the value is not much lower than the OR, RR, or HR, but not much confidence that the value
does not exceed the HR, RR, or HR. This could lead to confidence interval looking skewed above
the OR, RR, or HR (more confidence interval above, than below, the OR, RR, or HR).
If the 95% confidence intervals of the OR, RR, or HR does not include or overlap 1, then the
value is significant. If the 95% confidence intervals include or overlap 1, then the OR, RR, or HR
is not significant, because it is possible the the true value is 1, which is neutral, and can not be
significantly different than 1.
Figure 1.54 Confidence intervals (95%) that include 1 indicate that the value is not significantly
different. Confidence intervals above or below 1 without including it indicate that the value is
significantly different.
Kansas State University Human Nutrition Textbook
26

References
1. https://xkcd.com/1478/
Brian Lindshield
27

1.6 Publishing Research
After nutrition researchers have obtained their results, they want to disseminate them, or let
people know what they found. The primary way they do this is by publishing their results in
journals. The researchers put together a paper explaining their experiment and findings in a
journal article. An article’s primary components are normally an introduction, abstract,
methods, results, and discussion/conclusion. They submit the paper to a chosen journal and the
journal editor then selects expert researchers who will critically review the article. These
reviewers make sure that research published in journals is of good quality and of interest to
readers. In more rigorous journals the article might also need to meet a certain theme of an
issue that a journal wants to publish. This is a rigorous process that is humorously depicted by
this cartoon.
Web Link
Peer Review Process
To give you an idea of how rigorous this process is, let's consider some major nutrition journals.
Journal of Nutrition (JN)
American Journal of Clinical Nutrition (AJCN)
Journal of the Academy of Nutrition and Dietetics (formerly Journal of the American Dietetic
Association)
Nutrition Reviews
Annual Reviews of Nutrition
British Journal of Nutrition
European Journal of Clinical Nutrition
There are two major nutrition societies in the US: The American Society for Nutrition (ASN) and
the Academy of Nutrition and Dietetics (AND, formerly the American Dietetic Association). ASN
publishes the Journal of Nutrition and the American Journal of Clinical Nutrition, while AND
publishes the Journal of the Academy of Nutrition and Dietetics. If you want to see more about
the major nutrition societies, use the following links.
Web Links
American Society for Nutrition
Academy of Nutrition and Dietetics
Kansas State University Human Nutrition Textbook
28

The following table contains 2 measures, impact factor and acceptance rate for these journals.
The impact factor is a measure of influence of the journal. This measure indicates how many
people read the articles that are published in that journal. The acceptance rate is the % of
articles that are submitted that are actually accepted for publication.
Table 1.61 Selected nutrition journal impact factors and acceptance rates
Journal Impact Factor1 Acceptance Rate
Annual Reviews of Nutrition 6.8
American Journal of Clinical Nutrition 6.7 25%2
Journal of Nutrition 3.7 25%3
Advances in Nutrition 5.2
Nutrition Reviews 5.6
Journal of the Academy of Nutrition and Dietetics 3.6
British Journal of Nutrition 3.3
European Journal of Clinical Nutrition 3.9 40%4
The acceptance rate for three of these journals ranged from 25-40%. Thus, the majority of
submitted articles are rejected and sent back to the researchers. To put nutrition journals in
perspective, some of the top medical and science journals with a broad following have impact
factors as high as 75 and an acceptance rate of 5-10%.
Hopefully these numbers help you understand that peer review is a rigorous process where
peer reviewers "tear the article to pieces."
Figure 1.61 Dr. L's article after peer review
They do not physically shred the article (it is all done online), but there are often extensive
Brian Lindshield
29

revisions to make (maybe even multiple times) before the paper can be published, if you're so
lucky. Generally, the more difficult it is to get a paper accepted into a journal, the more solid
the research must be. Most of the information on the internet has not gone through peer
review and should be explored with some caution.
The following video clearly depicts the peer review process. There is also a diagram that
explains how the peer review process works.
Web Links
Video: Peer Review in 3 Minutes (3:15)
Peer Review Process Diagram
References & Links 1. ISI Web of Knowledge, http://admin-apps.webofknowledge.com/JCR/JCR, Nutrition and Dietetics, accessed 1/11/2017. 2. http://www.nutrition.org/publications/the-american-journal-of-clinical-nutrition/
3. http://www.nutrition.org/publications/the-journal-of-nutrition/
4. Seidell J, Shetty P . (2007) The baton passes on. Eur J Clin Nutr 61: 1-2.
Links Peer Review Process - http://www.eophtha.com/eophtha/Gallery/Images%20gallery/Journals/The%20process%20of%20peerreview.jpg American Society of Nutrition - http://www.nutrition.org/ Academy of Nutrition and Dietetics - http://www.eatright.org/ Diagram of the Peer Review Process - http://www.eophtha.com/eophtha/Gallery/Images%20gallery/Journals/The%20process%20of%20peerreview.jpg
Videos Peer Review in 3 Minutes - https://www.youtube.com/watch?annotation_id=annotation_2240740767&feature=iv&src_vid=twogpmM-SfY&v=rOCQZ7QnoN0
Kansas State University Human Nutrition Textbook
30

1.7 Interpreting Research
Now that you are familiar with the different forms of nutrition research, the next step is
understanding how to interpret and synthesize the information. To synthesize information on a
certain topic, the two most popular methods are meta-analyses and systematic literature
reviews. While there are differences between these two methods, they are similar overall in
that they aim to draw a conclusion from the body of research evidence rather than from one
study. We will focus on systematic literature reviews because of their rising popularity in
biomedical literature.
A systematic literature review does what the name implies, it systematically reviews the
literature related to a certain research question. For example, the research question might be,
"Does chocolate decrease blood pressure?" There is a method for performing the review
established ahead of time that details answers to questions such as:
How will journal articles be identified?
Using what databases?
What search terms will be used?
The end product is a conclusion based on the evidence in the identified journal articles. A
person in the following video compares it to reading Consumer Reviews or a consumer report
about something that you are going to buy. The Cochrane Collaboration performs many
systematic reviews; the first link is to a video about the Cochrane Collaboration, the second is a
link to the site itself.
Web Link s
Video: The Cochrane Collaboration - 1st 3 minutes (7:11)
The Cochrane Collaboration
Because they synthesize the findings from multiple trials or studies, systematic literature
reviews are considered the highest level of nutrition research evidence and are therefore
shown at the top of the strength of nutrition research pyramid below. In vitro studies are
shown at the bottom of the triangle because they are the weakest form of evidence overall. It
should be pointed out that most systematic literature reviews only consider epidemiological
studies and clinical trials and do not include animal studies or in vitro evidence. While these
studies are of less strength, they should still be considered.
Brian Lindshield
31

Figure 1.71 Strength of scientific research, a higher position on the pyramid mean greater
strength of that form of evidence.
There are a couple of other factors to consider relating to the different forms of research. First,
epidemiological studies cannot show causality (i.e. smoking causes lung cancer), but instead
identify relationships or associations (i.e. smoking is associated with lung cancer occurrence).
Clinical trials/human studies are the best form of primary research because their findings
should be directly translatable to patients. So why use other forms of research? The description
below should help explain why the other forms of research are also important.
In general, a certain sequence of studies in nutrition research is often followed as shown in the
figure below.
Kansas State University Human Nutrition Textbook
32

Figure 1.72 The progression of nutrition research. The shape indicates the selection of the most
promising and safest hypotheses being moved to the next level. Thus, there is a decrease in the
overall number of hypotheses represented by the height of the figure) being investigated by the
next form of research.
Epidemiological studies find relationships between food/food components and a specific health
outcome. This relationship is then investigated by in vitro studies and then, some of the most
promising move to animal studies. Then the most promising and safe food/food components
are moved into clinical trials/human studies. If it is an individual compound, there will be
smaller trials designed to see if the compound is safe before it is moved into larger clinical trials
to determine whether the food/food component results in beneficial health outcomes. The
overall effect of this process is to select the most promising and safe food/food components for
the clinical trials/human studies. This allows time and money to be used more efficiently,
because while clinical trials/human studies are the best form of research, they are also normally
the most expensive and time-consuming.
Researchers nevertheless have been tempted to skip directly to clinical trials in the past rather
than following the research progression. To illustrate what happens in these situations, the
following describes a couple of examples when "normal" research progression hasn't been
followed.
Beta-Carotene and Lung Cancer
In the early 1980s there was a lot of excitement among researchers over the epidemiological
Brian Lindshield
33

evidence showing that higher dietary consumption of the carotenoid, beta-carotene, decreased
lung cancer risk1. By the mid 1980’s, two large, randomized, placebo-controlled trials began to
determine whether high-dose β-carotene supplementation (far higher than dietary intake)
could decrease lung cancer incidence in high-risk populations before in vitro or animal studies
had investigated this relationship. The research community was shocked when these two
studies were terminated early in the mid 1990s because of significant increases in lung cancer
incidence among smokers receiving β-carotene supplements2,3. In vitro and animal studies
completed after the clinical trial found that as β-carotene intake shifts from normal dietary
levels to high, supplement-type levels, the effect on lung cancer development also shifts from
beneficial to detrimental in combination with smoke or carcinogen exposure 4. Thus, if the
normal research progression had been followed, it is likely that a lower dose of beta-carotene
would have been used or trials wouldn't have been undertaken at all.
Selenium, Vitamin E, and Prostate Cancer
Another example of when the research progression was not followed was the relationship
between selenium, vitamin E, and prostate cancer. Two clinical trials had found secondary
results that suggested that selenium and vitamin E supplementation may decrease prostate
cancer risk 5,6. A secondary result means it was not the primary outcome that the clinical trial
was designed to find, thus they need to be interpreted with some caution. Rather than
examining the relationship using in vitro and animal studies, a clinical trial was undertaken to
determine if selenium and vitamin E supplementation alone, or in combination, could decrease
the development of prostate cancer incidence 7. This clinical trial was also terminated early
because of a nonsignificant increase in prostate cancer in those receiving vitamin E 8, and a
nonsignificant increase in diabetes among those receiving selenium9. In vitro studies and animal
models performed since the clinical trial was undertaken and after its termination suggest that
vitamin E is not effective and that another form of selenium could have possibly been more
effective 10.
In addition to the lessons learned about the sequence of research in nutrition, these studies
add to growing evidence that suggests that single-agent interventions, even in combination,
may not be an effective strategy for improving health. The common nutrition research
approach, after epidemiology finds an association or relationship, is to use in vitro and animal
studies to identify the specific compound in a certain food that is responsible. This has been
termed the reductionist approach because it takes something complex (food) and reduces it
down to its simpler components. However, there is growing evidence that this may be a flawed
approach. Some nutrition researchers feel that more focus should be on the food itself, rather
than trying to discern exactly what is responsible for the beneficial health outcomes. Because it
may not be one or 2 compounds alone that are responsible for the effect, it might be difficult to
determine from the multitude of nutrients in foods which are responsible for the beneficial
Kansas State University Human Nutrition Textbook
34

effect. This will mean changes in the overall research approach, especially at the human
intervention studies/clinical trials level, because in most cases there is not a way to give a
“placebo food”11,12.
References & Links 1. Peto R, Doll R, Buckley JD, Sporn MB. Can dietary beta-carotene materially reduce human cancer rates? Nature 290, 201-208, 1981. 2. The effect of vitamin E and beta carotene on the incidence of lung cancer and other cancers in male smokers. the alpha-tocopherol, beta carotene cancer prevention study group. N Engl J Med. 330, 1029-1035, 1994. 3. Goodman GE, Thornquist MD, Balmes J, Cullen MR, Meyskens FL,Jr., Omenn GS, et al. The beta-carotene and retinol efficacy trial: Incidence of lung cancer and cardiovascular disease mortality during 6-year follow-up after stopping beta-carotene and retinol supplements. J Natl Cancer Inst 96, 1743-1750, 2004. 4. Lindshield BL, Erdman JW. (2006) Carotenoids. In: Bowman BA, Russell RM, editors. Present Knowledge in Nutrition. Washington, D.C.: International Life Sciences Institute. pp. 184-197. 5. Clark LC, Dalkin B, Krongrad A, Combs GF,Jr., Turnbull BW, Slate EH, et al. Decreased incidence of prostate cancer with selenium supplementation: Results of a double-blind cancer prevention trial. Br J Urol 81, 730-734, 1998. 6. Heinonen OP, Albanes D, Virtamo J, Taylor PR, Huttunen JK, Hartman AM, et al. Prostate cancer and supplementation with alpha-tocopherol and beta-carotene: Incidence and mortality in a controlled trial. J Natl Cancer Inst 90, 440-446, 1998. 7. Lippman SM, Goodman PJ, Klein EA, Parnes HL, Thompson IM,Jr., Kristal AR, et al. Designing the selenium and vitamin E cancer prevention trial (SELECT). J Natl Cancer Inst 97, 94-102, 2005. 8. Klein EA, Thompson IM, Tangen CM, Crowley JJ, Lucia MS, Goodman PH, Minasian LM, Ford LG, Parnes HL, Gaziano JM, Karp DD, Lieber MM, Walther PJ, Klotz L, Parsons JK, Chin JL, Darke AK, Lippman SM, Goodman GE, Meysken FL, Baker LH. Vitamin E and the Risk of Prostate Cancer: The Selenium and Vitamin E Cancer Prevention Trial (SELECT). JAMA 306, 1549-1556, 2011. 9. Lippman SM, Klein EA, Goodman PJ, Lucia MS, Thompson IM, Ford LG, et al. Effect of selenium and vitamin E on risk of prostate cancer and other cancers: The selenium and vitamin E cancer prevention trial (SELECT). JAMA 301, 39-51, 2009. 10. Lindshield BL, Ford NA, Canene-Adams K., Diamond AM, Wallig MA, Erdman JW Jr. Selenium, but not lycopene or vitamin E, decreases growth of transplantable Dunning R3327-H rat prostate tumors. PLoS One. 2010. 10. Gann PH, Khachik F. Tomatoes or lycopene versus prostate cancer: Is evolution anti-reductionist? J Natl Cancer Inst 95, 1563-1565, 2003. 11. Gann PH. Randomized trials of antioxidant supplementation for cancer prevention: First bias, now chance--next, cause. JAMA 301, 102-103, 2009.
Links Video: The Cochrane Collaboration - http://www.youtube.com/watch?v=AhtchOL1ofc The Cochrane Colaboration - http://www.cochrane.org/
Brian Lindshield
35

2 Energy-Yielding Macronutrients
As you have learned, there are three energy-yielding macronutrients: carbohydrates, proteins,
and lipids. This chapter goes more in depth about these major dietary components.
Sections:
2.1 Carbohydrates
2.2 Proteins
2.3 Lipids
Kansas State University Human Nutrition Textbook
36

2.1 Carbohydrates
Carbohydrates have become surprisingly divisive. Some people swear by them, others swear
against them. But it is important to understand that carbohydrates are a diverse group of
compounds that have a multitude of effects in the body. Thus, trying to make blanket
statements about carbohydrates is probably not a good idea.
Carbohydrates are named because they are hydrated (as in water, H 2O) carbon. Below is the
formula showing how carbon dioxide (CO2) and water (H2O) are used to make carbohydrates
(CH2O)n and oxygen (O2). The “n” after the carbohydrate in the formula indicates that the
chemical formula is repeated an unknown number of times, but that for every carbon and
oxygen, there will always be two hydrogens.
CO2 + H2O --> (CH2O)n + O2
Carbohydrates are produced by plants through a process known as photosynthesis. In this
process, plants use the energy from photons of light to synthesize carbohydrates. The formula
for this reaction looks like this:
6CO2 + 6H2O + Light --> C6H12O6 + 6O2
There are many different types of carbohydrates as shown in the figure below. The first way
that carbohydrates can be divided is into simple, complex, and sugar alcohols. As the names
imply, complex carbohydrates contain more sugar units, while simple carbohydrates contain
either 1 or 2 sugars. In the next sections, you will learn more about the different forms of
carbohydrates.
Brian Lindshield
37
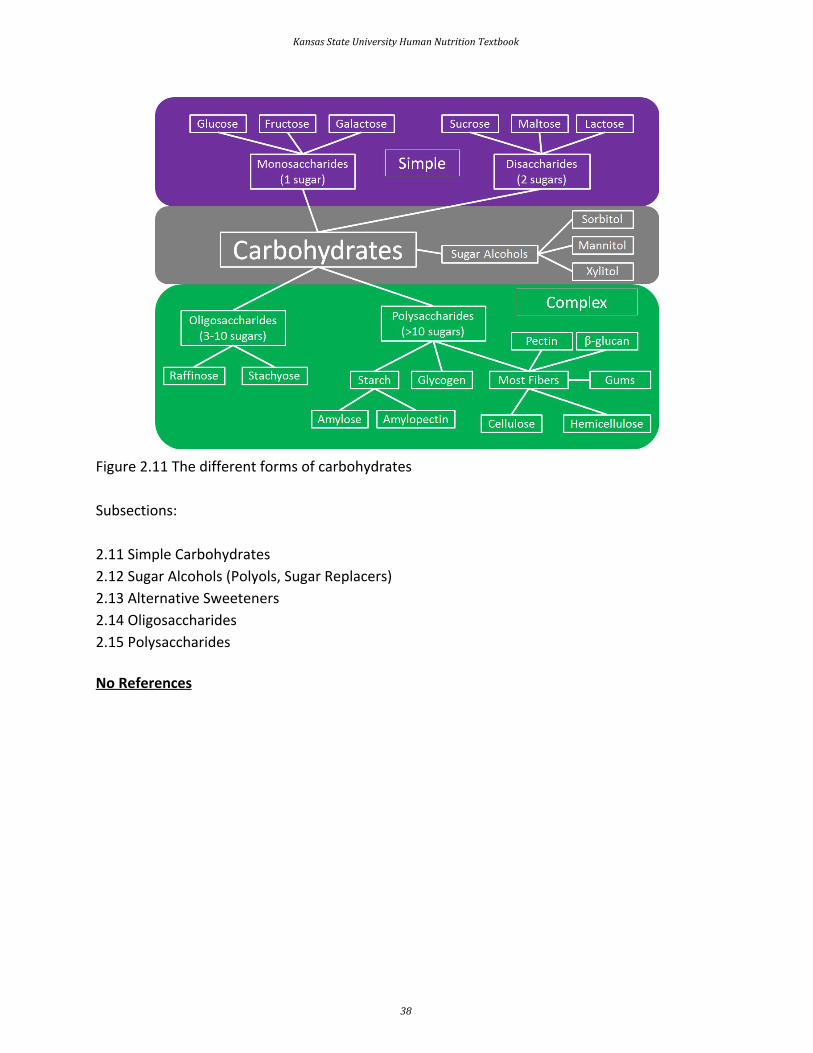
Figure 2.11 The different forms of carbohydrates
Subsections:
2.11 Simple Carbohydrates
2.12 Sugar Alcohols (Polyols, Sugar Replacers)
2.13 Alternative Sweeteners
2.14 Oligosaccharides
2.15 Polysaccharides
No References
Kansas State University Human Nutrition Textbook
38

2.11 Simple Carbohydrates
As shown in the figure below, simple carbohydrates can be further divided into
monosaccharides and disaccharides. Mono- means one, thus monosaccharides contain one
sugar. Di- means two, thus disaccharides contain 2 sugar units.
Figure 2.111 Overview of Carbohydrates
Monosaccharides
The 3 monosaccharides are: glucose, fructose and galactose. Notice that all are 6-carbon sugars
(hexoses). However, fructose has a five member ring, while glucose and galactose have 6
member rings. Also notice that the only structural difference between glucose and galactose is
the position of the alcohol (OH) group that is shown in red.
Brian Lindshield
39

Figure 2.112 The 3 monosaccharides
Glucose - Product of photosynthesis, major source of energy in our bodies
Fructose - Commonly found in fruits and used commercially in many beverages
Galactose - Not normally found in nature alone, normally found in the disaccharide lactose
Web Link
Not familiar with ring structures, see how glucose forms a ring
Disaccharides
Disaccharides are produced from 2 monosaccharides. The commonly occurring disaccharides
are:
Maltose (glucose + glucose, aka malt sugar) - seldom found in foods, present in alcoholic
beverages and barley
Sucrose (glucose + fructose, aka table sugar) - only made by plants.
Lactose (galactose + glucose, aka milk sugar) - primary milk sugar
The different disaccharides and the monosaccharides components are illustrated below.
Kansas State University Human Nutrition Textbook
40

Figure 2.113 The 3 disaccharides
Each of these disaccharides contains glucose and all the reactions are dehydration reactions.
Also notice the difference in the bond structures. Maltose and sucrose have alpha-bonds, which
are depicted as v-shaped above. You might hear the term glycosidic used in some places to
describe bonds between sugars. A glycoside is a sugar, so glycosidic is referring to a sugar bond.
Lactose, on the other hand, contains a beta-bond. We need a special enzyme, lactase, to break
this bond, and the absence of lactase activity leads to lactose intolerance.
High-Fructose Corn Syrup
Food manufacturers are always searching for cheaper ways to produce their food. One method
that has been popular is the use of high-fructose corn syrup as an alternative to sucrose.
High-fructose corn syrup contains either 42 or 55% fructose, which is similar to sucrose 1. Nevertheless, because an increase in high-fructose corn syrup consumption (see figure below)
has coincided with the increase in obesity in the U.S., there is a lot of controversy surrounding
its use.
Brian Lindshield
41

Figure 2.114 U.S. per capita sugar and sweetener consumption 2
Opponents claim that high-fructose corn syrup is contributing to the rise in obesity rates. As a
result, some manufactures have started releasing products made with natural sugar. You can
read about this trend in the following New York Times article in the link below. Also,
manufacturers tried to rebrand high-fructose corn syrup as corn sugar to get around the
negative perception of the name. But the FDA rejected the Corn Refiners Association request to
change the name officially to corn sugar as described in the second link. The last link is a video
made by the American Chemical Society that gives some background on how HFCS is produced
and how it compares to sucrose.
Web Links
Sugar is back on labels, this time as a selling point
No new name for high-fructose corn syrup (Video): Sugar vs. High Fructose Corn Syrup - What's the Difference? (2:41)
References & Links 1. http://www.fda.gov/food/ingredientspackaginglabeling/foodadditivesingredients/ucm324856.htm 2.http://www.foodnavigator-usa.com/Markets/The-changing-American-diet-consumption-of-corn-based-sweeteners-drops
Links
Kansas State University Human Nutrition Textbook
42

Not familiar with Ring structures, see how glucose forms a ring - http://en.wikipedia.org/wiki/File:Glucose_Fisher_to_Haworth.gif Sugar is back on labels, this time as a selling point - http://www.nytimes.com/2009/03/21/dining/21sugar.html?_r=1&ref=nutrition No new name for high-fructose corn syrup - http://well.blogs.nytimes.com/2012/05/31/no-new-name-for-high-fructose-corn-syrup/?_r=0
Video Sugar vs. High Fructose Corn Syrup - What's the Difference? - https://www.youtube.com/watch?v=fXMvregmU1g
Brian Lindshield
43

2.12 Sugar Alcohols (Polyols, Sugar Replacers)
Sugar(s) can provide a lot of calories and contribute to tooth decay. Thus there are many other
compounds that are used as alternatives to sugar that have been developed or discovered. We
will first consider sugar alcohols and then the alternative sweeteners in subsequent sections.
Below you can see the structure of three common sugar alcohols: xylitol, sorbitol, and
mannitol.
Figure 2.121 Structure of three commonly used sugar alcohols: xylitol, sorbitol, and mannitol1-3
Remember that alcohol subgroups are (OH), and you can see many of them in these structures.
Sugar alcohols are also known as "sugar replacers", because some in the public might get
confused by the name sugar alcohol. Some might think a sugar alcohol is a sweet alcoholic
beverage. Another name for them is nutritive sweeteners, which indicates that they do provide
calories. Sugar alcohols are nearly as sweet as sucrose but only provide approximately half the
calories as shown below. The name polyols also seems to be increasingly used to describe these
compounds.
Table 2.121 Relative sweetness of monosaccharides, disaccharides, and sugar alcohols4,5
Sweetener Relative Sweetness Energy (kcal/g)
Lactose 0.2 4*
Maltose 0.4 4
Glucose 0.7 4
Sucrose 1.0 4
Fructose 1.2-1.8 4
Erythritol 0.7 0.4
Isomalt 0.5 2.0
Lactitol 0.4 2.0
*Differs based on a person’s lactase activity
Kansas State University Human Nutrition Textbook
44

Sugars are fermented by bacteria on the surfaces of teeth. This results in a decreased pH
(higher acidity) that leads to tooth decay and, potentially, cavity formation. The major
advantage of sugar alcohols over sugars is that sugar alcohols are not fermented by bacteria on
the tooth surface. There is a nice picture of this process in the link below as well as a video
explaining the process of tooth decay.
Web Links
Sugar and Dental Caries
Video: Tooth Decay (1:06)
While not a sugar alcohol, tagatose is very similar to sugar alcohols. Tagatose is an isomer of
fructose, that provides a small amount of energy (1.5 kcal/g). 80% of tagatose reaches the large
intestine, where it is fermented by bacteria, meaning it has a prebiotic-type effect4. Notice the
similarity in structure of tagatose to sugar alcohols, the only difference being a ketone (=O)
instead of an alcohol (OH) group.
Figure 2.122 Structure of tagatose6
References & Links 1. https://pubchem.ncbi.nlm.nih.gov/compound/xylitol#section=Top 2. https://pubchem.ncbi.nlm.nih.gov/compound/D-Sorbitol#section=Top 3. https://pubchem.ncbi.nlm.nih.gov/compound/D-mannitol#section=Top 4. Wardlaw GM, Hampl J. (2006) Perspectives in nutrition. New York, NY: McGraw-Hill. 5. Whitney E, Rolfes SR. (2008) Understanding nutrition. Belmont, CA: Thomson Wadsworth. 6. http://en.wikipedia.org/wiki/File:Tagatose.png
Link Sugar and Dental Caries - http://www.asu.edu/courses/css335/caries.htm
Video Tooth Decay - http://www.youtube.com/watch?v=_oIlv59bTL4
Brian Lindshield
45

2.13 Alternative Sweeteners
Alternative sweeteners are simply alternatives to sucrose and other mono- and disaccharides
that provide sweetness. Many have been developed to provide zero-calorie or low calorie
sweetening for foods and drinks.
Because many of these provide little to no calories, these sweeteners are also referred to as
non-nutritive sweeteners (FDA is using high-intensity sweeteners to describe these products3). Aside from tagatose (described in sugar alcohol section), all of the sweeteners on the list below
meet this criteria. Aspartame does provide calories, but because it is far sweeter than sugar,
the small amount used does not contribute meaningful calories to a person's diet. Until the FDA
allowed the use of stevia, this collection of sweeteners were commonly referred to as artificial
sweeteners because they were synthetically or artificially produced. However, with stevia, the
descriptor artificial can no longer be used to describe these sweeteners. More recently, Luo
Han Guo Fruit extracts have also been allowed to be used as another high-intensity sweetener
that is not synthesized or artificially produced. The table in the link below summarizes the
characteristics of the FDA approved high-intensity sweeteners.
Web Link
FDA High-Intensity Sweeteners
Saccharin
Saccharin is the oldest of the artificial sweeteners. However, it should be noted that both sweet
and bitter taste receptors are triggered by it, so for some people it has an aftertaste that is
offputting 4,5. It has been found that this bitter or metallic flavor can sometimes be masked by
mixing alternative sweeteners 6.
Figure 2.131 Structure of saccharin 7
Kansas State University Human Nutrition Textbook
46

Aspartame
Aspartame is made up of 2 amino acids (phenylalanine and aspartate) and a methyl (CH 3) group. The compound is broken down during digestion into the individual amino acids. This is
why it provides 4 kcal/g, just like protein4. However, it is still considered noncaloric because it is
so sweet that we use very small amounts that don’t provide any meaningful caloric value.
Because it can be broken down to phenylalanine, products that contain aspartame contain the
following message: "Phenylketonurics: Contains phenylalanine." Phenylketonuria (PKU) will be
covered in greater detail in section 2.25. When heated, aspartame breaks down and loses its
sweet flavor 1.
Figure 2.132 Structure of aspartame8
Neotame
Neotame is like aspartame version 2.0. Neotame is structurally identical to aspartame except
that it contains an additional side group (bottom of figure below, which is flipped backwards to
make it easier to compare their structures). While this looks like a minor difference, it has
profound effects on the properties of neotame. Neotame is much sweeter than aspartame and
is heat-stable. It can still be broken down to phenylalanine, but such small amounts are used
that it is not a concern for those with PKU1,4.
Brian Lindshield
47

Figure 2.133 Structure of neotame9
Advantame
The newest, sweetest alternative sweetener approved by the FDA in 2014 is advantame. It is
heat-stable and does not have a trade name yet 3. Notice it also has a similar structure to
aspartame and neotame. Like Neotame it can broken down to phenylalanine, but such small
amounts are used that it is not a concern for those with PKU. However, it has a much higher
acceptable daily intake than Neotame 4, meaning there is less concern about adverse effects
from consuming too much.
Figure 2.134 Structure of advantame 10
Acesulfame-Potassium (K)
Kansas State University Human Nutrition Textbook
48

Acesulfame-potassium (K) is not digested or absorbed, therefore it provides no energy or
potassium to the body1. It is a heat-stable alternative sweetener.
Figure 2.135 Structure of acesulfame-potassium (K)11
Sucralose
Sucralose is structurally identical to sucrose except that 3 of the alcohol groups (OH) are
replaced by chlorine molecules (Cl). This small change causes sucralose to not be digested and
as such is excreted in feces 1,4. It is a heat-stable alternative sweetener.
Figure 2.136 Structure of sucralose12
Stevia
Stevia is derived from a South American shrub, with the leaves being the sweet part. The
components responsible for this sweet taste are a group of compounds known as steviol
glycosides. The structure of steviol is shown below.
Brian Lindshield
49

Figure 2.137 Structure of steviol13
The term glycoside means that there are sugar molecules bonded to steviol. The two
predominant steviol glycosides are stevioside and rebaudioside A. The structure of these two
steviol glycosides are very similar14. The structure of stevioside is shown below as an example.
Figure 2.138 Structure of stevioside15
The common name for a sweetener containing primarily rebaudioside A is rebiana. Stevia
sweeteners had been marketed as a natural alternative sweeteners, something that has been
stopped by lawsuits as described in the following link.
Web Link
What is natural and who decides?
Stevia is a heat-stable alternative sweetener.
Luo Han Guo Fruit Extracts
Luo Han Guo (aka Siraitia grosvenrii Swingle, monk) fruit extracts are a newer, natural
heat-stable alternative sweetener option derived from a native Chinese fruit. These extracts are
sweet because of the mogrosides that they contain 3. The structure of a mogroside is shown
below.
Kansas State University Human Nutrition Textbook
50

Figure 2.139 Structure of a mogroside 16
References & Links 1. Whitney E, Rolfes SR. (2008) Understanding nutrition. Belmont, CA: Thomson Wadsworth. 2. http://www.fda.gov/AboutFDA/Transparency/Basics/ucm214865.htm 3. http://www.fda.gov/food/ingredientspackaginglabeling/foodadditivesingredients/ucm397725.htm 4. Byrd-Bredbenner C, Moe G, Beshgetoor D, Berning J. (2009) Wardlaw's perspectives in nutrition. New York, NY: McGraw-Hill. 5. Fernstrom JD, Munger SD, Sclafani A, de Araujo IE, Roberts A, Molinary S (2012) Mechanisms for Sweetness. J Nutr 142 (6) 1134S–1141S. 6. Behrens M, Blank K, Meyerhof W. (2017) Blends of Non-caloric Sweeteners Saccharin and Cyclamate Show Reduced Off-Taste due to TAS2R Bitter Receptor Inhibition. Cell Chem Biol 24 (10) 1199-1204. 7.https://en.wikipedia.org/wiki/Saccharin#/media/File:Saccharin.svg 8. http://en.wikipedia.org/wiki/Aspartame 9. http://en.wikipedia.org/wiki/File:Neotame.png 10. http://en.wikipedia.org/wiki/File:Advantame.svg 11. http://en.wikipedia.org/wiki/File:AcesulfameK.svg 12. http://en.wikipedia.org/wiki/File:Sucralose2.svg 13. http://en.wikipedia.org/wiki/File:Steviol.svg 14. Carakostas MC, Curry LL, Boileau AC, Brusick DJ. (2008) Overview: The history, technical function and safety of rebaudioside A, a naturally occurring steviol glycoside, for use in food and beverages. Food and Chemical Toxicology 46 Suppl 7: S1. 15. http://en.wikipedia.org/wiki/File:Steviosid.svg 16. http://en.wikipedia.org/wiki/File:Mogroside_II_E.gif
Links FDA High-Intensity sweeteners - http://www.fda.gov/food/ingredientspackaginglabeling/foodadditivesingredients/ucm397725.htm What is natural and who decides? - http://www.nutraingredients-usa.com/Markets/Pure-Via-to-settle-class-action-suit-over-natural-claims
Brian Lindshield
51

2.14 Oligosaccharides
Within complex carbohydrates, there are oligosaccharides and polysaccharides.
Oligosaccharides (oligo means few) are composed of 3-10 sugar units and polysaccharides
contain greater than 10 sugar units.
Figure 2.141 Overview of carbohydrates
Raffinose and stachyose are the most common oligosaccharides. They are found in legumes,
onions, broccoli, cabbage, and whole wheat1. The link below shows the raffinose and stachyose
content of some plant foods.
Web Link
Raffinose and stachyose content of selected plant foods
Kansas State University Human Nutrition Textbook
52

The structures of the two oligosaccharides are shown below.
Figure 2.142 Structure of raffinose2
Figure 2.143 Structure of stachyose 3
Our digestive system lacks the enzymes necessary to digest these alpha 1-6 glycosidic bonds
found in oligosaccharides. As a result, the oligosaccharides are not digested and reach the colon
where they are fermented by the bacteria there. Gas is produced as a byproduct of this bacteria
fermentation that can lead to flatulence. To combat this problem, Beano® is a popular product
that contains an enzyme (alpha-galactosidase) to break down oligosaccharides, thereby
preventing them from being used to produce gas.
References & Links 1. Byrd-Bredbenner C, Moe G, Beshgetoor D, Berning J. (2009) Wardlaw's perspectives in nutrition. New York, NY: McGraw-Hill. 2. http://en.wikipedia.org/wiki/File:Raffinose.png 3. http://en.wikipedia.org/wiki/File:Stachyose.png
Videos
Brian Lindshield
53

Raffinose and stachyose content of foods - http://books.google.com/books?id=LTGFV2NOySYC&pg=PA374&lpg=PA374&dq=raffinose+and+stachyose+content+of+vegetables&source=bl&ots=X4Dr7jWmwL&sig=CJFvhAIysSZCP2SOy_MqhfoVYQQ&hl=en&ei=TSRITdTfLNH0gAfB2MX_BQ&sa=X&oi=book_result&ct=result&resnum=6&ved=0CD0Q6AEwBQ#v=onepage&q=raffinose%20and%20stachyose%20content%20of%20vegetables&f=false Beano's University of Gas - http://beano.com.cn/university-of-gas#
Kansas State University Human Nutrition Textbook
54

2.15 Polysaccharides
Poly means "many" and thus polysaccharides are made up of many monosaccharides (>10).
There are 3 main classes of polysaccharides: starch, glycogen, and most fibers. The following
sections will describe the structural similarities and differences between the 3 classes of
polysaccharides that are divided in the figure below.
Subsections:
2.151 Starch
2.152 Glycogen
2.153 Fiber
No References
Brian Lindshield
55

2.151 Starch
Starch is the storage form of glucose in plants. There are two forms of starch: amylose and
amylopectin. Structurally they differ in that amylose is a linear polysaccharide, whereas
amylopectin is branched. The linear portion of both amylose and amylopectin contains alpha
1-4 glycosidic bonds, while the branches of amylopectin are made up of alpha 1-6 glycosidic
bonds.
Figure 2.1511 Structure of amylose
Figure 2.1512 Structure of amylopectin
Amylopectin is more common than amylose (4:1 ratio on average) in starch 1,2. Some starchy
foods include grains, root crops, tubers, and legumes.
References & Links 1. Stipanuk MH. (2006) Biochemical, physiological, & molecular aspects of human nutrition. St. Louis, MO: Saunders Elsevier. 2. Byrd-Bredbenner C, Moe G, Beshgetoor D, Berning J. (2009) Wardlaw's perspectives in nutrition. New York, NY: McGraw-Hill.
Kansas State University Human Nutrition Textbook
56

2.152 Glycogen
Glycogen is similar to starch in that it is a storage form of glucose. Glycogen, however, is the
carbohydrate storage form in animals, rather than plants. It is even more highly branched than
amylopectin, as shown below.
Figure 2.1521 Structure of glycogen
Like amylopectin, the branch points of glycogen are alpha 1-6 glycosidic bonds, while the linear
bonds are alpha 1-4 bonds, as shown below.
Brian Lindshield
57

Figure 2.1522 Structure of glycogen1
The advantage of glycogen's highly branched structure is that the multiple ends (shown in red
above) are where enzymes start to cleave off glucose molecules. As a result, with many ends
available, it can provide glucose much more quickly to the body than it could if it was a linear
molecule like amylose with only two ends. We consume almost no glycogen, because it is
rapidly broken down by enzymes in animals after slaughter 2. References & Links 1. http://en.wikipedia.org/wiki/File:Glycogen.png 2. Whitney E, Rolfes SR. (2008) Understanding nutrition. Belmont, CA: Thomson Wadsworth.
Kansas State University Human Nutrition Textbook
58

2.153 Fiber
The simplest definition of fiber is indigestible matter. Indigestible means that it survives
digestion in the small intestine and reaches the large intestine.
There are 3 major fiber classifications 1:
Dietary Fiber - nondigestible carbohydrates and lignin that are intrinsic and intact in plants
Functional Fiber - isolated, nondigestible carbohydrates that have beneficial physiological
effects in humans
Total Fiber - dietary fiber + functional fiber
The differences between dietary and functional fiber are compared in the table below:
Table 2.1531 Differences between dietary fiber and functional fiber
Dietary Fiber Functional Fiber
Intact in plants Isolated, extracted, or synthesized
Carbohydrates + lignins Only carbohydrates
Only from plants From plants or animals
No proven benefit Must prove benefit
Dietary fiber is always intact in plants, whereas functional fiber can be isolated, extracted or
synthesized. Functional fiber is only carbohydrates, while dietary fiber also includes lignins.
Functional fiber can be from plants or animals, while dietary fiber is only from plants.
Functional fiber must be proven to have a physiological benefit, while dietary fiber does not.
Polysaccharide fiber differs from other polysaccharides in that it contains beta-glycosidic bonds
(as opposed to alpha-glycosidic bonds). To illustrate these differences, consider the structural
differences between amylose and cellulose (type of fiber). Both are linear chains of glucose, the
only difference is that amylose has alpha-glycosidic bonds, while cellulose has beta-glycosidic
bonds as shown below.
Brian Lindshield
59

Figure 2.1531 Structures of amylose and cellulose
The beta-bonds in fiber cannot be broken down by the digestive enzymes in the small intestine
so they continue into the large intestine.
Fiber can be classified by its physical properties. In the past, fibers were commonly referred to
as soluble and insoluble. This classification distinguished whether the fiber was soluble in
water. However, this classification is being phased out in the nutrition community. Instead,
most fibers that would have been classified as insoluble fiber are now referred to as
nonfermentable and/or nonviscous and soluble fiber as fermentable, and/or viscous because
these better describe the fiber's characteristics2. Fermentable refers to whether the bacteria in
the colon can ferment or degrade the fiber into short chain fatty acids and gas. Viscous refers to
the capacity of certain fibers to form a thick gel-like consistency. The following table lists some
of the common types of fiber and provides a brief description about each.
Table 2.1532 Common types of nonfermentable, nonviscous (insoluble) fiber
Fiber Description
Cellulose Main component of plant cell walls
Hemicellulose Surround cellulose in plant cell walls
Lignin Noncarbohydrate found within “woody” plant cell walls
Kansas State University Human Nutrition Textbook
60

Table 2.1533 Common types of fermentable, viscous (soluble) fiber
Fiber Description
Hemicellulose Surround cellulose in plant cell walls
Pectin Found in cell walls and intracellular tissues of fruits and berries
Beta-glucans Found in cereal brans
Gums Viscous, usually isolated from seeds
The following table gives the percentage of total dietary fiber in 5 foods.
Table 2.1534 Total dietary fiber (as percent of sample weight)3
Food Total Dietary Fiber
Cereal, all bran 30.1
Blueberries, fresh 2.7
Broccoli, fresh, cooked 3.5
Pork and beans, canned 4.4
Almonds, with skin 8.8
The table below shows the amount of nonfermentable, nonviscous fiber in these same five
foods.
Table 2.1535 Nonviscous fiber (as percent of sample weight) 3
Food Hemicellulose Cellulose Pectin Lignin Total
Cereal, all bran 15.3 7.5 0.9 4.3 28.0
Blueberries, fresh 0.7 0.4 0.4 0.9 2.4
Broccoli, fresh, cooked 0.9 1.2 0.7 0.3 3.1
Pork and beans, canned 0.9 1.6 0.3 0.2 3.0
Almonds, with skin 1.8 3.3 1.6 1.9 8.6
The table below shows the amount of fermentable, viscous fiber in these same five foods.
Brian Lindshield
61

Table 2.1536 Viscous Fiber (as percent of sample weight)3
Food Hemicellulose Pectin Total
Cereal, all bran 2.0 0.1 2.1
Blueberries, fresh 0.1 0.2 0.3
Broccoli, fresh, cooked 0.2 0.2 0.4
Pork and beans, canned 1.1 0.3 1.4
Almonds, with skin 0.2 tr 0.2
tr = trace amounts
Foods that are good sources of non fermentable, non viscous fiber include whole wheat, whole
grain cereals, broccoli, and other vegetables. This type of fiber is believed to decrease the risk
of constipation and colon cancer, because it increases stool bulk and reduces transit time 4. This
reduced transit time theoretically means shorter exposure to consumed carcinogens in the
intestine, and thus lower cancer risk.
Fermentable, viscous fiber can be found in oats, rice, psyllium seeds, soy, and some fruits. This
type of fiber is believed to decrease blood cholesterol and sugar concentrations, thus also
lowering the risk of heart disease and diabetes, respectively 4. Its viscous nature slows the
absorption of glucose preventing blood glucose from spiking after consuming carbohydrates. It
lowers blood cholesterol concentrations primarily by binding bile acids, which are made from
cholesterol, and causing them to be excreted. As such, more cholesterol is used to synthesize
new bile acids.
References & Links 1. DRI Book - [Anonymous]. (2005) Dietary reference intakes for energy, carbohydrate, fiber, fat, fatty acids, cholesterol, protein, and amino acids. Washington, D.C.: The National Academies Press. https://www.nap.edu/read/10490/chapter/9 2. Dietary Reference Intakes: Proposed Definition of Dietary Fiber Food and Nutrition Board. 2001 https://www.nap.edu/read/10161/chapter/3 3. Marlett JA. (1992) Content and composition of dietary fiber in 117 frequently consumed foods. J Am Diet Assoc 92: 175-186. 4. Byrd-Bredbenner C, Moe G, Beshgetoor D, Berning J. (2009) Wardlaw's perspectives in nutrition. New York, NY: McGraw-Hill.
Kansas State University Human Nutrition Textbook
62

3 Macronutrient Digestion
You probably do not think too much about what actually happens to the food you eat. This
section will describe in depth how what you eat is digested. The desired end result for the
learner will be an integrated understanding of the process. This will require higher levels of
thinking, but will prove to be well worth it in the end.
Sections:
3.1 Digestion at a Glance
3.2 Mouth to the Stomach
3.3 Stomach
3.4 Small Intestine
3.5 Macronutrient Digestion Review
3.6 Large Intestine
Brian Lindshield
63

3.1 Digestion at a Glance
Digestion is the process of breaking down food to be absorbed or excreted. The gastrointestinal
(GI, digestive) tract, the passage through which our food travels, is a "tube within a tube." The
trunk of our body is the outer tube and the GI tract is the interior tube, as shown below. Thus,
even though the GI tract is within the body, the actual interior of the tract is technically outside
of the body. This is because the contents have to be absorbed into the body. If it's not
absorbed, it will be excreted and never enter the body itself.
Figure 3.11 The digestive tract, also known as the gastrointestinal tract, is a "tube within a
tube"
A number of organs are involved in digestion, which collectively are referred to as the digestive
system.
Kansas State University Human Nutrition Textbook
64

Figure 3.12 The digestive system1
The organs that form the gastrointestinal tract (mouth, esophagus, stomach, small intestine,
large intestine (aka colon), rectum, and anus) come into direct contact with the food or
digestive content.
Figure 3.13 The gastrointestinal or digestive tract2
Brian Lindshield
65
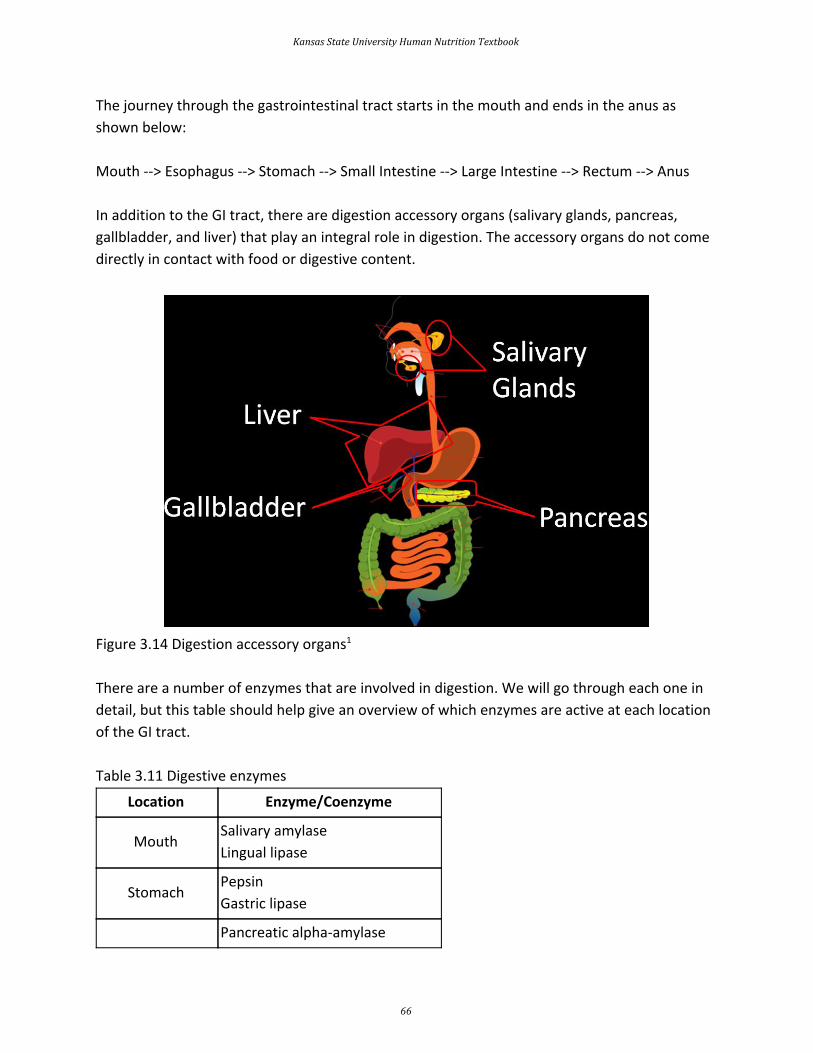
The journey through the gastrointestinal tract starts in the mouth and ends in the anus as
shown below:
Mouth --> Esophagus --> Stomach --> Small Intestine --> Large Intestine --> Rectum --> Anus
In addition to the GI tract, there are digestion accessory organs (salivary glands, pancreas,
gallbladder, and liver) that play an integral role in digestion. The accessory organs do not come
directly in contact with food or digestive content.
Figure 3.14 Digestion accessory organs1
There are a number of enzymes that are involved in digestion. We will go through each one in
detail, but this table should help give an overview of which enzymes are active at each location
of the GI tract.
Table 3.11 Digestive enzymes
Location Enzyme/Coenzyme
Mouth Salivary amylase
Lingual lipase
Stomach Pepsin
Gastric lipase
Pancreatic alpha-amylase
Kansas State University Human Nutrition Textbook
66

Small Intestine
Brush border disaccharidases
Pancreatic lipase
Colipase
Phospholipase-A2
Cholesterol esterase
Proteases
Brush border peptidases
References & Links 1. http://www.wpclipart.com/medical/anatomy/digestive/Digestive_system_diagram_page.png.html 2. http://commons.wikimedia.org/wiki/File:Digestivetract.gif
Brian Lindshield
67

3.2 Mouth to the Stomach
Digestion begins in the mouth, both mechanically and chemically. Mechanical digestion is called
mastication, or the chewing and grinding of food into smaller pieces. The salivary glands release
saliva, mucus, and the enzymes, salivary amylase, lingual lipase and lysozyme.
Figure 3.21 The mouth1
Salivary amylase cleaves the alpha 1-4 glycosidic bonds in the carbohydrate (typically starch)
molecules, amylose and amylopectin. However, salivary amylase cannot cleave the branch
points in amylopectin where there are alpha 1-6 glycosidic bonds, as shown in the figure below.
Overall this enzyme accounts for a minor amount of carbohydrate digestion.
Figure 3.22 Enzymatic action of salivary amylase. Purple arrows point to alpha 1-4 glycosidic
bonds that can be cleaved. The yellow arrows point to the alpha 1-6 glycosidic bonds that
Kansas State University Human Nutrition Textbook
68

cannot be cleaved
Another enzyme, lingual lipase, is also released in the mouth. Although it is released in the
mouth, it is most active in the stomach where it preferentially cleaves short-chain fatty acids in
the sn-3 position. Lingual lipase has a small role in digestion in adults, but may be important for
infants to help break down triglycerides in breast milk 2. Lysozyme helps break down bacteria
cell walls to prevent a possible infection.
Swallowing
Now that the food has been thoroughly chewed and formed into a bolus (a ball of masticated
food and saliva), it can proceed down the throat to the next stop in digestion. It will move down
the pharynx where it reaches a "fork in the road", with the larynx as one road and the
esophagus as the other. The esophagus road leads to the stomach; this is the direction that
food should go. The other road, through the larynx, leads to the trachea and ultimately the
lungs. This is definitely not where you want your food or drink going, as this is the pathway for
the air you breathe.
Figure 3.23 Cross section of face. The epiglottis covers larynx to prevent food and drink from
entering the lungs3
Fortunately, our body was designed in such a way that a small tissue, called the epiglottis,
covers the opening to the trachea. It directs the food down the correct road as shown below.
Brian Lindshield
69

Figure 3.24 Epiglottis is like a traffic cop guiding food down the correct digestion road.
Esophagus
Before being correctly guided into the esophagus, the bolus of food will travel through the
upper esophageal sphincter. Sphincters are circular muscles that are found throughout the
gastrointestinal tract that essentially serve as gates between the different sections. Once in the
esophagus, wavelike muscular movements, known as peristalsis, occur, as shown in the
animation and video in the links below.
Web Links
Peristalsis Animation
Video: Peristalsis (0:57)
At the end of the esophagus the bolus will encounter the lower esophageal sphincter. This
sphincter keeps the harmful acids of the stomach out of the esophagus. However, in many
people this sphincter is leaky, which allows stomach acid to reflux, or creep up, the esophagus.
Stomach acid is very acidic (has a low pH). The ruler below will give you an idea of just how
acidic the stomach is. Notice that the pH of gastric (term used to describe the stomach) fluid is
lower (more acidic) than any of the listed items besides battery acid.
Kansas State University Human Nutrition Textbook
70

Figure 3.26 pH of some common items 4
The leaking of the very acidic gastric contents results in a burning sensation, commonly referred
to as "heartburn." If this occurs more than twice per week and is severe, the person may have
gastroesophageal reflux disease (GERD). The following videos explain more about these
conditions.
Web Links
Video: Acid Reflux (1:28)
Video: GERD 101 (0.55)
Table 3.21 Review of Chemical Digestion in the Mouth
Macronutrient Action
Carbohydrates Salivary amylase cleaves 1,4-glycosidic bonds
Lipids Release of lingual lipase
Protein None
References & Links 1. Alan Hoofring, http://visualsonline.cancer.gov/details.cfm?imageid=4371 2. Shils ME, Shike M, Ross AC, Caballero B, Cousins RJ, editors. (2006) Modern nutrition in health and disease. Baltimore, MD: Lippincott Williams & Wilkins.
Brian Lindshield
71

3. http://en.wikipedia.org/wiki/File:Illu01_head_neck.jpg 4. http://upload.wikimedia.org/wikipedia/commons/4/46/PH_scale.png
Link Peristalsis - http://en.wikipedia.org/wiki/File:Peristalsis.gif
Videos Peristalsis Animation - http://www.youtube.com/watch?v=o18UycWRsaA Acid Reflux - https://www.youtube.com/watch?v=SW-QfyDSY5I GERD 101 - http://www.youtube.com/watch?v=FqdOvZkrSYk&feature=rec-lis-watch-cur_emp-farside_rn
Kansas State University Human Nutrition Textbook
72

3.3 Stomach
After going through the lower esophageal sphincter, food enters the stomach. Our stomach is
involved in both chemical and mechanical digestion. Mechanical digestion occurs as the
stomach churns and grinds food into a semisolid substance called chyme (partially digested
food).
The lining of the stomach is made up of different layers of tissue. The mucosa is the outermost
layer (closest to stomach cavity) as shown in the figure below.
Figure 3.31 The anatomy of the stomach 1
The mucosa is not a flat surface. Instead, its surface is lined by gastric pits, as shown in the
figure below.
Brian Lindshield
73

Figure 3.32 Gastric pits 2
Gastric pits are indentations in the stomach's surface that are lined by four different types of
cells.
Figure 3.33 Blowup of mucosa to show the structure of gastric pits 1
The following video is a nice introduction to gastric pits and talks about chief and parietal cells
that are covered in more detail below.
Kansas State University Human Nutrition Textbook
74

Web Link
Video: Gastric Pits (0:56)
At the bottom of the gastric pit are the G cells that secrete the hormone gastrin. Gastrin
stimulates the parietal and chief cells that are found above the G cells. The chief cells secrete
the zymogen pepsinogen and the enzyme gastric lipase. A zymogen is an inactive protein that
must be cleaved or altered to form the active protein. The parietal cells secrete hydrochloric
acid (HCl), which lowers the pH of the gastric juice (water + enzymes + acid). The HCl inactivates
salivary amylase and catalyzes the conversion of pepsinogen to pepsin. Finally, the top of the
pits are the neck cells that secrete mucus to prevent the gastric juice from digesting or
damaging the stomach mucosa 3. The table below summarizes the actions of the different cells
in the gastric pits.
Table 3.31 Cells involved in the digestive processes in the stomach
Type of Cell Secrete
Neck Mucus
Chief Pepsinogen and gastric lipase
Parietal HCl
G Gastrin
The figure below shows the action of all these different secretions in the stomach.
Figure 3.34 The action of gastric secretions in the stomach
Brian Lindshield
75

To reiterate, the figure above illustrates that the neck cells of the gastric pits secrete mucus to
protect the mucosa of the stomach from essentially digesting itself. Gastrin from the G cells
stimulates the parietal and chief cells to secrete HCl and enzymes, respectively.
The HCl in the stomach denatures salivary amylase and other proteins by breaking down the
structure and, thus, the function of it. HCl also converts pepsinogen to the active enzyme
pepsin. Pepsin is a protease, meaning that it cleaves bonds in proteins. It breaks down the
proteins in food into individual peptides (shorter segments of amino acids). The other enzyme
that is active in the stomach is gastric lipase. This enzyme preferentially cleaves the sn-3
position of triglycerides to produce 1,2-diglyceride and a free fatty acid, as shown below4. It is
responsible for up to 20% of triglyceride digestion 3.
Figure 3.35 Gastric Lipase action results in production of 1,2-diglyceride and a free fatty acid
The chyme will then leave the stomach and enter the small intestine via the pyloric sphincter
(shown below).
Figure 3.36 Cross section of the stomach showing the pyloric sphincter 5
Kansas State University Human Nutrition Textbook
76
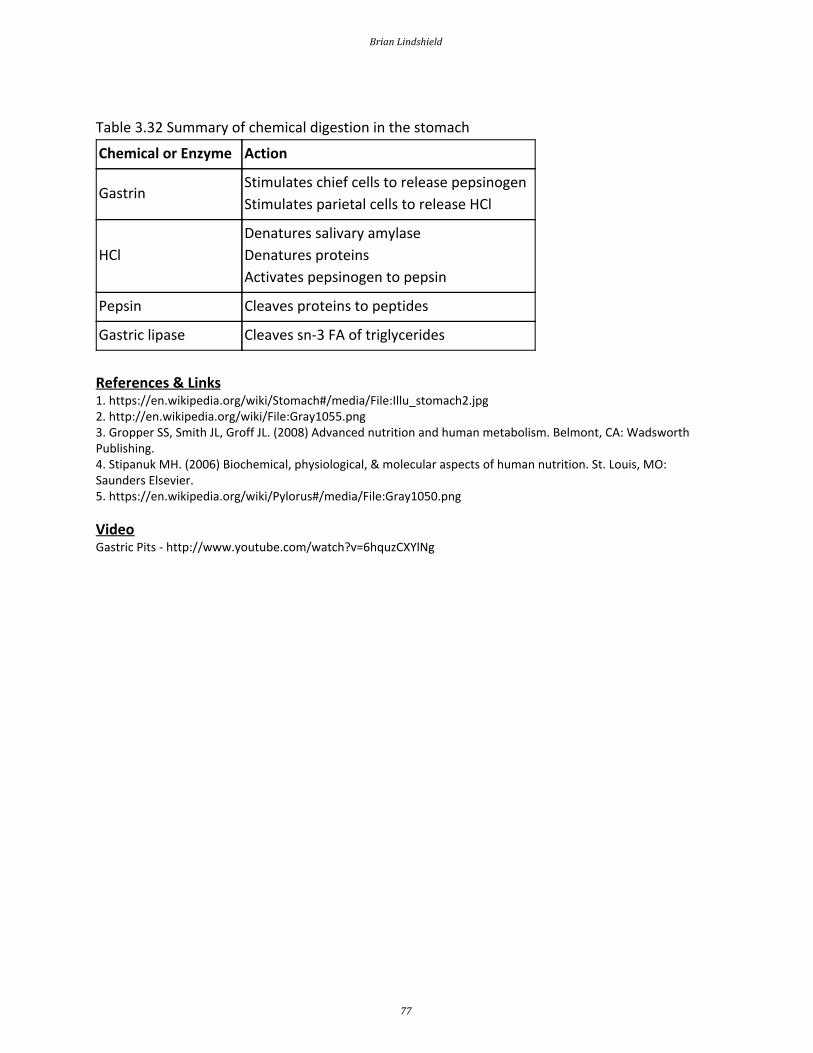
Table 3.32 Summary of chemical digestion in the stomach
Chemical or Enzyme Action
Gastrin Stimulates chief cells to release pepsinogen
Stimulates parietal cells to release HCl
HCl
Denatures salivary amylase
Denatures proteins
Activates pepsinogen to pepsin
Pepsin Cleaves proteins to peptides
Gastric lipase Cleaves sn-3 FA of triglycerides
References & Links 1. https://en.wikipedia.org/wiki/Stomach#/media/File:Illu_stomach2.jpg 2. http://en.wikipedia.org/wiki/File:Gray1055.png 3. Gropper SS, Smith JL, Groff JL. (2008) Advanced nutrition and human metabolism. Belmont, CA: Wadsworth Publishing. 4. Stipanuk MH. (2006) Biochemical, physiological, & molecular aspects of human nutrition. St. Louis, MO: Saunders Elsevier. 5. https://en.wikipedia.org/wiki/Pylorus#/media/File:Gray1050.png
Video Gastric Pits - http://www.youtube.com/watch?v=6hquzCXYlNg
Brian Lindshield
77

3.4 Small Intestine
The small intestine is the primary site of digestion. It is divided into three sections: the
duodenum, jejunum, and ileum (shown below). After leaving the stomach, the first part of the
small intestine that chyme will encounter is the duodenum.
Figure 3.41 Three sections of the small intestine1
The small intestine consists of many layers, which can be seen in the cross section below.
Figure 3.42 Cross section of the small intestine 2
Examining these layers closer, we are going to focus on the epithelium, which comes into
contact with the chyme and is responsible for absorption. The lumen is the name of the cavity
Kansas State University Human Nutrition Textbook
78

that is considered “outside the body” that chyme moves through.
Figure 3.43 Cross section of small intestine with the structures labeled2
The organization of the small intestine is in such a way that it contains circular folds and
finger-like projections known as villi. The folds and villi are shown in the next few figures.
Figure 3.44 Folds in the small intestine 2
Brian Lindshield
79

Figure 3.45 Villi in the small intestine3
Figure 3.46 Villi line the surface of the small intestine 2,4
If we were to zoom in even closer, we would be able to see that enterocytes (small intestine
absorptive cells) line villi as shown below.
Kansas State University Human Nutrition Textbook
80

Figure 3.47 Enterocytes line villi 4
The side, or membrane, of the enterocyte that faces the lumen is not smooth either. It is lined
with microvilli, and is known as the brush border (aka apical) membrane, as shown below.
Figure 3.48 Enterocyte, or small intestinal absorptive cell is lined with microvilli. This lined
surface is referred to as the brush border membrane.
Together these features (folds + villi + microvilli) increase the surface area ~600 times versus if
it was a smooth tube 5. More surface area leads to more contact with the enterocytes and thus,
Brian Lindshield
81

increased absorption.
Going even closer, we discover that the surface of the microvilli is covered by the hair-like
glycocalyx, which is glycoproteins and carbohydrates as shown below.
Figure 3.49 Glycocalyx lines the microvilli
Now that you have learned about the anatomy of the small intestine, the following subsections
go through the different digestive processes that occur there.
Subsections:
3.41 Digestive Hormones, Accessory Organs, & Secretions
3.42 Carbohydrate Digestion in the Small Intestine
3.43 Protein Digestion in the Small Intestine
3.44 Lipid Digestion in the Small Intestine
References & Links 1. http://commons.wikimedia.org/wiki/Image:Illu_small_intestine_catal%C3%A0.png 2. Author unknown, NCI, http://visualsonline.cancer.gov/details.cfm?imageid=1781 3. http://digestive.niddk.nih.gov/ddiseases/pubs/celiac/ 4. http://commons.wikimedia.org/wiki/Image:Gray1061.png 5. Byrd-Bredbenner C, Moe G, Beshgetoor D, Berning J. (2009) Wardlaw's perspectives in nutrition. New York, NY: McGraw-Hill.
Kansas State University Human Nutrition Textbook
82

3.41 Digestive Hormones, Accessory Organs & Secretions
Before we go into the digestive details of the small intestine, it is important that you have a
basic understanding of the anatomy and physiology of the following digestion accessory organs:
pancreas, liver, and gallbladder. Digestion accessory organs assist in digestion, but are not part
of the gastrointestinal tract. How are these organs involved?
Upon entering the duodenum, the chyme causes the release of two hormones from the small
intestine: secretin and cholecystokinin (CCK, previously known as pancreozymin) in response to
acid and fat, respectively. These hormones have multiple effects on different tissues. In the
pancreas, secretin stimulates the secretion of bicarbonate (HCO3), while CCK stimulates the
secretion of digestive enzymes. The bicarbonate and digestive enzymes released together are
collectively known as pancreatic juice, which travels to the small intestine, as shown below.
Figure 3.411 The hormones secretin and CCK stimulate the pancreas to secrete pancreatic juice1
In addition, CCK also stimulates the contraction of the gallbladder causing the secretion of bile
into the duodenum.
Pancreas
The pancreas is found behind the stomach and has two different portions. It has an endocrine
(hormone-producing) portion that contains alpha and beta cells that secrete the hormones
glucagon and insulin, respectively. However, the vast majority of the pancreas is made up of
acini, or acinar cells, that are responsible for producing pancreatic juice. The following video
does a nice job of showing and explaining the function of the different pancreatic cells.
Brian Lindshield
83
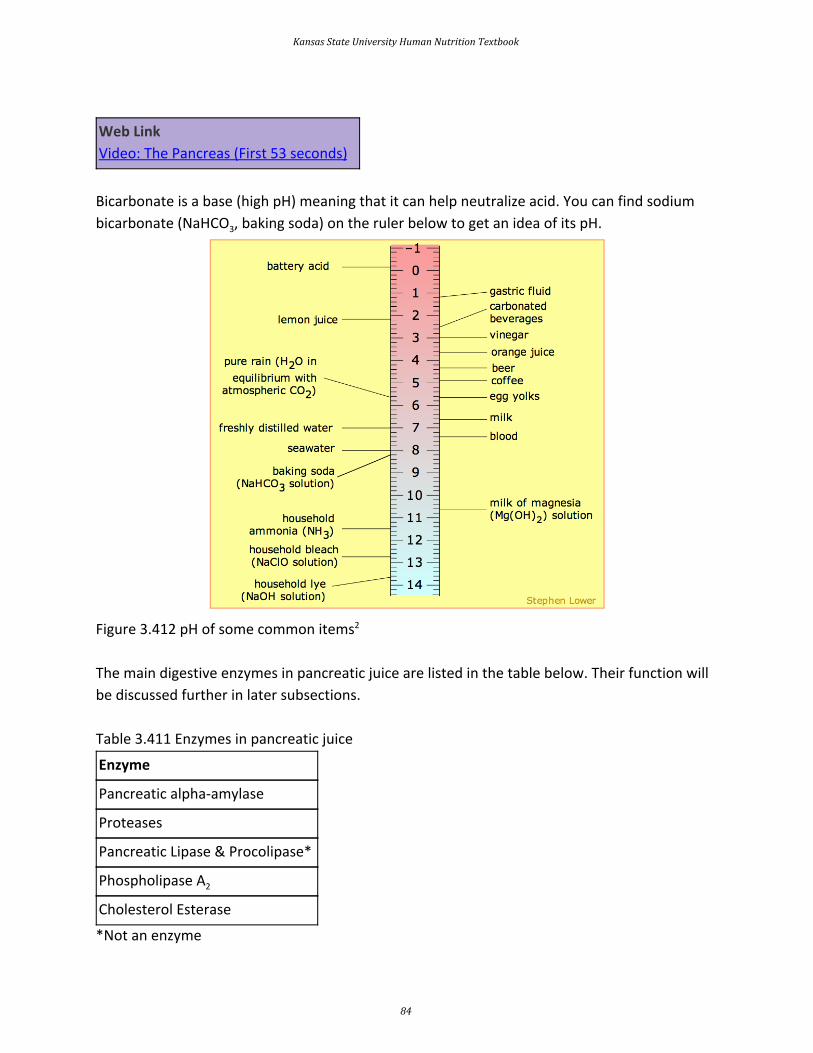
Web Link
Video: The Pancreas (First 53 seconds)
Bicarbonate is a base (high pH) meaning that it can help neutralize acid. You can find sodium
bicarbonate (NaHCO3, baking soda) on the ruler below to get an idea of its pH.
Figure 3.412 pH of some common items2
The main digestive enzymes in pancreatic juice are listed in the table below. Their function will
be discussed further in later subsections.
Table 3.411 Enzymes in pancreatic juice
Enzyme
Pancreatic alpha-amylase
Proteases
Pancreatic Lipase & Procolipase*
Phospholipase A2
Cholesterol Esterase
*Not an enzyme
Kansas State University Human Nutrition Textbook
84

Liver
The liver is the largest internal and most metabolically active organ in the body. The figure
below shows the liver and the accessory organs position relative to the stomach.
Figure 3.413 Location of digestion accessory organs relative to the stomach3
The liver is made up two major types of cells. The primary liver cells are hepatocytes, which
carry out most of the liver’s functions. Hepatic is another term for liver. For example, if you are
going to refer to liver concentrations of a certain nutrient, these are often reported as hepatic
concentrations. The other major cell type is the hepatic stellate (also known as Ito) cells. These
are lipid storing cells in the liver. These two cell types are depicted below.
Figure 3.414 Hepatocytes (PC) and hepatic stellate cells (HSC) along with an electron
microscope image showing the lipid droplets within a stellate cell 4
The liver's major role in digestion is to produce bile. This is a greenish-yellow fluid that is
composed primarily of bile acids, but also contains cholesterol, phospholipids, and the pigments
Brian Lindshield
85

bilirubin and biliverdin. Bile acids are synthesized from cholesterol. The two primary bile acids
are chenodeoxycholic acid and cholic acid. In the same way that fatty acids are found in the
form of salts, these bile acids can also be found as salts. These salts have an (-ate) ending, as
shown below.
Figure 3.415 Structures of the 2 primary bile acids
Bile acids, much like phospholipids, have a hydrophobic and hydrophilic end. This makes them
excellent emulsifiers that are instrumental in fat digestion. Bile is then transported to the
gallbladder.
Gallbladder
The gallbladder is a small, sac-like organ found just off the liver (see figures above). Its primary
function is to store and concentrate bile made by the liver. The bile is then transported to the
duodenum through the common bile duct.
Why do we need bile?
Bile is important because fat is hydrophobic and the environment in the lumen of the small
intestine is watery. In addition, there is an unstirred water layer that fat must cross to reach the
enterocytes in order to be absorbed.
Kansas State University Human Nutrition Textbook
86
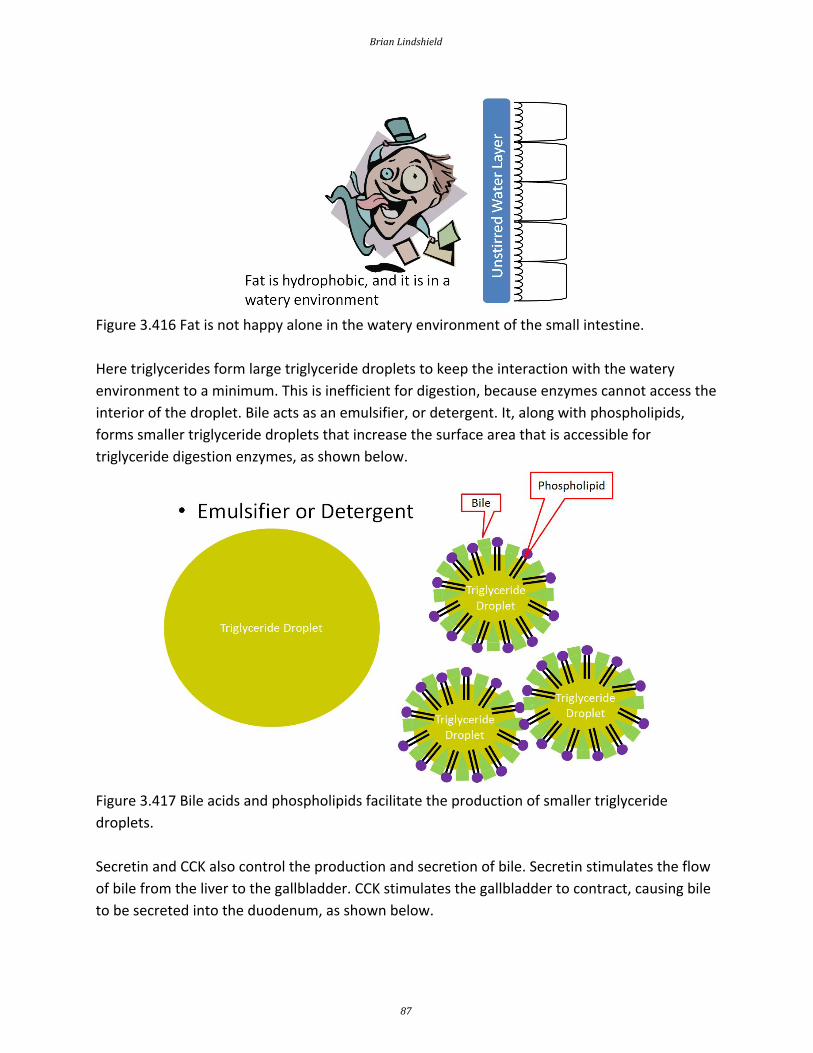
Figure 3.416 Fat is not happy alone in the watery environment of the small intestine.
Here triglycerides form large triglyceride droplets to keep the interaction with the watery
environment to a minimum. This is inefficient for digestion, because enzymes cannot access the
interior of the droplet. Bile acts as an emulsifier, or detergent. It, along with phospholipids,
forms smaller triglyceride droplets that increase the surface area that is accessible for
triglyceride digestion enzymes, as shown below.
Figure 3.417 Bile acids and phospholipids facilitate the production of smaller triglyceride
droplets.
Secretin and CCK also control the production and secretion of bile. Secretin stimulates the flow
of bile from the liver to the gallbladder. CCK stimulates the gallbladder to contract, causing bile
to be secreted into the duodenum, as shown below.
Brian Lindshield
87
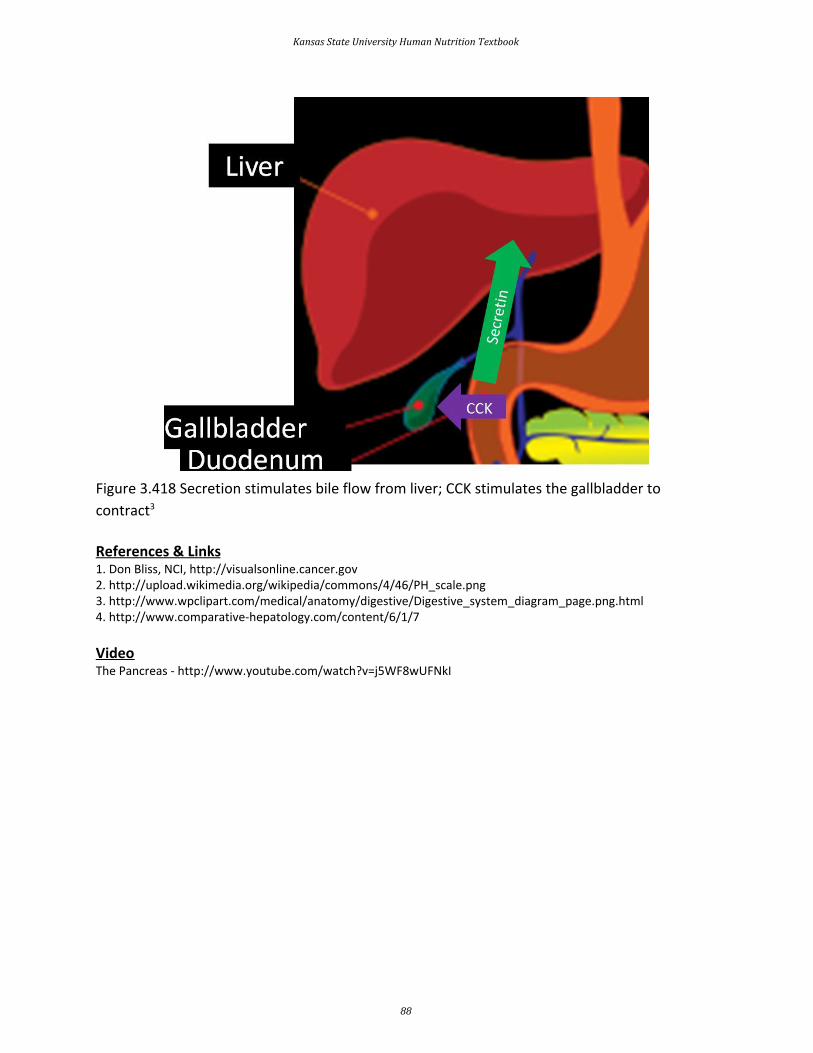
Figure 3.418 Secretion stimulates bile flow from liver; CCK stimulates the gallbladder to
contract3
References & Links 1. Don Bliss, NCI, http://visualsonline.cancer.gov 2. http://upload.wikimedia.org/wikipedia/commons/4/46/PH_scale.png 3. http://www.wpclipart.com/medical/anatomy/digestive/Digestive_system_diagram_page.png.html 4. http://www.comparative-hepatology.com/content/6/1/7
Video The Pancreas - http://www.youtube.com/watch?v=j5WF8wUFNkI
Kansas State University Human Nutrition Textbook
88

3.42 Carbohydrate Digestion in the Small Intestine
The small intestine is the primary site of carbohydrate digestion. Pancreatic alpha-amylase is
the primary carbohydrate digesting enzyme. Pancreatic alpha-amylase, like salivary amylase,
cleaves the alpha 1-4 glycosidic bonds of carbohydrates, reducing them to simpler
carbohydrates, such as glucose, maltose, maltotriose, and dextrins (oligosaccharides containing
1 or more alpha 1-6 glycosidic bonds). Pancreatic alpha-amylase is also unable to cleave the
branch point alpha 1-6 bonds1.
Figure 3.421 The function of pancreatic alpha-amylase
Figure 3.422 Products of pancreatic alpha-amylase
The pancreatic alpha-amylase products, along with the disaccharides sucrose and lactose, then
move to the surface of the enterocyte. Here, there are disaccharidase enzymes (lactase,
sucrase, maltase) on the outside of the enterocyte. Enzymes, like these, that are on the outside
of cell walls are referred to as ectoenzymes. Individual monosaccharides are formed when
lactase cleaves lactose, sucrase cleaves sucrose, and maltase cleaves maltose. There is also
another brush border enzyme, alpha-dextrinase. This enzyme cleaves alpha 1-6 glycosidic
Brian Lindshield
89

bonds in dextrins, primarily the branch point bonds in amylopectin. The products from these
brush border enzymes are the single monosaccharides glucose, fructose, and galactose that are
ready for absorption into the enterocyte 1.
Figure 3.423 Disaccharidases on the outside of the enterocyte.
References & Links 1. Gropper SS, Smith JL, Groff JL. (2008) Advanced nutrition and human metabolism. Belmont, CA: Wadsworth Publishing.
Kansas State University Human Nutrition Textbook
90

3.43 Protein Digestion in the Small Intestine
The small intestine is the major site of protein digestion by proteases (enzymes that cleave
proteins). The pancreas secretes a number of proteases as zymogens into the duodenum where
they must be activated before they can cleave peptide bonds 1. This activation occurs through
an activation cascade. A cascade is a series of reactions in which one step activates the next in a
sequence that results in an amplification of the response. An example of a cascade is shown
below.
Figure 3.431 An example of a cascade, with one event leading to many more events
In this example, A activates B, B activates C, D, and E, C activates F and G, D activates H and I,
and E activates K and L. Cascades also help to serve as control points for certain process. In the
protease cascade, the activation of B is really important because it starts the cascade.
The protease/colipase activation scheme starts with the enzyme enteropeptidase (secreted
from the intestinal brush border) that converts trypsinogen to trypsin. Trypsin can activate all
the proteases (including itself) and colipase (involved in fat digestion)1 as shown in the 2 figures
below.
Brian Lindshield
91

Figure 3.432 Protease/colipase activation cascade
Figure 3.433 The protease/colipase activation cascade
The products of the action of the proteases on proteins are dipeptides, tripeptides, and
individual amino acids, as shown below.
Kansas State University Human Nutrition Textbook
92
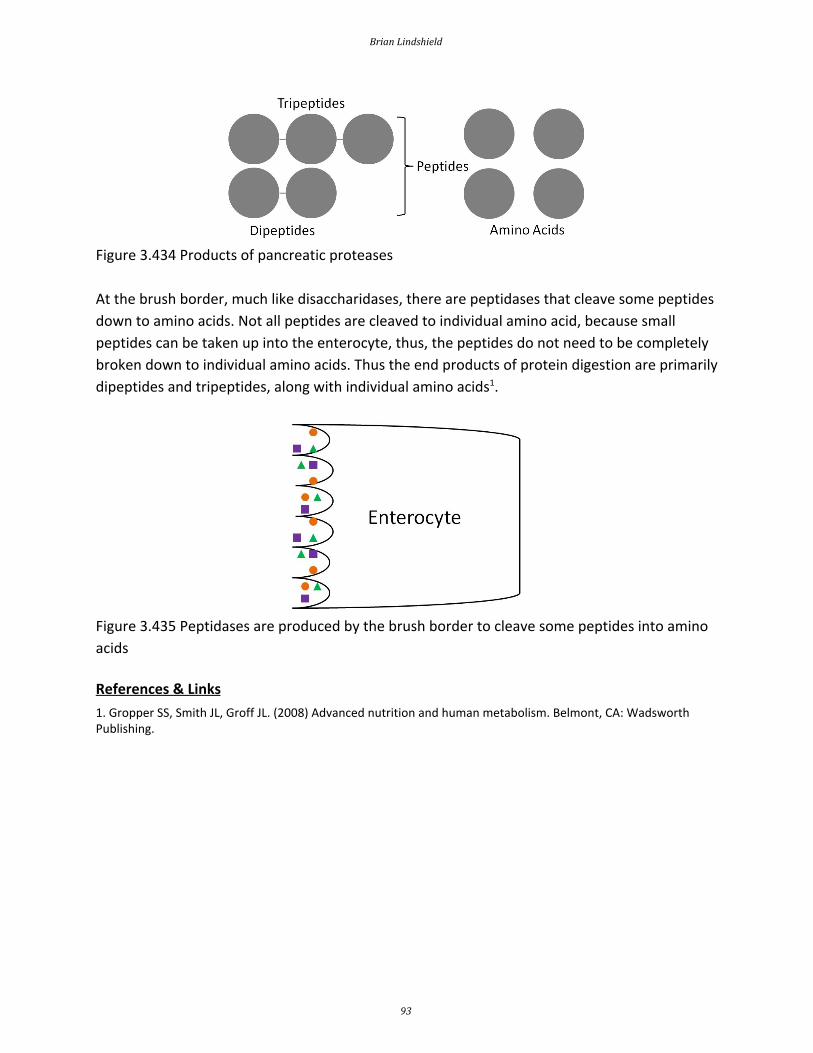
Figure 3.434 Products of pancreatic proteases
At the brush border, much like disaccharidases, there are peptidases that cleave some peptides
down to amino acids. Not all peptides are cleaved to individual amino acid, because small
peptides can be taken up into the enterocyte, thus, the peptides do not need to be completely
broken down to individual amino acids. Thus the end products of protein digestion are primarily
dipeptides and tripeptides, along with individual amino acids 1.
Figure 3.435 Peptidases are produced by the brush border to cleave some peptides into amino
acids
References & Links
1. Gropper SS, Smith JL, Groff JL. (2008) Advanced nutrition and human metabolism. Belmont, CA: Wadsworth Publishing.
Brian Lindshield
93
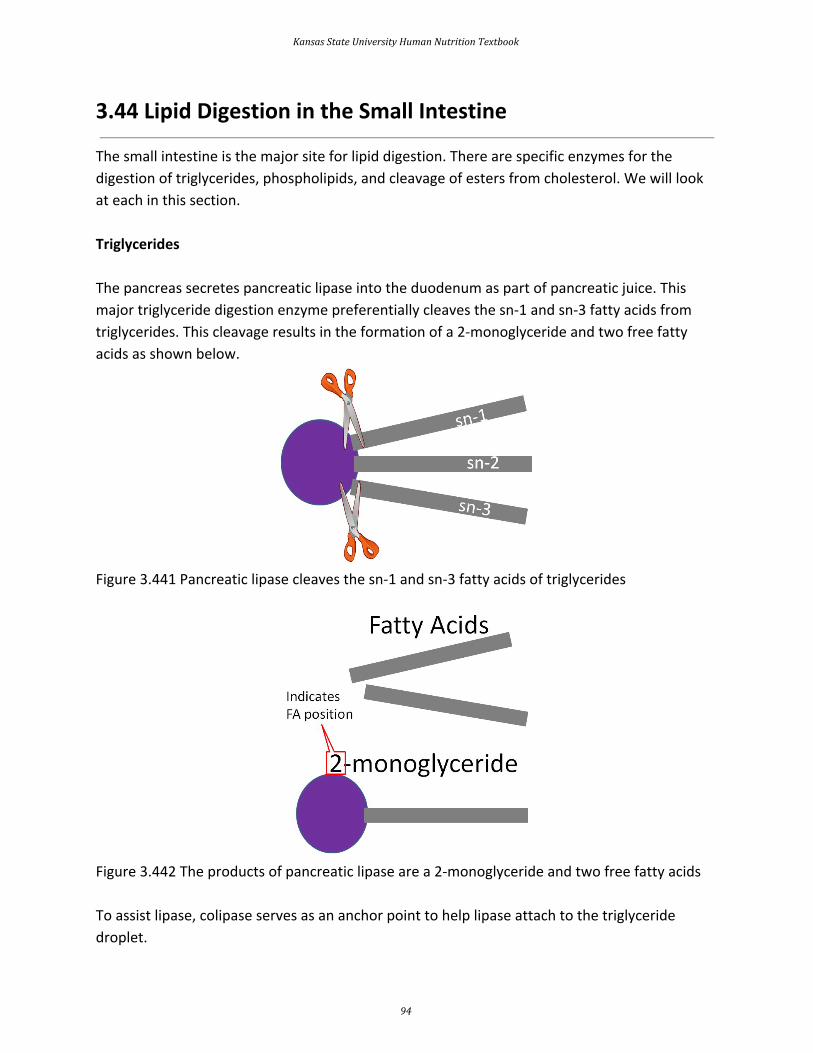
3.44 Lipid Digestion in the Small Intestine
The small intestine is the major site for lipid digestion. There are specific enzymes for the
digestion of triglycerides, phospholipids, and cleavage of esters from cholesterol. We will look
at each in this section.
Triglycerides
The pancreas secretes pancreatic lipase into the duodenum as part of pancreatic juice. This
major triglyceride digestion enzyme preferentially cleaves the sn-1 and sn-3 fatty acids from
triglycerides. This cleavage results in the formation of a 2-monoglyceride and two free fatty
acids as shown below.
Figure 3.441 Pancreatic lipase cleaves the sn-1 and sn-3 fatty acids of triglycerides
Figure 3.442 The products of pancreatic lipase are a 2-monoglyceride and two free fatty acids
To assist lipase, colipase serves as an anchor point to help lipase attach to the triglyceride
droplet.
Kansas State University Human Nutrition Textbook
94

Figure 3.443 Colipase helps anchor lipase to the triglyceride droplet
Phospholipids
The enzyme phospholipase A 2 cleaves the C-2 fatty acid of lecithin, producing lysolecithin and a
free fatty acid.
Figure 3.444 Phospholipase A 2 cleaves the C-2 fatty acid of lecithin
Figure 3.445 Products of phospholipase A 2 cleavage
Cholesterol Esters
The fatty acid in cholesterol esters is cleaved by the enzyme, cholesterol esterase, producing
cholesterol and a free fatty acid.
Brian Lindshield
95
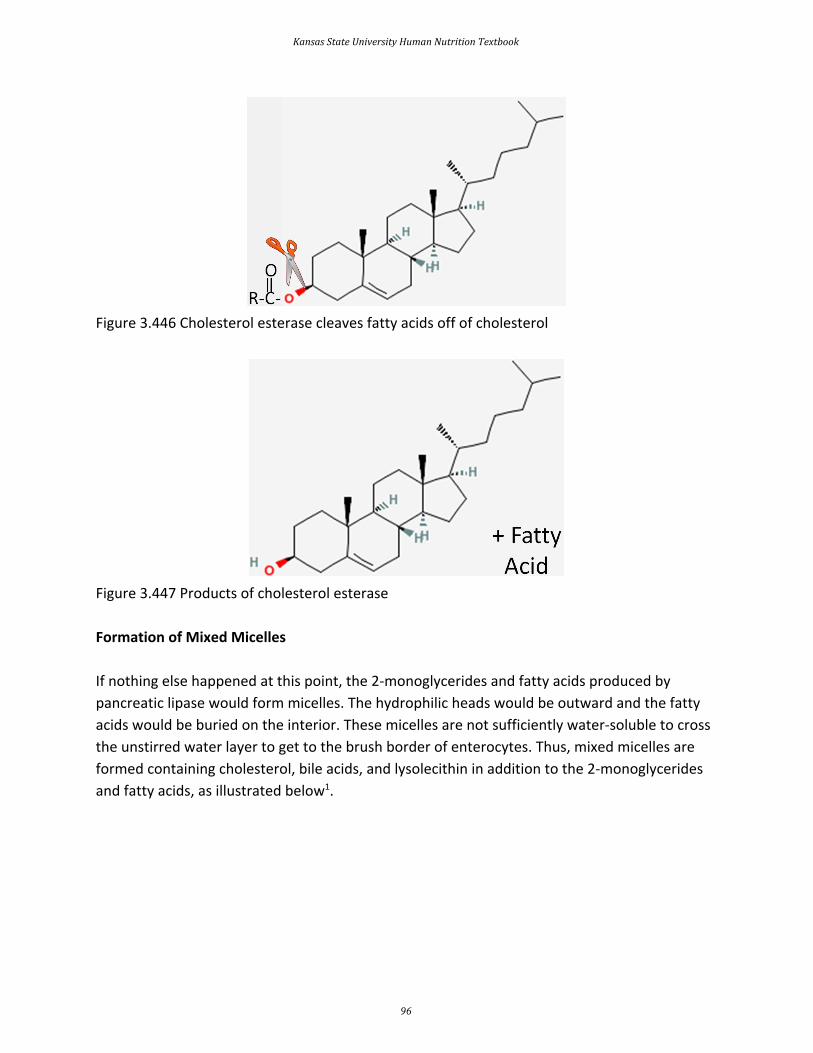
Figure 3.446 Cholesterol esterase cleaves fatty acids off of cholesterol
Figure 3.447 Products of cholesterol esterase
Formation of Mixed Micelles
If nothing else happened at this point, the 2-monoglycerides and fatty acids produced by
pancreatic lipase would form micelles. The hydrophilic heads would be outward and the fatty
acids would be buried on the interior. These micelles are not sufficiently water-soluble to cross
the unstirred water layer to get to the brush border of enterocytes. Thus, mixed micelles are
formed containing cholesterol, bile acids, and lysolecithin in addition to the 2-monoglycerides
and fatty acids, as illustrated below 1.
Kansas State University Human Nutrition Textbook
96

Figure 3.448 Normal (left) and mixed (right) micelles
Mixed micelles are more water-soluble, allowing them to cross the unstirred water layer to the
brush border of enterocytes for absorption.
Figure 3.449 Mixed micelles can cross the unstirred water layer for absorption into the
enterocytes
References & Links 1. Gropper SS, Smith JL, Groff JL. (2008) Advanced nutrition and human metabolism. Belmont, CA: Wadsworth Publishing.
Brian Lindshield
97

3.5 Macronutrient Digestion Review
The following figures review the digestion of the different macronutrients.
Carbohydrate Digestion
Figure 3.51 Review of carbohydrate digestion 1
Protein Digestion
Figure 3.52 Review of protein digestion1
Kansas State University Human Nutrition Textbook
98

Triglyceride Digestion
Figure 3.53 Review of triglyceride digestion1
Cholesterol Ester and Phospholipid Digestion
Figure 3.54 Review of cholesterol ester and phospholipid digestion 1
Brian Lindshield
99

After digestion, the products below are ready for uptake into the enterocyte.
Figure 3.55 Macronutrient digestion products ready for uptake into the enterocyte
References & Links 1. http://www.wpclipart.com/medical/anatomy/digestive/Digestive_system_diagram_page.png.html
Kansas State University Human Nutrition Textbook
100

3.6 The Large Intestine
We have reached a fork in the road. We could follow the uptake of the digested compounds
into the enterocyte or we could finish following what has escaped digestion and is going to
continue into the large intestine. Obviously from the title of this section we are going to do the
latter. As we learned previously, fiber is a crude term for physical material (since there is some
water as well) has survived digestion and reached the large intestine.
Figure 3.61 The fork in the road between finishing digestion in the colon and absorption into
the enterocyte
The ileocecal valve is the sphincter between the ileum and the large intestine. This name should
make more sense as we go through the anatomy of the large intestine.
Figure 3.62 The ileocecal valve1
The large intestine consists of the colon, the rectum, and the anus. The colon can be further
divided into the cecum (hence the -cecal in ileocecal valve, ileo- refers to ileum), ascending
Brian Lindshield
101

colon, transverse colon, descending colon, and sigmoid colon as shown below.
Figure 3.63 Anatomy of the large intestine and rectum2
The large intestine is responsible for absorbing remaining water and electrolytes (sodium,
potassium, and chloride). It also forms and excretes feces. The large intestine contains large
amounts of microorganisms like those shown in the figure below.
Figure 3.64 Magnified image of bacteria3
The large intestine can also be referred to as the gut. There are a large number of
microorganisms found throughout the gastrointestinal tract that collectively are referred to as
Kansas State University Human Nutrition Textbook
102

the flora, microflora, biota, or microbiota. Technically, microbiota is the preferred term because
flora means "pertaining to plants". There are 10 times more microorganisms in the
gastrointestinal tract than cells in the whole human body 4. As can be seen in the figure below,
the density of microorganisms increases as you move down the digestive tract.
Figure 3.65 Relative amount of bacteria in selected locations of the GI tract. cfu/ml = colony
forming unit, a measure of the number of live microorganisms in 1 mL of digestive sample 5,6
As described in the fiber sections, there are two different fates for fiber once it reaches the
large intestine. The fermentable, viscous fiber is fermented by bacteria. An example of
fermentation is the utilization of the oligosaccharides raffinose and stachyose by
microorganisms that results in the production of gas, which can lead to flatulence. Also, some
bile acids are fermented by microorganisms to form secondary bile acids that can be
reabsorbed. These secondary bile acids represent approximately 20% of the total bile acids in
our body. Fermentable fibers can be used to form short-chain fatty acids that can then be
absorbed and used by the body. The nonfermentable, nonviscous fiber is not really altered and
will be a component of feces, that is then excreted through the rectum and anus. This process
involves both an internal and external sphincter that are shown in figure 3.63 above.
Subsection:
3.61 Microbiota
References & Links 1. https://commons.wikimedia.org/wiki/File:Gray1075.png 2. http://en.wikipedia.org/wiki/Image:Illu_intestine.jpg 3. http://commons.wikimedia.org/wiki/Image:Cholera_bacteria_SEM.jpg 4. Guarner F, Malagelada J. (2003) Gut flora in health and disease. The Lancet 361(9356): 512. 5. DiBaise J, Zhang H, Crowell M, Krajmalnik-Brown R, Decker , et al. (2008) Gut microbiota and its possible
Brian Lindshield
103

relationship with obesity. Mayo Clin Proc 83(4): 460. 6. Adapted from: http://www.wpclipart.com/medical/anatomy/digestive/Digestive_system_diagram_page.png.html
Kansas State University Human Nutrition Textbook
104

3.61 Microbiota
There is increased attention given to the potential of a person's microbiota to impact health.
This is because there are beneficial and non-beneficial bacteria inhabiting our gastrointestinal
tracts. Thus, theoretically, if you can increase the beneficial or decrease the non- beneficial
bacteria, there may be improved health outcomes. In response to this, probiotics and prebiotics
have been identified/developed. A probiotic is a live microorganism that is consumed, and
colonizes in the body as shown in the figures below.
Figure 3.611 Probiotics the consumption of the bacteria itself
A prebiotic is a nondigestible food component that selectively stimulates the growth of
beneficial intestinal bacteria. Typically the food component is fermented by the bacteria. An
example of a prebiotic is inulin, which is shown in the figure below.
Figure 3.612 Inulin, an indigestible food component that is a commonly used prebiotic
Brian Lindshield
105

The net result is the same for both prebiotics and probiotics, an increase in the beneficial/non
beneficial microorganism ratio.
Figure 3.613 An effective prebiotic or probiotic should result in an increase in the beneficial
bacteria
The following video does a nice job of explaining and illustrating how probiotics work. The
NCCAM website is a good source of information if you have further questions on the topic.
Web Links
Video: Probiotics (3:40)
NCCAM: Probiotics
Some common examples of probiotics are DanActive® and Activia®.
Web Links
DanActive®
Activia®
The claims that companies made about their produce probiotic products have come under
scrutiny. Dannon settled with the US Federal Trade Commission to drop claims that its probiotic
products will help prevent colds or alleviate digestive problems, as seen in the top link below.
General Mills also settled a lawsuit that accused them of a falsely advertising the digestive
benefits of Yo-Plus a product it no longer sells, as seen in the second link.
Kansas State University Human Nutrition Textbook
106

Web Link
Dannon Agrees to Drop Exaggerated Health Claims for Activia Yogurt and DanActive Dairy Drink
General Mills Settles Yo-Plus Lawsuit
Some examples of prebiotics include inulin, other fructose-containing oligosaccharides and
polysaccharides, and resistant starch. Inulin is a polysaccharide that contains mainly fructoses
that are joined by beta-bonds, which allows them to survive digestion. The structure of inulin is
shown below.
Figure 3.614 Structure of inulin 1
Resistant starch is so named because it is a starch that is resistant to digestion. As a result, it
arrives in the colon to be fermented.
A couple of newer terms related to the microbiota that are increasingly being used are:
A synbiotic is a product that contains both probiotics and prebiotics. The syn-part of the term is
meant to indicate that there may be synergy by the combination of the two.
Postbiotics are metabolites secreted by the microbiota. There is increased interest in the
impact of these metabolites rather than just focusing on the population of the microbiota.
References & Links 1. http://en.wikipedia.org/wiki/File:Inulin_strukturformel.png 2. Douglas L, Sanders M. (2008) Probiotics and prebiotics in dietetics practice. American Dietetic Association.Journal of the American Dietetic Association 108(3): 510.
Links NCCAM: Probiotics - http://nccam.nih.gov/health/probiotics/ DanActive® - http://www.danactive.com/ Activia® - http://www.activia.us.com/
Brian Lindshield
107

Danimals® - http://www.danimals.com/New Campaign Markets Activia to Wider Audience - http://www.nytimes.com/2014/01/06/business/media/new-campaign-markets-activia-to-wider-audience.html?_r=0 General Mills Settles Yo-Plus Lawsuit - http://www.foodbusinessnews.net/articles/news_home/Site_News/2013/02/General_Mills_settles_Yo-Plus.aspx?ID={40F62478-1AA4-49DF-9330-E41E19E946D0}&cck=1
Video Probiotics - http://www.youtube.com/watch?v=2k8Puxz54FQ&NR=1
Kansas State University Human Nutrition Textbook
108
4 Macronutrient Uptake, Absorption & Transport
The term absorption can have a number of different meanings. Not everything that is taken up
into the enterocyte from the lumen will be absorbed, so the term uptake refers to compounds
being transported into the enterocyte. Absorption means that a compound is transported from
the enterocyte into circulation. Under most circumstances, compounds that are taken up will
then be absorbed. After this chapter, hopefully this distinction between these terms will be
clear. After later micronutrient chapters, hopefully you will understand the reason for
emphasizing this distinction.
Sections:
4.1 Crypts of Lieberkuhn & Enterocyte Maturation
4.2 Absorptive Lineup & Cell Membranes
4.3 Types of Cell Uptake/Transport
4.4 Carbohydrate Uptake, Absorption, Transport & Liver Uptake
4.5 Protein Uptake, Absorption, Transport & Liver Uptake
4.6 Lipid Uptake, Absorption & Transport
4.7 Glycemic Response, Insulin & Glucagon
Brian Lindshield
109

4.1 Crypts of Lieberkuhn & Enterocyte Maturation
There are some additional anatomical and physiological features of the small intestine that are
important to understand before defining uptake and absorption. Crypts of Lieberkuhn are pits
between villi as pointed out by the green arrow in the figure below.
Figure 4.11 A crypt of Lieberkuhn is the pit between the villi in the small intestine as pointed
out by the green arrow 1
The crypts of Lieberkuhn (often referred to simply as crypts) are similar to the gastric pits in the
stomach. The crypts contain stem cells that can differentiate to produce a number of different
cell types, including enterocytes2. From these stem cells in the crypt, immature enterocyte cells
are formed that mature as they rise, or migrate up, the villi. Thus, the tips at the top of villi are
where the mature, fully functioning enterocytes are located, as represented by the purple cells
in the figure below 3.
Figure 4.12 Crypts are represented by green arrows, fully mature enterocytes are represented
Kansas State University Human Nutrition Textbook
110

by the purple cells at the top of the villi
This maturation and migration is a continuous process. The life cycle of an enterocyte is 72
hours once it enters the villus from the crypt2. Once enterocytes have reached the top of the
villus, they are sloughed off and are either digested (lipid and protein contents taken up by
other enterocytes), or excreted in feces as depicted in the figure below.
Figure 4.13 Enterocytes sloughed off the villus. Unless these cells are digested and their
components are taken up by other enterocytes on the villus, they will be excreted in feces
Thus, we define absorption as reaching body circulation, because compounds taken up into
enterocytes might not make it into body circulation, and thus are not necessarily absorbed.
References & Links 1. http://digestive.niddk.nih.gov/ddiseases/pubs/celiac/ 2. Stipanuk MH. (2006) Biochemical, physiological, & molecular aspects of human nutrition. St. Louis, MO: Saunders Elsevier. 3. Gropper SS, Smith JL, Groff JL. (2008) Advanced nutrition and human metabolism. Belmont, CA: Wadsworth Publishing.
Brian Lindshield
111

4.2 Uptake Lineup & Cell Membranes
Having completed digestion in the small intestine, a number of compounds are ready for
uptake into the enterocyte. The figure below shows the macronutrient uptake lineup, or what is
ready to be taken up into the enterocyte.
Figure 4.21 The macronutrient uptake lineup
From lipids, we have the lysolecithin (from phospholipid), 2-monoglyceride (from triglycerides),
fatty acids, and cholesterol. From protein, there are small peptides (di- and tripeptides) and
amino acids. From carbohydrates, only the monosaccharides glucose, galactose, and fructose
will be taken up. The other macronutrient, water, has not been discussed so far because it does
not undergo digestion.
However, these compounds must now cross the plasma (cell) membrane, which is a
phospholipid bilayer. In the cell membrane, the hydrophilic heads of the phospholipids point
into the lumen as well as towards the interior of the cell, while the tails are on the interior of
the plasma membrane as shown below.
Kansas State University Human Nutrition Textbook
112

Figure 4.22 Plasma membrane of a cell
The plasma membrane contains proteins, cholesterol, and carbohydrates in addition to the
phospholipids. Membrane proteins, such as carriers, channels, pumps and transporters, are
important for moving some compounds through the cell membrane. The figure and two videos
below do a nice job of illustrating the components of the cell membrane.
Brian Lindshield
113

Figure 4.23 Cell membrane1
Web Links
Video: Cell Membrane (1:27)
Video: Voyage inside the cell: Membrane (1:23)
References & Links 1. http://en.wikipedia.org/wiki/File:Cell_membrane_detailed_diagram_4.svg
Videos Cell Membrane - http://www.youtube.com/watch?v=owEgqrq51zY
Voyage Inside the Cell: Membrane - http://www.youtube.com/watch?v=GW0lqf4Fqpg
Kansas State University Human Nutrition Textbook
114

4.3 Types of Cell Uptake/Transport
There are a number of different forms of uptake/transport utilized by your body. These can be
classified as passive or active. The difference between the two is whether energy is required
and whether (from a solute perspective) they move with or against a concentration gradient.
Passive transport does not require energy to move with a concentration gradient. Active
transport requires energy to move against the concentration gradient.
The energy for active uptake/transport is provided by adenosine triphosphate (ATP), which is
the energy currency in the body. The structures of adenosine and phosphate are shown below.
Figure 4.31 Structures of adenosine (left) and phosphate (right)
Tri- means three, thus ATP is adenosine with three phosphate groups bonded to it, as shown
below.
Figure 4.32 Structure of adenosine triphosphate (ATP)
Brian Lindshield
115

Phosphorylation is the formation of a phosphate bond. Dephosphorylation is removal of a
phosphate bond. Overall phosphorylation is a process that require energy. The net effect of
dephosphorylation is the release of energy. Thus, energy is required to add phosphates to ATP,
energy is released through removing phosphates from ATP.
The concentration gradient is a way to describe the difference between the concentration of
the solute outside of a cell versus the concentration inside of a cell. A solute is what is dissolved
in a solvent in a solution; the more solute the higher the concentration. Moving with the
gradient is typically moving of solute from a region of higher concentration to an area of lower
concentration (in order to reach equal solute concentrations on both sides of the membrane).
The exception is osmosis, which moves solvent instead of solute to have the same effect of
equalizing concentrations on both sides of the membrane. Moving against the gradient is
moving solute from an area of lower concentration to an area of higher concentration.
Subsections:
4.31 Passive Uptake/Transport
4.32 Active Uptake/Transport
No References
Kansas State University Human Nutrition Textbook
116

4.31 Passive Uptake/Transport
There are three forms of passive uptake/transport:
1. Simple Diffusion
2. Osmosis
3. Facilitated Diffusion
Below is more information of each type of uptake/transport.
1. Simple Diffusion
Simple diffusion is the movement of solutes from an area of higher concentration (with the
concentration gradient) to an area of lower concentration without the help of a protein, as
shown below.
Figure 4.311 Simple diffusion
2. Osmosis
Osmosis is similar to simple diffusion, but water moves instead of solutes. In osmosis water
molecules move from an area of lower solute concentration to an area of higher solute
concentration of solute as shown below. The effect of this movement is to dilute the area of
higher solute concentration to equalize the solute concentrations on both sides of the
membrane.
Brian Lindshield
117

Figure 4.312 Osmosis
The following videos do a nice job of illustrating osmosis.
Web Links
Video: Osmosis (0:47)
Video: Osmosis in the Kitchen (0:58)
Another example illustrating osmosis is the red blood cells in different solutions shown below.
Figure 4.313 Effect of salt solution concentration on red blood cells 1
We will consider the simple example of salt as the solute. If the solution is hypertonic, that
Kansas State University Human Nutrition Textbook
118

means that there is a greater concentration of salt outside (extracellular) the red blood cells
than within them (intracellular). Water will then move out of the red blood cells to the area of
higher salt concentration, resulting in the shriveled red blood cells depicted. Isotonic means
that there is no difference between concentrations. There is an equal exchange of water
between intracellular and extracellular fluids. Thus, the cells are normal, functioning red blood
cells. A hypotonic solution contains a lower extracellular concentration of salt than the red
blood cell intracellular fluid. As a result, water enters the red blood cells, possibly causing them
to burst.
3. Facilitated Diffusion
The last form of passive absorption is similar to simple diffusion in that it follows the
concentration gradient (higher concentration to lower concentration). However, it requires a
carrier protein to transport the solute across the membrane. The following figure and video do
a nice job of illustrating facilitated diffusion.
Figure 4.314 Facilitated diffusion examples2
Web Link
Video: Facilitated Diffusion (0:27)
References & Links 1. http://en.wikipedia.org/wiki/File:Osmotic_pressure_on_blood_cells_diagram.svg 2.https://en.wikipedia.org/wiki/Facilitated_diffusion#/media/File:Scheme_facilitated_diffusion_in_cell_membrane-en.svg
Videos Osmosis - http://www.youtube.com/watch?v=sdiJtDRJQEc Osmosis in the Kitchen - http://www.youtube.com/watch?v=H6N1IiJTmnc&NR=1&feature=fvwp Facilitated Diffusion - http://www.youtube.com/watch?v=s0p1ztrbXPY
Brian Lindshield
119

4.32 Active Uptake/Transport
There are two forms of active uptake/transport:
1. Active Carrier Transport
2. Endocytosis
1. Active Carrier Transport
Active carrier transport is similar to facilitated diffusion in that it utilizes a protein (carrier or
transport). However, energy is also used to move compounds against their concentration
gradient. The following figure and video do a nice job of illustrating active carrier transport.
Figure 4.321 Sodium-potassium ATPase (aka sodium-potassium pump) an example of active
carrier transport 1
Web Link
Video: Active Transport (0:21)
2. Endocytosis
Endocytosis is the engulfing of particles, or fluids, to be taken up into the cell in vesicles formed
from the cell membrane. If a particle is endocytosed, this process is referred to as phagocytosis.
If a fluid is endocytosed, this process is referred to as pinocytosis as shown below.
Kansas State University Human Nutrition Textbook
120

Figure 4.322 Different types of endocytosis2
The following video does a really nice job of showing how endocytosis occurs.
Web Link
Video: Endocytosis (0:35)
References & Links 1. https://en.wikipedia.org/wiki/File:Scheme_sodium-potassium_pump-en.svg 2. http://commons.wikimedia.org/wiki/File:Endocytosis_types.svg
Videos Active Transport - http://www.youtube.com/watch?v=STzOiRqzzL4 Endocytosis - http://www.youtube.com/watch?v=4gLtk8Yc1Zc
Brian Lindshield
121

4.4 Carbohydrate Uptake, Absorption, Transport & Liver Uptake
Monosaccharides are taken up into the enterocyte. Glucose and galactose are taken up by the
sodium-glucose cotransporter 1 (SGLT1, active carrier transport). The cotransporter part of the
name of this transporter means that it also transports sodium along with glucose or galactose.
Fructose is taken up by facilitated diffusion through glucose transporter (GLUT) 5. There are 12
glucose transporters that are named GLUT 1-12, and all use facilitated diffusion to transport
monosaccharides. The different GLUTs have different functions and are expressed at high levels
in different tissues. Thus, the intestine might be high in GLUT5, but not in GLUT12. Moving back
to monosaccharides, inside the enterocyte, all three are then transported out of the enterocyte
into the capillary (absorbed) through GLUT2 as shown below 1.
Figure 4.41 Carbohydrate uptake and absorption
Inside of each villus there are capillaries and lacteals as shown below. Capillaries are the
smallest blood vessels in the body, lacteals are also small vessels but are part of the lymphatic
system, as will be described further in a later subsection.
Kansas State University Human Nutrition Textbook
122

Figure 4.42 Anatomy of a villus2
The following video does a nice job of illustrating capillaries and lacteal and provides some basic
detail on uptake and absorption.
Web Link
Video: Absorption in the Small Intestine
The capillaries in the small intestine join to the portal vein, which transports monosaccharides
directly to the liver. The figure below shows the portal vein and all the smaller vessels from the
stomach, small intestine, and large intestine that feed into it.
Brian Lindshield
123
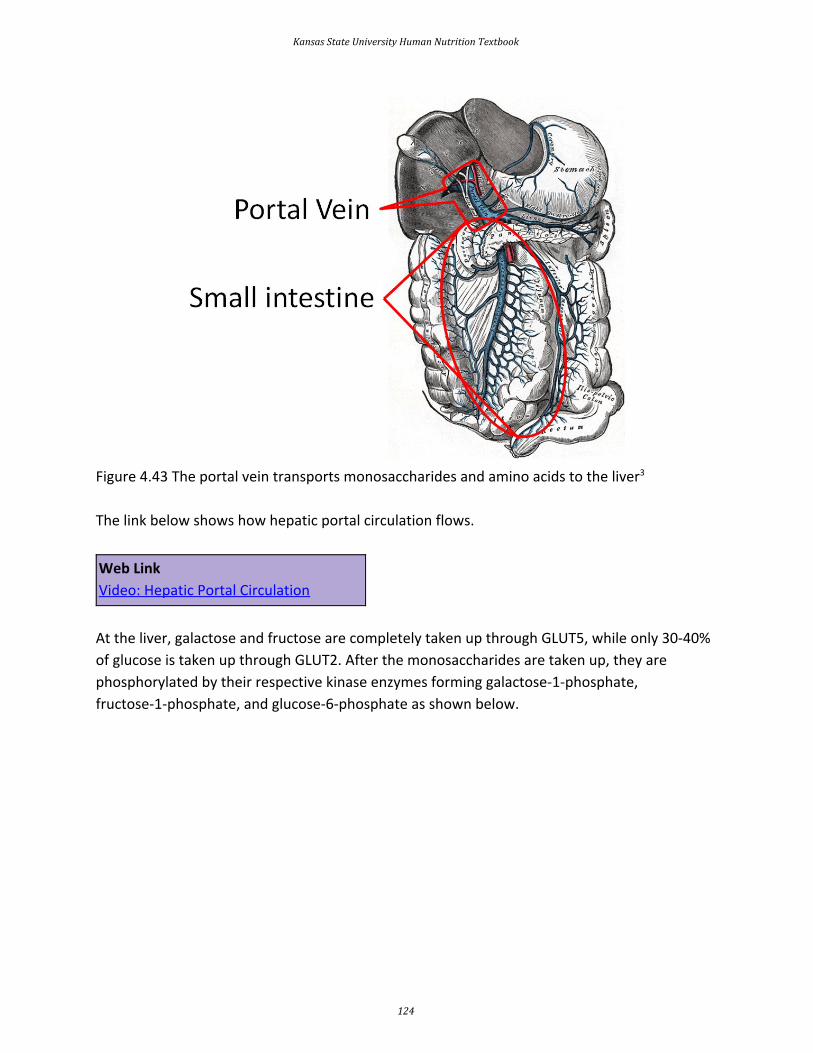
Figure 4.43 The portal vein transports monosaccharides and amino acids to the liver 3
The link below shows how hepatic portal circulation flows.
Web Link
Video: Hepatic Portal Circulation
At the liver, galactose and fructose are completely taken up through GLUT5, while only 30-40%
of glucose is taken up through GLUT2. After the monosaccharides are taken up, they are
phosphorylated by their respective kinase enzymes forming galactose-1-phosphate,
fructose-1-phosphate, and glucose-6-phosphate as shown below.
Kansas State University Human Nutrition Textbook
124

Figure 4.44 Hepatic monosaccharide uptake
Kinase enzymes normally phosphorylate substrates. Phosphorylation of the monosaccharides is
important for maintaining the gradient (by keeping unphosphorylated monosaccharide levels
within hepatocytes low) needed for facilitated diffusion through the GLUT transporters and for
keeping monosaccharides in cells (so they do not move back out if the gradient changes)3. In
order, for the monosaccharide to leave the phosphate will need to be cleaved or removed.
References & Links 1. Stipanuk MH. (2006) Biochemical, physiological, & molecular aspects of human nutrition. St. Louis, MO: Saunders Elsevier. 2. http://en.wikipedia.org/wiki/File:Intestinal_villus_simplified.svg 3. https://commons.wikimedia.org/wiki/File:Gray591.png
Video Absorption in the Small Intestine - http://www.youtube.com/watch?v=P1sDOJM65Bc Hepatic Portal Circulation - https://www.youtube.com/watch?v=x1qV38hWh0E
Brian Lindshield
125

4.5 Glycemic Response, Insulin, & Glucagon
If only 30-40% of glucose is being taken up by the liver, then what happens to the rest? How the
body handles the rise in blood glucose after a meal is referred to as the glycemic response. The
pancreas senses the blood glucose levels and responds appropriately. After a meal, the
pancreatic beta-cells sense that glucose concentrations are high and secrete the hormone
insulin, as shown below1.
Figure 4.51 Pancreatic beta-cells sense high blood glucose and secrete insulin
Thus, as can be seen in the following figure, blood insulin concentrations peak and drop with
blood glucose concentrations over the course of a day.
Kansas State University Human Nutrition Textbook
126

Figure 4.52 Representative figure of blood glucose and insulin levels during a 24-hour period 2
Blood glucose and insulinconcentrations rise following carbohydrate consumption, and they
drop after tissues have taken up the glucose from the blood (described below). Higher than
normal blood sugar concentrations are referred to as hyperglycemia, while lower than normal
blood sugar concentrations are known as hypoglycemia.
Insulin travels through the bloodstream to the muscle and adipose cells. There, insulin binds to
the insulin receptor. This causes GLUT4 transporters that are in vesicles inside the cell to move
to the cell surface as shown below.
Brian Lindshield
127

Figure 4.53 Response of muscle and adipose cells to insulin; 1) binding of insulin to its receptor,
2) movement of GLUT4 vesicles to the cell surface.
The movement of the GLUT4 to the cell surface allows glucose to enter the muscle and adipose
cells. The glucose is phosphorylated to glucose-6-phosphate by hexokinase (different enzyme
but same function as glucokinase in liver) to maintain gradient.
Figure 4.54 Response of muscle and adipose cells to insulin part 2; hexokinase phosphorylates
glucose to glucose-6-phosphate
Glucagon is a hormone that has the opposite action of insulin. Glucagon is secreted from the
alpha-cells of the pancreas when they sense that blood glucose levels are low, as shown below.
Kansas State University Human Nutrition Textbook
128

Figure 4.55 Glucagon secretion from pancreatic alpha-cells in response to low blood glucose
levels.
Glucagon binds to the glucagon receptor in the liver, which causes the breakdown of glycogen
to glucose as illustrated below.
Figure 4.56 Glucagon binding to its receptor leads to the breakdown of glycogen to glucose.
The glucose-6-phosphate has a phosphate removed and glucose is then released into
circulation to raise blood glucose concentrations as shown below.
Brian Lindshield
129

Figure 4.57 Glucagon leads to the release of glucose from the liver.
Subsections:
4.51 Diabetes
4.52 Glycemic Index
4.53 Glycemic Load
References & Links 1. Webb , Akbar , Zhao , Steiner . (2001) Expression profiling of pancreatic beta-cells: Glucose regulation of secretory and metabolic pathway genes. Diabetes 50 Suppl 1: S135. 2. http://en.wikipedia.org/wiki/File:Suckale08_fig3_glucose_insulin_day.jpg
Kansas State University Human Nutrition Textbook
130

4.51 Diabetes
Diabetes is a condition of chronically high blood sugar levels. The prevalence of diabetes in the
US has been rapidly increasing; the link below provides some statistics about prevalence.
Web Link
Diabetes Statistics
There are 2 forms of diabetes, type 1 and type 2.
In type 1 diabetes, not enough insulin is produced, as shown in the figure below.
Figure 4.512 Type 1 diabetes
As a result, GLUT4 does not make it to the surface of muscle and adipose cells, meaning glucose
is not taken up into these cells.
Type 1 diabetes was previously known as juvenile-onset, or insulin-dependent diabetes and is
estimated to account for 5-10% of diabetes cases1. Type 1 diabetics receive insulin through
injections or pumps to manage their blood sugar.
In type 2 diabetes, the body produces enough insulin, but the person's body is resistant to it. In
type 2 diabetics the binding of insulin to its receptor does not cause GLUT4 to move to the
surface of the muscle and adipose cells, thus no glucose is taken up.
Brian Lindshield
131

Figure 4.513 Type 2 diabetes
Type 2 diabetes accounts for 90-95% of diabetes cases and was once known as
non-insulin-dependent diabetes or adult-onset diabetes 1. However, with the increasing rates of
obesity, many younger people are being diagnosed with type 2, making the latter definition no
longer appropriate. Some people with type 2 diabetes can control their condition with a diet
and exercise regimen. This regimen improves their insulin sensitivity, or their response to the
body’s own insulin. Others with type 2 diabetes must receive insulin. These individuals are
producing enough insulin, but are so resistant to it that more is needed for glucose to be taken
up by their muscle and adipose cells.
The video below illustrates type 2 diabetes. However, I do not agree, nor do I teach, that type 2
diabetics have decreased insulin levels as described in the video.
Web Link
Video: Diabetes Mellitus (1:36)
References & Links 1. http://diabetes.niddk.nih.gov/dm/pubs/statistics/#what
Link Diabetes Statisitics - http://www.diabetes.org/diabetes-basics/statistics/
Video Diabetes Mellitus - http://www.youtube.com/watch?v=VLiTbb6MaEU
Kansas State University Human Nutrition Textbook
132

4.52 Glycemic Index
Research has indicated that hyperglycemia is associated with chronic diseases and obesity. As a
result, measures of the glycemic response to food consumption have been developed so that
people can choose foods with a smaller glycemic response. The first measure developed for this
purpose was the glycemic index. The glycemic index is the relative change in blood glucose after
consumption of 50 g of carbohydrate in a test food compared to 50 g of carbohydrates of a
reference food (white bread or glucose). Thus, a high glycemic index food will produce a greater
rise in blood glucose concentrations compared to a low glycemic index food, as shown below.
Figure 4.521 Blood glucose response to a high glycemic index (GI) food compared to a low
glycemic index food1
As a general guideline, a glycemic index that is 70 or greater is high, 56-69 is medium, and 55
and below is low. A stop light graphical presentation has been designed to emphasize the
consumption of the low glycemic index foods while cautioning against the consumption of too
many high glycemic index foods 2.
Brian Lindshield
133

Figure 4.522 Food glycemic index classifications2
The main problem with the glycemic index is that it does not take into account serving sizes.
Let's take popcorn (glycemic index 89-127) as an example. A serving size of popcorn is 20 g, 11 g
of which is carbohydrate 3. This is equal to approximately 2.5 cups of popcorn4. Thus, a person
would have to consume over 11 cups of popcorn to consume 50 g of carbohydrate needed for
the glycemic index measurement. Another example is watermelon, which has a glycemic index
of 103, with a 120 g serving containing only 6 g of carbohydrates 3. To consume the 50 g needed
for glycemic index measurement, a person would need to consume over 1000 g (1 kg) of
watermelon. Assuming this is all watermelon flesh (no rind), this would be over 6.5 cups of
watermelon4.
The website glycemicindex.com (link provided below) contains a database where you can
search to see the food's glycemic index and glycemic load (covered in the next section). The
database contains detail on how the measurement was done and more information on the
product itself. The top link below will take you to this website. The second link is to another
database that contains the same information that might be easier for some people to use.
However, please note that in the second link the glycemic loads are calculated using 100 g
serving sizes for all foods. This might not be the actual serving size for all foods, which is what is
typically used, so it is important to keep this in mind.
Web Links
glycemicindex.com
Glycemic Index & Glycemic Load of Foods
References & Links 1. http://upload.wikimedia.org/wikipedia/commons/e/ec/Glycemic.png 2. www.glycemicindex.com
Kansas State University Human Nutrition Textbook
134

3. Foster-Powell K, Holt SHA, Brand-Miller J. (2002) International table of glycemic index and glycemic load values: 2002. Am J Clin Nutr 76(1): 5. 4. USDA National Nutrient Database - http://www.nal.usda.gov/fnic/foodcomp/search/
Links Glycemicindex.com - http://www.glycemicindex.com/ Glycemic Index & Glycemic Load of Foods - http://dietgrail.com/gid/
Brian Lindshield
135

4.53 Glycemic Load
To incorporate serving size into the calculation, another measure known as the glycemic load
has been developed. It is calculated as shown below:
Glycemic Load = (Glycemic Index X (g) Carbs/serving)/100
Thus, in most instances, the glycemic load is a more meaningful measure of the glycemic
response of different foods. Considering the two examples from the glycemic index section,
their glycemic loads would be:
Popcorn
(89-127 X 11 g Carbs/Serving)/100= 10-14
Watermelon
(103 X 6 g Carbs/Serving)/100 = 6.18
As a general guideline for glycemic loads of foods : 20 or above is high, 11-19 is medium, and 10
or below is low1,2.
Figure 4.531 Food glycemic load classifications 1,2
Putting it all together, popcorn and watermelon have high glycemic indexes, but medium and
low glycemic loads, respectively.
Kansas State University Human Nutrition Textbook
136
You can also use the top two links below to find the glycemic loads of foods. However, please
note that in the second link the glycemic loads are calculated using 100g serving sizes for all
foods. This might not be the actual serving size for all foods, which is what is typically used, so it
is important to keep this in mind. The third link is to the NutritionData estimated glycemic load
tool that is pretty good at estimating the glycemic loads of foods, even if actual glycemic
indexes have not been measured.
Web Links
glycemicindex.com
Glycemic Index & Glycemic Load of Foods
Estimated Glycemic Load
References & Links 1. http://www.mendosa.com/gilists.htm 2. http://www.nutritiondata.com/help/estimated-glycemic-load
Links Glycemicindex.com - http://www.glycemicindex.com/ Glycemic Index & Glycemic Load of Foods - http://dietgrail.com/gid/ Estimated Glycemic Load - http://www.nutritiondata.com/help/estimated-glycemic-load
Brian Lindshield
137
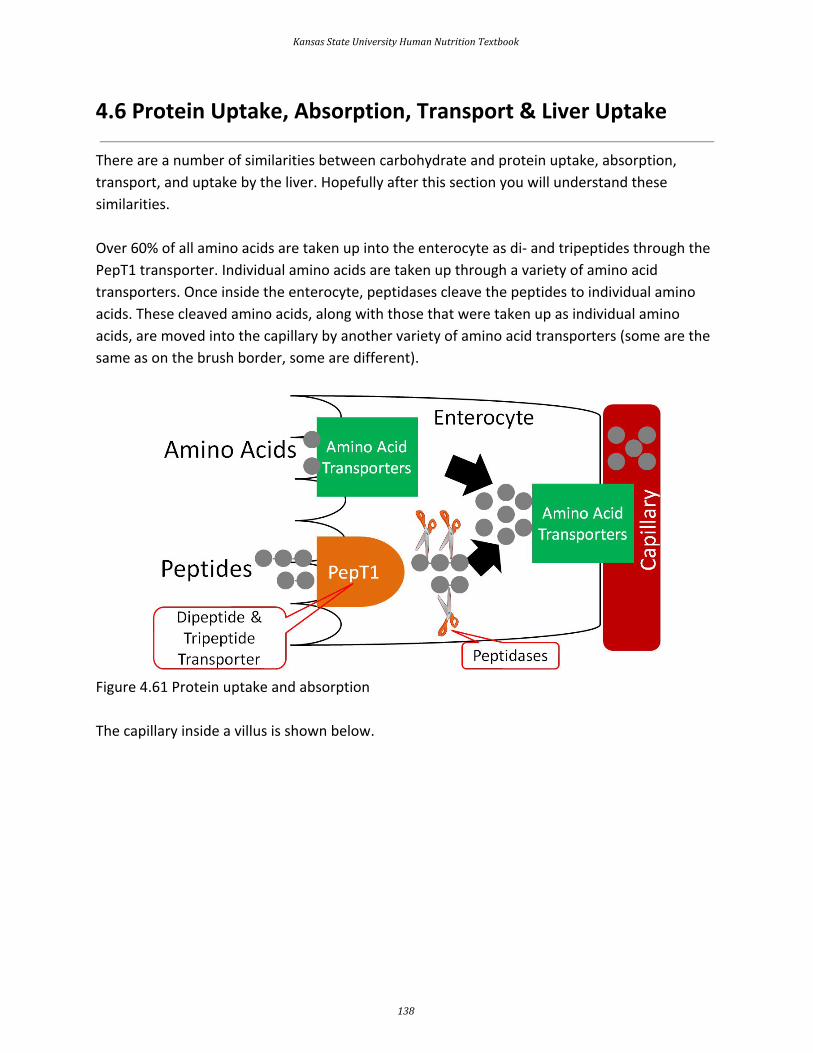
4.6 Protein Uptake, Absorption, Transport & Liver Uptake
There are a number of similarities between carbohydrate and protein uptake, absorption,
transport, and uptake by the liver. Hopefully after this section you will understand these
similarities.
Over 60% of all amino acids are taken up into the enterocyte as di- and tripeptides through the
PepT1 transporter. Individual amino acids are taken up through a variety of amino acid
transporters. Once inside the enterocyte, peptidases cleave the peptides to individual amino
acids. These cleaved amino acids, along with those that were taken up as individual amino
acids, are moved into the capillary by another variety of amino acid transporters (some are the
same as on the brush border, some are different).
Figure 4.61 Protein uptake and absorption
The capillary inside a villus is shown below.
Kansas State University Human Nutrition Textbook
138

Figure 4.62 Anatomy of a villus1
Like monosaccharides, amino acids are transported directly to the liver through the portal vein.
Figure 4.63 The portal vein transports monosaccharides and amino acids to the liver 2
Brian Lindshield
139

Amino acids are taken up into the hepatocyte through a variety of amino acid transporters. The
amino acids can then be used to either make proteins or are broken down to produce glucose,
as will be described in chapter 6.
Figure 4.64 Hepatic amino acid uptake
References & Links 1. http://en.wikipedia.org/wiki/File:Intestinal_villus_simplified.svg 2. https://commons.wikimedia.org/wiki/File:Gray591.png
Kansas State University Human Nutrition Textbook
140

4.7 Lipid Uptake, Absorption & Transport
Once mixed micelles reach the brush border of the enterocyte, two different lipid uptake
mechanisms are believed to occur, but lipid uptake is not completely understood. One
mechanism is that individual components of micelles may diffuse across the enterocyte.
Otherwise, it is believed that some components may be taken up through unresolved
transporters. For example, cholesterol transporters have been identified, but their overall
mechanism of absorption is not well understood. The individual compounds are taken up as
shown below.
Figure 4.71 Uptake of mixed micelle components into the enterocyte
Once inside the enterocyte, there are different fates for fatty acids, depending on their length.
Short- and medium-chain fatty acids move through the enterocyte and enter circulation
through the capillaries; they are transported by the protein albumin. They will be carried to the
liver by the portal vein, like monosaccharides and amino acids. Long-chain fatty acids,
2-monoglyceride, lysolecithin, and cholesterol will be re-esterified forming triglycerides,
phosphatidylcholine, and cholesterol esters, respectively. These re-esterified lipids are then
packaged into chylomicrons, which are lipoproteins, that are described in further detail in the
next section. These chylomicrons are too large to fit through the pores in the capillaries, but
they can fit through the larger fenestrations (openings) in the lacteal.
Brian Lindshield
141

Figure 4.72 Fates of lipids in the enterocyte
Lacteals (shown below) are small vessels that feed into the lymphatic system. Thus, the
chylomicrons enter the lacteals and enter into lymphatic circulation.
Figure 4.73 Anatomy of a villus, with the lacteal shown in blue 1
The lymphatic system is a system similar to the circulatory system in that it contains vessels
that transport fluid. However, instead of blood, the lymphatic system contains a clear fluid
known as lymph. There are a number of lymph nodes (small glands) within the lymphatic
system that play a key role in the body's immune system. The figure below shows the lymphatic
system.
Kansas State University Human Nutrition Textbook
142

Figure 4.74 The lymphatic system2
The following videos describe and illustrate how the lymphatic system and lymph functions.
Web Links
Video: Lymphatic System (0:49)
Video: Lymph Movement (0:44)
The lymphatic system enters general circulation through the thoracic duct that enters the left
subclavian vein as shown below. General in this case means that it is not directed to the liver
like other components that have been absorbed.
Brian Lindshield
143

Figure 4.75 The thoracic duct is where the lymphatic system enters circulation3
The animation below is an overview of lipid digestion, uptake, and initial transport. The video
gives a general overview of macronutrient digestion, uptake, and absorption now that you have
learned about all 3 macronutrients.
Web Links
Animation: Lipid Digestion, Uptake, and Transport
Video: Small Intestine (1:29)
Subsection:
4.71 Lipoproteins
References & Links 1. http://en.wikipedia.org/wiki/File:Intestinal_villus_simplified.svg 2. http://en.wikipedia.org/wiki/File:Illu_lymphatic_system.jpg 3. http://en.wikipedia.org/wiki/File:Gray505.png
Link http://www.wiley.com/college/grosvenor/0470197587/animations/Animation_Lipid_Digestion_and_Absorption/Energy/media/content/dig/anima/dig5a/frameset.htm
Videos
Kansas State University Human Nutrition Textbook
144

Lymphatic system - http://www.youtube.com/watch?v=qTXTDqvPnRk Lymph Movement - https://www.youtube.com/watch?v=UpiJMzfHgYM Small Intestine - http://www.youtube.com/watch?v=P1sDOJM65Bc
Brian Lindshield
145

4.71 Lipoproteins
Lipoproteins, as the name suggests, are complexes of lipids and protein. The proteins within a
lipoprotein are called apolipoproteins (aka apoproteins). There are a number of different
apolipoproteins that are abbreviated apo-, then an identifying letter (i.e. Apo A) as shown in the
chylomicron below.
Figure 4.711 Chylomicron structure 1
The following video does a nice job of illustrating the different lipoprotein components.
Web Link
Video: Lipoproteins (0:28)
There are a number of lipoproteins in the body. They differ by the apolipoproteins they contain,
size (diameter), density, and composition. The table below shows the difference in density and
diameter of different lipoproteins. Notice that as diameter decreases, density increases.
Table 4.711 The density and diameter of different lipoproteins2
Lipoprotein Density
(g/dL)
Diameter
(nm)
Chylomicrons 0.95 75-1200
VLDL (very low-density lipoproteins) 0.95-1.006 30-80
IDL (intermediate-density lipoproteins) 1.006-1.019 25-35
LDL (low-density lipoproteins) 1.019-1.063 18-25
Kansas State University Human Nutrition Textbook
146

HDL (high-density lipoproteins) 1.063-1.21 5-12
This inverse relationship is a result of the larger lipoproteins being composed of a higher
percentage of triglyceride and a lower percentage of protein as shown below.
Figure 4.712 Composition of lipoproteins 3
Protein is more dense than triglyceride (why muscle weighs more than fat), thus the higher
protein/lower triglyceride composition, the higher the density of the lipoprotein. Many of the
lipoproteins are named based on their densities (i.e. very low-density lipoproteins).
As described in the last subsection, the lipoproteins released from the small intestine are
chylomicrons. The video below does a nice job of showing, describing, and illustrating how
chylomicrons are constructed and function.
Web Link
Video: Chylomicrons (0:55)
The endothelial cells that line blood vessels, especially in the muscle and adipose tissue, contain
the enzyme lipoprotein lipase (LPL). LPL cleaves the fatty acids from lipoprotein triglycerides so
that the fatty acids can be taken up into tissues. The figure below illustrates how endothelial
cells are in contact with the blood that flows through the lumen of blood vessels.
Brian Lindshield
147

Figure 4.713 Lining of a blood vessel. The lumen is where the blood would be flowing, thus
endothelial cells are those that are in contact with blood4
LPL cleaves fatty acids from the triglycerides in the chylomicron, decreasing the amount of
triglyceride in the lipoprotein. This lipoprotein with less triglycerides becomes what is known as
a chylomicron remnant, as shown below.
Figure 4.714 The cleavage of triglycerides by LPL from a chylomicron leads to the formation of a
chylomicron remnant.
Now in the form of a chylomicron remnant, the digested lipid components originally packaged
into the chylomicron are directed to the liver where the chylomicron remnant is endocytosed.
Kansas State University Human Nutrition Textbook
148

This process of clearing chylomicrons from the blood takes 2-10 hours after a meal 2. This is why
people must fast 12 hours before having their blood lipids (triglycerides, HDL, LDL etc.)
measured. This fast allows all the chylomicrons and chylomicron remnants to be cleared before
blood is taken. However, whether patients should be asked to fast has been questioned as
described in the link below.
Web Link
Should you fast before a cholesterol test?
After the chylomicron remnant is endocytosed, it is broken down to its individual components
(triglycerides, cholesterol, protein etc.). In the liver, VLDL are produced, similar to how
chylomicrons are produced in the small intestine. The individual components are packaged into
VLDL and secreted into circulation as shown below.
Figure 4.715 Chylomicron remnants are taken up by the liver. The liver secretes VLDL that
contain cholesterol (C)
Like it does to chylomicrons, LPL cleaves fatty acids from triglycerides in VLDL, forming the
smaller IDL (aka VLDL remnant). Further action of LPL on IDL results in the formation of LDL. The
C in Figures 4.715 and 4.716 represents cholesterol, which is not increasing; rather, since
triglyceride is being removed, it constitutes a greater percentage of particle mass of
lipoproteins. As a result, LDL is composed mostly of cholesterol, as depicted in the figure below.
Brian Lindshield
149

Figure 4.716 Formation of IDL and LDL from VLDL
LDL contains a specific apolipoprotein (Apo B100) that binds to LDL receptors on the surface of
target tissues. The LDL are then endocytosed into the target tissue and broken down to
cholesterol and amino acids.
HDL are made up of mostly protein and are derived from the liver and intestine. HDL
participates in reverse cholesterol transport, which is the transport of cholesterol back to the
liver. HDL picks up cholesterol from tissues/blood vessels and returns it to the liver itself or
transfers it to other lipoproteins returning to the liver.
Figure 4.717 HDL is involved in reverse cholesterol transport
Kansas State University Human Nutrition Textbook
150

The animation under the transport button in the following link does a really nice job of going
through the process of lipoprotein transport.
Web Link
Lipoprotein Animation
You are probably familiar with HDL and LDL being referred to as "good cholesterol" and "bad
cholesterol," respectively. This is an oversimplification to help the public interpret their blood
lipid values, because cholesterol is cholesterol; it's not good or bad. LDL and HDL are
lipoproteins, and as a result you can't consume good or bad cholesterol, you consume
cholesterol. A more appropriate descriptor for these lipoproteins would be HDL "good
cholesterol transporter" and LDL "bad cholesterol transporter."
What's so bad about LDL? LDL enters the endothelium where it is oxidized. This LDL and/or
oxidized LDL is engulfed by white blood cells (macrophages), leading to the formation of what
are known as foam cells. The foam cells eventually accumulate so much LDL that they die and
accumulate, forming a fatty streak. From there the fatty streak, which is the beginning stages of
a lesion, can continue to grow until it blocks the artery. This can result in a myocardial infarction
(heart attack) or a stroke. HDL is good in that it scavenges cholesterol from other lipoproteins
or cells and returns it to the liver. The figure below shows the formation of the fatty streak and
how this can progress to a point where it greatly alters blood flow.
Brian Lindshield
151

Figure 4.718 The formation of a lesion in an artery 6
The video below does an excellent job of illustrating this process. However there are two
caveats to point out. First, it incorrectly refers to cholesterol (LDL-C etc.), and second, it is
clearly made by a drug company, so keep these factors in mind. The link below is the American
Heart Association’s simple animation of how atherosclerosis develops.
Web Link
Video: Atherosclerosis (5:36)
Cholesterol and CAD
Despite what you learned above about HDL, a recent study questions its importance in
preventing cardiovascular disease. It found that people who have genetic variations that lead to
higher HDL levels were not at decreased risk of developing cardiovascular disease. You can read
Kansas State University Human Nutrition Textbook
152

more about this interesting finding in the first link below. In addition, another recent study is
questioning whether saturated fat is associated with an increased risk of cardiovascular disease.
Web Link
Doubt Cast on the ‘Good’ in ‘Good Cholesterol’
Study Questions Fat and Heart Disease Link
References & Links 1. http://en.wikipedia.org/wiki/File:Chylomicron.svg 2. Byrd-Bredbenner C, Moe G, Beshgetoor D, Berning J. (2009) Wardlaw's perspectives in nutrition. New York, NY: McGraw-Hill. 3. Gropper SS, Smith JL, Groff JL. (2008) Advanced nutrition and human metabolism. Belmont, CA: Wadsworth Publishing. 4. http://en.wikipedia.org/wiki/File:Anatomy_artery.png 5. 7. Erdman JW Jr., MacDonald IA, Zeisel SH, editors. (2012) Present knowledge in nutrition - 10th ed. Ames, IA: Wiley-Blackwell. 6. http://en.wikipedia.org/wiki/File:Endo_dysfunction_Athero.PNG
Links Ask Well: Should you fast before a cholesterol test - http://well.blogs.nytimes.com/2016/05/24/ask-well-should-you-fast-before-a-cholesterol-test/ Lipoprotein Animation - http://www.wiley.com/legacy/college/boyer/0470003790/animations/cholesterol/cholesterol.swf Cholesterol and CAD - http://watchlearnlive.heart.org/CVML_Player.php?moduleSelect=chlcad Doubt Cast on the ‘Good’ in ‘Good Cholesterol’ - http://www.nytimes.com/2012/05/17/health/research/hdl-good-cholesterol-found-not-to-cut-heart-risk.html Study Questions Fat and Heart Disease Link - http://well.blogs.nytimes.com/2014/03/17/study-questions-fat-and-heart-disease-link/
Videos Lipoproteins - https://www.youtube.com/watch?v=x-4ZQaiZry8 Chylomicrons - http://www.youtube.com/watch?v=hRx_i9npTDU Atherosclerosis - http://www.youtube.com/watch?v=fLonh7ZesKs&feature=rec-HM-r2
Brian Lindshield
153

5 Common Digestive Problems
Before moving to metabolism, we are going learn about some common digestive problems.
Sections:
5.1 Peptic Ulcers
5.2 Gallstones
5.3 Irritable Bowel Syndrome
5.4 Inflammatory Bowel Disease
5.5 Celiac Disease & Gluten
5.6 Diverticulosis & Diverticulitis
5.7 Hemorrhoids
Kansas State University Human Nutrition Textbook
154

5.1 Peptic Ulcers
When the mucus layer of the stomach or duodenum becomes too thin, acid can erode the cells
lining these tissues. This results in a lesion known as a peptic ulcer, as shown below.
Figure 5.11 A peptic ulcer in the duodenum1
The first video says that goblet cells secrete mucus in the stomach. This is not correct; they
secrete mucus in the intestine. It should be neck cells in the stomach. The second link shows
what two ulcers actually look like in the stomach.
Web Links
Video: Gastric Ulcers (1:21)
Video: Endoscopy of Two Giant Gastric Ulcers (0:26)
10% of Americans will develop an ulcer in their lifetime. Despite common beliefs, these ulcers
are not caused by stress or spicy foods. Most ulcers are believed to be caused by the
acid-resistant bacteria, Helicobacter pylori. 30-40% of Americans are infected with this bacteria.
Helicobacter pylori causes a thinning of the mucus that protects the stomach and duodenum
from gastric acid. It is not clear how Helicobacter pylori is transmitted, though it may be
through contaminated food or water. It might also be spread through contact with vomit, feces,
or saliva of an infected person1.
Prolonged use of nonsteroidal anti-inflammatory drugs (NSAIDS) such as aspirin, ibuprofen, or
naproxen (Aleve) are also frequent causes of peptic ulcers. NSAIDs inhibit the production of a
Brian Lindshield
155

protective eicosanoid1. References & Links 1.https://www.niddk.nih.gov/health-information/digestive-diseases/peptic-ulcers-stomach-ulcers/definition-facts
Videos Gastric Ulcers - http://www.youtube.com/watch?v=98JaiKH2q3E Endoscopy of Two Giant Gastric Ulcers - http://www.youtube.com/watch?v=ncHcpzCnjGQ&feature=related
Kansas State University Human Nutrition Textbook
156

5.2 Gallstones
It is estimated that up to 1 million Americans are hospitalized annually as a result of gallstones,
making it the most common of all digestive diseases1. Gallstones are formed when bile hardens
in the gallbladder. 80% of gallstones are a result of cholesterol precipitation, while 20% are a
result of bile pigment precipitation 2. The cause of gallstones is unknown2. The way in which
gallstones are formed is shown in the following video.
Web Link
Video: Gallstones (0:27)
The following figure shows a severe case of gallstones.
Figure 5.21 Gallstones within a dissected gallbladder3
Many people do not experience symptoms from gallstones. They are usually discovered during
examination for another health condition. However, some people experience an "attack" or
pain that results from blockage of the bile ducts. The gallbladder is not essential, so the primary
treatment is cholecystectomy, the removal of the gallbladder. Bile then flows directly from the
liver into the small intestine.
References & Links 1. Bar-Meir S. (2001) Gallstones: Prevalence, diagnosis and treatment. The Israel Medical Association Journal 3(2): 111. 2. http://www.niddk.nih.gov/health-information/health-topics/digestive-diseases/gallstones/Pages/facts.aspx 3. http://en.wikipedia.org/wiki/File:Gallstones.jpg
Video Gallstones - http://www.youtube.com/watch?v=1q3NxfwSENM&feature=rec-HM-fresh+div
Brian Lindshield
157

5.3 Irritable Bowel Syndrome
Up to 20% of Americans may have irritable bowel syndrome (IBS). A syndrome is a group of
symptoms, not a disease. In IBS, the colon does not function correctly. The symptoms of IBS are
cramping, bloating, gas, diarrhea, and/or constipation. The cause of IBS is unknown. Diet
changes, stress reduction, and medicine may help manage the condition 1. To learn more about
IBS, see the reference below.
Reference 1.http://www.niddk.nih.gov/health-information/health-topics/digestive-diseases/irritable-bowel-syndrome/pages/definition-facts.aspx
Kansas State University Human Nutrition Textbook
158

5.4 Inflammatory Bowel Disease
Inflammatory bowel disease refers to a number of inflammatory conditions in the intestine. The
two most common are Crohn's Disease and ulcerative colitis. These two conditions differ mainly
in the areas of the intestine that are affected. Crohn's disease can occur anywhere throughout
the GI tract, but most commonly occurs in the last part of the ileum. Crohn's disease may also
involve all layers of the intestine 1. Ulcerative colitis are ulcers, or sores, in the lining of the colon
and/or rectum2. It is estimated that up to 1 million people have IBD in the United States. Half of
these individuals have Crohn's disease, and the other half have ulcerative colitis 3.
The figure in the link below illustrates the differences between these two conditions.
Web Links
Ulcerative Colitis vs. Crohn’s Disease
The exact causes of these two diseases is not known. One hypothesized cause is an overactive
immune system (autoimmune response, the immune system attack tissues/cells rather than
pathogens) that results in the chronic inflammation and collateral damage to the cells of the
intestine, resulting in formation of lesions.
Crohn's disease and ulcerative colitis present symptoms similar to other gastrointestinal
diseases, such as irritable bowel syndrome and GERD.
References & Links 1. http://www.niddk.nih.gov/health-information/health-topics/digestive-diseases/crohns-disease/Pages/facts.aspx 2.http://www.niddk.nih.gov/health-information/health-topics/digestive-diseases/ulcerative-colitis/Pages/facts.aspx 3. http://www.ccfa.org/info/about/crohns
Links Ulcerative Colitis vs. Crohn’s Disease - http://www.quibd.com/wp-content/uploads/2015/08/DIFFERENCES001.jpg
Brian Lindshield
159

5.5 Celiac Disease & Gluten
1 out of every 133 people in the United States has celiac disease 1. People with celiac disease
cannot consume the protein gluten because it causes their body to generate an autoimmune
response (immune cells attack the body's own cells) that causes damage to the villi in the
intestine, as shown below.
Figure 5.51 Different stages of celiac disease2
This damage to the villi impairs the absorption of macronutrients and micronutrients from food.
There are a variety of symptoms for celiac disease that vary depending on age and from person
to person.
What is gluten?
Gluten is a protein that is bound to starch in the endosperm of grains such as:
Wheat
Barley
Rye
Triticale
Kansas State University Human Nutrition Textbook
160
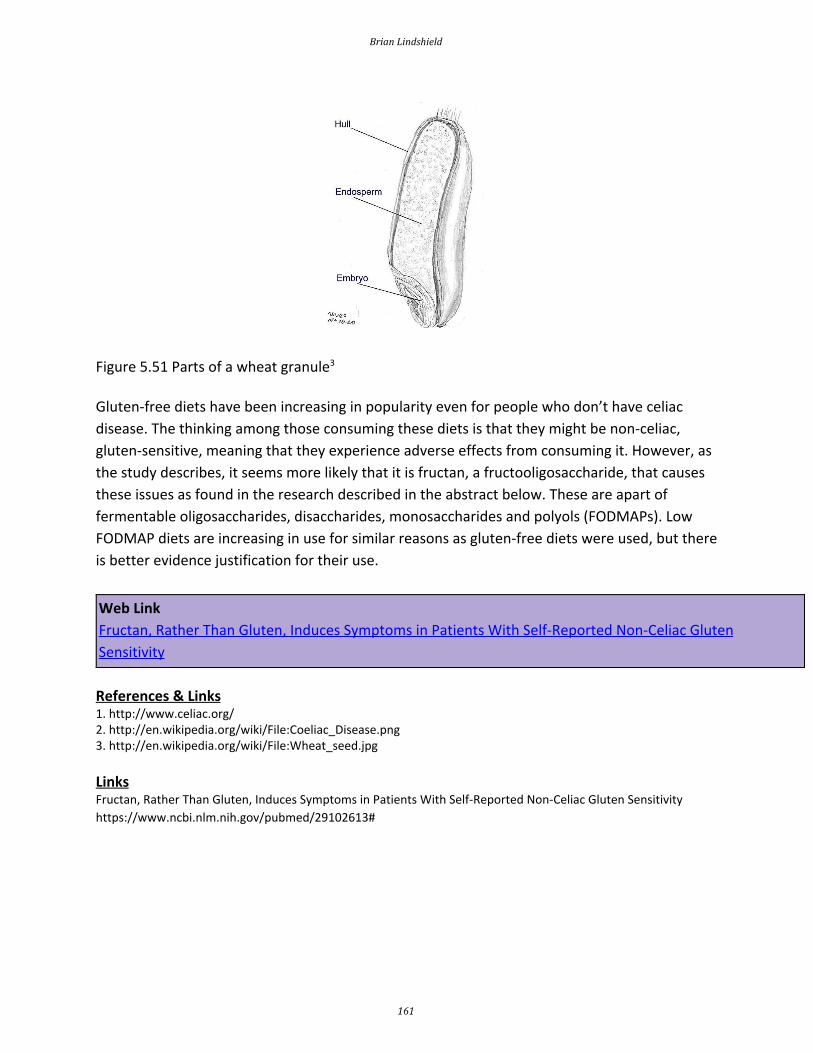
Figure 5.51 Parts of a wheat granule3
Gluten-free diets have been increasing in popularity even for people who don’t have celiac
disease. The thinking among those consuming these diets is that they might be non-celiac,
gluten-sensitive, meaning that they experience adverse effects from consuming it. However, as
the study describes, it seems more likely that it is fructan, a fructooligosaccharide, that causes
these issues as found in the research described in the abstract below. These are apart of
fermentable oligosaccharides, disaccharides, monosaccharides and polyols (FODMAPs). Low
FODMAP diets are increasing in use for similar reasons as gluten-free diets were used, but there
is better evidence justification for their use.
Web Link
Fructan, Rather Than Gluten, Induces Symptoms in Patients With Self-Reported Non-Celiac Gluten
Sensitivity
References & Links 1. http://www.celiac.org/ 2. http://en.wikipedia.org/wiki/File:Coeliac_Disease.png 3. http://en.wikipedia.org/wiki/File:Wheat_seed.jpg
Links Fructan, Rather Than Gluten, Induces Symptoms in Patients With Self-Reported Non-Celiac Gluten Sensitivity
https://www.ncbi.nlm.nih.gov/pubmed/29102613#
Brian Lindshield
161

5.6 Diverticulosis and Diverticulitis
Approximately 10% of people under 40, and 50% of people over 60 years old have a condition
known as diverticulosis 1. In this condition, diverticula (plural, diverticulum singular), or
outpouches, are formed at weak points in the large intestine, primarily in the lowest section of
the sigmoid colon, as nicely shown in the figure below and in the video in the web link below.
Figure 5.61 Diverticula on the large intestine 1
Web Link
Video: Diverticulosis (1:24)
It is believed that diverticula are formed as a result of a low-fiber diet because people may
strain more during bowel movements. Most people with diverticulosis do not know that they
have the condition. However, if the pouches become inflamed, then the condition is known as
diverticulitis. The most common symptom of this condition is abdominal pain. A liquid diet may
be needed until the inflammation is decreased, then fiber is gradually increased 1. References & Links 1.http://www.niddk.nih.gov/health-information/health-topics/digestive-diseases/diverticular-disease/Pages/facts.aspx#1
Video https://www.youtube.com/watch?v=ThuBZxbLo9g
Kansas State University Human Nutrition Textbook
162

5.7 Hemorrhoid s
Hemorrhoids are swollen or inflamed veins of the anus or lower rectum. An internal
hemorrhoid occurs within the anus, while an external hemorrhoid occurs in the skin
surrounding the anus. Symptoms of hemorrhoids include bleeding, pain during bowel
movements, and/or itching 1. It is estimated that “about 75% of people will have hemorrhoids at
some point in their lives” 2.
Figure 5.71 Hemorrhoids 3
The first 55 seconds of the following video does a nice job of illustrating what hemorrhoids are
and how they develop.
Web Link
Video: Hemorrhoid s (2:05)
The anus and lower rectum experience high pressure during bowel movements. Thus,
hemorrhoids are believed to be caused by straining during bowel movements. To prevent this
condition from occurring, it is recommended that people consume a high-fiber diet, drink
plenty of water, and exercise to produce regular, large, soft stools. In addition, people should
"go" at first urge and not wait until it is more than an urge 2.
Brian Lindshield
163

References & Links 1. http://www.webmd.com/a-to-z-guides/hemorrhoids-topic-overview 2. http://www.niddk.nih.gov/health-information/health-topics/digestive-diseases/hemorrhoids/Pages/facts.aspx 3. http://en.wikipedia.org/wiki/File:Hemorrhoid.png
Video Hemorrhoids - http://www.youtube.com/watch?v=C8vZoIhQCwU
Kansas State University Human Nutrition Textbook
164

6 Macronutrient & Alcohol Metabolism
Now that we have digested, taken up, absorbed, and transported the macronutrients, the next
step is to learn how these macronutrients are metabolized. Alcohol is also included at the end
of this chapter, even though it is not a macronutrient.
Sections:
6.1 Metabolism Basics
6.2 Carbohydrate Metabolism
6.3 Lipid Metabolism
6.4 Protein Metabolism
6.5 Alcohol Metabolism
Brian Lindshield
165

6.1 Metabolism Basics
Metabolism consists of all the chemical processes that occur in living cells. These
processes/reactions can generally be classified as either anabolic or catabolic. Anabolic means
to build, catabolic means to breakdown. If you have trouble remembering the difference
between the two, remember that anabolic steroids are what are used to build enormous
muscle mass.
Figure 6.11 One of these two is taking anabolic steroids, which one would be your guess?
An anabolic reaction/pathway requires energy to build something. A catabolic
reaction/pathway generates energy by breaking down something. This is shown in the example
below of glucose and glycogen. The same is true for other macronutrients.
Figure 6.12 The breakdown of glycogen to glucose is catabolic. The glucose can then be used to
produce energy. The synthesis of glycogen from glucose is anabolic and requires energy.
Anabolic and catabolic can also be used to describe conditions in the body. For instance, after a
meal there is often a positive energy balance, or there is more energy and macronutrients than
Kansas State University Human Nutrition Textbook
166

the body needs at that time. Thus, some energy needs to be stored and the macronutrients will
be used for synthesis, such as amino acids being used for protein synthesis. However, after a
fast, or a prolonged period without energy intake, the body is in negative energy balance and is
considered catabolic. In this condition, macronutrients will be mobilized from their stores to be
used to generate energy. For example, if prolonged enough, protein can be broken down, then
the released amino acids can be broken down to be used as an energy source.
A number of the metabolic reactions oxidize or reduce compounds. A compound that is being
oxidized loses at least one electron, while a compound that is reduced gains at least 1 electron.
To remember the difference, a mnemonic device such as OIL (oxidation is lost), RIG (reduction
is gained) is helpful. Oxidation-reduction reactions are illustrated in the figure below.
Figure 6.13 The purple compound is being oxidized, the orange compound is being reduced 1
Another way to remember oxidation versus reduction is LEO goes GER (like a lion)
Lose Electrons = Oxidize
G ain E lectrons = R educe
Iron is a good example we can use to illustrate oxidation-reduction reactions. Iron commonly
exists in two oxidation states (Fe 3+ or Fe2+). It is constantly oxidized/reduced back and forth
between the two states. The oxidation/reduction of iron is shown below.
Brian Lindshield
167

Fe3+ + e- → Fe2+ Reduced
Fe2+ → Fe3+ + e- Oxidized
However, some oxidation reduction reactions are not as easy to recognize. There are some
simple rules to help you recognize less obvious oxidation/reduction reactions that are based
upon the gain or loss of oxygen or hydrogen. These are as follows:
Oxidation: gains oxygen or loses hydrogen
Reduction: loses oxygen or gains hydrogen
References 1. http://en.wikipedia.org/wiki/Image:Gulf_Offshore_Platform.jpg
Kansas State University Human Nutrition Textbook
168

6.11 Cofactors
A number of enzymes require cofactors to function. Some also require what other textbooks
and resources refer to as coenzymes. But to keep things simple, we are going to include these
coenzymes in our definition of cofactors. Thus, cofactors can be either organic or inorganic
molecules that are required by enzymes to function. Many organic cofactors are vitamins or
molecules derived from vitamins. Most inorganic cofactors are minerals. The reason why some
vitamins and minerals are essential nutrients is because of their required role as cofactors for
some enzymes. Cofactors can be oxidized or reduced for the enzymes to catalyze the reactions.
Two common cofactors that are derived from the B vitamins, niacin and riboflavin, are
nicotinamide adenine dinucleotide (NAD) and flavin adenine dinucleotide (FAD), respectively.
The structure of NAD and FAD are shown below.
Figure 6.111 Structure of NAD1 upside down. The atoms are circled to help orient this structure
with Figure 6.113
Brian Lindshield
169

Figure 6.112 Structure of FAD2. The nitrogens are circled to help orient this structure with
Figure 6.114
Both of these cofactors can be reduced (or oxidized as well); NAD is reduced to form NADH,
while FAD is reduced to form FADH2 as shown in the 2 figures below.
Figure 6.113 The reduction of NAD to form NADH3
Figure 6.114 The reduction of FAD4 to FADH2
Kansas State University Human Nutrition Textbook
170

An example of a mineral that serves as a cofactor is Fe 2+ for proline and lysyl hydroxylases. We
will discuss later in detail why vitamin C (ascorbic acid) is needed to reduce iron to Fe2+ so that it
can serve as a cofactor for proline and lysyl hydroxylases.
Figure 6.115 Iron (Fe2+) is a cofactor for proline and lysyl hydroxylases
References & Links 1. http://en.wikipedia.org/wiki/File:NAD%2B_phys.svg 2. http://en.wikipedia.org/wiki/File:Flavin_adenine_dinucleotide.png 3. http://en.wikipedia.org/wiki/File:NAD_oxidation_reduction.svg 4. http://en.wikipedia.org/wiki/File:FAD_FADH2_equlibrium.png
Brian Lindshield
171

6.2 Carbohydrate Metabolism Pathways
There are many metabolic pathways/cycles/processes/reactions that are involved in the
synthesis or degradation of carbohydrates and compounds formed from them. Please note that
most of these pathways are not specific to carbohydrates only. Gluconeogenesis will be
covered in the protein section, because amino acids are a common substrate used for
synthesizing glucose.
Carbohydrate Pathways/Cycles/Processes/Reactions:
Glycogenesis
-glycogen synthesis
Glycogenolysis
-glycogen breakdown
Gluconeogenesis
-synthesis of glucose from a non-carbohydrate source
Glycolysis
-breakdown of glucose to pyruvate
Transition Reaction
-conversion of pyruvate to acetyl-CoA
Citric Acid (Tricarboxylic acid (TCA), Kreb's) Cycle
-acetyl-CoA combines with oxaloacetate to form citrate; ATP, NADH, and FADH 2 are produced in
the cycle
Electron Transport Chain
-oxidative phosphorylation, producing ATP from NADH and FADH2
Subsections:
6.21 Monosaccharide Metabolism
6.22 Glycogenesis & Glycogenolysis
6.23 Glycolysis
6.24 Transition Reaction
Kansas State University Human Nutrition Textbook
172

6.25 Citric Acid Cycle
6.26 Electron Transport Chain
6.27 Aerobic Glucose Metabolism Totals
6.28 Anaerobic Respiration
Brian Lindshield
173

6.21 Monosaccharide Metabolism
Galactose and fructose metabolism is a logical place to begin looking at carbohydrate
metabolism, before shifting focus to the preferred monosaccharide glucose. The figure below
reminds you that in the liver, galactose and fructose have been phosphorylated.
Figure 6.211 Uptake of monosaccharides into the hepatocyte
Galactose
In the liver, galactose-1-phosphate is converted to glucose-1-phosphate, before finally being
converted to glucose-6-phosphate1. As shown below, glucose 6-phosphate can then be used in
either glycolysis or glycogenesis, depending on the person's current energy state.
Figure 6.212 Conversion of galactose-1-phosphate to glucose-6-phosphate
Kansas State University Human Nutrition Textbook
174

Fructose
Unlike galactose, fructose cannot be used to form phosphorylated glucose. Instead,
fructose-1-phosphate is cleaved in the liver to form glyceraldehyde 3-phosphate, a glycolysis
(pathway that breaks down glucose) intermediate . This occurs through multiple steps, as
depicted below.
Figure 6.213 Conversion of fructose-1-phosphate to glyceraldehyde 3-phosphate
Glucose-6-Phosphate
Within hepatocytes or myocytes (muscle cells), glucose-6-phosphate can be used either for
glycogenesis (glycogen synthesis) or glycolysis (breakdown of glucose for energy production). If
the person is in an anabolic state, they will use glucose-6-phosphate for storage. If they are in a
catabolic state, they will use it for energy production. In an anabolic state, glucose-6-phosphate
will be used for glycogen synthesis for storage. In catabolic state, it will be used for energy
production.
Brian Lindshield
175

Figure 6.214 The "fork in the road" for glucose-6-phosphate
References & Links 1. Gropper SS, Smith JL, Groff JL. (2008) Advanced nutrition and human metabolism. Belmont, CA: Wadsworth Publishing.
Kansas State University Human Nutrition Textbook
176

6.22 Glycogenesis & Glycogenolysis
As discussed earlier, glycogen is the animal storage form of glucose. If a person is in an anabolic
state, such as after consuming a meal, most glucose-6-phosphate within the myocytes (muscle
cells) or hepatocytes (liver cells) is going to be stored as glycogen. The structure is shown below
as a reminder.
Figure 6.221 Structure of glycogen1
Glycogen is mainly stored in the liver and the muscle. It makes up ~6% of the wet weight of the
liver and only 1% of muscle wet weight. However, since we have far more muscle mass in our
Brian Lindshield
177

body, there is 3-4 times more glycogen stored in muscle than in the liver2. We have limited
glycogen storage capacity. Thus, after a high-carbohydrate meal, our glycogen stores will reach
capacity. After glycogen stores are filled, glucose will have to be metabolized in different ways
for it to be stored in a different form.
Glycogenesis
The synthesis of glycogen from glucose is a process known as glycogenesis.
Glucose-6-phosphate is not inserted directly into glycogen in this process. There are a couple of
steps before it is incorporated. First, glucose-6-phosphate is converted to glucose-1-phosphate
and then converted to uridine diphosphate (UDP)-glucose. UDP-glucose is inserted into
glycogen by either the enzyme, glycogen synthase (alpha-1,4 bonds), or the branching enzyme
(alpha-1,6 bonds) at the branch points 3.
Figure 6.222 Glycogenesis
Glycogenolysis
The process of liberating glucose from glycogen is known as glycogenolysis. This process is
essentially the opposite of glycogenesis with two exceptions: (1) there is no UDP-glucose step,
and (2) a different enzyme, glycogen phosphorylase, is involved. Glucose-1-phosphate is
cleaved from glycogen by the enzyme, glycogen phosphorylase, which then can be converted to
glucose-6-phosphate as shown below 3.
Kansas State University Human Nutrition Textbook
178

Figure 6.223 Glycogenolysis
References & Links 1. http://en.wikipedia.org/wiki/File:Glycogen.png 2. Shils ME, Shike M, Ross AC, Caballero B, Cousins RJ, editors. (2006) Modern nutrition in health and disease. Baltimore, MD: Lippincott Williams & Wilkins. 3. Gropper SS, Smith JL, Groff JL. (2008) Advanced nutrition and human metabolism. Belmont, CA: Wadsworth Publishing.
Brian Lindshield
179

6.23 Glycolysis
If a person is in a catabolic state or in need of energy, such as during fasting, most
glucose-6-phosphate will be used for glycolysis.
Figure 6.231 The "fork in the road" for glucose-6-phosphate
Glycolysis is the breaking down of one glucose molecule (6 carbons) into two pyruvate
molecules (3 carbons). During the process, a net of two ATPs and two NADHs are also
produced.
Figure 6.232 Glycolysis1
Kansas State University Human Nutrition Textbook
180

The following animation, using ball-and-stick models, allows you to control the 3 steps of
glycolysis.
Web Links
Glycolysis Animation
3 steps of Glycolysis
1. Energy investment step - 2 ATP are added to the 6 carbon molecule.
Figure 6.233 Glycolysis step 1, energy investment1
2. Glucose Split - The 6 carbon molecule is split into two 3 carbon molecules.
Brian Lindshield
181

Figure 6.234 Glycolysis step 2, glucose split 1
3. Energy harvesting step - 1 NADH and 2 ATPs are produced from each 3 carbon molecule
(there are two 3 carbon molecules formed from each glucose).
Figure 6.235 Glycolysis step 3, energy harvesting1
Thus, from a molecule of glucose, the harvesting step produces a total of four ATPs and two
NADHs. Subtracting the harvesting from the investment step, the net output from one molecule
of glucose is two ATPs and two NADHs.
Kansas State University Human Nutrition Textbook
182

The figure below shows the stages of glycolysis, as well as the transition reaction, citric acid
cycle, and electron transport chain that are utilized by cells to produce energy. They are also
the focus of the next 3 sections.
Figure 6.236 Glycolysis, transition reaction, citric acid cycle, and the electron transport chain 2
References & Links 1. http://en.wikipedia.org/wiki/File:Glycolysis.svg 2. http://en.wikipedia.org/wiki/File:CellRespiration.svg
Links Glycolysis Animation - http://www.science.smith.edu/departments/Biology/Bio231/glycolysis.html
Brian Lindshield
183

6.24 Transition Reaction
If a person is in a catabolic state, or needs energy, how pyruvate will be used depends on
whether adequate oxygen levels are present. If there are adequate oxygen levels (aerobic
conditions), pyruvate moves from the cytoplasm, into the mitochondria, and then undergoes
the transition reaction. If there are not adequate oxygen levels (anaerobic conditions), pyruvate
will instead be used to produce lactate in the cytoplasm. We are going to focus on the aerobic
pathway to begin with, then we will address what happens under anaerobic conditions in the
anaerobic respiration section.
Figure 6.241 Pyruvate fork in the road. What happens depends on whether it is aerobic or
anaerobic respiration1
The transition reaction is the transition between glycolysis and the citric acid cycle. The
transition reaction converts pyruvate (3 carbons) to acetyl CoA (2 carbons), producing carbon
dioxide (CO2) and a NADH as shown below. The figure below shows the transition reaction with
CoA and NAD entering, and acetyl-CoA, CO2, and NADH being produced.
Kansas State University Human Nutrition Textbook
184

Figure 6.242 Transition reaction 2
The acetyl is combined with coenzyme A (CoA) to form acetyl-CoA. The structure of CoA is
shown below.
Figure 6.243 Structure of coenzyme A3
Thus, for one molecule of glucose, the transition reaction produces 2 acetyl-CoAs, 2 molecules
of CO 2, and 2 NADHs.
References & Links 1. https://simple.wikipedia.org/wiki/Mitochondria#/media/File:Animal_mitochondrion_diagram_en_(edit).svg 2. http://en.wikipedia.org/wiki/Image:Citric_acid_cycle_with_aconitate_2.svg 3. http://en.wikipedia.org/wiki/Image:Coenzym_A.svg
Brian Lindshield
185

6.25 The Citric Acid Cycle
Acetyl-CoA is a central point in metabolism, meaning there are a number of ways that it can be
used. We are going to continue to consider its use in an aerobic, catabolic state (need energy).
Under these conditions, acetyl-CoA will enter the citric acid cycle (aka Krebs Cycle, TCA Cycle).
The following figure shows the citric acid cycle.
Figure 6.251 The citric acid cycle1
The citric acid cycle begins by acetyl-CoA (2 carbons) combining with oxaloacetate (4 carbons)
to form citrate (aka citric acid, 6 carbons). A series of transformations occur before a carbon is
given off as carbon dioxide and NADH is produced. This leaves alpha-ketoglutarate (5 carbons).
Another carbon is given off as CO 2 to form succinyl CoA (4 carbons) and produce another NADH.
In the next step, one guanosine triphosphate (GTP) is produced as succinyl-CoA is converted to
Kansas State University Human Nutrition Textbook
186

succinate. GTP is readily converted to ATP, thus this step is essentially the generation of 1 ATP.
In the next step, an FADH2 is produced along with fumarate. Then, after more steps, another
NADH is produced as oxaloacetate is regenerated.
Thus, the net output from one cycle is:
2 CO2
3 NADH
1 FADH2
1 GTP (converted to ATP)
The two carbons that are given off as CO 2 originally came from acetyl-CoA.
The first video and the animation do a good job of explaining and illustrating how the cycle
works. The second video is an entertaining rap about the cycle.
Web Links
Video: Citric acid cycle (0:44)
Citric acid cycle animation
Video: TCA (Kreb's) Cycle Rap (3:01)
There are two acetyl-CoAs produced from one glucose, so the net from one glucose is the
amount generated from two cycles:
4 CO2
6 NADH
2 FADH2
2 GTP (converted to ATP)
Through glycolysis, the transition reaction, and the citric acid cycle, multiple NADH and FADH 2 molecules are produced. Under aerobic conditions, these molecules will enter the electron
transport chain to be used to generate energy through oxidative phosphorylation as described
in the next section.
Brian Lindshield
187

Figure 6.252 The pathways involved in aerobic respiration 2
References & Links 1. http://en.wikipedia.org/wiki/Image:Citric_acid_cycle_with_aconitate_2.svg 2. http://en.wikipedia.org/wiki/File:CellRespiration.svg
Link Citric Acid Cycle Animation - http://www.wiley.com/college/boyer/0470003790/animations/tca/tca.htm
Video Citric acid cycle - http://www.youtube.com/watch?v=hw5nWB0xN0Y TCA (Kreb's) Cycle Rap - http://www.youtube.com/watch?v=aMBIs_Iw0kE
Kansas State University Human Nutrition Textbook
188

6.26 Electron Transport Chain
The electron transport chain is located on the inner membrane of the mitochondria, as shown
below.
Figure 6.261 The pathways involved in aerobic respiration 1
The electron transport chain contains a number of electron carriers. These carriers take the
electrons from NADH and FADH 2, pass them down the chain of complexes and electron carriers,
and ultimately produce ATP. More specifically, the electron transport chain takes the energy
from the electrons on NADH and FADH2 to pump protons (H +) into the intermembrane space.
This creates a proton gradient between the intermembrane space (high) and the matrix (low) of
the mitochondria. ATP synthase uses the energy from this gradient to synthesize ATP. Oxygen is
required for this process because it serves as the final electron acceptor, forming water.
Collectively this process is known as oxidative phosphorylation. The following figure and
animation do a nice job of illustrating how the electron transport chain functions.
Brian Lindshield
189

Figure 6.262 Location of the electron transport chain in the mitochondria 2
Web Link
ETC Animation
2.5 ATP/NADH and 1.5 ATP/FADH2 are produced in the electron transport chain. Some
resources will say 3 ATP/NADH and 2 ATP/FADH2, but these values are generally less accepted
now.
For one molecule of glucose, the preceding pathways produce:
Glycolysis: 2 NADH
Transition Reaction: 2 NADH
Citric Acid Cycle: 6 NADH, 2 FADH2
Total 10 NADH, 2 FADH2
Multiply that by the amount of ATP per NADH or FADH2 to yield:
10 NADH X 2.5 ATP/NADH = 25 ATP
2 FADH2 X 1.5 ATP/FADH2 = 3 ATP
Total 28 ATP
Kansas State University Human Nutrition Textbook
190

The first video does a nice job of illustrating and reviewing the electron transport chain. Note
that it uses 3 ATP/NADH and 2 ATP/FADH 2 so the totals from each cycle are different from
those listed above. The second video is a great rap video explaining the steps of glucose
oxidation.
Web Links
Video: Electron Transport (1:43)
Video: Oxidate it or Love it/Electron to the Next One (3:23)
References & Links 1. http://en.wikipedia.org/wiki/File:CellRespiration.svg 2. http://en.wikipedia.org/wiki/File:Mitochondrial_electron_transport_chain%E2%80%94Etc4.svg
Link ETC Animation - http://www.science.smith.edu/departments/Biology/Bio231/etc.html
Videos Electron Transport Chain - http://www.youtube.com/watch?v=1engJR_XWVU&feature=related Oxidate it or Love it/Electron to the Next One - http://www.youtube.com/watch?v=VCpNk92uswY&feature=response_watch
Brian Lindshield
191

6.27 Aerobic Glucose Metabolism Totals
The table below shows the ATP generated from one molecule of glucose in the different
metabolic pathways.
Table. 6.271 ATP generated from one molecule of glucose.
Metabolic Pathway ATP Generated
Glycolysis 2
Citric Acid Cycle 2
Electron Transport Chain 28
Total 32
Notice that the vast majority of ATP is generated by the electron transport chain. If we do the
math, 28/32 X 100 = 87.5% of the ATP from a molecule of glucose is generated by the electron
transport chain. Remember that this is aerobic and requires oxygen to be the final electron
acceptor. If 3 ATP/NADH and 2 ATP/FADH2 are used instead of 2.5 ATP/NADH and 1.5
ATP/FADH2 that were used above, total ATP and percentage of ATP produced by the electron
transport chain would be different. But the takeaway message remains the same. The electron
transport chain by far produces the most ATP from one molecule of glucose.
No References
Kansas State University Human Nutrition Textbook
192

6.28 Anaerobic Respiration
Conditions without oxygen are referred to as anaerobic. In this case, the pyruvate will be
converted to lactate in the cytoplasm of the cell as shown below.
Figure 6.281 Pyruvate fork in the road, what happens depends on whether it is aerobic or
anaerobic respiration1
What happens if oxygen isn't available to serve as the final electron acceptor? As shown in the
following video, the ETC becomes backed up with electrons and can't accept them from NADH
and FADH 2.
Web Link
Video: What happens when you run out of oxygen? (0:37)
This leads to a problem in glycolysis because NAD is needed to accept electrons, as shown
below. Without the electron transport chain functioning, all NAD has been reduced to NADH
and glycolysis cannot continue to produce ATP from glucose.
Brian Lindshield
193

Figure 6.282 Why NAD needs to be regenerated under anaerobic conditions2
Thus, there is a workaround to regenerate NAD by converting pyruvate (pyruvic acid) to lactate
(lactic acid) as shown below.
Figure 6.283. The conversion of pyruvic acid to lactic acid regenerates NAD 3,4
However, anaerobic respiration only produces 2 ATP per molecule of glucose, compared to 32
ATP for aerobic respiration. The biggest producer of lactate is the muscle. Through what is
known as the Cori cycle, lactate produced in the muscle can be sent to the liver. In the liver,
through a process known as gluconeogenesis, glucose can be regenerated and sent back to the
muscle to be used again for anaerobic respiration forming a cycle as shown below.
Kansas State University Human Nutrition Textbook
194

Figure 6.284 The Cori cycle5
It is worth noting that the Cori cycle also functions during times of limited glucose (like fasting) to spare glucose by not completely oxidizing it. References & Links 1. https://simple.wikipedia.org/wiki/Mitochondria#/media/File:Animal_mitochondrion_diagram_en_(edit).svg 2. http://en.wikipedia.org/wiki/File:CellRespiration.svg 3. https://en.wikipedia.org/wiki/Pyruvic_acid#/media/File:Pyruvic-acid-2D-skeletal.png 4. https://en.wikipedia.org/wiki/Lactic_acid#/media/File:Lactic-acid-skeletal.svg 5. https://commons.wikimedia.org/wiki/File:CoriCycle-noLang.svg#/media/File:CoriCycle-eng.svg
Video What happens when your run out of oxygen? - http://www.youtube.com/watch?v=StXlo1W3Gvg
Brian Lindshield
195

6.3 Lipid Metabolism Pathways
Five lipid metabolic pathways/processes will be covered in the following subsections:
6.31 Lipolysis (Triglyceride Breakdown)
-Breakdown of triglycerides to glycerol and free fatty acids.
6.32 Fatty Acid Oxidation (Beta-Oxidation)
-Breakdown of fatty acids to acetyl-CoA
6.33 De Novo Lipogenesis (Fatty Acid & Triglyceride Synthesis)
-Synthesis of fatty acids from acetyl-CoA and esterification into triglycerides
6.34 Ketogenesis (Ketone Body Synthesis)
-Synthesis of ketone bodies from acetyl-CoA
6.35 Cholesterol Synthesis
Kansas State University Human Nutrition Textbook
196

6.31 Lipolysis (Triglyceride Breakdown)
Lipolysis is the cleavage of triglycerides to glycerol and fatty acids, as shown below.
Figure 6.311 Lipolysis
There are two primary lipolysis enzymes:
1. Lipoprotein lipase (LPL)
2. Hormone-sensitive lipase (HSL)
Despite performing the same function, at the adipose level, the enzymes are primarily active for
seemingly opposite reasons. In the fed state, LPL on the endothelium of blood vessels cleaves
lipoprotein triglycerides into fatty acids so that they can be taken up into adipocytes, for
storage as triglycerides, or myocytes where they are primarily used for energy production. This
action of LPL on lipoproteins is shown in the two figures below.
Figure 6.312 Lipoprotein lipase cleaves fatty acids from the chylomicron, forming a chylomicron
remnant.
Brian Lindshield
197

Figure 6.313 Lipoprotein lipase cleaves triglycerides from VLDL and IDL, forming subsequent
lipoproteins (IDL and LDL) that contain less triglyceride
HSL is an important enzyme in adipose tissue, which is a major storage site of triglycerides in
the body. HSL activity is increased by glucagon and epinephrine ("fight or flight" hormone), and
decreased by insulin. Thus, in hypoglycemia (such as during a fast) or a "fight or flight"
response, triglycerides in the adipose are cleaved, releasing fatty acids into circulation that then
bind with the transport protein albumin. Thus, HSL is important for mobilizing fatty acids so
they can be used to produce energy. The figure below shows how fatty acids can be taken up
and used by tissues such as the muscle for energy production1.
Figure 6.314 Hormone-sensitive lipase
Kansas State University Human Nutrition Textbook
198

We are not going to focus on glycerol, but it does have two metabolic fates.
1. It can be broken down in glycolysis
2. It can be used to synthesize glucose (gluconeogenesis)
Figure 6.315 Metabolic fates of glycerol
References & Links
1. Byrd-Bredbenner C, Moe G, Beshgetoor D, Berning J. (2009) Wardlaw's perspectives in nutrition. New York, NY: McGraw-Hill.
Brian Lindshield
199

6.32 Fatty Acid Oxidation (Beta-oxidation)
To generate energy from fatty acids, they must be oxidized. This process occurs in the
mitochondria, but long chain fatty acids cannot diffuse across the mitochondrial membrane
(similar to absorption into the enterocyte). Carnitine, an amino acid-derived compound, helps
shuttle long-chain fatty acids into the mitochondria. The structure of carnitine is shown below.
Figure 6.321 Carnitine shuttles fatty acids into the mitochondria 1,2
Fatty Acid Shuttling
As shown below, there are two enzymes involved in this process: carnitine palmitoyltransferase
I (CPTI) and carnitine palmitoyltransferase II (CPTII). CPTI is located on the outer mitochondrial
membrane, CPTII is located on the inner mitochondrial membrane. The fatty acid is first
activated by addition of a CoA (forming acyl-CoA), then CPTI adds carnitine. Acyl-Carnitine is
then transported into the mitochondrial matrix with the assistance of the enzyme translocase.
In the matrix, CPTII removes carnitine from the activated fatty acid (acyl-CoA). Carnitine is
recycled back into the cytosol to be used again, as shown in the figure and animation below.
Even though carnitine is important for this action, taking supplemental carnitine will not
increase fatty acid oxidation. This is due to the fact that the amount of carnitine available is not
limiting fatty acid oxidation.
Kansas State University Human Nutrition Textbook
200

Figure 6.322 Transfer of fatty acids into the mitochondria3
Web Link
Fatty acid transfer from cytoplasm to mitochondria
Fatty Acid Activation
As shown below, the first step of fatty acid oxidation is activation. A CoA molecule is added to
the fatty acid to produce acyl-CoA, converting ATP to AMP in the process. Note that in this step,
the ATP is converted to AMP, not ADP. Thus, activation uses the equivalent of 2 ATP molecules4.
Brian Lindshield
201

Figure 6.323 Fatty Acid Oxidation
Fatty Acid Oxidation
Fatty acid oxidation is also referred to as beta-oxidation because 2 carbon units are cleaved off
at the beta-carbon position (2nd carbon from the acid end) of an activated fatty acid. The
cleaved 2 carbon unit forms acetyl-CoA and produces an activated fatty acid (acyl-CoA) with 2
fewer carbons, acetyl-CoA, NADH, and FADH2.
To completely oxidize the 18-carbon fatty acid above, 8 cycles of beta-oxidation have to occur.
This might seem like one too few cycles (18 divided by 2 is nine), but the last cycle will split the
4 carbon fatty acid into 2 acetyl-CoAs, meaning that it only takes 8 cycles to completely cleave
the fatty acid. Overall beta oxidation of an 18 carbon fatty acids will produce:
9 acetyl-CoAs
8 NADH
8 FADH2
Those 9 acetyl-CoAs can continue into the citric acid cycle, where they can produce:
9 GTP
9 FADH2
27 NADH
Kansas State University Human Nutrition Textbook
202

The products of the complete oxidation of a fatty acid are shown below.
Figure 6.324 Complete oxidation of a 18 carbon (C) fatty acid
Adding up the NADH and FADH 2, the electron transport chain ATP production from
beta-oxidation and the citric acid cycle looks like this:
NADH
8 (beta-oxidation) + 27 (TCA) = 35 NADH X 2.5 ATP/NADH = 87.5 ATP
FADH2
8 (beta-oxidation) + 9 (TCA) = 17 FADH 2 X 1.5 ATP/FADH2 = 25.5 ATP
GTP
9 GTP = 9 ATP
Total ATP from complete oxidation of an 18 carbon fatty acid:
87.5 + 25.5 + 9 = 122 ATP
Brian Lindshield
203

Subtract 2 ATP (ATP-->AMP) required for activation of the fatty acid:
122-2 = 120 Net ATP
Compared to glucose (32 ATP) you can see that there is far more energy stored in a fatty acid.
This is because fatty acids are in a more reduced form and thus, they yield 9 kcal/g instead of 4
kcal/g like carbohydrates4.
The following animation reviews lipolysis and beta-oxidation.
Web Link
Fatty Acid Metabolism
References & Links 1. http://en.wikipedia.org/wiki/File:Carnitine_structure.png 2. https://simple.wikipedia.org/wiki/Mitochondria#/media/File:Animal_mitochondrion_diagram_en_(edit).svg 3.https://en.wikipedia.org/wiki/Carnitine_palmitoyltransferase_I#/media/File:Acyl-CoA_from_cytosol_to_the_mitochondrial_matrix.svg 4. Berg JM, Tymoczko JL, Stryer L. (2002) Biochemistry. New York, NY: W.H. Freeman and Company.
Links Fatty acid transfer from cytoplasm to mitochondrian - http://brookscole.cengage.com/chemistry_d/templates/student_resources/shared_resources/animations/carnitine/carnitine1.html Fatty Acid Metabolism - http://www.wiley.com/legacy/college/boyer/0470003790/animations/fatty_acid_metabolism/fatty_acid_metabolism.htm
Kansas State University Human Nutrition Textbook
204
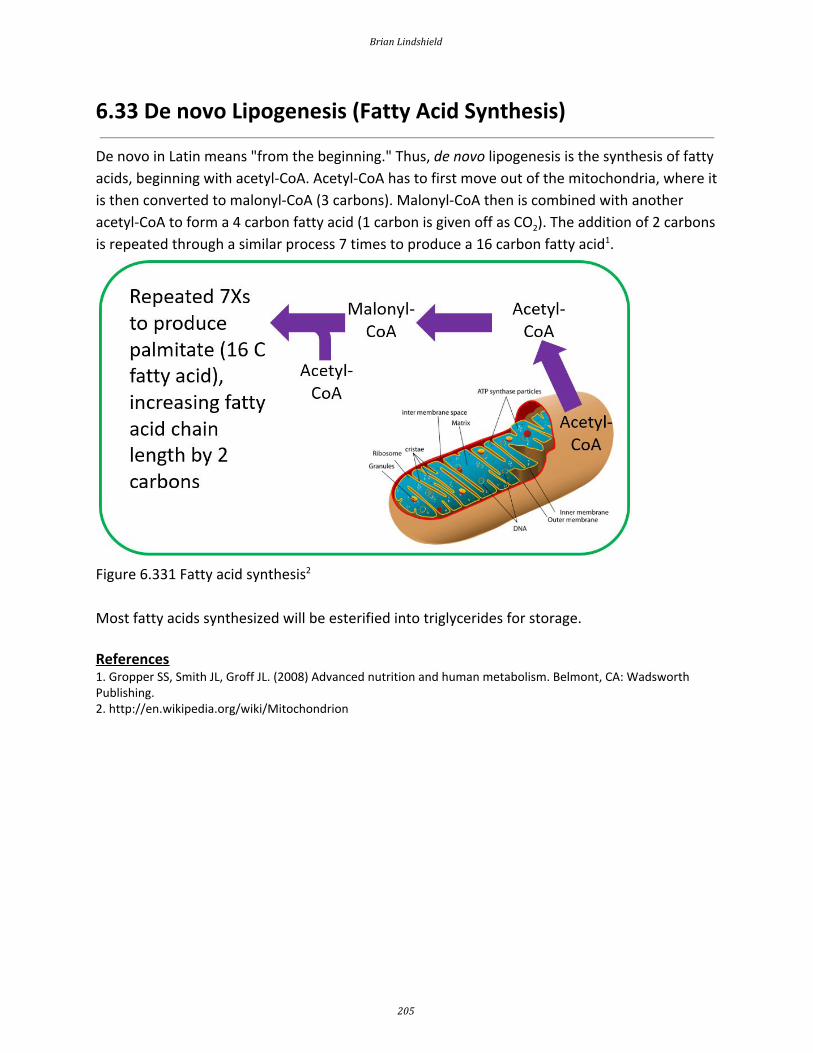
6.33 De novo Lipogenesis (Fatty Acid Synthesis)
De novo in Latin means "from the beginning." Thus, de novo lipogenesis is the synthesis of fatty
acids, beginning with acetyl-CoA. Acetyl-CoA has to first move out of the mitochondria, where it
is then converted to malonyl-CoA (3 carbons). Malonyl-CoA then is combined with another
acetyl-CoA to form a 4 carbon fatty acid (1 carbon is given off as CO 2). The addition of 2 carbons
is repeated through a similar process 7 times to produce a 16 carbon fatty acid 1.
Figure 6.331 Fatty acid synthesis 2
Most fatty acids synthesized will be esterified into triglycerides for storage.
References 1. Gropper SS, Smith JL, Groff JL. (2008) Advanced nutrition and human metabolism. Belmont, CA: Wadsworth Publishing. 2. http://en.wikipedia.org/wiki/Mitochondrion
Brian Lindshield
205

6.34 Ketone Body Synthesis
In cases where there is not enough glucose available for the brain (very low carbohydrate diets,
starvation), the liver can use acetyl-CoA, primarily from fatty acids (but also certain amino
acids), to synthesize ketone bodies (ketogenesis). The structures of the three ketone bodies;
acetone, acetoacetic acid, and beta-hydroxybutyric acid, are shown below.
Figure 6.341 The three ketone bodies from top to bottom (acetone, acetoacetic acid, and
beta-hydroxybutyric acid 1)
After they are synthesized in the liver, ketone bodies are released into circulation where they
can travel to the brain. The brain converts the ketone bodies to acetyl-CoA that can then enter
the citric acid cycle for ATP production, as shown below.
Kansas State University Human Nutrition Textbook
206

Figure 6.342 The production, release, use, or exhalation of ketone bodies 2
If there are high levels of ketones secreted, it results in a condition known as ketosis or
ketoacidosis. The high level of ketones in the blood decreases the blood’s pH, meaning it
becomes more acidic. It is debatable whether mild ketoacidosis is harmful, but severe
ketoacidosis can be lethal. One symptom of this condition is fruity or sweet smelling breath,
which is due to increased acetone exhalation.
References & Links 1. http://en.wikipedia.org/wiki/File:Ketone_bodies.png 2. http://commons.wikimedia.org/wiki/File:Liver.svg
Brian Lindshield
207

6.35 Cholesterol Synthesis
Acetyl-CoA is also used to synthesize cholesterol. As shown below, there are a large number of
reactions and enzymes involved in cholesterol synthesis.
Figure 6.351 Cholesterol synthesis pathway 1
Simplifying this, acetyl-CoA is converted to acetoacetyl-CoA (4 carbons) before forming
3-hydroxy-3-methylglutaryl-CoA (HMG-CoA). HMG-CoA is converted to mevalonate by the
enzyme HMG-CoA reductase. This enzyme is important because it is the rate-limiting enzyme in
cholesterol synthesis.
Kansas State University Human Nutrition Textbook
208

Figure 6.352 Cholesterol synthesis simplified 2
A rate-limiting enzyme is like a bottleneck in a highway, as shown below, that determines the
flow of traffic past it.
Figure 6.353 Bottleneck in traffic 3
Rate-limiting enzymes limit the rate at which a metabolic pathway proceeds. The
pharmaceutical industry has taken advantage of this knowledge to lower people's LDL levels
with drugs known as statins. These drugs inhibit HMG-CoA reductase and thus decrease
Brian Lindshield
209

cholesterol synthesis. Less cholesterol leads to lower LDL levels, and hopefully a lower risk of
cardiovascular disease.
The brand name of the statins approved for use in the US are 4:
Lipitor
Lescol
Mevacor
Pravachol
Crestor
Zocor
Livalo
The cholesterol guidelines have changed dramatically from the previous focus on LDL and HDL
target levels. Now statins are prescribed at set therapeutic doses based on assessed
cardiovascular risk rather than based off LDL and HDL target levels. It is also recommended that
only statins that have been shown to decrease cardiovascular disease risk be used, some have
only been shown to improve LDL/HDL levels. The link below is to the online calculator that can
be used to estimate individual’s risk.
Web Link
Check.Change.Control Heart Attack & Stroke Risk Calculator
The body synthesizes approximately 1 gram of cholesterol a day, whereas it is recommended
that we consume less than 0.3 gram a day. A number of tissues synthesize cholesterol, with the
liver accounting for ~20% of synthesis. The intestine is believed to be the most active among
the other tissues that are responsible for the other 80% of cholesterol synthesis 5. References & Links 1. https://en.wikipedia.org/wiki/Statin#/media/File:HMG-CoA_reductase_pathway.png 2. http://en.wikipedia.org/wiki/File:Squalene.svg 3. http://en.wikipedia.org/wiki/File:Bottleneck.svg 4. http://www.medicinenet.com/statins/page3.htm 5. Gropper SS, Smith JL, Groff JL. (2008) Advanced nutrition and human metabolism. Belmont, CA: Wadsworth Publishing.
Links Check.Change.Control Heart Attack & Stroke Risk Calculator - https://ccccalculator.ccctracker.com/
Kansas State University Human Nutrition Textbook
210

6.4 Protein Metabolism
Section 2.22 described how proteins are synthesized. Thus, this section will focus on how
proteins and amino acids are broken down. There are four protein metabolic pathways that will
be covered in this section:
Transamination
-transfer of an amino group from one amino acid to another
Deamination
-removal of an amino group, normally from an amino acid.
Gluconeogenesis
-synthesis of glucose from a non-carbohydrate source.
Protein Turnover/Degradation
-liberation of amino acids from proteins.
Subsections:
6.41 Transamination, Deamination, & Ammonia Removal as Urea
6.42 Gluconeogenesis
6.43 Protein Turnover/Degradation
Brian Lindshield
211

6.41 Transamination, Deamination & Ammonia Removal as Urea
The first step in catabolizing, or breaking down, an amino acid is the removal of its amine group
(-NH3). Amine groups can be transferred or removed through transamination or deamination,
respectively.
Transamination
Transamination is the transfer of an amine group from an amino acid to a keto acid (amino acid
without an amine group), thus creating a new amino acid and keto acid as shown below.
Figure 6.411 Generic transamination reaction where the top keto acid is converted to an amino
acid, while the bottom amino acid is converted to a keto acid1
Keto acids (also known as carbon skeletons) are what remains after amino acids have had their
nitrogen group removed by deamination or transamination. Transamination is used to
synthesize nonessential amino acids.
Deamination
Deamination is the removal of the amine group as ammonia (NH 3), as shown below.
Figure 6.412 Deamination of cytosine to uracil (nucleotides, not amino acids) 2
Kansas State University Human Nutrition Textbook
212

The potential problem with deamination is that too much ammonia is toxic, causing a condition
known as hyperammonemia. The symptoms of this condition are shown in the following figure.
Figure 6.413 Symptoms of Hyperammonemia3
Our body has a method to safely package ammonia in a less toxic form to be excreted. This
safer compound is urea, which is produced by the liver using 2 molecules of ammonia (NH3) and
1 molecule of carbon dioxide (CO 2). Most urea is then secreted from the liver and incorporated
into urine in the kidney to be excreted from the body, as shown below.
Brian Lindshield
213

Figure 6.414 Production of urea helps to safely remove ammonia from the body 4-6
References 1. http://en.wikipedia.org/wiki/File:Transaminierung.svg 2. http://en.wikipedia.org/wiki/File:DesaminierungCtoU.png 3. http://en.wikipedia.org/wiki/File:Symptoms_of_hyperammonemia.svg 4. http://commons.wikimedia.org/wiki/File:Liver.svg 5. http://upload.wikimedia.org/wikipedia/commons/b/b0/Kidney_section.jpg 6. http://en.wikipedia.org/wiki/File:Urea.png
Kansas State University Human Nutrition Textbook
214

6.42 Gluconeogenesis
Gluconeogenesis is the synthesis of glucose from noncarbohydrate sources. Certain amino acids
can be used for this process, which is the reason that this section is included here instead of the
carbohydrate metabolism section. Gluconeogenesis is glycolysis in reverse with an oxaloacetate
workaround, as shown below. Remember oxaloacetate is also an intermediate in the citric acid
cycle.
Figure 6.421 Gluconeogenesis is glycolysis in reverse with an oxaloacetate workaround 1
Not all amino acids can be used for gluconeogenesis. The ones that can be used are termed
glucogenic (red), and can be converted to either pyruvate or a citric acid cycle intermediate.
Other amino acids can only be converted to either acetyl-CoA or acetoacetyl-CoA, which cannot
be used for gluconeogenesis. However, acetyl-CoA or acetoacetyl-CoA can be used for
ketogenesis to synthesize the ketone bodies, acetone and acetoacetate. Thus, these amino
acids are instead termed ketogenic (green).
Brian Lindshield
215

Figure 6.422 Glucogenic (red), ketogenic (green), and glucogenic and ketogenic amino acids2
Fatty acids and ketogenic amino acids cannot be used to synthesize glucose. The transition
reaction is a one-way reaction, meaning that acetyl-CoA cannot be converted back to pyruvate.
As a result, fatty acids can't be used to synthesize glucose, because beta-oxidation produces
acetyl-CoA. Even if acetyl-CoA enters the citric acid cycle, the carbons from it will eventually be
completely oxidized and given off as CO2. The net result is that these carbons are not readily
available to serve as keto-acids or carbon skeletons for amino acid synthesis. Some amino acids
can be either glucogenic or ketogenic, depending on how they are metabolized. These amino
acids are referred to as glucogenic and ketogenic (pink).
References 1. http://en.wikipedia.org/wiki/File:CellRespiration.svg 2. http://en.wikipedia.org/wiki/File:Amino_acid_catabolism.png
Kansas State University Human Nutrition Textbook
216

6.43 Protein Turnover/Degradation
Proteins serve a number of functions in the body, but what happens when cells, enzymes, etc.
have completed their lifespan? They are recycled.
Proteins are broken down to amino acids that can be used to synthesize new proteins. There
are 3 main systems of protein degradation:
1. Ubiquitin-proteasome degradation
2. Lysosome degradation
3. Calpain degradation
1. Ubiquitin-Proteasome Degradation
Proteins that are damaged or abnormal are tagged with the protein ubiquitin. There are
multiple protein subunits involved in the process (E1-E3), but the net result is the production of
a protein (substrate) with a ubiquitin tail, as shown below.
Figure 6.431 Ubiquitination of a protein (substrate)1
This protein then moves to the proteasome for degradation. Think of the proteasome like a
garbage disposal. The ubiquitinated "trash" protein is inserted into the garbage disposal where
it is broken down into its component parts (primarily amino acids). The following video
illustrates this process nicely.
Web Link
Brian Lindshield
217

Video: Proteasome Degradation (0:44)
2. Lysosome Degradation
The lysosomes are organelles that are found in cells. They contain a number of proteases that
degrade proteins.
Figure 6.432 Lysosomes are organelles within the cell2
3. Calpain Degradation
The last degradation system is the calpain system, which is not as well understood, but does
require calcium.
References & Links 1. http://en.wikipedia.org/wiki/File:Ubiquitylation.svg 2. http://en.wikipedia.org/wiki/File:Illu_cell_structure.jpg
Video Proteasome Degradation - https://www.youtube.com/watch?v=w2Qd6v-4IIc
Kansas State University Human Nutrition Textbook
218

6.5 Alcohol Metabolism
The other energy source is alcohol. The alcohol we consume contains two carbons and is known
as ethanol.
Figure 6.51 Structure of ethanol1
Ethanol is passively absorbed by simple diffusion into the enterocyte. Ethanol metabolism
occurs primarily in the liver, but 10-30% is estimated to occur in the stomach 2. For the average
person, the liver can metabolize the amount of ethanol in one drink (1/2 ounce) per hour3. There are three ways that alcohol is metabolized in the body.
1. Catalase - an enzyme that we will cover again in the antioxidants section. Catalase is
estimated to metabolize less than 2% of ethanol, so it is not shown below or discussed further 4.
2. Alcohol dehydrogenase (ADH) - This is the major ethanol-metabolizing enzyme that converts
ethanol and NAD to acetaldehyde and NADH, respectively. Aldehyde dehydrogenase (ALDH)
uses NAD, CoA, and acetaldehyde to create acetyl-CoA and to produce another NADH. The
action of ADH is shown in the figure below.
Brian Lindshield
219

Figure 6.52 Ethanol Metabolism1,5
3. Microsomal ethanol oxidizing system (MEOS) - When a person consumes a large amount of
alcohol the MEOS, is the overflow pathway, that also metabolizes ethanol to acetaldehyde. It is
estimated that the MEOS metabolizes 20% of ethanol3, and it differs from ADH in that it uses
ATP to convert reduced nicotinamide adenine dinucleotide phosphate (NADPH + H+) to NADP+. The action of the MEOS is shown in the figure above.
At high intakes or with repeated exposure, there is increased synthesis of MEOS enzymes
resulting in more efficient metabolism, also known as increased tolerance. ADH levels do not
increase based on alcohol exposure. MEOS also metabolizes a variety of other compounds
(drugs, fatty acids, steroids) and alcohol competes for the enzyme's action. This can cause the
metabolism of drugs to slow and potentially reach harmful levels in the body 3.
Females have lower stomach ADH activity and body H2O concentrations. As a result, a larger
proportion of ethanol reaches circulation, thus, in general, females have a lower tolerance for
alcohol. About 50% of Taiwanese, Han Chinese, and Japanese populations have polymorphisms
in ALDH which cause the enzyme to have low activity 6. This leads to buildup of acetaldehyde
and undesirable symptoms such as: flushing, dizziness, nausea, and headaches 2. The following
short video explains what happens when the MEOS system gets involved in alcohol metabolism.
Kansas State University Human Nutrition Textbook
220

Web Link
Video: MEOS Overflow Pathway
References & Links 1. http://en.wikipedia.org/wiki/File:Ethanol_flat_structure.png 2. Byrd-Bredbenner C, Moe G, Beshgetoor D, Berning J. (2009) Wardlaw's perspectives in nutrition. New York, NY: McGraw-Hill. 3. Whitney E, Rolfes SR. (2008) Understanding nutrition. Belmont, CA: Thomson Wadsworth. 4. Gropper SS, Smith JL, Groff JL. (2008) Advanced nutrition and human metabolism. Belmont, CA: Wadsworth Publishing. 5. https://en.wikipedia.org/wiki/Acetaldehyde#/media/File:Acetaldehyde-2D-flat.svg 6. Zakhari, S. (2006) Overview: How Is Alcohol Metabolized by the Body? (2006) Alcohol Research and Health. 29 (4) 245-254.
Video MEOS Overflow Pathway - http://nutrition.jbpub.com/resources/animations.cfm?id=20&debug=0
Brian Lindshield
221

7 Integration of Macronutrient & Alcohol Metabolism
Understanding the different metabolic pathways is an important step. However, an integrated
understanding of the interconnectedness and tissue specificity of metabolism is where this
knowledge really becomes powerful. To this end, we will first cover how the different pathways
feed into one another and then talk about the metabolic capabilities of the different tissues in
the body. We will then discuss what happens metabolically during different conditions or when
consuming certain diets.
Sections:
7.1 Integration of Macronutrient & Alcohol Metabolic Pathways
7.2 Liver Macronutrient & Alcohol Metabolism
7.3 Extrahepatic Macronutrient & Alcohol Metabolism
7.4 Metabolic Conditions
Kansas State University Human Nutrition Textbook
222

7.1 Integration of Macronutrient and Alcohol Metabolic Pathways
If you were to draw all the macronutrient and alcohol metabolic pathways covered in chapter 6,
hopefully it would look something like the figure below. In this figure:
Carbohydrate pathways are orange
Triglyceride/fatty acid pathways are purple
Protein/amino acid pathways are green
Nonclassified pathways are gray
Figure 7.11 Integrated macronutrient and alcohol metabolism 1
To simplify, we are going to remove the glycerol and cholesterol pathways so that we can focus
on integrating the other pathways in macronutrient and alcohol metabolism.
Brian Lindshield
223

Figure 7.12 Removal of glycerol and cholesterol pathways 1
Thus, we are left with the following simplified figure:
Kansas State University Human Nutrition Textbook
224

Figure 7.13 Simplified integrated macronutrient and alcohol metabolism 1
Notice that acetyl-CoA is the the central metabolite in integrated metabolism that connects
many different pathways. For example, carbohydrates can be broken down to acetyl-CoA that
can then be used to synthesize fats and ultimately triglycerides.
References & Links 1. http://en.wikipedia.org/wiki/File:CellRespiration.svg
Brian Lindshield
225

7.2 Liver Macronutrient and Alcohol Metabolism
The liver is the organ that has the greatest macronutrient metabolic capability; there are a
number of metabolic functions that only the liver performs. However, there are two major
macronutrient metabolic processes, lactate synthesis and ketone body breakdown, that the
liver will not normally perform, as shown in the figure below.
Figure 7.21 Ketone body breakdown and lactate synthesis are major macronutrient metabolic
pathways that the liver does not normally perform 1
But aside from those two pathways, the liver performs all the other metabolic pathways that
you have learned about that are listed and shown below:
Glycogen synthesis and breakdown
Glycolysis
Gluconeogenesis
Alcohol oxidation
Kansas State University Human Nutrition Textbook
226

Ketone body synthesis
Fatty acid synthesis and breakdown
Triglyceride synthesis and breakdown
Protein synthesis and breakdown
Urea synthesis
VLDL synthesis
Glucose-6-phosphatase
Figure 7.22 Metabolic capability of the liver1
The liver is the only tissue that performs the following functions:
Ketone body synthesis
Urea synthesis
VLDL synthesis
The liver is also the primary, but not exclusive site, of the following functions:
Alcohol oxidation (also occurs in the stomach)
Brian Lindshield
227

Gluconeogenesis (also occurs in the kidney(s))
Glucose-6-phosphatase activity (also occurs in the kidney(s))
Lactate breakdown (also occurs in muscle)2
Glucose-6-phosphatase is important because it removes the phosphate from
glucose-6-phosphate so that glucose can be released into circulation. Kidneys can perform
gluconeogenesis and has glucose-6-phosphatase. However, it is estimated that 90% of glucose
formed from gluconeogenesis is produced by the liver; the remaining 10% is produced by the
kidney(s). It is also important to note that the muscle does not have this enzyme, so it cannot
release glucose into circulation 3. References & Links 1. http://en.wikipedia.org/wiki/File:CellRespiration.svg 2. Phypers B, Pierce JMT. (2006) Lactate physiology in health and disease. Continuing Education in Anaesthesia Critical Care & Pain, 6(3). 3. Stipanuk MH. (2006) Biochemical, physiological, & molecular aspects of human nutrition. St. Louis, MO: Saunders Elsevier.
Kansas State University Human Nutrition Textbook
228

7.3 Extrahepatic Macronutrient Metabolism
Because the liver is so important in metabolism, the term extrahepatic has been defined to
mean "located or occurring outside of the liver 1". We are next going to consider extrahepatic
tissue metabolism.
Figure 7.31 The liver "is kind of a big deal 2"
To start considering the metabolic capabilities of the extrahepatic tissues, we start by removing
pathways that only or mostly occur in the liver:
Alcohol oxidation
Gluconeogenesis
Ketone body synthesis
Urea synthesis
Lactate breakdown
Glucose-6-phosphatase
These metabolic processes are crossed off in the figure below.
Brian Lindshield
229

Figure 7.32 Removing the pathways that only or mostly occur in the liver3
We are left with metabolic capabilities that are listed and shown below.
Glycogen synthesis and breakdown
Glycolysis
Fatty acid synthesis and breakdown
Triglyceride synthesis and breakdown
Protein synthesis and breakdown
Kansas State University Human Nutrition Textbook
230

Figure 7.33 The metabolic capability of the extrahepatic tissues 3
We will use this figure as the base for metabolic capabilities of the different extrahepatic
tissues to compare what pathways other tissues can perform versus all the pathways
performed by extrahepatic tissues.
In an effort to keep this simple, we are going to focus on four extrahepatic tissues in the
following subsections:
7.31 Muscle Macronutrient Metabolism
7.32 Adipose Macronutrient Metabolism
7.33 Brain Macronutrient Metabolism
7.34 Red Blood Cell Macronutrient Metabolism
References & Links 1. http://www.cancer.gov/dictionary/?CdrID=44498 2. http://commons.wikimedia.org/wiki/File:Liver.svg
Brian Lindshield
231

3. http://en.wikipedia.org/wiki/File:CellRespiration.svg
Kansas State University Human Nutrition Textbook
232

7.31 Muscle Macronutrient Metabolism
Compared to extrahepatic tissues as a whole, in the muscle the following pathways are not
performed or are not important:
Fatty acid synthesis
Ketone body breakdown
These pathways are crossed out in the figure below.
Figure 7.311 The metabolic pathways that are not performed or important in the muscle,
compared to extrahepatic tissues as a whole1
Removing those pathways, the following metabolic pathways make up the muscle metabolic
capability:
Glycogen synthesis and breakdown
Brian Lindshield
233

Glycolysis
Protein synthesis and breakdown
Triglyceride synthesis and breakdown
Fatty acid breakdown
Lactate synthesis
Figure 7.312 Muscle metabolic capability 1
Muscle is a major extrahepatic metabolic tissue. It is the only extrahepatic tissue with
significant glycogen stores. However, unlike the liver, the muscle cannot secrete glucose after it
is taken up (no glucose-6-phosphatase). Thus, you can think of the muscle as being selfish with
glucose. It either uses it for itself initially or stores it for its later use.
References & Links 1. http://en.wikipedia.org/wiki/File:CellRespiration.svg
Kansas State University Human Nutrition Textbook
234

7.32 Adipose Macronutrient Metabolism
It probably does not surprise you that the major function of the adipose is to store energy as
triglycerides. Compared to extrahepatic tissues as a whole, in the adipose the following
pathways are not performed or are not important:
Glycogen synthesis and breakdown
Lactate synthesis
Ketone body breakdown
Fatty acid breakdown
Protein synthesis and breakdown
Citric acid cycle (not much since it is not an active tissue needing energy)
These pathways are crossed out in the figure below.
Figure 7.321 The metabolic pathways that are not performed or important in the adipose,
compared to extrahepatic tissues as a whole are crossed out 1
Brian Lindshield
235

Removing those pathways, we are left with metabolic capabilities listed below and depicted in
the following figure:
Glycolysis
Fatty acid synthesis
Triglyceride synthesis and breakdown
Figure 7.322 Adipose metabolic capability
Fatty acid synthesis only occurs in the adipose and liver. In the adipose, fatty acids are
synthesized and most will be esterified into triglycerides to be stored. In the liver, some fatty
acids will be esterified into triglycerides to be stored, but most triglycerides will be incorporated
into VLDL so that they can be used or stored by other tissues.
References & Links
Kansas State University Human Nutrition Textbook
236

1. http://en.wikipedia.org/wiki/File:CellRespiration.svg
Brian Lindshield
237

7.33 Brain Macronutrient Metabolism
Fatty acid breakdown does not occur to any great extent in the brain because of the low activity
of an enzyme in the beta-oxidation pathway limits the pathway’s activity 1. Compared to the
extrahepatic tissues as a whole, in the brain the following pathways are not performed or are
not important:
Glycogen synthesis and breakdown
Lactate synthesis
Fatty acid synthesis and breakdown
Triglyceride synthesis and breakdown
Protein synthesis and breakdown
These pathways are crossed out on the figure below.
Figure 7.331 The metabolic pathways that are not performed or important in the brain
compared to extrahepatic tissues as a whole are crossed out 2
Kansas State University Human Nutrition Textbook
238

Fatty acid breakdown does not occur to any great extent in the brain because low activity of an
enzyme in the beta-oxidation pathway limits the activity of this pathway2.
By removing those pathways the only pathways left are:
Glycolysis
Ketone body breakdown
Figure 7.332 Brain metabolic capability 1
Thus, due to its limited metabolic capabilities, the brain needs to receive either glucose or
ketone bodies to use as an energy source.
References & Links 1. Yang SY, He XY, Schulz H (1987) Fatty acid oxidation in rat brain is limited by the low activity of 3-ketoacyl-coenzyme A thiolase. J BIol Chem 262 (27): 13027-13032. 2. http://en.wikipedia.org/wiki/File:CellRespiration.svg
Brian Lindshield
239

7.34 Red Blood Cell Macronutrient Metabolism
Red blood cells are the most limited of the extrahepatic tissues because they do not contain a
nucleus or other cell organelles, most notably mitochondria.
Figure 7.341 Red blood cells do not contain mitochondria1
As a result, compared to the extrahepatic tissues, in red blood cells the following pathways are
not performed or are not important:
Glycogen synthesis and breakdown
Lactate breakdown
Fatty acid synthesis and breakdown
Triglyceride synthesis and breakdown
Protein synthesis and breakdown
Ketone body breakdown
These pathways are crossed off in the figure below.
Kansas State University Human Nutrition Textbook
240

Figure 7.342 The metabolic pathways that are not performed or important in the red blood
cells, compared to extrahepatic tissues as a whole are crossed off 2
If all those pathways are removed, only glycolysis is left, where pyruvate is converted to lactate.
Brian Lindshield
241
Figure 7.343 Red blood cell metabolic capability
Thus, red blood cells are one-trick ponies, only being able to perform glycolysis and produce
lactate.
Figure 7.344 Red blood cells are one-trick ponies
References & Links 1. http://en.wikipedia.org/wiki/Mitochondrion 2. http://en.wikipedia.org/wiki/File:CellRespiration.svg
Kansas State University Human Nutrition Textbook
242

7.4 Metabolic Conditions
You have learned about the pathways and the tissue metabolic capabilities, so now we’re going
to apply that knowledge to four conditions: fed state, fasting, the Atkins diet, and the
Ornish/Pritikin diet, as ways to illustrate how you can use this knowledge. In the fed state, we
are going to be considering what is happening metabolically after consuming all 3
macronutrients. In fasting, we’re going to be considering what is happening metabolically
during a prolonged period without food. The Atkins diet is a carbohydrate-restricted diet, so we
are going to consider what happens metabolically when someone is eating a diet that
essentially only contains protein and lipids over an extended period of time. Finally the
Ornish/Pritikin diet is a very low fat diet, so we’re going to consider what happens metabolically
when someone is eating a diet that is essentially only carbohydrates and protein over an
extended period of time. For each of these conditions, we’re going to consider what is
happening in the liver, muscle, adipose, and brain.
Now that you should have an understanding of the glycemic response and macronutrient
metabolism, you should be able to understand the broader effects of insulin and glucagon that
are summarized in the following tables. Knowing what hormone is elevated in the different
conditions helps you to understand the metabolism that occurs in different conditions.
Table 7.41 Insulin’s effects on targets in tissues 1,2
Effect Tissue Target
↑ Glucose Uptake Muscle, Adipose ↑ GLUT4
↑ Glucose Uptake Liver ↑ Glucokinase
↑ Glycogen Synthesis Liver, Muscle ↑ Glycogen Synthase
↓ Glycogen Breakdown Liver, Muscle ↓ Glycogen Phosphorylase
↑ Glycolysis,
↑ Transition Reaction
Liver, Muscle ↑ Phosphofructokinase-1
↑ Pyruvate Dehydrogenase Complex
↑ Fatty Acid Synthesis Liver ↑ Fatty Acid Synthase
↑ Triglyceride Synthesis Adipose ↑ Lipoprotein Lipase
Table 7.42 Glucagon’s effects on targets in tissues 2
Brian Lindshield
243

Effect Tissue Target
↑ Glycogen Breakdown Liver ↑ Glycogen Phosphorylase
↓ Glycogen Synthesis Liver ↓ Glycogen Synthase
↑ Gluconeogenesis Liver Multiple Enzymes
↓ Glycolysis Liver ↓ Phosphofructokinase-1
↑ Ketone Body Synthesis Liver ↑ Acetyl-CoA Carboxylase
↑ Triglyceride Breakdown Adipose ↑ Hormone-Sensitive
Lipase
The final subsection is a summary table that summarizes some pertinent details for these 4
conditions along with all protein, all carbohydrates, and all fat (triglyceride) diets.
Subsections:
7.41 Fed State
7.42 Fasting
7.43 Atkins Diet
7.44 Ornish/Pritikin Diet
7.45 Condition Summary Table
References & Links 1. Gropper SS, Smith JL, Groff JL. (2008) Advanced nutrition and human metabolism. Belmont, CA: Wadsworth
Publishing.
2. http://jpkc.gmu.cn/swhx/book/shyl/23.pdf
Kansas State University Human Nutrition Textbook
244

7.41 Fed State
In this condition, assume a person just consumed a meal containing carbohydrates, protein and
fat. As a result, this person is in an anabolic state with high blood glucose levels, meaning the
pancreas will secrete insulin.
The liver will take up glucose and synthesize glycogen until its stores are filled. After these
stores are full, glucose can be broken down through glycolysis to pyruvate, then form
acetyl-CoA in the transition reaction. Because we are in the fed or anabolic state, acetyl-CoA
will be used for ATP generation primarily but some will also be used for fatty acid synthesis,
which will be used for triglyceride synthesis. However, evidence suggests that this de novo
lipogenesis pathway does not occur to any great extent in humans1. Also it should be noted that
glucose is serving as the primary fuel source by tissues, so there is not as much being used for
synthesize fatty acids as there are in other conditions. These triglycerides, along with some
from liver (some triglycerides have been contributed by chylomicron remnants, it is not
necessarily the same triglycerides that are being used, but some from lipid pools in the liver
are), will be packaged into VLDL and secreted from the liver. Amino acids will also be taken up
and used for protein synthesis as needed. Because there is plenty of glucose, gluconeogenesis
and ketone body synthesis will not be operating to any great extent.
The muscle will take up glucose and synthesize glycogen until those stores are filled. Some
glucose will go through glycolysis to produce pyruvate, then form acetyl-CoA in the transition
reaction. The acetyl-CoA will enter the citric acid cycle, and NADH and FADH 2 produced will
enter the electron transport chain to generate ATP. Fatty acids that are cleaved from
chylomicrons, VLDL, IDL, and LDL are also going to be taken up. These fatty acids will be used to
synthesize triglycerides for storage. Whatever amino acids are taken up will be used for protein
synthesis. The muscle will not be secreting anything in this condition.
The adipose is going to take up glucose that will enter glycolysis, where pyruvate will be
produced, then acetyl-CoA will be produced in the transition reaction. Because we are in the
fed or anabolic state, the acetyl-CoA will be used for fatty acid synthesis, and the fatty acids will
be used for triglyceride synthesis. However, evidence suggests that de novo lipogenesis does
not occur to any great extent in humans1. Fatty acids that are cleaved from chylomicrons, VLDL,
IDL, and LDL are going to be taken up and primarily used to synthesize triglycerides for storage.
The adipose won’t be secreting anything under this condition.
The brain will have plenty of glucose available for its use, so it is not going to have to use
ketone bodies like it would during fasting and during prolonged Atkins diet consumption.
Brian Lindshield
245

References & Links 1. McDevitt RM, Bott SJ, Harding M, Coward WA, Bluck LJ, et al. (2001) De novo lipogenesis during controlled overfeeding with sucrose or glucose in lean and obese women. Am J Clin Nutr 74(6): 737-746.
Kansas State University Human Nutrition Textbook
246

7.42 Fasting
In this condition a person has been fasting for an extended period of time (18 hours or longer).
As a result, the person is in a catabolic state with low blood glucose levels, which leads the
pancreas to secrete glucagon.
The liver will break down glycogen to secrete glucose for other tissues to use until its stores are
exhausted. Amino acids and lactate from muscle will be used for gluconeogenesis to synthesize
glucose that will also be secreted. Glycolysis will not be occurring to any great extent to spare
glucose for use by other tissues. From the breakdown of amino acids, there will be an increase
in the synthesis and secretion of urea from the liver to safely rid the body of ammonia from the
amino acids. Fatty acids that are received from the adipose will be broken down to acetyl-CoA
and used to synthesize ketone bodies that are secreted for tissues, such as the brain, that
cannot directly use fatty acids as a fuel.
The muscle will break down glycogen to glucose until glycogen stores are exhausted, and
receive glucose from the liver that enters glycolysis, forming pyruvate. Some pyruvate will be
be converted to lactate to spare glucose. Pyruvate will enter the transition reaction to form
acetyl-CoA. The acetyl-CoA will then enter the citric acid cycle, and NADH and FADH 2 produced
will enter the electron transport chain to generate ATP. Once there isn’t enough glucose for the
muscle to use, fatty acids taken up from the adipose and from breakdown of muscle triglyceride
stores will be broken down to acetyl-CoA. The acetyl-CoA will then enter the citric acid cycle,
and NADH and FADH 2 produced will enter the electron transport chain to generate ATP. Amino
acids from protein breakdown and lactate (Cori Cycle) will be secreted to be used by the liver
for gluconeogenesis.
The adipose tissue will break down triglycerides to fatty acids and release these for use by the
muscle and the liver. It will not be taking up anything.
Given the limited glucose levels available, the brain will primarily be using ketone bodies as its fuel. No References
Brian Lindshield
247

7.43 Atkins Diet
In this condition, assume a person just started into phase I of the Atkins Diet and he/she has
just consumed a meal of all protein and fat with no carbohydrates. As a result, this person is in
an anabolic state, but blood glucose levels are low, meaning the pancreas will secrete glucagon.
Liver glycogen stores will be broken down to secrete glucose for other tissues. Glycolysis will
not be occurring to any great extent, in order to spare glucose for other tissues. Using amino
acids from digestion and lactate from muscle, gluconeogenesis will synthesize glucose that will
also be secreted. From the breakdown of amino acids, there will be an increase in the synthesis
and secretion of urea from the liver to safely rid the body of ammonia from the amino acids.
Amino acids will also be used for protein synthesis. Some triglycerides from chylomicron
remnants taken up will be broken down to fatty acids. These will then be broken down to
acetyl-CoA and used to synthesize ketone bodies that are secreted for tissues, such as the
brain, that cannot directly use fatty acids as a fuel. Other triglycerides will be packaged into
VLDL and secreted from the liver.
The muscle is going to break down glycogen to glucose, and receive glucose from the liver that
enters glycolysis, forming pyruvate. After glycogen is used up, most pyruvate produced by
glycolysis will be converted to lactate to spare glucose. Limited pyruvate will enter the
transition reaction to form acetyl-CoA. The acetyl-CoA will then enter the citric acid cycle, and
NADH and FADH2 produced will enter the electron transport chain to generate ATP. Once there
is not enough glucose for the muscle to use, fatty acids will be cleaved from and taken up from
chylomicrons, chylomicron remnants, VLDL, IDL, and LDL and broken down to acetyl-CoA. The
acetyl-CoA will then enter the citric acid cycle, and NADH and FADH2 produced will enter the
electron transport chain to generate ATP. Amino acids taken up will be used for protein
synthesis, and lactate will be secreted for the liver to use for gluconeogenesis (Cori cycle).
In the adipose, fatty acids that are cleaved from chylomicrons, chylomicron remnants, VLDL,
IDL, and LDL are also going to be taken up. These fatty acids will be used to synthesize
triglycerides for storage. With glucagon levels high in this condition, hormone-sensitive lipase
would be active. However, since this is an anabolic state, the net effect would be uptake of
fatty acids after cleavage by lipoprotein lipase. The adipose won’t be secreting anything under
this condition.
No References
Kansas State University Human Nutrition Textbook
248

7.44 Ornish/Pritikin Diet
In this condition, assume a person is on the Ornish/Pritikin diet and just consumed a meal
containing carbohydrates, with minimal but adequate amount of protein and no fat. As a result,
this person is in an anabolic state with high blood glucose levels, meaning the pancreas will
secrete insulin.
The liver will take up glucose and synthesize glycogen until its stores are filled. After these
stores are full, glucose can be broken down through glycolysis to pyruvate, then form
acetyl-CoA in the transition reaction. Because we are in the fed or anabolic state, acetyl-CoA
will be used for fatty acid synthesis, and the fatty acids will be used for triglyceride synthesis.
However, evidence suggests that this de novo lipogenesis pathway does not occur to any great
extent in humans 1. These triglycerides will be packaged into VLDL and secreted from the liver.
Amino acids will also be taken up and used for protein synthesis as needed. Because there is
plenty of glucose, gluconeogenesis and ketone body synthesis will not be operating to any great
extent.
The muscle will take up glucose and synthesize glycogen until those stores are filled. Some
glucose will go through glycolysis to produce pyruvate, then form acetyl-CoA in the transition
reaction. The acetyl-CoA will enter the citric acid cycle, and NADH and FADH 2 produced will
enter the electron transport chain to generate ATP. Fatty acids that are cleaved from VLDL, IDL,
and LDL are also going to be taken up. These fatty acids will be used to synthesize triglycerides
for storage. Whatever amino acids are taken up will be used for protein synthesis. The muscle
will not be secreting anything in this condition.
The adipose is going to take up glucose that will enter glycolysis, where pyruvate will be
produced, then acetyl-CoA will be produced in the transition reaction. Because we are in the
fed or anabolic state, the acetyl-CoA will be used for fatty acid synthesis, and the fatty acids will
be used for triglyceride synthesis. However, evidence suggests that de novo lipogenesis does
not occur to any great extent in humans1. Fatty acids that are cleaved from VLDL, IDL, and LDL
are going to be taken up and primarily used to synthesize triglycerides for storage. The adipose
won’t be secreting anything under this condition.
The brain will have plenty of glucose available for its use, so it is not going to have to use
ketone bodies like it would during fasting and during prolonged Atkins diet consumption.
References & Links 1. McDevitt RM, Bott SJ, Harding M, Coward WA, Bluck LJ, et al. (2001) De novo lipogenesis during controlled overfeeding with sucrose or glucose in lean and obese women. Am J Clin Nutr 74(6): 737-746.
Brian Lindshield
249

7.45 Condition Summary Table
Condition Uptake Secretion Catabolic or
Anabolic
Blood Glucose Concentration
Hormone Secreted
Cori Cycle Liver Adipose Muscle Liver Adipose Muscle
Fed State Glucose, FA (CM
Rem), AA
Glucose, FA
Glucose, FA, AA VLDL - - Anabolic High Insulin -
Fasting Lactate, AA, FA - FA
Urea, Ketone Bodies,
Glucose, VLDL
FA Lactate, AA Catabolic Low Glucagon +
Atkins
Lactate (minimal), FA (CM
Rem), AA
FA AA, FA, Glucose (minimal)
VLDL, Urea,
Glucose (minimal)
- Lactate (minimal) Anabolic Low Glucagon Low
Ornish Glucose, AA
Glucose, FA
Glucose, AA, FA
(minimal) VLDL - - Anabolic High Insulin -
All protein Lactate, AA
FA (minimal)
Glucose, AA
Urea, Ketone Bodies,
Glucose, VLDL
(minimal)
- Lactate Anabolic Low Glucagon +
All carbs Glucose, AA
Glucose, FA
Glucose, FA VLDL - AA Anabolic High Insulin -
All fat Lactate, FA (CM
Rem), AA FA
Glucose (minimal),
FA, AA
Glucose, VLDL FA Lactate,
AA Anabolic Low Glucagon Low
-, None; FA, Fatty acid; AA, Amino Acid; CM Rem, Chylomicron Remnant; VLDL, Very Low Density Lipoprotein
Kansas State University Human Nutrition Textbook
250

8 Micronutrients Overview & Dietary Reference Intakes (DRIs)
Micronutrients consist of vitamins and minerals. In this chapter, an overview of vitamins and
minerals will be presented followed by a description of the dietary reference intakes (DRIs),
which are used as benchmarks of micronutrient intake.
Sections:
8.1 Vitamins
8.2 Minerals
8.3 Covering Vitamins & Minerals
8.4 Dietary Reference Intakes (DRIs)
Brian Lindshield
251

8.1 Vitamins
The name vitamin comes from Casimir Funk, who in 1912 thought vital amines (NH3) were
responsible for preventing what we know now are vitamin deficiencies. He coined the term
vitamines to describe these compounds. Eventually it was discovered that these compounds
were not amines and the 'e' was dropped to form vitamins 1.
Vitamins are classified as either fat-soluble or water-soluble. The fat-soluble vitamins are:
Vitamin A
Vitamin D
Vitamin E
Vitamin K
The water-soluble vitamins are vitamin C and the B vitamins, which are shown in the table
below.
Table 8.11 The B vitamins and their common names
Vitamin Common Name
B1 Thiamin
B2 Riboflavin
B3 Niacin
B5 Pantothenic Acid
B6* Pyridoxine
B7 Biotin
B9 Folate
B12* Cobalamin
*Normally used instead of common names
A common question from students about B vitamins is: “Why are there so many B vitamins? It is
not like they ran out of letters in the alphabet to name them.”
Before they even knew that vitamins existed, a scientist named E.V. McCollum recognized that
a deficiency in what he called ‘fat-soluble factor A’ resulted in severe ophthalmia (inflammation
of the eye). In addition, a deficiency in ‘water-soluble factor B’ resulted in beriberi (a deficiency
discussed more later) 1.
Kansas State University Human Nutrition Textbook
252

Figure 8.11 Factor A deficiency led to ophthalmia, factor B deficiency led to beriberi
Factor A is what we now know as vitamin A. However, researchers soon realized that factor B
actually consisted of two factors that they termed B1 and B2. Then they realized that there are
multiple components in B2, and they began identifying the wide array of B vitamins that we
know today1.
You might be thinking “but the numbers on the B vitamins still do not add up." You are right,
vitamins B4, B8, B10, and B11 were discovered and then removed leaving us with the B vitamins
shown in Table 8.11.
Relative to other scientific milestones, the discovery of vitamins is a fairly recent occurrence, as
shown in the table below.
Table 8.12 Vitamin, year proposed, isolated, structure determined, and synthesis achieved up
to 19441
Vitamin Year Proposed Isolated Structure Determined Synthesis Achieved
Thiamin 1901 1926 1936 1936
Vitamin C 1907 1926 1932 1933
Vitamin A 1915 1939 1942 -
Vitamin D 1919 1931 1932 1932
Vitamin E 1922 1936 1938 1938
Niacin 1926 1937 1937 1867*
Biotin 1926 1939 1942 1943
Vitamin K 1929 1939 1942 1943
Brian Lindshield
253

Pantothenic Acid 1931 1939 1939 1940
Folate 1931 1939 - -
Riboflavin 1933 1933 1934 1935
Vitamin B6 1934 1936 1938 1939
* Was established long before it was known to be a vitamin
A number of B vitamins serve as cofactors/coenzymes. The following table lists the
cofactors/coenzymes formed from B vitamins that will be discussed in more detail in the
following subsections.
Table 8.13 Cofactors/coenzymes formed from B vitamins
Vitamin Cofactors/Coenzymes
Thiamin Thiamin Pyrophosphate (TPP)
Riboflavin Flavin Adenine Dinucleotide (FAD),
Flavin Mononucleotide (FMN)
Niacin Nicotine Adenine Dinucleotide (NAD),
Nicotine Adenine Dinucleotide Phosphate (NADP)
Pantothenic Acid Coenzyme A
Vitamin B6 Pyridoxal Phosphate (PLP)
Biotin -
Folate Tetrahydrofolate (THF)
Vitamin B12 Adenosylcobalamin, Methylcobalamin
References & Links 1. Carpenter K. (2003) A short history of nutritional science: Part 3 (1912-1944). J Nutr 133(10): 3023-3032
Kansas State University Human Nutrition Textbook
254

8.2 Minerals
Minerals are elements that are essential for body functions that cannot be synthesized in the
body. Some people refer to them as elements instead of minerals, and the names can be used
interchangeably. However, in the nutrition community, they are more commonly referred to as
minerals. Minerals can be divided up into three different categories:
Macrominerals
Trace Minerals (aka Microminerals)
Ultratrace Minerals
There is not an exact, agreed on definition for how the different categories are defined, but in
general they are defined by the amount required and found in the body such that:
Macrominerals > Trace Minerals > Ultratrace Minerals
Table 8.21 Alphabetical listing of the 20 minerals and their chemical symbols
Macrominerals Trace Minerals Ultratrace Minerals
Calcium (Ca) Chromium (Cr) Arsenic (As)
Chloride (Cl) a Copper (Cu) Boron (B)
Magnesium (Mg) Fluoride (F) Nickel (Ni)
Phosphorus (P)b Iodine (I) Silicon (Si)
Potassium (K) Iron (Fe) Vanadium (V)
Sodium (Na) Manganese (Mn)
Molybdenum (Mo)
Selenium (Se)
Zinc (Zn)
a Chlorine ion, Cl - b Phosphate in body, PO 4
The table below shows the estimated amount of the macrominerals, trace minerals, and
ultratrace minerals found in the body.
Brian Lindshield
255

Table 8.22 Amount of different minerals found in the body1
Macrominerals Trace Minerals Ultratrace Minerals
Calcium 1200 g Iron 4 g Silicon 1 g
Phosphorus 780 g Fluoride 3-6 g Boron 17 mg
Potassium 110-140 g Zinc 2.3 g Nickel 15 mg
Sodium 100 g Copper 70 mg Arsenic 7 mg
Chloride 95 g Selenium 14 mg Vanadium 0.1 mg
Magnesium 25 g Manganese 12 mg
Iodine 10-20 mg
Molybdenum 5 mg
Chromium 1-2 mg
The figure below shows the distribution of minerals in the periodic table, which you should be
familiar with from your chemistry education.
Figure 8.21 Minerals are elements, this figure shows their position within the periodic table2
References & Links 1. Emsley, John. Nature’s building blocks : an A-Z guide to the elements. 2001. Oxford, Oxford University Press. 2. http://en.wikipedia.org/wiki/File:Periodic_Table_by_Quality.SVG
Kansas State University Human Nutrition Textbook
256

8.3 Vitamins & Minerals Functional Categories
There are two common ways to teach about vitamins and minerals in nutrition classes. The
traditional way is to start with fat-soluble vitamins and go down through the vitamins
alphabetically (i.e. vitamin A, vitamin D, vitamin E, vitamin K). However, this method leads
students to learn about vitamins and minerals more individually instead of how they work
together. For instance, it makes sense to cover calcium with vitamin D, and iron with copper
and zinc. We are going to cover vitamins and minerals based on their function rather than
covering them by whether they are a water-soluble vitamin or trace mineral. The hope is that
you will gain a more integrative understanding of vitamins and minerals from this approach.
Here are the different functional categories that you are going to learn about. Notice that some
micronutrients fit into more than one functional category. Each vitamin and mineral is
presented in one section, with some mention of its overlap in other section(s) in certain cases.
Antioxidants Macronutrient
Metabolism
1-Carbon
Metabolism Blood
Bones &
Teeth Electrolytes
Vitamin E Thiamin Folate Vitamin K Vitamin D Sodium
Vitamin C Riboflavin Vitamin B12 Iron Calcium Potassium
Selenium Niacin Vitamin B6 Vitamin B6 Vitamin K Chloride
Iron Pantothenic Acid Folate Phosphorus Phosphorus
Copper Vitamin B6 Vitamin B12 Magnesium Magnesium
Zinc Biotin Copper Fluoride
Manganese Vitamin B12 Calcium Vitamin A
Riboflavin Vitamin C Iron
Iodine Copper
Manganese Zinc
Magnesium
No References
Brian Lindshield
257

8.4 Dietary Reference Intakes (DRIs)
Dietary Reference Intakes (DRIs) are more than numbers in the table, even though that is often
how many people view them. The link below takes you to the tables that many people
commonly associate with the DRIs. These tables have been updated to include the revised RDAs
for vitamin D and calcium.
Web Link
DRI Tables
Most of you are probably familiar with Dietary Guidelines. DRIs and Dietary Guidelines provide
different information for different audiences.
Dietary Guidelines provide qualitative advice to the public about diet and chronic disease
prevention and maintaining health.
DRIs provide quantitative advice to professionals about amounts of nutrients or food
components to be of benefit.
DRIs are a collective term to refer to these components:
profe
Estimated Average Requirement (EAR)
Recommended Dietary Allowance (RDA)
Adequate Intake (AI)
Tolerable Upper Intake Level (UL)
A number of people refer to the UL as simply the “upper limit”, leaving off “tolerable”.
The RDA is the measure that professionals use to assess the quality of people's diets. It is the
requirement estimated to meet the needs of 97.5% of the population. But the RDA is calculated
using the EAR. Therefore, the EAR needs to be set before an RDA can be set. There must be
applicable research in order to set an EAR. An EAR is the estimated requirement for 50% of the
population (hence the average in its name), as shown in the figure below. On the left vertical
axis is the risk of inadequacy, and on the bottom of the figure is the observed level of intake
that increases from left to right. We will talk about the right axis label in a later figure. Notice
that for the EAR, the risk for inadequacy is 0.5 (50%) whereas the RDA the risk of inadequacy is
0.025 (2.5%).
Kansas State University Human Nutrition Textbook
258

Figure 8.41 The EAR meets the needs of 50% of the population, RDA meets the needs of 97.5%
of the population.
The figure below shows the EAR on the normal distribution and splits out the different standard
deviations as percents. Notice that for 50% of population, their adequate intake is below the
EAR and 50% of the population their adequate intake is above the EAR.
Figure 8.42 The EAR meets the needs of 50% of the population as depicted in this normal
Brian Lindshield
259

distribution. SD - standard deviation
If an EAR is set, the formula for setting the RDA is:
EAR + 2 Standard Deviations = RDA
The following figure shows the distribution and how the percentages and standard deviation
changes from the EAR. Only 2.5% of the population will have a need above the RDA for a
particular nutrient. As you can see, the EAR is adequate for 50% (0.5) of the population and is
lower than the RDA. The RDA is adequate for 97.5% (0.025) of the population, and higher than
the EAR.
Figure 8.43 The RDA meets the needs for 97.5% of the population
For nutrients lacking the research evidence needed to set an EAR, an AI is set instead of an
EAR/RDA (thus, there will never be an AI and RDA for the same population class). An AI is a level
that appears to be adequate in a defined population or subgroup. Since an EAR/RDA is not been
set, it is not known how an AI compares to a RDA as shown in the figure below, but since an
RDA is based on research there is more confidence in it as an indicator than an AI.
Kansas State University Human Nutrition Textbook
260

Figure 8.44 The AI compared to the other DRI components, the question mark and dotted line
are meant to indicate that it is not known exactly where the AI would fall relative to and
EAR/RDA if they were set. The dotted EAR/RDA is meant to indicate that these are not set when
an AI is set.
The last of the DRIs is the Tolerable Upper Intake Level (UL). This is the highest level of daily
nutrient intake that is unlikely to pose risk of adverse health effects to almost all individuals in
the population. To set this, the committee first sets a no observed adverse effect level (NOAEL)
and/or the lowest observed adverse effect level (LOAEL). The UL is then set lower based on a
number of uncertainty/safety factors off the NOAEL or LOAEL as shown below. The right
vertical axis is used to represent the risk of an adverse event. Notice the NOAEL at the point
where no adverse effects have been reported. The LOAEL is somewhere above the NOAEL. The
UL is set at a level where it is believed that people will not experience the selected adverse
effect.
Brian Lindshield
261

Figure 8.45 Setting of the UL
How are Americans doing in meeting the DRIs? The following figure shows the percentage of
Americans that are not meeting the EAR for some of the earlier micronutrients that had DRIs
set. Keep in mind that the EAR is lower than the RDA.
Kansas State University Human Nutrition Textbook
262

Figure 8.46 Percent of Americans with usual intakes below the EAR1
Figure 8.47 Percent of Americans with usual intakes exceeding the AI1
Brian Lindshield
263
As you can see, a large percentage of Americans don't meet the EAR for vitamin E, magnesium,
vitamin A, and vitamin C. Also, keep in mind that this also does not include micronutrients that
have AI instead of EARs and RDAs.
References & Links 1. http://health.gov/dietaryguidelines/2015-scientific-report/06-chapter-1/d1-11.asp
Link DRI Tables - http://www.nationalacademies.org/hmd/~/media/Files/Activity%20Files/Nutrition/DRI-Tables/5Summary%20TableTables%2014.pdf?la=en
Kansas State University Human Nutrition Textbook
264

9 Antioxidant Micronutrients
This chapter will describe what antioxidants are and then discuss the three major antioxidant
micronutrients: vitamin E, vitamin C and selenium.
9.1 Antioxidants
9.2 Vitamin E
9.3 Vitamin C
9.4 Selenium
Brian Lindshield
265

9.1 Antioxidants
The antioxidant vitamins and minerals are:
Vitamin E
Vitamin C
Selenium
Iron
Copper
Zinc
Manganese
Riboflavin
In this chapter, we are going to cover vitamin E, vitamin C, and selenium in detail because being
an antioxidant is their primary function. Iron, copper, zinc, and manganese are cofactors for the
antioxidant enzymes catalase and superoxide dismutase, as shown below.
Figure 9.11 Antioxidant enzymes that use minerals as cofactors
Superoxide dismutase converts superoxide into hydrogen peroxide. Catalase converts hydrogen
peroxide into water. Iron, copper, and zinc will be covered in more detail in the blood, bones,
and teeth chapter (chapter 11). Manganese will be covered in the macronutrient metabolism
chapter.
Riboflavin, in the cofactor FAD, is an important cofactor for several antioxidant enzymes, but it
Kansas State University Human Nutrition Textbook
266

will be covered in more depth in the macronutrient metabolism micronutrients chapter
(Chapter 10).
Subsections:
9.11 Free Radicals & Oxidative Stress
9.12 What is an Antioxidant?
9.13 Meaningful Antioxidant(s)
9.14 Too Much of a Good Thing? Antioxidants as Pro-oxidants
Brian Lindshield
267
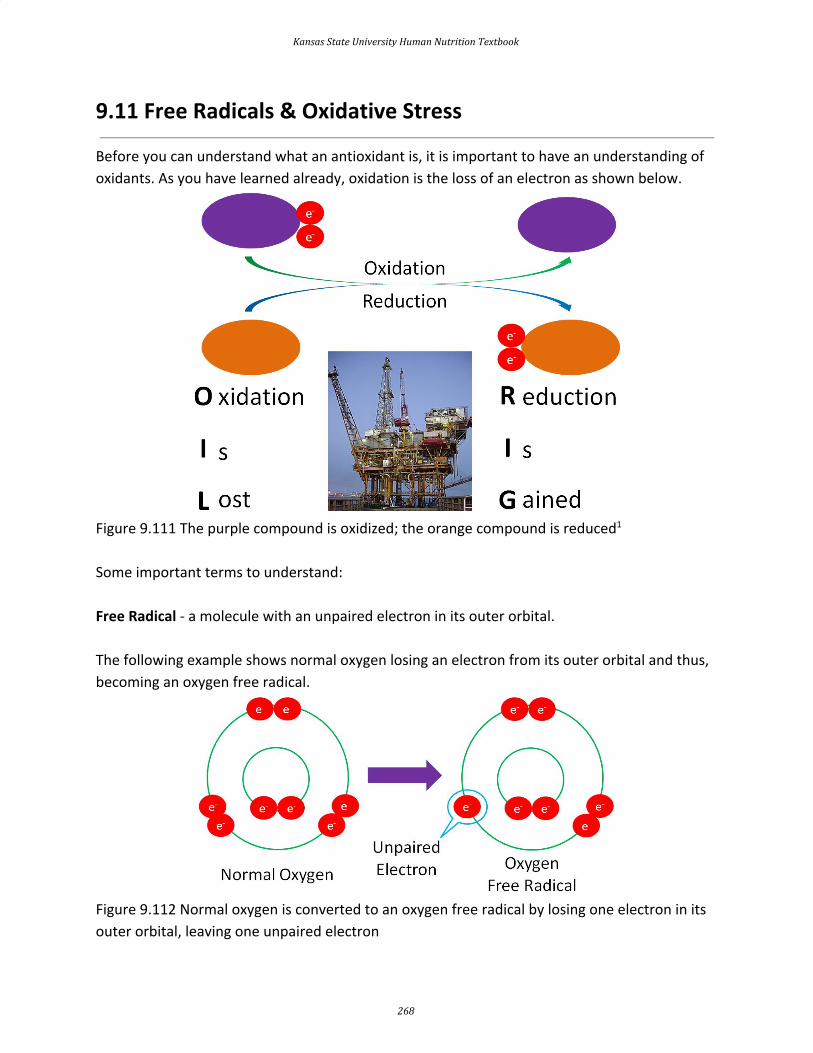
9.11 Free Radicals & Oxidative Stress
Before you can understand what an antioxidant is, it is important to have an understanding of
oxidants. As you have learned already, oxidation is the loss of an electron as shown below.
Figure 9.111 The purple compound is oxidized; the orange compound is reduced1
Some important terms to understand:
Free Radical - a molecule with an unpaired electron in its outer orbital.
The following example shows normal oxygen losing an electron from its outer orbital and thus,
becoming an oxygen free radical.
Figure 9.112 Normal oxygen is converted to an oxygen free radical by losing one electron in its
outer orbital, leaving one unpaired electron
Kansas State University Human Nutrition Textbook
268
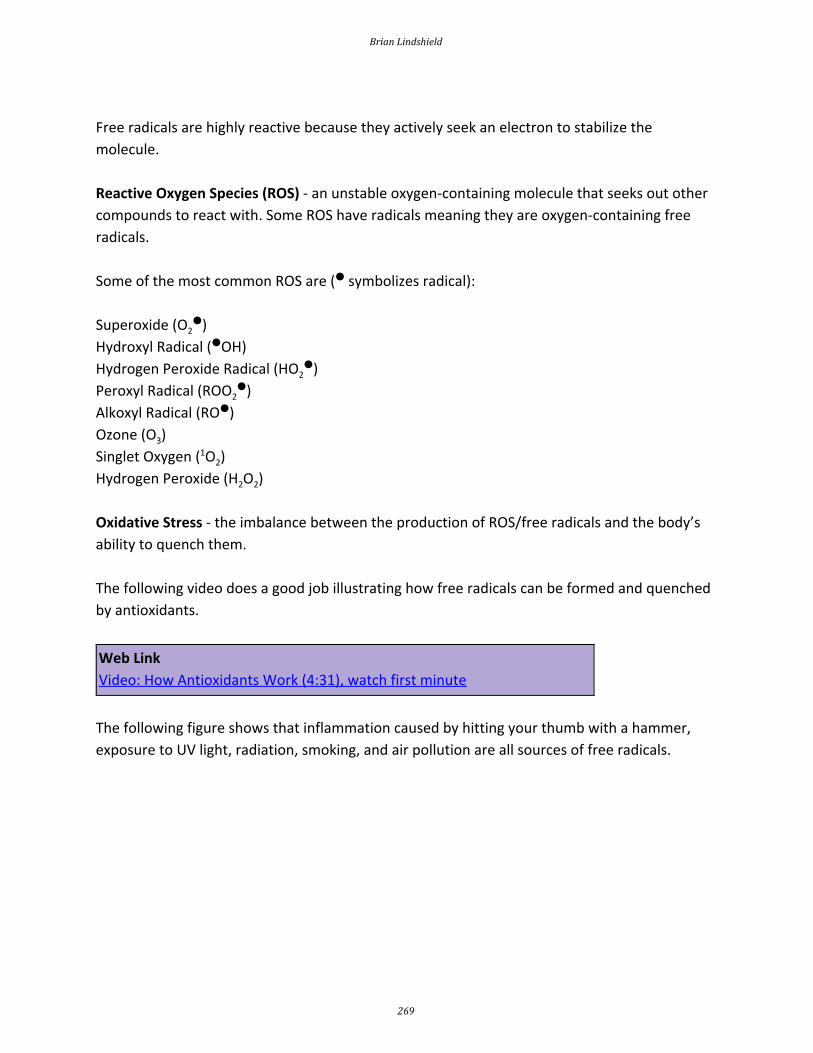
Free radicals are highly reactive because they actively seek an electron to stabilize the
molecule.
Reactive Oxygen Species (ROS) - an unstable oxygen-containing molecule that seeks out other
compounds to react with. Some ROS have radicals meaning they are oxygen-containing free
radicals.
Some of the most common ROS are (● symbolizes radical):
Superoxide (O 2●)
Hydroxyl Radical ( ●OH)
Hydrogen Peroxide Radical (HO 2●)
Peroxyl Radical (ROO2●)
Alkoxyl Radical (RO ●)
Ozone (O3) Singlet Oxygen (1O2) Hydrogen Peroxide (H2O2)
Oxidative Stress - the imbalance between the production of ROS/free radicals and the body’s
ability to quench them.
The following video does a good job illustrating how free radicals can be formed and quenched
by antioxidants.
Web Link
Video: How Antioxidants Work (4:31), watch first minute
The following figure shows that inflammation caused by hitting your thumb with a hammer,
exposure to UV light, radiation, smoking, and air pollution are all sources of free radicals.
Brian Lindshield
269

Figure 9.113 Some sources of free radicals
Free radicals can be generated by a variety of sources that can be classified as endogenous
(within the body) and exogenous sources (outside the body).
So, we have these free radicals searching for an electron, what's the big deal? The problem
arises if the free radicals/ROS oxidize LDL, proteins, or DNA as shown below.
Figure 9.114 Free radicals can attack LDL, proteins, and DNA 2,3
Kansas State University Human Nutrition Textbook
270

Oxidized LDL is more atherogenic, meaning it is more likely to contribute to atherosclerosis
(hardening of the arteries) than normal LDL. Protein oxidation is believed to be involved in the
development of cataracts. Cataracts are the clouding of the lens of the eye. If you would like to
see what it looks like, see the link below.
Web Link
Cataract Vision Simulator
If a nucleotide in DNA is attacked, it can result in a mutation. A mutation is a change in the
nucleotide or base pair sequence of DNA. Mutations are a common occurrence in cancer.
References & Links 1. http://en.wikipedia.org/wiki/Image:Gulf_Offshore_Platform.jpg 2. http://www.genome.gov/Pages/Hyperion/DIR/VIP/Glossary/Illustration/amino_acid.cfm?key=amino%20acids 3. http://www.genome.gov/Glossary/index.cfm?id=149
Videos How Antioxidants Work - https://www.youtube.com/watch?v=lG3OOXIXvxw
Links Cataract Vision Simulator - https://www.aao.org/eye-health/diseases/cataracts-vision-simulator
Brian Lindshield
271

9.12 What is an Antioxidant?
We are ready to move on to antioxidants, which as their name indicates, combat free radicals,
reactive oxygen species (ROS), and oxidative stress. As a humorous introduction, the link below
is to a cartoon that shows Auntie Oxidant kicking free radicals out of the bloodstream.
Web Link
Auntie Oxidant
But it is not quite that simple. You have probably heard the saying "take one for the team."
Instead of taking one for the team, antioxidants "give one for the team." The ‘giving’ is the
donation of an electron from the antioxidant to a free radical, in order to regenerate a stable
compound, as shown below.
Figure 9.121 Regeneration of normal oxygen from oxygen free radical by the donation of an
electron from an antioxidant
Donating an electron is how vitamins act as antioxidants. Minerals, on the other hand, are not
antioxidants themselves. Instead, they are cofactors for antioxidant enzymes.
These antioxidant enzymes include:
Superoxide dismutase (SOD): uses copper, zinc, and manganese as cofactors (there is more
than one SOD enzyme); converts superoxide to hydrogen peroxide and oxygen 1.
Catalase: uses iron as a cofactor; converts hydrogen peroxide to water1.
Glutathione peroxidase (GPX): is a selenoenzyme that converts hydrogen peroxide to water. It
Kansas State University Human Nutrition Textbook
272

can also convert other reactive oxygen species (ROSs) to water1.
The action of these enzymes is shown below.
Figure 9.122 Antioxidant enzymes that use minerals as cofactors
Antioxidants are thought to work in concert with one another, forming what is known as the
antioxidant network. A theorized antioxidant network is shown below. Alpha-tocopherol (major
form of vitamin E in our body) is oxidized by donating an electron to the reaction oxygen
species, thus stabilizing it. This leads to the formation of alpha-tocopherol radical. Ascorbate
(vitamin C) is then oxidized, forming dehydroascorbate to regenerate (reduce)
alpha-tocopherol. Ascorbate is then regenerated by the selenoenzyme thioredoxin reductase.
This demonstrates how antioxidants can function as a network to regenerate one another so
they can continue to function as antioxidants.
Brian Lindshield
273

Figure 9.123 The theorized antioxidant network 2
References & Links 1. Gropper SS, Smith JL, Groff JL. (2008) Advanced nutrition and human metabolism. Belmont, CA: Wadsworth Publishing. 2. Packer L, Weber SU, Rimbach G. (2001) Molecular aspects of alpha-tocotrienol antioxidant action and cell signalling. J Nutr 131(2): 369S-373S.
Link Auntie Oxidant - http://www.ibiblio.org/Dave/Dr-Fun/df200005/df20000523.jpg
Kansas State University Human Nutrition Textbook
274

9.13 Meaningful Antioxidant(s)
There is a lot of confusion among the public on antioxidants. For the most part, this is for a
good reason. Many food companies put antioxidant numbers on the packages that sound good
to consumers, who have no idea how to interpret them. Thus, it is increasingly important to
have an understanding of what a meaningful antioxidant actually is.
A meaningful antioxidant has two characteristics (these are based on the assumption that the
compound is an antioxidant):
1. Found in appreciable amounts in the right location where there are free radicals/ROS that
need to be quenched
2. It is not redundant with another antioxidant that is already serving as an antioxidant
What do these mean? Let's consider the example of lycopene and vitamin E (alpha-tocopherol),
which are both fat-soluble antioxidants. In vitro antioxidant assays have found that lycopene is
10-fold more effective in quenching singlet oxygen than alpha-tocopherol 1. However, when you
look at the concentrations found in the body, there is far more alpha-tocopherol than lycopene.
For example:
LDL on average contains 11.6 molecules of alpha tocopherol and 0.9 molecules of lycopene.
Thus, if we divide alpha tocopherol by lycopene 11.6/0.9 we find that there is on average 12.9
times more alpha-tocopherol than lycopene1.
Other examples in the body:
Prostate - 162-fold higher alpha-tocopherol than lycopene concentrations
Skin - 17 to 269-fold higher alpha-tocopherol than lycopene concentrations
Plasma - 53-fold higher alpha tocopherol than lycopene concentrations1
Thus, despite the fact that lycopene is a better antioxidant in vitro, since the concentration of
alpha-tocopherol is so much higher in tissues (locations of need), it is likely the more
meaningful antioxidant. In addition, if lycopene and alpha-tocopherol have similar antioxidant
functions (fat-soluble antioxidants), lycopene’s potential antioxidant action is redundant to
alpha-tocopherol’s antioxidant function and thus, also less likely to be a meaningful antioxidant.
Indeed, further examination of the literature has not suggested that lycopene can act as an
antioxidant in vivo, even though it is a good one in vitro 1.
Brian Lindshield
275

You may be wondering “What about the in vitro antioxidant assays, like the oxygen radical
absorbance capacity (ORAC) assay that some food and supplement companies are including on
their labels?” These values have been used to market the antioxidant potential of food
products companies/businesses. The link below is to a database of food ORAC values.
Web Link
ORAC Value Database
USDA removed its database of ORAC values (similar to the one above) “due to mounting
evidence that the values indicating antioxidant capacity have no relevance to the effects of
specific bioactive compounds, including polyphenols on human health 2.” However, going back
to the two characteristics of meaningful antioxidants, there really is no evidence that shows
that a high ORAC score leads to any benefit in vivo . This is because the measure also doesn't
take into account characteristics such as bioavailability. Bioavailability is the amount of a
compound that is absorbed or reaches circulation. Many of these purported super antioxidants
have not been shown to be absorbed or maintained in the body in a way that would suggest
that they would be meaningful antioxidants. Five years after it was removed, industry and
suppliers think it has been a good thing that it is no longer used as indicated in the following
article.
Web Link
Saying goodbye to ORAC was a good thing for industry, suppliers say
Instead some companies are marketing in antioxidants in different ways, like the aggressive approach taken by Welch’s grape juice described in the link below.
Web Link
Welch’s says grape juice is for men now
References & Links 1. Erdman, J.W., Ford, N.A., Lindshield, B.L. Are the health attributes of lycopene related to its antioxidant function? Arch Biochem Biophys, 483: 229-235, 2009. 2. http://www.ars.usda.gov/Services/docs.htm?docid=15866
Link ORAC Value Database - https://www.superfoodly.com/orac-values/ Saying goodbye to ORAC was a good thing for industry, suppliers say - http://www.nutraingredients-usa.com/Suppliers2/Saying-goodbye-to-ORAC-was-a-good-thing-for-industry-suppliers-say Welch’s says grape juice is for men now - https://www.cnn.com/2018/10/17/business/welchs-grape-juice-men/index.html
Kansas State University Human Nutrition Textbook
276

9.14 Too Much of a Good Thing? Antioxidants as Pro-oxidants
Chapter 1 described a clinical trial that found that high-dose beta-carotene supplementation
increased lung cancer risk in smokers. This is an example of findings that support that high
doses of antioxidants may be “too much of a good thing”, causing more harm than benefit. The
parabolic, or U-shaped figure, below displays how the level of nutrient concentration or intake
(x-axis) relates to an antioxidant measure (y-axis). The lowest level of antioxidant intake or
tissue concentration results in nutrient deficiency if the antioxidant is essential (vitamins and
minerals). Intake levels above deficient, but less than optimal, are referred to as low
suboptimal. Suboptimal means the levels are not optimal. Thus, low suboptimal and high
suboptimal sandwich optimal. The high suboptimal level is between optimal and where the
nutrient becomes toxic.
Figure 9.141 How the levels of nutrient concentration or intake alters oxidative stress in the
body. Going up the y-axis and to the right on the x-axis is higher (or increasing). Adapted from
reference 1
An example of where this phenomenon has been shown to occur is in the dog prostate with
toenail selenium concentrations, which are a good indicator of long-term selenium status1.
Brian Lindshield
277

Researchers found that when they plotted prostate DNA damage (antioxidant measure) against
toenail selenium status (nutrient concentration or intake) that it resulted in a U-shaped curve
like the one shown above 1. Thus, it is good to have antioxidants in your diet, but too much can
be counterproductive.
References & Links 1. Waters DJ, Shen S, Glickman LT, Cooley DM, Bostwick DG, et al. (2005) Prostate cancer risk and DNA damage: Translational significance of selenium supplementation in a canine model. Carcinogenesis 26(7): 1256-1262.
Kansas State University Human Nutrition Textbook
278

9.2 Vitamin E
There are 8 different forms of vitamin E: 4 tocopherols and 4 tocotrienols. The difference
between tocopherols and tocotrienols is that the former have a saturated tail, while the latter
have an unsaturated tail. Within tocopherols and tocotrienols, the difference between the
different forms is the position of the methyl groups on the ring. The 4 different forms within the
tocopherol and tocotrienols are designated by the Greek letters: alpha, beta, gamma, and delta.
The difference in these structures is shown in the figures below.
Figure 9.21 Structures of the different forms of vitamin E
For reasons that will be covered in a later subsection, the primary form of vitamin E found in
the body is alpha-tocopherol. The major, and possibly only, function of vitamin E is as an
antioxidant. When it serves as an antioxidant it forms an alpha-tocopherol radical, as shown
below.
Figure 9.23 Alpha-tocopherol radical1
Brian Lindshield
279

Alpha-tocopherol is believed to be the first part of an antioxidant network (shown below)
where it is oxidized to donate an electron to stabilize reactive oxygen species. Alpha-tocopherol
radical can then be reduced by the donation of an electron from ascorbate.
Figure 9.24 The theorized antioxidant network2
To help protect the antioxidant function of alpha-tocopherol (by preventing the formation of
alpha-tocopherol radical) in foods and during digestion, some manufacturers have added
compounds to this site of alpha-tocopherol through ester bonds. These are referred to as
alpha-tocopherol derivatives or alpha-tocopherol esters. The most common forms are
alpha-tocopherol acetate, alpha-tocopherol succinate, and alpha-tocopherol phosphate
(Ester-E®). The figures below show the structure of alpha-tocopherol acetate, and the structure
of succinic acid.
Figure 9.25 Alpha-tocopherol acetate
Kansas State University Human Nutrition Textbook
280

Figure 9.26 Succinic acid3
Alpha-tocopherol derivatives, such as acetate in alpha-tocopherol acetate, are cleaved prior to
absorption in the small intestine by esterases, meaning that alpha-tocopherol is absorbed, not
the alpha-tocopherol derivative.
Subsections:
9.21 Alpha-Tocopherol: Natural vs. Synthetic
9.22 Absorption, Metabolism & Excretion of Vitamin E
9.23 Dietary Vitamin E & Amounts Found in Body
9.24 Vitamin E Deficiency & Toxicity
9.25 Vitamin E DRI & IUs
References & Links 1. https://en.wikipedia.org/wiki/Radical_(chemistry)#/media/File:VitE.gif 2. Packer L, Weber SU, Rimbach G. (2001) Molecular aspects of alpha-tocotrienol antioxidant action and cell signalling. J Nutr 131(2): 369S-373S 3. http://en.wikipedia.org/wiki/File:Bernsteins%C3%A4ure2.svg
Brian Lindshield
281

9.21 Alpha-Tocopherol: Natural vs. Synthetic
In addition to being found naturally in foods, alpha-tocopherol can also be synthesized. It is
important to know whether alpha-tocopherol is natural or synthetic because the
stereochemistry (spatial arrangement) differs between these forms. In some cases
stereochemistry is used to three dimensionally depict whether a molecule is coming out
towards your or alternatively away from you. Alpha-tocopherol contains 3 chiral centers
(non-superimposable mirror images) designated as R or S. If this is a new topic to you or you
would like a refresher, the following link is a fun, animated chirality game.
Web Link
Chirality Game
The 3 chiral centers in alpha-tocopherol are located at the 2, 4’, and 8’ positions. You can see
the full numbering of tocopherols in the link below. In short, the rings are normal numbers and
the tail are prime numbers.
Web Link
Tocopherol Numbering
The figure below shows the 3 chiral centers without the other numbers.
Figure 9.211 The 2, 4’, and 8’ positions of alpha-tocopherol are chiral centers
In natural alpha-tocopherol, all 3 chiral centers are in the R configuration. Thus, it is designated
RRR-alpha-tocopherol. The R’s represent the 2, 4’, and 8’ positions of alpha-tocopherol,
respectively, as shown below1.
Kansas State University Human Nutrition Textbook
282

Figure 9.212 Natural alpha-tocopherol 2, 4’, and 8’ positions are in the R conformation
Synthetic alpha-tocopherol is a racemic (equal) mixture of all the different possibilities at the
three chiral centers. These are:
RRR
RRS
RSS
RSR
SRR
SSR
SSS
SRS
The two forms of alpha-tocopherol are designated (these are placed before alpha-tocopherol to
indicate whether it is natural or synthetic) as listed below:
1. Natural
New designation: RRR-alpha-tocopherol (because all 3 positions are RRR)
Old designation: d-alpha-tocopherol
2. Synthetic
New designation: all-rac-alpha-tocopherol (because it is a racemic mixture)
Old designation: dl-alpha-tocopherol
The old d and dl designations were describing the chemical structure that are sometimes still
used. Keep in mind the natural and synthetic are describing the stereochemistry of
Brian Lindshield
283

alpha-tocopherol and not whether it is naturally derived. For example, there are natural
alpha-tocopherol derivatives where the derivatives are added through synthetic procedures.
References & Links 1. http://lpi.oregonstate.edu/mic/vitamins/vitamin-E
Link Chirality Game - http://nobelprize.org/educational_games/chemistry/chiral/game/game.html Tocopherol Numbering - http://www.chem.qmul.ac.uk/iupac/misc/noGreek/toc.html
Kansas State University Human Nutrition Textbook
284

9.22 Vitamin E Absorption, Metabolism, & Excretion
You might be saying to yourself, “who cares about natural versus synthetic alpha-tocopherol.”
But the small change in stereochemistry makes a big difference in how alpha-tocopherol is
maintained in the body.
All forms of vitamin E (tocopherols, tocotrienols) are absorbed equally. Fat-soluble vitamins are
handled like lipids and thus are incorporated into chylomicrons that have triglycerides removed
by lipoprotein lipase. The chylomicron remnants containing the different forms of vitamin E are
then taken up by the liver. The figure below shows the absorption, metabolism, and excretion
of vitamin E.
Figure 9.221 The absorption, metabolism, and excretion of vitamin E
The liver contains a protein called alpha-tocopherol transfer protein (alpha-TTP), which is
responsible for maintaining higher levels of alpha-tocopherol in the body. Alpha-TTP
preferentially binds to 2R alpha-tocopherol and helps facilitate its incorporation into VLDL. 2R
means any form of alpha-tocopherol in which the 2 position is in the R conformation. The
following table summarizes the forms of alpha-tocopherol that bind well to alpha-TTP, and
those that don't bind well to alpha-TTP.
Brian Lindshield
285

Table 9.221 Alpha-tocopherol isomers and binding to alpha-TTP
Do not bind well to alpha-TTP Bind well to alpha-TTP
SRR RRR
SSR RRS
SSS RSS
SRS RSR
Other forms of vitamin E (gamma-tocopherol, tocotrienols) also don't bind well to alpha-TTP
and thus, are found in lower levels than alpha-tocopherol in the body. The following graph
shows plasma (liquid component of blood) vitamin E levels from a study in which subjects were
given 150 mg each of RRR-alpha-tocopherol, all-rac-alpha-tocopherol, or gamma-tocopherol 1.
Figure 9.222 Plasma vitamin E concentrations in response to a 150 mg dose of
RRR-alpha-tocopherol, all-rac-alpha-tocopherol, or gamma-tocopherol. Adapted from reference
1
As you can see in the figure, there was a greater rise in the plasma alpha-tocopherol levels after
receiving RRR-alpha-tocopherol vs. all-rac-alpha-tocopherol. This is not a surprise because
approximately 50% of all-rac-alpha-tocopherol is 2R alpha-tocopherol that binds well with
alpha-TTP. You can also see that the plasma gamma-tocopherol concentration is much lower
than either natural or synthetic alpha-tocopherol.
Kansas State University Human Nutrition Textbook
286

From VLDL and subsequent lipoproteins, vitamin E reaches tissues, with most vitamin E in the
body being found in the adipose tissue. There are 2 main routes of vitamin E excretion. The
major route of excretion is through bile that is then excreted in feces. The second route is in the
urine after vitamin E is chain-shortened in a process similar to beta-oxidation to make them
more water-soluble.
Reference 1. Traber MG, Elsner A, Brigelius-Floh R. (1998) Synthetic as compared with natural vitamin E is preferentially excreted as alpha-CEHC in human urine: Studies using deuterated alpha-tocopheryl acetates. FEBS Lett 437(1-2): 145-148.
Brian Lindshield
287

9.23 Dietary Vitamin E & Amounts Found in Body
The best food sources of vitamin E are primarily oils and nuts. As you can see below, the forms
of vitamin E that nuts and oils contain varies, with the two major forms being alpha and
gamma-tocopherol. Soybean, corn, and flaxseed oils are good sources of gamma-tocopherol.
Palm and canola oils contain almost equal amounts of alpha-tocopherol and
gamma-tocopherol. Safflower oil, almonds, sunflower oil, and wheat germ oil are good sources
of alpha-tocopherol. Beta-tocopherol and delta-tocopherol are found in lower levels in foods.
Tocotrienols, for the most part, are not found in high levels in the diet. The amount of
tocopherols in different nuts and oils are shown in the figure below.
Figure 9.231 Tocopherol distribution in plant products1
Three-fourths of the oil Americans consume is soybean oil. As a result, it is estimated that we
consume 2-4 times more gamma-tocopherol than alpha-tocopherol. Europeans consume more
olive, sunflower, and canola oil and thus are believed to consume at least 2 times more
alpha-tocopherol than gamma-tocopherol1.
Despite Americans’ higher intake of gamma tocopherol compared to other countries, our
serum (liquid portion of blood without coagulation proteins) concentrations do not differ much
as illustrated in the table below.
Kansas State University Human Nutrition Textbook
288
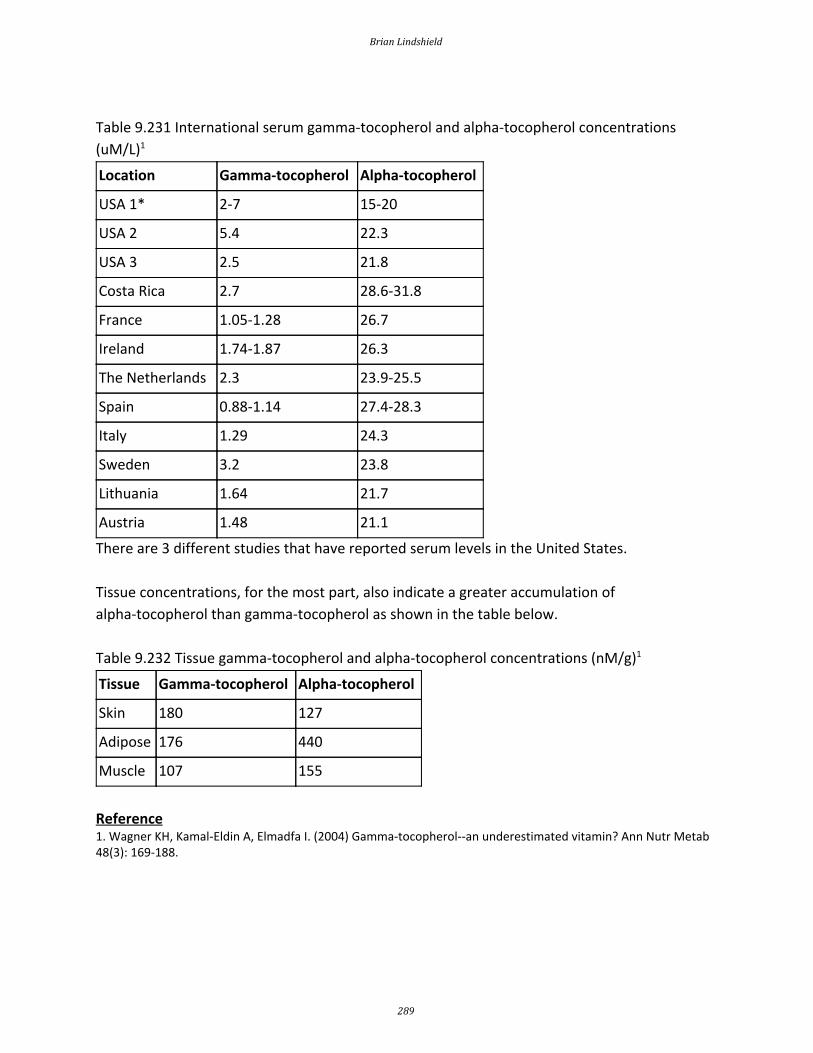
Table 9.231 International serum gamma-tocopherol and alpha-tocopherol concentrations
(uM/L)1 Location Gamma-tocopherol Alpha-tocopherol
USA 1* 2-7 15-20
USA 2 5.4 22.3
USA 3 2.5 21.8
Costa Rica 2.7 28.6-31.8
France 1.05-1.28 26.7
Ireland 1.74-1.87 26.3
The Netherlands 2.3 23.9-25.5
Spain 0.88-1.14 27.4-28.3
Italy 1.29 24.3
Sweden 3.2 23.8
Lithuania 1.64 21.7
Austria 1.48 21.1
There are 3 different studies that have reported serum levels in the United States.
Tissue concentrations, for the most part, also indicate a greater accumulation of
alpha-tocopherol than gamma-tocopherol as shown in the table below.
Table 9.232 Tissue gamma-tocopherol and alpha-tocopherol concentrations (nM/g) 1 Tissue Gamma-tocopherol Alpha-tocopherol
Skin 180 127
Adipose 176 440
Muscle 107 155
Reference 1. Wagner KH, Kamal-Eldin A, Elmadfa I. (2004) Gamma-tocopherol--an underestimated vitamin? Ann Nutr Metab 48(3): 169-188.
Brian Lindshield
289

9.24 Vitamin E Deficiency & Toxicity
Vitamin E deficiency is extremely rare. Depletion studies require years on a vitamin E-deficient
diet to cause deficiency 1. Deficiency primarily occurs in people with lipid malabsorption
problems or Ataxia with Isolated Vitamin E Deficiency (AVED). Individuals with AVED have a
mutation in their alpha-TTP that prevents it from functioning correctly. The primary symptoms
of vitamin E deficiency are neurological problems.
High levels of vitamin E intake do not result in a noted toxicity. However, higher levels of intake
of alpha-tocopherol (like achieved by taking supplements) are associated with decreased blood
coagulation. In particular, hemorrhagic stroke has been linked to high alpha-tocopherol intake
levels. The link below shows that in this condition a blood vessel ruptures or leaks in the brain.
Web Link
Hemorrhagic Stroke
It is believed that this increased bleeding risk is due to a alpha-tocopherol metabolite that has
anti-vitamin K activity. This potential antagonism will be described more in the vitamin K
section.
References & Links 1. DRI (2000) Dietary reference intakes for vitamin C, vitamin E, selenium, and carotenoids.
Link Hemorrhagic Stroke - http://heart.arizona.edu/heart-health/preventing-stroke/lowering-risks-stroke
Kansas State University Human Nutrition Textbook
290

9.25 Vitamin E DRI & IUs
Before 2001, all forms of vitamin E contributed to the RDA, using a measure called
alpha-tocopherol equivalents. This indicator essentially provided a value for all forms relative to
alpha-tocopherol. In 2001, the Dietary Reference Intake (DRI) committee decided only 2R forms
of alpha-tocopherol should be used to estimate the requirement, because these forms bind to
alpha-TTP. Thus, other forms of vitamin E (gamma-tocopherol, tocotrienols etc.) do not count
toward the requirement and the unit is now mg of alpha-tocopherol. As a result, soybean, corn,
and flaxseed oils, which are good sources of gamma-tocopherol, are no longer considered to be
good sources of vitamin E. The figure below is a reminder of the tocopherol content of different
nuts and oils.
Figure 9.251 Only the yellow bars count toward the 2001 DRI requirement1
Another level of complexity is added by international units (IU). IUs are a unit that are used to
describe the bioactivity of different compounds, including 4 vitamins: A, D, E, and C. You might
be wondering why these 4 vitamins, it is because these are the ones that were chosen by those
who set IUs. Most likely because these vitamins are commonly included in supplements. It
would be less confusing if these units were not used. However, most supplements use IUs, IUs
are not as common on food items.
For vitamin E, IUs are specific for alpha-tocopherol and adjusted for the molecular weight of the
Brian Lindshield
291

different forms (alpha-tocopherol acetate etc.). The conversion factors for converting IU to mg
of alpha-tocopherol are:
0.67 for RRR-alpha-tocopherol (and its esters)
0.45 for all-rac-alpha-tocopherol (and its esters)
Here are some example calculations showing how to use these conversion factors:
Example 1. For a supplement containing 100 IU of RRR-alpha tocopherol:
100 IU X 0.67 = 67 mg alpha-tocopherol
Example 2. For a supplement containing 100 IU of all-rac-alpha tocopherol:
100 IU X 0.45 = 45 mg alpha-tocopherol2,3
References & Links 1. Wagner KH, Kamal-Eldin A, Elmadfa I. (2004) Gamma-tocopherol--an underestimated vitamin? Ann Nutr Metab 48(3): 169-188. 2. DRI (2000) Dietary reference intakes for vitamin C, vitamin E, selenium, and carotenoids. 3. https://ods.od.nih.gov/factsheets/VitaminE-HealthProfessional/
Kansas State University Human Nutrition Textbook
292

9.3 Vitamin C
Vitamin C is well-known for being a water-soluble antioxidant. Humans are one of the few
mammals that do not synthesize vitamin C, making it an essential micronutrient. Other
mammals that do not synthesize vitamin C include primates, guinea pigs, and other less
prevalent species1. This means that some species like rats, mice, dogs and cats are not great
options for human vitamin C research since it is not an essential nutrient for them.
Vitamin C's scientific names are ascorbic acid or ascorbate and the oxidized form is
dehydroascorbic acid or dehydroascorbate. The structure of vitamin C is shown below.
Figure 9.31 Structure of ascorbic acid 2
When ascorbic acid is oxidized, it forms semidehydroascorbate (1 degree of oxidation) and then
dehydroascorbate (2 degrees of oxidation). The structure of dehydroascorbic acid is shown
below.
Figure 9.32 Structure of dehydroascorbic acid3
The figure below shows the reaction through which ascorbic acid can stabilize or quench 2 free
radicals. The 2 circled hydrogens are lost and replaced by double bonds when ascorbic acid is
oxidized to dehydroascorbic acid. Reducing dehydroascorbic acid back to ascorbic acid is the
Brian Lindshield
293

opposite reaction.
Figure 9.33 The oxidation-reduction reaction between ascorbic acid (left) and dehydroascorbic
acid (right) 2,3
Ascorbic acid is believed to be a part of an antioxidant network (shown below) where it is
oxidized to reduce alpha-tocopherol radicals. Dehydroascorbic acid can be reduced by
thioredoxin reductase, a selenoenzyme, to regenerate ascorbic acid.
Figure 9.34 The theorized antioxidant network4
Subsections:
9.31 Absorption and Tissue Accumulation of Vitamin C
9.32 Enzymatic Functions
9.33 Vitamin C Deficiency - Scurvy
9.34 Vitamin C Toxicity, Linus Pauling, & the Common Cold
References & Links
Kansas State University Human Nutrition Textbook
294

1. Stipanuk MH. (2006) Biochemical, physiological, & molecular aspects of human nutrition. St. Louis, MO: Saunders Elsevier. 2. http://en.wikipedia.org/wiki/File:Ascorbic_acid_structure.png 3. http://en.wikipedia.org/wiki/File:Dehydroascorbic_acid.png 4. Packer L, Weber SU, Rimbach G. (2001) Molecular aspects of alpha-tocotrienol antioxidant action and cell signalling. J Nutr 131(2): 369S-373S.
Brian Lindshield
295
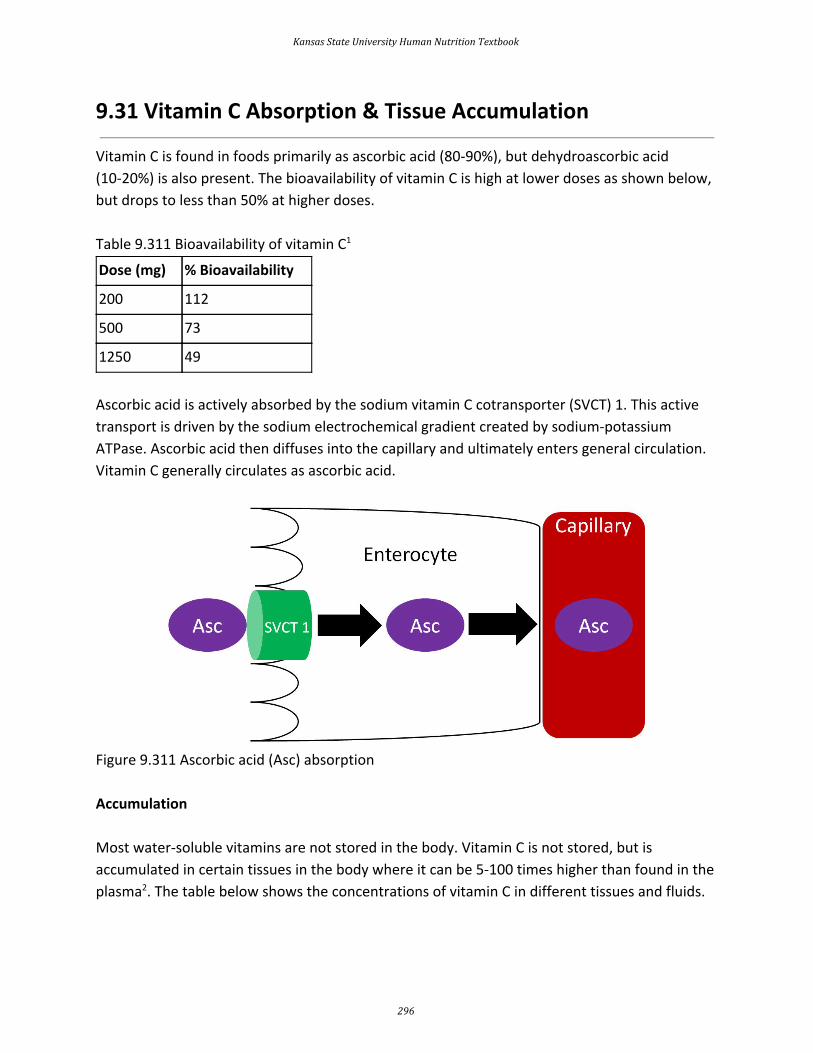
9.31 Vitamin C Absorption & Tissue Accumulation
Vitamin C is found in foods primarily as ascorbic acid (80-90%), but dehydroascorbic acid
(10-20%) is also present. The bioavailability of vitamin C is high at lower doses as shown below,
but drops to less than 50% at higher doses.
Table 9.311 Bioavailability of vitamin C 1
Dose (mg) % Bioavailability
200 112
500 73
1250 49
Ascorbic acid is actively absorbed by the sodium vitamin C cotransporter (SVCT) 1. This active
transport is driven by the sodium electrochemical gradient created by sodium-potassium
ATPase. Ascorbic acid then diffuses into the capillary and ultimately enters general circulation.
Vitamin C generally circulates as ascorbic acid.
Figure 9.311 Ascorbic acid (Asc) absorption
Accumulation
Most water-soluble vitamins are not stored in the body. Vitamin C is not stored, but is
accumulated in certain tissues in the body where it can be 5-100 times higher than found in the
plasma2. The table below shows the concentrations of vitamin C in different tissues and fluids.
Kansas State University Human Nutrition Textbook
296

Table 9.312 Human tissue & fluid ascorbic acid concentrations1
Organ/Tissue Vitamin C
Concentration*
Organ/Tissue Vitamin C
Concentration*
Pituitary Gland 40-50 Lungs 7
Adrenal Gland 30-40 Skeletal Muscle 3-4
Eye Lens 25-31 Testes 3
Liver 10-16 Thyroid 2
Brain 13-15 Cerebrospinal Fluid 3.8
Pancreas 10-15 Plasma 0.4-1
Spleen 10-15 Saliva 0.1-9.1
Kidneys 5-15
* mg/100 g wet tissue, mg/100 mL fluids
How does the body accumulate such high levels of vitamin C? There are 2 primary mechanisms:
1. Ascorbic Acid (Ascorbate) uptake using sodium-dependent vitamin C transporter (SVCT) 1 or
2
2. Ascorbic Acid (Ascorbate) Recycling
Ascorbic Acid (Ascorbate) transport using sodium-dependent vitamin C transporter (SVCT) 1
or 2
As shown below, SVCT 1 and SVCT 2 transport ascorbic acid or ascorbate into the cell against
the concentration gradient (represented by the orange wedge in the figure below). Like
absorption, this uptake is driven by the action of sodium-potassium ATPase. This mechanism is
saturable, meaning that at high concentrations it reaches a threshold where it cannot take up
ascorbic acid any faster. Thus, there is a limit to how much can be taken up through this
mechanism3.
Brian Lindshield
297

Figure 9.312 Ascorbic acid (Asc) uptake using SVCT 1 and 2 against the ascorbic acid
concentration gradient3
Ascorbic Acid (Ascorbate) Recycling
In ascorbic acid recycling, ascorbic acid is oxidized to dehydroascorbic acid (DHA). DHA is then
transported into the cell moving with its concentration gradient using GLUT1 or 3. Once inside
the cell, DHA is reduced back to ascorbic acid, thus maintaining the DHA gradient. As a result,
the cell is able to accumulate high levels of ascorbic acid3. The figure below depicts ascorbic
acid recycling.
Kansas State University Human Nutrition Textbook
298

Figure 9.313 Ascorbic acid recycling3 References & Links 1. Shils ME, Shike M, Ross AC, Caballero B, Cousins RJ, editors. (2006) Modern nutrition in health and disease. Baltimore, MD: Lippincott Williams & Wilkins. 2. Stipanuk MH. (2006) Biochemical, physiological, & molecular aspects of human nutrition. St. Louis, MO: Saunders Elsevier. 3. Li Y, Schellhorn H. (2007) New developments and novel therapeutic perspectives for vitamin C. J Nutr 137(10): 2171-2184.
Brian Lindshield
299

9.32 Enzymatic Functions
In addition to its antioxidant function, vitamin C is also a cofactor for a number of enzymes or
contributes to reducing a cofactor in others. Two of the most important enzymes that vitamin C
is involved proline hydroxylase and lysyl hydroxylase. These enzymes are important in the
formation of the protein collagen. Hydroxylase means that the enzymes add alcohol (hydroxyl,
-OH) to the amino acids proline and lysine, as shown below.
Figure 9.321 Prolyl hydroxylase adds an alcohol group (circled) to proline forming
hydroxyproline1,2
Figure 9.322 Lysyl hydroxylase adds an alcohol group (circled) to lysine forming hydroxylysine3,4
As shown below, prolyl and lysyl hydroxylases require ferrous iron (Fe 2+) to function. But in the
course of the hydroxylating proline or lysine, ferrous iron (Fe 2+) is oxidized to ferric iron (Fe3+).
Ascorbic acid is required to reduce Fe3+ to Fe2+, forming semidehydroascorbic acid in the
process. With Fe 2+, the enzyme is then able to continue to hydroxylate proline and lysine.
Kansas State University Human Nutrition Textbook
300

Figure 9.323 Ascorbic acid reduces iron so that it can continue to serve as a cofactor for prolyl
and lysyl hydroxylases
Why should you care about collagen formation? Because collagen is estimated to account for
30% or more of total body proteins 5. Collagen contains a number of hydroxylated prolines and
lysines that are needed for collagen strands to properly cross-link. This cross-linking is
important for collagen to wind together like a rope, forming the strong triple helix known as
tropocollagen. This process is shown in the following animation, as well as in the figure below.
Figure 9.324 Production of cross-linked tropocollagen in the presence of adequate vitamin C
But if there is not enough ascorbic acid available, the collagen strands are underhydroxylated
Brian Lindshield
301

and instead of forming strong tropocollagen, the underhydroxylated collagen is degraded as
shown below.
Figure 9.325 Production of underhydroxylated collagen
This weak collagen then results in the symptoms seen in the vitamin C deficiency, scurvy, that
will be discussed in the next subsection.
Ascorbic Acid is also needed for:
Carnitine synthesis
Tyrosine synthesis and catabolism
Serotonin (neurotransmitter) synthesis
Other hormone and neurotransmitter synthesis6
The figure below shows how ascorbic acid is needed for dopamine hydroxylase, which
ultimately produces the hormone epinephrine.
Kansas State University Human Nutrition Textbook
302

Figure 9.326 Dopamine beta-hydroxylase requires ascorbic acid to produce norepinephrine 7
References & Links 1. https://en.wikipedia.org/wiki/Proline#/media/File:Prolin_-_Proline.svg 2. http://en.wikipedia.org/wiki/File:Hydroxyproline_structure.svg 3. https://en.wikipedia.org/wiki/Lysine#/media/File:L-lysine-monocation-2D-skeletal.png 4. http://en.wikipedia.org/wiki/File:Hydroxylysine.png 5. Di Lullo G, Sweeney S, Korkko J, Ala-Kokko L, San Antonio J. (2002) Mapping the ligand-binding sites and disease-associated mutations on the most abundant protein in the human, type I collagen. The Journal of Biological Chemistry 277(6): 4223-4231. 6. Gropper SS, Smith JL, Groff JL. (2008) Advanced nutrition and human metabolism. Belmont, CA: Wadsworth Publishing. 7. http://en.wikipedia.org/wiki/File:Catecholamines_biosynthesis.svg
Brian Lindshield
303

9.33 Vitamin C Deficiency (Scurvy)
Why should you care about the details of prolyl and lysyl hydroxylases and their actions on
collagen hydroxylation and tropocollagen formation? Because they explain the symptoms of
vitamin C deficiency. While it is rare in the United States, vitamin C deficiency, known as scurvy,
displays symptoms that are a result of weak tropocollagen, that in turn, weakens connective
tissue throughout the body. Symptoms of scurvy include bleeding gums, pinpoint hemorrhages,
and corkscrew hairs as shown in the figure and link below.
Figure 9.331 Bleeding gums that occur in scurvy 1
Web Link
Corkscrew Hairs
Additional symptoms include impaired wound and fracture healing, easy bruising, and loose or
decaying teeth. Scurvy can be fatal if not treated. Scurvy was the first discovered nutrition
deficiency in 1746 by James Lind, who is shown below.
Kansas State University Human Nutrition Textbook
304

Figure 9.332 Dr. James Lind discovered that scurvy was caused by a nutrition deficiency3
Keep in mind as you read the description below that suggesting scurvy was due to a diet
deficiency, at that time, sounded like flu was caused by not consuming green beans. Sounds
pretty crazy, right? Because the concept of vitamines and compounds that would become
vitamins were not proposed until around 150 years later.
Lind was a surgeon on a British navy ship. Frequently during voyages the sailors would develop
scurvy for reasons that were not understood at the time. It was known that citrus fruits could
cure or prevent scurvy, but it was believed this was due to their acidity. Lind performed clinical
trials comparing citrus juice to dilute sulfuric acid and vinegar and found that only citrus juice
caused the sailors to recover, as depicted in the link below. As a result of the discovery, the
British sailors became known as "Limeys" because they would drink lime juice to prevent the
development of the disease4.
Web Link
Curing Scurvy
References & Links 1. http://en.wikipedia.org/wiki/File:Scorbutic_gums.jpg 2. Gropper SS, Smith JL, Groff JL. (2008) Advanced nutrition and human metabolism. Belmont, CA: Wadsworth Publishing. 3. http://en.wikipedia.org/wiki/File:James_lind.jpg 4. Carpenter K. (2003) A short history of nutritional science: Part 3 (1912-1944). J Nutr 133(10): 638-645.
Links
Brian Lindshield
305

Corkscrew Hairs - http://www.nlm.nih.gov/medlineplus/ency/imagepages/2345.htm Curing Scurvy - http://ericbakker.com/wp-content/uploads/2015/05/scurvy.png
Kansas State University Human Nutrition Textbook
306
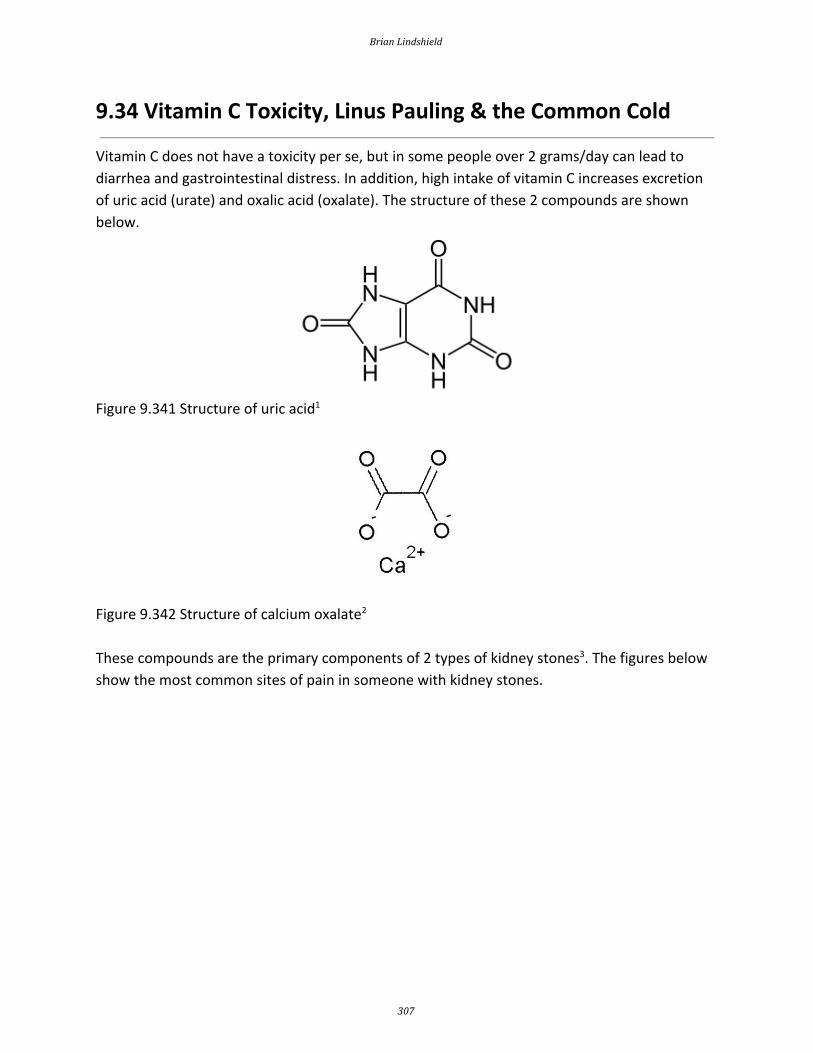
9.34 Vitamin C Toxicity, Linus Pauling & the Common Cold
Vitamin C does not have a toxicity per se, but in some people over 2 grams/day can lead to
diarrhea and gastrointestinal distress. In addition, high intake of vitamin C increases excretion
of uric acid (urate) and oxalic acid (oxalate). The structure of these 2 compounds are shown
below.
Figure 9.341 Structure of uric acid1
Figure 9.342 Structure of calcium oxalate2
These compounds are the primary components of 2 types of kidney stones3. The figures below
show the most common sites of pain in someone with kidney stones.
Brian Lindshield
307

Figure 9.343 Kidney stones normally cause pain in the shaded areas 4
The following video describes what kidney stones are and the symptoms that can occur if
someone has kidney stones. The second link shows some pictures of kidney stones.
Web Links
Video: Kidney Stones (3:28)
Kidney Stones
Calcium oxalate is one of the primary forms of kidney stones with uric acid stones being more
rare3. However, a link between excretion of these compounds and actual stone formation has
not been established. Nevertheless, high-dose vitamin C supplementation should be
approached with some caution, since it is not clear whether it increases the risk of forming
kidney stones 5.
Linus Pauling and the common cold
The person who popularized taking megadoses of vitamin C was Dr. Linus Pauling. Dr. Pauling
was a chemist, and is the only person to receive 2 unshared Nobel Prizes. The Nobel Prize is a
prestigious award, and Dr. Pauling was close to solving the structure of DNA. This would have
likely netted him another Nobel prize, but Watson and Crick beat him to it.
Kansas State University Human Nutrition Textbook
308
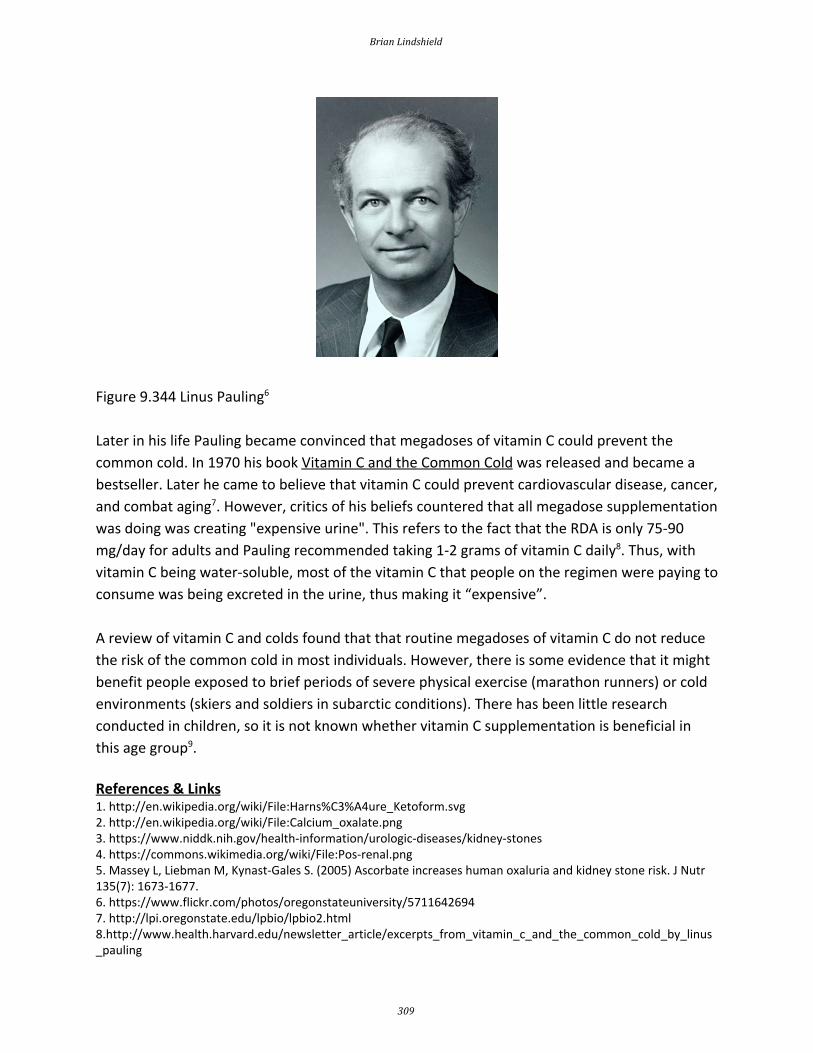
Figure 9.344 Linus Pauling6
Later in his life Pauling became convinced that megadoses of vitamin C could prevent the
common cold. In 1970 his book Vitamin C and the Common Cold was released and became a
bestseller. Later he came to believe that vitamin C could prevent cardiovascular disease, cancer,
and combat aging 7. However, critics of his beliefs countered that all megadose supplementation
was doing was creating "expensive urine". This refers to the fact that the RDA is only 75-90
mg/day for adults and Pauling recommended taking 1-2 grams of vitamin C daily8. Thus, with
vitamin C being water-soluble, most of the vitamin C that people on the regimen were paying to
consume was being excreted in the urine, thus making it “expensive”.
A review of vitamin C and colds found that that routine megadoses of vitamin C do not reduce
the risk of the common cold in most individuals. However, there is some evidence that it might
benefit people exposed to brief periods of severe physical exercise (marathon runners) or cold
environments (skiers and soldiers in subarctic conditions). There has been little research
conducted in children, so it is not known whether vitamin C supplementation is beneficial in
this age group9. References & Links 1. http://en.wikipedia.org/wiki/File:Harns%C3%A4ure_Ketoform.svg 2. http://en.wikipedia.org/wiki/File:Calcium_oxalate.png 3. https://www.niddk.nih.gov/health-information/urologic-diseases/kidney-stones 4. https://commons.wikimedia.org/wiki/File:Pos-renal.png 5. Massey L, Liebman M, Kynast-Gales S. (2005) Ascorbate increases human oxaluria and kidney stone risk. J Nutr 135(7): 1673-1677. 6. https://www.flickr.com/photos/oregonstateuniversity/5711642694 7. http://lpi.oregonstate.edu/lpbio/lpbio2.html 8.http://www.health.harvard.edu/newsletter_article/excerpts_from_vitamin_c_and_the_common_cold_by_linus_pauling
Brian Lindshield
309

9. Hemilä H, Chalker E, Douglas B. Vitamin C for preventing and treating the common cold. Cochrane Database of Systematic Reviews 2007, Issue 3. Art. No.: CD000980. DOI: 10.1002/14651858.CD000980.pub3.
Video Kidney Stones - https://www.youtube.com/watch?v=2ntH5PqSSlI
Links Kidney Stones - http://www.herringlab.com/photos/index.html
Kansas State University Human Nutrition Textbook
310
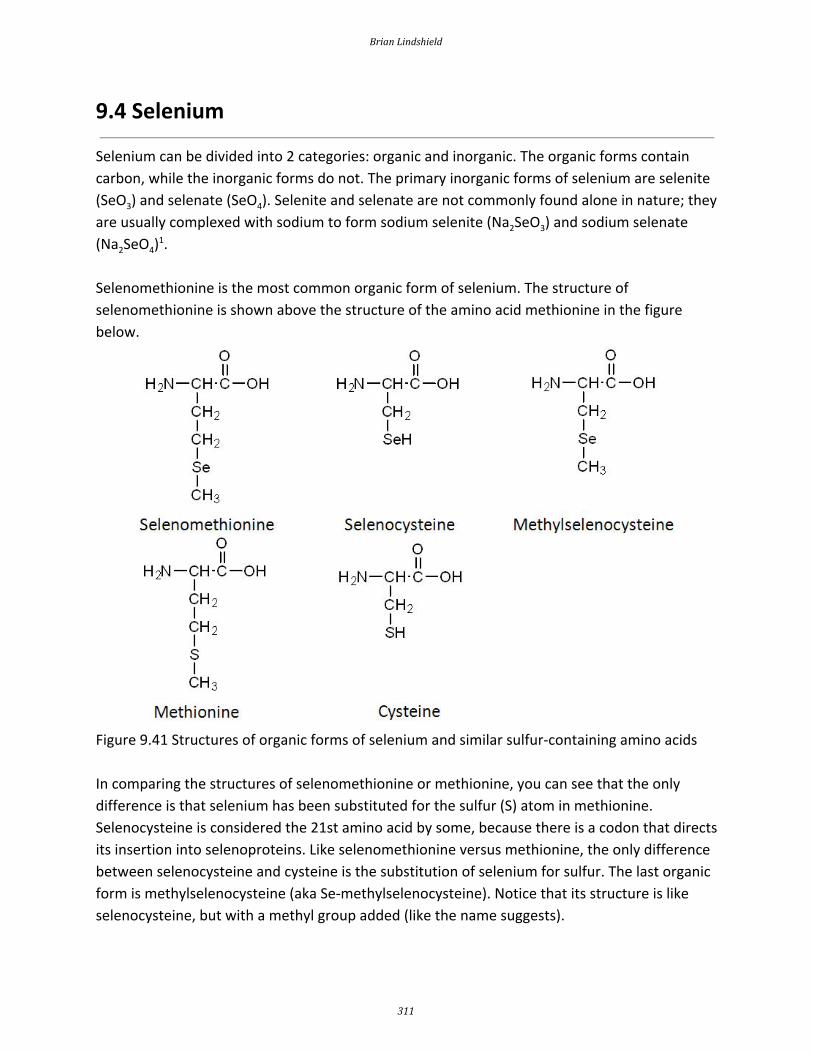
9.4 Selenium
Selenium can be divided into 2 categories: organic and inorganic. The organic forms contain
carbon, while the inorganic forms do not. The primary inorganic forms of selenium are selenite
(SeO3) and selenate (SeO 4). Selenite and selenate are not commonly found alone in nature; they
are usually complexed with sodium to form sodium selenite (Na 2SeO3) and sodium selenate
(Na2SeO4)1.
Selenomethionine is the most common organic form of selenium. The structure of
selenomethionine is shown above the structure of the amino acid methionine in the figure
below.
Figure 9.41 Structures of organic forms of selenium and similar sulfur-containing amino acids
In comparing the structures of selenomethionine or methionine, you can see that the only
difference is that selenium has been substituted for the sulfur (S) atom in methionine.
Selenocysteine is considered the 21st amino acid by some, because there is a codon that directs
its insertion into selenoproteins. Like selenomethionine versus methionine, the only difference
between selenocysteine and cysteine is the substitution of selenium for sulfur. The last organic
form is methylselenocysteine (aka Se-methylselenocysteine). Notice that its structure is like
selenocysteine, but with a methyl group added (like the name suggests).
Brian Lindshield
311

The selenium content of plants is dependent on the soil where they are grown. As shown
below, soil selenium levels vary greatly throughout the United States, meaning that the
selenium content of plant foods also greatly vary.
Figure 9.42 United States soil selenium levels2
The above map is interactive, so to see the soil selenium levels in a certain county or state, click
on it in the link below.
Web Link
USGS Soil Selenium Levels
Inorganic forms of selenium are commonly used in supplements. Selenomethionine is the most
common organic form of selenium in supplements and food. It is found in cereal grains such as
wheat, corn, and rice as well as soy. Yeast are typically used to produce selenomethionine for
supplements.
It should be noted that selenomethionine accumulates at much higher concentrations in the
body than other forms of selenium. This is because it can be nonspecifically incorporated into
body proteins in place of methionine. However, despite accumulating at higher levels,
selenomethionine is less effective than the methylselenocysteine in decreasing cancer
incidence or growth in animal models3. However, methylselenocysteine is not commonly
consumed, because it is a form that plants accumulate to prevent selenium from becoming
Kansas State University Human Nutrition Textbook
312

toxic to themselves. Thus, plants need to be grown in the presence of high selenium levels to
accumulate meaningful amounts of methylselenocysteine.
Subsections:
9.41 Selenoproteins
9.42 Selenium Absorption, Excretion, Toxicity & Its Questionable Deficiency
References & Links 1. Stipanuk MH. (2006) Biochemical, physiological, & molecular aspects of human nutrition. St. Louis, MO: Saunders Elsevier. 2. http://tin.er.usgs.gov/geochem/doc/averages/se/usa.html 3. Lindshield B, Ford N, Canene-Adams K, Diamond A, Wallig M, et al. (2010) Selenium, but not lycopene or vitamin E, decreases growth of transplantable dunning R3327-H rat prostate tumors. PloS One 5(4): e10423-e10423.
Link USGS Soil Selenium Levels - http://tin.er.usgs.gov/geochem/doc/averages/se/usa.html
Brian Lindshield
313

9.41 Selenoproteins
As mentioned earlier, selenium's antioxidant function is not due to the mineral itself, but a
result of the action of selenozymes. Selenoenzymes is a term used to describe the subset of
selenoproteins that are enzymes. This is illustrated in the figure below, where the different
colored circles represent amino acids in the crescent shaped enzyme. In most enzymes, the
mineral is a cofactor that is external to the enzyme, as shown on the left. Selenoenzymes
contain selenocysteine as an amino acid in the active site of the enzyme. Thus, in
selenoenzymes, selenium does not serve as a cofactor, which is different than most minerals
required for enzyme function.
Figure 9.411 Enzyme with a mineral cofactor versus a selenoenzyme with selenocysteine as an
amino acid in its active site.
25 human selenoproteins, containing the amino acid selenocysteine, have been identified. The
following table lists these selenoproteins along with their function.
Table 9.411 The 25 Human Selenoproteins1-3
Selenoprotein Function
Glutathione peroxidase 1 (GPX1) Antioxidant enzyme
Glutathione peroxidase 2 (GPX2) Antioxidant enzyme
Glutathione peroxidase 3 (GPX3) Antioxidant enzyme
Glutathione peroxidase 4 (GPX4) Antioxidant enzyme
Glutathione peroxidase 6 (GPX6) Antioxidant enzyme
Iodothyronine 5'-deiodinase-1 (DI1) Plasma T3 production
Iodothyronine 5'-deiodinase-2 (DI2) Local T3 production
Iodothyronine 5'-deiodinase-3 (DI3) T3 degradation
Thioredoxin reductase (TR1) Antioxidant enzyme
Kansas State University Human Nutrition Textbook
314
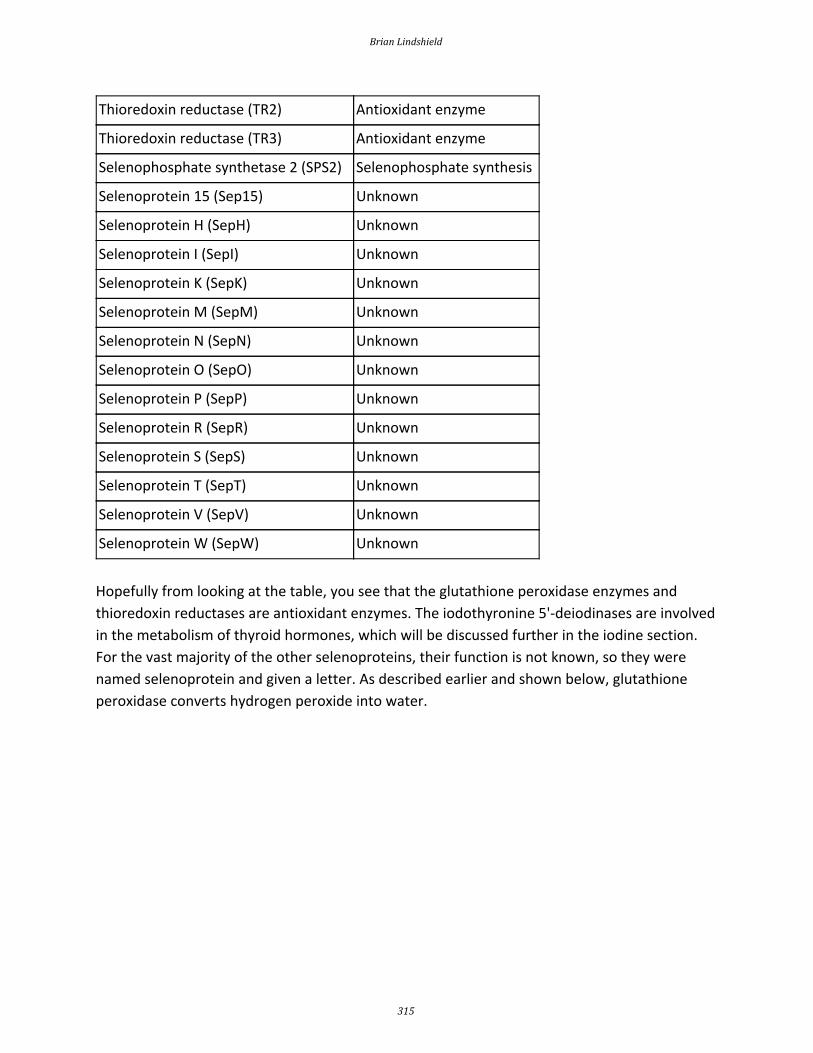
Thioredoxin reductase (TR2) Antioxidant enzyme
Thioredoxin reductase (TR3) Antioxidant enzyme
Selenophosphate synthetase 2 (SPS2) Selenophosphate synthesis
Selenoprotein 15 (Sep15) Unknown
Selenoprotein H (SepH) Unknown
Selenoprotein I (SepI) Unknown
Selenoprotein K (SepK) Unknown
Selenoprotein M (SepM) Unknown
Selenoprotein N (SepN) Unknown
Selenoprotein O (SepO) Unknown
Selenoprotein P (SepP) Unknown
Selenoprotein R (SepR) Unknown
Selenoprotein S (SepS) Unknown
Selenoprotein T (SepT) Unknown
Selenoprotein V (SepV) Unknown
Selenoprotein W (SepW) Unknown
Hopefully from looking at the table, you see that the glutathione peroxidase enzymes and
thioredoxin reductases are antioxidant enzymes. The iodothyronine 5'-deiodinases are involved
in the metabolism of thyroid hormones, which will be discussed further in the iodine section.
For the vast majority of the other selenoproteins, their function is not known, so they were
named selenoprotein and given a letter. As described earlier and shown below, glutathione
peroxidase converts hydrogen peroxide into water.
Brian Lindshield
315

Figure 9.412 Antioxidant enzymes that use minerals as cofactors
Remember that thioredoxin reductase can regenerate ascorbate from dehydroascorbate in the
theorized antioxidant network (shown below).
Figure 9.413 The theorized antioxidant network 4
References & Links 1. Gladyshev V, Kryukov G, Fomenko D, Hatfield D. (2004) Identification of trace element-containing proteins in genomic databases. Annu Rev Nutr 24: 579-596. 2. Beckett G, Arthur J. (2005) Selenium and endocrine systems. J Endocrinol 184(3): 455-465. 3. Stipanuk MH. (2006) Biochemical, physiological, & molecular aspects of human nutrition. St. Louis, MO: Saunders Elsevier. 4. Packer L, Weber SU, Rimbach G. (2001) Molecular aspects of alpha-tocotrienol antioxidant action and cell signalling. J Nutr 131(2): 369S-373S.
Kansas State University Human Nutrition Textbook
316

9.42 Selenium Absorption, Excretion, Toxicity & Its Questionable Deficiency
Selenium is highly absorbed. Thus, selenium levels in the body are not regulated by absorption,
but rather by urinary excretion. Organic selenium forms may be absorbed slightly better than
inorganic forms, as one study found that 98% of a dose of selenomethionine was absorbed,
compared to 84% of selenite1.
Selenium is primarily excreted in the urine, but at high levels it can be expired, producing garlic
odor breath.
Selenium toxicity can be a problem, especially for animals living in or around a body of water in
an area with high soil selenium levels. This is because runoff from the soil causes selenium to
collect in the water in high levels and then starts working its way up the food chain and causing
problems, as shown in the following link.
Web Link
Selenium Toxicity
In humans, the initial symptoms are nausea, fatigue, and diarrhea. If continued, the person may
develop hair and nail brittleness, rash or skin lesions, and nervous system abnormalities.
The questionable selenium deficiency is Keshan disease. This disease occurred primarily in the
mountainous regions of China, causing heart lesions. Below is a topographical map of China to
give you an idea of what areas are mountainous.
Brian Lindshield
317

Figure 9.421 Topographical map of China 2
You can see in the link below the areas where Keshan disease occurred. For the most part, you
can see that these 2 areas overlay.
Web Links
Distribution of Keshan Disease
However, sodium selenate supplementation failed to totally eradicate Keshan disease like you
would expect if it was caused by selenium deficiency. The incidence of Keshan disease also
fluctuated seasonally and annually, which is unusual for a deficiency and more consistent of an
infectious disease. Research found coxsackievirus in the heart of Keshan disease victims. They
isolated this virus and used it to perform the experiment illustrated below.
Kansas State University Human Nutrition Textbook
318

Figure 9.422 Keshan disease experiment3
One group of mice was fed an adequate selenium diet and another group a deficient selenium
diet. They were then infected with coxsackievirus that was mostly avirulent, but also contained
some virulent viruses. A virulent virus is one that causes a disease, and an avirulent virus is one
that does not cause a disease (some vaccines use avirulent viruses). After a period of time, they
found that the selenium deficient animals developed severe heart pathology, while the
selenium adequate animals did not develop heart pathology. They then isolated the virus from
the hearts of the mice from both groups and found that the coxsackievirus from the deficient
animals’ hearts had become mostly virulent3. They then took it one step further as shown in the
figure below.
Figure 9.423 Keshan disease experiment continued 3
They took the isolated virus from the selenium-deficient mouse hearts and infected selenium
adequate animals with it. The selenium adequate animals developed the severe heart
pathology like the selenium-deficient animals had previously.
Brian Lindshield
319

What's going on? They found mutations in the virus from the selenium-deficient animals that
they believe caused it to become virulent. They believe that high oxidative stress in these
animals leads to mutations in the virus, causing it to become virulent.
Who cares? Research has found similar results with vitamin E. Researchers are also examining
the effects on other viruses such as influenza (flu) and HIV. If they find a similar phenomenon
occurring in other viruses, it means that you and your friend who eats a horrible diet (eats no
fruit and vegetables) could be exposed to a virus. You don't know you were exposed because
your immune system fights off the virus. However, your friend gets sick. He/she can serve as a
host in which the virus mutates making it more virulent, which when you're exposed a second
time, may make you sick.
References & Links 1. Stipanuk MH. (2006) Biochemical, physiological, & molecular aspects of human nutrition. St. Louis, MO: Saunders Elsevier. 2. http://en.wikipedia.org/wiki/File:China_100.78713E_35.63718N.jpg 3. Beck M, Handy J, Levander O. (2004) Host nutritional status: The neglected virulence factor. Trends Microbiol 12(9): 417-423.
Links Selenium Toxicity - http://www.sci.sdsu.edu/salton/SeTooMuchTooLittle.html Distribution of Keshan Disease - http://pubs.acs.org/cen/80th/selenium.html
Kansas State University Human Nutrition Textbook
320

10 Macronutrient Metabolism Micronutrients
The macronutrient metabolism vitamins and minerals are:
Thiamin
Riboflavin
Niacin
Pantothenic Acid
Vitamin B6
Biotin
Vitamin B12
Vitamin C
Iodine
Manganese
Magnesium
All but three of these will be covered in this section. Vitamin B12 will be covered in the
one-carbon metabolism chapter, vitamin C was covered in the antioxidant chapter, and
magnesium is going to be covered in the electrolyte chapter. We are left with iodine,
manganese, and many of the B vitamins. You will learn about the 2 minerals followed by the B
vitamins with the order for the sections as follows:
10.1 Iodine
10.2 Manganese
10.3 Thiamin
10.4 Riboflavin
10.5 Niacin
10.6 Pantothenic Acid
10.7 Vitamin B 6
10.8 Biotin
Brian Lindshield
321

10.1 Iodine
Why is iodine first in this chapter? Partly because it is a mineral (but so is manganese), but
there is also a connection between iodine and selenium (last antioxidant in the previous
chapter). Iodine's only, yet critical, function is that it is required for thyroid hormone synthesis.
The figure below shows that the thyroid gland is a butterfly-shaped organ found in the neck.
The parathyroid glands are also found within the thyroid gland.
Figure 10.11 Location of thyroid and parathyroid glands 1
Iodine is found in foods primarily as iodide (I-), some bread dough has iodate (IO3-) added to
help with gluten cross-linking 2. This used to be more commonly used in the past than it is now.
Like selenium, iodide concentrations of the soil vary greatly, causing food concentrations to
greatly fluctuate. Sea water is high in iodine, thus foods of marine origin, such as seaweed and
seafood, are good dietary sources of iodine. Dairy products also tend to be good sources of
iodide because it is added to cattle feeds. Cattle receive iodine-containing medications, and
iodide-containing sanitizing solutions are used in dairy facilities3,4.
For most Americans, we consume ample iodine through the consumption of iodized salt.
Consumption of 1/2 teaspoon of iodized salt meets the RDA for iodine. There is a global logo for
iodized salt. However, I must admit that I do not recall ever seeing it myself.
The other link below is to a page that contains a scorecard map that depicts access to iodized
salt worldwide. It also contains a Youtube video that displays the reduction in iodine deficiency
over the last 2 decades.
Web Link
Global Iodized Salt Icon
Kansas State University Human Nutrition Textbook
322

Global Iodine Scorecard
Salt is iodized with either potassium iodide (KI) or potassium iodate (KIO 3). The positives of each
are:
Potassium iodide
+ Less expensive
+ Higher iodine content (76% vs. 59% for KIO 3) + More soluble
Potassium Iodate
+ More stable
The U.S. uses potassium iodide, but the form, and amount, used varies from
country-to-country. Most Americans’ salt intake comes from processed foods, many of which
are made with non-iodized salt. Iodine is well absorbed (~90%). Some dietary compounds
interfere with thyroid hormone production or utilization. These compounds are known as
goitrogens5. However, it is not believed that goitrogens are of clinical importance unless there is
a coexisting iodine deficiency 5.
Some examples of foods that contain goitrogens are 3,4,6:
Cassava
Figure 10.12 Cassava plants are typically grown in tropical and subtropical environments6
Brian Lindshield
323

Figure 10.13 The cassava roots are what are typically eaten, but first they must be peeled.
These are unprocessed7
Figure 10.14 Peeled cassava roots8
Millet
Figure 10.15 Millet growing in a field9
Kansas State University Human Nutrition Textbook
324

Figure 10.16 Millets10
Cruciferous Vegetables (broccoli, cabbage, Brussels sprouts)
Onions
Garlic
Soybeans
Peanuts
Subsections:
10.11 Thyroid Hormone
10.12 Iodine Deficiency & Toxicity
References & Links 1. http://en.wikipedia.org/wiki/File:Illu_thyroid_parathyroid.jpg 2. Gropper SS, Smith JL, Groff JL. (2008) Advanced nutrition and human metabolism. Belmont, CA: Wadsworth Publishing. 3. Byrd-Bredbenner C, Moe G, Beshgetoor D, Berning J. (2009) Wardlaw's perspectives in nutrition. New York, NY: McGraw-Hill. 4. Whitney E, Rolfes SR. (2008) Understanding nutrition. Belmont, CA: Thomson Wadsworth. 5. Anonymous. (2001) Dietary reference intakes for vitamin A, vitamin K, arsenic, boron, chromium, copper, iodine, iron, manganese, molybdenum, nickel, silicon, vanadium, and zinc. Washington, D.C.: National Academies Press. 6. http://en.wikipedia.org/wiki/File:Casava.jpg 7. http://en.wikipedia.org/wiki/File:Manihot_esculenta_dsc07325.jpg 8. http://en.wikipedia.org/wiki/File:PeeledCassava.jpg 9. https://en.wikipedia.org/wiki/Millet#/media/File:Grain_millet,_early_grain_fill,_Tifton,_7-3-02.jpg 10. https://en.wikipedia.org/wiki/Staple_food#/media/File:Pearl_millet_after_combine_harvesting.jpg
Links Global Iodized Salt Logo - https://en.wikipedia.org/wiki/File:Global_iodized_salt_logo.jpg Global Iodine Scorecard - http://www.ign.org/scorecard.htm
Brian Lindshield
325

10.11 Thyroid Hormone
The thyroid accumulates most absorbed iodine, keeping it for use to synthesize thyroid
hormone. The following video shows the thyroid and describes its function.
Web Link
Video: Thyroid (0:37)
As mentioned in the video, the two primary forms of thyroid hormone are triiodothyronine (T 3) and thyroxine (T 4).
Figure 10.111 The structure of triiodothyronine (T3)1
Figure 10.112 The structure of thyroxine (T 4)2
T4 is the primary circulating form, and is really a prohormone that is converted to the active T3 form.
The enzymes that metabolize thyroid hormones are known as deiodinases. There are three
deiodinases (Type I , Type II, Type III) that are selenoenzymes whose location and function are
summarized in the table below.
Table 10.11 Location and function of the three deiodinases3 Enzyme Tissues Function
Deiodinase Type I (DI1) Liver, kidney, thyroid gland Plasma T3 production
Kansas State University Human Nutrition Textbook
326
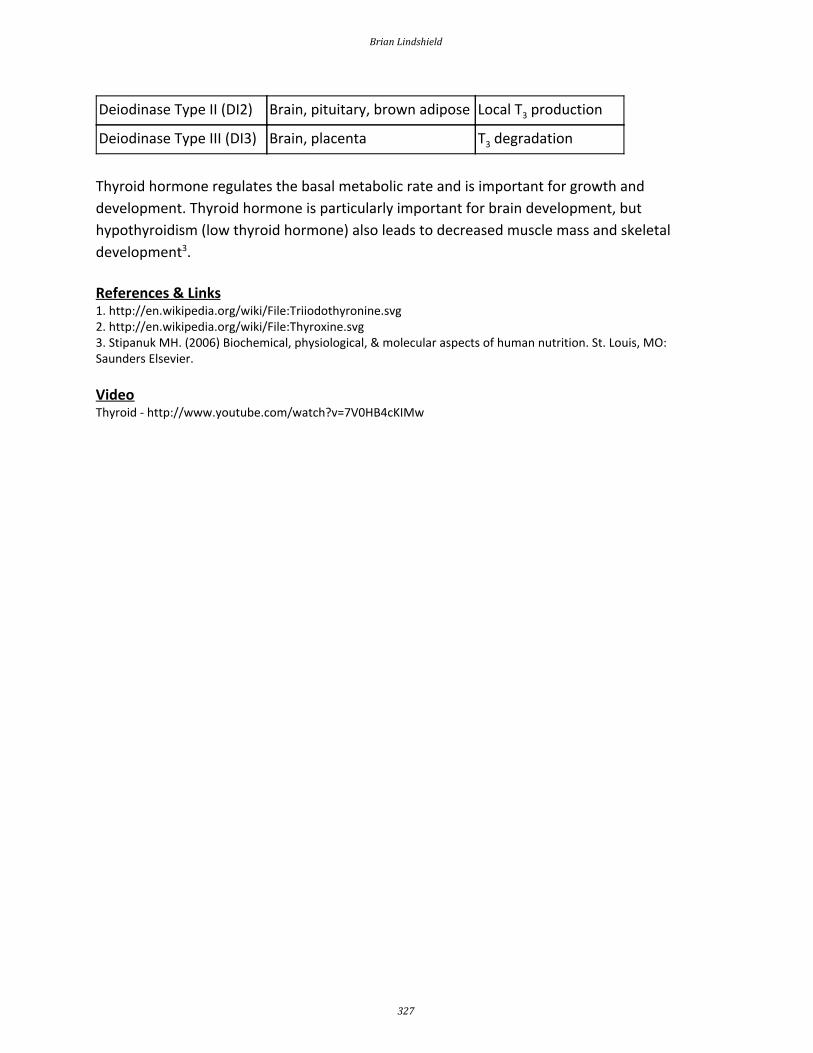
Deiodinase Type II (DI2) Brain, pituitary, brown adipose Local T 3 production
Deiodinase Type III (DI3) Brain, placenta T3 degradation
Thyroid hormone regulates the basal metabolic rate and is important for growth and
development. Thyroid hormone is particularly important for brain development, but
hypothyroidism (low thyroid hormone) also leads to decreased muscle mass and skeletal
development3. References & Links 1. http://en.wikipedia.org/wiki/File:Triiodothyronine.svg 2. http://en.wikipedia.org/wiki/File:Thyroxine.svg 3. Stipanuk MH. (2006) Biochemical, physiological, & molecular aspects of human nutrition. St. Louis, MO: Saunders Elsevier.
Video Thyroid - http://www.youtube.com/watch?v=7V0HB4cKIMw
Brian Lindshield
327

10.12 Iodine Deficiency & Toxicity
There are two iodine deficiency disorders (IDD): goiter and cretinism. Goiter is a painless
deficiency condition that results from the enlargement of the thyroid to help increase its ability
to take up iodine. A couple of pictures of goiter are shown below.
Figure 10.121 Pictures of women with goiters1,2
A more serious consequence of iodine deficiency occurs during pregnancy to the fetus. Iodine
deficiency during this time can lead to the cognitive impairment and stunted growth and known
as cretinism. This condition is characterized by severe hypothyroidism, speech loss, and
paralysis 3,4. The following links show some examples of individuals with cretinism.
Web Link
Cretinism
The World Health Organization calls iodine deficiency "the world's most prevalent, yet easily
preventable, cause of brain damage5." By saying it is easily preventable, they are referring to
the ability of salt iodization to prevent brain development problems. The following New York
Times article talks about how salt iodization may be the cheapest way to raise the world's IQ.
Web Link
In Raising the World’s I.Q., the Secret’s in the Salt
Iodine toxicity is rare, but like iodine deficiency, it can result in thyroid enlargement, and
hypothyroidism or hyperthyroidism. Acute toxicity results in gastrointestinal irritation,
abdominal pain, nausea, vomiting, and diarrhea 6.
Kansas State University Human Nutrition Textbook
328

References & Links 1. http://en.wikipedia.org/wiki/File:Kone_med_stor_struma.jpg 2. http://en.wikipedia.org/wiki/File:Goitre.jpg 3. Stipanuk MH. (2006) Biochemical, physiological, & molecular aspects of human nutrition. St. Louis, MO: Saunders Elsevier. 4. Shils ME, Shike M, Ross AC, Caballero B, Cousins RJ, editors. (2006) Modern nutrition in health and disease. Baltimore, MD: Lippincott Williams & Wilkins. 5. http://www.who.int/nutrition/topics/idd/en/ 6. Gropper SS, Smith JL, Groff JL. (2008) Advanced nutrition and human metabolism. Belmont, CA: Wadsworth Publishing.
Links Cretinism - http://www.gsi.ir/Images/MedicalGeology/cretinism1.jpg In Raising the World’s I.Q., the Secret’s in the Salt - http://www.nytimes.com/2006/12/16/health/16iodine.html?_r=1&pagewanted=all
Brian Lindshield
329

10.2 Manganese
We know far less about manganese than many other minerals. Like many minerals it serves as a
cofactor for a number of enzymes that are discussed in more detail below.
The enzyme superoxide dismutase uses manganese as a cofactor to convert superoxide to
hydrogen peroxide as shown below.
Figure 9.21 Antioxidant enzymes that use minerals as cofactors
In addition, both the enzymes involved in the gluconeogenesis oxaloacetate workaround use
manganese as cofactors as shown below.
Kansas State University Human Nutrition Textbook
330

Figure 10.22 Both enzymes of the oxaloacetate workaround in gluconeogenesis use manganese
as cofactors1
One enzyme in the urea cycle uses manganese as a cofactor.
Figure 10.23 Production of urea helps to safely remove ammonia from the body 2-4
Enzymes critical to the production of proteoglycans, which are essential components of
cartilage and bone, use manganese as a cofactor 5.
Brian Lindshield
331

Figure 10.24 Cartilage serves as a cushion between joints 6
Absorption of manganese is not well understood but is believed to be pretty low (<5%). The
main route (90%) of excretion is via bile excreted in feces 5. Deficiency and toxicities of
manganese are extremely rare. The deficiency is so rare in humans that there isn't much
information available on the symptoms of the condition. Symptoms in those who were
deliberately made deficient include vomiting, dermatitis, changes in hair color, & skeletal
defects5. Toxicity symptoms include neurological disorders similar to schizophrenia and
Parkinson's disease. In Chilean miners exposed to Mn-containing dust the toxicity was named
Manganese Madness7,8.
References & Links 1. http://en.wikipedia.org/wiki/Image:CellRespiration.svg 2. http://commons.wikimedia.org/wiki/File:Liver.svg 3. http://upload.wikimedia.org/wikipedia/commons/b/b0/Kidney_section.jpg 4. http://en.wikipedia.org/wiki/File:Urea.png 5. Gropper SS, Smith JL, Groff JL. (2008) Advanced nutrition and human metabolism. Belmont, CA: Wadsworth Publishing. 6. http://en.wikipedia.org/wiki/File:Illu_synovial_joint.jpg 7. Stipanuk MH. (2006) Biochemical, physiological, & molecular aspects of human nutrition. St. Louis, MO: Saunders Elsevier. 8. Shils ME, Shike M, Ross AC, Caballero B, Cousins RJ, editors. (2006) Modern nutrition in health and disease. Baltimore, MD: Lippincott Williams & Wilkins.
Kansas State University Human Nutrition Textbook
332

10.3 Thiamin
Thiamin (Vitamin B1) structurally consists of 2 rings that are bridged together as shown below.
Figure 10.31 Structure of thiamin1
Since it was one of the original vitamins, (remember it was the primary part of Factor B), it was
originally named thiamine (consistent with vitamine). The -e has since been dropped in its
spelling. Thiamin is sensitive to heat, so prolonged heating causes the cleavage of thiamin
between the 2 rings destroying its activity2.
Like most of the B vitamins, thiamin's primary function is as a cofactor for enzymes. It is not
thiamin alone that serves as a cofactor but instead thiamin diphosphate (thiamin + 2
phosphates), which is more commonly referred to as thiamin pyrophosphate (TPP). The
structure of thiamin pyrophosphate is shown below.
Figure 10.32 Structure of thiamin pyrophosphate (aka thiamin diphosphate) 3
In plants, thiamin is found in its free form, but in animals it is mostly thiamin pyrophosphate.
These phosphates must be cleaved before thiamin is taken up into the enterocyte4.
Thiamin uptake and absorption is believed to be an efficient process that is passive when
thiamin intake is high and active when thiamin intakes are low 4. There are two thiamin
transporters (THTR), THTR1 and THTR2, that are involved in thiamin uptake and absorption.
THTR1 is found on the brush border and basolateral membrane, while THTR2 is only found on
Brian Lindshield
333

the brush border membrane as shown below 5.
Figure 10.33 Thiamin uptake and absorption
Like most water-soluble vitamins there is little storage of thiamin.
Subsections:
10.31 Thiamin Functions
10.32 Thiamin Deficiency & Toxicity
References & Links 1. http://en.wikipedia.org/wiki/File:Thiamin.svg 2. Byrd-Bredbenner C, Moe G, Beshgetoor D, Berning J. (2009) Wardlaw's perspectives in nutrition. New York, NY: McGraw-Hill. 3. http://en.wikipedia.org/wiki/File:Thiamine_diphosphate.png 4. Gropper SS, Smith JL, Groff JL. (2008) Advanced nutrition and human metabolism. Belmont, CA: Wadsworth Publishing. 5. Said H, Mohammed Z. (2006) Intestinal absorption of water-soluble vitamins: An update. Curr Opin Gastroenterol 22(2): 140-146.
Kansas State University Human Nutrition Textbook
334
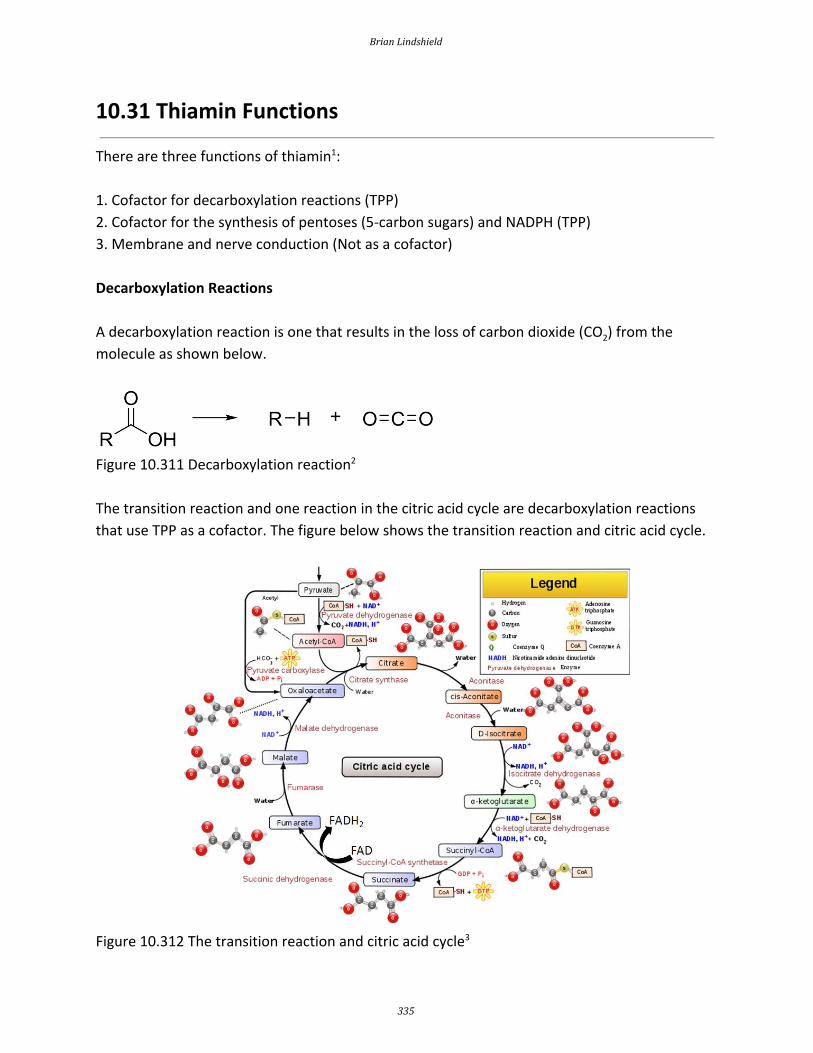
10.31 Thiamin Functions
There are three functions of thiamin 1:
1. Cofactor for decarboxylation reactions (TPP)
2. Cofactor for the synthesis of pentoses (5-carbon sugars) and NADPH (TPP)
3. Membrane and nerve conduction (Not as a cofactor)
Decarboxylation Reactions
A decarboxylation reaction is one that results in the loss of carbon dioxide (CO 2) from the
molecule as shown below.
Figure 10.311 Decarboxylation reaction2
The transition reaction and one reaction in the citric acid cycle are decarboxylation reactions
that use TPP as a cofactor. The figure below shows the transition reaction and citric acid cycle.
Figure 10.312 The transition reaction and citric acid cycle 3
Brian Lindshield
335

As shown below the conversion of pyruvate to acetyl CoA in the transition reaction is a
decarboxylation reaction that requires TPP as a cofactor. CO 2 (circled) is produced as a result of
this reaction.
Figure 10.313 The transition reaction requires TPP as a cofactor 3
A similar TPP decarboxylation reaction occurs in the citric acid cycle converting
alpha-ketoglutarate to succinyl-CoA. CO2 (circled) is given off as a result of this reaction.
Figure 10.314 Alpha-ketoglutarate dehydrogenase requires TPP as a cofactor3
TPP also functions as a cofactor for the decarboxylation of valine, leucine, and isoleucine
(branched-chain amino acids)1.
Synthesis of Pentoses and NADPH
TPP is a cofactor for the enzyme transketolase. Transketolase is a key enzyme in the pentose
phosphate (aka hexose monophosphate shunt) pathway. This pathway is important for
converting 6-carbon sugars into 5-carbon sugars (pentose) that are needed for synthesis of
DNA, RNA, and NADPH. In addition, pentoses such as fructose are converted to forms that can
be used for glycolysis and gluconeogenesis4. Transketolase catalyzes multiple reactions in the
Kansas State University Human Nutrition Textbook
336

pathway as shown below.
Figure 10.315 Transketolase in the pentose phosphate pathway uses TPP as a cofactor 5
Membrane and Nerve Conduction
In addition to its cofactor roles, thiamin, in the form of thiamin triphosphate (TTP, 3
phosphates), is believed to contribute in some unresolved way to nervous system function 1. References & Links 1. Gropper SS, Smith JL, Groff JL. (2008) Advanced nutrition and human metabolism. Belmont, CA: Wadsworth Publishing.
Brian Lindshield
337

2. https://commons.wikimedia.org/wiki/File:Decarboxylation_reaction.png 3. http://en.wikipedia.org/wiki/File:Citric_acid_cycle_with_aconitate_2.svg 4. Stipanuk MH. (2006) Biochemical, physiological, & molecular aspects of human nutrition. St. Louis, MO: Saunders Elsevier. 5. https://commons.wikimedia.org/wiki/File:PPP_(en).svg
Kansas State University Human Nutrition Textbook
338

10.32 Thiamin Deficiency & Toxicity
Thiamin deficiency is rare in developed countries, but still occurs in poorer countries where
white (aka polished) rice is a staple food. During the polishing process, thiamin, and many other
nutrients, are removed. Some people also have a mutation in THTR1 that causes them to
become thiamin deficient 1. Thiamin deficiency is known as beriberi, which, when translated,
means "I can't, I can't." The symptoms of beriberi are illustrated in the link below.
Web Link
Beriberi
There are two major forms of beriberi: dry and wet. Dry beriberi affects the nervous system,
with symptoms such as loss of muscle function, numbness, and/or tingling. Wet beriberi affects
the cardiovascular system resulting in pitting edema, along with enlargement of the heart 1. A
picture of a person with beriberi is shown below.
Figure 10.321 A person suffering from beriberi 2
Another group that is at risk for thiamin deficiency is alcoholics. There are three reasons why
alcoholics are prone to becoming deficient 3:
1. Alcohol displaces foods that are better sources of thiamin
2. Liver damage decreases TPP formation
3. Increased thiamin excretion
Brian Lindshield
339

The thiamin deficiency found in alcoholics is known as Wernicke-Korsakoff Syndrome.
Symptoms of this condition include paralysis or involuntary eye movement, impaired muscle
coordination, memory loss and confusion 3. The following video shows some of the symptoms of
this condition.
Web Link
Video: Wernicke-Korsakoff Syndrome (First 1:50)
Thiamin toxicity has never been reported as a result of oral intake. Thus, there is little worry
about thiamin toxicity4. References & Links 1. http://www.nlm.nih.gov/medlineplus/ency/article/000339.htm 2. http://en.wikipedia.org/wiki/File:Beriberi_USNLM.jpg 3. Gropper SS, Smith JL, Groff JL. (2008) Advanced nutrition and human metabolism. Belmont, CA: Wadsworth Publishing. 4. Stipanuk MH. (2006) Biochemical, physiological, & molecular aspects of human nutrition. St. Louis, MO: Saunders Elsevier.
Links Beriberi - http://www.moondragon.org/health/graphics/beriberi1.jpg Wernicke-Korsakoff Syndrome - http://www.youtube.com/watch?v=wDcyBXJAZNM
Kansas State University Human Nutrition Textbook
340

10.4 Riboflavin
A student once asked this question:
"I started taking the Mega Man Sport Multi-vitamin from GNC and about an hour or two after
consumption, with a meal, my pee is bright, practically neon yellow. What does that mean?"
Since this question is leading off the riboflavin section, you have probably surmised that
riboflavin is somehow involved. Indeed, flavin means yellow in Latin, and riboflavin is bright
yellow as shown below.
Figure 10.41 Riboflavin in solution1
Riboflavin is also a water-soluble B vitamin, so the student was excreting large amounts of
riboflavin in his urine, leading it to become "bright, practically neon yellow." The structure of
riboflavin is shown below.
Figure 10.42. Structure of riboflavin2
Brian Lindshield
341

Riboflavin is important for the production of two cofactors: flavin adenine dinucleotide (FAD) &
flavin mononucleotide (FMN).
FAD has been introduced before, but structurally you can see where riboflavin is within the
compound below.
Figure 10.43 Structure of FAD3
The 2 circled nitrogens are the sites that accept hydrogen to become FADH 2 as illustrated
below.
Figure 10.44 Addition of two hydrogens to the rings of FAD to form FADH24
The structure of FMN as shown below, is similar to FAD, except that it only contains one
phosphate group (versus 2) and doesn't have the ring structures off the phosphate groups that
are found in FAD.
Kansas State University Human Nutrition Textbook
342

Figure 10.45 The structure of FMN5
Riboflavin is photosensitive, meaning that it can be destroyed by light. This was a problem in
the old days when the milkman delivered milk in clear glass bottles. These have now been
replaced by cartons or opaque plastic containers to help protect the riboflavin content of the
milk.
Figure 10.46 Milk is no longer packaged in clear glass bottles to help protect its riboflavin from
light destruction
Riboflavin in foods is free, protein-bound, or in FAD or FMN. Only free riboflavin is taken up so
it must be cleaved, or converted before absorption 6. Riboflavin is highly absorbed through an
unresolved process, though it is believed a carrier is involved7. As you would guess from the
description above, riboflavin is primarily excreted in the urine.
Brian Lindshield
343

Subsections:
10.41 Riboflavin Functions
10.42 Riboflavin Deficiency & Toxicity
References & Links 1.http://en.wikipedia.org/wiki/File:Riboflavin_solution.jpg 2. http://en.wikipedia.org/wiki/File:Riboflavin.svg 3. http://en.wikipedia.org/wiki/File:Flavin_adenine_dinucleotide.png 4. http://en.wikipedia.org/wiki/File:FAD_FADH2_equlibrium.png 5. http://en.wikipedia.org/wiki/File:Flavin_mononucleotide.png 6. Gropper SS, Smith JL, Groff JL. (2008) Advanced nutrition and human metabolism. Belmont, CA: Wadsworth Publishing. 7. Said H, Mohammed Z. (2006) Intestinal absorption of water-soluble vitamins: An update. Curr Opin Gastroenterol 22(2): 140-146.
Kansas State University Human Nutrition Textbook
344

10.41 Riboflavin Functions
Riboflavin is required for the production of FAD and FMN. Below are some of the functions of
FAD and FMN1:
1. Citric Acid Cycle
2. Electron Transport Chain
3. Fatty Acid Oxidation
4. Niacin Synthesis
5. Vitamin B 6 Activation
6. Neurotransmitter Catabolism
7. Antioxidant Enzymes
1. Citric Acid Cycle - FAD is reduced to FADH2 in the citric acid cycle when succinate is converted
to fumarate by succinic dehydrogenase as circled below.
Figure 10.411 The citric acid cycle requires FAD2
Brian Lindshield
345

2. Electron Transport Chain - Under aerobic conditions, the electron transport chain is where
the FADH2 is used to produce ATP. Complex I of the electron transport chain includes an FMN
molecule. The electron transport chain is shown below.
Figure 10.412 Complex I in the electron transport chain contains FMN3
3. Fatty Acid oxidation - During fatty acid oxidation FAD is converted to FADH 2 as shown below.
Kansas State University Human Nutrition Textbook
346

Figure 10.413 Fatty acid oxidation requires FAD
4. Niacin synthesis - As you will hear more about in the niacin section, niacin can be synthesized
from tryptophan as shown below. An intermediate in this synthesis is kynurenine, and one of
the multiple steps between kynurenine to niacin requires FAD.
Figure 10.414 Niacin synthesis from tryptophan requires FAD4
5. Vitamin B6 Activation - The enzyme that creates the active form of vitamin B 6 (pyridoxal
phosphate) requires FMN.
Figure 10.415 Vitamin B6 activation requires FMN 5,6
6. Neurotransmitter Catabolism - The enzyme monoamine oxidase (MAO) requires FAD. This
enzyme shown below is important in the catabolism of neurotransmitters such as dopamine
and serotonin.
Brian Lindshield
347
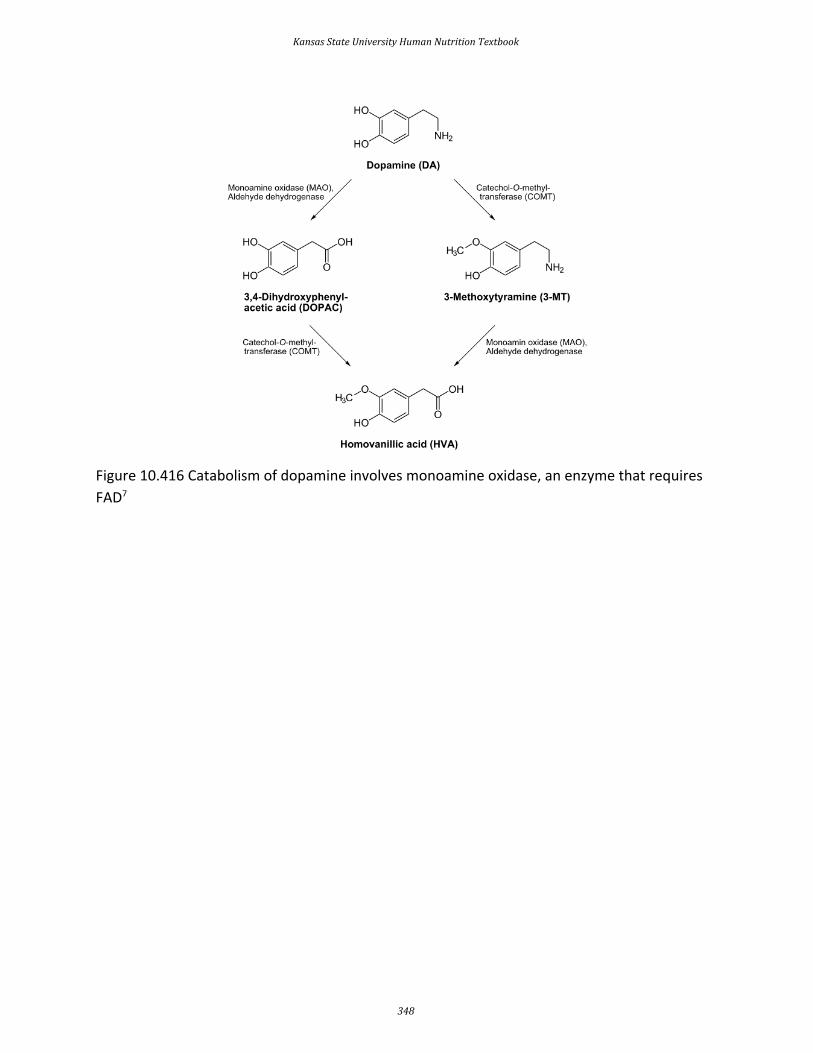
Figure 10.416 Catabolism of dopamine involves monoamine oxidase, an enzyme that requires
FAD7
Kansas State University Human Nutrition Textbook
348

Figure 10.417 Catabolism of serotonin involves monoamine oxidase, an enzyme that requires
FAD8
7. Antioxidant Enzymes - The antioxidant enzymes glutathione reductase and thioredoxin
reductase both require FAD as a cofactor. Thioredoxin reductase is a selenoenzyme. The
function of glutathione reductase is shown in the following link. Glutathione reductase can
reduce glutathione that can then be used by the selenoenzyme glutathione peroxidase to
convert hydrogen peroxide to water.
Web Link
The Glutathione Oxidation Reduction (Redox) Cycle
Brian Lindshield
349

In addition to the functions listed above, FAD is also used in folate activation, choline
catabolism, and purine metabolism 1. References & Links
1. Gropper SS, Smith JL, Groff JL. (2008) Advanced nutrition and human metabolism. Belmont, CA: Wadsworth Publishing. 2. http://en.wikipedia.org/wiki/File:Citric_acid_cycle_with_aconitate_2.svg 3. http://en.wikipedia.org/wiki/File:Mitochondrial_electron_transport_chain%E2%80%94Etc4.svg 4. https://commons.wikimedia.org/wiki/File:Nicotinic_acid_biosynthesis2.png 5. http://en.wikipedia.org/wiki/File:Pyridoxine_structure.svg 6. https://en.wikipedia.org/wiki/Pyridoxal_phosphate#/media/File:Pyridoxal-phosphate.svg 7. http://en.wikipedia.org/wiki/File:Dopamine_degradation.svg 8. http://en.wikipedia.org/wiki/File:Serotonin_biosynthesis.svg
Links
The Glutathione Oxidation Reduction (Redox) Cycle - http://lpi.oregonstate.edu/infocenter/minerals/selenium/gsh.html
Kansas State University Human Nutrition Textbook
350

10.42 Riboflavin Deficiency & Toxicity
Ariboflavinosis, riboflavin deficiency, is a rare condition that often occurs with other nutrient
deficiencies. The symptoms of this condition are shown in the figure below.
Figure 10.421 The symptoms of riboflavin deficiency1
The most notable symptoms include angular stomatitis (aka angular cheilitis, like cheilosis),
which is a lesion or cracking that forms at the corners of the mouth as shown below.
Brian Lindshield
351

Figure 10.422 Angular Cheilitis2
Glossitis is the inflammation of the tongue, which can be accompanied by redness or
inflammation of the oral cavity. Dermatitis (skin inflammation) is also frequently a symptom 3,4.
There has been no toxicity of riboflavin reported.
References & Links 1. http://www.fao.org/docrep/W0073e/p206.gif 2. http://en.wikipedia.org/wiki/File:Angular_Cheilitis.JPG 3. Gropper SS, Smith JL, Groff JL. (2008) Advanced nutrition and human metabolism. Belmont, CA: Wadsworth Publishing. 4. Byrd-Bredbenner C, Moe G, Beshgetoor D, Berning J. (2009) Wardlaw's perspectives in nutrition. New York, NY: McGraw-Hill.
Kansas State University Human Nutrition Textbook
352

10.5 Niacin
There are two forms of niacin: nicotinic acid and nicotinamide (aka niacinamide), that have a
carboxylic acid group or amide group, respectively. The structure of nicotinic acid and
nicotinamide are shown below.
Figure 10.51 Structure of nicotinic acid1
Figure 10.52 Structure of nicotinamide2
Niacin is important for the production of two cofactors: nicotinamide adenine dinucleotide
(NAD) and nicotinamide adenine dinucleotide phosphate (NADP +). The structure of NAD is
shown below; you can clearly see the nicotinamide at the top right of the molecule.
Figure 10.53 Structure of NAD3
Brian Lindshield
353

NAD is reduced to form NADH, as shown below.
Figure 10.54 Reduction of NAD to NADH 4
The structure of NADP+ is exactly the same as NAD, except it has an extra phosphate group off
the bottom of the structure, as shown below.
Figure 10.55 Structure of NADP+5
Like NAD, NADP+ can be reduced to NADPH.
Niacin is unique in that it can be synthesized from the amino acid tryptophan as shown below.
An intermediate in this synthesis is kynurenine. Many reactions occur between this compound
and niacin, and riboflavin and vitamin B6 are required for two of these reactions.
Kansas State University Human Nutrition Textbook
354

Figure 10.56 Tryptophan can be used to synthesize niacin6
To account for niacin synthesis from tryptophan, niacin equivalents (NE) were created by the
DRI committee to account for the amount of niacin in foods as well as their tryptophan content.
It takes approximately 60 mg of tryptophan to make 1 mg of niacin. Thus, the conversions to
niacin equivalents are:
1 mg Niacin = 1 NE
60 mg Tryptophan = 1 NE
The tryptophan levels of most foods is not known, but a good estimate is that tryptophan is 1%
of amino acids in protein7. Thus, lets take peanut butter, smooth style, with salt as an example8.
The peanut butter contains 13.403 mg of niacin and 25.09 g of protein8.
Step 1: Calculate the amount of tryptophan:
25.09 g X 0.01 (the numerical value of 1%) = 0.2509g of tryptophan
Step 2: Convert Grams to Milligrams
0.2509 g X 1000 mg/g = 250.9 mg of tryptophan
Step 3: Calculate NE from tryptophan
250.9 mg of tryptophan/(60 mg of tryptophan/1 NE) = 4.182 NE
Step 4: Add NEs together
13.403 NE (from niacin) + 4.182 (from tryptophan) = 17.585 NE
Most niacin we consume is in the form of nicotinamide and nicotinic acid 9, and in general is well
absorbed using an unresolved carrier10. However, in corn, wheat, and certain other cereal
Brian Lindshield
355

products, niacin bioavailability is low. In these foods, some niacin (~70% in corn) is tightly
bound, making it unavailable for absorption. Treating the grains with a base frees the niacin and
allows it to be absorbed. After absorption nicotinamide is the primary circulating form 7,9.
Subsections:
10.51 Niacin Functions
10.52 Niacin Deficiency & Toxicity
References & Links 1. http://en.wikipedia.org/wiki/File:Niacinstr.png 2. http://en.wikipedia.org/wiki/File:Nicotinamide_structure.svg 3. http://en.wikipedia.org/wiki/File:NAD%2B_phys.svg 4. http://en.wikipedia.org/wiki/File:NAD_oxidation_reduction.svg 5. http://en.wikipedia.org/wiki/File:NADP%2B_phys.svg 6. https://commons.wikimedia.org/wiki/File:Nicotinic_acid_biosynthesis2.png 7. Byrd-Bredbenner C, Moe G, Beshgetoor D, Berning J. (2009) Wardlaw's perspectives in nutrition. New York, NY: McGraw-Hill. 8. http://www.nal.usda.gov/fnic/foodcomp/search/ 9. Gropper SS, Smith JL, Groff JL. (2008) Advanced nutrition and human metabolism. Belmont, CA: Wadsworth Publishing. 10. Said H, Mohammed Z. (2006) Intestinal absorption of water-soluble vitamins: An update. Curr Opin Gastroenterol 22(2): 140-146.
Kansas State University Human Nutrition Textbook
356

10.51 Niacin Functions
Approximately 200 enzymes require NAD or NADP+. We will go through some selected
functions of NAD and NADP+. The following figures and legends show and describe the
functions of NAD and NADP+.
Figure 10.511 NAD is required for glycolysis 1
Brian Lindshield
357

Figure 10.512 NAD is required for the transition reaction and at three different points in the
citric acid cycle 2
Figure 10.513 NAD is required for fatty acid oxidation
Figure 10.514 Alcohol oxidation; NAD is required by alcohol dehydrogenase, and the MEOS uses
NADPH3,4
Kansas State University Human Nutrition Textbook
358

Figure 10.515 Fatty acid synthesis uses NADPH 5
HMG CoA reductase, the rate-limiting enzyme in cholesterol synthesis, uses NADPH. NADPH is
also used by the antioxidant enzyme glutathione reductase as shown in the link below6.
Web Link
The Glutathione Oxidation Reduction (Redox) Cycle
References & Links 1. http://en.wikipedia.org/wiki/File:CellRespiration.svg 2. http://en.wikipedia.org/wiki/File:Citric_acid_cycle_with_aconitate_2.svg 3. http://en.wikipedia.org/wiki/File:Ethanol_flat_structure.png 4. https://en.wikipedia.org/wiki/Acetaldehyde#/media/File:Acetaldehyde-2D-flat.svg 5. http://en.wikipedia.org/wiki/Mitochondrion 6. Gropper SS, Smith JL, Groff JL. (2008) Advanced nutrition and human metabolism. Belmont, CA: Wadsworth Publishing.
Links The Glutathione Oxidation Reduction (Redox) Cycle - http://lpi.oregonstate.edu/infocenter/minerals/selenium/gsh.html
Brian Lindshield
359

10.52 Niacin Deficiency & Toxicity
Pellagra is a niacin deficiency. This is no longer a common deficiency in developed countries,
but was in the U.S. in the early 1900s. This was because corn was a staple crop, meaning it was
what people primarily consumed. The bioavailability of niacin from corn is poor unless treated
with a base to release the bound niacin. The symptoms of pellagra are the 3 D's:
Dementia
Dermatitis
Diarrhea
Some refer to 4 D's in which the 4th D is death if the condition is not managed. The following
pictures show the symptoms of pellagra.
Figure 10.521 The 3 D's of pellagra1
Kansas State University Human Nutrition Textbook
360

Figure 10.522 A man with pellagra; notice the dermatitis on his arms2
The link below shows another picture of a person suffering from dermatitis as a result of
pellagra.
Web Link
Pellagra
Dietary niacin toxicity is rare. However, nicotinic acid (not nicotinamide) can improve people's
lipid profiles when consumed at levels far above the RDA. For instance the RDA and upper limit
(UL) is 14 or 16 (women & men) and 35 mg (both), respectively. Many people are taking 1-2
grams (up to 6 g/day) to get the benefits in their plasma lipid profiles as shown in the table
below4,5.
Table 10.521 Effects of nicotinic acid (>1.5 g/day) on plasma lipid profile 3
Measure Change
VLDL ↓ 25-40%
LDL ↓ 6-22%
HDL ↑ 18-35%
Total Cholesterol ↓ 21-44%
Triglycerides ↓ 21-44%
Brian Lindshield
361

It should be pointed out that there are special supplements for this purpose that include a
slower release nicotinic acid that helps prevent the toxicity symptoms (nicotinamide is not
toxic). A slow (aka long or extended) release form of niacin for people with atherosclerosis is
Niaspan®. The link below is to Niaspan’s site.
Web Link
Niaspan®
A study found that Niaspan plus a statin was no better than a statin alone in preventing heart
attacks, despite improvements in HDL and triglyceride concentrations. This result challenged
the understanding of the importance of HDL and triglyceride concentrations to heart attack
risk. The link below explains this study’s results.
Web Link
Niacin Drugs Don't Reduce Heart Attack Risk
The most well known of the toxicity symptoms is "niacin flush", which is a dilation of capillaries
accompanied by tingling that can become painful. This symptom is noted to occur at lower
levels than the other toxicity symptoms 6. Other symptoms include:
Gastrointestinal Distress
Liver Damage
A nicotinic acid receptor GPR109A, which is present in adipocytes and immune cells, is believed
to mediate niacin flush, but the beneficial effects on lipid profiles do not appear to be mediated
by it 7,8. It is not clear at this time the mechanism of action for the improvements in lipid
profiles7. Thus, nicotinic acid supplementation can improve lipid profile and lead to niacin flush,
while nicotinamide supplementation does not result in either outcome.
References & Links 1. http://www.fao.org/docrep/w0073e/p184.gif 2. http://en.wikipedia.org/wiki/File:Pellagra_NIH.jpg 3. Gille A, Bodor E, Ahmed K, Offermanns S. (2008) Nicotinic acid: Pharmacological effects and mechanisms of action. Annu Rev Pharmacol Toxicol 48: 79-106. 4. Byrd-Bredbenner C, Moe G, Beshgetoor D, Berning J. (2009) Wardlaw's perspectives in nutrition. New York, NY: McGraw-Hill. 5. Gropper SS, Smith JL, Groff JL. (2008) Advanced nutrition and human metabolism. Belmont, CA: Wadsworth Publishing. 6. Whitney E, Rolfes SR. (2008) Understanding nutrition. Belmont, CA: Thomson Wadsworth. 7. Ginsberg HN, Reyes-Soffer G.. (2013) Niacin: A long history, but a questionable future. Curr Opin Lipidol. 24: 475-479. 8. Liu D, Wang X, Kong L, Chen Z. (2015) Nicotinic acid regulates glucose and lipid metabolism through
Kansas State University Human Nutrition Textbook
362

lipid-independent pathways. Curr Pharm Biotechnol. 16: 3-10.
Links Pellagra - http://www.pathguy.com/lectures/mcgill_pellagra.jpg Niaspan® - http://www.niaspan.com/ Niaspan® Health Care Professional's Site - http://www.niaspanpro.com/ Niacin Drugs Don't Reduce Heart Attack Risk - http://www.nytimes.com/2011/05/27/health/policy/27heart.html
Brian Lindshield
363

10.6 Pantothenic Acid
Pantothenic acid has two roles in the body:
1. It is part of coenzyme A (CoA), this is its major role
2. It is part of acyl carrier protein
1. Coenzyme A
The structure of pantothenic acid is shown alone below and circled within coenzyme A.
Figure 10.61 The structure of pantothenic acid1
Figure 10.62 The structure of coenzyme A (CoA) with the pantothenic acid circled2
The functions of CoA are shown and described below3.
Kansas State University Human Nutrition Textbook
364

Figure 10.63 Acetyl-CoA is a central point in metabolism, and contains CoA4
Figure 10.64 CoA is used in fatty acid oxidation. The fatty acid is activated by adding CoA,
forming acyl-CoA.
Brian Lindshield
365

Figure 10.65 Fatty acid synthesis uses CoA 5
2. Acyl Carrier Protein
Acyl carrier protein, is also important in fatty acid synthesis 3.
Most pantothenic acid in food is found as CoA, which is cleaved prior to absorption. It is then
taken up into the enterocyte through the sodium-dependent multivitamin transporter (SMVT)
as shown below. Approximately 50% of pantothenic acid is absorbed; it is excreted primarily in
urine3.
Figure 10.66 The absorption of pantothenic acid
Deficiency of pantothenic acid is very rare. Pantothenic acid supplementation did relieve the
symptoms (burning feet and numbness of toes) of "burning feet syndrome" in prisoners in
World War II6. It is believed pantothenic acid deficiency was the cause of this syndrome. Other
symptoms noted are vomiting, fatigue, weakness, restlessness, and irritability3. No toxicity has
been reported.
Kansas State University Human Nutrition Textbook
366

References & Links 1. http://en.wikipedia.org/wiki/File:Pantothenic_acid_structure.svg 2. http://en.wikipedia.org/wiki/File:Coenzym_A.svg 3. Gropper SS, Smith JL, Groff JL. (2008) Advanced nutrition and human metabolism. Belmont, CA: Wadsworth Publishing. 4. http://en.wikipedia.org/wiki/File:CellRespiration.svg 5. https://en.wikipedia.org/wiki/File:Animal_mitochondrion_diagram_en_%28edit%29.svg 6. Shils ME, Shike M, Ross AC, Caballero B, Cousins RJ, editors. (2006) Modern nutrition in health and disease. Baltimore, MD: Lippincott Williams & Wilkins.
Brian Lindshield
367

10.7 Vitamin B 6
Vitamin B6 is composed of three compounds: pyridoxine, pyridoxal, and pyridoxamine.
Pyridoxine contains a methylhydroxyl group (-CH3OH), pyridoxal an aldehyde (-CHO), and
pyridoxamine an aminomethyl group (-CH3NH2), as shown below.
Figure 10.71 Structure of pyridoxine1
Figure 10.72 Structure of pyridoxal2
Figure 10.73 Structure of pyridoxamine3
All three forms can be activated by being phosphorylated. The phosphorylated forms can be
interconverted to the active, or the cofactor form of vitamin B6, pyridoxal phosphate (PLP). This
active form has a phosphate group added in place of a hydroxyl group. The enzyme that
catalyzes this reaction requires FMN (riboflavin cofactor), as shown below.
Kansas State University Human Nutrition Textbook
368

Figure 10.74 Vitamin B6 activation 1,4
In animal products, vitamin B6 is found in its cofactor forms, PLP and pyridoxamine phosphate
(PMP). The latter cofactor is less common than PLP. In plants, vitamin B 6 is primarily found as
pyridoxine, with up to 75% being pyridoxine glucoside, which is believed to be the plant storage
form6. Pyridoxine glucoside has a glucose added to pyridoxine as shown below.
Figure 10.75 Structure of pyridoxine glucoside 5
Vitamin B6 is well absorbed from foods (~75%) through passive diffusion. PLP and PMP are
dephosphorylated before uptake into the enterocyte. Some of the pyridoxamine glucoside is
cleaved to form free pyridoxine, but some pyridoxine glucoside is absorbed intact. Pyridoxine
glucoside absorption is lower (~50%) than pyridoxine alone. The primary circulating forms of
vitamin B 6 are pyridoxal and PLP. Vitamin B6 is primarily excreted in the urine, and like many
other B vitamins, vitamin B 6 is destroyed during cooking or heating6.
Brian Lindshield
369

Subsections:
10.71 Vitamin B 6 Functions
10.72 Vitamin B 6 Deficiency & Toxicity
References & Links 1. http://en.wikipedia.org/wiki/File:Pyridoxine_structure.svg 2. http://en.wikipedia.org/wiki/File:Pyridoxal.png 3. http://en.wikipedia.org/wiki/File:Pyridoxamine.png 4. https://en.wikipedia.org/wiki/Pyridoxal_phosphate#/media/File:Pyridoxal-phosphate.svg 5. http://pubchem.ncbi.nlm.nih.gov/summary/summary.cgi?cid=440188&loc=ec_rcs 6. Shils ME, Shike M, Ross AC, Caballero B, Cousins RJ, editors. (2006) Modern nutrition in health and disease. Baltimore, MD: Lippincott Williams & Wilkins.
Kansas State University Human Nutrition Textbook
370

10.71 Vitamin B 6 Functions
PLP is a cofactor for over 100 different enzymes, most are involved in amino acid metabolism.
In fact, without PLP, all amino acids would be essential because we would not be able to
synthesize nonessential amino acids. Below are some of the functions of PLP and PMP 1:
Figure 10.711 Transaminases require PLP or PMP2
Figure 10.712 Some deaminases require PLP3
Figure 10.713 Glycogen phosphorylase (glycogenolysis) requires PLP
Brian Lindshield
371
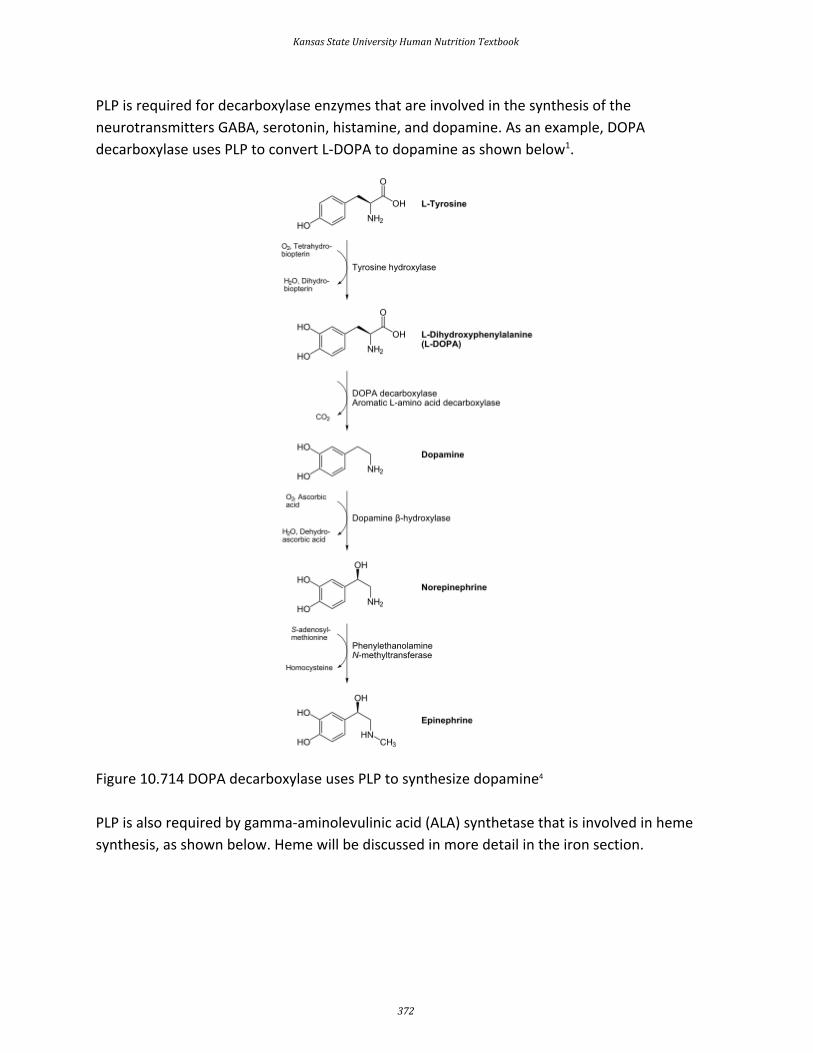
PLP is required for decarboxylase enzymes that are involved in the synthesis of the
neurotransmitters GABA, serotonin, histamine, and dopamine. As an example, DOPA
decarboxylase uses PLP to convert L-DOPA to dopamine as shown below1.
Figure 10.714 DOPA decarboxylase uses PLP to synthesize dopamine4
PLP is also required by gamma-aminolevulinic acid (ALA) synthetase that is involved in heme
synthesis, as shown below. Heme will be discussed in more detail in the iron section.
Kansas State University Human Nutrition Textbook
372

Figure 10.715 ALA synthetase uses PLP in the heme synthesis pathway 5
PLP is also used in one of the multiple reactions that occurs between kynurenine and niacin in
its synthesis from tryptophan.
Figure 10.716 PLP is required for niacin synthesis from tryptophan 6
In addition, PLP is also involved in:
Carnitine Synthesis
1-Carbon Metabolism
References & Links
1. Gropper SS, Smith JL, Groff JL. (2008) Advanced nutrition and human metabolism. Belmont, CA: Wadsworth Publishing. 2. http://en.wikipedia.org/wiki/File:Transaminierung.svg 3. http://en.wikipedia.org/wiki/File:DesaminierungCtoU.png 4. http://en.wikipedia.org/wiki/File:Catecholamines_biosynthesis.svg 5. http://en.wikipedia.org/wiki/File:Heme_synthesis.png 6. https://commons.wikimedia.org/wiki/File:Nicotinic_acid_biosynthesis2.png
Brian Lindshield
373

10.72 Vitamin B6 Deficiency & Toxicity
Vitamin B6 deficiency is rare, but symptoms include:
Skin or scalp ailments (seborrheic dermatitis)
Microcytic hypochromic anemia (small cells, low color)
Convulsions
Depression
Confusion
Given what we know about the functions of vitamin B 6 most of these symptoms make sense.
The microcytic hypochromic anemia is a result of decreased heme synthesis. The neurological
symptoms are due to the decreased production of neurotransmitters 1.
Vitamin B6, unlike many of the B vitamins, can produce toxicity. High doses of vitamin B6, taken
for an extended period of time, can lead to neurological damage 2. There are some potential
uses of vitamin B6 supplementation that are important to be done with consultation with a
physician.
One of the conditions that people take vitamin B 6 for is carpal tunnel syndrome. The following
video does a nice job of explaining and showing how this condition occurs.
Web Link
Video: Carpal Tunnel Syndrome (1:02)
While the evidence is not conclusive, it appears that vitamin B 6 supplementation may be
beneficial to those suffering from carpal tunnel syndrome and may be tried alone, or in
combination with other complementary treatments, before surgery is undertaken3,4.
Morning sickness (hyperemesis gravidarum) that occurs early in pregnancy is another condition
where vitamin B6 supplementation is utilized. The evidence again is not clear on whether it is
beneficial 5,6, but The American College of Obstetricians and Gynecologists suggests that vitamin
B6 may be tried first to treat nausea and vomiting during pregnancy7. In 2013, the FDA approved
doxylamine-pyridoxine (Diclegis) for use in pregnancy 8. It is not known exactly what causes
morning sickness, but it is believed that lower circulating vitamin B 6 levels are associated with
increased morning sickness severity9.
Kansas State University Human Nutrition Textbook
374

The last condition that vitamin B 6 is commonly supplemented for is premenstrual syndrome
(PMS). A systematic literature review found that it is inconclusive whether vitamin B 6 supplementation is beneficial in managing PMS 10.
References & Links 1. Stipanuk MH. (2006) Biochemical, physiological, & molecular aspects of human nutrition. St. Louis, MO: Saunders Elsevier. 2. Stipanuk MH. (2006) Biochemical, physiological, & molecular aspects of human nutrition. St. Louis, MO: Saunders Elsevier. 3. Ryan-Harshman M, Aldoori W. (2007) Carpal tunnel syndrome and vitamin B6. Canadian Family Physician 53(7): 1161-1162. 4. Aufiero E, Stitik T, Foye P, Chen B. (2004) Pyridoxine hydrochloride treatment of carpal tunnel syndrome: A review. Nutr Rev 62(3): 96-104. 5. Koren G, Maltepe C. (2006) Preventing recurrence of severe morning sickness. Canadian Family Physician 52(12): 1545-1546. 6. Tan P, Yow C, Omar S. (2009) A placebo-controlled trial of oral pyridoxine in hyperemesis gravidarum. Gynecol Obstet Invest 67(3): 151-157. 7. http://www.acog.org/Patients/FAQs/Morning-Sickness-Nausea-and-Vomiting-of-Pregnancy 8. Slaughter SR, Hearns-Stokes R, van der Vlugt T, Joffe HV. (2014) FDA approval of doxylamine-pyridoxine therapy for use in pregnancy. N Engl J Med. 370: 1081-1083. 9. Wibowo N, Purwosunu Y, Sekizawa A, Farina A, Tambunan V, Bardosono S. (2012) Vitamin B6 supplementation in pregnant women with nausea and vomiting. 116: 206-210. 10. Whelan A, Jurgens T, Naylor H. (2009) Herbs, vitamins and minerals in the treatment of premenstrual syndrome: A systematic review. The Canadian Journal of Clinical Pharmacology 16(3): e407-e429.
Video Carpal Tunnel Syndrome - http://www.youtube.com/watch?v=rewDQgqU5Hg
Brian Lindshield
375

10.8 Biotin
The 2 primary dietary forms of biotin are free biotin and biocytin (aka biotinyllysine) 1. The
structure of biotin is shown below.
Figure 10.81 Structure of biotin2
Biocytin is biotin bound to the amino acid lysine as seen in its structure below.
Figure 10.82 Structure of biocytin3
Free biotin is believed to be highly absorbed. Before uptake, biocytin is acted on by the enzyme
biotinidase, forming free biotin and lysine. Free biotin is then taken up into the enterocyte
through the sodium-dependent multivitamin transporter (SMVT), as shown below1,4,5.
Kansas State University Human Nutrition Textbook
376

Figure 10.83 Free biotin is taken up into the enterocyte by the SMVT.
Most biotin is excreted in the urine.
Subsections:
10.81 Biotin Functions
10.82 Epigenetics
10.83 Biotin Deficiency & Toxicity
References & Links
1. Gropper SS, Smith JL, Groff JL. (2008) Advanced nutrition and human metabolism. Belmont, CA: Wadsworth Publishing. 2. http://en.wikipedia.org/wiki/File:Biotin_structure.svg 3. http://commons.wikimedia.org/wiki/File:Biocytin.svg 4. Said H, Mohammed Z. (2006) Intestinal absorption of water-soluble vitamins: An update. Curr Opin Gastroenterol 22(2): 140-146. 5. Zempleni J, Wijeratne SSK, Hassan Y. (2009) Biotin. Biofactors 35(1): 36-46.
Brian Lindshield
377

10.81 Biotin Functions
Biotin is an important cofactor for carboxylase enzymes. As the name sounds, these enzymes add carboxylic acid groups (-COOH) to whatever compound they act on. In fatty acid synthesis, biotin is required by the enzyme that forms malonyl CoA from acetyl-CoA, as shown below1.
Figure 10.811 The conversion of acetyl CoA to malonyl CoA in fatty acid synthesis requires
biotin2
Another biotin-requiring carboxylase is one that converts pyruvate to oxaloacetate in
gluconeogenesis as shown below 1.
Kansas State University Human Nutrition Textbook
378

Figure 10.812 Biotin is required for conversion of pyruvate to oxaloacetate in the oxaloacetate
workaround of gluconeogenesis (like glycolysis in reverse with oxaloacetate workaround) 3
In addition to these two functions, biotin is also important for histone biotinylation and the
breakdown of isoleucine, leucine, methionine, and threonine 1.
Histone biotinylation is an epigenetic modification that is described in the next section.
Biotin is an effective treatment for brittle nail syndrome, but it has not been shown to improve
healthy nails4. There is little evidence to suggest that biotin improves healthy hair as well5. References & Links 1. Gropper SS, Smith JL, Groff JL. (2008) Advanced nutrition and human metabolism. Belmont, CA: Wadsworth Publishing. 2. http://en.wikipedia.org/wiki/File:Animal_mitochondrion_diagram_en_%28edit%29.svg 3. http://en.wikipedia.org/wiki/File:CellRespiration.svg 4. Scheinfeld N, Dahdah MJ, Scher R. (2007) Vitamins and minerals: their role in nail health and disease. 6(8): 782-787. 5. Famenini S, Goh C. (2014) Evidence for supplemental treatments in androgenetic alopecia. 13(7): 809-812.
Brian Lindshield
379

10.82 Epigenetics
What is epigenetics? Epigenetics means "above the genome." To use a computer analogy, if the
DNA sequence is the hardware, epigenetics can be viewed as the software. The nucleotide
sequence of the human genome is known, and there is surprisingly little difference between
individuals. However, the 2 main epigenetic modifications play a major role in determining
what genes are expressed:
DNA methylation
Histone modification
These epigenetic modifications are illustrated in the following link.
Web Link
Epigenetic modifications
DNA methylation is the addition of a methyl group to a DNA base, which decreases gene
transcription. Conversely, demethylation increases gene transcription.
DNA does not exist simply as long strands of double helix, instead it is packaged and shaped so
that it can fit in the nucleus of our cells. The first part of this packaging is that DNA is wrapped
around proteins called histones as shown below.
Figure 10.821 DNA is wrapped around histones1
Kansas State University Human Nutrition Textbook
380

Histone modification occurs when there are additions or subtractions to the histones
themselves. The most common is acetylation (addition of an acetyl group) or deacetylation of
histones. The structure of acetyl is shown below.
Figure 10.822 Structure of acetyl2
Histone acetylation causes the DNA structure to open up so that transcription can occur.
Histone deacetylation causes the DNA to become more tightly packed, preventing transcription
from occurring.
Together, these modifications to DNA and histones are known as the epigenetic code. The
following two videos do a good job explaining epigenetics and tying together its two different
methods of modification. The Tale of 2 Mice describes how great impact that the methylation
status (whether it is methylated or unmethylated) of the agouti gene has on physical
characteristics genetically identical mice. The second video illustrates how histone
modifications impact gene transcription.
Web Links
Video: A Tale of Two Mice (4:39)
Video: Histone Modifications (2:18)
How does this relate to biotin? Histones can be biotinylated, or have biotin added to the
histone. However, it should be noted that histone biotinylation is rare (<0.001% of human
histones H3 and H4), so it is questionable how much impact this action has 3. References & Links 1. http://en.wikipedia.org/wiki/File:Nucleosome_structure.png 2. http://en.wikipedia.org/wiki/File:Acetyl.svg 3. Kuroshi T, Rios-Avila L, Pestinger V, Wijeratne SSK, Zempleni J. (2011) Biotinylation is a natural, albeit rare, modification of human histones. Mol Genet Metab, 104, 537-545.
Links Epigenetic modifications - http://www.nature.com/nature/journal/v441/n7090/images/441143a-i2.0.jpg
Videos A Tale of Two Mice - https://www.youtube.com/watch?v=OOiCu5kzGxg Histone Modifications - http://www.youtube.com/watch?v=eYrQ0EhVCYA
Brian Lindshield
381

10.83 Biotin Deficiency & Toxicity
Biotin deficiency is very rare. Symptoms of biotin deficiency include 1:
Skin rash
Hair loss
Neurological Impairments
There are a couple of ways that a person could develop a deficiency in biotin. First, a very small
number of people are born with a mutation in biotinidase that results in them not being able to
cleave biocytin for absorption 1. Another way is through the consumption of raw eggs. Drinking
raw eggs is not something that most people do. However, some people do it to imitate
Sylvester Stallone's movie character Rocky, who consumed them as part of his boxing training
regimen. If you are not familiar with this movie the link below shows you how Rocky consumed
his raw eggs.
Web Link
Video: Rocky Raw Eggs (1:21)
The potential problem with consuming raw eggs routinely is that raw egg whites contain a
protein called avidin which binds biotin and prevents its absorption. However, it would take
more than two dozen egg whites consumed daily over many months to cause a deficiency,
making this an unlikely occurrence2. Cooking denatures avidin and prevents it from binding
biotin, meaning that cooked eggs are not a concern.
No toxicity of biotin has been reported.
References & Links 1. Byrd-Bredbenner C, Moe G, Beshgetoor D, Berning J. (2009) Wardlaw's perspectives in nutrition. New York, NY: McGraw-Hill. 2. Whitney E, Rolfes SR. (2008) Understanding nutrition. Belmont, CA: Thomson Wadsworth.
Videos Rocky Raw Eggs - http://www.youtube.com/watch?v=NhkdLHSKo9s
Kansas State University Human Nutrition Textbook
382

11 One-Carbon Metabolism Micronutrients
Three B vitamins are involved in what is known as 1-carbon metabolism. This is the movement
of 1 carbon units, generally methyl groups (CH 3). It is similar to the movement of the amino
group that occurs in transamination. As shown in the figure below, folate, vitamin B12, and
vitamin B 6 are the B vitamins involved in 1-carbon metabolism.
Figure 11.1 One-carbon metabolism depiction. 5-methyl tetrahydrofolate (THF) donates a
methyl group to cobalamin forming methylcobalamin. Methylcobalamin donates a methyl
group to homocysteine, forming methionine (amino acid). Alternatively, vitamin B 6 can be
utilized to convert homocysteine into cysteine.
Vitamin B6 has been described in the previous chapter, so this chapter is going to focus on
folate and vitamin B12. We will examine this figure in pieces, so that hopefully by the time this
chapter is completed, you will understand the role of all these vitamins in 1-carbon metabolism.
Sections:
11.1 Folate & Folic Acid
11.2 Vitamin B 12
11.3 B Vitamins, Homocysteine, & Cardiovascular Disease
Brian Lindshield
383

11.1 Folate & Folic Acid
Folate is a B vitamin that exists in either its reduced form (folate) or oxidized form (folic acid).
When folate is used in this section, we are referring to the reduced form, not the vitamin itself.
Another key distinction between the 2 terms is that folic acid refers to the synthetic form, while
folate refers to the natural form. Folic acid is only found in certain foods because they have
been fortified with it, not because they produce it. The structure of folic acid is shown below.
Figure 11.11 Structure of Folic Acid1
Another key difference between folate and folic acid is the number of glutamates in their tails.
Notice that glutamate is boxed in the structure of folic acid above. Folic acid always exists as a
monoglutamate, meaning it only contains 1 glutamate. On the other hand, about 90% of the
folate found in foods are polyglutamates, meaning there is more than 1 glutamate in their tail.
Folic acid is more stable than folate, which can be destroyed by heat, oxidation, and light 2. Table 11.11 summarizes the key differences between folate and folic acid.
Table 11.11 Comparison of folate to folic acid
Folate Folic Acid
Reduced Form Oxidized Form
Natural Synthetic
Polyglutamate Monoglutamate
More Stable
The bioavailability of folate was believed to be much lower than folic acid. 3 To account for these
differences, the DRI committee created dietary folate equivalents (DFEs) to set the DRIs4. DFEs
are defined as follows:
1 DFE = 1 ug food folate = 0.6 ug food folic acid = 0.5 ug folic acid on an empty stomach
Kansas State University Human Nutrition Textbook
384
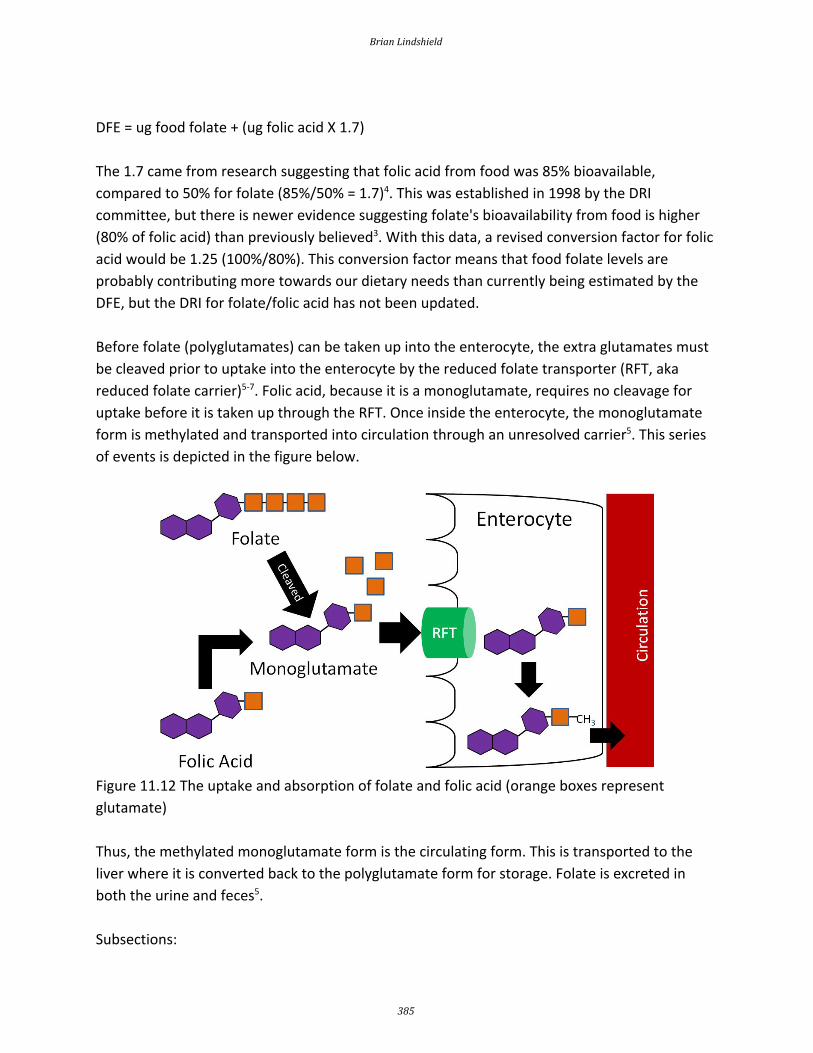
DFE = ug food folate + (ug folic acid X 1.7)
The 1.7 came from research suggesting that folic acid from food was 85% bioavailable,
compared to 50% for folate (85%/50% = 1.7)4. This was established in 1998 by the DRI
committee, but there is newer evidence suggesting folate's bioavailability from food is higher
(80% of folic acid) than previously believed3. With this data, a revised conversion factor for folic
acid would be 1.25 (100%/80%). This conversion factor means that food folate levels are
probably contributing more towards our dietary needs than currently being estimated by the
DFE, but the DRI for folate/folic acid has not been updated.
Before folate (polyglutamates) can be taken up into the enterocyte, the extra glutamates must
be cleaved prior to uptake into the enterocyte by the reduced folate transporter (RFT, aka
reduced folate carrier) 5-7. Folic acid, because it is a monoglutamate, requires no cleavage for
uptake before it is taken up through the RFT. Once inside the enterocyte, the monoglutamate
form is methylated and transported into circulation through an unresolved carrier5. This series
of events is depicted in the figure below.
Figure 11.12 The uptake and absorption of folate and folic acid (orange boxes represent
glutamate)
Thus, the methylated monoglutamate form is the circulating form. This is transported to the
liver where it is converted back to the polyglutamate form for storage. Folate is excreted in
both the urine and feces 5.
Subsections:
Brian Lindshield
385

11.11 Folate Functions
11.12 Folate Deficiency & Toxicity
References & Links 1. http://en.wikipedia.org/wiki/File:Folat.svg 2. Byrd-Bredbenner C, Moe G, Beshgetoor D, Berning J. (2009) Wardlaw's perspectives in nutrition. New York, NY: McGraw-Hill. 3. Winkels R, Brouwer I, Siebelink E, Katan M, Verhoef P. (2007) Bioavailability of food folates is 80% of that of folic acid. Am J Clin Nutr 85(2): 465-473. 4. Anonymous. (1998) Dietary reference intakes for thiamin, riboflavin, niacin, vitamin B6, folate, vitamin B12, pantothenic acid, biotin, and choline. Washington D.C.: National Academies Press. 5. Shils ME, Shike M, Ross AC, Caballero B, Cousins RJ, editors. (2006) Modern nutrition in health and disease. Baltimore, MD: Lippincott Williams & Wilkins. 6. Gropper SS, Smith JL, Groff JL. (2008) Advanced nutrition and human metabolism. Belmont, CA: Wadsworth Publishing. 7. Stipanuk MH. (2006) Biochemical, physiological, & molecular aspects of human nutrition. St. Louis, MO: Saunders Elsevier.
Kansas State University Human Nutrition Textbook
386

11.11 Folate Functions
The major function of folate is that it participates in 1-carbon metabolism. As described earlier,
this is the transfer of 1-carbon units from 1 compound to another. The cofactor form of folate is
tetrahydrofolate (THF). As is shown in the figure below, in order for THF to be formed, a methyl
group is transferred to cobalamin (vitamin B 12) from 5-methyl THF (THF plus a methyl group),
forming methyl-cobalamin. You can see this on the left side of the figure below.
Figure 11.111 One-carbon metabolism
There are 2 major cofactor functions of THF 1:
1. DNA Base Synthesis
THF is required for the synthesis of DNA bases (purines and pyrimidines) 1. As shown in the link
below, N10-formyl-THF (a form of THF) is needed in 2 reactions (3 and 9) in purine synthesis.
Web Link
Purine Synthesis
2. Amino Acid Metabolism
THF is a cofactor for enzymes that metabolize histidine, serine, glycine, and methionine1. The
following link shows that THF is a cofactor for serine hydroxymethyltransferase, the enzyme
that converts serine to glycine.
Brian Lindshield
387

Web Link
Serine to Glycine
References & Links 1. Gropper SS, Smith JL, Groff JL. (2008) Advanced nutrition and human metabolism. Belmont, CA: Wadsworth Publishing.
Links Purine Synthesis - http://themedicalbiochemistrypage.org/images/purinesynthesis.jpg Serine to Glycine - http://themedicalbiochemistrypage.org/images/glycine-synthesis.jpg
Kansas State University Human Nutrition Textbook
388

11.12 Folate Deficiency & Toxicity
Folate deficiency is affects some Americans. The hallmark symptom of folate deficiency is
megaloblastic (aka macrocytic) anemia. Megaloblastic anemia, as the name suggests, is
characterized by large, nucleated (most red blood cells do not have a nucleus), immature red
blood cells. This occurs because folate is needed for DNA synthesis; without it red blood cells
are not able to divide properly1. As a result, fewer and poorer functioning red blood cells are
produced that cannot carry oxygen as efficiently as normal red blood cells2.
A maternal folate deficiency can lead to neural tube defects in infants. The exact cause of
neural tube defects is unknown, but folate/folic acid supplementation has been shown to
decrease the incidence of neural tube defects3. The most common of these neural tube defects
is spina bifida (1 out of 2500 babies born in the United States), which is a failure of the neural
tube to close and the spinal cord and its fluid protrude out the infant's back, as shown below 4,5.
Figure 11.121 Spina bifida 6
The neural tube closes 21-28 days after conception 1, and with 50% of pregnancies estimated to
be unplanned, many women are not aware they are pregnant during this period 1,2. It is
recommended that women of childbearing age consume 400 ug of folic acid daily 1. However, to
expect all women to do this through supplements would likely be most difficult for those at
Brian Lindshield
389

most risk (women of low socioeconomic status, young mothers) because they might not be able
to afford or not know to take the supplement. In addition, in 1998 the FDA mandated that all
refined cereals and grains be fortified with 140 ug folic acid /100 grams of product 7. As you can
see below, spina bifida prevalence rates declined during the optional fortification years and
declined further once fortification became mandatory in the United States.
Figure 11.122 Neural tube defect prevalence 1995-20118
However, more recent research has found that folic acid supplementation begun before
conception reduced the occurrence and severity of neural tube defects 9.
The following link is an interesting account of the history that led up to the folic acid
fortification. It is not clear whether folic acid fortification was fully responsible for the decrease
in spina bifida rates shown above, but the rates are lower than they were pre-fortification.
However, you would think that the hope was that the impact would be greater than it has been
thus far. The second link is to the announcement that in 2016 the FDA approved the
fortification of corn masa flour.
Web Link
Folic Acid Fortification: Fact and Folly
FDA Approves Folic Acid Fortification of Corn Masa
Flour
Folate/Folic acid is not toxic, but it can mask a vitamin B12 deficiency and prevent its diagnosis.
This effect will be discussed further in the vitamin B 12 deficiency section.
Kansas State University Human Nutrition Textbook
390

References & Links 1. Byrd-Bredbenner C, Moe G, Beshgetoor D, Berning J. (2009) Wardlaw's perspectives in nutrition. New York, NY: McGraw-Hill. 2. Whitney E, Rolfes SR. (2008) Understanding nutrition. Belmont, CA: Thomson Wadsworth. 3. Stipanuk MH. (2006) Biochemical, physiological, & molecular aspects of human nutrition. St. Louis, MO: Saunders Elsevier. 4. http://www.cdc.gov/ncbddd/birthdefects/SpinaBifida.htm 5. http://www.nlm.nih.gov/medlineplus/ency/imagepages/19087.htm 6. https://www.cdc.gov/ncbddd/spinabifida/facts.html 7. Gropper SS, Smith JL, Groff JL. (2008) Advanced nutrition and human metabolism. Belmont, CA: Wadsworth Publishing. 8. http://www.cdc.gov/mmwr/preview/mmwrhtml/mm6401a2.htm 9. Bergman JEH, Otten E, Verheij JBGM, de Walle HEK. (2016) Folic acid supplementation influences the distribution of neural tube defect subtypes: A registry-based study. Reprod Toxicol. 59:96-100.
Link Folic Acid Fortification: Fact and Folly - http://www.fda.gov/AboutFDA/WhatWeDo/History/ProductRegulation/SelectionsFromFDLIUpdateseriesonFDAHistory/ucm091883.htm FDA Approves Folic Acid Fortification of Corn Masa Flour - https://www.fda.gov/NewsEvents/Newsroom/PressAnnouncements/ucm496104.htm
Brian Lindshield
391

11.2 Vitamin B 12
Vitamin B12 is unique among vitamins in that it contains an element (cobalt) and is found almost
exclusively in animal products. Neither plants nor animals can synthesize vitamin B 12. Instead,
vitamin B 12 in animal products is produced by microorganisms within the animal that the
products came from. Animals consume the microorganisms in soil or bacteria in ruminant
animals that produce vitamin B121. Some plant products, such as fermented soy products
(tempeh, miso) and the sea algae supplement, spirulina, are advertised as being good sources
of B 12. However, fermented soy products are not a reliable vitamin B 12 source2 and spirulina
contains a pseudovitamin B 12 compound that is not bioavailable 3. For vegans, supplements,
nutritional yeast, and fortified products like fortified soy milk can help them meet their vitamin
B12 needs4.
Vitamin B12's scientific name is cobalamin, which makes sense when you consider it contains
cobalt and many amine groups, as shown in the figure below.
Figure 11.21 Structure of vitamin B 12 (cobalamin)5
The other feature that is important in cobalamin is the circled R group. This is what differs
between the different cobalamins, whose names and R groups are shown in the following table.
Kansas State University Human Nutrition Textbook
392

Table 11.21 Different cobalamin forms
R Group Name
CN Cyanocobalamin
OH Hydroxocobalamin
H2O Aquocobalamin
NO2 Nitritocobalamin
5'-deoxyadenosyl Adenosylcobalamin*
CH3 Methylcobalamin*
*Cofactor Forms
The 2 cofactor forms are adenosylcobalamin and methylcobalamin. We can convert most
cobalamins into these 2 cofactor forms. Most foods contain adenosylcobalamin,
hydroxocobalamin, or methylcobalamin6. The most common form found in supplements is
cyanocobalamin, with some also using methylcobalamin7. Cyanocobalamin is a synthetic form
of the vitamin B 12.
The uptake, absorption, and transport of vitamin B12 is a complex process. The overall
bioavailability of vitamin B 12 is believed to be approximately 50%3, with the different cobalamin
forms having similar bioavailabilities7. Sublingual supplements of vitamin B12 have been found
to be equally efficacious as oral supplements7. Excretion occurs mostly through bile, with little
loss in urine 6.The following descriptions explain, and figures illustrate, this process.
Vitamin B12 is normally bound to protein in food. Salivary glands in the mouth produce
haptocorrin (formerly known as R protein), which travels with the food into the stomach. In the
stomach, acid converts pepsinogen into pepsin, and the protein intrinsic factor is released from
the parietal cells 1,8.
Brian Lindshield
393

Figure 11.22 Vitamin B12 in the stomach part 1 8,9
As pepsin frees B12 from protein, haptocorrin binds to the newly freed vitamin B12 (haptocorrin +
B12). Intrinsic factor escapes digestion and, along with haptocorrin + B12, exits the stomach and
enters the duodenum1,8.
Figure 11.23 Vitamin B12 in the stomach part 2 8,9
In the duodenum, pancreatic proteases break down haptocorrin, and again vitamin B12 is freed.
Intrinsic factor then binds vitamin B12 (intrinsic factor + B 12); intrinsic factor + B12 continues into
the ileum to prepare for absorption 1,8.
Kansas State University Human Nutrition Textbook
394

Figure 11.24 Vitamin B12 in the duodenum8,9
In the ileum, intrinsic factor + B12 is believed to be endocytosed by intrinsic factor binding to
cubulin (aka intrinsic factor receptor), forming an endosome inside the enterocyte. Intrinsic
factor is broken down in the enterocyte, freeing vitamin B 12. The free vitamin B12 is then bound
to transcobalamin II (TC II + B 12); TC II + B12 moves into circulation8.
Figure 11.25 Vitamin B12 absorption8,9
Brian Lindshield
395

The liver is the primary storage site for vitamin B12. Unlike most other water-soluble vitamins,
the liver is able to maintain significant stores of vitamin B 12. Uptake into the liver occurs
through the binding of TC II + B 12 to the TC II Receptor and the endocytosis of both the
compound and the receptor8. Vitamin B12 is once again freed after degradation of TC II. Vitamin
B12 is primarily stored in the liver as adenosylcobalamin6,8.
Figure 11.26 Hepatic uptake and storage of vitamin B 129
Subsections:
11.21 Vitamin B 12 Functions
11.22 Vitamin B 12 Deficiency & Toxicity
References & Links 1. Byrd-Bredbenner C, Moe G, Beshgetoor D, Berning J. (2009) Wardlaw's perspectives in nutrition. New York, NY: McGraw-Hill. 2. Craig W, Mangels A. (2009) Position of the american dietetic association: Vegetarian diets. J Am Diet Assoc 109(7): 1266-1282. 3. Watanabe F. (2007) Vitamin B12 sources and bioavailability. Exp Biol Med 232(10): 1266-1274. 4. http://www.vrg.org/nutrition/b12.php 5. http://en.wikipedia.org/wiki/File:Cobalamin.png 6. Gropper SS, Smith JL, Groff JL. (2008) Advanced nutrition and human metabolism. Belmont, CA: Wadsworth Publishing. 7. https://ods.od.nih.gov/factsheets/VitaminB12-HealthProfessional/ 8. Shils ME, Shike M, Ross AC, Caballero B, Cousins RJ, editors. (2006) Modern nutrition in health and disease. Baltimore, MD: Lippincott Williams & Wilkins. 9. http://commons.wikimedia.org/wiki/File:Illu_small_intestine_catal%C3%A0.png
Kansas State University Human Nutrition Textbook
396

11.21 Vitamin B 12 Functions
Vitamin B12 is a cofactor for 2 enzymes and is also important for neuron function as described
further below.
Methionine Synthase
Methionine synthase is an important enzyme in 1-carbon metabolism that uses
methylcobalamin as its cofactor and converts homocysteine to methionine by adding a methyl
group. Methionine then is converted to other compounds that serve as methyl donors, as
shown below 1.
Figure 11.211 One-carbon metabolism
These methyl donors can donate methyl groups for methylating DNA, an epigenetic
modification1.
Methymalonyl mutase
This enzyme uses adenosylcobalamin as its cofactor, and is important in the breakdown of odd
chain fatty acids (5 carbons etc.). As you know, odd chain fatty acids are less common than
even chain fatty acids, but this enzyme is required to properly handle these less common fatty
acids 1.
Demyelination
Brian Lindshield
397

In addition to its role as a cofactor for enzymes, vitamin B 12 is also important for preventing
degradation of the myelin sheath that surrounds neurons, as shown below.
Figure 11.212 Vitamin B12 is needed to maintain the myelin sheath that surrounds neurons2
The mechanism through which vitamin B12 prevents demyelination is not known3. References & Links 1. Byrd-Bredbenner C, Moe G, Beshgetoor D, Berning J. (2009) Wardlaw's perspectives in nutrition. New York, NY: McGraw-Hill. 2. https://en.wikipedia.org/wiki/Myelin#/media/File:Neuron_Hand-tuned.svg 3. http://lpi.oregonstate.edu/infocenter/vitamins/vitaminB12/
Kansas State University Human Nutrition Textbook
398

11.22 Vitamin B12 Deficiency & Toxicity
There are 2 primary symptoms of vitamin B12 deficiency:
Megaloblastic (Macrocytic) Anemia
Neurological Abnormalities
Megaloblastic (Macrocytic) Anemia
This is the same type of anemia that occurs in folate deficiency that is characterized by fewer,
enlarged, immature red blood cells. In vitamin B 12 deficiency, this can occur because there is not
enough cobalamin to convert 5-methyl THF to THF as it normally would as illustrated below.
Figure 11.221 One-carbon metabolism
Thus, THF is not available for normal DNA synthesis and the red blood cells do not divide
correctly.
Neurological Abnormalities
Vitamin B12 deficiency also results in nerve degeneration and abnormalities that can often
precede the development of anemia. These include a decline in mental function and burning,
tingling, and numbness of legs. These symptoms can continue to worsen and deficiency can be
fatal1.
The most common cause of vitamin B 12 deficiency is pernicious anemia, a condition of
Brian Lindshield
399
inadequate intrinsic factor production that causes poor vitamin B 12 absorption. This condition is
common in people over the age of 50 because they have the condition atrophic gastritis 2. Atrophic gastritis is a chronic inflammatory condition that leads to the loss of glands in the
stomach, as shown in the figure in the following link.
Web Link
Atrophic Gastritis
The loss of glands leads to decreased intrinsic factor production. It is estimated that ~6% of
those age 60 and over are vitamin B12 deficient, with 20% having marginal status 3. In addition to
the elderly, vegans are also at risk for vitamin B12 deficiency because they do not consume
animal products. However, the deficiency may take years to develop in adults because of stores
and recycling of vitamin B 122. Deficiency has the potential to occur much quicker in infants or
young children on vegan diets because they do not have stores that adults do4.
Folate/Folic Acid masking vitamin B12 deficiency
As mentioned above, folate and vitamin B12 lead to the same megaloblastic (macrocytic)
anemia. If high levels of folate or folic acid (most of the concern is with folic acid since it is
fortified in foods and commonly taken in supplements) is given during vitamin B12 deficiency, it
can correct this anemia. This is referred to as masking because it does not rectify the deficiency,
but it "cures" this symptom. Folate/folic acid can do this by providing so much folate that there
is enough THF for red blood cell division to occur even without having the cobalamin normally
needed to accept a methyl group from 5-methyl THF. This is problematic because it does not
correct the more serious neurological problems that can result from vitamin B 12 deficiency.
There are some people who are concerned about the fortification of cereals and grains with
folic acid because people who are B 12 deficient might not develop macrocytic anemia, which
makes a vitamin B12 deficiency harder to diagnose2.
No toxicity of vitamin B 12 has been reported.
References & Links 1. Byrd-Bredbenner C, Moe G, Beshgetoor D, Berning J. (2009) Wardlaw's perspectives in nutrition. New York, NY: McGraw-Hill. 2. Whitney E, Rolfes SR. (2008) Understanding nutrition. Belmont, CA: Thomson Wadsworth. 3. Allen L. (2009) How common is vitamin B-12 deficiency? Am J Clin Nutr 89(2): 693S-696S. 4. Gropper SS, Smith JL, Groff JL. (2008) Advanced nutrition and human metabolism. Belmont, CA: Wadsworth Publishing.
Links Atrophic Gastritis - http://book-med.info/gastritis/12812
Kansas State University Human Nutrition Textbook
400

11.3 B Vitamins, Homocysteine & Cardiovascular Disease
Homocysteine is a sulfur containing, non-proteinogenic (not used for making proteins) amino
acid whose structure is shown in the figure below.
Figure 11.31 Structure of homocysteine 1
Elevated circulating homocysteine levels have been found in people with cardiovascular
disease. Folate, vitamin B6, and vitamin B 12 contribute to the conversion of homocysteine to
methionine by providing methyl groups, thereby decreasing homocysteine concentrations, as
illustrated in the figure below. Thus, based on these facts, it was hypothesized that intake of
these B vitamins may decrease the risk of cardiovascular disease.
Figure 11.32 One-carbon metabolism
Research has found that intake of these B vitamins does decrease circulating homocysteine
concentrations. However, most studies have not found that it results in improved
cardiovascular disease outcomes2-4. It is debated why B vitamin intake has not resulted in
improved outcomes. Some think it is because the studies have not focused on individuals with
elevated homocysteine levels2, while others believe that homocysteine is a biomarker or
indicator of cardiovascular disease, not a causative or contributing factor to cardiovascular
disease development3.
References & Links 1. http://en.wikipedia.org/wiki/File:Homocysteine_racemic.png
2. Abraham J, Cho L. (2010) The homocysteine hypothesis: Still relevant to the prevention and treatment of
cardiovascular disease? Cleve Clin J Med 77(12): 911-918.
3. Cacciapuoti F. (2011) Hyper-homocysteinemia: A novel risk factor or a powerful marker for cardiovascular
Brian Lindshield
401

diseases? pathogenetic and therapeutical uncertainties. J Thromb Thrombolysis 32(1): 82-88.
4. Martai-Carvajal AJ, Sola J, Lathyris D. (2015) Homocysteine-lowering interventions for preventing cardiovascular
events. Cochrane Database Syst Rev. 1:CD006612.
Kansas State University Human Nutrition Textbook
402

12 Blood, Bones & Teeth Micronutrients
This chapter is a collection of vitamins and minerals that are involved in the structure or
function of blood, bones and teeth. The individual sections are:
12.1 Vitamin D
12.2 Calcium
12.3 Phosphorus
12.4 Fluoride
12.5 Vitamin K
12.6 Vitamin A
12.7 Iron
12.8 Zinc
12.9 Copper
Brian Lindshield
403

12.1 Vitamin D
Vitamin D is unique among the vitamins in that it is part vitamin, part hormone. It is considered
part hormone for two reasons: (1) we have the ability to synthesize it, and (2) it has
hormone-like functions. The amount synthesized, however, is often not enough to meet our
needs. Thus, we need to consume this vitamin under certain circumstances, meaning that
vitamin D is a conditionally essential micronutrient.
There are two major dietary forms of vitamin D: the form produced mainly by plants and yeast
is vitamin D2 (ergocalciferol), and the form mainly made by animals is vitamin D3 (cholecalciferol). The mainly terms in the previous sentence are because lichens, a symbiotic
relationship between 2 bacteria and a fungus, are able to synthesize vitamin D 3, and are being
utilized some now commercially as described in the following article.
Web Link
Veggie D3 maker explores novel production process to secure future funding supplies
The structures of these two forms are shown below. Notice that the only difference is the
presence of a double bond in D 2 tail that is not in D3.
Figure 12.11 Structure of vitamin D2 (ergocalciferol) and vitamin D3 (cholecalciferol) 1,2
We synthesize vitamin D 3 from cholesterol, as shown below. In the skin, cholesterol is
converted to 7-dehydrocholesterol. In the presence of UV-B light, 7-dehydrocholesterol is
converted to vitamin D3. Synthesized vitamin D will combine with vitamin D-binding protein
(DBP) to be transported to the liver. Dietary vitamin D 2 and D 3 is transported to the liver via
Kansas State University Human Nutrition Textbook
404
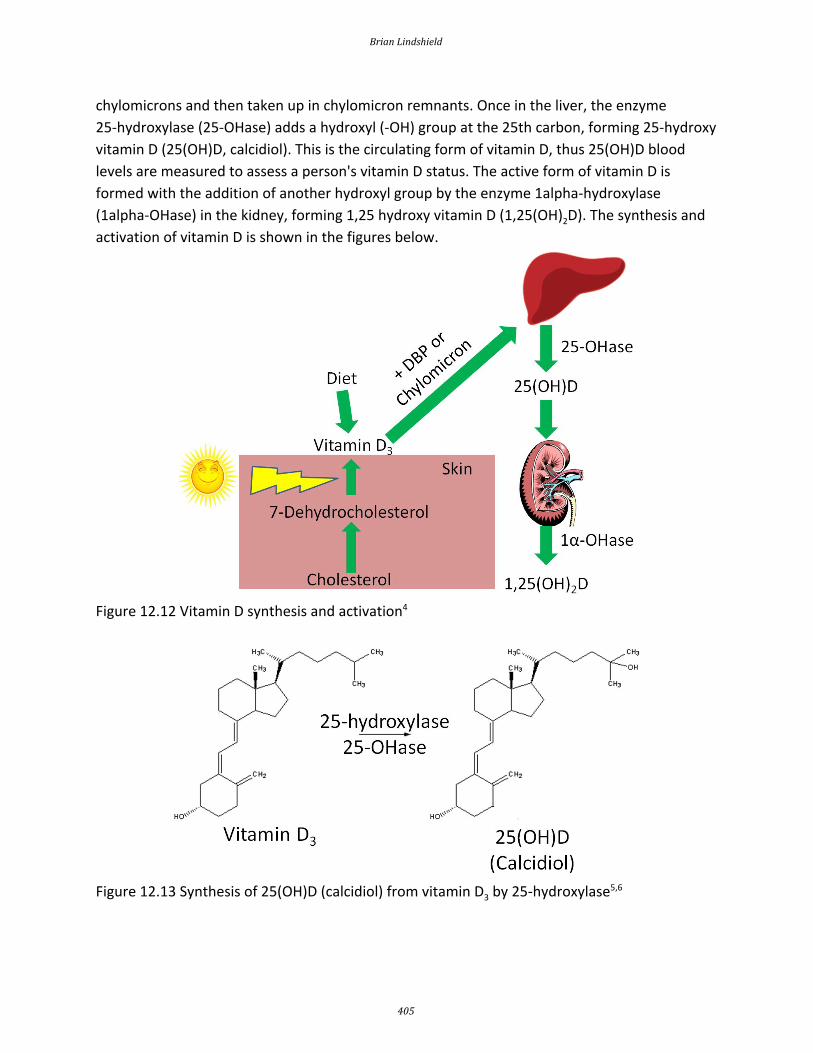
chylomicrons and then taken up in chylomicron remnants. Once in the liver, the enzyme
25-hydroxylase (25-OHase) adds a hydroxyl (-OH) group at the 25th carbon, forming 25-hydroxy
vitamin D (25(OH)D, calcidiol). This is the circulating form of vitamin D, thus 25(OH)D blood
levels are measured to assess a person's vitamin D status. The active form of vitamin D is
formed with the addition of another hydroxyl group by the enzyme 1alpha-hydroxylase
(1alpha-OHase) in the kidney, forming 1,25 hydroxy vitamin D (1,25(OH)2D). The synthesis and
activation of vitamin D is shown in the figures below.
Figure 12.12 Vitamin D synthesis and activation 4
Figure 12.13 Synthesis of 25(OH)D (calcidiol) from vitamin D 3 by 25-hydroxylase5,6
Brian Lindshield
405

Figure 12.14 Synthesis of 1,25(OH) 2D (calcitriol) from 25(OH)D by 1alpha-hydroxylase6
However, there are a number of other tissues that have been found to have 1alpha-hydroxylase
activity. Therefore, these tissues can activate circulating 25(OH)D to 1,25(OH)2D for their own
use.
Vitamin D 2 and D 3 were once thought to be equivalent forms of vitamin D, but research has
found that D3 supplementation increases 25(OH)D concentrations more than D2 supplementation7,8.
Subsections:
12.11 Environmental Factors That Impact Vitamin D3 Synthesis
12.12 Dietary or Supplemental Vitamin D
12.13 Response to Low Blood Calcium
12.14 Response to High Blood Calcium
12.15 Vitamin D Receptor
12.16 Vitamin D Deficiency, Toxicity, & Insufficiency
References & Links 1. http://en.wikipedia.org/wiki/File:Ergocalciferol.svg 2. http://en.wikipedia.org/wiki/File:Cholecalciferol.svg 3. Gropper SS, Smith JL, Groff JL. (2008) Advanced nutrition and human metabolism. Belmont, CA: Wadsworth Publishing. 4. http://commons.wikimedia.org/wiki/File:Liver.svg 5. https://en.wikipedia.org/wiki/Vitamin_D#/media/File:Reaction_-_cholecalciferol_to_calcidiol.png 6. https://en.wikipedia.org/wiki/Vitamin_D#/media/File:Reaction_-_calcidiol_to_calcitriol.png 7. Lehmann U, Hirch F, Stangl GI, Hinz K, Westphal S, Dierkes J. (2013) Bioavailability of vitamin D2 and D3 in Healthy Volunteers, a randomized placebo-controlled trial. J Clin Endocrinol Metab. 98(11): 4339-4345. 8. Tripkovic L, Wilson LR, Hart K, Johnsen S, de Lusignan S, Smith CP, Bucca G, Penson S, Chope G, Elliott R, Hypponen E, Berry JL Lanham-New SA. (2017) Daily supplementation with 15 μg vitamin D2 compared with vitamin
Kansas State University Human Nutrition Textbook
406

D3 to increase wintertime 25-hydroxyvitamin D status in healthy South Asian and white European women: a 12-wk randomized, placebo-controlled food-fortification trial. Am J Clin Nutr 106 (2): 481-490. Link Veggie D3 maker explores novel production process to secure future funding supplies - https://www.nutraingredients-usa.com/Article/2012/03/13/Veggie-vitamin-D3-maker-explores-novel-production-process-to-secure-future-supplies?utm_source=newsletter_daily&utm_medium=email&utm_campaign=Newsletter%2BDaily&c=yazB%2FDHFv2VlvQJ3xinVgQ%3D%3D
Brian Lindshield
407

12.11 Environmental Factors That Impact Vitamin D3 Synthesis
There are a number of environmental factors that affect vitamin D 3 synthesis:
Latitude
Season
Time of Day
Skin Color
Age
Clothing
Sunscreen
Latitude
The latitude a person is at affects that person's ability to synthesize vitamin D 3. There is an
inverse relationship between distance from the equator and UV light exposure. Thus, with
increased distance from the equator (increased latitude), there is decreased UV light exposure
and vitamin D 3 synthesis. The link below shows the latitude and longitude lines of the United
States.
Web Link
United States Latitude and Longitude Lines
Seasons
Seasons also make a difference in vitamin D 3 synthesis. In Boston (42० N), vitamin D synthesis
only occurs from March-October, because during late fall and winter not enough UV-B reaches
the earth's surface to synthesize vitamin D 3. However, in Los Angeles (34० N), vitamin D3 synthesis occurs year round2. The difference is the angle of the sun relative to latitude and how
many UV-B photons are absorbed before they reach the earth's surface1.
Kansas State University Human Nutrition Textbook
408

Figure 12.111 Seasons are also an important factor affecting vitamin D 3 synthesis
Time
Time of day is also an important factor in affecting vitamin D 3 synthesis. Vitamin D3 synthesis
increases in the morning before peaking at noon, then declines the rest of the day 1.
Figure 12.112 Time of day is an important factor for vitamin D 3 synthesis
Skin pigmentation
Another factor that plays an important role in vitamin D 3 synthesis is skin pigmentation. Skin
color is the result of increased production of the pigment melanin, as shown in the link below.
Web Link
Melanin
Very dark skin color can provide a sun protection factor (SPF) 8-30 for those individuals who
Brian Lindshield
409

never burn2. These individuals will require approximately 5- to 10-times greater sunlight
exposure than a light-skinned, white person to synthesize the same amount of vitamin D 32,3.
Age
Age also plays a factor in vitamin D3 synthesis. Aging results in decreased 7-dehydrocholesterol
concentrations in the skin, resulting in an approximately 75% reduction in the vitamin D 3 synthesis capability by age 70 3.
Figure 12.114 Aging decreases vitamin D synthesis
Clothing
Clothing is another factor that influences vitamin D3 synthesis. More clothing means that less
sun reaches your skin, and thus less vitamin D 3 synthesis.
Figure 12.115 Which of these 2 do you think is synthesizing less vitamin D?
Sunscreen, "Sensible Sun Exposure", and Tanning
There is quite a spirited debate on sunscreen, sun exposure, skin cancer, and vitamin D
synthesis. On one side are the vitamin D researchers, on the other side are dermatologists.
Vitamin D research found that SPF 8 sunscreen almost totally blocked vitamin D 3 synthesis 4.
Kansas State University Human Nutrition Textbook
410

However, the SPF value equals 1/(# photons that reaches your skin) meaning that SPF 30 means
1/30 UV photons reach your skin. Thus, vitamin D 3 synthesis shouldn't be totally blocked. In
addition, studies indicate that consumers apply 1/2 or less of the amount required to get the
listed SPF protection4. Researchers recommend sun exposure on the face, arms, and hands for
10-15 minutes 2-3 times per week between 10 AM-3 PM2,5. However, dermatologists do not like
"sensible sun exposure" because this is also the peak time for harmful sun exposure.
Dermatologists say that "sensible sun exposure" appeals to those who are looking for a reasons
to support tanning and are at highest risk (primarily young, fair-skinned females) of sun
damage. They argue that vitamin D can be provided through supplementation 3.
What about tanning beds? Not all tanning beds provide UV-B rays that are needed for vitamin
D3 synthesis. In fact, some advertise that they only use UV-A rays that are safer, even though
this is not the case 6. Virtually every health organization advises against using tanning beds,
because the risks are far greater than the potential benefits6,7.
References & Links 1. Shils ME, Shike M, Ross AC, Caballero B, Cousins RJ, editors. (2006) Modern nutrition in health and disease. Baltimore, MD: Lippincott Williams & Wilkins. 2. Holick M. (2008) Vitamin D: A D-lightful health perspective. Nutr Rev 66(10 Suppl 2): S182. 3. Stipanuk MH. (2006) Biochemical, physiological, & molecular aspects of human nutrition. St. Louis, MO: Saunders Elsevier. 4. Gilchrest B. (2008) Sun exposure and vitamin D sufficiency. Am J Clin Nutr 88(2): 570S. 5. Byrd-Bredbenner C, Moe G, Beshgetoor D, Berning J. (2009) Wardlaw's perspectives in nutrition. New York, NY: McGraw-Hill. 6. Whitney E, Rolfes SR. (2011) Understanding nutrition. Belmont, CA: Wadsworth Cengage Learning. 7. McGuire M, Beerman KA. (2011) Nutritional sciences: From fundamentals to food. Belmont, CA: Wadsworth Cengage Learning.
Links United States Latitude and Longitude Lines -
http://modernsurvivalblog.com/survival-skills/basic-map-reading-latitude-longitude/
Melanin - http://www.nytimes.com/imagepages/2007/08/01/health/adam/9620Melanin.html
Brian Lindshield
411

12.12 Dietary or Supplemental Vitamin D
Because of the possible double-edged sword of sun exposure for synthesizing vitamin D3, dietary or supplemental vitamin D is another alternative.
However, there are a limited number of foods naturally rich in vitamin D. Good sources of
vitamin D are fatty fish (salmon, tuna, etc.) and their oils (such as cod liver oil). The amount of
vitamin D in fatty fish varies greatly with wild-caught salmon being the highest. One study
showed that farmed salmon contained almost 75% less vitamin D than wild-caught salmon 1. It is not known whether this disparity exists between other types of farmed and wild-caught fish
varieties.
Table 12.121 Vitamin D content of fish1
Fish Vitamin D (IU/oz)
Blue Fish 280 ± 68
Cod 104 ± 24
Grey Sole 56 ± 36
Farmed Salmon 240 ± 108
Wild Salmon 988 ± 524
Farmed Trout 388 ± 212
Tuna 404 ± 440
Like vitamin C, E, and A, international units (IU) are also used for vitamin D.
For vitamin D the conversions are:
1 ug of D 3 = 40 IU
1 ug of 25-OH-D = 200 IU2
Thus, since not many foods contain vitamin D, many brands of cow’s milk have been fortified
with vitamin D2 or D3 (100 IU/8 oz) since the 1930s3. However, the actual measured amount of
vitamin D in many brands of cow’s milk is far less than stated on their labels 4,5. Part of this
problem stems from a lack of a standardized method for measuring vitamin D in the past.
Without standardized analysis, there inevitably was a wide range of variation from lab-to-lab in
the reported amount of vitamin D.
Kansas State University Human Nutrition Textbook
412

Another issue with relying on dairy products to provide vitamin D is the common problem of
lactose intolerance. Lactose intolerant individuals don't have lactase, the enzyme needed to
break down lactose. Common symptoms of this condition include:
Abdominal Pain
Abdominal Bloating
Gas
Diarrhea
Nausea6
Lactose intolerance is a fairly common problem worldwide, as shown in the map below.
Figure 12.121 Lactose intolerance worldwide (red high, green low) 7
The following table shows the percent of people who are lactose intolerant by race:
Table 12.122 Lactose intolerance rates 8 Race or ethnicity % Lactose Intolerant
Southeast Asian 98%
Native Americans 62-100% 9
Asian Americans 90%
Alaskan Eskimo 80%
African-American Adults 79%
Mexicans (rural communities) 74%
Brian Lindshield
413

North American Jews 69%
Greek Cypriots 66%
Cretans 56%
Mexican American Males 55%
Indian Adults 50%
African-American Children 45%
Indian Children 20%
Descendants of N. Europeans 5%
Thus, you can see that many people are lactose intolerant. Coincidentally, many of these
people have darker pigmented skin, meaning that they have an increased risk of vitamin D
deficiency/insufficiency because they require greater sun exposure to synthesize adequate
amounts of vitamin D3.
Other foods that are sometimes fortified are breakfast cereals and orange juice. Despite the
fact that orange juice doesn't contain fat, and vitamin D is fat-soluble, vitamin D is quite
bioavailable in orange juice 10.
Vitamin D in supplements is found as vitamin D 2 or D3. However, based on the recent evidence
suggesting that D2 isn't as beneficial as D3, many are being reformulated to contain D311.
References & Links 1. Lu Z, Chen TC, Zhang A, Persons KS, Kohn N, et al. (2007) An evaluation of the vitamin D3 content in fish: Is the vitamin D content adequate to satisfy the dietary requirement for vitamin D? J Steroid Biochem Mol Biol 103(3-5): 642. 2. Anonymous. (1997) Dietary reference intakes for calcium, phosphorus, magnesium, vitamin D, and fluoride. Washington, D.C.: National Academies Press. 3. Stipanuk MH. (2006) Biochemical, physiological, & molecular aspects of human nutrition. St. Louis, MO: Saunders Elsevier. 4. Holick MF, Shao Q, Liu WW, Chen TC. (1992) The vitamin D content of fortified milk and infant formula. New England Journal of Medicine, the 326(18): 1178. 5. Faulkner H, Hussein A, Foran M, Szijarto L. (2000) A survey of vitamin A and D contents of fortified fluid milk in ontario. J Dairy Sci 83(6): 1210. 6. http://digestive.niddk.nih.gov/ddiseases/pubs/lactoseintolerance/ 7. https://commons.wikimedia.org/wiki/File:World_map_of_lactose_intolerance.png 8. http://nutrigenomics.ucdavis.edu/?page=Information/Concepts_in_Nutrigenomics/Lactose_Intolerance 9. McBean LD, Miller GD. (1998) Allaying fears and fallacies about lactose intolerance. J Am Diet Assoc 98(6): 671. 10. Tangpricha V, Koutkia P, Rieke S, Chen T, Perez A, et al. (2003) Fortification of orange juice with vitamin D: A novel approach for enhancing vitamin D nutritional health. Am J Clin Nutr 77(6): 1478. 11. https://ods.od.nih.gov/factsheets/VitaminD-HealthProfessional/
Kansas State University Human Nutrition Textbook
414

12.13 Response to Low Blood Calcium
One of the major functions of vitamin D is to assist in maintaining blood calcium
concentrations. The other major regulators of blood calcium concentrations are 2 hormones:
parathyroid hormone (PTH) and calcitonin, which are released from the parathyroid glands and
thyroid glands, respectively. Bone serves as the calcium depot, or reservoir, if there is a
sufficient concentration in the body. In bone, calcium is found in hydroxyapatite crystals on a
collagen matrix.
The chemical formula of hydroxyapatite is:
Ca10(PO4)6(OH) 2
Calcium and phosphorus are either jointly deposited (deposition) or jointly liberated
(resorption) from bone hydroxyapatite to maintain/achieve blood calcium concentrations.
Osteoblasts are bone cells that are responsible for bone formation or depositing
hydroxyapatite. Osteoclasts are the bone cells that are responsible for breaking down or
resorption of bone. An easy way to remember the function of these cells is:
Osteoblasts " build" bone
Osteoclasts "chew" bone
Bone resorption is the process of liberating calcium and phosphorus from hydroxyapatite.
Bone deposition is the process of depositing calcium and phosphorus in bone as
hydroxyapatite.
Response to Low Blood Calcium
The parathyroid senses low blood calcium concentrations and releases PTH. These steps are
designed to maintain consistent blood calcium concentrations, but also affects phosphate
(phosphorus) concentrations. PTH has 3 effects:
1. Increases bone resorption
2. Decreases calcium and increases phosphorus urinary excretion
3. Increases 1,25(OH) 2D activation in the kidney 1,2
The first effect of PTH is increased bone resorption. Hydroxyapatite must be broken down to
release both calcium and phosphate. This effect is illustrated below.
Brian Lindshield
415

Figure 12.131 PTH effect 1: increased bone resorption3
The second effect of PTH is decreased calcium excretion in urine. This is a result of increased
calcium reabsorption by the kidney before it is excreted in urine. Kidney phosphate
reabsorption is decreased, meaning the net effect is less calcium, but more phosphate in
urinary excretion, as shown in the figure below.
Figure 12.132 PTH effect 2: decreased calcium, increased phosphorus excretion 3
The 3rd effect of PTH is that it increases 1,25(OH) 2D activation in the kidney, by increasing
1alpha-hydroxylase levels. The 1,25(OH) 2D then increases calcium and phosphorus absorption
in the small intestine to help raise blood calcium levels, as shown below. This mechanism will
be discussed in more detail in the vitamin D receptor subsection.
Kansas State University Human Nutrition Textbook
416

Figure 12.133 PTH effect 3: increased 1,25(OH)2D activation 3
Overall PTH causes more calcium and phosphate to be leached from bone, and absorbed from
the intestine, into the blood. Coupled with decreased calcium and increased phosphate urinary
excretion, means that blood calcium levels rise without a marked rise in phosphate levels, as
depicted in the figure below.
Figure 12.134 1,25(OH)2D increased calcium and phosphorus absorption3
Brian Lindshield
417

References & Links 1. Gropper SS, Smith JL, Groff JL. (2008) Advanced nutrition and human metabolism. Belmont, CA: Wadsworth Publishing. 2. Whitney E, Rolfes SR. (2011) Understanding nutrition. Belmont, CA: Wadsworth Cengage Learning. 3. http://en.wikipedia.org/wiki/File:Illu_thyroid_parathyroid.jpg
Kansas State University Human Nutrition Textbook
418

12.14 Response to High Blood Calcium
In adults, it is rare for blood calcium concentrations to get too high. However, in infants and
young children whose bodies, and thus bones, are not as large, the hormone calcitonin helps to
prevent blood calcium levels from getting too high 1.
Response to High Blood Calcium
High blood calcium concentrations are sensed by the thyroid, which releases calcitonin. This
response is designed to maintain/achieve normal blood calcium concentrations, but also affects
phosphate (phosphorus) levels. Calcitonin has 3 effects 1,2:
1. Decreases bone resorption, increases bone deposition
2. Increases calcium and phosphorus excretion in urine
3. Decreases 1,25(OH) 2D activation in the kidney
The first effect of calcitonin is to inhibit bone resorption, thus promoting the deposition of
calcium and phosphorus into bone as hydroxyapatite.
Figure 12.141 Calcitonin effect 1: increased bone deposition 3
The second effect of calcitonin is to increase calcium and phosphorus excretion in urine.
Brian Lindshield
419

Figure 12.142 Calcitonin effect 2: increased calcium and phosphorus excretion3
The third effect of calcitonin is to decrease 1alpha-hydroxylase levels, which decreases the
activation of 1,25(OH)2D. As a result, the absorption of calcium and phosphorus from the small
intestine is decreased, as shown below.
Figure 12.143 Calcitonin effect 3: decreased 1,25(OH)2D activation3
Overall, calcitonin inhibits the 3 actions that PTH uses to increase blood calcium levels. Thus,
more calcium and phosphate are deposited into bones and excreted into urine, as shown
below. This causes blood calcium levels to decrease.
Kansas State University Human Nutrition Textbook
420

12.144 Response to high blood calcium3
References & Links 1. Gropper SS, Smith JL, Groff JL. (2008) Advanced nutrition and human metabolism. Belmont, CA: Wadsworth Publishing. 2. Whitney E, Rolfes SR. (2011) Understanding nutrition. Belmont, CA: Wadsworth Cengage Learning 3. http://en.wikipedia.org/wiki/File:Illu_thyroid_parathyroid.jpg
Brian Lindshield
421

12.15 Vitamin D Receptor
Vitamin D, along with vitamin A, are unique among the vitamins in that they have nuclear
receptors. Many steroid hormones have nuclear receptors. The following figure illustrates the
action of a nuclear hormone receptor.
Figure 12.151 Nuclear hormone receptors action1
In the figure above of the hormone (in this case thyroid hormone) receptor, the receptor’s
ligand (something that binds to the receptor), enters the nucleus and binds to the thyroid
hormone receptor (TR). The TR has paired (formed a dimer) with the retinoid X receptor (RXR)
on the hormone response element (HRE) in the promoter (region before a gene in the DNA
sequence) of target genes. The HRE for thyroid hormone is the thyroid hormone response
element. Target genes are those whose transcription is altered by the hormone binding to its
receptor on the response element. The mRNA produced then leaves the nucleus where it is
translated into protein.
Vitamin A and D have nuclear receptors that act in the same fashion as nuclear hormone
receptors. The video below illustrates and explains the action of a nuclear hormone receptor.
Kansas State University Human Nutrition Textbook
422

Web Link
Video: Steroid Hormone Receptors (0:42)
1,25(OH)2D is considered to be the active form of vitamin D because it is the form that binds to
the vitamin D receptor (VDR). Like the thyroid hormone example above, there is a vitamin D
response element (VDRE) in the promoter of specific vitamin D target genes. In the figure
below, 25(OH)D, the major circulating form of vitamin D, is usually transported through the
blood to the a target tissue by vitamin D binding protein (DBP). The kidney converts 25(OH)D to
1,25(OH)2D by use of the enzyme 1alpha-hydroxylase, but this enzyme is also found in other
tissues to synthesize 1,25(OH)2D primarily for their own use (rather than secreting like the
kidney). The latter scenario is what is being represented in the in figure below. 1,25(OH)2D
(bound to DBP) moves from the kidney, or the tissue itself, into the nucleus. It then binds to the
vitamin D receptor (VDR), that is dimerized to the RXR on the vitamin D response element of
the target gene. Consequently, this binding causes an increases transcription of mRNA. The
mRNA then moves into the cytoplasm to synthesize specific proteins. This process is shown in
the figure below.
Figure 12.152 Vitamin D receptor and a generic target gene
It's through this action that 1,25(OH) 2D is able to increase calcium absorption. In this case, the
target gene is the calcium-binding protein calbindin. Thus, increased 1,25(OH)2D leads to
increased calbindin mRNA. This then leads to increased calbindin protein levels. Calbindin will
be discussed in more detail in the calcium section.
Brian Lindshield
423
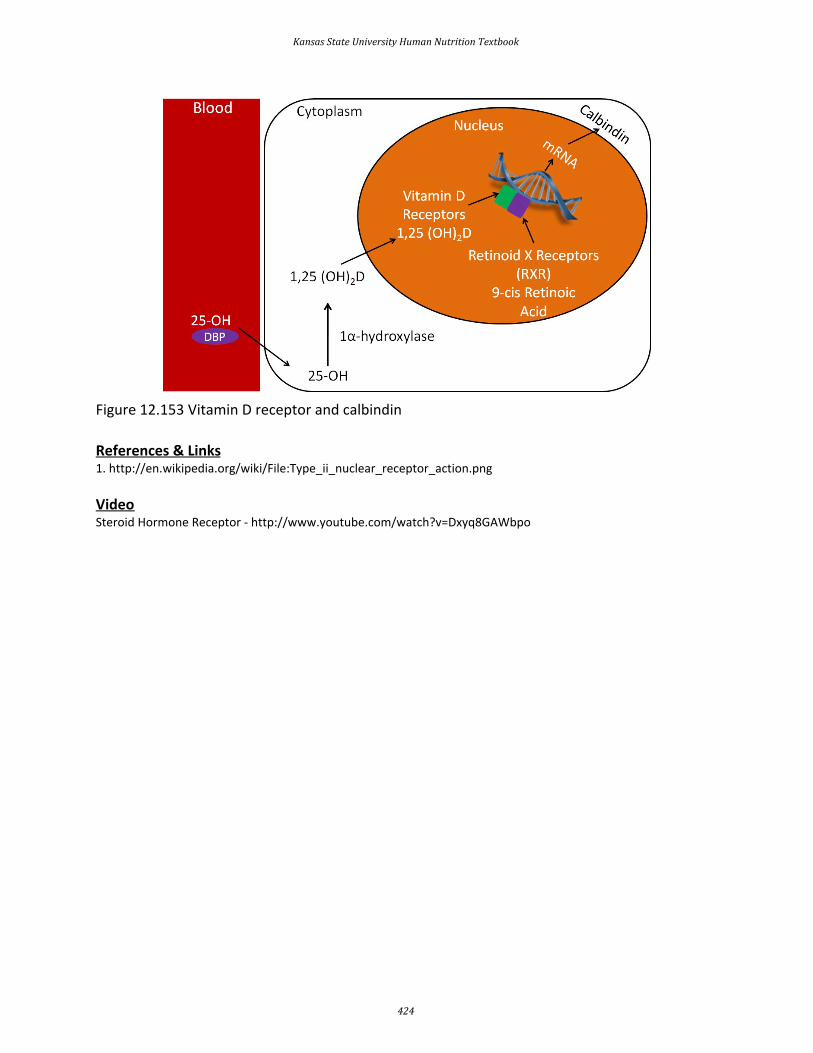
Figure 12.153 Vitamin D receptor and calbindin
References & Links 1. http://en.wikipedia.org/wiki/File:Type_ii_nuclear_receptor_action.png
Video Steroid Hormone Receptor - http://www.youtube.com/watch?v=Dxyq8GAWbpo
Kansas State University Human Nutrition Textbook
424

12.16 Vitamin D Deficiency, Toxicity & Insufficiency
Rickets is a vitamin D deficiency condition in infants and children. A lack of vitamin D leads to
decreased bone mineralization, causing the bones to become weak. The bones then bow under
pressure, leading to the characteristic bowed legs, as seen below.
Figure 12.161 Children suffering from rickets 1
Figure 12.162 X-ray from child suffering from rickets2
Another characteristic symptom of rickets is rachitic rosary, or beaded ribs. The beading occurs
at the areas where cartilage meets bone on the rib cage, as shown in the link below3.
Brian Lindshield
425

Web Link
Rachitic Rosary
Osteomalacia is a vitamin D deficiency in adults and results in poor bone mineralization. The
bone becomes soft, resulting in bone pain and an increased risk of fractures 3.
While rickets and osteomalacia are fairly rare in the United States, it is believed that vitamin D
insufficiency might be much more widespread. Insufficiency means that the level of intake, or
body status, is suboptimal (neither deficient nor optimal). The figure below illustrates this
concept.
Figure 12.163 Illustration of insufficient or suboptimal levels
Suboptimal/insufficient means intake, or status, is higher than deficient, but lower than
optimal. This is an important distinction to understand particularly for vitamin D, because there
have been some (like Dr. Michael Holick described in the link below) saying the people are
vitamin D deficient when their circulating 25(OH)D concentrations are lower than optimal. This
is different from a classical deficiency definition, where there is a condition associated with too
low level of intake or body status. What is really being described is that circulating 25(OH)D
concentrations might be suboptimal. A lot of the debate about vitamin D deficiency is nicely
captured in the article about Dr. Michael Holick, a prominent vitamin researcher.
Web Link
Selling America on Vitamin D - and reaping the profits
Kansas State University Human Nutrition Textbook
426

Thus, higher intake levels will provide additional benefits. The functions of vitamin D are
growing by the day due to increased research discoveries. These functions now include benefits
beyond bone health, further supporting the importance of vitamin D. In late 2010, an RDA for
vitamin D was established (was an Adequate Intake before). This made it, along with calcium,
the first micronutrients to have their DRIs revised 4. The RDA for vitamin D is 3 times higher than
the previous AI. Many believe these are more reasonable levels, while others think that the
new RDA is still not high enough. This belief, that many people’s vitamin D intake/status is
suboptimal, is challenged by a review described in the first link below that found that vitamin D
did not reduce osteoporosis risk. In addition, a recent meta-analysis (second link) concluded
that “there is probably no benefit to expect from vitamin D supplementation in normally
healthy people.”
Web Link
Vitamin D Ineffective for Preventing Osteoporosis
Limits of Vitamin D Supplements
Vitamin D from supplements can become toxic. You cannot develop vitamin D toxicity from sun
exposure, because the sunlight degrades a precursor of vitamin D3 in the skin 5. Vitamin D
toxicity results in hypercalcemia or high blood calcium levels. These become problematic
because it can lead to the calcification of soft tissues.
References & Links 1. http://en.wikipedia.org/wiki/File:Rickets_USNLM.gif 2. http://en.wikipedia.org/wiki/File:XrayRicketsLegssmall.jpg 3.Whitney E, Rolfes SR. (2011) Understanding nutrition. Belmont, CA: Wadsworth Cengage Learning. 4. http://iom.nationalacademies.org/Reports/2010/Dietary-Reference-Intakes-for-Calcium-and-Vitamin-D.aspx 5. Shils ME, Shike M, Ross AC, Caballero B, Cousins RJ, editors. (2006) Modern nutrition in health and disease. Baltimore, MD: Lippincott Williams & Wilkins.
Links Rachitic Rosary - http://1.bp.blogspot.com/_ZWqgYBROGHw/S9r9rOb8thI/AAAAAAAAAh4/y8uHS9m42MU/s1600/18111.jpg Selling America on Vitamin D - and reaping the profits - https://www.nbcnews.com/news/amp/ncna902276 Vitamin D Ineffective for Preventing Osteoporosis - http://well.blogs.nytimes.com/2013/10/17/vitamin-d-ineffective-for-preventing-osteoporosis/? Limits of Vitamin D Supplements - http://well.blogs.nytimes.com/2013/12/11/limits-of-vitamin-d-supplements/?
Brian Lindshield
427

12.2 Calcium
Calcium is a macromineral and the most abundant mineral in the body. The reason for calcium’s
abundance is its distribution in the skeleton, which contains 99% of the calcium in the body.
Subsections:
12.21 Calcium Absorption
12.22 Calcium Bioavailability
12.23 Calcium Functions
12.24 Calcium Deficiency & Toxicity
Kansas State University Human Nutrition Textbook
428
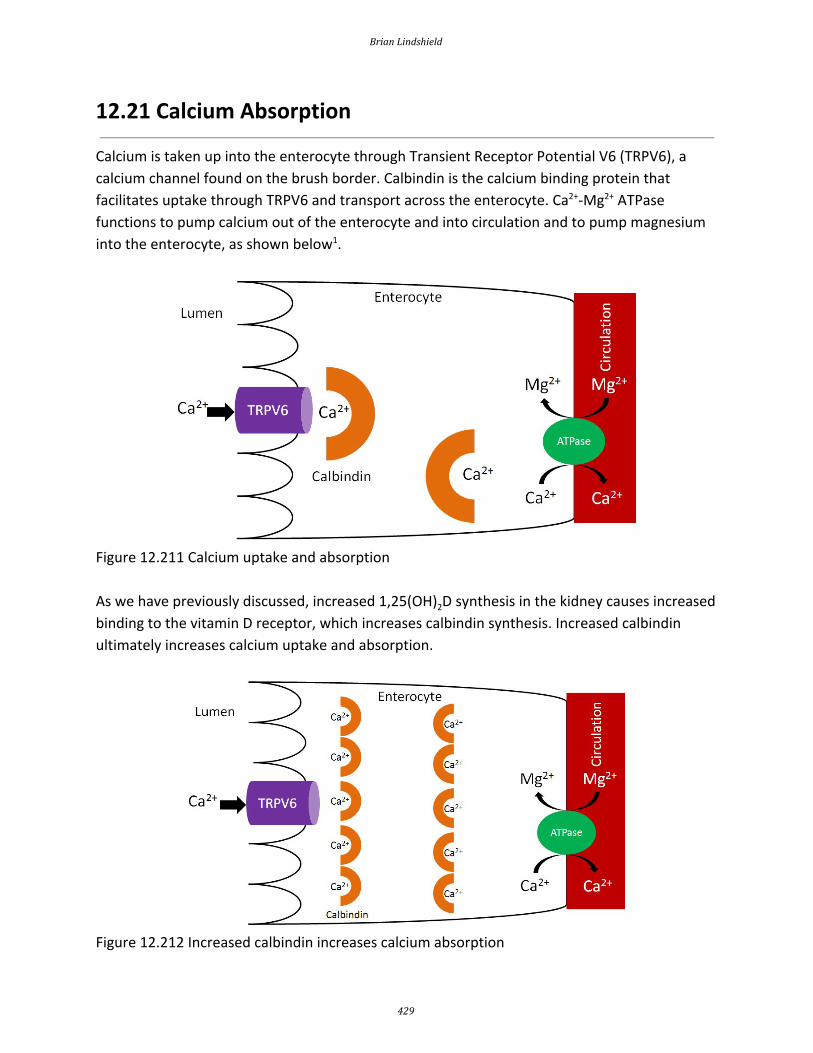
12.21 Calcium Absorption
Calcium is taken up into the enterocyte through Transient Receptor Potential V6 (TRPV6), a
calcium channel found on the brush border. Calbindin is the calcium binding protein that
facilitates uptake through TRPV6 and transport across the enterocyte. Ca 2+-Mg2+ ATPase
functions to pump calcium out of the enterocyte and into circulation and to pump magnesium
into the enterocyte, as shown below1.
Figure 12.211 Calcium uptake and absorption
As we have previously discussed, increased 1,25(OH)2D synthesis in the kidney causes increased
binding to the vitamin D receptor, which increases calbindin synthesis. Increased calbindin
ultimately increases calcium uptake and absorption.
Figure 12.212 Increased calbindin increases calcium absorption
Brian Lindshield
429

There are a couple of calcium-binding compounds that inhibit its absorption (normally by
binding to it). Therefore, even though some foods are good sources of calcium, the calcium is
not very bioavailable. Oxalate, found in high levels in spinach, rhubarb, sweet potatoes, and
dried beans, is the most potent inhibitor of calcium absorption 2. Recall that calcium oxalate is
one of the compounds that makes up kidney stones. Based on this understanding, it should not
be a surprise that formation of this compound inhibits calcium absorption.
Figure 12.213 Structure of calcium oxalate 3
Another inhibitor of calcium absorption is phytate. Phytate is found in whole grains and
legumes3. You will learn more about about it in the phosphorus section.
Figure 12.214 Structure of phytate4
References & Links 1. Gropper SS, Smith JL, Groff JL. (2008) Advanced nutrition and human metabolism. Belmont, CA: Wadsworth Publishing. 2. Shils ME, Shike M, Ross AC, Caballero B, Cousins RJ, editors. (2006) Modern nutrition in health and disease. Baltimore, MD: Lippincott Williams & Wilkins. 3. http://en.wikipedia.org/wiki/File:Calcium_oxalate.png 4. http://en.wikipedia.org/wiki/File:Phytic_acid.png
Kansas State University Human Nutrition Textbook
430

12.22 Calcium Bioavailability
Calcium bioavailability varies greatly from food to food, as shown in the table below. This table
gives the serving size, calcium content of that food, and percent absorbed. The calcium content
is multiplied by the absorption percentage to calculate the estimated calcium absorbed. Finally,
it shows the servings of each food needed to equal the estimated calcium absorbed from 1
serving of milk.
Table 12.221 Bioavailability of calcium from different foods sources 1-3
Food Serving
Size (g)
Calcium
content
(mg)
Absorption
(%)
Estimated
Calcium
Absorbed
Servings needed
to equal 240 mL
cow’s milk
Cow’s Milk 240 300 32.1 96.3 1.0
Almonds, dry roasted 28 80 21.2 17.0 5.7
Beans, Pinto 86 44.7 26.7 11.9 8.1
Beans, Red 172 40.5 24.4 9.9 9.7
Beans, White 110 113 21.8 24.7 3.9
Bok Choy 85 79 53.8 42.5 2.3
Broccoli 71 35 61.3 21.5 4.5
Brussel Sprouts 78 19 63.8 12.1 8.0
Cabbage, Chinese 85 79 53.8 42.5 2.3
Cabbage, Green 75 25 64.9 16.2 5.9
Cauliflower 62 17 68.6 11.7 8.2
Cheddar Cheese 42 303 32.1 97.2 1.0
Chinese mustard greens 85 212 40.2 85.3 1.1
Chinese spinach 85 347 8.36 29 3.3
Fruit Punch (CCM) 240 300 52 156 0.6
Kale 85 61 49.3 30.1 3.2
Kohlrabi 82 20 67.0 13.4 7.2
Mustard Greens 72 64 57.8 37.0 2.6
Orange juice (CCM) 240 300 36.3 109 0.8
Radish 50 14 74.4 10.4 9.2
Brian Lindshield
431

Rhubarb 120 174 8.54 10.1 9.5
Rutabaga 85 36 61.4 22.1 4.4
Sesame seeds, no hulls 28 37 20.8 7.7 12.2
Soy milk (tricalcium
phosphate)
240 300 24.0 72.0 1.3
Soy milk (calcium
carbonate)
240 300 21.1 66.3 1.0
Spinach 85 115 5.1 5.9 16.3
Sweet Potatoes 164 44 22.2 9.8 9.8
Tofu with Ca 126 258 31.0 80.0 1.2
Turnip Greens 72 99 51.6 51.1 1.9
Watercress 17 20 67.0 13.4 7.2
Yogurt 240 300 32.1 96.3 1.0
Notice that the foods high in oxalate like spinach, rhubarb, sweet potatoes, and dried beans are
poorly absorbed. But there are still a number of calcium sources outside of milk.
The 2 most common forms of calcium found in supplements are calcium carbonate and calcium
citrate. As you can see in the figure below, they differ in the amount of elemental calcium they
contain. This shows how much of the molecular weight of the compound is calcium.
Kansas State University Human Nutrition Textbook
432

Figure 12.221 Percent of calcium supplements that is elemental calcium 4
The higher the percent elemental calcium, the greater the amount of calcium you will receive
per given weight of that compound, versus a compound that has a lower elemental calcium
percentage. Both carbonate and citrate forms are well absorbed, but individuals with low
stomach acid absorb citrate better. Also, carbonate is best absorbed when taken with food,
while for citrate it is equally well absorbed when taken alone4.
Older research suggested that calcium citrate malate was more bioavailable than other calcium
sources. However, a more recent clinical study found no difference in the bioavailability of
calcium from calcium citrate malate in orange juice, skim milk, or calcium carbonate
supplements5. There is some evidence that suggests that even though bioavailability is the
same among these different forms, they might not be equally effective in improving bone
measures6. References & Links 1. Weaver CM, Plawecki KL. (1994) Dietary calcium: Adequacy of a vegetarian diet. Am J Clin Nutr 59(5 Suppl): 1238S-1241S. 2. Weaver CM, Proulx WR, Heaney R. (1999) Choices for achieving adequate dietary calcium with a vegetarian diet. Am J Clin Nutr 70(3 Suppl): 543S-548S. 3. Weaver C. (2009) Closing the gap between calcium intake and requirements. J Am Diet Assoc 109(5): 812-813. 4. http://www.ahs6.com/liquidcalcium/absorb.php 5. Martini L, Wood R. (2002) Relative bioavailability of calcium-rich dietary sources in the elderly. Am J Clin Nutr 76(6): 1345-1350. 6. Weaver C, Janle E, Martin B, Browne S, Guiden H, et al. (2009) Dairy versus calcium carbonate in promoting peak bone mass and bone maintenance during subsequent calcium deficiency. Journal of Bone and Mineral Research
Brian Lindshield
433

24(8): 1411-1419.
Kansas State University Human Nutrition Textbook
434

12.23 Calcium Functions
Calcium in hydroxyapatite is a major component of bones and teeth.
There are also a number of non-bone functions of calcium. Calcium is an intracellular signaling
molecule. Because of this, intracellular calcium is tightly controlled, primarily stored within
organelles.
Non-bone functions include:
Neurotransmitter release
Neurotransmitter release is stimulated by the opening of voltage-gated Ca2+ channels. This
stimulates the synaptic vesicle to fuse with the axon membrane and release the
neurotransmitter into the synapse, as shown below 1.
Figure 12.231 Calcium regulates neurotransmitter release2
Muscle contraction
Calcium is released in muscle cells, where it binds to the protein troponin, changes its shape,
and removes the tropomyosin blockade of actin active sites so that contraction can occur 3. This
can be seen in the following animation and figure (same link).
Web Link
Muscle contraction
Brian Lindshield
435

Hormone release
Calcium acts as an intracellular messenger for the release of hormones, such as insulin. The link
below shows how in the beta cells of the pancreas, the opening of voltage-gated calcium
channels stimulates the insulin granules to fuse with the beta cell membrane to release insulin.
Web Link
Insulin release
Blood Clotting
As will be discussed more in the vitamin K section, calcium binding to activated Gla proteins is
important in the blood clotting cascade.
Figure 12.232 Calcium bind to Gla proteins. Adapted from reference 4
Enzyme regulation
The binding of calcium to calcium-binding proteins also regulates the action of a number of
enzymes 4. References & Links 1. Byrd-Bredbenner C, Moe G, Beshgetoor D, Berning J. (2009) Wardlaw's perspectives in nutrition. New York, NY: McGraw-Hill. 2. http://en.wikipedia.org/wiki/File:Synapse_Illustration_unlabeled.svg 3.http://legacy.owensboro.kctcs.edu/GCaplan/anat/Notes/API%20Notes%20J%20%20Muscle%20Contraction.htm 4. Gropper SS, Smith JL, Groff JL. (2008) Advanced nutrition and human metabolism. Belmont, CA: Wadsworth Publishing.
Links Muscle contraction - http://legacy.owensboro.kctcs.edu/GCaplan/anat/Notes/API%20Notes%20J%20%20Muscle%20Contraction.htm Insulin release - http://www.dolcera.com/wiki/images/Image11.jpeg
Kansas State University Human Nutrition Textbook
436

12.24 Calcium Deficiency & Toxicity
Because of the large amount of calcium in bones (which can be mobilized), deficiency is rare1. Hypocalcemia (low serum blood calcium concentrations) can result in tetany (involuntary
muscle contractions) 2. In addition, calcium deficiency in children can lead to rickets, the same as
occurs in vitamin D deficiency. While not a deficiency, low calcium intake can lead to decreased
bone mineral density and the conditions osteopenia and osteoporosis. How these differ from
osteomalacia and normal bone is illustrated and described below. There are two different bone
components that we will consider to understand what is happening in the bone. Matrix is the
protein scaffolding (primarily collagen) onto which mineral is deposited. Mineral is at it sounds,
the mineral that is deposited on the matrix.
Figure 12.241 Bone states; the width of each figure represents the bone mass. The height of the
matrix and mineral boxes represents the relative proportion for matrix to mineral in the bone.
Adapted from reference 3.
Osteomalacia - Bone mass is normal, but the matrix to mineral ratio is increased, meaning there
is less mineral in bone.
Osteopenia - Bone mass is decreased, but the matrix to mineral ratio is not altered from normal
bone. This condition is intermediate in between normal and osteoporosis.
Osteoporosis - Bone mass is further decreased from osteopenia, but the matrix to mineral ratio
is not altered from normal bone3.
Brian Lindshield
437

To prevent osteoporosis it is important to build peak bone mass (the maximum amount that a
person will have in their lifetime), 90% of which is built by age 18 and 20 in females and males,
respectively, but can continue to increase until age 30. After that time, bone mass starts to
decrease. For women after menopause, bone mass decreases dramatically because of the
decrease in estrogen production, as shown in the link below5.
Web Link
Bone Mass
Combining the decrease after menopause (estrogen stimulates osteoblasts), so without
estrogen there is a steep decrease in bone mass. Combined with the fact that women have
lower peak bone mass to begin with, helps further explain why osteoporosis is more common
in females. A measure of bone status is bone mineral density. As the name indicates, bone
mineral density is a measure of the amount of mineral in bone. Dual energy X-ray
absorptiometry (DEXA) accurately measures bone mineral density using a small amount of
radiation. A DEXA is shown in the figure below.
Figure 12.242 DEXA scanner6
A person lies down on the table and the arm of the machine moves slowly over them.
From the scan, a bone mineral density t-score is generated. These measure your peak bone
density compared to a healthy 30-year old adult and give you values of how much higher or
lower you are7. The following table summarizes the levels and their scores.
Kansas State University Human Nutrition Textbook
438

Table 12.241 Categories and DEXA bone mineral density t-scores7
Category T-score
Normal +1 to -1 SD
Low bone mass (osteopenia) -1 to -2.5
Osteoporosis -2.5 or lower
This DEXA measurement cannot distinguish whether the low bone mineral density is due to too
little bone (osteoporosis) or too little mineral (osteomalacia)8. There are other methods of
measuring bone mineral density, such as peripheral DEXA and ultrasound. These typically are
done on the wrist or heel, but are not as accurate because that one area might not reflect the
bone mineral density in other parts of the body9.
Calcium toxicity is rare, occurring in those with hyperparathyroidism or high calcium
supplementation levels. Like vitamin D, toxicity can lead to calcification of soft tissues9. In
addition, a very high intake of calcium can lead to kidney stone formation.
References & Links 1. Shils ME, Shike M, Ross AC, Caballero B, Cousins RJ, editors. (2006) Modern nutrition in health and disease. Baltimore, MD: Lippincott Williams & Wilkins. 2. Gropper SS, Smith JL, Groff JL. (2008) Advanced nutrition and human metabolism. Belmont, CA: Wadsworth Publishing. 3. Sambrook, P. Bone structure and function in normal and disease states http://v5.books.elsevier.com/bookscat/samples/9780443070150/9780443070150.pdf 4. http://nof.org/articles/7 5. http://www.niams.nih.gov/Health_Info/Bone/Osteoporosis/bone_mass.asp 6. http://en.wikipedia.org/wiki/File:Bone_density_scanner.jpg 7. https://www.nof.org/patients/diagnosis-information/bone-density-examtesting/ 8. https://www.nhs.uk/conditions/dexa-scan/why-its-done/ 7. Byrd-Bredbenner C, Moe G, Beshgetoor D, Berning J. (2009) Wardlaw's perspectives in nutrition. New York, NY: McGraw-Hill.
Link Bone Mass - http://drugline.org/img/term/bone-mass-density-2046_2.gif Bone Mineral Density T-Scores - http://www.orthopaedicsurgeon.com.sg/wp-content/uploads/2011/11/t-scores-large.gif
Brian Lindshield
439
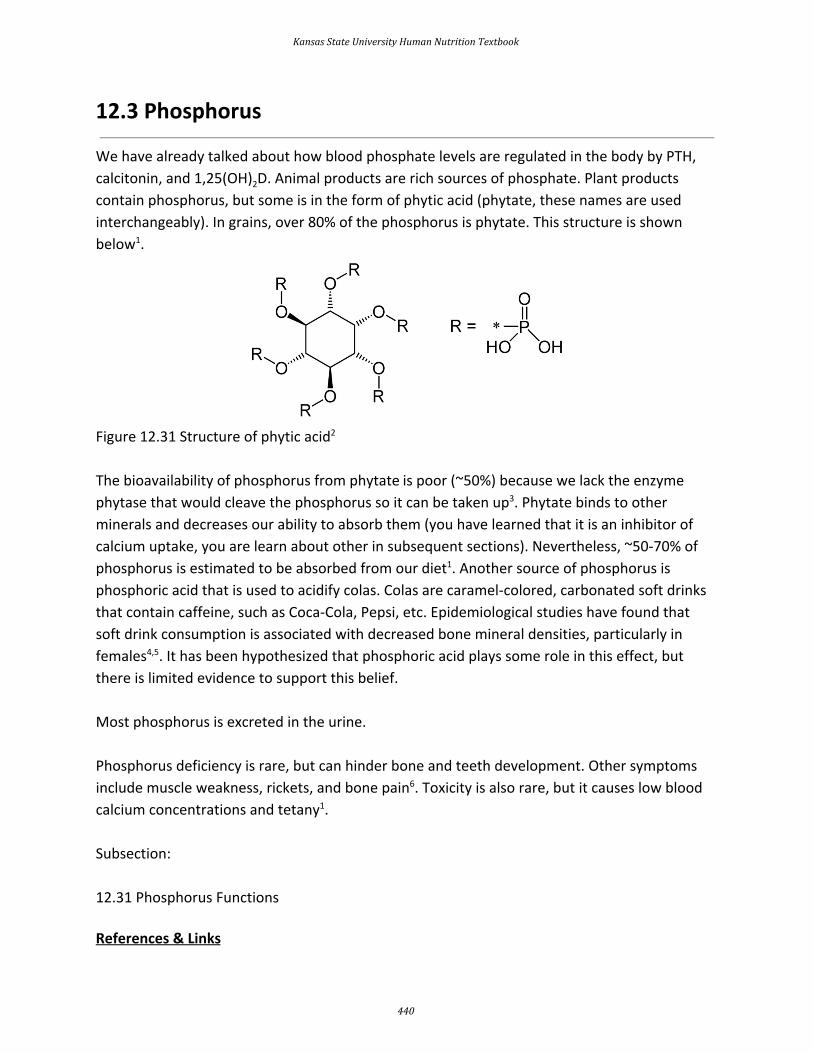
12.3 Phosphorus
We have already talked about how blood phosphate levels are regulated in the body by PTH,
calcitonin, and 1,25(OH)2D. Animal products are rich sources of phosphate. Plant products
contain phosphorus, but some is in the form of phytic acid (phytate, these names are used
interchangeably). In grains, over 80% of the phosphorus is phytate. This structure is shown
below1.
Figure 12.31 Structure of phytic acid 2
The bioavailability of phosphorus from phytate is poor (~50%) because we lack the enzyme
phytase that would cleave the phosphorus so it can be taken up3. Phytate binds to other
minerals and decreases our ability to absorb them (you have learned that it is an inhibitor of
calcium uptake, you are learn about other in subsequent sections). Nevertheless, ~50-70% of
phosphorus is estimated to be absorbed from our diet1. Another source of phosphorus is
phosphoric acid that is used to acidify colas. Colas are caramel-colored, carbonated soft drinks
that contain caffeine, such as Coca-Cola, Pepsi, etc. Epidemiological studies have found that
soft drink consumption is associated with decreased bone mineral densities, particularly in
females4,5. It has been hypothesized that phosphoric acid plays some role in this effect, but
there is limited evidence to support this belief.
Most phosphorus is excreted in the urine.
Phosphorus deficiency is rare, but can hinder bone and teeth development. Other symptoms
include muscle weakness, rickets, and bone pain6. Toxicity is also rare, but it causes low blood
calcium concentrations and tetany1.
Subsection:
12.31 Phosphorus Functions
References & Links
Kansas State University Human Nutrition Textbook
440

1. Gropper SS, Smith JL, Groff JL. (2008) Advanced nutrition and human metabolism. Belmont, CA: Wadsworth Publishing. 2. http://en.wikipedia.org/wiki/File:Phytic_acid.png 3. Phosphorus. Linus Pauling Institute Micronutrient Information Center. http://lpi.oregonstate.edu/mic/minerals/phosphorus#reference10 4. Tucker K, Morita K, Qiao N, Hannan M, Cupples LA, et al. (2006) Colas, but not other carbonated beverages, are associated with low bone mineral density in older women: The framingham osteoporosis study. Am J Clin Nutr 84(4): 936-942. 5. Libuda L, Alexy U, Remer T, Stehle P, Schoenau E, et al. (2008) Association between long-term consumption of soft drinks and variables of bone modeling and remodeling in a sample of healthy german children and adolescents. Am J Clin Nutr 88(6): 1670-1677. 6. Byrd-Bredbenner C, Moe G, Beshgetoor D, Berning J. (2009) Wardlaw's perspectives in nutrition. New York, NY: McGraw-Hill.
Brian Lindshield
441

12.31 Phosphorus Functions
Phosphorus has a number of functions in the body1.
Phosphate is a component of hydroxyapatite in bones and teeth, as described earlier.
Non-bone functions include:
Phosphorylation
Phosphates are used to activate and deactivate a number of proteins. In addition, compounds
are also frequently phosphorylated, like the monosaccharides shown below.
Figure 12.311 Uptake of monosaccharides into the hepatocyte
Phospholipids
Phosphates are a component of phospholipids, as shown below.
Kansas State University Human Nutrition Textbook
442

Figure 12.312 Structure of phosphatidylcholine (lecithin)2
DNA/RNA
DNA/RNA have a phosphate backbone as shown below.
Figure 12.313 Structure of DNA3
ATP
The major energy currency, ATP, stores energy in its phosphate bonds.
Figure 12.314 Structure of ATP4
Brian Lindshield
443

Secondary Messengers
The intracellular secondary messengers cyclic AMP (cAMP) and inositol triphosphate (IP3) both
contain phosphate. The action of these secondary messengers can be seen in the links below.
Web Links
cAMP
IP3
Other functions of phosphate include:
Acid/Base Balance
Intracellular Anion
References & Links 1. Gropper SS, Smith JL, Groff JL. (2008) Advanced nutrition and human metabolism. Belmont, CA: Wadsworth Publishing. 2. http://commons.wikimedia.org/wiki/File:Popc_details.svg 3. http://en.wikipedia.org/wiki/File:DNA_chemical_structure.svg 4. http://en.wikipedia.org/wiki/File:ATP_structure.svg
Links cAMP - http://courses.washington.edu/conj/gprotein/cyclicamp.htm IP3 - http://courses.washington.edu/conj/gprotein/ip3.htm
Kansas State University Human Nutrition Textbook
444

12.4 Fluoride
Fluoride is a nonessential mineral. It is not required by the body and it is not widely found in the
food supply. The majority of what we consume comes from fluoridated water. Other good
non-dietary sources are fluoridated toothpaste and dental rinses 1. Absorption of fluoride is near
100% for both dietary and non-dietary forms and it is rapidly excreted in the urine2.
Fluoride alters the mineralization of bones and teeth. It does this by replacing hydroxyl (OH)
ions in hydroxyapatite (Ca 10(PO4)6(OH) 2) , forming fluorohydroxyapatite. Fluorohydroxyapatite is
more resistant to acid degradation than hydroxyapatite, leading to fewer cavities 2.
Since it is a nonessential mineral, there is no fluoride deficiency, but lower levels is associated
with higher dental cavity rates. This connection is why so many water supplies are fluoridated.
However, fluoride can be quite toxic. Acute toxicity symptoms from large intakes of fluoride
include1:
Nausea
Vomiting
Diarrhea
Convulsions
Chronic toxicity results in an irreversible condition known as fluorosis, characterized by the
mottling and pitting of teeth as shown below.
Figure 12.41 Fluorosis3
Brian Lindshield
445

Figure 12.42 Severe case of fluorosis 4
As you can see from the figure below, fluorosis is more prevalent in the United States than
most people would probably believe.
Figure 12.43 Fluorosis prevalence by age in the United States 5
Kansas State University Human Nutrition Textbook
446

A comparison of the prevalence of fluorosis in US children, ages 12-15, indicates an increase
from the late 1980s to the early 2000s 5.
Figure 12.44 Change in dental fluorosis in 12-15 year-old US children 5
There is debate as to whether water should be fluoridated. The following links are examples of
just how conflicted the U.S. is. The first is a New York Times article on this topic. There is also an
article about Portland’s decision to begin fluoridating its water in 2014. The third article is
about a bill introduced by a Kansas lawmaker concerned about the effects of water
fluoridation. Salina, Kansas, which is home to one of Kansas State University’s campuses, voted
last November to not rescind its policy of fluoridating its water, as described in the fourth link.
Web Links
Fluoridation Debate, Redux
Portland Approves Fluoridation by ‘14
Fluoride to Stay in Salina Water
Brian Lindshield
447

References & Links 1. Byrd-Bredbenner C, Moe G, Beshgetoor D, Berning J. (2009) Wardlaw's perspectives in nutrition. New York, NY: McGraw-Hill. 2. Gropper SS, Smith JL, Groff JL. (2008) Advanced nutrition and human metabolism. Belmont, CA: Wadsworth Publishing. 3. http://en.wikipedia.org/wiki/File:Fluorosisb%26a.jpg 4. https://en.wikipedia.org/wiki/Dental_fluorosis#/media/File:FluorosisFromNIH.jpg 5. Beltran-Aguilar, ED, Barker, L, Dye, BA. (2010) Prevalence and Severity of Dental Fluorosis in the United States, 1999-2004. http://www.cdc.gov/nchs/data/databriefs/db53.htm
Links Fluoridation Debate, Redux - http://www.nytimes.com/2012/03/18/opinion/sunday/fluoridation-debate-redux.html? Portland Approves Fluoridation by ‘14 - http://www.nytimes.com/2012/09/13/us/portland-approves-adding-fluoride-to-water-by-14.html? Fluoride to Stay in Salina Water - http://www.salina.com/1d3c8158-0a31-5c90-b5b4-98afdda9ce92.html
Kansas State University Human Nutrition Textbook
448

12.5 Vitamin K
There are 3 forms of vitamin K. Phylloquinone (K1), the plant form of vitamin K, is the primary
dietary form of vitamin K. Its structure is shown below.
Figure 12.51 Structure of phylloquinone (K1), the 3 outside of the brackets indicates that the
structural unit inside the brackets is repeated 3 times1
Green leafy vegetables, broccoli, Brussels sprouts, and asparagus are foods that are good
sources of phylloquinone2.
Another form of vitamin K, menaquinone (K2), is synthesized by bacteria in the colon (and
potentially elsewhere). Menaquinone comprises ~10% of absorbed vitamin K every day and can
also be found in small amounts in animal products. Its structure is shown below 3.
Figure 12.52 Structure of menaquinone (K2). Menaquinones have side chains of varying length 4
In the structure above, if it was menaquinone-8, there would be 7 (8-1) repeating units of the
structure inside the brackets above.
The synthetic form of vitamin K is menadione (K3), whose structure is shown below.
Figure 12.53 Structure of menadione (K3) 5
Brian Lindshield
449

A tail, similar to the one found in menaquinone, has to be added to menadione for it to be
biologically active.
Vitamin K is absorbed like other fat-soluble substances. Approximately 80% of phylloquinone
and menaquinone are incorporated into chylomicrons and stored primarily in the liver 2,6. Once
metabolized, vitamin K is primarily excreted via bile in the feces, with a lesser amount excreted
in urine 6.
Subsections:
12.51 Vitamin K Functions
12.52 Vitamin K Deficiency & Toxicity
References & Links 1. http://en.wikipedia.org/wiki/File:Phylloquinone_structure.svg 2. McGuire M, Beerman KA. (2011) Nutritional sciences: From fundamentals to food. Belmont, CA: Wadsworth Cengage Learning. 3. Byrd-Bredbenner C, Moe G, Beshgetoor D, Berning J. (2009) Wardlaw's perspectives in nutrition. New York, NY: McGraw-Hill. 4. http://en.wikipedia.org/wiki/File:Menaquinone.svg 5. http://en.wikipedia.org/wiki/File:Menadione.png 6. Gropper SS, Smith JL, Groff JL. (2008) Advanced nutrition and human metabolism. Belmont, CA: Wadsworth Publishing.
Kansas State University Human Nutrition Textbook
450

12.51 Vitamin K Functions
Vitamin K is a cofactor for carboxylation reactions that add a CO 2 to the amino acid, glutamic
acid (glutamate), in certain proteins. The structure of glutamic acid is shown below.
Figure 12.511 Glutamic acid structure1
The enzyme, gamma-glutamyl carboxylase, uses a vitamin K cofactor to convert glutamic acid to
gamma-carboxyglutamic acid (Gla). Any protein that contains gamma-carboxyglutamic acid is
referred to as a Gla protein. After being used as a cofactor by gamma-glutamyl carboxylase to
produce a Gla protein, vitamin K becomes vitamin K epoxide (structure in the figure below).
Insert Figure https://commons.wikimedia.org/wiki/File:Vitamin-K-Epoxid.svg
Figure 12.512 Vitamin K epoxide structure2
Vitamin K epoxide needs to be converted back to vitamin K to serve as a cofactor again. Gla
proteins are those that contain glutamic acid(s) that have been converted to
gamma-carboxyglutamic acid(s). This formation of gamma-carboxyglutamic acid allows the 2
positive charges of calcium to bind between the 2 negative charges on the carboxylic acid
groups (COO -) in the Gla. The binding of calcium activates these proteins3-5.
Figure 12.512 Gamma-glutamyl carboxylase converts glutamic acid to gamma-carboxyglutamic
acid (Gla).
After being used as a cofactor by gamma-glutamyl carboxylase to produce a Gla protein,
vitamin K becomes vitamin K epoxide. Vitamin K epoxide needs to be converted back to vitamin
Brian Lindshield
451

K to serve as a cofactor again. Gla proteins are important in blood clotting. Blood clotting occurs
through a cascade of events, as shown in the following video. The animation below gives an
overview of blood clotting, the video is a fun depiction of the blood clotting cascade.
Web Link
Video: The Coagulation Cascade (2:29)
Within the blood clotting cascade, there a number of potential Gla proteins, as shown in the
figure below.
Figure 12.513 Blood clotting cascade with potential Gla proteins circled6
If these proteins within the blood clotting cascade are not activated to Gla, the cascade does
not proceed as normal, leading to impaired blood clotting. Warfarin (Coumadin) and dicumarol
are a couple of blood thinning drugs that inhibit this regeneration of vitamin K. This reduces the
amount of Gla in the blood clotting proteins, thus reducing the clotting response. The structure
of warfarin and dicumarol are shown below6.
Kansas State University Human Nutrition Textbook
452

Figure 12.514 Structure of warfarin8
Figure 12.515 Structure of dicumarol9
The following coumadin rap song video gives further information on warfarin.
Web Link
Video: Coumadin Rap Song (3:44)
Vitamin K may also be important for bone health. There are 3 Gla proteins found in bone:
osteocalcin, matrix Gla protein (MGP), and protein S7. Osteocalcin is a major bone protein,
constituting 15-20% of all non-collagen proteins in bone. However, overall, the function of
these 3 proteins in bone is not known 3,4. Some research suggests that higher vitamin K status or
intake decreases bone loss, but it is still not clear whether vitamin K truly is important for bone
health 10.
References & Links 1. https://en.wikipedia.org/wiki/Glutamic_acid#/media/File:Glutamic_Non-ionic.png 2. https://commons.wikimedia.org/wiki/File:Vitamin-K-Epoxid.svg 3. Gropper SS, Smith JL, Groff JL. (2008) Advanced nutrition and human metabolism. Belmont, CA: Wadsworth Publishing. 4. Byrd-Bredbenner C, Moe G, Beshgetoor D, Berning J. (2009) Wardlaw's perspectives in nutrition. New York, NY: McGraw-Hill. 5. McGuire M, Beerman KA. (2011) Nutritional sciences: From fundamentals to food. Belmont, CA: Wadsworth Cengage Learning. 6. http://en.wikipedia.org/wiki/File:Coagulation_full.svg
Brian Lindshield
453

7. Shils ME, Shike M, Ross AC, Caballero B, Cousins RJ, editors. (2006) Modern nutrition in health and disease. Baltimore, MD: Lippincott Williams & Wilkins. 8. http://en.wikipedia.org/wiki/File:Warfarin.svg 9. http://en.wikipedia.org/wiki/File:Dicumarol.svg 10. Shea MK, Booth S. (2008) Update on the role of vitamin K in skeletal health. Nutr Rev 66(10): 549-557.
Videos Hemostasis Animation- http://www.mhhe.com/biosci/esp/2002_general/Esp/folder_structure/tr/m1/s7/trm1s7_3.htm The Coagulation Cascade - https://www.youtube.com/watch?v=cy3a__OOa2M Coumadin Rap Song - http://www.youtube.com/watch?v=Mfk05IFfW48&feature=watch_response
Kansas State University Human Nutrition Textbook
454
12.52 Vitamin K Deficiency & Toxicity
Vitamin K deficiency is rare, but can occur in newborn infants. They are at higher risk, because
there is poor transfer of vitamin K across the placental barrier (from mother to fetus in utero ), their gastrointestinal tracts do not contain vitamin K producing bacteria, and breast milk is
generally low in vitamin K (most infant formula is fortified) 1. As a result, it is recommended (and
widely practiced) that all infants receive a vitamin K injection within 6 hours of birth2.
Prolonged antibiotic treatment (which kills bacteria in the gastrointestinal tract, including those
that produce menaquinone) and lipid absorption problems can also lead to vitamin K
deficiency3. Vitamin K deficient individuals have an increased risk of bleeding or hemorrhage.
Recall that high levels of alpha-tocopherol intake (levels that generally would only be achieved
through supplementation) can also interfere with vitamin K's blood clotting function. It is
believed that an alpha-tocopherol metabolite, with similar structure to the vitamin K forms you
learned about, antagonizes the action of vitamin K.
Phylloquinone and menaquinone have no reported toxicities. However, menadione can cause
liver damage1. References & Links 1. Gropper SS, Smith JL, Groff JL. (2008) Advanced nutrition and human metabolism. Belmont, CA: Wadsworth Publishing. 2. Byrd-Bredbenner C, Moe G, Beshgetoor D, Berning J. (2009) Wardlaw's perspectives in nutrition. New York, NY: McGraw-Hill. 3. McGuire M, Beerman KA. (2011) Nutritional sciences: From fundamentals to food. Belmont, CA: Wadsworth Cengage Learning.
Brian Lindshield
455

12.6 Vitamin A
There are 3 forms of vitamin A (retinol, retinal, and retinoic acid) that collectively are known as
retinoids. Retinol is the alcohol (OH) form, retinal is the aldehyde (COH) form, and retinoic acid
is the carboxylic acid (COOH) form, as shown in the figure below (areas of difference are
indicated by red).
Figure 12.61 Structure of the retinoids1
Among these different retinoids, retinol and retinal are fairly interchangeable. Either form is
readily converted to the other. However, only retinal is used to form retinoic acid, and this is a
one-way reaction. Thus, once retinoic acid is formed it can't be converted back to retinal, as
shown in the figure below.
Kansas State University Human Nutrition Textbook
456
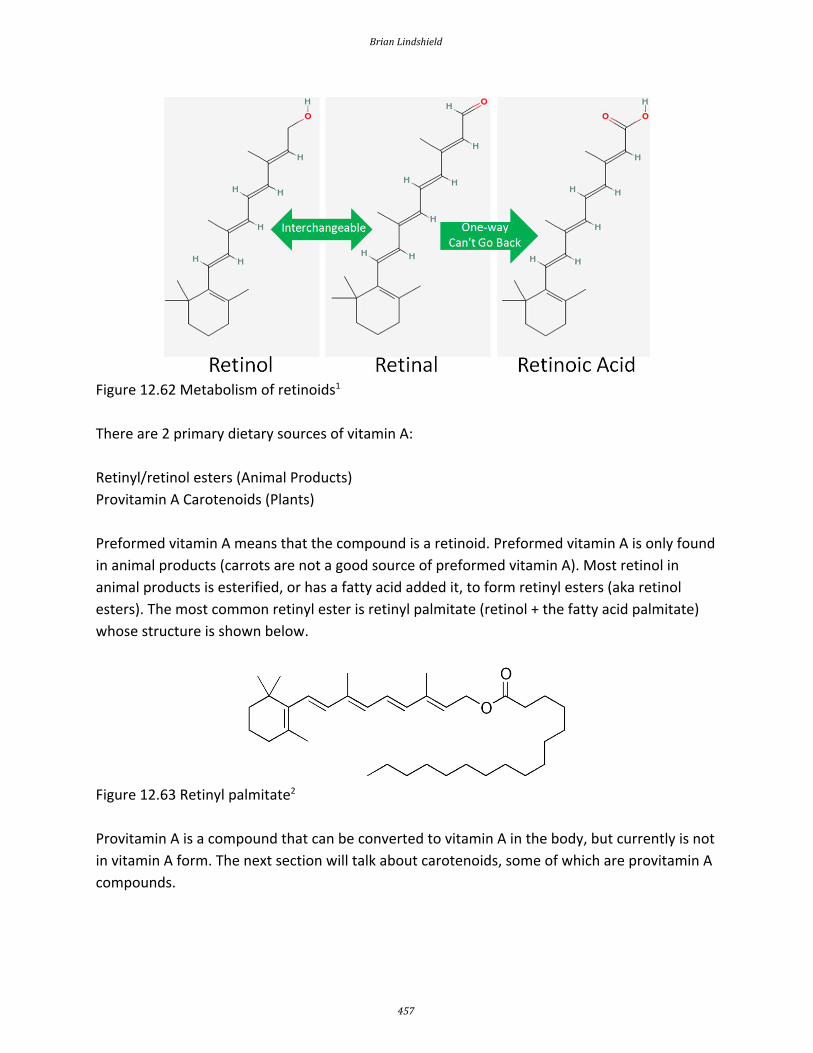
Figure 12.62 Metabolism of retinoids1
There are 2 primary dietary sources of vitamin A:
Retinyl/retinol esters (Animal Products)
Provitamin A Carotenoids (Plants)
Preformed vitamin A means that the compound is a retinoid. Preformed vitamin A is only found
in animal products (carrots are not a good source of preformed vitamin A). Most retinol in
animal products is esterified, or has a fatty acid added it, to form retinyl esters (aka retinol
esters). The most common retinyl ester is retinyl palmitate (retinol + the fatty acid palmitate)
whose structure is shown below.
Figure 12.63 Retinyl palmitate2
Provitamin A is a compound that can be converted to vitamin A in the body, but currently is not
in vitamin A form. The next section will talk about carotenoids, some of which are provitamin A
compounds.
Brian Lindshield
457

International units are also used for vitamin A, such that:
1 IU = 0.3 ug retinol or 0.6 ug beta-carotene
Subsections:
12.61 Carotenoids
12.62 Vitamin A Uptake, Absorption, Transport & Storage
12.63 Vitamin A Nuclear Receptors
12.64 Vitamin A Functions
12.65 Vitamin A Deficiency & Toxicity
References & Links 1. Structures from Pubchem http://pubchem.ncbi.nlm.nih.gov/ 2. http://en.wikipedia.org/wiki/File:Retinyl_palmitate.png
Kansas State University Human Nutrition Textbook
458

12.61 Carotenoids
Carotenoids are 40-carbon compounds that are found throughout nature. Animals do not
produce carotenoids, thus any found in animals (including people) come from consumed plants
or microorganisms. There are more than 600 natural carotenoids. However, the 6 main ones
found in the diet and in the body are1:
Beta-carotene
Alpha-carotene
Beta-cryptoxanthin
Lutein
Zeaxanthin
Lycopene
Many carotenoids are pigments, meaning they are colored. The table below gives the color of
some of these carotenoids, as well as some food sources.
Table 12.611 Carotenoids’ color and food sources
Carotenoid Color Food Sources
Beta-carotene/Alpha-carotene Orange Carrots, Sweet Potatoes, Leafy Greens
Lycopene Red Tomatoes, Watermelon, Pink Grapefruit
Lutein/Zeaxanthin Yellow Kale, Corn, Egg Yolks, Spinach
*Beta-cryptoxanthin is orange in color
Carotenoids can be further classified as provitamin A or non-provitamin A. Provitamin A
carotenoids are those that can be cleaved to form retinal, while the non-provitamin A
carotenoids cannot. The structure and classification of the 6 major carotenoids are shown
below.
Brian Lindshield
459

Figure 12.611 Structure and classification of the 6 major carotenoids
After provitamin A carotenoids are taken up into the enterocyte, some are cleaved to form
retinal. In the case of symmetrical beta-carotene, it is cleaved in the center to form 2 retinal
molecules as shown below.
Figure 12.612 Cleavage of beta-carotene 2 to retinal molecules2
Alpha-carotene and beta-cryptoxanthin are asymmetrical, thus they can be used to form only 1
retinal.
To help account for the fact that retinol can be made from carotenoids, the DRI committee
made retinol activity equivalents (RAE) that take into account the bioavailability and
bioconversion of the provitamin A carotenoids.
Kansas State University Human Nutrition Textbook
460

1 ug RAE
= 1 ug of retinol
= 2 ug of supplemental beta-carotene
= 12 ug of dietary beta-carotene
= 24 ug of alpha-carotene or beta-cryptoxanthin 3
Supplemental beta-carotene is much more bioavailable than dietary beta-carotene found in a natural matrix within plant food components. As a result, you need to consume 6 times more dietary beta carotene to have the same RAE value as supplemental beta-carotene. The RAE difference between the provitamin A carotenoids is due to beta-carotene being cleaved to form 2 retinals, where alpha-carotene and beta-cryptoxanthin are cleaved 1 retinal. As a result, twice as much dietary alpha-carotene and beta-cryptoxanthin needs to be consumed to have the same RAE value as dietary beta-carotene. References & Links 1. Lindshield BL, Erdman JW. (2006) Carotenoids. In: Bowman BA, Russell RM, editors. Present Knowledge in Nutrition. Washington, D.C.: International Life Sciences Institute. pp. 184-197.r 2. https://en.wikipedia.org/wiki/Retinal#/media/File:All-trans-Retinal2.svg 3. Anonymous. (2001) Dietary reference intakes for vitamin A, vitamin K, arsenic, boron, chromium, copper, iodine, iron, manganese, molybdenum, nickel, silicon, vanadium, and zinc. Washington, D.C.: National Academies Press.
Brian Lindshield
461

12.62 Vitamin A Uptake, Absorption, Transport & Storage
The uptake, absorption, transport, and storage of vitamin A and carotenoids are summarized in
the figure below.
Figure 12.621 Vitamin A uptake, absorption, transport, and storage. Adapted from reference 1
Esters are removed by esterases so that free retinol can be taken up into the enterocyte.
Preformed vitamin A is highly bioavailable (70-90%) if consumed with some fat2. Carotenoids
have a much lower bioavailability, which varies based on the carotenoid and matrix it is in when
consumed. Once provitamin A carotenoids are taken up into the enterocytes, they are: (1)
cleaved to retinal and then converted to retinol or (2) absorbed intact and incorporated into
chylomicrons.
Retinol in the enterocyte is esterified, forming retinyl esters. The retinyl esters are packaged
into chylomicrons (CM) and enter the lymph system. Once the chylomicrons reach circulation,
triglycerides are cleaved off to form chylomicron remnants (CM Rem). These are taken up by
hepatocytes, where the retinyl esters are de-esterified to form retinol. The liver is the major
storage site of vitamin A. For storage, the retinol will be transported from the hepatocytes to
the stellate cells and converted back to retinyl esters, the storage form of vitamin A.
If vitamin A is needed to be released into circulation, retinol will combine with retinol binding
Kansas State University Human Nutrition Textbook
462

protein (RBP). Retinol + RBP are then bound to a large transport protein, transthyretin (TTR). It
is believed that retinol + RBP would be filtered out by the kidney and excreted in urine if it was
not bound to TTR1.
After it is further metabolized, 60% of vitamin A is excreted in the urine, 40% in feces 2. References & Links 1. Stipanuk MH. (2006) Biochemical, physiological, & molecular aspects of human nutrition. St. Louis, MO: Saunders Elsevier.Stipaunuk 2. Gropper SS, Smith JL, Groff JL. (2008) Advanced nutrition and human metabolism. Belmont, CA: Wadsworth Publishing.
Brian Lindshield
463

12.63 Vitamin A Nuclear Receptors
Vitamin A, like vitamin D, has a nuclear receptor. Vitamin A technically has two nuclear
receptors, the retinoic acid receptors (RARs) and retinoid X receptors (RXRs). Vitamin A, like
polyunsaturated fatty acids, can be found in trans and cis forms, depending on the
conformation of its double bonds. The ligand for RARs is all-trans-retinoic acid, and the ligand
for RXRs is 9-cis retinoic acid.
As shown in the figure below, all-trans retinol is brought to the cell by RBP and TTR. All-trans
retinol is converted to all-trans-retinal, and then to all-trans-retinoic acid. RAR and RXR are
paired, or dimerized, on the retinoic acid response element (RARE) in the promoter region of
target genes. The binding of all-trans retinoic acid to RAR causes the transcription and
ultimately the translation of target proteins. This is why all-trans-retinoic acid is the active form
of vitamin A because it is the ligand for RARs, leading to many of the biologic effects attributed
to vitamin A. RXR is primarily a partner receptor for other nuclear hormone receptors and can
serve in this role even without its ligand. 9-cis retinoic acid is rarely found in physiologically
notable concentrations, so it is role is not entirely clear.
Figure 12.631 All-trans retinoic acid and retinoid X receptors
No References
Kansas State University Human Nutrition Textbook
464

12.64 Vitamin A Functions
Vitamin A has a number of important functions in the body.
Vision
The retina is the inner back lining of the eye that takes visual images and turns them into nerve
signals that are sent to the brain to form the images that we "see", as shown in the following
link1.
Web Link
Retina
Inside the retina are the photoreceptor cells, rods and cones. Cones are responsible for color
vision, while rods are important for seeing black and white. Within the rods, 11-cis retinal
combines with the protein, opsin, to form rhodopsin. When light strikes rhodopsin, the
compound splits into opsin and all-trans retinal. This sends a signal to your brain for us to “see”.
This process is illustrated in the figure below 1.
Figure 12.641 Vitamin A in the rod
Most all-trans retinal is converted back to 11-cis retinal through a series of steps so it can
continue to be used to form rhodopsin. However, this recycling is not 100% efficient. Vitamin A
Brian Lindshield
465

stores, or continued intake, is required to provide the 11-cis retinal needed to continue to form
rhodopsin. Normally, our eyes adapt to darkness by increasing the amount of rhodopsin
available so we can see under reduced light conditions 1. If a person does not have enough
rhodopsin he/she will become night blind, meaning his/her eyes do not adjust, or adjust very
slowly, preventing he/she from seeing under limited light conditions. The picture below is an
example of what night blindness looks like.
Figure 12.642 The left is normal vision, the right is what someone with night blindness would
see 2.
Cell Differentiation
Vitamin A, in particular retinoic acid, is important for cell differentiation, or the ability of stem
cells to develop into specialized cells.
Kansas State University Human Nutrition Textbook
466

Figure 12.642 Cellular differentiation3
Other functions that vitamin A is important for include:
Growth and development
Reproduction
Immune function
References & Links 1. Byrd-Bredbenner C, Moe G, Beshgetoor D, Berning J. (2009) Wardlaw's perspectives in nutrition. New York, NY: McGraw-Hill. 2. https://commons.wikimedia.org/wiki/File:P360_Onderdendam_goed_nachtzicht_ns_nachtblind.jpg 3.http://www.wikipremed.com/image.php?img=040601_68zzzz334000_Cell_differentiation_68.jpg&image_id=334000
Links Retina - http://webvision.umh.es/webvision/imageswv/Sagschem.jpeg
Brian Lindshield
467

12.65 Vitamin A Deficiency & Toxicity
Vitamin A deficiency is rare in North America, but is a huge problem in developing countries. In
many developing countries, they do not have a stable dietary source of retinoids or provitamin
A carotenoids. The figure below gives you an idea of countries where vitamin A deficiency is a
problem.
Figure 12.651 Prevalence of vitamin A deficiency worldwide 1
Often the earliest symptom of vitamin A deficiency is night blindness, due to the insufficient
production of rhodopsin. The reason that this is the earliest symptom, is that circulating vitamin
A (primary form is retinol) concentrations are homeostatically-controlled, meaning that they do
not change until after vitamin A stores are exhausted (because stores are used to maintain
circulating concentrations). This means that blood, serum, plasma measurements are going to
appear normal until all stores are exhausted. As a result, determining or diagnosing someone as
vitamin A deficient can be challenging. It also means that someone can be right on the brink of
deficiency and an assessment of the status they would appear the same as someone who has
adequate stores. There are further progressively worsening changes to the eye that occur
during vitamin A deficiency, collectively referred to as xerophthalmia, which are shown in the
link below.
Web Link
The eye signs of vitamin A deficiency
Ultimately the person can become blind. Vitamin A deficiency is the leading cause of blindness
Kansas State University Human Nutrition Textbook
468

in some parts of the world2.
Another symptom of vitamin A deficiency is hyperkeratosis. In this condition, cells overproduce
the protein keratin, causing the skin to become rough and irritated, as shown in the link below2.
Web Link
Hyperkeratosis
One way to counter vitamin A deficiency in developing countries is for staple crops, like rice and
corn, to contain beta-carotene. In the case of rice, Golden Rice was genetically modified to
produce beta-carotene. A second generation of golden rice, known as Golden Rice 2, has now
been developed. However, politics and regulations have prevented it from being used. This is
described in the first link. The second link is a nice figure that details the progress towards
Golden Rice being used. The third link describes the issues with how some research with it was
conducted. The fourth link is an opinion article that gives you a feel for the opposition to its use.
Web Links
Golden Rice
Golden Rice Project
Golden Rice Not So Golden for Tufts
‘Golden Rice’: A Dengvaxia fiasco waiting to happen
There are also corn varieties that have been bred (not genetically modified) to produce high
amounts of beta-carotene, as described in the link below.
Web Link
New Yellow Corn Could Boost Vitamin A, Save Sight
Vitamin A can be very toxic and can cause serious symptoms, such as blurred vision, liver
abnormalities, skin disorders, and joint pain 2,3. In addition, research has suggested that people
who consume high levels of vitamin A are more prone to bone fractures2. Toxic levels of vitamin
A are also teratogenic, which means they could cause birth defects.
This is important to keep in mind because a vitamin A derivative isotretinoin (13-cis retinoic
acid) was the active ingredient in the oral acne medication, Accutane. Accutane was effective,
as you can see in the video below.
Brian Lindshield
469

Web Link
Video: Accutane (1:10)
However, due to the number of adverse events reported from its consumption, Accutane was
recalled from the US market in 20094. Isotretinoin medications though are still commonly
prescribed.
Retin-A is a topical product of all-trans-retinoic acid. Women of childbearing age need to
exercise caution when using these products due to the risk of birth defects, should they
become pregnant3. People should not consume huge doses of vitamin A expecting to get the
same effects seen from these 2 medications5.
It is important to note that you cannot develop vitamin A toxicity from consuming too much
beta-carotene or other provitamin A carotenoids. This is prevented because the enzyme
cleavage of them is decreased in response to higher vitamin A status. Instead, a nontoxic
condition known as carotenodermia occurs when large amounts of beta-carotene are
consumed, where the accumulation of the carotenoid in the fat below the skin causes the skin
to look orange, as shown in the link below. Excess lycopene consumption leads to a similar
condition known as lycopenodermia, which appear more pink or orange.
Web Link
Carotenodermia
References & Links 1. http://en.wikipedia.org/wiki/File:Vitamin_A_deficiency.PNG 2. McGuire M, Beerman KA. (2011) Nutritional sciences: From fundamentals to food. Belmont, CA: Wadsworth Cengage Learning. 3. Byrd-Bredbenner C, Moe G, Beshgetoor D, Berning J. (2009) Wardlaw's perspectives in nutrition. New York, NY: McGraw-Hill. 4. http://www.drugwatch.com/accutane/ 5. Whitney E, Rolfes SR. (2011) Understanding nutrition. Belmont, CA: Wadsworth Cengage Learning.
Links The eye signs of vitamin A deficiency - http://www.cehjournal.org/article/the-eye-signs-of-vitamin-a-deficiency/ Hyperkeratosis - http://api.ning.com/files/pKcbIy8a8fSwvjlw-NqcoyW-h1U9xsjxM86*Pg7xe7WAS91frtrQFThTH2oDWcMvbUJ9Mlutd3B9tXk8hjbfmXkeZyJs-7Mi/follicularhyperkeratosis1.jpg Golden Rice - http://www.goldenrice.org/ ‘Golden Rice’: A Dengvaxia fiasco waiting to happen- http://opinion.inquirer.net/109834/golden-rice-dengvaxia-fiasco-waiting-happen#ixzz53FKBsYGO Golden Rice Project - http://blog.daimonie.com/2017/03/lets-talk-about-gmos-part-two-what-are.html New Yellow Corn Could Boost Vitamin A, Save Sight - http://www.npr.org/templates/story/story.php?storyId=18203237
Kansas State University Human Nutrition Textbook
470

Carotenodermia - http://4.bp.blogspot.com/__7hHVSyD26Y/R8xxsFbRc0I/AAAAAAAAAEs/I73lzYHNE5k/s1600-h/carotenodermia.jpg
Video Accutane - https://www.youtube.com/watch?v=r93K-w2saPA
Brian Lindshield
471

12.7 Iron
There are 2 major dietary forms of iron: heme iron and non-heme iron. Heme iron is only found
in foods of animal origin, within hemoglobin and myoglobin. The structure of heme iron is
shown below.
Figure 12.71 Structure of heme iron 1
Approximately 40% of iron in meat, fish, and poultry is heme-iron, and the other 60% is
non-heme iron 2.
Non-heme iron is the mineral alone, in either its oxidized or reduced form. The 2 forms of iron
are:
Ferric (Fe3+, oxidized)
Ferrous (Fe2+, reduced)
It is estimated that 25% of heme iron and 17% of non-heme iron are absorbed 2. Approximately
85-90% of the iron we consume is non-heme iron 2,3.
In addition to getting iron from food sources, if food is cooked in cast iron cookware, a small
amount of iron can be transferred to the food.
Many breakfast cereals are fortified with reduced iron, which looks like iron filings, as the
following video shows.
Web Link
Video: Iron for breakfast (1:02)
Kansas State University Human Nutrition Textbook
472

While the iron bioavailability of this reduced iron is low, some is absorbed4.
Supplements
Most iron supplements use ferrous (Fe 2+) iron, because this form is better absorbed, as
discussed in the next section. The figure below shows the percent of elemental iron in different
supplements. This is the percentage of elemental iron that is in each compound.
Figure 12.72 Elemental iron in different iron supplements 3
Iron chelates are marketed as being better absorbed than other forms of iron supplements, but
this has not been proven5. It is recommended that supplements are not taken with meals,
because they are better absorbed when not consumed with food 2.
Subsections:
12.71 Iron Uptake & Absorption
12.72 Iron Transport & Storage
12.73 Iron Functions
12.74 Iron Deficiency & Toxicity
References & Links 1. http://en.wikipedia.org/wiki/File:Heme.svg 2. Whitney E, Rolfes SR. (2011) Understanding nutrition. Belmont, CA: Wadsworth Cengage Learning. 3. http://foodfix.ca/health.php#en65 4. Garcia-Casal M, Layrisse M, Pena-Rosas J, Ramirez J, Leets I, et al. (2003) Iron absorption from elemental iron-fortified corn flakes in humans. role of vitamins A and C1-3. Nutr Res 23(4): 451-463. 5. Gropper SS, Smith JL, Groff JL. (2008) Advanced nutrition and human metabolism. Belmont, CA: Wadsworth
Brian Lindshield
473

Publishing.
Video Iron for breakfast - https://www.youtube.com/watch?v=pRK15XSqtAw
Kansas State University Human Nutrition Textbook
474
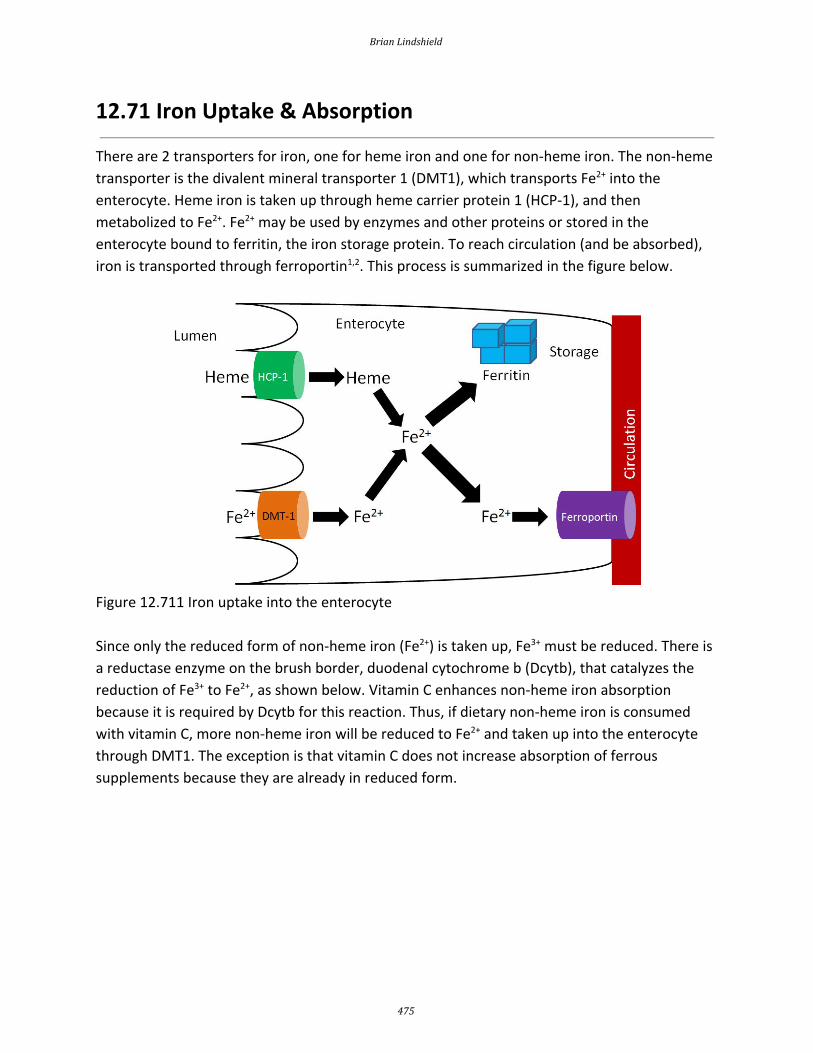
12.71 Iron Uptake & Absorption
There are 2 transporters for iron, one for heme iron and one for non-heme iron. The non-heme
transporter is the divalent mineral transporter 1 (DMT1), which transports Fe 2+ into the
enterocyte. Heme iron is taken up through heme carrier protein 1 (HCP-1), and then
metabolized to Fe2+. Fe 2+ may be used by enzymes and other proteins or stored in the
enterocyte bound to ferritin, the iron storage protein. To reach circulation (and be absorbed),
iron is transported through ferroportin1,2. This process is summarized in the figure below.
Figure 12.711 Iron uptake into the enterocyte
Since only the reduced form of non-heme iron (Fe2+) is taken up, Fe3+ must be reduced. There is
a reductase enzyme on the brush border, duodenal cytochrome b (Dcytb), that catalyzes the
reduction of Fe3+ to Fe2+, as shown below. Vitamin C enhances non-heme iron absorption
because it is required by Dcytb for this reaction. Thus, if dietary non-heme iron is consumed
with vitamin C, more non-heme iron will be reduced to Fe2+ and taken up into the enterocyte
through DMT1. The exception is that vitamin C does not increase absorption of ferrous
supplements because they are already in reduced form.
Brian Lindshield
475

Figure 12.712 Reduction of non-heme iron by Dcytb
In addition to vitamin C, there is an unidentified factor in muscle that enhances non-heme iron
absorption if consumed at the same meal 3. This unidentified factor is referred to as meat
protein factor (MPF). The table shows how MPF can increase non-heme iron absorption.
Table 12.711 Non-heme iron absorption from chicken or beef muscle fraction 3
Mean Fe
Absorption
(% of Dose)
Egg
Albumin
Whole
Muscle
Whole
Muscle
Protein
Heme-Free
Muscle
Protein
Chicken 8.41 16.43 26.98 36.81
Beef 11.21 31.52 44.15 38.29
Albumin is a protein, so the egg albumin represents a non-meat protein standard for
comparison. You can see that absorption is much higher with whole muscle. When only
consuming muscle protein, there is a slight increase from muscle itself, and when they look at
heme-free muscle iron, absorption is still higher than egg albumin3.
Inhibitors of non-heme iron absorption typically chelate, or bind, the iron to prevent
absorption. Phytates (phytic acid), which also inhibit calcium absorption, chelate non-heme iron
decreasing its absorption.
Kansas State University Human Nutrition Textbook
476

Figure 12.713 Structure of phytic acid4
Other compounds that inhibit absorption are:
Polyphenols (coffee, tea) 1
Figure 12.714 Structure of gallic acid, a polyphenol 5
Oxalate (spinach, rhubarb, sweet potatoes, and dried beans) 2
Figure 12.715 Structure of calcium oxalate 6
Calcium is also believed to inhibit iron uptake.
References & Links 1. Gropper SS, Smith JL, Groff JL. (2008) Advanced nutrition and human metabolism. Belmont, CA: Wadsworth Publishing. 2. Shils ME, Shike M, Ross AC, Caballero B, Cousins RJ, editors. (2006) Modern nutrition in health and disease. Baltimore, MD: Lippincott Williams & Wilkins. 3. Hurrell R, Reddy M, Juillerat M, Cook J. (2006) Meat protein fractions enhance nonheme iron absorption in humans. J Nutr 136(11): 2808-2812. 4. http://en.wikipedia.org/wiki/File:Phytic_acid.png 5. http://en.wikipedia.org/wiki/File:Gallic_acid.svg 6. http://en.wikipedia.org/wiki/File:Calcium_oxalate.png
Brian Lindshield
477

12.72 Iron Transport & Storage
Transferrin is the major iron transport protein (transports iron through blood). Fe3+ is the form
of iron that binds to transferrin, so the Fe2+ transported through ferroportin must be oxidized to
Fe3+. There are 2 copper-containing proteins that catalyze this oxidation of Fe2+: hephaestin and
ceruloplasmin. Hephaestin is found in the membrane of enterocytes, while ceruloplasmin is the
major copper transport protein in blood. Hephaestin is the primary protein that performs this
function in a coupled manner (occur together) with transport through ferroportin. This means
that the Fe2+ being transported through ferroportin is oxidized by hephaestin. Evidence
suggests that ceruloplasmin is involved in oxidizing Fe 2+ when iron status is low1. Once oxidized,
Fe3+ binds to transferrin and is transported to a tissue cell that contains a transferrin receptor.
Transferrin binds to the transferrin receptor and is endocytosed, as shown below2.
Figure 12.721 Transport and uptake of iron
Once inside cells, the iron can be used for cellular purposes (cofactor for enzyme etc.) or it can
be stored in the iron storage proteins ferritin or hemosiderin. Ferritin is the primary iron
storage protein, but at higher concentrations, iron is also stored in hemosiderin2.
Kansas State University Human Nutrition Textbook
478

Figure 12.722 Fates of iron within cells
There are 3 major compartments of iron in the body3:
1. Functional Iron
2. Storage Iron
3. Transport Iron
Functional iron consists of iron performing some function. There are 3 functional iron
subcompartments.
1. Hemoglobin
2. Myoglobin
3. Iron-containing enzymes
The functions of these subcompartments are discussed in the next section.
Iron Stores consist of:
1. Ferritin
2. Hemosiderin
The liver is the primary storage site in the body, with the spleen and bone marrow being the
other major storage sites.
Circulating iron is found in transferrin3.
Brian Lindshield
479

The following table shows how much iron is distributed among the different compartments.
Table 12.721 Iron Distribution in adults (mg Fe/kg body weight) 3
Men Women
Functional iron
Hemoglobin 32 28
Myoglobin 5 4
Fe-containing enzymes 1-2 1-2
Storage iron
Ferritin and hemosiderin ~11 ~6
Transport iron
Transferrin 0.04 0.04
Hopefully you notice that the majority of iron is in the functional iron compartment. The figure
below further reinforces this point, showing that most iron is found in red blood cells
(hemoglobin) and tissues (myoglobin).
Figure 12.723 Iron distribution in different compartments4
Also notice how small oral intake and excretion are compared to the amount found in the
different compartments in the body. As a result, iron recycling is really important, because red
blood cells only live for 120 days. Red blood cells are broken down in the liver, spleen, and bone
marrow and the iron can be used for the same purposes as described earlier: cellular use,
storage, or transported to another tissue on transferrin2. Most of this iron will be used for heme
Kansas State University Human Nutrition Textbook
480

and ultimately red blood cell synthesis. The figure below summarizes the potential uses of iron
recycled from red blood cells.
Figure 12.724 Iron recycling from red blood cells
Iron is unique among minerals in that our body has limited ability to excrete it. Thus, absorption
is the really the only way to regulate iron status. Absorption is controlled by the hormone
hepcidin. The liver has an iron sensor so when iron concentrations get high, this sensor signals
for the release of hepcidin. Hepcidin travels to the enterocytes where it causes degradation of
ferroportin. Thus, the iron is not able to be transported into circulation (since ferroportin is the
transporter through which this typically occurs)5.
Figure 12.725 Action of hepcidin 4
Brian Lindshield
481

The iron is now trapped in the enterocytes, which are eventually sloughed off and mostly
excreted in feces (some may be are digested for uptake by new enterocytes on the villi). Thus,
iron absorption is decreased through the action of hepcidin.
Figure 12.726 Enterocytes are sloughed off the villus and unless digested and their components
reabsorbed, they will be excreted in feces
References & Links 1. Yehuda S, Mostofsky DI (2010) Iron Deficiency and Overload: From Basic Biology to Clinical Medicine. New York, NY. Humana Press. 2. Gropper SS, Smith JL, Groff JL. (2008) Advanced nutrition and human metabolism. Belmont, CA: Wadsworth Publishing. 3. Stipanuk MH. (2006) Biochemical, physiological, & molecular aspects of human nutrition. St. Louis, MO: Saunders Elsevier. 4. http://en.wikipedia.org/wiki/File:Iron_metabolism.svg 5. Nemeth E, Ganz T. (2006) Regulation of iron metabolism by hepcidin. Annu Rev Nutr 26: 323-342.
Kansas State University Human Nutrition Textbook
482

12.73 Iron Functions
As we talked about in the previous subsection, there are 3 primary functional iron
subcompartments.
1. Hemoglobin
2. Myoglobin
3. Iron-containing enzymes
Hemoglobin contains heme that is responsible for red blood cells’ red color. Hemoglobin carries
oxygen to tissues. The function of hemoglobin can be seen in the link below.
Web Link
Hemoglobin
Myoglobin is similar to hemoglobin in that it can bind oxygen. However, instead of being found
in blood, it is found in muscle. The color of meat products is a result of the state that myoglobin
is in, as shown in the link below.
Web Link
Myoglobin & Meat Color
There are a number of enzymes that use iron as a cofactor. We've already talked about two in
this class.
Iron is a cofactor for the antioxidant enzyme, catalase, that converts hydrogen peroxide to
water, as shown below.
Brian Lindshield
483

Figure 12.731 Catalase uses iron as a cofactor
Iron is also a cofactor for proline and lysyl hydroxylases that are important in collagen
cross-linking. This was discussed previously in the vitamin C section. The function of these
enzymes is shown below.
Figure 12.732 Importance of ascorbic acid and iron to proline and lysyl hydroxylases
Heme iron is also found in cytochromes, like cytochrome c in the electron transport chain as
shown below 1.
Kansas State University Human Nutrition Textbook
484

Figure 12.733 Cytochrome c in the electron transport chain contains iron2
References & Links 1. Gropper SS, Smith JL, Groff JL. (2008) Advanced nutrition and human metabolism. Belmont, CA: Wadsworth Publishing. 2. http://wikidoc.org/index.php/File:ETC.PNG
Links Hemoglobin - http://www.nlm.nih.gov/medlineplus/ency/imagepages/19510.htm Myoglobin & Meat Color - http://meatisneat.files.wordpress.com/2009/09/slide11.jpg
Brian Lindshield
485

12.74 Iron Deficiency & Toxicity
The levels of iron in the different compartments is illustrated by the figure below. The red
above the table is meant to represent the amount of iron in the different compartments. In
early negative iron balance stage, iron stores are slightly depleted. Once the stores are almost
completely exhausted, this state is referred to as iron depletion. In iron deficiency, stores are
completely exhausted and the circulating and functional iron levels are also depleted. In iron
anemia, the circulating and functional iron levels are further depleted from iron-deficiency.
1 Great measure, but invasive 2 Small amount are released from liver, bone, and spleen – proportional to body stores 3 Also referred to as total iron-binding capacity
Figure 12.741 Measures of iron status1-3
The most common measures of iron status are hemoglobin concentrations and hematocrit
(described below) levels. A decreased amount of either measure indicates iron deficiency, but
these two measures are among the last to indicate that iron status is depressed. This is
because, as you can see in the figure above, the functional iron compartment (which contains
hemoglobin and is highly correlated to hematocit values) are not altered until you reach iron
deficiency. This is accomplished by using stores to maintain the circulating and functional iron
compartments. It is important that you understand limitations of these indicators so that you
can interpret the meaning of their values1.
The hematocrit, as illustrated in the figure below, is a measure of the proportion of red blood
cells (erythrocytes) as compared to all other components of blood. The components are
Kansas State University Human Nutrition Textbook
486
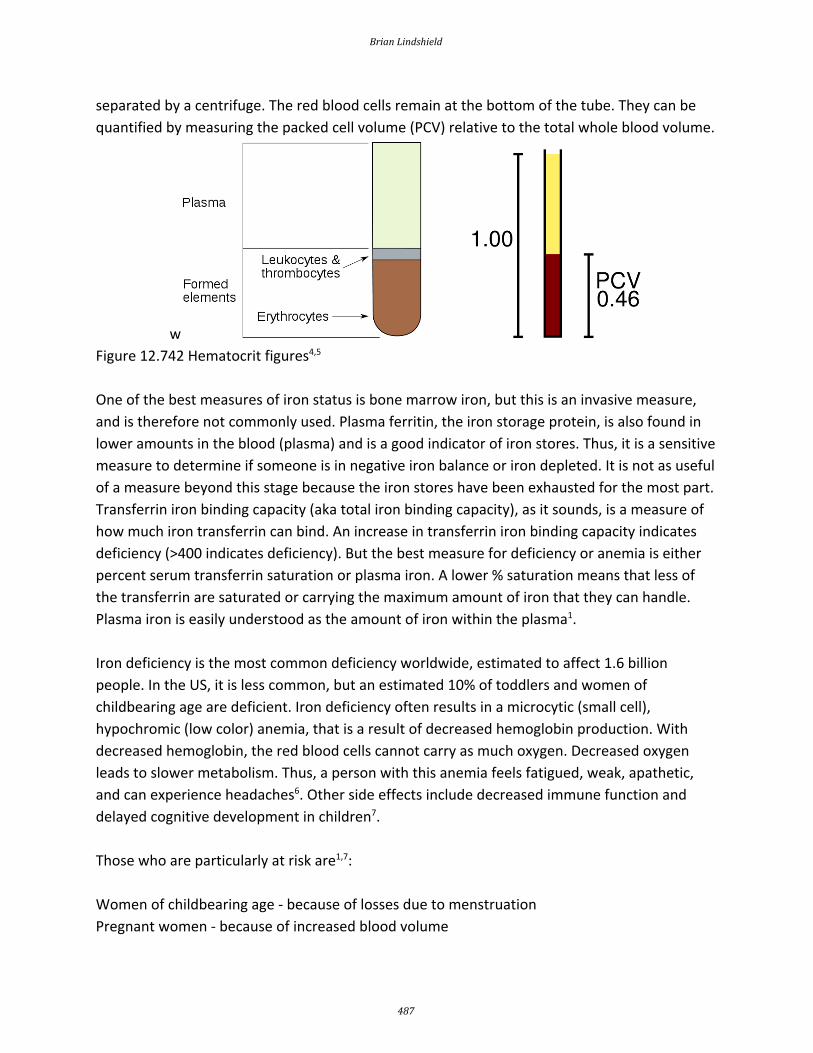
separated by a centrifuge. The red blood cells remain at the bottom of the tube. They can be
quantified by measuring the packed cell volume (PCV) relative to the total whole blood volume.
w
Figure 12.742 Hematocrit figures4,5
One of the best measures of iron status is bone marrow iron, but this is an invasive measure,
and is therefore not commonly used. Plasma ferritin, the iron storage protein, is also found in
lower amounts in the blood (plasma) and is a good indicator of iron stores. Thus, it is a sensitive
measure to determine if someone is in negative iron balance or iron depleted. It is not as useful
of a measure beyond this stage because the iron stores have been exhausted for the most part.
Transferrin iron binding capacity (aka total iron binding capacity), as it sounds, is a measure of
how much iron transferrin can bind. An increase in transferrin iron binding capacity indicates
deficiency (>400 indicates deficiency). But the best measure for deficiency or anemia is either
percent serum transferrin saturation or plasma iron. A lower % saturation means that less of
the transferrin are saturated or carrying the maximum amount of iron that they can handle.
Plasma iron is easily understood as the amount of iron within the plasma 1.
Iron deficiency is the most common deficiency worldwide, estimated to affect 1.6 billion
people. In the US, it is less common, but an estimated 10% of toddlers and women of
childbearing age are deficient. Iron deficiency often results in a microcytic (small cell),
hypochromic (low color) anemia, that is a result of decreased hemoglobin production. With
decreased hemoglobin, the red blood cells cannot carry as much oxygen. Decreased oxygen
leads to slower metabolism. Thus, a person with this anemia feels fatigued, weak, apathetic,
and can experience headaches 6. Other side effects include decreased immune function and
delayed cognitive development in children 7.
Those who are particularly at risk are1,7:
Women of childbearing age - because of losses due to menstruation
Pregnant women - because of increased blood volume
Brian Lindshield
487

Vegetarians/Vegans - because they do not consume heme iron sources
Infants - because they have low iron stores that can quickly be depleted
To give you a better understanding of these risks, it is helpful to look at how much higher the
RDAs are for women of reproductive age and pregnant women compared to men 8.
Women of reproductive age 18 mg/day
Pregnancy 27 mg/day
Men 8 mg/day
To put this in perspective, 3 oz of beef contains ~3 mg of iron. Thus, it can be a challenge for
some women to meet the requirement. The RDA committee estimates the iron requirements to
be 80% and 70% higher for vegans and endurance athletes, respectively. The increased
requirement for endurance athletes is based on loss due to "foot strike hemolysis", or the
increased rupture of red blood cells due to the striking of the foot on hard surfaces 3.
Iron toxicity is rare in adults, but can occur in children who consume too many supplements
containing iron. Symptoms of this acute toxicity include nausea, vomiting, and diarrhea 7.
50 out of 10,000 newborns in the United States are born with the genetic condition,
hemochromatosis. In this condition, there is a mutation in a protein in the enterocyte that
prevents the normal decrease of intestinal iron absorption. Without this protein these
individuals cannot decrease iron absorption. Since the body cannot excrete iron, it accumulates
in tissues, and ultimately can result in organ failure 1. References & Links 1. Gropper SS, Smith JL, Groff JL. (2008) Advanced nutrition and human metabolism. Belmont, CA: Wadsworth Publishing. 2. Stipanuk MH. (2006) Biochemical, physiological, & molecular aspects of human nutrition. St. Louis, MO: Saunders Elsevier. 3. McGuire M, Beerman KA. (2011) Nutritional sciences: From fundamentals to food. Belmont, CA: Wadsworth Cengage Learning. 4. http://en.wikipedia.org/wiki/File:Illu_blood_components.svg 5. http://en.wikipedia.org/wiki/File:Packed_cell_volume_diagram.svg 6. Whitney E, Rolfes SR. (2011) Understanding nutrition. Belmont, CA: Wadsworth Cengage Learning. 7. Byrd-Bredbenner C, Moe G, Beshgetoor D, Berning J. (2009) Wardlaw's perspectives in nutrition. New York, NY: McGraw-Hill. 8. Anonymous. (2001) Dietary reference intakes for vitamin A, vitamin K, arsenic, boron, chromium, copper, iodine, iron, manganese, molybdenum, nickel, silicon, vanadium, and zinc. Washington, D.C.: National Academies Press.
Kansas State University Human Nutrition Textbook
488

12.8 Zinc
Many animal products are good sources of zinc and are estimated to account for 70% of the
zinc North Americans’ consume1. An estimated 15-40% of consumed zinc is absorbed2. Zinc is
taken up into the enterocyte through the Zir-and Irt-like protein 4 (ZIP4). Once inside the
enterocyte, zinc can:
1. Bind to the zinc storage protein thionein. Once thionein has bound a mineral (or a metal) it is
known as metallothionein.
2. Be used for functional purposes.
3. Bind to the cysteine-rich intestinal protein (CRIP) where it is shuttled to a zinc transporter
(ZnT). After moving through the basolateral membrane, zinc primarily binds to the circulating
protein albumin3.
These functions are represented in the figure below.
Figure 12.81 Fates of zinc once it is taken up into the enterocyte
The zinc attached to albumin is transported to the liver through the portal vein. There is not a
major storage site of zinc, but there are pools of zinc in the liver, bone, pancreas, and kidney1. Zinc is primarily excreted in feces.
There are some similarities in how zinc and iron absorption are regulated. Increased zinc
Brian Lindshield
489

consumption results in increased thionein synthesis in the enterocyte. As a result, more zinc is
bound to thionein (forming metallothionein) and not used for functional uses or transported
into circulation, as represented by the thick and thin arrows in the figure below.
Figure 12.82 Fate of zinc under high zinc status
The enterocytes are then sloughed off preventing the bound zinc from being absorbed.
Figure 12.83 Enterocytes are sloughed off and excreted in feces.
There are a 3 inhibitors of zinc absorption (which are same ones you learned are also inhibitors
or iron absorption)3:
Phytate (phytic acid)
Kansas State University Human Nutrition Textbook
490

Figure 12.84 Phytic acid structure4
Polyphenols (coffee, tea) 3
Figure 12.85 Structure of the polyphenol gallic acid 5
Oxalate (spinach, rhubarb, sweet potatoes, and dried beans) 3
Figure 12.86 Structure of calcium oxalate6
Non-heme iron also inhibits zinc absorption.
In supplements, zinc is found as3,7:
Zinc oxide - 80% zinc
Zinc chloride - 23% zinc
Zinc sulfate - 23% zinc
Zinc gluconate - 14.3% zinc
Zinc oxide is the least bioavailable form, but since it is 80% zinc, it is commonly used in
Brian Lindshield
491

supplements7.
Subsections:
12.81 Zinc Functions
12.82 Zinc Deficiency & Toxicity
References & Links 1. Byrd-Bredbenner C, Moe G, Beshgetoor D, Berning J. (2009) Wardlaw's perspectives in nutrition. New York, NY: McGraw-Hill. 2. Whitney E, Rolfes SR. (2011) Understanding nutrition. Belmont, CA: Wadsworth Cengage Learning. 3. Gropper SS, Smith JL, Groff JL. (2008) Advanced nutrition and human metabolism. Belmont, CA: Wadsworth Publishing. 4. http://en.wikipedia.org/wiki/File:Phytic_acid.png 5. http://en.wikipedia.org/wiki/File:Gallic_acid.svg 6. http://en.wikipedia.org/wiki/File:Calcium_oxalate.png 7. Bowman BA, Russell RM, editors. (2006) Present knowledge in nutrition. Washington, DC: International Life Sciences Institute Press.
Kansas State University Human Nutrition Textbook
492

12.81 Zinc Functions
Zinc is a cofactor for up to 300 enzymes in the body 1. Enzymes that use zinc as a cofactor are
known as metalloenzymes.
Zinc is a cofactor for the antioxidant enzyme superoxide dismutase that converts superoxide to
hydrogen peroxide, as shown below.
Figure 12.811 Superoxide dismutase uses zinc as a cofactor
Alcohol dehydrogenase uses 4 zincs per enzyme. Its role in ethanol metabolism is shown
below2.
Brian Lindshield
493

Figure 12.812 Ethanol metabolism3,4
Delta-aminolevulinic acid dehydratase (ALA dehydrogenase), which is involved in heme
synthesis, uses 8 zincs/enzyme to form porphobilinogen, as shown below 2.
Figure 12.813 ALA dehydrogenase requires zinc in the heme synthesis pathway 5
The enzyme that cleaves the extra glutamates from folate so that it can be taken up into the
enterocyte is a metalloenzyme2. The cleavage of folate is shown in the figure below.
Kansas State University Human Nutrition Textbook
494

Figure 12.814 The absorption of folate and folic acid
Other notable metalloenzymes include DNA and RNA polymerase2.
Zinc is also important for the formation of zinc fingers in proteins. Zinc fingers help proteins
bind to DNA 2.
Figure 12.815 Structure of a zinc finger, zinc is the green atom bound in the center 6
Zinc is also important for growth, immune function, and reproduction 2.
A recent Cochrane review concluded that when taken within 24 hours of the onset of
symptoms, that zinc lozenges or syrup results in a significant decrease in the duration and
severity of common cold symptoms 7. Thus, commonly used zinc lozenges may be an effective
way to combat the common cold. However, large amounts of zinc consumption can be
problematic for copper and ultimately iron levels in the body, as described in the copper
section.
References & Links 1. Byrd-Bredbenner C, Moe G, Beshgetoor D, Berning J. (2009) Wardlaw's perspectives in nutrition. New York, NY: McGraw-Hill.
Brian Lindshield
495

2. Gropper SS, Smith JL, Groff JL. (2008) Advanced nutrition and human metabolism. Belmont, CA: Wadsworth Publishing. 3. http://en.wikipedia.org/wiki/File:Ethanol_flat_structure.png 4. https://en.wikipedia.org/wiki/Acetaldehyde#/media/File:Acetaldehyde-2D-flat.svg 5. http://en.wikipedia.org/wiki/File:Heme_synthesis.png 6. http://en.wikipedia.org/wiki/File:Zinc_finger_rendered.png 7. Singh M, Das RR. (2011) Zinc for the common cold (Review). The Cochrane Collaboration.
Kansas State University Human Nutrition Textbook
496

12.82 Zinc Deficiency & Toxicity
As can be seen on the bottom map in the link below, the risk of zinc deficiency is low in North
America, but there are other places in the world where it is much more common.
Figure 12.821 Worldwide prevalence of zinc deficiency1
At particular risk are children, pregnant women, elderly and the poor1. Symptoms of zinc
deficiency include 2,3:
Growth inhibition
Delayed sexual maturation
Dermatitis
Hair loss
Impaired immune function
Skeletal abnormalities
In the link below you can see a picture of an infant with dermatitis caused by zinc deficiency.
Web Link
Zinc Deficiency Dermatitis
Brian Lindshield
497

Another cause of zinc deficiency is mutation of ZIP4 that results in the condition acrodermatitis
enteropathica. Without ZIP4, zinc cannot be taken up efficiently into the enterocyte. This
condition is managed by administering very high levels of zinc, some of which is absorbed
through other mechanisms 3.
Zinc toxicity is not common, but an acute toxicity results in 2:
Nausea
Vomiting
Intestinal cramps
Diarrhea
Chronic toxicity can result in copper deficiency, as will be discussed in the copper section3.
References & Links 1. Wessells KR, Brown KH. (2012) Estimating the Global Prevalence of Zinc Deficiency: Results Based on Zinc Availability in National Food Supplies and the Prevalence of Stunting. PLoS ONE 7(11): e50568 2. Byrd-Bredbenner C, Moe G, Beshgetoor D, Berning J. (2009) Wardlaw's perspectives in nutrition. New York, NY: McGraw-Hill. 3. Gropper SS, Smith JL, Groff JL. (2008) Advanced nutrition and human metabolism. Belmont, CA: Wadsworth Publishing.
Links Zinc Deficiency - http://www.izincg.org/publications/deficiency Zinc Deficiency Dermatitis - http://img.tfd.com/mosbycam/thumbs/50029X-fx3.jpg
Kansas State University Human Nutrition Textbook
498

12.9 Copper
Like iron, copper is found in 2 forms:
1. Cupric (Cu2+), oxidized
2. Cuprous (Cu1+), reduced
Cu1+ is the form that is primarily absorbed, thus Cu 2+ is reduced to Cu1+ in the lumen. It is
believed that, like iron, enzymatic reduction of Cu2+ is stimulated by ascorbate. The exact
transporter that takes up the copper into the enterocyte is not known. It may be DMT1 that
takes up non-heme iron. Once inside the enterocyte, Cu1+ can1:
1. Bind to thionein to form metallothionein. While zinc is a better stimulator of thionein levels,
copper is actually a more avid binder to this protein.
2. Be used for functional uses as discussed in the next subsection.
3. Transported across the cell by an unknown carrier and then exported by ATP7A, an ATPase
transporter.
Like zinc, copper is transported through the portal vein to the liver bound to albumin, as shown
below. Albumin has a high affinity for Cu 2+, so Cu1+ is oxidized before transported to albumin
through ATP7A, as illustrated below.
Figure 12.91 Copper absorption
Brian Lindshield
499

Like zinc, there is not much storage of copper in the body. The liver is the primary site of
storage, where copper is taken up through an unknown transporter. If it is going to be stored, it
will bind with thionein to form metallothionein. Copper is transported through circulation body
by the copper transport protein ceruloplasmin, which can bind 6 coppers/protein as shown
below1.
Figure 12.92 Copper in the hepatocyte
Legumes, whole grains, nuts, shellfish, and seeds are good sources of copper2. It is estimated
that over 50% of copper consumed is absorbed1. Copper is primarily excreted in the feces.
There are number of different forms of copper used in supplements:
Copper sulfate (25% copper)
Cupric chloride (47% copper)
Cupric acetate (35% copper)
Copper carbonate (57% copper)
Cupric oxide (80% copper)
All of these forms of copper are bioavailable, except cupric oxide. Assays have shown that it is
not absorbed at all. Nevertheless, some supplements still use this form of copper 1,3.
Subsections:
12.91 Copper Functions
12.92 Copper Deficiency & Toxicity
12.93 How High Zinc Intake Can Lead to Iron & Copper Deficiencies
Kansas State University Human Nutrition Textbook
500

References & Links 1. Gropper SS, Smith JL, Groff JL. (2008) Advanced nutrition and human metabolism. Belmont, CA: Wadsworth Publishing. 2. Whitney E, Rolfes SR. (2011) Understanding nutrition. Belmont, CA: Wadsworth Cengage Learning. 3. Baker DH. (1999) Cupric oxide should not be used as a copper supplement for either animals or humans. J Nutr 129(12): 2278-2279.
Brian Lindshield
501
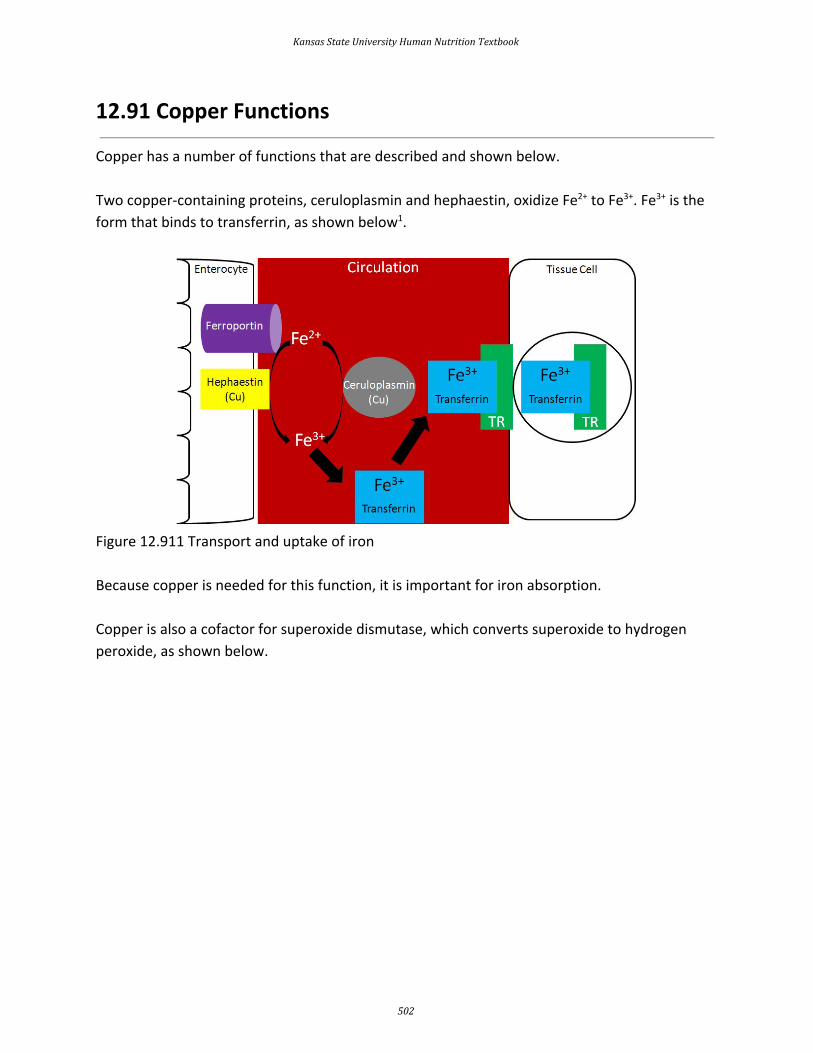
12.91 Copper Functions
Copper has a number of functions that are described and shown below.
Two copper-containing proteins, ceruloplasmin and hephaestin, oxidize Fe2+ to Fe3+. Fe 3+ is the
form that binds to transferrin, as shown below 1.
Figure 12.911 Transport and uptake of iron
Because copper is needed for this function, it is important for iron absorption.
Copper is also a cofactor for superoxide dismutase, which converts superoxide to hydrogen
peroxide, as shown below.
Kansas State University Human Nutrition Textbook
502

Figure 12.912 Superoxide dismutase uses zinc as a cofactor
Copper is also needed for hormone synthesis. For example, it is a cofactor for dopamine
beta-hydroxylase, which converts dopamine to norepinephrine, as shown below 1.
Figure 12.913 Dopamine beta-hydroxylase requires copper 2
Hopefully the following example looks vaguely familiar because we talked about this pathway in
the the vitamin C functions subsection. Ascorbic acid reduces Cu 2+ back to Cu1+ so that this
Brian Lindshield
503

enzyme can continue to function, as shown below1. This is analogous to how ascorbic acid
reduces Fe3+ back to Fe2+ so proline and lysyl hydroxylases can continue to function.
Figure 12.914 Dopamine beta-hydroxylase
Cytochrome c oxidase (complex IV) in the electron transport chain is a copper-containing
enzyme that reduces oxygen to form water, as shown below1.
Figure 12.915 Cytochrome c oxidase (complex IV)3
Lysyl oxidase, an enzyme that is important for cross-linking between structural proteins
(collagen and elastin), requires copper as a cofactor1. References & Links 1. Gropper SS, Smith JL, Groff JL. (2008) Advanced nutrition and human metabolism. Belmont, CA: Wadsworth Publishing. 2. http://en.wikipedia.org/wiki/File:Catecholamines_biosynthesis.svg 3. http://wikidoc.org/index.php/File:ETC.PNG
Kansas State University Human Nutrition Textbook
504

12.92 Copper Deficiency & Toxicity
Copper deficiency is rare in humans, but results in the following symptoms1,2:
Hypochromic anemia
Decreased white blood cell counts leading to decreased immune function
Bone abnormalities
Copper deficiency can result in a secondary iron deficiency, since Fe2+ cannot be oxidized to Fe3+
to bind to transferrin. This can cause the hypochromic anemia that occurs in iron deficiency.
Menke's disease is a genetic disorder that results in copper deficiency. It is believed that
individuals with this disease have a mutation in ATP7A that prevents copper from leaving the
enterocyte, thus preventing absorption1.
Copper toxicity is also rare in humans, but acute toxicity results in the following symptoms1,2:
Nausea, vomiting, diarrhea, abdominal pain
Chronic symptoms include 1,2:
Brain, liver, and kidney damage
Neurological damage
Wilson's disease is a genetic disorder where a mutation in ATP7B prevents copper excretion,
resulting in copper toxicity. One notable symptom is that individuals with this disease have
golden to greenish-brown Kayser-Fleischer rings around the edges of the cornea, as shown in
the link below1,2.
Web Link
Kayser-Fleischer rings
References & Links 1. Gropper SS, Smith JL, Groff JL. (2008) Advanced nutrition and human metabolism. Belmont, CA: Wadsworth Publishing. 2. Byrd-Bredbenner C, Moe G, Beshgetoor D, Berning J. (2009) Wardlaw's perspectives in nutrition. New York, NY: McGraw-Hill.
Link Kayser-Fleischer rings - http://www.nejm.org/doi/full/10.1056/NEJMicm1101534#t=article
Brian Lindshield
505

12.93 How High Zinc Intake Can Lead to Copper & Iron
Deficiencies
As you learned previously, thionein is the storage protein for zinc, but it more avidly binds
copper. When it binds a mineral, it becomes metallothionein. High zinc intake results in
increased thionein synthesis in the enterocyte. Thus, when an individual is consuming high zinc
levels (most likely by supplementation, unlikely from dietary sources), the enterocyte will have
high levels of thionein as shown below.
Figure 12.931 Zinc increases thionein production
The high levels of thionein will bind any copper that is taken up into the enterocyte (as
metallothionein), "trapping" the copper in the enterocyte and preventing it from being
absorbed into circulation, as shown below.
Kansas State University Human Nutrition Textbook
506

Figure 12.932 Copper taken up into the enterocyte is bound to thionein forming
metallothionein.
The enterocytes containing the "trapped" copper move up the crypt and are sloughed off and
excreted in feces. The copper consumed essentially is lost from the body through this process.
Figure 12.933 Enterocytes are sloughed off and excreted in feces
Without adequate copper being transported to the liver, no ceruloplasmin is produced and
released into circulation. The lack of copper further influences iron transport by decreasing
ceruloplasmin in circulation and hephaestin (another copper-containing protein) on the
membrane of the enterocyte. These 2 proteins normally convert Fe2+ to Fe3+ so that iron can
bind to transferrin.
Figure 12.934 Lack of copper means that hephaestin and ceruloplasmin aren't available to
oxidize Fe2+ to Fe3+
Without hephaestin and ceruloplasmin, Fe 3+ is not formed from Fe2+. As a result Fe2+ is
"trapped" in the enterocyte because it can't bind to transferrin as shown below.
Brian Lindshield
507

Figure 12.935 Fe2+ is trapped in the enterocyte
The enterocytes containing the "trapped" iron move up the crypt and are also sloughed off and
excreted in feces. The iron consumed essentially is lost from the body through this process.
Figure 12.936 Enterocytes are sloughed off and excreted in feces
In summary, high zinc intake increases thionein production, which traps all copper; the lack of
copper decreases circulating ceruloplasmin and hephaestin, which causes all iron to be trapped
as well. This example illustrates the interconnectedness of zinc, copper, and iron.
No References
Kansas State University Human Nutrition Textbook
508

13 Electrolyte Micronutrients
In this chapter, electrolytes will be explained before learning more about the 4 electrolyte
micronutrients. As a general rule deficiency and toxicity of these the electrolyte micronutrients
are rare, so they are presented in a single subsection rather than multiple subsection like most
of the micronutrients that you have learned about. Then, hypertension will be discussed, along
with the impact of these micronutrients on the condition.
Subsections:
13.1 Electrolytes
13.2 Sodium
13.3 Chloride
13.4 Potassium
13.5 Magnesium
13.6 Hypertension, Salt-Sensitivity & the DASH Diet
Brian Lindshield
509

13.1 Electrolytes
Electrolytes are compounds that separate into ions (molecules with a charge) in water.
Electrolytes can be separated into 2 classes:
Cations: ions that have a positive charge
Anions: ions that have a negative charge
The following table summarizes the major intracellular and extracellular electrolytes by giving
their milliequivalents (mEq)/L. Milliequivalents are a measure of charge. Thus, a higher value
means that the cation or anion is accounting for more charge.
Table 13.11 Major intracellular and extracellular electrolytes (mEq/L) 1,2
Intracellular Extracellular
Cations Anions Cations Anions
Potassium (K +) 150 Phosphate (PO4-) 104 Sodium (Na +) 142 Chloride (Cl -) 103
Magnesium (Mg2+) 40 Proteins 57 Bicarbonate (HCO 3-) 27
Sulfate (SO 42-) 20 Proteins 16
The following figure graphically shows the major intracellular and extracellular cations (green)
and anions (red).
Figure 13.11 Major intracellular and extracellular cations (green) and anions (red) 2
Electrolytes and proteins are important in fluid balance. Your body is 60% water by weight.
Two-thirds of this water is intracellular, or within cells. One-third of the water is extracellular, or
outside of cells. One-fourth of the extracellular fluid is plasma, while the other 3/4 is interstitial
Kansas State University Human Nutrition Textbook
510

(between cells) fluid. Thus, when considering total body water, around 66% is intracellular fluid,
25% is interstitial fluid, and 8% is plasma 3,4.
Fluid distribution between the different compartments are shown below.
Figure 13.12 Distribution of fluid in the body3,4.
References & Links 1. Byrd-Bredbenner C, Moe G, Beshgetoor D, Berning J. (2009) Wardlaw's perspectives in nutrition. New York, NY: McGraw-Hill. 2. Whitney E, Rolfes SR. (2011) Understanding nutrition. Belmont, CA: Wadsworth Cengage Learning. 3. Gropper SS, Smith JL, Groff JL. (2008) Advanced nutrition and human metabolism. Belmont, CA: Wadsworth Publishing. 4. Adapted from http://www.netterimages.com/image/21248.htm
Brian Lindshield
511
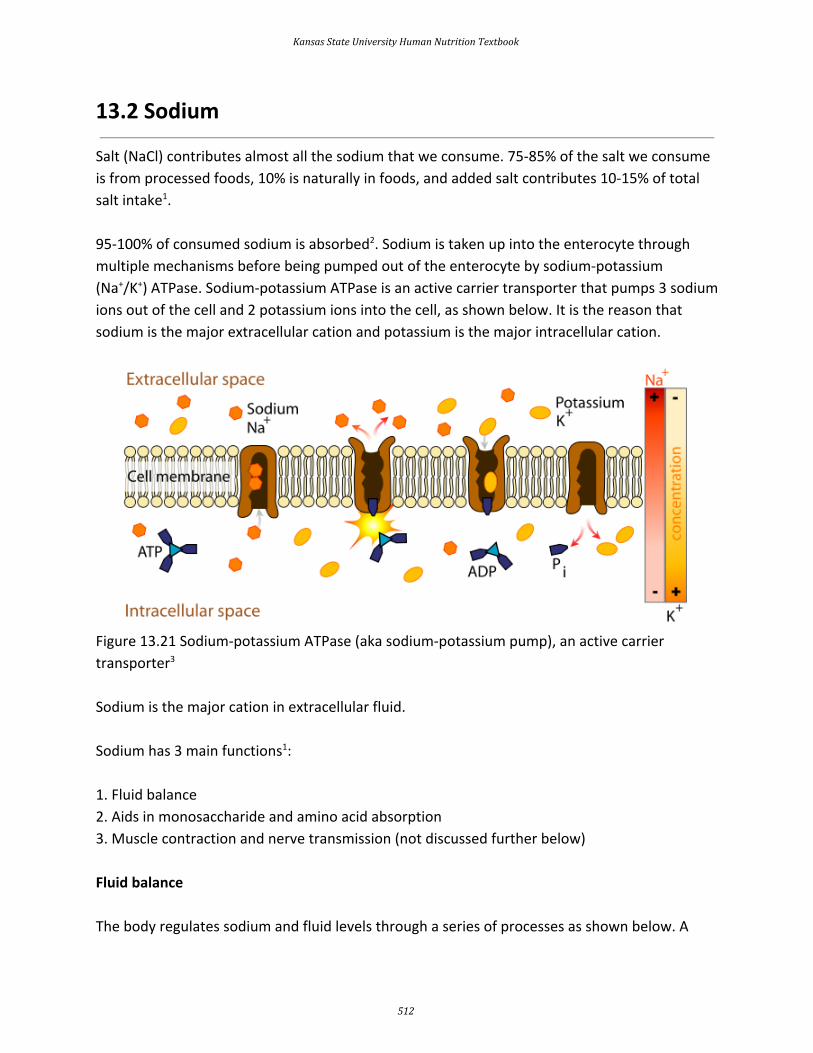
13.2 Sodium
Salt (NaCl) contributes almost all the sodium that we consume. 75-85% of the salt we consume
is from processed foods, 10% is naturally in foods, and added salt contributes 10-15% of total
salt intake1.
95-100% of consumed sodium is absorbed 2. Sodium is taken up into the enterocyte through
multiple mechanisms before being pumped out of the enterocyte by sodium-potassium
(Na+/K+) ATPase. Sodium-potassium ATPase is an active carrier transporter that pumps 3 sodium
ions out of the cell and 2 potassium ions into the cell, as shown below. It is the reason that
sodium is the major extracellular cation and potassium is the major intracellular cation.
Figure 13.21 Sodium-potassium ATPase (aka sodium-potassium pump), an active carrier
transporter3
Sodium is the major cation in extracellular fluid.
Sodium has 3 main functions1:
1. Fluid balance
2. Aids in monosaccharide and amino acid absorption
3. Muscle contraction and nerve transmission (not discussed further below)
Fluid balance
The body regulates sodium and fluid levels through a series of processes as shown below. A
Kansas State University Human Nutrition Textbook
512
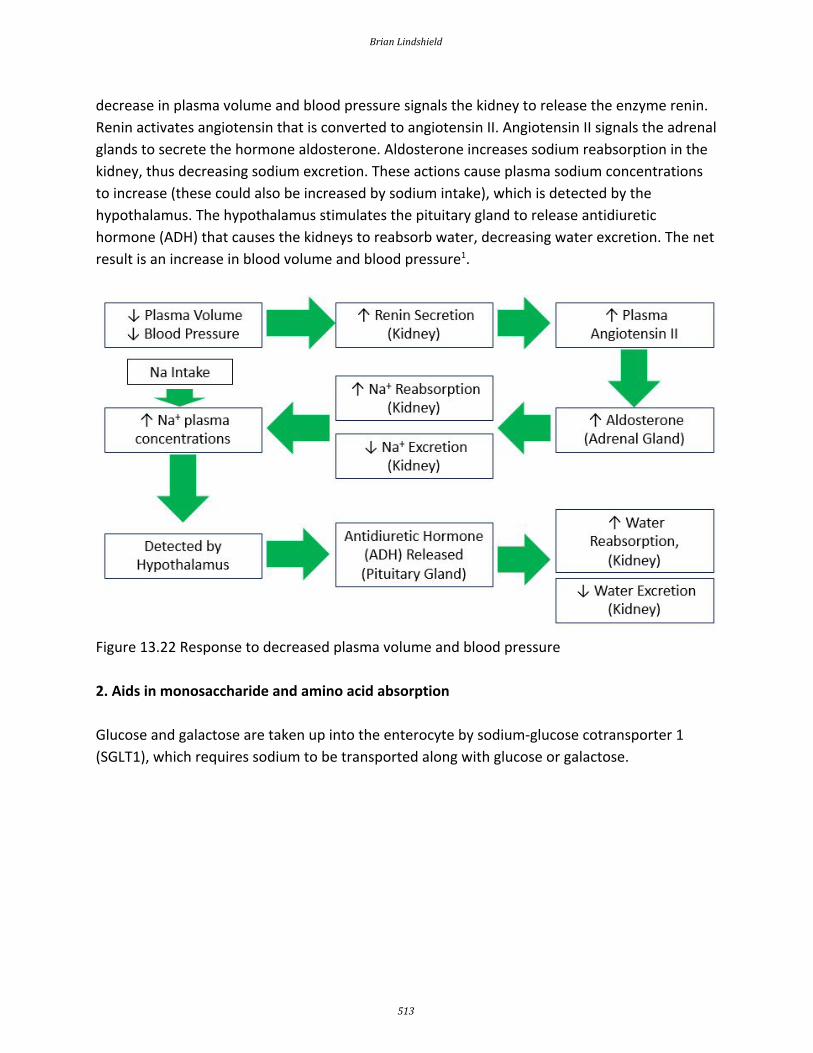
decrease in plasma volume and blood pressure signals the kidney to release the enzyme renin.
Renin activates angiotensin that is converted to angiotensin II. Angiotensin II signals the adrenal
glands to secrete the hormone aldosterone. Aldosterone increases sodium reabsorption in the
kidney, thus decreasing sodium excretion. These actions cause plasma sodium concentrations
to increase (these could also be increased by sodium intake), which is detected by the
hypothalamus. The hypothalamus stimulates the pituitary gland to release antidiuretic
hormone (ADH) that causes the kidneys to reabsorb water, decreasing water excretion. The net
result is an increase in blood volume and blood pressure 1.
Figure 13.22 Response to decreased plasma volume and blood pressure
2. Aids in monosaccharide and amino acid absorption
Glucose and galactose are taken up into the enterocyte by sodium-glucose cotransporter 1
(SGLT1), which requires sodium to be transported along with glucose or galactose.
Brian Lindshield
513

Figure 13.23 Carbohydrate Absorption
Amino acids are taken up and transported into circulation through a variety of amino acid
transporters. Some of these transporters are sodium-dependent (require sodium to transport
amino acids).
Figure 13.24 Protein absorption
Sodium deficiency is rare, and is normally due to excessive sweating. Sweat loss must reach
2-3% of body weight before sodium losses are a concern 1,2. This situation can occur in marathon
runners and ultra-marathon runners who sweat for many hours straight (without proper liquid
intake). But in general some practices like consuming salt pills to replace loss from sweating are
not needed. Low blood sodium levels (hyponatremia) can result in 1:
Headache
Kansas State University Human Nutrition Textbook
514

Nausea
Vomiting
Fatigue
Muscle Cramps
Sodium is not toxic because we can readily excrete it, but higher sodium intake increases the
risk of developing high blood pressure. High sodium intake also increases calcium excretion, but
studies have not found an increased risk of osteoporosis. High sodium intake may also increase
the risk of developing kidney stones (by increasing calcium excretion), because calcium oxalate
is the most common form of kidney stone 1. References & Links 1. Byrd-Bredbenner C, Moe G, Beshgetoor D, Berning J. (2009) Wardlaw's perspectives in nutrition. New York, NY: McGraw-Hill. 2. Gropper SS, Smith JL, Groff JL. (2008) Advanced nutrition and human metabolism. Belmont, CA: Wadsworth Publishing. 3. https://en.wikipedia.org/wiki/ATPase#/media/File:Scheme_sodium-potassium_pump-en.svg
Brian Lindshield
515

13.3 Chloride
Sodium's partner in salt, chloride, is the major extracellular anion. Almost all of the chloride we
consume is from salt, and almost all chloride is absorbed. It is excreted in urine like sodium.
Chloride has the following functions 1:
1. Aids in nerve impulses
2. Component of hydrochloric acid (HCl)
3. Released by white blood cells to kill foreign substances
4. Helps maintain acid-base balance
Chloride deficiency is rare, but can occur because of severe diarrhea or vomiting. Other
symptoms of this deficiency include1,2:
Weakness
Diarrhea and vomiting
Lethargy
Chloride is not toxic (because we readily excrete it), but since it is a part of salt, it is
recommended that we restrict our intake to avoid potential increases in blood pressure.
References & Links 1. Byrd-Bredbenner C, Moe G, Beshgetoor D, Berning J. (2009) Wardlaw's perspectives in nutrition. New York, NY: McGraw-Hill. 2. Gropper SS, Smith JL, Groff JL. (2008) Advanced nutrition and human metabolism. Belmont, CA: Wadsworth Publishing.
Kansas State University Human Nutrition Textbook
516

13.4 Potassium
Potassium is the major intracellular cation. Good sources of potassium include beans, potatoes
(with skin), milk products, orange juice, tomato juice, and bananas 1,2. Potassium, like sodium
and chloride, is well absorbed. Greater than 85% of consumed potassium is absorbed.
Potassium is primarily excreted in urine (~90%) 3. As you will learn in a later section, this is an
electrolyte that we should try to consume more of rather than limiting like sodium and
chloride.
Potassium is important for:
1. Fluid Balance
2. Nerve transmission and muscle contraction
Increased potassium intake results in decreased calcium excretion. This is the opposite effect of
increased sodium intake, which increases calcium excretion 1.
Potassium deficiency is rare but can be fatal. Symptoms include:
Weakness
Fatigue
Constipation
Irregular heartbeat (can be fatal)
Deficiency can occur in individuals that are on diuretics, drugs that increase urine production,
and individuals with eating disorders 1.
Toxicity is also extremely rare, only occurring if there is a problem with kidney function that
prevents it from being excreted normally. Symptoms of toxicity are irregular heartbeat and
even cardiac arrest (likely need to be potassium provided into circulation rather than consumed
in some way)1. References & Links 1. Byrd-Bredbenner C, Moe G, Beshgetoor D, Berning J. (2009) Wardlaw's perspectives in nutrition. New York, NY: McGraw-Hill. 2. Whitney E, Rolfes SR. (2011) Understanding nutrition. Belmont, CA: Wadsworth Cengage Learning. 3. Gropper SS, Smith JL, Groff JL. (2008) Advanced nutrition and human metabolism. Belmont, CA: Wadsworth Publishing.
Brian Lindshield
517

13.5 Magnesium
Magnesium is an electrolyte, but that is not considered its major function in the body. Green
leafy vegetables, beans, nuts, seeds, and whole grains are good sources of magnesium 1,2.
40-60% of consumed magnesium is absorbed at normal levels of intake. Magnesium is excreted
primarily in urine 3. Like potassium, this is an electrolyte that it is beneficial to consume more of.
55-60% of magnesium in the body is found in bone3. Some (30%) of this bone magnesium is
believed to be exchangeable, or can be used to maintain blood concentrations, similar to how
calcium in bones can be used to maintain blood concentrations.
Magnesium helps to stabilize ATP and nucleotides by binding to phosphate groups. Magnesium
plays a role in over 300 enzymes in the body. Here is a list of some of the physiological
processes that magnesium participates in3:
Glycolysis
TCA cycle
Fatty acid oxidation (beta-oxidation)
DNA and RNA transcription
Nucleotide synthesis
Muscle contraction
Magnesium deficiency is rare, but can be caused by prolonged diarrhea or vomiting. Symptoms
include1:
Irregular heartbeat
Muscle spasms
Disorientation
Seizures
Nausea
Vomiting
Magnesium toxicity is also rare but can occur from excessive use of magnesium-containing
antacids or laxatives. Symptoms include3:
Diarrhea
Nausea
Flushing
Kansas State University Human Nutrition Textbook
518
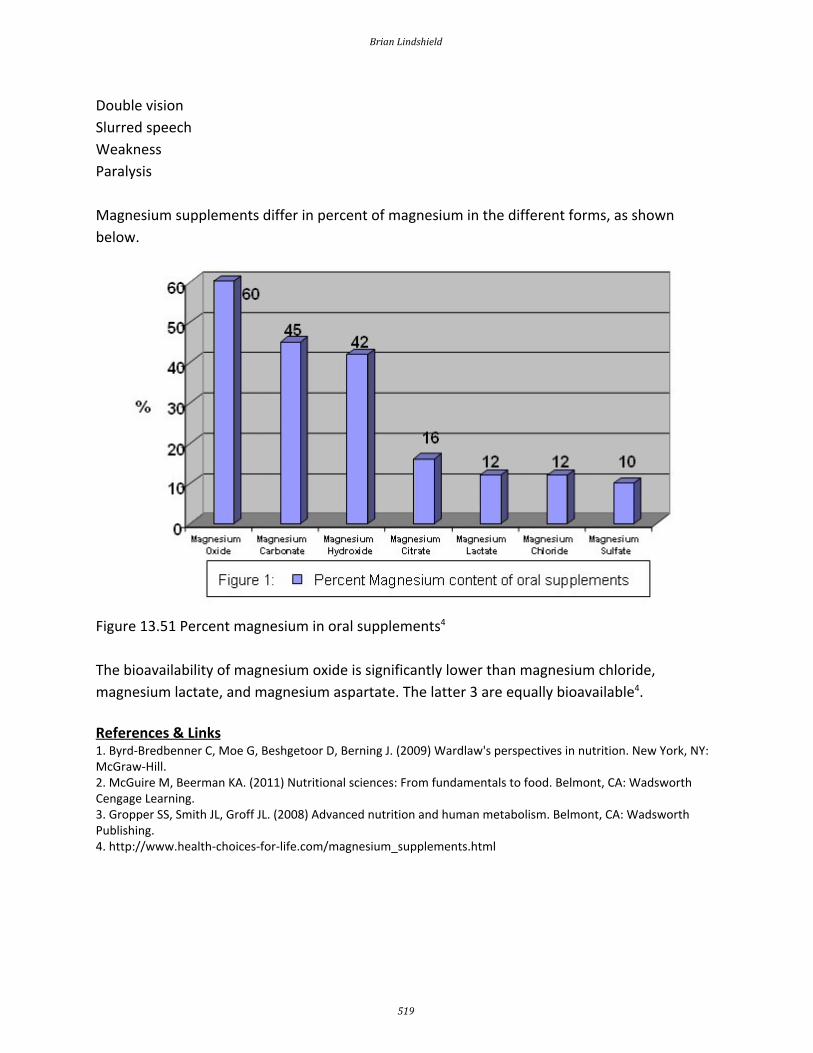
Double vision
Slurred speech
Weakness
Paralysis
Magnesium supplements differ in percent of magnesium in the different forms, as shown
below.
Figure 13.51 Percent magnesium in oral supplements4
The bioavailability of magnesium oxide is significantly lower than magnesium chloride,
magnesium lactate, and magnesium aspartate. The latter 3 are equally bioavailable 4. References & Links 1. Byrd-Bredbenner C, Moe G, Beshgetoor D, Berning J. (2009) Wardlaw's perspectives in nutrition. New York, NY: McGraw-Hill. 2. McGuire M, Beerman KA. (2011) Nutritional sciences: From fundamentals to food. Belmont, CA: Wadsworth Cengage Learning. 3. Gropper SS, Smith JL, Groff JL. (2008) Advanced nutrition and human metabolism. Belmont, CA: Wadsworth Publishing. 4. http://www.health-choices-for-life.com/magnesium_supplements.html
Brian Lindshield
519

13.6 Hypertension, Salt-Sensitivity & the DASH Diet
Approximately 27% of American adults have hypertension (high blood pressure), which
increases their risk of developing cardiovascular disease 1. Salt and/or sodium intake is believed
to be a major causative factor in the development of hypertension. However, it is now known
that not everyone is salt-sensitive. Salt-sensitive means that a person’s blood pressure
increases with increased salt intake and decreases with decreased salt intake. Approximately
25% of normotensive (normal blood pressure) individuals and 50% of hypertensive individuals
are salt-sensitive2. Most others are salt-insensitive, and in a small portion of individuals, low salt
consumption actually increases blood pressure1. Unfortunately, there is not a readily
employable clinical method to determine whether a person is salt-sensitive. There are some
known characteristics that increase the likelihood of an individual being salt-sensitive. They
are1:
Elderly
Female
African-American
Hypertensive
Diabetic
Chronic Kidney Disease
There is some evidence now suggesting that there may be negative effects in some people who
restrict their sodium intakes to the levels recommended by some organizations as described in
the first link below. The second link describes a couple of studies that had conflicting outcomes
as it relates to the importance of salt reduction in decreasing blood pressure and cardiovascular
disease. The third link is to a study that found that higher potassium consumption, not lower
sodium consumption, was associated with decreased blood pressure in adolescent teenage
girls.
Web Link
Report Questions Reducing Salt Intake Too Dramatically
Pour on the Salt? New Research Suggests More Is OK
For Teenagers, Potassium May Matter More Than Salt
This has led to debate because it is quite possible that is a very real issue whether salt-sensitive
individuals can decrease their sodium intake (to concomitantly reduce their blood pressure) in a
food environment where there are extremely limited options that do not contain meaningful
sodium levels. Thus, the push has been to reduce sodium levels in the food supply overall to
Kansas State University Human Nutrition Textbook
520

provide more options to those who are salts-sensitive. However, this is a push that benefits a
minority of the population. Also, further adding to this is the fact almost no one how he/she
responds to sodium/salt and there is disagreement over ideal/optimal intake levels.
To combat hypertension, the Dietary Approaches to Stop Hypertension (DASH) diet was
developed. This diet emphasizes:
fruits, vegetables, fat-free/low-fat milk and milk products, whole grain products, fish, poultry,
nuts
It limits:
red meat, sweets, added sugars, sugar-containing beverages
As a result the diet is high in:
potassium, magnesium, calcium, protein, fiber
The daily goals for the DASH diet are shown below:
Figure 13.61 DASH daily nutrient goals 3
To get an idea of what types of foods and how much would be consumed in the diet, an eating
Brian Lindshield
521

plan is shown below.
Figure 13.62 DASH eating plan3
The DASH diet has been shown to be remarkably effective in decreasing blood pressure in those
with hypertension. Nevertheless, most people with hypertension are not following the DASH
diet. In fact, evidence from the National Health and Nutrition Examination Survey found that
significantly fewer hypertensive individuals were following the DASH diet in 1999-2004 than
during 1988-1994, as shown in the table below4.
Kansas State University Human Nutrition Textbook
522

Table 13.61 Percent of hypertensive subjects in NHANES trial meeting the DASH goals 4
Variable NHANES
1988-1994
(n = 4336)
NHANES
1999-2004
(n = 3821)
Absolute
Change (%)
p-value
DASH Accordance 29.3 ± 1.5 21.7 ± 1.3 -7.6 <0.001
Total Fat 42.9 ± 1.8 35.9 ± 2.0 -7.0 0.01
Saturated Fat 20.6 ± 1.2 20.4 ± 1.4 -0.2 0.94
Protein 43.7 ± 2.0 47.7 ± 1.9 4.0 0.73
Cholesterol 26.4 ± 2.2 24.3 ± 1.6 -2.1 0.44
Fiber 20.2 ± 1.5 12.3 ± 0.9 -7.9 <0.001
Magnesium 14.2 ± 1.3 6.4 ± 0.8 -7.8 <0.001
Calcium 19.0 ± 1.6 17.6 ± 2.0 -1.4 0.58
Potassium 12.7 ± 0.9 11.7 ± 0.9 -1.0 0.46
Sodium 17.8 ± 1.5 14.6 ± 1.3 -3.2 0.21
The main components that contributed to the decrease in DASH diet accordance (how well the
recommendations are being met) were total fat, fiber, and magnesium, as indicated by their
high negative absolute changes.
References & Links 1. McGuire M, Beerman KA. (2011) Nutritional sciences: From fundamentals to food. Belmont, CA: Wadsworth Cengage Learning. 2. Whitney E, Rolfes SR. (2011) Understanding nutrition. Belmont, CA: Wadsworth Cengage Learning. 3. http://www.nhlbi.nih.gov/health/public/heart/hbp/dash/new_dash.pdf 4. Mellen P, Gao S, Vitolins M, Goff D. (2008) Deteriorating dietary habits among adults with hypertension: DASH dietary accordance, NHANES 1988-1994 and 1999-2004. Arch Intern Med 168(3): 308-314.
Links Report Questions Reducing Salt Intake Too Dramatically - http://www.usatoday.com/story/news/nation/2013/05/14/salt-diet-sodium-intake/2156143/ Pour on the Salt? New Research Suggests More Is OK - http://www.nbcnews.com/health/heart-health/pour-salt-new-research-suggests-more-ok-n179941 For Teenagers, Potassium May Matter More Than Salt - http://well.blogs.nytimes.com/2015/04/27/for-teenagers-potassium-may-matter-more-than-salt/
Brian Lindshield
523