FOODINTEGRITY - 400 Bad Request
81
FOODINTEGRITY Ensuring the Integrity of the European food chain 613688: Collaborative Project Seventh Framework Programme KBBE.2013.2.4-01: Assuring quality and authenticity in the food chain Deliverable: D4.3 Title: Knowledge base of analytical protocols optimized for particular applications related to authentication and quality of olive oil: detection range, limits (LDO, LOQ), cost, sensitivity, selectivity, etc. Author(s): Diego L. García‐González, Noelia Tena, Inmaculada Romero, Ramón Aparicio‐Ruiz, Manuel León, Ramón Aparicio, James Donarski, Freddy Thomas, Juan Fernández Pierna, Vincent Baeten, Yannick Weesepoel, Saskia van Ruth, Federica Camin, Luana Bontempo, Luisa Mannina, Tassos Koidis, Jana Hajslova, Monika Tomaniova, Martino Barbanera, Sonia Scaramagli. Beneficiary(s): Date of preparation: 12.12.2016 Period covered: 01.01.2014 ‐31.12.2016 Status: version 1 Dissemination level PU Public X PP Restricted to other participants RE Restricted to a group specified by the consortium CO Confidential, only members of the consortium The project has received funding from the European Union’s Seventh Framework Programme for research, technological development and demonstration under grant agreement No. 613688.
-
Upload
khangminh22 -
Category
Documents
-
view
0 -
download
0
Transcript of FOODINTEGRITY - 400 Bad Request

FOODINTEGRITY Ensuring the Integrity of the European food chain
613688: Collaborative Project
Seventh Framework Programme
KBBE.2013.2.4-01: Assuring quality and authenticity in the food chain
Deliverable: D4.3 Title: Knowledge base of analytical protocols optimized for
particular applications related to authentication and quality of olive oil: detection range, limits (LDO, LOQ), cost, sensitivity,
selectivity, etc. Author(s): Diego L. García‐González, Noelia Tena, Inmaculada Romero,
Ramón Aparicio‐Ruiz, Manuel León, Ramón Aparicio, James Donarski, Freddy Thomas, Juan Fernández Pierna, Vincent Baeten, Yannick Weesepoel, Saskia van Ruth, Federica Camin, Luana Bontempo, Luisa Mannina, Tassos Koidis, Jana Hajslova, Monika Tomaniova, Martino Barbanera, Sonia Scaramagli.
Beneficiary(s):
Date of preparation: 12.12.2016
Period covered: 01.01.2014 ‐31.12.2016
Status: version 1
Dissemination level PU Public X PP Restricted to other participants RE Restricted to a group specified by the consortium CO Confidential, only members of the consortium
The project has received funding from the European Union’s Seventh Framework Programme for research, technological development and demonstration under grant agreement No. 613688.

Deliverable 4.3, version 1, 12‐12‐2016
1
TABLE OF CONTENTS 1. Introduction ..................................................................................................................................... 2
2. Critical review of trade standards inside and outside EU ............................................................... 3
3. Sensory active compounds of VOO ............................................................................................... 25
4. Analysis of volatile compounds at industrial plant level in a routine basis .................................. 31
5. Advantages on non‐targeted analysis at plant level ..................................................................... 37
6. Protocols: Analytical aspects ......................................................................................................... 40
7. Analytical quality parameters........................................................................................................ 60
8. List of WP4 Participants ................................................................................................................. 68
9. References ..................................................................................................................................... 68

Deliverable 4.3, version 1, 12‐12‐2016
2
Deliverable 4.3 Knowledge base of analytical protocols optimized for particular applications related to authentication and quality of olive oil: detection range, limits (LDO, LOQ), cost, sensitivity, selectivity, etc.
1. Introduction The results of Deliverable 4.1 underlined the importance of determining the “Geographical
Provenance of Olive Oils”. Since the provenance can be referred to producing counties, countries or
wider regions, the survey seems to point out that investigations on the possibility of distinguishing
olive oils produced inside and outside the European Union (EU) would be welcomed by olive oil
actors. The survey also induced to think that instrumental methods based on non‐targeted analytical
techniques would be welcome because their advantages of simplicity and rapid result of the analyses
after a further research of their possibilities.
Until now, the chromatographic techniques combined with a mathematical model based on
Expert Systems (Aparicio and Alonso, 1994; García‐González et al., 2009, 2013) had produced good
results even determining neighbouring geographical origins but the protocol is time‐consuming as it
needs information from diverse chemical series (e.g. FAMES, TAGs, sterols, alcohols, waxes, etc.) that
have to be analysed with different standard and in‐house chromatographic methods. The need of
rapid methods much more adapted to active commerce has driven to check the feasibility of non‐
targeted techniques determining VOOs from EU and non‐EU producer countries as well as to know
which one would be better positioned when analysing blind samples. It is, however, a first step for
determining if non‐targeted techniques can compete with chromatographic ones.
From the viewpoint of analytical protocols, however, there is an enormous set of standards
and in‐house analytical protocols for determining the great number of series of chemical compounds
(e.g. FAMEs, TAGs, DAGs, sterols, alcohols, waxes, chlorophylls, carotenoids, volatiles, ethyl esters,
etc.) (León‐Camacho et al., 2013) identified in olive oil categories (i.e. virgin olive oil – VOO, olive oil
–OO, refined olive oil –ROO) and subcategories (e.g. extra virgin olive oil –EVOO, ordinary virgin olive
oil ‐ OVO, lampante virgin olive oil –LVOO) (Barjol, 2013) that compete between them to be the most
efficient and rapid, with the highest feasibility and reproducibility and to be the easiest to use inside
the context of Green Chemistry.
Another aspect is the definition of the authenticity of olive oil categories from values of their
chemical components. Although the standards of the International Olive Council (IOC) are applied in
a great majority of olive oil producer and importer countries and its chemical procedures are widely

Deliverable 4.3, version 1, 12‐12‐2016
3
implemented over the world, there are substantial differences between standards of different
national and international associations as pointed out below.
Thus, with the aim of reinforcing the application of some rapid methods based on
spectroscopy and spectrometry as well as enhancing their quality control, and prior to discussing
their results, the next section is focused on the analyses of the trade standards inside and outside the
EU by which olive oil categories are qualified according to their chemical composition. Current
standards from different national and international bodies are cross‐tabulated and compared with
the assistance of stakeholders for a better comprehension.
2. Critical review of trade standards inside and outside EU Seven international bodies are involved in the production of trade standards for olive oil
categories although all of them are based on IOC trade standards, in greater or lesser proportion.
The chemical protocols for determining the chemical compounds of usefulness for olive oil
authenticity are mostly based on those ones supported by six institutions: IOC, ISO, AOCS, IUPAC and
Codex Alimentarius. Brushstrokes of the institution characteristics involved in olive oil trade
standards are followed by a table (Table 2.1) in which the analytical protocols suggested by the
institutions for the determination of 34 physical‐chemical parameters are cross‐tabulated. The next
section is focused on underlining the differences in the values associated by each institution for each
one of the physical‐chemical parameters. Differences have a great impact on the qualification of
virgin olive oil categories up to the point that a samples qualified as EVOO for IOC might be qualified
as another category, or even to be considered as non‐genuine, for other institutions.
• International Olive Council (IOC): It can be considered the reference regulatory body
because it is the only intergovernmental organization in the world (set up in 1959 under the
auspices of the United Nations) that brings together most of olive oil producing and
consuming stakeholders. The latest trade standard was published in July 2016 (COI/T.15/NC
No 3/Rev. 11 ‐ Trade standard applying to olive oils and olive‐pomace oils). In addition, each
parameter is associated to a standard method that is regularly updated.
http://www.internationaloliveoil.org/
• Codex Alimentarius: The Codex Alimentarius or "Food Code" was established by FAO and
the World Health Organization in 1963 to develop harmonised international food
standards, and it include specific chemical limits for olive oil. However, this organization is
slower than IOC and EU in making changes to get adapted to new situations. Today there is
a high interest in IOC and Codex Alimentarius to be harmonized between them, which
involves reaching agreements with producing countries that are outside the IOC. The last

Deliverable 4.3, version 1, 12‐12‐2016
4
regulation is Codex Standard for Olive Oils and Olive Pomace Oils (CODEX STAN 33‐1981).
No analytical methods are associated.
http://www.fao.org/fao‐who‐codexalimentarius/codex‐home/es/
• European Union: The European Union regulation includes a complete norm on olive oil
including limits and associated methods (CEE No 2569/91 and subsequent amendments).
Similarly to IOC, the European Union also has an expert group that discuss about methods
and limits to be adapted to new situations. This group is under Directorate‐General for
Agriculture and Rural Development (Sub‐group Olive Oil). The norm is 1348/2013 of 16
December 2013 amending Regulation (EEC) No 2568/91 on the characteristics of olive oil
and olive‐residue oil and on the relevant methods of analysis, updated by Commission
Delegated Regulation (EU) 2015/1830 of 8 July 2015 and Commission Implementing
Regulation (EU) 2015/1833 of 12 October 2015. In addition, more updates are published.
The last one was published in September 2016 (Commission Delegated Regulation (EU)
2016/2095 of 26 September 2016 amending Regulation (EEC) No 2568/91 on the
characteristics of olive oil and olive‐residue oil and on the relevant methods of analysis).
http://ec.europa.eu/agriculture/olive‐oil_en
• United States of America (USA): The United States Department of Agriculture published in
2010 its own regulation on olive oil titled “United States Standards for Grades of Olive Oil
and Olive‐Pomace Oil“. In addition to establishing limits, it includes references to standard
methods of other regulatory bodies.
https://www.ams.usda.gov/grades‐standards/olive‐oil‐and‐olive‐pomace‐oil‐grades‐and‐
standards
• California (USA): The State of California (Californian Department of Food and Agriculture,
CDFA) also published its own regulation in 2014: Grade and Labeling Standards for Olive Oil,
Refined‐Olive Oil and Olive‐Pomace Oil. Like the norm of the United States Department of
Agriculture, this regulation includes both limits of physico‐chemical parameters and
references to standard methods of other regulatory bodies. Some amendments through
February 16, 2015 have been included.
https://www.cdfa.ca.gov
• Australia: The norm “Olive oils and olive‐pomace oils” was published by the Australian
Standards (AS 5264—2011). This norm also follows the establishment of limits, references
to analytical methods of other regulatory bodies, and some instruction in terms of
contaminants, food additives, etc.
http://www.aph.gov.au/
Deliverable 4.3, version 1, 12‐12‐2016
5
• South African National Standard (SANS): The South African Bureau of Standards
(SABS) provides standards and conformity assessment for a wide variety of materials.
The norm was published, as in other emergent olive oil producing countries, to
ensure quality and authenticity in the imported olive oil, and to favour the increasing
exportation. The norm is SANS 1377 (2015) (Government Gazette, 22 May, 2015,
pag. 32 No. 38803).
https://www.sabs.co.za/
Table 2.1, which begins with a row displaying the latest trade standards or regulations of the
above just cited international institutions and governments, shows the analytical methods suggested
for determining the physical‐chemical parameters described in the first column. The information of
the table is useful for a cross‐comparison of the methods, which three mean conclusions are:
The analytical methods suggested by the cited institutions to determine saponifiable and
unsaponifiable chemical series (e.g., FAMES TAG, sterols etc.) are indistinctly those supported by
IOC, ISO and AOCS although the methods proposed by IOC show more advantages when
comparing with others.
Other chemical compounds (i.e. FAEE, waxes, biophenols and PPP) are supported by IOC but not
for the other institutions and vice versa.
The analytical methods for determining physical parameters are mostly based on ISO analytical
methods, and they are supported by all the institutions.
The sections after Table 2.1 describe main characteristics of the IOC analytical methods
suggested for determining the most remarkable chemical parameters affecting the determination of
olive oil purity and hence the detection of adulterated olive oil samples. Each analysis of an IOC
analytical method is followed by a table showing the range or maximum or minimum values of each
one of the chemical compounds determined with the analytical method to decide if an olive is or is
not genuine according to the current international regulations. The values of repeatability and
reproducibility of IOC methods are then displayed although more information on quality parameters
is displayed in IOC website. Each section ends with comments on the analytical method, useful tips
and possible improvements discussed with stakeholders in different meetings.

Deliverable 4.3, version 1, 12‐12‐2016
6
Table 2.1. Summary of relevant international regulations concerning olive oil trade standards and analytical methods.
Determination International Olive Council
Codex Alimentarius
European Union USA California
(USA) Australia South Africa
Determination of the fatty acid composition
COI/T20/Doc No 33
COI/T20/Doc No24 ISO 5508:1990 AOCS Ch 2‐91 AOCS Ce 1f‐96 Sample preparation ISO 5509:2000 AOCS Cc 2‐66
(EU) 2015/1833 Annex IV
COI/T20/Doc No24 ISO 5508 AOCS Ch 2‐91 Methyl ester preparation AOCS Ce 2‐66 ISO 5509 COI7T20/Doc No 24
Methyl ester preparation AOCS Ce 2‐66 ISO 5509 COI/T20/Doc No24 Gas chromatography ISO 5508 AOCS Ch 2‐91
Methyl ester preparation AOCS Ce 2‐66 ISO 5509 COI/T20/Doc No24 Gas chromatography ISO 5508 AOCS Ch 2‐91
Methyl ester preparation AOCS Ce 2‐66 ISO 5509 COI7T20/Doc No 24 GC analysis ISO 5508 AOCS Ch 2‐91
Determination of trans fatty acid content
COI/T20/Doc No 33
COI/ T20/Doc No 17 ISO 15304:2002 AOCS Ce 1f‐96
(EU) 2015/1833 Annex IV
COI/ T20/Doc No 17 ISO 15304 AOCS Ce 1f‐96
ISO 15304 AOCS Ch 2a‐94 (Rev 2002) COI/T20/Doc No17 Rev 1
ISO 15304 AOCS Ch 2a‐94 (Rev 2002) COI/T20/Doc No17 Rev 1
ISO 15304 AOCS Ch 2a‐94 (Rev 2002) COI/T20/Doc No17 Rev 1
Sterol and triterpene dialcohols composition
COI/T20/Doc No 30
COI//T20/ Doc No 10 ISO 12228:1999 AOCS Ch 6‐91 COI//T20/ Doc No 30 2011 erythrodiol
(EU) 1348/2013 Annex IV
ISO 12228 COI//T20/ Doc No 10 AOCS Ch 6‐91 Erythrodiol+uvaol IUPAC 2431
ISO 12228 COI//T20/ Doc No 10 Rev 1 AOCS Ch 6‐91 Erythrodiol+uvaol IUPAC 2431 with capillary columns COI//T20/ Doc No 30
ISO 12228 COI//T20/ Doc No 10 Rev 1 AOCS Ch 6‐91 Erythrodiol+uvaol IUPAC 2431 with capillary columns COI//T20/ Doc No 30
ISO 12228 COI//T20/ Doc No 10 Rev 1 AOCS Ch 6‐91 Erythrodiol+uvaol IUPAC 2431 with capillary columns COI//T20/ Doc No 30

Deliverable 4.3, version 1, 12‐12‐2016
7
Table 2.1. Summary of relevant international regulations concerning olive oil trade standards and analytical methods (cont.).
Determination International Olive Council
Codex Alimentarius
European Union USA California
(USA) Australia South Africa
Determination of the wax content
COI/T20/Doc No 18 AOCS Ch 8‐02
COI/T20/ Doc No 18 AOCS Ch 8‐02
(EC) 702/2007 Annex IV
COI/T20/Doc No 18 rev 2 AOCS Ch 8‐02
COI/T20/Doc No 18 rev 2 AOCS Ch 8‐02 rev 2007
COI/T20/Doc No 18 rev 2 AOCS Ch 8‐02 rev 2007
COI/T20/Doc No 18 rev 2 AOCS Ch 8‐02 rev 2007
Determination of the aliphatic and triterpenic alcohol content
COI/T20/Doc No 26 Rev1
(EU) 2015/1833 Annex VI
Determination of the difference between the actual and theoretical ECN 42 triacylglycerol content
COI/T20/Doc No 20 AOCS Ch 5b‐89
COI/T20/ Doc No 20 AOCS Ce 5b‐89 (97)
(CE) 2472/97 Annex XVIII
COI/T20/ Doc No 23 AOCS Ce 5b‐89
COI/T20/Doc No 20 rev 3 AOCS Ce 5b‐89
COI/T20/Doc No 20 rev 3 AOCS Ce 5b‐89
COI/T20/Doc No 20 rev 3 AOCS Ce 5b‐89
Determination of the stigmastadiene content
COI/T20/Doc No 11/Rev2 COI/T20/Doc No 16/Rev1 (sterenes) ISO 15788‐1 AOCS Cd 26‐96
COI/T20/Doc No 11 ISO 15788‐1:1999 AOCS Cd 26‐96 (03) ISO 15788‐2:2003
(EC) 656/95 Annex XVII
COI/T20/Doc No 11 rev2 COI/T20/Doc No 16 rev1 (sterenes) ISO 15788‐1 AOCS Cd 26‐96
AOCS Cd 26‐96 COI/T20/Doc No 11 rev 2
AOCS Cd 26‐96 COI/T20/Doc No 11 rev 2
AOCS Cd 26‐96 COI/T20/Doc No 11 rev 2
Determination of the content of 2-glyceryl monopalmitate
COI/T20/Doc No 23 (EC) 702/2007
Annex VII COI/T20/Doc No 23
COI/T20/Doc No 23
COI/T20/Doc No 23
COI/T20/Doc No 23

Deliverable 4.3, version 1, 12‐12‐2016
8
Table 2.1 Summary of relevant international regulations concerning olive oil trade standards and analytical methods (cont.).
Determination International Olive Council
Codex Alimentarius
European Union USA California
(USA) Australia South Africa
Determination of unsaponifiable matter
ISO 3596 (diethyl ether extraction) ISO 18069 (hexane extraction) AOCS Ca 6b‐53
ISO 3596:2000 ISO 18069:2000 AOCS Ca 6b‐53
AOCS Ca 6b‐53 ISO 18609
Determination of organoleptic characteristics
COI/T20/Doc No 15
COI/T20/Doc No 15
(EU) 1348/2013 Annex V Amended by (EU) 2016/1227
COI/T20/ Doc No 15
COI/T20/ Doc No 15 (Rev 2)
COI/T20/ Doc No 15 (Rev 2)
COI/T20/ Doc No 15 (Rev 2)
Determination of free acidity
COI/T20/Doc No 34
ISO 660 (03) AOCS Cd 3d‐63
(EU) 2016/1227 Annex I
ISO 660 AOCS Cd 3d‐63
ISO 660 AOCS Ca 5a‐40
ISO 660 AOCS Ca 5a‐40
ISO 660 AOCS Ca 5a‐40
Determination of peroxide value
COI/T20/Doc No 35 ISO 3960 AOCS Cd 8b‐90
ISO 3960:2001 AOCS Cd 8b‐90
(EU) 2016/1784 Annex III
ISO 3960 AOCS Cd 8b‐90
AOCS Cd 8b‐90 ISO 3960
AOCS Cd 8b‐90 ISO 3960
AOCS Cd 8b‐90 ISO 3960
Determination of the absorbency in ultra-violet
COI/T20/Doc No 19 rev 3 ISO 3656 AOCS Ch 5‐91
COI/T20/Doc No 19 ISO 3656:2002 AOCS Ch 5‐91
(EU) 2015/1833 Annex III
ISO 3656 AOCS Ch 5‐91 COI/T20/Doc No 19
ISO 3656 AOCS Ch 5‐91 COI/T20/Doc No 19 rev2
ISO 3656 AOCS Ch 5‐91 COI/T20/Doc No 19 rev2
ISO 3656 AOCS Ch 5‐91 COI/T20/Doc No 19 rev2
Determination of the moisture and volatile matter
ISO 662 ISO 662:1998 ISO 662 ISO 662 AOCS Ca 2c‐25
ISO 662 AOCS Ca 2c‐25
ISO 662 AOCS Ca 2c‐25

Deliverable 4.3, version 1, 12‐12‐2016
9
Table 2.1 Summary of relevant international regulations concerning olive oil trade standards and analytical methods (cont.).
Determination International Olive Council
Codex Alimentarius
European Union USA California
(USA) Australia South Africa
Determination of the insoluble impurities in light petroleum
ISO 663 ISO 663:2000 ISO 663 ISO 663 AOCS Ca 3a‐46
ISO 663 AOCS Ca 3a‐46
ISO 663 AOCS Ca 3a‐46
Determination of the flash point
FOSFA Int. method ISO 15267 FOSFA Int. method
ISO 15267
Determination of trace metals copper, iron and nickel
ISO 8294 ISO 8294 AOAC 990.05 (iron and copper)
ISO 8294 ISO 8294 ISO 8294 ISO 8294 (copper and iron)
Determination of α-tocopherol ISO 9936 ISO 9936 ISO 9936 ISO 9936 ISO 9936 ISO 9936
Determination of traces of heavy metals
Lead ISO 12193 AOCS Ca 18c‐91 AOAC 994.02 Arsenic AOAC 952.13 AOAC 942.17 AOAC 985.16
Lead ISO 12193 AOCS Ca 18c‐91 AOAC 994.02 Arsenic AOAC 952.13 AOAC 942.17 AOAC 985.16
Lead ISO 12193 AOCS Ca 18c‐91 AOAC 994.02 Arsenic AOAC 952.13 AOAC 942.17 AOAC 985.16
Lead ISO 12193 AOCS Ca 18c‐91 AOAC 994.02 Arsenic AOAC 952.13 AOAC 942.17 AOAC 985.16
Detection of traces of halogenated solvents
COI/T20/Doc No 8
COI/T20/Doc No 8
(EEC) 2568/91 Annex XI
COI/T20/Doc No 8
Determination of waxes and alkyl esters
COI/T20/Doc No 28 COI/T.20/Doc. No 33
(EU) No 61/2011 Annex II
Determination of biophenols COI/T20/Doc No 29

Deliverable 4.3, version 1, 12‐12‐2016
10
Table 2.1 Summary of relevant international regulations concerning olive oil trade standards and analytical methods (cont.).
Determination International Olive Council
Codex Alimentarius
European Union USA California
(USA) Australia South Africa
Determination of waxes fatty acid methyl esters and fatty acid ethyl esters by GC using 3g of silica gel
COI/T20/Doc No 31 provisional
Determination of composition of triaclyglycerols and diaclyglycerols by GC in vegetable oils
COI/T20/Doc No 32 provisional ISO 29822 ISO 29822 ISO 29822
Pesticide residue ‐‐
Refractive Index ‐‐ ISO6320:2000 AOCS Cc 7‐25
Iodine value ‐‐
ISO 3961:1996 AOAC 993.20 AOCS Cd 1d‐2 NMKL 39
(EEC) 2568/91 Annex XVI
Determination of saponifiable value ‐‐ ISO 3657:2002 AOCS Cd 3‐25
Determination of the fatty acid in the 2-position of the triglycerides ‐‐ ISO 6800:1997
AOCS Ch 3‐91
Determination of relative density ‐‐ IUPAC 2101 with the appropriate conversion factor
Determination of oxidative stability index AOCS Cd 12b‐92 AOCS Cd 12b‐92
Determination of pyropheophytins ISO 29841 ISO 29841 ISO 29841

Deliverable 4.3, version 1, 12‐12‐2016
1
1) Determination of the fatty acid composition:
IOC method: COI/T.20/Doc. No 33 February 2015
This method describes a procedure for determining the content of FAME from C12 to C24,
including saturated, cis‐ and trans‐monounsaturated and cis‐ and trans‐polyunsaturated fatty acid
methyl esters. This method is used to guarantee the genuineness of the olive oil (fatty acid profile).
In its last revision this method is based on transesterification with methanolic solution of
potassium hydroxide at room temperature for oils with acidity ≤2.0. Another method is suggested for
virgin olive oils with acidity >2.0% and crude olive pomace, in which purification with silica‐gel SPE is
indicated. In the last revision, the figures have been set with two decimal points and the limits of
fatty acids ethyl ester heptadecanoic, heptadecenoic, eicosenoic acids have changed, and
consequently there some differences with the other norms.
Table 2.2 shows the limit values of fatty acids according to IOC and other regulations. Only
the differences with other regulations are shown. In this case, since IOC and EU provide the same
values, they are shown in the same column.
Table 2.2. IOC and EU values of fatty acid composition for olive oil and the differences found in other international regulations.
Parameter IOC/EU Codex Alimentarius USA California
(USA) Australia South Africa
Myristic acid (C14:0) ≤0.03 ≤0.05 ≤0.05 ≤0.05 ≤0.05 ≤0.05
Palmitic acid (C16:0) 7.50‐20.00 n.i. 7.0–20.0 7.0–20.0
Palmitoleic acid (C16:1) 0.30‐3.50 n.i.
Heptadecanoic acid (C17:0) ≤0.40 ≤0.3 ≤0.3 ≤0.3 ≤0.3 ≤0.3
Heptadecenoic acid (C17:1) ≤0.60 ≤0.3 ≤0.3 n.i. ≤0.4 ≤0.4
Stearic acid (C18:0) 0.50‐5.00
Oleic acid (C18:1) 55.00‐83.00 n.i. 53.0–85.0 53.0–85.0
Linoleic acid (C18:2) 2.50‐21.00 3.5‐21.0 3.5‐21.0 n.i. 2.5–22.0 2.5–22.0
Linolenic acid (C18:3) ≤1.00 n.i. ≤1.5 n.i. ≤1.5 ≤1.5
Arachidic acid (C20:0) ≤0.60
Gadoleic acid (eicosenoic) (C20:1) ≤0.50 ≤ 0.4 ≤ 0.4 n.i.
Behenic acid (C22:0) ≤0.20
Lignoceric acid (C24:0) ≤0.20
Note: n.i., non‐indicated (there is not any value specified for this parameter/category).
After a recent modification of IOC standard (2016), the regulation of EU has been modified
accordingly and there is not any deviation in this case.
Some differences were detected in some other norms:

Deliverable 4.3, version 1, 12‐12‐2016
2
‐Most of the other norms express the figures with one decimal place. This may cause some
disagreements between norms.
‐Codex Alimentarius shows slightly different figures for Myristic, heptadecanoic,
heptadecenoic, linolenic and gadoleic acids. It is important to remark that IOC and Codex are
undergoing a process of harmonization of values. It is also important to note that some climate
changes are causing some changes in fatty acid composition in some cultivars, and some regulations
have needed to be updated to favour international market.
‐USDA standards (USA) has the same disagreement than Codex Alimentarius.
‐ In the Californian standard, the disagreements are focused on myristic and heptadecanoic
acids, and on the fact that no values are indicated for palmitic, palmitoleic, heptadecenoic, oleic,
linoleic, and gadoleic acids.
‐The Australian Standard has the same disagreement that the Codex Alimentarius, and in
addition has different values for palmitic and oleic acid.
‐The South African standard shows the same values as the Australian standard.
Quality parameters:
Table 2.3 shows the quality parameters of precision, expressed as RSD (%), for both
repeatability and reproducibility.
Table 2.3. IOC values of analytical quality parameters (precision for repeatability and reproducibility) for the determination of fatty acids in olive oils.
Parameter RSDr (%) (Repeatability)
RSDR (%) (Reproducibility)
Myristic acid (C14:0) 11‐38 32‐52 Palmitic acid (C16:0) 0.53‐1.5 1.5‐4.7 Palmitoleic acid (C16:1) 1.3‐3.6 4.1‐7.2 Heptadecanoic acid (C17:0) n.i. n.i. Heptadecenoic acid (C17:1) n.i. n.i. Stearic acid (C18:0) 0.49‐1.2 2.1‐3.8 Oleic acid (C18:1) 0.11‐0.21 0.60‐0.85 Linoleic acid (C18:2) 0.2‐0.70 1.7‐2.4 Linolenic acid (C18:3) 1.2‐2.6 3.8‐5.4 Arachidic acid (C20:0) 3.0‐4.4 7.0‐9.8 Gadoleic acid (eicosenoic) (C20:1) 3.0‐8.9 6.2‐10.0 Behenic acid (C22:0) 6.9‐14.0 8.3‐17.0 Lignoceric acid (C24:0) 8.9‐24.0 19.0‐49.0
NOTE: RSDr (%), relative standard deviation in repeatability, RSDR (%), relative standard deviation in reproducibility. A range is shown since the value can vary between different categories of olive and olive‐pomace oils. n.i., non‐indicated (there is not any value specified for this parameter/category).

Deliverable 4.3, version 1, 12‐12‐2016
3
Comments on the analytical method, useful tips and possible improvements:
• The high diversity of available columns can produce differences in the performance of the
method. In general terms, the columns characterized with highest polarity are indicated for a
better separation of polyunsaturated fatty acids, while the lower polarity is better for
saturated and monoenoic compounds with the same chain length. In order to have a good
separation of trans fatty acids it is advisable to use columns of 50 m or longer (e.g. a column
of 50 m × 0.20−0.32 mm i.d. 0.1 × 0.2 μm film thickness with a cross‐linked stationary phase
of cyanopropylsiloxane).
• In aged columns, some deviations from the normal retention times can be observed as a
consequence of polymerization of the stationary phase.
• Hydrogen results in a better peak resolution than helium.
• Some non‐targeted methods can be proposed as alternative, although they cannot identify
individual fatty acids as the current standard requires. The use of mathematical equations
using signal intensities as variables can provide useful information of saturated fatty acids
(SFAs), the monounsaturated oleic acid (MUFA), and the polyunsaturated linoleic and
linolenic acids (PUFAs). One of these alternatives is 1H‐NMR spectroscopy. It shows a good
performance for FA quantification although there is some deviation from the GC results in
some individual fatty acids (e.g. saturated compounds), partly due to the sensitivity in the
integration step.
2) Determination of trans fatty acid content:
IOC method: COI/T.20/Doc. No 33 February 2015
It is the same method described above. In this case, the objective is to quantify the trans
isomers to detect the presence of heated or refined oils.
According to the differences between the IOC standard and other regulations, only the
standard of the Codex Alimentarius includes a difference consisting in no specification for the
categories of lampante oil and crude pomace oil.
Comments on the analytical method, useful tips and possible improvements:
• Long columns (e.g. 88% cyanopropyl aryl siloxane 100 m × 0.2 mm i.d. × 0.2 μm film
thickness) are more appropriate for separating trans fatty acids, although, as said above, a
column of 50 m allows separating cis and trans fatty acids with a good resolution.
Deliverable 4.3, version 1, 12‐12‐2016
4
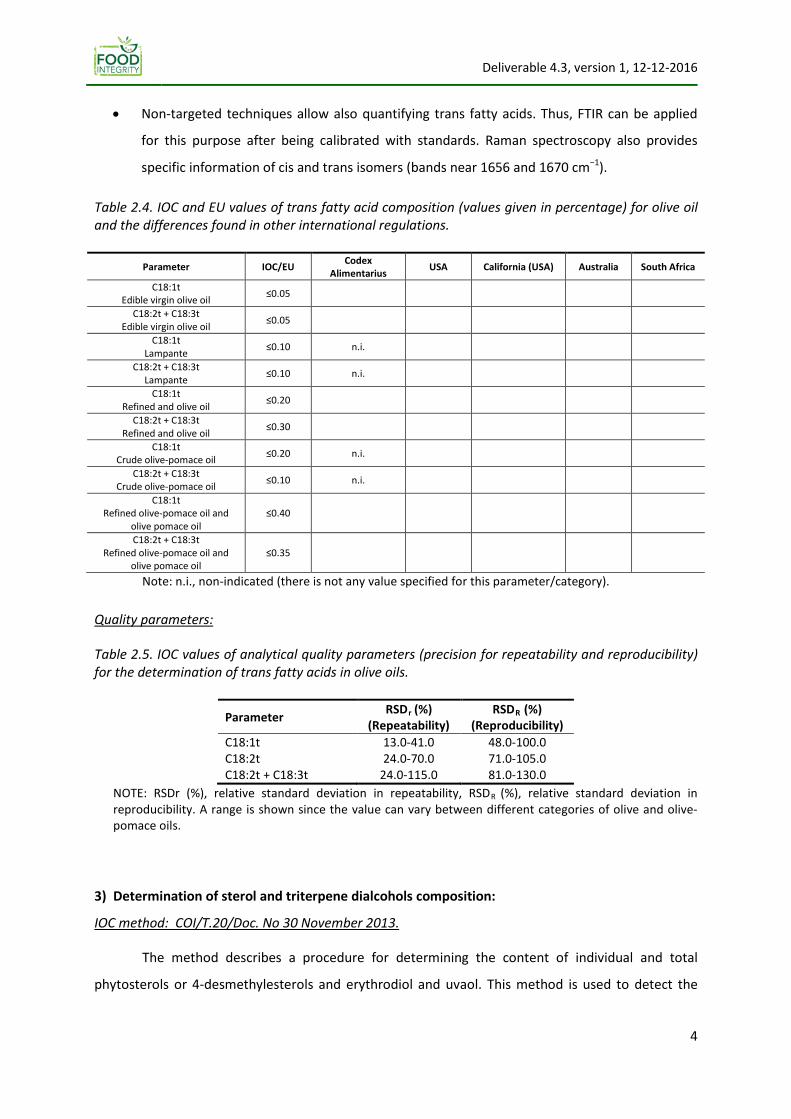
• Non‐targeted techniques allow also quantifying trans fatty acids. Thus, FTIR can be applied
for this purpose after being calibrated with standards. Raman spectroscopy also provides
specific information of cis and trans isomers (bands near 1656 and 1670 cm−1).
Table 2.4. IOC and EU values of trans fatty acid composition (values given in percentage) for olive oil and the differences found in other international regulations.
Parameter IOC/EU Codex Alimentarius USA California (USA) Australia South Africa
C18:1t Edible virgin olive oil ≤0.05
C18:2t + C18:3t Edible virgin olive oil ≤0.05
C18:1t Lampante ≤0.10 n.i.
C18:2t + C18:3t Lampante ≤0.10 n.i.
C18:1t Refined and olive oil ≤0.20
C18:2t + C18:3t Refined and olive oil ≤0.30
C18:1t Crude olive‐pomace oil ≤0.20 n.i.
C18:2t + C18:3t Crude olive‐pomace oil ≤0.10 n.i.
C18:1t Refined olive‐pomace oil and
olive pomace oil ≤0.40
C18:2t + C18:3t Refined olive‐pomace oil and
olive pomace oil ≤0.35
Note: n.i., non‐indicated (there is not any value specified for this parameter/category).
Quality parameters:
Table 2.5. IOC values of analytical quality parameters (precision for repeatability and reproducibility) for the determination of trans fatty acids in olive oils.
Parameter RSDr (%) (Repeatability)
RSDR (%) (Reproducibility)
C18:1t 13.0‐41.0 48.0‐100.0 C18:2t 24.0‐70.0 71.0‐105.0 C18:2t + C18:3t 24.0‐115.0 81.0‐130.0
NOTE: RSDr (%), relative standard deviation in repeatability, RSDR (%), relative standard deviation in reproducibility. A range is shown since the value can vary between different categories of olive and olive‐pomace oils.
3) Determination of sterol and triterpene dialcohols composition:
IOC method: COI/T.20/Doc. No 30 November 2013.
The method describes a procedure for determining the content of individual and total
phytosterols or 4‐desmethylesterols and erythrodiol and uvaol. This method is used to detect the

Deliverable 4.3, version 1, 12‐12‐2016
5
presence of vegetable edible oils in olive oils (by means of sterols content) and to detect the
presence of pomace oils in olive oils (by means triterpene dialcohols).
The procedure consists of: Saponification, separation of unsaponifiable matter with ethyl
ether, separation of sterol fraction by chromatography on a silica gel plate, transformation of sterols
into trimethyl‐silyl ethers and analysis by gas chromatography.
Table 2.6. IOC and EU values of sterols and triterpenic alcohols composition (values given in percentage except for total sterol that is given in mg/kg) for olive oil and the differences found in other international regulations.
Parameter IOC/EU Codex Alimentarius USA California (USA) Australia South Africa
Cholesterol ≤0.5 n.i.
Brassicasterol ≤0.11 Campesterol ≤4.02 ≤4.54 n.i. ≤4.8 ≤4.8
Stigmasterol <campesterol in edible oils ≤1.9 ≤1.9 ≤1.9
Delta‐7‐stigmastenol ≤0.52 n.i. Apparent beta‐sitosterol3 ≥93.0 n.i. ≥92.5 ≥92.5
Total sterol content (virgin olive oil, refined olive
oils and olive oil) 1000
Total sterol content (crude olive pomace oil) 2500 n.i.
Total sterol content (refined olive pomace oil) 1800
Total sterol content (olive pomace oil) 1600
Erythrodiol and uvaol content (% total sterols)
(virgin olive oil, refined olive oils and olive oil)
≤4.5 n.i.
Erythrodiol and uvaol content (% total sterols) (crude olive pomace oil, refined olive pomace oil,
and olive pomace oil)
>4.5 n.i. n.i.
Note: 1, Limit raised to < 0.2 for olive pomace oils; 2, subjected to decision trees; 3, sum of beta‐sitosterol + delta‐5‐avenasterol + delta‐5‐23‐stigmastadienol+clerosterol+sitostanol+delta 5‐24‐stigmastadienol); 4, campesterol values between 4.0 and 4.5 would be subjected to further testing; n.i., non‐indicated (there is not any value specified for this parameter/category).
The main difference is noticed in the limits for campesterol and stigmasterol. It is proved that
the concentrations of these two compounds are affected by latitude and altitude. These limits are
under discussions and the IOC includes some decision trees for campesterol concentration between
4.0 and 4.5. However, some regulations such as Australian and South African standards even
established a limit higher than 4.5. A harmonization program between IOC and Codex Alimentarius is
under progress.
Some standards do not include limits for total sterols (Australia and South Africa) or
erythrodiol and uvaol.

Deliverable 4.3, version 1, 12‐12‐2016
6
Quality parameters:
Table 2.7. IOC values of analytical quality parameters (precision for repeatability and reproducibility) for the determination of sterols and triterpenic alcohols.
Parameter RSDr (%) (Repeatability)
RSDR (%) (Reproducibility)
Cholesterol 7.2-18.8 17.8-31.9 Brassicasterol 2.7‐32.7 3.6‐115.2 Campesterol 0.9‐1.4 2.4‐2.9 Stigmasterol 1.5‐11.1 2.9‐15.6 Apparent β‐Sitosterol 0.10‐0.26 0.36‐1.75 Δ‐7‐Stigmastenol 2.6‐9.5 4.9‐25.3 Total sterol content 1.5‐3.3 5.8‐8.4 Erythrodiol + Uvaol 1.0‐15.3 4.6‐32.2
NOTE: RSDr (%), relative standard deviation in repeatability, RSDR (%), relative standard deviation in reproducibility. A range is shown since the value can vary between different categories of olive and olive‐pomace oils.
Comments on the analytical method, useful tips and possible improvements:
• Although the results are expressed as percentage of the total area of sterols, it is convenient
to improve the method to obtain information in absolute concentration because of the
possibility of any illegal process of removing sterols without forming fatty acid trans‐isomers.
That approach would involve updating the regulations with a new method resulted from
further studies.
• In the separation of sterols by TLC on silica gel with hexane/diethyl ether (65:35 v/v), it is
convenient to carry out two developments for a better separation.
• Some possible improvements are based in the substitution of the TLC separation by a HPLC
separation. The method would consist of separation of the fractions of sterols by HPLC with a
silica gel column, collection of the fraction, elimination of the solvent, further derivation, and
injection onto GC. This approach is not included in regulation yet, but some similar methods
are being explored at the moment since some industry labs already use HPLC for sterol
analysis.
• Although individual sterols cannot be quantified individually in an exhaustive manner as GC
does, total free and esterified sterols can be determined by 1H‐NMR and 31P‐NMR. This
method would be a rapid alternative tool although it requires strong magnetic fields (≥500
MHz).

Deliverable 4.3, version 1, 12‐12‐2016
7
4) Determination of the wax content:
IOC method: COI/T.20/Doc. no.18/ Rev. 2, 5 December 2003
This method describes a procedure for determining the even numbered of carbon atoms of
individual waxes, from C40 to C46, in olive oil. The separation of them is carried out according to the
number of carbon atoms. This method is used to distinguish between olive oil obtained from pressing
and that obtained from pomace oil.
The procedure consists of: Separation of waxes fraction by column chromatography on
hydrated silica gel. The separation of the fraction is not easy without experience. The obtained
fraction is analysed by gas chromatography.
Additionally, IOC provided an alternative method in which the waxes can be determined
together with fatty acid methyl esters and fatty acid ethyl esters (COI/T.20/Doc. No 28/Rev. 1 2010).
Table 2.8. IOC and EU values of wax concentrations (mg/kg) for olive oil and the differences found in other international regulations.
Parameter IOC/EU Codex Alimentarius USA California (USA) Australia South Africa
C42 + C44 + C46 Extra virgin olive oil and virgin
olive oil ≤150 ≤2501 ≤2502 ≤2502 ≤2502 ≤2502
C40 + C42 + C44 + C46 Ordinary virgin olive oil ≤250 ≤2501 n.i. n.i. n.i. n.i.
C40 + C42 + C44 + C46 Lampante virgin olive oil ≤300 n.i.
C40 + C42 + C44 + C46 Refined olive oil and olive oil ≤350
C40 + C42 + C44 + C46 Crude pomace oil, refined
pomace oil, and pomace oil >350
Crude pomace oil category is not defined
Note: 1, It does not specify the waxes included in the computation of the sum; 2, C40 is also included in the sum of waxes; n.i., non‐indicated (there is not any value specified for this parameter/category).
The main difference found in the regulations is based on the fact that C40 is not included in
the computation of the sum of wax concentration in the IOC regulation since a recent modification of
the norm. On the other hand, IOC standard includes a different value for ordinary and lampante
categories, while the first category (ordinary) is not defined by the rest of regulations. The standard
of Codex Alimentarius does not include this separation of categories and establish a maximum value
of 250 mg/kg for all the virgin categories. This standard does not include any instruction about how
to calculate this sum, although it referrers to the IOC and AOCS methods (COI/T.20/Doc. no. 18 or
AOCS Ch 8‐02).

Deliverable 4.3, version 1, 12‐12‐2016
8
Quality parameters:
Table 2.9. IOC values of analytical quality parameters (precision for repeatability and reproducibility) for the determination of waxes.
Parameter RSDr (%) (Repeatability)
RSDR (%) (Reproducibility)
C40 + C42 + C44 + C46 1.54‐3.64 4.58‐14.18 NOTE: RSDr (%), relative standard deviation in repeatability, RSDR (%), relative standard deviation in reproducibility. A range is shown since the value can vary between different categories of olive and olive‐pomace oils.
Comments on the analytical method, useful tips and possible improvements:
• Some alternatives have been proposed. These alternatives are based on the use of SPE
cartridges that can replace silica gel columns for sample purification. They require smaller
amounts of sample and a reduced volume of elution solvent.
• When the column is used for the first time, it is advisable to condition the column by raising
the temperature to 350 ºC gradually.
5) Determination of the aliphatic and triterpenic alcohol content:
IOC method: COI/T.20/Doc. no.26/Rev.1 February 2015
The method describes a procedure for determining the content of the even carbons of
aliphatic alcohols from C20 to C28 and the main 4,4‐dimethylsterols or triterpenic alcohols. This
determination can be used to detect the presence of pomace oils and second‐centrifugation virgin oil
as well as to characterize in higher degree the oil (e.g. characterization of monocultivars oils or
PDOs).
The procedure consists of: Saponification, separation of unsaponifiable matter with ethyl
ether, separation of alcohols fraction by chromatography on a silica gel plate, transformation of
alcohols into trimethyl‐silyl ethers and analysis by gas chromatography.
This method is provided by IOC and no reference was found in other regulations. On the
other hand, IOC and the other regulations do not provide reference values or limits, although it is
known that cycloartenol and 24‐methylenecycloartanol are present at higher concentrations.
Quality parameters:
Table 2.10. IOC values of analytical quality parameters (precision for repeatability and reproducibility) for the determination of waxes.
Parameter RSDr (%) (Repeatability)
RSDR (%) (Reproducibility)
Total aliphatic alcohol content 1.9‐2.8 6.9‐13.1

Deliverable 4.3, version 1, 12‐12‐2016
9
C22 + C24 + C26 + C28 NOTE: RSDr (%), relative standard deviation in repeatability, RSDR (%), relative standard deviation in reproducibility. A range is shown since the value can vary between different categories of olive and olive‐pomace oils.
Comments on the analytical method, useful tips and possible improvements:
• As it was mentioned above in the section of sterols, some alternatives based on HPLC
separation (instead of TLC) are being studied at the moment.
6) Determination of the difference between the actual and theoretical ECN 42 triacylglycerol
content:
IOC method: COI/T.20/Doc. No 20 /Rev. 3 2010
The method describes a procedure for determining the content of triacylglycerols with
equivalent carbon number equal to 42 (ECN 42). This method is used to detect the presence of small
amounts of seed oils in olive oils.
The procedure consists of: Determination of fatty acid composition by capillary gas
chromatography, calculation of theoretical composition of triacylglycerols with equivalent carbon
number equal to 42 (ECN 42) (there is a computer program to carry out this calculation) and
determination of triacylglycerols with ECN 42 by HPLC. Finally, the absolute difference between both
values of triacylglycerols with ECN 42 is calculated. A difference larger than the values adopted for
each type of oil indicates that the oil contains seed oils.
Table 2.11. IOC and EU values of ΔECN42 for olive oil and the differences found in other international regulations.
Parameter IOC/EU Codex Alimentarius USA California (USA) Australia South Africa ΔECN42
Edible virgin olive oils ≤ │0.2│
ΔECN42 Lampante virgin olive oil,
refined olive oil and olive oil (ROO+VOOs)
≤ │0.3│ Lampante category is not defined
ΔECN42 Crude olive pomace oil ≤ │0.6│ This category is not
defined
ΔECN42 Refined olive pomace oil and
olive pomace oil (ROPO+VOOs)
≤ │0.5│ crude olive pomace oil category is not define
Note: ΔECN42, Difference between the actual and theoretical ECN 42 triacylglycerol content; n.i., non‐indicated (there is not any value specified for this parameter/category).
No differences were found in this values, except for the absence of specific values for
lampante and crude olive pomace oil in the case of the standard of Codex Alimentarius.

Deliverable 4.3, version 1, 12‐12‐2016
10
Quality parameters:
Table 2.12. IOC values of analytical quality parameters (precision for repeatability and reproducibility) for the determination of ΔECN42 (difference between the actual and theoretical ECN 42 triacylglycerol content).
Parameter RSDr (%) (repeatability)
RSDR (%) (Reproducibility)
ΔECN42 2.77‐22.51 5.42‐46.19 ΔECN42
(determined with propionitrile)
1.57‐36.60 11.21‐36.80
NOTE: RSDr (%), relative standard deviation in repeatability, RSDR (%), relative standard deviation in reproducibility. A range is shown since the value can vary between different categories of olive and olive‐pomace oils.
The IOC standard method also provide the quality parameters for the same method carried
with propionitrile, which was a solvent recommended as alternative for improving results.
Comments on the analytical method, useful tips and possible improvements:
• In the analysis of fatty acids for the calculation of ECN42 samples are always firstly purified
through a silica gel solid‐phase extraction cartridge, and the sample spiked with hexane (olive
oil: hexane 1:4).
7) Determination of the stigmastadienes content:
IOC method: COI/T.20/Doc. no. 11/Rev. 2, 2001
The method describes a procedure for determining the content of stigmasta‐3,5‐diene. The
method is applied to detect the presence of refined vegetable oils (olive, olive‐pomace, oils from
sunflower, soybean, palm, etc.) in virgin olive oil at low concentrations since virgin olive oils and
crude olive‐pomace oil should not contain these compounds.
The procedure consists of: Saponification, separation of unsaponifiable matter with ethyl
ether, separation of steroidal hydrocarbon fraction by column chromatography on silica gel and
analysis by gas chromatography.
The IOC and EU recently lowered the limit for stigmastadiene from 0.1 to 0.05 due to higher
sensitivity that modern analytical instruments have today. However, this change has caused a series
of disagreement in the data with the other regulations.

Deliverable 4.3, version 1, 12‐12‐2016
11
Table 2.13. IOC and EU values of stigmastadiene content (mg/kg) for olive oil and the differences found in other international regulations.
Parameter IOC/EU Codex Alimentarius USA California (USA) Australia South Africa
Stigmastadiene content Extra virgin olive oil and
virgin olive oil ≤0.05 ≤0.15 ≤0.15 ≤0.10 ≤0.10 ≤0.10
Stigmastadiene content Ordinary virgin olive oil ≤ 0.101 ≤0.15 Category non
defined Category non
defined Category non
defined Category non
defined Stigmastadiene content Lampante virgin olive oil ≤0.50 n.i.
Note: 1, Ordinary category is not described in European regulation; n.i., non‐indicated (there is not any value specified for this parameter/category).
Quality parameters:
Table 2.14. IOC values of analytical quality parameters (precision for repeatability and reproducibility) for the determination of stigmastadienes.
Parameter RSDr (%) (Repeatability)
RSDR (%) (Reproducibility)
Stigmastadienes content 1.5‐8.41 6.26‐11.45 R1 sterene ratio 2.84‐3.00 6.86‐7.85
NOTE: RSDr (%), relative standard deviation in repeatability, RSDR (%), relative standard deviation in reproducibility. A range is shown since the value can vary between different categories of olive and olive‐pomace oils.
Comments on the analytical method, useful tips and possible improvements:
• The technology has undergone advances and today it is possible to obtain desterolised
vegetable oils that can be mixed with refined olive oil. For that reason, the IOC published a
method (COI/T.20/Doc. no. 16/Rev. 1, 2001) to determine sterenes (campestadienes and
stigmastadienes) to detect desterolised seed oils in refined oils. This determination is based
on the isolation of unsaponifiable matter, separation of sterene fraction with silica gel
chromatographic column impregnated with silver nitrate, and analysis by capillary GC. The
critical part of this determination is the optimization of the volumes used to extract each
fraction (three different fractions are extracted from the silica gel column). There is no
reference to a similar method to determine sterenes in the other regulations.
• The method of sterenes is only applied for the quantification of stigmastadiene if the
concentration is higher than 4 mg/kg. With lower concentrations (0.01‐4 mg/kg) the IOC
method for the “determination of the stigmastadiene content” (COI/T.20/Doc. no. 11/Rev. 2
2001) should be used.

Deliverable 4.3, version 1, 12‐12‐2016
12
8) Determination of the content of 2-glyceryl monopalmitate:
IOC method: COI/T.20/Doc. no. 23, 2006
The method describes a procedure for determining the content of 2‐glyceryl monopalmitate.
This method is used to detect re‐esterified oils in olive oils by means of the determination of the
percentage of palmitic acid at the 2‐position of the triacylglyerols.
The procedure consists of: Neutralization of the sample because the pH is important for the
activity of the pancreatic lipase; the reaction with the pancreatic lipase carries out a partial hydrolysis
specific for position 1 and 3 of the triacylglycerol; the product of the reaction, 2‐ monoacylglycerols,
is silanized and analysed by gas chromatography.
Table 2.15. IOC and EU values of 2-glycerylmonopalmytate (2P, expressed as percentage) for olive oil and the differences found in other international regulations.
Parameter IOC/EU Codex Alimentarius USA California
(USA) Australia South Africa
Content of 2P Edible virgin olive oils and
olive oil (ROO+VOOs)
≤ 0.9 (If C16:0 ≤14.0%)
≤ 1.0% (If C16:0 > 14.0%)
n.i. ≤ 1.8 for olive
oil (ROO+VOO)
≤1.5 for virgin olive oil
≤ 1.8 for olive oil
(ROO+VOO)
≤1.5 for virgin olive oil
≤ 1.8 for olive oil (ROO+VOO)
Content of 2P Non‐edible virgin olive oils
and refined olive oils
≤ 0.9 (If C16:0 ≤14.0%)
≤ 1.1 (If C16:0 > 14.0%)
n.i. n.i. for refined
olive oils
≤ 1.8 for refined olive
oil
≤1.5 for lampante VOO
≤1.8 for refined OO
≤1.5 for lampante VOO
≤1.8 for refined OO
Content of 2P Olive pomace oil
(ROPO+VOOs) ≤ 1.2 n.i. n.i. ≤ 2.2 ≤ 2.2
Content of 2P Crude and refined olive
pomace oils ≤ 1.4 n.i. n.i. ≤ 2.2 ≤ 2.2
Note: n.i., non‐indicated (there is not any value specified for this parameter/category).
In the case of the standard of Codex Alimentarius, it is established that the saturated fatty
acids at the 2‐position in the triglyceride (sum of palmitic & stearic acids) has to meet the following
maximum levels:
• Virgin olive oils: 1.5%
• Refined olive oil: 1.8%
• Olive oil: 1.8%
• Refined olive‐pomace oil: 2.2%
• Olive‐pomace oil: 2.2%

Deliverable 4.3, version 1, 12‐12‐2016
13
Quality parameters:
Table 2.16. IOC values of analytical quality parameters (precision for repeatability and reproducibility) for the determination of 2-glyceryl monopalmitate.
Parameter RSDr (%) (Repeatability)
RSDR (%) (Reproducibility)
Content of 2‐glyceryl monopalmitate
1.95‐8.91 10.17‐12.66
NOTE: RSDr (%), relative standard deviation in repeatability, RSDR (%), relative standard deviation in reproducibility. A range is shown since the value can vary between different categories of olive and olive‐pomace oils. Comments on the analytical method, useful tips and possible improvements:
• The method for the determination of the percentage of 2‐glyceryl monopalmitate has the
drawbacks of being a lengthy and tedious method.
• When sample acidity is > 3%, the oil has to be previously neutralized.
• The activity of the pancreatic lipase depends on the pH, which should be adjusted to 8.3.
• The lipase pancreatic is not stable and may lose activity easily.
• A large broad solvent front, low repeatability and tailing peaks are the major drawbacks of
on‐column injections.
9) Determination of unsaponifiable matter:
IOC method: It referrers to ISO and AOCS methods (ISO 3596, AOCS Ca 6b-53, ISO 18609)
The method describes a procedure for determining the fraction of the oil that fails to react
with soda and potassium hydroxide to produce soaps and remains soluble in classic solvents (e.g.,
hexane, petroleum ether, diethyl ether) after saponification.
The procedure is described in ISO 3596, “Determination of the unsaponifiable matter –
Method using diethyl ether extraction”, or AOCS Ca 6b‐53 or ISO 18609. The results should be
expressed in g of unsaponifiable matter per kg/oil.
Table 2.17. IOC and EU values of unsaponifiable matter (g of unsaponifiable matter per kg/oil) for olive oil and the differences found in other international regulations.
Parameter IOC Codex Alimentarius EU USA California
(USA) Australia South Africa
Unsaponifiable matter in olive oils ≤15 n.i. n.i. n.i. n.i.
Unsaponifiable matter in olive pomace oils ≤30 n.i. n.i. n.i. n.i.
Note: n.i., non‐indicated (there is not any value specified for this parameter/category).

Deliverable 4.3, version 1, 12‐12‐2016
14
The values for unsaponifiable matter are the same for IOC, EU, Codex Alimentarius, and USA,
However, there is not any reference to the unsaponifiable matter in the standards in California,
Australia and South Africa.
Quality parameters:
IOC do not provide information about quality parameters of this method.
Comments on the analytical method, useful tips and possible improvements:
• This method presents some problems because of the lack of accuracy and precision in the
results.
• The problems of precision partially come from the impossibility of extracting all of the
unsaponifiable matter and the formation of emulsions due to a too vigorous shaking in the
liquid‐liquid extraction. Other problems that can produce a low precision in the results are
soap hydrolysis, loss of unsaponifiable matter during solvent drying, evaporation and
incomplete saponification.
• These emulsions can be destroyed by adding small quantities of ethanol.
• The preferred solvent is diethyl ether. If soaps pass into the solvent together with the
unsaponifiable matter, a recommended action is to separate the soaps by washing the ether
extract with an aqueous solution of sodium hydroxide, which can provoke soap hydrolysis
and liberate acids.
• An incomplete saponification is one of the problems that may occur sometimes. This can be a
source of error. If an incomplete saponification occurred, then the unsaponifiable residue
containing the non‐saponified segment has to follow the same procedure again to be
saponified and extracted.
10) Determination of organoleptic characteristics:
IOC method: In addition to the standard method, there is a series of standards describing the
selection and training of panellists, and other characteristics of the panel room, conditions etc.:
COI/T.20/Doc. No 4/Rev. 1, September 2007, Sensory analysis: general basic vocabulary
COI/T.20/Doc. No 5/Rev. 1, September 2007, Glass for oil tasting
COI/T.20/Doc. No 6/Rev.1, September 2007, Guide for the installation of a test room
COI/T.20/ Doc. No 14/Rev. 4, May 2013, Guide for the selection, training and monitoring of
skilled virgin olive oil tasters

Deliverable 4.3, version 1, 12‐12‐2016
15
COI/T.20/Doc. No 15/Rev. 8, November 2015, Method for the organoleptic assessment of
virgin olive oil
COI/T.20/Doc. no. 22, November 2005, Organoleptic assessment of do extra virgin olive oil
COI/T.28/Doc. No 1, September 2007, Guidelines for the accreditation of laboratories
undertaking the sensory analysis of virgin olive oils
The method describes a procedure for determining odour and taste of virgin olive oil. This
method is used to classify the categories of virgin olive oils based on their odour and taste. The
median of defect and the median of the fruity attribute are calculated and are the basis for this
classification of categories. In this case, EU and IOC have some disagreements since EU do not
recognize the ordinary category.
Table 2.18. IOC values of Median of defects (Md) and Median of fruitiness (Mf) for olive oil and the differences found in other international regulations.
Category IOC Codex Alimentarius EU USA California
(USA) Australia South Africa
Extra VOO Md = 0 Mf > 0
Virgin VOO 0 < Md ≤ 3.5 Mf > 0
0 < Md ≤ 2.5 Mf > 0 0 < Md ≤ 2.5
Mf > 0 0 < Md ≤ 2.5
Mf > 0
0 < Md ≤ 2.5
Mf > 0
0 < Md ≤ 2.5
Mf > 0
Ordinary VOO
3.5 <Me ≤ 6.0 or
0 < Md ≤ 3.5 Mf = 0
2.5 <Me ≤ 6.0 or
0 < Md ≤ 2.5 Mf = 0
Category non
defined
Category non
defined
Category non
defined
Category non
defined
Category non
defined
Lampante VOO Md > 6.0 n.i.
Md>3.5 or
0 < Md ≤ 3.5 Mf = 0
Md>2.5 or
0 < Md ≤ 2.5 Mf = 0
Md>2.5 Md>2.5 Md>2.5
Refined OO n.i. n.i. n.i. n.i. Md ≤ 2.5 Md ≤ 2.5 Md ≤ 2.5
Olive Oil (ROO+VOO) n.i. n.i. n.i. n.i. Md ≤ 2.5 Mf > 0
Md ≤ 2.5 Mf > 0
Md ≤ 2.5 Mf > 0
Refined olive pomace oil n.i. n.i. n.i. n.i. Md ≤ 2.5 Md ≤ 2.5 Md ≤ 2.5
Olive pomace oil n.i. n.i. n.i. n.i. Md ≤ 2.5 Mf > 0
Md ≤ 2.5 Mf > 0
Md ≤ 2.5 Mf > 0
Note: n.i., non‐indicated (there is not any value specified for this parameter/category).
There are many disagreements between regulations. One of the reasons is that IOC is the
only regulation that recognize ordinary category, an intermediate category between virgin and
lampante. On the other hand, the limit between virgin and ordinary/lampante categories is 2.5 or 3.5
depending on the regulation. Thus, the limit was raised to 3.5 in some regulations to consider the
high level of uncertainty in the classification in the boundaries of these two categories. Another
source of disagreement is the fact the Californian, Australian and South African standards also
consider these values of Md and Mf for olive pomace and refined categories.

Deliverable 4.3, version 1, 12‐12‐2016
16
Quality parameters:
IOC does not provide information about the quality parameters of this method.
Comments on the analytical method, useful tips and possible improvements:
• The panel test needs to be improved in 5 aspects: Development of reference materials for
training and retraining of panellists as wells for panel test evaluation, improvement of the
harmonization of sensory panels, improvement of the data treatment and statistics,
improvement of training step, and development of new analytical tools for supporting the
sensory evaluation.
• The definitions of some attributes need to be improved, in particular in the case of some
emergent attributes (‘frostbitten olives’ sensory defect).
• The official method, however, is questioned by numerous VOO actors, because the
difference between virgin and extra‐virgin olive oils depends on the presence of defects,
whatever their level of perception. It is there where the method may fail sometimes: when
the panel test analyses oils that could not have any defect for some panel tests while others
have been able to detect defects at very low intensity of the sensory perception, which is
enough to qualify olive oils as virgin instead of extra‐virgin.
• Considering that the classification can be based on absence/presence of sensory defect, or
detection/non detection of these defects, some analytical parameters are of large
importance: limit of detection, subjectivity, inadequate training, too high sensitivity of some
assessors for some odours, odour thresholds.
11) Determination of free acidity:
IOC method: COI/T.20/Doc. No 34, November 2015.
The method describes a procedure for determining the content of the free fatty acid present
in the oil. This method is used to classify the categories of olive oils based on their free acidity (%
m/m) expressed in oleic acid.
The procedure consists of: The sample is solved in diethyl oxide/ethanol (95%) 1:1 (v/v) and
free fatty acid present in the sample are titrated using an ethanolic solution of potassium hydroxide.
In order to carry out the analysis, the acid value should be previously estimated to decide the
amount of sample used for the analysis.

Deliverable 4.3, version 1, 12‐12‐2016
17
Table 2.19. IOC values of free acidity (%) for olive oil and the differences found in other international regulations.
Parameter IOC Codex Alimentarius EU USA California
(USA) Australia South Africa
Free acidity Extra VOO ≤0.8 ≤0.5
Free acidity Virgin VOO ≤2.0 ≤1.0
Free acidity Ordinary VOO ≤3.3 Category non
defined Category non
defined Category non
defined Category non
defined Category non
defined Lampante VOO >3.3 n.i. >2.0 >2.0 >1.0 >2.0 >2.0
Free acidity Refined OO ≤0.3
Free acidity Olive Oil (ROO+VOO) ≤1.0 ≤0.8
Free acidity Crude olive pomace oil No limit Category
non defined
Free acidity Refined olive pomace oil ≤0.3
Free acidity Olive pomace oil ≤1.0 ≤0.8
Note: n.i., non‐indicated (there is not any value specified for this parameter/category).
The Californian standard shows the strictest values for acidity. Thus, the acidity is 0.5 for
extra virgin olive oil, while it is 0.8 for the rest of regulations. Another disagreement between
IOC/Codex Alimentarius and the rest of regulations is the acidity for lampante (3.3 versus 2.0).
Quality parameters:
Table 2.20. IOC values of analytical quality parameters (precision for repeatability and reproducibility) for the determination of free acidity.
Parameter RSDr (%) (Repeatability)
RSDR (%) (Reproducibility)
Free acidity collaborative study
2014 0.8‐9.3 3.0‐24.2
Free acidity collaborative study
2015 0.4‐1.3 3.1‐5.3
NOTE: RSDr (%), relative standard deviation in repeatability, RSDR (%), relative standard deviation in reproducibility. A range is shown since the value can vary between different categories of olive and olive‐pomace oils.
Comments on the analytical method, useful tips and possible improvements:
• The amount of sample could be reduced to half (0.5 g instead of 1.0 g) when the acidity of
the oil is expected to be high (7.5% or more).
• Other solvents can be used alternatively, such as ethanol:water (1:1).
• As an alternative method, free fatty acids can be determined by GC as FAMEs.

Deliverable 4.3, version 1, 12‐12‐2016
18
• Another alternative is with non‐targeted methods. Free fatty acids can be determined by
Fourier transform infrared spectroscopy (FTIR), with peaks near 1745 and 1711 cm−1, by
means of a calibration with standards.
• NIR is also applied for estimation of free fatty acids, although a calibration with samples of
the same cultivar is necessary.
• Another procedure with FTIR is to derivatize free fatty acids to the corresponding free fatty
acid salt after reacting with sodium carbodiimide (a weak base) in methanol. The resulting
salt presents a measurable spectroscopic band in a region without interference and
consequently this band is very easy to measure and calibrate.
12) Determination of peroxide value:
IOC method: It refers to ISO and AOCS methods (ISO 3960, AOCS Cd 8b-90). IOC has published its own
method as well: COI/T.20/Doc. No 35, July 2016.
The method describes a procedure for determining the peroxide value. This method is used
to classify the categories of olive oils based on their peroxide value in milleq. Peroxide oxygen per
kg/oil.
The procedure consists of: The sample is solved in acetic acid and chloroform and treated
with potassium iodide. The liberated iodine is titrated with standardized sodium thiosulphate
solution. In order to carry out the analysis, the peroxide value should be previously estimated to
decide the amount of sample used for the analysis.
Table 2.21. IOC values of peroxide value (PV, expressed as meq. O2/kg) for olive oil and the differences found in other international regulations.
Parameter IOC Codex Alimentarius EU USA California
(USA) Australia South Africa
PV Extra VOO ≤20.0 ≤15.0
PV Virgin VOO ≤20.0
PV Ordinary VOO ≤20.0 Category
non defined
Category non
defined
Category non
defined
Category non
defined
Category non
defined
PV Lampante VOO No limit Category non defined >20.0 >20.0 >20.0 >20.0 >20.0
PV Refined OO ≤5.0 PV Olive Oil (ROO+VOO) ≤15.0
PV Crude olive pomace oil No limit Category non defined
PV Refined olive pomace oil ≤5.0 PV Olive pomace oil ≤15.0
Deliverable 4.3, version 1, 12‐12‐2016
19
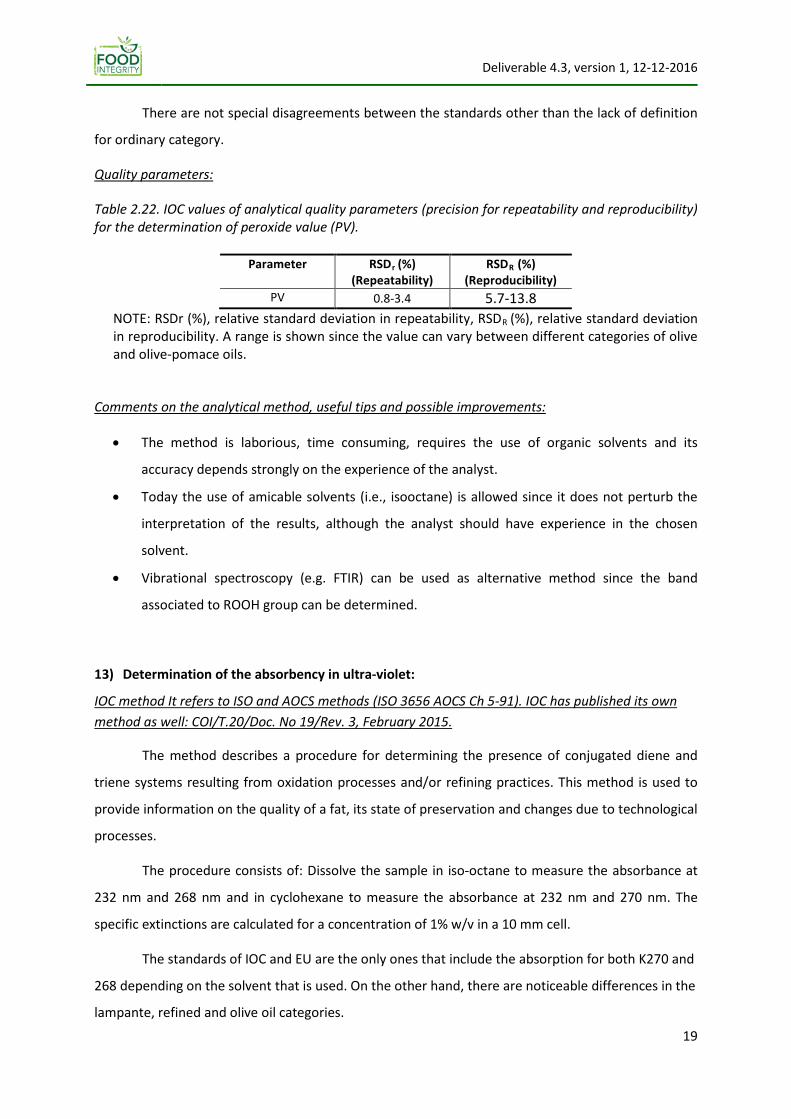
There are not special disagreements between the standards other than the lack of definition
for ordinary category.
Quality parameters:
Table 2.22. IOC values of analytical quality parameters (precision for repeatability and reproducibility) for the determination of peroxide value (PV).
Parameter RSDr (%) (Repeatability)
RSDR (%) (Reproducibility)
PV 0.8‐3.4 5.7‐13.8 NOTE: RSDr (%), relative standard deviation in repeatability, RSDR (%), relative standard deviation in reproducibility. A range is shown since the value can vary between different categories of olive and olive‐pomace oils.
Comments on the analytical method, useful tips and possible improvements:
• The method is laborious, time consuming, requires the use of organic solvents and its
accuracy depends strongly on the experience of the analyst.
• Today the use of amicable solvents (i.e., isooctane) is allowed since it does not perturb the
interpretation of the results, although the analyst should have experience in the chosen
solvent.
• Vibrational spectroscopy (e.g. FTIR) can be used as alternative method since the band
associated to ROOH group can be determined.
13) Determination of the absorbency in ultra-violet:
IOC method It refers to ISO and AOCS methods (ISO 3656 AOCS Ch 5-91). IOC has published its own method as well: COI/T.20/Doc. No 19/Rev. 3, February 2015.
The method describes a procedure for determining the presence of conjugated diene and
triene systems resulting from oxidation processes and/or refining practices. This method is used to
provide information on the quality of a fat, its state of preservation and changes due to technological
processes.
The procedure consists of: Dissolve the sample in iso‐octane to measure the absorbance at
232 nm and 268 nm and in cyclohexane to measure the absorbance at 232 nm and 270 nm. The
specific extinctions are calculated for a concentration of 1% w/v in a 10 mm cell.
The standards of IOC and EU are the only ones that include the absorption for both K270 and
268 depending on the solvent that is used. On the other hand, there are noticeable differences in the
lampante, refined and olive oil categories.

Deliverable 4.3, version 1, 12‐12‐2016
20
Table 2.23. IOC values of UV absorption for olive oil and the differences found in other international regulations.
Category IOC Codex Alimentarius EU USA California
(USA) Australia South Africa
Extra VOO K270/K268 ≤ 0.22
Δk ≤ 0.01 K232 ≤ 2.50
K232 n.i. K270 ≤ 0.22
Δk ≤ 0.01 K232 ≤ 2.40
Virgin VOO K270/K268 ≤ 0.25
Δk ≤ 0.01 K232 ≤ 2.60
K232 n.i.
Ordinary VOO K270/K268 ≤ 0.30 Δk ≤ 0.01
Category non
defined
Category non
defined
Category non
defined
Category non
defined
Category non
defined
Lampante VOO Category non defined
K270 > 0.25 Δk ≤ Ι0.01Ι K232 >2.60
K270 > 0.25 Δk > Ι0.01Ι
K232 > 2.60
K270 > 0.25 Δk >Ι0.01Ι
K232 > 2.60
Refined OO K270/K268 ≤ 1.25 Δk ≤ 0.16
K270 ≤ 1.10 Δk ≤ 0.16
K270 ≤ 1.10 Δk ≤ 0.16
K270 ≤ 1.10 Δk ≤ Ι0.16Ι
K270 ≤ 1.10 Δk ≤ 0.16
K270 ≤ 1.10 Δk ≤ 0.16
Olive Oil (ROO+VOO)
K270/K268 ≤ 1.15 Δk ≤ 0.15
K270 ≤ 0.90 Δk ≤ 0.15
K270 ≤ 0.90 Δk ≤ 0.15
K270 ≤ 0.90 Δk ≤ Ι0.15Ι
K270 ≤ 0.90 Δk ≤ Ι0.15Ι
K270 ≤ 0.90 Δk ≤ Ι0.15Ι
Crude olive pomace oil
Refined olive pomace oil
K270/K268 ≤ 2.0 Δk ≤ 0.20 K270K≤ 2.0
Δk ≤ Ι0.20Ι
Olive pomace oil K270/K268 ≤ 1.70 Δk ≤ 0.18 K270 ≤ 1.70
Δk ≤ Ι0.18Ι
Note: n.i., non‐indicated (there is not any value specified for this parameter/category).
Quality parameters:
Table 2.24. IOC values of analytical quality parameters (precision for repeatability and reproducibility) for the determination of UV absorption.
RSDr (%) (repeatability)
RSDR (%) (Reproducibility)
UV extinction at 232 nm in isooctane 0.41‐1.47 2.46‐5.48 UV extinction at 232 nm in cyclohexane 1.02‐1.42 2.81‐3.95
UV extinction at 268 nm in isooctane 1.10‐3.96 2.59‐8.00 UV extinction at 270 nm in cyclohexane 0.92‐4.02 2.37‐8.51 Variation of the specific extinction K at
270±4 nm in cyclohexane 1.09‐28.90 5.06‐147.51
Variation of the specific extinction K at 270±4 nm in isooctane 1.65‐121.08 10.00‐234.77
NOTE: RSDr (%), relative standard deviation in repeatability, RSDR (%), relative standard deviation in reproducibility. A range is shown since the value can vary between different categories of olive and olive‐pomace oils.
Comments on the analytical method, useful tips and possible improvements:
• New instrumentation has better characterized the exact wavelengths at which the
conjugated dienes and trienes absorb when using isooctane (232 nm and 268 nm) and
cyclohexane (solvent 232 nm and 270).

Deliverable 4.3, version 1, 12‐12‐2016
21
14) Determination of the moisture and volatile matter
IOC method: It refers to ISO methods (ISO 662).
The method describes a procedure for determining the content of water and volatile matter
in the oil.
The procedure consists of: The sample is heated at 105 ºC in a sand‐bath until moisture and
volatile matter are completely removed.
Table 2.25. IOC values of moisture and volatile matter (%) for olive oil and the differences found in other international regulations.
Category IOC Codex Alimentarius EU USA California
(USA) Australia South Africa
Extra VOO ≤0.2 n.i.
Virgin VOO ≤0.2 n.i.
Ordinary VOO ≤0.2 Category
non defined
Category non
defined
Category non
defined
Category non
defined
Category non
defined
Lampante VOO ≤0.3 Category non defined n.i. n.i.
Refined OO ≤0.1 n.i. Olive Oil
(ROO+VOO) ≤0.1 n.i.
Crude olive pomace oil ≤1.5 Category non
defined n.i.
Refined olive pomace oil ≤0.1 n.i.
Olive pomace oil ≤0.1 n.i.
Note: n.i., non‐indicated (there is not any value specified for this parameter/category).
In the last regulations of the European Union moisture is not mentioned as a relevant
parameter. On the other hand, there are not many disagreements between regulations in this
parameter.
Quality parameters:
Since there is not an IOC method, there is not information about the quality parameter of
this method.
Comments on the analytical method, useful tips and possible improvements:
• It is a methodology that has not underwent significant improvements. A high moisture may
have a negative effect in the performance of other methods.
15) Determination of alkyl esters:

Deliverable 4.3, version 1, 12‐12‐2016
22
IOC method: COI/T.20/Doc. No 28/Rev. 1, 2010; COI/T.20/Doc. No 31, November 2012.
The method describes a procedure for determining the content of the even numbered of
carbon atoms of individual waxes, from C40 to C46, and the content of the even numbered of carbon
atoms of ethyl and methyl esters, C16 and C18. The information from the method is used as a quality
parameter for extra virgin olive oil (FAEEs) and to detect mixtures of extra virgin olive oils with lower
quality olive oils (i.e., the presence of olive‐pomace in olive oil).
The procedure consists of: Separation of the fraction of interest by column chromatography
on hydrated silica gel. The obtained fraction is analysed by gas chromatography.
Table 2.26. IOC and EU values of fatty acid ethyl esters (FAEEs) (mg/kg) for olive oil and the differences found in other international regulations.
Parameter IOC/EU Codex Alimentarius USA California
(USA) Australia South Africa
FAEEs Extra VOO ≤35 n.i. n.i. n.i. n.i. n.i.
Note: n.i., non‐indicated (there is not any value specified for this parameter/category).
This parameter is only specified in IOC and European regulations and it is not mentioned in
the rest of regulations.
Quality parameters:
Table 2.27. IOC values of analytical quality parameters (precision for repeatability and reproducibility) for the determination of Ethyl esters concentration (FAEEs).
Parameter RSDr (%) (Repeatability)
RSDR (%) (Reproducibility)
FAEEs 2.41‐28.83 11.08‐79.88 NOTE: RSDr (%), relative standard deviation in repeatability, RSDR (%), relative standard deviation in reproducibility. A range is shown since the value can vary between different categories of olive and olive‐pomace oils.
Comments on the analytical method, useful tips and possible improvements:
• The presence of the ethyl esters of fatty acids (FAEEs) seems to indicate that olive oil could
have been obtained from unhealthy olives when harvested or because of inadequate
processing of olives. However, the relationship of fatty acid alkyl esters with sensory quality
soft‐deodorized oil is casual. Although FAEEs have been proposed as markers of the presence
of soft‐deodorized oils, their relationship with this kind of oils seems to be unclear as well.
For that reason, their utility is under discussion today as well as their limit.

Deliverable 4.3, version 1, 12‐12‐2016
23
16) Determination of pyropheophytins:
IOC method: There is no method established in IOC norm. The other norms (e. g. Australian
regulation) refers to an ISO method (ISO 29841).
Pyropheophytins has been proposed by Californian, Australian and South African regulations
as a marker of freshness for extra virgin olive oils.
Table 2.28. Differences found in international regulations concerning the pyropheophytins (PPPs) (%).
Parameter IOC Codex Alimentarius EU USA California
(USA) Australia South Africa
PPP Extra VOO n.i. n.i. n.i. n.i. ≤17 ≤17 ≤17
Quality parameters:
There is not information about the quality parameter of this method.
Comments on the analytical method, useful tips and possible improvements:
• In general terms, apart from the ISO method, the analyst can use two methods that use a
reverse‐phase solid‐phase extraction (RP‐SPE). The first method elutes with petroleum ether
(65‐95 ºC) and the second with petroleum ether (40‐60 ºC): ethyl ether (9:1) for removing
lipids. Acetone is used in both methods to collect the pigments.
• The critical point in both methods is the collection of the analytes in 0.2‐0.3 mL of acetone.
• The high volatility of acetone suggests making the injection in the HPLC instrument as rapid
as possible.

Deliverable 4.3, version 1, 12‐12‐2016
24
17) Other parameters:
Table 2.29. Differences found in the values of different parameters in international regulations.
Parameter Category IOC Codex
Alimentarius
EU USA California (USA) Australia South Africa
Inso
lubl
e im
purit
ies i
n lig
ht p
etro
leum
Extra VOO ≤0.1 n.i.
Virgin VOO ≤0.1 n.i.
Ordinary VOO ≤0.1
Category non
defined
Category non
defined
Category non
defined
Category non
defined
Category non
defined Lampante
VOO ≤0.2 n.i. n.i. n.i.
Refined OO ≤0.05 n.i. ≤0.1 ≤0.1 ≤0.1 Olive Oil (ROO+VOO) ≤0.05 n.i. ≤0.1 ≤0.1 ≤0.1
Crude olive pomace oil n.i. n.i. n.i. n.i. n.i. n.i. n.i.
Refined olive pomace oil ≤0.05 n.i. ≤0.1 ≤0.1 ≤0.1
Olive pomace oil ≤0.05 n.i. ≤0.1 ≤0.1 ≤0.1
Flas
h po
int
(ºC)
Crude olive pomace oil ≥120 n.i. n.i. n.i. n.i. n.i.
Trac
e m
etal
s cop
per a
nd ir
on
Extra VOO ≤ 3.0 ≤ 0.1 n.i.
Virgin VOO ≤ 3.0 ≤ 0.1 n.i.
Ordinary VOO
≤ 3.0 ≤ 0.1
Category non
defined
Category non
defined
Category non
defined
Category non
defined
Category non defined
Lampante VOO
≤ 3.0 ≤ 0.1 n.i. n.i.
Refined OO ≤ 3.0 ≤ 0.1 n.i.
Olive Oil (ROO+VOO)
≤ 3.0 ≤ 0.1 n.i.
Crude olive pomace oil n.i. n.i. n.i.
Refined olive pomace oil
≤ 3.0 ≤ 0.1 n.i.
Olive pomace oil
≤ 3.0 ≤ 0.1 n.i.
Alfa
- To
coph
erol
(m
g/kg
)
All categories ≤200 n.i.
Trac
es o
f he
avy
met
als
(mg/
kg)
All categories
Pb≤0.1 As≤0.1 n.i. n.i.1 n.i.1 n.i.1 n.i.1
Tra
ces o
f hal
ogen
ated
so
lven
ts (m
g/kg
)
All categories
≤0.1 (sum of
all solvents
≤0.2 mg/kg)
n.i.1 n.i. n.i.
Note: n.i., non‐indicated (there is not any value specified for this parameter/category); 1, should meet other food regulations.

Deliverable 4.3, version 1, 12‐12‐2016
25
3. Sensory active compounds of VOO
After characterizing the volatile compounds in foods for many years, it seems there is no
doubt in the scientific community that the sentence “I smell, therefore there are volatiles” emulating
the sentence “I think, therefore I exist“; both are paradigms of causal relationships. There is a casual
relationship when, in the case of sensory assessment, panellists smell if there are volatiles but if
there are not volatiles then panellists do not smell. However, despite this evidence some chemical
compounds that do not smell or simply have a casual mathematical relationship with aroma has been
proposed and they may fail in their relationship with sensory quality.
Sensory assessment based on detecting and identifying sensory descriptors in olive oil is the
standard method to qualify virgin olive oil samples in one of the three following categories: extra‐
virgin, virgin and lampante virgin olive oils. As the sensory assessment by panellists is the official
standards accepted by all the institutions involved in this sector, the chemical analysis of volatiles has
been focused on explaining the sensory descriptors perceived by these panellists. The relationship
between these descriptors and the volatiles responsible for them cane established by means of a
biochemical, chemical or physical explanations instead of mathematical algorithms that do not
explain the origin of the virgin olive oil aroma.
In fact, volatiles are direct metabolites produced in plant organs by intracellular biogenic
pathways. The growing unripe fruit synthesizes high molecular mass structures such as lipids,
proteins, and polysaccharides, of which the former is the main precursors of the volatiles. In the
course of ripening, there are changes in the metabolism of the fruit. Thus, ethylene production,
respiration climacteric rise, protein synthesis, increase of enzyme activities, and permeability of cell
membranes influence the biogenesis of volatiles. However, the volatiles, which are produced in
significant amounts when olives reach the climateric stage of ripeness, are mostly formed through
the action of enzymes that are released when the fruit is crushed, and their concentrations increase
substantially during the malaxation process. Figure 3.1 shows the main pathways involved in the
production of the volatile compounds responsible for the virgin olive oil aroma.
The primary precursors for the formation of volatiles are fatty acids (particularly linoleic and
α‐linolenic) and amino acids (leucine, isoleucine and valine). The main biochemical pathways
involved in virgin olive oil aroma biogenesis can be clustered as follows (Figure 3.1):

Deliverable 4.3, version 1, 12‐12‐2016
26
Figure 3.1. Biochemical and chemical pathways involved in the production of some of the virgin olive oil volatile. • Lipid metabolites:
- Fatty acid metabolism: Unripe fruits produce a variety of fatty acids and some minor volatile
compounds (primary and secondary alcohols). During ripening, fruits develop the ability to
convert some of the acids into ketones, esters and alcohols. Aliphatic esters, alcohols, acids,
and carbonyls derived from fatty‐acid metabolism can be found in virgin olive oil.
- Lipoxygenase pathway: This is the most extensively studied biochemical pathway directly
involved in the formation of the major volatile compounds of virgin olive oils. It is responsible
for the secondary volatile compounds that are usually found in all VOOs. The main precursors
are linoleic and α‐linolenic polyunsaturated fatty acids. It is well known that the formation of
C6 aliphatic volatile compounds from the 13‐hydroperoxides of linoleic and linolenic acids are
promoted in olives while C9 compounds are practically absent. E‐2‐hexenal, hexanal and Z‐3‐
hexenal are the major aldehydes found in virgin olive oils. Z‐3‐hexen‐1‐ol, E‐2‐hexen‐1‐ol and
hexan‐1‐ol are usually found at high concentrations, with their balance being influenced by the
stage of ripeness and variety of the olives. Other C6 volatile compounds such as Z‐2‐hexenal, E‐
3‐hexenal, Z‐2‐hexen‐1‐ol and E‐3‐hexen‐1‐ol are also produced through this pathway but they
are determined at lower concentrations.
- A cleavage reaction of the 13‐hydroperoxide of linolenic acid is mediated through the LOX
pathway and gives rise to the formation of pentene dimers ‐ 1‐penten‐3‐ol and 2‐penten‐1‐ol ‐
HOMOLYTIC CLEAVAGE OF 13-HYDROPEROXIDES
LIPOXYGENASE CASCADE
CONVERSION OFSOME AMINOACIDS
Volatilesof VirginOlive Oil
SUGAR FERMENTATION
FATTY ACIDMETABOLISM
C6: Aldehydes, alcohols & esters
C8:Alcohols& ketones
Lineal alcohols, acids, ketones &
esters
Alcoholic Butyric
C4 & C5: Branchedaldehydes & alcohols.
C5: Alcohols, ketones &aldehydes
DamagedFruits
HealthyFruits
Ethanol. ethyl acetate.
acetic acid
C4 & C5: Branchedalcohols & aldehydes

Deliverable 4.3, version 1, 12‐12‐2016
27
that have been identified in VOOs. Further activation of alcohol dehydrogenase might be
responsible for the formation of C5 aldehydes.
• Amino acid metabolites:
The structural skeleton of some volatiles is derived from the branched‐chain amino acids
(valine, leucine and isoleucine) by a series of biochemical transformations. Valine, leucine and
isoleucine are transformed into the branched aldehydes, 2‐methyl propanal, 3‐methyl butanal
and 2‐methyl butanal, respectively. Further activation of alcohol dehydrogenase converts the
aldehydes into the corresponding alcohols. Later the action of alcohol acyl transferase gives
rise to ester formation.
All the biochemical/chemical processes are responsible of the volatile compounds that are
determined in virgin olive oils. All the 50 samples of extra virgin oils collected in the study of
geographical traceability with non‐targeted techniques (Deliverables 4.1), were characterized by
SPME‐GC‐FID/MS to know their aroma profile. These samples show an important concentration of
different series of compounds (aldehydes, ketones, alcohols, esters, acids) described in Table 3.1.
The biochemical aspects are not enough to determine if a volatile is responsible for a sensory
descriptor evaluated in the official sensory assessment. Figure 3.2 shows the scientific base that have
to be obtained to decide if a chemical compound is a marker of an olive oil sensory defect. The
biological and chemical pathways are the base of the scientific pyramid. The origin of the defect,
because inadequate technological practices, has to be identified before determining the chemical
marker that increases its concentration under the previous conditions. Later, the marker has to be
quantified in concentrations upper their threshold when the sensory defect is detected by panelists,
and vice versa, and it has to smell the sensory defect at the adequate concentration either alone or in
synergy with other volatiles.
Thus, the establishment of the relationship between VOO chemical compounds and sensory
descriptors is the most complex aspect of the global flavor study. Great advances in instrumentation
allowed the identification of a great number of chemical compounds of VOOs (Morales et al., 2013).
The relationships between these compounds and the sensory attributes have been studied for years,
and several methods have been applied to establish these relationships in VOOs. Most of them are
based on regression equations that would not resist a validation step with blind samples although
there was an attempt that allowed relating volatiles sensory descriptors evaluated by 5 different
panels for VOO sensory assessment (Aparicio and Morales, 1995). This pioneer study concluded that
it was possible to explain six basic sensory aromas: green, bitter‐pungent, ripe olives, ripe‐fruit,
fruity, sweet and undesirable.
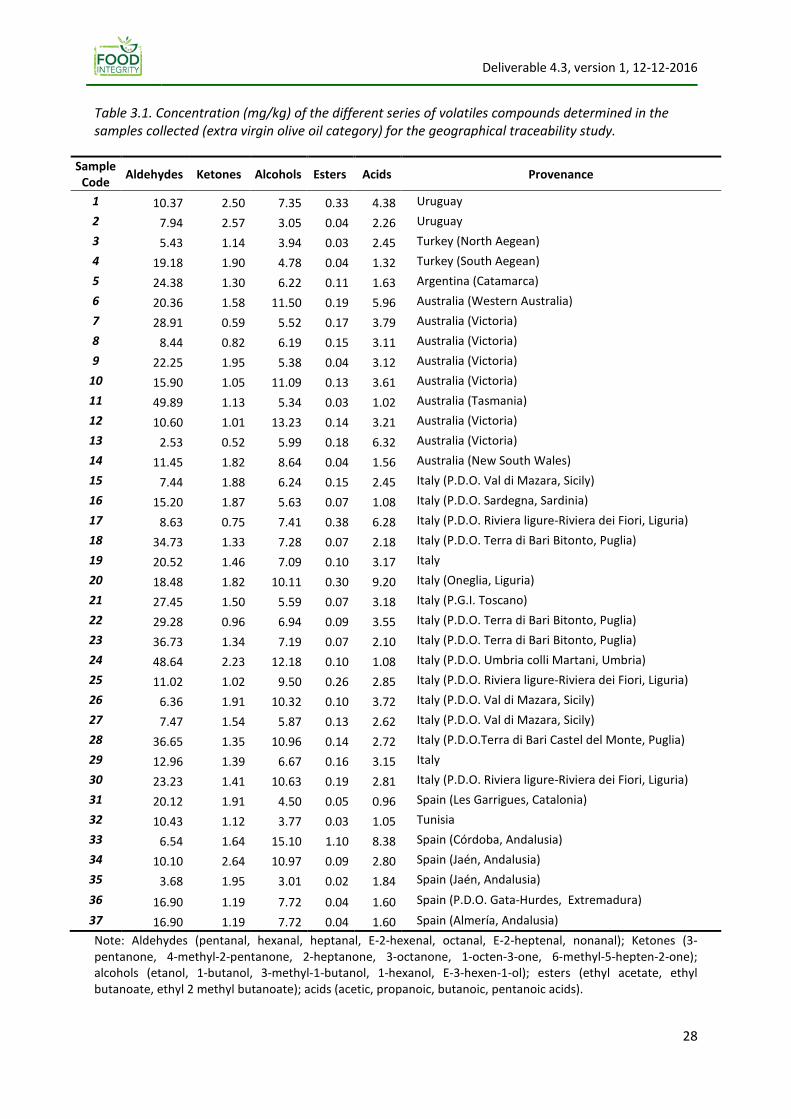
Deliverable 4.3, version 1, 12‐12‐2016
28
Table 3.1. Concentration (mg/kg) of the different series of volatiles compounds determined in the samples collected (extra virgin olive oil category) for the geographical traceability study.
Sample Code Aldehydes Ketones Alcohols Esters Acids Provenance
1 10.37 2.50 7.35 0.33 4.38 Uruguay 2 7.94 2.57 3.05 0.04 2.26 Uruguay 3 5.43 1.14 3.94 0.03 2.45 Turkey (North Aegean) 4 19.18 1.90 4.78 0.04 1.32 Turkey (South Aegean) 5 24.38 1.30 6.22 0.11 1.63 Argentina (Catamarca) 6 20.36 1.58 11.50 0.19 5.96 Australia (Western Australia) 7 28.91 0.59 5.52 0.17 3.79 Australia (Victoria) 8 8.44 0.82 6.19 0.15 3.11 Australia (Victoria) 9 22.25 1.95 5.38 0.04 3.12 Australia (Victoria)
10 15.90 1.05 11.09 0.13 3.61 Australia (Victoria) 11 49.89 1.13 5.34 0.03 1.02 Australia (Tasmania) 12 10.60 1.01 13.23 0.14 3.21 Australia (Victoria) 13 2.53 0.52 5.99 0.18 6.32 Australia (Victoria) 14 11.45 1.82 8.64 0.04 1.56 Australia (New South Wales) 15 7.44 1.88 6.24 0.15 2.45 Italy (P.D.O. Val di Mazara, Sicily) 16 15.20 1.87 5.63 0.07 1.08 Italy (P.D.O. Sardegna, Sardinia) 17 8.63 0.75 7.41 0.38 6.28 Italy (P.D.O. Riviera ligure‐Riviera dei Fiori, Liguria) 18 34.73 1.33 7.28 0.07 2.18 Italy (P.D.O. Terra di Bari Bitonto, Puglia) 19 20.52 1.46 7.09 0.10 3.17 Italy 20 18.48 1.82 10.11 0.30 9.20 Italy (Oneglia, Liguria) 21 27.45 1.50 5.59 0.07 3.18 Italy (P.G.I. Toscano) 22 29.28 0.96 6.94 0.09 3.55 Italy (P.D.O. Terra di Bari Bitonto, Puglia) 23 36.73 1.34 7.19 0.07 2.10 Italy (P.D.O. Terra di Bari Bitonto, Puglia) 24 48.64 2.23 12.18 0.10 1.08 Italy (P.D.O. Umbria colli Martani, Umbria) 25 11.02 1.02 9.50 0.26 2.85 Italy (P.D.O. Riviera ligure‐Riviera dei Fiori, Liguria) 26 6.36 1.91 10.32 0.10 3.72 Italy (P.D.O. Val di Mazara, Sicily) 27 7.47 1.54 5.87 0.13 2.62 Italy (P.D.O. Val di Mazara, Sicily) 28 36.65 1.35 10.96 0.14 2.72 Italy (P.D.O.Terra di Bari Castel del Monte, Puglia) 29 12.96 1.39 6.67 0.16 3.15 Italy 30 23.23 1.41 10.63 0.19 2.81 Italy (P.D.O. Riviera ligure‐Riviera dei Fiori, Liguria) 31 20.12 1.91 4.50 0.05 0.96 Spain (Les Garrigues, Catalonia) 32 10.43 1.12 3.77 0.03 1.05 Tunisia 33 6.54 1.64 15.10 1.10 8.38 Spain (Córdoba, Andalusia) 34 10.10 2.64 10.97 0.09 2.80 Spain (Jaén, Andalusia) 35 3.68 1.95 3.01 0.02 1.84 Spain (Jaén, Andalusia) 36 16.90 1.19 7.72 0.04 1.60 Spain (P.D.O. Gata‐Hurdes, Extremadura) 37 16.90 1.19 7.72 0.04 1.60 Spain (Almería, Andalusia) Note: Aldehydes (pentanal, hexanal, heptanal, E‐2‐hexenal, octanal, E‐2‐heptenal, nonanal); Ketones (3‐pentanone, 4‐methyl‐2‐pentanone, 2‐heptanone, 3‐octanone, 1‐octen‐3‐one, 6‐methyl‐5‐hepten‐2‐one); alcohols (etanol, 1‐butanol, 3‐methyl‐1‐butanol, 1‐hexanol, E‐3‐hexen‐1‐ol); esters (ethyl acetate, ethyl butanoate, ethyl 2 methyl butanoate); acids (acetic, propanoic, butanoic, pentanoic acids).
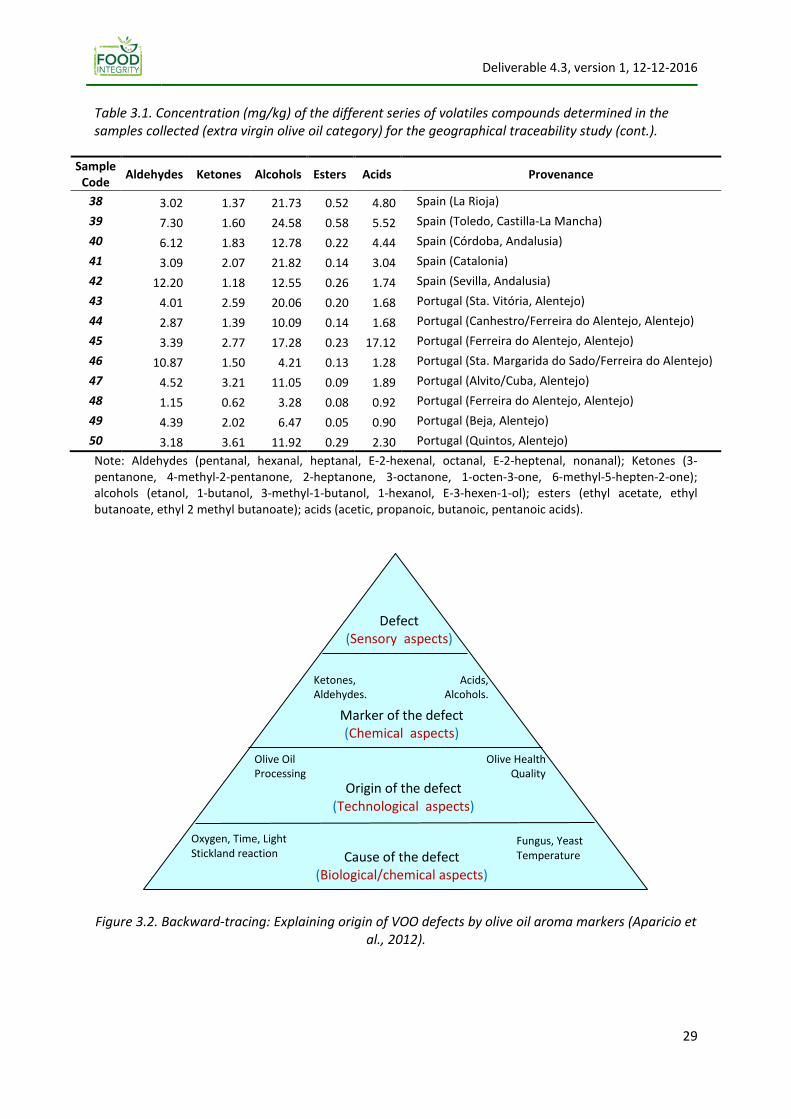
Deliverable 4.3, version 1, 12‐12‐2016
29
Table 3.1. Concentration (mg/kg) of the different series of volatiles compounds determined in the samples collected (extra virgin olive oil category) for the geographical traceability study (cont.).
Sample Code Aldehydes Ketones Alcohols Esters Acids Provenance
38 3.02 1.37 21.73 0.52 4.80 Spain (La Rioja) 39 7.30 1.60 24.58 0.58 5.52 Spain (Toledo, Castilla‐La Mancha) 40 6.12 1.83 12.78 0.22 4.44 Spain (Córdoba, Andalusia) 41 3.09 2.07 21.82 0.14 3.04 Spain (Catalonia) 42 12.20 1.18 12.55 0.26 1.74 Spain (Sevilla, Andalusia) 43 4.01 2.59 20.06 0.20 1.68 Portugal (Sta. Vitória, Alentejo) 44 2.87 1.39 10.09 0.14 1.68 Portugal (Canhestro/Ferreira do Alentejo, Alentejo) 45 3.39 2.77 17.28 0.23 17.12 Portugal (Ferreira do Alentejo, Alentejo) 46 10.87 1.50 4.21 0.13 1.28 Portugal (Sta. Margarida do Sado/Ferreira do Alentejo) 47 4.52 3.21 11.05 0.09 1.89 Portugal (Alvito/Cuba, Alentejo) 48 1.15 0.62 3.28 0.08 0.92 Portugal (Ferreira do Alentejo, Alentejo) 49 4.39 2.02 6.47 0.05 0.90 Portugal (Beja, Alentejo) 50 3.18 3.61 11.92 0.29 2.30 Portugal (Quintos, Alentejo) Note: Aldehydes (pentanal, hexanal, heptanal, E‐2‐hexenal, octanal, E‐2‐heptenal, nonanal); Ketones (3‐pentanone, 4‐methyl‐2‐pentanone, 2‐heptanone, 3‐octanone, 1‐octen‐3‐one, 6‐methyl‐5‐hepten‐2‐one); alcohols (etanol, 1‐butanol, 3‐methyl‐1‐butanol, 1‐hexanol, E‐3‐hexen‐1‐ol); esters (ethyl acetate, ethyl butanoate, ethyl 2 methyl butanoate); acids (acetic, propanoic, butanoic, pentanoic acids).
Figure 3.2. Backward-tracing: Explaining origin of VOO defects by olive oil aroma markers (Aparicio et al., 2012).
Cause of the defect (Biological/chemical aspects)
Marker of the defect (Chemical aspects)
Defect (Sensory aspects)
Fungus, Yeast Temperature
Oxygen, Time, Light Stickland reaction
Ketones, Aldehydes.
Acids, Alcohols.
Origin of the defect (Technological aspects)
Olive Oil Processing
Olive Health Quality

Deliverable 4.3, version 1, 12‐12‐2016
30
More recently, the research was focused on explaining sensory aroma defects since extra‐
virgin olive oil cannot have any sensory aroma defects, and the presence of these defects are the
basis for the category classification. Thus, a correct classification of samples into categories depends
on the absence or presence of sensory aroma defects even at very low level of perception. Figure 3.3
shows the scheme that we have followed to determine the chemical compounds that are markers of
VOO sensory aroma defects and to produce reference materials in future.
Figure 3.3. Protocol designed for determining the chemical compounds responsible for sensory aroma defects
Table 3.2 displays the markers that have been selected of some of the sensory defects. The
absence of these markers, or their occurrence at low concentration, has been checked in the extra
virgin olive oils analysed in the geographical study (Table 3.1).
SensoryAssessment
Thre
shol
dsof
mar
kers
Reference Materials
GC- Trap
Otherinstrumentation
FreshnessTraceability
by PPP
Traceability of Alcoholic & Butiric
Fermentations
Analyticalevaluation
SPME-GC ElectronicNose

Deliverable 4.3, version 1, 12‐12‐2016
31
Table 3.2 Volatiles that are markers of virgin olive oil sensory aroma defects.
Sensory defect Chemical compound OT (mg/kg) Sensory descriptor
Fusty
Octane 0.94 Alcane Ethyl butanoate 0.03 Fruity
Butanoic acid 0.65 Fusty Propanoic acid 0.72 Sour, mould
3‐Methyl‐1‐butanol 0.10 Vinegary 2‐Methyl‐1‐propanol 1.00 Irritant
Muddy‐sediment
Heptan‐2‐ol 0.01 Earth 6‐Methyl‐5‐hepten‐2‐one 1.00 Oily
1‐Penten‐3‐one 0.004 Mustard 2‐Butanol 0.15 Vinegary
Mustiness‐humidity
1‐Octen‐3‐ol 0.05 Musty, Earth 1‐Octen‐3‐one 0.01 Mushroom, mould Ethyl acetate 0.94 Intense Heptan‐2‐ol 0.01 Earth Acetic acid 0.50 Vinegary, sour
Heptan‐2‐ol 0.01 Earth E‐2‐Heptenal 0.042 Fatty, oxidized
Propanoic acid 0.72 Sour, mould
Winey‐vinegary Acetic acid 0.50 Vinegary, sour
Ethyl acetate 0.94 Intense 3‐Methyl‐butan‐1‐ol 0.10 Whisky
Rancid
Pentanal 0.24 Oily Hexanal 0.08 Oily, fatty Heptanal 0.50 Oily, fatty
E‐2‐Heptenal 0.042 Fatty, oxidized Octanal 0.32 Fatty Nonanal 0.15 Wax, fatty
E‐2‐Decenal 0.01 Fatty Hexanoic acid 0.70 Rancid
Metallic 1‐Octen‐3‐one 0.01 Mushroom, mould
1‐Penten‐3‐one 1 ×10‐3 Mustard 1,5‐Octadien‐3‐one 5 ×10‐4 Metallic, geranium
Burnt, Heated
(E)‐2‐Hexenol 5.0 Strong green 1‐Hexanol 0.40 Astringent Pentanal 0.24 Oily Nonanal 0.15 Waxy, fatty Hexanal 0.08 Oily, fatty1
Bottled 2,6‐Nonadienal 0.09 Cucumber
4. Analysis of volatile compounds at industrial plant level in a routine basis
In general terms, proposed analytical methods have to prove their applicability at industrial
plant level prior to reaching the level of standard level. Thus, all the analytical methods with the
support of IOC, ISO, and IUPAC, among other international institutions, have been checked in routine
analytical performances with success. Thus, in‐house analytical methods or those ones that have not
reached the status of standard method need to be successfully checked at industrial plant level to
prove their performance with different conditions and with real samples coming from industry. The

Deliverable 4.3, version 1, 12‐12‐2016
32
analytical methods based on spectroscopy and spectrometry techniques for determining the
geographical origin ‐ as described in section 5 of this deliverable ‐ have shown adequate results in the
correct samples classification but their resulting values in analytical quality parameters were not in
general good enough as to be validated at industrial plant level and need further improvements and
additional testing prior to be used at industry. On the other hand, the method based on the
quantification of volatiles for the correct classification of virgin olive oil samples inside their quality
designations was enough developed as to be checked at industrial plant level. For that reason, this
method was selected to be proven with real samples coming from industry as an additional testing
for quality control. Samples for the study of VOO geographical provenance were also characterized
by their volatile composition as shown in section 3 of the present document.
Thus, partner No. 25 (CSIC) checked the method for the quantification of volatiles (SPME‐GC‐
MS/FID) at industrial scale with the help of stakeholders that supplied blind samples qualified at
different sensory designations in the production season 2016. Stakeholders supplied 48 samples that
were characterized by their panel tests inside the designations of extra‐virgin (without any
detectable sensory defect) virgin (with slightly detectable sensory defects) and ordinary virgin or with
manifest sensory defects. Table 4.1 summarizes the number of samples clustered according to their
main sensory defects.
Table 4.1. Main sensory descriptors of 48 samples of virgin olive oils from different geographical origin supplied by stakeholders.
Designation Sensory attribute Samples Ordinary virgin Winey‐Vinegary‐ 11
Virgin
Winey‐Vinegary‐ 13 Mustiness 3 Fusty 4 Vinegary and fusty 3 Rancid 3
Extra‐virgin Green and fruity 11
The samples were characterized by the set of volatiles that are responsible for sensory
defects (Table 3.2). The first result was the absence of volatiles at concentrations 1.5 higher than
their odour thresholds in samples classified as extra‐virgin. A concentration 1.5 times higher than
their odour thresholds would mean that those volatiles may be perceived even in combination with
other volatiles in the matrix. As the concentrations were lower than these limits in extra virgin olive
oil, it means that volatiles identified as responsible for detective aroma descriptors do not contribute
to extra‐virgin aroma, which agrees with the definition of this designation where no defects must be
perceived (Table 2.18). Thus, the objective was to distinguish extra‐virgin samples from the other
Deliverable 4.3, version 1, 12‐12‐2016
33
designations with intense (ordinary virgin olive oil) or slight (virgin olive oil) sensory defects. Also,
there is a high interest in detecting, if possible, virgin olive oil samples characterized with very slight
sensory defects that could be problematic samples for panellists. The challenge was to check if there
is any kind of agreement between the absence and very slight presence of one or more detects
according to experts of stakeholders and the concentrations of the volatiles responsible for sensory
defects.
This study allowed a discussion about the role of three classical kinds of volatiles when
explaining sensory descriptors of virgin olive oil aroma. Figure 4.1 shows the concentrations (mg/kg)
of nonanal determined in the 48 samples of the study. This compound results from the chemical
oxidation of C9 fatty acids, and consequently it is not produced by any biochemical pathways in the
natural olive ripeness process. It means that the presence of this compound is an indicator of olive oil
rancidity (this volatile smells like wax and fatty) (Morales et al., 2013). In consequence, if panellists
(sensory assessors) do not detect the rancid descriptor in a virgin olive oil with higher enough
concentration of nonanal (e.g. more than three times its odour threshold), it can be inferred that the
sample is not fresh and the rancid perception is masked by some intense positive descriptors (i.e.
fruity, green, tomato). Furthermore, rancidity would be perceived as sooner as the concentrations of
volatiles masking nonanal decrease.
A volatile compound is detected by panellists if, and only if, its concentration is higher than
its odour threshold (OT). It means that a volatile with a concentration in olive oil lower than its OT
cannot contribute to aroma. The nonanal odour threshold is 0.15 mg/kg. However, this odour
threshold was determined in refined olive oil, where no other volatile compounds are present, which
is the usual and widely accepted procedure. It means that concentrations that are higher than the
odour threshold might not be detected in extra‐virgin olive oils (false negatives) because of the
masking process with desirable aroma descriptors as already said. Nevertheless, in the studied
samples, the lowest concentrations of nonanal (Figure 4.1) correspond to extra‐virgin olive oils
because this designation is qualified with absence of any sensory defect. In fact, the concentrations
of nonanal in the EVOOs are lower than OTs. Figure 4.1 shows also a dotted line that corresponds to
a concentration that is three times the nonanal OT. This concentration could be reasonably high
enough to contribute to VOO aroma even in the presence of other many compounds.

Deliverable 4.3, version 1, 12‐12‐2016
34
Figure 4.1 Concentrations of nonanal (mg/kg) determined in the 48 samples supplied by stakeholders. Nonanal odour threshold (OT) (0.150 mg/kg) and three times the OT are shown in the figure with a dotted line. samples beginning with “E” were qualified as extra-virgin olive oils (EVOO) by panel test.
Another type of volatile marker is acetic acid. Acetic acid is not only the marker of winey‐
vinegary aroma sensory descriptor but also the main responsible of this perception when smelled by
panelists. The etiology of acetic acid is an alcoholic fermentation due the combined action of yeasts
(saccharomyces, pischia, candida) and acetobacteria, the latter promoting the reaction ethanol (ADH
enzyme) acetaldehyde (ALDH enzyme) acetic acid. Acetic acid has been determined in all the
virgin olive oil designations (extra, virgin, ordinary and lampante), from very low to high
concentration. Thus, the perception of acetic acid when it is present at low concentrations is masked
by other volatiles, while this compound clearly contributes to a vinegary aroma when it is present at
high concentration. On the other hand, a sample qualified with this defective sensory aroma but with
very low concentration of acetic acid is suited to be an error, and this case would be a paradigm of
false positive. Figure 4.2 displays the concentrations of acetic acid in the set of samples supplied by
stakeholders. At first sight, only a few olive oils have concentrations of acetic acid lower than its
odour threshold. However, the masking process is so high that EVOO with appreciated
concentrations of acetic acid might not be enough as to detect a vinegary aroma by panelists. That
might be the case of EVOOs with concentrations around three times the acetic acid OT (dotted line in
Figure 4.2). All the samples upper the dotted line correspond to samples with an intense perception
to winey or vinegary or fusty or mustiness sensory descriptors.
E45
E48
E38
E46
E47
E42
E44
E39
E43
E41
E40 31 30 27 16 15 29 20 5 11 13 19 8 25 36 35 9 22 33 4 3 24 10 26 2 21 34 37 23 14 1 18 7 6 17 32 28 12
Samples (order number)
0.00
0.25
0.50
0.75
1.00
1.25
1.50
1.75
2.00
2.25
Non
anal
(mg/
kg)
OT determined in a refined olive oil matrix
Approx three times OT

Deliverable 4.3, version 1, 12‐12‐2016
35
Figure 4.2 Concentrations of acetic acid (mg/kg) determined in the 48 samples supplied by stakeholders. Acetic acid odour threshold (OT) (0.50 mg/kg) and three times the OT are shown in the figure with a dotted line. Note: samples beginning with “E” were qualified as extra-virgin olive oils (EVOO) by panel test.
Another type of volatile marker is ethanol. The metabolic etiology of ethanol also includes
the alcoholic fermentative process itself. The presence of ethanol cannot be exclusively associated to
a fermentation process during the olive oil extraction process but also the natural process of olive
ripeness. Despite the origin cannot be fermentative and it is present in all the virgin olive oil samples,
even in the highest quality ones, it has been suggested as a negative marker of EVOO. Thus, it would
be an error to suggest that EVOO should not have ethanol or at very low concentration as suggested
by some professionals. Furthermore, the ethanol odour threshold (30 mg/kg) is so high that it does
not contribute to olive oil aroma in most of the cases, even in many lampante virgin olive oils with a
high intensity of defects (Morales et al., 2013). This is the case of volatiles that can be markers of
inadequate good manufacturing practices when processing olives but they cannot be related to virgin
olive oil quality as suggested by some researchers. Figure 4.3 confirms these statements as EVOO
samples are spread over the range of concentrations of ethanol determined in 48 samples supplied
by stakeholders.
9 14 24 4 7E4
5E4
6E4
0 32 17 1 21 36 28 E42 6 37 18 26 E48
E39
E47 10 E44
E38
E41
E43 15 13 12 16 19 5 11 23 22 31 27 2 30 8 25 20 29 3 35 33 34
Samples (order number)
0.0
0.5
1.0
1.5
2.0
2.5
3.0
3.5
4.0
4.5Ac
etic
aci
d (m
g/kg
)
OT determined in refined olive oil matrix
Approx. three times OT

Deliverable 4.3, version 1, 12‐12‐2016
36
Figure 4.3 Concentrations of ethanol (mg/kg) determined in the 48 samples supplied by stakeholders. Ethanol odour threshold (OT) (30 mg/kg) is higher than the maximum concentration determined in the set of samples. Note: samples beginning with “E” were qualified as extra-virgin olive oils (EVOO) by panel test.
The last study of a routine application at industrial plant level was to distinguish extra virgin
olive oils from the other designations (virgin and ordinary) of lower sensory quality. The negligent
behaviour of some few dishonest sellers to label VOOs as EVOOs is the origin of an increasing malaise
of consumers to olive oil sensory assessment (García‐González and Aparicio, 2010). Any objective
methodology, based on the chemical composition directly and undoubtedly responsible for the
aroma is widely demanded by olive oil actors. This is the case of method determining the volatile
composition responsible for sensory defects.
Figure 4.4 shows the result of applying the statistical procedure of Principal Component
Analysis (PCA) to volatile markers of sensory defects (Table 3.2). Information reported by the
selected set of volatiles is not only able to distinguish EVOOs from the other lower virgin designations
but also seems to show a certain possibility of distinguish between virgin and ordinary oils on the
basis of the concentrations of the volatiles responsible for sensory defects. The main challenges may
be to establish some concentration limits and an easy way of interpretation and the evaluation of the
robustness when being used in many cultivars and quality levels. These challenges are, however,
among the final objectives of a recently approved EC funded project (OLEUM) to which some
partners of this work package are going to contribute.
14 25E
47 32 28E
42 17E
41 30 7 6 31E
39E
46 27 1 18 10 26 21 9 37E
40 5 29 12E
44E
38 11 3E
43 24 16 2 13 23 4 8 35 20 34E
48E
45 33 19 36 15 22
Samples (order number)
0
2
4
6
8
10
12
14
16
18
20
22
24
Etha
nol (
mg/
kg)

Deliverable 4.3, version 1, 12‐12‐2016
37
Figure 4.4 Principal Component Analysis applied to 48 samples supplied by stakeholders. Confidence Ellipse at 90% have been plotted for extra virgin olive oils (coded E). Almost 64% of the variance is explained by first two components.
5. Advantages on non-targeted analysis at plant level
From the results described in Deliverable 4.2 concerning the geographical identification by
non‐targeted techniques it can be inferred that this application still needs some improvements
before being applied at plant level. For that reason, the determination of volatile compounds was
selected to be checked with real samples collected at plant to providing quality assessment.
Regardless the results obtained in this study, it is clear that non‐targeted techniques provide some
clear advantages in analysing samples providing rapid data. The work carried out in this Work
Package has allowed a fruitful discussion among partner to extract some conclusions, which are
described below.
According to the implementation on plant level, valuable lessons could be learned.
Continuous monitoring of olive oil can be performed by Process Analytical Technology (PAT), setting
Critical Process Parameters (CCP), and Critical Quality Attributes (CQA) to monitor in‐line or on‐line.
Suitable techniques for PAT monitoring are vibrational spectroscopic techniques such as NIR, FTIR,
MIR and Raman. Using continuous monitoring, it is relatively simple to detect defects in CQA and
store a certain batch of olive oil in a separate container for further inspection. Upon examination of
VV V
V
V
VV VV
V
V VV
V
V V
VV
V
VV
V V
V
V
VE
EEE
E
E
E
E
EE
E
O
O
OOO
O
O
OO
O
O
-3 -2 -1 0 1 2 3
Factor 1 (34.94%)
-4
-3
-2
-1
0
1
2
3
4
Fact
or 2
(28.
97%
)
VV V
V
V
VV VV
V
V VV
V
V V
VV
V
VV
V V
V
V
VE
EEE
E
E
E
E
EE
E
O
O
OOO
O
O
OO
O
OLegend:E: extra‐virgin olive oilV: virgin olive oilO: ordinary virgin olive oil

Deliverable 4.3, version 1, 12‐12‐2016
38
the suspected olive oil batch, non‐targeted techniques such as mass spectrometry (IRMS, HD‐MS)
and/or NMR can be employed to completely analyse the sample on details to determine the cause of
the CQA. Depending on the size and quality control budget, the level of sophistication of the PAT
equipment and off‐line analysis methods can be determined.
In particular, non‐targeted spectroscopy has the potential to improve both the quality and
safety of commodities when used either an in‐line or at‐line capability. For example, high field
nuclear magnetic resonance (NMR) spectroscopy has the capability to determine the oxidation state
of oils, determination of free fatty acids, presence of trans‐fats, degree of saturation, confirmation of
geographical origin and the presence of adulterants. The strength and versatility of NMR
spectroscopy is derived from the fact that resonance peaks correspond to specific, interpretable,
chemical groups. Furthermore, the acquisition of data can be designed such that the resonance
peaks observed are quantitative, allowing the concentration of multiple components to be accurately
determined in a single run. Within a specific concentration range, dependant on the instrument type
and time of acquisition, all compounds containing the nuclei of interest (typically hydrogen) will be
detected. The technology is therefore, a fingerprinting tool, and a spectrum provides a profile that is
influenced by all components within the oil. In terms of product quality, this can be used to ensure
consistency between batches; and in terms of food fraud it allows for detection of unknown
compounds without a priori knowledge of their existence.
High‐field NMR spectroscopy does have some significant drawbacks, instrumentation is
expensive with high purchase and maintenance costs, and it requires dedicated specialised housing
facilities. The technology required dedicated trained operators. Practically, samples require
dissolution and the most suitable solvent, chloroform, is not amendable to use within a food plant;
this also prevents in‐line analysis. Potential solutions to these drawbacks include the developing field
of benchtop NMR spectrometers. Benchtop NMR spectrometers use the same phenomenon that is
exploited in high field NMR spectroscopy, albeit with limited sensitivity. Currently the technology is
rapidly developing, leading to increases in sensitivity and reproducibility and it is expected that it will
be a tool that can offer solutions to the food industry.
The advantages of non‐targeted profiling is the ability to compute required quality
parameters, as detailed above, simultaneously whilst looking for deviations of the profile from
previous batches. This captures information that is not defined, and therefore controlled, by the
aforementioned quality control parameters. In effect, the non‐targeted data provides a new
specification for the olive oil, leading to more consistent batches. Furthermore, storing the non‐

Deliverable 4.3, version 1, 12‐12‐2016
39
targeted data enables retrospective data analysis if required, to tackle issues such as product
complaints and product counterfeiting.
On the other hand, non‐targeted metabolomics/lipidomics is also proposed for the analysis
of all the detectable metabolites in a vegetal sample, including chemical unknowns. The main
advantage offered by this approach is the opportunity to discover novel compounds including the
possibility of detect e.g. unknown adulterants as well as specific authenticity markers. The main
problem is the development of analytical procedures, but standardisation and validation of these
methods are not completely fit for purpose yet, which is fundamental for the applications the
methods by industry and regulatory bodies. Furthermore, this non‐targeted method generate an
amount of data and thus need high performance bioinformatics tools. The statistical techniques used
are complex and difficult to understand by industries or regulatory bodies, which are not always
willing to accept evidence based on statistics. Thus, successful applications of such methods strongly
depend on the experimental setup (examined material authenticity, aim of the study, etc.), including
the data treatment. In fact, one of the major issues related to non‐targeted methods utilization is
implementing a correct data interpretation, which generally requires an experienced specialist and
time consuming data evaluation.
In general terms, some relevant issues in promoting the use of non‐targeted analysis at plant
level are the following:
1. Some characteristics (e.g. oxidation status of the oil) can be extracted from the spectral
information as an alternative to long and non‐accurate classical methods that are typically used.
2. Some of the current problems today are more adapted to a spectroscopy approach. For example,
geographical traceability, which is still demanded by consumers, require analyzing a large number of
compounds. Performing this analysis by chromatography would be time consuming and expensive.
Other challenge today more adapted to spectroscopic solutions is detecting unexpected
authentication problems.
3. Some regulatory bodies are reluctant to applying spectroscopic techniques and a big effort is
required for presenting the advantages of this analytical tools in scientific and regulatory fora. This
problem is in many cases due to a "conceptual barrier", rather than actual problems. For example,
there are some classical methods that present some problems (e.g. precision) and they are standard
methods today.

Deliverable 4.3, version 1, 12‐12‐2016
40
4. A feedback industry‐research is still necessary to promote the improvement of these methods. As
soon as some methods reach the industry, their feedback will serve to open new perspectives and
new strategies of improvement.
5. Due to the excellent precision values of these techniques, some modification can be done to get
smaller instruments. Although these smaller instruments may have less precision, their
characteristics are still good enough to get instrument that provides reliable information, with the
advantage of being portable.
6. Protocols: Analytical aspects
As already explained, the work package has been focused on the application of non‐targeted
methods in the particular case of geographical identification of virgin olive oil, which was proven to
be a relevant objective in the survey described in Deliverable 4.1. In this section, the protocols of the
non‐targeted methods used by the partners are described (Table 6.1). This information was
considered to be important to compare the results of each one of the analytical solutions employed.
Table 6.1. Techniques and instrumentation used by the partners that contributed to the deliverable.
Technique Partner (Developer) Section 13C‐NMR FERA 2.1 1H‐NMR Eurofins 2.2 δ13C‐, δ18O‐, δ2H‐IRMS Eurofins 2.2 FT‐Raman CRA‐W 2.3 NIR DLO 2.4 δ13C‐, δ18O‐, δ2H‐IRMS FEM 2.5 13C/12Cfatty acids ‐IRMS FEM 2.5 FTIR CSIC 2.6 1H‐NMR UNIROMA 2.7 NIR, FTIR, FT‐Raman QUB 2.8 U‐HPLC‒HRMS/MS VSCHT 2.9 E‐Nose COPITALA 2.10
6.1. Partner: FERA
13C-NMR Scope
This method describes the determination of the geographical provenance (European and
non‐European) of virgin olive oil by 13‐C NMR spectroscopy.
Analytical Principle
The determination of 13C by nuclear magnetic resonance (NMR).

Deliverable 4.3, version 1, 12‐12‐2016
41
Reagents
VOO samples are dissolved in a mixture of the following reagents: Deuterated chloroform
(CDCl3) and Tetramethylsilane (TMS).
Apparatuses
‐ Bruker 500 MHz (11.7 T) NMR spectrometer equipped with a 5 mm BBO probe tuned to
observe 13C. All NMR spectra were acquired at 300 K and then processed using Topspin 2.13
patch level 6 (Bruker, Germany).
‐ Vortex mixer.
‐ NRM tubes.
Analytical Procedure
A. Sample preparation
The olive oil samples were homogenised by roller mixing for 1 hour prior to preparation.
Samples for 13C NMR analysis were prepared following a protocol based on that of Vlahov et al.
(2010). Specifically, olive oil samples (200 ±20 mg) were dissolved in deuterated chloroform (CDCl3,
700 µl 0.03% v/v TMS). To ensure consistency, the accurate mass of sample was recorded and the
volume of deuterated chloroform added at a ratio of 3.5 µl per mg. Dissolved samples were vortex
mixed for 5 minutes prior to transfer of 600 µl to clean labelled NMR tubes. To prevent evaporation
of CDCl3, tubes were capped and sealed with parafilm. Samples were analysed within 24 hours of
preparation.
Each one of the main study samples were prepared and analysed in a random order
generated by random.org. After sample preparation, the main study samples were stored under
nitrogen in a darkened environment at room temperature to preserve.
B. Acquisition and data analysis
Spectra were acquired as quantitative 13C spectra using the inverse gated 13C pulse sequence
(zgig) to ensure that no NOE enhancement was observed. An observation pulse length of 4.5 μs (45°)
and a delay between transients of 20 s were used. It was acquired 65536 complex data points with a
spectral width of 236.59 ppm, giving an acquisition time of 1.1 s. Eight unrecorded (dummy)
transients and 256 acquisition transients were used, which mean a total experiment time of
approximately 93 minutes.
One‐dimensional (1D) 13C NMR spectroscopic data were processed using FELIX software
(Accelrys, San Diego, CA, USA). A sine‐bell shaped window function phase shifted by 90° was applied
over all data points before line broadening (1 Hz), Fourier transformation, phase and baseline
correction. The chemical shift of all the data was referenced to the TSP resonance at 0 ppm. The area

Deliverable 4.3, version 1, 12‐12‐2016
42
of the residual chloroform resonances (triplet – 76.7 ‐ 77.5 ppm) was set to unity for all the spectra
acquired.
To perform data analysis, 13C NMR spectroscopic data were de‐noised by thresholding the
data. The maximum single intensity of the noise region (175.0 – 218.3 ppm was determined and a
threshold of three times this value taken. All values under this threshold were set to zero. No
spectral binning was performed as it was assumed that variations in the chemical shift due to free
acidity would assist in geographical origin determinations.
Cost
Sample analysis cost would be 350 €.
6.2. Partner: Eurofins 1H-NMR
Scope
The objective is the evaluation of the efficiency of 1H NMR spectroscopy to discriminate
between European and non‐European origins of virgin olive oils.
Analytical Principle
The determination of 1H by nuclear magnetic resonance (NMR).
Reagents
Samples were dissolved in deuterated chloroform CDCl3 solvent.
Apparatus
‐ Bruker 400MHz spectrometer.
Analytical Procedure
Spectra were acquired at 301.8K using a Bruker 400MHz spectrometer equipped with a 5mm
BBI probe tune to observe 1H. Spectra were acquired using a zg sequence. An observation pulse
length of 8.17 µs was calibrated for a 90° classic zg sequence with a delay d1 of 10s and an
acquisition time of 3.98s. Spectra were obtained with 16 scans preceded by 4 dummy scans in a
range of 20.5 ppm. All NMR spectra phases were adjusted before pretreatments. The pretreatments
and statistical method were realized using the Statistical Toolbox of Matlab software, version R2009a
(The MathWorks, Natick, Massachusetts, USA).
Cost
Sample analysis by NMR cost would be 250 €.
δ13C-, δ18O-, δ2H-IRMS

Deliverable 4.3, version 1, 12‐12‐2016
43
Scope
The objective is the evaluation of the efficiency of IRMS spectroscopy with the 3 isotopic
parameters on the bulk oil: δ13C, δ18O and δ2H to discriminate between European and non‐European
origins of virgin olive oils.
Analytical Principle
The determination of δ13C, δ18O and δ2H isotopes by IRMS spectroscopy, and evaluation of
the IRMS efficiency on the bulk oil.
Reagents
Isotopes
‐ Tin and silver capsules. ‐ P2O5 at 97%. ‐ Nitrogen gas. ‐ Reference materials: fuel oil NBS‐22 and sugar IAEA‐CH‐6 (IAEA) for 13C/12C measurement;
IAEA‐CH‐6 (IAEA) for 18O/16O and NBS‐22 for D/H.
The isotopic values of the aforementioned international reference materials and therefore
also of the samples were expressed in δ‰ vs. V‐PDB (Vienna ‐ Pee Dee Belemnitella) for δ13C and
VSMOW (Vienna – standard mean ocean water) for δ18O and δD, according to the following formula:
[(RsRstd)/Rstd] 1000, where Rs is the isotope ratio measured for the sample and Rstd is the isotope
ratio of the international standard.
Apparatuses
The determinations were carried out on a Delta V Advantage (Thermo, Bremen, Germany)
connected to a FlashEA 1112 Elemental Analyser (Thermo, Bremen, Germany). The 18O/16O
determinations were carried out on a Delta V Advantage (Thermo, Bremen, Germany) connected to a
FlashHT Pyrolyser (Thermo, Bremen, Germany) and 2H/1H determinations were carried out on a
Isoprime (Elementar, Hanau, Germany) connected to a EuropyrOH pyrolyser (Elementar, Hanau,
Germany) (Camin et al., 2010). These parameters are continuously controlled by a proficiency testing
scheme, namely FIT‐PTS (Food analysis using Isotopic Techniques – Proficiency Testing Scheme,
http://www.eurofins.com/food‐and‐feed‐testing/food‐testing‐services/authenticity/fit‐pts). Eurofins
is also accredited on these 3 determinations by the French accreditation body COFRAC (more details
on http://www.cofrac.fr/Annexes/Sect1/1‐0287.pdf).
Analytical Procedure
A. Samples preparation
Isotopes. Sample aliquots of 0.3 mg were weighed in tin capsules for determination of 13C/12C and
silver capsules for quantification of 18O/16O and 2H/1H. For 13C/12C. For 18O/16O and D/H analysis, the

Deliverable 4.3, version 1, 12‐12‐2016
44
samples were stored in a desiccator above P2O5 for at least 24 h, then weighed into silver capsules
and put into the auto‐sampler equipped with a suitable cover. During measurement, dryness was
guaranteed by flushing nitrogen continuously over the samples. The pyrolyser temperature was 1450
C. The D/H and 18O/16O ratios of bulk olive oils were measured simultaneously in one run. The IRMS
measured first D/H and then, following the magnet jump, 18O/16O, taking about 10 min for each
sample. Before measuring D/H, the H3 factor, which allows correction of the contribution of [H3]+ to
the m/z 3 signal, was verified to be lower than 9.
B. Acquisition and data analysis
The isotope ratios were expressed in δ % versus V‐PDB (Vienna ‐ Pee Dee Belemnite) for
δ13C and V‐SMOW (Vienna ‐ Standard Mean Ocean Water) for δ18O and δD, according to the
following formula: [( R s ‐ Rstd)/ Rstd ] 1000, where R s is the isotope ratio measured for the sample
and Rstd is the isotope ratio of the international standard. The values were calculated against in‐
house oil standards, which were themselves calibrated against international reference materials: fuel
oil NBS‐22 and sugar IAEA‐CH‐6 (IAEA) for 13C/12C, benzoic acid IAEA‐601 (IAEA) and IAEA‐CH‐6 (IAEA,
with δ18O = þ36.4% vs V‐SMOW) for 18O/16O and NBS‐22 for D/H.
Cost
Sample analysis by IRMS cost would be 305 €.
6.3. Partner: CRA-W
FT-Raman
Scope
The method describes the possible discrimination of olive oil samples according to their
origin (EU vs. non EU) based on the spectroscopic Raman data.
Analytical Principle
From a chemical point of view, Raman spectroscopy is based on the vibrational transitions
occurring in the ground electronic state of the molecules. Raman scattering arises from the changes
in the polarisability or shape of the electron distribution in the molecule as it vibrates.
Apparatus
Figure 6.3.1 shows the Raman instrument used in this study, which is a Vertex 70 from
Bruker.

Deliverable 4.3, version 1, 12‐12‐2016
45
Figure 6.3.1: Raman instrument installed at the CRA-W and sample presentation device
Analytical Procedure
The parameters used in this work are as follows: resolution of 4 cm‐1, 128 scans and
wavenumber from 4000 to 0 cm‐1.
A. Data analysis
Two methods for data reduction are applied here: Principal Component Analysis (PCA) and
the Fisher Criterion (FC).
Principal Component Analysis (Massart et al., 1988) is used to reduce the data
dimensionality, and the selected features were used as the input of the classifiers.
PCA creates new orthogonal variables (scores or latent variables) that are linear
combinations of the original measured x‐variables (absorbances at different wavelengths). This can
be achieved by the method known as singular value decomposition of X:
nxmnxnnxmnxnnxnnxm PTPUX '' =Λ= being
U is the normalised score matrix T is the unnormalised score matrix. P is the loading matrix and the column vectors of P are called eigenvectors or loadings.
Fisher criterion (FC): This criterion (Duda and Hart, 1973) describes the ratio of between‐class
variance/within‐class variance that is helpful to decide which original variables have an important
discriminating power.
Discriminant analyses: Partial Least Squares Discriminant Analysis (PLS‐DA): PLS‐DA (Martens and
Naes, 1989) is a multivariate classification method based on PLS. PLS‐DA works to explain maximum
separation between defined classes in the data. It is done by a PLS regression against the dummy
matrix Y (+/‐1 for a two class model) which describes variation according to class.
All computations, chemometric analyses, and graphics were carried out with programs developed in
Matlab (The Mathworks, Inc., Natick, MA, USA) and the PLS Toolbox 8.1 (Eigenvector Research Inc.).
Deliverable 4.3, version 1, 12‐12‐2016
46
Cost
Sample analysis by Raman cost would be 4.50 €.
6.4. Partner: DLO
NIR
Scope
The method describes the procedure for performing a NIR examination in the infrared region
in virgin olive oil samples.
Analytical Principle
Near‐infrared spectroscopy (NIR) is a spectroscopic method that uses the near‐
infrared region of the electromagnetic spectrum (from about 14000‐4000 cm‐1) resulting in a NIR
fingerprint of the sample.
Apparatuses
‐ Spectra were acquired on a Büchi NIR Flex with liquid cell module. ‐ NIR tubes.
Analytical Procedure
NIR spectra were acquired in duplicate in transmission modus in a range of 1000 – 2500 cm‐1
at 37 ºC.
A. Data analysis
Initial screening of the analysis results was performed by The Unscrambler X 10.3 (Camo
Software, Norway). For each data‐set, three types of transformations were tested; SNV, 1st and 2nd
order Savitzky‐Golay (Gap 5). Each transformed data‐set was subsequently subjected to unsupervised
multivariate analysis (PCA) and supervised multivariate analysis (PLS‐DA).
After selection of the most discriminant dataset (EU‐nonEU), extensive supervised external
validation (PLS‐DA) by a customized R‐script (R‐gui, Switzerland). Training sets consisting of 80% of
the data‐set were randomly compiled and the remaining 20% of the data was predicted. This loop
was repeated 500 times so that every individual spectrum was predicted on average 103 times. The
R‐script code is available on request.
Cost
Sample analysis by NIR cost would be 20 €.
Deliverable 4.3, version 1, 12‐12‐2016
47
6.5. Partner: FEM
δ13C-, δ18O-, δ2H-IRMS
Scope
Determination of stable isotope ratios of the bioelements carbon, hydrogen and oxygen
(13C/12C, 2H/1H, 18O/16O) in bulk olive oils.
Analytical Principle
The H, C, and O isotopic composition of olive oils is related to the climatic conditions (relative
humidity, temperature, amount of precipitation) and geographical characteristics (distance from the
sea or other evaporation source, altitude, latitude) of the area where the plants grow. In the specific,
considering plants of a unique botanical origin, the 13C/12C ratios of plant compounds are affected by
several environmental and physiological factors that influence the stomatal conductance and the
intercellular and ambient CO2 concentration, such as relative humidity, temperature, amount of
precipitation, water stress, plant age, and maturation. The 2H/1H and 18O/16O ratios of plant material
reflect (a) the ratios of water uptake by the plant (linked to latitude, elevation, distance from the
evaporation source, temperature, and amount of precipitation), (b) the evaporative and diffusional
effects during transpiration (affected by relative humidity, temperature, isotope composition of
water vapor), and (c) the biosynthetic pathways including the isotopic exchange between organic
molecules and plant water.
Reagents
‐ P2O5.
Apparatuses − 2H/1H and 18O/16O determinations: Finnigan DELTA XP coupled with a pyrolyser (Finnigan
TMTC/EA, high temperature conversion elemental analyser, Thermo Scientific). The Pyrolyser
was with a Molecular Sieve 5A (1.2 m) GC column (Figure 6.5.1).
− 13C/12C determination: Isoprime IRMS (Elementar Analysensysteme GmbH, Germany)
coupled with an elemental analyser (Vario Isotope Cube, Elementar Analysensysteme GmbH,
Germany). To separate the gases, the Elemental Analyser was supplied with three molecular
sieves traps (Figure 6.5.2).
− Devices were interfaced with the IRMS through a dilutor (Conflo III, Thermo Scientific).
Analytical Procedure
Aliquots of 0.2 mg of sample were weighed in tin capsules for determination of 13C/12C and
silver capsules for quantification of 18O/16O and 2H/1H. For 18O/16O and 2H/1H analysis, the weighed

Deliverable 4.3, version 1, 12‐12‐2016
48
samples were stored in a desiccator above P2O5 for at least 4 days before analysis, then put into the
auto‐sampler equipped with a suitable cover. During measurement, dryness was guaranteed by
flushing nitrogen continuously over the samples. The pyrolyser temperature was 1450 °C. The 2H/1H
and 18O/16O ratios of bulk olive oils were measured simultaneously in one run. The IRMS measured
first 2H/1H and then, following the magnet jump, 18O/16O, taking about 10 min for each sample.
Before measuring 2H/1H, the H3 factor, which allows correction of the contribution of [H3]+ to the
m/z 3 signal, was verified to be lower than 9.
Figure 6.5.1. Determination of δ2H, δ13C and δ18O in bulk VOOs.
Figure 6.5.2. GC-MS/C/IRMS instrument.
The isotopic values were expressed in δ‰, (δ‰ = Rstd‐Rsample/Rstd), where Rsample is the
isotope ratio measured for the sample and Rstandard is the isotope ratio of the international standard.
Sample analyses were carried out in duplicate. The isotopic values were calculated against working
in‐house standards (extra virgin olive oils), which were themselves calibrated against international
reference materials: fuel oil NBS‐22 (IAEA‐International Atomic Energy Agency, Vienna, Austria) and

Deliverable 4.3, version 1, 12‐12‐2016
49
IAEA‐CH‐6 Sucrose for 13C/12C, and benzoic acid‐601 for 18O/16O. For δ2H beside the olive oil standards
(calibrated against NBS‐22 and IAEA‐CH‐7 Polyethylene, through the building of a linear relationship),
a second standard with a different δ2H value (magnesium stearate of the FIRMS FT scheme, δ2H
value: ‐228‰) was used.
The isotopic values were expressed in δ‰ vs. VPDB (Vienna Pee Dee Belemnite) for δ13C and
VSMOW (normalised in relation to the Vienna Standard Mean Ocean Water – Standard Light
Antarctic Precipitation VSMOW‐SLAP standard scale) for δ18O and δ2H.
Cost
Sample analysis by δ13C‐, δ18O‐, δ2H‐IRMS cost would be 189 €.
13C/12Cfatty acids -IRMS
Scope
Determination of stable isotope ratios of the carbon (13C/12Cfatty acids) in the four main fatty
acids (oleic acid, palmitic acid, stearic acid and linoleic acid) obtained by the trans‐esterification of
triglycerides from olive oils.
Analytical Principle
For the specific factors affecting stable isotope ratio of carbon see the previous Analytical
Principle section for bulk olive oil analysis. The Compound Specific Isotope Analysis (CSIA) allows
specific compounds to be targeted that are important to the overall make‐up of the particular
foodstuff. Thus, it has been carried out the determination of stable isotope ratios of the carbon
(13C/12Cfatty acids) in the four main fatty acids (oleic acid, palmitic acid, stearic acid and linoleic acid)
obtained by the trans‐esterification of triglycerides from olive oils.
Apparatuses 13C/12C determination:
‐ Trace GC Ultra (GC IsoLink + ConFlo IV, Thermo Scientific) equipped with an an autosampler
(Triplus, Thermo Scientific) and interfaced with an IRMS (DELTA V, Thermo Scientific) through
an open split interface and with a single‐quadrupole GC‐MS (ISQ Thermo Scientific) to
identify the compounds.
‐ Finnigan DELTA XP (Thermo Scientific, Bremen, Germany) coupled with an elemental
analyser (Flash EATM1112, Thermo Scientific). To separate the gases, the Elemental Analyser
was supplied with a Porapack QS (3m; 6 x 4 mm, OD/ID) GC column.
Reagents
‐ Hexane.
Deliverable 4.3, version 1, 12‐12‐2016
50
‐ Heneicosane. ‐ Methanol. ‐ Sodium Hydroxide. ‐ A BPX‐70 capillary column (60 m × 0.32 mm i.d. × 0.25 μm film thickness; SGE)
Analytical Procedure
An amount of 0.1g of olive oil was weighed into a 10 ml vial with 4 mL of hexane and 100 µL
of heneicosane (40 mg mL‐1 in hexane) as internal standard. Sample was trans‐esterified with 1 mL of
2 M methanolic sodium hydroxide solution and shaken for 1 min. The mixture was let stratify until
the upper layer became clear. 1 mL of the hexane solution was filtered and then injected into the GC‐
C‐IRMS.
Carbon isotope ratio (13C/12C) of the individual fatty acid methyl esters (FAME) was carried
out injecting 1 µL of solution in split mode (1:10). A BPX‐70 capillary column with He as carrier gas (at
a flow of 1 mL/min) was used. The injector temperature was set at 250 °C, and the oven temperature
of the GC started at 50 °C at which it was held for 4 min before heating at 30 °C/min to 170 °C, at 2
°C/min to 200 °C and finally at 1 °C/min to 210 °C. The eluted compounds were combusted into CO2
and H2O in a combustion furnace reactor operated at 1030 °C and composed of a nonporous alumina
tube (320 mm length) containing three wires (Ni/Cu/Pt, 0.125 mm diameter, 240 mm identical
length) braided and centered end‐to‐end within the tube. Water vapour was removed by a water‐
removing trap, consisting of a Nafion membrane.
The δ13C values are reported relative to reference CO2 of known carbon isotopic
composition, introduced directly into the ion source at the beginning and end of each run. All
samples were measured in triplicate, and the isotope ratios were expressed in δ‰ versus V‐PDB
(Vienna − Pee Dee Belemnite) for δ13C according to equation
δ‰ = Rstd‐Rsample/Rstd
where: Rsample is the isotope ratio measured for the sample, and Rstd is the isotope ratio of the internationally accepted standard.
To calculate δ13C values, a mixture of FAME reference standards was analysed before and
after every three samples to account for δ13C drift within the run. The instrumental data for each
sample were corrected on the basis of the difference existing between the δ13C value of the pure
compound in GC/C‐IRMS and that in EA‐IRMS. Moreover, the isotopic value of the internal standard
heneicosane added to each sample was checked to monitor the fatty acids (FA) extraction process.
Heneicosane was chosen as internal standard because it is not naturally present in olive oil. The δ13C
value of pure heneicosane was determined with EA‐IRMS.

Deliverable 4.3, version 1, 12‐12‐2016
51
Measured δ13C values for FAME are the product of both the carbon native to the molecule
and the contribution from the reagent (methanol) used for trans‐esterification. Therefore, an
empirical correction was applied to determine the effective carbon isotope value:
δ13CFA = [(Cn+1) δ13CFAME ‐ δ13CMeOH]/Cn
where: δ13CFAME, δ13CFA, and δ13CMeOH are the carbon isotopic values of FAME, fatty acid and methanol, respectively, and Cn is the number of C atoms in the fatty acid.
The δ13C of methanol was calculated by EA‐IRMS as a mean of 6 determinations.
Cost
Sample analysis by 13C/12Cfatty acids –IRMS cost would be 200 €.
6.6. Partner: CSIC
FTIR
Scope
This method describes the determination of FTIR spectra of virgin olive oil in order to obtain
chemical information related with geographical provenance (EU and non‐EU) of samples.
Analytical Principle
Fourier transform infrared spectroscopy (FTIR) has already been proven to be an appropriate
technique in the classification of virgin olive oils. FTIR spectra shows bands associated to functional
groups that can be related with specific chemical species. To classify samples into European and non‐
European oils by FTIR spectroscopy different accessories (ATR and transmission cells) are used.
Apparatus
Spectral data are collected using a Bruker Vertex 70 FTIR spectrometer (Figure 6.6.1)
equipped with a DGTS detector (Bruker Optics, Ettlingen, Germany).
Figure 6.6.1. FTIR spectrometer Vertex 70 used by the partner (CSIC).

Deliverable 4.3, version 1, 12‐12‐2016
52
The sampling station is equipped with different support of transmission cells
‐ KBr transmission cell with an optical path length of 150 μm. The cell used to collect the
spectra was a removable cell model 20510 (Specac, Orpington, UK). The spectral rage is
5000‐400 cm‐1; resolution 4 cm‐1 and scan number 22.
‐ CaF2 transmission cell (150 μm path length) with spectral range 6000‐900 cm‐1, resolution 4
cm‐1 and scan number 22 (Figure 6.6.2).
Figure 6.6.2. Transmission cells used by the partner(CSIC).
The samples are also analysed with the sampling station equipped with ATR multiple
bounces (6 bounces). The spectral range is 4000‐600 cm‐1, resolution 4 cm‐1 and scan number 50
(Figure 6.6.3).
Figure 6.6.3. ATR-FTIR used in the analysis of VOOs by the partner (CSIC).
Analytical Procedure
Transmission cells: Each spectrum is recorded at room temperature in the region of 5000− 400 cm−1
(KBr) and 6000‐900 cm‐1 (CaF2) using 22 scans at a resolution of 4 cm−1. Each sample was loaded into
the IR cell by using a micropipette (∼80 μL) and analysed in duplicate.
ATR: The spectrum is recorded at room temperature in the region 4000‐600 cm‐1, using 50 scans at a
4 cm‐1 of resolution. In this case, 250 µL per sample has been used, and the analyses were carried out
in duplicate.
In both cases (transmission cells and ATR), between samples, the cell or the ATR crystal was
thoroughly cleaned and dried by passing hexane through the cell or ATR by using vacuum and its
cleanliness was verified spectrally.
Spectra were examined using OPUS version 4.0 (Bruker Optics, Ettlingen, Germany) with
peak heights computed from the raw spectra and the results exported as ASCII data for further study
using Statistica version 8.0 (Statsoft, Tulsa OK) and Unscramble X 10.3 (CAMO software, Norway). For

Deliverable 4.3, version 1, 12‐12‐2016
53
each data‐set, different transformations were tested: SNV (standard normal variate) to remove
scattering effect and 1st and 2nd order Savitzky‐Golay derivative transformation. Each transformed
data‐set was subsequently subjected to unsupervised multivariate analysis (PCA) and supervised
multivariate analysis (PLS‐DA).
Cost
Sample analysis by FTIR costs would be 80 €.
6.7. Partner: UNIROMA1 1H-NMR
Scope
NMR approach together with a suitable statistical analysis has provided relevant results in
terms of olive oil geographical origin and adulteration. The scope of NMR metabolite profiling is to
verify the quality of olive oils and to define and confirm their geographical origin.
Analytical Principle
The NMR phenomenon is based on the fact that many nuclei have an intrinsic magnetic
moment. If an external magnetic field is applied, an energy transfer is possible between the base
energy to a higher energy level. The energy transfer takes place at a wavelength that corresponds to
radio frequencies and when the spin returns to its base level, energy is emitted at the same
frequency. The signal that matches this transfer is measured and processed in order to yield an NMR
spectrum for the nucleus concerned. The precise resonant frequency of the energy transition is
dependent on the effective magnetic field at the nucleus. This field is affected by electron shielding
which is in turn dependent on the chemical environment. As a result, information about the nucleus'
chemical environment can be derived from its resonant frequency and spin‐spin couplings.
Reagents
‐ Dimethyl sulfoxide deuterated (DMSO‐δ6) 99,9% D from EURISO‐TOP.
‐ Deuterated chloroform (CDCl3) 99,8% D EURISO‐TOP.
Apparatuses
‐ Bruker AVANCE 600 spectrometer operating at the proton frequency of 600.13 MHz (B0=
14.1 T) equipped with a Bruker multinuclear Z gradient 5 mm probe head.
‐ NMR tubes.
Analytical Procedure
A. Sample preparation
Deliverable 4.3, version 1, 12‐12‐2016
54
During the storage before the analysis the samples have to be protected from light and
oxygen in order to prevent the alteration of the product. The samples were analysed directly without
any extraction procedure which could degrade the product. Samples for 1H‐NMR analysis were
prepared by dissolving olive oil (20 µL), DMSO‐δ6 (20 µL) and CDCl3 (700 µL) directly in a 5 mm NMR
tube.
B. Acquisition and data analysis
The 1H‐NMR spectra were acquired at 300K using the following experimental conditions:
number of scans 1024; π/2 pulse ~8µs; time domain (TD) 64K data points; relaxation delay plus
acquisition time 3.5 s; spectral width 18.5 ppm. 1H‐NMR spectra were obtained by the Fourier
Transformation (FT) of the FID (Free Induction Decay) applying an exponential multiplication with a
line‐broadening factor of 0.3 Hz and zero filling (size = 64K) procedure. The resulting 1H‐NMR spectra
were phased manually. Chemical shifts were reported with respect to the residual CHCl3 signal set at
7.26 ppm. The baseline was corrected using the Cubic Spline Baseline Correction routine in the
Bruker Topspin software. In order to perform the statistical analyses, the intensity, i.e. the maximum
peak height, of 17 selected signals, was measured using an implemented semi‐automatic peak‐
picking routine present in the Bruker TOPSPIN software. The intensity of the selected signals was
compared with the intensity of the resonance at 2.251 ppm, due to α‐methylene protons of acyl
chains, normalized to 1000.
The intensities of the seventeen selected resonance were submitted to STATISTICA software
to carry out Principal Component Analysis (PCA) and Linear Discriminant Analysis (LDA). Moreover,
Partial Least Squares Discriminant Analysis (PLS‐DA) was performed using in‐house written functions
running under Matlab environment (release R2012b, version 8.0; The Mathworks, Natick, MA).
Discriminant classification techniques aim to find a relationship between a multivariate
independent vector X and a qualitative vector of responses. Accordingly, if a suitably designed
dummy response vector is introduced, traditional regression methods can be used also to tackle with
classification problems. In particular, when dealing with a classification problem involving 2 classes,
as in our case European and non‐European, one can build a dummy binary‐coded 1‐dimensional
response vector, so that, if a sample belongs to the class “European”, it will be coded as “1”, while if
it belongs to class “not European”, it will be coded as “0”. Under this assumption, to compute a
classification model corresponds to calculate the regression vector between the data matrix and the
dummy vector of responses.
In order to compute a classification model, PLS‐DA, as the name itself suggest, uses Partial
Least Squares Regression, i.e. computes a bilinear decomposition of both X‐ and Y‐spaces, under the

Deliverable 4.3, version 1, 12‐12‐2016
55
assumption that a relationship between the two internal spaces exists. The result is a linear classifier
that is statistically equivalent to Linear Discriminant Analysis, and it can be also applicable to all the
cases when LDA cannot be suitable (low number of samples to number of variables ratio and high
collinearity among the variables).
Cost
Sample analysis by NMR cost would be 100 €.
6.8. Partner: QUB
NIR, FTIR, FT-Raman
Scope
Calibration of models based on spectroscopic techniques to predict unknown olive oil
samples from European and non‐European origin.
Analytical Principle
Near‐infrared spectroscopy (NIR) uses the region of the electromagnetic spectrum (from
about 14000‐4000 cm‐1) that results in a fingerprint of the sample.
Raman spectroscopy is a spectroscopic technique commonly used in chemistry to provide a
fingerprint by which molecules can be identified. It relies on inelastic scattering, or Raman scattering,
of monochromatic light, usually from a laser in the visible, near infrared, or near ultraviolet range.
The laser light interacts with molecular vibrations, phonons or other excitations in the system,
resulting in the energy of the laser photons being shifted up or down. The shift in energy gives
information about the vibrational modes in the system. Infrared spectroscopy yields similar, but
complementary, information.
Apparatuses
FTIR
‐ Nicolet iS5 Thermo Scientific (Thermo Fisher Scientific, Dublin, Ireland). ATR iD7 accessory‐
diamond. Detector: DTGS KBr. Beamsplitter: KBr. Software: OMNIC.
RAMAN
‐ Ocean Optics. Software: OceanView Product version 1.5.2.
NIR
‐ Thermo Scientific FT‐NIR. Software: R Result Integration.
Analytical Procedures

Deliverable 4.3, version 1, 12‐12‐2016
56
FTIR, NIR and FT‐Raman spectroscopy were used as screening techniques in order to create a
database of spectroscopic data from the olive oil samples. Appropriate number of replicates was
considered (3 for FTIR and NIR and 2 for Raman).
FTIR: FTIR acquisition parameters: number of sample scans: 32; collection length: 51.1 s; resolution:
4 cm‐1; levels of zero filling: 2, number of scan points: 12415; number of FFT points: 65536; laser
frequency: 15798.0 cm‐1; interferogram peak position: 6100; apodization: N‐B Strong; phase
correction: mertz; number of background scans: 32; background gain: 4.0; range: 550‐4000 cm‐1. The
acquisition was repeated 3 times.
FT-RAMAN: Raman acquisition parameters: 4 cm‐1 resolution; integration time: 10 sec.; range: 200‐
3200 cm‐1. The acquisition was repeated twice.
NIR: NIR acquisition parameters: range 4000‐10000 cm‐1, resolution: 4 cm‐1, number of scans: 32.
The acquisition was repeated 3 times.
All spectra were pre‐processed according to a suitable standardized treatment which
includes three spectral filters, standard normal variate (SNV), first order derivative and Savitsky‐
Golay smoothing, applied in a sequential order. Pre‐processing of spectral data removed undesired
systematic variation in the data (i.e. baseline drift and wavenumber regions of low information
content) and enhanced the predictive power of multivariate calibration models. Pareto scaling was
also applied to the FTIR data.
The ranges of the spectra used for creating the models were:
‐ FTIR: from 654.2 to 1875.4 and from 2520 to 3120.7 cm‐1, 3781 variables.
‐ FT‐Raman: from 800 to 1800 cm‐1, 1001 variables.
‐ NIR: from 4500 to 9500 cm‐1, 2594 variables.
The following multivariate statistical procedures were applied: PCA as unsupervised
multivariate analysis techniques; and PLS and OPLS‐DA as supervised multivariate analysis
techniques.
6.9. Partner: VSCHT
U-HPLC‒HRMS/MS
Scope
The main objective of the method is to distinguish between the virgin olive oils from the
European and non‐European countries by metabolomic fingerprint employing ultra‐high

Deliverable 4.3, version 1, 12‐12‐2016
57
performance liquid chromatography coupled to high resolution tandem mass spectrometry (U‐HPLC‒
HRMS/MS).
Analytical Principle
Ultra‐high performance liquid chromatography coupled to high resolution tandem mass
spectrometry (U‐HPLC‒HRMS/MS) is used to create the metabolomic fingerprints of virgin olive oils.
Apparatuses
‐ U‐HPLC‒HRMS/MS system UltiMate 3000 RSLC. DART–TOFMS system consisting of a DART
ion source (IonSense, Saugus, MA, USA), an AccuTOF LP highresolution time‐of‐flight mass
spectrometer [JEOL (Europe), SAS, Croissy sur Seine, France] and an HTC PAL autosampler
AutoDART‐96 (Leap Technologies, Carrboro, NC, USA), was used (Figure 6.9.1).
‐ Q‐Exactive Plus mass spectrometer (Thermo Scientific, USA) used for analysis of sample
extracts was operated in both ESI(+) and ESI(‐) modes.
Figure 6.9.1. U-HPLC‒HRMS/MS system used by VSCHT
Reagents
‐ Toluene, isooctane, ethyl acetate and methanol HPLC‐grade.
Analytical Procedure
A. Sample preparation
For a preliminary evaluation of the influence of various solvents on the ionization process,
EVOO sample was diluted with toluene, isooctane and ethyl acetate in the range from 1:1 to 1:50
(v/v). To enable automated sample introduction, oil had to be diluted with solvent at least in ratio 1:1
(v/v) to decrease its viscosity. For optimal TAGs profiling, all studied oils were 50‐fold diluted with
toluene.
To extract polar compounds, 1mL of oil sample was placed into a 15‐mL plastic cuvette and
shaken automatically for 2min with 3mL of a methanol–water mixture (80:20, v/v).
Deliverable 4.3, version 1, 12‐12‐2016
58
B. Acquisition and data analysis
The operating conditions of a DART ion source were as follows: positive ion mode; helium
flow: 4.0 Lmin−1; discharge needle voltage: 3.0 kV; perforated and grid electrode potentials: +150
and +250 V, respectively. Conditions of TOFMS: cone voltage: +20 V, monitored mass range: m/z 50–
1000; acquisition rate: 5 spectramin−1; resolving power: approx. 6000 FWHM (full width at half
maximum). The distance between the DART gun exit and mass spectrometer inlet was 10mm.
Sample introductions (n=5, each sample) were carried out automatically using Dip–itTM samplers
(IonSense, Saugus, MA, USA). The sampling glass rod was immersed for 1 s into the sample hole of a
deepwell micro‐plate (Life Systems Design, Merenschwand, Switzerland) containing approx. 600 µL
of respective sample, and transferred to the optimized position in front of the DART gun exit. The
sample was then desorbed from the glass rod surface within 30 s, while the spectral data were
recorded. To perform a mass drift compensation for accurate mass measurements and elemental
composition calculations, a polyethylene glycol (average relative molecular weight 600) 200 µgmL−1
solution in methanol, was introduced manually at the end of each analysis run. To assess an inter‐day
repeatability of measurements, selected samples of diluted oils and methanol–water extracts were
analysed within 5 successive days.
To document the influence of gas beam temperature on the signal intensity, EVOO sample
(diluted in toluene, as described above) and its methanol–water extract, were analysed at different
temperatures ranging from 100 to 450 ◦C. For all follow‐up analyses of oils and oil extracts, the gas
beam temperature was set to 350 and 220 ◦C, respectively. To produce ammoniated ions of TAGs,
2mL autosampler vial containing 25% (w/w) aqueous ammonia solution (dopant), was placed 4.5mm
below the ion source exit. Aqueous methanolic extracts of polar compounds were analysed without a
use of any dopant.
The obtained data set was processed using Compound Discoverer 2.0 software (Thermo
Scientific, USA) followed by normalization in MS Excel prior to further processing for which statistical
software Simca 13.0 (Umetrics, Sweden) was used. Principal component analysis (PCA) was used to
transform the original data set into principal components (PC) which were further used for
orthogonal partial least square discriminant analysis (OPLS‐DA) for the purpose of statistical models
creation. Leave‐one‐out cross validation (LOOCV) was then performed to prove the model
applicability.
Cost
Sample analysis cost would be 180 €.

Deliverable 4.3, version 1, 12‐12‐2016
59
6.10. Partner: CoopItalia
E-Nose
Scope
The purpose of this procedure is to identified the geographical origin of extra virgin olive oils
through an un‐target analysis of the volatile compounds.
Analytical Principle
The principle of this analysis is based on an un‐target gas‐chromatographic analysis of the
volatile compounds released from the food matrix in the head‐space during a heating phase of the
analysis.
Apparatus
FGC E‐nose Heracles II (AlphaMos, Toulouse, France) was equipped with two columns
working in parallel mode: a non‐polar column (MXT5: 5% diphenyl, 95% methylpolysiloxane, 10 m
length and 180 Vm diameter) and a slightly polar column (MXT1701: 14% cyanopropylphenyl, 86%
methylpolysiloxane, 10 m length and 180 Vm diameter). A single comprehensive chromatogram was
created by joining the chromatograms obtained with the two columns (Figure 6.10.1).
Figure 6.10.1. FGC E-nose Heracles II used by COOPItalia.
Reagents
‐ 20 mL glass vials. ‐ Magnetic plug. ‐ Alkane solution (from n‐hexane to n‐hexadecane). ‐ Hydrogen (carrier gas).
Analytical Procedure

Deliverable 4.3, version 1, 12‐12‐2016
60
An aliquot of each sample (2 g ± 1%) was placed in a 20 mL vial and sealed with a magnetic
plug. The vial was placed in the Heracles’ auto‐sampler, which placed it in a shaker oven where it
remained for 20 min at 50°C, shaken at 500 rpm. Next, a syringe pierced the silicone septum of the
magnetic plug and sampled 5 ml of the head space. Prior to the chromatographic separation, the 5‐
ml headspace aliquot was adsorbed on a CARBOWAX trap maintained at 40°C for 65 s while the
carrier gas (H2) flowed through it in order to concentrate the analytes and to remove excess air and
moisture.
Subsequently, desorption was obtained by increasing the temperature of the trap up to
240°C in 93 s and the sample was injected. The thermal program started at 40°C (held for 2 s) and
increased up to 270°C at 3°C s‐1; the final temperature was held for 21 s. The total separation time
was 100 s.
At the end of each column, a FID detector was placed and the acquired signal was digitalized
every 0.01 s. For calibration, an alkane solution (from n‐hexane to n‐hexadecane) was used to
convert retention time in Kovats indices. Samples were analysed in quadruplicate.
The FGC E‐nose data processing was carried out with Alphasoft V12.44. The statistical
analysis was carried out using peak areas that were automatically calculated by the instrument’s
software.
Cost
Sample analysis by E‐Nose cost would be 5 €.
7. Analytical quality parameters The scope of the non‐targeted methods was to determine the geographical provenance of
virgin olive oils (VOOs). Although the methods yielded a quantitative result, the final response of the
methods was qualitative (binary): VOOs were produced inside or outside the European Union. Thus,
analytical quality parameters for methods based on binary responses were suggested to the partners
to be applied to their non‐targeted methods. The most important aspect is to make the decision in
defining positive/negative responses and to be consistent in the calculation of the quality
parameters. This is particularly important in the blind samples whose purpose is the comparison of
method performance. A result usually can be regarded as “positive” when it is associated with the
occurrence of a chemical marker that is our analytical target to characterize this sample. However,
the non‐targeted techniques applied in this study for a binary classification yes/no are mostly based
on a chemical profiling of the samples. In consequence, the definition of a positive/negative response

Deliverable 4.3, version 1, 12‐12‐2016
61
is not straightforward and a decision has to be made defining a specific question. In this case the
question could be “Is this oil European?” and consequently a positive answer (yes) would be a
European oil.
The quality analytical parameters calculated were the following:
‐ Repeatability (Precision), expressed as %RSD (of the whole spectra and of different spectral features).
‐ Variance (of the whole spectra and from different spectral features).
‐ False Positives(FP) (a non‐European VOO classified as European).
‐ False Negative (FN) (a European VOO classified as non‐European).
‐ True negative (TN) (samples correctly classified as produced outside EU).
‐ True positives (TP) (samples correctly classified as produced inside EU).
‐ Rate of false positives: FPTN
FP+
‐ Rate of false negatives: FNTP
FN+
‐ Reliability= 100‐%False Positive Rate‐%False Negative Rate
‐ Sensitivity: FNTP
TP+
‐ Selectivity: FPTN
TN+
‐ Efficiency: FNFPTNTP
TNTP+++
+
‐ Youden’s index: 100×(Sensitivity + Selectivity ‐ 1)
‐ Likehood ratio: Rate PositiveFalse
RateNegative False-1
In the course of the project some partners determined the quality analytical parameters of
their methods by using the first two sets of VOOs samples with known geographical provenance
(training set by means of cross validation and verification set). At the end of the project, the samples
from the blind set (which geographical provenance was unknown) were used to calculate the quality
parameters. All the partners provided the results for the prediction of the blind set of samples. In the
present section the different information provided by the partners are shown. The quality
parameters from the blind set were used for comparison between methods, which are shown in
Deliverable 4.2.
7.1. FERA

Deliverable 4.3, version 1, 12‐12‐2016
62
The reproducibility and repeatability of the method was assessed by preparing 7 aliquots of
the in house reference material. Data was acquired from each of the 7 samples to assess the
reproducibility of the method. Data acquisition from sample 7 was repeated a further 6 times to
assess the machine repeatability. A comparison of the sample preparation methodology
(IHR_sample) to the machine reproducibility (IHR_machine) was performed. The data were visually
inspected using principal components analysis (PCA) (Figure 7.1.1) to determine whether any data
grouping were observed. It was concluded that the sample preparation and data acquisition
methodologies were appropriate for analysis of olive oil samples.
Figure 7.1.1. PCA plot (data mean centre scaled, scores 1 and 2) of the 13C NMR data acquired from the in house reference material. Data-points labelled IHR_sample represent data acquired from separate samples. Data-points labelled IHR_machine represent data acquired from replicate analyses of the same sample.
Table 7.1.1. Values of the quality parameters for 13C-NMR method when determining the geographical origin of the blind set of VOO samples.
Rate of FP
Rate of FN Reliability Sensitivity Selectivity Efficiency Youden's
index Likelihood
ratio 0.4 0.6 0 0.4 0.8 0.6 20 2
7.2. EUROFINS
Eurofins analysed the quality parameters of 1H‐NMR and IRMS methodologies with
exclusively the blind set of VOO samples. Both rates, false positive and negative, and sensitivity are
lower in 1H‐NMR method while selectivity is lower in IRMS.
Table 7.2.1 Basic information of the analytical methods used to determine the geographical provenance of the supplied blind samples.
Method Rate of FP
Rate of FN Reliability Sensitivity Selectivity Efficiency Youden's
index Likelihood
ratio

Deliverable 4.3, version 1, 12‐12‐2016
63
1H‐NMR 0.8 0.2 0 0.8 0.2 0.5 0 1
IRMS 1.0 0 0 1.0 0 0.5 0 1.0
7.3. CRA-W
The quality parameters studied for the application of Raman spectroscopy to classification in
European and non‐European virgin olive oil samples were: rate of false positive, rate of false
negative, sensitivity and selectivity. The rate of false negative (0.28) was higher than false positive
(0.08). In this method, the sensitivity was 0.72 and selectivity 0.92.
Table 7.3.1. Quality parameters analysed for Raman spectroscopy in the study of virgin olive oils from cross-validation in training set samples.
Rate of FP
Rate of FN Reliability Sensitivity Selectivity Efficiency Youden's
index Likelihood
ratio
0.1 0.3 60 0.7 0.9 ‐ 60 7.0
Table 7.3.2 shows the quality parameters with VOO samples of the blind set. With set the
rate of false negative is lower than false positive.
Table 7.3.2. Quality parameters of the Raman spectroscopy method used to determine the geographical provenance of the blind samples.
Rate of FP
Rate of FN Reliability Sensitivity Selectivity Efficiency Youden's
index Likelihood
ratio
0.4 0.2 40 0.8 0.6 0.7 40 2.0
7.4. DLO
Table 7.4.1. Quality parameters described for the NIR 37 oC training set with cross-validation.
Quality parameters Results Units Rate of FP 0.01 Rate of FN 0.2 Reliability 80 Sensitivity 0.8 Selectivity 1.0 Efficiency 0.9 Youden's index 82 Likehood ratio 60 AvRepeatability (%RSD) 0.14 % MaxRepeatability (%RSD) 31 % AvVariance 0.002 AU MaxVar 0.21 AU

Deliverable 4.3, version 1, 12‐12‐2016
64
7.5. FEM
Table 7.5.1 displays the quality parameters for the method of the determination of stable
isotope ratio of 13C/12C in fatty acids from triglycerides from virgin olive oils. The repeatability is
calculated as limit of repeatability. The rate of false positives is higher than false negatives.
Table 7.5.1. Quality parameters of the analytical methods used to determine the geographical provenance of the supplied training samples.
Method Repeatability1 Rate of FP
Rate of FN Sensitivity Specificity Youden’s
index LDA with 5 fold cross validation (δ13Cbulk + δ18Obulk + δ2Hbulk +
13
77 0.2 0.03 1.0 0.8 77
δ13Cbulk 0.2‰
δ18Obulk 0.5‰ δ2Hbulk 3‰ δ13Cpalmitate 0.5‰ δ13Cstearate 1.2‰ δ13Coleate 0.8‰ δ13Clinoleate 0.6‰
Note: 1, calculated as limit of repeatability.
Table 7.5.2 shows the values of the quality analytical parameters when VOO samples of the
blind set were used. The value of reliability is high respect with other methods described.
Table 7.5.2. Quality parameters of the analytical methods used to determine the geographical provenance of the supplied blind samples.
Rate of FP
Rate of FN Reliability Sensitivity Selectivity Efficiency Youden's
index Likelihood
ratio
0.2 0 80 1.0 0.8 0.9 80 5
7.6. CSIC
Table 7.6.1 shows the values of the quality parameters of the results provided by CaF2‐FTIR
with the samples supplied in the training set (50 samples) and the verification set (18 samples).
Table 7.6.1. Quality parameters described for the FTIR method with CaF2 transmission cell calculated for the set for training set and verification set.

Deliverable 4.3, version 1, 12‐12‐2016
65
Method Rate of FP
Rate of FN
Reliability Sensitivity Selectivity Efficiency Youden’s index
Likelihood ratio
PLS‐DA (modelling)
0 0 100 1.0 1.0 1.0 100 0
PLS‐DA (Cross‐validation) 0.5 0.2 30 0.8 0.5 0.7 30 1.6
C‐SVM (verification set) 0 0.3 70 0.8 1.0 0.9 80 ‐
GDA (verification set)
0.2 0.5 30 0.5 0.8 0.7 30 2.5
Table 7.6.2 shows the values of the quality analytical parameters calculated when blind VOO
samples were predicted.
Table 7.6.2. Quality parameters described for the FTIR method with CaF2 transmission cell calculated for the set of blind samples.
Method Rate of FP
Rate of FN
Reliability Sensitivity Selectivity Efficiency Youden’s index
Likelihood ratio
C‐SVM 0.8 0 20 1 0.2 0.6 20 1.3 GDA 0.2 0.6 20 0.4 0.8 0.6 20 2.0
7.7. UNIROMA1
The quality parameters have been analysed for the NRM method in model, cross‐validation
and verification set for two classes of discriminant analysis (PLS‐DA and LDA). The rate of false
positive is lower in PLS‐DA than LDA, while the rate of false negative is equal in both discriminant
analyses. Selectivity, Youden’s index and likehood ratio are lower in LDA than PLS‐DA.
The partner used two models (PLS‐DA and LDA) to predict the geographical provenance of
blind samples analysed by RMN. Table 7.7.2 shows that both methods have the same values for the
quality parameters studied.
Table 7.7.1. Basic information of the analytical methods used to determine the geographical provenance of the supplied samples by NMR (in cross-validation applied to training set and in verification set).
Method Rate of FP
Rate of FN
Reliability Sensitivity Selectivity Efficiency Youden's index
Likelihood ratio
PLS‐DA (modelling)
0.1 0.1 80 0.9 0.9 0.9 80 7.0
PLS‐DA (Cross‐validation)
0.2 0.2 60 0.8 0.8 0.8 60 4.0
PLS‐DA (Verification set)
0.1 0.4 50 0.6 0.9 0.8 70 6.0
LDA (modelling)
0.1 0.1 80 0.9 0.9 0.9 80 7.0

Deliverable 4.3, version 1, 12‐12‐2016
66
LDA (Cross‐validation)
0.3 0.2 50 0.8 0.7 0.7 40 2.0
LDA (Verification set)
0.2 0.4 40 0.6 0.8 0.7 50 3.0
Table 7.7.2. The quality parameters described for the analytical method.
Method Rate of FP
Rate of FN Reliability Sensitivity Selectivity Efficiency Youden's
index Likelihood
ratio
PLS‐DA 0 1.0 0 0 1.0 0.5 0 ‐
LDA 0 1.0 0 0 1.0 0.5 0 ‐
7.8. QUB
Quality parameters were studied in the method for the determination of European and non‐
European origin virgin olive oils by spectroscopy (FTIR, NIR, Raman) in the middle of the course of
FoodIntegrity project. The rate of false positives is lower in NIR and Raman than FTIR, while the rate
of false negatives is lower in FTIR and Raman (Table 7.8.1). The values of reliability and sensitivity are
lower in Raman spectroscopy. In the case of Youden’s index, NIR spectroscopy is lower than the
others methods.
Table 7.8.1. Basic information of the analytical methods used to determine the geographical provenance of the supplied samples by spectroscopy (FTIR, NIR, Raman).
Method Rate of FP
Rate of FN Reliability Sensitivity Selectivity Efficiency Youden’s
index Likelihoo
d ratio FTIR 1.0 0 0 1.0 0 0.4 0 1.0
NIR 0.8 0.3 ‐10 0.8 0.2 0.4 0 1.0
Raman 0.8 0 20 1.0 0.2 0.6 20 1.3
Table 7.8.2 shows the values of the quality analytical parameters using the blind set of VOO
samples. Methods based on Raman and NIR show the same values for each quality parameter. Also
they have rates of false negative lower than false positive. FTIR method shows higher values of the
rate of false positive and sensitivity than the others spectroscopic methods.
Table 7.8.2. Basic information of the analytical methods used to determine the geographical provenance of the blind samples.
Method Rate of FP
Rate of FN Reliability Sensitivity Selectivity Efficiency Youden’s
index Likelihood
ratio FTIR 1.0 0 0 1.0 0 0.5 0 1.0
NIR 0.8 0.2 0 0.8 0.2 0.5 0 1.0
Raman 0.8 0.2 0 0.8 0.2 0.5 0 1.0

Deliverable 4.3, version 1, 12‐12‐2016
67
7.9. VSCHT
Table 7.9.1. The quality parameters described for the DART-TOF method.
Method Rate of FP
Rate of FN
Reliability Sensitivity Selectivity Efficiency Youden’s index
Likelihood ratio
OPLS‐DA (cross validation)
0.3 0.1 60 0.9 0.7 0.9 60 3.5
OPLS‐DA (verification set)
0.7 0.1 20 0.9 0.3 0.6 20 1.3
There are two models for classification the blind set in European and non‐European origin.
The second method includes the samples of verification set. This method has the value of rate of
false positives lower than the rate of false negatives.
Table 7.9.2. Quality parameters of the analytical method used to determine the geographical provenance of the supplied samples.
Method Rate of FP
Rate of FN
Reliability Sensitivity Selectivity Efficiency Youden’s index
Likelihood ratio
OPLS‐DA
1.0 0 0 1.0 0 0.5 0 1.0
OPLS‐DA (+verification set)
0.4 0.8 ‐20 0.2 0.6 0.4 ‐20 0.5

Deliverable 4.3, version 1, 12‐12‐2016
68
8. List of WP4 Participants 1 Fera Science Ltd. 2 EUROFINS 3 JRC IRMM 6 QUB 7 SITEIA.UNIPR 10 CRA‐W 13 DLO 14 VSCHT Praha 15 FEM 25 CSIC 38 UNIROMA1 Associated partner: CoopItalia.
9. References (1) León‐Camacho, M., Morales, M.T., Aparicio, R. Chromatographic methodologies: compounds
for olive oil traceability issues. In: Handbook of Olive Oil. Analysis and Properties, Aparicio, R., Harwood, J. (Editors). 2° Edition, Springer, New York, 2013, pp. 163‐217.
(2) Barjol, J.‐L. Introduction. In: Handbook of Olive Oil. Analysis and Properties, Aparicio, R., Harwood, J. (Editors). 2° Edition, Springer, New York, 2013, pp. 1‐17.
(3) Li, Y., García‐González, D.L., Yu, X., van de Voort, F.R. (2008). Determination of free fatty acids in edible oils using a variable filter array (VFA) IR spectrometer, J. Am. Oil Chem. Soc., 85 599‐604.

Deliverable 4.3, version 1, 12‐12‐2016
69
(4) Aparicio, R., Morales, M.T., García‐González, D.L. (2012). Towards new instrumental approaches to understand sensory perception of olive oil. Eur. J. Lipid Sci. Technol., 114, 1114‐1125.
(5) Morales, M.T., Aparicio‐Ruiz, R., Aparicio, R. Chromatographic methodologies: compounds for olive oil traceability issues. In: Handbook of Olive Oil. Analysis and Properties, Aparicio, R., Harwood, J. (Editors). 2° Edition, Springer, New York, 2013, pp. 261‐309.
(6) Aparicio, R., Morales M.T. (1995). Sensory wheels: a statistical technique for comparing QDA panels– application to virgin olive oil. J. Sci. Food Agric. 67, 247–257.
(7) G. Vlahov, A. A. Giuliani, P. Del Re, 13C NMR spectroscopy for determining the acylglycerol positional composition of lampante olive oils. Chemical shift assignments and their dependence on sample concentration. Analytical Methods 2, 916‐923 (2010).
(8) Camin, F., Larcher, R., Nicolini, G., Bontempo, L., Bertoldi, D., Perini, M., … Hoogewerff, J. (2010). Isotopic and elemental data for tracing the origin of European olive oils. Journal of Agricultural and Food Chemistry, 58(1), 570–577.
(9) Massart, D.L., Vandeginste B.G.M., Deming S. N., Michotte Y. & Kaufman L. (1988). Chemometrics: a textbook, Chapter 23, 395‐397, Elsevier Science Publishers B. V., Amsterdam.
(10) Duda R.O. & Hart P.E. (1973). Pattern Classification and Scene Analysis; John Wiley & Sons Inc.: New York.
(11) Martens H. & Naes T. (1989). Multivariate Calibration, (2nd edn) vol. 1. Wiley, Chichester, UK. (12) Baeten V., Meurens M., Morales M.T. & Aparicio R (1996). Detection of virgin olive oil
adulteration by Fourier transform Raman spectroscopy. J. Agric. Food Chem., 44, 2225‐2230. (13) Triba M.N., Le Moyec L., Amathieu R., Goossens C., Bouchemal N., Nahon P., Rutledge D.N.,
Savarin P.: PLS/OPLS models in metabolomics: the impact of permutation of dataset ok the K‐fold cross‐validation quality parameters. Molecular Biosystems 11 (2015): 13 ‒ 19.
(14) Aparicio, R., Alonso, V. Characterization of virgin olive oil by SEXIA expert system. Prog. Lipid Res. 1994, 33, 29–38.
(15) García‐González, D.L., Aparicio, R. Research in olive oil: Challenges for the near future. J. Agric. Food Chem. 2010, 58, 12569‐12577.
(16) García‐González, D.L., Luna, G., Morales, M.T., Aparicio, R. Stepwise geographical traceability of virgin olive oils by chemical profiles using artificial neural network models. Eur. J. Lipid Sci. Technol., 2009, 111, 1003‐1013.
(17) García‐González, D.L., Infante‐Domínguez, C., Aparicio, R. Table for Olive Oil Chemical Data. In: Handbook of olive oil. Analysis and Properties, Aparicio, R., Harwood, J. (Editors). 2° Edition, Springer, New York, 2013, pp. 739‐768.

i