Just around the corner from where you are: probabilistic isovist fields, inference and embodied...
25
The Journal of Space Syntax ISSN: 2044-7507 Year: 2014 volume: 5 issue: 1 Online Publicaon Date: 27 August 2014 hp://joss.bartle.ucl.ac.uk J S S Just around the corner from where you are: Probabilistic isovist fields, inference and embodied projection Sophia Psarra, Sam McElhinney The Bartle School of Graduate Studies University College London (UCL) Pages: 109-132
Transcript of Just around the corner from where you are: probabilistic isovist fields, inference and embodied...
The Journal of Space SyntaxISSN: 2044-7507 Year: 2014 volume: 5 issue: 1 Online Publication Date: 27 August 2014
http://joss.bartlett.ucl.ac.uk
J
SS
Just around the corner from where you are: Probabilistic isovist fields, inference and embodied projection
Sophia Psarra, Sam McElhinneyThe Bartlett School of Graduate StudiesUniversity College London (UCL)
Pages: 109-132

109
JOSS
Just around the corner from where you are: Probabilistic isovist fields, inference and embodiedprojection
Sophia Psarra, Sam McElhinneyThe Bartlett School of Graduate StudiesUniversity College London (UCL)
1. IntroductionAnalytical models and diagrams1 used in space syntax research describe the structure of spatial organisation, and index relationships of visibility and permeability in two dimensions. As such, they explain and represent spatial characteristics across the entire domain of a space. A whole sedimented ‘history’ of moving and cognising in layouts is ‘externalised’ in this way within the space syntax diagrams and models. Research has often focused on the link between embodied vision and the struc-ture captured in the diagram, between the internal, partial and temporary states of the former and the externalised system of relationships represented by the latter. The connection between these two
This paper concerns the development of a new computational stochastic analysis in order to gain insight into situated vision in spatial environments. It is structured in three parts. The first two parts present the theoretical framework for the new model, based on the following propositions: firstly, that isovists are bound configurations containing one or more areas of spatial points that are intervisible; secondly, that observers are capable of embodied projection in space, anticipating how relations seen from a position can be seen from other regions that are one step away from the current position, and building expectations about other spaces visible from these regions; and thirdly, that we need a method that describes isovists not as static units but as dynamic seeds for a global framework of knowledge. The final part of the paper presents the new method with the following functionalities: a. continuous-time stochastic discretisation of space for isovist root selection and isovist generation; b. quantification of geometric isovists properties based on successive isovist intersection; c. high resolution of isovist analysis; d. four quantitative isovist measures. These measures are discussed in hypothetical layouts and in the context of Mies van der Rohe’s Farnsworth House. The paper contributes a dynamic modelling technique to the discussion of diagrams and their capacity to represent embodied vision as actualised and virtually embedded possibilities, rather than as static structures.
Keywords:
Isovist, stochastic, overlap, inference, embodied projection.
‘states’ is expressed as the relationship between local spatial characteristics and global scale rela-tions. The correlation of connectivity (local measure) to integration (global measure) is used to account for the ways in which what can be seen from local parts is a good guide for all-to-all spatial intercon-nections (Hillier, 1996). Described as intelligibility, this measure captures a key formal property of spatial complexes, and a generic function of layouts (ibid.). Intelligibility is a mathematical expression of the capacity of a spatial complex to provide an intelligible picture without conscious effort (ibid.), and has implications for ease of movement and navigation (Penn, 2001; 2003).
Notes:1 We regard visual analytical outputs produced by space syntax analysis as diagrams in their function to represent the distribution of spatial properties through colour, aiding an intuitive under-standing of spatial layouts rather than a literal numeri-cal understanding of distri-bution of values.

110
JOSS
The Journal of Space Syntax
Volume 5 • Issue 1
A second strand of research approaches the re-lationship between local and global characteristics from the viewpoint of immersed vision and the hu-man subject. Conroy Dalton conducted experiments through virtual environments, which explored route selection as a relationship between simplest angular route and maintenance of close heading towards a destination (Conroy Dalton, 2001). Similar kinds of experiments by Hölscher and Brösamle (2007) in real environments have tested how familiarity with spatial complexes affects movement. Findings by the latter authors suggest that movement choices by users who do not have previous knowledge of a layout rely on connectivity, as opposed to choices by people who have such knowledge and use integration2.
Both mathematical expressions of intelligibility and empirical studies of spatial cognition have of-fered significant measures and concepts. However, the question of the cognitive relationship between locally observed relationships and global structure through embodied vision still remains open. Space syntax cannot yet capture how spatial knowledge obtained through embodied vision contributes to and affects global scale spatial understanding. We argue that this deficit is due to the lack of models and diagrams capable of measuring and visualis-ing characteristics of temporal spatial practice. We also suggest that this shortage derives from the way in which spatial information and cognition are conceptualised. Using diametrically opposite frameworks of local and global relationships, and bipolar notions such as perception and cognition leads to static models and structures. One such example is the division between the isovist – the ‘set of all points visible from a given vantage point in space’ (Benedikt, 1979, p.47) – and Visibility Graph Analysis (VGA) (Turner et al., 2001). The former is generally interpreted as an itemised geometrical unit of information, and set apart from the latter, which is a graph-based structure. Turner has argued
that spatial perception should be examined ‘as an active or dynamic process occurring between the agent and the environment’ (Turner, 2003, p.658). Yet, spatial description still lacks methods that can describe the mutual relation between observers and the spaces they observe, akin to Gibson’s definition of the ecological link between occupant and the environment (Gibson, 1979).
In this paper we present a new method and tools based on a continuous-time stochastic generation of isovists, measures and mappings. The larger questions we raise through this work are: do graph-based measures of visibility relations sufficiently account for spatial cognition? Can we, additionally to VGA, provide probabilistic methods so as to link spatio-temporal dynamics with synchronic frame-works of understanding? We suggest that in order to be able to address these questions, we need to go beyond static approaches to computation and visualisation.
The paper is structured in three parts. The first part reassesses isovists, suggesting that their defi-nition either as geometric units or as a relational set of points with reference to the point of observation underemphasises their property to include one or more areas of mutually intervisible locations, a characteristic captured by Turner et al.’s ‘clustering coefficient’ according to visibility distance (Turner et al., 2001). We explain that isovists are geometrically bound network-like structures. The way in which these characteristics relate to embodied vision and human intuition is through projection of the body to regions within the isovist. Such projection facili-tates consideration of how the presently occupied vantage position appears from these other regions. It also enables the construction of expectations of what further spaces may become visible spaces from these regions.
The second part of the paper presents a new method for isovist analysis based on the stochastic construction and successive overlaps of isovists.
Notes:2 A number of additional studies, such as those con-ducted by Wiener and Franz (2005) have suggested that isovist quantitative data pre-dict behaviours within an environment.

111
JOSS
Just around the cornerfrom where you are
Psarra, S. & McElhinney, S.
The proposed model has four key novel functionali-ties: a stochastic approach to isovist root selection and analytic discretisation of space; continuous-time calculation of geometric isovists with a 360-de-gree field of vision; high resolution spatial mappings, and four quantitative isovist measures. These measures are illustrated and discussed via eight hypothetical layouts testing the impact of inserting a solid block and a set of partitions inside a space. The final part of the paper provides application of the tool to Mies van der Rohe’s Farnsworth House. The purpose is mainly to test the methodology in the context of hypothetical and real examples rather than provide a coherent interpretation of spatial cognition or principles of spatial composition in this house. The aim is also to add to the lineage of tests that have been produced by Peponis, Turner and their colleagues on this building, and thus, provide a basis for comparison with previous work.
The major proposition in this paper is that sto-chastic isovist generation, and measures based on isovist intersection can function as seeds for a new kind of analysis. Such a methodology has the po-tential to address relationships between embodied vision and the overall structure of spatial environ-ments. This remains at the level of hypothesis and subject to future analysis.
2. Geometric isovist fields and visibility graphs – similarities and differencesWe begin by re-examining isovists and VGA so as to outline the differences between the two methods and their limitations. Benedikt’s definition of the isovist as a system of points visible from a vantage location (Benedikt, 1979) and the measures used to describe it (isovist area, real surface perimeter, occlusivity, radial variance, radial skewness and circularity) imply that an isovist is a relational set as well as a geometrical unit (Figure 1). However, the quantitative isovist fields he proposed via contours discretise space through isovist vantage points, each of which represent their respective isovist measures. As a result, the relational sets of all points contained in isovists are replaced by points of observation.
The work of Turner et al. (2001), upon which VGA and the DepthMap software is based, also discretises a layout, superimposing a parametrically defined tessellation on a plan. Points at the centre of each cell are taken as the roots of analysis, removing any potential bias related to isovist root selection. In VGA these points are stored as vertices constructing a graph of edges that represents their binary inter-connections (ibid.). This approach is fundamentally different to isovist fields as geometric information is explicitly discarded (ibid.). From this graph, DepthMap can produce standard space syntax measures, such as neighbourhood size (or connectivity) and integration (Turner and Penn, 1999). DepthMap offers analysis of isovist geo-
Figure 1:
The isovist described via radials.
(From Benedikt, 1979)

112
JOSS
The Journal of Space Syntax
Volume 5 • Issue 1
metric properties3, but there is a clear analytical split between isovist analysis and visibility analysis, with the former capturing characteristics of isovist geometry and the latter graph relations. This split is present within the two separate strands of analysis in the programme; one for isovist calculation and another for visibility graph. A correspondence between connectivity and Benedikt’s isovist area exists, but there is no similar relationship between graph properties and isovist geometry in relation to other measures. This is because the geometry of vision is embedded in the local-scale relations of connectivity, but discarded in the calculation of clustering coefficient and integration. Local meas-ures preserve geometric isovist information, as opposed to global ones which discard geometry for all-to-all graph relationships. The former are associated with what we observe from local parts; the latter are related to what we can process and understand as conceptual structure.
An isovist does, however, contain points which have a relation both to the point of observation and to other points that are internal and external to its neighbourhood. Turner et al. (2001) use this idea to
explain the generation of the visibility graph through ‘first-order’ and ‘second-order’ relations. The former refer to two isovists that overlap in a way that their generating roots are mutually visible (Figure 2a). The latter concerns relations among locations that are connected through a third point situated in the common area of the overlap (Figure 2b). The rela-tions of spatial points inside an isovist and outside of it are embedded in the measure of ‘clustering coefficient’, defined in graph terms as ‘the number of edges between all the vertices in the neighbour-hood of a generating vertex divided by the total number of possible connections with that neigh-bourhood size’ (Figure 2c; ibid., p.109). For Turner et al., the clustering coefficient measure expresses the potential for ‘visual looping’. In the Farnsworth House it is interpreted as explaining the distinction between architecture as disposition of objects and as spatial configuration (ibid.). This measure also relates to decision-making and navigation, including how much of the observers’ visual field is retained or lost as they move in a layout (ibid.).
The measure of clustering coefficient has simi-larities with overlapping spaces proposed by Psarra
Notes:3 These are: connectivity, isovist area, compactness, drift angle, drift magnitude, maximum radial, occlusivity, and perimeter.
Figure 2:
a) First order connectivity between isovists.
b) Second order connectivity between isovists.
c) Calculation of cluster-ing coefficient. Total actual edges between nodes (c1+c2 ) is com-pared to all possible edges (c1+c2+c3 ).
(From Turner et al., 2001)
a) b) c)

113
JOSS
Just around the cornerfrom where you are
Psarra, S. & McElhinney, S.
(1997a; 1997), and s- and e-partitions proposed by Peponis et al. (1997); that is, ‘informationally stable’ spatial units, derived from discontinuities of shape that affect visibility (ibid.). These partitions describe thresholds of informational stability that are geometrically defined. However, as Turner et al. suggest, isovists are good intuitive tools for think-ing about space. As opposed to e-partitions and s-partitions, which are generated by built shape, isovists derive from space as it may be seen and retain the geometry of vision at each spatial point. Yet, when isovist structures are graphed, their shape, directionality, geometry and the gradual overlaps of isovists are exchanged for formless graph relations. In an environment we perceive not only interconnections of spatial positions, but also ‘regions’ of positions clustered and bound by shape and geometry. Despite Turner et al. acknowledging the relational logic of isovists, operationally and conceptually, we are faced with a divide between isovists and graphs4. The implication is that the former are discrete geometrical elements as op-posed to the latter, which are relational and free of shape or geometry.
2.1. Redefining the isovist – Isovist neighbourhood relations Our first proposition is that isovists have the capac-ity to be both geometric expressions of situated vision and network-like structures. We explain this proposition starting with Benedikt’s original defini-tion (1979). An isovist consists of:
i. A viewpoint, or origin vertex [O]
ii. A set of points with direct visual connection to the origin [S]
iii. A geometric perimeter enclosing ‘S’ [P]
Within a convex isovist all points of ‘S’ have centralised and symmetrical relations with respect to ‘O’ (Figure 3a). As isovist convexity reduces, ‘S’ divides into subsets (Figures 3b, c). In this case relations inside the isovist can be described as fol-lows: firstly, any pair of points within each subset (S1, S2, S3,…) are mutually visible and have distributed relations to each other; and secondly, points in each subset are connected to points in other subsets only indirectly via ‘O’, which means they are in a symmetrical and non-distributed relationship to
Notes:4 It is essential to stress that the authors do not regard the isovist as a discrete unit; it is only the way in which VGA and various applica-tions of isovist analysis treat isovists as singular entities that we are concerned with here.
Figure 3:
a) Isovist expressed as origin, set of points and perimeter.
b) Isovist with increasing occlusive nature devel-ops sub-sets S1 and S2 .
c) Sub-sets S1 and S2 as distributed network regions with second order connectivity via O. a) b) c)

114
JOSS
The Journal of Space Syntax
Volume 5 • Issue 1
each other with respect to ‘O’. More specifically, the points within each subset are intervisible, while those across subsets are co-visible from ‘O’. These complex relations extend isovists beyond discrete units and even beyond connectivity or neighbour-hood size5, as the set of vertices immediately con-nected through an edge (Turner et al., 2001). They bring us to a re-formulation of the isovist definition from a bounded set of points all visible to a vantage point, to a bounded set that has the above property but also includes one or more regions of points that are intervisible.
The implication is that an observer at a vantage location grasps a relational set of points as a bound configuration, in Hillier’s notion of the term6 (1996). Taking isovist area as an example, viewers standing at ‘O’ are likely to perceive a location ‘L’ within the distributed network of ‘S2’ (Figure 3c) simultane-ously with the isovist area in which they are located. Observers can hypothetically project their body to another location within the isovist with respect to ‘O’. This inherently includes knowledge of ‘O’ and infer-ence of how the ‘O’- to -‘L’ relationship will look form ‘L’. Tied to situated vision, this interpretation takes us to a second proposition: isovists are geometrically bound configurations consisting of a vantage point and hypothetical alternative viewpoints. Through the relational logic of isovists, observers construct expectations of how the dynamics of spatial con-nections may alter from other regions, and speculate as to what might be revealed with movement. This hypothetical extension of the body to other regions implies that embodied vision is dynamic even when a viewer is stationary. Even at the level of a single isovist, spatial cognition depends on a complex network of spatial relations among actually and virtually occupied positions.
A similar proposition is put forward by Koch (2012) in a discussion of retail space, where us-ing an argument by Osborne (2008), he suggests that mannequins exemplify a ‘potentially imagined
elsewhere’ based on the expression of identity and ‘encouraging cognitive relocation and identification with an inanimate body’ (Koch, p.10-11). We suggest that cognitive relocation can be triggered by inani-mate bodies or objects, but belongs to more general processes of embodied projection we consciously or unconsciously perform in spaces7. These exist independently of specific building types, and over and above the issue of identity. Koch introduces this idea starting from the need to invert a com-mon assumption in certain space syntax studies that identifies the isovist with the ‘subject’ and the spatial surrounds with the ‘object’. He points out that a certain kind of ‘de-subjectification through deployment of multiple isovists in an equidistant grid’, occurs in Turner’s VGA (2012). We wish to avoid the duality between local and global, subject and object in favour of a process-based relation-ship between people and the environment, and process-based spatial understanding. The larger theoretical implication of this duality is that isovists are elements, entities or discrete units of informa-tion while graphs are about relationships. Any consideration that treats these representations as itemised should consider two facts: first, they are all defined as sets of points and distinguished from other points in a spatial continuum according to principles of linearity, convexity or isovist polygon formation; second, they are purposefully selected as representations for graph-based analysis in space syntax so as to overcome the indivisibility of space into discrete elements. They might be represented as nodes in a graph, but in geometrical and spatial terms are neither entities nor elements, but relational frameworks.
2.2. Overlapping isovists In order to expand the relational logic of isovists into an analytical framework we consider isovists from two successive points along a path (Figure 4). Points O1 and O2 are invisible from each other,
Notes:
5 Turner et al. (2001) explain that neighbourhood size can be thought of as equiv-alent to the isovist itself.
6 Configuration is defined by Hillier (1996) as ‘relations taking into account other re-lations’ (p.1).
7 Or even, as Psarra (2013) and Koch (2013) explain, in embodied and disembod-ied explorations through the imagination.

115
JOSS
Just around the cornerfrom where you are
Psarra, S. & McElhinney, S.
yet their regions share a region of overlap (L2) and contain regions of distributed networks (L1 and L2). One visual step separates L1 from L2, L2 from L3, and O1 from O2. During each of these steps, one region or point moves out of view and a new one becomes visible. In Turner et al.’s terms, there is first order visibility from L1 to O1, O1 to L2, L2 to O2, and finally O2 to L3, and second order relationships from L1 to L2, O1 to O2, and L2 to L3. In short, the isovists from O1 and O2 can be related to one another via their overlap region. This relationship can be numerically expressed by assigning an average value (such as geometrical area) from the isovists constructed at O1 and O2 to all points in L2. This value captures the combined values of both isovists. If applied to all spatial points in the configuration it describes the extent to which each point is one visual step away from large or small isovist areas.
Points O1 and O2 are considered as lying on a notional path, but all pairs of locations with a one-step or a two-step visual connection to each other generate isovists that overlap and contain these lo-cations (Figures 5a-c). Points that contribute a value
to any distinct third point might either be intervisible (first order) or co-visible from the third point, which means hidden from each other by an occluded edge (second order). It is therefore possible by compiling all values for all isovists a point falls within, and for all points in space, to produce quantitative visual fields. The spatial locations generating such fields do not record the values of isovists at isovists origins, but the values of all isovists to which each of these locations belong8. A value at any location provides a measure of the extent to which when taking a step away from this location in all available directions, or just around the corner from where an observer stands, the field expands or contracts (if the measure in question concerns area), is convex or star-like (if it concerns compactness), and so on.
It may at first seem counter-intuitive to record isovist values to all points in an isovist, rather than at the vantage point. However, as movement through space consists of continuous visual transformation, discrete vantage points do not usually correspond to any state of vision through motion. In terms of spatial cognition, the importance of overlap is that
Notes:8 More particularly, the value recorded is the sum of the values of all isovists each spatial point belongs to the value of the isovist gener-ated from each point (as the root location).
Figure 4:
Overlapping sequential isovists and their dis-crete sub-set regions.

116
JOSS
The Journal of Space Syntax
Volume 5 • Issue 1
it captures characteristics that are directly visible and additional ones that are not evident but can be inferred from a position. The projection of the body from actually to virtually occupied regions previously described concerns not only the relation-ship of O1 to L2, or to the rest of the points visible in the neighbourhood of the isovist, but also relations which cannot be seen from O1 but can be antici-pated as a possibility (Figure 4). The anticipation of the potential presence of O2 is provided from O1 by seeing L2 and the occluded edge from O1. From O1, L2 is understood as belonging to an area of overlap constructed by the isovist of O1 and another space. Moving from O1 to L2, what is inferred as possible is translated to actual as relationships are seen and stored in memory.
Modelling properties that occur one step away or just around the corner can therefore capture the probabilistic potential of movement. What we mean by ‘movement’ does not concern a continuous path through a series of spaces9, or large-scale exploration covering the entire layout or empirically observed aggregate movement of people. It rather describes ‘one step of actual or hypothetical move-ment’ falling within an isovist neighbourhood from any location and in any direction. Depending on the shape and configuration of a layout, this ‘step’ can
be relatively short or long, confined to local scale or extending to the global scale of the layout. In the case of a long ‘step’, as in a classical enfilade sequence, the axial symmetry of thresholds, oc-cluded radials, and the alignment of overlapping regions induce observers to anticipate a sequence of rooms lying ahead, not yet seen but inferred from a distance. Embodied projection formed at the first point of inference is re-evaluated and if necessary adjusted at the second point and in subsequent points. At the opposite end of this example is a jagged sequence of openings, where thresholds and isovist overlaps alternate on either side of the layout. The longest ‘step’ in this case is persistently one or two rooms long, with embodied projection and inference confined to a small scale.
In modelling situated vision as process we can-not rely on the interaction of what we see directly with all-to-all relationships, simply because the latter is measured outside direct experience (particularly for first-time viewers). We propose that it is the trans-formation in visual fields expressed as the relation-ship between each spatial location and the points that are immediately accessible from it (or that lie just around the corner), that capture the probabilistic potential of movement and the continuity of vision.
Notes:9 Certain studies have ex-amined movement along hypothetical paths created by point isovists (Psarra and Grajewski, 2000; Conroy Dalton and Dalton, 2001; Tzortzi, 2007; Psarra, 2009; Tzortzi, 2009, 2011) and have observed how visual relations and quantitative measures change or re-main constant along those. Although isovists were drawn along a sequence, at any given point the rep-resentation consists of static isovists. Even when isovists are overlapped, as with Hanson (1998), Psarra and Grajewski (2000) and Tzort-zi’s work (2007; 2009; 2011), isovists are achieved either from individual points that are architecturally signifi-cant or at regular intervals, and are drawn in isolation.
Figure 5:
a) Isovist O1 in space defines a visual threshold of a single visual step.
b) Isovists O2 and O3 occur within this threshold and so overlap point O1, therefore passing value to it.
c) Isovists O4 and O5 occur beyond this threshold and do not overlap point O1 or pass value to it.a) b) c)

117
JOSS
Just around the cornerfrom where you are
Psarra, S. & McElhinney, S.
3. A stochastic systemIn this section we present a prototype model for stochastic generation and visualisation based on isovist overlaps. We generate isovists within an imported architectural plan using a method akin to Benedikt’s optical array or radials (1979). Radial lines are arrayed at 1.5-degree increments to give a 360-degree field of vision. Isovist polygon verti-ces are defined at each nearest plan-line to radial intersection10. The process takes less than one tenth of a second per isovist in a typical plan and has four key features:
a. Stochastic sampling of root selection of isovists Space is ultimately not discrete but indivisible, consisting of an infinitesimal number of points. When constructing isovist fields in a plan from ‘all points’ (rather than isovists in individual locations of special interest), one issue requiring resolution by an appropriate convention is the identification of ‘all points’ from which isovists will be drawn. As previ-ously discussed, DepthMap establishes sample points by superimposing a lattice on a plan, and defining points at the centres of the square tiles of
the tessellation (Turner et al., 2001). The chosen grid resolution is either relative to the scale of the plan, or chosen so as to capture meaningful features or a ‘human-scale’ grid spacing of around one metre11 (ibid., p.106). The outcome is a ‘near-full’ description of a space according to criteria established by scale and/or human occupation by the software user. We propose an alternative stochastic method for discretising a layout through a continuous random selection of x, y coordinates that identifies isovist root locations. This rapidly provides a probabilistic and even distribution of sample points throughout a plan (Figures 6a, b).
b. Continuous-time generation of isovists and isovist intersections Isovist geometric values are calculated from the sample points and successively recorded to all points they contain. The sequential overlap of isovists generated in this manner provides a spectrum mapping. It is essential to explain that although equivalent results can be obtained by overlaying a tessellation and calculating geometric values of isovist overlaps, the stochastic approach
Notes:10 The model provides iso-vists according to different classifications of space, ranging from spaces that are both visible and acces-sible to those that are seen but cannot be accessed as they are behind glass, or are not occupiable being situated inside a gap on the floor or a void (Figure 22a, see in Endnotes). Two ad-ditional categorisations can account for spaces seen through reflective materials, allowing the model to cap-ture certain particularities in space design and materi-als (Figures 22b and c, see in Endnotes). These will be discussed in detail in future work.
11 In DepthMap, however, there is automatic choice of the grid size based on the maximum dimension of the input drawing and which is not related to human scale. This can be altered by the software user.
Figure 6:
a) An orthogonal grid centre tessellation of 3,000 points across a hypothetical layout.
b) A comparative stochastic distribution of 3,000 points across a hypothetical layout.
a) b)

118
JOSS
The Journal of Space Syntax
Volume 5 • Issue 1
to sampling points and the continuous analysis it facilitates has three advantages. Firstly, stochastic sampling continuously and randomly selects spatial points resulting in even levels of discretisation. It thus circumnavigates the problem of how to define the parametric ‘scale’ of the superimposed grid for each plan and comparatively across different plans. Secondly, the method is a continuous-time stochastic process, which allows continuous altera-tions to be made to the imported plan and resulting changes to be observed in continuous-time12. This continuity of sampling and quantifying cannot be obtained by a standard lattice, which depends on a discrete-time analytical process. Discrete-time process means that the system needs to be ana-lysed in its entirety, and that any potential changes go through iterative and discrete levels of analysis. Thirdly, the continuous-time stochastic process has the potential to integrate analysis of inanimate spatial units as in the current method with future simulations of movement and agent interactions.
c. High levels of resolution of spectrum mappingAn additional benefit of the stochastic approach is
high resolution of spatial mapping. The discretisa-tion method in VGA dictates the resolution of the visual distribution of measures and mappings, since values are calculated and assigned per grid cell. High-resolution mappings require finer grids and therefore larger and more complex graphs result-ing in far longer calculation times. The proposed stochastic system assigns and represents values to all points within isovists at the level of screen pixels, providing a high level of isovist field resolution. As a comparison, we provide two analyses of a simple hypothetical layout of two walls in a square space. Figure 7a shows VGA’s assessment of connectivity based on a 60x60 grid. Figure 7b shows our ver-sion of the same. The former entails 3,600 distinct numeric values, whilst the latter consists of 547,600.
d. Geometric measures of isovists We present four measures selected to bear com-parison to those identified by Benedikt (1979), Batty (2001), Turner et al. (2001) and Conroy Dalton and Dalton (2001). In Figures 9-16 we provide an expla-nation of how these measures work in hypothetical examples.
Notes:12 Recently, increased computational power has allowed other approaches to implement isovist fields in continuous-time, linking design processes with ana-lytical feedback (Schneider and König, 2012).
Figure 7:
Comparison of VGA and isovist mapping resolutions:
a) VGA connectivity mapping for a grid of 3,600 cells.
b) Isovist connectivity for stochastic sampling of 2,500 points.
a) b)

119
JOSS
Just around the cornerfrom where you are
Psarra, S. & McElhinney, S.
i] Connectivity (Cv ) Connectivity accounts for the number of times a location ‘V’ occurs within isovists or is ‘seen’. It is directly proportional to the number of points in space with which ‘V’ has a first-order connectivity. This measure is calculated by incrementing a count at ‘V’ whenever ‘V’ is found to be within an isovist, and is equivalent to connectivity as defined by Turner et al.13 (2001).
ii] Co-visibility (Iv )‘Co-visibility’ accounts for the mean area of all isovists ‘V’ is located within, and is measured by the sum of the area ‘A’ of all isovists containing ‘V’ divided by connectivity (Cv ) at ‘V’. It indicates the extent to which ‘taking the next step’ beyond the confines of a current isovist is likely to reveal greater or lesser visual area than currently available.
Equation 1: Co-visibility
iii] Compactness (Sv )‘Compactness’ accounts for the mean shape compactness (relative to a circle) of all isovists ‘V’ is located within. It describes the extent to which a step away from a current isovist is likely to reveal visual information with higher or lesser levels of convexity (or degree of intervisibility). It is calculated as the sum of the ‘isoperimetric coefficient’ (4πA) of all isovists that contain ‘V’, divided by connectivity at ‘V’.
Equation 2: Compactness
iv] Occlusivity (Ov )Occluded radial lengths are those edges of an isovist that are not physically defined and reveal previously unseen space during movement. For each isovist we establish an ‘occlusivity coefficient’ of isovist area against potential area that could be revealed by such edges (‘R’, Figure 8), calculated as follows:
Equation 3: Isovist ‘occlusive coefficient’
The measure of ‘Occlusivity’ is then calculated as the sum of the ‘occlusivity coefficient’ of all isovists that contain ‘V’ divided by connectivity (Cv ). It ac-counts for the potential area that can be revealed through occluded radials within one visual step.
Equation 4: Occlusivity
𝐼𝐼! =𝐴𝐴!!
!!!
𝐶𝐶!
𝑆𝑆! =4𝜋𝜋𝜋𝜋𝑖𝑖𝑅𝑅!
!!!!
𝐶𝐶!
𝑂𝑂! =𝑅𝑅!!!
!!!
𝐴𝐴!
𝑂𝑂! =𝑂𝑂!!
!!!
𝐶𝐶!
Notes:13 This is a static measure. A linear relationship has been demonstrated between this measure and Turner’s VGA ‘connectivity’ field values (with correlation of 0.8R2).
Figure 8:
Calculation of occlusive ratio; the sum of values of R 2 is compared to the isovist area.

120
JOSS
The Journal of Space Syntax
Volume 5 • Issue 1
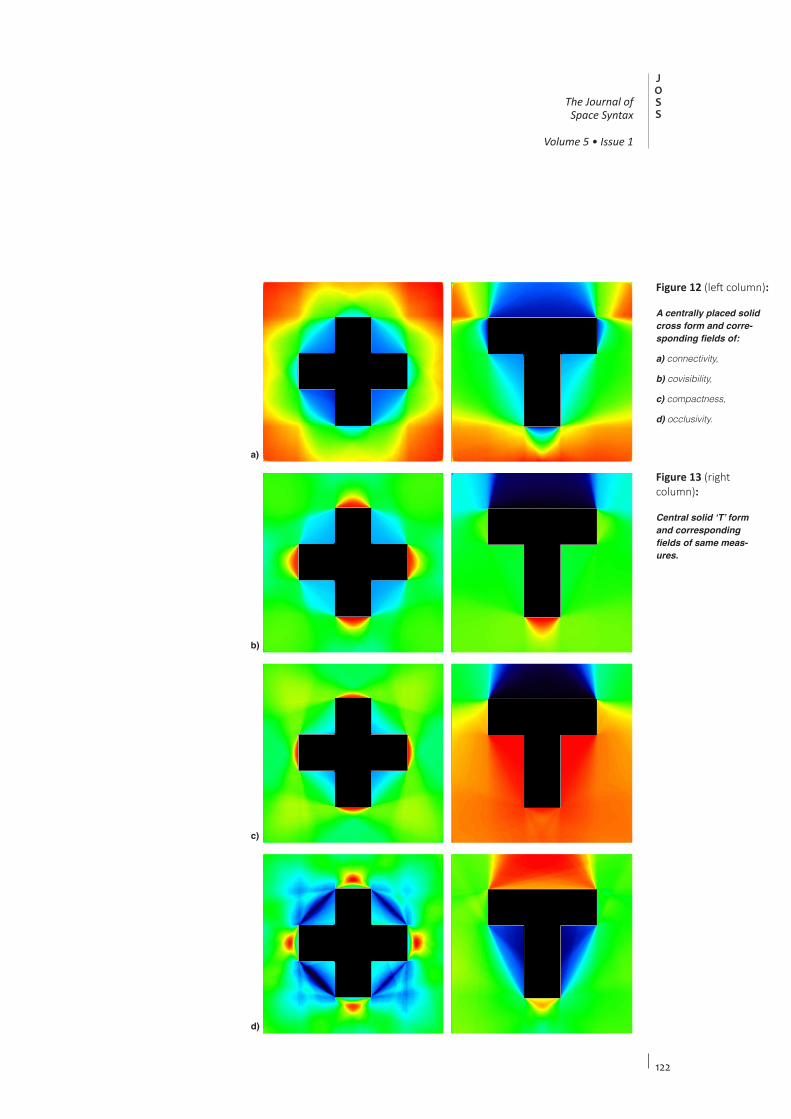
The four measures are discussed here using eight hypothetical layouts14 (Figures 9-16), followed by Mies van der Roher’s Farnworth House (Figures 17-21). The former are laid out by locating a block centrally or close to an edge (Figures 9-11), experi-menting with different shapes for the central block such as a cross and a T-shape (Figures 12, 13), and removing bars from these blocks to allow views through previously blocked regions (Figures 14-16). It is important to clarify that this section has mainly a methodological and illustrative purpose, rather than demonstrating the theoretical significance of the results in relation to spatial cognition.
Starting with the first series of layouts, Connec-tivity shows that by locating a block at the centre of the space, we maximise intervisibility of the points located at the four corners (Figure 9a). These points occur in most isovists and hence have high Connectivity values. The measure of Co-visibility (Figure 9b) identifies a diamond-shaped region circumscribing the central block and the locations of intersections of isovists of the highest areas in the layout. This makes sense, as the isovists of the highest Connectivity value generated from each of the four corners directly face two of the sides of the block intersecting at points located within the diamond-shaped area.
Since Co-visibility captures the extent to which a lesser or greater number of isovists overlap at a location, it follows that the higher the Connectivity of points one step away from a location, the higher the Co-visibility value of this location. High Co-visibility, therefore, is likely to take place within and in-between large regions of space. In Figure 9b where the block is placed centrally, there seems to be an inverse relationship of Co-visibility to Con-nectivity (with high values of Co-visibility located in the areas of low Connectivity and vice versa). Yet, the relationship between the two measures is not always one of inversion. When the block is moved closer to one or two of the outer edges (Figures 10b,
11b), high Co-visibility values occur in regions that are in middle and lower range of Connectivity shown in green on the left side of the central block (Figure 11b). This captures the fact that middle range Co-visibility values occur in proximity to isovists that have a large area still attracting a high number of overlaps, whilst low connectivity regions cannot.
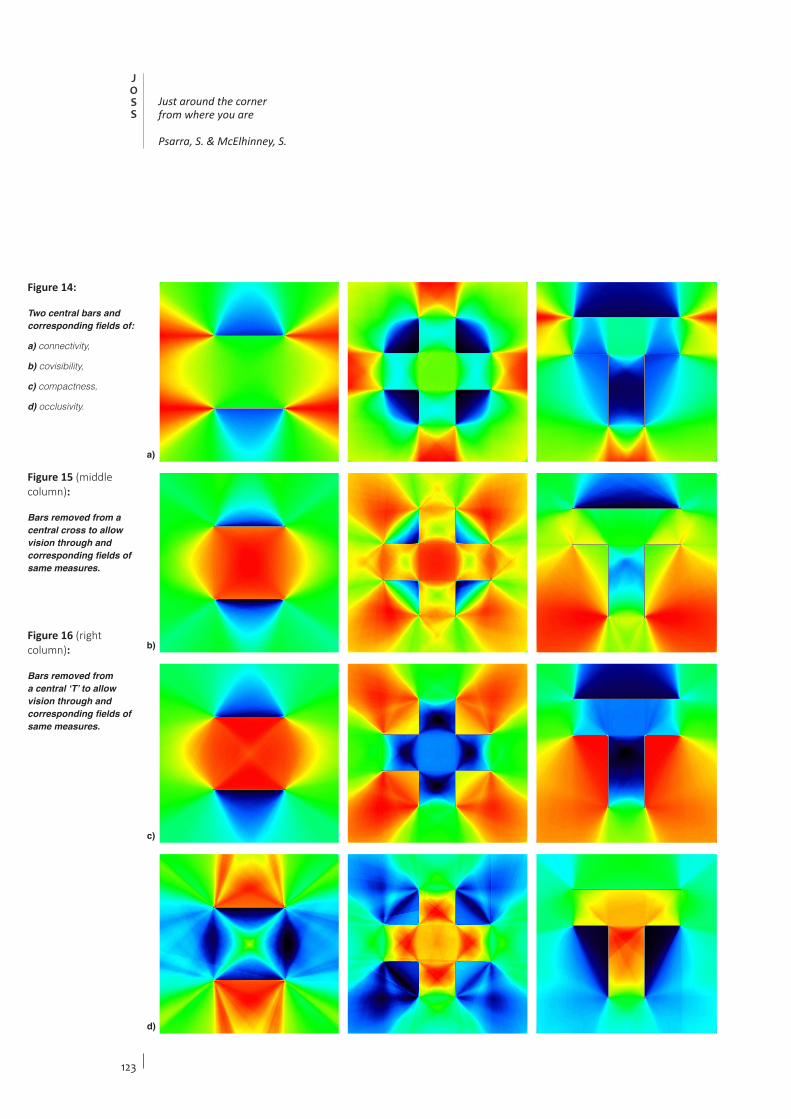
Compactness captures the extent to which a point falls within isovists of high convexity. In many of the hypothetical cases (Figures 9c-11c, 14c), this nearly matches the values of Co-visibility. This seems reasonable, as isovists of large area tend to have a high level of intervisibility or convexity; therefore, the areas with large isovists frequently overlap (high Co-visibility) and are expected to have a high Compactness. Nevertheless, there is not always a match between Co-visibility and Compactness. Significant variations can be seen in Figures 15b, c and 16b, c. Routes through the cen-tral space, which show middle to high Co-visibility values (Figures 15b, 16b) have very low values in terms of Compactness. Whilst Co-visibility captures these routes as links between spaces of large area, Compactness shows that they function as a network of low convexity spaces.
Finally, Occlusivity demarcates the highest level of intersections of isovists of long occluded edges and seems to be in an inverse relationship with Compactness (Figures 9d-16d). This is because spaces with high levels of convexity (Compactness) are less likely to generate isovists with occluded edges and are more informationally stable. Long narrow regions (i.e. lower convexity) of low isovist areas that are close to large regions are likely to have a high number of occluded edges. Together these characteristics in isovists result in high levels of Occlusivity in their overlap. From these regions, an observer can see rapid changes of visual fields (Figures 14d, 15d). However, this is not always the rule. Variations are found, as in Figures 16c, d. In these cases, the region of very low Compactness
Notes:14 These contain 500,000 value points derived from 5,000 sample points. Leg-ible fields are observed af-ter running the system up to the selection of 300 sample points.

121
JOSS
Just around the cornerfrom where you are
Psarra, S. & McElhinney, S.
Figure 9 (left column):
A centrally placed block and the resulting fields of:
a) connectivity,
b) covisibility,
c) compactness,
d) occlusivity.
Figure 10 (middle column):
Variations on block locations and corre-sponding fields of same measures.
Figure 11 (right column):
Variations on block locations and corre-sponding fields of same measures.
a)
b)
c)
d)
122
JOSS
The Journal of Space Syntax
Volume 5 • Issue 1
a)
b)
c)
d)
Figure 12 (left column):
A centrally placed solid cross form and corre-sponding fields of:
a) connectivity,
b) covisibility,
c) compactness,
d) occlusivity.
Figure 13 (right column):
Central solid ‘T’ form and corresponding fields of same meas-ures.
123
JOSS
Just around the cornerfrom where you are
Psarra, S. & McElhinney, S.
a)
b)
c)
d)
Figure 14:
Two central bars and corresponding fields of:
a) connectivity,
b) covisibility,
c) compactness,
d) occlusivity.
Figure 15 (middle column):
Bars removed from a central cross to allow vision through and corresponding fields of same measures.
Figure 16 (right column):
Bars removed from a central ‘T’ to allow vision through and corresponding fields of same measures.
124
JOSS
The Journal of Space Syntax
Volume 5 • Issue 1
above the ‘opened T’ configuration has middle val-ues of Occlusivity. This identifies a region between low convexity spaces but with relatively stable visual fields.
On the whole, the four measures seem to oper-ate as complementary pairs of values. Co-visibility seems to mediate between a high and middle range of Connectivity values, in a way which captures the relative spatial distribution of intervisible and co-visible points in the layouts. Comparison of Co-visibility to Compactness illustrates the extent to which areas of intervisible locations arise from the ways in which convexity of isovists are distributed in a system. The third and final pair, Compactness and Occlusivity, describes how stability or change of visual information arises from the relational distri-bution of convexity (stability) and occluded edges (change) in an environment.
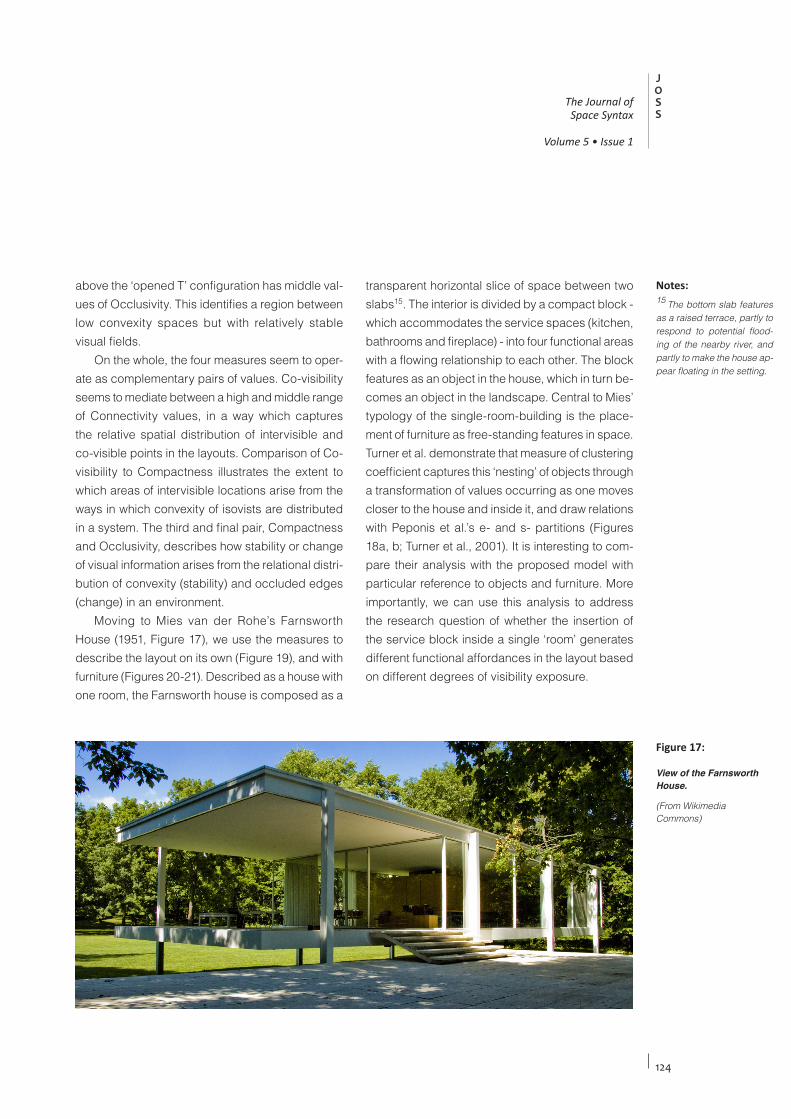
Moving to Mies van der Rohe’s Farnsworth House (1951, Figure 17), we use the measures to describe the layout on its own (Figure 19), and with furniture (Figures 20-21). Described as a house with one room, the Farnsworth house is composed as a
transparent horizontal slice of space between two slabs15. The interior is divided by a compact block - which accommodates the service spaces (kitchen, bathrooms and fireplace) - into four functional areas with a flowing relationship to each other. The block features as an object in the house, which in turn be-comes an object in the landscape. Central to Mies’ typology of the single-room-building is the place-ment of furniture as free-standing features in space. Turner et al. demonstrate that measure of clustering coefficient captures this ‘nesting’ of objects through a transformation of values occurring as one moves closer to the house and inside it, and draw relations with Peponis et al.’s e- and s- partitions (Figures 18a, b; Turner et al., 2001). It is interesting to com-pare their analysis with the proposed model with particular reference to objects and furniture. More importantly, we can use this analysis to address the research question of whether the insertion of the service block inside a single ‘room’ generates different functional affordances in the layout based on different degrees of visibility exposure.
Notes:15 The bottom slab features as a raised terrace, partly to respond to potential flood-ing of the nearby river, and partly to make the house ap-pear floating in the setting.
Figure 17:
View of the Farnsworth House.
(From Wikimedia Commons)

125
JOSS
Just around the cornerfrom where you are
Psarra, S. & McElhinney, S.
The results without furniture (Figures 19a-d) show that whereas the highest values of Connectiv-ity highlight the two front ends of the building, those of Co-visibility concentrate in the central front area where the fireplace is located. This means that this area features in most views from different positions in its neighbouring regions. Compactness (Figure 19c) picks up the L-shaped-area stretching from the back left to the front right of the house through the distribution of high values and hence, high convexity throughout. Comparatively to the rest of the spaces, this area is seen in a sequence of isovists that are convex and informationally stable. Finally, Occlusiv-ity (Figure 19d) highlights the kitchen area behind the block, in clear opposition to the living areas at the left, front left, front and front right of the house. This distribution indicates that the most continuous visual change occurs as one moves from the living area towards the kitchen.
Figures 20a-d and 21a-d demonstrate subtler differences in the distribution of values than those previously observed when furniture is included. Connectivity redefines the fireplace area as an area of privacy with low values (Figures 20a, 21a). In contrast, high values of Co-visibility are located im-mediately adjacent to objects and furniture (Figures 20b, 21b). The distribution of Co-visibility shows that these objects are seen from many different locations, punctuating visual fields and standing out as persistent features. The addition of furniture also inverts the patterns previously described by the measures of Compactness and Occlusivity (Figures 19c, d and 21c, d). With the introduction of objects, the living areas shift from high to low values of these measures, capturing the breaking of convexity due to furniture.
In response to the questions raised earlier about the Farnsworth House, we see that individually
Figure 18:
a) S- and e-partitions of the Farnsworth House (after Peponis et al., 1997).
b) Clustering coefficient of the Farnsworth House (after Turner et al., 2001).
a)
b)

126
JOSS
The Journal of Space Syntax
Volume 5 • Issue 1
a)
b)
c)
d)
Figure 19:
Farnsworth House, basic configuration, resulting fields of:
a) connectivity,
b) covisibility,
c) compactness,
d) occlusivity.

127
JOSS
Just around the cornerfrom where you are
Psarra, S. & McElhinney, S.
a)
b)
c)
d)
Figure 20:
Farnsworth House, secondary configura-tion and correspond-ing fields of:
a) connectivity,
b) covisibility,
c) compactness,
d) occlusivity.

128
JOSS
The Journal of Space Syntax
Volume 5 • Issue 1
a)
b)
c)
d)
Figure 21:
Farnsworth House, furniture configuration and corresponding fields of:
a) connectivity,
b) covisibility,
c) compactness,
d) occlusivity.
129
JOSS
Just around the cornerfrom where you are
Psarra, S. & McElhinney, S.
and in complementary pairs the measures seem to express the functional significance of certain regions in the house, such as the hearth area. The repetitive presence of this area in isovists due to high Co-visibility values (Figure 19b) expresses a certain kind of ‘centrality’ related to optical experi-ence. This centrality is in tension with the lower values of Co-visibility in this same area when fur-niture is included in the analysis (Figure 21b). The tension between the results from the two levels of analysis seems to express a compositional ten-sion between the entire spatial field of the house (divided by the service block) and the objects that are located inside it. Another functional expression articulated by Connectivity and Co-visibility values concerns the diagonal stretch that distinguishes the living areas from the kitchen and bedroom (Figure 21b). In relation to previous kinds of analysis, the proposed measures in Figures 19a-c capture func-tionally different areas modulated by the block and the furniture. In contrast, the measure of clustering coefficient is almost equally distributed around the central block (Figures 18a, b).
The proposed measures and their relationship to other types of analysis need further testing. A first observation that arises from the complementarity of measures at this preliminary stage, however, is that seeing areas of high Connectivity values in layouts comes along with registering relations of Co-visibility located in-between high Connectivity areas, and vice versa. A second observation is that due to high resolution, the distribution of values captures s- and e- partitions, suggesting that latent geometries of spatial subdivision are not simply dictated by built shape as suggested by Turner et al. Instead, there is a relational logic between microscopic properties of spatial locations, and macroscopic characteristics of the environment captured by isovist geometry and built shape, such as area, overlap, convexity, boundaries and occluded edges. The underlying suggestion is that embodied vision and embodied
projection register and infer actual and virtual to-pologies and Euclidian geometries of space, built shape and vision, and their complementary logic.
4. Discussion and future work We have presented a new approach to isovist analysis based on a continuous-time stochastic process for root isovist sampling, isovist generation and quantification of geometric isovist values. This approach stems from the recognition that VGA has certain disadvantages. The first is that the intuitive and relational aspects of isovists are discarded together with their geometric logic. The fact that points in space belong to isovist frameworks, which include network-like elements of topology and Euclidian geometry, is equally important as graphing the entire structure of a layout. The sec-ond drawback is that VGA graphs an entire map of what is seen and accessed through time, in which integration (mean shortest path length) is normally interpreted as guiding aggregate movement along certain paths. However, first-time viewers discover the shortest paths only after they experiment with movement and vision as temporary states. The third disadvantage is that VGA is based on discrete-time iterative process, so that there is no continuous-time integration between analysis and design, or of different features, such as spatial analysis and agent simulation.
In opting for isovists rather than graphs and as-signing isovist values to all points within an isovist rather than to the origin, this model significantly extends Benedikt’s and Turner et al.’s approaches. It retains isovist geometry and constructs spectrum variation of geometric measures at isovist intersec-tions in continuous space. The system resolves the problem of resolution at the level of input of grid size and output of measures through a continuous-time stochastic process. Finally, it generates probabilistic fields of spatial description that account for aver-age potentiality occurring in one-step movement or

130
JOSS
The Journal of Space Syntax
Volume 5 • Issue 1
the next isovist around the corner in all directions. The tool allows for alterations to the plan to be ob-served in continuous time, and has the potential to integrate additional features into a single platform in the future.
In terms of limitations, the method has focused on 360-degree ‘undirected’ vision and it would be useful to also consider directed isovists. We ac-knowledge that as different directions will usually lead to movement around different corners, the differential potentiality can be of more interest than the average potentiality in calculations in the future. In addition, the relationship between measures we have observed need quantitative explanation, as explanations are limited at the level of visual distri-bution of results.
At the beginning of the paper we stress the gap between situated vision and all-to-all graph relations, and explain that this is largely due to underlying gaps in available diagrams and models. We propose that a new isovist methodology with the potential to explain the relationship between situated vision and global structure in layouts should re-conceptualise isovists beyond discrete units, and re-formulate them as seeds for an extended framework of spatial knowledge. The first step in overcoming this gap is to model and diagram embodied vision as a probabilistic continuous-time process. The second step is to consider a system of actually and virtually occupied spatial points through hypothesis and projections along the structure of possibilities embedded in isovist relations. Equally significant to local and global graph measures are relations that lie one step from us at each point, and so are in a state of having been encountered, or feature instead as possibility, remaining un-actualised (Psarra, 2013).
At the more general theoretical level, we pro-pose the need to reconceptualise the relationship between the observer, embodied vision and the environment. The underlying suggestion is that the
distinction between two states, local and global, and the mathematical expression of their relation-ship (intelligibility) has been proved useful, but externalises the link between embodied vision and global structure and makes it static. Further, the distinction between perception (normally as-sociated with local relations) and spatial cognition (associated with global properties) in space syntax research is fundamentally Platonic in nature. This is because it sees cognition as an abstraction captured by global structure, and perception as locked in the empirical world of observation and the senses. This distinction disembodies cognition and reduces perception to mere information. In order to address the dynamic nature of the observer and space we need to reconceptualise both embodied vision and the structure of a spatial complex as spatial knowledge in process rather than as states at the opposite ends of information and structure. This has the potential to facilitate understanding of the process of discovery not as ‘an accumulation of perceptions….aggregated into a picture of the whole’ (Hillier, 2003), but as emergent and evolving spatial knowledge subject to hypothesis testing and embodied projection. This remains to be tested.
AcknowledgementsThe work described by this paper has been supported by the UCL Space Group EPSRC platform grant, EP/G02619X/1 (P7726), in the context of a research project on Dynamic Three Dimensional Space Syntax Model-ling, directed by Sophia Psarra at UCL. Sam McElhinney produced a novel approach to modelling and quantify-ing isovists through a stochastic model. Sophia Psarra contributed to the translation of this model to theoretical and analytical explanation. Contributions by Alan Penn have been instrumental. Thanks also to members of University College London’s Space Group: Bill Hillier, Kayvan Karimi, Sean Hanna, Tasos Varoudis and Carlos Molinero. Finally, we wish to thank Michael Benedikt for his encouragement to explore isovists both quantitatively and qualitatively throughout.
About the authors:Sophia Psarra ([email protected]) is a Reader in Architecture and Spatial Design and a member of the Space Group a t the Bar t le t t School of Graduate Stud-ies, UCL. Previously, she was Associate Professor at the Taubman College of Architecture+Urban Plan-ning, University of Michigan (USA) and Lecturer/Senior Lecturer in Cardiff Univer-sity. Her research explores the relationship between spatial characteristics, pat-terns of use, social relations and cultural meaning. She has collaborated with lead-ing cultural institutions on the application of space syntax on understanding the relationship between layout, exhibition narratives and visitors’ experience (The Museum of Modern Art, MoMA, New York, The Natural History Museum, London). Her activities in these areas have resulted in publications, (Architec-ture and Narrative – The Formation of Space and Cultural Meaning, Rout-ledge 2009), creative instal-lations and design projects. As a practicing architect, she has won first prizes in international architectural competitions. Her work has been exhibited in Venice Bi-ennale, the George Pompi-dou Center, NAI Rotterdam, London, Berlin, Milan and Athens in Europe.
Sam McElhinney([email protected]) founded MUD Archi-tecture in September 2012 as a vehicle to bring to-gether strands of research, teaching and practice. The practice has ongoing private housing projects including a self-build re-furbishment of a historic building. In addition, Sam currently runs the MA Archi-

131
JOSS
Just around the cornerfrom where you are
Psarra, S. & McElhinney, S.
References
Batty, M. (2001), ‘Exploring isovist fields: Space and shape in architectural and urban morphology’. In: Environ-ment and Planning B: Planning and Design, Vol. 28, p.123-150.
Benedikt, M. (1979), ‘To take hold of space: Isovists and isovist fields’. In: Environment and Planning B: Plan-ning and Design, Vol. 6, p.47-65.
Conroy Dalton, R. (2001), ‘The secret is to follow your nose; Route path selection and angularity’. In: Peponis, J., Wineman, J. and Bafna, S. (eds.), Proceedings of the Third International Space Syntax Symposium, Atlanta, U.S.A: Georgia Institute of Technology, p.47.1-47.14.
Conroy Dalton, R. and Dalton, N. (2001), ‘OmniVista; An application for isovist field and path analysis’. In: Peponis, J., Wineman, J. and Bafna, S. (eds.), Proceedings of the Third International Symposium on Space Syntax, Atlanta, U.S.A: Georgia Institute of Technology, p.25.1-25.10.
Gibson, J. J. (1979), The Ecological Approach to Visual Perception, Boston, MA: Houghton Mifflin.
Hanson, J. (1998), Decoding Homes and Houses, Cam-bridge: Cambridge University Press.
Hillier, B. (1996), Space is the Machine: A Configurational Theory of Architecture, Cambridge: Cambridge Uni-versity Press.
Hillier, B. (2003), ‘The architectures of seeing and going: Or, are cities shaped by bodies or minds? And is there a syntax of spatial cognition?’. In: Hanson, J. (ed.), Proceedings of the Fourth International Space Syntax Symposium, London: University College London, Vol. 1, p.06.1-06.34.
Hölscher, B. and Brösamle, C. (2007), ‘Capturing indoor wayfinding strategies and differences in spatial knowl-edge with space syntax’. In: Kubat, A. S., Ertekin, Ö., Güney, Y. I. and Eyübolou, E. (eds.), Proceedings of the Sixth International Space Syntax Symposium, Istanbul: I.T.U. Faculty of Architecture, p.043.1-043.12.
Koch, D. (2012), ‘Isovists revisited; Egocentric space, al-locentric space, and the logic of the mannequin’. In: Greene, M., Reyes, J. and Castro., A. (eds.), Proceed-
tecture course at the Can-terbury School of Architec-ture and is a member of the Space Group at UCL. His research work is focussed on developing real-time and motive spatial analytic models. Born in Bath, South West England, Sam studied architecture at Cambridge University and the Bartlett, University College Lon-don. On graduation from UCL he won the Ambrose Poynter Prize for his thesis ‘Labyrinths, Mazes and the Spaces Inbetween’. He has expansive theoretical and exhibit based research into adaptive maze and laby-rinth spaces. In 2010 he won the prestigious ‘Best Paper’ at the European Meeting of Cybernetics and Systems Research in Vi-enna. In the past he has lec-tured at numerous institu-tions including Cambridge University and the MAXXI in Rome. From 2005 to 2012 Sam was a key member of Surface Architects. After leaving Surface he acted as a Design Manager at Jason Bruges Studio, running the design, construction and commissioning of the pres-tigious WWF Experience Installation.
Endnotes
Figure 22:
a) Isovists of accessible (light grey) and visible space (dark grey). Plane W can be seen through.
b) Isovist of reflected space (dark grey). Plane W is reflective.
c) Isovist of specular space (dark grey). Plane W is reflective.
a) b) c)
132
JOSS
The Journal of Space Syntax
Volume 5 • Issue 1
ings of the Eighth International Space Syntax Sym-posium, Santiago de Chile: PUC, p.8144.1-8144.23.
Koch, D. (2013), ‘The architectural interface inside out: Interior-exterior relations, spatial models and configu-rational mirroring’. In: Kim, Y. O., Park, H. T. and Seo, K. W. (eds.), Proceedings of the Ninth International Space Syntax Symposium, Seoul: Sejong University, p.67.1-67.16.
Osborne, V. (2008), ‘The logic of the mannequin: Shop windows and the realist novel’. In Potvin, J. (ed.), The Places and Spaces of Fashion, 1800-2007, London: Routledge, p.186-199.
Peponis, J., Wineman, J., Rashid, M., Hong Kim, S. and Bafna, S. (1997), ‘On the description of shape and spatial configuration inside buildings: Convex parti-tions and their local properties’. In: Environment and Planning B: Planning and Design, Vol. 24, p.761-781.
Penn, A. (2001), ‘Space syntax and spatial cognition; Or, why the axial line?’. In: Peponis, J., Wineman, J. and Bafna, S. (eds.), Proceedings of the Third International Space Syntax Symposium, Atlanta, U.S.A: Georgia Institute of Technology, p.11.1-11.17; also published in: (2003), Environment and Behaviour, Vol. 35 (1), p.30-65.
Psarra, S. (1997), ‘Geometrical walks in architectural space – The synchronous order of geometry and the sequential experience of space’. Unpublished PhD Dissertation, London: University College London.
Psarra, S. (1997a), ‘Geometry and space in the architec-ture of Le Corbusier and Mario Botta’. In: Major, M. D., Amorim, L. and Dufaux, D. (eds.), Proceedings of the First International Space Syntax Symposium, London: University College London, p.32.1-32.29.
Psarra, S. (2003), ‘Top-down and bottom-up charac-terisations of shape and space’. In: Hanson, J. (ed.), Proceedings of the Fourth International Space Syntax Symposium, London: University College London, Vol. 1, p.31.1-31.17.
Psarra, S. (2009), Architecture and Narrative: The Formation of Space and Cultural Meaning London: Routledge.
Psarra, S. (2013), ‘Beyond analytical knowledge: The need for a combined theory of generation and explana-tion’. In: Kim, Y. O., Park, H. T. and Seo, K. W. (eds.),
Proceedings of the Ninth International Space Syntax Symposium, Seoul: Sejong University, p.065.1-065.22.
Psarra, S. and Grajewski, T. (2000), ‘Architecture, narrative and promenade in Benson and Forsyth’s Museum of Scotland’. In: Architectural Research Quarterly (arq), Vol. 4 (2), p.122-136.
Schneider, S. and König, R. (2012), ‘Real-time visibility analysis, enhancing calculation speed of isovists and isovist-fields using the GPU’. In: Proceedings, 11th Conference on Design and Decision Support Systems in Architecture and Urban Planning, Eindhoven.
Tzortzi, K. (2007), ‘Museum building design, and exhibition layout: Patterns of interaction’. In: Kubat, A. S., Ertekin, Ö., Güney, Y. I. and Eyübolou, E. (eds.), Proceedings of the Sixth International Space Syntax Symposium, Istanbul: I.T.U. Faculty of Architecture, p.072.1-072.16.
Tzortzi, K. (2009), ‘The art museum as a city of a machine for showing art’. In: Koch, D., Marcus, L. and Steen, J. (eds.), Proceedings of the Seventh International Space Syntax Symposium, Stockholm: Royal Institute of Technology, p.117.1-117.13.
Tzortzi, K. (2011), ‘Space: Interconnecting museology and architecture’. In: The Journal of Space Syntax, Vol. 2 (1), p.26-53.
Turner, A. and Penn, A. (1999), ‘Making isovists syn-tactic: Isovist integration analysis’. In: Major, M. D. and Amorim, L. (eds.), Proceedings of the Second International Space Syntax Symposium, Brazilia: Universidade de Brasilia, p.103-121.
Turner, A., Doxa, M., O’Sullivan, D. and Penn, A. (2001), ‘From isovists to visibility graphs: A methodology for the analysis of architectural space’. In: Environment and Planning B: Planning and Design, Vol. 28, p.103-122.
Turner, A. (2003), ‘Analysing the visual dynamics of spatial morphology’. In: Environment and Planning B: Planning and Design, Vol. 30, p.657-676.
Wiener, J. and Franz, G. (2005), ‘Isovists as a means to predict spatial experience and behaviour’. In: Freksa, C., Knauff, M., Krieg-Brückner, B., Nebel, B. and Barkowsky, T. (eds.), Spatial Cognition, Berlin: Springer-Verlag, Vol. 4, p.42–57.