Jurnal Ilmu dan Teknologi Kelautan Tropis - Journal IPB
10
Jurnal Ilmu dan Teknologi Kelautan Tropis Vol. 11 No. 2, Hlm. 427-435, August 2019 p-ISSN : 2087-9423 http://journal.ipb.ac.id/index.php/jurnalikt e-ISSN : 2620-309X DOI: http://doi.org/10.29244/jitkt.v11i2.24817 Department of Marine Science and Technology FPIK-IPB, ISOI, and HAPPI 427 OVERFISHING AND OVERCAPACITY SMALL SCALE FISHERIES IN SEMARANG CITY KAPASITAS PENANGKAPAN BERLEBIH DAN TANGKAP LEBIH PERIKANAN SKALA KECIL DI KOTA SEMARANG Jamaludin Malik 1* , Achmad Fahrudin 2 , Dietriech Geoffrey Bengen 2 and Taryono 2 1 Study Program of Coastal and Marine Resources Management, Graduate School of IPB University, Bogor, Indonesia 2 Faculty of Fisheries and Marine Science, IPB University, Bogor, Indonesia * E-mail: [email protected] ABSTRACT Fisheries in Semarang City are dominated by small-scale fisheries. This is indicated by the use of the largest fishing fleet of 10 gross tons operating near the coast. This study aims to analyze the status of small-scale fisheries in Semarang City for sustainable management. Sustainable management is management that guarantees the availability of natural resources and environmental services for future generations. The study was conducted for three months, namely September-November 2018 in the coastal waters of Semarang City, which was part of the Fisheries Management Region (WPP) 712. The method used in this study is the analysis of time series surplus production, namely data from the catch (ton/year) and the number of fishing gear (unit) within 10 years (2007-2016), to calculate the catch per-unit effort (CPUE), maximum sustainable yield (MSY), optimum effort (fopt), utilization rate (TP) and capacity level (TK). This study was obtained results of a downward trend in CPUE; the existing fishery catch or production in 2016 has exceeded the MSY value is 479 tons/year (Schaefer) and 439.11 tons/year (Fox); utilization rate of more than 100% which is 108-127% (Schaefer) and 118-138% (Fox), so that small-scale fisheries in Semarang City are at the level of over-exploited. Based on the fopt analysis, the number of fishing gear used (fexisting) has exceeded the optimum effort with a fishing capacity exceeding 100%, so that small-scale fisheries in Semarang City have experienced overcapacity. Keywords: CPUE, MSY, overfishing, overcapacity, small scale fisheries, Semarang ABSTRAK Perikanan di Kota Semarang didominasi oleh perikanan skala kecil. Hal ini ditandai dengan penggunaan armada perikanan paling besar 10 gros ton yang beroperasi di dekat pantai. Penelitian ini mempunyai tujuan menganalisis status perikanan skala kecil di Kota Semarang untuk pengelolaan berkelanjutan. Pengelolaan berkelanjutan yang dimaksudkan yaitu pengelolaan yang menjamin tersedianya sumber daya alam dan jasa lingkungan bagi generasi yang akan datang. Penelitian dilakukan selama 3 bulan yaitu September-November 2018 di perairan pesisir Kota Semarang yang menjadi bagian dari Wilayah Pengelolaan Perikanan (WPP) 712. Metode yang dipakai dalam penelitian ini adalah analisis data runtun waktu (time series) produksi surplus yaitu data dari hasil tangkapan (ton/tahun) dan jumlah alat tangkap (unit), dalam kurun waktu 10 tahun (2007-2016), untuk menghitung nilai catch per-unit effort (CPUE), potensi maksimum lestari (MSY), jumlah effort optimum (fopt), tingkat pemanfaatan (TP) dan tingkat kapasitas (TK). Penelitian ini diperoleh hasil adanya tren penurunan CPUE; hasil tangkapan/produksi perikanan eksisting telah melewati nilai MSY-nya yaitu sebesar 479 ton/tahun (Schaefer) dan 439,11 ton/tahun (Fox); tingkat pemanfaatan lebih dari 100% yaitu sebesar 108-127% (Schaefer) dan 118-138% (Fox), sehingga perikanan skala kecil di Kota Semarang berada pada tingkat over-exploited. Berdasarkan analisis fopt menunjukkan jumlah alat tangkap yang digunakan (fexisting) telah melebihi jumlah optimumnya dengan tingkat kapasitas penangkapan melebihi 100%, sehingga perikanan skala kecil di Kota Semarang telah mengalami kelebihan kapasitas penangkapan (overcapacity). Kata kunci: CPUE, MSY, overfishing, overcapacity, perikanan skala kecil, Semarang
-
Upload
khangminh22 -
Category
Documents
-
view
1 -
download
0
Transcript of Jurnal Ilmu dan Teknologi Kelautan Tropis - Journal IPB

Jurnal Ilmu dan Teknologi Kelautan Tropis Vol. 11 No. 2, Hlm. 427-435, August 2019
p-ISSN : 2087-9423 http://journal.ipb.ac.id/index.php/jurnalikt
e-ISSN : 2620-309X DOI: http://doi.org/10.29244/jitkt.v11i2.24817
Department of Marine Science and Technology FPIK-IPB, ISOI, and HAPPI 427
OVERFISHING AND OVERCAPACITY
SMALL SCALE FISHERIES IN SEMARANG CITY
KAPASITAS PENANGKAPAN BERLEBIH DAN TANGKAP LEBIH
PERIKANAN SKALA KECIL DI KOTA SEMARANG
Jamaludin Malik1*, Achmad Fahrudin2, Dietriech Geoffrey Bengen2 and Taryono2
1Study Program of Coastal and Marine Resources Management,
Graduate School of IPB University, Bogor, Indonesia 2Faculty of Fisheries and Marine Science, IPB University, Bogor, Indonesia
* E-mail: [email protected]
ABSTRACT
Fisheries in Semarang City are dominated by small-scale fisheries. This is indicated by the use of the largest fishing fleet of 10 gross tons operating near the coast. This study aims to analyze the status of small-scale fisheries in Semarang City for sustainable management. Sustainable management is
management that guarantees the availability of natural resources and environmental services for future generations. The study was conducted for three months, namely September-November 2018 in the coastal waters of Semarang City, which was part of the Fisheries Management Region (WPP) 712. The method
used in this study is the analysis of time series surplus production, namely data from the catch (ton/year) and the number of fishing gear (unit) within 10 years (2007-2016), to calculate the catch per-unit effort (CPUE), maximum sustainable yield (MSY), optimum effort (fopt), utilization rate (TP) and capacity level
(TK). This study was obtained results of a downward trend in CPUE; the existing fishery catch or
production in 2016 has exceeded the MSY value is 479 tons/year (Schaefer) and 439.11 tons/year (Fox); utilization rate of more than 100% which is 108-127% (Schaefer) and 118-138% (Fox), so that small-scale
fisheries in Semarang City are at the level of over-exploited. Based on the fopt analysis, the number of fishing gear used (fexisting) has exceeded the optimum effort with a fishing capacity exceeding 100%, so that small-scale fisheries in Semarang City have experienced overcapacity.
Keywords: CPUE, MSY, overfishing, overcapacity, small scale fisheries, Semarang
ABSTRAK
Perikanan di Kota Semarang didominasi oleh perikanan skala kecil. Hal ini ditandai dengan penggunaan
armada perikanan paling besar 10 gros ton yang beroperasi di dekat pantai. Penelitian ini mempunyai
tujuan menganalisis status perikanan skala kecil di Kota Semarang untuk pengelolaan berkelanjutan.
Pengelolaan berkelanjutan yang dimaksudkan yaitu pengelolaan yang menjamin tersedianya sumber daya
alam dan jasa lingkungan bagi generasi yang akan datang. Penelitian dilakukan selama 3 bulan yaitu
September-November 2018 di perairan pesisir Kota Semarang yang menjadi bagian dari Wilayah
Pengelolaan Perikanan (WPP) 712. Metode yang dipakai dalam penelitian ini adalah analisis data runtun
waktu (time series) produksi surplus yaitu data dari hasil tangkapan (ton/tahun) dan jumlah alat tangkap
(unit), dalam kurun waktu 10 tahun (2007-2016), untuk menghitung nilai catch per-unit effort (CPUE),
potensi maksimum lestari (MSY), jumlah effort optimum (fopt), tingkat pemanfaatan (TP) dan tingkat
kapasitas (TK). Penelitian ini diperoleh hasil adanya tren penurunan CPUE; hasil tangkapan/produksi
perikanan eksisting telah melewati nilai MSY-nya yaitu sebesar 479 ton/tahun (Schaefer) dan 439,11
ton/tahun (Fox); tingkat pemanfaatan lebih dari 100% yaitu sebesar 108-127% (Schaefer) dan 118-138%
(Fox), sehingga perikanan skala kecil di Kota Semarang berada pada tingkat over-exploited. Berdasarkan
analisis fopt menunjukkan jumlah alat tangkap yang digunakan (fexisting) telah melebihi jumlah optimumnya
dengan tingkat kapasitas penangkapan melebihi 100%, sehingga perikanan skala kecil di Kota Semarang
telah mengalami kelebihan kapasitas penangkapan (overcapacity).
Kata kunci: CPUE, MSY, overfishing, overcapacity, perikanan skala kecil, Semarang
Overfishing and Overcapacity Small Scale Fisheries . . .
http://journal.ipb.ac.id/index.php/jurnalikt 428
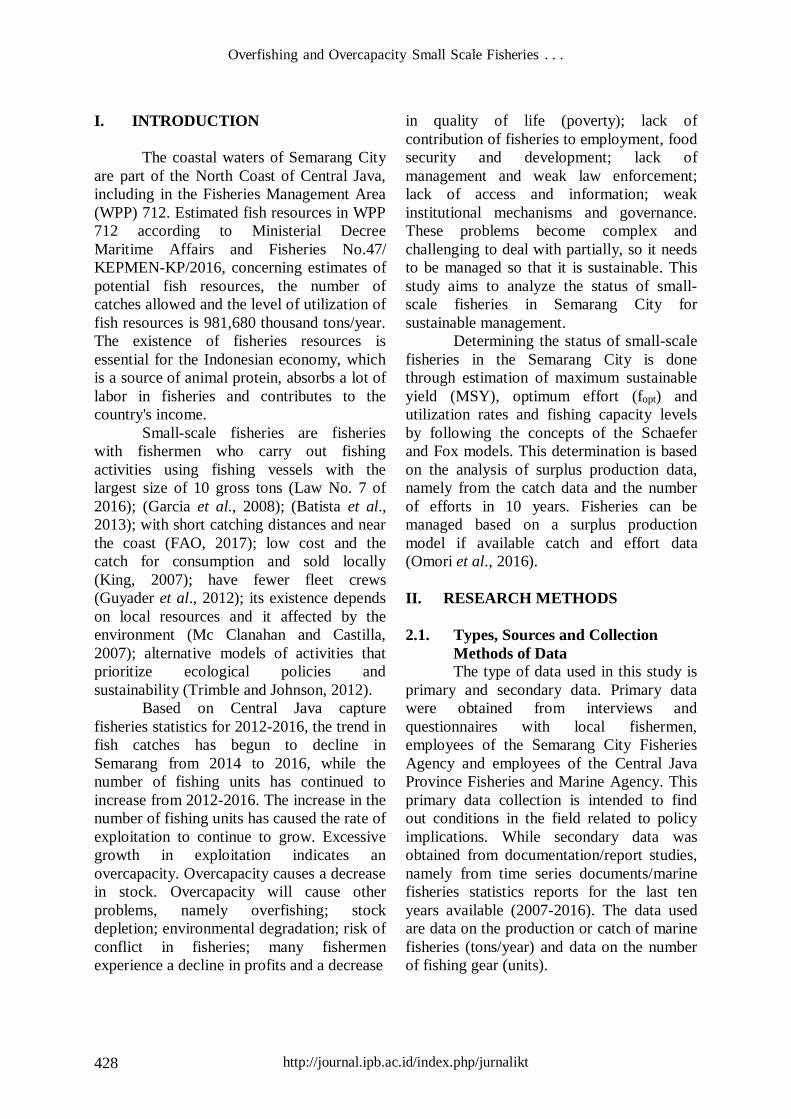
I. INTRODUCTION
The coastal waters of Semarang City
are part of the North Coast of Central Java,
including in the Fisheries Management Area
(WPP) 712. Estimated fish resources in WPP
712 according to Ministerial Decree
Maritime Affairs and Fisheries No.47/
KEPMEN-KP/2016, concerning estimates of
potential fish resources, the number of
catches allowed and the level of utilization of
fish resources is 981,680 thousand tons/year.
The existence of fisheries resources is
essential for the Indonesian economy, which
is a source of animal protein, absorbs a lot of
labor in fisheries and contributes to the
country's income.
Small-scale fisheries are fisheries
with fishermen who carry out fishing
activities using fishing vessels with the
largest size of 10 gross tons (Law No. 7 of
2016); (Garcia et al., 2008); (Batista et al.,
2013); with short catching distances and near
the coast (FAO, 2017); low cost and the
catch for consumption and sold locally
(King, 2007); have fewer fleet crews
(Guyader et al., 2012); its existence depends
on local resources and it affected by the
environment (Mc Clanahan and Castilla,
2007); alternative models of activities that
prioritize ecological policies and
sustainability (Trimble and Johnson, 2012).
Based on Central Java capture
fisheries statistics for 2012-2016, the trend in
fish catches has begun to decline in
Semarang from 2014 to 2016, while the
number of fishing units has continued to
increase from 2012-2016. The increase in the
number of fishing units has caused the rate of
exploitation to continue to grow. Excessive
growth in exploitation indicates an
overcapacity. Overcapacity causes a decrease
in stock. Overcapacity will cause other
problems, namely overfishing; stock
depletion; environmental degradation; risk of
conflict in fisheries; many fishermen
experience a decline in profits and a decrease
in quality of life (poverty); lack of
contribution of fisheries to employment, food
security and development; lack of
management and weak law enforcement;
lack of access and information; weak
institutional mechanisms and governance.
These problems become complex and
challenging to deal with partially, so it needs
to be managed so that it is sustainable. This
study aims to analyze the status of small-
scale fisheries in Semarang City for
sustainable management.
Determining the status of small-scale
fisheries in the Semarang City is done
through estimation of maximum sustainable
yield (MSY), optimum effort (fopt) and
utilization rates and fishing capacity levels
by following the concepts of the Schaefer
and Fox models. This determination is based
on the analysis of surplus production data,
namely from the catch data and the number
of efforts in 10 years. Fisheries can be
managed based on a surplus production
model if available catch and effort data
(Omori et al., 2016).
II. RESEARCH METHODS
2.1. Types, Sources and Collection
Methods of Data
The type of data used in this study is
primary and secondary data. Primary data
were obtained from interviews and
questionnaires with local fishermen,
employees of the Semarang City Fisheries
Agency and employees of the Central Java
Province Fisheries and Marine Agency. This
primary data collection is intended to find
out conditions in the field related to policy
implications. While secondary data was
obtained from documentation/report studies,
namely from time series documents/marine
fisheries statistics reports for the last ten
years available (2007-2016). The data used
are data on the production or catch of marine
fisheries (tons/year) and data on the number
of fishing gear (units).

Malik et al.
Jurnal Ilmu dan Teknologi Kelautan Tropis, Vol. 11, No. 2, August 2019 429
2.2. Location and Time of Study
This study was carried out in the
coastal waters of Semarang City, Central
Java Province, which was part of the
Fisheries Management Area (WPP) 712, as
in Figure 1. Data collection and analysis was
carried out for three months, September-
November 2018.
2.3. Data Analysis Method
Data on the amount of production or
catch and data on the number of fishing gears
are analyzed to calculate (i) catch per unit
effort (CPUE), (ii) maximum sustainable
yield (MSY) and optimum effort (fopt), (iii)
the level of utilization of fish resources (TP)
and the capacity level of fishing units (TK).
2.3.1. Catch per Unit Effort (CPUE)
CPUE value is calculated based on
the total amount of production or total catch
(tons/year) compared to the total effort
(units). In Tinungki (2005), Zulbainarni
(2016), CPUE can be formulated as follows:
………………………... (1)
Information: CPUE = catch per unit effort
(tons/year/units), Ʃ Catcht = total catch
(tons/year), dan Ʃ Effortt = total effort
(units).
Figure 1. Map of study location.

Overfishing and Overcapacity Small Scale Fisheries . . .
http://journal.ipb.ac.id/index.php/jurnalikt 430
2.3.2. MSY and fopt
Estimation of maximum sustainable
yield (MSY) and the amount of optimum
effort (fopt) can be done using the Schaefer
and Fox model (Pauly, 1983) in (Nugraha et
al., 2012), (Istikasari et al., 2016) as follows:
2.3.2.1.MSY and fopt Schaefer (Linear)
Model
1. Relationship between CPUE and effort (f)
CPUE = a + bf. …………………….... (2)
Information, from linear relations CPUE
and effort (f), is obtained: a: intercept, b:
slope.
2. Relationship between catch and effort
C/f = a + bf
C = af + bf² ………..………………. (3)
3. The optimum effort (fopt) is obtained from
the first derivative of the catch (C) with an
effort equal to zero.
C = af + bf²
Cˡ = a + 2bf = 0
2bf = -a
fopt = - (a/2b) …………….………….. (4)
4. The MSY value is obtained by
substituting the optimum effort (fopt) in
equation 3, so that it is obtained:
Cmax = a(-a/2b) + b(a²/4b²)
= -a²/2b + a²/4b
= (-2a² + a²)/4b
MSY = Cmax = - (a²/4b)
2.3.2.2.MSY and fopt Fox (Exponential)
Model
1. Relationship f with CPUE
CPUE = exp (a + bf)
information:
a and b are the natural anti log (ln) of
intercept
2. Relationship between f and C
C = f * (exp ^ (a + bf)) ….…………… (5)
fopt is obtained from the first derivative C/f
= 0
fopt = - (1/b) …..……………………… (6)
5. MSY is obtained by substituting fopt into
equation 7 so that it is obtained:
MSY = - (1/b) * e ^ (a-1) …….……… (7)
2.3.3. Utilization Level (TP) and Capacity
Level (TK)
According to Sparre and Venema
(1999), utilization level is expressed in
percent (%), expressed in formulas:
TP(i) = (Ci/MSY) x 100% ………………. (8)
Information: TP(i): utilization level of the
year I, Ci: the catch of year I, MSY:
maximum sustainable yield
Likewise, the capacity level expressed in
percent (%) and formulated:
TK(i) = (fi/fopt) x 100% ………………….. (9)
Information: TK(i): capacity level of arrest for
the year i.
fi : effort for the year i
fopt : optimum effort
III. RESULTS AND DISCUSSION
3.1. Catch per Unit Effort (CPUE) Calculation of CPUE value is
commonly used to determine the
development of fish stocks, and as an
indicator of the efficiency and effective
fishing operations without the need for as
much data as other methods (van Hoof and
Salz, 2001). The CPUE value is obtained by
dividing the data between the catch and the
amount of effort that has been standardized.
The CPUE values of small-scale fisheries in
Semarang City, 2007 until 2016 are
presented in the following Table 1.
Table 1. CPUE values of small-scale fisheries in Semarang City 2007-2016.
Year Production (tons/year) Effort (units) CPUE
2007 156.00 466 0.33
2008 164.00 784 0.21
2009 175.00 466 0.38
2010 372.00 466 0.80

Malik et al.
Jurnal Ilmu dan Teknologi Kelautan Tropis, Vol. 11, No. 2, August 2019 431
Year Production (tons/year) Effort (units) CPUE
2011 568.00 481 1.18
2012 583.00 481 1.21
2013 594.00 865 0.69
2014 606.00 1,032 0.59
2015 517.00 1,199 0.43
2016 352.00 1,199 0.29
The development trend or decrease in
CPUE value can be seen from the
relationship between CPUE and the effort.
This CPUE trend can illustrate the indication
of the status of utilization of fish resources in
the waters. Regarding CPUE and effort
relations on small-scale fisheries in
Semarang City can be seen in Figure 2
below.
Figure 2. Relationship CPUE and effort.
In Figure 2, it can be seen that the
CPUE and effort relationship is linearly
negative, meaning that the CPUE value
decreases with increasing effort. This
decrease in CPUE value indicates that fish
stocks began to decline, and the status
utilization of fish resources in the waters of
Semarang City indicates experiencing
overfishing. This is by (Jaya et al., 2017),
which states the decrease in CPUE indicates
the level of fish resource utilization is
overfishing. A decrease in CPUE value can
also indicate that capture operations are
increasingly inefficient. This inefficiency
occurs because the catches obtained are
getting smaller with the use of an increasing
amount of effort, so further analysis is
needed to be able to determine the optimum
amount.
3.2. MSY and fopt
The results analysis of maximum
sustainable yield (MSY) in small-scale
fisheries in Semarang City according to the
Schaefer model are 479 tons/year and the
optimum fishing gears can be operated (fopt)
is 962 units. According to the Fox model, the
MSY results are 439.11 tons/year, and fopt is
1,003 units, as presented in Figure 3 and 4
below.
Figure 3. MSY and fopt Schaefer model.
Figure 4. MSY and fopt Fox model.

Overfishing and Overcapacity Small Scale Fisheries . . .
http://journal.ipb.ac.id/index.php/jurnalikt 432
In Figure 3 (Schaefer Model) it can
be seen that the number of fishing units used
by fishermen (fexisting) in Semarang City in
2016 (amounting to 1,199 units) has
exceeded the number of optimum fishing
gear (1,003 units), so overcapacity has
occurred. This overcapacity caused
Semarang City's small-scale fisheries
production in 2016 to amount to 352 tons per
year past the sustainable potential value
(MSY) of 479 tons per year. This shows that
overfishing in small-scale fisheries in
Semarang City has occurred. Regarding
policy, this overcapacity certainly needs to
be reduced so that fisheries resources can be
managed sustainably. Based on the Schaefer
model, the number of fexisting 1,199 units
should be reduced by 237 units to return to
their optimum conditions of 962 units. In the
Schaefer model it has a disadvantage, namely
with the addition of continuous effort
(uncontrolled), then over time, the potential
of fisheries resources will be exhausted (Yt =
0). This can be seen in the form of an
inverted parabola graph in Figure 2 with the
final production equal to 0 (exhausted),
whereas in reality fisheries resources can
recover (renewable resources) and can
regenerate, so it is impossible to completely
run out. For this reason, the Fox model is
also considered to cover the weaknesses
found in the Schaefer model.
In Figure 4 (Fox Model), there is an
exponential graph, where continuous
pressure on fisheries resources by the number
of excessive effort, fisheries resources is not
up to extinction (Yt ǂ 0). This condition is
certainly more realistic by conditions in the
field that fisheries resources are renewable
resources. The results calculation of the
MSY value on this Fox model were obtained
at 439.11 tons per year with the optimum
effort devices of 1,003 units. Whereas in the
existing conditions namely small-scale
fisheries production in Semarang City in
2016 amounted to 352 tons per year with a
total effort of 1,199 units which also
exceeded the MSY value, so it was included
in the category of overfishing, with an excess
effort of 196 units must be decreased.
The occurrence of overfishing
conditions in small-scale fisheries in
Semarang City is also reinforced (Anas et al.,
2011), which states that the status of
utilization of fish resources in the waters of
Cirebon (which is the North Coast of Java
and part WPP 712) has overfishing. This is
indicated by the volume of catches to be
getting smaller, the size of the fish caught is
getting smaller and the time used to go to sea
is getting longer. The same opinion was also
conveyed (Triarso, 2012), which states that
the potential of fisheries resources in Central
Java is indicated to experience overfishing,
due to the pressure of arrests carried out by
small-scale fisheries which generally operate
on the coast.
3.3. Utilization Level (TP) and Capacity
Level (TK)
The utilization level of fisheries
resources shows a comparison of the amount
of annual catch production with its maximum
sustainable yield (MSY) and expressed in
percent. Similarly, the level of fishing
capacity is a comparison of the amount of
existing annual effort with the optimum
effort expressed in percent. The results
calculations regarding the utilization level of
fisheries resources and the capacity level in
small-scale fisheries in Semarang City are
shown in Table 2 below.
Table 2. The utilization level and capacity levels of small-scale fisheries in Semarang City
2007-2016
Year Production (tons/year) Effort (units) TP* (%) TP** (%) TK* (%) TK** (%)
2007 156 466 33 36 48 46
2008 164 784 34 37 81 78
Malik et al.
Jurnal Ilmu dan Teknologi Kelautan Tropis, Vol. 11, No. 2, August 2019 433
Year Production (tons/year) Effort (units) TP* (%) TP** (%) TK* (%) TK** (%)
2009 175 466 37 40 48 46
2010 372 466 78 85 48 46
2011 568 481 119 129 50 48
2012 583 481 122 133 50 48
2013 594 865 124 135 90 86
2014 606 1032 127 138 107 103
2015 517 1199 108 118 125 120
2016 352 1199 73 80 125 120
* (Schaefer model) with MSY = 479 tons/year and fopt = 962 units
** (Fox model) with MSY = 439,11 tons/ year and fopt = 1,003 units
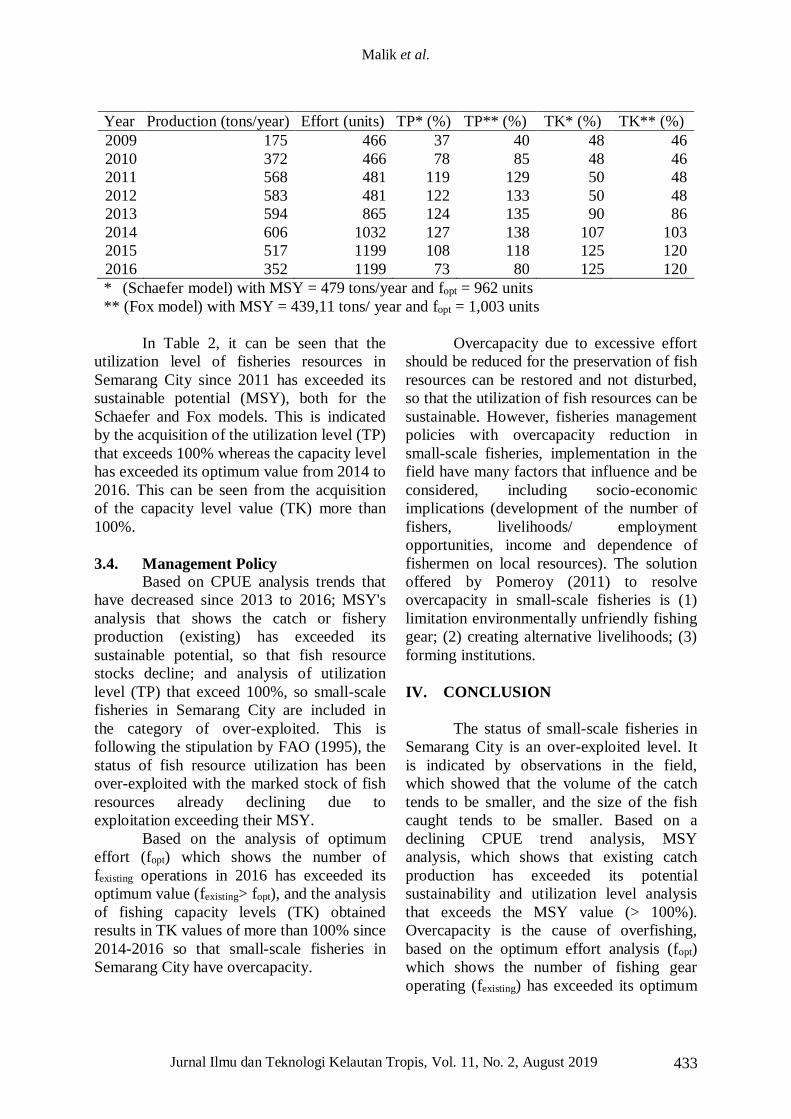
In Table 2, it can be seen that the
utilization level of fisheries resources in
Semarang City since 2011 has exceeded its
sustainable potential (MSY), both for the
Schaefer and Fox models. This is indicated
by the acquisition of the utilization level (TP)
that exceeds 100% whereas the capacity level
has exceeded its optimum value from 2014 to
2016. This can be seen from the acquisition
of the capacity level value (TK) more than
100%.
3.4. Management Policy Based on CPUE analysis trends that
have decreased since 2013 to 2016; MSY's
analysis that shows the catch or fishery
production (existing) has exceeded its
sustainable potential, so that fish resource
stocks decline; and analysis of utilization
level (TP) that exceed 100%, so small-scale
fisheries in Semarang City are included in
the category of over-exploited. This is
following the stipulation by FAO (1995), the
status of fish resource utilization has been
over-exploited with the marked stock of fish
resources already declining due to
exploitation exceeding their MSY.
Based on the analysis of optimum
effort (fopt) which shows the number of
fexisting operations in 2016 has exceeded its
optimum value (fexisting> fopt), and the analysis
of fishing capacity levels (TK) obtained
results in TK values of more than 100% since
2014-2016 so that small-scale fisheries in
Semarang City have overcapacity.
Overcapacity due to excessive effort
should be reduced for the preservation of fish
resources can be restored and not disturbed,
so that the utilization of fish resources can be
sustainable. However, fisheries management
policies with overcapacity reduction in
small-scale fisheries, implementation in the
field have many factors that influence and be
considered, including socio-economic
implications (development of the number of
fishers, livelihoods/ employment
opportunities, income and dependence of
fishermen on local resources). The solution
offered by Pomeroy (2011) to resolve
overcapacity in small-scale fisheries is (1)
limitation environmentally unfriendly fishing
gear; (2) creating alternative livelihoods; (3)
forming institutions.
IV. CONCLUSION
The status of small-scale fisheries in
Semarang City is an over-exploited level. It
is indicated by observations in the field,
which showed that the volume of the catch
tends to be smaller, and the size of the fish
caught tends to be smaller. Based on a
declining CPUE trend analysis, MSY
analysis, which shows that existing catch
production has exceeded its potential
sustainability and utilization level analysis
that exceeds the MSY value (> 100%).
Overcapacity is the cause of overfishing,
based on the optimum effort analysis (fopt)
which shows the number of fishing gear
operating (fexisting) has exceeded its optimum

Overfishing and Overcapacity Small Scale Fisheries . . .
http://journal.ipb.ac.id/index.php/jurnalikt 434
value; and analysis of capacity level (TK)
levels that have reached more than 100%.
Management policy solutions that can be
carried out by the Regional Government to
be sustainable, including restrictions/
reduction of fishing gear due to overcapacity.
ACKNOWLEDGMENTS
The author gives thanks to the Central
Java Provincial Government for the awarding
of scholarships to study doctoral programs at
Bogor Agricultural University through the
Central Java Provincial Budget.
Acknowledgements are also given by the
author to the Central Java Province's Office
of Maritime Affairs and Fisheries and the
Semarang City Fisheries Agency for all
assistance for the completion of this series of
studies.
REFERENCES
Anas, P. 2011. Study of the relationship
between fish resources and fisherman
poverty as the basis for policy
management of coastal areas in
Cirebon Regency, West Java
Province. IPB. Bogor. 183 p.
Batista, V.S., N.N. Fabre, A.C.M. Malhado,
and R.J. Ladle. 2013. Tropical
Artisanal Coastal Fisherίes:
Challenges and future directions. Fish
Science & Aquaculture, 22(1):1–
15.doi:10.1080/10641262.2013.82246
3.
Food and Agricultural Organization (FAO).
1995. Management for responsible
fisheries. Translation of: Code of
conduct for responsive fisheries.
FAO, Ministry of Agriculture, JICA.
Jakarta.
Food and Agriculture Organization of the
United Nations (FAO). 2017.
http://www.fao.org/fi/glossary.
[Accessed on February 7, 2017].
Garcia, S.M., E.H. Allison, N.J. Andrew, C.
Bene, G. Bianchi, G.J. de-Graaf, D.
Kalikoski, R. Mahon, and J.M.
Orensanz. 2008. Towards integrated
assessment and advice in small scale
físheríes: principles and processes.
FAO Físherίes and Aquaculture
Technical Paper, No. 515. FAO.
Rome. 84 p.
Guyader, O., P. Berthou, C. Koutsikopoulos,
F. Alban, S. Demanecheb, M.B.
Gaspare, R. Eschbaum, E. Fahy,
O. Tully, L. Reynal, O. Curtil, K.
Frangoudes, and F. Maynou. 2012.
Small scale fisheries in Europe: A
comparative analysis based on a
selection of case studies. Fìsheries
Research, 140:1–13. http://dx.doί.org/
10.1016/j.fishres. 2012.11.008.
Istikasari, I., A.K. Mudzakir, and D.
Wijayanto. 2016. The bioeconomic
analysis of Rajungan (Portunus
pelagίcus) uses the swept area
approach and Gordon Schaefer in
Demak Waters. Proceedings of the
5th Year National Seminar on the
Result of Research on Marine and
Marine Affairs. 433-447 pp.
Jaya, M.M., B. Wiryawan, dan D. Simbolon.
2017. Analysis of the utilization level
of tuna fish using the spawning
potential ratio method in Sendang
Biru Waters. J. Ilmu dan Teknologi
Kelautan Tropis, 9(2):597-604.
http://dx.doi.org/10.29244/jitkt.v9i2.1
9294.
King, M. 2007. Fisheries biology, assessment
and management. Second Edition.
Blackwell. Australia. 382 p.
Mc Clanahan, T.R. and J. Castίla. 2007.
Fisheries management; progress
toward sustainability. Blackwell
Publishing. Oxford. 332 p.
Ministry of Maritime Affairs and Fisheries
(MMAF). 2016. Decree of the
Minister of Maritime Affairs and
Fisheries Number 47/KEPMEN-
KP/2016 concerning the estimated
potential, the number of catches
allowed, and the level of utilization of

Malik et al.
Jurnal Ilmu dan Teknologi Kelautan Tropis, Vol. 11, No. 2, August 2019 435
fish resources in the Fisheries
Management Region of the Republic
of Indonesia. KKP. Jakarta. 6 p.
Nugraha, E., B. Koswara, and Yuniarti.
2012. Sustainable potential and
utilization level of Kurisi Fish
(Nempterus japonίcus) in the waters
of Banten Bay. J. Perikanan dan
Kelautan, 3(1):91-98.
Omori, K.L., J.M. Hoenig, M.A. Luehring,
and K. Baier-Lockhart. 2016. Effects
of under estimating catch and effort
on surplus production models. Fish
Res, 183:138–145. http://dx.doi.org/
10.1016/j.fishres.2016.05.021.
Pomeroy, R. 2011. Managing overcapacity in
small scale fisheries in Southeast
Asia. Marίne Policy, 36:520-527.
doi:10.1016/j.marpol.2011.10.002.
The Republic of Indonesia. 2016. Law No. 7
of 2016 concerning Protection and
empowerment of fishermen, fish
cultivators and salt farmers. Republic
of Indonesia State Secretariat. Jakarta.
38 p.
Sparre, P. and S.C. Venema. 1999.
Introduction of tropical fish stock
assessment. FAO and Fisheries
Research Center. Jakarta. 436 p.
Tinungki, G.M. 2005. Evaluation of surplus
production models in
estimating maximum sustainable
catches to support the Lemuru
fisheries management policy in the
Bali Strait. IPB. Bogor. 196 p.
Triarso, I. 2012. Potential and opportunities
for developing capture fisheries in
Pantura, Central Java. J. Saintek
Ƥerikanan, 8(1):65-73.
Trimble, M. and D. Johnson. 2012. Artisanal
fishing as an undesirable way of life?
The implications for governance of
fίshers wellbeing aspirations in
coastal Uruguay and south eastern
Brazil. Mar. Ƥolicy, 37:37–44.
doi:10.1016/j.marpol.2012.04.002.
Van Hoof, L. and P. Salz. 2001. Applying
CPUE as management tool.
Discussion paper EAFE Conference
2001. 10 p.
Zulbainarni, N. 2016. Theory and practice of
bioeconomic modeling in capture
fisheries management. Revised
Edition. IPB Press. Bogor. 338 p.
Received : 29 January 2019
Reviewed : 30 March 2019
Accepted : 15 July 2019