July 30, 2020 Mr. James A. DeWitt Office of Regulations and ...
159
Page 1 of 10 July 30, 2020 Mr. James A. DeWitt Office of Regulations and Interpretations Employee Benefits Security Administration Room N-5655 U.S. Department of Labor 200 Constitution Ave., NW Washington, DC 20210 Re: RIN 1210-AB95, Financial Factors in Selecting Plan Investments; Comments of the American Legislative Exchange Council (ALEC) in support of proposed regulation Dear Mr. DeWitt, The American Legislative Exchange Council (ALEC) submits these comments in support of a regulation proposed under Title I of the Employee Retirement Income Security Act of 1974 (ERISA). The proposed regulation would confirm that EIRSA requires plan fiduciaries to select investments and investment courses of actions based solely on pecuniary considerations relevant to the risk-adjusted economic value of a particular investment or investment course of action. The proposal would clarify that “investment behaviors, such as socially responsible investing, sustainable and responsible investing, environmental, social, and corporate governance (ESG) investing, and economically targeted investing” 1 fall outside of the pecuniary requirements mandated by ERISA. ALEC supports the proposed regulation and recommends that the Department of Labor, through the Employee Benefits Security Administration, adopt it. This recommendation follows ALEC research and analysis on public pension investments, which offer counterfactuals of what happens when divestments occur due to environmental or social reasons rather than pecuniary concerns. Individual investors can assume higher financial risk by making investment decisions that reflect personal convictions. However, investment portfolio managers operating under ERISA should avoid these risky, politically driven investment choices because ESG investing in public sector pension plans has led to lower returns and higher volatility. This comment will compare the available evidence of ESG investment returns compared to optimized risk investment portfolios (which have no ESG investing), specifically in terms of public pension investments, to help the Department’s analysis of the proposed regulation. Further, ALEC has published research regarding public pensions and non-pecuniary investing considerations that will help EBSA and the DOL’s economic analysis, such as “Unaccountable and Unaffordable” 2 and “Keeping the 1 See RIN 1210-AB95, Fed. Reg. 2020-13705. 2 Thomas Savidge, Jonathan Williams, Bob Williams, and Skip Estes. “Unaccountable and Unaffordable, 2019,” American Legislative Exchange Council, 2019, attached as Appendix 1. Hereafter “Unaccountable and Unaffordable.”
-
Upload
khangminh22 -
Category
Documents
-
view
2 -
download
0
Transcript of July 30, 2020 Mr. James A. DeWitt Office of Regulations and ...
Page1of10
July30,2020Mr.JamesA.DeWittOfficeofRegulationsandInterpretationsEmployeeBenefitsSecurityAdministrationRoomN-5655U.S.DepartmentofLabor200ConstitutionAve.,NWWashington,DC20210Re:RIN1210-AB95,FinancialFactorsinSelectingPlanInvestments;CommentsoftheAmericanLegislativeExchangeCouncil(ALEC)insupportofproposedregulationDearMr.DeWitt,TheAmericanLegislativeExchangeCouncil(ALEC)submitsthesecommentsinsupportofaregulationproposedunderTitleIoftheEmployeeRetirementIncomeSecurityActof1974(ERISA).TheproposedregulationwouldconfirmthatEIRSArequiresplanfiduciariestoselectinvestmentsandinvestmentcoursesofactionsbasedsolelyonpecuniaryconsiderationsrelevanttotherisk-adjustedeconomicvalueofaparticularinvestmentorinvestmentcourseofaction.Theproposalwouldclarifythat“investmentbehaviors,suchassociallyresponsibleinvesting,sustainableandresponsibleinvesting,environmental,social,andcorporategovernance(ESG)investing,andeconomicallytargetedinvesting”1falloutsideofthepecuniaryrequirementsmandatedbyERISA.
ALECsupportstheproposedregulationandrecommendsthattheDepartmentofLabor,throughtheEmployeeBenefitsSecurityAdministration,adoptit.ThisrecommendationfollowsALECresearchandanalysisonpublicpensioninvestments,whichoffercounterfactualsofwhathappenswhendivestmentsoccurduetoenvironmentalorsocialreasonsratherthanpecuniaryconcerns.Individualinvestorscanassumehigherfinancialriskbymakinginvestmentdecisionsthatreflectpersonalconvictions.However,investmentportfoliomanagersoperatingunderERISAshouldavoidtheserisky,politicallydriveninvestmentchoicesbecauseESGinvestinginpublicsectorpensionplanshasledtolowerreturnsandhighervolatility.
ThiscommentwillcomparetheavailableevidenceofESGinvestmentreturnscomparedtooptimizedriskinvestmentportfolios(whichhavenoESGinvesting),specificallyintermsofpublicpensioninvestments,tohelptheDepartment’sanalysisoftheproposedregulation.Further,ALEChaspublishedresearchregardingpublicpensionsandnon-pecuniaryinvestingconsiderationsthatwillhelpEBSAandtheDOL’seconomicanalysis,suchas“UnaccountableandUnaffordable”2and“Keepingthe
1SeeRIN1210-AB95,Fed.Reg.2020-13705.2ThomasSavidge,JonathanWilliams,BobWilliams,andSkipEstes.“UnaccountableandUnaffordable,2019,”AmericanLegislativeExchangeCouncil,2019,attachedasAppendix1.Hereafter“UnaccountableandUnaffordable.”

Page2of10
Promise:GettingPoliticsOutofPensions.”3
ALECisthenation’slargestnonpartisan,voluntarymembershiporganizationofstatelegislators.4ALEC,anditslegislativemembers,arededicatedtoadvancingtheprinciplesoflimitedgovernment,freemarkets,andfederalism.5
ALECisaforumforstakeholderstoexchangeideasanddevelopreal,state-basedpolicysolutionstoencouragegrowth,preserveeconomicsecurityandprotecthardworkingtaxpayers.BecauseofALEC’sfocusonstatepolicyideas,ALEChasawealthofexperienceanalyzingstatepublicpensionprograms,thepolicyimplicationsofinvestmentstrategiesrelatedtotheprogramsanddeterminingtypesofpoliciestoensuretheirsolvency.
“KeepingthePromise”includesdataandanalysisofpublicpensionsthathavemadeinvestmentdecisionsbasedonnonpecuniary,primarilypolitical,bases.ThedataandconclusionsinthepublicationshouldhelpthisDepartmentanalyzethepotentialeconomicimpactofplanfiduciariesmakinginvestmentdecisionsonsimilarnonpecuniaryfactors.
Problemswithpensionscanappeartobeinvisiblewhencertainconditionsarepresent.Ifpensionfundinvestmentshaveanexceptionallygoodyearorlawmakersmakealargerthanexpectedcontribution,lossesfromESG-typeinvestmentsmaynotbenoticeable.Apensionfund,though,getsintotroubleoveralongperiodoftime.6
ESGinvestingcanreduceaccesstosourcesofcapitalbylimitingwhataplancaninvestinandincreasecostsonpensionplans.7EvidencefromunrestrainedESGinvestingshowthatdivestmentshavelittletonoeffectonchanginghowthefirmsthataretargetedthroughdivestmentbehave,whilethecostsofdivestmentaresignificant.
ESGinvestingisnothingnewandtakesmanyforms.ArecentpopularformofESGinvestingisfossilfueldivestment,withtheCaliforniaPublicEmployeesRetirementSystem(CalPERS)andtheCaliforniaStateTeachersRetirementSystem(CalSTRS)divestingfromfossilfuels,specificallycoalcompaniesstartingin2015,8forexample.Forbothpublicpensions,aswellasotherprivatepensionssimilarlysituated,financiallossesfromdivestmentaresignificant.
ResearchbytheUniversityofChicagoLawSchoolProfessorDanielFischelfoundthatahypotheticalportfoliodiversifiedacrossallindustriesoutperformedahypotheticalportfoliodivestedfromenergystocksoverthepast50years.9Thedivestedportfolioproducedreturns0.7percentagepointsloweron
3TheodoreLafferty,KatiSiconolfi,JonathanWilliams,andElliotYoung.“KeepingthePromise:GettingPoliticsOutofPensions,”AmericanLegislativeExchangeCouncil,2016,attachedasAppendix2.Hereafter“KeepingthePromise.”4See“AboutALEC,”About,AmericanLegislativeExchangeCouncil,accessedJuly28,2020,https://www.alec.org/about/.5Id.6See,“KeepingthePromise”note3,above.7Id.8Id.9DavidFischel.“FossilFuelDivestment:ACostlyandIneffectiveInvestmentStrategy,”Compass-Lexecon,2015,attachedas

Page3of10
averageperyearthantheoptimalrisk-adjustedportfoliothatdidnotdivestfromenergy,representingamassive23percentagepointsdeclineininvestmentreturnsoverfivedecades.10ThatchartispicturedbelowinFigure1.
InadditiontoFischel’sresearch,weexaminetheactualinvestmentreturnsofpublicpensionplansthatengageinESGinvestingversuspublicpensionsthathaveinvestedinadiversifiedportfolio.Thiscommenthighlightsfourpublicpensioncases:California,NewYork,Tennessee,andWisconsin.CaliforniaandNewYorkengageinsometypesofESGinvesting,whileTennesseeandWisconsininvestusingadiversifiedportfoliowithoutpoliticallydriveninvestmentordivestment.
TheanalysiswillshowthatTennesseeandWisconsinhavebeenabletokeepannualpensioncostsforthestateandemployeesstable,predictable,andaffordablebynotengaginginESGinvesting.Ahealthypensionsystemrequiressoundinvestingandfundingpractices.11
Examinetheassumedandtheactualone-yearreturnsforboththeCalPERSandCalSTRSretirementsystemssince2001.Whileinvestmentreturnassumptionshaveremainedfairlyconstant(indicatedby
Appendix3.10Id.11“ALECStatementofPrinciplesonSoundPensionPractices,”AmericanLegislativeExchangeCouncil,2016,accessedJuly30,2020,https://www.alec.org/model-policy/alec-statement-of-principles-on-sound-pension-practices/.
Source:Fischel,Daniel,“FossilFuelDivestment:ACostlyandIneffectiveInvestmentStrategy;”CenterforResearchinSecurityPrices;French,Kenneth.
Figure1:OptimalRisk-AdjustedPortfoliovs.DivestedPortfolio,1965-2014

Page4of10
theblueline),actualone-yearinvestmentreturnshavebeenextremelyvolatile(indicatedbytheorangeline).Thisinvestmentreturnvolatilityhascontributedtorisingcosts,asannualrequiredcontributions(ARC)paymentsforthestateofCaliforniahasincreasedforbothCalPERS12andCalSTRS13overthepastdecade.TheARCpaymentcoversbothnormalcostsfortheyearandanamortizationpaymentofliabilitiesfrompreviousyears,bothofwhichdependpartiallyoninvestmentreturnsand,withCalifornianotmakingthefullARCpaymentseveryyear,unfundedliabilitiesgrewaswell.14ThosechartsarepicturedinFigure2.
FortheCalPERSsystem,investmentreturnassumptionswere8.25%,thenloweredto7.75%in2003,andthenloweredto7.5%in2010,whereitremainstoday.Meanwhile,investmentreturnshaveeitherfallenfarbelowassumedrateofreturnorfarabove,withanaveragerateofreturnof5.58%since2008,25.4%belowthecurrentassumedrateofreturnoninvestments.
TheCalSTRSsystemhadanassumedrateofreturnof8%untilitwasloweredto7.75%in2010,thenloweredto7.5%from2011to2017,andthenloweredtothepresentassumedreturnat7%.TheactualinvestmentrateofreturnforCalSTRSislikeCalPERS,investmentreturnsfallingfarbelowexpectationsorexceedinginvestmentexpectations.CalSTRShadanaveragerateofreturnof6.35%since2008,9.23%belowthecurrentassumedrateofreturnoninvestments.
ItisalsoimportanttonotethatCaliforniacurrentlyhasthelargestunfundedpensionliabilitiesinthe12“ComprehensiveAnnualFinancialReportfor2018-19,”CaliforniaPublicEmployees’RetirementSystem(CalPERS),30June2020,accessedJuly30,2020,https://news.calpers.ca.gov/get-the-facts-in-our-annual-financial-report-2/.13ComprehensiveAnnualFinancialReportfor2018-19,”CaliforniaStateTeachers’RetirementSystem(CalSTRS),30June2020,accessedJuly30,2020,https://www.calstrs.com/comprehensive-annual-financial-report.14Toreadmoreonpublicpensioncosts,seeUnaccountableandUnaffordable,note2,above.
Figure2:CaliforniaPublicEmployeeRetirementSystem(2a)andCaliforniaStateTeachersRetirementSystem(2b)AssumedvsActualInvestmentReturns,2001-2019
Source:PublicPlansDatabase;CenterforRetirementResearchatBostonCollege
Page5of10
UnitedStatesatover$780billion,or$19,720percapita.15Whilepoorinvestmentdecisionsarenotthesolecauseofthesemassiveunfundedliabilities,theyareacontributortothegrowthofunfundedliabilities.Forinstance,CalPERSandCalSTRSdivestedfromcompaniestiedtotobaccostartingin2001.From2001-2018,theCalPERSlost$3.6billionininvestmentreturns.16
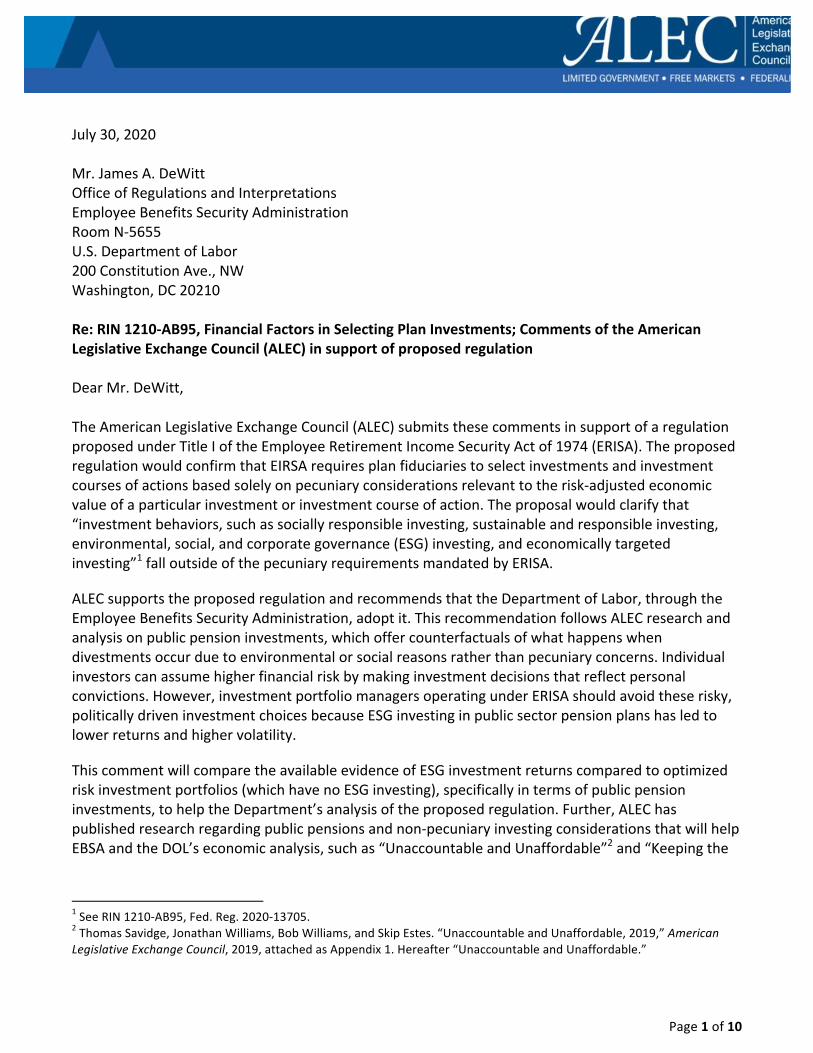
PoliticallydrivenESGinvestinganddivestingiscurrentlyaheatedissueinthestateofNewYork.AsofFY2019,NewYorkStatehasroughly$13billionofits$215.4billionCommonRetirementFundinvestmentsinfossilfuels.17Inaddition,NewYorkhasintegratedESGinvestmentprinciplesintoitscorporategovernancetoinclude,“sustainability,diversity,andaccountability”byinvesting$20billioninrenewableenergysources.18TheNewYorkStateCommonRetirementFundannualinvestmentreturnsisshowninFigure3.
Thefundmaintainedan8%assumedrateofreturnuntil2011whenitloweredto7.5%,thento7%in2017andfinally6.8%in2019.Since2001,investmentreturnshavebeenvolatile,eitherexceedingorfallingfarshortofassumedexpectations.Since2008,averageinvestmentperformancewas6.78%,0.25%belowcurrentassumedrateofreturn.NewYorkcurrentlyhasover$277billioninunfundedpensionliabilities($14,184percapita),the4thlargestunfundedpensionliabilityburdeninthenation.
15“Id.16HeatherGillers.“CalPERS’Dilemma:SavetheWorldorMakeMoney?”TheWallStreetJournal,June16,2019,https://www.wsj.com/articles/calpers-dilemma-save-the-world-or-make-money-11560684601.17“NewYorkStateCommonRetirementFundAssetListingasofMarch31,2019.”OfficeoftheNewYorkStateComptroller.March31,2019,https://www.osc.state.ny.us/sites/default/files/retirement/documents/pdf/2019-12/asset-listing-2019.pdf.18“NewYorkStateCommonRetirementFundComprehensiveAnnualFinancialReportfortheFiscalYearendingMarch31,2019.”OfficeoftheNewYorkStateComptroller.March31,2019,https://www.osc.state.ny.us/sites/default/files/retirement/documents/pdf/2019-11/comprehensive-annual-financial-report-2019.pdf.
Figure3:NewYorkCommonRetirementFund;AssumedvsActualInvestmentReturns,2001-2019
Source:PublicPlansDatabase;CenterforRetirementResearchatBostonCollege
Page6of10
ThesevolatileinvestmentreturnshavenecessitatedhigherARCpaymentstocoverinvestmentlossesandhaveledunfundedliabilitiestogrowovertime.
Despitethesevolatilereturnsandgrowingunfundedliabilities,somestillarguethattheCommonRetirementFund’scommitmentstoESGinvestinghavenotgonefarenough.NewYorkStateSenatorLizKruegerhasintroducedseveralbillsoverthepastfiveyearstodivesttheNewYorkStateCommonRetirementFund.SenatorKruegerrecentlyintroducedSenateBillS2126A,which“Relatestolimitationsoninvestmentsofpublicpensionfundsinfossilfuelcompanies.”19Thelegislationwouldcreatealistof“allcoalproducersandoilandgasproducersinwhichtheCommonRetirementFundhasdirectinvestments…theComptrollershalldivesttheCommonRetirementFundfromdirectinvestmentsinanycompanyontheexclusionlist,andceasenewdirectinvestmentsinanycompanythatmeetsthedefinitionofacoal,oil,orgasproducer.”20
SenateBillS2126Ahasdrawnsomepush-backfromNewYorkStateComptrollerThomasDiNapoli.Inanop-edforTheAlbanyTimes-Union,heemphasizedhisfiduciarydutyovertheCommonRetirementFund,stating:
“As trustee of the state pension fund, I have the fiduciary responsibility to protect theinvestmentstrategiesthatfundthelion'sshareofover$1billioninmonthlypensionpaymentstoNewYork'sstateandlocalpublicretireeswhodependupontheirwell-earnedpensions…TohavethestateLegislaturemicromanagetheinvestmentsofthestatepensionfundwouldbeadangerous step that would threaten the independence of the comptroller's office to makeinvestmentdecisionssolelyintheinterestofretirees,currentandfuture.”21
PublicsectorunionsinNewYorkalsohavestronglyopposedSenateBillS2126A.TheCivilServiceEmployeesAssociation,whichrepresents300,000publicandprivatesectormembers,statedthatS2126Awould,“jeopardizethefinancialsecurityofoveronemillioncurrentandfutureretirees.”22
AsnotedinUnaccountableandUnaffordable,stateswiththe10highestpublicpensionfundingratios23areWisconsin,SouthDakota,Utah,NewYork,Idaho,Tennessee,NorthCarolina,Delaware,Maine,andNebraska.24
19LizKrueger.“SenateBillS2126A:Relatestolimitationsoninvestmentsofpublicpensionfundsinfossilfuelcompanies.”NewYorkStateLegislature,2019-2020LegislativeSession,https://www.nysenate.gov/legislation/bills/2019/s2126.20Id.21ThomasP.DiNapoli.“N.Y.pensionfundoneoftheworld’smostresponsible.”AlbanyTimes-Union.July12,2020,https://www.timesunion.com/opinion/article/N-Y-pension-fund-one-of-world-s-most-responsible-15403354.php.22BernadetteHogan.“Unionsopposemovetomakestatedumpfossilfuelinvestmentsfrompensionfund,”NewYorkPost,April30,2019,https://nypost.com/2019/04/30/unions-oppose-move-to-make-state-dump-fossil-fuel-investments-from-pension-fund/23Thefundingratioistheratioofpensionplanassetstopensionplanliabilities.Largefundingratiosareakeyindicatorofawell-fundeddefinedbenefitplan.Toreadmoreonfundingratios,seeUnaccountableandUnaffordable,note2,above.24Id.
Page7of10
Ofthosestates,onlyNewYork’spublicpensionsystemutilizesESGinvesting.25NewYorkisamongthehighestfundedstatesbecauseofreformsthatcreateatieredpensionsystem,notESGinvesting.26Thelatestreforms,Tier6(enactedin2012),includeadefinedcontributionoptionforstateemployeesamongotherreformsthathelpedimproveNewYorkpensionfunding.27
AmongthestateswithoutESGinvesting,thiscommentwillfocusonTennessee,thepublicpensionsystemwiththelowestunfundedliabilitiespercapita,andWisconsin,thestatewiththehighestfundingratio.
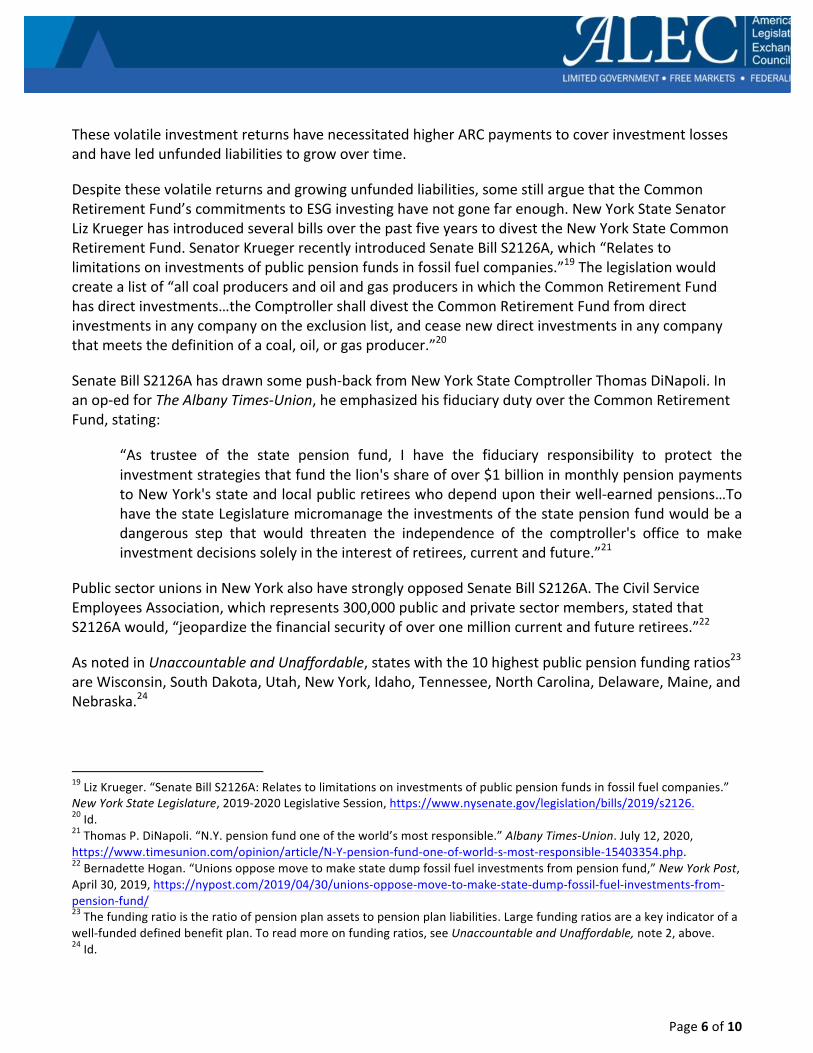
TheTennesseeRetireeGroupTrust(TGRT)isagrouptrustthatpoolsfundsfromthevariousTennesseepublicpensionplans(notincludingpoliticalsubdivisions),alongwithotherassetsinthecustodyoftheStateTreasurer,solelyforinvestmentpurposes.
Thestatedprimaryinvestmentobjectiveis,“toestablishastable,diversifiedinvestmentportfoliothat,inthelongterm,willmeetorexceedtheassumedrateofreturn,asadoptedbytheBoard,inordertoprovidesufficientliquiditytopaybeneficiariesinatimelymanner.”28
TheTGRTassumedandactualinvestmentreturnsareshowninFigure4.
25“ESG-Environmental,Social,andGovernance.”NationalAssociationofStateRetirementAdministrators(NASRA),Feb.2019,https://www.nasra.org/esg.26E.J.McMahon.“Testimony:Tier6Pension”EmpireCenterforPublicPolicy,January2012,accessedJuly30,2020,https://www.empirecenter.org/publications/e-j-mcmahon-testimonytier-6-pension/.27Id.28“TennesseeConsolidatedRetirementSystemComprehensiveAnnualFinancialReport(CAFR)FortheFiscalYearEndedJune30,2019.”June30,2019,https://treasury.tn.gov/Portals/0/Documents/Retirement/CAFR%20Reports/2019/2019%20CAFR_Full%20Report.pdf.
Figure4:TennesseeRetireeGroupTrust;AssumedvsActualInvestmentReturns,2001-2019
Page8of10
TheTGRThascomeclosetomeetingorexceedingitsassumedinvestmentgoals.TheTrust’sassumedrateofreturnhasbeen7.5%until2018whenitwasloweredto7.25%.Theinvestmentlossduetothefinancialcrisisin2008(-15.27%)wasnotnearlyassevereastheinvestmentlossesinCalifornia(-24%forCalPERSand-25.03%forCalSTRS)orNewYork(-26.38%).Since2008,theTGRThadanaverageinvestmentreturnof6.57%,9.43%belowthecurrentassumedrateofreturn.
TheTGRTwasfoundtoperformnearlyonparwiththeaveragereturnsonpublicpensioninvestmentsandtheS&P500.29BynotengaginginpoliticallydrivenESGpractices,theTGRThasstrictlyadheredtoitsfiduciarydutiesandreducedvolatilityininvestmentreturns.
Wisconsin,whichhasthebestfundedpublicpensionsysteminthenation,hasalsoavoidedESGinvesting.TheStateofWisconsinInvestmentBoard(SWIB)keyinvestmentphilosophiesinclude“Assetclassesandsub-assetclassesarebroadlydefinedtogainexposuretotheentireinvestableopportunitysetandcapturethegreatestdepthofavailableinvestmentopportunitiestotheextenttheyofferarisk-returntrade-offcommensuratewithSWIB’sreturnobjectivesandrisktolerance.”30
TheWisconsinEmployeeRetirementSystem(WRS)assumedvsactualone-yearinvestmentreturnsareshowninFigure5.
29ThomasSavidge“TennesseePublicPensions:AModelforPensionReform.”PoliticalEconomyResearchInstituteatMiddleTennesseeStateUniversityPolicyStudy,Aug.2020,attachedasAppendix4.30“BoardofTrusteesWisconsinRetirementSystemInvestmentPolicy.”StateofWisconsinInvestmentBoard,March18,2020,https://7ffb9e60-f2dc-4359-b148-1db6b9d76c71.filesusr.com/ugd/69fc6d_1183ae90c6854453acfd9a296a915c03.pdf.

Page9of10
AsnotedinFigure5,theWisconsinLegislatureandthen-Gov.ScottWalkersignedActs10and32in2011,whichincludedpublicpensionreforms.31TheseActsintroducedseveralpensioncostandrisk-sharingmeasures,suchasrequiringallWRSparticipants(includingpublicsafetyemployees)tocontributehalfofallannualrequiredcontributionforpensionplans(ARC).32ByrequiringparticipantsandthestatetosplittheARCpaymenteveryear,prudentinvestmentpracticesareincentivizedtominimizefinancialrisksandannualcosts.
31Act32modifiesthecost-sharingprovisionsofAct10,coveringmunicipalpoliceandfireemployersaswellasstateemployersoftroopersandvehicleinspectors.32KerriSeyfert.“TheWisconsinRetirementSystemIsFullyFundedandaModelforOtherStates.”ReasonFoundation,January14,2020,https://reason.org/commentary/the-wisconsin-retirement-system-is-fully-funded-and-a-model-for-other-states/.
Figure5:WisconsinRetirementSystem,AssumedvsActualInvestmentReturns,2001-2019
Page10of10
Whenmanagersofpublicpensionplansfocusonpecuniaryconsiderationsonly,theplansenjoygreaterlong-runinvestmentstability.33Privatepensionswouldlikelyenjoythesamebenefitiftheproposedregulationisadopted.Further,theevidencefrompublicpensionsisthatpoliticallydrivenESGinvestingleadstoforegonegainsandlong-runvolatility.Becauseoftheavailabledatafrompublicpensionsasdiscussedinthiscommentandtheattachedappendices,theDepartment’sproposedregulationregardingthe“InvestmentDuties”regulationisanecessary,andproper,interpretationofERISAandALECrecommendsitsadoption.
Sincerely,JonathonPaulHauenschild,Esq.DirectorJonathanWilliamsExecutiveVicePresident,PolicyandALECChiefEconomistThomasSavidgeResearchManager,CenterforStateFiscalReform
33ALECmembersadoptedaStatementofPrinciplesonSoundPensionPractices.Thefirsttwoprinciplesoutlinethatstategovernmentsshouldmakeinvestmentdecisionsbasedonstabilityandpredictability.Theseprinciplesmeanthatgovernmentpensionsshouldbesecureandsafefromhighriskassumptionsandbepredicableandstructuredtofostercertaintyfortaxpayersandpolicymakers.“ALECStatementofPrinciplesonSoundPensionPractices,”AmericanLegislativeExchangeCouncil,September12,2016,https://www.alec.org/model-policy/alec-statement-of-principles-on-sound-pension-practices/.

Appendix 1
Unaccountable and Unaffordable, 2019
1
2019UNACCOUNTABLE AND UNAFFORDABLE
ALEC.ORG
UNFUNDED PUBLIC PENSION LIABILITIES TOTAL NEARLY $5 TRILLION

UNACCOUNTABLE AND UNAFFORDABLE
Unaccountable and Unaffordable 2019Unfunded Public Pension Liabilities Total Nearly $5 Trillion
About the American Legislative Exchange Council The Unaccountable and Unaffordable 2019 report was published by the American Legislative Exchange Council (ALEC) as part of its mission to discuss, develop and disseminate model public policies that expand free markets, promote economic growth, limit the size of government and preserve individual liberty. ALEC is the nation’s largest nonpartisan, voluntary membership organization of state legislators, with more than 2,000 members across the nation. ALEC is governed by a Board of Directors of state legislators. ALEC is classified by the Internal Revenue Service as a 501(c)(3) nonprofit, public policy and educational organization. Individuals, philanthropic foundations, businesses and associations are eligible to support the work of ALEC through tax-deductible gifts.
About the ALEC Center for State Fiscal Reform
The ALEC Center for State Fiscal Reform strives to educate policymakers and the general public on the principles of sound fiscal policy and the evidence that supports those principles. We also strive to educate policymakers by outlining the policies that provide the best results for the hardworking taxpayers of America. This is done by personalized research, policy briefings in the states and by releasing nonpartisan policy publications for distribution such as Rich States, Poor States: ALEC-Laffer State Economic Competitiveness Index.
Managing Editors:
Jonathan WilliamsChief Economist Executive Vice President of PolicyAmerican Legislative Exchange Council
Thomas SavidgeResearch Manager, Center for State Fiscal ReformAmerican Legislative Exchange Council
Lee SchalkSenior Director, Tax and Fiscal Policy Task ForceAmerican Legislative Exchange Council
Contributing Authors:
Thomas SavidgeResearch Manager, Center for State Fiscal ReformAmerican Legislative Exchange Council
Jonathan WilliamsChief Economist Executive Vice President of PolicyAmerican Legislative Exchange Council
Bob WilliamsSenior Fellow, Center for State Fiscal ReformFounder, State Budget SolutionsAmerican Legislative Exchange Council
Skip EstesLegislative Manager, Center for State Fiscal ReformAmerican Legislative Exchange Council
Acknowledgements and Disclaimers
The authors wish to thank Lisa B. Nelson, Daniel Turner, Christine Phipps, Daniel Reynolds and the professional staff at ALEC for their valuable assistance with this project. The authors also wish to thank Ben Petrihos for his assistance with data collection.
All rights reserved. Except as permitted under the United States Copyright Act of 1976, no part of this publication may be reproduced or distributed in any form or by any means or stored in a database or retrieval system without the prior permission of the publisher. The copyright to this work is held by the American Legislative Exchange Council. This study may not be duplicated or distributed in any form without the permission of the American Legislative Exchange Council and with proper attribution.
Contact Information:
American Legislative Exchange Council 2900 Crystal Drive, Suite 600 Arlington, VA 22202 Tel : 703.373.0933 Fax: 703.373.0927 www.alec.org
2
2 0 1 9 | U N A C C O U N TA B L E A N D U N A F F O R D A B L E
INTRODUCTION
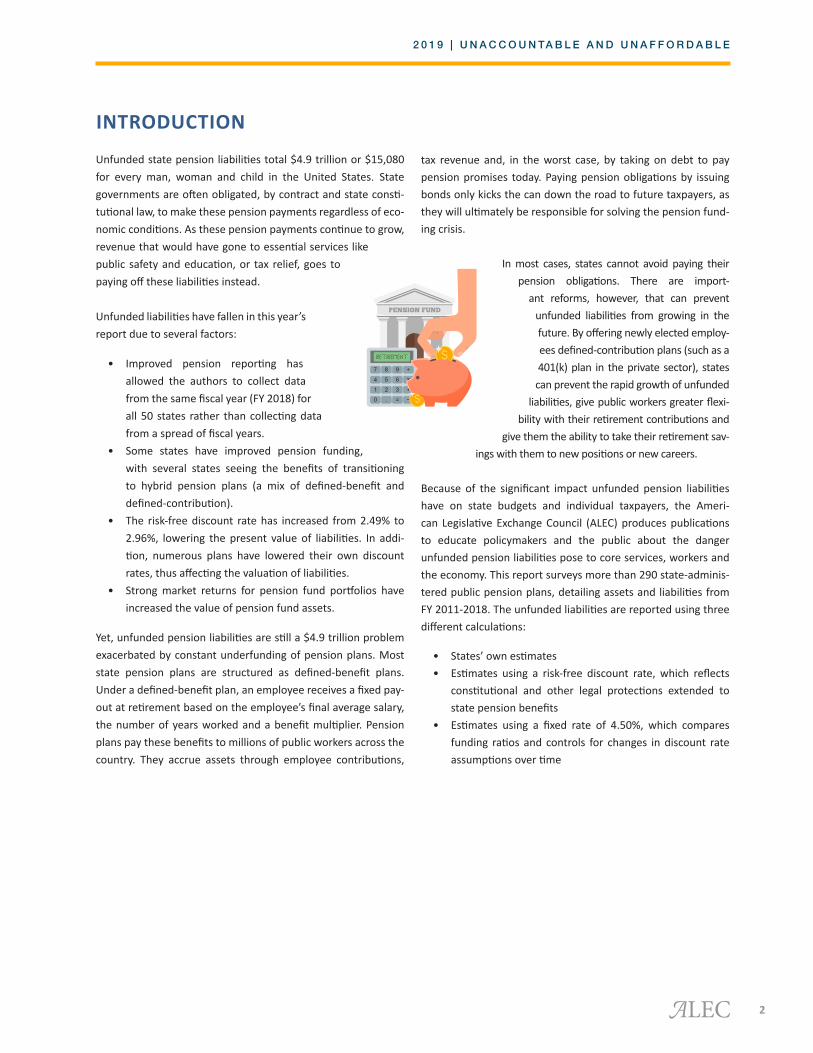
Unfunded state pension liabilities total $4.9 trillion or $15,080 for every man, woman and child in the United States. State governments are often obligated, by contract and state consti-tutional law, to make these pension payments regardless of eco-nomic conditions. As these pension payments continue to grow, revenue that would have gone to essential services like public safety and education, or tax relief, goes to paying off these liabilities instead.
Unfunded liabilities have fallen in this year’s report due to several factors:
• Improved pension reporting has allowed the authors to collect data from the same fiscal year (FY 2018) for all 50 states rather than collecting data from a spread of fiscal years.
• Some states have improved pension funding, with several states seeing the benefits of transitioning to hybrid pension plans (a mix of defined-benefit and defined-contribution).
• The risk-free discount rate has increased from 2.49% to 2.96%, lowering the present value of liabilities. In addi-tion, numerous plans have lowered their own discount rates, thus affecting the valuation of liabilities.
• Strong market returns for pension fund portfolios have increased the value of pension fund assets.
Yet, unfunded pension liabilities are still a $4.9 trillion problem exacerbated by constant underfunding of pension plans. Most state pension plans are structured as defined-benefit plans. Under a defined-benefit plan, an employee receives a fixed pay-out at retirement based on the employee’s final average salary, the number of years worked and a benefit multiplier. Pension plans pay these benefits to millions of public workers across the country. They accrue assets through employee contributions,
tax revenue and, in the worst case, by taking on debt to pay pension promises today. Paying pension obligations by issuing bonds only kicks the can down the road to future taxpayers, as they will ultimately be responsible for solving the pension fund-ing crisis.
In most cases, states cannot avoid paying their pension obligations. There are import-
ant reforms, however, that can prevent unfunded liabilities from growing in the future. By offering newly elected employ-ees defined-contribution plans (such as a 401(k) plan in the private sector), states can prevent the rapid growth of unfunded
liabilities, give public workers greater flexi-bility with their retirement contributions and
give them the ability to take their retirement sav-ings with them to new positions or new careers.
Because of the significant impact unfunded pension liabilities have on state budgets and individual taxpayers, the Ameri-can Legislative Exchange Council (ALEC) produces publications to educate policymakers and the public about the danger unfunded pension liabilities pose to core services, workers and the economy. This report surveys more than 290 state-adminis-tered public pension plans, detailing assets and liabilities from FY 2011-2018. The unfunded liabilities are reported using three different calculations:
• States’ own estimates• Estimates using a risk-free discount rate, which reflects
constitutional and other legal protections extended to state pension benefits
• Estimates using a fixed rate of 4.50%, which compares funding ratios and controls for changes in discount rate assumptions over time
3
1 = BEST 50 = WORST
CT 35 NJ 44 DE 4 MD 30
WA
OR
CA
NV
ID
UTCO
NMAZ
AK
HI
TX
OK
KS
WYSD
FL
LA
MSAL GA
SCAR
MO
IANE
NDMT
MN
WI
MI
IL IN OH
PA
NY
KY
TNNC
VAWV
ME
RI 10 MA 41
12
39
2
22
34
8
40
51
25
48
36
20
14 43
21 16
17
2624
38
18
47
4219
29
32
NH 9 VT 3
28
27
7
23
37
13
15
4945
11
50
31 3346
6
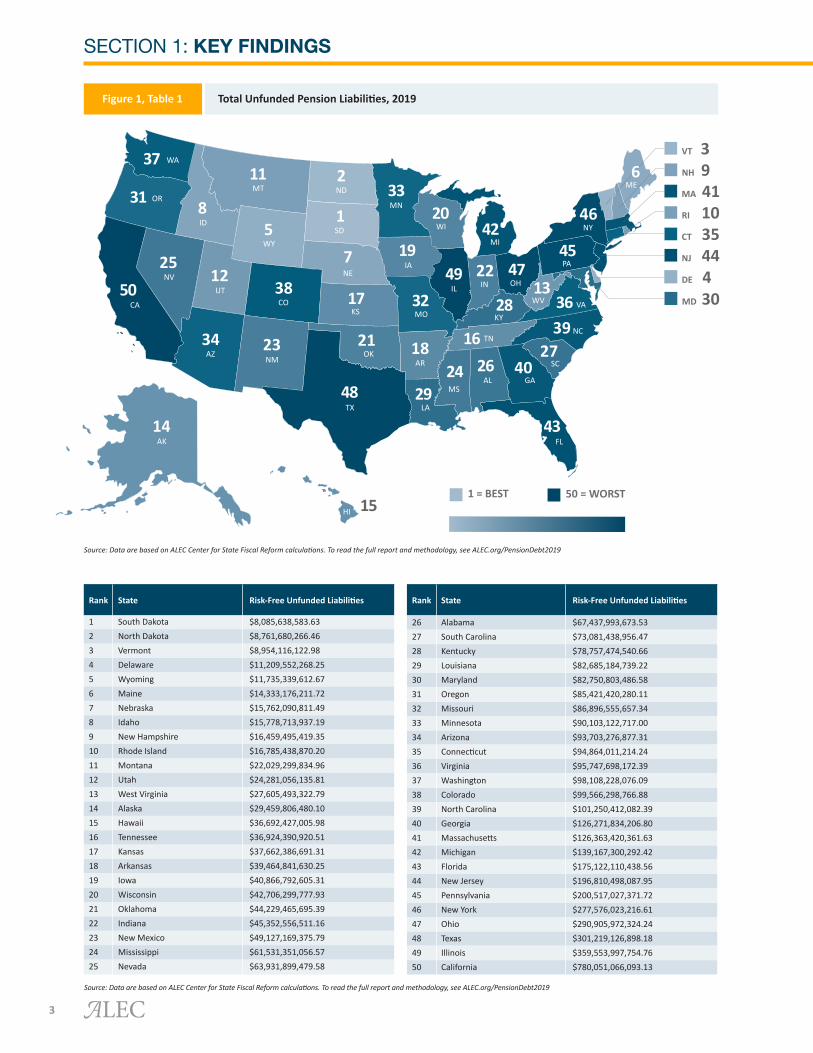
Total Unfunded Pension Liabilities, 2019Figure 1, Table 1
SECTION 1: KEY FINDINGS
Source: Data are based on ALEC Center for State Fiscal Reform calculations. To read the full report and methodology, see ALEC.org/PensionDebt2019
Source: Data are based on ALEC Center for State Fiscal Reform calculations. To read the full report and methodology, see ALEC.org/PensionDebt2019
Rank State Risk-Free Unfunded Liabilities
1 South Dakota $8,085,638,583.63 2 North Dakota $8,761,680,266.46 3 Vermont $8,954,116,122.98 4 Delaware $11,209,552,268.25 5 Wyoming $11,735,339,612.67 6 Maine $14,333,176,211.72 7 Nebraska $15,762,090,811.49 8 Idaho $15,778,713,937.19 9 New Hampshire $16,459,495,419.35 10 Rhode Island $16,785,438,870.20 11 Montana $22,029,299,834.96 12 Utah $24,281,056,135.81 13 West Virginia $27,605,493,322.79 14 Alaska $29,459,806,480.10 15 Hawaii $36,692,427,005.98 16 Tennessee $36,924,390,920.51 17 Kansas $37,662,386,691.31 18 Arkansas $39,464,841,630.25 19 Iowa $40,866,792,605.31 20 Wisconsin $42,706,299,777.93 21 Oklahoma $44,229,465,695.39 22 Indiana $45,352,556,511.16 23 New Mexico $49,127,169,375.79 24 Mississippi $61,531,351,056.57 25 Nevada $63,931,899,479.58
Rank State Risk-Free Unfunded Liabilities
26 Alabama $67,437,993,673.53 27 South Carolina $73,081,438,956.47 28 Kentucky $78,757,474,540.66 29 Louisiana $82,685,184,739.22 30 Maryland $82,750,803,486.58 31 Oregon $85,421,420,280.11 32 Missouri $86,896,555,657.34 33 Minnesota $90,103,122,717.00 34 Arizona $93,703,276,877.31 35 Connecticut $94,864,011,214.24 36 Virginia $95,747,698,172.39 37 Washington $98,108,228,076.09 38 Colorado $99,566,298,766.88 39 North Carolina $101,250,412,082.39 40 Georgia $126,271,834,206.80 41 Massachusetts $126,363,420,361.63 42 Michigan $139,167,300,292.42 43 Florida $175,122,110,438.56 44 New Jersey $196,810,498,087.95 45 Pennsylvania $200,517,027,371.72 46 New York $277,576,023,216.61 47 Ohio $290,905,972,324.24 48 Texas $301,219,126,898.18 49 Illinois $359,553,997,754.76 50 California $780,051,066,093.13
4
1 = BEST 50 = WORST
CT 48 NJ 44 DE 15 MD 20
WA
OR
CA
NV
ID
UTCO
NMAZ
AK
HI
TX
OK
KS
WYSD
FL
LA
MSAL GA
SCAR
MO
IANE
NDMT
MN
WI
MI
IL IN OH
PA
NY
KY
TNNC
VAWV
ME
RI 32 MA 37
4
9
14
2
21
7
16
398
43
10
13
3
50 6
12 1
18
2441
34
22
46
2519
36
26
NH 17 VT 28
35
29
5
45
20
30
47
4931
42
38
40 3327
11
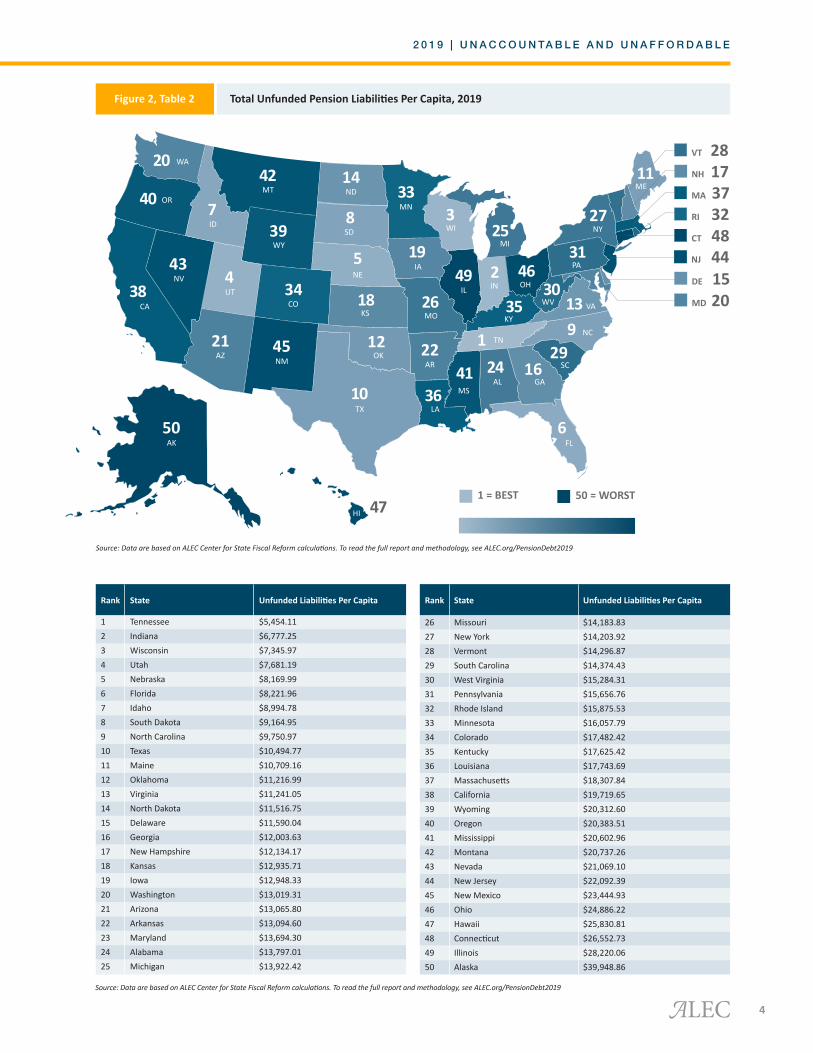
2 0 1 9 | U N A C C O U N TA B L E A N D U N A F F O R D A B L E
Total Unfunded Pension Liabilities Per Capita, 2019Figure 2, Table 2
Source: Data are based on ALEC Center for State Fiscal Reform calculations. To read the full report and methodology, see ALEC.org/PensionDebt2019
Source: Data are based on ALEC Center for State Fiscal Reform calculations. To read the full report and methodology, see ALEC.org/PensionDebt2019
Rank State Unfunded Liabilities Per Capita
1 Tennessee $5,454.11 2 Indiana $6,777.25 3 Wisconsin $7,345.97 4 Utah $7,681.19 5 Nebraska $8,169.99 6 Florida $8,221.96 7 Idaho $8,994.78 8 South Dakota $9,164.95 9 North Carolina $9,750.97 10 Texas $10,494.77 11 Maine $10,709.16 12 Oklahoma $11,216.99 13 Virginia $11,241.05 14 North Dakota $11,516.75 15 Delaware $11,590.04 16 Georgia $12,003.63 17 New Hampshire $12,134.17 18 Kansas $12,935.71 19 Iowa $12,948.33 20 Washington $13,019.31 21 Arizona $13,065.80 22 Arkansas $13,094.60 23 Maryland $13,694.30 24 Alabama $13,797.01 25 Michigan $13,922.42
Rank State Unfunded Liabilities Per Capita
26 Missouri $14,183.83 27 New York $14,203.92 28 Vermont $14,296.87 29 South Carolina $14,374.43 30 West Virginia $15,284.31 31 Pennsylvania $15,656.76 32 Rhode Island $15,875.53 33 Minnesota $16,057.79 34 Colorado $17,482.42 35 Kentucky $17,625.42 36 Louisiana $17,743.69 37 Massachusetts $18,307.84 38 California $19,719.65 39 Wyoming $20,312.60 40 Oregon $20,383.51 41 Mississippi $20,602.96 42 Montana $20,737.26 43 Nevada $21,069.10 44 New Jersey $22,092.39 45 New Mexico $23,444.93 46 Ohio $24,886.22 47 Hawaii $25,830.81 48 Connecticut $26,552.73 49 Illinois $28,220.06 50 Alaska $39,948.86
SECTION 1: KEY FINDINGS
5
1 = BEST 50 = WORST
CT 49 NJ 38 DE 8 MD 29
WA
OR
CA
NV
ID
UTCO
NMAZ
AK
HI
TX
OK
KS
WYSD
FL
LA
MSAL GA
SCAR
MO
IANE
NDMT
MN
WI
MI
IL IN OH
PA
NY
KY
TNNC
VAWV
ME
RI 40 MA 42
3
7
25
26
37
5
21
222
23
15
16
1
39 11
19 6
35
3143
41
18
27
3413
32
20
NH 33 VT 36
47
46
10
30
12
50
44
4845
28
24
14 174
9
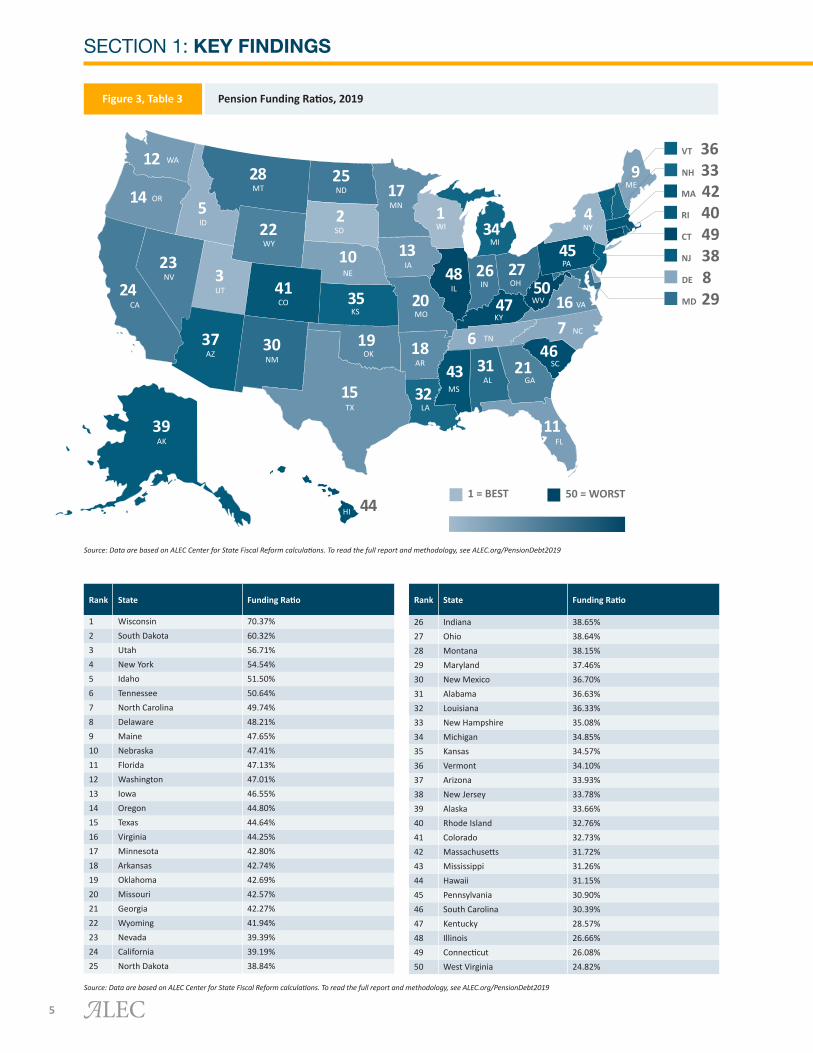
Pension Funding Ratios, 2019Figure 3, Table 3
Source: Data are based on ALEC Center for State Fiscal Reform calculations. To read the full report and methodology, see ALEC.org/PensionDebt2019
Source: Data are based on ALEC Center for State Fiscal Reform calculations. To read the full report and methodology, see ALEC.org/PensionDebt2019
Rank State Funding Ratio
1 Wisconsin 70.37%2 South Dakota 60.32%3 Utah 56.71%4 New York 54.54%5 Idaho 51.50%6 Tennessee 50.64%7 North Carolina 49.74%8 Delaware 48.21%9 Maine 47.65%10 Nebraska 47.41%11 Florida 47.13%12 Washington 47.01%13 Iowa 46.55%14 Oregon 44.80%15 Texas 44.64%16 Virginia 44.25%17 Minnesota 42.80%18 Arkansas 42.74%19 Oklahoma 42.69%20 Missouri 42.57%21 Georgia 42.27%22 Wyoming 41.94%23 Nevada 39.39%24 California 39.19%25 North Dakota 38.84%
Rank State Funding Ratio
26 Indiana 38.65%27 Ohio 38.64%28 Montana 38.15%29 Maryland 37.46%30 New Mexico 36.70%31 Alabama 36.63%32 Louisiana 36.33%33 New Hampshire 35.08%34 Michigan 34.85%35 Kansas 34.57%36 Vermont 34.10%37 Arizona 33.93%38 New Jersey 33.78%39 Alaska 33.66%40 Rhode Island 32.76%41 Colorado 32.73%42 Massachusetts 31.72%43 Mississippi 31.26%44 Hawaii 31.15%45 Pennsylvania 30.90%46 South Carolina 30.39%47 Kentucky 28.57%48 Illinois 26.66%49 Connecticut 26.08%50 West Virginia 24.82%
2 0 1 9 | U N A C C O U N TA B L E A N D U N A F F O R D A B L E
6
CT 30 NJ 34 DE 33 MD 19
WA
OR
CA
NV
ID
UTCO
NMAZ
AK
HI
TX
OK
KS
WYSD
FL
LA
MSAL GA
SCAR
MO
IANE
NDMT
MN
WI
MI
IL IN OH
PA
NY
KY
TNNC
VAWV
ME
RI 39 MA 44
1
45
6
26
38
16
42
3612
21
31
11
40
4 32
3 17
5
2227
35
2
14
2023
7
28
NH 8 VT 49
29
48
9
18
41
50
37
2547
13
45
43 1510
24
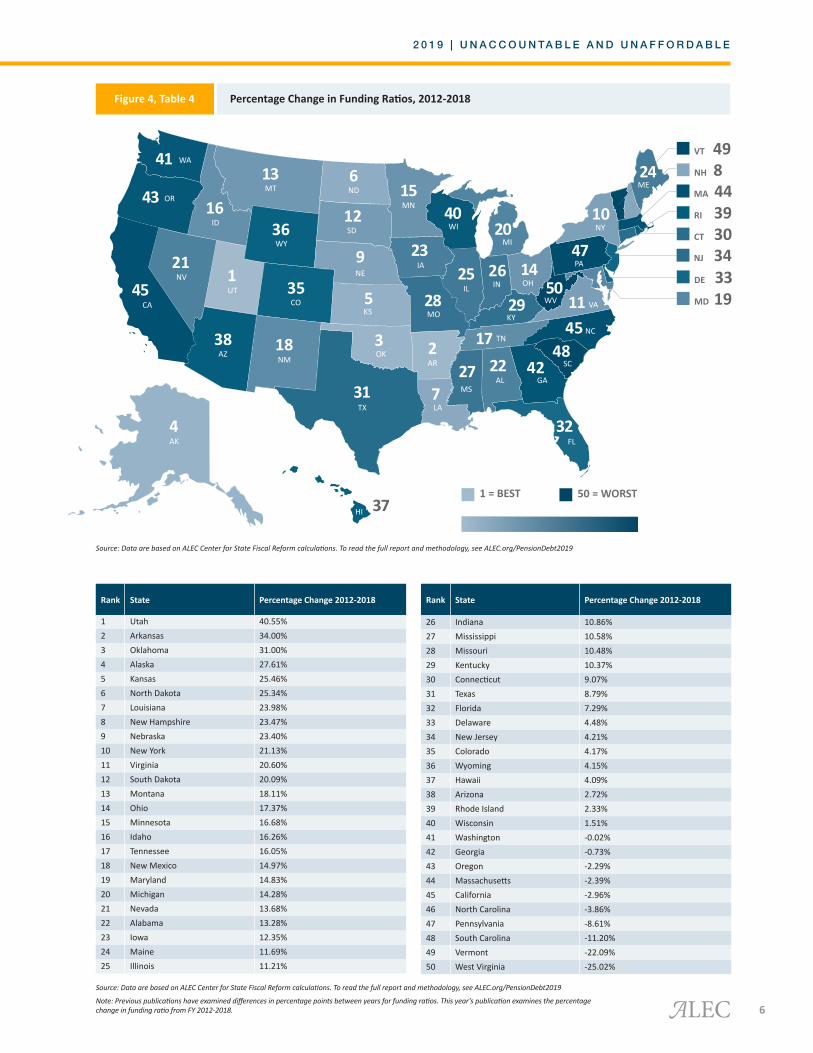
Percentage Change in Funding Ratios, 2012-2018Figure 4, Table 4
Source: Data are based on ALEC Center for State Fiscal Reform calculations. To read the full report and methodology, see ALEC.org/PensionDebt2019
Source: Data are based on ALEC Center for State Fiscal Reform calculations. To read the full report and methodology, see ALEC.org/PensionDebt2019
1 = BEST 50 = WORST
Rank State Percentage Change 2012-2018
1 Utah 40.55%2 Arkansas 34.00%3 Oklahoma 31.00%4 Alaska 27.61%5 Kansas 25.46%6 North Dakota 25.34%7 Louisiana 23.98%8 New Hampshire 23.47%9 Nebraska 23.40%10 New York 21.13%11 Virginia 20.60%12 South Dakota 20.09%13 Montana 18.11%14 Ohio 17.37%15 Minnesota 16.68%16 Idaho 16.26%17 Tennessee 16.05%18 New Mexico 14.97%19 Maryland 14.83%20 Michigan 14.28%21 Nevada 13.68%22 Alabama 13.28%23 Iowa 12.35%24 Maine 11.69%25 Illinois 11.21%
Rank State Percentage Change 2012-2018
26 Indiana 10.86%27 Mississippi 10.58%28 Missouri 10.48%29 Kentucky 10.37%30 Connecticut 9.07%31 Texas 8.79%32 Florida 7.29%33 Delaware 4.48%34 New Jersey 4.21%35 Colorado 4.17%36 Wyoming 4.15%37 Hawaii 4.09%38 Arizona 2.72%39 Rhode Island 2.33%40 Wisconsin 1.51%41 Washington -0.02%42 Georgia -0.73%43 Oregon -2.29%44 Massachusetts -2.39%45 California -2.96%46 North Carolina -3.86%47 Pennsylvania -8.61%48 South Carolina -11.20%49 Vermont -22.09%50 West Virginia -25.02%
Note: Previous publications have examined differences in percentage points between years for funding ratios. This year’s publication examines the percentage change in funding ratio from FY 2012-2018.
SECTION 1: KEY FINDINGS
7
1 = BEST 50 = WORST
CT 36 NJ 50 DE 34 MD 5
WA
OR
CA
NV
ID
UTCO
NMAZ
AK
HI
TX
OK
KS
WYSD
FL
LA
MSAL GA
SCAR
MO
IANE
NDMT
MN
WI
MI
IL IN OH
PA
NY
KY
TNNC
VAWV
ME
RI 22 MA 21
22
16
33
7
37
35
14
4622
12
39
19
22
9 22
44 13
40
228
41
15
4
2010
49
38
NH 3 VT 2
11
22
1
42
17
6
22
4718
48
43
22 4522
22
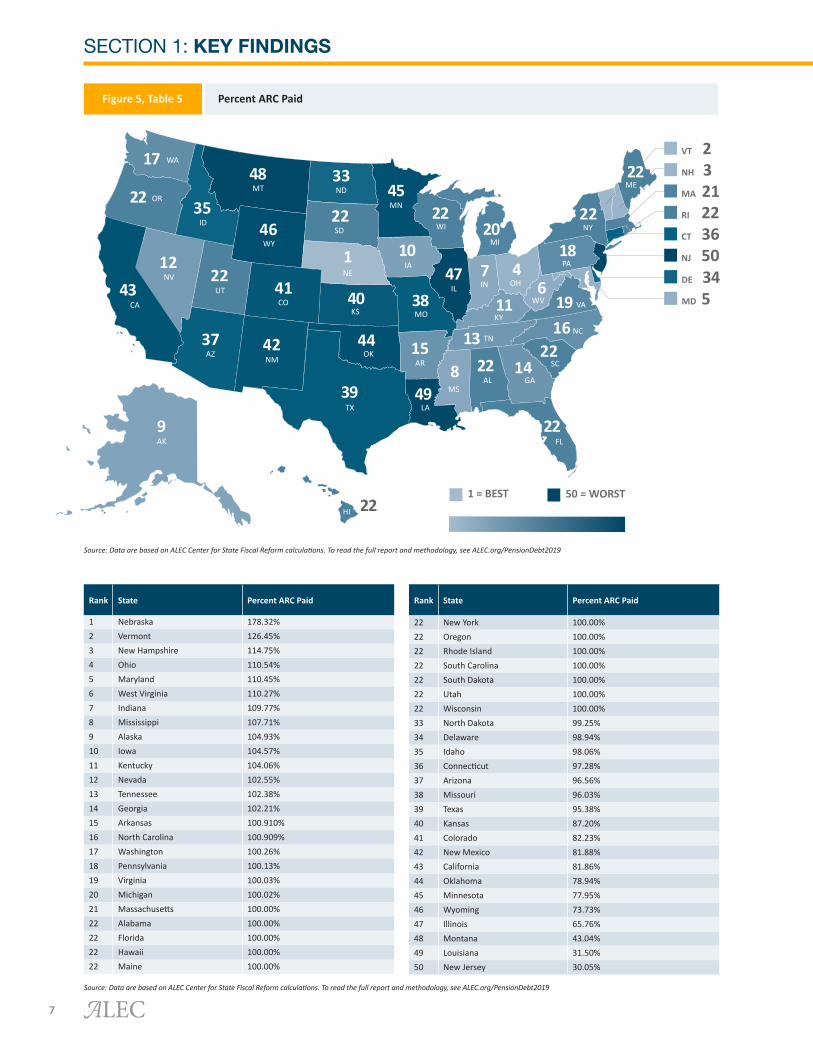
Percent ARC PaidFigure 5, Table 5
Source: Data are based on ALEC Center for State Fiscal Reform calculations. To read the full report and methodology, see ALEC.org/PensionDebt2019
Source: Data are based on ALEC Center for State Fiscal Reform calculations. To read the full report and methodology, see ALEC.org/PensionDebt2019
Rank State Percent ARC Paid
1 Nebraska 178.32%2 Vermont 126.45%3 New Hampshire 114.75%4 Ohio 110.54%5 Maryland 110.45%6 West Virginia 110.27%7 Indiana 109.77%8 Mississippi 107.71%9 Alaska 104.93%10 Iowa 104.57%11 Kentucky 104.06%12 Nevada 102.55%13 Tennessee 102.38%14 Georgia 102.21%15 Arkansas 100.910%16 North Carolina 100.909%17 Washington 100.26%18 Pennsylvania 100.13%19 Virginia 100.03%20 Michigan 100.02%21 Massachusetts 100.00%22 Alabama 100.00%22 Florida 100.00%22 Hawaii 100.00%22 Maine 100.00%
Rank State Percent ARC Paid
22 New York 100.00%22 Oregon 100.00%22 Rhode Island 100.00%22 South Carolina 100.00%22 South Dakota 100.00%22 Utah 100.00%22 Wisconsin 100.00%33 North Dakota 99.25%34 Delaware 98.94%35 Idaho 98.06%36 Connecticut 97.28%37 Arizona 96.56%38 Missouri 96.03%39 Texas 95.38%40 Kansas 87.20%41 Colorado 82.23%42 New Mexico 81.88%43 California 81.86%44 Oklahoma 78.94%45 Minnesota 77.95%46 Wyoming 73.73%47 Illinois 65.76%48 Montana 43.04%49 Louisiana 31.50%50 New Jersey 30.05%

2 0 1 9 | U N A C C O U N TA B L E A N D U N A F F O R D A B L E
8
CT 39 NJ 37 DE 6 MD 16
WA
OR
CA
NV
ID
UTCO
NMAZ
AK
HI
TX
OK
KS
WYSD
FL
LA
MSAL GA
SCAR
MO
IANE
NDMT
MN
WI
MI
IL IN OH
PA
NY
KY
TNNC
VAWV
ME
RI 32 MA 22
5
13
8
22
29
17
18
337
42
10
14
3
50 11
20 1
23
3449
28
35
46
2719
38
31
NH 15 VT 30
43
36
4
48
12
41
44
4525
47
26
40 249
21
Unfunded Liabilities as a Percentage of Gross State Product (GSP)Figure 6, Table 6
Source: Data are based on ALEC Center for State Fiscal Reform calculations. To read the full report and methodology, see ALEC.org/PensionDebt2019
Source: Data are based on ALEC Center for State Fiscal Reform calculations. To read the full report and methodology, see ALEC.org/PensionDebt2019
1 = BEST 50 = WORST
Rank State Unfunded Liabilities As A Percentage of GSP
1 Tennessee 10.14%2 Indiana 12.36%3 Wisconsin 12.70%4 Nebraska 12.71%5 Utah 13.63%6 Delaware 15.25%7 South Dakota 15.54%8 North Dakota 15.62%9 New York 16.63%10 Texas 16.71%11 Florida 16.85%12 Washington 17.34%13 North Carolina 17.96%14 Virginia 17.97%15 New Hampshire 19.49%16 Maryland 20.06%17 Idaho 20.48%18 Georgia 21.32%19 Iowa 21.54%20 Oklahoma 21.84%21 Maine 22.10%22 Massachusetts 22.19%23 Kansas 22.38%24 Minnesota 24.43%25 Pennsylvania 25.60%
Rank State Unfunded Liabilities As A Percentage of GSP
26 California 26.02%27 Michigan 26.40%28 Colorado 26.78%29 Arizona 26.90%30 Vermont 26.92%31 Missouri 27.25%32 Rhode Island 27.70%33 Wyoming 30.00%34 Alabama 30.41%35 Arkansas 30.73%36 South Carolina 31.24%37 New Jersey 31.64%38 Louisiana 32.14%39 Connecticut 34.41%40 Oregon 35.62%41 West Virginia 35.65%42 Nevada 37.76%43 Kentucky 37.85%44 Hawaii 39.12%45 Illinois 41.55%46 Ohio 43.04%47 Montana 43.77%48 New Mexico 48.98%49 Mississippi 53.58%50 Alaska 53.82%

SECTION 1: KEY FINDINGS
9
1 = BEST 50 = WORST
CT 20 NJ 24 DE 3 MD 18
WA
OR
CA
NV
ID
UTCO
NMAZ
AK
HI
TX
OK
KS
WYSD
FL
LA
MSAL GA
SCAR
MO
IANE
NDMT
MN
WI
MI
IL IN OH
PA
NY
KY
TNNC
VAWV
ME
RI 12 MA 11
6
13
9
4
44
14
21
3519
50
22
15
2
31 23
34 1
25
3748
40
33
42
4926
39
43
NH 47 VT 27
32
41
5
36
17
30
16
4629
45
28
38 78
10
Unfunded Liabilities as a Percentage of 2018 State General Fund ExpendituresFigure 7, Table 7
Source: Data are based on ALEC Center for State Fiscal Reform calculations. To read the full report and methodology, see ALEC.org/PensionDebt2019
Source: Data are based on ALEC Center for State Fiscal Reform calculations. To read the full report and methodology, see ALEC.org/PensionDebt2019
Rank State Liabilities as a Percentage of Expenditures
1 Tennessee 233.40%2 Wisconsin 259.39%3 Delaware 272.21%4 Indiana 284.82%5 Nebraska 362.35%6 Utah 369.35%7 Minnesota 397.01%8 New York 398.11%9 North Dakota 416.63%10 Maine 419.59%11 Massachusetts 437.30%12 Rhode Island 438.03%13 North Carolina 445.13%14 Idaho 455.37%15 Virginia 458.47%16 Hawaii 470.18%17 Washington 477.76%18 Maryland 483.05%19 South Dakota 508.21%20 Connecticut 510.02%21 Georgia 528.27%22 Texas 537.42%23 Florida 555.80%24 New Jersey 557.16%25 Kansas 562.80%
Rank State Liabilities as a Percentage of Expenditures
26 Iowa 563.06%27 Vermont 564.22%28 California 613.99%29 Pennsylvania 626.67%30 West Virginia 636.42%31 Alaska 649.60%32 Kentucky 700.90%33 Arkansas 734.59%34 Oklahoma 755.54%35 Wyoming 767.02%36 New Mexico 800.06%37 Alabama 828.68%38 Oregon 839.09%39 Louisiana 858.18%40 Colorado 881.66%41 South Carolina 908.97%42 Ohio 918.24%43 Missouri 938.10%44 Arizona 954.11%45 Montana 982.57%46 Illinois 1025.38%47 New Hampshire 1078.60%48 Mississippi 1106.66%49 Michigan 1360.25%50 Nevada 1597.26%
10
SECTION 2: POOR ASSUMPTIONS MAKE POOR PENSIONS
State governments have experienced increased pressure in their balance sheets from growing pension liabilities. This pressure is becoming more apparent with improved financial reporting. The Governmental Accounting Standards Board (GASB) statements 67 and 68 went into effect in FY 2014 and 2015, respectively. GASB 67 focuses on how pension plans measure assets and lia-bilities.
The changes declared in GASB 67 require plan assets to be valued each year so pension trustees cannot engage in “asset smooth-ing.” Asset smoothing is a process by which pension investment performance is averaged over a five-year period to “smooth out” swings in market performance. As noted by pension schol-ars Eileen Norcross and Sheila Weinberg, asset smoothing evens out investment swings and provides plan sponsors with predict-ability in annual contributions, but simultaneously hides the volatility of pension asset portfolios.1 Under GASB 67, pension plan officials must provide an actuarial value of assets (AVA) for that given year, putting an end to asset smoothing. This report’s analysis uses the AVA reported in state pension plan actuarial valuations each year.
Norcross and Weinberg also note under GASB 68, however, state governments can continue a form of asset smoothing. Govern-ments are permitted to defer the recognition of the difference between the return expected on plan assets and the actual return, with this “deferred inflow of resources” occurring over a 5-year period. This is the same as asset smoothing, which per-mits the sponsor to gradually incorporate any changes to the market value of assets that differ from the expected value of assets over time. They note, “The consequences of this practice remain the same [as the consequences of asset smoothing]. Market declines and gains are only gradually recognized, likely increasing the riskiness of sponsor behavior.”2
The new information required by GASB 67 and 68 is reported in the “Required Supplementary Information” section at the end of each state’s comprehensive annual financial report (CAFR) and in actuarial valuation documents for each pension plan. These notes include a breakdown of the annual required contribution (ARC), asset valuations and fiduciary net position for all pen-sion plans, how the pension plan discount rate is calculated and information about liability valuations.
Improved reporting and more accurate estimates of state obli-gations have shed light on the actual value of unfunded pen-sion liabilities. Many of the changes in assumptions based on
actuarial experience studies conducted in 2016 are still in place today (i.e., inflation assumption remains at 2.25%), while other assumptions have changed. For example, some plans have low-ered discount rates drastically (such as several Wyoming state pension plans lowering the discount rate from 7.75% to 7.00% in FY 2017), while other plans have incrementally decreased dis-count rates (such as the California Public Employee Retirement Multiemployer Fund, which gradually decreased its discount rate from 7.50% in FY 2016, to 7.25% in FY 2017, and then at 7.00% in FY 2018).3,4
Last year’s report (based on data from FY 2015-2017) estimated that unfunded liabilities totaled $5.9 trillion.5 To provide a more accurate picture of unfunded liabilities, in FY 2017 there was a total of $5.5 trillion unfunded liabilities, $500 billion more than the $5 trillion amount in FY 2018. While the lower unfunded liabilities total may appear positive, states should not be too quick to celebrate. Increased pension contributions, changes to pension plans, and strong investment returns contributed to improved pension funds for FY 2018. However, the risk-free discount rate increased from 2.49% to 2.96% in FY 2018 (thus lowering the present value of liabilities), also contributing to the lower assessment of liabilities. Ultimately, the root causes of rapidly growing unfunded liabilities (such as states failing to con-tribute according to their ARC) were not addressed in FY 2018. This means unfunded liabilities will continue to grow, especially in years with poor investment returns.
Most pension plans use historical trends to estimate future conditions of assets and liabilities.6 Past returns, however, are no guarantee of future performance. As state pension plans invest their funds in increasingly risky assets, the gap between expected rates of return and actual rates of return widens, with results falling far short of expectations.
The rate at which employees are vested (meaning the employee becomes eligible to secure rights to employer-provided pen-sion benefits) varies with the type of work and the length of the vesting period. Public school teachers, for example, have an extremely low vesting rate. Since FY 2011, the Michigan Pub-lic Schools Employees’ Retirement System (MPSERS), has had a vesting rate around 47%, with less than 33% of active employ-ees fully vesting.7 One reason for this low rate is that teachers often pay into a retirement system but leave the school district (usually to work as a teacher in another school district) before they become vested. When these teachers move districts before they become vested, the money their employers pay into the
SECTION 2: POOR ASSUMPTIONS MAKE POOR PENSIONS

11
retirement system does not move with them, but employee con-tributions do.
In contrast, defined-contribution pension plans allow workers to keep their retirement savings if they change locations or even if they choose to change careers entirely. As younger workers change jobs more frequently, the defined-contribution model, which allows workers take their retirement savings wherever they go, is particularly valuable to them.
Investment Rate of Return and Discount Rate
A plan’s assumed investment rate of return is based on a pension plan’s portfolio of investment assets and what those investments will earn. How much these investments will earn is subject to the interest rates and the risks associated with the assets. The assumed rate of return is thus a reflection of the risk of the plan’s investment assets. The discount rate is the rate used to determine the value today of the amount a pension plan must pay retirees in the future. To make matters more confusing, investment rate of return and discount rate
are often used interchangeably in state financial documents.
In the case of public pensions, however, investment rate of return and discount rate should not be used interchangeably, because there are different risk levels associated with pension assets and pension liabilities. Over the past four decades, pension asset funds have changed from low-risk, fixed income investments (such as U.S. Treasury bonds) to an increasingly volatile portfolio of stocks, bonds, and alternative investments such as office buildings and golf courses.8 This is the result of lower bond yields, the desire to chase higher returns, and politicians and plan managers using pen-sion funds to advance their own economic development or political agendas — a perfect storm of bad incentives.
The figure below shows the disparity between assumed rates of return (noted by the dotted line) and the actual annual return on investment (noted by the solid line). As pension plans invest in riskier assets, meeting the assumed rate of return for that year becomes less likely. Some years this pays off, and returns exceed expectations, while other years fall far short of assumed returns.
Source: Public Plans Database, Boston College Center for Retirement Research
20%
15%
10%
5%
0%
-5%
-10%
-15%
Inve
stm
ent R
etur
n (A
ssum
ed a
nd A
ctua
l)
2001 2002 2003 2004 2005 2006 2007 2008 2009 2010 2011 2012 2013 2014 2015 2016 2017 2018
Fiscal Year
Average 1-Year Return on Pension Investments
Average Assumed Return on Pension Investments
Average 1-Year Returns on Pension Investments Relative to Average Assumed Return for Pension Investments for All States, 2001-2018
Figure 8, Table 8
SECTION 2: POOR ASSUMPTIONS MAKE POOR PENSIONS
Variable 2001 2002 2003 2004 2005 2006 2007 2008 2009 2010 2011 2012 2013 2014 2015 2016 2017 2018Average 1-Year Return on Pension Investments
-4.91% -6.22% 8.95% 14.76% 10.55% 11.29% 15.25% -9.49% -9.42% 13.54% 15.31% 4.99% 13.05% 13.82% 2.32% 2.77% 13.06% 6.05%
Average Assumed Return on Pension Investments
7.99% 7.98% 7.95% 7.92% 7.92% 7.91% 7.90% 7.88% 7.85% 7.80% 7.74% 7.67% 7.63% 7.60% 7.54% 7.45% 7.33% 7.22%
12
2 0 1 9 | U N A C C O U N TA B L E A N D U N A F F O R D A B L E
Despite these bad incentives, the strong U.S. economy in 2019 led to strong investment performance, which increased the value of plan assets, resulting in lower unfunded liabilities. FY 2017 saw asset returns average 13.06%, (drastically increasing the value of assets) and FY 2018 saw returns average 6.05% (a positive return but still below the assumed return average of 7.22%).
Meanwhile, as stated previously, many states are still contrac-tually and constitutionally obligated to pay pension liabilities, so there has been a major divergence between the risk premi-ums of pension assets and liabilities. As the Society of Actuaries’ Blue-Ribbon Panel on Public Pension Plan funding recommends, “the rate of return assumption should be based primarily on the current risk-free rate plus explicit risk premium or on other similar forward-looking techniques.”9
Because U.S. Treasury bonds are insured with the full faith and credit of the United States government, the rate of return for these bonds is the best proxy for a risk-free rate. A valuation of lia-bilities based on a risk-free rate contrasts sharply with the overly optimistic assumptions used by nearly every public sector pension plan. As economist and pension scholar Joshua Rauh notes:
The logic of financial economics is very clear that measur-ing the value of a pension promise requires using the yields on bonds that match the risk and duration of that promise. Therefore, to reflect the present value cost of actually deliver-ing on a benefit promise requires the use of a default-free yield curve, such as the Treasury yield curve. Financial economists have spoken in near unison on this point. The fact that the stock market, whose performance drives that of most pension plan investments, has earned high historical returns does not justify the use of these historical returns as a discount rate for measuring pension liabilities.10
This report uses a more prudent discount rate calculated by aver-aging 10-year and 20-year U.S. Treasury bond yields to create a hypothetical 15-year bond yield to match the 15-year midpoint of paying pension liabilities. The discount rate calculated from these bond yields is the best proxy for a risk-free rate. The 15-year mid-point comes from GASB noting “the maximum acceptable amor-tization period [the length of time to pay liabilities] is 30 years.”11 In laymen’s terms, GASB recommends that no pension plan take longer than 30 years to fully pay its liabilities. Thus, 15 years is the simple midpoint for paying off those liabilities.
With the risk-free discount rate depending upon the average yield of the U.S. Treasury bonds, there have been changes to the discount rate each year. For 2019, the risk-free discount rate was 2.96% (an increase from 2.49% in 2018). This increase contrib-uted to the smaller unfunded liabilities in this report.
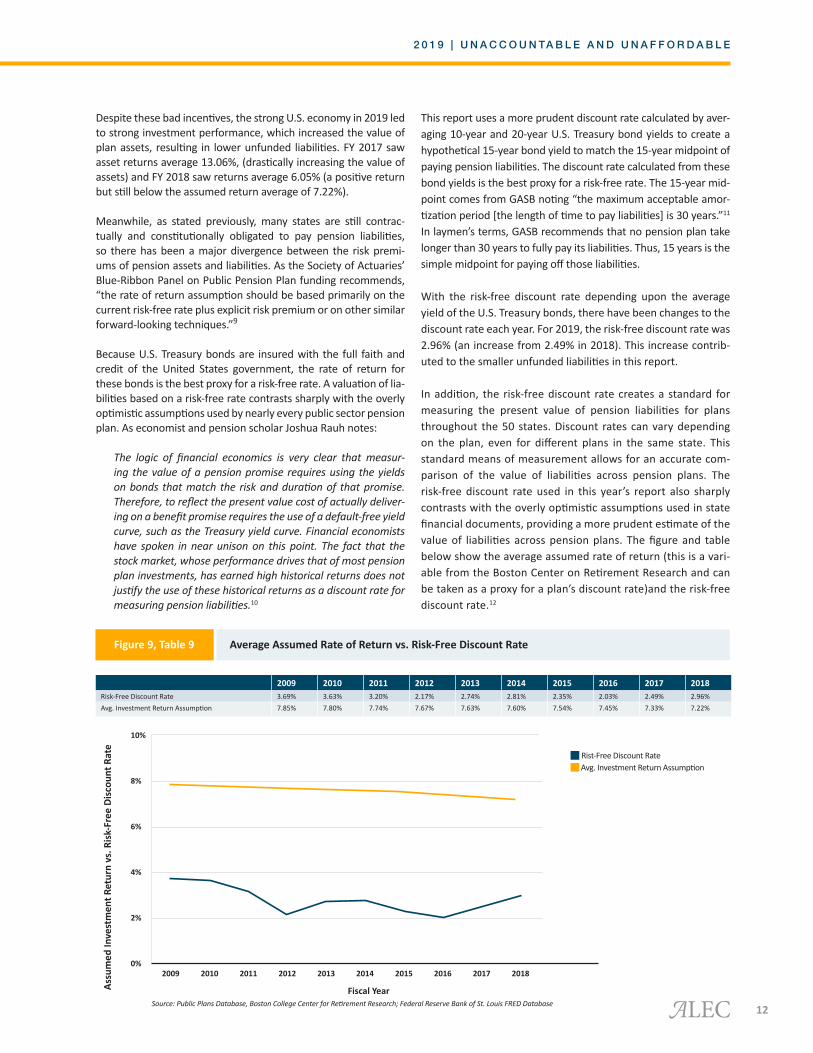
In addition, the risk-free discount rate creates a standard for measuring the present value of pension liabilities for plans throughout the 50 states. Discount rates can vary depending on the plan, even for different plans in the same state. This standard means of measurement allows for an accurate com-parison of the value of liabilities across pension plans. The risk-free discount rate used in this year’s report also sharply contrasts with the overly optimistic assumptions used in state financial documents, providing a more prudent estimate of the value of liabilities across pension plans. The figure and table below show the average assumed rate of return (this is a vari-able from the Boston Center on Retirement Research and can be taken as a proxy for a plan’s discount rate)and the risk-free discount rate.12
Source: Public Plans Database, Boston College Center for Retirement Research; Federal Reserve Bank of St. Louis FRED Database
10%
8%
6%
4%
2%
0%
Assu
med
Inve
stm
ent R
etur
n vs
. Ris
k-Fr
ee D
isco
unt R
ate
2009 2010 2011 2012 2013 2014 2015 2016 2017 2018
Fiscal Year
Rist-Free Discount Rate Avg. Investment Return Assumption
Average Assumed Rate of Return vs. Risk-Free Discount RateFigure 9, Table 9
2009 2010 2011 2012 2013 2014 2015 2016 2017 2018Risk-Free Discount Rate 3.69% 3.63% 3.20% 2.17% 2.74% 2.81% 2.35% 2.03% 2.49% 2.96%Avg. Investment Return Assumption 7.85% 7.80% 7.74% 7.67% 7.63% 7.60% 7.54% 7.45% 7.33% 7.22%
13
SECTION 2: POOR ASSUMPTIONS MAKE POOR PENSIONS
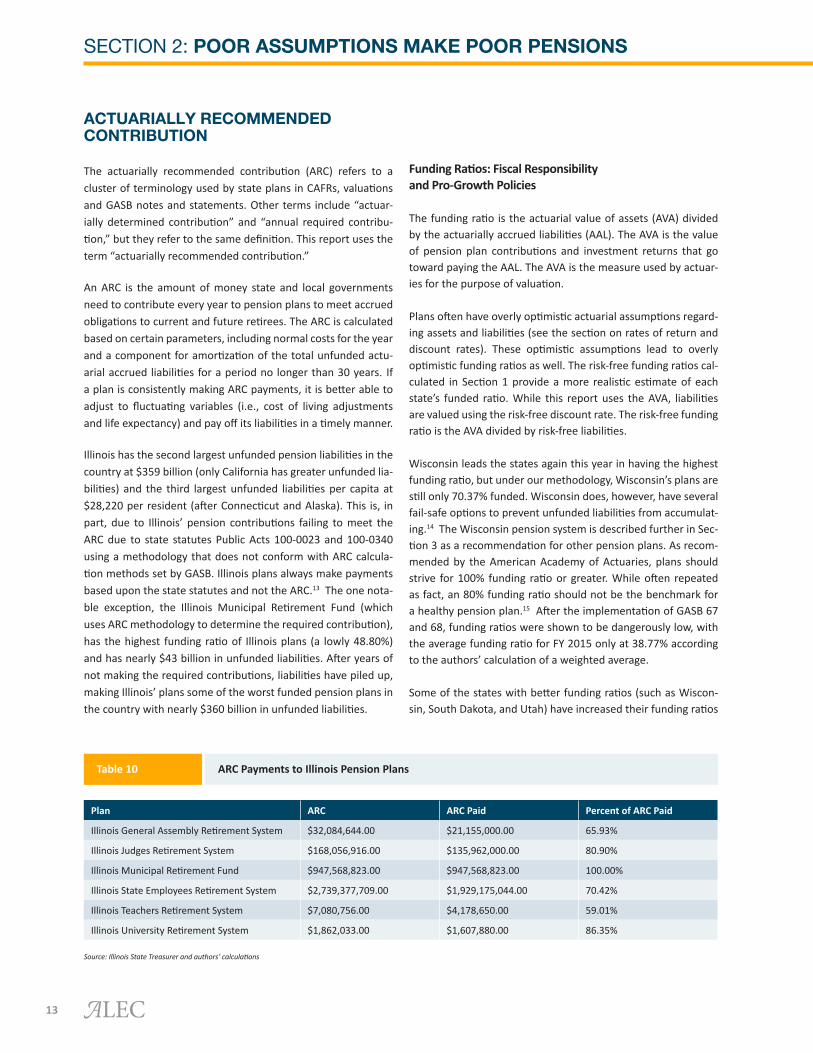
ACTUARIALLY RECOMMENDED CONTRIBUTION
The actuarially recommended contribution (ARC) refers to a cluster of terminology used by state plans in CAFRs, valuations and GASB notes and statements. Other terms include “actuar-ially determined contribution” and “annual required contribu-tion,” but they refer to the same definition. This report uses the term “actuarially recommended contribution.”
An ARC is the amount of money state and local governments need to contribute every year to pension plans to meet accrued obligations to current and future retirees. The ARC is calculated based on certain parameters, including normal costs for the year and a component for amortization of the total unfunded actu-arial accrued liabilities for a period no longer than 30 years. If a plan is consistently making ARC payments, it is better able to adjust to fluctuating variables (i.e., cost of living adjustments and life expectancy) and pay off its liabilities in a timely manner.
Illinois has the second largest unfunded pension liabilities in the country at $359 billion (only California has greater unfunded lia-bilities) and the third largest unfunded liabilities per capita at $28,220 per resident (after Connecticut and Alaska). This is, in part, due to Illinois’ pension contributions failing to meet the ARC due to state statutes Public Acts 100-0023 and 100-0340 using a methodology that does not conform with ARC calcula-tion methods set by GASB. Illinois plans always make payments based upon the state statutes and not the ARC.13 The one nota-ble exception, the Illinois Municipal Retirement Fund (which uses ARC methodology to determine the required contribution), has the highest funding ratio of Illinois plans (a lowly 48.80%) and has nearly $43 billion in unfunded liabilities. After years of not making the required contributions, liabilities have piled up, making Illinois’ plans some of the worst funded pension plans in the country with nearly $360 billion in unfunded liabilities.
Funding Ratios: Fiscal Responsibility and Pro-Growth Policies
The funding ratio is the actuarial value of assets (AVA) divided by the actuarially accrued liabilities (AAL). The AVA is the value of pension plan contributions and investment returns that go toward paying the AAL. The AVA is the measure used by actuar-ies for the purpose of valuation.
Plans often have overly optimistic actuarial assumptions regard-ing assets and liabilities (see the section on rates of return and discount rates). These optimistic assumptions lead to overly optimistic funding ratios as well. The risk-free funding ratios cal-culated in Section 1 provide a more realistic estimate of each state’s funded ratio. While this report uses the AVA, liabilities are valued using the risk-free discount rate. The risk-free funding ratio is the AVA divided by risk-free liabilities.
Wisconsin leads the states again this year in having the highest funding ratio, but under our methodology, Wisconsin’s plans are still only 70.37% funded. Wisconsin does, however, have several fail-safe options to prevent unfunded liabilities from accumulat-ing.14 The Wisconsin pension system is described further in Sec-tion 3 as a recommendation for other pension plans. As recom-mended by the American Academy of Actuaries, plans should strive for 100% funding ratio or greater. While often repeated as fact, an 80% funding ratio should not be the benchmark for a healthy pension plan.15 After the implementation of GASB 67 and 68, funding ratios were shown to be dangerously low, with the average funding ratio for FY 2015 only at 38.77% according to the authors’ calculation of a weighted average.
Some of the states with better funding ratios (such as Wiscon-sin, South Dakota, and Utah) have increased their funding ratios
Plan ARC ARC Paid Percent of ARC Paid
Illinois General Assembly Retirement System $32,084,644.00 $21,155,000.00 65.93%
Illinois Judges Retirement System $168,056,916.00 $135,962,000.00 80.90%
Illinois Municipal Retirement Fund $947,568,823.00 $947,568,823.00 100.00%
Illinois State Employees Retirement System $2,739,377,709.00 $1,929,175,044.00 70.42%
Illinois Teachers Retirement System $7,080,756.00 $4,178,650.00 59.01%
Illinois University Retirement System $1,862,033.00 $1,607,880.00 86.35%
Source: Illinois State Treasurer and authors’ calculations
ARC Payments to Illinois Pension PlansTable 10
14
2 0 1 9 | U N A C C O U N TA B L E A N D U N A F F O R D A B L E
every year since FY 2016 and remained above average, while the three worst funding ratios (Connecticut, Illinois and West Virginia) have seen their funding ratios drop since FY 2016 and have remained below average.
This report does not normalize plan assumptions of mortality or demographics, and instead uses the assumptions provided in the plans. However, a recent mortality study found that public sector employees have longer life expectancies than the gen-eral population.16 While it is great news that life expectancy has increased, this also means states must be prepared to pay out more pension benefits for longer periods of time than previously
anticipated. States will eventually need to address these rising costs or radically change the benefits new employees receive.
Overall, states with better economic outlooks also tend to have higher risk-free funding ratios. In the figure below, the average funding ratio of each state between 2012 and 2018 is displayed against the state’s average Rich States, Poor States economic outlook ranking over the same period. A trend line highlights the direction of the relationship. States with a positive Rich States, Poor States economic outlook ranking tend to have higher pen-sion funding ratios.
15
SECTION 3: SOLUTIONS TO THE PENSION FUNDING CRISIS
SECTION 3: SOLUTIONS TO THE PENSION FUNDING CRISIS
Making the Switch to Defined-Contribution
Ultimately, one of the best ways to solve the pension crisis is to change the way pension plans are structured. Changing from the current defined-benefit system toward a defined-contribu-tion system for new employees will improve the health of state pension plans by giving employees full control over their retire-ment savings.
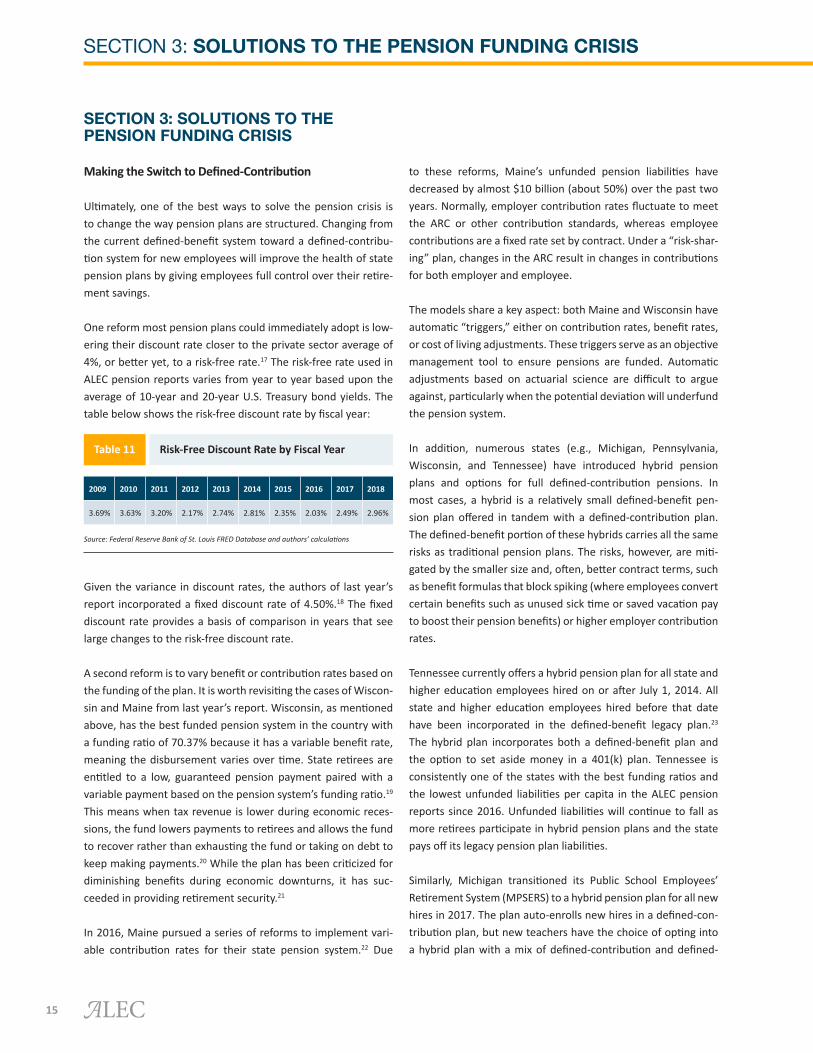
One reform most pension plans could immediately adopt is low-ering their discount rate closer to the private sector average of 4%, or better yet, to a risk-free rate.17 The risk-free rate used in ALEC pension reports varies from year to year based upon the average of 10-year and 20-year U.S. Treasury bond yields. The table below shows the risk-free discount rate by fiscal year:
Given the variance in discount rates, the authors of last year’s report incorporated a fixed discount rate of 4.50%.18 The fixed discount rate provides a basis of comparison in years that see large changes to the risk-free discount rate.
A second reform is to vary benefit or contribution rates based on the funding of the plan. It is worth revisiting the cases of Wiscon-sin and Maine from last year’s report. Wisconsin, as mentioned above, has the best funded pension system in the country with a funding ratio of 70.37% because it has a variable benefit rate, meaning the disbursement varies over time. State retirees are entitled to a low, guaranteed pension payment paired with a variable payment based on the pension system’s funding ratio.19 This means when tax revenue is lower during economic reces-sions, the fund lowers payments to retirees and allows the fund to recover rather than exhausting the fund or taking on debt to keep making payments.20 While the plan has been criticized for diminishing benefits during economic downturns, it has suc-ceeded in providing retirement security.21
In 2016, Maine pursued a series of reforms to implement vari-able contribution rates for their state pension system.22 Due
to these reforms, Maine’s unfunded pension liabilities have decreased by almost $10 billion (about 50%) over the past two years. Normally, employer contribution rates fluctuate to meet the ARC or other contribution standards, whereas employee contributions are a fixed rate set by contract. Under a “risk-shar-ing” plan, changes in the ARC result in changes in contributions for both employer and employee.
The models share a key aspect: both Maine and Wisconsin have automatic “triggers,” either on contribution rates, benefit rates, or cost of living adjustments. These triggers serve as an objective management tool to ensure pensions are funded. Automatic adjustments based on actuarial science are difficult to argue against, particularly when the potential deviation will underfund the pension system.
In addition, numerous states (e.g., Michigan, Pennsylvania, Wisconsin, and Tennessee) have introduced hybrid pension plans and options for full defined-contribution pensions. In most cases, a hybrid is a relatively small defined-benefit pen-sion plan offered in tandem with a defined-contribution plan. The defined-benefit portion of these hybrids carries all the same risks as traditional pension plans. The risks, however, are miti-gated by the smaller size and, often, better contract terms, such as benefit formulas that block spiking (where employees convert certain benefits such as unused sick time or saved vacation pay to boost their pension benefits) or higher employer contribution rates.
Tennessee currently offers a hybrid pension plan for all state and higher education employees hired on or after July 1, 2014. All state and higher education employees hired before that date have been incorporated in the defined-benefit legacy plan.23 The hybrid plan incorporates both a defined-benefit plan and the option to set aside money in a 401(k) plan. Tennessee is consistently one of the states with the best funding ratios and the lowest unfunded liabilities per capita in the ALEC pension reports since 2016. Unfunded liabilities will continue to fall as more retirees participate in hybrid pension plans and the state pays off its legacy pension plan liabilities.
Similarly, Michigan transitioned its Public School Employees’ Retirement System (MPSERS) to a hybrid pension plan for all new hires in 2017. The plan auto-enrolls new hires in a defined-con-tribution plan, but new teachers have the choice of opting into a hybrid plan with a mix of defined-contribution and defined-
Source: Federal Reserve Bank of St. Louis FRED Database and authors’ calculations
Risk-Free Discount Rate by Fiscal YearTable 11
2009 2010 2011 2012 2013 2014 2015 2016 2017 2018
3.69% 3.63% 3.20% 2.17% 2.74% 2.81% 2.35% 2.03% 2.49% 2.96%

16
benefit plans.24 The defined-benefit plan splits all costs 50-50 between employers and employees, and uses a 10-year amor-tization schedule and 6% discount rate. In addition, if the hybrid plan’s funding ratio falls below 85% for two consecutive years, the plan is closed to new hires until the funding ratio rises above the 85% threshold for two consecutive years.25
In 1996, Michigan was the first state in the nation to close its defined-benefit Michigan State Employee Retirement System (MSERS) and enroll new hires in a hybrid plan. 26 However, other state employee plans (such as MPSERS, the State Police Retirement System State Judges Retirement System, Municipal Employees Retirement System and the Legislative Retirement System) kept the defined-benefit option open to new hires. Thus, unfunded liabilities continue to accumulate in the other Michigan pension plans.27
The case of Michigan demonstrates that a transition to defined-contribution plans does not mean unfunded liabilities will disappear overnight (or even in one fiscal year). Michigan still ranks 42nd in the nation on unfunded liabilities, but the counterfactual would be much worse. If these reforms were not in place, Michigan would resemble its neighbor to the south-east, Ohio, or nearby Illinois. Ohio (48th in the nation) has $290 billion in unfunded liabilities, while Illinois (49th in the nation) has nearly $360 billion in unfunded liabilities. A study conducted by Richard Dreyfuss for the Mackinac Center found that Michi-gan’s unfunded liabilities would have been between $2.3-$4.5 billion greater if the reforms had not been made.28 By continu-ing reforms to transition more pension plans to defined-contri-bution, Michigan can steadily improve its retirement plans and reduce its unfunded liabilities.
Transparency is Necessary for Accountable Government
To keep government accountable, taxpayers, public sector employees and other stakeholders must be able to view gov-ernment financial documents in an easy and accessible manner. The call for greater transparency in government documents has remained constant throughout the various iterations of ALEC
Center for State Fiscal Reform publications. Disclosing key finan-cial information is required of publicly traded corporations —governments should be held to the same standard.
State and local governments can increase transparency by utiliz-ing digital record keeping and disclosing all financial information to the public in accessible and understandable formats in a reg-ular and timely manner. Failing to disclose key information (such as the financial status of the system, actuarial assumptions, investment portfolio composition and performance, investment decisions and findings of relevant independent assessments) keeps stakeholders in the dark. The ALEC “The Open Financial Statement Act” model policy outlines how digital records could modernize this process. The act replaces PDF-formatted audited financial statements of state, county, municipal and special dis-trict filings with filings utilizing Interactive Extensible Business Reporting Language (iXBRL). It also establishes these iXBRL audited financial statements as the only annual financial filing required from public agencies by the state, reducing duplicative reporting efforts and therefore reducing costs. The benefits of iXBRL are increased transparency, uniformity among state finan-cial documents and ease of accessing information such as asset and liability valuations, discount rates and mortality rates across pension plans.29
Conclusion
The strategies explained above illustrate ways states may limit the risks associated with pension mismanagement, but states can shed these risks entirely by switching to defined-contribu-tion plans. For the government employee, all costs are realized in the present, taking away the possibility of employers under-funding employee benefits. Employees can control where they invest retirement savings. Rather than leaving retirement invest-ments at the discretion of the political process, defined-contri-bution plans give employees the flexibility to choose how much they contribute. More importantly, defined-contribution plans allow employees to take retirement savings with them when they change positions, locations, or careers.
2 0 1 9 | U N A C C O U N TA B L E A N D U N A F F O R D A B L E
17
APPENDIX: METHODOLOGY
APPENDIX: METHODOLOGY
This year’s report features the most recently available data from FY 2017 and FY 2018. Since the previous edition of this report was published, states have improved their reporting of this data. As a result, this report also includes a more complete dataset from FY 2012 through FY 2018 that was not previously available.
Delaware, Indiana, North Carolina and Tennessee provided the most accessible and comprehensive data this year. The neces-sary information for each of these state pension plans could be found on a user-friendly website with easily accessible actuarial and financial document sections.30 North Carolina has shown significant improvements in pension data reporting. Massachu-setts also linked to its pension plan in the state CAFR — an excel-lent practice. However, data for some states — such as Alabama — required outreach to the state comptroller to acquire demo-graphic information. This elongated process to acquire finan-cial information (that Alabama is required to make public) is an unnecessary barrier to taxpayers who want to stay informed. It exemplifies how state reporting is critical to transparent and accountable pension policy.
This report uses each plan’s actuarial value of assets (AVA) and actuarial accrued liability (AAL) to calculate unfunded liabilities. This report, however, makes several assumptions regarding the structure of state liabilities and the quality of the actuar-ial assumptions to present a different estimate of each state’s liabilities than commonly is found in the state financial reports.
In addition, many plans use the phrase “rate of return” and “discount rate” interchangeably. Section 2 explained the differ-ences between an investment rate of return and a discount rate. As discussed in Section 2, there is a major difference between assumed return on investments and actual return on invest-ments.
Another important aspect highlighted in this report is how the discount rate affects the value of liabilities. Generally, the higher the discount rate, the lower the liability (and vice versa). Also mentioned in Section 2, assuming higher assumed rates of return and discount rates creates perverse incentives for policymakers to overvalue the returns on investment and undervalue liabili-ties. When this occurs, pension plans become underfunded.
For this report, a 15-year midpoint, using a hypothetical 15-year U.S. Treasury Bond yield, is used to derive an estimated risk-free discount rate of 2.96%. This is calculated as the average of the 10-year and 20-year bond yields. As stated in Section 2, the 15-year midpoint comes from the GASB recommendation that
a pension plan take no longer than 30 years to pay off its pen-sion liabilities. While states are not required to report their lia-bilities projected over a time series (i.e., reporting total liability due per year for the next 75 years), this report must assume the midpoint of state liabilities in order to recalculate state liabilities under different discount rate.
The risk-free rate is also used in the ALEC Other Post-Employ-ment Benefit Liabilities report. Applying the risk-free rate to both pension and OPEB liabilities allows for more accurate cross-state comparisons than simply comparing liability values in state financial documents.
The valuations in this report are calculated based on the pres-ent value of those liabilities. While it is difficult to estimate how much future liabilities will cost (because of changes in inflation and mortality rates, for example) the value of those future liabil-ities can be estimated today by calculating their present value. Present value is the value today of an amount of money in the future. The discount rate is the rate used to determine the value today of the amount a pension plan must pay retirees in the future.31 A general rule is the higher the discount rate, the lower the pres-ent value of future pension liabilities and vice versa. This study uses a discount rate that is lower than the discount rate in many state financial documents. This is, in part, to show a more con-servative valuation of those liabilities (compared to many state financial documents) and allow more accurate liability compari-sons to be made between states.
Discount rates used for pension plans can vary even among plans within a state. The use of a risk-free discount rate normal-izes discount rates across pension plans, providing the means to assess present value of liabilities across plans. This provides a basis of comparison for liabilities and funding ratios across the 50 states. Other variables provided by state financial documents such as mortality rates, demographics and health care costs were assumed to be correct and not normalized across plans.
This is a more prudent discount rate than many plans offer. The formula for calculating a risk-free present value for a liability requires first finding the future value of the liability. That for-mula, in which “i” represents a plan’s assumed discount rate, is FV = AAL x (1+i) ^15. The second step is to discount the future value to arrive at the present value of the more reasonably val-ued liability. That formula is PV = FV / (1+i) ^15, in which “i” represents the risk-free discount rate.
18
2 0 1 9 | U N A C C O U N TA B L E A N D U N A F F O R D A B L E
This methodology was developed by Bob Williams and Andy Biggs when this report was created by State Budget Solutions, which is now a project of the Center State Fiscal Reform at ALEC. It normalizes the liability values across plans and presents a more prudent valuation of liabilities than many state benefits plans with more rosy assumptions (such as higher discount rates). The inclusion of the fixed discount rate of 4.5%, was added by Thur-ston Powers in Unaccountable and Unaffordable, 2018.32
Data quality has improved, which has yielded improvements for utilizing various discount rates for different types of plans (e.g., single employer, cost-sharing multiple employer and agent mul-tiple employer). This reporting, however, is far from perfect, and there is much room for improvement. While some states did make clear distinctions between plan types, others aggregated pension liabilities and did not differentiate between plan types. For example, this year the California CalPERS plan was separated into the PERF A, PERF B, and PERF C plans, each with their own actuarial valuations instead of being aggregated into one CalP-ERS data entry.
Furthermore, the smaller plans that did report their investment rates of return tended to deviate from the national average more than larger plans, likely due to their smaller and less diver-sified funds. In some cases, smaller plans pool their assets with the state employee, teacher or police funds to reduce manage-ment costs. This created a comparison problem between states in terms of their investment rates of return. States with smaller plans tended to report a larger variance in their investment returns than states with consolidated funds as well as, problem-
atically, states with smaller plans that did not report investment rates of return.
Membership figures are collected from CAFRs, valuations and GASB notes, and are divided into active employees and benefi-ciaries (i.e., current retirees, inactive employees entitled to ben-efits who have not yet retired and survivors entitled to benefits). Some state plans used the term “inactive” to refer to different aggregations of inactive employees, such as retirees, inactive employees entitled to a future benefit, and inactive employees not entitled to a benefit. Supporting documents were used to parse the two groups. For example, the Connecticut Municipal Employee Retirement System (CMERS) ambiguously uses the term “inactive members” in its GASB 68 report but clarifies the figure in its GASB 67 report by parsing the total into retirees currently receiving benefits and inactive members entitled to benefits.
Actuarially recommended contributions (ARCs) and the percent-age of actuarially recommended contributions made were col-lected primarily from pension CAFRs, usually from tables titled “Schedule of Employer Contributions.” Actuarially determined contributions, actuarially recommended contributions, and actuarially determined contributions net of taxes and fees are reported as ARC in this study. Figures were collected from most recent to least recent year, with the aim of selecting actuarially recommended contribution rates that reflect the most recent actuarial assumptions, except in cases where actuarially rec-ommended contribution rates were retroactively replaced with contractually or legislatively required contribution rates.
19
REFERENCES
1 Weinberg, Sheila and Norcross, Eileen. “GASB 67 and GASB 68: What the New Accounting Standards Mean for Public Pension Reporting” Mer-
catus Policy Briefs. 15 June 2017. Retrieved from: https://www.mercatus.org/publications/urban-economics/gasb-67-and-gasb-68-what-new-
accounting-standards-mean-public-pension
2 Ibid.
3 “Wyoming Air Guard Firefighters’ Retirement System Actuarial Valuation Report for the Year Beginning January 1, 2019.” Wyoming Retirement
System. 18 April 2019. Retrieved from: https://retirement.wyo.gov/About/Reports?Label=Actuarial+Valuations&Sort=Most+Recent&Page=1
4 “State Actuarial Valuation As of June 30, 2018” CalPERS. 2019 October. Retrieved from: https://www.calpers.ca.gov/docs/forms-publica-
tions/2018-state-valuation.pdf
5 Powers, Thurston; Smith, Christine; Williams, Bob; and Williams, Jonathan. Unaccountable and Unaffordable 2018. American Legislative
Exchange Council. 2018. Retrieved from https://www.alec.org/publication/unaccountable-and-unaffordable-2018/
6 Andonov, Aleksandr and Rauh, Joshua D. “The Return Expectations of Institutional Investors” The Hoover Institution Economics Working Paper
18119. Nov 2018. Retrieved from: https://www.hoover.org/sites/default/files/research/docs/18119_rauh.pdf
7 “Michigan Public School Employees’ Retirement Fund Comprehensive Annual Financial Reports for Fiscal Years 2011-2018.” Office of the Auditor
General for the State of Michigan. Retrieved from: https://audgen.michigan.gov/completed-projects/
8 Williams, Jonathan, et al. “Keeping the Promise.”
9 Report of the Blue Ribbon Panel on Public Pension Plan Funding. Society of Actuaries. 2014. Retrieved from https://www.soa.org/brpreport364/
10 Rauh, Jonathan D. Testimony Before the Joint Select Committee on Solvency of Multiemployer Pension Plans. United States Senate & United
States House of Representatives. July 25th, 2018. https://www.pensions.senate.gov/sites/default/files/25JUL2018RauhSTMNT.pdf
11 “Statement No. 27: Accounting for Pensions by State and Local Governmental Employers.” Governmental Accounting Standards Board (GASB).
Nov. 1994. Retrieved from: https://www.gasb.org/resources/ccurl/44/286/GASBS-27.pdf
12 This variable is taken from the Boston Center for Retirement Research and the variable name is not changed. This variable name takes “rate of
return” as interchangeable from the “discount rate,” which this report criticized earlier in the report.
13 “Notes to Required Supplementary Information” Illinois Comprehensive Annual Financial Reports (Numerous Pension Plans). 2018. Retrieved
from: https://www.trsil.org/sites/default/files/documents/CAFR-FY2018_1.pdf
14 Seyfert, Kerri. “The Wisconsin Retirement System Is Fully Funded and a Model for Other States.” Reason Foundation. 14 January 2020. Retrieved
from: https://reason.org/commentary/the-wisconsin-retirement-system-is-fully-funded-and-a-model-for-other-states/
15 “The 80% Pension Funding Standard Myth.” American Academy of Actuaries Issue Brief. July 2012. Retrieved from: https://www.actuary.org/
sites/default/files/files/80_Percent_Funding_IB_071912.pdf
16 Joffe, Marc. “Commentary: The Downward Trend in US Life Expectancy and Its Uncertain Impacts on Public Pensions” Reason Foundation. 20
Dec. 2019. Retrieved from: https://reason.org/commentary/the-downward-trend-in-u-s-life-expectancy-and-its-uncertain-impacts-on-public-
pensions/
17 “ERISA 4022 Lump Sum Interest Rates.” Pension Benefit Guaranty Corporation (PBGC). Last updated Nov. 2019. Retrieved from: https://www.
pbgc.gov/prac/interest/vls#How-these-rates-are-used
18 Powers, Thurston, et al. Unaccountable and Unaffordable, 2018.
19 Seyfert, Kerri. “The Wisconsin Retirement System Is Fully Funded.” Reason Foundation. Jan. 2020.
20 Ibid.
21 Stein, Jason. “Wisconsin’s fully funded pension system is one of a kind.” Milwaukee Journal Sentinel. 26 Setp. 2016. Retrieved from: https://
projects.jsonline.com/news/2016/9/26/wisconsins-fully-funded-pension-system-is-one-of-a-kind.html
22 Braun, Martin Z. “Public Pensions Adopt Cost Sharing Mechanisms to Stem Volatility.” Bloomberg. July 17, 2018. https://www.bloomberg.com/
news/articles/2018-07-17/public-pensions-adopt-cost-sharing-mechanisms-to-stem-volatility
23 “GASB and Actuarial Information” Tennessee Department of Treasury. Updated 2019. Retrieved from: https://treasury.tn.gov/Retirement/
Boards-and-Governance/GASB-and-Actuarial-Information
24 Gilroy, Leonard, Randazzo, Anthony, and Takash, Daniel. “Michigan Adopts Most Innovative Teacher Pension Reform in the Nation.” Reason Foun-
dation. 16 June 2017. Retrieved from: https://reason.org/commentary/michigan-adopts-most-innovative-teacher-pension-reform-in-the-na-
tion/
25 Ibid.
26 Randazzo, Anthony. “Pension Reform Case Study: Michigan 2016 Update.” Reason Foundation. Aug. 2016. Retrieved from: https://reason.org/
wp-content/uploads/files/pension_reform_michigan.pdf
20
27 Ibid.
28 Dreyfuss, Richard C. “Policy Brief: Estimated Savings from Michigan’s 1997 State Employees Pension Plan Reform.” Mackinac Center for Public
Policy. 23 June 2011. Retrieved from: https://www.mackinac.org/15672
29 “Model Policy: The Open Financial Statement Act” American Legislative Exchange Council. 18 September 2018. Retrieved from: https://www.
alec.org/model-policy/the-open-financial-statement-act/
30 See State of Delaware Office of Pensions https://open.omb.delaware.gov/Financials.shtml; Indiana Public Retirement System https://www.
in.gov/inprs/annualreports.htm; North Carolina Total Retirement Plans https://www.myncretirement.com/governance/valuations-and-cafrs;
and the Tennessee Consolidated Retirement Systems https://treasury.tn.gov/Retirement/Boards-and-Governance/GASB-and-Actuarial-Infor-
mation.
31 Henderson, David. “Present Value” The Concise Encyclopedia of Economics (online at Econlib.org). Copyright 1999-2019. Retrieved from:
https://www.econlib.org/library/Enc/PresentValue.html
32 Powers, Thurston, et al. Unaccountable and Unaffordable, 2018.
2 0 1 9 | U N A C C O U N TA B L E A N D U N A F F O R D A B L E
24

Appendix 2
Keeping the Promise: Getting Politics Out of Pensions

3
AMERICAN LEGISLATIVE EXCHANGE COUNCIL • ALEC.ORGi

i
Keeping the Promise: Getting Politics Out of Pensions was published by the American Legislative Exchange Council (ALEC) as part of its mission to discuss, develop and dis-seminate model public policies that expand free markets, promote economic growth, limit the size of government and preserve individual liberty. ALEC is the nation’s larg-est nonpartisan, voluntary membership organization of state legislators, with more than 2,000 members across the country. ALEC is governed by a Board of Directors comprised of state legislators. Additionally, ALEC is classified by the Internal Revenue Service as a 501(c)(3) nonprofit, public policy and educational organization. Individu-als, philanthropic foundations, businesses and associations are eligible to support the work of ALEC through tax-deductible gifts.
About the American Legislative Exchange Council
The Center for State Fiscal Reform strives to educate policymakers, the media and the general public on the principles of sound fiscal policy and the evidence that supports those principles. This is done by personalized research, policy briefings in the states and by releasing nonpartisan policy publications for distribution, such as Rich States, Poor States: ALEC-Laffer State Economic Competitiveness Index.
About the ALEC Center for State Fiscal Reform
Contact Information
American Legislative Exchange Council
2900 Crystal Drive, Suite 600Arlington, VA 22202
Tel: 703.373.0933Fax: 703.373.0927
www.alec.org

ii
Authors
Theodore Lafferty, Legal Research AnalystCenter for State Fiscal Reform, American Legislative Exchange Council
Kati Siconolfi, Legislative Manager Center for State Fiscal Reform, American Legislative Exchange Council
Jonathan Williams, Vice PresidentCenter for State Fiscal Reform, American Legislative Exchange Council
Elliot Young, Research Analyst Center for State Fiscal Reform, American Legislative Exchange Council
iii
Acknowledgements and Disclaimers
The authors wish to thank Lisa B. Nelson, Bill Meierling, Bob Williams, Nathan Brinkman, Christine Smith, Ben Wilterdink, Anthony Iafrate, James Kennedy, Tony Bergida, Christine Phipps, Ashley Varner, Ashley Pratte and the professional staff at ALEC for their valuable assistance with this project. Joe Horvath of the Yankee Institute also played an important role in the de-velopment of this study.
All rights reserved. Except as permitted under the United States Copyright Act of 1976, no part of this publication may be reproduced or distributed in any form or by any means, or stored in a database or retrieval system without the prior permission of the publisher. The copyright to this work is held by the American Legislative Exchange Council. This study may not be du-plicated or distributed in any form without the permission of the American Legislative Exchange Council and with proper attribution.

iv
Table of Contents
Executive Summary ................................................................................................................................................... vChapter 1: Background on Public Pension Systems ................................................................................................... 1
Public Pension Plans in the United States ................................................................................................ 1Public Pensions Significantly Underfunded ............................................................................................. 2The Defined-Contribution Alternative ..................................................................................................... 4The Importance of Proper Plan Management ......................................................................................... 5Weak Fiduciary Standards Enable Pension Fund Cronyism ...................................................................... 5
Chapter 2: Economically Targeted Investments ......................................................................................................... 7ETIs Lead to Significant Lost Returns ....................................................................................................... 7Alabama Bets Big on ETIs ......................................................................................................................... 8Overview of Alabama’s ETIs ..................................................................................................................... 8Poor Performance of ETIs in Alabama ..................................................................................................... 9ETIs Weigh Down RSA Investment Returns .............................................................................................. 9RSA’s Real Estate Investments: A Key Contributor to Poor Performance .................................................. 9RSA’s Other ETIs Lead to Significant Losses ............................................................................................ 11Alabama’s Weak Fiduciary Standards Enable ETIs ................................................................................. 11Opaque Pension Reporting Conceals Performance of RSA’s ETIs ........................................................... 13Alabama’s Poor Pension Board Composition and Governance Enables ETIs .......................................... 13The Results of Alabama’s Pension Investment Model ........................................................................... 15ETIs Put Workers and Taxpayers at Risk ................................................................................................. 15Solutions for Fighting ETI Cronyism ....................................................................................................... 16
Chapter 3: Political Kickbacks .................................................................................................................................. 17Political Bias in Public Pension Funds .................................................................................................... 17CalPERS Kickbacks ................................................................................................................................. 19Political Kickbacks Cost Pension Funds .................................................................................................. 19Solutions for Fighting Political Kickback Cronyism ................................................................................. 20
Chapter 4: Political Crusades ................................................................................................................................... 21The Pension Divestment Movement Harms State Pension Funds ......................................................... 21Fossil Fuel Divestment ........................................................................................................................... 21Fossil Fuel Divestment Fails to Achieve Its Goals ................................................................................... 23California ............................................................................................................................................... 23New York ............................................................................................................................................... 24Vermont ................................................................................................................................................ 25Pension Divestment at the Municipal Level ........................................................................................... 25Fossil Fuel Divestment Threatens Pensioners’ Retirement .................................................................... 26Divestment from Individuals Based on Personal Beliefs ........................................................................ 26Rhode Island Trades Investment Returns for Politics ............................................................................. 27Shareholder Activism in Pension Fund Management ............................................................................ 29Public Pension Funds Advance Political Shareholder Resolutions ......................................................... 29Shareholder Activism to Silence Free Speech ........................................................................................ 30Shareholder Activism and Executive Compensation .............................................................................. 30Political Crusades Put Pensioners at Risk ............................................................................................... 30Solutions for Fighting Political Crusade Cronyism .................................................................................. 31
Conclusion .............................................................................................................................................................. 32Appendix A: Solutions for Prudent Pension Investment and Governance .............................................................. 33Appendix B: ALEC Model Policies ............................................................................................................................ 35Endnotes ................................................................................................................................................................. 40
v
Pensions are a valuable non-wage benefit that a large majority of state and local governments offer their employ-ees as part of their compensation packages. With approximately $3.8 trillion in total assets, millions of workers rely on the promises made by governments to provide a secure retirement through a lifelong pension. In order to keep these promises, pension funds should be managed for the exclusive purpose of providing retirement benefits to workers, with pension trustees doing their best to achieve the greatest possible return on investments.
Unfortunately, many lawmakers and pension plan officials have other priorities besides doing what is best for workers. They see the billions of pension fund dollars they manage as an opportunity to advance their own agen-das. Rather than investing to earn the best return for workers, they use pension funds in a misguided attempt to boost their local economies, provide kickbacks to their political supporters, reward industries they like, punish those they don’t and bully corporations into silence and behaving as they see fit.
As lawmakers and trustees knowingly make inferior investment decisions, sacrificing better returns in order to ad-vance political agendas, pension funding declines, jeopardizing workers’ retirement benefits and leaving taxpayers to pick up the tab. This reckless decision to place political agendas ahead of what’s best for workers is known as pension fund cronyism, and it is happening every year in pension funds across the country. This report exposes these dishonest practices and shows state and local policymakers what they can do to get politics out of their pen-sions and focus on keeping the promise to workers and retirees alike.
Executive Summary
KEEPING THE PROMISE: GETTING POLITICS OUT OF PENSIONS
1
Before addressing the many forms of pension fund cronyism in detail, some background on the mechanics and current underfunded status of public pensions is necessary. While pension fund cronyism is always det-rimental, the alarming and deteriorating state of public pension funds underscores the critical need to get pol-itics out of pensions.
There are three main reasons why most public pension plans are in such trouble. The first relates to the ac-tual funding of the plans. This includes both how the funding required from state and local governments is calculated each year and their commitment to making those payments. The second is related to the structure of the plans themselves, which permits state and lo-cal governments to get away with underfunding pen-sion plans for political convenience. The third relates to weak fiduciary standards that enable pension board members and fund managers to use public pension funds to advance political agendas at the expense of securing the best returns on pension investments. An examination of these causes is crucial to understanding the depth and breadth of the problem, and the steps policymakers need to take in order to comprehensively fix public pensions going forward.
Public Pension Plans in the United States
Nearly all state public pension plans operate on what is called a defined-benefit model. In defined-bene-fit plans, pension systems collect fund contributions from employees, their government employers (such as school districts) and the state or local government it-self. The money is then invested on behalf of those par-ticipating in the pension system. That fund is then used to pay obligations to retirees. A defined-benefit pen-sion plan guarantees, upon retirement, an employee will receive a specific benefit each period, regardless of market performance or contributions into the system.
While the amount that employees are required to con-tribute to a defined-benefit pension system is typically set through collective bargaining or other contractual negotiations, and the contribution from government employers is often derived from these negotiations or state law, the amount the state or local government directly contributes is calculated differently. Actuaries calculate the amount the government must contrib-ute to the pension system every year, known as the “annual required contribution” (ARC), based on the number of people in the system, their expected work years, retirement duration and the expected rate of re-turn on the fund’s investments. This last variable, the “discount rate,” has a significant effect on how large a government’s ARC payment will be. As states and cities increase the discount rate, their ARC payments decrease. This is because the higher the investment returns assumed by the plan, the less money the state or local government must contribute through the ARC payment to keep the plan well-funded.
Unfortunately, the vast majority of public pension plans rely on unrealistically high assumptions, often ex-pecting a whopping seven percent or more return — in each and every year.1 This is problematic because most financial experts believe assuming regular returns at these rates is unrealistic. Simply put, the expected re-turn on investment state and local governments use to calculate ARC payments is far too high.
Lowering the expected rate of return on pension in-vestments to a more reasonable level would serve to mitigate financial risks and help improve long-term plan solvency. In fact, these unrealistic assumptions led The Economist to declare in 2013 that “States need to wake up. The priority is to make taxpayers aware of the scale of the problem by accounting for it properly, rather than pretending the stock market fairy will mag-ic it away.”2
Chapter 1Background on Public Pension Systems
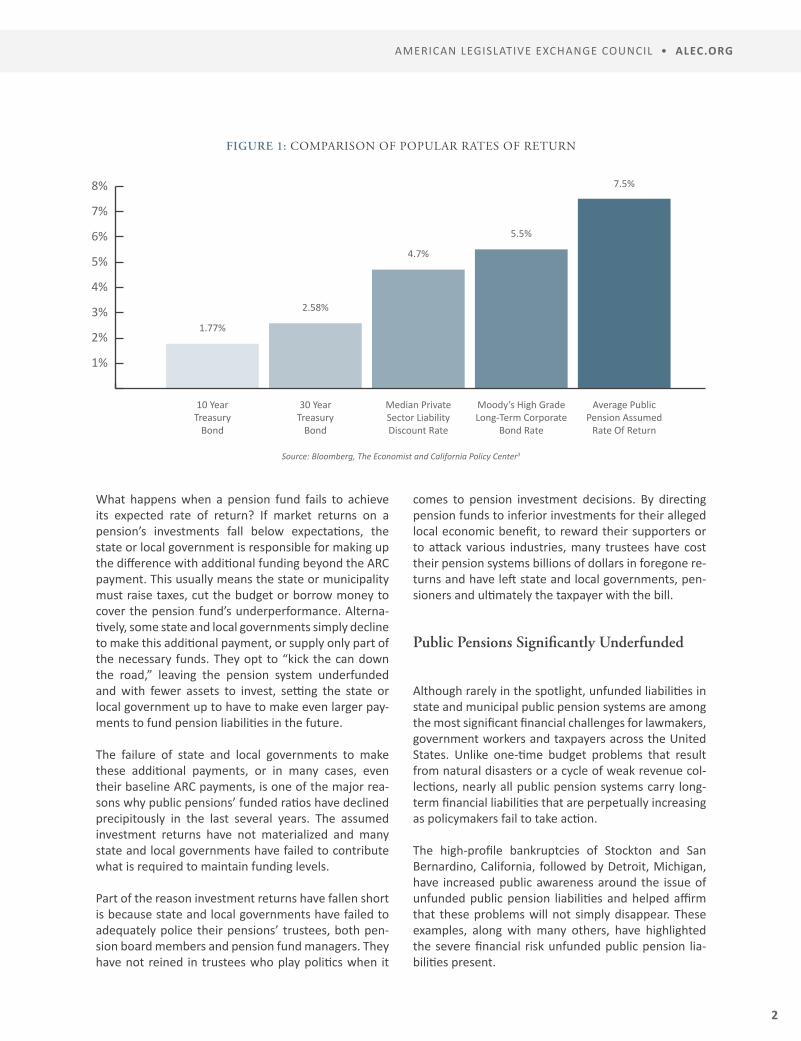
2
AMERICAN LEGISLATIVE EXCHANGE COUNCIL • ALEC.ORG
What happens when a pension fund fails to achieve its expected rate of return? If market returns on a pension’s investments fall below expectations, the state or local government is responsible for making up the difference with additional funding beyond the ARC payment. This usually means the state or municipality must raise taxes, cut the budget or borrow money to cover the pension fund’s underperformance. Alterna-tively, some state and local governments simply decline to make this additional payment, or supply only part of the necessary funds. They opt to “kick the can down the road,” leaving the pension system underfunded and with fewer assets to invest, setting the state or local government up to have to make even larger pay-ments to fund pension liabilities in the future.
The failure of state and local governments to make these additional payments, or in many cases, even their baseline ARC payments, is one of the major rea-sons why public pensions’ funded ratios have declined precipitously in the last several years. The assumed investment returns have not materialized and many state and local governments have failed to contribute what is required to maintain funding levels.
Part of the reason investment returns have fallen short is because state and local governments have failed to adequately police their pensions’ trustees, both pen-sion board members and pension fund managers. They have not reined in trustees who play politics when it
comes to pension investment decisions. By directing pension funds to inferior investments for their alleged local economic benefit, to reward their supporters or to attack various industries, many trustees have cost their pension systems billions of dollars in foregone re-turns and have left state and local governments, pen-sioners and ultimately the taxpayer with the bill.
Public Pensions Significantly Underfunded
Although rarely in the spotlight, unfunded liabilities in state and municipal public pension systems are among the most significant financial challenges for lawmakers, government workers and taxpayers across the United States. Unlike one-time budget problems that result from natural disasters or a cycle of weak revenue col-lections, nearly all public pension systems carry long-term financial liabilities that are perpetually increasing as policymakers fail to take action.
The high-profile bankruptcies of Stockton and San Bernardino, California, followed by Detroit, Michigan, have increased public awareness around the issue of unfunded public pension liabilities and helped affirm that these problems will not simply disappear. These examples, along with many others, have highlighted the severe financial risk unfunded public pension lia-bilities present.
8%
7%
6%
5%
4%
3%
2%
1%
FIGURE 1: COMPARISON OF POPULAR RATES OF RETURN
10 Year Treasury
Bond
30 YearTreasury
Bond
Median Private Sector LiabilityDiscount Rate
Moody’s High Grade Long-Term Corporate
Bond Rate
Average Public Pension Assumed
Rate Of Return
1.77%
2.58%
4.7%
5.5%
7.5%
Source: Bloomberg, The Economist and California Policy Center3
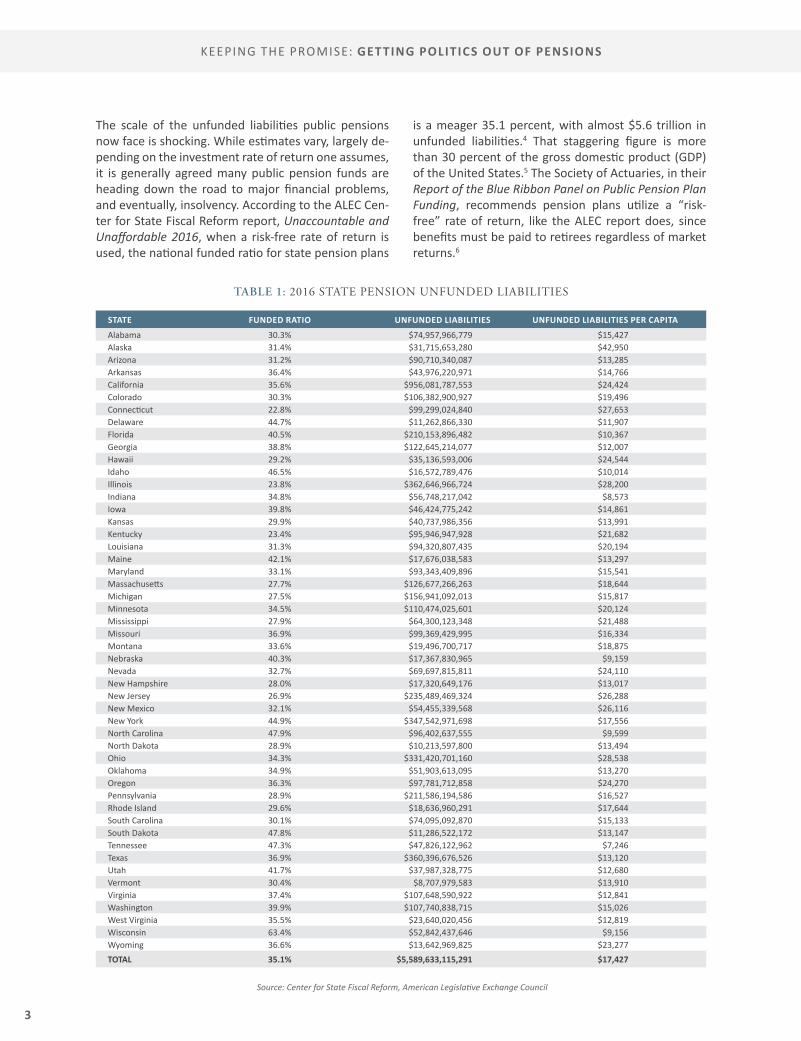
KEEPING THE PROMISE: GETTING POLITICS OUT OF PENSIONS
3
The scale of the unfunded liabilities public pensions now face is shocking. While estimates vary, largely de-pending on the investment rate of return one assumes, it is generally agreed many public pension funds are heading down the road to major financial problems, and eventually, insolvency. According to the ALEC Cen-ter for State Fiscal Reform report, Unaccountable and Unaffordable 2016, when a risk-free rate of return is used, the national funded ratio for state pension plans
is a meager 35.1 percent, with almost $5.6 trillion in unfunded liabilities.4 That staggering figure is more than 30 percent of the gross domestic product (GDP) of the United States.5 The Society of Actuaries, in their Report of the Blue Ribbon Panel on Public Pension Plan Funding, recommends pension plans utilize a “risk-free” rate of return, like the ALEC report does, since benefits must be paid to retirees regardless of market returns.6
TABLE 1: 2016 STATE PENSION UNFUNDED LIABILITIES
STATE FUNDED RATIO UNFUNDED LIABILITIES UNFUNDED LIABILITIES PER CAPITA
Alabama 30.3% $74,957,966,779 $15,427Alaska 31.4% $31,715,653,280 $42,950Arizona 31.2% $90,710,340,087 $13,285Arkansas 36.4% $43,976,220,971 $14,766California 35.6% $956,081,787,553 $24,424Colorado 30.3% $106,382,900,927 $19,496Connecticut 22.8% $99,299,024,840 $27,653Delaware 44.7% $11,262,866,330 $11,907Florida 40.5% $210,153,896,482 $10,367Georgia 38.8% $122,645,214,077 $12,007Hawaii 29.2% $35,136,593,006 $24,544Idaho 46.5% $16,572,789,476 $10,014Illinois 23.8% $362,646,966,724 $28,200Indiana 34.8% $56,748,217,042 $8,573Iowa 39.8% $46,424,775,242 $14,861Kansas 29.9% $40,737,986,356 $13,991Kentucky 23.4% $95,946,947,928 $21,682Louisiana 31.3% $94,320,807,435 $20,194Maine 42.1% $17,676,038,583 $13,297Maryland 33.1% $93,343,409,896 $15,541Massachusetts 27.7% $126,677,266,263 $18,644Michigan 27.5% $156,941,092,013 $15,817Minnesota 34.5% $110,474,025,601 $20,124Mississippi 27.9% $64,300,123,348 $21,488Missouri 36.9% $99,369,429,995 $16,334Montana 33.6% $19,496,700,717 $18,875Nebraska 40.3% $17,367,830,965 $9,159Nevada 32.7% $69,697,815,811 $24,110New Hampshire 28.0% $17,320,649,176 $13,017New Jersey 26.9% $235,489,469,324 $26,288New Mexico 32.1% $54,455,339,568 $26,116New York 44.9% $347,542,971,698 $17,556North Carolina 47.9% $96,402,637,555 $9,599North Dakota 28.9% $10,213,597,800 $13,494Ohio 34.3% $331,420,701,160 $28,538Oklahoma 34.9% $51,903,613,095 $13,270Oregon 36.3% $97,781,712,858 $24,270Pennsylvania 28.9% $211,586,194,586 $16,527Rhode Island 29.6% $18,636,960,291 $17,644South Carolina 30.1% $74,095,092,870 $15,133South Dakota 47.8% $11,286,522,172 $13,147Tennessee 47.3% $47,826,122,962 $7,246Texas 36.9% $360,396,676,526 $13,120Utah 41.7% $37,987,328,775 $12,680Vermont 30.4% $8,707,979,583 $13,910Virginia 37.4% $107,648,590,922 $12,841Washington 39.9% $107,740,838,715 $15,026West Virginia 35.5% $23,640,020,456 $12,819Wisconsin 63.4% $52,842,437,646 $9,156Wyoming 36.6% $13,642,969,825 $23,277TOTAL 35.1% $5,589,633,115,291 $17,427
Source: Center for State Fiscal Reform, American Legislative Exchange Council

4
AMERICAN LEGISLATIVE EXCHANGE COUNCIL • ALEC.ORG
The magnitude of unfunded liabilities has been in-creasing for years. In order to turn things around for failing defined-benefit pension systems – that is if policymakers wish to continue with a defined-benefit model – lawmakers must begin setting more reason-able assumed rates of return and commit to making the larger ARC payments this would require. They must also commit to doing everything they can to meet their assumed rates of return. This means eliminating pen-sion fund cronyism by insisting trustees invest solely in the interest of securing the best long-term, risk-adjust-ed returns and not allowing them to sacrifice portfolio performance in the pursuit of political agendas.
The Defined-Contribution Alternative
It is worth noting that some states and municipalities have escaped the perils of defined-benefit plans by creating new defined-contribution plans for government workers. A defined-contribution plan sets up a personal account that is owned by the employee and is entirely theirs upon full retirement. The typical defined-contribution plan is very similar to the 401(k) retirement savings accounts that most private sector employees utilize. While defined-contribution plans usually include payments from both the employee and the employer into their account, the employer (state or local government) makes no guarantee on what the eventual payout will be. Most private sector companies have realized the unsustainability of the defined-benefit model and switched to the 401(k) defined-contribution model years ago.
One of the key benefits of public defined-contribution plans is stability for state and local finances. Govern-ments can budget knowing, within a certain predict-able range, what contributions they will need to make to employees’ retirement accounts. The variation is a result of factors such as provisions to match employee contributions and changes in the number of govern-ment workers. These variables are far more predict-able than the ups and downs of global markets that determine defined-benefit plans’ investment returns, and consequently, the contributions required by state and local governments to keep their pension plans well-funded.
Defined-contribution plans also provide improved ac-countability for state and local governments. With de-fined-contribution plans, employees have a legal cause of action if the government fails to make its required
contribution. In addition, they provide greater trans-parency through personal account statements, where-in an employee may see the value of their pension and whether or not the government is making their proper payments. This stands in stark contrast to defined-ben-efit plans, where employees, and the taxpayers who are ultimately liable, can only hope state and local gov-ernments will faithfully make their “required” contri-butions to the pension fund.
This cause of action, combined with transparency, serves as an enforcement mechanism that ensures defined-contribution plans will be run as pay-as-you-go systems. So long as state and local governments make their reasonably predictable payments to pen-sioners’ accounts, no unfunded liabilities accrue at all. Defined-contribution plans avoid the risk endemic to defined-benefit plans, where fiscally irresponsible law-makers can make politically-beneficial promises today, but pass down a mountain of unfunded liabilities to fu-ture generations – and future lawmakers.
Finally, defined-contribution plans also have the ben-efit of essentially eliminating pension fund cronyism. Since employees in defined-contribution plans own their personal retirement accounts, they decide how their money is invested, often by choosing from a set of mutual funds managed by large, professional invest-ment firms. The investment policies of these funds are clearly described in their prospectus and most are solely focused on achieving the greatest return within certain parameters of risk. If an employee chooses to invest in a socially-driven fund, they may do so with-out risking any other employee’s investment returns or exposing the government, and taxpayers, to any addi-tional liability.
While few states have adopted defined-contribution plans, one area of the public sector where defined-con-tribution systems have taken root is academia. Many higher education faculty and administrative employees currently utilize defined-contribution plans, such as those offered by the financial services company, TIAA. These plans have proven highly successful. In Illinois, a state that is on the verge of having its bond rating reduced to junk level, the TIAA defined-contribution plans have recently enjoyed the highest possible credit rating from all four credit rating agencies.7
Keeping promises to current retirees and workers is of paramount concern, but this can best be accomplished by changing public pension plans for future employees. Moving away from a defined-benefit pension system
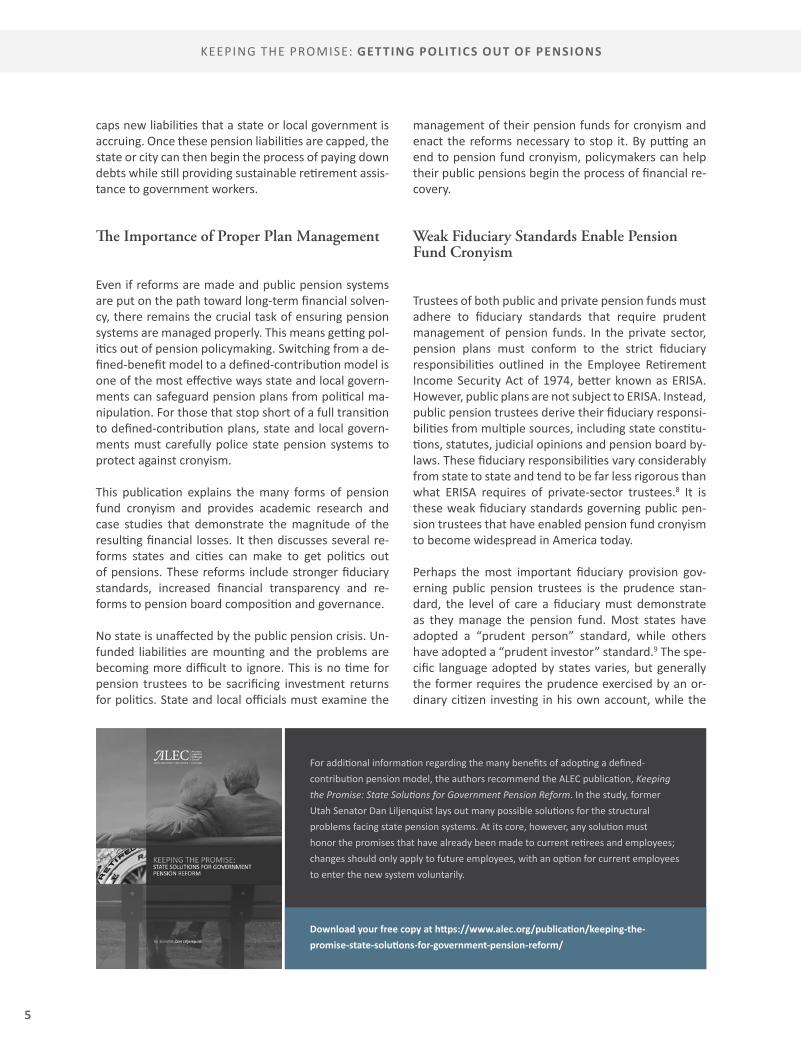
KEEPING THE PROMISE: GETTING POLITICS OUT OF PENSIONS
5
caps new liabilities that a state or local government is accruing. Once these pension liabilities are capped, the state or city can then begin the process of paying down debts while still providing sustainable retirement assis-tance to government workers.
The Importance of Proper Plan Management
Even if reforms are made and public pension systems are put on the path toward long-term financial solven-cy, there remains the crucial task of ensuring pension systems are managed properly. This means getting pol-itics out of pension policymaking. Switching from a de-fined-benefit model to a defined-contribution model is one of the most effective ways state and local govern-ments can safeguard pension plans from political ma-nipulation. For those that stop short of a full transition to defined-contribution plans, state and local govern-ments must carefully police state pension systems to protect against cronyism.
This publication explains the many forms of pension fund cronyism and provides academic research and case studies that demonstrate the magnitude of the resulting financial losses. It then discusses several re-forms states and cities can make to get politics out of pensions. These reforms include stronger fiduciary standards, increased financial transparency and re-forms to pension board composition and governance.
No state is unaffected by the public pension crisis. Un-funded liabilities are mounting and the problems are becoming more difficult to ignore. This is no time for pension trustees to be sacrificing investment returns for politics. State and local officials must examine the
management of their pension funds for cronyism and enact the reforms necessary to stop it. By putting an end to pension fund cronyism, policymakers can help their public pensions begin the process of financial re-covery.
Weak Fiduciary Standards Enable Pension Fund Cronyism
Trustees of both public and private pension funds must adhere to fiduciary standards that require prudent management of pension funds. In the private sector, pension plans must conform to the strict fiduciary responsibilities outlined in the Employee Retirement Income Security Act of 1974, better known as ERISA. However, public plans are not subject to ERISA. Instead, public pension trustees derive their fiduciary responsi-bilities from multiple sources, including state constitu-tions, statutes, judicial opinions and pension board by-laws. These fiduciary responsibilities vary considerably from state to state and tend to be far less rigorous than what ERISA requires of private-sector trustees.8 It is these weak fiduciary standards governing public pen-sion trustees that have enabled pension fund cronyism to become widespread in America today.
Perhaps the most important fiduciary provision gov-erning public pension trustees is the prudence stan-dard, the level of care a fiduciary must demonstrate as they manage the pension fund. Most states have adopted a “prudent person” standard, while others have adopted a “prudent investor” standard.9 The spe-cific language adopted by states varies, but generally the former requires the prudence exercised by an or-dinary citizen investing in his own account, while the
For additional information regarding the many benefits of adopting a defined-contribution pension model, the authors recommend the ALEC publication, Keeping the Promise: State Solutions for Government Pension Reform. In the study, former Utah Senator Dan Liljenquist lays out many possible solutions for the structural problems facing state pension systems. At its core, however, any solution must honor the promises that have already been made to current retirees and employees; changes should only apply to future employees, with an option for current employees to enter the new system voluntarily.
Download your free copy at https://www.alec.org/publication/keeping-the-promise-state-solutions-for-government-pension-reform/

6
AMERICAN LEGISLATIVE EXCHANGE COUNCIL • ALEC.ORG
latter requires the prudence exercised by an invest-ment professional.10 The prudent investor standard is tougher and expects a greater level of prudence from the fiduciary when making plan investment and man-agement decisions. Considering the number of workers relying on their investment decisions and the interest of all taxpayers in seeing their money wisely managed, states should adopt the prudent investor standard for public pension trustees to offer workers, retirees and taxpayers the most protection.
Fiduciaries are also subject to other provisions. Exam-ples include the duty to act in the sole interest of plan participants, diversify the investment portfolio and incur only reasonable administrative expenses. States should enact these additional requirements as each of these provisions strengthens a state’s fiduciary stan-dards. When adopted, each should be written in a way that leaves no doubt about what is expected of a trust-ee as they invest and manage the fund.
The Pew Charitable Trusts recently surveyed states’ fiduciary provisions, comparing them to the Uniform Law Commission’s Uniform Management of Public Employee Retirement Systems Act (UMPERSA). UMP-ERSA is a model law that seeks to modernize, clarify and make uniform the rules governing the investment and management of public retirement systems’ assets. It contains several model fiduciary provisions that may improve a state’s existing fiduciary provisions for pen-sion trustees.
Pew’s research included six of the most important fidu-ciary provisions for pension trustees. The table shows how many states have statutorily-codified fiduciary provisions for pension trustees that meet UMPERSA’s standards.11
Strong fiduciary standards are important because when fiduciary standards are weak, trustees have lat-itude to engage in pension fund cronyism. In effect, they are put on a “long leash,” permitted to invest in lo-cal pet projects, reward supporters with pension fund investments and pursue political agendas by investing in industries they like and divesting from those they don’t, regardless of losses to fund performance. On the other hand, when fiduciary standards are strong, trust-ees have clear and specific directions to control them. They are put on a “short leash,” required to invest in a manner that secures the best returns for plan partici-pants. Similar to the Uniform Law Commission’s UMP-ERSA, The ALEC Task Force on Tax and Fiscal Policy has developed its own recommendations to strengthen states’ fiduciary provisions for public pension funds in its Retirement System Board of Trustees and Employ-ees Prudent Investor Act.12 More information on this key model policy can be found in Appendix B.
Finally, accountability mechanisms should be estab-lished by states to ensure compliance with fiduciary responsibilities. First, states should require transpar-ency in financial reporting for public pension plans that allows lawmakers, pensions boards and average citizens to see all plan investments and evaluate their performance. In addition, states should reform pen-sion boards to serve as better watchdogs of pension funds. Research suggests certain types of pension board members are more likely to overweight local in-vestment and provide political kickbacks.13 Therefore, states should consider reforming the composition of pension boards and adopt board procedures to elim-inate opportunities for cronyism. These transparency and pension board reforms will help to hold board members accountable.
TABLE 2: STATE OVERVIEW OF SELECT FIDUCIARY PROVISIONS
FIDUCIARY ELEMENT STATES ADOPTING
Prudence requirement 50
Exclusive purpose of providing benefits 27
Solely in the interest of participants 26
Reasonable administrative expenses 22
Diversification of investments 27
Economically targeted investments, first prudent 8
Source: The Pew Charitable Trusts
KEEPING THE PROMISE: GETTING POLITICS OUT OF PENSIONS
7
Economically targeted investments (ETIs) are local in-vestments “that have been selected for their econom-ic or social benefits in addition to the investment re-turn to the employee benefit plan.”14 ETIs are a type of cronyism because they favor local investments over broad-based investing, even if it produces inferior re-turns. They seek to serve government-defined eco-nomic and social goals at the expense of pension fund performance. ETIs may be pursued by individual fund managers or pension boards who support them, acting under weak fiduciary standards that permit them to do so, or endorsed by state and local governments as of-ficial policy for pension investments. It is worth noting that some of the states that permit ETIs have specific limits on the percentage of the total portfolio that can be invested in ETIs, indicating recognition of the harm they do to pension performance.15
To be clear, not all local investments are ETIs. If a public pension fund, looking at the entire universe of invest-ment options determines a given investment offers the best risk-adjusted return ratio, and that investment happens to be local, this is not an ETI, and is an appro-priate investment. However, given the relatively small percentage of global investment opportunities that ex-ist within any particular state or municipality, local in-vestments should make up a very small percentage of a pension fund’s total portfolio if a fund manager is act-ing solely in the interest of securing the best possible long-term, risk-adjusted returns. Unfortunately, when fund managers, pension boards and governments con-sistently favor local investments, pension returns suf-fer, and taxpayers must pay the bill.
ETIs Lead to Significant Lost Returns
The theory behind ETIs is that pension funds should favor local investments, even at the cost of investment returns, because doing so will allegedly help the local
economy thrive or provide some social benefit. Gov-ernments and local initiatives that subscribe to this theory often pressure pension funds to try to stimu-late local economic development or pursue social goals by financing major projects with pension fund invest-ments – projects they may not wish to fund with tax-payer dollars. Since trustees have little to lose if the fiduciary standards governing them permit or encour-age ETIs, most of the risk is squarely upon pensioners, whose retirement benefits are put at risk, and taxpay-ers, who may have to ultimately make up the loss of returns caused by inferior investments.
While some may believe this is an acceptable trade-off, the loss of investment returns can be dramatic. Research indicates that ETIs consistently underper-form broad-based investments. Regression analysis of the effects of various types of investments on pension fund performance has found underperformance is es-pecially significant among two common forms of ETIs, local real estate and venture capital investments. Local real estate investments are predicted to deliver returns 7.90 percentage points lower compared to real estate investments generally. Local investments in venture capital are predicted to deliver returns 3.55 percentage points lower relative to venture capital investments generally.16 These are significant losses for any pension fund to sustain and are only compounded over time as any foregone returns in the present could be reinvested to gain further returns down the road.
Another study utilizing regression analysis to evaluate the performance of ETIs was conducted by Yale Pro-fessor Roberta Romano. She found, “Even when such investments have not been a total loss, they have often significantly underperformed alternative projects with far less risk. Accordingly, such investments do not meet prudential fiduciary standards.”17 The study cites some specific examples which highlight the failure of these investments. One such instance was the loss of more than $100 million after Kansas’ pension fund invested
Chapter 2Economically Targeted Investments
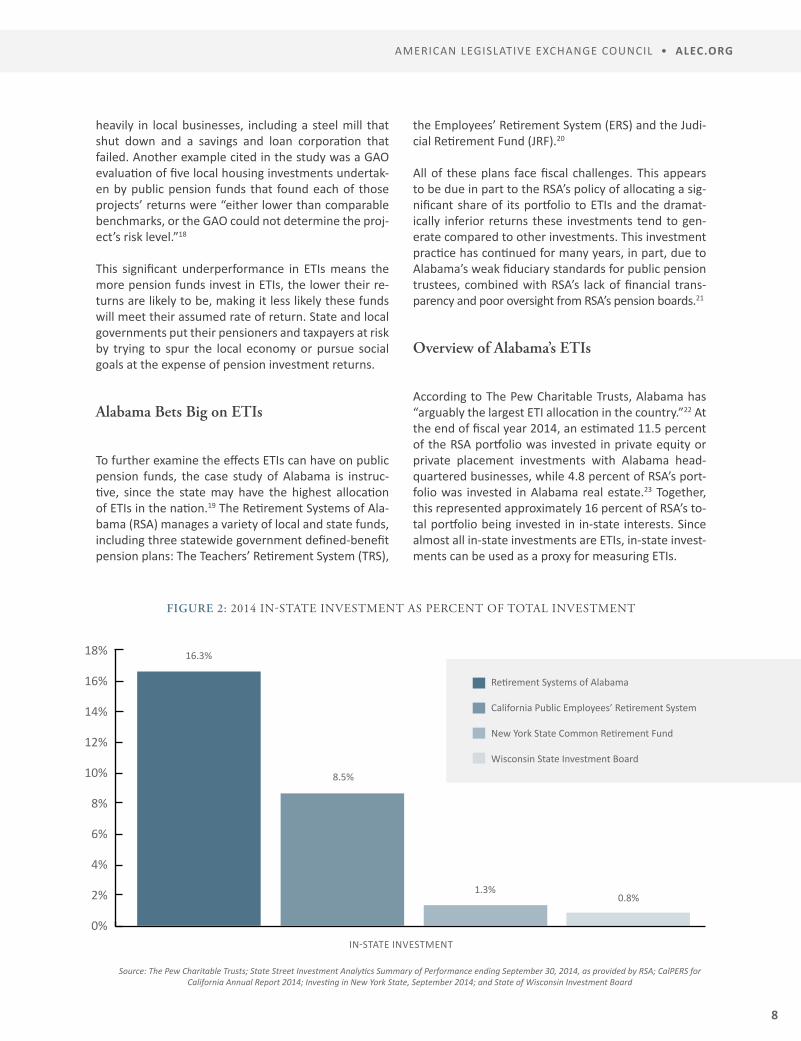
8
AMERICAN LEGISLATIVE EXCHANGE COUNCIL • ALEC.ORG
heavily in local businesses, including a steel mill that shut down and a savings and loan corporation that failed. Another example cited in the study was a GAO evaluation of five local housing investments undertak-en by public pension funds that found each of those projects’ returns were “either lower than comparable benchmarks, or the GAO could not determine the proj-ect’s risk level.”18
This significant underperformance in ETIs means the more pension funds invest in ETIs, the lower their re-turns are likely to be, making it less likely these funds will meet their assumed rate of return. State and local governments put their pensioners and taxpayers at risk by trying to spur the local economy or pursue social goals at the expense of pension investment returns.
Alabama Bets Big on ETIs
To further examine the effects ETIs can have on public pension funds, the case study of Alabama is instruc-tive, since the state may have the highest allocation of ETIs in the nation.19 The Retirement Systems of Ala-bama (RSA) manages a variety of local and state funds, including three statewide government defined-benefit pension plans: The Teachers’ Retirement System (TRS),
the Employees’ Retirement System (ERS) and the Judi-cial Retirement Fund (JRF).20
All of these plans face fiscal challenges. This appears to be due in part to the RSA’s policy of allocating a sig-nificant share of its portfolio to ETIs and the dramat-ically inferior returns these investments tend to gen-erate compared to other investments. This investment practice has continued for many years, in part, due to Alabama’s weak fiduciary standards for public pension trustees, combined with RSA’s lack of financial trans-parency and poor oversight from RSA’s pension boards.21
Overview of Alabama’s ETIs
According to The Pew Charitable Trusts, Alabama has “arguably the largest ETI allocation in the country.”22 At the end of fiscal year 2014, an estimated 11.5 percent of the RSA portfolio was invested in private equity or private placement investments with Alabama head-quartered businesses, while 4.8 percent of RSA’s port-folio was invested in Alabama real estate.23 Together, this represented approximately 16 percent of RSA’s to-tal portfolio being invested in in-state interests. Since almost all in-state investments are ETIs, in-state invest-ments can be used as a proxy for measuring ETIs.
18%
16%
14%
12%
10%
8%
6%
4%
2%
0%
FIGURE 2: 2014 IN-STATE INVESTMENT AS PERCENT OF TOTAL INVESTMENT
IN-STATE INVESTMENT
Retirement Systems of Alabama
California Public Employees’ Retirement System
New York State Common Retirement Fund
Wisconsin State Investment Board
Source: The Pew Charitable Trusts; State Street Investment Analytics Summary of Performance ending September 30, 2014, as provided by RSA; CalPERS for California Annual Report 2014; Investing in New York State, September 2014; and State of Wisconsin Investment Board
16.3%
8.5%
1.3%0.8%

KEEPING THE PROMISE: GETTING POLITICS OUT OF PENSIONS
9
Figure 2 demonstrates the dramatic disparity between Alabama’s in-state pension investments and those of other states. State pension programs with public data available on their ETIs include the California Public Employees’ Retirement System (CalPERS), New York State Common Retirement Fund and Wisconsin State Investment Board. Although CalPERS also has signifi-cant in-state investment at 8.5 percent of assets, Pew notes that the large amount of in-state investments for CalPERS are “driven by the size and volume of business activity in the state.”24
Poor Performance of ETIs in Alabama
RSA’s ETIs are concerning, due to their large volume and poor performance. RSA publishes limited information regarding the performance of its ETIs. However, what is available indicates RSA’s ETIs have not performed well and are a major contributor to the state’s pen-sion funds significantly underperforming the national average return for similar funds over the last 10 and 20-year time horizons. Table 3 shows how RSA’s port-folio has performed compared to the State Street and Wilshire Trust Universe Comparison Service’s (TUCS) medians. Both are considered industry benchmarks for the performance of pension assets. RSA’s investment underperformance is part of the reason the funding level of the state’s pensions has been on the decline.
ETIs Weigh Down RSA Investment Returns
RSA financial documents for the year ending Sep-tember 30, 2014, the only year where public data is currently available for individual asset performance, show that Alabama’s ETIs have significantly under-performed their non-ETI counterparts. Unfortunately, RSA does not provide any longer-term performance data for these individual assets. Still, comparing the performance of ETIs with non-ETIs demonstrates their dramatic difference in performance and suggests ETI returns are unlikely to match non-ETI returns in the long term.
As Figure 3 demonstrates, Alabama’s ETIs returned 1.21 percent for the year ending September 30th, 2014, while their non-ETIs returned 3.24 percent. In other words, RSA’s ETIs returned less than half of what their non-ETI counterparts returned. While it is only one year’s performance, the dramatic difference in re-turns indicates just how much RSA is losing by investing in ETIs.
RSA’s Real Estate Investments: A Key Contrib-utor to Poor Performance
While many factors influence RSA’s poor performance, RSA’s local real estate portfolio is a key contributor. About half of RSA’s total real estate portfolio consists of in-state properties. A recent news article from an
TABLE 3: TEN-YEAR AND TWENTY-YEAR RETURNS AS OF SEPTEMBER 30, 2014
10-YEAR GROSS OF FEES
20-YEAR GROSS OF FEES
TRS 6.43% 7.51%
ERS 6.15% 7.32%
TOTAL RSA 6.32% 7.43%
STATE STREET MEDIAN 7.28%
TUCS MEDIAN 7.35% 8.48%
STATE STREET 75TH PERCENTILE (BOTTOM QUARTILE)
6.71%
TUCS 75TH PERCENTILE (BOTTOM QUARTILE)
6.87% 8.06%
Source: The Pew Charitable Trusts; State Street Investment Analytics Summary of Performance ending September 30, 2014, as provided by RSA;
Wilshire TUCS
FIGURE 3: ALABAMA ETI VS. NON-ETI ONE-YEAR PERFORMANCE, YEAR ENDING
SEPTEMBER 30, 2014
3.5%
3.0%
2.5%
2.0%
1.5%
1.0%
0.5%
0.0%AVG NON-ETI AVG ETI
Source: Authors’ calculations, based on RSA data for preferred and private equity, private placements and real estate
3.24%
1.21%
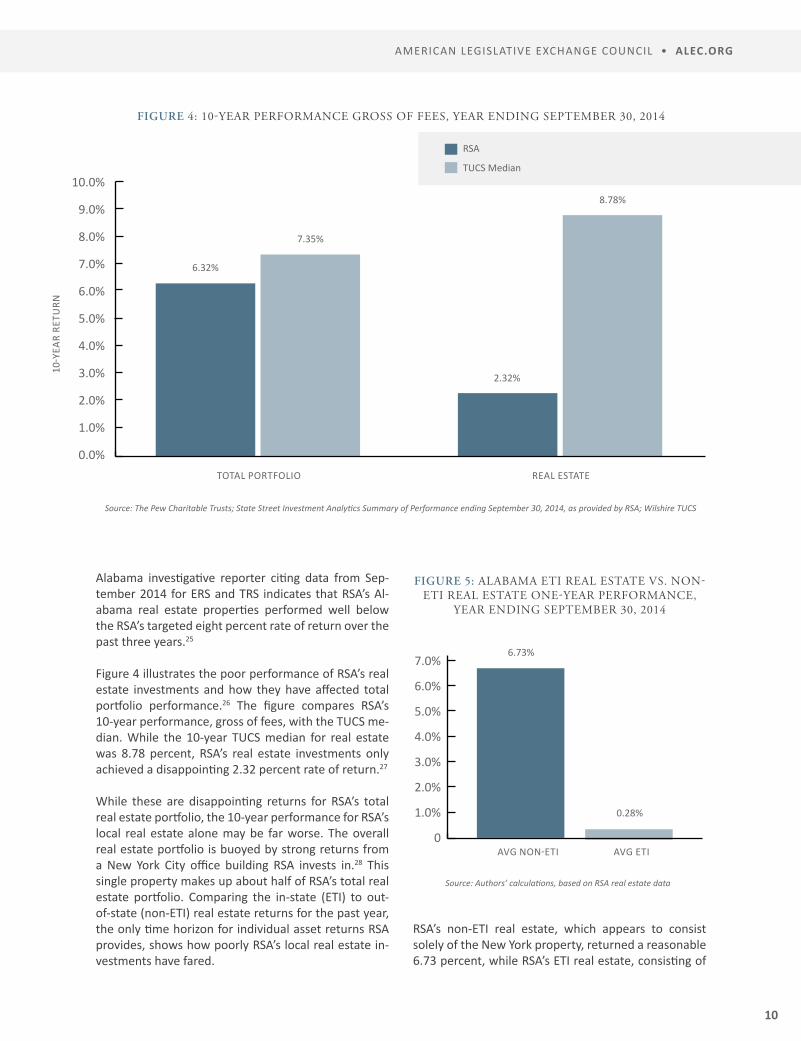
10
AMERICAN LEGISLATIVE EXCHANGE COUNCIL • ALEC.ORG
Alabama investigative reporter citing data from Sep-tember 2014 for ERS and TRS indicates that RSA’s Al-abama real estate properties performed well below the RSA’s targeted eight percent rate of return over the past three years.25
Figure 4 illustrates the poor performance of RSA’s real estate investments and how they have affected total portfolio performance.26 The figure compares RSA’s 10-year performance, gross of fees, with the TUCS me-dian. While the 10-year TUCS median for real estate was 8.78 percent, RSA’s real estate investments only achieved a disappointing 2.32 percent rate of return.27
While these are disappointing returns for RSA’s total real estate portfolio, the 10-year performance for RSA’s local real estate alone may be far worse. The overall real estate portfolio is buoyed by strong returns from a New York City office building RSA invests in.28 This single property makes up about half of RSA’s total real estate portfolio. Comparing the in-state (ETI) to out-of-state (non-ETI) real estate returns for the past year, the only time horizon for individual asset returns RSA provides, shows how poorly RSA’s local real estate in-vestments have fared.
RSA’s non-ETI real estate, which appears to consist solely of the New York property, returned a reasonable 6.73 percent, while RSA’s ETI real estate, consisting of
FIGURE 4: 10-YEAR PERFORMANCE GROSS OF FEES, YEAR ENDING SEPTEMBER 30, 2014
RSA
TUCS Median
Source: The Pew Charitable Trusts; State Street Investment Analytics Summary of Performance ending September 30, 2014, as provided by RSA; Wilshire TUCS
FIGURE 5: ALABAMA ETI REAL ESTATE VS. NON-ETI REAL ESTATE ONE-YEAR PERFORMANCE,
YEAR ENDING SEPTEMBER 30, 2014
7.0%
6.0%
5.0%
4.0%
3.0%
2.0%
1.0%
0AVG NON-ETI AVG ETI
Source: Authors’ calculations, based on RSA real estate data
10.0%
9.0%
8.0%
7.0%
6.0%
5.0%
4.0%
3.0%
2.0%
1.0%
0.0%
6.32%
7.35%
2.32%
8.78%
TOTAL PORTFOLIO REAL ESTATE
10-Y
EAR
RETU
RN
6.73%
0.28%
KEEPING THE PROMISE: GETTING POLITICS OUT OF PENSIONS
11
multiple local investments, returned a dismal 0.28 per-cent. This means that for the year ending September 30, 2014, RSA’s non-ETI real estate provided a return more than 24 times greater than RSA’s ETI real estate.
RSA’s poor real estate performance contrasts with the expectations set by Alabama Finance Director Bill New-ton. According to Newton, meeting the target eight percent rate of return is, “the most important func-tion of our investing approach. Everything else is not as important.”29 When RSA investments, such as real estate, fail to meet their own investment benchmarks, the financial wellbeing of retirees is on the line. As Dr. Henry Mabry, former Executive Secretary of the Alabama Education Association, explained:
“ The facts point to losses caused by alterna-tive investments such as real estate. Over the past five years, almost $700 million have gone down a rat hole thanks to these ‘investments.’ To put it in perspective, $700 million is more than twice what is spent on school transporta-tion for the whole state or over 12,000 teach-er units a year…Economic development of the state is great and wonderful, but economic de-velopment at the expense of active and retired TRS members does not pass muster.” 30
RSA’s Other ETIs Lead to Significant Losses
Not only has RSA’s ETI real estate performed poorly, but RSA’s other risky ETIs have put workers, retirees and taxpayers at risk. One example of a less than prudent ETI is the troubled firm Signal International. The Ala-bama-based oil repair and shipbuilding firm engaged in labor trafficking in 2006. The company enticed Indian guest workers to come to the United States to repair oil rigs, promising them they could receive green cards. In reality, workers had to pay $1,050 per month to live in guarded labor camps.31
In 2008, RSA started investing in Signal, eventually owning up to 47 percent of the troubled company.32 According to September 2014 data, both ERS and TRS invested $21 million in Signal, but these investments suffered a loss of 11 percent over the past three years.33 Regardless of the poor rate of return, ERS subsequently loaned Signal $24 million and TRS loaned Signal $49 million.34
In 2015, Signal agreed to pay $20 million to settle law-suits over labor trafficking that occurred in 2006. Brad-ley Myles, chief executive of the anti-human trafficking nonprofit, the Polaris Project, called the Signal lawsuits “one of the largest cases of labor trafficking in modern times.”35 Shortly after settling the lawsuits, Signal filed for Chapter 11 bankruptcy. According to the bankrupt-cy filing, Signal had, at that time, more than $100 mil-lion in debt and less than $50 million in assets.36 In No-vember of 2015, RSA purchased the bankrupt company for an estimated $90 million.37 RSA used the assets to start a new company, called World Marine.38
In another case, RSA lost millions of dollars in a deal with National Alabama, a subsidiary of National Steel Car. In 2007, RSA loaned $350 million to National Steel Car in a deal with its Chairman and CEO, Gregory Aziz. Aziz prom-ised to build a railcar manufacturing facility in the state that would employ more than 1,800 Alabama citizens.39 Instead, the results were quite different, as a Business Alabama article explains:
“Just before the recession hit in 2007, National Alabama — subsidiary of a Canadian rail car maker — built the plant to make rail cars for the U.S. freight market. When the bust came, those who helped finance the plant in support of jobs for the Shoals — chiefly the Retirement Systems of Alabama — were left with a plant in-stead of their expected return on investment.”40
Under Aziz, employment at the manufacturing facility never reached even 200 employees.41 Furthermore, Aziz later claimed that he would need an additional estimated $400 million to complete the facility.42 RSA went on to spend another $215 million to complete the project and took ownership of 100 percent of the stock in the facility from Aziz. The Alabama Securities Commission charged Aziz with 11 counts of securities fraud and arrested him.43 Eventually the commission dropped the charges after Aziz agreed to pay RSA back $21 million. Currently, RSA owns the property, with an estimated 1,150 citizens working at the facility.44
Alabama’s Weak Fiduciary Standards Enable ETIs
Alabama’s weak fiduciary standards are one of the main reasons RSA has been able to dedicate such a

12
AMERICAN LEGISLATIVE EXCHANGE COUNCIL • ALEC.ORG
large percentage of its portfolio to ETIs over the years. The Pew Charitable Trusts recently reviewed Alabama’s fiduciary provisions and compared them to the fidu-ciary provisions recommended in the aforementioned Uniform Law Commission’s Uniform Management of Public Employee Retirement Systems Act (UMPERSA). Pew compared Alabama’s fiduciary provisions for pen-sion trustees to six of the most relevant fiduciary provi-sions contained in UMPERSA. As the table shows, they found only two of Alabama’s statutorily-codified fidu-ciary provisions meet the standards set by UMPERSA.45
While Alabama has adopted a prudence requirement, it is the weaker prudent person standard as opposed to the stronger prudent investor standard, subjecting the investment decisions of the state’s pension trust-ees to less scrutiny. To its credit, Alabama’s Constitu-tion requires that RSA funds are held for the “exclusive purpose of providing benefits.” However, this has not stopped RSA’s pension boards from investing in ETIs, the purpose of which is not exclusively to provide re-tirement benefits, but instead to encourage economic development and pursue social goals.
Regarding the management of pension funds for the sole interest of plan participants, Alabama has some Constitutional and statutory language requiring pension funds are held “as in trust” and the Secre-tary-Treasurer is required to invest in the best interest of the funds. In addition, the Alabama Supreme Court has ruled the trust must be held “solely in the interest of the beneficiaries.” However, Pew research indicates that this provision is not explicit within Alabama stat-ute and the state’s Supreme Court has not rigorously enforced this fiduciary provision found in its ruling.
Furthermore, language requiring the Secretary-Trea-surer to invest in the fund’s best interest is ambiguous and has not stopped extensive investment in ETIs.
When it comes to administrative expenses, Alabama’s Constitution provides pension funds may be used only for benefits, refunds and expenses that are “diligently and honestly” deemed to be “current and necessary.” This vague language falls short of UMPERSA’s stan-dards in regards to reasonable administrative expenses.
The state has some statutory requirements for a diver-sified portfolio and RSA investment policies call for this as well. However, Pew research indicates Alabama’s statutory requirements do not meet UMPERSA’s stan-dards for diversification, and to the extent RSA’s own investment policies do, these are not properly codified in state statute.
Particularly relevant for Alabama, the state has not ad-opted UMPERSA’s standard for economically targeted investments. This standard allows fiduciaries to con-sider collateral benefits created by an investment in addition to the investment’s returns only if the trustee determines the investment providing these benefits would be prudent even without the collateral benefits. The state has no specific statutory language regarding ETIs, and RSA investment policies only mandate that ETIs have comparable returns to similar investments. While this language may seem reasonable, RSA is re-sponsible for adhering to its own investment policies and, as has been demonstrated, the underperfor-mance of ETIs has not stopped RSA from continuing to invest heavily in them.
TABLE 4: COMPARISON OF ALABAMA FIDUCIARY PROVISIONS WITH UMPERSA FIDUCIARY PROVISIONS
FIDUCIARY ELEMENT STATES ADOPTING ALABAMA STATUS
Prudence requirement 50 Yes
Exclusive purpose of providing benefits 27 Yes
Solely in the interest of participants 26 No
Reasonable administrative expenses 22 No
Diversification of investments 27 No
Economically targeted investments, first prudent 8 No
Source: The Pew Charitable Trusts

KEEPING THE PROMISE: GETTING POLITICS OUT OF PENSIONS
13
Opaque Pension Reporting Conceals Performance of RSA’s ETIs
Obtaining the full picture of RSA’s ETIs is difficult, due to the lack of detailed reporting and transparency. RSA does not report individual asset returns for all of its investments, and provides only one year of returns for those they do. The fact that none of RSA’s financial documents report ETIs as a distinct category and give their cumulative performance means the only way to get a picture of how ETIs have fared in RSA’s portfolio is to piece together the limited reporting on individual in-vestment returns across multiple categories, isolating the Alabama-based investments and aggregating their performance. While comparisons of ETI and non-ETI performance are possible, reporting ETIs as a distinct category would allow easier comparisons of their per-formance with the rest of the portfolio.
RSA could also improve its transparency by reporting longer time horizons for investment returns. This goes for both individual assets and asset classes. While RSA only reports one year returns for individual assets, RSA typically reports time horizons for asset classes between one month and 10 years. Reporting perfor-mance over longer time horizons for both would align with the long-term nature of pension liabilities and al-low for greater perspective of how various investments have performed over the years. This would also allow more comprehensive comparisons between ETI and non-ETI performance. The fact that RSA provides only one year returns for individual assets may indicate a deliberate effort to obscure the long-term underper-formance of ETIs in the portfolio.
RSA’s lackluster pension reporting was noted by a re-cent Mercatus Center study, Alabama at the Cross-roads: An Economic Guide to a Fiscally Sustainable Fu-ture, which explains,
“There is a stark difference between investment reports from private companies, such as TIAA-CREF, and those coming from the RSA. In addi-tion, little information is provided to the public on the performance of the RSA’s private place-ment portfolio year to year or on the types of investments undertaken.”46
Even with public information requests, the RSA has not been transparent. Since RSA comprehensive annual financial reports (CAFRs) state that more information is available to the public upon request, researchers from the Mercatus Center at George Mason University reached out to RSA on September 8th, 2015 and re-quested information. When RSA did not respond, the Mercatus Center then filed a formal Alabama Public Records Request on November 9th, 2015.47 As of the time of this publication, RSA has still not responded.
Alabama’s Poor Pension Board Composition and Governance Enables ETIs
Cronyism within the RSA may be due to its poor pen-sion board composition. The RSA’s two Boards of Con-trol lack diversity in their representation and primarily consist of plan participants. Furthermore, board mem-bers are not statutorily required to have any financial expertise. The TRS Board of Control consists of three ex-officio members and 12 elected plan participants, including 10 current employees and two retired em-ployees.48 The ERS/JRF Board of Control consists of four ex-officio members and nine plan participants, includ-ing three appointees from the governor and six elected plan participants.49 Notably, unlike many other states’ pension boards, Alabama’s Boards of Control have no public representatives.50
Some may believe this does not represent a problem. After all, shouldn’t plan participants, whose own re-tirement is tied to the pension plan, want to see the highest investment return possible to provide for a better funded pension? Unfortunately, evidence indi-cates board members, including plan participants, of-ten have other priorities. Statistical analysis of pension investments indicates plan participant representatives tend to overinvest in local investments as a share of their total portfolio, despite their tendency to under-perform.
According to a recent Hoover Institution study, a 10 percentage point increase in the proportion of partic-ipant-elected board members leads to a 1.34 percent-age point higher predicted allocation to in-state invest-ments. Further, a 10 percentage point increase in the proportion of state-appointed board members leads to a 2.48 percentage point higher predicted allocation to in-state investments. Lastly, a 10 percentage point increase in the proportion of state ex-officio board
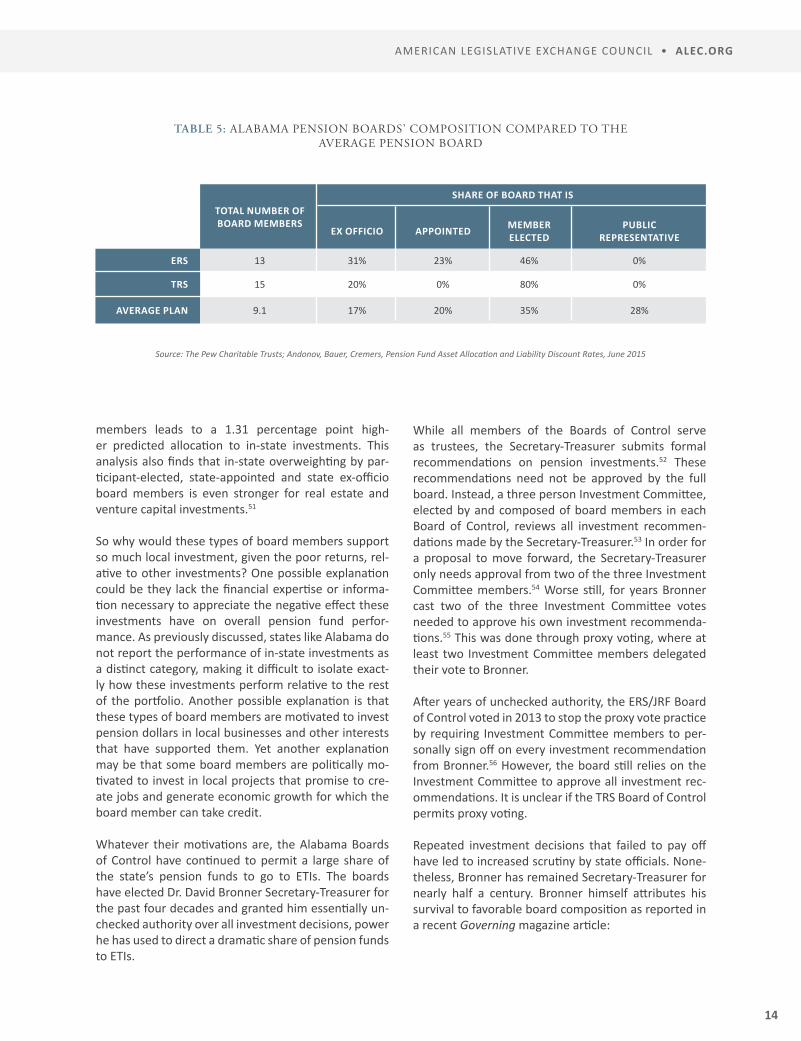
14
AMERICAN LEGISLATIVE EXCHANGE COUNCIL • ALEC.ORG
members leads to a 1.31 percentage point high-er predicted allocation to in-state investments. This analysis also finds that in-state overweighting by par-ticipant-elected, state-appointed and state ex-officio board members is even stronger for real estate and venture capital investments.51
So why would these types of board members support so much local investment, given the poor returns, rel-ative to other investments? One possible explanation could be they lack the financial expertise or informa-tion necessary to appreciate the negative effect these investments have on overall pension fund perfor-mance. As previously discussed, states like Alabama do not report the performance of in-state investments as a distinct category, making it difficult to isolate exact-ly how these investments perform relative to the rest of the portfolio. Another possible explanation is that these types of board members are motivated to invest pension dollars in local businesses and other interests that have supported them. Yet another explanation may be that some board members are politically mo-tivated to invest in local projects that promise to cre-ate jobs and generate economic growth for which the board member can take credit.
Whatever their motivations are, the Alabama Boards of Control have continued to permit a large share of the state’s pension funds to go to ETIs. The boards have elected Dr. David Bronner Secretary-Treasurer for the past four decades and granted him essentially un-checked authority over all investment decisions, power he has used to direct a dramatic share of pension funds to ETIs.
While all members of the Boards of Control serve as trustees, the Secretary-Treasurer submits formal recommendations on pension investments.52 These recommendations need not be approved by the full board. Instead, a three person Investment Committee, elected by and composed of board members in each Board of Control, reviews all investment recommen-dations made by the Secretary-Treasurer.53 In order for a proposal to move forward, the Secretary-Treasurer only needs approval from two of the three Investment Committee members.54 Worse still, for years Bronner cast two of the three Investment Committee votes needed to approve his own investment recommenda-tions.55 This was done through proxy voting, where at least two Investment Committee members delegated their vote to Bronner.
After years of unchecked authority, the ERS/JRF Board of Control voted in 2013 to stop the proxy vote practice by requiring Investment Committee members to per-sonally sign off on every investment recommendation from Bronner.56 However, the board still relies on the Investment Committee to approve all investment rec-ommendations. It is unclear if the TRS Board of Control permits proxy voting.
Repeated investment decisions that failed to pay off have led to increased scrutiny by state officials. None-theless, Bronner has remained Secretary-Treasurer for nearly half a century. Bronner himself attributes his survival to favorable board composition as reported in a recent Governing magazine article:
TABLE 5: ALABAMA PENSION BOARDS’ COMPOSITION COMPARED TO THE AVERAGE PENSION BOARD
FIDUCIARY ELE-MENT TOTAL NUMBER OF
BOARD MEMBERS
SHARE OF BOARD THAT IS
FIDUCIARY ELE-MENT EX OFFICIO APPOINTED MEMBER
ELECTEDPUBLIC
REPRESENTATIVE
ERS 13 31% 23% 46% 0%
TRS 15 20% 0% 80% 0%
AVERAGE PLAN 9.1 17% 20% 35% 28%
Source: The Pew Charitable Trusts; Andonov, Bauer, Cremers, Pension Fund Asset Allocation and Liability Discount Rates, June 2015
KEEPING THE PROMISE: GETTING POLITICS OUT OF PENSIONS
15
“ 80 percent of the board members for the teacher’s fund are elected by participants in the system. As long as Bronner keeps retirees and current workers happy, elected officials have limited options for telling him what to do. When asked why he’s never been fired with so many people after him, Bronner is frank: ‘Because,’ he says, ‘I’d snuggle up to the teach-er board. [Otherwise], the politicians would have nailed me decades ago.’”57
The Results of Alabama’s Pension Investment Model
Economically targeted investments have negatively impacted Alabama’s pension fund performance. For several years, the RSA has had a target of eight percent rate of return for ERS, TRS and JRF. However, according to the RSA’s CAFR for the period ending September 30, 2015, ERS only achieved a 5.43 percent rate of return, TRS, 5.41 percent, and JRF, 5.47 percent over the past decade.58
These lower than expected returns have led to a pre-cipitous decline in the plans’ funded ratios. According to official RSA accounting, based on RSA’s assumed rate of investment return, from 1997 to 2014, the ERS plan has declined from 111 percent funded to 63 per-cent funded. Meanwhile, the TRS plan has plummeted from 105 percent to 68 percent.59 Together, these plans represent $15 billion in unfunded liabilities, assuming RSA manages to meet its high predicted rate of invest-ment return every year.
However, most financial professionals believe such high assumed rates of return are unlikely to be realized in the coming years. The ALEC Center for State Fiscal Reform study, Unaccountable and Unaffordable 2016, examines state pensions through the lens of a risk-free rate of return, as is recommended by the Society of Ac-tuaries’ Blue Ribbon Panel. When Alabama’s pensions are examined through this more realistic valuation, the pension funding gap is much larger than reported in of-ficial state documents. In fact, Alabama’s pensions are merely 30 percent funded, while the state’s unfunded pension liabilities total an estimated $75 billion.60 For comparison, the state only collects an estimated $10 billion per year in taxes.61 Divided evenly among all cit-izens, the price tag for Alabama’s unfunded liabilities is $15,427 for every man, woman and child in the state.
ETIs Put Workers and Taxpayers at Risk
As the Alabama case study demonstrates, ETIs lead to lower returns for a state’s overall portfolio and put pensioners and taxpayers at risk. States should invest pension funds with the sole purpose of maximizing re-turns, rather than pursuing state economic and social benefits at the expense of worker’s retirement securi-ty. By adopting reforms to strengthen fiduciary respon-sibilities, enhance transparency and improve pension board diversity and management, lawmakers can keep their pension promises to retirees and workers without the need for difficult budget cuts or economically dam-aging tax increases.

16
• Trustees should manage the pension fund for the exclusive purpose of providing pension and other post-employment benefits to plan partici-pants and beneficiaries. Other post-employment benefits should be de-fined to include healthcare and other benefits outlined in the pension plan and not the limited, tangential benefits local economic develop-ment and social projects may provide.
• Trustees should manage pension funds solely in the interest of plan par-ticipants and beneficiaries as a whole, impartially. Fulfilling this provision should require pursuing the best long-term, risk-adjusted returns for the pension fund.
• All investments, whether in-state or out-of-state, should be evaluated equally, being held to the same risk-return standards, without favoritism for local investments. States should not use pension investment funds to make in-state investments in a misguided attempt to give special prefer-ence to certain companies or industries based on political agendas.
• States and municipalities should dispense with any statutory language encouraging or permitting economically targeted investments which in-variably reduce pension fund returns and increase investment risk.
• Reporting of investments should be done separately by asset class and by individual assets so it can be easily determined how investments are performing and increase accountability for fund managers.62
• Pensions should report the fund’s overall performance, asset class per-formance and individual asset performance over a 20 or more-year time horizon to show how assets have performed over time and allow stake-holders to see how actual performance has compared with the assumed rate of return.63
• Pension boards should be diversified to provide representation for all stakeholders, including taxpayers. This will prevent any special interest group from gaining too much power on the board and using pension funds to overweight local investments.
• Pension boards should have a certain number of seats dedicated to in-dependent financial professionals that serve as public representatives.
Solutions for Fighting ETI Cronyism

KEEPING THE PROMISE: GETTING POLITICS OUT OF PENSIONS
17
Another common variety of pension fund cronyism occurs when kickbacks, in the form of pension invest-ment funds, are directed to politically connected busi-nesses and other interests. Sometimes, these political kickbacks come from elected board members who re-ward campaign supporters by investing pension funds in their businesses or other interests. Other times, ex officio and appointed members may feel there are political gains to be had by investing pension funds in popular local businesses to create or retain jobs and have a local, visible accomplishment for which they can take credit. Whatever the motivation, making invest-ment decisions for personal political gain lowers pen-sion returns, resulting in pensions that are less secure and taxpayers facing a greater risk of having to bail out pension funds in the future.
Political Bias in Public Pension Funds
While pension trustees should be considering all in-vestment opportunities equally and impartially, they are frequently confronted by local businesses lobby-ing for pension fund investments. Research indicates this lobbying has significantly affected trustees’ invest-ment decisions. In a paper forthcoming in the Journal of Financial Economics, the authors find public pen-sion funds overweight local firms in their portfolio by 26 percent, relative to a diversified, market portfolio. Further, estimates indicate public pension funds over-weight local firms that make political contributions to local politicians by 23 percent, and overweight local firms that have significant lobbying expenditures by 17 percent.64
Chapter 3Political Kickbacks
FIGURE 6: PANEL A - POLITICAL CONTRIBUTIONS
1.0
0.9
0.8
0.7
0.6
0.5
0.4
0.3
0.2
10 20 30 40 50
Local Contribution Firms
Local Non-Contribution Firms
SURV
IVAL
PRO
BABI
LITY
HOLDING DURATION IN QUARTERS
Source: Bradley, Daniel, Pantzalies, Christos and Yuan, Xiaojing, The Influence of Political Bias in State Pension Funds
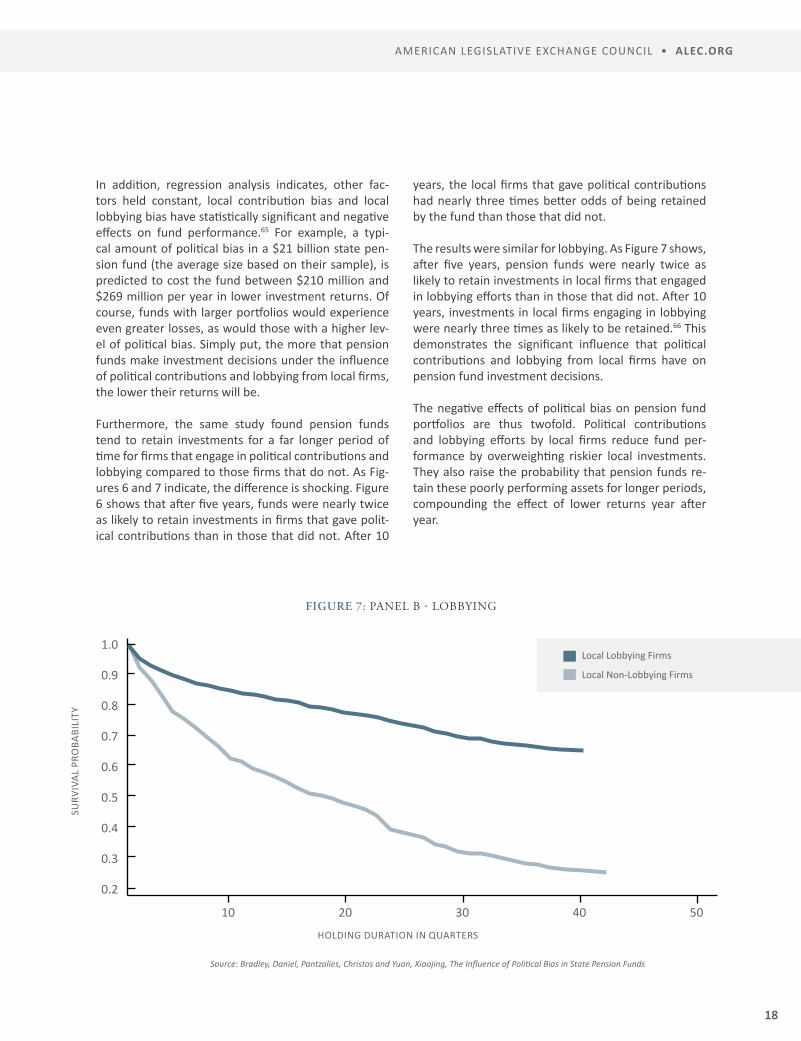
18
AMERICAN LEGISLATIVE EXCHANGE COUNCIL • ALEC.ORG
In addition, regression analysis indicates, other fac-tors held constant, local contribution bias and local lobbying bias have statistically significant and negative effects on fund performance.65 For example, a typi-cal amount of political bias in a $21 billion state pen-sion fund (the average size based on their sample), is predicted to cost the fund between $210 million and $269 million per year in lower investment returns. Of course, funds with larger portfolios would experience even greater losses, as would those with a higher lev-el of political bias. Simply put, the more that pension funds make investment decisions under the influence of political contributions and lobbying from local firms, the lower their returns will be.
Furthermore, the same study found pension funds tend to retain investments for a far longer period of time for firms that engage in political contributions and lobbying compared to those firms that do not. As Fig-ures 6 and 7 indicate, the difference is shocking. Figure 6 shows that after five years, funds were nearly twice as likely to retain investments in firms that gave polit-ical contributions than in those that did not. After 10
years, the local firms that gave political contributions had nearly three times better odds of being retained by the fund than those that did not.
The results were similar for lobbying. As Figure 7 shows, after five years, pension funds were nearly twice as likely to retain investments in local firms that engaged in lobbying efforts than in those that did not. After 10 years, investments in local firms engaging in lobbying were nearly three times as likely to be retained.66 This demonstrates the significant influence that political contributions and lobbying from local firms have on pension fund investment decisions. The negative effects of political bias on pension fund portfolios are thus twofold. Political contributions and lobbying efforts by local firms reduce fund per-formance by overweighting riskier local investments. They also raise the probability that pension funds re-tain these poorly performing assets for longer periods, compounding the effect of lower returns year after year.
FIGURE 7: PANEL B - LOBBYING
1.0
0.9
0.8
0.7
0.6
0.5
0.4
0.3
0.2
10 20 30 40 50
Local Lobbying Firms
Local Non-Lobbying Firms
SURV
IVAL
PRO
BABI
LITY
HOLDING DURATION IN QUARTERS
Source: Bradley, Daniel, Pantzalies, Christos and Yuan, Xiaojing, The Influence of Political Bias in State Pension Funds

KEEPING THE PROMISE: GETTING POLITICS OUT OF PENSIONS
19
CalPERS Kickbacks
The California Public Employees’ Retirement System (CalPERS) is the nation’s largest state-administered pension system and has been criticized for cronyist kickbacks over the years. As Steven Malanga explains in a City Journal article, CalPERS has made poor invest-ment decisions:
“CalPERS has also steered billions of dollars into politically connected firms. And it has ventured into ‘socially responsible’ investment strategies, making bad bets that have lost hundreds of millions of dollars. Such dubious practices have piled up a crushing amount of pension debt, which California residents—and their children—will somehow have to repay.”67
Some of this occurred when union leader Charles Valdes, who had no investing experience and twice filed for personal bankruptcy, served as chair of CalPERS’s Investment Committee. Valdes made several poor fi-nancial decisions, some of which appear to have been politically motivated. During his time as Investment Committee chair, CalPERS consistently granted invest-ment contracts to some of the state’s biggest political givers. In addition, Valdes accepted gifts from a fellow board member, Alfred Villalobos, who allegedly spent thousands of dollars trying to influence pension invest-ments. When questioned about his relationship with Villalobos, Valdes invoked the Fifth Amendment 126 times.68
One reason Valdes was not replaced as Investment Committee chair sooner was the board’s composition, where 6 of the 13 board members were selected by government workers, an arrangement that led to an
increasingly strong union presence on the board.69 This allowed Valdes to continue to serve despite his cro-nyist investments and the loss of returns for CalPERS. Malanga explains, “CalPERS’s members, who elect rep-resentatives to the fund’s board of directors, ignored concerns over Valdes’s suitability because they liked how he fought for those plusher benefits.”70 Even The New York Times, usually sympathetic to union causes, noted critics worried the board had become increas-ingly partisan and doubted CalPERS’s ability “to pro-vide for the 1.3 million public employees whose pen-sions it guarantees.”71
Despite the cronyism, Valdes was allowed to serve on the CalPERS board for 25 years, 13 of which he spent as Investment Committee chair. During his tenure as Investment Committee chair, CalPERS had one of the worst investment records of any public pension fund.72 The takeover of CalPERS board serves as a compelling example of the need for accountability in pension in-vestment decisions.
Political Kickbacks Cost Pension Funds
Using pension funds to reward politically connected businesses and interest groups lowers investment re-turns and jeopardizes pensioner’s retirement security. Pension trustees have an obligation to act in the best interest of pensioners and should never use pension funds to give political kickbacks to their supporters. Strong fiduciary standards defining how pension funds are to be managed can help prevent this. In addition, transparency in the investment process and a board with a greater diversity of ex officio, appointed and elected members, along with board seats for designat-ed public representatives, would ensure public pen-sions cannot be hijacked by special interests willing to tolerate such cronyism so long as their interests are served.

20
• States should adopt fiduciary duty of loyalty provisions which require pension trustees to act in the sole interest of beneficiaries as a whole, impartially, not just certain interest groups participating in the plan. Ful-filling this provision should require pursuing the best long-term, risk-ad-justed returns for the pension fund.
• Trustees should be required to fully disclose any conflicts of interest, in-cluding money and gifts given to trustees that may influence their invest-ment decisions, as well as affiliation with special interest groups.
• Before making any investment, trustees should be required to attest they have no conflict of interest with the investment. If they do, they should be required to recuse themselves from the decision-making process for that investment and any related votes.
• Trustees should be required to fully disclose campaign contributions they have received and recuse themselves from the decision-making process and any votes related to investing in those companies or interests.
• Pension boards should be diversified to provide representation for all stakeholders, including taxpayers. This will prevent any special interest group from gaining too much power on the board and using pension funds irresponsibly.
• Pension boards should have a certain number of seats dedicated to in-dependent financial professionals that serve as public representatives.
Solutions for Fighting Political Kickback Cronyism
KEEPING THE PROMISE: GETTING POLITICS OUT OF PENSIONS
21
One type of pension fund cronyism that has prolifer-ated recently is the use of pension funds to advance certain political viewpoints or causes. These political crusades regarding such issues as the environment, political speech and income inequality are frequently waged through divestment initiatives and by promot-ing shareholder resolutions at publicly-traded compa-nies. When pension funds pick a side in political dis-putes and decide they are going to use the pension fund as a weapon, investment returns decline and many citizens find their hard-earned retirement funds used to support political positions antithetical to their beliefs.
The Pension Divestment Movement Harms Pension Funds
One of the greatest threats to pension investment re-turns comes in the form of divestment from certain companies or industries. Pension divestment initiatives have been gaining traction recently, with many on the Left viewing them as a tool to advance their political agenda. By requiring pension funds to remove all in-vestments from certain companies or industries, they hope to increase firms’ cost of capital in an effort to put them out of business or change their behavior in some way. In order to examine this issue further, this report considers one of the most notable divestment efforts, fossil fuel divestment, and what it means for pensions.
Fossil Fuel Divestment
In recent years, various environmental organizations have been encouraging pension funds to divest from fossil fuel companies and other businesses that they believe are contributing to environmental harm. They have had some limited success, with several municipal-
ities enacting plans over the years to divest from fos-sil fuel companies and other businesses calculated to have a large carbon footprint. Recently, California be-came the first state to pass a law requiring the state’s public pension funds to divest from fossil fuel, specifi-cally coal companies. While it remains the only state to enact such legislation, several governors have publicly called for their state’s pension funds to divest from fos-sil fuel companies as well.
The financial losses from divestment are significant. A study conducted by University of Chicago Law School Professor Daniel Fischel found that a hypothetical port-folio diversified across all industries outperforms a hy-pothetical portfolio divested from energy stocks over the past 50 years.73 The divested portfolio produced returns 0.7 percentage points lower on average per year than the optimal risk-adjusted portfolio that did not divest from energy, representing a massive 23 per-cent decline in investment returns over five decades.74
Lower returns are not the only price of divestment. The initial cost of divestment should also be considered. This includes the costs of the initial review of existing investments, along with the commission fees to bro-kers and other trade costs accompanying every trade necessary to fully divest the portfolio. This is money that could be going to the pension system to improve its funding level and provide greater retirement securi-ty for workers and retirees in the future.
The ongoing administrative cost of complying with di-vestment rules is also significant.75 Pension plans that divest must continually investigate prospective invest-ments to see if they meet their state’s ecological stan-dards, while also monitoring their existing portfolio of investments to ensure none of those companies have begun to engage in business activity that necessitates divestment. This requires significant work on the part of the pension fund’s managers, resulting in higher management fees. It also means additional trading
Chapter 4Political Crusades
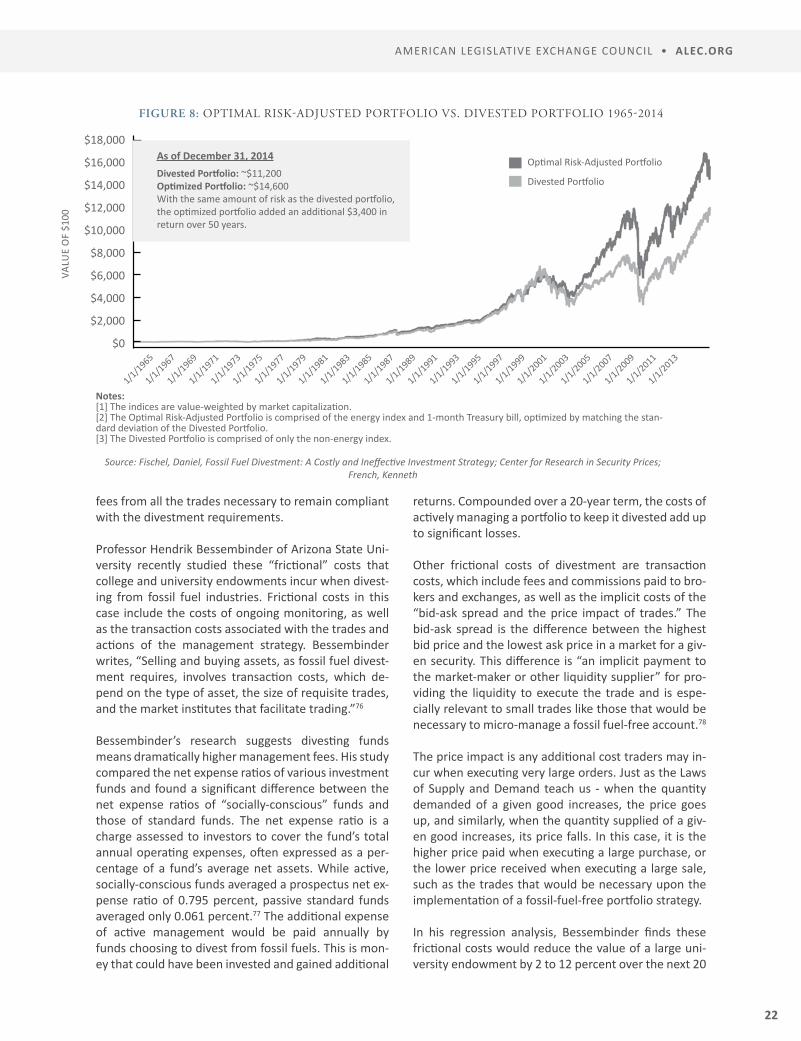
22
AMERICAN LEGISLATIVE EXCHANGE COUNCIL • ALEC.ORG
fees from all the trades necessary to remain compliant with the divestment requirements.
Professor Hendrik Bessembinder of Arizona State Uni-versity recently studied these “frictional” costs that college and university endowments incur when divest-ing from fossil fuel industries. Frictional costs in this case include the costs of ongoing monitoring, as well as the transaction costs associated with the trades and actions of the management strategy. Bessembinder writes, “Selling and buying assets, as fossil fuel divest-ment requires, involves transaction costs, which de-pend on the type of asset, the size of requisite trades, and the market institutes that facilitate trading.”76
Bessembinder’s research suggests divesting funds means dramatically higher management fees. His study compared the net expense ratios of various investment funds and found a significant difference between the net expense ratios of “socially-conscious” funds and those of standard funds. The net expense ratio is a charge assessed to investors to cover the fund’s total annual operating expenses, often expressed as a per-centage of a fund’s average net assets. While active, socially-conscious funds averaged a prospectus net ex-pense ratio of 0.795 percent, passive standard funds averaged only 0.061 percent.77 The additional expense of active management would be paid annually by funds choosing to divest from fossil fuels. This is mon-ey that could have been invested and gained additional
returns. Compounded over a 20-year term, the costs of actively managing a portfolio to keep it divested add up to significant losses.
Other frictional costs of divestment are transaction costs, which include fees and commissions paid to bro-kers and exchanges, as well as the implicit costs of the “bid-ask spread and the price impact of trades.” The bid-ask spread is the difference between the highest bid price and the lowest ask price in a market for a giv-en security. This difference is “an implicit payment to the market-maker or other liquidity supplier” for pro-viding the liquidity to execute the trade and is espe-cially relevant to small trades like those that would be necessary to micro-manage a fossil fuel-free account.78
The price impact is any additional cost traders may in-cur when executing very large orders. Just as the Laws of Supply and Demand teach us - when the quantity demanded of a given good increases, the price goes up, and similarly, when the quantity supplied of a giv-en good increases, its price falls. In this case, it is the higher price paid when executing a large purchase, or the lower price received when executing a large sale, such as the trades that would be necessary upon the implementation of a fossil-fuel-free portfolio strategy.
In his regression analysis, Bessembinder finds these frictional costs would reduce the value of a large uni-versity endowment by 2 to 12 percent over the next 20
FIGURE 8: OPTIMAL RISK-ADJUSTED PORTFOLIO VS. DIVESTED PORTFOLIO 1965-2014
$18,000
$16,000
$14,000
$12,000
$10,000
$8,000
$6,000
$4,000
$2,000
$0
1/1/1967
VALU
E O
F $1
00
1/1/1969
1/1/1971
1/1/1973
1/1/1975
1/1/1977
1/1/1979
1/1/1981
1/1/1983
1/1/1985
1/1/1987
1/1/1989
1/1/1991
1/1/1993
1/1/1995
1/1/1997
1/1/1999
1/1/2001
1/1/2003
1/1/2005
1/1/2007
1/1/2009
1/1/2011
1/1/2013
1/1/1965
Optimal Risk-Adjusted Portfolio
Divested Portfolio
As of December 31, 2014Divested Portfolio: ~$11,200Optimized Portfolio: ~$14,600With the same amount of risk as the divested portfolio, the optimized portfolio added an additional $3,400 in return over 50 years.
Notes: [1] The indices are value-weighted by market capitalization.[2] The Optimal Risk-Adjusted Portfolio is comprised of the energy index and 1-month Treasury bill, optimized by matching the stan-dard deviation of the Divested Portfolio.[3] The Divested Portfolio is comprised of only the non-energy index.
Source: Fischel, Daniel, Fossil Fuel Divestment: A Costly and Ineffective Investment Strategy; Center for Research in Security Prices; French, Kenneth
KEEPING THE PROMISE: GETTING POLITICS OUT OF PENSIONS
23
years. Results like these are one reason many univer-sities have been hesitant to divest from fossil fuel and other industries despite pressure, often from their own students, to do so.
Fossil Fuel Divestment Fails to Achieve Its Goals
Climate activists often cite four main benefits to en-courage funds to divest. The first holds that compa-nies that allegedly contribute to climate change can be punished by reducing their stock prices through divest-ment, thereby reducing their access to sources of cap-ital and increasing their costs. However, divestment is unlikely to accomplish this goal, and to the extent the effort is successful, the costs are often borne by the very investors choosing to divest. As was noted earlier, sales of large asset blocks typically occur at a discount to the market prices. Much of this discount is tempo-rary, as it basically represents a wealth transfer from the divesting investors to the market liquidity provid-ers who are “buying” the securities.79 Little historical evidence would indicate any permanent price effect resulting from divestment.
Another argument from activists is that fossil fuel secu-rities are overpriced, and thus likely to underperform in the long run. This too is not supported by the facts. According to Bessembinder, “Such claims are particu-larly prevalent at times when these stocks have recent-ly performed poorly – even though price declines over the past several months actually appear to be associat-ed with increased production of fossil fuels.”80
Yet another common claim by activists is divestment can help stigmatize firms engaging in allegedly harmful activities, hopefully motivating a change in behavior. The channels by which this change would occur, how-ever, are unclear. Research of past divestment behav-ior has found that divestment efforts have little to no effect.81 In addition, the Fischell study notes that there is no evidence of any discernable impact on the com-panies targeted by fossil fuel divestment supporters.82
Finally, proponents of fossil fuel divestment claim that divestment will raise awareness of the issue of climate change. In examining this claim, Fischell conducted an empirical review of the amount of news coverage ded-icated to the climate change issue and found evidence it is one of the most commonly reported topics in the United States today, indicating a divestment campaign is not necessary to raise public awareness of the matter.83
The evidence indicates claims that divestment will reduce reliance on fossil fuels or spur institutions to change allegedly bad behavior are speculative at best, while the costs associated with divestment are real and significant. Nonetheless, the fossil fuel divestment ef-fort continues to target public pension funds. Some of the most notable cases demonstrate that while divest-ment leads to foregone investment returns, this polit-ically-motivated campaign is still gaining momentum.
California
On October 8, 2015, Governor Jerry Brown signed into law Senate Bill 185, entitled “Investing with Values and Responsibility.”84 This signing was a noteworthy event, as according to California State Senate President Pro Tempore Kevin De León, it marked the first time a state had divested its pensions from coal.85 This divestment had added significance because California manages the two largest state pension funds in the country by as-set value, the California Public Employees’ Retirement System (CalPERS) and the California State Teachers’ Re-tirement System (CalSTRS), with $293 billion and $184 billion in assets, respectively.86
Senate Bill 185 prohibits CalPERS and CalSTRS from renewing existing investments or making new invest-ments in thermal coal companies. In regard to existing investments, the two funds must engage with these companies to determine if the companies are tran-sitioning their business model to clean energy. They must liquidate their investments with thermal coal companies on or before July 1, 2017. Finally, the funds must file a report with the Legislature, listing which thermal coal companies they divested from and which current thermal coal companies have agreed to tran-sition to clean energy. This report must be filed on or before January 1, 2018.87
Senator De León, who authored the law, remarked upon its signing, “Coal is a losing bet for California retirees and it’s also incredibly harmful to our health and the health of our environment,” emphasizing that environmentalism was the primary motive for the di-vestment.88 Assemblyman Rob Bonta, who present-ed the bill in the California Assembly, stated upon its passage in the Senate, “coal is the fuel of the past…it’s time to move on from this dirty energy source,” and “the law aligns investment policies with our values.”89 Unsurprisingly, the signing of the law was applauded by leaders of several prominent environmentalist in-terest groups.90

24
AMERICAN LEGISLATIVE EXCHANGE COUNCIL • ALEC.ORG
The bill’s final vote of 43-27 was “mostly along party lines with some Democrats abstaining.”91 This, combined with Governor Brown’s strong support, indicates this may not be the last climate related divestment legis-lation California will enact.92 Before divestment, CalP-ERS had approximately $167 million invested in 30 coal companies, while CalSTRS had an estimated $40 mil-lion invested in the industry.93
Despite the best intentions of supporters, divestment puts California’s pensioners at financial risk. Chris Ail-man, chief investment officer for CalSTRS, expressed misgivings over the economic and social consequences of divestment in California. Ailman explained:
“I’ve been involved in five divestments for our fund. All five of them we’ve lost money, and all five of them have not brought about social change.”94
Furthermore, many pensioners are concerned about the financial costs of divestment. A recent survey commissioned by the Independent Petroleum Associ-ation of America reveals that California pensioners are uneasy about divestment. The survey found that 54 percent of California pensioners thought divestment would decrease performance of the pension funds. Additionally, 64 percent of California pensioners stated that they would not recommend divestment from oil and gas to their fund managers.95
California legislators should listen to the concerns of their constituents. The research suggests they are cor-rect in believing divestment will adversely affect the state’s pension funds’ performance. Lawmakers should be directing their pension fund trustees to invest in a way that achieves the best returns for pensioners, not trying to use state pension funds to promote a political agenda.
New York
Similar to California, divestment is also a heated issue in New York. After California’s CalPERS and CalSTRS pension funds, New York has the third largest public pension fund in the country. Oil and natural gas invest-ments represented 5 percent of the total assets of New York’s two largest pension plans from fiscal years 2005 to 2013. Furthermore, during that time frame, oil and
natural gas investments contributed 9.8 percent of the plans’ total gains.96
Despite this, State Senator Liz Krueger recently intro-duced Senate Bill S5873, the Fossil Fuel Divestment Act. This Act would “require the fund to sell off its stocks in the top 200 largest fossil fuel companies by 2020.”97 However, the Act does permit New York’s Comptroller to cease divestment, as long as the Comptroller can convincingly demonstrate divestment has caused the fund to lose significant value.98 If the Act became law, New York would be the second state in the nation to enact fossil fuel divestment.
The Fossil Fuel Divestment Act was first introduced and referred to the Rules Committee on June 9, 2015.99 Af-ter seven months, the bill was referred to the Civil Ser-vice and Pensions Committee in January 2016 where it was approved. On April 11, 2016, the bill moved on to the Senate Finance Committee, where it stayed for the remainder of the 2016 legislative session.
During debate over the Act, State Comptroller Thom-as DiNapoli expressed misgivings. He was concerned divestment could conflict with his fiduciary duty. As manager of New York State’s pension funds, the Comp-troller is required to generate the best possible returns for pensioners. In a December 2015 letter to Senator Krueger, Comptroller DiNapoli explained:
“My fiduciary duty requires me to focus on the long term value of the Fund. To achieve that objective, the Fund works to maximize returns and minimize risks. Key to accomplishing this objective is diversifying the Fund’s investments across sectors and asset classes—including the energy sector, where fossil fuels continue to play an integral role in powering the world’s electricity generators, industry, transporta-tion, and infrastructure.”100
Hopefully, Comptroller DiNapoli’s concerns will be taken seriously. Pursuing a political agenda through divestment would hinder the Comptroller’s ability to wisely steward pension investments. New York pen-sioners deserve a well-managed, diversified portfolio that achieves the best possible returns to provide a se-cure retirement.
KEEPING THE PROMISE: GETTING POLITICS OUT OF PENSIONS
25
Vermont
Governor Peter Shumlin, who is leaving office in Janu-ary 2017, has also called for pension divestment of coal companies. Beyond this, he has singled out ExxonMobil as a specific company the state’s pension funds should target for divestment. The governor is not alone. He is joined in his demands by several environmental activ-ists in the Green Mountain State.
Governor Shumlin argues Vermont has a “moral re-sponsibility” to fight climate change and, as such, the state should divest its pension funds from fossil fuel companies.101 When it comes to ExxonMobil, the gov-ernor claims the company “hid what it knew about the dangers of climate change for decades.”102 However, this statement is merely an unsubstantiated allegation, part of the broader bullying campaign by some state attorneys general to discourage investment in the fossil fuel industry.103 For its part, ExxonMobil has fervently denied obstructing such information from the public.104
Interestingly, one of the governor’s most prominent opponents in regards to divestment is State Treasurer Beth Pearce, a fellow Democrat, who was appointed by Governor Shumlin six years ago.105 Pearce opposes divestment, explaining:
“We have a fiduciary responsibility of steward-ship of those taxpayer dollars, and the dollars for the members of the system. When those dol-lars go into a trust we are obliged to maximum return for those individuals,” she says. “So … I'm going to be guided by facts not by politics.”106
Despite the treasurer’s strong opposition, she agreed to at least review the divestment issue.107 However, it appears Pearce still believes that the foremost obliga-tion of the state’s pension funds should be to provide financial security for retirees, considering her recent statement that her “zeal on behalf of retirees’ pension funds hasn’t diminished as a result of her consider-ation of divestment.”108
Pearce’s concerns are well-founded. According to the Vermont Treasury, divestment would cost state pen-sion funds $10 million per year in lost returns. Further-more, the state pension funds would have to pay $8.5 million to implement the divestment process.109 Thom-as Golonka, chair of the Vermont Pension Investment
Committee, agrees that divestment is a complex and costly process.110
Despite the significant costs of divestment, Pearce still drew an ardently pro-divestment primary challenger, financial analyst Richard Dunne. This demonstrates how contentious fossil fuel divestment has become in Vermont politics. However, Pearce soundly beat Dunne in the 2016 Democratic primary.111
For now, at least, Vermonters are protected from the costs of fossil fuel divestment. As the state’s own trea-sury estimate indicates, there are significant costs to divestment, costs ultimately borne by pensioners and taxpayers.
Pension Divestment at the Municipal Level
In December of 2012, Seattle became the first major city to announce it would divest from fossil fuels.112 By April 2013, it was joined by nine other cities, including Madison, Wisconsin and San Francisco, California.113
As part of Seattle’s divestment process, then Mayor Mike McGinn personally issued a letter to Seattle City Employees’ Retirement System (SCERS) and the City of Seattle Voluntary Deferred Compensation Plan Com-mittee, the city’s two major pension funds.114 In the letter to SCERS, Mayor McGinn wrote “divesting the pension fund from these companies is one way” the city of Seattle can “discourage” them from extracting fossil fuel.115
On April 26, 2013, San Francisco's Board of Supervisors voted unanimously to urge its $16 billion pension fund to divest over $583 million from the fossil fuel indus-try.116 However, less than six months later, the board of the San Francisco Employees’ Retirement System (SFERS), which manages the pension fund, voted to reject the city’s call for divestment. On December 9, 2015, the SFERS board adopted a more limited pro-posal to divest from thermal coal companies, which amounted to about $21 million of its portfolio.117
These examples demonstrate fossil fuel divestment is not just a state issue, but one that municipalities also face. However, as demonstrated by the relatively few cities that have enacted divestment, most local law-makers and pension board members realize that using pension funds to advance political causes is a costly decision that jeopardizes workers’ retirement security.

26
AMERICAN LEGISLATIVE EXCHANGE COUNCIL • ALEC.ORG
Fossil Fuel Divestment Threatens Pensioners’ Retirement
As the case studies in California, New York, Vermont and various cities demonstrate, fossil fuel divestment is a major initiative that several states and municipal-ities are considering. However, using public pension funds to advance a political agenda comes at the price of investment returns. With the current underfunded status of so many public pension systems, state and local governments cannot afford to play politics with pension funds.
Divestment from Individuals Based on Personal Beliefs
Another form of divestment is the effort by some in-terest groups to pressure pension funds to divest from certain fund managers on account of their personal be-liefs. Perhaps the most notable example of this effort has been led by the American Federation of Teachers (AFT). In recent years, the AFT has promoted a divest-ment campaign targeting hedge-fund managers who have supported initiatives with which they disagree. The AFT has targeted some hedge-fund managers for their actions supporting school choice and favoring de-fined-contribution public pension systems. This is par-ticularly threatening given AFT’s influence over an esti-mated $1 trillion in public defined-benefit plans, many
of which hold investments in hedge-funds as part of their portfolio.118
By thoroughly examining financial reports and the charitable deductions of hedge-fund managers, AFT created a “blacklist” of roughly three dozen individu-als.119 Individuals earned a spot on the dubious list by personally supporting causes and organizations disap-proved of by AFT. Union pension funds then used the AFT blacklist as a guide to divest from the hedge-funds managed by these individuals. As Figure 9 shows, state pension funds in California, Illinois, New Jersey, New York, Oklahoma, Rhode Island and Washington state have all divested from hedge-funds to some degree.120
Not only have state pension funds succumbed to di-vestment pressure, but fund managers have been per-sonally targeted to try to change their behavior. For example, a recent Wall Street Journal article detailed what happened when a hedge-fund manager, Cliff As-ness, recently found himself on the blacklist.
Asness appears to have been originally blacklisted for serving on the board of the Manhattan Institute for Policy Research, an organization that promotes eco-nomic choice and individual responsibility and which supports, among other things, state and local govern-ments moving from defined-benefit public pension plans to defined-contribution plans. Shortly after his firm paid $25,000 to help found a pension policy group with AFT President Randi Weingarten, Asness was re-moved from the list.121 However, Asness continued to
FIGURE 9: PUBLIC-EMPLOYEE PENSION FUND DIVESTMENT FROM HEDGE-FUNDS
California Public Employees’ Retirement System (2014)
New York City Employee Retirement System (2016)
Illinois State Board of Investment (2016)
Public School Teachers’ Pension & Retirement Fund of Chicago (2015)
Employees’ Retirement System of Rhode Island (2014)
Oklahoma Firefighters Pension and Retirement System (2016)
Seattle City Employees’ Retirement System (2016)
New Jersey Public Employees’ Retirement System (2016)
$60 million
$75 million
$75 million*
$175 million
$1 billion
$1.5 billion
$4 billion
Getting Out of Hedge-FundsPublic-employee pension funds have pulled billions of dollars from hedge-funds in recent years, sometimes with the encouragement of the American Federation of Teachers.
*voted to divest from Third Point LLCSource: The Wall Street Journal; pension officials; published reports
$4.7 billion
KEEPING THE PROMISE: GETTING POLITICS OUT OF PENSIONS
27
serve on the Manhattan Institute board, and when CalSTRS later considered increasing their hedge-fund investments, Weingarten saw an opportunity to apply pressure. Her aide spoke with a CalSTRS official about Cliff Asness’s service as a Manhattan Institute board member and shortly after, a CalSTRS official spoke with Asness. Later that year, Asness announced that he would step down from the Manhattan Institute’s board. While his spokesperson said Asness already made the decision at the time of the call, the timing is certainly interesting. In a letter to The Wall Street Jour-nal, Asness claimed that his decision was not made on account of pressure from AFT.122 In any case, the fact that such a powerful organization is able and willing to threaten an individual’s personal livelihood through divestment is concerning.
Regrettably, AFT’s intimidation campaign comes at a great cost—the security of retirees. Pension funds should be managed to generate the best investment returns for pensioners, not target political enemies. By picking and choosing funds based on fund managers’ personal beliefs, rather than their funds’ investment performance, pension fund returns will likely decline and the financial stability of the fund could be at risk. As a recent Wall Street Journal article aptly explains:
“Sander Read, chief executive officer of Lyons Wealth Management, which hasn’t been tar-geted, likened what Ms. Weingarten is doing to ‘hiring a dentist because of their political be-liefs. You may see eye to eye on politics, but you may not have great, straight teeth.’”123
State and local governments should adopt fiduciary standards that prevent this type of personal divest-ment and put pensioners first by requiring investment decisions be made based on financial considerations, not on political agendas.
Rhode Island Trades Investment Returns for Politics
Another example of targeting individuals for divest-ment comes from Rhode Island, where an apparently politically-driven decision to divest from a high per-forming hedge-fund cost the state access to some of the best returns its pension portfolio had earned in re-
cent years. It is perhaps worse considering the decision makers in this case were financially-savvy professionals who should know better than to sacrifice substantial pension fund gains for political capital.
The Employees’ Retirement System of Rhode Island (ERSRI) is significantly underfunded. ALEC, in its most recent pension liabilities report, Unaccountable and Unaffordable 2016, found Rhode Island’s total pension funding ratio was a mere 29.6 percent, with a total un-funded pension liability of more than $18.6 billion.124 This unfunded liability is equivalent to $17,644 for ev-ery man, woman and child in Rhode Island.125 Knowing that ERSRI is already significantly underfunded makes any further losses from politically-motivated decisions all the more serious.
Rhode Island Governor Gina Raimondo is a key figure in the story. Raimondo was once a strong ally of pension reform. A former venture capitalist, Raimondo seemed to understand the limitations of the market, and why assuming unrealistically high investment returns was not in the best interest of the people of Rhode Island. Before she was elected to the state’s highest office, Raimondo served as Rhode Island’s General Treasurer, championing reform and a shift toward a hybrid pen-sion model that incorporated elements of managing the pre-existing defined-benefit system with elements of a 401(k)-style defined-contribution system, as well as reforms to cost-of-living-adjustments (COLAs). As observed by former Utah State Senator Dan Liljenquist in the 2013 ALEC publication, Keeping the Promise: State Solutions for Government Pension Reform:
“Gina Raimondo, the state’s treasurer and a Democrat, led pension reform in the state and defended it as a moral imperative. After declar-ing that Rhode Island had to choose between maintaining the pension system as it was and reducing other spending priorities, she said to a disgruntled public employee, ‘I would ask you, is it morally right to do nothing [on pen-sion reform], and not provide services to the state’s most vulnerable citizens? Yes, sir, I think this [reform] is moral.’”126
In 2012, The Wall Street Journal ran a feature, “The Dem-ocrat Who Took on the Unions,” cataloguing the reform processes Raimondo spearheaded and the Rhode Island General Assembly eventually implemented.127 Another
28
AMERICAN LEGISLATIVE EXCHANGE COUNCIL • ALEC.ORG
2012 Wall Street Journal article, “Rhode Island Miracle Explained,” described Raimondo’s visit with the Man-hattan Institute:
“The plan enacted in November cuts $3 billion of the state's $7 billion unfunded liability by raising the retirement age, suspending cost-of-living increases until the pension system is 80% funded, and even moving workers into a hybrid plan that has a smaller guaranteed annuity along with a 401(k)-style defined-contribution plan.”128
These efforts demonstrate how Raimondo and Rhode Island officials put in the hard work to start reforming the state’s pension system. However, after years of give-and-take with state employee unions, Raimondo seemed to cave under political pressure when it came to one critical decision, leaving doubts about how Rhode Island’s public pensions are governed.
Among Raimondo’s duties while serving as Rhode Is-land’s General Treasurer was leading the Rhode Island State Investment Commission. During her tenure, Third Point Partners’ Dan Loeb was tasked by the Com-mission to manage $74.3 million of Rhode Island’s $8 billion pension fund, an amount that was small consid-ering the size of Third Point’s $14 billion portfolio.129 Loeb had the reputation of being a strong hedge-fund manager, capable of providing better returns than many of his peers. In 2013, Loeb was recognized as one of the elites of his industry, making Institutional Inves-tor’s Alpha’s “Rich List,” a ranking of the hedge-fund industry’s 25 highest earners.130 Loeb earned Rhode Island “a 24.71 percent return that ranked Third Point as the state's best performing hedge-fund in 2013, ac-cording to state documents.”131 That nearly doubled the pension fund’s overall 14.01 percent return for the year.132 According to a Third Point spokesperson, “Rhode Island’s pensioners earned 49 percent, net of fees, over the two years they invested with us,” and Third Point’s fund had earned “a net annualized rate of return of 21.3 percent since 1995.”133
In a role unrelated to his management of Rhode Island pension assets, Loeb was an advocate for government reform, and served as director for a New York City-based non-profit, Success Academy Charter Schools.134 He also sat on the board of StudentsFirst, an organi-zation that advocates for teacher accountability.135 In
a June 2013 Bloomberg article, Loeb was described as “escalating a battle between hedge-fund managers and American Federation of Teachers (AFT) President Randi Weingarten over public-worker pensions.”136 A part of his personal activism was having “donated an extra $1 million to a group of charter schools to show his opposition to the head of the second-biggest U.S. teachers union.” These actions earned him a distinc-tion from the AFT for being “hostile to traditional pub-lic pensions.”137
AFT began to pressure Rhode Island to divest from Loeb’s fund. Alarmingly, “AFT wanted pension trustees to consider fund managers’ ties to groups that oppose defined-benefit retirement systems as a reason when hiring or firing them.”138 Ultimately, the Rhode Island State Investment Commission, chaired by Raimondo, unanimously decided to divest from hedge-funds, claiming hedge-funds were not a sound investment.
The Commission cited fees paid to the hedge-fund managers as part of the justification for their decision. They noted that, for three hedge-funds alone, Rhode Island paid a collective $2.6 million in fees in 2012. However, given that Third Point was the best perform-ing hedge-fund in 2013, and the outstanding invest-ment returns they provided, questions persist about the reasoning behind Third Point’s dismissal.
An informative Wall Street Journal editorial, “The Edu-cation of Gina Raimondo,” stated:
“It's hard to avoid the conclusion that Ms. Rai-mondo is trying to neutralize union opposition by throwing Mr. Loeb over the side. But Ms. Rai-mondo is fooling herself if she thinks that di-vesting from Third Point will atone for her pen-sion-reform heresy. The unions will still try to end her political career. Ms. Weingarten wants to make an example of Ms. Raimondo by show-ing other Democrats that favoring pension re-form is politically fatal.”139
When politics enters the policy equation, pension of-ficials can find themselves pressured to make poor in-vestment decisions. Raimondo found herself in such a situation and appears to have been willing to sacrifice the state’s pension performance for political consider-ations.

KEEPING THE PROMISE: GETTING POLITICS OUT OF PENSIONS
29
The Manhattan Institute and Dan Loeb once honored Raimondo for her work reforming the Rhode Island pension system, but even after a successful reform pro-cess had begun, AFT was able to apply political pres-sure to get state officials to punish Loeb for his support of school choice and public pension reform. So long as pension officials are subject to political pressure, there exists a risk that pension funds will be governed with politics, not pensioners, in mind. As noted by The Wall Street Journal, “Ms. Raimondo is a politician, and pol-iticians do what they feel they must to get elected.”140 Regardless of whether Raimondo acted on question-able motives, the fact that questions can be so easi-ly and reasonably raised is enough to provide a case study of the potential harm politics can have on proper pension fund governance.
Shareholder Activism in Pension Fund Management
Another startling misuse of pension fund assets occurs when managers use their large equity holdings to pro-mote shareholder resolutions that advance particular political agendas. This is inconsistent with what should be pension fund managers’ fiduciary duty to pursue the best investment returns possible for plan partici-pants.
Engagement in politically-driven shareholder activism does not relate to this mandate and wastes valuable time which trustees should be using to seek better fund performance. It also subjects important decisions on how to vote on shareholder resolutions to politi-cal concerns, as opposed to basing these decisions on what is best for investment returns. When a pension board considers introducing or supporting a resolu-tion, it should only be considering one thing: what is best for plan participants, in other words, what will help the company achieve the best performance. Fi-nally, politically-driven shareholder activism is unfair to plan participants and taxpayers because it appropri-ates the pension fund, made up of employee contribu-tions, employer contributions and taxpayer dollars to advance a political agenda with which many of these stakeholders may disagree.
Public Pension Funds Advance Political Shareholder Resolutions
Recently, there has been an increase in public pensions attempting to use shareholder resolutions to advance political agendas. The number of these resolutions is cause for concern. The Manhattan Institute’s Proxy Monitor tracks shareholder activism for the Fortune 250 companies and provides a good barometer for what is happening with shareholder resolutions across the country.
Proxy Monitor reports that resolutions to modify cor-porate activities affecting the environment, to disclose political spending and lobbying activity and to alter ex-ecutive compensation packages are some of the most common types of shareholder proposals. According to their research, of the 301 shareholder proposals for Fortune 250 companies in 2016, 58 related to environ-mental concerns, 54 to political spending or lobbying, 11 to equity compensation and 6 to other executive compensation.141
For the Fortune 250, labor-affiliated investors consti-tuted 53 percent of those proposing political spend-ing or lobbying related shareholder resolutions from 2006 to 2016.142 Labor-affiliated investors generally include state or municipal pension funds or multiem-ployer pension funds for private labor unions. The New York Common Retirement System, New York City Pension Funds and the American Federation of State, County and Municipal Employees (AFSCME) have been the shareholders most frequently sponsoring politi-cal spending and lobbying-related resolutions, with a combined 89 proposals from 2006 to 2016.143
Environmental activists continue to step up their efforts as well, submitting 459 environment-related share-holder proposals to Fortune 250 companies in just the last 10 years.144 Of those, 135 were resolutions relating to corporate policy on climate change or greenhouse gas emissions and 82 related to environmental sustain-ability.145 Further, social investing, religious and public policy-related institutional shareholders sponsored 74 percent of the 10-year total for environment-related proposals, with 38 percent attributed solely to social investing institutions.146 Typically, these resolutions ask the company to create a report on the financial risks of climate change, set targets for reducing greenhouse gas emissions or create plans for more “sustainable” operations. Public pensions have also played a signifi-
30
AMERICAN LEGISLATIVE EXCHANGE COUNCIL • ALEC.ORG
cant role in environment related shareholder activism, collectively issuing the second largest number of pro-posals over the last 10 years. The New York State Com-mon Retirement Fund and New York City Pension funds sponsored 16 and seven, respectively.147
Shareholder Activism to Silence Free Speech
In her recent book, The Intimidation Game, Wall Street Journal columnist Kimberley Strassel details organized efforts to chill free speech. “In June 2011, California state treasurer Bill Lockyer and New York City pub-lic advocate Bill de Blasio – both die-hard Democrats and both charged with overseeing the investment of pension-fund money – wrote letters to their respec-tive pension funds calling on them to use their heft to demand corporate political spending disclosure. Both CalPERS and CalSTRS quickly moved to formally adopt policies to do just that.”148 New York’s Bill de Blasio was recently quoted in a Media Matters memo about the political Left’s real goals regarding corporate disclosure of political activity. In the memo, de Blasio was quoted as saying, “We will use every tool, whether it is actions among consumers up to boycotts, whether it’s share-holder actions, whether it’s work from pension funds – to use the pension funds to direct Corporate America to change its ways—legal action, you name it, it’s on the table.”149
This is unsettling because it shows some pension fund managers are more interested in using the fund to si-lence political views they disagree with than managing the fund to get the best returns possible for workers. Pension trustees should not be using public pension funds to advance their own political crusades and should instead be focused on diligently managing the fund they have been entrusted with to earn the best returns possible and provide a secure retirement for plan participants.
Shareholder Activism and Executive Compensation
Another issue where pension funds are pushing polit-ical agendas through shareholder resolutions is exec-utive and CEO compensation. Shareholder proposals relating to stock option compensation or other execu-tive compensation are increasingly prevalent, with 17
being introduced among Fortune 250 companies in 2016 alone.150
One notable example of these efforts comes from Washington state. In his 2016 State of the State Ad-dress, Governor Jay Inslee directed the State Invest-ment Board to vote against executive compensation packages deemed too high. As a large shareholder in many companies, the Board may already vote against the salary of any executive if they believe it does not represent the financial health of the company. Howev-er, Governor Inslee wants the State Investment Board to go further by using their voting power to “reduce the widening pay gap between CEOs and their work-ers,” and encouraged the board to “promote this poli-cy with other states and institutional investors.”151 This is not the first time executive compensation has been politicized. Large institutional shareholders such as CalPERS, CalSTRS and AFSCME have regularly demand-ed decision rights on executive pay at the annual meet-ings of companies, both domestic and multinational.152
Attempts to influence compensation decisions, or any other significant financial actions of private com-panies, by public pension funds or government for political reasons, are a grave misuse of the time that pension managers should be spending to perform their fiduciary duties. They are an abuse of employee contri-butions, employer contributions and taxpayer dollars for the politicization of private issues.
Political Crusades Put Pensioners at Risk
As these examples have shown, when pension trust-ees place their own political agendas ahead of their re-sponsibility to achieve the best returns for the pension fund, pension returns often decline, placing pension-ers’ retirements in jeopardy. This activism is also unfair to both pensioners and taxpayers because it uses pub-lic funds to speak in their name, even when pension trustees take political positions contrary to their deep-ly-held views. Pension trustees should not be spend-ing their time, and risking other people’s money, on political crusades. Rather, they should use their time to research new investment opportunities and provide the best returns for the pension fund. Individuals serve on pension boards as trustees, not political activists.
31
• Trustees should manage pension funds solely in the interest of plan par-ticipants and beneficiaries as a whole, impartially. Fulfilling this provision should require pursuing the best long-term, risk-adjusted returns for the pension fund.
• Enact fiduciary provisions requiring any introduction of or vote on share-holder resolutions to be based solely on pursuing the best long-term, risk-adjusted returns for the pension fund.
• Dispense with any existing divestment requirements for specific compa-nies or industries.
• Require a comprehensive report from an independent financial consul-tant before any divestment action is approved detailing the estimated short-term and long-term cost of the proposed divestment.
• Require all introductions of and votes on shareholder resolutions to be made in consultation with the whole pension board.
• Require reporting each year of how a pension fund voted on each share-holder resolution and the justification for their decision.
Solutions for Fighting Political Crusade Cronyism

32
AMERICAN LEGISLATIVE EXCHANGE COUNCIL • ALEC.ORG
While significantly underfunded, public pension funds represent the retirement future of millions of American workers. As such, lawmakers have an obligation to public employees to ensure these funds are managed in workers’ best interest. When pension trustees misuse public pension funds to promote local economic development and social goals, reward supporters or promote political agendas, it endangers investment returns and jeopardizes the future of pensioners.
Workers deserve better. Policymakers have the opportunity to secure the prom-ises made to pensioners and their families by keeping politics out of pension policymaking. This can be achieved by adopting strong fiduciary standards for pension trustees, transparency rules that allow the public to see how pension funds are being managed and smart pension board reforms that hold trustees accountable. These reforms will guarantee proper pension fund management, which in turn will help state and local governments keep the pension promises they have made.
Conclusion
KEEPING THE PROMISE: GETTING POLITICS OUT OF PENSIONS
33
APPENDIX A: SOLUTIONS FOR PRUDENT PENSION INVESTMENT AND GOVERNANCE
States can keep their pension promises to workers and retirees through wise pension investment and governance. These solutions fall into three important categories: fiduciary standards, transparency rules and pension board gover-nance reforms.
States should adopt strong fiduciary standards for public pension trustees that require:
• Trustees should manage the pension fund for the exclusive purpose of providing pension and other post-em-ployment benefits to plan participants and beneficiaries. Other post-employment benefits should be defined to include healthcare and other benefits outlined in the pension plan and not the limited, tangential benefits local economic development and social projects may provide.
• Trustees should manage pension funds solely in the interest of plan participants and beneficiaries as a whole, impartially. Fulfilling this provision should require pursuing the best long-term, risk-adjusted returns for the pension fund.
• Dispensing with any economically targeted investments and industry divestment requirements which invariably reduce pension fund returns and increase investment risk.
• Adopting the prudent investor standard for pension fiduciaries.
• Any introduction of or vote on shareholder resolutions to be based solely on pursuing the best long-term, risk-ad-justed returns for the pension fund.
• Trustees may only incur administrative costs and fees that are appropriate and reasonable in relation to the assets of the retirement system.
• Trustees should diversify the investments of the retirement system, unless it is reasonably determined that, because of special circumstances, the purposes of the retirement system are better served without diversifying.
• Trustees should be held personally liable for losses deriving from failure to adhere to fiduciary standards.
State should adopt transparency rules that allow lawmakers, board members, pensioners and the public to see how pension funds are being managed, including:
• Reporting of investments should be done separately by asset class and by individual assets so it can be easily determined how investments are performing and increase accountability for trustees.153
• Pensions should report the fund’s overall performance, asset class performance and individual asset performance over a 20 or more-year time horizon to show how assets have performed over time and allow stakeholders to see how actual performance has compared with the assumed rate of return.154
• Require a comprehensive report from an independent financial consultant before any divestment action is approved detailing the estimated short-term and long-term costs of the proposed divestment.
• Require reporting each year of how a pension fund voted on each shareholder resolution and the justification for their decision.
• Pension board meetings should be live-streamed, recorded and easily accessible to the public.
• All pension related documents should be readily available to the public with necessary exceptions for confidentiality.
• Trustees should be required to disclose all personal investments, gifts, affiliations and other interests that may influence their investment decisions to allow the public to evaluate any potential conflicts of interest.
Appendices
34
AMERICAN LEGISLATIVE EXCHANGE COUNCIL • ALEC.ORG
States should adopt board reforms that require and enable trustees to serve as watchdogs, ensuring that fiduciary provisions are being followed and that pension funds are wisely managed:
Board composition:
• Pension boards should be diversified to provide representation for all stakeholders, including taxpayers. This will prevent any special interest group from gaining too much power on the board and using pension funds to over-weight local investments, grant political kickbacks or advance political crusades.
• Pension boards should have a certain number of seats dedicated to independent financial professionals that serve as public representatives.
Trustee responsibilities:
• Trustees should be required to report any failure by other trustees, including board members and pension fund managers, to adhere to fiduciary standards and other applicable law.
• Before making any investment, trustees should be required to attest they have no conflict of interest with the investment. If they do, they should be required to recuse themselves from the decision-making process for that investment and any related votes.
• Trustees should be required to fully disclose campaign contributions they have received and recuse themselves from the decision-making process and any votes related to investing in those companies or interests.
• While trustees may represent a specific group’s interests, they should be expected to act impartially to achieve the best returns for the fund.155
• Trustees should not be allowed to delegate their voting authority by proxy voting.
• Trustees dealing with day-to-day investment decisions, such as those serving on investment committees, should:
◦ Be required to have a minimal amount of financial experience and some form of industry certification.◦ Not be allowed to change the bylaws governing pension investments without approval from the full pension
board.156
Board management and operations:
• All trustees should be regularly apprised of investment performance, with specific details of how all individual assets have performed.
• Require all introductions of and votes on shareholder resolutions to be made in consultation with the whole pen-sion board.
• Pension boards should be required to consult with outside, independent financial advisors regarding their invest-ment strategy and investment decisions.
• States and municipalities should consider creating an independent investment board, apart from the pension board, made up of financial professionals to manage day-to-day investment decisions. Working with a pension fund’s chief investment officer, this independent board would work to achieve the pension board’s investment objectives with far less risk of political influence.
• Boards should provide education and training to all trustees to develop necessary core competencies for their service:
◦ All new trustees should be evaluated to determine their education needs in regards to fulfilling their fiduciary and financial responsibilities.
◦ All new trustees should be provided with and required to complete pension investment and finance training to assist them in making investment decisions and improve their ability to understand the effect certain investments have on overall portfolio performance.
◦ Periodic educational opportunities should be provided that help to improve core competencies and apprise trustees of any changes in their obligations as fiduciaries.
KEEPING THE PROMISE: GETTING POLITICS OUT OF PENSIONS
35
APPENDIX B: ALEC MODEL POLICIES
Model Policies: Wise Pension Investment and Governance
ALEC offers several model policies that states can reference as they refine their policies toward wise pension stew-ardship. These documents have the goals of promoting best practices for pension investment and governance. All ALEC model policies can be obtained by visiting www.alec.org.
ALEC Statement of Principles on Sound Pension Practices
• Stability – Government pensions should be secure and safe from high risk assumptions. State and local gov-ernments should eliminate incentives to underfund pension commitments, or to over-expend benefits beyond available revenues.
• Predictability – The pension obligations of states should be predictable and structured to foster certainty for taxpayers and policymakers. Contribution levels should be stable. Benefits of government pensions should be comparable to plans available by private citizens, and the costs and benefits should be sustainable.
• Adequacy – An unrealistically high assumed rate of return is a guaranteed way to underfund the government pension systems. State legislatures should fund 100 percent of Annually Required Contributions (ARC). Gov-ernment pension systems should use assumptions that are consistent with Governmental Accounting Stan-dards Board (GASB) and/or Generally Accepted Accounting Principles (GAAP) standards.
• Affordability – Government pension plans should be properly structured within affordable employee con-tributions and government financial support of their core functions, without imposing an undue burden on taxpayers.
• Transparency – Government pension systems should be transparent, open and non-political. Comprehensive Annual Financial Reports (CAFR) should be reasonably simple to understand and published in a timely manner.
• Responsibility – Risks should be balanced equitably among employees, government and taxpayers. Lawmak-ers and fund managers should be accountable for the adequacy and solvency of retirement funds.
• Ownership – Pension plans should ultimately benefit, reward, and compensate the work of government em-ployees. Employees should share in the benefits, risks, and decisions of their retirement plans and their mon-ey, while protecting against potentially risky or ill-informed individual decisions.
• Choice – Employees should be able to choose defined-contribution investment plans to help balance risk and gain within individual investment needs and strategies.
• Transportability – Government pension plans should move with employees throughout their careers, without locking employees into government jobs or penalizing those who chose to move in or out of the public sector.
• Liquidity – Government pension plans should consider adequate liquidity to allow employees to use or sell some of their assets, especially during personal or family emergencies.
• Safety – Legislators and other appropriate government organizations should have sufficient oversight and pro-tections to protect employees against security risks to pension plans, including waste, fraud, and abuse, and crimes such as embezzlement, identity theft, and cyber theft.
36
AMERICAN LEGISLATIVE EXCHANGE COUNCIL • ALEC.ORG
Retirement System Board of Trustees and Employees Prudent Investor Act
Summary
This Act promotes security, stability, and accountability in state retirement systems. A trustee or director of a state retirement system must comply with a series of prudent investor guidelines. These guidelines include risk and return objectives, diversification, loyalty, investment costs, compliance, and delegation of management functions.This Act shall be known and may be cited as the “{insert state} Retirement System Board of Trustees and Retire-ment System Employees Prudent Investor Act.”
Model Policy
Section 1. {Prudent Investor Rule}
(A) Except as otherwise provided in subsection B of this section, a trustee or director of any {insert state} retire-ment system who invests and manages, or delegates the approval of the investment or management of retirement system assets owes a duty to the beneficiaries of the system to comply with the prudent investor rule set forth in the “{insert state} Retirement System Board of Trustees and Retirement System Employees Prudent Investor Act.”
(B) A trustee or director or retirement system employee is not liable to a beneficiary or state taxpayer to the extent that the trustee, director or retirement system employee acted in reasonable reliance on the statutory provisions and rules of the retirement system. A trustee or director or retirement system employee who exercises reasonable care, skill, and caution in performance of actions as a trustee or director or retirement system employee is not liable to a beneficiary for the actual investment return results or retirement system operational results.
Section 2. {Standard of Care - Portfolio Strategy - Risk and Return Objectives}
(A) A trustee or director or retirement system employee shall invest and manage or approve the investment and management of retirement system assets as a prudent investor would, by considering the purposes, terms, distri-bution requirements, and other circumstances of the retirement system. In satisfying this standard, the trustee or director or retirement system employee shall exercise reasonable care, skill, and caution.
(B) A trustee or director or retirement system employee’s investment and management decisions or approval of investment and management decisions respecting individual assets of the retirement system must be evaluated not in isolation, but in the context of the retirement system’s portfolio as a whole and as a part of an overall invest-ment strategy having risk and return objectives reasonably suited to the statutory and rules governing the system. Investment and management decisions shall be made on an impartial basis.
(C) Among circumstances that a trustee or director or retirement system employee shall consider in investing and managing retirement system assets or the delegation of approval of investing and managing retirement system assets are those of the following as are relevant to the retirement system or its beneficiaries: (1) General economic conditions; (2) The possible effect of inflation or deflation; (3) The expected tax consequences of investment decisions or strategies;
(4) The role that each investment or course of action plays within the overall retirement system portfolio, which may include financial assets, interests in closely held enterprises, tangible and intangible personal property, and real property;
KEEPING THE PROMISE: GETTING POLITICS OUT OF PENSIONS
37
(5) The expected total return from income and the appreciation of capital; (6) Other resources of the retirement system on behalf of beneficiaries; (7) Needs for liquidity, regularity of income, and preservation or appreciation of capital; and (8) An asset's special relationship or special value, if any, to the purposes of the retirement system or to
the beneficiaries.
(D) A trustee or director or retirement system employee or a trustee or director or retirement system employee who delegates approval of investing and managing retirement system assets shall make a reasonable effort to ver-ify facts relevant to the investment and management of retirement system assets.
(E) A trustee or director or retirement system employee or a trustee or director or retirement system employee who delegates approval of investing and managing retirement system assets may invest in any kind of property or type of investment consistent with the standards of the “{insert state} Retirement System Board of Trustees and Retirement System Employees Prudent Investor Act.”
(F) A trustee or director or retirement system employee or a trustee or director or retirement system employee who delegates approval of investing and managing retirement system assets shall not make a determination to invest or increase the investment of retirement system assets based on ideological or non-financial related criteria for or against specific industries. A trustee or director or retirement system employee or a trustee or director or retirement system employee who delegates approval of investing and managing retirement system assets shall not make a determination to avoid investment of or reduce the investment of retirement system assets based on ideological or non-financial related criteria for or against specific industries. A trustee or director or retirement system employee or a trustee or director or retirement system employee who delegates approval of investing and managing retirement system assets shall not make a determination to employ or terminate employment of an in-vestment manager or consultant based on ideological or non-financial related criteria. Prior to a determination by a trustee or director or retirement system employee to avoid investment of or reduce the investment of retirement system assets in a specific industry, or employ or terminate employment of an investment manager or consultant, external expertise from an independent third-party must be consulted. The results and recommendation of the consulted expertise shall be made available for public review.
Section 3. {Diversification}
A trustee or director or retirement system employee or a trustee or director or retirement system employee who delegates approval of investing and managing retirement system assets shall diversify the investments of the re-tirement system unless it is reasonably determined that, because of special circumstances, the purposes of the retirement system are better served without diversifying.
Section 4. {Loyalty}
A trustee or director or retirement system employee or a trustee or director or retirement system employee who delegates approval of investing and managing retirement system assets shall invest and manage the retirement assets solely in the interest of the beneficiaries.
Section 5. {Investment Costs}
In investing and managing retirement system assets, a trustee or director or retirement system employee or a trustee or director or retirement system employee who delegates approval of investing and managing retirement system assets may only incur costs that are appropriate and reasonable in relation to the assets of the retirement system.

38
AMERICAN LEGISLATIVE EXCHANGE COUNCIL • ALEC.ORG
Section 6. {Reviewing Compliance}
Compliance with the prudent investor rule is determined in light of the facts and circumstances existing at the time of a trustee director or retirement system employee or a trustee or director or retirement system employee who delegates approval of investing and managing retirement system assets’ decision or action and not by hindsight.
Section 7. {Delegation of Investment and Management Functions}
(A) A trustee or director or retirement system employee may delegate investment and management functions. The trustee shall exercise reasonable care, skill, and caution in: (1) Selecting an agent; (2) Establishing the scope and terms of the delegation, consistent with the purposes and terms of the re-
tirement system; and (3) Periodically reviewing the agent's actions in order to monitor the agent's performance and compliance
with the terms of the delegation.
(B) In performing a delegated function, an agent owes a duty to the retirement system to exercise reasonable care to comply with the terms of the delegation.
(C) A trustee or director or retirement system employee of a retirement system who complies with the require-ments of subsection A of this section is not liable to the beneficiaries or to the retirement system for the decisions or actions of the agent to whom the function was delegated.
(D) By accepting the delegation of a retirement system function from the trustee or director or retirement system employee of a retirement system that is subject to the laws of this state, an agent submits to the jurisdiction of the courts of this state.
Section 8. {Severability clause.}
Section 9. {Repealer clause.}
Section 10. {Effective date.}
KEEPING THE PROMISE: GETTING POLITICS OUT OF PENSIONS
39
Other ALEC Model Policies:
The summaries of other relevant ALEC model policies are provided below in the interest of space. The full text of all ALEC model policies can be accessed at www.alec.org.
The Promoting Transparency in State Unfunded Liabilities statement of principles says that each retirement plan should report, in full, both its obligations and assets. It says, in part, “It is clear that citizens are demanding greater transparency in accounting for the costs of state and local government. Given the large and growing unfunded liabilities in pension and other post-employment benefit plans, it is crucial for state and local governments to meet accounting standards for these plans established by the Governmental Accounting Standards Board (GASB).”
The Resolution Calling for Enhanced Integrity in Public Employee Pension Plan Reporting calls upon the relevant standard-setting body, the Government Accounting Standards Board (GASB), to adopt reporting standards that require reporting as a liability on a governmental entity’s balance sheet any unfunded pension plan obligation for which it is responsible; reporting as a current expense the cost of any changes in benefits awarded on the basis of past service; clear disclosure of discount rates used in the calculation of pension liabilities; why such discount rates were selected; and the liabilities which would result if alternative discount rates were applied. It also requests GASB to send an official representative to present information and answer inquiries at a public hearing to be held by the relevant committee or committees.
The Unfunded Pension Liabilities Accounting and Transparency Act would require state retirement boards or other responsible entities to issue reports to the legislature on the funds they oversee. The reports would give the legislature several different ways of understanding the liabilities of each fund, including the outcomes of several “what if” scenarios. The act’s summary statement declares the following: “The legislature finds that the future liabilities of the state’s several post-retirement pension and benefits plans may exceed the ability of these plans to fully pay future claims, possibly requiring taxpayers to make unforeseen future contributions to ensure the solven-cy of these plans or the reduction or elimination of benefits to future and current retirees. Believing both of these alternatives to be unacceptable, the legislature seeks to identify the extent to which the several pension plans lack the necessary capital to pay all future obligations.”

40
AMERICAN LEGISLATIVE EXCHANGE COUNCIL • ALEC.ORG
1 “Ruinous promises.” The Economist. June 15, 2013. http://www.economist.com/news/leaders/21579463-states-cannot-pretend-be-good-fi-nancial-health-unless-they-tackle-pensions-ruinous-promises
2 Ibid.3 Treasury Bond Rates: “United States Rates and Bonds.” Bloomberg Markets. Accessed October 2016. Median Private Sector Liability Discount Rate: “Ruinous promises.” The Economist. June 15, 2013. Moody’s High Grade Long-Term Corporate Bond Rate: Ring, Ed. “The Impact of Moody’s Proposed Changes in Analyzing Government Pension Data.” The California Policy Center. January 8, 2013.
Average Public Pension Assumed Rate of Return: “Ruinous promises.” The Economist. June 15, 2013.4 Williams, Bob, Williams, Jonathan, Lafferty, Theodore and Curry, Sarah. Unaccountable and Unaffordable 2016. American Legislative Exchange
Council. October 2016. https://www.alec.org/publication/pensiondebt2016/5 Bureau of Economic Analysis. U.S. Department of Commerce. National Data, Table 1.1.5 Gross Domestic Product. http://www.bea.gov/iTable/
iTable.cfm?ReqID=9&step=1#reqid=9&step=3&isuri=1&903=56 Stein, Bob, et al. “Report of the Blue Ribbon Panel on Public Pension Plan Funding.” Society of Actuaries. February 2014. https://www.soa.
org/blueribbonpanel/7 McMorris, Bill. “Starting Over in the Land of Lincoln.” The Washington Free Beacon. January 15, 2013. http://freebeacon.com/politics/starting-
over-in-the-land-of-lincoln/ 8 Summary of Findings and Considerations for the Chairmen and Members of the Joint Committee on Alabama Public Pensions.” The Pew Char-
itable Trusts. January 13, 2016. http://www.rsa-al.gov/uploads/files/JCAPP_Pew_Report.Final.01.13.16.pdf9 Copland, James and Malanga, Steve. “Safeguarding Public-Pension Systems: A Governance-Based Approach.” The Manhattan Institute. March
9, 2016. http://www.manhattan-institute.org/html/safeguarding-public-pension-systems-governance-based-approach-8595.html10 Ibid.11 “Summary of Findings and Considerations for the Chairmen and Members of the Joint Committee on Alabama Public Pensions.” The Pew
Charitable Trusts. January 13, 2016. http://www.rsa-al.gov/uploads/files/JCAPP_Pew_Report.Final.01.13.16.pdf12 “Retirement System Board of Trustees and Employees Prudent Investor Act.” American Legislative Exchange Council. 2014. https://www.alec.
org/model-policy/retirement-system-board-trustees-employees-prudent-investor-act/ 13 Bradley, Daniel, Christos Pantzalis, and Xiaojing Yuan. “The Influence of Political Bias in State Pension Funds.” Forthcoming, Journal of
Financial Economics, 2016. 14 “Summary of Findings and Considerations for the Chairmen and Members of the Joint Committee on Alabama Public Pensions.” The Pew
Charitable Trusts. January 13, 2016. http://www.rsa-al.gov/uploads/files/JCAPP_Pew_Report.Final.01.13.16.pdf15 Ibid.16 Andonov, Aleksandar, Hochberg, Yael and Rauh, Joshua. “Pension Fund Board Composition and Investment Performance: Evidence from
Private Equity.” The Hoover Institution at Stanford University. March 2016. Returns cited from this study are measured as internal rate of return (IRR).
17 Romano, Roberta. “Public Pension Fund Activism in Corporate Governance Reconsidered.” Columbia Law Review, Vol. 93, No. 4, 1993. 18 Ibid.19 “Summary of Findings and Considerations for the Chairmen and Members of the Joint Committee on Alabama Public Pensions.” The Pew
Charitable Trusts. January 13, 2016. http://www.rsa-al.gov/uploads/files/JCAPP_Pew_Report.Final.01.13.16.pdf20 “About RSA.” The Retirement Systems of Alabama. Accessed March 23, 2016. http://www.rsa-al.gov/index.php/members/ 21 Dove, John and Smith, Daniel. “Alabama at the Crossroads: An Economic Guide to a Fiscally Sustainable Future.” The Mercatus Center
at George Mason University. March 22, 2016. http://mercatus.org/publication/alabama-crossroads-economic-guide-fiscally-sustainable-fu-ture-0. Also see: “Summary of Findings and Considerations for the Chairmen and Members of the Joint Committee on Alabama Public Pen-sions.” The Pew Charitable Trusts. January 13, 2016. http://www.rsa-al.gov/uploads/files/JCAPP_Pew_Report.Final.01.13.16.pdf
22 “Summary of Findings and Considerations for the Chairmen and Members of the Joint Committee on Alabama Public Pensions.” The Pew Charitable Trusts. January 13, 2016. http://www.rsa-al.gov/uploads/files/JCAPP_Pew_Report.Final.01.13.16.pdf
23 Ibid.24 Ibid. 25 Toner, Casey. “RSA’s winners and losers. Hint: the golf courses are a drag.” AL.com. September 29, 2015. http://www.al.com/news/index.
ssf/2015/09/rsas_winners_and_losers_hint_t.html 26 “Summary of Findings and Considerations for the Chairmen and Members of the Joint Committee on Alabama Public Pensions.” The Pew
Charitable Trusts. January 13, 2016. http://www.rsa-al.gov/uploads/files/JCAPP_Pew_Report.Final.01.13.16.pdf27 Ibid.28 Toner, Casey. “RSA’s winners and losers. Hint: the golf courses are a drag.” AL.com. September 29, 2015. http://www.al.com/news/index.
ssf/2015/09/rsas_winners_and_losers_hint_t.html 29 Farmer, Liz and Vock, Daniel. “Alabama’s One-Man Pension Show.” Governing. May 2016. http://www.governing.com/topics/mgmt/gov-ala-
bama-david-bronner.html30 Mabry, Henry. “TRS must be transparent and focus on its primary functions.” Alabama Political Reporter. January 23, 2013. http://www.
alreporter.com/trs-must-be-transparent-and-focus-on-its-primary-functions/ 31 Finn, Kathy. “Indian workers win $14 million in U.S. labor trafficking case.” Reuters. February 18, 2015. http://www.reuters.com/article/
us-usa-louisiana-trafficking-idUSKBN0LN03820150219. Also see: Toner, Casey. “What does Signal’s $20 million human trafficking settlement
Endnotes
KEEPING THE PROMISE: GETTING POLITICS OUT OF PENSIONS
41
mean for Alabama’s pension system?” AL.com. July 22, 2015. http://www.al.com/news/index.ssf/2015/07/what_does_signals_20_mil-lion_h.html
32 Ibid.33 Toner, Casey. “RSA’s winners and losers. Hint: the golf courses are a drag.” AL.com. September 29, 2015. http://www.al.com/news/index.
ssf/2015/09/rsas_winners_and_losers_hint_t.html34 Ibid.35 Brickley, Peg. “Accused of Labor Trafficking, Oil-Rig Repairer Files for Bankruptcy.” The Wall Street Journal. July 13, 2015. http://www.wsj.
com/articles/signal-international-files-for-bankruptcy-1436787503 36 Dugan, Kelli. “Mobile-based Signal International files for Chapter 11 bankruptcy protection.” AL.com. July 13, 2015. http://www.al.com/busi-
ness/index.ssf/2015/07/mobile-based_signal_internatio.html37 Dupont, Dale. “Judge approves sale of bankrupt Signal International.” Work Boat. November 25, 2015. http://www.workboat.com/news-
feed/2015/judge-approves-sale-of-bankrupt-signal-international38 Farmer, Liz and Vock, Daniel. “Alabama’s One-Man Pension Show.” Governing. May 2016. http://www.governing.com/topics/mgmt/gov-ala-
bama-david-bronner.html 39 Ibid.40 Bloom, Nedra. “Rail Car Plant Runs Full Circle, Back to Rail Cars.” Business Alabama. April 2013. http://www.businessalabama.com/Busi-
ness-Alabama/April-2013/Rail-Car-Plant-Runs-Full-Circle-Back-to-Rail-Cars/41 Smith, Tom. “Aziz to pay $21 million.” Times Daily. November 14, 2014. http://www.timesdaily.com/news/aziz-to-pay-million/arti-
cle_4f5e0d72-6c8a-11e4-a9c6-2b4c0b34affb.html42 McFarland, Janet. “Canadian CEO charged in Alabama securities fraud case.” The Globe and Mail. November 19, 2013. http://www.the-
globeandmail.com/report-on-business/international-business/us-business/canadian-ceo-charged-in-alabama-securities-fraud-case/arti-cle15505130/
43 Helm, Dave. “RSA in Line to Recoup $21 Million Over Railcar Deal Settlement.” Business Alabama. January 2015. http://www.businessala-bama.com/Business-Alabama/January-2015/RSA-in-Line-to-Recoup-21-Million-Over-Railcar-Deal-Settlement/
44 Farmer, Liz and Vock, Daniel. “Alabama’s One-Man Pension Show.” Governing. May 2016. http://www.governing.com/topics/mgmt/gov-ala-bama-david-bronner.html
45 “Summary of Findings and Considerations for the Chairmen and Members of the Joint Committee on Alabama Public Pensions.” The Pew Charitable Trusts. January 13, 2016. http://www.rsa-al.gov/uploads/files/JCAPP_Pew_Report.Final.01.13.16.pdf
46 Dove, John and Smith, Daniel. “Alabama at the Crossroads: An Economic Guide to a Fiscally Sustainable Future.” The Mercatus Center at George Mason University. March 22, 2016. http://mercatus.org/publication/alabama-crossroads-economic-guide-fiscally-sustainable-fu-ture-0
47 Ibid.48 “TRS/PREEHIP Board of Control Election Manual.” The Retirement Systems of Alabama. Accessed March 23, 2016. http://www.rsa-al.gov/
uploads/files/TRSElectionManual.pdf 49 “ERS Board of Control Election Manual.” The Retirement Systems of Alabama. Accessed March 23, 2016. http://www.rsa-al.gov/uploads/
files/ERS_Election_Manual_2015.pdf Also see: “TRS/PREEHIP Board of Control Election Manual.” The Retirement Systems of Alabama. Ac-cessed March 23, 2016. http://www.rsa-al.gov/uploads/files/TRSElectionManual.pdf
50 Ibid.51 Andonov, Aleksandar, Hochberg, Yael and Rauh, Joshua. “Pension Fund Board Composition and Investment Performance: Evidence from
Private Equity.” The Hoover Institution at Stanford University. March 2016.52 “ERS Board of Control Election Manual.” The Retirement Systems of Alabama. Accessed March 23, 2016. http://www.rsa-al.gov/uploads/
files/ERS_Election_Manual_2015.pdf Also see: “TRS/PREEHIP Board of Control Election Manual.” The Retirement Systems of Alabama. Ac-cessed March 23, 2016. http://www.rsa-al.gov/uploads/files/TRSElectionManual.pdf
53 Ibid.54 Ibid. 55 Farmer, Liz and Vock, Daniel. “Alabama’s One-Man Pension Show.” Governing. May 2016. http://www.governing.com/topics/mgmt/gov-ala-
bama-david-bronner.html 56 Britt, Bill. “ERS Board Votes Unanimously to Impose Move Oversight of ERS Investments.” Alabama Political Reporter. December 13, 2013.
http://www.alreporter.com/ers-board-votes-unanimously-to-impose-move-oversight-of-ers-investments/57 Farmer, Liz and Vock, Daniel. “Alabama’s One-Man Pension Show.” Governing. May 2016. http://www.governing.com/topics/mgmt/gov-ala-
bama-david-bronner.html 58 “Comprehensive Annual Financial Report, For the Fiscal Year Ended September 30, 2015.” The Retirement Systems of Alabama. September
30, 2015. http://www.rsa-al.gov/uploads/files/2015_RSA_CAFR.pdf59 Farmer, Liz and Vock, Daniel. “Alabama’s One-Man Pension Show.” Governing. May 2016. http://www.governing.com/topics/mgmt/gov-ala-
bama-david-bronner.html 60 Williams, Bob, Williams, Jonathan, Lafferty, Theodore and Curry, Sarah. Unaccountable and Unaffordable 2016. American Legislative Ex-
change Council. October 2016. https://www.alec.org/publication/pensiondebt2016/61 Greer, Lynn and Robertson, Katherine. “The fight for pension reform in Alabama.” AL.com. April 17, 2016. http://www.al.com/opinion/index.
ssf/2016/04/the_fight_for_pension_reform_i.html62 Ibid.63 Ibid.64 Bradley, Daniel, Pantzalis, Christos and Yuan, Xiaojing. “The Influence of Political Bias in State Pension Funds.” Forthcoming, Journal of Finan-
cial Economics, 2016.65 Two slightly different regression models estimated the coefficient for local contribution bias at negative 0.0054 or negative 0.0061, meaning
42
AMERICAN LEGISLATIVE EXCHANGE COUNCIL • ALEC.ORG
that quarterly fund performance will decrease by 0.28 percent or 0.32 percent for every one standard deviation increase in local contribution bias. Likewise, two regression models estimated the coefficient on local lobbying bias at negative 0.0048 or negative 0.0051, implying that quarterly fund performance will fall by 0.25 percent or 0.27 percent for every one standard deviation increase in local lobbying bias.
66 Bradley, Daniel, Pantzalis, Christos and Yuan, Xiaojing. “The Influence of Political Bias in State Pension Funds.” Forthcoming, Journal of Finan-cial Economics, 2016.
67 Malanga, Steven. “The Pension Fund That Ate California.” The City Journal. March 2013. http://www.city-journal.org/html/pen-sion-fund-ate-california-13528.html
68 Ibid. 69 Ibid.70 Ibid.71 Ibid.72 Malanga, Steven. “The Pension Fund That Ate California.” The City Journal. March 2013. http://www.city-journal.org/html/pen sion-fund-ate-
california-13528.html. Also see: Khinda, Philip S., Wellington, Donald E. and Zimiles, Ellen S. “Report of the CalPERS Special Review.” California Public Employees’ Retirement System. March 2011. https://www.calpers.ca.gov/docs/forms-publications/report-special-review.pdf
73 Fischel, Daniel R. “Fossil Fuel Divestment: A Costly and Ineffective Investment Strategy.” Compass-Lexecon. 2015. http://divestmentfacts.com/pdf/Fischel_Report.pdf
74 Ibid.75 Ibid.76 Bessembinder, Hendrik. “Frictional Costs of Fossil Fuel Divestment.” Arizona State University, University of Washington and Compass Lexecon.
2016.77 Ibid.78 Ibid.79 Krauss, Alan and Stoll, Hans. “Price Impacts of Block Trading on the New York Stock Exchange,” Journal of Finance, Vol. 27, pp.569-588, 1972.80 Bessembinder, Hendrik. “Frictional Costs of Fossil Fuel Divestment.” Arizona State University, University of Washington and Compass Lexecon.
2016.81 Romano, Roberta. “Public Pension Fund Activism in Corporate Governance Reconsidered.” Columbia Law Review, Vol. 93, No. 4, 1993. 82 Fischel, Daniel R. “Fossil Fuel Divestment: A Costly and Ineffective Investment Strategy.” Compass-Lexecon. 2015. http://divestmentfacts.
com/pdf/Fischel_Report.pdf83 Ibid.84 “California First State in the Nation to Divest from Coal.” California State Senate. October 8, 2015. http://sd24.senate.ca.gov/news/2015-10-
08-california-first-state-nation-divest-coal. Also see: “California Climate Leadership: Powering the New Economy.” Office of California Senate President pro Tempore Kevin de León. http://focus.senate.ca.gov/climate
85 Ibid.86 Ibid. 87 “Senate Bill No. 185, Chapter 605.” California Legislative Information. October 8, 2015. https://leginfo.legislature.ca.gov/faces/billNavClient.
xhtml?bill_id=201520160SB185 88 California First State in the Nation to Divest from Coal.” California State Senate. October 8, 2015. http://sd24.senate.ca.gov/news/2015-10-
08-california-first-state-nation-divest-coal 89 Chabria, Anita. “California passes bill forcing biggest pension funds to divest from coal.” The Guardian. September 2, 2015. http://www.
theguardian.com/environment/2015/sep/02/california-pension-funds-divest-coal Also see: Hill, Joshua S. “California Passes Bill To Force Two Biggest Pension Funds To Divest From Coal.” Clean Technia. September 3, 2015. http://cleantechnica.com/2015/09/03/california-passes-bill-force-two-biggest-pension-funds-divest-coal/
90 “California First State in the Nation to Divest from Coal.” California State Senate. October 8, 2015. http://sd24.senate.ca.gov/news/2015-10-08-california-first-state-nation-divest-coal
91 Chabria, Anita. “California passes bill forcing biggest pension funds to divest from coal.” The Guardian. September 2, 2015. http://www.theguardian.com/environment/2015/sep/02/california-pension-funds-divest-coal
92 Ibid.93 Ibid.94 Eshelman, Jeff. “Divestment wrong choice for California retirees.” East Bay Times. June 15, 2016. http://www.eastbaytimes.com/2016/06/15/
divestment-wrong-choice-for-california-retirees-east-bay-times-my-word/95 Ibid.96 “Pension Fund Overview.” Office of the New York State Comptroller. March 31, 2016. http://www.osc.state.ny.us/pension/snapshot.htm Also
see: Shapiro, Robert. “The Financial Contribution of Oil and Natural Gas Investments to Public Pension Plans in Seventeen States, Fiscal Years 2005 to 2013.” Sonecon. April 2015. http://www.api.org/~/media/files/statistics/pensions/report-public-pension-funds-in-17-states-2005-2013-shapiro-sonecon.pdf
97 Moodie, Alison. “New York pension fund could have made billions by divesting from fossil fuels – report.” The Guardian. March 4 2016. http://www.theguardian.com/sustainable-business/2016/mar/04/fossil-fuel-divestment-new-york-state-pension-fund-hurricane-sandy-ftse
98 Krueger, Liz. “Krueger, Ortiz Announce Fossil Fuel Divestment Act. Office of New York State Senator Liz Krueger. July 7, 2015. https://www.nysenate.gov/newsroom/press-releases/liz-krueger/krueger-ortiz-announce-fossil-fuel-divestment-act
99 “Senate Bill S5873.” The New York State Senate.100 “Letter to the Honorable Liz Krueger.” Office of the New York State Comptroller. December 30, 2015. https://www.scribd.com/doc/301460784/
Letter-from-Office-of-the-State-Comptroller-regarding-fossil-fuel-divestment101 “Text of Gov. Peter Shumlin’s speech to the Vermont Pension Investment Committee.” Vermont Digger. February 24, 2016. http://vtdigger.
org/2016/02/24/gov-peter-shumlins-speech-to-the-vermont-pension-investment-committee/

KEEPING THE PROMISE: GETTING POLITICS OUT OF PENSIONS
43
102 “Vermont pension panel says divestment study will take time.” The Washington Times. April 13, 2016. http://m.washingtontimes.com/news/2016/apr/13/vermont-pension-panel-says-divestment-study-will-t/
103 Shaw, Adam. “AGs, activists accused of ‘collusion’ on Exxon probe amid new emails.” Fox News Politics. April 18, 2916. http://www.foxnews.com/politics/2016/04/18/ags-activists-accused-collusion-on-exxon-probe-amid-new-emails.html
104 Schwartz, John. “State Officials Investigated Over Their Inquiry Into Exxon Mobil’s Climate Change Research.” The New York Times. May 19, 2016. http://www.nytimes.com/2016/05/20/science/exxon-mobil-climate-change-global-warming.html
105 Hallenbeck, Terri. “State Treasurer's Challenger Calls for Fossil-Fuel Divestment.” Seven Days. April 11, 2016. http://www.sevendaysvt.com/OffMessage/archives/2016/04/11/state-treasurers-challenger-calls-for-fossil-fuel-divestment
106 Kinzel, Bob. “In Treasurer Race, Incumbent Beth Pearce and Richard Dunne At Odds On Key Issues.” VPR. August 3, 2016. http://digital.vpr.net/post/treasurer-race-incumbent-beth-pearce-and-richard-dunne-odds-key-issues#stream/0
107 Polhamus, Mike. “Divestment Supporters Tie Issue To Coal Company’s Bankruptcy.” Vermont Digger. April 13, 2016. https://vtdigger.org/2016/04/13/divestment-supporters-tie-issue-to-coal-companys-bankruptcy/
108 Ibid.109 Roper, Rob. “Rob Roper: Fossil Fuel Divestment Decides Treasurer’s Primary.” Vermont Digger. August 24, 2016. http://vtdigger.org/2016/08/24/
rob-roper-fossil-fuel-divestment-decides-treasurers-primary/ 110 Parker, Bruce. “Vermont pension committee chair: Divestment ‘very difficult to do.’” Vermont Watchdog.org. March 17, 2016. http://watch-
dog.org/259834/divestment-very-difficult-to-do/ 111 “Close Calls, Write-Ins And Other Primary Surprises.” The Bridge. August 10, 2016. http://www.montpelierbridge.com/2016/08/washington-
county-senate-primary-news-brooks-squeaks-ahead-of-hill-by-six-votes-incumbents-stay-ahead/112 “10 Cities Divest From Fossil Fuel Investments.” SustainableBusiness.com. April 26, 2013. http://www.sustainablebusiness.com/index.cfm/
go/news.display/id/24815113 Ibid.114 Henn, Jamie. “Seattle Mayor Orders City to Divest from Fossil Fuels.” Fossil Free. December 22, 2012. http://gofossilfree.org/seattle-mayor-
orders-city-to-divest-from-fossil-fuels/115 Ibid.116 “10 Cities Divest From Fossil Fuel Investments.” SustainableBusiness.com. April 26, 2013. http://www.sustainablebusiness.com/index.cfm/
go/news.display/id/24815117 Sabatini, Joshua. “SF board decides not to divest pension money from fossil fuel companies.” The San Francisco Examiner. October 11, 2013.
http://archives.sfexaminer.com/sanfrancisco/sf-board-decides-not-to-divest-pension-money-from-fossil-fuel-companies/Con-tent?oid=2602319. “SFERS to Divest Public Holdings in Thermal Coal Companies.” San Francisco Employees’ Retirement System. December 9, 2015. https://mysfers.org/sfers-to-divest-public-holdings-in-thermal-coal-companies/
118 Mullins, Brody. “Teachers Union and Hedge Funds War Over Pension Billions.” The Wall Street Journal. June 28, 2016. http://www.wsj.com/articles/teachers-union-and-hedge-funds-war-over-pension-billions-1467125055
119 Ibid.120 Mullins, Brody. “Teachers Union and Hedge Funds War Over Pension Billions.” The Wall Street Journal. June 28, 2016. http://www.wsj.com/
articles/teachers-union-and-hedge-funds-war-over-pension-billions-1467125055. Also see: Depp, Terrence, Porzecanski, Katia and Sher-man, Stacie. “New Jersey Pension to Cut $9 Billion Hedge Fund Bet in Half.” Bloomberg. August 3, 2016. http://www.bloomberg.com/news/articles/2016-08-03/new-jersey-pension-moves-to-reduce-exposure-to-hedge-funds
121 Mullins, Brody. “Teachers Union and Hedge Funds War Over Pension Billions.” The Wall Street Journal. June 28, 2016. http://www.wsj.com/articles/teachers-union-and-hedge-funds-war-over-pension-billions-1467125055
122 Mullins, Brody. “Teachers Union and Hedge Funds War Over Pension Billions.” The Wall Street Journal. June 28, 2016. http://www.wsj.com/articles/teachers-union-and-hedge-funds-war-over-pension-billions-1467125055. Also see: Asness, Cliff. “I Believe in Defined-Benefit Pension Plans.” The Wall Street Journal. July 4, 2016. http://www.wsj.com/articles/i-believe-in-defined-benefit-pension-plans-1467665288
123 Ibid.124 Williams, Bob, Williams, Jonathan, Lafferty, Theodore and Curry, Sarah. Unaccountable and Unaffordable 2016. American Legislative Ex-
change Council. October 2016. https://www.alec.org/publication/pensiondebt2016/125 Ibid.126 Liljenquist, Dan. Keeping the Promise: State Solutions for Government Pension Reform. American Legislative Exchange Council. 2013. https://
www.alec.org/app/uploads/2015/12/Keeping-the-Promise_-State-Solutions-for-Government-Pension-Reform.pdf127 Finley, Allysia. “The Democrat Who Took on the Unions.” The Wall Street Journal. March 25, 2012. http://www.wsj.com/news/articles/SB10
001424052970204136404577207433215374066128 “Rhode Island Miracle Explained.” The Wall Street Journal. January 6, 2012.
http://www.wsj.com/news/articles/SB10001424052970203471004577142973695704092?cb=logged0.3392214849998896129 Avellana, Nicel Jane. “Rhode Island to Pull out Pension Fund From Daniel Loeb’s Third Point.” Venture Capitalist Post. February 1, 2014.
http://www.vcpost.com/articles/21284/20140201/rhode-island-to-pull-out-pension-fund-from-daniel-loebs-third-point.htm 130 Taub, Stephen. “The Rich List: The Highest-Earning Hedge Fund Managers of the Past Year.” Institutional Investor’s Alpha. May 6, 2014. http://
www.institutionalinvestorsalpha.com/Article/3337321/The-Rich-List-The-Highest-Earning-Hedge-Fund-Managers-of-the-Past-Year.html131 Herbst-Bayliss, Svea. “Update 1 – Loeb’s Hedge Fund Third Point to Lose Rhode Island as Client.” Reuters. January 31, 2014. http://www.
reuters.com/article/hedgefunds-loeb-idUSL2N0L603520140201132 Ibid.133 Ibid.134 Braun, Martin and Gordon, Amanda. “Loeb Opposes Teachers Union on Pensions as Asness Quits.” Bloomberg. June 12, 2013. http://www.
bloomberg.com/news/articles/2013-06-12/loeb-opposes-teachers-over-pensions-as-asness-withdraws135 “The Education of Gina Raimondo.” The Wall Street Journal. February 4, 2014. http://www.wsj.com/articles/SB1000142405270230394240
44
AMERICAN LEGISLATIVE EXCHANGE COUNCIL • ALEC.ORG
4579361013529520566136 Ibid.137 Ibid.138 Ibid.139 Ibid.140 Ibid.141 Copland, James and O’Keefe, Margaret. “Proxy Monitor 2016 Finding 3: Political Spending and Lobbying.” The Manhattan Institute. Accessed
September 2016. See Figure 2, Shareholder Proposals by Subtype, Fortune 250, 2016. http://www.proxymonitor.org/Forms/2016Finding3.aspx
142 Copland, James and O’Keefe, Margaret. “Proxy Monitor 2016 Finding 3: Political Spending and Lobbying.” The Manhattan Institute. Accessed September 2016. See Figure 3, Percentage of Politics-Related Shareholder Proposals by Type of Proponent, Fortune 250, 2006-2016. http://www.proxymonitor.org/Forms/2016Finding3.aspx
143 Copland, James and O’Keefe, Margaret. “Proxy Monitor 2016 Finding 3: Political Spending and Lobbying.” The Manhattan Institute. Accessed September 2016. See Figure 5, Politics-Related Shareholder Proposals by Sponsor, Fortune 250, 2006-2016. http://www.proxymonitor.org/Forms/2016Finding3.aspx
144 Copland, James and O’Keefe, Margaret. “Proxy Monitor 2016 Finding 2: Environmental Issues.” The Manhattan Institute. Accessed Sep-tember 2016. See Figure 2, Environment-Related Shareholder Proposals by Year, Fortune 250, 2006-2016. http://www.proxymonitor.org/Forms/2016Finding2.aspx
145 Copland, James and O’Keefe, Margaret. “Proxy Monitor 2016 Finding 2: Environmental Issues.” The Manhattan Institute. Accessed Septem-ber 2016. See Figure 7, Environment-Related Shareholder Proposals by Subtype, Fortune 250, 2006-2016. http://www.proxymonitor.org/Forms/2016Finding2.aspx
146 Copland, James and O’Keefe, Margaret. “Proxy Monitor 2016 Finding 2: Environmental Issues.” The Manhattan Institute. Accessed Sep-tember 2016. See Figure 4, Percentage of Environment-Related Shareholder Proposals by Type of Proponent, Fortune 250, 2006-2016, and Figure 5, Percentage of Environment-Related Shareholder Proposals by Proponent Subtype, Fortune 250, 2006-2016. http://www.proxymo-nitor.org/Forms/2016Finding2.aspx
147 Copland, James and O’Keefe, Margaret. “Proxy Monitor 2016 Finding 2: Environmental Issues.” The Manhattan Institute. Accessed Septem-ber 2016. See Figure 6, Environment-Related Shareholder Proposals by Sponsor, Fortune 250, 2006-2016. http://www.proxymonitor.org/Forms/2016Finding2.aspx
148 Strassel, Kimberley. The Intimidation Game: How the Left is Silencing Free Speech. pp. 230. Hatchette Book Group. New York. 2016.149 Ibid.150 Copland, James and O’Keefe, Margaret. “Proxy Monitor 2016 Finding 3: Political Spending and Lobbying.” The Manhattan Institute. Accessed
September 2016. See Figure 2, Shareholder Resolutions by Subtype, Fortune 250, 2016. http://www.proxymonitor.org/Forms/2016Finding3.aspx
151 Orenstein, Walker. “Inslee Asks State Agency to Reduce Income Inequality.” The Washington Times. January 13, 2016. http://www.washing-tontimes.com/news/2016/jan/13/inslee-asks-state-agency-to-reduce-income-inequali/
152 Dillon, Karen. “The Coming Battle Over Executive Pay.” Harvard Business Review. September 2009. https://hbr.org/2009/09/the-coming-bat-tle-over-executive-pay
153 Ibid.154 Ibid.155 Copland, James and Malanga, Steve. “Safeguarding Public-Pension Systems: A Governance-Based Approach.” The Manhattan Institute.
March 9, 2016. http://www.manhattan-institute.org/html/safeguarding-public-pension-systems-governance-based-approach-8595.html 156 Ibid.
KEEPING THE PROMISE: GETTING POLITICS OUT OF PENSIONS
52
i

Appendix 3
Fischel, “Fossil Fuel Divestment”

1
Fossil Fuel Divestment: A Costly and Ineffective Investment Strategy
Prof. Daniel R. Fischel1
President and Chairman, Compass Lexecon
I. Introduction
1. In recent years, certain groups concerned with the potential effects of global
climate change have urged institutions and other investors to divest from securities associated
with companies that explore for, produce, market and/or exploit fossil fuels. Advocacy for fossil
fuel divestment began in 2011 on college campuses like Swarthmore College in Pennsylvania
and Hampshire College in Massachusetts, and in 2012, Seattle became the first municipal entity
to commit to fossil fuel divestiture goals.2
2. Since then, varying degrees of divestment have been adopted by some other
institutions, while being rejected by others. For instance, in May 2014, Stanford University’s
Board of Trustees announced that it would undertake a limited divestment, focused exclusively
on coal mining companies, and in September 2014, the Rockefeller Brothers Fund announced
that it planned to substantially reduce its investments in fossil fuel companies.3 Fossil Free, a
project of the environmental group 350.org and a leading advocate of divestment, claims that,
during 2014, 181 institutions and local governments, along with 656 individuals, divested a total
1. My qualifications are described in Appendix A. I have been assisted in preparing this report by members
of Compass Lexecon’s professional staff. This study has been commissioned and financed by the Independent Petroleum Association of America (IPAA).
2. Michelle Y. Raji (2014) “Timeline: Fossil Fuels Divestment,” Harvard Crimson, October 2, 2014. 3. Michael Wines (2014) “Stanford to Purge $18 Billion Endowment of Coal Stock,” New York Times, May 7,
2014; Michael Calia (2014) “Rockefeller Fund Seeks to Shed Fossil-Fuel Investments; Family, Whose Fortune is from Oil, Aims to Limit Bets on Coal, Tar Sands in its Fund,” Wall Street Journal, September 22, 2014.
2
of $50 billion worth of assets.4 Divestments by government entities, educational institutions, and
philanthropic foundations constitute approximately 95 percent of these assets.5
3. By contrast, other institutions have resisted activists’ calls for divestment.
Trustees at American University voted in November 2014 to keep fossil fuel-related investments
held in their endowment fund, indicating that divestment would double its annual management
fees.6 Harvard University, which holds the largest university endowment valued at more than
$32 billion, has also opposed divestment. Harvard’s President, Drew Faust, commented:
“Divestment is likely to have negligible financial impact on the affected companies. And such a strategy would diminish the influence or voice we might have with this industry. Divestment pits concerned citizens and institutions against companies that have enormous capacity and responsibility to promote progress toward a more sustainable future.”7
4. Public commentary about divestment has also increased substantially. A recent
opinion piece in the New York Times advocated greater debate about divestment on college
campuses. It suggested that the costs of divestment to investors would be “not much,” and the
potential benefits large, pointing to a divestiture campaign in the 1980s focused on Apartheid-era
South African companies.8
5. Certainly, before divesting, investors and institutional fund managers should
consider the costs of divestiture and the likelihood that divestiture will contribute meaningfully
4. Fossil Free (2014) “Fossil Fuel Divestment: 2014 Accomplishments and Next Steps,”
http://gofossilfree.org/usa/wp-content/uploads/sites/6/2014/12/Divestment-Accomplishments-October-2014-Public.pdf.
5. Arabella Advisors (2014) “Measuring the Global Fossil Fuel Divestment Movement,” September 2014, http://www.arabellaadvisors.com/research/measuring-the-global-fossil-fuel-divestment-movement/.
6. Jeffrey A. Sine, Chair, Board of Trustees (2014) “Memorandum to American University Community,” November 21, 2014, http://www.american.edu/trustees/Announcement-November-21-2014.cfm.
7. Drew Faust, Harvard University Office of the President (2013) “Fossil Fuel Divestment Statement,” October 3, 2013, http://www.harvard.edu/president/fossil-fuels.
8. Evan J. Mandery (2014) “The Missing Campus Climate Debate,” New York Times, November 2, 2014.

3
to desirable environmental goals. In this report, I address these issues from the perspective of
financial economics, relying on widely-accepted principles of the field, as well as the large
literature on prior divestiture campaigns, including the South African case. I conclude that the
costs to investors of fossil fuel divestiture are highly likely and substantial, while the potential
benefits – to the extent there are any – are ill-defined and uncertain at best. Fossil fuel
divestiture is therefore unlikely to pass a cost-benefit test, particularly compared with alternative
ways investors who so desire can promote environmental goals.
II. Divestiture involves substantial costs for investors and others.
6. Investors seeking to comply with the goals of fossil fuel divestiture potentially
incur three key types of costs, described here and discussed more fully below:
• Trading costs. Divestiture involves selling certain securities and presumably buying
others, both of which involve payment of broker commissions and bid-ask spreads. • Diversification costs. By restricting the securities that can be included in a portfolio,
it is widely recognized that an investor loses the benefits of diversification, suffering lower investment returns for a given level of portfolio risk.
• Compliance costs. Investors must identify the specific securities to be divested from
an existing portfolio. Moreover, because firms evolve over time and new investment opportunities arise, there will be ongoing compliance costs to ensure that the portfolio continues to meet the desired standards.
7. These costs reduce the returns of an institution’s investments and thereby reduce
the institution’s ability to achieve its goals. As one article on university endowment spending by
the Association of American Universities noted, “[b]y far the most common categories of
endowment expenditures are scholarships and financial aid, faculty chairs and salaries and
4
academic support programs.”9 The article also states that “[m]any institutions with significant
endowments are making college free for thousands of low- and moderate-income students.”10
According to one study, higher education operating budgets receive 8.8 percent of their funding
annually from endowments.11 A recent economic study of 24 years of university endowment
data found that negative endowment returns lead to substantially lower payouts to fund
university operations: “a 10 percent negative endowment return is associated with an 8.2 percent
reduction in payouts.”12 The same study further found that “[a] negative endowment shock
equivalent to 10 percent of a university’s budget leads to a 4.9 percent reduction in the number of
tenure-system faculty during the following year … In addition to reducing tenure-system faculty,
universities react to negative shocks by also cutting support employees (e.g., secretaries) and to
some extent maintenance employees.”13 The costs imposed by divestment therefore have real
impacts on institutions and those who rely upon them. I discuss each of these costs in detail
below.
A. Trading Costs
8. Divestment generates trading costs for investors, including processing and
execution costs. Trade processing costs include payments to investment professionals to manage
and facilitate trades, as well as exchange fees and taxes involved in trading securities. These
costs vary across traders, depending on the types of securities they hold and whether they have 9. “Myths About College and University Endowments,” Association of American Universities, January 2009
(https://www.aau.edu/WorkArea/DownloadAsset.aspx?id=7792). 10. Id. 11. NACUBO (2013) “Educational Endowments’ Investment Returns Averaged 11.7% in FY2013; Strong
Improvement Over FY2012’s -0.3%,” Press Release, January 28, 2014, http://www.nacubo.org/Documents/EndowmentFiles/2013NCSEPressReleaseFinal.pdf.
12. Jeffrey R. Brown, Stephen G. Dimmock, Jun-Koo Kang, & Scott J. Weisbenner (2014) “How University Endowments Respond to Financial Market Shocks: Evidence and Implications,” American Economic Review 104(3):931-62, at 949.
13. Id., at 933-34.
5
investment professionals in-house, but they are often substantial, with a recent study finding that
institutional separate account fees for a large-cap domestic equity portfolio average 0.53 percent
of assets.14
9. Execution costs include the payment of an effective bid-ask spread and any price
impacts from a trade. The bid-ask spread is the difference between the price to sell a security
and the price to buy the same security, with the latter typically being higher.15 Financial
economists typically recognize the bid-ask spread as the fee security dealers earn for supplying
liquidity to traders.16 An investor incurs costs relating to the bid-ask spread both on the sale of
securities targeted for divestment (which would be sold at the relatively low bid price) and on the
purchase of replacement securities (which would be bought at the relatively high ask price).
10. The price impact component of execution is “the price concession an investor
may be forced to make for trading in in quantities greater than those associated with the posted
bid or ask price.”17 In other words, to sell a large quantity of securities, an investor must offer a
lower price, and to buy a large quantity of securities, an investor must pay a higher price. An
academic study of large investment management firms indicates that the average price impact of
trading for institutional investors is -0.35 percent of the price for sells and 1.0 percent for buys.18
11. A recent estimate from a widely-used source indicates that average processing
and execution costs for an institutional equity investor are approximately $0.18 per $100 of
14. Investment Company Institute (2006) “Mutual Funds and Institutional Accounts: A Comparison,” at p. 2. 15. Zvi Bodie, Alex Kane, and Alan J. Marcus (2014) Investments, Tenth Edition, McGraw-Hill Irwin, at p. 64. 16. John Y. Campbell, Andrew W. Lo, and A. Craig MacKinlay (1997) The Econometrics of Financial
Markets, Princeton University Press, at p. 100. 17. Zvi Bodie, Alex Kane, and Alan J. Marcus (2014) Investments, Tenth Edition, McGraw-Hill Irwin, at p. 76. 18. Louis K.C. Chan & Josef Lakonishok (1995) “The Behavior of Stock Prices Around Institutional Trades,”
Journal of Finance, (4):1147-1174, at p. 1148.

6
trading activity.19 The National Association of College and University Business Officers reports
that university endowments hold approximately $23 billion in energy-related assets.20 If all of
these assets were divested, the benchmark described above would indicate a total cost for
processing and execution alone of $40.2 million. If as described above, divestiture generated a
0.35 percent price impact for stock sales and a 1.0 percent impact for stock purchases, this
additional price impact would add $308 million in trading costs.
B. Diversification Costs
12. Investors typically want returns that are both high and steady from period to
period. However, there is a tradeoff between investment risk and return, with higher returns
usually available only by taking on more risk. However, when an investor diversifies their
portfolio by spreading their investment across more assets, it is widely recognized that the
investor can avoid this tradeoff and achieve a higher average return without an increase in risk.21
For the same reasons, restricting certain assets from a portfolio, as is required by a divestment
policy, reduces the average expected return from the portfolio at a given level of risk.
19. Elkins/McSherry Bundled VWAP Global Universe 4Q12 Estimates. This analysis is based on a survey of
major institutional traders, and is commonly used in the financial economics literature. It includes a price impact of 0.04 percent. See, e.g., Thomas, C.P., Warnock, F.E., & Wongswan, J. (2004) “The Performance of International Equity Portfolios,” Board of Governors of the Federal Reserve System International Finance Discussion Papers, Number 817; Domowitz, I., Glen, J., & Madhavan, A., (2001) “Liquidity, Volatility, and Equity Trading Costs across Countries and Over Time,” International Finance, 4(2):221-255.
20. According to 2013 NACUBO reports, the value of college endowments totaled more than $456,000,000,000 and endowments held approximately 5% of their assets in energy. Therefore, the value of energy assets was approximately $22,800,000,000. See, NACUBO, (2014) “U.S. and Canadian Institutions Listed by Fiscal Year 2013 Endowment Market Value and Change in Endowment Market Value from FY 2012 to FY 2013,” Revised February 2014 and the 2013 NACUBO – Commonfund Study of Endowments.
21. Burton G. Malkiel (2011) A Random Walk Down Wall Street: The Time-Tested Strategy for Successful Investing, W.W. Norton & Co., at pp. 202-214. This result requires that the assets not be perfectly positively correlated with each other, as I describe below.
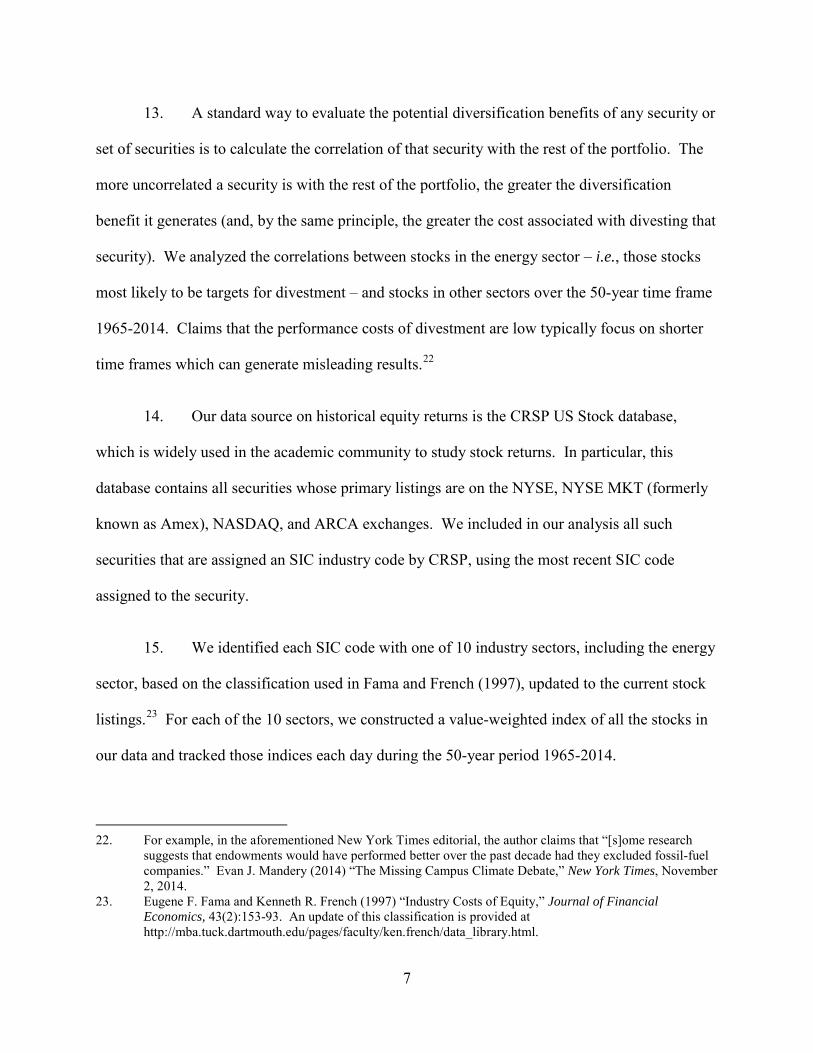
7
13. A standard way to evaluate the potential diversification benefits of any security or
set of securities is to calculate the correlation of that security with the rest of the portfolio. The
more uncorrelated a security is with the rest of the portfolio, the greater the diversification
benefit it generates (and, by the same principle, the greater the cost associated with divesting that
security). We analyzed the correlations between stocks in the energy sector – i.e., those stocks
most likely to be targets for divestment – and stocks in other sectors over the 50-year time frame
1965-2014. Claims that the performance costs of divestment are low typically focus on shorter
time frames which can generate misleading results.22
14. Our data source on historical equity returns is the CRSP US Stock database,
which is widely used in the academic community to study stock returns. In particular, this
database contains all securities whose primary listings are on the NYSE, NYSE MKT (formerly
known as Amex), NASDAQ, and ARCA exchanges. We included in our analysis all such
securities that are assigned an SIC industry code by CRSP, using the most recent SIC code
assigned to the security.
15. We identified each SIC code with one of 10 industry sectors, including the energy
sector, based on the classification used in Fama and French (1997), updated to the current stock
listings.23 For each of the 10 sectors, we constructed a value-weighted index of all the stocks in
our data and tracked those indices each day during the 50-year period 1965-2014.
22. For example, in the aforementioned New York Times editorial, the author claims that “[s]ome research
suggests that endowments would have performed better over the past decade had they excluded fossil-fuel companies.” Evan J. Mandery (2014) “The Missing Campus Climate Debate,” New York Times, November 2, 2014.
23. Eugene F. Fama and Kenneth R. French (1997) “Industry Costs of Equity,” Journal of Financial Economics, 43(2):153-93. An update of this classification is provided at http://mba.tuck.dartmouth.edu/pages/faculty/ken.french/data_library.html.

8
16. The standard measure of correlation is the correlation coefficient, which ranges
between -1.0 and +1.0.24 A correlation coefficient of -1.0 indicates a security that is perfectly
negatively correlated with the portfolio, such that whenever the portfolio’s value increases, the
security in question declines proportionally in value (and vice-versa). A correlation coefficient
of +1.0 indicates a security that is perfectly positively correlated with the portfolio, such that
whenever the portfolio’s value increases, the security in question also increases proportionally in
value (and vice-versa). A correlation coefficient of 0.0 means there is no statistical relationship
between the portfolio’s return and the return of the security in question.
17. For each of the ten sectors, we created a value-weighted stock price index for
stocks in that sector and another value-weighted index of all stocks in the other nine sectors, and
calculated the correlation between the returns of these two indices over the 1965-2014 period.
Exhibit A shows the correlations between each sector and the rest of the market. Of the ten
sectors, the energy sector has the lowest correlation with all other sectors, and therefore
the largest potential diversification benefits relative to the other nine sectors. Moreover, the
sector with the second lowest correlation with other sectors is the utility sector, another sector
that includes many likely fossil fuel divestment targets. These results indicate the potential for
substantial diversification costs associated with fossil fuel divestment.
18. To further quantify these costs, we also undertook an analysis of the reduction in
the average return an investor who divested from the energy sector would have received over the
1965-2014 period, relative to the average return received by an investor who did not divest.
Obviously, investors hold many different portfolios, and as discussed in the following section,
24. Burton G. Malkiel (2011) A Random Walk Down Wall Street: The Time-Tested Strategy for Successful
Investing, W.W. Norton & Co., at p. 206.

9
there are numerous ways an investor could implement fossil fuel divestment. It would be
impossible to precisely quantify the value of diversification for every possible investor and every
possible divestment strategy. However, as a rough gauge of the overall magnitude of
diversification costs, we estimated the reduction in returns to an investor who held the “market
portfolio” – i.e., the average equity investor in the market.
19. We also considered what is likely among the simplest and lowest compliance-cost
strategies for divestment, namely excluding from the portfolio any stock of a company in the
energy sector, as defined above. It is possible (although far from certain) that a more fine-tuned
divestment strategy that distinguished between different companies within this sector, or which
also identified select companies from other sectors like the auto industry, could have lower
diversification losses, but, as discussed in the following section, compliance costs for such a
strategy would also be higher.
20. Because returns on equities vary substantially over short periods of time, we
analyzed the effect of divestiture over a very long historical period – as noted above, the fifty
years from 1965 to 2014. It is possible that the future benefits of diversification will be larger or
smaller than past effects, and moreover, the impact of divestiture can vary substantially
depending on whether an investor happens to make trades during a downswing or upswing in the
market or energy sector. Recent changes in global energy markets have exerted significant
downward pressure on fossil fuel prices. For example, the Brent Crude Oil Index declined by
nearly 50 percent from June 2014 to December 2014. As would be expected, these declines in
underlying commodity prices have also been associated with declines in the share prices for
many public companies engaged in the exploration and production of fossil fuels (the S&P 500
Energy Index declined by approximately 15% from June 2014 to December 2014). The fifty
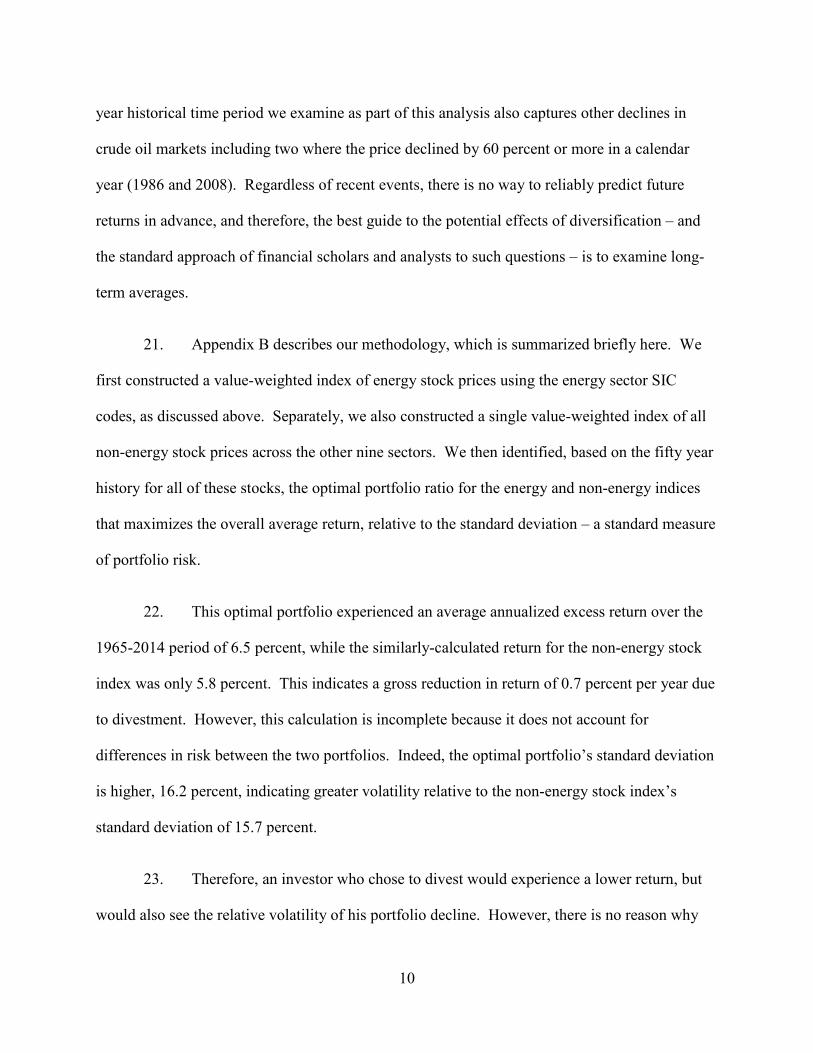
10
year historical time period we examine as part of this analysis also captures other declines in
crude oil markets including two where the price declined by 60 percent or more in a calendar
year (1986 and 2008). Regardless of recent events, there is no way to reliably predict future
returns in advance, and therefore, the best guide to the potential effects of diversification – and
the standard approach of financial scholars and analysts to such questions – is to examine long-
term averages.
21. Appendix B describes our methodology, which is summarized briefly here. We
first constructed a value-weighted index of energy stock prices using the energy sector SIC
codes, as discussed above. Separately, we also constructed a single value-weighted index of all
non-energy stock prices across the other nine sectors. We then identified, based on the fifty year
history for all of these stocks, the optimal portfolio ratio for the energy and non-energy indices
that maximizes the overall average return, relative to the standard deviation – a standard measure
of portfolio risk.
22. This optimal portfolio experienced an average annualized excess return over the
1965-2014 period of 6.5 percent, while the similarly-calculated return for the non-energy stock
index was only 5.8 percent. This indicates a gross reduction in return of 0.7 percent per year due
to divestment. However, this calculation is incomplete because it does not account for
differences in risk between the two portfolios. Indeed, the optimal portfolio’s standard deviation
is higher, 16.2 percent, indicating greater volatility relative to the non-energy stock index’s
standard deviation of 15.7 percent.
23. Therefore, an investor who chose to divest would experience a lower return, but
would also see the relative volatility of his portfolio decline. However, there is no reason why
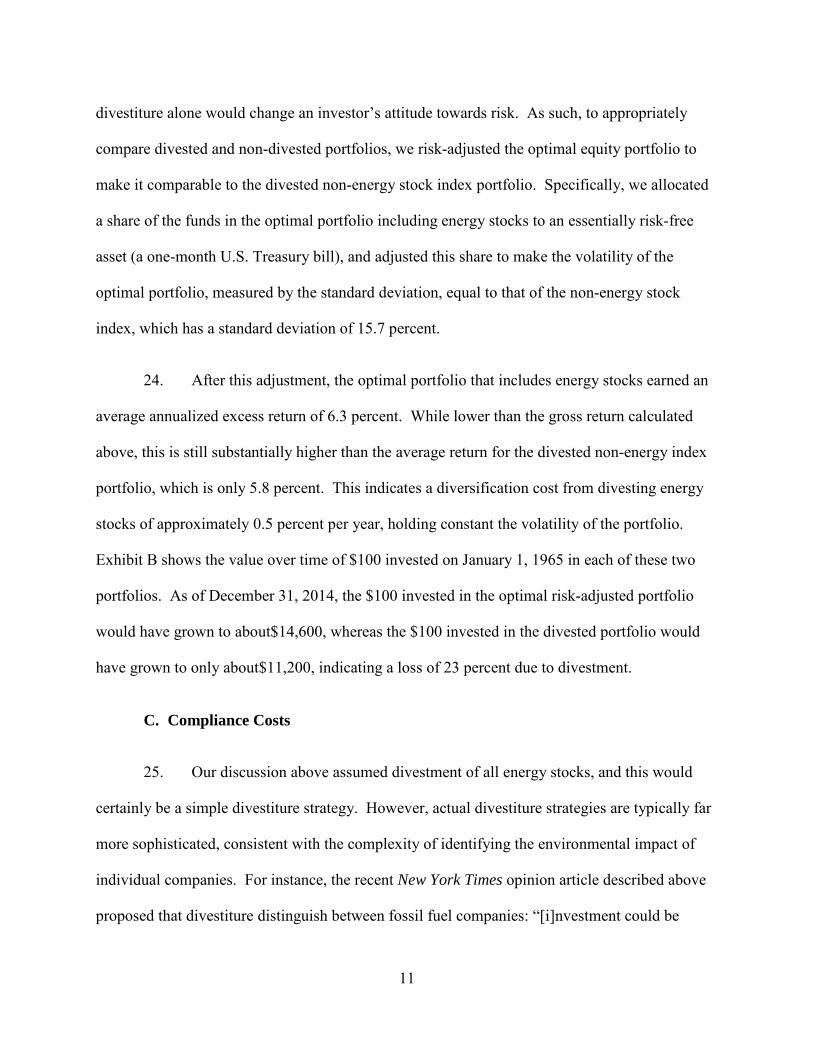
11
divestiture alone would change an investor’s attitude towards risk. As such, to appropriately
compare divested and non-divested portfolios, we risk-adjusted the optimal equity portfolio to
make it comparable to the divested non-energy stock index portfolio. Specifically, we allocated
a share of the funds in the optimal portfolio including energy stocks to an essentially risk-free
asset (a one-month U.S. Treasury bill), and adjusted this share to make the volatility of the
optimal portfolio, measured by the standard deviation, equal to that of the non-energy stock
index, which has a standard deviation of 15.7 percent.
24. After this adjustment, the optimal portfolio that includes energy stocks earned an
average annualized excess return of 6.3 percent. While lower than the gross return calculated
above, this is still substantially higher than the average return for the divested non-energy index
portfolio, which is only 5.8 percent. This indicates a diversification cost from divesting energy
stocks of approximately 0.5 percent per year, holding constant the volatility of the portfolio.
Exhibit B shows the value over time of $100 invested on January 1, 1965 in each of these two
portfolios. As of December 31, 2014, the $100 invested in the optimal risk-adjusted portfolio
would have grown to about$14,600, whereas the $100 invested in the divested portfolio would
have grown to only about$11,200, indicating a loss of 23 percent due to divestment.
C. Compliance Costs
25. Our discussion above assumed divestment of all energy stocks, and this would
certainly be a simple divestiture strategy. However, actual divestiture strategies are typically far
more sophisticated, consistent with the complexity of identifying the environmental impact of
individual companies. For instance, the recent New York Times opinion article described above
proposed that divestiture distinguish between fossil fuel companies: “[i]nvestment could be
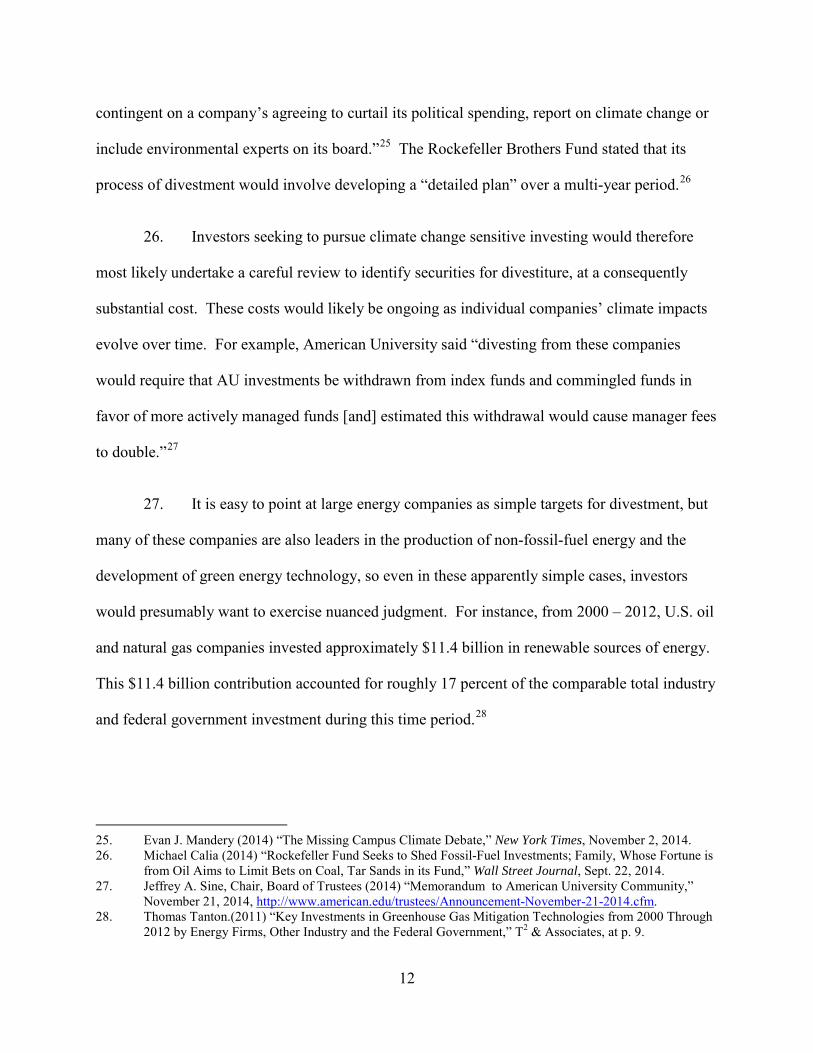
12
contingent on a company’s agreeing to curtail its political spending, report on climate change or
include environmental experts on its board.”25 The Rockefeller Brothers Fund stated that its
process of divestment would involve developing a “detailed plan” over a multi-year period.26
26. Investors seeking to pursue climate change sensitive investing would therefore
most likely undertake a careful review to identify securities for divestiture, at a consequently
substantial cost. These costs would likely be ongoing as individual companies’ climate impacts
evolve over time. For example, American University said “divesting from these companies
would require that AU investments be withdrawn from index funds and commingled funds in
favor of more actively managed funds [and] estimated this withdrawal would cause manager fees
to double.”27
27. It is easy to point at large energy companies as simple targets for divestment, but
many of these companies are also leaders in the production of non-fossil-fuel energy and the
development of green energy technology, so even in these apparently simple cases, investors
would presumably want to exercise nuanced judgment. For instance, from 2000 – 2012, U.S. oil
and natural gas companies invested approximately $11.4 billion in renewable sources of energy.
This $11.4 billion contribution accounted for roughly 17 percent of the comparable total industry
and federal government investment during this time period.28
25. Evan J. Mandery (2014) “The Missing Campus Climate Debate,” New York Times, November 2, 2014. 26. Michael Calia (2014) “Rockefeller Fund Seeks to Shed Fossil-Fuel Investments; Family, Whose Fortune is
from Oil Aims to Limit Bets on Coal, Tar Sands in its Fund,” Wall Street Journal, Sept. 22, 2014. 27. Jeffrey A. Sine, Chair, Board of Trustees (2014) “Memorandum to American University Community,”
November 21, 2014, http://www.american.edu/trustees/Announcement-November-21-2014.cfm. 28. Thomas Tanton.(2011) “Key Investments in Greenhouse Gas Mitigation Technologies from 2000 Through
2012 by Energy Firms, Other Industry and the Federal Government,” T2 & Associates, at p. 9.
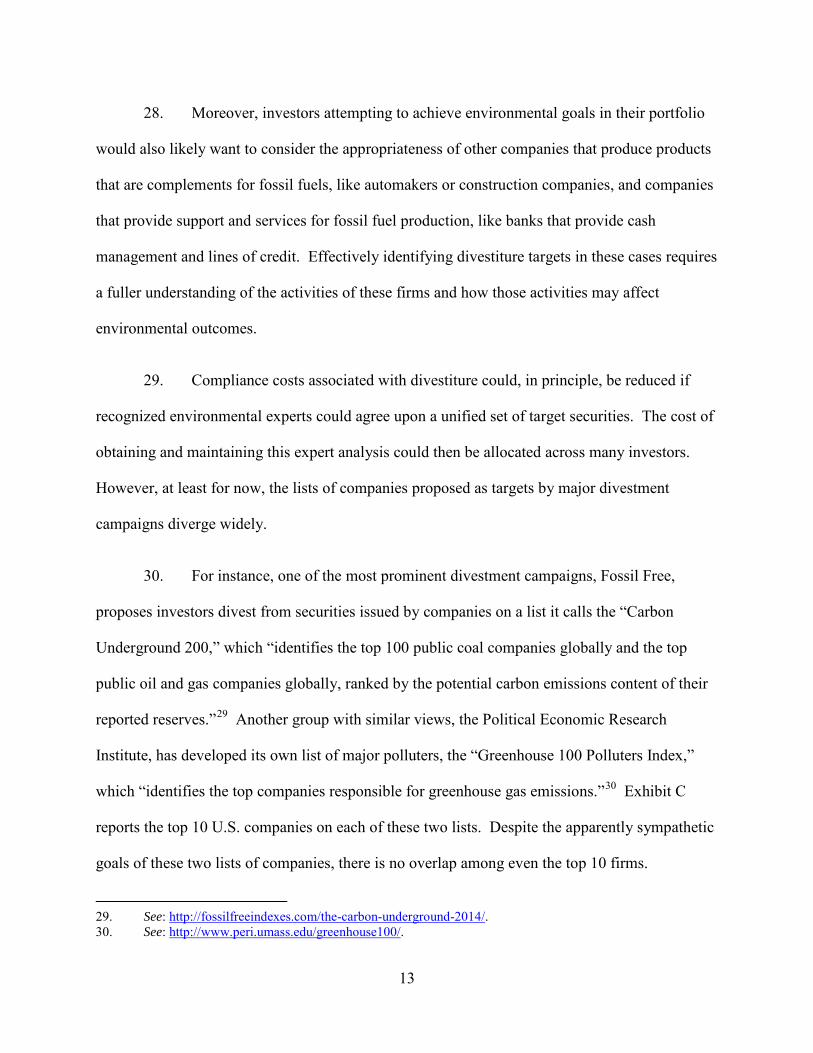
13
28. Moreover, investors attempting to achieve environmental goals in their portfolio
would also likely want to consider the appropriateness of other companies that produce products
that are complements for fossil fuels, like automakers or construction companies, and companies
that provide support and services for fossil fuel production, like banks that provide cash
management and lines of credit. Effectively identifying divestiture targets in these cases requires
a fuller understanding of the activities of these firms and how those activities may affect
environmental outcomes.
29. Compliance costs associated with divestiture could, in principle, be reduced if
recognized environmental experts could agree upon a unified set of target securities. The cost of
obtaining and maintaining this expert analysis could then be allocated across many investors.
However, at least for now, the lists of companies proposed as targets by major divestment
campaigns diverge widely.
30. For instance, one of the most prominent divestment campaigns, Fossil Free,
proposes investors divest from securities issued by companies on a list it calls the “Carbon
Underground 200,” which “identifies the top 100 public coal companies globally and the top
public oil and gas companies globally, ranked by the potential carbon emissions content of their
reported reserves.”29 Another group with similar views, the Political Economic Research
Institute, has developed its own list of major polluters, the “Greenhouse 100 Polluters Index,”
which “identifies the top companies responsible for greenhouse gas emissions.”30 Exhibit C
reports the top 10 U.S. companies on each of these two lists. Despite the apparently sympathetic
goals of these two lists of companies, there is no overlap among even the top 10 firms.
29. See: http://fossilfreeindexes.com/the-carbon-underground-2014/. 30. See: http://www.peri.umass.edu/greenhouse100/.
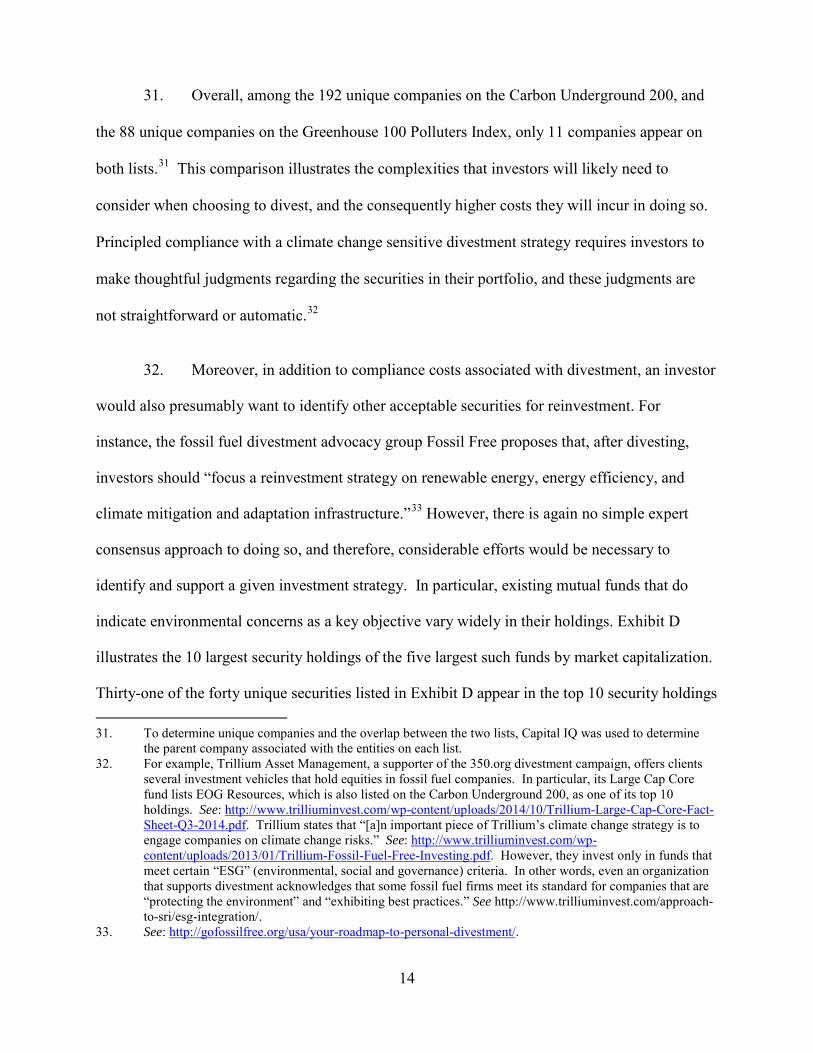
14
31. Overall, among the 192 unique companies on the Carbon Underground 200, and
the 88 unique companies on the Greenhouse 100 Polluters Index, only 11 companies appear on
both lists.31 This comparison illustrates the complexities that investors will likely need to
consider when choosing to divest, and the consequently higher costs they will incur in doing so.
Principled compliance with a climate change sensitive divestment strategy requires investors to
make thoughtful judgments regarding the securities in their portfolio, and these judgments are
not straightforward or automatic.32
32. Moreover, in addition to compliance costs associated with divestment, an investor
would also presumably want to identify other acceptable securities for reinvestment. For
instance, the fossil fuel divestment advocacy group Fossil Free proposes that, after divesting,
investors should “focus a reinvestment strategy on renewable energy, energy efficiency, and
climate mitigation and adaptation infrastructure.”33 However, there is again no simple expert
consensus approach to doing so, and therefore, considerable efforts would be necessary to
identify and support a given investment strategy. In particular, existing mutual funds that do
indicate environmental concerns as a key objective vary widely in their holdings. Exhibit D
illustrates the 10 largest security holdings of the five largest such funds by market capitalization.
Thirty-one of the forty unique securities listed in Exhibit D appear in the top 10 security holdings 31. To determine unique companies and the overlap between the two lists, Capital IQ was used to determine
the parent company associated with the entities on each list. 32. For example, Trillium Asset Management, a supporter of the 350.org divestment campaign, offers clients
several investment vehicles that hold equities in fossil fuel companies. In particular, its Large Cap Core fund lists EOG Resources, which is also listed on the Carbon Underground 200, as one of its top 10 holdings. See: http://www.trilliuminvest.com/wp-content/uploads/2014/10/Trillium-Large-Cap-Core-Fact-Sheet-Q3-2014.pdf. Trillium states that “[a]n important piece of Trillium’s climate change strategy is to engage companies on climate change risks.” See: http://www.trilliuminvest.com/wp-content/uploads/2013/01/Trillium-Fossil-Fuel-Free-Investing.pdf. However, they invest only in funds that meet certain “ESG” (environmental, social and governance) criteria. In other words, even an organization that supports divestment acknowledges that some fossil fuel firms meet its standard for companies that are “protecting the environment” and “exhibiting best practices.” See http://www.trilliuminvest.com/approach-to-sri/esg-integration/.
33. See: http://gofossilfree.org/usa/your-roadmap-to-personal-divestment/.
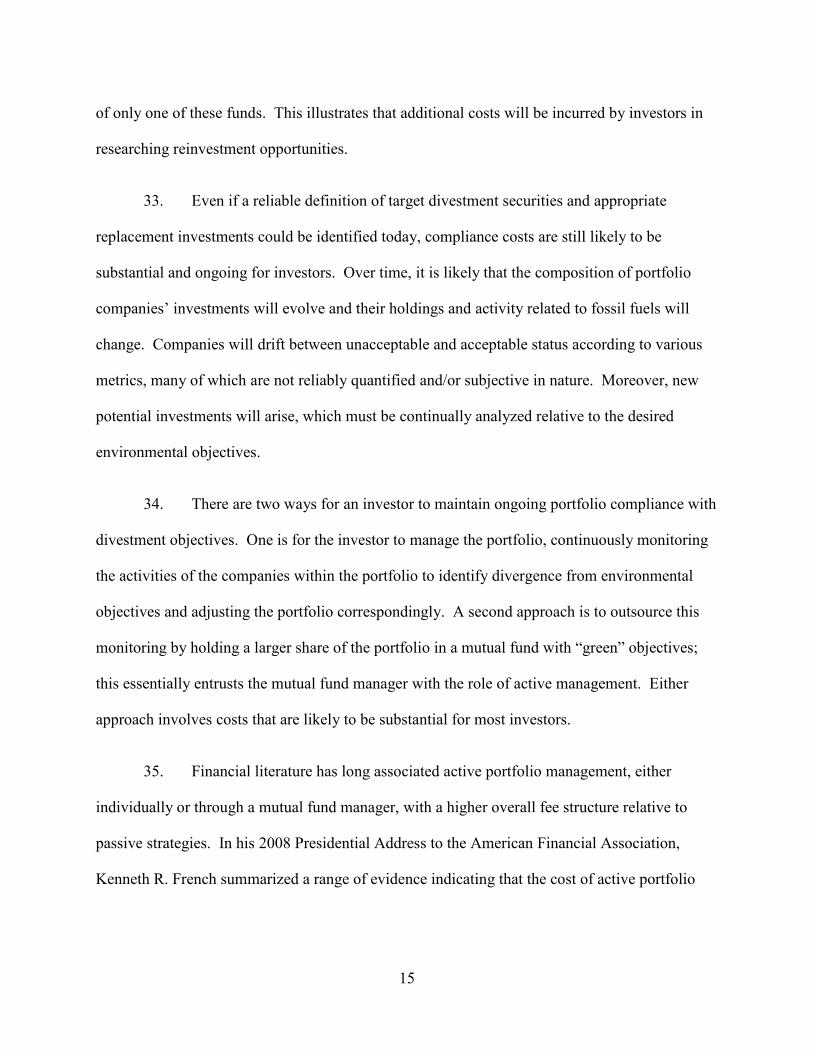
15
of only one of these funds. This illustrates that additional costs will be incurred by investors in
researching reinvestment opportunities.
33. Even if a reliable definition of target divestment securities and appropriate
replacement investments could be identified today, compliance costs are still likely to be
substantial and ongoing for investors. Over time, it is likely that the composition of portfolio
companies’ investments will evolve and their holdings and activity related to fossil fuels will
change. Companies will drift between unacceptable and acceptable status according to various
metrics, many of which are not reliably quantified and/or subjective in nature. Moreover, new
potential investments will arise, which must be continually analyzed relative to the desired
environmental objectives.
34. There are two ways for an investor to maintain ongoing portfolio compliance with
divestment objectives. One is for the investor to manage the portfolio, continuously monitoring
the activities of the companies within the portfolio to identify divergence from environmental
objectives and adjusting the portfolio correspondingly. A second approach is to outsource this
monitoring by holding a larger share of the portfolio in a mutual fund with “green” objectives;
this essentially entrusts the mutual fund manager with the role of active management. Either
approach involves costs that are likely to be substantial for most investors.
35. Financial literature has long associated active portfolio management, either
individually or through a mutual fund manager, with a higher overall fee structure relative to
passive strategies. In his 2008 Presidential Address to the American Financial Association,
Kenneth R. French summarized a range of evidence indicating that the cost of active portfolio
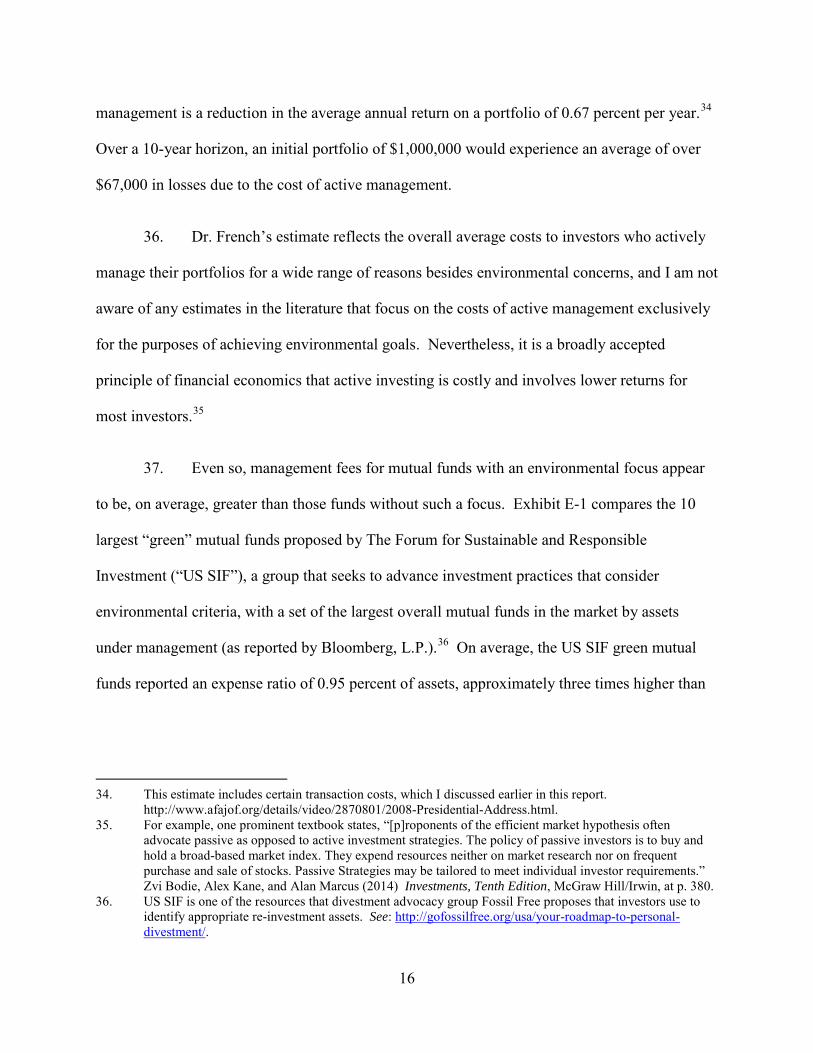
16
management is a reduction in the average annual return on a portfolio of 0.67 percent per year.34
Over a 10-year horizon, an initial portfolio of $1,000,000 would experience an average of over
$67,000 in losses due to the cost of active management.
36. Dr. French’s estimate reflects the overall average costs to investors who actively
manage their portfolios for a wide range of reasons besides environmental concerns, and I am not
aware of any estimates in the literature that focus on the costs of active management exclusively
for the purposes of achieving environmental goals. Nevertheless, it is a broadly accepted
principle of financial economics that active investing is costly and involves lower returns for
most investors.35
37. Even so, management fees for mutual funds with an environmental focus appear
to be, on average, greater than those funds without such a focus. Exhibit E-1 compares the 10
largest “green” mutual funds proposed by The Forum for Sustainable and Responsible
Investment (“US SIF”), a group that seeks to advance investment practices that consider
environmental criteria, with a set of the largest overall mutual funds in the market by assets
under management (as reported by Bloomberg, L.P.).36 On average, the US SIF green mutual
funds reported an expense ratio of 0.95 percent of assets, approximately three times higher than
34. This estimate includes certain transaction costs, which I discussed earlier in this report.
http://www.afajof.org/details/video/2870801/2008-Presidential-Address.html. 35. For example, one prominent textbook states, “[p]roponents of the efficient market hypothesis often
advocate passive as opposed to active investment strategies. The policy of passive investors is to buy and hold a broad-based market index. They expend resources neither on market research nor on frequent purchase and sale of stocks. Passive Strategies may be tailored to meet individual investor requirements.” Zvi Bodie, Alex Kane, and Alan Marcus (2014) Investments, Tenth Edition, McGraw Hill/Irwin, at p. 380.
36. US SIF is one of the resources that divestment advocacy group Fossil Free proposes that investors use to identify appropriate re-investment assets. See: http://gofossilfree.org/usa/your-roadmap-to-personal-divestment/.
17
the average expense ratio of the 10 largest mutual funds, which was reported at only 0.32 percent
over the same period (see Exhibit E-2).37
D. The overall cost of divestment is substantial.
38. While each of the individual costs discussed above is meaningful in isolation,
taken together these costs have the potential to substantially impair the future value of
endowments and other investor funds. For example, a 0.5 percent decrease in portfolio
performance impact on the estimated $456 billion in university endowment assets would
decrease annual growth by over $2 billion annually.38 An increase in compliance costs of 1
percent on the estimated $23 billion of those endowments invested in energy stocks would
further decrease annual growth by an additional $230 million.39 A reduction in wealth of this
magnitude could have a substantial impact on the ability of universities to achieve their goals,
such as the research, scholarships and services that universities are able to offer. As noted by
Harvard President Drew Faust,
“Significantly constraining investment options risks significantly constraining investment returns. The endowment provides more than one-third of the funds we expend on University activities each year. Its strength and growth are crucial to our institutional ambitions — to the support we can offer students and faculty, to the intellectual opportunities we can provide, to the research we can advance.”40
37. These calculations are based on the most recent data provided by Morningstar. 38. See, “U.S. and Canadian Institutions Listed by Fiscal Year 2013 Endowment Market Value and Change in
Endowment Market Value from FY 2012 to FY 2013,” Revised February 2014 (http://www.nacubo.org/Documents/EndowmentFiles/2013NCSEEndowmentMarket%20ValuesRevisedFeb142014.pdf).
39. Id.,.and The 2013 Commonwealth Study of College Endowments. 40. Drew Faust, Harvard University Office of the President (2013) “Fossil Fuel Divestment Statement,”
October 3, 2013, http://www.harvard.edu/president/fossil-fuels.
18
III. Divestiture is unlikely to impact equity values of divested companies or achieve other goals.
A. Divestiture is unlikely to impact equity values of divested companies.
39. The ostensible purpose of divestment would be to place capital market pressure
on certain companies to reduce or change business operations that activists believe may harm the
environment or impact climate change. However, basic and widely-accepted financial principles
indicate that divestment is in fact highly unlikely to have any substantial effect on these
companies.
40. Financial analysts typically represent the price of a stock as the present value of
the expected returns to the company’s investments.41 In highly liquid markets, a company’s
stock price cannot diverge in any persistent, substantial way from this fundamental value,
because otherwise, investors would have the opportunity to earn greater returns by buying or
selling the stock, a process known as arbitrage. As one textbook puts it, “[t]he idea that market
prices will move to rule out arbitrage opportunities is perhaps the most fundamental concept in
capital market theory.”42
41. This relationship between a company’s stock price and its fundamental value in
liquid markets means that divestment campaigns cannot materially affect stock prices and
therefore cannot materially change a company’s incentives to undertake certain activities or other
investors’ incentives to hold these companies in their portfolios. As an example, suppose a
particular company’s stock price is currently $100. While individual investors can and do differ
41. Richard A. Brealey, Stewart C. Myers, and Franklin Allen (2014) Principles of Corporate Finance (11th
ed.), McGraw-Hill Irwin, pp. 80-84. 42. Zvi Bodie, Alex Kane, and Alan J. Marcus (2014) Investments, Tenth Edition, McGraw-Hill Irwin, at p.
328. See also Hal R. Varian (2014) Intermediate Microeconomics (9th ed.), W.W. Norton & Co., at p. 205 (stating, “[a]s long as there are people around looking for ‘sure things’ we would expect that well-functioning markets should quickly eliminate any opportunities for arbitrage.”)
19
in their beliefs about a company’s future profitability, the $100 price can be thought of as a
market consensus view about the value of future profits and dividends for the company.
42. An investor who wishes to divest his portfolio of this stock would offer it for sale
and (putting aside the bid-ask spread) be able to sell the stock for approximately $100 per share,
with no reduction in the stock price, because if the stock price did decline, say to $95, other
investors would be able to earn $5 per share in arbitrage profits. This would lead other investors
to bid up the price back to $100. This is the simple logic of arbitrage that implies that divestiture
cannot materially reduce equity values.43
43. As described above, institutions currently engaged in fossil fuel divestment are
focused among the educational, philanthropic, and government sectors, and these institutions
hold a very small share of stock in the targeted companies. Even a substantially more
widespread adoption of divestment policies by these types of institutions would therefore have
little or no effect on share prices. As noted above, for instance, available estimates indicate that
college and university endowments have roughly $23 billion invested in energy and natural
resources. This is less than 1 percent of the more than $3.8 trillion in total current market
capitalization of the 200 companies on the Carbon Underground 200.44
B. Prior divestment campaigns have not impacted stock valuations.
44. The conclusion that divestiture campaigns are unlikely to affect targeted
companies is confirmed by the experience of prior campaigns. During the 1980s, a major
43. In theory, it could be possible for divestment to affect the price of a security that was highly illiquid, because of the lack of arbitrageurs. However, the stocks of most major companies targeted by divestment campaigns are traded on exchanges and have liquid markets for their equity. 44. Total current market capitalization is calculated as of year-end (12/31/2014), sourced from available data
on Bloomberg, L.P.
20
coordinated divestiture campaign targeted securities issued by companies with interests in South
Africa, with the goal of supporting an end to Apartheid. By 1986, over 100 colleges and
universities had adopted some form of South African divestment, as had the pension funds of
several states, including New Jersey and California, and major companies, including Lotus
Development and Levi-Strauss.45 In addition to being widely adopted by many institutional
investors, South African divestment is a far more narrowly-defined investment strategy with far
less controversial goals than fossil fuel divestment. Therefore, South African divestment would
be more likely to succeed in affecting change at the targeted companies.
45. Nevertheless, available evidence indicates that South African divestment had little
or no impact on the stock prices of targeted companies. A 1996 article used an event study
methodology to investigate whether South Africa divestiture announcements by major
institutional investors, including municipalities, states, and universities, impacted stock returns of
firms that chose to maintain their presence in South Africa during the 1983-1989 period.46 The
authors concluded that “[i]t appears that portfolio divestment announcements by major pension
funds and endowment associations had no important impact on stock prices of firms doing
business in South Africa.”47
46. Another study examined the stock price reactions of firms with high levels of
exposure in South Africa on 21 dates when pension funds announced policies of divestment.48
45. William H. Kaempfer, James A. Lehman, and Anton D. Lowenberg (1987) “Divestment, Investment
Sanctions, and Disinvestment: An Evaluation of Anti-Apartheid Policy Instruments,” International Organization 41(3):457-73, at 460-461.
46. Laurian Casson Lyttle and O. Maurice Joy (1996) “The Stock Market Impact of Social Pressure: The South African Divestment Case,” Quarterly Review of Economics and Finance, 36(4):507-527.
47. Id., at 519. 48. Siew Hong Teoh, Ivo Welch, and C. Paul Wazzan (1999) “The Effect of Socially Activist Investment
Policies on the Financial Markets: Evidence from the South African Boycott,” Journal of Business 72(1):35-89.
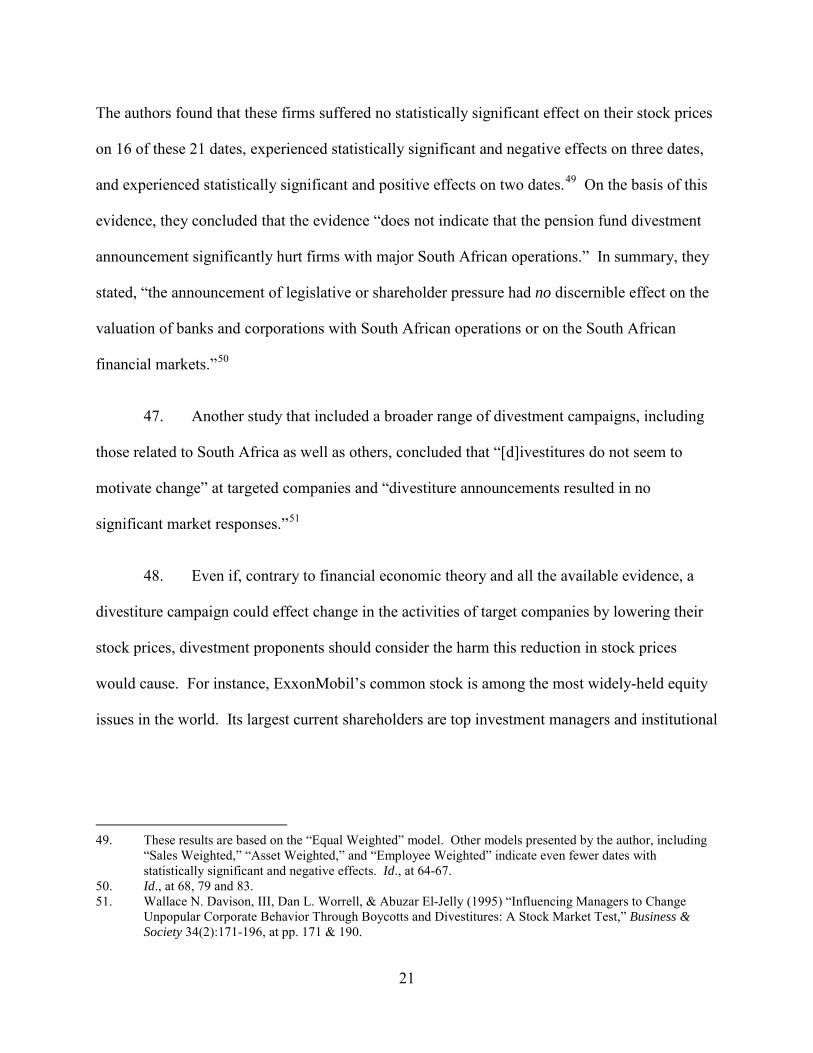
21
The authors found that these firms suffered no statistically significant effect on their stock prices
on 16 of these 21 dates, experienced statistically significant and negative effects on three dates,
and experienced statistically significant and positive effects on two dates.49 On the basis of this
evidence, they concluded that the evidence “does not indicate that the pension fund divestment
announcement significantly hurt firms with major South African operations.” In summary, they
stated, “the announcement of legislative or shareholder pressure had no discernible effect on the
valuation of banks and corporations with South African operations or on the South African
financial markets.”50
47. Another study that included a broader range of divestment campaigns, including
those related to South Africa as well as others, concluded that “[d]ivestitures do not seem to
motivate change” at targeted companies and “divestiture announcements resulted in no
significant market responses.”51
48. Even if, contrary to financial economic theory and all the available evidence, a
divestiture campaign could effect change in the activities of target companies by lowering their
stock prices, divestment proponents should consider the harm this reduction in stock prices
would cause. For instance, ExxonMobil’s common stock is among the most widely-held equity
issues in the world. Its largest current shareholders are top investment managers and institutional
49. These results are based on the “Equal Weighted” model. Other models presented by the author, including
“Sales Weighted,” “Asset Weighted,” and “Employee Weighted” indicate even fewer dates with statistically significant and negative effects. Id., at 64-67.
50. Id., at 68, 79 and 83. 51. Wallace N. Davison, III, Dan L. Worrell, & Abuzar El-Jelly (1995) “Influencing Managers to Change
Unpopular Corporate Behavior Through Boycotts and Divestitures: A Stock Market Test,” Business & Society 34(2):171-196, at pp. 171 & 190.
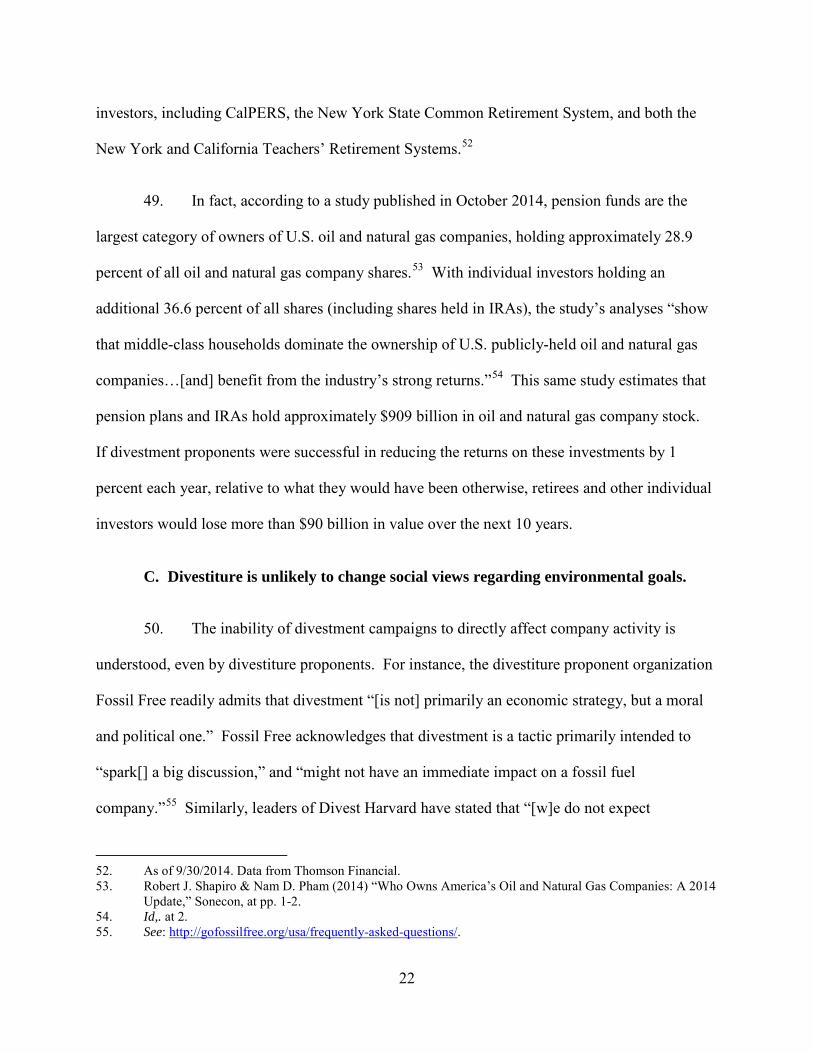
22
investors, including CalPERS, the New York State Common Retirement System, and both the
New York and California Teachers’ Retirement Systems.52
49. In fact, according to a study published in October 2014, pension funds are the
largest category of owners of U.S. oil and natural gas companies, holding approximately 28.9
percent of all oil and natural gas company shares.53 With individual investors holding an
additional 36.6 percent of all shares (including shares held in IRAs), the study’s analyses “show
that middle-class households dominate the ownership of U.S. publicly-held oil and natural gas
companies…[and] benefit from the industry’s strong returns.”54 This same study estimates that
pension plans and IRAs hold approximately $909 billion in oil and natural gas company stock.
If divestment proponents were successful in reducing the returns on these investments by 1
percent each year, relative to what they would have been otherwise, retirees and other individual
investors would lose more than $90 billion in value over the next 10 years.
C. Divestiture is unlikely to change social views regarding environmental goals.
50. The inability of divestment campaigns to directly affect company activity is
understood, even by divestiture proponents. For instance, the divestiture proponent organization
Fossil Free readily admits that divestment “[is not] primarily an economic strategy, but a moral
and political one.” Fossil Free acknowledges that divestment is a tactic primarily intended to
“spark[] a big discussion,” and “might not have an immediate impact on a fossil fuel
company.”55 Similarly, leaders of Divest Harvard have stated that “[w]e do not expect
52. As of 9/30/2014. Data from Thomson Financial. 53. Robert J. Shapiro & Nam D. Pham (2014) “Who Owns America’s Oil and Natural Gas Companies: A 2014
Update,” Sonecon, at pp. 1-2. 54. Id,. at 2. 55. See: http://gofossilfree.org/usa/frequently-asked-questions/.

23
divestment to have a financial impact on fossil fuel companies … Divestment calls on citizens to
build a powerful climate movement and pressure elected representatives to enact meaningful
legislation.”56
51. Obviously, climate change is one of the most controversial issues in public
discourse today, and the range of opinions about it is very wide. Even ignoring the broader
range of opinions and focusing solely on the economic debate, a recent survey of the economic
literature concluded there was “considerable uncertainty about the economic impact of climate
change,” and “large estimated uncertainty about the social cost of carbon.”57 Of course, even if
these debates could be resolved, there would still be vociferious debate about the appropriate role
of governments and private actors in policymaking. No matter where one stands on the science,
economics, and policy of the climate change debate, there is no basis to believe that divestment
will help resolve these issues or push the debate materially in any productive direction.
52. Even for those strong believers in the need to address climate change, the
divestiture proposition serves as more of a distraction than a contributor to public discourse
designed to further real, meaningful solutions to the problem. As one such strong proponent, the
President of Harvard University, has recognized:
“While I share their belief in the importance of addressing climate change, I do not believe, nor do my colleagues on the Corporation, that university divestment from the fossil fuel industry is warranted or wise…Because I am deeply concerned about climate change, I also feel compelled to ask whether a focus on
56. Chloe Maxmin, Hannah Borowsky and StudentNation (2014) “The Time to Divest: A Response to Harvard
President Drew Faust,” The Nation, October 15, 2013. 57. Richard S. J. Toll (2009) “The Economic Effects of Climate Change,” Journal of Economic Perspectives
23(2):29-51, at pp37, & 42.
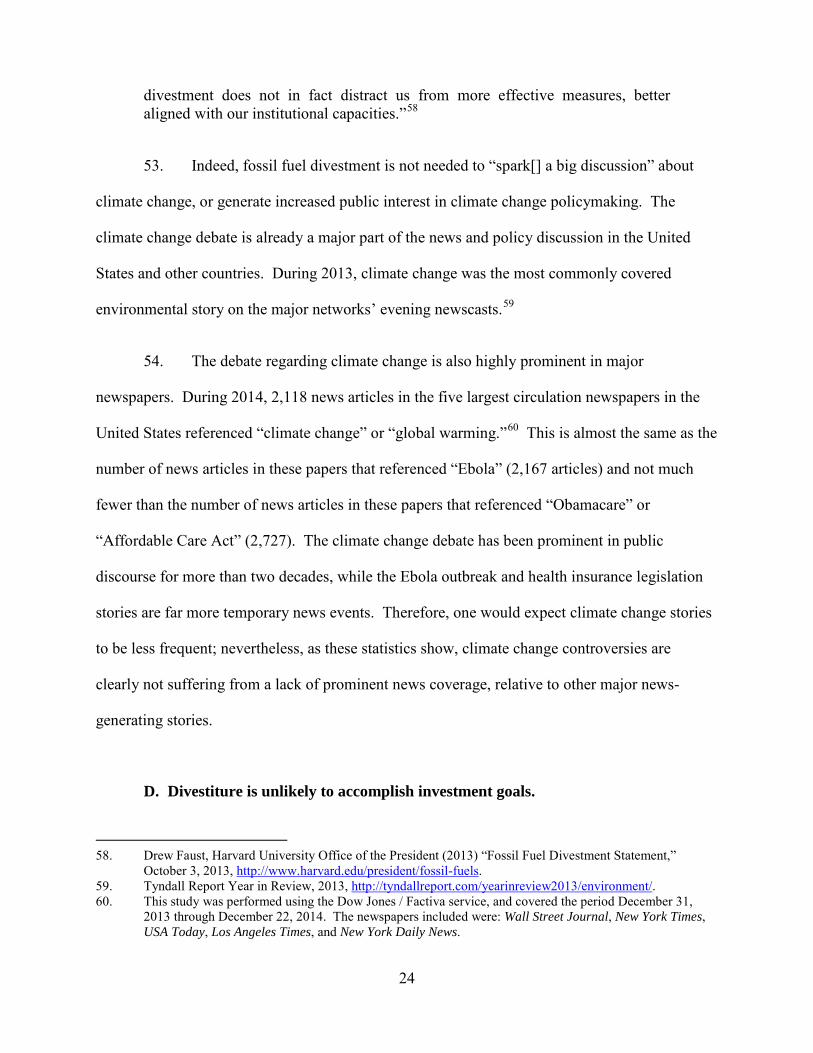
24
divestment does not in fact distract us from more effective measures, better aligned with our institutional capacities.”58
53. Indeed, fossil fuel divestment is not needed to “spark[] a big discussion” about
climate change, or generate increased public interest in climate change policymaking. The
climate change debate is already a major part of the news and policy discussion in the United
States and other countries. During 2013, climate change was the most commonly covered
environmental story on the major networks’ evening newscasts.59
54. The debate regarding climate change is also highly prominent in major
newspapers. During 2014, 2,118 news articles in the five largest circulation newspapers in the
United States referenced “climate change” or “global warming.”60 This is almost the same as the
number of news articles in these papers that referenced “Ebola” (2,167 articles) and not much
fewer than the number of news articles in these papers that referenced “Obamacare” or
“Affordable Care Act” (2,727). The climate change debate has been prominent in public
discourse for more than two decades, while the Ebola outbreak and health insurance legislation
stories are far more temporary news events. Therefore, one would expect climate change stories
to be less frequent; nevertheless, as these statistics show, climate change controversies are
clearly not suffering from a lack of prominent news coverage, relative to other major news-
generating stories.
D. Divestiture is unlikely to accomplish investment goals.
58. Drew Faust, Harvard University Office of the President (2013) “Fossil Fuel Divestment Statement,”
October 3, 2013, http://www.harvard.edu/president/fossil-fuels. 59. Tyndall Report Year in Review, 2013, http://tyndallreport.com/yearinreview2013/environment/. 60. This study was performed using the Dow Jones / Factiva service, and covered the period December 31,
2013 through December 22, 2014. The newspapers included were: Wall Street Journal, New York Times, USA Today, Los Angeles Times, and New York Daily News.

25
55. Some proponents of divestment hold that fossil fuel company stocks are likely to
suffer reductions in price over time, and therefore, that divestment is a successful investment
strategy, regardless of its impact on environmental goals. For instance, Fossil Free claims that
“investing in clean energy, efficiency, and other sustainable technologies can be even more
profitable than fossil fuels.”61
56. As discussed above, this claim is demonstrably false over the past 50 years. As
we showed, over the 1965-2014 period, a portfolio including both an energy sector stock index
and non-energy stocks experienced a 0.7 percent higher gross return, and a 0.5 percent higher
risk-adjusted return, relative to a divested portfolio of only the non-energy stock index.
57. Of course, everyone is entitled to their own opinion about the future course of
security prices, and it is certainly possible that, over some period, stocks of fossil fuel companies
will underperform other stocks. But unless an investor has private information about these
companies which is unavailable to other market participants (and I am not aware that any
divestment proponents claim they do have such private information), there is no reason to
assume that their current stock prices are “too high” or that they will inevitably decline.62
58. While there is a long-running and wide-ranging debate among academics about
whether securities markets are “efficient” in one form or another, there is nevertheless
widespread agreement that simple rules like “sell fossil fuel stocks” are not recipes for making
61. http://gofossilfree.org/usa/frequently-asked-questions/. 62. This applies to the discussion among some divestment advocates of “stranded assets,” i.e., company assets
that could become uneconomical to exploit at some point in the future due to changes in market prices or future regulations related to climate change. Divestment advocates do not claim to have private information about these changes in prices or regulations that are not available to the investing public at large; therefore, current security prices already incorporate the market consensus view about stranded assets.

26
money. As one textbook puts it, “[t]he bulk of the evidence, however, suggests that any
supposedly superior investment strategy should be taken with many grains of salt. The market is
competitive enough that only differentially superior information or insight will earn money; the
easy pickings have been picked.”63
IV. Conclusion
59. The economic evidence demonstrates that fossil fuel divestment is a bad idea.
The costs of divestment are clearly substantial. Trading costs like commissions are incurred in
virtually every securities transaction. Costs associated with reductions in diversification are a
bedrock principle of financial economics. Ongoing compliance costs mean that every future
securities transaction will need to be analyzed for its environmental impact. These costs have
real financial impacts on the returns generated by an investment portfolio, and therefore, real
impacts on the ability of an educational institution to achieve its goals.
60. By contrast, any benefits from fossil fuel divestment are likely to be non-existent.
There is no basis to believe that divestment can affect the stock prices or business decisions of
targeted firms. Moreover, there is broad agreement among financial professionals and academics
that simple investment rules like divestment from fossil fuel companies cannot generate superior
returns. Finally, divestment seems unlikely to affect the public debate or provide an effective
tool even for those who strongly feel the need to address climate change.
63. Zvi Bodie, Alex Kane, and Alan J. Marcus (2014) Investments, Tenth Edition, McGraw-Hill Irwin, at p.
380.

Exhibit A: Correlation of Each Sector With Other Nine Sectors
Sector Correlation1. Energy 0.67702. Utilities 0.70463. Healthcare 0.77444. Telecommunications 0.81385. Durables 0.82486. High-Technology 0.82597. Shops 0.86078. Non-Durables 0.86429. Other 0.9077
10. Manufacturing 0.9183
Source: CRSP.
Notes: For each sector, a value-weighted index of all stocks in that sector and a value weighted index of all stocks in the other nine sectors were created. The correlation between the excess returns of those two indices are shown in the Exhibit.

$0
$2,000
$4,000
$6,000
$8,000
$10,000
$12,000
$14,000
$16,000
$18,000
Val
ue o
f $10
0
Exhibit B: Optimal Risk-Adjusted Portfolio vs. Divested Portfolio 1965-2014
Optimal Risk-Adjusted Portfolio Divested PortfolioNotes: [1] The indices are value-weighted by market capitalization. [2] The Optimal Risk-Adjusted Portfolio is comprised of the energy index and 1-month Treasury bill, optimized by matching the standard deviation of the Divested Portfolio. [3] The Divested Portfolio is comprised of only the non-energy index. Sources: CRSP; Kenneth R. French.
As of December 31, 2014 Divested Portfolio: ~$11,200 Optimized Portfolio: ~$14,600 With the same amount of risk as the divested portfolio, the optimized portfolio added an additional $3,400 in return over 50 years.

Exhibit C. Top 10 Coal and Oil & Natural Gas Companies
Carbon Underground 200 Greenhouse 100 Polluters Index1. Peabody Energy American Electric Power2. ExxonMobil Duke Energy3. Arch Coal Southern Company4. Alpha Natural Resources Berkshire Hathaway5. Chevron Ameren6. Cloud Peak Energy Luminant7. ConocoPhillips FirstEnergy8. Consol Energy AES9. Nacco Industries Xcel Energy
10. Alliance Resource Partners Dominion Resources
Notes:
[2] All non-corporate entities have been removed.
Source: Carbon Underground 200; Bloomberg, L.P.; Political Economy Research Institute.
[1] The Carbon Underground 200 and Greenhouse 100 Polluters Index have been restricted to include only U.S. companies.
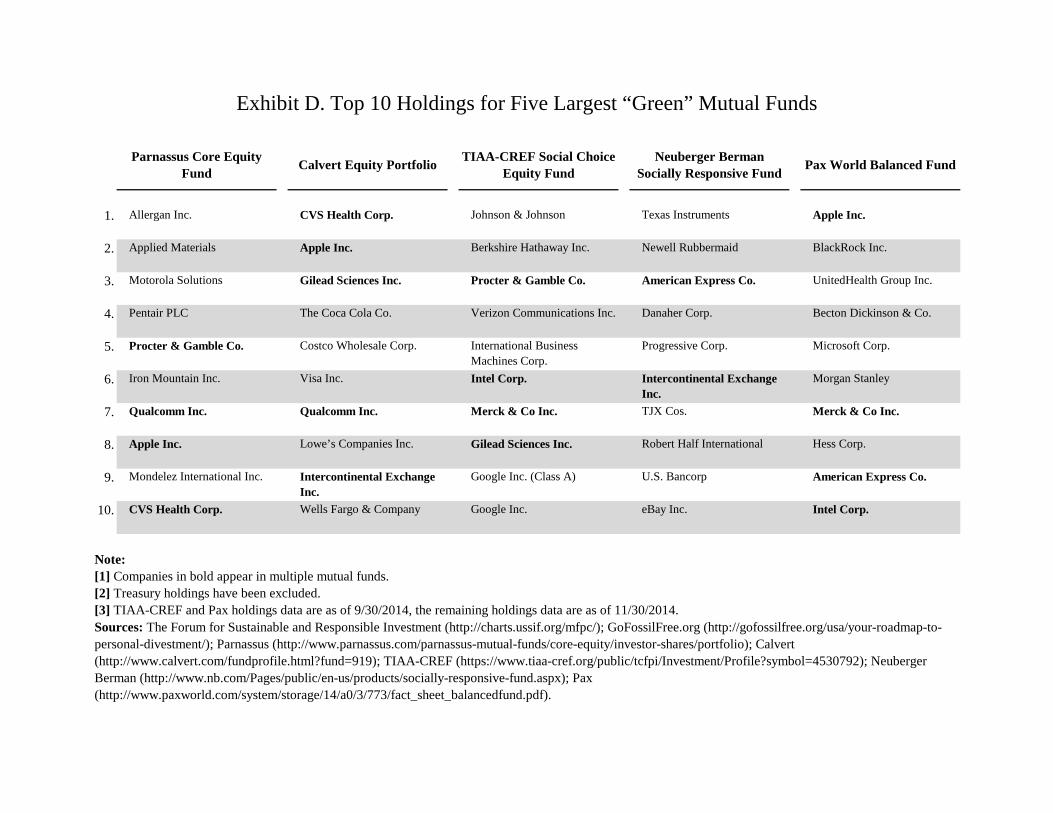
Exhibit D. Top 10 Holdings for Five Largest “Green” Mutual Funds
Parnassus Core Equity Fund
Calvert Equity PortfolioTIAA-CREF Social Choice
Equity FundNeuberger Berman
Socially Responsive FundPax World Balanced Fund
1. Allergan Inc. CVS Health Corp. Johnson & Johnson Texas Instruments Apple Inc.
2. Applied Materials Apple Inc. Berkshire Hathaway Inc. Newell Rubbermaid BlackRock Inc.
3. Motorola Solutions Gilead Sciences Inc. Procter & Gamble Co. American Express Co. UnitedHealth Group Inc.
4. Pentair PLC The Coca Cola Co. Verizon Communications Inc. Danaher Corp. Becton Dickinson & Co.
5. Procter & Gamble Co. Costco Wholesale Corp. International Business Machines Corp.
Progressive Corp. Microsoft Corp.
6. Iron Mountain Inc. Visa Inc. Intel Corp. Intercontinental Exchange Inc.
Morgan Stanley
7. Qualcomm Inc. Qualcomm Inc. Merck & Co Inc. TJX Cos. Merck & Co Inc.
8. Apple Inc. Lowe’s Companies Inc. Gilead Sciences Inc. Robert Half International Hess Corp.
9. Mondelez International Inc. Intercontinental Exchange Inc.
Google Inc. (Class A) U.S. Bancorp American Express Co.
10. CVS Health Corp. Wells Fargo & Company Google Inc. eBay Inc. Intel Corp.
Note:[1] Companies in bold appear in multiple mutual funds.[2] Treasury holdings have been excluded.[3] TIAA-CREF and Pax holdings data are as of 9/30/2014, the remaining holdings data are as of 11/30/2014.Sources: The Forum for Sustainable and Responsible Investment (http://charts.ussif.org/mfpc/); GoFossilFree.org (http://gofossilfree.org/usa/your-roadmap-to-personal-divestment/); Parnassus (http://www.parnassus.com/parnassus-mutual-funds/core-equity/investor-shares/portfolio); Calvert (http://www.calvert.com/fundprofile.html?fund=919); TIAA-CREF (https://www.tiaa-cref.org/public/tcfpi/Investment/Profile?symbol=4530792); Neuberger Berman (http://www.nb.com/Pages/public/en-us/products/socially-responsive-fund.aspx); Pax (http://www.paxworld.com/system/storage/14/a0/3/773/fact_sheet_balancedfund.pdf).
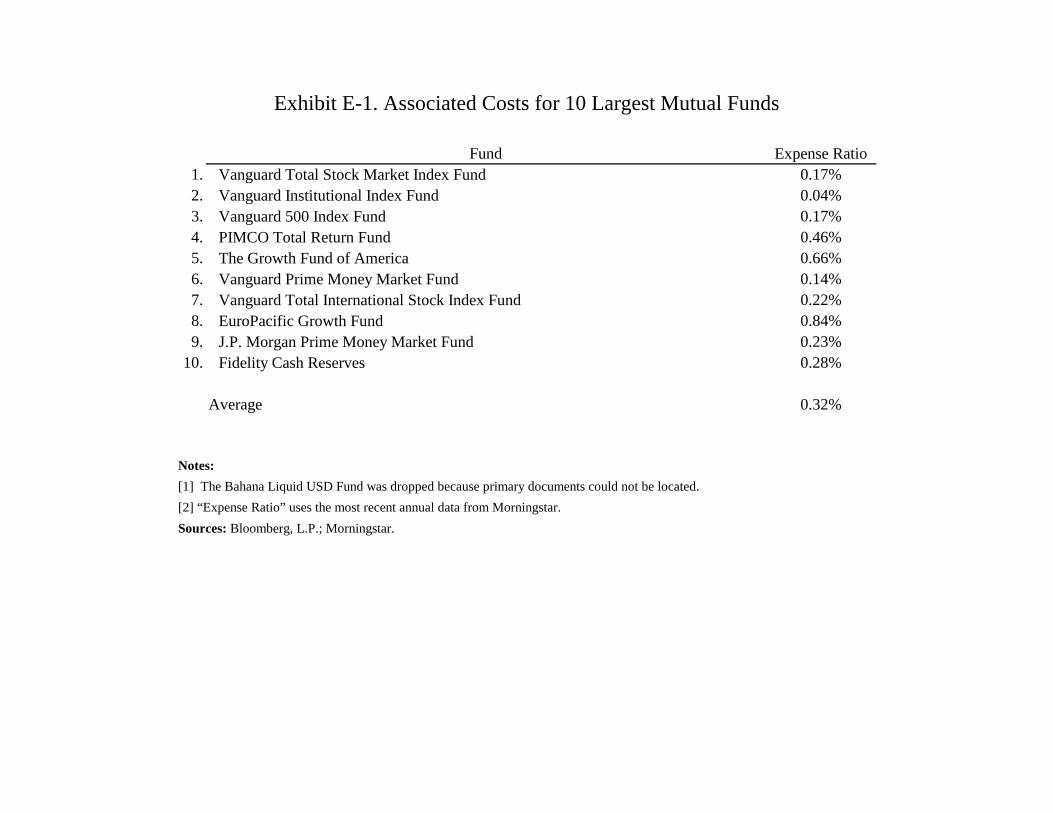
Exhibit E-1. Associated Costs for 10 Largest Mutual Funds
Fund Expense Ratio1. Vanguard Total Stock Market Index Fund 0.17%2. Vanguard Institutional Index Fund 0.04%3. Vanguard 500 Index Fund 0.17%4. PIMCO Total Return Fund 0.46%5. The Growth Fund of America 0.66%6. Vanguard Prime Money Market Fund 0.14%7. Vanguard Total International Stock Index Fund 0.22%8. EuroPacific Growth Fund 0.84%9. J.P. Morgan Prime Money Market Fund 0.23%
10. Fidelity Cash Reserves 0.28%
Average 0.32%
Notes:
[1] The Bahana Liquid USD Fund was dropped because primary documents could not be located.
[2] “Expense Ratio” uses the most recent annual data from Morningstar.
Sources: Bloomberg, L.P.; Morningstar.
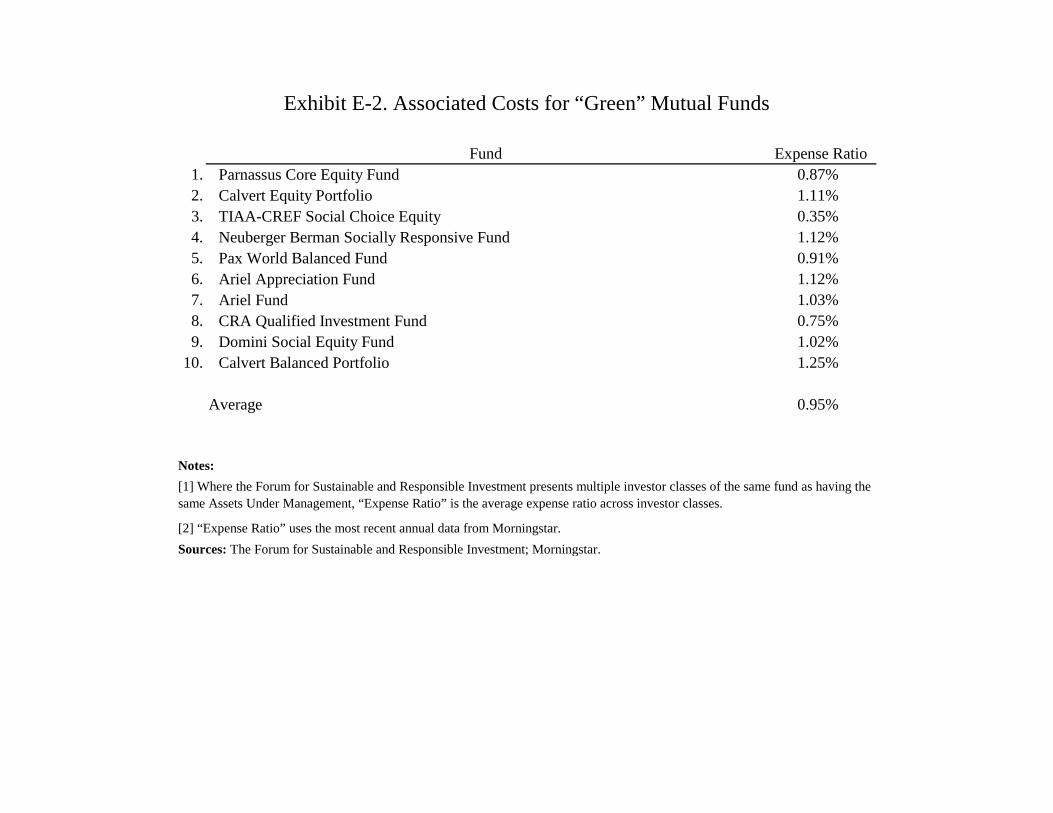
Exhibit E-2. Associated Costs for “Green” Mutual Funds
Fund Expense Ratio1. Parnassus Core Equity Fund 0.87%2. Calvert Equity Portfolio 1.11%3. TIAA-CREF Social Choice Equity 0.35%4. Neuberger Berman Socially Responsive Fund 1.12%5. Pax World Balanced Fund 0.91%6. Ariel Appreciation Fund 1.12%7. Ariel Fund 1.03%8. CRA Qualified Investment Fund 0.75%9. Domini Social Equity Fund 1.02%
10. Calvert Balanced Portfolio 1.25%
Average 0.95%
Notes:
[2] “Expense Ratio” uses the most recent annual data from Morningstar.
Sources: The Forum for Sustainable and Responsible Investment; Morningstar.
[1] Where the Forum for Sustainable and Responsible Investment presents multiple investor classes of the same fund as having the same Assets Under Management, “Expense Ratio” is the average expense ratio across investor classes.
1
APPENDIX A: KEY QUALIFICATIONS OF DANIEL R. FISCHEL
1. I am President of Compass Lexecon, a consulting firm that specializes in the
application of economics to a variety of legal and regulatory issues. I am also the Lee and Brena
Freeman Professor of Law and Business Emeritus at The University of Chicago Law School. I
have served previously as Dean of The University of Chicago Law School, Director of the Law
and Economics Program at The University of Chicago, and as Professor of Law and Business at
The University of Chicago Graduate School of Business, the Kellogg School of Management at
Northwestern University, and the Northwestern University Law School.
2. Both my research and my teaching have concerned the economics of corporate
law and financial markets. I have published approximately fifty articles in leading legal and
economics journals and am coauthor, with Judge Frank Easterbrook of the Seventh Circuit Court
of Appeals, of the book The Economic Structure of Corporate Law (Harvard University Press,
1991). Courts of all levels, including the Supreme Court of the United States, have cited my
articles as authoritative. My curriculum vitae, which contains a list of my publications, is
available on the Compass Lexecon website at http://www.compasslexecon.com/.
3. I have served as a consultant or adviser on economic issues to, among others, the
United States Department of Justice, the United States Securities and Exchange Commission, the
National Association of Securities Dealers, the New York Stock Exchange, the Chicago Board of
Trade, the Chicago Mercantile Exchange, the New York Mercantile Exchange, the United States
Department of Labor, the Federal Deposit Insurance Corporation, the Resolution Trust
Corporation, the Federal Housing Finance Agency, and the Federal Trade Commission.

2
4. I am a member of the American Economic Association and the American Finance
Association. I am also a member of the Board of Governors of the Becker Friedman Institute at
the University of Chicago and an Advisor to the Corporate Governance Project at Harvard
University. I am also a former member of the Board of Directors of the Center for the Study of
the Economy and the State at The University of Chicago, and former Chairman of the American
Association of Law Schools’ Section on Law and Economics. I have testified as an expert
witness in multiple proceedings in federal and state courts across the country.
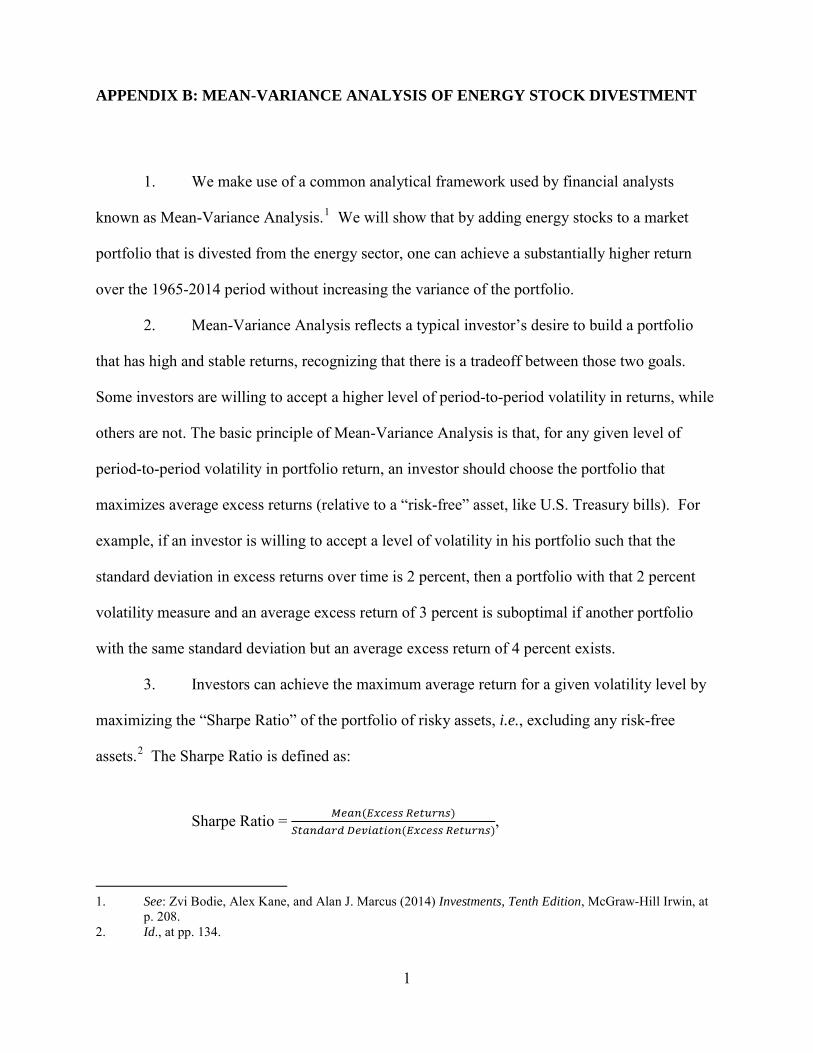
1
APPENDIX B: MEAN-VARIANCE ANALYSIS OF ENERGY STOCK DIVESTMENT
1. We make use of a common analytical framework used by financial analysts
known as Mean-Variance Analysis.1 We will show that by adding energy stocks to a market
portfolio that is divested from the energy sector, one can achieve a substantially higher return
over the 1965-2014 period without increasing the variance of the portfolio.
2. Mean-Variance Analysis reflects a typical investor’s desire to build a portfolio
that has high and stable returns, recognizing that there is a tradeoff between those two goals.
Some investors are willing to accept a higher level of period-to-period volatility in returns, while
others are not. The basic principle of Mean-Variance Analysis is that, for any given level of
period-to-period volatility in portfolio return, an investor should choose the portfolio that
maximizes average excess returns (relative to a “risk-free” asset, like U.S. Treasury bills). For
example, if an investor is willing to accept a level of volatility in his portfolio such that the
standard deviation in excess returns over time is 2 percent, then a portfolio with that 2 percent
volatility measure and an average excess return of 3 percent is suboptimal if another portfolio
with the same standard deviation but an average excess return of 4 percent exists.
3. Investors can achieve the maximum average return for a given volatility level by
maximizing the “Sharpe Ratio” of the portfolio of risky assets, i.e., excluding any risk-free
assets.2 The Sharpe Ratio is defined as:
Sharpe Ratio = 𝑀𝑀𝑀𝑀(𝐸𝐸𝐸𝑀𝐸𝐸 𝑅𝑀𝑅𝑅𝑅𝑀𝐸)𝑆𝑅𝑀𝑀𝑆𝑀𝑅𝑆 𝐷𝑀𝐷𝐷𝑀𝑅𝐷𝐷𝑀(𝐸𝐸𝐸𝑀𝐸𝐸 𝑅𝑀𝑅𝑅𝑅𝑀𝐸)
,
1. See: Zvi Bodie, Alex Kane, and Alan J. Marcus (2014) Investments, Tenth Edition, McGraw-Hill Irwin, at
p. 208. 2. Id., at pp. 134.
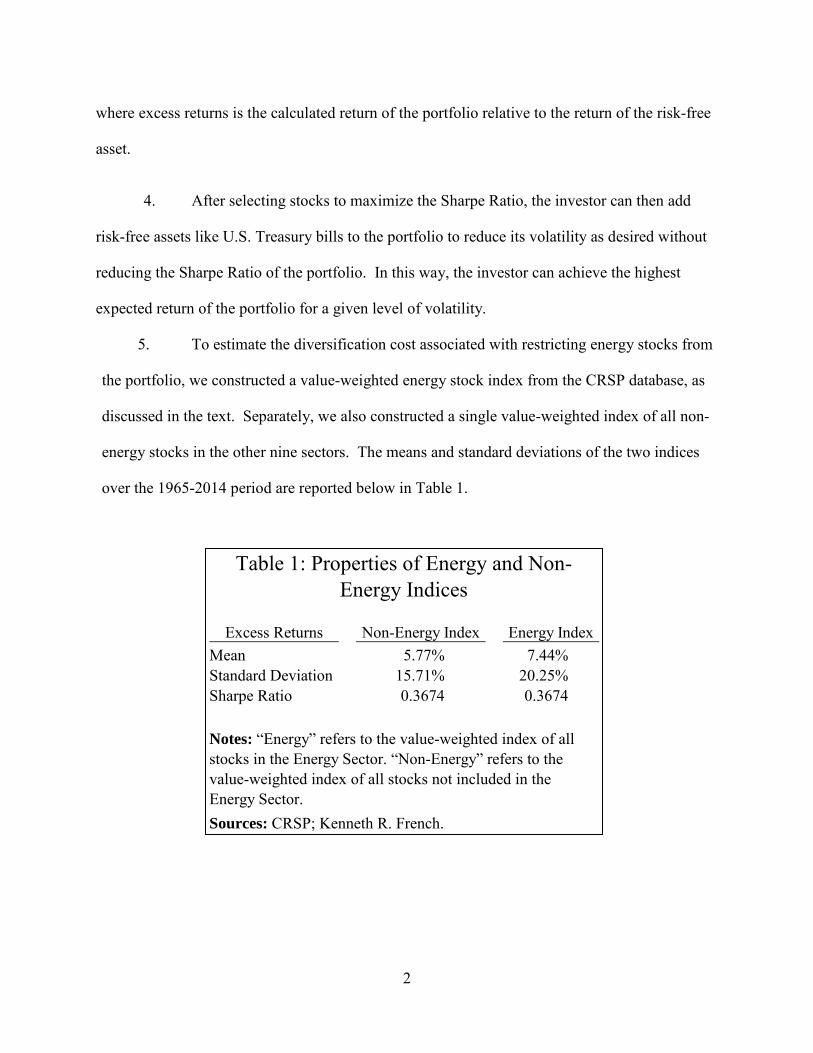
2
where excess returns is the calculated return of the portfolio relative to the return of the risk-free
asset.
4. After selecting stocks to maximize the Sharpe Ratio, the investor can then add
risk-free assets like U.S. Treasury bills to the portfolio to reduce its volatility as desired without
reducing the Sharpe Ratio of the portfolio. In this way, the investor can achieve the highest
expected return of the portfolio for a given level of volatility.
5. To estimate the diversification cost associated with restricting energy stocks from
the portfolio, we constructed a value-weighted energy stock index from the CRSP database, as
discussed in the text. Separately, we also constructed a single value-weighted index of all non-
energy stocks in the other nine sectors. The means and standard deviations of the two indices
over the 1965-2014 period are reported below in Table 1.
Excess Returns Non-Energy Index Energy IndexMean 5.77% 7.44%Standard Deviation 15.71% 20.25%Sharpe Ratio 0.3674 0.3674
Sources: CRSP; Kenneth R. French.
Notes: “Energy” refers to the value-weighted index of all stocks in the Energy Sector. “Non-Energy” refers to the value-weighted index of all stocks not included in the Energy Sector.
Table 1: Properties of Energy and Non-Energy Indices

3
6. As can be seen in the Table, the Energy Index has higher average returns, but also
a higher standard deviation, indicating greater volatility. Regardless of whether an investor is
willing to take on greater volatility or not, including the Energy Index in the portfolio in at least
some quantity generates diversification benefits because the Energy and Non-Energy indices are
not perfectly correlated. In particular, the correlation coefficient between the two indices is
0.6770.To demonstrate this, we calculated the Sharpe Ratio for portfolios which combined the
Energy Index and the Non-Energy Index with different weightings on each index. The portfolio
including both energy and non-energy stocks that maximizes the Sharpe Ratio contains an
allocation of 56.3 percent to the Non-Energy Index and 43.7 percent to the Energy Index. Table
2 below compares the Non-Energy index (i.e., the divested portfolio) to the optimal portfolio
including both indices.
7. Consistent with our findings above regarding the Energy Index, the optimal
portfolio including both indices has a higher average return, but also a higher standard deviation.
We can now add a risk-free asset to the optimal portfolio including both indices until its
volatility matches that of the divested portfolio. The risk-free asset for this analysis is the one-
Excess Returns Optimal Risky Portfolio Divested PortfolioMean 6.50% 5.77%Standard Deviation 16.20% 15.71%Sharpe Ratio 0.4012 0.3674
Sources: CRSP; Kenneth R. French.
Table 2: Properties of the Optimal Risky Portfolio
Notes: Two value weighted indices were created: the first contains all energy stocks, and the second contains all non-energy stocks in CRSP. “Optimal Risky Portfolio” refers to the combination of the value weighted indices that maximizes Sharpe Ratio, and “Divested Portfolio” refers to the portfolio that contains only non-energy stocks.
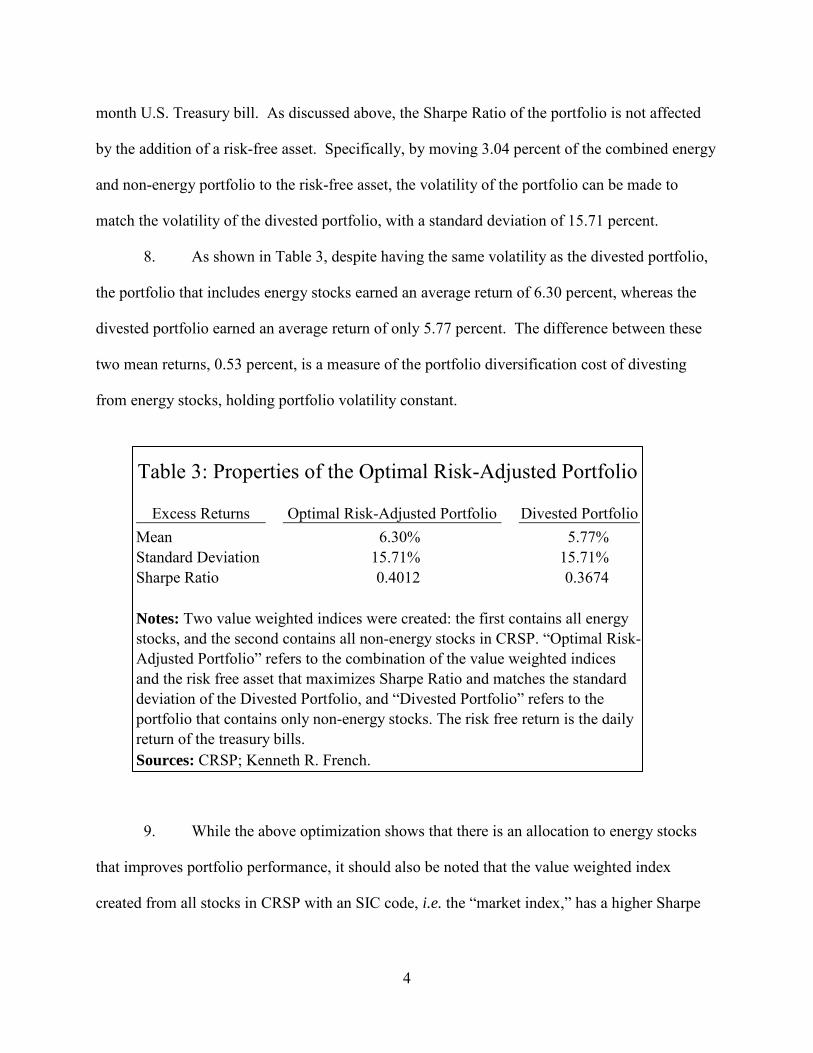
4
month U.S. Treasury bill. As discussed above, the Sharpe Ratio of the portfolio is not affected
by the addition of a risk-free asset. Specifically, by moving 3.04 percent of the combined energy
and non-energy portfolio to the risk-free asset, the volatility of the portfolio can be made to
match the volatility of the divested portfolio, with a standard deviation of 15.71 percent.
8. As shown in Table 3, despite having the same volatility as the divested portfolio,
the portfolio that includes energy stocks earned an average return of 6.30 percent, whereas the
divested portfolio earned an average return of only 5.77 percent. The difference between these
two mean returns, 0.53 percent, is a measure of the portfolio diversification cost of divesting
from energy stocks, holding portfolio volatility constant.
9. While the above optimization shows that there is an allocation to energy stocks
that improves portfolio performance, it should also be noted that the value weighted index
created from all stocks in CRSP with an SIC code, i.e. the “market index,” has a higher Sharpe
Excess Returns Optimal Risk-Adjusted Portfolio Divested PortfolioMean 6.30% 5.77%Standard Deviation 15.71% 15.71%Sharpe Ratio 0.4012 0.3674
Sources: CRSP; Kenneth R. French.
Notes: Two value weighted indices were created: the first contains all energy stocks, and the second contains all non-energy stocks in CRSP. “Optimal Risk-Adjusted Portfolio” refers to the combination of the value weighted indices and the risk free asset that maximizes Sharpe Ratio and matches the standard deviation of the Divested Portfolio, and “Divested Portfolio” refers to the portfolio that contains only non-energy stocks. The risk free return is the daily return of the treasury bills.
Table 3: Properties of the Optimal Risk-Adjusted Portfolio
5
Ratio than the divested index considered above. Therefore, the market index will also provide a
larger risk-adjusted return than the divested index. These results are reported in Table 4.
Excess Returns Non-Energy Index Market IndexMean 5.77% 5.86%Standard Deviation 15.71% 15.70%Sharpe Ratio 0.3674 0.3732
Sources: CRSP; Kenneth R. French.
Notes: “Non-Energy” refers to the value-weighted index of all stocks not included in the Energy Sector. “Market” refers to the value-weighted index of all stocks in the CRSP database that were assigned an SIC code.
Table 4: Properties of Energy and Non-Energy Indices

Appendix 4
Savidge, “Tennessee Public Pensions”
TennesseePublic
Pensions:A Model for Pension Reform
A P O L I C Y S T U D Y O F
Thomas Savidge
“Tennessee Public Pensions: A Model for Pension Reform”
A Policy Study by the Political Economy Research Institute at MTSU
Thomas Savidge
Center for State Fiscal Reform
American Legislative Exchange Council
2900 Crystal Drive
Suite 600
Arlington, VA 22202
Abstract: Tennessee’s public pension system recent reforms passed in 2014 have helped make
Tennessee one of the best public pension systems in the United States. This paper will first examine
the reforms made by Tennessee. The sections that follow will examine how Tennessee’s public
pension plans have fared compared to other states that have made reforms (i.e. Michigan and
Wisconsin) and states where no reforms to defined benefit pension plans have been made (i.e.
Alabama, Connecticut, and Illinois) in terms of contribution rates, funding ratios, and liability
valuations. The second part of this paper will make recommendations for future reform that will
help keep Tennessee one of the most competitive public pension plans in the United States.
JEL Subject Codes: H72; H75
Keywords: public pensions, Tennessee, pension reform
Copyright © 2020
Political Economy Research Institute at Middle Tennessee State University
Release: August 2020
A B O U T T H E P O L I T I C A L E C O N O M Y R E S E A R C H I N S T I T U T E AT M I D D L E T E N N E S S E E S TAT E U N I V E R S I T Y
Established in 2016, the Political Economy Research Institute is a joint venture between the Jennings A. Jones College of Business and the University Honors College, established with initial seed money from the Charles Koch Foundation.
The mission of the institute is to engage undergraduate and graduate students with faculty in research that will further the understanding of business and economic principles, as well as their impact on regional, national, and international financial conditions and the well-being of society. To advance its mission, the PERI will engage in research and educational programs which uncover the institutions and policies that encourage and enhance human well-being.
Learn more at www.mtsu.edu/peri
Guarantee of Quality Scholarship The Political Economy Research Institute at Middle Tennessee State University guarantees the quality of its public policy studies. All policy studies go through a rigorous refereeing process. If a fact or reference is found to be incorrect, we will update the study with appropriate, and noted, corrections.

INDEX
An Overview of the Tennessee Consolidated Retirement System .................................. 5
Calculation of Benefits for Defined Benefit Legacy Plans ................................................... 6
Calculating Benefits for the TCRS Hybrid Pension Plans ..................................................... 8
GASB 67 and 68: Nationwide Changes for Calculating Pension Obligations ........... 10
TCRS Contribution Rates Compared to the Rest of the Country ..................................... 13
TCRS Actuarial Valuations ................................................................................................................. 15
Methods for Liability Valuation ...................................................................................................... 18
Unfunded Liability Growth: How TCRS Compares Across the Nation .......................... 22
Keeping TCRS Competitive: Recommendations for Further Reform ............................ 25
Conclusion ................................................................................................................................................. 27
References ................................................................................................................................................. 28

5
An Overview of the Tennessee Consolidated Retirement System
The Tennessee Consolidated Retirement System (TCRS) was established in 1972 by an
Act of the Tennessee General Assembly. The Act consolidated seven existing retirement systems
to provide retirement, disability, and death benefits to state employees, public school teachers,
higher education employees, and employees of participating local governments.1 The Board of
Trustees consists of 20 members: nine ex officio members from the executive, legislative, and
judicial branches of state government, nine active TCRS members, and two retired TCRS
members. All members must be vested members of the TCRS.2 By state law, the State Treasurer
serves as chairman of the Board of Trustees and as a custodian of TCRS funds.3 Starting on July
1, 1981, the TCRS became noncontributory for most state employees. The State of Tennessee
assumed the employee contributions to the TCRS on behalf of those employees of up to 5% of
the employees’ earnable contributions.4 State employees and retirees who became members of
the pension system before July 1, 1981, had the employer-assumed contributions credited to their
respective retirement accounts.5 State employees who became members of the TCRS after July
1, 1981, do not contribute to this pension plan.6
Two major changes occurred in 2014, one nationwide and the other in Tennessee.
Nationwide, the Government Accounting Standards Board (GASB) issued statements 67 and 68,
1 State of Tennessee Department of Treasury. “Tennessee Consolidated Retirement System Comprehensive Annual
Financial Report (CAFR) For the Fiscal Year Ended June 30, 2019.” 30 June 2019. p. 81 Retrieved from:
https://treasury.tn.gov/Portals/0/Documents/Retirement/CAFR%20Reports/2019/2019%20CAFR_Full%20Report.pdf
2 State of Tennessee Department of Treasury. “Tennessee Consolidated Retirement System CAFR.” p. 81.
3 State of Tennessee Department of Treasury. “Tennessee Consolidated Retirement System CAFR.” p. 81.
4 State of Tennessee Department of Treasury. “TCRS Active Member Resource Guides for Legacy Retirement Plans
for State and Higher Education Employees.” Retrieved from: https://treasury.tn.gov/Retirement/Information-and-
Resources/Forms-and-Guides
5 State of Tennessee Department of Treasury. “TCRS Active Member Resource Guides for Legacy Retirement Plans
for State and Higher Education Employees.”
6 State of Tennessee Department of Treasury. “TCRS Active Member Resource Guides for Legacy Retirement Plans
for State and Higher Education Employees.”
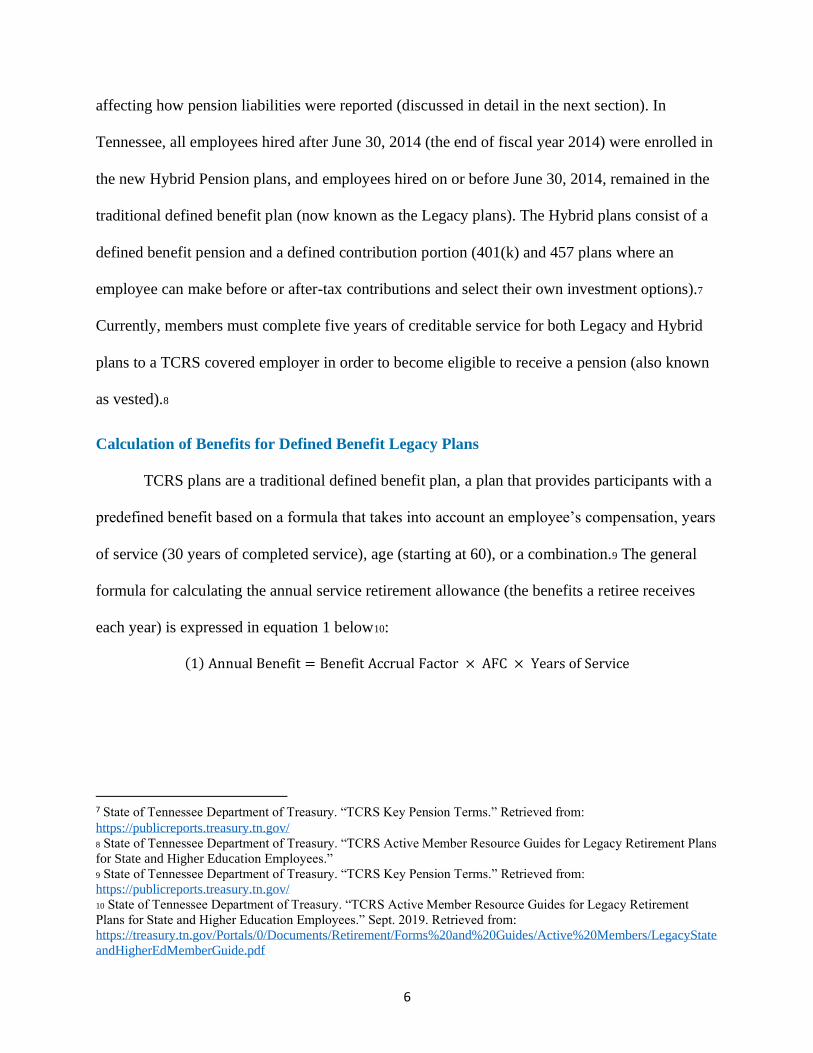
6
affecting how pension liabilities were reported (discussed in detail in the next section). In
Tennessee, all employees hired after June 30, 2014 (the end of fiscal year 2014) were enrolled in
the new Hybrid Pension plans, and employees hired on or before June 30, 2014, remained in the
traditional defined benefit plan (now known as the Legacy plans). The Hybrid plans consist of a
defined benefit pension and a defined contribution portion (401(k) and 457 plans where an
employee can make before or after-tax contributions and select their own investment options).7
Currently, members must complete five years of creditable service for both Legacy and Hybrid
plans to a TCRS covered employer in order to become eligible to receive a pension (also known
as vested).8
Calculation of Benefits for Defined Benefit Legacy Plans
TCRS plans are a traditional defined benefit plan, a plan that provides participants with a
predefined benefit based on a formula that takes into account an employee’s compensation, years
of service (30 years of completed service), age (starting at 60), or a combination.9 The general
formula for calculating the annual service retirement allowance (the benefits a retiree receives
each year) is expressed in equation 1 below10:
(1) Annual Benefit = Benefit Accrual Factor × AFC × Years of Service
7 State of Tennessee Department of Treasury. “TCRS Key Pension Terms.” Retrieved from:
https://publicreports.treasury.tn.gov/ 8 State of Tennessee Department of Treasury. “TCRS Active Member Resource Guides for Legacy Retirement Plans
for State and Higher Education Employees.”
9 State of Tennessee Department of Treasury. “TCRS Key Pension Terms.” Retrieved from:
https://publicreports.treasury.tn.gov/
10 State of Tennessee Department of Treasury. “TCRS Active Member Resource Guides for Legacy Retirement
Plans for State and Higher Education Employees.” Sept. 2019. Retrieved from:
https://treasury.tn.gov/Portals/0/Documents/Retirement/Forms%20and%20Guides/Active%20Members/LegacyState
andHigherEdMemberGuide.pdf

7
Tennessee state law sets the benefit accrual factor, which is currently 1.5%.11 For public safety
workers, instead of a Benefit Accrual Factor, a “Bridge Factor” of 0.75% is used to determine
the Annual Benefit.12 Divide the Annual Benefit by 12 to determine the member’s monthly
retirement allowance. Any changes to the Tennessee Consolidated Retirement System must be
made through the legislative branch. The Average Final Compensation (AFC) is the average of
the member’s five highest consecutive years of earnable compensation (although federal law
limits the maximum amount of compensation that can be recognized by a defined benefit plan)
and the maximum annual base benefit payable at retirement is limited to 94.5% of the member’s
AFC.13 Years of Creditable Service consist of membership service under the Legacy Plan and
any other periods of public service under an employer participating in the TCRS.14 The TCRS
also notes that members may establish creditable service time if they have previously withdrawn
service, military, educational, or peacekeeping service that interrupted member’s public
employment, and unused accumulated sick leave at retirement. 15 A vested member becomes
eligible for early retirement benefits when they reach age 55, but benefits are permanently
reduced by 0.4% for each month the date of retirement precedes the service retirement eligibility
(age 60 or 30 years of service). 16 It is important to note that, in terms of the TCRS, early
retirement is distinct from retirement due to disability. Disability retirement is defined as either
11 State of Tennessee Department of Treasury. “TCRS Active Member Resource Guides for Legacy Retirement
Plans for State and Higher Education Employees.”
12 State of Tennessee Department of Treasury. “TCRS Supplement for State Public Safety Officers-Legacy State
Employees Guide.” Dec. 2019. Retrieved from:
https://treasury.tn.gov/Portals/0/Documents/Retirement/Member/LegacyMemberSupplementGuideStatePublicSafety
Officers.pdf
13 State of Tennessee Department of Treasury. “TCRS Active Member Resource Guides for Legacy Retirement
Plans for State and Higher Education Employees.”
14 State of Tennessee Department of Treasury. “TCRS Active Member Resource Guides for Legacy Retirement
Plans for State and Higher Education Employees.”
15 State of Tennessee Department of Treasury. “TCRS Active Member Resource Guides for Legacy Retirement
Plans for State and Higher Education Employees.”
16 State of Tennessee Department of Treasury. “TCRS Active Member Resource Guides for Legacy Retirement
Plans for State and Higher Education Employees.”
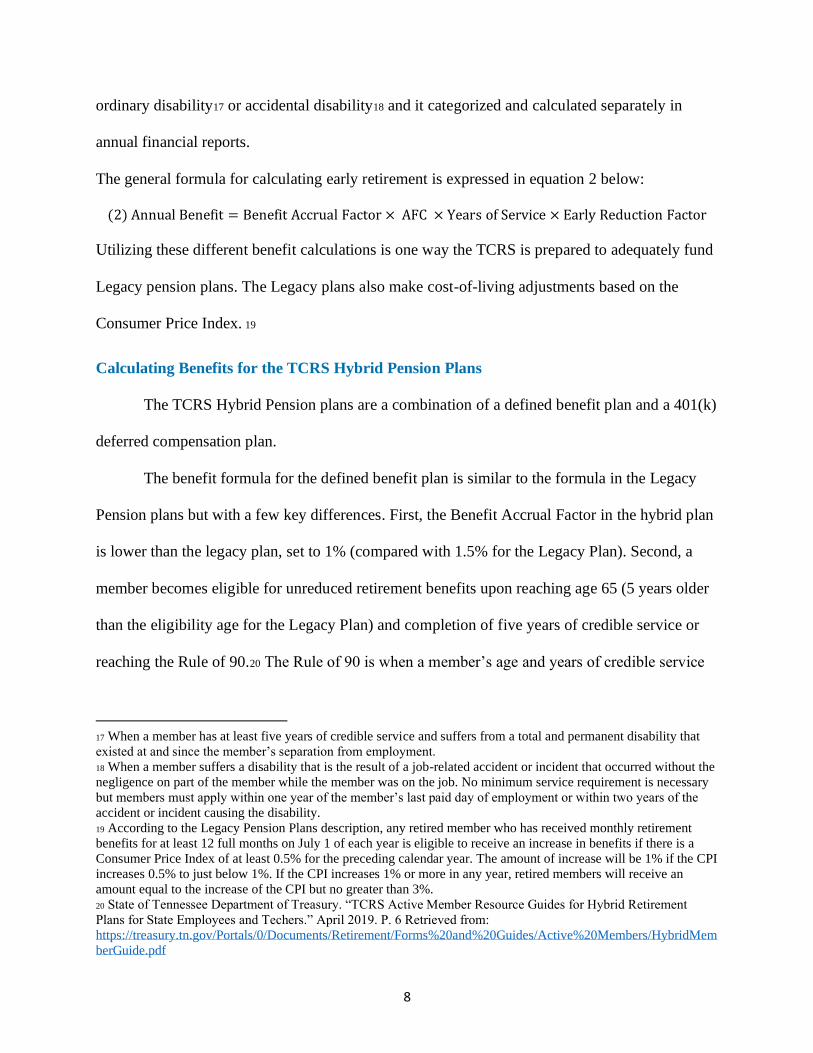
8
ordinary disability17 or accidental disability18 and it categorized and calculated separately in
annual financial reports.
The general formula for calculating early retirement is expressed in equation 2 below:
(2) Annual Benefit = Benefit Accrual Factor × AFC × Years of Service × Early Reduction Factor
Utilizing these different benefit calculations is one way the TCRS is prepared to adequately fund
Legacy pension plans. The Legacy plans also make cost-of-living adjustments based on the
Consumer Price Index. 19
Calculating Benefits for the TCRS Hybrid Pension Plans
The TCRS Hybrid Pension plans are a combination of a defined benefit plan and a 401(k)
deferred compensation plan.
The benefit formula for the defined benefit plan is similar to the formula in the Legacy
Pension plans but with a few key differences. First, the Benefit Accrual Factor in the hybrid plan
is lower than the legacy plan, set to 1% (compared with 1.5% for the Legacy Plan). Second, a
member becomes eligible for unreduced retirement benefits upon reaching age 65 (5 years older
than the eligibility age for the Legacy Plan) and completion of five years of credible service or
reaching the Rule of 90.20 The Rule of 90 is when a member’s age and years of credible service
17 When a member has at least five years of credible service and suffers from a total and permanent disability that
existed at and since the member’s separation from employment.
18 When a member suffers a disability that is the result of a job-related accident or incident that occurred without the
negligence on part of the member while the member was on the job. No minimum service requirement is necessary
but members must apply within one year of the member’s last paid day of employment or within two years of the
accident or incident causing the disability.
19 According to the Legacy Pension Plans description, any retired member who has received monthly retirement
benefits for at least 12 full months on July 1 of each year is eligible to receive an increase in benefits if there is a
Consumer Price Index of at least 0.5% for the preceding calendar year. The amount of increase will be 1% if the CPI
increases 0.5% to just below 1%. If the CPI increases 1% or more in any year, retired members will receive an
amount equal to the increase of the CPI but no greater than 3%.
20 State of Tennessee Department of Treasury. “TCRS Active Member Resource Guides for Hybrid Retirement
Plans for State Employees and Techers.” April 2019. P. 6 Retrieved from:
https://treasury.tn.gov/Portals/0/Documents/Retirement/Forms%20and%20Guides/Active%20Members/HybridMem
berGuide.pdf
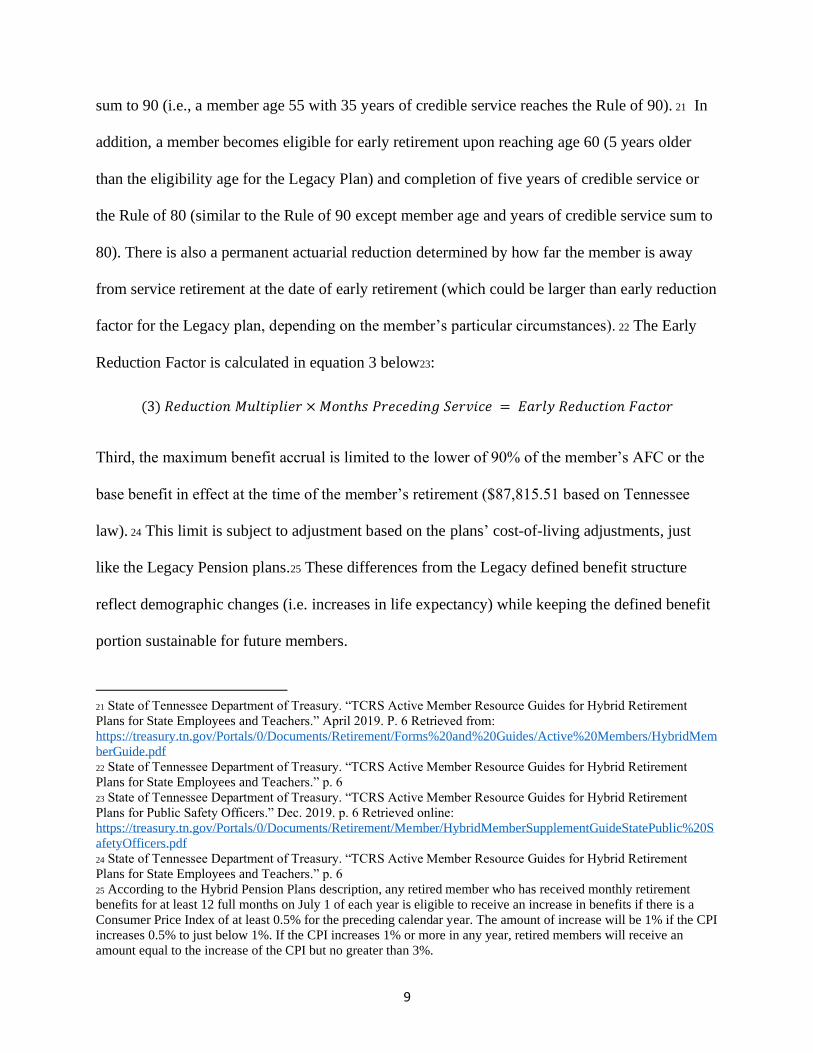
9
sum to 90 (i.e., a member age 55 with 35 years of credible service reaches the Rule of 90). 21 In
addition, a member becomes eligible for early retirement upon reaching age 60 (5 years older
than the eligibility age for the Legacy Plan) and completion of five years of credible service or
the Rule of 80 (similar to the Rule of 90 except member age and years of credible service sum to
80). There is also a permanent actuarial reduction determined by how far the member is away
from service retirement at the date of early retirement (which could be larger than early reduction
factor for the Legacy plan, depending on the member’s particular circumstances). 22 The Early
Reduction Factor is calculated in equation 3 below23:
(3) 𝑅𝑒𝑑𝑢𝑐𝑡𝑖𝑜𝑛 𝑀𝑢𝑙𝑡𝑖𝑝𝑙𝑖𝑒𝑟 × 𝑀𝑜𝑛𝑡ℎ𝑠 𝑃𝑟𝑒𝑐𝑒𝑑𝑖𝑛𝑔 𝑆𝑒𝑟𝑣𝑖𝑐𝑒 = 𝐸𝑎𝑟𝑙𝑦 𝑅𝑒𝑑𝑢𝑐𝑡𝑖𝑜𝑛 𝐹𝑎𝑐𝑡𝑜𝑟
Third, the maximum benefit accrual is limited to the lower of 90% of the member’s AFC or the
base benefit in effect at the time of the member’s retirement ($87,815.51 based on Tennessee
law). 24 This limit is subject to adjustment based on the plans’ cost-of-living adjustments, just
like the Legacy Pension plans.25 These differences from the Legacy defined benefit structure
reflect demographic changes (i.e. increases in life expectancy) while keeping the defined benefit
portion sustainable for future members.
21 State of Tennessee Department of Treasury. “TCRS Active Member Resource Guides for Hybrid Retirement
Plans for State Employees and Teachers.” April 2019. P. 6 Retrieved from:
https://treasury.tn.gov/Portals/0/Documents/Retirement/Forms%20and%20Guides/Active%20Members/HybridMem
berGuide.pdf
22 State of Tennessee Department of Treasury. “TCRS Active Member Resource Guides for Hybrid Retirement
Plans for State Employees and Teachers.” p. 6
23 State of Tennessee Department of Treasury. “TCRS Active Member Resource Guides for Hybrid Retirement
Plans for Public Safety Officers.” Dec. 2019. p. 6 Retrieved online:
https://treasury.tn.gov/Portals/0/Documents/Retirement/Member/HybridMemberSupplementGuideStatePublic%20S
afetyOfficers.pdf
24 State of Tennessee Department of Treasury. “TCRS Active Member Resource Guides for Hybrid Retirement
Plans for State Employees and Teachers.” p. 6
25 According to the Hybrid Pension Plans description, any retired member who has received monthly retirement
benefits for at least 12 full months on July 1 of each year is eligible to receive an increase in benefits if there is a
Consumer Price Index of at least 0.5% for the preceding calendar year. The amount of increase will be 1% if the CPI
increases 0.5% to just below 1%. If the CPI increases 1% or more in any year, retired members will receive an
amount equal to the increase of the CPI but no greater than 3%.
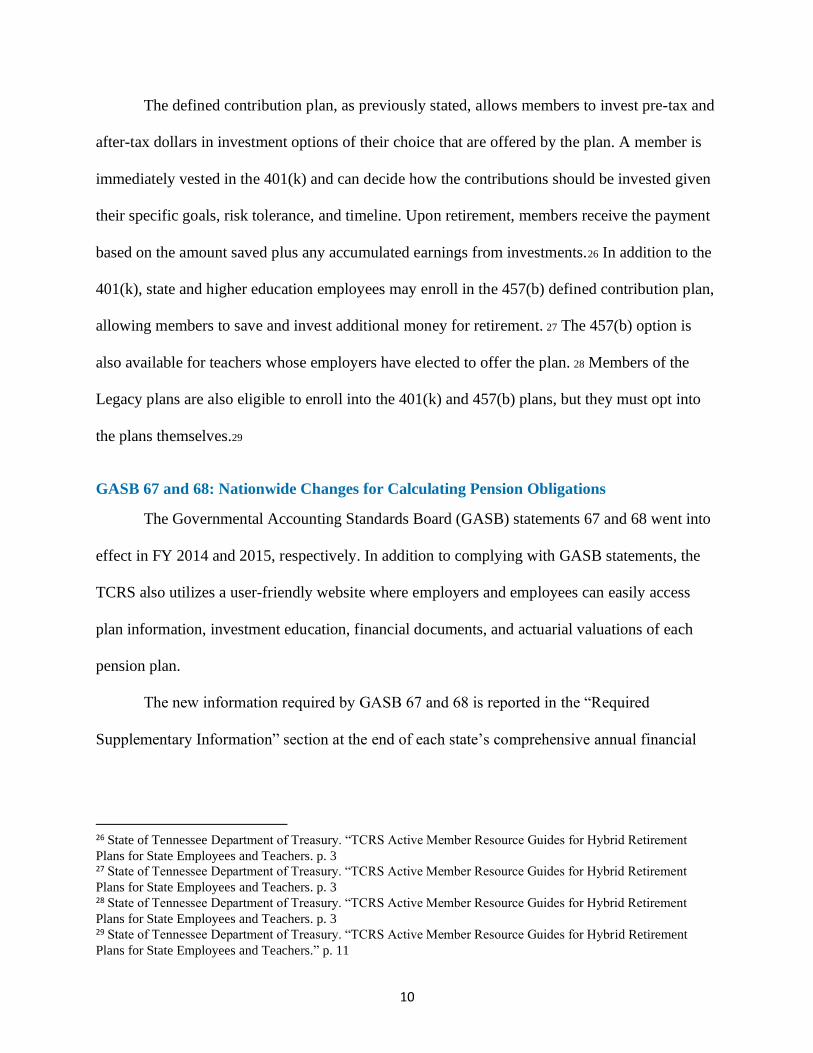
10
The defined contribution plan, as previously stated, allows members to invest pre-tax and
after-tax dollars in investment options of their choice that are offered by the plan. A member is
immediately vested in the 401(k) and can decide how the contributions should be invested given
their specific goals, risk tolerance, and timeline. Upon retirement, members receive the payment
based on the amount saved plus any accumulated earnings from investments.26 In addition to the
401(k), state and higher education employees may enroll in the 457(b) defined contribution plan,
allowing members to save and invest additional money for retirement. 27 The 457(b) option is
also available for teachers whose employers have elected to offer the plan. 28 Members of the
Legacy plans are also eligible to enroll into the 401(k) and 457(b) plans, but they must opt into
the plans themselves.29
GASB 67 and 68: Nationwide Changes for Calculating Pension Obligations
The Governmental Accounting Standards Board (GASB) statements 67 and 68 went into
effect in FY 2014 and 2015, respectively. In addition to complying with GASB statements, the
TCRS also utilizes a user-friendly website where employers and employees can easily access
plan information, investment education, financial documents, and actuarial valuations of each
pension plan.
The new information required by GASB 67 and 68 is reported in the “Required
Supplementary Information” section at the end of each state’s comprehensive annual financial
26 State of Tennessee Department of Treasury. “TCRS Active Member Resource Guides for Hybrid Retirement
Plans for State Employees and Teachers. p. 3 27 State of Tennessee Department of Treasury. “TCRS Active Member Resource Guides for Hybrid Retirement
Plans for State Employees and Teachers. p. 3 28 State of Tennessee Department of Treasury. “TCRS Active Member Resource Guides for Hybrid Retirement
Plans for State Employees and Teachers. p. 3 29 State of Tennessee Department of Treasury. “TCRS Active Member Resource Guides for Hybrid Retirement
Plans for State Employees and Teachers.” p. 11
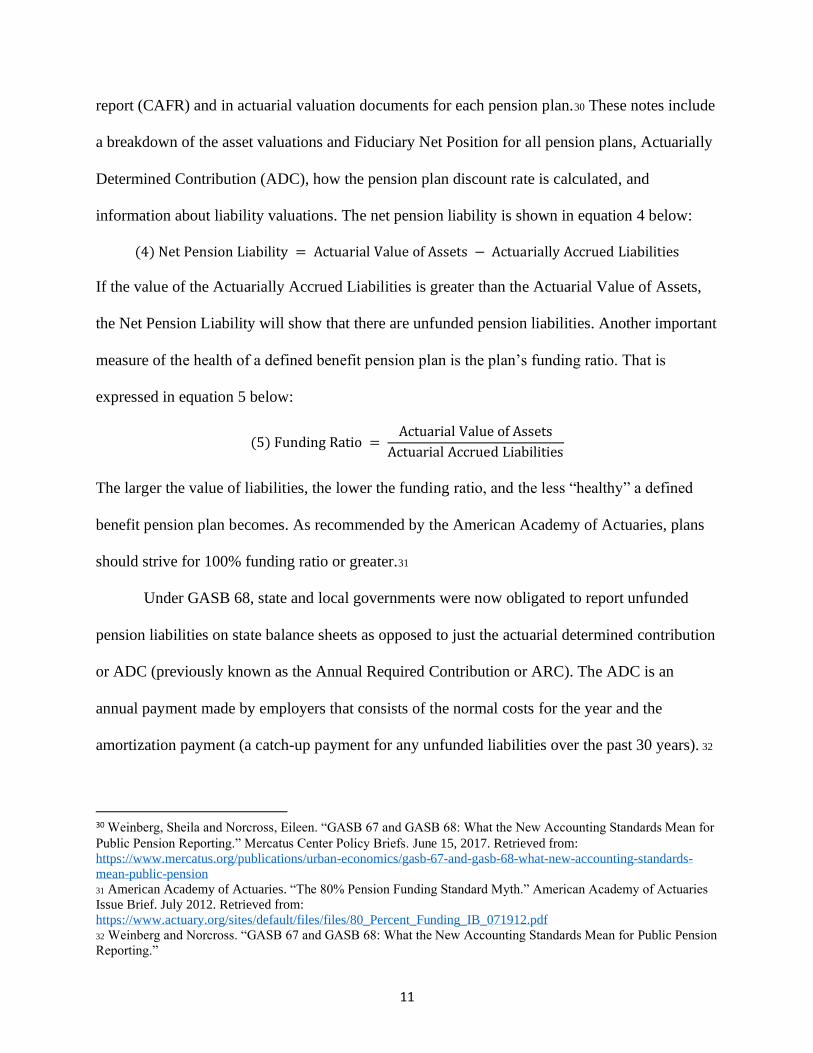
11
report (CAFR) and in actuarial valuation documents for each pension plan.30 These notes include
a breakdown of the asset valuations and Fiduciary Net Position for all pension plans, Actuarially
Determined Contribution (ADC), how the pension plan discount rate is calculated, and
information about liability valuations. The net pension liability is shown in equation 4 below:
(4) Net Pension Liability = Actuarial Value of Assets − Actuarially Accrued Liabilities
If the value of the Actuarially Accrued Liabilities is greater than the Actuarial Value of Assets,
the Net Pension Liability will show that there are unfunded pension liabilities. Another important
measure of the health of a defined benefit pension plan is the plan’s funding ratio. That is
expressed in equation 5 below:
(5) Funding Ratio = Actuarial Value of Assets
Actuarial Accrued Liabilities
The larger the value of liabilities, the lower the funding ratio, and the less “healthy” a defined
benefit pension plan becomes. As recommended by the American Academy of Actuaries, plans
should strive for 100% funding ratio or greater.31
Under GASB 68, state and local governments were now obligated to report unfunded
pension liabilities on state balance sheets as opposed to just the actuarial determined contribution
or ADC (previously known as the Annual Required Contribution or ARC). The ADC is an
annual payment made by employers that consists of the normal costs for the year and the
amortization payment (a catch-up payment for any unfunded liabilities over the past 30 years). 32
30 Weinberg, Sheila and Norcross, Eileen. “GASB 67 and GASB 68: What the New Accounting Standards Mean for
Public Pension Reporting.” Mercatus Center Policy Briefs. June 15, 2017. Retrieved from: https://www.mercatus.org/publications/urban-economics/gasb-67-and-gasb-68-what-new-accounting-standards-
mean-public-pension 31 American Academy of Actuaries. “The 80% Pension Funding Standard Myth.” American Academy of Actuaries
Issue Brief. July 2012. Retrieved from:
https://www.actuary.org/sites/default/files/files/80_Percent_Funding_IB_071912.pdf
32 Weinberg and Norcross. “GASB 67 and GASB 68: What the New Accounting Standards Mean for Public Pension
Reporting.”

12
Prior to GASB 68, state and local governments followed GASB 27 in disclosing pension funding
information. GASB 27 advised state governments to list the ADC and the actual amount the
employer contributed for that fiscal year. The difference between these two amounts was called
the “net pension obligation.”33
Improved reporting and more accurate estimates of state obligations have shed light on
the actual value of unfunded pension liabilities. GASB 67 also provided guidance on how
liabilities were to be valued. Prior to GASB 67, public pension plans used the expected return on
pension assets to assess the value of liabilities. Economists objected to this valuation, stating that
legally guaranteed pension promises should be valued with a lower discount rate. Weinberg and
Norcross note that GASB 67 attempts to “split the difference” by valuing liabilities covered by
pension assets with a higher discount rate and unfunded liabilities with a lower discount rate
based on the low-risk return on tax-exempt municipal bonds.34 Unfortunately, pension plan
managers can still alter the actuarial value of assets (and with it, a plan’s funding ratio). GASB
68 allows pension plans to delay the recognition of any differences between the assumed and
actual return on investments through a “deferred inflow of resources” occurring over a 5-year
period. Weinberg and Norcross (2017) note that this allows pension plans to “smooth” assets by
gradually recognizing market declines and gains. By introducing these market declines and gains
gradually, the volatility of pension asset portfolios remains hidden and incentivizes plan
managers to take greater investment risks.35
33 Weinberg and Norcross. “GASB 67 and GASB 68.” 34 Weinberg and Norcross, “GASB 67 and GASB 68.” 35 Weinberg and Norcross, “GASB 67 and GASB 68.”
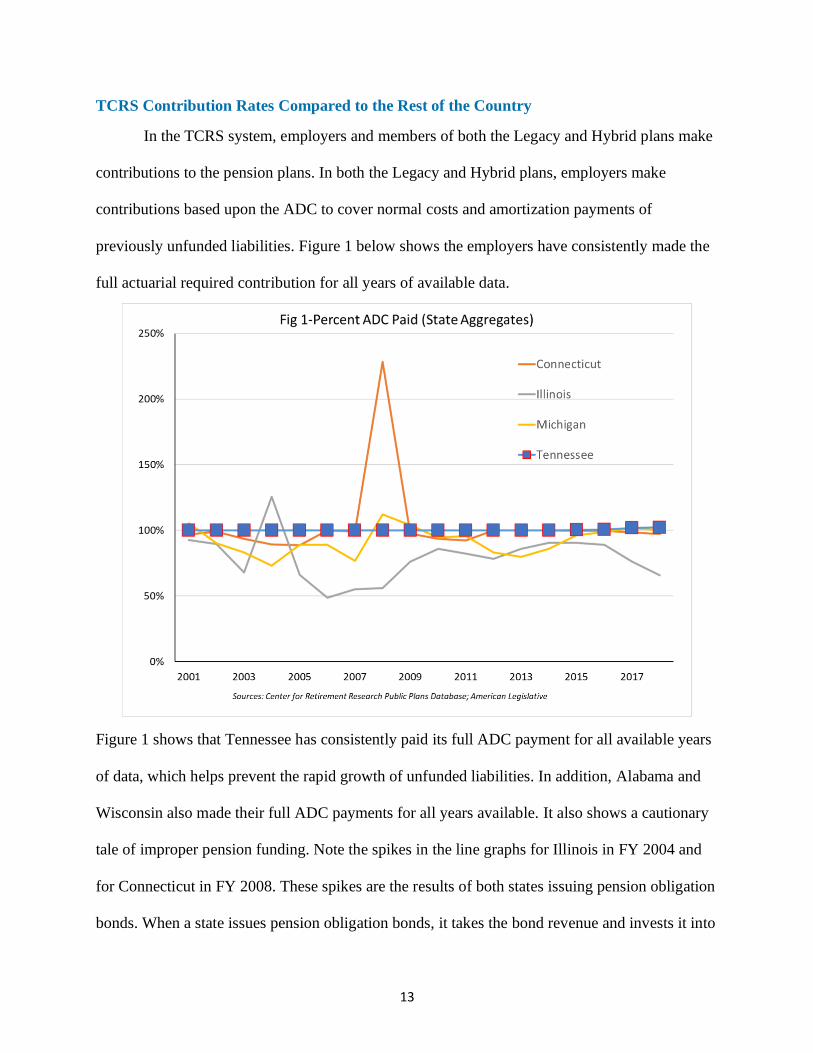
13
TCRS Contribution Rates Compared to the Rest of the Country
In the TCRS system, employers and members of both the Legacy and Hybrid plans make
contributions to the pension plans. In both the Legacy and Hybrid plans, employers make
contributions based upon the ADC to cover normal costs and amortization payments of
previously unfunded liabilities. Figure 1 below shows the employers have consistently made the
full actuarial required contribution for all years of available data.
Figure 1 shows that Tennessee has consistently paid its full ADC payment for all available years
of data, which helps prevent the rapid growth of unfunded liabilities. In addition, Alabama and
Wisconsin also made their full ADC payments for all years available. It also shows a cautionary
tale of improper pension funding. Note the spikes in the line graphs for Illinois in FY 2004 and
for Connecticut in FY 2008. These spikes are the results of both states issuing pension obligation
bonds. When a state issues pension obligation bonds, it takes the bond revenue and invests it into
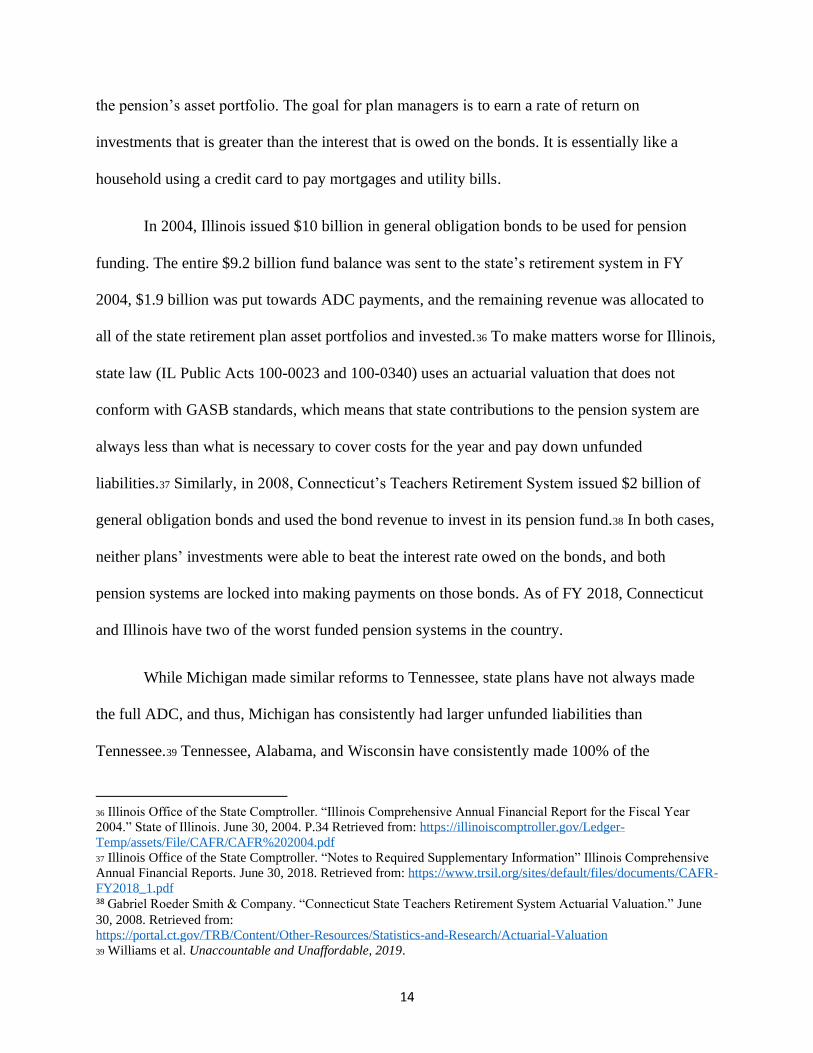
14
the pension’s asset portfolio. The goal for plan managers is to earn a rate of return on
investments that is greater than the interest that is owed on the bonds. It is essentially like a
household using a credit card to pay mortgages and utility bills.
In 2004, Illinois issued $10 billion in general obligation bonds to be used for pension
funding. The entire $9.2 billion fund balance was sent to the state’s retirement system in FY
2004, $1.9 billion was put towards ADC payments, and the remaining revenue was allocated to
all of the state retirement plan asset portfolios and invested.36 To make matters worse for Illinois,
state law (IL Public Acts 100-0023 and 100-0340) uses an actuarial valuation that does not
conform with GASB standards, which means that state contributions to the pension system are
always less than what is necessary to cover costs for the year and pay down unfunded
liabilities.37 Similarly, in 2008, Connecticut’s Teachers Retirement System issued $2 billion of
general obligation bonds and used the bond revenue to invest in its pension fund.38 In both cases,
neither plans’ investments were able to beat the interest rate owed on the bonds, and both
pension systems are locked into making payments on those bonds. As of FY 2018, Connecticut
and Illinois have two of the worst funded pension systems in the country.
While Michigan made similar reforms to Tennessee, state plans have not always made
the full ADC, and thus, Michigan has consistently had larger unfunded liabilities than
Tennessee.39 Tennessee, Alabama, and Wisconsin have consistently made 100% of the
36 Illinois Office of the State Comptroller. “Illinois Comprehensive Annual Financial Report for the Fiscal Year
2004.” State of Illinois. June 30, 2004. P.34 Retrieved from: https://illinoiscomptroller.gov/Ledger-
Temp/assets/File/CAFR/CAFR%202004.pdf
37 Illinois Office of the State Comptroller. “Notes to Required Supplementary Information” Illinois Comprehensive
Annual Financial Reports. June 30, 2018. Retrieved from: https://www.trsil.org/sites/default/files/documents/CAFR-
FY2018_1.pdf 38 Gabriel Roeder Smith & Company. “Connecticut State Teachers Retirement System Actuarial Valuation.” June
30, 2008. Retrieved from:
https://portal.ct.gov/TRB/Content/Other-Resources/Statistics-and-Research/Actuarial-Valuation
39 Williams et al. Unaccountable and Unaffordable, 2019.
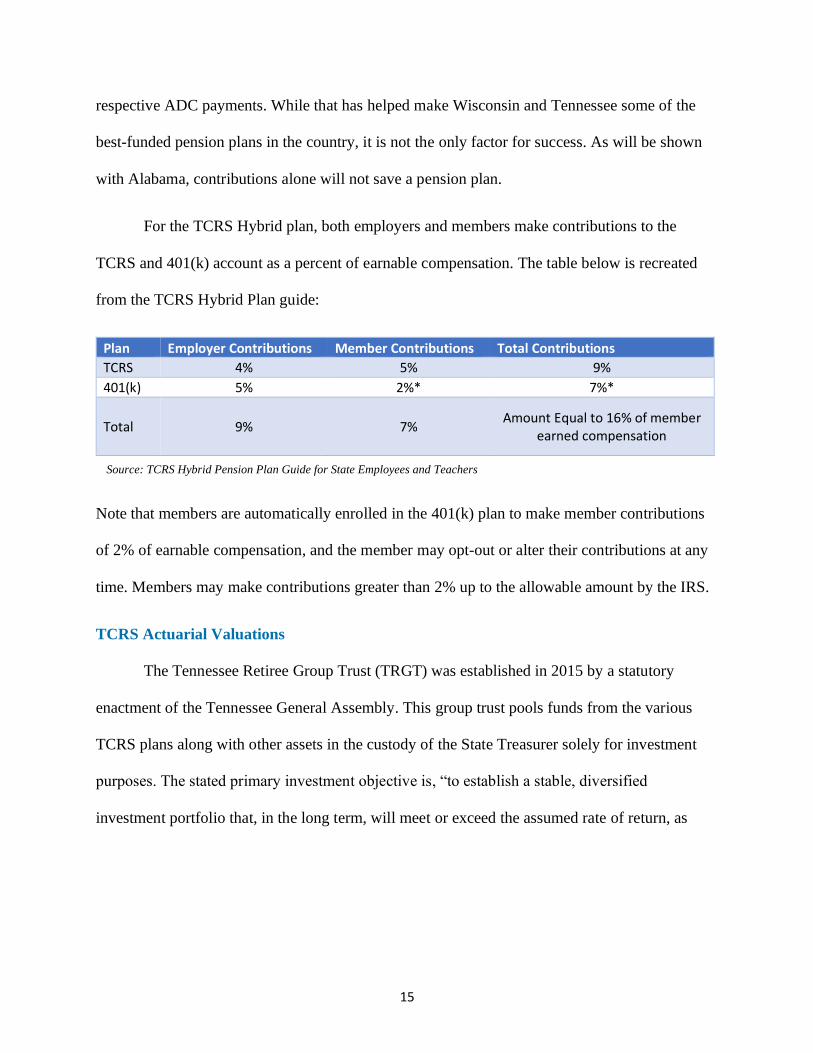
15
respective ADC payments. While that has helped make Wisconsin and Tennessee some of the
best-funded pension plans in the country, it is not the only factor for success. As will be shown
with Alabama, contributions alone will not save a pension plan.
For the TCRS Hybrid plan, both employers and members make contributions to the
TCRS and 401(k) account as a percent of earnable compensation. The table below is recreated
from the TCRS Hybrid Plan guide:
Plan Employer Contributions Member Contributions Total Contributions
TCRS 4% 5% 9%
401(k) 5% 2%* 7%*
Total 9% 7% Amount Equal to 16% of member
earned compensation
Note that members are automatically enrolled in the 401(k) plan to make member contributions
of 2% of earnable compensation, and the member may opt-out or alter their contributions at any
time. Members may make contributions greater than 2% up to the allowable amount by the IRS.
TCRS Actuarial Valuations
The Tennessee Retiree Group Trust (TRGT) was established in 2015 by a statutory
enactment of the Tennessee General Assembly. This group trust pools funds from the various
TCRS plans along with other assets in the custody of the State Treasurer solely for investment
purposes. The stated primary investment objective is, “to establish a stable, diversified
investment portfolio that, in the long term, will meet or exceed the assumed rate of return, as
Source: TCRS Hybrid Pension Plan Guide for State Employees and Teachers

16
adopted by the Board, in order to provide sufficient liquidity to pay beneficiaries in a timely
manner.”40
The figure and table below show the asset allocation of the TGRT as of the end of FY 2018:
Asset Class Fair Value Percentage Domestic Equity $15,382,953,801.00 31.04%
Domestic Fixed Income $14,558,721,699.00 29.37%
International Equity $7,333,130,584.00 14.79% International Fixed Income $33,250,847.00 0.07%
Short-Term Securities $2,876,812,549.00 5.80%
Real Estate $4,452,048,359.00 8.98%
Private Equities & Strategic Lending $4,928,734,870.00 9.94% Total $49,565,652,709.00 100.00%
Investment performance is another important aspect of fund stability as well. Investing in riskier
assets means that the investment returns will be more volatile year over year. In years that
40 State of Tennessee Department of Treasury. “Tennessee Consolidated Retirement System CAFR.” p. 59.
Domestic Equity
Domestic Fixed Income
International Equity
International Fixed Income
Short-Term Securities
Real Estate
Private Equities & Strategic
Lending
Source: TCRS CAFR FY 2018, p. 61
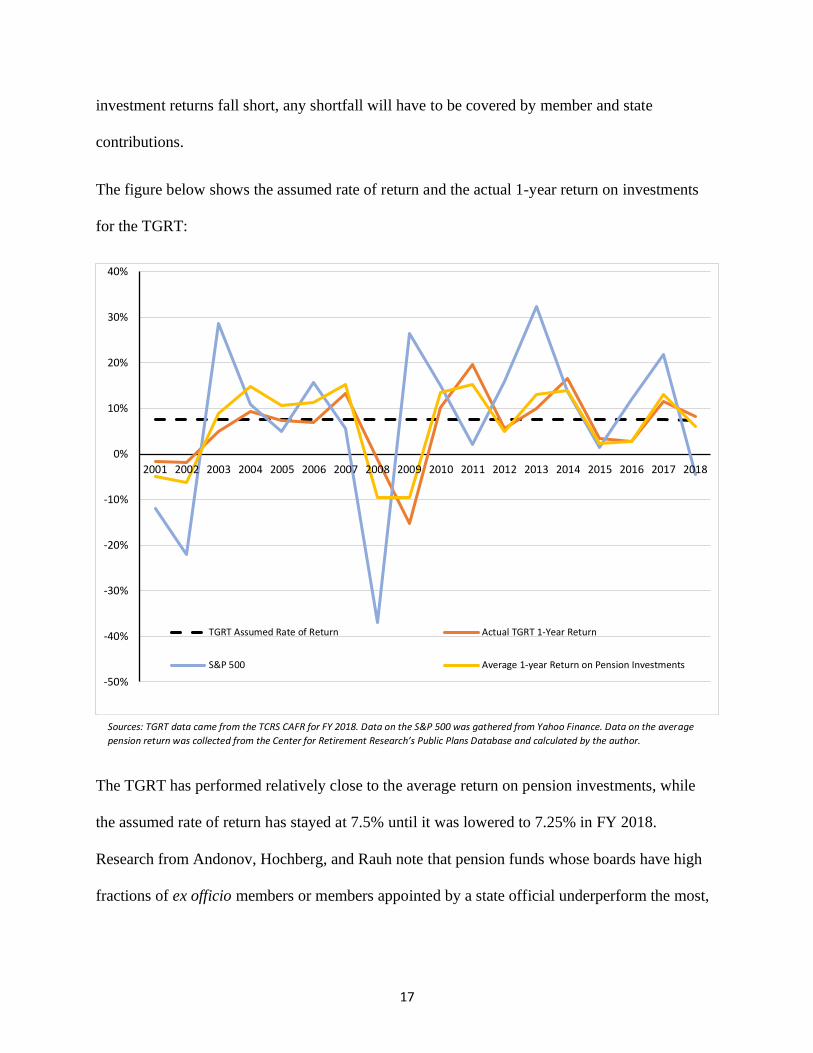
17
investment returns fall short, any shortfall will have to be covered by member and state
contributions.
The figure below shows the assumed rate of return and the actual 1-year return on investments
for the TGRT:
The TGRT has performed relatively close to the average return on pension investments, while
the assumed rate of return has stayed at 7.5% until it was lowered to 7.25% in FY 2018.
Research from Andonov, Hochberg, and Rauh note that pension funds whose boards have high
fractions of ex officio members or members appointed by a state official underperform the most,
-50%
-40%
-30%
-20%
-10%
0%
10%
20%
30%
40%
2001 2002 2003 2004 2005 2006 2007 2008 2009 2010 2011 2012 2013 2014 2015 2016 2017 2018
TGRT Assumed Rate of Return Actual TGRT 1-Year Return
S&P 500 Average 1-year Return on Pension Investments
Sources: TGRT data came from the TCRS CAFR for FY 2018. Data on the S&P 500 was gathered from Yahoo Finance. Data on the average
pension return was collected from the Center for Retirement Research’s Public Plans Database and calculated by the author.
18
followed by funds whose boards have a high fraction of members elected by participants.41 The
Alabama Employee Retirement System and Judges Retirement System (both share the same
Board of Control) and the Teachers Retirement System share a similar structure to the board of
trustees for the TGRT (a 13-person board consisting of elected plan members and ex officio
members).42 However, it is key to look at the role fiduciary responsibility plays in asset
performance. The TGRT is focused on long-term investment, whereas Retirement Systems of
Alabama (RSA) has different stated goals. Dove and Smith (2016) find the RSA has been
shifting to riskier investment strategy, such as golf courses, luxury hotels, office buildings and
print media.43 The RSA is investing in private placements, specifically investments meant to
encourage economic development in Alabama.44 Dove and Smith (2016) note that while the
Alabama Supreme Court ruled such investments are within RSA’s authority,45 the increased risk
has cost the RSA investment returns and left the RSA in a worse position than the TCRS.
Ultimately, the RSA is more volatile than the TGRT due to its sporadic investment policies.
Methods for Liability Valuation
As noted in the section discussing GASB 67 and 68, most state pension plans, including
the TCRS, use a “blended discount rate” to determine the present value of liabilities. However,
using a risk-free discount rate would better reflect the state’s inability to default on liabilities.
41 Andonov, Aleksandar; Hochberg, Yael V; and Rauh, Joshua D. “Pension Fund Board Composition and
Investment Performance: Evidence from Private Equity.” Hoover Institution Economics Working Papers. March
2016. Retrieved from: https://www.hoover.org/sites/default/files/research/docs/16104_-
_pension_fund_board_composition_and_investment_performance_-_andonov_hochberg_and_rauh.pdf 42 Retirement Systems of Alabama. “Boards of Control for the TRS, ERS, and JRF.” 2020. Online. Retrieved from:
https://www.rsa-al.gov/jrf/board-of-control/ and https://www.rsa-al.gov/ers/board-of-control/
43 Dove and Smith. “Alabama at the Crossroads.” p. 43.
44 Dove, John and Smith, Dan. “Alabama at the Crossroads: An Economic Guide to a Fiscally Sustainable Future.”
Mercatus Center at George Mason University. March 22, 2016. p. 42. Retrieved online:
https://www.mercatus.org/publications/urban-economics/alabama-crossroads-economic-guide-fiscally-sustainable-
future 45 Dove and Smith. “Alabama at the Crossroads.” p. 43.
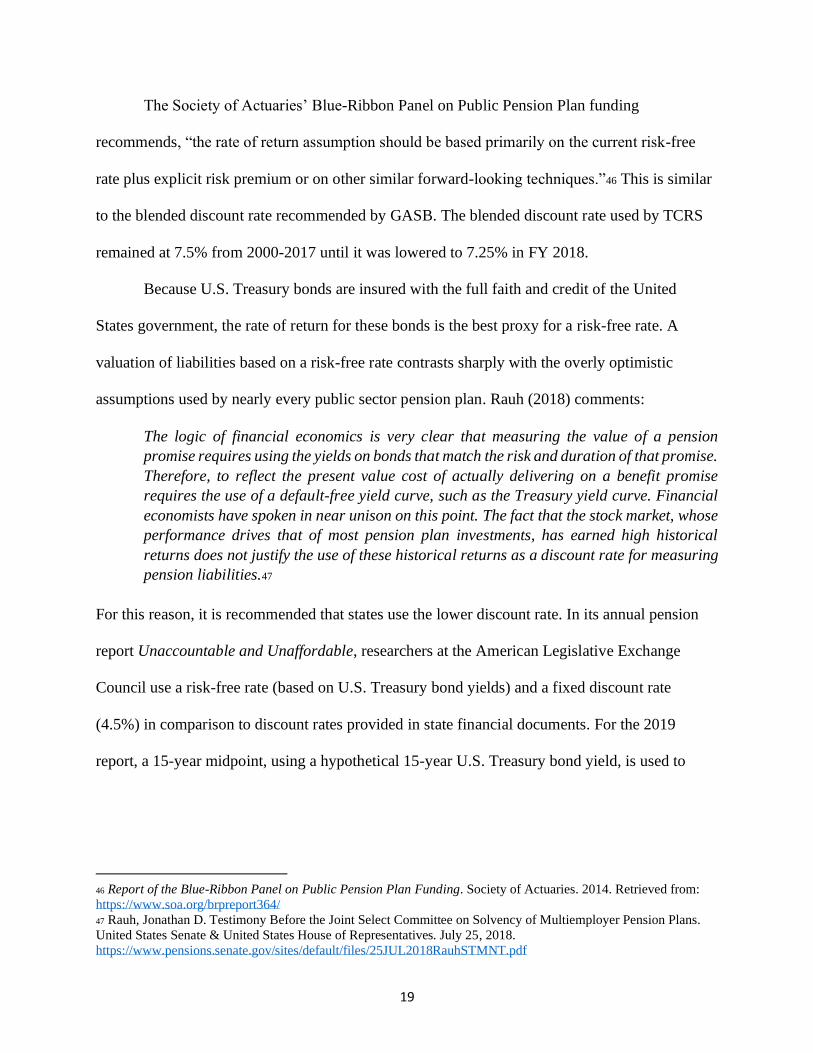
19
The Society of Actuaries’ Blue-Ribbon Panel on Public Pension Plan funding
recommends, “the rate of return assumption should be based primarily on the current risk-free
rate plus explicit risk premium or on other similar forward-looking techniques.”46 This is similar
to the blended discount rate recommended by GASB. The blended discount rate used by TCRS
remained at 7.5% from 2000-2017 until it was lowered to 7.25% in FY 2018.
Because U.S. Treasury bonds are insured with the full faith and credit of the United
States government, the rate of return for these bonds is the best proxy for a risk-free rate. A
valuation of liabilities based on a risk-free rate contrasts sharply with the overly optimistic
assumptions used by nearly every public sector pension plan. Rauh (2018) comments:
The logic of financial economics is very clear that measuring the value of a pension
promise requires using the yields on bonds that match the risk and duration of that promise.
Therefore, to reflect the present value cost of actually delivering on a benefit promise
requires the use of a default-free yield curve, such as the Treasury yield curve. Financial
economists have spoken in near unison on this point. The fact that the stock market, whose
performance drives that of most pension plan investments, has earned high historical
returns does not justify the use of these historical returns as a discount rate for measuring
pension liabilities.47
For this reason, it is recommended that states use the lower discount rate. In its annual pension
report Unaccountable and Unaffordable, researchers at the American Legislative Exchange
Council use a risk-free rate (based on U.S. Treasury bond yields) and a fixed discount rate
(4.5%) in comparison to discount rates provided in state financial documents. For the 2019
report, a 15-year midpoint, using a hypothetical 15-year U.S. Treasury bond yield, is used to
46 Report of the Blue-Ribbon Panel on Public Pension Plan Funding. Society of Actuaries. 2014. Retrieved from:
https://www.soa.org/brpreport364/
47 Rauh, Jonathan D. Testimony Before the Joint Select Committee on Solvency of Multiemployer Pension Plans.
United States Senate & United States House of Representatives. July 25, 2018.
https://www.pensions.senate.gov/sites/default/files/25JUL2018RauhSTMNT.pdf
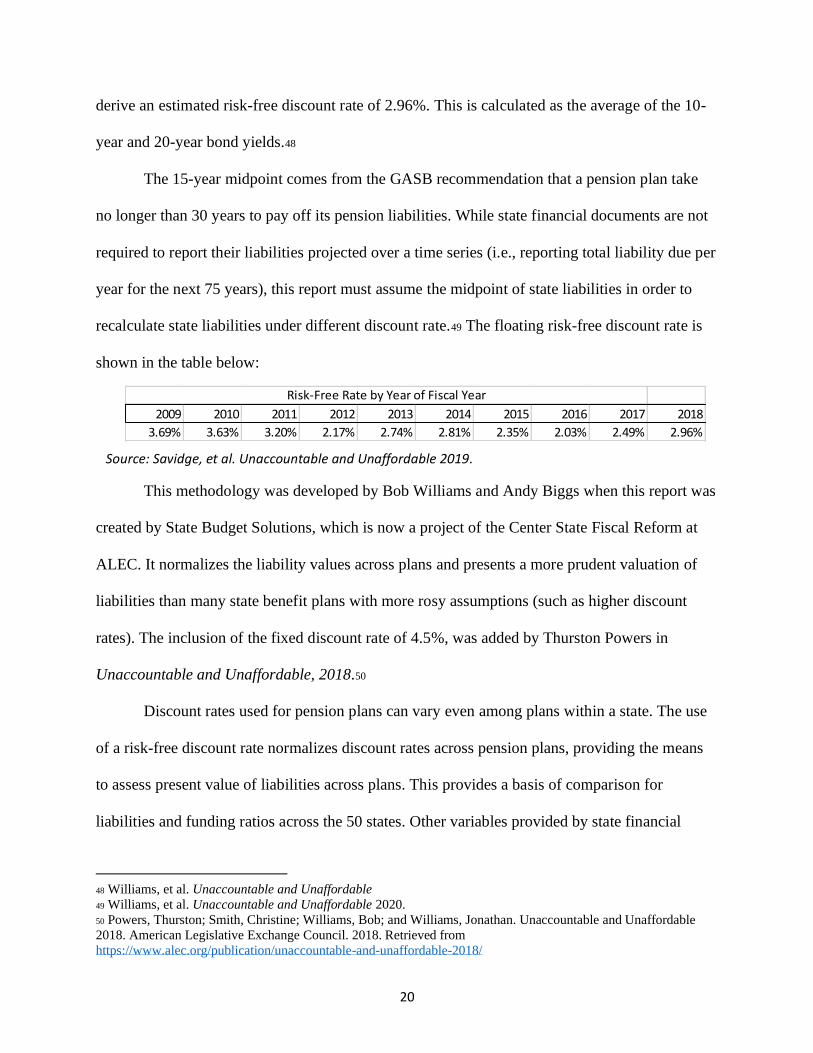
20
derive an estimated risk-free discount rate of 2.96%. This is calculated as the average of the 10-
year and 20-year bond yields.48
The 15-year midpoint comes from the GASB recommendation that a pension plan take
no longer than 30 years to pay off its pension liabilities. While state financial documents are not
required to report their liabilities projected over a time series (i.e., reporting total liability due per
year for the next 75 years), this report must assume the midpoint of state liabilities in order to
recalculate state liabilities under different discount rate.49 The floating risk-free discount rate is
shown in the table below:
This methodology was developed by Bob Williams and Andy Biggs when this report was
created by State Budget Solutions, which is now a project of the Center State Fiscal Reform at
ALEC. It normalizes the liability values across plans and presents a more prudent valuation of
liabilities than many state benefit plans with more rosy assumptions (such as higher discount
rates). The inclusion of the fixed discount rate of 4.5%, was added by Thurston Powers in
Unaccountable and Unaffordable, 2018.50
Discount rates used for pension plans can vary even among plans within a state. The use
of a risk-free discount rate normalizes discount rates across pension plans, providing the means
to assess present value of liabilities across plans. This provides a basis of comparison for
liabilities and funding ratios across the 50 states. Other variables provided by state financial
48 Williams, et al. Unaccountable and Unaffordable 49 Williams, et al. Unaccountable and Unaffordable 2020.
50 Powers, Thurston; Smith, Christine; Williams, Bob; and Williams, Jonathan. Unaccountable and Unaffordable
2018. American Legislative Exchange Council. 2018. Retrieved from
https://www.alec.org/publication/unaccountable-and-unaffordable-2018/
2009 2010 2011 2012 2013 2014 2015 2016 2017 2018
3.69% 3.63% 3.20% 2.17% 2.74% 2.81% 2.35% 2.03% 2.49% 2.96%
Risk-Free Rate by Year of Fiscal Year
Source: Savidge, et al. Unaccountable and Unaffordable 2019.
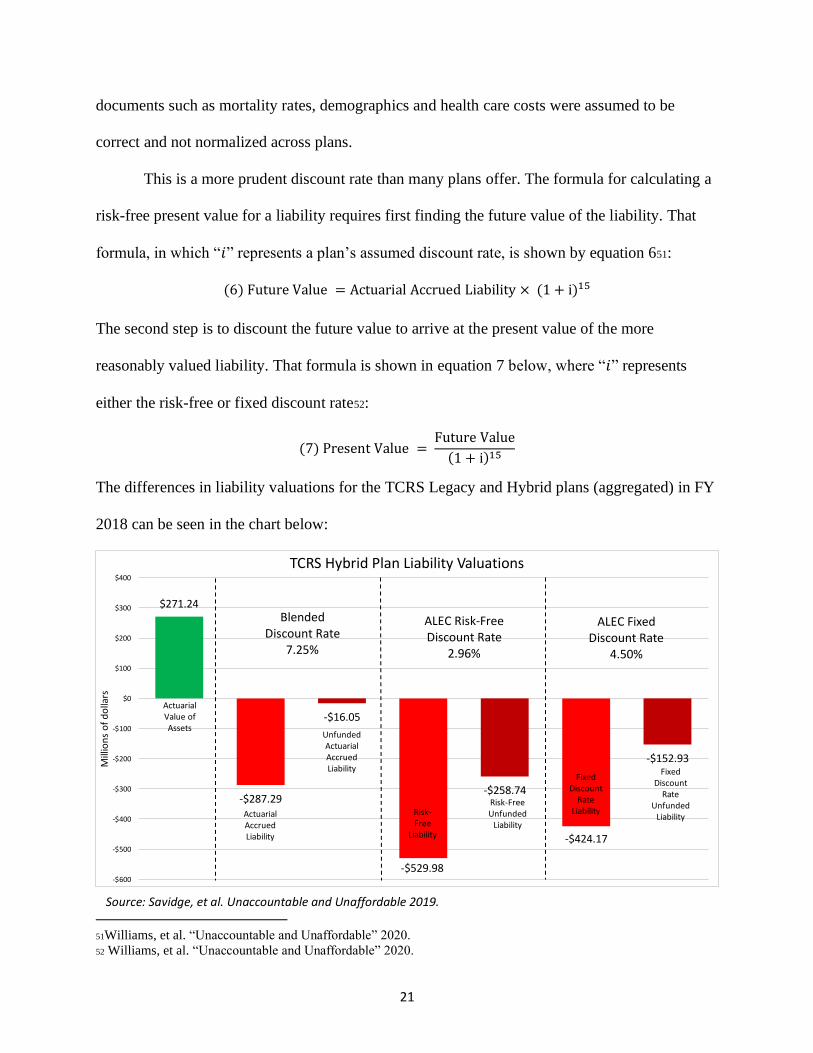
21
documents such as mortality rates, demographics and health care costs were assumed to be
correct and not normalized across plans.
This is a more prudent discount rate than many plans offer. The formula for calculating a
risk-free present value for a liability requires first finding the future value of the liability. That
formula, in which “𝑖” represents a plan’s assumed discount rate, is shown by equation 651:
(6) Future Value = Actuarial Accrued Liability × (1 + i)15
The second step is to discount the future value to arrive at the present value of the more
reasonably valued liability. That formula is shown in equation 7 below, where “𝑖” represents
either the risk-free or fixed discount rate52:
(7) Present Value = Future Value
(1 + i)15
The differences in liability valuations for the TCRS Legacy and Hybrid plans (aggregated) in FY
2018 can be seen in the chart below:
51Williams, et al. “Unaccountable and Unaffordable” 2020.
52 Williams, et al. “Unaccountable and Unaffordable” 2020.
$271.24
-$287.29
-$16.05
-$529.98
-$258.74
-$424.17
-$152.93
-$600
-$500
-$400
-$300
-$200
-$100
$0
$100
$200
$300
$400
Mill
ion
s o
f d
olla
rs
TCRS Hybrid Plan Liability Valuations
Actuarial Value of Assets
Blended Discount Rate
7.25%
ALEC Risk-Free Discount Rate
2.96%
ALEC Fixed Discount Rate
4.50%
ActuarialAccrued Liability
Unfunded ActuarialAccrued Liability
Risk-Free
Liability
Risk-Free Unfunded
Liability
Fixed Discount
RateLiability
Fixed Discount
Rate Unfunded
Liability
Source: Savidge, et al. Unaccountable and Unaffordable 2019.

22
Note that these liability valuations vary greatly, even with relatively small changes to the
discount rate assumptions.
Unfunded Liability Growth: How TCRS Compares Across the Nation
Most state government public pension systems are drastically underfunded. A report from
the American Legislative Exchange Council Found that, when controlling for discount rates,
unfunded pension liabilities from state pension plans reached $4.9 trillion in Fiscal Year 2018.53
Generally, public pension underfunding is due to a combination of four attributes: intentional
underfunding, poor management, market conditions and volatility, and benefit design issues.
53 Williams, et al. “Unaccountable and Unaffordable” 2020.
$37,612.73
-$40,265.30
-$2,652.57
-$74,278.38
-$36,665.65
-$57,479.95
-$21,214.91
-$80,000
-$60,000
-$40,000
-$20,000
$0
$20,000
$40,000
$60,000
Mill
ion
s o
f d
olla
rs
TCRS Legacy Liability Valuations
Actuarial Value of Assets
Blended Discount Rate
7.25%
ALEC Risk-Free Discount Rate
2.96%
ALEC Fixed Discount Rate
4.50%
ActuarialAccrued Liability
Unfunded ActuarialAccrued Liability
Risk-Free
Liability
Risk-Free Unfunded
Liability
Fixed Discount
Rate Liability
Fixed Discount Rate
Unfunded Liability
Source: Savidge, et al. Unaccountable and Unaffordable 2019.
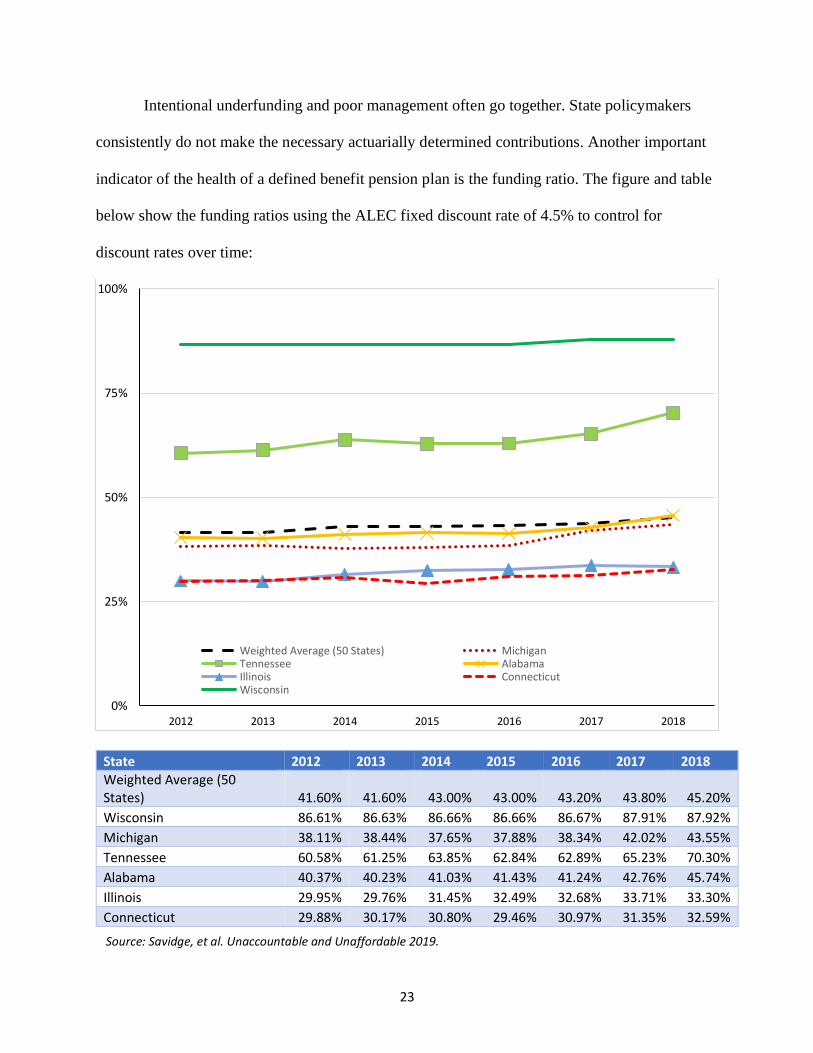
23
Intentional underfunding and poor management often go together. State policymakers
consistently do not make the necessary actuarially determined contributions. Another important
indicator of the health of a defined benefit pension plan is the funding ratio. The figure and table
below show the funding ratios using the ALEC fixed discount rate of 4.5% to control for
discount rates over time:
State 2012 2013 2014 2015 2016 2017 2018 Weighted Average (50 States) 41.60% 41.60% 43.00% 43.00% 43.20% 43.80% 45.20%
Wisconsin 86.61% 86.63% 86.66% 86.66% 86.67% 87.91% 87.92%
Michigan 38.11% 38.44% 37.65% 37.88% 38.34% 42.02% 43.55%
Tennessee 60.58% 61.25% 63.85% 62.84% 62.89% 65.23% 70.30%
Alabama 40.37% 40.23% 41.03% 41.43% 41.24% 42.76% 45.74%
Illinois 29.95% 29.76% 31.45% 32.49% 32.68% 33.71% 33.30%
Connecticut 29.88% 30.17% 30.80% 29.46% 30.97% 31.35% 32.59%
0%
25%
50%
75%
100%
2012 2013 2014 2015 2016 2017 2018
Weighted Average (50 States) MichiganTennessee AlabamaIllinois ConnecticutWisconsin
Source: Savidge, et al. Unaccountable and Unaffordable 2019.
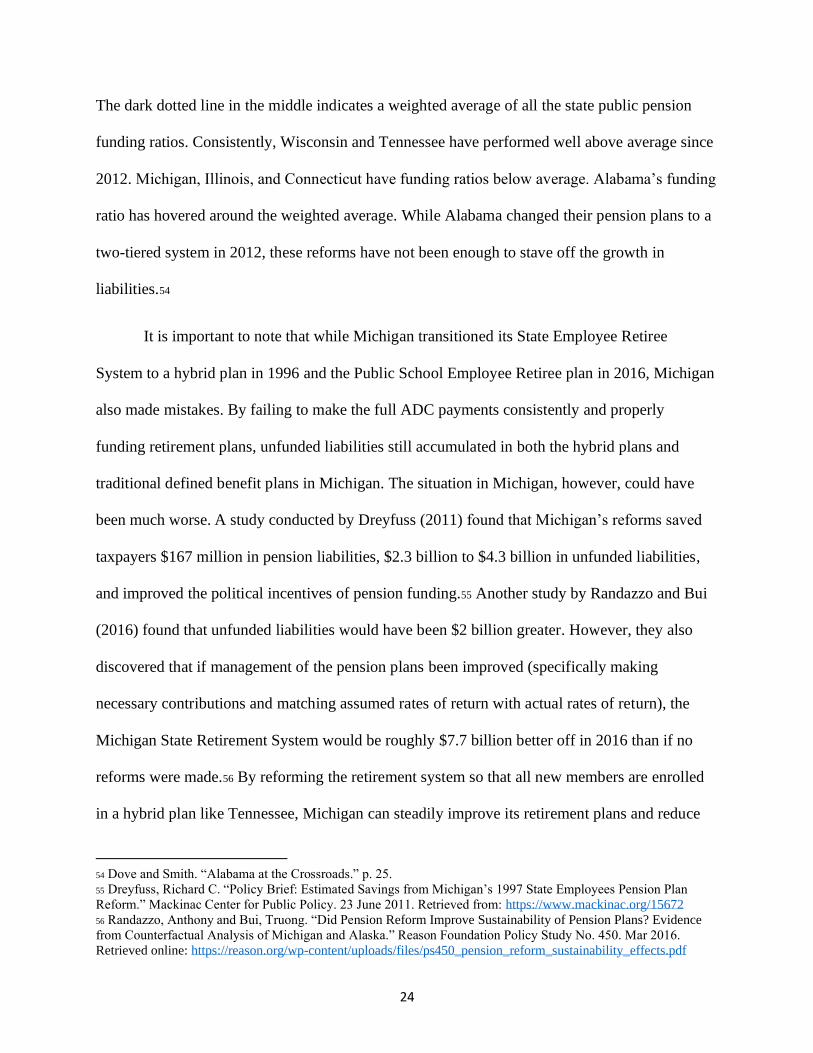
24
The dark dotted line in the middle indicates a weighted average of all the state public pension
funding ratios. Consistently, Wisconsin and Tennessee have performed well above average since
2012. Michigan, Illinois, and Connecticut have funding ratios below average. Alabama’s funding
ratio has hovered around the weighted average. While Alabama changed their pension plans to a
two-tiered system in 2012, these reforms have not been enough to stave off the growth in
liabilities.54
It is important to note that while Michigan transitioned its State Employee Retiree
System to a hybrid plan in 1996 and the Public School Employee Retiree plan in 2016, Michigan
also made mistakes. By failing to make the full ADC payments consistently and properly
funding retirement plans, unfunded liabilities still accumulated in both the hybrid plans and
traditional defined benefit plans in Michigan. The situation in Michigan, however, could have
been much worse. A study conducted by Dreyfuss (2011) found that Michigan’s reforms saved
taxpayers $167 million in pension liabilities, $2.3 billion to $4.3 billion in unfunded liabilities,
and improved the political incentives of pension funding.55 Another study by Randazzo and Bui
(2016) found that unfunded liabilities would have been $2 billion greater. However, they also
discovered that if management of the pension plans been improved (specifically making
necessary contributions and matching assumed rates of return with actual rates of return), the
Michigan State Retirement System would be roughly $7.7 billion better off in 2016 than if no
reforms were made.56 By reforming the retirement system so that all new members are enrolled
in a hybrid plan like Tennessee, Michigan can steadily improve its retirement plans and reduce
54 Dove and Smith. “Alabama at the Crossroads.” p. 25.
55 Dreyfuss, Richard C. “Policy Brief: Estimated Savings from Michigan’s 1997 State Employees Pension Plan
Reform.” Mackinac Center for Public Policy. 23 June 2011. Retrieved from: https://www.mackinac.org/15672
56 Randazzo, Anthony and Bui, Truong. “Did Pension Reform Improve Sustainability of Pension Plans? Evidence
from Counterfactual Analysis of Michigan and Alaska.” Reason Foundation Policy Study No. 450. Mar 2016.
Retrieved online: https://reason.org/wp-content/uploads/files/ps450_pension_reform_sustainability_effects.pdf
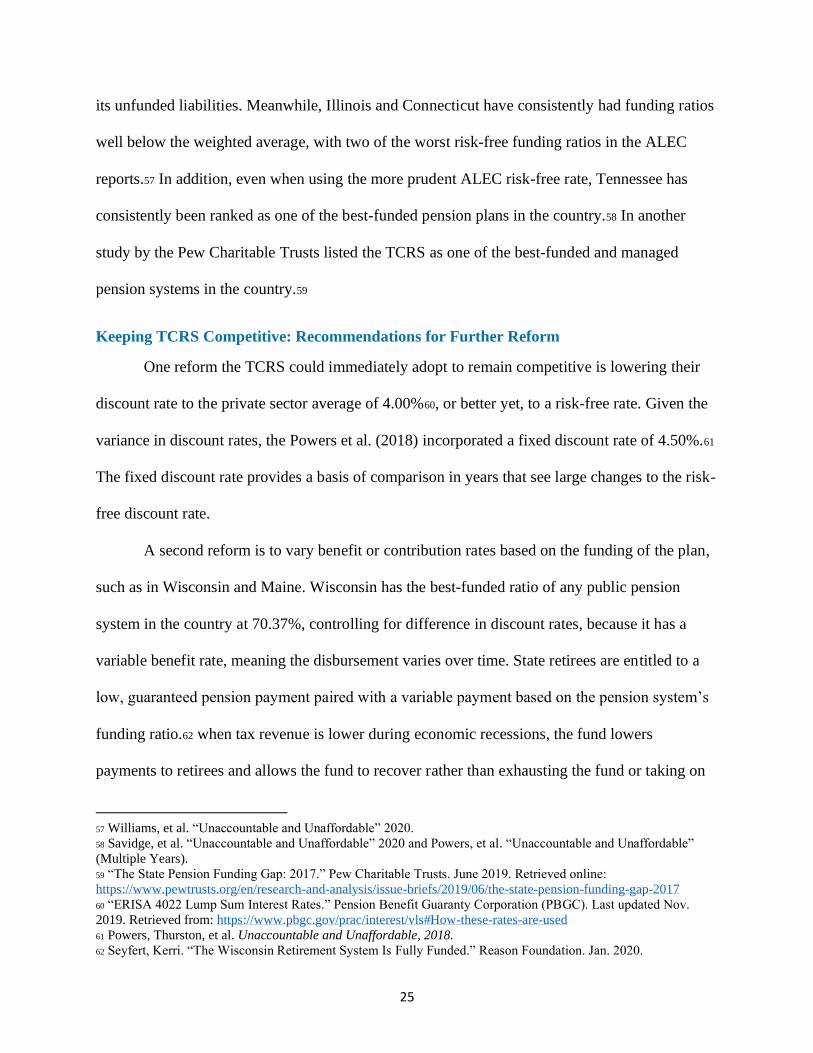
25
its unfunded liabilities. Meanwhile, Illinois and Connecticut have consistently had funding ratios
well below the weighted average, with two of the worst risk-free funding ratios in the ALEC
reports.57 In addition, even when using the more prudent ALEC risk-free rate, Tennessee has
consistently been ranked as one of the best-funded pension plans in the country.58 In another
study by the Pew Charitable Trusts listed the TCRS as one of the best-funded and managed
pension systems in the country.59
Keeping TCRS Competitive: Recommendations for Further Reform
One reform the TCRS could immediately adopt to remain competitive is lowering their
discount rate to the private sector average of 4.00%60, or better yet, to a risk-free rate. Given the
variance in discount rates, the Powers et al. (2018) incorporated a fixed discount rate of 4.50%.61
The fixed discount rate provides a basis of comparison in years that see large changes to the risk-
free discount rate.
A second reform is to vary benefit or contribution rates based on the funding of the plan,
such as in Wisconsin and Maine. Wisconsin has the best-funded ratio of any public pension
system in the country at 70.37%, controlling for difference in discount rates, because it has a
variable benefit rate, meaning the disbursement varies over time. State retirees are entitled to a
low, guaranteed pension payment paired with a variable payment based on the pension system’s
funding ratio.62 when tax revenue is lower during economic recessions, the fund lowers
payments to retirees and allows the fund to recover rather than exhausting the fund or taking on
57 Williams, et al. “Unaccountable and Unaffordable” 2020.
58 Savidge, et al. “Unaccountable and Unaffordable” 2020 and Powers, et al. “Unaccountable and Unaffordable”
(Multiple Years).
59 “The State Pension Funding Gap: 2017.” Pew Charitable Trusts. June 2019. Retrieved online:
https://www.pewtrusts.org/en/research-and-analysis/issue-briefs/2019/06/the-state-pension-funding-gap-2017
60 “ERISA 4022 Lump Sum Interest Rates.” Pension Benefit Guaranty Corporation (PBGC). Last updated Nov.
2019. Retrieved from: https://www.pbgc.gov/prac/interest/vls#How-these-rates-are-used
61 Powers, Thurston, et al. Unaccountable and Unaffordable, 2018.
62 Seyfert, Kerri. “The Wisconsin Retirement System Is Fully Funded.” Reason Foundation. Jan. 2020.
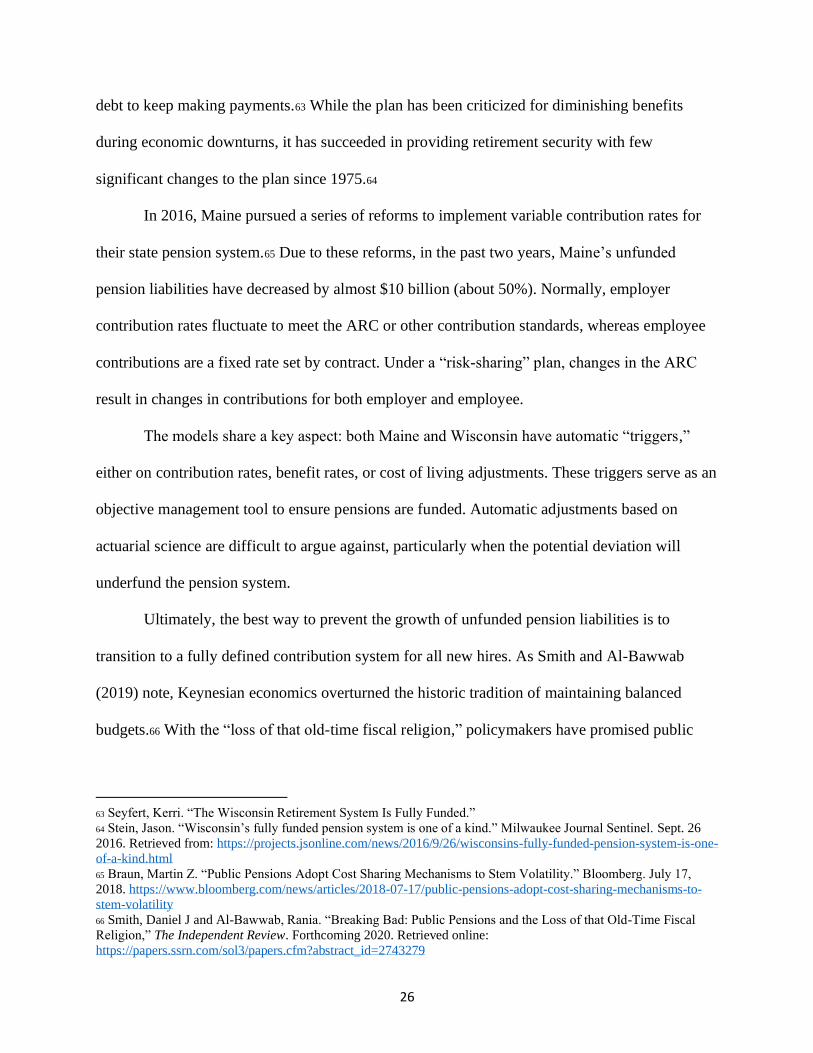
26
debt to keep making payments.63 While the plan has been criticized for diminishing benefits
during economic downturns, it has succeeded in providing retirement security with few
significant changes to the plan since 1975.64
In 2016, Maine pursued a series of reforms to implement variable contribution rates for
their state pension system.65 Due to these reforms, in the past two years, Maine’s unfunded
pension liabilities have decreased by almost $10 billion (about 50%). Normally, employer
contribution rates fluctuate to meet the ARC or other contribution standards, whereas employee
contributions are a fixed rate set by contract. Under a “risk-sharing” plan, changes in the ARC
result in changes in contributions for both employer and employee.
The models share a key aspect: both Maine and Wisconsin have automatic “triggers,”
either on contribution rates, benefit rates, or cost of living adjustments. These triggers serve as an
objective management tool to ensure pensions are funded. Automatic adjustments based on
actuarial science are difficult to argue against, particularly when the potential deviation will
underfund the pension system.
Ultimately, the best way to prevent the growth of unfunded pension liabilities is to
transition to a fully defined contribution system for all new hires. As Smith and Al-Bawwab
(2019) note, Keynesian economics overturned the historic tradition of maintaining balanced
budgets.66 With the “loss of that old-time fiscal religion,” policymakers have promised public
63 Seyfert, Kerri. “The Wisconsin Retirement System Is Fully Funded.”
64 Stein, Jason. “Wisconsin’s fully funded pension system is one of a kind.” Milwaukee Journal Sentinel. Sept. 26
2016. Retrieved from: https://projects.jsonline.com/news/2016/9/26/wisconsins-fully-funded-pension-system-is-one-
of-a-kind.html
65 Braun, Martin Z. “Public Pensions Adopt Cost Sharing Mechanisms to Stem Volatility.” Bloomberg. July 17,
2018. https://www.bloomberg.com/news/articles/2018-07-17/public-pensions-adopt-cost-sharing-mechanisms-to-
stem-volatility 66 Smith, Daniel J and Al-Bawwab, Rania. “Breaking Bad: Public Pensions and the Loss of that Old-Time Fiscal
Religion,” The Independent Review. Forthcoming 2020. Retrieved online:
https://papers.ssrn.com/sol3/papers.cfm?abstract_id=2743279
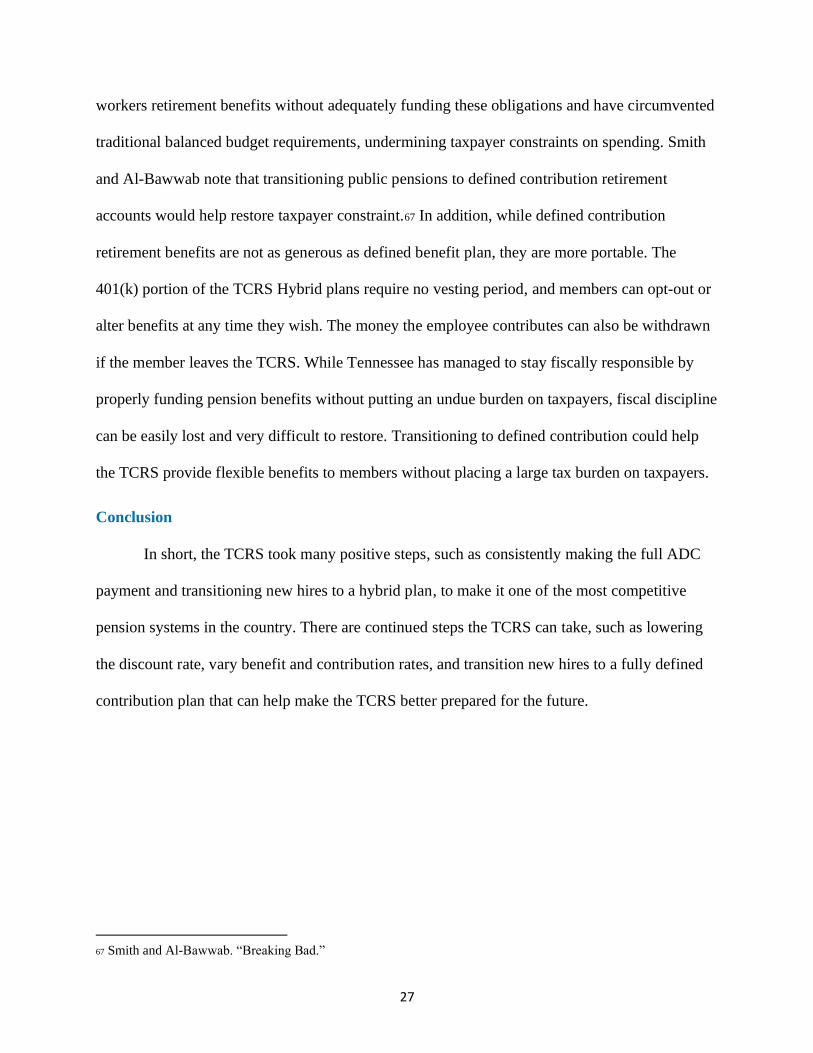
27
workers retirement benefits without adequately funding these obligations and have circumvented
traditional balanced budget requirements, undermining taxpayer constraints on spending. Smith
and Al-Bawwab note that transitioning public pensions to defined contribution retirement
accounts would help restore taxpayer constraint.67 In addition, while defined contribution
retirement benefits are not as generous as defined benefit plan, they are more portable. The
401(k) portion of the TCRS Hybrid plans require no vesting period, and members can opt-out or
alter benefits at any time they wish. The money the employee contributes can also be withdrawn
if the member leaves the TCRS. While Tennessee has managed to stay fiscally responsible by
properly funding pension benefits without putting an undue burden on taxpayers, fiscal discipline
can be easily lost and very difficult to restore. Transitioning to defined contribution could help
the TCRS provide flexible benefits to members without placing a large tax burden on taxpayers.
Conclusion
In short, the TCRS took many positive steps, such as consistently making the full ADC
payment and transitioning new hires to a hybrid plan, to make it one of the most competitive
pension systems in the country. There are continued steps the TCRS can take, such as lowering
the discount rate, vary benefit and contribution rates, and transition new hires to a fully defined
contribution plan that can help make the TCRS better prepared for the future.
67 Smith and Al-Bawwab. “Breaking Bad.”
28
References
American Academy of Actuaries. “The 80% Pension Funding Standard Myth.” American
Academy of Actuaries Issue Brief. July 2012. Retrieved from:
https://www.actuary.org/sites/default/files/files/80_Percent_Funding_IB_071912.pdf
Braun, Martin Z. “Public Pensions Adopt Cost Sharing Mechanisms to Stem Volatility.”
Bloomberg. July 17, 2018. https://www.bloomberg.com/news/articles/2018-07-17/public-
pensions-adopt-cost-sharing-mechanisms-to-stem-volatility
Dove, John and Smith, Dan. “Alabama at the Crossroads: An Economic Guide to a Fiscally
Sustainable Future.” Mercatus Center at George Mason University. March 22, 2016. p.
42. Retrieved online: https://www.mercatus.org/publications/urban-economics/alabama-
crossroads-economic-guide-fiscally-sustainable-future
Dreyfuss, Richard C. “Policy Brief: Estimated Savings from Michigan’s 1997 State Employees
Pension Plan Reform.” Mackinac Center for Public Policy. June 23, 2011. Retrieved
from: https://www.mackinac.org/15672
“ERISA 4022 Lump Sum Interest Rates.” Pension Benefit Guaranty Corporation (PBGC). Last
updated Nov. 2019. Retrieved from: https://www.pbgc.gov/prac/interest/vls#How-these-
rates-are-used
Findley. “Tennessee Consolidated Retirement System Hybrid Pension Plans Actuarial Valuation
and Report.” June 30, 2018. Retrieved from:
https://treasury.tn.gov/Portals/0/Documents/Retirement/Actuarial/ActuarialValuation201
8-Hybrid.pdf
Findley. “Tennessee Consolidated Retirement System Legacy Pension Plans Actuarial Valuation
and Report.” June 30, 2018. Retrieved from:
https://treasury.tn.gov/Portals/0/Documents/Retirement/Actuarial/ActuarialValuation201
8-Legacy.pdf
Gabriel Roeder Smith & Company. “Connecticut State Teachers Retirement System Actuarial
Valuation.” June 30, 2008. Retrieved from:
https://portal.ct.gov/TRB/Content/Other-Resources/Statistics-and-Research/Actuarial-
Valuation
Illinois Office of the State Comptroller. “Illinois Comprehensive Annual Financial Report for the
Fiscal Year 2004.” State of Illinois. June 30, 2004. P.34 Retrieved from:
https://illinoiscomptroller.gov/Ledger-Temp/assets/File/CAFR/CAFR%202004.pdf
29
In re Pension Reform Litigation, 118585 IL. 2015. Retrieved from:
https://courts.illinois.gov/Opinions/SupremeCourt/2015/118585.pdf
Powers, Thurston; Smith, Christine; Williams, Bob; and Williams, Jonathan. Unaccountable and
Unaffordable 2018. American Legislative Exchange Council. 2018. Retrieved from
https://www.alec.org/publication/unaccountable-and-unaffordable-2018/
Randazzo, Anthony and Bui, Truong. “Did Pension Reform Improve Sustainability of Pension
Plans? Evidence from Counterfactual Analysis of Michigan and Alaska.” Reason
Foundation Policy Study No. 450. March 2016. Retrieved online: https://reason.org/wp-
content/uploads/files/ps450_pension_reform_sustainability_effects.pdf
Rauh, Jonathan D. Testimony Before the Joint Select Committee on Solvency of Multiemployer
Pension Plans. United States Senate & United States House of Representatives. July 25,
2018. https://www.pensions.senate.gov/sites/default/files/25JUL2018RauhSTMNT.pdf
“Report of the Blue-Ribbon Panel on Public Pension Plan Funding.” Society of Actuaries. 2014.
Retrieved from: https://www.soa.org/brpreport364/
Retirement Systems of Alabama. “Boards of Control for the TRS, ERS, and JRF.” 2020. Online.
Retrieved from: https://www.rsa-al.gov/jrf/board-of-control/ and https://www.rsa-
al.gov/ers/board-of-control/
Williams, Jonathan; Savidge, Thomas; Estes, Skip; and Williams, Bob. Unaccountable and
Unaffordable: Unfunded Pension Liabilities in the 50 States. American Legislative
Exchange Council. 2019. https://www.alec.org/publication/unaccountable-and-
unaffordable-2019/
State of Tennessee Department of Treasury. “Tennessee Consolidated Retirement System
Comprehensive Annual Financial Report (CAFR) For the Fiscal Year Ended June 30,
2019.” June 30, 2019. p. 81 Retrieved from:
https://treasury.tn.gov/Portals/0/Documents/Retirement/CAFR%20Reports/2019/2019%2
0CAFR_Full%20Report.pdf
State of Tennessee Department of Treasury. “Forms and Guides: Active Member Resource
Guides for Hybrid and Legacy Pension Plans.” Tennessee Consolidated Retirement
Systems. 2020. Retrieved online: https://treasury.tn.gov/Retirement/Information-and-
Resources/Forms-and-Guides
State of Tennessee Department of Treasury. “GASB and Actuarial Information.” Tennessee
Consolidated Retirement Systems. 2019. Retrieved online:
https://publicreports.treasury.tn.gov/
Seyfert, Kerri. “The Wisconsin Retirement System Is Fully Funded.” Reason Foundation. Jan.
2020. Retrieved online: https://reason.org/commentary/the-wisconsin-retirement-system-
is-fully-funded-and-a-model-for-other-states/
30
Smith, Daniel J and Al-Bawwab, Rania. “Breaking Bad: Public Pensions and the Loss of that
Old-Time Fiscal Religion,” The Independent Review. Forthcoming 2020. Retrieved
online: https://papers.ssrn.com/sol3/papers.cfm?abstract_id=2743279
“The State Pension Funding Gap: 2017.” Pew Charitable Trusts. June 2019. Retrieved online:
https://www.pewtrusts.org/en/research-and-analysis/issue-briefs/2019/06/the-state-
pension-funding-gap-2017
Stein, Jason. “Wisconsin’s fully funded pension system is one of a kind.” Milwaukee Journal
Sentinel. Sept. 26, 2016. Retrieved from:
https://projects.jsonline.com/news/2016/9/26/wisconsins-fully-funded-pension-system-is-
one-of-a-kind.html
Weinberg, Sheila and Norcross, Eileen. “GASB 67 and GASB 68: What the New Accounting
Standards Mean for Public Pension Reporting.” Mercatus Center Policy Briefs. June 15,
2017. Retrieved from: https://www.mercatus.org/publications/urban-economics/gasb-67-
and-gasb-68-what-new-accounting-standards-mean-public-pension