Joye Lab University of Georgia
28
Biogeochemistry, Microbial Activity, and Microbial Distributions in Sediments of the Deep Slope Joye Lab University of Georgia S. Joye, M. Bowles , V. Samarkin, K. Hunter, K. Bowles, and K. Segarra, and H. Niemann (University of Basel, Switzerland)
-
Upload
khangminh22 -
Category
Documents
-
view
3 -
download
0
Transcript of Joye Lab University of Georgia

Biogeochemistry, Microbial Activity, and Microbial Distributions in Sediments of the Deep Slope
Joye LabUniversity of Georgia
S. Joye, M. Bowles, V. Samarkin, K. Hunter, K. Bowles, and K. Segarra,
andH. Niemann (University of Basel, Switzerland)

The Geobiological Engine
Gas Hydrate
Brine Pool
δ13CH4 = -45ä δ13CH4 = -60 to -65 ä
Beggiatoa sp.mat
Thiomargarita sp.mat
musselbed
Tube wormpatch
Sediment
Water Column
CH4
HCO3-
HS-
SO42-
Org CH2
Oil. alkanes
NO3-
AN
ME
AR
CH
SRB
VSB
Adv
ectiv
e/D
iffus
ive
Flux
CH4brine
CH4
CH4, oil,alkanes,
DOM
SRDOM AOM,HydOx
SO42- H2S
Sulfate reduction DOM, Hydrocarbon, VFA oxidation
CO2
CH3COOH
+H2
Methanogenesis (CO2, acetate); Homoacetogenesis
CH4
CO2
CH4
or VFA acetate
oil,
gas,
brin
e
Brine, alkanes, DOC, oil

Microorganisms-Macrofauna: positive and negative interactions possible
Macrofauna Response
Toxic? Optimal? Energy limited?
Joye et al. 2004
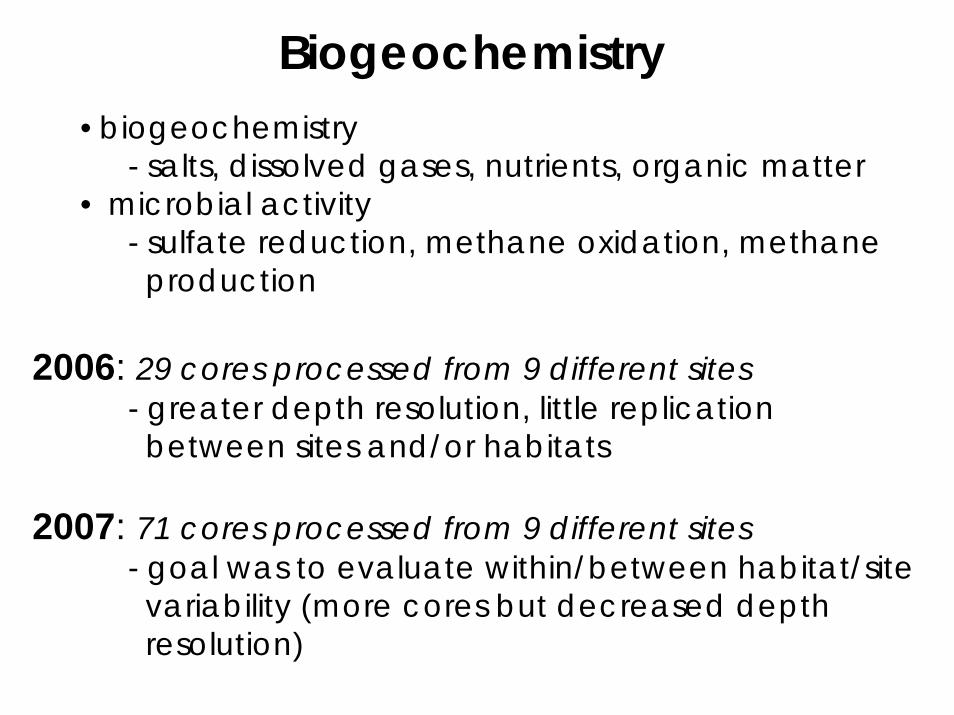
Biogeochemistry•biogeochemistry
- salts, dissolved gases, nutrients, organic matter• microbial activity
- sulfate reduction, methane oxidation, methaneproduction
2006: 29 cores processed from 9 different sites- greater depth resolution, little replication
between sites and/or habitats
2007: 71 cores processed from 9 different sites- goal was to evaluate within/between habitat/sitevariability (more cores but decreased depthresolution)

GeochemistryCores sectioned and pore water extracted with a
mechanical "squeezer"; pore water split and preserved for analyses.
push core

Microbial ActivityMeasuring microbial activity with radiotracers:
14Ccarbon
35Ssulfur
CH4 + SO42- CO3
2- + H2S + H2Omethane sulfate bicarbonate hydrogen sulfide water
push core
The microbial turnover of radioactive methane and sulfate is a way to measure anaerobic oxidation of methane (AOM) and sulfate reduction (SR) rates

Microbiology
Molecular Biology (ongoing)• DNA extraction and clone libraries• quantify abundance of specific groups by FISH
Organic Geochemistry (ongoing, HelgeNiemann)
• biomarkers
Classic Microbiology (ongoing)• cell counts

Amplify 16S rDNAgenes from
environmental samples
Develop markers for specific groups
of organisms
Hybridize ribosomes in intact cells with
fluorescent markers(FISH)
Identification by molecular phylogeny
Identification by lipid biomarkers
Methods to target ‘live’ biomassWho is there and What are they doing ?
cell wall
DNA
ribosomesWhat do I eat?
δ13C composition of cell material
Cartoon by B. Orcutt

Habitat Differences: Control
Control Core (no seepage), GC852
• low CH4 and DIC
• evidence for SO42- consumption and H2S production but
available SR rates are extremely low
• DOC and CH4 increase with depth so could fuel deeper SR

Habitat Differences: Brine
Brine Flow Core, AT340
• extremely high CH4 but not DIC (carbonate precipitation?)
• rapid SO42- depletion (SR plus upward brine advection)
• DOC and NH4+ concentrations elevated within brine
• AOM rates are ~50% of SR rates; a reductant other than CH4 is used by SRB

Habitat Differences: Oily Brine
Oily Brine Flow Core, MC853
• extremely high CH4 but, again, low DIC (carbonate ptt?)
• rapid SO42- depletion, limited H2S accumulation (faster advection?)
• DOC and NH4+ concentrations highest measured
• AOM rates are ~50% of SR rates; additional reductant

Habitat Differences: Beggiatoa mat
Beggiatoa mat core, AT340
• low CH4 and DIC; subsurface pH minimum due to H2S oxidation
• little SO42- depletion (rapid re-oxidation)
• low NH4+ but DOC increases substantially with depth
• AOM rates below detection; SR rates high (variable)

Habitat Differences: Pogonophora
Pogonophoran core, WR269/270
• high CH4 and DIC; elevated pH w/ depth
• rapid SO42- depletion and H2S accumulation
• low NH4+ but very high DOC (exudate from pogos?)
• unusual patterns of AOM and SR (decoupled)

Habitat Differences: Urchin
Urchin core, AC818
• high CH4 and DIC (highest observed)
• rapid SO42- depletion and H2S accumulation
• low NH4+ but high DOC (related to urchins/urchin activity?)
• AOM and SR on same scale; AOM > SR

Habitat Differences: AC601 Brine Pool
lake bottominside
edgeouteredge
~3m~40m
control
brine
0 500 1000 1500 2000-5
0
5
10
15
20
25
Cl- concentration (mM)
depth(cm)
controllake bottominner edgeedgeouter edge
0 5 10 15 20 25 30-5
0
5
10
15
20
25
SO4
2- concentration (mM)
depth(cm)
controllake bottominner edgeedgeouter edge
0 500 1000 1500 2000 2500 3000 3500-5
0
5
10
15
20
25
CH4 concentration (µM)
depth(cm)
controllake bottominner edgeedgeouter edge

Habitat Differences: AC601 Brine Pool0 500 1000 1500 2000
-5
0
5
10
15
20
25
Sulfate Reduction Rate (nmol cm-3
d-1
)
depth(cm)
controllake bottominner edgeedgeouter edge
SR Rate (nmol cm-3 d-1)
0 20 40 60 80 100-5
0
5
10
15
20
25
depth(cm)
controllake bottominner edgeedgeouter edge
0 5 10 15-5
0
5
10
15
20
25
AOM Rate (nmol cm-3
d-1
)
depth(cm)
controllake bottominner edgeedgeouter edge
Integrated Rates SR AOM % coupled Bi-MOG(mmol m-2 d-1) control 0.09 0.004 4 n.d.
outer edge 0.89 0.36 40 n.d.edge 35.4 0.28 0.8 0.02inner edge 18 0.04 0.2 0.06lake bottom 1.3 0.03 2 0.01
0 0.2 0.4 0.6 0.8 1 1.2-5
0
5
10
15
20
25
Bi-MOG Rate (nmol cm-3
d-1
)
depth(cm)
controllake bottominner edgeedgeouter edge
Bi_MOG Rate (nmol cm-3 d-1)AOM Rate (nmol cm-3 d-1)

DOC vs. Cl-
0
2000
4000
6000
8000
500 1000 1500 2000 2500
340 br DOC 340 mt DOCAC818 ur DOC
GC852 ct DOC
MC853 obr DOCMC853 br2 DOC
AC818 tw DOCAC601 bot DOC
AC601 ur DOC
DO
C (µ
M)
Chloride (mM)
µM D
OC
Brines are enriched with DOC
Animal cores show increases with DOC over depth independent of salt;TW most extreme
Controls also show some increase with depth
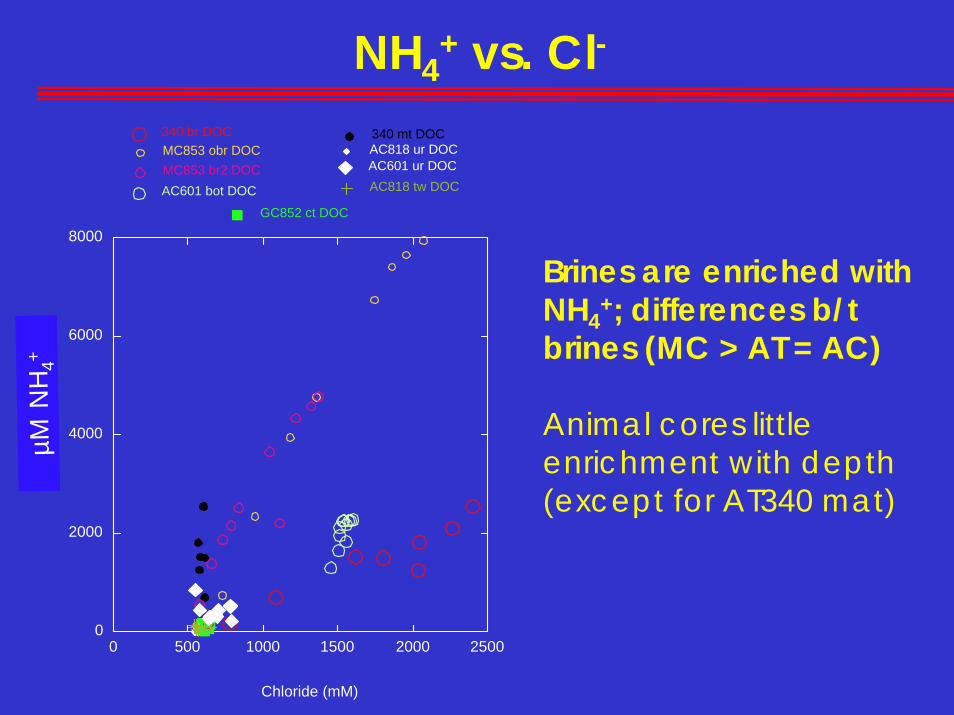
NH4+ vs. Cl-
340 br DOC 340 mt DOCAC818 ur DOC
GC852 ct DOC
MC853 obr DOCMC853 br2 DOC
AC818 tw DOCAC601 bot DOC
AC601 ur DOC
0
2000
4000
6000
8000
0 500 1000 1500 2000 2500
DO
C (µ
M)
Chloride (mM)
µM N
H4+
Brines are enriched with NH4
+; differences b/tbrines (MC > AT = AC)
Animal cores little enrichment with depth (except for AT340 mat)

Habitat Differences: Within Site
AT340-CH4
• highest CH4 in mat and brine environments
• increases with depth at all sites (less control)
• means with different letters are significantly different at α = 0.05 level
0 500 1000 1500 2000 2500
-1
1.5
4.5
8
12.5
AT340 Cross habitat - Methane
controlurchinmatbrine
CH4 (µmoles/L)
Depth(cm)
a
bb
a
cb
a
cb
ab
b
a
bb

Habitat Differences: Within Site
AT340-DIC• highest DIC in brines
• increases with depth at all sites (less control)
• means with different letters are significantly different at α = 0.05 level
0 5 10 15 20
-1
1.5
4.5
8
12.5
DIC ( mmoles/L)
Depth(cm)
controlurchinmatbrine
a
b,c
ab
b,c
a, ba, b
c
ab
bb
abbb
ab
bb

Habitat Differences: Within Site
AT340-NH4+
• highest NH4+ in brines
(mat, brine)
• increases with depth at all sites (less control)
• means with different letters are significantly different at α = 0.05 level
0 200 400 600 800 1000
-1
1.5
4.5
8
12.5
NH4+ (µmoles/L)
Depth(cm)
controlurchinmatbrine
a
b
a
c
b
d
ab
cc
a
c
a
cd
d
b
b
b

Habitat Differences Across Sites-Pogos
Pogonophoran-SR rates• maximal SR rates at
WR269/270
• rates in pogo cores from WR269 and AC818 comparable; AC645 lower
• means with different letters are significantly different at α = 0.05 level
0 10 20 30 40 50
-1
1.5
4.5
8
12.5
WR SRR645 SRR818 SRR
SR rate (nmol/cc/day)
Depth(cm)
a
aa
a
bb
a
a,bb
a
ab

Summary
1. Substantial habitat-associated variability in geochemistry and microbial activity: SR rates highest at brine sites; brines > microbial mats > pogos ~ tubeworms > urchins
2. Variability also noted in AOM rates: AOM rates highest at pogo sites (pogos > urchins > tubeworms > mats >>> brines)
3. Brine flow limits microbial activity: advection limits SO42-
availability and thus SR rates; AOM also hindered (salt?)
4. AC601 brine pool: highest SR activity at pool edges--best of both worlds (SW-SO4
2- and brine DOC?); AOM hindered and equal to MOG in the brine

Summary
5. Brines are a source of DOC and NH4+: Can see differences
in source fluids evident in slopes of chloride vs. DOC/NH4 plots.
6. Animals also a source of DOC?: Appears so. Labile organic C profiles will shed light on this (ongoing)
7. Significant differences between habitats within a site?: Yes! Replication between n=4 cores per habitat surprisingly good. Interactions between animals and microbial activity is clear; driving factors less clear

Remaining Work
Molecular biology: detailed studies of habitat variation (AT340 and AC601) and between site (pogos @ WR269, AC645 and AC818)
Remaining Geochemistry: labile DOC components (VFA); cations

Contributions to DSR Special IssueJoye, S.B., M.W. Bowles, V.A. Samarkin, K.S. Hunter, and H.
Niemann. Submitted. Biogeochemical signatures and microbial activity of different cold seep habitats along the Gulf of Mexico lower slope. Submitted to Deep Sea Research.
Orcutt, B.N., S.B. Joye, S. Kleindienst, K. Knittel, A. Ramette, A. Reitz, V.A. Samarkin, T. Truede, and A. Boetius. Submitted. Impact of natural oil and higher hydrocarbons on microbial diversity, distribution and activity in Gulf of Mexico cold seepsediments. Submitted to Deep Sea Research.
Wankel, S.D., S.B. Joye, V.A. Samarkin, S. Shah, G. Friderich, J. Melas-Kryiazi, and P.R. Girguis. Submitted. New constraints on diffusive methane fluxes and rates of anaerobic methane oxidation in a Gulf of Mexico brine pool through the use of a deep sea in situ mass spectrometer. Submitted to Deep Sea Research.

Planned PublicationsBowles et al. Methanogenesis at brine sites
Joye et al. AC601 brine lake (2006 cruise data)
Two to three additional biogeochemistry papers:
Joye et al. Habitat differences (2007 cruise data)
Joye et al. Brines comparison (2007 cruise data)
Joye, Roberts, et al. AC601 brine lake
Two to three molecular papers to be written by post doc Melitza Crespo-Medina: AT 340 paper, AC 601 paper and also a possible pogo paper
Reference
Joye, S.B., A. Boetius, B.N. Orcutt, J.P. Montoya, H.N. Schulz, M.J. Erickson, and S.K. Lugo. 2004. The anaerobic oxidation of methane and sulfate reduction in sediments from Gulf of Mexico cold seeps. Chemical Geology 205:219–238.