(JOVERNMENT OF INDIA ATOMIC ENERGY COMMISSION
128
H A.R.C - 7 (JOVERNMENT OF INDIA ATOMIC ENERGY COMMISSION SPECTROSCOPY DIVISION ANNUAL PROGRESS REPORT FOR 1973-74 BHABHA ATOMIC RESEARCH CENTRE BOMBAY. INDIA 1974
-
Upload
khangminh22 -
Category
Documents
-
view
1 -
download
0
Transcript of (JOVERNMENT OF INDIA ATOMIC ENERGY COMMISSION
H A.R.C - 7
(JOVERNMENT OF INDIA
ATOMIC ENERGY COMMISSION
SPECTROSCOPY DIVISION
ANNUAL PROGRESS REPORT FOR 1973-74
BHABHA ATOMIC RESEARCH CENTRE
BOMBAY. INDIA
1974
B.A.S.0 . -TB3
007ERMMSRT OP IHDIAATOMIC EHERGT COKXiSSIOH
COCO
«
SMCTROSCOPT 9I7ISI0NAIHUAL PROGRESS REPCKT FOR 1 9 7 3 - 7 4
BHiBdi ATOMIC RESEARCH OBTCREBOUBAI, ISDLa.
1974
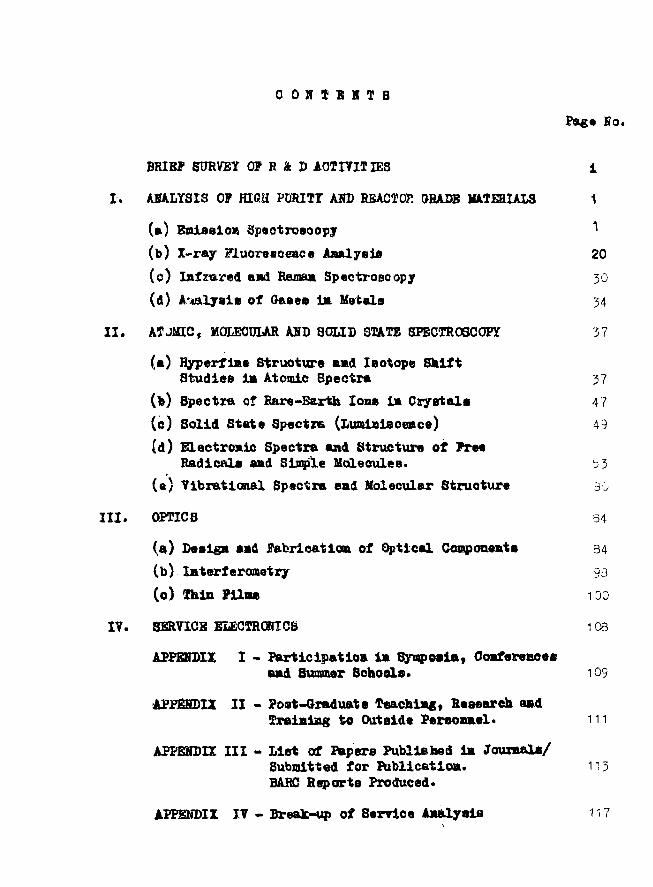
C O H I B N T B
Page Bo.
BRIBJP SURVEY OP H h J> AOTIYITIE8 1
I . AKALYSIS OF HIGH PURITY ADD REACTOR GRADE MATERIALS 1
(a.) Bniaalon Spaotroaoopjr ^
(b) X-ray Fluorescence Aaalysia 20
(c) Infrared aad Ramaa Spectroscopy 30
(d) AmLyais of Geaes 1* Metals 34
I I . A5PJMIC, M01ECUIAR AHD SOLID SIATE SPECTROSCOPY 37
(a) Hyperfla* Structure *»d Isotope Shift
8tudles la Atomic Spectra 37
(to) Spectra of Rare-Earth lone la Crystals 47
(c) Solid State Spectra (Luaiaisoeace) 49
[A) Elactroalc Spectra and Structure of FreeRadicals aad Simple Molecules. 33
(a) Yibratlcmal Spectre aad Molecular Structure so
I I I . OPTICS 34
(a) Dealga aad Jfebric&tiaa of Optical Compon«ta 34
(b) laterferometry 93
(o) Thin Films 130
IV. SERVICE ELECTRONICS 108
APPENDIX I - Participatioa l a Syispoaia, Ooafereaeesaad 8ummer Schools. 109
•APP&HDIX II - Poist-Oraduate T«achi««, Research aadSraiaiag to Out aide Peroonael. 111
APPENDIX I I I - List of Papers Published ia Journals/Submitted for Publicatioa. 113BARC Reporta Produced*
APPENDIX IT - Break-up of Service Aaalyaia 117
HIIEF 3DRVEY CP B & D ACTIVITIES
A b r i e f rer iew of the B A D a o t i r i t i e s was presented on January
11* 1974* They *re broadly -
I . AIALTSIS CF HIOH FUHITT AM REACTCR GRADE iSATERIALS
II. ATCWIC, MOLECULAR AHD 8 d . l l ) STATE 3PBCTR0SC0PT
I I I . OPTICS
IV. SERVICE ELECTRONICS
The need arose for the orgnnisation of a Speotroacopy laboratory
to proride analytioal aerrioe for di f ferent reaotor materials . The Main
adTsntage of epeefcroeoopy i a that i t 3?equirea only ainute quantit ies of
staples and enaU.ee the eatination of a large nunber of iBpurities in
trace aoounta eiBultaneoualy.
Bowerer* I nay Just aention here that the diviaion baa added
x-ray fluoreeoecoe apeotroaoopy for analytioal sexrioe durlsg the year
under reriew. I ta p o t e n t i a l i t i e s are well-knonn and hare been abundantly
oleez eren with the few analyses carried out so far in the diYisioft. Some
of these w e highlighted.
I t ia proposed to add to the ex i s t ing x-ray fluorescence epeotro-
acopy, Auger- end photo-electroa epeotrosoopy, Eeeides the ir application
in the analys is of e l eaents of low atonie nunbor, from fluorine downwards,
photo-eleotron speotroscopy iB extreiaely useful for the stwdiee of Burfaoe
properties of so l ids and electronio structure studies of nolecular spooies.
11
8a fax, infrared apeotaroaoopy ooeupied » prise plaoe in tbo
aaelytioal techniques. ¥• did indaed eet-ap, parbapa for tbe firat tin*
la the country, an infrared apcotroattter and need It for anelyaia of
~.*rj water* With tha advent of high sowar lasors, i t ia n#* possible to
UH Baaaa epeotroeoopy with «qual or bottom aaaa for afialytioal porpoasa.
fa hara raoantly aoqalrad aa argon ion laser with a Spax tripla aono-
obroamtar and a photon oounttog onlt with athtr aoeoaaoriaa. ¥« alao bara
1»«n balldlng Ha-la lavara of raaaonabltf povav*
With tbaaa* i t will now ha poaaihla to atudy low fraquaney
lattioa Tihrations and thalx intaraotlona on tbe vihronlo apaetra. B»a
l&sar Hainan apaotropbotonatar will anahla the idantlfioation of aeraral
jbvpuritiaa in aioaro aaqplaa (a« l i t t l a aa 0.002 nl) and' in araaa as wal l
aa 10 alorons, Surfaoa laporitlac oan tsa atadlad St tar by laa«r Baaan
apaotroaoopy,
Yo ara awara that tha rotation and rihratlon-rotation Banaa linaa
ara ideal for identifying ainat« pollntanta aereral kUoaetara away* Ihia
raqairea an Intense laear aenroc and la^gs l igbt gathering and high
resolution Baaan apeetrophotomatar. Wito tho expertlae and tha initial
work on laaers and aonoohsoaatora toat we bad, we afcell bt able to talld
aaob inatrtUMJuta. If one ware to look f«r an infrared inatranent, i t
Tcald hava to be 6 typa Connea naed for dataotion of CO and CO in planatu.
For iaotopia analyala we her* deralopod a nniqaa aafhod for deter-
adnlng tha abondanoea of baron leotopea bnaad on the knowledge that in a
BOj aoleoolei the laotopio noleoalea hare widely different saro>point
i l l
energiaa In th« ground and exoited alectsonlo atatan. This does not,
therefor*f require very highly reeolving instrument*. Thin ie e spin-
off txam molecular apeotroaoopy*
Baaio research in epeotrosoopy la important, and tfcs diricion
undartakaa re sear oh in atosio, nolooalar and solid atat« speotrosoopy.
Several aenior aoiontiata work on BOSS seleot probleas (shown under II,
Atoaio, Moleoulax and Solid State Speotroaoopy) In *adh of the above
ace&e with the oo-operation of jusiox aoievitista. I auat •opha.also hare
that xaaaaroh Is taken up only after diaoharging tb» analytioal raaponai-
bUity of the division.
Of the a«r«ral araaa, I shall just oito one ox tiro raaaaroh
pxohlaas a&d«rtek«n hy urn. Studies of high rasolntloa alaotronio ap«otr«
gi»a aa the isportant data on the «l«otronio states and the elaotron oon-
figtavatiOBS whioh givs rise to than states* 1 oarrest «nd«rataadiag of
tha spaotra will tall us aors of "kits Boleoular steuoture inoludlng the
Mtolsi of atoms sad a praoiaa knowladga of the aolaoalar paxaaetexs will
hslp in tba datorsdnation of diisooi*»tion anergias, xaaotiTitioa, ato.
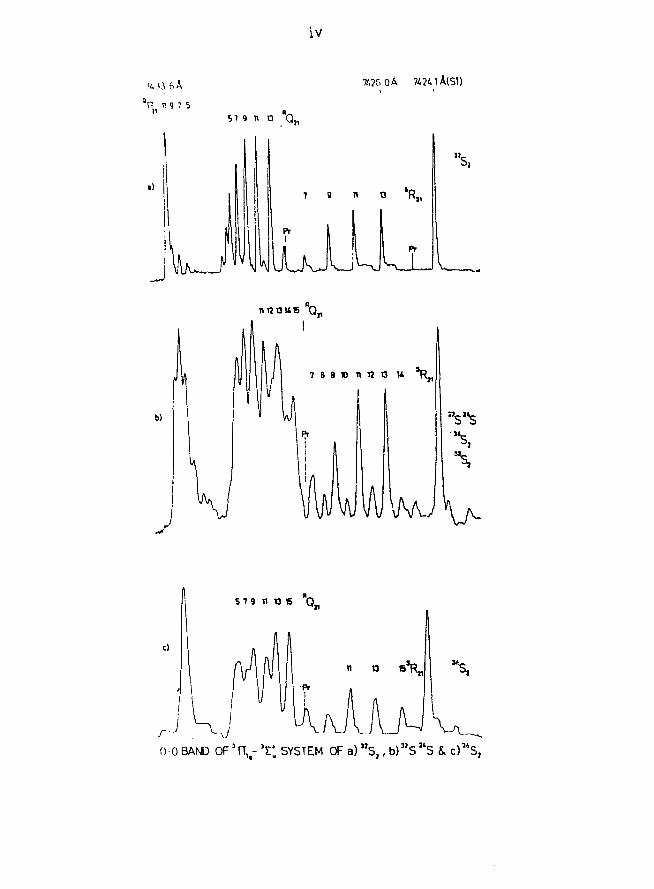
Let as take a aiaple aolooule like Sg. Pi«.1 illustrate a the
iaportsn«s of hi«h resolution rotational strustura stadias of Sg giTing
tUs Stssi expsiasntal sTid^see fesr ths ag?Ss s* i **> fe« «««>=, 3?igs1 also
shows tha all lapoxtant phsnoBwaoa of pradtsseoiatioa. In ofhax words, if
one w«rs to Ixsa&iats a atxtoro of all tht poosiBlo isotopio diatoaio
sulphur BoloouUs with tns right wavelength* i t i s poasible to disaooiate
IV
7475 0 A 74?4iA(Sl)
5 1 U 0 QJ(
1 9 n o *R,,
iLXLUJ
0-0BAND OF 'n^ -X SYSTEM OF a)"s , , b)"Sa 5 & c) *S,
only those aaleoular opeoiee for whioh the energy matches and no other.
The inportanoe of auoh speotrosoopio information i s evident.
We are presently planning to extend saoh spootrosoopio invest!-6 7 6 7
gatlons to Li Li, Li- and Li« eaploylBg laser exoited seleotive
•oleoular fluorr voenoe. Our osa vork on bores containing ooleoular species
and KB would also Be very interesting In 1MB regard.
Skiffioa i t to say that suoh ressaroh work I s of fundamental import-
ance to our own understanding sad also for any technological application.
In thia oonneotion, I aay mention t!»t during the last three years,
an extreaaly powerful rases of high precision speotrosoopy has emerged out
of saturation techniques using lasers . Eren when one i s able to achieve
very high resolutions with grating acraoobronotors, Dopplisr broadening sets
tha limit to precision speotroeoopy. This i s got over by the noval teoh-
nique of **aturation or non-linear, or Laafe Dip speotrosoopy. Thia i s
illustrated in the studies of the -v>* band of CS, known to be inactive -
but sad* active - a prediotion aad« In early f i f t i e s found possible aftur
nearly twenty years*
IIP, lanpur, i s actively eagaged in laser speotrosoopy, though not
in saturation speotrosoopy. I t I s proposed to collaborate with thea on
this aspeot ©f non-lineax speotrosoopy * On our part, we have so far built
a 2-n»tBS He-He laser with good power output. Zha Kleetrcnios *r?oap i s
working on stabilising i t s freqpaanoy when i t oan be used for saturation work.
There axe other areas like plaeoa ape«taroeoopy and for * i o h
speotrosoopy i s aa ideal diagnoatie tool bsosase i t I s essentially an
unpertarbiBg probe whloh atmplee * ayateai la apace and tla* - and we are
Aollaboratlag with the Plaaaa Payeios group la this work, and Bea* foi l
Bpeotroaoopy for the atady of th» apeotara of highly stripped atone - we
shall be aaklng aee of the fac i l i t ies at TaB~**~Qraaf laboratory for this
purpos*.
fhough, frea tha BoglanlBg It was r*alis*i that a good optloa
laboratory la an aaaentlal ooapoc?Qt to apootroaoopy laboratory, It was
•t«4«d only lata in 19^6. For aweral apootroaeople invsatlgatloBs, It
la naocaaary to bars in<*truMats aaisg optloa of high fsal i ty aad praolaion,
Tha fpfwtroaoopy laboratory baa, tharoforo, undartakaa the preparation of
high quality and preolaion optioa Ilka 7abry-P«rot platoa, leas systeaa,
large spherical aurfaoea ©to. vita which high roaalutioB intorfaroBttare
and apaotrographa of largo light gathering power oan be built - and are
aotually tailt as described later*
Intorferoaatry la on® er tha Major reaesroh araaa In optioa and
tha aoiantlat in>oharga. Tit, M.T.H.K. Hirty, la well-known teas hia work in
thla f ield. We alao he,vo a yonagar eoientiat trained on thUi filaa at the
Iaperial College of Soienoe and Technology who haa been working on tha
projeot, Interference and bend-paaa filters^
In the R k D Profile, oei.'tain ap^olfio projeots are identified and
are proposed In collaboration witn Teohnloal rnyaloa Birlelca. These
lnolude speotrophotofflstera, nonoohromatora, «to, Pebrioation of aueh
iiiLtruiBenta will bring out the best of technical ooopetenoa «»?»ilaU.- in
B.A.R.C.
It ha* been a oursosy glance, tut s t i l l , I hop*, It givee »
feeling of t&» anount of effort Involved. As mentioned earlier, the
flawt friorliy has always been to analytic*! oarrioe. Over the y«era,
there has teen no Increasing deaaod for aoalytioal aarrices from varioue
diTlaton* of B.A.R.C sad other units of DAE - not to aention outside
Institutions*
- V.A* VaraeinhaB

- 1 -
I . AHALY8IS OP HIGH PURITY AND REACTOR GRADE MATERIALS
l(a) EMISSION SPEOTRQSCQPY
1. Spectrographlc Determination of Boron In Uranium and i t s Oxides
(S.V. Grampurohit and V.8. D l x l t )
Boron hae a large absorption cross - sec t ion for thermal neutratea
and hence i t i s necessary to detec t i t at very low l e v e l s in nuclear
grade uranium. Further, during the processing of uranium, i t i s l i k e l y
t o be contaminated with boron and hence i t i s important to determine boron
at various s tages of fabrication of uranium. Among the methods t r i e d ,
there are a number of single and mixed epectroecopic carriers for boron
ana lys i s . A mixture of s i l v e r chloride and strontium fluoride in the rat io
4 i 1 was found t o be a sui table carr ier with which the s e n s i t i v i t y was
improved appreciably. A method was, therefore, developed using t h i s
oarrier for B-analys i s . In t h i s method, the epeotra are excited using a
d . c . arc and recorded on ?3A-1 emulsion using Hilger large quarte speotro-
graph. The background was found t o be quite low and i t has been poss ib le
t o use multiple exposuree for analys i s of one sample. With these modifi-
ca t ions , i t haB been possible t o a t ta in a de tec t ion U n i t of 0.01 ppm for
boron - a s e n s i t i v i t y of an order of magnitude greater than the previous
methods. The reproducibt l i ty and accuracy of the method has been checked
and i s found t o be sa t i s fac tory .
2 . Direct Spectrographio Determination of Boron in UP^
(P.S . Murty, S.M. Iferathe and P. Bugmiui Bai)
The standardisation of a method for the d irect determination of
boron i n TO* has been completed. UP. sample i s mixed with sodium f luoride
- 2 -
In the ratio 20M by weight and two hundred milligrams of the mixture i s
~ saded in a carrier-distillation eleotrode (U.C.C. type 1998). It i s
xcited at 5 amp. d.o. fcr 6 secondB and spectra are photographed on a
Hilger large quarts apectrograph. Antimony is used as the Internal
standard element. Using the line pair B 2497• 7 X/Sb 2445.5 X boron la
eatlaated with a sensitivity of 0.07 ppn. The precision of estimation
is • 16J6.
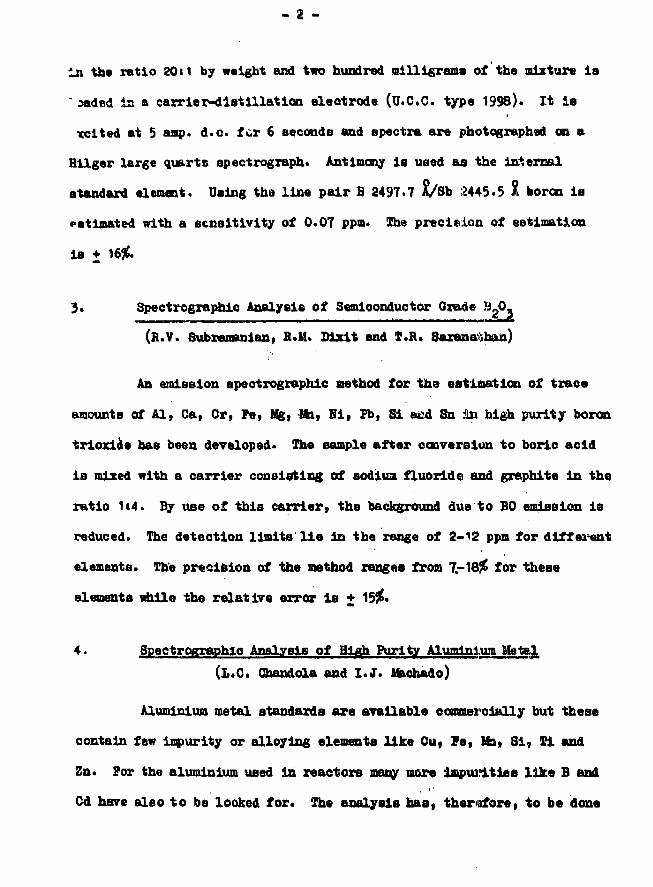
3. Spectrographio Analysis of Semiconductor Grade JigO.
(R.V. Subrenanlan, H.M. Dlxlt and T.R. Sarana- h&n)
An emission epeotrographic method for the estimation of trace
amountB of Al, Ca, Cr, Pe, Mg» -8b» Bit J i Si aed Sn iixx high purity boron
triorLde bas been developed. The sample after conversion to boric acid
i s mixed with a carrier consisting of sodium fluoride and graphite in the
ratio 1i4. By use of this carrier, the background due to BO emission i s
reduced. The deteotion limits l i e in the range of 2-12 ppm for different
elements. The precision of the method ranges from 7-18$ for these
elements while the relative error i s +
4 • Spectrographio Analysis of Hiflh Purity Aluminium Metel(l.C. Ghandola and I.J. Uachado)
Aluminium metal standards are available commercially but these
oontain few impurity or alloying elements like Cu, Pe, lfa» Si, II and
Zn. For the aluminium used in reactors many more impurities l ike B and
Cd have also to be looked for. The analysis has, therefore» to be done
Indirectly by converting the metal to oxide and analysing by comparison
with synthetic standards* Pun aluminium oxide Is available commercially
for the preparation of standards* The problem war to prepare aluminium
oxide from the metal and to know whether the impurities are retained or
lost during the conversion process.
A method was developed to convert the aluminium metal to alumi-
nium rxlde for this analysis, for this , the metal i s dissolved In hydro-
.chlorio acldi the Al Is precipitated with asmonium hydroxide* and the
supernatant solution and precipitate are evaporated co a water bath. The
dritd hydroxide Is then Ignited to aluminium oxide. 'the aluminium oxide
so obtained i s analysed by the method developed earlier^ .
To find out whether the lapurlties are retained or lost during
Idle conversion to oxide, an alumlnlua standard from AA aerieB supplied
by Johnson Ifetthey tt Oo. was converted to oxide by the method described
above. It wan found that impurities l ike Cu, Fe, Ma and Tl were retained
but impurities like Si , which have volati le chlorides, are partially lost
during the procesn.
The overall standard deviation for determination CD aluminium
ood.de was found to be +
1. L.C. Ohandola and I .J. Maohado, 8peotroscopy Mvisian,,Annual Progress Report 1972-73, BaHO-684, 16 (1973).
- 4 -
5. Spectrogxaphio Analysis of High Purity lta.0-
(vsA. Job, S.B. Kartha, 0. KriBhnamurty and Sheila Oopal)
Emission apectrography providea a rapid method for the aioulta-
neoua estimation of various impurities present in manganese dioxide which
is used aa a depolarizer In dry cells. These impurities act as poisoners
to the battery system and therefore hare to be analysed in trace amount.
We hare developed a d.c arc emission method for the quantitative
estimation of 20 impurity elements usicg preheated manganese dioxide. The
aim was to attain lowest possible estimation limits for as many impurity
elements as possible. Several buffer combinations have been tried. It
was found that low detection limits cannot be attained simultaneously for
all the impurity elements with any of the buffers we have studied • There-
fore t two separate methods were developed* In one method, 5# BeJ?2 Is
used as buffer to get good sensitivity for the elements Buoh as As. B, Sn,
Cd etc. For the elements like V, Ti, Cr and Fo, the sample is mixed with
an equal weight of graphite. Ga and an lines are used as internal
standards.
A set of standards containing the impurity elements in the
concentration range of 500 - 1 ppm were prepared and mixed with the
buffers In the required ratio. 90 mgs of th:Ls mixture loaded In the i"
U.C.C. graphite electrode drilled to the required depth Is excited in a
d.c. arc at 10 amp, current for 20 seoonds* The spectra are recorded on
a 3.4 meter JACO grating egectrograph with 30,000 l.p.i. grating blazed
- 5 -
at 3300 A. The estimation range for various elements are given below.
SU|Bi,Ag,Pb,Sb,In . . 2 - 100 ppm
Ae,Co,B,Mo,Cd,Y,Ca,Ha,Zn,Hl , . 10 - 100 "
Cr,Ti,Fe . . . . 20 - 500 "
The method i s found to be reproducible within + 10$ far most
of the elementB. Recovery tests showed that preheating the sample did
not result in the lose of any of the inpurtty elements.
6. Spectrographic Analysis of Wear Metals In Lubricating Oils
(S.V. Grampurohit and P. Meenakshi Baja Bao)
An emission spectrographic method for the determination of
wear metala Si, Pe, Mg, Hi, Al, Ti, Ou, Zn, Ag, Mo, Pb, Cr and Sn in
aviation oi ls i s being developed. The method consists of two parts: one
for the analysis of a l l elements except silicon and magnesium and the
second for the analysis of Si and Kg.
Part 1 - Since aviation o i l s are practically ashleee, conven-
tional ashing techniques are not applicable. In the present method,
therefore, 1 gm of oil i s ashed on 100 ng of gallium oxide which contains
10$ of lithium fluoride as caxrier. Standard? are prepared en gallium
oxide base for concentration range of 5 PPm to 100 ppm which also contain
10$ Lit as carrier. The spectra were recorded at 10 amps d.c. on a large
qu&rts speetrograph in the region 2400-3450 I . Beoovery tests showed
that rseovary for Si and Mg was poor. So a separate method is being
- 6 -
developed for the determination of 31 and Mg. HJfi
Part. 2 - Various matrices were tried for the analysis of 81 H• • ' , ^ 1
and Mg In o i l s and lanthanum oxide with a 1Q# Haf-caloiua carbonate ae M
carrier internal standard mixture (9*1) «&s found most su i table . Samples | j
are ashed on lanthanum oxide base to which the NaF-caloium carbonate ii1
mixture was added. Carrier mixed standards ranging from 5 ppm to 100 ppo |
1were also prepared* To aTOid the possibility of silicon contamination J
samples and the standards were ground In boron carbide mortar. The spectra I
were recorded at 12 amps. d.o. in a large quarts spectrograph in the J
xegion 2400-3450 A. Recovery tests showed that Si and Kg are completely 1
recovered in this case. By this method» most of the other elements of
Interest also were recovered well but in lanthanum oxide matrix 11 and Cr
do not get excited with good enough intensity. So the analysis has to be
carried out in two steps.
By adopting these methods the lowest detection limit that could
be achieved was 1 ppm on sample basis* with 1 gm of sample being ashed.
i t i s obvious that by increasing the amount of sample taken for ashing,
c:?nsitivity ctuld be increased.
7* Spectrographic Analysis of Thalloue Iodide(P.S. Murty and F. Eugmiri. Bai)
A semiqtantitative apectrographlc method has been developed for
the analysis of thallous iodide. The sample is mixed with pure graphite
in the ratio 1:1 by weight and fifteen milligrams of the mixture

- 7 -
i s aroed at 10 aap. d.o. The spectra ar« recorded on. a Bilger large
quarts speotrograph in the region 2400-3350 A. Tract impurities like
Pbf Co, Ca «to. are determined with a sensitivity ranging from b to
2$ ppa*
8* Bpeotrooheaical Analysis of Ihosuhorus Compounds
(T.B. Seranathan, M>J* Kan&t and T.8. 8ugandhi)
In an a f for t to aaki th« aziating aaniquantitatiT* method '
tor th« detaralnation of iiqpuritias in PCI, and P0C1, quantitativa, i t
was n«e«ssaz7 to m i u n easy remorel of the aanplt aftar prsconoentration.
Also, dua to the formation of phosphorio sold in tha saraplas i t was
diffioult to eraporata the sassple completely on graphite. Hence i t was
necessary to convert the final evaporated sample 1Bto a phosphate. Of
the two phosphates of Ca and Bi, the latter WAS preferred due to i t s
densenese. After axperiaenting with LiT, Sa? and graphite ts carriers
and buffers to be mixed with the phosphate, a mixture of Li? and graphite
was found to b« most suitable. Standards of bismuth phosphate for 15
topuritias were prepared* Their spectra were reoorded on Ullger large
quarts spectrograph with d.e. arc excitation and the working currea have
been drawn, final recovery experimentB for samples are being carried out.
1. H.J. K&mat, T.E. Saranathan and T.S. Sugandhi, Speetroecopy DivisionAnnual Progress Report, 1972-73. BAEC-684, 12 (1973)-
- 8 -
9. Determination of Boron In Calcium fluoride Using aCarrier Distillation Technique
(S.V. Grampurohit and V.S. Dixlt)
Calcium fluoride la used extensively as lining material in the
reduction of uranium tetrafluoride to uranium metal. I t i s necessary»
therefore, to analyse caloiua fluoride for Impurities like boron ftoioh
possess high capture crosa-sectlons for thermal neutrons.
A carrier-distillation method Is described here for the estimation
of boron in calcium fluoride. The sample i s mixed with 5% oopper azyfluorlde
containing 500 ppa of gallium. Copper-oxyfluoride acts as carrier and
gallium as Internal standard. 50 mg of this mixture Is loaded In pre-
arced TJ.C.C. 1990 electrode and excited using 15 amp. d.c. are. The spectra
are recorded in the region 2200-2850 A on SA-1 emulsion using a Hilger
large quarts spectrograph. The sensitire line of boron at 2497.7 A Is
ussd and a detection limit of 0.1 ppm i s attained. The precision of the
method i s +
Analysis of Trace Impurities in Strontium Carbonateby Spectrographlc
(B.B. Yengsaxkar *v$ H.S* Saksena)
In electronic industry, strontium carbonate i s required in a
highly purified form for cathode spxaying and thus i t becomes necessary
to derelop an analytical method for the analysis of SrCO- for trace
impurities. A spectrographlo method i s , therefore, being developed for
- 9 -
th« analysis of 11 impurities»
Initial experiments wife direct arcing of 8x00- showed that
burning of SrCO. was erratic and after a f«w aeconda the buUc of the
charge uaed to eoaa into the arc. The volatilisation etudiea alao showed
that the impurities like Fe, Al, Cu, Si, Kg take a prolonged tine for
excitation because of the low boiling point of SrCO,. In order to improve
the volatilisation and to have anooth burning, experiments were conducted
by mixing different ratios of matrix with graphite aa a buffer. I t was
experimentally found that •><•*< «g la equal proportions of SrCO, and graphite
waa moat suitable in increasing the sensitivity. Volatilization rates ot
different impurity elements were alao studied to determine the time of
exposure.
A set of standards containing the impurity elements in two groups
were prepared in the concentration ranges of 1 to 20 ppm and 10 to 200 pps
and ware then mixed with graphite in equal proportions. 50 mg of oharge
ia excited in a d.c. arc at 15 amp. current for a period of 30 seconds on
JACO 3.4 metre grating spectrograph equipped with 30,000 1.p.i . grating
biased at 3300 I . She foi l owing are the ranges of estimation for various
elemental
Al, Cu, Fe, Hg, Pb, 31 . . 1 to 20 ppm
Cd , . . . 10 to 200 ppm
Zn, Ha, Ba, Ca *. 50 t o 500 ppm
Chromium and bismuth are uaed a e internal standard elements.
- 10 -
Since the elements like Ha, Ca and Be are baring sensitive
linen in the region 4000 - 6000 I experiment8 are conducted on Hilger'e
large glass and quarts spectrograph to get higher sensitivity for these
elements* further experiments are in progress to determine the precision
and sensitivity of the method.
11. Spectrographic Analysis of High Purity Europium Oxide
(P.S. Hurty and S.M. Marathe)
A speotrographic method has been developed for the estimation
of Nd and Vj in high purity europium oxide. In order to make use of the
sensitive lines of Nd and By, most of which l i e in the CH band region,
the excitation of BiuO has been done in an oxygen atmosphere using a
Stallwood jet assembly. The spectra are recorded on Ebert 3*4 metre
plane grating spectrograph in the Becond order using a 30,000 l . p . i .
grating. The grating i s biased at 7,500 £ in the f irst order. Using
Nd 4061 £ and Ey 4078 £ the detection limit obtained for these elements
12. Spectrographic Determination of Trace Elements in Basalt Rocks
(L.C. Chandola)
Basalts are the main volcanic rocks in the Deccan Traps in
Maharashtra, in order to find the history of association of this host
rook with various mineral pockets, i t i s necessary to do the trace
element analysis of this rock. The main problem associated with spectro
- 11 -
graphic analysis of rooks for trace elements i s the non-availability of
standards. It *** found from literature that average basalt composition
was as follows t
SiO, - 50* **2°3 "*
Al,n_ „ \*£ Q jQj _
MgO - 10* TiO2 - 2*
Standards were, therefore, prepared on the matrix described
above. 49 elements contained in Spex Mix were added to the matrix at
various concentrations. Shese standards and samples were then mixed with
purs graphite and pure sine oxide In the ratio 1s1t1. One week sine l ine
was used as internal standard. The samples and standards were excited in
a d.c. arc run a. 10 amp* current and the spectrum was photographed in two
regions on large quarts spectrograph. Analysis of about 25 elementB could
be done by this technique. Of these B, Be, Co, Cr, Li, Mi, Si , Sr and V
were found to be present i s trace leve ls and Ysire quantitatively estimated.
13« Petermination of Iron In Pi-Ammonium Hydrogen BiOBphata
(S'V. Grampurohit and V.H.F. Kalmal)
Direct speetrographic estimation of iron in purified di-ammoniua
hydrogen phosphate cold not be carried out as the material had a tendency
to be ejected from the electrode. In addition, ammonium compound i t s e l f
prevented the Impurity spectrum from being suitably excited. Oa the other
hand, because of the presence Of phosphate radical, atomic absorption
- 12 -
aethod could not be employed. H«aae • speotrcoheaiatl aethod based en
t— extraction of iron vising solTent extraction technique followed by
a. trogrephic analysis has been worked oat for this determination.
Cbe gram of di-ammonium hydrogen phosphate i s dissolved in triply
disti l led eater and the pH of the solution adjusted to 10 using 25%
ammonia. A known volume of 2.5% oxine i s added dropwise to the above
solution and ahaken slowly. Iron forae a complex with oxine and i s
extracted using chloroform. The separated organio layer i s oolleoted and
the aqueous layer i s shaken again with another 10 al of chloroform. The
organic layers are collected and eraporated over 200 ag of graphite and
aixod in an agate mortar.
15 ag of this aixture ia loaded In pre-arced graphite electrode
( f U.C.c) and excited using a d.o. arc at 10 amps. The spectra are
recorded on SA-1 emulsion in the region 2400 to 3300 1 with the help of
Hilger large quarts spectrograph. The iron line at 2598 1 i s chosen ag
the analytical l ine. It has been possible to estimate iron upto 1 ppa
lerel .
14. Speotrocheaioal Analysis of Hoble Metal Alloys(L.C. Ohandola and V. Ibhajan)
Hoble metal alloys are used in the t ips of fountain pen nibs.
A method was developed for the analysis of these pen tips* The tips
were dissolved In aqua regia + hydrofluorio aoid and the solution was
dried on graphite. Suiiclile dilutions In graphite were prepared.
Quantitative estimations were made by comparing tha apeotra from the Be
dilutions with two sett of graphite baa« etandarda. Cue aet of standards
iflntalned 49 common tapurltlea and the other eat 10 noble aetale. Analyaic
\>f tha above methods showed that the pen tipa oonsiat of Hu-Hi-Co alloy.
1$. MTSBR - Mloro Spectral Bmiasion Analyser
(8.I.H.O. Eriahnaaaohari and B.E. Vengearkar)
In order to eheok tha effioienoy of Micro Surfaoe Bniaaion
analyser^ , tha apeotra of eopper-ohromiua alloy samples have been studied
for uniforaity of distribution of chromium in the sasplea. The apeotra were
recorded on Hilger's Baby Quarts Spaotrograph with an exposure of 2 minutes.
A set of preliminary experiments showed that the aenaitive lines of chroaiuo
are easily excited with copper aa ocunter electrode instead of tungsten and
the latter exhibited a more complex spectrum.
Since an exposure of 2 minutes leada to a considerable large crater
ea tha samplet i t i s decided to reduce the tine of exposure by using a
speetrograph of large aperture and aedium resolution, for this purpose, a
qtuMterHset w grating monoohromator fabrioated in tha division i s being
oonrertod Into a speotrograph by Incorporating a oamera attachment to record
the apeotra.
1. S.L.H.S. Exishnamachari And B.B. 7engMrkar» Bpeotrostsopy DivisionAmual Progress Report for 1972-73, BASC-684, 28, (1973).
16. A Modified Method for Analog!a of Bare Earths inHigh Purity Qadoliniua Oxide
(S.V. Qrampurohit «ad V.B.P. Kaiaal)
8pectrographio methods are widely used for the analysis of rare
earths in high purity rare earth oxides. As the spectra of rare earth
eleasnta are highly oomplex, oae bas to use high dispersion speotrographs
to carry out the analysis. Another difficulty that i s encountered i s
that the sensitive lines of asay rare earth elements l i e In the cyanogen
region and hence could not be used. To overcome these diff icult ies , a
spectrographio method i s worked out to determine trace rare eexth impu-
ri t ies in high purity gadolinium oxide. A Jarrell Ash 3*4 meter grating
epectrograph having a 1200 groores/mm grating i s used in the second order
at a reciprocal linear dispersion of 1.2 A/mm. A stall wood jet 1B used
with oxygen flowing at a rate of 15 litre/minute, this helped In suppre-
ssing the cyanogen fcssds and with these changes i t has been possible to
attain a detection limit of 0.0025$ for Sm, Dy and Y. The recovery of
the method was compared with X-ray fluoreacenoe analysis and i s found to
be quite satisfactory.
17. Spectrograpkio Determjnatloa of Iraoe Elements in Zeolites
(L.C. Ghandola)
Zeolite mineral pocket ara found in abundance in basalt rocks
around Poona in Maharashtra. In order to find the history of origin of
this guest mineral in the host rock, basalts, it 1 B necessary to do the
trace elenent analys i s . She standards for these minerals are not
avai lable and, therefore, were prepared In the laboratory. The following
average eospositian of the c e o l i t e s was taken as the • a t r i x i
S102 . . 60*
CaOO, . . 109C
KC1 . . U5%
A1 2O 3 . . 2556
To the above matrix f the Spex Ifix powder containing 49 elements
was added at various cono*rtrations ranging from 10 ppm t o 1,000 ppm.
These samples.and standards were tinea nixed with graphite and zinc oxide
in the rat io 1 I 1 I 1. The spectrum was obtained i n a senaer s t e l l a r t o
basalts*1 . In a l l , 25 elements were looted for sad out of these, Ba, Cu,
Pe, Id, Vg, Hi, Sr and 1 were found to be present in trace lerels . These
were auantitatirely eetinated.
1* L.C. Chandola, page 10of this Eeport.
18* SBectrogrannlc Determination of Trace Metale Collectedon Air Miters
(o. Eriahnamurty, H. Saraswatay and 0* Thomas)
Environmental air sample analysis has gained importance In the
recent times in Tiew of atmospheric pollution, especially in the Indus-
tr ia l and urban areas. The pollutants hare acute physiological effects
- 16 -
on human health. The particulates In the polluted ooaaunity mvlronment
~aiste of a wide range of metallic el went a besides a variety of
-anic matter*1'.
As part of the programme of tha environiuntal sample analysis,
w« have developed an emission spectrographie method for tha quantitative
estimation of tract matala Ma, Pb, Cr, Hi, V, Cd, AS and Zn In atuoepherlo
particulatea.
In tola aathod, air Is asplratad through a Whatnan Io.4t f i l ter
paper by •sans of the auction head of a nigh roluae air saapler for two
hours. In order to aroid tha losses of the traoe KCtals in the aaaple,
we bare adopted the wet ashing method. The sample oolleoted on the f i l t er
paper la charred with 1 ml of eulphurie acid (Q.R. grade) to decompose the
organic matter of the f i l t e r paper* 5 ml of concentrated nitr ic acid
(doubly disti l led) la added dropwise with subsequent stirring, fhe clear
solution le f t behind i s then evaporated slowly to drynass on & hot plate '
at about 25O°C. :
the weight of the residue left after charring usually varies
between 30 mg to 50 mg. This Is sade upto 75 mg by adding pure oonducting
graphite (UCC, 200 mesh). 25 mg of pure graphite containing 0*2$ of s«2°3
which acta as the internal standard i s mixed with this and ground thoroughly.
25 mg of the charge Is loaded In %* U.C.C. graphite electrode (anode )|
and i s excited In 10 amp. d.o. arc for 30 seconds. Spectra are recorded on
a large quarts prism spectrograph in the wavelength region 2500-3500 A.
- 17 -
111* oonoentration rangaa af tha varioua lmpurltiea are given
Pb, Or, 11,
Od
Aa, Sn
? • •
• *
• •
i
10
50
- 100
- 500
- 1000
ppa
ppa
ppa
Jha average standard deviation of Boat of tha eleaente la about
Detailed examination af tha epeotra af amaplaa collected over
papara hava ahom that oartais elansnfcs Uka Mg, S i , Al, Ou, Ca and
Fa, i f praaant at O.Jjt or abort, v i l l anppraaa tha intanaltiaa of traea
alaaaats and hanoa tba rasnlta nay not ba qaaatltatiTa for auoh aa«pl«a.
1. Jaa Teimg tang, AnAl.OhaB. 4£, 20A, (1972).
19* A Spdctrographio Mtthed far tha AmJjaia af Soil Saaplae
Ballary, 7.B. Xaxtha. and Y.A. Sanaa.)
fha analyala of txaea alaaa&ta In aoil aaaplaa la of laportanoa
for pollution atudiaa aa wall as other pnrpoaaa.
A d.o. arc apaetrographle aathod for tha aaalyaia of traoa alaaanta
la aoll aaaplas ia balng daralopad for tb4a purpoaa. Moat of th« organic
sanatituanta of tha aaapla la daatroyed by dxy aahiag at 450°0 in a furnace.
Shia dry aahad Mapla ia aixad with 33* graphite and 6% 8b20? containing
internal standard Id at 0.02*. The waple and ayafhatlo atandarda are
azeltad in a d.e. arc at 15 a»p». in an atmoaphare of oxygen. The apectra
- 18 -
w». reoorded on aa Ibex* 3.4 meter grating epeotrogxaph with 30,000 l . p . i
grr' ng biased at 3300 I, in the first order. At present, the effeot of
•ftjor components of soil Ilk* Si, 11, Fe, Ca, la and K en the canton trace
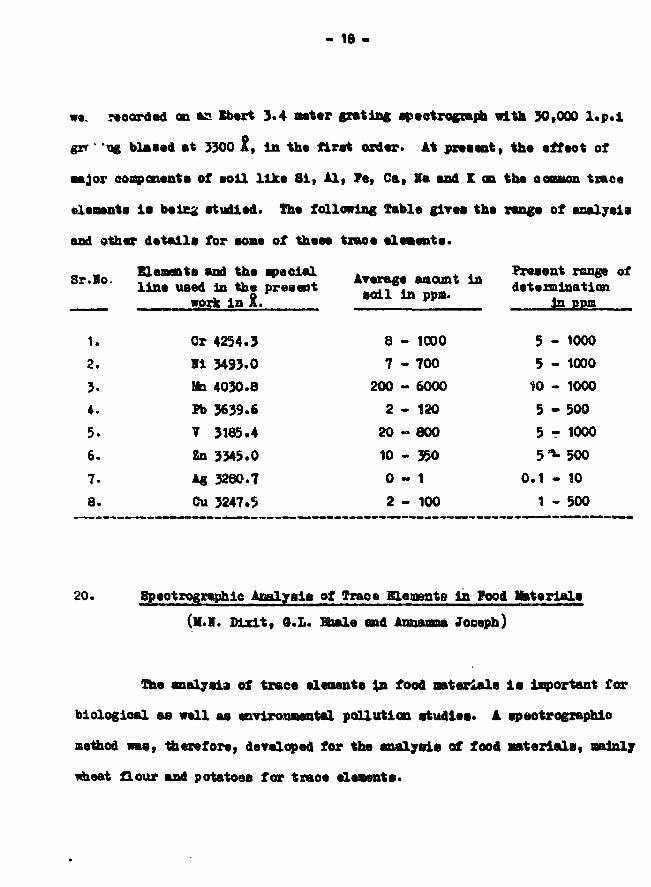
elements la belEjf studied. She following Table gives the range of analysis
and other details for soae of these txaoe elements*
Sr.lo m«»* l 1 i» « * «»• •P e c l « 1 ATe««e amount ins r *°~ l ine used In the present 1^V*TJZ~T determination
work in X. soil in ppm. to P P a
1. Or 4254.32. II 3493.03. Mn 4030.84. Fb 3639.65. V 3185.46. Zn 3345.07- Ag 3260.78. Cu 3247.5
8 - 1000
7 - 7 0 0
200 - 6000
2 - 1 2 0
20 - 800
10 - 350
0 - 1
2 - 1 0 0
5 - 1000
5 - 1000
10 - 1000
5 - 5 0 0
5 - 1000
5^-500
0 . 1 - 1 0
1 - 500
2 0 * 8peotrographic Analysis of Traoe Blementa In Food Materials
(K.H. D i x i t , O.L. Sbale and Armwana Joseph)
Hie snalysia of trace elements i n food materials i s important for
biological as well as environmental po l lut ion studio** A apeetrographio
method was, therefore, developed for the analys i s of food materia ls , mainly
wheat f lour and potatoes for traoe elements.
- 19 -
fh« food arterial i s ashed In a nuffle fumaoe at 550*0, and the
ash i s alxtd with pure graphite In tas ratio 1i2. 20 «gas of the aiiture
i s aroad «fe 10 anps. d.o. and th« apaetxa art rooordefl la tht region
2700 - 99 0 I on a 3>4 wttr Janrtl Aah aptotrofraph at a dlaparsion of
2.5 i/m*.
Standard* wara pr«par«4 hj nixing togtthar a synthetic matrix
and tfa* graphite baaad aptx standards In tha ratio 112.
n a altaants As, 04, Or, Vo, Mh, I I , Pb, Y and Zn can be estiaated
la tha range of 5 to 50 ppa with an arerage standard deTlation of +

- 20 -
l (b ) I-RAT ILUQHBSOBiaE AHALT8I8
1- A Systematic Study of tha Effect of Various Bacperimental
I s High Purity ZrOg.
(Jura Mohammad Qurbani*, P.P. Khanna,and R.lf. Agrawal)
The XH? determination of traaes of HfO2 in high purity ZrQj pose
di f f icul ty in the se lec t ion of experimental parameters and analytical
l inea for Hf owing to the almost oomplete overlap of the seoond order of
ZrKA l ine with f i r s t order H f L ^ l ine and substantial overlap of the
second order ZrK * . with the f i r s t order BILp 1 fi l i n e . A aysteaatio
study of the e f fec ts of the various available experimental parameters on
the determination of traces of HfO. In alroonia was, therefore, undertaken.
the Ihi l ipa semiautomatic X-ray spectrometer PW 1220 with asso-
ciated equipment has been used in these studies . A master standard of
•Hft HfO in ZrO has been prepared by dry-mixing oaleulated amount of HfO2
in tha highest available purity s lroonia. Shis has been diluted by
requisite proportion of airoonla to give the standards In the range of
50 ppa to \$> HfO2 In ZrO_. These standards are mind with equal propor-
tion of borio acid as a binding material 'and briquetted t o standard
dia. double layer p e l l e t s using borio aold as the backing pe l le t material.
These pe l l e t s have been used to study the effeots of the following experi-
aental parameters on the lowest detection l i m i t s , s e n s i t i v i t y and precis ion
of tha resu l t s t -
* Co. deputation from faculty of Scienoe, University of Kabul,Kabul, Afghanistan.

- 21 -
i) Tub* voltage and current;
ii) Oollinators (Coarse and Fine))
111) Scintillation and flow proportional oounters;
lv) Choice of analytical lines HfL^., HfLe fi and HfL«
Li?(200) analysing crystal and pulse height discrimination has been used
In all the caaee.
From these studies the optimum experimental parameters to give
the highest seneiti-rlty and the lowest detection limit have been obtained.
The limits of detection obtained was 150 ppmf which Includes 100 ppm due
to residual HfO_ present in the highest purity ZrO- used for the preparation
of standards, this residual HfO- content in ZrO used, has been determined
by ZBT only during the ooursa of these studies* Thus better detection
llait could not be obtained owing to the limitation of the purity of the
ziroomla available.
The precision of the method varies with the isnge of HfO. content
and a typical value is + 5% for the range 0.05# - 0.1#.
2. An X-ray Fluorescence Method for Analysis of Zn, Zrand U in ThO
(R.M. Dixit and S.E. Eapoor)
An XBF method for the determination of Zn, Zr and U in thorla
has been developed. Thorla sample Is mixed with io£ boric acid as
binder and this mixture is pressed Into a double lays? pellet. Tungsten
target tube with power of 60 KV - 35 n* is used for exciting ZnK^, while
- 22 - ,|
Ifor tt&oL and ULct a power of 85 KV - 25 mi la used, the estimation a
Hal t s of in, U and Zr are 10. 50 and 100 ppa respectively, She inter- %
i«rence between the l d 2 and ZrKa ia studied and ZrKgln aeoond order
of Ll?(200) oryatal 1* used for analysis. The lower estimation limit
for 0 and Zr la likely to be improved by use of Lif(22O) crystal. |1
The average precision of the aethod is about + 12%. r.
3. Analysis of Individual Hare garths in Bare Barth MJjfturee p
(R.M. Agrawal, P.P. Khanna and 8.K. salhotra) :;;|
Two of the XRF methods for the determination of individual rare- -||
earths In rare-earth mixtures are i ) Inert dilution with calcium as \ |
(i) v (2) I
oxalatev and, i i ) solution dilution method of Hose et a l . We have ~j
oompared these two methodB to assess their relative merits. The two |
approaches are found to give results in good agreement, the precisions ^
and accuracies obtained being equally good* However, the solution dilution '
method can be used with a snail quantity (a few mg) of the sample, whereas ::j
the inert dilution by calcium requires relatively larger amount (a few ]%
hundred mg) of the sample* As regards sensitivity also, the solution- 'U
dilution method has been found to be superior oompared t o the other. ,i'l
1) Locally developed for ease and rapidity i |2) Harry J. Rose et a l , Advan. in X-ray Anal. J_t,* p.34-36 (Plenum Prees 196ff
I
4. t-raj teoltott" Optioal Huoraacenoa of E m &trth» <« m««^ M
(l.K. Seuranathan, M.J. Kaaat and T.B. 8ugandhi)
Studies on tfc« 2BGV epeotra of rare eartha in minerale are being
oontlnued. Preliminary experiments on three minerals - aonaiite, pyro-
ohlor* and urutamlt* - abow luMLn«ao«no« only «h«n th«y art incorporated
In a aultabl* boat after dilution with pure 0,0_. The apeotra with four
dUutloca H50, 1i20, 1110 and 1»5 war* record«d by exciting the quartor-
nery oxide 2Li_O.3rO.UO .2W0 with I-raya.
In the eaae of aonasite, the fluoreaoenoe intenalty inoreaaea with
dilution whereaa for pyroohlore i t deoreaass. Ihle la probably due to the
elimination of Matrix effeet by dilution In the fonwc and reduction of
the aotual rare earth concentration with dilution in the latter mineral. In
arananite, the Intensity of the llnea of Qd and By lncreaae with dilution
while for 8a and Pr i t deore&aea. A detailed atudy ot the intenaity
pattern la in progreaa.
5. An ZRV Method for Analyaia of Sm, Bu, Gd, Ifr, Ho *»nd Y in Tb O
(L.O. Obandola, I .J. Mbehado and A.I. Mobile)
An HOP method has been dereloped for the deteralnatlon of Sm, Bu,
Sd, I|jr, Ho end Y In terbioa ori.de ualng the Rilllpa model P7 1220 epectro-
m«t«r. The range of determination 1B 0.01$ to \%. the terbium oxide la
oonTerted to terbium oxalate and mixed with aa equal amount by weight of
borlo add aa binder. A double layer pellet of boric aoid and sample +
borlo acid ie made. It was possible to use L d l l ines for a l l the rare-
- 24 -
earth* determined. For Y the E^ line was used. LUP crystal In the
tx-.. order waa employed for dispersion. How proportional oounter was
u Tor rare eartha and acintillatian oounter for yttrium. An inter-
ference to Dy 1 ^ line at 2 e - 56.58 was suspected from EuL ». line
at 2 ©• 56.94. i srimenta were done with aynthetic samples baring
known amounta of By and Su and no noticeable interference was observed.
The precision of the method la + 5&
6. Determination of Hb, Ta and Ti In Ore Concentrates(B.M. Agrawal, P.P. Khanna and S.K Malhotra)
The direct XPJ method^ ' for the determination of tantalum in
aeobate/tantalate ainaral oonoentrates has been modified In ordar to
increase the precision and accuracy of the method and also to extend the
method for determination of Nb and Ti. The method consist a in fusing the
sample with potassium bi-aulphate followed by dissolution and subsequent
incorporation on an inert matrix. The resulting product i s then analysed
by XBP using standard procedure. She chemical treatment and dissolution
eliminate the heterogeneity end particle size effects resulting in better
precision and accuracy.
( 0 Spectroecepy Division, Amual Progress Report for 1972-73) BARG-684»(1973), pp.39-4O.
7. Determination of Thorium in Uranium by XRJ Method(R.M. Dixit and S.K. Kapoor)
Preliminary studies on XRP determination of Th in uranium in the
range of 50 to 1000 ppm hare been completed. Th L ^ l ine can be easily
- 25 -
resolred from U I ^ . l ine in f irst order of LU(200) crystal, using
cs*rse (460 u) colligation. The lower estimation limit of thorium In
uranium in preliminary studies i s found to be 50 ppm, which can be
improved further by refinements In experimental conditions. Ih L o t 1
l ine i s sxolted by tungsten target X-ray tube working at 85 KV - 25 mk.
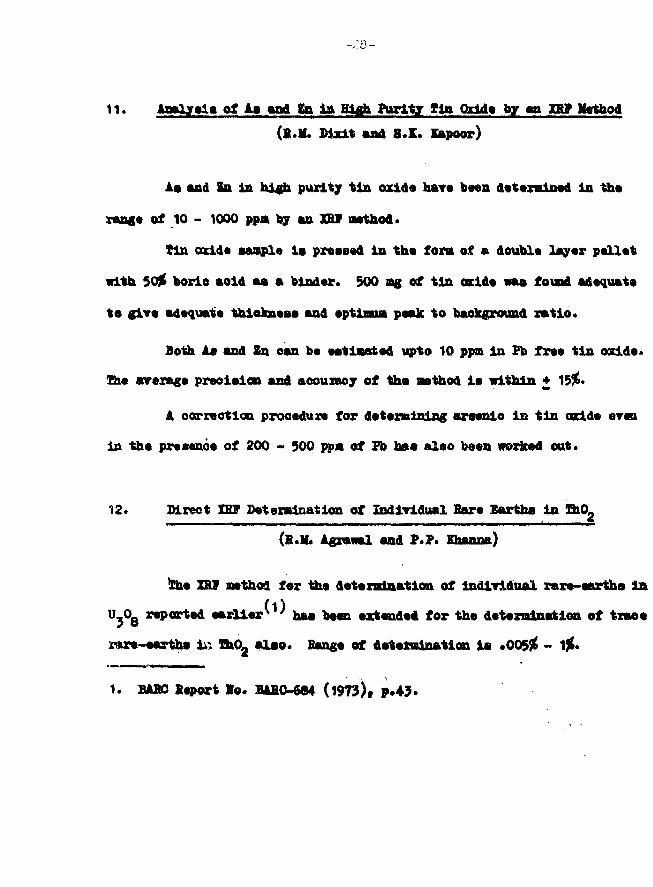
8. Intensity Studies on IBOf of Bare garths in Thorium
(l.B. Saranathan, M.J. Eamat end 1.8. Bugandhi)
fhlle applying the XBOP technique for the analyslii of rare earths
in thorium nitrate samples containing 81 200 ppa It was necessary to
remove i t with HV treatment. It waa observed that the addition of HP
izureased the intensity of the l ines of Od, Sm, l y , Eu end Pr by a factor
of 9 to 20* Apart from this the intense wide band enLssion of XhO£ at
4050 X i s suppressed completely with H? treatment. Tigs. 1 and 2 indi-
cate these observations. This wil l be useful In analysing oompamtirely
lapure samples diluted with pure nitrate end s t i l l retain the required
sensitivity*
In the case of HCQ. and HBv additions, there l a no change in lnten-
aity upto a certain stage (0.1 ad m& 0.2 ml of oono. H31 and HBr
reapeotiTely In 2 gms of ThO£) after which there i e considerable auppre-
of intensities In the ease of HC1 only.
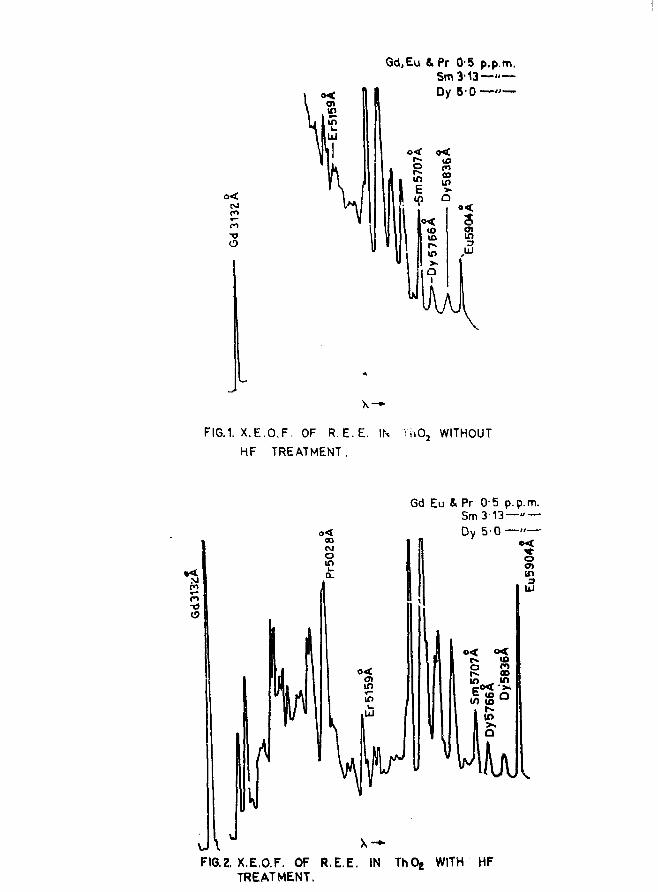
Gd,Eu 4 Pr 0-5 p.p.m.
Dy 5 0 •—"—
tvl
o
FI6.1. X.E.O.F. OF R.E.E.
HF TREATMENT.
ThO2 WITHOUT
•3nr> 1o
Gd Eu & Pr 0-5 p.p.m.Sm3-13— " —Qy 5'0 "
o
FIG.Z. X.E.O.F. OF R.E.E.TREATMENT.
IN ThO2 WITH HF

-27-
w*tion ofIn Joubl* and Trlcl* AUcallna Earth Oarbonata
(B.M. Agzaval ant P.I. Ibasna)
ZU aathoda hava boan doralopad for tho analyaia of double aa£
tdf i l* eax^anatca of alkaim* aaxtha for Individual alkalin* aarth
alaavata* Spring th« eouraa of analyaia of trlpla eaxbonatva, It waa
ofeaarvad taat tha gtomtrloal awtliod of amtrlx affoot oorraotloa by
eoaoawteatlon iriangla taohniiaa of lajlor at al* ' la not applloablc in
aratasa* Sbo aathod and tna approaoa has baan aodlflad» ao that
thay work roaaonably woll with auoa a taznary agrataa*
k ayataawtie atudy of too w r i t s and imitations of tho aodlflad
aps»re&o& to va^rloua othar texnazy and patudo toxnaxgr ayataae la In
1. SagOor at a l , inal.Chan. J&, 1699-1706 (.961)
3a*asB*natlon ef Bopaat Oortaai In flwmrihmini ooont Oalotaa
(R.M. Annual and P.P. Khama)
tho pnooduro alnllar t o taa dttamlnatlw of It «nd Va la
C*BO4 roportod •arliar^1^ an XHF wthot haa boom iorolopoA tor taa
datwadnatlon of oariua to thaawaiartaloomt grada OaBfy (0«) la tto oon-
. BtBO BoporlIo.BiB0-6B4 (1973)»
11. Analysis of As and 8n la High Parity *in Oxids by an IB? Method
(B.M. Bixit and 8.1. Kapoor)
As and 2n In high purity tin oxids hare been deterained in the
range of 10 - 1000 ppa by an XBf aethod.
Sin oxide sample i s pressed in the fora of a double layer pellet
with 50)t boric sold as a binder* 500 ag of tin oxids was fovnd adequate
to glYs adequate thleknsss and optiana peak to background ratio.
Both As and Zn oan be estiaatsd upto 10 ppa in Pb free tin oxids.
BM STsrags precision and aoouxaoy of the aethod i s within + 15&
A correction procedure for deteraining arssnio in t in oxide eren
in the presence of 200 - 500 ppa of Pb has also been worked out.
12. Direct ZBP Determination of ZndiTidual Bars Earths in ShO-
(H.K. Agrawal and P.P. Xhanoa)
the XBI aethod for the determination of lndiTidual rare-earths in
U?08 reported sarUer'1^ has bsen extended for the determination of trace
r*re-earths lx\ "BkO^ also. Bangs of dstermination Is .0055^ - i%»
1. BABO Stport l o . BABO-684 (1973), P .O.

13* XBI DataMlaatioa of ffta Tlatlma Ooatant «f OhlercpiatinioAeld Bolwfelon __
(S.M. AgmxA aai I . I . lfalketr*)
Aeourfcta dataralaatitia of pLatlsua aorfant of ehloroplatlnlo
ealution la ra*uirad la ordar to aaaaaa tha aadtabilifty of tha
lat ter la tha alaetroplatlrg battaa and alaa far vmluatln« tha eaat.
aaall aaouat sf tba aolufelon eould only vssally na upazad far aueb
astlyaaa. Bteadard aolutlaa-dllutlsm oatkad af Boaa at al'1^ baa baaa
aedifiad and ussd for tbia aaalya&a uaing atandard pla.tiznai eelutions
for addition and ataadardiaatlen.
1. Sarzy J. Boaa at al«» Adraa. In X-Baj Ami* JJ.f P«25«
rraaa, 1968K
14« Analyaia of Gaaaa by IBQP(f.B. S*M»ath»ia, M.J. Suat and 1.8. Sogandhi)
Work oa tba XBOf atudy -Of traoaa of ultregan. 1A axgaa aaa »aan
ialtlatad. A glaaa ohaalber haa »aaa fabricated with WJIMT tat
for T-x*j axoitatioa and quarts vladow for -Uw atudy of tha
optical fluoraseanoa* fttrtbay iayrotiaamta ara pUxmad
tha axyorloBaa ao^uirad ao far idtn this ehaabar*
-30-
l(c) IHJBAHBD AND BAMAH SPBCTBOSCCPY
1. Determination of Water in Organic Solvents by InfraredSpectrophotometry.
(Y.A. Sarma and Y.B. Kartha)
The presence of water and l i e influence on the propert ies and
react ion of organic compound* nakeB i t e quant i tat ive determination
necessary to the ana lys t . Of spec i f i c a n a l y t i c a l importance i s the need
to determine the water oontent of organic l i q u i d s l i k e methanol, acetone,
carbon tetrachlor lde and n-propyl aodne e t c . A aethod has been standardised
for the analys i s of t race amounts of water i n these l i q u i d s . Using quarts
c e l l s o f 1 mm path length and the fundamental. 0-H absorption frequency a t
3450 cm , a detect ion l i m i t of 100 ppm has bees reached In the case of
n-propyl amine- The major problem i n achieving lower de tec t ion l i m i t s in
t h i s case ar i see from the p o s s i b i l i t y of ease of contamination a t such lowj
concentrat ions . Special precautions hare t o be taken t o reduce contamination I
and further work 1B i n progress in extending t h i s method t o the other l iquidsj
as wel l a s to reduce t h e detect ion l i m i t . j
2 . Infrared Hoo-diaperBive Isotopie Analyser
(Y.B. Xartha, H.D. Jate l and P.K.S. Frakasa Bab)
Though the use of non-dispersive Infrared a n a l y s i s for process
control, pollution detection, gas analysis e t c i s well-known, i t has
never been recognised that the technique eould be very advantageously used
for isotopic analysis by infrared methods* We have recently designed a
system for the analyses of ieotopie molecules by this method. £he tech-
' :ue depend a on the use of pneumatic deteotore filled with tne gas under
' yeatigation, theae detectors responding to a chopped source of radiation.
Depending upon the absorption of the gas in the detector, the detector can
be made sensitire to any required lBOtopio component. So far the design
of such pnoMttle detectors hare bean empirical and involved a lot of
trial and error aethoda. fe have written a detailed computer programme
to optimise the da alga of such detectors for any analytical requirement.
The program computes the -various parameters of the detector which will give
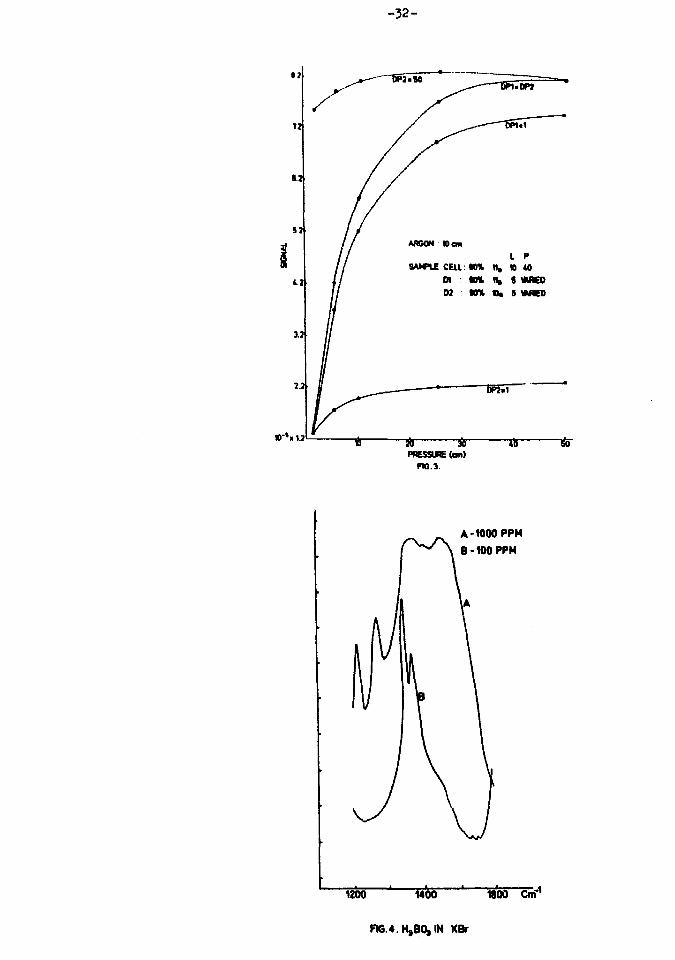
a mBTimum response. Cbe such calculation i s illustrated In Pig*}, where
the response is plotted as a function of pressure of the gas in the detector.
A suitable Instrument has been designed and Is being fabricated10 11for analysis of B - B mixtures.
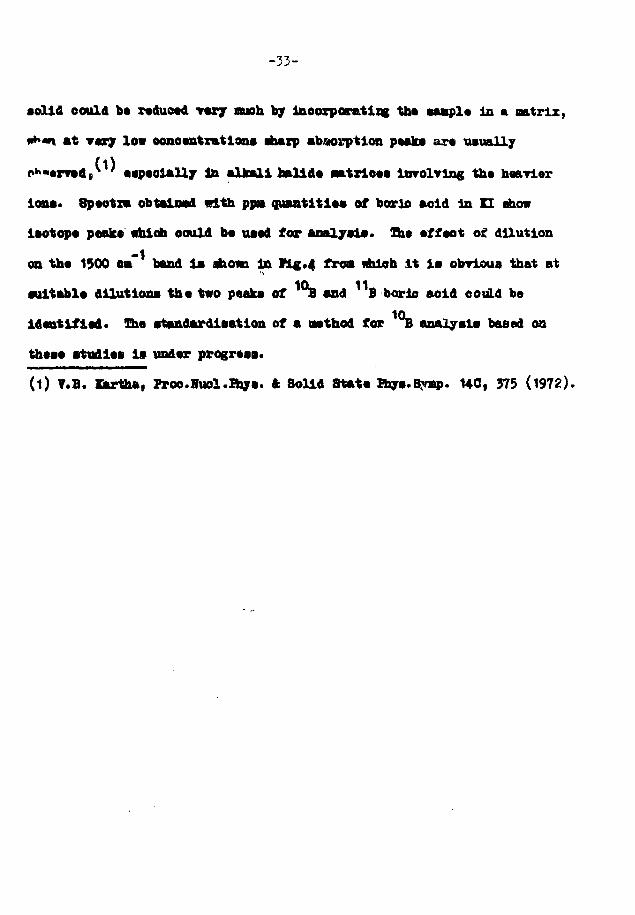
3- Boron Isotopic Analysis in Boric Acid
(V.A. Job, T.B. Eartha and S.B. Kartha)
An infrared method i s being developed for the analysis of boron
Isotopes In boric acid. COnrentlonal Infrared spectra of the solid Is
not Tery helpful In this ease because In the borie acid solid the isotopio
bands overlap due to various broadening Influences. Baaaa spectra tech-
nique, also Is not useful for isotopic analysis la this case, since the
vibrational sodas Involving sufficient Isotope shift do not appear or
appear only weak, In the Raman spectrum. Sis broadening effects In the
- 32 -
A-WOO PPM
B-100 PPM
ttOO 1400 1800 Cm"
FK3.4.H,BO,IN KBr
-33-
aolid eould b* reduced Y*ry auoh by Incorporating th* Munpl* in a matrix,
at T«ry low oono*ntx*tlana aharp abnosption p*aka are usually
*«p*olall7 in alkali halld* aatrlQM inrolvlng th* haarisr
ions. Sptotra obtalnad with ppa quaatitl** of baric acid in XX show
laotop* peak* whioh eould b* ua«d for analyaia. lh« affaot of dilution
on th* 1500 e»~ band la ahom In Fi£.4 froa #tloh i t ia obrioua that at
aultabl* dilutions th* two peaks of a and B boric aoid eould be
identified. The atandaxdiaatlon of a aathod for a analyaia based on
these atudiea ia under progrtaa*
(1) T.B. Kartha, Froo.Huol.Inya. * Solid Stat* Fhye.Syap. UC, 375 <1972).
!(•>
-34-
>WAT.TKTH a» Q&.SB8 XM MHFALS
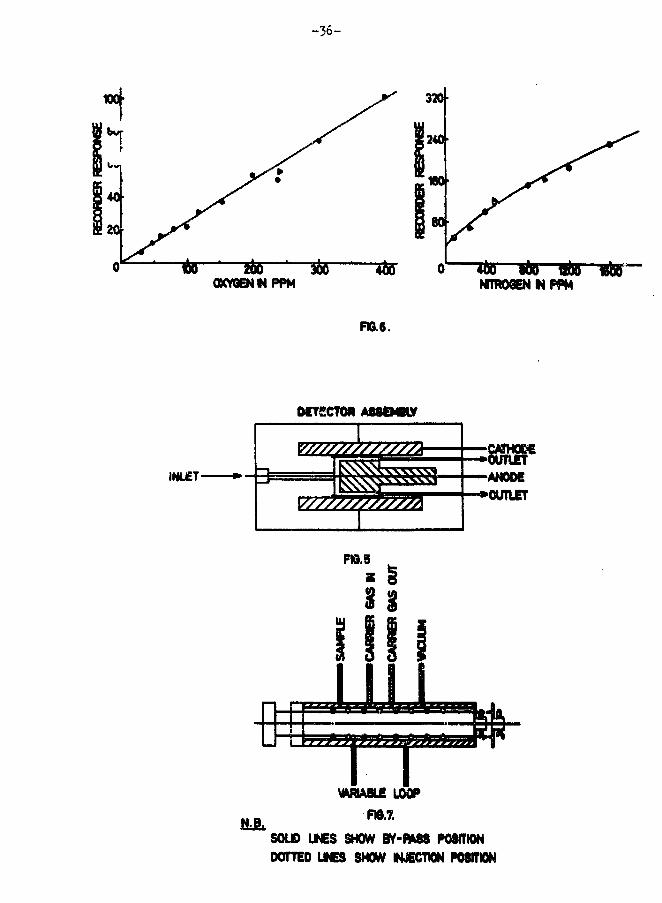
t- Determination of Oxygen end litrogon to Argon
(P.5. lahi and S.S. Biswas)
Argon i s widely used as an inert medium to Industry for welding.
She presoaoe of trace amounts of oxygen to argon has deteriorating effects
on the quality of the weld, particularly for aluminium and i t s alloys. In
laboratory an inert medium my be needed for carrying out certain experi-
ment s . Argon i s the only Inert gas being produced In bulk indigenously.
The gaa haa to be analysed for i t s oxygen and nitrogen contents, which are
the most likely impurities.
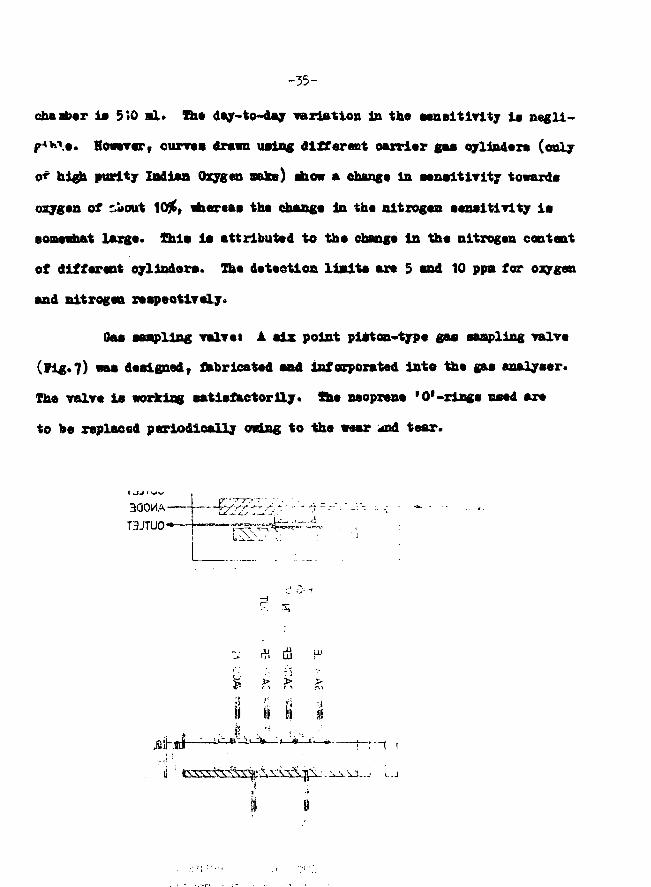
The development of a sensitive B -ray ionisation detector of basic
Sahln and Lipsky design (Pig.5) by us has prompted as to take up tills
development work. A 3 f t . long and i" Q.D. oopper tubing filled with 5A
llnde'e molecular sieve and maintained at 60°0 served as a oolum. About
3 ml of sample i s fed into this column with the help of the sampling valve
described below. At a flow rate of 60 co/mln. oxygen and nitrogen are
eluted after 75 and 133 see. respectively.
the gas ehromatographic method developed i s quiek, simple and
sensitive. The standard curves obtained axs shown In rig.6 and ware drawn
for the present assuming air to be consisting of only 0« and !„ In the
sample ratio of It*. HLcrolitz«8 of air were Injected into the vaouum
7«T f i l lsd with argon at HPP. The Internal volume of the vacuum
- 3 5 -
chaafter la 550 nl. The day-to-day variation In the sensitivity la negli-
f^^i.e. However, curves drawn ualng dlfferaet oarrler gaa oyllndera (only
o* high purity Indian Oxygen nake) dhow a change In aenaltirity towards
oxygen of tAiout 10& whereas the change in the nitrogen sensitivity la
somewhat large. Zhia la attributed to the change In the nitrogen content
of different oyllndera. The detection l i a i t s axe 5 and 10 ppa for ojygeo
and nitrogen respectively.
Gas sampling valve i A six point piston-type gas stapling -valve
(Fig.?) waa designed, fabricated and Infoxporated into the gaa analyser.
The valve i s working satisfactorily. Due neoprene '0'-rings used are
to be replaced periodically owing to the wear and tear.
I JJ »w
J3J7UO'*-
K UJ
>
II if fi if
\ \ i i
- 3 6 -
•00 BOO VuQ MOOKYGENWPPM WTR06ENNPPM
RG.6.
OfTeCTCM ASSEMBLY
INLET-
R0.5
—ANODE—•OUTLET
WBABLE LOOPPHJ.7.
SOUD UNES SHOW BY-f*SS POSITIONDOTTED UNES SHOW INJECTION POSITION
-37-
I I . ATOMIC, MQLECUIAB AID BQLP STATE 3PBCTB03C0PY
I l ( a ) HYPERHHE BTBUCTUBB AM) I8OT0PB 8HIW STUDIES Df ATOMIC SPECTRA
Isotope Shift S tud io l a Heodymiun Spectra
(S.A. Ahmad and O.D. Saksena)
Isotope sh i f t measurements in spectra of Hd with a view to obtai
info mat ions about th« configurations involved in the particular t rens i -
t iaa « u ini t iated by Eao et a l ' 1 ^ where A V (142-144) was investigated in
51 l i n e s between the region 5200 - 5900 1 and alaoat a l l of them belong-
ing to Nd I speotra. Ahn&d xad SakBena^2' stud!*'; Laotope shi f ts Ai>(142-144)
in 306 l ines of Nd I end Id X'i which resulted in assignment of the isotope
shif t t o Tarious energy leve ls of Hd I and Hd I I , and also configurations
were suggested for various energy l e r e l s .
The present study ie the continuation of the ear l ier work
mentions* above. The isotope s h i f t s hare been recorded in 296 l ine s of
Hd I and Hd II between 47'. 0 - 5200 S. Isotope sh i f t data on earlier
aeasureaents are avai lable only for 27 l i n e s .
The above Investigation, was aarried out on the Reoording labry-
Perot Spectrometer (RBPPOS) deeerlbe* e l e e * e r e ' 3 ' . fas source was a
liquldHtlr-oooled hollow cathode ejoplo/ing eiurcat between 16 BA and 32 IBA,
the carrier gaa being Me at a.5 oa of Hg= She grating CMployed i s a
15>000 Ipi one, rulsd over 10' x 4N avaa and hl»ied for 1.6 u. The
Pabry-Perot platea were A/100 and coated for Bsjcimsa ref lect iv i ty at
5000 X. Snaoesft «£ \Q » U * - « 501.48 at) and 12 asi ( A * - « 415.73 aflc)

- 3 8 -
were used. All the linea were recorded with entrance and exit s l i t s of
100 u width for monochromator recording and the same s l i t widths were
us for recording the structure through Pabry-Perot Interferometer.
The isotopio structures in the lines were recorded first with
natural samples of Hd which consists of sevsn stable isotopes, A • 142,
143. U4, 145, 146, 148 and 150. All the l ines were Investigated with a
single Isotope Hd (A • 144) with 94.4# purity- This was done In order to
establish whether the l ines In question were single l ines or more than
one l ine. This helped in great way for analysis «f the structure recorded
with natural samples. LineB showing small isotope shifts were recorded
with 28 mm spacer and enriched isotopes, U 2Sd (96.2£) and 144Hd (94-4$).
The information dsduoed from the present study are briefly
reported below. Throughout the discussion isotope shift atanda for
A. V (142-144).
1. Although an extensive classification of Fd lines have been
carried out by WyarV ' there are s t i l l a good number of unclassified
lines and only the wavelengths have been studied. She prerent study pro*
videa isotope shift av (142-144) in 43 such unclassified l ines . A good
number of them nay be due to transition r i p - f^da aa they ahow largo
values of Isotope shifts . A few of them could be classified taking the
energy levels of Blaise et al*5 ' and supplemsnted by our Mantrtasnt of
isotope shifts.
2. Isotope shifts have been measured In 109 classified lines of
Hd I . The classification i s due to WyarV . Una oagoltuAo of iaotope
-39-
shift varies between +40 to -110 ok. Most ox' the l ines show largo value
-f Isotope shift showing that In this region stoat of the transitions are4 4 2 J S jj 2
either of the f dp - 1 s or f*M p - Jrds type.
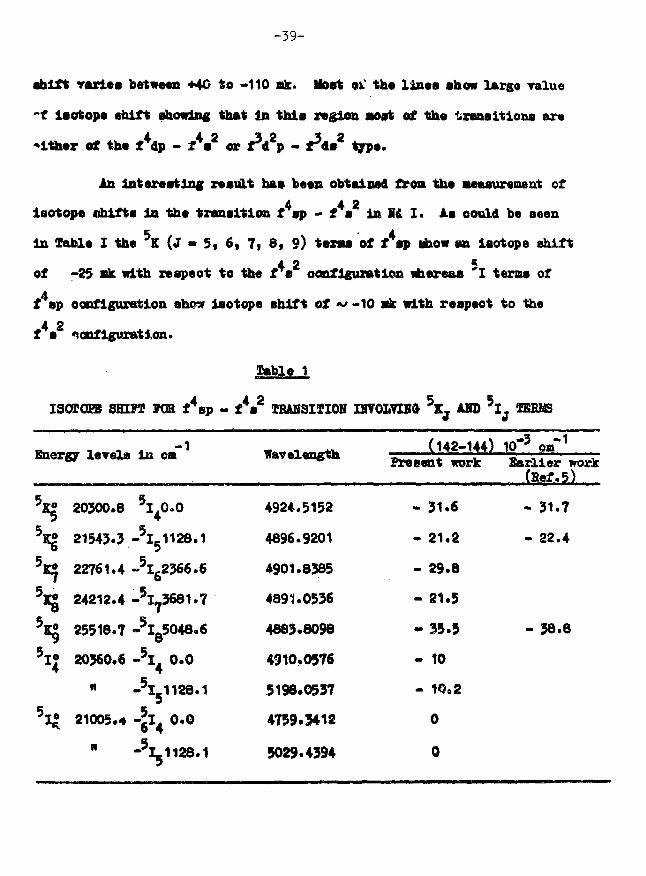
Aa interesting result has been obtained froa the measurement of4 4 2
isotope uhlfts in the transition f sp - f s la Id I . As oould be seenIn Sable I the 5K (J - 5, 6, 7, 8, 9) terms of f4sp show an isotope shift
4 2 5
of -25 mk with respect to the fTs configuration whereas I terms of
f sp configuration show isotope shift of « -10 mk with respect to the
f s configuration.Table 1
ISOTGEB SHIM 70B f sp
Energy levels
5 K 20300.8
5K| 21543.3
5K* 22761.45Xg 24212.4
5I« 25518.75IJ 20360,6
n
5 I* 21005.4
n
in ca"
5I4O.O
-5IC1128.1
-5I62366.6
-5I73681.7
-5I65048.6
- 5 I 0.0
-5I_1128.1
- | l 0.0
- ^ 1128.1
- f V TRAHSIIIOH
Wavelength
4924.5152
4896.9201
4901.8385
4891.0536
4883.8098
4910.0576
5198.0537
4759.3412
5029.4394
HJVOLVIH& 5Kj AXS 5 ]
(142-144)Present work
- 31.6
- 21.2
- 29.8
- 21.5
- 33.5
- 10
- 10.2
0
0
[ j ZEROS
10"3 oa*1
Earlier work(Ref.5)
- 31.7
- 22.4
- 38.8
-40-
3. There are only 24 lines which hare been classified as Id II
and for which the isotope ahift hav« been Measured in the present study.
Th< jotope ahift a. v (142-144) In 5165.1261 £ i s • 73.5 ak which i s the
hi< st positive shift reported for any of the Id II l ines, fhis shows
that the level 24842*9 on'1 i s a f d» I oval. This being f'ds - f4d tran-
sition gives the isotope shift of the level f3ds 24842.9 ac «• 73.5 mk.
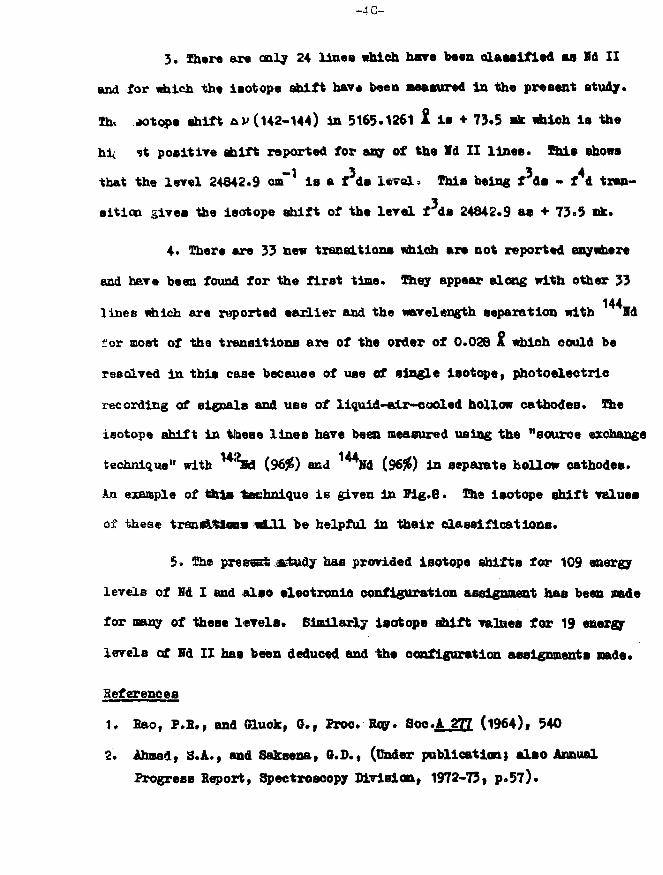
4. There are 33 new transitions which are not reported anywhere
and have been found for the first time. They appear along with other 33
144lines which are reported earlier and the wavelength separation with Nd
for moat of the transitions are of the order of 0.026 A whioh oould be
resolved in this case because of use of single isotope, photoelectric
recording of signals and use of liquid-air-cooled hollow cathodes. The
isotope shift in tbeae l ines have been measured using the "source exchange
technique" with U'*Hd (96#) and 14*Hd (96$) in separate hollow cathodes.
kn example of tfcts technique i s given in 7ig.6« The isotope shift values
of these trsnstSloM wl.ll be helpful In their classifications.
5* She proeas* «tudy has provided isotope shifts for 109 energy
levels of Nd I and also electronic configuration assignment has been o&de
for many of these levels* Similarly isotope shift values for 19 energy
levels of Hd II has been deduced and the configuration assignments made*
References
1. Baof P.B,, and Stack, 0 . , Proo. Roy. Soc.A 277 ( 1 9 6 * ) I 940
2. Ahmad, S.A., and Saksena, O.D., (Under publication; also Annual
Progress Report, Spectroscopy Division, 1972-73, p.57).
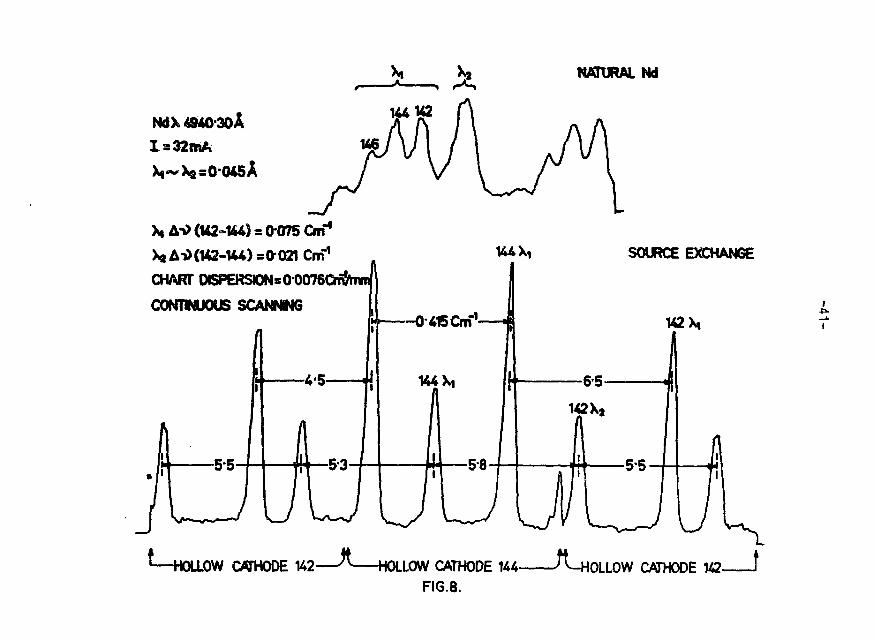
NATURAL Nd
1=32mA
X, AT> (U2-144) s 0 075 Cm"1
XaA->>(U2-1U)=aO21 Cm"1
CHART OISPERSION-00
C0NTWU0US SCANNWG
UiX, SOURCE EXCHANGE
U2X,
*—HOLLi,0W CATHODE 1A2 " HOLLOW CATHODE 1 U ^ _ HFIG.8.
IOLLOW CATHODE M2
- 4 2 -
3. Sakaene, G.D., and Ahwd, B.A., BAB0-2S0 (1967).
4. Wy%xt, J.F., Theaiat UniTerBlty of Paris (1968).
5. Blalae, J . , Oherillard, / . , Yergea, J . , and Wyart, J . f . ,
Speotroohesioa lo ta , 2JB (1970), 733-981.
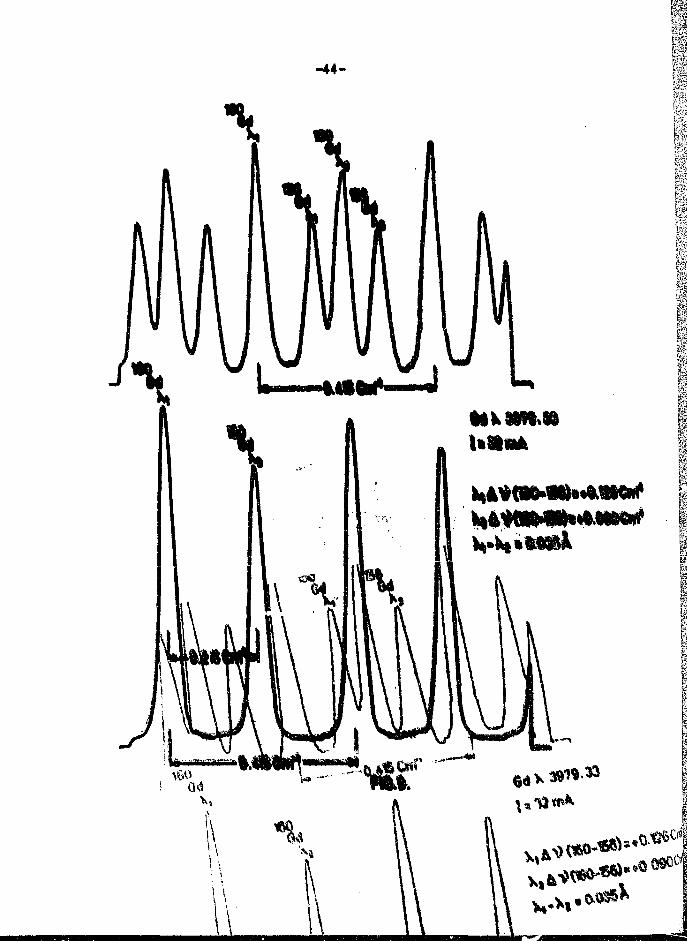
2. Isotope Shift Studies in Oadollnlua Spectra
(3.A. Ahnad, A. Tenugopalan and <J.D. Sakaena)
Iaotopa ahlft In four linaa In Od I apaetxwa ware raportcd by
Brix at al^2>5^ atudlad laotop* ahifta in larga munbar
of llnea of Qd I and Gd II apaotra and evaluated the ahlfta In loma '
alaetronle confl^uzatioos of Od* Xopfanaann at a&r lnraatl^atad tha
laotopa ablfta In nine llnea of Gd I between 901$ - 5617 £ and ten linea
between 4092 - 4401 A ualcg aaaplea enriobed In a l l the even iaotopea of
Gd.
She present work waa undertaken to sake a more detailed atudy
156 160 / s
of isotope ahifta tcnrolring Gd and Gd. She iaotope abift ( i s )
a v (160 - 156) •easureaents hare bw»i s»xried out In 130 linea in Gd I
and Gd II epeotxa between 3930 - 4140 I. laotope shift data on earlier
Beaaureaenta are arailable only for nine llnea In thie region. Mwiy of
them hart been daaaified by Buaael^' and by Tan Klaef at a l ' 6 ' . EoweTer,(7}with Hie help of energy lerela l i s t ing of Blaiae et al v ' and tJie preaent
isotope ahlft Beaaurfloenta, i t waa poaaible to olaaalfy a numbei' of
additional linea in the spectra of Gd I and Gd II .
-43 -
9M abova iBVtattjptlona w»« surlal oat on tha BtoovAtug
Qpaotnawtar daaerlbad •l««fe»r/ t t'. 9 M axpattaantal
datalla are tha M M M fttratt thava axeapt that tha IMngHtacot plataa
««« aoatad f«i> aaifrun xattaetgrlty at 4500 I . A 10i7»alxtar« of1IOfl4 (95.5*) and 196M (93.6*) with a l a aia ( • r . 415O73 •£) apeear
far r«o«rd3ae IS in all *ha llota* iHMnr i o n than two ooapananta
(OH mat 4me to 160 -afl 156 iaotepaa) appaarad in tht atnioturc of tha
lisa (aaa fl«.«) i* «M vaeovdad with a aiagla Uefcopa 1<0Qd (95.5*) and
with 10 m ( ftf • 901*48 *X) aad 12 » apaoara. Uaaa atevlag amU IS
war* isvastlcfttad wiUi 2S aa apaoar*
f«am tkt psaaant atudj* It baa baam poaaiala to daduea ttia
1. If, has baaa suucsatad tbat tha variation la laotopa ahift (is)
(160-156) valuta 1B dlffarwit tana «f f V p ooafl«ui*ti«, i .a . v
3i 4f 5, 6, 7) t«zM ara *»• t© oonflfomtlan aljtla* with
tht V ' - 2, 3t 4, 5f 6) tana of f7dap oaafUu»tK», as 1hava arc
7ari«ticas ia IS valuaa o£ 99(jT • S, 5, 4» 5) tana alat. a a j both
f7caS
8* **•• ootfl4«atloii has only tan raotatty raportad by Haia«
at a l ^ wd aa aasllar » daU ia arallaUe fw this MtflgmatlcA. Ow
data w X« far A a - f7da* tTaaaltion alow that than to a larga aomaa-
«wl«r lwalvad fop tha eUhtfc f-alaetMft, aad it » • baaa dadoead that
h m 1.0, « A la oloaw to tha vain* a* 1,1 auffaatrt «V
-44 -
-45-
3. Zhla Is th« first study which reports negative 18 values in
oaee of Od. Ibe negative shifts are expected onlj in case of Gd II l ines
usually they are very weak in intensity In hollow cathode spectra.
L-. with RKFPO3 It was possible to record IS in these weak lines. She
highest negative shift is of the order of -70 aK for 1600d and 156Gd for
8 8 -f p - f s transition.
4. The usefulness of IS is deciding about the configuration is
evident from the data in Table I, which gives the isotcpe shifts in the
7 2energy levels which a l l combine with f ds configuration. As can be seent
the suggestion of Russel that these energy levels fora a aultiplet7
originating from f dsp configuration i s erroneous as only two enezgy levels
32020.38 cm"1 and 31647.51 cm" enow large enough Isotope shift to be f dsp.
The energy levels 31999.02 em"1, 32149.95 em"1 sad 32251.80 ca"1 show(7)similar isotope shift and the g-values as reported by Blaise et e l has
made us to suggest that they are 5P_, 5Pg and P1 t a n s respectively smd7they originate froa f dsp ocnfigux&tlaD.
References
1. Kllnlcenberg, P.T.A., Ehysiea J g , (1946), 39*
2. a) Brix, P . , 8 . PhysUcJ^t (1952), 579.
b) Brixi P . , and Sugler, B .S . , S. PhysUc J3£, (1952), 562.
3 . Brix. P . , and Liaaenberger, K., Z. Phr ik 141. (1955).
4o Eopfersum, B«» Xragerf L. f and 8t«ud*l| &.» AsB»P&yalk jg^, (19575* 258*
5. Busself H.fi., SCSkQ, (1950), 550.
6. Van ELeef, Sh. A.K.f Blaise, J . ( asd Wyart, J . J . , S. £« Hiys, H (1S71),
7. Blaise« J.» CJhevillard, J . , Tergest J»» «Bd Wyart f J»F.»
3peetrochiH. Acta 2681 (1971), 1.
8. Sakseaa, O.D.( a&d Ahaad, S.A., BIB0-S09 (196?)*
9. Blaise , J . t aaa St«%d»lf A . , S. Snails | 0 J , (19§S)» 111.

Tabla 1
Bnergjr l«vaL«
31794.80
32020.38
31847.51
31999.%
32149.55
32251*80
32341.16
Busaol (5) Blaise et PreB«*rfc studies
Term and configu-ration.
f7d«p
Term and configu-ration.
A .
J -- 6
\
J - 3
J - 2
J • 1
J « 0
goba. I.S. (160-156)(for transitions
to f7da2).
Suggested tern andconfiguration
1.485
1.540
1.500
+ 106.9 oK f dep confined
128.7
1.575 + 109.7
1.700 + 108.6
2.230 + 102.3
+ 99
f7d«p 1.666)
1.833)
on
102.185; ea-1
-47 -
I l (b ) SPBCTBA, OP HAHB EARTH IONS IB CHYSTA1S
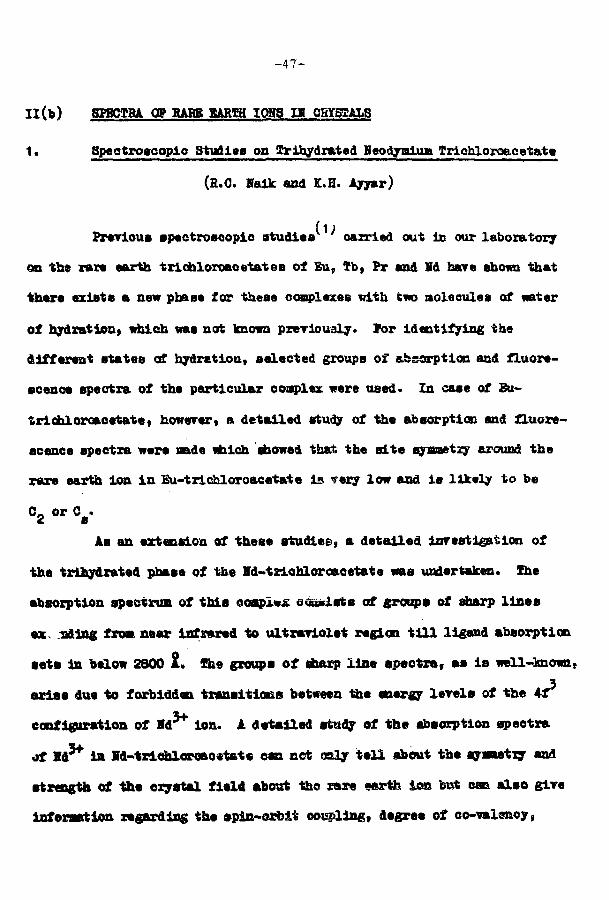
1. Spectroscopic Studies on Trihydrated Heodyalua Trlchloroacetate
(H.O. ffaik and K.H. Ayyar)
Prerious spectroscopie studies can-led out Is our laboratory
on th» rare earth trichloroao s ta te s of Eu, Tb, Pr and Vd bare shown that
th«r« exlsta a new phase for these ooaplexes with two aoleeules of water
of hydratiou, which was not kaown pxerlously* Tor Identifying the
different s tates of hydratiou, selected groups of absorption and fluore-
scence spectra of the particular couples were used. In case of Eu-
$richlorcae«tat«i however, a detailed study of the absorption and f luore-
scence spectra wars aade which showed that the s i t e syoaetxy around the
rare earth ion i n Eu-trlchloro&catate Is ?ery low and i s l ikely to be
C2 O r Cs*
As an extension of these studies9 a detai led investigation of
the trlhydrated phase of the Id-tKLchloroacetata was undertaken. The
absorption spsctrum of th i s soai>l*£ owwists of groups of sharp l i n e s
ex allng from near infrared to ultraTiolet region t i l l ligand absorption
se t s in below 2800 £ . She groups of sharp 11ns sp«ctra, as i s well-knownf
arise due to forbiddan transltio&s between the energy l e r e l s of the 4 i
configuration of Id Ion. A detailed study of the absorption speotra
<»f Hd3* in Id-trichloro&o«Ut« can not asl? t e l l about the syaaetry and
strength of the crystal f i e ld about tao rare mrth ion bat can a l so gire
infoxtttlan regarding the »pin-erfelt ooesling, degree of co-mLemey,
- 4 3 -
nephelauxetie effect ate. in tha complex under study. Establishing tha
energy levels of the nx* aarth Ion v is , Id , from tha absorption
spectra i s th« first step in such studias.
Absorption spectra wars raoordad at 77"K batman 4000 - 9000 1
using a Steinheil spactrograph with medium optics and also a Jarrel Ash
grating spectrograph with a 15,000 lines/inch grating biased at 4000 £.
Single crystals grown froa an aqueous solution of Hd-triehloroaoetates,
and aaalad in a Tycor tubing with a faw cm of helium were used for al l
absorption studies. She various absorption groups observed between
4000 - 9000 I hare been assigned to different electronic transitions of
the Id ion. In order to locate the higher Stark levels sf tte ground
state, a knowledge of which la quite essential for locating the Stark levels
of the excited states froa tha absorption Bpaotral studies, spectra wera
recorded by varying tha temperature of tha sample between liquid nitrogen
aisd rooa temperature. The most unambiguous inforaation regarding tha ground
state splitting cams from tha transition Pi ->• Iq/2* *& $&*•> oasaf the
excited Pi state with J • + § does not spl i t under * crystal field and
therefore consists of a single level. Hence tha additional linos which
appeared at higher temperature could ba assigned to higher Stark lor els of
the ground state, via, Iq/9' J^>8lj»i.» of tha full absorption spectrum to
establish the Stork fine structure of Individual «T levels of Id3* la
Id(CGl_COO)_.3H.O and the calculation of the Slater parameters, V2, I.»
Pg sad the spin-orbit coupling oonstant la In progress.
1. R.C. Haik and E.H. Ayyar, Anaial Prograsa Beport 1972-73 (BABC-684),Spectrosoopy Division, p.62-65.
-49-
Il(o) 8QMI) STUB STSCTBA - JgRBMBSGBSOM
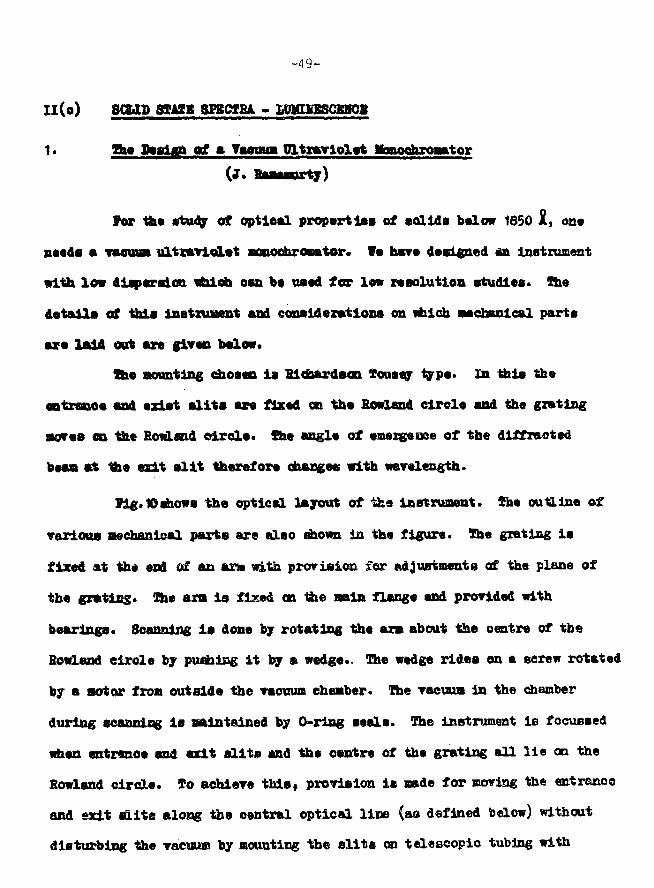
1. The P»sffi of * •aooua Ultraviolet Monoojurosator(J. Baaaaurty)
For the study of optical properties of eollds below 1650 I , one
needs a vaeutn ultraviolet aenochroaator. We bare designed an Instrument
with lew dispersion which oan be used for low resolution studies• She
details of this lnsttuaent and considerations on which mechanical parts
are laid oat are given bslow.
the mounting ehosen Is Richardson Xousey type. In this the
entrance and exist s l i t s are fixed on the Rowland circle and the grating
war90 en the Rowland circle . The angle of eaergease of the diffracted
bean at -the exit s l i t therefore changes with wavelength.
Hg.tOshows the optical layout of the instrument. She outline of
various mechanical parts are also shown la the figure. The grating i s
fixed at the ead of an ara with provision for adjustments of the plane of
the grating. 2he a n i s fixed on the sain flange and provided with
bearings. Scanning i s done by rotating the am about the centre of the
Rowland circle by pushing i t by a wedge.. The wedge rides on a screw rotated
by a motor from outside the vacuum cheaber. The vacvus In the chamber
during scanning i s maintained by 0-rlng seals. The instrument ie focussed
when entrance and exit s l i t s and the centre of the grating al l l i e on the
Rowland circle. To achieve this , provision ie Bade for moving the entrance
and exit s l i t s along the central optical line (as defined below) without
disturbing the vacuum by mounting the s l i t s on telescopic tubing with

-5 ")-
VACUUM CHAMBER
EXIT arr
ZERO ORDER POSITION
"tNTRANCESLIT-
ROWLAND CIRCLE-
FK3.1O.
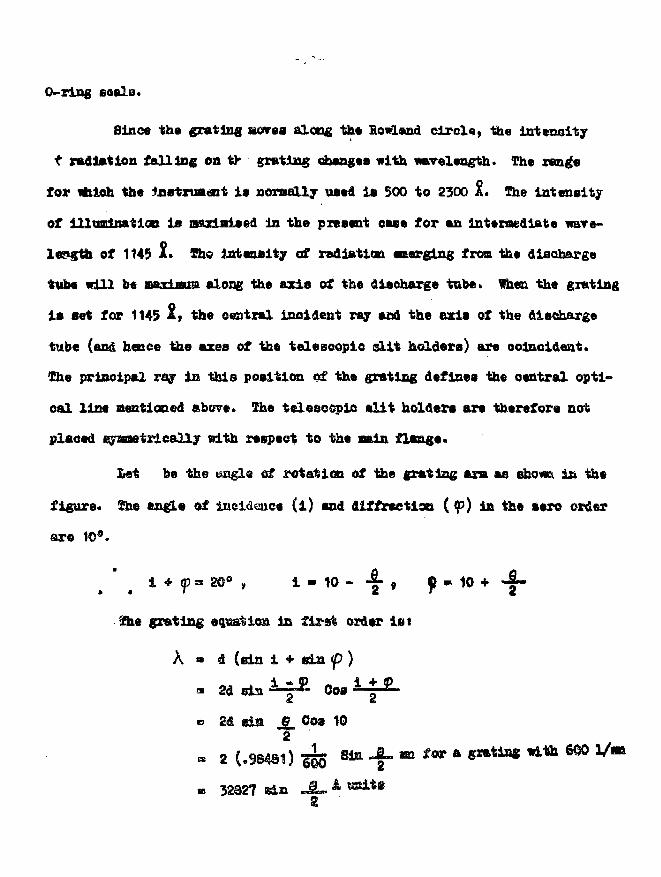
O-rlng eealB.
Since the grating acres a!cog the Ecu&snd circle, the intensity
t radiation falling on th grating changes with wavelength. The range
for ifcteh the instruaant i» normally used la 500 to 2300 1. The intensity
of illumination is naxtaised in the present ease for an lnteraediate ware-
leagtb of 1145 A. She intensity of radiation emerging frost th« discharge
tube Kill be »«T>'"»" along the axle of the discharge tube, mien the grating
la set for 1145 *\ the central incident ray aod the axia of the discharge
tube (and hence the axes of the teleecopie slit holders) are coincideat.
The principal raj in this position of the grating defines the oentral opti-
cal line mentioned above. The telescopic s l i t holder* are therefore cot
plaoed eyaoetrically with respect to the sain flange.
Iiet be the engla of rotation of the grating ara ae shorn ia the
figure. She angle of ineidene* ( i ) and diffraetioE (<p) in the aero order
are 10ffl.
fflxe grating equatioa in first order 1st
A * d (sin 1 + s i s <p )
- 2d sla - — ^ Ooa i * ?
2d sia J9^ Oos 10
2 (.98481) A Sis JL. . for a gntiag idth 6®0 l /
32S21 sia J LS
- 5 2 -
Av i expression gives the output wavelength as a function of rotation
C* "ngle of grating on the lowland circle, the rallies of the output
wavelength for 4° and 8" rotation of the frating are 1145 2 and 2290 £
respectively.
The centre! optical line, therefore, eorreaponds to a rotatia of
the grating by four degrees fret the sero order. In this position the
inclination of the axes of the teleseopio tubings oaxryiag the entrance
and exit s l i t s are 12° and 8* respectively to the tube axis (axis porpen-
dicular to the sain flange)* The radius of the Rowland circle is 20.03 CB.
and tiie reciprocal linear dispersion at the exit sl it i s 41 t/am.
She system is designed for use with a windowless discharge tube.
The liquid nitrogen trap diffusion poop, valve, etc. are stockist ed on the
isaln chamber. AH these oan be pushed on rails to have access to the
grating mount, arm* drive, carriage for cleaning, alignment, etc*
I I ( d ) . KLECTRCglD SgEOTBA AST) SFBDCTUSE Of PEES HJUHOALSAHD SIMPLE MOUSCUIES
"•• Bgjnyestigation of the Band Systems of IS
(T.£. Balaaubraaanlan and N.i.. Ifareslnham)
In continuation of the re lnves t iga t lon of the i and the ft -systems
of the NS (which was taken up in order to resolve the discrepancy be t -
ween microwave end op t i ca l Bpectroscoplo data) and ana lys i s of the 0-1 band
of the f -system has been completed. i. close examination of the 0-0 band
revealed a breaking off of the Q11 and P 2 2 branches suggeatiag" that r o t a -
t i ona l l e v e l s with Pg <H > 58) and ? 1 (H >/ 67) belonging to the v » 0 l e v e l
2of the i n i t i a l state are predisgooiated. Althou^a the 0-1 band i s much
stronger than the O-O, i t s analysis could net provide any eonfiraatory
evidence on the predisaociatlon, as f ie "last l ines" , crucial for the con-
firmation, were badly overlapped. I t i s proposed.to take up the analysis
of the nuch weaker 0-2 band. She predissoeiation- provides & useful upper
limit of De 4- 46204 cm for the dissociation energy of HS.
The analysis of the 0-0 band of the A -system has now been completed2
and revised rotational constants f«i? the i n i t i a l & s ta te have been derived.2
BoSi F1 and F rotational terns of the v » 0 level of the A Btate seem bo
be perturbed t "fiie Ig terms rather severelyf for J values below 33• 5 and2
hence could not be described by the usual & fansulae. for J ^33 .5 5 hem-
e^rer, the perturbation apparently ceases and both ? 1 and Eg could be f i t ted
to the appropriate fesmnla©. She vetae of BQ => 0o6964g o®"* thus derived
-1 (2)differa significantly from the tial^e 0.6925 o» reported by Barrow et al
Also, the present analysis has, for the first t iae, enabled a quantitative2
«> .uatlon of the ooapllng constant A of the 4 state* It i s proposed to
> 'y the other bands of the system which night provide further olues in
the analysis of the perturbation.
(1) T.K. Balasubramanian and N.A. Vaxasisbam, J.Mol.Spectrosoopy (Acceptedfor publication).
(2) R.P. Barrow, 0. Itrumooud and P.B. Zeenan, Proo.Phys.Soo.London 6JA,365 (1954).
2. . Absorption Spectrum of OS-
(C.G. Mahajan* and G.
In the vacuum ultraviolet oarbon disulphide has a rery strong
absorption band eastern in the 2200-1800 A region followed by a progression of
diffuse bands extending from 1750-1650 I . Another strong sbsorption systen
l i e s in the 1625-1500 1 region. Detailed Tibrational aoalysia of the last
system has not been done so far. With the Tlew to investigate this
along the lines KLeenan did on CS2) we tmdertook to scan the 0S2
absorption in the Tacuum ultraviolet region (2200-1500 £) .
(A) 2200-1800 I System
This strong system, firstly photographed by Prioe and Simpaon'1^
was shorn to consist of a single progression with a frequency differeooo of
410 CM" (varies between 390 and 430 ca"1) corresponding to the exoitation
of the totally symmetric stretching node, V. whioh has a value of 658 OK"1
in the grouad state, \ \ BamsastKy asad Bao^2', b*eides th« strong
, observed some weak bands and assigaed thase bands to a progression
* DAB Junior Sesearch Pellotr
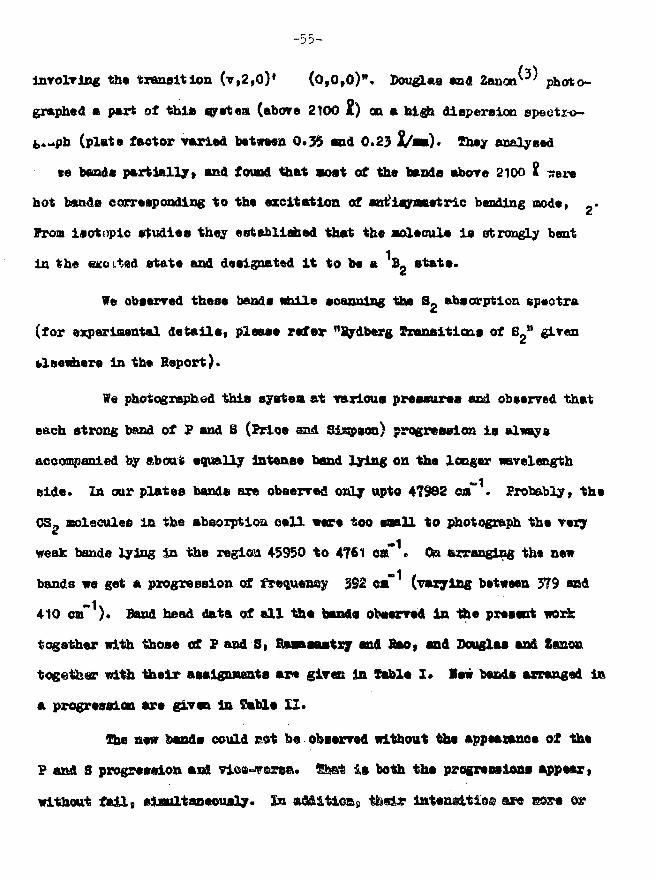
-55-
involvlng th« transition (v,2,0)' (0,0,0)". Douglas and Zanon' ' photo-
graphed a part of this system (above 2100 2) on a high diepereioa epeetro-
fc*-pb (plate factor varied between 0.35 end 0.23 %/wm). fhey analysed
se banda partially, and found that west of the bands above 2100 i ?ax*
hot banda corresponding to the excitation of attt'iaraatrtrlc bending mode, _•
Proa isotoplo studies they established that the aolecule i s ertrongly bent
in th« excited atate and deaignated It to be a B. state.
We observed these bands while scanning the S- absorption spectra
(for experimental details* please refer "Sydberg Tranaitieris of B" given
tlsewhere In the Report).
We photographed this ayarfcea at various pressuraa and observed that
each strong band of P and S (Prioe Sid Slssjssoa) progression i s always
accompanied by about equally intense bead lying on the longer wavelength
side. In our plates bands are observed only upto 47982 ea~ . Probably, the
OSg asaleculee in the absorption ce l l ware too small to photograph the very
weak bands lying in the regies 45950 to 4761 oa" > OR arranging the new
bands we get a progression of frequeasy 392 ca° (varying between 379 end
410 era" }. Band head data of a l l til* bands observed in the present work
together with those of P and S, Rraasastxr and Bao, and Douglas and Eaaoa
togetbaa? with ttielr asslgnsentB art givet 3A Kabls I* lew bands arranged la
a progression are given In Sable I I .
She aew bands could cat be observed without the appearance of the
P and 8 pragresftion aai vica-ToreR. Sfes* i» both the pz-egresslons appear,
without fa i l s siaultaaeously. In «^itiGEp tfcisir intensitios
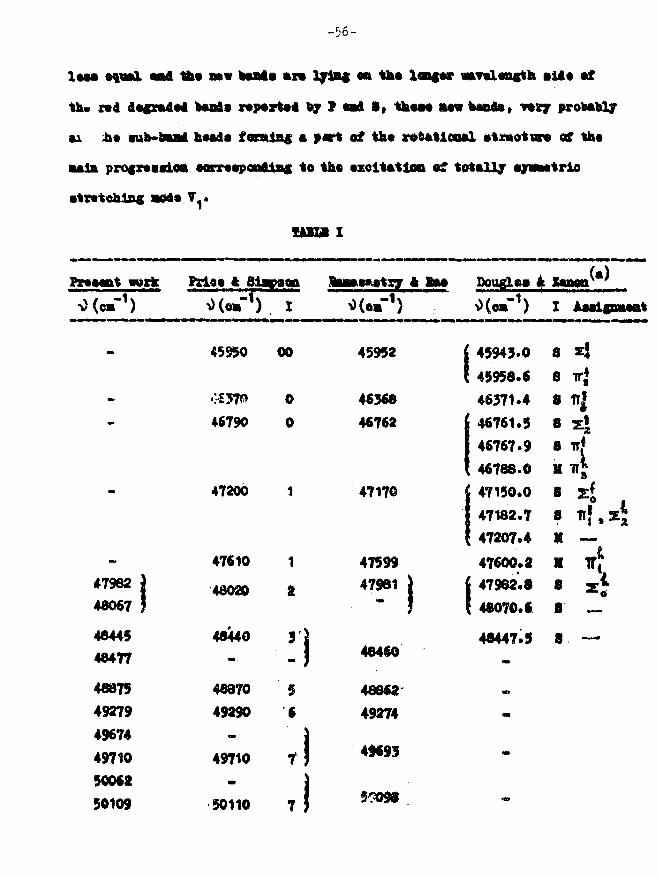
- 5 6 -
sad th« saw baaia axa tytei •» **»• 3,«acsr «*T*l«agth all* «f
rt i dagmdat teals r*p*rt«i by P tad 1, tksa* MSW bands, -vtsj probably
ii« sub-tat hMds f«mlB« A »«rt of th« x««*tiaa«l utmotars of th«
pro(x«ssiOB oarrssponAlBC to *b* •zoit*tloo «f
•trvtohlsg aod« 1^»
uam i
Pnaant Paias ft Blapaon
0(oaT ) Isastsy ft tm Douglas it
47982
48067
4844548477
488754927949674497105006250109
45950 00
0
046790
47200
47610
48020
48440
48370
49290
49710
50110
1
2
!156
45952
46368
46762
47170
4759947981
48460
468*2
49274
49693
45943.045958.646371.446761.546767.946788.047150.047182.747207.447600.247982.848070.6
8 zj8 TTg
8 1T{8 z»8 IT*
X88VX88
?
48447.5 8
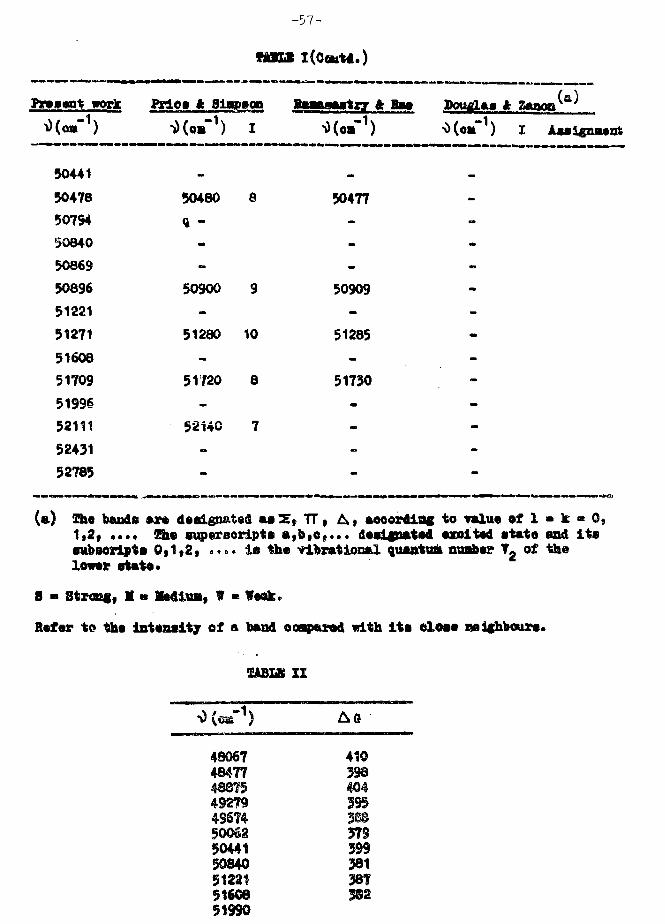
-57 -
l(O«*ts.)
Present work Price ft Slapeon
5044150478507545084050869508965122151271516085170951996521115243152785
50480
q -
50900
51280
51720
52140
8
9
10
8
7
50477
50909
51285
51730
Bsmsastrr ft Has Dou^Las ft
ft~
(a) She bands as* designated u Z f TT, &, aeoovdlag to ralu« »I 1 • k « 0,1,2, . . . . She superscript* a,fe,e»... dtalgoated azoltad atato and i t seubsoripts 0 ,1 ,2 , .••• i s the vitaational quasrtuA nuobar T£ of thelower state.
8 - 8tranf, M « Ifediua, 7 - Weak.
Refer to the Intensity of a band ooaparad with i t s close neichbours.
IABLX II
^ (oaf1)
48067484774887549279
50062504415084051221516G851990
4103984043%
37539938138?382
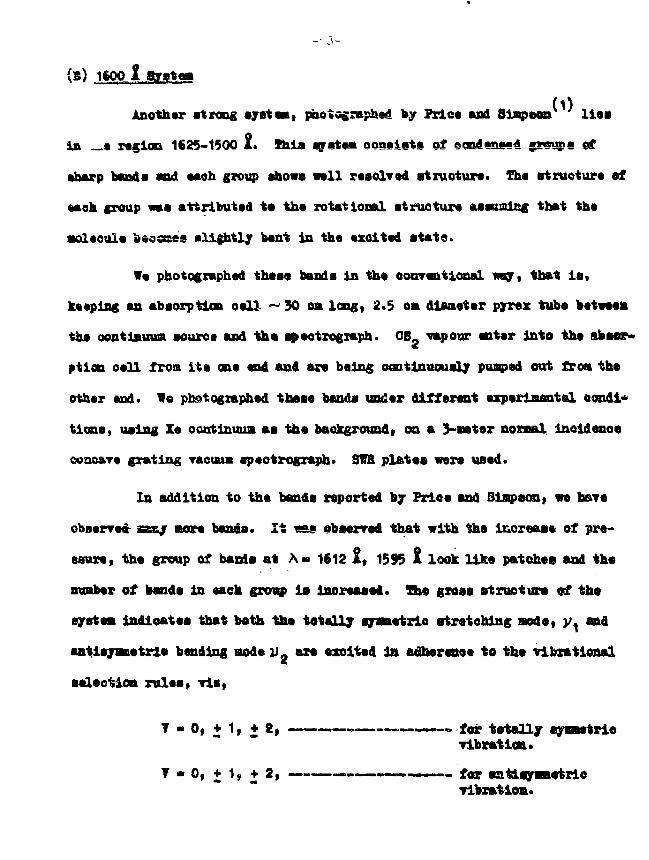
\S) 1<0p
Another strong sjstea, photographed by Price and Siaqpeoa l i e s
in —* region 1625-1500 I . Miia ayataa consists of egaiiasad g*eups e?
•harp bands sod each group show* well resolved structure. The structure of
eaah group was attributed to the rotational structure assuming that the
•oO.«ool« isoases tli^btly bent In the «xoit«d otate.
W« photographed thooo bands in the coaroutional way, that i s .
keeping an absorption oelJ ~ 30 cm ioag» 2.5 OM diameter pyrex tube between
the oontlnuua source and the spectrograph. 0B_ repots? enter into the ssBor*
ptioa oell from i t s one end and are being continuously puqped out from the
other end. Ve photographed thase bands under different experimental o<mdi*
tions, using Xe oontinuua as the background, on a Vaster normal lnoldanoe
grating Tacuua epeotrograph. 8TO plates were used.
In addition to the bands reported by Prioe and Btmpsxm, we have
BBSE/ more bands. I t sas abcerred that with the icoreas« of pre-
eaure, the group of bands at hm 1612 I , 1595 £ look like patches and the
number of bend* In each group i s increased. The gross structure of the
system indicates that both the totally aysnetrio stretching nods, y1 and
aatisyBBotrltt bending node l»2 are excited in adherenoe to the Tibrational
•election rules,
T " °» t 1» t 2» * -Tibratim.
T • 0t + 1, • 2, — — — — « — — — . — for aatiaymetrieribratioa.
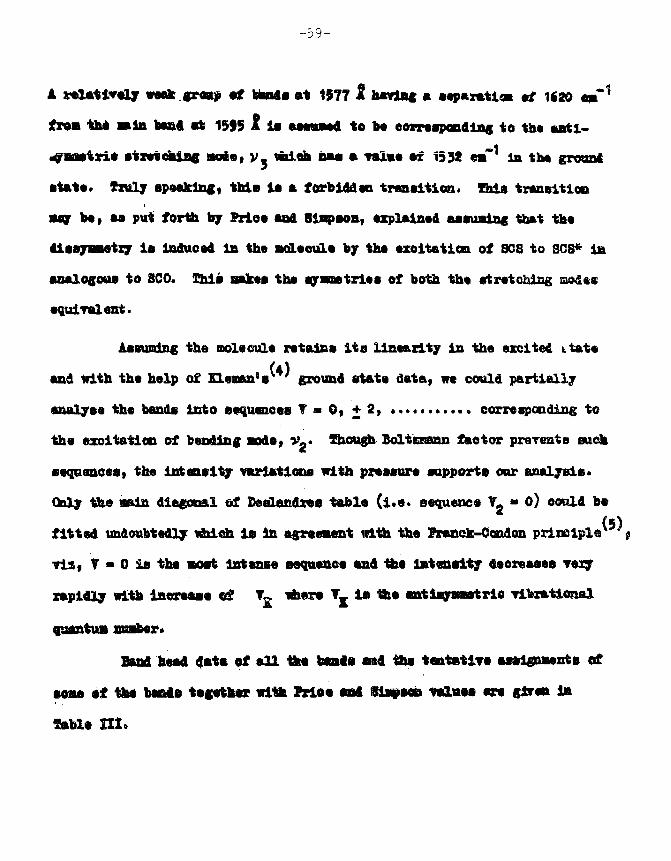
- 3 9 -
A relatively ««ak groa? ef bands at 1577 £ having a scparatlm of 1620 eaf1
frwa the aaln bant at 1595 ^ ia asstuMa to be corresponding to the anti-
stretching soie , y_ wsica naa a ralue af 1532 eaf1 ia. th*
atat*. tzuly spoaklXMi, thia la a forbiddtQ tnaal t ioa , Chla traneitioe
»gr b«i aa put forHi by Prle* aad 8SJ >aonf «zplain«d aaauatac that th«
altayanstxy ia Induced la ths BdaeuLa by tha exoitatioa of BCS to SOS* la
analogous to BCO. Tbl* sakta th* ayaostrLcs of both th« atrctobiag
•qulralost.
the nol«oul* ratalaa i t s lineaxlty in the excited s.tat«
and with the help of Kleaan's ground atate data, we could partially
analyse th* bands into sequences T « 0 , + 2 , corresponding to
the excitation of bending soda, V£. Though Boltesann factor prevents such
atqpaneest the intensify variations with pressure supports our analysis.
Ctaly the aaln diagonal of Sealandvee table ( i . e . sequence Vg » 0) could be
fitted undoubtedly vSiieh i s In agreement with the Sranek-Condon prineipls^ (
, T • 0 i s the meat intense sequence and the intensity decreases
rapidly with increase «f T£ nh^re Tj. lit the antlaymstrlo Tibrational
quantuB number.
Band head data of a l l fta taaia and the tentstir* asslfflnonts of
•one ef t&tt ba&le t«««kkar witk frioa and fission ralu** are glran 1M
Sable H I ,
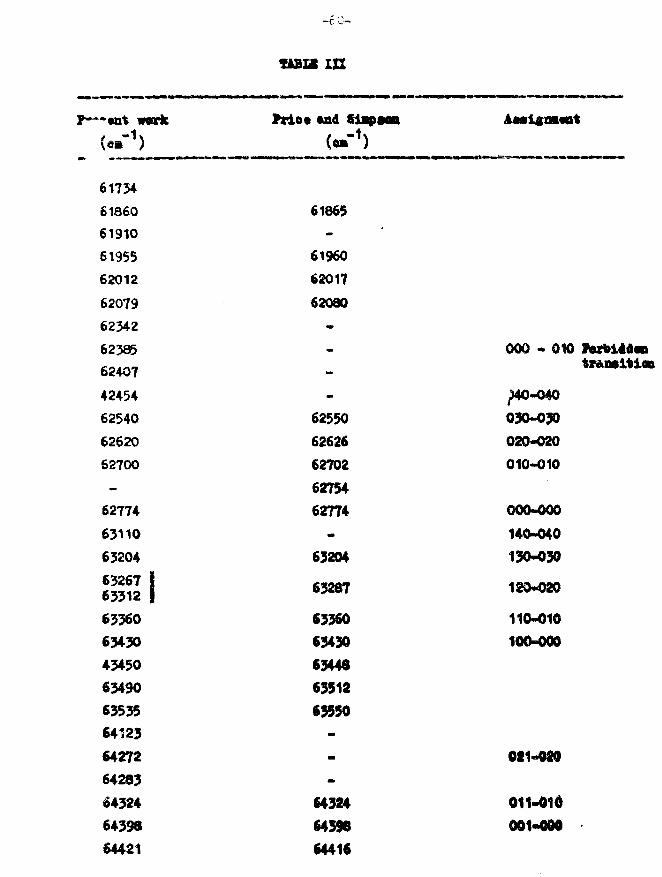
-6 C-
«nt work
in
Yrio* tad Slap
61734
£1860
61910
61955
62012
62079
62342
62385
62407
42454
62540
62620
62700
62774
63110
63204
6326763312
63360
63430
43450
63490
63535
64123
64272
64283
64324
64398
64421
61865
61960
62017
62080
62550
62626
62702
62754
62774
63204
63287
6336063430634486351263550
000 - 010
^40-040
030-030
020-020
010-010
000-000
140-040
130-030
120-020
110-010
100-000
64324
6439664416
021-020
011-410
001-000

Present voile
64445
64757
64827
64685
64955
64979
65049
65120
65132
65202
65261
65427
65486
- f 1 -
stan in
File* and
64452
111-010
101-000
Bts exalted state Tibsatlosai oeoaterta d*rlv*d froa our «naly»iB,
vl-ttk ttelr ««WMpceadiaf -valaai la tat grwuad state ax* llsttd in
17.
TABLE X?
Bxeited state
\?3
- 656
m 324
• 1624
eaT
ea"
teound
657.
396.
1532.
state
98 eaT
7«"1
Beferenoea
1. 1.0. Price and CM. SUapsco, *roo. Boy. 800. London, 165A. 272 (193B)
2c 0. Baaaaeatry and I.H. Bao, Ind. J. Phjs., 2J,» 318 (1947)*
3* A.S. Douglas and I. Zanon, Can. J. Pny«. £2, 627 (19*4).
4. 1. ELcnan, 0t«. J. Hay*., £1, 2034 (1963).
5. 0. Harsberg, Molecular Spectra and Molecular Structure, Yol.III,
(D. Tan Soatrend, .966), pp»152.
3. HalsTtrtication of Rotational Struotur* of 0 . Bands
(O.L. Bhala)
2 2
The 5-3» 6-3, 7-2 and 8-2 banda of the avoond aafl^tlTa (A ir - I t)
band ayatam of 0 w«r« piiotograpbtd under nigh reaolutioa and di»pereion
on a 3.4 n«tr« Bb«rt grating •ptotrograph. These were than analyse* for
their rotational structure• It was found that the spin-orbit coupling con-
stant A of the upper state has negative sign for • ' 4. !>• However, for T' ^
A was seen to be positire.In addition to th is , the splittings of the I-doublets in the upper
2state A -n~u were carefully studied. Earlier workers did not carry out
these lnTesSlgatiaas and hence the spin-splitting constant V , which represent!
the Magnetio interaction between I and B was not d«tazsiaed. Heccitly,
Albrltton et al (1973) ( 1' suspected tb« entire high resolution data of
previous workers to a non-linear least-squares f i t and obtained a oospiets
set of molecular constants. But significantly, V was oadtted 1A their
calculations too.
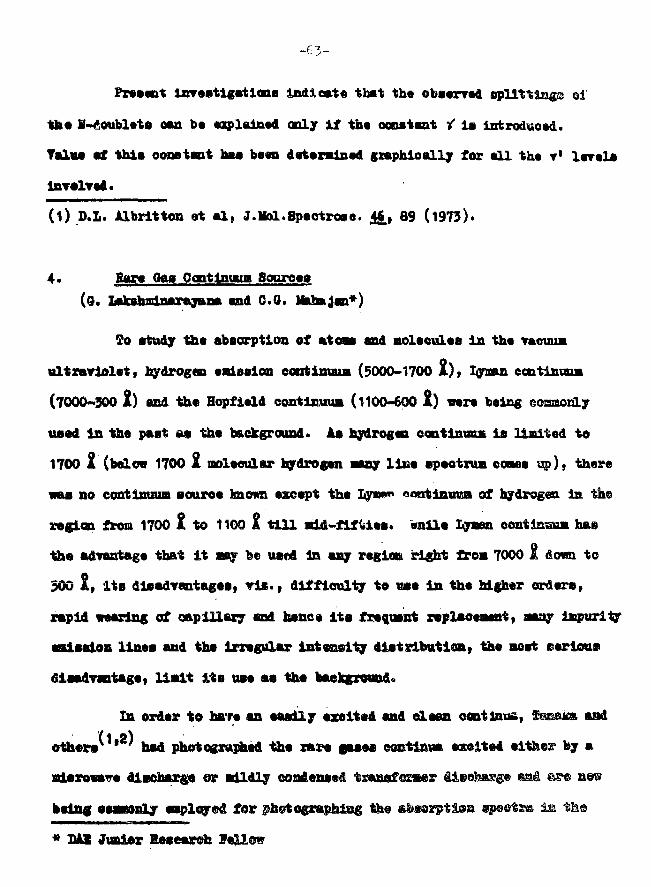
-6 3 -
Preeent investlgatlone indicate that the obaerred opllttlags oi
the I*«oublete can be explained only i f the constant V la introduced.
Taint sf thia oonetant baa been determined graphically for all the T1 Itnrela
(1) D.L. Albrltton at a l , J.Hol.Spaotroaa. 44, 89 (1973).
4. Bara 0*8 OontlnuuB Soorcaa(©. LakehmlnarejRiHi and 0.0. Malm Jan*)
5o atudy tha abaorption of a,toas and aolvculae In tha
ultz&vlolet, hydrogen aslsaion coutinuun (5000-1700 X), Igrsan eontijuaui
(7000-300 1) and tha Hopfiald continuum (1100-600 £) wara being conaonLj
uaad In the paat a* tha background. Aa hydrogen contlnam la Halted to
1700 1 (below 1700 A. molecular hydrogen aany l ine epaotnm eonea v®), there
was no eontlnuuB souroa known except tha Lywm oontlnuwa of hydrogen is. the
region from 1700 £ to 1100 I t i l l add-flfUea. wnlle Lywo oontlnsaa has
the advantage that i t any be ua«d In any region rl«ht fro« 7000 £ Som to
500 X, Ita dlaadrantagea, v i s . , dlffloul^r to «ae in the higher ordara,
rapid wearing of capillary end hence Ita frequent xvplaoeaent, aany lujjurit
eaiaalon linea and tha irregular intensity i lats lbatisn t the seat earioae
disadvantage, l iadt Ita uae aa tha baekgroand^
In order to ha'ra an easily exalted and clean cent tome, Tmam. aad
other*v f ' had photographed tha xar* faaea eoctinm azoited either by a
Hd«ro«ava discharge &e nildly eoadenscd ts«&sfo£»er
•elag aaaaonly employed for photograpMag ths «&«arpti@n
* MB Junior Research Fellow
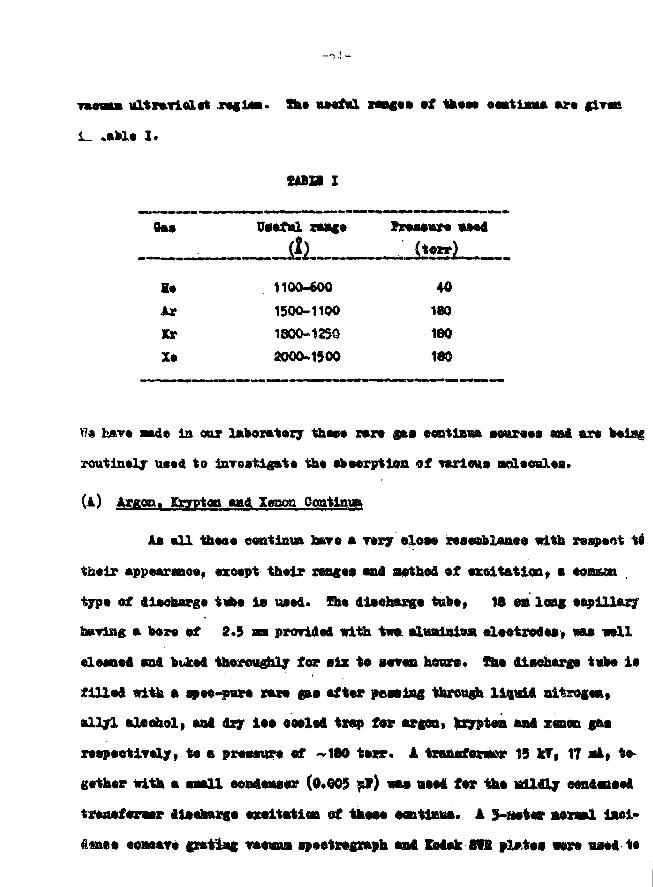
ultravlalat xaglaa* Ifea twofttl >•>«•• »f tkaaa aoatlaaa ara «iTta
abla I .
I4BW I
On*
H«
Ar
Kr
X*
Uaaful ra*f e
ill1100-600
1500-1100
1800>1250
2OOO-15OO
ftroaaura wood
(torr)
40
180
180
180
W<s ha?« aade ia oar laboratory thsea rara gaa eeatlsva aeureaa aai arc
routinely u*«d to inroatlgat* th« aaaarptlaa of Tarloua ocdccnlse.
(A) Argon« Kgjptfin and leooa Ocntlmift
Aa a l l thaoa eontlnisi bar a a rary eloaa saaaBBianea with reapaot
thai? *ppearaao6t axeapt thalr rangas and aathod of exeit&tioa, a tomun
typa of Aiaeoarga tvba la uaad* fha diaetesga tuba, 18 e» loag «ap
a bora of 2*5 aa prorldeA with two alualnlrai alaotrodaa, naa wall
alaanad an* bukai thorou^T for alx to aavan hoar a* S M dlgeharga tvba la
flUad trltk a aaao-pBra rara fi«a aftor pea»i>« throa«jh l i««U altrogam*
allyl aOaohol, aai dry iaa ooalad trap for arjon, locyptoa and zeaan fan
raapaotivaly, to a proaaura of ~180 tarr. k traaafonaer 13 kff 17 aA» to-
gathor witli a aaaU ooaiaaaor (0.005 sf) « M «»•* for «bo sdlaljr oonAoaaaA
tatoaforaar ilaaJkavca axoitstiott of tkoao ooottetaa. 4 3-aot«t »oraal imol»
-raawui •footrognBh mat IMak f t l »l».toa mra naaA U

-65-
photograph the csattoua. Sig.1t above a phot one trio tr&ee of th«s« eentinua.
1« our ai» naa Halted to produce the •arloua eontlnua for the
molecular absorption etw-iito ice did not go la detail as to their appearance
and variation of Intensities with respeot to pressure In the discharge tub**
(2)4anakak ' has obserred eereral enlsxLon and absorption bands goodag(2)up along with these oontinua. In the case of krypton, fsnalnr ' has reported
fire absorption bands at A - 1247.6 £, 1246.1 £, 1244.8 X, 1243*7 £, 1242.5 1
and one eaissitsa band at 1327 A. In our plates the absorption bands> pro=
bably because of feigji pressure we used, are so strong that they marge into
one another to form a continuous absorption patch (1250 - 1225 I ) . And
besides the emission bands at N • 1327 £ reported by Zsaaka, we hare obserred
s ix asre diffuse SBiseion band* lying on the shorter vcvreleagth side of the
krypton rssonano* l ine A • 1236 I . As these bands appear along with the
krypton esntlawm ooly* the carrier of these bands ito assaaed tobe
aoleaule. Chsir hand head data arc glren In table I I .
1223*51
1219.03
1207.8?
1193.27
1192.16
1172*19
1158.27
81732
82032
82793
83803
83881
©531©
86335
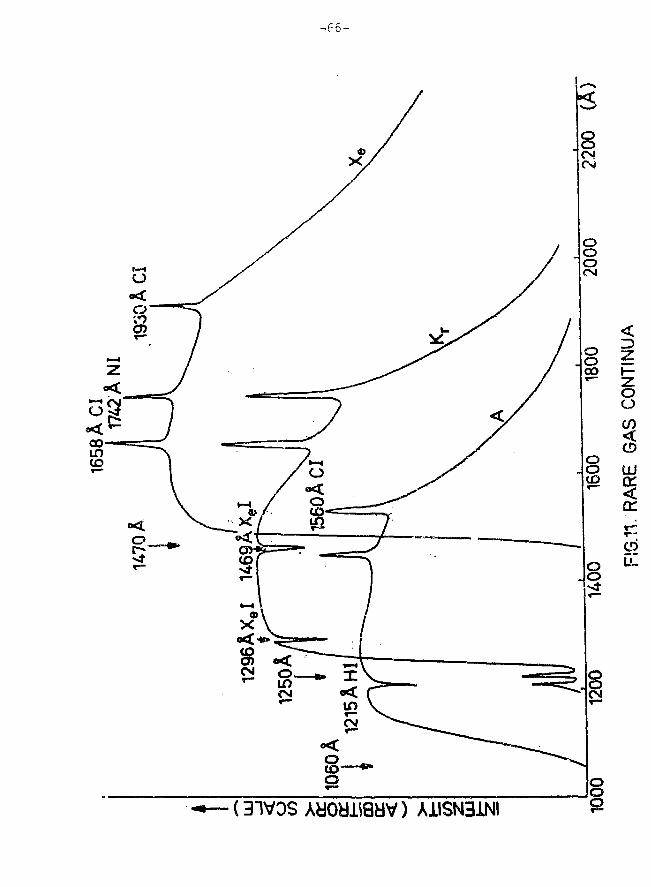
- f - 6 -
-67-
(B) Hopfleld Helium Qontiranur3»4'
Since no known, material transmits In the helium regloa (1100-600 I )
.u4 light radiation should go directly on to the grating froa the discharge
tube. This continuum la most efficiently produced In a mildly condensed
discharge through continuously flowing highly purified helium gee at a
pressure of 40 torr. Ihis require* the running of discharge in a tubs that
•is separatod from the apectrograph by a series of s l i t s of rarylng widths.
that Is by Betting up a differential puaping system whici facilitates to
maintain the eracoatiou of the opeotrogzaph chamber to a very low pressure
( ~ 10 toxr) while a pressure of 40 torr ±JB raiintained in the discharge tubs.
We hare dfedigaed and fabricated soda a differential puupiag arrange*
sent and have photogrephad the a^liua emisBion contlnxatm (110-600 I ) , fhie
continuum i s now being sssed for absorption spectral in-^itigatitm in this
regies.
Eefareneeii
1. F.&. fiUdnsofi ana 7. &»*&&&, J.Opt.Soe.Am. &f 344 (1955)
2. 1* Ssnakft, J.0pi.8eo.4a. 4Jj.f 710 (1955)
3. J.J. HopfictU, Ibys.Ber, ^5, 1133 (i93O)i &, 784 (19!IO)
4* T. fanaka, A.8. Jurea and "8.3. LaKlaao, ;.0pt.Sse>la. 4J[»
304 (Mtay 1958).
-6d-
Bydberg Trancltiorw of S_
.S. Mabajsa*;, G. Lakshminarstfs\n& and H.JL. Varasinham)
The vacuum ultraviolet apectrua of &2 Is known to bar* three
regions of absorption bauds whioh belong to 0 £JJ X £** system
(1B5O-17OO 1 ) , B3-n «- I 3 £" ^ system (1780-1650 1) and E» 1« I S** O g
system (1550-1400 A). The first and th« last sgretesis have been stawstt to
belong to the first two members of the Bydberg sexlea*
(-rrg3p)2, 3 1 ^ ( - g ^
i*iere n » 4- for state C
n • 5 for states B 4 f.
With a view to find the higher membere of thie Bydbarg aeries «e
have Investigated the absorption spectrum of S. in ttte 1600-1100 A re -^.
The spectra were recorded by using the so-called "after-glov»
method. A mixture of sulphur vapour and purified helium or argon was
@ubject«d to r-f discharge in a side tube. (She r-f leads were so adjusted
that the r-f disoharge glow did not extend into the naln absorption c«U
and this i s vday i t i s called the "after-slow" method). She disoharge
produote from the side tube enter into the absorption cel l and were being
continuously pumped out. The absorption ce l l , 50 on long and 2.5 cm die.
pyrex tube was plaoed between the epeotrograph fluorit« winders and the
krypton or argon oontintaim source, the spectra were recorded on
incidence consave grating vacuum spectrograph (plate factor 5»&
M2 .Jrasicr Besearch fellow
-69-
Kodak 811 and Xlfttt 02 plat®® ®9£®
In th* px*«*nt wark, b**la*a th* know, abaoxytlen bead* of 8a IK.
tn* v«otam ultrariolot x*gl*u, wny asw abaozptioa band* ha*« beta photo-
gx*ph*d In th* vgiaa, 1500-1380 I> 8 2 I M B I to In tnaBtapareat in th« stgton
136O-1200 I a« ido abaerptloc could b» obacrrad uadar T»xlou» condition*.
Photoiutzlo trao« of th* 82 absorption band* tn th* 1520-1380 1 ngloa ic
i s th* figur* 12.
(A) Erdberg »«rl*»
. . . . (TTg3p)£, x ' s " . . . . (T
i ) States B ft g
B <- X and ? « - I prograssl^&a, erUlncUjr pbotogy«ph*d by Bcaoraa
• t al^ ' were ,lnt«qrpx*tad as the tao spin atatea of Sg oor«, r l s , ~" */«
and TTI havins & e«pssati« of 4 ^ ea" . 4a •&«•* «tate*? IIJE*
f 0 ^ 'g as® ftppE«Ktaattog to ( A 0 ? W
band ahotiLd afecw the Seablet «SHact&re. S*c«uc* ef th* bett*r
snployefl tn t&s precast wasrfej, e » ^ fees! eoAd »• M « » to bar* a Ttiy el ear
donblot stxuotax*. In additice t# tlxt«, wo esULd •tal ly sec the £«giftd&ti«
•xMbitaS iy< seso «f th* fetmde. & e b«as4 hmd Oftts ®f tbas*
are giT*a ±a fable X.

E-X
F-X-
n1469AXeI
o
2-0
FIG. 12. \ACUUM ULTRAVIOLET SPECTRUM OF
- 7 1 -
725 on" for groutid state, * S~ to 820 cm" for the excited state ®ad
hence the saxlsua Intensity i s shifted away fron the (0y0) bead* £h$
ound head data are given la Table II . Putting VQQ •> 69925 en*1, the expsot-
ed positioa of (0,0) band together with the atonic data In the Bydberg
fornula
V • I.P - •/ • f \2 where a » 6
, quantom defect «- U6? ^
We get a value of 9*39 e? for the f irst ionisation potential of S. v&ieh i s
in cloae agreement with the -value of 9*36 + 0*02 eV obtained by Berkowits
fron the photoionisation mass •pectroaetry.
Ihue from a l l the above eotteideration*, this new prajreBaicn i s , 1E
e l l probabilities, the third menber of the Bydfcerg eeries.
(B) FroeresBione I . II & III
Among the new bands photographed we have tentatively classified
most of -Hie bands into thr@a differuai. progressions. She band head data sf
these progreseions are givea in table III . She intensities, growth sad
decay of these progressions are siollar to that of B *-I en! I -%-X progre-
ssicos of S.c Zhus the cazTier of these progressions i s t ies aseumsd t9 fee
la aMitim to the absve four progr«>jiom t there are mm
aot be fittea m OB@ &T the stbar prcgrsesisa. Sh@ir
as eorreepoudisg «&TsssaBb€? i?iaXiuss ars gi-ras i&
enelysia n
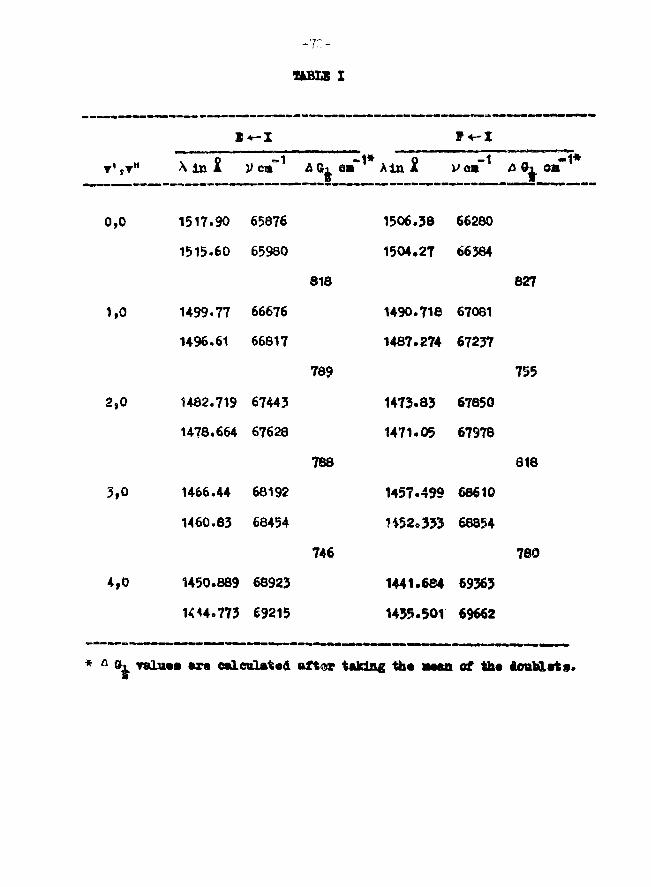
o,
1,
2,
3,
T H
0
,0
,0
rO
X
?K XXX A
1517.90
1515.60
1499.77
1496.61
1482.719
1478.664
1466.44
1460.83
1450.889
K44.773
Vcm"1
65876
65980
66676
66817
67443
67628
68192
68454
68923
€9215
_7 _
BLBLE I
a Cri «•"
818
789
788
746
0
1506.38
1504.27
1490.718
1487.274
1473.83
1471.05
1457.499
H52,333
1441.684
1435.501
LI
ye " 1
66280
66364
67081
67237
67850
67978
68610
68854
69363
69662
a Gh oa"1*
827
755
818
780
* a «r« c«lcaUt«d aftor taking th« **en at th* ioatalvts.
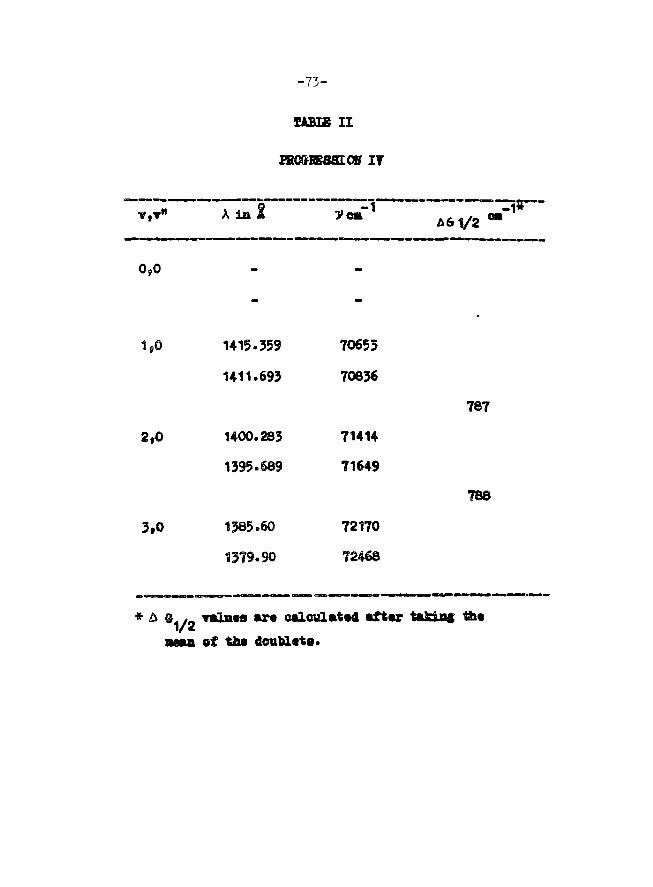
0,0
- 7 3 -
TABLE I I
IBG&BESSIOB IT
1SO
2,0
3,0
* A S i / 2
1415.359
1411.693
1400.283
1395.689
1385.60
1379.90
raluvs arc
70655
70836
787
71414
71649
788
72170
72468
after taking tb*
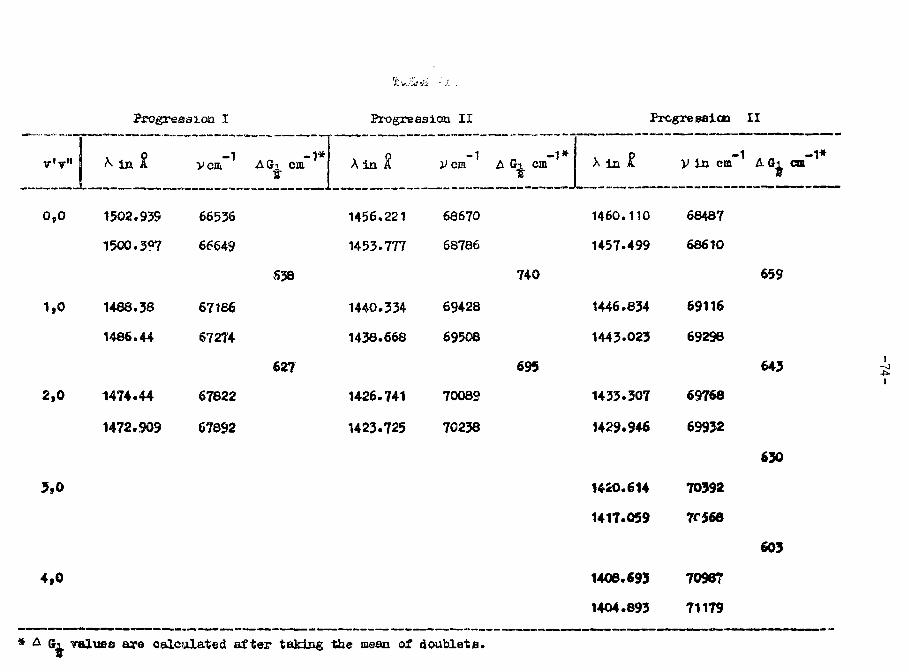
0,0
1,0
2,0
5.0
4.0
Progression I Progression II Progression II
in
1502.93S
1500.39?
1488.38
1486.44
1474.44
1472.909
vcm-1
Gi cm- 1 *
66536
66649
67186
67274
67822
67892
S38
627
1456.221
1453.777
1440.334
1438.668
1426.741
1423*725
68670
68786
69428
69508
70082
70238
* A Gi values are calculated after taking the mean of doublets.
740
695
X in A v in cm" A. Gi cm- 1 *
1460.110 68487
1457.499 68610
1446.834 69116
1443.023 69298
1433.307 69768
1429.946 69932
K2O.614 70392
1417.059 7C568
1408.693 7098T
1404.893 71179
659
643
630
603
i-o
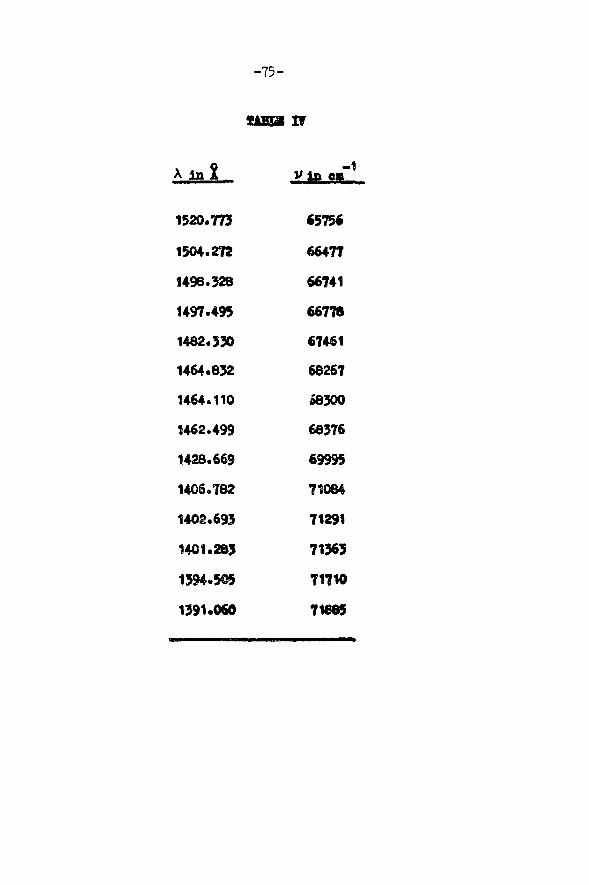
- 7 5 -
TF
A m i
1520.773
1504.272
1496.328
1497.495
1482.330
1464.832
1464.110
1462.499
1428.669
1406.782
1402.693
1401.283
1394.505
1391.060
Via of1
65756
66477
66741
66778
67461
68267
08300
68376
69995
71084
71291
71365
7171©
7 tees
-76-
Beferenoes
* R.?. Barrow and H.P. du Parcq, XLeoeatal Sulphur, Id* O.B. Meyert
(interaoience, Hew look, 1965).
B.S. Barrow,, E.P. du Parcq aad J.M. Sicks* J«2taya. B. , Series 2 ,
1 , 413 (1969).
2. J.M. Ricks,, H.7. Barrow, J.Phys. B,, Series 2 f £ , 906 (1969)*
3. R.J. Donovan, 0. Husain, and O.D. Stevenson, Trene. Para. Soc.
Ho.665, 66,, Port I , (Januazy 19/70).
4. W.C. Price and George Collins, Fnye. ReT. ^6, 714 (193$)«
5. E.S. Mulliken, J. Amer. Chem. Soc., 86, 3183 (1964).
6. Nat.Bur.Stand. Giro. 467 (Atomic Snergy LeTele), 1958.
7. J. BerkowLtz and 0. Llfschltz , J.Chem.Hays. 4§, 4346 J968 ) .
6. Flash PhotolyslB of Methyl Pontate
(s.L.N.G-. JTi tpfrnftrnpoVif*T! )
In continuation of the work on the flash p! rtolyaia of methyl
formate, d-mathyl formate and methyl formats-d,., the flasli photoly»l« of
fully deuterated methyl formate (DCOOCD,) has been coopl«t«d. Troai
the*e Grtudiet; i t i s found that the metboayl radicals (0H.0) formed
th* photodeooaposition of the parent molecule are about four tinea as
efficient as the formyl radicals (BCO) In produoing forsaldehyd*.

Mercury Sensitised Photodeoomposition of Organic CoBpounde(8.L.H.Q. Krlthnafflaohari)
When hydrogen 1B photodeoooposed In the presence of
vapour, th« absorption spectrum of the HgH radical lying at 4000 A could
be_«een. The HgH, eTldeatly, has be«n formed M ft result of the reaction
of the excited mercury atom In the P level with hydrogen aolecul* and
the decomposition of the hydrogen molecule has takes place through the
sensitised photodeooaposition. Experiments ere under my to detemise
the lifetime of these excited mercury atans and also to examine the
poBBibilitiy of uti l is ing the technique of saaeitised photedeooaposition
to other organic aolecules and obserre the spectra of traneieat species.
8« Ti it«wjnnL'tion of the Strmot'fs offrog Rotational Constants. g-Ietraaffie*
(v.Ao Job)
She ooaplete etxueture of a poS^etasio solocule can b«
from 3N-6 Independent pasKneters where H Is the number of atoms In the
molecule. When the molecule has gome oyimutry and i f toe egranatiy group
of the molecule i s known from fffehe? ooasifieratioaa, the aumber of
met«re to be dttenslae* reduces to the zn^ber of t©taHy ep^stslo
tiooal modes. Bvea this nwiabsr ie usually saeh Isrgar tS^a the
independent rotational
experimental data on staffieieafc ntKabsg1 &£ ieot©pie ef@ei@e of th®
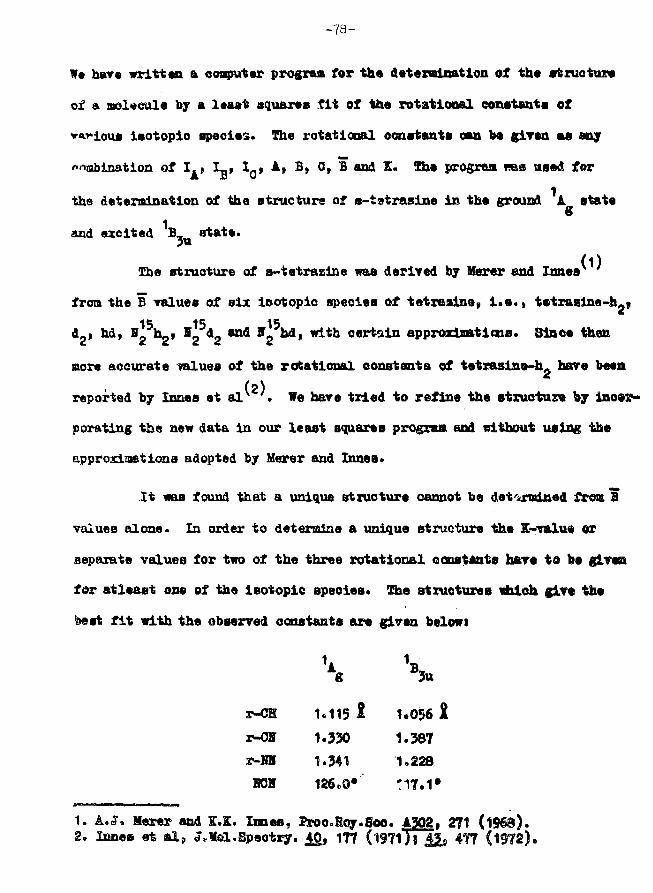
- 7 8 -
We have written a computer program for the determination of the structure
of a molecule by a least squares f i t of the rotational constants of
isotopio species. The rotational constants can be given as any
of I. f I_, I-» A, B, 0, B and K. The program was used for
the determination of the structure of n-iatrasine in the ground A state
and excited B_ state.3u
She structure of a-tetrazlne was derived by Merer and Innes
froa the B values of six iootopic species of tetreaine, i . e . , tetrazine-hj,
d , hd, N h2» ffg <*2 aa& *2 bd» w i t b o e r ^ i n approjdmtitaiB. Since then
more accurate values of the rotational constants of tetrastao-h. hove beea
(2)reported by Innes st alN . We have tried to refine the structure by ino»s>»
porating the new data in our least squares program and without using the
approxia&tiana adopted by Merer and Innes.
It was found that a unique structure cannot be determined from ¥
values alone. In order to determine a unique structure the K-vftlu« or
separate values for two of the three rotational constants h&ve to be gives
for atleaet one of the isotopic speoies* The at rue tores tthloh give the
best f i t with the observed constants are given belowi
r-CH 1.115 1 1.056 X
r-OT 1.330 1.387
r-OT 1.341 1.228
BOH 186.0* H7 .1 #
1. A.<J, Merer and E.E. Imes, lroo.Boy.Soe. 4302. 271 (1963).2. lanes et al7 J^Mol.Speotry. jLO, 177 (1971) I 12» 4T7 (1972)*
-79-
9* Construction of a HeaoseoQBd Mjaah Ehotolysls Uait
(S.li.1.3. Eriahnanaeteri)
Ih« introduction of lasers in the flash photolysis technique
extends th« resolTable tiaa from the aieroseeoad to the nanosteoad range.
Tor this purpose, a lasar isbosc radiation i s In the ultraviolet region
i s required to bring about the in i t ia l phot odeeoapositioa and another
laser which serves as a source of continuous radiation and the appro-
priate delay mechanism are also required, frequency doubling of the
ruby laser radiation or a pulsed nitrogen laser which gives radiation
in the ultraviolet region would serve as a convenient source for
initiating the photodeeOHponition* The design of this set up la complet-
ed and 'too required eosopgments are being procured.
Il(e). TIBBATIQSAL SPECTRA. MSP MOOUSOUIAB 3TEDCTUKE
1. Calcu la t loa of Oentrifujcal D i s t o r t i o n Constants ofLarge Molacules
(R. D'Ounha)
A computer program baa been written for the evaluation of the
mentrtfugal distortion constant a of substituted beuEenes* Using the
foroe constants obtained by Long and Steels , the centrifugal distor-
tion constants for pentafluorobensene (CLF_H) have been calculated aad
eoapared with those obtained from the microwave spectrum.
It was found that centrifugal distortion constants were not
very sensitive to changes 1: the foroe constants.
1, S.A. Long and D. Steele, Spectrochia.Acta J£t 1947 (19O3).
2. Hornnl Coordinate Analysis of CF, SeCl and 07 BeCS
(N.D. Patel and P.E. Wahi)
A norual coordinate analysis is being made for the aoleouleat
G?3SeCl, C7 SeBr and C7 SeCS. Recently, one of us (P.E. lahi)^1' has
obtained infrared spectra of these molecules in gaseous state and Hsaan
spectra in liquid state for these compounds« The kinetic energy ssatrlces
for these molecules have been oomputed using GlttS conputer prograame. A
Modified Valence Force Field is proposed to be utilised for the calculation
and the initial set of foroe constants are transferred from the triflaoro-
methyl compound, such as P (0P_)_ and sow selenium helide.3 3
3- Vibrations! Spectra and Honaal Coordinate Analysisof 4-Methyl and 5-Methyl Pyriaddlfies
(T.A. Sana)
Earlier, we have assigned the fundamental frequencies of pyri-
midine, pyrimidine-d. and 2-chloropyrimidine, by doing a normal coordinate
analysis . So test the uniqueness of the set of potential energy con-
stants thus obtained, we are extending these studies to 4-aethyl and
5-methyl pyrimidines for which the vibrational spectra data i s available.
She init ial results show satisfactory agreeaent between the observed and
calculated frequencies. Refinement of force constants i s in progress.
1. T.A. Santa (Spectrochin. Acta - la press).
4° Yibrational Spectra end Horaal Coordinate AnalyaiB ofBenaotrifluoride
(7.Bo Kariha and E. D'Ounha)
( 1 2 )In continuation of tho ertudy of spectra of substituted bensenee *
a detailed study of the infrared and Hainan spectra of CgE.CV, and CfiS OF
has betSB carried ou*. Careful measurements, on purified amplee, of
contours in the infrared and depolarleetion ratios of Bamn spectra
given unambiguous assigniBants for ta* C?_ modes t J - CT- stretching mode
and several in-plane and out-of-plans bending raedes. lenml ecerainate
analysis incorporating these jrerlsefi scBigKuasnts has HOW be®a eoi >l@teS aod
ahoma vary good agreement between calculated and observed frequencies.(1 2)As J~ the studies with other substituted benzenes * , these quantitative
caJ -"latione hare shown very good correlation between the vibrational
modea of bannene and substituted benxenes. Some of the redundancies over-
looked in calculation by other author a hare also been included in the
present Btudiea.
1. N.D. Patel, V.B. Kartha and N.A. Karasioham, J.Mai. Spectry. 48.185-201 (1973).
2. Ibid, pp.202-211 (1973).3- C. LaLaw aad H.G. Snyder, Speotrochim. Acta, 27_A, 2073 (1971).
b' Yibrational Spectral Studies on leotopio Boraginea(G.S. Ghodgaonkar and T.B. Kartha)
Aa discusBed in earlier studies ' * , the atructural infomaticas
as well as Yibrational spectral data of this important boron ring compound
is rather incomplete and we have undertaken & detailed study of the various
isotopic borazines. Boraiine and partially deuterated borasines hare been
sjnthaeieed and their infrared spectra have been obtained. In order to get
information on structural parameters a high resolution sp«ctral study i s
planned. She expected fine structure in rotational Raman spectra and
vibration-rotation spectra have been calculated with an assumed B,a etru-
. Esperlraestal set up for obtaining auon high resolution apactr* la
now being planned.1. G.S. Ghodgaonkar and V.B. Eartba, B*A.R*0.-6S4, 100, (1973).2. T.B. Kartha, S.L.H.G. Krishnamachari aod C.I. Subraimnis^;
J.Mol.Spectry., 2J, 149 (1967).3. V.B. Kartha and I.A. Haraaiflbaa, International Conference on
Spectroeeopy, Invited Salks, Bombay, Jati"ary (1967)>

-33-
6. 8pactroscopic Studies on Bare Barth Oooplexee
(VIBI Kartha and T.S. Sugandhi)
Previous studies^ ' on the spectra of rare earth formates have
shorn that the C-H frequencies i s these formates ero Tery senaitiTe to
their coordination strength. In order to correlate the two quantities
more accurately, a detailed study of the infrared and Earaan spectre of
rare earth formates haye been undertaken. Raman epeotra (and also laser
induced fluorescence spectra) of several formates have now been obtained
on the Spez 1401 Banan Spectrometer using 4416 4 excitation of a He-Cd
laser at 15 Ml ps«rer« She Baraan etwdies hare cosfirned the results
Infrared data. Further studies on the complete Interpretation of the
spectra i s being carried out.
1. 7.B. Eartha and £.Y» f&akur, Proc. CheBistry Symp. 7ol .II ,165-167 (1972), Aligarh Bgaslim Univtrsity, Dec 21-23 (1972).

III . 0PTI08
III (a) mSJQM AMP HaBtlQUIOl (M QPtlOAL
(M.Y.I.X. Marty)
Introduction
Iscsnxly, •*»eral authors^ potato* out tho exiatenoe of
•ultlply dlap«^ii«4 l i^ i t la existing ooanroial aat«ahr«a^torB of
0s«zs7-Iiixn«r ^rpe. Soao of tti» taxljr ref*rene*a to the aaaltijpl/ din*
pera«d li^tait aay b« fouad la tho pap«rs hj Staaa ani Solsttaa^ ' and fey(7)Alp«rV". Jhe reasoa for tfcio has b«en roaliaod to b« Mlaly duo to
the fact that the olf-axia «aa«le of the concur* aphorleal alxrora la
net large enough. Ii\ Tory high reoolutioa type of laatrunents t the off-
axis angle la Invariably kept small to keep the eontributlon «f un-
oomp«neat«d eoaa and other aberration* aa low aa possible* In thaa*
inartruaeata tho protelea of aultlply diaporaod light la aoaotlaos Tory
s«ricn« and tho ibeoxy of thla ph«noaanoK has boon preaen&ed by
mttolderf a&d I*BdQKv8' and also by Pribrsa and Penohlna^9'. Sailtlply
diaporaod light la not proaent for a l l poaitiona of the diffmotion
grating but oaOy in oortolm nglena aa dlaenaaad 1B rofs. (0) and (9)»
We shall »ot go lato the nl»«TO dotalla for tho prodietloi of nultiply
Aiaporaod light hero. H«osnt-)j, l i l l ^ 1 0 ' amd also Ohupp bad toasts'11'
hare propoaod to eottrort tho epherloal adrrora of tho «oaraBtioBal
Osexay^oxaor •anoohx-oaator into off-aada paraboloid* tBerafcy
th* off-axis angles on th* mirrors to suoh a large value that the problew
of multiply disperaed light does not ariaa. However, th« coaaa cancella-
tion along th* length of th* s l i t require* that the 0- configuration
x«.a*r than 2- configuration be vised for the monochromator^ . Hares
and BIBO Chupp and Grants^ ' point out a principle, attributed to Gary,
which enables the determination of the minimim off-axis angle required
in any in-plane monochromator design BO that multiply dispersed light
oannot occur. This principle i s very elegant and simple to use. We
shall see how this principle can be used to deriae a Csezny-IDurner nuaao-
ohromator design ic. which the off-exis angles of the spherical nlrrura
&r* kept Tery small.
Gary Principle
Gary principle may be stated in the following wayi Arrange the
oollioator mirror and focussing mirror in suoh a way that the normals
to the inner edges of these mirrors will not pass through the aperture
of the dispersing element. Thus for a given relative position of the
spherical airror and the plane diffraction grating, there i s a particular
min-t ipi off-axis angle which should b* used to aroid nultiply dispersed
light. Fig. ^indicates the geometry of such a situation fro* which we
can dsrir* the following relationships
t* & > (4-E) / 2 E • — (1)
Whore f ta g- number of the instsimmt in tks plane of

-86-
SPWWCAS. MWWR
CCNTIR Or ORVKTUM
NCCENT MWCHM.ft*
DFFRACTED PfWCPAl
2.0 i
IS-
1.0-
F9O.13.
8 10 t2 t* 16 18
FO.14.
t • off-axis angle of the ooncave mitrer as indicated in Vlg.1,
and I • factor indicating the position of the plane grating rela-tive to the oonoave mixror.
Thu* Kf i s the distance of the plane grating fro» thespherical aixror of focal length ?*
Tht above relation reducea tot
f # 9 > 1.5 (2)
given by Chupp end Grants ' nben K • 1. Fig.14 ahowa a plot of
f 6 T I . I where the range of Taluea chosen for K i s from 0.8 to 2.0.
Xhs value of E • 0.8 eorreeponda to xoughljr the position chosss for the
plane grating in the conoasroial Bonoohxoaatore. It i s seen easily froa
f ig .2 that the ainiiaum persissisle off-oxie angle oomes steeply dorm for
& given f* es K increases to 2.0. !Ehe value of f * 9 i s 2.0 for
K » 0.8 fAiile i t i s only 0.5 when K » 2.0. Shus there i s a 4-fold re-
luetion in the value ©£ ffliniBsm off»*xi« angle. The value of E • 2.0
corraspoads to the position of the plane grating being located by the
side of the centre of curvature of the spherical Mirror. Kiere i s no
special advantage to go beyond the ralue of X «• 2.0*
Monaehroaator
uti l is ing t&® abore principle, we aay now sse *4»t i s the
physical axraugejeaat f©r & wmo$&2?amt&E' usijsg a ssainal 100 x 100 HS
plane gratiag ead & Qoadnml focal Isagtfe @f 71© as. ©si»g tfee m k s ©f
is 14.2s.
aons»rclal instrument with tne above parameters la only 6.75°. Of course,
_» la dona to keep down the off-aria aberrations and maintain a higher
solution. Now let ua aee wfaat la the adniMua off-axia angle liien K «
2.0. fhla tutna out to be 5.82°. Thus the requirement on the mlnimirc
off-axie angle haa been drastically out down when I - 2.0.
uf course, In thla design the entrance and exit s l i t s are some-
what awkwardly situated and also the physical length of the Instrument
la increased. Also, to clear the positions of the entrance and exit
sl i ta from the collimated beams, one should aotually use off-axis angle a
Blightly larger than the calculated ones from the relation ( i ) t A
achenatic dlagran of a monochromator ie shown In Pig .19 baaed on., the
principles enunciated abore. Ctoe may be inclined to frown upon such a
design since the instrument Is much larger than the conventional Geeray-*
Turner monochromator. But one should remember that people are putting
up with Schmidt canerae which are two times as long as their focal
lengths. In fact, the proposed design of the ncnochrooator has the
resemblance to the Schmidt system In so far as the plane grating (aperture
stop) i s located at the plane of centres of curvature. The two centres
of curvature of the collimating and focussing spherical mirrors l i e on
either aide of the dispersing element as though they are guards not
letting any of the normals from the spherical mirrors hit the dispersing
element thus carrying the Cory principle to i t s logical conclusion. The
abore procedure is recommended only when the highest possible resolving
power fros* an instrument with spherical mirrors Is to be obtained without
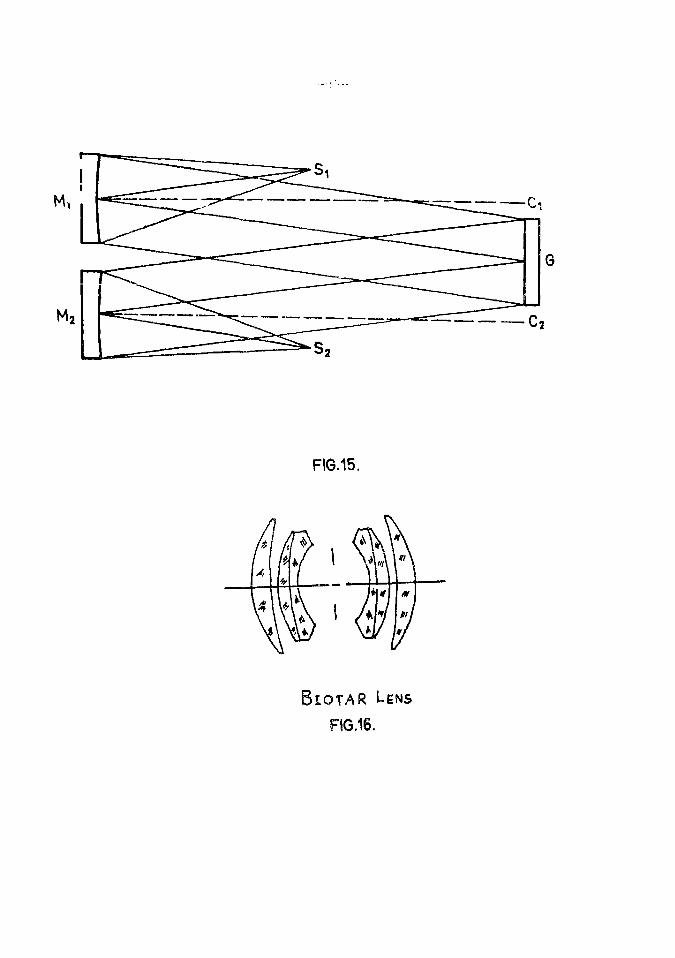
M
FIG.15.
B I O T A R LENS
FIG.16.
the multiply dispersed light, Where such requireaent la not needed as
for instance in some illumination aonoohr coat ore or iflonoehronatora used
in soae apectrophotometere of law resolution, the conventional value for
X of about 0.8 should be chosen and the corresponding off-axis angle
used for the sirrors. Actually, it i s only necessary to choose for X
« velne of about 1.5 to 1.6 (not K - 2.0) and obtain reasonably saall
off-axis angles. It ie probably neoevsary to use snail plane nlrrore
near the s l i t s to deviate the light by 90°. Thua in practice th« instru-
ment will be only 50 - 60$ longer than the oonrontional monochrcnator.
Befersmces
1. 1. Watanabe and G.C. Tabisa, Appl.Opt. £ , 1132 (1967).
2. CM. Penchina, Appl.Opt. J6, 1029 (1967).
3. J.K. Tyler and B.C. Smith, J.Opt.Soo.Am* ^6, 1390 (1966).
4. A.B. Shafer and S.O. Land on, Appl.Opt. 8, 1063 (1969).
5. A. Watanabe, Applied Spectroeoopy, 22, 198 (1968).
6. R.?. Stassa and O.f. Salzaan, Jr., Opt°Soc.Am.y i^t 126 (1953).
7. 9.L. Alpert, Appl.Opt. ±, 437 (1962).
8. J.J. Mltterldorf and D.O. land on, Appl.Opt. 2» U31 (196S).
9. J.K. Frljram and CM. Penchina, Appl.Opt. 2, 2055 (1966).
10. R.A. Hill, Appl.Opt. 8, 575 (1969).
11. T.L. Cbupp and P.O. Orsnti, Appl.Opt. 8, 925 (1969).
12. R.O. Ha«r@s9 Appl.Opt. &, 1963 (1969).
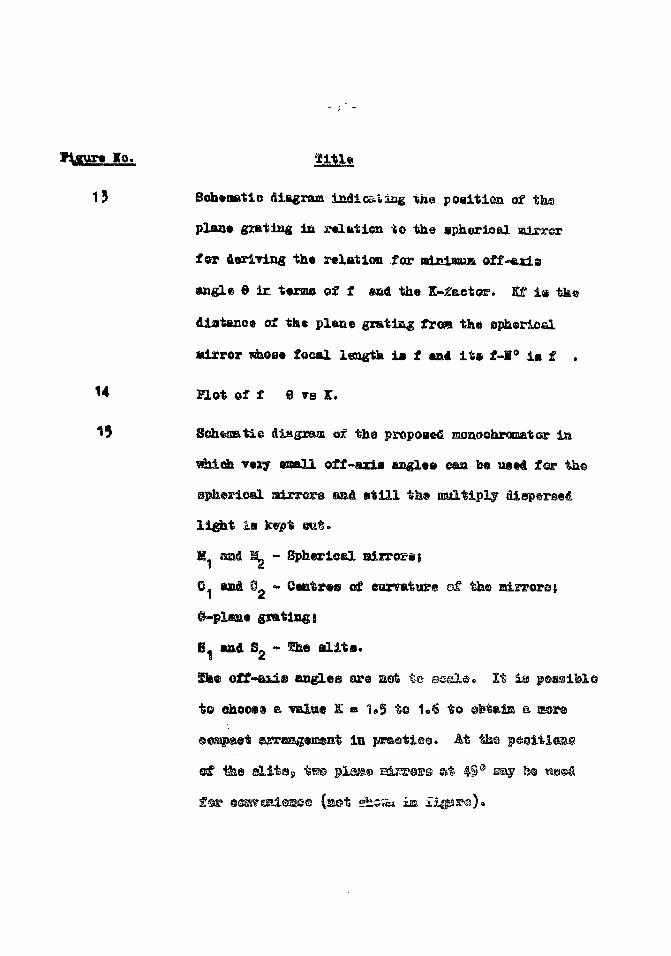
I O .
13 Sohemtio diagram indits-iiag the position of th©
plan* gzating la relation to the spherical airror
for deriving th« relation far njni«p»i off-e.sd,s
angle 6 ir terms of f end the K-fector. Kf i« tke
diattanea of the plane grating froa the sp&srioel
focal l«3gth i s f and itn f-I° i s £ .
14 ELot of f 6 TB K.
15 SchesBtie diagram of the proposed monockresnator
Ttry enaU off-axis angles eaa be used for th®
splaerioal alrrers aafi s t i l l »h» isultiplj
l ight Is krpt
M mad 2 - Spherlosl
0. aM 0. - e«ity«e of earmfcure ©f tfee
B, and Sg - £he s l i t s .
Sa® off-esls angles are
to ehoosa & mlee K s 1*5 t© 1S$ to ©fetaiia a
in
for e^ai i sas© (act ebs«ui im
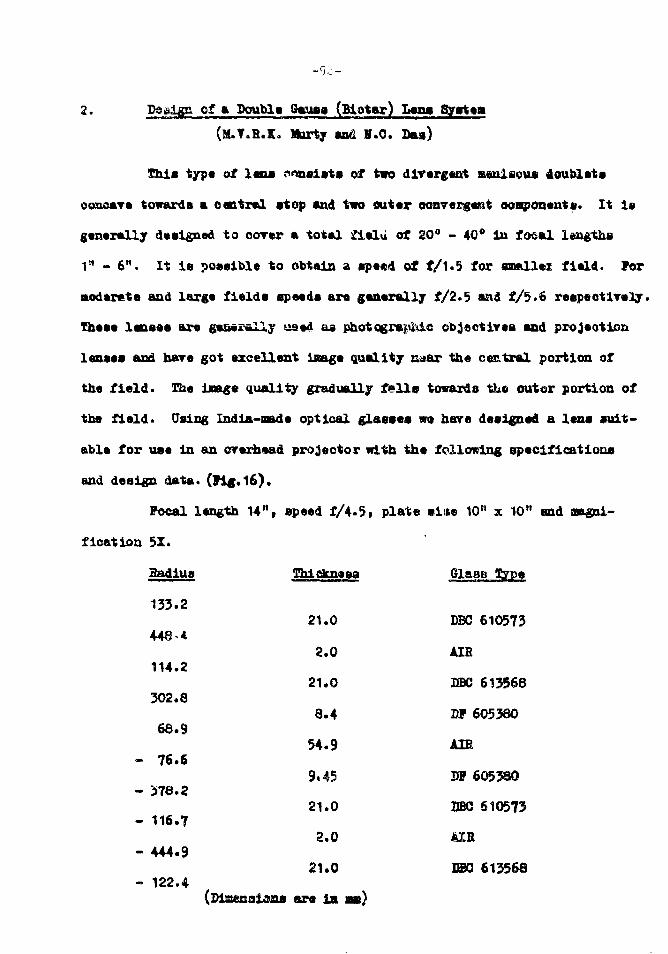
2. JDeslgn of a Double Own (Biotar) Lens Systea
(M.Y.B.K. Marty and H.O. Baa)
Chi* type of lens ?oa«i*ts of two divergent ssnlscua doublet*
ooncare toward* a contra! atop and two outer oonvergeat components. It Is
generally designed to oorcr a total flelu of 20° - 40° in focal lengths
1" - 6". It le possible to obtain a spe«d of f/1.5 for nmllex field. For
aoderete and large field* speed* are generally f/2.5 aad f/5.6 respeotlrely.
These lenses are ge&*£«lly us*d as photogrftpMc cbj«ctiT«a and projeotlon
lenses and hare got excellent ijsage quality tutor the ceatral portion of
the f ie ld . The image quality gradually f s l l s towards the outer portion of
the field. Using India-made optical glasses wa hare designed a leas suit-
able for use in an orerhead projector with the following specifications
and deBign data. (Fig.i6).
Focal length 14", speed f/4.5, plate si«e 10" x 10n and Magni-
fication 51 •
Badiue
133.2
448-4
114.2
302.8
66.9
- 76.6
- 378.2
- 116.7
- 444.9
- 122.4
Thickness
21.0
2.0
21.0
8.4
54.9
9.45
21.0
2.0
21.0
(Diasnaiana ore la as)
Glass type
DBC 610573
AIR
BBC 613568
DF 605380
AIR
m 605380
BBC 610573
MB
DEC 613568
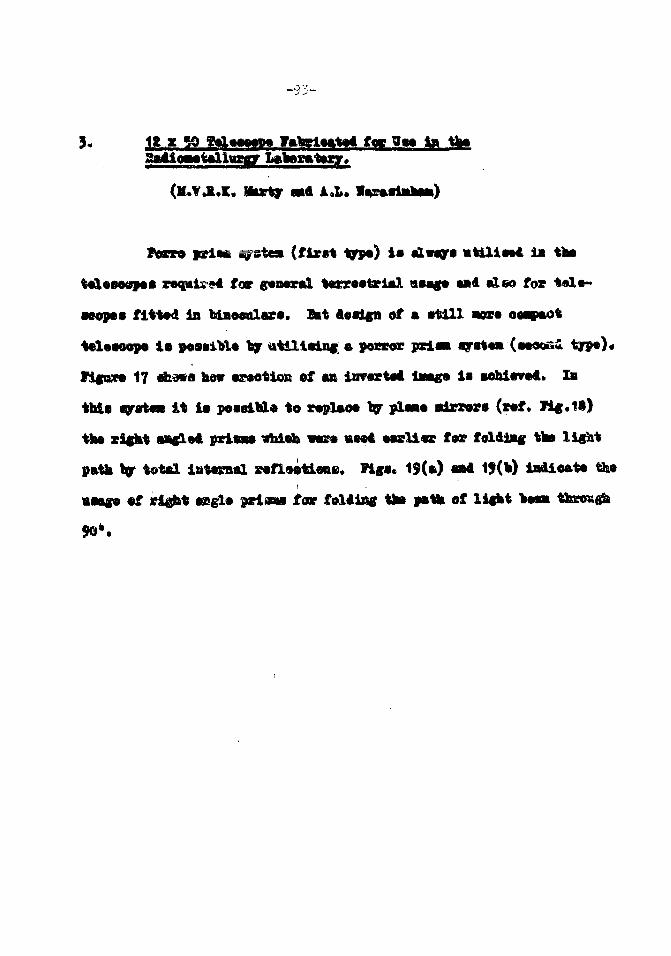
-33-
x «0 galaaaw Ia,teiafctad fog 3— la
(M.V.R.K. Hwtj a»4 l.L.
jrifct ^staa (first TP«) ia t l n f i «%Ui»%* la tba
t«l«eos9aa reqaic-94 foar gonaral W«r»»trial aaago aad also for tol»->
aeopaa fittod in idBoeulara. Bit Aoalffn of a. atll l «ora ooavaot
t«laaoopa ia poaaibla Iqr atUla±n« a posror prlaa ayrtwi (aaooai t/p«)<
Kffixea 17 abava hev ascoticm of an invartad Imga ia aehiavad. la
tbi« ajata* i t ia poaaialo to raplaoa toy ylaao adrrora (raf. li«.1S)
tha xiffrt »a«le4 priaaa ^hieb vasa «aai w U n far foldl^ taa light
path Iqr total intaiaal safloatUne. ?!«•« 19(») a»4 19(«) iniioata th«
«aa«a «f rigtet mgU ytimm for folding tte pftHi of li«kt

FIG. 17. PORRO PRISM SYOfEM (SECOND TYPE)
FIG. 18. ARRANGEMENT OF THE OPTICALSYSTEM OF MIRRORS.
•m
\
r
/X
/I 11111
\iFlG.19a RIGHT ANGLE PRSM USED WITH HYPOTENUSE
AS ENTRANCE AND EXIT RACE
\
rlG.19hL RIGHT ANGLE PRISM USED WITHHYPOTENUSE AS THE REFLECTING FACE

-95-
4. Direct Vision Bpeotrosoope Utilising; » Prien and eTransmission Sratlng of 600 grooves per an.
(M.V.R.K. Murty and A.L. Karaslahait)
This instrument haa the merit of linear dispersion of radiations
having different wavelengths, compared to non-linear dispersion of the
instrument incorporating & single piece dispersion prism.
A grating of 600 l ines per no i s chosen as the best since there
i s an upper limit to the practical number of grooves per am for trans-
mission gratlnge. This arises from the fact that a* the angle of diffra-
ction approaches the face angle of the groove* store and aore of the light
i s lost by Internal reflection.
Being for the grating a resin with index of refraction of
1.566, the crit ical angle is 39° 42'. Thus the naxLawa possible blase
angle for a transmission grating using suoh a resin is about 38°, at
incidences
Jrom Fig. 20, Sin f ' • 1.566Sin 38°
Therefore ? « 74° 38*
and 6 « 74° 38* — 38°
- 36° 38«
d Sin S • a ^
Zhorefora S4s 36' 3S1 • ^
d i s the groove spacing of tos grating aM • i s the order ©f th©
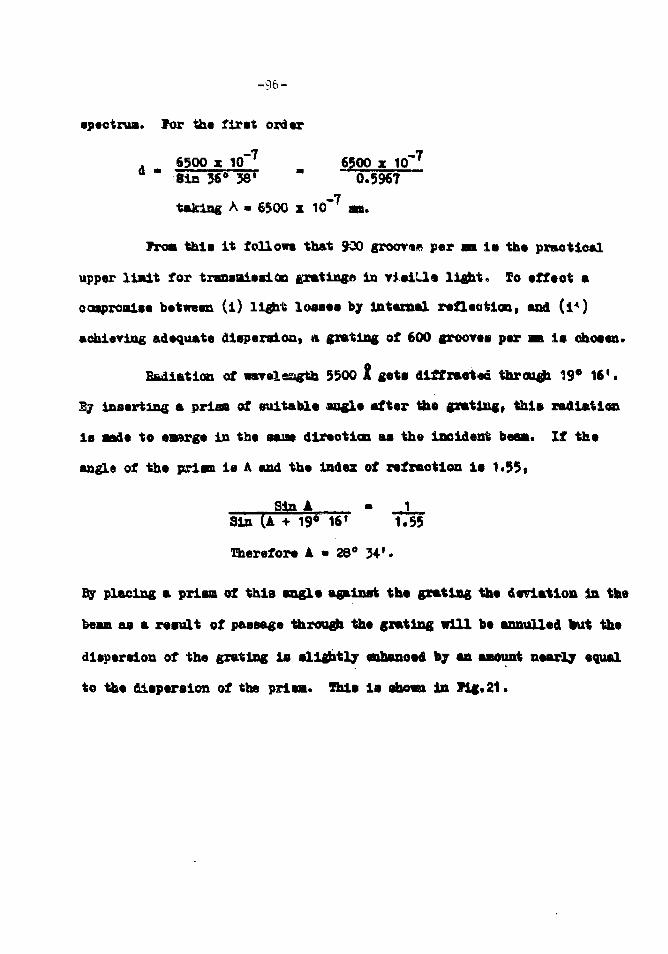
-96-
apectrua. for the firat order
. 6500 x 10"7 6500 x 10'7
" 8in 36° 381 " 0.5967taking A - 6500 x 10~7 am.
Froa this i t follow* that 900 groove par an ia tha praotioal
upper limit for transaission gratinga in r i s i U s l ight, lo tffaot a
ooaproaise batman ( i ) light losses by internal rafltotiaa, and ( i 4 )
aotiieTing adaquate diep«raion, a grating of 600 grooras par BB ia ohoaan.
Badiatic» of waralesaffth 5500 1 gat* diffraotad through 19° 16*.
By inserting a priaa of suitabla angle after tha grating, this radiation
ia aada to emwge in the eaos direction as tha incident bean. If tha
angle of tha prism ia A and tha index of refraction ia 1.55»
Sin A - 1Sin (A + 19° 16' 1.55
Therefore A - 28° 34'.
By placing a priaa of this angle against tha grating tha doviation in tha
beam aa a rasult of passage through tha grating will be annulled But the
dispersion of the grating is slightly enhanced by aa amount nearly equal
to tha dispersion of the prism. Shis is shomi In fig. 21.
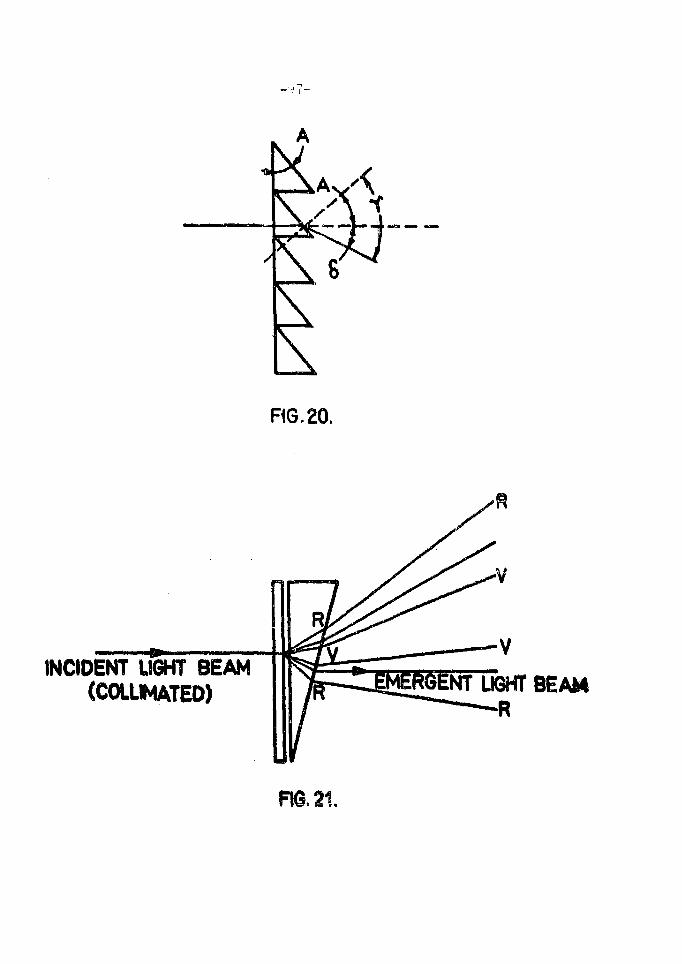
- • - I I -
RG.20.
INCtOENT UGHT BEAM(COLLNATED) .WENT LIGHT BEAM
R
FIG. 21.

Jaaln lategarowtag PaUg ft La—r t s w o
(M.f ,1.x. Marly « 4 1 J , nukla)
faa oomroatioBal Jaada l»t«rfaros*>t«r eonalats of tvo idon
plates of glass. I t ia geaarally saed with tax extern*** scars*
of whit» l ight . Ifc* inatzuMuit. h«.a b«*n found to ba axteSHely «»«ful If
naln< a oolliamtod fc»*> of l ight , then tha ooUiaatod teaai ia obtain©*
froB a white l ight aourcw i t l a M/oosaasy to «%taia e^flat*
la Both beaaa. This varaioD was ttaad aarlier for dots&TSdaln*
aaall Alff«r*no*a ia r«fraotiv« lndioea of two liquida. fhc
Tertica; ia aead with Q*lliaa%vd light froai a las«v scare* smd 1% ia found
to hi uoBftal for taatlag parallcllsa ot wiadovs and othar optical clcstaste*
A high qoflliiy eolliaatlBg l«na i s roqtiirad for this inatr.3s®at. So
iBoroaaa tha ••raatiliigr of tha iasianuMat a doable w@%@ ass^aag^aant i s
a»*4 l* on* of th« hatsia so that a »aekgroa»d of straight .fringes with
varlaVL* sssaratlOB and dlnot ioa O«B 'M» obiad»*d. k fypioal sohwaatie
dlagnra of th« lastraasnt ia ahowa la Tig. 22.
fk is l»t«rf«r*«*t«tr ia sacte—ly assitel la Tsriotis f ie lds of
rasMoraa auoh M aacoijiiMdes, dlffttsicn rtvdien, haat teansfaar twadios
•to. i s addition to owkloal Us i iae of •?tl«&l
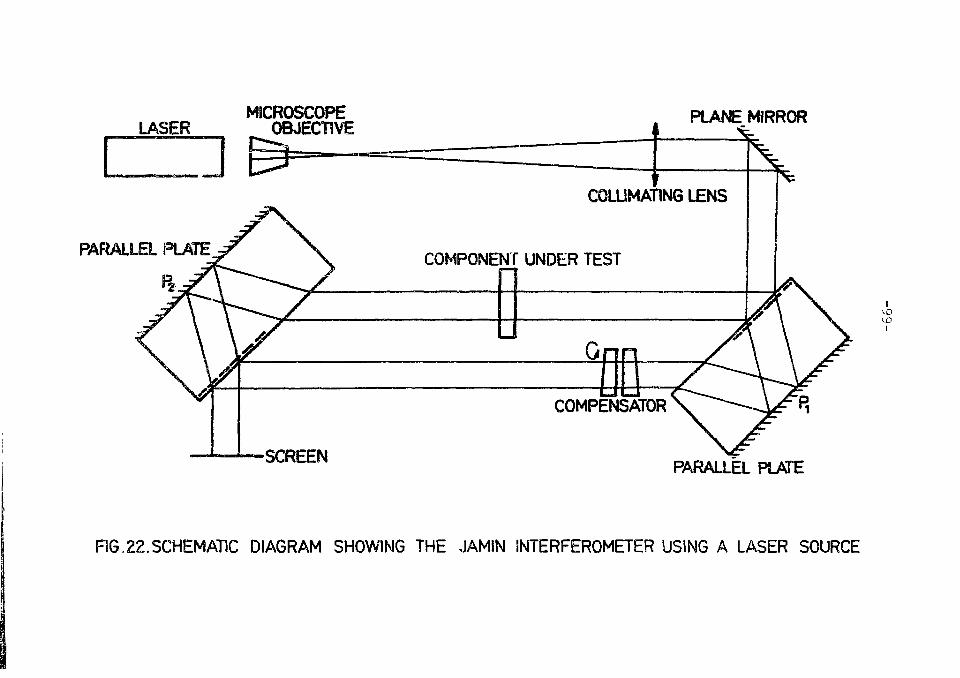
MICROSCOPELASER OBJECTIVE
PARALLEL PLATE
R
•SCREEN
PLANE MIRROR
COLUMATING LENS
COMPONENT UNDER TEST
PARALLEL PLATE
I
F1G.22.SCHEMATIC DIAGRAM SHOWING THE JAMIN INTERFEROMETER USING A LASER SOURCE

m(o)
1. Equipment for the yabrtoatioa oaf Multilayer OpticalThin film Devices..
(l.V.S.H. Apptno)
Multilayer optical thin fUm devices suoh as fabry-F»rot
mirrors, laser mirrors, interference filtwrs ato. ar« aada by depositing
in vacuum a number of thin films of different dielsotrfc materials of
•pacified thicknesses one orar the other on a auitable substrata plat*.
Bach f i l a in suoh a stack should be very uniform and to fabricate each
spectrally good quality thin film devices a big coating plant of atleaat
19" chamber diameter and a good optical film thickness monitor are
necessary.
A vacuum coating plant of 19" chamber with different accessories
i s designed and will be fabricated in the division. Some major parts for
this unit are ready for assembly and some more acceasories fcr this unit
are designed and the detailed working drawing* for the following parts
&re aadet 1) Beam guide light tube for thickness monitor; 2} Rotating
substrate holder; 3/ Baffle plate with ahuttar assembly; 4) Val'y.a base
plates; 5) Substrate heater» 6) Gauge adoptert and 7) MultifiXament turret.
for ffloniteslng the thickness of ttiin films aceureboly feai'Sig
deposition an optical monitor la design*d and the optical eet up of this
unit ia fabrioatei, f i t isd and aligned to the exist lag 12* rmavaw. coating
plant. Shis assembly generates a modulated light beam cad a gold* tub*
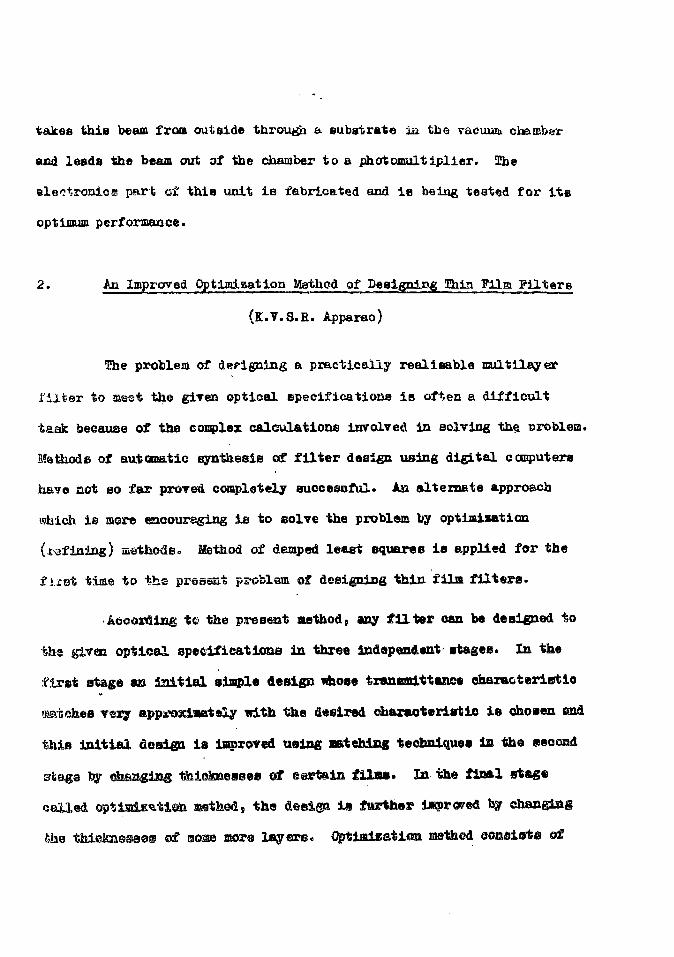
takes this beam from outside through a substrate ia the vacuua. chamber
aud leads the beam out of the chamber to a phot©multiplier. The
electronic® part of this unit iB fabricated and is being tested for its
optimum performance.
2. An Improved Optlmjgation Method of Designing Thin Film Filters
(E.V.S.E. Apparao)
The problem of def-igning a practically realisable multilayer
f i l ter to saeet the given optical specifications i s often a difficult
task because of the complex calculations involved In solving the problem.
Methods of automatic synthesis of f i l t er design using digital cemputere
have not so fax proved completely successful. Asa alternate approach
which is more encouraging Is to solve the problem by optimisation
(.Tafiaing) methods. Method of damped least squares i s applied for the
first time to the prsssct problem of designing this, film f i l ters .
Aooordlng to the present method, any f i l t e r oan be designed to
the givm optical specifications in three indapenfitnt stages. In the
first stage an t s i t i a l simple design ufaose tranemittanc* eharacterietio
•mtehes very ftppsrosimtsiv with the desired chaxaoteristic i s chosen end
this in i t ia l desigu i s improved using matching techniques In the eeccsrad
shags by @haBgis& thieSaaesBus of eertsin f i l o s . In tha final stage
oalled optisiiE«itie& method, the desi®a la frarthes? 4J )rw®a by ehanglag
feha tisl@kn@@s0i of soae more layers. Optimisation mathod oon*iiote of
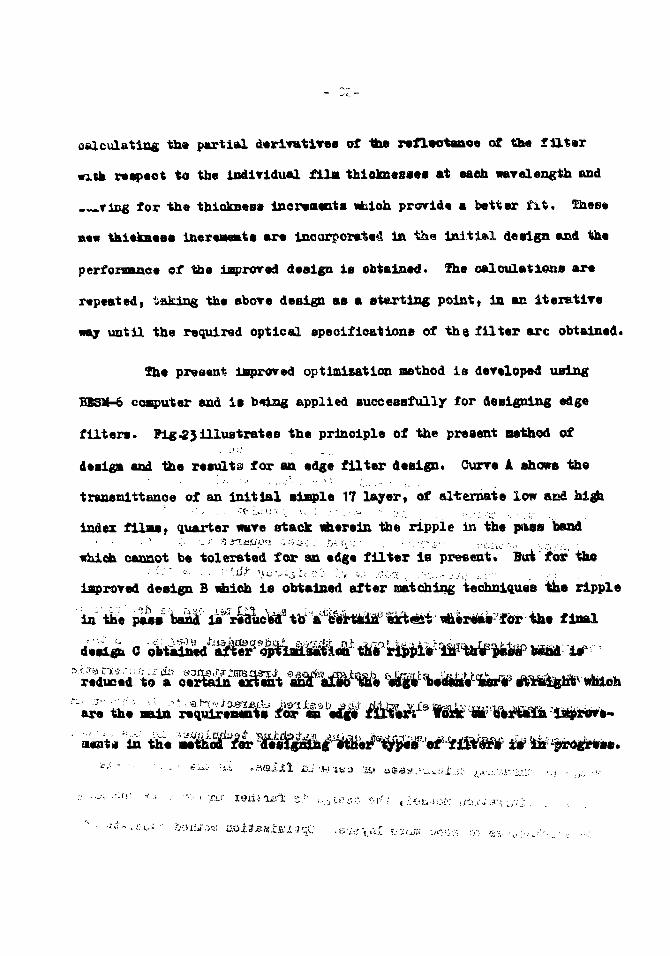
calculating the partial derivatives of 1he reflectance of the f i l t er
wits, respect to th« individual f l la thioknessea at each wavelength and
ring for the thickness increments itiioh provide a better f i t . ThtsB*
new thieknese inereaeats axa incorporated In the init ial dealgn an* tha
performance of tha improved design ia obtained* the calculations are
repeatedi taking the above design aa a starting point, In an iteratire
H J until the required optical specifications of the f i l ter arc obtained•
The present improved optimisation method i s developed using
EBSM-6 computer and ia b«ing applied successfully for designing edge
f i l ters . Pig £3 illustrates the principle of the present oethod of
desiga and the results for an edge f i l ter design. Curre A shows the
transmittanoe of an ini t ia l simple 17 layer, of alternate low and high
index f i l a s , quarter rare stack wherein the ripple in the pitas band
vhieh cannot be tolerated for aa edge f i l t er i s present* Bat for th»
improved design B idiioh i s obtained after matching techniques the ripple
in the pwa band is riaWedHb a ce^^ final
dealgu 0 obt.ln*d e ^
r.d^.d to » c.rtain extent an d al.o the *i«. b.<»«, Wr*
"are' the main r^q.JLr.^t. tor «* * . • f i l t er . WoA «a
in th. '^^tHr "^ffil^im^W&'^mm i. in proe™..

TS80
350 450 550WAVELENGTH IN
A<
B<
c<
/ START WITH A
S. SIMPLE DESIGN
/ IMPROVE THE
DESIGN USING
N. MATCHING TECHNIQUES
/ IMPROVE THE
DESIGN FURTHER USING
\WTIMIZATION METHOD
650METHOD OF DESIGN
F5G.23. PRINCIPLE OF THE METHOD OF DESliN & THE TRANSMITTANCEOF THE EDGE FILTER DESIGNS DESCRIBED IN TABLE ! .
(A1, INITIAL DESIGN, B: IMPROVED DESIOH, C:FINAL DESIOH^
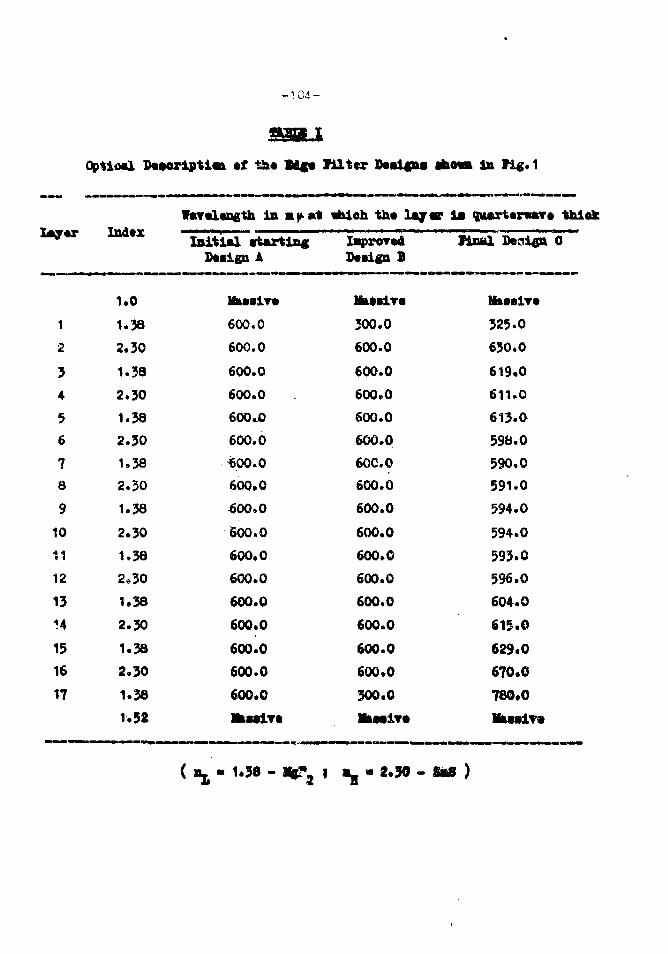
- 1 0 4 -
Optioal Ifeacriptim »f the Uf« W t t r Daaiffts showi la f l« . 1
1
2
34
56
78
9
to4 1V •
12
13
14
15
16
17
Xndtx
1.0
1.38
2.30
1.38
2.30
1.38
2.30
1.38
2.30
1.38
2.30
1.38
2,30
1.38
2.30
1.38
2.30
1.38
1.52
Wartlcngth in apKt \
Initial starting
Muair.
600.0600.0
600.0600.0600.0
600.0*OQ.O
600.0
600.0
600.0
600.0
600.0
600.0
600.0
600.0
600.0
600.0
tfileh th* lay
ImprovedDcaign B
M»*.iT.
300.0600.0
600.0600.0
600.0600.0600,0600.0
600.0
600.0600.0600.0
600.0
600.0
600.0600.0
300.0llM.iT.
V i s quartern*?* to:
final Design 0
Ihaair.
325.0
630.0
619.0611.0613.0598.0590.0591.0594.0
594.0593.0596.0
604.0
615.0
629.0
67O.G
780.0HUMiT*
- 1.38 - I »g - 2.30 - SaS )
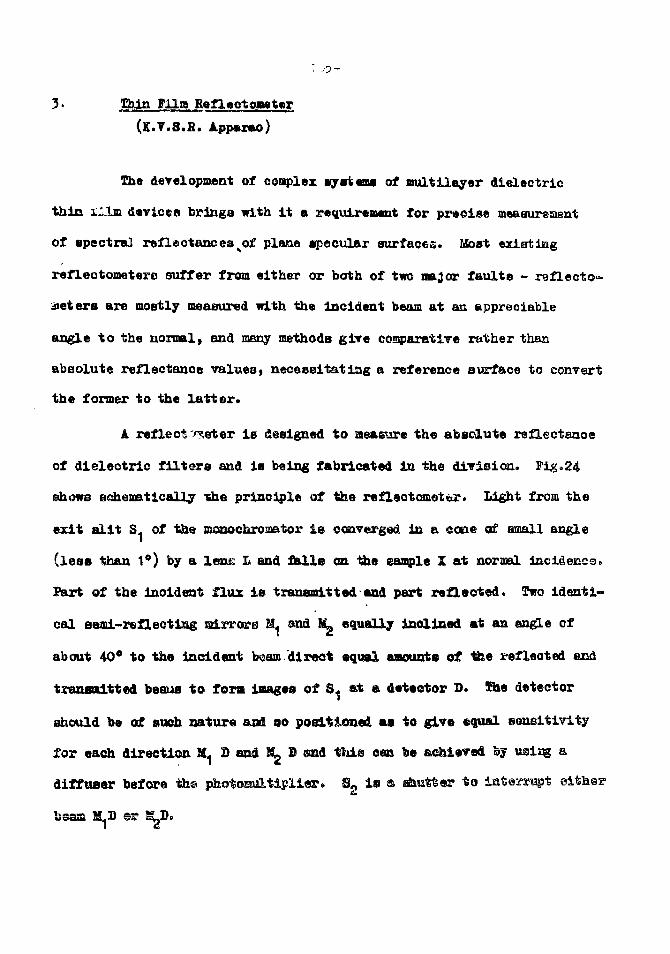
3- Thin Pila RaflaotoiMtwr(K.Y.S.H. A.pp»rao)
The development of complex systems of multilayer dielectric
thin Him devices brings with i t a requirement for precise measurement
of spectra] reflectancesso£ plane specular surfaces. Most existing
reflectometera suffer from either or berth of two major faults - re fleet o-
jietera are mostly measured with the Incident beam at an appreciable
angle to the normal, and many methods give comparative rather than
absolute reflectance valuesf neceaeitat lag a reference surface to convart
the former to the lat ter .
A reflect'^-eter ie designed to measure the absolute reflectance
of dielectric f i l ters and i s being fabricated in the division. Fig.24
shows schematically *he principle of the reflectometei?. Light from the
exit s l i t S. of the monochrosaator i s converged in a cone ef small angle
( less than 1°) by a lent: L and fa l l s an the sample 2 at normal incidence>
Part of the incident flux i s transmitted and part reflected. Two identi-
cal semi-reflecting mirror® £L and ^ equally inclined at an angle of
about 40° to the incident beam direct equal amounts of tfee refloated and
transmitted beaus to fora images of S« &t a detector D< She detector
should be of such nature and oo positioned as to give equal sensitivity
for each direction M1 B end B D m& this can be achieved vj uaiag a
diffuaer before fe© pbotooultiplier* S« i s a Aatlar to iaterrupt ©ither
bsasa H.B ©r ^D.
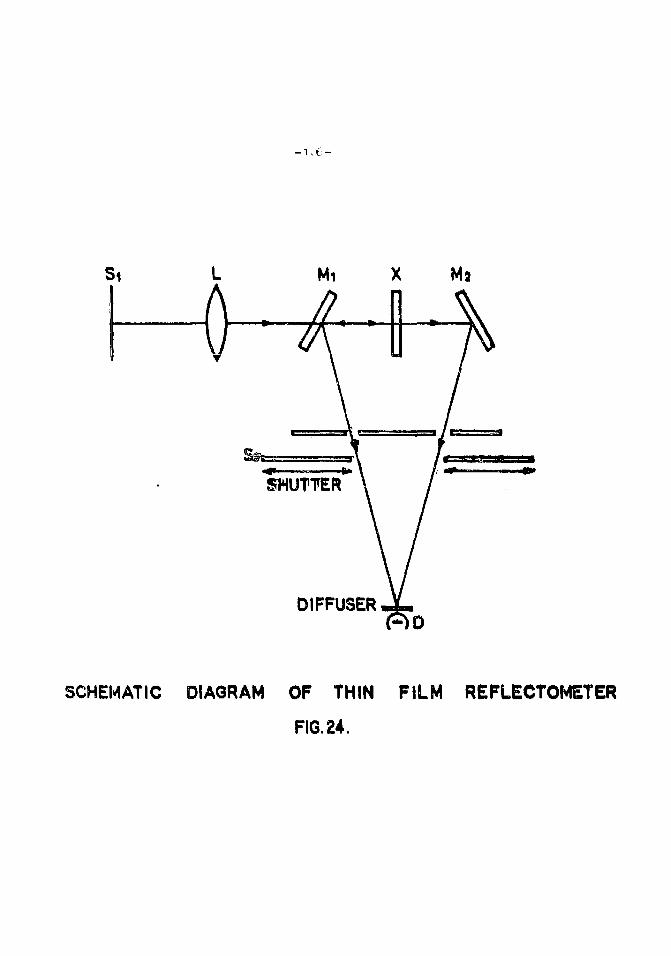
-1 > t -
DIFFUSER
SCHEMATIC DIAGRAM OF THIN FILM REFLECTOMETER
FIG. 24.
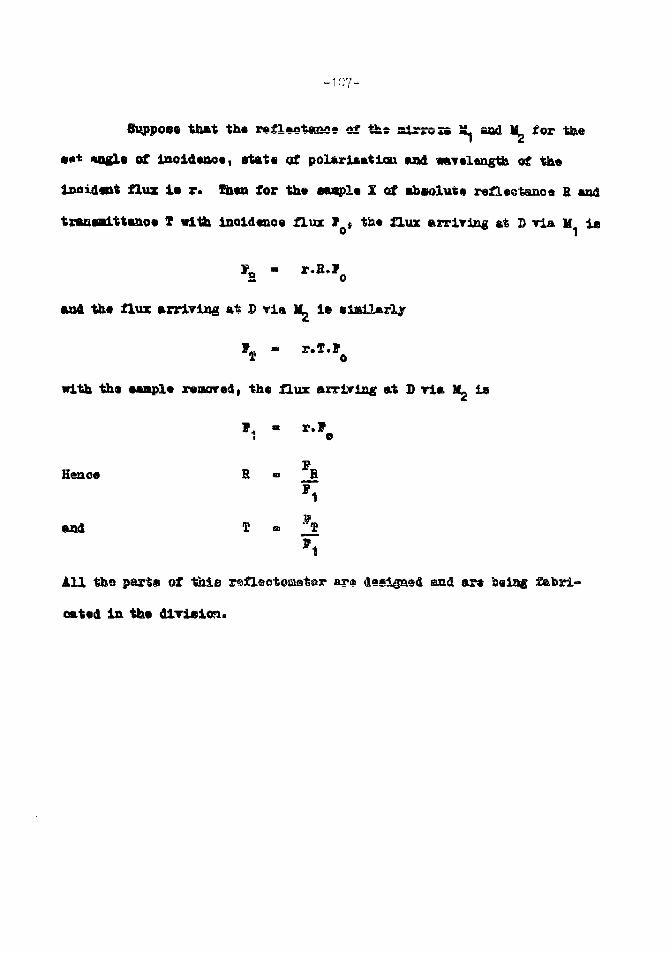
-107-
8upj>os« that the t+flmata&s* of tht sirrcss 5L and M_ for ttee
•#t «ogl« of inoldano*, state of polarisation and mralwigth of th«
l»aid«nt flux i« r. Xb«n for th« aaapl* X of abcolut* refl«etaao« B and
txttnialttaao* T with lnold«uo« flux ft tht flux azriTlug at D via H i s
¥H - *.B.f0
and th« flux arrirlog at 2) Tia ML le
o
with th» sanpl* rsoarsd, the flux arriving at D ria M_ is
»1 " ****
Eenca H « H
All ths paxtn of this r@flsotemat©r a?a d«sigasd end ar* beiag fabri-
oatad In th«
- 1 0 8 -
IV.
The service electronics group, 1A addition to doing the regular
aaintenance of a l l electronic equipments in the division, also oarries out
the fabrication of the eleotronlo instrunents required by the various groups.
During this period, one signal amplifier, reference amplifier and
a phase sensitive reotifler for the Infrared isotopic analyser hare been
fabricated. The voltage gain of th« signal amplifier i s 2500. The noise
referred to the input i s 35 micro volts, further tests on the linearity,
stability etc. are in progress*
Two Zener stabilised power supplies capable of giving 25 na at
4.5 d.c. with 1 H7 P.P.ripple for Jaoophones have been fabricated.
Cue higher voltage d.c. power supply capable of giving 5 to 15 H*
around 5600 V d.c. to excite He-Be lasef has seen fabricated. It gives an
open circuit voltage of 6600 V d.c. for the Initiation of the discharge.
Maintenance and servicing of a l l the existing electronic equip-
ments in the division have also been done throughout the year.

09-
APHMDII i
PARflOIPATIOM 18 SYMPOSIA, OGBTEBBBUES AID SfTKHB SOHOOXS
1* A review of the E A D t o t i r i t l a s of the divis ion was held la
January 1974 In which senior soientlorts of the division, presented the
Eesearoh and Berelopaeat work being carried out In t h e i r respective f i e l d s .
2 . Dr. ff.A* lar&siahsai delirered a aeries of lecture* a t the
Marathawada University, Auraogabad.
3 . Dr. V.B. Xartha attended the Tarkahop on 8peotrophotoa»tiyB,
Indian Chemical Sooiety s Bombay Eranoh, Deoember 1973t and fl&T» a talk
on 'Basic Principles of Absorption Speetrophotoastry*.
4 . Dr. t .B . Eartha g»T« two lectures on Basra Soattering and Kstion
of Molecules In Condensed Systems, t o the partiolpanta In the Course on
'lAsers and Light Scattering' , Buolear Ehyaioa. DiTision, BARO, July 1973«
5* Dr. V.A. Job gars a seminar t o tits Cfaealeal Ibysles Group at the
T*ta Inst i tute of ftrndaamintai Besearoh, (Ostobtr '73) en 'High Hesclutlca
SLactronlo Spectra of Polyatoaio Molecules'.
6. Dr. P. Baoakoteswara Rao gare one lecture on "OoaBmloation with
Ixtra lerr iatra l OiTHisatlon" at the 'Antiobsolenoe Leotur«s-IXII' f
September 1973*
7. Dr. E.G. Balk and Shri E . I . Ayyar prtscmted « pspe?
"Absorption and fluorescence Spectra of Sareplss s a t SertolttB
acetates" In the Qyaposiua en Qusntua ant Qpte-EUets-oeiCBj,
-11 •>
Deputation
Dr. M.V.H.S. Hurty want on deputation to Institute HaoionaL a*
trophi«±oa Optioa Y Kleotronioa (HAGS), Maxleo, as a Tieiting Professor
for a period of 4 month*, from 4.2.73 to 5.6.73 and to tha BniYvrsity of
Rochester for a pariod of 2& aonths frost 5.10.73 to 14*12*73.
2. Dr. ifah&Tlr Sin^i, who was on deputation to Belgium for training
under the Indo-Belgiua Huclear Co-operation Frograms for 1972-73*
returned to India In lfay 1974.
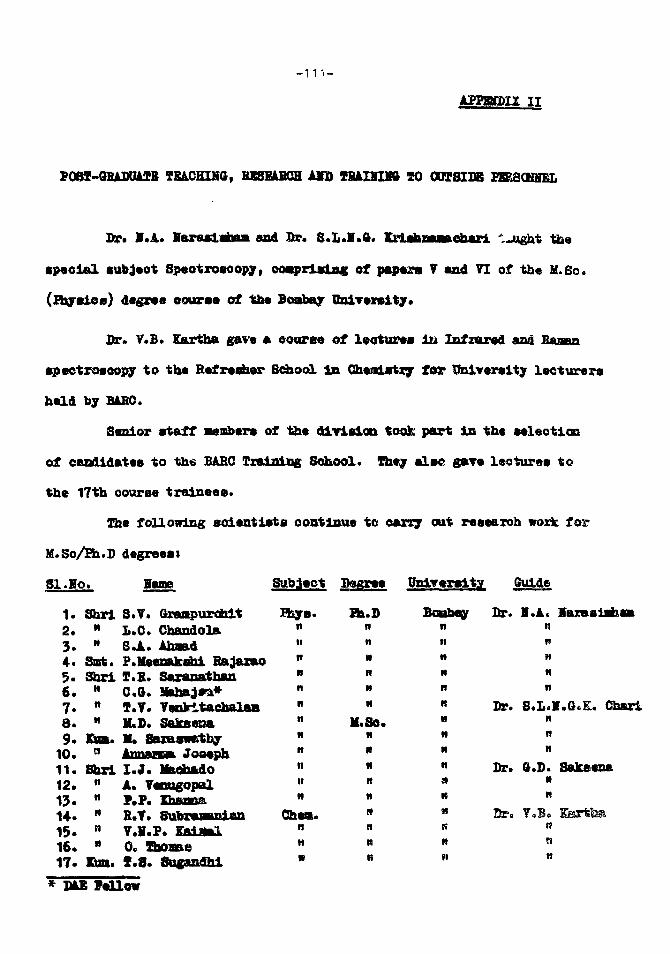
- 1 1 1 -
APFBHDIZ II
P08T-GHAD04IE TEACHING, BB8BABGH AID THAUTMB SO OUTSIDE
Dr. V.A. laraalahaa and Br. S .L.I .0 , Kpiehnaaaohari "jught the
specia l subject Speotroaoopy, cojaprlslng of paper* 7 and VI of the M.So.
( A y a i e s ) degree course of the Boabay unirersity.
Dr. V.B. Kartha gave a course of leaturee in Infzared and Banna
apeetrosoopy t o the Befresaer School In Chenlatxy fox* UniTereity lecturers
held by BiRO.
Senior s ta f f members of the dlrlaton took: part in the seleot loa
of candidates to the EABC Training School. They e l s e gare lectures t o
the 17th course tra inees .
The following s c i e n t i s t s oontlzme to carry out research vork for
M.Sc/Ph.D degreesi
81.Ho. garo U t S
1. Shrl S.V. Graapurohit2* " L.O. Chandolfl.3 . " S.A. Ahoad4. Sot. P.Meenakshi Eajarao5. Shrl I .E . Saranathan6. H CO. !hha3*a*7. n I . ? . TenVltachalaB8 . M M.D. Sakseaa9 . fin. M. SaxaanKthy
10. n anuanaa Joseph11. Shri I . J . Maohado12. n A. Tanugopal13. M P.P. Khsma14. " B . T . Subrananlan15. H T.I .P. EAiial16. 8 0. Thome17. KUn. T.S. Sogandnl
Rsys.nii
nnnit
it
H
nnn
ft
nm
Ph.Dnn•R
H
•1
M.So.N
R
R
H
R
nn
BoBbeynnnM
nK
II
H
R
n
m
«
Dr. K.A. laxasiabaannH
H
It
Dr. S.Lal.G-E. CharinnH
Dr. O.D. SaJcaesa
Br. T0B. Bffttia
a
DAE fel low
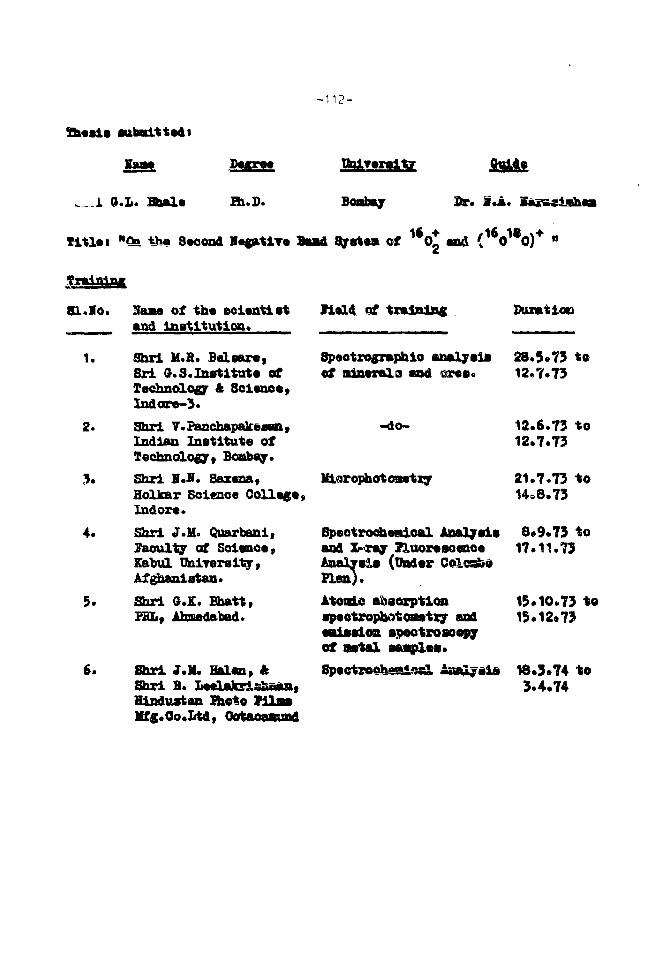
- 1 1 2 -
sutaatLttedt
Essa.
9.L. Bnale HuD.
UolTcrai.tr
Boofaay Sir. f *a.
l l t l t l nCn thm Second legfttlTe of
81.Ho.
1.
2.
6.
3Taaa of th« eeisutlatand Institution*
Shrl M.8. fiftLser«tSri a.S.Instltut* ofTechnology ft 3cl«ne*»Indare-3*Shrl V« ganehapaltewn»Indian Institute ofTechnology» Boabsy.Shrl 9.H. Saxena,Holkar Scleaoe College,Indore.Sari J.H. Quarbeni,faculty of Salenoe,Kabul UnlToraiiar,Afghanistan.
Shri O.K. EbattfFBI, ihmedabed.
Shri J.M. Halsn,Shrl B. fHindustan Ihoto TllasMfg.Oo.Iitd, Ootac
field of training Suxmtion
Spaotrosraphlo analysis 28*9c73 toof mineralo and ©*•*•. 12.7.73
12.6.73 to12.7.73
21.7.73 to14=8.73
Miarophotosstxy
Bpeotrocheaioal AaaOjsls 8*9.73 toand t r a y ZLuorasoence 17.11.73Analjais (UnderPisa).•toaie absorptionspeotrophotoaatty andsBlssloit apootroBoepyof astal sa«plos.8peotroohesl^sl
15.10.73 to15.12.73
18.3.74 to3.4.74
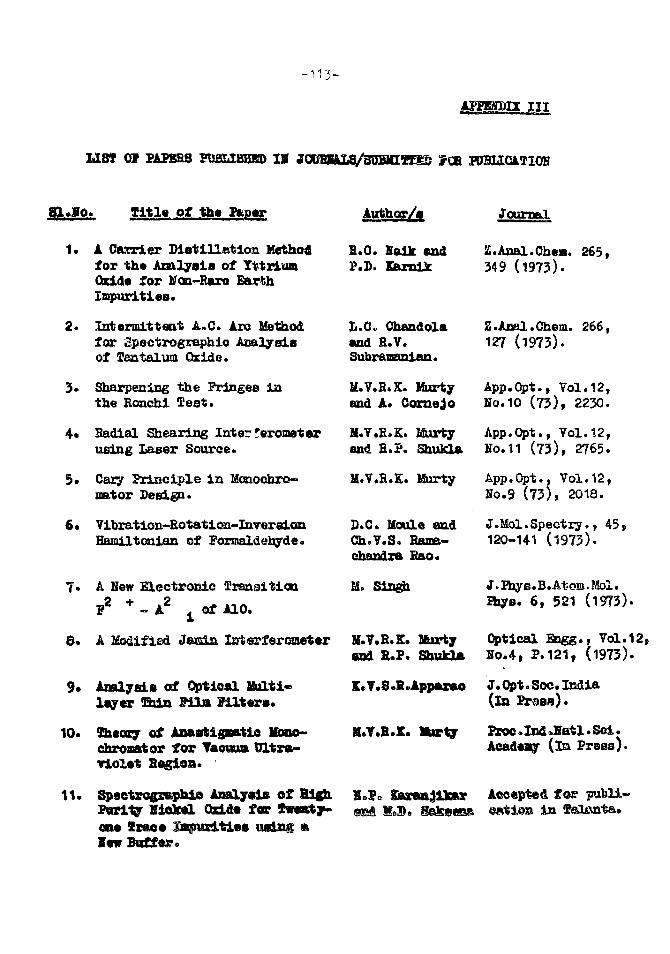
- 1 1 3 -
m
118t OOP PAPBBS POagJSHED I I SOdEKLS/SUSMlTIMt ?CR PUBHCATIOH
T i t l e o f the Paper Author/a Journal
1. A Carrier Distillation Methodfor th* Amlyaia of YttriumOxide for Kon-Raro EarfchImpurities*
2. Intermittent A.C. Aro Methodfor Spoctrogxaphio Analysisof Tantalum Oxide.
3» Sharpening the Fringes lathe Bonchl l e s t .
4* Radial Shearing Interferometerusing Laser Source.
5. Cary Principle in Monoehro-rator Design.
6. Yibration-Eotation-InvereiortHamiltonian of Formaldehyde •
7. A New Electronic Transit-ion
F2 + - A2 t of A10.
3* A Modified Jessin Iirlerferoseter
9. AmlyeiB of Optical Bolti-lay«r Ihin Pilm Filter*.
10. Iheory of AnaartigsBatia Kono-ehroaator for Yao«um Ultra-
H.O. Balk and1\V. Karnii
Ii.O. Chandolaand R.V.Subramanian.
M.V.B.K. I&irtyend A. Come j o
M.T.B.K. Murtyand B.f. Shukla
M.V.R.Ec Murty
D.C. Moule andCh.Y.S. Bama-chandra Rao.
M, Singh
M.V.B.K. Ifeirty Optical & g g . , Vol.12,and B.P. ShuklA No.4, P.121, (1973).
SS.Anal.Ohes. 265,349 (1973).
Z.Anal.Chem. 266,127 (1973).
App.Opt., Vol.12,No.10 (73) , 2230.
App.Opt., Vol.12,No.11 (73) , 2765.
App.Opt.. Vol.12,No.9 (73) , 2018.
J.Mol.Spectry., 45120-141 (1973).
J. Fhye.B.At-om. Mol.Shys. 6, 521 (1973).
K.V.ScB.Apparao
M.T.BcE.
J. Opt o Soc. India( in Prass).
Proc. Ind »ffatl. Sol.Academy ( l a Prase).
11. Spsctrogrophio Asalysls ofParity fiiok«l Oad.d« for fvtaft y-oce Sxaoe XapislticsI«w Buffar*
£u«BJlk»r Accepted f ©r®«ti©B In faieuata.
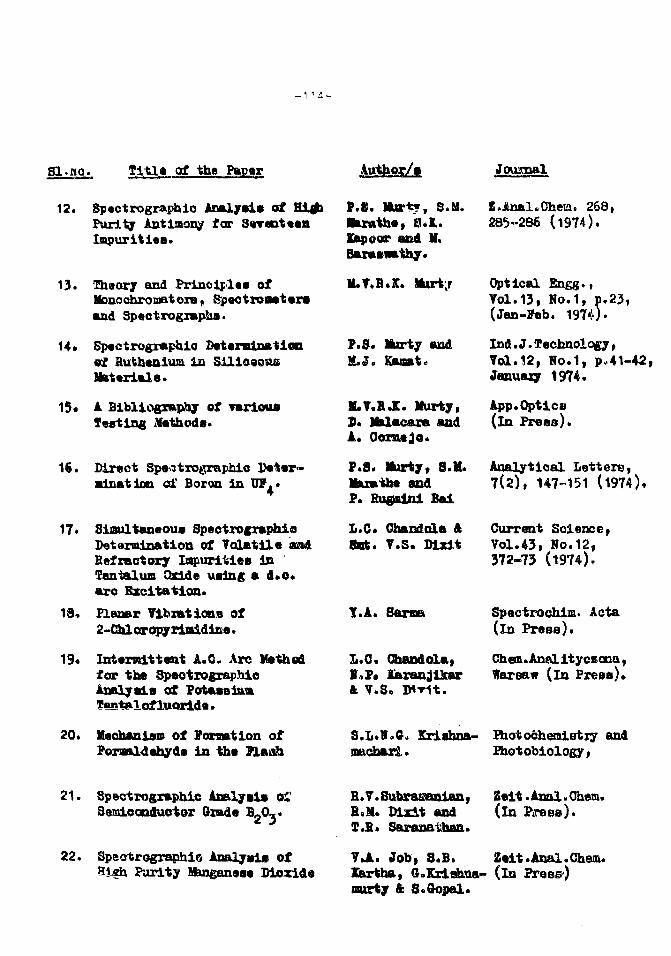
- 1 •• i -
81.110. Title of the Paper Author/a Journal
12. 8pectrographio Analysis of HitflPurity Antimony far SwrsnteenImpurities.
13. Theory and Principles ofHonochroaatorSfi Spectrometersand 3pectrogiap2is.
14* Spectrographio Determination«f Ruthenium in SUioeoaoMaterials.
15* A Bibliography of variousTesting Methods.
16. Direct Speatrographio Defrsr-•Inatioo d' Boron in .*
17. SiEsultaneous Spec-fcroffraphioDetarmlnation of TalatU« «adBsfnactory IapuriticB InTantalum Qslde using a d.o.aro Excitation.
18* Planar Yitorations of2-Chloropyrlaidlii«.
19. Intermittent A.C. Arc Methodfor the SpeotrographioAnalyals of PotassiumIantaiofluoride.
20. Meohftniaa? of Pernation ofPoroaldehyde in the Plaab
t.t. Mur1?T S-M.•aratha, 8.1.lap oar and M.Baranmthy.
M.T.H.X. \kirtj
P.S. lacrty nod
Z.ioal.Ohem. 268,885-286 (1974).
Optical Engg.«Vol.13i No.1, p.23,(Jan-Fab. 1974).
Ind.J-Technology tTol.12, No.1, p 41-42,January 1974.
App.OptiCB(in Frees).
Analytical Letters,7(2), 147-151 (1974),
Current Science,Vol.43, No.12,372-73 (1974).
Spectrochim. Acta(in Press).
Chan. Anal ityceona,Warsaw (in Press)*
S.L*H*ff« Krishna- Photochemistry andgnchari• P^ot obiology,
H.T.R.E. Murty,B. Ihlacara andA. Ooraejo.
P.S. Murty, 8.M.Haxmthe andP. Rugaini Bai
I.C. Chandola ASot. 7.S. Dizit
Y.A. Sarma
L.O. Ohaodola,B,,P, Karanjlkark V.S.
21. Spectrographic AnalysisSemiconductor Grade
22. Spectrographio Analy»i» ofHi5h Purity Manganese Dioxide
Zeit.Anal.Cham.(in
B.V.SubraKaalan,E.M. Dizit andT.B. Saranathaa.
VJl. Job, S.B. Zeit.Anal.Chem.Eartha, S.Xrishna- (in Press)ourty & S.Qopel.

BABC HEPQBT8 PBOKPOBP
81.Ho. T i t l e of the Beport
1. A Hew Oarrier for BpeotrographioDetermination of S i lver , Moly-bdenum and Calcium in Uranium.
2 . Spectrographio Determination ©ff r e e s Impurit ies i s MagnesiumMetal.
3« Annual Progress Report for1972-73.
4* X-ray Sluotreacenoe Determinationof Trace Impurit lea Hbt ? e , Ifaand Tl i n Hi# i Purity TaQ0_ and
5 , X-rey f luorceoence Analyeis ofLow Alloy S t e e l s f or Ho, Cu, f i ,Cr, Ma raid Y.
6* A Hornal Coordinate AxsalyEis ofMethyl Aatine end i t s Deuter&tedSpeelee*
7 . Speotrographlc AnalysiB of HighPurity Antimony for SeventeenTrace I o p u r i t i e a .
8* Spectrographio Setexmination ofBare Earths I n ^ u r i t i e s InPurif ied Samarium Cteid*.
9 . Determinatioii of Boroe i n Cnleinmfluoride by Carrier DistillationMethod.
10. Spectrographio Analyst® of HighPurity Manganese Dioxide.
Author/a
B.H. D i x i t , B.V.Subraaanian, P.P.Xhanoa and 3 .B .SindgUcar.
0 . KriBhnamurty,Kum. She i la Copaland S. Kriahnan
V.B. Xartha andH.A. laraaiaham
B.M. Agruvml andand P.P. Ehannae
-do-
G.S. Ghodgaoakar
P. Sreeraoamurty,S.M. Iferethe,3.E. Xapoor andE* Saraewathy.
S.7. Graiqpurahitft 7.K.P.
3 .7 . Grampurohit& Suit. Y.S. Dixit
Beport Ho.
BABC-664
BABC-669
EABC-684
BARC-698
BARC-699
BABC-7OO
BAHG-680
BABC-710
BABC-714
surfej and Rum. S.(Jopal.
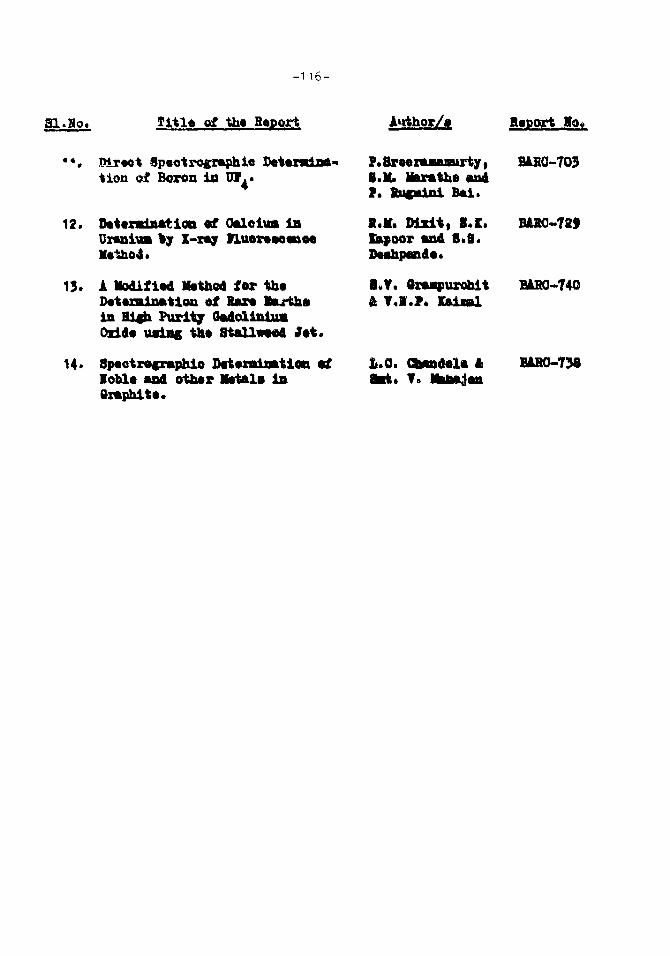
- 1 1 6 -
Sl.Ho. f i t l< of tht H«port Author/a Jto«_
**. Mr«ot Spsotrographio Detor«inft-tion of Boron In BI ••
12. B«ttndn*tioa «f Oalciua Inby I-xoy n u « r t N « i M
13. 1 Modified tftthsd f»r th*DttuBinfttioa of Bw«in High Purity foftolinlu*Orld* uaiag tht 8taU«*od J«t .
U . Si»otr»cr«phio Dttcndnation ttIobl« and otbsr Ibtala In
P. 8r«ez«aaaurty tg.M. liuMthe andf. luc&ini B*i.
X.M. D l x i t , 8 . 1 .bpoor and 8*8*Daahpcnda.
8.Y. taaapurotaitSt f , 1 . 7 . Eaiwl
L.O. Gfemdola ftT. Ifafeftdaa
BARO-703
BAS0-T29
BARO-740
BtitO-738

-117-
Bre«&-up of Sex-riot isaljtic t*s iht yta* 1973
~- SSL S££rE.A.B.O
1* Analytical Chemistry Division
2. Atosde fuels DiYiadLos
3* Centre! Woricehop*
4. Oheoietsy Dirieioa
5. Chemical Ingin8«rifig DiTisioa
6. Mrisicn of Badiologioal Pr-ot«eti«a
7* Health fbyeies Diriaicn
8. Heavy latex* Bivieion
9* Isotope Division
10* Mstellursr Bivisioa
11. Optp-Sl«etroolCB Section
12. Bt&cter Ssjgiaeerisg BlTlsiea
13. Heaotor Opcmtlona Mfision
14. Sedmical Bsyeioa Divisiaa
15. Uzmnitra Sstal Pl*mt
16. Variable Kaergj Ojol0tr®B
Bepartawnt of Atoialo
1?f Atoffii«
13o loaiaa Bur®19« Power Pro3»ctB20. Beaoter EeB<s&?ch C(Bits« (%BSB B?©|set) 12
3aS67
2
394
310
2
5
37
3
10
1
1
7
e
953
3
1
1IS
16S
2513
10
1484
1594
18
9
87
18
110
13
7
86
59
5078
3
72
130
129
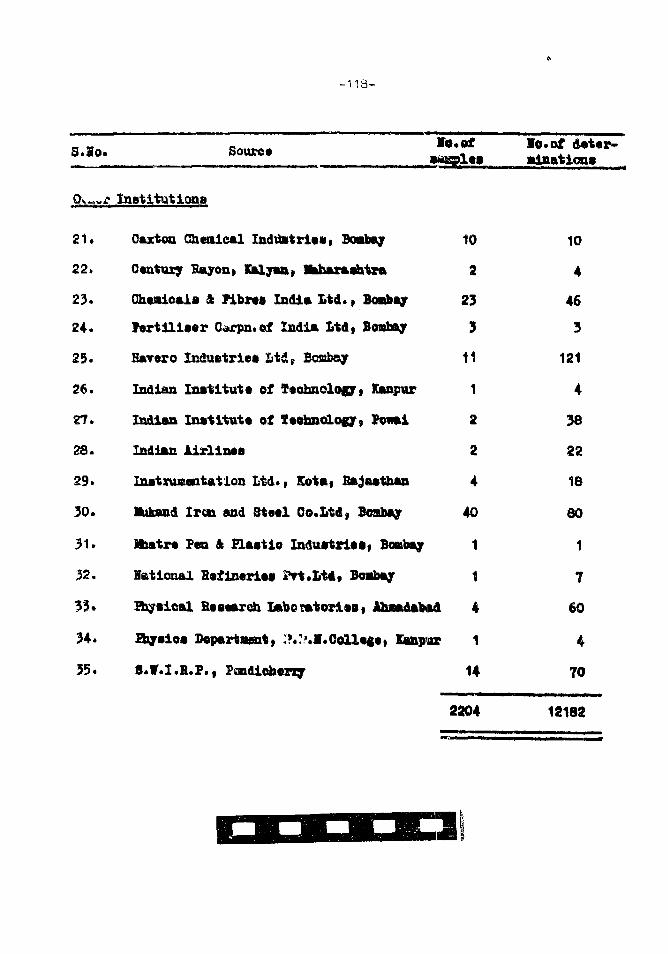
- 1 1 8 -
3.1o.
0* £
21.
22.
23.
24.
25.
26.
ZJ.
28.
29.
30.
31.
32.
33.
34.
35.
Source *••**
Institutions
Oaxton Chemical Industrie*, Bombay
Century Rayon, Kalyaa, Maharashtra
Chemicals 4 Fibres India l t d . , Bombay
fert i l i ser O^rpn.of India l td , Bombay
Barero Industrie* 2JtdE Boafcay
Indian Institute of Technologyt Kanpur
Indian Institute of leohnology, Ponai
Indian Airlines
Instrumentation Ltd* • Sotaf Rajasthan
sukand Iran and Steel Oo.Ltd, Bcabay
Miatre Pen & Hastie Industries, Bonbay
national Refineries SVt.X.ta, Bombay
Physios Departamt, :*.!M.0olla8*) Kanpur
8*V.I.R.P., Pcndicherry
10
2
23
3
11
1
2
2
4
40
1
1
4
1
14
2204
lo.of deter-minations
10
4
46
3
121
4
38
22
18
80
1
7
60
4
70
12182