
Journal of the Serbian Chemical Society Vol 29 1964 (ex ...
448
This is a reproduction of a library book that was digitized by Google as part of an ongoing effort to preserve the information in books and make it universally accessible. http://books.google.com
-
Upload
khangminh22 -
Category
Documents
-
view
1 -
download
0
Transcript of Journal of the Serbian Chemical Society Vol 29 1964 (ex ...

This is a reproduction of a library book that was digitized by Google as part of an ongoing effort to preserve the information in books and make it universally accessible.
http://books.google.com

SRPSKO HEMIJSKO DRUSTVO (BEOGRAD)
BULLETIN
OF THE CHEMICAL
SOCIETY
Belgrade
(Glasnik Hemijskog drustva — Beograd)
Vol. 29, No. 1-2, 1964
Editor:
MILOS MLADENOVlC
Editorial Board:
DBJjC, D., DESPlC. A., DI2DAR, Z., DIM1TRIJEVK5, DJ., KONeAR.DJURDJEVI<;, S.,
LEKO, A., MlLlC, M., MLADENOVlC, M., MIHAILOVlC. M., MlCOVlC. V., RADOSAV-
UEVlC, S., RASAJSKI, S., STEFANOVlC, DJ., TUTUNDZlC, P., HOROV1C, A. CELAP, M.
Published by
SRPSKO HEMIJSKO DRUSTVO (BEOGRAD)
1965.
I .1 i h\. U\ if
UNIVERSITY OF CALIFORNIA

Translated and published for U. S. Department of Commerce and
the National Science Foundation Washington, D. C, by
the NOLIT Publishing House, Terazije 27/11, Belgrade, Yugoslavia
1965
Translated by
DANICA LADJEVAC and ALEKSANDRA STOJILJKOVlC
Edited by
PAUL PIGNON
Printed in Beogradski Graficki Zavod, Belgrade

CONTENTS
R. Popovid, K. Nikolid and Z. Blagojevic:
Contribution to the Coulometric Determination of Sulfonamides 5
M. Jovanovid and R. Babid:
Amperometric Determination of Hydrochloric Acid Using the Bismuth -
-Bismuth Bimetallic Pair 13
V. Rajkovid:
Calibration Curves for the Quantitative X - ray Diffraction Analysis of
Sb2O3, Sb2O4 and Sb by the Internal Standard Method 17
V. Rajkovid:
Sedimentation Influence on Calibration Curves for X - ray Diffraction
Analysis of Some Antimony Compounds (Part I) 23
V. Rajkovid:
Sedimentation Influence on Calibration Curves for X - ray Diffraction
Analysis of Some Antimony Compounds (Part II) 29
V. Rajkovid:
Sedimentation Influence on Calibration Curves for X - ray Diffraction
Analysis of Some Antimony Compounds (Part III) 35
S. Mladenovic and B. Filipovid:
Determination of Small Amounts of Copper in Cadmium 43
B. PodoleSov:
The Oxidative Splitting of Some Fluorenone Derivatives by means of Lead
Tetraacetate 49
M. Rogid:
Reaction of Phenylmagnesium Bromide with Six -and Five - membered
Steroid Lactones 57
V. Canid and T. Stojsavljevid:
Phytin Content of Wheat 71


GLASNIK HEMIJSKOG DRUSTVA, Vol. 29, No. 1—2, 1964, pp. 1—9.
CONTRIBUTION TO THE COULOMETRIC DETERMINATION
OF SULFONAMIDES
by
RADOMIR M. POPOVIC, KOSTA J. NIKOLIC and ZORA T. BLAGOJEVIC
The literature describes numerous methods for the determination
of sulfonamides using the characteristics of the benzene nucleus, and
the presence of the — SO2, SO2NH2 and NH2 groups.
The pharmacopoeial procedures for the determination of
sulfonamides and their salts mainly refer to the reactions of diazo-
tizing, bromizing, neutralization and titration in an anhydrous medium.
In selecting a method for determining sulfonamides we decided
on coulometry because it has certain advantages over the conventional
volumetric titration.
Coulometry is a precise and reliable method especially for deter-
nvnig small quantities. It does not require the preparation of titrimetric
solutions. The reaction rate may be changed and therefore it requires
more accuracy in adding the reagents. The apparatus used is simple
and the procedure is economical of time the reagents.
Sykut(1) performed the coulometric titration of solfonamides with
a solution of potassium bromide in hydrochloric acid at pH 2 — 2.5.
Sulfonamides, as weak organic acids, dissociate in aqueous
solutions giving an H+ ion which can be neutralized with a base.
We made use of this in our experiments.
The mechanism of the reaction is as follows:
H2N—QH4—SO2NHR^(H2N—QH4—SO2N R)H+ ( 1 )
H2N—QHi—SO2NR/H+ + NaOH^(H2N—C6H4SO2— NR)Na+ +
+ H2O (2)
The reaction of the salts obtained is alkaline in aqueous solution,
except for sodium salts of sulfathiourea whose reaction is neutral.
Since the characteristics of the sodium salts of sulfonamides
allow them to be determined acidimetrically we applied coulometric
titration to them too.
The reaction that proceeds in the solution can be expressed as
follows:
2(H2N—C,H4—SO2NR)Na+ + 2H+ + SO* = i±2(H2N—CeH4—
—SO2NR)H+ + Na2SO4 (3)

6
EXPERIMENTAL
Reagents
— Ethanol 96°/0
— Solution of sodium sulfate 1 M (322.21 g sodium sulfate +
+ 10H2O dissolved in water and made up to one 1000 ml with
water).
— Thymolphthalein (i):(0.3g dissolved in 100ml of 96°/0
ethanol).
—m-Nitrophenol (i):(0.3g dissolved in 100 ml of water).
— Methyl-red (i):(0.1g dissolved in 100 ml of 70% ethanol).
— 0.01 N sodium hydroxide solution
— 0.01 N hydrochloric acid solution.
For determining sulfonamides we used pure substances which
are used as raw materials for the production of galenic sulfonamide
drugs.
Apparatus
The apparatus is shown in Fig. 1.
220 V 50~
mA — milliammeter
S —Rectifier
T — Variac
St — Stabilizor
Pr —Switch
R — Potentiometer
E — Electrode
M —Stirrer
\aAaaaI
R
s
Fig. 1.

7
The d.c. was obtained from a selenium pile rectifier, regulation
transformer and stabilizer, connected to the 220 V network. The
regulation transformer and a variable resistor were used to adjust the
voltage and the current. The current range was 1— 100 mA.
A Chavin Arnoux milliammeter measured the current. The
electrodes were of platinum. The cathodic and anodic spaces were
connected via a small flask with a porous bottom covered with a
thin layer of agar-agar and potassium nitrate.
The current flow time was measured with a chronometer to
an accuracy of 0.2".
Procedure
(a) Determination of sulfonamides
A solution of l0mg of sulfonamide is pipetted into the catho
dic space of the flask and 10 ml 1M sodium sulfate an 2 drops of
the corresponding indicator are added. The solution is stirred and
a constant current is passed until color change of the indicator.
A blank run is also made simultaneously (ethanol, sodium
sulfate solution and the indicator).
The quantity of sulfonamide is calculated from the equation
Eit
8= 96.500
where
g= quantity of sulfonamide
E= chemical equivalent
i = current
t= current flow time
b) Determination of sodium salts of sulfonamides
A volume of solution of the sodium salts containing 10 mg
of the salt is pipetted into the anodic space and 10 ml 1 M sodium
sulfate and 2 drops of a corresponding indicator are added. A
constant current is passed through the solution until the indicator
changes in color.
In parallel with the coulometric titrations we determined the
sulfonamides volumetrically with 0.01 N sodium hydroxide. The
sodium salts were titrated with 0.01 N hydrochloric acid. The
indicators used were the same as in the coulumetric titrationis. The
results are shown in tables 1,2,3,4,5,6,7,8 and 9.

TABLE 1
(sulfanilamine)—4,6—dimethylpyrimidine (sulfamethazine) 0.5 g dissolved in
100 ml 96°/0 ethanol. Indicator — thymolphthalein
Pipetted Found by Found by volumetric
mg coulometry, mg method, mg
10 10.02 10.02
10 10.02 10.02
10 10.05 10.03
10 10.05 10.03
10 10.02 10.02
10 10.02 10.02
10 10.05 10.03
12 12.01 12.03
12 12.01 12.03
12 12.01 12.03
TABLE 2
(sulfanilamine)—4—methylpyrimidine (sulfamerazine) 0.200g dissolved in 100
ml of 96°/0 ethanol. Indicator — thymolphthalein.
Pipetted Found by Found by volumetric
mg coulometry, mg method, mg
10 10.02 10.03
10 10.02 10.03
10 9.99 9.99
10 10.02 10.03
10 1002 10.03
10 10.02 9.99
10 9.99 9.99
12 10.03 12.03
12 12.03 12.01
12 11.95 12,01

9
TABLE 3
2 — (sulfanilamine)—thiaiol (sulfathyiazol) 1 g dissolved in 100 ml 96°/0 elhanol.
Indicator — thymolphthalein
Pipetted Found by Found by volumetric
mg coulometry, nig method, mg
10 9.99 10.00
10 9.99 10.00
10 10.03 10.05
10 10.03 10.05
10 9.99 1000
10 10.03 10.05
10 9.99 10.00
15 15.15 15.08
15 15.15 15.08
IS 15.12 15.08
TABLE 4
2 — (sulfanilamine thiourea (sulfathiourea) 0.5 g dissolved in 100 ml 960/0 ethanol
Indicator — m—nitrophenol
Pipeted Found by Found by volumetric
mg coulometry, mg method, mg
10 10.08 10.10
10 10.05 10.03
10 10.08 10.10
10 10.08 10.10
10 10.08 10.10
10 10 08 10.03
10 10.08 10,03
12 12.07 12.07
12 12.07 12.07
12 12.07 12.03

10
TABLE 5
2 — (sulfanilamine)—methylthiazol (sulfazol) I g dissolved in 100 ml 96°/o elhanol.
Indicator — ihymolphihalein
Pipetted Found by Found by volumetric
mg coulometry, mg method, mg
10 10.00 9.99
10 10.00 9.99
10 9.97 9.96
10 10.00 9.99
10 9.97 9.96
10 9.97 9.99
10 10.00 9.99
12 11.97 11.96
12 11.97 11.96
12 11.97 11.90
TABLE 6
3 — (sulfanilamine)—2—phenylpyrazol (sulfaphenazol, Plisulphan) 0.5 g dissolved
in 100 ml 96% ethanol. Indicator — thymolphthalein
Pipetted Found by Found by volumetric
mg coulometry, mg method, mg
10 9.87 9.87
10 9.89 9.90
10 9.89 9.90
10 9.87 9.87
10 9.89 9.90
10 9.89 9.87
12 11.86 11.83
12 11.86 11.87
12 11.86 11.83
10 9.89 9.87

11
TABLE 7
Sulfanilacetamide—sodium (sulfacetamide sodium) 1 g dissolved in 100 ml distilled
water. Indicator — methyl red
Pipetted Found by Found by volumetric
mg coulometry, mg method, mg
10 10.02 9.97
10 10.02 9.97
10 10.05 1002
10 10.02 9.97
10 10.05 10.02
10 10 05 10.02
10 10.02 9.97
12 12.01 12.00
12 12.01 12.00
12 12.01 12.05
TABLE 8
2 — (sulfanilamine—) pyrimidine sodium (sulfadiazine sodium) 1 g dissolved in
100 ml of water. Indicator — methyl red
Pipetted Found by Found by volumetric
mg coulometry, mg method, mg
10 10.01 10.07
10 10.01 10.07
10 9.98 10.01
10 9.98 10.01
10 9.98 10.01
10 9.95 10.01
10 9.95 10.01
12 12.01 12.08
12 12.01 12.08
12 11.98 12.11

12
TABLE 9
2 — (sulfanilamine) — thiazol sodium (sulfathiazol sodium) lg dissolved in 100
ml of water. Indicator — methyl red
Pipetted Found by Found by volumetric
mg coulometry, mg method, mg
10 10.50 10.48
10 10.50 10.48
10 10.50 10.48
10 10.47 10.45
10 10.47 10.45
10 10.47 10.45
10 10.47 10.48
15 15.75 15.72
15 15.72 15.72
15 15.72 15.70
DISCUSSION
The tables show good agreement between the coulometric and
volumetric results. Hence, we may conclude that the presence of the
sulfonamide and its neutralization products does not influence the
electrochemical reactions, and hydrogen and hydroxyl ions are pro
duced with 100 percent current efficiency.
Since the sulfonamides investigated have different dissociation
constants different indicators were used. The indicator was chosen
so that the end-point should be as close to the equivalence point
as possible. The influence of ethanol on dissociation of the indicator
was negligible so that no corrections were necessary.
The results of the coulometric determinations are within the
errors permitted by the Yugoslav Pharmacopeia, so the method may
be recommended for quick precise determination of small quantities
of sulfonamides.
REFERENCES
1. Sykut, K. "Coulometrische Mikrobestimmung von Sulfanilamiden" —
Annales Universitatis Marise Curie Sklodowska (Lublin, Polonia) Section AA,6 :
47, 1951.
1. Skudi, J. "The Iodination of p-Aminobenzenesulfonamide and Some
Symmetrical Azobenzenesulfonamides" — Journal of the American Chemical Society
(Easton, Pa) 59 : 1480, 1937.
3. Pharmacopea Danica — Editio IX — Kobenhavn: Nyt Nordisk Forlag
Arnold Busk, 1948.
GLASNIK HEMTJSKOG DRUSTVA, Vol. 29, No. 1—2, 1964, pp. 11—15.
AMPEROMETRIC DETERMINATION OF HYDROCHLORIC
ACID USING THE BISMUTH- BISMUTH BIMETALLIC PAIR
by
MOMIR S. JOVANOVlC and RADOSLAV V. BABIC
In addition to the glass electrodes which is mainly used in
pH-determinations, antimony and bismuth electrodes are also often
used as indicator electrodes. The amperometric technique with two
identical or two different electrodes, on account of its simplicity
and because it does not require constructing titration curves, is now
acquiring increasing application. Therefore, it is not surprising
that bismuth and antimony have been used in attempts to perform
neutralization titrations using bimetallic pairs of these metals with
other metals. Thus in 1928, Fuoss(1) studied the applicability of
bismuth paired with silver as a bimetallic indicator pair in titrations
of hydrochloric acid with sodium hydroxide. In the same year,
Franke and Willaman(2) investigated the dependence of the EMFof
an antimony-amalgam copper pair on the pH of the solution. A
significant contribution to the knowledge of the behavior of bime
tallic systems in neutralization titrations was recently made by Stock
and Purdy'3), who for the first time applied the system of identical
indicator electrodes (antimony-antimony pair) in alkalimetric titra
tions of some strong and weak acids.
Since there are no reports in the literature on the application
of the bismuth-bismuth bimetallic pair to the neutralization systems,
we have started investigations attempting to use this as the end-point
detecting system in the titration of hydrochloric acid with sodium
hydroxide.
EXPERIMENTAL
Solutions. The titrations were carried out with n/10 solution
of hydrochloric acid, made from concentrated ac'd (p.a. C. Erba).
It was standardized in the usual way by titrating a weighed amount
of anhydrous sodium carbonate (p.a., E. Merck). Thus it was found that
Thci = 3.601 mg/ml.
The standardized acid was used to standardize an n/1 0 sodium
hydroxide (p.a. Chemapol) solution which was to be used as the
titrant. It was found that
TNaOH = 4.034 mg/ml.

14
Apparatus. The indicator electrodes were made by inserting two
rods of metallic bismuth into glass tubes which were as narrow as
possible, so that 1mm of the metal protruded out of the tube. The
electrodes were fixed to the glass tube by means of glue resistent
to water, dilute acids and bases. The bismuth was connected to the
electrical circuit by means of a few drops of mercury.
The elements of the electric circuit were connected as shown
in Fig. 1. By means of a potentiometrically connected resistor, the
voltage from an accumulator battery was adjusted so that the current
between the bismuth electrodes in the solution was 1 5 y.A.
Fig. 1
The titrations were carried out at room temperature in a 100
ml beaker. The solutions were stirred with a magnetic stirrer.
Method. To obtain a current of 1 5 y.A between the electrodes
of the bimetallic pair it is necessary to apply an external voltage
of some hundreds of mV to the electrodes. This voltage depends on

15
the surface area of the electrodes and the dilution of the solution,
and therefore it need not necessarily be measured. The essential
point is that the electrodes cannot be polarized equally by such a
small voltage between them. The electrode which is more polarized
will behave as an indicator electrode and the other as a standard
electrode(4).
Bismuth electrode is known to be a redox electrode and its
responsiveness to changes of the pH of the solution is based on the
reduction of the oxide coating to metallic bismuth in acid media:
Bi(OH)3 + 3H+ + 3e = Bi° + 3HOH
In the titration of acids, with decreasing acidity of the solution,
the possibility of reduction to metallic bismuth decreases so the
current at the electrode falls (cathode). The current drop for a given
increment of the titrant will be greatest just before the titration
end-point. When the end-point is reached, the other electrode will
start functioning as an indicator. With increasing alkalinity of the
solution the anodic oxidation of bismuth to the ionic state will occur,
and this will result in an increase of the anodic current. A qualita
tive graph of the titration curve is shown in Fig. 2.
A|
ml of titrant
Fig. 2
Accordingly, the titration end-point is reached when the galvanometer
deflexion is maximal.
Table 1 shows some results of a series of determinations of
n/10 hydrochloric acid by titrating it with n/10 sodium hydroxide.

16
TABLE 1
No.Taken
mgHCl
Consumed
ml NaOH
Found
mg HQ
Difference
in mg
Error
it
1. 3.601 0.970 3.565 — 0.036 — 1.0
2. 3.601 0.978 3.597 — 0.004 —0.1
3. 10.803 2.950 10.849 + 0.046 + 0.42
4. 10.803 2.920 10.741 — 0.062 — 0.56
5. 18.005 4.940 18.170 + 0.165 —0.9
6. 18.005 4.851 17.839 — 0.166 — 0.9
Only maximal deviations are shown
School of Chemical Engineering Received, May 21st, 1964
Institute of Analytical Chemistry
Beograd
REFERENCES
1. Fuoss, R. M. "Bimetallic Electrodes for Titrations Involving a Change
of Hydrogen—Ion Concentration" — Industrial and Engineering Chemistry, Ana
lytical Edition (New York) 1: 125, 1929.
2. Franke, K. W. and J. J. Willaman. "Measurement of Hydrogen -Ion
Concentrations in the Control of Pulp and Paper Manufacture" — Industrial
and Engineering Chemistry (New York) 20: 87, 1928.
3. Stock, J. T. and W. C. Purdy. "Antimony— Antimony Potentiometric
Titration System" — Chemist Analyst (Phillipsburg 47: 37—38, 1958.
4. Lingane, J. J. Electroanalytical Chemistry — New York: Interscience
Publishers, 1958, p.2.
GLASNIK HEMIJSKOG DRUSTVA, Vol. 29, No. 1—2, 1964, pp. 17—22.
CALIBRATION CURVES FOR THE QUANTITATIVE X—RAY
DIFFRACTION ANALYSIS OF Sb2O3, Sb2O4 AND Sb BY THE
INTERNAL STANDARD METHOD
by
VERA RAJKOVlC
In 1895 Rontgen discovered X-rays, and in 1919 Hull(1) pointed
out the simplicity and advantage of X-ray analysis over the chemical
analysis of powders. However, it was not until 1936 that Clark and
Reynolds(2) adapted the internal standard method, previously used
in optical spectroscopy, for X-ray determination of quartz in
mine dust.
At first a film technique was used. In 1945 the Norelco X-ray
diffraction spectrometer appeared(3), allowing more precise quanti
tative analysis of powder mixtures. Soon after, H. P. Klug. L. E.
Alexander and E. Kummer published a series of papers on the use
of this spectrometer, preparing specimens and the theory of the
method(4-9).
The purpose of the present work was to investigate whether
quantitative X-ray diffraction analysis of antimony compounds is
possible and to plot calibration curves for their determination.
EXPERIMENTAL
Apparatus. — All X-ray measurements were made on an Iso-
debyreflex I apparatus, product of R. Seifert, Hamburg, with a
Berthold goniometer and an automatic recorder. The apparatus worked
under the following conditions:
X-ray tube with two Lindeman windows and a Cu anode.
Voltage 4 OkV, current 20mA.
GM counter type IZ=10, scanning speed 1° O/min
Maximum strength height 1000 counts/sec
Preparation ofspecimens. The specimens were made by Kay's met-
hod(10) modified to be suitable for most of powdered materials(11).
The method consists in dispersing 0.4 g of solid mixture in a certain
quantity of a dispersion medium and spreading a some of this
suspension over a 4 cm2 slide. 0.4 g of solid mixture was dispersed
in 2 ml of the dispersion medium, and 0.08 ml of the suspension
was put on each slide.
2

18
Solid mixtures of all three measured components were prepared
as shown schematically below:
Measured component Solid diluent
\ /
\ /
\ /
Sample Internal standard
(Natural or synthetic) (Etalon)
\ /
\ /
\ /
Elementary mixture Filler
\ /
\ /
\ /
Solid mixture
In the solid mixtures, the same substance amorphous silica di
oxide, was used as the diluent and filler for all three measured com
ponent. The ratio of the filler to the elementary mixture was 1 : 1.
The ratio of the specimen to the internal standard (etalon) varied with
each measured component. It was determined experimentally by
X-rays, and had to be such that the line intensity of the measured
component was at least twice that of the internal standard.
The components were mixed and the mixture homogenized by
stirring three times with ether until complete evaporation in an agate
mortar with a ball pestle.
Dispersion medium. — Microscopic(12) and visual observation
of the sedimentation(13' 14' 15) and the qual'ty of the specimens showed
that a mixture of 8 volumes of iso-amyl acetate, 4 volumes of ethyl
alcohol and 3 volumes of 4% colodium in ether is most suitable
for mixtures containing Sb2 63. Usually a large quantity of this
dispersion medium is made and kept in a bottle tightly stoppered
with a rubber bung.
Determination of I/Is and plotting the calibration curve. — In
the internal standard method the calibration curve is a plot of
///^ against the percentage concentration of the measured compo
nent, where:
/ = maximum intensity diffracted by the measured component
7S = maximum intensity diffracted by the internal standard.
These two values were determined for each specimen and each
concentration of the measured component.
For each measured component ///s was determined for five
concentrations, 20 — 100%, of the measured component. Three
specimens were taken from each mixture and three recordings were
made for each specimen, each on a different place on the specimen.
Hence each I/Is value represents an average of mine measurements.

19
RESULTS AND DISCUSSION
In the solid mixtures from which specimens were made for
plotting calibration curves for Sb2O3, Sb2O4 and Sb, the three
2f
20 -40, 60 80
Fig. 1 — Calibration curve for quantitative determination of Sb2O,
100%
Sb203
substances were combined as measured components and as internal
standards. This was practicable because the main lines of their
diffraction series are close but do not coincide:
Main line for Sb2O3 0Cu= 13.84°
„ „ „ Sb2O4 0Cu= 14.54°
„ „ „ Sb 0Ca= 14.38°.
34|
20 to €6 etf
Fig. 2 — Calibration curve for quantitative determination of Sb2O,
100%
Sb204

20
3
2
1
2* to 60 ab loom
Sb elem.
Fig. 3 — Calibration curve for quantitative determination of Sb
To specimens in which Sb2O3 was the measured component
elementary antimony was added as the internal standard, in the
following proportion:
(Sb2O3 + SiO2):Sb=l : 1.
To specimens in which Sb2O4 was the measured component, Sb2O3
was added as the internal standard in the proportion
(Sb2O4 + SiO2):Sb2O3= 12: 1.
To specimens in which Sb was the measured component, Sb2O3
was added as the internal standard in the proportion
(Sb + SiO2):Sb2O3 = 8 : 1.
The three calibration curves obtained for the solid mixtures
are shown in Fig. 1, 2, and 3. All the curves are linear and can
be used for the quantitative determination of Sb2O3, Sb2O4 and Sb
in powdered material when the concentration of the measured
component is between 20— 100%.
The scattering of the points is smallest for Sb2O3. For Sb2O4
and Sb it is slightly greater does not exceed that for quartz obta
ined by other authors.

REFERENCES
1. Hull, A. W. "A New Method of the Chemical Analysis" — The Journal
of the American Chemical Society (Washington) 41 (7) : 1168,1919.
2. Clark, G. L. and D. H. Reynolds. "Quantitative Analysis of Mine Dusts"
— Industrial and Engineering Chemistry, Analytical Edition (Washington) 8:(1):
36, 1936.
3. Friedeman, H. "Geiger Counter Spectrometer for Industrial Research"
— Electronics (New York) 18 (4) : 132— 137, 1945.
4. Alexander, L. E. and H. P. Klug. "Basic Aspects of X-ray Absorption
in Quantitative Diffraction Analysis of Powder Mixture" — Analytical Chemistry
(Washington) 20(10) : 886—889, 1948.
5. Alexander, L. E., H. P. Klug, and E. Kummer. "Statistical Factors
Affecting the Intensity of X-rays Diffracted by Crystalline Powders" — Journal
of Applied Physics (Lancaster) 19:747—751, 1948.
6. Alexander, L. E., E. Kummer, and H. P. Klug. "Dead Time and Non-
-Linearity Characteristics of the Geiger Countor X-Ray Sectrometer" — Journal
of Applied Physics (Lancaster) 20 : 735—740, 1949.
7. Klug, H. P., L. E. Alexander, and E. Kummer. "Quantitative Analysis
with the X-Ray Spectrometer" — Analytical Chemistry (Washington) 20 (7) : 607—
—609, 1948.
8. Alexander, L. E. and E. Kummer. "X-Ray Diffraction Analysis of
Crystalline Dusts" — Journal of Industrial Hygiene and Toxicology (New York)
30: 166—168, 1948.
9. Klug, H. P. "Quantitative Analysis of Powder Mixtures with Geiger
Counter Spectrometer"— Analytical Chemistry (Washington) 25(1) : 704—708, 1953.
10. Kay, K. "Rapid Quartz Analysis by X-Ray Spectrometry" — American
Industrial Hygiene Association Quaterly, 11 (12) : 185— 194, 1950.
11. Simid, V. M. and V. D. Rajkovid. "Metoda pripremanja primeraka za
kvantitativno odredivanje sadrzaja jedinjenja i minerala metodom rentgenske
difrakcije" (A Method of Preparing Samples for Qualitative Determination of
the Content of Compounds and Minerals by X-Ray Diffraction) — Beograd
(unpublished).
12. Rajkovid, V. D. "Mikroskopsko ispitivanje pojave aglomeracije u
suspenzijama Sb2O, u amilacetatu, etil alkoholu i njihovim smeSama" (Micros
copic Investigation of Agglomeration in suspensions of Sb2O3 in Amyl Acetate,
Ethyl Alcohol and Their Mixtures) — Beograd (In press).
13. Petronid-Rajkovid, V. D. "Sedimentacija u suspenzijama smesa spra-
senih Sb2Oj, Sb, i SiO2 u amilacetatu" (Sedimentation in Mixture Suspensions
of Powdered Sb2Oj, Sb and SiO2 in Amyl Acetate)— Hemijska industrija (Beograd)
15 (11): 2032—2032c, 1961.
14. Petronid-Rajkovid, V. D. "Uticaj kolodijuma na sedimetaciju suspcnzija
Sb2Oj, Sb i SiO2 u amilacetatu" (Effect of Colodium on the Sedimentation of
Sb2Oj, Sb and SiO2 Suspensions in Amyl Acetate) — Hemijska industrija (Beog
rad) 16(1): 121—124, 1962.
15. Petronid-Rajkovid, V. D. "Uticaj Cvrstog razblazivaCa na sedimentaciju
smesa Sb2Oj i Sb suspenzovanih, u amilacetatu, etil alkoholu i njihovim smesama"
(Effect of Solid Diluent on the Sedimentation of Sb2O3 and Sb Mixtures Suspen
ded in Amyl Acetate, Etyl Alcohol and Their Mixtures) Hemijska industrija
(Beograd). In press.


GLASNIK HEMIJSKOG DRUSTVA, Vol. 29, No. 1—2, 1964, pp. 23—28.
SEDIMENTATION INFLUENCE ON CALIBRATION CURVES
FOR X-RAY DIFFRACTION ANALYSIS OF SOME ANTIMONY
COMPOUNDS.
Part I. — INFLUENCE OF QUANTITY QF SUSPENSION PER SPECIMEN
ON THE I h RATIO
by
VERA RAJKOVlC
Many authors0 _4) have investigated the possibility of precise
determination of quartz in mine dust by quantitative X-ray diffrac
tion analysis. The results have been interpreted in different ways.
H. P. Klug and co-authors(66) classified the prevailing methods in
three groups according to the composition and absorption properties
of the tested material:
1 . If the tested material contains n components whose absorp
tion coefficients are equal, direct analysis, i.e. direct determination
of the concentration of one of its components, is possible. In such
cases the concentration is proportional to the diffracted intensity
I. The calibration curve is a straight line.
2. If the mixture contains two components (binary system)
whose absorption coefficients are different, the concentration of
the determined component is not proportional to the diffracted
intensity. Here, calibration curves must be plotted of the dependence
of the ratio 1/(1) 0 on the % concentration of the component deter
mined. I is the X-ray intensity diffracted by the determined component
in the tested material, (/)0 is the intensity diffracted by the pure
determined component.
3. If the mixture contains n components whose absorption
coefficients are different, a given quantity of an internal standard
or etalon substance is added to a sample. Direct analysis is not
possible in this case either, so calibration curves must be plotted
of the dependence of ///, on the % concentration of the determined
compound. Here / is the intensity diffracted by the determined com
pound and I, that diffracted by the internal standard in the same
specimen.
The plotting of calibration curves for quantitative X-ray
analysis of some antimony compounds in powdered material requi
red extensive and varied investigations because a slight change in
one of the conditions in making specimens often caused a change
in the shape and position of the calibration curve.

24
The purpose of this work was to find out the optimal condi
tions for plotting calibration curves for the quantitative determina
tion of antimony trioxide by the internal standard method. To
determine these conditions we made suspensions conta-ning different
volumes of the dispersion medium per 0.4 g of the powdered
material, applied different volumes of the suspension to slides of
the same area, and then observed the changes in ///, ratio and the
shape of the calibration curves.
EXPERIMENTAL
The technique for making synthetic samples, mixtures of sus
pensions and specimens is presented in another paper(7). It is the
same throughout this series of investigations dealing with the
problem of obtaining good calibration curves for the quantitative
determination some antimony compounds in a powdered material
by X-ray diffraction analysis.
X-ray measurements were made with an Isodebyeflex I appa
ratus produced by R. Seifert, Hamburg.
Solid powder mixtures had the following composition:
(Sb2O3 + SiO2) : Sb = 1 : 1 (without filler).
Dispersion medium for making the suspension was obtained
by mixing 8 volumes of isomylacetate, 4 volumes of ethyl alcohol
and 3 volumes of 4% colodium in ether. Usually a large quantity
of the dispersion medium was made and kept in a bottle tightly
stoppered with a rubber bung.
Dilution of suspension: 0.4 g of powdered material per 1—2.5
ml of the dispersion medium.
Quantity of suspension per slide, was the amount of suspension
needed to cover a 4 cm2 slide, made by cutting a microscope slide
in three equal pieces.
Results of X-ray measurements
All investigations were performed with mixtures of the com
position
(Sb2O3 + SiO2):Sb = 1: 1
and concentrations of 20— 100°/0 Sb2O3. Four suspensions were made
from each mixture by dispersing 0.4 g of the powdered material
in 1—2.5 ml of the dispersion medium. Three specimens were made
of each suspension with 0.08 ml and 0.16 ml of the suspension
per slide. Each specimen was X-rayed in three positions on the
holder of a goniometer, so that the ///, ratios ( are averages) of 9
measurements of 3 specimens.
DISCUSSION
The calibration curves in Fig. 1 show the dependence of ///,
on the °/0 concentration of Sb2O3 when the dilution of the suspension
is 0.4 g of powdered material per 1.5 ml of the dispersion medium
and when the specimens are made of 0.08 ml and 0.16 ml of
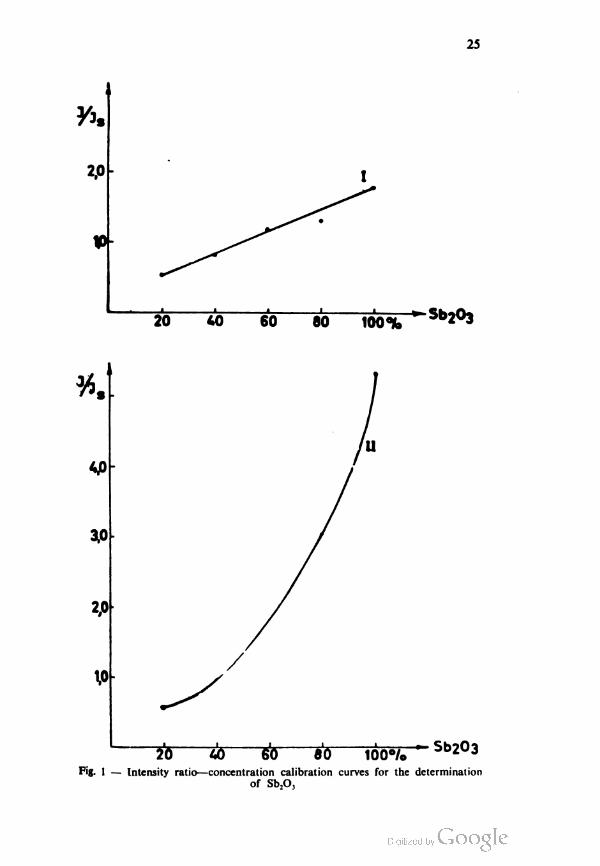
209 40 6<5 80 100% r Sb2°3
Fig. 1 — Intensity ratio—concentration calibration curves for the determination
of Sb,O'

26
suspension. Curve 1 was plotted for the 0.08 ml specimens and
curve II for the 0.16 ml specimens. Curve I is linear course and
curve II is exponential. The curves obtained for the other dilutions
were very similar.
An attempt was made to interpret the I/Is changes with
change in the quantity of suspension per slide by the "absorption
theory" of L. E. Alexander and H. P. Klug. According to this
theory, if the mixture contains n components with different absorp
tion coefficients, the line of the component that absorbs weakest
will be weaker and, vice versa, the line of the component that
absorbs strongest will be stronger(8).
The mass absorption coefficients of the components of the
tested mixtures are given in Table 1. According to the absorption
theory, the line for Sb, whose mass absorption coefficient is higher
would be the stronger, while the Sb2O3 line would be the weaker.
However, for specimens made from mixtures in which Sb2O3 and
Sb were equal in weight, the l|ls, i.e. /sb203 'sb ratios show that
the intensity of the antimony trioxide is the stronger. We hypothe
sized that the changes of the I/I, ratio were due to selective
sed'mentation of the components in the suspensions during drying.
If the particle size distribution of all components is the same in
all, the test, Sb2O3 particles of the same dimensions, having a lower
specific gravity, will move slower than the Sb particles in the
same suspension. The specific gravities and the absorption coeffi
cients of the components are given in Table 1 .
TABLE 1
Compound 1 Mass j^"™ 1 SPec1ficK coefficient | gravity
Sb2O, 239.32 5.67
Sb 284 6.684
This selective sedimentation could only increase the Sb2O,
concentration and decrease the Sb concentration in the surface
layer of the specimen, i.e. increase the ratio of their surface layer
concentrations. This change would depend on the duration and
the conditions of sedimentation. Since this accords with the X-ray
measurements of I/I, presented in Fig. 1 as calibration curves I
and II, the above hypothesis appeas to be correct.
A more detailed check of this hypothesis and study of different
effects on the ///, ratio will be presented in further papers.
REFERENCES
1. Clark, G. L. and D. H. Reynolds. Quantitative Analysis of Mine Dusts'
— Industrial and Engineering Chemistry, Analytical Edition (Washington) 8(1):
: 36, 1936.
2. Alexander, L. E. and E. Kummer „Х-Ray Diffraction Analysis of Crys-
taline Dusts" — Journal of Industrial Hygiene and Toxicology (New York) 30:
: 166— 168, 1948.
3. Kay, K. "Rapid Quartz Analysis by X-Ray Spectrometry" — American
Industrial Hygiene Associaton Quarterly (Washington) 11:185— 194,1950.
4. Stefanovic, A. N. and V. M. Simic, ..Determination of Quartz Content
in the Mines of Socialist Republic of Ssrbia by Chemical and Rapid X-Ray
Diffraction Method", in: International Congress on Occupational Health — Helsinki,
1957.
5. Klug, H. P. and L E. Alexander . X-Ray Diffraction Procedure for
Polycrystalline and Amorfous Material — New York: John Wiley and Sons, 1954.
6. Klug H. P., L. E. Alexander, and E. Kummer. "Quantitative Analysis
with the X-Ray Spectrometer" — Analytical Chemistry (Washington) 20(7):607
—609, 1948.
7. Simic, V. M. and V. D. Rajkovic. "Metoda pripremanja primeraka za
kvantitativno odredivanje sadrzaja jedinjenja i minerala metodom rendgenske difrak-
cije" (Method of Preparing, Specimens for Quantitative Determination of the
Content of Compounds and Minerals by the X-Ray Diffraction Method) (Beograd)
(unpublished).
8 Klug, H. P. "Quantitative Analysis of Powder Mixtures with the Geiger-
-Counter Spirometer" — Analytical Chemistry (Washington) 25(1): 704—708,
1953.

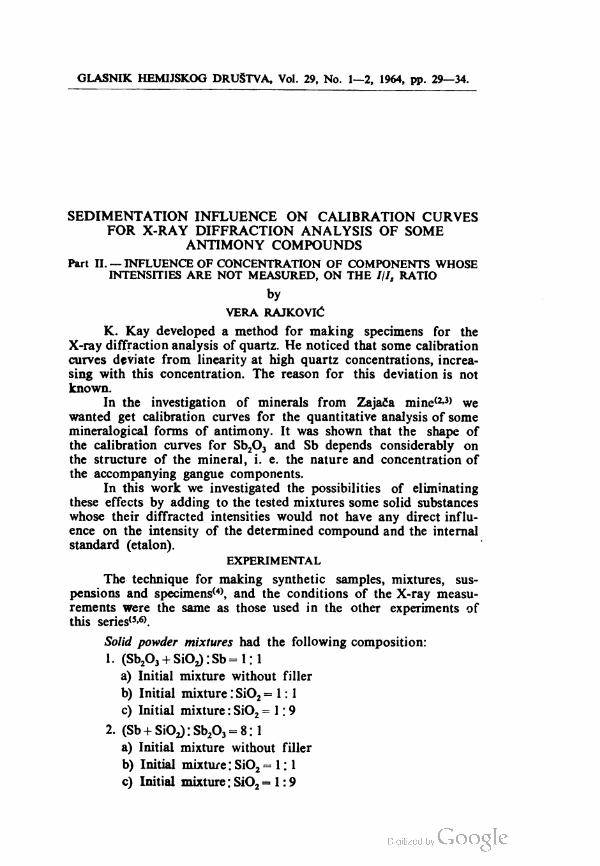
GLASNIK HEMIJSKOG DRUSTVA, Vol. 29, No. 1—2, 1964, pp. 29—34.
SEDIMENTATION INFLUENCE ON CALIBRATION CURVES
FOR X-RAY DIFFRACTION ANALYSIS OF SOME
ANTIMONY COMPOUNDS
Part II. — INFLUENCE OF CONCENTRATION OF COMPONENTS WHOSE
INTENSITIES ARE NOT MEASURED, ON THE ///, RATIO
by
VERA RAJKOVlC
K. Kay developed a method for making specimens for the
X-ray diffraction analysis of quartz. He noticed that some calibration
curves deviate from linearity at high quartz concentrations, increa
sing with this concentration. The reason for this deviation is not
known.
In the investigation of minerals from ZajaCa mineaJ) we
wanted get calibration curves for the quantitative analysis of some
mineralogical forms of antimony. It was shown that the shape of
the calibration curves for Sb2O3 and Sb depends considerably on
the structure of the mineral, i. e. the nature and concentration of
the accompanying gangue components.
In this work we investigated the possibilities of eliminating
these effects by adding to the tested mixtures some solid substances
whose their diffracted intensities would not have any direct influ
ence on the intensity of the determined compound and the internal
standard (etalon).
EXPERIMENTAL
The technique for making synthetic samples, mixtures, sus
pensions and specimens(4), and the conditions of the X-ray measu
rements were the same as those used in the other experiments of
this series"-0.
Solid powder mixtures had the following composition:
1. (Sb2O3 + SiO2):Sb = 1: 1
a) Initial mixture without filler
b) Initial mixture .9 SiO2 =1:1
c) Initial mixture : SiO2 =1:9
2. (Sb + SiO2):Sb2O3 = 8: 1
a) Initial mixture without filler
b) Initial mixture : SiO2 =1:1
c) Initial mixture ; SiO2 =1:9

30
Dispersion medium was obtained by mixing 8 volumes of
isoamylacetate, 4 volumes of ethyl alcohol and 3 volumes of 4%
colodium in ether. The dilution of the suspension was 1—2.5 ml
of the dispersion medium per 0.4 g of the powdered mixture.
Quantity of suspension per slide was 0.08 ml or 0.16 ml of
the suspension per 4 cm2.
RESULTS AND DISCUSSION
Selective sedimentation of the measured components in the
spec;mens was observed. It was observed that sedimentation was
greater in specimens of mixtures with higher concentrations of the
tested compound. The calibration curves for such specimens were
exponential instead of linear. This is illustrated by the calibration
curve for 20— 100% of Sb2O3 and the mixture composition under
la, and the curve for 20— 100% of Sb and the mixture composi
tion under 2a.
Assuming that these deviations were due to differing con
ditions of sedimentation of Sb2O3 and Sb particles in mixtures of
a given series, we made a more detailed analysis of the sedimentation
of suspensions of solid powder mixtures in graduated 10 ml cylin
ders(78). It was possible to visually observe the selective sedimen
tation because of the different colors of the components: Sb2O3
is white and Sb dark grey. The composition of the dispersion
medium and its volume per unit mass of powdered material were
the same as for making specimens.
The experiments were made with Sb2O3 + Sb and Sb2O3 +
+ Sb + SiO2 mixtures. It was found that an increased concentration
of amorphous SiO2 in a solid mixture, i.e. in the corresponding
suspension, retards selective sedimentation of the measured compo
nents Sb2O3 and Sb in a time period which corresponds to the
specimen drying time.
These experiments lead to the conclusion that if the sedi
mentation of Sb2O3 and Sb in all suspensions of a given series
took place under the same conditions, the calibration curves for
Sb2O3 and Sb would be linear. To obtain at least similar sedimen
tation conditions in a given series without changing the ratio of
the tested compound and the internal standard (etalon), we added
the same quantity of silica dioxide to all solid mixtures with 20—
— 100% of Sb2O3 and 20—100% of Sb, i.e. the weight ratios were
1 : 1 and 1 : 9. Suspensions and specimens of these mixtures and of
the initial mixtures were made under identical conditions. The
corresponding calibration curves in Fig. lb and lc for Sb2O3 and
2b and 2c for Sb show that our assumption, that changes of the
I/Is values were caused by selective sedimentation of Sb2O3 and Sb
in specimens is correct because they do not occur if the sedimen
tation is retarded by the addition of silica dioxide.
The role of the amorphous silica dioxide appears to be the
same as that of a spectrochemical buffer, a substance which is
added to the specimen to minimize the dependence of excitation
emission on the general composition of the specimen apart from
the concentrations of the elements being directly determined(9).
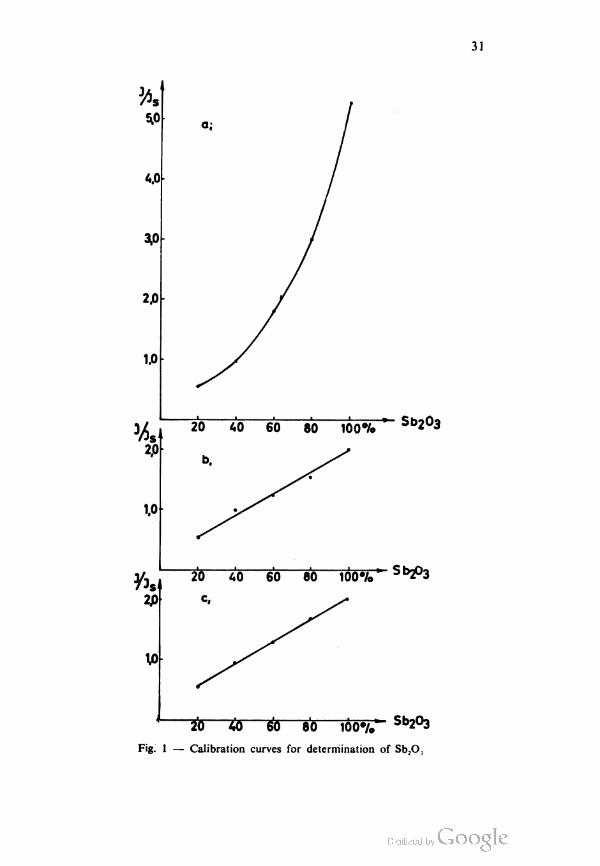
31
20 55 £5 80 ioo^/T" Sb203
Fig. 1 — Calibration curves for determination of Sb2O.


REFERENCES
1. Kay, K. "Rapid Quartz Ana'ysis by X-Ray Spectrometry" — American
Industrial Hygiene Association Quarterly (Nsw York) 11 (12): 185—194, 1950.
2. Ivkovic, V. and V. Petronic. "Bistrenje magnezijum h'oridom lugova
dobijenih luzenjem antimonovih ruda rastvorom natrijum sulfida", (Use of Mag
nesium Chloride to Extract Lyes Obtained by Leaching Antimony Minerals with
Sodium Sulphide Solution) — Glasnik hemijskog druStva (Beograd) 20 (6): 397—
404, 1955.
3. Ivkovic, V. and V. Petronic. "Pojava petovalentnog oksida antimona u
antimonovim rudama u okolini Zajace" (The Occurence of Pentavalent Oxide
of Antimony in Antimony Minerals in the Vicinity of Zajaca) — Hemijska
iudustrija (Beograd) 13 (7): 1205—1207, 1959.
4. Simic, V. and V. Rajkov;c. "Metoda pripremanja primeraka za kvanti-
tativno odredivanja sadrzaja jedinjenja i minerala metodom rentgenske difrakcije"
(Method of Preparing Specimens for Quantitative Determination of the Content
of Compounds and Minerals by the X-ray Diffraction Method) — Beograd
(Unpublished).
5. Rajkovic, V. D. "Kalibracione krive za kvantitativnu rentgensku difrak-
cionu analizu Sb263, Sb2O4 i Sb metodom unutrasnjeg standarda" (Calibration
Curves for the Quantitative X-ray Diffraction Analysis of Sb2O3, Sb2O4 and Sb
by the Internal Standard Method) — Glasnik hemijskog druStva (Beograd)
29(1—2), 1964.
6. Rajkovic, V. D. "Uticaj sedimentacije na oblik kalibracionih krivih za
rentgensku difrakcionu analizu nekih jedinjenja antimona. I. — Uticaj kolicine
suspenzije po primerku na odnos I/I," (Sedimentation Influence on Calibration
Curves for X-ray Diffraction Analysis of Some Antimony Compounds. I. — In
fluence of the Amount of Suspension per Specimen on the I/Is Ratio) — Glasnik
hemijskog druStva (Beograd) 29(1—2), 1964.
7. Petronic—Rajkovid, V. D. "Sedimentacija u suspenzijama smesa spra-
senih Sb2Oj, Sb i SiO2 u amil acetatu" (Sedimentation in Suspensions of Powder
Mixtures of Sb2O3, Sb and SiO2 in Amyl Acetate) — Hemijska industrija
(Beograd) 15 (11):2032—2032c, 1961.
8. Petroni<5—Rajkovic, V. D. "Uticaj kolodijuma na sedimentaciju suspenzja
Sb2Oj, Sb i SiO2 u amil acetatu" (Influence of Colodium on the Sedimentation
of Suspensions Sb2OJ, Sb and SiO2 in Amyl Acetate) — Hemijska industrija
(Beograd) 16(1): 121—124, 1962.
9. Ristic, S. Privremena spektroanaliticka terminologija (Temporary Spectro-
analytical Terminology) — Beograd: Spsktrohemijska sekc,ja srpskog hemijskog
druStva, 1958.
з


GLASNIK HEMIJSKOG DRUSTVA, Vol. 29, No. 1—2, 1964, pp. 35—44.
SEDIMENTATION INFLUENCE ON CALIBRATION
CURVES FOR X-RAY DIFFRACTION ANALYSIS
OF SOME ANTIMONY COMPOUNDS
Part III. — DIRECT ANALYSIS
by
VERA D. RAJKOVIC
According to the classification of L. E. Alexander and
H. P. Klug, direct analysis by measur;ng the diffracted intensity
of a specific compound in a mixture, is possible only if the mixture
contains n components whose absorption coefficients are the same.
If the mixture contains components with different absorption coef
ficients direct analysis is not possible. In this case the internal
standard method is applied (1,2).
Experiments to find out the most suitable calibration curves
for the quantitative analysis of some antimony compounds by the
internal standard method, lead to the following statements: 1)
the I/I, ratio is proportional to the ratio of the concentration of
the determined compound and the internal standard (etalon) in
the surface layer of the specimen but not to the ratio of their
concentrations in the mixture from which the specimen is made,
and 2) deviations of the calibration curves from linearity are due
to selective sedimentation in the specimens (3,4).
The latter statement was checked by visual observation of
selective sedimentation of Sb2O3 and Sb particles in suspensions
of their mixtures in 10 ml graduated glass cylinders. From the
change of the color distribution in separated sediments and sus
pensions during sedimentation we concluded that our statement was
tenable (5,6).
A more reliable check was made in the present work, by
X-ray measurement of the intensity of one component of three-
component systems.
EXPERIMENTAL
The technique for making the mixtures, suspensions and
specimens (7) and the conditions for X-ray measurements are the
same as in the other papers of this series of investigations dealing
with the problem of obtaining good calibration curves for ths

36
quantitative determination of antimony compounds in powdered
material (l,2).
Solid powdered mixtures in this work contained antimony
trioxide, elementary antimony and amorphous silicon dioxide. They
were divided into three groups according to the content of ele
mentary antimony. Mixtures of group I contained 60%, group II
25% and of group III 5% of Sb. The concentrations of antimony
trioxide and silicon dioxide were changed as shown in Table 1.
TABLE 1
Group I 50% Sb Group II 25% Sb Group HI 5% SbNumber
% sb2o3 %SiO2 % Sb2O3 % SiO, % Sb2O3 % SiO,
1 50 25 50 5 90
2 40 10 20 55 4 91
3 30 20 15 60 3 92
4 20 30 10 65 2 93
5 10 40 5 70 1 94
The Dispersion medium was obtained by mixing 8 volumes of
isoamyl-acetate, 4 volumes of ethyl alcohol and 3 volumes of 4%
colodium in ether.
Dilution of suspensions: 1— 2.5ml of the dispersion medium
per 0.4 g of powdered material.
Quantity of suspension per slide: 0.08 ml or 0.16 ml of sus
pension per 4 cm2.
RESULTS AND DISCUSSION
There were 2 phases in this study of the influence of se
dimentation in specimens for X-ray diffraction analysis of powders
on the measured intensity of one component of the mixture:
1. investigation of the possiblity of direct analysis for the
determination of the content of one component in the mixture;
2. observation of the change of the maximum diffracted
intensity of a component of fixed concentration in a series of
tested mixtures with change of the concentrations of the other
Components whose intensities are not measured.
Investigation of the possibility of determining Sb20} content by direct
analysis
The calibration curves in Fig. la for the dependence of the
intensity of diffracted radiation of Sb2O3 on % concentration of
Sb2O3 were obtained by X-ray measurements of specimens made
from mixtures from group I in Table 1. The curves in Fig. 2 a,
were obtained on specimens made from mixtures from group II,
and those in Fig. 3a for specimens made from mixtures from group
III in Table I.

37


1
13.8614.06
14.8312.50
11.9415.42
19.2815.69
TABLE2
GeoupIII
%Sbfi,
2
24.3920.00
23.0622.64
32.2419.28
22.6720.17
3
32.2829.22
35.1131.19
39.4131.48
34.5600.95
4
41.8933.29
36.7239.08
47.6437.83
46.3137.5
5
47.8345.33
45.1143.23
56.2848.67
51.2800.00
5
28.0726.46
22.3326.03
28.7226.56
20.0039.49
e
00.0636.00
35.0058.64
49.3946.44
31.0044.02
GeoupII
%Sb20,
50.4243.09
46.e50.89
55.2856.00
41.6960.69
e
58.5860.43
55.6165.72
e.13
68.2246.42
69.72
20
64.06
e.52
56.0869.28
77.1176.17
53.9373.00
25
27.e22.78
22.3824.11
13.4417.45
15.9419.17
e
46.P31.92
32.7534.83
19.8027.55
26.0326.56
20
GeoupI
%Sb20,61.55
49.2842.52
54.1128.26
43.6735.34
00.65
00
64.8355.22
51.0056.58
35.77
e.52
50.8849.22
00
73.5972.39
e.72
64.4756.81
82.4773.86
74.02
50
Dilution1.0ml
1.5ml
2.0ml
2.5ml
1.0ml
1.5ml
2.eml
2.5ml
Su6pen6ionfor6pecimen
0.08
ml
0,16
ml

40
100%sib^^ ^T6o°/iSb25,3
40 f
20
'Sb'
20
e.
00%SiO2—
-^100%Sb2O3
-i 1— i
—100%Sb203
Fig. 3 — The dependence of Isb on the concentration of other substances i
the mixtures
32.022.P
22.6724.28
22.8621.94
19.8600.22
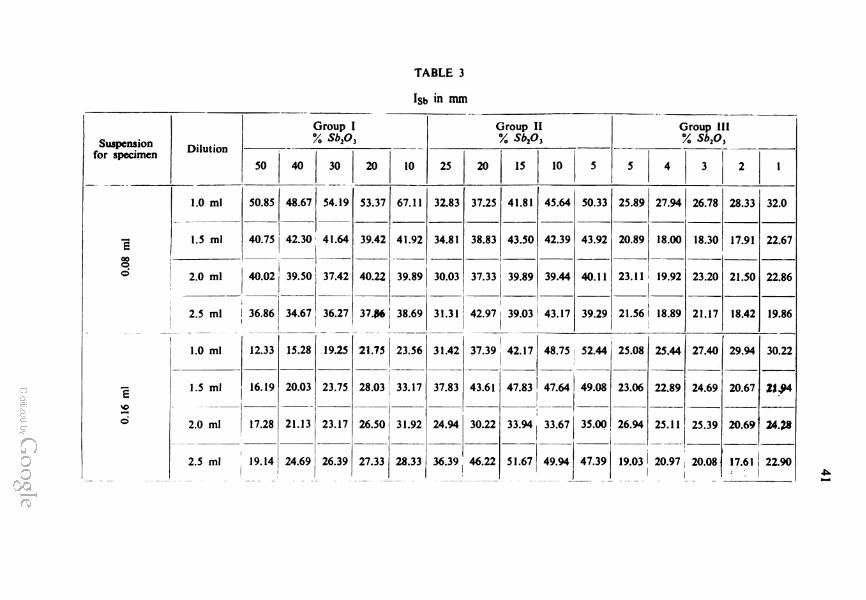
TABLE3
Isb
inmm
Su6pen6ion foe6pecimen
oE
Dilution
GeoupI%Sb2Os
e 00
00
e
1.0ml
1.5ml
50.85
48.67
54.19
53.37
1e
GeoupII
%Sb_°,
e
67.11
00.75i42.00
41.64
2.0ml
00.0239.50
2.5mlI36.86
37.42
39.42!41.92
00.22
32.8334.81
39.8900.0337.33
e 15
37.2538.83
34.67:36.27|37.86]38.69
41.8143.50
39.89
1e
GeoupIII
7„
Sb2o,
45.6450.33
42.3939.44
31.3142.9739.0343.17
43.92
25.89127.9426.78
20.8918.00
00.1123.1119.92
39.29!21.5618.89
1.0ml
12.33
1.5ml
93.192.0ml
17.282.5ml
19.14
15.2819.2521.7523.56
20.03!23.75
21.1323.17
24.69
26.39
28.03
33.1726.5031.92
27.3328.33
31.42j37.3942.17
37.8343.61I47.83
48.7552.4425.0825.44
47.64
24.94
00.2236.3946.22
33.9433.67
51.67
49.94
49.e835.e0
47.39
23.0626.94
22.8925.11
28.3318.00117.91
23.2021.17
21.5018.42
27.0024.69
25.3919.0320.9720.08II
29.9420.67
20.6917.61

42
All suspension were diluted with 2 ml of the dispersion
medium per 0.4 g of the powdered material. Curves marked with I
were obtained by measuring specimens made with 0.08 ml and
those marked with II with 0.16 ml of suspension per slide.
The maximum intensities of diffracted radiation for Sb2O3 in
Table 2 show that very similar curves are obtained for other
dilutions as well. Figures lb, 2b, and 3b present the respective
calibration curves for the determination of Sb,O, by the internal
standard method.
It is clearly seen that the shapes of the calibration curves
obtained by direct analysis and the internal standard method are
quite similar. However, deviations of the direct analysis curves are
smaller than those for the internal standard method. This can
only be ascribed to the fact that in the direct analysis method the
diffracted intensity maximum is proportional to the Sb2O3 con
centration in the surface layer of the specimen. With the internal
standard method the ///, ratio is proportional to the concentration
ratio of the Sb2O3 and Sb components in the surface layer, and
thus depends the surface layer concentrations of both, so that
greater deviations from the values which would be obtained if
there was no sedimentation are possible.
This is confirmed by the following results.
Investigation of the change of the maximum intensity for Sb for a
series of mixtures with a fixed Sb concentration
The same specimens made from mixtures given in Table 1,
were used in this experiment.
The X-ray intensities are given in Table 3. The curves for the
dependence of intensity I for Sb in mm on the concentration
increase of Sb2O3 and decrease of SiO2 in the mixtures are shown
in 1 c, 2 c, and 3 c. The suspensions employed were also diluted
with 2 ml of the dispersion medium per. 0.4 g of powdered material.
Curves for the other dilutions are not shown because they are very
similar in shape apart from random errors.
These curves indubitably prove that deviation from linearity
of the calibration curves for X-ray diffraction analysis of powder
is due to selective sedimentation in specimens during their making
and drying.
These results also show that the absorption theory or
L. E. Alexander and H. P. Klug is not satisfactory in case of the
analysis of antimony trioxide. If deviations in direct analysis were
due to different mass absorption coefficients of the components,
they would not occur in the internal standard method. Hower, for
antimony trioxide they become greater. This accords with the
hypothesis of selective sedimentation in specimens and confirms
that the diffracted intensity of a component in a mixture is pro
portional to its concentration in the surface of the specimen.

REFERENCES
1. Klug, H. P. and L. E. Alexander. "X-Ray Diffraction Procedure for
Polycrystalline and Amorphous Material" — New York: John Wiley and Sons, 1954.
2. Klug, H. P., L. E. Alexander and E. Kummer. "Quantitative Analysis
with the X-Ray Spectrometer" — Analytical Chemistry (Washington) 20(7):
607—609, 1948.
3. Rajkovic, V. D. "Uticaj sedimentacije na oblik kalibracionih krivih za
rentgensku difrakcionu analizu nekih jedinjenja antimona. I. — Uticaj kolicine
suspenzije po primerku na odnos I/Is" (Sedimentation Influence on the Shape of
Calibration Curves for X-ray Diffraction Analysis of Some Antimony Compounds.
I. — The Influence of the Quantity of Suspension per Specimen on the I/I,
Ratio) — Glasnik hemijskog drustva (Bsograd) 29(1—2), 1964.
4. Rajkovid, V. D. "Uticaj sedimentacije na oblik kalibracionih krivih
za rentgensku difiakcionu analizu nekih jedinjenja antimona. II. — Uticaj kon-
centracije komponenata 6iji se intenziteti ne mere na vrednost odnosa I/Is"
(Sedimentation Influence on the Shape of Calibration Curves for X-ray Diffraction
Analysis of Some Antimony Compounds. II. Influence of the Concentration of
Components Whose Intensities Are Not Measured on the I/Is Ratio) — Glasnik
hemijskog druStva (Beograd) 29(1—2), 1964.
5. Petronic—Rajkovic, V. D. "Sedimentacija u suspenzijama smesa spra-
senih Sb2O3, Sb i SiO2 u amil aceta'.u" (Sedimentation in Suspensions of Mixtures
of Powdered Sb2O„ Sb and SiO2 in Amyl Acetate) — Hemijska industrija (Beo
grad) 15(11): 2032—2032c, 1961.
6. Petronic1—Rajkovic, V. D "Uticaj kolod'juma na sedimentaciju suspen-
zija Sb2O,, Sb i SiO2 u amilacetatu" (Influence of Colodium on the Sedimentation
of Suspensions of Sb,O3, Sb and SiO2 in Amyl Acetate) — Hemijska industrija
(Beograd) 16(1): 121—124, 1962.
7. Simic, V and V. D. Rajkovic, "Metoda pripremanja primeraka za
kvantitativno odredivanje sadrzaja jedinjenja i minerala metodom rendgenske
difrakcije" (Method of Preparing Spjcimens for Quantitative Determination of
the Contents of Compounds and Minerals by the X-ray Diffraction Method) —
(Beograd) (unpublished).


GLASN1K HEMIJSKOG DRUSTVA, Vol. 29, No. 1—2, 1964, pp. 45 —49.
DETERMINATION OF SMALL AMOUNTS OF COPPER
IN CADMIUM1
by
SRETEN N. MLADENOVlC and BOZlDAR FILIPOV1C
Among the methods for the determination of copper in elec
trolytic cadmium of 99.99% purity the colorimetric method with
sodium diethyldithiocarbamate, cupral, has been found to be the
most sensitive. Copper diethyldithiocarbamate, formed by the reac
tion of copper with sodium diethyldithiocarbamate, is extracted
with carbon tetrachloride0) from an aqueous solution of pH 4.5
to 5.0. The amount of copper is determined by measuring the
intensity of the yellow color of the solution. Because the copper
complex is only formed, in a narrow pH-range, the method is of
limited value.
By investigating the effect of the pH on complex formation
and on the extraction of copper carbamate we have established
that the pH-range for complex formation and extraction with
carbon tetrachloride is considerably wider (Table 1).
TABLE 1
8.10— *g Cu in I g Cd; extraction with carbon tetrachloride
ExperimentpH of aqueous
solutionAbsorption
0.6 10.0
1.7 10.0
2.4 10.0
4.9 10.0
8.5* bad separation of layers
9.6* 10.0
10.0* 10.0
*) ammonia solution
*) Communicated at the XXXIV* International Congress of Industrial
Chemistry, September 1963, Belgrade.

46
In acid media of pH 0.6 to 4.9 and in alkaline ammonia solu
tions of pH > 9 the intensity of the yellow extract is the same.
These findings show that copper in cadmium can be determined
within these pH-rangas without determining the actual pH. In the
pH-range 5.0 to 9.0 the extraction is not easy to do, especially
in the presence of a precipitate. This difficulty may be ascribed
to the form in which the copper is present; copper is not easily
extracted from the precipitate and therefore only a small fraction
of it goes into the carbon tetrachloride solution. Moreover, the
separation of the organic and aqueous layer is very bad.
No. of graduations
Fig. l
We also used toluene as an extraction solvent and got results
similar to those with carbon tetrachloride. Experiments with dif
ferent amounts of copper in cadmium and with toluene as the
solvent showed that all the copper diethyldithiocarbamate was
extracted in one operation and that there is a relation between
the concentration and the extinction (Table 2 and Fig. 1).
The results for the effect on the determination of copper
using toluene were the same as with carbon tetrachloride (Table 3).
The same absorption was obtained for identical copper con
centrations in acid aqueous solutions of pH from 0.8 to 4.6 and
in alkaline ammonia solutions of pH > 9, indicating that the
determination can be carried out in these pH-ranges. The extraction

47
TABLE 2
Copper in cadmium
Experiment
1
2
3
4
5
6
7
8
Cu
Y
0
4
6
8
10
12
16
20
Absorption %
0.0
6.0
8.0
10.5
12.2
15.0
19.0
23.0
TABLE 3
8.10-' Cu in 1 g Cd; extraction with toluene
Experiment pH of aqueous solution Absorption %
1 0.8 10.0
2 1.6 10.0
3 4.6 10.0
4 7.2* 9.2
5 7.7* 9.0
6 9.0' 10.0
7 10.0* 10.0
*) Ammonia solution
of copper from acid and slightly alkaline ammonia solutions goes
better with toluene than with carbon tetrachloride. The separation
of layers is also very good. However, the extraction of copper
complex with toluene it not complete.
Using the possibility of extracting copper diethyldiihiocarba-
mate complex with toluene we have developed a method for the
determination of copper in cadmium. The results obtained with
the two extraction solvents were in good agreement.
Procedure. 25 ml of water is added to ten grams of cathodic
cadmium and then concentrated nitric acid (a total of 25 ml) is
added slowly till the cadmium is completely dissolved. The cadmium
solution is transferred to a 100 ml volumetric flask which is then
filled up to the mark.
To an aliquot of the solution (10 ml; 1 g cadmium) 10.0 ml
of distilled water and 1 ml of 0.3% sodium diethyldithiocarbamate
solution is added. The solution is transferred to a separatory fun
nel and 10 ml of toluene is added. After vigorous shaking for
two minutes the toluene extract is put in a cuvette and the color

48
intensity of copper diethyldithiocarbamate is determined with a
blue light filter.
The results show that copper in cadmium can be determined
with cupral in a considerably wider pH-range by using toluene as
the extraction solvent.
School of Technology Received, Sept. 16th, 1964
Institute for Physical Chemistry
and Electrochemistry
REFERENCES
') Grisevich, A. N. and Kladnitskaia, K. B. "Bystryi metod opredeleniia
malykh kolichest' medi v tsinke i kadmii" (Rapid Method for the Determination
of Small Quantities of Copper in Zinc and Cadmium) — Zavodshaia. Labora-
toriia (Moskva) 27; 1343—1345. 1961.

GLASNIK HEMIJSKOG DRUgTVA, Vol. 29, No. 1—2, 1964, pp. 51—56.
THE OXIDATIVE SPLITTING OF SOME FLUORENONE
DERIVATIVES BY MEANS OF LEAD TETRAACETATE
by
BOJAN D. PODOLESOV
As a continuation of our work on the condensation and
properties of polyoxo compounds (1,2) we have carried out the
condensation of 2-acetylfluorene with diethyl oxalate in the presen
ce of sodium ethylate. From earlier investigations made by Wisli-
cenus(3) and Janculev and PodoleSov(1), and on the basis of the
experimental conditions employed in this condensation, we expected
it to take place at the active methylene group in the 9-position
and at the acetyl group ;n the 2-position of the fluorene nuclei.
In this condensation two compounds were isolated. The main
product melted at 114— 117°C and its elementary analysis corres
ponded to 9 - oxalo - fluorenoyl - 2 - pyruvate. The other product,
which was isolated in a smaller amount, melted at 173°C and its
elementary analysis corresponded to the formula C^H^O^. The
structure of this compound will be reported in a forthcoming paper.
According to the works of E. Bear(4) the oxidative splitting
of aroylcarboxylic acids by means of lead tetraacetate gives aryl-
carboxylic acids. Similarly, according to Janculev and Podolesov(2),
the splitting of ethyl aroylpyruvates also gives arylcarboxylic acids.
On the basis of these works we assumed that the oxidative
splitting of ethyl 9 -oxalo - fluorenoyl - 2 - pyruvate wauld give the
hitherto little described fluorene - 2,9 - dicarboxylic acid. However,
the oxidative splitting of ethyl 9 - oxalo - fluorenoyl - 2- pyruvate
(I) did not give rise to the expected fluorene - 2,9 - dicaroxylic
acid (II) but to the well-known 9 - fluorenone - 2 - carboxylic acid
(Ha) which was determined by the preparation of its methyl ester.
From these results it follows that in the oxidative splitting
of ethyl 9 - oxalo - fluorenoyl - 2 pyruvate the —CO—CH2—CO—
—COOC2H5 group in the 2-position is oxidized to the carboxylic
group, and the —CO—COOC2H3 group in the 9-position to the
keto group.
In order to explain the unexpected oxidative splitting of the
—CO—COOC2H5 group in the 9-position we have studied the
oxidative splitting of ethyl fluorenyl - 9 - gyoxalate (III).
4

5o
Lll^A^-CO-Chj-CO-COOC^s
coom
COOh
On the basis of the results obtained in the oxidative splitting
of ethyl 9 - oxalo - fluorenoyl - 2 - pyruvate, the oxidative splitting of
ethyl fluorenyl- 9 - glyoxalate should give rise to already known
fluorenone. However, we were unable to isolate fluorenone from
the reaction mixture and we obtained only small amounts of flu-
orene - 9 - carboxylic acid.
Pb(CH3COO)4
COOC2H5
COOH
The oxidative splitting of substituted derivatives of ethyl
fluorenyl - 9 - glyoxalate gave different results. The splitting of ethyl
2 - nitrofluorenyl - 9 - glyoxalate resulted in the formation of 2 - nitro-
fluorenone, and in the oxidation of ethyl 2,7 - dibromofluorenyl -
-9-glyoxalate gave 2,7-dibromofluorenone.
COOC2H5
From these results it may be concluded that the CO—COOC2H5
group in the 9-position is oxidized with lead tetra-acetate to the
keto group only in case of substituted derivatives of ethyl fluore-
nyl-9-glyoxalate.

51
The results of the oxidative splitting with lead tetraacetate
of the compound melting at 114— 117°C and of the other substi
tuted derivatives of ethyl fluorenyl-9-glyoxalate prove that the struc
ture ascribed to ethyl 9-oxalo-fluorenoyl-2-pyruvate is correct.
The mechanism of the oxidative splitting of the —CO—
—COOC2Hj grouping in the 9-position encountered in substituted
derivatives of ethyl fluorenyl-9-glyoxalate will be published later.
EXPERIMENTAL
Condensation of 2-acetylfluorene with diethyl oxalate (ratio 1 : 2)
in the presence of sodium ethylate (ethyl 9-oxa]o-fluorenoyl-2-pyruvate)
In a 200 ml round-bottomed flask with a condeser and a
CaCl2-tube, sodium ethylate was prepared from 0.69 g of sodium
(0.03 mole) and 1.38 g (0.03 mole) of absolute alcohol after N.
Lund and J. Bjerrum (5): Anhydrous ether was added to the reaction
mixture until all the sodium was covered. After one hour heating
on a water-bath, the reaction mixture was left to stand overnight.
To the obtained sodium ethylate solution, with constant stirring,
were added first 3; 12g(0.015 mole) of 2-acetylfluorene, and then,
4.38 g (0.03 mole) of freshly distilled diethyl oxalate, slowly and
with cooling so that no overheating of the reaction mixture occu
rred. After standing for three days, the reaction mixture was
orange colored.
The reaction product was filtered off, washed with ether and
dried in air. The obtained 7.7 g of orange colored sodium deriva
tive was treated with ice cold hydrochloric acid (1:1). 6.6 g of
brown-red condensation product was obtained after drying in air.
It was readily soluble in alcohol, acetone, glacial acetic acid and
ethyl acetate. It was then treated with 200 ml of benzene whereby
a dark red colored deposit was left undissolved. The benzene
solution was filtered and left to crystallize.
After standing two days the benzene solution yielded about
1.5 g of a dark red precipitate which melted at 100°C. After some
time the concentrated filtrate gave an additional 3 g of a yellow
precipitate which melted at 110°C. Further standing of the filtrate
resulted in the formation of a yellow deposit which melted at
150°C. The crystals melting at 100—1 10°C, after two further crystall
izations, gave yellov needles of m. p. 114°C (Kofler block m. p.
117°C). The results of the elementary analysis corresponded to
ethyl 9-oxalo-fluorenoyl-2-pyruvate (la).
Analysis
Found :C 67.45%; H 4.90%
Calculated for C23H,0O7:C 67.74%; H 4.94%.
The recrystallization of the yellow needles melting at 150°C
from benzene or acetone gave crystalline plates melting at 168—
-169°C (lb).
52
Analysis:
Found :C71.10°/0; H 4.34%
Calculated for C^HsoCVC 71.63%; H 4.51%.
Oxidative splitting of ethyl 9-oxalo-fluorenoyl-2-pyruvate with
lead tetraacetate (9-Fluorenone-i-carboxylic acid) (Ila).
To a suspension of 1 g of ethyl 9-oxalo-fluorenoyl-2-pyruvate
(m. p. 114— 117°C) in 48 ml of 98% acetic acid, 8g of powdered
lead tetraacetate was added. In the course of 30 minutes the suspen
sion turned to a yellow colored solution and its temperature rose
about 6°C. The reaction mixture was stirred for a further 6 hours
and a yellow precipitate separated. The stirring was continued
for 15 hour whereby lead tetraacetate completely disappeared from
the solution. To remove any traces of unreacted lead tetraacetate
a few ml of ethylene glycol were added to the reaction mixture.
The separated yellow reaction product was filtered off and dried.
The yield was about 0.25 g. By adding water to the filtrate an
additional 2 g of the reaction product was obtained. Recrystalliza-
tion from glacial acetic acid gave yellow needles melting at 333°.
The mixed mcl:ing point determination with an authenti.
sample of 9-fluorenone-2-carboxylic acid showed no depressionc
Analysis:
Found :C 74.78%; H 3.85%;
Calculated for CuH8O3:C 74.99%; H 3.60%.
Methyl ester of 9-fluorenone-2-carboxylic (lib)
The product of the oxidative splitting of 9-oxalo-fluorenoyl-
-2-pyruvate was determined by the preparation of its methyl ester
in the following way:
By heating 0.15 g of the oxidation product (Ha), m. p. 333°C,
with 5 ml of thionyl chloride on a water bath for 90 minutes
a clear solution was obtained. The excess thionyl chloride was
removed in vacuo and the solid residue was heated on a water-
bath with 30 ml of methanol for 90 minutes. Then active charcoal
was added to the solution, the mixture was boiled for 5 minutes
and filtered hot. On cooling the methanolic solution yielded long
shiny needles melting at 182°C. Repeated recrystallization yielded
crystals of m. p. 182— 184°C. The mixed melting point with an
authentic specimen of 9-fluorenone-2-carboxylic acid (m. p. 180—
185°C, prepared according to Fortner(8)) gave no depression.
Analysis:
Found ;C 75.38%; H 4.30%;
Calculated for CI5H10O3:C 75.62% H 4.23%
From the elementary analysis of the oxidation product (Ila)
and its melting point and from the melting point of the correspon
ding methyl ester, it may be concluded that its structure corresponds
to 9-fluorenone-2-carboxylic acid.

S3
Oxidative splitting of ethyl fluorenyl-9-glyoxalate (III) with lead
tetraacetate
Ten grams of ethyl fluorenyI-9-gluoxalate prepared by the
method of Wislicenus (3) was dissolved in 100 ml of 99% acetic
acid with an addition of 2—3 ml of water. 30 g of lead tetraacetate
was added to the solution and the reaction mixture was kept at
60°C with warming and constant stirring for about 30 hours.
Then a small amount of ethylene glycol was added in order to
remove the unreacted lead tetraacetate. The reaction mixture was
diluted with water, the separated flaky precipitate was collected
and the filtrate was extracted with ether. The sticky yellow pre
cipitate was dissolved in benzene and from the cooled solution
an almost white product was deposited. It was recrystallized from
benzene-petroleum ether, yielding about 0. 1 g of a substance melting
at 210—230°C. Recrystallization from a mixture of glacial acetic
acid and water yielded white needles melting at 321°C (lit. 325°C(0)).
The mixed malting point with fluorene-9-carboxylic acid remained
unchanged.
On removal of the solvents, etherial extract and the benzene
solution gave a yellow-red residue from which fluorene was obtained.
Distillation of the residue furnished no fluorenone but only
fluorene, which was probably formed by the decomposition of ethyl
fluorenyl-9-carboxylic acid.
The oxidative splitting of ethyl 2-nitrofluorenyl-9-glyoxalate (IV) with
lead tetraacetate
To a solution of 0.84 g of powdered ethyl 2-nitrofluorenyl-
-9-glyoxylate (m. p. 140— 144°C)(10) in 70 ml of acetic acid, 4 g of
powdered lead tetraacetate were added. The reaction mixture was
heated at 50—60°C with constant stirring for about 20 hours.
After some time a yellow crystalline precipitate appeared. Some
ml of ethylene glycol were added in order to remove the unreacted
lead tetraacetate, and the separated product was filtered off, giving
0.35 g of compound melting at 210°C. Recrystallization from glacial
acetic acid with the addition of active charcoal gave long shiny
needles of m. p. 216—217° (lit. 218.5°C)(1».
Analysis:
Found :C 69.15%; H 3.20%;
Calculated for C13H7NO3:C 69.33%; H 3.13%.
The mixed melting point with 2-nitrofluorenone obtained
by the oxidation of 2-nitrofluorene with dichromate showed no
depression. All thes data show that the obtained product is 2-nitro
fluorenone.

54
Oxidative splitting of ethyl 2-7-dibromofluorenyl-9-glyoxalate (V) with
lead tetraacetate
To a mixture of 0.8 g of ethyl 2.7-dibromofluorenyl-9-glyo-
xalate(12) and 50 ml of 98% acetic acid 5 g of powdered lead
tetraacetate was added. The reaction mixture was kept at 55—60°C
with constant stirring for 20 hours. Then some ml of ethylene glycol
were added in order to remove the unreacted lead tetraacetate,
and the reaction mixture was diluted with water. The separated
precipitate was recrystallized from 96% alcohol, yielding about
0.25g of a crystalline product in the form of yellow needles which
melted at 202° (lit 202°C)(13).
Analysis:
Found :C 46.30%; H 1.95%;
Calculated for C13H6OBr2:C 46.19%; H 1.95%.
The mixed melting point with 2,7-dibromofluorenone prepared by
the oxidation of 2,7-dibromofluorene showed no depression.
The obtained oxidation product was determined in the form
of its ox me which crystallized as light yellow needles of m. p.
236—237° (lit. 235°C)(13).
From the above data it is evident that the obtained product
is 2,7-dibromofluorenone-9.
Institute of Chemistry
School of Sciences
University of Skoplje Received, May 25'*, 1964

REFERENCES
1. Jan&ulev, J. and B. Podolesov. — Annulaire de la Faculte de Philosophic
de I' Um'versite de Skoplje — Section des science naturelles (Skoplje) 11: 39, 1958.
2. JanSulev, J. and B. Podolesov. "Oxydativer Abbau von Aroylbrenztra-
ubensauren aethylester mit Bcitetraacetat" — Croatica Chimica Acta (Zagreb)
33: 59, 1961.
3. Wislicenus, W. "Uber Fluoren- und Inden- Oxalester" — Berichte der
deutschen chemischen Gesellschaft (Weinheim) 33: 771—773, 1900.
4. Baer, E. "Oxidative Cleavage of -Keto Acids and -Keto Alcohols bv
Means of Lead Tetraacetate" — Journal of the American Chemical Society 62
1597—1606, 1940.
5. Lund, N. and J. Bjerrum. "Eine einfache Methode zur Darstellung
wasserfreier Alkohole" — Berichte der deutschen chemischen Gesellschaft (Wein-
heim) 64: 210—213, 1931.
6. Ray, F. and G. Rieveschl. "Alkamine Esters of Fluorenone Carboxylic
Acid" — Journal of the American Chemical Society 65: 836, 1943.
7. "Fluorenone-2-Carboxylic Acid", in : Organic Syntheses Collective
Volume 3—1955, p. 420.
8. Former, M. "Ober 2-Benzoylfluoren und iiber Reten" — Monatshefte
fur Chemie 25 : 443—451, 1904.
9. Staudinger, H. "Ober Ketene. Ill Mittheilung. Diphenylketen" — Ber
ichte der deutschen chemischen Gesellschaft (Weinheim) 39 : 3062—3067, 1906.
10. Wislicenus, W. and A. Weitmeyer. "Ober Fluoren und 2-Nitrofluoren-
9-oxalsaureathylester" — Annalen der Chemie 436 : 1—9.
11. Ullmann F. and Ed. Mallet "Ober einige Fluorenon Derivate" —
Berichte der deutschen chemischen Gesellschaft (Weinheim) 31: 1696, 1898.
12. Tobler, R., Th. Holbro, P. Sutter, and W. Kern. "Ober Bromfluorene"
—Helvetica Chemica Acta 24: 100— 109e, 1941.
13. Schmidt, J. and K. Bauer; — Berichte der deutschen chemischen
Gesellschaft (Weinheim) 38: 3754, 3767, 1905.


GLASNIK HEMUSKOG DRUSTVA, Vol. 29, No. 1—2, 1964, pp. 57—71.
REACTION OF PHENYLMAGNESIUM BROMIDE WITH SIX-
AND FIVE-MEMBERED STEROID LACTONES*
by
MILORAD M. ROGIC
It is welll known that five-membered lactones in reaction
with an excess of a Grignard reagent give a tertiary alcohol(I)
which can be subjected to Barbier-Wieland degradation. In the lite
rature there is not much data concerning the reaction of a Grig
nard reagent with six-m:mbered lactones. However, it was recently
found that the lactone of 4,5-seco-4-nor-androstane-5,l 1,17-trihy-
droxy-3-oic acid reacts with an excess of phenylmagnesium bromide
in an unexpected manner, giving 3,5-seco-4-nor-3-phenyl-3,l 1,17-
trihydroxy-androstane-5-one as the main product, and a small quantity
of 3,5-seco-4-nor-3,3-diphenyI-l l,17-dihydroxy-2-androsten-5-one(2).
This may be explained by assuming that the intermediate formed
after the attack of the phenyl ion on the lactone carbonyl can undergo
an intramolecular hydride ion transfer.
This paper describes another abnormal Grignard reaction of
a six-membered lactone.
1 Ozonolysis(3) of progesterone at —70° in ethyl acetate-methy-
2ene chloride gave about 70% yield of 3,5-seco-4-nor-pregnane-
b,5-dione-3-oic acid(4) (II). This compound was reduced with sodium
horohydride in an alkaline alcoholic solution, and then heated with
(Iydrochloric acid, whereby the corresponding six-membered lactone
(bll) of the above acid was obtained; its infrared spectrum had
oands at 3490, 1725, 1255, 1110, 1075, 1055, and 965 cm-1. The
kxidation of the C20-hydroxyl group with chromic acid gave the
beto-lactone (IV) whose infrared spectrum did not show the hydroxyl
dand at 3490 cm-1, but had a band at 1705 cm-1, characteristic for
open-chain ketones. The nuclear magnetic resonance spectrum of this
keto-lactone had a resonance signal for the C5 proton at 6.14 t,
which is in good agreement with an axial proton resonance, which
•) This work was done at the Worcester Foundation for Experimental
Biology in Srewsbury, Mass., USA, where the author, at that time on leave of
absence from School of Sciences in Beograd, was postdoctoral research fellow
during 1961—1962. The author expresses his thanks to Dr. Marcel Gut for
financial support.

58
usually appears between 6.05 and 6.48 t(2-7). Hence, the C5-hydroxyl
group of the intermediate 5-hydroxy acid must be equatorial. From
the filtrate [obtained after crystallization of the hydroxy-lactone
III, a small quantity of a substance melting at 185° was isolated.
This substance is probably the C5-isomeric lactone with lactone III
since its infrared spectrum was very similar to that of the lactone
III. However, this compound was not further investigated.
When the hydroxy-lactone III was treated with an excess of phe-
nylmagnesium bromid a mixture of two compounds, compound V,
m. p. 156—158° and compound VII, m. p. 110— 112°, was obtained.
These compounds were easily separated on a silica gel column. The
compound V, m.p. 156— 158°, was isolated in a 56% yield and it
had an analysis for C26H36O2. It absorbed ultraviolet light at Xj^?11
224m (x and 264m [x, and its infrared spectrum had bands at 3580
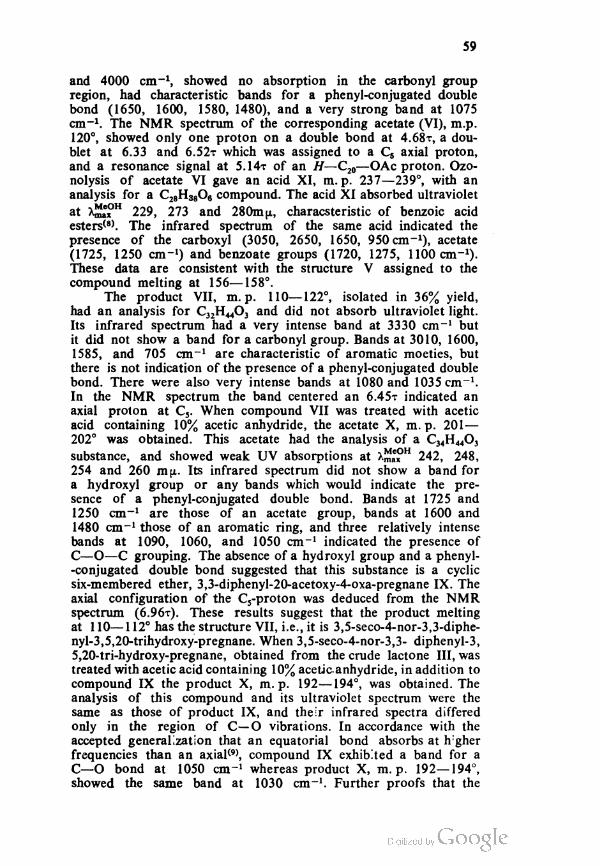
59
and 4000 cm-1, showed no absorption in the carbonyl group
region, had characteristic bands for a phenyl-conjugated double
bond (1650, 1600, 1580, 1480), and a very strong band at 1075
cm-1. The NMR spectrum of the corresponding acetate (VI), m.p.
120°, showed only one proton on a double bond at 4.68t, a dou
blet at 6.33 and 6.52x which was assigned to a C6 axial proton,
and a resonance signal at 5.14t of an H—C20—OAc proton. Ozo-
nolysis of acetate VI gave an acid XI, m.p. 237—239°, with an
analysis for a C28H38O6 compound. The acid XI absorbed ultraviolet
at >wH 229, 273 and 280m [t, characsteristic of benzoic acid
esters(8). The infrared spectrum of the same acid indicated the
presence of the carboxyl (3050, 2650, 1650, 950 cm-1), acetate
(1725, 1250 cm-1) and benzoate groups (1720, 1275, 1100 cm-1).
These data are consistent with the structure V assigned to the
compound melting at 156— 158°.
The product VII, m.p. 110—122°, isolated in 36% yield,
had an analysis for CjjH^Oj and did not absorb ultraviolet light.
Its infrared spectrum had a very intense band at 3330 cm-1 but
it did not show a band for a carbonyl group. Bands at 3010, 1600,
1585, and 705 cm-1 are characteristic of aromatic moeties, but
there is not indication of the presence of a phenyl-conjugated double
bond. There were also very intense bands at 1080 and 1035 cm-1.
In the NMR spectrum the band centered an 6.45t indicated an
axial proton at C5. When compound VII was treated with acetic
acid containing 10% acetic anhydride, the acetate X, m. p. 201—
202° was obtained. This acetate had the analysis of a C34H44O3
substance, and showed weak UV absorptions at X™°H 242, 248,
254 and 260 mp. Its infrared spectrum did not show a band for
a hydroxyl group or any bands which would indicate the pre
sence of a phenyl-conjugated double bond. Bands at 1725 and
1250 cm-1 are those of an acetate group, bands at 1600 and
1480 cm-1 those of an aromatic ring, and three relatively intense
bands at 1090, 1060, and 1050 cm-1 indicated the presence of
C—O—C grouping. The absence of a hydroxyl group and a phenyl-
-conjugated double bond suggested that this substance is a cyclic
six-membered ether, 3,3-diphenyl-20-acetoxy-4-oxa-pregnane IX. The
axial configuration of the C5-proton was deduced from the NMR
spectrum (6.96t). These results suggest that the product melting
at 110— 112° has the structure VII, i.e., it is 3,5-seco-4-nor-3,3-diphe-
nyl-3,5,20-trihydroxy-pregnane. When 3,5-seco-4-nor-3,3- diphenyl-3,
5,20-tri-hydroxy-pregnane, obtained from the crude lactone III, was
treated with acetic acid containing 10% acetic anhydride, in addition to
compound IX the product X, m.p. 192— 194°, was obtained. The
analysis of this compound and its ultraviolet spectrum were the
same as those of product IX, and their infrared spectra differed
only in the region of C—O vibrations. In accordance with the
accepted generalization that an equatorial bond absorbs at h gher
frequencies than an axial(9), compound IX exhibited a band for a
C—O bond at 1050 cm-1 whereas product X, m.p. 192—194°,
showed the same band at 1030 cm-1. Further proofs that the

60
latter compound is a cw-isomer of 3,3-d'phenyl-20-acetoxy-4-oxa-
pregnane with the equatorial proton at C5 were obtained by nuc
lear magnetic spetroscopy. The resonance signal for 5p-proton of
this compound appeared at 6.77t and for protons of the C19 methyl
group at 8.93t, while the resonance of the protons the CI9 methyl
group of compound IX appeared at 9.27.
When compound VII was treated with acetic anhydride in
boiling pyridine and then boiled in an acetic acid solution an oil
which contained no hydroxyl group was obtained. The infrared
spectrum of this compound had bands at 1725 and 1250 cm-1
(acetate), and a band at 1370 cm-1 (CH3—C)6, which was stronger
then the same band of 3,3-diphenyl-20-acetoxy-4-oxa-pregnane IX,
indicating the presence of two acetate groups. Bands at 1700,
1650, 1600 and 1575 cm-1 showed the presence of a phenyl-
-conjugated double bond. In addition the ultraviolet spectrum of
this compound was typical for a conjugated Ph2C = CH— system(Ie l0).
These recults suggest that the diacetate product is 3,5-seco-4-nor-
-3,3-diphenyl-5,20-diacetoxy-pregn-2-ene XII.
The benzaote of the hydroxy acid XI, m. p. 237-239°, obtained
by ozonolysis of compound V, on hydrolysis with 20% alcoholic
potassium hydroxide followed by boiling with hydrochloric acid,
gave the lactone of 2,5-seco-3,4-nor-20-hydroxy-pregnane-2-oic acid
XIII, m. p. 237-239°. This compound had an analysis of C19H30O3,
and did not absorb ultraviolet light. Its infrared spectrum showed
bands at 3500, 1780 (characteristic of five-membered lactones(11)),
1280, 1225, 1190 and 1110 cm-1. The NMR spectrum showed a
resonance signal at 6.25 t, which is in good agreement with an
axial C5 proton. The same compound XIII was obtained by ozo-
nization of 3,5-seco-4-nor-3,3-diphenyl-5,20-diacetoxy-pregn-2-ene
XII. The acid obtained had an infrared spectrum typical of an
acid(6), and after treatment with alcoholic potassium hydroxide and
boiling with hydrochloric acid it was converted to a crystalline
substance whose properties were identical with those of the five-
-membered lactone XIII.
The five-membered lactone XIII treated with an excess of phe-
nulmagnesium bromide gave only one product-2,5-seco-3,4-bis-nor-
-2,2-diphenyl-2,5,20-trihydroxy-pregnane XIV, m. p. 190°. This had
an analysis of C31H42O3. It did not absorb ultraviolet light and its
infrared spectrum was consistent with the spectrum of an alcohol
containing no phenyl-conjugated double bond. The NMR indicated
the presence of an axial proton at C5 (6.27 t). When 2,5-seco-3,4-
-bis-nor-2,2-diphenyl-2,5,20-trihydroxypregnane XIV was treated
with acetic anhydride at room temperature, followed by boiling in
an acetic acid solution, an oily product was obtained. This product
was chromatographed on a silica gel column furnishing a crystalline
substance m.p. 203-204°, and a small amount of an oil. The pro
duct m.p. 203-204° had an analysis of C33H42O3 and its ultraviolet
spectrum was the same as for the six-membered cyclic ethers IX
and X. The infrared spectrum showed neither the presence of a
hydroxyl group nor a phenyl-conjugated double bond. The NMR
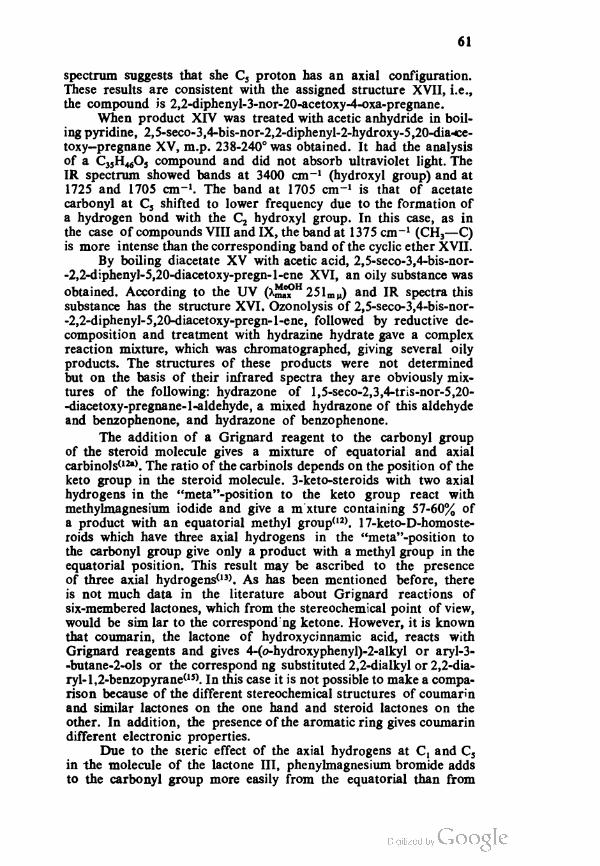
61
spectrum suggests that she C, proton has an axial configuration.
These results are consistent with the assigned structure XVII, i.e.,
the compound is 2,2-diphenyl-3-nor-20-acetoxy-4-oxa-pregnane.
When product XIV was treated with acetic anhydride in boil
ing pyridine, 2,5-seco-3,4-bis-nor-2,2-diphenyl-2-hydroxy-5,20-dia-ce-
toxy—pregnane XV, m.p. 238-240° was obtained. It had the analysis
of a CjjH^Oj compound and did not absorb ultraviolet light. The
IR spectrum showed bands at 3400 cm-1 (hydroxyl group) and at
1725 and 1705 cm-1. The band at 1705 cm-1 is that of acetate
carbonyl at C5 shifted to lower frequency due to the formation of
a hydrogen bond with the C2 hydroxyl group. In this case, as in
the case of compounds VIII and IX, the band at 1375 cm-1 (CH3—C)
is more intense than the corresponding band of the cyclic ether XVII.
By boiling diacetate XV with acetic acid, 2,5-seco-3,4-bis-nor-
-2,2-diphenyl-5,20-diacetoxy-pregn-l-ene XVI, an oily substance was
obtained. According to the UV (X^eOH 251m|1) and IR spectra this
substance has the structure XVI. Ozonolysis of 2,5-seco-3,4-bis-nor-
-2,2-diphenyl-5,20-diacetoxy-pregn-l-ene, followed by reductive de
composition and treatment with hydrazine hydrate gave a complex
reaction mixture, which was chromatographed, giving several oily
products. The structures of these products were not determined
but on the basis of their infrared spectra they are obviously mix
tures of the following: hydrazone of l,5-seco-2,3,4-tris-nor-5,20-
-diacetoxy-pregnane-l-aldehyde, a mixed hydrazone of this aldehyde
and benzophenone, and hydrazone of benzophenone.
The addition of a Grignard reagent to the carbonyl group
of the steroid molecule gives a mixture of equatorial and axial
carbinols(I2a). The ratio of the carbinols depends on the position of the
keto group in the steroid molecule. 3-keto-steroids with two axial
hydrogens in the "meta"-position to the keto group react with
methylmagnesium iodide and give a m xture containing 57-60% of
a product with an equatorial methyl group(12). 1 7-keto-D-homoste-
roids which have three axial hydrogens in the "meta"-position to
the carbonyl group give only a product with a methyl group in the
equatorial position. This result may be ascribed to the presence
of three axial hydrogens(13). As has been mentioned before, there
is not much data in the literature about Grignard reactions of
six-membered lactones, which from the stereochemical point of view,
would be sim lar to the correspond ng ketone. However, it is known
that coumarin, the lactone of hydroxycinnamic acid, reacts with
Grignard reagents and gives 4-(o-hydroxyphenyl)-2-alkyl or aryl-3-
-butane-2-ols or the correspond ng substituted 2,2-dialkyl or 2,2-dia-
ryl-l,2-benzopyrane(15). In this case it is not possible to make a compa
rison because of the different stereochemical structures of coumarin
and similar lactones on the one hand and steroid lactones on the
other. In addition, the presence of the aromatic ring gives coumarin
different electronic properties.
Due to the sceric effect of the axial hydrogens at C, and C5
in the molecule of the lactone III, phenylmagnesium bromide adds
to the carbonyl group more easily from the equatorial than from

62
the axial side. Since the ratio of products V and VII does not
depend on the reaction time (in other words, products V and VII
are the result of a kinetically controlled reaction), and since the
same ratio of products was obtained using different rations of
reagents, this means that the formation of product V is also in
dependent of the concentration of phenylmagnes'um bromide. The
refore, in the reaction of phenylmagnesium brom'de with the lactone
III, two intermediate products, E and A, may be formed:
4)
Since there is a free hydroxyl group at C20, it must be assumed
that this reacts too. However, since there is a large excess of
phenylmagnesium bromide, it is less probable that the other pos
sible reaction, disproportionate of the following type, could occur
to any extent.
However, if it does, the formation of the unsaturated cyclic ether
V would be easily explained by trans-diaxial el mination (16) of
water. Another possible explanation is that in the next step of
reaction the second molecule of phenylmagnesium bromide may
act on the intermediate complex in two ways. In the first case,
like in the reaction of esters (17) with an excess of a Grignard
reagent, the nucleophilic phenyl ion displaces the _O—C group.
This explains the formation of the tertiary carbinol. Howeve, in
stead of acting on the initial carbonyl carbon atom (reaction 1),
the nucleoph lie phenyl ion may attack the axial hydrogen of the
neighboring CH2 group of the intermediate E, thus causing trans-
-diaxial elimination (reaction 2):

63
Thus, the intermediate E, once formed, can react further, yielding
either tertiary carbinol or cyclic olefin. However, because of the
presence of the phenyl group and oxygen on the same carbon
atom, reaction 2 probably proceeds faster than reaction 1, and it
may be assumed that most of the molecules of the lactone III
wh ch react via the intermediate E yield the unsaturated product
V. In case of the intermediate A, the stereochemical conf,guration
required for trans-diaxial el'mination does not exist, and further
reaction occurs as in reaction 1, yielding tertiary carbinol VII.
The fact that under identical conditions the reaction of five-
-memb;red lactone XIII and phenylmagnesium bromide only gave
tertiary carbinol clearly shows that for the formation of unsatu
rated product V it is necessary to have a hydrogen trans-diaxially
oriented with the -OMgBr group. Nevertheless, it should be pointed
out that the explanation given for this „abnormal" Grignard reaction
does not exclude other mechan sms. Consequently, to establ sh
the course of this reaction with certainty, further investigations
are needed.
EXPRIMENTAL*
(3,5-Seco-4-nor-pregnane-5,20-dione-3-oic acid II*). — A solu
tion of progesterone I, 5 g in 100 ml methylene chloride, 100 ml
ethyl acetate and 2 ml of acetic acid, was cooled at —70° and
treated w th a stream of ozone-enr'ched oxygen. After ozon'zation
was complet, 3.5 ml 30% hydrogen peroxide was added to the
solution. The reaction nurture was left overnight at room tempera-
* Melting points are not corrected. Ultraviolet absorption spectra were
determined on a Cary 1 1 MS spectrophotometer on methanolic solutions. Infrared
spectra were taken on solid ma'erial incorporated into potassium bromide pellets.
NMR spectra were taken at 60 Mc/s in deuterated chloroform containing tetra-
methyl silane as the internal standard on a Varian V4300 B High Resolution
Spectrometer. The results are expressed inT unitst1S).

64
ture and then concentrated to a small volume. The residue was
dissolved in ether and extracted with IN sodium carbonate solution.
The acid II was precipitated with 3N hydrochloric acid and
filtered off. The yield of the crude acid II vas 60—70%. It was
crystallzed from methanol to m. p. 174— 176°. IR spectrum: 3100,
1735, 1695, 1675, 1185, 950 cm-1.
20-Hydroxy-4-oxa-pregnane-3-one, (III). — To a solution of
acid II, 2.5 g in 30 ml IN sodium hydroxide and 8 ml 95% ethanol,
1 g of sodium borohydride was added, and the mixture was reflu-
xed for 2 hr. The excess of sodium borohydride was destroyed
with a few drops of acetic acid, then 20 ml of 2N hydrochloric
acid was added and boiled for 30 min. The separated solid was
filtered off and crystallized from methanol, yielding 1.67 g (70%)
of hydroxylactone III, m. p. 252—254°. IR spectrum: 3490, 1725,
1255, 1110 cm-1.
Analysis for C20H32O3:
Calcd.: C, 74.96; H, 10.06
Found : C, 75.16; H, 9.93
From the mother l'quor of crystallization of crude hydroxylactone
III an additional 600 mg of oily material was obtained. It sol'dif ed
from methanol-ether solution, m. p. 185°. The IR spectrum of
this substance was very similar to that of hydroxylactone III, but
it was not investigated further.
4-Oxa-pregnane-3,20-dione (IV). — The hydroxyactone III,
65 mg, was dissolved in ether, 5 ml, and sodium dichromate
solution, 2 ml, containing a few drops of sulfuric acid. The reaction
mixture was stirred at room temperature for 2 hr and the ether
solution separated. The water solution was extracted a few times
with 5 ml portions of ether. The comb'ned etheral solutions were
washed with brine, dried over magnesium sulfate and evaporated.
The residue was crystall zed from methanol, giving 53 mg of
ketone IV, m.p. 152-154°. IR spectrum: 1725, 1705, 1080,
1060, cm-1. NMR: 6.14t.
Analysis for C20H30O3:
Calcd.: C, 75.43; H, 9.49
Found.: C, 75.37; H, 9.54
Reaction of phenylmagnesium bromide with the six-membered
lactone III. — To a solution of phenylmagnesium brom'de prepared
from 2.6 g of activated magnesium and 10.6 ml of bromobenzene in
dry ether, a solution of the lactone III, 2.5 g in tetrahydrofurane,
150 ml, was added dropwise through 2 hr. The mixture was kept
under reflux for 4 hr. Then a saturated solution of ammonium
chloride was added and the precipitated solid was filtered. The
water solution was extracted several times with ether. The combi
ned etheral solutions were washed with brine, dried over magnesium
sulfate and concentrated. The oily residue was dissolved in benzene
and chromatographed on a silica gel column. Eluates of 2% ethyl

65
acetate in benzene gave 1.67 g (56%)of crustalline material, m. p.
156—158° (from methanol). Eluates with 20% ethyl acetate in
benzene gave 1.30 g (36%) of solid m. p. 110—112°. Using 50%
ethyl acetate in benzene an additional 2—4% of oily material was
eluted whose infrared spectra shows the presence of hydroxyl and
carbonyl groups, but it was not investigated further. The substance
m. p. 156— 158° (V), shows the following bands in the IR spectrum:
3580, 3400, 3010, 1650 (very strong), 1600, 1580, 1480, 1075 cm1.
UV spectrum: X™?H 2641m*, e= 16700, 224^m, e= 13700. NMR:
6.14t.
Analysis for C26H36O2:
Calcd.: C. 82.06; H, 9.54
Found : C, 82.17; H. 9.54
The compound VII, m. p. 110— 112° does not absorb ultraviolet
light. IR spectrum: 3330, 3010, 1600, 1485, 1085, 1035, 705 cm-1.
NMR: 6.45t.
Analysis for C32H44O3:
Calcd.: C, 80.63; H, 9.30
Found: C, 82.44; H, 9.39
Ozonolysis of 3-phenyl-20-acetoxy-4-o.xa-pregn-2-ene (VI). —
When compound V, m. p. 156-158°, was treated with acetic anhy
dride in pyridine, the corresponding acetate VI, m. p. 120°, was
obtained. Its infrared spectrum does not show a band for a hydroxyl
group. A solution of this acetate, 2 g in 30 ml of acetic acid and
30 ml of ethyl acetate, was cooled to 0° and treated with a stream
of ozone-enriched oxygen. When the reaction had stopped 30
ml water was added to the solution and the reaction mixture
left overnight at room temperature. The solution was concen
trated and ihe residue dissolved in aceti acid, 90 ml. To this solu
tion 1 g of chromic acid d'ssolved in 4 ml of water was added
and heated for 30 min at 40-50°. The excess chromic acid was
reduced with methanol and the reaction nrxture concentrated to
small volume, diluted with water and extracted with ether. The
etheral solutions were comb:ned, washed with brine and extrac
ted with 0.25N sodium hydroxide solution. The alkaline solution
was acidified with 3N hydrochloric acid and extracted with ether.
This etheral solution was washed with brine, dried over mag
nesium sulfate and evaporated in vacuo. The yield of the acid
XI, m. p. 237-238°, was 1.80 g (73%). IR spectrum: 3050, 2650,
1725, 1650, 1275, 1250, 1 100, 950 cm"1. UV spectrum: X™?"
229m(x, e=11180, 273 mjx, s- 1040, 280m^, £=1000.
Analysis for C28H38O6:
Calcd. ; C, 71.46; H, 8.14
Found : C, 71.64; H, 8.15
5

66
2Q-Hydroxy-3-nor-4-oxa-pregnane-2-one (XIII). — The acid XI,
1.25 g, was dissolved in 20% potassium xydroxide solution in 80%
ethanol, 20 ml, and boiled for 2 hr. The reaction mixture was
acidified with concentrated hydrochloric acid, diluted with water,
15 ml, and boiled for 30 min. The resulting solution was poured
into cold water, extracted with ether, the ether evaporated and the
rec due dissolved in methylene chloride. This solution was washed
at 0" with a concentrated sodium bicarbonate solution, dried over
magnesium sulfate and concentrated to yield 667 mg (87) of the crude
lactone XIII. The lactone XIII was crystallized from methanol,
m. p. 237-239°. IR spectrum: 3500, 1775, 1205, 1180, 1100,980
cm-1. NMR: 6.25 t.
Analysis for C,9H30O3:
Calcd.: C, 74.47; H, 9.87
Found: C, 74.68; H. 9.94.
Dehydration of 3.5-seco-4-nor-3,3-diphenyl-3, 5, 20-trihydroxy
pregnane ( VII).—a) A solution of diphenylcarbinol VII, 1.6 g. in
30 ml of acetx acid and 3 ml of acetic anhydride, was boiled
for 4 hr. After removing acetic acid, the resulting oil was chro-
matographed on a silica gel column. Eluates obtained with benzene
were comb:ned and crystallized from methanol to give 1,49 g of
product IX, m.p. 201-202°. IR spectrum: 1725, 1600 1485, 1250,
1090, 1060, 1050 cm-1. UV spectrum: Xmac?H242m[x,e = 857. 248ma,
e= 1400, 254m}A, e= 1870, 260 m^, c= 1430. NMR: 6.96t.
Analysis for C34H44O3:
Calcd.: C, 80.56; H, 8.86
Found: C, 81.31; H, 8.76
Eluates of 2% ethyl acetate in benzene gave 186 mg of only sub
stance XII. IR Spectrum: 1725, 1700 1650, 1600, 1575, 1485.
1245, 1075, 1030 cm"1. UV spectrum: XJ£?H 251 mjx, s - 13000,
b) A solut'on of diphenylcarbinol VII, 3 g in 45 ml of pyridine
and 4 ml of acetic anhydride, was boiled for 2.5 hr. The excess
of anhydride was destroyed with water and then acetic acid evapo
rated to dryness. The oily residue was dissolved in acetic acidi 45 ml.
water, 0.5 ml, was added and boiled for 16 hr. After removing
acetic acid the resulting oil was dissolved in ether and the etheral
solution washed first with water, then with saturated sodium bi
carbonate solution and finaly with brine. After drying over mag
nesium sulfate, ether was evaporated and the residue dissolved in
benzene and chromatographed on a silica gel column. Eluates of
of 2% ethyl acetate in benzene gave only one product, identical
with compound XII from the preceeding experiment.
c) When crude hydroxy-lactone III was used for the reaction
with phenylmagnesium bromide, the isolated diphenylcarbinol VII in
reaction with acetic acid gave a mixture of compounds IX and X.
The resulting oil was chromatographed on a silica gel column.

67
Eluates of pure benzene gave in about 18% yield a substance m.p.
192-194°, followed by product IX, m.p. 201-202°. The compound
X, m.p. 192-194°, had the same UV spectrum as product IX. IR
spectrum: 1725, 1685, 1600, 1580, 1485. 1245, 1075, 1030 cm-1.
NMR: 6.78 i.
Analysis for C34H44O3:
Calcd.: C, 81.56; 8.86
Found: C, 81.70; 8.91
Ozonolysis of diphenylethylene-diacetate XII. — Ozonolys's and
hydrolysis were performed as for the reaction VI—►XI. From 2.8 g
of XII, 1.24 g of the lactone XIII was obta'ned. Th's product was
identical with the lactone obtained from XI as described above.
Reaction of phenylmagnesium bromide with five-membered
lactone XIII.— To a phenylmagnesium brom de solut on prepared
from 1 g of activated magnesium and 4 ml of bromobenzene n
dry ether, a solution of the lactone XIII, 900 mg n 25 ml of
tetrahydrofurane, was added dropwise. The m xture was kept under
reflux for 6 hr and worked up as described for the reaction of
six-membered lactone III. Chromatography on a sil ca gel column,
using 5% ethyl acetate in benzene gave only one product, XIV,
1.24 g. This compound was crystallized from a methylene chloride—
hexane solution and had m. p 190°. IR spectrum: 3300, 3010,
1600, 1485, 1180, 1085, 1045, 1010 cm-1. NMR: 6.27 t.
Analysis for C31H42O3:
Calcd.: C, 80.47; H, 9.15
Found: C, 80.71; H, 9.32
2,2 Diphenyl-3-nor-4-oxa-20-acetoxy-pregnane- (XVII).— A so
lution of diphenylcarbinol XIV, 800mg in 20 ml of pyr'd:ne and
2 ml of acetic anhydride, was left at room temperature overn ght.
After remov'ng pyridine in vacuo, the res'due was d ssolved in
acetic acid, 30 ml, 0.5 ml of water was added and boiled for 6 hr.
Acetic acid was distilled in vacuo, the residue d ssolved in benzene
and chromatographed on a silica gel column. Eluates of 2 % ethyl
acetate in benzene gave 580 mg of compound XVII, mp. 203-204°
(from methanol). IR spectrum: 1725, 1600 1485, 1375 1250
1050, cm-1. UV spectrum: X™?" 242 m\x,z = 850; 248m{x,e = 1360;
254 m|x,e= 1845; 260 imt, s=1400.
Analysis for C33H42O3:
Calcd.: C, 81.44; H, 8.70
Found: C, 81.70; H, 8.81
Eluates of 5% ethyl acetate in benzene gave 120 mg of oily sub
stance XVI which had the following bands in IR spectrum:
1725, 1685, 1600, 1575, 1245, 1075, 1030 cm-1. UV spectrum:
> = 25 limx, e=13500.

68
2,5seco-3,4-bis-nor-2,2-diphenyl-2-hidroxy-5.20-diacetoxy-pregna
ne (XV).— A solut on of d phenylcarb nol XIV, 1.8 g in 40 ml of
pyridine and 4 ml of acetic anhydride, was boiled for 2.5 hr. Pyri
dine was evaporated in vacuo and to the residue 150 ml of cold
water was added. The resulting solid (2.03 g) was filtered and
crystallized from methylene chloride-methanol to givg XV, m. p.
238-240°. IR spectrum: 3400, 3010, 1725, 1705, 1600, 1485, 1375,
1255, 1245, 1060, 1035 cm-1.
Analysis for C^H^O^.
Calcd.: C, 76.89; H, 8.50
Found: C, 76.99; H, 8,33
2,5- Seco -3,4- bis-nor - 2,2-diphenyl-5,-20- diacetoxy -pregn -I- ene
(XVI). — A solution of compound XV, 1.5 g in 50 ml of acetic
acid and 0.5 ml of water, was boiled for 6 hr. The acid was
removed in vacuo. The remaining oil had IR and UV spectrums
identical with product XVI described above.
A solution of this crude olefin XVI, 1 g in 50 ml of methy
lene chloride and 50 ml of ethyl acetate was cooled at 0° and
treated with a stream of ozone-enriched oxygen. After reductive
decomposition of ozonide, treatment with hydrazine hydrate and the
usual work up, by chromatography on a silica gel column several oily
products were isolated in small yields. According to their IR spectra
these are probably hydrazone of l,5-seco-2,3,4-tris-nor-5,20-diaceto-
xy-preganne-l-aldehyde, a mixed hydrazone of this aldehyde and
benzophenone, and a hydrazone of benzophenone.
REFERENCES
1. a) Henry, L. "Synteses diverses du dimSthylisopropylcarbinol" — Comptes
Rendus des Seances de VAcademie des Sciences (Paris) 144: 308, 1907.
b) Newman, M. S., W. S. Fones and W. F. Booth. "The Reaction of
Bromomagnesium Derivatives of Acetylenic Alcohols with Formaldehyde" —
Journal of the American Chemical Society (Easton, Pa.) 67: 1053, 1945.
c) Weizmann, Ch. and F. Bergman. "Interaction between Grignard
Compounds and Maleic Acid Dsrivatives" — Journal of the American Chemical
Society (Easton, Pa.) 60: 2647, 1938.
d) Losanitch, S. "Sur la constitution de la divalolactone" — Comptes
Rendus des Seances de V Academie des Sciences (Paris) 153: 390, 1911.
e) Ryer, A. and W. Gebert. "3 P-Acetoxy-17 a-hydroxynor-5-cholenic
Acid Lactone, a Byproduct of the Oxidation of Sitosterol" — Journal of the
American Chemical Society (Easton) 74: 41, 1952.
2. Caspi, E., W. Schmid and B. T. Khan. "Degradation of Corticosteroids.
V. — Preparation and Certain Reactions of ll-Oxygenated-3-5-seco-4-nor-5 P-
-hydroxy-3-oic Acid 3,5-Lactones" — Journal of Organic Chemistry (Baltimore)
26: 3898, 1961.
3. a) Turner, R. B. "Steroides Labelled with Isotopic Carbon: Choleste-
none and Testosterone" — Journal of the American Chemical Society (Easton*
72: 579, 1950. '

69
b) Hartman, J. A., A. J. Tomasewski, and A. S. Drciding. "The Partial
Degradation and Rsconstitution of the 'A' Ring of Es radiol" — Journal of
the American Chemical Society (Easton) 78: 5662, 1956.
c)9Soloway, A. and D. Fukushima. "The Preparation and Propsrties of
4-Oxa-17 a-hydroxy-21-acetoxy-A!-pregaane-3,l 1,20-trione" — Journal of the Ame
rican Chemical Society (Easton) 75: 5442, 1953.
4. Reichstein, T. and H. G. Fuchs. "Uber Bestandteile der Nelennieren-
rinde und verwandte Stoffe. Nachweis der Lage der Doppelbindung im Cortico-
steron" — Helvetica Chemica Acta (Basel) 23: 676, 1940.
5. Edward, J. T. and P. F. Morand. "Stereochemical Studies. II. — Con
figurations of Some 4-oxachoIestanes" — Canadian Journal of Chemistry (Ottawa)
38: 1325, 1960.
6. Bellamy, L. The Infrared Spectra of Complex Molecules — New York:
John Wiley and Sones, Inc., 1958.
7. Shoolery, J. N. and M. T. Rogss. "Nuclear Magnetic Spsctra of Steroids"
— Journal of the American Chemical Society (Easton) 80: 5121, 1958.
8. Ungnads, H. ' E. aid R. W. Lamb. "The Absorption Spectra of Benzoic
Acid and Esters" — Journal of the American Chemical Society (Easton) 74:
3789, 1952.
9. a) Barton, D. H., J. E. Page, and C. W. Shoppee. "Infrared Absorption
of Halogen-Steroids" — Journal of the Chemical Society (London): 331, 1956.
b) Cole, A. R. H., R. N. Jones, and K. Dobriner. "A Relationship
between the Stereochemical Configuration of 3-Hydroxysteroids and Their Infrared
Absorption Spectra" — Journal of the American Chemical Society (Easton) 74:
5571 (1952).
c) Mare, P. B. D. de la, W. Klyne, D. J. Millen, J. G. Pritchard, and
D. Watson. "Cyclic Sulphites Derived from the ChSoropropanediols" — Journal
of the Chemical Society (London): 1813, 1956.
10. Maystre, Ch., A. Frey, A. Wettstein and K. Miescher. "(Jber Steroide.
Ein einfacher Abban der Gallensauren-Seitenkette zur Methylketonstupe" —
Helvatica Chemica Acta (Basel) 27. 1815, 1944.
11. Rasmussen, R. S. and R. Brattain. "Infrared Spectra of Some Carbo-
xylic Acid Derivatives" — Journal of the American Chemical Society (Easton)
71: 1073, 1949.
12. a) Regarding the stereochemistry of the nuc'eophilic addition to the
carbonyl group of the cyclic ketones, see for example: A. V. Kamernitzky and
A. A. Akhrem. "The Stereochemistry of ReacJon of Nucleophillc Addition to
the Carbonyl Group of Cyclic Ketones" — Tetrahedron (London) 18: 705, 1962.
b) Barton, D. H., A. S. Campos-Neves and R. C. Cookson. "The
3-Methylcholestanols and Their Derivatives" — Journal of the Chemical Society
(London); 3500, 1956.
c) Ruzicka, L., P. Meister, and V. Ptelog. "Uber Steroide und Sexual-
hormone. Unteruchungen iiber den Zusammenhang zwischen {Constitution and
Geruch bei Steroiden. Methyl-androstan-und Allo-pregnan-Derivate" — Helvetica
chemica acta (Basel) 30: 867, 1947.
13. Clinton, R. O., R. G. Christiansen, H. C. Neumann, and S. C. Las-
kowski. "D-Homosteroids (II) 17a-ethynyl-D-homoetiocholane-3, 17adiol- 1 l-ones
and Related Compounds" — Journal of the American Chemical Society (Easton)
80: 3389, 1958.
14. Ruzicka, L., N. Wahba, P. T. Herzig, and H. Hausser. "Uber Steroid
und Sexualhormone. 17a P-Methyl-D-homo-testosteron; ein Betrag zur Bestimmun
des sterichen Verlaufes von Reaktionen am Kohlenstoffatom 17a der D-homo-
Steroide" — Chemische Berichte (Weinheim) 85: 491, 1952.
15. a) Smith, L. I. and P. M. Ruoff. "The Chemistry of Vitamin E. XXII.
The Reaction between Grignard Reagents and Coumarins and Hydrocoumarins"
— Journal of the American Chemical Society (Easton) 62: 145, 1940.
b) Lowenbein, A. E. Pongracz und E. A. Spiess. "Uber 2,4-Diaryl-
Chromane" — Chemische Berichte (Weinheim) 57: 1517, 1924.

70
16. Gould, E. S. Mechanism and Structure in Organic Chemistry — New
York: Holt, Rinehart and Winston, 1959, pp. 478, 484.
17. Royals, E. E. Advanced Organic Chemistry — New York: Prentice
Hall, Inc., 1954, p. 685.
18. Jackman, L. M. Application of Nuclear Magnetic Resonance Spectro
scopy in Organic Chemistry — New York: The Macmillan Co., 1959, p. 47.
19. Brown, H. C. and C. P. Gorg. "A Simple Procedure for the Chromic
Acid Oxidation of Alcohols to Ketones of High Purity" — Journal of the Ame
rican Chemical Society (Easton) 83: 2952, 1961.
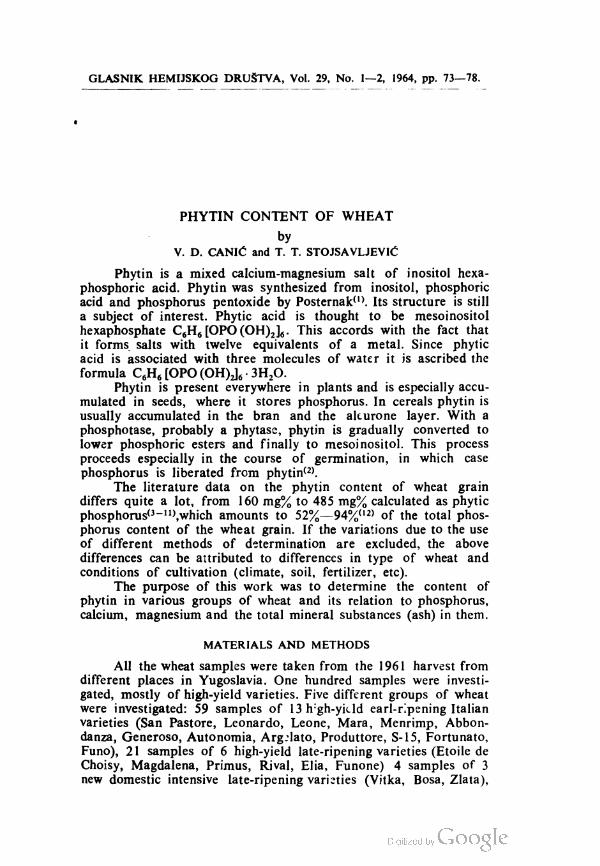
GLASNIK HEMIJSKOG DRUSTVA, Vol. 29, No. 1—2, 1964, pp. 73—78.
*
PHYTIN CONTENT OF WHEAT
by
V. D. CANIC and T. T. STOJSAVLJEVIC
Phytin is a mixed calcium-magnesium salt of inositol hexa-
phosphoric acid. Phytin was synthesized from inositol, phosphoric
acid and phosphorus pentoxide by Posternak(l). Its structure is still
a subject of interest. Phytic acid is thought to be mesoinositol
hexaphosphate C6H6 [OPO (OH)2]6. This accords with the fact that
it forms salts with twelve equivalents of a metal. Since phytic
acid is associated with three molecules of water it is ascribed the
formula C6H« [OPO (OH)2]6 - 3H2O.
Phytin is present everywhere in plants and is especially accu
mulated in seeds, where it stores phosphorus. In cereals phytin is
usually accumulated in the bran and the alturone layer. With a
phosphotase, probably a phytase, phytin is gradually converted to
lower phosphoric esters and finally to mesoinositol. This process
proceeds especially in the course of germination, in which case
phosphorus is liberated from phytin(2).
The literature data on the phytin content of wheat grain
differs quite a lot, from 160 mg% to 485 mg% calculated as phytic
phosphorus0 -u),which amounts to 52%—94%"2) of the total phos
phorus content of the wheat grain. If the variations due to the use
of different methods of determination are excluded, the above
differences can be attributed to differences in type of wheat and
conditions of cultivation (climate, soil, fertilizer, etc).
The purpose of this work was to determine the content of
phytin in various groups of wheat and its relation to phosphorus,
calcium, magnesium and the total mineral substances (ash) in them.
MATERIALS AND METHODS
All the wheat samples were taken from the 1961 harvest from
different places in Yugoslavia. One hundred samples were investi
gated, mostly of high-yield varieties. Five different groups of wheat
were investigated: 59 samples of 13 h'gh-yitld earl-ripening Italian
varieties (San Pastore, Leonardo, Leone, Mara, Menrimp, Abbon-
danza, Generoso, Autonomia, Arg:lato, Produttore, S-15, Fortunate
Funo), 21 samples of 6 high-yield late-ripening varieties (Etoile de
Choisy, Magdalena, Primus, Rival, Elia, Funone) 4 samples of 3
new domestic intensive late-ripening varieties (Vitka, Bosa, Zlata),
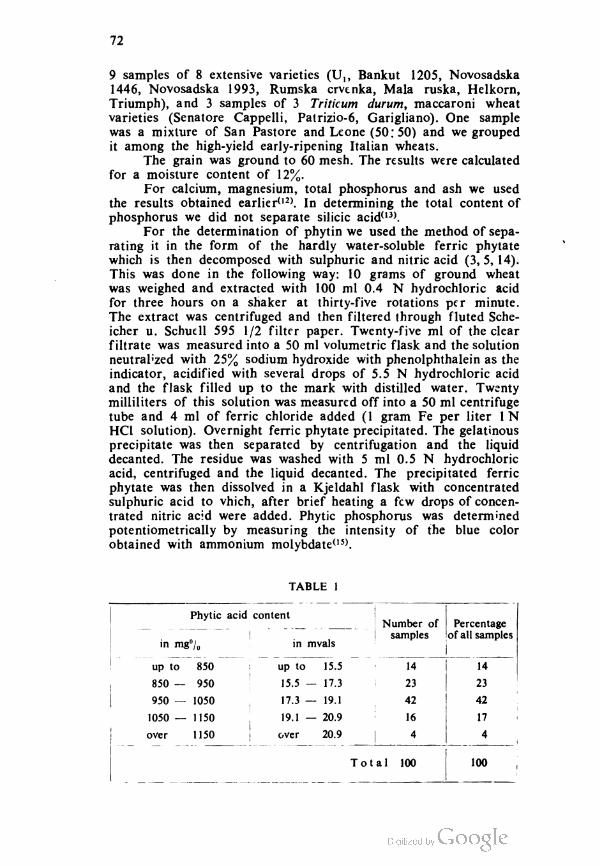
72
9 samples of 8 extensive varieties (U,, Bankut 1205, Novosadska
1446, Novosadska 1993, Rumska crvenka, Mala ruska, Helkorn,
Triumph), and 3 samples of 3 Triticum durum, maccaroni wheat
varieties (Senatore Cappelli, Patrizio-6, Garigliano). One sample
was a mixture of San Pastore and Leone (50: 50) and we grouped
it among the high-yield early-ripening Italian wheats.
The grain was ground to 60 mesh. The results were calculated
for a moisture content of 12%.
For calcium, magnesium, total phosphorus and ash we used
the results obtained earlier(l2). In determining the total content of
phosphorus we did not separate silicic acid(13).
For the determination of phytin we used the method of sepa
rating it in the form of the hardly water-soluble ferric phytate
which is then decomposed with sulphuric and nitric acid (3,5, 14).
This was done in the following way: 10 grams of ground wheat
was weighed and extracted with 100 ml 0.4 N hydrochloric acid
for three hours on a shaker at thirty-five rotations per minute.
The extract was centrifuged and then filtered through fluted Sche-
icher u. Schuell 595 1/2 filter paper. Twenty-five ml of the clear
filtrate was measured into a 50 ml volumetric flask and the solution
neutralized with 25% sodium hydroxide with phenolphthalein as the
indicator, acidified with several drops of 5.5 N hydrochloric acid
and the flask filled up to the mark with distilled water. Twenty
milliliters of this solution was measured off into a 50 ml centrifuge
tube and 4 ml of ferric chloride added (1 gram Fe per liter 1 N
HC1 solution). Overnight ferric phytate precipitated. The gelatinous
precipitate was then separated by centrifugation and the liquid
decanted. The residue was washed with 5 ml 0.5 N hydrochloric
acid, centrifuged and the liquid decanted. The precipitated ferric
phytate was then dissolved in a Kjeldahl flask with concentrated
sulphuric acid to vhich, after brief heating a few drops of concen
trated nitric acid were added. Phytic phosphorus was determined
potentiometrically by measuring the intensity of the blue color
obtained with ammonium molybdate(15).
TABLE 1
Phytic acid content
Number of Percentage
1 samples of all samples
in mg°/0 in mvals
up to 850 up to 15.5 14 14
850 — 950 15.5 — 17.3 23 23
950 — 1050 17.3 — 19.1 42 42
1050 — 1150 19.1 — 20.9 16 17
over 1 1 50 over 20.9 4 4
Total 100 100

73
To calculate the content of phytic acid the formula of meso-
inositol hexaphosphate was used in the anhydrous form with a
molecular weight of 660 and equivalent weight 55.
RESULTS AND DISCUSSION
The content of phytic acid in the samples varied from 627.8
to 1245.4 mg%. This is shown in Table 1.
The mean value (A/), the standard deviation (8) and the vari
ation coefficient for the tested samples are:
M = 976.5 mg%
8 =111.4 mg%
CV%= 11.4
The phytic acid content expressed in milliequivalents (milli-
vals) varied from 11.2 to 22.6, with a mean value 17.8 mvals.
The contents of ash, calcium, magnesium, total and phytic
phosphorus, and the percentage of phytic phosphorus of total
phosphorus, are shown in Table 2.
TABLE 2
Italian
high-yieldHigh-
-yield late-
-ripening
New
Yugoslav
intensive late-
-ripening
Extensive
varieties
Maccaroni
wheats
early-
-ripening
(Triticum
durum)
Number of varieties 13(59) 6(21) 3(4) 8(9) 3(3)
(samples)
Ash in % 1.62 1.62 1.62 1.79 1.77
Calcium in 36.8 37.4 35.6 42.9 41.5
mg% (mval) (1.8) (1.9) (1.8) (2.1) (2.1)
Magnesium in 121.7 122.2 133.5 138.5 124.6
mg% (mval) (10.0) (10.1) (11.0) (11.4) (10.2)
Phosphorus as 843.8 853.2 838.2 950.9 887.1
P2O5 in mg%
(phytic)
(630.2) (608.7) (604.5) (691.2) (647.4)
% of phytic in 74.7 71.3 72.1 72.7 72.9
total P2Os
Phytic acid in 976.2 942.8 936.3 1070.8 1004.8
mg% (mval) (17.7) (17.2) (17.0) (18.2) (18.2)
The phytic acid content decreased in the following order:
extensive varieties, maccaroni wheats (Triticum durum), Italian high-
-yield early-ripening, high-yield late-ripening, new Yugoslav inten
sive late-ripening varieties. There is an obvious difference in the
phytic acid content of the extensive and maccaroni varieties and the
early and late-ripening high-yield varieties.
In some samples the percentage of total phosphorus as phytic
phosphorus varies from 50.3 to 96.1%. Varieties containing more
phosphorus had more phytic acid too, but while usually with a lower

74
percentage of phytic in total phosphorus. The highest percentage
of total phosphorus as phytic was found the Italian high-yield
early-ripening varieties — 74.7%.
The ratio of phytic acid to calcium and magnesium is inte
resting because phytin is the calcium magnesium salt of phytic
acid. The total millivals of calcium and magnesium was about
12.1. This indicates that 5.7 mvals (the difference up to 17.8
mvals) of phytic acid could be neutralized with other metals(1*).
Tabb 2 shows that groups of wheats with a larger ash content
also have a larger content of calcium, magnesium, phosphorus and
phytic acid. The total millivals of calcium and magnesium from
11.8 to 13.5 corresponds to the ash content, i.e., varieties with a
larger ash content also have a higher millivals total of calcium and
magnesium. The ratio between the millivals of calcium and mag
nesium is 1:5 and 1 : 6, i. e. fairly constant. Assuming that calcium
and magnesium are quantitatively associated with phytic acid it
may be sa«d that two thirds of phytic acid in wheat is neutralized
with calcium and magnesium and their millival ratio is between
1 : 5 and 1:6, as was already shown recently06).
REFERENCES
1. Posternak, S. — Helvetica chimica acta (Basel) 4: 150, 1921.
2. Schormiiller, J. Lehrbuch der Lebensmittelchemie — Berlin—Gdttingen—
—Heidelberg: Springer—Verlag, 1961.
3. Courtois, J. and Ch. Peres. — Bulletin de societi chimique et biologique
(Paris) 30: 195, 1948.
4. Perez, Ch. Contribution a I'etude de la specificite de la phytase, — Paris:
Imprim. M. Declume, Lons-le Sonuier, 1949.
5. Pringle, W. J. S. and T. J. Moran. — Journal of the Society of Che
mistry and Industry (London) 61: 108, 1942.
6. Menger, A. — Getreide und Mehl (Berlin) 1: 9—12, 1951.
7. Greaves, J. E. and C. T. Hirst. — Cereal Chemistry (St. Paul) 6: 1 15—
— 120, 1929.
8. Webster, J. E. — Journal of Agricultural Research (Washington)
37: 123—130, 1928.
9. Hay, J. G. — Cereal Chemistry (St. Paul) 19: 326—332, 1942.
10. Schormiiller, J. and G. Wiirdig. — Deutsche Lebensmittel Rundschau
(Berlin), 53: 1— 10, 1957.
11. Kurmies, B. — Phosphorsdure (Berlin) 20: 126—133, 1960.
12. Simic, I., V. Canic and T. Stojsavljevic. — Hemijska industrija
(Beograd) (in press).
13. Schormiiller, J. and H. Hoffmann. — Nahrung (Berlin) 5: 155, 1961.
14. Common, R. H. — Analyst (Cambridge) 65: 79—85, 1940.
15. Kent—Jones, D. W. and A. J. Amos. Modern Cereal Chemistry, V ed.
— Liverpool: The Northern Publication Company, 1957, p. 574.
16. Mihajlovic, Antid, M. and D. Hadzijev. — Glasnik Hemijskog druStva
(Beograd) 27: 135—140, 1963.

SRPSKO HEMUSKO DRUSTVO (BEOGRAD)
BULLETIN
OF THE CHEMICAL
SOCIETY
Belgrade
(Glasnik Hemijskog drustva — Beograd)
Vol. 29, No. 3-4, 1964.
Editor:
MILOS MLADENOVlC
Editorial Board:
DELlC, D., DESPlC, A., DIZDAR, Z., DIMITRIJEVlC, DJ., KONCAR-DJURDJEViC, S.
LEKO, A., MILlC, M., MLADENOVlC, M., MlHAJLOVlC, M„ MlCoVlC, V., RADOSAV-
LJEVlC, S., RASAJSKI, S., STEFANOVlC, DJ., TUTUNDZlC, P., HOROVIC, A , dELAP, M
Published by
SRPSKO HEMUSKO DRUSTVO (BEOGRAD)
1966.
Translated and published for U.S. Department of Commerce and
the National Science Foundation, Washington. D. C, by
the NOLIT Publishing House, Terazije 27/H, Belgrade, Yugoslavia
1966.
Translated by
DANICA LADJEVAC and ALEKSANDRA STOJ1LJKOVIC
Edited by
PAUL PIGNON
Printed in Beogradski Graficki Zavod, Belgrade

CONTENTS
D.M. Vueurovic, R.2. Vrafar and LB. Ilic: Oxidation and Hydrolysis
Kinetics of Oxidized Iron in Aqu eous Solutions at Elevated Temperature
and Pressure in an Autoclave 5
P. S. Tutundzic and V. C Scepanovic : Minor Constituents in Native Natural
Products, Ashes and Slags. VI. Semiquantitative Spectrograph^ Deter
mination of Secondary Constituents in Natural Materials and Their
Products 15
T. A. Kiss: A Contribution to the Complexometric Determination of Metals.
VII. Potentiometric Determination of Iron, Copper, Nickel, Zinc,
Magnesium, Manganese, Lead, Cobalt and Cadmium 23
M. Hranisavljevic—Jakovljevic, I. Pejkovic—Tadic, K. Jakovljevic and J.
Miljkovic—Stojanovic: Thin-layer Chromatography of Inorganic
Ions II. — Separation of Metal Dithizonates 27
M. V. Susie, D. S. Veselinovic and D. i. Suznjevic: The Reaction between
Sodium Tungstate and L-Ascorbic Acid 31
V. Vajgand and T. Pastor: Determination of Tertiary Amines and Salts of
Organic Acids in Glacial Acetic Acid by Conductometric Titration 41
B. L. Bastic and M. V. Piletic: Contribution to the Study of Benzothiazoles,
Benzimidazoles and Benzoxazoles. II. Benzothiazoles Obtained by
Condensation of o-Aminothiophenol with Pyridinecarboxylic Acids 49
M. Lj. Mihailovic, S. Grujic and D. Hadzijev: Chemical Investigation of
Wheat. 10. Nucleotide Composition of Ribonucleic Acid of Wheat
Leaves 55
J. J. Bojanovic, A. D. Jevtovic and M. O, Corbie: The Effect of Insulin on the
Metabolism of Proteins, Lipids and Glucides. VIII. The Action of
Successive Hyperinsulinemia on Blood Serum Lipoproteins 65


GLASN1K HEMUSKOG DRUSTVA, Vol. 29, No. 3—4, 1964, pp. 81—93.
OXIDATION AND HYDROLYSIS KINETICS OF OXIDIZED
IRON IN AQUEOUS SOLUTIONS AT ELEVATED TEMPERA
TURE AND PRESSURE IN AN AUTOCLAVE
DUSAN VUCUROVIC, RAJKO VRACAR and ILIJA ILIC
The oxidation of bivalent iron by gaseous oxygen from aqueous
solutions has been studied by several authors(1 -2-3). Their results show
that it in a number of phases: 1) dissolution of oxygen, 2) adsorption
of its molecules on the surface of bivalent salt, 3) transformation of
molecular to atomic oxygen, 4) oxidation by atomic oxygen.
This multiphase process considerably retards* the rate of oxidation
at room pressure and temperature. Phase 1) has a particularly great
retarding influence. At room temperature and pressure this heterogeneous-
homogeneous process provides maximum solubility of 7 mg/1 of water.
With increasing temperature in an open vessel the solubility decreases,
becoming negligible at 100°C.
According to some authors(4) the presence of copper ions in the
aqueous solution accelerates the oxidation. It is reported that with a
fine spray of oxygen and the presence of copper ions oxidation proceeds
to completion. However, investigations done so far, and our results
as well(5), show that quantitative oxidation of Fe2+ under normal
conditions is hardly possible in a reasonable time.
On the other hand, in oxidation of Fe2+ by gaseous oxygen in a
closed vessel at elevated temperatures, the solubility of oxygen in the
solution is higher. The increased solubility and the increased rates of
the other phases with higher temperature greatly accelerate oxidation.
Iron oxidation in a closed vessel at a given solution pH is accompa
nied by simultaneous hydrolysis of the oxidized iron. According to the
literature(3- 6) the chemism of oxidation and hydrolysis depends on the
presence of free acid in the solution. In acidified aqueous solutions, with
an excess of free sulphuric acid, it can be expressed as follows:
by
4FeSO4+02+2H2SO4=2Fe2(SO4)3+2H2O
Fe2(SO4)3+nH2O=3H2SO4+Fe2O3 . nH2O
and in solutions without an excess of free acid:
(1)
(2)
6 FeSO4+l 72O2+nH2O=Fe2(SO4)3+Fe2O3 . nH2O
Fe2(SO4)3+(3+n)H2O=Fe2O3 . nH2O+3 H2SO4
(3)
(4)

6
Obviously, the difference is that in Eq. (1) sulphuric acid directly
participates in the oxidation reaction and in Eq.(3) some of the iron
oxidizes to hydrated oxide which precipitates. However, the above dif
ferences are not constant. Later in the process the sulphuric acid extra
cted by hydrolysis according to Eq.(4) will participate in oxidation.
After a time this leads to transformation of the process in Eq.(3) to that
in Eq.(i).
The precipitation of iron and the extraction of H2SO4 by hydrolysis
represent an important characteristic of the autoclave oxidation process.
Oxidation of Fe2+ by oxygen in an autoclave and simultaneous
hydrolysis of oxidized iron are very important from the practical point
of view. The formation of ferric hydroxide or other hardly soluble salts
of trivalent iron is accompanied by a greater change of the isobar potential
than in the formation of the same compounds of bivalent iron, nickel,
cobalt and some other metals. Hence Fe3+ precipitates by hydrolysis at
considerably lower pH than the other metals, so it can be separated from
them to.
If iron is in bivalent form in the so1ution it must first be oxidized.
It has been pointed out that oxidation by gaseous oxygen, the mcst
suitable oxidizing agent, at room pressure and temperature is a slow
process. Therefore it is reasonable to try oxidation in an autoclave
with simultaneous hydrolysis of Fe3+ to separate it from other metals.
It is well known that iron is always present in sulphide nickel-
containing cobalt minerals. In the processing of these minerals by acid
leaching in an autoclave with the presence of oxygen Fe3+ hydrolyzes.
If the initial iron has a sulphide form before hydrolysis it must first
be oxidized. This behavior of the iron and knowledge of this behavior
is an important prerequisite for successful extraction of cobalt and nickel.
In this work we wished to contribute to the study of the kinetics
of ferrous sulphate autoclave oxidation and hydrolysis of the ferric
sulphate formed. It is of practical interest to find what conditions of
autoclave oxidation produce quantitative oxidation of iron and how
much of it can be separated by hydrolysis, i. e. what are the optimal
conditions to get maximum purification of iron from the solution.
To this end the influence of the following factors was investigated:
a) temperature, b) oxidation time, c) initial Fe2+ concentration in the
solution, d) acidity of the solution, e) partial pressure of oxygen.
EXPERIMENTAL
An aqueous solution of chemically pure FeSO4 . 7 H?O was oxidized
in an autoclave. Ferric sulphate was dissolved in a quantity that corres
ponded to the desired concentration of Fe2+ in the solution.
Oxidations were performed in an acid-resistant autoclave with one
liter of the solution. The autoclave was electrically heated and a constant
temperature maintained automatically. The solution was intensively
mixed with a metal mixer built into the autoclave. Before heating, gaseous
O2 was introduced into the autoclave to the desired pressure.

7
At the end of the oxidation time (measured from when the desired
temperature was reached), the mixing was discontinued and the autoclave
air-cooled to room temperature. The cooling time lasted on average
about five hours. After cooling the excess of O2 was released and the
solution taken out and filtered to separate the iron precipitate.
The quantities of oxidized and hydrolyzed iron were determined
by measuring the bivalent and the total iron in the filtrate. The change
of solution acidity was determined by measuring the pH with a pH-
meter.
a) Influence of temperature
Runs were made at 50, 80, 110, 140, 170, and 200°C. The working
specification of the autoclave did not allow temperatures higher than
200°C.
The results are shown in Table 1 and Fig. 1.
TABLE 1
Influence of temperature on quantities of oxidized and hydrolyzed iron
Concentration of solution: 1.45 g Fe2 x/l;
Oxidation time: 3 hours; P02 15 atm;
Initial pH of solution: 3.5
Temp Pressure
(atm)
Cone.
Fe2+
after
oxidat.
(g/D
Oxidi
zed
Fe2+
(g/D
Oxidi
zed
/—>
£9
Hydr.
Fe3+
(g/D
Hydr.
Fe3+
Diff.between
hydeol.edoxidiz.
Fe(%)
m6fteoxid6t.
% Fe2+
(%)
+ 0(%)
20 15 1.368 0.081 6.68 1.413 0.036 1.79 4.89 3.28
50 15.5—16.5 0.921 0.531 36.67 1.086 0.366 25.20 11.47 2.51
80 18 —19 0.279 1.173 80.90 0.387 1.065 73.42 7.48 2.02
110 20 —21.5 0.095 1.355 93.50 0.116 1.305 91.01 2.49 1.85
140 24 —25.5 0.060 1.392 95.86 0.088 1.364 93.93 1.93 1.80
170 30.5—32.5 0.044 1.406 96.96 0.072 1.388 95.71 1.25 1.77
200 41 — 43 0.022 1.428 98.46 0.023 1.427 98.41 0.00 1.75
It can be seen from the results that for a given time the percentage
of oxidized iron increases with increasing temperature.
The quantity of trivalent iron increases most rapidly in the tempera
ture range up to 1 10°C. Above this the percentage of oxidation continues
to rise, but considerably slower as it approaches 100.

8
20 50 80 110 140 170 200
TEMPERATURE, °C
Fig. 1. Dependence of quantity of oxidized and
hydrolyzed Fe on temperature
1. Oxidized Fe
2. Hydrolyzed Fe
Likewise the hydrolysis rate of oxidized iron also increases with
increasing temperature. The temperature dependence of hydrolysis
relative to the initial concentration of Fe2+ in solution is the same as
the temperature dependence of oxidation. Up to 110°C hydrolysis pro
ceeds intensively and above this slows down considerably. This means
that most of the iron is extracted from the solution (91%) below this
temperature.
The curve in Fig. 2 shows the relation between the oxidation and
hydrolysis processes. At low temperatures (up to 50°) the difference
between the quantities of oxidized and hydrolyzed iron is considerable.
This means that in this temperature range hydrolysis goes considerably
slower. However, with increasing temperature the rate of hydrolysis
increases faster than that of oxidation, reducing the difference. At
200°C, under the given working conditions, the difference disappears,
all the ferric sulphate hydrolyzes and the oxidized iron precipitates.
Hydrolysis during autoclave oxidation forms free H2SO4 which
reduces the pH of the solution. Under the given conditions at 200°C the
initial pH of 3.5 is reduced to 1.75.

9
b) Influence of oxidation time
The above results show that for a concentration of 1.45 g Fe2+/1
of the solution it is not possible to obtain quantitative oxidation even
if oxidation lasts 3 hours at a temperature of 200°C.
TABLE 2
Influence of oxidation time on quantity of oxidized Fe2
Concentration of solution: 1.45 g F^x/l
Temperature 200°C, Po2 15 atm, PWOrking 41—43 atm
pH of solution before oxidation: 3.5
Oxid. time
(h)
Concentr.
of Fe2+
after oxid.
(g/D
Oxidized
Fe2+
(g/D
Oxidized
Fe*+
(%)
Hydrolyzed
fraction of
oxidized
Fe (%)
pH after
oxidation
1 0.046 1.404 96.83 100.00 1.80
2 0.031 1.419 97.89 100.00 1.77
3 0.023 1.427 98.48 100.00 1.75
4 0.014 1.436 99.07 100.00 1.73
5 0.002 1.448 99.87 100.00 1.70

10
Since the specification of the autoclave did not allow the use of higher
temperatures, further studies were made to see whether it is possible
to get complete oxidation and how in a longer time oxidation changes
with time in general.
Expsriments were carried out at the optimal temperature of 200°C
for periods of 1, 2, 3, 4, and 5 hours.
Complete oxidation of bivalent iron in a starting concentration of
1.45 g/1 of solution is possible (Table 2) under the given conditions if
9 the process lasts 5 hours.
The above results also show that the bulk of the Fe2+ (96.83%)
oxidizes in the first hour and in this period the oxidation rate is maxi
mum. The rest of it oxidizes much more slowly. The oxidation rate
decreases and much more time is required for the completion of the
process.
Hydrolysis of oxidized iron was complete in all the investigated
periods of time. This implies that hydrolysis practically depends only
on temperature and the acidity of the solution.
c) Influence of the bivalent iron concentration
It may be seen from the above that a concentration of 1.45 g Fe2+ /I
completely oxidizes in a period of five hours. To simplify study of the
influence of the starting concentration of Fe2+, experiments were made
with an oxidation time of 2 hours. It was found that oxidation was
complete even at a concentration of 4.52 g Fe2+/1 at 200°C. Therefore
a series of experiments were made to study the influence of the Fe2+
starting concentration on the time required for complete oxidation.
It was found that a concentration above about 5 g Fe2+/1 comple
tely oxidizes in a period of one hour, so this was adopted as optimal
for investigating the influence of the Fe2+ concentration on oxidation
and hydrolysis. This fact leads to the important conclusion that an
increased Fe2+ concentration reduces the time required for complete
oxidation.
TABLE 3
Influence of concentration of Fe2 + on oxidation and hydrolysis of oxidised iron.
Time of oxidation 1 hr, temperature 200 °C. Po2, 15 atm /"working 41—43 aim
pH of solution before oxidation 3,5
3
t - +
+ 9SS~* *—-
o
Coe.Fe Coe,of afteoxiction(gll) Oxidied
(gll)
J 8 . + X
Hyde.FeHyde.p6i
oxid(%)
pHafteoxid6tion
+ o+ o
o£
1.45 0.046 1.40 96.83 0.046 1.404 100.00 1.80
4.52 0.00 4.52 100.00 0.000 4.520 100.00 1.15
9.30 0.00 9.30 100.00 0.265 9.036 97.09 0.95
14.34 0.00 14.34 100.00 1.240 13.100 91.14 0.85—0.90
18.90 0.04 16.86 99.84 5.030 13.870 73.95 0.80—0.85
46.20 0.14 46.06 99.70 32.240 13.960 31.21 0.80—0.85

11
100
r-,45
O
2 40O
UT35
_join
30z
z 25oCL-
U. 20
o
ZISC
l-9
cc 10i-
zLLl 5uzcu
I1
2
^/
z
/
/
/
OXIDIZED AND HYDRCLVSED IRON, g/l OF
Fig. 3. Dependence of quantity of hydrolyzed and
oxidized Fe on concentration of Fe2+ in solution
1. Quantity of hydrolyzed Fe
2. Quantity of oxidized Fe
Table 3 and Fig. 3 show that the quantity of oxidized iron increases
with increasing Fe2+ concentration in the solution, in which case all
concentrations greater than or equal to 4.52 g/l of the solution completely
oxidize in one hour.
Likewise, the quantity of hydrolyzed iron increases with increasing
Fe2+ up to about 14 g/l of solution. However, for concentrations
larger than 14 g/l it remains constant.
This influence of the Fe2+ starting concentration on the process
of hydrolysis is due to change of acidity of the solution. The more
Fe2+ there is in the solution, i.e., the more Fe3+ hydrolyzes, the more
free H2SO4 there is. At a sufficiently high concentration, so much sul
phuric acid will separate that the pH will reach a value at which further
hydrolysis is not possible.
From the above results it follows that for a starting pH 3.5 the
limiting Fe2+ concentration is aproximately 14 g/l of solution. By
oxidation and subsequent hydrolysis of this quantity, the free H2SO4
reduces the pH value to 0.80—0.85, at which the process of hydrolysis
completes.
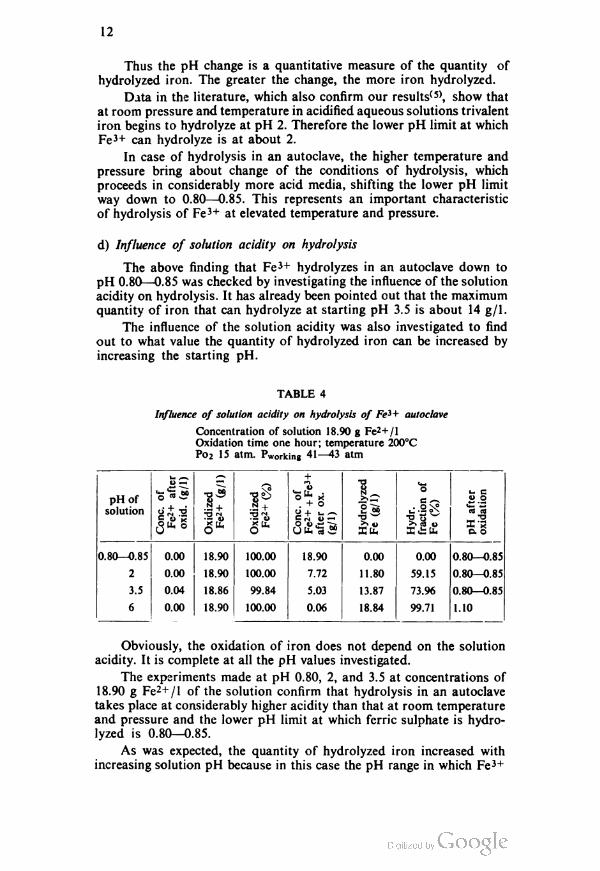
12
Thus the pH change is a quantitative measure of the quantity of
hydrolyzed iron. The greater the change, the more iron hydrolyzed.
Data in the literature, which also confirm our results(5), show that
at room pressure and temperature in acidified aqueous solutions trivalent
iron begins to hydrolyze at pH 2. Therefore the lower pH limit at which
Fe3+ can hydrolyze is at about 2.
In case of hydrolysis in an autoclave, the higher temperature and
pressure bring about change of the conditions of hydrolysis, which
proceeds in considerably more acid media, shifting the lower pH limit
way down to 0.80—0.85. This represents an important characteristic
of hydrolysis of Fe3+ at elevated temperature and pressure.
d) Influence of solution acidity on hydrolysis
The above finding that Fe3+ hydrolyzes in an autoclave down to
pH 0.80—0.85 was checked by investigating the influence of the solution
acidity on hydrolysis. It has already been pointed out that the maximum
quantity of iron that can hydrolyze at starting pH 3.5 is about 14 g/1.
The influence of the solution acidity was also investigated to find
out to what value the quantity of hydrolyzed iron can be increased by
increasing the starting pH.
TABLE 4
Influence of solution acidity on hydrolysis of Fe3+ autoclave
Concentration of solution 18.90 g Fe2+/1
Oxidation time one hour; temperature 200°C
P02 15 atm. Pworking 41—43 atm
t- ^
OxidizedFe2+(g/1)
t Hydeolyzed
Fe(g/1) Hyde.
fectionof
Fe(%)
pH of
solution
T3\o 0
x m6fteoxid6tion
V w+ o
"+C u y
.H +
gr< V —
0.80—0.85 0.00 18.90 100.00 18.90 0.00 0.00 0.80—0.85
2 0.00 18.90 100.00 7.72 11.80 59.15 0.80—0.85
3.5 0.04 18.86 99.84 5.03 13.87 73.96 0.80—0.85
6 0.00 18.90 100.00 0.06 18.84 99.71 1.10
Obviously, the oxidation of iron does not depend on the solution
acidity. It is complete at all the pH values investigated.
The experiments made at pH 0.80, 2, and 3.5 at concentrations of
18.90 g Fe2+/1 of the solution confirm that hydrolysis in an autoclave
takes place at considerably higher acidity than that at room temperature
and pressure and the lower pH limit at which ferric sulphate is hydro
lyzed is 0.80—0.85.
As was expected, the quantity of hydrolyzed iron increased with
increasing solution pH because in this case the pH range in which Fe3+
13
is hydrolyzed is increased. Increase ofsolution pH from 3.5 to 6 increases
the quantity of hydrolyzed iron by about 5 g/1 of solution, so that
the maximum quantity of iron that can be separated by hydrolysis is
19 g/1 solution.
e) Influence of the partial pressure of oxygen
The partial pressure, i. e. the amount of oxygen is one of the factors
that influences Fe2+ oxidation.
Since complete oxidation of iron at a concentration higher than
about 5 g/1 of solution is achieved at Pq2 15 atm in one hour, investiga
tions of the influence of Po2 were only carried out to see whether under
these conditions the iron can be oxidized with even less O2.
4
f) Characteristics of the precipitate obtained by hydrolysis
No unified opinion can be found in the literature concerning the
mechanism of the hydrolysis of ferric sulphate. In the introduction of
this paper we give reactions of hydrolysis, from which it follows that
hydrated iron oxide is formed by hydrolysis of Fe2(SO4)3. However,
in acidified aqueous solutions hydrolysis usually proceeds with the
formation of basic salts, whose form depends on the conditions. Posnjak
and Merwinf7) studied the equilibrium of the Fe2O3—SO3—H2O system
and found that in hydrolysis Fe3+ can form six kinds of basic salts.
Other authors(8) found that with high acidity of the solution hydrolysis
produces a basic salt of the FeSO4(OH) type.
In our experiments, at temperatures higher than 140°C, we obtained
a characteristic brownish-red precipitate. It has the form of tiny grains,
and its filtering and sedimentation properties are good. These characte
ristics make it similar to a crystalline material.
Chemical analysis of the precipitate showed that it contains 61.4%
Fe and 2.2% S. The high iron content and the small sulphur content,
and the above physical properties, show that the precipitate is a mixture
of the dehydrated oxide Fe2O3 and a small amount of a basic salt.
At temperatures lower than 140°C the precipitate is light red and
its separation from the solution is more difficult. The same content of
sulphur and 52% of iron imply that there is no dehydration of the
precipitate and the basic component is in the form of Fe2C*3 . nH2O.

REFERENCES
1. Greiver, N. S. et al. Osnovy metallurgii Tom I, Part П — Moskva: 1961, pp. 227—
237.
2. Gromov, B. V. — Zhurnal prikladnoi khimii (Moskva) (5—6) : 62—68, (1946).
3. Latimer, B. — Okislitelnye sostoiania elementov i ikh potentzi li v vodnykh rastvo-
rakh — Moskva, 1964.
4. Greiver, N. S. et al. Osnovi metallurgi Tom II — Moskva, 1962, pp. 619—622.
5. Spasic. M., D. VuCurovic, and R. Vracar. "Separacija gvozda i nikla i dobijanje
visokoprocentnog niklovog koncentrata iz iudnicke vode zivinog nalaziSta
Avala" (Separation of Iron and Nickel and Pioduction of High-Percent Nickel
Concentrate from Mine Water of the Avala Mercury Mine) — Tehnika (Beograd)
(3) : 55—59, 1964.
6. Kasherininov, G. O. — Tsvetnie metalli. (Moskva) (5) : 25—29, 1961.
7. Posnjak, E. and H. E. Merwin. — Journal of the American Chemical Society
(Washington) 44, 1922.
8. Zbor. Nauchno-tehknich. obsh. tsvetmoi metallurgii (Collected Contributions to
Non-Ferrous Metallurgy), 1959, p. 119.

GLASNIK HEMIJSKOG DRUSTVA, Vol. 29, No. 3—4, 1964, pp. 95—105
MINOR CONSTITUENTS IN NATIVE NATURAL PRODUCTS,
ASHES AND SLAGS. VI.
SEMIQUANTITATIVE SPECTROGRAPHIC DETERMINATION
OF SECONDARY CONSTITUENTS IN NATURAL MATERIALS
AND THEIR PRODUCTS
P. S. TUTUND2IC and V. C. S^EPANOVIC
Besides their principal components, all natural materials — ores,
minerals, soils, rocks, coal, plants, etc. — contain small quantities of
a large number of elements. These are called secondary constituenls.
The determination of these elements can be important both for pure and
applied science. From the point of view of pure science their determi
nation in natural materials can contribute to the knowledge of the
composion of the earth's crust, and also to the knowledge of the
distribution of given atomic species on the earth MAiJ.n.M). From
the practical point of view, their determination in natural materials
can help towards more complete utilization of the products of these
materials, and also to the discovery of new raw materials, especially
for rare metals. Also, by determining them in soils, plants and related
materials, their biochemical role can be discovered, which is very
important with regard to the nutrition of plants, and also of animals
and man UAW.M9.
In view of its multiple importance we tried to work out a semiquanti
tative spectrographic method for the determination of microelements.
We required the method to satisfy three principle conditions: 1, it should
be suitable for determining a large number of elements; 2, the procedure
should be preferably simple and suitable for routine analysis; 3, the
accuracy should be as high as possible for a semiquantitative spectro
graphic determination.
In choosing the elements to be determined, we wanted from the
first to include the rare metals. We also tried to include elements whose
determination lines all lie within a given spectral region, which could
be photographed all on one plate in a high dispersion apparatus. In
this way we arrived at 20 elements whose lines are covered by the spectral
region 2450 to 3500 A. These elements and the wavelengths of their
spectral lines are given in Table 1.

16
TABLE 1
The elements determined and their spectral lines
ElementWavelength
ElementWavelength
Ag 3280.68 Mn 2576.10
B 2496.78 Mo 3170.35
Be 3131.06 Nb 2950.88
Cd 3261.06 Ni 3002.49
Co 3044.01 Pb 2833.07
Cr 2843.25 Sn 3175.02
Cu 3247.54 Ti 3372.80
Ga 2943.64 V 3102.30
Ge 3256.09 Zn 3345.02
In 2651.18 Zr 3438.23
The determination of line intensities and the construction of the analytical
curves in quantitative spectral analysis is rather complicated and time-
consuming, and so is not convenient for routine application. We therefore
sought to simplify the determination of line intensities, by visual estima
tion. Our method involves counting the degrees of the spectral line on
a spectrogram obtained with a rotating logarithmic step-sector(6,7).
It is well known that the elements of the base, i. e. the principle
constituents of the material examined, exercise a great influence on the
accuracy of spectrochemical determinations. The influence of secondary
component elements is generally negligible. To get the highest possible
accuracy, the chemical composition of the base for the standards should
be as close as possible to that of the material to be analysed. For this
reason we used for the standard base a mixture of the oxides of the
elements which are the principal components of igneous rocks. The
proportions of these elements were the same as in igneous rocks, these
proportions being taken as average for the elements in the earth's
crust(4,12). The composition of the mixture for the standard base is
given in Table 2.
TABLE 2
Average quantities of principle components in igneous rocks
(average concentrations in the earth's crust)
Compound SiO2 A12O3 Fe2O3 CaO Na2O K2O MgO SOj
% 59.1 15.1 13.3 4.6 3.37 2.98 2.8 0.225

17
Fig. 1. Appearance of a spectrogram obtained with the V rotating logarithmic
step-sector.
We introduced known concentrations of the elements to be determi
ned into the standard base, by adding Spex-G! powder, which contains
43 chemical elements in a graphite base(7). This powder includes all
the elements we had selected for determination except gallium and
indium. We made a special standard for these two, using their pure
oxides and our base. The concentrations of the 20 elements to be deter
mined in our standards were as follows:
0.1% 0.01% 0.001% 0.0001%.
In preparing the standards we also added 3% of bismuth oxide, bismuth
serving as a sort of internal standard, or a control element. In successful
spectrograms the lines of bismuth appear in well-determined degrees,
as may seen from Table 3.
2

18
TABLE 3
Bismuth lines and their degrees
Wavelength
(A)Degree
Wavelength
(A)Degree
2627.9 5 2938.3 7
2780.5 5 3024.6 6.8
2809.6 5 3397.2 6.5
Using the standards we plotted calibration curves for the semiquanti
tative determination of the 20 elements. These curves are given in Fig. 2.
As may be seen, most of the curves are straight lines. This indicates
that good accuracy should be obtained. It may be pointed out that it
is possible to determine a large number of elements in a wide concentra
tion range, from 10-1 to 10 -4%.

19

20

Fig. 3. Optical setup of the illumination of the spectrograph.
1-optical axis, 2-electrodes, 3-F-958 lense, 4-intermediate
diaphragm, 5-lense on the sector, 6-rotating sector, 7-slit,
8-lense, 9-prism.
mi
65
13mm
JL
Fig. 4. Form of the electrodes.
The operating conditions were as follows:
Spectrograph: Hilger E 478
Excitation: continuous arc, stabilized
Current: 10 amps
Optical setup : as for quantitative determination (Fig. 3)
Rotating step-sector: 7° step, ratio 2:1; 1600 t/min
Interelectrode gap: 9 mm, constant

22
Charge: 20 mg of mixture, in the form of a well-homogenized powder
Exposure time: about 2.5 min, until complete combustion
Spectral range: 2450—3500 A
Photographic plates: Kodak B.10
The form of the electrodes is shown in Fig. 4.
We found that the errors were not higher than 30%. In some
cases we got accuracies as high as with quantitative spectrochemi-
cal methods, with errors of less than 10%. For example, with a few
improvements, we got an accuracy in the determination of germanium
as high as that obtained by quantitative methods, i. e. errors always
less than 10%(»).
The method described may be recommended for the semiquantitative
determination of small quantities of elements in soils, rocks, wastes
from the treatment of ores, the ashes of coal and of crude oil, and similar
materials.
School of Technology,
Physical Chemistry and Electrochemistry Institute
and Inorganic Chemistry Institute, Beograd
REFERENCES
1. Bayer, E. — Experientia 12 : 365, 1956.
2. Bertrand, G. — Analytica Chimica Acta 2 : 770, 1948.
3. Bibliography of References to the Literature on the Minor Elements and Their
Relation to Plant and Animal Nutrition, 1th Supplement to the 3rd Edition —
New York: Chilean Nitrate Educational Bureau, Inc., 1947, p. 121.
4. Green, J. — Bulletin of the Geological Society of America 70 : 1127, 1959.
5. Khambaraev, I. and R_. Talipov. —- Uzbekskii geologicheskii zhurnal (5) : 3, 1960.
6. Kler, M. M. et al. Priblizhennyi kolichestvennyi spektraVnyi analiz mineraVnogo
syr'ia (Approximate Quantitative Spectral Analysis of Mineral Ores) — Moskva:
Gosgeoltekhizdat, 1959.
7. Mitteldorf, A. J. — The Spex Speaker 2(2) : 1, 1957 (c. f. Applied Spectroscopy
10:12, 1956).
8. Nicholas, D. Y. D. — Journal of the Science of Food and Agriculture 8 : 15,
1957 (Supplementary issue).
9. Rankama, K. and Th. G. Sahama. Geochemistry — Chicago: The University of
Chicago Press, 1950, p. 912.
10. Thatcher, R. W. — Science 79 : 463, 1934.
11. Tutundzic, P. S. and V. C. Scepanovic. — Revue Universelle des Mines 15 (5) : 309,
1959.
12. Vinogradov, A. P. — Geokhimiia (1) : 6, 1956.
13. Vinogradov, A. P. —- The Geochemistry of Rare and Dispersed Chemical Elements
in Soils — New York: Consultants Bureau, Inc., 1959, p. 209.
14. Zul'fugarly, D. I. Rasprostranenie mikroelementov v kaustobiolitakh, organizmakh,
osadochnykh porodakh i plastovykh vodakh (Distribution of Microelements in
Caustobioliths, Organisms, Sedimentary Rocks and Underground Water) —
Baku: Azerbaidzhanskii Universitet, 1960, p. 230.
GLASNIK HEMIJSKOO DRUSTVA Vol. 29, No. 3—4, 1964, pp. 107—113
A CONTRIBUTION TO THE COMPLEXOMETRIC DETERMI
NATION OF METALS. VII. POTENTIOMETRIC DETERMI
NATION OF IRON, COPPER, NICKEL, ZINC, MAGNESIUM,
MANGANESE, LEAD, COBALT AND CADMIUM*
by
TIBOR A. KISS
In our earlier works(1,2) we used visual indicators for direct titra
tion of copper, nickel, zinc, magnesium, manganese, lead, cobalt,
cadmium and iron with ethylenediaminetetraacetic acid (EDTA), and
then checked, compared and modified different known methods. We got
results for metals by various methods in good agreement. In these
works(I,2) we also developed inverse titration methods, i. e. titrations
of EDTA with metals. The results of these titrations were also consistent,
but in all determinations they were slightly lower than those obtained
by titrations of EDTA with metals. We ascribed this disagreement to
the indistinct color change.
To find out whether this indicator error was the only cause of the
inconsistency, in this work we carried out titrations with the same metal
solutions and EDTA, indicating the titration end point potentiome-
trically. The volumetric factors of the metal solutions obtained by
different methods of direct potentiometric titration with EDTA were
in good agreement, but slighly lower than those obtained with metal
indicators.
For potentiometric titrations of higher metal concentrations we
modified the usual methods by first titrating acidified metal solutions
to near the equivalence point. Then by adding a buffer we were easily
able to keep the rest of the metal in solution and titrate it to the end
point. The results obtained by these methods were consistent and in
good agreement with those obtained by the unmodified methods.
We developed potentiometric methods of inverse titration, i. e.
titration ofEDTA with metals, for both dilute and concentrated solutions.
The results for metals agreed were consistent but slighly lower than
those obtained by potentiometric titrations of the metals with EDTA,
and slighly higher than those of EDTA titration with the metals in the
presence of visual indicators.
* Part VI., Glasnik hemijskog druStva (Beograd) 28 (5—6), 1963.

TABLE1
Metal6olutionvolumeteicfactoe6gotbydiffeentmethods.Re6ult6aeeameansof6—9e6timation6ofdiffeentamountofmetal:
upto50ml0.1Mand0.01MofmetalsolutionoeEDTA.
cadmium
1.01321.01282") 1.01003)
1.0129 1.0119 1.0120'")1.01244>
1.0122
cobalt1.2012
1.20072")1.2007 1.1992 1.1998'") 1.1998
0.99950.99932") 0.99913)
0.9988'")0.99844)
lead 0.9992 0.9983 0.9986
megeee
1.09221.09212")
1.0921 1.0917 1.0918'") 1.0918
magneium
1.e23
1.00932")1.0089,) 1.0075'")
1.00694)1.0091 1.0050 1.0072
zinc 1.0087
1.0e502">
1.00543)1.0052 1.0009 1.0033'")
1.00274)
1.0000
nickel
1.0584
1.05652<01.05713)
1.0568 1.05381.05521") 1.05484)
1.0550
coppe1.0499
1.04602") 1.04562*) 1.04583)1.0461«)
1.04578)1.0458 1.0404 1.0433'«)
1.0400'*)
1.04244) 1.04277)1.0426')
1.e400
ieon 1.09851.09815«) 1.09776")
1.0979"0
1.0979 1.0963 1.0972")
1.0971«0
1.09e
Met6ltitetionwithEDTAinpeeenceofindic6toe10)
potentiometeically
aveage EDTAtitetionwithmet6l
inpeeenceofindic6toe
potentiometeically
aveage
1)Bymethodafte(eeAnalogou6tomethod
6fte(e
eBymethodafte(8)
eAn6logou6tomethod
6fte(8)
a)withmecueyelecteode b)withplatinumelecteode a)withmeecueyelecteode b)withpl6tinumelecteode
5)Bymethod6fte(e
6)Bymethod6fte(5)
7)Analogou6tomethod
afte(5)
a)atm36t20°C b)6tm36t80°C c)6tm56t20°C
8)Bymethod6fte(6)
9)An6logou6tomethod(6) e)Method6deceibedin
pape6(1.e
25
From Table 1 it may be concluded that the inconsistency of the
results of metal titrations with EDTA and of EDTA titrations with metals
is mainly due to an error in the color change determination.
EXPERIMENTAL
Preparation of standard solutions
For the potentiometric titrations we used the same standard solutions
as in our earlier works(l,2), in which we described their preparation.
All reagents were Merck, p. a.
Instruments and equipment
A Radiometer PHM 22p pH-meter and a Radiometer TTA 1
potentiometric titration set were used.
Radiometer P 100 and K 100 electrodes were used for the potentio
metric redox titrations of iron and copper, and for the determination
of the other elements a K 100 electrode and a mercury electrode (plati
num sheet coated with electrolytically deposited mercury) prepared by
Siggia's method(3).
For titrations with a bimetal electrode pair(4) we used a platinum
and a tungsten electrode.
Determination of iron
Iron (III) was titrated by the methods of Pribil and co-workers(5)
at pH 3 at room temperature. The equilibrium redox potential of the
indicator electrode was established more quickly if the titrated solution
was heated at 80°C and if titration was done at pH 5 in a solution
buffered with ammonium acetate.
Large concentrations of iron were titrated in acidified solution to
near the equivalence point, then the pH was adjusted to 3 or 5 and the
titration completed.
Inverse titrations were done under similar conditions.
The results are shown in Table 1.
Determination of copper
By the method of Siggia and co-workers(3) EDTA was titrated
with 0.1 M copper sulphate in presence of pyridine at pH 7.5 with a
platinum and mercury indicator electrode. Analogous to the above
method we developed inverse methods, i. e. titrations of copper sulphate
with EDTA, in small and large concentrations.
Up to 30 mg of copper in 60 ml of titrated solution buffered with
ammonia and ammonium acetate was titrated at room temperature
without ammonium rodanide(6) and at 40°C with the addition of am
monium rodanide(0). Titrations up to 120 mg of copper in 60 ml of the
solution and inverse titrations were performed in similar ways.

26
By titrating at pH 10 in ammoninum buffer(8) we could not obtain
a satisfactory potential rise at the equivalence point(6).
The results are shown in Table 1.
Determination of nickel, zinc, magnesium, manganese lead, cobalt and
cadmium
Siggia and co-workers(3) titrated EDTA with 0.1 M solution of
nickel nitrate, zinc nitrate, magnesium chloride, manganese chloride,
manganese acetate and lead nitrate in solutions buffered with 50%
pyridine, using a mercury and a saturated calomel electrode. Under
these conditions we got a good potential rise even if we used other
salts such as the sulphates of nickel, magnesium, manganese and cadmi
um, zinc chloride and lead nitrate.
Inverse titrations of a 0.1 M metal solutions with EDTA were
performed in a similar way.
Copper, nickel, zinc, magnesium, lead and cadmium were potentio-
metrically titrated directly in an ammonium medium in presence of
tartaric acid by the methods of Budanova and Platonova(4). The end
point was determined with a bimetal electrode pair (platinum, tungsten).
We also titrated EDTA with metal solutions in a similar way.
The results are shown in Table 1.
DISCUSSION
When elements are determined by retitration the added excess of
EDTA is titrated with a standard metal solution. This metal solution
is usually standardized by titration with EDTA but not inversely by
titration of EDTA with the metal. Since we found (Table 1) that the
titer of the metal solution obtained by EDTA titration with the metal is
different from that obtained by inverse titration it is recommended that
the metal solutions with which retitration is performed be standardized
by titrating EDTA with the metals.
Department of Chemistry Received March 7, 1964
University of Novi Sad
REFERENCES
1. Canic, V. D. and T. A. Kiss. — Glasnik hemijskog drustva (Beograd) 27 : 103, 1962.
2. Kiss, T. A. — Glasnik hemijskog drustva (Beograd) 28(5—6) 1963.
3. Siggia, S., D. W. Eichlen, and R. C. Rheinhart. — Analytical Chemistry 27 : 1745,
1955.
4. Budanova, L. M., and O. P. Platonova. — Zavodskaia Laboratoriia (Moskva)
21 : 1294, 1955.
5. Pfibil. R., Z. Kudela, and B. Matyska. Chemicky Listy (Praha) 44 : 222, 1950;
Pfibil. R., Z. Kudela, and B. Matyska. — Collection of Czechoslovac Chemical
Communications (Praha) 16:80, 1951.
6. Belcher, R., D. Gibbons and T. S. West. — Analytica Chimica Acta (Amsterdam)
13 :226, 1955.
7. Pfibil, R. — Himija 2 : 185, 1952.
8. Flaschka, H. A. EDTA Titrations — New York: Pergamon Press, 1959, p. 110.

GLASNIK HEMIJSKOG DRUSTVA, Vol 29, No. 3—4, 1964, pp. 115—120
THIN-LAYER CHROMATOGRAPHY OF INORGANIC IONS
II. — SEPARATION OF METAL DITHIZONATES
MIRJANA HRANISAVLJEVIC-JAKOVLJEVIC, IVANKA PEJKOVIC-TADIC,
KOSTA JAKOVLJEVIC and JELENA MILJKOVIC-STOJANOVIC
In recent years thin layer chromatography has been applied for
analyzing mixtures of inorganic salts. By this method Seiler et al. (1)
have separated cations of almost all analytical groups. However, in the
separation of elements of H2S-group tailing of spots occurred and in
case of the (NH4)2S group and the alkaline earth metal group zones
of some cations overlapped. Solvent systems used in these separations
were mixtures of polar solvents containing a large amount of water or
acid (up to 20%), thus prolonging the running time to as much as 3
hours.
To avoid the difficulties encountered by Seiler and coworkers we
have studied the separation of metal ions in the form of their complexes
with organic compounds(2). Such metal complex compounds may be
expected to behave like organic substances on a silica gel layer, i. e.
to be separated by nonpolar solvents in a short time. We have decided
to use dithizone [diphenylthiocarbazone, HDz, (I)] as the complexing
agent, since it is a nonspecific reagent which reacts with a great number of
metal ions forming colored complexes soluble in organic solvents.
by
/
\
CtHs
/NH—N N—N
S=C/
\
H H-S-Ct //
\
\N = N
\N=N
\C6H5
Communicated at XXXIVth International Congress of Industrial Chemistry,
Beogiad, 1963.

28
Acording to Fischer(3) the dithizone complexes formed in acid and
neutral media have the following formulae:
M,HDZ, M„ (HDz2) and M„, (HDz)3
where Af, is a monovalent, Mn a divalent and Mm a trivalent metal.
HDz represents the monovalent thioketone residue of dithizone. In
alkaline media, it is assumed that complexes of the following type are
formed:
My Dz/2, A/„Dz
where Dz is the divalent dithizone residue.
The separation of metals from mixtures in the form of metal dithi-
zonates has already been done in a few cases by other chromatographic
methods. In 1954, Venturello and Ghe(4) studied the behavior of some
metal dithizonates on paper impregnated with buffer solutions, but
they only succeeded in separating three metals: silver, mercury and zinc.
The separation of dithizonates on a column of alumina was performed
back in 1942(5), but in fact T. Ashizava,(6) in 1961, was the first to carry
out a systematic chromatographic investigation of metal dithizonates
on aluminum oxide columns.
By thin-layer chromatography we have separated the dithizonates
of the following metals: mercury, copper, bizmuth, zinc, lead, cadmium,
nickel and cobalt.
An aqueous solution of metal ions is first extracted with a chloro
form solution of dithizone; the pH of the aqueous solution determines
the order in which the metal dithizonates get extracted. At pH 3 dithizone
reacts with mercury, copper and bizmuth, at pH 5 with zinc, lead and
cadmium, and at pH 7 with nickel and cobalt. These three chloroform
extracts are separately chromatographed on a thin layer of silica gel in
benzene-methylene chloride (50 : 10, v/v). The separation takes 15 to
30 mmutes (Fig. 1).
Fig. 1

29
Since the separated complexes are colored, no detecting reagent
is necessary and the course of separation can be followed visually. The
colors of complexes are different and characteristic for each element
and determination of Rf-values <s not necessary (Table 1).
TABLE 1
PH Complex (8) Colour R/x 100
3 Hg(.HDz)2 orange 54
Bi (HDz)s pink-brown 37
Cu (HDz)2 dark violet-brown 47
5 Zn (HDz)2 light violet SO
Pb (HDz)2 red 34
Cd(HDz\ yelow orange 13
7 Ni(HDz)2 dark gray 41
Co(HDz)2 dark violet 32
* Copper dithizonate at pH 5-6
other Rf value (Rf x 100 = 38)
(CuDz) is green-brown and has the
It should be noted that sometimes co-extraction of metal ions can
take place. This is because not all metal dithizonates react simultaneously
or quantitatively; in addition, on prolonged shaking of aqueous and
chloroform solutions, metal dithizonates can pass into the aqueous
phase. An excess of dithizone does not interfere with the identification
of cations, since the blue spot of dithizone itself (Fig 1.) does not coincide
either in color or in Rf-value with any metal dithizonate in the mixture.
Since by this method microgram amounts of metals can be determined,
it can be used for their determination in biological material and water.
EXPERIMENTAL
Materials: 0.1% aqueous solutions of acetate or chloride of mercury,
copper, cadmium, lead, nickel and cobalt; 0.1% aqueous solution of
Bi (OH)CO3 with a few drops of acetic acid.
Solvent system: benzene-methylene chloride (50 : 10, v/v)
Running time: 15—35 minutes depending on the number of cations
present in the mixture.
Procedure: One milliliter of the solution of each salt is put into a
small separatory funnel and the mixture (total 8ml) is acidified with
acetic acid to pH 3. To 2 ml of this mixture 2 ml of 0.1% solution of dithi
zone in chloroform is added and the obtained mixture is vigorously
shaken for one minute. The lower organic layer is separated and the
aqueous layer is shaken once more with 2 ml of dithizone solution.
The chloroform layer is again separated and combined with the first
extract. These two extracts make solution I which contains dithizonates
of mercury, copper and bismuth. To remove the traces of these cations
30
from the aqueous solution it is necessary to extract the remaining aqueous
solution twice more, each time with 2 ml of chloroform dithizone solution
and once with 3—4 ml of pure chloroform; these chloroform solutions
are discarded.
The remaining aqueous solution is adjusted to pH 5 by adding dilute
ammonia, and then it is vigorously shaken twice, each time with 2 ml
of dithizone solution in chloroform. The separated chloroform layers
are united and they make solution II which contains dithizonates of
cadmium, lead and zinc. The remaining aqueous solution is extracted
twice again, each time with 2 ml of chloroform dithizone solution and
once with 3—4 ml of pure chloroform and these chloroform solutions
are again discarded.
The aqueous solution is then adjusted to pH 6 by the addition of
dilute ammonia and extracted twice, each time with 2 ml of 0.1%
solution of dithizone in chloroform. The united chloroform extracts
make solution III, which contains dithizonates of cobalt and nickel.
20 [x 1 of each solution (I, II and III) is applied by means of a micro-
pipette to a chromatoplate (20x13x0.5 cm) coated with a thin layer
of silica gel (0.2 mm thick). Original "Silicagel G nach Stahl" or a mixture
of 87 parts of silica gel (240—270 mesh) and 13 parts of gypsum is used.
The chromatoplates are air dried for 12 hours. They are developed
in chromatographic tanks (24x16x8 cm) previously saturated with
solvent mixture.
Received March 7, 1964
School of Science
Institute of Chemistry
Beograd
REFERENCES
1. Seiler, H. M. — Helvetica Chimica Acta (Basel) 43: 1938, 1960. Stahl, E.
Diinnshicht-Chromatographie — Berlin: Springer, 1963, pp 481—495.
2. Hranisavljevic-Jakovljevi<5, M., I. Pejkovic-Tadic, and K. Jakovljevid. —
Scientific Reports — Roma: Instituto Superiore di Sanita, 1963.
3. Fisher, H. — Angewichte Chemie (Berlin) 47: 685—692, 1934. Ivanchev, G:
Ditizon i egd primenie. (Dithizone and Its Application) — Moskva: Izda-
tel'stvo inostrannoi literatury, 1961, pp. 33.
4. Venturello, O. and A. M. Ghe. — Analytica chimica acta — (Amsterdam)
10: 343, 1954.
5. Erametsa, O. — Suomen Kemistilehti, 16B: 13, 1943, (Cited in — Chemical
Abstracts 40: 4620, 1946.)
6. Ashizawa, T. — Japan Analyst 10: (4), 350—354, 1961. (Cited in — Ana
lytical Abstracts 10: (8), 3060, 1963).
7. Stahl, E. — Diinnschicht-Chromatographie — Berlin: Springer, 1963, pp 7— 10.
8. Ivanchev, G. — Ditizon i ego primenie (Dithizone and Its Applications) —
Moskva: Izdatel'stvo inostrannoi literaturi, 1961, pp. 133.

GLASNIK HEMUSKOG DRUSTVA, Vol. 29, No. 3—4, 1964, pp. 121—129
THE REACTION BETWEEN SODIUM TUNGSTATE AND
/.-ASCORBIC ACID
by
M. V. SUSIC, D. S. VESELINOVIC and D. 2. SUZWEVIC
The reaction between sodium tungstate and L-ascorbic acid has
been little studied. In the literature there are some data(1,2) which
indicate that the tungstate interferes with the spectrophotometry deter
mination of niobium from L-ascorbic acid solution and that the reaction
product of tungstate and L-ascorbic acid is adsorbed on anionic ion-
exchange resin. The aim of our work was a more detailed study of this
reaction.
Since in the reaction ofsodium tungstate and L-ascorbic acid a colo
red compound is formed, we studied its absorption spectrum in the region
from 1000 to 330 mjji. The measurements were carried out at room tempe
rature, in cuvettes of 1 cm (glass cuvettes for the visible and quartz
for the UV region), using water as the reference solution.

32
From the spectrophotogram shown in Fig. 1 it may be seen that
there is no absorption maximum in the studied wavelength region and
that the absorption increases with decreasing wavelength. The absorption
at shorter wavelengths was not measured since L-ascorbic acid absorbs
below 330 ma.
The color intensity of the solution increases on standing. Investiga
tion of the dependence of the absorbance on time (Fig. 2) have shown
that the absorbance become practically constant after six hours.
The ratio of tungstate to L-ascorbic acid in the compound obtained
was determined by Job's method of continuous variation(3-4). The
determinations were made with 0.01 M solutions of ascorbic acid and
sodium tungstate. By mixing these two standard solutions mixtures
containing different molar ratios — L-ascorbic acid/sodium tungstate
= a — were obtained and their abscrbances were measured with a
spectrophotometer after standing from 10 to 12 hours. The measurements
were performed at room temperature.
From the results given in Fig. 3 it may be seen that a sharp maximum
is obtained for a=2 and an inflexion point for a= 1 at all the wavelengths
studied. Accordingly, sodium tungstate reacts with L-ascorbic acid in
two ways: 1. — with one molecule of L-ascorbic acid, and 2. — with
two molecules of L-ascorbic acid. Compound 2 is colored.
The reaction of sodium tungstate with L-ascorbic acid was also
studied by the molar ratio method after Harwey and Manning (5,6)
The absorbance was plotted against the molar ratio of L-ascorbic acid
and sodium tungstate, n, at a constant concentration of sodium tungstate
(0.035 M).
0,5
a
OA3600
o
f 1A
3700 %
3900' *
6100o
1/ —
A
0 300 600 900 1200 1500
t mm
Fig. 2

0,55
9 4 2.3 2 1.5 1 0.66 0,33 0,25 0,11
Fig. 3
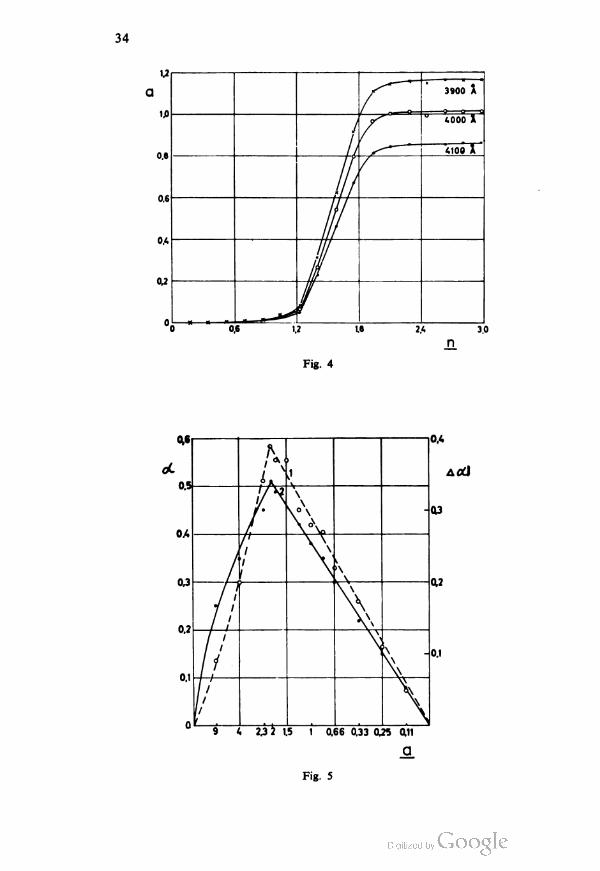
Fig. 5

35
The curve in Fig. 4 shows two distinct inflexions, at n= 1.2 and
n=1.96 for all the wavelengths studied. These findings are in accordance
with the results obtained by Job's method and they prove that sodium
tungstate may react with either one or two molecules of L-ascorbic acid.
Since L-ascorbic acid is optically active with a specific rotation
[a]D =22° for the undissociated form (in 2 N sulphuric acid) and
[a]u= 105° for the dissociated form (sodium salt)(7), a change of the angle
of optical rotation may be expected if the reaction with sodium tungstate
gives rise to the formation of anions ofL-ascorbic acid from undissociated
molecules. A similar effect should be obtaintd in case a compound is
formed from L-ascorbic acid and sodium tungstate but only if the newly
formed compound and the undissociated acid have different specific
rotations. From the aforesaid it follows that the method of continuous
variation could be applied by measuring the optical rotation in depen
dence on the molar ratio a.
For this purpose solutions were prepared by mixing 0.035 M
standard solutions of L-ascorbic acid and sodium tungstate in the same
way as in the determination of Job's curve by spectrophotometry. In
addition, L-ascorbic acid solutions of concentrations corresponding to
the acid concentrations in the mixed solutions were prepared. After
standing 6—10 hours, to allow equilibration, the optical activity of each
solution was measured. The measurements were performed with a
polarimeter of 0.02° accuracy, in cuvettes of 1 dm. The light source
was a spectral sodium lamp.
The results are shown in Fig. 5 and in Table 1. From the angles of
rotation given in Table 1 it may be seen that the rotation is considerably
augmented in the presence of sodium tungstate. Curve 1 in Fig. 5 shows
the dependence of the optical rotation on the molar ratio a. Curve
2 shows the dependence of the difference between the angle of rotation
of the mixed solution and that of the ascorbic acid solution, Aa, on a.
From the both curves it may be seen that the maximum is at a=2,
which is in accordance with the spectrophotometric determinations. The
inflexion point at a=l could not be precisely determined since the
changes lie within the limits of experimental error.
The change of the optical rotation, under the given experimental
conditions, could net be augmented by increasing either the concentration
or the cuvette length, since in both cases the light from the sodium lamp
was absorbed and measurements were not possible.
The reaction products of L-ascorbic acid and sodium tungstate
were also investigated by paper chromatography, using methanol as
the mobile phase. The spots of L-ascorbic acid were detected with silver
nitrate solution or acid iodine solution and strach, and those of tung
state with stannous chloride solution.
The chromatography was performed with solutions obtained by
mixing 0.25 M solutions of L-ascorbic acid and sodium tungstate in
ratios 4 : 1 and 1 : 4. 0.01 ml of each solution was applied to the chro
matographic paper. The solvent front advanced to 17.2 cm, in two hours.
The chromatograms of the solutions containing an excess of L-ascor
bic acid over sodium tungstate had three spots of L-ascorbic acid with
3*

36
TABLE 1
Molar
ratio
•Solution mixture in ml (room temperature)
a W HA H2O <x° Aa
95.5 45
45 5
0.25
0.160.09
410 40
40 10
0.35
0.150.20
2.3315 35
35 15
0.45
0.110.34
216.65 33.35
33.35 16.65
0.51
0.120.39
1.8717.50 32.50
32.50 17.50
0.49
0.120.37
1.520 30
30 20
0.47
0.100,37
1.2222,50 27.50
27.50 22.50
0.42
0.120.30
125 25
25 25
0.38
0.100.28
0.8227.50 22.50
22.50 27.50
0.35
0.080.27
0.6630 20
20 30
0.30
0.080.22
0.4335 15
15 35
0.22
0.050.17
0.2540 10
10 40
0.15
0.040.11
0.1145 5
5 45
0.08
0.030.05
* Concentration of parent solutions 0.0350 M.
Rf-values 0.0, 0.37 and 0.73. The spot with Rf=0.0 corresponded to
the compound formed from L-ascorbic acid and sodium tungstate, since
tungstate was also found to have Rt=0.0. Rt=0.37 corresponded to
sodium ascorbate and Rf=0.73 to ascorbic acid, as was established on
separate chromatograms of L-ascorbic acid and a mixture of sodium
ascorbate and L-ascorbic acid.
On the chromatograms of solutions containing an excess of sodium
tungstate over L-ascorbic acid, the presence of L-ascorbic acid was

37
established by a spot with Rr=0.35. This finding indicated that all
the ascorbic acid was present in the form of its sodium salt. The Rr—of
tungstate was also found to be 0.0.
These results show that in the presence of an excess of sodium tung
state sodium ascorbate forms, indicating that the reaction between these
two compounds involves their Na+ and H+ ions. However, in the pre
sence of an excess of L-ascorbic acid, in addition to the above reaction,
the formation of a compound from L-ascorbic acid and sodium tungstate
is observed.
DISCUSSION
The results show consistently that the reaction between sodium
tungstate and L-ascorbic acid takes place in two ways — one molecule of
sodium tungstate reacts either with two molecules or with one molecule
of L-ascorbic acid. The first path results in the formation of a colored
compound whose absorption spectrum is shown in Fig. 1. Since neither
sodium tungstate nor L-ascorbic acid are colored, it is evident that
a compound of L-ascorbic acid and sodium tungstate is formed. This
was confirmed by the chromatographic investigations which showed
that in solutions containing a molar ratio L-ascorbic acid: sodium tung
state >1, the ascorbic acid portion exhibited the same Rf—value as the
tungstate ion, i. e. an Rf which differed from those of L-ascorbic acid and
sodium ascorbate.
From the literature it is known that sodium tungstate reacts with
organic acids (oxalic, tartaric, citric) giving rise, according to some
authors(8), to a complex ion:
Na2 WO4 + H2C2O4 ^± Na2 (WO3C2O4) + H2O ( 1 )
or to colloidal tungstic acid according to others :(9)
Na2WO4 + H2C2O4^H2WO4 + Na2C2O4. (2)
Both types of reaction bring about an increase of the pH of the
solution. We observed the same effect with L-ascorbic acid, i. e. the pH
of the mixed solution of L-ascorbic acid and sodium tungstate was
considerably higher than that of the L-ascorbic acid solution of the same
dilution. Therefore, in our opinion, the reaction between sodium tungstate
(1 molecule) and L-ascorbic acid (2 molecules) takes place according
to the following equation:
Na2 WO4 + 2 HA^Na2 (WO3 A2) + HzO (3)
The spectrum of the complex anion is shown in Fig. 1. The possibility
of tungstic acid formation, which also satisfies the above stoichiometric
relation, is excluded since the colored compound would represent tungstic
acid, and the other organic acids should also give rise to a colored com
pound with the same absorption spectrum. However, this has not been
observed in reactions with a number of organic acids stronger and
weaker than L-ascorbic acid (10j. In addition, the chromatographic
analysis would give only the Rf-values of L-ascorbic acid and sodium

38
ascorbate whereas the Rt-value common to tungstate and ascorbic
acid would not be found. The appearance of the third Rr-value undoub
tedly confirms the hypothesis that a compound of L-ascorbic acid and
sodium tungstate is formed.
The reaction between tungstate and L-ascorbic acid in which the
ratio of molecules entering into the reaction a=\.2 results in the forma
tion of a polyanion by the action of the H+ ion of the acid:
6 WO4 2- + 7 HA^H (W6O21) 5- + 7 A- + 3 H2O (4)
In the literature this reaction is well-known as the reaction of tungstate
with mineral acids01-12'13). In this reaction the molar ratio of L-ascorbic
acid and sodium tungstate in a= 1.17 and this is in good agreement with
the found ratio n=1.3. This reaction is also confirmed by the chromato
graphic identification of only sodium ascorbate in case the reaction is
carried out in the presence of an excess of sodium tungstate.
APPARATUS AND REAGENTS
Measurements were made with a Unicam SP 500 spectrophotometer
and a Zeiss (Jena) "Kreispolarimeter" polarimeter. Chromatographic
separations were performed on Whatman -MM 1 paper. All reagents
used were p. a., produced by Kemika and Merck.
School of Science Received May 15th, 1964
Institute of Physical Chemistry
Beograd
Institute of Chemistry,
Technology and Metallurgy
Beograd
-
REFERENCES
1. Janauer, G. E., and J. Korkisch. "Spectrophotometrische Bestimmung von Niob
mit Ascorbinsâure" —- Analitica Chimica Acta 24 : 270—275, 1962.
2. Korkisch, J., A. Farag, and F. Hecht. "A Sensitive Test for Uranium by Ion-
Exchange Concentration" — Mikrochimica Acta 3 : 415—425, 1958.
3. Job, P. "Etude spectrographique de la formation des complexes en solution et
de leur stabilite" — Comptes Rendus (Paris) 180 : 928—930, 1925.
4. Job, P. "Recherches sur la formation des complexes mineraux en solution et sur
leur stabilite" — Annales de Chimie 9 : 1 13—209, 1928.
5. Yoe, J. H. and A. L. Jones. "Gravimetric Determination of W with anti-l,5-di
(p-methoxyphenyl)-5-hydroxarnino-3-oxiimino-l-pentene" — Industrial Engi
neering Chemistry, Analytical Edition 16 : 45—48, 1944.
6. Harwey, A. E. and D. L. Manning. "Spectrophotometric Methods of Establishing
Empirical Formulas of Colored Complexes in Solution" —Journal ofthe American
Chemical Society 72 : 4488-4493, 1950.
7. Vogel, H. Chemie und Technik der Vitamine — Stuttgart: Verlag Ferdinand Enke,
1940, p. 134.
8. Vartapetian, O. and P. Sakellaridis. "Etude spectrophotometrique du complexe
oxalotungstique" — Comptes Rendus (Paris) 234 : 1621, 1952.
9. Savchenko G.S. „Spektrofotometricheskoe issledovanie vzaimodeistviia vol'
framata i molibdata natriia s nekotorymi organicheskimi kislotami v vod-
nom rasvore" (Spectrophotometry of the Interaction of Sodium Tungstate
and Sodium Molybdate with Some Organic Acids in Aqueous Solutions)
— Khimia red. Elementov 2 : 68, 1955.
10 Autor's unpublished data.
11. Sonchay, P. "Contribution a l'etude des phenomènes de condensation en chimie
generale. VI. Utilisation des mesures de solubilite" — Bulletin de la sociéte
chimique de France: 932—938, 1951.
12. Sonchay, P. and M. Teyssedre. "Relation generalisees entre courbe de titrage
cryoscopique et potentiometrique" — Bulletin de la sociéte chimique de France:
938—945, 1951.
13. Bettinger, P. J. "Studies of the Tungsten-containing Species Present in Acidified
Sodium Tungstate Solutions" — Jurnal of the American Chemical Society
79 : 3355—3358, 1957.


GLASNIK HEMUSKOG DRUSTVA, Vol. 29, No. 3—4, 1964, pp. 131— 137
DETERMINATION OF TERTIARY AMINES AND SALTS OF
ORGANIC ACIDS IN GLACIAL ACETIC ACID BY
CONDUCTOMETRIC TITRATION
by
VILIM VAJGAND and TIBOR PASTOR
The quantitative determination of organic substances, by measure
ment of the high frequency conductance of their solutions has recently
been increasingly applied. On account of its simplicity and rapidity,
high frequency titration has relegated conductometric titration to a
subordinate role. However this latter method often gives better results
in nonaqueous media than in aqueous solutions. Thus the titration of
sulphuric acid in glacial acetic acid gives to two end points, and in the
same solvent, the titration of a mixture of sulphuric and hydrochloric
acid was successful(1).
Conductometric titrations of weak bases in different nonaqueous
solvents were carried out by McCurdy and Calt(2). They observed that
in the course of the titration the conductance changed more rapidly in
in a mixture of 1,4-dioxane and formic acid than in acetic acid, and thus
easier and more precise determination of the titration end-point was
possible. They therefore recommend this solvent for the determination
of individual components of a mixture. However, this is only possible
when the difference in the basicity of individual components is greater
than one pKb unit.
Lippincott and Timnick(3) titrated aniline in acetic acid. Good
results were obtained in individual determinations but in the titration
of a mixture of amines the end-point corresponded to the total amount
of bases in the solution. More detailed investigations on the determination
of weakly basic amines in acetic acid were performed by Skodin and
co-workers(4). They succeeded in titrating very weak bases such as for
example diphenylamine (^=13.2 in water). This success they ascribed
to the basicity of weak bases in water (pK^\Q—14) being increased
several times in acetic acid (pK^6—10). They also successfully titrated
a mixture of bases in the same solvent.
The aim of the present work was to determine by conductometric
titration a series of organic bases which are important pharmaceutical
products, including novalgin, which could not be satisfactorily determi
ned either by potentiometric, biamperometric or derivative polarographic
titrations. In addition, the possibility of using antimony electrodes in
conductometric titrations in glacial acetic acid was studied.

42
EXPERIMENTAL
The investigations were performed with a Ludwig Seibold type
LFM conductometer. The electrodes used were the platinum electrodes
of the apparatus and two bright platinum electrodes of 1 cm2. The
distance between them was 4 mm. In addition, Radiometer antimony
electrodes at a distance of 15 mm were employed.
The solution was placed in a vessel of diameter 3 cm and height
about 12 cm. It was stirred with a magnetic stirrer and its temperature
was kept constant at 23 ±0.26° by means of Thermostat type NB ultra-
thermostat. The volume cf the titrated solutions was about 30 ml.
The preparation of standard solutions and the purification of the
solvent are described in a previous paper(5).
Tnj comparative method was potentiometric titration but novalgin
was de ermined gravimetrically(6).
9e io'
3
2
0' 4-
1 2 3 4 5 ml HCIO^
Fig. 1

43
Our investigations were aimed at the study of the direct titration and
retitration methods. The direct titration was performed with perchloric
acid solution and gave good results in the determination of alkaloids
and salts of organic acids. However, with the other bases given in Table
I, the results were too high. The shape of the curves obtained in the
direct titration method is shown in Fig. 1.
On account of the limited applicability of direct titration we investi
gated the retitration method. In these determinations an excess of per
chloric acid was added to the solution of the base, and the unconsumed
acid was rotitrated with sodium acetate solution. By this method it was
possible to determine a greater number of organic bases, including noval-
gin. The behavior of novalgin differed from that of other titrated substan
ces. Tne shape of curves obtained in the determination of bases by th's
method are given in Fig. 2 and correspond to the titration of strong
4.5f
5
*
2
ml CHaCOONa
1 5
Fig. 2

44
36- 10=
ml CH3COOH0
acids with strong bases. (Fig. 3) However, the shape of the curve for
novalgin is quite different. This might be explained by the hypothesis
that after addition of an excess of perchloric acid, novalgin reacts with
more than two acid equivalents (consumes two acid equivalents) and
gives rise to a compound which behaves as a weak acid. However the
shape of the titration curve also depends on the amount of perchloric
acid added. If the excess of perchloric acid solution is great, the conduc
tance first decreases and then increases (Fig. 4). If it is small the conduc
tance increases steadily from the beginning of the titration. The amount of
the titration agent corresponding to the ascending part of the curve
depends on the time interval between the addition of perchloric acid to
the novalgin solution and the beginning of the titration. If the titration
is carried out immediately after the addition of perchloric acid, this

45
amount is small and determination of the titration end-point is very
difficult. Therefore, it is best to titrate the solution 10—15 minutes after
the addition of perchloric acid.
Of all the titrated substances only novalgin and niamide consume
two equivalents of perchloric acid. It is of interest to note that in potentio-
metric determination niamide consumes only one acid equivalent. In
the determination of brucine (basicity constants A*=7.2xl0-4 and
2.5 x 10⁻¹¹) only one titration endpoint was obtained and it corresponded
to the consumption of one equivalent of the titration reagent. Such a
behavior of brucine was established by Hara and West(7) by high frequ
ency titration.
Acetic acid anhydride increases the conductance of the solution of
the investigated substance in acetic acid. According to Bel'skii and

TABLE1
0.0994±0.0003 0.0997±0.0001 0.0985±0.0003 0.0992±0.0002 0.0993±0.0003 0.0983±0.0004 0.0993±0.0008
Conductometeictitetioninthepeeence
ofSbelecteode
Indieecttitetion Foundg
No.oftite. 3 3 4 5 13 3 6
0.e03±0.0000 0.0988±0.0005 0.0993±0.0002 0.0999±0.0006 0.0996±0.0003
0.0997±0.0e2Dieecttitetion Foundg
No.of
tite.3 5 4 4 7 4
0.0992±0.0003 0.0999±0.0004
0.0986±0.0e03 0.0994±0.0e02
0.e01±0.0013 0.0988±0.0003 0.0989±0.0005
Conductometeictitetioninthepeeence
ofPtelecteode
Indieecttitetion Foundg
No.of
tite. 6 7 8 5 4e 93
0.e01±0.0001 0.1004±0.0003 0.0996±0.0002 0.0992±0.0004 0.0997±0.0004
0.0997±0e02Dieecttitetion
Foundg
No.of
tite.5 3 5 3 7 3
Foundbypotent, tite.oe
gevim.
g
0.0991 0.0994 0.0981 0.0988 0.0985 0.0984 0.0994 0.0991 0.0992 0.0984 0.0994
T6ken
g 0.ee0.e00 0.e00 0.e00 0.e00 0.e00 0.e00
0.ee0.e00 0.e00 0.e00
Titeted6ub6teceSodium66licyl6te
Sodiump-6mino
66licyl6te
Sodiumbenzo6te
N6ecotieBeucine
Steychnine
Struchninenitete
Nicotin6mide
Antipyeine
Ni6mide Nov6lgin

47
Vinnik(8), in a mixture of acetic acid and acetic acid anhydride, the
greatest conductance is obtained when the ratio of the components
is 1 : 1. The dielectric constant of the mixture increases from 6.1 (con
stant of pure acetic acid at 25°C) to 20.7 (constant of the pure anhydride).
In addition to platinum electrodes, which were used in our previous
works, antimony electrodes proved convenient for conductometric
titration. On account of their shape the changes of conductance due to
the stirring of the solution were considerably smaller than in case of
platinum electrodes.
The titrated substances and the results obtained with platinum and
antimony electrodes are given in Table 1.
The titration of theobromine was not successful on account of the
precipitate formed. Procaine hydrochloride, quinine, and pyridoxine
could not be titrated in the presence of mercuric acetate.
School of Science
Institute of Chemistry
Beograd
Received 14 July, 1964,
REFERENCES
1. Higuchi, T, and C. R. Rehm. "Conductometric Titration of Sulfuric and Hydro
chloric Acids and Their Mixtures in Anhydrous Acttic Acid" — Analytical
Chemistry (Washington) 27(3) : 408—411, 1955.
2. McCurdy, W. H. Jr., and J. Gait. "Improved Conductometric Titration of Weak
Bases" — Analytical Chemistry (Washington) 30(5) : 940—946, 1958.
3. Lippincott, W. T. and A. Timnik. "High Frequency Titrations of Some Substituted
Anilines in Glacial Acetic Acid" —- Analytical Chemistry (Washington) 28(11) :
1690—1692, 1956.
4. Shkodin, A. M, L. P. Sadovmchaia, and V. S. Panchenko. "Titrovanie smess-
osnovail v bezvonol uksusnol kislote" (Titration of Mixtures of Bases in Anhy,
drous Acetic Acid) — Zhurnal Analiticheskoi Khimii (Moskva) 17(5) : 540—543i
1962.
5. Vajgand, V. and T. Pastor. "Derivativna polarografska titracija baza u sircetnoj
kiselini perhlornom kiselinom u prisustvu antimonovih ili hinhidronovih ele-
ctroda" (Derivative Polarographic Titration of Bases in Acetic Acid with Per
chloric Acid in the Presence of Antimony and Quinhidrone Electrodes) Glasnik
hemijskog drustva (Beograd) 28 : 1, 1963.
6. Gosudarstvennaia Farmakopeia SSSR —- Moskva: Gosudarstvennoe izdatelstvo
medishchinskovi Literatur'i 1952.
7. Hara, R. and Ph. W. West. "High Frequency Titrations of Some Organic Functio
nal Groups" — Analytica Chimica Acta (Amsterdam) 15 : 193—200, 1956.
8. Bel'skii, B. E. and M. I. Vinnik. "Kislotno-osnovanoe vzaimodeistvie v sisteme
uksusnaia kislota — uksusnii angidrid" (Acid—Base Interaction in Acetic acid-
Acetic Anhydride System) — Izvestii Akademii Nauk SSSR (Moskva) 12 : 2132—
2136, 1963.

GLASNIK HEMIJSKOG DRUSTVA, Vol. 29, No. 3—4, 1964, pp. 139—144
CONTRIBUTION TO THE STUDY OF BENZOTHIAZOLES,
BENZIMIDAZOLES AND BENZOXAZOLES.
II. BENZOTHIAZOLES OBTAINED BY CONDENSATION
OF o-AMINOTHIOPHFNOL WITH
PYRIDINECARBOXYLIC ACIDS
by
BORIVOJE L. BASTIC and MIROSLAV V. PILETIC
Pyridylbenzothiazoles can be prepared in different ways(1). Zuba-
rovski and Voronina have synthesized them by heating a mixture of
pyridinemonocarboxylic acid with o-aminothiophenol several hours
in a sealed tube at elevated temperatures(2).
To simplify the procedure and to improve the yields of pyridylben
zothiazoles we attempted to synthesize them from the same starting
components (pyridinemonocarboxylic acid and o-aminothiophenol)
but at a lower temperature (on account of partial decomposition at
higher temperatures), avoiding using sealed tubes and trying to shorten
the time of heating.
Attempts to carry out the condensation in an open vessel either
in the presence or absence of the usual solvents were unsuccessful.
After heating the starting acids were always isolated and o-aminothio
phenol was oxidized giving rise to the corresponding disulphide.
In recent years Hein, Alheim and Levitt(3) and Rau and
Braunwartth(4) have employed polyphosphoric acid as catalyst and
solvent in syntheses of similar compounds. By employing
polyphosphoric acid in the synthesis of benzothiazoles, the
condensation of o-aminothiophenol with picolinic, nicotinic or izo-
nicotinic acid, furnished better yields of the corresponding benzothia
zoles. The reaction was carried out in an open vessel, at a lower tempera
ture and the period of heating was shortened.
Table 1 shows Zubarovski and Veronina's results and those which
we obtained using polyphosphoric acid as catalyst and solvent.
4
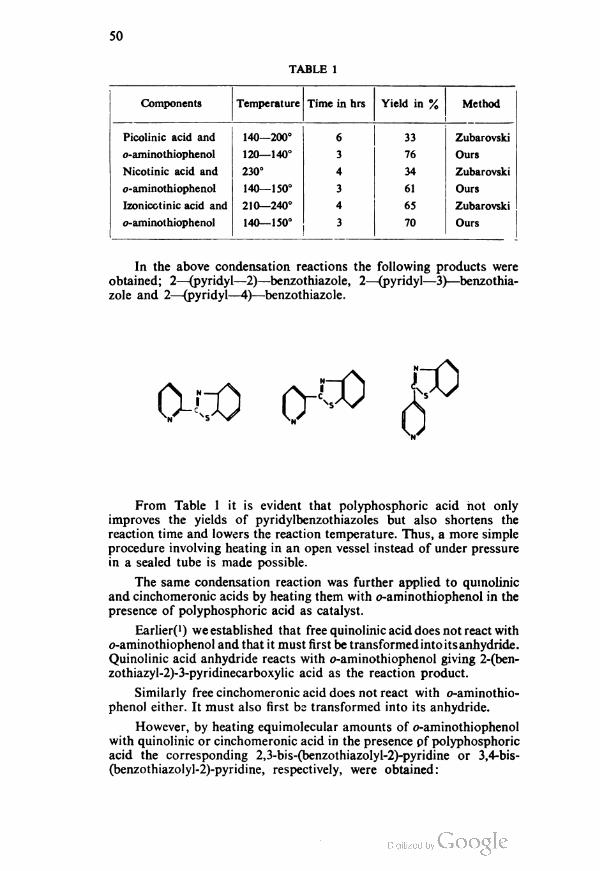
50
TABLE 1
Components Temperature Time in hrs Yield in % Method
Picolinic acid and 140—200° 6 33 Zubarovski
o-aminothiophenol 120—140° 3 76 Ours
Nicotinic acid and 230° 4 34 Zubarovski
o-aminothiophenol 140—150° 3 61 Ours
Izonicotinic acid and 210—240° 4 65 Zubarovski
o-aminothiophenol 140—150° 3 70 Ours
In the above condensation reactions the following products were
obtained; 2—(pyridyl—2)—benzothiazole, 2—(pyridyl—3)—benzothia-
zole and 2—(pyridyl—4)—benzothiazole.
From Table 1 it is evident that polyphosphoric acid not only
improves the yields of pyridylbenzothiazoles but also shortens the
reaction time and lowers the reaction temperature. Thus, a more simple
procedure involving heating in an open vessel instead of under pressure
in a sealed tube is made possible.
The same condensation reaction was further applied to quinolinic
and cinchomeronic acids by heating them with o-aminothiophenol in the
presence of polyphosphoric acid as catalyst.
EarlierC) we established that free quinolinic acid does not react with
o-aminothiophenol and that it must first be transformed into its anhydride.
Quinolinic acid anhydride reacts with o-aminothiophenol giving 2-(ben-
zothiazyl-2)-3-pyridinecarboxylic acid as the reaction product.
Similarly free cinchomeronic acid does not react with o-aminothio
phenol either. It must also first bz transformed into its anhydride.
However, by heating equimolecular amounts of o-aminothiophenol
with quinolinic or cinchomeronic acid in the presence pf polyphosphoric
acid the corresponding 2,3-bis-(benzothiazolyl-2)-pyridine or 3,4-bis-
(benzothiazo!yl-2)-pyridine, respectively, were obtained:

51
Although we heated equimolecular amounts of the components
in the presence of polyphosphoric acid at the relatively low temperature
of 120—140° for only one hour, expecting that only one carboxylic
group would enter into the reaction, both carboxylic groups reacted,
probably due to the catalytic action of the polyphosphoric acid.
These findings, together with the already mentioned catalytic action
of polyphosphoric acid, undoubtedly indicate that this acid is a very
useful agent in the condensation reactions of o-aminothiophenol with
pyridinecarboxylic acids.
The catalytic action of polyphosphoric acid in similar reactions
producing benzothiazoles, benzimidazoles and benzoxazoles is under
investigation.
EXPERIMENTAL
Melting points are not corrected
Industrial polyphosphoric acid (Fluka) was used.
1 : Condensation of o-aminothiophenol with picolinic acid
In a 100 ml flask equimolecular amounts of o-aminothiophenol
(2g) and finely powdered dry picolinic acid (2g) were mixed together
and then polyphosphoric acid (9 ml) was added. The flask was connected
to an upright condenser fitted with a calcium chloride tube. The reaction
mixture was heated at 120—140° in a paraffin oil bath 3 hrs, with occasio
nal shaking. At a temperature of about 120° water started to separate
and to condense on the inner walls of the flask, dissolution became
complete and the solution gradually turned dark-colored. At the end of
heating the separation of crystalline needles on the walls of the flask
was observed. The hot solution was immediately poured into cold water
(200 ml) whereby a resinous product was precipitated, which however
soon transformed into a white crystalline precipitate. After standing a
short while the crystals were filtered off and dried. The yield of the crude
product was 76% (2.6 g).
The crude product was dissolved in hot alcohol (30 ml) and recry-
stallized with addition of active charcoal. The crystals (1.6 g) melted
4»
52
at 136 °C and the addition of water to the nitrate furnished an additional
amount (0.5 g) of crystals of the same m. p. The total yield of light
gray crystals was 61% (2.1 g). The mixed melting point of this compound
with a specimen of 2-(pyridyl-2) benzothiazole showed no depression.
2. Condensation of o-aminothiophenol with nicotinic acid
In a 100 ml flask equimolecular amounts of o-aminothiophenol
(2 g) and nicotinic acid (2 g) were mixed and then polyphosphoric acid
(9 ml) was added. The further procedure was as above, the reaction
mixture being heated at 140—150° for 3 hrs. At about 120° water started
to separate, everything dissolved and the solution gradually turned dark.
The hot solution was then poured into water (300 ml) and left to cool.
Slow addition of KOH until the reaction mixture was strongly alkaline
resulted in the separation of a greenish precipitate which after standing
a short while was filtered off and dried. The yield of the crude product
was 61% (2.1 g).
The crude product was dissolved in hot alcohol (30 ml) and treated
with active coal. Water was added to the hot filtrate. The deposit which
separated on cooling was filtered, washed with water and dried. The
yield of greenish crystals melting at 128° was 40% (1.4 g); the m. p.
corresponds to that of 2-(pyridyl-3)-benthiazole.
3. Condensation of o-aminothiophenol with izonicotinic acid
In a 100 ml flask equimolecular amounts of o-aminothiophenol
(2 g) and izonicotinic acid (2 g) were mixed and then polyphosphoric
acid (9 ml) was added. The further procedure was as above, the reaction
mixture being heated at 140—150° for 3 hrs. At about 120° water started
to separate, everything dissolved and the solution gradually turned
dark. At the end of heating, separation of a yellow sublimate on the
inner walls was observed. The hot solution was poured into water
(400 ml) and left to stand for 2 hrs. Since only a small amount of a
deposit was separated, KOH was added until the reaction mixture was
strongly alkaline, whereby an additional precipitate was obtained. The
yield of the crude product was 70% (2.4 g).
The crude product was dissolved in hot alcohol (120 ml), active char
coal was added and the mixture was filtered hot. After cooling water
was added to the filtrate, which was warmed until dissolution, and then
it was left to stand. The deposit which separated on cooling was filtered
off and dried: m. p. 134—135°, corresponding to the m. p. of 2-(pyridyl-4)
benzothiazole. The yield of light green crystals was 47% (1.6 g).
The mixed melting point of this compound and the compound obtained
by the decarboxylation of the condensation product of o-aminothiophenol
and cinchomeronic acid anhydride showed no depression.
4. Condensation of o-aminothiophenol with quinolinic acid
In a 100 ml flask equimolecular amounts of o-aminothiophenol
(1.25 g) and finely powdered dry quinolinic acid (1.65 g) were mixed
S3
and then polyphosphoric acid (9 ml) was added. The flask was connected
to an upright condenser fitted with a calcium chloride tube. The reaction
mixture was heated at 120—140° in a parrafin oil bath for one hour
with occasional shaking. At 115° water started to separate. Heating was
continued until the evolution of bubbles from the liquid surface ceased.
The hot solution was poured into cold water (200 ml) whereby a resinous
precipitate was obtained which soon transformed into a white crystalline
deposit. The latte was left to stand for 3 hrs and then filtered off.
The crude product was dissolved in hot alcohol (150 ml), active
charcoal was added and after filtration the filtrate was left to cool. The
separated crystals were filtered off. Water was added to the filtrate,
whereby a further amount of crystals was obtained. The yield was
23% (0.8 g): m. p. 193°. The mixed melting point of this compound
with 2,3-bis-(benzothiazyl-2)-pyridine obtained by an other method(1)
showed no depression.
5. Condensation of o-aminothiophenol with cinchomeronic acid
In a 100 ml flask equimolecular amounts of o-aminothiophenol
(2.5 g) and finely powdered dry cinchomeronic acid (3 g) were mixed
and then polyphosphoric acid (9 ml) was added. The procedure was
further cairied out as above described, heating the reaction mixture at
120—140° for one hour. At 120° water started to separate, everything
dissolved and the reaction mixture turned dark-colored. The hot solution
was poured into water (400 ml) whereby a resinous precipitate was
obtained. After short standing it was filtered off.
The crude product was dissolved in a small amount of alcohol,
active charcoal was added, and after filtration, water was added to the
nitrate. The separated precipitate was filtered off, dissolved in alcohol
and the solution was filtered again. On cooling the filtrate furnished
crystals, which were filtered off and dried: m. p. 157°. The yield was
26% (0.90 g).
Analysis:
Calculated for C19HHN3S2: C 66.06%; H 3.21%; N 12.17%
Found : C 66.17%; H 3.10%; N 11.98%
School of Technology
Institute of Organic Chemistry

REFERENCES
1. Bastic, B. and M. Piletic. "Prilog prouCavanju benzotiazola, benzimidazola i
benzoksazola. I. Reakcija izmedu anhidrida hinolinske kiseline i o-aminotiofenola
(Contribution to the study of Benzothiazoles, Benzimidazoles and Benzoxazoles)
— Clasnik Hemijskog DruStva (Beograd) 28 (—4), 149, 1963.
2. Zubarovski, V. M. and A. I. Voronina. "Kondensatsia o-aminotiofenol s
geterotsiklicheskimi karbonovymi kislotami" (Condensation of o-amino-
thiophenol with Heterocyclic Carboxylic Acids) — Zhurnal Obschei Khimii
(Moskva) 23 : 140—145, 1953.
3. Hein.D., R. Alheim and. J Leavitt. "The Use of Polyphosphoric Acid in the Synthe
sis of Benzothiazoles" — Journal of the American Chemical Society (Easton,
Pa) 79 : 427-^129, 1957.
4. Rau, Ch. and J. Braunwarth. "The Synthesis of the Bisbenzothiazoles" — Journa
of Organic Chemistry (Easton, Pa) 26 : 3434—3436, 1961.

GLASNIK HEM1JSKOG DRUSTVA, Vol. 29, No. 3—4, 1964, pp. 145—155
CHEMICAL INVESTIGATION OF WHEAT
10*
NUCLEOTIDE COMPOSITION OF RIBONUCLEIC ACID OF
WHEAT LEAVES**
by
MIHAILO U. MIHAILOVIC, STOJAN GRUJIC and DIMITRUE HADZIJEV
INTRODUCTION
Our preliminary study(1) of wheat shoots showed that about 34
percent of the total phosphorus present in shoots was incorporated in
Na***.
These investigations also demonstrated that in shoots of high-
yield varieties there is more extensive accumulation of RNA than in low
yield varieties, when the age of the shoots, nutritional conditions, light
factors, etc., are equal. This finding might explain the more intensive
processes, related to protein biosynthesis, cell division, photosynthetic
and oxidative phosphorylation, and respiration capacity, which take
place in the high-yield varieties, but on the other hand, many other bio
logical-varietal characteristics of wheat varieties would still remain
unexplained.
The participation of uridine derivatives in sugar, /. e. starch bio
synthesis is well known. Our preliminary observation that these deriva
tives are present in increased amounts in the leaves of high-yield varieties
led us to think that a possible difference in the rate of incorporation of
free uridylic acid in RNA might represent qualitative characteristic
of the RNA composition of low and high-yield varieties.
It is of interest to note that while the nucleotide composition of
DNA and RNA isolated from wheat germ has already been investigated
(2,3,4,5) tf,e nucleotide composition of wheat-leaf RNA has not yet been
determined. The reason for this is probably the exceptionally easy iso
lation of these acids from wheat germ, while the isolation of RNA
either from green leaves or ripe whole grain involves many difficulties.
* Paper 9 : Glasnik hemijskog druStva Beograd 28, 1963.•* Preliminary communication: Biochimica et Biophysica Acta (Amsterdam)
87 : 499—502, 1964.
*** NA, nucleic acids; DNA, desoxyribonucleic acid; RNA, ribonucleic acid.

56
The present study was therefore undertaken with the purpose of investi
gating the nucleotide composition of RNA of green wheat leaves,
and at the same time, of devizing a convenient method for this kind
of research.
MATERIALS AND METHODS
For the study of the nucleotide composition of RNA the following
wheat varieties were used: Yugoslav low-yield varieties Bankut 1205 and
Novosadska 1446, and the high-yield varieties San Pastore (Italian) and
Etoile de Choisy (French). For analysis, young shoots 10—12 days old
were used.
As previously confirmed, the method of Ogur and Rosen does not
separate selectively and quantitatively the DNA from RNA in green
wheat leaves(1). A very convenient and satisfactory method for this
purpose appeared to be that of Schmidt and Thannhauser(6). However,
recent investigations have shown that by using the original extraction
procedure, in alkaline digest, partial destruction of mononucleotides
occurs(7). This concerns especially cytidylic acid, which is deaminated
to uridylic acid, but a similar decomposition, which follows first order
reaction kinetics, is also characteristic for adenylic acid and to a lesstr
extent even for uridylic acid(7). For this reason, in the present work
the extraction of NA was performed using the sodium chloride procedure,
since this salt solution efficiently disrupts the electrovalent bonds
supposed to exist between NA and proteins, but does not affect NA.
Therefore extraction with 10 percent sodium chloride was applied, accor
ding to Williams(8), followed by precipitation of NA with ethanol at
a lower temperature, according to the procedure of Scholtisstk(9).
The precipitated acids were then treated with potassium hydroxide, and
the RNA present in the mixture was hydrolyzed to mononucleotides by
a modified procedure of Schmidt and Thannhauser, which has already
been satisfactorily applied by Davidson and Smellit(10), and Thomas
and Sherratt(3). By using such a modification we expected to get RNA
and DNA fractions which would be suitable for purine and pyrimidine
determinations. Details of the entire procedure for the isolation of
RNA from green wheat leaves and its hydrolysis to mononucleotides
are presented in Scheme 1.
Mononucleotides were separated on a short column of ion-exchange
resin — commercial Dowex 1 x 10 (Cl-), 200—400 mesh particle size,
previously transformed into the formate form, as outlined by Hurl-
bert(11). The column was prepared from a dilute water suspension of
ion exchange resin in chromatographic glass tubes of 5 and 6 mm,
diameter respectively. The column length was 7 cm, after Cohn and
Volkin(i2).
The elution was performed by the discontinuous technique with
the following eluents : 0.05 M HCOOH for cytidylic acid, 0.5 M HCOOH
for adenylic acid, a mixture of 0.1 M HCOONH4 and 0.05 M HCOOH
for uridylic and pseudouridylic acids, and a mixture of 0.2 M HCOONH4
and 0.5 M HCOOH for guanylic acid.

57
Fresh wheat leaves (6 g), defatted with ethanol,
toluene and acetone and dried in a stream of air (yield
1.1 g), were treated in a centrifuge tube twice with 4
ml of 0.2 N psrchloric acid at O" and centrifuged
Combined supernatants:
Acid-soluble fraction (free
nucleotides). Discarded.
I
Residue :
The residue was neutralized with 0.3 N
aqueous potassium hydroxide in the
presence of phenol-red as indicator.
Then 1 5 ml of 10 percent sodium chloride
was added and the sample was heated
in a boiling water bath for 30 minutes.
The extract was filtered through a sin
tered glass filter (G-2). Extraction was
then repeated twice for 15 minutes with
additional 10 ml aliquots of salt solution
followed by refiltering.
i
Combined salt extracts:
Nucleic acid and protein contaminants.
Three volumes of ethanol were added
(approximately 100 ml), the solution left
overnight at- 10°, and then centrifuged.
Cellulose fibrous residue. Discarded.
Residue :
Nucleic acids and protein impurities.
The precipitate was rinsed with ethanol
and ethyl ether, dried in a stream of
air and then hydrolyzed with 0.3 N
aqueous potassium hydroxide at 37°
for 18 hours. The resulting hydrolyzate
was carefully acidified with concentrated
perchloric acid and adjusted to pH 1,
and the fraction of DNA which preci
pitated was separated by centrifugation
\
Precipitate: Supernatant:
DNA and KCIO4 Ribonucleotides and hydrolysis pro
ducts of protein impurities. The solution
was neutralized with potassium hydro
xide. The precipitated KCIO3 was
separated by centrifugation, and the
resulting clear supernatant was applied
to a column of ion-exchange resin.
Scheme I. — Method for the isolation of RNA nucleotides from green
wheat leaves.
Supernatant :
Discarded.
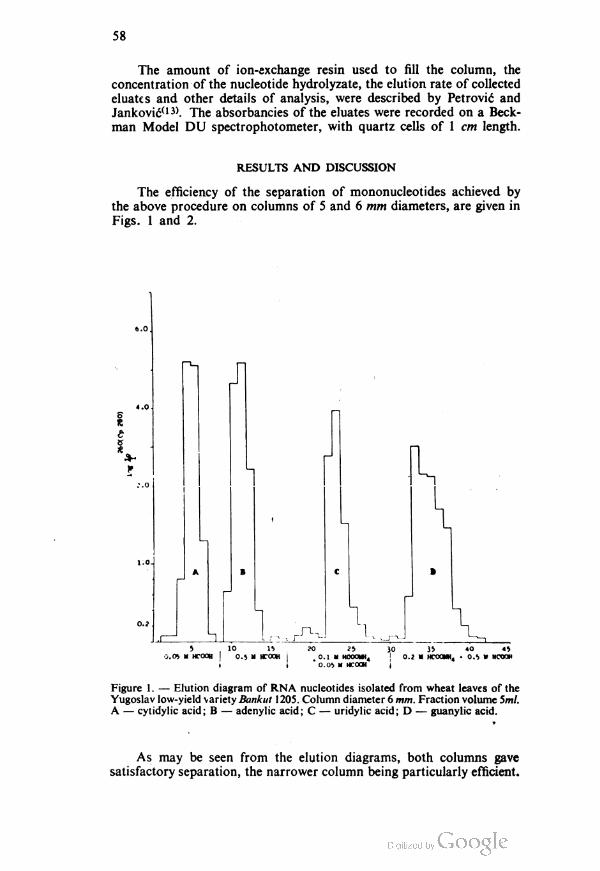
58
The amount of ion-exchange resin used to fill the column, the
concentration of the nucleotide hydrolyzate, the elution rate of collected
eluates and other details of analysis, were described by Petrovic and
Jankovic(13). The absorbancies of the eluates were recorded on a Beck-
man Model DU spectrophotometer, with quartz cells of 1 cm length.
RESULTS AND DISCUSSION
The efficiency of the separation of mononucleotides achieved by
the above procedure on columns of 5 and 6 mm diameters, are given in
Figs. 1 and 2.
6.0
Jl
^1
0.06 U HCOOH10 160.6 » HCOOH
20 2},0.11 KOOaUHj' 0.06 II HCOOH
3'0 35 «0 450.2 ■ HCOCHHa - 0.6 » HCOOH
Figure I. — Elution diagram of RNA nucleotides isolated from wheat leaves of the
Yugoslav low-yield variety Bankut 1 205. Column diameter 6 mm. Fraction volume 5m/.
A — cytidylic acid; B — adenylic acid; C — uridylic acid; D -— guanylic acid.
As may be seen from the elution diagrams, both columns gave
satisfactory separation, the narrower column being particularly efficient.

59
n
J1
» - 10 m 1? ?0 25 30 35 40
0.05 * KCOQH 0.5 M ^0.1 M HCOOIH. 0.? M HCOOWH. . 0.5 M HCOOH
HCOOH 1 0.05 M HCOOH |
Figure 2. — Elution diagram of RNA nucleotides isolated from wheat leaves of the
Italian high-yield variety
San Pastore. Column diameter 5 mm. Fraction volume 5 ml.
A — cytidylic acid; B — adenylic acid; C — uridylic acid;
D — guanylic acid.
For instance, in the separation of nucleotides of San Pastore practically
all the uridylic acid was present in only two eluates of 5 ml. Similar
sharp separations were also obtained in the case of cytidylic and adenylic
acids, while guanylic acid was eluted from the column, somewhat
slowler, thus confirming the finding of other authors(,3).
The appearance of small amounts of pseudouridylic acid (eluted
just before uridylic acid) in the eluates of both varieties (low-yield and
high-yield), suggests that this acid might also play an important role in
the formation of wheat RNA.
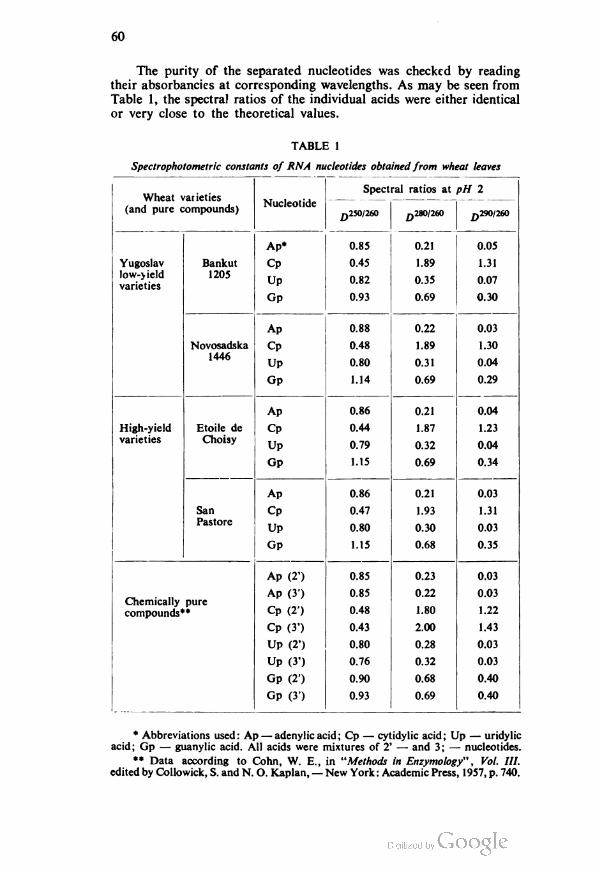
60
The purity of the separated nucleotides was checked by reading
their absorbancies at corresponding wavelengths. As may be seen from
Table 1, the spectral ratios of the individual acids were either identical
or very close to the theoretical values.
TABLE 1
Spectrophotometric constants of RNA nucleotides obtained from wheat leaves
Spectral ratios at pH 2
(and pure compounds)
Wheat varietiesNucleotide
£250/260D280/260 D290/260
Ap* 0.85 0.21 0.05
Yugoslav
low-yield
varieties
Bankut
1205
Cp
Up
Gp
0.45
0.82
0.93
1.89
0.35
0.69
1.31
0.07
0.30
Ap 0.88 0.22 0.03
Novosadska
1446
Cp
Up
0.48
0.80
1.89
0.31
1.30
0.04
Gp 1.14 0.69 0.29
Ap 0.86 0.21 0.04
High-yield
varieties
Etoile de
Choisy
Cp
Up
0.44
0.79
1.87
0.32
1.23
0.04
Gp 1.15 0.69 0.34
Ap 0.86 0.21 0.03
San Cp
Up
0.47
0.80
1.93
0.30
1.31
0.03Pastore
Gp 1.15 0.68 0.35
Ap (2') 0.85 0.23 0.03
Chemically pure
compounds**
Ap (3')
Cp (2')
0.85
0.48
0.22
1.80
0.03
1.22
Cp (3') 0.43 2.00 1.43
Up (2') 0.80 0.28 0.03
Up (3') 0.76 0.32 0.03
Gp (2') 0.90 0.68 0.40
Gp (3') 0.93 0.69 0.40
* Abbreviations used: Ap — adenylic acid; Cp — cytidylic acid; Up — uridylic
acid; Gp — guanylic acid. All acids were mixtures of 2' — and 3; — nucleotides.
** Data according to Cohn, W. E., in "Methods in Enzymology" , Vol. III.
edited by Collowick, S. and N. O. Kaplan, — New York : Academic Press, 1957, p. 740.

61
Although in previous investigations of the purine and pyrimidine
composition of RNA or DNA hydrolyzates the methods of paper
chromatography or paper electrophoresis were mostly used for the
separation of the bases(14), the application of the ion-exchange technique
offers great advantages when plant materials tissues are to be analyzed.
This goes especially for wheat material, which gives nucleic acid hydro
lyzates contaminated with considerable amounts of proteins, such as
globulins or their hydrolysis products. These impurities are easily
removed from the column simply by rinsing with water. Furthermore,
the use of this technique might possibly facilitate further research con
cerning the occurence and content regularities of pseudouridylic acid in
plant tissues in general.
Disadvantages attributed to this method of separation, such as
long elution times, a large number of fractions and spectrophotometer
readings, were essentially overcome by using weighed samples of
defatted leaf, and technical details described recently by Petrovic and
Jankovic(13). Since the elution of cytidylic, adenylic and uridylic acids
was usually completed with 25 ml of eluate per acid, and guanylic acid
TABLE 2
Nucleotide composition of RNA isolated from leaves of some low-yield and high-yield
wheat varieties
Low-yield varieties High-yield varieties
Nucleotide Novosadska
1446
Bankut
1205
San
Pastore
Etoile
de Choisy
Micromoles*
Cp 5.19 4.91 5.01 5.85
Ap 5.31 4.70 4.83 5.13
Up 5.16 4.61 4.87 5.76
Gp 6.32 5.52 5.72 7.83
Sum 21.98 19.74 20.42 24.57
In molar %
Cp 23.62 24.87 24.50 23.80
Ap 24.15 23.81 23.67 20.89
Up 23.48 23.36 23.84 23.45
Gp 28.74 27.97 27.98 31.86
Purine (pyrimidine
bases 1.12 1.07 1.07 1.12
(Ap + Gp)/(Cp + Up)
6-amino / 6-oxo bases
(Ap + Cp)/(Gp + Up)
0.91 0.94 0.94 0.81
* For 6 g fresh leaves

62
with 50 ml of eluate, the total separation of ribonucleotides did not last
more than eight hours.
In addition, the application of the ion-exchange technique allowed
us to separate as much as 25 micromoles of ribonucleotides, without
losses and overlapping of the individual acids, by using a column which
contained only 2 ml (volume) of packed wet resin (see Figures 1 and 2).
Our results also confirm the applicability of Williams' method(8)
for the preliminary extraction of NA. Although this extraction is not
always quantitative, as recently found on materials such as Euglena or
Chlorella(15), in the comparative investigation of nucleotide composi
tion this disadvantage was of negligible importance, as was the lower
selectivity of this method when applied to wheat tissue(1,,6). .
The content of individual acids in RNA, calculated from the cor
responding molar extinction coefficients for pure 2' — and 3' — nucleoti
des, are listed in Table. 2.
Although our preliminary study has shown that high yield varieties,
as compared to Yugoslav low-yield varieties, are richer in free nucleoti
des, especially in adenine and uridine derivatives, no significant diffe
rences were found in the nucleotide composition of their RNA. This
concerns particularly uridylic acid, /. e. the acid component which might
be expected to show a significant difference.
The mean value of the ratio of purine to pyrimidine bases, f. e.
(Ap+Gp)/(Cp+Up), was 1.09, while the ratio of 6-amino to 6-oxo
bases, i. e. (Ap+Cp)/(Gp+Up), was less than unity, varying in the range
0.81 to 0.95(see Table 2). The ratio (Gp+Cp)/(Ap+Up) was 1.15(mean
value), and the ratio (Gp+Up)/(Ap+Cp) had a mean value 1.11, /. e.
these ratios were somewhat different from those of wheat germ establi
shed recently by Vanyushin and Belozerskii(5). Similar values for the
RNA composition of plants were reported not long ago by other authors
(i7-2i) These results show that RNA isolated from wheat leaves, regard
less of variety, belongs to the GC (guanine, cytosine) type, and as such
follows Chargaff's rule(22). In both varieties the sum of guanylic and
cytidylic acids is higher than the sum of adenylic and uridylic acids, and
the amount of purine bases is larger then the amount of pyrimidine
bases.
Department of Chemistry Received June 1, 1964.
School of Sciences
Beograd
Department of Chemistry
University of Novi Sad
Novi Sad
REFERENCES
1. Mihailovic, M.Lj.,M,, Antic, andD. Hadzijev. "Phosphorus Compounas in Leaves
and Roots of Wheat" (to be published).
2. Wyatt, G. R. "The Purine and Pyrimidine Composition of Deoxypentose Nucleic
Acids" — Biochemical Journal (Cambridge) 48 : 584—590, 1951.
3. Thomas, A. J. and H. A. Sherratt. "The Isolation of Nucleic Acid Fractions from
Plant Leaves and Thsir Purine and Pyrimidine Composition" — Biochemical
Journal (Cambridge) 62 : 1—4, 1956.
4. Lipshilz, R. and E. Chargaff. "Studies on Nucleoproteins. IV. Preparation of the
Desoxyribonucleoprotein and Fractionation of the Desoxyribonucleic Acid of
Wheat Germ"—Biochimica el Biophysica Acta (Amsterdam) 19 : 256—266, 1956.
5. Vanyushin, B. F. and A. N. Belozerskil. "Composition of Ribonucleic Acid in
Higher Plants" — Doklady Akademii Nauk SSSR (Moskva) 127 : 455^58, 1959.
6. Schmidt, G. and S. J. Thannhauser. "A Method for the Determination of Deso
xyribonucleic Acid, Ribonucleic Acid, Phosphoproteins in Animal Tissues" —
Journal of Biological Chemistry (Baltimore) 161:83—89, 1945.
7. Bottger, B. and H. G. Fritz. "Determination of Ribonucleic Acid in Plant Material''
— Biochimica et Biophysica Acta (Amsteidam) 61 : 621—622, 1962.
8. Williams, R. F. "The Estimation of Nucleic Acid Phosphorus in Plant Material" —
Australian Journal of Experimental Biology and Medical Science (Adelaide)
23 : 213—219, 1945.
9. Scholtissek, C. "Relation of the Ribonucleic Acid of the Nuclei, Mitochondria,
Microsomes and Cell Sap of Rat Liver, Spleen and Kidney" — Biochemische
Zeitschrift (Berlin) 332 : 458—466, 1960.
10. Davidson, J. N. and R. M. S. Smellie. "Phosphorus Compounds in the Cell" —
Biochemical Journal (Cambridge) 52: 594—599, 1952.
11. Hurlbert, R. B. "Preparation of Nucleoside Diphosphates and Triphosphates",
in : Collowick, S. and N. O. Kaplan (Editors). Methods in Enzymology, Vol. Ill —
New Yotk: Academic Press, 1957, pp. 785—805.
12. Cohn, W. E. and E. Volkin. "Nucleoside-5'-phosphates from Ribonucleic Acid"
— Nature (London) 167 : 483-^184, 1951.
13. Petrovic. S. and V. Jankovic. "Simple Ion-exchange Methods for Analysis of
Ribonucleic Acids" — Bulletin of the Boris Kidrii Institute of Nuclear Sciences
(Beograd—Vinca) 13(3) : 47—55, 1962.
14. Markham, R. "Nucleic Acids, Their Components and Related Compounds",
in: Paech, K. and M. V. Tracey (Editors). Modern Methods of Plant Analysis,
Vol. IV— Berlin: Springer Verlag, 1955, p. 246.
15. Smillie, R. M. and G. Krotkov. "The Estimation of Nucleic Acids in Some Algae
and Higher Plants" — Canadian Journal of Botany (Ottawa) 38 : 31—49, 1960.
16. Martin, E. M. and R. K. Moiton. "Enzymic and Chemical Properties of Cyto
plasmic Particles from Wheat Roots" — Biochemical Journal (Cambridge)
64 : 687—693, 1956.

64
17. Ross, C. W. "Nucleotide Composition of Ribonucleic Acid from Vegetative and
Flower ing Cocklebur Shoot Tips" — Biochimica et Biophysica Acta (Amsterdam)
55 : 387—388, 1962.
18. Wallace, J. and P. O. P. Ts'o. "Nucleotide Composition of Various Ribosomes"
— Biochemical and Biophysical Research Communications (New York) 5 : 125—
129, 1961.
19. Reddi, K. K. "Isolation and Properties of Ribosenucleic Acid from Tobacco
Leaves" — Biochimica et Biophysica Acta (Amsterdam) 23: 208—210, 1957.
20. Lyttleton, J. W. "Nucleoproteins of White Clovei" — Biochemical Journal
(Cambridge) 74 : 82—90, 1960. -,
21. Sisakyan, N. M., M. S. Odintsova, and N. A. Cherkasina. ..Nucleotide Compo
sition of Ribonucleic Acid of Plant Cellular Structures" — Biokhimiya (Moskva)
25:160—163, 1960
22. Elson, D. and E. Chargaff. "Regularities in the Composition of Pentose Nucleic
Acids" — Nature (London) 173 : 1037—1038, 1954.

GLASNIK HEMIJSKOG DRUSTVA, Vol. 29, No. 3—4, 1964, pp. 157—193
THE EFFECT OF INSULIN ON THE METABOLISM
OF PROTEINS, LIPIDS AND GLUCIDES.
VIII. THE ACTION OF SUCCESSIVE HYPERINSULINEMIA
ON BLOOD SERUM LIPOPROTEINS
by
J ELENA J. BOJANOVIC, ANKA D. JEVTOVlC and MILANKA O. CORBIC
It is known that insulin reduces alimentary hyperinsulinemia
(insulin clearing effect) and chlolesteremia (4-6) shortly after its admini
stration. On the other hand it has been found that in patients subjected
to long therapy with insulin shocks (in schizophrenia), the level of total
lipids and especially that of neutral fats in the circulation is considerably
above normal(2). These data prompted us to investigate the ratio of
serum lipoprotein fractions in the course of successive administration of
large quantities of insulin over a long period of time, and to observe
the delayed insulin effect (several hours after administration). In our
opinion these data might be of interest not only for the observation of
metabolic processes and their interrelations with respect to the insulin
effect, but also they might be of importance in case of long application
of insulin therapy with regard to side-effects and the disturbances they
cause.
MATERIALS AND METHODS
Electroph'-retic investigations of serum lipoprotein fractions were
made on six shizophrenic patients (female) aged from 20 to 30 years.
Other diseases were excluded by examination. During the insulin shock
therapy blood was taken just before injection and 20 minutes after insu
lin coma began (about two and a half hours after injection). Insulin was
given intramuscularly, the dose being determined individually, ranging
from 100 to 160 units. Before the first insulin coma, the patients were
given small amounts of insulin. Patients were wakened from coma
by the i. v. administration of glucose. The serum was taken in the usual
way(1).
Paper electrophoresis of lipoprotein fractions was done by the
method of Swahn(7). Spots of 0.03 ml of serum were applied to 4 x 40 cm.
strips of Schleicher Scull 2043 bM paper. The electrophoresis was
performed in a veronal-sodium veronal, buffer pH = 8.6, u,=0.1, at a
voltage of 170 V, over five hours. Fractions were detected by staining
s

66
with solution of Sudan black B in 50% ethanol. The staining time, was 45
minutes. After this the strips were washed with 50% ethanol. The dried
strips were impregnated with glycerol and the optical density of the spots
was measured photometrically. The amounts of individual fractions are
given in percentages. The results were statistically evaluated by the
basic methods(1).
RESULTS AND DISCUSSION
The relative amounts of serum lipoprotein fractions in shizophrenic
patients before insulin shock therapy and found in healthy persons of the
same sex and age do not essentially differ(3). However, in insulin coma
and in conditions attained several hours after insulin administration
we found considerable differences in the lipoprotein electrophoresis
patterns. We also found that these values vary during the therapy period
observed.
Insulin Effect in Successive Shocks
Daily administration of insulin in quantities sufficient to produce
deep comas resulted in increase of the percentage of a-lipoproteins. In
all periods observed the changes of a-lipoproteins were of the same sense
but of different intensities. The greatest increase relative to other fractions
was found in the tenth successive shock (the change is statistically highly
significant). In the first and twentieth shock the increase was consi
derably smaller (in the first the change is statistically significant, in the
twentieth shock it is unsignificant). However, although the a-lipoprotein
fraction was increased in insulin coma its level in the blood decreased
in the course of the therapy. Thus in the twentieth shock, although it
was increased, its relative level was of the same order as before the first
insulin coma.
The relative values of the (3-lipoprotein level was decreased in insulin
shocks. The changes were of the same sense in all periods observed but of
different intensities. In the tenth shock the relative decrease was the
greatest and the change was statistically significant. In the first and twenti
eth shock the decrease was small and not statistically significant. How
ever, although the relative values of the ^-lipoproteins were decreased
in insulin shocks, they was increased in the course of therapy, so
that in the twentieth shock they were higher than before the first shock.
The y-lipoprotein fraction was decreased in all insulin shocks observ
ed, but the changes were small and not statistically significant. The
serum y-lipoprotein level decreased in the course of the therapy so that
in the twentieth coma it was lower than before the first shock.
Delayed Insulin Effect Observed 24 Hours After Insulin Administration
Investigation of lipoproteins 24 hours after insulin administration,
in the period in which the optimal functions in tissues should be attained,
showed that the delayed insulin effect is manifested in changes whose
sense and degree depend upon the duration of therapy.

67
55
5^
hi/> 53
z
w 52
hoa. 51a.
oa 50
12 A
49J
48
LEVEL OF P>- LIPOPROTEINS
BEFORE THE FIRST SHOCK
—O
LEVEL OFod-LIPOPROTEINS
BEFORE THE FIRST SHOCK
X
LEVEL OF ({9-LIPOPROTEINS
BEFORE THE FIRST SHOCK
FIRST TENTH TWENTIETH
IM^MI IM SHOCK
Fig. 1
S'

68
1 1 i
BEFORE 24 HOURS 24 HOURS
THE FIRST AFTER AFTER
THE NINTH THE NINETEENTH
INSULIN INSULIN
SHOCK SHOOK
Fig. 2

69
TABLE 1
Statisticaly calculated results for relative levels of serum lipoprotein fractions in
schizophrenic patiens (female) before the injection of insulin and in insulin shock
c
°S— 80(J
¥>
Values
before
in shock
* j Range of
Jg values
£3
S5
Mean values
—standard
deviation
cu co.9
73C .
55 IU $
before first 6 26.60-36.47 31.70±3.49 1 .43] 1 1 .01
in first 6 31.35-39.44 36.03±3.37 1.371 9.35
O
13.65
before tenth 6 ! 21.84-32.42 26.08 + 3.65 ' 1.49 13.991 i — +26.46
in tenth
before
twentieth
6 29.38-35.93 1 32.98 ±2.64 1.08 8.00
6 I 21.07— 31.49 I 28.47 + 3.75 1.53 13.17
31.96 ±6.02 2.69 18.84in twentieth] 5 21.48-36.39
before first 6 48.05-56.55 | 51. n* 2V\ I . is 5.r,2
1 46.48-52 00
+ 12.26
in first
s
o
coD,
before
tenth
in tenth
before
twentieth
49.33 ±2.28
57. V) 6 1.01 58.75±1.41
46.26-58.87 I 53.44 ±4.83
-4.73
0.93 4.62
in twentieth i 5
before first 6
in first i 6
before
tenth
in tenth
before
twentieth
in twentieth
before first
in first
before
tenth
in tenth
before
twentieth
in twentieth
51.35-61.36 I 56.07±3.67
47.69-61.83 I 55.16±5.05
0.52
1.97
1.50
2.40
9.04
6.54
13.55-20.43 16.50 ; 2.66
10.00-18.65 | 14.63±2.82
10.03-19.34
10.52-17.80
10.20-17.56
7.30-16.92
1.37- 1.99
1.18- 1.60
1.77-
1.29-
2.71
2.00
1.63- 2.91
1.35- 2.88
15.29±3.47
13.58±3.26
2.26 9.15
1.09 16.12
1.15
1.42 22.69
15.44±2.78
12.87-4.02
1.65 ±0.25
1.38±0.18
2.29-0.32
1.63 ! 0.26
.33
1.13
0.70
0.13
0.1 1
2.02±0.45 0.18 22.28
1.82.1.0.61 0.27
9.04
1.62
-11.33
19.27
11.18
24.00
18.00
u -—> cU 6D
p = 0.05
p<0.01
p>0.05
p>0.05
p ; 0.05
p. 0.05
p. 0.05
p>0.05
1.80|31.23
0.1015.15
16.64 p 0.05
1 -16.36 ;p = 0.0513.04; r
13.97
15.95
-28.82 p. 0.01
33.52
-9.90 p>0.05
* % Decrease or increase and level of significance are given relative to values
before the shock

70
TABLE 2
Statisticaly calculated results for relative levels of serum lipoprotein fractions
in schizophrenic patients (female) 24 hours after the administration of insulin
Subjectofinveti
gation
Numbeofc6e6 %deceeaeoe
incee6eeel6tive tov6luebefoee1thefie6t6hock
Levelof6ignifi ceceeel6tivetov6luebefoeethe
fie6t6hock
% decre
ase or in
crease re
lative to
values 24
hours af
ter the ni
neth shock
Levelof6ignific6nceeel6tivetova lue24houe66fte thenineth6hock
Values before
24 hours after
shock
Meev6lue
before the
first6 31.70 - — - —
aafter the
nineth6 26.08 -17.73 p<0.05
— —
after the
nineteenth6 28.47 -10.19 p>0.05 + 9.16 p>0.05
before the
first6 51.78 - - — —
LipopeoteinfectionP
after the
nineth6 58.75 + 13.46 p<0.001
- —
after the
nineteenth6 56.07 + 8.28 p=0.05 -4.56 p>0.05
before the
first6 16.50 - — - —
7after the
nineth6 15.29 -7.33 p>0.05
—
after the
nineteenth6 15.44 -6.42 p>0.05 . 0.98 p>0.05
3
before the
first6 1.65 - - —
Y
after the
nineth6
6
2.29 + 38.79 p- 0.01— -
after the
nineteenth2.02 + 22.42 p>0.05 -11.79 p>0.05
Insulin shock two and a half hours after injection, was characterized
by a decreased large molecule lipoprotein level relative to the other
lipoprotein fractions, while after 24 hours we found that the level of
(J-lipoproteins in the entire observed period of the therapy was higher
than before the first shock. The changes were statistically significant
The greatest increase of ^-lipoproteins and the (3/a ratio was found 24.
hours after the ninth sucessive shock. After nineteen shocks some decrease

71
of the level of this fraction was observed but it was still considerably
higher than before the first shock.
It is interesting to note that in analogous experiments on animals
the delayed effect of insulin on nonesterified and esterified serum fatty
acids was a considerable increase of their concentration (unpublished
data obtained in our laboratory).
The decrease of the a-lipoprotein level was greatest and statistically
significant 24 hours after nine successive shocks. However, the increase
of the relative value of the a-lipoprotein fraction which appeared on
further administration of the same quantities of insulin was small and
not statistically significant.
The decrease of the y-lipoprotein relative to the other fractions in
the course of successive administration of insulin was small and not
statistically unsignificant; after nineteen shocks the changes were
practically negligible.
The changes of the serum lipoprotein fractions in the period of the
delayed insulin effect are evidently due to altered metabolic processes in
the liver, whereby it is necessary to take into cons:deration not only the
direct effect of insulin on these processes but also an increased amount
or an increased activity of insulin antagonists under these conditions.
Chemical Institute
School of Medicine
Beograd
Received May 13, 1964
REFERENCES
1. Bojanovic, J., A. Jevtovic; M. Corbie and D. Rosic. "Uticaj insulina na metabo-
lizam belancevina, lipida i glicida. III. Uporedna ispitivanja azotnih sastojaka
seruma u insulinskom Soku kod metabolicki zdravih osoba, obolelih od Sizofre-
nije" (The Effect of Insulin on the Metabolism of Proteins, Lipids and Glucides.
III. Comparative Investigations of Nitrogenous Substances of Serum in Insulin
Shock in Metabolically Healthy Schizophrenics) — Glasnik Hemijskog DruStva
25—26 : 373, 1960—1961.
2. Bojanovic, J., M. Levntal-KarakuSevic and K. Nikolic. "Uticaj insulina na meta-
bolizam belancevina, lipida i glicida. II. Sadrzaj lipidnih sastojaka seruma u
osoba obolelih od sizofrenije i njihove promene u dubokoj insulinskoj komi"
(The Effect of Insulin on the Metabolism of Proteins, Lipids and Glucides II.
The Content of Lipid Components in Serum of Schizophrenics and Their
Changes in Deep Insulin Coma) — Acta Medica lugoslavica 16 : 151, 1962.
3. Fine, J. J. Gtou1ade, M. Saint-Paul and T. Tizzani. "Apport de la methode quanti
tative a la connaissance de la physiologie des proteines, glyco et lipoproteines
seriques chez l'homme et ranimal" — Biologie Medicale 45 : 591 ; 1956.
4. NeSkovic, M., J. Bojanovic, M. Corbie, Lj. Stefanovic, Z. Mladenovic-Stoimirovic,
I. Kulic-Japundzic and D. Kostic. "The Effect of Insulin on the Metabolism of
Proteins, Lipids and Glucide. IV. Action of Glucose on the Insulin Clearing
Effect" — Zbornik radova Medicinskog fakulteta (Beograd) 1 : 37, 1962.
5. Nikolic, V., B. Nikolic, V. Pavlovic-Kentera and V. PeriSic. "Normalne vrednosti
lipoproteida seruma" (Normal Values of Serum Lipoproteins) — Srpski arhiv za
celokupno lekarstvo 86 : 838, 1958.
6. Scaife, J., and B. Migicovsky. "Effect of Alloxan, Insulin and Thyroxine on Chole
sterol and Fatty Acids Synthesis by Rat-Liver Homogenates" — Canadian Journal
of Biochemistry and Physiology 35 : 15, 1957.
7. Swain, B. "Determination of Total Lipids in Serum" — Scandinavien Journal
Clin. Lab. Investigation 4 : 98, 1952; Blod Lipids Suppl 5 : 9, 1953.

SRPSKO HEMIJSKO DRUSTVO (BEOGRAD)
BULLETIN
OF THE CHEMICAL
SOCIETY
Belgrade
(Glasnik Hemijskog drustva , Beograd)
Vol. 29, No. 5 - 6, 1964.
Editor:
MILOS MLADENOVIC
Editorial Board:
DELlC, D., DESPlC, A., DIZDAR, Z., DIMtTRIJEVl£, DJ., KONCAR-DJURDJEVIC, S.,
LEKO, A., MILIC. M., MLADENOVIC. M., MIHAJLOVlC, M., MIfjOViC, V., RADOSAV-
LJEVlC, s., raSajski, S., STEFANOVlC, DJ., TUTUNDZlC, P., HOROViC, A., Celap, m.
Published by
SRPSKO HEMIJSKO DRUSTVO (BEOGRAD)
1966.

Translated and published for U. S. Department of Commerce and
the National Science Foundation, Washington, D. C, by
the NOLIT Publishing House, Terazije 27/11, Belgrade, Yugoslavia
1966
Translated by
DANICA LADJEVAC and ALEKSANDRA STOJILJKOVIC
Edited by
PAUL PIGNON
Printed in Beogradski Graficki Zavod, Belgrade

CONTENTS
Slobodan M. Ristic and Vidosava M. Georgijevic:
Refractometric Investigations of 2-2 bis (p-chlorophenyl)-l-l-l-Trichloro-
ethane (p, p'-DDT) in Various Organic Solvents. Ill 5
Ankica M. Antic-Jovanovic and Milorad G. Jeremic:
Spectrophotometric Investigations of Crystallohydrates and Crystallodeute-
lates of Some Transition Elements and Their Solutions in H2O and D2O. ... 13
J. Misovic and S. Ramasechan:
The Space Group Determination of 2 Amino 4'Bromo Benzophenone and
2 Amino 4'Chloro Benzophenone 21
Sreten N. Mladenovic:
Coulometric Determination of Manganous Ion 31
Sreten N. Mladenovic:
Polarographic Determination of Copper in the Presence of Lead 35
Sreten N. Mladenovic:
Polarographic Determination of Tin in Zinc 39
Tibor A. Kiss:
A Contribution to the Complexometric Determination of Metals. VI. Deter
mination of Manganese, Lead, Cobalt, Cadmium, and Iron 43
D. Delic and M. A. Jovanovic:
Determination of the Diffusion Coefficient and Its Temperature Dependence
in Dealkalization of Sodium from Na-Ca-Silicate Glass 49
D. Delic and M. A. Jovanovie:
Dealkalization from Glass as a Kinetic Process 59
Dusan Vucurovic, Rajko 2. Vracar, and Uija B. Hie:
Extraction of Manganese from Poor Manganous Ores by Reductive Roas
ting and Leaching in Ammoniacal Solution 67
Dusan M. VuCuiovic, Ilija B. Ili<5, and Rajko 2. Vracar:
Extraction of Manganese from Poor Ores by Roasting with Ammonium
Salts 75

GLASNIK HEMIJSKOG DRUSTVA, Vol. 29, No. 5—6, 1964, pp. 169—180
REFRACTOMETRIC INVESTIGATIONS of 2-2 bis
(/>-chlorophenyl) - 1 - 1 - 1 - TRICHLOROETHANE (p, p' -DDT)
IN VARIOUS ORGANIC SOLVENTS. III.
by
SLOBODAN M. RISTlC and VIDOSAVA M. GEORGIJEVlC
I. INTRODUCTION AND REFERENCE TO EARLIER COMMUNICATIONS
Our earlier investigations of the refractive index of solutions
of the insecticide 2 — 2 — bis (p — chlorophenyl) — 1-1 — 1 — trichlor-
ethane, better known as DDT, have shown some interesting details
about the behavior of this molecule in different organic solvents.
The present communication in part completes our earlier works(1, 2)
and partly extends them.
First of all we would like to correct an omission made in
the second paper (II) of our investigations by publishing here
Table 1, which contains a summary and a survey of our earlier
work, but brought up to date with the results of later measure
ments (cf. Table 1). The numeration on the lines in Fig. 1 of
paper II correspond to the solvents in the order given in Table 1.
As can be seen, before the present communication the behavior of
the p, p' — isomer of DDT was refractometrically investigated in 25
organic solvents. All the measurements were made at constant
temperature / = 25.0° ±0.05 and with sodium light (D line). The 9
— value, as defined in paper I, is given for all these solutions.
From these 9-values an attempt was made(2) to find a relation
between 9 and som; other constants, and indeed certain rough
relations are given in the table which can be checked by the data
in the other columns.
2. REFRACTOMETRIC DETERMINATION OF DDT IN NEW SOLVENTS
In the work reported here nine further solvents were inves
tigated under experimental conditions as similar as possible to
those of the earlier communications. Specifications of these solvents
are given in the list below.

6
SOLVENTS USED (Paper III):
1. Cyclohexanol — "Carlo Erba S. A., Milano, p. a." — Refractive index directly
determined at 25.0°C, 1.46425.
2. Decalin — "Carlo Erba S. A., Milano p. a." — Refractive index directly
determined at 25.0°C, n% = 1.47488.
3. Tetralin — supplied by the Chemistry Institute of this Faculty. Refractive
index directly determined at 25.0°C, n% = 1.54614.
4. Nitrobenzene -— "Norwood, O., USA", p. a. — Refractive index directly
determined at 25.0°C, n*,5 = 1.54996.
5. Phenyl hydrazine — "Judex Chemicals". Refractive index directly determined
at 25.0°C, nl5= 1.60161.
6. Quinoline — "Glavkoks, USSR", purum. Refractive index directly determined
1.62170at 25.0°C, n2J= 1.62206 (redistilled); two other samples had nj*
and «^f= 1.61687.
7. Carbon disulfide — "Carlo Erba S. A., Milano, p. a." Refractive index di
rectly determined at 25.0°C, 1.62384.
8. Acetylene tetrabromide — "E. Merck", Darmstadt, p. a. Refractive index di
rectly determined at 25.0° C />"= 1.63426.
9. a—Monobromine naphtalene — "Carlo Erba, S. A., Milano, p. a.". Refrective
index directly determined at 25.0°C, nV= 1.65661.
Refractometric curves of p, p' — DDT solutions in these
solvents are given in Fig. 1. Except for quinoline solution, where
the 9-value is about ±0, which will be discussed later (Figs. 2 and 3),
these are high refractive index solvents.
c%
30
33
34
I\
V<000 1.4*000 1,50000 1,52000 1*4000 VK000 1*5000 1,60000 1/52000 1*4000 1*6000
Fig. 1

7
As can be seen in Fig. 1, the slopes of the curves on either
side of quinoline have a different direction, i. e. the <p-value clearly
changes sign in case of solvents such as quinoline.
TABLE 1
Investigated solutions of p, p'—DDT
Solvent <P-,,Ac
An
Found"0lit. w25°
"4M
1. Chloroform 0.00188, 1.44200 1.44270 1.47992 119.389
2. Carbon tetrachloride 0.00182, 1.45747 1.45759 1.5842 153.838
3. Methyl alcohol (obs.) 0.00 1770 1.32736 1.3267 0.78740 32.042
3.a Methyl alcohol 0.00 1520 1.32857 1.32773 0.78643 32.042
4. Methyl acetate 0.00 1760 1.35818 1.35935 + 0.92740 74.078
5. Ethyl acetate 0.001634 1.36981 1.36979 0.89455 88.104
6. Acetone 0.00156, 1.35687 1.35660 0.78508 58.087
7. Ethyl alcohol 0.00 1500 1.35934 1.35941 0.78554 46.086
7.a Ethyl alcohol 0.00 142„ 1.36184 1.36790 0.8066 46.086
8. Paraldehyde 0.00144, 1.40226 1.40486 t 0.9943 + 132.16
9. Ethyl ether 0.00137, 1.35055 1.3497 0.7135 + 74.14
10. Petrol ether 0.00134, 1.36193 — — 74.14
11. Piperidine 0.00123, 1.45087 1.45035 0.8606+ 85.15
12. Dioxane 0.001210 1.42000 1.42025 1.02687 88.104
13. Benzene 0.00113, 1.40108 — 0.7165 —
14. Acetyl acetone 0.00107, 1.44917 1.45178 + 0.9712 100.11
15. Cyclohexanine 0.000936 1.44947 1.4460 0.94206 98.140
16. Oleic acid 0.00089, 1.45877 1.4571 + 0.8870 282.452
17. Toluol 0.00082, 1.49340 1.49405 0.86220 92.134
18. Benzene 0.00081, 1.49787 1.49790 0.87368 78.108
19. Pyridine 0.00069, 1-50712 1.5067 0.9786 79.098
20. Monochlorbenzol 0.00064, 1.52143 1.52211 1.10630 112.557
21. Benzyl chloride 0.00063, 1.53668 1.54151 r 1.1026+ 126.58
22. Acetophenone 0.000546 1.53136 1.5322 1.2382 120.144
23. Bromoform 0.00034, 1.59288 1.5980+ 2.890+ 252.766
24. Benzyl benzoate 0.00029, 1.56718 1.5681 + 1.114+ 212.236
25. Aniline 0.00015, 1.58365 1.58318 + 1.01750 93.124
26. Cyclohexanol 0.00087, 1.464251.46560"-6
0.9449 100.16
27. Decalin 0.00085, 1.47488 1.48280 0.8960138.11""
28. Tetralin 0.00051, 1.54602 1.54614 0.9710 132.20
29. Nitrobenzene 0.000526 1.54996 1.55045 + 1.1950 125.1
30. Phenyl hydrazine 0.00017, 1.601611.6081320-3
1.0884 108.14
31. Quinoline 0.00004, 1.62206 1.62450 1.0896 129.1
32. Carbon disulfide 0.000 162 1.623841.62950'8
1.2628 76.14
33. Acetylene tetrabromide 0.00059 1.63426 1.63795 2.9638 345.70
34. a-monobrome-naphthalene 0.00045 6.656611.65876"-4
1.4875 207.0
Table 1 also contains data for checking relations (4—7) of
paper II. The considerable fluctuations in the constant W (expression 7,
Paper II), persist here, so it is still impossible to find out the

8
cause for this fluctuations. However, the number of substances
for which the product in the last column falls far outside a fairly
wide average is relatively small.
3. INVESTIGATION OF THE INFLUENCE OF TEMPERATURE
AND WAVELENGTH ON THE <p-VALUE
In our earlier investigations wc tried to get the steadiest
possible temperature (/ = 25.00;t0.05oC) and monochromatic wave
length (NaD). In this work, with a carbon disulfide solution of
p, p' — DDT we determined the temperature coefficient of 9 (—\ , and
\dt /
its wavelength coefficient, I — J. These quantities were measured espe-
cially for the practically important temperature region 20 — 25 — 30CC,
and the X-region of the Fraunhofer lines C—D = G' (i.e. 6563,
5893 and 4340 A). Because of the lack of a special monochromator
the refractive index of the solution was determined at various
wavelengths using the monochromator system of a Bonet-Maury
absolute colorimeter. This was done by removing selenium cell
detector, so that the beam of monochromatic light (with the smallest
slit) selected by means of the wavelength drum was directly incident
on the prism of the Pulfrich refractometer. Since the Bonet-Maury
instrument has one grating as the dispersion system, the mono-
chromaticity was satisfactory for our purposes. Tables 2 and 3
show these determinations and the result.
TABLE 2
Influence of temperature on 9 for CS2-solution of DDT
C% n™ (p'° C% n2D5 (p» C% n™ q>»
0 00 1.62704 0.00 1.62384 0.00 1.619831.8-10—• 1.3 10 4 3.4 10-4
5.73 1.62598 7.07 1.62295 3.35 1.618671.610-4 1.710-4
1.4- 10-"
8.47 1.62571 9.32 1.62223 12.69 1.618041.8-10—• 1.710-4 1.210-4
17.86 1.62384 18.58 1.62072 22.17 1.617141.6-10—• 1.610-4
1.2 10-"
20.96 1.62375 20.71 1.62045 26.20 1.61669
1.510-"
26.19 1.61983
mean value
1.69 10-4
mean value
1.56 10- 4
mean value
1.30 10-*
ffl
2.6- 10-4
20/25 ffl
5.8-10-4
25/30

9
TABLE 3
Influence of wavelength onf for CS2-solulion of DDT
c%„20
nD na,
0.00 1.61771 1.62704 1.67517
1.4 io-4 1.7 io-4 4.7- IO-4
5.27 1.61699 1.62616 1 67269
1.6 io-4 1.8 io-44.6- 10-4
5.73 1.61681 1.62598 1.67253
1.3 io-4 1.6 io-43.310 4
8.47 1.61664 1.62571 1.67235
1.4 io-4 1.8 io-43.8- 10-4
17.86 1.61529 1.62384 1.66831
1.2 io-4 1.610 4 3.9- 10-4
20.96 1.61511 1.62375 1.66684
mean
1.36
value
10 4
mean
1.69
value
-10 4
mean value
4.09- 10-4
|rf<?] = 4.9.10 7 |—1= 1.810-6
ld\]ciD \_d'A]DIG'
As can be seen: 1 — in carbon disulfide solution of p, p' —DDT y
decreases with increasing temperature in the investigated temperature
intervals (although not much: 0.03 and 0.06 x I0-''/degree): 2 — for
the same solution cp increases with decreasing monochromatic
wavelength for the wavelength interval used here 6563—4340 A
(Ha — Hy -X— lines).
4. DETERMINATION OF THE SOLUBILITY, DENSITY AND nD
OF SOME SATURATED DDT SOLUTIONS
In order to be able to acquire some additional information
on the process of dissolution in the systems investigated, we tried
the concentrations up to saturation in order to determ'ne some
values of the solubility of p. p' — DDT which could not be found in
the available literature0). We also determined pycnometrically the
TABLE 4
Some characteristics of saturated solutions of pp'—DDT
in some organic solutions
Solvent C5al df n2£ sat.
Carbon disulfide
Chloroform
Quinoline
1.3458
1.4783
1.1956

10
density of the solution at constant temperature (t = 25.00'C). These
and the corresponding nD values are shown in Table 4. As can be
seen, the solubilities at this temperature are considerable for all
three solvents, so they are quite suitable for refractometric deter
mination of solute concentration in view of their suitable numerical
values (except for quinoline which will be discussed in section 6).
5. CHECK OF THE REFRACTIVITY FORMULA
The various well-known, mainly empirical relations between
refractive index and density can still provide additional data on the
dissolution process when applied to the solutions, because molecular
refractivities have an additive character, if the dissolution is a physical
process.
For some solutions, for which we determined concentrations
until saturation (carbon disulfide and chloroform solutions) we
checked the additivity of the molecular refractivity formula by the
Lorentz-Lorentz formula
„ n2-\ M
The additivity of all the solvents used is good, and that of the
solutions is satisfactory. Good agreement of the RL for the pure
solvents with some literature data further confirms our results
(for both nD and d\). Table 5 gives the determined specific and
molecular refractivities of the solvents and solutions, from which
we could get not only the molecular refractivity of the solid solute,
i. e. p, p' — DDT, but also its refractive index, provided the normal
molecular weight for this compound is valid (AfDDT = 354.5).
TABLE 5
Solvent
Solution or R"
Solvate
Carbon disulfide 21.17 0.2781
Chloroform 21.01 0.1762
CS2 + DDTsoi. sat. 45.84 0.2607
CHClj + DDTsoi. sat. 38.64 0.1996
DDTsoiid (theory) 84.30 0.2378
DDTsoiid (exper.) 87.56 0.2470
This obviously confirms what was stated at the beginning
of this section. However, it should be pointed out that even values
with above 10% deviation are satisfactory, since saturated solutions
were used and deviations are expected.

11
6. REFRACTOMETRY OF QUINOLINE DDT SOLUTION
The p, p' — DDT solution in quinoline is particularly interesting
since our first investigations showed that its 9 is extremely low,
practically zero. Using two other samples of quinoline, we purified
it by distillation but the results did not change. The solution
showed a very small, if any one, practically constant 9-value,
despite the high solubility of p, p' — DDT in quinoline. Figure 2
shows the analytical refraction curves for this case, the left curve
being for nondistilled and the right for distilled quinoline of the
same origin.
c%
HO 1.U0O0
Fig. 2
This represents, as far as we know, the first certain case
where the additivity of molecular refractivities does not hold: the
density of the solution increases ovbiously with increasing concen
tration, while nD remains constant or changes only slightly.
The fact that the concentration coefficient of the quinolinic
solution of p, p' — DDT is practically zero is to some extent
predictable from data for the refractive index of the solid substance
published by E. L. Gooden (1045)(5), and a group from the Armor
Research Foundation (rilinois)((,): the two indices of solid p, p —DDT
n„ = 1.618 and np = 1.626 are very close to the refractive index of
the solvent (1.61687-1.62206). This obviously implies that the
dominant factor determining 9 should be considered to be the
difference between the refractive indices of the solute and the
12
solvent (n — n0) rather than the refractive index of the solvent (n0)
itself. Nevertheless, the refractometric behavior of the quinoline
solution of p, p' — DDT is still rather obscure, since the usual mean
3 _
refractive index n = \inan&ny = 1.663, which can be useful for
determining the molecular refractivity of solid compounds, is not
suitable for interpreting the refractivity of the saturated solution.
7. DISCUSSION OF RESULTS AND CONCLUSION
Aside from nine new solvents the influences of temperature
and wavelength on 9 were investigated. These influences are similar
as on the refractive index, but latter being clearly more important.
The quinolinic solution is thus in so far interesting at present,
just because this dom'nant component of the <p-value is inactivated,
and it may be poss:ble to define more precisely th: importance of
the other components whose effect is otherwise not obvious.
Work on this problem will be continued.
Institute for Physical Chemistry
School of Sciences
University of Beograd
(Yugoslavia)
REFERENCES
1. Ristic, S. "Refraktometrijska ispitivanja 2-2-bis (/J-hIorfenil)-l-l-l-trihlorelana
(p, p'- DDT-a) u raznim organskim ras.varacima. I. (Refractometric Inves
tigations of 2-2-bis (/)-chlorphenyl)-l-l-l-trichlorethane (p,p'—DDT) in
Various Organic Solvents. I.) — Glasnik Srpskog hemijskog drustva (Beograd)
16:81-99,1951.
2. Ristic. S. and V. Radak. "Refraktometrijska ispitivanja 2-2-bis (/>-hlorfenil)-
-1-1-1-trihloretana (p,p'—DDT-a) u raznim organskim rastvaracima. II."
(Refractometric Investigations of 2-2-bis (/)-chlorphenyI)-l-l-l-trichlorethane
(p, p'— DDT) in Various Organic Solvents. II.) — Glasnik Srpskog hemijskog
drustva (Beograd) 22:93-98, 1957.
3. De Oag, E. R. Chemistry and Uses of Insecticides — London: Chapman and
Hall. Ltd., 1949.
West, T. F. and G. A. Campbell. DDT, The Synthetic Insecticide — London:
Chapman and Hall, Ltd., 1948.
Frcar, D. E. H. Chemistry of Insecticides — London: Chapman and Hall.
Ltg., 1949.
4. Partington, J. R. An Advanced Treatise on Physical Chemistry Vol. 4 — London:
Longmans, Green and Co, 1953.
5. Gooden, E. L. "Optical Crystallographic Properties of DDT" — Journal of
the American Chemical Society (Easton, Pa) 67: 1616, 1945.
6. Crystallographic Data, Contributed by Armor Research Foundation of Illinois
Institute of Tech lology — Analytical Chemistry (Easton, Pa) 20:247-277, 1948.

GLASNIK HEMIJSKOG DRUSTVA, Vol. 29, No. 5—6, 1964, pp. 181—189
SPECTROPHOTOMETRIC INVESTIGATIONS OF
CRYSTALLOHYDRATES AND CRYSTALLODEUTERATES
OF SOME TRANSITION ELEMENTS AND THEIR
SOLUTIONS IN H2O AND D2O*
by
ANKICA M. ANTIC-JOVANOVlC and MILORAD G. JEREMlC
It is known that the color of transition element ions depends
on the typ; of ligands surrounding them. Tsuchida(1) empirically
arranges the ligands in a series according to their abilities to shift
the maximum of their absorption spectrum. The sequence in this
series docs not change with change of the central ion. Of special
interest is the investigation of the substitution of ordinary water
by heavy water, a rather similar ligand but with different nuclear mass.
The influence of heavy water on the color of hydrated salts
was first studied by Joos and B6hm(2) on potass'um-chromium-
-selenium and potassium-chromium-sulfate alum. Later Bell(3) studied
this effect on copper sulfate. However, these authors only observed
changes in color intensity and made some qualitative measurements
of the color tint, in both cases colorimetricaly.
By spectrophotometric measurements with a Cary Model 14
recording spectrophotometer, Halpern and Harkness(4) recently
obtained some more precise data on the shift of the absorption
band maxima for a number of ions in solution in ordinary and
heavy water in the form of perchlorate salts.
We have not found any exact data on absorption expressed
for instance terms of absorptivity.
The purpose of the present work was to investigate the
substitution of H2O by D,0 in crystallohydrates and crystallo-
deuterates of ions of some elements of the first transition series
and their solutions, using absorption and reflection spectra. Our
aim was to obtain more complete quantitative data on absorption
spectra and their changes in these two strongly polar solvents.
For this purpose we made spectrophotometric measurements of the
absorption of hydrate crystals of Ni++, Co++, Fe++, Cr++, Cu+ +
and Mn++ and their solutions in ordinary and heavy water in the
region 2.000 to 10 000A usmg a Unicam SP 500 spectrophotometer.
* Reported at the 11th International Spectroscopy Colloqium in Beograd,
October, 1963.

14
EXPERIMENTAL
Saturated solutions of the above ions were prepared from
anhydrated sulfate salts, p. a., by dissolution in ordinary and heavy
water at a constant temperature of 25±0.05°C, at which temperature
all spectrophotometric measurements were made too. An exception
was ferous sulfate which was not first anhydrated but directly
dissolved in weakly acidified water, pH = 5.0. To investigate the
influence of dilution and the validity of Lambert-Beer's law we
also made measurements at considerably lower concentrations —
0.5 to 2M.
Crystals were obtained by slow evaporation from saturated
solutions. For the formation of deuterohydrates evaporation was
carried out in a closed system with constant monitoring of the
vapor pressure and at constant temperature. Ferrosulfate crystals
were formed from weakly acid solutions in a nitrogen atmosphere
so to prevent any oxidation of ferrous to ferric ions. After three
or four weeks growth, we got crystals with 1— 2 cm edges which
could be used for optical measurements. For this purpose the
crystals were normally cut in the direction of the main optical
axis and were polished into thin plates of 0.2 to 1.5±0.05mm.
The absorption spectra of the solutions and the crystals are
shown in Figs. 1, 2, 3, 4, 5.
The spectrophotograms show changes in absorption, both in
the solution and the crystals, on the replacement of ordinary water
Fig. 1. Absorption spectra of NiS(V7H2O and NiSO„-7D2O crystals and their
solutions in H2O and D2O.
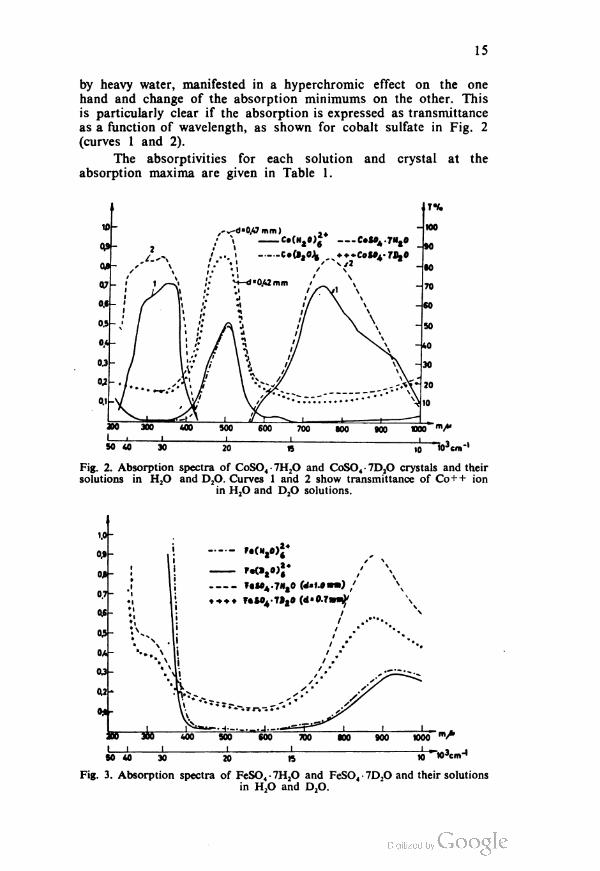
15
by heavy water, manifested in a hyperchromic effect on the one
hand and change of the absorption minimums on the other. This
is particularly clear if the absorption is expressed as transmittance
as a function of wavelength, as shown for cobalt sulfate in Fig. 2
(curves 1 and 2).
The absorptivities for each solution and crystal at the
absorption maxima are given in Table 1.
TV.
200 300 400 500 600 700 900 900 BOO mf
I 1 1 1 1 l__ ,
50 40 30 20 15 10 103cm_1
Fig. 2. Absorption spectra of CoSO4-7H2O and CoSO4 7D2O crystals and their
solutions in H2O and D2O. Curves 1 and 2 show transmittance of Co++ ion
in H2O and D2O solutions.
..oh
Fig. 3. Absorption spectra of FeSO4 - 7H2O and FeSO4 - 7D2O and their solutions
in H2O and D2O.

16
--- Cr(H20)|*
CrCB20)l
KCr(S04)2-l2M40 (d*D.62mm)
» +++♦ KCr(t04)2. 12S20 [d-O.kkmm)
50 40 10 ■ em
Fig. 4. Absorption spectra of chrome alum and solutions in H2O and D2O
TABLE 1
Absorptivity oj crystals and their solutions in H-.O and D20
Samplemax
mu,
Absorptivity in
H,O D.O
Ni(H2O)|+
710
650
390
2.09
1.84
4.85
±0.05
±0.05
±0.05
1.98
1.73
4.60
±0.05
±0.05
±0.05
NiSO4-7H2O
700
640
390
12.1
11.5
27.3
±0.1
±0.1
±0.1
11.3
10.5
27.0
±0.1
±0.1
±0.1
Co(H2O)i+ 505 5.12 ±0.05 4.99 ±0.05
CoSO4-7H2O 500 21.0 ±0.5 20.0 ±0.5
Fe(H2O)*+ 950 1.62 ±0.05 1.55 ±0.05
FeSO4-7H2O 875 8.8 ±0.5 7.8 ±0.5
Cr(H2O)^+580
410
5.80
6.20
±0.05
±0.05
5.45
6.05
±0.05
±0.05
KCr(SO4),12H2O560
400
10.8
12.3
±0.5
±0.5
9.9
11.4
±0.5
±0.5
Cu(H2O)*+ 800 12.62 ±0.1 11.80 ±0.1
CuSO4-5H2O 760 15.0 ±0.8 46.3 ±0.8
Mn(H2O)*+ 400 0.040 ±0.01 0.030 ±0.01

17
Cu(DaO)|*
CuSO^-JH|0
1000 m/"
10 103cm"'
Fig. 5. Absorption spectra of CuSO4 - 5H2O and CuSO4 - 5D2O and their solutions
in H2O and D2O.
The differences in absorptivity between solutions in ordinary
and heavy water vary from 2.5% for Co(D2O)e+ to 6.5% for
Cu(D2O)6+, while for crystals this difference is about twice as big.
For more precise determination of the absorption maximum
we also used emission spectrophotography. Photographs were taken
on a PGS 2 spectrograph with a plane diffraction grating and a
recording microphotometer. Thus we got the position of the maxima
to considerably higher accuracy and determined the shifts caused
by the substitution of ordinary water by heavy water. Results are
shown in Table 2.
TABLE 2
Shifts of absorption band maxima on replacing HjO by D20
SampleWave number of band
maximum in H2O (cm-1)Shift in cm-
Ni(H2O)*+ 25468 + 62±20
Co(H2O)*+ 19774 + 30±12
Cr(H2O)^+ 17384 + 45±15
n 24190 + 63±20
Mn(H2O)2+ 14939 + 6± 3
2

18
This table shows that there are shifts towards higher energies,
i. e. smaller wavelengths, which is in good agreement with the
first qualitative observation(2 3' 5) and other recent measurements(4).
According to ligand field theory this effect arises from the
difference in field intensity produced by ordinary and heavy water
as ligands surrounding the central ion. On the other hand, this
difference can be explained by the hypothesis(4) that differences in
the dipole moment of ordinary and heavy water cause changes in
the energy of the ligand-central ion bond, which is higher with
Fig. 7 — Reflection spectra of crystals

19
heavy water, thus shifting the absorption maximum to a shorter
wavelength.
Besides absorption spectra we also measured reflection spectra
of crystals using a Unicam SP 500 spectrophotometer. Measurements
on crystals of different densities gave data which are, at least
qualitatively, in agreement with the absorption spectrophotometric
measurements. Figures 6 and 7 show reflection spectra of crystals
of the same density.
As can be seen the intensity of reflection of crystals with
heavy water is greater than with ordinary water, while the shift of
reflection maximum is similar to the shift of the absorption
maximum.
REFERENCES
1. Tsucida, R. "Absorption Spectra of Coordination Compounds" — Bulletin of
the Chemical Society of Japan (Tokyo) 13:338, 1938.
2. Joos, G. and H. Bohm. "Influence of Heavy Water of Crystallization on the
Line-Like Absorption Spectra of Chrome Alums" — Physikalische Zeitschrift
vereinigt mil dem Jahrburh der Radioaktivitat and Elektronik (Leipzig) 36 : 862,
1935.
3. Bell, J. "Influence of Heavy Water on the Colour of Hydrated Salts" — Nature
(London) 137:534, 1936.
4. Halpern, J. and A. C. Harkness. "Spectra of Some Transition Metal Ions and
Complexes in D2O" — Journal of Chemical Physics (Lancaster, New York)
31:1147, 1959.
5. Katchenkov, S. M. "Absorption Spectra of Praseodymium and Neodymium
in Heavy Water" — Comptes rendus de I'academie des Sciences V. S. S. R
(Moskva) 18:557, 1938.
V

GLASNIK HEMUSKOG DRUSTVA, Vol. 29, No. 5—6, 1964, pp. 191—197
THE SPACE GROUP DETERMINATION OF 2 AMINO 4'
BROMO BENZOPHENONE AND 2 AMINO 4'
CHLORO BENZOPHENONE
J. MISOVIC, S. RAMASECHAN, Indian Institute of Science, India.
INTRODUCTION
This investigation was undertaken as part of a project at the
Physics Department of the Indian Institute of Science for the
accurate determination of the crystal structures of the substituted
benzophenones, with a view to determination how substitution of
groups in various positions and the formation of inter and intra
molecular hydrogen bonds affect the angle between the planes of
the two benzene rings1-2-3-4 (1940, 1945, 1954, 1954). It became
increasingly clear that the steric hiderance between the hydrogens
in the 6.6' positions would prevent the molecule from being
coplanar.
These compounds were prepared in the Organic Chemistry
Department of the Indian Istitute of Science, by Dr. M. V. Bhatt5
(1953), who was interested in the mechanisms of substitution in
the benzophenones. By thorough analysis using various organic
techniques6 (1936) he was able to definitely fix the positions of
the amino, bromo and chloro positions. The crystals were needle
shaped and yellow. Good crystals were grown by slow evaporation
from the saturated petroleum-benzene solution.
The crystals appeared to be orthorhombic on examination
under a polarisation microscope.
MORPHOLOGICAL MEASUREMENT
The crystal was fixed on to the goniometer head of a Unicam
two-circle goniometer and the needle axis was made to coincide
with the axis of rotation. The centering etc., were done by the
usual procedure. The best developed face of the crystal was the
A-pinacoid; some of the prism faces (m, I, n) were also quite well
developed. The a and c faces were extremely small. The brachydome/
and the pyramid o were easily recognisable. The only two other
forms recognisable, although very small, were the macrodome (d)
and the pyramid (/).
Table 1 gives the p and cp values for the different planes
observed on the surface of the crystal. There were a few other

22
very tiny faces but the angles were not measured. The angles
given are accurate to +15' arc. This low accuracy was due to the
great flakiness of the crystal, so that the reflections were not sharp.
TABLE 1
Data from the gor.iometer measurements of 2 amino — 4' bromo benzophenone crystal
Forms Indices
a 0 90° 100
m 16°50' 90° 110
1 31°10' 90° 120
n 42° 10' 90° 130
b 90° 90° 010
n 137°55' 90° 130
1 148'30' 90° 120
m 163°15' 90° TlO
a 180 90° Too
m 196°58' 90° iio
I 2H"15' 90° 120
n 222° 10' 90° 130
b 270° 90° oTo
n 317°52' 90° 130
I 228°50' 90° 120
m 343° 12' 90° iio
a 0° 90° 100
0 16°50' 57°20' 221
o 163°50' 57°20' 221
0 196°50' 57°20' 221
0 343°50' 57°20' 221
d 0° 36°15' 101
d 180° 36°15' 101
f 90° 25° 021
f 270° 25° 021
i 31°10' 24° 122
i148550'
24° 122
i 2IT10' 24° 1 22
i 328°50' 24= 122


24
The face marked in the projection as 221, because of its size,
was first taken to be the parametral plane (1 1 1). From this we
got the axial ratios
0.31:1:0.45,
but later X-ra.y measurements showed that the actual index of this
plane is (221) and not (111). The indexing in the projection follows
• this identification and the axial ratios come out to be
0.3070: 1:0.2294.
From the symmetry one can see that the crystal most probably
belongs to the point group mm2 (Cj).
Figure 2 gives the crystal habit of amino-4' brome benzophe-
none. The crystals of 2 amino —4' chloro benzophenone were
extremely fine needles. However, when grown from alcohol-water
solution under isothermal conditions very good crystals could be
obtained. Measurements of the angles for this crystal on the two-
-circle goniometer gave practically identical results to those obtained
for 2 amino —4' bromo benzophenone. The crystal habit of this
crystal was also very similar to that of the bromo compound.
Since the angular measurement were by no means very accurate
it was not possible to determine the differences in the axial ratios
by the morphological method.
UNIT CELL AND SPACE GROUP
A rotation picture about the needle axis and Weissenberg
zero, first and second layer photographs were taken. In this expe
riment copper Ka radiation filtered through a nickel filter was
used. The linear absorption coefficients of 2 amino-4' bromo
benzophenone and 2 amino-4' chloro benzophenone are 52.83 cm-1
and 35.60 cm-1, respectively. In order to reduce the absorption
error very small crustals of diameter 2 mm were used for taking
the photographs.
For getting the systematic absences the zero, first and second
level Weissenberg photographs about the c axis were taken. They
showed no systematic absences of general (hkl) reflections. Hence
the cell type is primitive (P). Zero-level photographs reveal the
extinctions noted in Table 2. Tables 2 and 3 give the crystallo-
graphic data for 2 amino 4' bromo benzophenone and 2 amino 4'
chloro benzophenone.

25
TABLE 2
Crystallographic data for 2 amino — 4' bromo benzophenone
a = 7.84A 6 = 25.54 A c = 5.86A
a = (3 = y = 90°
Axial ratios are 0.3070:1:0.2294
Number of molecules per unit cell: 4
Conditions limiting possible reflections:
hkl No conditions
MX) h=2n
0*0 k=2n
00/ / = 2 n
Okl k+l=2n
hOI h = 2n
hkO No conditions.
This show that the space group is Pna 2, (No. 33 in the International Tables
for X-ray Crystallography — 1952).
TABLE 3
Crystallographic data for 2 amino-4'- chloro benzophenone
a =7.896 A 6 = 25.21 A c = 5.74A
a = p=Y=90°
Axial ratios 0.3132: 1:02277
Number of molecules per unit eel: 4
Conditions limiting possible reflections:
hkl No conditions
MX) h~*2n
0*0 k = 2 n
00/ / = 2 n
Okl k + l=2n
hOI h = 2n
hkO No conditions
Hence group is Pna 2, (No 33 in the International Tables for
X-ray Crysta1lography — 1952).
The specific grivities of 2 amino —4' bromo and 2 amino —4'
chloro benzophenone are 1.59 and 1.37, respectively. From the
specific gravity and molecular weight the number of molecules per
unit cell is 4 for both compound.
The sin2 6 values were calculated using the formula for an
orthorhombic system. For the zero layer the Lorentz and polarisations
corrections were read from Buerger's Tables. For the higher layers the
j_
curve of [1 ) against sin2 0 was drawn and the 1/L. P.
\ 4 sin2 6/
factor was calculated X-ray diffraction data.

26
70
60
SO
to
iO
20
'0
n 1 .7 3 A .5 .6 .7 .8 .9 1.0 N
Fig. 3. Distribution for 2 amino-4' bromo benzophenone hkO reflections, 6 ranges
compared with theoretical curves 1 and 1
compared with theoretical curves 1 and 1

27
TABLE 4
N (Z), in percentage, for hk0 reflections of 2 amino-A' bromo benzophenone
Z
Range 0.1 0.2 0.3 0.4 0.5 0.6 0.7 0.8 0.9 1.0
I 21.00 35.00 44.00 52.00 55.00 59.00 62.00 69.00 69.00 70.00
II 16.33 30.61 38.76 44.90 49.90 48.98 56.12 64.29 66.33 68.37
111 39.81 41.67 48.15 48.15 53.70 55.56 57.41 64.81 64.81 66.67
Mean 25.71 35.76 43.64 48.35 52.87 54.51 58.51 66.03 66.71 68.35
N (Z), in percentage, of the two functions for N (Z) (theoretical values)
Z
0.1 0.2 0.3 0.4 0.5 0.6 0.7 0.8 0.9 1.0
l-exp(-Z) 9.52 18.13 25.92 32.97 39.35 45.12 50.34 55.07 59.34 63.21 (curve 1)
erfI— z) 24.81 34.53 41.87 47.38 52.05 56.14 59.72 62.89 65.72 68.33(curve 1)
TABLE 5
N (Z), In percentage, for hk0 reflections of 2 amino-4' bromo benzophenone
Z
Range 0.1 0.2 0.3 0.4 0.5 0.6 0.7 0.8 0.9 1.0
I 23.40 34.04 46.81 51.06 55.32 57.45 59.57 63.83 68.09 68.09
II 18.87 30.19 45.28 52.83 52.83 56.60 53.49 62.26 62.26 67.92
III 13.04 30.43 43.48 43.48 43.48 43.48 47.83 52.17 52.17 60.87
IV 19.23 30.77 38.46 42.31 46.15 46.15 53.84 57.69 67.31 78.85
V 0 34.55 41.82 45.45 52.73 60.00 63.64 63.64 63.64 67.27
VI 0 20.75 50.94 49.24 54.72 54.72 62.26 62.26 62.26 62.26
Mean 21.64 30.12 44.46 47.40 50.87 53.07 57.60 60.31 62.62 67.54
The data for the intensity measurements were gotten by the
multiple film technique of Robertson7 (1943). The M0 and Okl
Weisscnbergs were recorded by oscillating the crystal about the c
and a axes through 200'. The tim; of exposure was of the order
of 20—30h. A different standard intensity sca'e was prepared
foi each layer, with a given reflection for each particular layer.
The intensities of the diffraction spots were measured by
comparison with the standard spots. Thus the intensities of the
diffraction spots were placed on a relative numerical scale.
WILSON'S STATISTICAL METHOD
Although the space group is determined, it was necessary
aplly Wilson's statistical method8 (1949) for the detection of the center
of symmetry, since the absences for Pna 2, and Pnam arc identical.
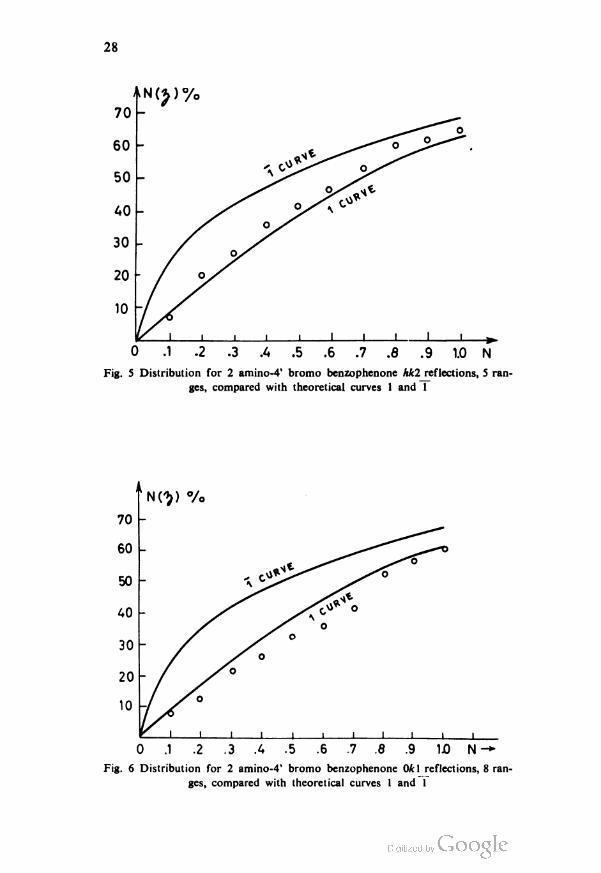
28
V1 I i i i i I l l I I ».
0 .1 .2 .3 A .5 .6 .7 .8 .9 1.0 N
Fig. 5 Distribution for 2 amino-4' bromo benzophenone hkl reflections, 5 ran
ges, compared with theoretical curves 1 and 1
Fig. 6 Distribution for 2 amino-4' bromo benzophenone (M:l reflections, 8 ran
ges, compared with theoretical curves 1 and I

29
The hkO reflections were divided into two sets of ranges — for
the first set sin2 6 was 0—0.2, 0.2—0.4, and 0.4—0.6 with 54,51
and 55 reflections in each range, respectively. The secend set, for
the same group of hkO reflections, had sin2 6 0—0.1, 0.1—0.2,
0.2—0.3, 0.3—0.4, 0.4—0.5 and 0.5—0.6, with 25, 28, 24, 27,
28 and 27 reflections, in each range respectively. Table 1 gives
the results for the two sets of ranges. In Fig. 3 the two distribution
curves obtained for these and the theoretical curves for the centro
and non-centro-symmetric distributions are given. In a similar
manner the All, A21, Okl reflections were divided into ranges and
distribution curves drawn. The curves in Figs. 4, 5 and 6 give the
distribution of intensities as compared with theoretical curves.
One notices that while the hkl data gives a curve close to the
centro-symmetric value, the hk2 unequivocally shows a non-centro-
symmetric distribution. Therefore, the space group for both crystals
is Pna 2i.
The crystal structures of both compounds will be given in a
separate paper.

REFERENCES
1. O'Shaughnessy, M. T., and Rodebush, W, H. "Ultraviolet Apsorption Spectra
of Organic Molecules. The Dependence Upon Restricted Rotation and
Resonance" — The Journal of The American Chemical Society 62: 2906 —
2912, 1940.
2. Jones, R. N. "Some Factors Influencing the Ultraviolet Apsorption Spectra
of Polynuclear Aromatic Componds. I. A General Survey" — Journal of
the American Chemical Society 67: 2127—2150, 1945.
3. Braude, E. A., Sondheimer, F., and Forbes, W. F. "Steric Effects in the
Electronic Spectra of Organic Compounds" — Nature 173: 117— 119, 1954.
4. Rekker, R. F., and Nauta, Th., W. "Steric Effects in the Electronic Spectra
of Substituted Benzophenones. I. Symmetrically Substituted Methyl Benzo-
phenones" — Recueil des Travaux Chimique de Pays Bas 73: 969—79, 1954.
5. Bhatt, M.V. Thesis, Bombay University, 1953.
6. Tanasescu, I., and Silberg, A. "The Action of Acid Chlorides on Schiff Bases
and Considerations of the Products of These Bases" — Bulletin de la Societe
Chimique de France 3 (5): 224—839: 1926.
7. Robertson, J. M. "Technique of Intensity Measurements in X-Ray Crystal
Analysis by Photographic Methods" — Journal of Scientific Instruments
20: 175—179, 1943.
8. Wilson, A. J. C. "Possible X-Ray Determination of a Center of Symmetry"
— Research (London) 2: 246, 1949.

GLASNIK HEMIJSKOG DRUSTVA. Vol. 29, No. 5—6, 1964, pp. 199—20!
COULOMETRIC DETERMINATION OF MANGANOUS ION
by
SRETEN N. MLADENOVIC
Small amounts of manganese are most often determined
colorimetrically by measuring the color intensity of permanganate
ion solutions. Coulometric determination of the manganous ion
either at constant current density or at limited potential is
prevented by reactions taking place either before or simultaneously
with the reduction and oxidation of manganous ions.
From neutral and acid solutions, before the reduction of the
manganous ion, hydrogen is evolved at the platinum cathode.
However, at the platinum anode several reactions can take place
depending on the acidity of the solution:
Mn2+ - e -»- Mn3+ eo = 1.51 V (1)
Mn2i -It —> Mn4- eo = 1.84 V (2)
Mn2- + 2H2O- 2e - MnO2 +4H+ eo = 1.24 V (3)
Mn2+ + 4H2O- 5e -> MnO4" + 8H+ eo = 1.51 V (4)
2H2O-4e —> 4H+ + O2 eo = 1.23 V (5)
The equations show that some of these reactions increase the
acidity of the solution, i. e. the hydrogen ion concentration. In the
oxidation of 1 gram-ion of manganese to manganese dioxide two
faradays are consumed but 4 gram-ions of hydrogen are generated.
In the oxidation of 1 gram-ion of manganese to permanganate 5
faradays are consumed but 8 gram-ions of hydrogen are produced.
These data show that the number of gram-ions of hydrogen
generated is not equal to the number of faradays consumed.
Therefore the amount of electricity required for the reduction of
hydrogen ions in order to restore the original pH of the solution
is not equal to the amount consumed in the oxidation of manganous
ions. It is therefore possible to follow two or more reactions
taking place simultaneously and to determine the extent to which
they occur.
Communicated at IXth Meeting of the Serbian Chemical Society, 1961.

32
In a previous paper(1), we found by potential measurements
that from slightly acid solutions manganese dioxide and oxygen
are formed at the anode. These findings were taken as the basis
for the coulometric determination of manganous ion by measuring
the increase of the electrolyte acidity. The increase of hydrogen
ion concentration in the course of the separation of manganese
dioxide is given by equation (3): 4 gram-ions of hydrogen are
equivalent to 1 gram-ion of manganese.
However, since the separation of manganese dioxide takes place
with simultaneous evolution of oxygen, whereby the acidity of the
electrolyte is increased, the coulometric determination of manganese
involves the following operations:
1. Quantitative separation of manganese dioxide;
2. Coulometric determination of H-ions after the separation
of manganese dioxide;
3. Calculation of the amount of hydrogen ion produced in
the course of manganese dioxide separation.
The procedure of the coulometric determination of manganous
ion is as follows:
In a neutral solution of sodium sulphate which serves as the
anolyte and which is separated from the catholyte by means of a
conveniently arranged bridge with sodium suphate solution, manga
nous ions separate on the platinum anode in the form of manganese
dioxide with simultaneous evolution of oxygen: the cessation of
the separation of brown manganese dioxide indicates that all the
manganese from the anolyte has precipitated. After the precipitation
of manganese dioxide, the anode is taken out of the solution and
washed with a small amount of water above the anolyte. Then
another platinum electrode which is connected as the cathode, is
put into the solution. The acid produced in the course of
manganese dioxide precipitation is coulometrically determined in
the usual way in the presence of methyl red. The amount of
manganese is calculated from the equation
(c-a)A
-———= x
IF
where A = the atomic weight of manganese
b =the amount of electricity consumed in the oxidation
of manganous ion
c =the amount of electricity consumed in the reduction
of H ion,
x = the amount of manganese in g
Table 1 shows the results obtained by coulometric determi
nation of manganese in amounts ranging from 1.730 to 2.595 mg.
The error ranged from -1.11% to 0.63%.

33
TABLE 1
Current Time Manganese Error
m A sec. Taken Found %
8.35 719.1 1.730 1.712 -1.11
8.35 731.8 1.730 1.741 0.63
8.35 730.0 1.730 1.737 0.39
8.35 727.7 1.730 1.731 0.10
8.35 728.0 1.730 1.732 0.11
8.35 729.0 1.730 1.734 0.25
8.35 721.9 1.730 1.717 -0.63
8.35 1080.6 2.595 2.571 -0.85
8.35 1092.2 2.595 2.598 0.21
8.35 1091.8 2.595 2.597 0.17
This determination indicates that the consumption of one
faraday may not always produce one equivalent of a given ion
(hydrogen ion in this case) in the electrolyte. This is of practical
and theoretical importance for new determinations of stoimetric
relations.
Institute of Physical Chemistry
and Electrochemistry
School of Technology,
Beograd
REFERENCES
1. Tutund2ic, P. S. and S. Mladenovic. '9Quantitative electrolytische Erzengung
von Permanganationen" — Analitica Chimica Acta 12: 382—389, 1955.
2. Mladenovic, S.: Thesis, 1956, School of Technology, Beograd.
3


GLASNIK HEMIJSKOG DRUSTVA, Vol. 29, No. 5—6, 1964, pp. 203—206
POLAROGRAPHIC DETERMINATION OF COPPER IN THE
PRESENCE OF LEAD*
by
SRETEN N. MLADENOVIC
Up to the present there has been no suspicion as to the
accuracy of polarographic determination of copper in an ammoniacal
medium in the presence of lead or in lead. This can be ascribed
mainly to the low solubility of lead hydroxide in ammonium
hydroxide, cited in all analytical chemistry textbooks, and to the
conviction that the solubility is low since there are a lot of data
in the literature on the insolubility of lead hydroxide. The good
results obtained so far by polarographic determinaiion of copper
in ammonium chloride and ammonium hydroxide t1-2-3) show that
suspicion as to the reliability and accuracy of the method would
certainly be groundless.
We have, found, however, that the quantities of copper in
solutions of different ores which also contain lead determined
electrogravimetrically and polarographically were not in good
agreement: the quantity of copper found polarographically in
ammoniac medium was always slightly larger than that obtained
electrogravimetrically.
We also found that the quantity of copper in zinc found
polarographically in ammoniac medium was always larger than that
obtained polarographically or electrogravimetrically in acid medium.
Since this zinc contained lead and lead was the biggest impurity,
we considered this the reason for the disagreement of the results,
as has been confirmed by a number of experiments on a polarograph.
This is shown in Table 1.
The table shows that with increasing quantity of lead in the
supporting electrolyte 4MNH4OH + 2MNH4Cl, the wave heights
increase linearly with lead concentration, although the copper content
is constant. Besides copper, lead, ammonium hydroxide and ammo
nium chloride there were also sodium sulphite and gelatine in the
* Reported at the 1st Yugoslav Congress on pure and applied che
mistry, 1960.
3*

36
TABLE 1
Supporting electrolyte: 4M. NHtOH + 2M. NHtCl + I ml satur. Na2SOs/50 ml
+ 1 ml 0.1% gelatine 150 ml
Wave height Copper Lead
mm 10-6 g/50 ml 10-6 g/50 ml
13.5 40 0
19.0 40 50
25.0 40 100
32.0 40 150
38.0 40 200
74.0 40 500
27.0 80 0
33.0 80 50
38.5 80 100
44.0 80 ISO
49.5 80 200
supporting electrolyte. This unexpected increase of the wave height
may be ascribed to the composition of the electrolyte, first of all
to the presence of ammonium chloride in the supporting electrolyte.
The solubility product of lead hydroxide LPb(OH)2 at 18° is 6.8 X 10⁻¹³,
the dissociation constant of ammonium hydroxide K at 25°
is 1.79 x 10⁻⁵. For the ammonium hydroxide and ammonium chloride
concentration in the supporting electrolyte and the K of ammonium
hydroxide we obtain the approximate concentration of hydroxy!
ions aOH — = 3.58 x 10⁻⁵. From LPb(0H)2 a°d Aoh the concentration
of lead ions is 0.53 x 10⁻³ g ions//, or 0.11 g lead//. From this
calculation it follows that 5.5 mg of lead may be found in 50 ml
of the supporting electrolyte of the given composition.
From the data in Table 1 the quantity of lead in the sup
porting electrolyte in the presence of copper is much less than in
the solution. Therefore all the lead in our experiments was in the
form of ions, which could be reduced on a dripping mercury
electrolyte.
Our results also show that the potential of the half-wave of
lead is the same as the potential of the half-wave of copper in
ammoniacal medium, and that it differs slightly from that of lead
in saline acid medium (Fig. 1).
From the wave heights of solutions with the same quantity
of copper and different quantities of lead it can be concluded that
under the given conditions the wave height increases by about 6 mm
per 50 g of lead. Accordingly the polarographic determination of
lead in ammoniac medium may be assumed to be possible.

37
Supporting electrolyte + Cu
03 OA 0.5 06 0.7 08 0.9 1.0 (V)
03 0 4 0.5 0 6 07 08 03 (V )
Voltage
Supporting electrolyte + Cu
Voltage
Fig. I.
Hence we arrive at the important conclusion that in ammoniac
medium of the given composition, copper cannot be determined
polarographically in the presence of lead, unless the quantity of
lead is much less than that of copper so that lead practically does
not increase the wave height of copper.
We checked this conclusion by polarographic determination
of copper in cathodic zinc with 0.013% of lead and cathodic zinc
melted with 0.002% of lead. By polarographic determination of
copper in acid medium we got that there was 0.0006% of copper
in the cathodic zinc and 0.0004% in the melted cathodic zinc. By
polarographic determination of copper in ammoniac medium
(4M. NH4OH+ 2MNH4CI), we got the percentage of copper in the
cathodic zinc 0.0075% and in the melted cathodic zinc 0.0022%.
Therefore, polarographic determination of copper in the precence
of lead gives higher (less accurate) results the greater the lead
content. Therefore copper in zinc must be determined in acidic
medium or by some other method in the absence of materials
which disturb the determination of copper. This principle may be
extended to all cases of determining copper in the absence of iron
if the content of copper is not much larger than that of lead.
A further general conclusion is that by polarographic deter
mination of substances in any medium in the presence of hardly
soluble compounds, it is necessary to check whether the hardly
soluble compound present does not reduce or oxidize at the same
potential as the substance investigated. If so, it is necessary to
determine whether its presence influences the quantitative deter
mination and in what way.
Our results show that in polarographic determination of
copper too high results are obtained in the presence of lead.
Attention is drawn to this error now because of the belief that
lead hydroxide is so hardly soluble in ammoniacal medium that
the lead remaining in the solution can be practically neglected.

38
This belief was backed up by the analytical reaction of lead which
shows that with ammonium hydroxide lead produces a precipitate
which is insoluble in the excess of the precipitating agent, but this
in fact says nothing about the quantity of lead remaining in the
solution.
REFERENCES
1. Svatek, E., Z. Roubal, and P. Pfibil. "Nov6 komplexotvorn6 latky". —
Chemicki Listy (Praha) 11:1472—1475, 1953.
2. V6ri§kova, M. — Collection of Czechoslovakian Chemical Communications
(Praha) 11:580, 1939.
3. Siniakova, S. I. — Zhurnal analiticheskoi khimii (Moskva) 1:241, 1946.

GLASNIK HEMUSKOG DRUSTVA, Vol. 29, No. 5—6, 1964, pp. 207—211
POLAROGRAPHIC DETERMINATION OF TIN IN ZINC*
by
SRETEN N. MLADENOVIC
Coulometric methods of determining tin with dithiol(l, 2- 3) and
phenyl fluorine(4) cannot be successful in the presence of even
negligible quantities of certain impurities since many types of ions
can react with the developer reagents.
The separation of tin from these ions is often uncertain and
time-consuming and therefore the tin content found after the
separation is unreliable.
Iodomectric determination of small quantities of tin from large
sample portions (e. g. zinc and copper) with preliminary reduction
of stannic ions and a blank test has also proved unreliable.
Polarographic determination of small quantities of tin (50ySn)
is possible after concentrating the tin from large sample portions.
Concentration of tin from various solutions is possible by
recipitating it with ammonium hydroxide in the presence of ferric
chloride, which with the ammonium hydroxide forms feric hydroxide.
In this case feric hydroxide does not act as a tin collector, but
in some cases (Sn in Zn or Cu) as an agent for extracting tin
from a large quantity of the main, primary compound of the sample.
On the other hand, in case tin does not separate, the elementary
component of the sample with the supporting electrolyte forms
a pulp which makes polarographic determination of tin impossible.
The determination of tin without preliminary concentration
in a large sample portion or a large quantity of electrolyte is
limited by the low tin concentration and the low sensitivity of the
polarograph.
Extraction of tin by distillation and subsequent concentration
is a long and tedious process, although in principle good.
Determination of tin in samples whose basic components
form complex soluble compounds with ammonium hydroxide can
be done without preliminary distillation. However, if lead is present
Reported at the First Yugoslav Congress on Pure and Applied Chemistry,
1960.

40
in such samples as an impurity polarographic determination of tin
is the more unreliable the greater the quantity of lead. Reducing
lead ions on a dropping mercury electrode at almost the same
potential as that at which tin ions are reduced, in a saline acidic
medium, causes superposing of tin and lead waves. To determine
tin in the presence of lead. Lindane(5' has developed an indirect
method whose error increases the more the tin-lead concentration
ratio differs from one.
In view of the fact that strontium sulfate is a collector of
lead sulfate, we considered the possibility of separating tin from
lead by precipitating lead sulfate and strontium sulfate, and then
determining tin polarographically.
In polarographic determination of lead in the supporting
electrolyte:
HC1, cone, p. a 5 ml
a lead wave does not appear even with considerable quantities of
lead (400y and 500y) and high polarograph sensitivity (Radiometer
In determining tin (l00y, 200y and 300y) in the same
supporting electrolyte in whih lead is determined, the polarograms
show a linear dependence between wave height and tin concentration.
This is shown in Table 1.
In polarographic determination of tin (100 y, 200 y, 300 y)
from a solution constanting 400 y of lead we obtained the same
wave heights as without lead (Table 1).
From these tests it can be concluded that lead does not
interfere with the polarographic determination of tin from this
supporting electrolyte mentioned.
The tin polarographic wave heights in this supporting electro
lyte, after dissolving tin hydroxide precipitated with ammonium
hydroxide from samples containing lead, in the presence of ferric
chloride, are equal to those obtained by direct polarographic
determination of the same quantities of tin without preliminary
precipitation (Table 1).
lMNa2SO4
Sr(NO3)2 , p. a. .. .
Gelatine, 1% solution
Water
Fe powder, p. a. .. .
10 ml
0.5 g
1 ml
to 50 ml
. 0.5 g

41
TABLE 1
Wave height Lead Tin Remarks
mm 10- 6g 10 <>g
19 0 100
38 0 200
56 0 300
19 400 100
38 400 200
56 400 300
0 400 0
0 600 0
0 400 0
19 400 100
38 400 200
55 400 300
19 400 100
Determination of tin after preci
pitating Fe (OH)3 with ammonium
hydroxide
Sample with 40 g Zn and 400 y Pb
In these tests we determined the collector capacities of both
ferric hydroxide, in the presence of which tin quantitatively
precipitates, and strontium sulfate, the lead collector.
This procedure for the separation of tin from lead was found
suitable for polarographic determination of tin in electrolytic zinc
containing of the order of 10_4% tin or less and 10 3 % or
more lead.
The procedure was checked by adding l00y of tin to solutions
with 40 g zinc and 400 y lead. The tin wave height from such
solutions was always equal that obtained with this quantity of tin
in samples without zinc (Table 1).
From all these results it follows that tin in zinc in the
presence of lead can be determined after separation from zinc and
lead by the following procedure:
100 g of zinc is dissolved in concentrated hydrochloric acid.
Near the end of dissolution several milliliters of concentrated nitric
acid is added. The solution is transferred to a 500 ml measuring
flask which is filled with water up to the mark and then shaken.
Two portions of this solution, 200 ml each, are pipetted into two
600 ml beakers. To each b:aker 25 ml 0.5% of ferric chloride solution
is added and then 1 ml of a standard tin solution (1 ml — 0.0001 g Sn)

42
is added to one of them. Portions of 0.5 ml 0.1 n sodium perman
ganate are added to each beaker, and the mixture shaken, heated
and precipitated with ammonium hydroxide. After filtering through
ordinary filter paper (black band) the precipitate is dissolved with
10 ml of hot hydrochloric acid and the filter paper washed with
hot water. The total volume of the solution (with water) should
amount to 80—100 ml. This solution is heated and precipitated
again with ammonium hydroxide. The solution is filtered, the
precipitate dissolved with 5 ml of hot hydrochloric acid and the
filter paper washed with hot water. To this solution 10 ml 1M
sodium sulfate solution is added and diluted with water up to
40 ml. Then 0.5 g of strontium nitrate is added, stirred well and
left to stand for at least half an hour with occasional stirring.
The solution is then filtered through a filter paper (black band)
and the filtrate caught in a 50 ml measuring flask. The filter
paper is washed with warm water, 1 ml of 1% gelatine added and the
measuring flask filled up to the mark with water. 0.5 g of iron
powder is then added to the measuring flask. In half an hour,
with occasional stirring, stannic and ferric ions are reduced. The
solution is then filtered of iron powder and polarographed.
Tin does not interfere with the polarographic determination
of lead in electrolytic zinc with 0.0001% tin and 0.003 to 0.005%
lead in the supporting electrolyte, hydrochloric acid. If there is
more tin, it shoud be removed by distillation.
The procedure for determining tin in zinc can be successfully
used for determining it in copper containing lead.
This method is quicker and more reliable than other methods,
so it can bz recommended for determining tin in zinc and copper.
REFERENCES
1. Jantsch. G., A. Hummer-Kroupa, and I. Gansinger, I. — Zeitschrift fur
analitische chemie (Munchen-Berlin) 128: 451, 1948.
2. Farnsworlh, M. and J. Pekola, "Determination of Small Amounts of Tin
with Dithiol" — Analytical Chemistry (Washington) 26: 735—737, 1954.
3. Onishi, H. and E. B. Sandell. "Colorimetric Determination of Traces of Tin
with Dithiol" — Analytica chimica acta (Amsterdam) 14: 153— 161, 1956.
4. Luke, C. "Photometric Determination of Tin with Phenylfluorane; Determi
nation of Tin in Lead and 1 % Antimony-Lead Alloys — Analytical
Chemistry (Washington) 28: 1276—1279, 1956.
5. Lingane, J. J. "Systematic Polarographic Metal Analysis; Determination of
Tin, Lead, Nickel, and Zinc in Copper-Base Alloys" — Industrial and
Engineering Chemistry, Analytical Edition (Washington) 18: 429—432, 1946.
GLASNIK HEMUSKOG DRUSTVA, Vol. 29, No. 5—6, 1964, pp. 213—217
A CONTRIBUTION TO THE COMPLEXOMETRIC
DETERMINATION OF METALS.
VI — DETERMINATION OF MANGANESE, LEAD, COBALT,
CADMIUM, AND IRON*
by
TIBOR A. KISS**
Extending an earlier work(l' to the direct determination of
manganese, lead, cobalt, cadmium, and iron, we have checked different
methods of complexometric titration of metals with ethylene
diamine tetraacetic acid (EDTA) and found good agreement between
the volumetric factors of the metal solutions.
For the titration of larger concentrations of metals we modified
the well-known methods: first we titrated weakly acid metal solu
tions to near the equivalence point, then, by adding a buffer,
we retained the remaining small amount of metal in the solution
and titrated it to the end point. The volumetric factors obtained
by the modified methods agree well with those obtained by the
unmodified methods.
We also worked out the methods of reverse titration, /. e.
titration of a standard EDTA solution with a tested metal solution.
Although the volumetric factors of metal solutions obtained by such
titrations are mutually consistent they are lower than those obtained
by titrating metals with EDTA: by 0.1% in the case of manganese,
lead and cadmium, and 2% in the case of cobalt and iron. This
difference is probably due to the fact that the solutions cannot be
titrated until color change but instead must be titrated until the
disappearance of the tint of the initial color. Whether or not this
error of the indicator is the sole factor causing the difference, or
whether it may bz ascribed to other factors, will probably be
shown by potentiometric determinations now under way.
For comparison purposes the metals were determined by some
of the usual gravimetric methods. The results are in good agreement
with those obtained by titration of EDTA with metals.
• Part V: Glasnik hemijskog druStva (Beograd) (in press).
** School of Technology, Novi Sad

44
EXPERIMENTAL PROCEDURE
Preparation of standard solutions
0.1 M EDTA solution. Purified EDTA, p. a. Merck (Titriplex
III), was dried at 80° C and used as the primary standard12' 3).
37.225 g of the salt was dissolved in water and diluted to 1000 ml.
The factor of the EDTA solution did not change in several
months(4- 5).
Approximately 0.1 M manganese, cobalt, cadmium and ferric
sulphate and lead nitrate solutions were prepared by dissolving
0. 1 M of the salts in water and diluting to one liter.
0.01 M metal solutions and 0.1 M EDTA solution were
prepared by diluting 0.1 M solutions. The preparation of the
solutions was checked by preparing several solutions by the same
procedure and titrating each solution by the same method. The
factors of such solutions remained unchanged in several months.
All the solutions were prepared with water purified with ion
exchangers(6) and kept in polyethylene bottles12- 7).
The volumetric flasks were calibrated in the usual way.
Temperature corrections of volumes of metal and EDTA solutions
were also made.
Determination of manganese
In the presence of eriochrome black T. Of the various methods
of complexometric titration of manganese available(83' 9a- 10a- "a- ,2)
we chose the following to determine small concentrations: without
the addition of tartrate at room temperature(12a) and at 80° C(l2a),
in the presence of potassium sodium tartrate at room temperature
and at 80° C(l2b- c) , and with the addition of triethanolamine(9a).
Titrations performed at room temperature without the addition of
tartrate, did not give a sharp color change of the indicator and
the blue color was not marked. More noticeable color changes
were obtained at 80° C both without and with the addition of
tartrate. With the addition of triethanolamine a sharp color change
was obtained even at room temperature.
We modified the above methods to determine larger concen
trations of metals and to titrate EDTA with manganese.
In the presence of pyrocatechol violet. Smaller concentrations
were titrated by the methods of Malat and Suk"3a' b) . These were
adapted for the determination of larger concentrations and for the
titration of EDTA with manganese.
Manganese was determined by the usual gravimetric methods
in the form of manganese sulphate(14) and manganese pyrophos-
phate"5a).

TABLE1
Mangeee
Le6d
Cob6lt
C6dmium
Iron
Mol6rity
MetaltitetionwithEDTAinpre6enceof:
Pyeoc6techolViolet EeiocheomeBl6ckT
Variou6indicator6
EDTAtitetionwithmet6linpeeenceof:
Pyeoc6techolViolet EriochromeBl6ckT
V6eiou6indicator6
Gevimeteic6lly
0.1
1.09181.0993
1.0924 1.0920
0.01
1.0912 1.0911 1.0922 1.0921
1.0717W 1.0710C)
0.1
0.01
0.99950. 0.9994e.
0.9983 0.9983
9992 9993 .9981 9984
0.998100
0.1
0.01
1.20e1.2014
1.20121.20150)1.19931.1991
1.19P1.19940)
1.1995C)
0.1
1.0131 1.0133 1.0118 1.0120
0.01
1.01341.0100 1.0193
1.0119
1.011CK6) 1.0117C)
1.0
1.0985 1.0987 1.0983 1.0981
e.01
1.09841.09801.09800) 1.0982O 1.0987C)
1.0986(6>
1.09601.0965
1.0965 1.09611.09e
1.09641.05600°)
1.09610) 1.0965C) 1.0960W1.0961CO
Volumeteicf6ctor6ofmetal6olution6gotbydiffeentmethod6.Reult6are Me66urement6weem6deupto50ml0.1Med
1.)InpreenceofMuroxide4.)Inpeeenceof2.)Inpreenceofv6ei6mieblueB
66licylic6cid5.)InpeeenceofCheome
3.)InpeeenceofAzurolS
6ulfo66licylicacid6.)A66ulphate
mee6of6—9etim6tion6ofdiffeent6mount6ofmetal6.
0.01Mofmetal6olutionorEDTA.
7.)A6pyeopho6phatee.)A6oxide
8.)A6cheom6te
9.)Electeogevimetric6lly

46
Determination of lead
In the presence of eriochrome black r(8b- 9b- 10b- llb' l6). Up to
30 mg of lead was determined by the methods given in(16a, b c) at
40° C in the presence of potassium sodium tartrate. Larger concen
trations of lead were determined and reverse titrations performed by
modified methods.
For comparison, lead was determined gravimetrically in the
form of lead chromate(l7) by the method in (15b).
Determination of cobalt
Smaller concentrations of cobalt were determined in the presence
of murexide(8c' 9c- ,0c- Uc' 18), in the presence(6) and absence(8c) of
sodium acetate and in the presence of pyrocatechol violet(13a- b) .
From 0.1 M cobalt sulphate solution, cobalt was determined
electrogravimetrically by the method in (19a). Larger concentrations
of cobalt, and EDTA with cobalt sulphate, were titrated by modified
methods.
Determination of cadmium
Small concentrations of cadmium were titrated in the presence
of eriochrome black T(6- l6b- 20) at room temperature without the
addition of ammonium chloride(20a) and at 40° C in the presence
of amonium chloride(20b) , and in the presence of pyrocatechol
violet(138- b).
For comparison cadmium was determined gravimetrically in
the form cadmium sulphate(21a) and electrogravimetrically(2,b).
Determination of iron
Iron (III) was determined in the presence of salicylic acid(22),
sulphosalicylic acid(23), variamine blue B: smaller concentrations by
the method of (24a) and larger by that of (24b), in the presence
of chrome azurol S(25) and in the presence of pyrocatechol violet
by the method(26). By modifying each of the above methods we
determined large concentrations of iron and titraed EDTA with iron.
We determined iron gravimetrically in the form of iron oxide(21c).

REFERENCES
1. Canič, V. D. and T. A. Kiss — Glasnik hemijskog druStva (Beograd) 27:
103, 1962.
2. Blaedel, W. J. and H. T. Knight — Analytical Chemistry (Easton, Pa) 26
741, 1954.
3. Hall, J. L. J. A. Gibson, P. R. Wilkinson, and H. O. Phillips — Analytical
Chemistry (Easton, Pa) 26: 1484, 1954.
4. Diehl, H. — Analytical Chemistry (Easton, Pa) 22:, 503, 1950.
5. Goetz, C. A., T. C. Loomis, and H. Diehl — Analytical Chemistry (Easton,
Pa) 22: 798, 1950.
6. Flaschka, H. — Mikrochemie vereinigt mikrochimica Acta (Wien) 39: 38, 1952.
7. Betz, J. D., and C. A. Noll — Journal of the American Water Work Association
(New York) 42: 749, 1950.
8. Schwarzenbach, G. Die komplexometrische Titration — Stuttgart: Ferdinand
Enke Verlag, 1960, a: p. 72, b: p. 87, c: p. 73.
9. Pfibil, R. Komplexone in der chemischen Analyse — Berlin: VEB, Deutscher
Verlag der Wissenschaften, 1961, a: p. 257, b: p. 256, c: p. 283.
10. Flaschka, H. A. EDTA Titrations — New York: Pergamon Press, 1959, a: p.
77, b: p. 76, c: p. 63.
11. Welcher, F. J. The Analytical Uses ofEthylenediamine Tetraacetic Acid — New
York: D. Van Nostrand Company, Inc., 1958, a: p. 218, b: p. 189, c: p. 230.
12. a) Kinnunen, J. and B. Merikanto — Chemist-Analyst (Phillipsburg) 43: 93, 1954;
b) Flaschka, H. and A. M. Amin — Mikrochemica Acta (Wien) 414, 1953;
c) Flaschka, H. A. M. Amin, and R. Zaki — Chemist-Analyst (Phillipsburg
43: 67, 1954;
see also: Flaschka, H. — Chemist-Analyst (Phillipsburg) 42: 56, 1953: Flaschka,
H. and R. Puschl — Zhurnal analiticheskoi khimii (Moskva) 143: 330, 1954;
Pfibil, R. — Collection of Czechoslovakian Chemical Communications (Praha)
20: 165, 1955; Kôrbl, J. and R. Pfibil — Chemicke Listy (Praha) 51: 302,
1957; Kôrbl, J. and R. Pfibil — Chemicke Listy (Praha) 51: 1061, 1957;
Flaschka, H. and F. Sadek — Mikrochemie vereinigt mikrochemica Acta
(Wien) 1, 1957; Kôrôs, E. and I. Poczok — Magyar Kém. Folyóirat (Buda
pest) 64: 250, 1958.
13. a) Malát, M. V. Suk, and A. Jeničková — Chemicke Listy (Praha) 48: 663,
Malát, M., V. Suk, and A. Jeničková — Collection of Czechoslovakian Che
mical Communications (Praha) 19: 1156, 1954;
b) Suk, V. and Malát — Chemist-Analyst (Phillipsburg) 45: 30, 1956.
14. Lundell, G. E. F. and J. L Hoffman. Outlines of Methods of Chemical Ana
lysis — New York: John Wiley and Sons, 1958, p. 105.
15. Vogel, A. I. Quantitative Inorganic Analysis, Second Edition — London:
Longmans Green and Co. Ltd., 1960, a: p. 468, a: p. 421.

48
16. a) Flaschka, H. Mikrochemie vereinigt mikrochimica Acta (Wien) 39: 315, 1952;
b) Flaschka, H. and F. Huditz — Zhurnal analilicheskoi khimii (Moskva)
137: 172, 1952;
c) Pfibil, R. — Chemicke-Listy (Praha) 48: 818, 1954; Pfibil, R. — Collection
of Czechoslovakian Chemical Communications 19: 1162, 1954;
see also: Goetz, C. A. and F. J. Debrecht — Analytical Chemistry (Easton,
Pa) 27: 1972, 1955; Pinston, J. L. and Kenner, C. T. — Analytical Chemistry
(Eston, Pa) 27: 446, 1955.
17. Karaoglanov, Z. — Zhurnal analilicheskoi khimii (Moskva) 103: 113, 1935;
Guzel', L. — Zhurnal analilicheskoi khimii (Moskva) 104: 107, 1936; Grote,
F. — Zhurnal analilicheskoi khimii (Moskva) 122: 395, 1941; Sarudi, I. Zhurnal
analilicheskoi khimii (Moskva) 125: 370. 1943; Hoffman, W. A. and W. E.
Brandt — Analytical Chemistry (Eston, Pa) 28: 1437, 1956.
18. Flaschka, H. and F. Huditz — Chemist-Analyst (Phillipsburg) 41: 172, 1952;
Porter, J. D. — Chemist-Analyst (Phillipsburg) 41: 33, 1952; Flaschka, H,
and H. Abdine — Chemist-Analyst (Phillipsburg) 44: 30, 1955; Harris, W., F.
T. R. Sweet — Analytical Chemistry (Eston, Pa) 26: 1649, 1954.
19. Exner, F. —Journal of the American Chemical Society (Easton, Pa) 25: 896, 1903;
see also: Coehn, A. and M. Glaser — Zhurnal analilicheskoi khimii (Moskva)
33: 9, 1903; Brophy D. H. — Industrial Engineering Chemistrv (Analytical
Edition) 3: 363, 1931.
20. a) Strafford, N. — Analyst (Cambridge) 78: 733, 1953;
b) Biedermann, W. and G. Schwarzenbach — Chimia 2: 56, 1948.
21. Erdey, L. A ktmiai ar.alizis siilyszerinti modszerei — Budapest: Akademiai
kiad6 1960, a: p. 160, b: p. 158, c: p. 347.
22. Cheg, K.L. T. Kurtz, and S. H. Bray — Analytical Chemistry (Eston, Pa)
24: 1640, 1952; Sweester, P. B. and C. E. Bricker — Analytical Chemistry
(Easton, Pa) 25: 253, 1953.
23. Patrovsky, V. and M. Huka — Chemicke Listy (Praha) 50: 1108, 1956; Brown,
E. G. and T. J. Hayes — Analyst (Combridge) 79: 220, 1954.
24. Flaschka, H. — Mikrochimica Acta (Wien) 361: 1954; Erdey, L. and A.
Bodor — Zhurnal analilicheskoi khimii (Moskva) 137: 410, 1953.
25) Theis, M. — Zhurnal analilicheskoi khimii (Moskva) 144: 106. 1955; Theis,
M. Zhurnal analilicheskoi khimii (Moskva) 351: 144, 1955; Sommer. L. and
Z. Kolarik — Chemicke Listy (Praha) 50: 1445, 1956.
26. Sir, Z. and R. Pfibil — Chemicke Listy (Praha 50: 221, 1956; Sir, Z. and
R. Pfibil — Collection of Czechoslovakian Chemical Communications 21:
866, 1956.

GLASN1K HEMUSKOG DRUSTVA, Vol. 29, No. 5—6, 1964, pp. 219—228
DETERMINATION OF THE DIFFUSION COEFFICIENT
AND ITS TEMPERATURE DEPENDENCE
IN DEALKALIZATION OF SODIUM FROM
Na—Ca—SILICATE GLASS
by
D. DELIC and M. A. JOVANOVIC
DETERMINATION OF DEALKALIZED SODIUM
One-liter milk bottles produced in Yugoslavia were used. We
chose these bottles to get a large enough area of glass (580 cm2)
exposed to the action of water and a sufficient ratio of the volume
of dealkalizing medium to the area of glass"- 2) provided. This enabled
us to obtain the desired accuracy.
The glass had the following characteristics:
— chemical composition: 71.08% SiO2; 0.71%Al2O3; 0.18%
Fe-,O3; 9.20% CaO; 1.22% MgO; 17.21% Na2O; 0.28% SO3.
— transformation point: Tg = 512°±3
— specific weight: = 2.4954 ±0.0002
The inner surfaces of the bottles were exposed to the action
of fresh distilled water at temperatures of 40, 60, 80 and 98°.
The quantity of sodium removed was determined by flame
photometry.
Three bottles were simultaneously investigated each time.
The results (mean values for three samples) are shown in
Tables 1, 2, 3 and 4.
THE PROCESS OF SODIUM DISSOLUTION IN
DEALKALIZATION WITH WATER
Processes which take place when a glass surface is treated
with water must be considered from the point of view of the glass
structure. According to present-day knowledge glass has an anion
net in which alkalis deposit as ions. Therefore, the action of water
may be such that molecules or ions of water interact with the
alkalis in one of the ways described below.
4

5o
Reaction between water and alkalis proceeds very rapidly
compared with the rate of travel of ions, in our case sodium ions,
into or out of the glass. The quantity of sodium which transfers
into the water as a function of time is therefore determined either
by the rate of diffusion of water ions through the boundary layer
to sodium capable of reacting, or by the rate at which sodium
ions can travel from their original place to the surface(3). The
slower of these two processes determines the whole dealkalization
process(4). It is here assumed that the anion net retains the form
of a porous boundary layer for some time.
By losing sodium ions, the glass should become electronegative.
An electrical double layer would form on the surface, holding up
further removal of sodium ions. As this is not the case it is
obvious that electrical neutrality is maintained by counter-diffusion
of other ions, replacing the sodium(4). Since calculation of double
diffusion is very difficult and since one diffusion constant is much
smaller than the other, the process will be considered as simple
diffusion. The constant used will not differ much from the constant
of the slower diffusion, and in our case sodium diffusion.
TABLE 1
Quantities of sodium removed at 40°
Dealkalization time
h
Quantity of sodium removed
mol. cm-2
each total each x 10s total x 10«
1 3 3 4.03 4.03
2 3 6 3.39 7.42
3 3 9 2.57 9.99
4 3 12 2.04 12.03
5 3 15 1.04 13.07
6 3 18 0.91 13.98
Quantities of sodium removed at 60°
TABLE 2
Dealkalization time
h
Quantity of sodium removed
mol. cm-2
each total each x 10* total x 10*
1 3 3 5.32 5.32
2 - 3 6 4.03 9.35
3 3 9 3.16 12.51
4 3 12 2.64 15.15
5 3 15 2.10 17.25
6 3 18 1.61 18.86

51
TABLE 3
Quantities of sodium removed at 80°
Dealkalization time Quantity of sodium removed
h mol. cm-2
each total each x 10* total x 10«
1 3 3 7.74 7.74
2 3 6 6.29 14.03
3 3 9 5.45 19.48
4 3 12 4.39 23.87
5 3 15 3.84 27.71
6 3 18 3.10 30.81
Quantities of sodium removed at 98°
TABLE 4
Dealkalization time
h
Quantity of sodium removed
mol. cm-2
each total each x 10' total x 10'
1 3 3 19.52 19.52
2 3 6 15.07 34.59
3 3 9 12.97 47.56
4 3 12 10.32 57.88
5 3 15 8.71 66.59
6 3 18 8.32 74.91
DISSOLUTION OF SODIUM AS A DIFFUSION PROCESS
From Fick's second law we have
*f=2>*£ (1)
dt dx2
where
c — concentration of Na in the boundary surface of glass
(mol/cm3)
x — distance of the layer from the boundary surface (cm)
D — diffusion coefficient (cm2/sec)
t — time (sec)
Taking the initial concentration as cq, so that c = co for all x>0
for / = 0, and assuming a sodium concentration c = 0 for f = 0and
x = 0, we get the following solution of eg. (1):

52
*"=f['-*(275)] (2>
For investigating thin layers(5) the quantity removed m (in
moles) from a layer of cross-section q, whose coordinates go from
xi, to x2, is given by
m = q J c(x, t)dx (3)
Substituting for c(x, t) from eq. (2) we obtain
If we write -/) = —==, so that dx=2VDt dr, we obtain
2]/Dt
m=q-c^Dt J [l-<l>(n)]dTi (5)
For the limiting values xj = 0 and x2 = oo we have
m = q.c0.]/Dt /[l-<D(r))]dr) (6)
In this case
so that
oo
f [i-a>(Y])]rf7) = -L
m = ?~.coV^/ (7)
K *
From m/q = Q it follows that the total quantity of sodium removed
per cm2 in time /
Q= ^=c0-|/^[molcm-2] (8)
V *
/. the diffusion coefficient is
02-71
Z) = ^2— [cm2-sec-i] (9)
The above relation shows a linear dependence between the
quantity dissolved and the square root of the time, with slope

53
which depends on the diffusion coefficient.
Our experimental results show that the quantity of sodium
dissolved depends linearly in time except in the initial phase of the
reaction (Fig. 1). This confirms the findings of some authors that
dealkalization behaves as a diffusion process.
Hence, from the experimental results in Tables 1, 2, 3 and 4
we can calculate the diffusion coefficient (eq. 9).
The concentration of sodium is calculated assuming that it
is the same throughout the glass, from the percentage of sodium
in the glass and its density.
Hence we obtain that the initial concentration of sodium is
c0 = 0.012559 [moI.cm-3]
The experimental results for the diffusion coefficient are
calculated statistically by the least squares method. From the data
given in Tables 5, 6, 7 and 8 the arithmetic mean of the diffusion
coefficient for each temperature is found to correspond to a "one
sigma" law(6).
7i
96
SO
54
46
41
36
30
M
«8
12
6
« 2 1 4 ft h
Fig. 1. Relation between dissolved quantity of sodium and the square root of the
duration removed
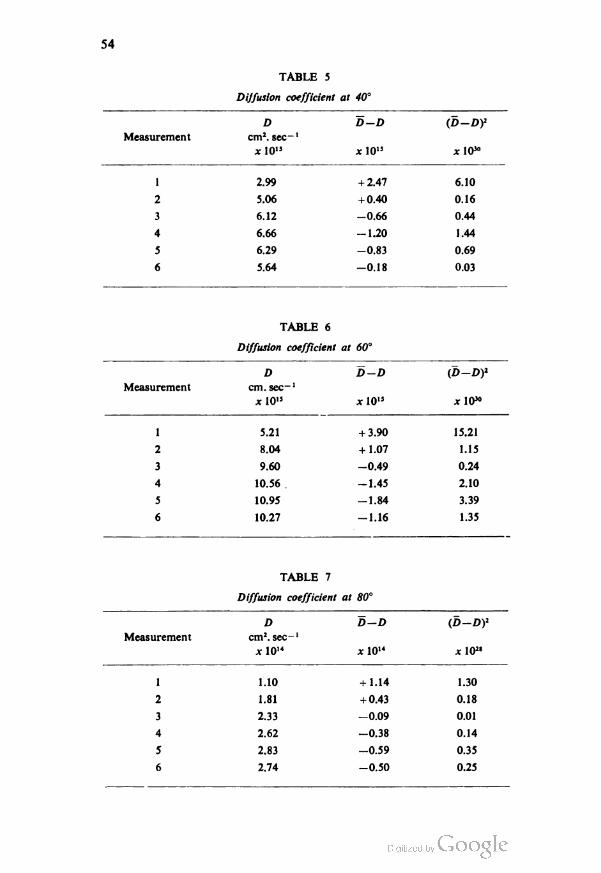
54
TABLE 5
Diffusion coefficient at 40°
D D-D
jcIO13
(D-Dy
x 1030
Measurement cm2, sec- 1
xW
1 2.99 + 2.47 6.10
2 5.06 + 0.40 0.16
3 6.12 -0.66 0.44
4 6.66 -1.20 1.44
5 6.29 -0.83 0.69
6 5.64 -0.18 0.03
Diffusion coefficient at 60°
TABLE 6
D D-D
xlO15
(p-DY
Measurement cm. sec-1
xlO15 x 105°
1 5.21 + 3.90 15.21
2 8.04 + 1.07 1.15
3 9.60 -0.49 0.24
4 10.56 -1.45 2.10
5 10.95 -1.84 3.39
6 10.27 -1.16 1.35
Diffusion coefficient at 80°
TABLE 7
D D-D (D-Df
*102«
Measurement cm2, sec-1
xlO14 xW
1 1.10 + 1.14 1.30
2 1.81 + 0.43 0.18
3 2.33 -0.09 0.01
4 2.62 -0.38 0.14
5 2.83 -0.59 0.35
6 2.74 -0.50 0.25

55
TABLE 8
Diffusion coefficient at 98°
D D-D (D-D)2
Measurement cm2, sec-1
x 1014 x 10M x 10"
1 7.01 +6.30 39.69
2 11.01 +2.30 5.29
3 13.88 -0.57 0.32
4 15.41 -2.10 4.41
5 16.31 -3.00 9.00
6 16.21 -2.90 8.41
TABLE 9
Mean values of the diffusion coefficient
Temperature 0meariCm2-SeC-1
40° 5.95 10-"± 1.33 10-"
60° 9.88 10-»±2.47 10-15
80° 2.4710-14±0.6710-14
98° 14.56- 10-14±3.6610-14
Table 9 shows the mean diffusion coefficients for each
temperature. From the diffusion coefficients and the relation giving
their temperature dependence
D=D0-e-E,RT (10)
we can calculate the activation energy of Na-ions.
Integrating eg. (10) we get
lnD = \nD0-\—1— (11)
The activation energy is calculated by the least squares
method using the data in Table 10.

56
TABLE 10
Data for calculating the activation energy
1 I2 /
D T InZ)—
-InZ)
T 7 T
x 103 x 106 x W
5.95 10-ta
313 -32.755 3.195 10.208 -104.652
9.88 10- i?333 -32.248 3.003 9.018 - 96.841
2.47- 10- H 353 -31.332 2.883 8.026 - 88.764
1.46 10-1 1
371 -29.555 2.695 7.263 - 79.651
I -125.890 11.726 34.515 - 269.908
Solving the equations
[In D] = 41 1 E
In A)
[T]R
, 1 , 1
— InZ)
T T
E
T
(12)
(13)
for — we obtain that
R
--=6.23-103
R
Substituting the value for R= 1.987[cal. degree-1 moh1] we
obtain the activation energy
E= 12.38-103 [cal. mol-']
DEPENDENCE OF SODIUM DISSOLUTION ON TEMPERATURE
The influence of temperature on the ion velocity and thus
on the magnitude of the diffusion coefficient is given by
D = D0-e-EIRr(10)
where
E —
R —
T —
D —
de
activation energy
gas constant
absolute temperature
diffusion coefficient
diffusion constant
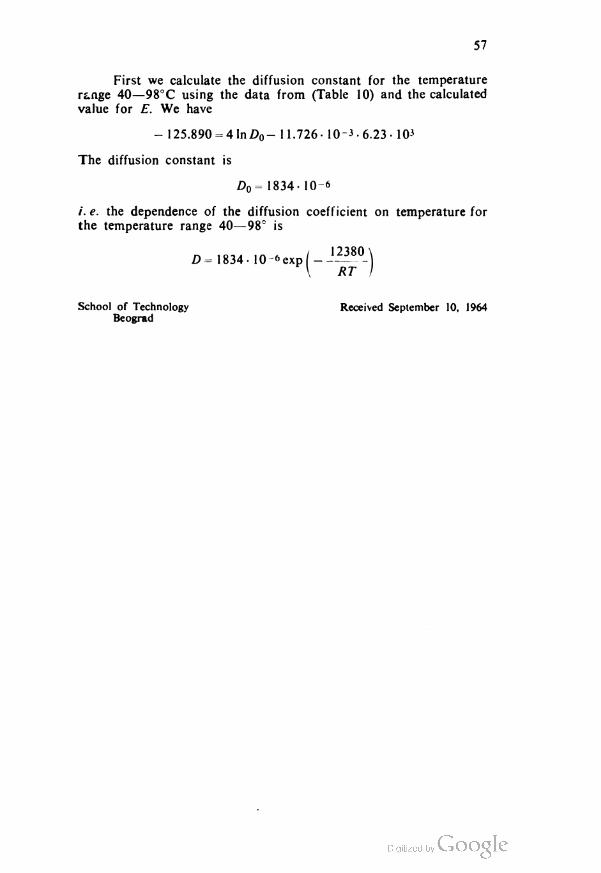
57
First we calculate the diffusion constant for the temperature
range 40—98°C using the data from (Table 10) and the calculated
value for £. We have
- 1 25.890 = 4 In £>„- 11.726- 10 3-6.23- 10'
The diffusion constant is
£>o= 1834- 10"
i. e. the dependence of the diffusion coefficient on temperature for
the temperature range 40—98° is
D=1834-10 f-expj -
School of Technology
Beograd
Received September 10, 1964

REFERENCES
1. Krishnaswanny, S. P. and S. Sudhir. — Bulletin of the Central Glass and
Ceramics Research Institute 3:116, 1956.
2. Berger, E. and W. Geffken "Griinsatzliches iibcr die chemiche Angreifbarkeit
von Glasern". — Glastechnische Berichte (Frankfurt a/M) 14: 351—359, 1936.
3. Zagar, L., in: Sitzung der Fachausschuss I der Deutsche Glastechnische Gesell-
schaft (Frankfurt a/M) — April, 1959.
4. Douglas, R. W. and I. O. Isard. "The action of Water and of Sulfur Dioxide
on Glass Surfaces" — Journal of the Society of Glass Technology (Thornton)
23: 289—335, 1949.
5. Hauffe, K. Reaktionen in und an festen Stoffen — Berlin: Springer-Verlag, 1955.
6. Batner, L. and M. Pozin. Matematicheskie melody v khimicheskoi tekhnike —
Moskva: Goskhimizdat, 1960.

GLASNIK HEMUSKOG DRUSTVA, Vol. 29, No. 5—6, 1964, pp. 229—237
DEMORALIZATION FROM GLASS AS A KINETIC PROCESS
by
D. DEL1C and M. A. JOVANOVIC
We used one-liter milk bottles of Yugoslav production, made
of Na-Ca-silicate glass of the following composition: 71.08% SiO2;
0.71%AI2O3; 0.18%Fe2O3; 9.20% CaO; 1.22%MgO; 17.21% Na2O;
0.28% SO3.
The inner surface of the bottles was exposed to the action of
fresh distilled water at temperatures of 40, 60, 80 and 98°. Each
time three bottles were investigated simultaneously.
The content of removed sodium was determined by flame
photometry: total quantities were determined.
Taking the inner surface area of the bottles as 580 cm2.
Tables 1, 2, 3 and 4 show results for the quantity of sodium
removed per 1 dm2 (mgNaO/dm2).
TABLE 1
Quantity of sodium removed at 40"
TimeQuantity removed
Sample I Sample II Sample III Mean value
3 0.128 0.129 0.120 0.125
6 0.237 0.231 0.223 0.230
9 0.314 0.315 0.302 0.310
12 0.380 0.374 0.366 0.373
15 0.408 0.405 0.402 0.405
18 0.434 0.437 0.428 0.433
We tried to apply Jander's law of the rate of reaction in the
solid state(1) to the process of dealkalization of glass. For this
purpose it was necessary to determine the thickness of the dealka-
lized surface layer. This is practically impossible but an effective
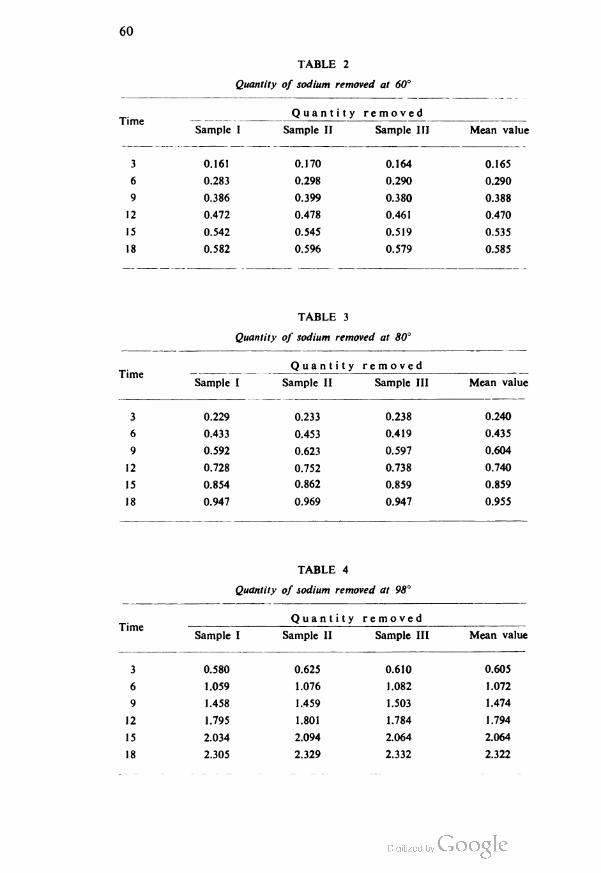
60
TABLE 2
Quantity of sodium removed at 60°
Time
Quantity removed
Sample I Sample II Sample III Mean value
3 0.161 0.170 0.164 0.165
6 0.283 0.298 0.290 0.290
9 0.386 0.399 0.380 0.388
12 0.472 0.478 0.461 0.470
15 0.542 0.545 0.519 0.535
18 0.582 0.596 0.579 0.585
Quantity of sodium removed at 80°
TABLE 3
Time
Quantity removed
Sample I Sample II Sample III Mean value
3 0.229 0.233 0.238 0.240
6 0.433 0.453 0.419 0.435
9 0.592 0.623 0.597 0.604
12 0.728 0.752 0.738 0.740
15 0.854 0.862 0.859 0.859
18 0.947 0.969 0.947 0.955
Quantity of sodium removed at 98°
TABLE 4
Time
Quantity removed
Sample I Sample II Sample III Mean value
3 0.580 0.625 0.610 0.605
6 1.059 1.076 1.082 1.072
9 1.458 1.459 1.503 1.474
12 1.795 1.801 1.784 1.794
15 2.034 2.094 2.064 2.064
18 2.305 2.329 2.332 2.322

61
or theoretical thickness can be calculated assuming that all the
sodium is removed from this layer. Then, knowing the total
quantity of sodium removed experimentally, we can calculate the
theoretical thickness of the dealkalized layer.
The content of Na2O is given by
G = a - y - m - y
where
G = quantity of Na2O removed (mg/cm2)
a = dealkalized area of glass surface (cm2)
y = thickness of dealkalized layer (cm)
m= quantity of Na2O in glass (weight %)
Y = specific weight of glass (g/cm2)
We have therefore
GA = 10- 10- yx- 17.21 - — - 2.4954
100
or
Gx
yx= — [cm]
43.025
where
Gx = quantity of Na2O removed (mg/dm2) at the given tempe
rature and time
yx = theoretical thickness of the layer dealkalized (cm) at the
given temperature and time
The theoretical layer thicknesses are given in Table 5.
According to Jander's theory the reaction rate in the solid
state is given by
y2 = k-l
where
y— thickness of the reaction layer
t — time
k — constant
The reaction rate constants are given in Table 6.
The reaction rate constants were calculated by the least
squares method. From the data given in tables 7, 8, 9 and 10 it
was found that the arithmetical mean of the rate constants for
each temperature corresponds to "one sigma" conditions(2).

62
TABLE 5
Theoretical thickness of the dealkalized layer
Temperature Duration Thickness of the dealkalized
of removal, °C of removal, h layer, y-104 cm
40 3 0.029
40 6 0.053
40 9 0.072
40 12 0.087
40 IS 0.094
40 18 0.100
60 3 0.038
60 6 0.067
60 9 0.090
60 12 0.109
60 15 0.124
60 18 0.136
80 3 0.056
80 6 0.101
80 9 0.140
80 12 0.172
80 15 0.200
80 18 0.222
98 3 0.141
98 6 0.249
98 9 0.342
98 12 0.415
98 IS 0.485
98 18 0.540
TABLE 6
Reaction rate constants
Temperature
k (cm2 cec-') 40°
*1016
60°
xlO"
80°
xlO13
98°
*1014
7.41 12.96 2.87 1.84
k, 12.96 20.83 4.72 2.87
k, 16.05 25.00 6.05 3.61
K 17.59 27.55 6.85 3.99
k, 16.30 38.52 7.41 4.36
As 14.83 26.89 7.17 4.24

63
TABLE 7
Reaction rate constant at 40"
k k-k
(x 10")
(k=ky
Measurement cm2 - sec-1
(* 10") (x 10")
1 7.41 + 6.78 45.97
2 12.96 + 1.23 1.51
3 16.05 -1.86 3.46
4 17.59 -3.40 11.56
5 16.30 -2.11 4.45
6 14.83 -0.64 0.41
Reaction rate constant at 60°
TABLE 8
k k-k
(xlO")
(k-ky
(x 10")
Measurement cm2 - sec-1
(* 10")
1 12.96 + 10.66 113.63
2 20.83 + 2.79 7.78
3 25.00 - 1.48 1.90
4 27.55 - 3.93 15.44
5 28.52 - 4.90 24.01
6 26.89 - 3.27 10.69
Reaction rate constant at 80°
TABLE 9
k k-k
(x 10")
(k-ky
(x 10*)
Measurement cm2- sec-1
(x 10")
1 2.87 + 2.97 8.82
2 4.72 + 1.12 1.25
3 6.05 -0.21 0.04
4 6.85 -1.01 1.02
5 7.41 -1.57 2.46
6 7.17 -1.33 1.77

64
TABLE 10
Reaction rate constant at 98°
k k-k
(xlO14)
(k-k)2
(x 1028)
Measurement cm2- sec-'
(x 1014)
1 1.84 + 1.64 2.69
2 2.87 + 0.61 0.37
3 3.61 -0.13 0.02
4 3.99 -0.51 0.26
5 4.36 -0.88 0.77
6 4.24 -0.76 0.58
Table 1 1 shows the mean k-values at each temperature.
TABLE 11
Mean values for reaction rate constants
Temperature °C A-mean cm2 - sec- 1
15.54- 10-16±3.6710-16
25.76- 10 -"±5.89 10-
6.4410-"±3.0710-,s
3.8110-,4±0.9410-14
In an earlier paper(31 we treated this process as a diffusion
process and determined the diffusion coefficient.
The dependence of the reaction rate constant on the diffusion
coefficient can be expressed as follows:
k = k'D
Table 12 shows the results for k and D and the calculated
values for k'.
TABLE 12
Dependence of the reaction rate constant on the diffusion coefficient
Temperature k D k'
°C cm2 sec-1 cm2 -sec-1
40 15.54- 10-16 5.95- 10-" 0.26117
60 15.76-10-'6 9.88- lO15 0.26072
80 6.44- 10-" 2.47- 10-14 0.26071
90 3.81 10 14 14.57- 10- 14 0.26095
40
60
80
98

65
mean = 0.261
Hence
A: = 0.261 D
In the same work(3) we determined the dependence of the
diffusion coefficient on temperature:
where
k — rate constant
R— gas constant
T— absolute temperature
Hence the process of the removal of sodium from glass can
be interpreted by Jander's theory.
School of Technology Received September 10, 1964
Therefore the process can be expressed as follows:
Beograd
5

REFERENCES
1. Jander, W. "Reaktionen im festen Zustande bei hoheren Temperaturen I
Mitteilung" — Zeitschrift fur anorganische Chemie (Leipzig) 163: 1-30, 1927.
2. Batnner, L. and M. Pozin. Matematicheskie metody v khemicheskoi tekhniki —
Moskva: Goskhimizdat, 1960.
3. Delid D. and M. Jovanovic. "Utvrdivanje koeficijenta difuzije i njegove
zavisnosti od temperature kod izluzivanja natrijuma iz Na-Ca-silikatnog
stakla. (Determination of the Diffusion Coefficient and its Temperature
Dependence in Dealkalization of Sodium Na-Ca-Silicate Glass) — Glasnik
Hemijskog drustva (Beograd) 29, 5—6 1964.
GLASNIK HEMIJSKOG DRUSTVA, Vol. 29, No. 5—6, 1964, pp. 239—246
EXTRACTION OF MANGANESE FROM POOR MANGANOUS
ORES BY REDUCTIVE ROASTING AND LEACHING IN
AMMONIACAL SOLUTION
by
DUSAN VUCUROVlC, RAJKO 2. VRACAR and ILIJA B. ILIC
Manganese is mainly produced by pyrometallurgical methods.
The chemical affinity of manganese for oxygen, especially in case of
its lowest oxide MnO, is considerably stronger than that of a number
of other metals, such as lead, nickel, iron, zinc, etc. For this reason to
break the chemical bond between Mn and oxygen in MnO requires
a high temperature and a strong reductive atmosphere, which is hard
to get with conventional reducing apparatuses. In the production of
ferromanganese in blast or arc furnaces in the presence of carbon,
reduction is followed not only by high temperatures but also by
carbonization of the ferromanganese. Carbon-free metallic manganese
is produced by silicothermal and alumothermal reduction. However,
the production of ferromanganese or manganese by these procedures
can only be economical if the ore is rich, with a manganese content
of not less than 35%.
Since many countries, including Yugoslavia, have deposits of
poor manganese ores, efforts have been made to find out possibilities
of extracting manganese by hydrometallurgical procedures. The
literature data show that the following procedures have been studied
most: leaching manganese ore with sulphuric, sulphurous and nitric
acid solutions; leaching with water and introducing SO2; roasting
with ammoniac salts, or with SO2, with subsequent water leaching of
the soluble manganese compounds formed(1,2,3,4'5).
Recent attempts to extract manganese with solutions of am
moniac salts have attracted particular attention. It has been noticed
that MnO has the property of oxides of copper and some other metals
of dissolving in solutions of ammoniac salts, in which case Mn goes
into solution in the form of a complex ammoniac ion.
This procedure was first used by Bradley and Fitch(1). They first
roasted ore in a reducing atmosphere to convert MnO2 to soluble
MnO and then leached it with ammonium sulphate solutions. Cohen
5'

68
trations up to 10% (NH^SC^ were used and the maximum manganese
extraction was 70%.
As distinct from earlier authors, Dean used an ammoniac solution
of ammonium carbonate for leaching the reduced roasted ore(6). By
treating MnO, manganese is converted to a soluble complex according
to the following reaction:
C
I
/ONH4 O—C—NH2
MnO + O = C( =Mn(
XNH2 XONH4
By diluting the filtrate after leaching, or by introducing CO2,
the complex can be precipitated to manganese carbonate. Dean's
process is promising because it gets good dissolution of MnO, up
to 80—100 g Mn/1 solution. The ammonium carbonate solution can
be simply prepared by introducing CO2 into ammoniac solution, and
its regeneration after use is easy. This especially cuts costs.
Systematic research has been done at the Nonferrous Metallurgy
Department of the School of Technology in Beograd on possibilities
of processing the poor manganese ore from Kopaonik (Yugoslavia).
The method of ammoniacal leaching one of the methods investigated
and optimum conditions were sought.
EXPERIMENTAL
Ore composition and methods oj investigation. — Laboratory
tests were made with "Novo Brdo" — Kopaonik manganese ore
whose chemical composition is given in Table 1. The sample was
ground 100%—60 mesh.
TABLE 1.
Chemical composition of the ore in %
Mn Fe Pb Zn Cu As Sb MgO Al2O3
21.10 30.71 3.32 1.35 0.10 0.35 1.20 6.10 20.48 11.53
Mineralogical analysis showed that ore contained: psilomelane,
pyrolusite, mangansiderite, chalcopyrite, cerussite, limonite, sphalerite,
galenite, smithsonite, pyrite, calcite, quartz, etc.
From these analyses it is obvious that the ore is poor. Manganese
is mainly present in the quadrivalent form, mainly in psilomelane.
The fact that manganese is present in the form of a mineral is significant
for its reduction and extraction with ammoniac solution.
Ore was reduced with hydrogen in a cylindrical electric oven
with automatic temperature regulation, to convert high manganese
oxides to MnO. The hydrogen flow-rate was regulated by a capillary
meter. After reduction the ore was cooled to room temperature in a
hydrogen atmosphere and then transferred to the solution for leaching.
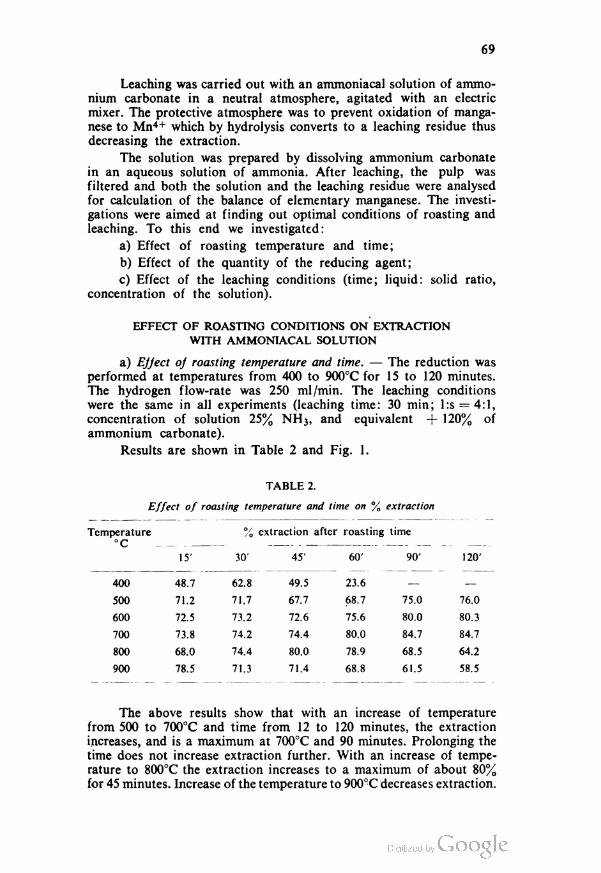
69
Leaching was carried out with an ammoniacal solution of ammo
nium carbonate in a neutral atmosphere, agitated with an electric
mixer. The protective atmosphere was to prevent oxidation of manga
nese to Mn4+ which by hydrolysis converts to a leaching residue thus
decreasing the extraction.
The solution was prepared by dissolving ammonium carbonate
in an aqueous solution of ammonia. After leaching, the pulp was
filtered and both the solution and the leaching residue were analysed
for calculation of the balance of elementary manganese. The investi
gations were aimed at finding out optimal conditions of roasting and
leaching. To this end we investigated:
a) Effect of roasting temperature and time;
b) Effect of the quantity of the reducing agent;
c) Effect of the leaching conditions (time; liquid: solid ratio,
concentration of the solution).
EFFECT OF ROASTING CONDITIONS ON EXTRACTION
WITH AMMONIACAL SOLUTION
a) EJJect oj roasting temperature and time. — The reduction was
performed at temperatures from 400 to 900°C for 15 to 120 minutes.
The hydrogen flow-rate was 250 ml/min. The leaching conditions
were the same in all experiments (leaching time: 30 min; l:s = 4:1,
concentration of solution 25% NH3, and equivalent + 120% of
ammonium carbonate).
Results are shown in Table 2 and Fig. 1.
TABLE 2.
Effect of roasting temperature and time on % extraction
Temperature % extraction after roasting time
15' 30' 45' 60' 90' 120-
400 48.7 62.8 49.5 23.6 —
500 71.2 71.7 67.7 68.7 75.0 76.0
600 72.5 73.2 72.6 75.6 80.0 80.3
700 73.8 74.2 74.4 80.0 84.7 84.7
800 68.0 74.4 80.0 78.9 68.5 64.2
900 78.5 71.3 71.4 68.8 61.5 58.5
The above results show that with an increase of temperature
from 500 to 700°C and time from 12 to 120 minutes, the extraction
increases, and is a maximum at 700°C and 90 minutes. Prolonging the
time does not increase extraction further. With an increase of tempe
rature to 800°C the extraction increases to a maximum of about 80%
for 45 minutes. Increase of the temperature to 900°C decreases extraction.
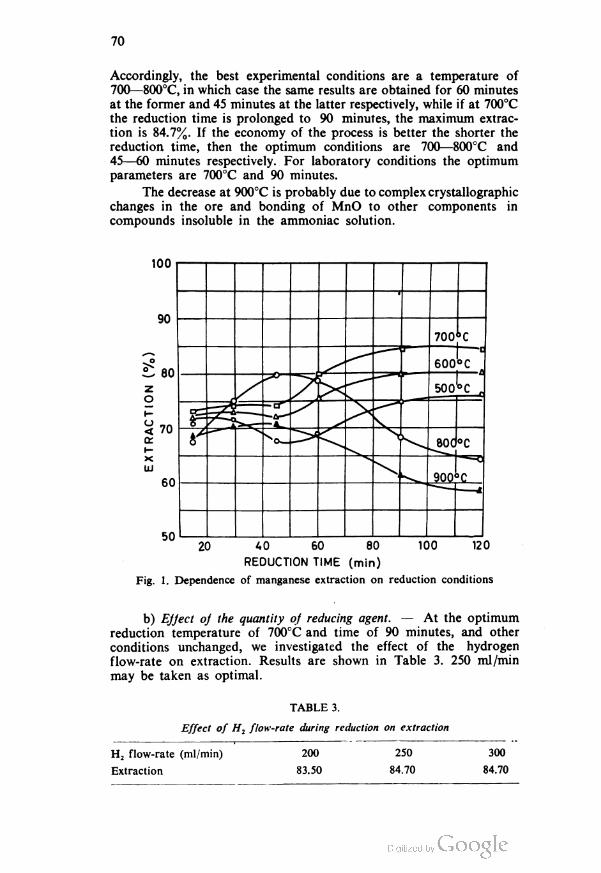
70
Accordingly, the best experimental conditions are a temperature of
700—800°C, in which case the same results are obtained for 60 minutes
at the former and 45 minutes at the latter respectively, while if at 700°C
the reduction time is prolonged to 90 minutes, the maximum extrac
tion is 84.7%. If the economy of the process is better the shorter the
reduction time, then the optimum conditions are 700—800°C and
45—60 minutes respectively. For laboratory conditions the optimum
parameters are 700°C and 90 minutes.
The decrease at 900°C is probably due to complex crystallographic
changes in the ore and bonding of MnO to other components in
compounds insoluble in the ammoniac solution.
100
90
^70
x
LU
60
50
700 »C
r
600°C1 a
^° ———'
£f -cr
500•c.
o .
>
s
N80C °c
900
c
20 100 12040 60 80
REDUCTION TIME (min)
Fig. 1. Dependence of manganese extraction on reduction conditions
b) EJject oj the quantity of reducing agent. — At the optimum
reduction temperature of 700°C and time of 90 minutes, and other
conditions unchanged, we investigated the effect of the hydrogen
flow-rate on extraction. Results are shown in Table 3. 250 ml/min
may be taken as optimal.
TABLE 3.
Effect of H2 flow-rate during reduction on extraction
H2 flow-rate (ml/min)
Extraction
200
83.50
250
84.70
300
84.70
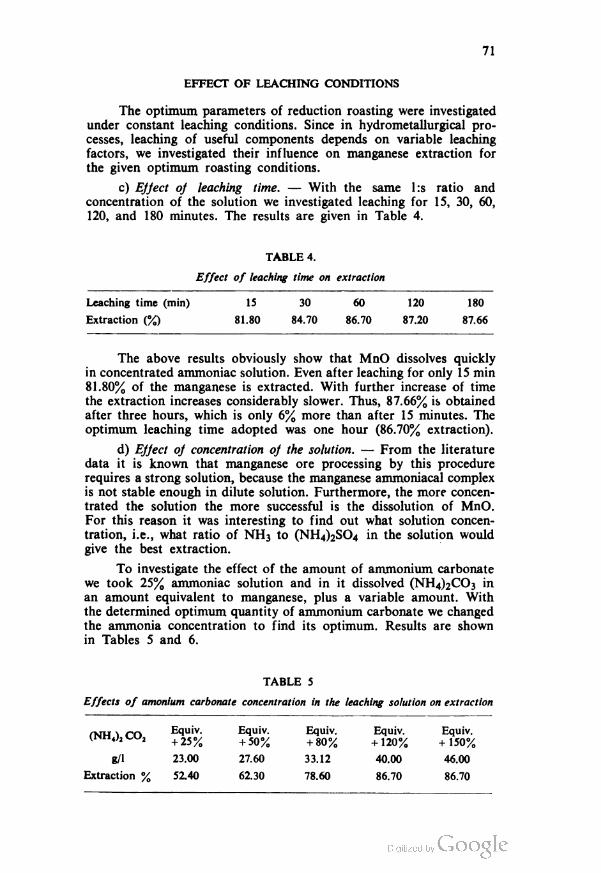
71
EFFECT OF LEACHING CONDITIONS
The optimum parameters of reduction roasting were investigated
under constant leaching conditions. Since in hydrometallurgical pro
cesses, leaching of useful components depends on variable leaching
factors, we investigated their influence on manganese extraction for
the given optimum roasting conditions.
c) Efject oj leaching time. — With the same l:s ratio and
concentration of the solution we investigated leaching for 15, 30, 60,
120, and 180 minutes. The results are given in Table 4.
TABLE 4.
Effect of leaching time on extraction
Leaching time (min) 15 30 60 120 180
Extraction (%) 81.80 84.70 86.70 87.20 87.66
The above results obviously show that MnO dissolves quickly
in concentrated ammoniac solution. Even after leaching for only 15 min
81.80% of the manganese is extracted. With further increase of time
the extraction increases considerably slower. Thus, 87.66% is obtained
after three hours, which is only 6% more than after 15 minutes. The
optimum leaching time adopted was one hour (86.70% extraction).
d) Ejject oj concentration oj the solution. — From the literature
data it is known that manganese ore processing by this procedure
requires a strong solution, because the manganese ammoniacal complex
is not stable enough in dilute solution. Furthermore, the more concen
trated the solution the more successful is the dissolution of MnO.
For this reason it was interesting to find out what solution concen
tration, i.e., what ratio of NH3 to (NH4)2SO4 in the solution would
give the best extraction.
To investigate the effect of the amount of ammonium carbonate
we took 25% ammoniac solution and in it dissolved (NH^CC^ in
an amount equivalent to manganese, plus a variable amount. With
the determined optimum quantity of ammonium carbonate we changed
the ammonia concentration to find its optimum. Results are shown
in Tables 5 and 6.
TABLE 5
Effects of amonium carbonate concentration in the leaching solution on extraction
(NH4)2CO2Equiv.
+ 25%
Equiv.
+ 50%
Equiv.
+ 80%
Equiv.
+ 120%
Equiv.
+ 150%
g/1 23.00 27.60 33.12 40.00 46.00
Extraction % 52.40 62.30 78.60 86.70 86.70

72
TABLE 6
Effect of the free ammonium concentration in the leaching solution on manganese
extraction
NH3 concentration (%) 15 20 25
Extraction (%) 56.0 86.7 86.7
The above results confirm that successful extraction requires
a high solution concentration of ammonia and ammonium carbonate.
Optimum quantities of these components were equiv. +120%
(NH4)2CO3 and 20% NH3.
e) FJJect oj the l:s ratio. — All the above experiments were made
at a constant l:s ration 4:1. Since manganese extraction also depends
on this factor a number of experiments were made to determine its
effect. Leaching was performed with optimum solution concentration
[20% NH3 and equiv. +120% (NH4)2SO3] and optimum leaching
time (60 min).
TABLE 7
Effect of the leaching solution 1:3 ratio on extraction
l:s 2:1 4:1 6:1 8:1 10:1
Extraction (%) 39.70 86.70 91.30 94.00 94.10
The above results show that increasing the liquid to solid ration
to 8:1 increases extraction.' With this ratio the extraction is 94.00%.
Therefore, for successful dissolution of MnO from the roast and con-
vertion of Mn to ammoniac complex, one of the necessary conditions
is a relatively high l:s ratio in leaching.
f) Behavior oj the other ore components in ammoniacal leaching. —
From the chemical analysis it can be seen that the manganese ore
contained 30.71% Fe, 3.32% Pb, 1.35% Zn, and small quantities of
Cu, Sb, and As. Except for iron all the other metals are in the form
of native or complex sulfides, insoluble in ammoniac solution.
This is mainly why these metals are not found in the filtrate after
leaching. Iron is in the form of an oxide, mainly limonite. Fe2O3 and
FeO are soluble in ammoniac solution. However, by reductive roasting
Fe2O3 is mainly reduced to Fe3O4 which is insoluble in ammoniac
solution. Due to this, only some of the iron goes into solution. With
optimum roasting and leaching conditions about A—5% Fe dissolves.
This behavior of the accompanying components in ammoniac
leaching makes this procedure highly selective, especially relative to
leaching with mineral acids. The selectivity and the possibility of
regenerating the solution are two highly important characteristics of
this leaching process.
School of Technology Received November 3, 196
REFERENCES
1. Salli, A. Marganets — Moskva: Metalurgizdat, 1959.
2. Daughterty Charles, C. Recovery of manganese from — USA Patent 2890103
9.06.59.
3. Williams, B. "Precede de recuperation de manganese dans les minerals et
les scories" — French Patent 1138922. 21. 06. 57.
4. Stringham, W. S. and G. N. Summers. "Verfahren zur Gawinnung fon Mn
aus Mn Materialen" — West German Patent.
5. Burnoczky, L. "Az urkuti karbonamos manganerc kensavas lugzasa" — Koh.
Lapok 13 (2—3): 143—145, 1959.
6. Dean, R. S., E. S. Leaver, and T. L. Joseph. — Inform. Circ. U. S. Bur. Min.
No. 6770, 1954.


GLASNIK HEMUSKOG DRUSTVA, Vol. 29, No. 5—6, 1964, pp. 247—254
EXTRACTION OF MANGANESE FROM POOR ORES BY
ROASTING WITH AMMONIUM SALTS
by
DUSAN M. VUCUROVlC, IL1JA B. ILTC, and RAJKO 2. VRACAR
In an earlier work(8) we presented some of the most important
procedures for processing poor manganese ores, and pointed out the
possibilities of processing. According to Keys and Klegg these procedures
can in many cases compete with usual melting on ferromanganese
from high-quality ores. Yugoslavia has considerable deposits of poor
manganese ores, whose processing is becoming a more and more
important problem. Therefore, besides the process of reduction roasting
and leaching with ammoniac solutions, we have studied roasting ore
with ammonium salts.
This procedure has been studied by a number of authors (3, 4- 5- 6- 7).
Their investigations have proved that 75—90% of manganese can be
extracted by roasting and leaching of the roast in water. The economical
advantages of these procedures are the greater because they allow
regenerating of expensive reagents.
Several authors have worked on treating poor manganese ores
of different mineralogical compositions to get a manganese concentrate.
This work has lead to the development of corresponding procedures.
Sweet and Cartly(1) suggest a procedure for roasting complex ores
with(NH4)2SO4. By roasting, NH3 and CO2 are extracted, which are
condensed in water, and the (NH4)2CO3 solution obtained is later
used for precipitating manganese. After (NH4)2SO4 solution has been
separated from the precipitate, it is regenerated and the salt used again.
In 1957, Williams(3) patented a procedure for the processing of
oxido-silicate ores and manganese slag. Besides ammonium sulfate
he added (NH4)2SO3, NH4HSO3, NH4C1 to the mixture, and for
silicate manganous slag NH4F which converts MnSiO3 to MnO during
the roasting. This procedure yielded good results, the percentage of
manganese extracted even exceeding 90%.
In view of the current importance of manganese extraction from
Yugoslav ores, we have made extensive investigations, with regard
the specific characteristics of Yugoslav raw material etc. to determine
which parameters of ore roasting with ammonium salts influence
the degree of manganese extraction.
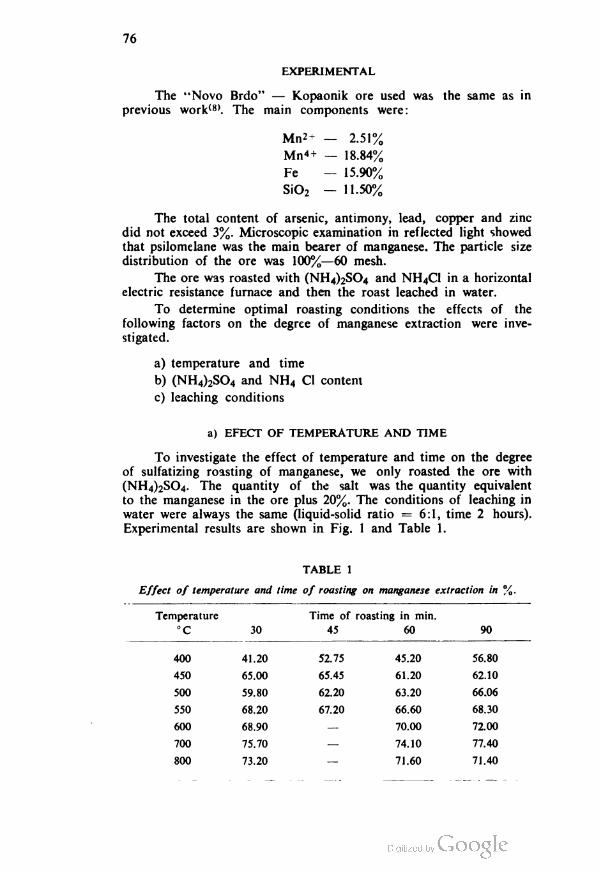
76
EXPERIMENTAL
The "Novo Brdo" — Kopaonik ore used was the same as in
previous work(8). The main components were:
Mn2- — 2.51%
Mn4+ — 18.84°0
Fe — 15.90%
SiO2 — 11.50%
The total content of arsenic, antimony, lead, copper and zinc
did not exceed 3%. Microscopic examination in reflected light showed
that psilomelane was the main bearer of manganese. The particle size
distribution of the ore was 100%—60 mesh.
The ore was roasted with (NH4)2SO4 and NH4CI in a horizontal
electric resistance furnace and then the roast leached in water.
To determine optimal roasting conditions the effects of the
following factors on the degree of manganese extraction were inve
stigated.
a) temperature and time
b) (NH4)2SO4 and NH4 CI content
c) leaching conditions
a) EFECT OF TEMPERATURE AND TIME
To investigate the effect of temperature and time on the degree
of sulfatizing roasting of manganese, we only roasted the ore with
(NH4)2SO4. The quantity of the salt was the quantity equivalent
to the manganese in the ore plus 20%. The conditions of leaching in
water were always the same (liquid-solid ratio = 6:1, time 2 hours).
Experimental results are shown in Fig. 1 and Table 1.
TABLE 1
Effect of temperature and time of roasting on manganese extraction in %.
Temperature Time of roasting in min.
°C 30 45 60 90
400 41.20 52.75 45.20 56.80
4S0 65.00 65.45 61.20 62.10
500 59.80 62.20 63.20 66.06
550 68.20 67.20 66.60 68.30
600 68.90 — 70.00 72.00
700 75.70 — 74.10 77.40
800 73.20 71.60 71.40

77
100
90
80
c 70
(
I 60
1
u.
°50zo
1= AO
o<a 30
KLU20
10
0400 450 500 550 600 700 800
TEMPERATURE
Fig. 1. Dependence of manganese extraction on roasting temperature.
Time of roasting — 30 minutes.
By roasting at temperatures from 400°C to 800°C the MnO2
present dissociates to MnO, while (NH4)2SO4 decomposes at 350°C
according to reaction
(NH4)2SO4 = 2NH3+H2O+SO3 (1)
The released SO3 reacts with MnO:
MnO+SO3 = MnSO4 (2)
By increasing the temperature, reactions (1) and (2) are shifted
to right and the kinetics of the process is stepped up.
As can be seen from Fig. 1 and Table 1, the convertion of man
ganese oxide to sulfate increases up to 700°C. Further increase of the
temperature reduces it, since MnSO4 decomposes strongly at about
800°C.
The effect of roasting time at higher temperatures is small,
because, as can be seen from Table 1, if the roasting time is prolonged
from 30'to 90' at 700°C, the percentage of extraction increases by
only 2%. At lower temperatures the kinetics of the process is slower.
The purpose of investigating the effect of temperature and time
on the degree of sulfatizing roasting was to find conditions where
only manganese gets converted to a soluble sulfate form while the
other accompanying metals remain in insoluble form. As iron is the
most frequent of the non-gangue components in the ore besides man
ganese, we followed up iron extraction in the solution parallel with
manganese.

78
By investigating the conditions of sulfatizing iron roasting it
can be concluded that its water soluble forms FeSO4, Fe2(SO4)3 and
FeS2Og are resistant only at roasting temperatures below 550°C.
Above this temperature iron extraction sharply decreases (Table 2,
Fig. 2). By analysing the decomposition pressures of the above
soluble iron compounds, it was found that FeSO4 dissociates intensely
even at 480°C while the somewhat more resistant forms Fe2(SO4)3
and FeS2Og decompose strongly at temperatures between 530 and
560°C.
Comparison of the results in Tables 1 and 2 obviously indicates
that the selectivity between manganese and iron is almost total at the
optimal temperature of 700°C. Thus, an almost pure solution of
manganese sulfate with an extraction degree of about 76% is obtained
in a relatively short roasting time of thirty minutes at 700°C.
TABLE 2
Effect of temperature and time of roasting on iron extraction in %
Temperature Time of roasting in min.
°C 30 45 60 90
400 19.31 18.21 17.99 21.07
450 15.00 13.80 14.26 17.90
500 14.00 10.20 4.60 2.90
550 4.61 3.30 — 2.52
600 2.20 — 2.50 1.95
700 0.54 0.00 0.00 0.00
800 0.00 0.00 0.00 0.00
400 500 600 700 800
TEMPERATURE
Fig. 2. Dependence of iron extraction on temperature of roasting.
Roasting time 30 minutes.

79
b) EFFECT OF THE QUANTITY OF (NH^SO, AND NH4C1
Our subsequent investigations were aimed at determining optimal
quantities of ammonium sulfate at the optimal roasting temperature
and time. The results are shown in Table. 3.
From the table it may be seen that increasing the quantity of
ammonium sulfate from 20% to 30% more than the equivalent gives
a slight increase, about 2.5%, while further increase does not influence
extraction any more. Nevertheless, in our further work we used the
latter quantity.
TABLE 3
Effect of quantity of (NH,)2SO4 on manganese and iron extraction in %
(NHJ^O, Equiv. + 10 Equiv. + 20 Equiv. + 30 Equiv. + 40
(g) 11.14 12.15 13.17 14.18
%Mn 77.0 77.4 79.7 79.8
%Fe 0.00 0.00 0.00 0.11
Obviously that it is not possible to convert all the manganese
to a sulfate form suitable for further extraction with ammonium sulfate.
According to the literature data it is rather difficult to convert bound
MnO to MnSO4. MnO may be bound in a compound with higher
undissociated manganese oxides, and with SiO2 and FeO, where it
forms compounds of the x MnO. vSiO2and xMnO. ySiO2.zFoO type.
In addition, the particle size distribution of the ore also influences
the extraction. If the particle size is small, in our case fractions smaller
than 60 mesh, the chemism of roasting goes easier, while manganese
oxide trapped in large particles reacts hardly at all.
However, it is known that MnO reacts rather strongly with
chlorine and some of its compounds forming highly water-soluble
manganous chloride. In this case roasting in the presence of ammonium
chloride goes according to the reaction.
MnO+2NH4Cl=MnCl2+2NH3+H2O (3)
To study the influence of ammonium chloride on manganese
extraction, other conditions being constant roasting was carried out
with different additions of this compound. Results are shown in Table 4.
Table 4 shows that ammonium chloride considerably increases
manganese extraction up to a quantity equivalent to half the optimum
quantity of (NH^SO^ Transfer of iron to the solution under these
conditions is negligibly small so a pure solution of manganous sulfate
is obtained. The extraction decreases with further increase of the
quantity of ammonium chloride. In our case the optimum quantity
is 1/4 of the optimum quantity of (NH^SO4, with a maximum
extraction of 89.5—90% under the above roasting conditions.

80
TABLE 4
Effect of NH4C1 on manganese and iron extraction degree in %
quantity of NH4C1 as fraction of optimum quantity of (NH4),SO4
NH4C1 1/8 1/4 1/2 1 1 + 10% 1+20%
(g) 1.646 3.292 6.584 13.169 14.486 15.800
%Mn 82.00 89.50 90.30 74.70 71.80 71.40
%Fe 0.44 0.60 0.00 0.00 0.00 0.87
CONDITIONS OF ROAST LEACHING
After each roasting the roast was leached in water with agitation.
The quantity of water and leaching time during the investigations of
the optimal roasting conditions were: liquid-solid ratio = 6:1, time
2 hours.
For the optimal roasting conditions we investigated the conditions
of extracting manganous sulfate and manganous chloride from the
roast. The extraction of these salts depends mainly on the l:s ratio
and the leaching time. Data on the effect of the l:s ratio are shown
in Table 5. The table shows that the maximum extraction, 92.3%,
is obtained with a small quantity of water, i.e. with a 2:1 l:s phase
ratio. This is due to the high solubility of the salts in water. The leaching
time was 2 hours.
TABLE 5
Effect of l:s ratio on manganese and iron extraction in
2:1 4:1 6:1 8:1
%Mn 92.30 89.75 89.50 91.50
%Fe 0.44 0.33 0.60 0.65
The effect of leaching time on manganese extraction was also
investigated under optimal roasting conditions and optimal l:s ratio
=2:1. Results are shown in Table 6. It can be seen that manganese
salts obtained by roasting dissolve quickly, i.e. the optimal leaching
time is only 30 minutes. With prolonged leaching, like with increased
l:s ratio, somewhat lower extractions are obtained, which can be
ascribed to hydrolysis of manganese salts.
TABLE 6
Effect of leaching time on manganese and iron extraction in %
Time in min. 15 30 60 120 180
%Mn 88.88 93.00 91.40 91.50 90.90
%Fe 0.53 0.44 0.30 0.40 0.15

81
After leaching the solution was separated from the precipitate
by filtering. The filtering rate considerably dependeb on the roasting
conditions. Roasting at 550°C gives a roast which precipitates on
leaching and is not easily filtered because of the presence of colloidal
Fe3+ ions. The roast obtained at higher temperatures is easily
filtered after leaching. The iron in it is in the form of an oxide which
does not cause trouble, so filtering proceeds quickly and the solution
remains clear.
Further research is in progress on sulfatization roasting of the
same ore plus pyrite in an SO2 gas stream.
School of Technology Received November 3, 1964
Beograd
C

SRPSKO HEMUSKO DRUSTVO (BEOGRAD)
BULLETIN
OF THE CHEMICAL
SOCIETY
Belgrade
(Glasnik Hemijskog druStva — Beograd)
Vol. 29, No. 7, 1964.
Editor:
MILOS MLADENOVIC
Editorial Board:
B. BOZlC, D. VITOROVIC, D. DELlC, A. DESPlC, Z. DIZDAR, D. DIMITRUEVlC, S. KON-
CAR-DURDEVIC, A. LEKO, M. MLADENOVIC, M. MIHAILOVlC, V. MlCOVlC. S. RALX)-
SAVLJEVlC, S. RASAJSKI D. STEFANOVlC. P. TRPINAC, M. CELAP.
Published by
SRPSKO HEMIJSKO DRUSTVO (BEOGRAD)
1966.

Translated and published for U. S. Department of Commerce and
the Nitional Science Foundation, Washington, D. C., by
the NOLIT Publishing House, Terazije 27/11, Belgrade, Yugoslavia
1966
Translated by
DANICA LADJEVAC and ALEKSANDRA STOJILJKOVIC
Edited by
PAUL PIGNON
Printed in Beogradski GrafiCki Zavod, Belgrade

CONTENTS
S. M. Ristic and /. M. Baranac:
Effect of Solution pH on the Absorption Spectra of Pelargonidol, Delphinidol
and Malvinozide 5
B. Pavlovic and D. Petrovic:
Determination of Uranium and Thorium Concentrations and Their Distribu
tion in Some Mineral Deposits by Means of Photo-nuclear Method .... 19
M. V. Susie, D. S. Veselinovic and D. Suinjevic:
Reactions of Organic and Inorganic Acids with Sodium Tungstate. I.
pH-Metric and Conductometric Titrations 27
D. S. Veselinovic, D. i. Suinjevic and M. V. SuSic:
Reactions of Monobasic Organic and Inorganic Acids with Sodium
Tungstate. II. Determination of Hexatungstate Polyanion Polymerization
Constant 37


GLASNIK HEMIJSKOG DRUSTVA, Vol. 29, No. 7, 1964, pp. 283—299.
EFFECT OF SOLUTION pH ON THE ABSORPTION SPECTRA
OF PELARGONIDOL, DELPHINIDOL AND MALVINOZIDE
by
SLOBODAN M. RISTIC and JELISAVETA M. BARANAC
I. INTRODUCTION
The present paper deals with the investigation of absorption
spectra of some important anthocyanidols as a function of the pH
of the buffered solutions in which they are observed.
2. EXPERIMENTAL
The absorption spectra in the region from 200 to 1000 m|x were obtained
on a UNICAM S.P. 500 spectrophotometer. All pH-measurements were performed
with a Beckmann pH-meter, type H-2 (glass electrode). pH-buffered solutions were
prepared according to Sorensen and ClarkO, concentrations of the solute were
of the order 10-5mu. except when otherwise stated. Samples of anthocyanidols used
were mainly commercial products whose purity was checked chromatographically.
A. Investigations in acid media were carried out with seven buffer solutions
with pH-values in the range 1 to 5. These solutions were prepared by dissolving
p.a. reagents in redistilled water, and were kept in paraffined bottles for liquid rea
gents. One important difficulty encountered was the fading of the red forms of antho
cyanidols. The further the pH away from the optimal stability region, the more
rapidly the fading took place, so that for some pH-values ordinary, direct-reading
spectrophotometry was impossible. However, since we first established the possible
limiting values of "the fading effect" (which will be discussed later in more detail)
we were able to define precisely the spectrophotograms of the red forms of the antho
cyanidols.
Characteristic absorption spectra of these compounds which can be rela
tively observed in strongly acid media (pH = 1—2) are characterized by an intense
red color which is visually observable. Figure 1 shows the spectrophotograms of
these colored forms (see caption).
As seen in Fig. 1 the red forms of the anthocyanidols show three absorption
maxima (Xmaxi, > maxii and Xmaxni starting from long waves) which are well-defined and
which can be differentiated from the corresponding values in aqueous and nona
queous solvents(2). Characteristic values of these maxima are more accurately and
more clearly given in Table I (together with the spectra of blue and colorless forms
which will be discussed later). It may be assumed that the individuality of the "red"
anthocyanidol forms is satisfactorily defined spectrophotometrically; some spectre-
photometric features of these forms, and their correlation with the structure and
the behavior of these compounds, will be discussed later.

At
0.800
0.700
0.600
0.500
0.400
0.30 0
0.200
0.100
pP PELAOGONIOOL CHLORIOE pM » 1 ItP' PELARGONIOOL CHLORIOEO OELPHINtOOL CHLORIOE
pH ■ 1 .30pH s 1 10
'\
M NALVIN CHLORIOE pH s 1.10
/ \p /
\ \/ -u / ', \ A/A\ / /w y / \\\ /
\
uvy // v'71 \M
200 250 300 350 400 450 500 550 600 650 700 750 800^
Fig. 1 Absorption spectra of "red" cationic forms of anthocyanidols and antho-
cyanosides
The effect of fading was studied by systematically following the changes of
absorption spectra with well-buffered different pH-values of the solutions. We also
measured directly the absorption spectra of faded forms at some well-defined constant
pH-values. Figures 2 and 3 show these observations in case of pelargonidol solutions
and Fig. 4 in case of delphinidol solutions.
200 2S0 l56 350 (00 (S0 SOO 5S0 600 650 700 750 100 \m(.
Fig. 2 Absorption spectra of pelargonidol chloride in dependance on solution pH

-4
TABLEI
Ab6oeptionspecteofthemaincoloeedform6ofanthocyanidol6andanthocyanozide6
6< — — —
CORRESPONDINGCOLORLESSFORMS
a3 6e0
5500
ee
— — —
— — —
emax.ivl — — —
amax.Ill 2P.0 2P.0
350.0
amax.II — —
Xmax.I—
x ft,2.60 2.60 4.05
Noo-ionized
ionicfoem6IPBP IPBP IPBd IPBm
— - — 6P0
637000
e007e0 8P0
4800 500e
— ee
REDCATIONICFORMS 6,
e,500
9000 11,500
e,6e
Xmax.IV - —
350.0
Xmax.Ill
265.0 265.0
2e.0
275.0
Xmax.II
420.0 420.0
—
415.0
Xmax.I.
505.0 505.0 520.0 520.0
X a. 1.e 1.00 1.e 1.e
Ionicfoem
PK+ PK+ DK+ MK+
63 e00e
CORRESPONDINGCOLORLESSFORMS—
6. —
300.0
s <<
a KOS—
Xmax.I
£
-
12.20 8.0e
e.22X o.
Non-ionized
ionicfoem6 IPKP IPKD IPKM
a3P00
—
7500
625000
—
7800
BLUEANIONICFORMS
a,
120000 9500 9500
Xmax.Ill
295.0
—
325.0
Xmax.II
450.0
-6e.0
Xmax.I
6e.0
600.0
6e.0
Ionicform
X
12.20 8.00
e.22
PA- De Me

8
Figure 2 clearly shows that with decreasing acidity of the buffered pelar-
gonidol solution, the first absorption maximum in the visible region = 505.0
my. and the second (XJ^'j, = 420.0m(x) are less pronounced. However, in spite of
the decreased absorbance, the characteristic wavelengths remain unchanged. Simul
taneously the formation of a new absorption maximum f^JJ^ni = 2^°-° mV)
be observed and it seems that the absorbances of the disappearing maxima are
"leaking out" into the newly formed one. It is evident that this maximum belongs
to the product of the fading reaction. On account of the proximity of the new ab
sorption maximum, the height of the third maximum of the pelargonidol cation
(^maxin = 265.0 mo.) is not the same at different pH-values of the solution. This
makes difficult the estimation of the precize characteristic wavelength of the newly
formed maximum. Genetic correlation of the absorption spectra of pelargonidol
cation with the basic colorless form is more directly shown by the appearance of
the isosbestic point in Fig. 3, where spectrophotograms of pelargonidol and the
corresponding faded forms at different pH-values are given.
The process and mechanism of the effect of pH on the absorption spectra
of anthocyanidols and anthocyanosides can be explained if two important assumptions
are made (howewer, their validity should be checked in the given case). Firstly,
according to the theory formulated by Lewis and CalvinO), and Pauling (1939/
1946)(4), anthocyanidol cations appearing in acid media have the structure ofresonance
hybrid in which different electrometric structures participate in various amounts;
formerly it was assumed that the only electrometric structures present were those
of the oxonium and carbenium types. It is very likely that the coloredforms are char
ged and that they have the betainoid valence structure of a resonance hybrid, since
they originate from the ionic form of a pseudo-base, whereas the colorless forms
have the nonchromophoric valence structure in ionogenous but nonionized form(5),
since all the oxonium and carbenium combinations are excluded by the hydroxylation
of the C2 of the flavylium chromophoric grouping. — Secondly, the colored resonance
hybrid cations (and anions) can be in equilibrium with the undissociated ionoge
nous form of the pseudo-base (or pseudo-acid) provided the applicability of the
law of mass action is established, i.e. the constancy of Kjis and Kj(j , or the pK-
-values for the investigated compound is confirmed. Taking into account all the
aforesaid, a tentative but probable scheme of the main processes may be put forward ;
for the time being it will fairly reliably define the existence of an ionic equilibrium
between the red cation (or the blue anion) and the ionic form of the corresponding
pseudo-base (or pseudo-acid). However, this scheme will be less complete in case
of violet and colorless forms whose individualities are already spectrophotometrically
well established.
Such investigations of equilibria between spectrophotometrically active forms
(hybrid cation) and ionic forms of pseudo-bases which in the visible region are
spectrophotometrically inactive have already been carried out with pH-metric indi
cators, but not with anthocyanosides. However, Sondheimer and Kertesz (1953)C)
have applied this method of investigations to pelargonoside (pelargonine). In view
of the fact that such investigations make possible the quantitative estimation of
the ratio between the colored and the colorless form, we applied them to pelargonidol,
delphinidol and malvinoside. From the measured absorbance values of spectro
photometrically active forms of pelargonidol, delphinidol and malvinoside at diffe
rent pH-values and applying them to the ionic equilibrium (I) between the resonance
hybrid cation (RHC+) and ionic form of the pseudobase (IPB) —
(RHC)+ + H2O^(IPB) + H3O+ (I)
we can calculate the quantitative relation between the dissociated and the undisso
ciated anthocyanidols from the equation
pKb=pH+log(^r) (1)

9
m
Fig. 4
Uo I3o So loc (SO 500 550 600 (SO 700 7S0 800 Xmf
Absorption spectra of the "red" cationic form of delphinidol chloride
and of its faded forms.

TABLE2.
Jonicequilibriumbetweenpel6rgonidoleedc6tion6(PC+)edblueeion6(PA~)edthecoeeepondingcoloele6nonionizedionic
peudob6e(IPB)oepeudo6cid(IPA)
m=12.206a-=240000;m=9.056iPA=6.800
pK»
11.15 11.45 11.81 11.7511.e
11.94
pK>mcan=11.36
PA-XmaxI=600.0ma
pA-%IPA%
13.6 41.4
e.9
82.0 88.4 93.9
86.0058.60
29.e18.00 11.60 6.80
A
0.650 0.507 0.355 0.298 0.2650.200
PH11.95
11.e11.45
11.e
e.22
9.80
m=1.e6pc+=e.500;m=4.056n>B-2.6e
pKb 2.322.e
2.77 2.63 2.77
pK"mean-2.63
PC+XmaxI=505.0mu.IPB%
0.84 9.91 23.33 48.34 75.0e
PC+%
99.93
P.01
76.6751.e
25.00
mA
0.7960.700
0.ee0.5e
0.350
1.251.e
2.25 2.60 3.25

11
The results are given in Table II (together with the data for the electrolytic dissociation
of the blue anion which are to be mentioned later). These results are important since
they offer the possibility of determining the percentages of the colored form present.
For example, at pH = 1.25 under the specified conditions PK+ =99.16%, DK+ =
= 98.60% and MK.+ = 96.55% i.e. the differences in behavior of the investigated
hybrid cations are small but perceptible.
B. Investigations in basic media were carried out analogously as described
under A, with eight buffered solutions of pH in the range 8 to 12. The absorption
spectra of investigated blue forms under optimal stability conditions are shown
in Fig. 5; the effect of pH on the absorbance of pelargonidol is demonstrated in
Fig. 6, while the appearance of the "faded" form is indicated in Fig. 7.
BOOATrp
5. Absorption spectra of anionic blue forms of anthocyanidols
and anthocyanosides
pH s 12 20
pH s 11.95
pHs 11.95
pH s 1 1 70
pH s II.U
pH : 11 10
pH s 10.22
pH * 9. SOpH • 9 05
750 900
Fig. 6. Absorption spectra of the blue form of pelargonidol chloride as a function
of solution pH

12
100 3*0 SCO S10 «00 <» MO J» «« MO TOO 7S» M«
Fig. 7. Absorption spectra of anionic blue forms of pelargonidol chloride and of
its faded forms.
Characteristic parameters of these spectra are given in Table I. The effect of fading
was followed here too as earlier described, and is seen in the spectrophotograms
(Fig. 7). On the basis of the above assumptions the following ionic equlibrium between
the resonance hybrid anion (RHA-) and the ionic form of the pseudo-acid, in
a basic medium,
(IPA) + H2O^(RHA)- + H3O+ (II)
can be interpreted in the same way as before. Analogously, the equation
pK.-p„+,og^) (2)
can be used to calculate the percentage concentrations of the resonance hybrid anion
and the colorless, undissociated but ionogenous form of the pseudo-acid conjugated
with it. The data and the results of these calculations are summarized in Table II.
However, conclusions concerning the conjugate faded blue forms cannot be formu
lated on the basis of our present investigations. From data given in Table II in which
the constancy of the pK-value in the pH-region from 9 to 1 1 (variations about 5%)
is shown, the existence of these forms is evident since their spectroscopic absorptions
do not overlap to any extent with the characteristic maxima of the blue form
(xm« l = 600° mV-, Xmtxii = 450° mV-'< Xm£Tiii = 295° mV- The colorless forms of the
red cation and the blue anion of pelargonidol are shown in Fig. 8. Without any deeper
analysis it may be concluded that the faded forms of the red and the blue ions are
clearly distinct. This practically means that the pseudo-acid and the pseudo-base
possess clearly distinct absorption spectra.

13
Ami-
Fig. 8 Absorption spectra of the colorless, red and blue forms of pelargonidol
chloride
MO »0 300 350 (00 (50 500 550 600 650 700 700 600 kmt
Fig. 9 Absorption spectra of the violet form of pelargonidol chloride

14
C. Spectrophotometry investigations in the pH-region between strongly acid
and strongly basic, where there exist stability regions for resonance hybrid cations
and anions, are very delicate on account of the ever lower stability of the active
chromophoric systems. For the present we only give the absorption spectra of the
violet form of pelargonidol (Fig. 9). which could be measured in the pH-region
from 7.00 to 8.00.
DISCUSSION
From the absorption spectra of the main colored forms of antho-
cyanidols, i.e. the red cation and of the blue anion (Figs. 2 and 6)
it may be seen that, in spite of drastic pH-changes, some absorption
maxima remain at the same wavelength. For example in acid media,
the red resonance hybrid cation (Figs. 1 and 5) of pelargonidol (PK)
is denned with three absorption maxima Xmaxi = 505.0m[x, Xmaxn = 420mu.,
X max in = 265.0mpi, and the blue resonance hybrid anion by the three
maxima X™xi = 600.0m^, Xmtxii = 450,0m[jL, Xmaxm = 295.0mu.. The
specificity of these maxima in basic media is unchanged provided they are
not disturbed by the appearance of some new maxima in their proxi
mity which might arise from other spectrophotometrically active forms.
Such an example was encountered with the maxima Xmax m256.0 m\i
and Xmtxiu = 295.0 mjx which were disturbed by the maxima
X max in and Xmaxiu of the "faded" forms. To obtain more reliable
values of Xm*xni and Xm£x m it is indispensable to measure the
absorption spectra in pH-regions which are optimal for the stability
of the cation or anion, i.e. regions in which the concentration of the
interfering "faded" form is minimal (Table II). The same situation
is encountered with delphinidol and malvinoside, although greater
complexity of their chromophoric systems necessarily makes the charac
teristics discussed here less clear.
The "violet" and "faded" forms are less precisely defined in our
investigations, although we were able to measure their absorption
spectra (Fig. 9). In fact, the characteristic absorption maxima of the
violet form are not only subject to disturbances but they are also con
siderably less stable than those of the other forms.
Without going here into too much detail, we can indicate and
provisionally interpert the course of indicator color changes in buffered
anthocyanidol solutions, for example those of pelargonidol. From our
observations of the indicator curve of pelargonidol, obtained in strongly
acidic and strongly basic media (Fig. 10), where an almost direct
transition of the red into the violet and blue forms, and vice versa,
is observed, it may be concluded that the violet form is probably in
direct interaction with the red resonance hybrid cation, or with the
blue resonance hybrid anion in neutral and near-neutral pH-regions.
This would be in good agreement with Pauling's theory of the essentially
ionic nature of the respective chromophores. The faded form of pelar
gonidol with a deteriorated K-chromophoric grouping would absorb
only in the ultraviolet region (Fig. 8) and would be formed by the
hydratation of the amphipolar K-chromophoric violet structures. Such

15
*o so so 70 eo » *>
Jfl 30 10 SO 60 <»l 70
Fig. 10. Indicator curve of peiargonidol chloride
a -point of transition of blue to violet
appoint of transition of violet to red
£J -point of transition of red to violet
pi-point of transition of violet to blue
an interpretation of the course of indicator color changes is in many
details consistent with the observations made by L. di Bella (7) mecocya-
nine by visual spectrometry.
The main colored forms of the investigated substances are consi
derably sensitive to pH-changes (Fig. 11). In Fig. 11 the absorption
spectra of a classical indicator (lithmus) and peiargonidol in the pH-range
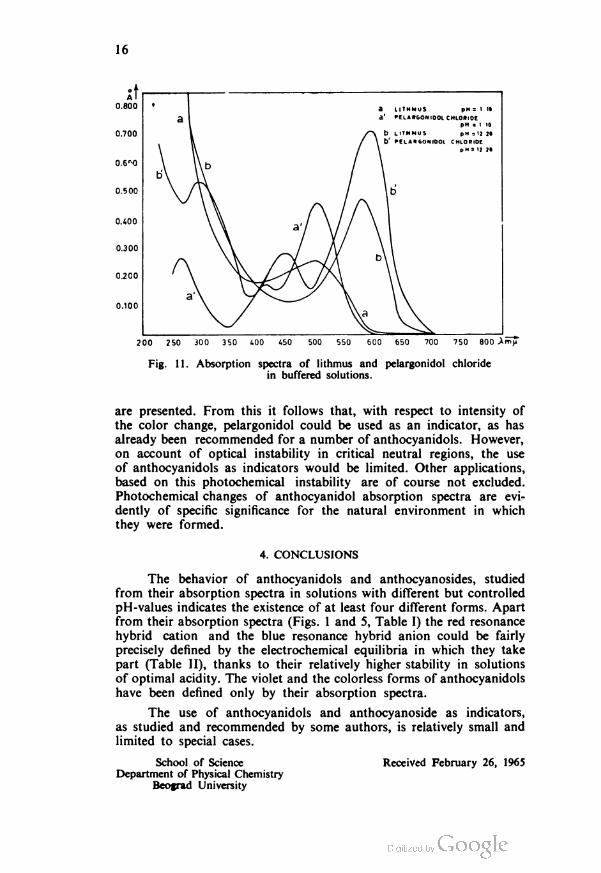
16
0.400
0.500
0.700
0.200
0.800
0.100
0.300
200 260 300 350 400 450 500 550 6Q0 650 700 750 800 Xmp
Fig. 11. Absorption spectra of lithmus and pelargonidol chloride
in buffered solutions.
are presented. From this it follows that, with respect to intensity of
the color change, pelargonidol could be used as an indicator, as has
already been recommended for a number of anthocyanidols. However,
on account of optical instability in critical neutral regions, the use
of anthocyanidols as indicators would be limited. Other applications,
based on this photochemical instability are of course not excluded.
Photochemical changes of anthocyanidol absorption spectra are evi
dently of specific significance for the natural environment in which
they were formed.
The behavior of anthocyanidols and anthocyanosides, studied
from their absorption spectra in solutions with different but controlled
pH-values indicates the existence of at least four different forms. Apart
from their absorption spectra (Figs. 1 and 5, Table I) the red resonance
hybrid cation and the blue resonance hybrid anion could be fairly
precisely defined by the electrochemical equilibria in which they take
part (Table II), thanks to their relatively higher stability in solutions
of optimal acidity. The violet and the colorless forms of anthocyanidols
have been defined only by their absorption spectra.
The use of anthocyanidols and anthocyanoside as indicators,
as studied and recommended by some authors, is relatively small and
limited to special cases.
School of Science Received February 26, 1965
Department of Physical Chemistry
Bcograd University
4. CONCLUSIONS

REFERENCES
1. Ktinster, P.W. and A. Thiel. Logarithmische Rechentafeln, (Puffergemische nach
Sorensen und Clark). — Berlin: Walter de Gruyter & Co, 1956.
2. Distic, S. and J. Baranac. "Les spectres d'absorption des anthocyanidols et
anthocyanosides et leur characteristiques particulieres dans les differents sol-
vants", in: XI Colloquium Spectroscopicum Internationale. (Communication
B-88), Beograd, 1963.
3. Lewis, G. N. and M. Calvin. "The Color of Organic Substances" — Chemical
Reviews (Baltimore) 25: 273—277, 1939.
4. Pauling, L. "Recent Work on the Configuration and Electronic Structure of
Molecules with Some Applications to Natural Products", in: Forschritte der
Chemie Org. Naturstoffe. Band HI — Wien: Springer Verlag, 1939, pp. 203—235.
5. Acheson R. M. An Introduction to the Chemistry of Heterocyclic Compounds —
New York: Intersceince Publishers Inc., 1960.
6. Sondheimer, E. and Z. I. Kertesz. "On the Relation between Spectral Changes
and pH of the Anthocyanin Pelargonidin 3-Monoglucoside" — Journal of the
American Chemical Society (Easton Pa.) 75: 1507—1508, 1953.
7. Bella, L. "Sulle variazioni de colore degli antociani e sul loro impiego come
indicatori" — Atti delta Societa dei Matematice di Modena 77 : 62—94, 1946.
8. Clark, W. M. The Determination of Hydrogen ions, III rd. Ed.—London: Tyndall
Co., 1928.
9. Pratt, O. B. and H. O. Swartout. "Fruit and Vegetable Pigments as Indica
tors" — Science (Washington) 71: 486—487, 1930.
2


GLASNIK HEMIJSKOG DRUSTVA, Vol. 29, No. 7, 1964, pp. 301—309
DETERMINATION OF URANIUM AND THORIUM CONCEN
TRATIONS AND THEIR DISTRIBUTION IN SOME MINERAL
DEPOSITS BY MEANS OF PHOTO-NUCLEAR METHOD*
by
BOSKO PAVLOVIC and DRAGANA PETROVIC
Photo-nuclear methods for determining the concentration of
radioactive elements in natural deposits have been applied more or
less successfully by a great number of research workers U-2.3.4). By
using a photo-nuclear technique we studied the distribution of radio
active inclusions and the concentrations of uranium and thorium in
some natural sediments (travertines), some igneous rocks (andesite
and granodiorite) and in some samples of coal.
The photo-nuclear method we used is based on the registration
of tracks in emulsion at a 2 tc steradian angle. A finely ground sample
of the studied rock was dried and then placed in a layer on the emulsion.
The powder was left on the emulsion for 15 to 20 days at room tempe
rature. The time of exposure depended on the activity of the investi
gated sample. In the case of coal we did not use powder, but on account
of its specific properties, small sticks were finely polished and their
polished sides were placed on the emulsion. The time of exposure and
further treatment of the photo-nuclear plate were the same as for
samples in powder.
Ilford C2 and home-made IFSRS photo-nuclear plates were used.
Uford plates were developed by means of the standard ID 19 developer,
and IFSRS plates with amidol reagent. The counting of the tracks
and the measurement of their lengths was carried out by means of a
Zeiss microscope (magnification 10 x 10).
The powder was poured uniformly on the emulsion so that the thickness
of the layer was not larger than the greatest range, R, of investigated a-particles.
According to Poole and Mathews(5), when the registration of tracks in emulsion
is made at an angle of 2 7r steradian and the thickness of / is greater than R, then each
square centimeter of the sample's surface will emit Nx a-particles per time unit,
regardless of the thickness of the layer. If Ni decays take place per volume unit of
the radioactive source whose thickness l> R, the number, N_x, of a-particles registered
in the emulsion per time unit will be
* Communicated at the XI Meeting of the Serbian Chemical Society.

20
Nx=-^KR-p) (1)
4
R' the range of a-particles in the investigated sample
where K =R the range of a-particles in the air
the range of a-particles in the emulsion
and p =the relative range of a-particles in the emulsion
Since the investigated samples of rocks contained radioelements from series
238U + 235U and 232Th, many of which were a-emitters, the equation (1) had to
be transformed, and for example, for one radioactive series it was written as
N* = 1 *2(/t-p) (2)
where N is the total number of a-particles emitted per time unit by radioelements
of one series occuring in the volume unit of the investigated sample, and 2 - j j
is the sum of R - p ranges of the a-particles.
If we know the number n of a-particles emitted per time unit by each radio
active parent (i.e. 23*U, 235U, and 232Th) when in radioactive equilibrium with its
decay product, and the ratio 238U/235 U, as well as the density d of the examined
sample and the concentrations C of uranium 234, uranium 235 and thorium 232,
we find that the number N of a-particles emitted per volume unit per unit time will be
N= ndC (3)
for each of these elements. Inserting the numerical values in equations (2) and (3)
we find that each square centimeter of the sample surface will emit the following
number of a-particles originating from uranium and thorium, respectively:
^=9.21 x \0AdCuK (4)
NTh = 2.44 x W d- CTh K (5)
Since the investigated samples consisted of different components, each of
which had a certain stopping force, s, for a-particles, the constant K in equations
(4) and (5) should be expressed as a function of the concentration of idnividual ele
ments present in the sample and their stopping forces.
From Coppens'(2) calculations it follows that
0.85 x 10
K
d CjjSi_ (6)
At
From equations (4), (5) and (6) it is found that
NU = 9.2CUK' (7)
NTh = 2MCThK' (8)
where
0.85K-
C,S, (9)
The equations (7) and (8) show that it is possible to calculate the concentrations
C\j and Cfh by counting the number of tracks of a-particles and knowing the value

21
of K'. If the examined sample contains the elements of both uranium and thorium
series, the number of a-particles emitted per surface unit per time unit will be
A'- (9.2 (?</ + 2.64 CTi,)K' (10)
Since this equation contains two unknown quantities, Cu and C77,, it is neces
sary to form another equation for the ratio of C>/, : CV, and then on the basis of
these two equations to calculate C,. and Cjh-
Comparing the lengths of many tracks registered in the emulsion it is observed
that they fall into a rather wide range. The longest tracks originate from ThC
(*12Po), RaC (2MPo) and AcA (2l5Po). Tracks whose lengths in the emulsion are
equivalent to a length of more than 7 cm in air belong to ThC, whereas those whose
lengths are equivalent to lengths from 5.8 to 7 cm, in air originate from a-particles
emitted by AcA and RaC In view of the fact that the atoms of ThC and other
radioelements present in the sample are not located only in the layer contiguous
with the emulsion but throughout the sample, it is evident that some of the shorter
tracks belong to a-particles retarded during their passage through the sample.
If the lengths of the tracks in the emulsion are equivalent to lengths of 7 cm
in air, from equations (1) and (3) it is found that the number of a-particles emitted
by Th and ThC per time unit per surface unit is
n, 0.25 Nn K' (11)
If the lengths of the tracks in the emulsion are equivalent to lengths between
5.8 and 7 cm in air, the number of a-particles per time unit per surface unit is
n: -0.25 tf'(0.78 NTh i.\ANv) (12)
The final equation for the determination of thorium and uranium concen
tration is obtained from equations (II) and (12)
CTh 3 3
C" 0.8 (13)
"1
To successfully apply equation (13) and in order to reduce the error (to less
than 4- 20%) it is necessary to measure the lengths of some hundreds of tracks.
The concentrations C, and Cn, can be determined from equations (4). (5),
(10) and (13) if we know the number and the lengths of the tracks as well as the
absorption coefficient. Equation (9) shows that the value of coefficient K' can be
obtained only if we know the quantitative chemical composition of the studied
sample; otherwise we have to use the data for K' published in literature.
Since no data on the coefficient K' for travertine, andesite and coal had been
reported so far, we performed the quantitative analysis of the samples. The results
are given in Table 1, and on the basis of these we have calculated the values of the
coefficient K' for travertine, andesite and coal. We also verified the published data
of K' for granodiorites(6). Table 2 shows the calculated values of K' and the con
centrations of uranium and thorium.
As already mentioned, the aim of our investigations was not only to determine
the uranium and thorium concentrations, but also to study the distribution of radio
activity in mineral fractions of travertine. In addition, we wanted to find out whether
the radioelements found in andesite, grandiorites and coal occur in inclusions or
are uniformly distributed. Techniques used in these investiagtions are described
in a previous publication(7).
The experiments showed that a-eniitters are distributed in travertine com
ponents of higher specific gravity as well as in those of lower specific gravity. However,
in andesite and granodiorites, the radioelements are mainly concentrated in inclusions
of higher specific gravity.
In the coal samples we found that the activity was uniformly distributed through
out the mass.

22
TABLE I
Quantitative Analyses of Samples in which U and Th Concentrations Were Determined
Elements
TRAVERTINEANDE-
SITE
GRANOD1-
ORITECOAL
NiSka 1 Debarska
banja ; banjaBor Prilep
1 Ravno
I VucjePican Podlabin
Ca 33.10 23.68 5.85 2.87 2.58 3.16 2.24
Si 2.47 3.04 26.64 30.0 30.0 0.64 0.44
Al 1.69 2.70 9.86 8.62 7.95 0.86 0.55
Fc 0.98 0.40 • 3.03 3.56 1.63 1.90
Mil 0.35 0.30 0.15* • • •
Na 0.30 0.74 2.17 2.57 2.65 0.41 0.03
K * * 1.47 3.26 3.24 0.35 0.03
Ba*
0.17 * * » • •
S•
1.34 0.08* • 2.07 2.07
Ti *0.36 0.48 0.28 * •
P • • 0.04 0.22 0.38 • •
N» • * • * 0.60 0.72
H 0.59 0.67 • 0.11 0.13 2.30 2.64
C 49.66 50.16 46.19 48.1 47.62 10.93 11.60
C 10.40 11.98 0.54 • * 76.20 76.57
* Concentrations smaller than 0.03O/„.
TABLE 2
Values of K' Coefficient and Concentrations of Uranium and Thorium
TRAVERTINE ANDESITEGRANODIO-
RITECOAL
cd1
«.2, L- cdau
0 <JB
l6bin
|JSp
Boe Peil > 3cd rn -S Pod
c s
-
as™
A 6.04 6.09 6.14 5.98 5.92 7.27 7.12
K' 14.07 13.95 13.85 14.39 14.36 11.56 11.54
Cu(nl0 6g/g) 47.8 17.2 1.5 2.3 2.5 90.6 83.7
CTh(N10-og/g) 26.3 1 5.8 11.9 16.5 50.7 46.2
DISCUSSION
The data on uranium and thorium concentrations in samples
of travertine, andesite, granodiorite and coal obtained by the photo-
-nuclear method were not found to agree with the results obtained
by other methods. In travertines, uranium has been determined fluoro-
metrically and thorium by means of the emanometric method; in other
rock samples and in coals, uranium and thorium have been determined
by the radiometric method.
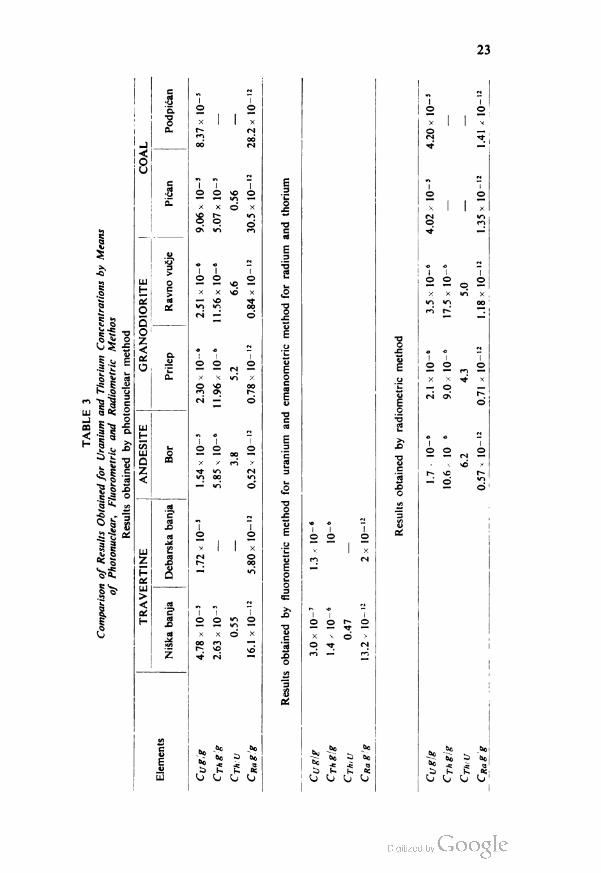
23
P P
-Si S|
— — oo —
— — »n
u u <o o
o-C
E
T3
o o
-ac
£
Ec
G
>,
OS
6c
6c It6u
i S K «U O O O
o
ic ©
I Io o— — o
o ©
— o
fN 0\
I=
o
r~ so
—' d
to_6c _6c
K 6C S> 6o
?? -* i oi h K a;
U O 5j

24
The data given in Table 3 show that the differences in the values
of uranium concentrations in travertines, obtained by photo-nuclear
and fluorometric method are greater than the order of concentrations
established. Such differences were obtained to a lesser extent in coal
samples as well. Since the differences are greater than the error of
the photo-nuclear method, the explanation of these results should be
looked for in the methods themselves. For example, in the fluorometric
method the determination of uranium concentration is based on its
properties, i.e. on the fluorescence of uranium salts, whereas the deter
mination by photo-nuclear method involves counting the tracks of
a-particles and measuring their lengths. If the individual members of
one radioactive series are not in radioactive equilibrium, the number
of tracks and the ratio of their lengths will not be the same as when
all the radioelements are in equilibrium. Hence, the results obtained
from the number of a-particles by the method described do not represent
the actual concentrations of uranium.
According to the radioactive equilibrium the following concen
trations of radium correspond to the uianium concentrations in traver
tines determined by the photo-nuclear method: for the sample from
Niska Banja — calculated 1.61 xl0-11 gRa/g, measured — 1.32 x
10 11 gRa/g; for travertine from Debarska Banja, calculated 5.8 x 10⁻¹²
gRa/g, measured 2.1 x 10⁻¹². Thus, the concentrations of radium
calculated on the basis of uranium concentrations determined by the
photo-nuclear method do agree at least in order of magnitude with
the radium concentrations determined by other methods. This indicates
that the concentration of radium is in fact determined by the number
of tracks of a-particles and that Coppens' formulae (equations 10 and
13) cannot be applied in all cases. Since the calculated concentrations
of radium in travertine do agree with those obtained by measurement,
and the calculated concentrations of uranium are not consistent with
those obtained by measurement, it follows that in these sediments
uranium and radium are not in radioactive equilibrium. From data
given in Table 3 it is evident that there is no radioactive equilibrium
between uranium and radium in the samples studied, and that from
the number of a-particles the concentration of radium is determined,
although Coppens' formula is used. The discrepency between the results
of the photo-nuclear method and other methods might be explained by
assuming that the daughter radioelements are not in radioactive equili
brium with the parents. The photo-nuclear method can be applied
for the determination of uranium and thorium concentrations only in
those samples in which U and Th are in radioactive equilibrium with
their decay products.
It has been established that radioactive elements are differently
distributed in individual components of travertines, igneous rocks
and coals. We have already found earlier171 that all the components
of travertine are radioactive to a greater or lesser extent. Since travertine
is formed by precipitation from aqueous solutions, it is very likely
that the radioelements are adsorbed by all its components. Similar
findings have been established with coal too. However, in igneous
rocks, uranium, thorium and their decay products are located in inclu

25
sions which are usually of higher specific gravity than the main mass
of the rock.
School of Technology Recieved February II, 1965
University of Beograd
Institute of Physics, SR Srbija
Beograd
REFERENCES
1. Curie, I. "Sur la possibility d'etudier l'activite des roches par l'pbservation des
trajectoirs des rayons a dans l'emulsion photographique" — Journal de Phisique
et le Radium (Paris) 7: 313—319 (1946).
2. Coppens, R. "Etude de la radioactivite de quelques roches par l'emulsion photo
graphique" — Billetin de Societe Francaise de Mineralogie et de Cristallographie
(Paris) 73: 217—321 (1950).
3. Poole, J. and C. Mathews. "Use of Nuclear Plates for the Determination of
Uranium and Thorium Contents of Radioactive Ores" — Nature (London)
169 : 408—409 (1952).
4. Juric, M. O. Adamovic, S. Popov and J. Kostic. "Odredjivanje koliCine urana
u stijenama i neke karakteristike rada s nuklearnim emulzijama na reaktoru
u VinCi" (Determination of Uranium Content in Ores and Some Characteristics
of the Work with Nuclear Emulsions on Vinca Reactor) — Vesnik Drustva
matematiiara i fiziiara (Beograd) 28: 125—134 (1960).
5. Poole, J. and C. Mathews. "The Use of Nuclear Plates for the Measurements
of the Radioactive Contents of Materials" — Seientic Proceedings of Royal
Dublin Society (Dublin) 23: 305—316 (1951).
6. Jurain, G. "Contribution a la connaissance geochimique des families de Tutanium
et du thorium dans les Vosges meridionales. Application de certains resultats
en prospection des gisement d'uranium"; — Rapport C.E.A. No. 2154 Centre
d'etude nudeaires de Saclay (1962).
7. Pavlovic, B. "Raspodela radioaktivnosti po frakcijama razlicitih specificnih
tezina nekih sedimenata" (Distribution of Radioactivity in Fractions of Diffe
rent Specific Gravity in Some Sediments) — Glasnik Hemijskog Drustva (Beograd)
28: 245—256 (1963).
8. Soltan, A. "Contribution to Methods of Measuring the Concentrations of Ura
nium and Thorium in Minerals" — Proceedings of the First International Con
ference on the Peaceful Uses of Atomic Energy (Geneva) 8: 271 (1955).
9. Petrascou, M. and S. Beslin. "A Method for the Measuring of Uranium and
Thorium Using Nuclear Emulsion". — Proceedings of the First International
Conference on the Peaceful Uses of Atomic Energy (Geneva) 8: 273 (1955).
10. Brandao, F., E. Frotta—Pessoa, N. Margem and W. Pezez. "The Employment
of Liquid Emulsion for the Estimation of Uranium from Radioactive Minerals"
— Proceedings of the First International Conference on the Peaceful Uses of Ato
mic Energy (Geneva) 8: 274 (1955).

24
The data
of uranium
anH -

GLASNiK HEMIJSKOG DRUSTVA, Vol. 29, No. 7, 1964, pp. 311—320
REACTIONS OF ORGANIC AND INORGANIC ACIDS WITH
SODIUM TUNGSTATE. I. pH-METRIC AND CONDUCTOMETRIC
TITRATIONS
by
M1LENK.O V. SuSlC, DRAGAN S. VESEL1NOVK? and DESANKA SUZNJEVIC
According to the data available in the literature, in the reaction
of organic and inorganic acids with sodium tungstate two types of
compound are formed: polyanions of tungstic acid and complexes of
tungstic acid with reacting acids. The formation of polyanions has
been observed mainly in reaction with inorganic acids. Decrease of
the pH of the solution and the increase of the reactant concentration
result in the formation of hexatungstate (HW6 02f)(1,2'3) and metatung-
state (W4O132-) and W,0O322" and W20O6i )(5 ) polyanions. In acetic
and phenylacetic acid(4) solution W3Oi^ polyanion is formed.
Most authors have reported that organic acids give complexes
with tungstate (6'7-8). The oxalato complex was found to have the
composition [WO3C2O4]2". However, there are some data indicating
that oxalic acid separates collodial tungstic acid without complexing(11).
In a previous paper(8) we established that L-ascorbic acid reacts
with sodium tungstate and gives, depending on the ratio used, two
types of compound: hexatungsate polyanion HW6O2i (formed by
the action of H+ of the acid) and the complex [WO3A2]2- (A- is the
monobasic anion of L-ascorbic acid). These findings indicate that
other, particularly organic acids may also react with sodium tungstate
giving two types of compound. Therefore we investigated the reaction
of sodium tungstate with the following acids: formic, L-ascorbic,
acetic, propionic, hydrochloric and nitric.
The reaction of sodium tungstate with L-ascorbic acid, repre
sented by equations (1) and (2), is accompanied by a decrease of the
total number of ions, especially H+-ions. This effect was
7 H+ + 7 A- + 12 Na+ + 6 WO^- — HW6 0'f t
+ 12Na+ + 7A 3H2O (1)
2 H+ + 2 A- + 2 Na+ + WO4 ^ [WO3A2]2- + 2 Na+ + H2O (2)
also observed in the reaction of tungstate with other acids and it could
be followed by pH-metric and conductometric measurements.
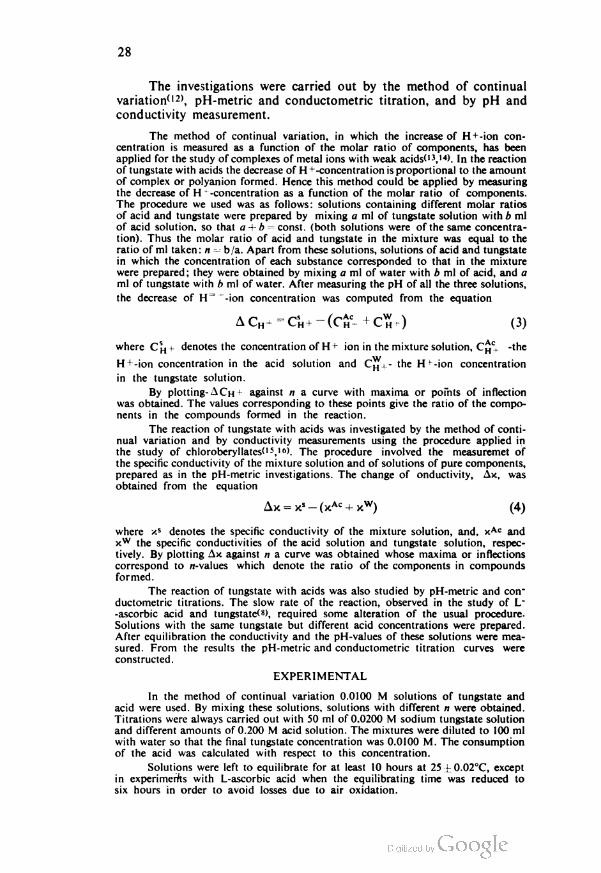
28
The investigations were carried out by the method of continual
variation02), pH-metric and conductometric titration, and by pH and
conductivity measurement.
The method of continual variation, in which the increase of H + -ion con
centration is measured as a function of the molar ratio of components, has been
applied for the study of complexes of metal ions with weak acidsC3,'*). |n the reaction
of tungstate with acids the decrease of H H -concentration is proportional to the amount
of complex or polyanion formed. Hence this method could be applied by measuring
the decrease of H -concentration as a function of the molar ratio of components.
The procedure we used was as follows: solutions containing different molar ratios
of acid and tungstate were prepared by mixing a ml of tungstate solution with b ml
of acid solution, so that a + b = const, (both solutions were of the same concentra
tion). Thus the molar ratio of acid and tungstate in the mixture was equal to the
ratio of ml taken: n b/a. Apart from these solutions, solutions of acid and tungstate
in which the concentration of each substance corresponded to that in the mixture
were prepared; they were obtained by mixing a ml of water with b ml of acid, and a
ml of tungstate with b ml of water. After measuring the pH of all the three solutions,
the decrease of H= -ion concentration was computed from the equation
AC„-=CsH+-(ci!ic-+C^) (3)
where CSH y denotes the concentration of H * ion in the mixture solution, C^c- -the
H + -ion concentration in the acid solution and Cw - the H ! -ion concentration
in the tungstate solution.
By plotting- ACh 1 against n a curve with maxima or points of inflection
was obtained. The values corresponding to these points give the ratio of the compo
nents in the compounds formed in the reaction.
The reaction of tungstate with acids was investigated by the method of conti
nual variation and by conductivity measurements using the procedure applied in
the study of chloroberyllates"5,1'')- The procedure involved the measuremet of
the specific conductivity of the mixture solution and of solutions of pure components,
prepared as in the pH-metric investigations. The change of onductivity, Ax, was
obtained from the equation
Ax = xs - (xAc + xw) (4)
where x5 denotes the specific conductivity of the mixture solution, and, xAc and
xw the specific conductivities of the acid solution and tungstate solution, respec
tively. By plotting Ax against n a curve was obtained whose maxima or inflections
correspond to n-values which denote the ratio of the components in compounds
formed.
The reaction of tungstate with acids was also studied by pH-metric and con9
ductometric titrations. The slow rate of the reaction, observed in the study of L9
-ascorbic acid and tungstate^*), required some alteration of the usual procedure.
Solutions with the same tungstate but different acid concentrations were prepared.
After equilibration the conductivity and the pH-values of these solutions were mea
sured. From the results the pH-metric and conductometric titration curves were
constructed.
EXPERIMENTAL
In the method of continual variation 0.0100 M solutions of tungstate and
acid were used. By mixing these solutions, solutions with different n were obtained.
Titrations were always carried out with 50 ml of 0.0200 M sodium tungstate solution
and different amounts of 0.200 M acid solution. The mixtures were diluted to 100 ml
with water so that the final tungstate concentration was 0.0100 M. The consumption
of the acid was calculated with respect to this concentration.
Solutions were left to equilibrate for at least 10 hours at 25 t 0.02°C, except
in experiments with L-ascorbic acid when the equilibrating time was reduced to
six hours in order to avoid losses due to air oxidation.
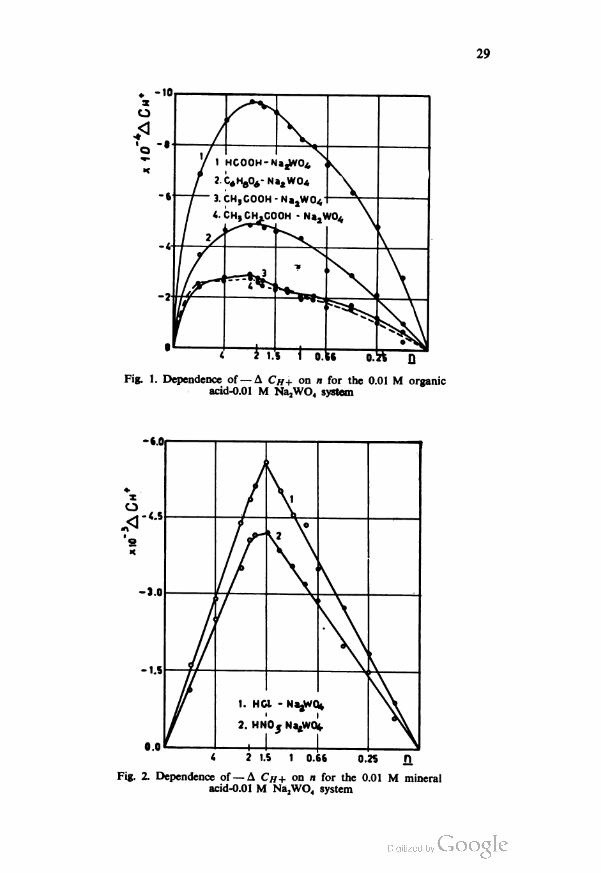
29
Fig. 1. Dependence of— A CH+ on n for the 0.01 M organic
acid-0.01 M Na,WO4 system

30
Fig. 3. Dependence of— A K on n for the 0.01 M organic
acid-0.01 M Na2 WO, system
Fig. 4. Dependence of— A x on n for the 0.01 M mineral
acid-0.01 M Na2WQ4 system

31
Fig. 5. pH metric titrations of 100 ml 0.01 M Na2 WO4
with 0.2 M organic acids
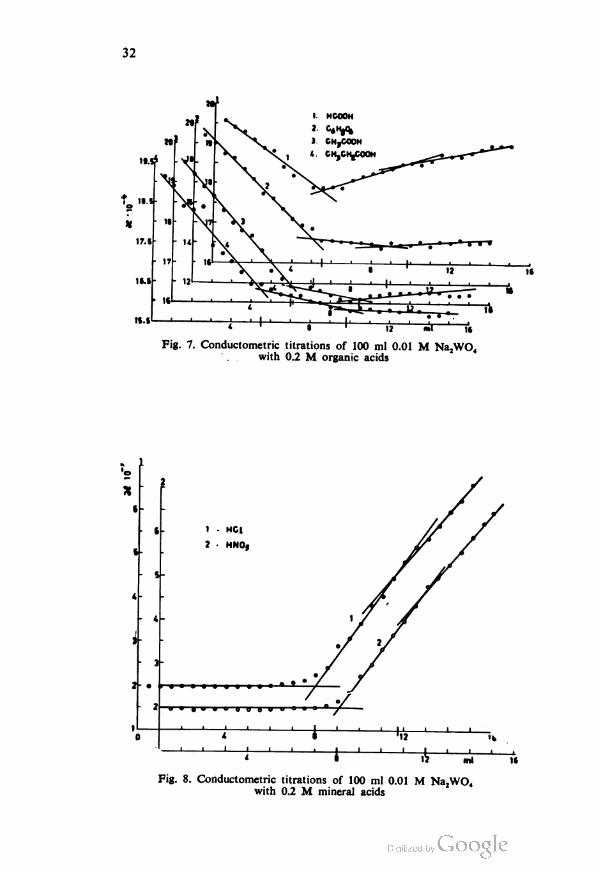
32
Fig. 7. Conductometric titrations of 100 ml 0.01 M Na2WO4
with 0.2 M organic acids
Fig. 8. Conductometric titrations of 100 ml 0.01 M Na2WO4
with 0.2 M mineral acids

33
Curves obtained by the method of continual veriation from pH-values are
shown in Figs. 1 and 2, and those obtained by means of conductivity measurements
are given in Figs. 3 and 4. Curves obtained by means of potentiometric and conducto-
metric titrations are presented in Figs. 5, 6, 7 and 8.
The shapes of the curves obtained by the method of continual variation show
that by decreasing the strength of the acid the absolute values of ACH+ and Ax
are also decreased, and the assymetry of the curve is greater. This is explainable
since the absolute pH-value of the solution increases with decreasing acid strength,
whereby ACh+ and Ax are decreased. The assymetry of the curve is due to different
degrees of dissociation of the acid in the reaction mixture and in the pure solution.
The same effect was also observed in titrations. Increase of the acid dissociation
constant brings about a greater change of potential in pH-metric and a greater change
of conductivity in conductometric titrations.
The molar ratios, n, corresponding to reaction products of sodium tungstate
and the acids are given in Table I.
TABLE I
Valeus of the molar n, obtained by different methods
Continual variation methods Titrations
From From x pH-met conducto
pH-measurements measurements ric metric
acid «i n2 "i "2 n "1 «2
HCOOH 2 1 2 1 1.5 1.1 2
C„ H, O, 2 1 2 1 1.5 1.2 2
CH3COOH 2 1 2 1 1.5 1.2 1,9
CH3CH2COOH 2 1 2 1 1.5 1.1 2
HC1 1,5 — 1.5 — 1.5 1.6 2.3
HNO3 1.5 2 1.5 2 1.5 1.6 2.4
DISCUSSION
From Table I it may be seen that the values of n for organic
acids obtained by the method of continual variation and by conducto
metric titrations are n = 2 and n = l.l-— 1.2, respectively. These values
correspond to complex formation and to hexatungstate anion formation
with L-ascorbic acid. No separation of colloidal tungstic acid was
observed. Hence it follows that the investigated monobasic organic
acids react with Na2WO4 giving the complex anion/WO3AC2/2- (n = 2;
Ac = anion of monobasic acid) whereas the action of H+ ion produces
hexatungstate polyanion HW6 O2i5-.
For mineral acids all methods give the following n-values : n = 2—
—2.5 and n = 1.5—1.6. The former value corresponds to colloidal
tungstic acid formation, confirmed by the opalescence of the solution,
and the latter (n=1.5—1.6) to the formation of metatungstate anion
obtained by the action of acid H+ ion. The value n=1.5—1.6 was
also obtained for organic acids in pH-metric titration.
The formation of hexatungstate anion takes place at pH fa 6—7.
Metatungstate and complex anion are formed simultaneously at lower
pH. Accordingly, it might be expected that mineral acids would also
3

34
give hexatungstate polyanion at pH greater than 6. This was not ex
perimentally confirmed since these effects, being masked by other
reactions, cannot be observed by the methods used.
The formation of other types of polyanion was not observed.
Their existence in the solution has been reported as established by
pH-metric titration using a quinhydrone electrode. However, we have
found that quinhydrone, and other compounds containing an enol
group (L-ascorbic acid, pyrogallol, etc., react with sodium tungstate;
hence the data obtained with a quinhydrone electrode cannot be taken
as satisfactorily reliable, especially for small pH variations.
APPARATUS AND REAGENTS
A Beckman pH-Meter Model H-2, VEB Priifgerate Model NB thermostat
and laboratory apparatus for conductivity measurements with an accuracy of 0.5%
were used. All reagents were p.a., made by "Kemika" and "Merck".
School of Science
Department of Physical Chemistry, Beograd Received January 7, 1964
Institute of Chemistry, Technology and
Metallurgy, Beograd

REFERENCES
1 . Souchay, P. "Conditions d'existence et propriety des divers ions contenus dans
les solutions de tungstates" — Annales de Chimie (Paris) 18:61, 1943.
2. Souchay, P. "Utilization des mesures de solubilite" — Bulletin de la sociite
chimique de France 932, 1951.
3. Bettinger, D. J. and S. Y. Tyrre. "Studies of the Tungsten-Containing Species
Present in Acidified Sodium Tunstate Solutions" — Journal of the American
Chemical Society 79:3355, 1957.
4. Britton, H. T. S., and W. L. German. "Physicochemical Studies of Complex
Acids. Part I. Tungstic Acid" — Journal of the Chemical Society: 1249, 1930.
5. El Wakkad, S. E. S., and H. A. Rizk. "The Polytungstates and the Colloidal
Nature and the Amphoteric Character of Tungstic Acid" — Journal of Physical
Chemistry 61 :494, 1957.
6. SuSic, M. V. "The Polarographic Behavior of Tungsten in an Oxalic Acid Solu
tion" —- Bulletin of the Boris Kidrit Institute of Nuclear Sciences 13(4): 9, 1962.
7. Deshmukkh, G. S., and D. P. Srivastava. "Polarograficheskoe opredelenie vol'
frama" (Polarographic Determination of Tungsten) — Zhurnal analiticheskoi
khimii 15 :601, 1960.
8. Susie, M. V., D. S. Veselinovic, and D. Z. Suinjevic. "Ispitivanje reakcije natri-
jumvolframata sa 1-askorbinskom kiselinom" — Glasnik hemijskog drustva
(Beograd) (in press).
9. Tchakirian, M. A., and O. Vartap£tian. "Etude spectrophotom6trique du com-
plexe oxalomolybdique" — Comptes rendus hebdomadaires des seances de /'-
academic des sciences 234:212, 1952.
10. Vartap6tian, O., and M. P. Sakellaridis. "Etude spectrophotomdtrique du com-
plexe oxalotungstique" - Comptes rendus hebdomadaires des seances aeVacadimie
des sciences 234:1621, 1952.
11. Savchenko, G. S. "Spektrofotometricheskoe issledovanie vzaimodeistviia vol'-
framata i molibdata natriia s nekotorymi organicheskimi kislotami v vodnom
rastvore" (Spectrophotometric Study of the Interaction of Sodium Tungstate
and Molybdate with Some Organic Acids in Aqueous Solution) — Khimiia
redkikh elementov — 2:68, 1955.
12. Job, M. P. "Etude spectrophotographique de la formation des complexes en
solution et de leur stabilite" — Comptes rendus hebdomadaires des seances de
Vacadimie des sciences 180:928, 1925.
13. Rai, A. K., and R. C. Mehrotra. "Some Lower n-Alkanoate Complexes of
Bivalent Metals in Aqueous Solutions. Copper Mono-Acetato and Zinc
Mono-Acetato Complexes" — Zeitschrift fur physikalische Chemie 29 : 237, 1961.
14. Banerjee, S. N., A. K. Sen Gupta, and S. K. Siddhanta. "Some Aliphatic Mono-
carboxylate Complexes of Bivalent Metals in Aqueous Solution. I. Lead Mono-
acetato Complex" — Journal of the Indian Chemical Society 35 :269, 1958.
15. Purkayastha, B. C. "Fluoroberyllates" — Journal of the Indian Chemical Society
24:257, 1947.
16. Purkayastha, B. C. "Chloroberyllates" — Journal of the Indian Chemical Society
25:81, 1948.
3*


GLASNIK HEMIJSKOG DRUSTVA, Vol. 29, No. 7, 1964, pp. 321—326
REACTIONS OF MONOBASIC ORGANIC AND INORGANIC
ACIDS WITH SODIUM TUNGSTATE.
II. DETERMINATION OF HEXATUNGSTATE POLYANION
POLYMERIZATION CONSTANT
by
DRAGAN S. VESELINOVIC, DESANKA 2. SU2NJEVIC AND MILENKO
V. SUSIC
In a previous paper(1) it was shown that hexatungstate anion,
HW6Ofr, is formed regardless of the type of organic or inorganic
acid used, provided solution pH = 6—7. This condition is fulfilled
when the concentration of sodium tungstate is greater than that of
the acid; then, the following equilibrium reactions take place in the
solution :
6WO4- + 7H+^±HW6O^r + 3H2O (1)
H+ + Ac- — HAc (2)
Ac- denotes the anion of the monobasic acid used. Since the hexatung
state anion is formed by the polymerization of WO4- ion under the
influence of the acid, the constant of this reaction, which will be named
the hexatungstate anion polymerization constant, is given by the follo
wing expression:
IChW6° 21 J
The dissociation constant of the acid is given by
(4)
k JCh+]x[CAc-]
[ChaJ
The total concentration of tungstate in the solution is
Cwo2- = Cwo2- + 6 Chw ojr (5)4 4 o 21
and that of the acid
ChAc = CHAc + CAc- (6)

38
The C° denote the initial molar concentrations of tungstate and the
acid used, and the C the equilibrium concentrations of the corresponding
ions.
The concentration of the acid anion is given by the equation
Cac- = C Ac" +7 CHw, o J- (7)
in which C'Ac denotes the concentration of the acid anion formed
by dissociation. In case of monobasic acids this concentration is equi
valent to the H+ ion concentration:
CAc- + CH+ (8)
From equations (6) and (4) the following expression is obtained:
CH+ X CHAc .jy.
ChAc= k + c£ (9)
which gives the concentration of the undissociated acid provided the
values of CHAc and k are known, while CH+ is measured directly.
By substituting the obtained CHAc value in equation (6), the con
centration of the acid anion CAc- is obtained.
Equations (8) and (7) give
Chwo5-=CAc"~Ch+ (10)
" 6 21 7
from which the polyanion concentration can be obtained. If the calcu
lated concentration is put in equation (5) the concentration of tung
state Cwo2- is obtained, provided its initial concentration, Cwo2-,4 4
is known.
From the values obtained for Cwo2-, CHW6o5- and CH+, by4 21
means of equation (3), the hexatungstate anion polymerization constant
can be calculated.
In determining the pH of the solution by means of a glass elec
trode we measure the activity of hydrogen ions, and therefore the aH+
obtained should be corrected for the activity factor in order to obtain
the actual concentration of H+ ions. For that, we carry out an approxi
mate calculation of the concentration of the all ions assuming that
the activity of hydrogen ions is equivalent to the concentration. From
the values obtained, provided the concentration of sodium ion is known,
the ionic strength of the solution is obtained by means of the equation
^=l/2 2cini2 (11)
The activity coefficient fH+ for the given ionic strength is calculated
from the Debye-Huckel equation:
log fH+= -0.51 ^ (12)

39
which may be assumed to be sufficiently accurate for (jl<0.1. The experi
mental H+-ion activity, corrected for the activity factor, gives the
concentration of hydrogen ions CH+ which is used for the calculation
of the hexatungstate anion polymerization constant.
The extrapolation of the straight line giving the dependence of
pK/-log K on YV- yields the value of pK for \i = 0.
10
IS,
10
H
Mr
10
Mr
HC0OH
C4H404
CHjCOOH
ch.ghjCOoh
HCt
Fig. 1 Dependence of pK on /(x for different acids. •-titrations; •-method of
continual variation
TABLE I
pH-values of solutions with different C° 2- , and C^Ac , at 25°C.
PH
4 ChAc hcooh c„ h8 o6 ch3 cooh ch3 ch2 cooh HC1 hno3
0.01 0.001 6.85 6.89 6.85 6.83 6,78 6.75
0.01 0.002 6.80 6.83 6.80 6.78 6.70 6.70
0.01 0.003 6.73 6.78 6.75 6.72 6.62 6.64
0.01 0.004 6.67 6.75 6.70 6.67 6.58 6.60
0.01 0.005 6.64 6.68 6.64 6.62 6.52 6.56
0.01 0.006 6.58 6.62 6.56 6.57 6.45 6.47
0.01 0.007 6.50 6.55 6.52 6.51 6.38 6.36
0.009 0.001 6.97 7.00 6.86 6.88 6.70 6.80
0.008 0.002 6.79 6.90 6.74 6.72 6.60 6.68
0.007 0.003 6.62 6.75 6.60 6.59 6.44 6.51
0.006 0.004 6.43 6.57 6.42 6.42 6.25 6.34
0.0055 0.0045 6.34 — 6.30 6.30 6.20 6.22
I. Titrations
II. Method of continual variation

40
The hexatungstate polymerization constant was calculated from
data obtained by pH-metric investigation of the reaction of tungstateo o
with monobasic acids'". The values of pH, Cwo2- and CHac for4
formic, acetic, propionic, hydrochloric and nitric acid are given in
Table I. The dependence of pK on j/|x is graphically represented in
Fig. 1 for each of the acids. The values of pK for ja = 0 are shown in
Table II.
TABLE II
pK-values (|x = 0) for HWjOj, obtained with different acids
Acid HCOOH C,H, O, CH3COOH CH3CH2COOH HC1 NHOj t=25°C
PK 59.5 60.75 59.5 60.0 59.0 60.75 60±1
The results show that pK is not dependent on the type of the
acid used; hence, all the acids react with sodium tungstate in the same
way producing polymerization of tungstate anion by the action of H+.
Since the polymerization reactions are mainly irreversible it is
essential to establish the reversibility of hexatungstate anion formation ;
only then will the pK-values obtained be thermodynamically valid.
However, apart from the consistency of the pK for different acids,
there are no other data on the reversibility of this reaction. Hence,
this result represent an apparent pK-value (pK').
School of Science
Department of Physical Chemistry, Beograd, Received January 7, 1964
Institute of Chemistry, Technology and
Metallurgy, Beograd
REFERENCES
1. SuSic, M. V., D. S. Veselinovic, and D. 2. Suznjevid: "Reakcije organskih i
neorganskih monobaznih kiselina sa Na2WO4. I. pH-metrijska i kondukto-
metrijska ispitivanja" (Reactions of Organic and Inorganic Acids with Sodium
Tungstate. I. pH-Metric and Conductometric Titrations) — Glasnik hemijskog
druStva (Beograd) 29(7), 1964.
SRPSKO HEMIJSKO DRUSTVO (BEOGRAD)
BULLETIN
OF THE CHEMICAL
SOCIETY
Belgrade
(Glasnik Hemijskog drustva — Beograd)
Vol. 29, No. 8-9-10, 1964
Editor:
MILOS MLADENOVIC
Editorial Board:
B. BOZlC, D. VITOROVlC, D. DELlC. A. DESPlC, Z. DIZDAR. D. DIMITRIJEVlC, S. KON-
CAR-DURDEVlC. A. LEKO, M. MLADENOVIC, M. MIHAILOVlC. V. MlCOVl6. S.RADO-
SAVUEVlC, S. RASAJSKI, D. STEFANOVlC. P. TUTUNDZlC, M.CELAP,
Published by
SRPSKO HEMIJSKO DRUSTVO (BEOGRAD)
1 966.

Translated and published for U. S. Department of Commerce and
the National Science Foundation Washington, D. C, by
the NOLIT Publishing House, Terazije 27/11. Belgrade, Yugoslavia
1966
Edited by
PAUL PIGNON
Printed in Beogradski Graficki Zavod, Belgrade

11th MEETING OF THE CHEMISTS OF THE
SR. OF SERBIA
AND
ANNUAL CONVENTION OF THE SERBIAN
CHEMICAL SOCIETY
January 25—27, 1965
HELD AT THE SCHOOL OF TECHNOLOGY
UNIVERSITY OF BEOGRAD


CONTENTS
Page
5. Koniar-Durdevic
Bases of Modern Chemical Engineering and Its Developmental Trends.... 17
M. Bogosavljevic
An Approximate Mathematical Model for Trinitration of Toluene 18
M. Bogosavljevic
Dynamic Characteristics of the Process of o-Cresol Dinitration 19
M. Mitrovic
Heat Transfer from a Short Heating Element to Water Flow in an Annulus 20
S. Koniar-Durdevic and O. Vukovic
Investigation of Corrosion of Similar System in a Mobile Fluid 21
M. Mitrovic and M. Strunk
An Experimental Study of Heat and Mass Transfer Involving the Humid
Air - P2 O, System 22
S. Cvijovic and I. Vranic
Application of Dimensional Analysis to Construction of Graphs for Determi
nation of Direct Duct Equivalent Diameters for Given Flow Rate
and Pressure Drop 23
S. KonCar-Durdevic and O. Popovic
Local Mass Transfer to Thin Flat Plates Submerged in a Moving Fluid 24
S. KonCar-Durdevic, M. Mitrovic and S. Cvijovic
Heat Transfer with Simultaneous Endothermic Chemical Reaction 25
R. Jovanovic and S. KonCar-Durdevic
Application of Adsorption Method to the Study of Mass Transfer in Ultrasonic
Field 26
S. Koniar-Durdevic and R. Radosavljevic
Application of Adsorption Method to Flow Modeling in Heat Exchangers 27
V. Alic and S. KonCar-Durdevic
Classification of Methods for Calculation of Water Cooling Towers 28
M. IvaniSevic
Some Experience with Automatic Monitoring of Boiler Feed Water 29
S. KonCar-Durdevic and V. Alic
Experimental Evaluation of Methods for Calculating Water Cooling Towers 30
B. Perovic
Estimation of the Length of a Vertical Pneumatic Drying Tube 31
V. Krajovan, S. Veselinovic and S. Gacesa
A New Aeration System for Continuous Microbiological Processes 32
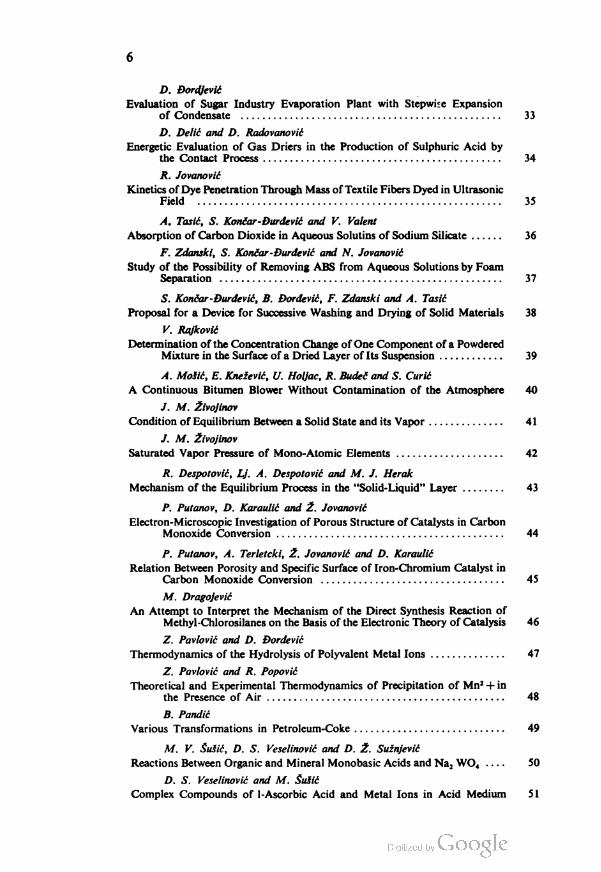
6
D. Dordjevic
Evaluation of Sugar Industry Evaporation Plant with Stepwise Expansion
of Condensate 33
D. Delic and D. Radovanovic
Energetic Evaluation of Gas Driers in the Production of Sulphuric Acid by
the Contact Process 34
R. Jovanovic
Kinetics of Dye Penetration Through Mass of Textile Fibers Dyed in Ultrasonic
Field 35
A. Tasic, S. Koniar-Durdevic and V. Valent
Absorption of Carbon Dioxide in Aqueous Solutins of Sodium Silicate 36
F. Zdanski, S. Koniar-Durdevic and N. Jovanovic
Study of the Possibility of Removing ABS from Aqueous Solutions by Foam
Separation 37
S. Koniar-Durdevic, B. Dordevic, F. Zdanski and A. Tasic
Proposal for a Device for Successive Washing and Drying of Solid Materials 38
V. Rajkovic
Determination of the Concentration Change of One Component of a Powdered
Mixture in the Surface of a Dried Layer of Its Suspension 39
A. MoSic, E. Kneievic, U. Holjac, R. BudeC and S. Curic
A Continuous Bitumen Blower Without Contamination of the Atmosphere 40
J. M. Zivojinov
Condition of Equilibrium Between a Solid State and its Vapor 41
J. M. iivojinov
Saturated Vapor Pressure of Mono-Atomic Elements 42
R. Despotovic, Lj. A. Despotovic and M. J. Herak
Mechanism of the Equilibrium Process in the "Solid-Liquid" Layer 43
P. Putanov, D. Karaulic and i. Jovanovic
Electron-Microscopic Investigation of Porous Structure of Catalysts in Carbon
Monoxide Conversion 44
P. Putanov, A. Terletcki, 2. Jovanovic and D. Karaulit
Relation Between Porosity and Specific Surface of Iron-Chromium Catalyst in
Carbon Monoxide Conversion 45
M. Dragojevic
An Attempt to Interpret the Mechanism of the Direct Synthesis Reaction of
Methyl-Chlorosilanes on the Basis of the Electronic Theory of Catalysis 46
Z. Pavlovic and D. Dordevic
Thermodynamics of the Hydrolysis of Polyvalent Metal Ions 47
Z. Pavlovic and R. Popovic
Theoretical and Experimental Thermodynamics of Precipitation of Mn2 + in
the Presence of Air 48
B. Pandic
Various Transformations in Petroleum-Coke 49
M. V. Susie, D. S. Veselinovic and D. Z. Suznjevic
Reactions Between Organic and Mineral Monobasic Acids and Na2 WO4 50
D. S. Veselinovic and M. Susie
Complex Compounds of 1-Ascorbic Acid and Metal Ions in Acid Medium 51
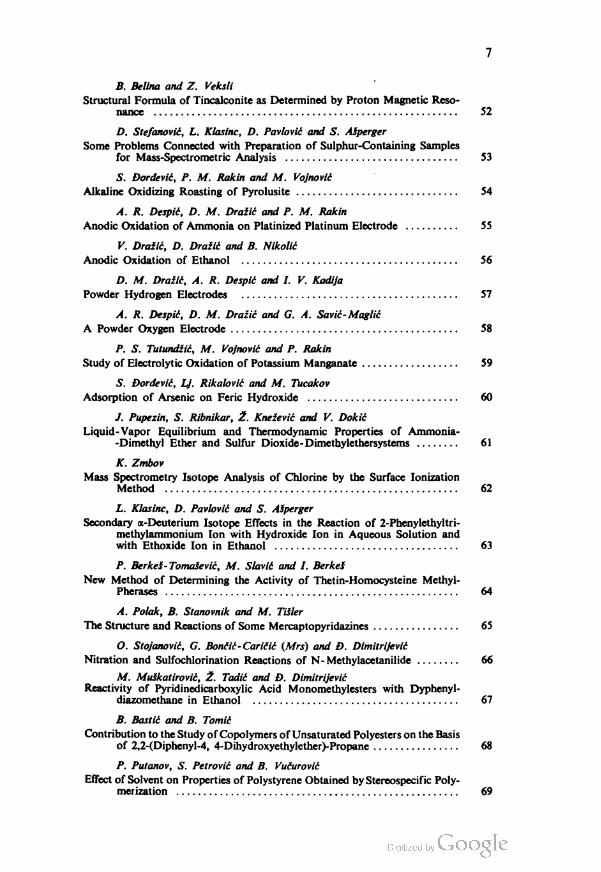
7
B. Belina and Z. Veksli
Structural Formula of Tincalconite as Determined by Proton Magnetic Reso
nance 52
D. Stefanovic, L. Klasinc, D. Pavlovic and S. ASperger
Some Problems Connected with Preparation of Sulphur-Containing Samples
for Mass-Spectrometric Analysis 53
S. Dordevic, P. M. Rakin and M. Vojnovic
Alkaline Oxidizing Roasting of Pyrolusite 54
A. R. Despic, D. M. Drazic and P. M. Rakin
Anodic Oxidation of Ammonia on Platinized Platinum Electrode 55
V. Drazic, D. Drazic and B. Nikolic
Anodic Oxidation of Ethanol 56
D. M. Drazic, A. R. Despic and I. V. Kadija
Powder Hydrogen Electrodes 57
A. R. Despic, D. M. Drazic and G. A. Savic-Maglic
A Powder Oxygen Electrode 58
P. S. Tutundzic, M. Vojnovic and P. Rakin
Study of Electrolytic Oxidation of Potassium Manganate 59
S. Dordevic, Lj. Rikalovic and M. Tucakov
Adsorption of Arsenic on Feric Hydroxide 60
J. Pupezin, S. Ribnikar, Z. Knezevic and V. Dokic
Liquid-Vapor Equilibrium and Thermodynamic Properties of Ammonia-
-Dimethyl Ether and Sulfur Dioxide- Dimethylethersystems 61
K. Zmbov
Mass Spectrometry Isotope Analysis of Chlorine by the Surface Ionization
Method 62
L. Klasinc, D. Pavlovic and S. ASperger
Secondary a-Deuterium Isotope Effects in the Reaction of 2-Phenylethyltri-
methylammonium Ion with Hydroxide Ion in Aqueous Solution and
with Ethoxide Ion in Ethanol 63
P. BerkeS- TomaSevic, M. Slavic and I. BerkeS
New Method of Determining the Activity of Thetin-Homocysteine Methyl-
Pherases 64
A. Polak, B. Stanovnik and M. TiSler
The Structure and Reactions of Some Mercaptopyridazines 65
O. Stojanovic, G. BonCic-Caridi (Mrs) and D. Dimitrijevic
Nitration and Sulfochlorination Reactions of N- Methylacetanilide 66
M. MuSkatirovic, Z. Tadii and D. Dimitrijevic
Reactivity of Pyridinedicarboxylic Acid Monomethylesters with Dyphenyl-
diazomethane in Ethanol 67
B. Bastic and B. Tomic
Contribution to the Study of Copolymers of Unsaturated Polyesters on the Basis
of 2,2-(Diphenyl-4, 4-Dihydroxyethylether)-Propane 68
P. Putanov, S. Petrovic and B. VuCurovic
Effect of Solvent on Properties of Polystyrene Obtained by Stereospecific Poly
merization 69

8
B. Bastic and M. Piletic
Condensation of o-Aminophenol with Phyridinecarbonic Acids 70
V. Rekalic, M. Tenc-Popovic and S. Radosavljevic
Synthesis of Bis (2-Chlorethyl) Formal 71
D. Dimitrijevic, Z. Tadic and M. MiSic- Vukovic
Reactivity of Pyridine-2-Carboxylic Acids 1 -Oxides in their Reaction with
Diphenyldiazomethane 72
Z. Maksic and M. Randic
Maximum Overlap Hybridization in Cyclopropane and Some Related
Molecules 73
J. Jovanovic
1, 4-Di-/»-Alkylbenzenes — Determination of their Structures by Physical
Methods 74
D. Dzokic
The Effect of Alcohols on Some Properties of Dodecylbenzene-Sulfonate
Solutions 75
D. Dzokii and R. Trajkovic
Textile Dyeing in Presence of Organic Solvents 76
M. Diamic and J. Neukom
Saponification of Pectin in Plant Materials and Extraction of Sodium Pectate 77
V. Krajovan, S. Veselinovic and B. Grubnic
Preparation of Foodei Yeast from Feeds Obtained by Mild Hydrolysis of
Wheat Hay, Sunflower Husks and Maize Ears 78
R. Vilentic
Isomerization of Primary Gasolines 79
M. Tenc-Popovic, O. Olic-Leko, V. Rekalic and S. Radosavljevic
Synthesis of Polysulfide Polymers 80
J. SaSii and S. Radosavljevic
Separation of a Mixture of Trimer and Tetramer of Phosphornitrile Chloride 81
S. Radosavljevic and J. SaHic
Concerning the Synthesis of Phosphornitrile Chloride 82
A. M. Leko and M. A. Leko
On the Action of Metalic Magnesium on Nitric Acid 83
S. Pribicevic
Increasing the Utilization Coefficient of NaCl from Sulphate Type Brines 84
M. B. Celap, T. I. Nikolic, T. J. Janjic and M. B. Dimitrijevic
Study of the Reactions of Hexanitrocobaltates (III) with Amino Acids. II.
Reactions with DL-Alanine, ^-Alanine, DL-a-Aminobutyric Acid
and DL-Valine 85
S. Pribicevic
Technological Scheme for the Production of NaCl from Sulphate Type Brines 87
M. B. Celap, D. J. Radanovic and T. J. Janjic
Study of the Reactions of Hexanitrocobaltates (III) with Amino Acids. III.
Determination of the Configuration of Dinitroglycinatocobaltates (III) 88
S. Pribicevic
Removal of Chromium from Raw Materials of Industry 90
M. Milojevic
Bod Contribution of Heat Sterilized Algae 91
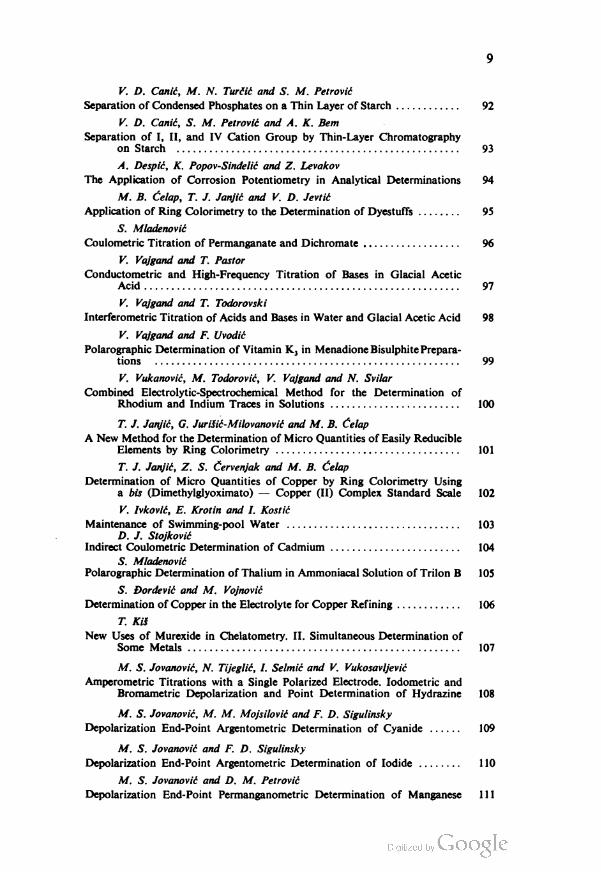
9
V. D. Conic, M. N. TurCic and S. M. Petrovic
Separation of Condensed Phosphates on a Thin Layer of Starch 92
V. D. Canic, S. M. Petrovic and A. K. Bern
Separation of I, II, and IV Cation Group by Thin-Layer Chromatography
on Starch 93
A. Despic, K. Popov-Sindelic and Z. Levakov
The Application of Corrosion Potentiometry in Analytical Determinations 94
M. B. Celap, T. J. Janjic and V. D. Jevtic
Application of Ring Colorimetry to the Determination of Dyestuffs 95
5. Mladenovic
Coulometric Titration of Permanganate and Dichromate 96
V. Vajgand and T. Pastor
Conductometric and High-Frequency Titration of Bases in Glacial Acetic
Acid 97
V. Vajgand and T. Todorovski
Interferometric Titration of Acids and Bases in Water and Glacial Acetic Acid 98
V. Vajgand and F. Uvodic
Polarographic Determination of Vitamin K3 in Menadione Bisulphite Prepara
tions 99
V. Vukanovic, M. Todorovic, V. Vajgand and N. Svilar
Combined Electrolytic-Spectrochemical Method for the Determination of
Rhodium and Indium Traces in Solutions 100
T. J. Janjic, G. JuriSic-Milovanovic and M. B. Celap
A New Method for the Determination of Micro Quantities of Easily Reducible
Elements by Ring Colorimetry 101
T. J. Janjic, Z. S. Cervenjak and M. B. Celap
Determination of Micro Quantities of Copper by Ring Colorimetry Using
a bis (Dimethylglyoximato) — Copper (II) Complex Standard Scale 102
V. Ivkovic, E. Krotin and I. Kostic
Maintenance of Swimming-pool Water 103
D. J. Stojkovtf
Indirect Coulometric Determination of Cadmium 104
5. Mladenovic
Polarographic Determination of Thalium in Ammoniacal Solution of Trilon B 105
S. Dordevic and M. Vojnovic
Determination of Copper in the Electrolyte for Copper Refining 106
T. Kis
New Uses of Murexide in Chelatometry. II. Simultaneous Determination of
Some Metals 107
M. S. Jovanovic, N. Tijeglic, I. Selmic and V. Vukosavljevic
Amperometric Titrations with a Single Polarized Electrode. lodometric and
Bromametric Depolarization and Point Determination of Hydrazine 108
M. S. Jovanovic, M. M. Mojsilovic and F. D. Sigulinsky
Depolarization End-Point Argentometric Determination of Cyanide 109
M. S. Jovanovic and F. D. Sigulinsky
Depolarization End-Point Argentometric Determination of Iodide 110
M. S. Jovanovic and D. M. Petrovic
Depolarization End-Point Permanganometric Determination of Manganese 111
10
Lj. Vrhovac, L. PenzeS and M. Jovanovic
Electrometric Determination of Sulfite in Spent and Cooking Liquor in Pro
duction of Semi Chemical Pulp 112
Lj. Vrhovac, M. Jovanovic and L. PenzeS
Iodometric Determination of Sulfite by the Depolarization End Point Method 113
T. Kii
New Uses of Murexide in Chelatometry I. Direct Determination of Cadmium,
— Zinc, Manganese, Bismuth and Thorium 1 14
S. Jankovic and hi. Milojevic
Dimethyl Phthalate and Dibutyl Phthalate as New Standards for Water
Turbidity 115
B. Knezevic
Total Base Number of Motor Oils 116
D. J. Stojkovic
Coulometric Mercurometric Potentiometric Determination of Anions 117
R. Dimitrijevic and A. KoSulic
Determination of Rhenium in Some Yugoslav Ores 118
A. Antic-Jovanovic
Experimental Study and Critical Survey of the Methods for Spectrochemical
Detection and Dosage of Lithium 1 19
M. Kliska and S. Blazin
A Modification of the Porous Electrode Method for Steel Analysis 120
V. Antonijevic and M. Pravica
Reaction of Molybdenum with Diphenylcarbazone 121
A. Muk
Reaction of Zirconium with Arsenazo III in Strongly Acid Media 122
G. T. Hajdukovic
Spectrophotometry Determination of Niobium in Uranium Alloys with
Xylenol Orange 123
S. Ristic and J. Baranac
Investigation of the Effect of pH on Absorption Spectra of Pelargonidol,
Delphinidol and Malvidol 124
M. Jeremic
Contribution to General Physico-Chemical and Spectral Properties of Synthetic
Ruby 125
/. Babin and D. Polic
Determination of 3, 4-Benzopyrene Content in the Condensate of Cigarette
Smoke 126
Babin and D. Polic
Possibility of a Mechanical Fraction Collector of a New Construction 127
D. Vukanovic
Splitting Effect and Spectral Analysis of Traces in Direct Current Arc 128
M. Rogulic and R. Nicholson
Quantitative Determination of G. P. Zones in Al-Zn Alloys 129
M. Rogulic
Age-Hardening of Aluminum-Silver Alloy 130
B. Bozic and D. Mihajlovic
The Influence of Strain Ageing on the Alternate Bending Test Endurance of
Mild Steel 131
1 1
B. Boiic and D. Mihajlovic
The Alternate Bending Test Behavior of Carbon Steel at Temperatures Up
to 400° 132
N. Vidojevic, N. Novovic-Simovic and J. Popovic
Maraging of Nickel Steel 133
C. B. Petrovic, D. S. Trifunovic and M. B. Janiic
A Process for Manufacturing Thin Homogeneojs Porous Bodies 134
£>. Drobnjak
Influence of Beta Grain Size on Beta-Alpha Transformation Mechanism and
Kinetics in Uranium 135
B. Duric
The Isothermal Decomposition of Uranium - 2 WT.% Niobium Alloy 136
A. Mihajlovic, M. Kostic and P. Tepavac
The Influence of Cooling Rate on the Structure of U - 0.65% Mo Alloy 137
V. Logomerac
Magnetizing Roasting of Limonitic Iron Ore 138
V. Logomerac
Substitution of Imported Ore for Steel by Indigenous Raw Material 139
B. Durkovic, Z. Popovic and D. Sinadinovic
Regeneration of Waste Material in Production of Semiconducting Elements 140
M. Spasic, B. Durkovic and D. Sinadinovic
On the Cyanidation of Gold from the Golden-Bearing Pyrite of Lece Mine 141
S. Dordevic, O. Tatic-Janjic and J. Tarabic
The Behavior of Arsenic, Antimony and Bismuth in the Electrolyte for Copper
Refining 142
S. Dordevic and M. Halai
A Laboratory Procedure for Electrolytic Copper Refining 143
V. Milenkovic, S. Todorovic and D. Cvetkovic
Some Characteristics of Cold Drawn OFHC Copper Wire with Large Drafts 144
/. G. Stamenkovic, R. Kubat
Calculation of Enthalpy Changes of Two-Stage Oxidation of Uranium Dioxide 145
B. Zivanovic and M. Ristic
General Kinetic Equation of Zinc Oxyde Sintering 146
D. Delic, R. Detelic, E. Kostic and M. Ristic
Critical Analysis of Kinetics of UO2+x Sintering Process 147
V. Petrovic, E. Kostic, R. Detelic and M. Ristic
Comparative Microstructural Analysis of Powders of Sintered UO2+x 148
F. Sigulinsky, and M. Stevanovic
A Critical Survey of Methods for Measuring Density of Sintered Materials 149
S. Kis and M. M. Ristic
Reaction Kinetics in Solid State of the System UO2+X-Al 150
/. Katanic
Measuring of Thermal Conductivity of Ceramics at Temperatures from 20°
to 200°C 151
M. Stevanovic
Effect of Fast Neutron Irradiation on Mechanical Properties of Refractory
Oxydes 152

12
O. Lj. Cukovic
Spontaneous Decomposition of Agate 153
D. Delic and M. Tecilazic-Stevanovic
Hydratation of (Ca, K) Montmorillonite. II. Adsorption Isothermes 154
/. Zlatanovic
Possibility of Manufacture of Fine Porcelain Without Feldspar from Yugoslav
Raw Materials 155
M. Tecilazic-Stevanovic, T. Janaikovic and V. Kovaievic
The Possibility of Industrial Application of Bentonite from the Surroundings
of NiS 156
M. Dimitrovski
Contribution to the Study of Volcanic Glass from the Kratovo Area 157
/. Zlatanovic, M. Matkalijeva and M. Dimitrovski
Contribution to the Study of Ring Formation in Rotary Cement Kilns 158
B. Pavlovic and D. Petrovic
Photo-Nuclear Determination of Uranium and Thorium in Some Yugoslav
Rocks 159
D. Cvijetiianin, V. Bulovic and K. Zmbov
Isotope Analysis of Uranium Samples by Alpha Spectrometry 160
R. Radosavljevic, M. Kovaievic, V. Vujovic and D. Dordevic
The Radioactivity of K*° in Rainwater and Freshwater in the Environment
of Vinca 161
R. Despotovic
Radionuclide Distribution in a Heterogeneous System 162
D. CvjetiCanin and S. Ratkovic
Separation of Americium from Plutonium by Anion Exchange 163
N. Milic
The Extraction of Plutonium With Some Nitro-Compounds 164
V. Jezdic, M, Skakun and S. Konstantinovic
Synthesis of Some Organic Phosphorus Insecticides Labeled With Phosphorus
-» P and Sulphur-35 5 165
D. Paligoric and Lj. Dobrilovic
Determination of the Detection Energy Treshold of the 4-n Liquid Scintillation
Counter 166
£>. Bek-Uzarov, Lj. Dobrilovic and D. Paligoric
Dependence of Counting Efficiency of the 4-rc Liquid Scintillation Counter
on Source Height 167
D. Novkovic and D. Bek-Uzarov
Gamma Radiation Dose Measurement with an Air-Equivalent Ionization
Chamber 168
Lj. Dobrilovic
Position of Maximum and Halfwidth of an Alpha Particle Spectral Line as
a Function of Source Thickness 169
/. Draganic, B. Radak and V. Markovic
Mixed Pile Radiations in Aqueous Radiochemistry 170
Z. Draganic, M. Kosandc, M. Tonic, D. Ovcin and I. Draganic
Radiolysis of Aqueous Alkaline Solutions of Oxalates in Presence of Oxygen 171

13
M. Tonic and Z. Draganic
The Possibility of Inducing Synthesis of Labeled Oxalic Acid With 60Co Gamma
Rays 172
Lj. Josimovic and O. Gal
Chemical Determination of Radiolysis Products in Solid Systems 173
O. Gal and J. Patko
Luminescence in Some Solid Oxalates Irradiated With High Doses of Reactor
and MCo Gamma Radiation 174
A. Steiner, E. Mohoroviiic, M. Kirigin and E. Cerkovnikov
Contribution on Protection of Living Organisms After the Action of Ionizing
Radiation 175
M. Dzamic, B. Jankovic and S. Veljkovic
The Effect of Ionizing Radiation on Pectin, II 177


ABSTRACTS

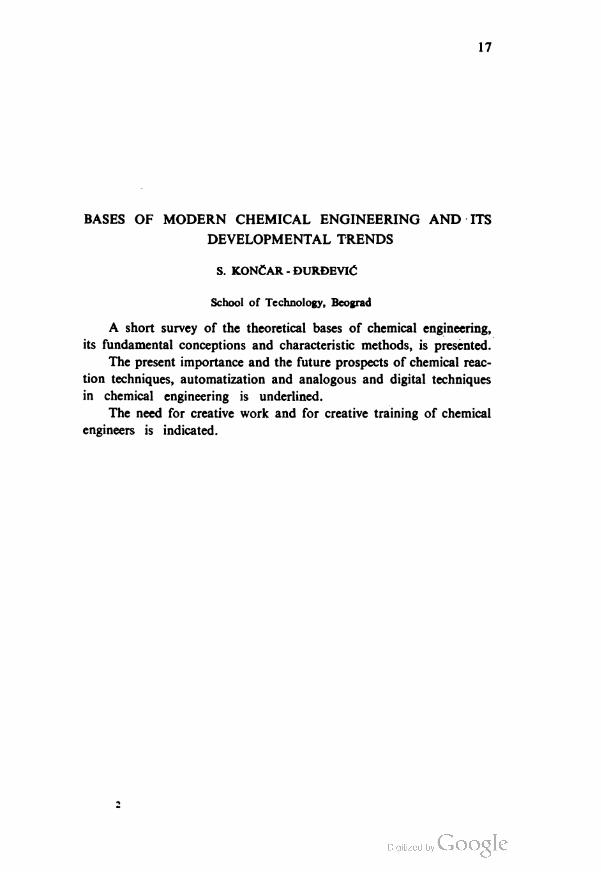
17
BASES OF MODERN CHEMICAL ENGINEERING AND ITS
DEVELOPMENTAL TRENDS
S. KONCAR - DURDEVlC
School of Technology, Beograd
A short survey of the theoretical bases of chemical engineering,
its fundamental conceptions and characteristic methods, is presented.
The present importance and the future prospects of chemical reac
tion techniques, automatization and analogous and digital techniques
in chemical engineering is underlined.
The need for creative work and for creative training of chemical
engineers is indicated.

18
I — 1
AN APPROXIMATE MATHEMATICAL MODEL FOR
TRINITRATION OF TOLUENE
M. BOGOSAVUEVlC
School of Technology, Novi Sad
An analog mathematical model which approximately corresponds
to the process of mono-, di-, and trinitration of toluene with sulphuric-
-nitric acid mixture is presented. The process proceeds continuously
in a system of mixer and separator units which makes possible the
recyclization of spent acids. The set of equations obtained in the form
of functions G(s) makes it possible to determine, by means of an analog
computer, all the main factors which affect the dynamic characteristics
of the process and the system units.

19
1 — 2
DYNAMIC CHARACTERISTICS OF THE PROCESS
OF o-CRESOL DINITRATION
M. BOGOSAVLJEVlC
School of Technology, Novi Sad
The usual procedure for the preparation of dinitro-o-cresol con
sists in the sulphonation and nitration of o-cresol. However, experiments
have shown that the same product may also be obtained by direct
nitration with a sulphuric-nitric acid mixture. To determine more
closely the principles governing the simplified procedure of direct
nitration of o-cresol, it was of interest to define the characteristics of
the process itself. These dynamic characteristics are given in the form
of corresponding functions, G(s), for each phase of the process separately.
The obtained analog mathematical scheme of the process makes it
possible to determine the characteristics of the process by means of
an analog computer.

20
I — 3
HEAT TRANSFER FROM A SHORT HEATING ELEMENT TO
WATER FLOW IN AN ANNULUS
M. MITROVlC
School of Technology, Beograd
Heat transfer from a heated element which is part of the inner
tube of an annulus to water flowing in the annulus was examined.
The length of the heated element was of the same order of mag
nitude as the hydraulic diameter of the annulus. Experiments were
performed with small temperature difference between the heated
element and the water, so that effects of natural convection were negle-
gible and isothermal conditions could be assumed. The heat flux or
the temperature of the element surface were held constant. The results
in the laminar flow region for three annuli with different equivalent
diameters fitted the known expression
Nu = 1.86 Re,/j Pr''> (L/Dh)-,/2
while in the turbulent region
Nu ~T0'''
where t„ is the wall shear stress on the inner tube.

21
1 — 4
INVESTIGATION OF CORROSION OF SIMILAR SYSTEMS
IN A MOBILE FLUID
S. KONCAR - DURDEVlC, and O. VUKOVlC
Institute for Chemistry, Technology and Metallurgy. Department of Chemical
Engineering, Beograd; School of Technology, Beograd
We sought correlation factors between the rate of corrosion of
geometrically similar models when the corrosion is produced by a
mobile fluid.
The systems studied were dynamically as well as geometrically
similar.
The models were thin plates in the ratios 1 : 2 : 4. They were cor
roded in a mobile solution of sulphuric acid. The following magni
tudes were kept constant: Reynolds number, the period of corrosion,
the concentration of sulphuric acid, the temperature.
The results indicate the existence of correlation factors.
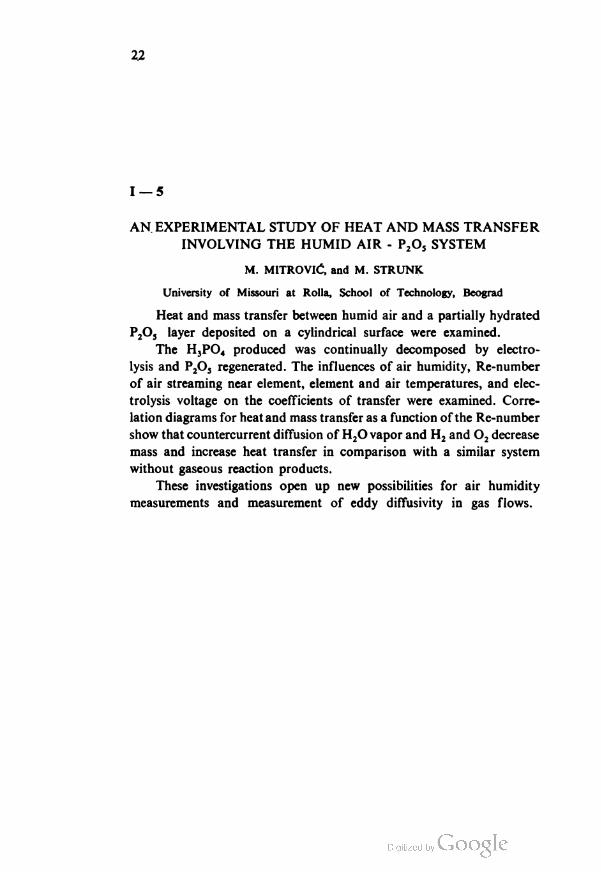
22
1 — 5
AN. EXPERIMENTAL STUDY OF HEAT AND MASS TRANSFER
INVOLVING THE HUMID AIR - P2O5 SYSTEM
M. MITROVlC, and M. STRUNK
University of Missouri at Rolla, School of Technology, Beograd
Heat and mass transfer between humid air and a partially hydrated
P2O3 layer deposited on a cylindrical surface were examined.
The H3PO4 produced was continually decomposed by electro
lysis and P2O5 regenerated. The influences of air humidity, Re-number
of air streaming near element, element and air temperatures, and elec
trolysis voltage on the coefficients of transfer were examined. Corre
lation diagrams for heat and mass transfer as a function of the Re-number
show that countercurrent diffusion of H20 vapor and H2 and Oz decrease
mass and increase heat transfer in comparison with a similar system
without gaseous reaction products.
These investigations open up new possibilities for air humidity
measurements and measurement of eddy diffusivity in gas flows.

23
1 — 6
APPLICATION OF DIMENSIONAL ANALYSIS TO CONSTRUC
TION OF GRAPHS FOR DETERMINATION OF DIRECT DUCT
EQUIVALENT DIAMETERS FOR GIVEN FLOW RATE AND
PRESSURE DROP
S. CVIJOVlC, AND I. VRANlC
School of Technology, Beograd
Dimensional analysis is applied to turbulent flow of fluids and
a new variable Q = (wd2e ) is introduced which is a function of the
duct cross section and the flow rate.
The following criteria are obtained, expressed in terms of Rey
nolds number, the friction factor and the relative roughness:
K, = (fRe2)'/> , (K2 = (fRe5)'''
and
K3 = (fRe2 n3)1/'
where
K, = dea, K2 = ^. a and K, = e a a = r^]/3
V- L i[*2J
Using these results and the known correlation f = f(Re, n) the
function Ki = f(K.2) is plotted with K3 as a parameter.
This graph allows direct determination of the equivalent diameter
for a given duct instead of the trial and error method commonly used.
24
1—7
LOCAL MASS TRANSFER TO THIN FLAT PLATES
SUBMERGED IN A MOVING FLUID
S. KONCAR-DURDEViC, and O. POPOVlC
Institute for Chemistry, Technology and Metallurgy, Beograd School of Tech
nology, Beograd
Local mass transfer to flat plates fixed perpendicularly or at small
angles to the normal to directioa of flow of the fluid was studied.
Particular attention was paid to qualitative differences in mass
transfer to the front and rear sides of plates under the same flow condi
tions. The flow rate and plate dimensions were changed. The plates
were circular. Local mass transfer coefficients were determined as a
function of radius. The relationship between the local coefficient and
the hydrodynamic conditions is presented graphically in the form
Ah = ARe"

25
I — 8
HEAT TRANSFER WITH SIMULTANEOUS ENDOTHERMIC
CHEMICAL REACTION
S. KONeAR-DURDEVl£, M. MITROVlC and S. CVIJOVlC
School of Technology, Beograd
The conditions of heat transfer with simultaneus catalytic decom
position cf methanol into formaldehyde and hydrogen in a nitrogen
atmosphe e were examined. The reaction took place on a silver tube
which served as the catalyst and constituted the inner tube of an an-
nulus. The heat transfer as a function of catalyst temperature and met
hanol concentration in nitrogen is compared with that without chemical
reaction.
The influence of the flow rate and reactant preheating was also
examined.

26
I — 9
APPLICATION OF ADSORPTION METHOD TO THE STUDY
OF MASS TRANSFER IN ULTRASONIC FIELD
R. JOVANOVlC and S. KONeAR-DURDEVK!:
School of Technology, Beograd
The effect of the parameters of the ultrasonic field on mass transfer
from a dye solution to an anodically oxidized surface of aluminum was
studied by the adsorption method developed at the School of Techno
logy in Beograd (Depa tment of Chemical and Metallurgical Enginee
ring). This method is based on the measurement of dye intensity by
light reflected from surfaces coated with suitable adsorbents. The
results obtained by this method were checked by dissolving the adsorbed
dye and by carrying out the colorimetry of this solution. The accuracy
in direct colorimetry of surfaces and in colorimetry of the desorbed
dye differed by 0.7 to 1.9% in favor of the latter method.
The dependance of the quantity of the adsorbed dye upon the tem
perature, adsorption time and parameters of the ultrasonic field is
shown graphically.

27
I — 10
APPLICATION OF ADSORPTION METHOD TO FLOW
MODELING IN HEAT EXCHANGERS
S. KONCAR-DURDEVlC, and R. RADOSAVUEVlC
Institute for Chemistry, Technology and Metallurgy, Department of Chemical
Engineering, School of Technology, Beograd
By adsorption of methyleneblue on silica gel conditions of hydrc-
dynamic similarity were investigated on geometrically similar models.
The models were plate heat exchangers with aluminum plates as the
heat-trasfer areas coated with silica gel.
Under the conditions defined by equality of the Reynolds num
bers Rei = Re2 = Re3 which theoretically ensure similarity of the
flow, diffusion and thermal fields of the system, methyleneblue solu
tion was introduced to the exchangers.
By reflectance measurements along the length and width of the
plates the function reflectance against Re-number was obtained for
geometrically symmetric points. From the results the flow field was
indirectly determined, which allows determination of the thermal
field by analogy.
Conditions for similarity of flow and thermal fields in the exchan
gers were investigated and determined.
The experiments are the starting point for the calculation of heat
transfer coefficients using experimentally obtained mass transfer coeffi
cient, and hence for flow and heat transfer modeling.

28
I — 11
CLASSIFICATION OF METHODS FOR CALCULATION OF
WATER COOLING TOWERS
V. ALlC, and S. KONCAR-DURDEVIC
School of Technology, Bcograd; Prva Iskra Enterprise, Baric
It is pointed out that the many published methods for calculation
of water cooling towers have not been classified, which makes their
application difficult.
By systematic study of 38 published methods it has been shown
that they can be classified from the following aspects:
1) the purpose; 2) the principles; 3) the way the theoretical expres
sions an: worked out; 4) the theoretical expressions; 5) the way the
parameters are defined and interpreted; 6) the accuracy.
Classification schemes according to these aspects are given.

29
I — 12
SOME EXPERIENCE WITH AUTOMATIC MONITORING OF
BOILER FEED WATER
M. IVANISEVIC
Kombinat nafte i plina, Zagreb, Rafinerija nafte, Rijeka
The Rijeka Petroleum Refinery has its own steam power plant
which provides steam for the refinery and also produces some of the
electrical energy. The water to feed this plant is pumped from a stream
which passes through the Refinery. The water is softened by decar-
bonization and ion-exchange. The water quality is checked in a laboratory.
The total hardness used to be determined by the old method with
soap-suds. Two years ago this check was made semi-automatic, so that
the total hardness is continuously monitored and the number of opera
tors reduced. At the same time the efficiency and accuracy is increased.
Some analytical data for the feed water and the results of the
earlier and the automatic monitoring are presented.

30
I — 13
EXPERIMENTAL EVALUATION OF METHODS FOR CALCULA
TING WATER COOLING TOWERS
S. KONCAR-DURDEVlC and V. ALlC
School of Technology, Beograd, Prva Iskra, Enterprise, Baric
10 methods were evaluated experimentally.
Experimental and calculated results are compared.
In the calculations the Merkel criterion was used.
Correction factors are given.

31
1 — 14
ESTIMATION OF THE LENGTH OF A VERTICAL PNEUMATIC
DRYING TUBE
B. PEROVl£
Prva Iskra Enterprise, Baric
The necessary time of contact between moist particles and the
stream of hot air in pneumatic drying plants is very short. Generally
the drying time varies from one to eight or nine seconds, according
to the moisture content of the feed material and its distribution in
individual particles.
This short drying time makes it necessary to rigorously deter
mine factors affecting it. One of these is the drying tube length.
Using the basic kinematic laws, a formula for estimating the vet tical
tube length has been worked out. It has the form
H = f(t, w, de)
where
H is the tube length;
t the required drying time;
h> the necessary air velocity;
de the equivalent particle diameter.

I — 15
A NEW AERATION SYSTEM FOR CONTINUOUS
MICROBIOLOGICAL PROCESSES
V. KRAJOVAN, S. VESELlNOVl£, and S. GA(5eSA,
School of Technology, Novi Sad
In modern continuous microbiological processes the energy spent
on aeration and all other operations is minimized. There are many
different aeration systems which meet the needs of production more
or less successfully. Data about the performance of these systems are
often contiadictory and incomplete.
The velocity of oxygen dissolution during aeration depends mostly
on rate of renewal of the liquid-gas interface. Aeration devices must
create sufficiently large interface areas to allow rapid renewal of the
contact area. Therefore air mixing must be such that the air is introduced
tangentially to the direction of movement of the liquid. Inside the
fermentor there should be static elements and the streams of liquid
must collide. All the mass inside the fermentor must be in a state of
homogenous mixing of gas and liquid in the form of foam.
A new aeration system ("Neoplanta") has been developed. In a
pilot fodder yeast plant producing 300-400 kg dry yeast per day we
obtained 56.5 % as dry yeast of the input of reducing substances with
a concentration of reducing substances in the feed of 30 g/1 and an
aeration rate of 28.6 m3 per kg dry yeast matter. With a feed concen
tration of 25 g/1, these figures were 61 % and 28.2 mi respectively.
On an industrial scale the aeration energy would be 0.4-0.5 kWh/kg
dry yeast substance.
33
1—16
EVALUATION OF SUGAR INDUSTRY EVAPORATION PLANT
WITH STEPWISE EXPANSION OF CONDENSATE
D. DORDEVlC
School of Technology — Beograd
The four-step evaporation plant serves to show that the consumption
of vapor in the first unit of the plant with stepwise expansion is about
10 % lower than when the condensate is not expanded. To shorten the
long calculation, even though an approximate method is used, the
calculation should first be made without taking into account the expan
sion of the condensate, the calculated consumption of fresh vapor should
then be decreased by 10%, and the calculation then repeated starting
from the first unit of the plant and taking into account the expansion
of the condensate.
New formulas enabling an accurate evaluation of plant utilizing
vapors obtained by stepwise expansion of the condensate are given.
3
34
1 — 17
ENERGETIC EVALUATION OF GAS DRIERS IN THE PRO
DUCTION OF SULPHURIC ACID BY THE CONTACT PROCESS
D. DELlC and D. RADOVANOVlC
School of Technology — Beograd
The usual heat balances, used for obtaining the utility coefficient
of a process are not always satisfactory. In recent times, energetic
evaluation of a process is carried out by means of a reversibility coefficient
on the basis of energy balance.
In this paper the evaluation of gas driers in sulphuric acid production
by contact process is performed by means of a reversibility coefficient.
The energy balance was obtained on the basis of matter, entropy and
enthalpy balances, and was then used to determine the reversibility
coefficient of the gas driers.
35
1 — 18
KINETICS OF DYE PENETRATION THROUGH MASS OF
TEXTILE FIBERS DYED IN ULTRASONIC FIELD
R. JOVANOVlC
School of Technology, Beograd
The effect of ultrasonic field parameters on the diffusion of the
dye through the fiber mass was studied by measuring the position of
the diffusion front microscopically, and determining the changes of dye
concentrations from the surface towards the fiber center. The distribution
of dye concentration on a cross-section of the fiber was measured by
means of a specially constructed microphotometer. Investigations have
shown that the ultrasound affects the depth of dye penetration through
fiber mass in two ways.
The presence of cavities increases the gradient of dye concentration,
on account of which the rate of mass penetration by diffusion is greater.
An intense ultrasonic field in which there are no cavities produces chan
ges in diffusion permeability of fiber and therefore the activation energy
of the dyeing process is lowered.

36
1 — 19
ABSORPTION OF CARBON DIOXIDE IN AQUEOUS SOLUTIONS
OF SODIUM SILICATE
A. TASlC, S. KONCAR-DURDEVr£, and V. VALENT
School of Technology, Beograd
The absorption of carbon dioxide in aqueous solutions of sodium
silicate was studied.
The influence of concentration, gas flow rate and rate of mixing
on the absorption involving chemical reaction, measured by means
of the pH change, were studied.
The optimal initial concentration of the solution was determined,
at which the end of reaction and the beginning of gel-structure for
mation coincide.

37
1 — 20
STUDY OF THE POSSIBILITY OF REMOVING ABS FROM
AQUEOUS SOLUTIONS BY FOAM SEPARATION
F. ZDANSKI, S. KONeAR-DURDEVl£, and N. JOVANOVlC
School of Technology — Beograd
The separation of alkyl benzene sulfonate from aqueous solu
tions in the concentration range 0.5 g ABS/1 to 0.01 g ABS/1 has been
studied. The separation was done by foaming achieved by blowing
air into the solution.
The relationships between the enriching ratio, the air flow rate,
the blowing time and the initial concentration were studied.
The reduction of the ABS concentration in the solution was up
to 87 %, while the volume reduction was relatively small. The enriching
ratio was up to over ten.

38
I — 21
PROPOSAL FOR A DEVICE FOR SUCCESSIVE WASHING AND
DRYING OF SOLID MATERIALS
S. KONCAR-DURDEVlC, B. DORDEVlC, F. ZDANSKI, and A. TASlC
Institute for Chemical, Technical and Metallurgical Research, Beograd
School of Technology — Beograd
The development of a device which permits washing or extraction
and drying of solid materials in the same apparatus is described.
Some characteristic measured parameters are given. The advan
tages of this type of apparatus compared with conventional devices
are pointed out.

39
I — 22
DETERMINATION OF THE CONCENTRATION CHANGE OF
ONE COMPONENT OF A POWDERED MIXTURE IN THE
SURFACE OF A DRIED LAYER OF ITS SUSPENSION
V. RAJKOVlC
School of Technology
The analysis of the process in the layer of suspension during drying
is outlined. A method is given for calculating the concentration change
of one component of a dispersed mixture in the surface of a dried layer
of its suspension.
The method was verified experimentally in the case of SD2O3
and Sb by quantitative X-ray diffraction analysis.

40
1-23
A CONTINUOUS BITUMEN BLOWER WITHOUT CONTAMINA
TION OF THE ATMOSPHERE
A. MOSlC, E. KNE2EVIC, J. HOLJAC, R. BUDEC and S. CURlC
Rafinerija nafte — Sisak
In production capacities larger than 100 tons per day, a plant
for continuous blowing of bitumen has great advantage over blowing
in batches. It allows better utilization of the reactor volumen, better
contact of the crude bitumen and air, uniformity of the quality of the
product and easier control of the process.
Plant for continuous blowing of 150 tons of bitumen per day
with two main and one accessory reactors was built in the petroleum
refinery in Sisak. Air, either alone or diluted with water vapor, is
introduced into the main reactor. The accessory reactor serves for
completition of the reaction and the cessation of foaming of the mass.
Thus, blowing of air or water vapor into the third reactor is not necessary.
The crude material is heated to the starting reaction temperature indi
rectly by means of distilled oil which receives heat partly from worked-up
bitumen and partly from a special tube oven and then transmits it to
the crude bitumen in the main, entering, automatically regulated heat
exchanger. This avoids the local overheatings and chemical decompo
sitions which bring about the formation of coke and plant standstills.
The problem of atmosphere contamination was successfully solved
by washing waste mists in a special scrubber and by burning up waste
gases which have a bad smell and contain cancerogenic materials.
The plant was built on site from the columns and vessels of unused
old tanks for the primary distillation of petroleum. The material of
old distillation tanks was first examined by mechanical and metallo-
graphic methods. The idea for the plant originated in the factory with
the aim of utilizing all available material and reducing expences to
a minimum; in fact the existing plant was simply reconstructed.
This reconstruction was done after two-years experimentation
whereby it was established that bitumen for civil engineering could
be obtained from mixed-basic crude petroleum from Posavina.
41
II — 1
CONDITION OF EQUILIBRIUM BETWEEN A SOLID STATE AND
ITS VAPOR
J. M. 2IVOJINOV
Institute of Physics, School of Technology
From statistical and quantum mechanical consideration of the
equilibrium between a solid and its vapor at temperatures between
0°K and the triple point it is found that the equilibrium condition
is such that the ratio of the partition functions of vapor and solid must
be constant. It is shown that this ratio is the same, however many particles
(atoms or molecules) transfer from one phase to the other, provided
that the total energy of the vapor-solid system is constant.

42
II -2
SATURATED VAPOR PRESSURE OF MONO-ATOMIC
ELEMENTS
J. M. 2IVOJINOV
Institute of Physics, School of Technology
A theoretical equation of state is given which determines the
pressure of a mono-atomic element as function of temperature. It
contains constants characteristic for a given elements Pc — critical
pressure, Tc — critical temperature, s — sublimation energy at 0°K,
w — melting energy at triple point, R — universal gas constants. In
comparison with Van der Waals equation it may be said that now the
constant s-w/RT is known for every mono atomic substance.

43
II — 3
MECHANISM OF THE EQUILIBRIUM PROCESS IN THE
"SOLID- LIQUID" LAYER
R. DESPOTOVlC, U. A. DESPOTOVlC and M. J. HERAK
Ruder BoSkovic Institute, Zagreb
From study of the adsorption-desorption equilibrium in solid-
-liquid systems the quantitative ratios for dynamic equilibrium bet
ween cations of various valencies in the adsorption layer have been
determined.
These results may also be applied in the study of decontamination
processes. The results of experiments on europium decontamination
from polystyrol and DURAN 50 glass surfaces are given and compared
with quantitative data for the model systems.

44
II — 4
ELECTRON-MICROSCOPIC INVESTIGATION OF POROUS
STRUCTURE OF CATALYSTS IN CARBON MONOXIDE
CONVERSION
P. PUTANOV, D. KARAULlC and 2. JOVANOVlC
Institute for Chemistry, Technology and Metallurgy Beograd
The surface configuration of various catalysts for the conversion
of carbon monoxide has been investigated.
Reproduction of catalyst surfaces was carried out by the method
of replicas; a polystyrene film was used for the preparation of the
first reprint.
Data obtained in the study of the porous structure of investigated
catalysts may be used for a complex estimation of their qualities,
especially with respect to optimal diffusion of reactants in the conversion
process.

45
II — 5
RELATION BETWEEN POROSITY AND SPECIFIC SURFACE
OF IRON-CHROMIUM CATALYST IN CARBON MONOXIDE
CONVERSION
P. PUTANOV, A. TERLETCKI, 2. JOVANOVlC and D. KARAULlC
Institute for Chemistry, Technology and Metallurgy
Beograd
In the study of the relation between the activity and textural pro
perties of catalysts for the conversion of carbon monoxide, a detailed
investigation of the relation between the porosity and specific surface
of iron-chromium catalysts was performed.
Porosity was determined by means of apparent and actual densities,
and specific surfaces were determined by the BET method. The results
show that there is no strict dependence among the textural properties
observed, but it would be possible to combine these magnitudes in
order to achieve the desired properties of the catalyst.

46
II — 6
AN ATTEMPT TO INTERPRET THE MECHANISM OF THE
DIRECT SYNTHESIS REACTION OF METHYL-CHLOROSILA-
NES ON THE BASIS OF THE ELECTRONIC THEORY OF
CATALYSIS
M. DRAGOJEVIC
School of Technology, University of Beograd
Starting from the fact that minimal quantities of admixtures can
have an important influence on the rate of the direct synthesis reaction
of methylchlorosilanes, a new mechanism of this reaction is proposed.
The considerations are based on the semiconducting and doping proper
ties of silicon in the light of the electronic theory of catalysis.

47
II — 7
THERMODYNAMICS OF THE HYDROLYSIS OF
POLYVALENT METAL IONS
Z. PAVLOVlC and D. DORDEVlC
School of Technology, Tuzla
The process of ion hydrolysis has been experimentally investi
gated by many authors. From their experimental values for the hy
drolysis constants the standard free energies AF° (kcal/mol) for
individual products of hydrolysis of metal ions have been worked
out. By comparing the A F° value in a water solution with that
for the final product of the hydrolysis, i. e. the metal hydroxide, and
with the calculated A F° values for the hydrolysis products, a linear
relationship between A F° for hydrolysis products and the number
of bound OH9 groups was found.
According to M. W. Latimer certain metal ions, i. e. their hydro
lysis products, deviate from this rule, e.g. In3+. However according
to Biederman and Norman the A F° calculated for InOH + + from
K - hydrolysis obeys the above linear relationship. Lineartity has also
been confirmed for polynuclear ions which are formed by hydrolysis
interaction if the OH - groups are reduced to one metal ion. Using
this linearity it is possible to predict graphically A F°s for metal ion
hydrolysis products which have not yet been determined experimentally
or for which the standard free energies are not known, using the known
A F° values for the free ion and the metal hydroxide. Formulas have
been established for calculating the standard free energy A F° for the
hydrolysis products of metal ions.
48
II — 8
THEORETICAL AND EXPERIMENTAL THERMODYNAMICS
OF PRECIPITATION OF Mn2+ IN THE PRESENCE OF AIR
Z. PAVLOVlC and R. POPOVlC
School of Technology, Tuzla
The behaviour of Mn2+ ions in sulphate solution during pre
cipitation and the influence of atmospheric oxygen on an insufficiently
isolated system is considered from the standpoint of electrochemical
thermodynamics. The system Mn2+ - water solution and Mn3+ - water
solution are theoretically treated separately. The homogeneous and
heterogeneous equilibriums of the system which are observed on the
log a - pH graph are considered. The equilibriums of the oxidation of
manganese on the V. A. (Voltcalories) - pH graphs are also considered.
The effect of oxygen on the precipitation of Mn (OH)2, and the
possibility of its conversion into oxides — MnO, Mn2O3, Mn3O4,
MnO2, were examined by studying the pH and the way the final equ-
librium is established.
Marked changes in the quantity of NaOH required to neutralize
the N2SO4 present in the system and after precipitation were noted.
From the obtained results it may be concluded that no one of the above
oxides is the final precipitate, but that it is actually a heterogeneous
mixture consisting of them.

49
II — 9
VARIOUS TRANSFORMATIONS IN PETROLEUM-COKE
B. PANDlC
Ruder BoSkovic Institute, Zagreb
The process of graphitization of petroleum-coke in the temperature
range 1400 to 2800 °C was investigated. Above 1900 °C, when most
of the primitive crystallites formed are of hexagonal orientation, the
crystallization proceeds simultaneously in two independent ways. Some
of the crystallites continue to grow in rhomboidal modification which,
at 2200 °C, passes over into hexagonal. At 2400 °C, these crystallites
acquire an ideal arrangement, forming a graphite phase. The rest of
the crystallites grow more slowly, without achieving complete order,
thus forming a nongraphite phase.
The process of crystallite growth was investigated and the volume
ratio of phases is given in a temperature-time diagram.

5o
II — 10
REACTIONS BETWEEN ORGANIC AND MINERAL MONOBASIC
ACIDS AND Na2W04
M. V. SUSIC, D. S. VESELINOVlC, and D. 2. SU2NJEV1C
School of Science, Beograd and The Institute for Chemistry, Technology and Metal
lurgy, Beograd
The reactions between Na2WO4 and HCOOH, C6H8O6, CH3COOH .
CH3CH2COOH, HC1 and HNO3 have been studied by pH and con
duction measurements using the continual variation method and titra
tion. It has been found that organic acids form complex anions of
the type [WO3AC2P Ac (monobasic acid anion). Organic and mineral
acids, through the influence of the H + ion, form two types of polyanions,
HWftO5-2i and W4O2_i3 and strong mineral acids exclude colloidal
tungstic acid. Hexatungstic anion forms at pH %6 — 7, and metatung-
stic and complex anion simultaneously at pH < 6. A provisional
value of the hexatungstic anion polymerization constant for ionic
strength \x = 0 at 25 °C, pK' = 60 is calculated from the pH measu
rements.

51
II — 11
COMPLEX COMPOUNDS OF 1-ASCORBIC ACID AND METAL
IONS IN ACID MEDIUM
D. S. VESELINOV1C and M. V. SuSlC
School of Sciences, Beograd and Institute for Chemistry, Technology
and Metallurgy, Beograd
Studies of reactionsof UO2+ +,Zn++,Co++, Ni++,Mn++ Pb++,
Cd++,Ca+ + and A1 + + + ions and 1-ascorbic acid, by the continual vari
ation method of measurement, have shown that all the bivalent ions
form cationic complexes of the [MeA]T type (Me- bivalent metal ion;
A- anion of monobasic 1-ascorbic acid). Aluminum also forms an
[A1A2]+ cationic complex. Dissociation constants of these complexes
for ionic strength (x = 0, at 25 °C, have been determined [pK = 3.04
(U), pK = 1.4 (Co), pK = 1.05 (Ni), pK = 1.1 (Mn), pK = 1.0 (Zn),
pK=1.8 (Pb), pK=1.3 (Cd), pK = 1.05 (Ca), pK = 3.7 (Al)].

52
II — 12
STRUCTURAL FORMULA OF TINCALCONITE AS
DETERMINED BY PROTON MAGNETIC RESONANCE
B. BELINA and Z. VEKSLI
From the proton magnetic resonance spectra of tincalconite re
corded between — 1 53 °C and + 80 °C. OH — groups and water
molecules were established. By dehydration at 88 °C over P2O5 in
vacuum tincalconite loses three water molecules per formula unit with
an amorphous remainder. The proton resonance line-shape of this
dehydration product corresponds to the OH-group spectrum. The
comparison of the experimental curve at low temperatures with the
oretical curves for two different OH : H2O latios suggests that Na2
[B4O5 (OH)4]. 3H2O is the correct formula for tincalconite. This means
the polyanion is the same as in borax, which fully agrees with crystallo-
chemical requirements in this series of compounds.

S3
11-13
SOME PROBLEMS CONNECTED WITH PREPARATION OF
SULPHUR - CONTAINING SAMPLES FOR
MASS - SPECTROMETRIC ANALYSIS
D. STEFANOVlC, L. KLASINC, D. PAVLOVlC and S. ASPERGER
Ruder BoSkovic Institute, Zagreb
There are several methods for preparing samples for mass-spectro-
metric isotope analysis of sulphur. These methods were compared to
find the most convenient one for organic compounds. The influence
of impurities on the measured isotope ratios is discussed.

54
II- 14
ALKALINE OXIDIZING ROASTING OF PYROLUSITE
S. DORDEViC, P. M. RAKIN and M. VOJNOVIC
School of Technology, Beograd and Institute for Chemistry, Technology and Metal
lurgy, Beograd
A number of experiments have been made on oxidizing roasting
of pyrolusite to find the conditions for the highest yield of potassium
manganate.
To avoid difficulties which occur at the beginning of heating of
the charge, a new way of heating was developed whose essential fea
ture is alkaline oxidizing heating in two operations.
Using raw materials of specified quality, the yield of potassium
manganate was examined as a function of: 1) heating temperature,
2) heating time, 3) partial pressure of oxygen and water vapor in the
reaction atmosphere, 4) grain size of raw materials.
The results are presented in tables and graphs and discussed.

55
II -15
ANODIC OXIDATION OF AMMONIA ON PLATINIZED
PLATINUM ELECTRODE
A. R. DESPlC, D. M. DRA2IC and P. M. RAKIN
School of Technology, Beograd
A galvanostatic method was used to follow the potential-time
dependence during polarization of a platinized platinum electrode
in strong alkaline solutions of ammonia at different concentrations.
The experimental results were used to determine characteristic electrode
parameters. Some effects were observed which have not been reported
in the literature so far. Possible mechanisms of anodic oxidation are
discussed.

56
II -16
ANODIC OXIDATION OF ETHANOL
V. DRAZlC, D. DRA2l£ and B. NIKOLIC
School of Technology and Institute for Chemistry, Technology and Metallurgy,
Beograd
The establishment of specific potentials at a platinized platinum
electrode in IN KOH containing ethanol has been examined. The
galvanostatic method for determining the behavior structure of the
total electrode overpotential at different anode currents was used.
On the basis of the results the mechanism of the electrochemical
reaction of the oxidation of ethanol is discussed.
57
11-17
POWDER HYDROGEN ELECTRODES
D. M. DRA2lC, A. R. DESPlC and I. V. KADIJA
School of Technology and Institute for Chemistry, Technology and Metallurgy,
Beograd
The influence of the construction of the holder of a powder elec
trode on the contact between the particles of the active powder and the
corresponding ohmic potential diop has been investigated. A construction
has been worked out which practically eliminates these effects.
It has been shown that such electrodes, beside their use in fuel
cells, can be used for laboratory examination of the electrochemical
activity of different catalytically active powders.
The electrochemical characteristics of three different kinds of
active powder were determined : Raney-nickel, specially treated fibrous
nickel, and porous nickel.

58
11 — 18
A POWDER OXYGEN ELECTRODE
A. R. DESPIC, D. M. DRA2IC and G. A. SAVIC-MAGLIC
School of Technology and Institute for Chemistry, Technology and Metallurgy,
Beograd
The catalytic activity of Raney-silver powders of different grain
size distribution has been investigated. The results show that the Raney-
-silver powder electrode has similar electrochemical characteristics
to the Justi-type sintered Raney-silver electrode.
The possibility of decreasing the weight and cost of the electrodes
by using nonmetalic materials for the inactive supports of the catalytically
active components was examined. It has been shown that silver-plated
glass fibres and particles of a cationic exchange resin, packed in a sui
table way, give electrodes of the same quality as those made with Raney
silver.

59
II -19
STUDY OF ELECTROLYTIC OXIDATION OF POTASSIUM
MANGANATE
P. S. TUTUND2IC, M. VOJNOVlC and P. RAKIN
Institute for Chemistry, Technology and Metallurgy Beograd, and School of Techno
logy Beograd
An attempt was made to follow the piocess of electrochemical
oxidation of potassium manganate by measuring the potential of an
inert electrode immersed in the electrolyte during electrolysis. This
avoids the use of standard analytical methods which are not simple
and do not give satisfactory results.
A platinum electrode was used. Its potential was measured rela
tive to an Hg/HgO reference electrode and was registered continuously
during the electrolysis. The results indicate that this method could be
used for automatization of the process.
60
11-20
ADSORPTION OF ARSENIC ON FERIC HYDROXIDE
S. DORDEVlC, U. RIKALOVlC, and M. TUCAKOV
School of Technology, Beograd
In the hydrometallurgy of zinc the solution is commonly puiified
of arsenic by precipitation with ferric hydroxide, but there are different
opinions about how the arsenic precipitates. Some authors consider
that it is adsorbed on ferric hydi oxide and others that it reacts with
ferric hydroxide to form compounds.
By precipitating ferric hydroxide under the same conditions as
in the leach we proved that arsenious and arsenic ions are adsorbed
on it, because it was possible to fit the results to Freundlich's adsorption
isotherm.

61
II -21
LIQUID-VAPOR EQUILIBRIUM AND THERMODYNAMIC
PROPERTIES OF AMMONIA-DIMETHYL ETHER AND SULFUR
DIOXIDE-DIMETHYLETHERSYSTEMS
J. PUPEZIN, S. RIBNIKAR, Z. KNEZEVlC, and V. DOKlC
Liquid-vapor equilibrium data for the systems Me2O-NH3 and
Me2O-SO2 are presented and used to evaluate the excess thermodynamic
functions.
The system Me2O-NH3 forms a positive azeotrope with mole
fraction 0.33 in Me2O at the normal boiling point of —37.5 °C. The
excess free energy is almost regular at —50 °C, with a maximum of
150 cal/mole. The maximum of the excess enthalpy is 110 cal/mole
at a mole fraction of Me2O 0.45.
The excess entropy is negative. The results are discussed with
regard to weakening of the hydrogen bonds in liquid ammonia by
addition of dimethyl ether.
The system Me2O-SO2 forms a negative azeotrope with mole
fraction of Me2O 0.41 at the normal boiling point of 0.4 °C. The excess
free energy, enthalpy and entropy are negative, and almost symmetrical;
their values in the equimolar mixture at —32.5 °C are —0.45, —1.20
and —0.75 kcal/mole, respectively. It was found that the theory of
ideal associated mixtures can be successfully applied to the Me2O-SO2
mixture.
62
II -22
MASS SPECTROMETRY ISOTOPE ANALYSIS OF CHLORINE
BY THE SURFACE IONIZATION METHOD
K. ZMBOV
Boris Kidric Institute of Nuclear Sciences, VinCa
A mass spectrometry method for isotope analysis of chlorine from
solid samples is described. BaCl2 samples are ionized in a surface ioni
zation ion source.The temperature dependence of the Ba + and BaCl+
ion currents are measured. Ion intensities of the order of 10-" amps
are obtained with microgram samples, allowing precise isotope analysis.

63
11-23
SECONDARY a-DEUTERlUM ISOTOPE EFFECTS IN THE
REACTION OF2-PHENYLETHYLTRIMETHYLAMMONIUM ION
WITH HYDROXIDE ION IN AQUEOUS SOLUTION AND WITH
ETHOXIDE ION IN ETHANOL
L. KLASINC, D. PAVLOVIC, S. ASPERGER
Ruder BoSkovic Institute, Zagreb
Secondary a-deuterium isotope effects in the reaction of 2-phenyl-
ethyltrimethylammonium iodide with ethoxide ion in ethanol at 40.0°
and with hydroxide ion in aqueous solution at 97.0° have been found
to be very small. The results suggest that the hydrogen compound reacts
slightly faster than the deuterium compound. The secondary a-deuterium
isotope effect in the reaction of 2-phenylethyl bromide with sodium
ethoxide in ethanol is appreciably larger — 9 percent per deuterium
atom at 59.8°. The implications of these results with regard to the
reaction mechanism are discussed.

64
11-24
NEW METHOD OF DETERMINING THE ACTIVITY OF
THETIN-HOMOCYSTEINE METHYL-PHERASES
P. BERKES-TOMASEViC, M. SLAVIC, and I. BERKES
The new method for determining the activity of thetin-homo-
cysteine methylpherases is described. The homocysteine left after
transmethylation is determined. Homocysteine is also assayed in an
aliquot without dimethyl-(3-propiothetin. Methionine is calculated
from the difference. To get the differences of the concentration of ho
mocysteine the total amount of thiol group, i.e. —S—S— and —SH
functions, was measured amperometrically after Benesch and Benesch.
Ten or more samples were done in parallel. The results are evaluated
statistically and presented in tables.
Using this method the optimum pH and the optimum concentra
tions of both substrates were determined.
65
III — 1
THE STRUCTURE AND REACTIONS OF SOME
MERCAPTOPYRIDAZINES
A. POLAK, B. STANOVNIK and M. TlSLER
Department of Chemistry
University of Ljubljana
Among the heterocyclic compounds with thicamide groups in
the ring system, 3-mercapto-6(lH)-pyridazinthione is particularly
interesting with regard to structure and reactivity. The pK values
determined and spectroscopic evidence show that it exists predomi
nantly in the monomercapto monothione form with a thioamide group
with a strongly dipolar character.
We tried some reactions characteristic for thiols with this compo
und. We perfomed some addition reactions with acrylonitrile, ethyl
acrylate and cyclopentadiene. Addition of all these compounds inva
riably involved the 3-mercapto group, as was proved by independent
synthesis involving alkylation which gave identical products. The
addition product with cyclopentadiene further reacted in a Diels-Alder
reaction with another molecule of cyclopentadiene; the product was
identical with that of the reaction with dicyclopentadiene.
Hydroxymethylation and aminomethylation of the compound were
also studied. Hydroxymethylation yielded a bis-hydroxymethyl derivative.
It was established that one ofthe hydroxymethyl groups was bound on the
ring nitrogen at position 1 of the pyridazine system and the other on
the exocyclic sulfur at position 3. Aminomethylation yielded, depending
on the reaction conditions, a mono-Mannich base or a bis-Mannichbase.
With further chemical transformations it was shown that mono-amino-
methylation proceeds at position 1 of the pyridazine system. However
the bis-aminomethylated product is analogous to the bis-hydroxymethyl
derivative. Further evidence which supports the proposed structures
was obtained by comparing the UV spectra with those of the parent
compounds. Pyridazines which contain only one thioamide group,
e.g. 3-chloro-6(lH)-pyridazine-thione, are only aminomethylated at
position 1 .
5

66
m-2
NITRATION AND SULFOCHLORINATION REACTIONS OF
N-METHYLACETANILIDE
O. STOJANOVIC, G. BONCIC-CARICIC (Mrs) and D. DIMITRIJEVIC
Institute of Organic Chemistry, School of Technology Beograd
In previous papers we stated that with N-methylacetanilide it
was not possible to perform the well known Friedel-Crafts reaction,
which proceeds without difficulties with acetanilide. To study the effect
of the N-methyl-acetyl group, we investigated the reactions of nitration
and sulfochlorination of N-methylacetanilide.
Nitration of N-methylacetanilide was more difficult than nitration
of acetalinide, which is in agreement with recent literature data. How
ever it was successful, and produced a good yield of o-and p-derivative.
The o to p ratio was not determined.
It was also possible to perform the sulfochlorination reactions
of N-methylacetanilide, but it was noted that the necessary conditions
were a little more strict. A very poor yield was obtained and according
to IR spectrography mainly o-derivative.
67
III-3
REACTIVITY OF PYRIDINEDICARBOXYLIC ACID
MONOMETHYLESTERS WITH DYPHENYLDIAZOMETHANE
IN ETHANOL
M. MUSKATIROVlC, 2. TADIC and D. DIMITRIJEVIC
Institute of Organic Chemistry, School of Technology, Beograd
Earlier we studied pyridinemonocarboxylic acids by means of
the rate constants of their reactions with DDM in ethanol, and con
cluded that their reactivities, with regard to the position of the car-
boxylic group, decrease in the order 4>2>3. This order disagrees to
some extent with previous opinions.
In the present work, the reaction rates of pyridinedicarboxylic
acid monomethylesters with DDM in ethanol were measured. It was
concluded that the relative position of the carboxylic and carbmethoxy
groups being the same, the carboxylic group's reactivity depends on
its position relative to the nitrogen atom in the pyridine nucleus as in
the case of pyridinemonocarboxylic acids. In other words, the order
of reactivity is 4>2>3.
It was further concluded that the rate constants depend on the
presence and position of the nitrogen atom in the pyridine nucleus,
while the influence of the carbmethoxy group is limited almost exclusively
to steric hindrance of carboxylic participation in the resonance of the
pyridinecarboxylic acid molecule.
3»

68
ni— 4
CONTRIBUTION TO THE STUDY OF COPOLYMERS OF
UNSATURATED POLYESTERS ON THE BASIS OF 2,2-(DI-
PHENYL-4, 4-DIHYDROXYETHYLETHER)-PROPANE
B. BASTlC and B. TOMlC
School of Technology, Beograd and Idol Chemical Products, Novi Sad
Glycolic components of unsaturated polyesters were replaced
by 2,2-(diphenyl-4,4-dihydroxyethylether)-propane whereas the un
saturated (phtallic and maleic) and saturated dicarboxylic acid remained
unchanged. On account of the increased distance between the ester
groups, the properties of the polycondensate and of its copolymers
were altered. The copolymerization of the polycondensate was first
effected, and then the action of various chemical reagents was investi
gated. Considerable improvements of properties with respect to copo
lymer polycondensates containing glycolic components were established.
The presence of free hydroxyl groups was proved by isocyanate; sub
sequent esterification of these groups with fatty acids was followed by
copolymerization with monomers. Copolymers were found to be more
resistent to the action of mild alkalies, glycol, glycerol and some other
chemical agents.

69
III — 5
EFFECT OF SOLVENT ON PROPERTIES OF POLYSTYRENE
OBTAINED BY STEREOSPECIFIC POLYMERIZATION
P. PUTANOV, S. PETROVlC and B. VUCUROVlC
Institute for Chemistry, Technology and Metallurgy Beograd
Polystyrene was polymerized in different solvents in the presence
of Ziegler's catalyst A1(C2H5)3 — TiCU. The effect of these solvents
on the stereospecifity of the polymerization was investigated.
The solvents studied were benzene, toluene and xylene.
The effects of the solvents under identical experimental conditions
was studied by comparing molecular weights, specific gravities, melting
points, color and yields of polymers.
70
III — 6 _
CONDENSATION OF o-AMINOPHENOL WITH
PHYRIDINECARBONIC ACIDS
B. BASTlC and M. PILETlC
School of Technology, Institute for Organic Chemistry, Beograd
We earlier published the results of reactions between pyridine-
monocarbonic acids and quinoline and cinchomeronic acid with
o-aminothiophenol, in the presence of polyphosphoric acid.
In this work we condensed the same acids with o-aminophenol,
in the presence of polyphosphoric acid as catalyst and solvent— with
out which the reaction will not go. The reaction products were the
corresponding pyridyl-benzoxsazoles, some of them previously unknown.
In some cases intermediaries, which indicate the course of the reaction
were isolated.

71
m-7
SYNTHESIS OF BIS (2-CHLORETHYL) FORMAL
V. REKALIC, M. TENC-POPOVlC and S. RADOSAVLJEVlC
Institute of Inorganic Chemistry, School of Technology and Institute for Chemistry,
Technology and Metallurgy, Bcograd
The synthesis of bis (2-chlorethyl) formal with and without addi
tion of catalysts is reported. Calcium chloride and sulfuric and hydro
chloric acid were used as catalysts. The following conditions were deter
mined: quantities of catalysts, reaction time and temperature.

72
III -8
REACTIVITY OF PYRIDINE-2-CARBOXYLIC ACIDS 1-OXIDES
IN THEIR REACTION WITH DIPHENYLDIAZOMETHANE
D. DIMITRIJEVIC, 2. TADIC and M. MISlC-VUKOVIC
Institute of Organic Chemistry, School of Technology Beograd
In previous papers we reported on studies of the reactivity of
pyridine monocarboxylic acid-l-oxides with diphenyldiazomethane.
The rate constants were compared with the corresponding ones for
pyridinemonocarboxylic acids, and the exceptionally low reactivity
of the 2-carboxylic group was observed. It was concluded that this
fact cannot be explained only in terms of electron density effects due
to the particular relative position of the carboxylic and the 1-oxide
group.
To learn more about this phenomenon the reaction rate constants
of monomenthylesters of pyridine carboxylic acid-l-oxides and of
pyridine dicarboxylic acid-l-oxides with a 2 carboxylic group were
investigated.
It was expected that determining the rate constants under suitable
reaction conditions would give more information about the reactivity
of the a-carboxylic group.
By comparing the rate constants obtained in this way and using
data about the reaction products and the IR spectra, it was concluded
that there is a hydrogen bond between the carboxylic group in position
2 and the — N+0- group, which explains the low reactivity of this
carboxylic group.
73
III -9
MAXIMUM OVERLAP HYBRIDIZATION IN CYCLOPROPANE
AND SOME RELATED MOLECULES
Z. MAKSlC and M. RANDlC
Ruder BoSkovic Institute, Zagreb
The hybridization in cyclopropane, spiropentane, nortricyclene
and 1,1 -dimethyl cyclopropane is calculated on the criterion of maxi
mum overlap. The s-p content in the general hybrids is found to be
sensitive to changes in the interorbital angle 0jj . The results give infor
mation about the strain associated with bent bonds and its deloealization.
The procedure also allows calculation of skeletal angles, such as Ci C2 C3
in nortricyclene, which determine the geometry of the molecule.

74
III — 10
1, 4-DI-w-ALKYLBENZENES — DETERMINATION OF THEIR
STRUCTURES BY PHYSICAL METHODS
J. JOVANOVlC
Petroleum Institute, Hanover and School of Technology — Beograd
A) Symmetrical 1,4-di-w-alkylbenzenes containing 16, 20, 24 and
26 C-atoms in primary n-alkyl chains were synthesized by the following
reaction steps: alkanophenone, alkylbenzene, and/valkyl alkanophenone.
B) Symmetrical 1 ,4-di-n-alkylbenzenes containing 16 and 30
C-atoms in secondary n-alkyl chains were synthesized by the following
reaction steps: alkanophenone, dialkylphenyl carbinol, alkylbenzene,
/7-alkylalkanophenone and dialkyl-(/?-alkyl)-phenyl carbinol.
Their stuctures were determined by means of infra-red spectra,
gas chromatography and mass spectrometry.

75
III- 11
THE EFFECT OF ALCOHOLS ON SOME PROPERTIES OF
DODECYLBENZENE-SULFONATE SOLUTIONS
D. DZOKlC
School of Technology, Beograd
Some properties of dodecylbenzenesulfonate solutions in the
presence of methyl, ethyl, n-butyl, n-amyl and n-hexyl alcohol were
investigated.
The wetting and foaming increase with increasing dodecylben
zenesulfonate and alcohol concentration in the following sequence:
methyl — ethyl — n-butyl — n-amyl — n-hexyl.
The effect of alcohol on the surface tension of dodecylbenzene
sulfonate was also determined.
76
III- 12
TEXTILE DYEING IN PRESENCE OF ORGANIC SOLVENTS
D. DZOKlC and R. TRAJKOVlC
School of Technology, Beograd
The possibility of dyeing textiles in the presence of certain organic
solvents was investigated. It was established that with small concen
trations of certain solvents the exhaustion of dyes is improved. Under
such conditions the time of half-dyeing is reduced and dyeing is possible
at lower temperatures.

77
III -13
SAPONIFICATION OF PECTIN IN PLANT MATERIALS AND
EXTRACTION OF SODIUM PECTATE
M. DZAMlC and J. NEUKOM
Agriculturchemisches Institut ETH, Zurich and Agriculture School, Beograd
Conditions of saponification of pectic substances in apple pulp
and extractions at different temperatures were studied.
It was found that by alkaline treatment and extraction at 0 °C,
it is possible to get good yields of high molecular sodium pectate.
It also appears that there were some differences in properties
of pectin obtained under different conditions.
78
III — 14
PREPARATION OF FODDER YEAST FROM FEEDS OBTAINED
BY MILD HYDROLYSIS OF WHEAT HAY, SUNFLOWER
HUSKS AND MAIZE EARS
V. KRAJOVAN, S. VESELINOVIC and B. GRUBNIC
School of Technology, Novi Sad
Hydrolysis of wheat hay, sunflower husks and maize ears was
carried out at 125 °C for one hour. In case of hay and maize the hy-
dromodule was 1 : 4 and in case of sunflower husks 1 : 7. Hydrolysis
was effected with sulphuric acid whose concentration varied from
0.0 to 3.0 %. It was established that 3.92—43.56 % of the dry wheat
hay material was hydrolyzed giving 3.29 to 24.16% of reducing sub
stances (calculated with respect to starting material). From 6.4 to
47.20 % of the dry maize ears material was hydrolyzed giving from
1.55 to 40.90% of reducing substances (calculated with respect to
starting material). With the sunflower husks, from 3.35 to 33.20 %
of the dry material was hydrolyzed and from 0.45 to 13.55 % of reducing
substances was obtained.
Yeast propagation from the wheat hay gave 56.5 % of dry yeast
material calculated with respect to the reducing substances or 10.7 %
when calculated with respect to hay. With sunflower husks a yield of
45 % of dry yeast material was obtained, with respect to reducing sub
stances, or 8.56 % with respect to starting material. With maize ears
a yield of 52.6 % of dry yeast material was obtained calculated with
respect to reducing substances or 18.80% when calculated with respect
to starting material.

79
III — 15
ISOMERIZATION OF PRIMARY GASOLINES
R. VILEN&C
Zagreb, Miljacka 44/111
In order to establish whether ionic exchangers may be used as
catalysts in the isomerization of hydrocarbons, a series of experiments
were performed with primary gasolines from Struzec petroleum.
Seven types of cationic exchangers were used.
The effect of y -radiation on gasoline hydrocarbons was also inves
tigated.
Isomerization reactions were followed by means of gas chromato
graphy, infra-red spectra and octane ratings.
Cationic exchangers were found to produce considerable structural
changes in fractions containing C5- and C^-hydrocarbons, less changes
in fractions with C7-hydrocarbons and only slight changes in fractions
consisting of C8—C10 hydrocarbons.
y-radiation was also found to produce isomerization of primary
gasolines.
Optimal duration of contact of the hydrocarbons with ionic exchan
gers in isomerization reactions was determined.
It was established that the capacity of dry exchanger considerably
affects the isomerization process and the intensity of changes observed.

80
III — 16
SYNTHESIS OF POLYSULFIDE POLYMERS
M. TENC-POPOVlC, O. OLlC-LEKO, V. REKALlC and S. RADOSAVLJEVlC
Institute for Chemistry, Technology and Metallurgy and School of Technology,
Beograd
Polysulfide polymers with formula (— R-S* —)„ can be prepared
by reaction of alkyldihalides and alkali polysulfides.
The reaction conditions with 1,2-dichlorethane, bis (2-chlorethyl)
ether and bis (2-chlorethyl) formal were investigated.
The quantities of the components and the dispersion agent, reaction
time and temperature were varied.

81
III —17
SEPARATION OF A MIXTURE OF TRIMER AND TETRAMER
OF PHOSPHORNITRILE CHLORIDE
J. SASiC and S. RADOSAVLJEVlC
Institute for Chemistry, Technology and Metallurgy Beograd
According to the literature pure trimer is obtained by steam distil
lation whereas the tetramer is hydrolyzed to tetramethaphosphinic
acid under these conditions. In the present paper it has been shown
that the tetramer is not hydrolyzed under these conditions. Even on
prolonged treatment with water at the same temperature only a small
percentage of tetramer was found to be hydrolyzed. Thus, this method
can be used for the separation of trimer and tetramer of phosphornitrile
chloride.
6

82
III — 18
CONCERNING THE SYNTHESIS OF PHOSPHORNITRILE
CHLORIDE
S. RADOSAVLJEVlC and J. SASl£
Institute for Chemistry, Technology and Metallurgy, Beograd
The effects of catalysts (ignited MgCl2.6H2O and TiCl4), molar
ratio of reactants, and temperature of the yields of the crystalline fraction
in the synthesis of phosphornitrile chloride of various polymerizations
were investigated. The polymerization was carried out in monochlo-
robenzene as solvent. The following conditions were found to be opti
mal: MgCl2-6H2O as catalyst, molar ratio of reactants NH4CI : PCI5
= 2:1, and temperature 129—130 °C.

83
III- 19
ON THE ACTION OF METALLIC MAGNESIUM ON NITRIC
ACID
(Preliminary communication)
A. M. LEKO and M. A. LEKO
Institute of Inorganic Chemistry — School of Technology and Institute for Chemistry,
Technology and Metallurgy, Beograd
The action of metallic magnesium on nitric acid of different con
centrations was investigated. The degree of reduction and the quantity
of hydrogen evolved as function of the nitric acid concentration were
determined. Of the products of reduction only the nitrous acid was
determined, by dissolving magnesium in the presence of m-phenyle-
nediamine.
6«
84
III — 20
INCREASING THE UTILIZATION COEFFICIENT OF NaCl
FROM SULPHATE TYPE BRINES
s. pribiceviC
Institute for Mining, Technology and Chemistry, Tuzla
The changes of the NaCl utilization coefficient on evaporation
of brines are surveyed. The utilization coefficient for Yugoslav brines
has been found to be 0.45 to 0.83. A method for the evaporation of
brines with soda factory waste water containing CaCl2 is proposed.
This would increase the utilization coefficient by at least 100/. Since
in this way Na2SO4 is converted into NaCl, and the sewage from the
factory contains sodium chloride, the theoretical utilization coefficient
for Yugoslav brines would be augmented from 0.45 to 1.14 and from
0.83 to 1.04 (calculated with respect to sodium chloride present in
brine).
Conditions for mixing brines and the waste water are described.
The behavior of calcium sulphate in brine systems was investigated
and a scheme for its removal is presented. Data on features of the use
of soda factory waste water in the sodium chloride industry are given
and four different technological schemes have been designed on the
basis of these.

85
III -21
STUDY OF THE REACTIONS OF HEXANITROCOBALTATES
(HI) WITH AMINO ACIDS.
II. REACTIONS WITH DL-ALANINE, 0-ALANINE, DL-a-AMINO-
BUTYRIC ACID AND DL-VALINE
M. B. CELAP, T. I. NIKOLlC, T. J. JANJlC and M. B. DIMITRIJEVIC
Institute of Chemistry, School of Sciences, University of Beograd and Institute of
Chemistry, Technology and Metallurgy, Beograd
In an earlier paper we reported on the reaction of potassium and
sodium hexanitrocobaltate (III) with glycine. Thereby we established
that four nitro-groups in the complex ion are substituted by two gly
cine rests, i.e. that this amino acid behaves as a bidentate ligand forming
two five-membered rings with the central cobalt atom. It was thus
possible to prepare a new class of complex compounds: dinitrodigly-
cinatocobaltates (III), M1[Co(H2N - CH2 COO)2(NO2)2].
Continuing our investigations, we examined the reactions of alkali
hexanitrocobaltates (III) with DL-alanine. (3-alanine, DL-a amino-butyric
acid and DL-valine. We have established that these reactions take place
in a way analogous to that described above, giving rise to four new
classes of complex compounds of trivalent cobalt with amino acids:
1. Dinitrobis (DL-alaninato) cobaltates (III),
M 1 [Co (H3C . CH COO)2 (NO2)J
NH2
2. Dinitrobis (|3-alaninato) cobaltates (III)
M 1 [Co (H2N - CH2CH2COO)2 (NO2)2]
3. Dinitrobis (DL-a-aminobutyrato) cobaltates (III).
M 1 [Co (H3C - CH2CH - COO)2 (NO2)J
NH2

86
4. Dinitrobis (DL-divalinato) cobaltates (III)
M 1 j^Co |"3£ > CH - CH . COO)j (NO2)2 J
The corresponding silver and mercurous salts were obtained by
double decomposition of alkali salts of the compounds described
with silver and mercurous nitrate, respectively.
In addition, these complex compounds were also synthesized by
air oxidation of cobalt (II) to cobalt (III) in the presence of alkali nitrites
and alkali salts of the corresponding amino acid.

87
III — 22
TECHNOLOGICAL SCHEME FOR THE PRODUCTION OF
NaCl FROM SULPHATE TYPE BRINES
s. pribi£evi£
Institute for Mining, Technology and Chemistry, Tuzla
A technological scheme based on the removal of SO4 ions by con
verting brines into an NaCl-CaSO4-H2O system is presented.
Precipitated gypsum is removed and the brine is treated with soda
and converted into NaCl-Na2SO4-H2O system whereby 78—95 %
SO4 ions are eliminated.
The effects of various factors on the process were investigated.
Such as the effect of SO4 ion concentration in the crude and concentrated
brines, the concentration of CaCl2 in waste brines, the effect of tempe
rature, etc. Optimal conditions for the process were established.

88
HI -23
STUDY OF THE REACTIONS OF HEXAN1TROCOBALTATES
(III) WITH AMINO ACIDS. III. DETERMINATION OF THE
CONFIGURATION OF DINITRODIGLYCINATOCOBALTATES
(HI).
M. B. CELAP, D. J. RADANOVIC and T. J. JANJIC
Institute of Chemistry, School of Sciences, University of Beograd and Institute of
Chemistry, Technology and Metallurgy, Beograd
In a recent paper we established that the action of glycine on he-
xanitrocobaltates (III) gives rise to a new class of complex compounds
of tervalent cobalt with amino acids: dinitrodiglycinatocobaltates (III).
M 1 [Co (H2 N, CH2 COO)2 (NO2)J
Since the complex salts contain in complex ion two nitro groups
and two glycyl rests as ligands, it might be expected on the basis of
the Werner coordination theory, that they would give rise to five geo
metrical isomers. In two of them the nitro groups would be in the
trans position, in the other three the nitro groups would be in the cis
position. Therefore, the cis isomers ought to resolvable into optical
antipodes, and the cot responding trans isomers should be symmetrical
and optically inactive. To establish the position of the two nitro groups
in the complex salts obtained, we attempted to resolve them into optical
antipodes. By fractional crystallization of the d-cinchonine salt we
obtained two diastereoisomers from which we prepared the optical
antipodes in the form of the corresponding silver salts. Thus we proved
that dinitrodiglycinatocobaltates (III) contain two nitro groups in the
cis position.
This conclusion agrees with the fact that by the action of potas
sium glycocolate on potassium dinitrodiglycinato-cobaltate (III) (3-tri-
glycinatocobalt (III) is obtained, which is only possible if the nitro
groups are in the cis position. In addition, this reaction indicates that
both the carboxyl and the amino groups of the glycine rests are in the
cis position. This finding was confirmed by the fact that by the action
89
of potassium nitrite on (1-isomer of triglycinatocobalt (III) a product
identical with potassium dinitrodiglycinatocobaltate (III) was obtained.
In addition six new, in principle different procedures for the prepa
ration of potassium dinitrodiglycinatocobaltate (III) were developed.
In all cases the products were identical with potassium dinitrodigly
cinatocobaltate (III) prepared by the action of potassium glycocollate
on potassium hexanitrocobaltate (III). This was proved by ultraviolet,
visible and infrared spectography, and paper chromatography. It can
be concluded that the isomer obtained is the most stable form of dini
trodiglycinatocobaltate (III).

90
III — 24
REMOVAL OF CHROMIUM FROM RAW MATERIALS OF
INDUSTRY
S. PRIBICEVIC
Institute for Mining, Chemistry and Technology, Tuzla
Some of these raw materials contain CrO4 ion. A method was
developed for the removal of chromium consisting in the reduction
of OO4 to Cr3+ ion through the presence of H2S in the brine. Trivalent
chromium was then precipitated in the form of Cr(OH)3 and absorbed
on Fe(OH),.
A system for the regeneration of Fe-ion by separating Fe and Cr
on ion-exchange resins was developed.

91
III -25
BOD CONTRIBUTION OF HEAT STERILIZED ALGAE
M. MILOJEVIC
Civil Engineering School, Beograd
Algae may be found in effluents from sewage treatment plants,
oxidation ponds and tertiary treatment plants, and in natural water
bodies. When algae die they may contribute to the total BOD of these
waters.
Mixed algae cultures, heat-sterilized for 1/2 an hour at 121 °C
had a 5-day BOD approximately equal to one half the dry weight of
algae cells present in the suspension. The rate of the biochemical oxygen
uptake was somewhat greater than that generally accepted for average
sewage.

92
IV-1
SEPARATION OF CONDENSED PHOSPHATES ON A THIN
LAYER OF STARCH
V. D. CANlC, M. N. TURClC and S. M. PETROVIC
Institute of Chemistry, University of Novi Sad
Thin layer chromatography has not previously been applied for
separating condensed phosphates. Investigations of starch as the adsor
bent for thin layer chromatography indicate that corn starch can be
used for separating condensed phosphates. Ascending and circular
chromatography on a thin layer of starch were applied. Better separa
tions may be obtained by the circular technique by which as many as
20 samples on a plate can be chromatographed. Destruction of the
starch layer by the solvent mixture or the detection solutions was not
observed, so the detected blue zones of heteropolymolybdophosphoric
acid can easily be perceived on the white background. Besides linear
chain polyphosphates, by using different solvents it is possible to separate
the cyclic polyphosphates of linear chain polyphosphates. Polyphosphate
preparations used in the food and other industries can be qualitatively
analyzed quickly by this technique.

93
IV — 2
SEPARATION OF I, II, and IV CATION GROUP BY THIN-LAYER
CHROMATOGRAPHY ON STARCH
V. D. CANlC, S. M. PETROVlC and A. K. BEM
Institute of Chemistry, University of Novi Sad
The separation of 1, 1 1 and IV cation group was effected by thin-layer
chromatography on maize starch.
The solvent for the separation of Pb2+, Ag+and Hg2+was a mixture
of acetone and 3 N HNOj (1 : 1), for the separation of Ba2+, Ca2+,
Sr2+ and Mg2+ a mixture of acetone and 3 N HC1 (2 : 3), and for II
cation group a mixture of acetone and 3 N HCI (1 : 1).
Rf-values of cations are given in Tables.

94
IV-3
THE APPLICATION OF CORROSION POTENTIOMETRY IN
ANALYTICAL DETERMINATIONS
A. DESPlC, K. POPOV-SINDELlC and Z. LEVAKOV
School of Technology, Beograd
The use of corrosion current and corrosion potential for analytical
purposes is considered theoretically.
Expetiments were made on a system consisting of copper immersed
in a deaerated CH3COOK+CH3COOH solution as the corroding
electrode, and silver ion solutions of various concentrations containing
an inert electrodeas the corroding agents. It was shown that at sufficiently
low concentrations the corrosion current depends mainly on the diffusion
conditions at the inert electrode and that in case this is well defined
both the corrosion cuirent and the corrosion potential can be used
for determining the silver-ion concentration in the solution within the
limits of accuracy characteristic for amperometric and potentiometric
methods, respectively.

95
IV-4
APPLICATION OF RING COLORIMETRY TO THE DETERMINA
TION OF DYESTUFFS
M. B. CELAP, T. J. JANJlC and V. D. JEVTlC
Institute of Chemistry, School of Sciences, University of Beograd and Institute of
Chemistry, Technology and Metallurgy, Beograd
The Weiss ring-colorimetry method was applied to the semiquan
titative determination of the following dyestuffs: Indigo carmine, eryth-
rosin A, amaranth O, new coccine, Victoria blue B, tartrazine, azorubin
S, alizarine S, eosin, light green SF, Guinea green B, fuchsin, eriochrome
black T, saphranine, ponceau 3R, cyanine, gelborange S, and methyl
violet 6B.
The amount of dye required for one determination ranges from
half a gamma to twenty gammas. The errors were a few percent.
The method was checked by determining azorubin S, methyl
violet 6B, tartrazine, and amaranth O in various materials.

96
IV — 5
COULOMETRIC TITRATION OF PERMANGANATE AND
DICHROMATE
S. MLADENOVlC
School of Technology, Beograd
The total amount of permanganate and dichromate can be quan
titatively determined by coulometric titration with electrolytically-
-formed ferrous ions. In this titration the number of gram-equivalents
of permanganate and dichromate is equal to the number of Faradays
consumed.
Permanganate and dichromate can also be coulometrically deter
mined from the amount of hydrogen ions, consumed in the reduction
of permanganate and dichromate:
MnO4-+4H + + 3e-> MnO,+2H,O
Cr2O,2-+14H +6e-+Cr3+ + 7H,O
In the reduction of one gram-equivalent of permanganate 4/3
gram-ions of hydrogen are consumed, and 4/3 Faradays are required
for their reduction; in the reduction of one gram-equivalent of dichro
mate 7/3 gram-ions of hydrogen are consumed and 7/3 Faradays are
requiied for their reduction. The total amount of permanganate and
dichromate is determined on the basis of the decrease of the amount
of acid in the electrolyte which is titrated coulometrically.
Since different amounts of electricity are consumed in coulometric
titration of permanganate and dichromate with electrolytically-formed
ferrous ions and hydrogen ions, it is possible to determine, on the
basis of the amounts of electricity consumed in bot titrations, the indi
vidual quantities of permanganate and dichromate present.

97
IV-6
CONDUCTOMETR1C AND HIGH-FREQUENCY TITRATION
OF BASES IN GLACIAL ACETIC ACID
V. VAJGAND and T. PASTOR
School of Sciences. Beograd
Conductometric titrations of tertiary amines and salts of organic
acids in glacial acetic acid were performed in the presence of platinum
and antimony electrodes by direct and indirect methods. The results show
that a greater number of bases may be determined by the indirect
method than by the direct method and that the former is more accurate.
A large amount of acetic anhydride in the solvent mixture has an un
favorable effect on the titration accuracy and on the shape of the
titration curve.
The same compounds were determined by high frequency titration.
The results again showed that a large amount of acetic anhydride
should be avoided.
7

98
IV-7
INTERFEROMETRIC TITRATION OF ACIDS AND BASES IN
WATER AND GLACIAL ACETIC ACID
V. VAJGAND and T. TODOROVSKI
School of Sciences — Beograd
The conditions under which acids can be titrated with bases and
vice versa by measuring slight changes of the refractive index caused
by neutralisation were investigated. The equivalence point is found
at the intersection of two straight lines, regardles of whether the titra
tion is made in an aqueous medium or in glacial acetic acid. By this
method it is possible to determine strong and weak acids and mixtures
of them in water, and it is particularly promising foi determinations
in nonaqueous media. Successful titrations were made of some weak
bases in glacial acetic acid.
99
IV-8
POLAROGRAPHIC DETERMINATION OF VITAMIN K3 IN
MENADIONE BISULPHITE PREPARATIONS
V. VAJGAND and F. UVODIC
School of Sciences and Production Monitoring Laboratory of Galenika
Determination of vitamin K3 in bisulphite preparations by the
methods described in pharmacopoeias requires a considerable amount
of the starting material and takes a long time because the addition
compound has to be converted to pure menadione which is then extrac
ted and determined by cerimetric titration.
Vitamin K3 is polarographically determined in organic solvents,
and therefore cannot be so determined in bisulphite preparations which
are only water soluble. The polarographic methods for its determination
in the latter described so far reduce to the mere comparison of waves
of the sample and a standard solution whose vitamin K3 content has
to be determined by the methods mentioned above.
By investigating the behaviour of vitamin K3 in different solvents
and in the presence of varying amounts of sodium bisulphite, we found
the conditions under which its direct polarographic determination in
bisulphite preparations is possible.

100
IV — 9
COMBINED ELECTROLYTIC-SPECTROCHEMICAL METHOD
FOR THE DETERMINATION OF RHODIUM AND INDIUM
TRACES IN SOLUTIONS
V. VUKANOVIC, M. TODOROVlC, V. VAJGAND and N. SVILAR
School of Science, Beograd
This paper describes the principles of a method in which electro
lytic separation and excitation in an intermittent arc take place simul
taneously. Preliminary investigations with separation on a rotatory
copper electrode have shown that this method is specially useful for
elements having electrochemical potentials between +0.5 and —1 V.
Rhodium and indium were chosen as representatives of this group of
elements. We studied the conditions for the electrolytic separation of
traces of these elements and for their spectrochemical determination
in the absence and presence of large quantities of other elements (Al
and Pb).
101
IV -10
A NEW METHOD FOR THE DETERMINATION OF MICRO
QUANTITIES OF EASILY REDUCIBLE ELEMENTS BY RING
COLORIMETRY
T. J. JANJIC, G. JURlSlC-MILOVANOVIC and M. B. CELAP
School of Sciences, University of Beograd
A new method is described for the determination of micro quan
tities of rhodium, tellurium, selenium, silver, mercury, paladium, plati
num and gold.
A known volume of the solution to be analysed is washed out
on a ring oven. Development is carried out with a convenient reducing
reagent, whereby the elements appear in the form of coloured rings,
which are then compared with the rings of a standard scale.
The quantities of individual elements necessary for one deter
mination are only a few micrograms, and the average errors range
from 1 % (for Pt) to 5.3 % (for Ag).
The above elements may be determined by this method in the
presence of other elements which are not reduced under these con
ditions. The method has been used to determine the composition of
various materials.

102
IV-11
DETERMINATION OF MICRO QUANTITIES OF COPPER BY
RING COLORIMETRY USING A bis (DIMETHYLGLYOXIMATO)
— COPPER (II) COMPLEX STANDARD SCALE
T. J. JANJlC, Z. S. CERVENJAK and M. B. CELAP
School of Sciences, University of Beograd and Institute for Nuclear Materials,
Beograd
A new method for the determination of micro quantities of copper
by ring colorimetry using a bis (dimethylglyoximato) — copper (II)
complex standard scale is described.
Copper is washed on a ring oven with a 2 % dimethylglyoxime
solution in n-butanol saturated with 2N ammonia. Brown rings are
formed, which can be directly compared with the rings of a standard
scale. The determination is not affected by the presence of platinum
(1 : 100 ratio), gold (1 : 100), silver (1 : 100), mercury (1 : 300), bis
muth (1 : 300), cadmium (1 : 200), molybdenum (1 : 500), arsenic
(1 : 100), antimony (1 : 50), tin (1 : 50), zinc (1 : 20), nickel (1 : 10),
manganese (1 : 10) or iron (1 : 5).
The procedure requires only a few micrograms of copper so that
it is very suitable for the analysis of traces in different materials.
The error of the method is on average 2 % which corresponds
to the errors of other micromethods.
The method may be succesfully applied for the determination
of micro quantities of copper in different inorganic and organic ma
terials, as was proved by the determination of copper in ores, alloys
and some biological materials.

103
IV- 12
MAINTENANCE OF SWIMMING-POOL WATER
V. IVKOVlC, E. KROTIN and I. KOSTlC
School of Technology
The main properties of swimming-pool water required are that
it be clear, bartericidal and of suitable temperature.
Most often water is clouded by algae; these can be killed by the
addition of copper sulphate. The water can be cleared by aluminum
sulphate and the bacteria destroyed by elementary chlorine.
The main difficulty encountered in maintenance is the problem
of keeping the necessary amount of copper in solution, and simulta
neously permitting the hydrolysis of aluminum sulphate, i.e. the forma
tion of aluminum hydroxide.
A series of experiments were performed to study conditions for
the formation of aluminum hydroxide, copper hydroxide and basic
copper carbonate in dependance on the PH at various concentrations
of aluminum and copper.
104
IV — 13
INDIRECT COULOMETRIC DETERMINATION OF CADMIUM
D. J. STOJKOVlC
School of Technology and Institute for Chemistry, Technology and Metallurgy,
Beograd
Indirect coulometric determination of cadmium was effected in
two phases. The first phase involved the electrolysis of aqueous Na2SO4
solution with platinum electrodes, the catholyte being separated from
the anolyte. The cadmium ion in the catholyte was equilibrated with
hydroxyl ions giving Cd(OH)2. The current strength and the electro
lysis time could be altered without restriction, provided the precipitation
of cadmium was quantitative.
In the second phase, the catholyte for the new circuit of electrolysis
was obtained by mixing the filtrate, after the separation of
Cd (OH)2 , with the anolyte from the first phase and with the
content of the electrolytic bridge. The anolyte consisted of a
fresh solution of sodium sulphate. By using platinum electrodes
and a constant current strength, a coulometric acidimetric determination
of hydrogen ions in the catholyte was performed, that is determin
ation of the acid formed in the anolyte in the first phase. This acid is
equivalent to the amount of cadmium and it is not neutralized by the
excess of hydroxyl ions formed in the catholyte in the first phase.
End-point determination was performed using tashiro indicator.
The determination of other cations which exhibit a behavior similar
to that of cadmium is under investigation.

105
IV — 14
POLAROGRAPHIC DETERMINATION OF THALLIUM IN
AMMONIACAL SOLUTION OF TRILON B
S. MLADENOVlC
School of Technology — Bcograd
In acid and ammoniacal solutions the ion of thallium is reduced
at the mercury dropping electrode at potentials equal or very close to
the reduction potentials of ions of lead, tin and cadmium.
However, in ammoniacal solution of trilon B, lead, tin and cad
mium do not form polarographic waves while thallium does.
This method is suitable for the determination of thallium in the
presence of cadmium, tin and other metals.

106
IV-15
DETERMINATION OF COPPER IN THE ELECTROLYTE FOR
COPPER REFINING
S. DORDEVlC and M. VOJNOVlC
School of Technology, Bcograd
The method of electrogravimetric determination of copper in
the presence of As and Sb was in proved by preliminary oxidation
of As'" and Sb'" to Asy and Sb'' using 0.1 KBrO3.

107
IV- 16
NEW USES OF MUREXIDE IN CHELATOMETRY.
II. SIMULTANEOUS DETERMINATION OF SOME METALS
T. KlS
School of Technology, University of Novi Sad
With Murexide as the indicator, many simultaneous direct titra
tions of cadmium, zinc, manganese, bismuth and thorium with diso-
dium ethylenediaminetetraacetate are possible, e.g. determination cf
copper and manganese, nickel and zinc, manganese, zinc and cobalt,
copper and mercury.
The relative errors and standard deviations are within the limits
of simultaneous chelatometric titrations.

108
VI -17
AMPEROMETRIC TITRATIONS WITH A SINGLE POLARIZED
ELECTRODE. IODOMETRIC AND BROMATOMETRIC DEPO
LARIZATION END POINT DETERMINATION OF HYDRAZINE
M. S. JOVANOVlC, N. TUEGLlC, I. SELMlC and V. VUKOSAVLJEVlC
School of Technology, Beograd
Nernst's equation for the electrode potential cannot be applied
for an electrode in the solution of an irreversible system. Coursier has
called the potential observed in such cases an "irreversible potential".
It does not depend much on the concentration of the electroaclive ionic
species. If an irreversible system is to be determined by means of a
reversible system, the potential of the electrode will not change until
the end point is reached. Then as depolarization of the electrode by
the reversible titrant begins a sudden current jump cccurs in the till
then balanced circuit. The more irreversible the system to be determined,
the higher the current jump and the easier detection cf the end point.
This was proved by determining strongly irreversible hydrazine with
reversible iodine or bromate titrants.
109
IV- 18
DEPOLARIZATION END-POINT ARGENTOMETRIC
DETERMINATION OF CYANIDE
M. S. JOVANOVl£, M. M. MOJSlLOVlC and F. D. SIGULINSKY
School of Technology, Beograd
It is shown that end-point depolarization of the electrode is appli
cable in argentometry if platinum is used for the electrode. Accor
ding to Muller the responsibility of platinum to change of the Ag ion
concentration is due to the presence of the reversible argento-argenti
system at the end-point. According to Allen and Hickling it is due
to alloying of platinum with silver after the platinum has been pretreated
in some way. When cyanide is to be determined after Liebig, two succe-
sive depolarizations of the electrode, i.e. two current jumps may be
expected — the first when Ag [Ag (Cn)2] starts forming and the second
when it stops. This was shown to be the case.

1 10
IV-19
DEPOLARIZATION END-POINT ARGENTOMETRIC
DETERMINATION OF IODIDE
M. S. JOVANOVlC and F. D. SIGULINSKY
School of Technology, Beograd
The depolarization end-point technique was applied for the de
termination of an irreversible system by means of a reversible one. In
precipitation titrations, the degree of depolarization of the indicator
electrode depends on the value of the corresponding solubility product.
Thus the behaviour of the electrode is very similar to, when it is immer
sed in an irreversible system to which it does not correspond. At the
end-point even a slight excess of the ions of the titrant will induce a
relatively great depolarization of the electrode. The resulting current
jump can be observed on a sensitive galvanometer.

1 1 1
IV-20
DEPOLARIZATION END-POINT PERMANGANATOMETRIC
DETERMINATION OF MANGANESE
M. S. JOVANOVlC and D. M. PETROVlC
School of Technology, Beograd
In 1952 Coursier introduced the idea of an "irreversible poten
tial". From this a method for end-point detection by observing the
establishment of the reversible Nernst potential at the indicator
electrode was developed. If an irreversible system is to be analysed
by means of a reversible one, the electrode will begin to respond to
changes of the concentration of the electroactive ionic species at the
end-point. At the same time depolarization of the electrode begins,
which is manifested as a sharp current jump at the e.p.

112
IV-21
ELECTROMETRIC DETERMINATION OF SULFITE IN SPENT
AND COOKING LIQUOR IN PRODUCTION OF SEMI
CHEMICAL PULP
LJ. VRHOVAC, L. PENZES and M. JOVANOVlC
School of Technology, Beograd
The spent or black liquor which is obtained in semi-chemical
pulp production (NSSC process) contains apart from lignosulfonic
acids and destroyed polysaccharides, a certain amount of residual
sulfite, which is the active chemical in the delignification of wood.
Determination of this sulfite is very interesting from both the tech
nological and economical point of view. Due to the very dark color
of the liquor it is very difficult to determine the sulfite by the usual
volumetric titration method, so the use of ordinary indicators is not
possible.
Therefore the possibility of using two electrometric methods —
the depolarization end-point and the dead-stop end-point methods —
has been studied. In both cases a stabilized weakly acidified solution
of the liquor was titrated with iodine until the sudden current jump
due to depolarization of the electrode by the reversible iodine-iodide
system. To check the methods sulfur dioxide was removed from the
solution with a stream of nitrogen, oxidized in a closed system with
hydrogen peroxide and gravimetrically determined as barium sulfate.
It has been shown that both methods can be used for spent and
cooking liquors. This is particularly important for spent liquor since
no other fast and precise method exists. The methods can be applied
for the determination of sulfite in all other cases where the solution
is dark colored as well.

113
IV -22
IODOMETRIC DETERMINATION OF SULFITE BY THE
DEPOLARIZATION END POINT METHOD
LJ. VRHOVAC, M. JOVANOVlC and L. PENZES
Faculty of Technology, Beograd
The titration end point of an irreversible system can be determined
from the beginning of the electrode response to changes of concentration
of the electroactive ionic species of the reversible titrant. This principle
is used in the determination of the irreversible sulfite-sulfate system.
The volumetric methods for the determination of sulfite involve titration
of an acidified iodine solution with the sulfite solution being determined.
In this work it has been shown that this titration can be done in
reverse, i.e. with the iodine solution as the titrant. To avoid concen
tration changes of the sulfite the solution was stabilized by addition
of a small amount of EDTA. At the end point, due to establishment
of the reversible potential of the indicator electrode, a sudden current
jump appears. By this method it is possible to determine sulfite in cases
where other indicators cannot be used.
S

114
IV-23
NEW USES OF MUREXIDE IN CHELATOMETRY I. DIRECT
DETERMINATION OF CADMIUM, ZINC, MANGANESE,
BISMUTH AND THORIUM
T. KlS
School of Technology, University of Novi Sad
Owing to the lability of metal-Murexide complexes, and the sta
bility of ordinary auxiliary complexes, Murexide has only been used
for titrating a few metals (calcium, nickel, cobalt and copper).
We have established that Murexide forms complexes with some
other metals and that by using new labile auxiliary complexes these
elements can also be titrated with disodium ethylenediaminetetraacetate:
bismuth and thorium at pH 2 using nitrate to form the auxiliary complex ;
manganese and zinc at pH 10 using ammonia; cadmium at pH 5 also
using nitrate, or sulfate or acetate. The errors and standard deviations
in determination of macro and micro amounts of these metals were
within the limits of direct complexometric titrations.
115
IV — 24
DIMETHYL PHTHALATE AND DIBUTYL PHTHALATE AS
NEW STANDARDS FOR WATER TURBIDITY
S. JANKOVlC and M. MILOJEVl£
The stability of some emulsions prepared from dimethyl or dibutyl
phthalate and mixtures of ethanol or methanol and water was investi
gated. It was established that some of these emulsions show such a
stability that they can be proposed as standards for the determination
of water turbidity below 10 mg/1 (expressed as SiO2); these findings
are of special importance for waterworks practice.
8*

116
IV-25
TOTAL BASE NUMBER OF MOTOR OILS
B. KNEZEVlC
Kombinat nafte i plina — Zagreb
Rafinerija nafte — Rijeka
Motor oils often contain alkaline chemical additives which ne
utralize acid fuel combustion products (SO2 and SO3). These sulfur
acids blow past into the crankcase and react with oil causing deposit-
-forming materials, and attacking metal parts causing corrosive wear.
The alkaline value of these additives and the compounded oils is expres
sed as the "Total Base Number", TBN.
Many methods have been developed for testing the alkaline value
of additives and finished oils. The most widely used methods for deter
mination of TBN are the ASTM D-664 and a modified one with glacial
acetic and perchloric acid. The choice of method depends on the type
and chemical composition of the additives and how much of them there
is in the oil.
Experimental data gotten with both methods are presented.

117
IV — 26
COULOMETRIC MERCUROMETRIC POTENTIOMETRIC DE
TERMINATION OF ANIONS
D. J. STOJKOVlC
School of Technology and Institute for Chemistry, Technology and Metallurgy,
Beograd
Mercurous ions formed by anodic oxidation in the supporting
electrolyte 0.2 M KNO3 were used as the coulometric reagent for the
determination of oxalate, chloride, bromide and iodide ion respectively.
The end-point was determined potentiometrically with an indicator
electrode at I = O. The indicator electrode in the determination of
oxalate, chloride and bromide ion was a generator mercury electrode
from the coulometric circuit, whereas the iodide ion was determined
by means of a special indicator mercury electrode in the form of the
letter "J". The determinations were performed at a constant current
in the coulometric circuit. Diagrams of EMF = f(t) and mm = f(t)
were recorded; diagrams of the first derivative of these two magnitudes
are given as well. The method can be applied to the determination of
micro and submicro quantities.
118
IV — 27
DETERMINATION OF RHENIUM IN SOME YUGOSLAV ORES
R. DIMITRIJEVlC and A. KOSUTIC
Institute for Chemistry, Technology and Metallurgy, Beograd
The increasing importance of rhenium in the world and rapid
growth of its production make it necessary to investigate rhenium
content in some Yugoslav ores.
In order to determine rhenium content we developed a method
suitable for our working conditions. The experimental conditions
were such as to ensure full reproducibility of results.
The content of rhenium was determined in molybdenite concen
trates from Majdanpek and Mackatica as well as in ores from these
areas.
It was found that the molybdenite concentrate from Majdanpek
contains 0.17 % of rhenium. This is one of the largest rhenium concen
trations found so far in the world. Molybdenite concentrates containing
0.03 % of rhenium are already used for the exploitation of rhenium.
119
V-l
EXPERIMENTAL STUDY AND CRITICAL SURVEY OF THE
METHODS FOR SPECTROCHEMICAL DETECTION AND
DOSAGE OF LITHIUM
A. ANTICJOVANOVIC
School of Science, Institute for Physical Chemistry, Beograd
A thorough and critical study of the published work on methods
of specti ochemical detection and determination of lithium was made.
The relatively simple spectrum of this element may be further simplified
by appropriate choice of the method of excitation, which can increase
selectivity in relation to other elements and possible interferences,
especially from the very similar alkalis.
A comparative experimental study was made of the methods of
arc, spark and flame excitation for this element, under well-defined
conditions, which clearly proved that flame excitation is best. Various
influences on /./-emission of different flame sources were investigated.
The results were compared with data of other investigators and were
critically examined with a view to better detectability and quantitative
determination of this element.

120
V-2
A MODIFICATION OF THE POROUS ELECTRODE METHOD
FOR STEEL ANALYSIS
M. KLISKA and S. BLA2IN
Boris Kidric Institute of Nuclear Sciences, Vinca
A general survey of spectrochemical analysis of steel and the
methods of solution analysis is made with particular reference to the
spectrochemical analysis of steel solutions. The application of the
porous electrode method for steel analysis is described. The technique
developed allows analysis of steel of different compositions and in
different forms with the following elements: Al (0.03 — 1.5%), Cr
(0.02 — 1 %), Mn (0.04 — 2 %), Mo (0.03 — 1.5 %), Ni (0.08 — 4 %)
and V (0.012 — 0.6 %).
The precision of the method is 9 — 13 % for Cr, V 6 — 11 %, for
Al, Mn, Mo and 5 % for Ni.

121
V-3
REACTION OF MOLYBDENUM WITH DIPHENYLCARBAZONE
V. ANTONIJEVlC and M. PRAVICA
Boris Kidric Institute of Nuclear Sciences, Vinca
The dissociation of dyphenylcarbazone and conditions under
which molybdenum complexes form in 10 % ethanol were studied
spectrophotometricaly. The possibility of extracting molybdenum
with diphenylcarbazone in chloroform was investigated and the opti
mal conditions determined. Conditions for direct spectrophotometric
determination of molybdenum in uranium-molybdenum alloys and
the interference of different cations and anions in the determination
of 0.05 - 2 % molybdenum in alloys are presented.

122
V-4
REACTION OF ZIRCONIUM WITH ARSENAZO III
IN STRONGLY ACID MEDIA
A. MUK
Boris Kidric Institute of Nuclear Sciences, Vinca
The color reaction of zirconium with arsenazo III and the influ
ence of the perchloric acid concentration on sensitivity in determining
microquantities of zirconium was investigated. The mole ratios for
zirconium and uranium complexes were determined. Beer's law was
found to hold in the range 0.1-2.5[xg and 0.04-1.0ug/25 ml for uranium
and zirconium, respectively. The results suggest the possibility of their
simultaneous determination.

123
V-5
SPECTROPHOTOMETRIC DETERMINATION OF NIOBIUM IN
URANIUM ALLOYS WITH XYLENOL ORANGE
G. T. HAJDUKOVl£
Boris Kidric Institute of Nuclear Sciences, Vinca
In slightly acid medium niobium reacts with xylenol orange giving
an absorption maximum at 560 m u.
Beer's law holds in the range 10-60 (xg of niobium in 50 ml, in
the presence of twenty-fold ammonium oxalate and 1.0 ml 0.1 % xylenol
orange.
The interference of other elements was investigated. Uranium
does not interfere up to 10 mg.

124
V — 6
INVESTIGATION OF THE EFFECT OF pH ON ABSORPTION
SPECTRA OF PELARGON1DOL, DELPHINIDOL and MALVIDOL
S. RISTiC and J. BARANAC
School of Science, Beograd
Absorption spectra of pelargonidol chloride, delphinidol chloride
and malvidol chloiide in a series of buffered solutions were investi
gated. Anthocyanidol solutions of 3 xl0-5 M were used and buffered
solutions were prepared according to Sorensen.
It is known that, depending on the pH, anthocyanidols can exist
in many different forms which, under certain conditions, have diffe
rent equilibria. In this study an attempt was made to define the regions
of existence of the two main ionic forms (the red cation and the blue
anion). This was done by determining constants of the respective ionic
equilibria, and study of the processes involved. Apart from tautomeric
and ionic equilibria specific chemical and photochemical processes
are involved, the role and importance of which are not yet completely
understood.
Further investigations will involve other forms and their mutual
relations.
125
V — 7
CONTRIBUTION TO GENERAL PHYSICO-CHEMICAL AND
SPECTRAL PROPERTIES OF SYNTHETIC RUBY
M. JEREMlC
School of Science, Beograd
Physico-chemical properties, spectral characteristics and Cr3+
content of some samples of synthetic ruby obtained by the method of
Verneuil were investigated.
Although the avaliable samples of synthetic ruby are not optically
perfect, they show a number of characteristics which indicate that the
defects may be ascribed rather to mechanical-technical imperfection
of the production process than to essential features of the procedure.
Further improvements of the method are under investigation.

126
V — 8
DETERMINATION OF 3, 4-BENZOPYRENE CONTENT IN THE
CONDENSATE OF CIGARETTE SMOKE
J. BABIN and D. POLld'
Laboratory for Experimental Oncology School of Medicine, Beograd
Analysis of the smoke condensate of Yugoslav cigarettes showed
that the condensate of 100 cigarettes (without butts) contains 0.567
micrograms of 3, 4-benzopyrene.
Separation was effected by column and paper chromatography
and the fractions were analyzed by means of absorption and fluores
cence spectra.

127
V — 9
POSSIBILITY OF A MECHANICAL FRACTION COLLECTOR
OF A NEW CONSTRUCTION
J. BABIN and D. POLl£
Laboratory for Experimental Oncology, School of Medicine — Beograd
On the basis of a recently published design* we developed a new
construction for a device which may be used as a fraction collector.
This device functions on the buoyancy principle and mechanically-
-produced rotation permitting automatic collection of chromatographic
fractions. It may also be used for analogous automatic measuring of
either equal volumes of liquids or of masses of different materials.
*) Philips D. M. P. Nature 164.545-1949

128
V — 10
SPLITTING EFFECT AND SPECTRAL ANALYSIS OF TRACES
IN DIRECT CURRENT ARC
D. VUKANOVlC
School of Technology — Beograd
The measured splitting effect of elements in the plasma of a direct
current arc, perpendicular to its axis, was correlated with the duration
of particles stay in the plasma as determined by other autors. The
correlation confirmed that changes in the duration of particle stay
in the plasma should be taken into consideration in explaining the mecha
nism of the effect of substances added to the plasma of arc (third part
ner effect).

129
VI- 1
QUANTITATIVE DETERMINATION OF G. P. ZONES IN Al-Zn
ALLOYS
M. ROGULlC and R. NICHOLSON
School of Technology, Beograd
Small-angle X-ray scattering and electron-microscopy investi
gations have been made of Al-10 at. % Zn, Al-6.7 at. % Zn and Al - 4.5
at. % Zn. During the early stage of age-hardening G. P. zones precipitate
but to a smaller extent than calculated from the miscibility gap in the
phase diagram. Constant integrated intensity at small angles does not
mean that precipitation has finished and the state of metastable equili
brium defined by the miscibility gap has been reached, but suggests a
slowing down of the process, which seems to be influenced by kine
matic and thermodynamic factors.
»

130
VI-2
AGE-HARDENING OF ALUMINUM-SILVER ALLOY
M. ROGULlC
School of Technology, Beograd
An aluminum - 5.9 at. % silver has been quantitative investigated
by electron microscopy. The alloy was solution-treated at 520 °C and
aged 3 days at 130 °C. Most zones observed on the electron micro
graphs were 20 A whereas the volume fraction of the precipitated phase
was 2.5 : 10' 2. These data lead to the conclusion that the equilibrium
state defined by the miscibility gap in the phase diagram has not been
reached during this stage of precipitation.

131
VI -3
THE INFLUENCE OF STRAIN AGEING ON THE ALTERNATE
BENDING TEST ENDURANCE OF MILD STEEL
B. BO2l£ and D. MlHAJLOVlC
School of Technology, Beograd
The influence on strain ageing of 0.05 % C steel in the alternate
bending test was studied. A high deformation-amplitude (bending
angle ± 90°) method was used. The experiments were caried out at
temperatures of 20, 90, 120 and 150° for different ageing times. It was
established that in this strain range strain ageing lowers the endurance
of the steel. The time taken to reach the minimum cycle number (N)
is an exponential function of the ageing temperature in °K. The activation
energy of the process corresponds to that of the carbon atom diffusion.

132
VI-4
THE ALTERNATE BENDING TEST BEHAVIOR OF CARBON
STEEL AT TEMPERATURES UP TO 400°
B. BO2l£ and D. MIHAJLOVlC
School of Technology, Beograd
Carbon steels show increasing tensile strength and fatigue strength
and decreasing ductility with increasing temperature above 100°, reaching
turning values between 200-400°. Published results mostly refer to
fatigue tests in the low stress high-endurance range. In the invesliga-
tion presented here the following steels were tested by alternate ben
ding in the low-endurance high-plastic-strain range: S 0145, S 1330,
S 1430, S 1530 and S 1730. No. of cycles to fracture was minimum at
300-325 °C, regardless of the carbon content. These results support
the hypothesis that this type of brittleness is produced by atmosphere
locking of dislocations. It appears too, that at low endurances the fa
tigue life may be determined by the plastic strain.
133
VI-5
MARAGING OF NICKEL STEEL
N. VIDOJEVlC, N. NOVOVlC-SIMOVlC and J. POPOVlC
School of Technology, Beograd
Maraging improves the mechanical properties of structural steels
and gives a good combination of strength and plasticity. The strength
is increased by age-hardening of martensite, which has a high plasticity
and low strength. The aim of this work was to produce a steel with
such characterictics and to find the relation between heat treatment
and the effects produced during age-hardening. A heat of 30 kgs was
made. The steel was solution-treated at 820 °C for 20 min, air cooled
to produce martensite and aged at between 250 °C and 600 °C for 1 min
to 24 hours. Hardness measurements showed that the maximum effect
is obtained by ageing at 450 °C. The maximum hardness was 50 HRC.

134
VI-6
A PROCESS FOR MANUFACTURING THIN HOMOGENEOUS
POROUS BODIES
C. B. PETROVlC, D. S. TRIFUNOVlC and M. B. JANClC
Institute for Chemistry, Technology and Metallurgy, Beograd
A method of producing thin homogeneous porous bodies by sin
tering loose metal powder particles was investigated. The shape, size,
size distribution, temperature and time of sintering were varied and
their effects on the properties of sintered products were studied.

135
VI-7
INFLUENCE OF BETA GRAIN SIZE ON BETA-ALPHA TRANS
FORMATION MECHANISM AND KINETICS IN URANIUM
D. DROBNJAK
Boris KidriC Institute, VinCa
The influence of time and temperature in the beta-phase region
on the alpha grain size and shape obtained on quenching was studied.
Incieasing the duration or temperature of the beta-anneal before
cooling coarsens the alpha grain size, and modifies the shape from
equiaxed to irregular feathery and plate-like. These changes are attri
buted to the influence of the beta grain size on the beta-alpha transfor
mation mechanism and kinetics.

136
VI-8
THE ISOTHERMAL DECOMPOSITION OF URANIUM - 2 WT. %
NIOBIUM ALLOY
B. DURlO
Boris Kidric Institute, VinCa
The isothermal decomposition of uranium-2 wt % niobium alloy
quenched from the gamma phase field into the temperature range
350 - 685 °C was studied. It proceeds by three distinct transformation
mechanisms: diffusion (640-685 °C),bainitic (570 - 600 °C), and mar-
tensitic (below 550 °C). In the diffusional range typical Widmanstatten
precipitation of the beta or the alpha phase occurs.

137
VI-9
THE INFLUENCE OF COOLING RATE ON THE STRUCTURE
OF U - 0.65 % Mo ALLOY
A. MIHAJLOVlC, M. KOSTlC and P. TEPAVAC
Boris Kidric Institute, VinCa
Uranium alloys with low molybdenum additions are used as fuel
for gas-graphite natural uranium reactors. The molybdenum increases
the thermal and radiation stability by increasing the stiength and fineness
of the alpha grain structure.
The influence of the cooling rate on the beta-alpha transformation
temperature was studied and the correlation between the transformation
temperature and the alpha-grain size was determined. From the conti
nuous-cooling diagram and the change in the microstructure with the
cooling rate it was concluded that at a cooling rate of 10° /s the beta-alpha
transformation mechanism changes. The optimal cooling rate from
beta temperature range for getting fine polygonal alpha grains was
determined.

138
VI-10
MAGNETIZING ROASTING OF LIMONITIC IRON ORE
V. LOGOMERAC
Zagreb University School of Technology, Sisak
One of the most promising processes for the enrichment of indi
genous limonitic iron ore is magnetizing roasting followed by magnetic
separation. Work done to date is outlined, and conditions for getting
concentrates containing 57-61 % Fe and less than 8 % SiO2 are presen
ted. These results provide the basis foi industrial application of the
prosess, thereby making it possible for the Yugoslav iron and steel
industry too to exploit ores of a quality now normaly being used abroad.
139
VI— 11
SUBSTITUTION OF IMPORTED ORE FOR STEEL BY INDIGE
NOUS RAW MATERIAL
V. LOGOMERAC
Zagreb University School of Technology, Sisak
Yugoslav steel works today use exclusively imported hematite
for steel refining. However, our country has a number of raw materials
which with proper pretreatment and processing, could completely
cover the total ore needs for refining. One of these is concentrate ob
tained from blast furnace flue dust. With this in view systematic expe
riments have been done in one of oui steel plants. The results confirm
that pelletized blast furnace flue dust concentrate is completely satis
factory for refining.

140
VI -12
REGENERATION OF WASTE MATERIAL IN PRODUCTION
OF SEMICONDUCTING ELEMENTS
B. DURKOVlC, Z. POPOVlC and D. SINADINOVIC
School of Technology, Beograd
In the production of semiconducting elements the utilisation of
germanium is 20 - 30 % while the rest is waste. Depending on the tech
nique the remaining geimanium appears mostly in the form of small
plates or sawdust-powder, mixed with waste-material from the saw
and other dirt. A smaller fraction is lost in the form of a solution oi
in various evaporation compounds etc.
Regeneration of germanium fiom waste material in the shape of
small plates and powder is of special interest. The conditions for rege
neration, its problems, and results particularly with regard to utilisation
of metal and purity of the product are presented.

141
VI- 13
ON THE CYANIDATION OF GOLD FROM THE GOLDEN-BEA
RING PYRITE OF LECE MINE
M. SPASlC, B. DURKOVlC and D. SINADINOVlC
School of Technology, Beograd
One of the problems in the gold-cyanidation of gold-bearing pyrite
is the relatively low leaching of gold, and the great consumption of
cyanide at leaching.
The results of metallurgical preparation of pyrite to increase the
utilisation of gold and decrease the consumption of cyanide are presented.
The preparation included pyrometallurgical, hydrometallurgical
and mechanical treatment of concentrate, under various conditions.
The results indicate that considerable improvement of the gold cyani-
dation process could be obtained if the raw material was metallurgically
treated first.

142
VI- 14
THE BEHAVIOR OF ARSENIC, ANTIMONY AND BISMUTH
IN THE ELECTROLYTE FOR COPPER REFINING
S. DOROEVIC, O. TATIC-JANJIC and J. TARABIC
School of Technology and Institute for Chemistry, Technology and Metallurgy,
Beograd
There is not enough data about the valency states of arsenic, anti
mony and bismuth in the electrolyte during the process of copper tefining,
or about the nature of various precipitates of them which are formed
in the electrolyte.
The behavior of trivalent antimony in the presence of pentavalent
arsenic in the electtolyte for copper refining was studied. AsV forms
precipitates with Sb III with the atomic ratio As : Sb= 1. The solubility
of this piecipitate was determined at several temperatures and at various
sulfuric acid concentrations.
The rate of precipitate formation in the presence of pentavalent
arsenic and trivalent bismuth in the electrolyte was measured. The
solubility of bismuth at senate in sulfutic acid was detei mined.

143
VI- 15
A LABORATORY PROCEDURE FOR ELECTROLYTIC COPPER
REFINING
S. DORDEVlC and M. HALAl
School of Technology and Institute for Chemistry, Technology and Metallurgy,
Beograd
A laboratory scale apparatus for electrolytic copper refining was
developed to allow electrolytic copper refining under conditions identical
to those in an industrial plant.
The following basic factors were observed: current density, elec
trolyte composition regaiding basic components, electrode materials,
electrode spacing, electrolyte composition regarding impurities, opera
ting temperature, electrolyte circulation, concentration of addition
agents, and continual operation.
The apparatus was tested in a series of experiments.

144
VI -16
SOME CHARACTERISTICS OF COLD DRAWN OFHC COPPER
WIRE WITH LARGE DRAFTS
V. MILENKOVlC. S. TODOROVlC and D. CVETKOVfC
School of Technology Beograd, Cable factory Svetozarevo
The possibility of cold drawing OFHC copper wire in large drafts
is dealt with. The suitability of the wire for cold drawing was examined
in terms of the mechanical and physical properties. Cold drawing was
done in two ways, one to study the characteristics of drawing machines
the other to study the suitability of the metal for deformation by cold
drawing.
The results show that the construction of drawing machines does
not correspond to the metallurgical aspects of cold di awing, which
is of great importance in practice.

145
VII -1
CALCULATION OF ENTHALPY CHANGES OF TWO-STAGE
OXIDATION OF URANIUM DIOXIDE
I. G. STAMENKOVIC and R. KUBAT
Boris KidriC Institute, Laboratory for reactor materials, VinCa
The reaction heat of the first and second oxidation stages of stoichio
metric uranium dioxide has been determined by differential thermal
analysis (DTA) at a heating rate of 4 °C/min under atmospheric pres
sure. Both calibration materials and uranium dioxide powder were
examined in mixtures with AI2O3.
The paper also describes the possibilities of determining enthalpy
changes of the separate oxidation stages of uranium dioxide and the
enthalpy change of the formation of the intermediate oxide U3 O7.
10

146
VII -2
GENERAL KINETIC EQUATION OF ZINC OXIDE SINTERING
B. 2IVANOVIC and M. RISTlC
Boris Kidric Institute, Laboratory for reactor materials, Vinca
Zinc oxide was studied with a view to more accurate definition
of the kinetics of oxide material sintering. Particular attention was
paid to volume shrinkage of pressed samples in the temperature range
700- 1200 °C in 0 - 4 hours. The results show that the equations of
Kingery, Fedorchenko, Burke and Pines cannot be used to describe
the process studied. Under the above conditions the equation A V/V = kt
where k and n are functions of temperature is valid.
147
VII-3
CRITICAL ANALYSIS OF KINETICS OF U02+* SINTERING
PROCESS
D. DELlC, R. DELETlC, E. KOSTlC and M. RISTlC
Boris Kidric Institute, Laboratory for reactor materials, VinCa
Analysis of the sintering kinetics of UO2+x powders has shown
that neither Fedorchenko's equation for shrinkage of pressed samples
in the early stages of sintering, nor Pines' equation for its later stages
can be applied. Shrinkage of sintered plates goes as A V/V = ktn.
A detailed analysis of the mechanism of sintering and of a number
of other processes taking place simultaneously provides an explanation
of the discrepancy between our kinetic equation and the relations of
Fedorchenko and Pines.
to*

148
VII-4
COMPARATIVE MICROSTRUCTURAL ANALYSIS OF
POWDERS OF SINTERED UO2+x
V. PETROVlC, E. KOSTlC, R. DELETlC and M. RISTlC
Boris Kidric Institute, Laboratory for reactor materials, Vinca
Detailed microstructural analysis of sintered UO2+x powders
clearly shows that sintering proceeds in two stages. Investigation of
pore size during heating gave the following results: in the first stage
of sintering the pore size growth rate is fairly slow, whereas after 1000°
it becomes much faster. Study of changes occurring in the grain size
of sintered pallets yielded various equations for grain growth in the
first and second stages of sintering.

149
VII-5
A CRITICAL SURVEY OF METHODS FOR MEASURING
DENSITY OF SINTERED MATERIALS
F. SIGULINSKI and M. STEVANOVlC
Boris Kidri£ Institute, Laboratory for reactor materials, VinCa
Methods for measuring the density of sintered materials are sur
veyed. Experimental results, accuracy and factors affecting the accuracy
are analysed. Particular attention is paid to sources of error.

150
vn-6
REACTION KINETICS IN SOLID STATE OF THE SYSTEM
UO2 - Al
S. KIS and M. M. RISTlC
Boris Kidric Institute, Laboratory for reactor materials, VinCa
The paper presents results of a reaction kinetics study in the po-
lydispersed UO2 - Al system, with molar ratio 3: 13, in the temperature
range 600 - 760°. It also points out the possibility of applying modi
fied equations to reaction kinetics in monodispersed systems. The
activation eneigy of the reaction between uranium dioxide and alu
minum with the temperature range under examination was found to
be 30.5 kcal/mol. In addition, an essential relationship was found
between the size distribution of uranium dioxide powder and kinetic
parameters of the reaction.

151
VII-7
MEASURING OF THERMAL CONDUCTIVITY OF CERAMICS
AT TEMPERATURES FROM 20° TO 200°C
J. KATANlC
Boris Kidric Institute, Laboratory for reactor materials, Vinfia
Thermal conductivities of ceramics in the temperature range
20 - 200 °C were measured by Schroder's absolute method. The construc
tion and principles of the apparatus are described. The measuring of
heat flux and temperature is not necessary — by means of two boiling
liquids a constant temperature drop across the sample (10 - 20 °C) is
maintained. The time necessary for a certain quantity of the distillate
to accumulate is measured. The advantages of this apparatus are poin
ted out. The estimated error does not exceed ± 5 % for heat conducti
vities below 0.2 cal/cm sec 0 °C. Heat conductivity measurements of
glass, sintered ZnO, TiO2, UO2 etc at 40.5 °C are given. In case of cera
mics the results have been reduced to theoretical density.
152
VII-8
EFFECT OF FAST NEUTRON IRRADIATION ON MECHANICAL
PROPERTIES OF REFRACTORY OXIDES
M. STEVANOVlC
Boris Kidri6 Institute, Laboratory for reactor materials, VinCa
The study deals with effect of fast neutron irradiation of an inte
gral flux of the order of 1020 nr /cm2 upon the elastic constants, micro-
hardness and mechanical properties of monocrystals and sintered
samples of AI2O3 and MgO. On the basis of the results the mechanism
of the primary and secondary effects of irradiation upon the mechanical
properties of oxides are discussed. A hypothesis is proposed concer
ning the mechanism of elasticity modulus changes of sintered samples.

153
VII — 9
SPONTANEOUS DECOMPOSITION OF AGATE
O. U. CUKOVlC
School of Technology — Beograd
Spontaneous decomposition of agate on a piece of a laboratory
mortar was followed over a period Of 18 months. Spectral analysis
of material taken from the decomposed surfaces of the piece was per
formed. The material was photographed both at the beginning of the
experiment and after 18 months. Keeping the agate at a constant 100 °C
for one month brougth no increase of the decomposition rate.

154
VII- 10
HYDRATATION OF (Ca, K) MONTMORILLONITE.
II. ADSORPTION ISOTHERMS
D. DEL1C and M. TECILAZlC-STEVANOVlC
Institute for Inorganic Chemistry, School of Technology, Beograd
By an isopiezometric method, adsorption isotherms for (Ca, K)
montmorillonite have been determined at 20 and 35 °C. Calcium and
potassium isoeletronic ions were chosen as complementary cations,
because of theoretical and practical knowledge of the behaviour of
(Ca, K) montmorillonite. Hydratation was studied with the hope that
detailed knowledge of the thermodynamic state of the adsorbed water
would give data not only about the adsorbed phase, but also about
the nature of the mineral surface involved in the process of adsorption too.
From the experimental results (isotherms), the differential heats
and the differential entropies of water adsorption on (Ca, K) montmo
rillonite were determined. The starting material was montmorillonite
mineral separated from Wyoming bentonite.
155
VII- 11
POSSIBILITY OF MANUFACTURE OF FINE PORCELAIN
WITHOUT FELDSPAR FROM YUGOSLAV RAW MATERIALS
J. ZLATANOVlC
University of Skopje
A test was made to examine the possibility of making fine por
celain from raw materials from the area of Bujanovac without adding
feldspar. The experiments were carried out under industrial conditions
at the Boris KidriC works, Titov Veles. The raw materials from the
Bujanovac area contain, besides kaolin and feldspar, the products
of feldspar decomposition kaolin aluminum oxide and free silicic acid.
These enable the quartz sand mixtures to retain material plasticity,
even with up to 50 % sand. The results of the test are satisfactory.
156
VII- 12
THE POSSIBILITY OF INDUSTRIAL APPLICATION OF BEN-
TONITE FROM THE SURROUNDINGS OF NlS
M. TECILAZlC-STEVANOVlC, T. JANACKOVlC and V. KOVACEVlC
Institute for Inorganic Chemical Technology, School of Technology, Beograd
Bentonite reserves from places near Ni5 — Zavidince, MeCiji Do
and Jelenkovac — are of unequal quality and quantity. One possible
way of solving the exploitation problem as well as the problem of the
wider industrial application of bentonite from the area is to produce
commercial bentonite, starting with a mixture of bentonite clays from
the three places mentioned.
This was the main subject of this study. By alkali treatment of
manufactured mixtures (three components), a commercial bentonite
was manufactured which proved good for casting and ground injection.
In suspensions of more than 6 % these bentonites could also be used
for drilling fluid. Theoretical considerations of the geological proper
ties of dispersed bentonite-water systems as a function of bentonite
concentration are also given.

157
VII -13
CONTRIBUTION TO THE STUDY OF VOLCANIC GLASS FROM
THE KRATOVO AREA
M. DIMITROVSKI
University of Skopje
The large reserves of volcanic glass-opcidiane discovered on the
slopes of the mountain Crni Vrh, have attracted the attention of the
construction industry, as a possible new raw material for the manu
facture of light concretes. The author has studied the composition and
physico-chemical properties of this glass when heated to different
temperatures. The chemical composition and ignition loss do not differ
from those of glasses currently used in production in e.g. Hungary,
Bulgaria and Russia. The experiments, carried out on laboratory scale
did not give the optimum results citied in the literature. The raw mate
rial has desirable properties, since it maximally expands at between
800 - 900 °C. The expansion experiments were carried out with other
raw materials of volcanic origin too, for example tuffs, but the results
were unsatisfactorily low.

158
VII-14
CONTRIBUTION TO THE STUDY OF RING FORMATION IN
ROTARY CEMENT KILNS
J. ZLATANOVlC, M. MATK.ALUEVA and M. DIMITROVSKI
University of Skopje
The reasons for ring formation in rotary kilns for clinker firing
have been examined over a long period of time. The authors conclude
that ashes from the coal used to heat the kiln are one of the main fac
tors. By using different coal (containing less ash) it was possible to
eliminate ring formation almost completely.
With some coal, e.g. from Aleksinac, a ring formed after 7 days,
when the kiln had to be shut down so that the ring could be removed.
With Soko coal this period was prolonged and by use of a suitable
process technique, ring formation was almost eliminated.

159
VIII -1
PHOTO-NUCLEAR DETERMINATION OF URANIUM AND
THORIUM IN SOME YUGOSLAV ROCKS
B. PAVLOVlC and D. PETROVlC
School of Technology, Beograd
Determination of uranium and thorium in some rocks by obser
ving alpha-particle tracks in photo-nuclear emulsions gives results
that do not always agree with those gotten by uranium fluorimetry
and thorium emanometry. Those deviations are particularly great in
the results for uranium concentrations in travertines.
Analyzing the origin of these deviations we come to the conclu
sion that they are a consequence of radioactive disequilibrium between
some elements of the radioactive series in the rocks. Thus Coppen's
formula which we used to calculate the uranium and thorium concen
trations in the photo-nuclear method may only be applied in case these
elements are in radioactive equilibrium with their disintegration products.
160
VIII-2
ISOTOPE ANALYSIS OF URANIUM SAMPLES
BY ALPHA SPECTOMETRY
D. CVJETlCANIN, V. BULOVlC and K. ZMBOV
Boris Kidric Institute, Hot-Laboratory Department and Analysis and Measurement
Department, VinCa
Theisotopic ratios234U/«sU and 235U/238U jn depleted, natural
and slightly enriched (up to 2 wt. % 23SU) uranium samples were de
termined by alpha spectrometry using a Frisch-type ionization chamber.
The results were compared with the 233U content determined by mass
spectrometry.
The 234TJ/238 U and 235(j/23su alpha activity ratios in the samples
investigated were within (0.163 ± 0.05)— (2.98 ± 0.03) and (0.018 ± 0.002)
— (0.125 ± 0.002), respectively.
The data obtained for our samples show a definite dependence
of the 234U/235U isotopic ratio on the 235u content.

161
VIII -3
THE RADIOACTIVITY OF K«> IN RAINWATER AND
FRESHWATER IN THE ENVIRONMENT OF VINCA
R. RADOSAVLJEVlC, M. KOVACEVlC V. VUJOVlC, D. DORDEVlC
Boris KidriC Institute, Department of Radiological Protection, Vinca
The natural background in the biosphere originates mostly from
potassium-40 (85 %). At the Institute of Nuclear Science at Vinca the
content of potassium is systematically determined in various bioma-
terials—tainwater, freshwater and soil. Determination of the potassium
contained in the rainwater which is sampled at ground level shows
considerable deviation from seasonal variations. Also, it is found that
the content of potassium depends on the quantity of rainwater.
The potassium content was measured over a long period in the
water of the Danube, in drinking water prepared from the Danube
water, in the stream Mlaka and in the river BoleCica.
it
162
VIII-4
RADIONUCLIDE DISTRIBUTION IN A HETEROGENEOUS
SYSTEM
R. DESPOTOVlC
Laboratory of Radiochemistry, Department of Physical Chemistry, Ruder Boskovic
Institute, Zagreb
In a two-phase solid-liquid system the mechanism of migration
of radionuclides from the liquid to the solid phase depends on the
genotypic and phenotypic properties of the system.
The process of heterogeneous exchange in solid-liquid model
systems was investigated and the influence of genotypic and pheno
typic properties on the kinetics and nature of the mechanism is analyzed.
The radionuclide distribution in the two-phase systems conside
red indicates that the crystallization-dissolution equilibrium and ion
self-diffusion in the crystal lattice are dominant factors.

163
VIII -5
SEPARATION OF AMERICIUM FROM PLUTONIUM BY ANION
EXCHANGE
D. CVJETlCANIN and S. RATKOVlC
Boris KidriC Institute, Hot-Laboratory Department, VinCa
A method for the separation of Am3+ from Pu4+ by anion exchange
on Dowex 1, X4, at 50 °C is described. The procedure allows quanti
tative seperation of small amounts of americium from plutonium in
one run.
The method was used for the determination of 241Am, 241Pu (by
measuring the alpha activity of 241Am built-up from241Pu) and "3Pu
in plutonium samples, using alpha spectrometry.
a

164
VIII—6
THE EXTRACTION OF PLUTONIUM WITH SOME
NITRO-COMPOUNDS
N. MILlC
Boris Kidric Institute, Hot-Laboratory Department, VinCa
The extraction of Pu4+ and PuO22+ from aqueous solutions of
nitric acid using nitromethane, nitrobenzene, and a mixture of them
and a mixture of nitromethane and thenoyltrifluoroacetone was studied.
The dependence of the extraction coefficients of Pu on the initial
aqueous HNO3 concentration and on the extractant concentration in
the organic phase was determined.

165
vra-7
SYNTHESIS OF SOME ORGANIC PHOSPHORUS INSECTICIDES
LABELED WITH PHOSPHORUS-»P AND SULPHUR-"S
V. JEZDlC, M. SKAKUN and S. KONSTANTINOVlC
Boris Kidric Institute, Hot-Laboratory Department, VinSa
Malathion (0,0-dimethyl dithiophosphate of diethyl mercaptosuc-
cinate) and dipterex (0.0-dimethyl-2,2,2-trichloro-l-hydroxyethyl phosp
hate) belong to a group of organic phosphorous compounds which
have been widely applied in agriculture as powerful insecticides. To
study their insecticidal effect, methods have been developed of synthe-
zing these compounds labeled with radioactive isotopes i2P and 35S.
This paper describes a procedure for the synthesis of malathion-35S
starting from sulfuric acid-35S, and of malathion-32/', starting from
red phosphorus 32P. This procedure is simpler and has a higher yield
than procedures previously described. It can be used within the range
10 to 40 mmoles.
The method for dipterex- i2P is very simple. It has been developed
for 1 to 5 mmoles.

166
vm-8
DETERMINATION OF THE DETECTION ENERGY THRESHOLD
OF THE LIQUID SCINTILLATION COUNTER
D. PALIGORIC and U. DOBRILOVlC
Boris KidriC Institute, Department of Analysis and Measurement
Metrology, Vinca
A method of determining the detection energy threshold of the
4 — liquid scintillation coincidence spectrometer for pure ^-emitters
is described.
The threshold was determined at the maximum energy of 3H in
integral spectra, recorded with two photomultipliers, singly and in
coincidence.
The position of the energy maximum of 3H was obtained from
the cross-section of the integral spectra of 35S and 35S+3H.

167
VIII-9
DEPENDENCE OF COUNTING EFFICIENCY OF THE 4-n
LIQUID SCINTILLATION COUNTER ON SOURCE HEIGHT
D. BEK-UZAROV, LJ. DOBRILOVlC and D. PALIGORlC
Boris Kidrit Institute, Department of Analysis and Measurement, Vin6a
It has been found that the source height has different effects on
the counting efficiency of the 4-tt scintillation counter for pure beta
emitters with different energy maxima.
This dependence was investigated with the following isotopes:
3H, 35S, 2n4Tl, and 32P for sources with different flask diameters from
10-42 mm, corresponding to weights of 0.3-32 g.

168
VIII-10
GAMMA RADIATION DOSE MEASUREMENT WITH AN
AIR-EQUIVALENT IONIZATION CHAMBER
D. NOVKOVlC and D. BEK-UZAROV
Boris KidriC Institute, Department of Analysis and Measurement, VinCa
Calculation of an air-equivalent material is given. One of the
air-equivalent materials for making an ionization chamber is described.
The calculations were checked by measuring the X-radiation of
the material over a wide range of energies.

169
VIII- 11
POSITION OF MAXIMUM AND HALFWIDTH OF AN ALPHA
PARTICLE SPECTRAL LINE AS A FUNCTION OF SOURCE
THICKNESS
U. DOBRILOVlC
Boris Kidric Institute, Department of Analysis and Metrology, V'inca
Our experimental results confirm the theoretical analytical expres
sion for the final shape of an alpha spectrum line (Kocharov and
Korovlev). With increasing source thickness the position of the maxi
mum shifts to lower energy and its halfwidth increases.
The dependence was investigated on 421Am sources in the range
5.3 xl0-6 to 8.4 xl0-2 h/Ro (h = source thickness, Ro = range of
alpha particle of given energy in source material).
170
IX- 1
MIXED PILE RADIATIONS IN AQUEOUS RADIOCHEMISTRY
I. DRAGANIC, B. RADAK and V. MARKOVlC
Boris Kidric Institute, Department of Radiochemistry, VinCa
The application of mixed pile radiation in aqueous radiochemistry
is discussed from the aspect of dosimetry and experimental techniques.
Two dosimetric methods are considered in detail — the calori-
metric and the chemical method.
A differential calorimeter is described. It is constructed so as to
permit simultaneous measurement of energy absorption in liquid and
solid samples. Gamma and neutron contributions can be derived from
energy absorption measurements in different materials. The possibility
of putting liquid samples in the calorimeter make it very useful for radio
chemistry studies.
The chemical system uses oxalic acid decomposition in light and
heavy water solutions. It allows determination of gamma and neutron
contributions to total absorbed doses in a similar way to the calori-
metrical method. Different G-values for oxalic acid decomposition
induced by gammas and pile protons or deuterons are presented.

171
IX-2
RADIOLYSIS OF AQUEOUS ALKALINE SOLUTIONS OF
OXALATES IN PRESENCE OF OXYGEN
Z. DRAGANIC, M. KOSANIC, M. TONfC, D. OVCIN and I. DRAGANIC
Boris Kidric institute. Department of Radiochemistry, VinCa
Radiation yields of CO2, H2 and H2O2 were measured at 50 mM
oxalate and 0.6 mM oxygen concentration. The initial pH was varied
from 9.5-13. In some cases the consumption of O2 was followed pola-
rographically ([O2] — 0.3 mM.) Using 14C as a radioactive indicator
the possibility of oxalic acid reforming by recombination of carboxylic
radicals was studied. The results show that in the presence of O2 refor
mation of oxalic acid is not possible and that the sharp decrease of
oxalic ion decomposition with increasing pH is due to a change in the
nature of the hydroxyl radicals. Reactions of O- ion radicals with oxalic
acid, hydrogen peroxide and oxygen are discussed. The reaction scheme
allows calculation of the primary molecular hydrogen yields and short-
-lived reducing species. Some observations concerning the primary
oxidizing species of water radiolysis are made.
172
IX 3
THE POSSIBILITY OF INDUCING SYNTHESIS OF LABELED
OXALIC ACID WITH WC0 GAMMA RAYS
M. TONIC and Z. DRAGANiC
Boris Kidric Institute, Department of Radiochemistry, Vinca
The possibility of inducing synthesis of 14C-labelled oxalic acid
with radiation has been studied. Aqueous solutions of potassium oxalate
(1.10-2 and 5.10 ^m, pH 7.0-13) in the presence of NaHHCO3 (5.10-4)
or H14COONa (1.10_2M) were investigated. Experiments were made
in the presence and absence of oxygen.
The mechanism of formation of labelled oxalic acid and the
inhibitory action of oxygen are discussed.

173
IX 4
CHEMICAL DETERMINATION OF RADIOLYSIS PRODUCTS
IN SOLID SYSTEMS
U. JOSIMOVIC and O . GAL
Boris KidriC Institute, Department of Radiochemistry, VinCa
The observation of the effect of radiation on solid oxalic acid and
ammonium oxalates requires determination of the final, stable radio-
lysis products. To do this we used the method of chemical analysis of
irradiated samples dissolved in water. Since radiolysis of a system
produces related chemical compounds, the analysis of an aqueous
solution of the irradiated system is a rather complex problem i.e. the
identification and quantitative determination of some compounds
require a method which is both selective and very sensitive. Qualitative
analysis (spot reactions and paper chromatography) were made for a
series of compounds expected. Quantitative specific spectrophotometric
measurements of the total extinction of aqueous solutions of irradiated
samples were also made. Comparison was made with pure compounds.
The results provide data on the nature of the products. By spectropho
tometric methods with 2,7 dihydroxynaphthalene and phenylhydra-
zinchlorhydrate the dependence of the total measured amounts of pro
ducts on the absorbed dose was found for both gamma and reactor
radiation.

174
IX-5
LUMINESCENCE IN SOME SOLID OXALATES IRRADIATED
WITH HIGH DOSES OF REACTOR AND «°Co GAMMA
RADIATION
O. GAL and J. PATKO
Boris Kidric Institute, Department of Radiochemistry and Institute of Applied
Physics, Kossuth Lajos University, Debrecen
Some general observation on the luminescence phenomena in
duced by high doses of ionizing radiation are presented. Results of
fluorescence measurements of different oxalic acid and ammonium
oxalate samples exposed to high doses of mixed pile and ^Co gamma
radiation are given. The causes of these phenomena are considered.

175
IX-6
CONTRIBUTION ON PROTECTION OF LIVING ORGANISMS
AFTER THE ACTION OF IONIZING RADIATION
A. STEINER, E. MOHOROVIClC, M. KIRIGIN and E. CERKOVNIKOV
Institute of Physics and Institute of Chemistry and Biochemistry, University of
Zagreb, Medical School, Rijeka
The influence of dosage X-ray tube voltage and some biocatalysators
on germination of wheat seeds.
It was earlier shown in laboratory and field experiments that
some bio-catalysators to some extent inhibit the action of X and gamma
rays on the germination and yield of corn and soya beans (Biochimica
e biologia sperimentale II (1963) 158; Acta Pharm. lug. XIV (1964) 1;
IV Kongres farm. Jug. X. 1964 — Opatija).
Continuing this work, we studied influence of the X-ray tube
voltage on irradiated wheat germination.
The experiments were made with "Mara" wheat from Cepic 1963
harvest. In each experiment 200 grains were X-rradiated. They were
then put 30 minutes in a solution of calcium hydroxide, washed in
distilled water, and put in Petri dishes containing sterilized sand (about
90 g) mixed with 50% of Shive nutrient solution (Macht, J. Lab. Clin.
Med. 26 (1941, 957), dilluted with water or some plant hoimones so
lution. The grains germinated in a dark hot-bed at a temperature of
28°C. Every third day 5 ml of dist. water was added. After 8 days the
lengths of shoots were measured. Each experiment was repeated 3
times. The results were statistically treated and compared.
Group 1. The experiments were divided in two groups.
The dosage was constant — 2 kr, and the tube voltage was 85, 115
or 145 KV. The wheat only grew on nutrient substrate: the results
were compared with analogous experiments where to the nutrient
solution was added some MCPA (4 chlor-2 methylphenoxy acetic acid),
2,4-D (2,4-dichlorphenoxy acetic acid) or PMCA (phenilmercopto
acetic acid). In all these experiments the smallest shoot length was
for 85 KV, and the largest with 115 KV radiation.

176
Group 2: At 100 KV doses 4 and 20 kr were given. The shoots
for 20 kr were much bigger than at 4 kr, but still less than for nonirri-
diated wheat. At 4 kr the biggest inhibition was obtained without
hormones, with 100 mg/grain with 2,4-D and 1000 mg/grain with
PMOA. At 20 kr the best results were with 10 mg/grain MCPA and
poorest without hormones and with 1000 mg/grain PMCA.
Hence a) Laboratory in experiments the shoot length depends
not only on the dose but also on the X-ray tube voltage.
b) By adding bio-catalysators it is possible to reduce the inhi
bitory action of X-rays.

177
IX — 7
THE EFFECT OF IONIZING RADIATION ON PECTIN, II
M. D2AMl£, B. JANKOVfC and S. VELJKOVlC
Institute for the Application of Nuclear Energy in Agriculture, Veterinary Science
and Forestry Beograd (Zemun) and School of Agriculture, Beograd
Some effects of gamma-rays on apple pectin under different con
ditions were studied. The following doses were used: 0.02, 0.05, 0.1,
1.0 and 2.0 Mrad.
The following properties and changes were determined: Spe
cific viscosity, degree of esterification, thermal degradation activa
tion energies, rate constants, the influence of some electrolytes in pectin
solutions.
Further research is under way.
12


Izdava6
IZDAVACKO PREDUZECIi "NOLIT". beograd, terazije 27
*
Stampa
BEOGRADSKI GRAFlCKI ZAVOD, BEOGRAD, BULEVAR VOJVODE MlSlCA 17