Journal of Science, Technology, Mathematics and Education ...
196
Journal of Science, Technology, Mathematics and Education (JOSTMED) Volume 8(3) i JOURNAL OF SCIENCE, TECHNOLOGY, MATHEMATICS AND EDUCATION (JOSTMED) J O U R N A L O F S C I E N C E , T E C H N O L OG Y , M A T H E M A T I C S A N D E D U C A T I O N ( J O S T M E D) ISSN: 0748 – 47102 VOLUME 8(3), AUGUST, 2012
-
Upload
khangminh22 -
Category
Documents
-
view
3 -
download
0
Transcript of Journal of Science, Technology, Mathematics and Education ...

Journal of Science, Technology, Mathematics and Education (JOSTMED) Volume 8(3)
i
JOURNAL OF SCIENCE, TECHNOLOGY, MATHEMATICS AND EDUCATION
(JOSTMED)
JOURNAL
OF
S CIE
NCE,
TECHNOLOGY, MATHEMATICSA
ND
EDUC
ATION
(JOSTMED)
ISSN: 0748 – 47102
VOLUME 8(3), AUGUST, 2012

Journal of Science, Technology, Mathematics and Education (JOSTMED) Volume 8(3)
ii
WELCOME TO JOSTMED
Welcome to the Journal of Science, Technology, Mathematics and Education (JOSTMED). The JOSTMED is a scholarly based journal published thrice in a year by the Department of Science Education, School of Science and Science Education, Federal University of Technology, Minna, Nigeria, since September 1998. The scope of the Journal includes the research, development, and practice in all areas of Science, Technology, Mathematics and Education.
INSTRUCTIONS TO CONTRIBUTORS
1. General Guidelines i. Types of Manuscripts: The Editorial Board of the Journal of Science, Technology,
Mathematics and Education accepts only scholarly and original articles that meet its aim and scope. Contributions must be original, therefore, authors is/are to guarantee that their article is original and not currently being considered for publication elsewhere.
ii. Language: The JOSTMED is published in English Language.
iii. Length: Usually full-length article, survey or report should be between 3,000 - 5,000 words (12 – 15 pages).
iv. Abstract and Keywords: Each article should be summarized in about 150 -200 words, serving as a brief description of the content of the article. In addition, following the abstract, supply 4 - 5 keywords/phrases that characterize the content of the paper and which can be used for indexing purposes.
v. Manuscript: Manuscripts, including the abstract and references, should be typed double-spaced on A4 paper set-up using Times New Roman, 12 font size.
vi. Review: Each submission will be subjected to blind peer-review by at least two experts in the fields of the articles. Before the publication of accepted article, corresponding authors will receive a PDF version of their manuscript for final proofing. It should, however, be emphasized that changes in content (new or additional results, corrected values, changes in article title, etc) are not permitted without the approval of the Managing Editor.
2. Copyright Only original papers will be accepted and processed. Paper accepted will be subjected to
viper anti-plagiarize detector software. In addition, no compensation will be given in respect of published papers. However, authors reserve the right to use their own materials for purely educational and research purposes.
3. Format of Submitted Manuscripts All manuscripts, written in good English, should be submitted electronically as an e-mail attachment (in Microsoft Word format not scanned copy) to the journal e-mail:
[email protected]; [email protected] or Managing editor’s e-mail: [email protected]; [email protected]
When submitting manuscript in a paper version three copies should be submitted in double line spacing with wide margins, and not more than 12 pages with illustrations inserted. Extra page will attract additional amount of N1,000.00/$7.00 per page.
Each article submitted must be accompanied with an assessment fee of three thousand naira (N3,000) only in cash or bank draft in favour of the Managing Editor (JOSTMED). Submission of manuscript is accepted throughout the year.
The beginning of the manuscript must bear the title of the paper and the full names of authors and their affiliations for correspondence (including e-mail and telephone

Journal of Science, Technology, Mathematics and Education (JOSTMED) Volume 8(3)
iii
number). Where there are two or more authors include the addresses for correspondence (e-mail and postal addresses) for the contact author. Once the article is accepted for publication, the final version should be submitted online. Where that is not possible, the manuscript must be provided, accompanied by a Recordable CD of the same version labelled with: author name(s); titles of article and file name. The author must ensure that the final submission is complete, grammatically correct and without spelling or typographical errors. In preparing the disk, please use Microsoft Word. The sum of Ten Thousand (N10,000) naira only (£50.00 or $100 US Dollar) should be paid to journal account.
The online version of the published articles are available at www.jostmed.com: www.jostmedng.com and www.futminna.edu.ng and can be accessed through the Internet free of charge.
4. Organization The background and purpose of the manuscript should be given first, followed by details of methods, materials, procedures and equipment used (where applicable). Findings, discussion, conclusions and recommendations should follow in that order. Appendices are not encouraged, but may be countenanced if considered necessary for the manuscript content to be understood. Specifically, author is/are advised to consult the current APA Manual for the details they may need.
6. Figures and Tables Figures, charts and diagrams should be kept to a minimum, they must be numbered consecutively with roman numerals and a brief title. When submitting electronically, figures should be prepared separately, numbered consecutively and submitted in one of JPEG File interchange (jpg), CompuServe GIF (gif), and PC Paintbrush (pcx). Images should not exceed width of 450 pixels.
7. References The author should ensure that the references given are complete. References to personal letters, papers presented at meetings and other unpublished material may be included. Where such materials may help in the evaluation of the paper, copies should be made available to the Managing - Editor. Papers that are part of a series should include a citation of the previous papers, and explanatory materials may be appended to the manuscript to avoid footnotes. Citation of an author's work in the text should follow the author / date method of citation; the surname of the author (s) and year of publication should appear in text. Generally, the format for citations in the Manuscript for references is that of the latest edition of the American Psychological Association (APA) format. At the end of the article, a reference list in alphabetical order must be given.
8. Disclaimer The views and styles expressed in the articles in this publication are those of the
individual authors and are not necessarily shared by the reviewers, the editors, the editorial consulting board, the Department of Science Education, or the Federal University of Technology, Minna.
Dr. Gambari, A. I. Managing Editor, (JOSTMED),
Department of Science Education, Federal University of Technology, P. M. B. 65, Minna, Niger State, Nigeria.
E-mail: [email protected]; [email protected]; [email protected] Website: www.gambari.mgfglobal.com
Blog site: www.gambari.com Phone No: +234-816-680-7534; +234-803-689-7955; +234-805-558-6716

Journal of Science, Technology, Mathematics and Education (JOSTMED) Volume 8(3)
iv
EDITORIAL BOARD Editor-in-Chief - Dr. (Mrs). C. C. Nsofor Managing Editor - Dr. A. I. Gambari Associate Editor - Dr. Alabi T. O. Associate Editor - Mr. A. A. Yaki Associate Editor - Mr. U. S. B. Idris Account Editor - Mrs. R. G. Wodu
EDITORIAL ADVISERS NAME SUBJECT ADDRESS Prof. (Mrs.) V. I. Ezenwa Chemistry Education F.U.T. Minna Prof. Afolabi Ayo Samuel Civil & Chemical Engineering, University of South Africa Prof. (Mrs.) R. Uyanga Science Education University of Uyo Prof. P. A. O. Okebukola Biology L. A. S. U., Lagos Prof. I. O. Inekwe Mathematics Education A.B.U. Zaria Prof. M. O. Yusuf Educational Technology University of Ilorin Prof. SanjayMistra Computer Cyber Security, F.U.T. Minna Prof. C. Ugodulunwa Test and Measurement UniJos Prof. (Mrs.) U.N.V. Agwagah Science Education Uiversity of Nigeria Nsukka Prof. J. M. Baba Geography F. U. T., Minna
SUSCRIPTION RATES Nigeria Rate (Personal) N1,000.00 Rate (Institutions) N2,000.00
Other Countries Rate (Personal) $25.00 / £15.00 Rate (Institutions) $35.00 / £22.00
All Cheques should be made payable to:
The Managing Editor, JOSTMED, Department of Science Education,
Federal University of Technology, Minna, Nigeria. Subscription must be pre-paid and must include 10% handling charges
Copyright ©
Journal of Science, Technology, Mathematics and Education
All rights reserved
ISSN 0748-4710

Journal of Science, Technology, Mathematics and Education (JOSTMED) Volume 8(3)
v
CONTRIBUTORS TO THE ISSUE
1. Abdulkareem, K. A. & Mustapha O. T. Department of Plant Biology, University of Ilorin, Ilorin. Nigeria. E-mail: [email protected] Phone No: +234-803-372-5024 2. Salau, Rasaq Bolakale Department of Chemistry, Federal University of Technology, Minna, Nigeria E-mail: [email protected] Phone No: +60146429915 3. 1Ibrahim Isah Lakan & 2Yahaya Sayyadi Mohammad 1Department of Chemistry, IBB University, Lapai, Niger State. 2PhD Candidate, Environmental Engineering, A.B.U, Zaria. E-mail: [email protected] Phone No: +234-803-574-4222 4. Momoh O.L., Amadi, A.N., Abdulfatai I.A., Omananyi, Y.A., Onoduku, U.S. & Onah M. Department of Geology, School of Natural and Applied Sciences, Federal University of Technology, Minna, P.M.B. 65, Minna, Niger State, Nigeria. Email: [email protected] Mobile Phone No: +2347067596900 5. Garba Inuwa Kuta Department of Geography Federal University of Technology Minna, Niger State, Nigeria E-mail: [email protected] Phone No: +234-803-678-1078 6. 1Fadipe, A. L., 2Babayi, H.&1Ogunleye, D. 1Department of Chemistry, & 2Department of Microbiology, Federal University of Technology, Minna, Nigeria. E-mail: [email protected] Phone No: +234-803-967-1733 7. Adisa, A. F. Department of Agricultural Engineering, Federal University of Agriculture, Abeokuta, Ogun State, Nigeria Email: [email protected] Phone No: +234-803-631-9686 8. *DIM, P. E.1 & J. O. Okafor2 Department of Chemical and Environmental Engineering, University of Nottingham, United Kingdom 2. Department of Chemical Engineering, Fed. University of Tech., Minna Nigeria E-mail: [email protected] Phone No: +234(0)8037462750

Journal of Science, Technology, Mathematics and Education (JOSTMED) Volume 8(3)
vi
9. Ogwueleka, Francisca Nonyelum Department of Computer Science, Federal University of Technology, Minna. E-Mail: [email protected] Phone No: +234-816-847-1775 10. Dr. Sunday Olatunji Oyegbile, Department of Estate Management, Federal University of Technology, Minna. Nigeria E-mail: [email protected] 11. Bake, G. G.*1 & Sadiku, S.O.E.1 Department of Water Resources, Aquaculture and Fisheries Technology, School of Agric and Agricultural Technology, Federal University of Technology Minna, P.M.B 65 Minna, Nigeria E-mail: [email protected] Phone No: +234-816-285-0992 12. Orire, A. M & Adam, I. A. Department of Water Resources, Aquaculture and Fisheries Technology Federal University of Technology, Minna. P.M.B 65 E-mail: [email protected] Phone No: +234-807-630-5217 13. Musa Bawa Department Of Mathematics / Computer Science Ibrahim Badamasi Babangida University, Lapai, Nigeria Phone No: +234-805-825-9616 14. Abubakar, S., Akinwande, N. I. & Abdulrahman, S. Department of Mathematics/Statistics Federal University of Technology, Minna E-mail: [email protected] Phone No: +234-806-803-7304 15. Onasanya, S. A (Ph.D), Ahmed, M. A. (Ph.D) & Oputa, G. O Department of Science Education, University of Ilorin, P.M.B. 1515, Ilorin, Nigeria E-mail: [email protected] Phone No: +234-803-507-1475 16. Orji, Nna Sunday Nigerian Educational Research and Development Council (NERDC), Sheda, Abuja, C/o Box 895 Gwagwalada, Abuja; E-Mail: [email protected] Phone No: +234-806-925-9978 17. Dantani Isah Sani (PhD) Department of Early Childhood Care Education Niger State College of Education, Minna E-Mail: [email protected] Phone No: +234-806-563-3213

Journal of Science, Technology, Mathematics and Education (JOSTMED) Volume 8(3)
vii
18. Obiweluozo E. P. (Mrs.) Department of Educational Foundations University of Nigeria, Nsukka. E-Mail: [email protected] Mobile Phone: +234-806-494-8019 19. Yaki, Akawo Angwal Science Education Department, Federal University of Technology Minna Email: [email protected] Phone No: +234-706-707-4366 20. EEggbbiittaa UUggbbaalluu,, AAttttaaoocchhuu NNiiggeerriiaann EEdduuccaattiioonnaall RReesseeaarrcchh aanndd DDeevveellooppmmeenntt CCoouunncciill ((NNEERRDDCC)) SSHHEEDDAA--AAbbuujjaa.. CCuurrrriiccuulluumm DDeevveellooppmmeenntt CCeennttrree.. EEmmaaiill:: eeggbbiittaauu@@yyaahhoooo..ccoomm PPhhoonnee NNoo:: +234-803-598-6346 21. 1Shitu KelaniOkunade (PhD) 2Olawale Surajudeen Adebayo (MNCS, MCPN), 3Yisa, V. Legbo & 4Baba Meshach 1Department of Science Education 2,3,4Department of Cyber Security Science 1,2,3,4Federal University of Technology, Minna, Niger State, Nigeria E-mail: [email protected]
Phone No: +234-805-332-8241 22. Bolaji, O. A. General Studies Department, School of Education, Emmanuel Alayande College of Education. Oyo E-mail: [email protected] Phone no: +234-703-265-6077
Journal of Science, Technology, Mathematics and Education (JOSTMED) Volume 8(3)
viii
TABLE OF CONTENTS 1. Evaluation of Growth and Yield of Different Varieties of Cowpea (Vigna Unguiculata [L.] Walp) in Southern Guinea Savannah. Abdulkareem, K. A. & Mustapha O. T............ 2 2. Comparative Evaluation of Analytical Techniques for the Quantification of Potassium in Fruit Juices and Corresponding Beverages. SALAU, Rasaq Bolakale. .................... 8 3. Production of Perfume from Pineapple, Water Melon and Pawpaw Fruit Extracts. Ibrahim Isah Lakan & Yahaya Sayyadi Mohammad. ........................................ 14 4. Exploration of Groundwater within the Mariam Babangida Girls Science Secondary School Minna Northcentral Nigeria Using Schlumberger Vertical Electrical Sounding Techniques. Momoh O.L., Amadi, A. N., Abdulfatai I.A., Omananyi, Y.A., Onoduku, U.S. & Onah M. .................................................................................. 18 5. Assessing the Problems of Sewage Disposal Management in Abuja, Nigeria. Garba, Inuwa Kuta ........................................................................................................ 27 6. Phytochemical and in Vitro Antimicrobial Screening of the Ethanolic Extract ofTheobromacacao Seeds and its Fractions. Fadipe, A. L., Babayi, H. & Ogunleye, D. ....................................................................................................................... 39
7. Effect of Stripper Forward Speed on Header Losses and Harvester Efficiency of a Self Propelled Grain Harvester. Adisa, A. F. ................................................................... 49 8. Development and Characterization of Adsorbent from Coconut Shells for Purification of Dye Wastewater. DIM, P. E. & Okafor, J. O. ........................................................ 58 9. Medical Fraud Detection System in Health Insurance Schemes Using Link and Basket Analysis Algorithm. Ogwueleka, Francisca Nonyelum ...................................... 69 10. Rent Payment Options and the Way Forward For a Developing Economy. Sunday Olatunji Oyegbile................................................................................................ 81 11. Basic Morphometric Measurements and Growth Pattern, of Heterotis Niloticus from River Kaduna Flood Plains, Nigeria. Bake, G. G. & Sadiku, S. O. E. ................................. 91 12. The Effect of Feeding Frequency and Feeding Rate on the Growth Performance of Clarias Gariepinus Juveniles. Orire, A. M. & Adam, I. A. ................................................. 101 13. A Comparison of the Respective Accuracies of the Adams-Bashforth and Milne’s Methods for Some Initial Value Problems (Ivp). Musa Bawa. .............................................. 108 14. A Mathematical Model of Measles Disease Dynamics. Abubakar, S., Akinwande, N. I. & Abdulrahman, S. .............................................................................................116 15. Constructivist Instructional Design: Creating a Multimedia Package for Teaching Introductory Technology in Nigerian Secondary Schools Onasanya, S. A, Ahmed, M. A. & Oputa, G. O. ............................................................................................... 123 16. Relationships between Students’ Task Engagement and Learning Outcomes in Chemistry. Orji, Nna Sunday. ............................................................................. 132

Journal of Science, Technology, Mathematics and Education (JOSTMED) Volume 8(3)
ix
17. Student Perception of the Causes and Penalties of Examination Malpractice: A Case Study of Niger State College of Education, Minna. Dantani, Isah Sani. .......... 142
18. Enhancing Listening in Children for Effective Teaching and Learning in Primary Schools. Obiweluozo, E. P. .............................................................................................. 148
19. Effects of Two Study Strategies on Secondary School Students, Achievement in Biology. Yaki, Akawo Angwal. ........................................................................................ 155
20. Enhancing Quality through Research: An Investigation into Technical and Vocational Teachers Perception and Level of Involvement in Educational Research. EEggbb ii tt aa,, UUggbbaa lluu AAtt ttaaoocchhuu.. ......................................................................................................... 163 21. The Challenges of Missing Results of E-Examination in Nigerian Universities. Shitu Kelani Okunade, Olawale Surajudeen Adebayo, Yisa, V. Legbo & Baba Meshach. ......................................................................................................... 173 22. Intergrating Enterpreneurship Education into Science Education: Science Teachers Perspectives. Bolaji, O. A. ……………………………………………………………………………… 180
Journal of Science, Technology, Mathematics and Education (JOSTMED) Volume 8(3)
1
JOSTMED, VOLUME 8(3), AUGUST, 2012
JOURNAL
OF
S CIE
NCE,
TECHNOLOGY, MATHEMATICSA
ND
EDUC
ATION
(JOSTMED)
Journal of Science, Technology, Mathematics and Education (JOSTMED) Volume 8(3)
2
EVALUATION OF GROWTH AND YIELD OF DIFFERENT VARIETIES OF COWPEA (Vigna unguiculata [L.] Walp) IN SOUTHERN GUINEA SAVANNAH
Abdulkareem, K. A. & Mustapha, O. T.
Department of Plant Biology, University of Ilorin, Ilorin. Nigeria E-mail: [email protected]
Phone No: +234-803-372-5024
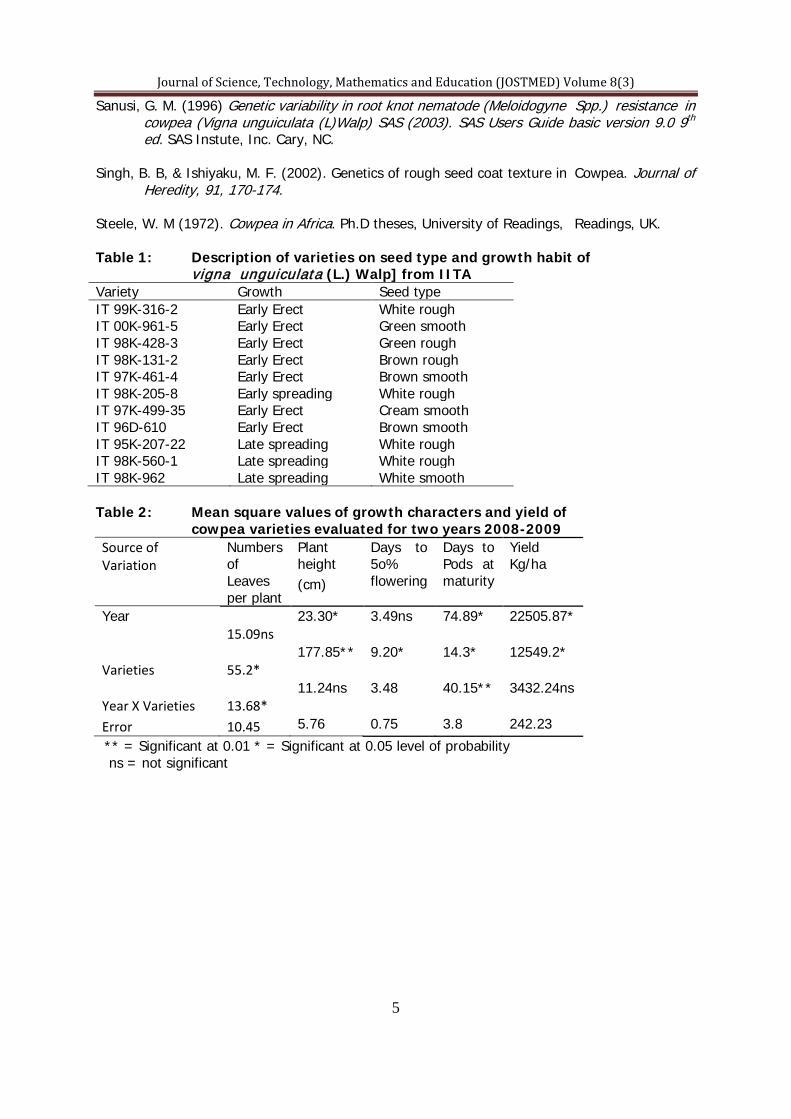
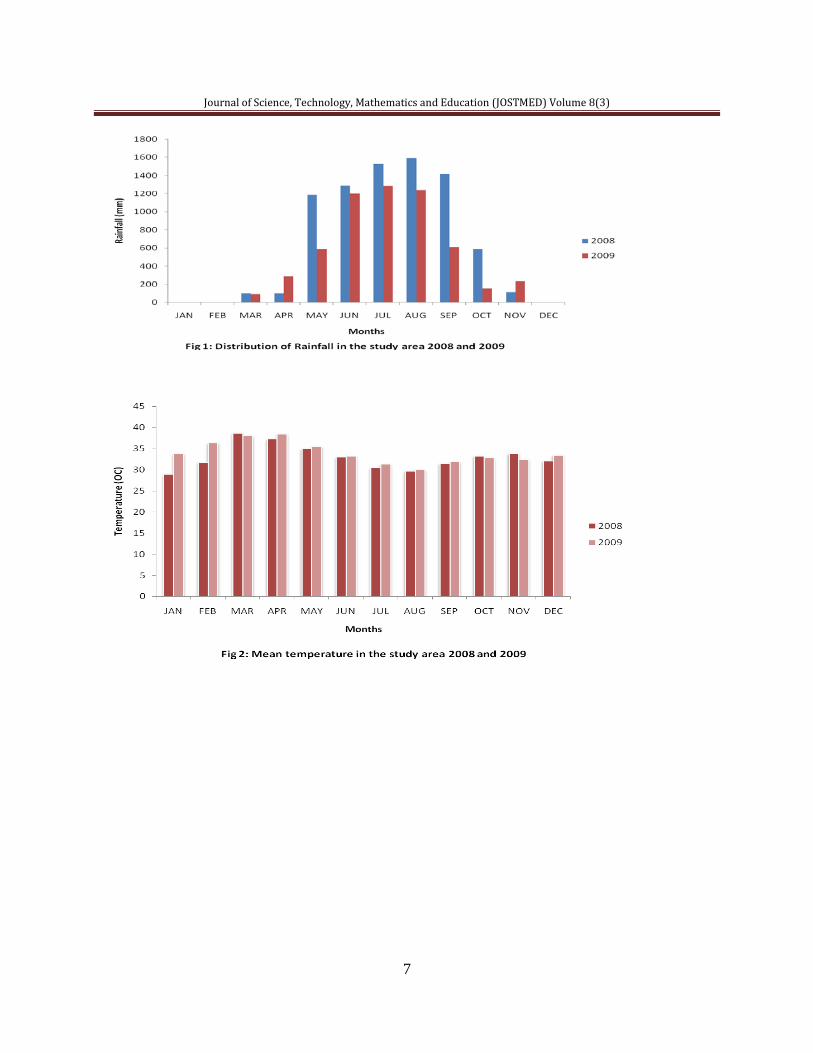
Abstract Eleven early maturing varieties of cowpea obtained from IITA Ibadan were planted in a randomized complete block design with three replications in the Biological garden of the University of Ilorin permanent site .Growth and yield parameters such as number of leaves per plant, plant height at maturity, number of days to 50% flowering , days to pod maturity and grain yield were evaluated. The result showed that IT 98K-131-2 produced highest number of leaves and this could be recommended as fodder for livestock while IT 97K-499-35 was found to have the highest yield in terms of seeds as compared to other varieties after the evaluation of growth and yield parameters. Variety IT 00K-961-5 had the tallest height at maturity while variety IT 98K-205-8 had the least height .Most of the varieties flowered between 40-42 days after planting. Early maturing varieties took between 60-70 days to mature. Keywords: Cowpea, Varieties, Evaluation, Growth and Yield Introduction Cowpea, Vigna unguiculata (L.) Walp, is an important food legume and a versatile crop cultivated in the tropics for its dry seeds, green leaves, green pods and dry fodder, green manure and as a cover crop (Steele,1972; Duke,1990). It is an important staple food and cheap source of protein for rural and urban dwellers with the demand for the commodity increasing in the nation. However, the domestic production of the crop is in the hand of small scale farmers who obtain average yield of 200-350 kg ha-1 and in some cases extremely low yield due to lack of improved varieties. Early maturing varieties of cowpea and varieties resistant to pest and diseases are produced continuously to meet the demand of farmers (Fatokun, 2002). It is therefore, important to evaluate these new varieties in the Southern Guinea savannah agro-ecological zone for the varieties suited for cultivation in the area. In Nigeria, cowpea is grown mainly by subsistence farmers in traditional farming systems of mixed cropping, intercropping or relay cropping of cowpea with sorghum (Olufajo and Singh, 2002). Research works has been established on various aspects of cowpea in view of its human utility values and importance in livestock breeding. This research work was therefore intended to evaluate the performance of the early maturing varieties developed by the IITA. This was done with the intention of establishing which of the varieties is best suited to the Southern Guinea Savannah with a view to introducing the varieties to the area. Materials and Methods Eleven cowpea varieties collected from the International Institute of Tropical Agriculture (IITA), Ibadan, were used for this study. The origins, growth habit, seed type of the varieties are presented in Table 1. The experiment was conducted on a piece of land in the Biological garden of the University of Ilorin Permanent Site, Ilorin, Nigeria .This falls within the Southern guinea savannah agro-ecological zone with Latitude 8 30N and Long 4 33E. Eleven cowpea varieties were sown on a plot of land in mid July 2008 (the rainfall was heavy during this period) and early September 2009 consisting of eight rows which measured 2.5m x 1.2m apart with a plant to plant spacing
Journal of Science, Technology, Mathematics and Education (JOSTMED) Volume 8(3)
3
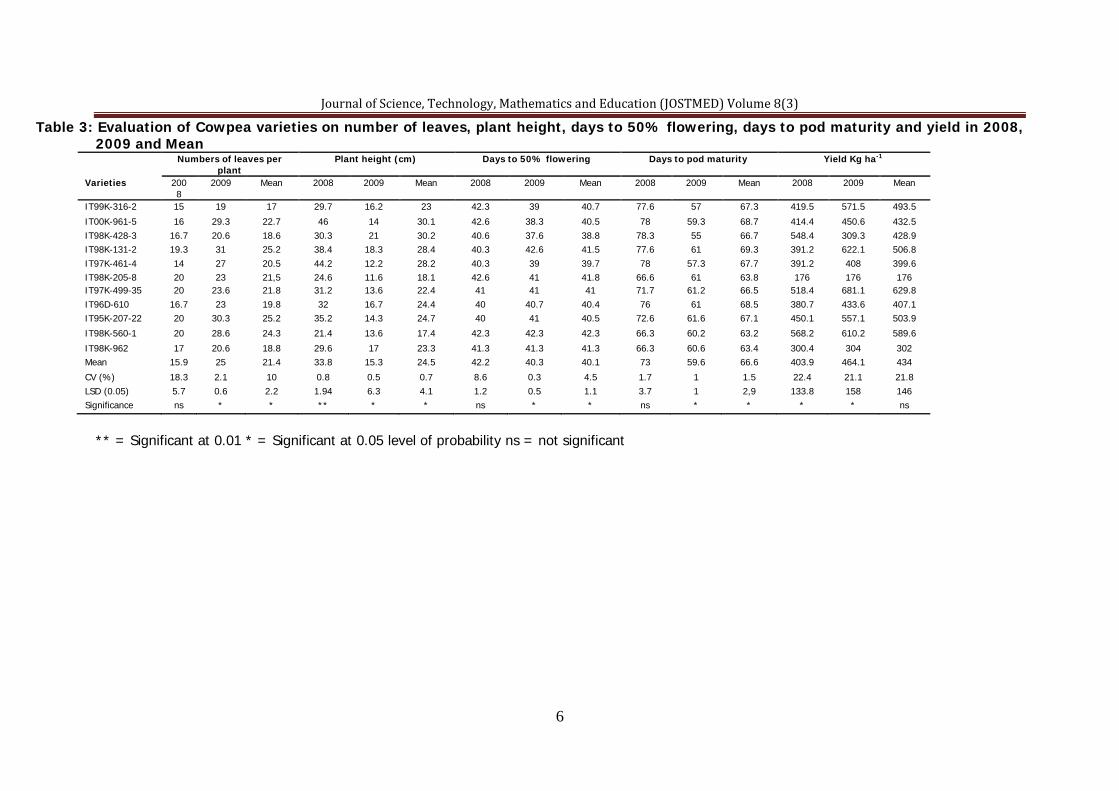
of 18cm within row with each variety been replicated three times in a randomised complete block design for both seasons. Three seeds were sown per hole. No fertilizer was used and weeding was done manually as at when due. At flowering (between 7-8 weeks), the cowpea were sprayed with Dimethiote EC 40% at 2 litres/ha. At maturity, agronomic data were taken from the plants in the middle row of each plot to reduce border effect. The data collected included number of leaves per plant, plant height, Days to 50% flowering, number of days to pod maturity and grain yield per hectare. All the data collected were subjected to analysis of variance (ANOVA) using SAS (SAS, 2003). Significant mean differences were determined with least significant difference (LSD) at 0.05 level of probability. Results and Discussion Table 1 shows that all the cowpea varieties had similar growth habit except IT 95K-207-22, IT 98K-962 , IT 98K-560-1 that are late spreading types and variety IT 98K-205-8 which is an early spreading type. However the colour and texture of the seed coat varied. Singh and Ishiyaku (2002) reported that seed coat and texture are inherent genetic constituents. The effect of year, variety and year x variety interactions as expressed by mean square values are presented in Table 2. The effect due to year was significant for plant height, days to pod maturity and grain yield but not significant for growth parameters such as number of leaves and days to 50% flowering. There was no significant difference in year x variety interaction except number of leaves and days to 50% flowering. Growth and yield performances of cowpea varieties for the two years are shown in Table 3. The number of leaves per plant was not significant in 2008 but was significant at 2009 experiment, the mean value for number of leaves per plant ranged from 15.0cm to 20.0cm in 2008 while in 2009 it ranged from 19.0cm to 31.0cm. Average number of leaves throughout the years ranged between 17.0cm and 25.2cm with varieties IT 98K-131-2 producing highest number of leaves. IT-99K-316-2 had the lowest number of leaves. The early maturing cultivars planted in the month of July 2008 when the rain was heavy had low number of leaves due to water logging. Cowpea is less tolerant of water logging ( Duke, 1981). Due to the excessive water in the soil, the temperature of the soil was reduced and this affected the crop. Cowpea is better cultivated in light soils that have good aeration and drainage (Duke, 1990). In 2008 due to low temperature caused by heavy rain, less seed germination was observed on the beds. This reduction in plant density gave rise to less number of leaves on the plant. In 2009 the temperature was favourable and a high plant density was obtained and hence large number of leaves was recorded. Bitterbender et al. (1984) reported that high cowpea density sown produces more leaves. It was observed in table 3 that the plant height at maturity differed significantly among the varieties. The plant height may be the means of variability. Plant height and number of leaves were used to evaluate the vegetative growth by Futuless and Baker (2010). Pfeiffer and Harris (1990) also observed that these measurements are good indicators of vegetative growth. The mean value for plant height varied between 17.4cm and 30.2cm with varieties IT 98K-560-1 and IT 98K-428-3 respectively . In 2008 it was observed that variety IT 00K-961-5 had the tallest height with 46.0cm while the least height was recorded in variety IT 98K-560-1 with 21.4cm. In 2009 the tallest plant height was 21.0cm in variety IT 98K-428-3 but the least plant height was IT 98K-205-8 with 11.3cm. The number of days to 50% flowering did not differ significantly among the varieties in 2008 cropping season. However, most varieties had flowered between 40-42 days after planting
Journal of Science, Technology, Mathematics and Education (JOSTMED) Volume 8(3)
4
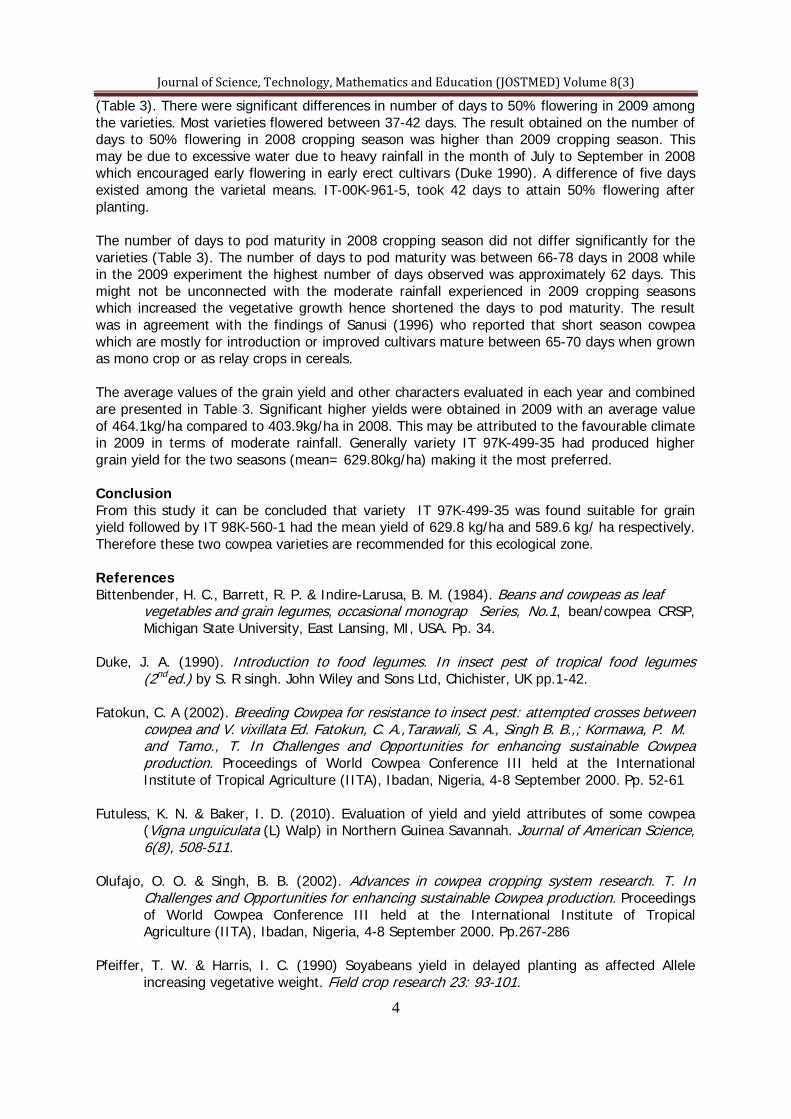
(Table 3). There were significant differences in number of days to 50% flowering in 2009 among the varieties. Most varieties flowered between 37-42 days. The result obtained on the number of days to 50% flowering in 2008 cropping season was higher than 2009 cropping season. This may be due to excessive water due to heavy rainfall in the month of July to September in 2008 which encouraged early flowering in early erect cultivars (Duke 1990). A difference of five days existed among the varietal means. IT-00K-961-5, took 42 days to attain 50% flowering after planting. The number of days to pod maturity in 2008 cropping season did not differ significantly for the varieties (Table 3). The number of days to pod maturity was between 66-78 days in 2008 while in the 2009 experiment the highest number of days observed was approximately 62 days. This might not be unconnected with the moderate rainfall experienced in 2009 cropping seasons which increased the vegetative growth hence shortened the days to pod maturity. The result was in agreement with the findings of Sanusi (1996) who reported that short season cowpea which are mostly for introduction or improved cultivars mature between 65-70 days when grown as mono crop or as relay crops in cereals. The average values of the grain yield and other characters evaluated in each year and combined are presented in Table 3. Significant higher yields were obtained in 2009 with an average value of 464.1kg/ha compared to 403.9kg/ha in 2008. This may be attributed to the favourable climate in 2009 in terms of moderate rainfall. Generally variety IT 97K-499-35 had produced higher grain yield for the two seasons (mean= 629.80kg/ha) making it the most preferred. Conclusion From this study it can be concluded that variety IT 97K-499-35 was found suitable for grain yield followed by IT 98K-560-1 had the mean yield of 629.8 kg/ha and 589.6 kg/ ha respectively. Therefore these two cowpea varieties are recommended for this ecological zone. References Bittenbender, H. C., Barrett, R. P. & Indire-Larusa, B. M. (1984). Beans and cowpeas as leaf vegetables and grain legumes, occasional monograp Series, No.1, bean/cowpea CRSP, Michigan State University, East Lansing, MI, USA. Pp. 34. Duke, J. A. (1990). Introduction to food legumes. In insect pest of tropical food legumes (2nded.) by S. R singh. John Wiley and Sons Ltd, Chichister, UK pp.1-42. Fatokun, C. A (2002). Breeding Cowpea for resistance to insect pest: attempted crosses between cowpea and V. vixillata Ed. Fatokun, C. A.,Tarawali, S. A., Singh B. B.,; Kormawa, P. M. and Tamo., T. In Challenges and Opportunities for enhancing sustainable Cowpea production. Proceedings of World Cowpea Conference III held at the International Institute of Tropical Agriculture (IITA), Ibadan, Nigeria, 4-8 September 2000. Pp. 52-61 Futuless, K. N. & Baker, I. D. (2010). Evaluation of yield and yield attributes of some cowpea (Vigna unguiculata (L) Walp) in Northern Guinea Savannah. Journal of American Science, 6(8), 508-511. Olufajo, O. O. & Singh, B. B. (2002). Advances in cowpea cropping system research. T. In Challenges and Opportunities for enhancing sustainable Cowpea production. Proceedings of World Cowpea Conference III held at the International Institute of Tropical Agriculture (IITA), Ibadan, Nigeria, 4-8 September 2000. Pp.267-286 Pfeiffer, T. W. & Harris, I. C. (1990) Soyabeans yield in delayed planting as affected Allele increasing vegetative weight. Field crop research 23: 93-101.
Journal of Science, Technology, Mathematics and Education (JOSTMED) Volume 8(3)
5
Sanusi, G. M. (1996) Genetic variability in root knot nematode (Meloidogyne Spp.) resistance in cowpea (Vigna unguiculata (L)Walp) SAS (2003). SAS Users Guide basic version 9.0 9th ed. SAS Instute, Inc. Cary, NC. Singh, B. B, & Ishiyaku, M. F. (2002). Genetics of rough seed coat texture in Cowpea. Journal of Heredity, 91, 170-174. Steele, W. M (1972). Cowpea in Africa. Ph.D theses, University of Readings, Readings, UK. Table 1: Description of varieties on seed type and growth habit of vigna unguiculata (L.) Walp] from IITA Variety Growth Seed type IT 99K-316-2 Early Erect White rough IT 00K-961-5 Early Erect Green smooth IT 98K-428-3 Early Erect Green rough IT 98K-131-2 Early Erect Brown rough IT 97K-461-4 Early Erect Brown smooth IT 98K-205-8 Early spreading White rough IT 97K-499-35 Early Erect Cream smooth IT 96D-610 Early Erect Brown smooth IT 95K-207-22 Late spreading White rough IT 98K-560-1 Late spreading White rough IT 98K-962 Late spreading White smooth Table 2: Mean square values of growth characters and yield of cowpea varieties evaluated for two years 2008-2009 Source of Variation
Numbers of Leaves per plant
Plant height
Days to 5o% flowering
Days to Pods at maturity
Yield Kg/ha
(cm)
Year 15.09ns
23.30* 3.49ns 74.89* 22505.87*
Varieties 55.2* 177.85** 9.20* 14.3* 12549.2*
Year X Varieties 13.68* 11.24ns 3.48 40.15** 3432.24ns
Error 10.45 5.76 0.75 3.8 242.23
** = Significant at 0.01 * = Significant at 0.05 level of probability ns = not significant
Journal of Science, Technology, Mathematics and Education (JOSTMED) Volume 8(3)
6
Table 3: Evaluation of Cowpea varieties on number of leaves, plant height, days to 50% flowering, days to pod maturity and yield in 2008, 2009 and Mean
Numbers of leaves per plant
Plant height (cm) Days to 50% flowering Days to pod maturity Yield Kg ha-1
Varieties 2008
2009 Mean 2008 2009 Mean 2008 2009 Mean 2008 2009 Mean 2008 2009 Mean
IT99K-316-2 15 19 17 29.7 16.2 23 42.3 39 40.7 77.6 57 67.3 419.5 571.5 493.5
IT00K-961-5 16 29.3 22.7 46 14 30.1 42.6 38.3 40.5 78 59.3 68.7 414.4 450.6 432.5 IT98K-428-3 16.7 20.6 18.6 30.3 21 30.2 40.6 37.6 38.8 78.3 55 66.7 548.4 309.3 428.9 IT98K-131-2 19.3 31 25.2 38.4 18.3 28.4 40.3 42.6 41.5 77.6 61 69.3 391.2 622.1 506.8 IT97K-461-4 14 27 20.5 44.2 12.2 28.2 40.3 39 39.7 78 57.3 67.7 391.2 408 399.6 IT98K-205-8 20 23 21,5 24.6 11.6 18.1 42.6 41 41.8 66.6 61 63.8 176 176 176 IT97K-499-35 20 23.6 21.8 31.2 13.6 22.4 41 41 41 71.7 61.2 66.5 518.4 681.1 629.8 IT96D-610 16.7 23 19.8 32 16.7 24.4 40 40.7 40.4 76 61 68.5 380.7 433.6 407.1 IT95K-207-22 20 30.3 25.2 35.2 14.3 24.7 40 41 40.5 72.6 61.6 67.1 450.1 557.1 503.9
IT98K-560-1 20 28.6 24.3 21.4 13.6 17.4 42.3 42.3 42.3 66.3 60.2 63.2 568.2 610.2 589.6
IT98K-962 17 20.6 18.8 29.6 17 23.3 41.3 41.3 41.3 66.3 60.6 63.4 300.4 304 302 Mean 15.9 25 21.4 33.8 15.3 24.5 42.2 40.3 40.1 73 59.6 66.6 403.9 464.1 434
CV (%) 18.3 2.1 10 0.8 0.5 0.7 8.6 0.3 4.5 1.7 1 1.5 22.4 21.1 21.8 LSD (0.05) 5.7 0.6 2.2 1.94 6.3 4.1 1.2 0.5 1.1 3.7 1 2,9 133.8 158 146 Significance ns * * ** * * ns * * ns * * * * ns
** = Significant at 0.01 * = Significant at 0.05 level of probability ns = not significant
Journal of Science, Technology, Mathematics and Education (JOSTMED) Volume 8(3)
7
Journal of Science, Technology, Mathematics and Education (JOSTMED) Volume 8(3)
8
COMPARATIVE EVALUATION OF ANALYTICAL TECHNIQUES FOR THE QUANTIFICATION OF POTASSIUM IN FRUIT JUICES AND CORRESPONDING BEVERAGES
SALAU, Rasaq Bolakale Department of Chemistry,
Federal University of Technology, Minna, Nigeria E-mail: [email protected]
Phone No: +60146429915 Abstract Chronological advancement in technology has introduced sophistication to analytical chemistry. This positive development was necessitated by the need to answer myriads of questions such as the degree of selectivity, cost effectiveness, accuracy, sensitivity, speed and versatility of the evolving techniques. This trend in increasing complexity constitutes a major threat to the earlier classical chemical methods, which, invariably being considered obsolete. This research effort aimed at unraveling the invalidity of this claim. In the study, classical chemical methods were exemplified by gravimetric and titrimetric analytical techniques, while the modern physico-chemical methods were exemplified by flame emission and atomic absorption spectrophotometric techniques. These techniques were applied in quantifying potassium in fruit juices expressed from five selected tropical fruits namely: Apple(pome spp),Ginger(zingiber officinalis),Lemon (citrus orantifolia) and Orange(citrus reticulata).The result was evaluated using standard deviation and co-efficient of variation. The four representative techniques used were able to quantify the element of interest (potassium) and were also quite comparable in terms of sensitivity, specificity, selectivity, precision and accuracy. Introduction The superiority of the accuracy and precision of the instrumental technique over the classical techniques has for long been a subject of contention among the analytical chemists.Wilson (1962) pessimistically opined: ‘time may come when gravimetric and titrimetric methods of determination will only be of historical interest as other methods such as solvent extraction, ion exchange and of course various instrumental method which need no tedious preliminary separation and which of course combine identification with determination”. This assertion, if valid, may defeat the whole essence of fundamental chemical analysis. Analysts cannot shy away from verifying a method by a standard reference material as well as estimating the composition of the material. In these cases, the gravimetric technique is highly employed (Beck, 1991, Valcarel, 1995). The titrimetric analysis involves the application of fundamental principle of stoichiometry, thermodynamics and chemical equilbria (Beck, 1991 and Valcarel, 1995). An attempt at comparing analytical methods must bear in mind a suitable substance that could tolerate the application of various analytical techniques. Potassium is an element of choice based on this description. This attribute has made potassium element relevant in the comparison of various analytical techniques in chemical science. Potassium is one of the most determined elements, being a chief constituent of animals and vegetable intracellular fluids. It has a complimentary function with sodium in the extra cellular fluids in the animal living cells. Potassium determination is a useful index for estimating fruits for fruit juice content of food products (Pearson, 1976). Potassium is also a valuable content of fruit, milk, meat, vegetable, legumes and in fertilizer compounding. It is also an important element in the soil for uptake by plants. Healthwise, deficiency and excessiveness of potassium constitute serious
Journal of Science, Technology, Mathematics and Education (JOSTMED) Volume 8(3)
9
problems. These are medically referred to as hypokalemia and hyperkalemia respectively. These conditions ca be brought about through dietary intake and/or other numerous circumstances (Kornan, 1965). In the quantitative assay of potassium, a lot of techniques have been used (Kohler,1953), Sporek and Williams (1955) have used tetraphenylborate in complexing potassium in gravimetric analysis. Both titrimetric and gravimetric procedure involving Chloroplatinate have also been used to determine potassium in fruit juice as stipulated by (A.O.A.C, 1995). It has also been well established that such instrumental techniques as Atomic Absorption Spectrophotometry (AAS), Atomic Emission Spectrophotometry (AES), Flame Atomic Absorption Spectrophotometry (FAAS) and Flame Atomic Emission Spectrophotometry (FAES) quantified potassium in fruits and fruit juices to high degree of success A.O.A.C (1995) and Zuchetti, (1993) The aim of this study is to validate or prove otherwise that the assertion that the classical techniques are no longer relevance as analytical methods. The study also aimed at comparing both classical chemical methods with modern instrumental method along with possible modifications to upgrade their efficiencies. The comparisons are orientated towards their relative specificity, sensitivity, accuracy precision, speed, and versatility and cost effectiveness. Materials and Methods Collection of samples Samples of fresh fruits were obtained from four major fruit markets in Lagos. The corresponding fruit juice beverages were selected among fast selling beverage products also in Lagos. Table 1: Food and beverage samples used in the analysis Fruits Corresponding Common Name Botanical Name Beverage Product Tropical Apple Pome specie Crown Apple Juice Ginger Zingiber officinalis Fanta Ginger Ale Lemon Citrus orantifola Limca Lemon Drink Orange Citrus reticulata Gold Spot Orange Pine-Apple Ananas comosus Thymas Pine Apple Juice Sample preparations Cut pieces of the sample of each of the fruits were put in a clean white cloth, which was squeezed to express the juice. Mixture of concentrated Nitric Acid and Perchloric Acid (Middleton and Stuckey, 1953) was used to digest all the samples. The choice of this method is because it is less time consuming and controllable from abnormal violence. Instrumental determination of potassium The analytical instruments: Atomic Absorption Spectrophotometer (A.A.S.) and the Flame Emission Spectrophotometer (F.E.S) were used. 5g of each sample digest were made to 50 cm3 for the quantification of potassium in both instruments. Standard concentrations of potassium solutions were prepared from AnalarR grade Potassium Chloride. These were done to obtain calibrations for the test samples. Classical methods of determining potassium Gravimetric Analysis: The samples’ digests were further heated in order to obtain concentrates. Tetraoxochlorate VII (Perchloric) Acid (60% w/w) in mixed butan-1-ol and pure Ethylethanoate
Journal of Science, Technology, Mathematics and Education (JOSTMED) Volume 8(3)
10
ester were reacted with the digest concentrate (Beck, 1991). Precipitates were obtained. The potassium contents were then evaluated. Titrimetric Analysis: The sample digests were heated further to almost dryness. sodium Cobaltinitrite complex solutions were added to the digest and titrated with of 0.05mole dm-3 potassium permanganate (Beck, 1991).The potassium contents were evaluated stoichiometrically. Recovery of techniques used Samples were prepared to obtain recovery as a measure of accuracy of the techniques used. Standard addition method was used as follows: 1000ppm of potassium iodide solution was prepared by weighing 4.256g of Analar grade Potassium Iodide and dissolving it in de-ionised water. The volume was made to 1 dm3 mark of the volumetric flask..1cm3 of the Potassium Iodide which corresponded to 1 mg of potassium was pipetted and dropped on the sample digest prepared from 5g of the raw sample. This is the new.re- try sample. The four methods were re- run with the new re-try samples. Results and Discussion Comparable values were obtained with respect to the amount of potassium in each sample analysed. The sample recorveries of all the techniques ranged between 98.56-99.01 %. This attests to their high accuracies of all the four techniques. All methods revealed specificities. The flame emission method is specifically amenable for alkali metal (Middleton and Stuckey, 1953). The technique employed the flame source of excitation, which was not as intensive enough as to cause excitation in most other elements in other groups. The atomic absorption possessed a similar high degree of specificity for the potassium metal; though atomic absorption is known to offer a wide range of detect ability for metals. As a matter of fact, the technical principle employed the use of source lamp tubes (Sydney, 1968) for a particular element – hence potassium element was detected by use of potassium source tubes. Use of Cobaltinitrite complex as suggested by Piper (1984 ), showed that potassium could be specifically detected ruling out interference of ions of calcium, magnesium, aluminium, sulphate, phosphate and chlorides as well as some alkali metals like Lithium, sodium, Rubidium and Caesium. In the same manner, the Perchloric method chosen for the gravimetric analysis also ruled out the interference of chloride, Nitrate, tartarates, Borates and phosphate of sodium and lithium. All the four techniques used had high measure of sensitivity to detect even the little quantity presence of potassium as was demonstrated by the low traces observed in beverage products. These instrumental techniques were quite versatile in this attribute. They have been shown to detect as low as part per billion presences of metals (Sydney, 1968). However, the sensitivities of the classical techniques were of appreciable magnititude. The chosen cobaltinitrite route for the titrimetric has once been shown (Smith, 1925) to be sensitive to as low as the range of 0.08 mg to 42 mg. The gravimetric technique was able to determine the low potassium load in fruit juice beverage. The standard deviation and relative precision (co-efficient of variation) values expressed in percentage depicted high precision for all the techniques used. By this, it is implied that the techniques had less degree of variability of their outputs in the repeated determinations. In other words, there is a marked display of less vulnerability to error in all the techniques used. Precision of the AAS and FES was improved as suggested (BSI, 1995) by setting the wavelength of the
Journal of Science, Technology, Mathematics and Education (JOSTMED) Volume 8(3)
11
instrument to 766.5nm and mixing sample with caesium chloride to final concentration of 0.04g per dm3 prior to analysis. This adjustment was also able to reduce interferences. The choice of tetraoxochlorateVII (perchloric) procedure (Wilhard, 1972) was a major enhancer of its reproducibility. The procedural modification (Piper, 1984) of the titrimetic method was by addition of concentrated sodium chloride solution followed by rapid addition of the agents in situ, under a carefully standardized conditions. This was responsible for reproducibility of the cobaltinitrite procedure for titrimetry. The accuracy of all the four techniques used was comparable and of high degree with all the methods used. The study showed that recovery percentage of the analytical techniques was above 96 per cent. The automation process in instrumental technique had a contribution to the accuracy only a little above the classical techniques. This edge was a less significant methodic error, which was likely to have occurred along the procedural stages in the classical technique. The automation in the instrumental technique has short-cut many processes that would have been done manually in the classical procedure. Conclusion The foregoing exercise showed that the four techniques were able to determine the element of interest (potassium), both in the natural fruit juice and fruit juice beverages. The quantity of potassium was more substantial in the natural fruit juice than in the commercially processed fruit juice beverages samples. All the techniques were able to quantify as low as 0.62mg of potassium per 100mg of the sample. This study is of great significance in fact that though the classical techniques may be more laborious, they are still techniques of choice when accuracy, specificity, precision, selectivity and cost are needed to be weighed against the monopoly of sensitivity and time-savings of the Instrumental techniques. The future analytical challenges should therefore be directed towards modifying and modernizing the classical techniques based on rational and sound chemical principles of the classical techniques. The study also revealed that locally accessible, cheap and natural fruit juices can be a very good alternative to the expensive and capital intensive processed juice beverages in sourcing essential nutrients like potassium. Acknowledgement The support, guidance and contributions of Late Dr. O O. Ladipo of Chemistry Department UNILAG are appreciated. May his gentle soul rest in peace. References
A. O. A. C. (Association of Official Analytical Chemist) (1995). Official method of analysis 8th Edition,
1916. Beck, C. M. (1991). Classical analysis: A look at the past, present and the future: Anal. Chem. 63,
993A – 1003A Kohler, M. Z. (1953). Precipitation of Potassium and tetraphenyl from mineral acid solution. Anal.
Chem 138, 9. Kornan, R. P. (1965). Cell potassium: Molecular biology and medical uses, USA.
Journal of Science, Technology, Mathematics and Education (JOSTMED) Volume 8(3)
12
Middleton, G. & Stuckey, R. E. (1953). The preparation of biological material for the determination of trace metal. Analyst, 532. Pearson, D. (1976). Chemical analysis of food, 7th ed., London: Churchill Livingston. Pg 35, Piper, C. S. (1984). Industrial titrimetric determination of sodium potassium cobaltinitrite with permanganate. Journal of soc. Chem.. Ind. 52 391. Sidney Signia, (1968). Survey of analytical chemistry 2nd ed. USA: McGraw Hill Publisher. Smith, G. F. & Ross, J. E. (1925). Gravimetric determination of potassium chlorate. J. American Chemical society, 47, 774. Sporek, K. F. & Williams, A. F. (1955). Gravimetric determination of Potassium tetra phenyl boron Analyst, 80 347. Valcarel, M. Rios, A. (1995). Chemical basis of elements analyses. Analyst 120, 2291-2299. Wilhard, H. H & Smith, G. F. (1972). Solubility of potassium per chlorate in organic solvent. Journal American chemical society, 44, 2816. Wilson, C..D. (1962). Comprehensive analytical chemistry 1st ed. London: Elservier publisher. Zuchetti, S. C. (1993). Determination of major elements. Atomic spectroscopy, 14(2), 60-64. British Standard Institution (1995). British standard BS En 1134 pp 16.
Journal of Science, Technology, Mathematics and Education (JOSTMED) Volume 8(3)
13
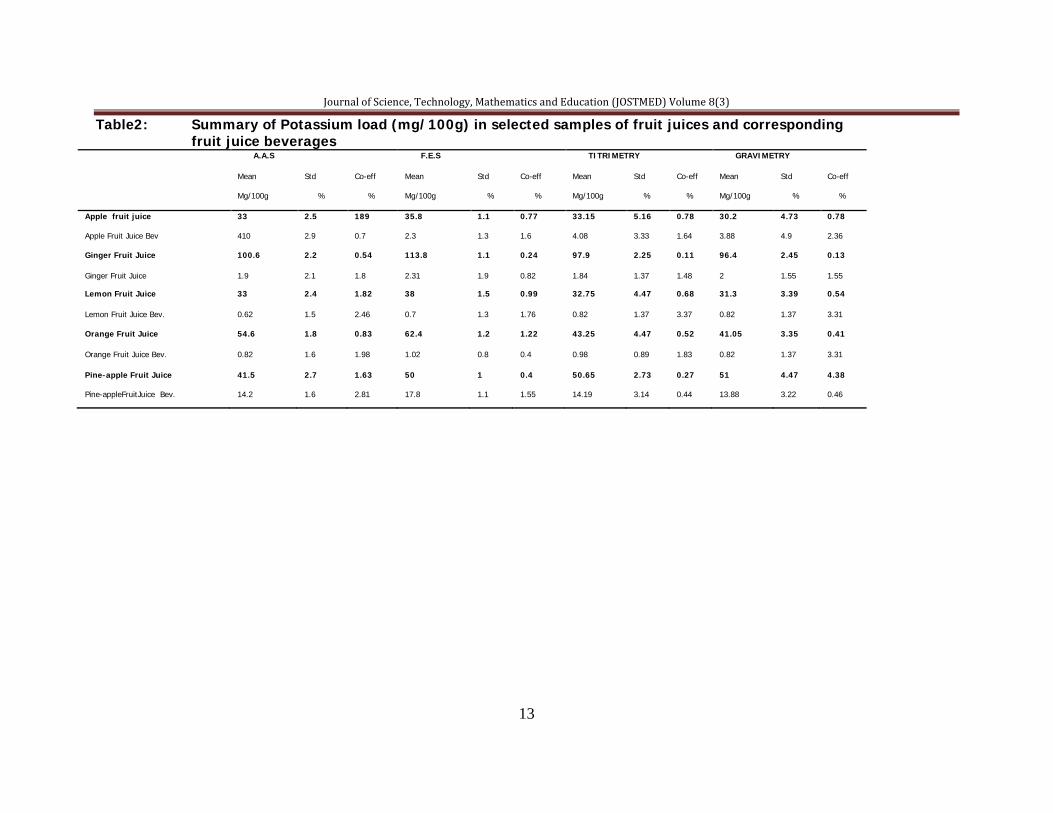
Table2: Summary of Potassium load (mg/100g) in selected samples of fruit juices and corresponding fruit juice beverages
A.A.S F.E.S TITRIMETRY GRAVIMETRY
Mean Std Co-eff Mean Std Co-eff Mean Std Co-eff Mean Std Co-eff
Mg/100g % % Mg/100g % % Mg/100g % % Mg/100g % %
Apple fruit juice 33 2.5 189 35.8 1.1 0.77 33.15 5.16 0.78 30.2 4.73 0.78
Apple Fruit Juice Bev 410 2.9 0.7 2.3 1.3 1.6 4.08 3.33 1.64 3.88 4.9 2.36
Ginger Fruit Juice 100.6 2.2 0.54 113.8 1.1 0.24 97.9 2.25 0.11 96.4 2.45 0.13
Ginger Fruit Juice 1.9 2.1 1.8 2.31 1.9 0.82 1.84 1.37 1.48 2 1.55 1.55
Lemon Fruit Juice 33 2.4 1.82 38 1.5 0.99 32.75 4.47 0.68 31.3 3.39 0.54
Lemon Fruit Juice Bev. 0.62 1.5 2.46 0.7 1.3 1.76 0.82 1.37 3.37 0.82 1.37 3.31
Orange Fruit Juice 54.6 1.8 0.83 62.4 1.2 1.22 43.25 4.47 0.52 41.05 3.35 0.41
Orange Fruit Juice Bev. 0.82 1.6 1.98 1.02 0.8 0.4 0.98 0.89 1.83 0.82 1.37 3.31
Pine-apple Fruit Juice 41.5 2.7 1.63 50 1 0.4 50.65 2.73 0.27 51 4.47 4.38
Pine-appleFruitJuice Bev. 14.2 1.6 2.81 17.8 1.1 1.55 14.19 3.14 0.44 13.88 3.22 0.46
Journal of Science, Technology, Mathematics and Education (JOSTMED) Volume 8(3)
14
PRODUCTION OF PERFUME FROM PINEAPPLE, WATER MELON AND PAWPAW FRUIT EXTRACTS
1Ibrahim Isah Lakan & 2Yahaya Sayyadi Mohammad
1Department of Chemistry, IBB University, Lapai, Niger State, Nigeria
2PhD Candidate, Environmental Engineering, Ahmadu Bello University, Zaria, Nigeria.
E-mail: [email protected] Phone No: +234-803-574-4222Phone No:
Abstract: Perfume can be produced from many sources. Those sources that are readily available for man’s use include; plants, barks, flowers, fruits and leaves. This research is on production of perfume from three fruits; pineapple, water melon and pawpaw. The extracts from the fruits were each subjected to refluxing for about 30mins. The solution were then treated with solvent extractor and separated by solvent extraction. About 30cm3 of pineapple, water melon and pawpaw fruit extracts produced 16cm3, 12.73cm3 and 9.67cm3 of perfume respectively. The extracts used were compared and it was found that the perfume produced from pineapple fruit gave a better yield and quality than that of water melon and pawpaw as the odour could be perceived even after washing the fabric. Therefore, it is concluded that perfume could be synthesized from pineapple, water melon and pawpaw fruit extracts and that small scale business may utilize its production for poverty eradication in the society. Introduction Perfumes are substances generally made by blending plant oil, selecting animal secretions and synthetic chemicals to produce a pleasant odour. During the early centuries, for a body to smell of a pleasant odour was noteworthy. Modern medicine has observed that in certain illnesses, the skin gives out a scent (Thompson, 1995). Perfume is a mixture of fragrant essential oils, aroma compounds, fixative and solvent used to give the human body, animals and objects a pleasant smell or scent (Micheal, 2005). The world’s first recorded chemist is considered to be a woman named Tapputi, a perfume maker who distilled flower, oils and calamus with other aromatics, then filtered and put them back in the still several times (Levey, 2005). The Persian chemist, Ibn Sina introduced the process of extracting oils from flowers by means of distillation; the procedures are the most commonly used today. He first experimented on rose flower until his discovery of liquid perfumes when mixtures of oils and herbs were crushed and blended (Burr, 2003). Modern perfumes contain synthesized deodorants. Synthetic aromatics are often used as alternative sources of compounds that are not easily obtained from natural sources. Coumarin for example is a naturally occurring compound that can be inexpensively synthesized from terpenes (Turin, 2006). Orchid scents (salicylates) are usually not obtained directly from the plant itself but are instead synthetically created to match the fragrance compounds found in various orchids (Burr, 2004). Sources of perfumes include plant, barks, flowers and blossom, fruits, leaves and twigs. Perfumes from fresh fruits such as apple and strawberry are produced synthetically because they do not yield the expected odour and have low fragrance (Patrick, 2006). Pineapple fruit is a complex flower-head that forms around the stem. The top crown of the leaves contain a bud, which when mature indicate that the fruit is ready for harvest. The popularity of
Journal of Science, Technology, Mathematics and Education (JOSTMED) Volume 8(3)
15
pineapple is due to its sweet-sour taste containing sugar, malic acid and citric acid. Water melon fruit which is also called water melon is referred to by botanist as a pepo, a berry which has a thick and fleshy center (Dane, 2007). Pepos are derived from an inferior ovary and are characteristics of the cucurbitaceae (Daniel, 2000). Pawpaw fruits often occur as clusters of up to nine individual fruits, the ripe fruit is soft and thin skinned (Layne, 1996) Materials and Methods The fruits were collected from market outlet in Minna town. The following were the apparatus used in this study; Conical Flask (250cm3), Measuring Cylinder (10cm3 and 100cm3)/Syringe, Beakers (50, 100, 200 and 500cm3), Spatula (small), Funnels, Hot Plate and Stirrer (model: Jenway 1000), Analytical Weighing Balance, Washed Bottles, Bucket, Retort Stand with Clamp, Rubber Tubes, Flat Bottom Flask (100ml), Boiling and Test Tubes, Reflux Apparatus, Wire Gauze, Water and Sand Bath, Separator Funnel (100ml and 250ml). The reagents used are Pineapple Extract, Water Melon Extract, Pawpaw Extract, Ethanol, Conc. H2SO4 acid, Ice Block, Distilled Water, Ethoxyethane Solution, NaHCO3 Solution, Na2SO4 Salt. Production of Perfume from Pineapple Extract 30cm3 of pineapple extract was added to 10cm3 of ethanol with two drops of conc. H2SO4 and refluxed for 30mins on sand bath. The solution was then cooled in ice bath for 20mins. 3cm3 of cold water and 3cm3 of ethoxyethane were added and the mixture allowed to settle for 20mins. The aqueous layer was decanted and discarded. 1cm3 of 5% NaHCO3 was added and the mixture shaken gently until gas evolution ceased by extraction using separatory flask, and the process repeated until the solution became neutral to litmus paper. The organic layer was dried over Na2SO4 (anhydrous). Production of Perfume from Water Melon Extract 30cm3 of water melon extract was added to 10cm3 of ethanol with two drops of conc. H2SO4 and refluxed for 30mins on sand bath. The solution was then cooled in ice bath for 20mins. 3cm3 of cold water and 3cm3 of ethoxyethane were added and allowed to settle for 20mins. The aqueous layer was decanted and discarded. 1cm3 of 5% NaHCO3 was added and shaken gently until gas evolution ceased by extraction using separatory flask, and the process repeated until the solution became neutral to litmus paper. The organic layer was dried over Na2SO4 (anhydrous). Production of Perfume from Pawpaw Extract 30cm3 of pawpaw extract was added to 10cm3 of ethanol with two drops of conc. H2SO4 and refluxed for 30mins on sand bath. The solution was then cooled in ice bath for 20mins. 3cm3 of cold water and 3cm3 of ethoxyethane were added and allowed to settle for 20mins. The aqueous layer was decanted and discarded. 1cm3 of 5% NaHCO3 was added and shaken gently until gas evolution ceased by extraction using separatory flask, and the process repeated until the solution became neutral to litmus paper. The organic layer was dried over Na2SO4 (anhydrous).
Journal of Science, Technology, Mathematics and Education (JOSTMED) Volume 8(3)
16
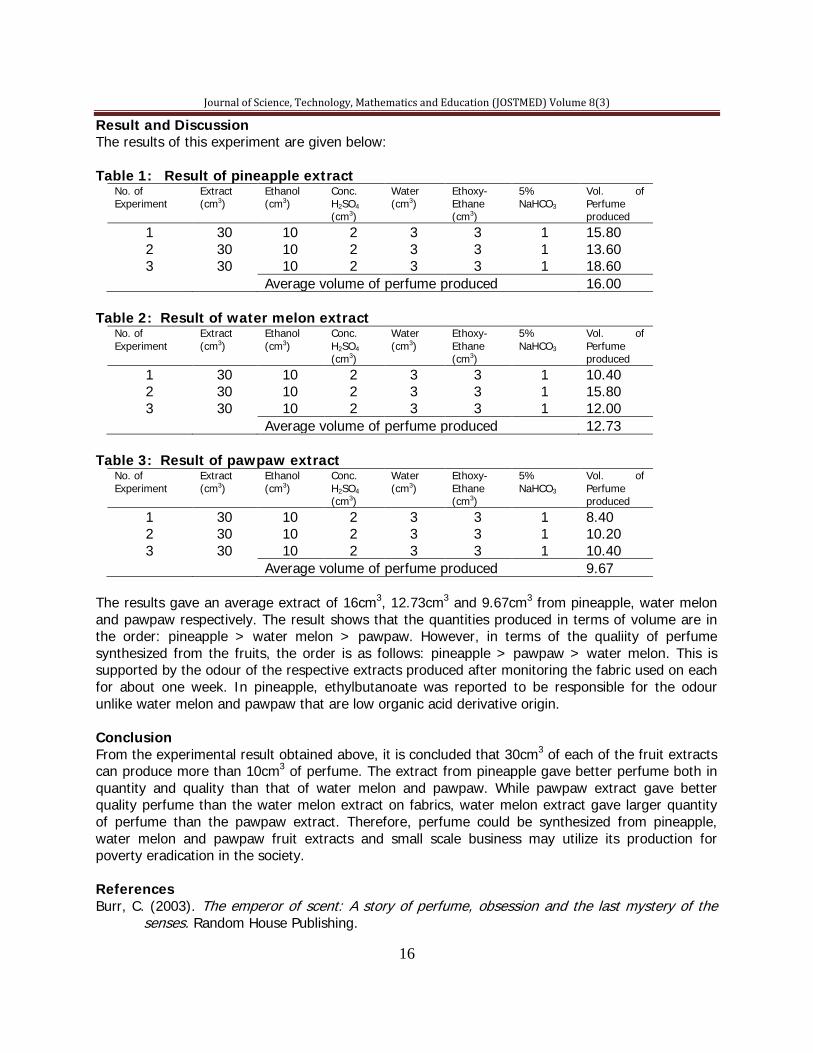
Result and Discussion The results of this experiment are given below: Table 1: Result of pineapple extract
No. of Experiment
Extract (cm3)
Ethanol (cm3)
Conc. H2SO4 (cm3)
Water (cm3)
Ethoxy- Ethane (cm3)
5% NaHCO3
Vol. of Perfume produced
1 30 10 2 3 3 1 15.80 2 30 10 2 3 3 1 13.60 3 30 10 2 3 3 1 18.60
Average volume of perfume produced 16.00 Table 2: Result of water melon extract
No. of Experiment
Extract (cm3)
Ethanol (cm3)
Conc. H2SO4 (cm3)
Water (cm3)
Ethoxy- Ethane (cm3)
5% NaHCO3
Vol. of Perfume produced
1 30 10 2 3 3 1 10.40 2 30 10 2 3 3 1 15.80 3 30 10 2 3 3 1 12.00
Average volume of perfume produced 12.73 Table 3: Result of pawpaw extract
No. of Experiment
Extract (cm3)
Ethanol (cm3)
Conc. H2SO4 (cm3)
Water (cm3)
Ethoxy- Ethane (cm3)
5% NaHCO3
Vol. of Perfume produced
1 30 10 2 3 3 1 8.40 2 30 10 2 3 3 1 10.20 3 30 10 2 3 3 1 10.40
Average volume of perfume produced 9.67 The results gave an average extract of 16cm3, 12.73cm3 and 9.67cm3 from pineapple, water melon and pawpaw respectively. The result shows that the quantities produced in terms of volume are in the order: pineapple > water melon > pawpaw. However, in terms of the qualiity of perfume synthesized from the fruits, the order is as follows: pineapple > pawpaw > water melon. This is supported by the odour of the respective extracts produced after monitoring the fabric used on each for about one week. In pineapple, ethylbutanoate was reported to be responsible for the odour unlike water melon and pawpaw that are low organic acid derivative origin. Conclusion From the experimental result obtained above, it is concluded that 30cm3 of each of the fruit extracts can produce more than 10cm3 of perfume. The extract from pineapple gave better perfume both in quantity and quality than that of water melon and pawpaw. While pawpaw extract gave better quality perfume than the water melon extract on fabrics, water melon extract gave larger quantity of perfume than the pawpaw extract. Therefore, perfume could be synthesized from pineapple, water melon and pawpaw fruit extracts and small scale business may utilize its production for poverty eradication in the society. References Burr, C. (2003). The emperor of scent: A story of perfume, obsession and the last mystery of the senses. Random House Publishing.

Journal of Science, Technology, Mathematics and Education (JOSTMED) Volume 8(3)
17

Journal of Science, Technology, Mathematics and Education (JOSTMED) Volume 8(3)
18
Burr, C. (2004). The emperor of scent: A true story of perfume and obsession. Random House Publishing. Dane, F, & Liu, J. (2007). Diversity and origin of cultivated watermelon. Genetic Resources and Crop Evolution. Daniel, L. (2000). Domestification of plant in the old world. Oxford University Press, 3rd Edition. P.193. Layne, D. R. (1996). The pawpaw: A new fruit crop for kentucky and the United States. Hot Science, 31,15-22. Levey, N, Mandel, H. & Korman, S. H. (2005). Elevated plasma citrulline and arginine due to consumption of watermelon. http://dx.doi.org Michael, T. (2005). Archaeological dig sniffs out world’s oldest perfumery. http://news.scotman.com Patrick, S. (2006). Perfume the story of a murderer. Vintage Publishing. Thompson, J., Kumar, P., Gupta, S. & Graham, V. M. (1995). Inhalation challenge, effects of perfumes strips in patients with asthma. http://www.ncbi.nim.nih.gov
Journal of Science, Technology, Mathematics and Education (JOSTMED) Volume 8(3)
19
EXPLORATION OF GROUNDWATER WITHIN THE MARIAM BABANGIDA GIRLS SCIENCE SECONDARY SCHOOL MINNA NORTHCENTRAL NIGERIA USING
SCHLUMBERGER VERTICAL ELECTRICAL SOUNDING TECHNIQUES
Momoh O.L., Amadi, A.N., Abdulfatai I.A., Omananyi, Y.A., Onoduku, U.S. & Onah M.
Department of Geology, School of Natural and Applied Sciences, Federal University of Technology, Minna, P.M.B. 65, Minna, Niger State, Nigeria.
Email: [email protected] Mobile Phone No: +234-706-759-6900,
Abstract A Geoelectrical investigation adopting Schlumberger vertical electrical sounding (VES) have been carried out to explore for groundwater within the premises of Mariam Babangida Girls Science Secondary School, Bosso, Minna, Niger State. This is with a view to resolve the problem of acute water shortages experienced by the staff and students of the institution. The area lies within the basement rock complex of North Central Nigeria with biotite granite and muscovite granite constituting the main lithological units. The survey was carried out using ABEM SAS 300C Terrameter along five (5) established traverses with 40m maximum electrode separation. The VES data were analyzed and interpreted through curve matching and the use of Resist software to obtain the geoelectric parameters. These were used in constructing the 1D geoelectric sections and the isopach map. The geoelectric sections revealed the presence of four geo-electric layers namely the top soil, the weathered layer, the partly weathered/fractured bedrock and the resistive bedrock. The contoured depth to bedrock contour map reveals a significant linear feature delineated by the VES as fractures beneath T2V7, T2V8 and T3V9 and is filled with clayey substratum except T3V9 that are characterized by clayey sand materials. T3V9 is therefore recommended for drilling and groundwater development to a depth of about 30m. However, the groundwater potential of the study area is generally very low. Keywords: Exploration, Groundwater, Schlumberger Ves, Minna Introduction The study area is located within the premises of Mariam Babangida Girls Science Secondary School (MBGSSS) Minna Niger State, northcentral Nigeria. It is bounded by latitude 9039'23''N to 9039'27''N and longitude 6031'15''E to 6031'19''E. It falls within the guinea savannah belt. Productive boreholes within the area as obtained in other parts of the Basement Complex of Nigeria are normally located within the porous and permeable weathered basement and fracture column of the basement lithology (Satpathy and Kanungo, 1976; Olorunfemi and Fasuyi, 1993; Momoh and Olasehinde, 2010). The area has two distinct seasons, the wet (May to October) and prolong dry (November to March) with annual rainfall varying between 1270mm and 1524mm (Iloeje, 1981).The relative humidity is generally low except at the peak of the rainy season while the diurnal temperature ranges from 35 to 24ºC. The need to explore for groundwater becomes necessary in view of the fact that the available surface water is inadequate and not portable. For any successful development of groundwater scheme to be completed, the geoelectrical characteristics of the subsurface geologic/geoelectric sequences have to be properly understood. The weathered layer is known all over the world to have the capability of accumulating groundwater to appreciable level due to its significant high porosity and permeability (Palacky and Kadekaru, 1979 and Olorunfemi, 1990).
Journal of Science, Technology, Mathematics and Education (JOSTMED) Volume 8(3)
20
Research has equally shown that high groundwater yield in the basement terrain is normally obtained in areas where relatively thick overburden overlies fractured column (Olorunniwo and Olorunfemi, 1987, Olorunfemi and Fasuyi, 1993). The ability of electrical resistivity method in delineating the different subsurface geoelectric configurations, the aquiferous unit together with their geoelectric/geologic characteristics and subsurface linear structures cannot be over emphasized (Awni et al, 2004; Adiat et al, 2009). This will ultimately help in resolving the lateral and vertical limitation of basement aquifers observed by Satpathy and Kanugo, 1976. The available statistics shows that the population of the school community is well above 1,000. The school equally operates boarding system and at present lack effective functional water supply system. This has resulted in students searching for water from the neighboring communities that depend on shallow hand dug well. Hence, the search for groundwater within the school premises becomes very necessary. This study is meant to create awareness on the productive aquifer so as to guide both the government and the school authorities involved in groundwater development on the possible areas and depth that boreholes could be drilled for potable and sustainable water supply within school communities.
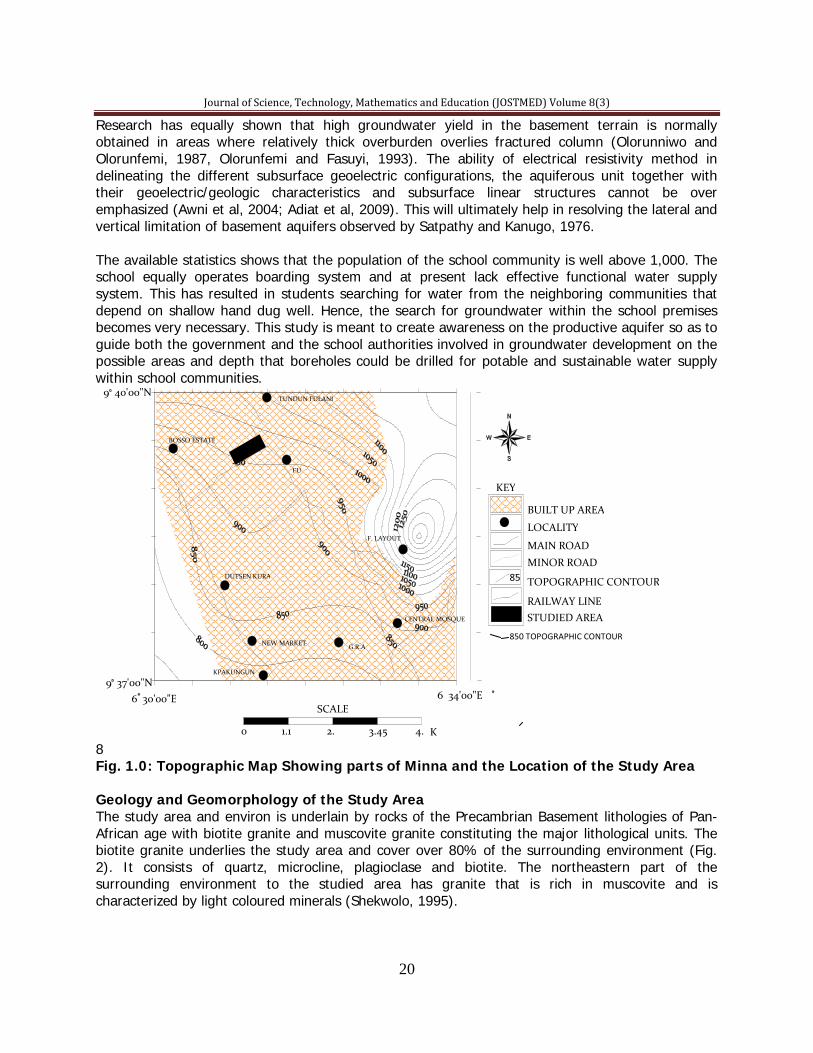
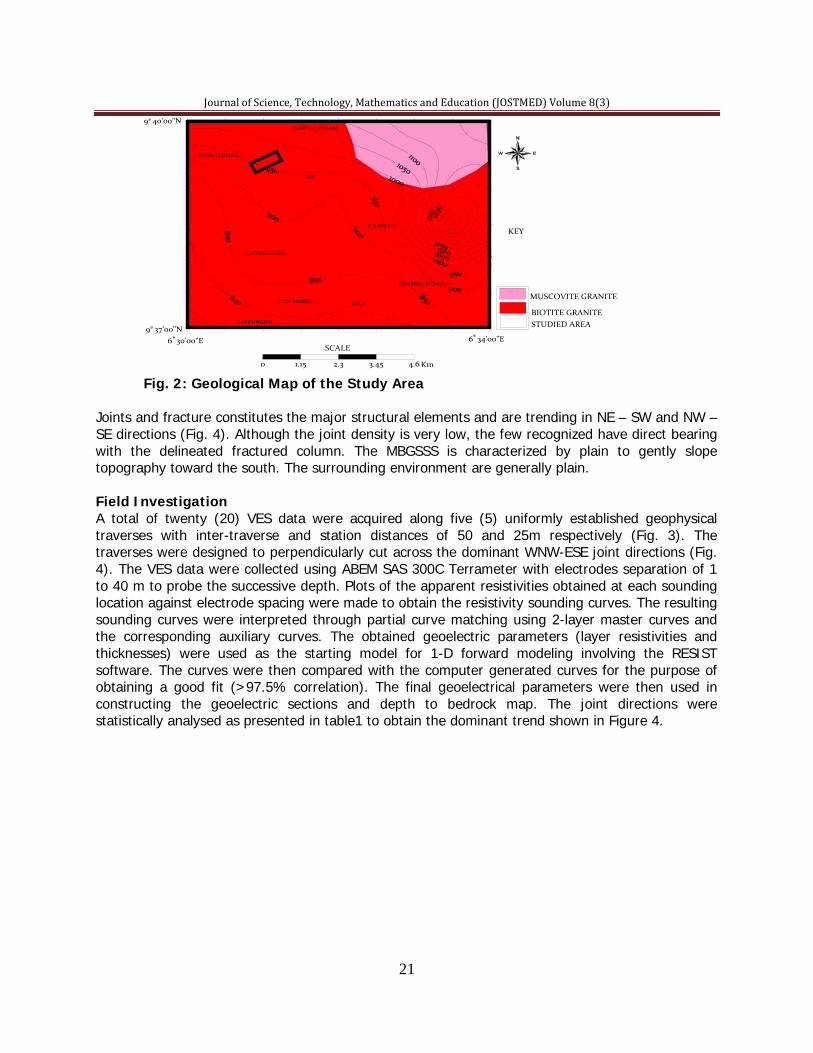
8 Fig. 1.0: Topographic Map Showing parts of Minna and the Location of the Study Area Geology and Geomorphology of the Study Area The study area and environ is underlain by rocks of the Precambrian Basement lithologies of Pan-African age with biotite granite and muscovite granite constituting the major lithological units. The biotite granite underlies the study area and cover over 80% of the surrounding environment (Fig. 2). It consists of quartz, microcline, plagioclase and biotite. The northeastern part of the surrounding environment to the studied area has granite that is rich in muscovite and is characterized by light coloured minerals (Shekwolo, 1995).
TUNDUN FULANI
FU
BOSSO ESTATE
DUTSEN KURA
G.R.A
CENTRAL MOSQUE
0 1.1 2. 3.45 4.
SCALE K
6 34'00"E 9 37'00"N
9 40'00"N
6 30'00"E
F. LAYOUT
NEW MARKET
KPAKUNGUN
BUILT UP AREA LOCALITY MAIN ROAD MINOR ROAD TOPOGRAPHIC CONTOUR RAILWAY LINE STUDIED AREA
KEY
850 TOPOGRAPHIC CONTOUR
85
Journal of Science, Technology, Mathematics and Education (JOSTMED) Volume 8(3)
21
TUNDUN FULANI
FUT
BOSSO ESTATE
DUTSEN KURA
G.R.A
CENTRAL MOSQUE
0 1.15 2.3 3.45 4.6
SCALE
Km
6 34'00"E9 37'00"N
9 40'00"N
6 30'00"E
F. LAYOUT
NEW MARKET
KPAKUNGUN
BIOTITE GRANITESTUDIED AREA
KEY
MUSCOVITE GRANITE
Fig. 2: Geological Map of the Study Area
Joints and fracture constitutes the major structural elements and are trending in NE – SW and NW – SE directions (Fig. 4). Although the joint density is very low, the few recognized have direct bearing with the delineated fractured column. The MBGSSS is characterized by plain to gently slope topography toward the south. The surrounding environment are generally plain. Field Investigation A total of twenty (20) VES data were acquired along five (5) uniformly established geophysical traverses with inter-traverse and station distances of 50 and 25m respectively (Fig. 3). The traverses were designed to perpendicularly cut across the dominant WNW-ESE joint directions (Fig. 4). The VES data were collected using ABEM SAS 300C Terrameter with electrodes separation of 1 to 40 m to probe the successive depth. Plots of the apparent resistivities obtained at each sounding location against electrode spacing were made to obtain the resistivity sounding curves. The resulting sounding curves were interpreted through partial curve matching using 2-layer master curves and the corresponding auxiliary curves. The obtained geoelectric parameters (layer resistivities and thicknesses) were used as the starting model for 1-D forward modeling involving the RESIST software. The curves were then compared with the computer generated curves for the purpose of obtaining a good fit (>97.5% correlation). The final geoelectrical parameters were then used in constructing the geoelectric sections and depth to bedrock map. The joint directions were statistically analysed as presented in table1 to obtain the dominant trend shown in Figure 4.
Journal of Science, Technology, Mathematics and Education (JOSTMED) Volume 8(3)
22
P1P2
P3
P4
P5
PPROFILE LINE
STATION
KEY
9 39'31.0"N
9 39'23.5"N
T1V1
T1V2
T1V3
T1V4
T2V8
T2V7
T2V6
T2V5
T3V9
T3V10
T3V11
T3V12
T5V17
T5V17
T5V19
T5V20
T4V13
T4V13
T4V15
T4V16
TIVI TRAVERSE/ VES
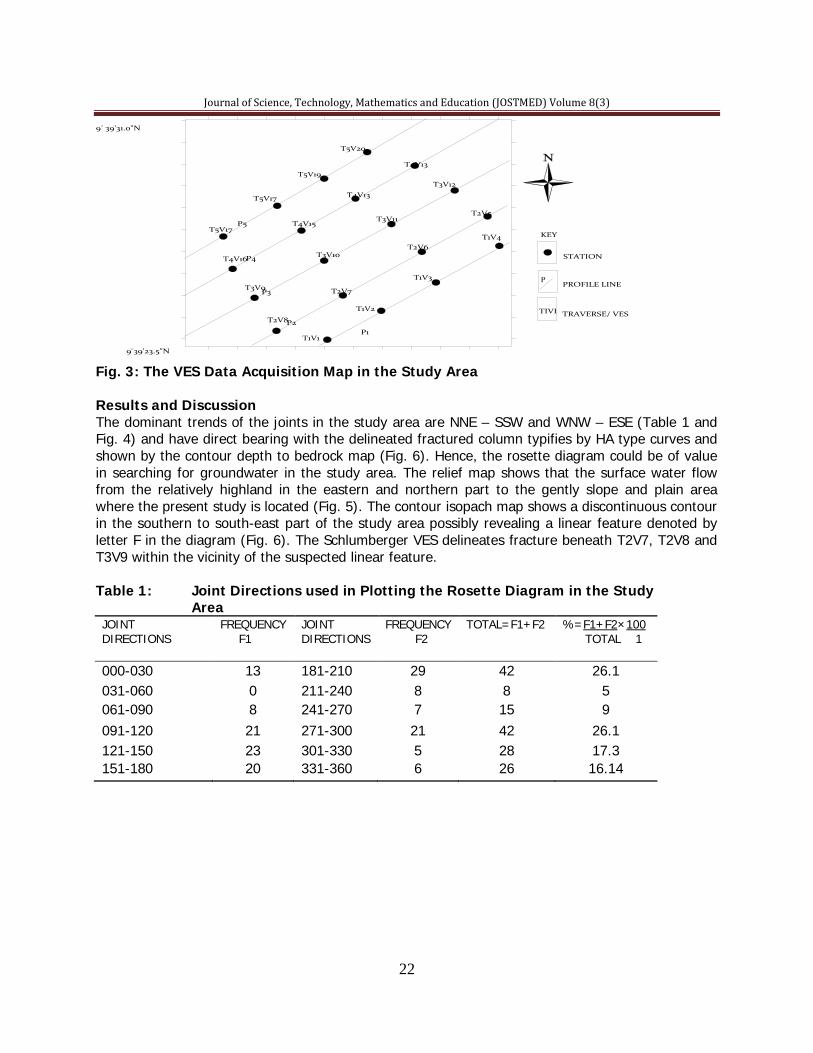
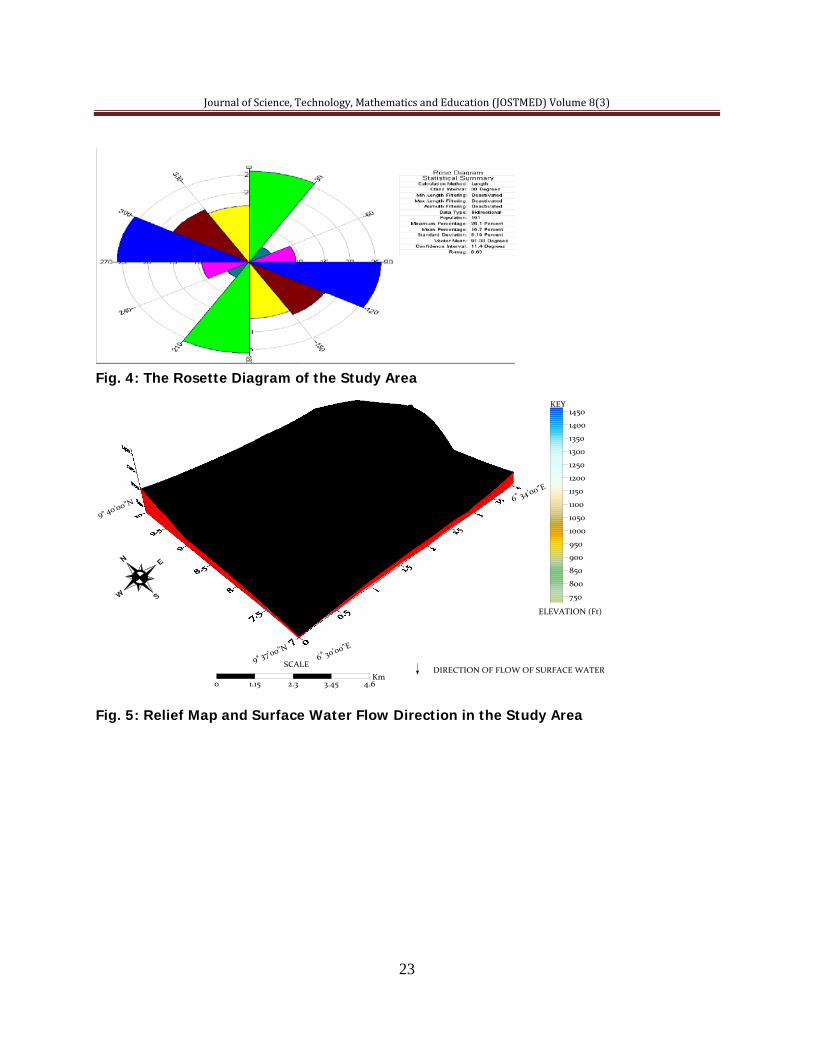
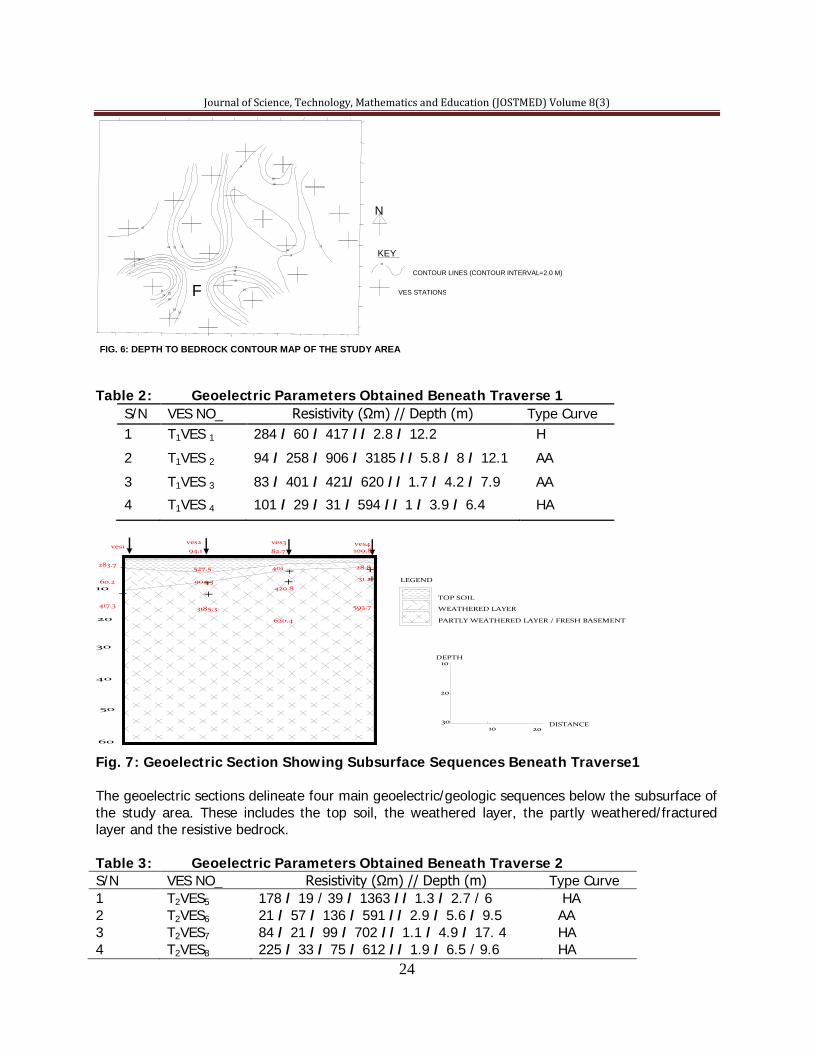
Fig. 3: The VES Data Acquisition Map in the Study Area Results and Discussion The dominant trends of the joints in the study area are NNE – SSW and WNW – ESE (Table 1 and Fig. 4) and have direct bearing with the delineated fractured column typifies by HA type curves and shown by the contour depth to bedrock map (Fig. 6). Hence, the rosette diagram could be of value in searching for groundwater in the study area. The relief map shows that the surface water flow from the relatively highland in the eastern and northern part to the gently slope and plain area where the present study is located (Fig. 5). The contour isopach map shows a discontinuous contour in the southern to south-east part of the study area possibly revealing a linear feature denoted by letter F in the diagram (Fig. 6). The Schlumberger VES delineates fracture beneath T2V7, T2V8 and T3V9 within the vicinity of the suspected linear feature. Table 1: Joint Directions used in Plotting the Rosette Diagram in the Study Area JOINT DIRECTIONS
FREQUENCY F1
JOINT DIRECTIONS
FREQUENCY F2
TOTAL=F1+F2 %=F1+F2×100 TOTAL 1
000-030 13 181-210 29 42 26.1 031-060 0 211-240 8 8 5 061-090 8 241-270 7 15 9 091-120 21 271-300 21 42 26.1 121-150 23 301-330 5 28 17.3 151-180 20 331-360 6 26 16.14
Journal of Science, Technology, Mathematics and Education (JOSTMED) Volume 8(3)
23
Fig. 4: The Rosette Diagram of the Study Area
6 34'00"E
9 37'00"N
9 40'00"N
6 30'00"E
0 1.15 2.3 3.45 4.6Km
SCALE
750
800
850
900
950
1000
1050
1100
1150
1200
1250
1300
1350
1400
1450KEY
ELEVATION (Ft)
DIRECTION OF FLOW OF SURFACE WATER
Fig. 5: Relief Map and Surface Water Flow Direction in the Study Area
Journal of Science, Technology, Mathematics and Education (JOSTMED) Volume 8(3)
24
Table 2: Geoelectric Parameters Obtained Beneath Traverse 1
S/N VES NO_ Resistivity (Ωm) // Depth (m) Type Curve 1 T1VES 1 284 / 60 / 417 // 2.8 / 12.2 H
2 T1VES 2 94 / 258 / 906 / 3185 // 5.8 / 8 / 12.1 AA
3 T1VES 3 83 / 401 / 421/ 620 // 1.7 / 4.2 / 7.9 AA
4 T1VES 4 101 / 29 / 31 / 594 // 1 / 3.9 / 6.4 HA
10
20
30
40
50
60
ves1ves2 ves3 ves4
283.7
60.2
417.3
94.1
527.5
904.3
3185.3
82.7
401
420.8
620.4
100.8
28.8
31.2
593.7TOP SOIL
WEATHERED LAYER
PARTLY WEATHERED LAYER / FRESH BASEMENT
LEGEND
10
20
30 DISTANCE
DEPTH
10 20
Fig. 7: Geoelectric Section Showing Subsurface Sequences Beneath Traverse1 The geoelectric sections delineate four main geoelectric/geologic sequences below the subsurface of the study area. These includes the top soil, the weathered layer, the partly weathered/fractured layer and the resistive bedrock. Table 3: Geoelectric Parameters Obtained Beneath Traverse 2 S/N VES NO_ Resistivity (Ωm) // Depth (m) Type Curve 1 T2VES5 178 / 19 / 39 / 1363 // 1.3 / 2.7 / 6 HA 2 T2VES6 21 / 57 / 136 / 591 // 2.9 / 5.6 / 9.5 AA 3 T2VES7 84 / 21 / 99 / 702 // 1.1 / 4.9 / 17. 4 HA 4 T2VES8 225 / 33 / 75 / 612 // 1.9 / 6.5 / 9.6 HA
26 24 22
20 18
16
14
12 12 10 8
24 22 20 18 16
14
14 12
16 18
16
N
F
KEY 20
VES STATIONS CONTOUR LINES (CONTOUR INTERVAL=2.0 M)
FIG. 6: DEPTH TO BEDROCK CONTOUR MAP OF THE STUDY AREA
Journal of Science, Technology, Mathematics and Education (JOSTMED) Volume 8(3)
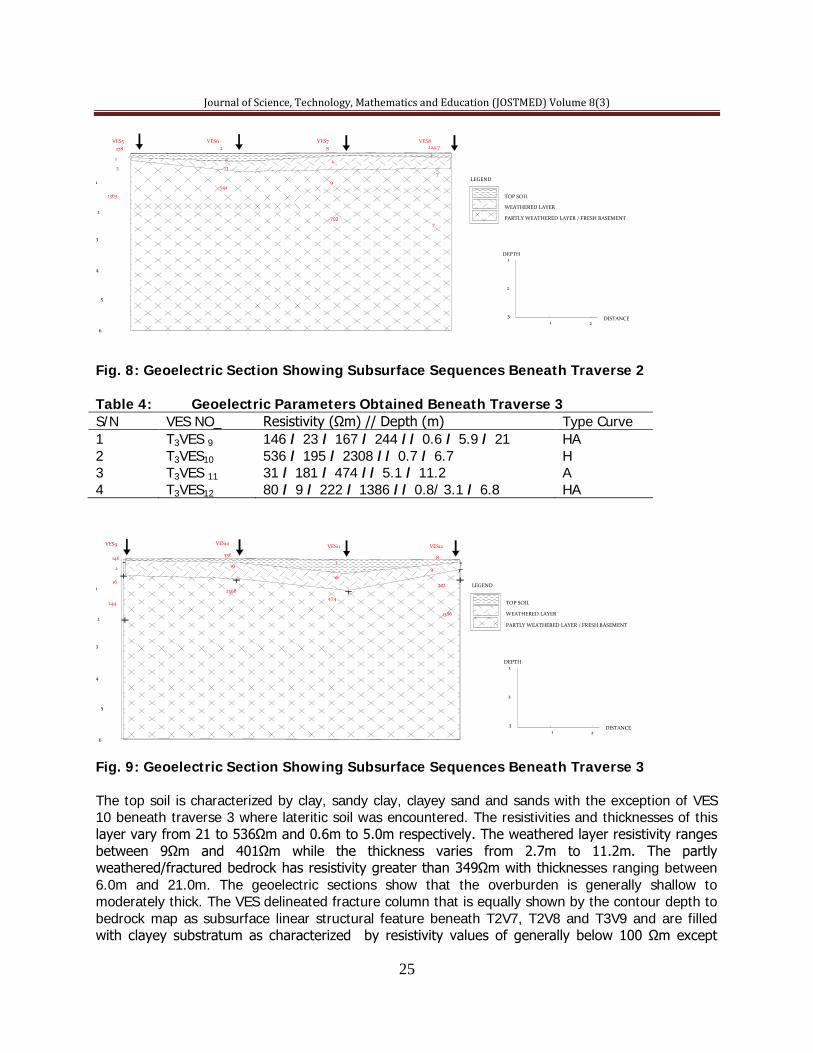
25
Fig. 8: Geoelectric Section Showing Subsurface Sequences Beneath Traverse 2 Table 4: Geoelectric Parameters Obtained Beneath Traverse 3 S/N VES NO_ Resistivity (Ωm) // Depth (m) Type Curve 1 T3VES 9 146 / 23 / 167 / 244 // 0.6 / 5.9 / 21 HA 2 T3VES10 536 / 195 / 2308 // 0.7 / 6.7 H 3 T3VES 11 31 / 181 / 474 // 5.1 / 11.2 A 4 T3VES12 80 / 9 / 222 / 1386 // 0.8/ 3.1 / 6.8 HA
Fig. 9: Geoelectric Section Showing Subsurface Sequences Beneath Traverse 3 The top soil is characterized by clay, sandy clay, clayey sand and sands with the exception of VES 10 beneath traverse 3 where lateritic soil was encountered. The resistivities and thicknesses of this layer vary from 21 to 536Ωm and 0.6m to 5.0m respectively. The weathered layer resistivity ranges between 9Ωm and 401Ωm while the thickness varies from 2.7m to 11.2m. The partly weathered/fractured bedrock has resistivity greater than 349Ωm with thicknesses ranging between 6.0m and 21.0m. The geoelectric sections show that the overburden is generally shallow to moderately thick. The VES delineated fracture column that is equally shown by the contour depth to bedrock map as subsurface linear structural feature beneath T2V7, T2V8 and T3V9 and are filled with clayey substratum as characterized by resistivity values of generally below 100 Ωm except
1
2
3
4
5
6
TOP SOIL WEATHERED LAYER PARTLY WEATHERED LAYER / FRESH BASEMENT
LEGEND
1
2
3 DISTANCE
DEPTH
1 2
VES9 VES10 VES11 VES12 146
2
16
244
536 19
2308
3
18
474
8
9 222
1386
1
2
3
4
5
6
TOP SOIL WEATHERED LAYER PARTLY WEATHERED LAYER / FRESH BASEMENT
LEGEND
1
2
3 DISTANCE
DEPTH
1 2
VES5 VES6 VES7 VES8 178 1
3
1363
2
5
13
591
8
2
9
702
224.7 3
7
7
Journal of Science, Technology, Mathematics and Education (JOSTMED) Volume 8(3)
26
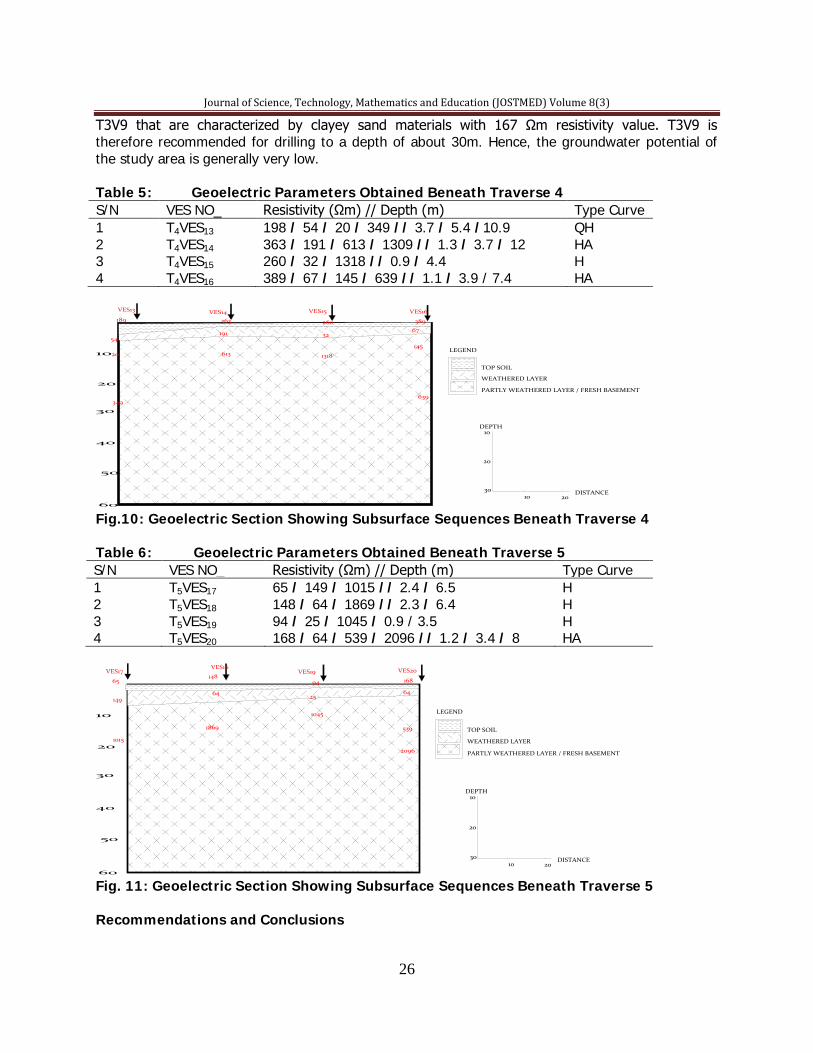
T3V9 that are characterized by clayey sand materials with 167 Ωm resistivity value. T3V9 is therefore recommended for drilling to a depth of about 30m. Hence, the groundwater potential of the study area is generally very low. Table 5: Geoelectric Parameters Obtained Beneath Traverse 4 S/N VES NO_ Resistivity (Ωm) // Depth (m) Type Curve 1 T4VES13 198 / 54 / 20 / 349 // 3.7 / 5.4 /10.9 QH 2 T4VES14 363 / 191 / 613 / 1309 // 1.3 / 3.7 / 12 HA 3 T4VES15 260 / 32 / 1318 // 0.9 / 4.4 H 4 T4VES16 389 / 67 / 145 / 639 // 1.1 / 3.9 / 7.4 HA
10
20
30
40
50
60
TOP SOIL
WEATHERED LAYER
PARTLY WEATHERED LAYER / FRESH BASEMENT
LEGEND
10
20
30 DISTANCE
DEPTH
10 20
189
54
20
349
363
191
613
260
32
1318
38967
145
639
VES13 VES14 VES15 VES16
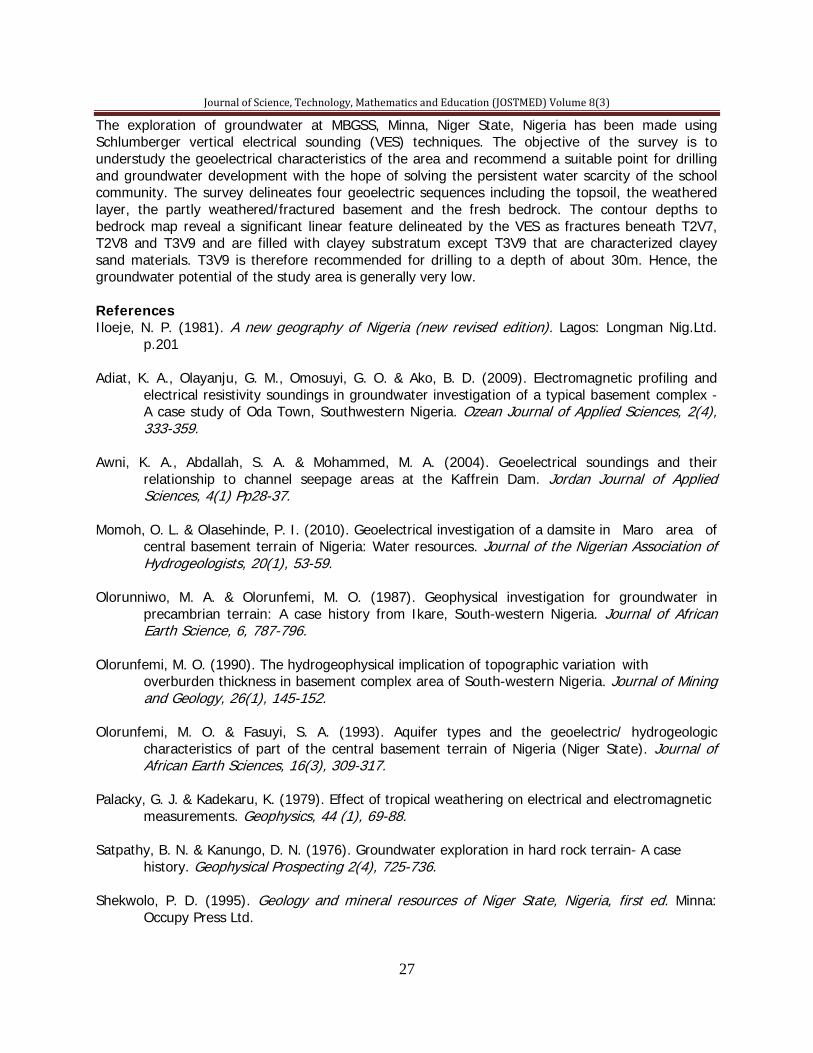
Fig.10: Geoelectric Section Showing Subsurface Sequences Beneath Traverse 4 Table 6: Geoelectric Parameters Obtained Beneath Traverse 5 S/N VES NO_ Resistivity (Ωm) // Depth (m) Type Curve 1 T5VES17 65 / 149 / 1015 // 2.4 / 6.5 H 2 T5VES18 148 / 64 / 1869 // 2.3 / 6.4 H 3 T5VES19 94 / 25 / 1045 / 0.9 / 3.5 H 4 T5VES20 168 / 64 / 539 / 2096 // 1.2 / 3.4 / 8 HA
10
20
30
40
50
60
TOP SOIL
WEATHERED LAYER
PARTLY WEATHERED LAYER / FRESH BASEMENT
LEGEND
10
20
30 DISTANCE
DEPTH
10 20
VES17VES16
VES19 VES20
65
149
1015
148
64
1869
94
25
1045
168
64
539
2096
Fig. 11: Geoelectric Section Showing Subsurface Sequences Beneath Traverse 5 Recommendations and Conclusions
Journal of Science, Technology, Mathematics and Education (JOSTMED) Volume 8(3)
27
The exploration of groundwater at MBGSS, Minna, Niger State, Nigeria has been made using Schlumberger vertical electrical sounding (VES) techniques. The objective of the survey is to understudy the geoelectrical characteristics of the area and recommend a suitable point for drilling and groundwater development with the hope of solving the persistent water scarcity of the school community. The survey delineates four geoelectric sequences including the topsoil, the weathered layer, the partly weathered/fractured basement and the fresh bedrock. The contour depths to bedrock map reveal a significant linear feature delineated by the VES as fractures beneath T2V7, T2V8 and T3V9 and are filled with clayey substratum except T3V9 that are characterized clayey sand materials. T3V9 is therefore recommended for drilling to a depth of about 30m. Hence, the groundwater potential of the study area is generally very low. References Iloeje, N. P. (1981). A new geography of Nigeria (new revised edition). Lagos: Longman Nig.Ltd. p.201 Adiat, K. A., Olayanju, G. M., Omosuyi, G. O. & Ako, B. D. (2009). Electromagnetic profiling and electrical resistivity soundings in groundwater investigation of a typical basement complex - A case study of Oda Town, Southwestern Nigeria. Ozean Journal of Applied Sciences, 2(4), 333-359. Awni, K. A., Abdallah, S. A. & Mohammed, M. A. (2004). Geoelectrical soundings and their relationship to channel seepage areas at the Kaffrein Dam. Jordan Journal of Applied Sciences, 4(1) Pp28-37. Momoh, O. L. & Olasehinde, P. I. (2010). Geoelectrical investigation of a damsite in Maro area of central basement terrain of Nigeria: Water resources. Journal of the Nigerian Association of Hydrogeologists, 20(1), 53-59. Olorunniwo, M. A. & Olorunfemi, M. O. (1987). Geophysical investigation for groundwater in precambrian terrain: A case history from Ikare, South-western Nigeria. Journal of African Earth Science, 6, 787-796. Olorunfemi, M. O. (1990). The hydrogeophysical implication of topographic variation with overburden thickness in basement complex area of South-western Nigeria. Journal of Mining and Geology, 26(1), 145-152. Olorunfemi, M. O. & Fasuyi, S. A. (1993). Aquifer types and the geoelectric/ hydrogeologic characteristics of part of the central basement terrain of Nigeria (Niger State). Journal of African Earth Sciences, 16(3), 309-317. Palacky, G. J. & Kadekaru, K. (1979). Effect of tropical weathering on electrical and electromagnetic measurements. Geophysics, 44 (1), 69-88. Satpathy, B. N. & Kanungo, D. N. (1976). Groundwater exploration in hard rock terrain- A case history. Geophysical Prospecting 2(4), 725-736. Shekwolo, P. D. (1995). Geology and mineral resources of Niger State, Nigeria, first ed. Minna: Occupy Press Ltd.

Journal of Science, Technology, Mathematics and Education (JOSTMED) Volume 8(3)
28
ASSESSING THE PROBLEMS OF SEWAGE DISPOSAL MANAGEMENT IN ABUJA, NIGERIA
Garba, Inuwa Kuta Department of Geography
Federal University of Technology Minna, Niger State, Nigeria
E-mail: [email protected]) Phone No: +234-803-678-1078
Abstract The beauty of an environment is incomplete without adequate provision of a befitting sewage disposal system. Part of Abuja municipality experience offensive odour especially in squatter and market areas and streets messed up as a result of sewage from manholes. The paper is aimed at assessing the effectiveness of the management of sewage in a modern city with Abuja municipality as a case study. The essence of good sewage disposal system is very important especially in Abuja. Most data collected for the research were obtained through interviews and personal discussion with staff of Abuja Environmental Protection Board (AEPB), structured questionnaire administered on residents of the Federal Capital Territory and physical observation by the researcher. Simple random sampling was used for selection, also charts and percentage was used for the description of the data. The result now shows that the sewage disposal system has been neglected for a long time which has resulted to a lot of problems such as public sewer problem, sewage overflow, poor maintenance of sewage facilities etc. within the Federal Capital Territory. The Federal Capital Development Authority should revisit the initial plan of the sewage disposal plan of the Abuja Municipal in order to upgrade the facilities, prompt and regular maintenance of these facilities should be adhere to The need to employ professionals to run the A.E.P.B. is also very important. Introduction Abuja, the Federal Capital of Nigeria was created due to the inability of Lagos, the former capital city to efficiently and effectively perform its role as a Federal Capital, because of its multiple roles or station as a State and a Federal Capital which brought about amongst other things problems of housing, overpopulation, poor drainage, and poor sewage disposal. To ease above problems, the government established a new Federal Capital Territory in Abuja and embarked on the construction of houses and infrastructural facilities for the people moving into the Territory with the plan to avert the problems encountered in Lagos. The Abuja Municipality comprises the Central Area, Garki I, Garki II, Wuse I, Wuse II, Asokoro, Maitama, Gudu, Utako and Jabi district and the waste water collection system for the city is the integrated trunk sewer collection system with a treatment plant. The system is a gravity collection system with no light stations, force mains or other powered devices which is made possible by the good terrain the city has. In order to reduce the load on the waste water treatment plant, the separate system is adopted, that is storm run-off is not allowed to enter the stationery sewage (The Abuja Master Plan, 1979). The construction of the interceptor sewage schedule I and III which take the sewage from the city to the sewerage treatment plant has attained 90% and 97% completion respectively. The construction of schedule II has attained 65% completion level. The construction of the pilot starter sewerage treatment plant, which is to cater for the city’s initial population of about 200,000 people has been awarded since 1981, and has attained 65% completion. As a temporary measure, most of the built-up areas of city were provided with septic

Journal of Science, Technology, Mathematics and Education (JOSTMED) Volume 8(3)
29
tanks which are considered adequate for the present population (The Making of a New Capital, 1996). Public utilities are fraught with management problems. Up till date, the treatment plant for Abuja municipality is yet to be completed. Considering the huge amount of money spent so far by the Federal Government for effective sewage disposal, construction works are still going on especially on the treatment plant. Also, sewer lines in use are channelled to streams with the attendant danger on the inhabitants of the city and environment in general. Also, there is the problem of blocked lines causing surges in most parts of the city. Sewage disposal as defined by Steel and McGhee (1979), it applies to the act of disposing by any method. It may be done with or without previous treatment of the sewage. Lawal (2000) identified two major obvious system for the conveyance of sewage, the combined system and the system. Additionally, he stateed that there is a compromise, the partially-seperate system. They are exposed below:- Combined Sewage System In this system, the whole of the waste matters and surface is conveyed by a single sewer, and this system is suited to the needs of very large cities and towns. It has merit of simplicity, possible lower first cost and the provision of large sewers which are easy to inspect and keep clean. Separate Sewage System In this system of sewerage, the whole of the soil sewage, that is the waste matter from W.C.S; urinal, sinks, lavatory basins and baths are conveyed by one sewer (the soil sewer or foul water) and the rain water from streets, roofs of houses and yards by another (the surface-water sewer). Mara (1976) identified two (2) two methods of sewage disposal namely: (i) Conservancy Method: This of disposal of sewage is isolated building or communities that cannot be served sewer system. Conservancy sanitation has been defined as sanitation by keeping refuse matter in privies, pails, earth. Closet and Cessol for its periodic removal. (ii) Water Borne System: This is a method of sewage disposal in which sewage is conveyed in pipes known as sewers from its place of production to its place of treatment and disposal. Statement of the Problem In the study area, it is discovered that some parts of the municipality experience offensive odour especially in squatter and market areas and streets messed up as a result of sewerage from manholes. Over the years, sewage system in Nigeria has developed due to largely individual efforts of households and several non-governmental agencies. The Federal, State and Local governments, ESAs have in the past intervened in situation matters in one way or the other. The Agencies of Government that have been involved in sanitation include: Federal Ministry of Health, defunct Directorate for Food, Roads and Rural Infrastructure (DFFRI), Federal Ministry of Water Resources, Federal Ministry of Agriculture, State Water Agencies and local Governments. The Efforts of the various Agencies were not guided by a clear-cut sanitation policy for Nigeria. It is observed that with effective sewage disposal management, these problems should not be experienced. The above problem, if allowed to continue, will have effect on the environment because sewage disposal is as important to the city or environment just as there is need for adequate position of complementary facilities like road network, drainage system, electricity, and telecommunication and

Journal of Science, Technology, Mathematics and Education (JOSTMED) Volume 8(3)
30
so on. Therefore, this paper is aimed at assessing the effectiveness of sewage disposal in Abuja city with a view to offer recommendation based on the findings. Aim and objectives The aim of this research work is to assess the problem of effective sewage disposal management in Abuja municipality of the Federal Capital Territory. To achieve this aim the following objectives shall be pursued: (i) To assess the functionality and adequacy of facilities provided by the government in Abuja Municipality area. (ii) To identify the problem encountered by Abuja Environmental Protection Board in the management of sewage in Abuja Municipality area. (iii) To identify the problem encountered by the general populace using the sewage disposal facilities and proffer solutions to them. Study area location As contained in the Making of a New Capital City (1986), the Federal Capital Territory is located in the geographical centre of Nigeria. It lies between latitude 8o5' to 9o20' North of the equator and longitude 64o5' to 7o39' East of the Greenwich Meridian. This geographically places it at the North of Kaduna State. Being centrally located, Abuja is easily accessible from all parts of Nigeria and indeed, the principal cities of Africa. Placed in the North-Eastern quadrant of the territory and in a position easily identified as Aso Hill is the crescent shaped city, Abuja, the new Federal Capital a mere 3 percent of the Territory.
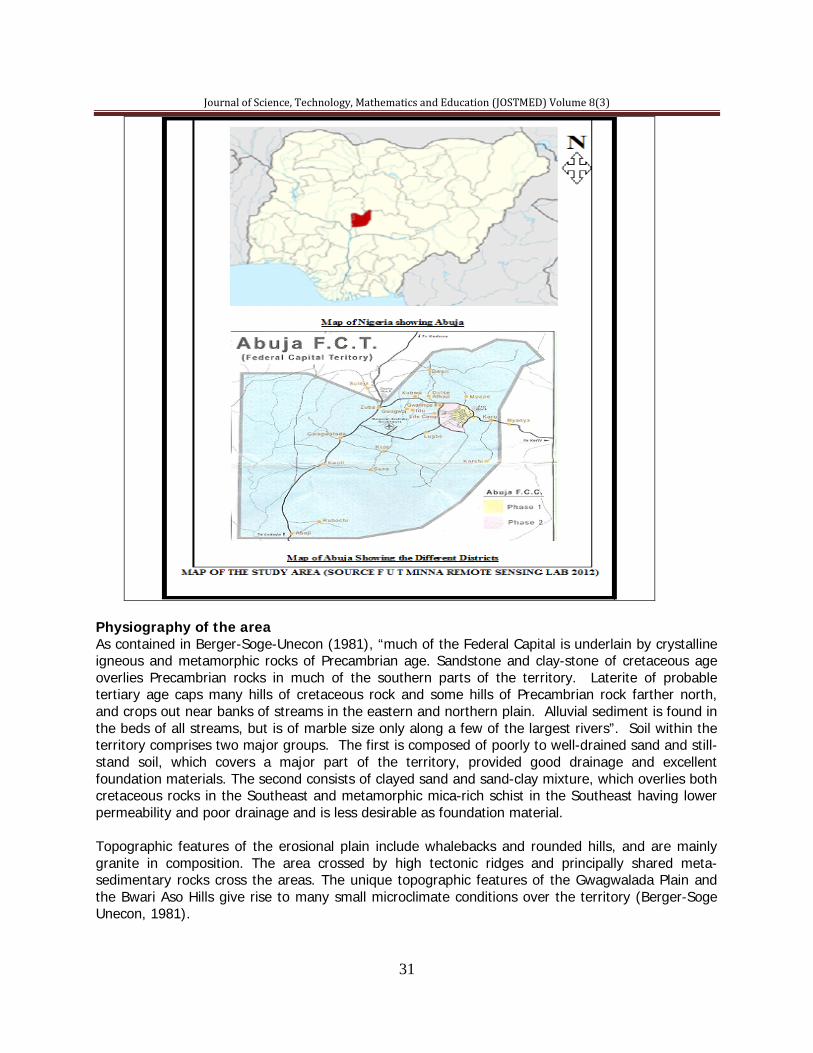
Journal of Science, Technology, Mathematics and Education (JOSTMED) Volume 8(3)
31
Physiography of the area As contained in Berger-Soge-Unecon (1981), “much of the Federal Capital is underlain by crystalline igneous and metamorphic rocks of Precambrian age. Sandstone and clay-stone of cretaceous age overlies Precambrian rocks in much of the southern parts of the territory. Laterite of probable tertiary age caps many hills of cretaceous rock and some hills of Precambrian rock farther north, and crops out near banks of streams in the eastern and northern plain. Alluvial sediment is found in the beds of all streams, but is of marble size only along a few of the largest rivers”. Soil within the territory comprises two major groups. The first is composed of poorly to well-drained sand and still-stand soil, which covers a major part of the territory, provided good drainage and excellent foundation materials. The second consists of clayed sand and sand-clay mixture, which overlies both cretaceous rocks in the Southeast and metamorphic mica-rich schist in the Southeast having lower permeability and poor drainage and is less desirable as foundation material. Topographic features of the erosional plain include whalebacks and rounded hills, and are mainly granite in composition. The area crossed by high tectonic ridges and principally shared meta-sedimentary rocks cross the areas. The unique topographic features of the Gwagwalada Plain and the Bwari Aso Hills give rise to many small microclimate conditions over the territory (Berger-Soge Unecon, 1981).

Journal of Science, Technology, Mathematics and Education (JOSTMED) Volume 8(3)
32
The people and the population Abuja before now was inhabited by the Gbagyi people and as a result of moving the Federal Capital to Abuja, it is now inhabited by people from across Nigeria, it is a city owned by not individual ethnic groups or states, but all citizens of Nigeria. For the fact that Abuja was carved out of three States in the Federation it is obvious that apart from English, the official language, are Hausa, Igbo and Yoruba Nigerian major languages, several other district dialects are being spoken in various communities of the territory. The International Planning Association (IPA), the designers of the Master Plan, projected the population of the Territory to hit ideally a 3.1 million mark and completion of the 4th and 5th (final) development phase of the Territory (The making of a new Capital city for Nigeria 4th ed. 1996). Since the movement from Lagos began in 1982, the population of Abuja has been growing. The population of the territory as recorded in 1991 National Census was 378,571. However, with the final movement of the Federal Government Ministries and parastatals as well as other multinational corporations, the population today is put at over 4 million (2006 National Census). Planning and design of Abuja The Federal Capital Territory is divided into six (6) Area Councils, namely: Abuja Area Council, Abuja Municipal Area Council, Gwagwalada Area Council, Kuje Area Council, Bwari Area Council and Kwali Area Council. Abuja Municipal Area Council (AMAC) comprises Asokoro, Maitama, Wuse, Garki, Gudu, Jabi, Utako and Central Area. Popular towns and villages in AMAC often referred to as satellite towns are Karshi, Nyanya, Gwagwa, Karmo, Karu, Jiwa, Kubwa, Ushafa, Sarki Share, etc. The site of the capital city occupies an area of about 250 square kilometers. The Abuja Master Plan is projected to cater for 3.1 million people in the land of about 800,000square kilometers when fully developed. The physical development of the Territory is planned into four phases. Phase one is expected to accommodate 230,000 people while Phases 2, 3, and 4 are expected to provide for 585,000; 640,000 and 1.7 million people respectively (The Making of a Capital City, 1995). The first phase which has been developed, involved the development of the Federal Capital City (FCC) Abuja, a crescent shaped city that covers approximately 250sq.kilometer. 3% of the total land – of the Territory, is divided into: Central Area, Garki I & II, Wuse I & II, Asokoro, Maitama, Utako, Jabi and Gudu.
Table 1: A Table Showing the FCT District Land Allocation and Population
District Land Budget in Hectares
Planned Population Present Population
Central Area Garki Wuse Asokoro Maitama
Total
1,685 865
1,530 897
1,050 6,000
30,000 50,000 69,000 30,000 35,000
214,000
120,000 210,326 89,007 73,568 106,712 599,613
Source: Development Control, FCT Abuja (2007) With the exception of the Central Area, the other districts are of mixed residential, and office accommodation for both public offices and private individuals structures for numerous government and private organizations as well as individual families
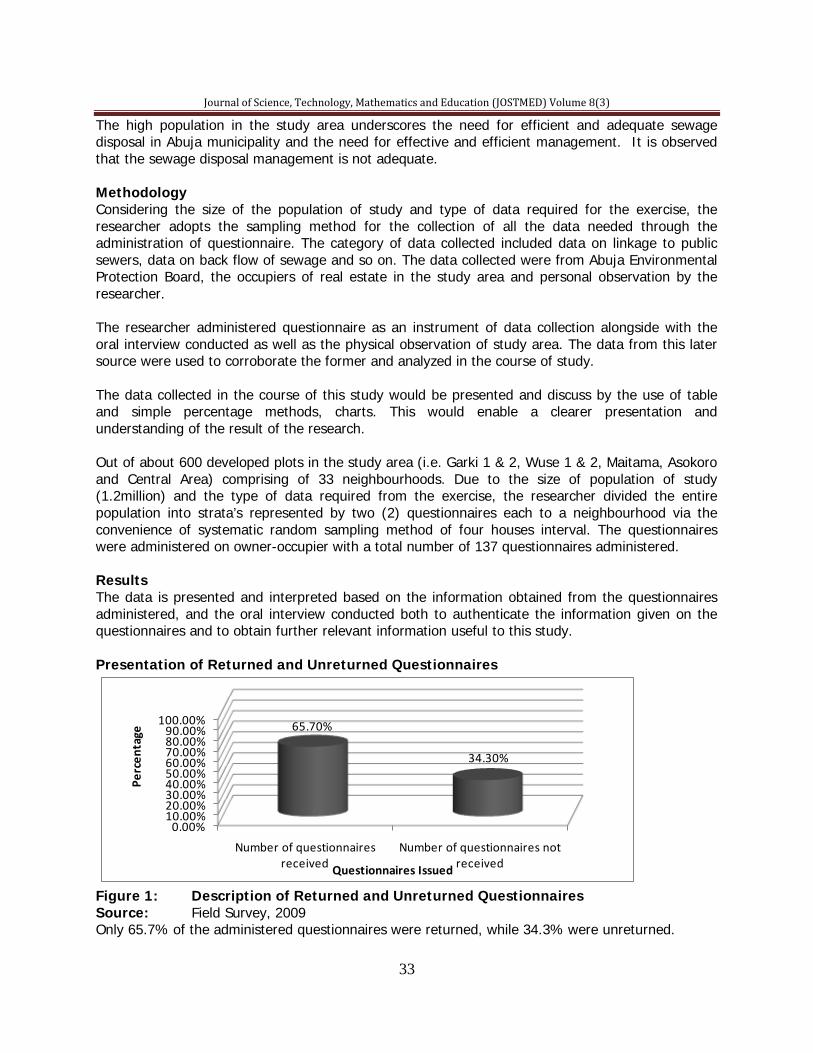
Journal of Science, Technology, Mathematics and Education (JOSTMED) Volume 8(3)
33
The high population in the study area underscores the need for efficient and adequate sewage disposal in Abuja municipality and the need for effective and efficient management. It is observed that the sewage disposal management is not adequate. Methodology Considering the size of the population of study and type of data required for the exercise, the researcher adopts the sampling method for the collection of all the data needed through the administration of questionnaire. The category of data collected included data on linkage to public sewers, data on back flow of sewage and so on. The data collected were from Abuja Environmental Protection Board, the occupiers of real estate in the study area and personal observation by the researcher. The researcher administered questionnaire as an instrument of data collection alongside with the oral interview conducted as well as the physical observation of study area. The data from this later source were used to corroborate the former and analyzed in the course of study. The data collected in the course of this study would be presented and discuss by the use of table and simple percentage methods, charts. This would enable a clearer presentation and understanding of the result of the research. Out of about 600 developed plots in the study area (i.e. Garki 1 & 2, Wuse 1 & 2, Maitama, Asokoro and Central Area) comprising of 33 neighbourhoods. Due to the size of population of study (1.2million) and the type of data required from the exercise, the researcher divided the entire population into strata’s represented by two (2) questionnaires each to a neighbourhood via the convenience of systematic random sampling method of four houses interval. The questionnaires were administered on owner-occupier with a total number of 137 questionnaires administered. Results The data is presented and interpreted based on the information obtained from the questionnaires administered, and the oral interview conducted both to authenticate the information given on the questionnaires and to obtain further relevant information useful to this study. Presentation of Returned and Unreturned Questionnaires
0.00%10.00%20.00%30.00%40.00%50.00%60.00%70.00%80.00%90.00%
100.00%
Number of questionnaires received
Number of questionnaires not received
65.70%
34.30%
Perc
enta
ge
Questionnaires Issued
Figure 1: Description of Returned and Unreturned Questionnaires Source: Field Survey, 2009 Only 65.7% of the administered questionnaires were returned, while 34.3% were unreturned.
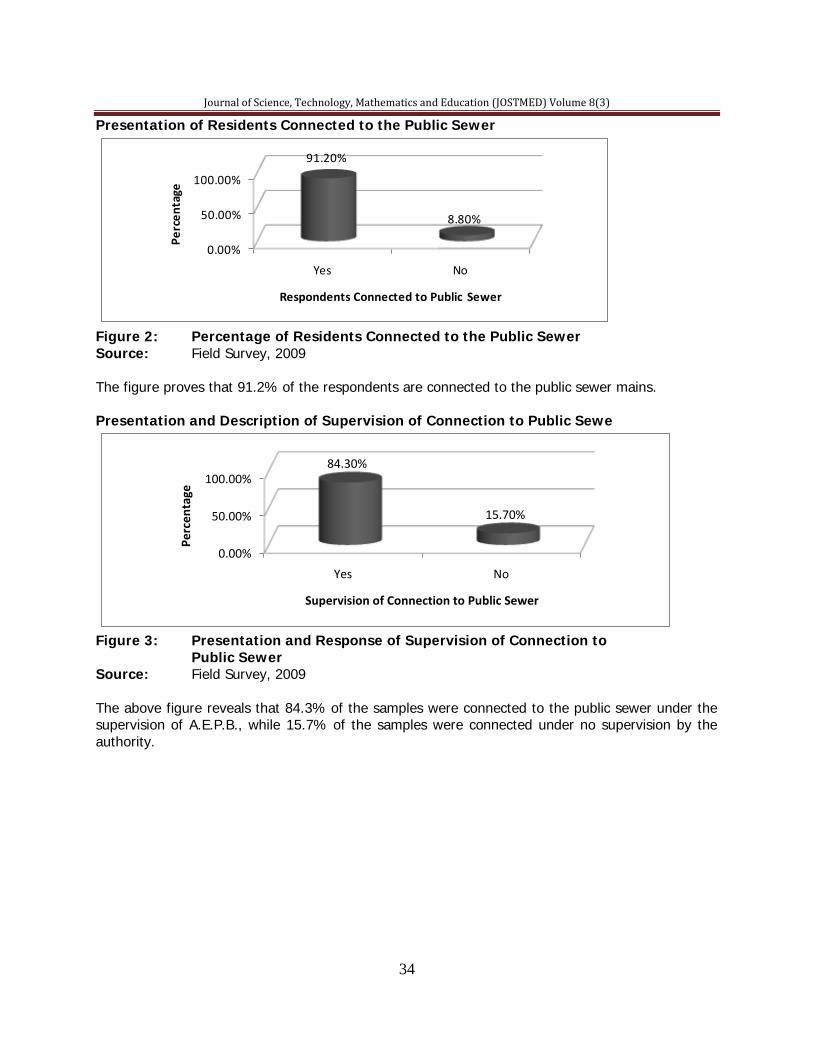
Journal of Science, Technology, Mathematics and Education (JOSTMED) Volume 8(3)
34
Presentation of Residents Connected to the Public Sewer
0.00%
50.00%
100.00%
Yes No
91.20%
8.80%
Perc
enta
ge
Respondents Connected to Public Sewer
Figure 2: Percentage of Residents Connected to the Public Sewer Source: Field Survey, 2009 The figure proves that 91.2% of the respondents are connected to the public sewer mains.
Presentation and Description of Supervision of Connection to Public Sewe
0.00%
50.00%
100.00%
Yes No
84.30%
15.70%
Perc
enta
ge
Supervision of Connection to Public Sewer
Figure 3: Presentation and Response of Supervision of Connection to Public Sewer Source: Field Survey, 2009 The above figure reveals that 84.3% of the samples were connected to the public sewer under the supervision of A.E.P.B., while 15.7% of the samples were connected under no supervision by the authority.
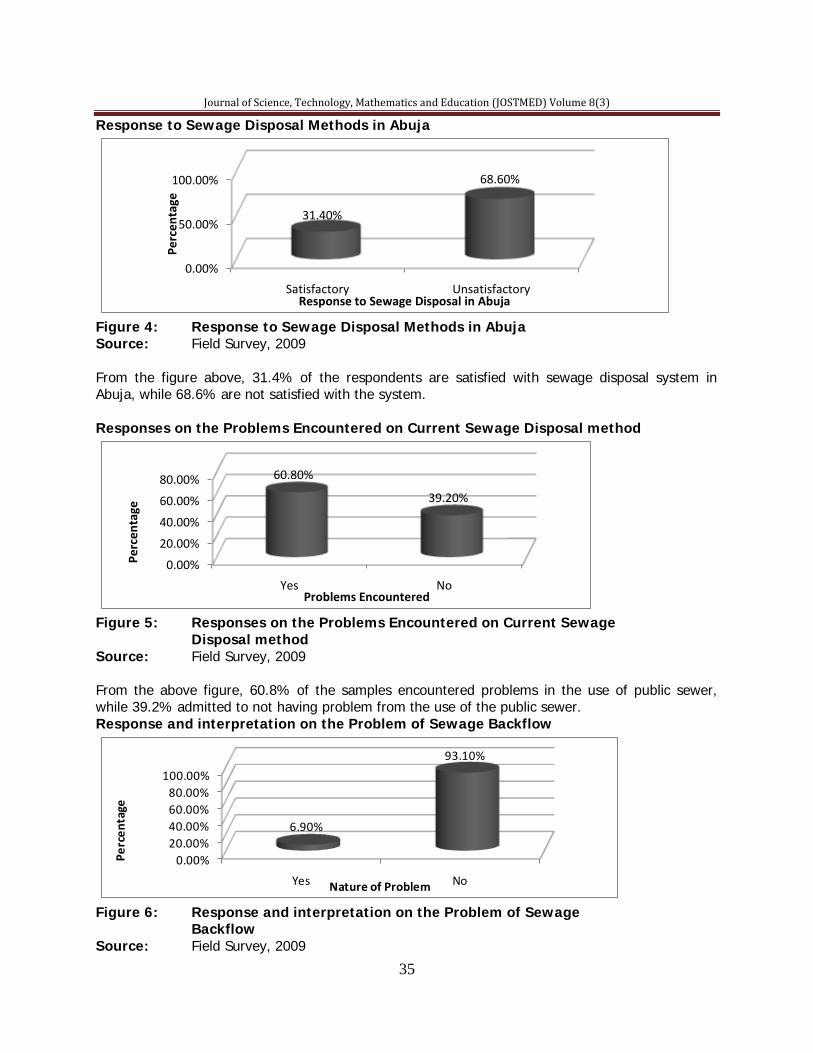
Journal of Science, Technology, Mathematics and Education (JOSTMED) Volume 8(3)
35
Response to Sewage Disposal Methods in Abuja
0.00%
50.00%
100.00%
Satisfactory Unsatisfactory
31.40%
68.60%Pe
rcen
tage
Response to Sewage Disposal in Abuja
Figure 4: Response to Sewage Disposal Methods in Abuja Source: Field Survey, 2009 From the figure above, 31.4% of the respondents are satisfied with sewage disposal system in Abuja, while 68.6% are not satisfied with the system. Responses on the Problems Encountered on Current Sewage Disposal method
0.00%
20.00%
40.00%
60.00%
80.00%
Yes No
60.80%
39.20%
Perc
enta
ge
Problems Encountered
Figure 5: Responses on the Problems Encountered on Current Sewage Disposal method
Source: Field Survey, 2009 From the above figure, 60.8% of the samples encountered problems in the use of public sewer, while 39.2% admitted to not having problem from the use of the public sewer. Response and interpretation on the Problem of Sewage Backflow
0.00%20.00%40.00%60.00%80.00%
100.00%
Yes No
6.90%
93.10%
Perc
enta
ge
Nature of Problem
Figure 6: Response and interpretation on the Problem of Sewage Backflow
Source: Field Survey, 2009
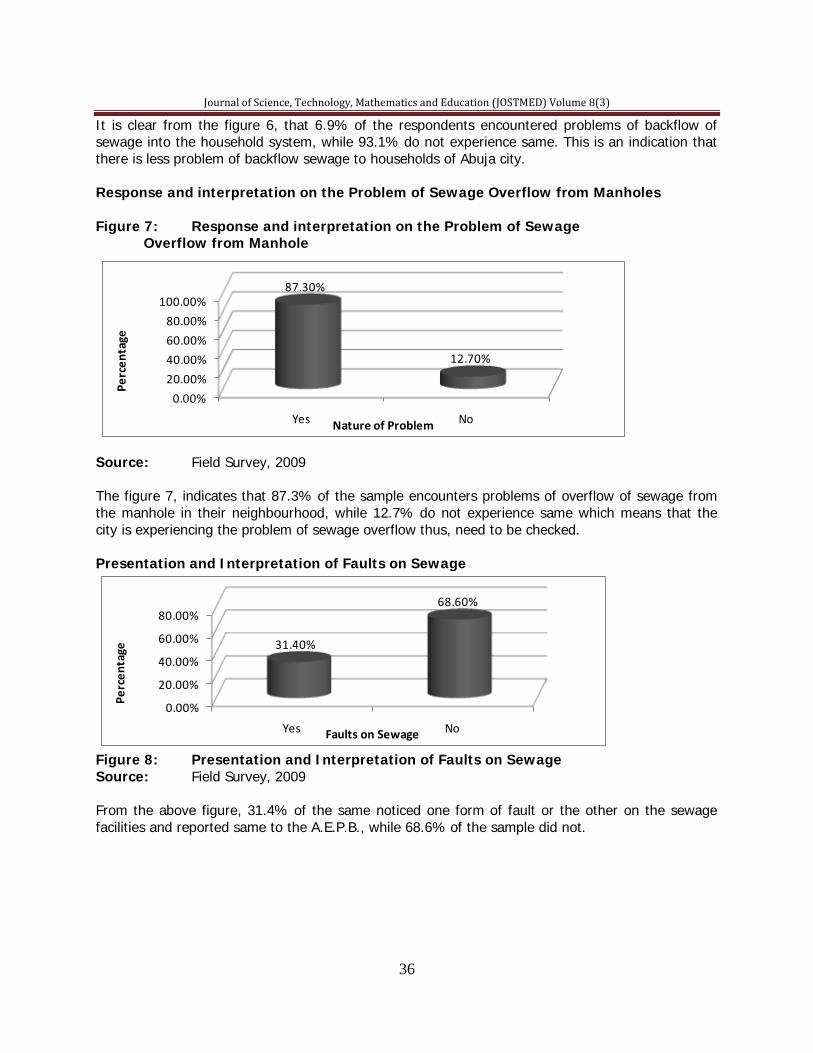
Journal of Science, Technology, Mathematics and Education (JOSTMED) Volume 8(3)
36
It is clear from the figure 6, that 6.9% of the respondents encountered problems of backflow of sewage into the household system, while 93.1% do not experience same. This is an indication that there is less problem of backflow sewage to households of Abuja city. Response and interpretation on the Problem of Sewage Overflow from Manholes Figure 7: Response and interpretation on the Problem of Sewage Overflow from Manhole
Source: Field Survey, 2009 The figure 7, indicates that 87.3% of the sample encounters problems of overflow of sewage from the manhole in their neighbourhood, while 12.7% do not experience same which means that the city is experiencing the problem of sewage overflow thus, need to be checked. Presentation and Interpretation of Faults on Sewage
0.00%
20.00%
40.00%
60.00%
80.00%
Yes No
31.40%
68.60%
Perc
enta
ge
Faults on Sewage
Figure 8: Presentation and Interpretation of Faults on Sewage Source: Field Survey, 2009 From the above figure, 31.4% of the same noticed one form of fault or the other on the sewage facilities and reported same to the A.E.P.B., while 68.6% of the sample did not.
0.00%20.00%40.00%60.00%80.00%
100.00%
Yes No
87.30%
12.70%
Perc
enta
ge
Nature of Problem
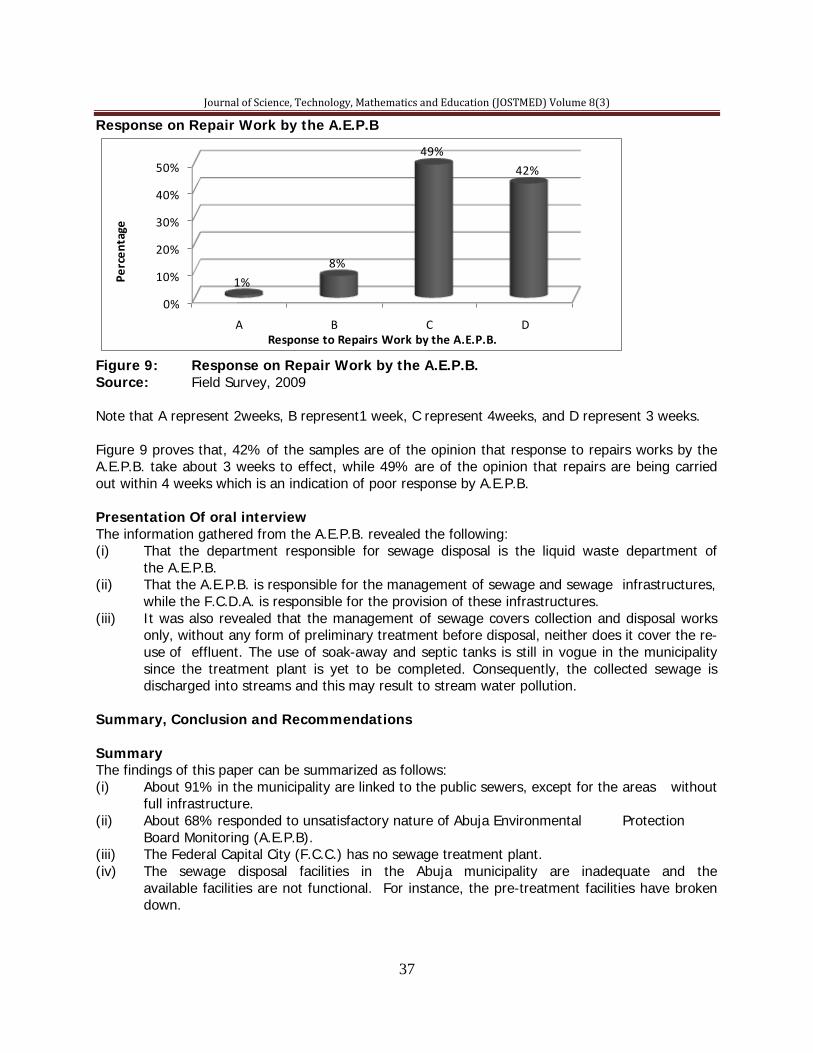
Journal of Science, Technology, Mathematics and Education (JOSTMED) Volume 8(3)
37
Response on Repair Work by the A.E.P.B
0%
10%
20%
30%
40%
50%
A B C D
1%8%
49%42%
Perc
enta
ge
Response to Repairs Work by the A.E.P.B.
Figure 9: Response on Repair Work by the A.E.P.B. Source: Field Survey, 2009 Note that A represent 2weeks, B represent1 week, C represent 4weeks, and D represent 3 weeks. Figure 9 proves that, 42% of the samples are of the opinion that response to repairs works by the A.E.P.B. take about 3 weeks to effect, while 49% are of the opinion that repairs are being carried out within 4 weeks which is an indication of poor response by A.E.P.B. Presentation Of oral interview The information gathered from the A.E.P.B. revealed the following: (i) That the department responsible for sewage disposal is the liquid waste department of the A.E.P.B. (ii) That the A.E.P.B. is responsible for the management of sewage and sewage infrastructures, while the F.C.D.A. is responsible for the provision of these infrastructures. (iii) It was also revealed that the management of sewage covers collection and disposal works only, without any form of preliminary treatment before disposal, neither does it cover the re- use of effluent. The use of soak-away and septic tanks is still in vogue in the municipality since the treatment plant is yet to be completed. Consequently, the collected sewage is discharged into streams and this may result to stream water pollution. Summary, Conclusion and Recommendations Summary The findings of this paper can be summarized as follows: (i) About 91% in the municipality are linked to the public sewers, except for the areas without full infrastructure. (ii) About 68% responded to unsatisfactory nature of Abuja Environmental Protection Board Monitoring (A.E.P.B). (iii) The Federal Capital City (F.C.C.) has no sewage treatment plant. (iv) The sewage disposal facilities in the Abuja municipality are inadequate and the available facilities are not functional. For instance, the pre-treatment facilities have broken down.

Journal of Science, Technology, Mathematics and Education (JOSTMED) Volume 8(3)
38
(v) The Abuja Environmental Protection Board Monitoring does not carry out periodic maintenance of the sewage disposal facilities or infrastructure; rather, they carry out unplanned maintenance. Conclusion Going by all the data presented and interpreted in this paper, which is aimed at assessing the problem of effective sewage disposal management in the Abuja municipality of the Federal Capital Territory, one conclude that: (a) The facilities provided for the disposal and treatment of sewage in Abuja is grossly inadequate and the available facilities are non-functional. (b) There is the problem of quick response to the repairs of disposal facilities by the A.E.P.B. (c) There is a problem of sewage overflow and backflow in the study area. Recommendations The following are the recommendations based on the summary of findings: (i) In view of the problem of treatment of sewage before disposal, the Federal Capital Development Authority should make the provision of treatment plants a priority project, which should be awarded to a reputable contractor as soon as possible. (ii) The Ministry of Federal Capital Territory should increase the fund allocation to the A.E.P.B., also capital allocation to purchase the required specialized machines should be made available. Skilled and knowledgeable manpower should be made available through the training of personnel in the relevant fields to acquire this knowledge. (iii) A check on developers that build on sewage line should be discharged by directing the sewer line to avoid blockage. The structures should be at least 10 meters away from the sewer line. Provision for access to right of way of the sewer line should be considered and provide. (iv) The A.E.P.B. should be partially commercialized and privatized so as to improve its services. (v) Finally, the A.E.P.B. should prepare a periodic maintenance schedule for the sewage disposal facilities, and adhere to it, and should adopt planned corrective maintenance policy, rather than the total breakdown maintenance that presently obtains. References
Berger, F.O, Soge, R.B.& Unicon, T.D.(1981). Concept Plan for the wastewater treatment and disposal system in Abuja. Abuja: Macmillan Pub. Co.
Census (1991) National Population Census in Nigeria. Census (2006) National Population Census in Nigeria. Developmental Control, FCT Abuja (2007) Lawal, M. I. (2000). Estate development practice in Nigeria. Ottawa: Ottawa Publishing Co. Ltd. Mara, D. (1976). Sewage treatment in hot climates. London: John Wiley and Sons Inc. Steel, E. W. & McGlace, T. J. (1979). Water supply and sewerage. 5th ed. New York: McGraw-Hill
Inc. The Making of a New Capital City for Nigeria, 2nd Ed. (1986) F.C.D.A.

Journal of Science, Technology, Mathematics and Education (JOSTMED) Volume 8(3)
39
The Making of a New Capital city for Nigeria 4th ed. (1996) F.C.D.A The Master Plan for Abuja, the New Federal Capital City of Nigeria (1979). United Nations Environment Networks (2002). Freshwater thematic portal. Publications and
conference proceedings on a wide range of water issues, including water quality, water and ecosystems, and urban water resources, as well as Policies and best practices strategies. http://freshwater.unep.net/ [Date site visited: 9th May, 2008].
Journal of Science, Technology, Mathematics and Education (JOSTMED) Volume 8(3)
40
PHYTOCHEMICAL AND IN VITRO ANTIMICROBIAL SCREENING OF THE ETHANOLIC EXTRACT OF Theobromacacao SEEDS AND ITS FRACTIONS
1Fadipe, A. L., 2Babayi, H.&1Ogunleye, D.
1Department of Chemistry, Federal University of Technology, Minna, Nigeria.
2Department of Microbiology, Federal University of Technology, Minna, Nigeria.
E-mail: [email protected] Phone No: +234-803-967-1733
Abstract Phytochemical screening of the crude ethanolic extract of T. cacao seeds and its partitioned- soluble portions revealed the presence of carbohydrates, flavonoids, saponins, tannins, alkaloids, steroidal nucleus and cardiac glycosides. The extract and its soluble portions were evaluated against sixteen pathogenic organisms at 4,000µg/ml using agardilution method. The ethanolic extract exhibited bacteriostatic effect on only Escherichia coli (ATCC 9637), while petroleum ether extract and the partitioned soluble portions of the ethanolic extract had no inhibitory effect on any of the test organisms at the same concentration. Further purification of the active extract using column chromatography gave rise to four major fractions that revealed varying number of spots in different solvent media. These spots presented different colors under sunlight, UV light and iodine crystals. Antibacterial assayof these fractions against E. coli, showed that three of the fractions also inhibited the growth of the organism at 4,000µg/ml. The minimum inhibitory concentration (MIC)and minimum bacteriocidal concentration (MBC) of the active ethanolic extract was4000µg/ml for both, while that of the active fractions ranged from 3250-3500µg/ml and 3250-3500µg/ml respectively.This shows that the crude ethanolic extract of the seeds of T. cacao and its fractions could be a potential source of antimicrobial agents. Keywords: Column chromatography,ethanolic extract, Escherichia coli,fractions, Introduction Theobroma cacao Linn (Family: Sterculiaceae, formerly, Malvaceae) is a tropical evergreen small tree. It has perennial leaves and small reddish flowers with pink calyx. Fruits (cocoa pods) are yellowish-red and of variable sizes. They are made up of numerous seeds (cocoa beans), which are fleshy and embedded in a white pulp. These seeds are the sole source of cocoa powder and butter which are important ingredients used in chocolate, pharmaceutical and cosmetic industries (Silva et al., 2009). Fermented roasted seeds are very rich in fats (Henderson et al., 2009). Cocoa seeds have been reported to possess anti-cariogenic activity (Ooshimaet al., 2000), anti-tumor activity (Prezaet al., 2010), anti-oxidant activity (Othman et al., 2007; Bubonja-Sonjeet al., 2011) and anti-listerial activity (Bubonja-Sonjeet al., 2011) as a result of the presence of flavonols and procyanidins (flavonoids) in the seeds (Kenny et al., 2004). Theantibacterial activity of the ethanolic extract of the seed bark against penicillin G resistant strain of Staphylococcus aureushas been reported (Perez and Anesini, 1994;Smullenet al., 2007; Bubonja-Sonjeet al., 2011). In view of the wide range of the medicinal values of the seeds of T. cacao,it is of interest to study the antimicrobial efficacy of extracts/portions of these seeds against a wider range of organisms. This work, therefore screens the ethanolic extract of the seeds of T. cacao, its partitioned-soluble portions and its fractions phytochemically and their in vitro antimicrobial properties against a wide range of selected microbes using standard methods.This becomes pertinent in order to find natural product alternatives that will help prevent the widespread of microbial infection.
Journal of Science, Technology, Mathematics and Education (JOSTMED) Volume 8(3)
41
Materials and Method Collection of plant material Fresh pods of T. cacao were collected from a farm in Ifon, Orolu Local Government Area of Osun state, Nigeria in the month of August, 2010. The plant was identified and authenticated by MallamGallahof the herbarium section, Department of Biological Sciences, Ahmadu Bello University, Zaria, Nigeria and a voucher specimen made and deposited. The seeds were then separated from the pods, air-dried at room temperature and pulverized. Extraction of plant material Five hundred grams (500g) of pulverized air-dried seeds of T. cacao was macerated and extracted exhaustively with 96% ethanol for a week at room temperature. The resulting mixture was filtered, concentrated in vacuo using a rotatory evaporator and evaporated to dryness over a water bath at 70oC to yield a dark brown gummyextract coded ‘TcE’(% yield, 8.26). The extract was further macerated and exhaustively defatted with petroleum ether for 3 days at room temperature. Extract was treated as for TcEto yield a dark brown oily mass coded ‘TcP’ (% yield, 5.3) Phytochemical screening of the crude extracts The concentrated extracts, TcP and TcE were screenedfor the presence of various secondary metabolites using standard methods (Sofowora, 1993; Evans, 1996) Partitioning of crude ethanolic extract (TcE) Twenty grams (20g) of TcE was suspended in 200ml of distilled water, shaken vigorously and the mixture allowed to stand for 2h after which it was filtered and the filtrate in a separatory funnel, partitioned with 100ml x 5 portions of chloroform. The organic phase was removed, concentrated in vacuo, dried, weighed and coded CHCl3-soluble portion of partitioned ethanolic extract of T.cacao (TcEc;golden brown mass; % yield, 13.5). The residual water-soluble portion was again successively and exhaustively partitioned with 100ml x 5 portion of ethyl acetate and 100ml x 6 portions of n-butanol, respectively. The resulting organic portions were concentrated, dried, weighed and coded EtOAc-soluble (TcEe; dark brown mass; % yield, 21.5) and BuOH-soluble (TcEb; brownish gummy mass; % yield, 31) portions of partitionedethanolic extract of T. cacao, respectively. The residual aqueous portion was concentrated, dried, weighed and coded (TcEr; light brown gummy mass;% yield, 28). Phytochemical screening of the partitioned-soluble portions All partitioned-soluble portions (TcEc, TcEe, TcEb and TcEr) werealso screened for the presence of various secondary metabolites (Sofowora, 1993; Evans, 1996). Source of microorganisms The extracts/portions obtained from the seeds of T. cacaowere tested against sixteen isolates.The bacterial strains used were:Bacillus subtilis(clinical strain),Staphylococcus spp. (clinical strain A and B), Staphylococcus aureus (clinical strain and ATCC 13709), Staphylococcus epidermidis (clinical strain)Escherichia coli (clinical strain and ATCC 9637), Pseudomonas aeruginosa (clinical strain and ATCC 27853), Proteus spp. (clinical strain), Salmonella gallinarium(clinical strain), Salmonella paratyphi C (clinical strain) and Salmonella typhi (clinical strain), while thefungal (yeast) strains were: Candida albicans (clinical strain and ATCC 10231). All bacterial and fungal stock cultures were obtained from Microbiology unit, Faculty of Veterinary Medicine, Ahmadu Bello University, Zaria, Kaduna State, Nigeria and National Institute for Pharmaceutical Research and Drug development, Idu, Abuja, Nigeria.
Journal of Science, Technology, Mathematics and Education (JOSTMED) Volume 8(3)
42
Preparation of inoculums The viability test for each organism was carried out by resuscitating each microorganism on nutrient agar medium (NA, MHA) and incubating at 4oC for 24h. The stock cultures were diluted with fresh MHA to achieve 1x10⁶cfu/ml(Duraipandiyanet al., 2006). A loopful of the standard culture was used for the antimicrobial assay. Antimicrobial susceptibility testingof crude extracts/portions The agar dilution method was used to test the antibacterial/antifungal efficacy of the crude extracts/portions/standard drug (Babayiet al., 2007). 400mg of each extract/portion/drug was reconstituted in 1ml tween-80 after which 4ml of sterile distilled water was added. 1ml of each reconstituted extract/portion/drug was then transferred to sterile Petri dishes containing 19ml of MHA. Plates were prepared in duplicates and allowed to set at room temperature. A loopful of standardized bacterial/yeast culture was streaked unto each solidified agar plate. Plates for standard (positive) control, extract sterility control (ESC), organism viability control (OVC) and medium sterility control (MSC) were also prepared alongside. All plates were incubated aerobically at 37oC for 24h. Determination of minimum inhibitory concentration (MIC) The NIPRD protocol of 2006 was adopted. Briefly, 1ml of the active extract solution (TcE) at 4,000µg/ml was added to 19ml of sterile Mueller Hinton broth and subsequently transferred to make solution of varying concentrations of 4,000, 3750, 3500, 3250, 3000, 2750, 2500, 2250 and 2000 µg/ml respectively. A loopful of the standardized E. coli (ATCC 9637) was inoculated into the broth containing different concentration of the extract and incubated at 37oC for 24h. The test tubewith the least concentration of the extract at which no detectable growth was observed was considered as the MIC. Determination of minimum bacteriocidal concentration (MBC) A loopful of culture was collected from the tubeshowing no detectable growth from the MIC tubes above and sub-cultured onto freshly prepared MHA plates.Inoculated plates were incubated at 37oC for 24h. The least concentration at which no detectable growth was observed after incubation was taken as the MBC. Fractionation of crude ethanolicic extract (TcE) Ten grams (10g) of ‘TcE’ was fractionated using column chromatography. The column was packed with silica gel (60-120 mesh) and chloroform using the wet method.Varying proportions of increasing polarity of chloroform-methanol was used as the mobile phase. Identical fractions were pooled using TLC and concentrated under vacuum. Fractions obtained were subjected to antibacterial testing as above. Thin layer chromatography (TLC) TLC of all fractions was carried out using oven baked pre-coated aluminium plates (0.25mm) as the stationary phase and various solvent systems as the mobile phase.Chromatoplates were examined under lights (sunlight and ultraviolet) and iodine crystals in an iodine chamber. Results The ethanolic extract (TcE) and its partitioned-soluble portions (TcEc, TcEe, TcEb and TcEr) revealed the presence of several bioactives as shown in Table 1.
Journal of Science, Technology, Mathematics and Education (JOSTMED) Volume 8(3)
43
Table 1: Preliminary phytochemical screening of crude extracts/ partitioned-soluble portions of T. cacaoseeds Bioactive Components Crude extracts/portions
TcP TcE TcEc TcEe TcEb TcEr Carbohydrates − ++ − + +++ ++ Reducing sugars − ++ − + +++ ++
Combined reducing Sugars − ++ − − ++ ++ Tannins − +++ − − ++ + Phlobatannins − − − − − − Saponins − + − − + + Flavonoids − +++ + ++ +++ ++
Steroidal Nucleus +++ +++ +++ +++ +++ ++ Cardiac Glycosides − ++ − + ++ ++ Free Anthraquinones − − − − − − Combined Anthraquinones − − − − − − Alkaloids + +++ + ++ +++ +
Key: + = low concentration; ++ = moderate concentration; +++ = high concentration; − = absent. Antimicrobial activity of the crude ethanolic extract (TcE) and its partitioned-soluble portions (TcEc, TcEe, TcEb and TcEr) in comparison with ampicloxat 4,000µg/ml against test organisms is shown in Table 2. Table 2: Antimicrobial activity of crude extracts/ partitioned-soluble portions/Ampiclox Test Organisms Activity of test compounds against test organisms
TcP TcE TcEc TcEe TcEb TcEr Ampiclox Bacterial strains Bacillussubtilis(clinical strain) − − − − − − +
Staphyloccus spp. (clinical strain A) − − − − − − +
Staphyloccus spp. (clinical strain B) − − − − − − +
S. aureus (clinical strain) − − − − − − +
S. aureus (ATCC 13709) − − − − − − +
S. epidermidis (clinical strain) − − − − − − +
Escherichia coli (clinical strain) − − − − − − −
E. coli (ATCC 9637) − + − − − − +
Proteus spp. (clinical strain) − − − − − − +
Pseudomonas aeruginosa (clinical strain) − − − − − − +
P. aeruginosa(ATCC 27853) − − − − − − +
Salmonella gallinarium(clinical strain) − − − − − − +
S. paratyphi C (clinical strain) − − − − − − +
S. typhi(clinical strain) − − − − − − +
Fungal strains Candida albicans (clinical strain) − − − − − − +
C. albicans (ATCC 10231) − − − − − − +
Key: + = activity; − = no activity. The least concentration of the active ethanolic extract (TcE) that inhibited the growth ofE. coli is shown in Table 3.
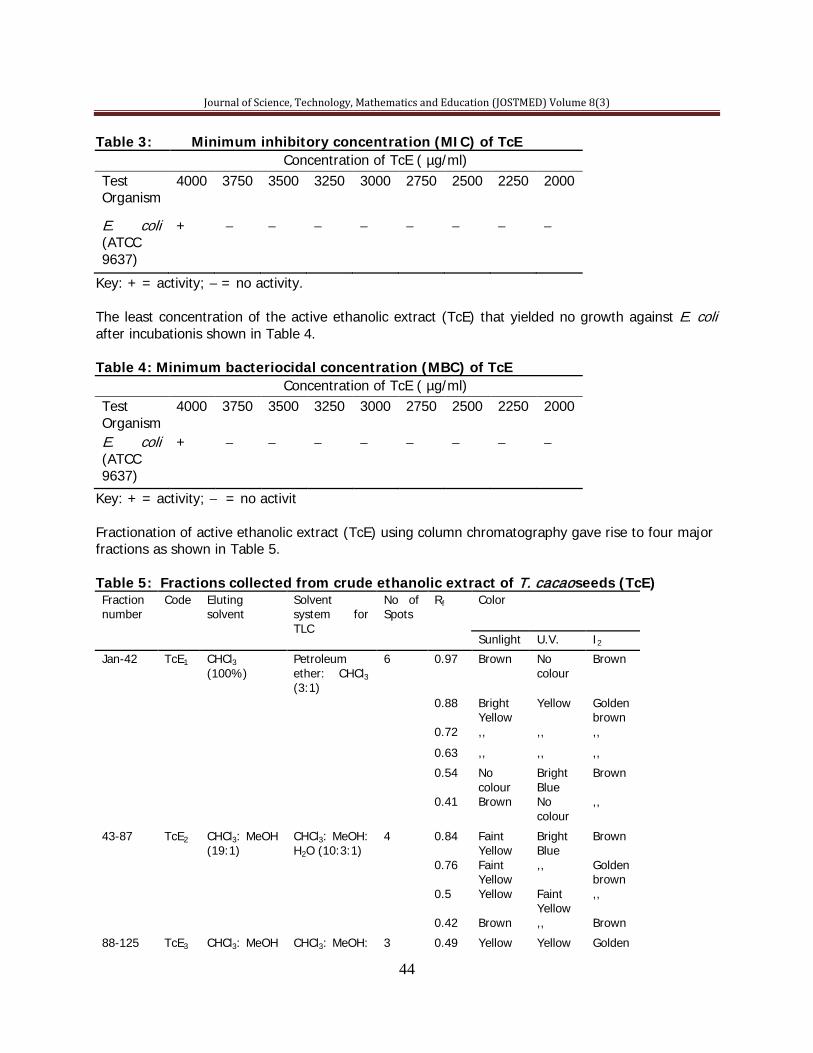
Journal of Science, Technology, Mathematics and Education (JOSTMED) Volume 8(3)
44
Table 3: Minimum inhibitory concentration (MIC) of TcE Concentration of TcE ( µg/ml) Test Organism
4000 3750 3500 3250 3000 2750 2500 2250 2000
E. coli (ATCC 9637)
+ − − − − − − − −
Key: + = activity; − = no activity. The least concentration of the active ethanolic extract (TcE) that yielded no growth against E. coli after incubationis shown in Table 4. Table 4: Minimum bacteriocidal concentration (MBC) of TcE Concentration of TcE ( µg/ml) Test Organism
4000 3750 3500 3250 3000 2750 2500 2250 2000
E. coli (ATCC 9637)
+ − − − − − − − −
Key: + = activity; − = no activit Fractionation of active ethanolic extract (TcE) using column chromatography gave rise to four major fractions as shown in Table 5. Table 5: Fractions collected from crude ethanolic extract of T. cacaoseeds (TcE) Fraction number
Code Eluting solvent
Solvent system for TLC
No of Spots
Rf Color
Sunlight U.V. I2
Jan-42 TcE1 CHCl3 (100%)
Petroleum ether: CHCl3 (3:1)
6 0.97 Brown No colour
Brown
0.88 Bright Yellow
Yellow Golden brown
0.72 ,, ,, ,,
0.63 ,, ,, ,,
0.54 No colour
Bright Blue
Brown
0.41 Brown No colour
,,
43-87 TcE2 CHCl3: MeOH (19:1)
CHCl3: MeOH: H2O (10:3:1)
4 0.84 Faint Yellow
Bright Blue
Brown
0.76 Faint Yellow
,, Golden brown
0.5 Yellow Faint Yellow
,,
0.42 Brown ,, Brown
88-125 TcE3 CHCl3: MeOH CHCl3: MeOH: 3 0.49 Yellow Yellow Golden

Journal of Science, Technology, Mathematics and Education (JOSTMED) Volume 8(3)
45
(9:1) H2O (7:3:1) Brown
0.3 Faint Yellow
,, ,,
0.21 ,, ,, ,,
126-171 TcE4 CHCl3: MeOH (8:2)
CHCl3: MeOH: H2O (5:3:1)
3 0.33 Yellow Yellow Golden brown
0.2 ,, ,, ,,
0.1 ,, ,, ,,
Antibacterial assay of the four fractions (TcE1-TcE4) obtained from fractionation of crude ethanolic extract (TcE) against E coli (ATCC 9637) is shown in Table 6. Table 6: Antibacterial activity of column fractions of TcE Fractions Antibacterial activity at 4,000µg/ml. TcE1 - TcE2 + TcE3 +
TcE4 + Key: + = activity; − = no activity. The least concentration of the three active fractions of the active ethanolic extract (TcE) that inhibited the growth of E. coli (ATCC 9637) is shown in Table 7. Table 7: Minimum inhibitory concentration (MIC) of active column fractions of TcE Concentration of fractions (µg/ml) Fractions 4000 3750 3500 3250 3000 2750 2500 2250 2000
TcE2 + + + − − − − − − TcE3 + + + + − − − − − TcE4 + + + + − − − − −
Key: + = activity; − = no activity. The least concentration of the three active fractions of the active ethanolic extract (TcE) that yielded no growth against E. coli (ATCC 9637) after incubation is shown in Table 8. Table 8: Minimum bacteriocidal concentration (MBC) of active column fractions of (TcE) Concentration of fractions (µg/ml) Fractions 4000 3750 3500 3250 3000 2750 2500 2250 2000
TcE2 + + + − − − − − − TcE3 + + + − − − − − − TcE4 + + + + − − − − −
Key: + = activity; − = no activity.
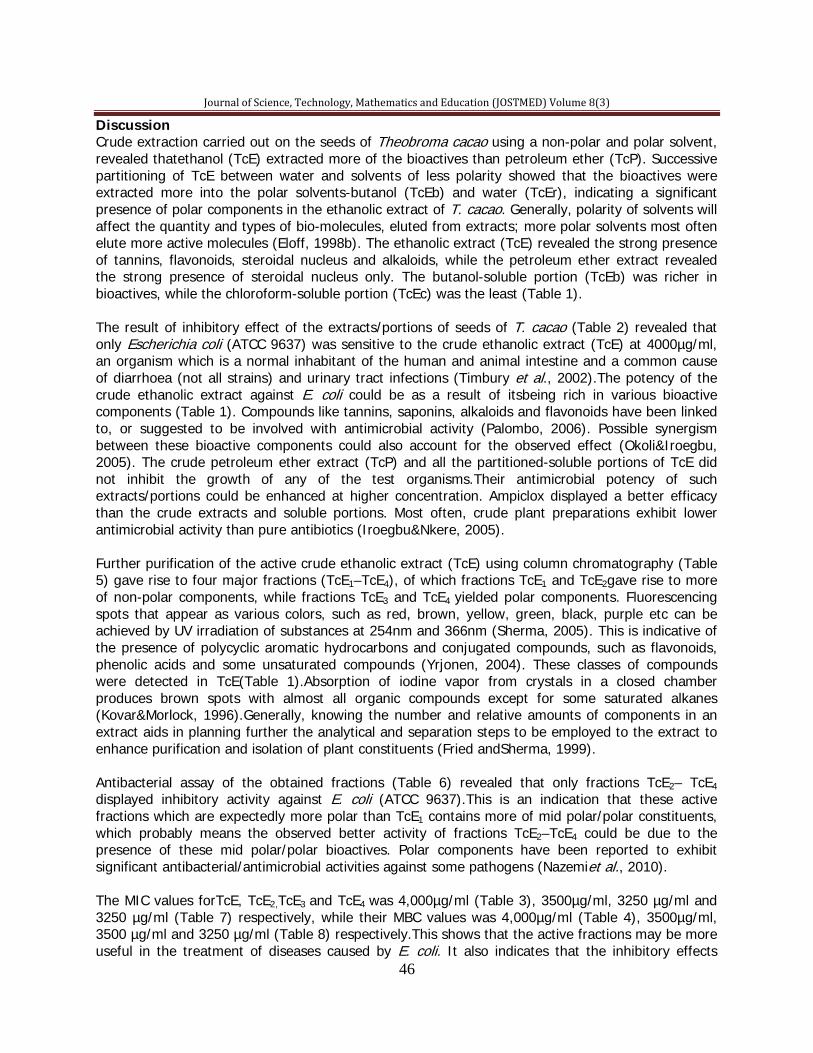
Journal of Science, Technology, Mathematics and Education (JOSTMED) Volume 8(3)
46
Discussion Crude extraction carried out on the seeds of Theobroma cacao using a non-polar and polar solvent, revealed thatethanol (TcE) extracted more of the bioactives than petroleum ether (TcP). Successive partitioning of TcE between water and solvents of less polarity showed that the bioactives were extracted more into the polar solvents-butanol (TcEb) and water (TcEr), indicating a significant presence of polar components in the ethanolic extract of T. cacao. Generally, polarity of solvents will affect the quantity and types of bio-molecules, eluted from extracts; more polar solvents most often elute more active molecules (Eloff, 1998b). The ethanolic extract (TcE) revealed the strong presence of tannins, flavonoids, steroidal nucleus and alkaloids, while the petroleum ether extract revealed the strong presence of steroidal nucleus only. The butanol-soluble portion (TcEb) was richer in bioactives, while the chloroform-soluble portion (TcEc) was the least (Table 1). The result of inhibitory effect of the extracts/portions of seeds of T. cacao (Table 2) revealed that only Escherichia coli (ATCC 9637) was sensitive to the crude ethanolic extract (TcE) at 4000µg/ml, an organism which is a normal inhabitant of the human and animal intestine and a common cause of diarrhoea (not all strains) and urinary tract infections (Timbury et al., 2002).The potency of the crude ethanolic extract against E. coli could be as a result of itsbeing rich in various bioactive components (Table 1). Compounds like tannins, saponins, alkaloids and flavonoids have been linked to, or suggested to be involved with antimicrobial activity (Palombo, 2006). Possible synergism between these bioactive components could also account for the observed effect (Okoli&Iroegbu, 2005). The crude petroleum ether extract (TcP) and all the partitioned-soluble portions of TcE did not inhibit the growth of any of the test organisms.Their antimicrobial potency of such extracts/portions could be enhanced at higher concentration. Ampiclox displayed a better efficacy than the crude extracts and soluble portions. Most often, crude plant preparations exhibit lower antimicrobial activity than pure antibiotics (Iroegbu&Nkere, 2005). Further purification of the active crude ethanolic extract (TcE) using column chromatography (Table 5) gave rise to four major fractions (TcE1–TcE4), of which fractions TcE1 and TcE2gave rise to more of non-polar components, while fractions TcE3 and TcE4 yielded polar components. Fluorescencing spots that appear as various colors, such as red, brown, yellow, green, black, purple etc can be achieved by UV irradiation of substances at 254nm and 366nm (Sherma, 2005). This is indicative of the presence of polycyclic aromatic hydrocarbons and conjugated compounds, such as flavonoids, phenolic acids and some unsaturated compounds (Yrjonen, 2004). These classes of compounds were detected in TcE(Table 1).Absorption of iodine vapor from crystals in a closed chamber produces brown spots with almost all organic compounds except for some saturated alkanes (Kovar&Morlock, 1996).Generally, knowing the number and relative amounts of components in an extract aids in planning further the analytical and separation steps to be employed to the extract to enhance purification and isolation of plant constituents (Fried andSherma, 1999). Antibacterial assay of the obtained fractions (Table 6) revealed that only fractions TcE2– TcE4 displayed inhibitory activity against E. coli (ATCC 9637).This is an indication that these active fractions which are expectedly more polar than TcE1 contains more of mid polar/polar constituents, which probably means the observed better activity of fractions TcE2–TcE4 could be due to the presence of these mid polar/polar bioactives. Polar components have been reported to exhibit significant antibacterial/antimicrobial activities against some pathogens (Nazemiet al., 2010). The MIC values forTcE, TcE2,TcE3 and TcE4 was 4,000µg/ml (Table 3), 3500µg/ml, 3250 µg/ml and 3250 µg/ml (Table 7) respectively, while their MBC values was 4,000µg/ml (Table 4), 3500µg/ml, 3500 µg/ml and 3250 µg/ml (Table 8) respectively.This shows that the active fractions may be more useful in the treatment of diseases caused by E. coli. It also indicates that the inhibitory effects
Journal of Science, Technology, Mathematics and Education (JOSTMED) Volume 8(3)
47
produced bythe ethanolic extract and its fractions are only bacteriostatic in action (Babayiet al., 2007). Conclusion The crude ethanolic extract and its fractions displayed in-vitro inhibitory activities against E. coli (laboratory strain) at 4000µg/ml than its partitioned-soluble portions. This suggests that with further fractionation, purification and isolation, the seeds of T. cacao couldprovide veritable source(s) of active pure antimicrobial agents. References Babayi, H., Fadipe, A. L., Ogbadoyi, E. O., Gana, P., Usman, K. M., Okogun, J. I., Kolo, I., Onigbanjo, H. O. Igele, I. & Oladosu, P. (2007). The antimicrobial activity ofDetarium senegalensis and Erythrinasenegalensison selected organisms. Journal of research in Bioscience 3(3), 1-9. Bubonja-Sonje, M., Giacometti, J. & Abram, M. (2011). Antioxidant and antilisterial activity of rosemary extract polyphenols. Food Chemistry 127 (4), 1821-1827. Duraipandiyan, V., Ayyanar, M. & Ignacimuthu, S. (2006). Antimicrobial activity of some ethnomedicinal plants used by Paliyr tribe from Tamil Nadu, India, BMC Complement Alternat Med. 6, 35-36.
Eloff, J. N. (1998b). Which extract should be used for the screening and isolation of antimicrobial components from plants? J. Ethnopharmacol, 60, 1-8.
Evans, W .C. (1996).Trease and Evans’ pharmacognosy.14th Ed. London: W. B. Saunders Company Ltd, pp. 227, 245, 251.
Fried, B. & Sherma, J. (1999).Thin layer chromatogaphy: Techniques and applications, 4thEd.
New Yor: Marcel Dekker Inc. pp: 145-175. Henderson, J. S., Joyce, R. A., Hall, G. R., Hurst, W. J. & McGovem, P. E. (2009). Chemical and archeological evidence for the earliest cacao beverages. Proc. Natl. Acad. Sci. USA 104, 18937-18940. Iroegbu, C. U. & Nkere, C. K. (2005). Evaluation of the antibacterial properties of Picralima nitidastem bark extracts. International Journal of Molecular Medicine and Advances in Sciences, 1(2), 182-189.
Kovar, K. A. & Morlock, G. E. (1996). Detection, identification and documentation: Handbook of thin layer chromatography, 2nd ed. New York: Sherma, J. & Fried, B., Marcel Dekker, Inc. pp: 205-239.
Kenny, T. P., Keen, C. L., Jones, P., Hung, H. J., Schmitz, H. H & Gershwin, M. E. (2004).
Pentamericprocyanidins isolated from Theobroma cacao seeds selectively down regulate ErbB2 in human aortic endothelial cells. ExpBiol Med (Maywood), 229 (3), 255-263. Nazemi, M; Khoshkhoo, Z., Motalebi, A., Firozjaee, H. K. & Pishehvarzad, F. (2010). Identification of nonpolar component and antibacterial activities of Iophonlaevistylus from Persian Gulf. Int. J. of Env.Sci and Dev, 1(2),107-110.
Journal of Science, Technology, Mathematics and Education (JOSTMED) Volume 8(3)
48
Okoli, A. S. & Iroegbu, C. U. (2004). Evaluation of extracts of Anthocleistadjalonensis,Nauclea latifolia and Uvariaafzalii from cases of non-gonococcal urethritis. J. of Ethnopharmacol, 92 (1),135-144. Othman, A., Ismail, A., Abddulghani, N. & Adenan, I. (2007). Antioxidant capacity and phenolic content of cocoa beans. Food Chemistry, 100 (4),1523-1530. Ooshima, T., Osaka, Y., Sasaki, H., Osawa, K., Yasuda, H., Matsumura, M., Sobue, S & Matsumoto, M. (2000). Caries inhibitory activity of cacao bean husk extract in in-vitro and animal experiments. Archives of Oral Biology 45 (8), 639-645. Perez, C & Anesini, C. (1994). Antibacterial activity of alimentary plants against Staphylococcus aureus growth. Am J Chin Med. 22 (2), 169-174. Preza, A. M., Jaramillo, M. E., Puebla, A. M., Mateos, J. C., Hernandez, R & Luoo, E. (2010). Antitumor activity against murine lymphoma L5178Y model of proteins from cacao (Theobroma cacao L.) seeds in relation withinvitro antioxidant activity. BMC Complementary and alternative medicine, 10, 61.
Palombo, E. A. (2006). Phytochemicals from traditional medicinal plants used in the treatment of
diarrhoea: Modes of action and effects on intestinal function. Phytotheraphy Research, 20(9), 717-724. Sherma, J. (2005). Thin layer chromatography of pesticides-A review of applications for 2002-2004. ActaChromatographica, 15, 5-30. Silva, T. E. R., Cidade, L. C., Alvim, F. C., Cascardo, J. C. M. & Costa, M. G. C. (2009). Studies on genetic transformations of Theobroma cacao L.: Evaluation of different polyamines and antibiotics on somatic embryogenesis and the efficiency of uidA gene transfer by Agrobacterium tumefaciens. Plant Cell Tiss organ Cult, 99, 287-298. Smullen, J., Koutsou, G. A., Forster, H. A., Zumbe, A. & Storey, D. M. (2007). The antibacterial activity of plant extracts containing polyphenols against Streptococcus mutans. Caries Res. 41 (5), 342-9. Sofowora, E.A (1993). Medicinal plants and traditional medicine in Africa. Ife, Nigeria, University press, pp. 12-23.
Timbury, M. C., McCartney, A. C., Thakker, B & Ward, K.N. (2002). Notes on medical
microbiology. Edinburg: Churchill Livingstone, pp 30-34, 61-62, 66-67, 70, 72-76, 136-146. Yrjonen, T. (2004). Extraction and planar chromatographic separation techniques in the
analysis of natural products. Ph.DThesis, Division of Pharmacognosy, Faculty of Pharmacy,University of Helsinki, CosmoprintOy, Helsinki, Finland, pp. 14, 21, 25-26, 31-32, 35, 40.
Journal of Science, Technology, Mathematics and Education (JOSTMED) Volume 8(3)
49
JOSTMED, VOLUME 8(3), AUGUST, 2012
JOURNAL
OF
S CIE
NCE,
TECHNOLOGY, MATHEMATICSA
ND
EDUC
ATION
(JOSTMED)
Journal of Science, Technology, Mathematics and Education (JOSTMED) Volume 8(3)
50
EFFECT OF STRIPPER FORWARD SPEED ON HEADER LOSSES AND HARVESTER EFFICIENCY OF A SELF PROPELLED GRAIN HARVESTER
Adisa, A. F.
Department of Agricultural Engineering, Federal University of Agriculture, Abeokuta, Ogun State, Nigeria.
Email: [email protected] Phone No: +234-803-631-9686
Abstract The introduction of modern high- yielding rice varieties which are more susceptible to shattering loss than traditional varieties has increased the problem of harvesting because of the greater amount of crop that has to be handled or feed into the machine. Every attempt to reduce post harvest losses must inevitably begin with minimizing losses during harvesting. A developed 30cm width prototype stripping harvester was evaluated to further establish stripper harvesting technology in Nigeria by determining the effect of forward speed on header losses and harvester efficiency. At optimum settings of the critical operating parameters ( machine rotor height and forward speed), when rotor height was set at 270 mm, the forward speed was 3 km/h where minimum shattering loss was 4.3%, stubble loss was 4.5%, lodging loss was 2.1% and harvester efficiency was 81%. Also when rotor height was set at 220mm, the shatter loss was 7.0%, stubble loss was 4.8%, lodging loss was 2.7% and harvester efficiency was 77%. Hence machine settings at 270 mm rotor height, 3 km/h forward speed is hereby recommended. Keywords: Header Losses, Stripper, Forward Speed, and Grain Harvester. Introduction The crop harvesting equipment available to small scale farmers mostly in the developing countries have not received adequate improvement over the years. Knives, sickles and scythes continue to be the traditional tools used for harvesting crops (Stout and Cheze, 1999). In the past, some reapers with low power rating were developed, but because of their low field capacity, high cost and other operational problems, they were usually not considered suitable alternatives to the manual methods (Carruthers, 1985). Whenever serious grain losses occur at harvest, it reduces the profitability of crops. The grain can be lost at a number of places during harvest like pre-harvest loss due to natural shedding, at the front due to front header type or set up, and also from the threshing system of the machine due to concave drum and sieve settings, Riethmuller (2001). Seed losses occur in the four basic operations performed by conventional combine harvester in recovering the seed which are cutting, threshing, seed and chaff separating and cleaning units, Kepner et al (2005). Grain losses in stripper harvesting occur at the gathering/stripping operation which are shattering (grains spilled on the ground), stubble (grains left on the standing stalks) and lodging (grain left on the lodged stalks) losses. Rice harvesting requires cutting of the matured heads, threshing, cleaning and bagging. With mechanical means, it is not as tedious as when done manually. Apart from the intensive labour involved, losses are encountered at various stages of harvesting and processing which are usually higher with manual than mechanical method of harvesting, (Ajiboye, 2007). Losses and waste will need to be curbed even more than in the past at harvesting and post harvesting stages. Few men and more cost effective methods and machines will be required to reduce the adverse effect high inflation has on labour and machinery costs (Ferreira et al., 2001).
Journal of Science, Technology, Mathematics and Education (JOSTMED) Volume 8(3)
51
Introduction of modern high- yielding rice varieties which are more susceptible to shattering loss than traditional varieties has increased the problem of harvesting because of the greater amount of crop that has to be handled or feed into the machine (Tado and Quick, 2003). Every attempt to reduce post harvest losses must inevitably start with minimizing losses during harvesting. These losses can be reduced by resetting the machine and changing the harvesting technique. The losses should be assessed so that corrective measure can be taken to minimize the loss. There was a need to develop a harvester which should be simple without involving any complex production technology. At Silsoe Research Institute in United Kingdom, stripping harvester was developed in late 1980s. Philippine Rice Research Institute in early 1990s improved on this for their country side peasant farmers (Tado and Quick, 2003). This stripping harvester was developed as an alternative to manual harvesting for small scale rice farmers. The stripping comb- like resilient elements were mounted horizontally on an upward rotating drum which engages crop stalks as machine advances forward. In machinery development, there is need to optimize the critical operating parameters of the stripping harvester (Tado, 2002). Tado and Quick (2003) observed that stripper rotor performance was highly influenced by parameters of forward speed and rotor height. Johnson (2000) carried out a research and designed improved form of crop feeding rate into the rotor of an axial flow combine harvester for effecting a threshing and separating action on the crop materials passing through between the rotor and the concave assembly. This study is to determine the effect of stripper forward speed which varies the machine’s crop feeding rate on header losses and harvester efficiency of a self propelled prototype stripper harvester prototype (Adisa, 2009). Methodology Agrophysical characteristics of cereal crops to be harvested are essential parameter which was considered in developing a 30 cm width self propelled prototype stripping harvester which was tested on a faro 44 rice variety field in Zaria, Nigeria in 2008 and the study work got completed in 2009s . This was done to further establish this new stripper harvesting technology in Nigeria by studying the effect of machine forward speed on header losses like shattering, lodging and stubble and harvester efficiency at different machine settings of the critical operating parameter like rotor height. At different machine forward speeds and rotor heights, the crop material feeding rate of the machine differs which affected performance of the machine. The effect of forward speed in combination of rotor height and rotor speed on the field performance of the rice harvester with minimum header loss were determined to know the best combination. A randomized complete block design (RCB) was adopted to carry out the study of the effect of machine forward speed and rotor height on header losses and harvester efficiency. The harvester was operated at five forward speeds 3 km/h, 4 km/h, 5 km/h, 6km/h and 7 km/h in combination with two rotor heights 270mm and 220mm at a set rotor speed. The rotor heights 270 mm and 220 mm were the two available settings of the lowest tip of the stripper and the ground level. A three factorial experiment, where a parameter was varied while others were fixed at a time was conducted. At each run, the grains that shattered on the ground inside a square quadrant of 0.1 m2 were collected, grains left behind on the standing crops (stubble) were collected and the grains left on the lodged crops were also collected and they were weighed. Before the harvesting started, crop harvesting of 1m2 area was done manually covering several locations on each of the block and the average were found to determine crop yield per hectare. Total grains stripped per each plot were collected and was weighed. The following formulas were used to calculate the header losses, shattering loss, stubble loss, lodging loss and harvester efficiency.
Journal of Science, Technology, Mathematics and Education (JOSTMED) Volume 8(3)
52
The following are the parameters computed in this study: (i) Shattering losses, Sl (loss caused by the header due to vibration and it impact on the crop during harvesting, kg) (ii) Lodging losses, Lg (grains left behind on lodged plants, kg) (iii) Stubble losses, St (grains left on stubbles by the header, Kg) Each of the losses was expressed as percentage of the total yield (TY) in each plot using equations 1, 2,3,4 and5. TY = Ct + Sl + Lg + St (kg) ……………….(1) Ct = mass of total grain and MOG harvested (kg) Sl = mass of shattered grains x 100(%) …………….…(2) TY Lg = mass of grains left on lodged crops x 100(%) …………… (3) TY St = mass of grains left on stubble (standing crop) x100(%) … (4) TY The harvester efficiency was calculated by expressing the mass of grain harvested (stripped) and conveyed through the box to the total yield as shown below:
η= ......(%)100xTYCtg (5) (Kalsirisilp and Singh, 2001)
Where: Ctg = total grain stripped and collected, kg Where: MOG is materials other than grain. Results and Discussion Figure 1 shows the effect of harvester forward speed on shattering loss at two levels of rotor heights. At rotor height 270 mm, the graph is a linear one that rises from 4.5% to 7.0% as the harvester speed increased from 3km/h to 7 km/h. Also at 220 mm rotor height, the graph follow a polynomial trend as the shattering loss increased from 3 km/h and later began to drop at 6 km/h. The shattering loss 6.8% at rotor heights 220 mm and 270 mm was the same at machine forward speed 6.9km/h.This is an indication that as the crop feed rate was increased at higher forward machine speed, the crop was disturbed more, hence the harvester shattered the grains more which may require that the intake entrance be increased at high speed of the harvester. Figure 2 shows the effect of machine forward speed on stubble loss at two levels of rotor height. At rotor height 27 0mm, the stubble loss graph was a linear and it slightly rose as the forward speed increased. When the machine was set at 220 mm rotor height, the graph was of a polynomial trend which increased though not too sharp increase as the forward speed increased. At harvester forward speed 3.4 km/h, the stubble loss 4.6% was the same at 220 mm and 270 mm. Increased crop feed rate of the harvester does not have much significant effect in leaving grains behind on the standing crops. Figure 3 shows the effect of harvester forward speed on the lodging loss at two levels of rotor height. The graph is a linear one at 270 mm rotor height setting and the lodging loss rose from 2.0% to 3.5% when the machine forward speed increased from 3 km/h to 7 km/h. The behavour of the graph when rotor height was set at 220 mm was only slightly different from when it was set at 270 mm. Lodging loss rose from 2.5% to 3.0% when machine forward speed increased from 3 km/h to 7 km/h. More grains were left on the lodged crops as the forward speed of the machine increased or crop feed rate increased. This because it has lesser time to pick up grains from lodged crops.
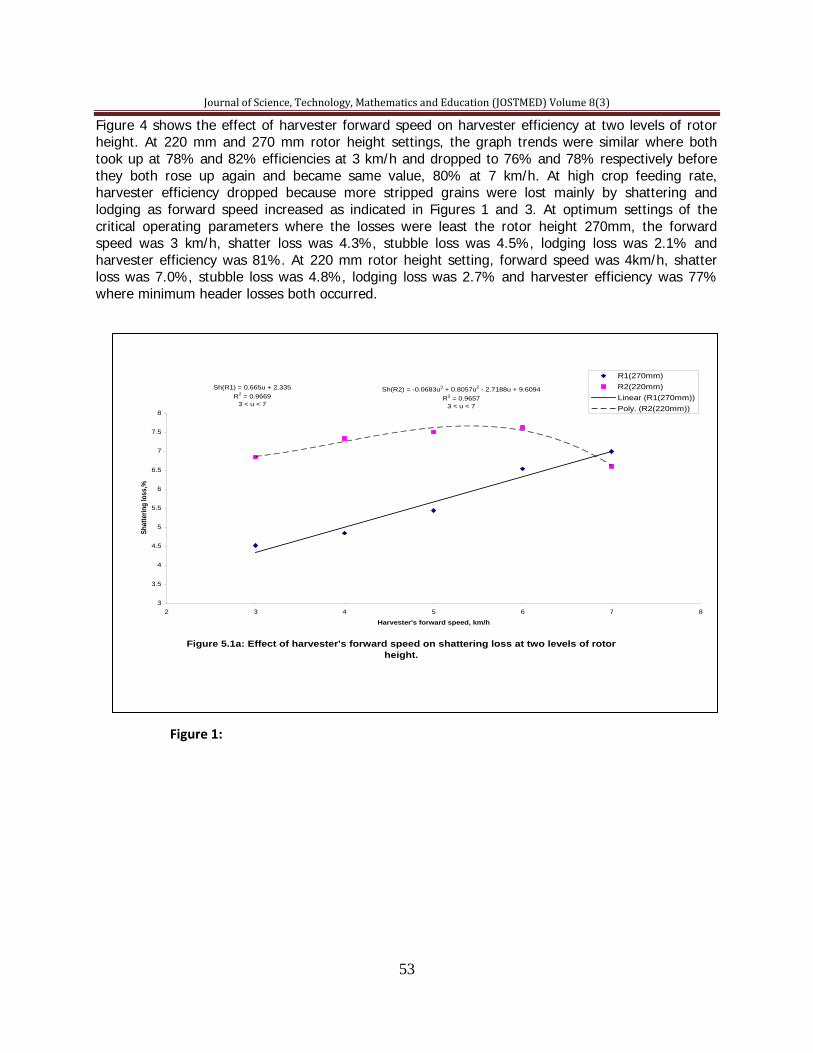
Journal of Science, Technology, Mathematics and Education (JOSTMED) Volume 8(3)
53
Figure 4 shows the effect of harvester forward speed on harvester efficiency at two levels of rotor height. At 220 mm and 270 mm rotor height settings, the graph trends were similar where both took up at 78% and 82% efficiencies at 3 km/h and dropped to 76% and 78% respectively before they both rose up again and became same value, 80% at 7 km/h. At high crop feeding rate, harvester efficiency dropped because more stripped grains were lost mainly by shattering and lodging as forward speed increased as indicated in Figures 1 and 3. At optimum settings of the critical operating parameters where the losses were least the rotor height 270mm, the forward speed was 3 km/h, shatter loss was 4.3%, stubble loss was 4.5%, lodging loss was 2.1% and harvester efficiency was 81%. At 220 mm rotor height setting, forward speed was 4km/h, shatter loss was 7.0%, stubble loss was 4.8%, lodging loss was 2.7% and harvester efficiency was 77% where minimum header losses both occurred.
Figure 5.1a: Effect of harvester's forward speed on shattering loss at two levels of rotor height.
Sh(R1) = 0.665u + 2.335R2 = 0.9669
3 < u < 7
Sh(R2) = -0.0683u3 + 0.8057u2 - 2.7188u + 9.6094R2 = 0.9657
3 < u < 7
3
3.5
4
4.5
5
5.5
6
6.5
7
7.5
8
2 3 4 5 6 7 8
Harvester's forward speed, km/h
Shat
terin
g lo
ss,%
R1(270mm)R2(220mm)Linear (R1(270mm))Poly. (R2(220mm))
Figure 1:
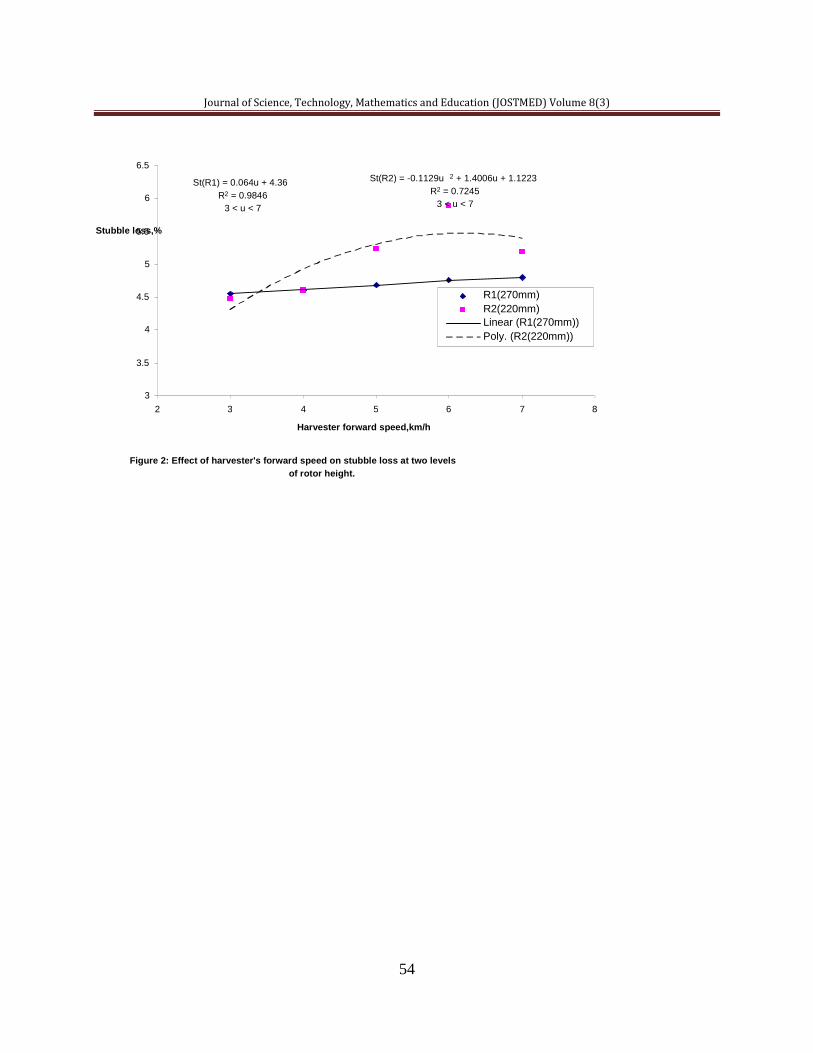
Journal of Science, Technology, Mathematics and Education (JOSTMED) Volume 8(3)
54
Figure 2: Effect of harvester's forward speed on stubble loss at two levels of rotor height.
St(R1) = 0.064u + 4.36 R 2 = 0.9846
3 < u < 7
St(R2) = -0.1129u 2 + 1.4006u + 1.1223 R 2 = 0.7245
3 < u < 7
3
3.5
4
4.5
5
5.5
6
6.5
2 3 4 5 6 7 8 Harvester forward speed,km/h
Stubble loss,%
R1(270mm) R2(220mm) Linear (R1(270mm)) Poly. (R2(220mm))
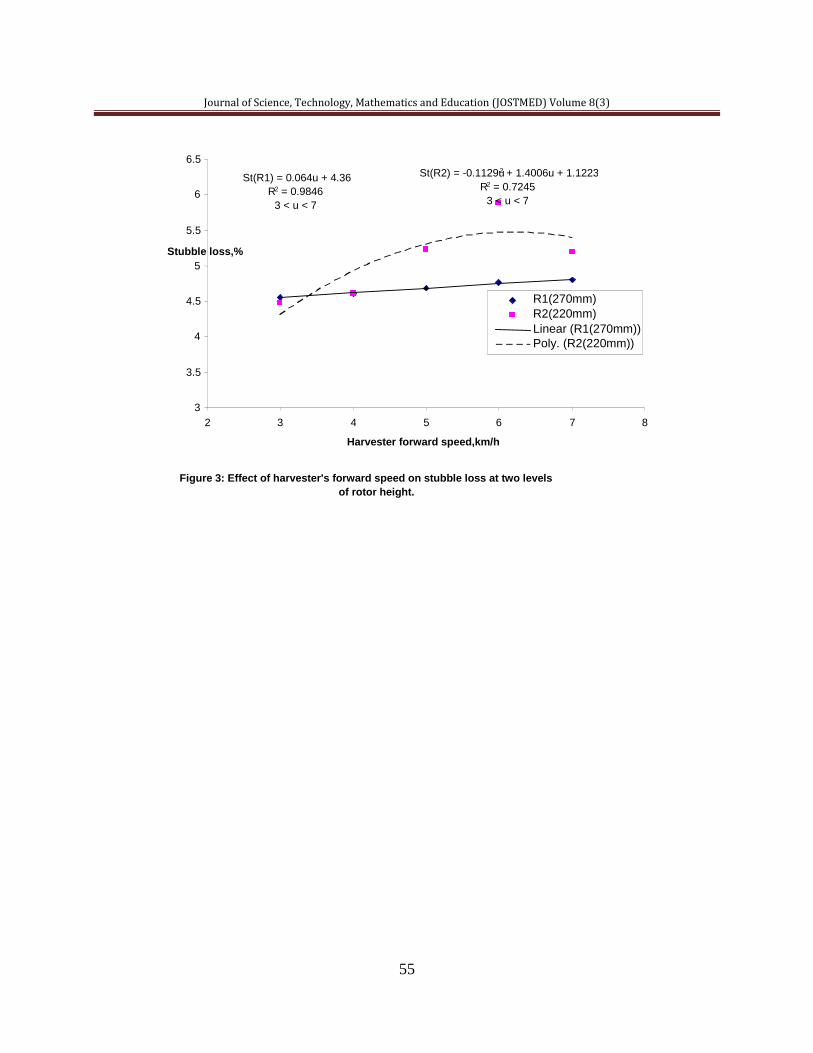
Journal of Science, Technology, Mathematics and Education (JOSTMED) Volume 8(3)
55
Figure 3: Effect of harvester's forward speed on stubble loss at two levels of rotor height.
St(R1) = 0.064u + 4.36 R 2 = 0.9846
3 < u < 7
St(R2) = -0.1129u 2 + 1.4006u + 1.1223 R 2 = 0.7245
3 < u < 7
3
3.5
4
4.5
5
5.5
6
6.5
2 3 4 5 6 7 8 Harvester forward speed,km/h
Stubble loss,%
R1(270mm) R2(220mm) Linear (R1(270mm)) Poly. (R2(220mm))
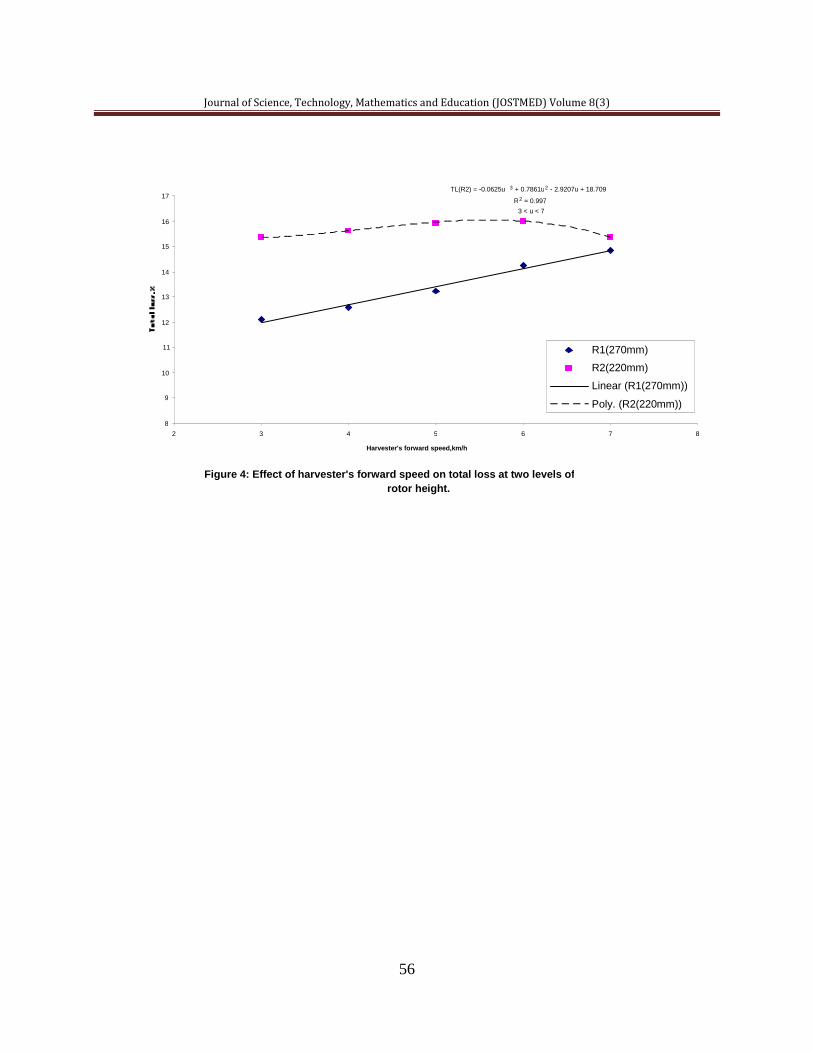
Journal of Science, Technology, Mathematics and Education (JOSTMED) Volume 8(3)
56
Figure 4: Effect of harvester's forward speed on total loss at two levels of rotor height.
TL(R2) = -0.0625u 3 + 0.7861u 2 - 2.9207u + 18.709 R 2 = 0.997
3 < u < 7
8
9
10
11
12
13
14
15
16
17
2 3 4 5 6 7 8 Harvester's forward speed,km/h
R1(270mm) R2(220mm) Linear (R1(270mm)) Poly. (R2(220mm))
Journal of Science, Technology, Mathematics and Education (JOSTMED) Volume 8(3)
57
Conclusion A 30cm width prototype stripper harvester was evaluated to determine forward speed effect on header losses and harvester efficiency. This effect was of forward speed when crop is fed at variable rate into the machine on the stripper header losses like shattering, stubble, lodging and harvester efficiency. The shattering loss increased at both rotor heights 220 mm and 270 mm as the forward speed increased. Stubble loss increased slightly at 270 mm rotor height while it increased a bit more at 220 mm rotor height. Lodging loss increased rapidly at two rotor heights 220 mm and 270 mm as the machine forward speed increased. The harvester efficiency decreased to minimum points 74% and 78% at 220 mm and 270 mm rotor heights at 6km/h machine forward speed respectively. At optimum settings of the critical operating parameters, the forward speed was 3 km/h resulting into minimum shatter loss of 4.3%, stubble loss was 4.5%, lodging loss was 2.1% and harvester efficiency was 81% at 270 mm rotor height. When the rotor height was set at 220 mm, the forward speed was 4 km/h resulting into minimum shatter loss of 7.0%, stubble loss was 4.8%, lodging loss was 2.7% and harvester efficiency was 77%. References Adisa, A. F. (2009). Development and performance evaluation of a pedestrian controlled rice stripper. Unpublished Ph.D Thesis, Ahmadu Bello University, Zaria, Nigeria. Ajiboye, V. A. (2007). Development and performance evaluation of a motorized single axle cowpea harvester. Unpublished Ph.D Thesis, Ahmadu Bello University, Zaria, Nigeria. Carruthers, I. (1985). Tools for agriculture, I. T. Publications in Association with GTZ/Gate, U.K. Ferreira, D. B., Ferreira O. O., Alonco A. D. S. & Bley H. (2001). Grain loss monitoring during all harvest season (Gathering and Processing Losses), in the irrigated rice crop, and its result in reducing losses due to immediate adjustment in the combines. America Society of Agricultural and Biological Engineers (ASAE). ASAE Publication 011075 Michigan, U. S. A. Johnson, M. (2000). Feeding crop to the rotor of an axial flow combine harvester. IP Research Tools, Data and Communities, U. S.A. Kepner, R. A., Bainer R. & Barger, E. L. (2005). Principles of farm machinery. CBS Publishers & Distributors, third edition, New Delhi, India.
Kalsirisilp, R. & Singh, G. (2001). Adoption of a stripper Header for Thai-made rice combine
harvester. J. Agric. Eng. Res. 80(2), pp163 – 172. Riethmuller, G. (2001). Harvest loss estimation, agriculture Western Australia, farm Note 04196,
Australia. Stout, B. A. & Cheze, B. (1999). CIGR handbook of agricultural engineering volume III. Published by the America Society of Agricultural Engineers, U. S. A. Tado, C. J. M. (2002). Influences on the performance of the stripper rotor in rice. VDI-MEG 384. Published Dissertation. University of Hohenheim, Stuttgart, Federal Republic of Germany, 143pp.

Journal of Science, Technology, Mathematics and Education (JOSTMED) Volume 8(3)
58
Tado, C. J. M. & Quick, G. R. (2003). Development of pedestrian controlled stripper harvesters for Southeast Asian rice fields. Proceedings of the International Conference on Crop Harvesting and Processing, ASAE Publication Number 701p1103e, Kentucky U. S. A.
Journal of Science, Technology, Mathematics and Education (JOSTMED) Volume 8(3)
59
DEVELOPMENT AND CHARACTERIZATION OF ADSORBENT FROM COCONUT SHELLS FOR PURIFICATION OF DYE WASTEWATER
*Dim, P. E.1,2 & Okafor, J. O.2
1. Process and Environmental Research Division, Department of Chemical and Environmental Engineering,
University of Nottingham, United Kingdom 2. Department of Chemical Engineering,
Federal University of Technology, Minna Nigeria E-mail: [email protected]
Phone No: +234(0)8037462750 Abstract Preparation and characterization of adsorbent from coconut shell has been carried out successfully through chemical activation process using KOH, H3PO4 and KH2PO4 as activating agents. The effects of carbonization temperatures and activating agents on yield (dry weight basis), pore volume, iodine number were studied. The result showed that in all cases, increasing the carbonization temperature from 400 to 700 °C caused a decrease in the percentage yield of carbon and bulk density while the iodine number and pore volume is increased as temperature increased. Proximate analysis showed that the coconut shell is made up of 7.4 % moisture content, 10 % volatile matter, 2.5 % ash content while the fixed carbon is 80.01 %. The developed adsorbent have ash content ranges from 1.98-2.80 %, bulk density from 0.49-0.67 g/ml and pore volume ranging from 0.59-0.79 ml/g. The effectiveness of the developed adsorbent carbon was tested on dye effluent to determine its adsorption capacity. The performances of the adsorbents were observed to vary with the chemical activation agent used as follows KOH> H3PO4> KH2PO4 at all the carbonization temperatures. Keywords: Coconut shell, characterization, adsorbent, purification, wastewater, dye. Introduction Coconut shell is used for manufacturing of a variety of products of commercial importance including activated carbons. Activated carbon is the oldest known adsorbent (Gupta and Suhas, 2009; Carrott et al., 2003; Lillo-Rodenas et al., 2007; Phan et al., 2006). Commercially available activated carbon are usually derived from natural materials such as wood, coconut shell, lignite or coal, but almost any carbonaceous materials may be used as precursor for the preparation of carbon adsorbent (Rozada et al.,2003; Crini, 2006).The activated carbon is extensively used in the refining and bleaching of vegetable oils and chemical solutions, water purification, recovery of solvents and other vapours, recovery of gold, in gas masks for protection against toxic gases, in filters for providing adequate protection against war gases/nuclear fall outs, etc (CBD, 2006; Gupta and Suhas, 2009). Activated carbon is a non-graphite form of carbon which could be produced from any carbonaceous material such as coal, lignite, wood, paddy husk, coir pith, coconut shell, etc. (Nwabanne and Igbokwe, 2012; Roque-Marlberbe, 2007; Olafadehan et al., 2012).Studies have shown that activated carbons are good materials for removal of different types of dyes in general, but there use is still sometimes limited due to high cost. Therefore the choice of coconut precursors over others is due to is available locally in large quantity and have potentials as sorbent due to their physicochemical characteristics and low-cost. Coconut shell is cheap and abundant agricultural by-products in tropical countries like Nigeria and Ivory Coast. Adsorption technique is one of the preferred methods for the removal of dyes from wastewater because of its efficiency and low-cost. In this regards, several types of carbons or adsorbents have been prepared form agricultural by-products such as bagasse (Valix et al., 2004; Juang et al., 2001, 2002a; Tsai et al., 2001; Ahmedna et al., 2000), coir pith
Journal of Science, Technology, Mathematics and Education (JOSTMED) Volume 8(3)
60
(Namasivayam and Kavitha, 2002; Namasivayam et al., 2001a), banana pith (Kadirvelu et al., 2003), date pits (Banat et al., 2003),sago waste (Kadirvelu et al., 2003), silk cotton hull (Kadirvelu et al., 2003), corn cob (Juang et al., 2002a),maize cob (Kadirvelu et al., 2003), straw (Kannan and Sundaram, 2001), rice husk (Mohamed, 2004; Malik, 2003; Guo et al., 2003; Kannan and Sundaram, 2001), rice hulls (Ahmedna et al., 2000), fruit stones (Aygu¨n et al., 2003), nutshells (Aygu¨n et al., 2003; Ahmedna et al., 2000), pinewood (Tseng et al., 2003), sawdust (Malik, 2003), coconut tree sawdust (Kadirvelu et al., 2000, 2003), bamboo (Wu et al., 1999) and cassava peel (Rajeshwarisivaraj et al., 2001a), have been used for the removal of dye from wastewater. Generally the public perception of water quality is greatly influenced by the colour. In wastewater the first contaminant to be noticed is usually colour (Banat et al.,1996).Any amount of dyes present in water is highly visible and undesirable (Robinson et al., 2001; Banat et al., 1996). Today dye is still one of the most important class of pollutants, and once they enter the water it is no longer good and sometimes difficult to treat as dye have synthetic origin and complex molecular structure which makes them more stable and difficult to be biodegradable (Gupta and Suhas, 2009; Forgacs et al., 2004; Rai et al., 2005). Industrial wastewaters are often contaminated with various compounds like phenol, chromium, suspended solids, dissolved organic compounds, etc, and it is recommended that these wastewaters should be treated to an environmentally acceptable limit. The current problems in wastewater treatment stem primarily from the increasing pollution of wastewaters by organic compounds that are difficult to decompose biologically. These substances resist the self-purification capabilities of rivers as well as their inability to decompose in conventional wastewater treatment plants (Olafadehan and Aribike, 2000).The aim of this study is to prepare adsorbent from coconut shell at different temperatures using different activating agents; and to compares their performance for the removal of dye from wastewater. Materials and Methods The materials and equipment employed in this work include among others, phosphoric acid, sodium thiosulphate, potassium hydroxide, di-hydrogen teraoxophosphate acid, dye effluent, dessicator, hotspot furnace, electric oven, heating mantle and turbidometer. All the chemicals used are of analytical grade. In this work, coconut shell was collected from Bosso Market in Minna, Niger state. The dye effluent on the other hand was collected from a local dye industry in F-Layout Mobile Minna, Nigeria, using a plastic can of ten litres capacity. The coconut shells were separated and cleaned from other materials such as coconut fiber and dirt by hand picking. The soil on coconut shell was removed by washing with clean water. The washed sample was spread under the sun to remove the liquid content from its solid phase in other to reduce the moisture content and make it ready for carbonization. The crushing process was carried out to first crush the coconut shell to smaller sizes. After carbonization the sample was crushed again to powdered form using mortar and pestle. All the experimental analysis in this research was conducted in triplicate and the values reported are the average limits within deviation of 0.002%. Proximate Analysis of Raw Coconut shell Determination of moisture content A known weight (2g) of raw coconut shell sample was dried in an oven at 105oC until a constant weight was attained. The moisture content was determined as the difference between the initial and final weight (ASTM, 1987). Determination of volatile matter The standard crucible was preheated in the muffle furnace at 400 °C for 5 minutes. The crucible was cooled in the desiccators and 2 g coconut sample was placed in it. The crucible was now placed
Journal of Science, Technology, Mathematics and Education (JOSTMED) Volume 8(3)
61
in the muffle furnace at 900 °C for 5 minutes. The loss in weight accounts for the volatile content of the coconut shell. Determination of ash content The standard crucible was preheated in the muffle furnace. It was then cooled in the desiccators. 2 g of coconut shell sample was placed in the crucible and heated at 750 °C for 1 hour. The incombustible residue gives the ash content of the coconut shell. Determination of fixed carbon This is gotten by deducting the sum of the percentages of ash, volatile, and moisture content from 100. It is expressed as Fixed carbon %= 100-moisture %- ash %- volatile matter % Carbonization and Chemical Activation The coconut shell was divided into four samples of 300 g each and labelled M1, M2, M3, and M4.The carbonization process was monitored at the temperature of 400 oC, 500 oC, 600 oC and 700 oC respectively for 2 hours in a furnace for each sample. The carbonized samples were divided into four (4) parts according to the carbonization temperatures. Chemical activation involves the impregnation of each part of the carbonized sample with 1M phosphoric acid (H3PO4), 1 M potassium hydroxide (KOH) and 1 M di-hydrogen teraoxophosphate acid (KH2PO4) for 24 hours to open the pore, after which it was dried in oven at 110 oC for 3 hours (Okafor and Aneke, 2005).The next step was washing of the activated carbon with distilled water. The washed water was tested with litmus paper until it became neutral. The activated carbon was then drained and dried at room temperature (Okafor and Aneke, 2005). After drying at room temperature; the activated carbon was dried in an oven at a temperature of 110 oC for 3 hours. This process was followed by packing the activated carbon into plastic containers. Finally, characteristic properties of produced activated carbon such as ash content, pore volume, iodine number, and yield and bulk density were determined. The activated carbons were used to treat dye effluent using standard procedures as described by Dias et al ( 2007); Yusuf and Sonibare (2005); Madukasi et al ( 2001). The dye effluent was characterized before and after treatment with the developed adsorbent carbon samples. Results and Discussion The results of proximate analysis of moisture content, ash content, volatile matter and fixed carbon are presented on Table 1.0 and these values that were obtained are in agreement with standard precussors (Su et al, 2006; Jambulingam et al, 2007). Table 2.0 presents the effect of carbonization temperature on char yield while Table 3.0 shows the results of chemical activation of coconut shell. Table 4.0 shows the physical properties of activated coconut shell using different activating agents and at various temperatures while Table 5.0 is the characteristic properties of dye effluent before and after treatment with the developed coconut shell-based active carbons.
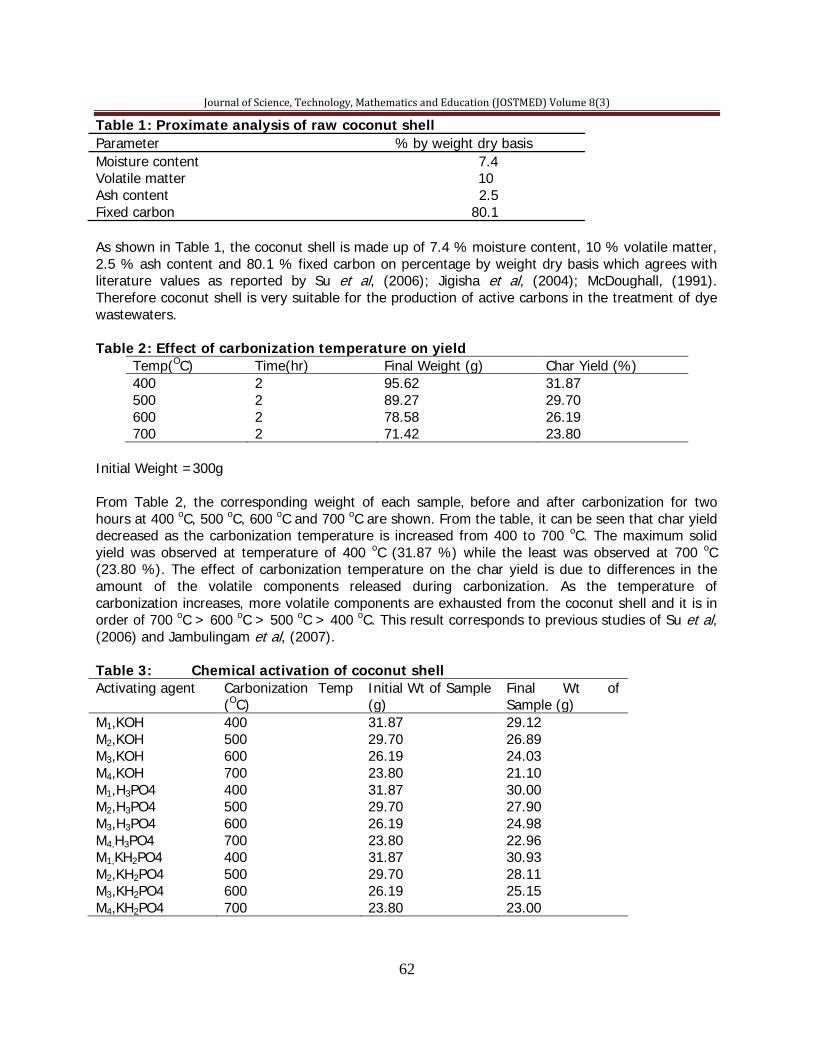
Journal of Science, Technology, Mathematics and Education (JOSTMED) Volume 8(3)
62
Table 1: Proximate analysis of raw coconut shell Parameter % by weight dry basis Moisture content 7.4 Volatile matter 10 Ash content 2.5 Fixed carbon 80.1 As shown in Table 1, the coconut shell is made up of 7.4 % moisture content, 10 % volatile matter, 2.5 % ash content and 80.1 % fixed carbon on percentage by weight dry basis which agrees with literature values as reported by Su et al, (2006); Jigisha et al, (2004); McDoughall, (1991). Therefore coconut shell is very suitable for the production of active carbons in the treatment of dye wastewaters. Table 2: Effect of carbonization temperature on yield
Temp(OC) Time(hr) Final Weight (g) Char Yield (%) 400 2 95.62 31.87 500 2 89.27 29.70 600 2 78.58 26.19 700 2 71.42 23.80
Initial Weight =300g From Table 2, the corresponding weight of each sample, before and after carbonization for two hours at 400 oC, 500 oC, 600 oC and 700 oC are shown. From the table, it can be seen that char yield decreased as the carbonization temperature is increased from 400 to 700 oC. The maximum solid yield was observed at temperature of 400 oC (31.87 %) while the least was observed at 700 oC (23.80 %). The effect of carbonization temperature on the char yield is due to differences in the amount of the volatile components released during carbonization. As the temperature of carbonization increases, more volatile components are exhausted from the coconut shell and it is in order of 700 oC > 600 oC > 500 oC > 400 oC. This result corresponds to previous studies of Su et al, (2006) and Jambulingam et al, (2007). Table 3: Chemical activation of coconut shell Activating agent Carbonization Temp
(OC) Initial Wt of Sample (g)
Final Wt of Sample (g)
M1,KOH 400 31.87 29.12 M2,KOH 500 29.70 26.89 M3,KOH 600 26.19 24.03 M4,KOH 700 23.80 21.10 M1,H3PO4 400 31.87 30.00 M2,H3PO4 500 29.70 27.90 M3,H3PO4 600 26.19 24.98 M4,H3PO4 700 23.80 22.96 M1,KH2PO4 400 31.87 30.93 M2,KH2PO4 500 29.70 28.11 M3,KH2PO4 600 26.19 25.15 M4,KH2PO4 700 23.80 23.00
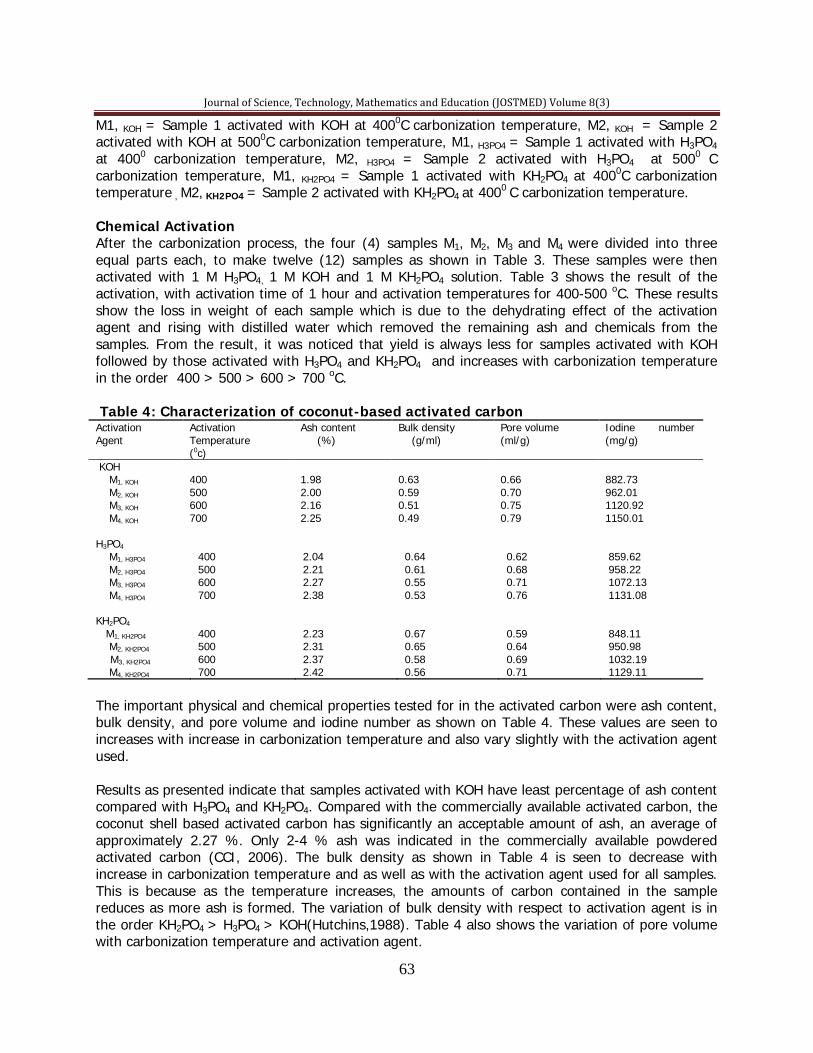
Journal of Science, Technology, Mathematics and Education (JOSTMED) Volume 8(3)
63
M1, KOH = Sample 1 activated with KOH at 4000C carbonization temperature, M2, KOH = Sample 2 activated with KOH at 5000C carbonization temperature, M1, H3PO4 = Sample 1 activated with H3PO4
at 4000 carbonization temperature, M2, H3PO4 = Sample 2 activated with H3PO4 at 5000 C carbonization temperature, M1, KH2PO4 = Sample 1 activated with KH2PO4 at 4000C carbonization temperature , M2, KH2PO4 = Sample 2 activated with KH2PO4 at 4000 C carbonization temperature. Chemical Activation After the carbonization process, the four (4) samples M1, M2, M3 and M4 were divided into three equal parts each, to make twelve (12) samples as shown in Table 3. These samples were then activated with 1 M H3PO4, 1 M KOH and 1 M KH2PO4 solution. Table 3 shows the result of the activation, with activation time of 1 hour and activation temperatures for 400-500 oC. These results show the loss in weight of each sample which is due to the dehydrating effect of the activation agent and rising with distilled water which removed the remaining ash and chemicals from the samples. From the result, it was noticed that yield is always less for samples activated with KOH followed by those activated with H3PO4 and KH2PO4 and increases with carbonization temperature in the order 400 > 500 > 600 > 700 oC. Table 4: Characterization of coconut-based activated carbon Activation Agent
Activation Temperature (0c)
Ash content (%)
Bulk density (g/ml)
Pore volume (ml/g)
Iodine number (mg/g)
KOH M1, KOH
M2, KOH
M3, KOH
M4, KOH
400 500 600 700
1.98 2.00 2.16 2.25
0.63 0.59 0.51 0.49
0.66 0.70 0.75 0.79
882.73 962.01 1120.92 1150.01
H3PO4
M1, H3PO4
M2, H3PO4 M3, H3PO4 M4, H3PO4 KH2PO4 M1, KH2PO4
M2, KH2PO4
M3, KH2PO4
M4, KH2PO4
400 500 600 700 400 500 600 700
2.04 2.21 2.27 2.38 2.23 2.31 2.37 2.42
0.64 0.61 0.55 0.53 0.67 0.65 0.58 0.56
0.62 0.68 0.71 0.76 0.59 0.64 0.69 0.71
859.62 958.22 1072.13 1131.08 848.11 950.98 1032.19 1129.11
The important physical and chemical properties tested for in the activated carbon were ash content, bulk density, and pore volume and iodine number as shown on Table 4. These values are seen to increases with increase in carbonization temperature and also vary slightly with the activation agent used. Results as presented indicate that samples activated with KOH have least percentage of ash content compared with H3PO4 and KH2PO4. Compared with the commercially available activated carbon, the coconut shell based activated carbon has significantly an acceptable amount of ash, an average of approximately 2.27 %. Only 2-4 % ash was indicated in the commercially available powdered activated carbon (CCI, 2006). The bulk density as shown in Table 4 is seen to decrease with increase in carbonization temperature and as well as with the activation agent used for all samples. This is because as the temperature increases, the amounts of carbon contained in the sample reduces as more ash is formed. The variation of bulk density with respect to activation agent is in the order KH2PO4 > H3PO4 > KOH(Hutchins,1988). Table 4 also shows the variation of pore volume with carbonization temperature and activation agent.
Journal of Science, Technology, Mathematics and Education (JOSTMED) Volume 8(3)
64
As carbonization temperature increases the pore volume is observed to increase. The pore volume of the coconut shell activated carbon based on activation agent is as follows KOH > H3PO4 > KH2PO4. This shows that pore volume is a function of activation agent and temperature as well as the precursor used. This was collaborated in the study by Gregg and Singh (1982), where it was shown that pore volume is a function of activating agent and temperature. The iodine number, which is defined as the milligram (mg) of iodine adsorbed per gram (g) of activated carbon, was used as a measure of adsorption capacity of activated carbon produced. According to Kim (2004), iodine value expresses the actual adsorptive power of the adsorbent. Thus it is a more practical parameter to use than the specific surface area of the adsorbent to compare its adsorptive capacity. For the iodine number determination of the activated carbon, Table 4 shows that as the carbonization temperature is increased from 400 to 700 oC, the iodine number also increased from 882.73- 1150.01 mg/g for samples activated with KOH, 859.62- 1131.08 mg/g for samples activated with H3PO4 and 848.11- 1129.11 mg/g for samples activated with KH2PO4. In comparison with standard values, the iodine number should range between 900-1200 mg/g (ASTM, 2002).Therefore, it can be said of the developed adsorbent as having met the standard because all their values are within the prescribed range. Generally, carbonization and activation agent have a significant effect on the formation of adsorbent porous structures. Treatment of Wastewater The dye effluent was analyzed for pH, turbidity, colour; odour, density, total solid, and biochemical oxygen demand (BOD) before and after treatment with the active carbons. The results are presented in Table 5. After the initial measurement of these parameters, the wastewater was treated with the developed activated carbon for 24 hours and it was observed that the pH was from 12.59 to 8.9-10.11. These values fall within the admissible limit of 6-9.5 according to environmental protection act (EPA, 2004).
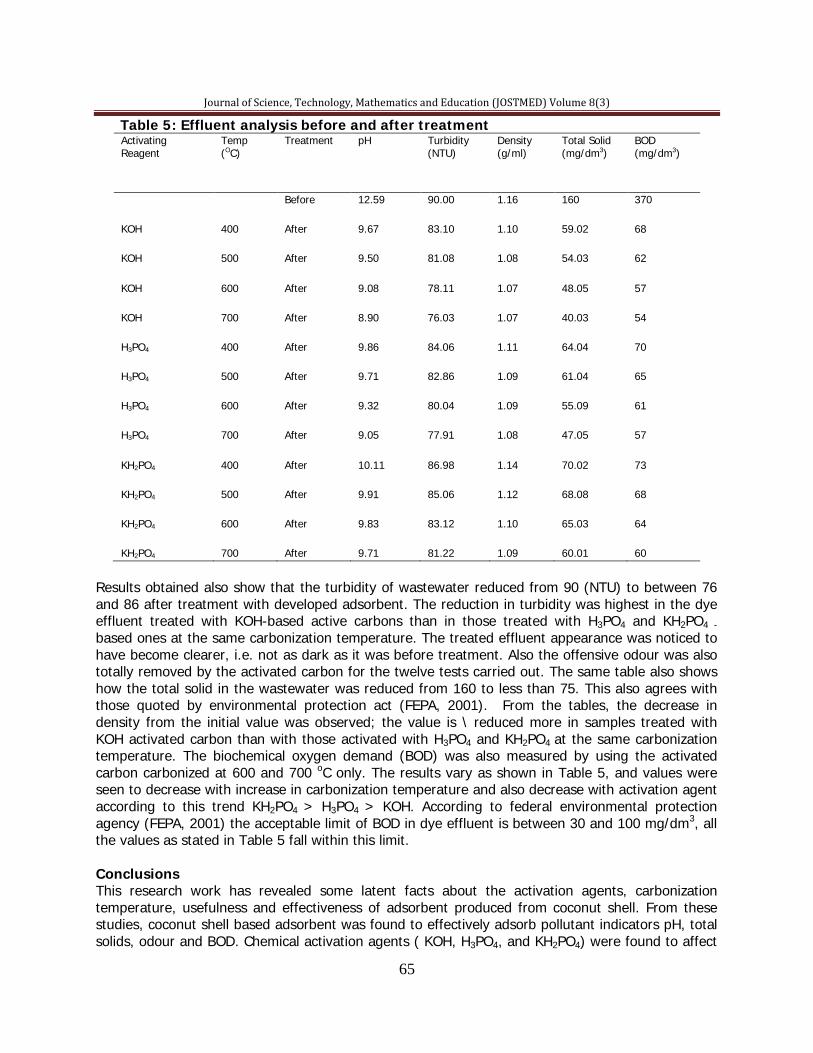
Journal of Science, Technology, Mathematics and Education (JOSTMED) Volume 8(3)
65
Table 5: Effluent analysis before and after treatment Activating Reagent
Temp (OC)
Treatment pH Turbidity (NTU)
Density (g/ml)
Total Solid (mg/dm3)
BOD (mg/dm3)
Before 12.59 90.00 1.16 160 370
KOH 400 After 9.67 83.10 1.10 59.02 68
KOH 500 After 9.50 81.08 1.08 54.03 62
KOH 600 After 9.08 78.11 1.07 48.05 57
KOH 700 After 8.90 76.03 1.07 40.03 54
H3PO4 400 After 9.86 84.06 1.11 64.04 70
H3PO4 500 After 9.71 82.86 1.09 61.04 65
H3PO4 600 After 9.32 80.04 1.09 55.09 61
H3PO4 700 After 9.05 77.91 1.08 47.05 57
KH2PO4 400 After 10.11 86.98 1.14 70.02 73
KH2PO4 500 After 9.91 85.06 1.12 68.08 68
KH2PO4 600 After 9.83 83.12 1.10 65.03 64
KH2PO4 700 After 9.71 81.22 1.09 60.01 60
Results obtained also show that the turbidity of wastewater reduced from 90 (NTU) to between 76 and 86 after treatment with developed adsorbent. The reduction in turbidity was highest in the dye effluent treated with KOH-based active carbons than in those treated with H3PO4 and KH2PO4 - based ones at the same carbonization temperature. The treated effluent appearance was noticed to have become clearer, i.e. not as dark as it was before treatment. Also the offensive odour was also totally removed by the activated carbon for the twelve tests carried out. The same table also shows how the total solid in the wastewater was reduced from 160 to less than 75. This also agrees with those quoted by environmental protection act (FEPA, 2001). From the tables, the decrease in density from the initial value was observed; the value is \ reduced more in samples treated with KOH activated carbon than with those activated with H3PO4 and KH2PO4 at the same carbonization temperature. The biochemical oxygen demand (BOD) was also measured by using the activated carbon carbonized at 600 and 700 oC only. The results vary as shown in Table 5, and values were seen to decrease with increase in carbonization temperature and also decrease with activation agent according to this trend KH2PO4 > H3PO4 > KOH. According to federal environmental protection agency (FEPA, 2001) the acceptable limit of BOD in dye effluent is between 30 and 100 mg/dm3, all the values as stated in Table 5 fall within this limit. Conclusions This research work has revealed some latent facts about the activation agents, carbonization temperature, usefulness and effectiveness of adsorbent produced from coconut shell. From these studies, coconut shell based adsorbent was found to effectively adsorb pollutant indicators pH, total solids, odour and BOD. Chemical activation agents ( KOH, H3PO4, and KH2PO4) were found to affect
Journal of Science, Technology, Mathematics and Education (JOSTMED) Volume 8(3)
66
the adsorptive capacity of the activated coconut shell based upon variations in the characteristics of the carbons such as ash content, bulk density, pore volume and iodine number. Coconut shell-based KOH adsorbent had higher adsorption capacities than coconut shell-based H3PO4 and KH2PO4 adsorbents. This may be as a result of high surface area of the KOH activated carbon compared to H3PO4 activated carbon and KH2PO4 activated carbon. Using coconut shell to develop adsorbent have potentially provide a less expensive and more environmentally friendly raw material than the commercial coal, as well as producing an active carbon processed from a renewable material instead of a non-renewable one. References Ahmedna, M., Marshall, W.E. & Rao, R. M. (2000). Production of granular activated carbons from select agricultural by-products and evaluation of their physical, chemical and adsorption properties. Bioresour. Technol. 71, 113–123 ASTM D 4607, (2002). Standard test method for determination of iodine number of activated carbon, ASTM International. Aygun, A., Yenisoy-Karakas, S. & Duman, I. (2003). Production of granular activated carbon from fruit stones and nutshells and evaluation of their physical, chemical and adsorption properties. Micropor. Mesopor. Mater. 66, 189–195. Banat, I. M., Nigam, P., Singh, D. & Marchant, R. (1996). Microbial decolorization of textile-dye- containing effluents: a review. Bioresour.Technol. 58, 217–227 Banat, F., Al-Asheh, S. & Al-Makhadmeh, L. (2003). Evaluation of the use of raw and activated date pits as potential adsorbents for dye containing waters. Process Biochem. 39, 193–202. Cameron Carbon Incorporation (CCI), (2006). Activated carbon, manufacture, structure, and properties. New York: Havre Press, Pp 1 -11. Carrott, P. J. M., Ribeiro-Carrott, M. M. L., Moura˜o, P. A. M., Lima, R. P. (2003). Preparation of activated carbons from cork by physical activation in carbon dioxide. Adsorpt. Sci. Technol. 21, 669–681 Coconut Development Board (2006). Coconut processing technology. 6 (69), 77- 80. Crini, G. (2006). Non-conventional low-cost adsorbents for dye removal: A review. Bioresource Technology, 97, 1061–1085. Dias, M. J., Alvim-Ferraz, M. C. M., Almeida, M. F., Rivera-Utrilla, J. & Sanchez-Polo, M. (2007). Waste materials for activated carbon preparation and its use in aqueous-phase treatment, Journal of Environmental Management, 85,833-846. EPA, Waste-Treatment Systems. (2004). Upgrading textile operations to reduce pollution, united states environmental protection agency. Washington DC, USA, In: EPA Technology Transfer, EPA-625/3-74-004, 1-2.
Journal of Science, Technology, Mathematics and Education (JOSTMED) Volume 8(3)
67
FEPA. (Federal Environmental Protection Agency). (2001). Guidelines to standards for environmental pollution control in Nigeria, Lagos, Nigeria, In Hutchin, R. A. (1988). Activated carbon system for separation of liquids. int; hanbook of separation techniques for chemical engineering. 2nd Edn. (Schweitzer P.A. Ed.) New York: Mc Graw Hill Book Co, pp. 70-72. Forgacs, E., Cserhati, T. & Oros, G. (2004). Removal of synthetic dyes from wastewaters: A review. Environ. Int. 30, 953–971. Gregg, S. J. & Sing, K. S. W. (1982). Adsorption, surface area and porosity. 2nd ed., AP, Guo, Y., Yang, S., Fu, W., Qi, J., Li, R., Wang, Z. & Xu, H. (2003). Adsorption of malachite green on micro-and mesoporous rice husk-based active carbon. Dyes Pigments, 56, 219–229 Gupta, V. K. & Suhas, A. (2009). Application of low-cost adsorbents for dye removal – A review. Journal of Environmental Management, 90, 2313–2342. Hutchin, R. A. (1988). Activated carbon system for separation of liquids. int; hanbook of separation techniques for chemical engineering, 2nd Edn. (Schweitzer P.A. Ed.). New York: McGraw Hill Book co, pp. 70-72. Jambulingam, M., Karthikeya, S., Sivakumar, P., Kiruthika, J. & Maiyalagan, T. (2007).Characteristics studies of some activated carbons from agricultural wastes. Journal of Scientific and Industrial Resaerch, 66(6), 495-500. Jigisha, P., Channiwala, S. A., & Chosal, G. K. (2004). A correlation for calculating higher heating value (hhv) from proximate analysis of solid fuels. Chemical Engineering Department, Sarvajanik College of Engineering and Technology, Surat, Gujarat 395007, India. Juang, R. S., Tseng, R. L. & Wu, F. C. (2001). Role of microporosity of activated carbons on their adsorption abilities for phenols and dyes. Adsorption, 7, 65– 72. Juang, R. S., Wu, F.C., Tseng, R. L. (2002a). Characterization and use of activated carbons prepared from bagasses for liquid-phase adsorption. Colloid Surf. A: Physicochem. Eng. Aspect, 201, 191–199. Kadirvelu, K., Palanivel, M., Kalpana, R. & Rajeswari, S., (2000). Activated carbon prepared from an agricultural by-product for the treatment of dyeing industry wastewater. Bioresour. Technol., 74, 263–265. Kadirvelu, K., Kavipriya, M., Karthika, C., Radhika, M., Vennilamani, N., & Pattabhi, S. (2003). Utilization of various agricultural wastes for activated carbon preparation and application for the removal of dyes and metal ions from aqueous solutions. Bioresour.Technol., 87, 129– 132. Kannan, N. & Sundaram, M. M. (2001). Kinetics and mechanism of removal of methylene blue by adsorption on various carbons - a comparative study. Dyes Pigments, 51, 25–40 Kim, D. S. (2004). Activated carbon from peach stones using phosphoric acid activation at medium temperatures, Journal of Environmental Science and Health, 5, 1301-1318.
Journal of Science, Technology, Mathematics and Education (JOSTMED) Volume 8(3)
68
Lillo-Rodenas, M. A., Marco-Lozar, J. P., Cazorla-Amoros, D. & Linares-Solano, A. (2007). Activated carbons prepared by pyrolysis of mixtures of carbon precursor/alkaline hydroxide. J. Anal. Appl. Pyrolysis 80, 166–174. Madukasi, E.; Olayinka, K. O. & Osinowo, F. A. O. (2001). Treatment of textile effluents using alum and activated carbon. J. Chem.Soc. of Nigeria, 26 (2), 174-178. Malik, P. K. (2003). Use of activated carbons prepared from sawdust and rice-husk for adsorption of acid dyes: a case study of acid yellow 36. Dyes Pigments, 56, 239–249. McDougall, G. J. (1991). The physical nature and manufacture of activated carbon. J. S. Afri. Int. Min.Metall, 91(4).pp 109-120. Mohamed, M. M. (2004). Acid dye removal: Comparison of surfactant modified mesoporous FSM-16 with activated carbon derived from rice husk. J. Colloid Int. Sci., 272, 28–34. Namasivayam, C. & Kavitha, D. (2002). Removal of Congo red from water by adsorption onto activated carbon prepared from coir pith, an agricultural solid waste. Dyes Pigments 54, 47– 58. Namasivayam, C., Dinesh Kumar, M., Selvi, K., Begum Ashruffunissa, R., Vanathi, T. & Yamuna, R. T. (2001a). Waste coir pith—a potential biomass for the treatment of dyeing wastewaters. Biomass Bioenergy 21, 477–483. Nwabanne, T. J. & Igbokwe, K. P. (2012). Comparative study of lead (II) removal from aqueous solution using different adsorbents. International Journal of Engineering Research and Applications. 2(4), 1830-1838. Olafadehan, O. A. & Aribike, D. S. (2000). Treatment of industrial wastewater effluent, Journal of Nigerian Society of Chemical Engineers, 19, 50- 53. Olafadehan, O. A., Jinadu, O.W., Salami, L. & Popoolas, O. T. (2012). Treatment of brewery wastewater effluent using activated carbon prepared from coconut shell. International Journal of Applied Sciences and Technology, 2(1), 165-178. Okafor, J. O. & Aneke, N. A. G. (2005). Characterization and adsorbents for the purification of coca- cola effluent. Journal of the Nigerian Society of Chemical Engineers, 21,Pp 19-24. Phan, N. H., Rio, S., Faur, C., LeCoq, L., LeCloirec, P., & Nguyen, T. H. (2006). Production of fibrous activated carbons from natural cellulose (jute, coconut) fibers for water treatment applications. Carbon, 44, 2569–2577. Rai, H. S., Bhattacharyya, M. S., Singh, J., Bansal, T. K., Vats, P. & Banerjee, U. C. (2005). Removal of dyes from the effluent of textile and dyestuff manufacturing industry: A review of emerging techniques with reference to biological treatment. Crit. Rev. Env. Sci. Technol. 35, 219–238. Rajeshwarisivaraj, Sivakumar, S., Senthilkumar, P. & Subburam, V. (2001a). Carbon from Cassava peel, an agricultural waste, as an adsorbent in the removal of dyes and metal ions from aqueous solution. Bioresour. Technol. 80, 233–235.
Journal of Science, Technology, Mathematics and Education (JOSTMED) Volume 8(3)
69
Robinson, T., McMullan, G., Marchant, R. & Nigam, P. (2001). Remediation of dyes in textile effluent: A critical review on current treatment technologies with a proposed alternative. Bioresour. Technol. 77, 247–255. Roque-Marlberbe, R. M. A. (2007). Adsorption and diffusion in nonporous materials. USA: CRS Press. Pp39-255. Rozada, F., Calvo, L. F., Garcia, A. I., Martin-Villacorta, J. & Otero, M. (2003). Dye adsorption by sewage sludge-based activated carbons in batch and fixed-bed systems. Bioresour. Technol., 87, 221–230. Su, W., Zhou, L. & Zhou, Y. (2006). Preparation of microporous activated carbon from raw coconut shell by two step procedure. Chinese J.Chem.Eng., 266-269. Tsai, W. T., Chang, C. Y., Lin, M. C., Chien, S. F., Sun, H. F. & Hsieh, M. F. (2001). Adsorption of acid dye onto activated carbon prepared from agricultural waste bagasse by ZnCl2 activation. Chemosphere, 45, 51–58. Tseng, R. L., Wu, F. C., & Juang, R. S. (2003). Liquid-phase adsorption of dyes and phenols using pinewood-based activated carbons. Carbon, 41, 487–495. Valix, M., Cheung, W. H. & McKay, G. (2004). Preparation of activated carbon using low temperature carbonisation and physical activation of high ash raw bagasse for acid dye adsorption. Chemosphere 56, 493–501. Wu, F. C., Tseng, R. L. & Juang, R. S., (1999). Preparation of activated carbons from bamboo and their adsorption abilities for dyes and phenol. J. Environ. Sci. Health A, 34, 1753–1775. Yusuf, R. O. & Sonibare, J. A. (2005) Characterization of textile industries’ effluents in Kaduna, Nigeria and pollution implications. Global Nest: the Int. J., 6(3), 212-221.
Journal of Science, Technology, Mathematics and Education (JOSTMED) Volume 8(3)
70
MEDICAL FRAUD DETECTION SYSTEM IN HEALTH INSURANCE SCHEMES USING LINK AND BASKET ANALYSIS ALGORITHM
Ogwueleka, Francisca Nonyelum
Department of Computer Science, Federal University of Technology, Minna.
E-Mail: [email protected] Phone No: +234-816-847-1775
Abstract The loss by medical institutions due to fraudulent medical-healthcare transactions was noted to have amounted to a good percentage of the nation’s yearly medical expenditure. Timely detection and prevention of fraud could aid in the recovery of lots of money in medical organizations. The designed system used link analysis and basket analysis algorithms, data mining techniques that provide the solutions required to uncover new fraud schemes and transform the new knowledge to medical business rules for real-time transaction screening through identification of unknown fraud patterns from the analysis of transactional data. These algorithms provided adequate means in discovering groups of providers sharing a large number of patients with valid patient identity as in the ghost patient billing fraud scheme and simultaneously uncovered groups of patients/patient IDs appearing in transactions performed by several providers with identified groups of providers rendering services to the same patients. The designed detection system is a main-memory optimized high performance Java cross-platform disk-based relational database management system (DBMS) featuring real-time replication and advanced disaster recovery. The results from the analysis prove that they are effective algorithms for accurate detection of medical fraud. especially in areas of provider-patient and ghost patient billing fraud. Keywords: Data mining, medical fraud, ghost patient billing, provider-patient, link analysis, basket analysis

Journal of Science, Technology, Mathematics and Education (JOSTMED) Volume 8(3)
71
Introduction Frauds have plagued medical institutions for a long time (Ogwueleka, 2011a). There are different types of frauds in the medical industry and these frauds cost them millions of naira per year. Fraud detection has become an imperative and vital task for the medical industry (Ogwueleka, 2009b). Currently, a number of methods have been implemented to detect frauds, from both statistical approaches, such as data mining and hardware approaches, such as firewalls, and smart cards (Ogwueleka, 2009a). Fraud detection is an incessantly growing subject and requires a tool that is intelligent enough to adapt to criminals strategies and ever changing tactics to commit fraud. Data mining is a popular way to fight frauds because of its effectiveness (Ogwueleka and Inyiama, 2009a) Data mining is the search for new, valuable and nontrivial information in large volumes of data. It is a cooperative effort of humans and computers. Best results are achieved by balancing the knowledge of human experts in describing problems and goals with the search capabilities of computers (Han & Kamber, 2000). Timely information on fraudulent activities is strategic to the health care institutions. Medical fraud detection is very essential. Medical frauds are not so evident, and are also not easy to detect (Ogwueleka, 2008). Medical care fraud is produced when either the provider practices are inconsistent with business or medical practices, and result in an unnecessary cost or reimbursement of services that are not medically necessary or that fail to meet professionally recognized standards for health care (Ogwueleka, 2011a). Medical fraud can take place at different stages. Fraud in health care industry can be grouped into illegal actions related to associate, medical professionals, staff and manager, and suppliers. According to the National Health Care Anti-Fraud Association (NHCAA, 2005), health care fraud is an intentional deception or misrepresentation made by a person, or an entity that could result in some unauthorized benefit to him or his accomplices. Typical medical fraud schemes include billing for services not actually performed; falsifying a patient’s diagnosis to justify procedures that are not medically necessary; misrepresenting procedures performed to obtain payment for non-covered services (such as cosmetic surgery); “upcoding” (billing for a more costly service than the one actually performed); “unbundling”(billing each stage of a procedure as if it were a separate procedure); accepting kickbacks for patient referrals; waiving patient co-pays or deductibles and over-billing the insurance carrier or benefit plan (involves both the provider and the patient)(Megaputer, 2007). Billing for services never rendered and charging for more expensive procedures are just two ways that fraudulent health care providers affect patients (Ogwueleka, 2011a). The sad fact remains that health care providers have also been known to perform unnecessary medical services for the singular purpose of collecting insurance payments. Fraudulent providers also falsify medical treatment histories or diagnoses of medical conditions and use up patients’ health care benefits, putting people’s lives at risk. The possibility to drain a patient’s private insurance benefits means that when they might really be needed, a patient may not have access to the appropriate insurance amounts required for adequate treatment. If a patient’s medical insurance is depleted, that may affect future treatments and in serious cases lead to premature death. For health care payers, the long-term benefits of implementing a fraud detection solution offset high the initial implementation costs. In monitoring medical billing fraud, one of the most common services provided by medical billing review companies is the ability to detect Current Procedural Terminology (CPT) code unbundling. CPT codes are an established list of five-digit numbers used to identify the medical procedures and services provided by physicians. The unbundling problem occurs when doctors submit their bills
Journal of Science, Technology, Mathematics and Education (JOSTMED) Volume 8(3)
72
listing charges for routine procedures that should be classified under a specific CPT code, but instead are broken up and filed as a combination of several separate CPT codes. Physicians do this because they can get more reimbursement money for the sum of the individual procedures than for the single composite service. This behaviour is illegal and constitutes insurance fraud, but it occurs on a regular basis. Companies performing review of medical billing for insurance purposes often claim to perform data mining on the submitted bills to look for these filing patterns. In actual sense, they usually run some low-level expert systems or neural networks that have been programmed to look for specific types of known patterns. Again, the data mining involving the discovery of the suspicious patterns initially occurred offline and the known patterns are incorporated into a set of rules to be matched automatically against online data (Westpal & Blaxton, 1998). The result of extreme fraudulent claims is excessive billing amounts, excessive per-doctor patients, higher per-patient costs, higher per-patient tests, etc (Ogwueleka, 2011a). This excess can be identified using special analytical tools. Provider statistics include total amount billed, total number of patients, total number of patient visits, per-patient average billing amounts, per-patient average visit numbers, per-patient average medical tests, per-patient average medical test costs, per-patient average prescription ratios of specially monitored drugs, etc. When abusive claims are repeated frequently, the consequent is higher provider statistics. Various provider statistics can be used to identify fraudulent claims. Statistical analytic techniques can reveal excessive providers who might be completely unintelligent but it will be difficult to identify modest level fraud activities. Sophisticated techniques are thereby applied. Medical fraud detection involves account auditing and detective investigation. Careful account auditing can reveal suspicious providers and policyholders (Rosella, 2008). It is better to audit all claims carefully one after another. Auditing all claims is not possible by any practical means and it is extremely difficult to audit providers without substantial clues. A practical approach is to develop short lists for scrutiny and perform auditing on providers and patients in the short lists. Various analytic techniques can be employed in developing audit short lists. Excessive fraudulent claims lead deviations in aggregate claims statistics. Fraudulent claims also develop into patterns that can be detected using predictive models Ogwueleka, 2009b). Health care agencies are seeking automated tools to aid them in identifying and flagging suspicious activities and sorting of the valid transactions from the fraudulent ones. Massive volume and complexity of healthcare transactions complicate the task of their timely and accurate validation of transactions and prevention of fraud (Ogwueleka, 2011a). The task of fighting fraud involves two major analytical steps, namely discovering unknown patterns and relations signifying new fraud schemes as solving this task will help to find past offenders and their fraudulent transactions; and incorporating discovered knowledge as business rules for screening new transactions, flagging and blocking fraudulent transactions in real time (Megaputer, 2007). Automatic fraud detection helps to reduce the manual parts of a fraud screening/checking process becoming one of the most established industry/government data mining applications (Phua et al, 2005). Data mining, as a process that uses a variety of data analysis tools to discover patterns and relationships in data can be used for making valid prediction. The work of data mining is to analyze a huge amount of data and to extract some practical information that can be interpreted for future uses. In doing this, the purpose of data mining has to be defined and the right structure of possible model or patterns that fit to the given data set found out. When the right model for the data have been gotten then the model can be used for predicting future events by classifying the data
Journal of Science, Technology, Mathematics and Education (JOSTMED) Volume 8(3)
73
(Ogwueleka, 2008). Data mining can be used in different kinds of databases (e.g. relational database, transactional database, object-oriented database and data warehouse) or other kinds of information repositories (e.g. spatial database, time-series database, text or multimedia database, legacy database and the World Wide Web) (Han & Kamber, 2000). Therefore, data to be mined can be numerical data, textual data, graphics or audio. Data mining techniques are used to discover hidden knowledge, unknown patterns and new rules from large data sets, which maybe useful for a variety of decision making activity. With the increasing economic globalization and improvements in information technology, large amounts of medical data are being generated and stored. These can be subjected to data mining techniques to discover hidden patterns and obtain predictions for trends in the future and the behaviour of the medical institutions. With the immediacy offered by data mining, latest data can be mined to obtain crucial information at the earliest. This in turn would result in improved medical institution responsiveness and awareness of fraud leading to reduced costs and increased revenue. Data mining techniques start by sampling or selecting some of the training data like 20 percent or less of the total. An algorithm is then applied to explore the training data, seeking patterns in it. Patterns are then tested and refined on data, which have been kept aside for this purpose, called the “test” data. In addition to the training and test sets, it uses a “validation” set to estimate generalization error, in order to see how well the model performs under conditions of actual use. Link and basket analysis algorithm installed on computers are used to spot unusual patterns in health care claims. It flags any indicative of possible fraud including - medical provider charging far more than peers for particular services, medical providers that provide more tests or procedures per patient than peers, medically improbable procedures, such as one patient having dozens of the same tests, given the choice of similar treatments, billing for the more expensive one more often than peers, high percentage of patients traveling long distances for routine services or tests, and high prices for medical equipment or supplies that can be purchased for far less. Association algorithms are types of data mining algorithm used to find correlations between different attributes in a dataset. The most common application of this kind of algorithm is for creating association rules, which can be used in a market basket analysis. The study was limited to two types of medical fraud, which include provider-patient fraud and ghost patient billing The objectives of this study are as follows: automating the process of finding relationships and patterns in raw data and utilization of the results in an automated decision support system; the use of data mining technique on the large volumes of data available in the medical industry to identify fraudulent patterns and trends in their transactions; the use of the identified patterns and trends relating to fraudulent activities to provide training to the designed model, which will then learn to detect such fraudulent operations, and the use of data mining techniques to break barriers in business transactions by helping the medical industry become an agile competitor able to harness strategic business opportunities. Literature Review Data mining provides the technology to analyze mass volume of data and/or detect hidden patterns in data to convert raw data into valuable information (Chye et al, 2002). In healthcare, data mining is becoming increasingly popular, if not increasingly essential. Several factors have motivated the use of data mining applications in healthcare. The existence of medical insurance fraud and abuse, for example, has led many healthcare insurers to attempt to reduce their losses by using data mining tools to help them find and track offenders (Christy, 1997). There have been reports of successful data mining applications in healthcare fraud and abuse detection (Milley, 2000). Another factor is that the huge amounts of data generated by healthcare transactions are too complex and

Journal of Science, Technology, Mathematics and Education (JOSTMED) Volume 8(3)
74
voluminous to be processed and analyzed by traditional methods. Data mining can improve decision-making by discovering patterns and trends in large amounts of complex data (Biafore, 1999). Data can be a great asset to healthcare organizations, but they have to be first transformed into information. The goal of data mining is to learn from data, and there are two broad categories of data mining strategies: supervised and unsupervised learning (Matkovsky & Nauta, 1998). The method used in this study is unsupervised modeling. The attributes and models of fraud are not known, but the patterns and clusters of data uncovered by data mining can lead to new discoveries. The concept of fraud detection has been founded on data mining techniques such as association rules and classification. Research on fraud detection has been focused on pattern matching in which abnormal patterns are identified from the normality. Some of theses are the Instruction Detection Framework and algorithms for pattern comparison proposed by Lee et al (1999). Major & Riedinger (2002) presented a tool for the detection of medical insurance fraud. They proposed a hybrid knowledge/statistical-based system, where expert knowledge is integrated with statistical power. Another framework presented for the detection of healthcare fraud, is a process-mining framework by Yang & Hwang (2006). The framework is based on the concept of clinical pathways where structure patterns are discovered and further analyzed. Phua et. al (2005) highlights fraud committed in insurance industry as one of the most studied in terms of the number of data mining-based fraud detection publications, existing four sub-groups of insurance fraud detection: home, crop, automobile and medical insurances. In (Yamanishi et al, 2004), an on-line discounting learning algorithm was used to indicate whether a case has a high possibility of being a statistical outlier in data mining applications such as fraud detection is used for identifying meaningful rare cases in health insurance pathology data from Australia’s Health Insurance Commission (HIC). The performance of a k-Nearest Neighbor (kNN) algorithm with the distance metric being optimized using a genetic algorithm was applied in a real world fraud detection problems faced by the HIC (He et al, 1999). The hot spots methodology that entails the use of clustering and rule induction techniques has been used to identify possible frauds in the Australian Governments public health care system, Medicare (Williams, 1999). Becker et al (2002) identified the effects of fraud control expenditures and hospital and patient characteristics on upcoding, treatment intensity and health outcomes in the Medicare and Medicaid programs. A data mining framework that uses the concept of clinical pathways (or integrated care pathways) was utilized for detecting unknown fraud and abusive cases in a real-world data set gathered from the National Health Insurance (NHI) program in Taiwan (Yang & Hwang, 2005). Another model that uses attributes mainly derived from various expense fields of claims by experts’ consultants was also designed to detect suspicious claims in the Taiwan NHI program (Chan & Lan, 2001). In this study, Link Analysis algorithms were used as they prove to be efficient tools for identifying frauds such as patient-provider fraud while additional analytical algorithms are used for detecting other types of fraudulent transactions such as ghost patient billing. The Basket Analysis algorithm developed provided an adequate means to discovering groups of providers sharing a large number of patients. These algorithms were used because they gave the most appropriate and accurate results in terms of patient-provider medical fraud and providers sharing larger number of patients. Methodology Medical fraud detection requires compilation of potentially huge data, involving complex computation and sorting operations. The data mart platform for medical fraud detection was based on the designed architecture where the claim payment records are first transformed and loaded into
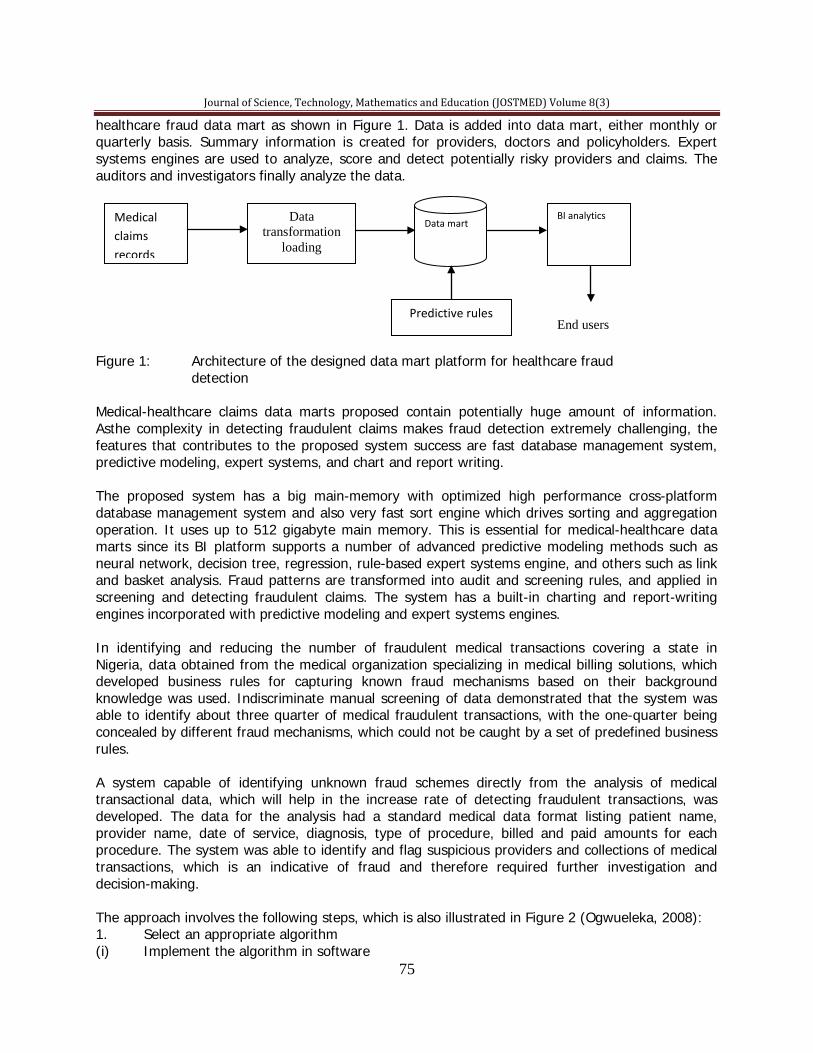
Journal of Science, Technology, Mathematics and Education (JOSTMED) Volume 8(3)
75
healthcare fraud data mart as shown in Figure 1. Data is added into data mart, either monthly or quarterly basis. Summary information is created for providers, doctors and policyholders. Expert systems engines are used to analyze, score and detect potentially risky providers and claims. The auditors and investigators finally analyze the data.
Figure 1: Architecture of the designed data mart platform for healthcare fraud detection
Medical-healthcare claims data marts proposed contain potentially huge amount of information. Asthe complexity in detecting fraudulent claims makes fraud detection extremely challenging, the features that contributes to the proposed system success are fast database management system, predictive modeling, expert systems, and chart and report writing. The proposed system has a big main-memory with optimized high performance cross-platform database management system and also very fast sort engine which drives sorting and aggregation operation. It uses up to 512 gigabyte main memory. This is essential for medical-healthcare data marts since its BI platform supports a number of advanced predictive modeling methods such as neural network, decision tree, regression, rule-based expert systems engine, and others such as link and basket analysis. Fraud patterns are transformed into audit and screening rules, and applied in screening and detecting fraudulent claims. The system has a built-in charting and report-writing engines incorporated with predictive modeling and expert systems engines. In identifying and reducing the number of fraudulent medical transactions covering a state in Nigeria, data obtained from the medical organization specializing in medical billing solutions, which developed business rules for capturing known fraud mechanisms based on their background knowledge was used. Indiscriminate manual screening of data demonstrated that the system was able to identify about three quarter of medical fraudulent transactions, with the one-quarter being concealed by different fraud mechanisms, which could not be caught by a set of predefined business rules. A system capable of identifying unknown fraud schemes directly from the analysis of medical transactional data, which will help in the increase rate of detecting fraudulent transactions, was developed. The data for the analysis had a standard medical data format listing patient name, provider name, date of service, diagnosis, type of procedure, billed and paid amounts for each procedure. The system was able to identify and flag suspicious providers and collections of medical transactions, which is an indicative of fraud and therefore required further investigation and decision-making. The approach involves the following steps, which is also illustrated in Figure 2 (Ogwueleka, 2008): 1. Select an appropriate algorithm (i) Implement the algorithm in software
Medical claims records
Data transformation
loading
Data mart BI analytics
End users Predictive rules
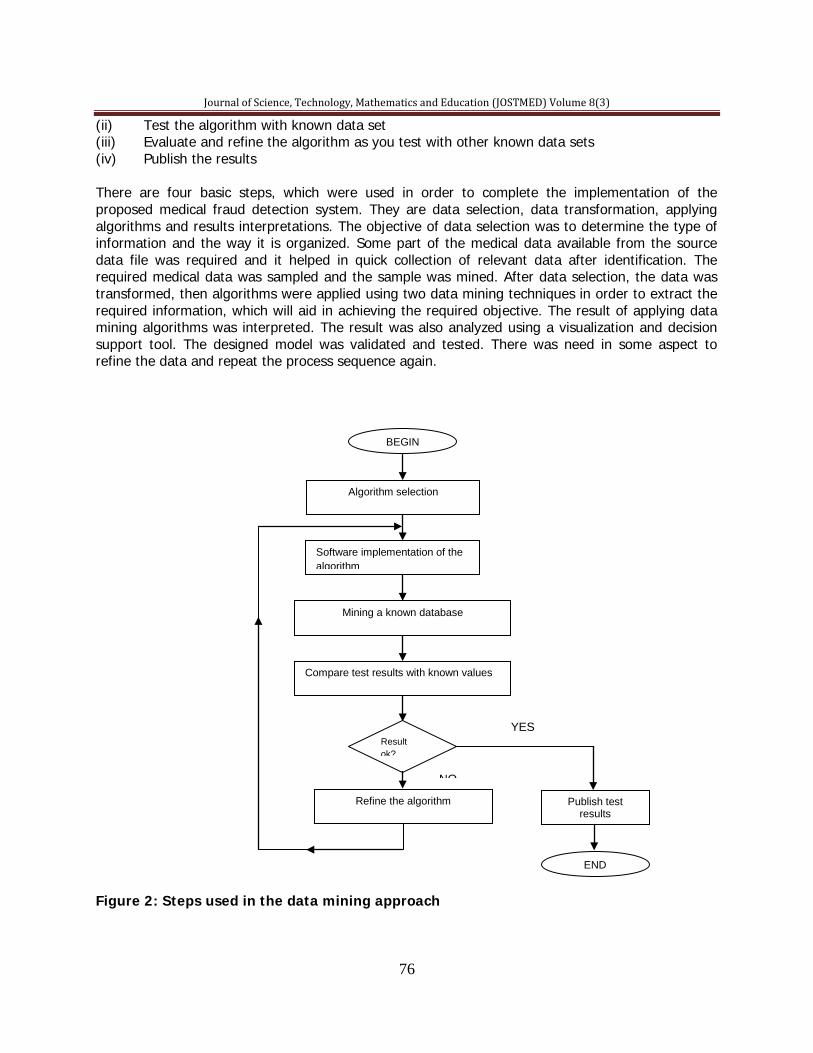
Journal of Science, Technology, Mathematics and Education (JOSTMED) Volume 8(3)
76
(ii) Test the algorithm with known data set (iii) Evaluate and refine the algorithm as you test with other known data sets (iv) Publish the results There are four basic steps, which were used in order to complete the implementation of the proposed medical fraud detection system. They are data selection, data transformation, applying algorithms and results interpretations. The objective of data selection was to determine the type of information and the way it is organized. Some part of the medical data available from the source data file was required and it helped in quick collection of relevant data after identification. The required medical data was sampled and the sample was mined. After data selection, the data was transformed, then algorithms were applied using two data mining techniques in order to extract the required information, which will aid in achieving the required objective. The result of applying data mining algorithms was interpreted. The result was also analyzed using a visualization and decision support tool. The designed model was validated and tested. There was need in some aspect to refine the data and repeat the process sequence again.
Figure 2: Steps used in the data mining approach
Algorithm selection
Software implementation of the algorithm
Mining a known database
Compare test results with known values
Refine the algorithm
Result ok?
Publish test results
END
NO
YES
BEGIN
Journal of Science, Technology, Mathematics and Education (JOSTMED) Volume 8(3)
77
Results To reduce the volume of medical data to be analyzed and concentrate on possible patients for fraud, the records of patients who received more than 70 medical transactions during one calendar year was isolated and the records studied. The resulting data contained about 220,000 transactions, which were explored with the help of advanced analytical algorithms of the data mining system. The algorithm for the statistics summary demonstrated that the remaining records corresponded to 800 patients, 320 types of performed medical transactions, and 750 providers, 10 of which were larger hospitals performing more than 3,000 individual transactions yearly. In detecting different medical fraud occurring for medical institutions, Link Analysis algorithms are very efficient tools for identifying frauds such as patient-provider fraud while additional analytical algorithms are best suited for detecting other types of fraudulent transactions such as ghost patient billing. This is noted from the model results obtained after testing. The Basket Analysis algorithm provided adequate means in discovering groups of providers sharing a large number of patients and/or just valid patient IDs as in the ghost patient billing fraud scheme. This algorithm simultaneously uncovered groups of patients/patient IDs appearing in transactions performed by several providers, and also identified groups of providers rendering services to the same patients. The designed detection system is a large main-memory optimized high performance Java cross-platform disk-based relational DBMS, featuring real-time replication, advanced disaster recovery, MM-DBMS level speed, embedded operation and supports SQL. It is optimized for large main-memory. Its single buffer architecture allows not only caching a large number of data pages, up to 512GB, but also handles large sorting data. The algorithm was written in Java. It can run on various platforms, such as, Windows, Mac OS X, and Linux. The databases created can be ported onto other platforms without costly conversions. As it was Java 100%, it can be integrated into the medical institution's J2EE web-servers or Java business applications. Embedding the designed DBMS is as simple as adding an archive file and calling start/stop APIs. The embedding greatly improved the performance of the system by virtually eliminating communication cost. The detection system provides various data recovery mechanism and replication. It does not only prevent major data loss from disasters and computer virus attacks, but it also removes the need to make daily or periodic backups. The system employed advanced locking and concurrency control mechanisms. Discussion Medical transactions can be so complicated that a medical fraud investigator has to work very hard to separate fraudulent transactions from legitimate ones. The presence of a large number of overlapping patients should definitely raise doubt/suspicion for an analyst and require further investigation. The aim of a fraud detection system is not only to discover past fraudulent transactions and create a list of the corresponding offenders, but also to screen every new transaction with the discovered business rules and prevent processing suspicious transactions in real time. An analyst should schedule the most suspicious transactions for a more detailed manual scrutiny. To automate the process of knowledge discovery and applying business rules for verification of transactions, a unique platform for rapid visual development of reusable push-button analytical solutions was utilized. This system allows an analyst to create and distribute advanced analytical
Journal of Science, Technology, Mathematics and Education (JOSTMED) Volume 8(3)
78
scenarios throughout the organization. The system automatically executes these scenarios when certain predefined conditions become true. The medical institution gains the capability to quickly and consistently identify new fraud schemes and monitor the validity of submitted transactions in real time. The data mining process used the following six basic steps: defining the problem, preparing data, exploring data, building models, exploring and validating models, and deploying and updating models. As creating a data-mining model is a dynamic and iterative process, the six steps were utilized. After exploring the available medical data, it was noted that the data was insufficient to create the appropriate mining models and that more data will be looked for. Several models were built before realizing that they do not answer the problem posed when the problem is defined and so the problem was redefined. The models were updated after they have been deployed because more medical data became available. Most steps in the data mining process were repeated as many times as needed to create a good model. The most commonly used techniques in data mining are artificial neural networks (non-linear predictive models that learn through training and resemble biological neural networks in structure), decision trees (tree-shaped structures that represent sets of decisions which generate rules for the classification of a dataset), genetic algorithms (optimization techniques that use processes such as genetic combination, mutation, and natural selection in a design based on the concepts of evolution), and rule induction (the extraction of useful if-then rules from data based on statistical significance). The scope of this study limited it to only link and basket analysis. Analyzing links in data mining establishes relationships between the records in the database which would otherwise be impossible to find because they cannot be predicted and so cannot be found other than by accident. It is a relatively recent technique, which has become well known through shopping basket analysis, which indicates popular combinations..
Link analysis is performed by investigators in many areas, from epidemiology to fraud detection, from criminal investigations to the study of social networks. Linkage data is typically modeled as a graph, with nodes representing entities of interest to the domain, and links representing relationships or transactions. An example is collection of medical data subpoenaed for a criminal investigation. The links as well as nodes may have attributes specific to the domain or relevant to the method of collection, such as, link attributes indicating the certainty or strength of a relationship, or probability of a fraud. Link analysis is distinct from techniques that construct connectionist networks, Bayesian belief networks, and association rules. These techniques discover and represent associations based on the aggregate statistical characteristics of a sample of instances drawn from some population, while link analysis begins with data that can be represented as a network and attempts to infer useful knowledge from the nodes and links of that network. Link analysis helped in this study to ask and answer questions of: which nodes are crucial or central to the network, which links can be strengthened to enhance the operation of the network effectively, can the existence of undetected links or nodes be inferred from the known data, are there similarities in the structure of sub-parts of the network which may indicate an underlying relationship, what are the relevant sub-networks within a much larger network, and what data model and level of aggregation best reveal certain types of links and subnetworks. Analyzing medical information revealed valuable medical fraud information. Basket analysis helped to determine what aspect of the medical fraud that occurs at the same time or at different times.
Journal of Science, Technology, Mathematics and Education (JOSTMED) Volume 8(3)
79
Conclusion Medical institutions have to be able to distinguish fraudulent activities from legitimate business transactions. Fraud schemes are rapidly changing and medical institutions need to be able to differentiate new fraud patterns without an explicit prior knowledge of these patterns. Data mining tools capable of processing large volumes of data, determining rules for separating fraud from legitimate transactions, and detecting unusual events deviating from normal operation patterns should be utilized by the medical institutions. The two regular medical fraud methods, provider-patient fraud and ghost patient billing can be discovered using link analysis and basket analysis algorithms. These two methods cannot be exposed through the use of simple predefined business rules. Link analysis as a subset of network analysis, explores associations between objects. Link analysis helped in this study by providing the crucial relationships and associations between many objects of different types that are not apparent from isolated pieces of information. The designed automatic computer-based link analysis employed will aid the medical industry greatly in reducing fraudulent medical activities. The problem of medical fraud detection has several key characteristics, such as, fraud being rare, and reliability of the medical data. Typically less than 0.1% of the transactions are fraudulent in the case of medical fraud. This means that there are very few examples of fraud in the data. The data is highly skewed and this is the root cause of many of the problems associated with this class of problem. The marking/tagging of transactions as being fraudulent is usually a manual task and is often subject to various sources of error. These errors effectively introduce a level of ‘noise’ into the data. This was a major problem. Despite these limitations, the results obtained from the use of these two algorithms – link and basket analysis shows their effectiveness in this area. This study has shown that the implementation of data mining tools and techniques can increase the quality and timeliness of detecting medical fraud, and the real-time flagging of suspicious transactions. Medical institutions can be saved by timely discovery and elimination of fraudulent transactions in healthcare. References
Becker, D., Kessler, D. & McClellan, M. (2002). Detecting medicare abuse. Journal of Health
Economics, 24, 189–210. Biafore, S. (1999). Predictive solutions bring more power to decision makers. Health Management
Technology, 20(10), 12-14. Chan, C. L. & Lan, C. H. (2001). A data mining technique combining fuzzy sets theory and Bayesian
classifier – An application of auditing the health insurance fee. Proceedings of the International Conference on Artificial Intelligence, 402–408.
Chye, K. H., Leong G., & Chan K. (2002). Data mining and customer relationship marketing in the
banking industry. Singapore Management Review. Christy, T. (1997). Analytical tools help health firms fight fraud. Insurance & Technology, 22(3), 22-
26.

Journal of Science, Technology, Mathematics and Education (JOSTMED) Volume 8(3)
80
Han, J. & Kamber, M. (2000). Data mining: Concepts and Techniques. San Francisco: Morgan Kaufmann.
He, H., Graco, W., & Yao, X. (1999). Application of genetic algorithms and k-nearest neighbour
method in medical fraud detection. Proceeding of SEAL1998, pp. 74– 81. Lee, W., Stolfo, K., Salvatore J. & Mok, K. W. (1999). Algorithms for mining system audit data,
computer science department, Columbia University. Matkovsky, I.P. & Nauta K.R. (1998). Overview of data mining techniques. Presented at the Federal
Database Colloquium and Exposition: San Diego, CA. Megaputer (2007). Medical fraud detection - megaputer case study in data mining. Moscow:
Megaputer intelligence, Ltd. Milley, A. (2000). Healthcare and data mining. Health Management Technology, 21(8), 44-47. Major, J. & Riedinger, D. (2002). EFD: A hybrid knowledge/statistical based system for the detection
of fraud. Journal of Risk and Insurance, 69(3), 309-324. National Health Care Anti-Fraud Association (NHCAA). (2005). Health care fraud: A serious and
costly reality for all Americans, 2005 REPORT, http://www.nhcaa.org Ogwueleka, F. N. & Inyiama, H. C. (2009a). Credit card fraud detection using artificial neural
networks with a rule-based component. IUP University Journal of Science and Technology, 5(1), 40-47.
Ogwueleka, F. N. (2011a). Medical fraud detection system using link and basket analysis algorithm.
3rd International Conference on Mobile e-Services. Nigeria.
Ogwueleka, F. N. (2011b). Data mining application in credit card fraud detection system. Journal of Engineering, Science and Technology, 6(3), 311-322.
Ogwueleka, F. N. (2009b). Applications of data mining techniques in healthcare data. Botswana Journal of Technology, 18(2).
Phua, C., Lee V., Smith, K., & Gayler, R. (2005). A comprehensive survey of data mining-based
fraud detection research. Artificial Intelligence Review. Monash University, Clayton, Australia. Pp 24-21.
Rosella predictive knowledge and data mining (2008). Rosella BI Platform for healthcare data mart
solutions. Pp 4-6. Westpal, C. & Blaxton, T. (1998). Data mining solutions methods and tools for solving real-world
problems. New York: Wiley Computer Publishing. Pp 8-15, 34-40. Williams, G. (1999). Evolutionary hot spots data mining: An architecture for exploring for interesting
discoveries. In Proceeding of PAKDD99. pp 15.

Journal of Science, Technology, Mathematics and Education (JOSTMED) Volume 8(3)
81
Yang, W. S. & Hwang, S. Y. (2006). A process-mining framework for the detection of healthcare fraud and abuse. Expert Systems with Applications, 31, 56-68.
Yamanishi, K., Takeuchi, J., Williams, G. & Milne, P. (2004). On-line unsupervised outlier
detection using finite mixtures with discounting learning algorithms. Data Mining and Knowledge Discovery, 8, 275–300.

Journal of Science, Technology, Mathematics and Education (JOSTMED) Volume 8(3)
82
RENT PAYMENT OPTIONS AND THE WAY FORWARD FOR A DEVELOPING ECONOMY
Sunday Olatunji Oyegbile,
Department of Estate Management, Federal University of Technology,
Minna. Nigeria E-mail: [email protected]
Abstract This Paper examines the debate on the options to be adopted in rent payments by tenants occupying some types of properties especially in developing economies. It considers the historical and various approaches to rent payment, the various methods and options of rent payment along side with their merits and demerits. The various types of rents are also discussed with suggestion on the best method of rent payment and possible implementation strategies to be adopted especially in a developing economy like Nigeria. Keywords: Rent, Rent Payment, Developing Economy Introduction Rent payment practices differ all over the world. Historically, when the majority of the world economies was largely agrarian in nature, rents were paid at the end of the harvest period to the owner of the land who lease out land to tenant for planting of agricultural products (Kemp,1998; Chen , 2003). Rents were paid in kind by way of giving agricultural products to the owner of land at the end of every harvest period. By implication, the rent was paid as many times as crops were harvested at the end of the farming season and not at the beginning of a lease period as is often the case today. As the society develops, different practices evolve ranging from weekly, bi-weekly, monthly, quarterly and yearly payment of rent as the situation or condition warrants (Satsangi, 1998). While rent payment in earlier times were largely restricted to payment of rent for usage of agricultural land, rent is today paid for multiple of reasons ranging from residential, recreation, industrial and commercial property uses(Sobba et al 2008). While it was easy to pay rent on land leased out for agricultural purposes at the end of the harvest period, people have started questioning the feasibility and rationality of paying rent on landed property at the beginning of the lease period and paying of rent 1-3 years in advance as is currently the practice in Nigeria (Keating, 1998, Crook, 1998). There is increasing clamour that rents on residential, industrial (factories, warehouses, workshops) and commercial property (especially shops, offices and stores) should be paid on a monthly basis. In Nigeria recently, a non-governmental body, ‘Socio-Economic Rights and Accountability Project’ has supported the plan by the Attorney General of the Federation to legislate and criminalise the payment of rent in advance In a recent publication, it was indicated that the federal government is advocating that just as salaries of workers are paid monthly, owners of property should not demand more than a months rent in advance (Adetokunbo, 2008).. This paper will therefore examine historical developments with respect to rent payment and the options that have become the practice thus far. It will throw light on the problems associated with each method and suggest ways of making rent payment less burdensome to the tenants while at the same time take into consideration the desires of the landlords.

Journal of Science, Technology, Mathematics and Education (JOSTMED) Volume 8(3)
83
Study Area The paper is limited to rent payment on residential and commercial properties. The survey is carried out in six selected states of the federation namely Kaduna, Jos, Minna, Lagos, Ibadan and Akure. The cities were purposively selected to achieve the set out objective of this paper. Specifically, three states each were selected from the north and south of the country so as to achieve geographical spread in data collection for the study. Furthermore, there is clear evidence that these cities have experienced increased in developmental activities largely because they are all capital cities of their states. The developments taking place are from both the public and private sectors that have responded to increase in demand for residential and commercial properties in the cities. Activities in the land market have been on the rise to meet up with increasing demands for living accommodation and spaces for commercial activities. The state governments have responded in each of the cities by way of building residential and commercial structures and allocating vacant plots of land to investors to provide new buildings. Aim and Objective of Study The study seeks to investigate the various rent payment options in practice in selected location in Nigeria with the aim of advising on the most feasible options in the light of the evolving economic environment. The objectives sets are (i) to investigate the historical developments and issues surrounding rent payment (ii) to identify the different rent payment options in practices in selected locations in Nigeria (iii) to highlight the advantages and disadvantages of the different approaches to rent payment (iv) to recommend the most feasible rent payment approach in the light of the prevailing economic situation in Nigeria Methodology The study was carried out using both primary and secondary sources of data. The list of secondary data sources consulted is adequately documented at the end of this paper. The primary data was obtained using questionnaires and conducting personal interviews on occupants and landlords of residential and commercial properties. A total of six hundred questionnaires were administered with one hundred shared in each of the selected cities of Kaduna, Jos, Minna, Lagos, Ibadan and Akure. The one hundred questionnaires were shared equally between occupants of residential and commercial properties in each of the selected cities. On the whole, 93.5% of the questionnaires were filled and returned. In addition, five estate surveying firms were selected randomly from the registered list of practising firms in those cities. Table 1: Questionnaires Administered on Commercial & Residential Property Owners/Occupiers
No. of Question- naire administered to Commercial Property owners
No. of Question-naire Returned by Commercial property owners
No. Of Question- naire administered to Residential Property owners
No. of Question- naire Returned by Residential Property owner
Kaduna 50 46 50 47 Jos 50 48 50 48 Minna 50 50 50 44 Lagos 50 46 50 46

Journal of Science, Technology, Mathematics and Education (JOSTMED) Volume 8(3)
84
Ibadan 50 45 50 48 Akure 50 45 50 48 Total 300 280 300 281 % Response
93.33% 93.66%
Overall % Response to the 600 questionnaire administered
93.50%
Source: Author’s Fieldwork, 2007 Concepts and Definitions of Rent Rent has been defined variously as payment, usually monthly, for use of space or property or consideration paid for the right to use and possess property (Priemus, 1998). It is the profit in money, provisions, chattels, or labour, issuing out of lands and tenements in consideration for its use (Balchin, 1996a). A rent somewhat resembles an annuity except that while rent is issued or paid over land, the latter is a mere personal charge. Siegel (1968) observed that “rent is what you get for letting the house, which labour made, or the land, which God made, being used by people who may need it more than you do”. It is the periodic payment made to a lessor in consideration for the rights granted to the tenant under the lease (Oni, 2008). Rent is the price paid for use of land/improvement. Rent from the real estate perspective could simply be defined as “the amount paid for the use of land and/or improvements or for the use of capital good”. It is a payment or series of payments made by the lessee to an owner for use of some property, facility, equipment, or service. Usually, It is an amount fixed by contract, made by a tenant at specified intervals in return for the right to occupy or use the property of another (Walker, 2008).Except in the case of very short tenancies, the rent is normally expressed as an annual sum or payment made weekly, monthly, or half yearly or at any other agreed interval. To the tenant, it is often seen as that payment he reluctantly makes to his “shylock” landlord for the use of his “decrepit” house or office space. That is, the price paid for use of land and or improvements on land (Tucker, 2009). According to kuye (2000), it is a periodic payment for the use of another person’s property. This payment could be weekly, monthly or yearly depending on the terms and conditions of the tenancy. It is a fixed periodic payment made by a tenant or occupant of property to the owner for the possession and use thereof, usually by prior agreement of the parties (Barton, 1998). According to Davies (2006), rent is a payment made by a tenant at intervals in order to occupy a property (Anas, 1997). History of rent payment The payment of rent started back in England under the feudal system. In this system, the king owned all land, and his tenant were entitled to hold only those portions of the land allotted by him under conditions imposed by him, (Turner, 2004). Various forms of tenure were developed for specific services required of the holder of lands. The earliest form of service was by knights, involving allegiance and military service to the overlord (landlord) and through him to the king. Later, in lieu of rendering military service, freehold tenants were permitted to make money payment as ‘socage’ to the overlords who were levied at irregular intervals. ‘Socage’ payments were abolished by statutes in the reign of Charles II, king of England, and were replaced by annual payments of fixed sum, or a certain amount of produce, as rents. Tenants making such payments were then said to hold their land by ‘free and socage tenure’. Such tenants took oath of loyalty to the overlord but were relieved of any military obligations (Balchin, 1996b).

Journal of Science, Technology, Mathematics and Education (JOSTMED) Volume 8(3)
85
The mode and manner of payment of rent is greatly determined by the nature of the economy (Charles, 2000). In a buoyant economy, the agent can ask and get virtually whatever the client wants and the manner of payment in terms of duration i.e. either weekly, monthly or even annually (Arnott, 1997). For example in Nigeria in the 1970’s when the economy was buoyant and landlords were making lots of money, collecting rents of up to five years in advance was common. But from about the late eighties, depression set in, with properties remaining vacant for long. The situation did not change immediately until democratic governance sets in 1999 and vacant properties started being occupied more quickly either by buying, selling or leasing. In many advanced countries, the system of workforce and their mode of payment also matter a lot in the determination of the type and duration of rent payment option in place (Baar, 1998, Pollakowski, 1997)). In the United Kingdom, workers are either paid on a daily basis, weekly, twice monthly or on a monthly basis (Heffley, 1998). Whereas in many countries including most African countries where workers are paid monthly, rents tends to follow a different pattern. This could therefore explain why daily, weekly and bi-monthly rents are uncommon. Survey of Different Rent payment Practices in Selected Locations in Nigeria There are different rent payment options that are in practice in different areas depending on the circumstances that encouraged such practices. This study investigated the common rent payment practices in the six cities in Nigeria (i) Multiple-years payment This is a practice whereby rent is paid ahead of time for many years. Before the occupiers are allowed possession of premises, they are required to pay up-front rent for two or more years depending on the circumstances that may dictate such payment. In the period around the 1999 when the economy was booming and demand for rentable apartment was very high, investigation carried among practicing Estate Surveyors and Valuers revealed that property owners especially in Abuja, Lagos and Port Harcourt among others experienced many cases of landlord insisting on advance payment of rent for at least two years (Adetokunbo, 2008),. In some cases, rent of up to five years were demanded and paid for in advance. Advance rent payment arrangements of this nature are referred to as leasing or lease arrangement and it is prevalent mostly among high income earners, top executives and professionals. Many government agencies that took up leases of premises also paid multiple rents as they claimed that it ensures security of tenure over the property being occupied. (ii) Annual Payment This kind of rent payment covers only a period of one year. Rent payments of this nature which do not exceed one year duration are termed tenancy agreement. This payment commences from the date the tenancy agreement is signed and terminates twelve months later on the last day preceding the date the lease agreement was signed. It normally takes effect from any date agreed between the owner or his agent and the proposed occupier of the premises. During the course of this study, it was observed that most rents in Nigeria last for a duration of one year particularly with respect to most commercial properties, and residential accommodations especially two bedrooms, three bedrooms, Duplexes, maisonettes, terrace houses and large palatial apartments.
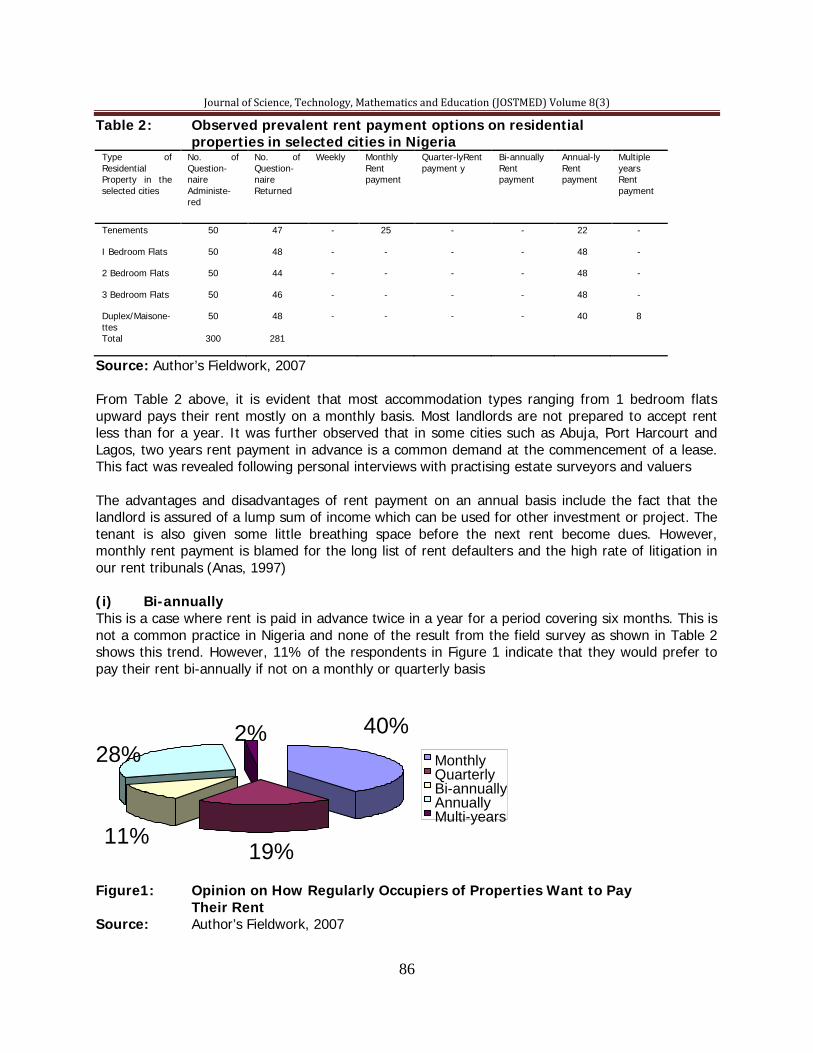
Journal of Science, Technology, Mathematics and Education (JOSTMED) Volume 8(3)
86
Table 2: Observed prevalent rent payment options on residential properties in selected cities in Nigeria
Type of Residential Property in the selected cities
No. of Question-naire Administe-red
No. of Question-naire Returned
Weekly Monthly Rent payment
Quarter-lyRent payment y
Bi-annually Rent payment
Annual-ly Rent payment
Multiple years Rent payment
Tenements 50 47 - 25 - - 22 -
I Bedroom Flats 50 48 - - - - 48 -
2 Bedroom Flats 50 44 - - - - 48 -
3 Bedroom Flats 50 46 - - - - 48 -
Duplex/Maisone-ttes
50 48 - - - - 40 8
Total 300 281
Source: Author’s Fieldwork, 2007 From Table 2 above, it is evident that most accommodation types ranging from 1 bedroom flats upward pays their rent mostly on a monthly basis. Most landlords are not prepared to accept rent less than for a year. It was further observed that in some cities such as Abuja, Port Harcourt and Lagos, two years rent payment in advance is a common demand at the commencement of a lease. This fact was revealed following personal interviews with practising estate surveyors and valuers The advantages and disadvantages of rent payment on an annual basis include the fact that the landlord is assured of a lump sum of income which can be used for other investment or project. The tenant is also given some little breathing space before the next rent become dues. However, monthly rent payment is blamed for the long list of rent defaulters and the high rate of litigation in our rent tribunals (Anas, 1997) (i) Bi-annually This is a case where rent is paid in advance twice in a year for a period covering six months. This is not a common practice in Nigeria and none of the result from the field survey as shown in Table 2 shows this trend. However, 11% of the respondents in Figure 1 indicate that they would prefer to pay their rent bi-annually if not on a monthly or quarterly basis
Figure1: Opinion on How Regularly Occupiers of Properties Want to Pay Their Rent Source: Author’s Fieldwork, 2007
40%
19% 11%
28% 2%
Monthly Quarterly Bi-annually Annually Multi-years

Journal of Science, Technology, Mathematics and Education (JOSTMED) Volume 8(3)
87
According to the survey, the advantage that will result from this is that it will reduce the pressure on tenant and reduces the rate of rent default as compared to when rent is paid annually. Practicing surveyors who are reluctant to take up the responsibility of collecting rent weekly or monthly found this option more attractive. They argued that collecting rents bi-annually or for a longer period is administratively less cumbersome and cheaper for them than when it is done weekly, quarterly or monthly. (i) Quarterly This is a case where the rent paid in advance covers a period of three months. The result in Figure 1 shows that 19 % of the respondents would like rent to be paid quarterly as it relieves them of the burden of raising a lump sum of money to pay to the landlord and provides them with more ready income for meeting their other pressing financial commitments. As for the landlords, paying rent for a shorter duration like in this case make carrying out of repairs to the building more difficult as most maintenance activities need large amount of money. Payment of money monthly is therefore said to slow down the rate and frequency at which repairs are carried out. Most of the estate surveyors interviewed opine that non-payment a lump sum rent is a disincentive to investment in real estate particularly in developing economy where real estate finance is so scarce. (ii) Monthly Monthly rent payment is rent that is paid usually at the beginning of the lease period to cover a thirty day period or such number of days that equals to a month. The investigation carried out shows that rent payment of this kind is more associated with low income earners such as tradesmen, junior civil servants, unskilled lowly paid factory workers and such other group of people who occupies single room apartments popularly refers to as tenement buildings. The survey carried out shows that the group that clamour for monthly payment of rent do so largely because they claim that their income comes in ones in a month and that the income is relatively small and takes a large chunk of their monthly earnings. Salaries and wages in most third world countries and Nigeria in particular are paid on a monthly basis. This reason possibly explains why there is great clamour for rent to be paid on a monthly basis. In Figure 1, 40% of the respondents would rather wish that rent is paid on a monthly basis. Table 4 also gives other reasons normally advanced by those advocating for monthly payment of rent
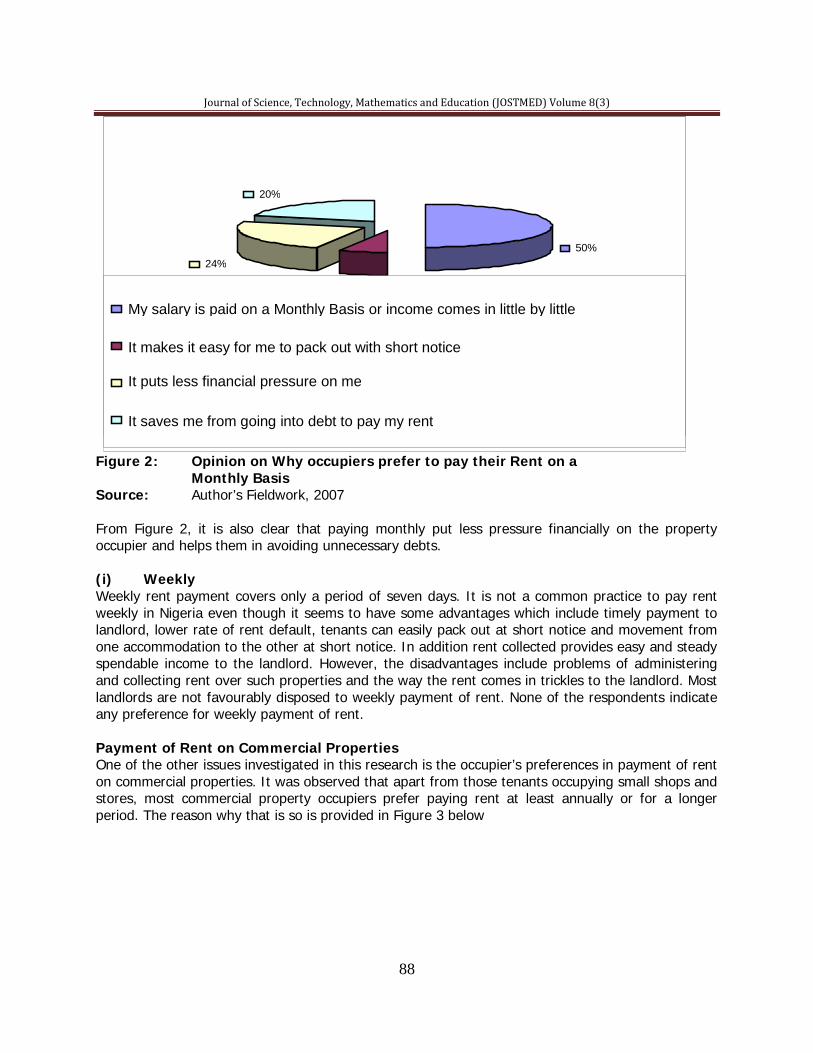
Journal of Science, Technology, Mathematics and Education (JOSTMED) Volume 8(3)
88
Figure 2: Opinion on Why occupiers prefer to pay their Rent on a Monthly Basis Source: Author’s Fieldwork, 2007 From Figure 2, it is also clear that paying monthly put less pressure financially on the property occupier and helps them in avoiding unnecessary debts. (i) Weekly Weekly rent payment covers only a period of seven days. It is not a common practice to pay rent weekly in Nigeria even though it seems to have some advantages which include timely payment to landlord, lower rate of rent default, tenants can easily pack out at short notice and movement from one accommodation to the other at short notice. In addition rent collected provides easy and steady spendable income to the landlord. However, the disadvantages include problems of administering and collecting rent over such properties and the way the rent comes in trickles to the landlord. Most landlords are not favourably disposed to weekly payment of rent. None of the respondents indicate any preference for weekly payment of rent. Payment of Rent on Commercial Properties One of the other issues investigated in this research is the occupier’s preferences in payment of rent on commercial properties. It was observed that apart from those tenants occupying small shops and stores, most commercial property occupiers prefer paying rent at least annually or for a longer period. The reason why that is so is provided in Figure 3 below
50%
6% 24%
20%
My salary is paid on a Monthly Basis or income comes in little by little It makes it easy for me to pack out with short notice
It puts less financial pressure on me
It saves me from going into debt to pay my rent
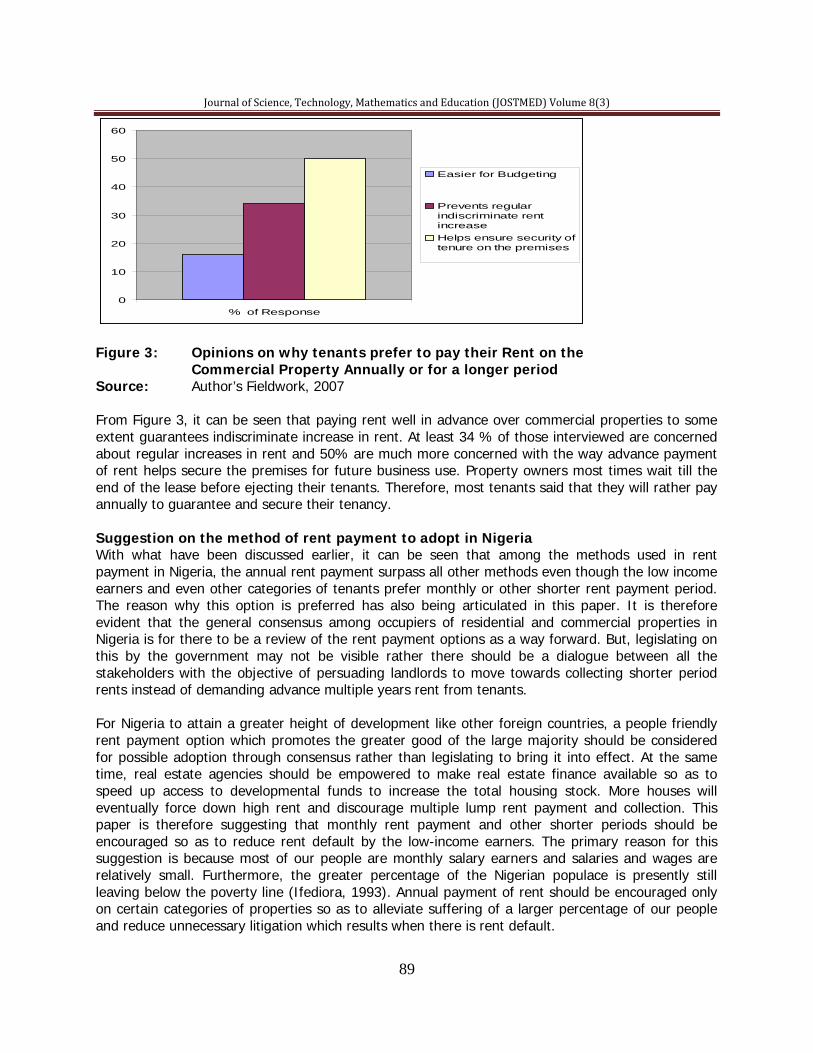
Journal of Science, Technology, Mathematics and Education (JOSTMED) Volume 8(3)
89
0
10
20
30
40
50
60
% of Response
Easier for Budgeting
Prevents regularindiscriminate rentincreaseHelps ensure security oftenure on the premises
Figure 3: Opinions on why tenants prefer to pay their Rent on the Commercial Property Annually or for a longer period Source: Author’s Fieldwork, 2007 From Figure 3, it can be seen that paying rent well in advance over commercial properties to some extent guarantees indiscriminate increase in rent. At least 34 % of those interviewed are concerned about regular increases in rent and 50% are much more concerned with the way advance payment of rent helps secure the premises for future business use. Property owners most times wait till the end of the lease before ejecting their tenants. Therefore, most tenants said that they will rather pay annually to guarantee and secure their tenancy. Suggestion on the method of rent payment to adopt in Nigeria With what have been discussed earlier, it can be seen that among the methods used in rent payment in Nigeria, the annual rent payment surpass all other methods even though the low income earners and even other categories of tenants prefer monthly or other shorter rent payment period. The reason why this option is preferred has also being articulated in this paper. It is therefore evident that the general consensus among occupiers of residential and commercial properties in Nigeria is for there to be a review of the rent payment options as a way forward. But, legislating on this by the government may not be visible rather there should be a dialogue between all the stakeholders with the objective of persuading landlords to move towards collecting shorter period rents instead of demanding advance multiple years rent from tenants. For Nigeria to attain a greater height of development like other foreign countries, a people friendly rent payment option which promotes the greater good of the large majority should be considered for possible adoption through consensus rather than legislating to bring it into effect. At the same time, real estate agencies should be empowered to make real estate finance available so as to speed up access to developmental funds to increase the total housing stock. More houses will eventually force down high rent and discourage multiple lump rent payment and collection. This paper is therefore suggesting that monthly rent payment and other shorter periods should be encouraged so as to reduce rent default by the low-income earners. The primary reason for this suggestion is because most of our people are monthly salary earners and salaries and wages are relatively small. Furthermore, the greater percentage of the Nigerian populace is presently still leaving below the poverty line (Ifediora, 1993). Annual payment of rent should be encouraged only on certain categories of properties so as to alleviate suffering of a larger percentage of our people and reduce unnecessary litigation which results when there is rent default.

Journal of Science, Technology, Mathematics and Education (JOSTMED) Volume 8(3)
90
Implementation Strategies and Recommendations For the proposed suggested method of rent payment to be feasible, the following implementation strategies are recommended for adoption. (i) Government should set up a high power committee to look into the issue of rent payment situation in the country with the aim of determining the challenges faced by people in paying their rents. (ii) Thereafter, the government should embark on serious sensitisation of both landlord and tenant to encourage short term rent payment which seems to be the option preferred by most people in the selected cities and the whole country in general. This approach of encouraging the stakeholders is preferred as passing a law to that effect may be counter productive as was the case with rent control laws that were introduced in time past Conclusion This write up has examined the various rent payment options practice in Nigeria and suggestions have been put forward on the need for a better tenant friendly and landlord acceptable modality of rent payment. It suggested that all stakeholders should be encouraged to embrace shorter duration rent payment options. It considered the various rent payment options, their advantages and disadvantages and finally advocated for the need to encourage monthly rent payment option especially with respect to residential and commercial type of properties. References Adetokunbo, M. (2008). Socio-economic rights and accountability project, Nigeria. The Nigerian Tribune Newspaper, Ibadan, African Press. Anas, A. (1997). Rent control with matching economies: a model of European housing market regulation. Journal of Real Estate Finance and Economics, 15(1), 111-137. Arnott, R. (1995). Time for revisionism on rent control? Journal of Economic Perspectives, 9(1), 99- 120. Balchin, P. (1996a). The United Kingdom. In Balchin, P. (ed), Housing policy in Europe. London: Routledge. Balchin, P. (1996b). Introduction to private rented housing. In Balchin, P. (ed), Housing policy in Europe. London: Routledge. Barton, S. (1998) The success and failure of strong rent control in the city of berkeley, 1978-1995. In Keating, D. Tietz, M. & Skabursis, A. (1998), Rent control. regulation and the rental housing market. Center for Urban Policy Research. New Brunswick: Rutgers University Charles, W. M. (2000). The anti-rent era in New York law and politics (1839 -1865) studies in legal history. USA: University of North Carolina Press. Chen, P. (2003). A study of land rent in pre-liberation china, international law and taxation, USA. Crook, T. (1998). The supply of private rented housing in Canada. Netherlands Journal of Housing and the Built Environment, 13(3) ,327-353. Davis, U. S. (2006). Lease agreements. Downloaded on 25th July, 2008 from www.cmo/citycode/detail.cfm
Journal of Science, Technology, Mathematics and Education (JOSTMED) Volume 8(3)
91
Heffley, D. (1998), Landlords, tenants and the public sector in a spatial equilibrium model of rent control. Regional Science and Urban Economics, 28, 745-772. Keating, D. (1998). Rent control: Its origins, history and controversies. In Keating, D., Tietz, M. & Skabursis, A. (1998). Rent control. regulation and the rental housing market center for urban policy research. Brunswick: Rutgers University. Kemp, P. A. (1998). Private renting in England. Netherlands Journal of Housing and the Built Environment, 13 (3), 233-255. Ifediora, G. S. A (1993). Appraisal frame work. Enugu: Snapp Press. Oni, A. O. (2008). An empirical study of Lagos state rent edict of 1997. The Journal of the Nigeria Institution of Estate Surveyors and Valuers, 31(1). Pollakowski, H. O. (1997). The effects of rent deregulation in New York City. Cambridge: WP 67, MIT Center for Real Estate. Priemus, H. (1998). Commercial rented housing. Netherlands Journal of Housing and the Built Environment, 13(3), 255-279. Satsangi, M. (1998). Private rented housing in France. Netherlands Journal of Housing and the Built Environment, 13(3), 301-327.
Siegel, F. (1968). The on going revolt against the masses. New York.
Sobba, M. & Purcell, J. (2008). Flexible cash rental arrangement, Columbia: Published by MU Extension, University of Missouri. Tucker, G. (2009). The laws of wages, profits, and rent, investigated. UK: Bibliolife. Turner, M. E., Beckett, J. V. & Afton, B. (2004). Agricultural rent in England, 1690- 1914. UK: Cambridge University Press. Walker, F. A. (2008). Land and its rent. UK: Bibliolife.
Journal of Science, Technology, Mathematics and Education (JOSTMED) Volume 8(3)
92
BASIC MORPHOMETRIC MEASUREMENTS AND GROWTH PATTERN, OF HETEROTIS NILOTICUS FROM RIVER KADUNA FLOOD PLAINS, NIGERIA
Bake, G. G.*1 & Sadiku, S.O.E. 1
Department of Water Resources, Aquaculture and Fisheries Technology, School of Agric and Agricultural Technology,
Federal University of Technology Minna, P.M.B 65 Minna. Niger State, Nigeria E-mail: [email protected] Phone No: +234-816-285-0992
Abstract A total of 144 Heterotis niloticus specimen were collected from River Kaduna flood plains using the gill net. Relationship between basic morphometric measurement, growth pattern, food and feeding habit of H. niloticus, were examined and evaluated using linear regression and correlation through length-weight relationship (LWR), Sampling of the specimen was done fortnightly The specimens had mean standard length of 27.09± 4.73 cm, total length of 24.3- 49.4 cm, mean body weight ranges between 261.5±145.0 g, mean eyes diameter of 1.30±0.15cm, mean head length of 6.29±1.75 cm and mean snout length of 4.8±0.86 cm. There was a strong relationship between the standard length and the body weight, the eyes diameter and the standard length, snout length and standard length, head length and the standard length, snout length and the weight, head length and the weight (P<0.05). However, the correlation of the eye diameters and the weight was insignificant (P>0.05). We can conclude from this investigation that the growth pattern analysis of H. niloticus from River Kaduna flooded plains depicts a negatively allometric growth pattern with a b value of 1.16. Keywords: K value; Length –weight relationship, Snout length, head length, Heterotis niloticus. Introduction Fish provides 22% of the protein intake in sub-Saharan Africa (FAO, 2007), however in some countries where other animal proteins are scarce or expensive it can exceed 50%. In sub-Sahara African, per capital fish consumption is the lowest compared with other regions of the world and it is still on the decline FAO (2007). This is largely due to decline in capture fisheries in comparison to and the growing population. Since fishing products cannot meet the rising demands for fish, the importance of fish in the economy and ecology of island water has generated a lot of interest. Over the years aquaculture has gained a rapid interest worldwide due to the importance of fish as a cheap source of animal protein, since beef is beyond the reach of the average citizen especially in the developing nations (FAO, 2007). Heterotis niloticus (Cuvier 1829) of the family Osteoglossidae is among the most highly valued species in West African inland fisheries and it is widely distributed in tropical rivers and freshwater lakes of western and central Africa (Moreau 1982, Leveˆque et al. 1990). In spite of their great evolutionary and fishery significance, the bony tongue fishes of the family Osteoglossidae (Osteoglossiformes) generally have not received extensive study. All six of the known bony tongue species inhabit tropical lowland rivers, lakes, and wetlands (Heterotis niloticus (Cuvier, 1829) in Africa, Arapaima gigas (Schinz, 1822) and Osteoglossum spp. in the Amazon Basin, and Scleropages spp. in Southeast Asia, the East Indies, and northeastern Australia). All bonytongue practice some form of parental care, ranging from nest guarding (Heterotis and
Journal of Science, Technology, Mathematics and Education (JOSTMED) Volume 8(3)
93
Arapaima) to mouth brooding (Osteoglossum and Scleropages ). Heterotis niloticus, the only species of bonytongue (Osteoglossidae) in Africa (Greenwood 1973, Moreau 1982, Li and Wilson 1996), occurs in rivers of West Africa, the Nilo-Sudanian region and the Congo region of Central Africa (Daget, 1957 and Leveque et al. 1990), and has been introduced in many lakes and aquaculture centers such as Lake Kossou in Ivory Coast, Lake Nyong in Cameroon (Moreau 1974, Depiere and Vivien 1977). Heterotis niloticus (Cuvier 1829) is a species widely distributed in the Nigerian waters especially in the fresh waters rivers of Nigeria. There is only one specie of this genus Heterotis hence species niloticus (Bard et al; 1976 Akegbejo-Samson, 1999; Idodo-Umeh 2003). It constitutes an important food source within the region and comprises a portion of the inland fish in Nigeria due to its delicacy. It is widely know in Nigeria but not widely use in research and production probably due to its in ability to easily adapt to environmental changes. Although under suitable condition and proper feeding, Heterotis niloticus grow reasonably fast to 1m in 11 month culture, (Reed et.al 1967). In fisheries science the uses of length–weight relationships, includes calculation of condition factors comparing observed and expected length–weight values (e.g. Le Cren, 1951; Sparre, and Venema, 1998; Knaepkens et al., 2002) and the elucidation of causal factors of spatial differences in condition (Fortin et al., 1990; Copp, 2003). They also enable determination of weight of fish during stock assessment when only lengths are available (Oscoz et al., 2005). Length and weight data are useful standard results of fish sampling programs (Morato et al., 2001). In fish, size is generally more biologically relevant than age, mainly because several ecological and physiological factors are more size-dependent than age-dependent. Consequently, variability in size has important implications for diverse aspects of fisheries science and population dynamics (Erzini, 1994). One of the most commonly used analyses of fisheries data is length - weight relationship (Mendes et al., 2004), hence length-weight regressions have been used frequently to estimate weight from length since direct weight measurements can be time-consuming in the field (Sinovcic et al., 2004). However inspect of River Kaduna richly blessed with a lot of commercially culturable fish species little studies have been done on the relationship between basic morphometric measurement, growth pattern and food and feeding habits especially Heterotis niloticus. It is in this view that this research was carried out. The main objective of this research is to investigate the relationship between basic morphometric measurement and growth pattern of Heterotis niloticus from River Kaduna flood plain in Niger state of Nigeria through their length and weight measurement and condition factor. Materials and Methods Sampling area The Kaduna River is a major tributary of the Niger River, which took its source from Jos Plateau and flows in a northwesterly direction then southwards to join the Niger downstream of Wuya at Nupeko in Niger state. It covers a distance of about 575km and drains on area of about 66,300km2 of diverse topography. The river is dammed at Shiroro also in Niger state about 348km down its course to form a reservoir with a surface area of about 312 km2. The river is divided into two topographical zones. The upper zone; from its source to Zungeru town. This area is undulating with many rocky hills and rapids. While the lower zone starts downstream of Zungeru town to the confluence a distance of about 150 km (Folorunsho, 2004). This area is characterized by the presence of an extensive flood plain covering a total of about 150,000 hacter down the Niger. Fish sampling and Measurement Specimens of Heterotis niloticus were collected fourth nightly from fishermen at three sampling sites namely Nku, Nupeko and Fokpo along river Kaduna flood plains from May 2006 – October 2006. Gill
Journal of Science, Technology, Mathematics and Education (JOSTMED) Volume 8(3)
94
nets of mesh sizes ranging from 5-10 cm were the fishing gear used. Specimens collected were kept chilled in an ice chest to reduce post humous digestion of the stomach contents while in transit to the laboratory. At the laboratory total length (TL) was measured from the tip of the snout (mouth closed) to the extended tip of the caudal fin. Standard length (SL) was measured from the tip of the snout to the caudal peduncle, other basic morphemetric features; head length, snout length and eyes diameter were measured with the aid of a measuring board and a mathematic set divider. The lengths were taken with measuring board to the nearest 0.1 cm. Body weight of individual fish was measured to the nearest 0.1 g with an electric balance after removing the adhered water and other particles from the surface of body. Linear regression was employed to determine the type of relationship between any given pairs of variables and their linear equation. Correlation analysis was used to ascertain the significance of this relationship a derivative of length weight study is the ponderal index denoted as Where W = weight (g) L= standard length (cm) The length-weight relationship (LWR) was expressed by the equation: Log weight = Log a + b Log length Where a and b are regression constants. The condition factor was calculated using the formular: K = [100 W] / L3 Where K = condition factor, L = standard length (cm) and W = weight (g). Results Morphometric measurement of Heterotis niloticus The result of the biometrics of Heterotis niloticus specimens examined provides information on standard length of the specimens which ranged from 21-45 cm with a corresponding body weight ranging from 90-900g and total length ranging from 24.3 – 49.4. The result of the morphometric measurement of Heterotis niloticus specimens examined provides the following information; the snout length ranged from 4.2-8.4 cm with a mean standard deviation of 1.30±0.15, while the head length ranges between 4-9 cm with a mean deviation of 6. 29±1.75. Relationship between the morphometric measurements Body weight- snout length relationship The snout length was regressed against the bodyweight as shown in fig 1 it was observed that there was a strong positive relationship between the snouts length and the weight as correlation co-efficient r was 0.80 and was significant (P<0.05) This means that an increase in weight was associated with an increase in snout length. Standard length- Snout length relationship Snout length was regressed against the standard length as shown fig 2 it was observed that there was a significant relationship between the snout length and the standard length as correlation co-efficient r was 0. 66 (P <0.05). This means that a proportional increased in the standard length was associated with increase in head length. Body weight- head length relationship The head length was regressed against the weight as shown in fig 3 it was observed that there was a strong positive relationship between the head length and the body weight. Correlation co-efficient r was 0.56 and was significant (P <0.05). This indicates that a proportional increase in the body weight can be associated with an increase in the head length
Journal of Science, Technology, Mathematics and Education (JOSTMED) Volume 8(3)
95
Standard length - head length relationship The head length was regressed against the weight as shown in fig 4 it was observed that there was a strong positive relationship between the head length and the body weight correlation co-efficient r was 0.54 and was significant (P <0.05). This indicates that a proportional increase in the standard length can be associated with an increase in the head length Body weight – Eyes diameter Relationship Eye diameter was regressed against the weight as shown in fig 5 it was observed that there was no relationship between the eye diameter and the body weight correlation co-efficient r was 0.05 hence in significant (P >0.05). This means that an increase in weight does not necessary increase the eye diameter. Standard length –eye diameter relationship Eye diameter was regressed against standard length as shown in fig 6 it was observed that there was a very strong relationship between the eye diameter and the standard length as correlation co-efficient r was 0.36 and was significant (P <0.05) hence an increase in standard length was associated with a proportional increase in eye diameter. Length –Weight relationship and growth pattern of Heterotis niloticus The condition factor and growth of the fish were derived from the standard length and the body weight measurement of the specimens. Log weight was regressed against log length as shown in fig 7 and Table 2. Growth in fish is exponential as described by equation Y=ax (Huxley 1932 and Wooten 1992) Linearised as log U=log +log (Lecren, 1951). It was observed that the growth of Heterotis niloticus was negatively allometric with b value 1.16. There was a very strong relationship between the standard length and the total body weight and the correlation co-efficient r was 0.91. Table 2 the condition factors otherwise called ponderal index denoted, as K of Heterotis niloticus from River Kaduna flooded plains ranges from 0.73-2.63 with a mean value of 1.21±0.33. Discussion From the result of the basic morphometric measurement of the 144 Heterotis niloticus specimens examined, it was observed that the fish must have the ability to grow big, hence can be a fast growing fish. Biometric analysis of body parts showed that when the snout length was regressed against the standard length; there was a strong positive correlation. This correlation was significant hence; it was observed that an increase in the length of the fish also leads to an increase in the snout length. The head length also showed a strong positive correlation when regressed against the standard length, hence an increase in the length was associated with an increase with head length Eye diameter regressed against the standard length gave a positively linear correlation. This means that for an increase in length there was also a proportional increase in the eye diameter. From the above analysis it can be said that, any increase in size could be associated to all part of the fish. This agrees with the theory of proportionality of growth state of the organism (Mosby 2009). There was a strong positive linear relationship between the snout length and the body weight; this implies that for any increase in weight there is also a proportional increase in the snout length. The head length also showed a strong positive relationship when regressed against the body weight this means that for increase in the body weight of the fish the head length also increased, however the above statement cannot be said of the eye diameter when it was regressed against the weight; it was
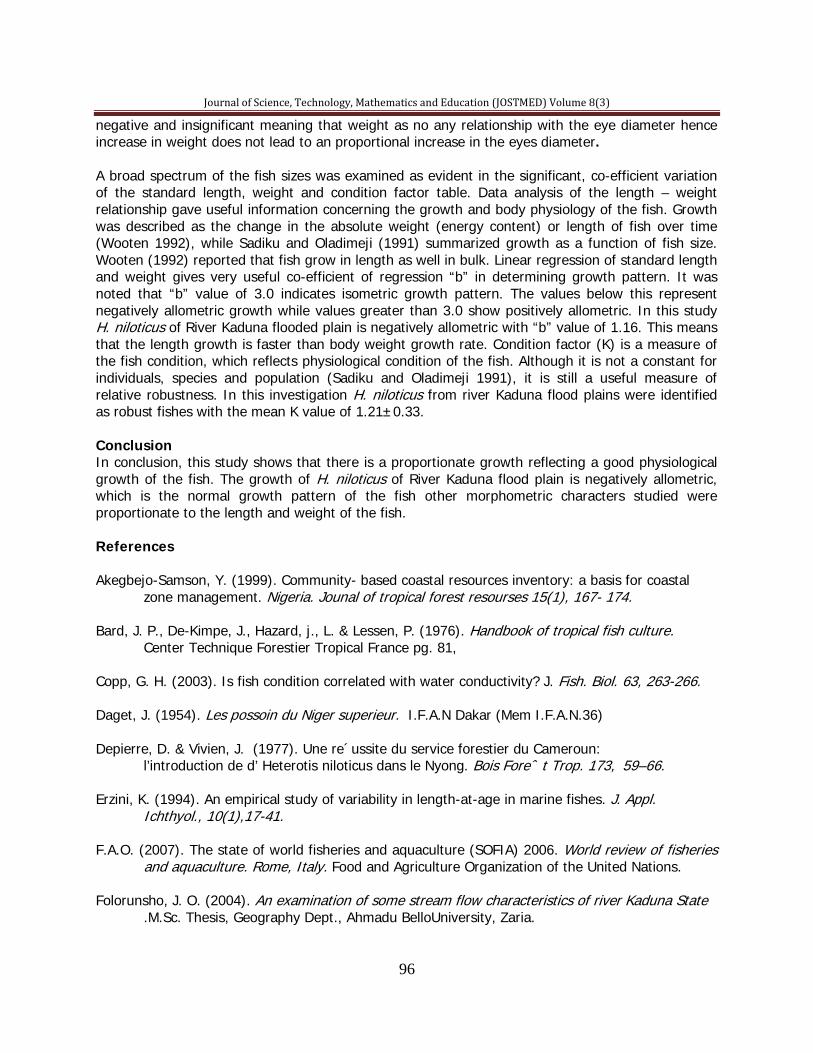
Journal of Science, Technology, Mathematics and Education (JOSTMED) Volume 8(3)
96
negative and insignificant meaning that weight as no any relationship with the eye diameter hence increase in weight does not lead to an proportional increase in the eyes diameter. A broad spectrum of the fish sizes was examined as evident in the significant, co-efficient variation of the standard length, weight and condition factor table. Data analysis of the length – weight relationship gave useful information concerning the growth and body physiology of the fish. Growth was described as the change in the absolute weight (energy content) or length of fish over time (Wooten 1992), while Sadiku and Oladimeji (1991) summarized growth as a function of fish size. Wooten (1992) reported that fish grow in length as well in bulk. Linear regression of standard length and weight gives very useful co-efficient of regression “b” in determining growth pattern. It was noted that “b” value of 3.0 indicates isometric growth pattern. The values below this represent negatively allometric growth while values greater than 3.0 show positively allometric. In this study H. niloticus of River Kaduna flooded plain is negatively allometric with “b” value of 1.16. This means that the length growth is faster than body weight growth rate. Condition factor (K) is a measure of the fish condition, which reflects physiological condition of the fish. Although it is not a constant for individuals, species and population (Sadiku and Oladimeji 1991), it is still a useful measure of relative robustness. In this investigation H. niloticus from river Kaduna flood plains were identified as robust fishes with the mean K value of 1.21±0.33. Conclusion In conclusion, this study shows that there is a proportionate growth reflecting a good physiological growth of the fish. The growth of H. niloticus of River Kaduna flood plain is negatively allometric, which is the normal growth pattern of the fish other morphometric characters studied were proportionate to the length and weight of the fish. References Akegbejo-Samson, Y. (1999). Community- based coastal resources inventory: a basis for coastal zone management. Nigeria. Jounal of tropical forest resourses 15(1), 167- 174. Bard, J. P., De-Kimpe, J., Hazard, j., L. & Lessen, P. (1976). Handbook of tropical fish culture. Center Technique Forestier Tropical France pg. 81, Copp, G. H. (2003). Is fish condition correlated with water conductivity? J. Fish. Biol. 63, 263-266. Daget, J. (1954). Les possoin du Niger superieur. I.F.A.N Dakar (Mem I.F.A.N.36) Depierre, D. & Vivien, J. (1977). Une re´ussite du service forestier du Cameroun: l’introduction de d’ Heterotis niloticus dans le Nyong. Bois Foreˆ t Trop. 173, 59–66. Erzini, K. (1994). An empirical study of variability in length-at-age in marine fishes. J. Appl. Ichthyol., 10(1),17-41. F.A.O. (2007). The state of world fisheries and aquaculture (SOFIA) 2006. World review of fisheries and aquaculture. Rome, Italy. Food and Agriculture Organization of the United Nations. Folorunsho, J. O. (2004). An examination of some stream flow characteristics of river Kaduna State .M.Sc. Thesis, Geography Dept., Ahmadu BelloUniversity, Zaria.
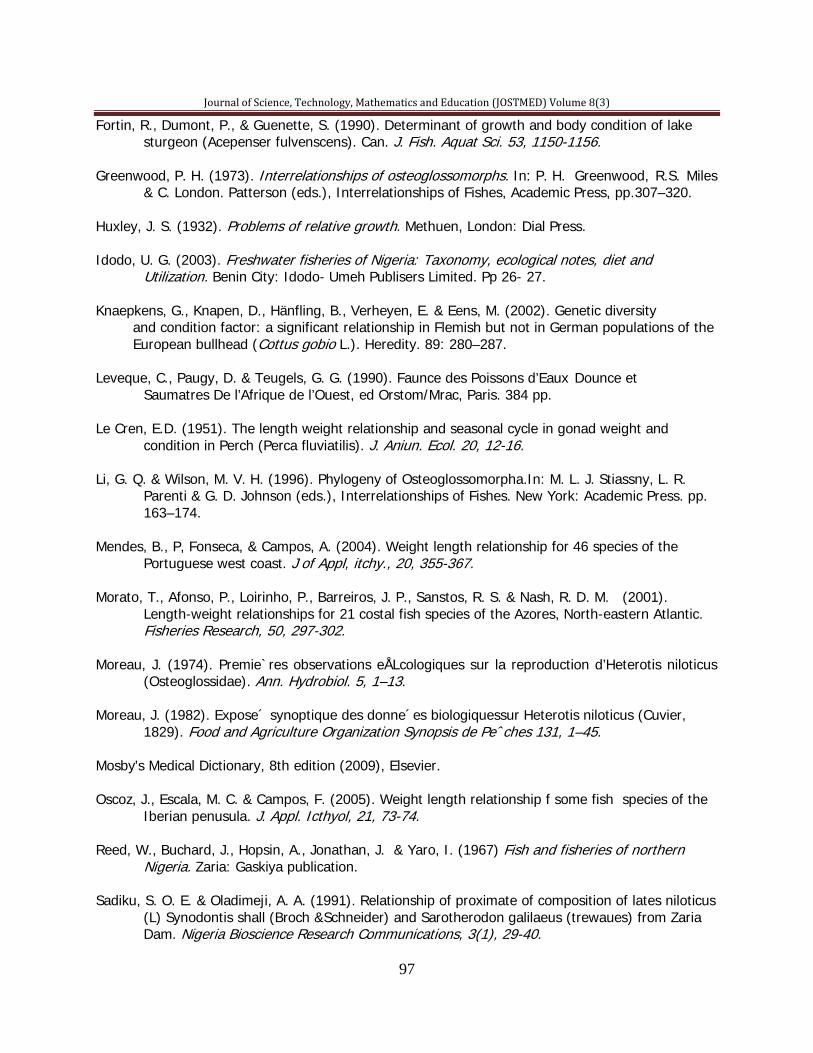
Journal of Science, Technology, Mathematics and Education (JOSTMED) Volume 8(3)
97
Fortin, R., Dumont, P., & Guenette, S. (1990). Determinant of growth and body condition of lake sturgeon (Acepenser fulvenscens). Can. J. Fish. Aquat Sci. 53, 1150-1156. Greenwood, P. H. (1973). Interrelationships of osteoglossomorphs. In: P. H. Greenwood, R.S. Miles & C. London. Patterson (eds.), Interrelationships of Fishes, Academic Press, pp.307–320. Huxley, J. S. (1932). Problems of relative growth. Methuen, London: Dial Press. Idodo, U. G. (2003). Freshwater fisheries of Nigeria: Taxonomy, ecological notes, diet and Utilization. Benin City: Idodo- Umeh Publisers Limited. Pp 26- 27. Knaepkens, G., Knapen, D., Hänfling, B., Verheyen, E. & Eens, M. (2002). Genetic diversity and condition factor: a significant relationship in Flemish but not in German populations of the European bullhead (Cottus gobio L.). Heredity. 89: 280–287. Leveque, C., Paugy, D. & Teugels, G. G. (1990). Faunce des Poissons d’Eaux Dounce et Saumatres De l’Afrique de l’Ouest, ed Orstom/Mrac, Paris. 384 pp. Le Cren, E.D. (1951). The length weight relationship and seasonal cycle in gonad weight and condition in Perch (Perca fluviatilis). J. Aniun. Ecol. 20, 12-16. Li, G. Q. & Wilson, M. V. H. (1996). Phylogeny of Osteoglossomorpha.In: M. L. J. Stiassny, L. R. Parenti & G. D. Johnson (eds.), Interrelationships of Fishes. New York: Academic Press. pp. 163–174. Mendes, B., P, Fonseca, & Campos, A. (2004). Weight length relationship for 46 species of the Portuguese west coast. J of Appl, itchy., 20, 355-367. Morato, T., Afonso, P., Loirinho, P., Barreiros, J. P., Sanstos, R. S. & Nash, R. D. M. (2001). Length-weight relationships for 21 costal fish species of the Azores, North-eastern Atlantic. Fisheries Research, 50, 297-302. Moreau, J. (1974). Premie`res observations eÅLcologiques sur la reproduction d’Heterotis niloticus (Osteoglossidae). Ann. Hydrobiol. 5, 1–13. Moreau, J. (1982). Expose´ synoptique des donne´es biologiquessur Heterotis niloticus (Cuvier, 1829). Food and Agriculture Organization Synopsis de Peˆches 131, 1–45. Mosby's Medical Dictionary, 8th edition (2009), Elsevier. Oscoz, J., Escala, M. C. & Campos, F. (2005). Weight length relationship f some fish species of the Iberian penusula. J. Appl. Icthyol, 21, 73-74. Reed, W., Buchard, J., Hopsin, A., Jonathan, J. & Yaro, I. (1967) Fish and fisheries of northern Nigeria. Zaria: Gaskiya publication. Sadiku, S. O. E. & Oladimeji, A. A. (1991). Relationship of proximate of composition of lates niloticus (L) Synodontis shall (Broch &Schneider) and Sarotherodon galilaeus (trewaues) from Zaria Dam. Nigeria Bioscience Research Communications, 3(1), 29-40.

Journal of Science, Technology, Mathematics and Education (JOSTMED) Volume 8(3)
98
Sinovcic, G. M., Franicevic, B., Zorica, V. & Clles, K. (2004). Length weight and length-length relationship of 10 pelagic fish species from Andrantic Sea (Croatia). J. Of Appl, Icthy,20: 156-167. Sparre, P. & Venema, S. C. (1998). Introduction to tropical fish stock assessment, part 1: Manual. FAO Fisheries Technical Paper 306/1, pp: 433. Wooten, R.G. (1972) Tertiary level ecology fish ecology. New York, USA: Chapman and Hal,. PP127- 128.
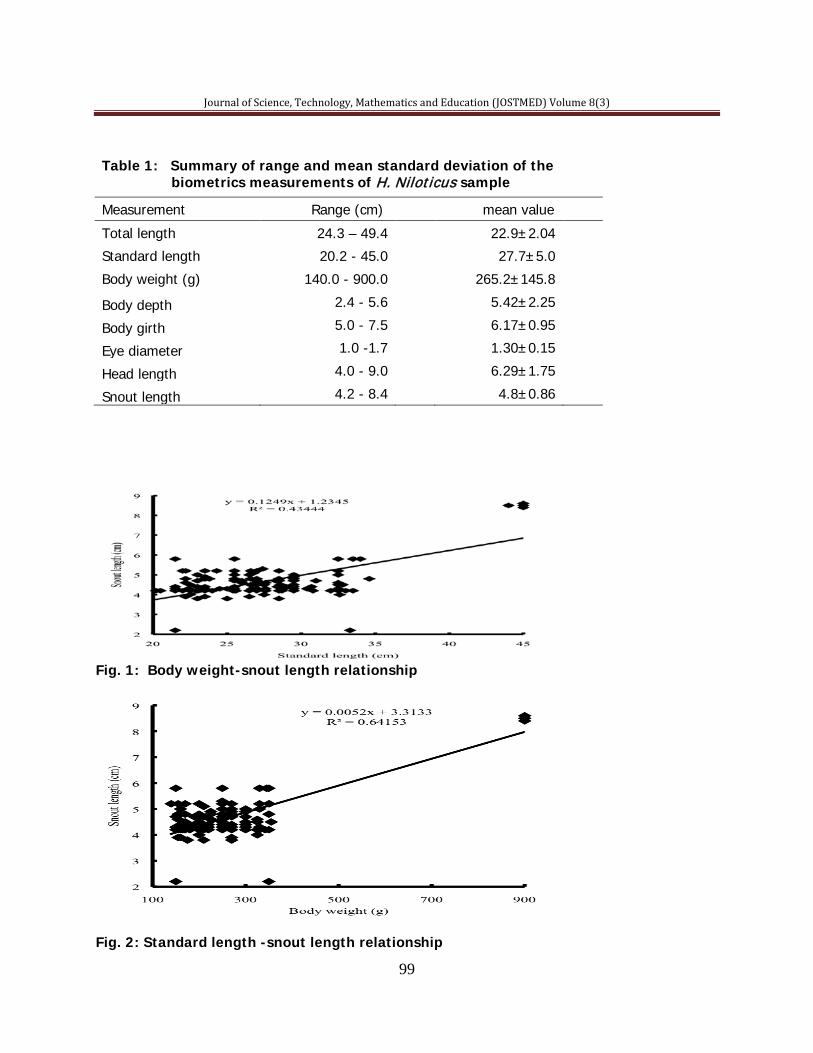
Journal of Science, Technology, Mathematics and Education (JOSTMED) Volume 8(3)
99
Table 1: Summary of range and mean standard deviation of the biometrics measurements of H. Niloticus sample
Measurement Range (cm) mean value
Total length 24.3 – 49.4 22.9±2.04 Standard length 20.2 - 45.0 27.7±5.0 Body weight (g) 140.0 - 900.0 265.2±145.8
Body depth 2.4 - 5.6 5.42±2.25
Body girth 5.0 - 7.5 6.17±0.95
Eye diameter 1.0 -1.7 1.30±0.15
Head length 4.0 - 9.0 6.29±1.75
Snout length 4.2 - 8.4 4.8±0.86
Fig. 1: Body weight-snout length relationship
Fig. 2: Standard length -snout length relationship
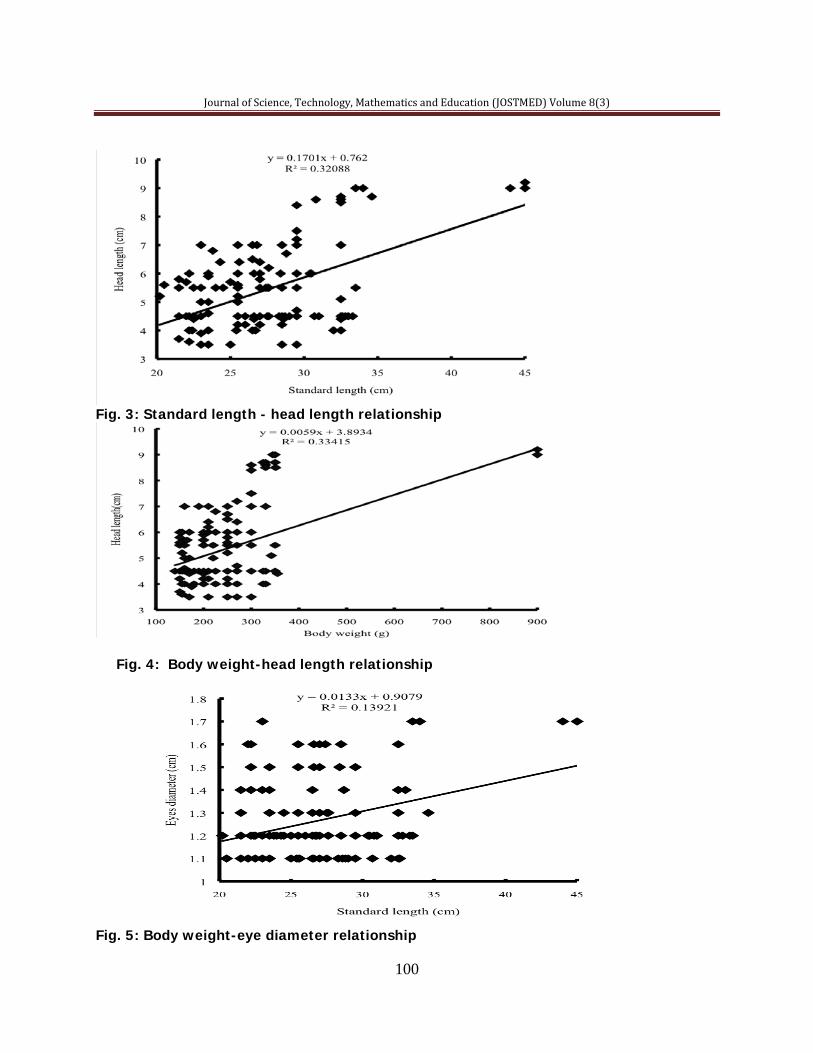
Journal of Science, Technology, Mathematics and Education (JOSTMED) Volume 8(3)
100
Fig. 3: Standard length - head length relationship
Fig. 4: Body weight-head length relationship
Fig. 5: Body weight-eye diameter relationship
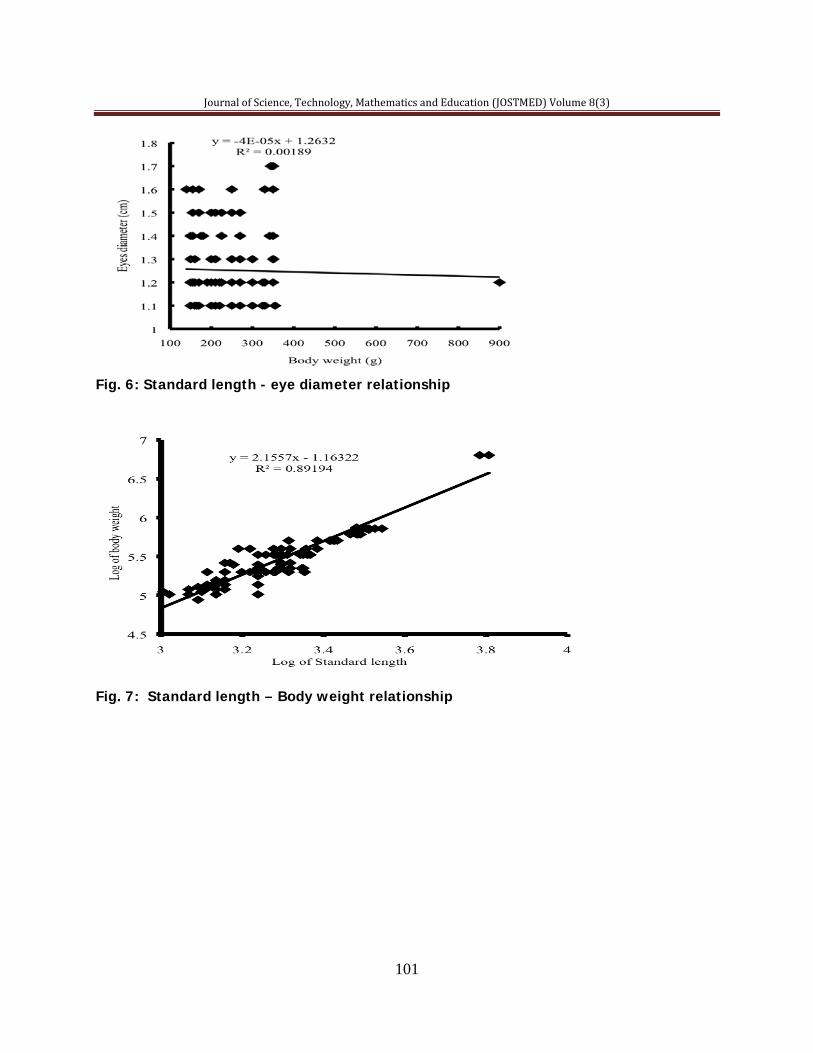
Journal of Science, Technology, Mathematics and Education (JOSTMED) Volume 8(3)
101
Fig. 6: Standard length - eye diameter relationship
Fig. 7: Standard length – Body weight relationship
Journal of Science, Technology, Mathematics and Education (JOSTMED) Volume 8(3)
102
THE EFFECT OF FEEDING FREQUENCY AND FEEDING RATE ON THE GROWTH PERFORMANCE OF CLARIAS GARIEPINUS JUVENILES
Orire, A. M. & ADAM, I. A.
Department of Water Resources, Aquaculture and Fisheries Technology, Federal University of Technology, Minna. P.M.B 65
E-mail: [email protected] Phone No: +234-807-630-5217
Abstract An 8 weeks growth study was conducted to evaluate the optimal feeding rate and feeding frequency for Juvenile Clarias gariepinus 25.58±0.02g. 20 fishes were replicated randomly distributed in 27 tanks and placed on a Netherland commercial catfish diet - Coppens. They were fed at 2%, 6% and 10% rates of their body weights, and at frequency of 5, 3, and 1 time(s) daily. Results obtained indicated significant difference (p< 0.05) in the growth parameters. Treatment I with feeding rate of 2% and feeding frequency of 5 times daily gave best growth performance in terms of mean weight gain (3.10g), specific growth rate (1.85), as well as feed conversion ratio (2.19). However, there was no significant difference (P>0.05) in the mean weight gain values of treatments II, IV, VII, VIII and IX. While treatment with feeding regime of 6% body weight and once daily feeding frequency gave the poorest growth rate with mean weight gain 1.21g. feed conversion ratio (9.13), specific growth rate (0.96). Therefore, for better growth rate, Clarias gariepinus juvenile should be fed 2% body weight given 5 times daily. Keywords: Feeding rate, Feeding frequency, Clarias gariepinus, juvenile. Introduction The poor feeding practices, high cost and low quality of fish feeds are some of the major constraints to the growth and rapid development of aquaculture in Nigeria. Fish feed is the most expensive input in aquaculture operations (Jauncey and Ross, 1982).Feeding rates and frequencies are in part a function of fish size. As fish grow, feeding rates and frequencies should be adjusted throughout the grow-out period (Hinshaw, 1999 and Robinson el al. 1998). Feeding fish is labor intensive and can be expensive since it is dependent on labour availability, farm size, fish species, rearing system, and water quality variables (Albert, 1990). Generally, feeding once daily is satisfactory for food fish grow out. Research has shown that feeding fish twice daily is not necessarily beneficial. Although fish fed twice daily were offered more feed than fish fed once daily, the extracted feed fed was not completely converted into weight gain. It is likely that feeding twice daily increase feed conversion because, if the feeder is not careful, feed can be easily wasted by overfeeding. (Tomlovell, 1989). Helfrich and Smith (2001)reported that fish fed every other day or every third day consume up to 50-65 % more feed that those fed once daily. Houlihan, et al. (2001) also reported that feeding six days per week would impact negatively in single-crop systems because the smaller fish may lose more weight was shown in our study. And the condition factor, a nutritional status indicator that measures the relationship between fish body weight and length, is lower for fish fed once a week than fish fed more frequently (Albert, 1990). Fish farmers have not gotten proper guidance on the specific feeding rate and frequency for every category of fishes due to paucity of information. Most farmers therfore, resort to arbitrary style of feeding their fish. This mostly results to feed wastage and either over or under feeding of fishses. This research seeks to investigate and establish appropriate feeding regime for Clarias gariepinus juvenile.
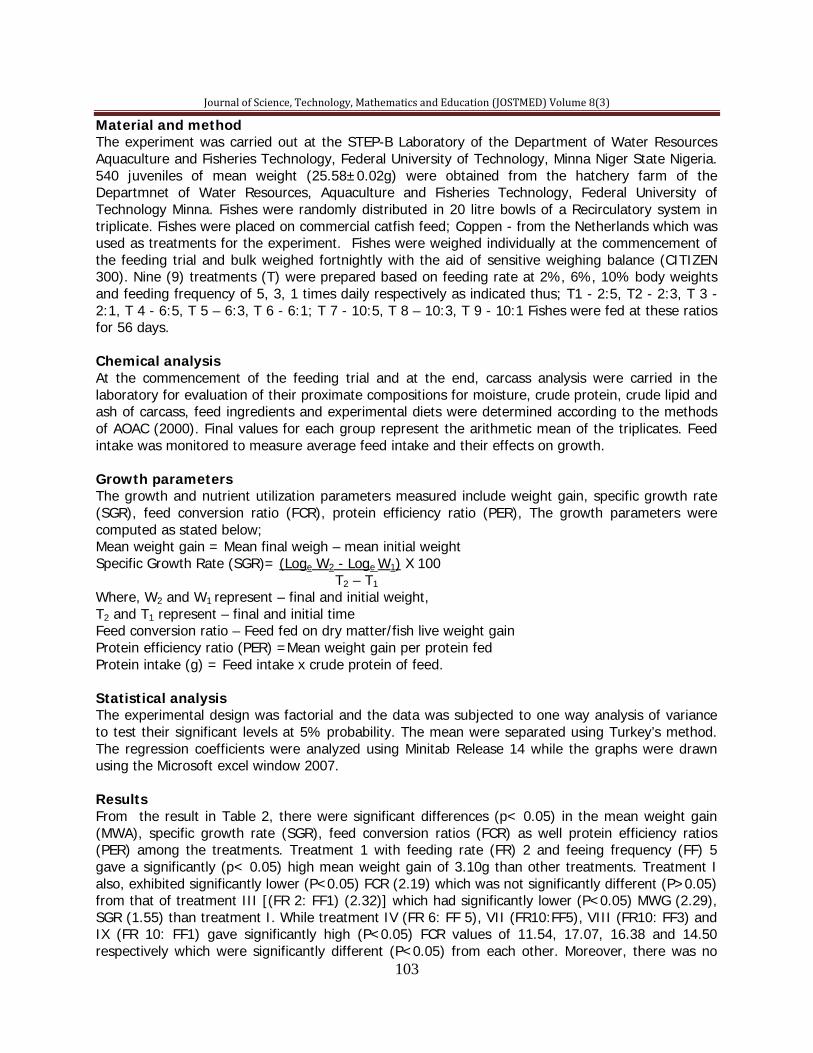
Journal of Science, Technology, Mathematics and Education (JOSTMED) Volume 8(3)
103
Material and method The experiment was carried out at the STEP-B Laboratory of the Department of Water Resources Aquaculture and Fisheries Technology, Federal University of Technology, Minna Niger State Nigeria. 540 juveniles of mean weight (25.58±0.02g) were obtained from the hatchery farm of the Departmnet of Water Resources, Aquaculture and Fisheries Technology, Federal University of Technology Minna. Fishes were randomly distributed in 20 litre bowls of a Recirculatory system in triplicate. Fishes were placed on commercial catfish feed; Coppen - from the Netherlands which was used as treatments for the experiment. Fishes were weighed individually at the commencement of the feeding trial and bulk weighed fortnightly with the aid of sensitive weighing balance (CITIZEN 300). Nine (9) treatments (T) were prepared based on feeding rate at 2%, 6%, 10% body weights and feeding frequency of 5, 3, 1 times daily respectively as indicated thus; T1 - 2:5, T2 - 2:3, T 3 - 2:1, T 4 - 6:5, T 5 – 6:3, T 6 - 6:1; T 7 - 10:5, T 8 – 10:3, T 9 - 10:1 Fishes were fed at these ratios for 56 days. Chemical analysis At the commencement of the feeding trial and at the end, carcass analysis were carried in the laboratory for evaluation of their proximate compositions for moisture, crude protein, crude lipid and ash of carcass, feed ingredients and experimental diets were determined according to the methods of AOAC (2000). Final values for each group represent the arithmetic mean of the triplicates. Feed intake was monitored to measure average feed intake and their effects on growth. Growth parameters The growth and nutrient utilization parameters measured include weight gain, specific growth rate (SGR), feed conversion ratio (FCR), protein efficiency ratio (PER), The growth parameters were computed as stated below; Mean weight gain = Mean final weigh – mean initial weight Specific Growth Rate (SGR)= (Loge W2 - Loge W1) X 100 T2 – T1
Where, W2 and W1 represent – final and initial weight, T2 and T1 represent – final and initial time Feed conversion ratio – Feed fed on dry matter/fish live weight gain Protein efficiency ratio (PER) =Mean weight gain per protein fed Protein intake (g) = Feed intake x crude protein of feed. Statistical analysis The experimental design was factorial and the data was subjected to one way analysis of variance to test their significant levels at 5% probability. The mean were separated using Turkey’s method. The regression coefficients were analyzed using Minitab Release 14 while the graphs were drawn using the Microsoft excel window 2007. Results From the result in Table 2, there were significant differences (p< 0.05) in the mean weight gain (MWA), specific growth rate (SGR), feed conversion ratios (FCR) as well protein efficiency ratios (PER) among the treatments. Treatment 1 with feeding rate (FR) 2 and feeing frequency (FF) 5 gave a significantly (p< 0.05) high mean weight gain of 3.10g than other treatments. Treatment I also, exhibited significantly lower (P<0.05) FCR (2.19) which was not significantly different (P>0.05) from that of treatment III [(FR 2: FF1) (2.32)] which had significantly lower (P<0.05) MWG (2.29), SGR (1.55) than treatment I. While treatment IV (FR 6: FF 5), VII (FR10:FF5), VIII (FR10: FF3) and IX (FR 10: FF1) gave significantly high (P<0.05) FCR values of 11.54, 17.07, 16.38 and 14.50 respectively which were significantly different (P<0.05) from each other. Moreover, there was no

Journal of Science, Technology, Mathematics and Education (JOSTMED) Volume 8(3)
104
significant difference (P>0.05) in the SGR values of treatments IV (1.22), VII (1.21) and VIII (1.20) respectively. exhibited lowest mean weight gain (1.21g) but with no significant difference in its SGR value (0.96) and that of treatment II (FR 2: FF 3) (0.94). However, treatments VII, VIII and IX despite high FCR values gave a significantly high (P<0.05) PER values with no significant difference (P>0.05) among them (1.00, 1.07 and 1.05 respectively) than treatment I (0.25) and III (0.36) whose FCR values were the lowest (2.19 and 2.32 respectively). Furthermore, treatment V whose FCR value (7.20) was also significantly moderately high (P<0.05) gave a significantly high (P<0.05) MWG (2.56) and SGR values (1.34) than treatments II (1.96/0.96), IV (1.74/1.22), VI (1.21/0.96), VII (1.73/1.21), VIII (1.66/1.20) and IX (1.89/1.27) respectively. Furthermore, figure 1 showed the growth response which depicted treatment I with best growth performance while treatment VI exhibited poorest growth curve. Other treatments fell in between the two treatments I and VI. Table 1: Coppens Feed Proximate Composition* % CP %Lipid %Ash %Moisture 46.00 14.80 7.20 6.50 * As indicated by the manufacturer.
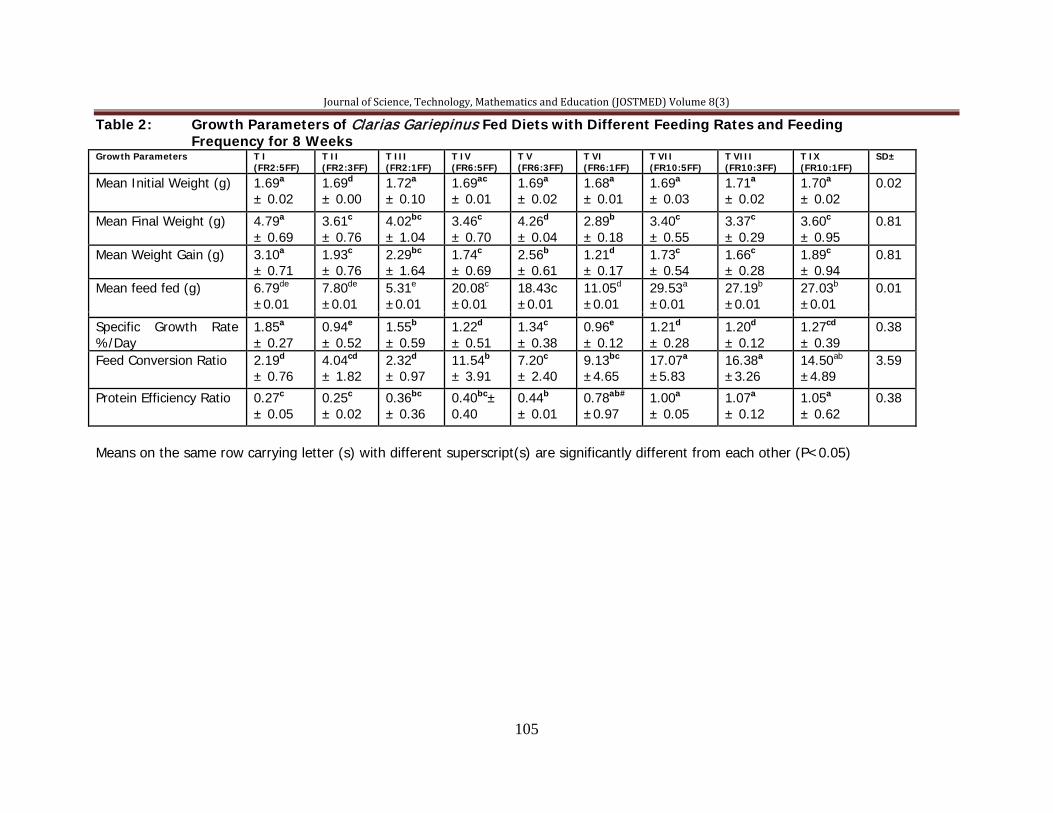
Journal of Science, Technology, Mathematics and Education (JOSTMED) Volume 8(3)
105
Table 2: Growth Parameters of Clarias Gariepinus Fed Diets with Different Feeding Rates and Feeding Frequency for 8 Weeks Growth Parameters T I
(FR2:5FF) T II (FR2:3FF)
T III (FR2:1FF)
T IV (FR6:5FF)
T V (FR6:3FF)
T VI (FR6:1FF)
T VII (FR10:5FF)
T VIII (FR10:3FF)
T IX (FR10:1FF)
SD±
Mean Initial Weight (g) 1.69a
± 0.02 1.69d
± 0.00 1.72a ± 0.10
1.69ac ± 0.01
1.69a ± 0.02
1.68a ± 0.01
1.69a ± 0.03
1.71a ± 0.02
1.70a ± 0.02
0.02
Mean Final Weight (g) 4.79a ± 0.69
3.61c ± 0.76
4.02bc
± 1.04 3.46c ± 0.70
4.26d ± 0.04
2.89b ± 0.18
3.40c ± 0.55
3.37c ± 0.29
3.60c ± 0.95
0.81
Mean Weight Gain (g) 3.10a ± 0.71
1.93c ± 0.76
2.29bc
± 1.64 1.74c ± 0.69
2.56b ± 0.61
1.21d ± 0.17
1.73c ± 0.54
1.66c ± 0.28
1.89c ± 0.94
0.81
Mean feed fed (g) 6.79de
±0.01 7.80de
±0.01 5.31e
±0.01 20.08c
±0.01 18.43c ±0.01
11.05d
±0.01 29.53a
±0.01 27.19b
±0.01 27.03b
±0.01 0.01
Specific Growth Rate %/Day
1.85a ± 0.27
0.94e ± 0.52
1.55b ± 0.59
1.22d ± 0.51
1.34c ± 0.38
0.96e ± 0.12
1.21d ± 0.28
1.20d ± 0.12
1.27cd
± 0.39 0.38
Feed Conversion Ratio 2.19d ± 0.76
4.04cd
± 1.82 2.32d ± 0.97
11.54b ± 3.91
7.20c ± 2.40
9.13bc
±4.65 17.07a
±5.83 16.38a
±3.26 14.50ab
±4.89 3.59
Protein Efficiency Ratio 0.27c ± 0.05
0.25c ± 0.02
0.36bc
± 0.36 0.40bc± 0.40
0.44b ± 0.01
0.78ab#
±0.97 1.00a ± 0.05
1.07a
± 0.12 1.05a ± 0.62
0.38
Means on the same row carrying letter (s) with different superscript(s) are significantly different from each other (P<0.05)
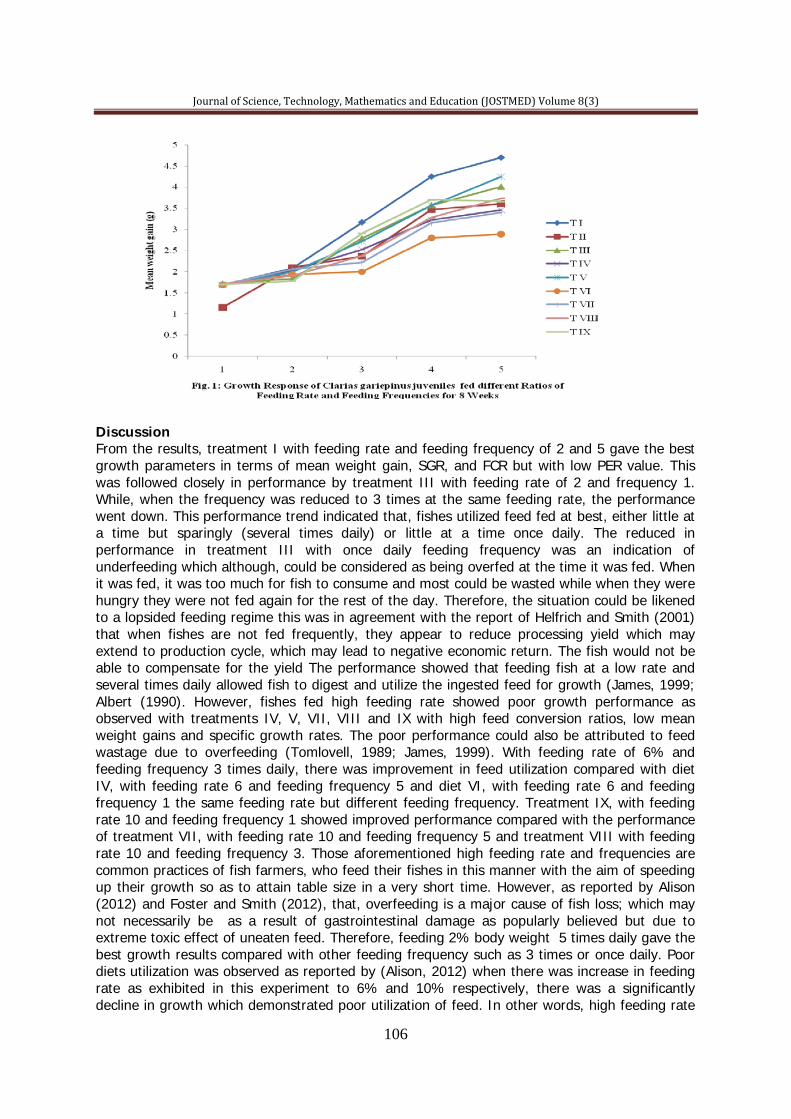
Journal of Science, Technology, Mathematics and Education (JOSTMED) Volume 8(3)
106
Discussion From the results, treatment I with feeding rate and feeding frequency of 2 and 5 gave the best growth parameters in terms of mean weight gain, SGR, and FCR but with low PER value. This was followed closely in performance by treatment III with feeding rate of 2 and frequency 1. While, when the frequency was reduced to 3 times at the same feeding rate, the performance went down. This performance trend indicated that, fishes utilized feed fed at best, either little at a time but sparingly (several times daily) or little at a time once daily. The reduced in performance in treatment III with once daily feeding frequency was an indication of underfeeding which although, could be considered as being overfed at the time it was fed. When it was fed, it was too much for fish to consume and most could be wasted while when they were hungry they were not fed again for the rest of the day. Therefore, the situation could be likened to a lopsided feeding regime this was in agreement with the report of Helfrich and Smith (2001) that when fishes are not fed frequently, they appear to reduce processing yield which may extend to production cycle, which may lead to negative economic return. The fish would not be able to compensate for the yield The performance showed that feeding fish at a low rate and several times daily allowed fish to digest and utilize the ingested feed for growth (James, 1999; Albert (1990). However, fishes fed high feeding rate showed poor growth performance as observed with treatments IV, V, VII, VIII and IX with high feed conversion ratios, low mean weight gains and specific growth rates. The poor performance could also be attributed to feed wastage due to overfeeding (Tomlovell, 1989; James, 1999). With feeding rate of 6% and feeding frequency 3 times daily, there was improvement in feed utilization compared with diet IV, with feeding rate 6 and feeding frequency 5 and diet VI, with feeding rate 6 and feeding frequency 1 the same feeding rate but different feeding frequency. Treatment IX, with feeding rate 10 and feeding frequency 1 showed improved performance compared with the performance of treatment VII, with feeding rate 10 and feeding frequency 5 and treatment VIII with feeding rate 10 and feeding frequency 3. Those aforementioned high feeding rate and frequencies are common practices of fish farmers, who feed their fishes in this manner with the aim of speeding up their growth so as to attain table size in a very short time. However, as reported by Alison (2012) and Foster and Smith (2012), that, overfeeding is a major cause of fish loss; which may not necessarily be as a result of gastrointestinal damage as popularly believed but due to extreme toxic effect of uneaten feed. Therefore, feeding 2% body weight 5 times daily gave the best growth results compared with other feeding frequency such as 3 times or once daily. Poor diets utilization was observed as reported by (Alison, 2012) when there was increase in feeding rate as exhibited in this experiment to 6% and 10% respectively, there was a significantly decline in growth which demonstrated poor utilization of feed. In other words, high feeding rate
Journal of Science, Technology, Mathematics and Education (JOSTMED) Volume 8(3)
107
at limited frequency would lead to feed wastage. Catfish a benthic feeder would also utilize feed fed little at a time and sparingly since it will take it sometime to graze for the feed (James, 1999). However, in a large farm, most farmers resulted to feeding their fishes at most 3 times daily due to labor cost (Robinson et al., 1998) but it from this finding, 3 times daily would not yield the expected output in terms of growth. Conclusion Efficient diet utilization by Clarias gariepinus juveniles was found to be appropriate at 2% body weight fed 5 times daily. This level of feeding minimized feed wastage as optimal utilization was achieved. It is therefore recommended that Clarias gariepinus juveniles should be raised at this level of feeding rate and feeding frequency to ensure effective usage of high cost of feed and feeding. Acknowledgements The authors express appreciation to the World Bank STEP-B Innovator of Tomorrow’s grant for enabling successful execution of the research work. Reference Alison, N. (2012). www.pets.ca A.O.A.C. (2000). (Association of Official Analytical Chemists). Official method of analysis 17thedition .AOAC, Inc; Gaithersburg, M.D, USA. Albert, G. J. T. (1990) Standard methods for the nutrition and feeding of farmed fish and shrimp. Volume 1: the Essential Nutrient. Volume2: Nutrient Sources Foster and Smith (2012). www.peteducation.com Robinson, E., Li, M. & Brunson, M. (1998). Feeding catfish in commercial ponds. Southern Regional Aquaculture center, fact sheet 181. Helfrich, L. & Smith, S. (2001). Fish kills, their causes and prevention. Virgina Cooperative Extension Service Publication 420-252 Hinshaw, B. (1999). Craige, S. (2002). Understanding fish nutrition, feeds, and fedding. Publication no. 420-256. Houihan, D., Bouiard, T & Jobling, M. (2001). Food intake in fish. lOWA State: Black well science Ltd. Pp418. James, M. K. (1999). Aquarium fish magazine. www.bestfish.com downloaded Sept. 2012
Jauncey, K. & Ross, B. (1982). A guide to tilapia feeds and feeding. UK: Published by Institute of
Aquaculture, University of Stirling, Stirling. , p111. Tom, L. V. (1989). Nutrition and feeding of fish. New York: Nostr and Reinhold, P.260

Journal of Science, Technology, Mathematics and Education (JOSTMED) Volume 8(3)
108
JOSTMED, VOLUME 8(2), APRIL 2012
JOURNAL
OF
S CIE
NCE,
TECHNOLOGY, MATHEMATICSA
ND
EDUC
ATION
(JOSTMED)
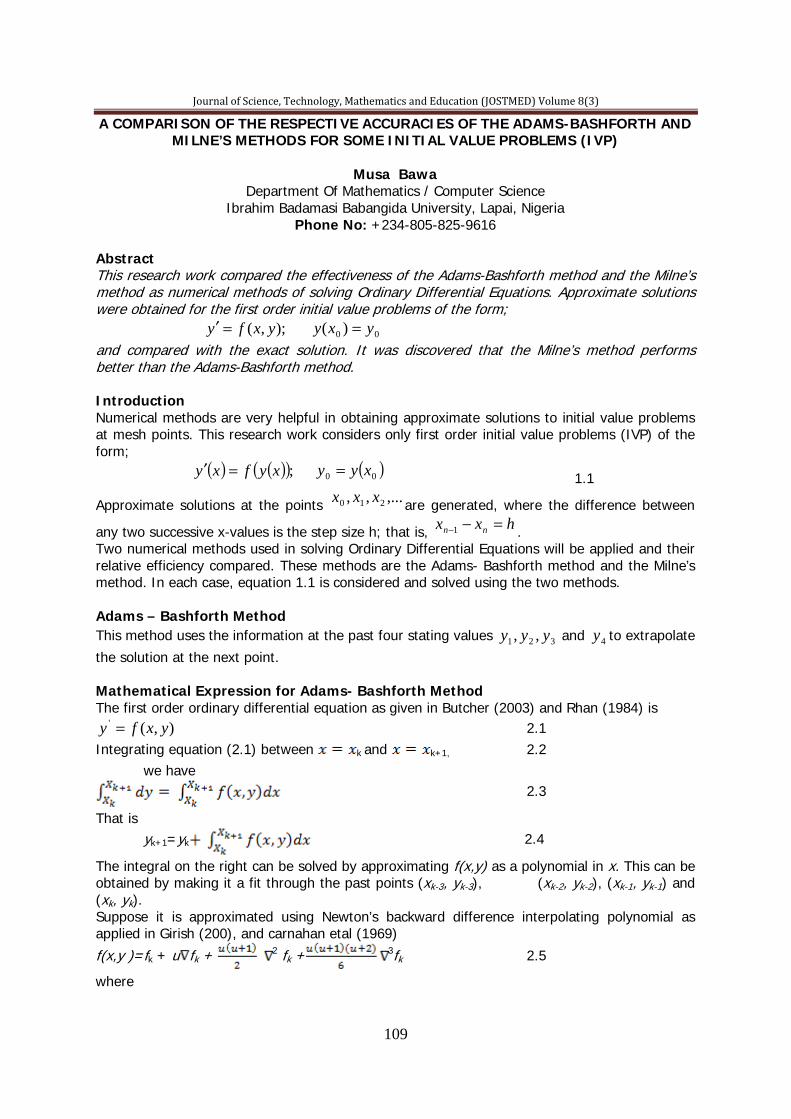
Journal of Science, Technology, Mathematics and Education (JOSTMED) Volume 8(3)
109
A COMPARISON OF THE RESPECTIVE ACCURACIES OF THE ADAMS-BASHFORTH AND MILNE’S METHODS FOR SOME INITIAL VALUE PROBLEMS (IVP)
Musa Bawa
Department Of Mathematics / Computer Science Ibrahim Badamasi Babangida University, Lapai, Nigeria
Phone No: +234-805-825-9616 Abstract This research work compared the effectiveness of the Adams-Bashforth method and the Milne’s method as numerical methods of solving Ordinary Differential Equations. Approximate solutions were obtained for the first order initial value problems of the form; );,( yxfy =′ 00 )( yxy = and compared with the exact solution. It was discovered that the Milne’s method performs better than the Adams-Bashforth method. Introduction Numerical methods are very helpful in obtaining approximate solutions to initial value problems at mesh points. This research work considers only first order initial value problems (IVP) of the form; ( ) ( )( );xyfxy =′ ( )00 xyy = 1.1
Approximate solutions at the points ,...,, 210 xxx are generated, where the difference between
any two successive x-values is the step size h; that is, hxx nn =−−1 . Two numerical methods used in solving Ordinary Differential Equations will be applied and their relative efficiency compared. These methods are the Adams- Bashforth method and the Milne’s method. In each case, equation 1.1 is considered and solved using the two methods. Adams – Bashforth Method This method uses the information at the past four stating values 321 ,, yyy and 4y to extrapolate the solution at the next point. Mathematical Expression for Adams- Bashforth Method The first order ordinary differential equation as given in Butcher (2003) and Rhan (1984) is
),(' yxfy = 2.1 Integrating equation (2.1) between k and k+1, 2.2
we have 2.3
That is yk+1=yk 2.4
The integral on the right can be solved by approximating f(x,y) as a polynomial in x. This can be obtained by making it a fit through the past points (xk-3, yk-3), (xk-2, yk-2), (xk-1, yk-1) and (xk, yk). Suppose it is approximated using Newton’s backward difference interpolating polynomial as applied in Girish (200), and carnahan etal (1969)
f(x,y )=fk + u fk + 2 fk + 3fk 2.5
where

Journal of Science, Technology, Mathematics and Education (JOSTMED) Volume 8(3)
110
hxx
u k−= 2.6
and fk, 2fk,
3fk are backward differences at point x =xk Hence
Yk+1=( ) ( )( )
∫ +
∇+++∇++∇++ 1 32
621
21k
k
x
x kkkkk dxfuuufuufufy 2.7
From equation (2.6) dx=hdu 2.8 and at x=xk, u = 0 2.9 at x=xk+1, u = 1 2.10 Substituting equations (2.8) and (2.10) in equation (2.7) gives Yk+1 = yk + h fk + u fk + 2 fk + 3fk ] du
Yk+1 = yk + h [fk + fk + 2 fk + 3fk] 2.11
Expressing the backward differences in terms of function values and substituting in equation (2.11) gives Yp
k+1 = yk + [- 9fk-3 + 37fk-2 – 59fk-1 + 55fk] 2.12
Equation (2.12) is called Adams Bashforth-formula of order four and is used as a predictor formula. The superscript P indicates the predicted value of yk+1. The corrector formula is developed similarly. Construct a Newton’s backward difference interpolating polynomial passing through the points (xk-2, yk-2), (xk-1, yk-1), (xx,yk) and (xk+1, yp k+1) as
= fk+1 + fk+1 + 2 fk+1 + 3fk+1 2.13
where hxx
u k 1+−= 2.14
and fk+1, 2fk+1,
3fk+1 are backward differences at point x=xk+1 substituting equation (2.13) in equation (2.4) and integrating between x=xk and x=xk+1 gives
Yk+1 = yk + fk+1 + u fk+1+ 2fk+1 +3fk+1] dx. 2.15
From equation 2.14
2.16
xk, u= -1 2.17
xk+1, u = 0 2.18 Substituting equation (2.16) to (2.18) in equation (2.15) gives Yk+1 = yk +h fk+1 + u fk+1+ 2fk+1 + 3fk+1] du
Yk+1 = yk + h [ fk+1 - fk+1 - 2fk+1 - 3fk+1] 2.19

Journal of Science, Technology, Mathematics and Education (JOSTMED) Volume 8(3)
111
Expressing the backward differences in terms of function values, and substituting in equation (2.19) gives YC
k+1 = yk + [fk-2 – 5fk-1 + 19fk + 9f p k+1] 2.20
Equation (2.20) is called Adam-moulton formula and is used as a corrector formula. The superscript C indicates the corrected value of yk+1
The equations (2.12) and (2.20) constitute the Adam-bashforth-moulton predictor- corrector method. Milne’s Method The Milne’s method, like Adam – Bashforth method uses the information at past four solution points to extrapolate the solution at the next point. Therefore, in order to apply Milne’s method, three more solution points, in addition to the starting solution point are computed. Mathematical Expression for Milne’s Method. From equation (2.1)
( )yxfy ,' = Integrating between x =xk-3 and x= xk+1, we have
( )∫ +
−
+= ++ik
k
x
xkk dxyxfyy3
,31 3.1
To solve the integral on the right approximate f(x,y) as a polynomial in x. This is obtained by making it a fit through the past points (xk-3, yk-3), (xk-2 , yk-2), (xk-1 , yk-1) and (xk , yk). suppose it is approximated using Newton’s forward difference interpolating polynomial as in John and Kurtis (2004)
f(x,y)= fk-3+ u fk-3 + 2fk-3 + 3fk-3 3.2
where
hxx
u k 3−−= 3.3
and fk-3 , 2fk-3 , 3fk-3 are forward differences at point x = xk-3. Therefore, equation (3.1) becomes
Yk+1 = yk+3 + fk-3 +u fk-3 + 2fk-3+ 3fk-3] dx 3.4
From equation (3.3) dx = hdu 3.5
xk-3, u =0 3.6
xk+1 , u =4 3.7 Substituting equation (3.5) to (3.7) in equation (3.4) gives Yk+1 = yk+3 + h fk-3 + u fk-3 + 2fk-3 + 3fk-3] du
Yk+1 = yk-3 + h [ 4fk-3 + 8 fk-3 + 2 fk-3 ++ 3fk-3] 3.8
Expressing the forward differences in terms of function values, and substituting in equation (3.8) gives Yp
k+1 = yk-3 + [2fk-2 – fk-1 + 2 fk] 3.9

Journal of Science, Technology, Mathematics and Education (JOSTMED) Volume 8(3)
112
Equation (3.9) is called Milne’s formula of order four and is used as a predictor formula. The superscript P indicates the predicted value of yk+1. To derive the corrector formula, construct a Newton’s difference interpolating polynomial passing through the points (xk-1 , yk-1), (xk , yk) and (xk+1 , yp k+1) as: f(x,y) = fk+1 +u fk-1 + 2fk-1 3.10
To evaluate the integral in order to obtain the value of yk+1 as yk+1 = yk-1 +
3.11
By Simpson’s rd rule for numerical integration
[fk-1 + 4fk + fPk+1] 3.12
Substituting equation (3.12) in equation (3.11) we have: Yc
k+1 = yk+1 + [fk-1 + 4fk + fPk+1] 3.13
Equation (3.13) is called Simpson’s formula and is used as a corrector formula. The Superscript C indicates the corrected value of yk+1. Hence equation (3.9) and (3.13) constitute the Milne – Simpson’s predictor corrector method popularly known as Milne’s method. Starting Values The Adams – Bashforth method and Milne’s method both require information at 21 , yy and 3y to start. The first of these values is given by the initial condition. In the first – order initial value problems of the form.
( );,' yxfy = ( ) 00 yxy = The other three starting values are obtained by the Runge- Kutta method Analysis and Results In order to appreciate the differences between the two methods, we now turn the theoretical properties of the methods into computational reality. Hence, this section presents examples to illustrate the use of the two methods. Example 1.1 Using both methods to solve ;' xyy −= ( ) 20 =y on the interval [0,1] with h=0.1 Solution: Here f(x,y)= y-x, x0 = 0 and y0 =2, the three additional starting values are obtained using Runge-Kutta method as y1 = 2.2051708, y2 = 2.4214026 and y3 =2.6498585 Hence
= y1 – x1 = 2.1051708 = y2 – x2 = 2.2214026
= y3 – x3 = 2.3498585 Then using equation (2.12) and (2.20), we compute and generate the table below for Adams – Bashforth method and equations (3.9) and (3.13) for Milne’s method.
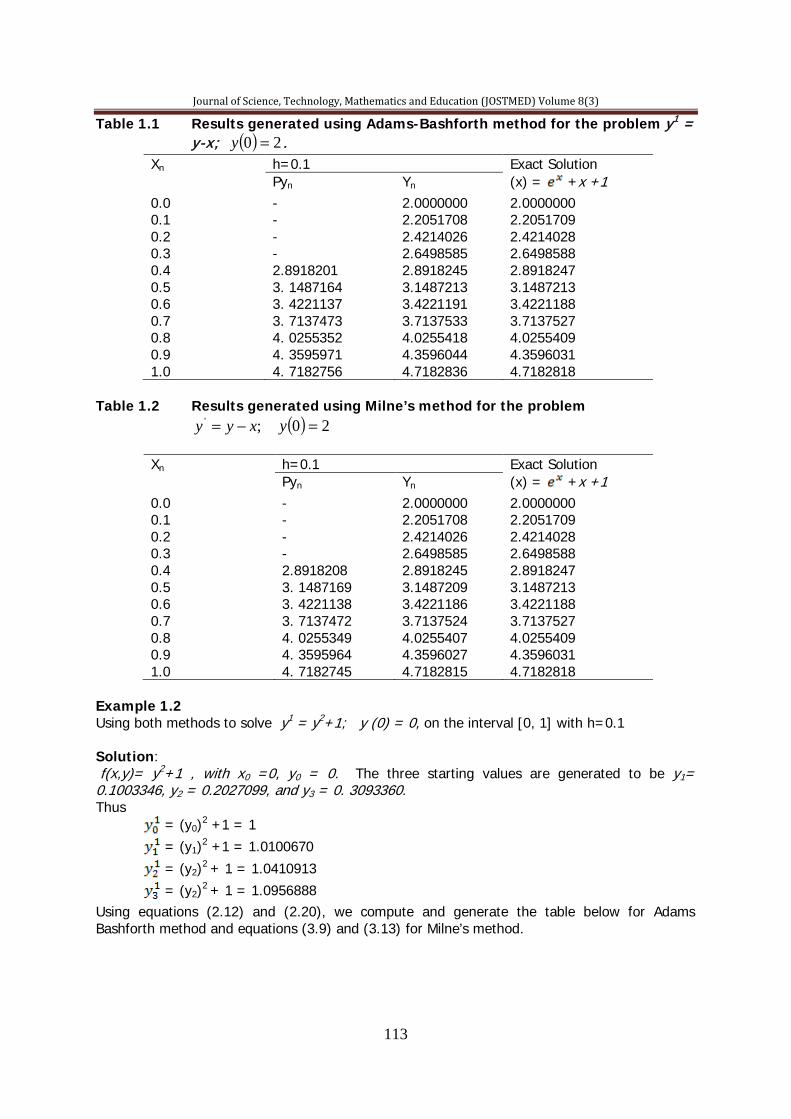
Journal of Science, Technology, Mathematics and Education (JOSTMED) Volume 8(3)
113
Table 1.1 Results generated using Adams-Bashforth method for the problem y1 = y-x; ( ) 20 =y .
Xn h=0.1 Exact Solution (x) = +x +1 Pyn Yn
0.0 - 2.0000000 2.0000000 0.1 - 2.2051708 2.2051709 0.2 - 2.4214026 2.4214028 0.3 - 2.6498585 2.6498588 0.4 2.8918201 2.8918245 2.8918247 0.5 3. 1487164 3.1487213 3.1487213 0.6 3. 4221137 3.4221191 3.4221188 0.7 3. 7137473 3.7137533 3.7137527 0.8 4. 0255352 4.0255418 4.0255409 0.9 4. 3595971 4.3596044 4.3596031 1.0 4. 7182756 4.7182836 4.7182818
Table 1.2 Results generated using Milne’s method for the problem ;' xyy −= ( ) 20 =y
Xn h=0.1 Exact Solution (x) = +x +1 Pyn Yn
0.0 - 2.0000000 2.0000000 0.1 - 2.2051708 2.2051709 0.2 - 2.4214026 2.4214028 0.3 - 2.6498585 2.6498588 0.4 2.8918208 2.8918245 2.8918247 0.5 3. 1487169 3.1487209 3.1487213 0.6 3. 4221138 3.4221186 3.4221188 0.7 3. 7137472 3.7137524 3.7137527 0.8 4. 0255349 4.0255407 4.0255409 0.9 4. 3595964 4.3596027 4.3596031 1.0 4. 7182745 4.7182815 4.7182818
Example 1.2 Using both methods to solve y1 = y2+1; y (0) = 0, on the interval [0, 1] with h=0.1 Solution: f(x,y)= y2+1 , with x0 =0, y0 = 0. The three starting values are generated to be y1= 0.1003346, y2 = 0.2027099, and y3 = 0. 3093360. Thus = (y0)
2 +1 = 1 = (y1)2 +1 = 1.0100670
= (y2)2 + 1 = 1.0410913
= (y2)2 + 1 = 1.0956888 Using equations (2.12) and (2.20), we compute and generate the table below for Adams Bashforth method and equations (3.9) and (3.13) for Milne’s method.
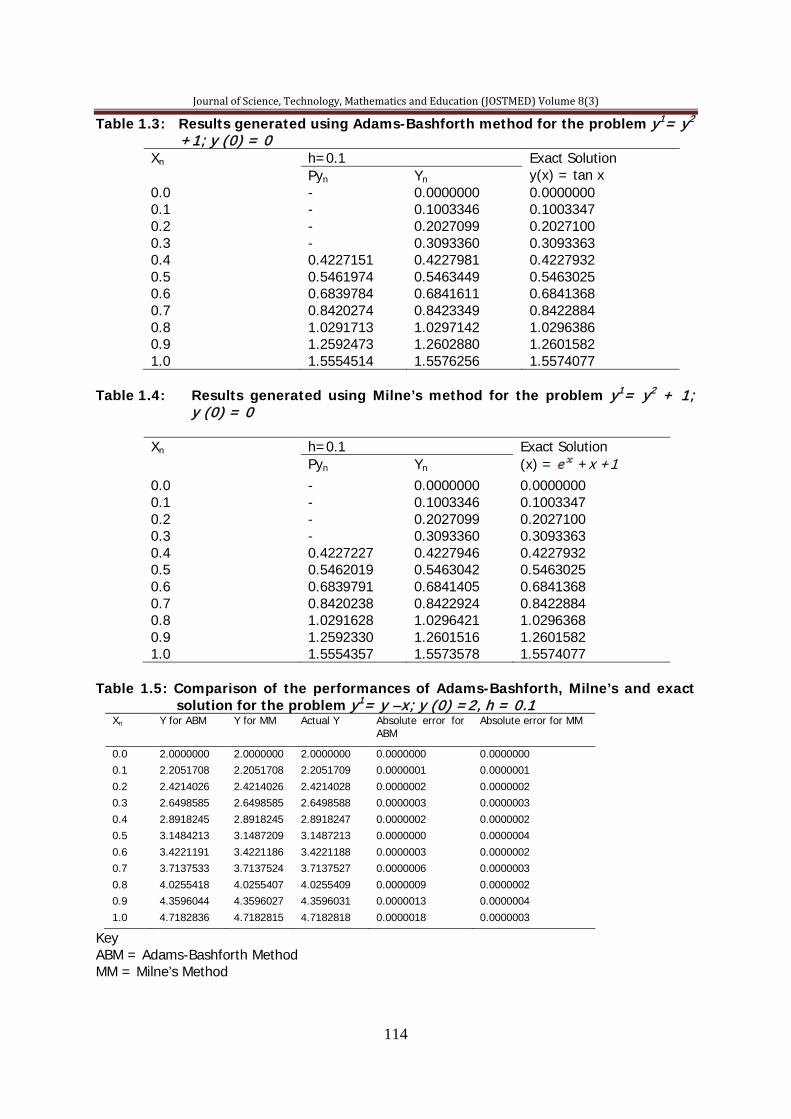
Journal of Science, Technology, Mathematics and Education (JOSTMED) Volume 8(3)
114
Table 1.3: Results generated using Adams-Bashforth method for the problem y1= y2 +1; y (0) = 0
Xn h=0.1 Exact Solution y(x) = tan x Pyn Yn
0.0 - 0.0000000 0.0000000 0.1 - 0.1003346 0.1003347 0.2 - 0.2027099 0.2027100 0.3 - 0.3093360 0.3093363 0.4 0.4227151 0.4227981 0.4227932 0.5 0.5461974 0.5463449 0.5463025 0.6 0.6839784 0.6841611 0.6841368 0.7 0.8420274 0.8423349 0.8422884 0.8 1.0291713 1.0297142 1.0296386 0.9 1.2592473 1.2602880 1.2601582 1.0 1.5554514 1.5576256 1.5574077
Table 1.4: Results generated using Milne’s method for the problem y1= y2 + 1; y (0) = 0
Xn h=0.1 Exact Solution (x) = +x +1 Pyn Yn
0.0 - 0.0000000 0.0000000 0.1 - 0.1003346 0.1003347 0.2 - 0.2027099 0.2027100 0.3 - 0.3093360 0.3093363 0.4 0.4227227 0.4227946 0.4227932 0.5 0.5462019 0.5463042 0.5463025 0.6 0.6839791 0.6841405 0.6841368 0.7 0.8420238 0.8422924 0.8422884 0.8 1.0291628 1.0296421 1.0296368 0.9 1.2592330 1.2601516 1.2601582 1.0 1.5554357 1.5573578 1.5574077
Table 1.5: Comparison of the performances of Adams-Bashforth, Milne’s and exact solution for the problem y1= y –x; y (0) =2, h = 0.1
Xn Y for ABM Y for MM Actual Y Absolute error for ABM
Absolute error for MM
0.0 2.0000000 2.0000000 2.0000000 0.0000000 0.0000000 0.1 2.2051708 2.2051708 2.2051709 0.0000001 0.0000001 0.2 2.4214026 2.4214026 2.4214028 0.0000002 0.0000002 0.3 2.6498585 2.6498585 2.6498588 0.0000003 0.0000003 0.4 2.8918245 2.8918245 2.8918247 0.0000002 0.0000002 0.5 3.1484213 3.1487209 3.1487213 0.0000000 0.0000004 0.6 3.4221191 3.4221186 3.4221188 0.0000003 0.0000002 0.7 3.7137533 3.7137524 3.7137527 0.0000006 0.0000003 0.8 4.0255418 4.0255407 4.0255409 0.0000009 0.0000002 0.9 4.3596044 4.3596027 4.3596031 0.0000013 0.0000004 1.0 4.7182836 4.7182815 4.7182818 0.0000018 0.0000003
Key ABM = Adams-Bashforth Method MM = Milne’s Method
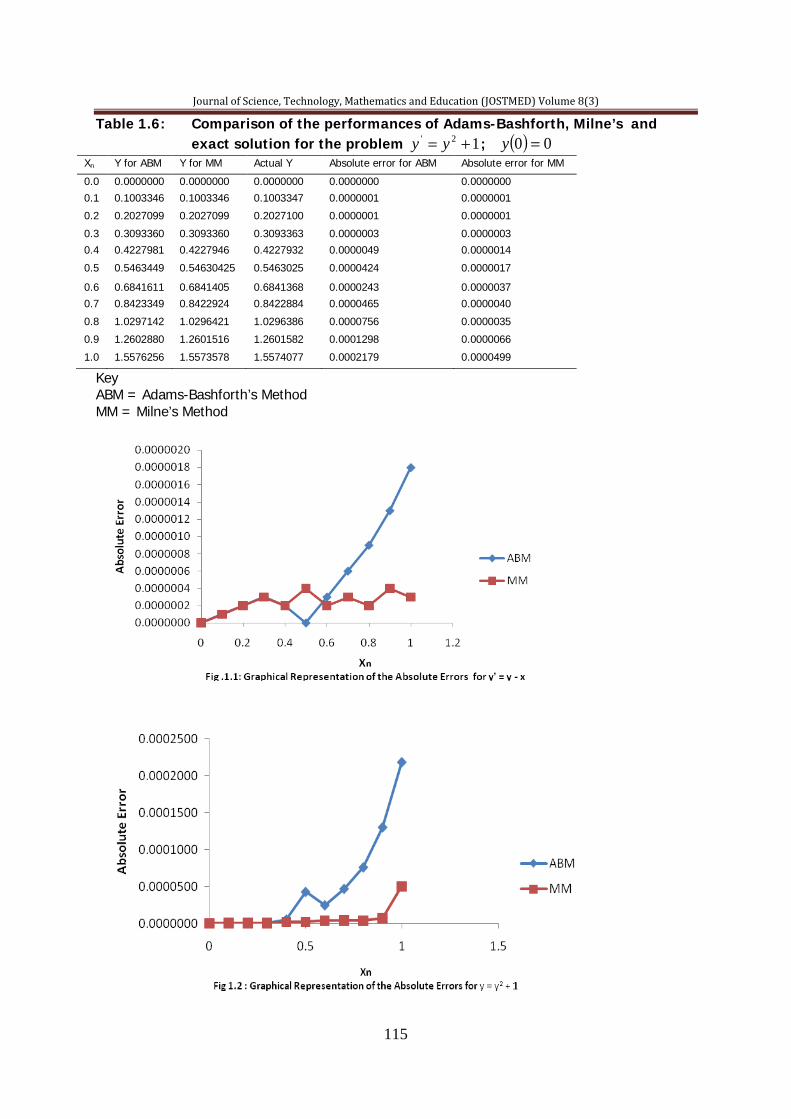
Journal of Science, Technology, Mathematics and Education (JOSTMED) Volume 8(3)
115
Table 1.6: Comparison of the performances of Adams-Bashforth, Milne’s and exact solution for the problem 12' += yy ; ( ) 00 =y
Xn Y for ABM Y for MM Actual Y Absolute error for ABM Absolute error for MM
0.0 0.0000000 0.0000000 0.0000000 0.0000000 0.0000000 0.1 0.1003346 0.1003346 0.1003347 0.0000001 0.0000001
0.2 0.2027099 0.2027099 0.2027100 0.0000001 0.0000001
0.3 0.3093360 0.3093360 0.3093363 0.0000003 0.0000003 0.4 0.4227981 0.4227946 0.4227932 0.0000049 0.0000014
0.5 0.5463449 0.54630425 0.5463025 0.0000424 0.0000017
0.6 0.6841611 0.6841405 0.6841368 0.0000243 0.0000037 0.7 0.8423349 0.8422924 0.8422884 0.0000465 0.0000040
0.8 1.0297142 1.0296421 1.0296386 0.0000756 0.0000035
0.9 1.2602880 1.2601516 1.2601582 0.0001298 0.0000066
1.0 1.5576256 1.5573578 1.5574077 0.0002179 0.0000499
Key ABM = Adams-Bashforth’s Method MM = Milne’s Method
Journal of Science, Technology, Mathematics and Education (JOSTMED) Volume 8(3)
116
Looking at the tables and graphical representations of the absolute errors of the two methods, it is clear that as the xn values approaches one, the absolute error margin gets bigger. For table 1.5 and graph 1.1, the percentage error for ABM at xn = 1.0 is 0.000038% while that of MM is 0.000006%. similarly, from table 1.6 and graph 1.2, the percentage error for ABM at xn =1.0 is 0.0139912% while that of MM is 0.0032048%. Conclusion From the tables of results, graphs and percentage error of each of the methods employed, the reliability of the Milne’s method over Adams Bashforth’s method is self evident. The Milne’s method will be credited for its higher accuracy. References Butcher, J. C. (2003). Numerical methods for ordinary differential equations. John Wiley. Carnahan, B., Luther, H. A. & Wilkies, J. O. (1969). Applied numerical methods. New York: John Wiley and Sons. Girish, N. (2009). Numerical methods (A programming approach). New Delhi: S. K. Kataria and Sons. John, H. M. & Kurtis, K. F. ( 2004). Numerical methods using matlab. New Jersey: USA.Prentice-Hall Inc. Rhan, D. M. (1984). Penalty and barrier functions” numerical methods for constrained optimization. London: Academic Press Inc.
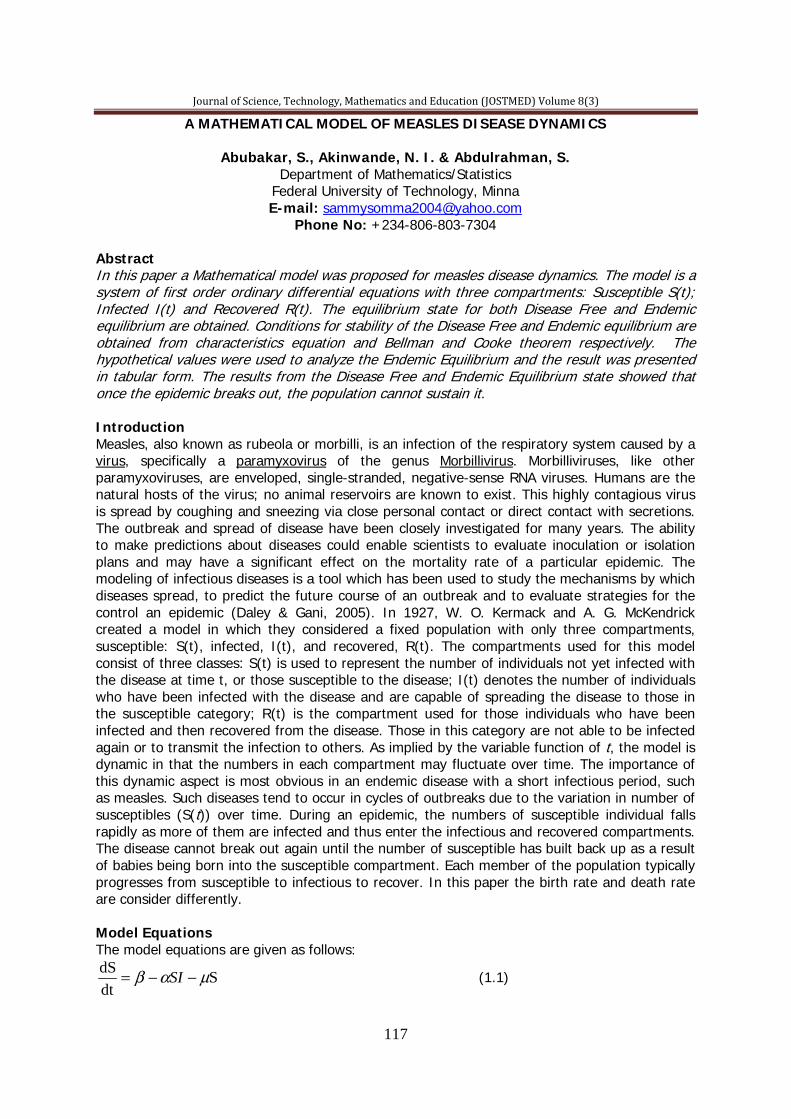
Journal of Science, Technology, Mathematics and Education (JOSTMED) Volume 8(3)
117
A MATHEMATICAL MODEL OF MEASLES DISEASE DYNAMICS
Abubakar, S., Akinwande, N. I. & Abdulrahman, S. Department of Mathematics/Statistics
Federal University of Technology, Minna E-mail: [email protected]
Phone No: +234-806-803-7304 Abstract In this paper a Mathematical model was proposed for measles disease dynamics. The model is a system of first order ordinary differential equations with three compartments: Susceptible S(t); Infected I(t) and Recovered R(t). The equilibrium state for both Disease Free and Endemic equilibrium are obtained. Conditions for stability of the Disease Free and Endemic equilibrium are obtained from characteristics equation and Bellman and Cooke theorem respectively. The hypothetical values were used to analyze the Endemic Equilibrium and the result was presented in tabular form. The results from the Disease Free and Endemic Equilibrium state showed that once the epidemic breaks out, the population cannot sustain it. Introduction Measles, also known as rubeola or morbilli, is an infection of the respiratory system caused by a virus, specifically a paramyxovirus of the genus Morbillivirus. Morbilliviruses, like other paramyxoviruses, are enveloped, single-stranded, negative-sense RNA viruses. Humans are the natural hosts of the virus; no animal reservoirs are known to exist. This highly contagious virus is spread by coughing and sneezing via close personal contact or direct contact with secretions. The outbreak and spread of disease have been closely investigated for many years. The ability to make predictions about diseases could enable scientists to evaluate inoculation or isolation plans and may have a significant effect on the mortality rate of a particular epidemic. The modeling of infectious diseases is a tool which has been used to study the mechanisms by which diseases spread, to predict the future course of an outbreak and to evaluate strategies for the control an epidemic (Daley & Gani, 2005). In 1927, W. O. Kermack and A. G. McKendrick created a model in which they considered a fixed population with only three compartments, susceptible: S(t), infected, I(t), and recovered, R(t). The compartments used for this model consist of three classes: S(t) is used to represent the number of individuals not yet infected with the disease at time t, or those susceptible to the disease; I(t) denotes the number of individuals who have been infected with the disease and are capable of spreading the disease to those in the susceptible category; R(t) is the compartment used for those individuals who have been infected and then recovered from the disease. Those in this category are not able to be infected again or to transmit the infection to others. As implied by the variable function of t, the model is dynamic in that the numbers in each compartment may fluctuate over time. The importance of this dynamic aspect is most obvious in an endemic disease with a short infectious period, such as measles. Such diseases tend to occur in cycles of outbreaks due to the variation in number of susceptibles (S(t)) over time. During an epidemic, the numbers of susceptible individual falls rapidly as more of them are infected and thus enter the infectious and recovered compartments. The disease cannot break out again until the number of susceptible has built back up as a result of babies being born into the susceptible compartment. Each member of the population typically progresses from susceptible to infectious to recover. In this paper the birth rate and death rate are consider differently. Model Equations The model equations are given as follows:
S dtdS µαβ −−= SI (1.1)

Journal of Science, Technology, Mathematics and Education (JOSTMED) Volume 8(3)
118
( )ISIdtdI µδγα ++−= (1.2)
RIdtdR µγ −= (1.3)
The parameters are defined as follows: β= Birth rate α= contact rate μ = Natural death rate S = Susceptible γ = Recovery rate I = Infected δ = Death rate due to disease R = Removed with immunity/ Recovery Equilibrium State of the Model
At equilibrium 0===dtdR
dtdI
dtdS
Let yIxS == , and zR = 0=−− xxy µαβ (2.1)
( ) 0=++− yxy µδγα (2.2) 0=− zy µγ (2.3)
From (2.3)
γµzy = (2.4)
From (2.2) ( )[ ] 0=++− yx µδγα (2.5)
Either 0=y or ( ) 0=++− µδγαx But 0≠y
( ) 0=++− µδγαx
αµδγ ++=x (2.6)
Substituting (2.4) and (2.6) into (2.1) we obtained,
0=
++−
++−
αµδγµ
γµ
αµδγαβ z
0=
++−
++−α
µδγµγ
µδγµβ z
++−=
++α
µδγµβγ
µδγµz
( ) ( )µδγµγαβγµδγαµ ++−=++z
( )( )µδγαµ
µδγµγαβγ++
++−=z (2.7)
Substituting (2.7) into (2.4) ( )
( )
++
++−=µδγαµ
µδγµγαβγγµy

Journal of Science, Technology, Mathematics and Education (JOSTMED) Volume 8(3)
119
( )( )
++
++−=µδγα
µδγµαβγµµγy
( )( )µδγα
µδγµαβ++
++−=y (2.8)
αµδγ ++=x ,
( )( )µδγα
µδγµαβ++
++−=y and ( )
( )µδγαµµδγµγαβγ
++++−=z (2.9)
The Disease Free Equilibrium (DFE) The equilibrium state in the absence of infection is known as Disease Free Equilibrium or zero equilibrium and is such that, y = 0, Hence we substitute y = 0 into equations (2.1), (2.2) and (2.3) we obtain
xµβ =
µβ=x (2.10)
y = 0 and z = 0 Therefore the Disease Free equilibrium is:
( )
= 0,0,,,µβzyx (2.11)
The Endemic Equilibrium (EE) State The equilibrium state with the presence of infection (i. e. y ≠ 0) is known as endemic equilibrium or non- zero equilibrium. Therefore, equation (2.9) gives the endemic equilibrium state. That is,
( )
( )( )
( )
++
++−++
++−++µδγαµ
µδγµγαβγµδγα
µδγµαβα
µδγ ,,
(2.12)
Stability of the Equilibrium State Stability Analysis of the Disease Free Equilibrium (DFE)
0=−− xxy µαβ
( ) 0=++− yxy µδγα 0=− zy µγ
The Jacobian determinant of this system of equations is given by: ( )
+−=
0y
yJ α
µα ( )
γµδγα
α++−x
x
− µ00
The characteristic equation ( )
++−=−
0detdet y
yIJ α
λµαλ ( )
γλµδγα
α−++−x
x
)(00
0=
+− λµ
( ) ( )[ ]( )[ ] ( )[ ] 0=+−−+−++−−++− λµααλµλµδγαλµα yxxy
( ) ( )[ ]( )[ ] ( ) 02 =+++−++−++ λµαλµλµδγαλµα xyxy (3.1) But recall from equation (2.11) the DFE is given as:

Journal of Science, Technology, Mathematics and Education (JOSTMED) Volume 8(3)
120
( )
= 0,0,,,µβzyx
Then,
( )2λµ + ( ) 0=
−++− λµδγµβα (3.2)
Either ( ) 02 =+ λµ or ( ) 0=−++− λµδγµβα
Therefore, ,1 µλ −= ,2 µλ −= and ( )µδγµβαλ ++−=3 (3.3)
From (3.3) 01 <λ and 02 <λ
03 <λ if ( )µδγµβα ++<
03 >λ if ( )µδγµβα ++>
Hence, the DFE is stable if ( )µδγµβα ++< and unstable if ( )µδγ
µβα ++>
Stability Analysis of the Endemic Equilibrium (EE) At non- zero equilibrium we have
( )zyx ,, = ( )( )
( )( )
++
++−++
++−++µδγαµ
µδγµγαβγµδγα
µδγµαβα
µδγ ,,
Expanding (3.1) we have ( ) ( )[ ]( )[ ] ( ) 02 =+++−++−++ λµαλµλµδγαλµα xyxy
( )
(3.4) 0222
22322
222222
3222222
=++−−−−−−−−−−−−−−−
−−−−−+++++
λαµαλµλλαµλλµλαµµλδλγλλαµλαδλαγλµµδλµγλ
µγµαµαδµαγµλαλαµλαλαµαµµα
xyxyyyyyyyyyxxxyxxxy
Collect the like terms of λ ( ) ( )[ ] ( )[ ( )( ) ]
( )( ) (3.5) 022223
22
22223
=++++−+−+++−+−+++−−+−
xyxyyxyyxyx
αµµαµµδγµαλµµαµδγααµλµδγαλ
We apply Bellman and Cooke theorem of stability. Let (3.5) take the form:
( ) ( ) ( )[ ] ( )[ ( )( ) ]( )( ) (3.6)
2222322
22223
xyxyyxyyxyxH
αµµαµµδγµαλµµαµδγααµλµδγαλλ
++++−+−+++−+−+++−−+−=
Setting λ = iw we have ( ) ( ) ( )wiGwFiwH += (3.7)
Substituting λ = iw into (3.6) we have ( ) ( ) ( ) ( )[ ]( ) ( )[ ( )( ) ]
( )( ) 22223
22
22223
xyxyiwyxyyxiwyxiwiwH
αµµαµµδγµαµµαµδγααµµδγα
++++−+−+++−+−+++−−+−=
( ) ( ) ( )[ ] ( )[ ( )( ) ]( )( ) (3.8)
2222322
22223
xyxyiwyxyyxyxwiwiwH
αµµαµµδγµαµµαµδγααµµδγα
++++−+−+++−+−+++−−−=
Separating the real and imaginary parts of (3.8) we have ( ) ( )( ) ( ) ( )[ ] (3.9) 3 2 2222 µδγααµµαµµδγµα ++−−−++++−= yxwxyxywF
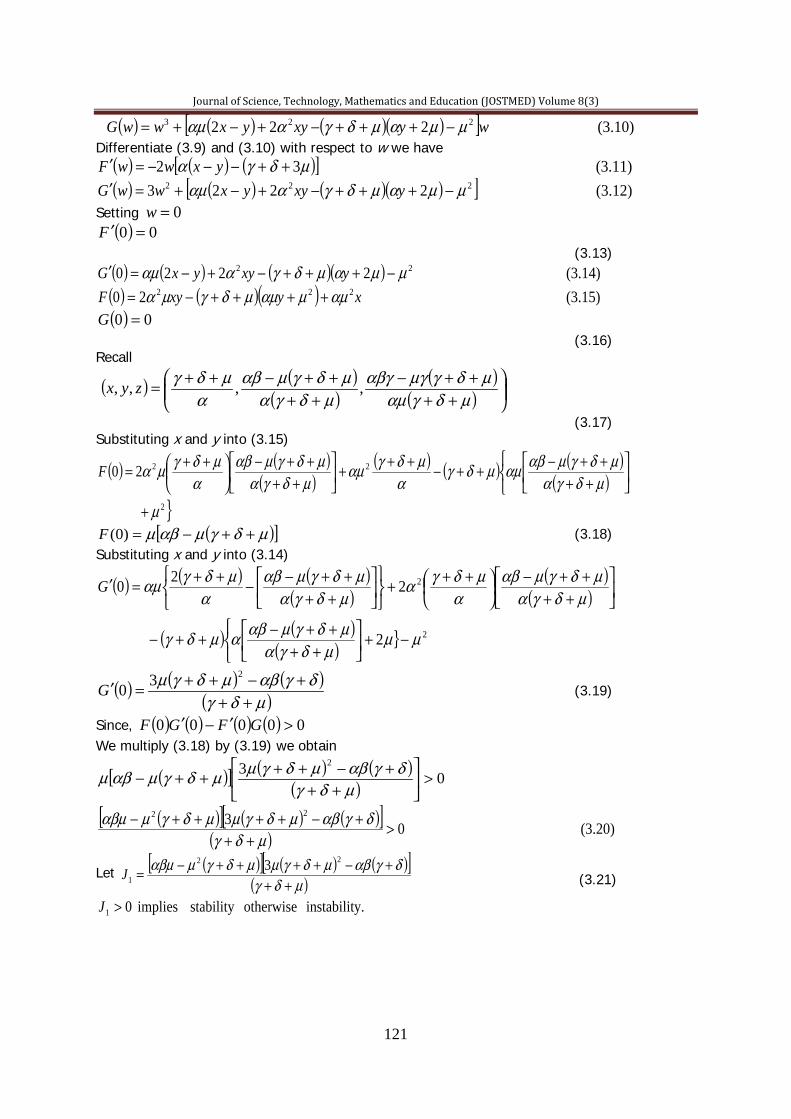
Journal of Science, Technology, Mathematics and Education (JOSTMED) Volume 8(3)
121
( ) ( )[ ( )( ) ] (3.10) 222 223 wyxyyxwwG µµαµδγααµ −+++−+−+= Differentiate (3.9) and (3.10) with respect to w we have
( ) ( ) ( )[ ] (3.11) 32 µδγα ++−−−=′ yxwwF
( ) ( )[ ( )( ) ] (3.12) 2223 222 µµαµδγααµ −+++−+−+=′ yxyyxwwG Setting 0=w
( ) 00 =′F (3.13)
( ) ( ) ( )( ) (3.14) 2220 22 µµαµδγααµ −+++−+−=′ yxyyxG
( ) ( )( ) (3.15) 20 222 xyxyF αµµαµµδγµα ++++−=
( ) 00 =G (3.16) Recall
( ) ( )( )
( )( )
++
++−++
++−++=µδγαµ
µδγµγαβγµδγα
µδγµαβα
µδγ ,,,, zyx
(3.17) Substituting x and y into (3.15)
( ) ( )( )
( ) ( ) ( )( )
20
2
22
µ
µδγαµδγµαβαµµδγ
αµδγαµ
µδγαµδγµαβ
αµδγµα
+
++
++−++−+++
++
++−
++=F
( )[ ]µδγµαβµ ++−=)0(F (3.18) Substituting x and y into (3.14)
( ) ( ) ( )( )
( )( )
( ) ( )( ) 2
220
2
2
µµµδγα
µδγµαβαµδγ
µδγαµδγµαβ
αµδγα
µδγαµδγµαβ
αµδγαµ
−+
++
++−++−
++
++−
+++
++
++−−++=′G
( ) ( ) ( )( )µδγ
δγαβµδγµ++
+−++=′230G (3.19)
Since, ( ) ( ) ( ) ( ) 00000 >′−′ GFGF We multiply (3.18) by (3.19) we obtain
( )[ ] ( ) ( )( ) 03 2
>
++
+−++++−µδγ
δγαβµδγµµδγµαβµ
( )[ ] ( ) ( )[ ]( ) (3.20) 03 22
>++
+−++++−µδγ
δγαβµδγµµδγµαβµ
Let ( )[ ] ( ) ( )[ ]( ) 3 22
1 µδγδγαβµδγµµδγµαβµ
+++−++++−=J
(3.21)
y.instabilit otherwise stability implies 01 >J
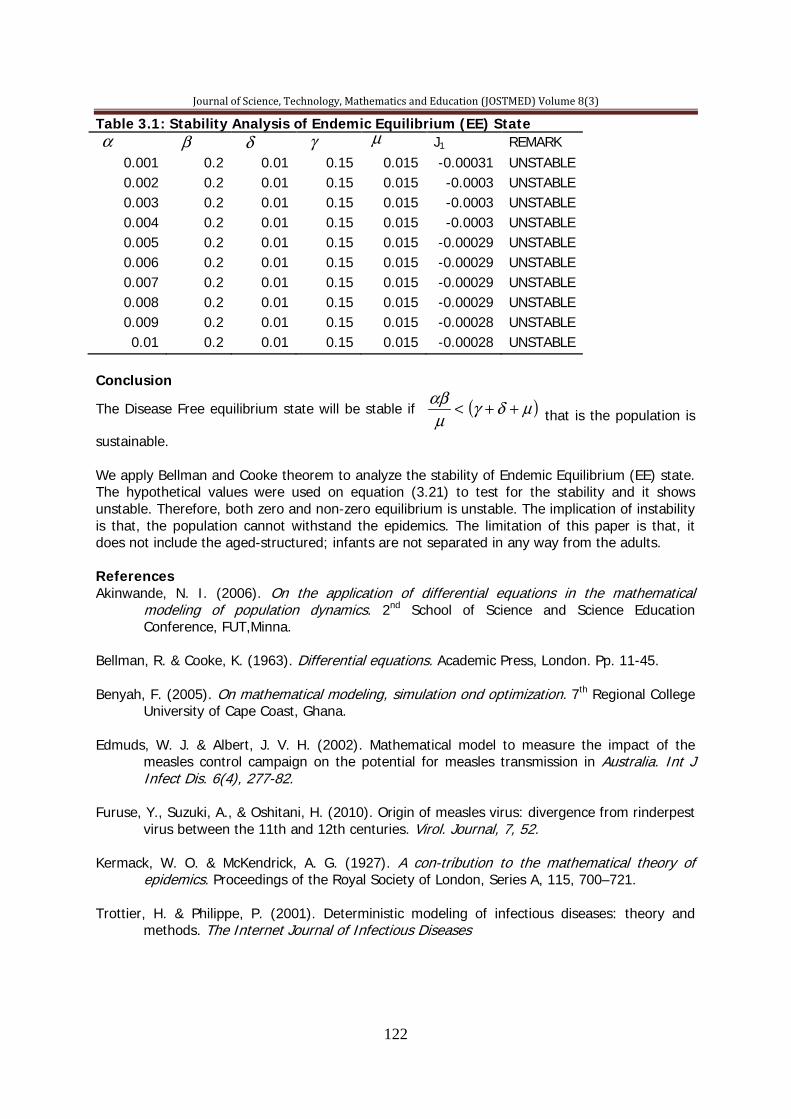
Journal of Science, Technology, Mathematics and Education (JOSTMED) Volume 8(3)
122
Table 3.1: Stability Analysis of Endemic Equilibrium (EE) State α β δ γ µ J1 REMARK
0.001 0.2 0.01 0.15 0.015 -0.00031 UNSTABLE 0.002 0.2 0.01 0.15 0.015 -0.0003 UNSTABLE 0.003 0.2 0.01 0.15 0.015 -0.0003 UNSTABLE 0.004 0.2 0.01 0.15 0.015 -0.0003 UNSTABLE 0.005 0.2 0.01 0.15 0.015 -0.00029 UNSTABLE 0.006 0.2 0.01 0.15 0.015 -0.00029 UNSTABLE 0.007 0.2 0.01 0.15 0.015 -0.00029 UNSTABLE 0.008 0.2 0.01 0.15 0.015 -0.00029 UNSTABLE 0.009 0.2 0.01 0.15 0.015 -0.00028 UNSTABLE 0.01 0.2 0.01 0.15 0.015 -0.00028 UNSTABLE
Conclusion
The Disease Free equilibrium state will be stable if <µ
αβ ( )µδγ ++ that is the population is
sustainable.
We apply Bellman and Cooke theorem to analyze the stability of Endemic Equilibrium (EE) state. The hypothetical values were used on equation (3.21) to test for the stability and it shows unstable. Therefore, both zero and non-zero equilibrium is unstable. The implication of instability is that, the population cannot withstand the epidemics. The limitation of this paper is that, it does not include the aged-structured; infants are not separated in any way from the adults. References Akinwande, N. I. (2006). On the application of differential equations in the mathematical modeling of population dynamics. 2nd School of Science and Science Education Conference, FUT,Minna. Bellman, R. & Cooke, K. (1963). Differential equations. Academic Press, London. Pp. 11-45. Benyah, F. (2005). On mathematical modeling, simulation ond optimization. 7th Regional College University of Cape Coast, Ghana. Edmuds, W. J. & Albert, J. V. H. (2002). Mathematical model to measure the impact of the measles control campaign on the potential for measles transmission in Australia. Int J Infect Dis. 6(4), 277-82. Furuse, Y., Suzuki, A., & Oshitani, H. (2010). Origin of measles virus: divergence from rinderpest virus between the 11th and 12th centuries. Virol. Journal, 7, 52. Kermack, W. O. & McKendrick, A. G. (1927). A con-tribution to the mathematical theory of epidemics. Proceedings of the Royal Society of London, Series A, 115, 700–721. Trottier, H. & Philippe, P. (2001). Deterministic modeling of infectious diseases: theory and methods. The Internet Journal of Infectious Diseases

Journal of Science, Technology, Mathematics and Education (JOSTMED) Volume 8(3)
123
JOSTMED, VOLUME 8(3), AUGUST, 2012
JOURNAL
OF
S CIE
NCE,
TECHNOLOGY, MATHEMATICSA
ND
EDUC
ATION
(JOSTMED)
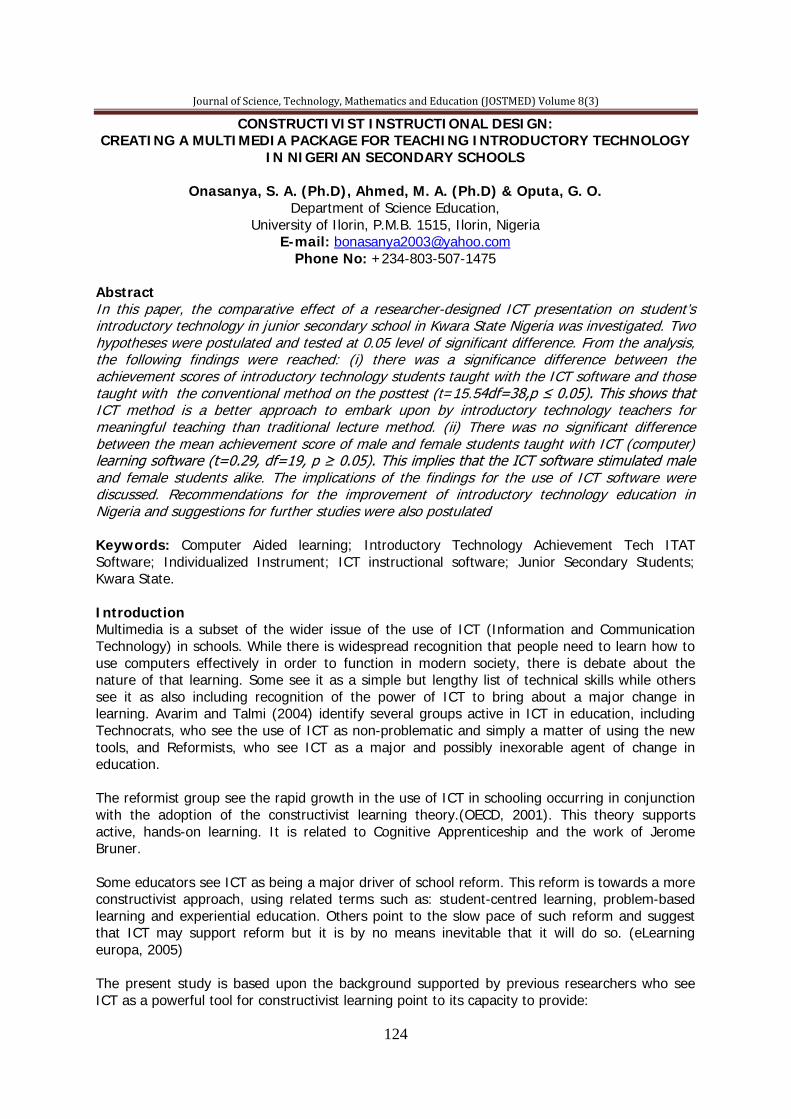
Journal of Science, Technology, Mathematics and Education (JOSTMED) Volume 8(3)
124
CONSTRUCTIVIST INSTRUCTIONAL DESIGN: CREATING A MULTIMEDIA PACKAGE FOR TEACHING INTRODUCTORY TECHNOLOGY
IN NIGERIAN SECONDARY SCHOOLS
Onasanya, S. A. (Ph.D), Ahmed, M. A. (Ph.D) & Oputa, G. O. Department of Science Education,
University of Ilorin, P.M.B. 1515, Ilorin, Nigeria E-mail: [email protected]
Phone No: +234-803-507-1475 Abstract In this paper, the comparative effect of a researcher-designed ICT presentation on student’s introductory technology in junior secondary school in Kwara State Nigeria was investigated. Two hypotheses were postulated and tested at 0.05 level of significant difference. From the analysis, the following findings were reached: (i) there was a significance difference between the achievement scores of introductory technology students taught with the ICT software and those taught with the conventional method on the posttest (t=15.54df=38,p ≤ 0.05). This shows that ICT method is a better approach to embark upon by introductory technology teachers for meaningful teaching than traditional lecture method. (ii) There was no significant difference between the mean achievement score of male and female students taught with ICT (computer) learning software (t=0.29, df=19, p ≥ 0.05). This implies that the ICT software stimulated male and female students alike. The implications of the findings for the use of ICT software were discussed. Recommendations for the improvement of introductory technology education in Nigeria and suggestions for further studies were also postulated Keywords: Computer Aided learning; Introductory Technology Achievement Tech ITAT Software; Individualized Instrument; ICT instructional software; Junior Secondary Students; Kwara State. Introduction Multimedia is a subset of the wider issue of the use of ICT (Information and Communication Technology) in schools. While there is widespread recognition that people need to learn how to use computers effectively in order to function in modern society, there is debate about the nature of that learning. Some see it as a simple but lengthy list of technical skills while others see it as also including recognition of the power of ICT to bring about a major change in learning. Avarim and Talmi (2004) identify several groups active in ICT in education, including Technocrats, who see the use of ICT as non-problematic and simply a matter of using the new tools, and Reformists, who see ICT as a major and possibly inexorable agent of change in education. The reformist group see the rapid growth in the use of ICT in schooling occurring in conjunction with the adoption of the constructivist learning theory.(OECD, 2001). This theory supports active, hands-on learning. It is related to Cognitive Apprenticeship and the work of Jerome Bruner. Some educators see ICT as being a major driver of school reform. This reform is towards a more constructivist approach, using related terms such as: student-centred learning, problem-based learning and experiential education. Others point to the slow pace of such reform and suggest that ICT may support reform but it is by no means inevitable that it will do so. (eLearning europa, 2005) The present study is based upon the background supported by previous researchers who see ICT as a powerful tool for constructivist learning point to its capacity to provide:

Journal of Science, Technology, Mathematics and Education (JOSTMED) Volume 8(3)
125
(i) Active and highly motivating engagement with students (ii) Powerful tools to create text, art, music, sound, models, presentations, movies etc. that produce high quality products and remove much of the tedium normally associated with such creation (iii) An error-forgiving environment in which editing of a product fosters learning by trial and error (iv) Easy communication in text, voice, video (v) Quick access to information and resources (Avarim and Talmi 2004; OECD 2001; eLearning europa, 2005) Educators are finding, however, that while ICT can provide a technical environment for constructivist learning to occur, there needs to be high quality teaching to develop and sustain an environment that will challenge and inspire students to learn. (Avarim and Talmi 2004) One of the problems of teaching and learning is the method of imparting knowledge to learners. According to Stone (1991), the major difficulty in sciences is the method by which the subjects are customarily taught without regards to instructional materials. The pedagogical approach in imparting knowledge to learners has become inadequate to their needs. Bajah (1995) and Okeke (1986) found that science subjects has not been taught in Nigeria schools the way pupils benefits most, as science instruments has mostly been teacher –centered. For the past two decades, science education has been facing a lot of difficulties which include poor performance of students in science subjects (Adeyegbe, 1992). Introductory technology, like other science subjects, recorded poor students’ performance both in national and international examination (Akale, 1986). Many factors contributed to the poor performance of students in introductory technology examination (Akale, 1986, Okebukola and Jegede (1986). These factors include:
(i) Inability of the teachers to put across the concepts to the students (ii) Lack of skills and competence required for teaching (iii) Shortage of qualified introductory technology teachers (iv) Lack of teaching materials and necessary equipment Introductory technology as a subject is very important for the scientific and technological advancement of any nation. Though its usefulness cuts across all fields of human endeavor, the low enrolment of students in the subject at both secondary and post secondary levels has been a source of concern to various people especially introductory technology educators at various times (Omosewo, 1999; Balogun, 1985; Ogunneye, 1982; Orisaseyi, 1977; Ogunyemi and Eboda, 1974). Lack of active participation of students is one of the factors responsible for students’ poor performances in West African Examination Council (WEAC) results of secondary schools where students’ performances are generally poor in introductory technology, physics, chemistry, biology and other sciences –related subjects (WEAC, 2000). This pattern of poor performance in the sciences by students is also observed in tertiary institutions (Olarinoye, 1987). Omosewo (1999:99), asserted that. Teachers were using the lecture method of teaching the subject in the secondary schools. The direct impact of this method on learners is that it often leads to lack of understanding and this might cause poor performance and low enrolment of students in the subject. The low enrolment in introductory technology is a cog in the wheel of the scientific and technological progress in this nation. Many of the students see science as too abstract to comprehend, thereby resorting to memorization or rote of learning. Many students have also changed from science subjects to art and commercial subjects while some dropped out and some failed woefully at the final

Journal of Science, Technology, Mathematics and Education (JOSTMED) Volume 8(3)
126
examination. Meanwhile, various attempts have been by government, school proprietors and teachers to facilitate effective teaching and learning of these science courses, which are the rudiments of development of any nation. Textbooks have been constantly reviewed and rewritten in simpler forms and teaching aids of various types designed, yet the problems persist. Ogunleye (2000) found out that in the era of technological advancement, technology has had minimum impact on education. This is because 80% of teachers in Nigeria are mostly using the chalkboard and textbook method (traditional method) in teaching. Actually, most schools do not have modern equipment and materials. The few schools that have this equipment are unable to use them effectively as a result of erratic electric power supply and at times the inability of some teachers to operate some of this equipment. However, constant use of the traditional method of teaching is a major factor contributing to poor academic achievement introductory technology students. One of the major problems faced by students is inability to remember what has been learnt. This problem is often caused by too much theoretical expression by the teachers while learners are passive listeners. Students memorize and regurgitate facts and concepts. The above problems confronting the teaching and learning of introductory technology can be handled using slide presentations, video presentation process, and other interactive ICT software facilities in which a student interacts with and is guided by visual equipment of study aimed at achieving certain instructional goals (Eke, 1988, Ezeliora, 1987, and Onasanya, 2002). Computer can be used to transform classroom instruction into a series of rich memorable experiences and thus reduce boredom and forgetfulness for teaching subjects including introductory technology. In the recent years, the use of this equipment in the process of teaching and learning has become widespread in educational institutions with the development of microcomputer (Ezeliora, 1997; Onasanya, 2002). Abimbade (1996) reported that the use of computer (i) increases the time of learners devote to learning , (ii) Enhance the speed of availability of data and information, (iii) Provide immediate feed-back (iv) Assist less qualified teachers and (v) Increase teachers efficiently and effectiveness. Udousoro and Abimbade (1997) and Adeniyi (1997) pointed out that students taught mathematics and physics with visual aid achieved higher cognitively than those taught without computer. This study was carried out to determine the effect of ICT on introductory technology and its implication on student’s performance. It was to address the problem of consistence poor performance of students in junior secondary schools and tertiary levels. The purpose of the study was to compare the effect of ICT presentation and the traditional method of teaching (chalk-and -talk method) in teaching and learning introductory technology in secondary schools in Kwara State, Nigeria. Materials and Method Research Hypotheses The following null hypotheses were formulated and tested at p ≤ 0.05 so as to obtain answers to the research questions: (i) There is no significant difference between the mean achievement scores of students taught introductory technology with ICT presentation and those taught without the ICT (Verbal presentation).

Journal of Science, Technology, Mathematics and Education (JOSTMED) Volume 8(3)
127
(ii) There is no significant difference between the mean achievement scores of male and female students taught introductory technology with the ICT presentations. Research Design The research design was a pretest – posttest experimental control group design carried out in some junior secondary schools in Kwara State. The study used two groups of randomized pretest and posttest design. Sample and Population The population for this study was made up of all junior secondary class three students in two Local Government Areas in Ilorin East Local Government Areas of Kwara State. The sample subjects were drawn from two co-educational and two single gender schools in Ilorin East Local Government Areas of Kwara State. The subjects from the co-educational schools were selected by the use of stratified random sampling technique. This method was chosen so that the gender variable could be appropriately represented. Research Design The researcher used an experimental research approach. Therefore, the pretest and posttest control group design was used for the study. Twenty (20) students offering introductory technology were randomly selected for the study from each of four secondary schools. In all, there were forty (40) males and forty (40) females. The students were taught the same concepts in introductory technology using the conventional method and the ICT learning software. Instrumentation The test instrument was made up of 50 items of the Introductory Technology Achievement Test (ITAT) which was used as pretest and posttest to measure both the lower and higher cognitive skills of the students in introductory technology. The test items required multiple-choice objective questions with five options (A-E) as possible answers to the questions which the students answered before and after the experiment. The experimental group was exposed to introductory technology lesson using ICT method for period of six weeks while the control group was taught the same introductory technology using the conventional traditional method. After the duration of six weeks of treatment for the experimental group and the six week of lecture method for the control group, the posttest (ITAT) was administered to both groups at the same tradition in the usual per-pencil method. The treatment instrument which was interactive ICT learning software was developed by the researcher using the subject contents drawn from the secondary school syllabus. The program was written in Visual Basics, Fire Works, CorelDraw and Microsoft Word. The topics treated were selected based on junior secondary school the syllabus. The topic selected was from first term scheme of work and falls between the periods that research was carried out. The development of courseware for this research material follows the systematic and recursive approach of instructional development model put forth by Mervill and Goodman (1972); Philips (1987); and Dick and Carey (1996).However, five trails were made before the packages become successful. It was then tested with some few selected secondary schools in Ilorin, Kwara State. These schools used for testing the package falls between the population of the study but not part of the schools selected for research study. Some of the complaints from these selected students about the packages was later used for further modification and finally perfected the package.

Journal of Science, Technology, Mathematics and Education (JOSTMED) Volume 8(3)
128
Validity and Reliability of the Instruments The ICT presentation (introductory technology package less) items were pilot tested and found to satisfy face, content and construct validity by three experts in educational technology, science education departments. Item analysis of the instrument was also carried out to determine the facility and discrimination indices after which the final items for the instrument were selected and the reliability coefficient computer using the split-half approach and the Richard Kuderson formula 21 (KR-2). The value obtained for the reliability coefficient was 0.95 and this was considered to be adequate for this study. Method of Data Analysis The mean, standard deviation and the t-test statistical analysis scores of the different groups were computed and used in testing the hypothesis. The level of the significance adopted for the analysis was p≤ 0.05. This level of significance formed the basis for rejecting or not rejecting each of the hypotheses. Results Two research questions were raised in this study and two null hypotheses were formulated and tested to provide answers to the research questions. Analyses of the pretest and posttest data collected by means of the introductory technology were used to answer the research questions using the two null hypotheses as guide. Means, standard deviations and the t-test were employed in analysing the pretest and posttest data. The level of significance adopted for the analysis is 0.05. This level of significance formed the basis for rejecting or not rejecting a null hypothesis. The summary of the data analysis and results is presented below. A pretest was administered to both the experimental and control groups. The test was the 50-item multiple-choice introductory technology. The subjects were allowed forty minutes to do the test. The test was given to determine the academic equivalent of the experimental and control groups. The mean scores of students in the experimental and control groups on the pretest were calculated and the t-test computed for the two means. Table 2 shows the means, standard deviations and the result of the t-test analysis. Table 2: t-test comparison of the mean scores of experimental and control groups on the pretest Variable N df Mean SD t.value
Calculated t-value Critical
p-value
Remark
Experimental Group
40 38 13.84 2.86 *0.22
2.08
0.83
Not Significant Control Group 40 13.65 3.09
* Not significant at 0.05 The result in Table 2 indicates that there is no significant difference at 0.05 level of significance between the pretest mean scores of the experimental and control groups (t = 0.22, df = 38, p > 0.05). This means that the subjects in the experimental and control groups were at the same entry level with regards to academic ability before the introductory technology topics were presented to them. Their mean scores were statistically the same.
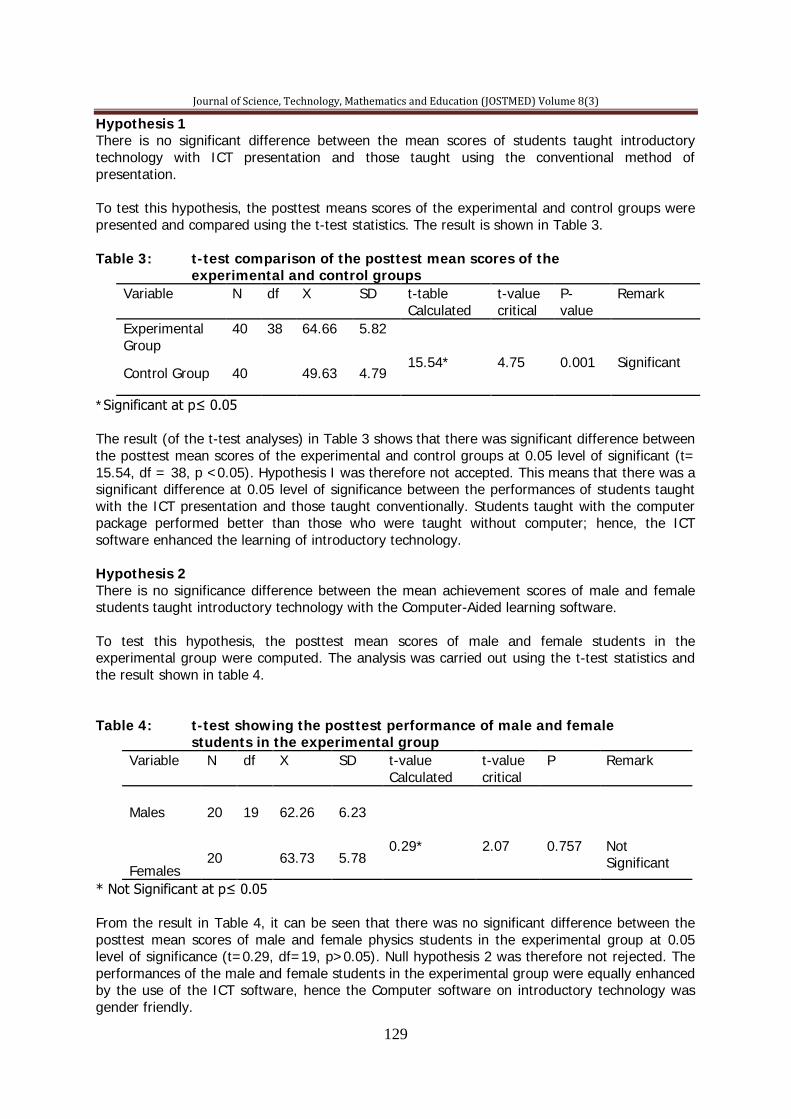
Journal of Science, Technology, Mathematics and Education (JOSTMED) Volume 8(3)
129
Hypothesis 1 There is no significant difference between the mean scores of students taught introductory technology with ICT presentation and those taught using the conventional method of presentation. To test this hypothesis, the posttest means scores of the experimental and control groups were presented and compared using the t-test statistics. The result is shown in Table 3. Table 3: t-test comparison of the posttest mean scores of the experimental and control groups
Variable N df X SD t-table Calculated
t-value critical
P-value
Remark
Experimental Group
40 38 64.66 5.82 15.54*
4.75
0.001
Significant
Control Group 40 49.63 4.79
*Significant at p≤ 0.05 The result (of the t-test analyses) in Table 3 shows that there was significant difference between the posttest mean scores of the experimental and control groups at 0.05 level of significant (t= 15.54, df = 38, p <0.05). Hypothesis I was therefore not accepted. This means that there was a significant difference at 0.05 level of significance between the performances of students taught with the ICT presentation and those taught conventionally. Students taught with the computer package performed better than those who were taught without computer; hence, the ICT software enhanced the learning of introductory technology. Hypothesis 2 There is no significance difference between the mean achievement scores of male and female students taught introductory technology with the Computer-Aided learning software. To test this hypothesis, the posttest mean scores of male and female students in the experimental group were computed. The analysis was carried out using the t-test statistics and the result shown in table 4. Table 4: t-test showing the posttest performance of male and female students in the experimental group
Variable N df X SD t-value Calculated
t-value critical
P Remark
Males
20
19
62.26
6.23
0.29*
2.07
0.757
Not Significant
Females
20 63.73 5.78
* Not Significant at p≤ 0.05 From the result in Table 4, it can be seen that there was no significant difference between the posttest mean scores of male and female physics students in the experimental group at 0.05 level of significance (t=0.29, df=19, p>0.05). Null hypothesis 2 was therefore not rejected. The performances of the male and female students in the experimental group were equally enhanced by the use of the ICT software, hence the Computer software on introductory technology was gender friendly.

Journal of Science, Technology, Mathematics and Education (JOSTMED) Volume 8(3)
130
Discussion Finding on Table 3 indicates that there was a significant difference in the introductory technology achievement of students taught with the Computer –Aided learning software. Those students taught with the computer software performed better in the introductory technology achievement test compared with those who were taught using the conventional method. The result seem to agree with earlier studies which concluded that students taught mathematics and Physics with computer achieved higher cognitively than those taught without computer (Udousoro and Abimbade, 1997); Adeniyi, 1997); Hassan, 1997) and Jonah, 1991) James and Barbara (2002) asserted that CAL promotes intrinsic motivation for graduate students to learn better, therefore be seen as a tool for effective teaching and learning of introductory technology subjects. ICT is an effective tool that can efficiently and effectively develop individual’s cognitive structure, psychomotor and affective abilities. Findings on Table 4 indicated that there was no significant difference between the performances of male and female students who were taught introductory technology software. The male and female students performed equally well. The result agrees with the findings of Abdullahi (1982) who found that gender did not influence students’ performance in science generally. Conclusion From the findings of this research work, the following conclusions were drawn: (i) Instructional strategies that teachers employ in teaching science subjects at secondary school level have significant effects on students’ achievement. The findings of the present study showed that better performance in introductory technology can be achieved through the use of ICT software package. (ii) Male and female students were affected positively and equally by the use of ICT software package in teaching introductory technology. This showed that the ICT is not gender dependent. Recommendations From the findings of the present study, the following recommendations are made.
1. The use of ICT, CAI for teaching and learning in our schools should be encourages. Therefore, computer instructions should be made compulsory for teachers and students in all levels of our educational systems.
2. Curriculum planners should enforce/inoculate the use of ICT and computer education/training into school curricula.
3. Educators should continue to lay more emphasis and implement the concepts of educational technology as a means of enhancing the quality of education.
4. Federal Government should fully implement ICT literacy at all levels of education in Nigeria.
5. In-service training should be given to teachers on educational technology particular on the production and use of computerized instructional materials.
6. There is need for government and non-governmental organizations to organize seminars, workshops, conferences as well as in-service training for teachers on methodology of teaching so as to be able to compare and contrast effects of different methods of teaching on students’ achievement.
7. Schools should be equipped with computer and Internet facilities and other necessary instructional packages like slide and video presentations.
8. Science teachers should learn how to prepare lesson notes and instructional packages using the ICT method of presentations.
9. Emphasis should be placed on making learning to be a learner-centered affairs as well as teaching for meaningful learning.
10. The role differentiation amongst boys and girls should be avoided when teaching science and technology. Each gender deserves equity in exposure to educational experience.

Journal of Science, Technology, Mathematics and Education (JOSTMED) Volume 8(3)
131
11. Academic cooperation, though not to the point of replication or subjugation should be worked out by departments of introductory technology/computer science and educational Technology to develop adequate software for effective learning. References Abdullahi, A. (1981). A study of factors with interest in science career. Journal of Research in Curriculum (JORIC), 6 (1), 69-76. Abimbade, A. (1996). Principles and practice of educational technology. Ibadan: International Publishers Ltd.
Adeniyi, A. (1997). Computer aided instruction and achievement in physics: Innovation in science,technology and mathematics. STAN Proceeding of Ajumogobia Memorial Conference, pp257-260. Adeyegbe, S. O. (1992). Assessing students’ work in chemistry: The WAEC state of the art. A paper Delivered at STAN Chemistry Workshop for Chemistry Teachers, A.B.U, Kano Campus, 10-15 April.
Akale, M.A.G. (1986). Assessment of students achievement in science: What implications for teachers training. Proceeding of the 27th Annual Conference of the Science Teacher Association of Nigeria (STAN). Aviram, R. & Talmi, D. (2004 ). Are you a technocrat a reformist or a holist? eLearning Europa, http://www.elearningeuropa.info/index.php?page=doc&doc_id=4965&doclng =6&menuzone=1 Bajah, S. T. (1995). Practical skills in science and technology. A Key Note Address Delivered at the 36th Annual Conference of STAN, Maiduguri, 14th –19th August.
Balogun, T.A. (1985). Interest in service and technology education in Nigeria. Journal of the Science Teachers Association of Nigeria (STAN), (1&2), 92-99.
E-learning Europa (2005). A new paradigm for school education. http://elearningeuropa.info/index.php?page=doc&doc_id=5947&doclng=6& menuzone=1
Ezeliora, B. (1997). Computer: A new technology in chemistry teaching and learning: innovation in science, technology and mathematics. STAN proceeding of Ajumogobia Memorial College, pp257-260.
Hassan, Z . M. (1997). An export system for teaching mathematics and physics. Unpublished B. Tech. Project, Mathematics/Computer Science Department, Federal University of Technology, Minna.
James, P. & Barbara, P. (2002). A web enabled graduate course: Two perspectives: Technology tools for use in the classroom. Proceeding of the Seventh Annual Mid-South Instructional Technology Conference, Middle Tennessee State University. April 7-9, 2002.
Jonah, A. O. (1991). Use of computer to aid effective teaching of mathematics in secondary school. Unpublished B. Tech. Project, Mathematics/Computer science Department, Federal University Of Technology, Minna.

Journal of Science, Technology, Mathematics and Education (JOSTMED) Volume 8(3)
132
Mervill, M. A. & Goodman, R. I. (1972). Selecting instructional strategies and media: A place to being in. U.S.A. national special media institute. OECD (2001). Learning to change. Recovered from http://www.oecdbookshop.org/ Ogunleye, A. O. (2000). Towards the optimal utilization and management of resources for the effective teaching and learning of physics in schools. In O.O. Busari (Ed),41st Annual Conference Proceeding, Journal of STAN.
Ogunneye, W. (1982). The relative effect of selected instructional styles on student achievement in physics. Journal of (STAN), 21(1), 97-101.
Ogunyemi, E. O. & Eboda, F. M. (1974). Cognitive preferences among high and low physics achievers in two nigeria secondary schools. African Journal of Education Researches, 1(1), 107-133.
Okebukola, A. O. & Jegede, O. J. (1986). The under achieving student in science. opinions on the etiology of ailment. Proceeding of the 27th Annual Conference of the STAN. Pp. 57- 63. Okeke, E. A. (1986). Remedies for student poor performance in biology. Proceeding of the 27th Annual Conference of Science Teacher Association of Nigeria.
Olarinoye, R. D. (1987). The inquiry and discovery method of teaching science. Journal of STAN, 21 (1), 168-180.
Omosewo, E. O. (1999). Impact and discovery method of teaching on students’ achievement in physics. Journal of Nigerian Association of Teachers of Technology (JONATT), 3(1), 99- 107.
Orisaseyi, S. (1977). A critical look at the attitude of secondary schools students to physics. Journal of STAN, 16 (1), 49-55. Philip, B. (1987). Author languages for computer aided learning: London. Macmillian Education Ltd. Udousoro, U. J. & Abimbade, A. (1997). The place of computer assisted instruction in mathematics. STAN Proceeding of Ajumogobia Memorial Conference. Pp.238- 243.
West African Examination Council (WAEC) (2000). Examinations report in science subjects. Lagos: WAEC
Journal of Science, Technology, Mathematics and Education (JOSTMED) Volume 8(3)
133
RELATIONSHIPS BETWEEN STUDENTS’ TASK ENGAGEMENT AND LEARNING OUTCOMES IN CHEMISTRY
Orji, Nna Sunday
Nigerian Educational Research and Development Council (NERDC), Sheda, Abuja C/o Box 895 Gwagwalada, Abuja;
E-mail: [email protected]; Phone No: +234-806-925-9978
Abstract To promote Science and Technology at the classroom level, for national growth and global competitiveness, nations are now paying more attention to various aspects of student efforts in the learning of science. This study investigated Students’ Science Task Engagement in relation to their learning outcomes (attitude and achievement) in Chemistry. A stratified sample of 60 students drawn from 10 schools was used in the study. The student task engagement record (STER), a classroom observation instrument, was used to record students’ on-task and off-task behaviour (engagement) during chemistry lessons. At the end of the observation period (6 weeks), the Chemistry Achievement Test (CAT) and chemistry Attitude Questionnaire (CAQ) were administered to ascertain students’ chemistry achievement and attitude respectively. The engagement scores of the students were correlated with their achievement and attitude scores using Pearson’s product moment correlation. Students’ task engagement was found to have significant, positive correlation (r = .74) with achievement in chemistry; and non-significant negative correlation (r= -0.03) with attitude toward chemistry. It was therefore recommended that strategies for promoting task engagement should be taught and promoted in schools. Both practicing and trainee science teachers should build capacity in fostering engaging learning activities. Introduction Advancement in Science and Technology has become a global phenomenon; science now permeates almost all facets of human endeavor, and nations are increasingly investing huge resources into the ‘doing’ and ‘learning’ of science for development and global competitiveness. Consequently, scientists and science educationists are today more recognized as playing crucial roles in advancement. At the classroom level, students’ active involvement in ‘doing’ and ‘learning’ of science is being regarded as a predictor of success in and sustainable advancement of science (Adesoji, Ige, Iroegbu & Olagunju, 2003). Several researches (Chapman, 2003; Cangelosi, 1993; Capie and Tobin, 1981; Orji, 2011; and Yair, 2000) have studied students’ engagement in relation to academic achievement and attitude. They assert that student variables – including their pursuits (efforts) or active participation influence their learning outcomes. Students’ active involvement in science task is regarded as a predictor of success in science; and is a mark of high performing schools and high achieving students (Howe & Raleigh, 1996). Researchers (Chapman, 2000; Sandholtz & Dwyer, 1994; and Orji, 2011) proffered various definitions of students’ engagement based on their individual perspectives of students’ engagement; their theoretical inclinations (whether sociological, psychological, ecological or cognitive); the aspect of student activity they wish to monitor; and their purpose for and use of the study. According to Orji (2011), students’ engagement refers to students’ mental and social involvement in learning task. He described it by sociological factors (feeling belonging, cooperation and group work), psychological factors (interest personality, motivation) and situational factor (institutional classroom variables). This description agrees with the assertion that ‘human is made up of cognition (have cognitive ability) and is a social being (Piaget, 1978 & Knowles, 1978 in Orji, 2011).

Journal of Science, Technology, Mathematics and Education (JOSTMED) Volume 8(3)
134
Orji (2011) cited studies (Cangelosi, 1993; Courtney, 1989; Knowles, 1978) that focused on sociological indicators of student engagement (the need to be part of an activity, pressure from peers, expectations and values) with emphasis on ‘cooperation’, ‘involvement’, ‘participation’, 'taking-part-in’ and ‘attendance’ in an organized social activity. Other studies (Piaget, 1978 and Lowe, 1970 in Orji, 2011) focused on psychological indicators (interest personality, motivation) such as ‘involvement’, ‘attentiveness’, ‘student initiative’, ‘curiosity’ and ‘enthusiasm’. There are also the ecological or situational/institutional explanation /determinants of student engagement. For instance, conducive classroom climate and instructional management promote students’ task engagement (Chapman, 2003; Cangelosi, 2000). Chapman (2003) cited some researches (Brophy, 1983; Fisher et al., 1980; McIntyre, et al., 1983) that made use of time-based indices (e.g. time-on-task) to describe overt student engagement, and others (Dintrich & De Groot, 1990; Pintriah’s Schranben, 1992) that described cognitive engagement (covert engagement). He described student engagement as student’s “willingness” to participate in routine school activities such as attending classes, submitting required work and following teachers’ directions in class. Task engagement includes students’ psychological presence in or focus on task activities and is often manifested in the time and effort that people devote to a particular activity; it includes students’ affective responses to learning task (Orji, 2006). According to Newman (1986) cited in Sandholtz and Dwyer (1994), student engagement involves students’ devotion of substantial time and effort to a task, and their concern for quality of their work, and their committing themselves because the work seems to have significance beyond its personal instrumental value. Measuring Student Task Engagement Various measurements of student task engagement have appeared in several researches (Adeyele, 1987; Beasley, 1983; Chapman, 2003; Capie and Tobin, 1981; Kounin, 1970; McIntyre and O’Hair, 1996; Orji, 2011; Ramadas & Kulkami, 1982). Chapman (2003) measured students’ cognitive, behavioral and affective task engagement using ‘time-on-task’, ‘involvement’ and ‘willingness to participate’ index. He measured the extent to which students were attending to and expending mental effort in the learning task (use of cognitive and meta-cognitive strategies); the extent to which students actively respond to the tasks (asking relevant questions, solving task-related problems, and participating in relevant discussions with teachers/peers); and the level of student’s investment in and their emotional reactions to the learning tasks (e.g. high levels of interest or positive attitudes towards the learning tasks). His instruments for assessing student task engagement included student self-report measures, checklists and rating scales, direct observations, work sample analysis, and focused case studies. Orji (2011) utilized index of participation that emphasize ‘effort-on-task’ rather than ‘time-on-task’. He noted that measurement of student engagement/participation could be on individual basis (that is by judging acts of individual students who performed them) or on whole-class or group–basis (measuring total number of students involved in required task). He also used terms such as ‘intensity’, ‘extent’, ‘forms’ and ‘degree’ of participation in learning activity as criteria for measuring and describing engagement. Using questionnaires, checklists and participation chart/scale, he measured participation index of motivation, interest, activity, appearance, attentiveness, attitude/values, concern for skill, contribution to group discussions, earliness to class, emotional balance, helpfulness in class, home work submission, independent study, influence popularity, initiatives, interest in study, motivation, outspokenness, regularity of attendance, responsibility self-control and social interaction. Adeyele (1987) measured students’ participation during classroom/laboratory interaction using a 5-point student classroom participation scale (SCPS). Student activities included: questions, answers, discussions, students work on problems or writing of answers, material provision or

Journal of Science, Technology, Mathematics and Education (JOSTMED) Volume 8(3)
135
improvisation by students, attentive involvement of student (listening), suggestions, utilizing opportunity to participate, copying notes on dictation, and sharing of jokes to releases tensions. Ramadas and Kulkarni (1982) measured student engagement in terms of spontaneous participation of pupil and pupil initiation, taking note of: the frequency of occurrence of spontaneous responses; and the time during which there were no individual responses and most of the pupils were showing a lack of interest. Beasley (1983) adapted the approach of Kounin (1970) for measuring observed pupil task involvement behaviours. Students were rated as ‘definitely in’, ‘probably in’, ‘waiting’ and ‘out’ of the task. The task engagement included: student performance of requested activity, listening, watching, answering questions, writing note, watching teacher, watching demonstration, manipulating apparatus, collating data, reading and solving problems and summarizing material. According to Capie and Tobin (1981), it is important the observer makes two inferences relative to each pupil observed: “what does the teacher expect to be the focus of the pupils’ attention? And “is the pupil indeed attending to the desired focus?” The percentage of positive responses becomes the on-task rate for the pupil or the class and multiplying this by the allocated time yields the actual engaged time for a lesson. Other researches prefer to use of the ‘time indices’, rather than frequency/effort indices to measure student task engaged (Johnson & Butts, 1983; McGarity and Butts, 1984; Sandholtz & Dwyer, 1994). This study used “on-task” and “off-task” index to record student engagement in science. Student Task Engagement in Science Students’ active engagement is crucial for success in science, considering the nature of science and science learning. Johnson and Butts (1983) studied student science achievement in relation to engaged time (observed and perceived), and personal characteristics of academic aptitude, reasoning ability, attitude towards science, and locus of control. Engaged time was positively related to achievement, reasoning ability, attitude and locus of control, but negatively related with academic aptitude. Ramadas and Kulkarni (1982) found that relating science content to students’ experiences, cooperative learning, and use of teaching aids and experiments enhanced task engagement in science. Problem-solving activity or process-skill activities have also been shown to promote students’ engagement (Simpson and Troost, 1982; Bloom, 1980 in Tobin, 1986). Shymansky and Penick (1977) in Orji (2006) investigated the relationship between students’ self-perception, problem-solving and engagement in science task. They found that students' willingness to take charge of their learning with the materials and activities on hand fosters engagement. Okebukola and Ogunniyi (1986) asserted that teachers’ direct/indirect verbal behaviours affect student participation; while Capie and Tobin (1981) suggested the promotion of science engagement through group work. Problem and Objective of the study Low attitude and poor achievement in the sciences have been the concern of education stakeholders in developing countries including Nigeria. More worrying are students’ recurring dis-engagement, ill-motivation, absenteeism and disinterestedness during chemistry lessons which tendencies are said to impact negatively on their school success. This study, therefore, focused on science task ‘engagement’ and its relation to students’ achievement and attitude chemistry. It sought to obtain information about the pattern and nature of student involvement in science learning task; as well as to ascertain the relationship between students’ ‘on-task’/‘off-task’ behaviours and their achievement in and attitude towards chemistry.
Journal of Science, Technology, Mathematics and Education (JOSTMED) Volume 8(3)
136
Research Questions This study sought to address the questions: 1. What is the nature and extent of students’ task engagement in chemistry? 2. What is the relationship between students’ task engagement and (i) Achievement in chemistry? (ii) Attitudes towards chemistry? Hypotheses The following hypotheses were tested in the study: HO1: There is no significant relationship between students’ engagement and their achievement in chemistry HO2: There is no significant relationship between students’ engagement and their attitude towards chemistry Methodology Research Design The study used correlation design. This descriptive survey allowed the researcher to investigate the nature and extent to which variations in student task-engagement corresponds with variations in students’ achievement and attitude towards chemistry. It did not, however, seek to determine cause-effect relationship among the variables. Recent studies (Chapman, 2003) utilized correlation design to investigate students’ engagement in relation to learning outcomes. Sample and Sampling Techniques The study population included the entire SS II science students of all secondary schools in Ibadan, Oyo State. 10 public secondary schools that offer chemistry at the SS II level were randomly selected for the study. From these, 60 SSII chemistry students (6 per school) were selected by stratified random sampling. The 6 selected students were from same science class and had average achievement scores in chemistry [ascertained via school records]. Instrumentation Data were collected using a direct classroom observation instrument - the Student Task Engagement Record (STER) and 2 questionnaires - Chemistry Achievement Test (CAT) and Chemistry Attitude Questionnaire (CAQ) developed by the researcher and validated by science education experts. The Student Task Engagement Record (STER) is a two-point scale for recording student overt task-engagement (appendix Ia). Each of the six selected students is observed in 20 second turns. STER classified students’ behaviour as: 1 = engaged behaviour (on-task) and 0 = non-engaged (off-task). Evidence of engaged behaviour included students’ activities of: (i) Physically attending; looking at the teacher or the chalkboard; (ii) Working at desk i.e., taking notes from the lecture or chalkboard; and (iii) Interaction with teacher or students; such as, asking questions, responding to questions, or commenting on the objective-related issues. Any behaviour that was not classified as one of the above was judged to have been non-engaged or off-task. Inter-raters reliability coefficient of 0.65 was obtained for the instrument [comparing ratings from two independent concurrent observation of students’ engagement during a chemistry lesson]. The Student Chemistry Achievement Test (CAT) is a 30-item multiple choice objective test (4 options) covering the topics: Acids, Bases, Salts and Carbon/Carbon Compounds. These topics, contained in the term’s scheme of work, were covered by the teachers at the study period.
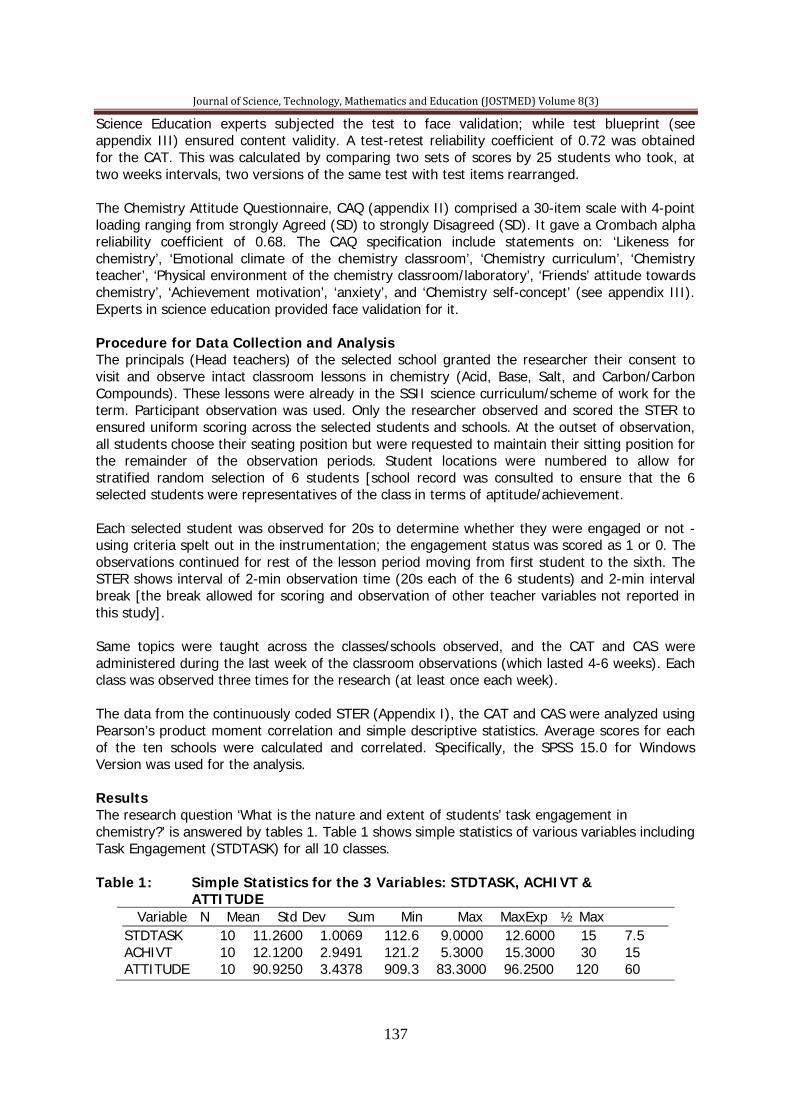
Journal of Science, Technology, Mathematics and Education (JOSTMED) Volume 8(3)
137
Science Education experts subjected the test to face validation; while test blueprint (see appendix III) ensured content validity. A test-retest reliability coefficient of 0.72 was obtained for the CAT. This was calculated by comparing two sets of scores by 25 students who took, at two weeks intervals, two versions of the same test with test items rearranged. The Chemistry Attitude Questionnaire, CAQ (appendix II) comprised a 30-item scale with 4-point loading ranging from strongly Agreed (SD) to strongly Disagreed (SD). It gave a Crombach alpha reliability coefficient of 0.68. The CAQ specification include statements on: ‘Likeness for chemistry’, ‘Emotional climate of the chemistry classroom’, ‘Chemistry curriculum’, ‘Chemistry teacher’, ‘Physical environment of the chemistry classroom/laboratory’, ‘Friends’ attitude towards chemistry’, ‘Achievement motivation’, ‘anxiety’, and ‘Chemistry self-concept’ (see appendix III). Experts in science education provided face validation for it. Procedure for Data Collection and Analysis The principals (Head teachers) of the selected school granted the researcher their consent to visit and observe intact classroom lessons in chemistry (Acid, Base, Salt, and Carbon/Carbon Compounds). These lessons were already in the SSII science curriculum/scheme of work for the term. Participant observation was used. Only the researcher observed and scored the STER to ensured uniform scoring across the selected students and schools. At the outset of observation, all students choose their seating position but were requested to maintain their sitting position for the remainder of the observation periods. Student locations were numbered to allow for stratified random selection of 6 students [school record was consulted to ensure that the 6 selected students were representatives of the class in terms of aptitude/achievement. Each selected student was observed for 20s to determine whether they were engaged or not - using criteria spelt out in the instrumentation; the engagement status was scored as 1 or 0. The observations continued for rest of the lesson period moving from first student to the sixth. The STER shows interval of 2-min observation time (20s each of the 6 students) and 2-min interval break [the break allowed for scoring and observation of other teacher variables not reported in this study]. Same topics were taught across the classes/schools observed, and the CAT and CAS were administered during the last week of the classroom observations (which lasted 4-6 weeks). Each class was observed three times for the research (at least once each week). The data from the continuously coded STER (Appendix I), the CAT and CAS were analyzed using Pearson’s product moment correlation and simple descriptive statistics. Average scores for each of the ten schools were calculated and correlated. Specifically, the SPSS 15.0 for Windows Version was used for the analysis. Results The research question ‘What is the nature and extent of students’ task engagement in chemistry?’ is answered by tables 1. Table 1 shows simple statistics of various variables including Task Engagement (STDTASK) for all 10 classes. Table 1: Simple Statistics for the 3 Variables: STDTASK, ACHIVT & ATTITUDE
Variable N Mean Std Dev Sum Min Max MaxExp ½ Max STDTASK 10 11.2600 1.0069 112.6 9.0000 12.6000 15 7.5 ACHIVT 10 12.1200 2.9491 121.2 5.3000 15.3000 30 15 ATTITUDE 10 90.9250 3.4378 909.3 83.3000 96.2500 120 60
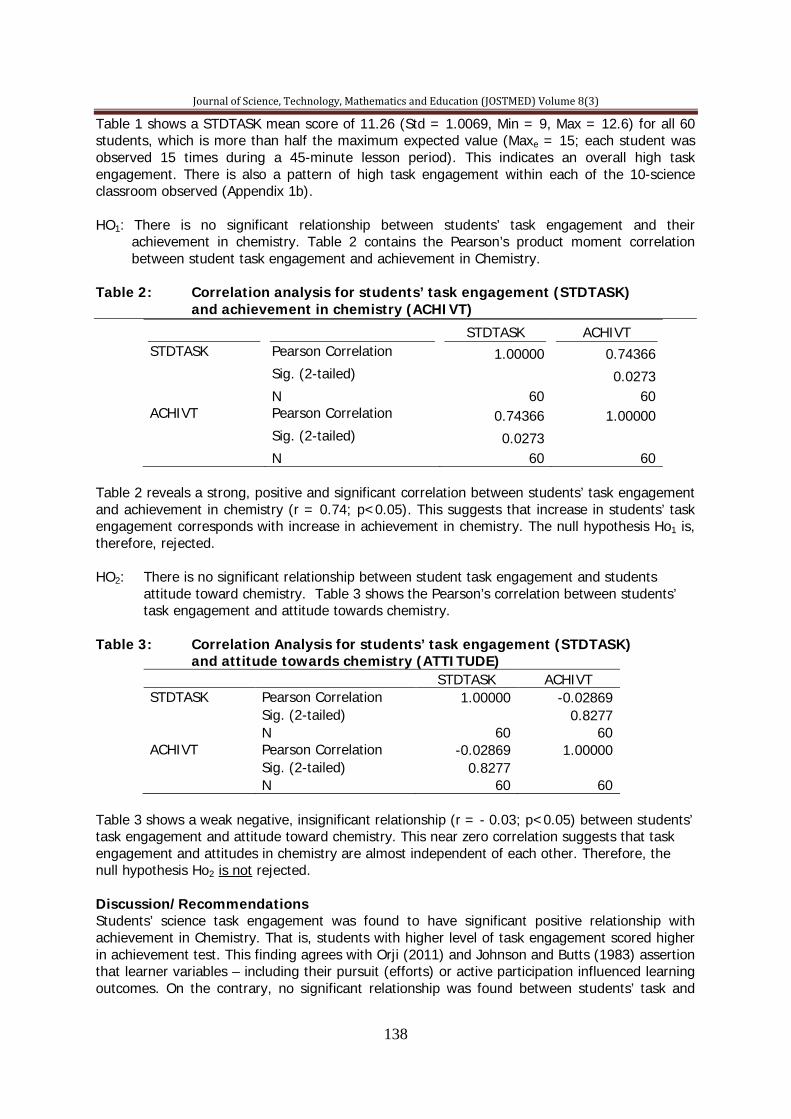
Journal of Science, Technology, Mathematics and Education (JOSTMED) Volume 8(3)
138
Table 1 shows a STDTASK mean score of 11.26 (Std = 1.0069, Min = 9, Max = 12.6) for all 60 students, which is more than half the maximum expected value (Maxe = 15; each student was observed 15 times during a 45-minute lesson period). This indicates an overall high task engagement. There is also a pattern of high task engagement within each of the 10-science classroom observed (Appendix 1b). HO1: There is no significant relationship between students’ task engagement and their achievement in chemistry. Table 2 contains the Pearson’s product moment correlation between student task engagement and achievement in Chemistry. Table 2: Correlation analysis for students’ task engagement (STDTASK) and achievement in chemistry (ACHIVT)
STDTASK ACHIVT STDTASK Pearson Correlation 1.00000 0.74366 Sig. (2-tailed) 0.0273 N 60 60 ACHIVT Pearson Correlation 0.74366 1.00000 Sig. (2-tailed) 0.0273 N 60 60
Table 2 reveals a strong, positive and significant correlation between students’ task engagement and achievement in chemistry (r = 0.74; p<0.05). This suggests that increase in students’ task engagement corresponds with increase in achievement in chemistry. The null hypothesis Ho1 is, therefore, rejected. HO2: There is no significant relationship between student task engagement and students attitude toward chemistry. Table 3 shows the Pearson’s correlation between students’ task engagement and attitude towards chemistry. Table 3: Correlation Analysis for students’ task engagement (STDTASK) and attitude towards chemistry (ATTITUDE)
STDTASK ACHIVT STDTASK Pearson Correlation 1.00000 -0.02869 Sig. (2-tailed) 0.8277 N 60 60 ACHIVT Pearson Correlation -0.02869 1.00000 Sig. (2-tailed) 0.8277 N 60 60
Table 3 shows a weak negative, insignificant relationship (r = - 0.03; p<0.05) between students’ task engagement and attitude toward chemistry. This near zero correlation suggests that task engagement and attitudes in chemistry are almost independent of each other. Therefore, the null hypothesis Ho2 is not rejected. Discussion/Recommendations Students’ science task engagement was found to have significant positive relationship with achievement in Chemistry. That is, students with higher level of task engagement scored higher in achievement test. This finding agrees with Orji (2011) and Johnson and Butts (1983) assertion that learner variables – including their pursuit (efforts) or active participation influenced learning outcomes. On the contrary, no significant relationship was found between students’ task and

Journal of Science, Technology, Mathematics and Education (JOSTMED) Volume 8(3)
139
attitude towards chemistry suggesting that any trend between students’ engagement and attitude was a chance occurrence. The study therefore makes the following recommendations: (i) In addition to exposure to subject contents, students should be taught “what it takes to be actively engaged in science lessons; (ii) Science teachers should seek practical ways to foster students’ engagement for academic excellence; (iii) Pre-service and serving teachers should be trained on designing and conducting appropriate learning task that will physically, mentally and socially engage students; (iv) Schools should create enabling environment for student cooperation, as well as pay attention to factors that encourage students’ willing and motivation to devote substantial time and effort to learning tasks. Conclusion Promoting science and technology for national growth and global competitiveness has been the priority of nations. At the classroom level, educationists and researchers are now focusing on the contribution of students’ variables to successful learning and doing of science. This study sought to ascertain the relationship between students’ science task engagement and achievement and attitude toward chemistry. It found that students’ engagement had positive significant relationship with achievement, but was insignificantly related with attitude. Thus, school science improvement projects should target preparing and motivating students’ for active task engagement in science. References Adeleye, F. B. (1987).The relationship between teacher questioning styles and students’ classroom participation and achievement in biology. Unpublished Doctoral Dissertation, University of Ibadan, Ibadan. Adesoji, F. A., Ige, T. A., Iroegbu, T. O. & Olagunju, A. M. (2003). Innovations in science teaching for new millennium. O. Ayodele-Bamisaiye, I. A. Nwazuoke and A. Okediran (Eds) Education this Millennium – Innovation in Theory and Practice.Ibadan: Macmillan Publishers. Beasley, W. (1983). Teacher management behaviours and pupil task involvement during small group laboratory activities. Journal of Research in Science Teaching, 20 (8), 713 - 719. Capie, W. & Tobin, K. (1981). Pupil engagement in learning tasks: A fertile area for research in science teaching. Journal of Research in Science Teaching, 18, 409 - 417. Cangelosi, J. S. (1993). Classroom management strategies: Gaining and maintaining students’ cooperation. London: Longman. Chapman, E. (2003). Alternative Approaches to assessing student engagement rates. Practical Assessment, Research & Evaluation, 8 (13). Retrieved from http://PAREonline.net/getvn.asp?v=8&n=13. Howe, A. C. & Raleigh, N. C. (1996). Adolescents' motivation, behavior and achievement in science. Retrieved from http://www.narst.org/publications/research/Adolescent.cfm

Journal of Science, Technology, Mathematics and Education (JOSTMED) Volume 8(3)
140
Johnson, T. F. & Butts, D. P. (1983). The relationship among college science student achievement, engaged time, and person characteristics. Journal of Research in Science teaching, 20 (4), 357 - 366. Kounin, J. S. (1970). Discipline and group management in classrooms. New York: Holt, Rinehart & Winston. McGarity, J. R. & Butts, D. P. (1984). The relationship among teacher classroom management behaviour, student engagement and student achievement of middle and high school science students of varying aptitude. Journal of Research in Science Teaching, 21, 55 - 61. McIntyre, D. J. & O’Hair, M. J. (1996). The reflective roles of the classroom teacher. Califonia: Wadsworth. Okebukola, P. A. & Ogunniyi, M. B. (1986). Effects of teacher’s verbal exposition on students level of class participation and achievement in biology. Science Education, 70 (1), 45 - 51. Orji, N. S. (2006). Relationship among teacher classroom management behaviours, students’ task engagement, and students’ outcomes in chemistry. Unpublished Master’s Thesis, University of Ibadan, Ibadan. Orji, N. S. (2011).The influence of adults’ socio-psychological characteristics on their active participation in adult educational programme. Nigerian Journal of Teacher Education and Teaching, 9 (1), 356-370. Ramadas, J. S. & Kulkarni, V. G. (1982). Pupil participation and curriculum relevance. Journal of Research in Science Teaching, 19 (5), 357 - 365. Sandholtz, J. H. & Dwyer, D. C. (1994). Student engagement revisited: Views from Technology- rich classroom. Cupertino: Apple. Simpson, R. O. & Twoost, K. M. (1982). Influences on commitment to and learning of science among adolescent students. Science Education, 66 (5), 763 - 781. Yair, G. (2000). Educational battle field in America: The tag-of-war over students’ engagement with instruction. Sociology of Education, 73, 247 - 269.

Journal of Science, Technology, Mathematics and Education (JOSTMED) Volume 8(3)
141
APPENDIX I
A: Student’s Task-Engagement Record (STER)
Stud
. N
o./
02-M
ar
05-J
un
08-S
ep
11-D
ec
14-1
5
17-1
8
20-2
1
23-2
4
26-2
7
29-3
0
32-3
3
35-3
6
38-3
9
41-4
2
44-4
5
Tota
l
Tim
e (m
in]
1 2 3 4 5 6 Total *Key: 1 = on-task/engaged 0 = off-task/disengaged B: Class Average scores for: STDTASK, ACHIVT & ATTITUDE C1 C2 C3 C4 C5 C6 C7 C8 C9 C10
AVE STDTASK
11 11 12 11 13 12 11 12 9 12
AVE ACHIVT
15 14 13 13 12 9 12 12 5 16
AVE ATTITUDE
91 95 95 90 10 90 91 96 92 83

Journal of Science, Technology, Mathematics and Education (JOSTMED) Volume 8(3)
142
Instruction: Please tick in the appropriate column to show your feelings toward the statements. SA – Strongly Agree; A = Agree; D = Disagree; SD = Strongly Disagree.
APPENDIX II
Chemistry Attitude Questionnaire (CAQ) The statements in this questionnaire seek to find out how you feel about chemistry. Select freely the option that expresses your feelings toward Chemistry. There is no right or wrong answers. Name of student: ____________________________________________ Sex: _________ Class: __________ CHEMISTRY ATTITUDE STATEMENTS S/N ITEMS SA A D SD 1 Chemistry is a fun 2 I have good feelings towards chemistry 3 I like chemistry 4 I would enjoy being a chemist or chemical scientist 5 Everyone should learn chemistry 6 I feel nervous in chemistry class 7 I usually look forward to my chemistry class 8 We do a lot fun activities in chemistry class 9 We learn about important things in chemistry class 10 We cover interesting topics in chemistry class 11 I love spending my free time studying chemistry 12 I consider our chemistry classroom attractive and comfortable 13 Our chemistry classroom/laboratory contains a lot of interesting equipment 14 My chemistry teacher encourages me to learn more chemistry 15 I enjoy talking to my chemistry teacher after class 16 My chemistry teacher makes good plans for us 17 Sometimes my chemistry teacher makes me feel dumb 18 My chemistry teacher expects me to make good grades 19 My best friends like chemistry 20 Most of my friends do well in chemistry 21 I always try hard, no matter how difficult the work 22 When I fail that makes me try that much harder 23 I always try to do my best in school 24 I try hard to do well in chemistry 25 Chemistry makes me feel as though I am lost in a bush 26 Chemistry tests make me afraid 27 I would probably not do well in sciences if I took it in college. 28 I consider myself a good chemistry student 29 I think I am capable of becoming an engineer, scientist, chemist or doctor 30 In chemistry class, I feel being in control of my learning
Journal of Science, Technology, Mathematics and Education (JOSTMED) Volume 8(3)
143
STUDENT PERCEPTION OF THE CAUSES AND PENALTIES OF EXAMINATION MALPRACTICE: A CASE STUDY OF NIGER STATE COLLEGE OF EDUCATION, MINNA
Dantani Isah Sani (Ph.D)
Department of Early Childhood Care Education Niger State College of Education, Minna
E-Mail: [email protected] Phone No: +234-806-563-3213
Abstract This paper examined the student’s perception of factors and solutions to examination malpractice in Nigerian colleges of education. The design of the study was survey. Three research questions guided the study all students in the Nigerian colleges of education constituted the population while 400 students of colleges of education Minna were randomly selected as sample. The instrument used to collect data was constructed by the researcher and was face validated by three lecturers in the department of psychology with reliability coefficient of 0.84. The data were analysed using percentages and mean. The findings show among others that all the identified examination malpractices exist, the introduction of micro-chips into the examination halls was found to be the most frequent. Also, the findings revealed that the causes of examination malpractice among others are, lack of adequate preparation by the students, distractions in the college that are non-academic, large population of students in the examination halls and non-coverage of the course content by the lecturers. The penalties are light penalties such as cancellation of the examination involved, at most, rustication for one session. From the findings of this study, it is recommended that there should be improvement in the delivery of instruction especially at the foundation i.e. (primary) level. The use of mobile phones as the new devise for examination malpractice should be curtailed or that the colleges should ban the use of mobile phones in the examination halls. Introduction The value and functionality of any educational system lie in its ability to actualize the goals of education. In the educational systems, world over, the examination process makes the difference. The goals of national education systems and indeed national development become like mirage if examination ethics are not encouraged and instituted (Olatunbosun, 2009). Till date, examination is still the best tool for an objective assessment and evaluation of what learners have achieved after a period of schooling. Hence, any action that undermines examinations poses a great threat to the validity and reliability of examination results and certification. Unfortunately, the process of examination in Nigerian tertiary institutions, colleges of education inclusive, has become a “contemporary shame” (Olatunbosun, 2009). This is because of the phenomenon of examination malpractice that has become endemic in the educational system. Examination malpractice is an illegal or unethical behaviour by somebody in the process of testing an examinees ability or knowledge by means of question (Ikupa, 1997). Similarly, Kibler (1988, as cited in Kibler, 1993) defined examination malpractices as forms of cheating and plagiarism that involve students giving and receiving unauthorized assistance in an academic exercise or receiving credit for work that is not their own. The Examination (Alutu & Aluede, 2006) explains examination malpractice as any act of omission or commission by a person who in anticipation of, before, during or after any examination fraudulently secure any unfair advantage for himself or any other person in such a manner that contravenes the rules and regulations to the extent of undermining the validity, reliability, authenticity of the examination and ultimately the integrity of the certificates issued. Oluyeba and Daramola 1992 (cited in Alutu & Aluede, 2006) remarked that examination malpractice is any irregular behaviour exhibited by a candidate or anybody charged with the conduct of examination before, during or after the

Journal of Science, Technology, Mathematics and Education (JOSTMED) Volume 8(3)
144
examination that contravenes the rules and regulations governing the conduct of such examination. The major forms of examination malpractice reported are: Impersonation and bringing in foreign materials (books, calculator), substituting worked scripts, stealing, converting, misappropriating scripts, collusion in the examination hall (copying); mass/ organized cheating involving assistance from teachers and outsiders; and insult/assault on supervisors/ invigilators (Oluyeba and Daramola, 1992). This trend in examination malpractices is inimical to academic development and advancement and needs to be drastically addressed. The hues and cries about examination malpractices which took place at all level of the Nigerian educational system is nothing but a reflection of the society. The Nigerian society is that which celebrates mediocre and view cheats as being smart. The society does not want to know how an individual achieves success. The important thing is the success (Oduwaiye, 2009). In actual fact, examination malpractice is a variant of the corruption in offices, students cheat from primary to tertiary institutions to move from one level of education to another. All sorts of malpractices take place in and around examination venues in order to achieve success. To make matters worse, it is not only students that are involved, parents, lecturers, examination officials, all collude with students to perpetrate this act (Ijaiya, 2004). The collusion between one and more of these agents makes it more difficult to combat. Even the penalties stipulated in Act 33 of 1999 ranging from cancellation of results to 21- year- jail term have failed to achieve any significant shift from the cheating culture (Olasehinde, 1993). The college of education system evaluates the achievement of students’ learning by administering two major types of examinations. Each course is evaluated by continuous assessment test (C.A. Test) and semester examination. These two types of examinations are not spared of malpractices of one type or another. It was a common occurrence to see the list of students expelled from the college of education Minna on account of examination malpractice. It was the intention of this researcher to look into the reasons why students cheat, the forms of cheating and evaluate the penalties for examination as perceived by the students. There is an array of literature on the factors responsible for examination malpractice in Nigeria. They are students’ lack of adequate preparation for examination, poor school facilities, poor sitting arrangement, socio-economic factors (Ijaya 1998;). Other factors identified are certificate syndrome, political – undertone proliferation of private schools, poor invigilation procedure, supervisory role of school administrators (Peter, 2002). Another factor why examination malpractice has not been reduced to its barest minimum is the fact that the penalties for examination malpractice as stipulated in Act 33 of 1999 have not been fully applied. Ijaiya (2004) however felt strongly that as jail term or public execution has not been able to deter armed robbery in Nigeria, a jail term stipulated in Act 33 of 1999 would not stop examination malpractice and so, he advocated for the elimination of the link that exists among the perpetrators of examination malpractice. On the penalties for examination malpractice, Act 33 of 1999 stipulates cancellation of results, heavy fine as much as N100, 000.00 or a jail term up to 21 years. This act remains a toothless bulldog as many of these penalties have not been implemented. College of Education Minna, (1998) stipulates a number of penalties such as rustication for not less than two semesters to expulsion. All these penalties are to serve as deterrent to students. Purpose of Study Considering the magnitude and the continuous occurrence of examination malpractice in the Nigerian educational system, it is no doubt necessary to research into this area before the Nigerian Certificates become worthless papers. Also, in the era of anti-corruption in the Nigerian
Journal of Science, Technology, Mathematics and Education (JOSTMED) Volume 8(3)
145
society, the educational institutions need to join this crusade and totally rid the system of this plague. It was therefore, the intention of this paper is to examine the forms of examination malpractices, the causes as well as evaluate the penalties for examination malpractices in Nigerian Colleges of Education using Niger State College of Education as a case study. Research Questions The following research questions were answered in the study 1. Which are the most frequently used examination malpractice in Nigerian colleges of Education?2. 2. What are the factors responsible for examination malpractice in Nigerian Colleges of Education?3. 3. What are the solutions to these examination malpractices? Methodology The population of this study included all the students of Niger State College of Education, Minna. The study sample consisted of 400 students randomly selected across schools and directorates. Fifty students were sampled from six (6) schools and two (2) directorates. That is, the schools of Arts and Social Sciences, school of languages, school of technical education, school of education, school of sciences and school of vocational education. The directorates are directorate of pre-NCE and directorate of university affiliated programmes (DUAP). The instrument used to collect data was Questionnaire on Students Perception of the Causes and Penalties of Examination Malpractice (QSPCPEM) constructed by the researcher and was face validated by three lecturers in the department of psychology with reliability coefficient of 0.84. It had three parts A, B and C consisting of 11, 10 and six items respectively. Section A requires the respondents to rank 11 forms of malpractice according to their frequency of occurrence while part B identifies 10 factors responsible for examination malpractices using four-point likert rating scale of Strongly Agree, Agree, Disagree and Strongly Disagree. Section C also called for respondent’s agreement or otherwise on the penalties. The data were analysed using percentages, mean and presented in tables. The mean of 2.50 was taken as the average mean; therefore items with a mean of 2.50 and above were accepted while those below 2.50 were rejected. Results and Discussions Table 1: Result of a rank order by student’s of the types of examination malpractice S/N Type of Malpractice Freq % Rank 1 Introducing micro-chips into examination venue 232 58 1 2 Collusion with other students 15 3.75 4 3 Collusion with invigilators 15 3.75 4 4 Spying on another students examination scripts 30 7.5 3 5 Impersonation (i.e) making another person to write
examination 10 2.5 7
6 Bringing into examination venue prepared answer scripts 13 3.25 6 7 Taking away answer scripts from examination venue
without submission 10 2.5 7
8 Undue advantage from course lecturer i.e leakage 10 2.5 7 9 Use of mobile phones to communicate answers among
students 10 2.5 7
10 Exchange of question paper/answer scripts containing handwritten information during an examination
10 2.5 7
11 Lecturers assisting students during and after examination 45 11.3 2

Journal of Science, Technology, Mathematics and Education (JOSTMED) Volume 8(3)
146
All the respondents agreed that the identified types of examination malpractice exist in the Nigerian Colleges of Education. 58% of the students ranked and agreed that introduction of micro-chips into examination venue was the most commonly used type of examination malpractice. Lecturers assisting students during and after examination were ranked second by 11.25% of the respondents. This goes along way in explaining why you see students loitering around staff offices even after the examinations. Spying on another student’s examination scripts was ranked third while collusion with other students and invigilators were ranked fourth. Bringing into examination venue prepared answer scripts was ranked sixth while taking away answer scripts from examination venue without submission, impersonation (i.e) making another person to write examination, undue advantage from course lecturer i.e leakage, use of mobile phones to communicate answers among students and exchange of question paper/answer scripts containing handwritten information during an examination had the same ranking. Table 2: Students’ Perception of the Causes of Examination Malpractice S/N Factor Mean
X Decision
1 Students are not well prepared for the examination 3.05 Accepted 2 There are a lot of distractions in the examination
venue 2.3 Rejected
3 There are many distractions in the college that are non-academic
3.03 Accepted
4 Supervision is not effective in examination halls 2.4 Rejected 5 Students population is too large for the invigilators 3.17 Accepted 6 The sitting arrangement is too close and not adequate 3.05 Accepted 7 Students wants to pass despite their weak academic
performance 3.15 Accepted
8 Lecturers do not cover the course content 2.9 Accepted 9 It is a practice to cheat 2.35 Rejected 10 Poverty of parents 2.45 Rejected
Table 2 reveal that factors 1, 3 5, 6, 7 and 8 are responsible for examination malpractice in the college of education Minna. it is clear that one of the major causes of examination malpractice is the fact that students want to pass despite their weak academic performance(х=3.15). This is as a result of emphasis placed on certificates in Nigeria. This is strongly linked to item eight which has to do with lecturers not covering the course content. Also, large population was accepted as a major cause of examination malpractice (х=3.17). Another factor accepted by student as the cause of examination malpractice is the inadequacy and closeness of the sitting arrangement. Furthermore, students’ ill-preparedness for the examination as well as many distractions that are non-academic were accepted by students as factors causing examination malpractice. It has been observed that majority of the students spend more time on activities that are non-academic such as student’s social and political activities, travelling and student’s politics at departmental, school and student union levels. These activities take them away from lectures and when they find out that the semester has run out they begin to look for how to cut corners. Student’s perception of the penalties for examination malpractice is shown on table 3.

Journal of Science, Technology, Mathematics and Education (JOSTMED) Volume 8(3)
147
Table 3: Students perception of the penalties for examination malpractice S/N Items Mean Decsion
X 1 21 years of imprisonment is appropriate 2.36 Rejected 2 Refer to the law court as it is a criminal case 2.64 Accepted 3 Cancellation of the examination involved 2.65 Accepted 4 Rustication for a semester or session 2.64 Accepted 5 Expulsion from the college 2.3 Rejected 6 Payment of heavy fine as much as fifty thousand naira 2.21 Rejected Table 3 reveals that students disagreed to heavy penalties for examination malpractice. They rejected imprisonment for a period of 21 years, heavy fine as much as fifty thousand naira and expulsion from the college. They perceived that rustication for a semester or session would reform rather than a damaging penalty such as expulsion from the college, knowing that such penalty may be the end of a student’s education. Student’s response indicated preference to cancellation of such examination or reference to the law court. Conclusion and Recommendations The findings of this study revealed students perception of the causes of examination malpractice with large population as being the major factor/cause. They perceived that the following penalties given by the college are accepted. The penalties are cancellation of the examination involved, rustication for a semester or session and referral to the law court as it is a criminal case. The 21 years imprisonment, payment of heavy fine as much as fifty thousand naira and expulsion from the college was perceived to be too harsh for students. Based on the findings, the following recommendations are made towards curbing examination malpractice to barest minimum. (i) Many students who engage in examination malpractice have been found to be academically weak which are traceable to the school foundation in their educational ladder. It is recommended that there should be improvement in the delivery of instruction especially at the foundation i.e. primary level. (ii) School facilities in term of sitting arrangement and halls have been a major cause of examination malpractice. The Colleges should guide against indiscriminate admission of students so as not to overstretch the facilities available. There should be good environment like good ventilation, good examination chairs and adequate spacing between students. A lot of temptations to cheat exist when seats are too close to one another. The National Commission for Colleges of Education (NCCE) is waging war against overpopulation in the Nigerian Colleges of Education. Colleges should continue to admit students based on the facility available. (iii) The use of mobile phones as the new devise for examination malpractice should be curtailed. The colleges should ban the use of mobile phones in the examination halls. (iv) The integrity of the college of education lecturer is important in curbing examination malpractice. Undue familiarity which can make some students to have advanced Knowledge of the examination should be totally discouraged. (v) The invigilators should be very vigilant in their supervision of examination and should be fair to everyone. The question of double standard should not be mentioned. (vi) Niger State College of Education, Minna should mount campaigns more frequently on the ills and penalties of examination malpractices until the evil is totally stamped out of our educational system.
Journal of Science, Technology, Mathematics and Education (JOSTMED) Volume 8(3)
148
(vii) There should be adequate monitoring/supervision by the college management to ensure that lecturers cover the course content, also, non-academic activities such as unionism activities should be reduced to cut down unnecessary distractions in the colleges of education in Nigeria. References Aaron, R. M. (1992). Student academic dishonesty: Are collegiate institutions addressing the issue? NAPSA Journal, 29: 103-113. Alutu, A. N. G. & Aluede, O. (2006). Secondary school students’ perception of examination malpractices and examination ethics. Journal of human ecology, 20(4). Ijaiya, N. Y. S. (2004). Agents of examination malpractice in Nigerian public examinations: Who is the strongest link? Paper presented at the 7th National Conference of the National Association of Educational Researchers and Evaluators (NAERE) held at Unilag, 21 st- 24th June, 2004. Ijaiya, Y. (1998). Eradicating examination malpractices: A macro-theoretical framework option. Nigerian Journal of Development Issues: 2(2), 72 - 85. Ikupa, J. C. B (1997). Causes and cure of examination malpractices. The Business Administrator, 1(1), 38- 39. Kibler, W. L (1993). Academic dishonesty: A student development dilemma. NAPSA Journal, 30, 252- 260. Niger State College of Education (2010). Guidelines on the conduct/invigilation of examination and penalty for misconduct and malpractices. Minna Oduwaiye, R.O. (2009). Students perception of factors and solutions to examination malpractice in Nigerian Universties: A case study of University of Ilorin. Ilorin Journal of Education. Olasehinde, F. A. O. (1993). Cheating in examinations in the University of llorin: Styles, causes and remedies. Nigerian Journal of Educational Foundations, 4(1), 16 – 22. Olatunbosun, J. B. (2009). Examination malpractice in secondary school in Nigeria: What sustains it. European Journal of Educational Studies 1(3). Oluyeba, N. F. & Daramola, S. O. (1992). Incidences and detection of examination malpractices in Nigerian public examinations. Paper presented on behalf of WAEC on Examination Malpractices, University of Benin, Benin city, Nigeria Peter, E. (2002). Research uncovers students' tricks in examinations. The Punch, p.42.
Journal of Science, Technology, Mathematics and Education (JOSTMED) Volume 8(3)
149
ENHANCING LISTENING IN CHILDREN FOR EFFECTIVE TEACHING AND LEARNING IN PRIMARY SCHOOLS
Obiweluozo E. P. (Mrs.)
Department of Educational Foundations University of Nigeria, Nsukka. E-Mail: [email protected]
Mobile Phone: +234-806-494-8019 Abstract This study examined listening for effective teaching and learning for children in primary schools. Three research questions guided the study and a descriptive survey design was adopted. The population consisted of all the primary school teachers in Awka South Local Government Area of Anambra State. From the population a sample size of 110 teachers was drawn. The data obtained was analyzed using mean and standard deviations. The findings revealed that listening is essentially important for effective teaching and learning for children in primary schools. It also indicated factors that impede efficient listening as well as strategies for enhancing children’s listening. Based on the findings of the study, recommendations were made. Introduction Listening is an indispensable skill in human communication. It is used far more than any other single language skill in normal daily life. For instance, people everywhere at all times, in all situations essentially engage in listening on a daily basis. They spend a greater percentage of their time in listening to radios, their friends, their family members, co-workers, colleagues, among others than in speaking, reading, or writing. In addition, the hours students spend in the classroom listening can be approximated to be hundred percent (Tutoring and Academic Success Centres “TASC” 2001). Listening is the process of focusing all attention to a source of sound in order to hear. Discovery Education (2008) defined listening as paying attention or making an effort to hear something. Websters (2008) defined listening as paying attention in order to hear. In the words of Azikiwe (2007), listening means hearing with comprehension. Thus there is a difference between hearing and listening. When one recognises the sound of a moving car, running tap, breaking of fire wood or a baby’s cry, we say that the person heard whatever happened. But when one is asked a question in his native or second language and he fails to give the correct answer he has not listened although he heard. Listening is usually the first activity a child engages in. It provides a veritable foundation in the formation of speech habit of a child in later life. With the child’s listening, rules and nuances of the language are acquired in a rather unconscious manner. In a similar vein, Sholes (2008) noted that the more the skills a child gains during the early years in speaking and listening, the better he learns to read and write with ease in later life. In other words, early years are essential for teaching children how to listen in order to learn. Children could be taught this as early as in primary school. Primary education is the first port of call of official or formal education for children from age six to eleven years. FRN (2004) see it as the key to success or failure of the entire education system. If children are taught to be active listeners: possessing requisite listening skills, this could enhance their performance in school. It makes teaching and learning process effective. In fact, it cuts across all school activities. Without children, listening attentively to the teacher, the lesson may not be assimilated or grasped and the topic taught may not be remembered. Children’s understanding may not be there to capture the lessons taught before processing it to be stored in retentive memory. Children who fail to listen attentively in class lessons appear to be the never-do-well who lags behind in their studies. Teaching and learning are defined as the ways in which teachers and pupils interact, and in which pupils interact with one another (Effective Learning and Teaching in Scottish Secondary

Journal of Science, Technology, Mathematics and Education (JOSTMED) Volume 8(3)
150
School: English, html). Listening provides the aural input that serves as a basis for language acquisition and enables learners to interact in spoken communication (Klein, 2008). Thus, effective teaching and learning is contingent on listening. To listen, involve the ears, the eyes, whole-self, that is, undivided attention and heart. Listening is a process that consists of five elements: hearing, attending, understanding, responding, and remembering. Hearing is the physiological dimension of listening that occurs when sound waves strike the ear at a certain frequency and loudness is influenced by background noise. Attending is the process of filtering out some messages and focusing on others. Understanding occurs when we make sense of a message, responding consists of giving observable feedback to the speaker such as eye contact and appropriate facial expressions while remembering is the ability to recall information (Stewart, 2005). Listening is not just a passive activity; pupils have to be active participants in teaching and learning process. Listening effectively requires the application of considerable listening skills and practice. It needs to be learned. Listening skills according to Stewart (2005) are described as ‘listening with hearts’ or ‘hearing between the words’. Listening skills consists of non-verbal and symbolic communication. Non-verbal communication is also known as ‘body language’ and includes facial expressions, posture, hand gesture, tone of voice, smell and other communications perceived by one’s senses. For instance, when one does not speak, his/her non-verbal communications convey a message. Symbolic communications are demonstrated by the house one live in, the cloths one wear and especially the words one use. However, the subject of contention is that because listening is not a school subject like reading and writing, or mathematics, people think it comes naturally as long as they can hear or listen to directions or instructions on how to carry out a task. This appears to be true. Thus, listening is not recognized as a subject important to be taught. Azikiwe (2007) stated that listening is not as simple as people think and this serve to underline the need for teaching listening skills to enable the learners to comprehend spoken language with ease in any situation. Tutoring and Academic Success Centres (TASC) (2009) advocated that children should be taught listening so that they can learn to listen and learn better. Some variables appear to be a constraint to efficient listening in teaching and learning process. For instance, a classroom that is too hot or too cold, or noisy for children to stay appears to hinder the children from listening to the teacher’s lesson. Sometimes the attitude of the children influences their listening to the teacher. Some of the children appear to be naughty, some are indifferent, some are biased about their teacher, some of the children have their mind closed and some do not pay attention when the lesson is going on. Lack of eye contact and use of language not understood by the children could hinder the children from listening. This is in line with the findings of Klein (2007) which states that people do not listen when the mind is closed, and when the listener is biased about the speaker as well as when there is no eye contact. Adequate nutrition appears to be a problem to some families. Children who arrive at school hungry are less able to concentrate on schoolwork (Jukes, 2006). Such crop of children may not be in a good mood to listen to the teacher’s lesson. It is against this background that this work is conceived to determine the importance of listening, the factors that impede efficient listening and strategies to remediate the situation. Purpose of the Study In specific terms the study sought to: (i) Examine the essentials of listening in children for effective teaching and learning in primary schools. (ii) Identify the factors which generally impede listening in children for effective teaching and learning in primary schools. (iii) Determine the strategies for enhancing listening in children for effective teaching and learning in primary schools.
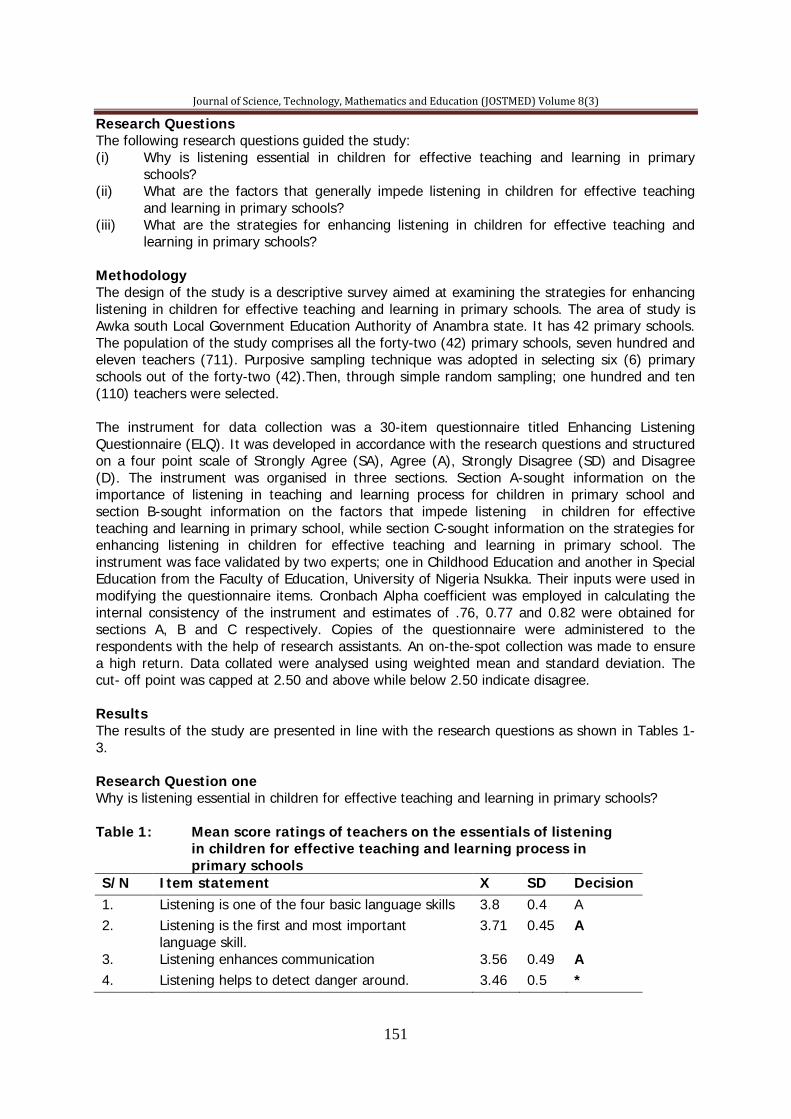
Journal of Science, Technology, Mathematics and Education (JOSTMED) Volume 8(3)
151
Research Questions The following research questions guided the study: (i) Why is listening essential in children for effective teaching and learning in primary schools? (ii) What are the factors that generally impede listening in children for effective teaching and learning in primary schools? (iii) What are the strategies for enhancing listening in children for effective teaching and learning in primary schools? Methodology The design of the study is a descriptive survey aimed at examining the strategies for enhancing listening in children for effective teaching and learning in primary schools. The area of study is Awka south Local Government Education Authority of Anambra state. It has 42 primary schools. The population of the study comprises all the forty-two (42) primary schools, seven hundred and eleven teachers (711). Purposive sampling technique was adopted in selecting six (6) primary schools out of the forty-two (42).Then, through simple random sampling; one hundred and ten (110) teachers were selected. The instrument for data collection was a 30-item questionnaire titled Enhancing Listening Questionnaire (ELQ). It was developed in accordance with the research questions and structured on a four point scale of Strongly Agree (SA), Agree (A), Strongly Disagree (SD) and Disagree (D). The instrument was organised in three sections. Section A-sought information on the importance of listening in teaching and learning process for children in primary school and section B-sought information on the factors that impede listening in children for effective teaching and learning in primary school, while section C-sought information on the strategies for enhancing listening in children for effective teaching and learning in primary school. The instrument was face validated by two experts; one in Childhood Education and another in Special Education from the Faculty of Education, University of Nigeria Nsukka. Their inputs were used in modifying the questionnaire items. Cronbach Alpha coefficient was employed in calculating the internal consistency of the instrument and estimates of .76, 0.77 and 0.82 were obtained for sections A, B and C respectively. Copies of the questionnaire were administered to the respondents with the help of research assistants. An on-the-spot collection was made to ensure a high return. Data collated were analysed using weighted mean and standard deviation. The cut- off point was capped at 2.50 and above while below 2.50 indicate disagree. Results The results of the study are presented in line with the research questions as shown in Tables 1-3. Research Question one Why is listening essential in children for effective teaching and learning in primary schools? Table 1: Mean score ratings of teachers on the essentials of listening in children for effective teaching and learning process in primary schools S/N Item statement X SD Decision 1. Listening is one of the four basic language skills 3.8 0.4 A 2. Listening is the first and most important
language skill. 3.71 0.45 A
3. Listening enhances communication 3.56 0.49 A 4. Listening helps to detect danger around. 3.46 0.5 *

Journal of Science, Technology, Mathematics and Education (JOSTMED) Volume 8(3)
152
5. Listening provides the moral input that serves as the basis for language acquisition.
3.29 0.46 *
6. Listening enables learners to interact in spoken communication.
3.6 0.49 *
7. Listening enhances learning of languages. 3.43 0.5 * 8. Listening is used far more than any other single
language skill in normal daily life. 3.32 0.47 *
9. Listening is one of the most important on-the-job communication skills.
3.39 0.49 *
The result on Table 1 indicated that teachers agreed with the 9 items that listening is essential in children for effective teaching and learning in primary schools since they have mean ratings of 2.50 and above. The standard deviations range from 0.40 to 0.50.This indicated that the respondents were not far from the mean and not far from one another in their opinions Research Question Two What are the factors that generally impede listening in children for effective teaching and learning? Table 2: Mean ratings on the factors that impede listening in children for effective teaching and learning in primary school S/N Item statement X SD Decision 1.
Unconducive classrooms; too hot or too cold, noisy for children.
3.8 0.4 A
2.
Teacher that has a speech defect and cannot articulate his\her words very well
3.52 0.5 A
3.
A listener that has hearing impairment 3.39 0.49 *
4.
If the children do not like the teacher 3.14 0.35 *
5. When the mind is closed 3.29 0.45 * 6.
Prejudice or being biased about the speaker (teacher)
3.27 0.44 *
7. Lack of concentration by the children 3.42 0.49 * 8.
Lack of eye contact 3.46 0.5 *
9.
Using a language that the children does not understand
3.36 0.48 *
10. Unpleasant mood of the children 3.51 0.5 * 11.
Too much distraction, noise or some other discomfort
3.51 0.5 *
The data on table 2 above showed that the 11 items were perceived as factors which impede listening in children for effective teaching and learning in primary school since they have mean scores of 2.50 points and above. The standard deviation of the score generated in all the items are small indicating that the variations of the scores from the mean are not so much. Research Question Three What are the strategies for enhancing listening in children for effective teaching and learning in primary schools?

Journal of Science, Technology, Mathematics and Education (JOSTMED) Volume 8(3)
153
Table 3: Mean ratings of teachers on strategies for enhancing listening in children for effective teaching and learning in primary schools S/N Item statement X SD Decision 1.
Deliberate training should begin as early as possible from the time a child can take orders.
3.75 0.44 A
2.
Children should be started with simple instructions, which will require sound discrimination.
3.48 0.5 A
3.
Teachers should train children’s ears properly to distinguish between the similar sounds they hear.
3.27 0.45 A
4.
Provision of classroom environment that encourages good listening.
3.66 0.47 *
5.
Ensure that in classroom speaking-listening situation that the language is understood by both parties.
3.37 0.49 *
6.
Teachers should use appropriate tone, pitch, volume and speed in speaking.
3.45 0.5 *
7.
Teachers should provide practice in listening experiences through discussion.
3.48 0.5 *
8.
Teachers should provide reinforcement for pupils’ listening experiences by asking them to listen to news, radio and television
3.55 0.5 *
9.
Teachers should make pupils understand or realize that they would do better in their class work/studies only if they have listened efficiently.
3.63 0.48 *
10.
Teachers should build a programme in which listening are consistently taught and practiced.
3.31 0.46 *
Key: * Agree = A Disagree = D The result on Table 3 above indicates the 10 strategies as effective measures for enhancing children for effective teaching and learning in primary school. This is evident in the mean scores which were above 2.50 the cut of point perceived as effective measures. The standard deviations generated from the mean scores on the items are small. This indicates that the score of the respondents are not vary far from the mean and from one another’s responses. Discussion The data on the Table 1 showed the essentials of listening in children for effective teaching and learning in primary schools. Listening is an indispensable tool for effective teaching and learning in primary schools. This corroborates the findings of Klein (2008) that listening provides the moral input that serves as a basis for language acquisition and enables learners to interact in a spoken manner. The data on Table 2 indicated the factors teachers perceive as impediments to listening in children for effective teaching and learning in primary schools. Their responses showed that in schools, classrooms that are too hot or too cold or noisy are not conducive for children to listen attentively to teacher’s lesson. Children, who do not like their teacher, refuse to listen to the teacher’s lesson and lack of eye contact by the listener, among others. This is in line with the findings of Klein (2007) which stated that people do not listen when the mind is closed, when they are biased about the teacher as well as when there is no eye contact. All these affect teaching and learning in schools.

Journal of Science, Technology, Mathematics and Education (JOSTMED) Volume 8(3)
154
An overview of the items in Table 3 indicated the strategies the teachers perceive would enhance listening in children for effective teaching and learning in primary schools. The findings agree with the NCLRC (2004) which stated that listening exercises that are meant to train should be success-oriented and build up student’s confidence in their listening ability. Also, Azikiwe (2007), TASC, (2001) and Hart (2007) posited that children should be taught listening so that they can learn to listen and listen to learn better. Recommendations Based on the findings of the study, the following recommendations are made: (i) Children should be trained to listen from the time a child can take orders. (ii) Children should be started with simple instructions which will require sound discrimination. (iii) Teachers should train children’s ears properly to distinguish between the similar sounds they hear. (iv) Provision of classroom environment that encourage good listening is essential. (v) Teachers should use appropriate tone, pitch, volume and speed in speaking to children. (vi) Teachers should provide reinforcement for pupils’ listening experiences by asking them to listen to news, radio and television. (vii) Teachers should make pupils understand or realize that they would do better in their class work/studies only if they have listened efficiently. Conclusion Listening is an essential ingredient in teaching and learning process. It enhances learning of language and all other school subjects. It behoves one to take a subject or course in listening so that pupils, students and everybody would learn to listen, and listen to learn. It is essentially important to listen with one’s eyes as well as one’s ears. This could enhance effective teaching and learning in primary schools. Referecnes
Azikiwe, U. (2007), Language teaching and learning. Onitsha, Nigeria: Africana First Publisher Limited.
Discovery Education (2008) Division of discovery communications, listening.
http://www.incret.org/compendium/browse.asp.Retrieved 07/03/2009 Effective Learning and Teaching in Scottish Secondary School: English. Retrieved from
http://www.Effective%20learning%20teaching%20-%20English%20(html).html on 13/7/2009.
Federal Republic or Nigeria (2004). National policy on education. Yaba-Lagos: NERDC Press. Hart, D. J. (2007). Children learning music advice for parent, Retrieved from http://Ezine
Articles.com/7 on 13/7/2009. Jukes M. (2006), Early childhood health, nutrition and education. Paper Commissioned for the
EFA Global Monitoring Report 2007, Story foundation: Early Childhood care and Education.
Klein, K. (2009) Improving communication skills: Effective listening strategies Retrieved from
http://www.ypkenya.org/2009/07/active-listening/ on 07/03/2009. Merriam-Webster (2008). Webster’s all-in-one dictionary & thesaurus eds. Incorporated USA:
Federal Street Press.

Journal of Science, Technology, Mathematics and Education (JOSTMED) Volume 8(3)
155
NCLRC. (2009). The essentials of language teaching (2004): strategies for developing listening skills in http://www.nclrc.org/essentials/listening/stratlisten.htm. Retrieve on 07/03/2009.
Sholes, D. (2008). Development of oral language in primary classrooms. File://E:Development%.
Retrieved on 07/03/2009. Stewart, G. (2005) Better communication results. Types of nonverbal communication Retrieved
from File://E:Types%20of%20nonverbal%20communcation%20Listening%20Skills .htm. On 03/7/2009
Tutoring and academic success centres “TASC” (2001). file://E:/studyskills.htm Tutoring and
academic success centres. Retrieved on.07/03/2009.

Journal of Science, Technology, Mathematics and Education (JOSTMED) Volume 8(3)
156
EFFECTS OF TWO STUDY STRATEGIES ON SECONDARY SCHOOL STUDENTS, ACHIEVEMENT IN BIOLOGY
Yaki, Akawo Angwal.
Science Education Department, Federal University of Technology Minna
Email: [email protected] Phone No: +234-706-707-4366
Abstract The study was informed by the need to evolve ways to improve students’ performance in science. The study examines the effect of study strategy on academic achievement of senior secondary school students in some selected secondary school in Minna, Niger state. A pre-test, post test experimental and control group design was adopted for the study. Three secondary schools were purposively selected; the sample size was 86 which was drawn using random sampling technique. The study was guided by two research questions and two research hypotheses. The instrument used was biology achievement test (BAT) made up of 20 multiple choice objective questions which was duly validated by experts. The data collected were analyzed using one way ANOVA and t-test at 0.05 significant levels. Results from the data analysis indicated a significant difference in the mean achievement score between the experimental groups and control group in favour of the experimental groups. On the other hand, there was no significant difference between the mean achievement score of male and female students exposed to Survey, Question, Read, Recite and Review (SQ3R) and Rereading study strategy. From the finding, it was concluded that SQ3R and Rereading study strategy enhances student’s academic performance, it was also concluded that SQ3R and Rereading study strategy enhances students achievement in science and is gender friendly. From the findings, it was recommended among others that seminars, conferences and counseling be organized for teachers and students on the benefit of SQ3R and Rereading study strategy Keywords: SQ3R, Rereading study strategy and Performance Introduction Study strategy is one of the most important processes in life. It is the way a student plans his private readings, after classroom learning so as to master what he/she is taught in a subject. Study strategies are learning tendencies that enable students to work privately (Omotere, 2011). Good study habits assist students to acquire adequate skills and competences in a subject or area of specialization as well as enhance academic performance in that subject area. Science teaching and learning in Nigeria have suffered a lot of set backs. This can be seen in the continuous poor performance of secondary school students in WAEC and NECO as documented by Ezenwa (2005) and Gambari (2010). The main causes of poor performance can be attributed to a lot of factors chiefly among them is poor study habits and ineffective learning style (Wenyi, 2002). In view of this Omotere (2011) posits that most secondary school students have poor study habit which might lead to poor academic performance. Bakare (1997) in Emmanuel (2003) opined that study habits should be logical, dynamic, functional and relevant to the personal characteristic of the individual learner. The West Africa Examination Council (WAEC) Annual Report (2001-2006) attributed students’ poor performance to poor teaching and weak preparation of candidates for examination and recommended teaching and good preparation of candidate as the only remedy to student’s poor performance in both junior and senior secondary certificate examinations. Umoranyanyi (1999) observed that study habit is a good predictor of learning outcome in school to support this Omotere (2011)
Journal of Science, Technology, Mathematics and Education (JOSTMED) Volume 8(3)
157
posits that most secondary school students have poor study strategy which might lead to poor academic performance hence the drive for this study. The SQ3R is an acronym that stands for S=survey, Q=question, R= Read, R= Recite, and R= Review (SQ3R) study skill is an approach that is learner centered. It helps in the development of learning skill and strategies as well as recognizes each individual’s ability to study at his own pace. This will enable individual learners to develop their learning potentials and encourage learners to choose both the way and direction for their own learning. Yahaya (2004) found that SQ3R study skill improve students study habit and thereby improve their performance. Issa (2008) in mathematics, found that students who employ SQ3R study strategy perform better than those who study via the conventional method. Lusford (1993) in Issa (2008) found that research on learning strategy identified SQ3R study strategy to be appropriate for all learners. The rereading strategy is a strategy in which a learner reads a text more than once i.e. reading and rereading it severally. Faust & Glenzer (2000) observed that rereading strategy is a useful pedagogical tool and has potential benefit for enhancing readers’ comprehension as well as enjoyment of literature. They concluded that the rereading strategy helps students obtain meaning of their favorite reading sections and makes meaning with texts. On the contrary, Short, Kane, and Peeling (2000) found that rereading a longer text may be time consuming. Empirical finding from Hsieh & Dwyer (2009) shows that rereading strategy enhances students’ performance than those who study via the conventional method. Brown (2002) also found that female Japanese college students’ reading comprehension improved through the use of rereading strategies. However Josemon (2006) revealed that in order to maximize students’ academic achievement, approaches to study and study strategy of the students are as important as classroom environment and that inability of a school system to develop useful study habits in its learners leads to wastage and stagnation. This study attempt to find out the extent, to which training in study or study habit behaviour could solve the achievement problem in science, biology inclusive. Gender issues have been linked with performance of students in academic tasks in several studies but without any definite conclusion. The findings of Umar (2011) and Yaki (2011) revealed that there is no significant gender difference in the performance of students in science concepts. Contrary to this Chinweze (2007), found that male students perform better than female students in science and technology concepts. Statement of the problem Fibersima (2001) identified poor study habit as one of the major causes of student’s poor performance in examination. The desire to pass by all means syndrome without studying effectively usually leads students into examination malpractice or failure. Anameze (1999) and Ewemyi (2002) found in their studies that many Nigerian students have defective study habits. They noted that poor study habits could result in little or no learning. Jackson (1971) in Yahaya (2003) observed that there was positive correlation between students study strategy and their academic performance. Ajayi, Opadare & Anwola (1997) reported a study involving 450 students from ten secondary schools Ibadan municipality. They discovered that candidates got involved in exam malpractice due to laziness, poor teaching and study strategy among others. The issue is of concern in science education, hence the need to find ways to reverse the trend of poor performance of students in science Biology inclusive especially at the secondary level. Considering the teacher to student ratio especially in public school which is 80-120 per class to a teacher. The focus is on the study skill of individual learner. A learner needs to identify that he needs to improve his strategies in reading. Such as underlining, high lightening or writing notes in his book etc. One of the methods that could be employed to improve study habits and performance in science is the provision of appropriate information on relevant study skills, this

Journal of Science, Technology, Mathematics and Education (JOSTMED) Volume 8(3)
158
form a major basis for this study. Research on gender in science has been inconclusive, hence gender is considered as a moderating variable in this study. Research questions To guide the study, the following questions are raised: (i) Is there any difference in the performance of student who employed SQ3R, rereading study strategy and those who did not use it? (ii) Is there any gender difference in the performance of students who employed SQ3R and rereading study strategies? Research Hypotheses (i) There is no significant difference in the performance of student who employed SQ3R, rereading study strategies and those who did not use it (ii) There is no significant gender difference in the performance of student who employed SQ3R study strategies (iii) There is no significant gender difference in the performance of student who employed rereading study strategies Methodology The research design is a pretest posttest experimental and control group design. The population was all Biology students in Minna metropolis. The sample for this study was randomly drawn from three comparable co-educational secondary schools Minna metropolis. Preliminary investigation showed that the schools were comparable in terms of academic standard, method of student’s admission, recruitment of teachers, physical facilities and science materials. The sample of this study are 84 senior secondary school students who are systematically drawn and assigned into experimental group 1, (n=28). Subjects in this group will be instructed on how to study ecology using SQ3R: Survey: this means to get the best overall picture of what one is going to study before the proper study in detail. Scanning for general ideal; the title, headings, subheadings, Captions under picture, charts, graphs or maps, Review questions or teacher-made study guides, Introductory and concluding paragraphs. This should be done in few minutes and by so doing one can make some prediction before the reading. Question: ask your self questions or the concept you are studying as you read or study on. Turn each heading and subheading into a question or question asked by the author especially while practicing this technique, write this question down. These questions give one the direction, focus and goal to satisfy rather than simply looking at words. Read: Reading is the translation of symbols, or letters into words and sentence that have meaning for individual looking at them. The reader must follow a sequence of symbols arranged in a particular way –in English from left to right, in Hebrew from right to left, and in Chinese from top to bottom. Read with attention and carefully looking for the answer to your question i.e. read to answer the question you have asked yourself or the author has asked i.e. answering your proposed question looking for main ideas, highlighting and labeling text. Sort out ideas and evaluate them. If the contents does not relate to the question, give it only a glance, read selectively. The best way to improve your reading speed is simply to practise under time conditions. Recite: One should stop reading periodically and recall the important ideas, concept in the material you have read to fix them in your memory. The good things to recite are answers to your proposed questions. Recite is to say to yourself allow or write down a key phrase that sums up the major points and answers the question. It is important to use your own words, not just copy a phrase from the book.
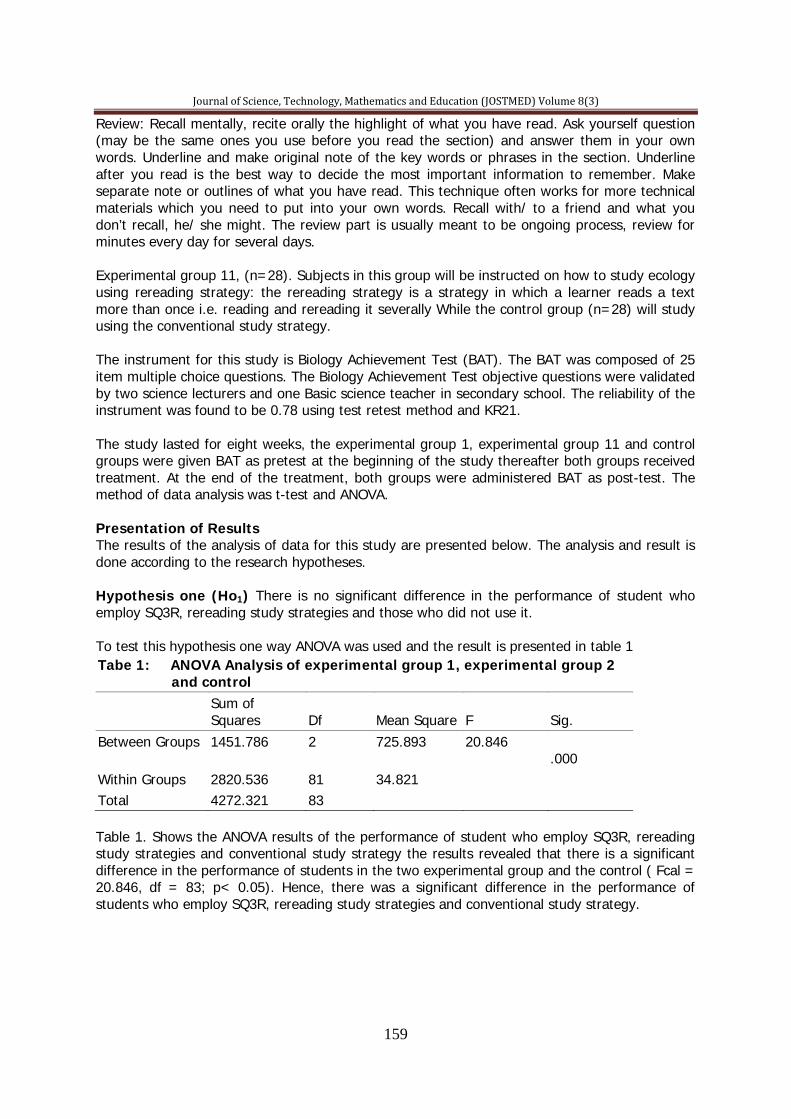
Journal of Science, Technology, Mathematics and Education (JOSTMED) Volume 8(3)
159
Review: Recall mentally, recite orally the highlight of what you have read. Ask yourself question (may be the same ones you use before you read the section) and answer them in your own words. Underline and make original note of the key words or phrases in the section. Underline after you read is the best way to decide the most important information to remember. Make separate note or outlines of what you have read. This technique often works for more technical materials which you need to put into your own words. Recall with/ to a friend and what you don’t recall, he/ she might. The review part is usually meant to be ongoing process, review for minutes every day for several days. Experimental group 11, (n=28). Subjects in this group will be instructed on how to study ecology using rereading strategy: the rereading strategy is a strategy in which a learner reads a text more than once i.e. reading and rereading it severally While the control group (n=28) will study using the conventional study strategy. The instrument for this study is Biology Achievement Test (BAT). The BAT was composed of 25 item multiple choice questions. The Biology Achievement Test objective questions were validated by two science lecturers and one Basic science teacher in secondary school. The reliability of the instrument was found to be 0.78 using test retest method and KR21. The study lasted for eight weeks, the experimental group 1, experimental group 11 and control groups were given BAT as pretest at the beginning of the study thereafter both groups received treatment. At the end of the treatment, both groups were administered BAT as post-test. The method of data analysis was t-test and ANOVA. Presentation of Results The results of the analysis of data for this study are presented below. The analysis and result is done according to the research hypotheses. Hypothesis one (Ho1) There is no significant difference in the performance of student who employ SQ3R, rereading study strategies and those who did not use it. To test this hypothesis one way ANOVA was used and the result is presented in table 1 Tabe 1: ANOVA Analysis of experimental group 1, experimental group 2 and control Sum of
Squares Df Mean Square F Sig. Between Groups 1451.786 2 725.893 20.846
.000 Within Groups 2820.536 81 34.821 Total 4272.321 83 Table 1. Shows the ANOVA results of the performance of student who employ SQ3R, rereading study strategies and conventional study strategy the results revealed that there is a significant difference in the performance of students in the two experimental group and the control ( Fcal = 20.846, df = 83; p< 0.05). Hence, there was a significant difference in the performance of students who employ SQ3R, rereading study strategies and conventional study strategy.
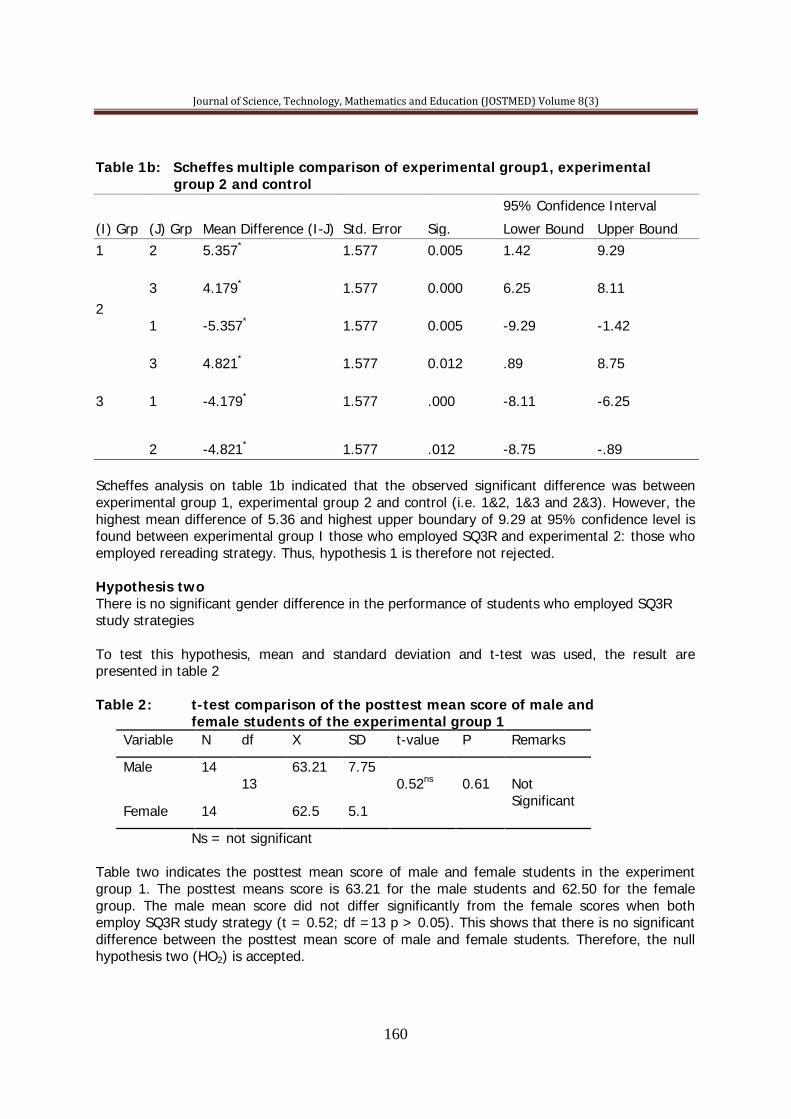
Journal of Science, Technology, Mathematics and Education (JOSTMED) Volume 8(3)
160
Table 1b: Scheffes multiple comparison of experimental group1, experimental group 2 and control
(I) Grp (J) Grp Mean Difference (I-J) Std. Error Sig.
95% Confidence Interval
Lower Bound Upper Bound 1 2 5.357* 1.577 0.005 1.42 9.29
3
4.179*
1.577
0.000
6.25
8.11
2 1
-5.357*
1.577
0.005
-9.29
-1.42
3
4.821*
1.577
0.012
.89
8.75
3
1
-4.179*
1.577
.000
-8.11
-6.25
2
-4.821*
1.577
.012
-8.75
-.89
Scheffes analysis on table 1b indicated that the observed significant difference was between experimental group 1, experimental group 2 and control (i.e. 1&2, 1&3 and 2&3). However, the highest mean difference of 5.36 and highest upper boundary of 9.29 at 95% confidence level is found between experimental group I those who employed SQ3R and experimental 2: those who employed rereading strategy. Thus, hypothesis 1 is therefore not rejected. Hypothesis two There is no significant gender difference in the performance of students who employed SQ3R study strategies To test this hypothesis, mean and standard deviation and t-test was used, the result are presented in table 2 Table 2: t-test comparison of the posttest mean score of male and female students of the experimental group 1
Variable N df X SD t-value P Remarks
Male 14 13
63.21 7.75 0.52ns
0.61
Not Significant
Female 14 62.5 5.1
Ns = not significant Table two indicates the posttest mean score of male and female students in the experiment group 1. The posttest means score is 63.21 for the male students and 62.50 for the female group. The male mean score did not differ significantly from the female scores when both employ SQ3R study strategy (t = 0.52; df =13 p > 0.05). This shows that there is no significant difference between the posttest mean score of male and female students. Therefore, the null hypothesis two (HO2) is accepted.
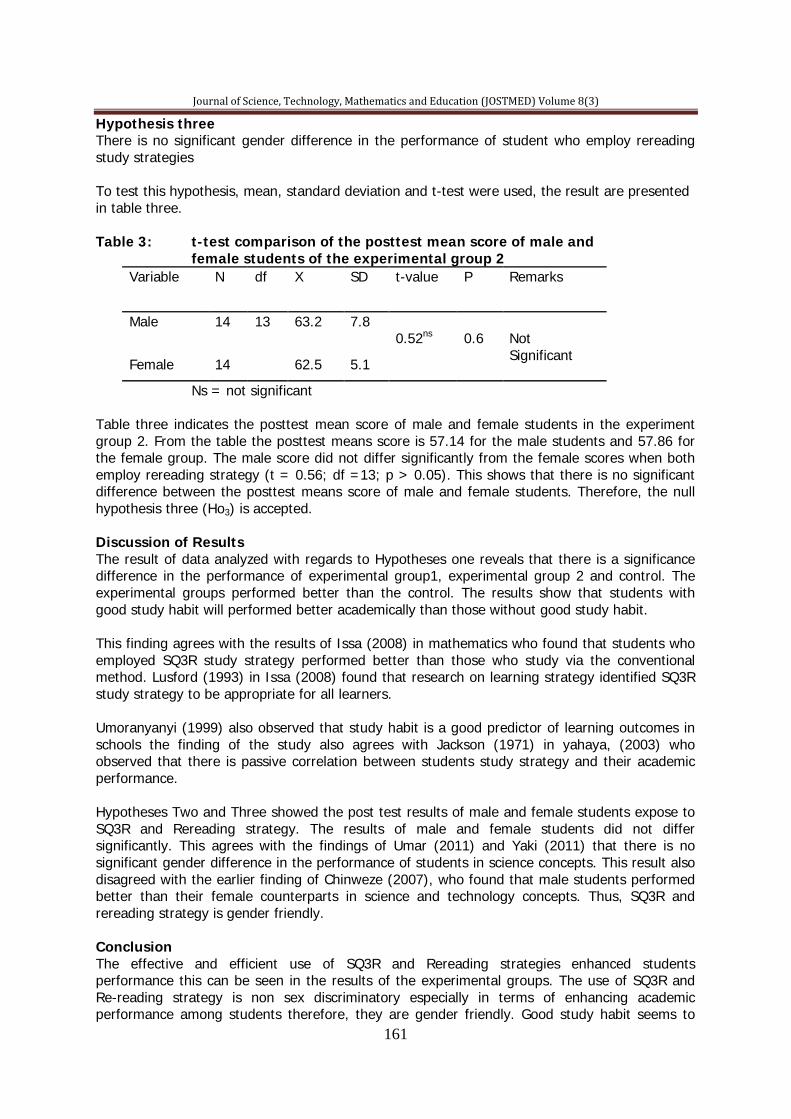
Journal of Science, Technology, Mathematics and Education (JOSTMED) Volume 8(3)
161
Hypothesis three There is no significant gender difference in the performance of student who employ rereading study strategies To test this hypothesis, mean, standard deviation and t-test were used, the result are presented in table three. Table 3: t-test comparison of the posttest mean score of male and female students of the experimental group 2
Variable N df X SD t-value P Remarks
Male 14 13 63.2 7.8 0.52ns
0.6
Not Significant
Female 14 62.5 5.1
Ns = not significant Table three indicates the posttest mean score of male and female students in the experiment group 2. From the table the posttest means score is 57.14 for the male students and 57.86 for the female group. The male score did not differ significantly from the female scores when both employ rereading strategy (t = 0.56; df =13; p > 0.05). This shows that there is no significant difference between the posttest means score of male and female students. Therefore, the null hypothesis three (Ho3) is accepted. Discussion of Results The result of data analyzed with regards to Hypotheses one reveals that there is a significance difference in the performance of experimental group1, experimental group 2 and control. The experimental groups performed better than the control. The results show that students with good study habit will performed better academically than those without good study habit. This finding agrees with the results of Issa (2008) in mathematics who found that students who employed SQ3R study strategy performed better than those who study via the conventional method. Lusford (1993) in Issa (2008) found that research on learning strategy identified SQ3R study strategy to be appropriate for all learners. Umoranyanyi (1999) also observed that study habit is a good predictor of learning outcomes in schools the finding of the study also agrees with Jackson (1971) in yahaya, (2003) who observed that there is passive correlation between students study strategy and their academic performance. Hypotheses Two and Three showed the post test results of male and female students expose to SQ3R and Rereading strategy. The results of male and female students did not differ significantly. This agrees with the findings of Umar (2011) and Yaki (2011) that there is no significant gender difference in the performance of students in science concepts. This result also disagreed with the earlier finding of Chinweze (2007), who found that male students performed better than their female counterparts in science and technology concepts. Thus, SQ3R and rereading strategy is gender friendly. Conclusion The effective and efficient use of SQ3R and Rereading strategies enhanced students performance this can be seen in the results of the experimental groups. The use of SQ3R and Re-reading strategy is non sex discriminatory especially in terms of enhancing academic performance among students therefore, they are gender friendly. Good study habit seems to

Journal of Science, Technology, Mathematics and Education (JOSTMED) Volume 8(3)
162
enhance academic achievement consequently poor study habit leads to low academic achievement and that may leads to examination malpractice, withdrawal from school which may also lead to other social vices hence students should be encourage to use SQ3R and Rereading study strategies. Recommendations From the findings of this study the following recommendations are made: (i) Seminars conferences and counseling be organized for teachers and student on the benefit of SQ3R and Rereading study strategy (ii) Teachers and parents should encourage their students to employ SQ3R and Rereading study strategy in their personal study because it is gender friendly. (iii) Students should employ healthy study strategy such as SQ3R and rereading strategies to enhance their academic achievement in science. References
Ajayi, J. B, Opadare, G. B. & Ariwoola, S. A. T. (1997). Examination malpractice in secondary Schools in Ibadan, Oyo State: Incidence, causes and control measures. Unpublished B.Ed project report. Nsukka; University of Nigeria
Ajibola M. A (2008) Journal of international studies – Issue 851. Retrieve on 2009 0317 Anameze, C. M. (2001). Study habit modification programme for Nigerian adolescent students in
the new millennium. In R. U. M. Ikonkwo & R.O. Okoye (Eds). The Nigerian perpective. Lagos: Onwuka and sons publishers.
Brown, S. (2002). What happens when people reread? Paper presented at the 13th Annual
World Congress of the Association Internationale de Linguistique Appliquee, Singapore, (ERIC Document Reproduction Service No. ED 473 080).
Eweniyi, G. D. (2002). The efficacy of moral/religious counseling in checking examination
Malpractice among secondary school students in Ogun state. The Nigerian journal of guardian and counseling, 8(1), 47-50.
Ferbersima, D. (2003). Types and effects of examination malpractice amongst adolescent in
perspective.Lagos; Onwuka publishers. Faust, M. A., & Glenzer, N. (2000). I could read those parts over and over: Eighth graders
rereading to enhance enjoyment and learning with literature. Journal of Adolescent & Adult Literacy, 44 (3), 234–239.
Gunning, T. G. (2003). Creating literacy instruction for all children (4th edition). Boston: pearson
Education inc. Hsieh, P.-H., & Dwyer, F. (2009). The Instructional effect of online reading strategies and
Learning Styles on Student Academic Achievement. Educational Technology & Society, 12 (2), 36–50.
Issa, A. (2008) Effects of survey, question, read, recite and review (SQ3R) study skill on senior
secondary school mathematics achievement in minna metropolis. Unpublished B,Tech project, science education department, Federal university of technology Minna.

Journal of Science, Technology, Mathematics and Education (JOSTMED) Volume 8(3)
163
Josemon, P.G. (2006). A study of the influence of certain pshycho-social correlates on pupils in the acquisition of biological concepts at secondary school level. A PhD thesis of Mathma Ghandi University, Kottayam.
Notis, K. & Kathrine, K. (2005). The effect of instruction modality and prior knowledge on
learning point group symmetry. journal of science education and technology 14(1)51- 58.
Orji, A. B. C. & Ebele, F. U. (2006). Personality system of instrument and student academic
performance in integrated science. Sokoto educational review, 8 (2), 149-156. Short, R. A., Kane, M. & Peeling, T. (2000). Retooling the reading lesson: Matching the right
tools to the job. ReadingTeacher, 54 (3), 284–295. Smith, S. A. (2003). The potential of multicultural literature changing understanding of self and
others. Multicultural perspective, (2)17-23. Retrieved on 2006-05- 19. Umar, A. A. (2011). Effects of biology practical activities on students process skills Acquisition in
Minna Niger state. Journal of Science, Technology, Mathematics and Education (JOSMED), 7 (2).
Umoinyangi, I. E. (1999). Student socio-psychological factors as determinant at
achievement in Senior secondary school mathematics. An unpublished Ph.D dissertation, University of Ibadan
Yahaya, L.A. (2003). Relationship between study habits and attitude of secondary school
Students toward examination malpractice in Kwara state. Abuja Journal of Education 5 (1)216-234 .
Yahaya , L. A. (2004) Effects of group counseling and SQ3R on the study habits of secondary
school students in Ilorin. Journal of education research and development, (1)125 – 136. Yaki, A. A. (2010) Effects of computer animation and guided inquiry on students learning
outcomes in ecological concepts. Unpublished M.ed dissertation, science and environmental education deparment, University of Abuja.

Journal of Science, Technology, Mathematics and Education (JOSTMED) Volume 8(3)
164
ENHANCING QUALITY THROUGH RESEARCH: AN INVESTIGATION INTO TECHNICAL AND VOCATIONAL TEACHERS PERCEPTION AND LEVEL OF INVOLVEMENT IN
EDUCATIONAL RESEARCH
EEggbbiittaa UUggbbaalluu,, AAttttaaoocchhuu NNiiggeerriiaann EEdduuccaattiioonnaall RReesseeaarrcchh aanndd DDeevveellooppmmeenntt CCoouunncciill ((NNEERRDDCC)) SSHHEEDDAA--AAbbuujjaa.. CCuurrrriiccuulluumm
DDeevveellooppmmeenntt CCeennttrree.. EEmmaaiill:: eeggbbiittaauu@@yyaahhoooo..ccoomm
PPhhoonnee NNoo:: +234-803-598-6346
Abstract This study investigated Technical, Vocational Education (TVE) Teachers’ perception and level of involvement in educational research. Two research questions covering aspects of technical teachers’ perception and involvement in educational research were formulated. The descriptive survey method of research was used. Purposely sampling technique was used to select two hundred Technical and Vocational teachers from 5 technical colleges in Kogi, Benue states and Plateau States took part in the study. The purposeful sampling technique was used to select the technical colleges from the states. Questionnaire was constructed by the researcher and subjected to content validity, and test-retest reliability was used. Coefficients of 0.83 and 0.84 were obtained respectively. Data were analyzed using percentages, means and standard deviations. The findings showed that while the technical teachers had good perception of educational research, they do not get involved, actively in the conduct of educational research. The study most importantly revealed that researchers do not carry technical teachers along, actively, in the conduct of researches in a education as it relates to technical and vocational education. This study established that the poor utility of technical and vocational education research in Nigeria is traceable to technical teachers’ non-active involvement in the conduct of educational research. It was recommended among others that for Nigeria to achieve quality technical and vocational education that will make for technological and human capital development, researchers and technical teachers should form a strong partnership in the conduct of educational research as this will enhance research utility, and thus, national development. Introduction Technical and Vocational Education (TVE) as defined by United Nation Educational Scientific and Cultural Organization UNESCO (2001) as a comprehensive term referring to those aspects of the educational process involving, in addition to general education, the study of technologies and related sciences, and the acquisition of practical skills, attitudes, understanding and knowledge relating to occupation in various sectors of economic and social life. Technical Education, all over the world, is seen as one of the greatest investments for the future. Consequently, there is always a general concern about the school systems, the methods of teaching, and the quality of technical teachers. However, due to the strong faith in science and technology as instruments for national and global development, there is a more growing concern geared towards providing the best of science and technology education. This quest for national development through science and technology has had overreaching effect on the teaching and learning of TVE in colleges. Of great importance is the increased research activity aimed at improving the teaching and learning of TVE Technical and vocational educators, through research, have considerably advanced knowledge on how learners learn science, technical and vocational related subjects. By applying theories and methods of research from other disciplines (cognitive psychology, education, sociology, epistemology), that is by working in a top-down mode, technical and vocational educators are leading the fields of Technical, Vocational Education and Training (TVET) education into maturity.

Journal of Science, Technology, Mathematics and Education (JOSTMED) Volume 8(3)
165
At the same time, the reverse process, a bottom-up procedure is taking place. By carrying out investigations on how students understand the concepts and problems associated with TVE, the position not only to suggest better methods of teaching and learning of the concepts associated with TVE, but also, we lay the foundation for new methodologies that can be applied to other school subjects, as well as to the whole educational process. The ultimate target, ultimate mission, is to reshape, to restructure not only technical education and science education, but also all education. If TVE teachers who are, in the main, charged with the responsibility of ensuring that results of researches in Technical and Vocational Education produce the desired effect, get involved in the business of conducting research, then some more fundamental change would be expected in the utility of research findings for improved delivery of technical and vocational education. Teachers’ involvement in the conduct of educational research has elicited various responses from experts. Taber (2000) suggested that there are largely two distinct groups of people researching the process of learning technical and vocational education. The two groups she identified are the researcher-practitioners or teacher researchers and the professional researchers, who she also referred to as the academics who are employed (at least in part) to carry out educational research. The teacher- researchers, according to Taber (2000) are teachers in schools, colleges and the educational contexts actively researching on the teaching and learning that takes place in their own classrooms. Some authors (Kyle, W.C; Linn M.C; Bitner, B.L; Mitchener, C.P and Perry B. (1991) Taber, (2000); Costa N, Marques, L, and Kempa, R.F. (2000) identified three levels of teachers' involvement in the conduct of an educational research. These levels are: (i) when teachers are used as subjects of research by researches; (ii) when teachers actively carry out research by themselves; and (iii) when teachers collaborate with researchers in carrying out research i.e. teachers form partnership with researchers. The poor take - up of research by policymakers and practitioners in education has been clearly identified by McGaw (1996). In his comments on the findings of reviews of educational research in Australia, McGaw noted that while educational research in Australia is seen to have much strength, there are a number of significant issues of concern. These issues of concern are: (i) the links between research and policy and practice are weak; (ii) a perception amongst educational practitioners and policy makers that educational research is largely irrelevant to practice. This perception has influenced a decline in support from governments for educational research; (iii) the educational research community is seen to be too fragmented across associations and higher education institutions with only a limited amount of cross communication and networking; and (iv) In vocational education, in particular, there is a dearth of worthwhile general or basic research and there tends to be a lack of any effective critique of training programs or policies. McGaw suggested that practitioners and educational administrators in vocational education should be involved more as "sponsors" of research activities. He pointed out that such involvement leads to ownership of outcomes and a more receptive climate for the take up of research outcomes. Scroufe (1997) provided a detailed description of why it is perceived that "educational research does not provide critical, trustworthy, policy-relevant information about problems of compelling interest to the general public." He suggested that there needs to be a greater involvement of

Journal of Science, Technology, Mathematics and Education (JOSTMED) Volume 8(3)
166
policymakers and practitioners in the planning, conduct, dissemination and implementation of educational research. Similar to Okebukola (2003), he recommended the adoption of planning approaches that will yield more synthesis and convergence of educational research without compromising traditional values such as Independence, the cumulative nature of research, and the importance of shaping questions as well as answers. Hancock, R. (1997) pointed out that technical teachers have always contributed to educational research, at least as subjects of the research; in this they may have entered a 'data extraction agreement'. It has been reported that this is the most common level of teachers' involvement in the conduct of research in education (Elliot, 1991; Wagner, 1997; Kempa, 2000). Teachers are widely used in completing of questionnaires, delivery of special instructional strategy, object of inquiry, etc. Taber (2000 suggested that the teachers at this level of involvement have no control over the research agenda, perhaps, no special interest in the research topic, and may well be encouraged not to change their normal way of doing things while the research is in progress. Taber further opined that in the process of research, it is, most at times deemed necessary to limit how much the teacher knows about the purpose of and focus of the research. Teachers' involvement here is more passive than active. Findings from Hancock (1997) reviewed that most teachers are reluctant in participating in research even at the least level: This, he asserted, has led to the realization of wrong results from research activities especially when teachers are used as subjects of research. This agrees with the assertions made by Kempa (2000) that most teachers do always give 'idealized' information far from their actual practices thereby most research reports seem somewhat untrue. From the foregoing, some key facts emerge: teachers are reluctant to contribute or participate in research; teachers do not give actual information about their practices; teachers' involvement in research as subjects of research only make them mere passive participants in the research; and teachers enter into a data extraction agreement with researchers when they are used as subjects of research. Kempa, had recommended a number of actions which they believe would improve the links between researchers and practitioners and enhance the take up of educational research findings: (i) strengthening and encouraging the use of action research approaches; (ii) further development of research and development networks involving both researchers and practitioners using one-on-one contact; joint workshops and seminars; joint staff development activities; etc (iii) development of best practice publications encouraging researcher/practitioner links; (iv) disseminating research in practitioner/administrator focused publications; and (v) publication of critical reviews of educational research from a practitioner perspective; The theme of the 'importance of involving practitioners in research and its dissemination' is re-iterated in a paper by Bowe, Ball and Gold (1992). The paper describes the difficulties experienced in the implementation of the "Technical and Vocational Education Initiative" (TVEI) in the United Kingdom. In particular, Bowe et al, suggest that readers of research findings and associated policy innovations need to feel they are being invited to have an 'active' role in building upon the

Journal of Science, Technology, Mathematics and Education (JOSTMED) Volume 8(3)
167
research findings by testing and applying them in the practical context. They contrasted this with the frequent current one-way narratives in which the 'practitioner reader' plays a 'passive' role and as a result, feels idle and redundant with no other function but to either accept or reject what is proposed. Bowe et al pointed out that practitioners do not confront policy/research texts as naive readers. They come with histories, experience, values and purposes of their own. They will have vested interests and will be quite naturally skeptical, fearful and suspicious of innovations and changes and the motives of those proposing them. They suggested that researchers and policy makers need to be close to the practitioners, involving them and gaining some understanding of their backgrounds and feelings. These need to be assessed and considered, not only at the time of dissemination and implementation, but even at the time of planning and conduct of the research. It is noted that the consistent view presented by all of these commentators and researchers, is that if educational research is to count, deliberate action must be taken to engage policy makers, administrators and practitioners in all stages of research activities. Researchers themselves must also remain engaged beyond just the delivery of the research report. Kempa (2000) however asserted that researchers and practitioners should form partnership not at the generation of research but primarily on the application of research. He further opined that partnership should be symbiotic in nature with the sole aim of bridging the traditional gulf between research in education and its application. To Taber (2000) such partnership should involve all stages- the generation and application of research. She maintained that where teachers share in the perception of the research problem, and the planning and analysis of research, they will feel they have ownership of the research, and it is likely to permanently affect their teaching behavior in a way that does not just happen by being the subject of research activity. By implication, collaboration between researchers and practitioners either at the generation of research or application will enhance the utility of, or access to, research findings on the side of practitioners. Following the foregoing, it is very pertinent to properly investigate the perception and level of involvement of Science, Technical and Vocational Teachers in educational research in Nigeria for improved utilization of educational research in our technical schools. Statement of problem The emphases on the need for enhanced teaching and learning of Technical and Vocational (TVE) education in our colleges through research have grown over the years. However, the perception of TVE teachers in involving educational research for enhanced classroom teaching has remained mere expressions. The problem in this study was therefore an investigation into Technical and Vocational teacher’ perception and level of involvement in research. Research Questions Answers to the following questions were sought 1. What is the level of Technical and Vocational teachers in educational research? 2. What is Technical and Vocational teachers’ perception of educational research? Methodology Research Design Survey research design employing questionnaires was adopted.

Journal of Science, Technology, Mathematics and Education (JOSTMED) Volume 8(3)
168
Sample and sampling procedure Five Public Technical Colleges from two states (Kogi and Benue) and Plateau were selected using purposeful sampling technique. Three technical colleges were selected from each of the two states while two technical and two technical science making a total of four were selected from Plateau, a total of 200 Technical and Vocational teachers of both sexes were involved in the study. Instrument One instrument, Questionnaire on Teachers' Perception and Involvement in Research developed by the researcher was used for the study. The questionnaire is divided into three (3) sections A, and C. Section A sought information on Teachers background, a 4-point response grid namely; Often (4), Sometimes (3), rarely (2) and Never (1), focused on teachers involvement in research, while section C sought information on teachers’ perception of research. Data Collection and Analysis The researcher administered the instrument, with the assistance of the Heads of the various Departments (Technical and Vocational), to all the Technical and Vocational teachers in the five Colleges sampled for the study. Each teacher was given three (3) days to go through the questionnaire and complete it. The completed questionnaires were collected after the third day. Frequency counts, Percentages, Means and Standard deviations were used for data analysis. Results and Discussion The results of the data analysis are presented in tab Table 1: Frequency, percentage, weighted mean ratings and standard deviation of technical and vocational teachers level of involvement in educational research S/N Statement Often
-4 Some times -3
Rarely -2
Never (1) X SD
1 I deliberately carry out research on my students in technical class.
36 (18.00)
88 (44.0) 54 (27.0) 2.13 0.94
2 Doing research is a difficult thing that in technical education, it cannot be done just by anyone
18 (9.0) 64 (32.0)
50 (25.0) 68 (34.0) 2.16 0.99
3 I have undertaken research in technical projects leading to the award of a certificate, Diploma or Degree in the last five (5) years.
42 (21.9) 44 (22.0) 36 (18.0) 78 (39.0) 2.25 1.18
4 I engage myself in solving specific problems confronting the school technical teaching
28 (14.0) 84 (42.0)
34 (17.0) 54 (27.0) 2.43 1.03
5 I present paper(s) in educational conference(s)/seminar(s) in technical areas.
12 (6.0) 26 (13.0) 38 (19.0) 124 (62.0) 1.72 0.85
6 I submit research article for publications in learned journals in technical and vocational education.
4(2.0 40(20.0) 52(26.0) 104(52.0) 1.96 1.04
7 I carry out research in Technical/ Vocational education in conjunction with some researchers
24 (12.0) 32 (16.0) 56 (28.0) 88 (44.0) 1.96 1.04
8 I help researchers in administering their questionnaire to technical teachers and/ or students.
38 (19.0) 70 (35.0) 54 (27.0) 38 (19.0) 2.54 1.01
9 I assist technical researchers to teach during their experiments.
14 (7.0) 52 (26.0)
78 (39.0) 56 (28.0) 2.12 0.9
10 I assist technical researchers in carrying out classroom observations
24 (12.0) 52 (26.0)
48 (24.0) 76 (38.0) 2.77 1.05

Journal of Science, Technology, Mathematics and Education (JOSTMED) Volume 8(3)
169
11 Questionnaire on Issues relating to my Job as a science and technical teacher are administered to me.
72 36.0) 58 29.0) 22 (11.0) 48 (24.0) 2.26 1.18
12 Researchers observe my classroom teaching.
18 (9.0) 66 (33.0)
54 (27.0) 62 (31.0) 2.38 0.98
13 Researchers interview me as Technical/Vocational teacher
38 (19.0) 58 (29.0)
46 (23.0) 58 (23.0) 2.59 1.1
14 Questionnaire and tests for researcher purposes are administered to students in technical class with my involvement.
32 (16.0) 98 (49.0)
26 (13.0) 44 (22.0) 2.59 1
15 I should provide necessary information to researchers whenever they need it from me.
58 (290) 68 (34.0)
20 (10.0) 54 (27.0) 2.65 1.16
Weighted Average
*Values in parentheses represent percenta The response profiles for the different statements indicate, as shown in the Table above, that there are some variations on how often technical/vocational teachers are involved in research. However, the mean values for the various response categories clearly point that science teacher involvement in research is a far-cry. The "Never" category attracted the highest percentage of all with a total of 33.5%. This is followed by the 'sometime' response category with 28.3%; the 'often' category attracted the least with only 16.7%. The 'rarely' category had a percentage of 23.4. The weighted average of 2.47 indicates that teachers rarely get involved in research. Although the 'sometimes' response category attracted a reasonable percentage, it appears to have been inflated as a result of the relatively high ratings for the following statements. Statement 4: I engage myself in solving specific problems confronting the school technical/vocational teaching. Statement 8: I help researchers in administering their questionnaire to other technical teachers and/ or students. Statement 14: Questionnaire and tests for research purpose are administered to students in technical class with my involvement. Apart from statement 4, the other two do not show teachers active involvement in research. It rather indicates how often they are being used by researchers in completing and administering of questionnaires to other teachers or students. It is interesting to point out here that, a reasonable percentage (42.0) of teachers indicated that they, although not often, do engage themselves in solving specific problem confronting the school science/technical/vocational teaching. However, statements 1, 3, 5, and 6, which involves teachers active involvement in research disproportionately attracted the 'never' response category. The worst of these are statements 5 and 6. Statement 5: I present paper(s) in educational conference(s)/seminars Statement 6: I submit research article(s) for publication in learned Journal(s). 62% of the respondents indicated, as can be seen in Table 4, that they have never presented any article in educational conferences or seminars, if they ever attend such conferences/seminars. More than 50% responded that they have never submitted any article for publication in learned journals; out of the remaining 48%,
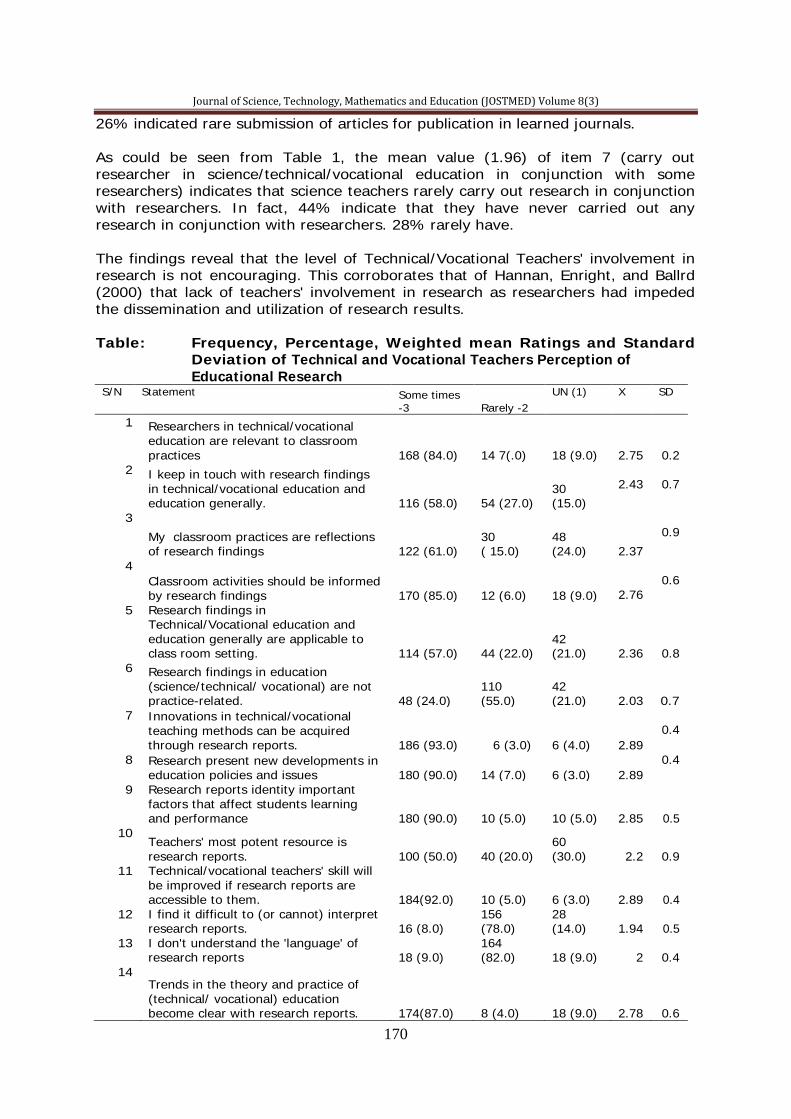
Journal of Science, Technology, Mathematics and Education (JOSTMED) Volume 8(3)
170
26% indicated rare submission of articles for publication in learned journals. As could be seen from Table 1, the mean value (1.96) of item 7 (carry out researcher in science/technical/vocational education in conjunction with some researchers) indicates that science teachers rarely carry out research in conjunction with researchers. In fact, 44% indicate that they have never carried out any research in conjunction with researchers. 28% rarely have. The findings reveal that the level of Technical/Vocational Teachers' involvement in research is not encouraging. This corroborates that of Hannan, Enright, and Ballrd (2000) that lack of teachers' involvement in research as researchers had impeded the dissemination and utilization of research results. Table: Frequency, Percentage, Weighted mean Ratings and Standard Deviation of Technical and Vocational Teachers Perception of Educational Research S/N Statement Some times
-3 Rarely -2 UN (1) X SD
1 Researchers in technical/vocational education are relevant to classroom practices 168 (84.0) 14 7(.0) 18 (9.0)
2.75 0.2 2 I keep in touch with research findings
in technical/vocational education and education generally. 116 (58.0) 54 (27.0)
30 (15.0)
2.43
0.7
3
My classroom practices are reflections of research findings 122 (61.0)
30 ( 15.0)
48 (24.0) 2.37
0.9
4 Classroom activities should be informed by research findings 170 (85.0) 12 (6.0) 18 (9.0)
2.76
0.6
5 Research findings in Technical/Vocational education and education generally are applicable to class room setting. 114 (57.0) 44 (22.0)
42 (21.0) 2.36 0.8
6 Research findings in education (science/technical/ vocational) are not practice-related. 48 (24.0)
110 (55.0)
42 (21.0)
2.03 0.7 7 Innovations in technical/vocational
teaching methods can be acquired through research reports. 186 (93.0) 6 (3.0) 6 (4.0) 2.89
0.4
8 Research present new developments in education policies and issues 180 (90.0) 14 (7.0) 6 (3.0) 2.89
0.4
9 Research reports identity important factors that affect students learning and performance 180 (90.0) 10 (5.0) 10 (5.0) 2.85 0.5
10 Teachers' most potent resource is research reports. 100 (50.0) 40 (20.0)
60 (30.0) 2.2 0.9
11 Technical/vocational teachers' skill will be improved if research reports are accessible to them. 184(92.0) 10 (5.0) 6 (3.0) 2.89 0.4
12 I find it difficult to (or cannot) interpret research reports. 16 (8.0)
156 (78.0)
28 (14.0) 1.94 0.5
13 I don't understand the 'language' of research reports 18 (9.0)
164 (82.0) 18 (9.0) 2 0.4
14 Trends in the theory and practice of (technical/ vocational) education become clear with research reports. 174(87.0) 8 (4.0) 18 (9.0) 2.78 0.6
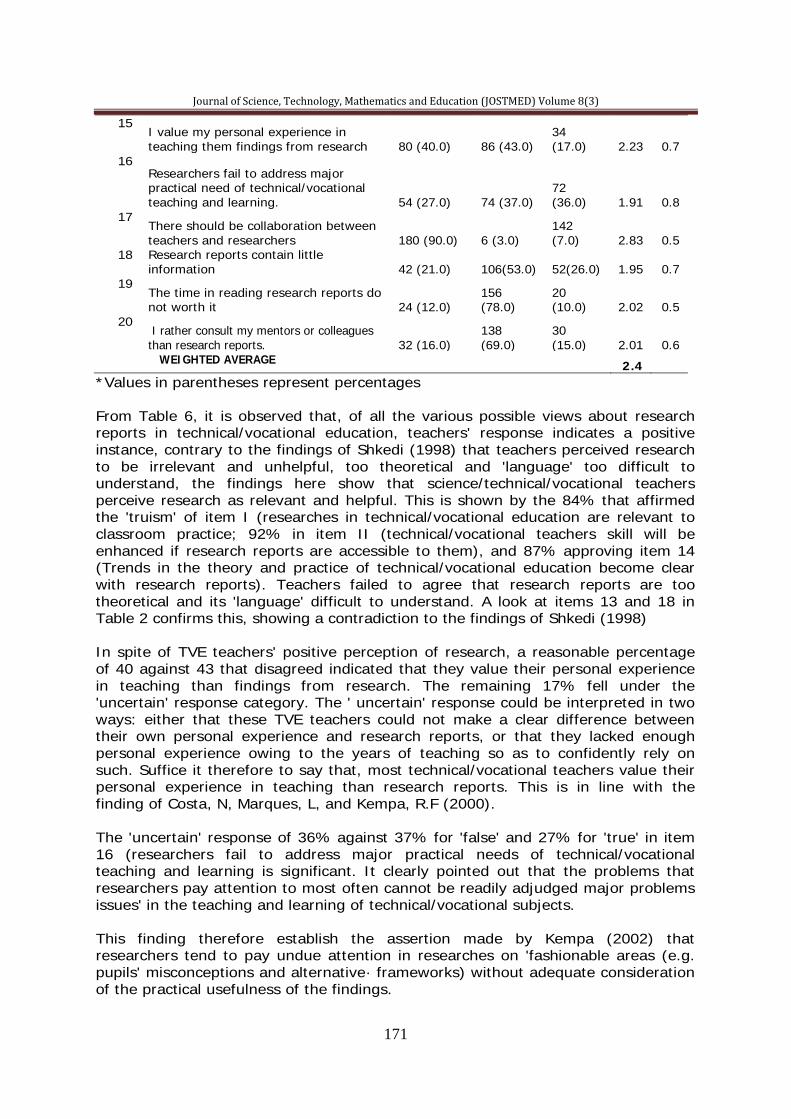
Journal of Science, Technology, Mathematics and Education (JOSTMED) Volume 8(3)
171
15 I value my personal experience in teaching them findings from research 80 (40.0) 86 (43.0)
34 (17.0) 2.23 0.7
16 Researchers fail to address major practical need of technical/vocational teaching and learning. 54 (27.0) 74 (37.0)
72 (36.0) 1.91 0.8
17 There should be collaboration between teachers and researchers 180 (90.0) 6 (3.0)
142 (7.0) 2.83 0.5
18 Research reports contain little information 42 (21.0) 106(53.0) 52(26.0) 1.95 0.7
19 The time in reading research reports do not worth it 24 (12.0)
156 (78.0)
20 (10.0) 2.02 0.5
20 I rather consult my mentors or colleagues than research reports. 32 (16.0)
138 (69.0)
30 (15.0) 2.01 0.6
WEIGHTED AVERAGE 2.4 *Values in parentheses represent percentages From Table 6, it is observed that, of all the various possible views about research reports in technical/vocational education, teachers' response indicates a positive instance, contrary to the findings of Shkedi (1998) that teachers perceived research to be irrelevant and unhelpful, too theoretical and 'language' too difficult to understand, the findings here show that science/technical/vocational teachers perceive research as relevant and helpful. This is shown by the 84% that affirmed the 'truism' of item I (researches in technical/vocational education are relevant to classroom practice; 92% in item II (technical/vocational teachers skill will be enhanced if research reports are accessible to them), and 87% approving item 14 (Trends in the theory and practice of technical/vocational education become clear with research reports). Teachers failed to agree that research reports are too theoretical and its 'language' difficult to understand. A look at items 13 and 18 in Table 2 confirms this, showing a contradiction to the findings of Shkedi (1998) In spite of TVE teachers' positive perception of research, a reasonable percentage of 40 against 43 that disagreed indicated that they value their personal experience in teaching than findings from research. The remaining 17% fell under the 'uncertain' response category. The ' uncertain' response could be interpreted in two ways: either that these TVE teachers could not make a clear difference between their own personal experience and research reports, or that they lacked enough personal experience owing to the years of teaching so as to confidently rely on such. Suffice it therefore to say that, most technical/vocational teachers value their personal experience in teaching than research reports. This is in line with the finding of Costa, N, Marques, L, and Kempa, R.F (2000). The 'uncertain' response of 36% against 37% for 'false' and 27% for 'true' in item 16 (researchers fail to address major practical needs of technical/vocational teaching and learning is significant. It clearly pointed out that the problems that researchers pay attention to most often cannot be readily adjudged major problems issues' in the teaching and learning of technical/vocational subjects. This finding therefore establish the assertion made by Kempa (2002) that researchers tend to pay undue attention in researches on 'fashionable areas (e.g. pupils' misconceptions and alternative· frameworks) without adequate consideration of the practical usefulness of the findings.

Journal of Science, Technology, Mathematics and Education (JOSTMED) Volume 8(3)
172
Conclusion Technical and Vocational Educators, through research will considerable advance in knowledge on how learners learn technical and vocational by applying theories and practical methods of research thereby improve the productivity of the technical educators. Recommendations Following the findings of the study the following recommendation are made: *A link should be formed between polytechnic, technical colleges/research institutes and schools where the findings of educational research are discussed and ways of incorporating them into practical teaching. *TVE teachers themselves should form local research teams that should solely be engaged in solving the local school problems bedevilling Technical and Vocational teaching. Such teams should also focus on bringing research finding to meet local conditions. This will require serious collaboration between teachers and researchers. *TVE teachers should get involved in active research and, certain incentives should be provided for them as a way of encouraging and motivating them. References
Bowe, R., Ball, S.J. and Gold, A. (1992) Reforming education and changing schools. Rutledge, London: Kogan pages.
Costa, N., Marques, L. & Kempa, R. F. (2000). Science teachers' awareness of
findings from education research. Research in Science and Technology Education, 18 (37 - 44).
Elliot, J. (1991). Action research for educational change. Milton Keynes: Open University press Hancock, R. (1997). Why are class teachers reluctant to become researchers? British Journal of
In-service Education, (23) 86-99 Hannan, A., Enright, H. & Ballard, P. (2000). Using research: The result of a pilot study
comparing teachers, general practitioners and surgeons. Retrieved from website http/www.leeds.ac.uk/educol.
Kempa, R. F. (2002). Research and practice of chemistry education. Research and
Practice in Europe, 3(3), 327-343. Kyle, W.C., Linn, M. C., Bitner, B. L., Mitchener, C. P. & Perry, B. (1991). The role of research in
science teaching: An ANSTA theme paper. Science Education, (75), 413-418. McGaw, B. (1996). Linking educational research with policy and practice. ACER. Newsletter
Supplement, No. 85 Autumn, 4 pages. Okebukola, P. A. (2003). Development of a strategic plan for enhancing relevance of
Science and Technology for all in Africa. Science Education International, 24(1).

Journal of Science, Technology, Mathematics and Education (JOSTMED) Volume 8(3)
173
Shkedi, A. (1998). Teachers’ attitude towards research: a challenge for qualitative researchers. International Journal of Qualitative Studies in Education, 16(10), 38-41.
Sroufe, G. E. (1997). Improving the "awful reputation" of educational research.The Educational
Researcher, 26(7), 26-28. Taber, K. (2000). Case studies and generalizability- grounded theory and research in science
education. International Journal of Science Education, 22 (5), 469-487.

Journal of Science, Technology, Mathematics and Education (JOSTMED) Volume 8(3)
174
THE CHALLENGES OF MISSING RESULTS OF E-EXAMINATION IN NIGERIAN UNIVERSITIES
1Shitu KelaniOkunade (PhD)
2Olawale Surajudeen Adebayo (MNCS, MCPN), 3Yisa, V. Legbo & 4Baba Meshach
1Department of Science Education 2,3,4Department of Cyber Security Science
1,2,3,4Federal University of Technology, Minna, Niger State, Nigeria E-mail: [email protected]
Phone No: +234-805-332-8241
Abstract The spate of missing results as one of the challenges of e-examination system in Nigeria is quite unacceptable and condemnable. This is a situation where e-examination candidates take exams and are reportedto haveno results at the end of the examination. This scenario has prompted the researchers to examine the reasons e-examination results should not be instantly released which resulted into missing results. The research examined whether the menace of missing results is directly or indirectly dependent on the adequacy or otherwise of the system’s database. The research also examinesthe dependency of candidates’ performance on the appropriateness of questions and technical know-how of the system. The research at the end makes recommendations on the best way to reduce the menace of missing results and improve the performance of the e-examination candidates.The research carried out a survey by distributing questionnaires and interviewing the stakeholders involve in e-Examination. The results show that there is correlation between the responses of the selected candidates and the researchers’ hypotheses. It was therefore concluded that lack of technical know-how and inadequate data storage and process is invariably contribute to the menace of missing results. Keywords: eExamination, Nigerian universities, challenges, missing results Introduction The introduction of web application into the computing technology has brought about a significant revolution in our social life including the traditional system of education and examination (Rout & Patnaik, 2011). Many Nigerian universities are beginning to re-evaluate their traditional methods of examining their students. This is so because it is becoming difficult to organize credible examinations devoid of challenges and get the result on time especially now that there is population explosion in our institutions. The trend now is the adoption of the web-based testing and assessment systems which facilitates greater flexibility than the traditional approach. Basically, e-examination can be defined as a system that involves the conduct of examination through the web or the internet (Ayo, Akinyemi, Adebiyi, Ekong, 2007) According to Awosiyan (2010), e-Examination would remove all human errors recorded in traditional pen and paper examination and create opportunity for students to access their results immediately. In addition, the examination would make it difficult for students to be involved in any kind of examination malpractice. It also reduces the magnitude of grading on the part of teachers/lecturers As good and advantageous as e-examination is, it is not without its challenges. One notable challenge observed in our study is the issue of missing results.Interestingly, the institution among other reasons, adopted the e-examination for its levels 100 and 200 students to forestall incidences of missing results which had become unbearable.There are other challenges like examination malpractice, students’computer illiteracy,inadequate ICT infrastructure, unconducive examination halls, epileptic power supply, lack of reliable alternative to PHCN power

Journal of Science, Technology, Mathematics and Education (JOSTMED) Volume 8(3)
175
supply,inadequate security of test materials(lack of internet system that minimise the risk of test items). This paper, therefore, intends to examine the causes of missing results in an electronic examination approach that had been described as having the solution to all human errors peculiar to the traditional pen and paper examination. Research Questions
i. What is the effect of inadequate system data storage and process on the menace of students’ missing results?
ii. What is the effect of ambiguous instructions on the menace of students’ missing results? iii. What is the effect of inappropriate questions (ambiguous questions) on the
performance of e-examination candidates? iv. What is the effect of illiteracy/technical know-how on the performance of e-
examination candidates? Hypotheses 1. H0: There is no significant correlation between systems’ inadequate data storage and process and candidates’ missing results 2. H1: There is significant correlation between systems’ inadequate data storage and process and candidates’ missing results 1. H0: There is no correlation between the performance of the candidates and the adequacy of e-examination questions. 2. H1: There is correlation between the performance of the candidates and the adequacy of e-examination questions. 1. H0: There is no correlation between the performance of the candidates and technical know-how of the system 2. H1: There is correlation between the performance of the candidates and technical know- how of the system 1. H0: There is no correlation between technical know-how of the system and candidate’s missing results 2. H1: There is correlation between technical know-how of the system candidate’s missing results Objectives The main objective of this research work is to examine the challenges of e-examination in Nigeria with emphasis on missing results. Towards this end, the research examined:
i. The reason why the results of e-exams should not be released on time. ii. The causes of missing results in the conduct of e-exams. iii. Whether the students’ missing results depend on the inadequate data storage and
process of the system. iv. Whether there is correlation between students’ performance and standard of e-
examination questions. v. Whether there is correlation between missing results, students’ performance and system
technical-know-how. Related works Over time, many scholars have worked on the development of e-examination system to bring about reduction in the fatigue emanating from manual examination system. This has brought great improvement to the way and manner of examining and assessing candidates in various academic exercises. Also, various surveys and inquisitions into the conduct of e-examination systems have continued to ameliorate the existing system and bring about better e-examination system.
Journal of Science, Technology, Mathematics and Education (JOSTMED) Volume 8(3)
176
Zhenming, et al., (2003) developed a web-based examination System as an effective solution for mass education evaluation. This system represents a novel online examination system based on a Browser/Server framework whichcarries out the examination and auto-grading for objective questions and operating questions, such asprogramming, operating Microsoft Windows, editing Microsoft Word, Excel, PowerPoint, etc. The system has since been widespread and successfully applied to the distance evaluation of basic operating skills of computer science, suchas the course of computer skills in Universities and nationwide examination for high school graduates in Zhejiang Province, China. Emary and Al-Sondos (2006) in their paper presents a software that was structured into two major modules: The first one was an online website to review and make self-test for all the materials of economic course while the second part is an online examination using a large database bank of questions through which the level of students can be evaluated immediately and some statistical evaluations can be obtained. In his paper titled“web-based educationalassessment system”, (He, 2006) presents web-based assessment by applying Bloom’s taxonomy to evaluate student learning outcomes and teacherinstructional practices in real time. This system has shown a great performance with its experimentation inscience and mathematics courses of two local high schools. In their bid to examine the challenges of manual examination system and recommend a better system, Ayo et al (2007) proposed a model for e-Examination in Nigeria where all applicants are subjected toonline entrance examination. Their findings revealed that the system has the potential to eliminate someof the problems that are associated with the traditional methods of examination such as impersonationand other forms of examination malpractices. In their work, Al-Bayati and Hussein (2008) developed an applied Generic Software of multiple kinds of e-exams package that is oriented to Hearing Impaired (HI) persons. The examinationmaterial of this package is translated into language of HI persons like sign language and finger spelling.This generic software serves as empty templates to the teacher who would like todevelop his required e-exam for various subjects (mathematics, language, science, etc.) and desired setof exam kinds (multiple choices, matching between words, fill in the blanks, etc.). In another work, Schramm (2008) looked at e-learning web based system that could simply offer and grademathematical questions with infinite patience. Therefore it needs the capability for in and output ofmathematical formulas, the dynamic generation of plots and the generation of random expressions andnumbers. Huszti and Petho (2008) view an electronic system as a difficult part of e-learning security. Their paper describes acryptographic scheme that emphasised needs for security consciousness and requirements, such that authenticity, anonymity, secrecy,robustness, correctness without the existence of a Trusted Third Party be embedded into e-exam system.. The proposed protocol at the end of examination provides a receipt to students, a proof of a successful submission, and it is based on existence ofanonymous return channels. Ipaye (2009) in his paper discussed the process of establishing e-learning environment based on the development of e-learning in the Open University of Nigeria (Akinsanmi et al, 2010) also proposed a web-based examination system where tests inmultiple choice formats will be taken online and grading is done immediately.This web application was developed on the platform of Microsoft.net, using the ASP.NET web server, C# as the intermediate language, ADO.NET to interact with the relationaldatabase and Microsoft SQL server as the relational database.

Journal of Science, Technology, Mathematics and Education (JOSTMED) Volume 8(3)
177
Rashad et al, (2010) is another paper onweb- based online examination system that carriesout the examination and auto-grading for students exams. This system facilitates the conduct of exams, collection of answers, auto marking the submissions and production of reports for the test. The system supportsmany kinds of questions and was tested on the internet platform, which makes it suitable for both local and remoteexamination. The system is a good resource for stakeholders like lecturers, instructors, teachers and others who may wish to createnew exams or edit existing ones as well as students participating in the exams. In order to seriously tackled the associated security challenges in the e-examination system, (Adebayo andAbdulhamid, 2011) carried out a survey on the acceptability of the current e-examination system and proposed an acceptable secured-oriented e-exams system. Their study designed an online-based e-exams system with cryptographic means of encrypting and decrypting questions meant for the system with biometric means of identifying and monitoring candidates. Their system if properly implemented can help to solve most related issues in e-examination system. Methodology This research majorly aimed to examine the cause of missing results in a well-structured online e-examination system. In order to get accurate information, questionnaire was designed and distributed to some selected candidates. Interviews were also conducted for some other stakeholders involved in the conduct of e-examination. Three Universities were selected in the northern part of Nigeria namely Federal University of Technology Minna, University of Ilorin and Ahmadu Bello University Zaria. The results of the questionnaire were tabulated below in Table 6.1. Sample Questions
i. Does inadequate system data storage and processhave effect on the menace of students’ missing results? Yes or No
ii. Do ambiguous instructions on the system interface have effect on the menace of students’ missing results? Yes or No
iii. Do inappropriate questions (ambiguous questions) have any effect on the performance of e-examination candidates? Yes or No
iv. Does illiteracy/technical know-how have effect on the menace of missing result and performance of e-examination candidates? Yes or No Table 6.1: Results obtained on the questionnaire distributed for the selected stakeholders participating in the e-examination Hypotheses Response Total
Yes (Accepted)
No (Rejected)
Indifference
Inadequate data Storage in the Database
60 20 20 100
Inappropriate Questions 50 200 50 300 Lack of Technical Know-how 70 20 10 100 Total 180 240 80 500
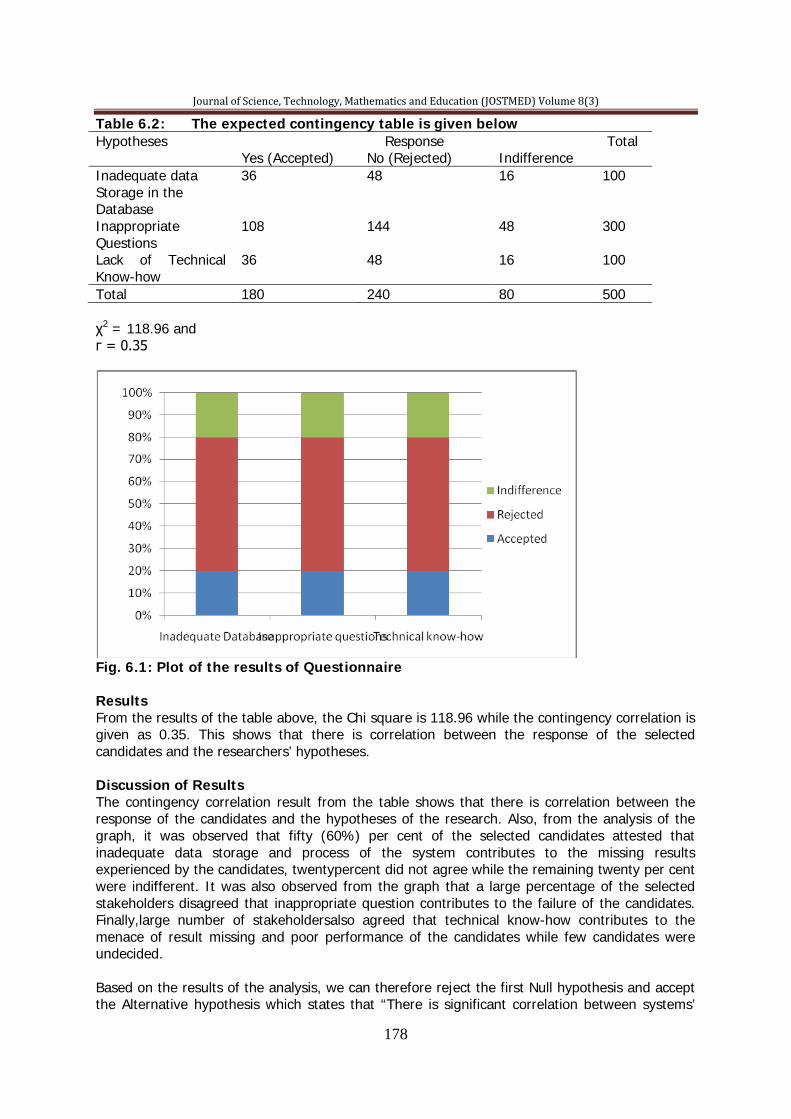
Journal of Science, Technology, Mathematics and Education (JOSTMED) Volume 8(3)
178
Table 6.2: The expected contingency table is given below Hypotheses Response Total
Yes (Accepted) No (Rejected) Indifference Inadequate data Storage in the Database
36 48 16 100
Inappropriate Questions
108 144 48 300
Lack of Technical Know-how
36 48 16 100
Total 180 240 80 500 χ2 = 118.96 and г = 0.35
Fig. 6.1: Plot of the results of Questionnaire Results From the results of the table above, the Chi square is 118.96 while the contingency correlation is given as 0.35. This shows that there is correlation between the response of the selected candidates and the researchers’ hypotheses. Discussion of Results The contingency correlation result from the table shows that there is correlation between the response of the candidates and the hypotheses of the research. Also, from the analysis of the graph, it was observed that fifty (60%) per cent of the selected candidates attested that inadequate data storage and process of the system contributes to the missing results experienced by the candidates, twentypercent did not agree while the remaining twenty per cent were indifferent. It was also observed from the graph that a large percentage of the selected stakeholders disagreed that inappropriate question contributes to the failure of the candidates. Finally,large number of stakeholdersalso agreed that technical know-how contributes to the menace of result missing and poor performance of the candidates while few candidates were undecided. Based on the results of the analysis, we can therefore reject the first Null hypothesis and accept the Alternative hypothesis which states that “There is significant correlation between systems’

Journal of Science, Technology, Mathematics and Education (JOSTMED) Volume 8(3)
179
inadequate data storage and process and candidates’ missing results”. We can also accept the second Null hypothesis which states that” There is no correlation between the performance of the candidates and the adequacy of e-examination questions”.On the same node we equally reject the third Null hypothesis and accept the Alternative hypothesis which state that “There is correlation between the performance of the candidates and technical know-how of the system”.Finally, we reject the fourth Null hypothesis and accept the alternate hypothesis which state that “There is correlation between technical know-how of the system and candidate’s missing results” base on the result. Conclusion We can therefore concluded based on the analysis of the results that the systems’ inadequate data storage and process contributes to the menace of e-examination missing results. We also conclude that the technical know-how of the candidates is invariably contributed to the performance of the candidates and missing result but not the adequacy of the examination questions. The followings have therefore, been identified as the causes of the missing results in the e-Examination in Nigeria: 1. Many students don’t usually submit their answers at the end of examination due to lack of technical know-how 2. If there is inconsistence in the storage and process of the system, it might affect result availability 3. Non release of results on time 4. Ambiguous instructions might confuse the student to do the right things which might lead to result missing. Recommendations The followings are the recommendedbest practices to have a very good e-examination system free of missing results and some other anomalies:
i. The results of the examination should be released to the candidates immediately after the exam. Although we gather during the interview that some institutions would like to generate money by withholding the results and charge candidatesfees for checking their result. Institutionsshould look elsewhere to generate revenue.
ii. There should be adequate training for participants before the e-examination system. iii. The questions should be well-structured. iv. The instructions should be clearly stated.
References Akinsanmi, O., Agbaji, O. Ruth, T. & Soroyewun, M. B. (2010). Development of E-assessment Platform for Nigerian Universities. Research Journal of Applied Sciences, Engineering and
Technology, 2(2) 170-175. Al-Bayati, A. M. & Karim, Q. H. (2008). Generic software of e-exam eackage for hearing impaired persons (Mathematics as Case Study). 2nd Conference on Planning and Development of Education and Scientific Research in the Arab States.955-962 Awosiyan, K. (2010). Stress and success of NOUN examination. Nigerian Tribune, July1, 10. Ayo, C. K., Akinyemi, I. O, Adebiyi, A. A., & Ekong, U. O. (2007). The prospects of e-examination
implementation in Nigeria.Turkish Online Journal of Distance Education, 8(2), 1715- 1718.
Emary, I. M. E., Jihad, A. A. & Abu, A. (2006). An outline website for tutoring and examination
of economic course. American Journal of Applied Sciences, 3(2) 1715-1718.
Journal of Science, Technology, Mathematics and Education (JOSTMED) Volume 8(3)
180
He, L. (2006). A novel Web-based educational assessment with Bloom’s Taxonomy. Current Developments in Technology-assisted Education, 1861-1865. Huszti, A. & Petho, A. (2008) A secure electronic exam system, informatikaa Felsooktataban.
1-7.
Ipaye, B. (2009). E-learning in a Nigerian open university national open university of Nigeria. Pp1-11. Olawale, A. & Shafi’i, M. A. (2011). E-exam for nigerian universities with emphasis on security and result integrity. International Journalof the Internet and Management (IJCIM), 18(2), 47-59. http:/www.ijcim.th.org/vl8nSPC.htm. Rasheed, Z. M., Mahmud, S. K., Ahmed, E. H. & Mahmud, A. Z. (2010). An arabic web-based exam management system. International Journal of Electrical & Computer Science (IJECS) 10(1), 48-55. Rout, G. & Patnaik, S. (2011). A case study on E-examination in universities in Odisha. International Journal of Internet Computing vol. 1(2) Schramm, T. (2008). E-assessment and e-exam for geomatics studies, department of geomatics. Hafen City University, Hamburg, Hebebrandstrabe1, 22297. Hamburg, Germany. http:/www.hcu-hamburg.de.geomatics. Zhenming, Y., Zhang, & Zhan, G. (2003). A novel web-based online examination system for computer science education. 33rd ASEEE/IEEE Frontiers Science Education Conference text msg33F-7-33F-10
Journal of Science, Technology, Mathematics and Education (JOSTMED) Volume 8(3)
181
INTERGRATING ENTERPRENEURSHIP EDUCATION INTO SCIENCE EDUCATION: SCIENCE TEACHERS PERSPECTIVES.
Bolaji, O. A.
General Studies Department, School of Education, Emmanuel Alayande College of Education. Oyo
E-mail: [email protected] Phone no: +234-703-265-6077
Abstract The focal thrust of this paper is to explore the perspectives of science teachers towards integrating entrepreneurial education into science education in Afijio, Atiba, Oyo-East and West Local Government Areas of Oyo State, Nigeria. A stratified random sampling techniques was used to select three hundred and twenty (320) science teachers from sixteen secondary schools in the study areas. Three null hypotheses were set to investigate the significance of the teachers perspective towards integrating entrepreneurship education into science education. A self made, validated questionnaire titled “Developing Entrepreneurship Skills through Science Education Questionnaire (DESTSEQ) with a reliability index of 0.63 was used to elicit responses from the subjects of the study. With t-test statistical analysis at 0.05 level of significance, it was deduced that science teachers perspective of entrepreneurship education has a significant influence on integrating entrepreneurship education in science education (t-cal = 23.52, t-crit (0.05) = 1.96, df = 318). The gory implications of integrating entrepreneurship education into science education were highlighted and some plausible recommendations articulated.
Keywords: Entrepreneurs, Entrepreneurial Skills, Entrepreneurship Education, Science Education.
Introduction An entrepreneur is one who combines and coordinates factors of production and use them to produce goods and services. Griffins (1984) define the entrepreneur as a person who takes risks by introducing new ways of making old products and also introduces new products, he perceives opportunities that other business operators do not see or do not care about. Some entrepreneurs use information that is generally available to produce something entirely new. Schumputer in Encarta (2009) sees the entrepreneur as “an innovator, the person who develops a new product, a new market or a new means of production” it also acknowledged that the entrepreneur is an individual who assumes the responsibility of establishing or running a venture and risk associated with the expectation of making a profit. It is the entrepreneur who decides the product, acquires the facilities and brings together the labour force, capital and raw materials and assembles them in a meaningful, systematic order to produce the products. Ogundele (2007) identified the top ten characteristics of today entrepreneurs as: recognize and take advantage of opportunity, resourcefulness, creativity, visionary, independent thinker, hard worker, optimistic, innovator, risk taker, leader. The word entrepreneurial is the adjectural form of the word entrepreneur. It is used to qualify a person, a situation, and organization or a group of people who are exhibiting behaviours that are typical of entrepreneurs or intrapreneurs, based on the above. In this context, entrepreneurial, intrapreneurship and entrepreneurship from the holistic point of view exist in convergence in the relationship of the three constructs. Butter (1990) defines the constructs, entrepreneurial, interpreneurship and entrepreneurship as process of owning and managing a business enterprise with the hope of making profit. Enterpreneurship skills or elements are combination of motivation, vision with judgement, communication determination, optimism, courage, endurance and the power of creating cooperation which finds markets opportunities (Bolarinwa, 2001 and Ezeudu, 2008).

Journal of Science, Technology, Mathematics and Education (JOSTMED) Volume 8(3)
182
Ojukwu (2001) and Ogundele (2007) described entrepreneurship development as a programme of human capital development inputs aimed at increasing the supply of adequately trained entrepreneurs who are innovated to make a success out of business. Entrepreneurship education defined by Bolarinwa (2001) as education that provides training, experience and skills that are suitable for entrepreneurial endeavours. For a nation to emerge developed, there should be massive entrepreneurial development across the nation. This should start from homes, primary, secondary and tertiary educational institutions. Entrepreneurial skills development should become a culture as in the case of India and other developed nations of the World (Ogundele 2007). Thus, if entrepreneurship skills development has capacity to enhance the national development, can such skills be instilled in the ming of youths right from secondary schools through science education. Science education was seen by Oguniyi (1985) as an educational aspect which assists the learners in developing certain attitudes, knowledge and skills regarding the order in nature. Science education aims at producing scientifically literate citizens as well as producing a potential of scientific and technological manpower. Science education has introduced a lot of changed in our world today and it will continue to do so in the future (Ezeudu, 2008, Orukotan, 2007); Okebukola, 2007; Akinkugbe, 2007). It is found that achievement in science education will go a long way in reducing illiteracy and poverty which are impediments for national development. Therefore, teaching science education should go pari-parsu with the instilling of entrepreneurial skills in the students to encourage the young mind develop traits peculiar to job provider and not job-seekers. The question is do secondary school science teacher perceive science teaching and learning as avenue to develop entrepreneurial skills like alertness to profit opportunities, handling uncertainties, coordinating scarce resources and innovating skills (Swedberg, 2000). Statement of the Problem There is vicious cycle of poverty, unemployment and under development plaguing Nigeria economy. The orientation of Nigerian youths cannot grow beyond the level of exposure had in the teaching-learning process. If the cycle is to be broken and Nigeria economy to thrive and be vibrant, there is urgent need to instill entrepreneurial skills in the mind of the youth. The question is do the science teachers perceive teaching and learning Science with this conception of instilling entrepreneurial skills simultaneously? Purpose of the Study
(i) To Investigate the perception of science teachers towards developing of entrepreneurial skills through science education;
(ii) To determine gender difference in science teachers perception of developing entrepreneurial skills through science education;
(iii) To verify the impact of conference and seminar attendance on science teachers perception of developing entrepreneurial skills through teaching science education. Research Hypotheses The following hypotheses were put forth in the course of conducting the study:
Ho1: There is no significant influence of science teachers perception on the developing of entrepreneurial skills through science education;
Ho2: There is no significant gender difference in the perception of science teachers towards the developing of entrepreneurial skills in students.
Ho3: There is no significant impact of conference and seminar attendance on the science teachers perception of developing entrepreneurial skills through science education.
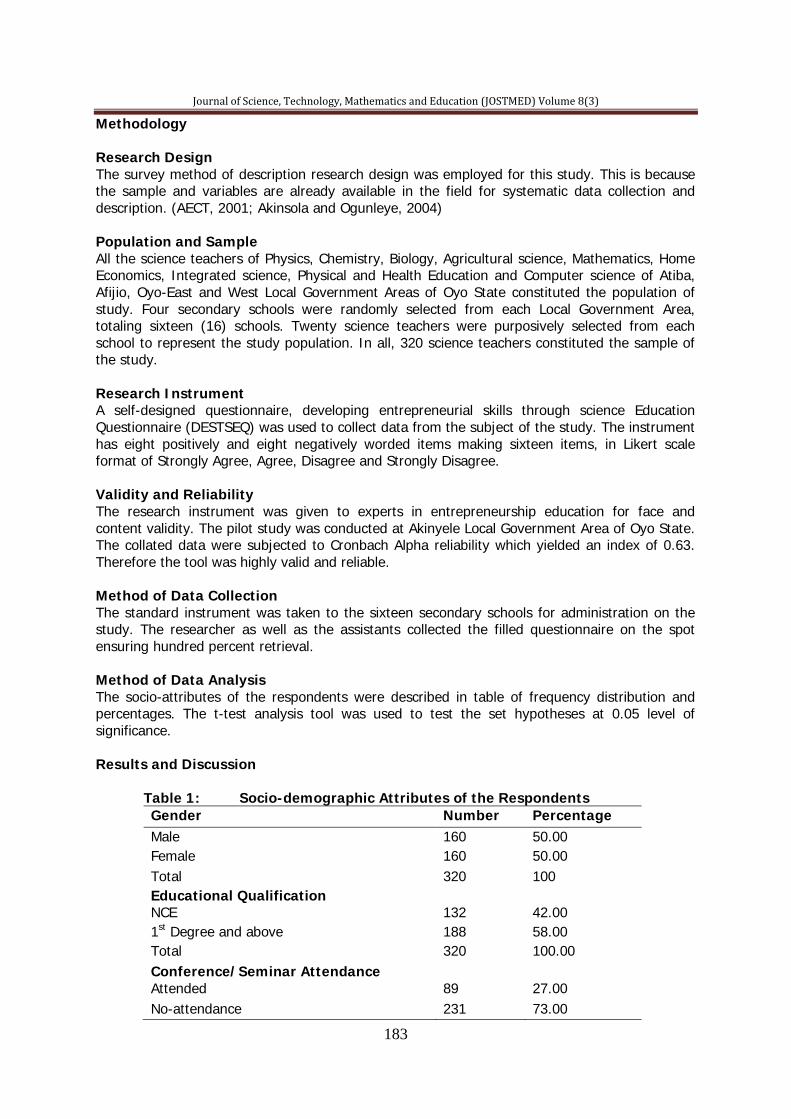
Journal of Science, Technology, Mathematics and Education (JOSTMED) Volume 8(3)
183
Methodology Research Design The survey method of description research design was employed for this study. This is because the sample and variables are already available in the field for systematic data collection and description. (AECT, 2001; Akinsola and Ogunleye, 2004) Population and Sample All the science teachers of Physics, Chemistry, Biology, Agricultural science, Mathematics, Home Economics, Integrated science, Physical and Health Education and Computer science of Atiba, Afijio, Oyo-East and West Local Government Areas of Oyo State constituted the population of study. Four secondary schools were randomly selected from each Local Government Area, totaling sixteen (16) schools. Twenty science teachers were purposively selected from each school to represent the study population. In all, 320 science teachers constituted the sample of the study. Research Instrument A self-designed questionnaire, developing entrepreneurial skills through science Education Questionnaire (DESTSEQ) was used to collect data from the subject of the study. The instrument has eight positively and eight negatively worded items making sixteen items, in Likert scale format of Strongly Agree, Agree, Disagree and Strongly Disagree. Validity and Reliability The research instrument was given to experts in entrepreneurship education for face and content validity. The pilot study was conducted at Akinyele Local Government Area of Oyo State. The collated data were subjected to Cronbach Alpha reliability which yielded an index of 0.63. Therefore the tool was highly valid and reliable. Method of Data Collection The standard instrument was taken to the sixteen secondary schools for administration on the study. The researcher as well as the assistants collected the filled questionnaire on the spot ensuring hundred percent retrieval. Method of Data Analysis The socio-attributes of the respondents were described in table of frequency distribution and percentages. The t-test analysis tool was used to test the set hypotheses at 0.05 level of significance. Results and Discussion Table 1: Socio-demographic Attributes of the Respondents
Gender Number Percentage Male 160 50.00 Female 160 50.00 Total 320 100 Educational Qualification NCE 132 42.00 1st Degree and above 188 58.00 Total 320 100.00 Conference/Seminar Attendance Attended 89 27.00 No-attendance 231 73.00
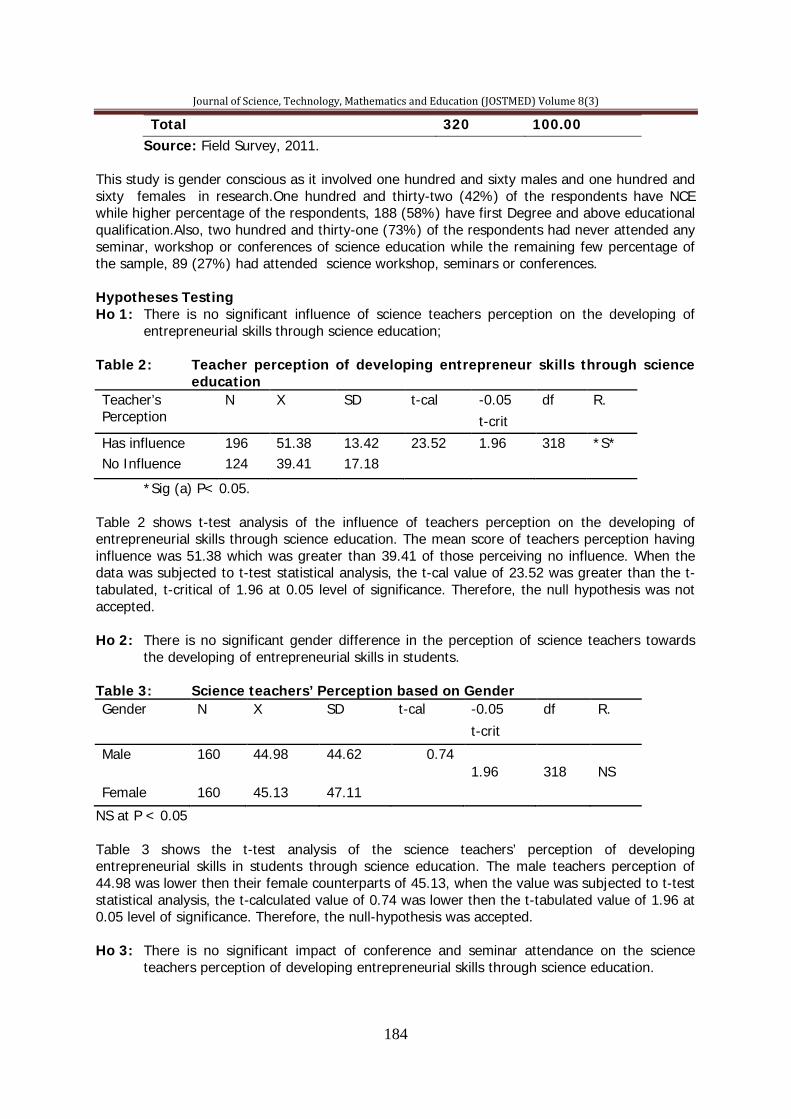
Journal of Science, Technology, Mathematics and Education (JOSTMED) Volume 8(3)
184
Total 320 100.00 Source: Field Survey, 2011.
This study is gender conscious as it involved one hundred and sixty males and one hundred and sixty females in research.One hundred and thirty-two (42%) of the respondents have NCE while higher percentage of the respondents, 188 (58%) have first Degree and above educational qualification.Also, two hundred and thirty-one (73%) of the respondents had never attended any seminar, workshop or conferences of science education while the remaining few percentage of the sample, 89 (27%) had attended science workshop, seminars or conferences. Hypotheses Testing
Ho 1: There is no significant influence of science teachers perception on the developing of entrepreneurial skills through science education;
Table 2: Teacher perception of developing entrepreneur skills through science
education Teacher’s Perception
N X SD t-cal -0.05 df R. t-crit
Has influence 196 51.38 13.42 23.52 1.96 318 *S* No Influence 124 39.41 17.18
*Sig (a) P< 0.05.
Table 2 shows t-test analysis of the influence of teachers perception on the developing of entrepreneurial skills through science education. The mean score of teachers perception having influence was 51.38 which was greater than 39.41 of those perceiving no influence. When the data was subjected to t-test statistical analysis, the t-cal value of 23.52 was greater than the t-tabulated, t-critical of 1.96 at 0.05 level of significance. Therefore, the null hypothesis was not accepted.
Ho 2: There is no significant gender difference in the perception of science teachers towards
the developing of entrepreneurial skills in students. Table 3: Science teachers’ Perception based on Gender Gender N X SD t-cal -0.05 df R.
t-crit
Male 160 44.98 44.62 0.74 1.96 318 NS Female 160 45.13 47.11
NS at P < 0.05 Table 3 shows the t-test analysis of the science teachers’ perception of developing entrepreneurial skills in students through science education. The male teachers perception of 44.98 was lower then their female counterparts of 45.13, when the value was subjected to t-test statistical analysis, the t-calculated value of 0.74 was lower then the t-tabulated value of 1.96 at 0.05 level of significance. Therefore, the null-hypothesis was accepted.
Ho 3: There is no significant impact of conference and seminar attendance on the science
teachers perception of developing entrepreneurial skills through science education.
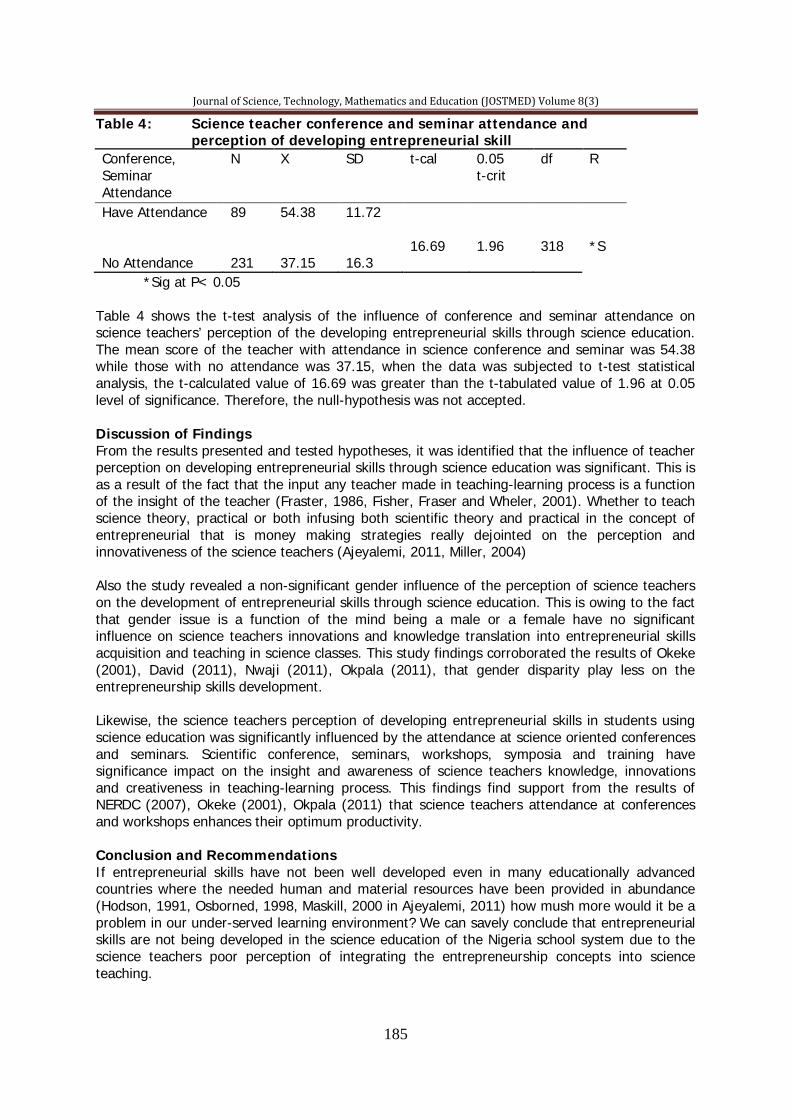
Journal of Science, Technology, Mathematics and Education (JOSTMED) Volume 8(3)
185
Table 4: Science teacher conference and seminar attendance and perception of developing entrepreneurial skill Conference, Seminar Attendance
N X SD t-cal 0.05 t-crit
df R
Have Attendance 89 54.38 11.72 16.69
1.96
318
*S
No Attendance 231 37.15 16.3 *Sig at P< 0.05 Table 4 shows the t-test analysis of the influence of conference and seminar attendance on science teachers’ perception of the developing entrepreneurial skills through science education. The mean score of the teacher with attendance in science conference and seminar was 54.38 while those with no attendance was 37.15, when the data was subjected to t-test statistical analysis, the t-calculated value of 16.69 was greater than the t-tabulated value of 1.96 at 0.05 level of significance. Therefore, the null-hypothesis was not accepted. Discussion of Findings From the results presented and tested hypotheses, it was identified that the influence of teacher perception on developing entrepreneurial skills through science education was significant. This is as a result of the fact that the input any teacher made in teaching-learning process is a function of the insight of the teacher (Fraster, 1986, Fisher, Fraser and Wheler, 2001). Whether to teach science theory, practical or both infusing both scientific theory and practical in the concept of entrepreneurial that is money making strategies really dejointed on the perception and innovativeness of the science teachers (Ajeyalemi, 2011, Miller, 2004) Also the study revealed a non-significant gender influence of the perception of science teachers on the development of entrepreneurial skills through science education. This is owing to the fact that gender issue is a function of the mind being a male or a female have no significant influence on science teachers innovations and knowledge translation into entrepreneurial skills acquisition and teaching in science classes. This study findings corroborated the results of Okeke (2001), David (2011), Nwaji (2011), Okpala (2011), that gender disparity play less on the entrepreneurship skills development. Likewise, the science teachers perception of developing entrepreneurial skills in students using science education was significantly influenced by the attendance at science oriented conferences and seminars. Scientific conference, seminars, workshops, symposia and training have significance impact on the insight and awareness of science teachers knowledge, innovations and creativeness in teaching-learning process. This findings find support from the results of NERDC (2007), Okeke (2001), Okpala (2011) that science teachers attendance at conferences and workshops enhances their optimum productivity. Conclusion and Recommendations If entrepreneurial skills have not been well developed even in many educationally advanced countries where the needed human and material resources have been provided in abundance (Hodson, 1991, Osborned, 1998, Maskill, 2000 in Ajeyalemi, 2011) how mush more would it be a problem in our under-served learning environment? We can savely conclude that entrepreneurial skills are not being developed in the science education of the Nigeria school system due to the science teachers poor perception of integrating the entrepreneurship concepts into science teaching.
Journal of Science, Technology, Mathematics and Education (JOSTMED) Volume 8(3)
186
Science teachers gender did not influence the perception of the teacher towards integrating entrepreneurship education into science education whereas the science teacher attendance at learned conference and seminars did. Recommendations The importance of entrepreneurial skills in science and in science education is debatable, therefore, every effort must be made to implement the various science curricula as intended. A concrete presentation of the abstract science education content is needed for our students to meaningfully learn and vocationally employed. They should be taught entrepreneurial skills through science education. That is, for a meaningful science education and for science to serve the needs of development in Nigeria, the development of entrepreneurial skills in our school science is a sine qua non. Therefore, the following recommendations were put forth :
(i) All the stakeholders, especially government must play their roles in this. The science teachers association of Nigeria (STAN) needs to be more vehement in its demand for minimum provisions for the teaching of science as science.
(ii) Government must provide the necessary human and material resources. (iii) teachers must be active to their responsibilities and be committed to change. (iii) Science teacher educators must review their teacher preparation curriculum
programmes to ensure that science teacher-trainnees are themselves exposed to all the practical and entrepreneurial activities in the different curriculum during training.
(iv) It may then be necessary to mount intensive continuous education programmes to re- orient science teachers on the proper implementation of the science curricula with the perspective of entrepreneurial skills development. Whatever the argument for or against the development of entrepreneurial skills through science education it is incontrovertible that engagement of students in practical activities in entrepreneurial skills would make their learning more concrete and aid the acquisition and development of many life-coping skills. References Ajeyalemi, D. (2011). Practical work in school science: are the aims and objectives being achieved? STAN Memorial lecture presented at the 52nd Annual Conference of the Science Teacher Association of Nigeria, Akure, August 15-20, 2011. Akinkugbe, O.O. (2007). Pavcity of resource, poverty of ideas, the reluctant duo in science. A Paper Delivered at the Ajumogobia Foundation Lecture. 50th Anniversary Conference of the STAN. Bolarinwa, K. O. (2001). Incorporating enterpreneurship business education curriculum: An equilibrium way for sustainable poverty alleviation in Nigeria. A paper Presented at the 14th Annual Conference of the Nigeria Association of teachers of Technology (NATT) 152- 156. Butter, R. (1990). Artisans and entrepreneurs in the rural philipines: Case monographs 2. Amsterdan University Press. David, H. (2011). Overcoming the gender gap in maths, science and technology: A 21st century view A. N. Nosike et al, 1st International Technology, Education and Environment Conference, September. 5-8 2011, Omoky, Nigeria. Encarta (2009). Microsoft Encarta. 1993-2008 Microsoft Corporation. Okere, A. O. (2001). Essentials of special education. Nsukka: Afro-Orbis Publications Ltd.

Journal of Science, Technology, Mathematics and Education (JOSTMED) Volume 8(3)
187
Ezeudu, F.O. (2008). Restructuring our science technology and mathematics (stm) education for entrepreneurship in Nsikak-Abas Udofia (Ed). Proceedings of the 49th Annual Conference. Nwaji, O. J. (2011). Gender, feminism and the girl-child. In Jacinta, A. Opara et al, Proceedings of the International Conference Teaching, Learning and change 2011, 5-8 September, 2011, Omoku-Nigeria. Ojukwu, K. O. (2001). Entrepreneurship development in business education: Crital success factor in starting small business enterprises. Business Education Journal, 3(3), 103. Okebukola, P. A. O. (2007). Science, technology and mathematics education for sustainable development. Keynote Address presented at the Golden Jubilee Anniversary Conference of the Science teachers Association of Nigeria, Sokoto, August 23, 2007. Okpala, P. N. (2011). Reforms in science, technology engineering and mathematics (STEM) education. A keynote Address Presented at the 52nd Annual Conference of Science Teachers Association of Nigeria (STAN), August 15-20, 2011. Oguniyi, M. B. (1985). The moral imperative, A science educator’s View Point. 26th Annual Conference Proceedings of STAN. Orukokan, A. F. (2007). Curriculum enrichment of STM education as a basis for sustainable develop. STAN Proceedings 50th Anniversary Conference pp. Swedberg, R. (2000). The social science view on entrepreneurship: Introduction and practical implications. In Swedberg, R. (ed). Entrepreneurship: The Social Science View. New York: Oxford University press, 7 - 44.