Journal of Medicine and Life - Repository of Research and ...
122
Journal of Medicine and Life Journal of Medicine and Life Editor-in-Chief: Dafin F. Mureşanu Volume 8 • Special Issue 2• 2015 Founding Editor: Florian Popa Editorial Board Adrian Streinu-Cercel, “Carol Davila” University of Medicine and Pharmacy, Bucharest, Romania Ioanel Sinescu, “Carol Davila” University of Medicine and Pharmacy, Bucharest, Romania Andy Petroianu, Federal University of Minas Gerais, Belo Horizonte, Brazil Kypros Nicolaides, King’s College Hospital, London, U.K. Bogdan Ovidiu Popescu, “Carol Davila” University of Medicine and Pharmacy, Bucharest, Romania Ladislau Steiner, University of Virginia, Charlottesville, VA, U.S.A. Brian T. Pickering, University of Bristol, U.K. Luigi Frati, “La Sapienza” University of Rome, Rome, Italy Christos Kittas, University of Athens, Greece Madjid Samii, Medical University of Hannover, Hannover, Germany Eliot Sorel, “George Washington” University School of Medicine, Washington D.C., U.S.A. Miron Bogdan, “Carol Davila” University of Medicine and Pharmacy, Bucharest, Romania Emil Toescu, University of Birmingham, Birmingham, U.K. Tudorel Ciurea, Craiova University of Medicine and Pharmacy, Craiova, Romania Executive Editor Victor Lorin Purcărea,"Carol Davila'' University of Medicine and Pharmacy, Bucharest, Romania Scientific Council Leon Wegnez, A.I.D.A. Brussels, Brussels, Belgium Marius Bojiţă, “Iuliu Haţieganu” University of Medicine and Pharmacy, Cluj, Romania Theodor Purcărea, Romanian-American University, Bucharest, Romania Mircea Diculescu, “Carol Davila” University of Medicine and Pharmacy, Bucharest, Romania Ion Ababii, “Nicolae Testemiţeanu” University of Medicine and Pharmacy, Chişinău, Republic of Moldavia Ion Fulga, “Carol Davila” University of Medicine and Pharmacy, Bucharest, Romania Valeriy Zaporozhan, Odessa State Medical University, Odessa, Ukraine Ecaterina Ionescu, “Carol Davila” University of Medicine and Pharmacy, Bucharest, Romania Silviu Constantinoiu, “Carol Davila” University of Medicine and Pharmacy, Bucharest, Romania Ioan Lascăr, “Carol Davila” University of Medicine and Pharmacy, Bucharest, Romania Vlad Ciurea, “Carol Davila” University of Medicine and Pharmacy, Bucharest, Romania Mircea Penescu, “Carol Davila” University of Medicine and Pharmacy, Bucharest, Romania Gabriela Radulian, “Carol Davila” University of Medicine and Pharmacy, Bucharest, Romania Dan Andronescu, “Carol Davila” University of Medicine and Pharmacy, Bucharest, Romania Alexandru Ciocâlteu, “Carol Davila” University of Medicine and Pharmacy, Bucharest, Romania Mircea Beuran, “Carol Davila” University of Medicine and Pharmacy, Bucharest, Romania Victor Stoica, “Carol Davila” University of Medicine and Pharmacy, Bucharest, Romania Constantin Copotoiu, Tg. Mureş University of Medicine and Pharmacy, Tg. Mureş, Romania Petre Bordei, “Ovidius” University, Constanţa, Romania Adriana Sarah Nica, “Carol Davila” University of Medicine and Pharmacy, Bucharest, Romania Crina Sinescu, “Carol Davila” University of Medicine and Pharmacy, Bucharest, Romania Virgiliu Ancăr, “Carol Davila” University of Medicine and Pharmacy, Bucharest, Romania Dafin Mureşanu, “Iuliu Haţieganu” University of Medicine and Pharmacy, Cluj, Romania Dan Mischianu, “Carol Davila” University of Medicine and Pharmacy, Bucharest, Romania Dragoş Stanciu, “Carol Davila” University of Medicine and Pharmacy, Bucharest, Romania Dumitru Borţun, National School of Politic and Administrative Studies, Bucharest, Romania Constantin Zaharia, “Carol Davila” University of Medicine and Pharmacy, Bucharest, Romania Dana Mincă, “Carol Davila” University of Medicine and Pharmacy, Bucharest, Romania Mugurel Constantin Rusu, “Carol Davila” University of Medicine and Pharmacy, Bucharest, Romania Gheorghe Orzan, Academy of Economic Studies, Bucharest, Romania Virgiliu Arion, “Carol Davila” University of Medicine and Pharmacy, Bucharest, Romania Ion Sârbu, “Carol Davila” University of Medicine and Pharmacy, Bucharest, Romania Dumitru Lupuliasa, “Carol Davila” University of Medicine and Pharmacy, Bucharest, Romania Gelu Onose, “Carol Davila” University of Medicine and Pharmacy, Bucharest, Romania Ana Maria Vlădăreanu, “Carol Davila” University of Medicine and Pharmacy, Bucharest, Romania Petrişor Geavlete, “Carol Davila” University of Medicine and Pharmacy, Bucharest, Romania Doina Pleşca, “Carol Davila” University of Medicine and Pharmacy, Bucharest, Romania Nica Dan Aurel, “Carol Davila” University of Medicine and Pharmacy, Bucharest, Romania Editorial Members Assistant Editors Publishing Editors C. Poiana G.D. Petrescu R. Costea P. Radu C.M. Gheorghe E.M. Pahontu Consulting Student Editors G.A. Sterian G.Bobîrnac C. Cazac Editorial Office P.O.Box 35-59, 35 Bucharest, Romania. Phone/Fax: +40 21 318 07 59. E-mail: [email protected] Copyright © 2011 Journal of Medicine and Life, Bucharest, Romania Printed at ''Carol Davila'' University Press, 8 Eroilor Sanitari Blvd., 050474 Bucharest, Romania Typesetting and cover graphic: P. Radu Print ISSN 1844-122x Online ISSN 1844 – 3117 Online ISSN 1844 – 3109 www.medandlife.ro www.medetvie.ro
-
Upload
khangminh22 -
Category
Documents
-
view
4 -
download
0
Transcript of Journal of Medicine and Life - Repository of Research and ...
Journal of Medicine and Life
Journal of Medicine and Life Editor-in-Chief: Dafin F. Mureşanu Volume 8 • Special Issue 2• 2015 Founding Editor: Florian Popa
Edi tor ia l BoardAdrian Streinu-Cercel, “Carol Davila” University of Medicine and Pharmacy, Bucharest, Romania
Ioanel Sinescu, “Carol Davila” University of Medicine and Pharmacy, Bucharest, Romania
Andy Petroianu, Federal University of Minas Gerais, Belo Horizonte, Brazil Kypros Nicolaides, King’s College Hospital, London, U.K.
Bogdan Ovidiu Popescu, “Carol Davila” University of Medicine and Pharmacy, Bucharest, Romania
Ladislau Steiner, University of Virginia, Charlottesville, VA, U.S.A.
Brian T. Pickering, University of Bristol, U.K. Luigi Frati, “La Sapienza” University of Rome, Rome, Italy
Christos Kittas, University of Athens, Greece Madjid Samii, Medical University of Hannover, Hannover, Germany
Eliot Sorel, “George Washington” University School of Medicine, Washington D.C., U.S.A.
Miron Bogdan, “Carol Davila” University of Medicine and Pharmacy, Bucharest, Romania
Emil Toescu, University of Birmingham, Birmingham, U.K. Tudorel Ciurea, Craiova University of Medicine and Pharmacy, Craiova, Romania
Execut ive Ed i tor Victor Lorin Purcărea,"Carol Davila'' University of Medicine and Pharmacy, Bucharest, Romania
Scient i f i c Counci l Leon Wegnez, A.I.D.A. Brussels, Brussels, Belgium Marius Bojiţă, “Iuliu Haţieganu” University of Medicine and
Pharmacy, Cluj, Romania
Theodor Purcărea, Romanian-American University, Bucharest, Romania
Mircea Diculescu, “Carol Davila” University of Medicine and Pharmacy, Bucharest, Romania
Ion Ababii, “Nicolae Testemiţeanu” University of Medicine and Pharmacy, Chişinău, Republic of Moldavia
Ion Fulga, “Carol Davila” University of Medicine and Pharmacy, Bucharest, Romania
Valeriy Zaporozhan, Odessa State Medical University, Odessa, Ukraine
Ecaterina Ionescu, “Carol Davila” University of Medicine and Pharmacy, Bucharest, Romania
Silviu Constantinoiu, “Carol Davila” University of Medicine and Pharmacy, Bucharest, Romania
Ioan Lascăr, “Carol Davila” University of Medicine and Pharmacy, Bucharest, Romania
Vlad Ciurea, “Carol Davila” University of Medicine and Pharmacy, Bucharest, Romania
Mircea Penescu, “Carol Davila” University of Medicine and Pharmacy, Bucharest, Romania
Gabriela Radulian, “Carol Davila” University of Medicine and Pharmacy, Bucharest, Romania
Dan Andronescu, “Carol Davila” University of Medicine and Pharmacy, Bucharest, Romania
Alexandru Ciocâlteu, “Carol Davila” University of Medicine and Pharmacy, Bucharest, Romania
Mircea Beuran, “Carol Davila” University of Medicine and Pharmacy, Bucharest, Romania
Victor Stoica, “Carol Davila” University of Medicine and Pharmacy, Bucharest, Romania
Constantin Copotoiu, Tg. Mureş University of Medicine and Pharmacy, Tg. Mureş, Romania
Petre Bordei, “Ovidius” University, Constanţa, Romania Adriana Sarah Nica, “Carol Davila” University of Medicine and Pharmacy, Bucharest, Romania
Crina Sinescu, “Carol Davila” University of Medicine and Pharmacy, Bucharest, Romania
Virgiliu Ancăr, “Carol Davila” University of Medicine and Pharmacy, Bucharest, Romania
Dafin Mureşanu, “Iuliu Haţieganu” University of Medicine and Pharmacy, Cluj, Romania
Dan Mischianu, “Carol Davila” University of Medicine and Pharmacy, Bucharest, Romania
Dragoş Stanciu, “Carol Davila” University of Medicine and Pharmacy, Bucharest, Romania
Dumitru Borţun, National School of Politic and Administrative Studies, Bucharest, Romania
Constantin Zaharia, “Carol Davila” University of Medicine and Pharmacy, Bucharest, Romania
Dana Mincă, “Carol Davila” University of Medicine and Pharmacy, Bucharest, Romania
Mugurel Constantin Rusu, “Carol Davila” University of Medicine and Pharmacy, Bucharest, Romania
Gheorghe Orzan, Academy of Economic Studies, Bucharest, Romania
Virgiliu Arion, “Carol Davila” University of Medicine and Pharmacy, Bucharest, Romania
Ion Sârbu, “Carol Davila” University of Medicine and Pharmacy, Bucharest, Romania
Dumitru Lupuliasa, “Carol Davila” University of Medicine and Pharmacy, Bucharest, Romania
Gelu Onose, “Carol Davila” University of Medicine and Pharmacy, Bucharest, Romania
Ana Maria Vlădăreanu, “Carol Davila” University of Medicine and Pharmacy, Bucharest, Romania
Petrişor Geavlete, “Carol Davila” University of Medicine and Pharmacy, Bucharest, Romania
Doina Pleşca, “Carol Davila” University of Medicine and Pharmacy, Bucharest, Romania
Nica Dan Aurel, “Carol Davila” University of Medicine and Pharmacy, Bucharest, Romania
Ed i tor ia l Members
Assistant Editors Publishing Editors C. Poiana G.D. Petrescu R. Costea P. Radu C.M. Gheorghe E.M. Pahontu
Consulting Student EditorsG.A. Sterian G.Bobîrnac C. Cazac
Editorial Office P.O.Box 35-59, 35 Bucharest, Romania. Phone/Fax: +40 21 318 07 59.
E-mail: [email protected] Copyright © 2011 Journal of Medicine and Life, Bucharest, Romania
Printed at ''Carol Davila'' University Press, 8 Eroilor Sanitari Blvd., 050474 Bucharest, Romania
Typesetting and cover graphic: P. Radu
Print ISSN 1844-122x Online ISSN 1844 – 3117Online ISSN 1844 – 3109
www.medandlife.ro www.medetvie.ro

Journal of Medicine and Life
Journal of Medicine and Life Editor-in-Chief: Dafin F. Mureşanu Volume 8 • Special Issue 2• 2015 Founding Editor: Florian Popa
Table of contents
Reviews Information needs assessment of medical equipment offices based on Critical Success Factors (CSF) and Business System Planning (BSP) methods Khorrami F, Ahmadi M, Alizadeh A, Roozbeh N, Mohseni S
1
Marital instability and its predictors in a representative sample of Mashhadi citizens, Iran, 2014 Vakili V, Baseri H, Abbasi Shaye Z, Bazzaz MM
8
Original Art icles Genetic diversity of Plasmodium Vivax in South of Iran: A cross-sectional study Sharifi-Sarasiabi K, Hosseiniteshnizi S, Dehghan F, Madani A
14
The effects of Transcutaneous Electrical Nerve Stimulation on postural control in patients with chronic low back pain Rojhani-Shirazi Z, Rezaeian T
19
Assessment and attitude of university students about elderly: Preliminary Study Tabari ZA, Ghaedi FB, Hamissi JH, Eskandari S
28
Epidemiology and clinical manifestation of fungal infection related to Mucormycosis in hematologic malignancies Noorifard M, Sekhavati E, Jalaei Khoo H, Hazraty I, Tabrizi R
32
The investigation of antibacterial activity of selected native plants from North of Iran Koohsari H, Ghaemi EA, Sadegh Sheshpoli M, Jahedi M, Zahiri M
38
The association between serum C-reactive protein and macronutrients and antioxidants intake in hemodialysis patients Kooshki A, Samadipour E, Akbarzadeh R
43
Influencing factors on cervical cancer screening from the Kurdish women’s perspective: A qualitative study Rasul VH, Cheraghi MA, Behboodi Moqadam Z
47
A trans-theoretical approach to alcohol abuse profile in the general population of an islamic country - Mashhad, Iran Vakili V, Shojaee P, Yaghmaei A, Abbasi Shaye Z
55
Association between Body Mass Index and frequency and grade of varicocele in southeast Iran Fazeli F, Shahraki M, Bazzaz MM, Fazeli K
62
A clinical trial comparing the effect of peer education and orientation program on the anxiety levels of pre-CABG surgery patients Esmaeili R, Jannati Y, Ghafari R, Charati JY, Jelodar HN
66
Menopause knowledge and attitude among Iranian women Taherpour M, Sefidi F, Afsharinia S, Hamissi JH
72
General Art icles
GIS based analysis of Intercity Fatal Road Traffic Accidents in Iran Alizadeh A, Zare M, Darparesh M, Mohseni S, Soleimani-Ahmadi M
77
Investigating the effective factors in creatinine changes among hemodialysis patients using the linear random effects model Shabankhani B, Kazemnezhad A, Zaeri F
83
Effect of temperature on the setting time of Mineral Trioxide Aggregate (MTA) Sharifi R, Araghi S, Ghanem S, Fatahi A
88
Case Presentat ions
A conceptual investigation of variables affecting the success and acceptance of SMS Marketing in Iran Adhami A, Rabiee A, Adhami M
92
Special Art icles
Spatial distribution and the prevalence of speech disorders in the provinces of Iran Abbastabar H, Alizadeh A, Darparesh M, Mohseni S, Roozbeh N
99
Spatial distribution and prevalence of physical disabilities in the provinces of Iran Abbastabar H, Alizadeh A, Darparesh M, Mohseni S, Roozbeh N
105
Comparing the effectiveness of mindfulness and emotion regulation training in reduction of marital conflicts Molajafar H, Mousavi SM, Lotfi R, Seyedeh Madineh Ghasemnejad, Falah M
111
Young researchers area
Investigating the effects of Hydroalcoholic extract of jujube fruit (Zizyphus vulgaris L.) on second degree burn wound healing in Balb/c mice Vafaei F, Abdollahzadeh F
117

Journal of Medicine and Life
Journal of Medicine and Life Vol. 8, Special Issue 2, 2015, pp.1-7
Information needs assessment of medical equipment offices based on Critical Success Factors (CSF) and Business
System Planning (BSP) methods
Khorrami F*, Ahmadi M**, Alizadeh A***, Roozbeh N****, Mohseni S***
*Department of Health Information Technology, Hormozgan University of Medical Sciences, Bandar Abbas, Iran **Department of Health Information Management, Tehran University of Medical Sciences, Tehran, Iran ***Department of Public Health, Faculty of Health, Hormozgan University of Medical Sciences, Bandar Abbas, Iran ****Reproductive Health, Shahid Beheshti University of Medical Science, Tehran, Iran
Correspondence to: Ali Alizadeh, MD, Department of Public Health, Faculty of Health, Hormozgan University of Medical Sciences, Shahid Chamran Blvd., Hormozgan, Bandar Abbas, Iran, Postal code: 79166-13885, Phone: (+98) 7633336202, E-mail: [email protected] Received: May 18th, 2015 – Accepted: July 27th, 2015
Abstract Introduction: Given the ever-increasing importance and value of information, providing the management with a reliable information system, which can facilitate decision-making regarding planning, organization and control, is vitally important. This study aimed to analyze and evaluate the information needs of medical equipment offices. Methods: This descriptive applied cross-sectional study was carried out in 2010. The population of the study included the managers of statistic and medical records at the offices of vice-chancellor for treatment in 39 medical universities in Iran. Data were collected by using structured questioners. With regard to different kinds of designing information systems, sampling was done by two methods, BSP (based on processes of job description) and CSF method (based on critical success factors). The data were analyzed by SPSS-16. Results: Our study showed that 41% of information needs were found to be critical success factors of managers of office. The first priority of managers was “the number of bed and bed occupancy in hospitals”. Of 29 identified information needs, 62% were initial information needs of managers (from the viewpoints of managers). Of all, 4% of the information needs were obtained through the form, 14% through both the form and database, 11% through the web site, and 71% had no sources (forms, databases, web site). Conclusion: Since 71% of the information needs of medical equipment offices managers had no information sources, the development of information system in these offices seems to be necessary. Despite the important role of users in designing the information systems (identifying 62% of information needs), other scientific methods is also needed to be utilized in designing the information systems.
Keywords: needs assessment, Management Information Systems, medical equipment and supplies, medical, equipment office
Introduction
Medical devices developed for human application are used for diagnostic or treatment purposes. They may be either an instrument, an apparatus, or a material. Moreover, these devices can be used for daily patient care as well as for medical scientific purposes [1]. These medical devices must be kept in good condition to prevent from injuries occurring both in patients as well as in users. Moreover, to face the tough competition environment and complex health care system, the hospital should take the appropriate cost controls in response to that situation. The clinical engineering department (CED) in the hospital is responsible for the patient and clinical staff safety in using medical devices. Besides, the cost control in related operational activities of medical devices (such as purchase, contract, repair, and maintenance) is another important job for this department [2-5].
In Iran, CED is known as the medical equipments in the organizational structure of the Ministry of Health Department treatment and hospitals.
Medical equipment office (MEO) is one of the most important offices among hygiene ministry level and the country’s medical sciences universities. The main responsibility of this office in the hygiene ministry level is to organize the medical equipment condition in the country and the supervising on production process, importing, distributing, supplying, using, maintaining, exporting, quality, and quantity improving the country’s internal medical equipment producing and supervising the importing of medical equipment quality. Finding needs of medical equipment in the country, getting an ID for the medical equipment firms, coding and dividing this equipment, controlling this equipment in the market, evaluating complains and referring them to the judiciary office are important tasks of this center [6].
Nowadays, in developing countries, half of the medical equipment are hardly in a proper situation for
Journal of Medicine and Life
Journal of Medicine and Life Vol. 8, Special Issue 2, 2015
2
using and because of the medical equipment without an appropriate management (improper infrastructure, without necessary foundation for purchasing and providing, training and maintenance and operation from imported technology) wasting national hygiene source are still being continued [7].
On the other hand, with concern to the presence limits in human and financial sources especially in the governmental part, protecting from the national investment and with providing an appropriate sufficiency vital role of medical equipment, are the other responsibilities of the ministry and other centers [5,8,9].
According to the estimation done in Iran, for launching new hospitals, one third of the construction costs and equipping hospital are allocated to the medical equipment purchasing and on the other hand, for medical equipment repair and maintenance; 10-20% of the purchasing price should be estimated in the budget in advance [10]. In other words, if the hospital’s chief believes in the main plan of medical equipment management and use, there would be economy in the hospital’s costs, in a way that only by doing one of the maintenance management details meaning preventing maintenance there can be a reduction in repair cost from 45 to 50% [7,10,11]. So, the medical equipment case in all governmental parts, cooperative, private in management and economical view are of important concern and not paying attention to those would make managers face serious challenges [10].
According to the mentioned problems and this view that “each information always and in each place should be accessible for managers” would force information managers use scientific methods for providing information needs of this office [12], since the gathered information could instantly help the medical equipment managers in the decision-making. In order to identify the information needs, sample of information systems should be followed, that besides basic conditions and projects operating standards, the user’s urgent and primary needs should be concerned [13]. In this research with an emphasis and contingency view, the samples were done with the help of two methods, BSP (Business System Planning) and CSF (Critical Success Factors) to information needs analyzing the medical equipment office.
BSP method: This methodology in the 70s was invented to solve problems and disorders relevant to the information systems in the IBM Corporation and were gradually improved. Until present, it has become a successful method for different projects execution in this field (either in industry or in services) [14]. This constructive method mentioned in the information systems scheduling discussion, for assisting the organization in information systems planning, because the user’s information needing security was utilized from success factors of this methodology, concern and emphasis on occupation processes, data management being one of the most important of the organization
sources, planning from top to bottom and the system’s bottom to top [15].
CSF method: The idea of identifying critical success factors as a basis for determining the information needs of managers was proposed by Daniel [11], but popularized by Rockart [19]. The idea is very simple: in any organization, certain factors will be critical to the success of that organization, in the sense that, if objectives associated with the factors are not achieved, the organization will fail - perhaps catastrophically. The CSFs approach was applied in case studies carried out in the UK universities [16].
In this research, researchers tried to evaluate and analyze hygiene information needs, and medical equipment office Iran University of Medical Sciences, so, hopefully, the results of this research could be utilized in designing and managing the information choice in this office. Working method
This research is of functional and descriptive type. Study societies in this research were department managers of medical equipment of 39 of the medical universities of the country, and were done in 2010. The questionnaires were given to the whole research society persons, by sending an administrable e-envelope or e-mail and the answers were taken from 14 universities after 3 times following and during 8 months.
According to the variety of methods in information systems design, this research was sampled by, BSP method based on processes and responsibility explanations and CFS method based on vital factors of successful managers. The reason for choosing 2 methods at the same time was that despite the other researcher’s hint, since the differences in organizations information needs and this point that organizations are in different steps in information systems life cycle, it cannot be said that there is a fixed methodology for all the information systems design of organization management. Having said that it has been proposed that the information systems design should be done according to the contingency view and with one or more of the methods.
This research was done in 4 stages. At first, it is evaluated by the open questionnaire, the need of remedy hygiene information from the approach of occupied managers in the medical equipment section of remedy assistance on medical sciences university of the country. With the use of this questionnaire, the manager’s information was gathered in two sections (demographic information) and variety of information needs.
In the second stage, it was evaluated by internal and external sources, infrastructure, responsibility explanations, and processes relevant to the section and information defined for managers for dealing with the responsibility. Then, in the third stage, with the use of the results from the previous stages, a questionnaire was defined including all the managers information needs of
Journal of Medicine and Life
Journal of Medicine and Life Vol. 8, Special Issue 2, 2015
3
medical equipment office of remedy assistance. This questionnaire was divided into 4 categories of general information, specific information, human and resource information and references to laws, regulations and strategic documents for defining priority, being given to the managers’ hand and experts with experience in the medical equipment office of medical sciences universities of the country, so as to divide certified information needs according to Likert rule (from very high 5 to poor 1). The prioritization of information needs in this stage was specified by the average equilibrium. In cases that average would be equal, the first one forth and in case of the first one forth they were equal, the quantity of frequency with high and very high priority, in priority of needs would be picked as a proper one. The proper choice for information need was the first one forth. Based on that, if the first one forth was 3 or more than that, (in other words more than 25% of the managers, the priority of needs had been picked less than average). The relevant information need was accounted as a proper
level and otherwise as an improper one. In the fourth stage, after prioritizing and defining the information needs, source of getting these needs in the existence system, was defined and the best source for getting information needs was proposed. In order to analyze data, SPSS software V.16 was utilized.
Results
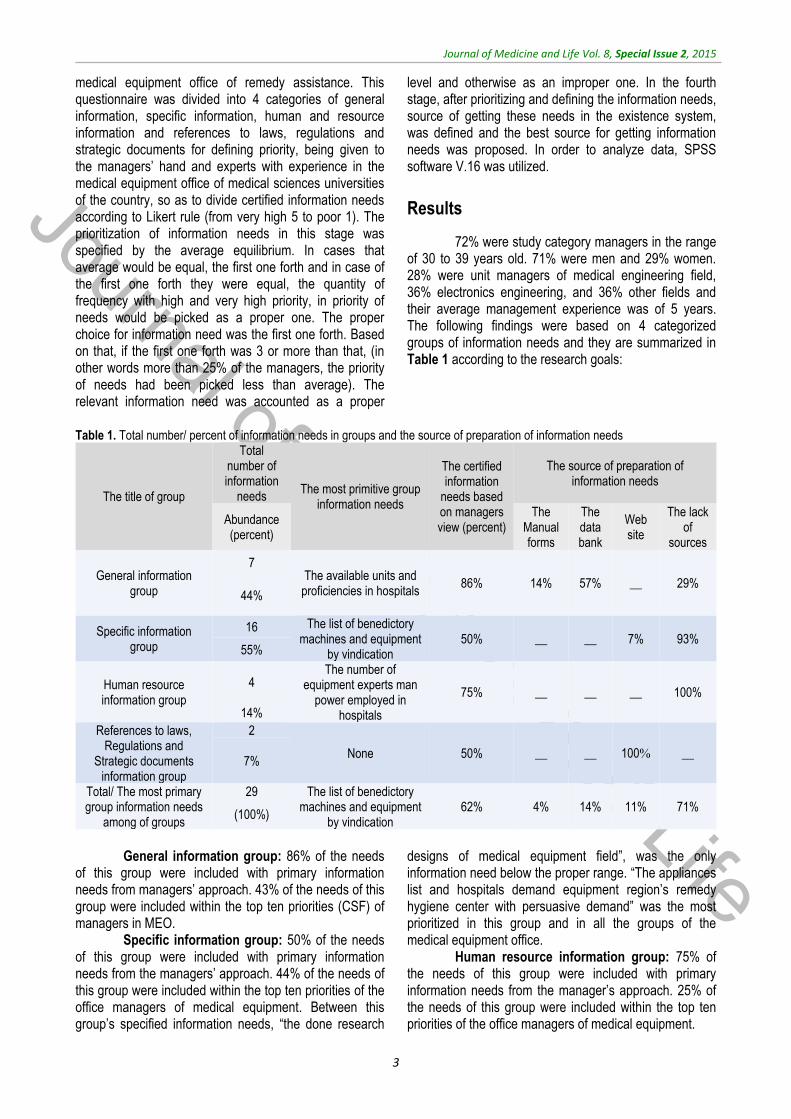
72% were study category managers in the range of 30 to 39 years old. 71% were men and 29% women. 28% were unit managers of medical engineering field, 36% electronics engineering, and 36% other fields and their average management experience was of 5 years. The following findings were based on 4 categorized groups of information needs and they are summarized in Table 1 according to the research goals:
Table 1. Total number/ percent of information needs in groups and the source of preparation of information needs
The source of preparation of information needs
The certified information
needs based on managers view (percent)
The most primitive group information needs
Total number of information
needs The title of group The lack
of sources
Web site
The data bank
The Manual forms
Abundance (percent)
29% __ 57% 14% 86% The available units and proficiencies in hospitals
7 General information
group 44%
93% 7% __ __ 50% The list of benedictory
machines and equipment by vindication
16 Specific information group 55%
100% __ __ __ 75%
The number of equipment experts man
power employed in hospitals
4 Human resource information group
14%
__ 100% __ __ 50% None
2 References to laws, Regulations and
Strategic documents information group
7%
71% 11% 14% 4% 62% The list of benedictory
machines and equipment by vindication
29 Total/ The most primary group information needs
among of groups (100%)
General information group: 86% of the needs
of this group were included with primary information needs from managers’ approach. 43% of the needs of this group were included within the top ten priorities (CSF) of managers in MEO.
Specific information group: 50% of the needs of this group were included with primary information needs from the managers’ approach. 44% of the needs of this group were included within the top ten priorities of the office managers of medical equipment. Between this group’s specified information needs, “the done research
designs of medical equipment field”, was the only information need below the proper range. “The appliances list and hospitals demand equipment region’s remedy hygiene center with persuasive demand” was the most prioritized in this group and in all the groups of the medical equipment office.
Human resource information group: 75% of the needs of this group were included with primary information needs from the manager’s approach. 25% of the needs of this group were included within the top ten priorities of the office managers of medical equipment.
Journal of Medicine and Life
Journal of Medicine and Life Vol. 8, Special Issue 2, 2015
4
References to laws, Regulations, and Strategic documents information group: one case of two in this group was included within the primary information needs from the manager’s approach.
All in all, 62% of the group’s specified information needs included with primary information needs from the manager’s approach. 3% of the information needs were below the proper range. 4% of the
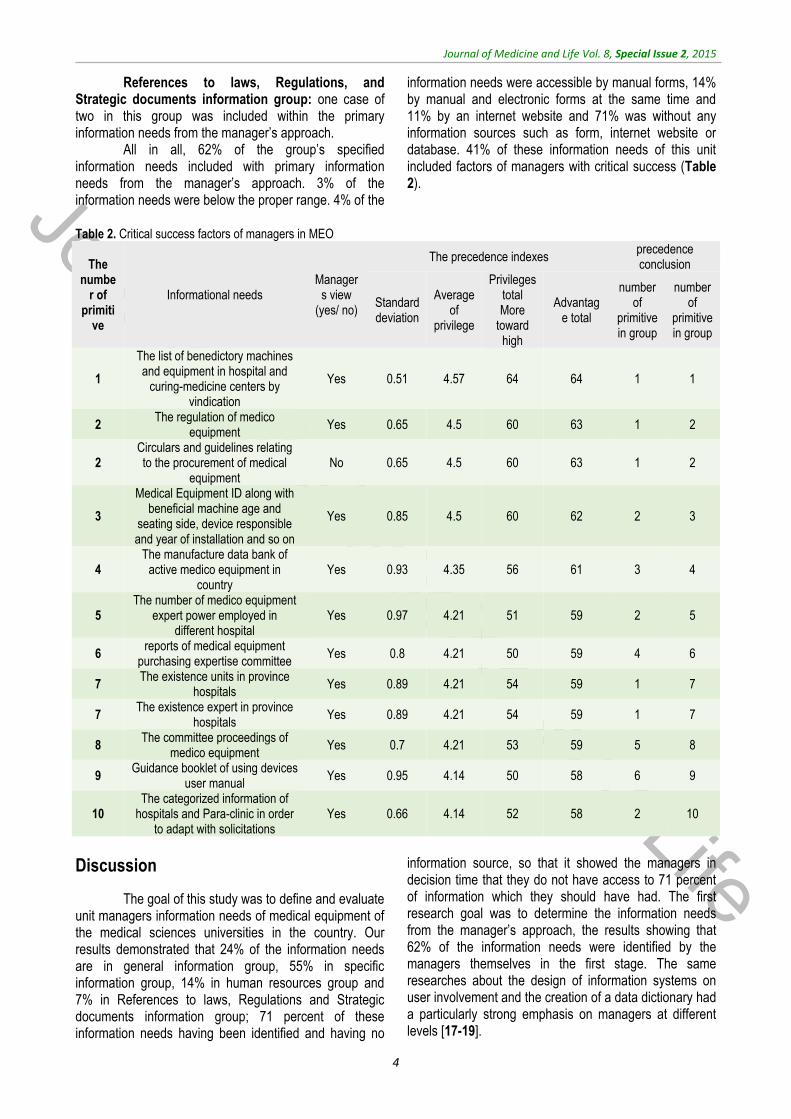
information needs were accessible by manual forms, 14% by manual and electronic forms at the same time and 11% by an internet website and 71% was without any information sources such as form, internet website or database. 41% of these information needs of this unit included factors of managers with critical success (Table 2).
Table 2. Critical success factors of managers in MEO
precedence conclusion
The precedence indexes
Managers view
(yes/ no) Informational needs
The numbe
r of primiti
ve
number of
primitive in group
number of
primitive in group
Advantage total
Privileges total More
toward high
Average of
privilege
Standard deviation
1 1 64 64 4.57 0.51 Yes
The list of benedictory machines and equipment in hospital and
curing-medicine centers by vindication
1
2 1 63 60 4.5 0.65 Yes The regulation of medico
equipment 2
2 1 63 60 4.5 0.65 No
Circulars and guidelines relating to the procurement of medical
equipment 2
3 2 62 60 4.5 0.85 Yes
Medical Equipment ID along with beneficial machine age and
seating side, device responsible and year of installation and so on
3
4 3 61 56 4.35 0.93 Yes The manufacture data bank of
active medico equipment in country
4
5 2 59 51 4.21 0.97 Yes The number of medico equipment
expert power employed in different hospital
5
6 4 59 50 4.21 0.8 Yes reports of medical equipment
purchasing expertise committee 6
7 1 59 54 4.21 0.89 Yes The existence units in province
hospitals 7
7 1 59 54 4.21 0.89 Yes The existence expert in province
hospitals 7
8 5 59 53 4.21 0.7 Yes The committee proceedings of
medico equipment 8
9 6 58 50 4.14 0.95 Yes Guidance booklet of using devices
user manual 9
10 2 58 52 4.14 0.66 Yes The categorized information of
hospitals and Para-clinic in order to adapt with solicitations
10
Discussion
The goal of this study was to define and evaluate unit managers information needs of medical equipment of the medical sciences universities in the country. Our results demonstrated that 24% of the information needs are in general information group, 55% in specific information group, 14% in human resources group and 7% in References to laws, Regulations and Strategic documents information group; 71 percent of these information needs having been identified and having no
information source, so that it showed the managers in decision time that they do not have access to 71 percent of information which they should have had. The first research goal was to determine the information needs from the manager’s approach, the results showing that 62% of the information needs were identified by the managers themselves in the first stage. The same researches about the design of information systems on user involvement and the creation of a data dictionary had a particularly strong emphasis on managers at different levels [17-19].
Journal of Medicine and Life
Journal of Medicine and Life Vol. 8, Special Issue 2, 2015
5
The second goal was to identify the information needs in MEO managers from other sources. In this stage of research, at the first structure, task works and processes in MEO were specified, because the responsibility explanation and structure and research goal were the most noticeable points in the BSP method. This way the analyzer could analyze the system details better and they could get enough information in the organization case and centers of information producing the next steps. 38% of the managers information needs were specified this way. In his research, Babaie stated that the reason for not taking the users’ needs seriously was that they tended to make the border for their needs and they only demanded for information that they were aware. That was why the library studies and the use of scientific methods for the identification of information needs was necessary, those being hidden in the managers approach [20].
The third research goal was to evaluate (prioritize) and define the information needs from the first and second stages. After prioritizing the information needs, 3% of the information needs turned out to be below the group from the prioritized level. Prioritizing is one of the uses of CSF method in this research. In this method, for each organization, something less than 10 critical or sensitive factors [21] that take into account the decision-making, were introduced. These factors depend on specific conditions of the organizations so they should be rectified during the experience period. These key factors needed to be consecutively considered by contractors. Critical success factors of MEO managers are shown in Table 2.
The most prioritized MEO information need was “The list of requested sets and equipments with justification”. According to the survey of the World Health Organization Global expenditure on medical devices increased from US$ 145 billion in 1998 to US$ 220 billion in 2006, representing an annual growth rate exceeding 10%. Surely, management of requests issue can help reducing costs and storage devices and also fixing the defective of centers which is covered by the storage program [9].
According to Table 2, the information need “medical equipment principles” and “directives” and instructions of providing and purchasing the medical equipments with little space, being the second priority of MEOs that this is covered by the website of the medical office of the Ministry of Health, that can be a sample for the other units so as to share information between colleagues and managers.
Information needs “medical equipment registration system with an appliance of useful life cycle and position, appliance responsible and the installation year” being the third priorities. In an article entitled “Effect of management system implementation and maintenance of medical equipment in VALIASR hospital costs in Arak 2006”, Jadidi underlined that after the evaluation of 691 medical equipment appliance, 57.73% of them were
without technical certification and this factor was mentioned as a block in the optimal use of medical equipment [10].
Information needs “information database of current medical equipment companies in Iran” represents the fourth priority. In their article entitled “Materials Database Reorganization Plan, Medical Equipment Country” Khani and colleagues confirmed the importance of medical equipment certification and total information gathering relevant to the current companies in medical equipment and facilities including inside and outside, continuing that this information database creates high discipline in the medical equipment information structure. They also added that the most important benefit of having a certification of medical engineering companies is the awareness of the import range of each company, accessibility to medical equipment statistics efficiency condition especially in the economical equipment, but unfortunately, in offices, the current cycle relevant to the medical equipment, there is no organized system for CVs of companies, branches and importers. This issue caused that sometimes, based on the expert’s personal information, managers would have unexpected functions relevant to this issue [22].
The fifth priority relevant to the information need was “Specifications of manpower who is employed in the medical centers”. Based on the evaluation performed by Amerion, 44% of the existent medical equipment does not have even one technician or engineer [23]. Also in the same study, after the evaluation of 691 medical equipment appliances, Jadidi declared that 74% of the appliances do not have fixed and experienced human forces and this is mentioned as the optimal use block of the medical equipment [10].
The sixth and eighth information needs were followed by “reports of medical equipment purchasing expertise committee “and” medical equipment committee agreement“. The same articles have focused on the importance and the role of the medical equipment committee in the manager’s approach and all the hospital managers believing in the organization and creation of the medical engineering unit, although nothing has been done for the launching of that unit so far, and none of the expertise committee hospitals have purchased any medical equipment file [10].
The ninth information need was “guideline paper of appliance uses“. In their article entitled “The study of maintenance and care of the cost of medical equipment to hospitals Iranian health Medical Sciences University 2000”, Noori and colleagues showed that only 37.2% of the under study hospitals used guideline paper from the medical equipment and 15.6% of the under study equipment had service guideline paper. These papers showed service process and efficient detection tables of medical appliances and consecutive detecting date that should be followed by a caring unit and medical engineering or companies with after sale services and

Journal of Medicine and Life
Journal of Medicine and Life Vol. 8, Special Issue 2, 2015
6
mentioned cases, so checking and detecting services of this appliance are done better [6].
Information needs “Sectors and professions in hospitals” and “hospital leveling information and Para clinics for adjusting with demands” are the seventh and ninth priorities in the critical success factors table, including prioritized general information of the medical equipment managers, that play an important role in the proper decision for the purchasing of the needed medical equipment for under cover centers [24].
The fourth goal of the research was the proposal for source or sources of prioritized information needs of remedy assistance medical equipment unit. 71% of the information needs was without specific sources such as manual form, website or software.
Conclusion
Based on the results that were mentioned, it is recommended that: since the information need study does not have that much background in Iran and according to the done searching in this case, the product of these studies are limited to few cases which showed that there is deep space in the basic study and theory, technical, methods and information evaluation facilities matters. Therefore, it is recommended that the management
information systems design with information needs certified in all hygiene ministry parts, are done by scientific methods.
In general, it is recommended that at first existence management information systems in the medical equipment office of medical sciences university should be evaluated with concentration on the university information management under vision of one unit or independent management information center, there being the possibility of management and omission of the managing parallel working in the different units of the university. Then, the second stage underlines the creation of expertise workgroups, information quantity based on certifying scientific methods and according to the integration management information system with the use of new technology of design. Acknowledgement
The article is result of a searching design entitled “information producing process rectifying based on managers information needs of medical sciences universities of Hormozgan remedy hygiene services”, ratified by the medical sciences university. From the office’s respectful managers of MEOs of medical sciences universities of country, it was appreciated that they cooperated in running this plan.
References
1. Palanichamy G. Basic Principles of Risk Management for Medical Device Design. 2007.
2. Lenel A, Temple-Bird C, Kawohl W, Kaur M. How to Organize a System of Healthcare Technology Management. World Health Organization, 2009.
3. David Y, Jahnke EG. Planning Hospital Medical Technology Management. IEEE Engineering in Medicine and Biology Magazine. May-June 2004; 23,3:73-79.
4. David Y, Judd TM. Management and Assessment of Medical Technology, Clinical Engineering (Principles and Applications in Engineering, 2003, RC, New York.
5. Chien CH, Huang YY, Chong FC. A framework of medical equipment management system for in-house clinical engineering department. 32nd Annual International Conference of the IEEE EMBS, August 31, 2010, Buenos Aires: IEEE.
6. Medical Equipment Department Tehran: Ministry of Health and Medical Education. 2014. http://www.imed.ir/.
7. Nori Tajer M, Dabaghi F, Mohammadi R, Haghani H. The study of maintenance and care of the cost of medical equipment to hospitals Iranian health Medical Sciences University 2000. Journal Of Iran
University of Medical. 2002; 9(30):445-454.
8. Ameriom A, Hamze Atani B, Mohebi H. Medical equipment maintenance management review in two military hospitals selected countries. Jornal of Military Medicine. 2008; 9(3):189-195.
9. Department of Essential Health Technologies. Development of medical device policies. 2011, Switzerland: WHO Press.
10. Jadidi R, Bayati A, Arab M. Effect of management system implementation and maintenance of medical equipment in Vsliasr hospital costs in Arak 2006. Journal of Arak University Medical Science. 2008; 11 (4) :41-48.
11. Halbwachs H. Maintenance and the life expectancy of healthcare equipment in developing economies. Health-Estate. 2000; 54(2):26-31.
12. Csiki I, Marcu A, Ungurean C. Description of the National Health Information System in Romania. 2005, Bucharest: WHO Regional Office for Europe.
13. Revere D, Turner M. Understanding the information needs of public health practitioners: A literature review to inform design of an interactive digital knowledge
management system. Journal of Biomedical Informatics. 2007; 40,410-21.
14. Wikipedia. Business system planning: Wikipedia. 2014. http://en.wikipedia.org/wiki/Business_system_planning.
15. IBM. Information System Planning. 1 ed., 2000, Tehran: Dadeh Pardazi Iran.
16. Huotari ML, Wilson TD. Determining organizational information needs: the Critical Success Factors approach. Information Research. 2001; 6(3). http://www.shef.ac.uk/is/publications/infres/paper108.html.
17. Mendoza O, Chong YC. Developing health management information systems: a practical guide for developing countries. WHO Regional Office for the Western Pacific. 2004; 1-53. http://whqlibdoc.who.int/publications/2004/9290611650.pdf.
18. Cibulskis RE, Hiawalyer G. Information Systems for Health Hector Monitoring in Papua New Guinea. Bulletin of the World Health Organization (WHO). 2002; 80(9):752-8. http://www.who.int/bulletin/archives/en/80(9)752.pdf.
19. Chishimba P, Limbambala E, Gwai E, Kachaka C. The HMIS in Zambia: A Trace on the Implementation Steps. In:

Journal of Medicine and Life
Journal of Medicine and Life Vol. 8, Special Issue 2, 2015
7
Programmes ZIH. Zambia: Central Board of Health. 2003. http://www.cboh.gov.zm/documents/HMIS/HMIS Background Document - Final – November 12.pdf.
20. Babaie M. Information Needs Assessment. 3 ed., 2007, Tehran: Iranian Research Institute for Scientific Information and Documentation, 56-62.
21. Eslami Y. Role of management information systems in decision-making Iran Yasa managers. 1994, Tehran: Tarbiat Modarres University, 23-7.
22. Khani Jazni R, Safavi H, Soleimani A, Moslemi A. Materials Database Reorganization Plan, Medical Equipment Country. Journal of Medicine and Purification. 2004; 55:84-97.
23. Ameriom A, Hamze Atani B, Mohebi H. Medical equipment maintenance management review in two military hospitals selected countries. Journal of Military Medicine. 2008; 9(3):189-195.
24. Department of Essential Health Technologies. Introduction to medical equipment inventory management. 2011, Switzerland: Department of Essential Health Technologies.
Journal of Medicine and Life
Journal of Medicine and Life Vol. 8, Special Issue 2, 2015, pp.8-13
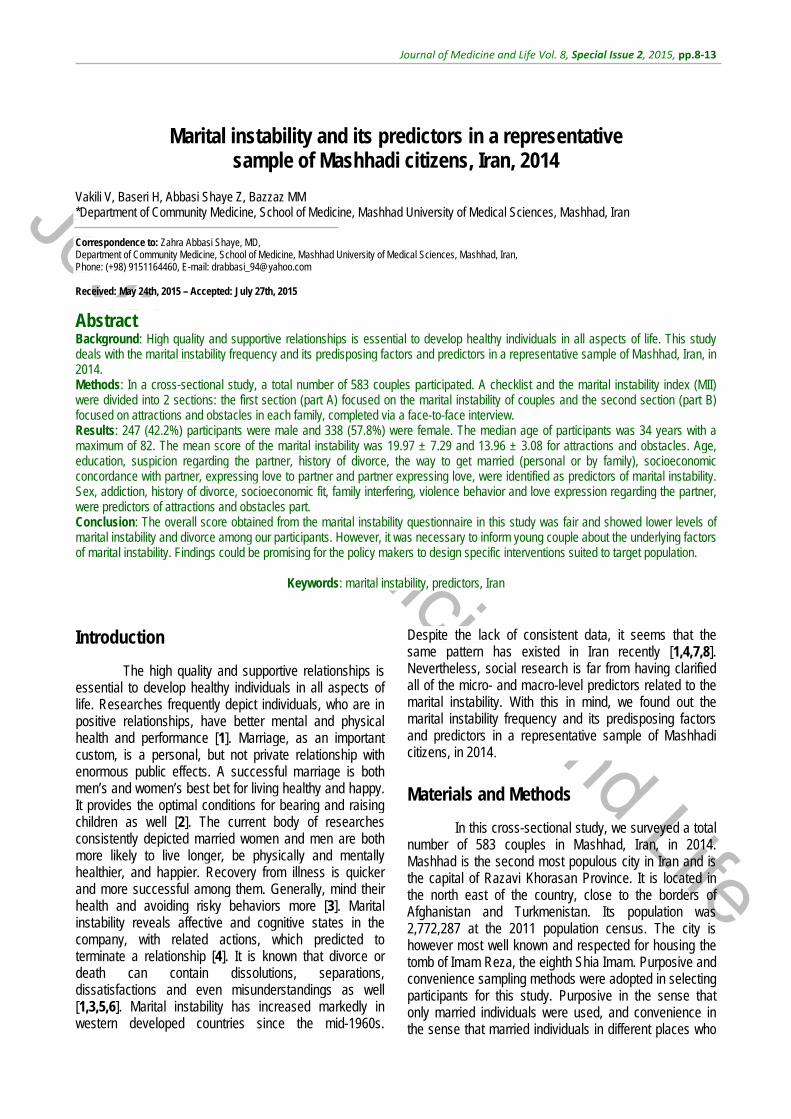
Marital instability and its predictors in a representative sample of Mashhadi citizens, Iran, 2014
Vakili V, Baseri H, Abbasi Shaye Z, Bazzaz MM *Department of Community Medicine, School of Medicine, Mashhad University of Medical Sciences, Mashhad, Iran Correspondence to: Zahra Abbasi Shaye, MD, Department of Community Medicine, School of Medicine, Mashhad University of Medical Sciences, Mashhad, Iran, Phone: (+98) 9151164460, E-mail: [email protected] Received: May 24th, 2015 – Accepted: July 27th, 2015
Abstract Background: High quality and supportive relationships is essential to develop healthy individuals in all aspects of life. This study deals with the marital instability frequency and its predisposing factors and predictors in a representative sample of Mashhad, Iran, in 2014. Methods: In a cross-sectional study, a total number of 583 couples participated. A checklist and the marital instability index (MII) were divided into 2 sections: the first section (part A) focused on the marital instability of couples and the second section (part B) focused on attractions and obstacles in each family, completed via a face-to-face interview. Results: 247 (42.2%) participants were male and 338 (57.8%) were female. The median age of participants was 34 years with a maximum of 82. The mean score of the marital instability was 19.97 ± 7.29 and 13.96 ± 3.08 for attractions and obstacles. Age, education, suspicion regarding the partner, history of divorce, the way to get married (personal or by family), socioeconomic concordance with partner, expressing love to partner and partner expressing love, were identified as predictors of marital instability. Sex, addiction, history of divorce, socioeconomic fit, family interfering, violence behavior and love expression regarding the partner, were predictors of attractions and obstacles part. Conclusion: The overall score obtained from the marital instability questionnaire in this study was fair and showed lower levels of marital instability and divorce among our participants. However, it was necessary to inform young couple about the underlying factors of marital instability. Findings could be promising for the policy makers to design specific interventions suited to target population.
Keywords: marital instability, predictors, Iran Introduction
The high quality and supportive relationships is essential to develop healthy individuals in all aspects of life. Researches frequently depict individuals, who are in positive relationships, have better mental and physical health and performance [1]. Marriage, as an important custom, is a personal, but not private relationship with enormous public effects. A successful marriage is both men’s and women’s best bet for living healthy and happy. It provides the optimal conditions for bearing and raising children as well [2]. The current body of researches consistently depicted married women and men are both more likely to live longer, be physically and mentally healthier, and happier. Recovery from illness is quicker and more successful among them. Generally, mind their health and avoiding risky behaviors more [3]. Marital instability reveals affective and cognitive states in the company, with related actions, which predicted to terminate a relationship [4]. It is known that divorce or death can contain dissolutions, separations, dissatisfactions and even misunderstandings as well [1,3,5,6]. Marital instability has increased markedly in western developed countries since the mid-1960s.
Despite the lack of consistent data, it seems that the same pattern has existed in Iran recently [1,4,7,8]. Nevertheless, social research is far from having clarified all of the micro- and macro-level predictors related to the marital instability. With this in mind, we found out the marital instability frequency and its predisposing factors and predictors in a representative sample of Mashhadi citizens, in 2014.
Materials and Methods
In this cross-sectional study, we surveyed a total number of 583 couples in Mashhad, Iran, in 2014. Mashhad is the second most populous city in Iran and is the capital of Razavi Khorasan Province. It is located in the north east of the country, close to the borders of Afghanistan and Turkmenistan. Its population was 2,772,287 at the 2011 population census. The city is however most well known and respected for housing the tomb of Imam Reza, the eighth Shia Imam. Purposive and convenience sampling methods were adopted in selecting participants for this study. Purposive in the sense that only married individuals were used, and convenience in the sense that married individuals in different places who
Journal of Medicine and Life
Journal of Medicine and Life Vol. 8, Special Issue 2, 2015
9
had time and expressed their consent in responding to our questionnaires, were used.
The survey was done by using a checklist and the marital instability index (MII) [9]. The checklist included the socio-demographic characteristics and factors related to the marriage of the respondents. The MII questionnaire consisted of 18 questions with Likert scale (from one (never) to 5 (always) scores) that were divided into 2 sections: first section (part A) focused on the marital instability of couples (14 questions) and the second section (part B) focused on attractions and obstacles in each family (4 questions). The score of 70 for part A and 5 for part B indicated the highest level of instable marriage and the score of 14 for part A and 20 for part B suggested the lowest level of marital instability. We used the Persian version of the questionnaire, being valid and reliable before [10]. The demographic information, including age, sex, education level, job status, and history of smoking, as well as drug or alcohol abuse, and etc., were asked in the checklist. We referred to the public transport stations, public parking lots, car parks of shopping centers, banks, hospitals and universities all around the city for data collection. The parking of Imam Reza holy Shrine was also a place for sampling the collection procedure. A total number of 583 questionnaires were completed.
The Ethics Committee of Mashhad University of Medical Sciences approved the study. The interviewers explained the objectives of research for the participants and the latter were assured about the privacy of their personal data, and after getting the consent, they filled the questionnaires.
SPSS 11.5 software (SPSS Inc., Chicago, Illinois, USA) was used for all the statistical analyses. The
standard descriptive statistics were applied to describe the pattern of the data. Chi-square test was used to examine the significance of the association between categorical data. The normality of the data was checked with Kolmogorov–Smirnov test. ANOVA and Kruskal-Wallis tests were also applied in normal and non-normal distributions respectively. Linear regressions were used to predict the factors’ influence on marriage instability. All the tests were 2-tailed, and the probability values less than 0.05 (p<0.05) were considered significant.
Results
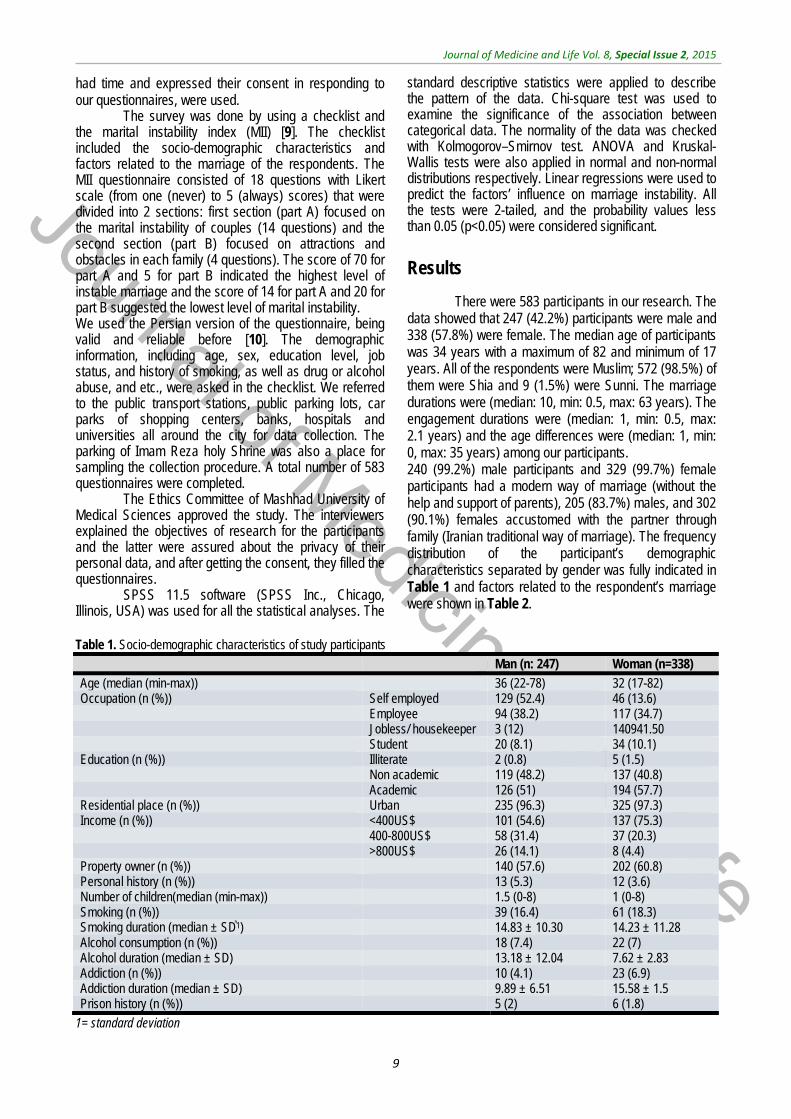
There were 583 participants in our research. The data showed that 247 (42.2%) participants were male and 338 (57.8%) were female. The median age of participants was 34 years with a maximum of 82 and minimum of 17 years. All of the respondents were Muslim; 572 (98.5%) of them were Shia and 9 (1.5%) were Sunni. The marriage durations were (median: 10, min: 0.5, max: 63 years). The engagement durations were (median: 1, min: 0.5, max: 2.1 years) and the age differences were (median: 1, min: 0, max: 35 years) among our participants. 240 (99.2%) male participants and 329 (99.7%) female participants had a modern way of marriage (without the help and support of parents), 205 (83.7%) males, and 302 (90.1%) females accustomed with the partner through family (Iranian traditional way of marriage). The frequency distribution of the participant’s demographic characteristics separated by gender was fully indicated in Table 1 and factors related to the respondent’s marriage were shown in Table 2.
Table 1. Socio-demographic characteristics of study participants
Man (n: 247) Woman (n=338)
Age (median (min-max)) 36 (22-78) 32 (17-82) Occupation (n (%)) Self employed 129 (52.4) 46 (13.6) Employee 94 (38.2) 117 (34.7) Jobless/ housekeeper 3 (12) 140941.50 Student 20 (8.1) 34 (10.1) Education (n (%)) Illiterate 2 (0.8) 5 (1.5) Non academic 119 (48.2) 137 (40.8) Academic 126 (51) 194 (57.7) Residential place (n (%)) Urban 235 (96.3) 325 (97.3) Income (n (%)) <400US$ 101 (54.6) 137 (75.3) 400-800US$ 58 (31.4) 37 (20.3) >800US$ 26 (14.1) 8 (4.4) Property owner (n (%)) 140 (57.6) 202 (60.8) Personal history (n (%)) 13 (5.3) 12 (3.6) Number of children(median (min-max)) 1.5 (0-8) 1 (0-8) Smoking (n (%)) 39 (16.4) 61 (18.3) Smoking duration (median ± SD͌1) 14.83 ± 10.30 14.23 ± 11.28 Alcohol consumption (n (%)) 18 (7.4) 22 (7) Alcohol duration (median ± SD) 13.18 ± 12.04 7.62 ± 2.83 Addiction (n (%)) 10 (4.1) 23 (6.9) Addiction duration (median ± SD) 9.89 ± 6.51 15.58 ± 1.5 Prison history (n (%)) 5 (2) 6 (1.8)
1= standard deviation

Journal of Medicine and Life
Journal of Medicine and Life Vol. 8, Special Issue 2, 2015
10
Table 2. Characteristics related to marriage
Man Woman P-Value
Age at marriage (median (min-max)) 25 (14-57) 21 (10-45) <0.001 Family relationship (n (%)) 77 (31.4) 81 (24.2) 0.05 Infertility History (n (%)) 4 (2) 12 (3.7) 0.5 Suspicion to partner (n (%)) 17 (7) 32 (15.9) 0.002 Divorce history (n (%)) 14 (5.8) 17 (5.2) 0.01 Divorce in parents (n (%)) 25 (10.2) 30 (9.1) 0.05 Pre-marital relationship with partner (n (%)) 45 (20.8) 77 (22.9) <0.001 Refer to counselor before marriage (n (%)) 38 (15.4) 58 (16.8) 0.67 Cultural-ideological concordance with the partner’s family (n (%)) 201 (81.7) 257 (76.7) 0.15 Socio-economic concordance with the partner’s family (n (%)) 205 (83.3) 254 (75.8) 0.03 Agreement of your family for marriage (n (%)) 228 (93.1) 300 (89.3) 0.12 Agreement of family’s partner for marriage (n (%)) 236 (95.9) 308 (91.9) 0.05 Family's and friends’ Interfering (n (%)) 46 (18.8) 69 (20.7) 0.56 Financial dependence on their family (n (%)) 37 (15) 55 (16.4) 0.66 Expressed love to partner (n (%)) 204 (83.3) 276 (82.6) 0.84 Receive love expressions from partner (n (%)) 213 (86.9) 263 (78.3) 0.007 Violence behavior against partner (n (%)) 29 (11.8) 46 (13.7) 0.50
The mean score of marital instability in part A
was 19.97 ± 7.29 out of the maximum 57 and minimum 14 and was 13.96 ± 3.08 with a maximum of 20 and minimum of 4 in part B. The median score of each question for men and women was shown in Table 3. For
the females A2 and A4 questions, the highest score was received. Our analysis showed that questions A2, A4, A6, A8, A10 and B3 had a statistically significant difference between men and women (p-value <0.05/ Table 3).
Table 3. Marital instability aspects according to gender
Part A Man
(median)Woman (median)
p-value
Sometimes married people think they would enjoy living apart from their Spouse. How often do you feel this way? (A1)
2 1 <0.001
Even people who get along quite well with their spouse sometimes wonder whether their marriage is working out. Have you ever thought: marriage might be
in trouble? (A2) 1 2 <0.001
Have your spouse ever thought: marriage might be in trouble? (A3) 1 1 0.58 Have you ever talked With family members, friends, clergy, counselors, or Social
workers about problems in your marriage? (A4) 1 2 <0.001
Has your spouse talked with relatives, friends, or a Counselor about problems either of you were having with your marriage? (A5) 1 1 0.82
Has the thought of getting a divorce or separation crossed your mind? (A6) 1 2 <0.001 Has the thought of getting a divorce or separation crossed your
Spouse’s mind? (A7) 1 1 0.97
Have you or your spouse ever seriously suggested the idea of divorce? (A8) 1 1 0.01 Did you discuss about division of property? (A9)
1 1 0.47
Have you talked about filing a petition to an attorney? (A10) 1 1 0.03 Have you or your spouse consulted an attorney about a divorce or separation?
(A11) 1 1 0.14
Because of problems people are having with their marriage they sometimes leave home either for a short time or as a trial separation. Has this ever happened in
your marriage? (A12) 1 1 0.35
Have you talked about filing a petition your spouse? (A13) 1 1 0.12 Have you or your spouse filed a divorce or separation
Petition at court? (A14) 1 1 0.45
Part B How often do you eat your main meal with your spouse? (B1) 4 4 0.27 How often do you meet your friends with your spouse? (B2) 3 3 0.78
How often do you help your spouse doing home activities? (B3) 2 3 0.01 How often do you go to cinema, party, travel with your spouse? (B4) 3 3 0.90
Journal of Medicine and Life
Journal of Medicine and Life Vol. 8, Special Issue 2, 2015, pp.8-13
After the analysis, we found that there were significant differences between the mean score of part A and smoking, alcohol and drug abuse (smoking, alcohol consumption and drug abuse can lead to instability, p<0.001), but there were no statistical differences between the mean score of part B and smoking and alcohol consumption. However, we had a significant difference between drug abuse and the mean score of part B (p<0.001).
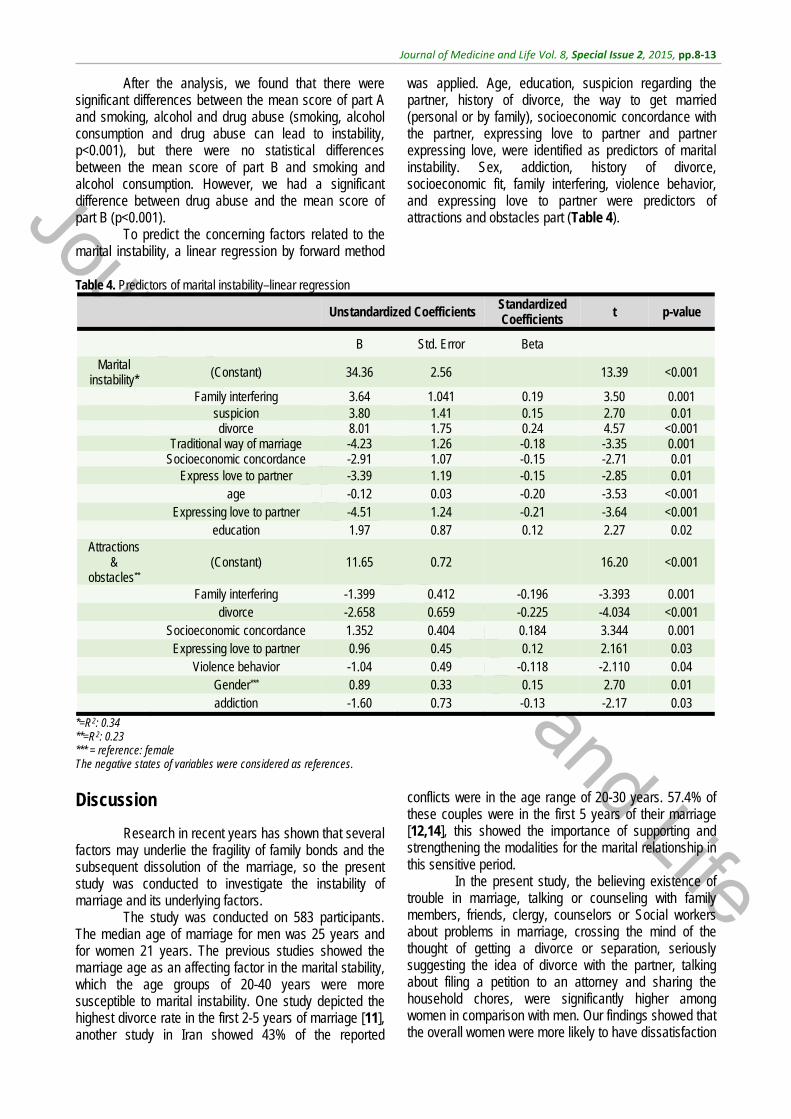
To predict the concerning factors related to the marital instability, a linear regression by forward method
was applied. Age, education, suspicion regarding the partner, history of divorce, the way to get married (personal or by family), socioeconomic concordance with the partner, expressing love to partner and partner expressing love, were identified as predictors of marital instability. Sex, addiction, history of divorce, socioeconomic fit, family interfering, violence behavior, and expressing love to partner were predictors of attractions and obstacles part (Table 4).
Table 4. Predictors of marital instability–linear regression
Unstandardized Coefficients Standardized Coefficients t p-value
B Std. Error Beta
Marital instability* (Constant) 34.36 2.56 13.39 <0.001
Family interfering 3.64 1.041 0.19 3.50 0.001 suspicion 3.80 1.41 0.15 2.70 0.01 divorce 8.01 1.75 0.24 4.57 <0.001 Traditional way of marriage -4.23 1.26 -0.18 -3.35 0.001 Socioeconomic concordance -2.91 1.07 -0.15 -2.71 0.01 Express love to partner -3.39 1.19 -0.15 -2.85 0.01 age -0.12 0.03 -0.20 -3.53 <0.001 Expressing love to partner -4.51 1.24 -0.21 -3.64 <0.001 education 1.97 0.87 0.12 2.27 0.02
Attractions &
obstacles** (Constant) 11.65 0.72 16.20 <0.001
Family interfering -1.399 0.412 -0.196 -3.393 0.001 divorce -2.658 0.659 -0.225 -4.034 <0.001 Socioeconomic concordance 1.352 0.404 0.184 3.344 0.001 Expressing love to partner 0.96 0.45 0.12 2.161 0.03 Violence behavior -1.04 0.49 -0.118 -2.110 0.04 Gender*** 0.89 0.33 0.15 2.70 0.01 addiction -1.60 0.73 -0.13 -2.17 0.03
*=R2: 0.34 **=R2: 0.23 *** = reference: female The negative states of variables were considered as references. Discussion
Research in recent years has shown that several factors may underlie the fragility of family bonds and the subsequent dissolution of the marriage, so the present study was conducted to investigate the instability of marriage and its underlying factors.
The study was conducted on 583 participants. The median age of marriage for men was 25 years and for women 21 years. The previous studies showed the marriage age as an affecting factor in the marital stability, which the age groups of 20-40 years were more susceptible to marital instability. One study depicted the highest divorce rate in the first 2-5 years of marriage [11], another study in Iran showed 43% of the reported
conflicts were in the age range of 20-30 years. 57.4% of these couples were in the first 5 years of their marriage [12,14], this showed the importance of supporting and strengthening the modalities for the marital relationship in this sensitive period.
In the present study, the believing existence of trouble in marriage, talking or counseling with family members, friends, clergy, counselors or Social workers about problems in marriage, crossing the mind of the thought of getting a divorce or separation, seriously suggesting the idea of divorce with the partner, talking about filing a petition to an attorney and sharing the household chores, were significantly higher among women in comparison with men. Our findings showed that the overall women were more likely to have dissatisfaction

Journal of Medicine and Life
Journal of Medicine and Life Vol. 8, Special Issue 2, 2015
12
from their marriage and were more likely to complain. It might be related to patriarchy. In a patriarchal society like Iran, power is primarily held by adult men. Males predominate in roles of political leadership, moral authority, social privilege and control of property; and, in the domain of the family, fathers or father figures hold authority over women and children [15]. Emotional differences between man and woman might be another related factor [16].
Religious beliefs and cultural adaptation are important factors in the stability of the family, as in the study of the causes of divorce, Rayhani and Ajam [14] reported that 73% of the marital instability predisposing factors are due to religious and cultural factors [14]. On the other hand, another study in Australia revealed higher levels of religious beliefs as a barrier for breakdown of marriage both among men and women [4], Yarnoz argued about the attachment of the human’s thoughts, perceptions and believes with his performance and interpersonal relationships [17]. Bottonari’s study admitted the relationship between the individual’s beliefs and marital instability as well [18]. However, in our study, no significant difference was observed.
We found in our study an economical in-concordance between wife, husband, and their families, as a predictor of marital instability. This finding was concordant with the previous studies. When there is economical concordance between couples, unrealistic expectations are less frequent. Usually, the point of view of themselves and their first degree family members are closer to each other, therefore, they do not prefer over another, and do not humiliate each other as well and generally the relationship is less challenging [14,19].
The parents’ interfering is another important factor that could cause trouble and fight among couples in our study. As Halford [20] showed, 10.6% of the divorce cases happened because of the families interfering [20]. In Iran, which is an Islamic country, the traditional form of marriage through families was more common previously. However, recent evolutions in technology, culture, economy and the educational level spatially among women as well as other environmental aspects had a deep influence of the way young men and women choose their spouse.
In present study, 11.8% men and 13.7% women reported spousal violence. Kulu [11] mentioned violence as the second-largest divorce predisposing factor in his study. Generally, men are more violent in spousal relationship and despite the compatibility with the wife; violence could lead to her dissatisfaction because she assesses her physical and psychological safety in danger. Violence arrows other adverse effects such as fear and anxiety for spouse and children as well, on the other hand, the acceptability of the couples among the family and neighbors have influenced [11]. We believe further studies warrant the attention in Iran.
Researchers have reported addiction, smoking, and drinking alcohol as the main causes leading to marital
instability and divorce. On the other hand, Iran was faced with the rising trend of addiction rates in the world as well, the highest rate of heroin and opium addiction per capita worldwide reported from Iran: 1 in 17 is a regular drug user and 20% of Iranians aged 15 to 60 is involved in drug abuse [21]. In this study, the history of smoking, drinking alcohol and drug abuse had related with marital instability. The impact of these factors on the instability of marriage was expressed repeatedly previously. Halford’s study stated the addiction as 18.2 percent of the causes of divorce [20], Paul’s research also betrayed drinking alcohol, and using drugs, the most commonly cited reasons for the instability of marriage [22].
This study introduced the history of divorce, socioeconomic concordance among partners, family interfering, and education as predictors of marital instability. However, the strongest predictor was history of divorce. On the other hand, factors such as the traditional way of marriage thorough family, socioeconomic concordance with partner, love expression to partner were protecting factors. These results are similar to other studies [13,23,24]. In attractions and obstacles domain socioeconomic concordance, love expression to partner was shown by enhancing factors for marital stability, and family interfering, violent behavior, history of divorce, addiction was highlighted by reducing factors, and the strongest predictor was socioeconomic concordance between couples. These results are similar to other studies [13,23].
Given the results of this study, there is a growing need for planning about determinants of marital instability. Education regarding the criteria of spouse selection can be started very soon, even before marriage age, during school. Socioeconomic concordance among partners warrants consideration. Family interfering and love expression to partner are other important protective factors for marriage stability which are highly connected to education too. Based on our culture, we suggested young men and women, even in the modern way of marriage, to involve their family in their decision for marriage because having their support may prevent future interfering.
The strength point of our study was its generalization based on our best attempts to share a representative sample in this survey. However, we had restrictions in selecting a real representative sample; we suggested future studies to apply random sampling methods based on the total population to provide samples that are more representative. The average score of marital instability index, as well as details and predisposing factors mentioned clearly here, lack in other surveys from Iran.
This study had limitations, including the fact that people were reluctant to share their personal information. Sexual dissatisfaction played an important role in the instability of marriage, which was not possible to investigate in the present study. We suggested longitudinal design for a better understanding of this issue in future researches.

Journal of Medicine and Life
Journal of Medicine and Life Vol. 8, Special Issue 2, 2015
13
Conclusion
The instability of marriage is one of the major problems in many developed and developing countries. The overall score obtained from the marital instability questionnaire in this study was fair and showed lower levels of marital instability among our participants. However, the determination of the underlying factors can help policy makers provide a better environment in order for couples to have a more stable relationship. Training workshops on life skills to raise the awareness regarding the factors contributing to the marital instability among young couples would be of interest.
Conflict of interest
The authors declared that there is no conflict of interest. Acknowledgements
We kindly appreciate the efforts of all people involved in the project of recruiting participants and collecting the data. We thank all the participating couples for their cooperation and for providing personal information. This project was sponsored by Mashhad University of Medical Sciences.
References
1. Repetti RL, Taylor SE, Seeman TE. Risky families: family social environments and the mental and physical health of offspring. Psychol Bull. 2002 Mar; 128(2):330-66.
2. Kamp Dush CM, Rhoades GK, Sandberg-Thoma SE, Schoppe-Sullivan SJ. Commitment across the Transition to Parenthood among Married and Cohabiting Couples. Couple Family Psychol. 2014 Jun; 3(2):126-136.
3. Mannering AM, Harold GT, Leve LD, Shelton KH, Shaw DS, Conger RD et al. Longitudinal associations between marital instability and child sleep problems across infancy and toddlerhood in adoptive families. Child Dev. 2011 Jul-Aug; 82(4):1252-66. doi: 10.1111/j.1467-8624.2011.01594.x.
4. Kreager DA, Felson RB, Warner C, Wenger MR. Women’s Education, Marital Violence, and Divorce: A Social Exchange Perspective. J Marriage Fam. 2013 Jun 1; 75(3):565-581.
5. Maneta EK, Cohen S, Schulz MS, Waldinger RJ. Linkages between childhood emotional abuse and marital satisfaction: The mediating role of empathic accuracy for hostile emotions. Child Abuse Negl. 2014 Aug 20. pii: S0145-2134(14)00277-4. doi: 10.1016/j.chiabu.2014.07.017.
6. Schoen R, Urton W, Woodrow K, Baj J. Marriage and divorce in twentieth century American cohorts. Demography. 1985 Feb; 22(1):101-14.
7. Haskey J. The proportion of married couples who divorce: past patterns and
current prospects. Popul Trends. 1996 spring; (83):25-36.
8. Zandiyeh Z, Yousefi H. Woman’s experiences of applying for a divorce. Iran J Nurs Midwifery Res. 2014 Mar; 19(2):168-72.
9. Booth A, Johnson D, Edwards NJ. Measuring marital instability. Journal of Marriage and the Family. 1983; 45:387–394.
10. Sanai Zaker MB, Alaghband S, Falahati SH, Hooman A. Measures of family and marriage. 2nd ed., 2007, Iran: Besat.
11. Kulu H. Marriage duration and divorce: the seven-year itch or a lifelong itch?. Demography. 2014 Jun; 51(3):881-93. doi: 10.1007/s13524-013-0278-1.
12. Delkhamoush MT. Hierarchy of marriage values among the Iranian youth. Journal of Family Research. Summer 2009; 5(2) (18):207-230.
13. Jebraeili H, Taheri M. The role of cultural values in preferences for age of marriage and difference between spouses. Developmental Psychology (Journal of Iranian Psychologists). Summer 2014; 10, 40:421-429.
14. Reyhani T, Ajam M. The survey of divorce causes of Gonabad city in1381. Ofogh-e-danesh. 2003; 8(2):96-100.
15. Carter J. Patriarchy and violence against women and girls. Lancet. 2014 Nov 21. pii: S0140-6736(14)62217-0. doi: 10.1016/S0140-6736(14)62217-0.
16. Eslami AA, Hasanzadeh A, Jamshidi F. The relationship between emotional intelligence health and marital satisfaction: A comparative study. J Educ
Health Promot. 2014 Feb 21; 3:24. doi: 10.4103/2277-9531.127616.
17. Yarnoz-Yaban S. Attachment style and adjustment to divorce. The Spanish Journal of Psychology. 2010; 13:210-219.
18. Bottonari KA, Roberts JE, Kelly MAR, Kashdan TB, Ciesla JA. A prospective investigation of the import of attachment style on stress generation among clinically depressed individuals. Behavior Research and Therapy. 2007; 45:179-188.
19. Archuleta KL, Britt SL, Tonn TJ, Grable JE. Financial satisfaction and financial stressors in marital satisfaction. Psychol Rep. 2011 Apr; 108(2):563-76.
20. Halford WK, Lizzio A, Wilson KL, Occhipinti S. Does working at your marriage help?. Couple relationship self-regulation and satisfaction in the first 4 years of marriage. Journal Fam Psychol. 2007 Jun; 21(2):94-185.
21. Razzaghi EM, Movaghar AR, Green TC, Khoshnood K. Profiles of risk: a qualitative study of injecting drug users in Tehran, Iran. Harm Reduct J. 2006 Mar 18; 3:12.
22. Paul R, Denise P. People’s Reasons for Divorcing: Gender, Social Class, the Life Course, and Adjustment. Journal of Family Issues. 2003 July; 24(5):602-626.
23. Lehrer EL. Determinants of Marital Instability: a cox regression model. Economics. 1988; 20:195-210.
24. Heaton TB. Factors Contributing to Increasing Marital Stability in the United States. Journal of Family Issues. 2002 April; 23(3):392-409.
Journal of Medicine and Life
Journal of Medicine and Life Vol. 8, Special Issue 2, 2015, pp.14-18
Genetic diversity of Plasmodium Vivax in South of Iran: A cross-sectional study
Sharifi-Sarasiabi K* ***, Hosseiniteshnizi S**, Dehghan F*, Madani A****
*Molecular Medicine Research Center, Hormozgan University of Medical Sciences, Bandar Abbas, Iran, and Khalij Fars Hospital, Bandar Abbas, Iran **Department of Biostatistics, Faculty of Para-Medicine, Hormozgan University of Medical Sciences, Bandar Abbas, Iran ***Infectious and Tropical Diseases Research Center, Hormozgan University of Medical Sciences, Bandar Abbas, Iran ****Social Determinants in Health Promotion Research Center, Hormozgan University of Medical Sciences, Bandar Abbas, Iran
Correspondence to: Farzaneh Dehghan, MSc Molecular Medicine Research Center, Hormozgan University of Medical Sciences, Shahid Mohammadi Hospital, Bandar Abbas, Iran, Phone: (+98) 9171685935, Fax: (+98) 7633354939, E-mail: [email protected] Received: May 18th, 2015 – Accepted: July 27th, 2015
Abstract Despite declining the number of malaria cases in Iran, increased prevalence of malaria is supposed to be due to migration from eastern neighboring countries of Iran, which are abundant in Plasmodium vivax (P. vivax). The circumsporozoite protein (CSP) of the P. vivax, is one of the candidate antigens for antimalaria vaccine. The diversity of P. vivax populations circulating in Iran has been investigated by using circumsporozoite protein (CSP) in this study. A hundred and eighteen blood samples were collected from patients diagnosed with P. vivax malaria from south of Iran during 2007-2008. All samples were analyzed by using nested-PCR/ RFLP and 18 were sequenced. Genotyping of Pvcsp gene showed that VK210 type was predominant (95%) in south of Iran. Sequence analysis of Pvcsp gene revealed 6 distinct allelic variants in VK210 type. The present data indicate that there is some degree of genetic diversity among P. vivax populations in Hormozgan province of Iran. It seems that in neighbors of Iran, VK210 type is predominant, probably due to similar vector of malaria in these regions.
Keywords: Plasmodium vivax, malaria, protozoan circumsporozoite protein, malaria vaccines, Iran
Introduction
Among the human malaria parasites, Plasmodium vivax is the most geographically widespread species in the tropical and subtropical regions of the word [1,2]. P. vivax remains a major obstacle in controlling malaria [3] in Iran, located in the Eastern Mediterranean region in central Asia [4]. In 2011, centers for disease control and prevention (CDC) reported that the number of malaria cases has decreased to 2656 cases [5] and P. vivax was the cause of approximately 90% of all malaria infections [6]. Despite the low incidence of malaria [7], its high prevalence in Iran could be related to the migration of people from neighboring countries (i.e. Pakistan and Afghanistan). This can be interpreted by taking a look at the annual malaria cases in Pakistan and Afghanistan which are 500000 cases and 3 million cases respectively [8], Due to the fact that P. vivax is the predominant plasmodium species in these countries, research on intervention strategies to control this parasite appeared to be essential [9,10]. Designing effective vaccines is one of the control strategies, but because of genetic diversity in natural parasite populations, the development of an effective vaccine has been limited [11]. Even though prevention, diagnosis, and treatment of P. vivax malaria is
difficult, most efforts in eliminating malaria and action of malaria vaccines are focused on P. falciparum [12].
The circumsporozoite protein (CSP) of the P. vivax which, is the most abundant protein on the surface sporozoite, is one of the candidate antigens for antimalarial vaccine [13,15]. Based on sequence analyses, Pvcsp consists of three different alleles, VK210, VK247 and P. vivax-like with one of three types of nonapeptide repeat units GDRA(A/D)GQPA, ANGA(G/D)(N/D)QPG and APGANQ(E/G)GGAA respectively [16-18]. CSP variant (VK210, VK247&P.vivax-like) was found in clinical isolates of P. vivax, thus CSP serves as a helpful tool for genotyping [18,20].
The Ministry of Health and Medical Education of Iran initiated a national malaria elimination program with the goal of eliminating malaria by 2025, and molecular studies on circulating species of P. vivax in endemic area in Iran will provide information to achieve this important goal. Therefore, this study’s aim was to detect the genetic diversity in CSP gene of P. vivax in one of the endemic areas of malaria in Iran. The genetic diversity of CSP is distinguished with PCR-RFLP technique & DNA sequencing, which may assist future management of P. vivax malaria and designing an effective malaria vaccine.
Journal of Medicine and Life
Journal of Medicine and Life Vol. 8, Special Issue 2, 2015
15
Materials & Methods
A total of 118 blood samples were taken from P. vivax infected patients after an initial diagnosis by Giemsa-stained thin & thick blood smears. These samples were collected in 2007 and 2008 from two malaria endemic areas of Hormozgan province including Minab (46 samples) and Bandar-e-Jask (72 samples) in the south of Iran (Fig. 1).
The ethics committee of Hormozgan University of Medical Sciences approved the protocol for this study and the written informed consents were obtained from each patient or parents before participating in the study.
Genomic DNA extraction & PCR analysis for Pvcsp gene
Genomic DNA was extracted from 100μl of each blood sample with the DNG-PLUS extraction kit (Cinnagen, Iran) according to the manufacturer's recommendations. The quality of the isolated DNA from each specimen was determined by electrophoresis on 1% agarose gel containing ethidium bromide and visualized by an UV transilluminator. DNA samples were stored at -20°C until PCR was performed.
A nested PCR method was implemented to amplify the repeat regions of Pvcsp gene by using 2 sets of primers as described by Henry-Halldin et al [2]. The oligonucleotide primers and expected PCR product with the appropriate size are shown in Table 1.
Table 1. Primers sequence in this study
size of PCR product Primer sequence Primer names
1100bp ATGTAGATCTGTCCAAGGCCATAAA PVCS1F 680bp
TAATTGAATAATGCTAGGACTAACAATAG GCAGAACCAAAAAATCCACGTGAAAATAAG CCAACGGTAGCTCTAACTTTATCTAGGTAT
PVCS1R PVCS2F PVCS2R
The first PCR reaction was performed in a total
volume of 25μl containing: 1μl DNA template, 1μl of each
primer at 10 pmol/ μl, 0.5μl of deoxyribonucleotide
triphosphate (dNTP) (200mM), 2μl buffer 10X (100mM
Tris-Hcl (pH 8.8), 500 Mm Kcl), 1.5μl mgcl2 and 1 unit Tag
DNA polymerase (Cinnagen, Iran).
PCR conditions consisted of an initial
denaturation at 95°C for 5 min followed by 30 cycles of
denaturation at 95°C for 1 min, annealing at 58°C for 1
min and extension at 72°C for 1 min with a final extension
at 72°C for 10 min.
The second PCR reaction was performed in a
total volume of 50μl containing: 3μl of 1:50 diluted of first
PCR product in distilled water, 2μl of each primer, 1μl of
dNTP (200mM), 4μl buffer 10x, 2.5μl mgcl2 and 2U Tag
DNA polymerase. The PCR conditions were the same as
the first PCR except for the fact that the annealing
temperature was increased to 62°C. PCR amplified
products were vitalized by gel Doc system after
electrophoresis on 2% agarose gel.
Genotyping Pvcsp gene by PCR–RFLP
The repeat regions of the Pvcsp gene for the two
major types, VK210 and VK247 were genotyped by PCR–
RFLP, as previously described [25]. To distinguish the two
types of P. vivax repeats, VK210 and VK247, the PCR
products were separately digested with Alu I or BstN1
(MBI, Fermentase, Lithuania) in a total volume of 20 µl for
3 hrs according to the supplier’s instructions. Alu I sites
were not present in VK247 sequence, while those of
VK210 harbors and BstN1 sites were not seen in VK210
sequence, unlike the numerous sites in VK247 sequence
[23,25].
The electrophoresed DNA fragments were
visualized on an ultraviolet transilluminator following
ethidium bromide staining by electrophoresis on
2% agarose gel.
Sequencing
DNA sequencing analysis was performed in both directions for 18 PCR products, which had 6 different restriction patterns in an ABI 3130 Genetic analyzer with a BigDye Terminator V3.1 cycle sequencing kit. The sequences were aligned by using Gene Runner Software (Version 3.05) and then compared with previously sequences of Pvcsp gene available in GenBank with the MULT align program.
Results
The participants of the study were 79 male (67%) and 39 female (33%) patients aged 4-70 years.
The result of DNA amplification by the nested PCR method based on the primers used in this study showed the same size of approximately 680 bp for the Pvcsp gene in the DNA preparation obtained from all isolates (Fig. 2).
Fig. 1 Map of Iran showing the location of the study region. http://www.safareiran.com
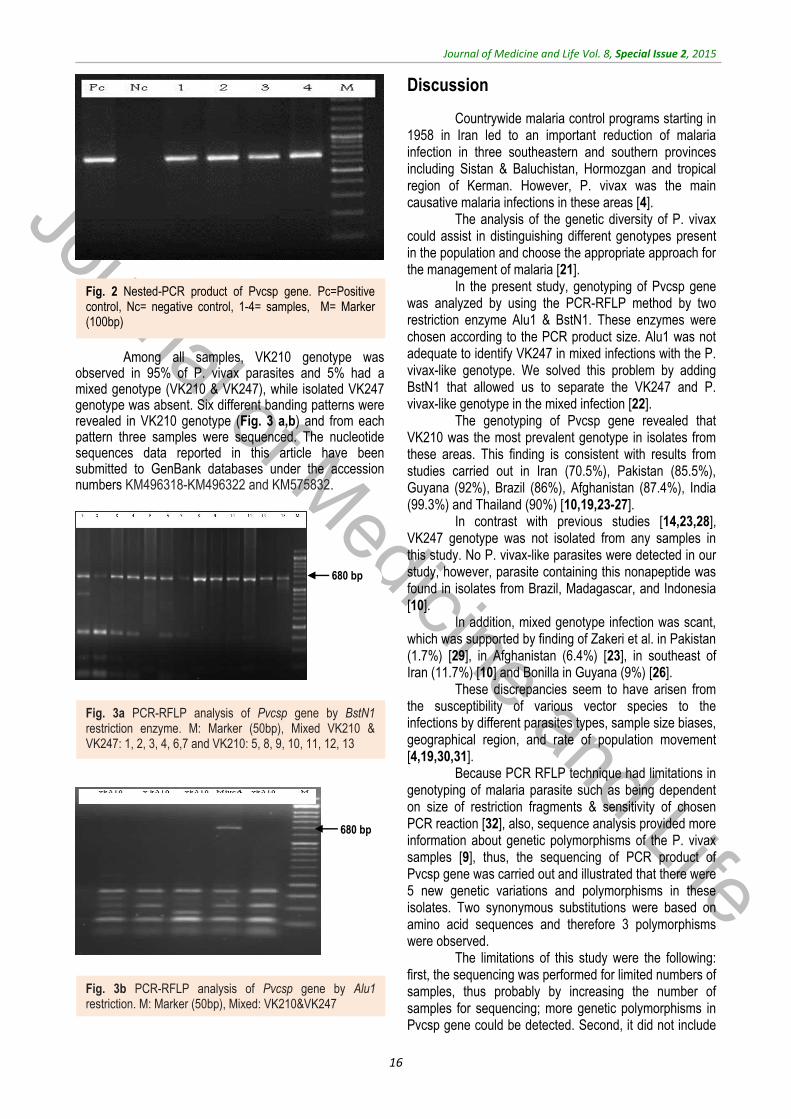
Journal of Medicine and Life
Journal of Medicine and Life Vol. 8, Special Issue 2, 2015
16
680 bp
680 bp
Among all samples, VK210 genotype was observed in 95% of P. vivax parasites and 5% had a mixed genotype (VK210 & VK247), while isolated VK247 genotype was absent. Six different banding patterns were revealed in VK210 genotype (Fig. 3 a,b) and from each pattern three samples were sequenced. The nucleotide sequences data reported in this article have been submitted to GenBank databases under the accession numbers KM496318-KM496322 and KM575832.
Discussion
Countrywide malaria control programs starting in 1958 in Iran led to an important reduction of malaria infection in three southeastern and southern provinces including Sistan & Baluchistan, Hormozgan and tropical region of Kerman. However, P. vivax was the main causative malaria infections in these areas [4]. The analysis of the genetic diversity of P. vivax could assist in distinguishing different genotypes present in the population and choose the appropriate approach for the management of malaria [21]. In the present study, genotyping of Pvcsp gene was analyzed by using the PCR-RFLP method by two restriction enzyme Alu1 & BstN1. These enzymes were chosen according to the PCR product size. Alu1 was not adequate to identify VK247 in mixed infections with the P. vivax-like genotype. We solved this problem by adding BstN1 that allowed us to separate the VK247 and P. vivax-like genotype in the mixed infection [22]. The genotyping of Pvcsp gene revealed that VK210 was the most prevalent genotype in isolates from these areas. This finding is consistent with results from studies carried out in Iran (70.5%), Pakistan (85.5%), Guyana (92%), Brazil (86%), Afghanistan (87.4%), India (99.3%) and Thailand (90%) [10,19,23-27]. In contrast with previous studies [14,23,28], VK247 genotype was not isolated from any samples in this study. No P. vivax-like parasites were detected in our study, however, parasite containing this nonapeptide was found in isolates from Brazil, Madagascar, and Indonesia [10]. In addition, mixed genotype infection was scant, which was supported by finding of Zakeri et al. in Pakistan (1.7%) [29], in Afghanistan (6.4%) [23], in southeast of Iran (11.7%) [10] and Bonilla in Guyana (9%) [26]. These discrepancies seem to have arisen from the susceptibility of various vector species to the infections by different parasites types, sample size biases, geographical region, and rate of population movement [4,19,30,31]. Because PCR RFLP technique had limitations in genotyping of malaria parasite such as being dependent on size of restriction fragments & sensitivity of chosen PCR reaction [32], also, sequence analysis provided more information about genetic polymorphisms of the P. vivax samples [9], thus, the sequencing of PCR product of Pvcsp gene was carried out and illustrated that there were 5 new genetic variations and polymorphisms in these isolates. Two synonymous substitutions were based on amino acid sequences and therefore 3 polymorphisms were observed. The limitations of this study were the following: first, the sequencing was performed for limited numbers of samples, thus probably by increasing the number of samples for sequencing; more genetic polymorphisms in Pvcsp gene could be detected. Second, it did not include
Fig. 2 Nested-PCR product of Pvcsp gene. Pc=Positive control, Nc= negative control, 1-4= samples, M= Marker (100bp)
Fig. 3a PCR-RFLP analysis of Pvcsp gene by BstN1 restriction enzyme. M: Marker (50bp), Mixed VK210 & VK247: 1, 2, 3, 4, 6,7 and VK210: 5, 8, 9, 10, 11, 12, 13
Fig. 3b PCR-RFLP analysis of Pvcsp gene by Alu1 restriction. M: Marker (50bp), Mixed: VK210&VK247
Journal of Medicine and Life
Journal of Medicine and Life Vol. 8, Special Issue 2, 2015
17
all of the P. vivax isolates which were circulating among patients of the mentioned regions in south of Iran.
Conclusion
Although few samples were sequenced in this study, and the data may not represent the whole picture of genome diversity of the parasite population in the region, the results suggested parasite populations with relatively diverse genetic backgrounds in the south of Iran. VK210 is predominant in eastern neighbors of Iran, which could be probably due to similarity of vectors and could be used for designing a DNA vaccine for malaria.
Acknowledgements Authors would like to acknowledge Mohseni GH,
Taghizadeh N, Nejadeydi M, Ahmadpour H, Yerian M, Rasti H, and Ameri K, in Hormozgan University of Medical Sciences and Health Services, for their useful contributions in the study. Conflict of interest Authors declare they have no conflict interest. Funding organization Molecular Medicine Research Center, Hormozgan University of Medical Sciences.
References
1. Cui L, Escalante AA, Imwong M, Snounou G. The genetic diversity of Plasmodium vivax populations. Trends Parasitol. 2003; 19(5):220-226.
2. Henry-Halldin CN, Sepe D, Susapu M, McNamara DT, Bockarie M, King CL, Zimmerman PA. High-throughput molecular diagnosis of circumsporozoite variants VK210 and VK247 detects complex Plasmodium vivax infections in malaria endemic populations in Papua New Guinea. Infect Genet Evol. 2011; 11(2):391–398.
3. Arnott A, Mueller I, Ramsland PA, Siba PM, Reeder JC, Barry AE. Global Population Structure of the Genes Encoding the Malaria Vaccine Candidate, Plasmodium vivax Apical Membrane Antigen 1 (PvAMA1). PLOS Neglected Tropical Dis. 2013; 7 (10): doi:10.1371/journal.pntd.0002506.
4. Zakeri S, Mehrizi A, Djadid N, Snounou G. Circumsporozoite protein gene diversity among temperate and tropical Plasmodium vivax isolates from Iran. Tropical Medicine and International Health. 2006; 11:729–737.
5. Nateghpour M, Edrissian G, Raeisi A, Motevalli-Haghi A, Farivar L, Mohseni G, Rahimi-Froushani A. The Role of Malaria Microscopy Training and Refresher Training Courses in Malaria Control Program in Iran during 2001-2011. Iran J Parasitol. 2012; 7:104-109.
6. Miahipour A, Keshavarz H, Heidari A, Raeisi A, Rezaeian M, Rezaie S. Genetic Variation of MSP-1 Gene in Plasmodium vivax Isolated from Patients in Hormozgan Province, Iran using SSCP-PCR. Iranian J Parasitol. 2012; 7:1-7.
7. Shahbazi A, Raeisi A, Nateghpour M, Mohebali M, Asmar M, Mirhendi H. Genetic structure of Plasmodium vivax population assessed by sequence analysis of the merozoite surface protein
3β gene. Iranian J of Clin Infec Dis. 2010; 5:126-132.
8. Ullah R, Ayaz S, Zarin Sh, AbdEIslam NM. Prevalence of Plasmodium Vivax Using PCR Method in Afghan Refugee Ghamkol Camp District Kohat, Pakistan. Life Sci J. 2013; 10(1):2948-2953.
9. Lopez AC, Ortiz A, Coello J, Sosa-Ochoa W, Torres RE, Banegas EI, Jovel I, Fontecha GA. Genetic diversity of Plasmodium vivax and Plasmodium falciparum in Honduras. Malar J. 2012; 26(391). doi 10.118 /1475-2875-11-391.
10. Abouei Mehrizi A, Naeimi P, Dinparast Jadid N, Raeisi A, Arshi SH, Snounou G, Zakeri S. Genotyping of Iranian Plasmodium vivax populations by using circumsporozoite protein gene (CSP) marker. Proceedings of the 4th National Congress of Biotechnology of Iran, 2005 Aug 24-26, Kerman, Iran.
11. Soares LA, Evangelista J, Orlandi PP, Almeida ME, de Sousa LP, Chaves Y, Barbosa-Filho R, Lacerda MV, Mariuba LA, and Nogueira PA. Genetic Diversity of MSP1 Block 2 of Plasmodium vivax Isolates from Manaus (Central Brazilian Amazon). J Immunol Res. 2014; doi: 10.1155/671050.
12. Carlton JM, Sina BJ, Adams JH. Why Is Plasmodium vivax a Neglected Tropical Disease?. PloS Negl Trop Dis. 2011; 5.
13. Hwang SY, Kim SH, Kho WG. Genetic characteristics of polymorphic antigenic markers among Korean isolates of Plasmodium vivax. Korean J Parasitol. 2009; 47. doi 10.3347/kjp. 47. S. S51.
14. de Souza-Neiras WC, de Melo LM, Machado RL. The genetic diversity of Plasmodium vivax - A Review. Mem Inst Oswaldo Cruz, Rio de Janeiro. 2007; 102: 245-254.
15. Storti-Melo LM, de Souza-Neiras WC, Cassiano GC, Joazeiro AC, Fontes CJ, Bonini-Domingos CR, Couto AA, Povoa MM, Rossit AR, Machado RL.
Plasmodium vivax circumsporozoite variants and Duffy blood group genotypes in the Brazilian Amazon region. Trans R Soc Trop Med Hyg. 2009; 103:672–678.
16. Souza-Neiras WC, Storti-Melo LM, Cassiano GC, Couto VS, Couto AA, Soares IS, Carvalho LH, Cunha MG, Povoa MM, Herrera S, Herrera MA, Rossit AR, Carareto CM, Machado RL. Plasmodium vivax circumsporozoite genotypes: a limited variation or new subspecies with major biological consequences?. Malar J. 2010; 9(178).
17. Cheng Y, Ito D, Sattabongkot J, Lim CS, Kong DH, Ha KS, Wang B, Tsuboi T, Han ET. Serological responses to a Soluble recombinant chimeric Plasmodium vivax circumsporozoite protein in VK210 and VK247 population. Malar J. 2013; 12(323). doi: 10.1186/1475-2875-12-323.
18. Gonzalez JM, Hurtado S, Arevalo-Herrera M, Herrera S. Variants of the Plasmodium vivax circumsporozoite protein (VK210 and VK247) in Colombian isolates. Mem Inst Oswaldo Cruz. 2001; 96(5):709–712.
19. Raza A, Ghanchi NK, Thaver AM, Jafri S, Beg MA. Genetic diversity of Plasmodium vivax clinical isolates from southern Pakistan using pvcsp and pvmsp1 genetic markers. Malar Journal. 2013; 12(16).
20. Prugnolle F, Rougeron V, Becquart P et al. Diversity, host switching and evolution of Plasmodium vivax infecting African great apes. J Ayala. 2013; 110: 8123–8128.
21. Heidari A, Keshavarz H, Hajjaran H, Ebrahimi SM, Kabiri K, Naseri MH. Genetic Variation and Selection of Domain I of the Plasmodium vivax Apical embrane Antigen-1(AMA-1) Gene in Clinical Isolates from Iran. Iranian J Parasitol. 2013; 8: 536-544.
Journal of Medicine and Life
Journal of Medicine and Life Vol. 8, Special Issue 2, 2015
18
22. Alves RT, Povoa MM, Goldman IF, Cvasini CE, Rossit ARB et al. A new polymerase chain reaction/ restriction fragment length polymorphism protocol for Plasmodium vivax circumsporozoite protein genotype (VK210, VK247, and P. vivax-like) determination. Diagnostic Microbiology and Infec Dis. 2007; 415–419.
23. Zakeri S, Safi N, Afsharpad M, Butt W, Ghasemi F, Mehrizi AA, Atta H, Zamani G, Djadid ND. Genetic structure of Plasmodium vivax isolates from two malaria endemic areas in Afghanistan. Acta Trop. 2010; 113:12–19.
24. Machado RL, Povoa MM. Distribution of Plasmodium vivax variants (VK210, VK247 and P. vivax-like) in three endemic areas of the Amazon region of Brazil and their correlation with chloroquine treatment. Trans R Soc Trop Med Hyg. 2000; 94:377–381.
25. Kim JR, Imwong M, Nandy A, Chotivanich K, Nontprasert A,
Tonomsing N, Maji A, Addy M, Day NPJ, White NJ, Pukrittayakamee S. Genetic diversity of Plasmodium vivax in Kolkata, India. Malar J. 2006; 5(71).
26. Bonilla JA, Validum L, Cumming R, Palmer CJ. Genetic diversity of Plasmodium vivax Pvcsp and Pvmsp1 in Guyana, South America. Am J Trop Med Hyg. 2006; 75:830–835.
27. Imwong M, Pukrittayakamee S, Grüner AC, Renia L, Letourneur F, Looareesuwan S, White NJ, Snounou G. Practical PCR genotyping protocols for Plasmodium vivax using Pvcs and Pvmsp1. Malar J. 2005; 4(20).
28. Moon SU, Lee HW, Kim JY, Na BK, Cho SH, Lin K, Sohn WM, Kim TS. High frequency of genetic diversity of Plasmodium vivax field isolates in Myanmar. Acta Trop. 2009; 109:30-36.
29. Zakeri S, Raeisi A, Afsharpad M, Kakar Q, Ghasemi F, Atta H, Zamani G, Memon MS, Salehi M, Djadid ND. Molecular characterization of
Plasmodium vivax clinical isolates in Pakistan and Iran using pvmsp-1, pvmsp-3alpha and pvcsp genes as molecular markers. Parasitol Int. 2010; 59:15-21.
30. Kim TS, Kim HH, Lee SS, Na BK, Lin K, Cho SH, Kang YJ, Kim DK, Sohn Y, Kim H, Lee HW. Prevalence of Plasmodium vivax VK210 and VK247 subtype in Myanmar. Malar J. 2010; 9:195.
31. Huang B, Huang Sh, Su XZ, Guo H, Xu Y, Xu F, Hu X, Yang Y, Wang Sh, Lu F. Genetic diversity of Plasmodium vivax population in Anhui province of China. Malar J. 2014; 13(346). doi: 10.1186/1475-2875-13-346.
32. Zhong D, Bonizzoni M, Zhou G, Wang G, Chen B, Vardo-Zalik A, Cui L, Yan G, Zheng B. Genetic diversity of Plasmodium vivax malaria in China and Myanmar. Infect Genet Evol. 2011; 11:1419-1425.
Journal of Medicine and Life
Journal of Medicine and Life Vol. 8, Special Issue 2, 2015, pp.19-27
The effects of Transcutaneous Electrical Nerve Stimulation on postural control in patients
with chronic low back pain
Rojhani-Shirazi Z*, Rezaeian T**
*Physical Therapy, School of Rehabilitation Sciences, Shiraz University of Medical Sciences, Shiraz, Iran **Student Research Committee, School of Rehabilitation Sciences, Shiraz University of Medical Sciences, Shiraz, Iran
Correspondence to: Tahere Rezaeian, MSc of Physical Therapy, Student Research Committee, School of Rehabilitation Sciences, Shiraz University of Medical Sciences, 1 Abiverdi St., Chamran Blv., Shiraz, Iran, Postal Code: 71947-33669, Phone: (+98) 71-36271552, Fax: (+98) 71-36272495, E-mail: [email protected] Received: May 25th, 2015 – Accepted: July 27th, 2015
Abstract Objective: The effects of transcutaneous electrical nerve stimulation (TENS) on postural control in patients with low back pain which is not well known. This study aimed to evaluate the effects of TENS on postural control in chronic low back pain. Methods: This study was an experimental research design. Twenty-eight patients with chronic LBP (25-45 Y/ O) participated and by using a random allocation, were divided to samples who participated in this study. The mean center of pressure (COP) velocity and displacement were measured before, immediately and 30 min after the intervention. The tests were done with eyes open and closed on a force platform. Sensory electrical stimulation was applied through the TENS device. The descriptive statistics, independent sample T-test and ANOVA with repeated measurement on time were used for data analysis. Results: The results of the present study demonstrated that the application of the sensory electrical stimulation in chronic LBP patients showed a statistically significant improvement in postural control in Medio-lateral direction with no corresponding effect on the anterior-posterior direction immediately following the TENS application and 30 minutes after it in closed eyes conditions as compared to baseline. The application of TENS decreased the displacement and velocity of COP (p≤0.05), 30 minutes after the application of sensory electrical stimulation. The results showed that the mean displacement and velocity of COP decreased in eyes open position (p≤0.05). Also, immediately and 30 minutes after the application of sensory electrical stimulation, COP displacement and velocity in ML direction with eyes closed significantly decreased in the intervention group in comparison with control group (p≤0.05). Conclusion: The application of TENS in patients with chronic low back pain could improve postural control in these patients.
Keywords: chronic low back pain, postural control, Transcutaneous Electrical Nerve Stimulation
Introduction
Low back pain (LBP) is a very common disorder, and studies have shown that more than 80% of the people will suffer from LBP over their lifetime [1-3]. Many of the acute LBP patients present this disorder during 4 weeks, but recurrence of pain episodes is common [4]. 10–40% of the individuals with LBP develop into having chronic LBP and are considered as the most costly musculoskeletal disorder for society [1,4].
One of the most important factors in the genesis
and persistence of nonspecific LBP is stability and control of the spine. Studies in LBP patients have indicated
impairments in the deep trunk muscles (e.g. transverses
abdominis and multifidus) responsible for maintaining the stability of the spine [5,6].
The human postural system is controlled by the coordination of the three sensory sources including visual, vestibular and proprioceptive inputs. These systems provide information about the status and movements of
the body in the space and continuously transmit and generate enough force for controlling and maintaining
balance in various situations [7,8]. Therefore, it is clear that a disruption in any of these sensory systems will affect the postural control. The previous studies revealed that the postural control in subjects with chronic low back pain and some components of these systems such as the physiology of afferent and efferent nerves may be affected [9,10]. This damage can lead to a significantly greater sway in the upright standing, which may play a role in the recurrence of low back pain [9].
A poor postural control mechanism in subjects with low back pain is not known yet completely [11]. Proprioceptive inputs or sensory integration deficits have been suspected as the possible causes of balance impairments in people with chronic low back pain although there is no sufficient evidence in this issue [12].
Since subjects with low back pain exhibit postural control impairment, researchers could find a new
Journal of Medicine and Life
Journal of Medicine and Life Vol. 8, Special Issue 2, 2015
20
insight into rehabilitation for postural control impairment in these patients.
One potential means of further enhancing the improvement in proprioception is subsensory stochastic resonance (SR) electrical stimulation. SR stimulation is a type of electrical or mechanical stimulation with an alternating electric field that, at a subsensory level, has been shown to enhance the detection and transmission of weak sensory signals [14,15]. Stochastic resonance is thought to alter the transmembrane potential of neurons, causing the cell to depolarize and make it more likely that an action potential will result [13]. It has shown promise in improving balance in various populations including the elderly [17,20] those with diabetic neuropathy [25], and those recovering from stroke [28]. As somatosensory feedback is an important component to the balance control system, it has been theorized that the improved balance observed with SR stimulation is a result of the enhanced proprioceptive input [20].
In 2002, Gravelle et al. tested the effect of SR with low-level electrical noise, applied at the knee, on balance control in healthy elderly volunteers. They showed that low-level input noise (electrical or mechanical) could enhance the sensitivity of the human somatosensory system. The results suggested that the imperceptible electrical noise, when applied to the knee, could enhance the balance performance of healthy older adults [19,20].
In 2002, Dhruv and colleagues showed that low-level electrical noise could significantly improve fine-touch sensitivity on the plantar surface of the foot in the elderly by using Semmes-Weinstein monofilaments. Therefore, the study suggested that the electrical noise-based techniques might enable people to overcome functional difficulties due to age-related sensory loss [16,17].
Transcutaneous electrical nerve stimulation (TENS) is one of these modalities that can improve neuromuscular function/ pain status and therefore its benefits in low back pain patients, who experience pain and muscle weakness around the pelvis, trunk and lower limbs leading to low back pain.
TENS, which involves the pulsatile stimulation of sensory fibers, is used primarily for the purpose of pain modulation in physiotherapy [21]. Different types of TENS treatment are often referred to as Hi-TENS and Low-TENS. TENS for pain control usually applies high frequency stimulation; while for excitatory effects of sensory inputs on the motor system, lower frequencies (10 Hz), have generally been used. Studies using Trans-Cranial Magnetic Stimulation (TMS) have obtained evidence that the application of TENS at different body sites influences cortico-motor excitability. Therefore, the application of TENS may interfere in the modulation of cortical motor responses including postural control responses [22]. Fraser et al. stated that the motor effects are likely to critically depend on the frequency of sensory stimulation [23].
In 2002, Gravelle et al. investigated the effect electrical noise, used at the knee, on postural control in healthy older adults. They showed that electrical or mechanical noise could improve the human somatosensory system. The results showed that when
used to the knee, the electrical noise could improve the postural performance of healthy elderly people [20].
The application of TENS to the neck muscles in patients with hemispatial neglect has been shown to improve spatial orientation and postural control [24].
Therefore, TENS is usually used with sensory threshold or supra-threshold amplitude compared with sub-threshold sensorimotor signals of SR. TENS seems to be more acceptable than SR stimulation among patients because of its perceptible stimulation current but its effect on postural control is unknown [25].
Several investigations on the effects of SR have reported improvements in balance control when an electrical or mechanical noise was applied [20,28,29,44].
To the best of our knowledge, no study has investigated the possible effect of TENS on postural control in patients with low back pain. Therefore, the purpose of this study was to evaluate the acute effect of application of TENS on postural control in chronic low back patients.
Materials and methods
Participants Twenty-eight chronic low back pain (CLBP)
patients (24 women, 4 men) participated in this study and were matched for age, weight, height, and BMI. All the participants were included in this study if they had a diagnosis of chronic low back pain from a physician who recruited them from referrals of local physiotherapy clinics in Shiraz. Low back pain is defined as pain in the area between the 12th rib and the gluteal folds. All the patients had mild to moderate (0 to 40%) disability in Oswestry questionnaire and their age range was between 25-45 years.
The inclusion criteria were age between 25-45 years, localized back pain, lasting for more than 6 months and radiating no further than the buttock, no previous history of sciatica or other radicular involvement, at least 3 of the 10 visual analog scales (VAS) and mild to moderate (0 to 40%) disability in Oswestry questionnaire.
The exclusion criteria were the history of neurological signs such as sensory or motor deficits, like paralysis or vestibular system impairment, dizziness and medication with known effects on balance, history of spinal surgery, rheumatic diseases, diabetes, mental disorders, pregnancy, lower extremity injuries, and neuromuscular diseases. Procedures
After a visit and check of the inclusion criteria, all the participants signed an informed consent form approved by the ethics committee of Shiraz University of Medical Sciences and then participated in this study.
Through non-random sampling, twenty-eight CLBP patients (25-45 y/ o) participated in this study. Then, by using block randomization, they were allocated in the intervention and control groups. Fourteen subjects received TENS, while the remaining fourteen received sham intervention. In addition, the patients did the tests
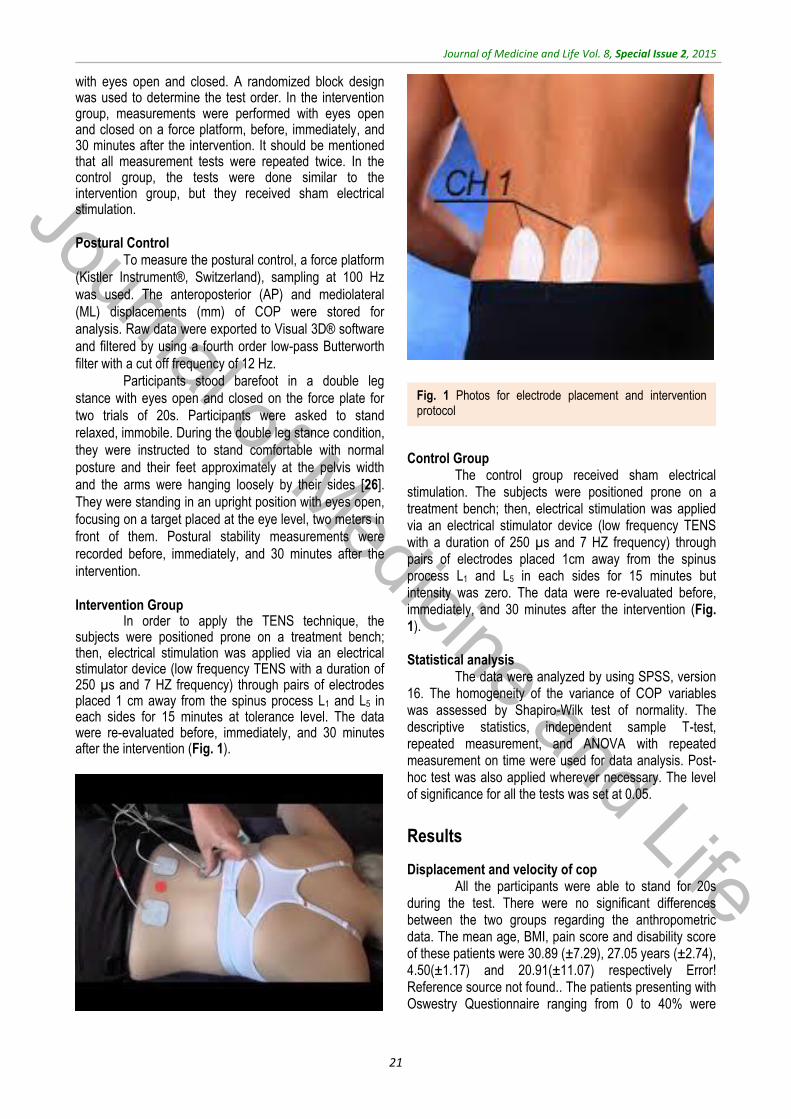
Journal of Medicine and Life
Journal of Medicine and Life Vol. 8, Special Issue 2, 2015
21
with eyes open and closed. A randomized block design was used to determine the test order. In the intervention group, measurements were performed with eyes open and closed on a force platform, before, immediately, and 30 minutes after the intervention. It should be mentioned that all measurement tests were repeated twice. In the control group, the tests were done similar to the intervention group, but they received sham electrical stimulation. Postural Control
To measure the postural control, a force platform
(Kistler Instrument®, Switzerland), sampling at 100 Hz
was used. The anteroposterior (AP) and mediolateral
(ML) displacements (mm) of COP were stored for
analysis. Raw data were exported to Visual 3D® software
and filtered by using a fourth order low-pass Butterworth
filter with a cut off frequency of 12 Hz.
Participants stood barefoot in a double leg
stance with eyes open and closed on the force plate for
two trials of 20s. Participants were asked to stand
relaxed, immobile. During the double leg stance condition,
they were instructed to stand comfortable with normal
posture and their feet approximately at the pelvis width
and the arms were hanging loosely by their sides [26].
They were standing in an upright position with eyes open,
focusing on a target placed at the eye level, two meters in
front of them. Postural stability measurements were
recorded before, immediately, and 30 minutes after the
intervention. Intervention Group
In order to apply the TENS technique, the subjects were positioned prone on a treatment bench; then, electrical stimulation was applied via an electrical stimulator device (low frequency TENS with a duration of 250 µs and 7 HZ frequency) through pairs of electrodes placed 1 cm away from the spinus process L1 and L5 in each sides for 15 minutes at tolerance level. The data were re-evaluated before, immediately, and 30 minutes after the intervention (Fig. 1).
Control Group
The control group received sham electrical stimulation. The subjects were positioned prone on a treatment bench; then, electrical stimulation was applied via an electrical stimulator device (low frequency TENS with a duration of 250 µs and 7 HZ frequency) through pairs of electrodes placed 1cm away from the spinus process L1 and L5 in each sides for 15 minutes but intensity was zero. The data were re-evaluated before, immediately, and 30 minutes after the intervention (Fig. 1). Statistical analysis
The data were analyzed by using SPSS, version 16. The homogeneity of the variance of COP variables was assessed by Shapiro-Wilk test of normality. The descriptive statistics, independent sample T-test, repeated measurement, and ANOVA with repeated measurement on time were used for data analysis. Post-hoc test was also applied wherever necessary. The level of significance for all the tests was set at 0.05.
Results
Displacement and velocity of cop All the participants were able to stand for 20s
during the test. There were no significant differences between the two groups regarding the anthropometric data. The mean age, BMI, pain score and disability score of these patients were 30.89 (±7.29), 27.05 years (±2.74), 4.50(±1.17) and 20.91(±11.07) respectively Error! Reference source not found.. The patients presenting with Oswestry Questionnaire ranging from 0 to 40% were
Fig. 1 Photos for electrode placement and intervention protocol
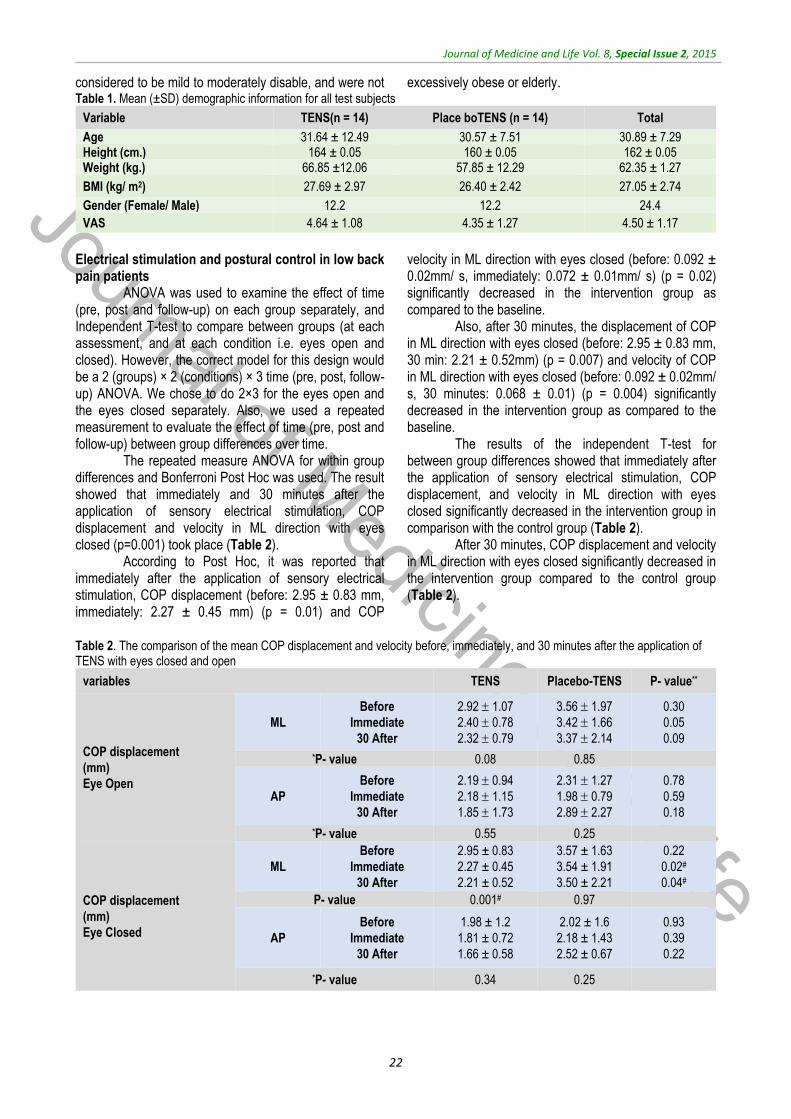
Journal of Medicine and Life
Journal of Medicine and Life Vol. 8, Special Issue 2, 2015
22
considered to be mild to moderately disable, and were not excessively obese or elderly. Table 1. Mean (±SD) demographic information for all test subjects
Variable TENS(n = 14) Place boTENS (n = 14) Total
Age 31.64 ± 12.49 30.57 ± 7.51 30.89 ± 7.29 Height (cm.) 164 ± 0.05 160 ± 0.05 162 ± 0.05 Weight (kg.) 66.85 ±12.06 57.85 ± 12.29 62.35 ± 1.27
BMI (kg/ m2) 27.69 ± 2.97 26.40 ± 2.42 27.05 ± 2.74
Gender (Female/ Male) 12.2 12.2 24.4
VAS 4.64 ± 1.08 4.35 ± 1.27 4.50 ± 1.17
Electrical stimulation and postural control in low back pain patients
ANOVA was used to examine the effect of time (pre, post and follow-up) on each group separately, and Independent T-test to compare between groups (at each assessment, and at each condition i.e. eyes open and closed). However, the correct model for this design would be a 2 (groups) × 2 (conditions) × 3 time (pre, post, follow-up) ANOVA. We chose to do 2×3 for the eyes open and the eyes closed separately. Also, we used a repeated measurement to evaluate the effect of time (pre, post and follow-up) between group differences over time.
The repeated measure ANOVA for within group differences and Bonferroni Post Hoc was used. The result showed that immediately and 30 minutes after the application of sensory electrical stimulation, COP displacement and velocity in ML direction with eyes closed (p=0.001) took place (Table 2).
According to Post Hoc, it was reported that immediately after the application of sensory electrical stimulation, COP displacement (before: 2.95 ± 0.83 mm, immediately: 2.27 ± 0.45 mm) (p = 0.01) and COP
velocity in ML direction with eyes closed (before: 0.092 ± 0.02mm/ s, immediately: 0.072 ± 0.01mm/ s) (p = 0.02) significantly decreased in the intervention group as compared to the baseline.
Also, after 30 minutes, the displacement of COP in ML direction with eyes closed (before: 2.95 ± 0.83 mm, 30 min: 2.21 ± 0.52mm) (p = 0.007) and velocity of COP in ML direction with eyes closed (before: 0.092 ± 0.02mm/ s, 30 minutes: 0.068 ± 0.01) (p = 0.004) significantly decreased in the intervention group as compared to the baseline.
The results of the independent T-test for between group differences showed that immediately after the application of sensory electrical stimulation, COP displacement, and velocity in ML direction with eyes closed significantly decreased in the intervention group in comparison with the control group (Table 2).
After 30 minutes, COP displacement and velocity in ML direction with eyes closed significantly decreased in the intervention group compared to the control group (Table 2).
Table 2. The comparison of the mean COP displacement and velocity before, immediately, and 30 minutes after the application of TENS with eyes closed and open
variables TENS Placebo-TENS P- value**
COP displacement
(mm)
Eye Open
ML
Before
Immediate
30 After
2.92 1.07
2.40 0.78
2.32 0.79
3.56 1.97
3.42 1.66
3.37 2.14
0.30
0.05
0.09
*P- value 0.08 0.85
AP
Before
Immediate
30 After
2.19 0.94
2.18 1.15
1.85 1.73
2.31 1.27
1.98 0.79
2.89 2.27
0.78
0.59
0.18
*P- value 0.55 0.25
COP displacement
(mm)
Eye Closed
ML
Before
Immediate
30 After
2.95 ± 0.83
2.27 ± 0.45
2.21 ± 0.52
3.57 ± 1.63
3.54 ± 1.91
3.50 ± 2.21
0.22
0.02#
0.04#
P- value 0.001# 0.97
AP
Before
Immediate
30 After
1.98 ± 1.2
1.81 ± 0.72
1.66 ± 0.58
2.02 ± 1.6
2.18 ± 1.43
2.52 ± 0.67
0.93
0.39
0.22
*P- value 0.34 0.25

Journal of Medicine and Life
Journal of Medicine and Life Vol. 8, Special Issue 2, 2015
23
COP Velocity
(mm/ s)
Eye Open
ML
Before
Immediate
30 After
0.09 0.03
0.072 0.02
0.072 0.02
0.11 0.06
0.10 0.05
0.10 0.07
0.24
0.05
0.10
*P- value 0.14 0.82
AP
Before
Immediate
30 After
0.06 0.03
0.06 0.03
0.058 0.05
0.071 0.04
0.06 0.02
0.072 0.04
0.80
0.57
0.48
*P- value 0.65 0.34
COP Velocity
(mm/ s)
Eye Closed
ML
Before
Immediate
30 After
0.09 ± 0.02
0.072 ± 0.01
0.068 ± 0.01
0.11 ± 0.05
0.11 ± 0.06
0.11 ± 0.07
0.10
0.03#
0.04#
*P- value 0.001# 0.78
AP
Before
Immediate
30 After
0.062 ± 0.03
0.055 ± 0.02
0.052 ± 0.01
0.065 ± 0.05
0.067 ± 0.04
0.079 ± 0.02
0.87
0.38
0.24
*P- value 0.36 0.30
#Significant at p<0.05 *Repeated measure ANOVA for within group differences was used. **Independent T-test for between group differences was used.
The repeated measurement for between group
differences was done and the results of between groups test indicated that the variable group at COP displacement in ML direction with eyes closed (f = 4.39 , p = 0.04) and at COP velocity in ML direction with eyes closed (f = 4.8, p = 0.03) was significant (Fig. 2,3).
The within subject test indicated that there was a significant time effect, in other words, the groups changed in COP displacement and velocity over time (f = 3.31, p = 0.04, f = 4.04, p = 0.02). Moreover, the interaction of time and group was not significant (Table 3).
Table 3. The comparison of the mean COP displacement and velocity between intervention and control group before, immediately, and 30 minutes after the application of TENS with eyes closed and open
variables TENS Placebo-TENS Pvalue#
time Time*group group
COP displacement (mm) Eye Open
ML Before Immediate 30 After
2.92 1.07
2.40 0.78
2.32 0.79
3.56 1.97
3.42 1.66
3.37 2.14
0.28 0.61 0.07
Fig. 2 The comparison of the mean COP displacement before, immediately and 30 minutes after the application of TENS with eyes closed in both of groups
Fig. 3 The comparison of the mean COP velocity before, immediately and 30 minutes after the application of TENS with eyes closed in both of groups
Journal of Medicine and Life
Journal of Medicine and Life Vol. 8, Special Issue 2, 2015
24
AP Before Immediate 30 After
2.19 0.94
2.18 1.15
1.85 1.73
2.31 1.27
1.98 0.79
2.89 2.27
0.61 0.16 0.42
COP displacement (mm) Eye Closed
ML Before Immediate 30 After
2.95 ± 0.83 2.27 ± 0.45 2.21 ± 0.52
3.57 ± 1.63 3.54 ± 1.91 3.50 ± 2.21
0.04* 0.09 0.04*
AP Before Immediate 30 After
1.98 ± 1.2 1.81 ± 0.72 1.66 ± 0.58
2.02 ± 1.6 2.18 ± 1.43 2.52 ± 0.67
0.8
0.10
0.4
COP Velocity (mm/ s) Eye Open
ML Before Immediate 30 After
0.09 0.03
0.07 0.02
0.07 0.02
0.11 0.06
0.10 0.05
0.10 0.07
0.09 0.30 0.24
AP Before Immediate 30 After
0.06 0.03
0.06 0.03
0.058 0.05
0.07 0.04
0.06 0.02
0.07 0.04
0.73 0.39 0.79
COP Velocity (mm/ s) Eye Closed
ML Before Immediate 30 After
0.09 ± 0.02 0.07 ± 0.01
0.06 ± 0.01
0.11 ± 0.05 0.11 ± 0.06
0.11 ± 0.07 0.02* 0.26 0.03*
AP Before Immediate 30 After
0.06 ± 0.03 0.05 ± 0.02 0.05 ± 0.01
0.06 ± 0.05 0.06 ± 0.04 0.07 ± 0.02
0.75 0.14 0.41
*Significant at p<0.05 # repeated measurement for between group differences over time was done
Discussion
Our study was designed to investigate whether TENS is effective on the postural control. Displacement and velocity were used as a criterion for the estimation of postural control. The results of this study showed that low frequency TENS stimulation effectively improved postural control in LBP patients and this effect was still significant 30 minutes after the protocol.
According to our results, the application of sensory electrical stimulation in CLBP patients revealed a statistically significant improvement in postural control in mediolateral direction immediately following the application of TENS and 30 minutes after it with eyes closed as compared to the baseline. It means that application of TENS decreased the displacement and velocity of COP.
This finding was consistent with the results of Laufer and Dickstein [27]. They measured postural control parameters during double stance with force platform. The results showed that the application of TENS induced a significant reduction in mean velocity in the mediolateral direction of the center of pressure. These findings
indicated that the electrical stimulation applied to the knees might be effective in improving postural control [27].
In another study performed in 2006, Priplata et al. showed that COP displacement among the patients with diabetic neuropathy, stroke, and healthy elderly subjects decreased by the application of noise. Therefore, they showed that the application of subsensory mechanical noise to the feet of patients with diabetic neuropathy and stroke reduced the postural control [28].
The results of the present study confirmed that the displacement and velocity of COP changed with the application of electrical stimulation as compared to the use of placebo-TENS. The result showed that immediately and 30 minutes after the application of sensory electrical stimulation, COP displacement and velocity in ML direction with eyes closed significantly decreased in the intervention group compared to the controls.
Dickstein [18] also confirmed these results. He investigated the effect of TENS applied to the posterior aspect of the legs, on postural control during stance. The

Journal of Medicine and Life
Journal of Medicine and Life Vol. 8, Special Issue 2, 2015
25
results indicated that the application of TENS decreased the postural control as expressed by a decrease in the mean of COP velocity in both the mediolateral and anterior–posterior direction. Thus, it showed that the application of low-amplitude TENS to the lower limbs decreases the postural sway during stance [18].
Moreover, the differences were significant only in
the ML direction. It could be attributed to the impairment
in controlling the anteroposterior direction due to reduced
motion of the lumbar spine and increased activity of
lumbopelvic muscles [30]. Therefore, these patients may
use the muscles, which act in the frontal plane and
increased activation of these muscles may induce muscle
fatigue. The influence of muscle fatigue due to alteration
in the trunk position and pain may induce further changing
in the mediolateral direction. Luana Man reported a higher
variability in the mediolateral direction and confirmed the
deficit in the anteroposterior direction in LBP patients [31].
In addition, hip muscles have an important role in
shifting forces from the lower limb up to the spine during
the upright tasks and may influence the development of
LBP. A poor endurance and delay in firing of the hip
abductor (gluteus medius) and hip extensor (gluteus
maximus) muscles have been reported in patients with
LBP [32]. In 2002, Nadler reported that female athletes
with weakness in the left abductors were significantly
more likely to develop LBP [33]. Therefore, the probable
Gluteus Medius muscle weakness may theoretically help
in developing LBP occurrence and more changes in the
mediolateral direction.
Also, Janda proposed that LBP patients have a
slower activation of the gluteus medius and maximus and
the abdominal muscles [34].
The impaired balance control with eyes closed is
consistent with the well-documented phenomenon of
improved human balance control with visual input [35]. It
has been demonstrated that the visual inputs play a
dominant role in stance regulation [36]. Thus, the visual
loss or visual deficit in human beings can induce different
changes in the postural control. LBP is known to decrease
proprioceptive capacity [37,38], which may induce
dependence on the visual system [38]. In 2010, Luana
Man showed that LBP patients deprived from visual
information presented an increased postural instability
[31]. Also, the result showed no significant differences in
the COP parameters with eyes open in these studies.
This may be due to the fact that patients had intact
information systems (visual, vestibular and
somatosensory).
No studies to date have evaluated the effect of TENS on
postural control in patients with CLBP but some studies
showed the efficacy of TENS on the reduction of pain,
disability and increased range of motion of the lumbar
spine in patients with LBP following application of TENS
[39-42].
Exactly how sensory electrical stimulation acts
on postural control is not yet clear, but the balance
improvements shown by the application of TENS are
stated to be the result of an increased proprioception
input. Electrical nerve stimulation improves
corticomotoneural excitability by activating group Ia large
muscle afferents, Ib afferents from Golgi organs, group II
afferents from slow and rapidly skin afferents, and
cutaneous afferent fibers [23].
Birmingham et al. also noted that the patients
with poorer proprioceptive ability showed a greater
improvement after the application of an external device
[43]. Also, in 2002, Peurala et al. assessed the effects of
electrical stimulation by using glove or sock electrodes in
chronic stroke patients. They showed that sensory
stimulation might enhance limb function after stroke [44].
Proprioceptive input from the muscles of the legs
and trunk plays an important role in maintaining postural
stability [45], suggesting that balance dysfunction in CLBP
may be due to the altered proprioception feedback from
the lumbar spine [38]. A somatosensory feedback has a
necessary role in the proprioceptive system [13].
Therefore, the improvement in this sense following the
use of TENS increases the sensory afferents.
In this study, we applied the low frequency
pattern because previous studies showed beneficial
effects of low frequency (1.7 and 5 Hz) and burst-type
TENS for the rehabilitation of the motor impairments in
patients with stroke [46].
There were several limitations in the current study. Firstly,
the duration of the follow-up was limited. Secondly, we did
not assess electromyography muscular activity of erector
spine muscles and thirdly the proprioception sense of the
low back spine was not measured in this study. Therefore,
further research is required to assess the effect of TENS
in LBP on postural control and other outcomes
(proprioception) for longer time periods.
Conclusion
Our study was done to determine if TENS might
improve postural control. There were significant
differences in the displacement and velocity before,
immediately and 30 minutes after the treatment with eyes
closed condition. Low frequency TENS with contraction
level amplitude seems to have positive effects on postural
control in chronic LBP patients. Therefore, this study
showed the efficacy of low frequency TENS on the
improvement of postural control in patients with chronic
LBP.

Journal of Medicine and Life
Journal of Medicine and Life Vol. 8, Special Issue 2, 2015
26
Acknowledgements The authors would like to thank Dr. Nasrin
Shokrpour for editorial assistance and Mrs. Sareh Roosta for statistical analysis at Center for Development of
Clinical Research of Nemazee Hospital. This article is extracted from a Master of Sciences thesis Tahere Rezaeian, MSc, proposal number 6511.
References
1. Dillingham T. Evaluation and management of low backpain: and overview. State of the Art Reviews. 1995; 9(3):559–74.
2. Airaksinen O, Brox JI, Cedraschi C. European guidelines for the management of chronic non-specific low back pain. 2005, Brussels, European Commission Publications.
3. Katz JN. Lumbar disc disorders and low-back pain: socioeconomic factors and consequences. J Bone Joint Surg Am. 2006; 88:21–4.
4. Croft P, Macfarlane G, Papageorgiou A, Thomas E, Silman A, Thomas W, Silman A. British Medical Journal. 2(May 1998):1356–9.
5. Hodges PW, Richardson CA. Delayed postural contraction of transversus abdominis in low back pain associated with movement of the lower limb. J Spinal Disord. 1998; 11:46–56.
6. Moseley GL, Hodges PW, Gandevia S. Deep and superficial fibers of the lumbar multifidus muscle are differentially active during voluntary arm movements. Spine. 2002; 27:29–36.
7. Brumagne S, Cordo P, Verschueren S. Proprioceptive weighting changes in persons with low back pain and elderly persons during upright standing. Neuroscience Letters. 2004; 366(1):63-6.
8. Della Volpe R, Popa T, Ginanneschi F, Spidalieri R, Mazzocchio R, Rossi A. Changes in coordination of postural control during dynamic stance in chronic low back pain patients. Gait & Posture. 2006; 24(3):349-55.
9. Boucher P. Postural stability in diabetic polyneuropathy. Diabetes Care. 1995; 18(5): 638-45.
10. McPartland JM, Brodeur RR, Hallgren RC. Chronic neck standing balance, and suboccipital muscle atrophy--a pilot study. Journal of manipulative and physiological therapeutics. 1997; 20(1): 24.
11. Leinonen V. Lumbar paraspinal muscle function, perception of lumbar position, an postural control in disc herniation-related back pain. Spine. 2003; 28(8): 842.
12. Lin YH, Sun MH. The effect of lifting and lowering an external load on repositioning error of trunk flexion-extension in subjects with and without low back pain. Clinical rehabilitation. 2006; 20(7):603-8.
13. Collins AT, Blackburn JT, Olcott CW, Miles J, Jordan J, Dirschl DR, Weinhold PS. Stochastic resonance electrical stimulation to improve proprioception in
knee osteoarthritis. The Knee. 2010; 317-322.
14. Collins JJ, Imhoff TT, Grigg P. Noise-enhanced tactile sensation. Nature. 1996; 770.
15. Cordo P, Inglis JT, Verschueren S, Collins JJ, Merfeld DM, Rosenblum S, Buckley S, Moss F. Noise in human muscle spindles. Nature. 1996; 383: 769-770.
16. Devanne H, Maton B. Role of proprioceptive information in the temporal coordination between joints. Experimental brain research. 1998; 119(1): 58-64.
17. Dhruv NT, Niemi JB, Harry JD, Lipsitz LA, Collins JJ. Enhancing tactile sensation in older adults with electrical noise stimulation. Neuroreport. 2002; 13(5): 597.
18. Dickstein R, Laufer Y, Katz M. TENS to the posterior aspect of the legs decreases postural sway during stance. Neuroscience letters. 2006; 393(1): 51-55.
19. Felson DT, Zhang Y. An update on the epidemiology of knee and hip osteoarthritis with a view to prevention. Arthritis & Rheumatism. 1998; 41(8): 1343-1355.
20. Gravelle DC, Laughton CA, Dhruv NT, Katdare KD, Niemi JB, Lipsitz LA, Collins JJ. Noise-enhanced balance control in older adults. Neuroreport. 2002; 13(15):1853.
21. Sluka KA, Walsh D. Transcutaneous electrical nerve stimulation: basic science mechanisms and clinical effectiveness. Journal of Pain. 2003; 4:109-121.
22. Mima T, Oga T, Rothwell J, Satow T, Yamamoto J, Toma K. Short-term high-frequency transcutaneous electrical nerve stimulation decreases human motor cortex excitability. Neuroscience letters. 2004; 355(1):85-8.
23. Ridding MC, Brouwer B, Miles TS, Pitcher JB, Thompson PD. Changes in muscle responses to stimulation of the motor cortex induced by peripheral nerve stimulation in human subjects. Experimental Brain Research. 2000; 131: 135-143.
24. Perennou DA, Leblond C, Amblard B, Micallef JP, Herisson C, Pelissier JY. Transcutaneous electric nerve stimulation reduces neglect-related postural instability after stroke. Archives of Physical Medicine and Rehabilitation. 2001; 82: 440-448.
25. Rojhani Shirazi Z et al. The effect of transcutaneous electrical nerve stimulation on joint position sens in
patients with knee joint osteoarthritis. Physiotherapy Theory and Practice. 2014.
26. Kiers H et al. Postural sway and integration of proprioceptive signals in subjects with LBP. Human Movement Science. 2015; 39(0): 109-120.
27. Laufer Y, Dickstein R. TENS to the Lateral Aspect of the Knees During Stance Attenuates Postural Sway in Young Adults. TheScientificWorld Journal. 2007; 7:1904-11.
28. Priplata AA, Patritti BL, Niemi JB, Hughes R, Gravelle DC, Lipsitz LA. Noise‐enhanced balance control in patients with diabetes and patients with stroke. Annals of Neurology. 2006; 59 (1):4-12.
29. Dickstein R, Laufer Y, Katz M. TENS to the posterior aspect of the legs decreases postural swayduring stance. Neuroscience Letters. 2006; 393: 51-55.
30. van Drunen P, Maaswinkel E, van Der H, van Dieen JH, Happee R. Identifying intrinsic and reflexive contributionsto low-back stabilization. Journal of Biomechanics. 2013; 46, 1440–1446.
31. Mann L, Kleinpaul JF, Pereira Moro AR, Mota CB, Carpes FP. Effect of LBP on postural stability in younger women: Influence of visual deprivation. J Bodyw Mov Ther. 2010; 14(4):361-6.
32. Kankaanpaa M, Taimela S, Laaksonen D, Hanninen O, Airaksinen O. Back and hip extensor fatigability in chronic low back pain patients, and controls. Arch. Phys. Med.Rehabilitation. 1998; 79:412-417.
33. Nadler SF. Hip muscle imbalance and low back pain in athletes: influence of core strengthening. Medicine & Science in Sports & Exercise. 2002; 34(1): 9-16.
34. Janda V. Muscles central nervous motor regulation and back problems. In: Korr IM. The neurobiologic mechanisms in manipulative therapy. 1978, New York, Plenum Pr, 27-41.
35. Shumway-Cook A, Woollacott MH. Motor control: translating research into clinical practice. 2007, Lippincott Williams & Wilkins, 158-162.
36. Lee DN, Vision LJ. The most efficient source of proprioceptive information for balance control. Agressologie. 1977; 18: 83-94.
37. Mientjes M, Frank J. Balance in chronic low back pain patients compared to healthy people under various conditions in upright standing. Clinical Biomechanics. 1999; 14(10):710-6.

Journal of Medicine and Life
Journal of Medicine and Life Vol. 8, Special Issue 2, 2015
27
38. Brumagne S, Janssens L, Janssens E, Goddyn L. Altered postural control in anticipation of postural instability in persons with recurrent low back pain. Gait & posture. 2008; 28(4):657-62.
39. Melzack R, Vetere P, Finch L. Transcutaneous Electrical Nerve Stimulation for Low Back Pain A Comparison of TENS and Massage for Pain and Range of Motion. Physical Therapy. 1983; 63(4): 489-493.
40. Grant DJ. A randomized comparative trial of acupuncture versus transcutaneous 2006. Electrical nerve stimulation for chronic back pain in the elderly. Pain. 1999; 82(1): 9-13.
41. Chesterton LS. Sensory stimulation (TENS): effects of parameter manipulation on mechanical pain thresholds in healthy human subjects. Pain. 2002; 99(1): 253-262.
42. Carroll D. Transcutaneous electrical nerve stimulation (TENS) for chronic pain. The Cochrane Library. 2002.
43. Birmingham T, Kramer J, Kirkley A, Inglis J, Spaulding S, Vandervoort A, Knee WN. Bracing for medial compartment osteoarthritis: effects on proprioception and postural control. Rheumatology. 2001; 40(3):285-9.
44. Peurala SH, Pitkänen K, Sivenius J, Tarkka IM. Cutaneous electrical stimulation may enhance sensorimotor
recovery in chronic stroke. Clin Rehabil. 2002; 16:709-16.
45. Popa T, Bonifazi M, Della Volpe R, Rossi A, Mazzocchio R. Adaptive changes in postural strategy selection in chronic low back pain. Experimental Brain Research. 2007; 177(3):411-8.
46. Sonde L, Gip C, Fernaeus SE, Nilsson CG, Viitanen M. Stimulation with low frequency (1.7 Hz) transcutaneous electric nerve stimulation (low-tens) increases motor function of the poststroke paretic arm. Scand. J. Rehabil. Med. 1998; 30: 95–99.
Journal of Medicine and Life
Journal of Medicine and Life Vol. 8, Special Issue 2, 2015, pp.28-31
Assessment and attitude of university students about elderly: Preliminary Study
Tabari ZA*, Ghaedi FB*, Hamissi JH**, Eskandari S*** *Department of Periodontics, Qazvin University of Medical Sciences, Qazvin, Iran **Periodontics and Dental Caries Prevention Research Center, Qazvin University of Medical Sciences, Qazvin, Iran ***Dentist Correspondence to: Jalaleddin H Hamissi, MD, Associate Professor, Periodontics and Dental Caries Prevention Research Center, College of Dentistry, Qazvin University of Medical Science, Shaheed Bahonar Blv., Qazvin, P.O. Box: 34197-59811, I.R. Iran. Mobile phone: ++989121812543, E-mail: [email protected], [email protected] Received: May 18th, 2015 – Accepted: July 27th, 2015
Abstract Aims: The aim of this study was to evaluate the attitude of dental students towards elderly patients. This approach might increase the responsiveness and need of the geriatric dental education within the undergraduate dental students curriculum, which is the persistent necessity for today communities. Methods & Materials: A cross–sectional study was conducted on 201 students who were randomly selected. The investigation was carried out in Qazvin University of Medical Sciences. The attitude of dental students towards elderly was measured with a self-administered questionnaire consisting of an Aging Semantic Differential scale (ASD), which was developed by Rozencranz and Mc Nevin. Results: According to the findings of this study, the students’ attitude remained very positive towards the elderly patients as they showed a strong demand to work with elderly patients. This consisted of a 24 bipolar pair of adjectives that described the attributes of behavioral characteristics thought to be applicable to persons of all ages. Conclusion: According to our finding, the future geriatric dentistry is not towards a weak point in Iran as compared with the undesirable attitudes of dental students in the developed countries.
Keywords: attitudes, aging, education, training, geriatric education Introduction
Increasing the quality of health care is the main great concern in all health care systems [1,2]. And, oral health is a portion of general health and it affects the total happiness of individuals [3]. Medical and health literature shows high demands for geriatric care in a world in which health professionals, in particular physicians, tend to exhibit negative attitudes toward the elderly. In some universities, students are dedicated to having trainings and attending the senior people [4-6].
We are living in an old age population. Ageing has proceeded extremely in developed countries, but in developing countries, it has also begun to present considerable increases [7-8].
Iran has started to come across with the population ageing too. Nevertheless, Iran still has a relatively young population; the amount of elderly being likely to be double in less than 20 years [9].
According to the report of the United Nations, the statistical projections demonstrated a rapid growth of the elderly population in Iran. While the number of people with 60 years old age and above in Iran were 5.4% in 1975 it will be increasing to 10.5% in 2025 and also 21.7% in
2050 [10]. As a matter of fact the total size of Iran population will fail to double in next fifty years, but the number of elderly aged 65 years and over will experience about six-more times increase [11].
Rendering to the United Nations, the number of people aged 60 years or older was likely to be 629 million in 2002 and to be develop to nearly a billion by year 2050 [12]. The amount of people aged over 60 years will reach up to 21% of the population [13,14]. The increasing number of elderly people and decreasing rates of edentulous highlight the importance of dental education especially focusing on dental geriatrics [15-17].
Geriatric dental education could be defined as a part of helping pre-doctoral dental curriculum. This deals with special knowledge, attitude and technical skills required in the provision of oral health care to older adults [18]. Consciousness of the necessity for dental geriatrics within the undergraduate dental student curriculum has been increased significantly in the western world [19,20]. However, no steps have been taken in this part of the word regarding this matter. Particularly, very little was known about the way the dental students responded to geriatric patients. In order to develop an ability in managing geriatric patients, dental students must undergo
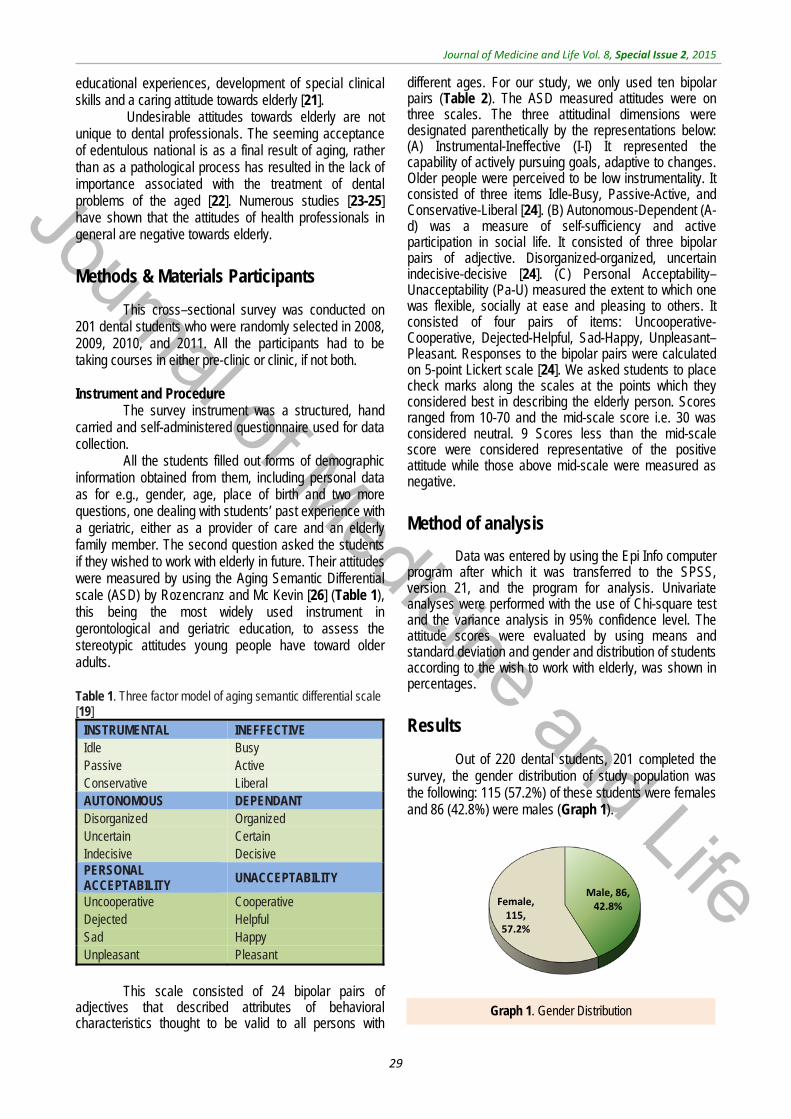
Journal of Medicine and Life
Journal of Medicine and Life Vol. 8, Special Issue 2, 2015
29
educational experiences, development of special clinical skills and a caring attitude towards elderly [21].
Undesirable attitudes towards elderly are not unique to dental professionals. The seeming acceptance of edentulous national is as a final result of aging, rather than as a pathological process has resulted in the lack of importance associated with the treatment of dental problems of the aged [22]. Numerous studies [23-25] have shown that the attitudes of health professionals in general are negative towards elderly.
Methods & Materials Participants
This cross–sectional survey was conducted on 201 dental students who were randomly selected in 2008, 2009, 2010, and 2011. All the participants had to be taking courses in either pre-clinic or clinic, if not both. Instrument and Procedure
The survey instrument was a structured, hand carried and self-administered questionnaire used for data collection.
All the students filled out forms of demographic information obtained from them, including personal data as for e.g., gender, age, place of birth and two more questions, one dealing with students’ past experience with a geriatric, either as a provider of care and an elderly family member. The second question asked the students if they wished to work with elderly in future. Their attitudes were measured by using the Aging Semantic Differential scale (ASD) by Rozencranz and Mc Kevin [26] (Table 1), this being the most widely used instrument in gerontological and geriatric education, to assess the stereotypic attitudes young people have toward older adults. Table 1. Three factor model of aging semantic differential scale [19]
INSTRUMENTAL INEFFECTIVE Idle Busy Passive Active Conservative Liberal AUTONOMOUS DEPENDANT Disorganized Organized Uncertain Certain Indecisive Decisive PERSONAL ACCEPTABILITY
UNACCEPTABILITY
Uncooperative Cooperative Dejected Helpful Sad Happy Unpleasant Pleasant
This scale consisted of 24 bipolar pairs of
adjectives that described attributes of behavioral characteristics thought to be valid to all persons with
different ages. For our study, we only used ten bipolar pairs (Table 2). The ASD measured attitudes were on three scales. The three attitudinal dimensions were designated parenthetically by the representations below: (A) Instrumental-Ineffective (I-I) It represented the capability of actively pursuing goals, adaptive to changes. Older people were perceived to be low instrumentality. It consisted of three items Idle-Busy, Passive-Active, and Conservative-Liberal [24]. (B) Autonomous-Dependent (A-d) was a measure of self-sufficiency and active participation in social life. It consisted of three bipolar pairs of adjective. Disorganized-organized, uncertain indecisive-decisive [24]. (C) Personal Acceptability–Unacceptability (Pa-U) measured the extent to which one was flexible, socially at ease and pleasing to others. It consisted of four pairs of items: Uncooperative-Cooperative, Dejected-Helpful, Sad-Happy, Unpleasant–Pleasant. Responses to the bipolar pairs were calculated on 5-point Lickert scale [24]. We asked students to place check marks along the scales at the points which they considered best in describing the elderly person. Scores ranged from 10-70 and the mid-scale score i.e. 30 was considered neutral. 9 Scores less than the mid-scale score were considered representative of the positive attitude while those above mid-scale were measured as negative.
Method of analysis
Data was entered by using the Epi Info computer program after which it was transferred to the SPSS, version 21, and the program for analysis. Univariate analyses were performed with the use of Chi-square test and the variance analysis in 95% confidence level. The attitude scores were evaluated by using means and standard deviation and gender and distribution of students according to the wish to work with elderly, was shown in percentages.
Results
Out of 220 dental students, 201 completed the survey, the gender distribution of study population was the following: 115 (57.2%) of these students were females and 86 (42.8%) were males (Graph 1).
Male, 86, 42.8%Female,
115, 57.2%
Graph 1. Gender Distribution
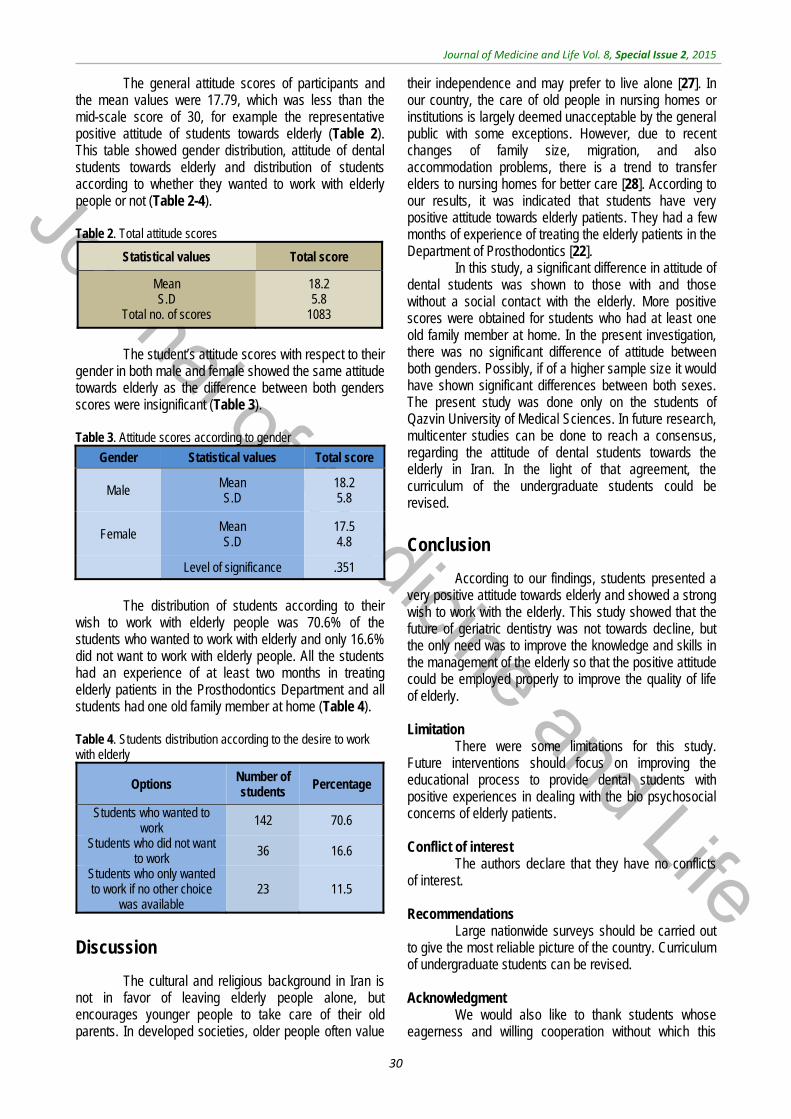
Journal of Medicine and Life
Journal of Medicine and Life Vol. 8, Special Issue 2, 2015
30
The general attitude scores of participants and the mean values were 17.79, which was less than the mid-scale score of 30, for example the representative positive attitude of students towards elderly (Table 2). This table showed gender distribution, attitude of dental students towards elderly and distribution of students according to whether they wanted to work with elderly people or not (Table 2-4). Table 2. Total attitude scores
Statistical values Total score
Mean S.D
Total no. of scores
18.2 5.8
1083
The student’s attitude scores with respect to their
gender in both male and female showed the same attitude towards elderly as the difference between both genders scores were insignificant (Table 3). Table 3. Attitude scores according to gender
Gender Statistical values Total score
Male Mean S.D
18.2 5.8
Female Mean S.D
17.5 4.8
Level of significance .351
The distribution of students according to their
wish to work with elderly people was 70.6% of the students who wanted to work with elderly and only 16.6% did not want to work with elderly people. All the students had an experience of at least two months in treating elderly patients in the Prosthodontics Department and all students had one old family member at home (Table 4).
Table 4. Students distribution according to the desire to work with elderly
Options Number of students
Percentage
Students who wanted to work
142 70.6
Students who did not want to work 36 16.6
Students who only wanted to work if no other choice
was available 23 11.5
Discussion
The cultural and religious background in Iran is not in favor of leaving elderly people alone, but encourages younger people to take care of their old parents. In developed societies, older people often value
their independence and may prefer to live alone [27]. In our country, the care of old people in nursing homes or institutions is largely deemed unacceptable by the general public with some exceptions. However, due to recent changes of family size, migration, and also accommodation problems, there is a trend to transfer elders to nursing homes for better care [28]. According to our results, it was indicated that students have very positive attitude towards elderly patients. They had a few months of experience of treating the elderly patients in the Department of Prosthodontics [22].
In this study, a significant difference in attitude of dental students was shown to those with and those without a social contact with the elderly. More positive scores were obtained for students who had at least one old family member at home. In the present investigation, there was no significant difference of attitude between both genders. Possibly, if of a higher sample size it would have shown significant differences between both sexes. The present study was done only on the students of Qazvin University of Medical Sciences. In future research, multicenter studies can be done to reach a consensus, regarding the attitude of dental students towards the elderly in Iran. In the light of that agreement, the curriculum of the undergraduate students could be revised.
Conclusion
According to our findings, students presented a very positive attitude towards elderly and showed a strong wish to work with the elderly. This study showed that the future of geriatric dentistry was not towards decline, but the only need was to improve the knowledge and skills in the management of the elderly so that the positive attitude could be employed properly to improve the quality of life of elderly. Limitation
There were some limitations for this study. Future interventions should focus on improving the educational process to provide dental students with positive experiences in dealing with the bio psychosocial concerns of elderly patients. Conflict of interest
The authors declare that they have no conflicts of interest. Recommendations
Large nationwide surveys should be carried out to give the most reliable picture of the country. Curriculum of undergraduate students can be revised. Acknowledgment
We would also like to thank students whose eagerness and willing cooperation without which this

Journal of Medicine and Life
Journal of Medicine and Life Vol. 8, Special Issue 2, 2015
31
survey would have not been possible. There were no funds for this research. We would like to show our
appreciation to Mrs. Adeleh Ghodousi for the statistical work.
References
1. World Health Organization (WHO). Quality and accreditation in health services. A global review. 2003, Geneva (Switzerland), The Organization.
2. Naito M, Kato T, Fuji W, Ozeki M, Yokoyama M, Hamajima N, Saitoh E . Effects of dental treatment on the quality of life and activities of daily living in institutionalized elderly in Japan. Arch Gerontol Geriatr. 2010; 50:65–68.
3. Hamissi J, Ramezani GH, Ghodousi A. Prevalence of dental caries among high school attendees in Qazvin, Iran. J Indian Soc Pedod Prev Dent. 2008; 26:53-5.
4. Prathibha V. The Ageing Game: Improving medical student attitudes toward caring for the elderly. J Am Med Directors Assoc. 2006; 47:224-229.
5. Brooks TR. Attitudes of medical students and family practice residents toward geriatrics patients. J Natl Med Assoc. 1993; 85:61–64.
6. Deary IJ, Smith R, Mitchell C, MacLennan WJ. Geriatric medicine: Does teaching alter medical students’ attitudes to elderly people?. Med Educ. 1993; 27:399–405.
7. Weil DN. Population aging http://ssrn.com/abstract=893608.
8. Gavrilov LA, Heuveline P. Aging of Population. In: Demeny P, McNicoll G. The Encyclopedia of Population. 2003, New York, Macmillan, 32–37.
9. Jogataee M. The Elderly World Day. Monthly Magazine of University of Social Welfare and Rehabilitation Science, 2005, Tehran, Iran, 11: 2.
10. United Nations World Population Ageing: 1950-2050, Countries of area: Iran (Islamic Republic of). http://www.un.org/esa/population/publicati
ons/worldageing19502050/pdf/113iran(.pdf.
11. Mehryar AH, Ahmad-Nia S. Age-Structural Transition in Iran: Short and Long-term Consequences of Drastic Fertility Swings During the Final Decades of Twentieth Century, presented at the CICRED Seminar on Age-Structural Transitions: Population Waves, Disordered Cohort Flows and the Demographic Bonus. February 2004, Paris, 23–26.
12. World Health Organization. Health statistics and health information system. 2008. http:// www.who.int/health info/survey/ageingdefnolder/en/ index.html.
13. The United Nations. Population aging 2006 “department of economic and social affairs”. 2006. http:// www.un.org/esa/population/publication/aging/graph.vdf.
14. The United Nations. Implication on aging society division of social policy and development. 2002. http:/ /www.un.org/esa/aging/agiimp.htm.
15. Fabiano AJ, Waldrop PD, Davis LE. Understanding dental students knowledge and perception of older people: towards a new model of geriatric dental education. J Dent Educ. 2005; 69:419-30.
16. Mohammad RA, Preshaw MP, Ettinger LR, Current status of predoctrol education in U.S dental schools. J Dent Educ. 2003; 17:509-14.
17. Nunn J, Freeman R, Anderson E, Carneiro CL, Yazdanie N. Inequalities in access to education and health care. Eur J Dent Educ. 2008; 12:30-9.
18. Thomas AM, Ship J, Current status of geriatric education in American dental schools. J Dent Educ. 1981; 45:589-91.
19. Eyison J, Mann J, Mersel A. A comparative study of the attitude of dental students towards elderly. Eur J Prosthodont 1992; 2:87-90.
20. Beck JD, Ettinger RL, Paul CL. Oral health status: impact of dental students’ attitude toward the aged. Gerodontologists. 1979; 19:580-85.
21. Kiyak HA, Milgrom P, Conrod D. Dentists attitudes towards and knowledge of the elderly. J Dent Educ. 1982; 46:266-73.
22. Kiyak HA. Psychological factors in dental needs of the elderly. Spec Care Dent. 1981; 1:22-30.
23. Firetell DN, Stade EH. The declining complete denture patient pool in dental schools. J Prosthet Dent. 1984; 51:122-25.
24. Lee B, Kim CB, Han S. The portrayal of older people in the television advertisements: a cross cultural content analysis of United States and South Korea. Int’l J Aging and human development. 2006; 63:279-97.
25. Adegbembo AO, Leake JL, Main PA, Lawrence HP, Chapman ML. The influence of dental insurance on institutionalized older adults in ranking their oral health status. Spec Care Dent. 2005; 25:275-85.
26. Rosencranz HA, McKevin TE. A factor analysis of attitudes towards the aged. Gerontologist. 1969; 9:55–59.
27. Bowling A, Grundy E, Farquhar M. Living Well into Old Age. First. 1997, Glasgow: Open University Press.
28. Teymoori F, Dadkhah A, Shirazikhah M. Social welfare and health (mental, social, physical) status of aged people in Iran. Middle East Journal of Age and Ageing. 2006; 3:39–45.

Journal of Medicine and Life
Journal of Medicine and Life Vol. 8, Special Issue 2, 2015, pp.32-37
Epidemiology and clinical manifestation of fungal infection related to Mucormycosis in hematologic malignancies
Noorifard M*, Sekhavati E**, Jalaei Khoo H***, Hazraty I****, Tabrizi R*****
*Department of Infectious Diseases, AJA University of Medical Sciences, Tehran, Iran **Larestan School of Medical Sciences, Larestan, Iran ***Department of Hematology & Oncology, AJA University of Medical Sciences, Tehran, Iran ****Department of Anesthesiology and Critical Care, AJA University of Medical Sciences, Tehran, Iran *****Health Policy Research Center, Shiraz University of Medical Sciences, Shiraz, Iran Correspondence to: Reza Tabrizi, MSc Student of Epidemiology, Health Policy Research Center, Shiraz University of Medical Sciences, Shiraz, Iran, Postal Code: 7619813159, Phone/ Fax: (+98) 7132309615, Mobile phone: (+98) 9378454302, E-mail: [email protected] Received: May 25th, 2015 – Accepted: July 27th, 2015
Abstract Introduction: Mucormycosis is an opportunist fungus infection with acute and rapidly progressive nature in the hematologic malignancy patients. This study was done to investigate the prevalence and clinical manifestations of this infection among hematologic malignancies. Methodology: This cross-sectional study (descriptive-analytical) was performed while investigating medical records of 30 patients with hematologic malignancy affected by Mucormycosis in Imam Reza Hospital between 2001 and 2013. After collecting the data, it was entered in SPSS 19 Software with a provided checklist that included demographic characteristics, clinical manifestations, and it was analyzed by using descriptive (mean, frequency) and inferential (chi- square and independent -t-test) statistical methods (p-value < 0.05 was considered as statistically significant). Findings: Overall, the prevalence of Mucormycosis was 4.29 per 100 patient hematologic malignancies. The infection proportion among men and women was 72. 2, 27.6%, respectively. The maximum cases of Mucormycosis were observed among AML patients (62.1%). The most common place of involvement was lung (89.4%) and fever was the most popular sign of the infection (100%). The most considerable and effective factor in the prognosis of infection was using combined therapy of Amphotericin Band surgery (debridement) that has statistically significant correlation (p<0.05). Conclusion: Considerable prevalence and death related to Mucormycosis infection among patients of hematologic malignancy showed the importance of having strategies for its prevention and early diagnosis especially among acute leukemia patients.
Keywords: epidemiology, Mucormycosis, hematologic malignancy
Introduction
Mucormycosis is one of original order of fungus Zygomycetes that is considered as important human pathogens. Mucormycosis is a fatal, opportunist fungus with acute infectious and rapid progress nature. Although this aggressive fungal infection is rare, it is common among patients whose immune system of their body has been disturbed for different reasons [21].
During recent decades, a high percent of infected patients by this infection has been observed significantly among diabetic patients, malnutrition children, patients with severe burning, people affected by hematologic malignancy and during therapy with immunosuppressive, cytotoxins, corticosteroids or after surgery and trauma [2,12,15]. In patients with hematologic malignancies, this fungus causes death by its effect and delays or stops the influence of anticancer treatment. Among common forms of Mucormycosis disease, we can mention pulmonary, rhino-cerebral, gastrointestinal,
cutaneous, and distributed form [8]. Mucormycosis causes emboli and necrosis of the tissues by invading blood vessels and spreads through the body by blood current [7,8]. Generally, the infection prognosis depends on several factors including infection place, speed of disease diagnosis, type of cancer, extension, and severity based upon the fungus’ invasion and host body’s immune system [20]. The early diagnosis of the disease is very important from the treatment view. Unfortunately, doubt is focused on clinical symptoms of the disease. Also, diagnosis probability of the disease before death is just 23- 50%. Early medical and surgery treatment can prevent Mucormycosis development and in some cases, it may remove the disease with surgery (depending on expansion and lesion) and Amphotericin B [10,11].
During the two last decades, the studies have shown an increase of Mucormycosis compared to other invading fungi as Aspergillus among people having deficiency in immune system [17]. In 2002, the study of Marr et al. showed that the number of Mucormycosis
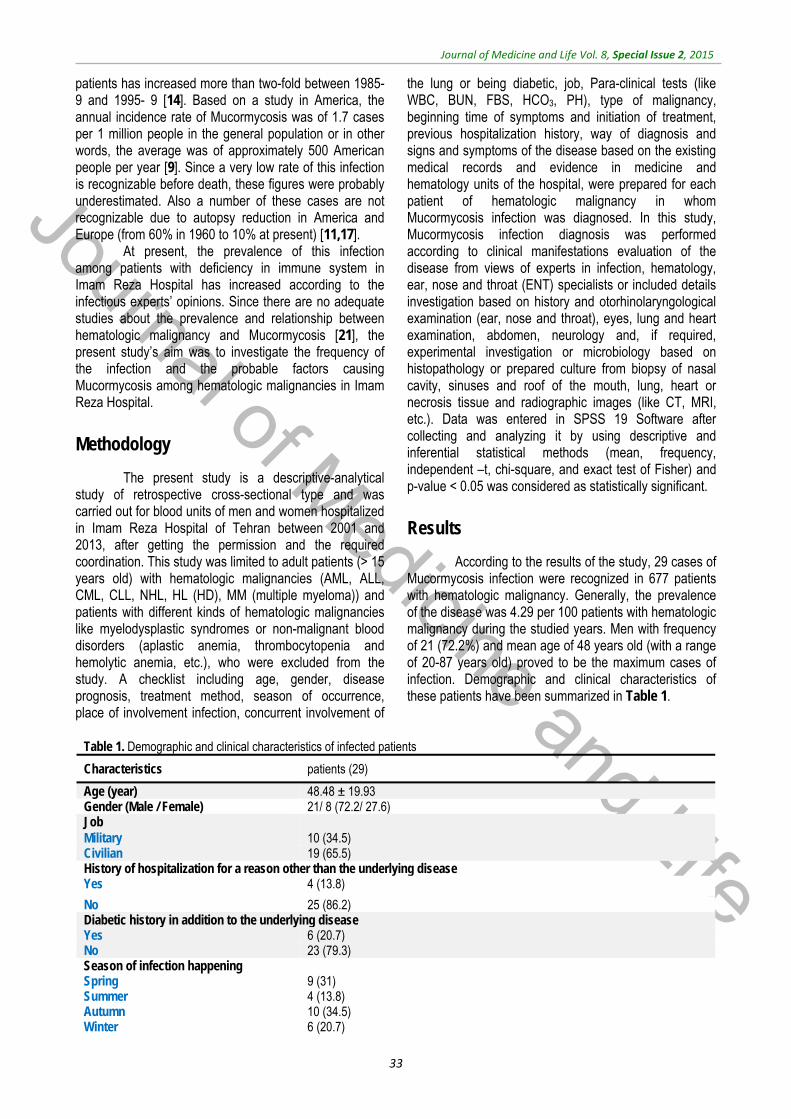
Journal of Medicine and Life
Journal of Medicine and Life Vol. 8, Special Issue 2, 2015
33
patients has increased more than two-fold between 1985- 9 and 1995- 9 [14]. Based on a study in America, the annual incidence rate of Mucormycosis was of 1.7 cases per 1 million people in the general population or in other words, the average was of approximately 500 American people per year [9]. Since a very low rate of this infection is recognizable before death, these figures were probably underestimated. Also a number of these cases are not recognizable due to autopsy reduction in America and Europe (from 60% in 1960 to 10% at present) [11,17].
At present, the prevalence of this infection among patients with deficiency in immune system in Imam Reza Hospital has increased according to the infectious experts’ opinions. Since there are no adequate studies about the prevalence and relationship between hematologic malignancy and Mucormycosis [21], the present study’s aim was to investigate the frequency of the infection and the probable factors causing Mucormycosis among hematologic malignancies in Imam Reza Hospital.
Methodology
The present study is a descriptive-analytical study of retrospective cross-sectional type and was carried out for blood units of men and women hospitalized in Imam Reza Hospital of Tehran between 2001 and 2013, after getting the permission and the required coordination. This study was limited to adult patients (> 15 years old) with hematologic malignancies (AML, ALL, CML, CLL, NHL, HL (HD), MM (multiple myeloma)) and patients with different kinds of hematologic malignancies like myelodysplastic syndromes or non-malignant blood disorders (aplastic anemia, thrombocytopenia and hemolytic anemia, etc.), who were excluded from the study. A checklist including age, gender, disease prognosis, treatment method, season of occurrence, place of involvement infection, concurrent involvement of
the lung or being diabetic, job, Para-clinical tests (like WBC, BUN, FBS, HCO3, PH), type of malignancy, beginning time of symptoms and initiation of treatment, previous hospitalization history, way of diagnosis and signs and symptoms of the disease based on the existing medical records and evidence in medicine and hematology units of the hospital, were prepared for each patient of hematologic malignancy in whom Mucormycosis infection was diagnosed. In this study, Mucormycosis infection diagnosis was performed according to clinical manifestations evaluation of the disease from views of experts in infection, hematology, ear, nose and throat (ENT) specialists or included details investigation based on history and otorhinolaryngological examination (ear, nose and throat), eyes, lung and heart examination, abdomen, neurology and, if required, experimental investigation or microbiology based on histopathology or prepared culture from biopsy of nasal cavity, sinuses and roof of the mouth, lung, heart or necrosis tissue and radiographic images (like CT, MRI, etc.). Data was entered in SPSS 19 Software after collecting and analyzing it by using descriptive and inferential statistical methods (mean, frequency, independent –t, chi-square, and exact test of Fisher) and p-value < 0.05 was considered as statistically significant.
Results
According to the results of the study, 29 cases of Mucormycosis infection were recognized in 677 patients with hematologic malignancy. Generally, the prevalence of the disease was 4.29 per 100 patients with hematologic malignancy during the studied years. Men with frequency of 21 (72.2%) and mean age of 48 years old (with a range of 20-87 years old) proved to be the maximum cases of infection. Demographic and clinical characteristics of these patients have been summarized in Table 1.
Table 1. Demographic and clinical characteristics of infected patients
Characteristics patients (29)
Age (year) 48.48 ± 19.93 Gender (Male / Female) 21/ 8 (72.2/ 27.6) Job Military 10 (34.5) Civilian 19 (65.5) History of hospitalization for a reason other than the underlying disease Yes 4 (13.8)
No 25 (86.2) Diabetic history in addition to the underlying disease Yes 6 (20.7) No 23 (79.3) Season of infection happening Spring 9 (31) Summer 4 (13.8) Autumn 10 (34.5) Winter 6 (20.7)
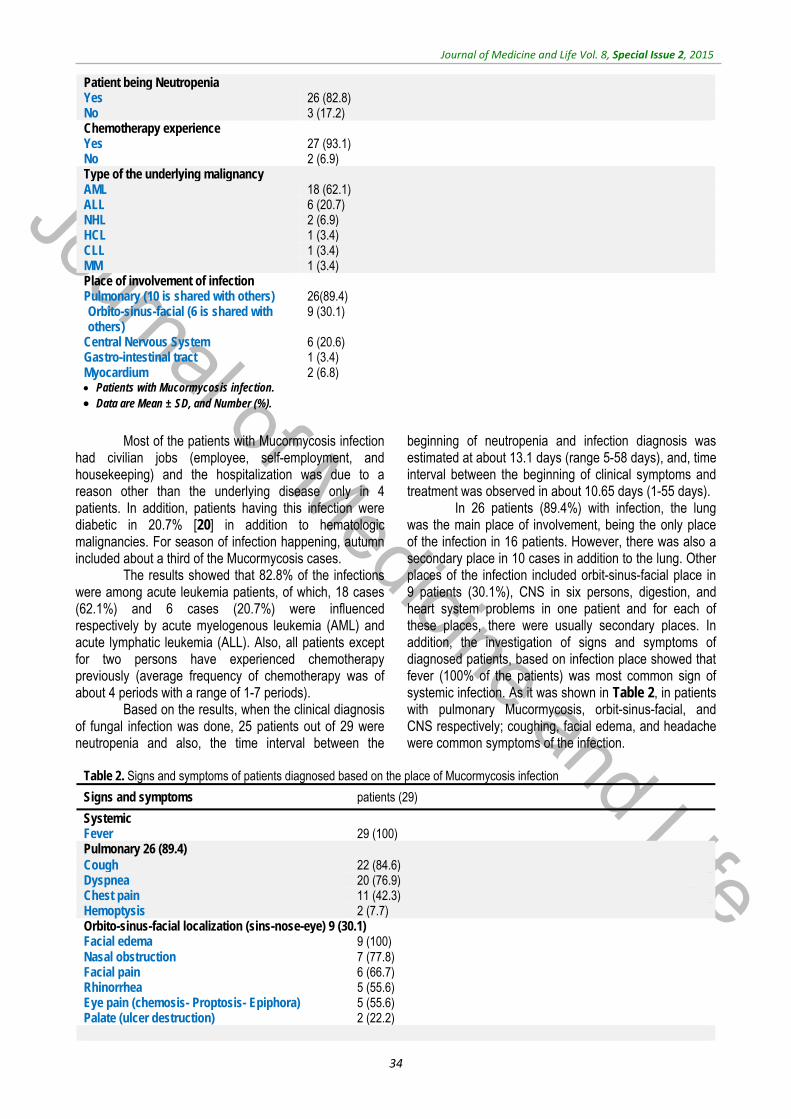
Journal of Medicine and Life
Journal of Medicine and Life Vol. 8, Special Issue 2, 2015
34
Patient being Neutropenia Yes 26 (82.8) No 3 (17.2) Chemotherapy experience Yes 27 (93.1) No 2 (6.9) Type of the underlying malignancy AML 18 (62.1) ALL 6 (20.7) NHL 2 (6.9) HCL 1 (3.4) CLL 1 (3.4) MM 1 (3.4) Place of involvement of infection Pulmonary (10 is shared with others) 26(89.4) Orbito-sinus-facial (6 is shared with others)
9 (30.1)
Central Nervous System 6 (20.6) Gastro-intestinal tract 1 (3.4) Myocardium 2 (6.8) Patients with Mucormycosis infection. Data are Mean ± SD, and Number (%).
Most of the patients with Mucormycosis infection
had civilian jobs (employee, self-employment, and housekeeping) and the hospitalization was due to a reason other than the underlying disease only in 4 patients. In addition, patients having this infection were diabetic in 20.7% [20] in addition to hematologic malignancies. For season of infection happening, autumn included about a third of the Mucormycosis cases.
The results showed that 82.8% of the infections were among acute leukemia patients, of which, 18 cases (62.1%) and 6 cases (20.7%) were influenced respectively by acute myelogenous leukemia (AML) and acute lymphatic leukemia (ALL). Also, all patients except for two persons have experienced chemotherapy previously (average frequency of chemotherapy was of about 4 periods with a range of 1-7 periods).
Based on the results, when the clinical diagnosis of fungal infection was done, 25 patients out of 29 were neutropenia and also, the time interval between the
beginning of neutropenia and infection diagnosis was estimated at about 13.1 days (range 5-58 days), and, time interval between the beginning of clinical symptoms and treatment was observed in about 10.65 days (1-55 days).
In 26 patients (89.4%) with infection, the lung was the main place of involvement, being the only place of the infection in 16 patients. However, there was also a secondary place in 10 cases in addition to the lung. Other places of the infection included orbit-sinus-facial place in 9 patients (30.1%), CNS in six persons, digestion, and heart system problems in one patient and for each of these places, there were usually secondary places. In addition, the investigation of signs and symptoms of diagnosed patients, based on infection place showed that fever (100% of the patients) was most common sign of systemic infection. As it was shown in Table 2, in patients with pulmonary Mucormycosis, orbit-sinus-facial, and CNS respectively; coughing, facial edema, and headache were common symptoms of the infection.
Table 2. Signs and symptoms of patients diagnosed based on the place of Mucormycosis infection
Signs and symptoms patients (29)
Systemic Fever 29 (100) Pulmonary 26 (89.4) Cough 22 (84.6) Dyspnea 20 (76.9) Chest pain 11 (42.3) Hemoptysis 2 (7.7) Orbito-sinus-facial localization (sins-nose-eye) 9 (30.1) Facial edema 9 (100) Nasal obstruction 7 (77.8) Facial pain 6 (66.7) Rhinorrhea 5 (55.6) Eye pain (chemosis- Proptosis- Epiphora) 5 (55.6) Palate (ulcer destruction) 2 (22.2)
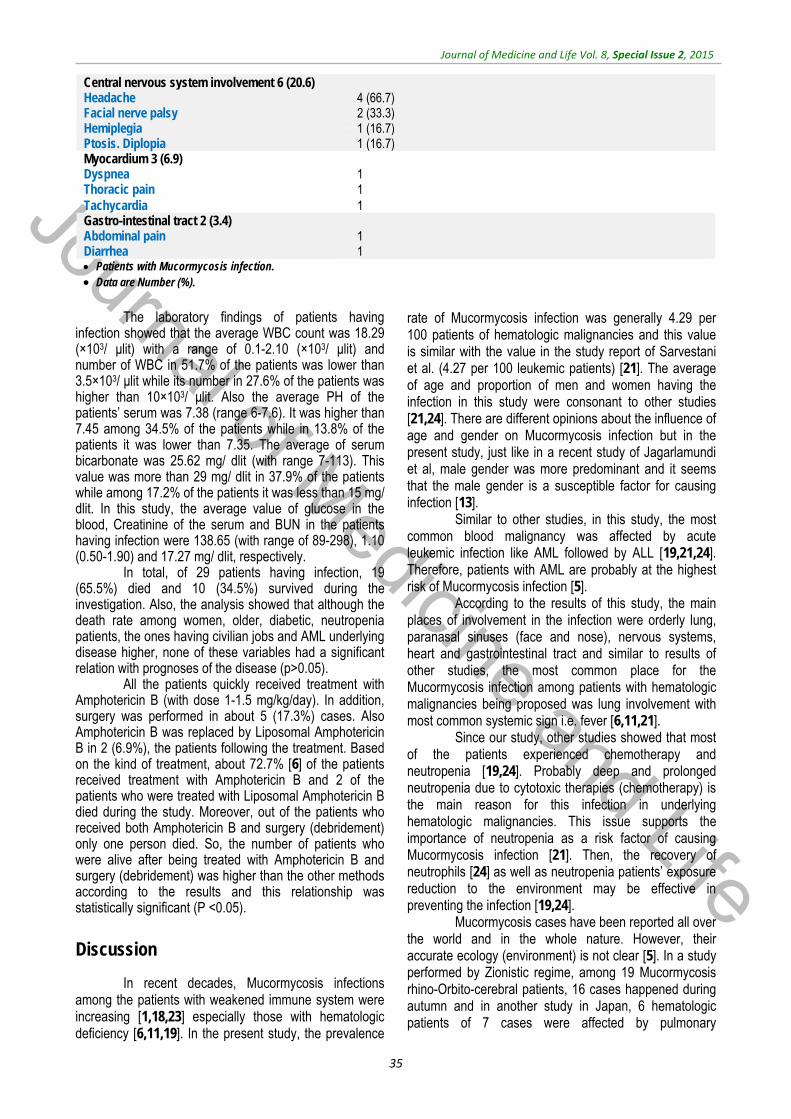
Journal of Medicine and Life
Journal of Medicine and Life Vol. 8, Special Issue 2, 2015
35
Central nervous system involvement 6 (20.6) Headache 4 (66.7) Facial nerve palsy 2 (33.3) Hemiplegia 1 (16.7) Ptosis. Diplopia 1 (16.7) Myocardium 3 (6.9) Dyspnea 1 Thoracic pain 1 Tachycardia 1 Gastro-intestinal tract 2 (3.4) Abdominal pain 1 Diarrhea 1 Patients with Mucormycosis infection. Data are Number (%).
The laboratory findings of patients having
infection showed that the average WBC count was 18.29 (×103/ μlit) with a range of 0.1-2.10 (×103/ μlit) and number of WBC in 51.7% of the patients was lower than 3.5×10³/ μlit while its number in 27.6% of the patients was higher than 10×103/ μlit. Also the average PH of the patients’ serum was 7.38 (range 6-7.6). It was higher than 7.45 among 34.5% of the patients while in 13.8% of the patients it was lower than 7.35. The average of serum bicarbonate was 25.62 mg/ dlit (with range 7-113). This value was more than 29 mg/ dlit in 37.9% of the patients while among 17.2% of the patients it was less than 15 mg/ dlit. In this study, the average value of glucose in the blood, Creatinine of the serum and BUN in the patients having infection were 138.65 (with range of 89-298), 1.10 (0.50-1.90) and 17.27 mg/ dlit, respectively.
In total, of 29 patients having infection, 19 (65.5%) died and 10 (34.5%) survived during the investigation. Also, the analysis showed that although the death rate among women, older, diabetic, neutropenia patients, the ones having civilian jobs and AML underlying disease higher, none of these variables had a significant relation with prognoses of the disease (p>0.05).
All the patients quickly received treatment with Amphotericin B (with dose 1-1.5 mg/kg/day). In addition, surgery was performed in about 5 (17.3%) cases. Also Amphotericin B was replaced by Liposomal Amphotericin B in 2 (6.9%), the patients following the treatment. Based on the kind of treatment, about 72.7% [6] of the patients received treatment with Amphotericin B and 2 of the patients who were treated with Liposomal Amphotericin B died during the study. Moreover, out of the patients who received both Amphotericin B and surgery (debridement) only one person died. So, the number of patients who were alive after being treated with Amphotericin B and surgery (debridement) was higher than the other methods according to the results and this relationship was statistically significant (P <0.05).
Discussion
In recent decades, Mucormycosis infections among the patients with weakened immune system were increasing [1,18,23] especially those with hematologic deficiency [6,11,19]. In the present study, the prevalence
rate of Mucormycosis infection was generally 4.29 per 100 patients of hematologic malignancies and this value is similar with the value in the study report of Sarvestani et al. (4.27 per 100 leukemic patients) [21]. The average of age and proportion of men and women having the infection in this study were consonant to other studies [21,24]. There are different opinions about the influence of age and gender on Mucormycosis infection but in the present study, just like in a recent study of Jagarlamundi et al, male gender was more predominant and it seems that the male gender is a susceptible factor for causing infection [13].
Similar to other studies, in this study, the most common blood malignancy was affected by acute leukemic infection like AML followed by ALL [19,21,24]. Therefore, patients with AML are probably at the highest risk of Mucormycosis infection [5].
According to the results of this study, the main places of involvement in the infection were orderly lung, paranasal sinuses (face and nose), nervous systems, heart and gastrointestinal tract and similar to results of other studies, the most common place for the Mucormycosis infection among patients with hematologic malignancies being proposed was lung involvement with most common systemic sign i.e. fever [6,11,21].
Since our study, other studies showed that most of the patients experienced chemotherapy and neutropenia [19,24]. Probably deep and prolonged neutropenia due to cytotoxic therapies (chemotherapy) is the main reason for this infection in underlying hematologic malignancies. This issue supports the importance of neutropenia as a risk factor of causing Mucormycosis infection [21]. Then, the recovery of neutrophils [24] as well as neutropenia patients’ exposure reduction to the environment may be effective in preventing the infection [19,24].
Mucormycosis cases have been reported all over the world and in the whole nature. However, their accurate ecology (environment) is not clear [5]. In a study performed by Zionistic regime, among 19 Mucormycosis rhino-Orbito-cerebral patients, 16 cases happened during autumn and in another study in Japan, 6 hematologic patients of 7 cases were affected by pulmonary
Journal of Medicine and Life
Journal of Medicine and Life Vol. 8, Special Issue 2, 2015
36
Mucormycosis with a similar seasonal trend during August and September [16,22]. In our study, autumn included the maximum rate of the infection. Probably, heat transfer system in the therapeutic centers is most important factor in spreading fungal spoors among the patients because of temperature fall in this season. The prevalence of Mucormycosis was reduced significantly in the study of Sarvestani et al. by doing some practices to control and improve the environment condition that included transferring the flowers and live plants outside the units, isolation of neutropenia patients being at risk, wearing masks and controlling air quality for the exposure reduction to spoors [21].
A key matter in Mucormycosis management is the acknowledgment of the correct diagnosis [11]. Based on the results of the studies, the infection diagnosis by blood culture before death of neutropenia patients is unusual [6,11]. In addition, sputum culture was rarely useful in patients with pulmonary involvement. So, the diagnosis is possible by invading methods (biopsy or surgery for culture and histology) [11]. Unfortunately, using these methods is difficult and risky in most of the patients with hematologic malignancies especially those with pulmonary involvement due to their very bad general status and severe thrombocytopenia. For this reason, there is yet no standard method [6]. In the present study, we tried to investigate the clinical signs and experiments to have a more accurate diagnosis of the infection cases in order to diagnose the infection based on infection invasion to peripheral bones and soft tissues in CT scan and MRI where biopsy is impossible. Therefore, these problems in the clinical diagnosis of the infection are the main reasons for the lack of clear insight about the epidemiology of the infection and this issue caused most of the patients to be under presumptive therapies for Mucormycosis treatment and also many patients were not recognized because of the non-existence of standard proving method [5].
According to the results of studies, removing Mucormycosis infection may need several approaches simultaneously including anti-fungal treatment, surgery (debridement), and improving the predisposing condition [6,24]. In our study, just like in the study of Sarvestani et al., all the patients received Amphotericin B [21]. Treatment with Amphotericin B has several side effects especially in treating patients with nervous system Mucormycosis, these side effects, and penetration limitation causing a lack of effectiveness for this medicine. Therefore, replaced treatment of Liposomal Amphotericin B (L-AmB) was applied to treat the patients with a nervous system involvement in our study [24]. However, it is considerable that using this medicine has a limitation due to its high price and unavailability [21]. Also, like in the reports of some studies, our results showed that the treatment with Amphotericin B is not useful in most of the patients, while the use of a combination of this medicine and surgery (debridement) reduces death [19,24].
In spite of recent medical developments, this fungal infection has weak prognosis. Generally, 65.5% of
death was reported in this study, that being in agreement with figures reported in the study done by Gleissner et al. and Liviopagani et al. [3,24]. According to the studies performed, the death rate is so much different and it has been observed to be between 33.3-63% in Korean and Italian studies and reached 96% in spread Mucormycosis patients [1,4,24]. These differences related to death caused by Mucormycosis may be accountable for many factors including the early diagnosis, infection place, and the person’s status of immune system, improving accompanied factors, and applied type of treatment [21].
In spite of limitations related to the retrospective type of the study, our study suggested valuable information. One advantage of the study is the collection of information of the hospitalized patients having hematologic malignancies during the study. Our study confirmed that among the patients of hematologic malignancies, patients with AML had the highest risk of generating the Mucormycosis infection and continuing intense chemotherapy increased infection risk by generating neutropenia patients. Death reduction related to Mucormycosis infection by combined therapy of using Amphotericin B and surgery (debridement) was the most notable finding of the study, which can cause an improvement in the prognosis of the patients having the infection. Since the Mucormycosis infection has a high mortality rate, preventing and reducing the incidence rate of these infections seems to be a priority for the patients with hematologic malignancies, in spite of developed therapies in best medical centers.
Conclusion
According to the issues discussed earlier, the prevalence of this infection among patients having hematologic cancers is considerable. On the other hand, the prevalence of chronic diseases such as hematologic malignancies, that are the most important risk factors of the infection, is increasing. Therefore, expecting a further rise of the real prevalence rate for these diseases is not far from the mind compared to estimated rate of the present study. However, we can reduce the progress of the infection with controlling and preventing underlying diseases. Although we want to slow the progress, interventions and their effects are time consuming. Therefore, we cannot expect to reduce these rates even with very good and fundamental interventions. As a result, this issue highlighted that secondary prevention is of special importance as early diagnosis in place of primary prevention in this area. Assuring secondary prevention in all the patients hospitalized in the hospitals may not be acceptable and effective but it must be considered in the people in high risk, such as the neutropenia patients presenting hematologic malignancies, especially those with acute leukemic malignancy, so that incurred dangers can be minimized. Since the diagnosis time and treatment are very important, it is better to start the treatment of
Journal of Medicine and Life
Journal of Medicine and Life Vol. 8, Special Issue 2, 2015
37
Mucormycosis disease in case there are suspicions regarding the clinical symptoms and no waiting is preferred for the biopsy result (culture and smear). Also because the most common way of the infection transfer is through the inhalation of spoors, taking the proper measures for controlling and changing the environment that reduce the risk of exposure to fungal spoors, seems the best approach for the prevention of the fatal infection. Recommendations
Developing scientific researches and performing cohort studies to estimate the incidence rate of different hematologic malignancies and also risk factors of the infection.
Accurate recording and establishment of the electronic information bank for the infection in medical document centers, so that researchers could use them and inform policy makers and planners.
Developing knowledge and mental presence of doctors regarding the symptoms of the disease in susceptible patients and regarding the diagnosis and quick treatment of the infection among these patients.
Warning patients about hematologic malignancies regarding the symptoms of Mucormycosis disease. Acknowledgement
Last but not least, we would like to greatly acknowledge the financial supports for the research and technology assistance of the Medical Sciences University of Iranian Army, respectful personnel of Imam Reza Hospital, especially specialists and nurses of blood, medical documents, laboratory and pathology units for helping us in collecting the data.
References
1. Bitar D, Van Cauteren D, Lanternier F et al. Increasing incidence of zygomycosis (Mucormycosis), France, 1997–2006. Emerg Infect Dis. 2009; 15:1395–401.
2. Denning DW. Invasive aspergillosis. Clin Infect Dis. 1998; 26:781-803.
3. Funada H, Matsuda T. Pulmonary Mucormycosis in a hematology ward. Intern Med. 1996; 35:540–4.
4. Gleissner B, Schilling A, AnagnostopolousI, Siehl I, Thiel E. Improved outcome of zygomycosis in patients with hematological diseases?. Leuk Lymphoma. 2004; 45:1351-60.
5. Jagarlamundi R, Kumar L, KochupillaiV, Kapil A, Banerjee U, Thulkar S. Infections in acute leukemia: ananalysis of 240 febrile episodes. MedOncol. 2000; 17(2):111-6.
6. Mortazavi J, Shabahang M, Danesi A. Rhino-orbito-cerebral Mucormycosis: report of 9 cases in Holy Prophet Hospital. Iran Medical Sciences of University Journal. 2001; 26,8:397-404.
7. Jung SH, Kim SW, Park CS, Song CE, Cho JH, Lee JH et al. Rhino-cerebral Mucormycosis: consideration of prognostic factors and treatment modality. AurisNasus Larynx. 2009; 36(3):274-9.
8. Lerchenmuller C, Goner M, Buchner T, WE B. Rhino-cerebral zygomycosis in a patient with acutely morphoblastic leukemia. Ann Oncol. 2001; 12(3):415-9.
9. Marr KA, Carter RA, Crippa F, Wald ALC. Epidemiology and outcome of mould infections in hematopoietic stem cell transplant recipients. Clin Infect Dis. 2002; 34:909-17.
10. Nosari A, Oreset P, Montillo M et al. Mucormycosis in hematologic malignancies: an emerging fungal infection. Haematologica. 2000; 85:1068-71.
11. Pagano L, Caira M, Candoni A et al. The epidemiology of fungal infections in patients with hematologic malignancies: the SEIFEM-2004 study. Haematologica. 2006; 91(8):1068-75
12. Pagano L, Girmenia C, Mele L et al. Infections caused by filamentous fungi in patients with hematologic malignancies. A report of 391 cases by GIMEMA Infection Program. GIMEMA Infection Program; GruppoItalianoMalattieEmatologichedell’Adulto. Haematologica. 2001; 86:862-70.
13. Pagano L, Offidani M, Fianchi L et al. Mucormycosis in hematologic patients. Haematologica. 2004; 89(2):207-14.
14. Pak J, Tucc V, Vincent A, Sandin R, Greene J. Mucormycosis in immune challenged patients. Interdisciplinary Focus. 2008; 1(2):106-13.
15. Patterson TF, Kirkpatrick WR, White M et al. Invasive aspergillosis. Disease spectrum, treatment practices, and outcomes. I3 Aspergillus Study Group. Medicine. 2000; 79:250-60.
16. Petrikkos G, Skiada A, Lortholary O, Roilides E, Walsh T, Kontoyiannis PD. Epidemiology and Clinical Manifestations of Mucormycosis. CID. 2012; 53.23-54.
17. Prabhu RM. Mucormycosis and entomophthoramycosis: a review of the clinical manifestations, diagnosis and treatment. ClinMicrobiol Infect. 2004; 10(1):31-47.
18. Rees JR, Pinner RW, Hajjeh RA, Brandt ME, Al R. The epidemiological features of invasive mycotic infections in the San Francisco Bay area, 1992-1993: Results of population-based laboratory active surveillance. Clin Infect Dis. 1998; 27:1138-47.
19. Roden MM, Zaoutis TE, Buchanan WL et al. Epidemiology and outcome of Mucormycosis: a review of 929 reported cases. Clin Infect Dis. 2005; 41:634–53.
20. Roodbari M, Roodbari MS, Farhadi Z, Khorasani A, Heydari R. Investigating Popular Fungal Infections of Blood Receivers and Bone Grafters. Navideno Journal. 2008; 42:31-6.
21. Sarvestani A, Pishdad C, Sh B. Epidemiology and Clinical Characteristics of Mucormycosis in Patients with Leukemia; A 21-year Experience from Southern Iran. Bull Emerge Trauma. 2014; 2(1):38-43.
22. Talmi YP, Goldschmeid-Reouven A, Bakon M et al. Rhino-orbital and rhino-orbit cerebral Mucormycosis. Otolaryngol Head Neck Surg. 2002; 127:22–31.
23. Torres-Narbona M, Guinea J, Martinez-Alarcon J et al. Impact of Mucormycosis on microbiology overload: a survey study in Spain. J. Clin Microbiol 2007; 45:2051–3.
24. Ashraf T, Abdolmajid F, Mahnaz A. Clinical Manifestations Investigation and Therapeutic results for Rhino-orbito- cerebral Murcormysis in two Referred Centers. Medical Sciences Journal, Medical Sciences University of Tehran. 2014; 72,1:46- 51.
Journal of Medicine and Life
Journal of Medicine and Life Vol. 8, Special Issue 2, 2015, pp.38-42
The investigation of antibacterial activity of selected native plants from North of Iran
Koohsari H*, Ghaemi EA**, Sadegh Sheshpoli M***, Jahedi M****, Zahiri M**** *Department of Microbiology, Azadshahr Branch, Islamic Azad University, Azadshahr, Iran
**Department of Microbiology, Golestan University of Medical Sciences, Gorgan, Iran
***Department of Molecular Medicine, Golestan University of Medical Science, Gorgan, Iran ****Young Researchers and Elite Club, Azadshahr Branch, Islamic Azad University, Azadshahr, Iran
Correspondence to: Hadi Koohsari, MD Department of Microbiology, Azadshahr Branch, Islamic Azad University, 30 Shahid Rajaiy Street, P.O. Box: 49617-89985, Azadshahr, Iran. Phone: (+98) 1746722223-6, Fax: (+98) 1746724003, Mobile phone: (+98) 9112730361, E-mail: [email protected] Received: May 14th, 2015 – Accepted: July 27th, 2015
Abstract Plant derived products have been used for medicinal purposes during centuries. Bacterial resistance to currently used antibiotics has become a concern to public health. The development of bacterial super resistant strains has resulted in the currently used antibiotic agents failing to end many bacterial infections. For this reason, the search is ongoing for new antimicrobial agents, both by the design and by the synthesis of new agents, or through the search of natural sources for yet undiscovered antimicrobial agents. Herbal medications in particular have seen a revival of interest due to a perception that there is a lower incidence of adverse reactions to plant preparations compared to synthetic pharmaceuticals. Coupled with the reduced costs of plant preparations, this makes the search for natural therapeutics an attractive option. This research was carried out to assess the antibacterial activity aqueous and ethanolic extracts of six Azadshahr township Native plants in north of Iran against six species of pathogen bacteria by using three methods of Disk diffusion, Well method and MBC. The results of this research indicated that the effect of ethanol extracts were more than aqueous extract and among six plants, Lippia citriodora and Plantago major ethanol extract had the most antibacterial activity in any of the three methods. Gram-positive bacteria were more sensitive than gram-negative bacteria. Staphylococcus epidermidis and Staphylococcus aureus were the most susceptible Gram-positive bacteria.
Keyword: antibacterial effect, medicine plants, Disk Diffusion method, Well method, MBC
Introduction
Despite the apparent advantages of new medicine compared to traditional medicine, using chemical drugs represents a major drawback, which is becoming more threatening every day and causes antibiotic resistance. This is an acute problem that the World Health Organization has been confronted with. Thus, scientists are trying to find new antimicrobial drugs in a constant effort. Herbs used in the rich traditional medicine of Iran are a good source of finding such antimicrobial drugs. According to the estimation of WHO, 80% of the world’s population believe in the effects of herbal medication in treating diseases [1]. Organic plants produce secondary metabolites, which can be considered an important drug source having antibacterial and antifungal effects. In Iranian traditional medicine, the use of herbs is common in burns, skin disorders, infectious diseases, sepsis, and inflammation [2,3].
Considering the unique climate and great herbal drugs diversity of Golestan province, Azadshahr district was chosen to conduct the research. The object of the study was to evaluate the effects of aqueous extracts and ethanol extracts of 6 (six) endemic plants of Azadshahr district, namely Lippia citriodora, Plantago major,
Sambucus ebulus, Althaea officinalis, Tilia bengonifolia, Adiantum capillus-veneris, on 6 (six) important human pathogenic bacteria including Escherichia coli, Staphylococcus aureus, Salmonella typhimurium, Staphylococcus epidermidis, Shigella dysentery and Enterococcus faecalis. In addition to different diseases, these Barcia also caused food poisoning.
Materials and methods
Identification and collection of herbs Field operations were carried out to identify the
natural habitat of herbs. After collecting different types by using the herbarium of Islamic Azad University of Gorgan, herbs were identified and confirmed. Then, the required parts (leaves, flowers, etc.) were cut and dried in an appropriate condition (dark and dry). After being dried, plants were grinded and their powder was used in extraction. Preparation of aqueous extract of herbs
Sterile distilled water was used as a solvent in preparing the aqueous extracts. To prepare the aqueous
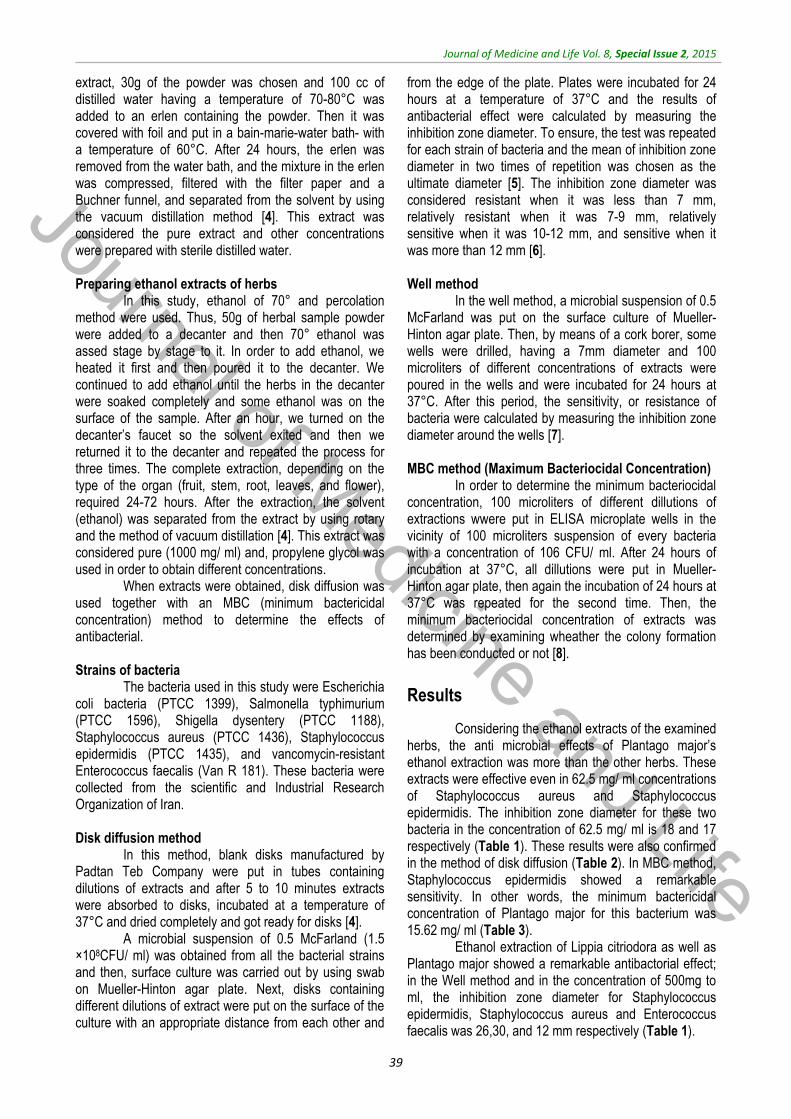
Journal of Medicine and Life
Journal of Medicine and Life Vol. 8, Special Issue 2, 2015
39
extract, 30g of the powder was chosen and 100 cc of distilled water having a temperature of 70-80°C was added to an erlen containing the powder. Then it was covered with foil and put in a bain-marie-water bath- with a temperature of 60°C. After 24 hours, the erlen was removed from the water bath, and the mixture in the erlen was compressed, filtered with the filter paper and a Buchner funnel, and separated from the solvent by using the vacuum distillation method [4]. This extract was considered the pure extract and other concentrations were prepared with sterile distilled water. Preparing ethanol extracts of herbs
In this study, ethanol of 70° and percolation method were used. Thus, 50g of herbal sample powder were added to a decanter and then 70° ethanol was assed stage by stage to it. In order to add ethanol, we heated it first and then poured it to the decanter. We continued to add ethanol until the herbs in the decanter were soaked completely and some ethanol was on the surface of the sample. After an hour, we turned on the decanter’s faucet so the solvent exited and then we returned it to the decanter and repeated the process for three times. The complete extraction, depending on the type of the organ (fruit, stem, root, leaves, and flower), required 24-72 hours. After the extraction, the solvent (ethanol) was separated from the extract by using rotary and the method of vacuum distillation [4]. This extract was considered pure (1000 mg/ ml) and, propylene glycol was used in order to obtain different concentrations.
When extracts were obtained, disk diffusion was used together with an MBC (minimum bactericidal concentration) method to determine the effects of antibacterial. Strains of bacteria
The bacteria used in this study were Escherichia coli bacteria (PTCC 1399), Salmonella typhimurium (PTCC 1596), Shigella dysentery (PTCC 1188), Staphylococcus aureus (PTCC 1436), Staphylococcus epidermidis (PTCC 1435), and vancomycin-resistant Enterococcus faecalis (Van R 181). These bacteria were collected from the scientific and Industrial Research Organization of Iran. Disk diffusion method
In this method, blank disks manufactured by Padtan Teb Company were put in tubes containing dilutions of extracts and after 5 to 10 minutes extracts were absorbed to disks, incubated at a temperature of 37°C and dried completely and got ready for disks [4].
A microbial suspension of 0.5 McFarland (1.5 ×10⁸CFU/ ml) was obtained from all the bacterial strains and then, surface culture was carried out by using swab on Mueller-Hinton agar plate. Next, disks containing different dilutions of extract were put on the surface of the culture with an appropriate distance from each other and
from the edge of the plate. Plates were incubated for 24 hours at a temperature of 37°C and the results of antibacterial effect were calculated by measuring the inhibition zone diameter. To ensure, the test was repeated for each strain of bacteria and the mean of inhibition zone diameter in two times of repetition was chosen as the ultimate diameter [5]. The inhibition zone diameter was considered resistant when it was less than 7 mm, relatively resistant when it was 7-9 mm, relatively sensitive when it was 10-12 mm, and sensitive when it was more than 12 mm [6]. Well method
In the well method, a microbial suspension of 0.5 McFarland was put on the surface culture of Mueller-Hinton agar plate. Then, by means of a cork borer, some wells were drilled, having a 7mm diameter and 100 microliters of different concentrations of extracts were poured in the wells and were incubated for 24 hours at 37°C. After this period, the sensitivity, or resistance of bacteria were calculated by measuring the inhibition zone diameter around the wells [7]. MBC method (Maximum Bacteriocidal Concentration)
In order to determine the minimum bacteriocidal concentration, 100 microliters of different dillutions of extractions wwere put in ELISA microplate wells in the vicinity of 100 microliters suspension of every bacteria with a concentration of 106 CFU/ ml. After 24 hours of incubation at 37°C, all dillutions were put in Mueller-Hinton agar plate, then again the incubation of 24 hours at 37°C was repeated for the second time. Then, the minimum bacteriocidal concentration of extracts was determined by examining wheather the colony formation has been conducted or not [8].
Results
Considering the ethanol extracts of the examined herbs, the anti microbial effects of Plantago major’s ethanol extraction was more than the other herbs. These extracts were effective even in 62.5 mg/ ml concentrations of Staphylococcus aureus and Staphylococcus epidermidis. The inhibition zone diameter for these two bacteria in the concentration of 62.5 mg/ ml is 18 and 17 respectively (Table 1). These results were also confirmed in the method of disk diffusion (Table 2). In MBC method, Staphylococcus epidermidis showed a remarkable sensitivity. In other words, the minimum bactericidal concentration of Plantago major for this bacterium was 15.62 mg/ ml (Table 3).
Ethanol extraction of Lippia citriodora as well as Plantago major showed a remarkable antibactorial effect; in the Well method and in the concentration of 500mg to ml, the inhibition zone diameter for Staphylococcus epidermidis, Staphylococcus aureus and Enterococcus faecalis was 26,30, and 12 mm respectively (Table 1).
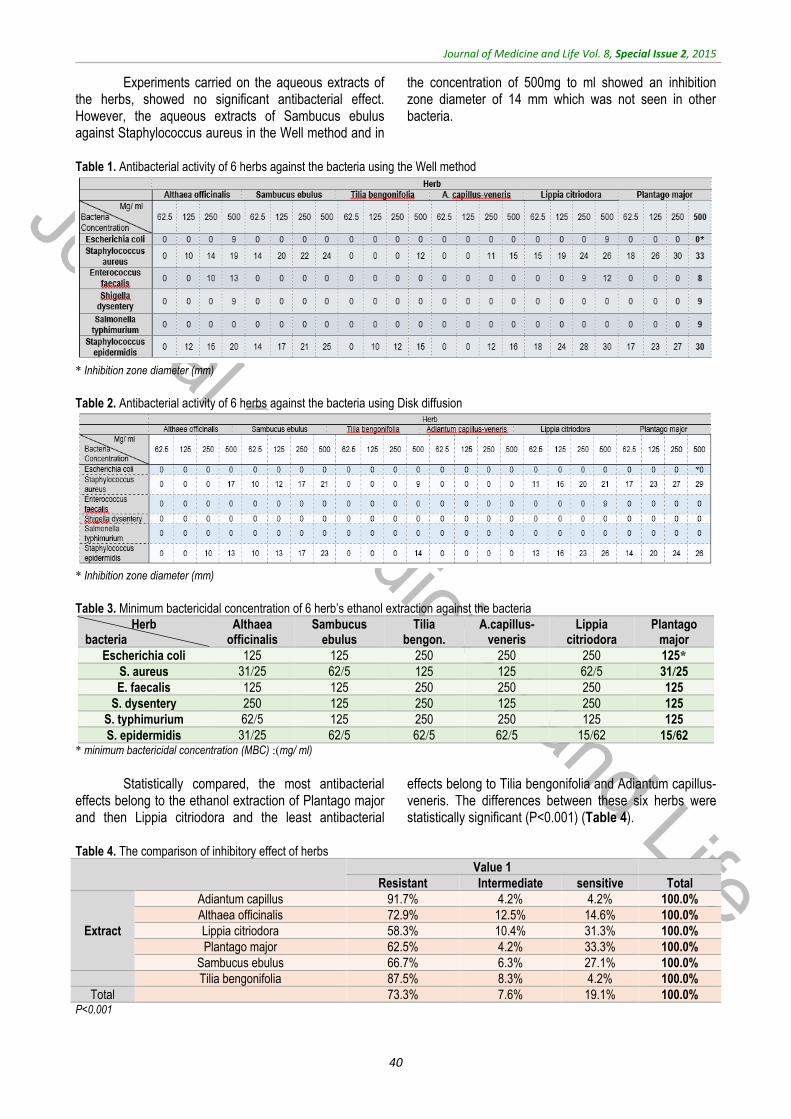
Journal of Medicine and Life
Journal of Medicine and Life Vol. 8, Special Issue 2, 2015
40
Experiments carried on the aqueous extracts of the herbs, showed no significant antibacterial effect. However, the aqueous extracts of Sambucus ebulus against Staphylococcus aureus in the Well method and in
the concentration of 500mg to ml showed an inhibition zone diameter of 14 mm which was not seen in other bacteria.
Table 1. Antibacterial activity of 6 herbs against the bacteria using the Well method
* Inhibition zone diameter (mm)
Table 2. Antibacterial activity of 6 herbs against the bacteria using Disk diffusion
* Inhibition zone diameter (mm)
Table 3. Minimum bactericidal concentration of 6 herb’s ethanol extraction against the bacteria
Plantago major
Lippia citriodora
A.capillus-veneris
Tilia bengon.
Sambucus ebulus
Althaea officinalis
Herb bacteria
*125 250 250 250 125 125 Escherichia coli
25/31 5/62 125 125 5/62 25/31 S. aureus
125 250 250 250 125 125 E. faecalis
125 250 125 250 125 250 S. dysentery
125 125 250 250 125 5/62 S. typhimurium
62/15 62/15 5/62 5/62 5/62 25/31 S. epidermidis * minimum bactericidal concentration (MBC) :)mg/ ml)
Statistically compared, the most antibacterial
effects belong to the ethanol extraction of Plantago major and then Lippia citriodora and the least antibacterial
effects belong to Tilia bengonifolia and Adiantum capillus-veneris. The differences between these six herbs were statistically significant (P<0.001) (Table 4).
Table 4. The comparison of inhibitory effect of herbs
Value 1
Total sensitive Intermediate Resistant
100.0% 4.2% 4.2% 91.7% Adiantum capillus
Extract
100.0% 14.6% 12.5% 72.9% Althaea officinalis
100.0% 31.3% 10.4% 58.3% Lippia citriodora
100.0% 33.3% 4.2% 62.5% Plantago major
100.0% 27.1% 6.3% 66.7% Sambucus ebulus
100.0% 4.2% 8.3% 87.5% Tilia bengonifolia
100.0% 19.1% 7.6% 73.3% Total P<0.001
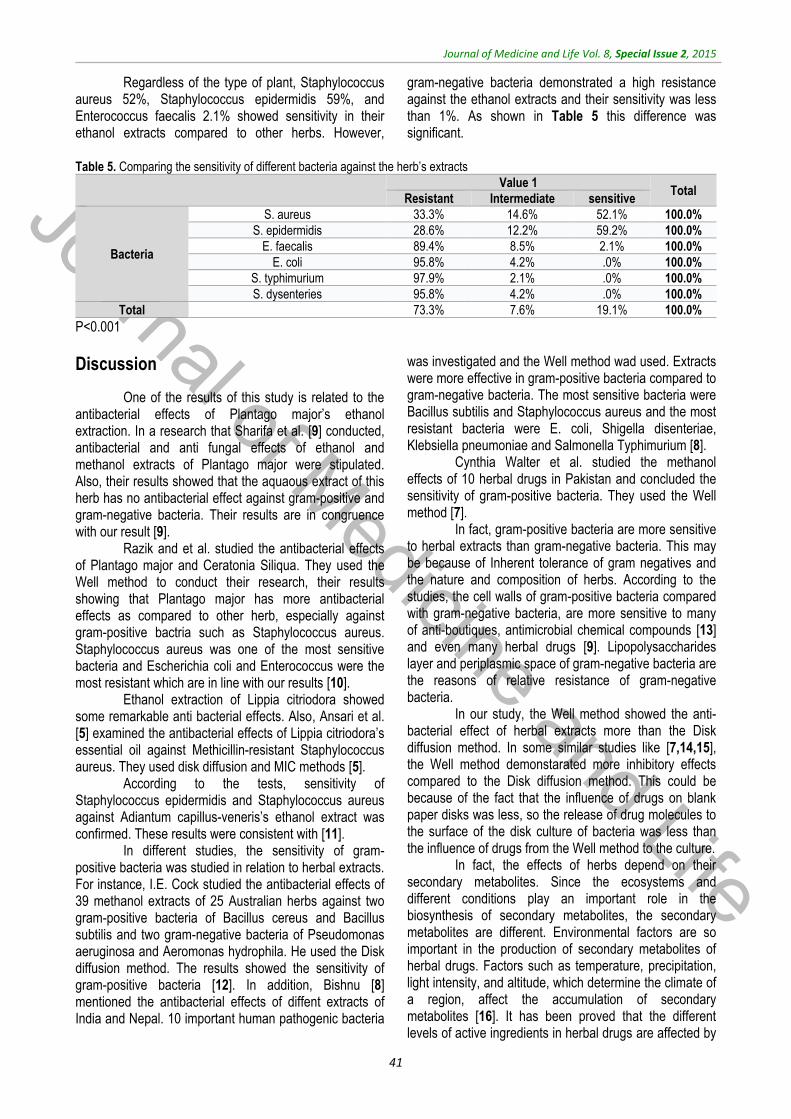
Journal of Medicine and Life
Journal of Medicine and Life Vol. 8, Special Issue 2, 2015
41
Regardless of the type of plant, Staphylococcus aureus 52%, Staphylococcus epidermidis 59%, and Enterococcus faecalis 2.1% showed sensitivity in their ethanol extracts compared to other herbs. However,
gram-negative bacteria demonstrated a high resistance against the ethanol extracts and their sensitivity was less than 1%. As shown in Table 5 this difference was significant.
Table 5. Comparing the sensitivity of different bacteria against the herb’s extracts
Total Value 1
sensitive Intermediate Resistant
100.0% 52.1% 14.6% 33.3% S. aureus
Bacteria
100.0% 59.2% 12.2% 28.6% S. epidermidis
100.0% 2.1% 8.5% 89.4% E. faecalis
100.0% .0% 4.2% 95.8% E. coli
100.0% .0% 2.1% 97.9% S. typhimurium
100.0% .0% 4.2% 95.8% S. dysenteries
100.0% 19.1% 7.6% 73.3% Total
P<0.001
Discussion
One of the results of this study is related to the antibacterial effects of Plantago major’s ethanol extraction. In a research that Sharifa et al. [9] conducted, antibacterial and anti fungal effects of ethanol and methanol extracts of Plantago major were stipulated. Also, their results showed that the aquaous extract of this herb has no antibacterial effect against gram-positive and gram-negative bacteria. Their results are in congruence with our result [9].
Razik and et al. studied the antibacterial effects of Plantago major and Ceratonia Siliqua. They used the Well method to conduct their research, their results showing that Plantago major has more antibacterial effects as compared to other herb, especially against gram-positive bactria such as Staphylococcus aureus. Staphylococcus aureus was one of the most sensitive bacteria and Escherichia coli and Enterococcus were the most resistant which are in line with our results [10].
Ethanol extraction of Lippia citriodora showed some remarkable anti bacterial effects. Also, Ansari et al. [5] examined the antibacterial effects of Lippia citriodora’s essential oil against Methicillin-resistant Staphylococcus aureus. They used disk diffusion and MIC methods [5].
According to the tests, sensitivity of Staphylococcus epidermidis and Staphylococcus aureus against Adiantum capillus-veneris’s ethanol extract was confirmed. These results were consistent with [11].
In different studies, the sensitivity of gram-positive bacteria was studied in relation to herbal extracts. For instance, I.E. Cock studied the antibacterial effects of 39 methanol extracts of 25 Australian herbs against two gram-positive bacteria of Bacillus cereus and Bacillus subtilis and two gram-negative bacteria of Pseudomonas aeruginosa and Aeromonas hydrophila. He used the Disk diffusion method. The results showed the sensitivity of gram-positive bacteria [12]. In addition, Bishnu [8] mentioned the antibacterial effects of diffent extracts of India and Nepal. 10 important human pathogenic bacteria
was investigated and the Well method wad used. Extracts were more effective in gram-positive bacteria compared to gram-negative bacteria. The most sensitive bacteria were Bacillus subtilis and Staphylococcus aureus and the most resistant bacteria were E. coli, Shigella disenteriae, Klebsiella pneumoniae and Salmonella Typhimurium [8].
Cynthia Walter et al. studied the methanol effects of 10 herbal drugs in Pakistan and concluded the sensitivity of gram-positive bacteria. They used the Well method [7].
In fact, gram-positive bacteria are more sensitive to herbal extracts than gram-negative bacteria. This may be because of Inherent tolerance of gram negatives and the nature and composition of herbs. According to the studies, the cell walls of gram-positive bacteria compared with gram-negative bacteria, are more sensitive to many of anti-boutiques, antimicrobial chemical compounds [13] and even many herbal drugs [9]. Lipopolysaccharides layer and periplasmic space of gram-negative bacteria are the reasons of relative resistance of gram-negative bacteria.
In our study, the Well method showed the anti-bacterial effect of herbal extracts more than the Disk diffusion method. In some similar studies like [7,14,15], the Well method demonstarated more inhibitory effects compared to the Disk diffusion method. This could be because of the fact that the influence of drugs on blank paper disks was less, so the release of drug molecules to the surface of the disk culture of bacteria was less than the influence of drugs from the Well method to the culture.
In fact, the effects of herbs depend on their secondary metabolites. Since the ecosystems and different conditions play an important role in the biosynthesis of secondary metabolites, the secondary metabolites are different. Environmental factors are so important in the production of secondary metabolites of herbal drugs. Factors such as temperature, precipitation, light intensity, and altitude, which determine the climate of a region, affect the accumulation of secondary metabolites [16]. It has been proved that the different levels of active ingredients in herbal drugs are affected by
Journal of Medicine and Life
Journal of Medicine and Life Vol. 8, Special Issue 2, 2015
42
climate. However, the accumulation and distribution of secondary metabolites is not equal and the differences in results of studies may be because of the differences in climate effects of different variations of herbs.
As a result, natural products with herbal origin play an important role in treating diseases and in considering the increase in the antibiotic resistance in pathogenic bacteria, the search for antimicrobial drugs
being of utmost importance. Also, the study of metabolism and mechanism of compounds of these herbs could lead to new and more effective drugs. Acknowledgments
Special thanks to Islamic Azad University of Azadshahr that supported us financially during these projects.
References
1. Capasso L. 5300 years ago, the Ice Man used natural laxatives and antibiotics. Lancet. 1998; 352(9143):1864.
2. Oussalah M, Caillet S, Saucie L, Lacroix M. Inhibitory effects of selected plant essential oils on the growth of four pathogenic bacteria: E. coli O157:H7, Salmonella Typhimurium, Staphylococcus aureus and Listeria monocytogenes. vol. 18, 2007, Canada, Elsevier, 414-420.
3. Shahidi B. Evaluation of antibacterial properties of some medicinal plants used in Iran. Journal of Ethnopharmacology. 2004; 94, 2-3, 301-305.
4. MaRhhadian NV, Rakhshandeh H. Antibacterial and antifungal effects of Nigella sativa extracts against S. Aureus, P Aeroginosa and C. Albicans. Pakistan Jornal Medical Sci. 2005; 21, 1, 47-52.
5. Ansari M, Tehrani MS, Larijani K. Antibacterial activity of Lippa citriodora herb essence against MRSA Staphylococcus aureaus. African Journal of Microbiology Research. 2012; 6, 1, 16-19.
6. Dulger B, Gonuz A. Antimicrobial Activity of Certain Plants used in Turkish
Traditional Medicine. Asian Journal of Plant Sciences. 2004; 3, 1, 104-107.
7. Walter C, Shinvari ZK, Afzal I, Malik RN. Antibacterial Activity in Herbal Products Used in Pakistan. Pakistan Journal Of Botany. 2011; 43, SI, 155-162.
8. Joshi B, Lekhak S, Shorma A. Antibacterial Property of Different Medicinal Plants: Ocimum sanctum, Cinnamomum zeylanicum, Xanthoxylum armatum and Origanum majorana. Nepal Journals Online. 2009; 5, 1, 143-150.
9. Sharifa AA, Neoh YL, Iswadi MI, Khairul O, Abdul Halim M, Jamalubin M, Mohamed Azman AB, Hing HL. Effects of Methanol, Ethanol and Aqueous Extract of Plantago majoron Gram Positive Bacteria, Gram Negative Bacteria and Yeast, Annals of Microscopy. 2008; 8, 42-44.
10. Abd Razik BM, Hasan HA, Murtadha MK. The Study of Antibacterial Activity of Plantago Major and Ceratonia Siliqua. The Iraqi Postgraduate. 2012; 11, 1, 130-135.
11. Mahboubi A, Kamalinejad M, Shalviri M, Karbasi Z, Jafariazar Z, Asgarian R. Evalution of antibacterial activity of three
Iranian medical plants. African Journal of Microbiology Research. 2012; 6, 9, 2048-2052.
12. Cock IE. Antibacterial Activity of Selected Australian Native Plant Extracts. The Internet Journal of Microbiology. 2008; 4, 2, 1-8.
13. Kittika N, Natta L, Orapin K. Antibacterial Effect of Five Zingiberaceae Essential Oils. Molecules. 2007; 12, 8, 2047-2060.
14. Indh MN, Hatha AM, Abirosh C, Harsha U, Vivekanandan G. Antimicrobial activity of some of the south-Indian spices against serotypes of Escherichia coli, Salmonella, Listeria monocytogenes and Aeromonas hydrophila. Brazilian Jornal of Microbiology. 2006; 37, 2, 199-203.
15. Dadgar T, Asmar M, Mazandarani M, Bayat H, Moradi A, Bazori M, Gaemi E. Antibacterial activity of certain Iranian medical plants against methicillin resistant and sensitive Staphylococcus aureus. Asian Jornal Plant Sci. 2006; 5, 5, 861-5.
16. Davise FS, Albrigo LG, Citrus AB. Citrus. 1994, CAB, Wallington, International Press, 9814.

Journal of Medicine and Life
Journal of Medicine and Life Vol. 8, Special Issue 2, 2015, pp.43-46
The association between serum C-reactive protein and macronutrients and antioxidants intake
in hemodialysis patients
Kooshki A*, Samadipour E**, Akbarzadeh R** *Department of Nutrition & Biochemistry, Sabzevar University of Medical Sciences, Sabzevar, Iran **Para Medicine School, Sabzevar University of Medical Sciences, Sabzevar, Iran Correspondence to: E. Samadipour, MSc in Nursing, Para Medicine School, Sabzevar University of Medical Sciences, Sabzevar, Iran, Mobile phone: (+98) 9153715910, E-mail: [email protected] Received: May 18th, 2015 – Accepted: July 27th, 2015
Abstract Background: Despite the high levels of inflammation in hemodialysis patients and the effects of diet on systemic inflammation, such as the development of atherosclerosis and cardiovascular disease, few studies have evaluated the relationship of macronutrients and antioxidants intake with serum C-reactive protein (CRP). Therefore, this study assessed the relationship between serum high sensitivity CRP (hs-CRP) with macronutrients and antioxidants intake and serum albumin. Methods: This cross-sectional study used census sampling to select 75 hemodialysis patients (35 men and 40 women) who attended the hemodialysis department of Vaseie Hospital of Sabzevar, Iran. After obtaining the written consent, all the patients were interviewed and dietary data was collected by using a semi-quantitative food frequency questionnaire including 160 food items. Diet analysis was performed with Nutritionist IV. Before being connected to the dialysis machine, 5 cc fasting blood samples were obtained from all participants and serum hs-CRP and albumin levels were measured. All the statistical analyses were conducted with SPSS -for Windows, version 16.0. Results: The patients’ mean body mass index was 20.09 ± 3.27 kg/ m2. The participants’ intake of antioxidants and all macronutrients, except for carbohydrates and proteins, was less than the standard levels. Moreover, the hs-CRP had significant inverse relationships with serum albumin (P=0.0001) and vitamin E and C intakes but was not significant. Also, a significant relationship was observed between hs-CRP levels and the intake of energy (P=0.002) and protein (P=0.0001). Conclusion: Our findings indicated hs-CRP levels of hemodialysis patients to have significant inverse relationships with serum albumin and vitamin E and C intakes but was not significant. Also, a significant relationship was observed between hs-CRP levels and the intake of energy and protein.
Keywords: serum C-reactive protein, macronutrients, antioxidants, cardiovascular, hemodialysis Introduction
The number of patients on hemodialysis, a treatment option for chronic renal failure, is increasing constantly and rapidly [1]. Over 11,000 patients are currently undergoing hemodialysis in Iran and this number increases with about 8% every year. The mortality rate of dialysis patients is 4.0-5.3 times higher than that of the general population. Besides, cardiovascular diseases are responsible for 40%-50% of the deaths among dialysis patients and cause a mortality rate 5-20 times higher than that in the general population [2]. Even the presence of classical risk factors of cardiovascular diseases in these patients cannot justify such a high mortality rate. In fact, it is now evident that systemic inflammation plays an important role in the development of atherosclerosis [3].
The prevalence of inflammation has been reported as 35%-65% among hemodialysis patients [3,4]. Although the exact reasons of inflammation in hemodialysis patients are yet to be clarified [5], C-reactive protein (CRP), a positive acute phase protein produced in
the liver, is an inflammatory biomarker whose levels increase in response to inflammation [6,7]. Studies have suggested high serum CRP as a strong predictor of death, especially due to cardiovascular disease, in hemodialysis patients [8,9] and have reported such high levels in 30%-50% of the patients [10-12]. A low concentration of serum albumin has also been identified as a strong predictor of death due to cardiovascular diseases in patients with chronic renal failure [13], i.e. every 1 g/ dL decrease in serum albumin increases the patients’ risk of mortality by seven times [14]. Moreover, every 10-unit increase in the dialysis malnutrition score (DMS) and malnutrition inflammation score (MIS) has been found to increase the risk of mortality by 7.7 and 10.0 times, respectively [14].
Several factors such as anorexia, limited intake of some food groups, loss of water-soluble nutrients such as vitamin C during hemodialysis, accumulation of nitrogen compounds in blood and uremia, reduced neuropeptide Y, increased serum leptin, and catabolic state due to increased inflammatory cytokines (e.g. CRP)
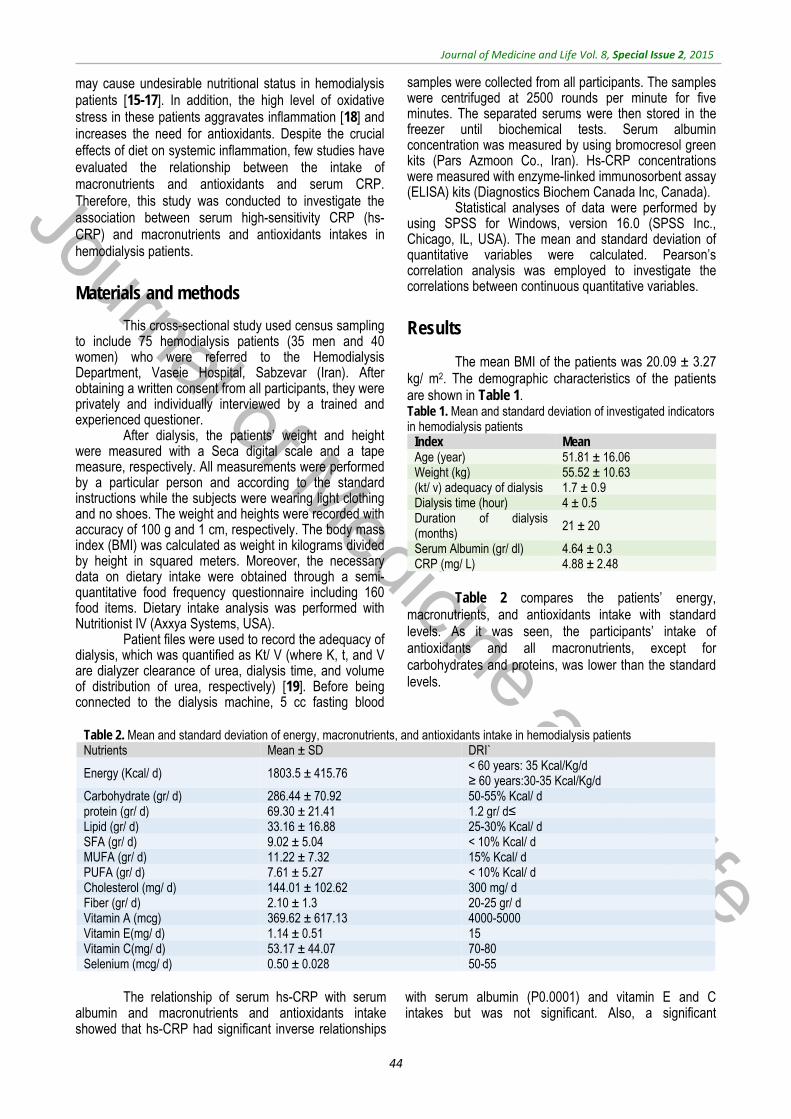
Journal of Medicine and Life
Journal of Medicine and Life Vol. 8, Special Issue 2, 2015
44
may cause undesirable nutritional status in hemodialysis patients [15-17]. In addition, the high level of oxidative stress in these patients aggravates inflammation [18] and increases the need for antioxidants. Despite the crucial effects of diet on systemic inflammation, few studies have evaluated the relationship between the intake of macronutrients and antioxidants and serum CRP. Therefore, this study was conducted to investigate the association between serum high-sensitivity CRP (hs-CRP) and macronutrients and antioxidants intakes in hemodialysis patients.
Materials and methods
This cross-sectional study used census sampling to include 75 hemodialysis patients (35 men and 40 women) who were referred to the Hemodialysis Department, Vaseie Hospital, Sabzevar (Iran). After obtaining a written consent from all participants, they were privately and individually interviewed by a trained and experienced questioner.
After dialysis, the patients’ weight and height were measured with a Seca digital scale and a tape measure, respectively. All measurements were performed by a particular person and according to the standard instructions while the subjects were wearing light clothing and no shoes. The weight and heights were recorded with accuracy of 100 g and 1 cm, respectively. The body mass index (BMI) was calculated as weight in kilograms divided by height in squared meters. Moreover, the necessary data on dietary intake were obtained through a semi-quantitative food frequency questionnaire including 160 food items. Dietary intake analysis was performed with Nutritionist IV (Axxya Systems, USA).
Patient files were used to record the adequacy of dialysis, which was quantified as Kt/ V (where K, t, and V are dialyzer clearance of urea, dialysis time, and volume of distribution of urea, respectively) [19]. Before being connected to the dialysis machine, 5 cc fasting blood
samples were collected from all participants. The samples were centrifuged at 2500 rounds per minute for five minutes. The separated serums were then stored in the freezer until biochemical tests. Serum albumin concentration was measured by using bromocresol green kits (Pars Azmoon Co., Iran). Hs-CRP concentrations were measured with enzyme-linked immunosorbent assay (ELISA) kits (Diagnostics Biochem Canada Inc, Canada).
Statistical analyses of data were performed by using SPSS for Windows, version 16.0 (SPSS Inc., Chicago, IL, USA). The mean and standard deviation of quantitative variables were calculated. Pearson’s correlation analysis was employed to investigate the correlations between continuous quantitative variables.
Results
The mean BMI of the patients was 20.09 ± 3.27 kg/ m2. The demographic characteristics of the patients are shown in Table 1. Table 1. Mean and standard deviation of investigated indicators in hemodialysis patients
Mean Index 51.81 ± 16.06 Age (year) 55.52 ± 10.63 Weight (kg) 1.7 ± 0.9 (kt/ v) adequacy of dialysis 4 ± 0.5 Dialysis time (hour)
21 ± 20 Duration of dialysis (months)
4.64 ± 0.3 Serum Albumin (gr/ dl) 4.88 ± 2.48 CRP (mg/ L)
Table 2 compares the patients’ energy,
macronutrients, and antioxidants intake with standard levels. As it was seen, the participants’ intake of antioxidants and all macronutrients, except for carbohydrates and proteins, was lower than the standard levels.
Table 2. Mean and standard deviation of energy, macronutrients, and antioxidants intake in hemodialysis patients
DRI`Mean ± SD Nutrients < 60 years: 35 Kcal/Kg/d ≥ 60 years:30-35 Kcal/Kg/d 1803.5 ± 415.76 Energy (Kcal/ d)
50-55% Kcal/ d 286.44 ± 70.92 Carbohydrate (gr/ d) 1.2 gr/ d≤ 69.30 ± 21.41 protein (gr/ d) 25-30% Kcal/ d 33.16 ± 16.88 Lipid (gr/ d) < 10% Kcal/ d 9.02 ± 5.04 SFA (gr/ d) 15% Kcal/ d 11.22 ± 7.32 MUFA (gr/ d) < 10% Kcal/ d 7.61 ± 5.27 PUFA (gr/ d) 300 mg/ d 144.01 ± 102.62 Cholesterol (mg/ d) 20-25 gr/ d 2.10 ± 1.3 Fiber (gr/ d) 4000-5000 369.62 ± 617.13 Vitamin A (mcg) 15 1.14 ± 0.51 Vitamin E(mg/ d) 70-80 53.17 ± 44.07 Vitamin C(mg/ d) 50-55 0.50 ± 0.028 Selenium (mcg/ d)
The relationship of serum hs-CRP with serum
albumin and macronutrients and antioxidants intake showed that hs-CRP had significant inverse relationships
with serum albumin (P0.0001) and vitamin E and C intakes but was not significant. Also, a significant
Journal of Medicine and Life
Journal of Medicine and Life Vol. 8, Special Issue 2, 2015
45
relationship was observed between hs-CRP levels and intake of energy (P=0.002) and protein (P=0.0001).
Discussion
According to our findings, a significant inverse relationship was observed between serum hs-CRP and serum albumin. Studies have shown that decreased serum albumin can strongly predict mortality, especially mortality due to cardiovascular diseases, in these patients [20]. Albumin is also an important indicator of nutritional status of hemodialysis patients and a negative acute phase reactant [21,22]. Kaysen reported approximately similar results and found 7% of the patients to have serum albumin levels lower than normal [23]. Research has suggested that the risk of mortality begins when serum albumin concentrations fall to as low as 4 g/ dl and increases considerably with levels below 3 g/ dl [24].
The inverse relationship between serum hs-CRP (positive acute phase protein) and serum albumin was also confirmed by Qureshi [25]. However, Nasri, did not observe any significant relationship between serum CRP and serum albumin [26]. In an effort to establish relationships between the dietary intake of antioxidants and serum hs-CRP concentrations, we found vitamin E and C intakes to have an inverse relationship with serum hs-CRP. Naghashpour and Bertran reported consistent results as they showed significantly lower vitamin A and β-carotene intake (precursor of vitamin A) in people with higher levels of serum hs-CRP compared to those with lower serum hs-CRP [27,28]. Similarly, Fredrikson et al. did not detect any significant relationship between serum hs-CRP and vitamin E intake [29]. Likewise, Naghashpour found no relationship between serum hs-CRP and vitamin C and selenium intake [28]. In contrast, Kafshani could establish a significant inverse relationship between selenium intake and serum CRP [30].
Antioxidants affect plasma CRP probably through their effect on upstream cytokines, especially tumor necrosis factor alpha (TNF-α), interleukin 1β (IL-1β) and interleukin-6 (IL-6), that are the main producers of acute phase response [31]. Researchers believe that vitamin C inhibits lipopolysaccharide activity, which causes the production of TNF-α and IL-6. It also inhibits the production of interleukin-2 (IL-2) after the incidence of stressful factors. Several mechanisms have been suggested for oxidative and non-oxidative processes [32].
Accordingly, oxidative damage leads to an inappropriate activation of nuclear transcription factor, leading to increased expression of inflammatory proteins. Antioxidants such as vitamin C inhibit the activation of this pathway and substantially reduce plasma F2-isoprostane (an oxidative stress marker) levels [33]. Vitamin E has also been shown to decrease the activity of lipoxygenases, which inhibit the activity of IL-1β. As CRP production is regulated directly by IL-6 and IL-1β, the down-regulation of these factors by antioxidants would reduce serum CRP [34,35].
In the current study, a significant relationship was observed between hs-CRP levels and the intake of energy and protein. Consistent results were reported by Naghashpour who found no significant relationship between the received energy and hs-CRP levels. However, he did not assess the relationship between serum hs-CRP and macronutrients [28]. Moreover, Kafshani indicated the absence of relationships between received macronutrients and CRP levels [30]. In contrast, Bertran et al. showed that lower intake of many nutrients such as carbohydrate, protein, lipid, and tocopherol was associated with higher concentrations of plasma CRP [27]. These inconsistencies may be due to the differences in the software used in food analysis, measurement methods, and sample size.
Conclusion
This research revealed that hemodialysis patients’ intake of antioxidants and all macronutrients, except for carbohydrates and protein, is lower than the standard levels. It also indicated significant inverse relationships only between hs-CRP receiving and serum albumin and vitamin E, C and selenium intakes but was not significant. Also, a significant relationship was observed between hs-CRP levels and the intake of energy and protein. Acknowledgement
The authors appreciate the respected Vice Presidents of Research and Education, the head and dialysis department staff of Vaseie Hospital, Sabzevar University of Medical Sciences, and all patients who kindly participated in this study.
References
1. Kalantar–Zadeh K, Ikizler T, Block G, Avran MM, Kopple JD. Malnutrition – Inflammation complex syndrome in dialysis patients: Causes and Consequences. Am J Kidney Dis. 2003; 42(5): 864-881.
2. Addollahzad H, Eghtesadi SH, Noormohammadi E, Khadem Ansari MH, Nejadghashti H, Esmaeilzadeh A. Effect of vitamin C supplementation on oxidative stress in hemodialysis patients. Urmia Med J. 2007; 18(2): 490-497.
3. Korevaar JC, Van Manen JG, Dekker FW, De Waart DR, Boeschoten EW, Krediet RT. Effect of an increase in C - reactive protein level during a hemodialysis session on mortality. J Am Soc Nephrol. 2004; 15(11): 2916-2922.
Journal of Medicine and Life
Journal of Medicine and Life Vol. 8, Special Issue 2, 2015
46
4. Yao Q, Lindholm B, Stenvinkel P. Inflammation as a cause of malnutrition, atherosclerotic cardiovascular disease and poor outcome in hemodialysis patients. Hemodial Inter. 2004; 8(2):118-129.
5. Seifi S, Mokhtari A. Serum IL- 6 Level and associated factors: hemdialysis patients. Tehran University Medical Journal. 2008; 66(4): 270-276.
6. Eduardo L, Nathan WL. C-reactive protein and end – stage renal disease. Semi Dial. 2004; 17(6):438-448.
7. Wanner C, Metzger T. C-reactive protein a marker for all-cause and cardiovascular mortality in hemodialysis patients. Nephrol Dial Transplant. 2002; 17(8):29-32.
8. Taylor SP, Taylor BT. Healthcare-associated pneumonia in hemodialysis patients: Clinical outcomes in patients treated with narrow versus broad spectrum antibiotic therapy. Respirology. 2012 Oct 16. doi: 10.1111/j.1440-1843.2012.02306.x.
9. Stenvinkel P, Yeun JY. Role of inflammation in malnutrition and atherosclerosis in chronic renal failure. In: Kopple JD, Massry SG. Kopple and Massry's nutritional management of renal disease. 2nd ed., 2004, Philadelphia: Lippincott Williams & Wilkins, 199-212.
10. Ortegea O, Rodriguez I, Gallar P, Carreno A, Ortiz M, Espejo B et al. Significance of high C-reactive protein Levels in pre-dialysis patients. Nephrol Dial Transplant. 2002; 17(6):1105-1109.
11. Abedi, Ghasem, Ahmadi Azadeh, Rostami Farideh. Assessment of quality of life in hepatitis B patients compared with healthy people. Life Sci J 2012; 9(4):5339-5343.
12. Razeghi E, Lessan Pezeshki M, Aazari Pour A. Evaluation of variable acute phase proteins in hemodialysis patients. Tehran University Medical Journal. 2006; 64(9):78-82.
13. Bamgbola FO, Kaskel FJ. Uremic malnutrition inflammation syndrome in chronic renal disease: a pathobiologic entity. J Ren Nutr. 2003; 13:250-8.
14. Kalantar-Zadeh K, Kopple JD, Block G, Humphreys MH. A malnutrition-inflammation score is correlated with morbidity and mortality in maintenance hemodialysis patients. Am J Kidney Dis. 2001; 38:1251-1263.
15. Mehrotra R, Kopple JD. Causes of protein-energy malnutrition in chronic renal failure. In: Kopple JD, Massry SG. Kopple and Massry's nutritional management of renal disease. 2nd ed., 2004, Philadelphia: Lippincott Williams & Wilkins, 168-82.
16. Abedi G, Mohamadpour A, Rostami F, Ahmadinia F, Rajabi M. Study of Consumption Pattern of Food and Obesity of Female Students of Mazandaran University of Medical Sciences. J Mazand Univ Med Sci; 2011; 21(80): 77-80 (Persian).
17. Morais AAC, Silva MAT, Faintuch J, Vidigal EJ, Costa RA, Lyrio DC et al. Correlation of Nutritional status and food intake in hemodialysis patients. Clinics. 2005; 60:185-192.
18. Locatell F, Canaud B, Eckardt KU, Stevnikel P, Wanner C, Zoccali C. Oxidative stress in end stage renal disease: an emerging heart to patient outcome. Nephrol Dial Transplant. 2003; 18(7):1272-1289.
19. Daugirdas JT, Stone JCV. Physiologic principles and urea kinetic modeling. In: Daugirdas JT, Blake PG, Ing TS. Handbook of Dialysis. 3rd ed., 2001, Philadelphia: Lippincott Williams & Wilkins, 15-45.
20. Kunitoshi I, Masahiko T, Shinichiro Y, Koshiro F. Serum C-reactive protein (CRP) and risk of death in chronic dialysis patients. Nephrol Dial Transplant. 1999; 4:1956-1960.
21. Rosenthal AF. Low albumin, is it nutritional dialysis and transplantation. 1999.
22. Lacson EJR, Own WJR, Lowrie EG. What are the causes and consequences of the chronic inflammatory state in chronic dialysis patients. Seminar in Dialysis. 2000; 13:164-166.
23. Kaysen GA, Stevenson FT, Depner TA. Determinants of albumin concentration in hemodialysis patients. Am J Kidney Dis. 1997; 29: 658-668.
24. John T, Daugridas JT. Chronic hemodialysis prescription: a urea kinetic approach: Handbook of dialysis. 3 rd ed., 2001, Boston, Little Brown Company.
25. Qureshi AR, Alvestrand A, Danielsson A, Divino-Filho JEC, Gutierrez A, Linoholm B, et al. Factors predicting malnutrition in hemodialysis patients: A cross-sectional study. Kidney International. 1998; 53: 773–782.
26. Nasri H. Serum C-reactive protein (CRP) in association with various nutritional parameters in maintenance hemodialysis patients. Bratisl Lek Listy. 2005; 106(12):390-5.
27. Bertran N, Camps J, Fernandez–Ballart J, Arija V, Ferre N, Tous M et al. Diet and lifestyle are associated with serum C-reactive protein concentration in a population-based study. J Lab Clin Med. 2005; 145(1): 41-46.
28. Naghashpour M, Amani R, Haghighizadeh MH, Nematpour S .The association of diet and anthropometric indices with high-sensitive C-reactive protein (hs-CRP), among depressed and healthy female nurses. Journal of Shahrekord University of Medical Sciences. 2012; 14(2):11-22.
29. Fredrikson GN, Hedblad B, Nilsson JA, Alm R, Berglund G, Nilsson J. Association between diet, Lifestyle, metabolic cardiovascular risk factors and plasma C-reactive protein levels. Metabolism. 2004; 53(11): 1436-1442.
30. KafeShani O, Entezari MH, Hoseini M, Mohebrasool M, Sohrabi F, Torabi A. Correlation of inflammatory and nutrients intake in Asfahan hemodialysis patients. Iranian journal of Health Research. 2010; 6(2): 344-350.
31. Christain P, Hiscock N, Penkowa M. Supplementation with vitamins C and E inhibit interleukin-6 from contracting human skeletal muscle. J Physiol. 2004; 558(2):633-645.
32. Gladys B, Mrion D. Factors associated with oxidative stress in human populations. Am J Epidemiol. 2002; 156(3):123-136.
33. Carcamo M, Pedraza A, Borquez-Ojeda O, Gold DW. Vitamin C suppress TNF-α- induced NFKB activation by inhibiting IKBα phosphorylation. Biochemistry. 2004; 41:12995-13002.
34. Devaraj S, Jialal I. Alpha–tocopherol decrease interleukin -1 beta release from activated human monocytes by inhibition of 5-lipoxygenase. Arterioscler Thromb Vasc Biol. 1999; 19:1125-1133.
35. Forouhi NG, Sattar N, Mckeigue PM. Relation of C-reactive protein to body fat distribution and features of the metabolic syndrome in Europeans and South Asians. Int J Obes Relat Metab Disord. 2001; 25:1337-1331.
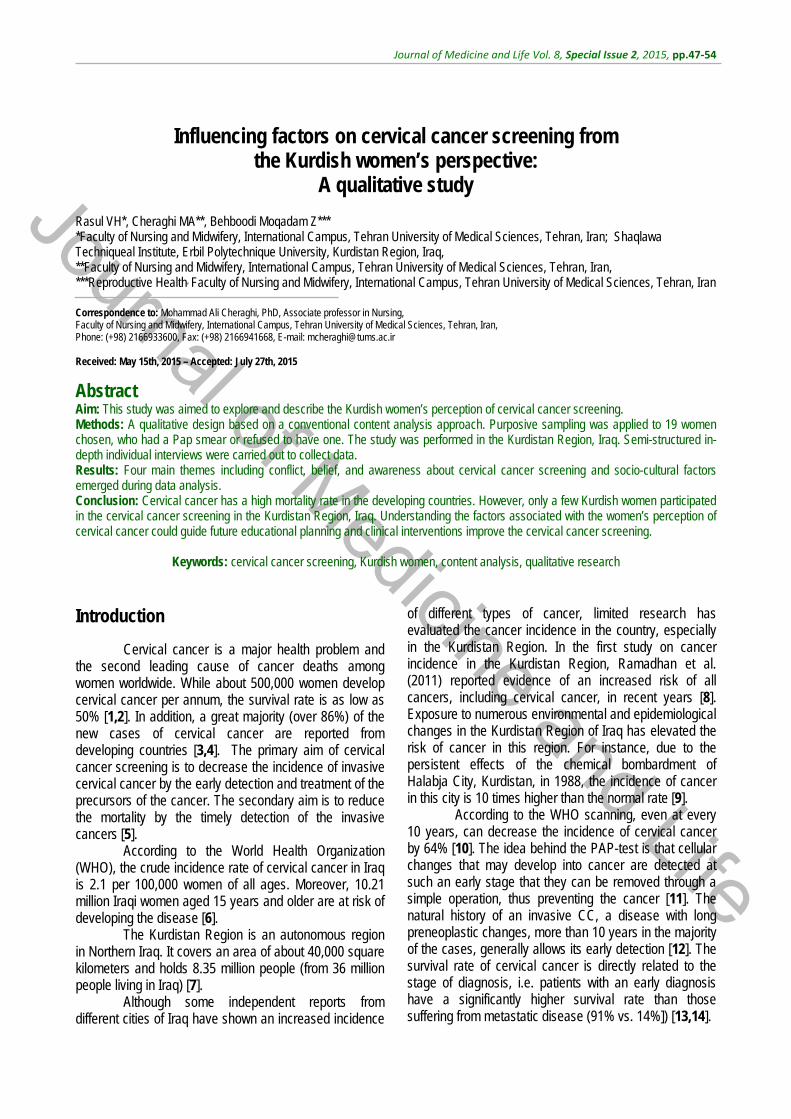
Journal of Medicine and Life
Journal of Medicine and Life Vol. 8, Special Issue 2, 2015, pp.47-54
Influencing factors on cervical cancer screening from the Kurdish women’s perspective:
A qualitative study Rasul VH*, Cheraghi MA**, Behboodi Moqadam Z*** *Faculty of Nursing and Midwifery, International Campus, Tehran University of Medical Sciences, Tehran, Iran; Shaqlawa Techniqueal Institute, Erbil Polytechnique University, Kurdistan Region, Iraq, **Faculty of Nursing and Midwifery, International Campus, Tehran University of Medical Sciences, Tehran, Iran, ***Reproductive Health, Faculty of Nursing and Midwifery, International Campus, Tehran University of Medical Sciences, Tehran, Iran Correspondence to: Mohammad Ali Cheraghi, PhD, Associate professor in Nursing, Faculty of Nursing and Midwifery, International Campus, Tehran University of Medical Sciences, Tehran, Iran, Phone: (+98) 2166933600, Fax: (+98) 2166941668, E-mail: [email protected] Received: May 15th, 2015 – Accepted: July 27th, 2015
Abstract Aim: This study was aimed to explore and describe the Kurdish women’s perception of cervical cancer screening. Methods: A qualitative design based on a conventional content analysis approach. Purposive sampling was applied to 19 women chosen, who had a Pap smear or refused to have one. The study was performed in the Kurdistan Region, Iraq. Semi-structured in-depth individual interviews were carried out to collect data. Results: Four main themes including conflict, belief, and awareness about cervical cancer screening and socio-cultural factors emerged during data analysis. Conclusion: Cervical cancer has a high mortality rate in the developing countries. However, only a few Kurdish women participated in the cervical cancer screening in the Kurdistan Region, Iraq. Understanding the factors associated with the women’s perception of cervical cancer could guide future educational planning and clinical interventions improve the cervical cancer screening.
Keywords: cervical cancer screening, Kurdish women, content analysis, qualitative research
Introduction
Cervical cancer is a major health problem and the second leading cause of cancer deaths among women worldwide. While about 500,000 women develop cervical cancer per annum, the survival rate is as low as 50% [1,2]. In addition, a great majority (over 86%) of the new cases of cervical cancer are reported from developing countries [3,4]. The primary aim of cervical cancer screening is to decrease the incidence of invasive cervical cancer by the early detection and treatment of the precursors of the cancer. The secondary aim is to reduce the mortality by the timely detection of the invasive cancers [5].
According to the World Health Organization (WHO), the crude incidence rate of cervical cancer in Iraq is 2.1 per 100,000 women of all ages. Moreover, 10.21 million Iraqi women aged 15 years and older are at risk of developing the disease [6].
The Kurdistan Region is an autonomous region in Northern Iraq. It covers an area of about 40,000 square kilometers and holds 8.35 million people (from 36 million people living in Iraq) [7].
Although some independent reports from different cities of Iraq have shown an increased incidence
of different types of cancer, limited research has evaluated the cancer incidence in the country, especially in the Kurdistan Region. In the first study on cancer incidence in the Kurdistan Region, Ramadhan et al. (2011) reported evidence of an increased risk of all cancers, including cervical cancer, in recent years [8]. Exposure to numerous environmental and epidemiological changes in the Kurdistan Region of Iraq has elevated the risk of cancer in this region. For instance, due to the persistent effects of the chemical bombardment of Halabja City, Kurdistan, in 1988, the incidence of cancer in this city is 10 times higher than the normal rate [9].
According to the WHO scanning, even at every 10 years, can decrease the incidence of cervical cancer by 64% [10]. The idea behind the PAP-test is that cellular changes that may develop into cancer are detected at such an early stage that they can be removed through a simple operation, thus preventing the cancer [11]. The natural history of an invasive CC, a disease with long preneoplastic changes, more than 10 years in the majority of the cases, generally allows its early detection [12]. The survival rate of cervical cancer is directly related to the stage of diagnosis, i.e. patients with an early diagnosis have a significantly higher survival rate than those suffering from metastatic disease (91% vs. 14%]) [13,14].
Journal of Medicine and Life
Journal of Medicine and Life Vol. 8, Special Issue 2, 2015
48
No screening programs for cervical cancer existed in the Kurdistan Region until 2004. The first study on cervical intraepithelial neoplasia (CIN) in the Kurdistan Region was performed by the Ministry of Health. Since the results indicated the presence of dysplasia in 4.4% of the population, the Ministry of Health established a cervical cancer screening program in the Kurdistan Region. The program was also initiated in Erbil in 2006, in Duhok in 2008, and in Sulemani in 2009 [15]. However, the WHO reported an absence of data about the estimated coverage of cervical cancer screening in Iraq by age and study [6]. While there is no specific obligation to perform cervical cancer screening, the physicians’ recommendation seems to be the most important motivator in this regard. Since little knowledge is available about the determinants of Kurdish women’s participation in screening programs, enhancing the overall cancer screening rates will widely depend on the information about the factors associated with screening for various cancer types including cervical cancer. As no qualitative study has focused on this subject in the Kurdistan Region, the present research sought to describe and explore the experiences of Kurdish women of cervical cancer screening.
Methods
Design
A qualitative design based on a conventional content analysis approach was used. Qualitative research is a form of social inquiry that focuses on the way people make sense of their experiences and the world in which they live [16]. Content analysis is potentially one of the most important research techniques in the social sciences that the researcher examines artifacts of social communication [17]. Objectives
The current study aimed to explore the perspectives of the participants about the influencing factors on cervical cancer screening programs. Data collection and participants
Semi-structured in-depth interviews were performed with 19 women who either had a Pap test or refused to take the test in the Kurdistan Region, Iraq. The participants should have been chosen based on purposeful sampling strategy according to the maximum variation technique. The criteria for the samples inclusion for this study were: a) Married women who agreed to participate in the study, b) Kurdish women who lived in the Kurdistan Region, Iraq, c) The women who had experience regarding cervical cancer screening (referred or not referred) in a governmental or private section, d) The women who had a health checkup profile in the healthcare centers, who did not follow a cervical cancer
screening program. Non Iraqi Kurdish women were excluded. Recruitment continued as long as new themes continued emerging from the interviews, and data saturation was reached at 16 interviews and the 17th,18th,19th did not have any extra information.
The interviews were individually conducted in the Pap smear center and the participants' workplace. Each interview lasted about 40-72 minutes. Data were collected from May 14 to November 20, 2014. The individual interview questions were:
What is the women’s perception regarding cervical cancer
What is the meaning of cervical cancer screening from their perspective
Have you ever had a cervical cancer screening test? If yes, what would you say about your experience? If you have never received a cervical cancer screening test, could you share the reasons?
The interviews were conducted in the participants’ native language (Kurdish) and then translated into English by first author as an emic researcher. A bilingual speaker then revised and confirmed the translations. Each interview was recorded and transcribed verbatim and then analyzed concurrently [18,19]. Ethical considerations
The Ethics Committee of Tehran University of Medical Sciences (Project Number: 130/ 1117, Approval Date: 10/08/2014) and Ministry of Health and Director of Health in Erbil (Number: 65, Date: 12/05/2014) approved the study proposal and confirmed its ethical considerations. All participants were informed and explained the reasons and the methods of the study. Individuals who agreed to participate in the study signed written consent forms and allowed the tape-recording of the interviews. They were also ensured about the voluntary nature of participation and their right to withdraw at any time. Data analysis
Based on the instructions of Graneheim and Landman, the interviews were transcribed verbatim and the transcriptions were read thoroughly several times [18]. After acquiring a general idea of the subject, the obtained texts were broken into condensed meaning units. These meaning units were abstracted and coded. The codes were then compared and allocated to different subcategories and categories based on their similarities and differences. A number of themes were ultimately formulated to express the latent content of the text. Trustworthiness
Member checking, peer checking, and prolonged engagement were present to guarantee trustworthiness [19]. In order to perform member checking, the
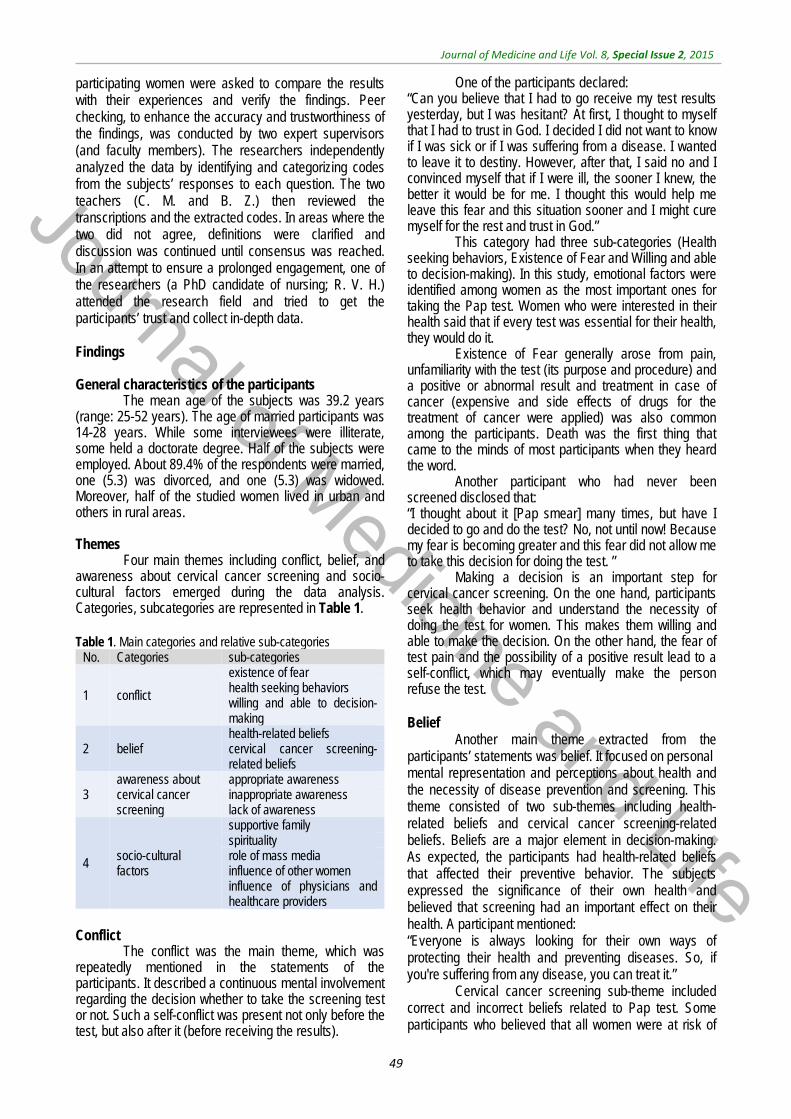
Journal of Medicine and Life
Journal of Medicine and Life Vol. 8, Special Issue 2, 2015
49
participating women were asked to compare the results with their experiences and verify the findings. Peer checking, to enhance the accuracy and trustworthiness of the findings, was conducted by two expert supervisors (and faculty members). The researchers independently analyzed the data by identifying and categorizing codes from the subjects’ responses to each question. The two teachers (C. M. and B. Z.) then reviewed the transcriptions and the extracted codes. In areas where the two did not agree, definitions were clarified and discussion was continued until consensus was reached. In an attempt to ensure a prolonged engagement, one of the researchers (a PhD candidate of nursing; R. V. H.) attended the research field and tried to get the participants’ trust and collect in-depth data. Findings General characteristics of the participants
The mean age of the subjects was 39.2 years (range: 25-52 years). The age of married participants was 14-28 years. While some interviewees were illiterate, some held a doctorate degree. Half of the subjects were employed. About 89.4% of the respondents were married, one (5.3) was divorced, and one (5.3) was widowed. Moreover, half of the studied women lived in urban and others in rural areas. Themes
Four main themes including conflict, belief, and awareness about cervical cancer screening and socio-cultural factors emerged during the data analysis. Categories, subcategories are represented in Table 1.
Table 1. Main categories and relative sub-categories
No. Categories sub-categories
1 conflict
existence of fear health seeking behaviors willing and able to decision-making
2 belief health-related beliefs cervical cancer screening-related beliefs
3 awareness about cervical cancer screening
appropriate awareness inappropriate awareness lack of awareness
4 socio-cultural factors
supportive family spirituality role of mass media influence of other women influence of physicians and healthcare providers
Conflict
The conflict was the main theme, which was repeatedly mentioned in the statements of the participants. It described a continuous mental involvement regarding the decision whether to take the screening test or not. Such a self-conflict was present not only before the test, but also after it (before receiving the results).
One of the participants declared: “Can you believe that I had to go receive my test results yesterday, but I was hesitant? At first, I thought to myself that I had to trust in God. I decided I did not want to know if I was sick or if I was suffering from a disease. I wanted to leave it to destiny. However, after that, I said no and I convinced myself that if I were ill, the sooner I knew, the better it would be for me. I thought this would help me leave this fear and this situation sooner and I might cure myself for the rest and trust in God.”
This category had three sub-categories (Health seeking behaviors, Existence of Fear and Willing and able to decision-making). In this study, emotional factors were identified among women as the most important ones for taking the Pap test. Women who were interested in their health said that if every test was essential for their health, they would do it.
Existence of Fear generally arose from pain, unfamiliarity with the test (its purpose and procedure) and a positive or abnormal result and treatment in case of cancer (expensive and side effects of drugs for the treatment of cancer were applied) was also common among the participants. Death was the first thing that came to the minds of most participants when they heard the word.
Another participant who had never been screened disclosed that: “I thought about it [Pap smear] many times, but have I decided to go and do the test? No, not until now! Because my fear is becoming greater and this fear did not allow me to take this decision for doing the test. ”
Making a decision is an important step for cervical cancer screening. On the one hand, participants seek health behavior and understand the necessity of doing the test for women. This makes them willing and able to make the decision. On the other hand, the fear of test pain and the possibility of a positive result lead to a self-conflict, which may eventually make the person refuse the test. Belief
Another main theme extracted from the participants’ statements was belief. It focused on personal mental representation and perceptions about health and the necessity of disease prevention and screening. This theme consisted of two sub-themes including health-related beliefs and cervical cancer screening-related beliefs. Beliefs are a major element in decision-making. As expected, the participants had health-related beliefs that affected their preventive behavior. The subjects expressed the significance of their own health and believed that screening had an important effect on their health. A participant mentioned: “Everyone is always looking for their own ways of protecting their health and preventing diseases. So, if you're suffering from any disease, you can treat it.”
Cervical cancer screening sub-theme included correct and incorrect beliefs related to Pap test. Some participants who believed that all women were at risk of

Journal of Medicine and Life
Journal of Medicine and Life Vol. 8, Special Issue 2, 2015
50
developing cervical cancer tended to have a Pap test. As one informant said: “Pap test is used for the early diagnosis of cervical cancer. All women should have this test done three months after their marriage. If the result is normal, the test should be repeated every three years afterward.”
Meanwhile, some participants had incorrect beliefs related to the need for a Pap test. For instance, they believed that those who had gynecological problems were at risk of cancer. Some others believed that just old women needed to have a Pap test or that trust in God would protect them from developing cancer. Obviously, those who perceived a Pap test to have a low necessity did not feel the need for screening. A woman explained that: “In my opinion, a Pap test is necessary for those who are married or suffering from genital infections or those who have a problem and an abnormal condition. I have had none of these cases, you know, I have been married for 15 years and even eight months after separating from my husband, I had no problems. Therefore, I do not think I need a Pap smear.” Awareness about cervical cancer screening
This theme indicated the participants’ information and understanding about cervical cancer screening. It consisted of three sub-themes, namely appropriate awareness, inappropriate awareness, and lack of awareness.
Appropriate awareness covered the women’s correct information obtained from appropriate sources such as health care providers, books, and mass media. One of the participants explained: “Because I was very young when I got married and there are sores in my cervix, my doctor told me to take care of myself. She told me that I might suffer from cervical cancer in the future and that this test [Pap test] would diagnose the disease early.”
Inappropriate awareness indicated the participants’ misinformation obtained from invalid sources like family, friends, or other women. A woman who lived in the rural area and whose husband died from cancer stated: “I consulted with some of the women in my neighborhood and they had the same idea and they said that maybe I got the disease from my husband.”
Lack of awareness included the gaps in knowledge identified by the participants. The subjects commonly lacked knowledge about what a Pap test was, which cancer it was used for, and how often one it should be done, and why it was performed. One of the informants said: “I do not know anything about when I should start [Pap test].”
Another woman who was screened following her doctor’s recommendation declared: “Because I did not know what this test was useful for, I thought that it was an important test for diagnosing my disease.”
Socio-cultural factors
The participants’ statements about factors affecting their health behaviors through the larger environmental system were categorized in a theme called socio-cultural factors.
This theme highlighted the importance of social relationships in one’s life and comprised five sub-themes, namely supportive family, spirituality, role of mass media, influence of other women, and influence of physicians and healthcare providers.
The first sub-theme was family related to the role of a family in a woman’s health. Those women who had children responded that their children were the most important aspect of their life. The women mentioned that their health was important for the children's future. At the same time, the participants who expressed those families had a supportive role in getting Pap test. This sub-theme included the family support, encouragement, and companionship for doing the test. As a participant stated: “My family encouraged me a lot; even my father told me he would help me if I needed anything.”
The second sub-theme (spirituality) covered behaviors that rooted in religion. These behaviors included praying, trust in God, and belief in destiny. One participant with a gynecological problem who had delayed her Pap test until the doctor’s recommendation stated: “I always say in God we trust! With this hope, I consider myself to be away from this disease and I said Insha’Allah God will protect me from this disease. For this reason, I have not been thinking about the test so much.”
The third sub-theme, i.e. the role of mass media, emphasized the significance of media in information provision. Mass media, e.g. television, radio, newspapers, and magazines, play a crucial role in the construction of the public beliefs about health. They can simultaneously convey the same massage to large numbers of people. One of the participants expressed that: “Because this subject is repeated in neither the community nor the mass media such as television or newspapers, perhaps no one can remember this. The media does not pay attention to this matter. In Kurdistan, very little is spoken about this topic.”
The forth sub-theme in this theme, i.e. the influence of women’s attitudes/ behaviors, highlighted the influence of others and peers on the participants’ health and screening knowledge acquisition and tendency to have a Pap test. Some women justified their lack of interest in having a Pap test by the fact that none of their family members or women around them had taken the test. A participant stated: “If I saw that most other women took the test, it would possibly influence me. I would say that the test would not kill anyone and that everyone could do this test. So, why shouldn’t I do it? This could make me to overcome my fear little by little to go and do the test.”
Similarly, the influence of physicians and healthcare providers on the participants’ cervical cancer
Journal of Medicine and Life
Journal of Medicine and Life Vol. 8, Special Issue 2, 2015
51
screening behaviors was underscored by most participants. Some women indicated that their doctors played a role in their Pap test knowledge acquisition and the decision to have a Pap smear. Some subjects also reported that they did not have a Pap test because their doctor did not explain the necessity of the test or did not remind them to have one. For example, a participant who did not recently have a Pap test declared that she would have done a Pap test if her doctor had recommended her to do so: “Our health care system does not push us or force us to go and have a Pap smear. For instance, if I have a gynecology problem, I go to a gynecologist. However, my doctor never asks if I have had a checkup. She never tells me that it is good to do this test. She would never ask this question to encourage us to come and have the test.”
Discussion
The present study sought to explore the women’s perspectives of cervical cancer screening in the Kurdish culture and context. Based on our findings, cervical cancer screening is a process that starts with a woman’s decision to have the test. Moreover, all our participants were able and free to make decisions. We also found that women had to deal with a series of conflicts and worries while making a decision to have a Pap test. Furthermore, women who were or were not screened had to cope with different worries and fears. In addition to their fear of the test itself (e.g. pain and unknown nature), they were worried about having cancer. Almost all participating women associated cancer with death. Some of them described cancer as a death sentence without a cure and thus evaded the test to avoid a positive result. In contrast, the screeners in this study emphasized the significance of a Pap test in preventing death due to cancer. Similar findings were reported by Guilfoyle et al. [20] and Hatcher et al. [21]. However, fear and anxiety about having a Pap test was only reported by one-third of the participants in a study in England. Moreover, women who had at least once attended the cervical cancer screening were less likely to express fear and anxiety [22]. Since the mentioned conflicts exerted significant effects on women’s tendency to participate in cervical cancer screening, providing clear information about a Pap test is essential to increase the willingness to have the test.
According to the Kurdish women in the current research, beliefs and knowledge about cervical cancer screening played a key role in the decision to have a Pap test. Women were more likely to have the test if there were prevailing beliefs about the risk of getting cancer such as having symptoms. However, women who believed they were at a lower risk of getting cancer or those who had no symptoms were less willing to have the test. Likewise, trusting in God and belief in destiny reduced the chances of a woman having a Pap test and this was one of the reasons for refusing the test.
Previous research has also highlighted the relation between low perceived risk of cervical cancer and low uptake of screening [21,23-25]. Therefore, the women’s awareness about their risk of cervical cancer has to be enhanced to increase their participation in screening programs. Likewise, trusting in God and belief in destiny reduced the chances of a woman having a Pap test and this was one of the reasons for refusing the test. For instance, they believed that a Pap test was only needed when they had some symptoms or when their doctor recommended it. Wong et al. [26], Al-Naggar and Isa [27] and Ma et al. [24] reported similar findings.
The results of the present study revealed that all health decisions were made or rationalized based on awareness. In fact, awareness about a Pap test, its purpose, importance, technique, procedure, advantages, and disadvantages can affect a woman’s decision to participate in cervical cancer screening. Women with less knowledge on the importance and purpose of Pap tests had a lower chance of having the test. Considering the limited knowledge of some participants, increasing education about the cervical cancer and Pap smear was necessary to improve Kurdish women’s understanding and perception of these subjects [25,28-30]. Therefore, the women’s awareness about their risk of cervical cancer has to be enhanced to increase their participation in screening programs.
According to our findings, increased knowledge about cervical cancer and the Pap test led to a positive perception regarding the health promotion and disease prevention and created an accurate base for correct beliefs about the Pap test. The screeners and other participants in the present research reported that the Kurdish women had limited awareness and misconceptions about cervical cancer, the Pap test, and women’s health issues. For instance, they believed that a Pap test was only needed when they had some symptoms or when their doctor recommended it. Wong et al. [26], Al-Naggar and Isa [27] and Ma et al. [24] reported similar findings.
Before having a Pap test, a woman has to accept the test, i.e. women’s impression of the test can largely affect their tendency of having or not having the test. Some participants discussed their embarrassment, fear of being unfamiliar with the test and pain of test causing the test refusal. However, others said that they have taken the test with these negative feelings. Consistent findings were also suggested by previous research [27,31,32].
Women who had undergone a Pap test reported less fear and stress. They confirmed that they had been comfortable during the test and that the test had been painless and easy to perform. Since these subjects were aware of the importance and necessity of the Pap test, they were more willing to have the test in the future (without embarrassment). They were also recommending others to have the test. Similar results were also obtained by Studts et al. [33].
Journal of Medicine and Life
Journal of Medicine and Life Vol. 8, Special Issue 2, 2015
52
Although most of our participants agreed that early diagnosis of cancer increased the treatment success, the participating women also believed that a cancer diagnosis was associated with an early death. In fact, their fear of a positive result sometimes prevented them from having the test. A lack of knowledge about the slow progression of cervical cancer and the necessity of regular screening was hence detected in the studied population. Fear of a cancer diagnosis has been previously introduced as one the most common reasons for not having a Pap test [28]. Likewise, in a qualitative study in Malaysia, the women’s wrong beliefs about the purpose of the Pap test (i.e. detecting an existing cervical cancer) and the inevitability of death after a cancer diagnosis were identified as barriers to the participation in cancer screening, detection, and treatment [26].
We found that socio-cultural factors play an important role in the Kurdish women’s health. Most participants mentioned their responsibility toward their family as the main reason for taking care of their own health. At the same time, the family’s companionship and encouragement were introduced as important factors in encouraging the participants to have the test. Nevertheless, some women tended to avoid the test despite being supported by their families. Comparable results were indicated by Calvo [34]. Conversely, the findings of a study in the United States showed that most Hmong women (younger and older) made decisions about screening independently without counseling their family members, clans, or anyone else [35].
Women considered their spiritual beliefs to be able to protect them from serious disease. The Kurdish women’s belief in destiny reduced their perceived individual control over health and disease. This finding was consistent with the findings of Guilfoyle et al. [20].
Our participants underscored the importance of mass media as a primary source of health information. Nevertheless, since they mainly used local media, they had never heard of cervical cancer screening programs. Similarly, Panamanian women, who received health information from local media, were found to have limited and sometimes inaccurate information regarding cervical cancer screening [34]. However, in Kinshasa, word of mouth communication was the most important source of information [30].
In the absence of different sources of health information programs issued by the Ministry of Health and national policies regarding cervical cancer screening, the majority of our participants suggested the role of doctors and healthcare providers as the most important factor in determining a woman’s decision of having a Pap test. A similar finding was indicated by Wong et al. [26]. Another study conducted by Horo et al. indicated that only 21.4% of the women performed a cervical cancer screening prior to the study with a delay of several years. Their focus related to no recommendation for cervical cancer screening by doctors and the absence of national policies
for the early detection of cervical neoplasia, especially at the beginning age [36].
Some participants also highlighted the relations between healthcare providers and women as a major issue in Kurdistan. In other words, healthcare providers were reported not to try to provide women with information about having a Pap test. Poor communication of healthcare personnel has been previously suggested as a barrier to participation in cervical cancer screening programs [22]. Similarly, a study in Serbia revealed a poor communication between women and gynecologists and the absence of a proper counseling [37]. Consistent findings were also published by Abdullah and Su [31] and Ali-Risasi et al. [30]. As crucial sources of information, healthcare providers can deliver recommendations and explain the advantages and importance of cervical cancer screening. Impressive communication between healthcare providers and the Kurdish women was identified as the most important factor.
Finally, the weak social influence observed among Kurdish women in the present study can justify the participants’ inappropriate understanding of cervical cancer screening and the lower tendency to have relevant tests. Prior to their own experience, our participants did not hear of the test from any other women. This finding of the present study was in contrast with the results of other studies [21,38].
Conclusion
Our results underscored the significance of interventions to increase the awareness regarding the importance and necessity of cervical cancer screening among Kurdish women. Providing relevant information can reduce the conflicts, misconceptions, and anxiety among women and eliminate the negative effects of such feelings on women’s decisions to have a Pap test. Since our findings highlighted the absence of a suitable system to encourage women to participate in screening programs in Kurdistan Region of Iraq, policy makers and the Ministry of Health are required to develop a well-designed program (similar to that implemented in developed countries) to ensure a successful screening. Such a program needs to detect and motivate women who have never had a Pap test. Furthermore, healthcare providers need to acquire better communication skills and recommend Pap tests more often. In addition, Kurdish mass media should be used to educate all women. Limitation
As a qualitative research study, the selection of participants presupposed a small number and these findings might not be generalized to the target population. Acknowledgments
This study was financially supported by Tehran University of Medical Sciences and Hawler Ministry of Higher Education.

Journal of Medicine and Life
Journal of Medicine and Life Vol. 8, Special Issue 2, 2015
53
Conflict of interest There is no conflict of interest
“Cervical cancer screening by visual inspection in Cˆote d’Ivoire, operational and clinical aspects according to HIV status,”
References
1. Saleem A, Tristram A, Fiander A, Hibbitts S. Prophylactic HPV vaccination: a major breakthrough in the fight against cervical cancer?. J Minerva Med. Dec 2009; 100,6:503-23. http://www.ncbi.nlm.nih.gov/pubmed/20010484.
2. W. H. Organization. Human Papillomavirus [HPV] and Cervical Cancer. 2014. http://www.who.int/mediacentre/factsheets/fs380/en/.
3. Kent A. HPV Vaccination and Testing. Rev Obstet Gynecol. 2010; 3,1:33-4.
4. Kumakech E, Andersson S, Wabinga H, Berggren V. Integration of HIV and cervical cancer screening perceptions and preferences of communities in Uganda. BMC Women’s Health J. 2015; 15,23. doi 10.1186/s12905-015-0183-4.http://www.biomedcentral.com/1472-6874/15/23.
5. Schoofs J, Krijger K, Vandevoorde J, Van Rossem I, Devroey D. Health-related factors associated with the participation in cervical cancer screening. Journal of Research in Health Sciences. 2015; 15,1:11-16.
6. WHO/ ICO Information Centre on HPV and Cervical Cancer [HPV Information Centre]. Human Papilloma Virus and Related Cancers in Iraq. cited 2014 November 29. http//:www.who.int/hpvcentre.
7. Anon. Iraqi Kurdistan. cited 2014 11 October. http://en.wikipedia.org/wiki/Iraqi_Kurdistan.
8. Ramadhan OT et al. Cancer Incidence Rate in the Kurdistan Region/Iraq from 2007-2009. Asian Pacific Journal of Cancer Prevention. 2011; 12:123-9.
9. Al-Humadi HA. Epidemiology of Colon & Rectal Cancer in Iraq. World Journal of Colorectal Surgery. 2009; 1,15.
10. Beydag KD. Knowledge and Applications of the Midwives and Nurses at an Educational Hospital on the Early Diagnosis of Cervix Cancer. Asian Pacific Journal of Cancer Prevention. 2011; 12,2:481-5.
11. Bengtsson E, Malm P. Screening for Cervical Cancer Using Automated Analysis of PAP-Smears. Hindawi Publishing Corporation. Computational and Mathematical Methods in Medicine. vol. 2014, 2014, Article ID 842037.
12. Ibáñez R, Alejo M, Combalia N et al. Underscreened Women Remain Overrepresented in the Pool of Cervical Cancer Cases in Spain: A Need to Rethink
the Screening Interventions. Hindawi Publishing Corporation, BioMed Research International, Vol. 2015, 2015, Article ID 605375.
13. Akbari F, Shakibazadeh E, Pourreza A, Tavafian S. Barriers and Facilitating Factors for Cervical Cancer Screening: a Qualitative Study from Iran. Iranian Journal of Cancer Prevention. 2010; 3,4.
14. Perkins RB, Anderson BL, Gorin SS, Schulkin JA. Challenges in cervical cancer prevention: a survey of U.S. obstetrician-gynecologists. Am J Prev Med. 2013; 45,2:175-81. doi: 10.1016/j.amepre.2013.03.019. http:// www.ncbi.nlm.nih.gov/pubmed/23867024.
15. Director of Cervical Cancer department, Erbil/ Kurdistan Region of Iraq: Ministry of Health, 2014.
16. Holloway L, Wheeler S. Qualitative research in nursing and health care. 3rd Ed., 2010, United Kingdom, John Wiley & Sons Ltd Publications.
17. Krippendorf K. Content analysis An introduction to its methodology. 3rd Ed., 2013; Los Angeles, CA: Sage Publications.
18. Graneheim UH, Lundman B. Qualitative Content Analysis in Nursing Research: Concepts, Procedures and Measures to Achieve Trustworthiness. J Nurs Educ Today. 2004; 24,2:105-12.
19. Streubert H, Carpenter D. Qualitative Research in Nursing. 2011, China: Lippincott Williams & Wilkins.
20. Guilfoyle S, Franco R, Gorin SS. Exploring Older Women’s Approaches to Cervical Cancer Screening. J Health Care Women Int. 2007; 28,10:930-50.
21. Hatcher J, Studts CR, Dignan M, Turner LM, Schoenberg NE. Predictors of Cervical Cancer Screening for Rarely or Never Screened Rural Appalachian Women. J Health Care Poor Underserved. 2011; 22,1:176-93.
22. Cadman L, Waller J, Ashdown-Barr L, Szarewski A. Barriers to Cervical Screening in Women Who Have Experienced Sexual Abuse: An Exploratory Study. J Fam Plann Rep Health Care. 2012; 38,4:214-20.
23. Schoenberg N, Baltisberger J, Bardach S, Dignan M. Perspectives on Pap Test Follow-up Care Among Rural Appalachian Women. J Women Health. 2010; 50,6:580-97.
24. Ma GX, Gao W, Fang CY et al. Health Beliefs Associated With Cervical Cancer Screening Among Vietnamese Americans. J Women Health. 2013; 22,3:276-88.
25. Sudenga SL, Rositch AF, Otieno WW, Smith JS. Knowledge, Attitudes, Practices, and Perceived Risk of Cervical Cancer Among Kenyan Women: Brief Report. Int J Gynecol Cancer. 2013; 23,5:895-9.
26. Wong LP, Wong YL, Low WY, Khoo EM, Shuib R. Knowledge and Awareness of Cervical Cancer and Screening Among Malaysian Women Who Have Never Had a Pap Smear: A Qualitative Study. J Singapore Med. 2009; 50,1:49-53.
27. Al-Naggar RA, Isa ZM. Perception and Opinion of Medical Students About Pap Smear Test: A Qualitative Study. Asian Pacific Journal of Cancer Prevention. 2010; 11,2:435-40.
28. Dhendup T, Tshering P. Cervical Cancer Knowledge and Screening Behaviors Among Female University Graduates of Year 2012 Attending National Graduate Orientation Program, Bhutan. BMC Women Health. 2014; 14,44.
29. Hwaid AH. Knowledge and Awareness of Papillomavirus and Cervical Cancer Among College Students and Health Care Workers Women in Diyala, Iraq. Am J Public Health Res. 2013; 1,8:221-5.
30. Ali-Risasi C, Mulumba P, Verdonck K, Vanden Broeck D, Praet M. Knowledge, Attitude and Practice About Cancer of the Uterine Cervix Among Women Living in Kinshasa, the Democratic Republic of Congo. BMC Women Health. 2014; 14,30.
31. Abdullah F, Su TT. Enhancement of the Cervical Cancer Screening Program in Malaysia: A Qualitative Study. Asian Pacific Journal of Cancer Prevention. 2010; 11,5:1359-66.
32. Pan XF, Zhao ZM, Sun J et al. Acceptability and Correlates of Primary and Secondary Prevention of cervical Cancer Among Medical Students In Southwest China: Implications for Cancer Education. PloS One. 2014; 9,10.
33. Studts CR, Tarasenko YN, Schoenberg NE. Barriers to Cervical Cancer Screening Among Middle-Aged and older Rural Appalachian Women. J Community Health. 2013; 38,3:500-12.
34. Calvo A. Social contraction of cervical cancer screening among women in Panama city, Panama, Theses and dissertation, University of South Florida. 2005. http://scholarcommonos.us.edu/etd/2805.
35. Thorburn S, Kue J, Keon KL, Zukoski A. We don’t Talk About it and Other Interpersonal Influences on Hmong Women’s Breast and Cervical Cancer

Journal of Medicine and Life
Journal of Medicine and Life Vol. 8, Special Issue 2, 2015
54
Screening Decisions. Health Educ Res. 2013; 28,5:760-71.
36. Horo AP, Coulibaly JDK, Koffi A et al. Cervical Cancer Screening Program by Visual Inspection: Acceptability and Feasibility in Health Insurance Companies. Hindawi Publishing Corporation.
Obstetrics and Gynecology International Journal. 2015. 2015, Article ID 798453.
37. Matejic B, Kesic V, Markovic M, Topic L. Communications About Cervical Cancer Between Women and Gynecologists in Serbia. Int J Public Health. 2008; 53,5:245-51.
38. White HL, Mulambia C, Sinkala M et al. Motivations and Experiences of Women Who Accessed "See and Treat" Cervical Cancer Prevention Services in Zambia. J Psychosom Obstet Gynaecol. 2012; 33,2:91-8.
Journal of Medicine and Life
Journal of Medicine and Life Vol. 8, Special Issue 2, 2015, pp.55-61
A trans-theoretical approach to alcohol abuse profile in the general population of an islamic
country - Mashhad, Iran
Vakili V*, Shojaee P*, Yaghmaei A**, Abbasi Shaye Z* *Department of Community Medicine, Mashhad University of Medical Sciences, Mashhad, Iran **Department of Community Medicine, Legal Medicine Organization, Mashhad University of Medical Sciences, Mashhad, Iran Correspondence to: Zahra Abbasi Shaye, MD, Department of Community Medicine, School of Medicine, Mashhad University of Medical Sciences, Mashhad, Iran, Phone: (+98) 9151164460, E-mail: [email protected] Received: May 17th, 2015 – Accepted: July 27th, 2015
Abstract Background: From a public health perspective, alcohol-related problems have enormous social and individual consequences. Objectives: The aim of the present study was to apply the TTM on the general population of Mashhad city to evaluate the change levels and possible relative factors regarding alcohol abuse. Methods: In a cross-sectional design, a total number of 564 people from the General Population of Mashhad, Iran participated. Stages of change questionnaire based on trans-theoretical model (TTM) and the checklist including socio-demographic characteristics as well as possible related factors were used. SPSS 11.5 software was used for all statistical analyses. Results: Among 564 people who took part in this survey, 245 (43.43%) had the history of alcohol consumption or they were current alcohol users. The analysis showed that 19.2% of the participants were in pre-contemplation stage, 3.3% in contemplation, 1.2% in preparation, 2.9% in action, 2% in maintenance and 71.4% were in termination phase. Age, job, smoking, and hookah smoking were identified as predictors of pre-contemplation stage. Marital status, job, and smoking were predictors of termination phase. Conclusion: This picture is from an Islamic holy city where assumed religious beliefs have cramped drinking patterns. According to harm of alcohol abuse, it is necessary to tailor the intervention for target populations. Factors identified as predictors of alcohol abuse such as age, marital status and occupation, as well as being cigarette and hookah smokers should be taken into account in the design of future interventions.
Keywords: alcohol, trans-theoretical model, stages of change
Background
From a public health perspective, alcohol-related problems have enormous social and individual consequences. Drinking continuum from abstinence, abuse, and dependency to hazardous drinking varied [1]. Evidence showed that the health and economic burden of drinking is far greater due to hazardous drinking rather than abuse or dependency [2]. Generally, alcohol consumption has been reported to be less than 10% in part of the world, but can reach more than 10% in young men in some areas. The prevalence of alcohol dependency is much lower than alcohol use and was estimated to be 0.2% in 2010 [3].
Religious beliefs have cramped Drinking in Islamic countries such as Iran and Saudi Arabia therefore producing, selling, and drinking alcohol is a punishable crime [4]. On the other hand, scientific debate and health programming were postponed due to stigma linked to alcohol use in such countries [5].
However, alcoholic beverages are available in Iran as a result of black market and illegally homemade products [6,7]. The first national document regarding alcohol misuse was established by the office dedicated to
alcohol prevention within the Iranian Ministry of Health and Medical Education in 2013 [8].
This study used the trans-theoretical model (TTM) which was developed by Prochaska and DiClemente. The TTM was generalizable across a wide range of problem behaviors as well as a wide diversity of populations with such behaviors. Behavioral change was composed of six stages (pre-completion, completion, preparation, action, maintenance and termination) [9-11]. The TTM enabled the use of appropriate interventions specifying the stage of change regarding individuals included and increased the success rate [12,13].
The TTM has been widely accepted and endorsed by researchers and clinicians working in the area of health behavior change [14]. Although the model was developed for the use with any health behavior [15], little is known to individuals about the applicability of the trans-theoretical model of intentional behavior change (TTM) with unhealthy alcohol consumption [16].
Objectives
The aim of the present study was to apply the TTM on the general population of Mashhad city to
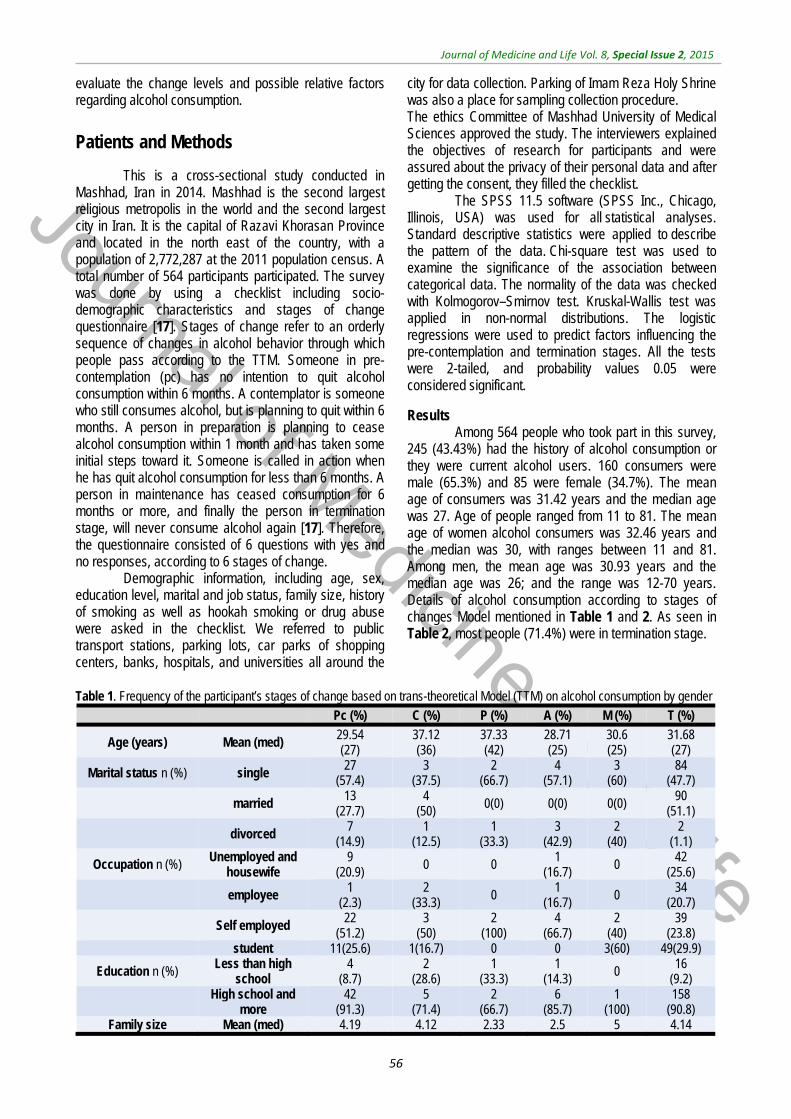
Journal of Medicine and Life
Journal of Medicine and Life Vol. 8, Special Issue 2, 2015
56
evaluate the change levels and possible relative factors regarding alcohol consumption.
Patients and Methods
This is a cross-sectional study conducted in Mashhad, Iran in 2014. Mashhad is the second largest religious metropolis in the world and the second largest city in Iran. It is the capital of Razavi Khorasan Province and located in the north east of the country, with a population of 2,772,287 at the 2011 population census. A total number of 564 participants participated. The survey was done by using a checklist including socio-demographic characteristics and stages of change questionnaire [17]. Stages of change refer to an orderly sequence of changes in alcohol behavior through which people pass according to the TTM. Someone in pre-contemplation (pc) has no intention to quit alcohol consumption within 6 months. A contemplator is someone who still consumes alcohol, but is planning to quit within 6 months. A person in preparation is planning to cease alcohol consumption within 1 month and has taken some initial steps toward it. Someone is called in action when he has quit alcohol consumption for less than 6 months. A person in maintenance has ceased consumption for 6 months or more, and finally the person in termination stage, will never consume alcohol again [17]. Therefore, the questionnaire consisted of 6 questions with yes and no responses, according to 6 stages of change.
Demographic information, including age, sex, education level, marital and job status, family size, history of smoking as well as hookah smoking or drug abuse were asked in the checklist. We referred to public transport stations, parking lots, car parks of shopping centers, banks, hospitals, and universities all around the
city for data collection. Parking of Imam Reza Holy Shrine was also a place for sampling collection procedure. The ethics Committee of Mashhad University of Medical Sciences approved the study. The interviewers explained the objectives of research for participants and were assured about the privacy of their personal data and after getting the consent, they filled the checklist.
The SPSS 11.5 software (SPSS Inc., Chicago, Illinois, USA) was used for all statistical analyses. Standard descriptive statistics were applied to describe the pattern of the data. Chi-square test was used to examine the significance of the association between categorical data. The normality of the data was checked with Kolmogorov–Smirnov test. Kruskal-Wallis test was applied in non-normal distributions. The logistic regressions were used to predict factors influencing the pre-contemplation and termination stages. All the tests were 2-tailed, and probability values 0.05 were considered significant.
Results Among 564 people who took part in this survey,
245 (43.43%) had the history of alcohol consumption or they were current alcohol users. 160 consumers were male (65.3%) and 85 were female (34.7%). The mean age of consumers was 31.42 years and the median age was 27. Age of people ranged from 11 to 81. The mean age of women alcohol consumers was 32.46 years and the median was 30, with ranges between 11 and 81. Among men, the mean age was 30.93 years and the median age was 26; and the range was 12-70 years. Details of alcohol consumption according to stages of changes Model mentioned in Table 1 and 2. As seen in Table 2, most people (71.4%) were in termination stage.
Table 1. Frequency of the participant’s stages of change based on trans-theoretical Model (TTM) on alcohol consumption by gender
Pc (%) C (%) P (%) A (%) M (%) T (%)
Age (years) Mean (med) 29.54 (27)
37.12 (36)
37.33 (42)
28.71 (25)
30.6 (25)
31.68 (27)
Marital status n (%) single 27
(57.4) 3
(37.5) 2
(66.7) 4
(57.1) 3
(60) 84
(47.7)
married 13
(27.7) 4
(50) 0(0) 0(0) 0(0)
90 (51.1)
divorced 7
(14.9) 1
(12.5) 1
(33.3) 3
(42.9) 2
(40) 2
(1.1)
Occupation n (%) Unemployed and
housewife 9
(20.9) 0 0
1 (16.7)
0 42
(25.6)
employee 1
(2.3) 2
(33.3) 0 1
(16.7) 0 34
(20.7)
Self employed 22
(51.2) 3
(50) 2
(100) 4
(66.7) 2
(40) 39
(23.8) student 11(25.6) 1(16.7) 0 0 3(60) 49(29.9)
Education n (%) Less than high
school 4
(8.7) 2
(28.6) 1
(33.3) 1
(14.3) 0 16
(9.2)
High school and more
42 (91.3)
5 (71.4)
2 (66.7)
6 (85.7)
1 (100)
158 (90.8)
Family size Mean (med) 4.19 4.12 2.33 2.5 5 4.14
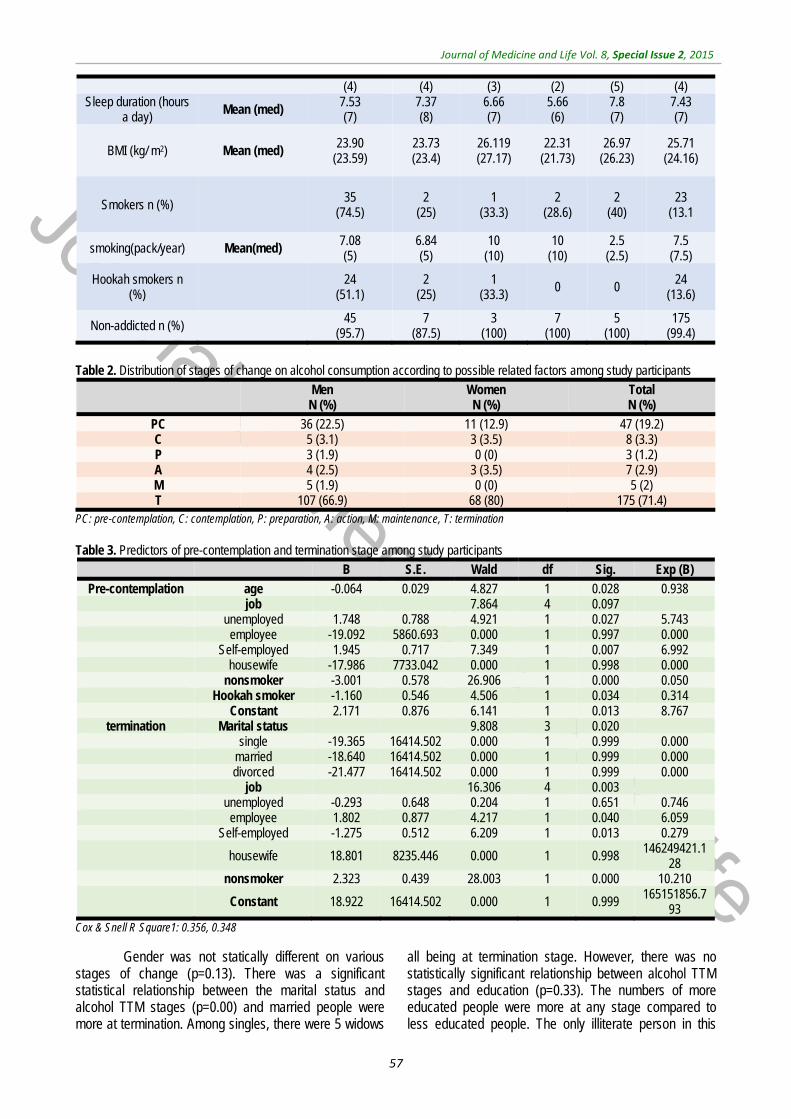
Journal of Medicine and Life
Journal of Medicine and Life Vol. 8, Special Issue 2, 2015
57
(4) (4) (3) (2) (5) (4) Sleep duration (hours
a day) Mean (med) 7.53 (7)
7.37 (8)
6.66 (7)
5.66 (6)
7.8 (7)
7.43 (7)
BMI (kg/ m2) Mean (med) 23.90
(23.59) 23.73 (23.4)
26.119 (27.17)
22.31 (21.73)
26.97 (26.23)
25.71 (24.16)
Smokers n (%) 35 (74.5)
2 (25)
1 (33.3)
2 (28.6)
2 (40)
23 (13.1
smoking(pack/year) Mean(med) 7.08 (5)
6.84 (5)
10 (10)
10 (10)
2.5 (2.5)
7.5 (7.5)
Hookah smokers n (%)
24 (51.1)
2 (25)
1 (33.3)
0 0 24 (13.6)
Non-addicted n (%) 45
(95.7) 7
(87.5) 3
(100) 7
(100) 5
(100) 175
(99.4)
Table 2. Distribution of stages of change on alcohol consumption according to possible related factors among study participants
Men N (%)
Women N (%)
Total N (%)
PC 36 (22.5) 11 (12.9) 47 (19.2) C 5 (3.1) 3 (3.5) 8 (3.3) P 3 (1.9) 0 (0) 3 (1.2) A 4 (2.5) 3 (3.5) 7 (2.9) M 5 (1.9) 0 (0) 5 (2) T 107 (66.9) 68 (80) 175 (71.4)
PC: pre-contemplation, C: contemplation, P: preparation, A: action, M: maintenance, T: termination
Table 3. Predictors of pre-contemplation and termination stage among study participants
B S.E. Wald df Sig. Exp (B)
Pre-contemplation age -0.064 0.029 4.827 1 0.028 0.938 job 7.864 4 0.097 unemployed 1.748 0.788 4.921 1 0.027 5.743 employee -19.092 5860.693 0.000 1 0.997 0.000 Self-employed 1.945 0.717 7.349 1 0.007 6.992 housewife -17.986 7733.042 0.000 1 0.998 0.000 nonsmoker -3.001 0.578 26.906 1 0.000 0.050 Hookah smoker -1.160 0.546 4.506 1 0.034 0.314 Constant 2.171 0.876 6.141 1 0.013 8.767
termination Marital status 9.808 3 0.020 single -19.365 16414.502 0.000 1 0.999 0.000 married -18.640 16414.502 0.000 1 0.999 0.000 divorced -21.477 16414.502 0.000 1 0.999 0.000 job 16.306 4 0.003 unemployed -0.293 0.648 0.204 1 0.651 0.746 employee 1.802 0.877 4.217 1 0.040 6.059 Self-employed -1.275 0.512 6.209 1 0.013 0.279
housewife 18.801 8235.446 0.000 1 0.998 146249421.128
nonsmoker 2.323 0.439 28.003 1 0.000 10.210
Constant 18.922 16414.502 0.000 1 0.999 165151856.793
Cox & Snell R Square1: 0.356, 0.348
Gender was not statically different on various stages of change (p=0.13). There was a significant statistical relationship between the marital status and alcohol TTM stages (p=0.00) and married people were more at termination. Among singles, there were 5 widows
all being at termination stage. However, there was no statistically significant relationship between alcohol TTM stages and education (p=0.33). The numbers of more educated people were more at any stage compared to less educated people. The only illiterate person in this
Journal of Medicine and Life
Journal of Medicine and Life Vol. 8, Special Issue 2, 2015
58
survey who was a 70-year-old man was at termination stage. There was a statistically significant relationship between Hookah smoking and alcohol TTM stages (P=0.00). Hookah smoking was more common at pre-contemplation stage. Cigarette smoking and alcohol consumption (regardless of alcohol TTM stage) have a statistically significant relationship (p=0.00). There was no statistically significant relationship between alcohol TTM stages and age (p=0.74), family size (p=0.08), sleeping hours per day (p=0.34), smoking amount (pack/ year) (p=0.15B) and BMI as well (P=0.39). There was a statistically significant relationship between job and stages of change on alcohol (p=0.007). Employees and students were more likely tempted to quit alcohol. 24 participants were housewives and all were at termination. Age, cigarette smoking and hookah smoking, were identified as predictors of pre contemplation stage. Being unemployed and self-employed were predictors of pre-contemplation stage. Unemployed people were 5.7 times more than students in pre-contemplation stage (P=0.02) and self-employed were 6.99 times more than students in pre-contemplation stage (p=0.00). The marital status, job, and smoking were predictors for termination stage. Most employees with governmental jobs were 6 times at alcohol termination stage compared to students (p=0.04). Nonsmokers were 10.2 times more likely to terminate alcohol compared to smokers (Table 3).
We asked people if they had an Encourager to quit alcohol, and there was a significant statistical relationship between having a motivator to quit and alcohol TTM stages (P=0.02). However, there was no statistical relationship regarding the person who encouraged people to quit (a friend or family member or consultant) (p=0.857). Therefore, it is not important who motivates people to quit alcohol and abstention. People, who were aware of alcohol disadvantages, were more likely to quit alcohol (P=0.00). There was a statistically significant relationship between family history of alcohol consumption and alcohol TTM stages (P=0.00). People without a family history of alcohol consumption were predominantly more likely at termination stage. There was a significant statistical relationship between the onset of alcohol abuse at school age and alcohol TTM stages (P=0.00). People began alcohol consumption at school ages and were not eager to simply quit alcohol. 64.1 of the pre-contemplators had predicted their problematic alcohol abuse at the onset of drinking and finally the awareness of the existence of consultant institutes had a statistically significant relationship with alcohol TTM stages (P=0.04).
Discussion
In this survey, 43.43% of the participants reported previous or present history of alcohol consumption. However, most people with history of
alcohol consumption had quit and were in the termination stage according to TTM stages of change model. It can be due to Islamic religious beliefs in Iran and social condition in which alcohol consumption is not acceptable [25,28].
Women were more likely to quit alcohol (66.9% in men vs. 80% in women at termination stage) and men were more likely to continue consumption (22.5% in men vs. 12.9 in women at pre-contemplation stage), most surveys done all over the world showed that drinking is more prevalent among men than among women and abstention is more prevalent among women [18-21,30-38]. Even in communities where female and male alcohol abuse prevalence was the same, males had worse alcohol abuse habits specially risky and heavy drinking [22-25,29,36,38,39]. The proportion of alcohol consumption between men and women varied according to the region, culture of people, religion, etc., but men were exceeding than women in most studies, and, according to some literature data regarding the level of alcohol abuse they were even three times more [27,29,30] and women were more abstainers [40].
The marital status was a robust predictor of alcohol consumption in young adulthood [41]. Marriage decreases alcohol consumption [30,31,35,41-44]. In this survey, single people were more likely to use alcohol (57.4% of singles vs. 27.7% of married who were in pre-contemplation stage), but there was not such a big difference between singles and married people at termination stage (44.9% of singles vs. 51.1 of married at termination stage). Although these differences were all significant and the marital status was an important factor for alcohol abuse (p=0.00), the widows in our study were all woman and at termination stage. There were different results in different surveys about widows’ alcohol consumption, some were the same as our result [32,35,45] and the other was against [46]. There was not enough number of cases to find the relationship between getting divorced and alcohol consumption in our survey and further studies are needed to investigate this relationship.
Family size was not different between alcohol TTM stages. Some surveys showed having children was an encouraging factor to quit alcohol [39].
Occupation was an important factor for alcohol TTM stages. Unemployed people were 5.7 times more than students at pre-contemplation stage. Self-employed people were 6.99 times more than students at pre-contemplation stage. People with governmental jobs had 6 times more at alcohol termination compared to students. Employees and students were more likely at termination stage, while people who were on their own jobs without
Journal of Medicine and Life
Journal of Medicine and Life Vol. 8, Special Issue 2, 2015
59
governmental employment were at pre-contemplation stage. Many studies showed a relationship between job and alcohol consumption pattern but most focused on job according to income and the results in most studies revealed that high-income jobs were associated with more alcohol consumptions [26,35,37,40,47,48]. All housewives quit alcohol in our survey, and this was reported in some surveys as well; and the reason could be due to the nature of the housework that was fairer than other jobs with lower conflict levels and the roll of satisfactory marital communication with partner as well as commitment to familial responsibilities [49]. According to some papers being unemployed contributed to alcohol consumption [29], but others were against this and showed that alcohol consumption was more among the employed ones [37] although in these studies authors suggested a relationship between consumption and economic status and income [26,37,40,47,50,51]. Also, lower educated people tended to worsen the consumption habits such as heavy drinking [47,51]. In our survey, unemployed tended to use alcohol more and the same as Fone DL et al. mentioned in 2013, unemployed people were more alcohol users [36]. In our survey, there was no relationship between education and alcohol consumption, but findings showed a total alcohol consumption, regardless of alcohol TTM stages, being more prevalent among well educated people. Keeping in mind the low number of participants, however such a result has been mentioned in several surveys, in which higher-educated people tended to use alcohol more than lower-educated ones [35,39,40,50,51]. Although according to most surveys higher education was related to more alcohol consumption in average, but lower educated people had worse alcohol consumption habits such as heavy drinking and they showed worse results such as more fatalities due to alcohol overuse [51,52]. Relationships between addiction and alcohol TTM stages was not statistically significant and needed further investigation; more participants and hookah smoking were identified as predictors of pre contemplation stage. Near a quarter of people at pre-contemplation stage were smokers while a small amount of people at termination stage, were smokers. Therefore, smoking was significantly more common among people who drank alcohol. Several surveys showed the relationship between drinking and smoking. Hookah smoking was statistically important and people in termination phase were more likely not hookah smokers [38,44,48], but the amount of smoking (pack / year) was not statistically significant in this study. Further studies warranted attention. Sleep hours per day and BMI were not related to alcohol TTM stages in this study. People, who were aware of alcohol disadvantages, were
more likely to quit alcohol, most of the people at termination stage were aware of the disadvantages. Therefore, it seemed that adequate information to population was an effective method. Family history of alcohol abuse was a strong predictor and most of the people at termination were without a family member using alcohol. Previous studies indicated a family history of alcohol addiction as a strong predictor of alcoholism as well [49].
While having an encourager to quit was a predictor of the termination stage, it was not important who encouraged them to quit. Anyone could be helpful. This may be due to the low number of participants in these categories in the present study. Further investigations with more sample sizes were appreciated to the better understanding.
People who began alcohol consumption at school ages did not tend to quit alcohol. Underage drinking was thought to be a powerful predictor of later adult alcohol abuse and alcohol dependence in previous studies as well. Near half of the pre-contemplators had predicted their problematic alcohol abuse at the onset of drinking.
The observed relation among alcohol abuse stages of changes and the determinants should interpret with caution and because of cross-sectional design that all variables were measured simultaneously, their association not necessarily establishing the causation. On the other hand, data were subjective and self-reported. It might result in over or under reporting. Longitudinal designs with objective measures would be of interest in future studies. However, this was the first study to investigate the Stages of change alcohol abuse and related factors in Iranian adults. On the second thought, data collection by trained interviewers and unawareness of them from the purpose of the study strengthened the results. Representativeness was assured through random selections of public areas across the city.
Near half of the participants reported previous or present history of alcohol consumption and only half were lifelong abstainers. This picture is from an Islamic holy city where assumed religious beliefs have cramped drinking patterns. According to the harm of alcohol abuse, it was necessary to tailor intervention for target populations. Factors identified as predictors of alcohol abuse such as age, marital status and occupation as well as being cigarette and hookah smokers should be taken into account in the design of future interventions.
Acknowledgements We kindly appreciate the efforts of all the people
involved in the project for the recruitment of participants
Journal of Medicine and Life
Journal of Medicine and Life Vol. 8, Special Issue 2, 2015
60
and collection of the data. This project is sponsored by Mashhad University of Medical Sciences.
Funding/ Support This study was supported by Mashhad University
of Medical Sciences, Mashhad, Iran.
References
1. Rehm J, Allamani A, Vedova RD, Elekes Z, Jakubczyk A, Landsmane I et al. General practitioners recognizing alcohol dependence: a large cross-sectional study in 6 European countries. Ann Fam Med. 2015 Jan; 13(1):28-32. doi: 10.1370/afm.1742.
2. Lindgren KP, Neighbors C, Wiers RW, Gasser ML, Teachman BA. Evaluating implicit drinking identity as a mediator of drinking motives and alcohol consumption and craving. Addict Behav. 2015 Apr; 43:33-8. doi: 10.1016/j.addbeh.2014.12.004.
3. WHO. Global status report on alcohol and health, 2014, Geneva: World Health Organization.
4. Michalak L, Trocki K, Katz K. I am a Muslim and My Dad is an Alcoholic - What Should I Do?: Internet-Based Advice for Muslims about Alcohol. J Muslim Ment Health. 2009 Mar 1; 4(1):47-66.
5. Glass JE, Williams EC, Bucholz KK. Psychiatric comorbidity and perceived alcohol stigma in a nationally representative sample of individuals with DSM-5 alcohol use disorder. Alcohol Clin Exp Res. 2014 Jun; 38(6):1697-705. doi: 10.1111/acer.12422.
6. Paasma R, Hovda KE, Hassanian-Moghaddam H et al. Risk factors related to poor outcome after methanol poisoning and the relation between outcome and antidotes—a multicenter study. Clin Toxicol (Phila). 2012; 50: 823–831.
7. Moghadam M, Talebi S, Sadeghi H, Gholami K, and Lankarani K. Therapeutic response to folinic acid in methanol poisoning epidemic in Shiraz. Iran J Med Sci. 2008; 33: 22–26 Memarian T. The tasks of diff erent organizations in the fi ght against alcoholism has been established by Addiction Expert Bureau. Iranian Students’ News agency (Tehran), 2012. http://isna.ir/fa/ news/91062917548.
8. Prochaska JO, DiClemente CC. Transtheoretical therapy toward a more integrative model of change. Psychotherapy: Theory, Research & Practice. 1982; 19, 276-88.
9. West R. Time for a change: putting the Transtheoretical (Stages of Change) Model to rest. Addiction. 2005; 100(8), 1036-9.
10. Koyun A, Eroglu K. The transtheoretical model use for smoking cessation. IASSR Journal. 2014; 130-134.
11. Evers KE, Paiva AL, Johnson JL, Cummins CO, Prochaska JO, Prochaska JM et al. Results of a transtheoretical
model-based alcohol, tobacco and other drug intervention in middle schools. Addict Behav. 2012; 37(9),1009-18.
12. Koyun A, Eroglu K. The transtheoretical model use for smoking cessation. IASSR Journal. 2014; 130-134.
13. Plummer BA, Velicer WF, Redding CA, Prochaska JO, Rossi JS, Pallonen UE et al. Stage of change, decisional balance, and temptations for smoking: Measurement and validation in a large, school-based population of adolescents. Addictive Behaviors. 2001; 26(4),551-571.
14. Anderson S, Keller C. Examination of the transtheoretical model in current smokers. Western Journal of Nursing Research. 2002; 24(3),282-294.
15. Baumann S, Gaertner B, Schnuerer I, Bischof G, John U, Freyer-Adam J. How well do TTM measures work among a sample of individuals with unhealthy alcohol use that is characterized by low readiness to change?. Psychol Addict Behav. 2013 Sep; 27(3):573-83. doi: 10.1037/a0029368.
16. Prochaska JO, DiClemente CC, Norc ross JC. In search of how people change: applications to addictive behaviors. Am Psychol. 1992; 47:1102–14.
17. Can smoking aggravate my multiple sclerosis symptoms?. Johns Hopkins Med Lett Health After 50. 2012; 24(2): 7.
18. Wilsnack RW. Gender and alcohol consumption: patterns from the multinational GENACIS project. Addiction. 2009; 104(9): 148. 500-7.
19. Wilsnack RW et al. Gender differences in alcohol consumption and adverse drinking consequences: cross‐cultural patterns. Addiction. 2000; 95(2): 251-265.
20. Engs RC, Hanson DJ. Gender differences in drinking patterns and problems among college students: A review of the literature. Journal of Alcohol and Drug Education. 1990; 35(2): 36-47.
21. Fillmore MT, Weafer J. Alcohol impairment of behavior in men and women. Addiction. 2004; 99(10): 1237-1246.
22. Naimi TS et al. Binge drinking among US adults. Jama. 2003; 289(1): 70-5.
23. Bonet de Luna C, Lopez Gimenez R. Alcohol and tobacco consumption of middle school students in the municipality of Madrid. An Esp Pediatr. 1993; 38(1): 49-53.
24. Nolen-Hoeksema S. Gender differences in risk factors and consequences for alcohol use and problems. Clin Psychol Rev. 2004; 24(8):981-1010.
25. Salzer J, Stenlund H, Sundstrom P. The interaction between smoking and Epstein-Barr virus as multiple sclerosis risk factors may depend on age. Mult Scler. 2013.
26. Manouchehrinia A et al. Tobacco smoking and disability progression in multiple sclerosis: United Kingdom cohort study. Brain. 2013; 136(Pt 7):2298-304.
27. Ely M et al. Gender differences in the relationship between alcohol consumption and drink problems are largely accounted for by body water. Alcohol and Alcoholism. 1999; 34(6):894-902.
28. Kerr-Correa F et al. Patterns of alcohol use between genders: a cross-cultural evaluation. J Affect Disord. 2007; 102(1-3): 265-75.
29. Curran PJ, Muthen BO, Harford TC. The influence of changes in marital status on developmental trajectories of alcohol use in young adults. Journal of Studies on Alcohol and Drugs. 1998; 59(6): 647.
30. Prescott CA, Kendler KS. Associations between marital status and alcohol consumption in a longitudinal study of female twins. J Stud Alcohol. 2001; 62,5:589-604.
31. Hedstrom AK et al. Nicotine might have a protective effect in the etiology of multiple sclerosis. Mult Scler. 2013; 19(8):1009-13.
32. Liew H. The effects of marital status transitions on alcohol use trajectories. Longitudinal and Life Course Studies. 2012; 3(3):332-345.
33. Seaman P, Edgar F. Creating better stories: Alcohol and gender in transitions to adulthood. Glasgow: Glasgow Centre for Population Health, 2012.
34. Lifestyle Statistics, H.a.S.C.I.C., Statistics on Alcohol: England, 2013, H.a.S.C.I.C. Lifestyle Statistics, Editor 2013: UK.
35. Windle M. Alcohol use among adolescents and young adults. Population. 2003; 45(5.9):19.5.
36. Fone DL et al. Socioeconomic patterning of excess alcohol consumption and binge drinking: a cross-sectional study of multilevel associations with neighbourhood deprivation. BMJ Open. 2013; 3(4).
37. Mueller BA, Nelson JL, Newcomb PA. Intrauterine environment and multiple sclerosis: a population- based case-control study. Mult Scler. 2013; 19(1):106-11.
38. Kretsch N, Harden KP. Marriage, Divorce, and Alcohol Use in Young Adulthood A Longitudinal Sibling-Comparison Study. Emerging Adulthood. 2013; 2167696813513260.
39. Berggren F, Nystedt P. Changes in alcohol consumption: An analysis of self-
Journal of Medicine and Life
Journal of Medicine and Life Vol. 8, Special Issue 2, 2015
61
reported use of alcohol in a Swedish national sample 1988—89 and 1996—97. Scandinavian Journal of Public Health. 2006; 34(3):304-311.
40. Liang W, Chikritzhs T. Brief report: marital status and alcohol consumption behaviours. Journal of Substance Use. 2012; 17(1):84-90.
41. De Leon J et al. Association between smoking and alcohol use in the general population: stable and unstable odds ratios across two years in two different countries. Alcohol Alcohol. 2007; 42(3):252-7.
42. Zins M et al. Alcohol consumption and marital status of French women in the GAZEL cohort: a longitudinal analysis between 1992 and 1996. Journal of Studies on Alcohol and Drugs. 2003; (6)64:784.
43. Malyutina S et al. Trends in alcohol intake by education and marital status in an urban population in Russia between the mid 1980s and the mid 1990s. Alcohol and Alcoholism. 2004; 39(1):64-69.
44. Casswell S, Pledger M, Hooper R. Socioeconomic status and drinking patterns in young adults. Addiction. 2003; 98(5):601-10.
45. Zhu Q et al. Drunkenness and its associations with risky health behaviors among adolescents and young adults in three Asian cities: Hanoi, Shanghai, Taipei. Drug and Alcohol Dependence, 2014.
46. Jennison KM, Johnson KA. Parental alcoholism as a risk factor for DSM-IV-defined alcohol abuse and dependence in American women: the protective benefits of dyadic cohesion in marital communication. Am J Drug Alcohol Abuse. 2001; 27(2):349-74.
47. Giskes K et al. Individual and household-level socioeconomic position is associated with harmful alcohol consumption behaviours among adults. Aust N Z J Public Health. 2011; 35(3):270 -7.
48. Grittner U et al. Alcohol consumption and social inequality at the individual and
country levels—results from an international study. The European Journal of Public Health. 2013; 23(2):332-339.
49. Jefferis BJ, Manor O, Power C. Social gradients in binge drinking and abstaining: trends in a cohort of British adults. J Epidemiol Community Health. 2007; 61(2):150-3.
50. Dierker L et al. The proximal association between smoking and alcohol use among first year college students. Drug Alcohol Depend. 2006; 81(1):1-9.
51. Epler AJ, Sher KJ, Piasecki TM. Reasons for abstaining or limiting drinking: a developmental perspective. Psychol Addict Behav. 2009; 23(3):428-42.
52. Hedstrom AK et al. Alcohol as a modifiable lifestyle factor affecting multiple sclerosis risk. JAMA Neurol. 2014; 71(3):300-5.
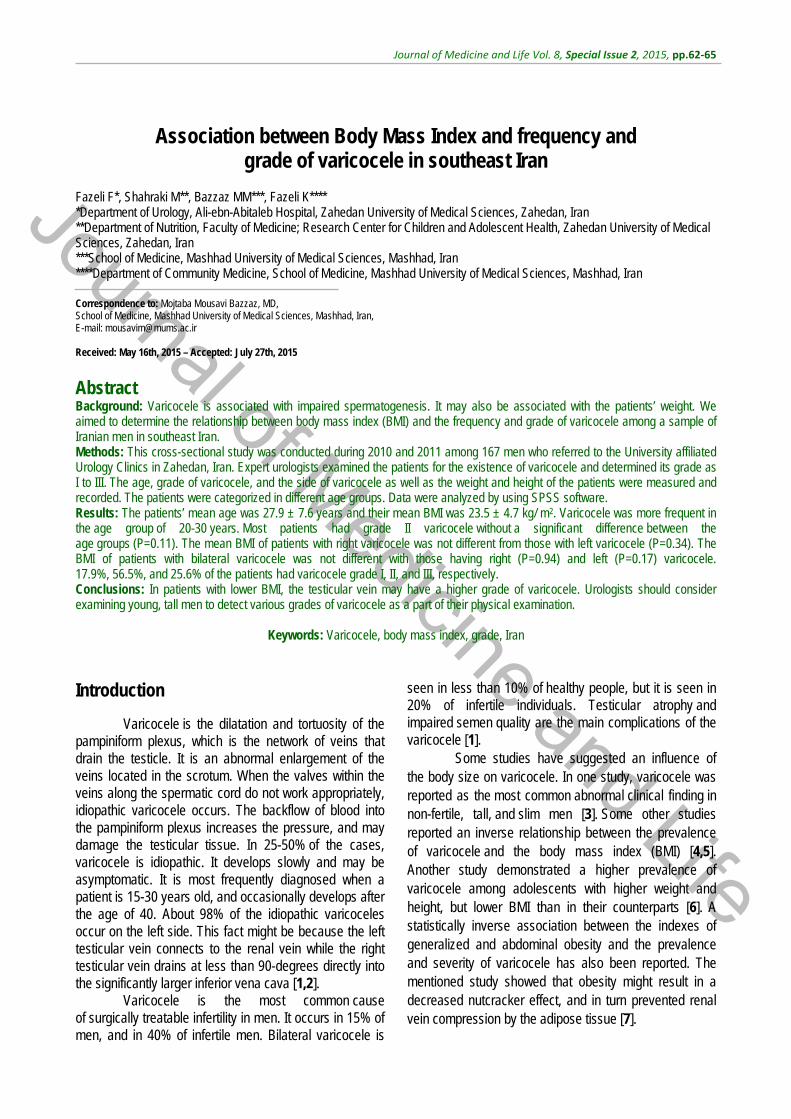
Journal of Medicine and Life
Journal of Medicine and Life Vol. 8, Special Issue 2, 2015, pp.62-65
Association between Body Mass Index and frequency and grade of varicocele in southeast Iran
Fazeli F*, Shahraki M**, Bazzaz MM***, Fazeli K**** *Department of Urology, Ali-ebn-Abitaleb Hospital, Zahedan University of Medical Sciences, Zahedan, Iran **Department of Nutrition, Faculty of Medicine; Research Center for Children and Adolescent Health, Zahedan University of Medical Sciences, Zahedan, Iran ***School of Medicine, Mashhad University of Medical Sciences, Mashhad, Iran ****Department of Community Medicine, School of Medicine, Mashhad University of Medical Sciences, Mashhad, Iran Correspondence to: Mojtaba Mousavi Bazzaz, MD, School of Medicine, Mashhad University of Medical Sciences, Mashhad, Iran, E-mail: [email protected] Received: May 16th, 2015 – Accepted: July 27th, 2015
Abstract Background: Varicocele is associated with impaired spermatogenesis. It may also be associated with the patients’ weight. We aimed to determine the relationship between body mass index (BMI) and the frequency and grade of varicocele among a sample of Iranian men in southeast Iran. Methods: This cross-sectional study was conducted during 2010 and 2011 among 167 men who referred to the University affiliated Urology Clinics in Zahedan, Iran. Expert urologists examined the patients for the existence of varicocele and determined its grade as I to III. The age, grade of varicocele, and the side of varicocele as well as the weight and height of the patients were measured and recorded. The patients were categorized in different age groups. Data were analyzed by using SPSS software. Results: The patients’ mean age was 27.9 ± 7.6 years and their mean BMI was 23.5 ± 4.7 kg/ m2. Varicocele was more frequent in the age group of 20-30 years. Most patients had grade II varicocele without a significant difference between the age groups (P=0.11). The mean BMI of patients with right varicocele was not different from those with left varicocele (P=0.34). The BMI of patients with bilateral varicocele was not different with those having right (P=0.94) and left (P=0.17) varicocele. 17.9%, 56.5%, and 25.6% of the patients had varicocele grade I, II, and III, respectively. Conclusions: In patients with lower BMI, the testicular vein may have a higher grade of varicocele. Urologists should consider examining young, tall men to detect various grades of varicocele as a part of their physical examination.
Keywords: Varicocele, body mass index, grade, Iran Introduction
Varicocele is the dilatation and tortuosity of the pampiniform plexus, which is the network of veins that drain the testicle. It is an abnormal enlargement of the veins located in the scrotum. When the valves within the veins along the spermatic cord do not work appropriately, idiopathic varicocele occurs. The backflow of blood into the pampiniform plexus increases the pressure, and may damage the testicular tissue. In 25-50% of the cases, varicocele is idiopathic. It develops slowly and may be asymptomatic. It is most frequently diagnosed when a patient is 15-30 years old, and occasionally develops after the age of 40. About 98% of the idiopathic varicoceles occur on the left side. This fact might be because the left testicular vein connects to the renal vein while the right testicular vein drains at less than 90-degrees directly into the significantly larger inferior vena cava [1,2].
Varicocele is the most common cause of surgically treatable infertility in men. It occurs in 15% of men, and in 40% of infertile men. Bilateral varicocele is
seen in less than 10% of healthy people, but it is seen in 20% of infertile individuals. Testicular atrophy and impaired semen quality are the main complications of the varicocele [1].
Some studies have suggested an influence of the body size on varicocele. In one study, varicocele was reported as the most common abnormal clinical finding in non-fertile, tall, and slim men [3]. Some other studies reported an inverse relationship between the prevalence of varicocele and the body mass index (BMI) [4,5]. Another study demonstrated a higher prevalence of varicocele among adolescents with higher weight and height, but lower BMI than in their counterparts [6]. A statistically inverse association between the indexes of generalized and abdominal obesity and the prevalence and severity of varicocele has also been reported. The mentioned study showed that obesity might result in a decreased nutcracker effect, and in turn prevented renal vein compression by the adipose tissue [7].
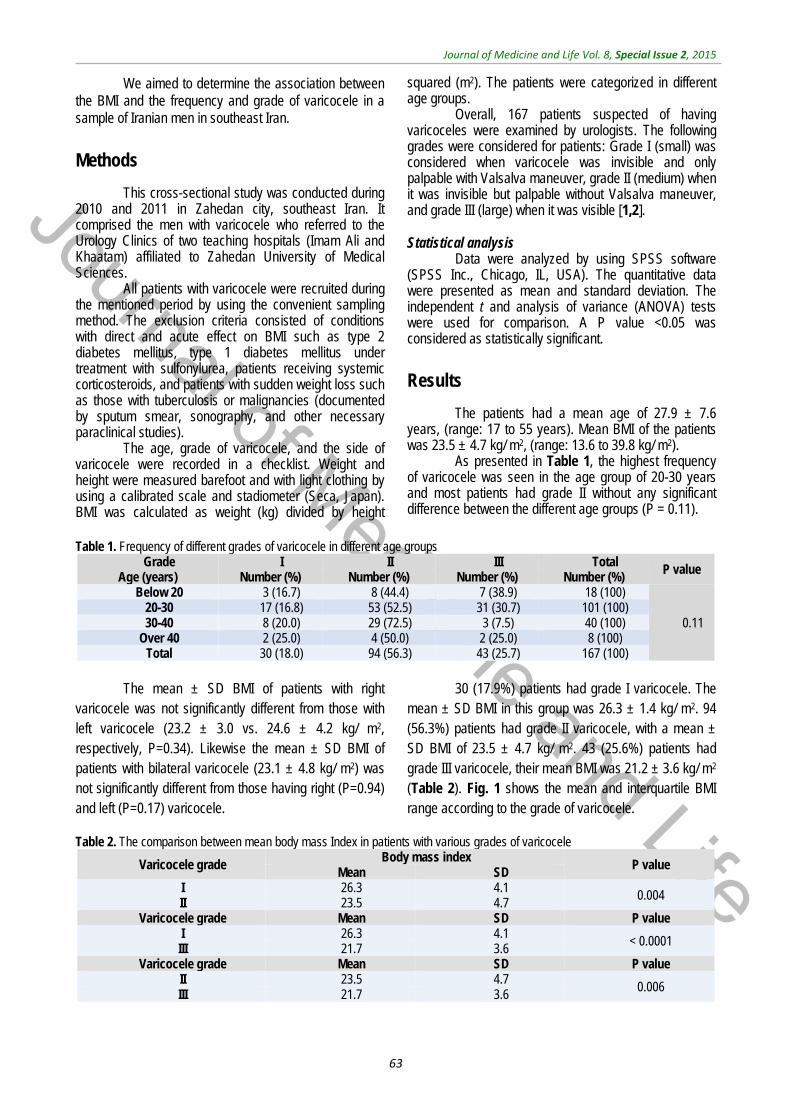
Journal of Medicine and Life
Journal of Medicine and Life Vol. 8, Special Issue 2, 2015
63
We aimed to determine the association between the BMI and the frequency and grade of varicocele in a sample of Iranian men in southeast Iran.
Methods
This cross-sectional study was conducted during 2010 and 2011 in Zahedan city, southeast Iran. It comprised the men with varicocele who referred to the Urology Clinics of two teaching hospitals (Imam Ali and Khaatam) affiliated to Zahedan University of Medical Sciences.
All patients with varicocele were recruited during the mentioned period by using the convenient sampling method. The exclusion criteria consisted of conditions with direct and acute effect on BMI such as type 2 diabetes mellitus, type 1 diabetes mellitus under treatment with sulfonylurea, patients receiving systemic corticosteroids, and patients with sudden weight loss such as those with tuberculosis or malignancies (documented by sputum smear, sonography, and other necessary paraclinical studies).
The age, grade of varicocele, and the side of varicocele were recorded in a checklist. Weight and height were measured barefoot and with light clothing by using a calibrated scale and stadiometer (Seca, Japan). BMI was calculated as weight (kg) divided by height
squared (m2). The patients were categorized in different age groups.
Overall, 167 patients suspected of having varicoceles were examined by urologists. The following grades were considered for patients: Grade I (small) was considered when varicocele was invisible and only palpable with Valsalva maneuver, grade II (medium) when it was invisible but palpable without Valsalva maneuver, and grade III (large) when it was visible [1,2]. Statistical analysis
Data were analyzed by using SPSS software (SPSS Inc., Chicago, IL, USA). The quantitative data were presented as mean and standard deviation. The independent t and analysis of variance (ANOVA) tests were used for comparison. A P value <0.05 was considered as statistically significant.
Results
The patients had a mean age of 27.9 ± 7.6 years, (range: 17 to 55 years). Mean BMI of the patients was 23.5 ± 4.7 kg/ m2, (range: 13.6 to 39.8 kg/ m2).
As presented in Table 1, the highest frequency of varicocele was seen in the age group of 20-30 years and most patients had grade II without any significant difference between the different age groups (P = 0.11).
Table 1. Frequency of different grades of varicocele in different age groups
Grade Age (years)
I II III Total P value Number (%) Number (%) Number (%) Number (%)
Below 20 3 (16.7) 8 (44.4) 7 (38.9) 18 (100)
0.11 20-30 17 (16.8) 53 (52.5) 31 (30.7) 101 (100) 30-40 8 (20.0) 29 (72.5) 3 (7.5) 40 (100)
Over 40 2 (25.0) 4 (50.0) 2 (25.0) 8 (100) Total 30 (18.0) 94 (56.3) 43 (25.7) 167 (100)
The mean ± SD BMI of patients with right
varicocele was not significantly different from those with left varicocele (23.2 ± 3.0 vs. 24.6 ± 4.2 kg/ m2, respectively, P=0.34). Likewise the mean ± SD BMI of patients with bilateral varicocele (23.1 ± 4.8 kg/ m2) was not significantly different from those having right (P=0.94) and left (P=0.17) varicocele.
30 (17.9%) patients had grade I varicocele. The mean ± SD BMI in this group was 26.3 ± 1.4 kg/ m2. 94 (56.3%) patients had grade II varicocele, with a mean ± SD BMI of 23.5 ± 4.7 kg/ m2. 43 (25.6%) patients had grade III varicocele, their mean BMI was 21.2 ± 3.6 kg/ m2
(Table 2). Fig. 1 shows the mean and interquartile BMI range according to the grade of varicocele.
Table 2. The comparison between mean body mass Index in patients with various grades of varicocele
Varicocele grade Body mass index
P value Mean SD
I 26.3 4.1 0.004 II 23.5 4.7
Varicocele grade Mean SD P value I 26.3 4.1 < 0.0001 III 21.7 3.6
Varicocele grade Mean SD P value II 23.5 4.7
0.006 III 21.7 3.6

Journal of Medicine and Life
Journal of Medicine and Life Vol. 8, Special Issue 2, 2015
64
Discussion
We found an inverse association between BMI and the grade of varicocele. The mean BMI of our patients (23.5kg/ m2) was higher than that documented in Chen and Haung’s study (22.8kg/ m2) [7], and lower than that in Gokce and colleagues’ study (25.1kg/ m2) [3].
Some studies showed a higher prevalence of varicocele among individuals with a low BMI [3,5]. In a study conducted in 2009 in Taiwan, the biochemical factors and BMI of 102 patients with varicocele were compared with 95 controls. Patients with varicocele had lower cholesterol levels than the healthy controls. The prevalence of varicocele in men with a low BMI was significantly higher than that of the others [7]. Consistent with these findings, Tsao and colleagues also showed that the prevalence and severity of varicocele were inversely associated with generalized and abdominal obesity [8]. The findings of our study are in line with the aforementioned studies. We found that the mean BMI was significantly higher in patients with grade I than in those
with grades II and III of varicocele, and the mean BMI was inversely associated with the severity of varicocele.
Because of anatomical reasons, the most common location for the occurrence of varicocele is in the left testicle. It was documented that more than 80% of the men with left varicocele are prone to bilateral varicocele. In our study, most patients (78.7%) had bilateral varicocele, 14.2% had left side varicocele, and 7.1% had right side varicocele. The mean BMI was not significantly different in patients with right or left varicocele. These findings are consistent with some previous studies [9,10].
The inverse association of BMI and varicocele is well documented [11-13]. Some researchers suggested that the lower prevalence of varicocele in obese persons might be because of increased adipose tissue, making physical examination difficult. However, a study conducted among 1079 patients, of whom 330 (30.6%) had varicocele detected by ultrasound, did not confirm this hypothesis [14].
A study conducted among a population-based sample of 1050 young men revealed an inverse relationship between obesity and varicocele. This study confirmed that obesity might result in a decreased nutcracker effect, which may prevent renal vein compression by the adipose tissue [15].
In our present study, the highest frequency of varicocele was documented in the age group of 20-30 years. The mean age of patients who had varicocele in a previous study in Iran was higher [16,17].
Conclusion
In patients with lower BMI, the testicular veins may have a higher grade of varicocele. In other words, men with a higher grade of varicocele, have a lower BMI. Urologists should consider examining young, tall men to detect various grades of varicocele as a part of their physical examination.
References
1. Tanagho EA, Mc Anninch JW. Smith’s General Urology. Lange Mc Grew Hill. 2008; 707.
2. Campbell MF, Wein AJ, Kavoussi R. Campbell-Walsh Urology, 9th Edition, Vol. 1, Chapter 19, Male infertility, 2007, Philadelphia: WB Saunders.
3. Gökçe A, Davarcı M, Yalçınkaya FR, Güven EO, Balbay MD. Relationship of Varicocele with height and obesity in men presenting with infertility. European Urology Supplements. 2009; 8, 8:599.
4. Handel LN, Shetty R, Sigman M. The Relationship between Varicocele and Obesity. The Journal of Urology. 2007; 178, 5:2138-2139.
5. Nielsen ME, Zderic S, Freedland SJ, Jarow JP. Insight on Pathogenesis of Varicoceles: Relationship of Varicocele and Body Mass Index. Adult Urology. 2006; 392.
6. May M, Taymoorian K, Beutner S, Helke C, Braun KP, Lein M, Roigas J, Hoschke B. Body size and weight as predisposing factors in varicocele. Scand J Urol Nephrol. 2006; 40(1):45-8.
7. Chen SS, Huang WJ. Differences in Biochemical Markers and Body Mass Index between Patients with and Without Varicocele. J Chin Med Assoc. April 2010; 73; 4:194-8.
8. Fauci AS, Harrison S. Principles of internal medicine, 17th Edition, Part 5: Evaluation and management of obesity, 2008, New York, McGraw-Hill Medical.
9. Delaney DP, Carr MC, Kolon TF, Snyder HM, Zderic SA. The physical characteristics of young males with varicocele. BJU Int. 2004; 94:624.
10. Grober ED, Chan PT, Zini A, Goldstein M. Microsurgical, Schlegel PN, Goldstein M. Intraoperative varicocele treatment of persistent or recurrent varicocele. Fertile Sterile. 2004; 82(3):718-22.
11. Handel LN, Shetty R, Sigman M. The relationship between varicoceles and obesity. J Urol. 2006; 176(5):2138-40.
Fig. 1 Mean and interquartile range of body mass index according to the grade of varicocele

Journal of Medicine and Life
Journal of Medicine and Life Vol. 8, Special Issue 2, 2015
65
12. Abedi G, Rostami F, Nikpor B. Analyzing of regression model of environmental health quality of residential in slum areas. International Journal of Collaborative Research on Internal Medicine & Public Health. 2012; 4(2):137-143.
13. Tsao CW, Hsu CY, Chou YC, Wu ST, Sun GH, Yu DS, Fan PL, Chen HI, Chang SY, Cha TL. The relationship between varicoceles and obesity in a young adult population. Int J Androl. 2009; 32(4):385-90.
14. Chanc Walters R, Marguet CG, Crain DS. Lower prevalence of varicoceles in obese patients found on routine scrotal ultrasound. J Urol. 2012; 187(2):599-601.
15. Tsao CW, Hsu CY, Chou YC, Wu ST, Sun GH, Yu DS, Fan PL, Chen HI, Chang SY, Cha TL. The relationship between varicoceles and obesity in a young adult population. Int J Androl. 2009; 32(4):385-90.
16. Karimpour A, Jor Saraaei G, Moosa Nejad N, Agha Jaani Mir A, Esmaeil Nejad Moghadam A. Frequency of
varicocele in men with primary and secondary infertility referred to the infertility Center of Mazandaran Province. Feiz J. 2006; 37(1):50-5.
17. Abedi G, Ebadattalab, Rostami F. Analyzing Quality Gap of Nursing Services in the Selective Academic Hospitals. International Journal of Collaborative Research on Internal Medicine & Public Health, 2012; 4; 10: 1809-1815
Journal of Medicine and Life
Journal of Medicine and Life Vol. 8, Special Issue 2, 2015, pp.66-71
A clinical trial comparing the effect of peer education and orientation program on the anxiety levels
of pre-CABG surgery patients
Esmaeili R*, Jannati Y**, Ghafari R**, Charati JY**, Jelodar HN*** *Orthopedic Research Center, Mazandaran University of Medical Sciences, Sari, Iran **Mazandaran University of Medical Sciences, Sari, Iran ***Critical Care Nursing, Mazandaran University of Medical Sciences, Sari, Iran Correspondence to: Hadi Nematian Jelodar, Master Student of Critical Care Nursing, Member of Student Research Committee, Nursing and Midwifery College, Vesal Street, Sari, Iran, Phone: +989119088394, E-mail: [email protected] Received: May 19th, 2015 – Accepted: July 27th, 2015
Abstract Background and Objectives: One of the main treatment methods of coronary artery disease is coronary artery bypass graft (CABG) surgery. The anxiety level in patients undergoing this surgery is relatively very high. Thus, reducing anxiety in these patients is an important step toward wellness. This study aimed to compare the effects of peer education (PE) and orientation program (OP) on the anxiety levels of patients before CABG surgery. Material and Methods: This randomized controlled trial was conducted in 2014 at the Mazandaran Heart Center on three groups of 50 persons each: PE, OP, and control (Cl). The anxiety levels of patients in each group were measured one day and one hour before the surgery. All groups received routine education. In addition, the PE group received PE and the OP group received OP. Two questionnaires were used to collect the demographics and the clinical data; and Spielberg state anxiety questionnaire was used to measure the anxiety level. Data from descriptive statistics, chi-square, ANOVA, ANCOVA, Bonferroni, and Fisher exact test were analyzed in SPSS v20 software. Findings: The mean anxiety score before surgery was not significantly different in the three groups (P=0.955). However, after the intervention at 1 h before surgery, the mean anxiety level in the PE and OP group was lower than in the Cl group (P=0.000). However, the mean anxiety score between PE and OP groups showed no significant difference (P=0.051). Conclusion: Both PE and OP group reduced the anxiety naturally developed in a patient before surgery. Although the influence of the PE group was greater in reducing anxiety, the use of this technique in clinical practices required further studies.
Keywords: peer group education, employee orientation program, anxiety, coronary artery bypass grafting, clinical trial
Introduction
Cardiovascular diseases are the most common and significant cause of death worldwide [1]. The outbreak of these diseases is rapidly increasing in the Middle East, constituting about 40% of the total deaths [2]. The latest WHO report for Iran states that cardiovascular diseases are the first reason for deaths here, of which >45% of the deaths occur due to coronary artery diseases [3]. Despite the availability of facilities of medicinal treatment and invasive interventions, surgery requirement has significantly reduced in the present time; CABG surgery remains one of the major methods for treating coronary artery diseases [1]. One of the frequent problems of patients before the surgery is higher levels of anxiety in this case as compared to that in other surgeries, since heart is closely related to human life and death [4]. In a German research conducted in 2007, the pre- and post-CABG surgery anxiety level was 34–24.7%, respectively [5]. Lopez et al. [6] reported that the fear of surgery, getting into a strange setting, separation from
family and its outcomes, feeling of helplessness, and the probability of death during surgery are the most critical reasons for anxiety in CABG patients before surgery. Increased anxiety results in raised heart beat, hypertension, the possibility of dysrhythmia, delayed wound healing [7], increased infection risk, electrolytes and fluid imbalance, altered sleep pattern [8], higher post-operation pain, postponed discharge [9], and, finally, lower patients’ satisfaction with treatment style and nursing care [10]. Generally, two different methods, medicinal and non-medicinal, are applied to lower pre-surgery anxiety of the patients. The non-medicinal ones have fewer side effects and risks as compared with the medicinal methods. These methods were not prescribed by the doctor. In addition, their implementation was easier, safer, and non-invasive [11].
One of the appropriate non-medicinal methods that can reduce the anxiety level is the provision of sufficient information and training about the disease, its control, and care, and follow-up program by the knowledgeable people involved in the same disease. In

Journal of Medicine and Life
Journal of Medicine and Life Vol. 8, Special Issue 2, 2015
67
this training method, a plain, intimate, and secure setting is created, where the patients mutually share their experiences and feelings about the malady afflicting them. As a result, they utilize their peers’ fruitful and constructive experiences as a model, which promotes the disease treatment process and alleviates the associated symptoms [12]. The peer education (PE) group members could communicate better with their peers (patients) and encourage them to conduct themselves in suitable healthy behaviors, since they can share their weak and strong points as well as experiences at negligible or no cost [13]. Supporting the peers makes the patients more prepared mentally for the heart surgery and motivates them for a positive approach toward cardiac recovery [14].
On the other hand, since the fear for unknown as a result of lack of knowledge and unfamiliarity with the setting and the manner in which the cardiac surgery is performed, are the most initial and major reasons behind anxiety and worry [15], offering a program that familiarizes patients with the operating room, ICU, and the available devices in these wards seems like a significant approach toward reducing the patients’ pre-operation anxiety [16]. In an orientation program (OP), the information, cognitive and speech power, experiences and knowledge, and, consequently, their awareness about the events and phenomena in the setting increases [17]. Nowadays, in Iran, previous studies on training and familiarization of patients undergoing surgery have been conducted in the consulting rooms and pre-operation the familiarization of patients with the ICU and operating room is very infrequent. To raise self-care related knowledge, awareness, and skill via OP, allows the patient to get better adjusted with the problems of coronary artery bypass graft (CABG) surgery, such as anxiety [18].
Considering the exacerbated anxiety levels in patients about undergoing CABG surgery in comparison with other surgeries [4], no study has compared the effect of training by the PE and OP on pre-CABG surgery anxiety levels of patients. This question that arises regards which of the two methods, namely PE or OP, is more effective in lowering the patients’ anxiety levels in a research design ahead of CABG surgery.
Method
This research is a clinical trial conducted with the aim of comparing the effect of training by PE and OP on the patients’ anxiety levels before CABG surgery. The study units were selected by a convenient sampling method. Then, the samples were assigned to either of the groups by a random block allocation. In the present study, a different block was selected every week, for example, the control group in the 1st week, the OP group in the 2nd week, and the PE group in the 3rd week. In order to prevent data contamination and to create a bias, the sampling process was started each week, depending on the study units discharged in the previous week, and,
when no unit was discharged, sampling was not performed until it occurred. The sample size was determined with a confidence coefficient of 95% and a test power of 80%, 50 subjects being taken into account for each group. The inclusion criteria were include the patients undergoing CABG surgery for the first time, at least 18 years of age; fully conscious and knowledgeable regarding the time, place, and person; lacking physical and cognitive disorders; lacking medical education or related to it; no prior medical diagnosis of anxiety and depression; and not taking tranquilizer, anti-depressants, or anti-anxiety drugs at one month before surgery. The exclusion criteria were the unwillingness of patients to continue the participation in the study, and their condition worsening during the study period. The data collection tool consisted of three parts: personal traits, medical data, and Spielberg state anxiety questionnaire. To define the validity of the questionnaire’s first and second sections, face validity was employed, such that this questionnaire was presented to 10 people of the Mazandaran University of Medical Science faculty staff and modifications were made to the questionnaire post receiving their comments. The state of anxiety is the same instantaneous individual anxiety expressing the person’s current feeling or emotion at a time period like getting prepared for the surgery [19]. The Spielberg anxiety questionnaire had global validity and reliability. According to Mahram’s report for the mentioned test validity, the mean anxiety of normal and standard community in all age brackets was compared at 5% and 1%, to achieve a meaningful result, indicating the validity of anxiety measurement. The scientific reliability was also verified by α-Cronbach formula, which was 0.9452 in the normal community and 0.9418 in the standard community [20]. In addition, its reliability and validity in the Iranian society cardiac patients was confirmed via the study by Akbarzade et al.[21].
The questionnaire was made up of 20 multiple questions, with the options of “very little, little, a lot, and very much”. This questionnaire’s minimum score was 20 and the maximum was 80. In this research, the score 20–39 indicated mild anxiety, 40-59 indicated average anxiety, and 60-80 indicated intense anxiety [22].
After receiving the agreement from the research deputy of Mazandaran University of Medical Science and presenting the same to the Director of Mazandaran Heart Center, the researcher was referred to this center, and the list of patients undergoing CABG surgery during the past years was analyzed, seeking their peers. The inclusion criteria for peers covered the following ones: holding the least education level as a diploma had a successful CABG surgery at least a year before, having the right social relations, and having no anxiety or mild anxiety based on the Spielberg state anxiety questionnaire.
In the current study, in order to match the peers with the patients in terms of age and gender, two peers were selected to train the patients, of whom one was a 50-year-old man who trained male patients and a 45-year-old woman who trained the female patients. Then, the peers were trained by the researcher according to the CABG surgery candidate patients’ educational needs,
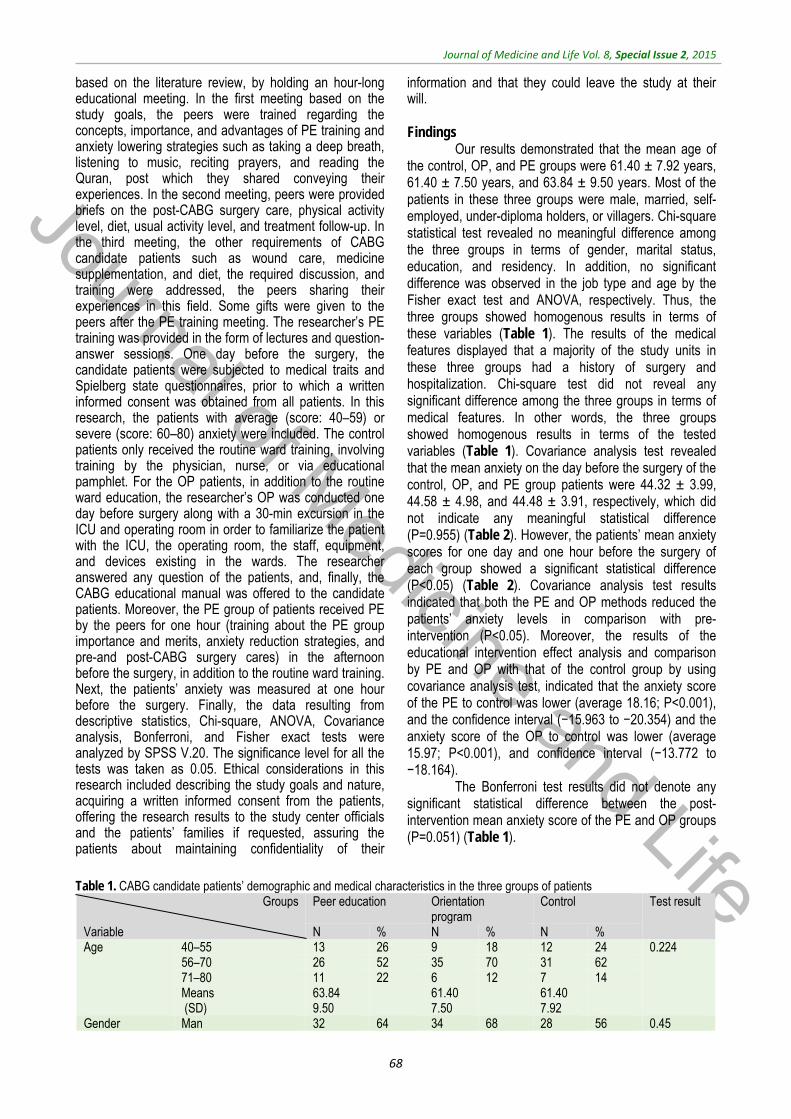
Journal of Medicine and Life
Journal of Medicine and Life Vol. 8, Special Issue 2, 2015
68
based on the literature review, by holding an hour-long educational meeting. In the first meeting based on the study goals, the peers were trained regarding the concepts, importance, and advantages of PE training and anxiety lowering strategies such as taking a deep breath, listening to music, reciting prayers, and reading the Quran, post which they shared conveying their experiences. In the second meeting, peers were provided briefs on the post-CABG surgery care, physical activity level, diet, usual activity level, and treatment follow-up. In the third meeting, the other requirements of CABG candidate patients such as wound care, medicine supplementation, and diet, the required discussion, and training were addressed, the peers sharing their experiences in this field. Some gifts were given to the peers after the PE training meeting. The researcher’s PE training was provided in the form of lectures and question-answer sessions. One day before the surgery, the candidate patients were subjected to medical traits and Spielberg state questionnaires, prior to which a written informed consent was obtained from all patients. In this research, the patients with average (score: 40–59) or severe (score: 60–80) anxiety were included. The control patients only received the routine ward training, involving training by the physician, nurse, or via educational pamphlet. For the OP patients, in addition to the routine ward education, the researcher’s OP was conducted one day before surgery along with a 30-min excursion in the ICU and operating room in order to familiarize the patient with the ICU, the operating room, the staff, equipment, and devices existing in the wards. The researcher answered any question of the patients, and, finally, the CABG educational manual was offered to the candidate patients. Moreover, the PE group of patients received PE by the peers for one hour (training about the PE group importance and merits, anxiety reduction strategies, and pre-and post-CABG surgery cares) in the afternoon before the surgery, in addition to the routine ward training. Next, the patients’ anxiety was measured at one hour before the surgery. Finally, the data resulting from descriptive statistics, Chi-square, ANOVA, Covariance analysis, Bonferroni, and Fisher exact tests were analyzed by SPSS V.20. The significance level for all the tests was taken as 0.05. Ethical considerations in this research included describing the study goals and nature, acquiring a written informed consent from the patients, offering the research results to the study center officials and the patients’ families if requested, assuring the patients about maintaining confidentiality of their
information and that they could leave the study at their will. Findings
Our results demonstrated that the mean age of the control, OP, and PE groups were 61.40 ± 7.92 years, 61.40 ± 7.50 years, and 63.84 ± 9.50 years. Most of the patients in these three groups were male, married, self-employed, under-diploma holders, or villagers. Chi-square statistical test revealed no meaningful difference among the three groups in terms of gender, marital status, education, and residency. In addition, no significant difference was observed in the job type and age by the Fisher exact test and ANOVA, respectively. Thus, the three groups showed homogenous results in terms of these variables (Table 1). The results of the medical features displayed that a majority of the study units in these three groups had a history of surgery and hospitalization. Chi-square test did not reveal any significant difference among the three groups in terms of medical features. In other words, the three groups showed homogenous results in terms of the tested variables (Table 1). Covariance analysis test revealed that the mean anxiety on the day before the surgery of the control, OP, and PE group patients were 44.32 ± 3.99, 44.58 ± 4.98, and 44.48 ± 3.91, respectively, which did not indicate any meaningful statistical difference (P=0.955) (Table 2). However, the patients’ mean anxiety scores for one day and one hour before the surgery of each group showed a significant statistical difference (P<0.05) (Table 2). Covariance analysis test results indicated that both the PE and OP methods reduced the patients’ anxiety levels in comparison with pre-intervention (P<0.05). Moreover, the results of the educational intervention effect analysis and comparison by PE and OP with that of the control group by using covariance analysis test, indicated that the anxiety score of the PE to control was lower (average 18.16; P<0.001), and the confidence interval (−15.963 to −20.354) and the anxiety score of the OP to control was lower (average 15.97; P<0.001), and confidence interval (−13.772 to −18.164).
The Bonferroni test results did not denote any significant statistical difference between the post-intervention mean anxiety score of the PE and OP groups (P=0.051) (Table 1).
Table 1. CABG candidate patients’ demographic and medical characteristics in the three groups of patients
Groups Variable
Peer education Orientation program
Control Test result
N % N % N % Age 40–55 13 26 9 18 12 24 0.224
56–70 26 52 35 70 31 62 71–80 11 22 6 12 7 14 Means (SD)
63.84 9.50
61.40 7.50
61.40 7.92
Gender Man 32 64 34 68 28 56 0.45
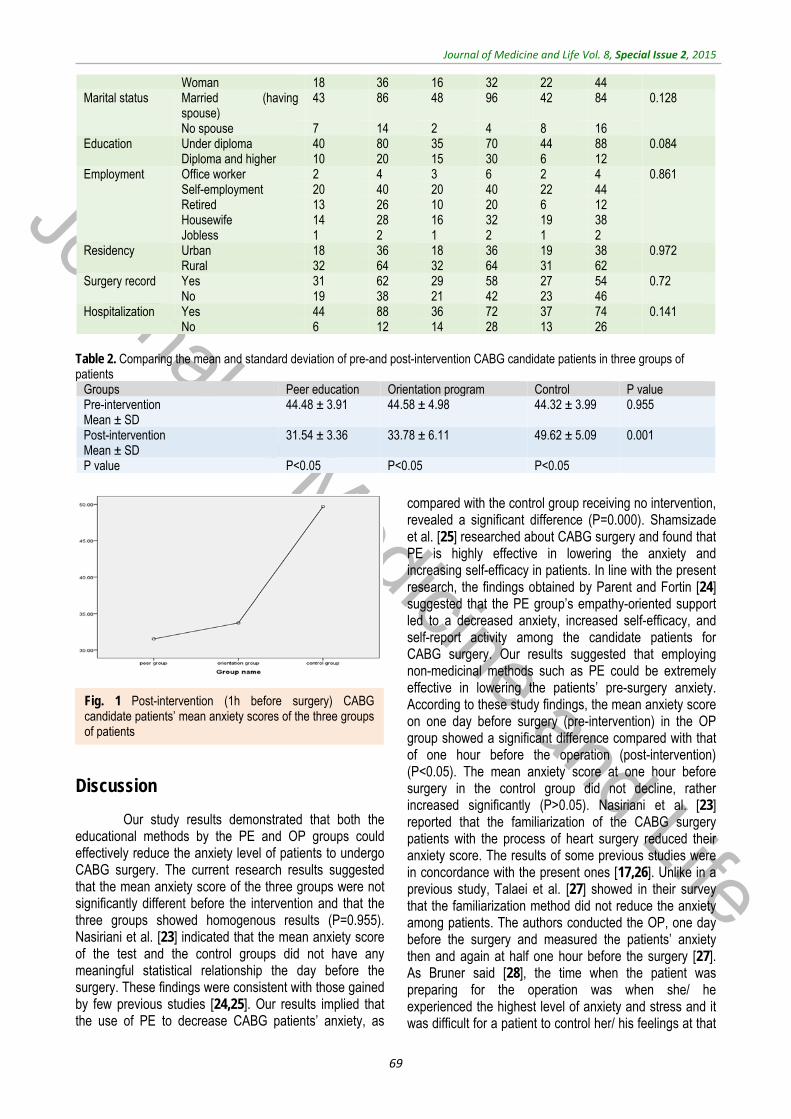
Journal of Medicine and Life
Journal of Medicine and Life Vol. 8, Special Issue 2, 2015
69
Woman 18 36 16 32 22 44 Marital status Married (having
spouse) 43 86 48 96 42 84 0.128
No spouse 7 14 2 4 8 16 Education Under diploma 40 80 35 70 44 88 0.084
Diploma and higher 10 20 15 30 6 12 Employment Office worker 2 4 3 6 2 4 0.861
Self-employment 20 40 20 40 22 44 Retired 13 26 10 20 6 12 Housewife 14 28 16 32 19 38 Jobless 1 2 1 2 1 2
Residency Urban 18 36 18 36 19 38 0.972 Rural 32 64 32 64 31 62
Surgery record Yes 31 62 29 58 27 54 0.72 No 19 38 21 42 23 46
Hospitalization Yes 44 88 36 72 37 74 0.141 No 6 12 14 28 13 26
Table 2. Comparing the mean and standard deviation of pre-and post-intervention CABG candidate patients in three groups of patients
Groups Peer education Orientation program Control P value Pre-intervention Mean ± SD
44.48 ± 3.91 44.58 ± 4.98
44.32 ± 3.99 0.955
Post-intervention Mean ± SD
31.54 ± 3.36 33.78 ± 6.11 49.62 ± 5.09 0.001
P value P<0.05 P<0.05 P<0.05
Discussion
Our study results demonstrated that both the educational methods by the PE and OP groups could effectively reduce the anxiety level of patients to undergo CABG surgery. The current research results suggested that the mean anxiety score of the three groups were not significantly different before the intervention and that the three groups showed homogenous results (P=0.955). Nasiriani et al. [23] indicated that the mean anxiety score of the test and the control groups did not have any meaningful statistical relationship the day before the surgery. These findings were consistent with those gained by few previous studies [24,25]. Our results implied that the use of PE to decrease CABG patients’ anxiety, as
compared with the control group receiving no intervention, revealed a significant difference (P=0.000). Shamsizade et al. [25] researched about CABG surgery and found that PE is highly effective in lowering the anxiety and increasing self-efficacy in patients. In line with the present research, the findings obtained by Parent and Fortin [24] suggested that the PE group’s empathy-oriented support led to a decreased anxiety, increased self-efficacy, and self-report activity among the candidate patients for CABG surgery. Our results suggested that employing non-medicinal methods such as PE could be extremely effective in lowering the patients’ pre-surgery anxiety. According to these study findings, the mean anxiety score on one day before surgery (pre-intervention) in the OP group showed a significant difference compared with that of one hour before the operation (post-intervention) (P<0.05). The mean anxiety score at one hour before surgery in the control group did not decline, rather increased significantly (P>0.05). Nasiriani et al. [23] reported that the familiarization of the CABG surgery patients with the process of heart surgery reduced their anxiety score. The results of some previous studies were in concordance with the present ones [17,26]. Unlike in a previous study, Talaei et al. [27] showed in their survey that the familiarization method did not reduce the anxiety among patients. The authors conducted the OP, one day before the surgery and measured the patients’ anxiety then and again at half one hour before the surgery [27]. As Bruner said [28], the time when the patient was preparing for the operation was when she/ he experienced the highest level of anxiety and stress and it was difficult for a patient to control her/ his feelings at that
Fig. 1 Post-intervention (1h before surgery) CABG candidate patients’ mean anxiety scores of the three groups of patients
Journal of Medicine and Life
Journal of Medicine and Life Vol. 8, Special Issue 2, 2015
70
time point. Thus, it was probable that factors such as not measuring post-surgery anxiety and re-comparing the groups with each other as well as measuring anxiety score at the time when the patient was preparing for the surgery could have affected the results. The result of this research did not indicate any meaningful statistical difference between the PE and OP groups toward lowering the patients’ anxiety level (P=0.051). In addition, in their study, Field et al. [29] discovered identical results, according to which, compared with the interpersonal psychotherapy, the PE supportive group did not reveal any significant difference in lowering the levels of anxiety and depression in pregnant women. Salavati et al. [30] compared the effect of personal education and PE on the quality of life of heart failure patients. They concluded that, although both the methods enhanced the life quality, the impact of PE group training was inconsistent as compared with the present research results [30]. In his research, Gharib [31] comparatively analyzed the effect of Benson relaxation and familiarization methods on the vital signs and anxiety of Endoscopic Retrograde Cholangiopancreatography (ERCP) candidate patients and demonstrated that the familiarization process was effective in reducing the patients’ anxiety level, which was incompatible with the results of the present study.
Our research limitations included the individual differences, and the psychological condition of the study units responding to the questions, which could have influenced the answering and the study units’ family, and
socioeconomic problems, whose overall control was beyond the study potential.
Conclusion
Our study results indicated the effect of education by the PE and OP groups on lowering the patients’ pre-operative CABG surgery anxiety. Both methods remarkably decreased the patients’ anxiety level. However, the impact of the two methods was equal, both being equally preferable. With respect to the findings of the present study, employing the two proposed non-medicinal, simple, effective, economical, and cost-effective approach was recommended to lower pre-surgery anxiety among the cardiac patients. We proposed to conduct such a study at a broader level and to prevent other patients from suffering of chronic diseases in the future. Acknowledgement
This article is the result of the thesis in critical care nursing for a master degree that was registered in clinical trial site (code: IRCT2014102619677N1). Also, this project was conducted with the help of deputy of Research grant of Mazandaran University of Medical Science. We would like to thank the peers and patients who participated in this study.
References
1. Tung H, Hunter A, Wei J. Coping, anxiety and quality of life after coronary artery bypass graft surgery. J Adv Nurs. 2008; 61(6):651-63. doi: 10.1111/j.1365-2648.2007.04557.x.
2. Loscalzo J. Harrison's cardiovascular medicine. 2010, McGraw-Hill Medical New York.
3. World Health Organization. NCD Country Profiles ,Dec 2011. www.who.int/.
4. Smeltzer SC, Bare BG, Hinkle JL, Cheever KH. Brunner and Suddarth's Textbook of Medical Surgical Nursing. In One Volume, 2010, Lippincott Williams & Wilkins.
5. Krannich JH, Weyers P, Lueger S, Herzog M, Bohrer T, Elert O. Presence of Depression and Anxiety before and after coronary artery bypass graft surgery and their relationship to age. BMC Psychiatry. 2007; 7(47):1-6.
6. Lopez V, Sek Ying C, Poon CY, Wai Y. Physical, psychological and social recovery patterns after coronary artery bypass graft surgery: a prospective repeated measures questionnaire survey. Int J Nurs Stud. 2007; 44(8):1304-15.
7. Barker R, Kober A, Hoerauf K, Latzke D, Adel S, Kain ZN et al. Out-of-hospital auricular acupressure in elder patients with hip fracture: a randomized double-blinded trial. Acad Emerg Med. 2006; 13(1):19-23.
8. Barnason S, Zimmerman L, Nieveen J. The effect of music intervention on anxiety in the patient after coronary artery bypass grafting. Heart Lung. 1995; 24(2):124-32.
9. Agarwal A, Ranjan R, Dhiraaj S, Lakra A, Kumar M, Singh U. Acupressure for prevention of preoperative anxiety: a prospective, randomised, placebo controlled study. Anaesthesia. 2005; 60(10).978-81.
10. Caumo W, Ferreira MBC. Perioperative anxiety: psychobiology and effects in postoperative recovery. The Pain Clinic. 2012; 15(2):87-101. doi: http://dx.doi.org/10.1163/156856903321579217.
11. Triantafyllou K. Deep Sedation for Endoscopic Retrograde Cholangio Pacreatography. World J Gastrointest Endosc. 2011; 3(2):34-39. doi: 10.4253/wjge.v3.i2.34.
12. Keller R, Frankbader M, Beltrun K, Ascalon M, Bowarferres SL. Peer education: an innovative approach for integrating standards into practice. J Nurs Care Qual. 2011; 26(2):120-27. doi: 10.1097/NCQ.0b013e3181f63845.
13. Gillespie P, O'Shea E, Paul G, O'Dowd T, Smith SM. Cost effectiveness of peer support for type 2 diabetes. Int J Technol Assess Health Care. 2012; 28(1):3-11. doi: 10.1017/S0266462311000663.
14. Colella TJF, King KM. Peer support. An under-recognized resource in cardiac recovery. Eur J Cardiovasc Nurs. 2004; 3(3):211-7.
15. Kutluturkan S, Gorgulu U, Hatice F, Karavelioglu A. The effects of providing pre-gastrointestinal endoscopy written educational material on patients’ anxiety: a randomized controlled trial. Int J Nurs Stud. 2010; 47(9):1066-73. doi: 10.1016/j.ijnurstu.2010.01.007.
16. Philippe F, Meney M, Larrazet F, Ben Abderrazak F, Dibie A, Meziane T et al. Effects of video information in patients undergoing coronary angiography. Arch Mal Coeur Vaiss. 2006; 99(2):95-101.
Journal of Medicine and Life
Journal of Medicine and Life Vol. 8, Special Issue 2, 2015
71
17. Chan R, Webster J, Bennett L. Effects and feasibility of a multi-disciplinary orientation program for newly registered cancer patients: design of a randomised controlled trial. BMC Health Serv Res. 2009; 9(203):1-5. doi: 10.1186/1472-6963-9-203.
18. Hoseini S, Soltani F, Babaee Beygi M, Zarifsanaee N. The effect of educational audiotape programme on anxiety and depression in patients undergoing coronary artery bypass graft. Journal of Clinical Nursing. 2013; 22(11-12):1613-19. doi: 10.1111/jocn.12125.
19. Ghobari Nabat B. Relationship between anxiety in parents with exceptional and normal chidren. Journal of Area and University. 2007; 31:56-70.
20. Mahram B. Standardization of Spielberger's State Anxiety Inventory in Mashhad, Iran Master Thesis Assessment and Measurement in Psychology Faculty, Alame Tabatabai University,1994.
21. Akbarzadeh F, Rajbar Kouchaksaraei F, Bagheri Z, Ghezel M. Effect of preoperative information and reassurance in decreasing anxiety of patients who are candidate for coronary artery bypass graft surgery. J Cardiovasc Thorac Res. 2009; 1(2):25-28.
22. Roohi G, Rahmani H, Abdollahi AA, Mahmoodi G. The effect of music on anxiety level of patients and some of
physiological responses before abdominal surgery. J Gorgan Uni Med Sci. 2005; 7(1):75-78.
23. Dehghani H, Dehghani K, Nasiriani K, Banaderakhshan H. The effect of familiarization with cardiac surgery process on the anxiety of patients undergoing coronary artery bypass graft surgery. Modern Care, Scientific Quarterly of Birjand Nursing and Midwifery Faculty. 2014; 10(4):257-63.
24. Parent N, Fortin F. A randomized, controlled trial of vicarious experience through peer support for male first-time cardiac surgery patients: impact on anxiety, self-efficacy expectation and self-reported activity. Heart Lung. 2000; 29(6):389-400.
25. Varaei S, Cheraghi MA, Seyedfatemi N, Talebi M, Bahrani N, Shamsizadeh M et al. Effect of peer education on anxiety in patients candidated for coronary artery bypass graft surgery: a randomized control trial. Jornal of Nursing Education. 2013; 2(3):28-37.
26. Gharib A, Mohammad Khan Kermanshahi S, Hajizadeh E. The effect of Orientation technique on vital sign and anxiety level of patients undergoing Endoscopic Retrograde Cholangiopancreatography(ERCP). NMJournal. 2012; 2(3):51-60.
27. Talaei A, Toufani H, Hojjat SK, Jami-Alahmadi Z. Effect of Familiarizing the Patient with the Personnerl and Operating Room on the Day before Surgery for Preoperative Anxiety. The Quarterly Journal of Fundamentals of Mental Health. 2004; 6(21-22):57-61.
28. Woods SL, Sivarajan Froelicher ES, Motzer SA, Bridges EJ. Cardiac nursing. 2010, Lippincott Williams & Wilkins.
29. Field T, Diego M, Delgado J, Medina L. Peer support and interpersonal psychotherapy groups experienced decreased prenatal depression, anxiety and cortisol. Early Hum Dev. 2013; 89(9):621-4. doi: 10.1016/j.earlhumdev.2013.04.006.
30. Borzou SR, Salavati M, Bayat Z, Soltanian AR, Homayounfar Sh. A comparison of Individual and Peer Educational Methods on Quality of life in patients with heart failure. Iranian Journal of Medical Education. 2014; 14(9):1-11.
31. Gharib A. Comparison of effect of Orientation technique and Relaxation on vital sign andanxiety level of patients undergoing Endoscopic Retrograde Cholangiopancreatography(ERCP). M.Sc Dissertation of Critical Care Nursing, Nursing & Midwifery Faculty of Tarbiat Modares University of Medical Sciences. 2011.

Journal of Medicine and Life
Journal of Medicine and Life Vol. 8, Special Issue 2, 2015, pp.72-x76
Menopause knowledge and attitude among Iranian women
Taherpour M*, Sefidi F**, Afsharinia S***, Hamissi JH**** *Midwifery Department, Qazvin University of Medical Science, Qazvin, Iran **Department of Psychometrics, Qazvin University of Medical Sciences, Qazvin, Iran ***Dentist ****Department of Periodontics and Preventive Dentistry, College of Dentistry, Qazvin University of Medical Sciences, Qazvin, Iran Correspondence to: Jalaleddin H Hamissi, MD, Associate Professor in Periodontics and Preventive Dentistry, College of Dentistry, Qazvin University of Medical Sciences, P.O. Box. 34197-59811, Shahid Bahonar Blv., Qazvin, Iran, Mobile phone: (+98) 9121812543, E-mail: [email protected], [email protected] Received: May 15th, 2015 – Accepted: July 27th, 2015
Abstract Objective: The present study was done to assess the effects of training on knowledge and attitude level promotion of post menopause women about menopause. Methods & Material: The research communication included 100 menopausal women aged 45-60 years, who were selected in a stratified manner (according to the economic status: poor, average, and good). The tool used was an examiners-made questionnaire, which contained 3 parts: demographic characteristics, knowledge and attitude measurement. Results: Eleven percent of the studied women had a low knowledge regarding menopause and 1% was good. After training, 27% got a good knowledge and no one remained at the low level. The attitude of 59% of the studied women regarding menopause was positive and 80% got a positive attitude after training. A significant relation was found between knowledge and attitude, before and after training. Conclusion: Despite the fact that the majority of women judge menopause as a positive incident, it seems that paying attention to their training caused the bringing to their knowledge of the natural menopause and having a healthy and jolly life.
Keywords: knowledge, promotion, menopause Introduction
Menopause is a combination of two Greek words, meno (monthly), and pause (stop), it means the stopping of the menstruation and the ending of fertility. The natural age of menopause is 45-55 years and its main cause is the stopping of the natural activity of the ovaries. It would also occur following the ovaries extraction by surgical operation [1]. Menopause, the cessation of menstruation, is a psychosocial and biological event. The psychosocial phenomena surrounding menopause are attitudes, perceptions and expectations. Clinically, menopause represents the cessation of the monthly cycles. It is a transitional period in women’s life [2]. Due to the decrease in the production of estrogen, there are some symptoms of menopause such as vaginal dryness, intercourse problem, joint pain, muscle pain, back pain, skin thinning, and dryness, fornication, osteoporosis (bone problems), sleep problems (insomnia) or disturbed sleep, urinary problems, sensations, forgetfulness, hot flushes and other vasomotor symptoms. The psychological symptoms or effects include anxieties, mood swings, and emotional problems [2]. Research conducted by Enrighe (2003), Adodo (2004) and Senwna (2008) revealed that the daily intake of 800-1500 mg of calcium, the consumption of the dairy products such as milk, cheese and yogurt, fish liver
oil, farm fresh products such as wheat germ, grain and vegetable, should be taken into account. The consumption and drinking of plenty of water and a decrease in smoking, caffeine consumption, and alcoholic intake can prevent osteoporosis and increase bone strength during menopause. Hormone replacement therapy (HRT) can be used to replace the loss and decline in estrogen hormone production [3,4]. Attitude refers to feelings, beliefs, and reactions of an individual towards an event, phenomena, object, or person. Attitudes are not innate attributes of mankind, they are learnt responses (Adewuyi, 2006) [5].
The most common symptoms reported by women during the menopause transition are hot flushes and night sweats, which affect approximately 70% of women in Europe and North America. However, the prevalence of vasomotor symptoms and the experience of menopause vary considerably between cultures and countries [6,7]. Cultural differences have been explained by differences in attitudes and meanings of menopause, such as the extent to which menopause is seen as a medical condition or a natural phenomenon, or whether mid-life represents positive or negative social changes and/ or values within a society [8].
Additional explanations offered by researchers for the differences in symptom experience within and between cultures include diet, body mass index, exercise
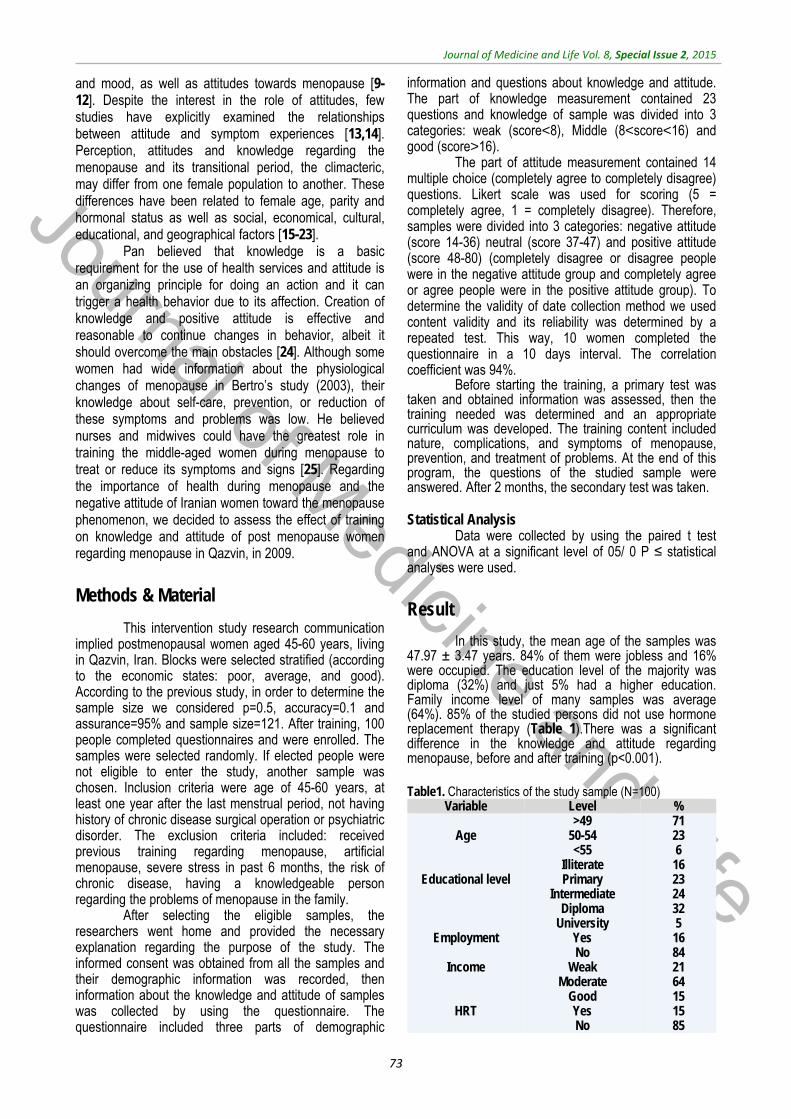
Journal of Medicine and Life
Journal of Medicine and Life Vol. 8, Special Issue 2, 2015
73
and mood, as well as attitudes towards menopause [9-12]. Despite the interest in the role of attitudes, few studies have explicitly examined the relationships between attitude and symptom experiences [13,14]. Perception, attitudes and knowledge regarding the menopause and its transitional period, the climacteric, may differ from one female population to another. These differences have been related to female age, parity and hormonal status as well as social, economical, cultural, educational, and geographical factors [15-23].
Pan believed that knowledge is a basic requirement for the use of health services and attitude is an organizing principle for doing an action and it can trigger a health behavior due to its affection. Creation of knowledge and positive attitude is effective and reasonable to continue changes in behavior, albeit it should overcome the main obstacles [24]. Although some women had wide information about the physiological changes of menopause in Bertro’s study (2003), their knowledge about self-care, prevention, or reduction of these symptoms and problems was low. He believed nurses and midwives could have the greatest role in training the middle-aged women during menopause to treat or reduce its symptoms and signs [25]. Regarding the importance of health during menopause and the negative attitude of Iranian women toward the menopause phenomenon, we decided to assess the effect of training on knowledge and attitude of post menopause women regarding menopause in Qazvin, in 2009.
Methods & Material
This intervention study research communication implied postmenopausal women aged 45-60 years, living in Qazvin, Iran. Blocks were selected stratified (according to the economic states: poor, average, and good). According to the previous study, in order to determine the sample size we considered p=0.5, accuracy=0.1 and assurance=95% and sample size=121. After training, 100 people completed questionnaires and were enrolled. The samples were selected randomly. If elected people were not eligible to enter the study, another sample was chosen. Inclusion criteria were age of 45-60 years, at least one year after the last menstrual period, not having history of chronic disease surgical operation or psychiatric disorder. The exclusion criteria included: received previous training regarding menopause, artificial menopause, severe stress in past 6 months, the risk of chronic disease, having a knowledgeable person regarding the problems of menopause in the family.
After selecting the eligible samples, the researchers went home and provided the necessary explanation regarding the purpose of the study. The informed consent was obtained from all the samples and their demographic information was recorded, then information about the knowledge and attitude of samples was collected by using the questionnaire. The questionnaire included three parts of demographic
information and questions about knowledge and attitude. The part of knowledge measurement contained 23 questions and knowledge of sample was divided into 3 categories: weak (score<8), Middle (8<score<16) and good (score>16).
The part of attitude measurement contained 14 multiple choice (completely agree to completely disagree) questions. Likert scale was used for scoring (5 = completely agree, 1 = completely disagree). Therefore, samples were divided into 3 categories: negative attitude (score 14-36) neutral (score 37-47) and positive attitude (score 48-80) (completely disagree or disagree people were in the negative attitude group and completely agree or agree people were in the positive attitude group). To determine the validity of date collection method we used content validity and its reliability was determined by a repeated test. This way, 10 women completed the questionnaire in a 10 days interval. The correlation coefficient was 94%.
Before starting the training, a primary test was taken and obtained information was assessed, then the training needed was determined and an appropriate curriculum was developed. The training content included nature, complications, and symptoms of menopause, prevention, and treatment of problems. At the end of this program, the questions of the studied sample were answered. After 2 months, the secondary test was taken. Statistical Analysis
Data were collected by using the paired t test and ANOVA at a significant level of 05/ 0 P ≤ statistical analyses were used.
Result
In this study, the mean age of the samples was 47.97 ± 3.47 years. 84% of them were jobless and 16% were occupied. The education level of the majority was diploma (32%) and just 5% had a higher education. Family income level of many samples was average (64%). 85% of the studied persons did not use hormone replacement therapy (Table 1).There was a significant difference in the knowledge and attitude regarding menopause, before and after training (p<0.001). Table1. Characteristics of the study sample (N=100)
%Level Variable7123 6 16 23 24 32 5 16 84 21 64 15 15 85
>49 50-54 <55
Illiterate Primary
Intermediate Diploma
University Yes No
Weak Moderate
Good Yes No
Age
Educational level
Employment
Income
HRT
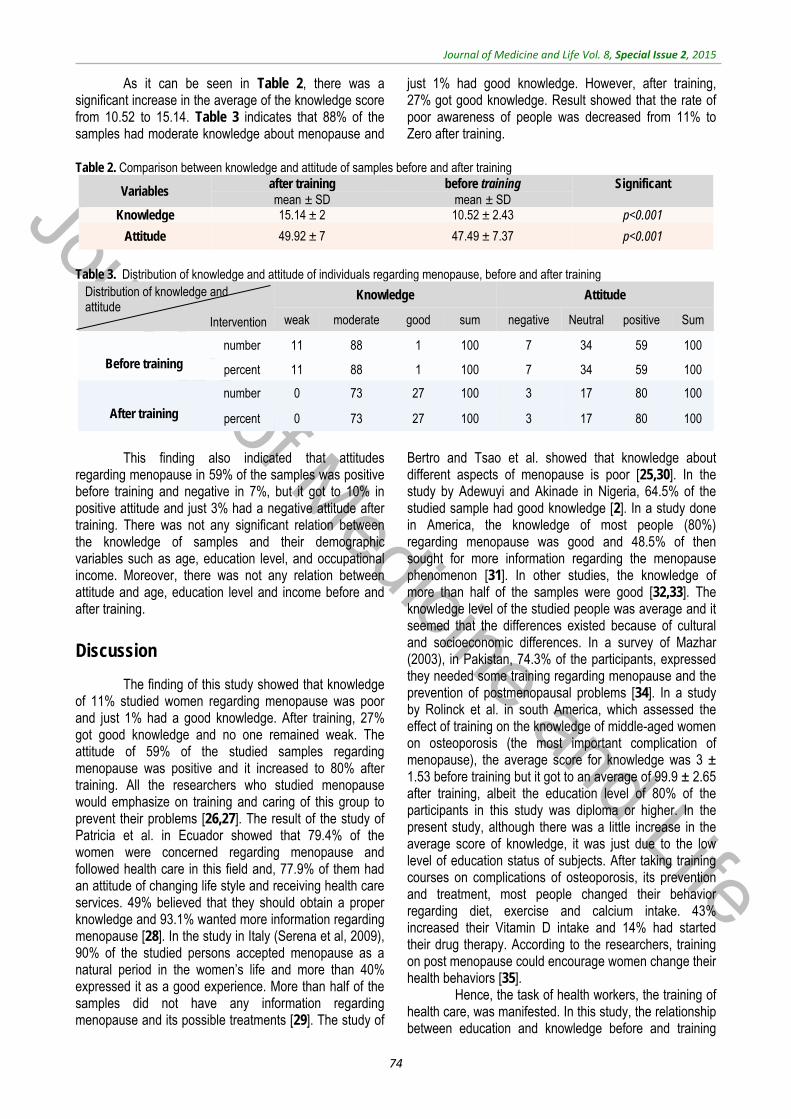
Journal of Medicine and Life
Journal of Medicine and Life Vol. 8, Special Issue 2, 2015
74
As it can be seen in Table 2, there was a significant increase in the average of the knowledge score from 10.52 to 15.14. Table 3 indicates that 88% of the samples had moderate knowledge about menopause and
just 1% had good knowledge. However, after training, 27% got good knowledge. Result showed that the rate of poor awareness of people was decreased from 11% to Zero after training.
Table 2. Comparison between knowledge and attitude of samples before and after training
Significant
before training after training Variables
mean ± SD mean ± SD p<0.00110.52 ± 2.43 15.14 ± 2 Knowledge
p<0.001 47.49 ± 7.37 49.92 ± 7 Attitude
Table 3. Distribution of knowledge and attitude of individuals regarding menopause, before and after training
Distribution of knowledge and attitude
Intervention
Knowledge Attitude
weak moderate good sum negative Neutral positive Sum
Before training
number 11 88 1 100 7 34 59 100
percent 11 88 1 100 7 34 59 100
After training
number 0 73 27 100 3 17 80 100
percent 0 73 27 100 3 17 80 100
This finding also indicated that attitudes
regarding menopause in 59% of the samples was positive before training and negative in 7%, but it got to 10% in positive attitude and just 3% had a negative attitude after training. There was not any significant relation between the knowledge of samples and their demographic variables such as age, education level, and occupational income. Moreover, there was not any relation between attitude and age, education level and income before and after training.
Discussion
The finding of this study showed that knowledge of 11% studied women regarding menopause was poor and just 1% had a good knowledge. After training, 27% got good knowledge and no one remained weak. The attitude of 59% of the studied samples regarding menopause was positive and it increased to 80% after training. All the researchers who studied menopause would emphasize on training and caring of this group to prevent their problems [26,27]. The result of the study of Patricia et al. in Ecuador showed that 79.4% of the women were concerned regarding menopause and followed health care in this field and, 77.9% of them had an attitude of changing life style and receiving health care services. 49% believed that they should obtain a proper knowledge and 93.1% wanted more information regarding menopause [28]. In the study in Italy (Serena et al, 2009), 90% of the studied persons accepted menopause as a natural period in the women’s life and more than 40% expressed it as a good experience. More than half of the samples did not have any information regarding menopause and its possible treatments [29]. The study of
Bertro and Tsao et al. showed that knowledge about different aspects of menopause is poor [25,30]. In the study by Adewuyi and Akinade in Nigeria, 64.5% of the studied sample had good knowledge [2]. In a study done in America, the knowledge of most people (80%) regarding menopause was good and 48.5% of then sought for more information regarding the menopause phenomenon [31]. In other studies, the knowledge of more than half of the samples were good [32,33]. The knowledge level of the studied people was average and it seemed that the differences existed because of cultural and socioeconomic differences. In a survey of Mazhar (2003), in Pakistan, 74.3% of the participants, expressed they needed some training regarding menopause and the prevention of postmenopausal problems [34]. In a study by Rolinck et al. in south America, which assessed the effect of training on the knowledge of middle-aged women on osteoporosis (the most important complication of menopause), the average score for knowledge was 3 ± 1.53 before training but it got to an average of 99.9 ± 2.65 after training, albeit the education level of 80% of the participants in this study was diploma or higher. In the present study, although there was a little increase in the average score of knowledge, it was just due to the low level of education status of subjects. After taking training courses on complications of osteoporosis, its prevention and treatment, most people changed their behavior regarding diet, exercise and calcium intake. 43% increased their Vitamin D intake and 14% had started their drug therapy. According to the researchers, training on post menopause could encourage women change their health behaviors [35].
Hence, the task of health workers, the training of health care, was manifested. In this study, the relationship between education and knowledge before and training

Journal of Medicine and Life
Journal of Medicine and Life Vol. 8, Special Issue 2, 2015
75
was not significant, which was in contrast with other studies [32,36]. The reason would be the low number of highly educated samples; the majority of the subjects having an education level under diploma.
Ten studies were reported on women’s attitudes; according to 6 of these studies, women who described menopause as a natural life transition had positive attitudes [37-42] but 4 studies did not mention whether attitudes were positive or negative [43-46]. Having no idea showed the lack of knowledge regarding menopause. Further researches in other countries reported positive attitude of the subjects.
In one survey, the attitude of most women regarding menopause and the cessation of menstruation was sense of obviation; they thought became an experienced and positive person [16]. Koster (1991) also reported that 66% of the Dornish women’s attitude toward menopause was the feeling of obviation; in this study, the closer to menopause the more positive attitude existed in women [33]. In a study by Adewuyi and Akinade in Nigeria, 61% of the women had a positive attitude regarding menopause [2]. Findings also indicated that after learning about the attitude it was sufficient to great knowledge, attitudes being formed. In this study, there was not any significant relation between education and attitudes before and after training, which was in contrast with other studies [16]. This might be the reason for the lack of a significant relationship between knowledge and education discussed here.
Most authors, who discussed the theory of training a patient (Client), encouraged health care workers to follow the principles of teaching and learning. Evaluation is one of the most important steps of the training program for patients [47]. Today, client training has changed from training to education, conceptually. Especially when the measurement of learning comes out,
behavior changes and corporation of clients in making decisions about the training process is very important. The corporation of a client in the process of training-learning is a fundamental philosophy in empowering clients [48].
Conclusions
Health education has a significant impact on increasing knowledge, attitude, and practice of menopausal women to word postmenopausal complication. Hence, the improvement of health behavior in postmenopausal women during menopause should be emphasized on learning regarding the problems of menopause.
Goals of medicine, health promotion, health maintenance, and minimizing the suffering of people included in the prevention concept, and the most important step in prevention is health training. Since education is a tool for public health, according to the results obtained from this study and similar surveys, it was acknowledged that all women who experienced menopause should be trained. Improving knowledge regarding the natural menopause and changing attitude could change the behavior and improve their performance. Conflict of interest and funding
The authors have not received any funding or benefits from industry in order to conduct this study. Acknowledgements
The author would like to thank those menopausal women whose eagerness and willing cooperation to this survey, made it possible.
References
1. Abernity K. Preparing for what to Expert Proof Care Mother Child. Menopause. 1999; 8(3):67-70.
2. Adewuyi TDO, Akinade EA. Perception and attitudes of Nigerian women towards menopause. Procedia Social and Behavioral Sciences. 2010; 5:1777-1782.
3. Enrighe G. Guide to natural remedies for health and well-being. Mexico: Orvit Publishing. Ferguson KJ, Hoegh C, Johnson S. Estrogen, replacement therapy: a survey of women knowledge and attitudes. Arch. Intern Medline. 2004; 149:133-136.
4. Senwna BT. With menopausal women in the family: Implication for national development. Journal of Family Development. 2008; 3(1):73-81.
5. Adewuyi TO. Effect of Rational Emotive Behavioral and Reality therapies on
attitude of Federal teachers towards retirement. Unpublished Ph.D thesis submitted to Department of Guidance and Counseling, Faculty of Education, University of Ilorin, Ilorin, Kwara State, Nigeria. 2006.
6. Freeman EW, Sherif K. Prevalence of hot flushes and night sweats around the word: a systematic review. Climacteric. 2007; 10:197-214.
7. Hunter MS. Predictors of menopausal symptoms: psychosocial aspects. Baillieres Clin Endocrinol Metab. 1993; 7(1):33-45.
8. Avis NE, Crawford S. Cultural differences in symptoms and attitudes toward menopause. Menopause Manage. 2008; 17(3):8-13.
9. Green R, Santoro N. Menopausal symptoms and ethnicity: the Study of
Women’s Health across the Nation. Womens Health. 2009; 5(2):127-133.
10. Santoro NF, Green R. Menopausal symptoms and ethnicity: lessons from the Study of Women’s Health across the Nation. Menopausal Med. 2009; 17(1):56-58.
11. Thurston RC, Sowers MR, Chang Y et al. Adiposity and reporting of vasomotor symptoms among midlife women: the Study of Women’s Health Across the Nation. Am J Epidemiol. 2008; 167(1):78-85.
12. Avis NE, Crawford SL. SWAN: what it is and what we hope to learn. Menopause Manage. 2001; 10(3):8-15.
13. Hunter MS, Rrndall M. Bio-psycho-socio- cultural perspectives on menopause. Best Pract Res Clin Obstet Gynaecol. 2007; 21:261-274.

Journal of Medicine and Life
Journal of Medicine and Life Vol. 8, Special Issue 2, 2015
76
14. Hunter MS, Gupta P, Papitsch-Clarke A, Sturdee D. Mid-aged Health in Women from the Indian Subcontinent (MAHWIS): a quantitative and qualitative study of experience of menopause in UK Asian women, compared to UK Caucasian and women living in Delhi. Climacteric. 2009; 12(1):26-37.
15. Ferguson K. Hoegh C. Johnson S. Estrogen replacement therapy. A survey of women’s knowledge and attitudes. Arch Intern M ED. 1989; 149:133-6.
16. Avis NE, McKinlay SM. A longitudinal analysis of women’s attitudes toward the menopause: results from the Massachusetts Women’s Health Study. Maturitas. 1991; 13:65-79.
17. Hunskaar S, Backe B. Attitudes towards and level of information on perimenopausal and postmenopausal hormone replacement therapy among Norwegian women. Maturitas. 1992; 15:183-94.
18. Lock M. Ambiguities of aging: Japanese experience and perceptions of menopause. Med Psychiatry. 1986; 10:23-46.
19. Taffe J, Garamszegi C, Dudley E, Dennertein L. Determinants of self rated Menopause ststus. Maturitas. 1997; 27:223-9.
20. Kaufert P, Boggs PP, Ettinger B, Woods NF, Utian WH. Women and menopause : beliefs, attitudes, and behaviors. The North American Menopause Society 1997 Menopause Survey. Menopause. 1998; 5:197-202.
21. Liao K, Hunter MS, White P. Beliefs about menopause of general practitioners and mid-aged women. Fam Pract. 1994; 11:408-12.
22. Hvas L. Menopausal women’s positive experience of growing older. Maturitas. 2006; 54:245-51.
23. Hvas L. Positive aspects of menopause: a qualitative study. Maturitas. 2001; 39:11-7.
24. Pan HA WU, HSU Ciao. The perception of Menopause among Women in Taiwan. Maturitas. 2002; 4:269-74.
25. Bertro C. What do women think about menopause? A qualitative study of women's expectations, apprehensions
and knowledge about the climacteric period. Int Nurs Rev. 2003; 50(2):109-18.
26. Hunter MO, Dea I. An evaluation of a health education intervention for mid-aged women: five year follow- up of effects upon knowledge, impact of menopause and health. Patient Educ Couns. 1999; 38(3):249-55.
27. Rotem M, Kushnir T, Levine R, Ehrenfeld M. A psych-educational program for improving women’s attitudes and coping with menopause symptoms. J Obstet Gynecol Neonatal Nurs. 2005; 34(2):233-40.
28. Patricia L, Peter C, Luis H, Fernando O. Perception and attitudes toward the menopause among middle aged Women from Guayaquil, Ecuador. Maturitas. 2007; 57:233-238.
29. Serena D, Rodolfo C, Paola M, Roberto S, Cinzia C, Alessandro L, Mele A. Menopause: Knowledge, attitude and practice among Italian women. Maturitas. 2009; 63:246-252.
30. Tsao LI, Chang WY, Hung LL, Chang SH, Chou PC. Perimenopausal knowledge of mid-life women in northern Taiwan. J Clin Nurs. 2004; 13(5):627-35.
31. Sharps PW, Phillips J, Oguntimalide L, Saling J, Yun S. Knowledge, attitudes, perceptions and practices of African-American women toward menopausal health. J Natl Black Nurses Assoc. 2003; 14(2):9-15.
32. Larocco SA, Polit DF. Womens knowledge about the menopause. Nurs Res. 1980 Jan-Feb; 29(1):10-3.
33. Koster A. Chango-of-life anticipations, attitudes, and experiences among middle-aged Danish women. Health Care Women Int. 1991; 12(1):1-13.
34. Mazhar SB, Gul-e-Erum. Knowledge and attitude of older women towards menopause. J Coll Physicians Surg Pak. 2003; 13(11):621-24.
35. Rolinck SJ, Kopher R, Jackson J, Fischer LR, Compo R. What is the impact of osteoporosis education and bone mineral density testing for postmenopausal women in a managed care setting?. Menopause. 2001; 8(2):141-48.
36. Gur A, Sarac AJ, Nas K, Cevik R. The relationship between educational level
and bone mineral density in postmenopausal women. BMC Fam Pract. 2004; 5:18.
37. Barth Olofsson AS, Collins A. Psychosocial factors, attitudes to menopause and symptoms in Swedish perimenopausal women. Climacteric. 2000; 3(1):33-42.
38. Shea JL. Chinese women’s symptoms: relation to menopause, age and related attitudes. Climacteric. 2006; 9(1):30-39.
39. Cheng MH, Wang SJ, Wang PH, Fuh JL. Attitudes toward menopause among middle-aged women: a community survey in an island of Taiwan. Maturitas. 2005; 52(3-4):348-355.
40. Akkuzu G, Orsal O, Kecialan R. Women’s attitudes toward menopause and influencing factors. Turkiya klinikleri J Med Sci. 2009; 29(3):666-674.
41. Bell ML. Attitudes toward menopause in Mexican American women. Health Care Women Int. 1995; 16(5):425-435.
42. Wilbur J, Miller A, Montgomery A. The influence of demographic characteristics, menopausal status, and symptoms on women’s attitude toward menopause. Women Health. 1995; 23(3):19-39.
43. Hess R, Olshansky E, Ness R et al. Pregnancy and birth history influence women’s experience of menopause. Menopause. 2008; 15(3):435-441.
44. Hess R, Bryce C, Hays R et al. Attitudes toward menopause: status and race differences and the impact on symptoms. Menopause. 2006; 13(6):986.
45. Huffman SB, Myers JE, Tingle LR, Bond LA. Menopause symptoms and attitudes African American women: closing the knowledge gap and expanding opportunities for counseling. J Counsel Dev. 2005; 83(1):48-56.
46. Sievert LL, Espinosa-Hernandez G. Attitudes toward menopause in relation to symptom experience in Puebla, Mexico. Women Health. 2003; 38(2):93-106.
47. Haines ST. Patient Education: A Tool in Out Patients Management of Deep Vein Thrombosis. Pharmachothrapy. 1998; 8(6):158-164.
48. Hoeman SP. Rehabilitation Nursing Process, Application and Outcomes. 3rd Ed., 2001, Philadelphia: Mosby.
Journal of Medicine and Life
Journal of Medicine and Life Vol. 8, Special Issue 2, 2015, pp.77-82
GIS based analysis of Intercity Fatal Road Traffic Accidents in Iran
Alizadeh A*, Zare M**, Darparesh M***, Mohseni S****, Soleimani-Ahmadi M*****
*Department of Public Health Social Determinants in Health Promotion Research Center, Hormozgan University of Medical Sciences, Bandar Abbas, Iran **Department of Occupational Health Engineering, Faculty of Health, Hormozgan University of Medical Sciences, Bandar Abbas, Iran ***Research Center for Social Determinants of Health Promotion, Hormozgan University of Medical Sciences, Bandar Abbas, Iran ****Department of Public Health, Faculty of Health, Hormozgan University of Medical Sciences, Bandar Abbas, Iran *****Department of Medical Entomology and Vector Control, Faculty of Health, Hormozgan University of Medical Sciences, Bandar Abbas, Iran Corresponding to: Mehdi Zare, MD Department of Occupational Health Engineering, Faculty of Health, Hormozgan University of Medical Sciences, Shahid Chamran Blvd.,Hormozgan, Bandar Abbas, Iran, Postal code: 79166-13885, Phone: (+98) 7633336202, E-mail: [email protected] Received: May 27th, 2015 – Accepted: July 27th, 2015
Abstract Road traffic accidents including intercity car traffic accidents (ICTAs) are among the most important causes of morbidity and mortality due to the growing number of vehicles, risky behaviors, and changes in lifestyle of the general population. A sound knowledge of the geographical distribution of car traffic accidents can be considered as an approach towards the accident causation and it can be used as an administrative tool in allocating the sources for traffic accidents prevention. This study was conducted to investigate the geographical distribution and the time trend of fatal intercity car traffic accidents in Iran. To conduct this descriptive study, all Iranian intercity road traffic mortality data were obtained from the Police reports in the Statistical Yearbook of the Governor’s Budget and Planning. The obtained data were for 17 complete Iranian calendar years from March 1997 to March 2012. The incidence rate (IR) of fatal ICTAs for each year was calculated as the total number of fatal ICTAs in every 100000 population in specified time intervals. Figures and maps indicating the trends and geographical distribution of fatal ICTAs were prepared while using Microsoft Excel and ArcGis9.2 software. The number of fatal car accidents showed a general increasing trend from 3000 in 1996 to 13500 in 2012. The incidence of fatal intercity car accidents has changed from six in 100000 population in 1996 to 18 in 100000 population in 2012. GIS based data showed that the incidence rate of ICTAs in different provinces of Iran was very divergent. The highest incidence of fatal ICTAs was in Semnan province (IR= 35.2), followed by North Khorasan (IR=22.7), and South Khorasan (IR=22). The least incidence of fatal ICTAs was in Tehran province (IR=2.4) followed by Khozestan (IR=6.5), and Eastern Azarbayejan (IR=6.6). The compensation cost of fatal ICTAs also showed an increasing trend during the studied period. Since an increasing amount of money was being paid yearly for the car accidents, which were in their nature preventable, the key players in road safety including governments, car manufacturers, and road developers were recommended to use GIS based accident data for a more efficient planning and budgeting towards the intercity car accidents reduction.
Keywords: GIS, Intercity Fatal Accidents, Iran Introduction
Road traffic accidents including city car traffic accidents and intercity car traffic accidents (ICTAs) are among the most important causes of morbidity and mortality, due to the growing number of vehicles, risky behaviors, and changes in lifestyle of the general population [2]. According to the global status report on road safety in 2013, by WHO, the total number of road traffic deaths around the world remained unacceptably high at 1.24 million per year [1]. Although some researchers have reported an enormous growth in the
number of motor vehicles as a main cause of accidents [2], surprisingly 97% of the road accidents occur in developing countries, which have only 48% of vehicles [2]. This fact emphasized on the multifactor nature of the accident causes, which should be considered by researchers and experts in the accident analysis and causation.
While the WHO reported five factors including drinking and driving, speeding, and failing to use motorcycle helmets, seat-belts, and child restraints as the key risk factors of road traffic accidents, there are many elements that should be considered in road traffic
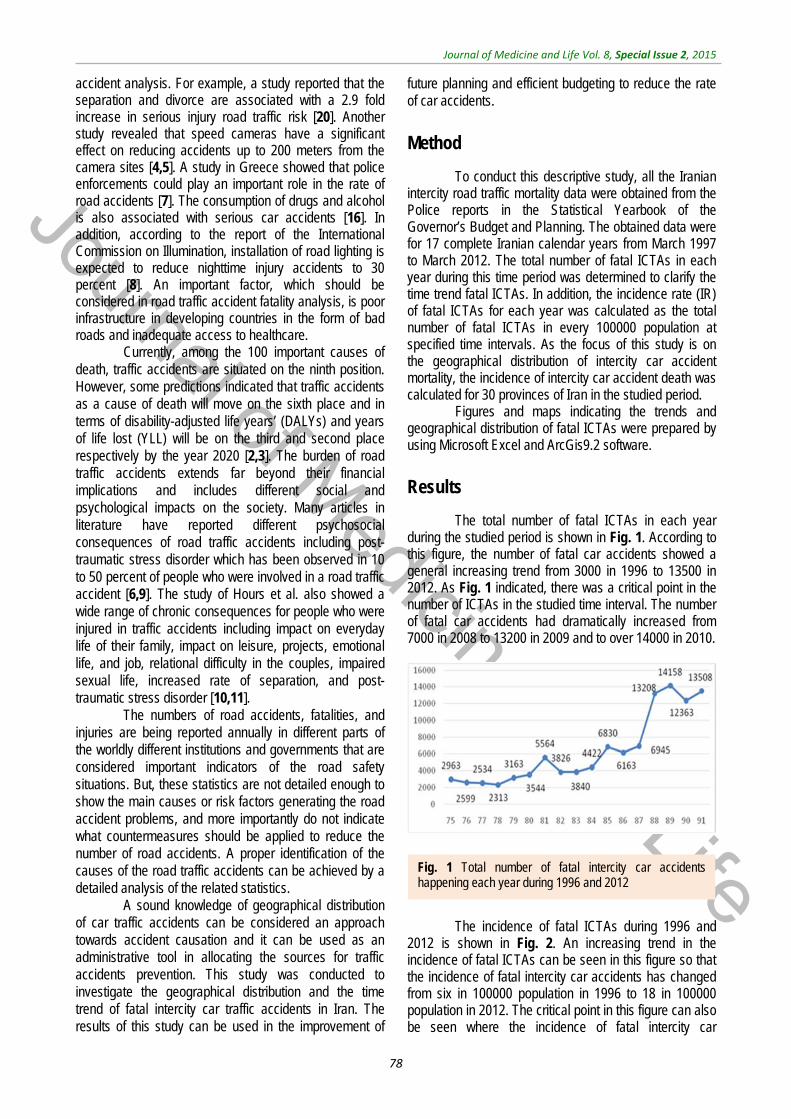
Journal of Medicine and Life
Journal of Medicine and Life Vol. 8, Special Issue 2, 2015
78
accident analysis. For example, a study reported that the separation and divorce are associated with a 2.9 fold increase in serious injury road traffic risk [20]. Another study revealed that speed cameras have a significant effect on reducing accidents up to 200 meters from the camera sites [4,5]. A study in Greece showed that police enforcements could play an important role in the rate of road accidents [7]. The consumption of drugs and alcohol is also associated with serious car accidents [16]. In addition, according to the report of the International Commission on Illumination, installation of road lighting is expected to reduce nighttime injury accidents to 30 percent [8]. An important factor, which should be considered in road traffic accident fatality analysis, is poor infrastructure in developing countries in the form of bad roads and inadequate access to healthcare.
Currently, among the 100 important causes of death, traffic accidents are situated on the ninth position. However, some predictions indicated that traffic accidents as a cause of death will move on the sixth place and in terms of disability-adjusted life years’ (DALYs) and years of life lost (YLL) will be on the third and second place respectively by the year 2020 [2,3]. The burden of road traffic accidents extends far beyond their financial implications and includes different social and psychological impacts on the society. Many articles in literature have reported different psychosocial consequences of road traffic accidents including post-traumatic stress disorder which has been observed in 10 to 50 percent of people who were involved in a road traffic accident [6,9]. The study of Hours et al. also showed a wide range of chronic consequences for people who were injured in traffic accidents including impact on everyday life of their family, impact on leisure, projects, emotional life, and job, relational difficulty in the couples, impaired sexual life, increased rate of separation, and post-traumatic stress disorder [10,11].
The numbers of road accidents, fatalities, and injuries are being reported annually in different parts of the worldly different institutions and governments that are considered important indicators of the road safety situations. But, these statistics are not detailed enough to show the main causes or risk factors generating the road accident problems, and more importantly do not indicate what countermeasures should be applied to reduce the number of road accidents. A proper identification of the causes of the road traffic accidents can be achieved by a detailed analysis of the related statistics.
A sound knowledge of geographical distribution of car traffic accidents can be considered an approach towards accident causation and it can be used as an administrative tool in allocating the sources for traffic accidents prevention. This study was conducted to investigate the geographical distribution and the time trend of fatal intercity car traffic accidents in Iran. The results of this study can be used in the improvement of
future planning and efficient budgeting to reduce the rate of car accidents.
Method
To conduct this descriptive study, all the Iranian intercity road traffic mortality data were obtained from the Police reports in the Statistical Yearbook of the Governor’s Budget and Planning. The obtained data were for 17 complete Iranian calendar years from March 1997 to March 2012. The total number of fatal ICTAs in each year during this time period was determined to clarify the time trend fatal ICTAs. In addition, the incidence rate (IR) of fatal ICTAs for each year was calculated as the total number of fatal ICTAs in every 100000 population at specified time intervals. As the focus of this study is on the geographical distribution of intercity car accident mortality, the incidence of intercity car accident death was calculated for 30 provinces of Iran in the studied period.
Figures and maps indicating the trends and geographical distribution of fatal ICTAs were prepared by using Microsoft Excel and ArcGis9.2 software.
Results
The total number of fatal ICTAs in each year during the studied period is shown in Fig. 1. According to this figure, the number of fatal car accidents showed a general increasing trend from 3000 in 1996 to 13500 in 2012. As Fig. 1 indicated, there was a critical point in the number of ICTAs in the studied time interval. The number of fatal car accidents had dramatically increased from 7000 in 2008 to 13200 in 2009 and to over 14000 in 2010.
The incidence of fatal ICTAs during 1996 and 2012 is shown in Fig. 2. An increasing trend in the incidence of fatal ICTAs can be seen in this figure so that the incidence of fatal intercity car accidents has changed from six in 100000 population in 1996 to 18 in 100000 population in 2012. The critical point in this figure can also be seen where the incidence of fatal intercity car
Fig. 1 Total number of fatal intercity car accidents happening each year during 1996 and 2012

Journal of Medicine and Life
Journal of Medicine and Life Vol. 8, Special Issue 2, 2015
79
accidents has increased from 12 in 100000 population to 28 in 100000 population during 2009 and 2011.
The geographical distribution of fatal ICTAs during the studied period is shown in Fig. 3 in terms of the average of fatal ICTAs per 100000 population in different provinces. According to this figure, the highest incidence of fatal ICTAs is in Semnan province (IR= 35.2), followed by North Khorasan (IR=22.7), South Khorasan (IR=22), Qazvin (IR=20.5), and Markazi (IR=19.1). The lowest incidence of fatal ICTAs is in Tehran province (IR=2.4) followed by Khuzestan (IR=6.5), Eastern Azerbaijan (IR=6.6), Western Azerbaijan (IR=7.1), Ardebil (IR=7.2), Kermanshah (IR=7.9), and RazaviKhorasan (IR=8).
To clarify the time trend of the intercity car traffic accidents in different provinces of Iran during 1996 and 2012, the geographic distribution of fatal car accidents incidence rate is illustrated in Fig. 4-7. These figures illustrate the fatal car accidents incidence rates in 1996, 2002, 2007, and 2012 in different provinces of Iran.
Fig. 2 Incidence of intercity fatal car accidents during 1996 and 2012
Fig. 3 Geographical distribution of the intercity fatal car traffic accidents incidence rate in different provinces of Iran during 1996 and 2012
Fig. 4 Geographical distribution of the intercity fatal car traffic accidents incidence rate in different Provinces of Iran in 1996
Fig. 5 Geographical distribution of the intercity fatal car traffic accidents incidence rate in different provinces of Iran in 2002
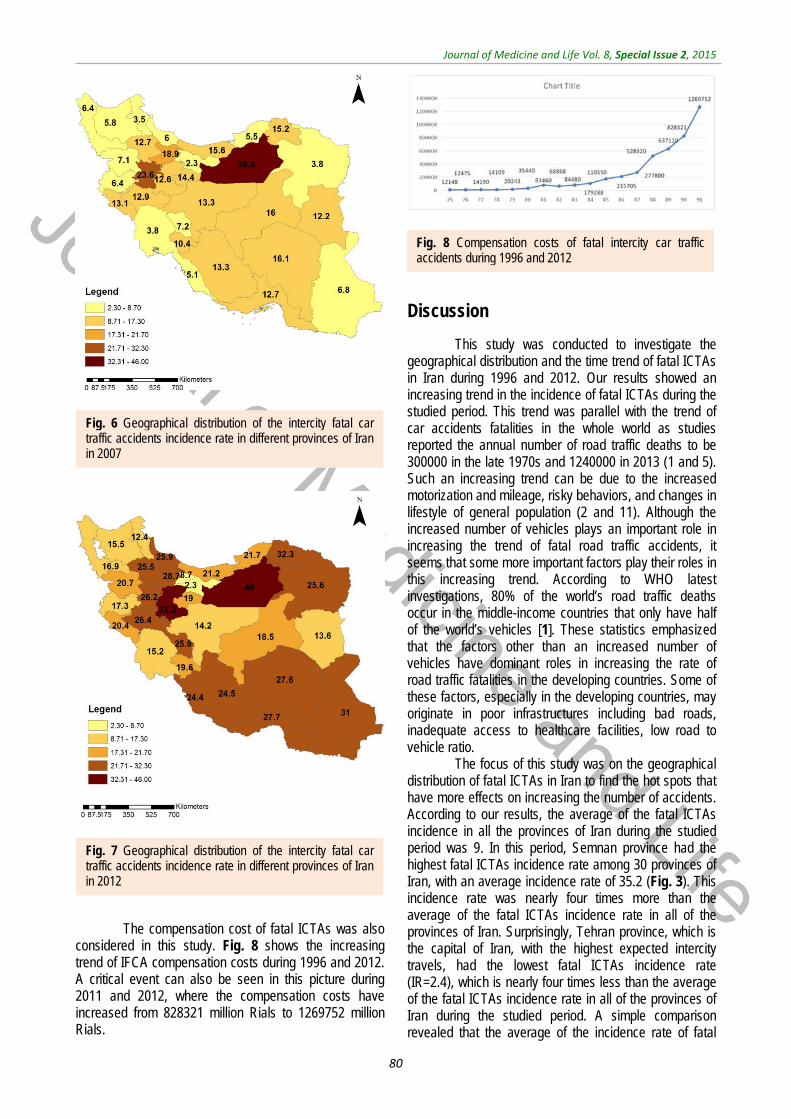
Journal of Medicine and Life
Journal of Medicine and Life Vol. 8, Special Issue 2, 2015
80
The compensation cost of fatal ICTAs was also
considered in this study. Fig. 8 shows the increasing trend of IFCA compensation costs during 1996 and 2012. A critical event can also be seen in this picture during 2011 and 2012, where the compensation costs have increased from 828321 million Rials to 1269752 million Rials.
Discussion
This study was conducted to investigate the geographical distribution and the time trend of fatal ICTAs in Iran during 1996 and 2012. Our results showed an increasing trend in the incidence of fatal ICTAs during the studied period. This trend was parallel with the trend of car accidents fatalities in the whole world as studies reported the annual number of road traffic deaths to be 300000 in the late 1970s and 1240000 in 2013 (1 and 5). Such an increasing trend can be due to the increased motorization and mileage, risky behaviors, and changes in lifestyle of general population (2 and 11). Although the increased number of vehicles plays an important role in increasing the trend of fatal road traffic accidents, it seems that some more important factors play their roles in this increasing trend. According to WHO latest investigations, 80% of the world’s road traffic deaths occur in the middle-income countries that only have half of the world’s vehicles [1]. These statistics emphasized that the factors other than an increased number of vehicles have dominant roles in increasing the rate of road traffic fatalities in the developing countries. Some of these factors, especially in the developing countries, may originate in poor infrastructures including bad roads, inadequate access to healthcare facilities, low road to vehicle ratio.
The focus of this study was on the geographical distribution of fatal ICTAs in Iran to find the hot spots that have more effects on increasing the number of accidents. According to our results, the average of the fatal ICTAs incidence in all the provinces of Iran during the studied period was 9. In this period, Semnan province had the highest fatal ICTAs incidence rate among 30 provinces of Iran, with an average incidence rate of 35.2 (Fig. 3). This incidence rate was nearly four times more than the average of the fatal ICTAs incidence rate in all of the provinces of Iran. Surprisingly, Tehran province, which is the capital of Iran, with the highest expected intercity travels, had the lowest fatal ICTAs incidence rate (IR=2.4), which is nearly four times less than the average of the fatal ICTAs incidence rate in all of the provinces of Iran during the studied period. A simple comparison revealed that the average of the incidence rate of fatal
Fig. 6 Geographical distribution of the intercity fatal car traffic accidents incidence rate in different provinces of Iran in 2007
Fig. 7 Geographical distribution of the intercity fatal car traffic accidents incidence rate in different provinces of Iran in 2012
Fig. 8 Compensation costs of fatal intercity car traffic accidents during 1996 and 2012
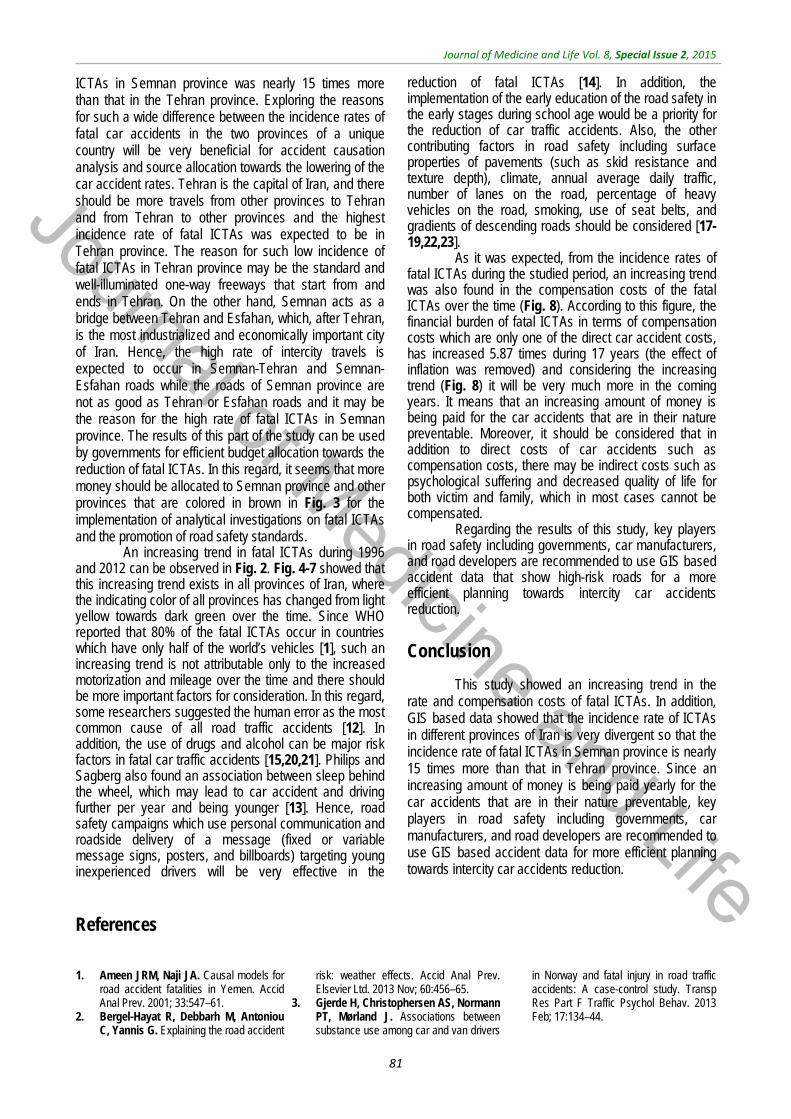
Journal of Medicine and Life
Journal of Medicine and Life Vol. 8, Special Issue 2, 2015
81
ICTAs in Semnan province was nearly 15 times more than that in the Tehran province. Exploring the reasons for such a wide difference between the incidence rates of fatal car accidents in the two provinces of a unique country will be very beneficial for accident causation analysis and source allocation towards the lowering of the car accident rates. Tehran is the capital of Iran, and there should be more travels from other provinces to Tehran and from Tehran to other provinces and the highest incidence rate of fatal ICTAs was expected to be in Tehran province. The reason for such low incidence of fatal ICTAs in Tehran province may be the standard and well-illuminated one-way freeways that start from and ends in Tehran. On the other hand, Semnan acts as a bridge between Tehran and Esfahan, which, after Tehran, is the most industrialized and economically important city of Iran. Hence, the high rate of intercity travels is expected to occur in Semnan-Tehran and Semnan-Esfahan roads while the roads of Semnan province are not as good as Tehran or Esfahan roads and it may be the reason for the high rate of fatal ICTAs in Semnan province. The results of this part of the study can be used by governments for efficient budget allocation towards the reduction of fatal ICTAs. In this regard, it seems that more money should be allocated to Semnan province and other provinces that are colored in brown in Fig. 3 for the implementation of analytical investigations on fatal ICTAs and the promotion of road safety standards.
An increasing trend in fatal ICTAs during 1996 and 2012 can be observed in Fig. 2. Fig. 4-7 showed that this increasing trend exists in all provinces of Iran, where the indicating color of all provinces has changed from light yellow towards dark green over the time. Since WHO reported that 80% of the fatal ICTAs occur in countries which have only half of the world’s vehicles [1], such an increasing trend is not attributable only to the increased motorization and mileage over the time and there should be more important factors for consideration. In this regard, some researchers suggested the human error as the most common cause of all road traffic accidents [12]. In addition, the use of drugs and alcohol can be major risk factors in fatal car traffic accidents [15,20,21]. Philips and Sagberg also found an association between sleep behind the wheel, which may lead to car accident and driving further per year and being younger [13]. Hence, road safety campaigns which use personal communication and roadside delivery of a message (fixed or variable message signs, posters, and billboards) targeting young inexperienced drivers will be very effective in the
reduction of fatal ICTAs [14]. In addition, the implementation of the early education of the road safety in the early stages during school age would be a priority for the reduction of car traffic accidents. Also, the other contributing factors in road safety including surface properties of pavements (such as skid resistance and texture depth), climate, annual average daily traffic, number of lanes on the road, percentage of heavy vehicles on the road, smoking, use of seat belts, and gradients of descending roads should be considered [17-19,22,23].
As it was expected, from the incidence rates of fatal ICTAs during the studied period, an increasing trend was also found in the compensation costs of the fatal ICTAs over the time (Fig. 8). According to this figure, the financial burden of fatal ICTAs in terms of compensation costs which are only one of the direct car accident costs, has increased 5.87 times during 17 years (the effect of inflation was removed) and considering the increasing trend (Fig. 8) it will be very much more in the coming years. It means that an increasing amount of money is being paid for the car accidents that are in their nature preventable. Moreover, it should be considered that in addition to direct costs of car accidents such as compensation costs, there may be indirect costs such as psychological suffering and decreased quality of life for both victim and family, which in most cases cannot be compensated.
Regarding the results of this study, key players in road safety including governments, car manufacturers, and road developers are recommended to use GIS based accident data that show high-risk roads for a more efficient planning towards intercity car accidents reduction.
Conclusion
This study showed an increasing trend in the rate and compensation costs of fatal ICTAs. In addition, GIS based data showed that the incidence rate of ICTAs in different provinces of Iran is very divergent so that the incidence rate of fatal ICTAs in Semnan province is nearly 15 times more than that in Tehran province. Since an increasing amount of money is being paid yearly for the car accidents that are in their nature preventable, key players in road safety including governments, car manufacturers, and road developers are recommended to use GIS based accident data for more efficient planning towards intercity car accidents reduction.
References
1. Ameen JRM, Naji JA. Causal models for road accident fatalities in Yemen. Accid Anal Prev. 2001; 33:547–61.
2. Bergel-Hayat R, Debbarh M, Antoniou C, Yannis G. Explaining the road accident
risk: weather effects. Accid Anal Prev. Elsevier Ltd. 2013 Nov; 60:456–65.
3. Gjerde H, Christophersen AS, Normann PT, Mørland J. Associations between substance use among car and van drivers
in Norway and fatal injury in road traffic accidents: A case-control study. Transp Res Part F Traffic Psychol Behav. 2013 Feb; 17:134–44.
Journal of Medicine and Life
Journal of Medicine and Life Vol. 8, Special Issue 2, 2015
82
4. Jabbari A. Rural road accident investigation and prevention in Iran. 1981. Aston University.
5. Krüger NA. Fatal connections-socioeconomic determinants of road accident risk and drunk driving in Sweden. J Safety Res. National Safety Council and Elsevier Ltd. 2013 Sep; 46:59–65.
6. Masuri MG, Isa KAM, Tahir MPM. Children, Youth and Road Environment: Road Traffic Accident. Procedia - SocBehavSci. Elsevier B.V. 2012 Jan; 38:213–8.
7. World Health Organization. Global status report on road safety 2013: supporting a decade of action. 2013. Geneva.
8. Chossegros L, Hours M, Charnay P, Bernard M, Fort E, Boisson D et al. Predictive factors of chronic post-traumatic stress disorder 6 months after a road traffic accident. Accid Anal Prev. Elsevier Ltd. 2011 Jan; 43(1):471–7.
9. Costa N, Silva R, Mendonça MC, Real FC, Vieira DN, Teixeira HM. Prevalence of ethanol and illicit drugs in road traffic accidents in the centre of Portugal: An eighteen-year update. Forensic SciInt. 2012 Mar 10; 216(1-3):37–43.
10. Elvik R. Risk of road accident associated with the use of drugs: a systematic review and meta-analysis of evidence from epidemiological studies. Accid Anal Prev. Elsevier Ltd. 2013 Nov; 60:254–67.
11. Fernandes A, Neves J. An approach to accidents modeling based on compounds road environments. Accid Anal Prev. Elsevier Ltd. 2013 Apr; 53:39–45.
12. Fu R, Guo Y, Yuan W, Feng H, Ma Y. The correlation between gradients of descending roads and accident rates. SafSci. Elsevier Ltd. 2011 Mar; 49(3):416–23.
13. Hours M, Chossegros L, Charnay P, Tardy H, Nhac-Vu HT, Boisson D et al. Outcomes one year after a road accident: Results from the ESPARR cohort. Accid Anal Prev. Elsevier Ltd. 2013 Jan; 50:92–102.
14. Kanchan T, Kulkarni V, Bakkannavar SM, Kumar N, Unnikrishnan B. Analysis of fatal road traffic accidents in a coastal township of South India. J Forensic Leg Med. Elsevier Ltd. 2012 Nov; 19(8):448–51.
15. Koushki PA, Bustan M. Smoking, belt use, and road accidents of youth in Kuwait. SafSci. 2006 Oct; 44(8):733–46.
16. Li H, Graham DJ, Majumdar A. The impacts of speed cameras on road accidents: an application of propensity score matching methods. Accid Anal Prev. Elsevier Ltd. 2013 Nov; 60:148–57.
17. Peltzer K, Renner W. Psychosocial correlates of the impact of road traffic accidents among South African drivers
and passengers. Accid Anal Prev. 2004 May; 36(3):367–74.
18. Phillips RO, Sagberg F. Road accidents caused by sleepy drivers: Update of a Norwegian survey. Accid Anal Prev. Elsevier Ltd. 2013 Jan; 50:138–46.
19. Phillips RO, Ulleberg P, Vaa T. Meta-analysis of the effect of road safety campaigns on accidents. Accid Anal Prev. Elsevier Ltd. 2011 May; 43(3):1204–18.
20. Rangel T, Vassallo JM, Herraiz I. The influence of economic incentives linked to road safety indicators on accidents: the case of toll concessions in Spain. Accid Anal Prev. Elsevier Ltd. 2013 Oct; 59:529–36.
21. Stübig T, Petri M, Zeckey C, Brand S, Müller C, Otte D et al. Alcohol intoxication in road traffic accidents leads to higher impact speed difference, higher ISS and MAIS, and higher preclinical mortality. Alcohol. Elsevier Ltd; 2012 Nov; 46(7):681–6.
22. Wanvik PO. Effects of road lighting: an analysis based on Dutch accident statistics 1987-2006. Accid Anal Prev. 2009 Jan; 41(1):123–8.
23. Yannis G, Papadimitriou E, Antoniou C. Multilevel modelling for the regional effect of enforcement on road accidents. Accid Anal Prev. 2007 Jul; 39(4):818–25.

Journal of Medicine and Life
Journal of Medicine and Life Vol. 8, Special Issue 2, 2015, pp.83-87
Investigating the effective factors in creatinine changes among hemodialysis patients using the linear
random effects model
Shabankhani B*, Kazemnezhad A**, Zaeri F*** *PhD Candidate in Biostatistics, Faculty of Medical Sciences, Tarbiat Moodares University, Tehran, Iran **Department of Biostatistics, Faculty of Medical Sciences, Tarbiat Modares University, Tehran, Iran ***Department of Biostatistics, Shahid Beheshti University of Medical Sciences, Tehran, Iran Correspondence to: Anoshiravan Kazemnezhad, MD, Department of Biostatistics, Faculty of Medical Sciences, Tarbiat Modares University, Tehran, Iran, E-mail: [email protected] Received: May 25th, 2015 – Accepted: July 27th, 2015 Abstract Background and objectives: Out of 10 apparently healthy humans, one was somewhat suffering from one of the types of renal disease. Hemodialysis is known as the most applicable method of taking care of this group of patients. In addition, serum creatinine is an important mark in the performance of kidneys. The aim of the present study was to investigate the effective factors in creatinine and its effect on the performance of kidneys. Materials and methods: The present study is a longitudinal experiment in which 500 participants were randomly selected from the hemodialysis patients in Mazandaran Province. Creatinine variable was considered as the longitudinal responding variable, which was measured 3 times per year over a period of 6 years. The random effects model was also considered the most appropriate model for the collected data. Results: The total mean value of creatinine was 1.62 ± 0.49, among men 1.69 ± 0.46 and among women 35.1 ± 0.49. Variables of weight (p<0.001), age of disease diagnosis (p<0.001), time (p<0.001), gender (p<0.005), and cardiovascular diseases were significant and had effects on the trend of creatinine changes among the hemodialysis patients. Creatinine mean value had an increasing trend. Conclusion: Blood creatinine had a significant effect on the performance of kidneys, and the identification of variables that affected the creatinine level was highly helpful in controlling the performance of the kidneys. The results of most studies conducted on hemodialysis patients indicated that by measuring and controlling variables like weight, tobacco consumption, and control of related diseases like blood pressure could predict and control creatinine changes precisely.
Keywords: creatinine changes, hemodialysis patients, linear random effects model Introduction
Global statistics indicate that there are 550 million renal patients. That is, out of 10 apparently healthy people, one suffers from a type of renal diseases. Nowadays, hemodialysis is known as the most applicable method to provide healthcare to this group of patients. About 70% of the renal patients are treated through this method [1]. In the USA, about 10 to 15% of the adults suffer from renal failure. In 1988, approximately 3,200,000 patients with renal disease were going through their final stages, 72% of whom were treated through hemodialysis [2]. Iran’s Ministry of Health has also reported the prevalence of this disease, 2.5 out of 1000 people, and predicted its annual growth to be 12% in 2006. The kidney transplant is the best treatment for this disease. However, considering the low statistics of kidney transplant in Iran, i.e. 24 cases out of 1 million, hemodialysis is still the most common method to prevent the disease. The hemodialysis of the patients imposes high expenses on the health system such that in the current year, the Health Deputy of the Ministry of Health has spent 20 billion tomans (one US dollar equals 3,200 tomans – free market
rate of exchange) on the filters of dialysis devices, and the annual expense for the hemodialysis of a patient has been estimated to be 18 million tomans [3,4]. Due to the high prevalence of this disease, a large body of research has been conducted on this issue. However, most of them have utilized classical statistical methods, which were not flawless due to the type of relationship between the thematic variables. The present study was an attempt to analyze the data by using advanced statistical analysis methods. An important marker of performance of kidneys is serum creatinine, and in most studies, it has been introduced as the marker of kidneys’ performance [5-8].
In medical studies, responses need to be measured frequently in order to evaluate more precisely the intervention methods. However, in some cases, the researchers have to deal with correlated responses and in most cases, this correlation is sensitive to time, i.e. the intensity of the correlation increases or decreases with time. Due to this correlation, typical methods like the method of the least square means that it cannot be employed. That is why methods that are dealing with correlated responses have nowadays gained a high significance. For instance, one can refer to changes in markers related to diseases over time such as frequent
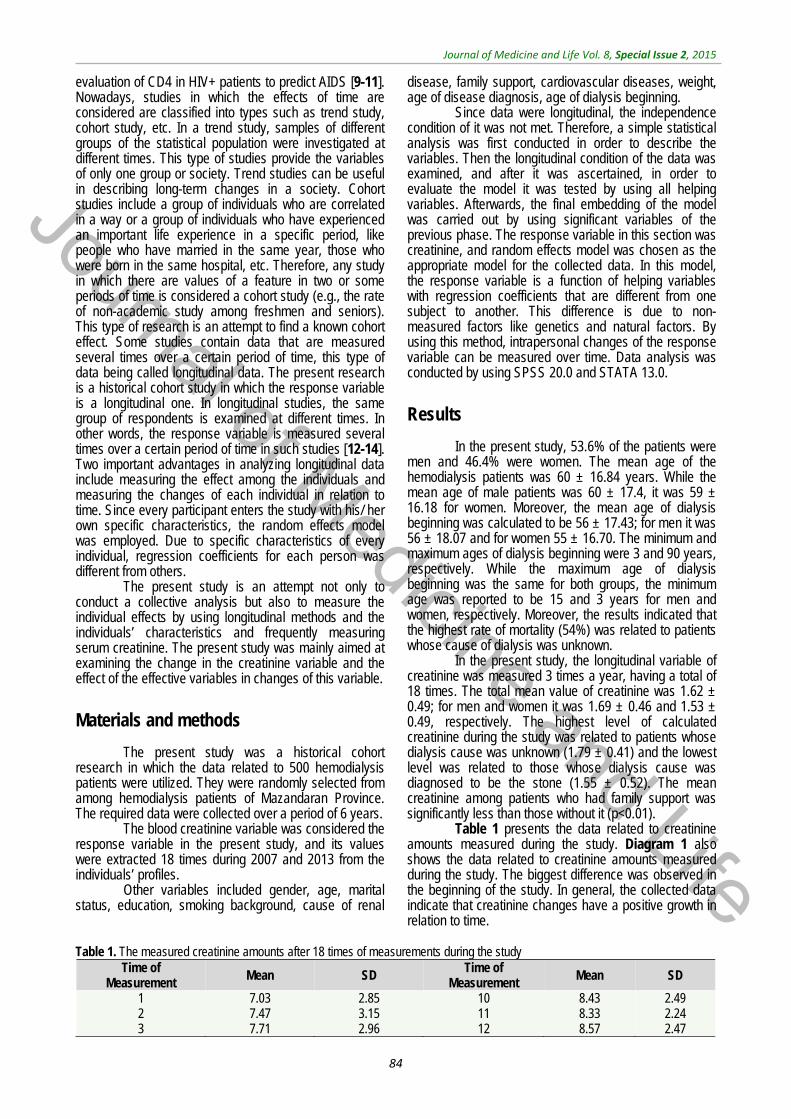
Journal of Medicine and Life
Journal of Medicine and Life Vol. 8, Special Issue 2, 2015
84
evaluation of CD4 in HIV+ patients to predict AIDS [9-11]. Nowadays, studies in which the effects of time are considered are classified into types such as trend study, cohort study, etc. In a trend study, samples of different groups of the statistical population were investigated at different times. This type of studies provide the variables of only one group or society. Trend studies can be useful in describing long-term changes in a society. Cohort studies include a group of individuals who are correlated in a way or a group of individuals who have experienced an important life experience in a specific period, like people who have married in the same year, those who were born in the same hospital, etc. Therefore, any study in which there are values of a feature in two or some periods of time is considered a cohort study (e.g., the rate of non-academic study among freshmen and seniors). This type of research is an attempt to find a known cohort effect. Some studies contain data that are measured several times over a certain period of time, this type of data being called longitudinal data. The present research is a historical cohort study in which the response variable is a longitudinal one. In longitudinal studies, the same group of respondents is examined at different times. In other words, the response variable is measured several times over a certain period of time in such studies [12-14]. Two important advantages in analyzing longitudinal data include measuring the effect among the individuals and measuring the changes of each individual in relation to time. Since every participant enters the study with his/ her own specific characteristics, the random effects model was employed. Due to specific characteristics of every individual, regression coefficients for each person was different from others.
The present study is an attempt not only to conduct a collective analysis but also to measure the individual effects by using longitudinal methods and the individuals’ characteristics and frequently measuring serum creatinine. The present study was mainly aimed at examining the change in the creatinine variable and the effect of the effective variables in changes of this variable.
Materials and methods
The present study was a historical cohort research in which the data related to 500 hemodialysis patients were utilized. They were randomly selected from among hemodialysis patients of Mazandaran Province. The required data were collected over a period of 6 years.
The blood creatinine variable was considered the response variable in the present study, and its values were extracted 18 times during 2007 and 2013 from the individuals’ profiles.
Other variables included gender, age, marital status, education, smoking background, cause of renal
disease, family support, cardiovascular diseases, weight, age of disease diagnosis, age of dialysis beginning.
Since data were longitudinal, the independence condition of it was not met. Therefore, a simple statistical analysis was first conducted in order to describe the variables. Then the longitudinal condition of the data was examined, and after it was ascertained, in order to evaluate the model it was tested by using all helping variables. Afterwards, the final embedding of the model was carried out by using significant variables of the previous phase. The response variable in this section was creatinine, and random effects model was chosen as the appropriate model for the collected data. In this model, the response variable is a function of helping variables with regression coefficients that are different from one subject to another. This difference is due to non-measured factors like genetics and natural factors. By using this method, intrapersonal changes of the response variable can be measured over time. Data analysis was conducted by using SPSS 20.0 and STATA 13.0.
Results
In the present study, 53.6% of the patients were men and 46.4% were women. The mean age of the hemodialysis patients was 60 ± 16.84 years. While the mean age of male patients was 60 ± 17.4, it was 59 ± 16.18 for women. Moreover, the mean age of dialysis beginning was calculated to be 56 ± 17.43; for men it was 56 ± 18.07 and for women 55 ± 16.70. The minimum and maximum ages of dialysis beginning were 3 and 90 years, respectively. While the maximum age of dialysis beginning was the same for both groups, the minimum age was reported to be 15 and 3 years for men and women, respectively. Moreover, the results indicated that the highest rate of mortality (54%) was related to patients whose cause of dialysis was unknown.
In the present study, the longitudinal variable of creatinine was measured 3 times a year, having a total of 18 times. The total mean value of creatinine was 1.62 ± 0.49; for men and women it was 1.69 ± 0.46 and 1.53 ± 0.49, respectively. The highest level of calculated creatinine during the study was related to patients whose dialysis cause was unknown (1.79 ± 0.41) and the lowest level was related to those whose dialysis cause was diagnosed to be the stone (1.55 ± 0.52). The mean creatinine among patients who had family support was significantly less than those without it (p<0.01).
Table 1 presents the data related to creatinine amounts measured during the study. Diagram 1 also shows the data related to creatinine amounts measured during the study. The biggest difference was observed in the beginning of the study. In general, the collected data indicate that creatinine changes have a positive growth in relation to time.
Table 1. The measured creatinine amounts after 18 times of measurements during the study
Time of Measurement Mean SD
Time of Measurement Mean SD
1 2 3
7.03 7.47 7.71
2.85 3.15 2.96
10 11 12
8.43 8.33 8.57
2.49 2.24 2.47
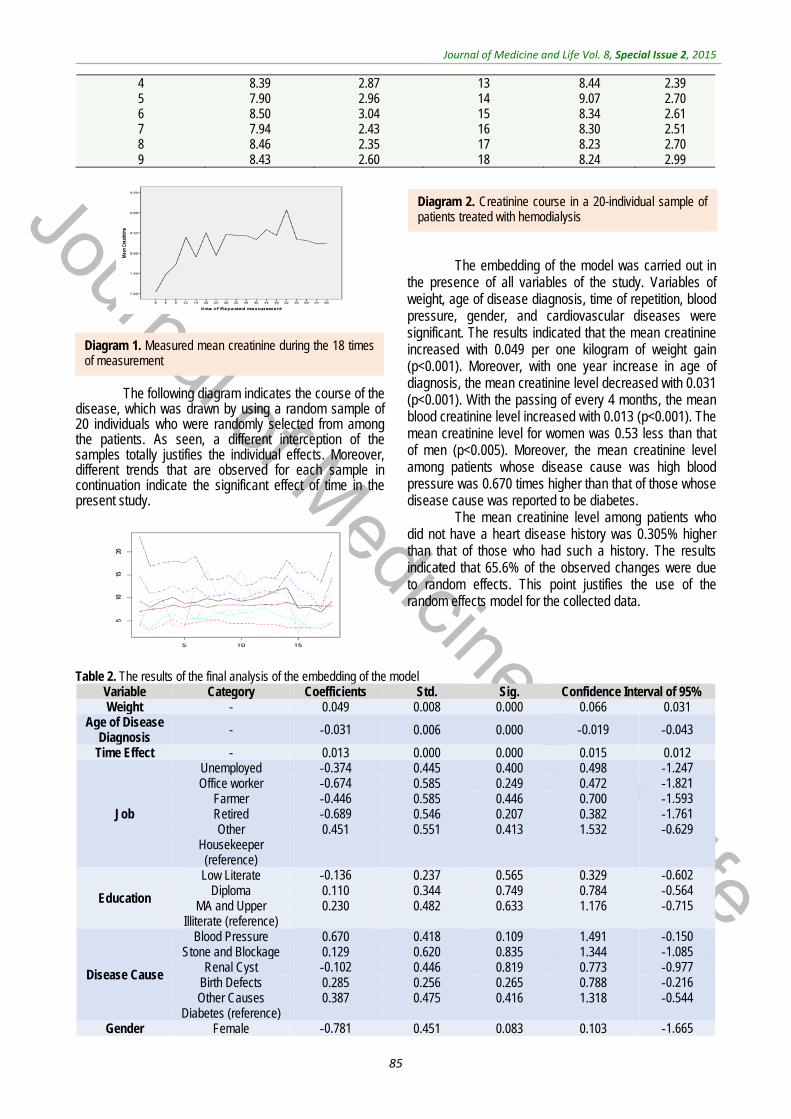
Journal of Medicine and Life
Journal of Medicine and Life Vol. 8, Special Issue 2, 2015
85
4 5 6 7 8 9
8.39 7.90 8.50 7.94 8.46 8.43
2.87 2.96 3.04 2.43 2.35 2.60
13 14 15 16 17 18
8.44 9.07 8.34 8.30 8.23 8.24
2.39 2.70 2.61 2.51 2.70 2.99
The following diagram indicates the course of the disease, which was drawn by using a random sample of 20 individuals who were randomly selected from among the patients. As seen, a different interception of the samples totally justifies the individual effects. Moreover, different trends that are observed for each sample in continuation indicate the significant effect of time in the present study.
The embedding of the model was carried out in the presence of all variables of the study. Variables of weight, age of disease diagnosis, time of repetition, blood pressure, gender, and cardiovascular diseases were significant. The results indicated that the mean creatinine increased with 0.049 per one kilogram of weight gain (p<0.001). Moreover, with one year increase in age of diagnosis, the mean creatinine level decreased with 0.031 (p<0.001). With the passing of every 4 months, the mean blood creatinine level increased with 0.013 (p<0.001). The mean creatinine level for women was 0.53 less than that of men (p<0.005). Moreover, the mean creatinine level among patients whose disease cause was high blood pressure was 0.670 times higher than that of those whose disease cause was reported to be diabetes.
The mean creatinine level among patients who did not have a heart disease history was 0.305% higher than that of those who had such a history. The results indicated that 65.6% of the observed changes were due to random effects. This point justifies the use of the random effects model for the collected data.
Table 2. The results of the final analysis of the embedding of the model
Variable Category Coefficients Std. Sig. Confidence Interval of 95% Weight - 0.049 0.008 0.000 0.066 0.031
Age of Disease Diagnosis - 0.031- 0.006 0.000 0.019- 0.043-
Time Effect - 0.013 0.000 0.000 0.015 0.012
Job
Unemployed 0.374- 0.445 0.400 0.498 1.247- Office worker 0.674- 0.585 0.249 0.472 1.821-
Farmer 0.446- 0.585 0.446 0.700 1.593- Retired 0.689- 0.546 0.207 0.382 1.761- Other 0.451 0.551 0.413 1.532 0.629-
Housekeeper (reference)
Education
Low Literate 0.136- 0.237 0.565 0.329 0.602- Diploma 0.110 0.344 0.749 0.784 0.564-
MA and Upper 0.230 0.482 0.633 1.176 0.715- Illiterate (reference)
Disease Cause
Blood Pressure 0.670 0.418 0.109 1.491 0.150- Stone and Blockage 0.129 0.620 0.835 1.344 1.085-
Renal Cyst 0.102- 0.446 0.819 0.773 0.977- Birth Defects 0.285 0.256 0.265 0.788 0.216- Other Causes 0.387 0.475 0.416 1.318 0.544-
Diabetes (reference) Gender Female 0.781- 0.451 0.083 0.103 1.665-
Diagram 1. Measured mean creatinine during the 18 times of measurement
Diagram 2. Creatinine course in a 20-individual sample of patients treated with hemodialysis
Journal of Medicine and Life
Journal of Medicine and Life Vol. 8, Special Issue 2, 2015
86
Male (reference)
Smoking Yes 0.112- 0.277 0.685 0.430 0.655-
No (reference) Cardiovascular
Disease Yes 0.305 0.197 0.123 0.692 0.082- No
Variance of Random Effect
- 6.409 0.917 0.000 8.208 4.610
Discussion
The results of the present study indicated that variables of gender, age of disease diagnosis, cardiovascular disease, and blood pressure have a significant effect on blood creatinine changes. A review of the studies conducted on this issue and their comparison indicated that there are more significant variables. However, it is clear that longitudinal studies depend on time. Therefore, values are measured over time, and that is why data recorded in the forms are different from the collected ones because they have not been recorded at the same time.
Luigi et al. conducted a study in order to predict serum creatinine among 179 hemodialysis patients. The results of their study indicated that there was a significant difference between CRP and increased changes in serum creatinine. They employed multivariate linear regression and categorized the patients according to their gender and diabetes stage. They concluded that age could be considered a predictive factor for serum creatinine in men. Another objective of their study was to determine the potential relationship between serum creatinine, senility, gender, and dialysis efficiency. Since creatinine is the product of the muscles and the body’s mechanism that declines in older patients, and probably due to less development of muscle mass in women, age, with its approved effect on gender, has a higher importance in predicting serum creatinine. The results of their study are in agreement with those of the present study [5].
A study was conducted on 7,719 adult hemodialysis patients in the USA, in order to investigate their mortality risk and changes in their diet criteria. The values measured of serum albumin and serum creatinine before the experiment were remarkably related to mortality risk which in turn had a reversible relationship with serum creatinine in the beginning of the study. There was a strong reversible relationship between the number of neutrophils and serum albumins and between the number of neutrophils and creatinine [15]. In another study conducted by Kaysen et al. in order to compare the effects of creatinine and albumin among 364 patients with hemodialysis, the results indicated that creatinine changes over time were not significant. Moreover, age, gender, race, and diabetes were reported to be significant, which is in line with the present study [6]. Ramer et al. conducted a retrospective study on 2,131,248 adults in Pennsylvania. Among these adults, 6,657 had severe hemodialysis. The results of their study indicated that 43% of those with severe hemodialysis died
one year after admission. In comparison with the present study in which death probability was 17% in the first year, a significant difference was observed, which could be related to the fact that the participants in Ramer’s study were going through the final stages of their disease. Moreover, variables of age, gender, race, and insurance status in Ramer’s study and other studies conducted in the USA were reported as significant variables with survival of this group of the patients, these results being in line with those of the present study [16].
Another study was conducted in order to predict premature death among diabetic patients suffering from hemodialysis, in which risk factors related to mortality within 3, 6, and 12 months were investigated. The relationship between age and heart diseases was reported to be significant [17]. Speckman reported that the main risk factors in patients with hemodialysis are diabetes and cardiovascular diseases. That is why diabetes was considered the basic cause of disease in the present study [18].
Johansen et al. [19] studied 54 hemodialysis patients. In their study, they measured the performance of the patients’ kidneys 4 times in a year. Changes in repetition sizes were investigated with regulations for differences of age, gender, race, and diabetes status basis. No remarkable change was observed in body weight, fat mass, and lean body mass. The reason for the different results of this study and the present study can be attributed to the short period of follow-up in Johansen’s study compared to the present one [19].
Oomichi et al. conducted a study in order to investigate the effect of regular control of blood sugar in the survival of diabetic patients with chronic hemodialysis. In the beginning of hemodialysis, there was no significant difference in the admission age, dialysis duration, blood pressure, proportion of heart patients, and serum creatinine level in the three groups. The most important factor in the survival of this group of the patients was reported to be the quality of healthcare provided to these individuals [20].
Another study was conducted in order to investigate the quality of life among 90 patients with dialysis in Malaysia. The mean age of the patients was 7.94 ± 14.1 and the maximum occupational frequency was related to the unemployed with 71.1%. The main cause of disease was unknown. The mean weight was 57.7 and the mean duration of dialysis was 55 ± 39 months. Diabetes, high blood creatinine, and decreased calcium were introduced as the significant variables of the study. The mean serum creatinine was 3.7 [21].

Journal of Medicine and Life
Journal of Medicine and Life Vol. 8, Special Issue 2, 2015
87
Another study was conducted in order to investigate the results of dialysis simultaneously in 7 countries including France, Germany, Italy, Japan, Spain, the UK, and the USA. In this study, 24,392 patients were selected from 327 centers in these countries. The study was conducted by using a longitudinal method. In this study, the patient’s age, gender, and diabetes were
introduced as the cause of end stage renal disease (ESRD) [22].
While hemodialysis to some extent enhances life expectancy among renal patients who are going through final stages, the quality of life among such patients has been reported to be low. That is why related effective variables are highly significant.
References
1. Brunner FP, Brynar, Challah et al. Renal replacement therapy in Patients with Diabetic Nephropathy. Nephrology, dialysis, Transplantation. 1998; 3:585-594.
2. Fitsgerald JT, Schanzer A, Chin AI, Mcvicar JP, Perez RV, Troppmann C. Outcomes of upper arm arteriovenous fistulas for maintenance hemodialysis access. Arch Surg. 2004; 1390:201-8.
3. Ghods AJ, Ossareh S, Savaj S. Results of renal transplantation of the Hashemi Nejad kidney Hospital Tehran. Clin Transplant. 2000; 203-10.
4. Ghods AJ. Renal transplantation in Iran. Nephrol Dial Transplant. 2002; 17:222-8.
5. Vernaglione L, Marangi AL, Cristofano C, Giordano R, Chimienti S, Basile C. Predictors of serum creatinine in haemodialysis patients: a cross‐sectional analysis. Oxford Journals Medicine & Health Nephrology Dialysis Transplantation. 18, 6:1209-1213.
6. Kaysen GA, Chertow GM, Adhikarla R, Young B, Ronco C et al. Inflammation and dietary protein intake exert competing effects on serum albumin and creatinine in hemodialysis patients. Kidney International 60.1. Jul 2001; 333-40.
7. Takai I, Fukuhara S, Nakai S, Shinzato T, Maeda K. Effect of creatinine generation rate on the relationship between hemodialysis prescription and health-related quality of life. Journal of Artificial Organs 5.2. Jun 2002; 123-131.
8. Alvarez L, Torregrosa JV, Peris P, Monegal A, Bedini JL et al. Effect of hemodialysis and renal failure on serum
biochemical markers of bone turnover. Journal of Bone and Mineral Metabolism22.3. May 2004; 254-9.
9. Liang KY, Zeger SL. Longitudinal data analysis using generalized linear models. Biometrika. 1986 Jan; 73(1):13-22.
10. Gardiner JC, Luo Z, Roman LA. Fixed effects, random effects and GEE: What are differences?. Stat in Med. 2009 Jan; 28(2):221-239.
11. Myers RH, Montgomery DC, Vining GG. Generalized linear models. 2002, USA: Wiley & Sons.
12. Diggle PJ, Heagerty PJ, Liang KY, Zeger SL. Analysis of Longitudinal Data. 2nd ed., 2002, Oxford: Oxford Science Publications.
13. Molenberghs G, Verbeke G. Models for Discrete Longitudinal Data. 2005, New York: Springer.
14. Jansen I, Beunckens C, Molenberghs G, Verbeke G, Mallinckrodt C. Analyzing Incomplete Discrete Longitudinal Clinical Trial Data. Statistical Science. 2006; 21(1):52–69.
15. Pifer TB, Mccullough KP, Port FK, Goodkin DA, Maroni BJ, Held PJ, Young EW. Mortality risk in hemodialysis patients and changes in nutritional indicators: DOPPS. Kidney International. 2002; 62, 2238–2245. doi:10.1046/j.1523-1755.2002.00658.x.
16. Ramer SJ, Cohen ED, Chang CCH, Unruh ML, Barnato AE. Survival after Acute Hemodialysis in Pennsylvania, 2005-2007: A Retrospective Cohort Study. Plos One. August 2014; 9, 8:e105083.
17. Mauri JM, Vela E, Cle`ries M. Development of a predictive model for early death in diabetic patients entering hemodialysis: a population-based study. Acta Diabetol. 2008; 45:203–209. doi: 10.1007/s00592-008-0043-x.
18. Speckman RA, Frankenfield DL, Roman SH, Eggers PW et al. Diabetes Is the Strongest Risk Factor for Lower-Extremity Amputation in New Hemodialysis Patients. Diabetes Care27.9. Sep 2004; 2198-203.
19. Johansen KL, Kaysen GA, Young BS, Hung AM, da Silva M, Chertow GM. Longitudinal study of nutritional status, body composition, and physical function in hemodialysis patients 1, 2, 3, 4. American Society for Clinical Nutrition. April 2003; 77,4: 842-846.
20. Takeshi O, Masanori E, Tsutomu T, Tomoaki M et al. Impact of Glycemic Control on Survival of Diabetic Patients on Chronic Regular Hemodialysis: A 7-year observational study. Diabetes Care29.7. Jul 2006; 1496-500.
21. Yusop NB, Mun CY, Shariff ZM, Huat CB. Factors Associated with Quality of Life among Hemodialysis Patients in Malaysia. PLoS One 8.12. Dec 2013; e84152.
22. Young EW, Goodkin DA, Mapes DL, Port FK, Keen ML et al. The Dialysis Outcomes and Practice Patterns Study (DOPPS): An international hemodialysis study. Kidney International 57.S74. Jan 2000; S74-S81.
Journal of Medicine and Life
Journal of Medicine and Life Vol. 8, Special Issue 2, 2015, pp.88-91
Effect of temperature on the setting time of Mineral Trioxide Aggregate (MTA)
Sharifi R*, Araghi S*, Ghanem S**, Fatahi A*** *Endodontics Department, School of Dentistry, Kermanshah University of Medical Sciences, Kermanshah, Iran **School of Dentistry, Kermanshah University of Medical Sciences, Kermanshah, Iran ***Medical Biology Research Center, School of Dentistry, Kermanshah University of Medical Sciences, Kermanshah, Iran Correspondence to: Solmaz Araghi, MD, Endodontics Department, School of Dentistry, Kermanshah University of Medical Sciences, Shahid Beheshti Blvd., Kermanshah, Iran Phone: (+98) 83 38358258, Mobile phone: (+98) 912-214-4368, E-mail: [email protected] Received: May 24th, 2015 – Accepted: July 27th, 2015
Abstract Introduction: Mineral trioxide aggregate (MTA) has numerous applications in dentistry due to various advantages. However, its long setting time has still remained a problem. The current study was conducted to investigate the effect of temperature (ambient and distilled water temperature) on the setting time of mineral trioxide aggregate (MTA). Materials and methods: This experimental study comprised of two parts. In the first part, MTA and distilled water samples were kept at ambient temperature for 24 hours (before mixing: effect of distilled water temperature on the setting time of MTA and after mixing: effect of distilled water and ambient temperature on the setting time of MTA), and analyzed and divided into three groups: group 1 (4°C), group 2 (37°C) and group 3 (90°C). The mixed samples were placed in the glass cylinders with an internal diameter of 8 mm and a height of 10 mm, and kept at 37°C temperature and 100% humidity. In the second part, the samples were prepared the same as those of the first part and divided into three groups according to the terms of maintenance: group 1 (4°C), group 2 (37°C) and group 3 (75°C). The mixed samples were then put in glass cylinders with an internal diameter of 8 mm and a height of 10 mm and the samples of groups 1, 2 and 3 were kept at 4, 37 and 75 °C, respectively. At the end of each part, the primary and final setting times were measured by Gilmore needle. Data were analyzed by SPSS using Kruskal-Wallis test (p<0.05). Results: The findings of this study showed a significant reduction of the primary and final setting time of MTA for the samples of both parts of the study with an increase in ambient temperature (p<0.05). Conclusion: This study indicated that increased ambient temperature caused a reduction in the setting time of MTA.
Keywords: Mineral Trioxide Aggregate (MTA), setting time, temperature
Introduction
Mineral trioxide aggregate (MTA) was first introduced in dentistry in 1993 as a filling material for the root apex. MTA has also been recommended for the pulp capping, pulpotomy, blocking the pores in the teeth with open apex, restoration of root perforations and canal filling [1].
MTA was first presented as derivatives of calcium oxide, silicate dioxide, and aluminum oxide that are converted to calcium silicate, dicalcium silicate and tricalcium aluminate compounds. Later, it was found that MTA, in addition to having bismuth oxide radiopaque factor, is very much similar to Portland cement. Depending on the type of commercial product, MTA compounds are different and are composed of 75% Portland cement, 20% bismuth oxide and 5% calcium sulfate dihydrate (Dentsply Tulsa) or 80% Portland cement and 20% bismuth oxide (MTA Angelus) [2].
Moreover, MTA contains slight amounts of SiO2, CaO, MgO, Al2O3, K2SO4 and Na2SO4 [3,4]. Studies have shown that MTA and Portland cement have similar
antimicrobial activities [6] and biocompatibility [7] in some properties such as the improvement of periapical lesions [5]. MTA is available in white and grey forms. The white type, which is aesthetically superior, lacks tetracalcium aluminoferrite. The color difference is mainly due to lower amount of iron oxide in white MTA. The grey type of MTA is not usually used in cases where beauty is concerned [4].
Clinically, MTA has numerous advantages such as high sealing potential [8,9] good biocompatibility [10,11], acceleration of the amelioration of periapical lesions [12,13] and halting root inflammatory resorption [14]. In addition, the setting time of MTA is not influenced by the unfavorable effect of humidity or blood [15]. Although MTA is preferred in many dental treatments due to its numerous advantages, it has some deficiencies, including the handling problem and the long setting time [16]. Studies have shown that the setting time of MTA is longer than the common canal fillings such as amalgam, super-EBA, Intermediate Restorative Material (IRM) [17] and biodentine [18]. The longer setting time of root canal fillings is an unfavorable property because it facilitates
Journal of Medicine and Life
Journal of Medicine and Life Vol. 8, Special Issue 2, 2015
89
cement leakage in periapical procedures [19]. Clinically, some conditions like reverse filling and sealing perforation require a faster setting time in order to prevent dissolution of the components of the filling material by blood or tissue fluids [20]. As a generally accepted advantage, canal filling materials need to be immediately hardened after the insertion into the canal cavity to minimize the contact time of the filling material with vital tissues [18].
Various studies have been conducted to overcome the longer setting time of MTA. Lee et al. reported that although adding hydration accelerators such as citric acid, lactic acid, sodium chloride, and calcium lactate gluconate improves the setting time, it reduces the compressive strength during the mixing stage of MTA [21]. AlAnenzi et al. showed that adding KY, CaCl2 or NaOC1 liquids to grey MTA improves the handling properties and reduces the setting time [22]. Recently, an attempt has been made to replace MTA by a calcium aluminosilicate cement called Quick-Set with a faster setting time. Although this material was similar to MTA in many restorative properties of periapical tissues, it resulted in more inflammation [23].
Aesthetically, white MTA is superior to the grey MTA [4] but the setting time of white MTA is longer than that of the grey type [1]. Further studies are needed to analyze the long setting time of MTA, especially the white type. This study investigated the effect of ambient temperature on the setting time of commercial white MTA.
Materials and methods
In this experimental study, white MTA (Angelus, Brazil) was used. The effect of temperature was evaluated in two Parts.
In the first part, 9 packages of MTA (each containing 0.5 gr MTA) and 9 distilled water ampoules (5 ml) were divided into three groups (n=3) according to the ambient temperature: - group one at 4°C (in refrigerator for 24 hours) - group two at 37°C (in incubator for 24 hours) - group three at 90°C (in incubator for 24 hours)
The samples were immediately mixed with 3/ 1 proportion (MTA powder to distilled water) according to the manufacturer’s instruction. The mixed materials were placed in glass cylinders (8 mm internal diameter and 10 mm height) and kept in incubator at 37°C and 100% humidity.
In the second part, the samples were prepared similarly to those of the first part and divided into three groups based on the maintenance conditions: - group one at 4°C (in refrigerator for 24 hours) - group two at 37°C (in incubator for 24 hours) - group three at 75°C (in incubator for 24 hours)
Then, the samples were immediately mixed with 3/ 1 proportion (MTA powder to distilled water) according to the manufacturer’s instruction. The mixed materials were poured in glass cylinders (8 mm internal diameter
and 10 mm height) and the samples of group 1, 2 and 3 were kept at 4, 37 and 75 °C, respectively under 100% humidity.
At the end of each part, the setting time of samples was measured by Gilmore needle according to similar studies [24-27]. Gilmore needle is composed of a metal frame on which two vertical axes are installed. A weight, to the end of which a needle with a specified diameter is attached, is installed on each of these vertical axes. A thin needle (415.6 gr) is attached to the bigger weight and a thick needle (2.12 mm in diameter) is attached to the smaller weight. The samples were tested at intervals of 1 or 5 minutes.
The primary and final setting times were respectively considered the times that the tip of light and heavy weights did not have an observable effect on MTA surface. The setting time of each sample was recorded. The obtained data were analyzed by SPSS software using Kruskal-Wallis test. P<0.05 was considered significant.
Results
The setting time of MTA was analyzed by two primary and final needles at different temperatures in incubator and sterile liquid. As reported in Table 1, in the primary needle test, the temperature of 4°C indicated the highest mean value for the setting time of MTA and the temperature of 75°C showed the lowest setting time with the mean time of 20 minutes. Based on the results of Kruskal-Wallis test, this difference was reported to be significant (p<0.023). As for the final needle test, the temperature of 4°C with the mean time of 87 showed the highest mean value for the setting time of MTA and temperature of 75°C indicated the lowest mean value for the setting time of MTA. To analyze and confirm the difference between the effects of different temperatures on the setting time of MTA, Kruskal-Wallis test was run and the findings showed a significant difference between temperatures (p<0.025).
Table 1 presents the number, mean values, and standard deviation of the setting time of MTA at different temperatures in incubator. According to Table 2, in the primary needle, the maximum mean setting time was reported for 4°C with the mean time of 43 minutes. Also, the minimum mean setting time was reported for 90°C with the mean time of 20 minutes. The results of Kruskal-Wallis test revealed that this difference was statistically significant (p<0.02). In the final needle test, the maximum mean setting time was observed at the temperature of 4°C with the mean time of 93 minutes. Further, the minimum mean setting time in the final needle test was reported for the temperature of 90°C with the mean time of 38 minutes. The findings of Kruskal-Wallis test showed this difference to be statistically significant (p<0.023). Tables 2-1 show the number, mean value, and standard deviation of the setting time of MTA at different temperatures of sterile liquid.

Journal of Medicine and Life
Journal of Medicine and Life Vol. 8, Special Issue 2, 2015
90
Table 1. Number, mean value, and standard deviation for the setting time of MTA at different temperatures in incubator Final needle Primary needleTemperature
SDMean NumberSDMean Number3 87 3 3 42 3 4°C 3 47 3 327 3 37°C 3 37 3 020 3 75°C
Table 2. Number, mean value, and standard deviation for the setting time of MTA
Final needle Primary needleTemperature SDMean NumberSDMean Number393 3 343 3 4°C 075 3 335 3 37°C 338 3 020 3 90°C
Discussion
One of the major problems of MTA is its long setting time. The current study investigated the effect of ambient temperature on the setting time of MTA. The results indicated a difference in the setting time at different temperatures. The results of the primary and final needle tests in incubator indicated that the minimum and maximum setting times of MTA were reported for the samples kept at temperatures of 4 and 75 °C, respectively. However, similar results were obtained for distilled water at different temperatures. These findings demonstrate that temperature can affect the setting time of MTA and the setting time reduces with a rise in temperature.
To confirm the effect of ambient temperature on MTA properties, Saghiri et al. showed that temperature could influence the surface hardness and the microscopic structure of MTA [24]. The effect of temperature on the setting time of MTA can be attributed to the chemical processes of the main material of MTA, Portland cement. Portland cement is hardened in contact with water; this is when a chemical reaction occurs between water and cement [28]. It has been shown that the size of particles [29], proportion of powder to liquid [30], presence of air in
the mixture [31] and ambient temperature [32,33] can affect the physical properties, hydration process and synthesis of Portland cement. The hydration of MTA produces calcium hydroxide and hydrate silicate calcium (H-S-C) gel. H-S-C gel results in cement resistance, thereby contributing to the stability of hydrated cement [34]. According to the research, the hydration of Portland cement reacts to temperature and this reaction is pyrogenic [35,36].
In the present study, the setting time of MTA varied from 37 to 93 minutes depending on the ambient temperature or distilled water temperature. In previous studies, different setting times have been reported for the white MTA (ProRoot MTA), 165 ± 5 minutes [23], 170 ± 2 minutes [37] and 228.33 ± 2.88 [18], which are higher than those of the present study. Other studies have also reported a longer setting time for MTA than that of the current study [38-43], which can be due to the conditions of using distilled water regardless of temperature. Conclusion
The results of this study showed that ambient temperature before and after mixing has a significant impact on the setting time of MTA and the increased ambient temperature reduces the setting time.
References
1. Parirokh M, Torabinejad M. Mineral trioxide aggregate: a comprehensive literature review-Part I: chemical, physical, and antibacterial properties. J Endod. 2010; 36(1):16-27.
2. Dorileo MC, Bandeca MC, Pedro FL, Volpato LE, Guedes OA, Dalla Villa R et al. Analysis of metal contents in Portland Type V and MTA-based cements. Scientific World Journal. 2014; 2014:983728.
3. Asgary S, Shahabi S, Jafarzadeh T, Amini S, Kheirieh S. The properties of a new endodontic material. J Endod. 2008; 34:990–3.
4. Patel N, Patel K, Baba SM, Jaiswal S, Venkataraghavan K, Jani M. Comparing gray and white mineral trioxide aggregate as a repair material for furcation perforation: an in vitro dye extraction study. J Clin Diagn Res. 2014; 8(10):ZC70-3.
5. da Silva SR, da Silva Neto JD, Veiga DF, Schnaider TB, Ferreira LM. Portland cement versus MTA as a root-end filling material. A pilot study. Acta Cir Bras. 2015; 30(2):160-4.
6. Hasan Zarrabi M, Javidi M, Naderinasab M, Gharechahi M. Comparative evaluation of antimicrobial activity of three cements: new endodontic
cement (NEC), mineral trioxide aggregate (MTA) and Portland. J Oral Sci. 2009; 51(3):437-42.
7. Koçak S, Erten H, Baris E, Türk S, Alaçam T. Evaluation of the biocompatibility of experimentally manufactured portland cement: An animal study. J Clin Exp Dent. 2014; 6(1):e17-21.
8. Lee SJ, Monsef M, Torabinejad M. Sealing ability of a mineral trioxide aggregate for repair of lateral root perforations. J Endod. 1993; 19(11):541-4.
9. Singh P, Paul J, Al-Khuraif AA, Vellappally S, Halawany HS, Hashim M, Abraham NB, Jacob V, Thavarajah R.

Journal of Medicine and Life
Journal of Medicine and Life Vol. 8, Special Issue 2, 2015
91
Sealing ability of mineral trioxide aggregate, calcium phosphate cement, and glass ionomer cement in the repair of furcation perforations. Acta Medica (Hradec Kralove). 2013; 56(3):97-103.
10. Yoshimine Y, Ono M, Akamine A. In vitro comparison of the biocompatibility of mineral trioxide aggregate, 4META/MMA-TBB resin, and intermediate restorative material as root-end-filling materials. J Endod. 2007; 33(9):1066-9.
11. Chang KC, Chang CC, Huang YC, Chen MH, Lin FH, Lin CP. Effect of tricalcium aluminate on the physicochemical properties, bioactivity, and biocompatibility of partially stabilized cements. PLoS One. 2014; 9(9):e106754.
12. Chang SW, Oh TS, Lee W, Cheung GS, Kim HC. Long-term observation of the mineral trioxide aggregate extrusion into the periapical lesion: a case series. Int J Oral Sci. 2013; 5(1):54-7.
13. Paul ML, Mazumdar D, Vyavahare NK, Baranwal AK. Healing of the periapical lesion in posterior teeth with mineral trioxide aggregate using orthograde technique - Two case reports. Contemp Clin Dent. 2012; 3(Suppl 2):S264-8.
14. Sharifi R, Parirokh M, Satvati SR, Torabinejad M. Treatment of inflammatory root resorption using mineral trioxide aggregate: A case report. Dental Hypotheses. 2014; 5(4):172.
15. Naik RM, Pudakalkatti PS, Hattarki SA. Can MTA be: Miracle trioxide aggregate?. J Indian Soc Periodontol. 2014; 18(1):5-8.
16. Butt N, Talwar S, Chaudhry S, Nawal RR, Yadav S, Bali A. Comparison of physical and mechanical properties of mineral trioxide aggregate and Biodentine. Indian J Dent Res. 2014; 25(6):692-7.
17. Torabinejad M, Hong CU, McDonald F, Pitt Ford TR. Physical and chemical properties of a new root-end filling material. J Endod. 1995; 21(7):349-53.
18. Kaup M, Schäfer E, Dammaschke T. An in vitro study of different material properties of Biodentine compared to ProRoot MTA. Head Face Med. 2015; 11(1):16.
19. Parirokh M, Torabinejad M. Mineral trioxide aggregate: a comprehensive literature review-Part III: Clinical applications, drawbacks, and mechanism of action. J Endod. 2010; 36(3):400-13.
20. Bramante CM, Kato MM, Assis GF, Duarte MA, Bernardineli N, Moraes IG
et al. Biocompatibility and setting time of CPM-MTA and white Portland cement clinker with or without calcium sulfate. J Appl Oral Sci. 2013; 21(1):32-6.
21. Lee BN, Hwang YC, Jang JH, Chang HS, Hwang IN, Yang SY, Park YJ, Son HH, Oh WM. Improvement of the properties of mineral trioxide aggregate by mixing with hydration accelerators. J Endod. 2011; 37(10):1433-6.
22. AlAnezi AZ, Zhu Q, Wang YH, Safavi KE, Jiang J. Effect of selected accelerants on setting time and biocompatibility of mineral trioxide aggregate (MTA). Oral Surg Oral Med Oral Pathol Oral Radiol Endod. 2011; 111(1):122-7.
23. Kohout GD, He J, Primus CM, Opperman LA, Woodmansey KF. Comparison of Quick-Set and mineral trioxide aggregate root-end fillings for the regeneration of apical tissues in dogs. J Endod. 2015; 41(2):248-52.
24. Saghiri MA, Lotfi M, Joupari MD, Aeinehchi M, Saghiri AM. Effects of storage temperature on surface hardness, microstructure, and phase formation of white mineral trioxide aggregate. J Endod. 2010; 36(8):1414-8.
25. International Organization for Standardization Dental root canal sealing materials ISO 6876:2001.
26. ASTM C266-13, Standard Test Method for Time of Setting of Hydraulic-Cement Paste by Gillmore Needles, ASTM International, 2013, West Conshohocken, PA, www.astm.org.
27. Wiltbank KB, Schwartz SA, Schindler WG. Effect of selected accelerants on the physical properties of mineral trioxide aggregate and Portland cement. J Endod. 2007; 33(10):1235-8.
28. Taylor HFW. Cement chemistry. 2nd ed., 1997, London: Thomas Telford.
29. Osbaeck B, Johansen V. Particle size distribution and rate of strength development of Portland cement. J Am Ceram Soc. 1989; 72:197–201.
30. Bentz DP. Influence of water-to-cement ratio on hydration kinetics: simple models based on spatial considerations. Cem Concr Res. 2006; 36:238–44.
31. Buenfeld N, Okundi E. Release of air from unsaturated aggregate during setting of concrete. J Construction and Building Materials. 1999; 13:143–7.
32. Klieger P. Effect of mixing and curing temperature on concrete strength. ACI J Proc. 1958; 54:1063–81.
33. Mouret M, Bascoul A, Escadeillas G. Strength impairment of concrete mixed in hot weather: relation to porosity of bulk fresh concrete paste and maturity. Mag Concrete Res. 2003; 55:215–23.
34. Camilleri J. Hydration mechanisms of mineral trioxide aggregate. Int Endod J. 2007; 40:462–70.
35. Escalante-Garcı´a JI, Sharp JH. The microstructure and mechanical properties of blended cements hydrated at various temperatures. Cem Concr Res. 2001; 31:695–702.
36. Price WH. Factors influencing concrete strength. J Aci J Proc. 1951; 47:417–32.
37. Gandolfi MG, Iacono F, Agee K, Siboni F, Tay F, Pashley DH, Prati C. Setting time and expansion in different soaking media of experimental accelerated calcium-silicate cements and ProRoot MTA. Oral Surg Oral Med Oral Pathol Oral Radiol Endod. 2009; 108(6):e39-45.
38. Dammaschke T, Gerth HU, Zu¨ chner H, Scha¨ fer E. Chemical and physical surface and bulk material characterization of white ProRoot MTA and two Portland cements. Dent Mater. 2005; 21:731–8.
39. Budig CG, Eleazer PD. In vitro comparison of the setting of dry ProRoot MTA by moisture absorbed through the root. J Endod. 2008; 34:712–4.
40. Watts JD, Holt DM, Beeson TJ, Kirkpatrick TC, Rutledge RE. Effects of pH and mixing agents on the temporal setting of tooth-colored and gray mineral trioxide aggregate. J Endod. 2007; 33:970–3.
41. Coomaraswamy KS, Lumley PJ, Hofmann MP. Effect of bismuth oxide radioopacifier content on the material properties of an endodontic Portland cement-based (MTA-like) system. J Endod. 2007; 33:295–8.
42. Lee YL, Lee BS, Lin FH, Yun Lin A, Lan WH, Lin CP. Effects of physiological environments on the hydration behavior of mineral trioxide aggregate. Biomaterials. 2004; 25:787–93.
43. Storm B, Eichmiller FC, Tordik PA, Goodell GG. Setting expansion of gray and white mineral trioxide aggregate and Portland cement. J Endod. 2008; 34:80–2.
Journal of Medicine and Life
Journal of Medicine and Life Vol. 8, Special Issue 2, 2015, pp.92-98
A conceptual investigation of variables affecting the success and acceptance of SMS Marketing in Iran
Adhami A*, Rabiee A**, Adhami M*
*Kerman University of Medical Sciences, Kerman, Iran **Payam Noor University, Tehran, Rey, Iran Correspondence to: Masoumeh Adhami, MD, Kerman University of Medical Sciences, Iran, Jomhouri Blvd., Kerman, Iran, Phone/ Fax: (+98) 03431215617, E-mail: [email protected] Received: May 25th, 2015 – Accepted: July 27th, 2015
Abstract This paper’s aim was to develop a conceptual overview of SMS marketing and delineate factors of new communications technologies on business practice. This study, which was a descriptive survey, was built on primary and secondary data source including a literature review of SMS marketing and a Questionnaire were used as the primary means of collecting secondary data. The sample size of 300 patients was determined according to the Cochran formula. Moreover, data analysis was done in SPSS by using linear regression, chi-square, t-test and Binomial test. According to the research, sex, age, education, relevance, timeliness, reliability to sender, sense of control were variables affecting the SMS marketing acceptance. This paper was qualitative and provided a solid conceptual foundation for the future empirical research on e- marketing. The potential limitation was related to the broad user of computer and mobile. In this research, we considered SMS marketing, Mobile marketing, SMS advertising as the same subject. This research will be a useful resource with important insight into the factors that may encourage or determine consumer acceptance of this new form of direct marketing. This paper addressed an important timely issue, and added to the body of literature and knowledge focusing on e-marketing.
Keywords: SMS marketing, advertising, Iran
Introduction and motivation
Today, the production and delivery of goods may not be sufficient because it has changed in development activities and in a competitive environment and customers must be attracted. Advertising is considered as a part of marketing success.
Successful companies, particularly in export, as well as the improvement of the quality of their products following the design, and the implementing of effective and dynamic marketing systems are highlighted.
It is perhaps not an exaggeration to assert that the mobile phone is the most ubiquitous personal item in the world. Over the years, the mobile phone has become an increasingly attractive product with added features. SMS marketing in an effort to effectively and successfully use this capacity for the introduction of the goods and services.
A long journey has been made from the radio transmitter using Morse code for maritime applications developed by Guglielmo Marconi in the 1890s, to Motorola’s “walkie-talkie” developed for the US Army during the World War II, to the current third generation of mobile telephones for the consumer [20].
At the outset, it is useful to define mobile marketing. In this paper, we adopted the Mobile Marketing
Association’s definition: “Any form of marketing, advertising, or sales promotion activity aimed at consumers and conducted over a mobile channel” [9].
“Mobile marketing” is seen as the use of wireless media as an integrated content delivery and direct response vehicle within a cross-media marketing communications program.
Mobile marketing also known as wireless marketing, promises vast opportunity, still in an experimental phase business, has little experience using these new marketing tools.
However, Mobile Marketing is merely part of e-marketing. E-marketing is about much more than just the internet. It involves other technologies that enable customer relationship management, enterprise resource planning, supply chain management, text messaging, bar code scanners and digital TV [13].
Telephone marketing, mail and mobile telephony, as well as digital TV and the Internet, have supplemented traditional tools. In order to maximize their effectiveness, SMS, known as text messaging, is a store-and-forward communication system for the mobile phone. International Data Corporation stated that SMS is the most popular mobile data application having a recorded 65 percent of mobile phone users sending text messages

Journal of Medicine and Life
Journal of Medicine and Life Vol. 8, Special Issue 2, 2015
93
daily. According to the GSM Association, cell phone users send more than 10 billion SMS messages each month, making SMS the most popular mobile data service. The use of short message service is very popular among the people of the world. According to many people, they use these services because they are “cheap” and a fast learner. Currently, 83% of English and, 79% German people use SMS. It was also anticipated that the number of messages sent in 2012 reached 3.7 trillion. This figure is double the current number of messages [4].
Unlike any previous technology, mobile phone is now perceived as a social necessity, especially among teenagers. The mobile phone has become a true “extension of man”.
Mobile penetration ranges from 11% for 5–8-year-olds to 81% for 13–14-year-olds and reaches saturation point at 91% for 16–18-year olds, according to the Child wise survey [5].
Increasingly, parents are giving children their first mobiles at the age of 8 as a way to stay in touch and for increased security and safety. Texting is as natural to children as picking up a phone. In fact, texting is overtaking speaking, particularly for girls. It is becoming their primary form of communication: 62% of the girls aged 14–16 send four or more text messages per day. They view it as more fun as well as more practical.
This massive surge in mobile ownership and usage has created a strong opportunity for brands to market especially to teens and twines in a completely new way [6,10,12].
Text message advertisements have been found to boost consumers’ inclination to purchase by 36 per cent, which partly explains its growing popularity among marketers. In addition, they are considered as forms of one-to-one marketing. Businesses have effectively implemented SMS advertising to update their customers, and track people and parcels [15].
As a media channel, the mobile is unique. While it has mass market reach, it is also a highly target able and track able interactive media. In addition, SMS advertising is also commonly used to reinforce other traditional media such as broadcast and print media. Studies have found that mobile advertising campaigns generate higher response rates as compared to direct mail and internet banner ads. Higher frequency of SMS usage shows a greater acceptance and familiarity of use of this technology [1,7,11,19].
In Iran, using short message service was put into operation for the first time in 2003. From this year onwards, the use of mobile phone text messages gradually became popular among Iranian users. In 2007, eight billion text messages were exchanged in Iran. This year, 20 million text messages were exchanged daily by mobile users, that figure was more special on days of
festivities. Services SMS via GSM modem is also another way of sending bulk SMS. In this system, along with the modem, software installed on a computer and managing the SMS messages are done [18,21].
In this research, after the study and review of library literature, each of the 10 hypotheses that were based on a research question, has been tested through a questionnaire. Research hypotheses
1. There is no significant relationship between sex and adoption of SMS marketing. 2. The assumption is that young people are more welcoming with the SMS marketing. 3. The assumption is that individuals with a higher education are more welcoming with SMS marketing. 4. There is a relationship between the identification of the sender and the compliance with SMS marketing. 5. There is a relationship between the content of SMS marketing and the rate of acceptance. 6. There is a relationship between the timeliness of the content of the SMS marketing and the rate of acceptance. 7. Messages with customized content have more impact. 8. Messages that are sent at the appropriate time have a greater impact. 9. Repetition and frequency of SMS marketing will reduce the interest and attention of the audience. 10. In the case of audiences, once they are capable of avoiding the SMS marketing, the acceptance rate will be increased.
Terminology Sex: Is a biological concept and purpose, means woman or man. Age: Chronological age of the study participants.
Personal and Institutional trust: Personal trust is composed of two components. The first component is concerned with the customer’s relationship with the company that uses SMS marketing. This relationship would be a reflection of the cumulative experiences with the company’s products and services or encounters with the company’s service personnel. This relationship shapes the customer’s perception of the company’s products and services, including its perceived trustworthiness. Personal trust can also be affected by social influence. This is based on the experiences that friends, family members, colleagues or other acquaintances in the customer’s social network have had with the company. Related information: Get the right information to the right people.
Journal of Medicine and Life
Journal of Medicine and Life Vol. 8, Special Issue 2, 2015
94
Timely information: Access to information in appropriate time. Personalization: Use name or title of SMS receivers to greeting them and showing understanding to their need. Sending time: when the SMS is send. Day or night. Repetition and Frequency: Number of SMS advertising within a specified period (day). Perceived control: Consumers perceive that they have control over the number and type of mobile messages that they receive. For example by offers an opt-out option in SMS text. Methodology
Given the nature of the research objectives it was determined that qualitative research techniques would contribute to an in-depth understanding of SMS marketing, being the most appropriate for this research [2].
In this study, data collection methods including the searching on the Internet, studying internal and external books and journal additionally in order to achieve theoretical foundations, we took advantage of from other researcher experiences. Also a questionnaire was applied as a main tool for data collection and obtained desired data and hypothesis test.
In Iran, SMS marketing study began from 2000 by using SMS as a way of communicating. This study was run in 2013 and the questionnaire took place between Apr and May 2013.
The statistical populations are residents of Kerman. Statistical sample includes individuals who are literate in addition to using their mobile phones for the communication purposes as audio device will use to send an SMS.
In this study, the sampling was random and the Cochrane formula was used. Accordingly, the sample size was 150. But, for more accuracy in citing the research results, the sample increased to 300 people.
150
)5.1(5.0)96.1(14000001.0)5.1(5.0)96.1(400000
22
2
n
The questionnaire was generated by the
researcher and by the study of the research literature and marketing professors. Which is the one that includes 19 five-choice Likert scale questions?
The reliability of the test was determined by Cronbach’s alpha as it follows: Table 1. Reliability Statistics
Cronbach’s Alpha Cronbach’s Alpha Based on
Standardized Items N of Items
0.774 0.770 19
As signified, the Cronbach alpha was 0.77, which was on good rating.
To analyze the data, descriptive and inferential statistics were used as it follows:
Descriptive statistics: In this study, descriptive statistics were used to analyze demographic data. For this purpose, demographic data are shown in the frequency table (Table 2).
Inferential statistics: for data analysis and hypothesis testing, analytical techniques were used, including: chi-square (X2), regression-test and one-sample binomial test [3,8,14,16,17].
Result and Finding
In this analysis, collected demographic data of the sample have been investigated by using appropriate descriptive analysis tools. In this section, the results of descriptive analyzes are presented. Table 2. Frequency table
University education
Age Sex FREQUENCY
NO YES
<40 >40 MALE
FEMALE
137 163 211 89 162 138 COUNT 45%
54%
70%
29%
54% 46% %
The results of the questionnaire were noted in
Table 1. Almost no significant differences between our respondents and the results of the balance will be split equally on both sexes.
The age of the majority of respondents was less than 40 years. In addition, in terms of university education they were educated.
For testing hypotheses (1, 2, and 3) namely, whether between gender, age, education and the rate of adoption of SMS marketing were related, we used the chi-square test. Also correlations between the independent and dependent variable (level of adoption SMS marketing) through regression calculation was done.
Consider the following assumptions: H0: R=0 H0: R≠0
If the hypothesis H0 is rejected, it means that the
independent variable on the dependent variable has an effect, and vice versa.
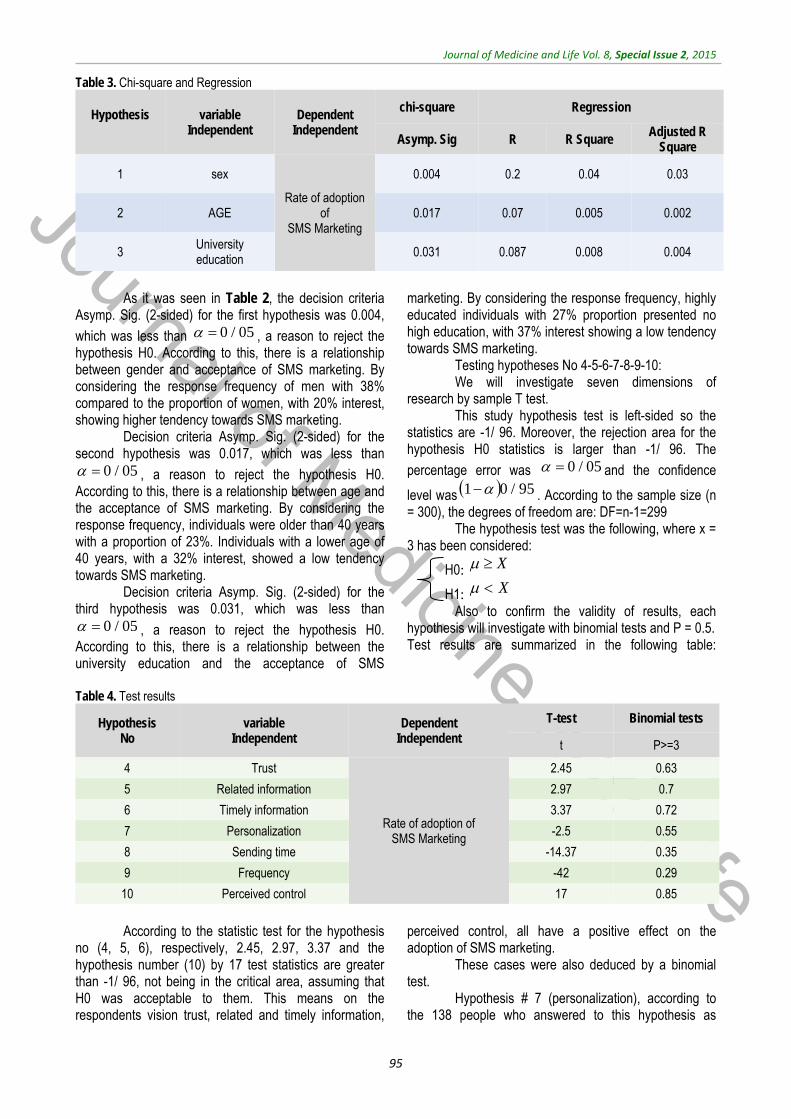
Journal of Medicine and Life
Journal of Medicine and Life Vol. 8, Special Issue 2, 2015
95
Table 3. Chi-square and Regression
Hypothesis
variable Independent
Dependent Independent
chi-square Regression
Asymp. Sig R R Square Adjusted R
Square
1 sex
Rate of adoption of
SMS Marketing
0.004 0.2 0.04 0.03
2 AGE 0.017 0.07 0.005 0.002
3 University education 0.031 0.087 0.008 0.004
As it was seen in Table 2, the decision criteria
Asymp. Sig. (2-sided) for the first hypothesis was 0.004,
which was less than , a reason to reject the hypothesis H0. According to this, there is a relationship between gender and acceptance of SMS marketing. By considering the response frequency of men with 38% compared to the proportion of women, with 20% interest, showing higher tendency towards SMS marketing.
Decision criteria Asymp. Sig. (2-sided) for the second hypothesis was 0.017, which was less than
, a reason to reject the hypothesis H0. According to this, there is a relationship between age and the acceptance of SMS marketing. By considering the response frequency, individuals were older than 40 years with a proportion of 23%. Individuals with a lower age of 40 years, with a 32% interest, showed a low tendency towards SMS marketing.
Decision criteria Asymp. Sig. (2-sided) for the third hypothesis was 0.031, which was less than
, a reason to reject the hypothesis H0. According to this, there is a relationship between the university education and the acceptance of SMS
marketing. By considering the response frequency, highly educated individuals with 27% proportion presented no high education, with 37% interest showing a low tendency towards SMS marketing.
Testing hypotheses No 4-5-6-7-8-9-10: We will investigate seven dimensions of
research by sample T test. This study hypothesis test is left-sided so the
statistics are -1/ 96. Moreover, the rejection area for the hypothesis H0 statistics is larger than -1/ 96. The
percentage error was and the confidence
level was . According to the sample size (n = 300), the degrees of freedom are: DF=n-1=299
The hypothesis test was the following, where x = 3 has been considered:
H0:
H1: Also to confirm the validity of results, each
hypothesis will investigate with binomial tests and P = 0.5. Test results are summarized in the following table:
Table 4. Test results
Hypothesis No
variable Independent
Dependent Independent
T-test Binomial tests
t P>=3
4 Trust
Rate of adoption of SMS Marketing
2.45 0.63
5 Related information 2.97 0.7
6 Timely information 3.37 0.72
7 Personalization -2.5 0.55
8 Sending time -14.37 0.35
9 Frequency -42 0.29
10 Perceived control 17 0.85
According to the statistic test for the hypothesis
no (4, 5, 6), respectively, 2.45, 2.97, 3.37 and the hypothesis number (10) by 17 test statistics are greater than -1/ 96, not being in the critical area, assuming that H0 was acceptable to them. This means on the respondents vision trust, related and timely information,
perceived control, all have a positive effect on the adoption of SMS marketing.
These cases were also deduced by a binomial test.
Hypothesis # 7 (personalization), according to the 138 people who answered to this hypothesis as
05/0
05/0
05/0
05/0 95/01
XX

Journal of Medicine and Life
Journal of Medicine and Life Vol. 8, Special Issue 2, 2015
96
medium, final results of the binomial tests have not accepted. So, assuming H0 was rejected.
Hypothesis # 8 (sending time) had no effect on the rate of adoption of SMS marketing. So, assuming H0 was rejected.
Hypothesis # 9 (repetition and frequency) in addition no effect on the rate of adoption of SMS marketing may be adversely affected regarding brand or company name. So, assuming H0 was rejected. Results summary
1. Men were more interested in SMS marketing than women.
2. Persons under 40 years old were more interested in SMS marketing.
3. Those without higher education were more interested in SMS marketing.
4. Trust, related and timely information, perceived control, having a positive effect regarding the adoption of SMS marketing.
5. Personalization had no significant positive effect on the amount of adoption of SMS marketing.
6. Sending time had no significant positive effect on the amount of adoption of SMS marketing.
7. Repetition and frequency of SMS marketing had a negative effect on the amount of adoption of SMS marketing.
Conclusion
1. In the process of study, it was revealed that men are more interested than women in SMS marketing. However, the reason for this tendency was not checked. Now question is: therefore, it should be focused on group of men. Answer is in the meaning of word targeting. If the SMS marketing engage to the needs of women as professional and targeted, can be attracted this segment of population. Using phrases like “remarkable women” or “ladies read” are the type of targeting these large groups of society. Accordingly, topics of interest for both genders in terms of variety and the traction must be identified and duly informed.
2. As the statistical samples were identified, people who were aged less than 40 years had more enthusiasm to accept SMS marketing. If part of this willingness was due to the age of this group, by harmonization between contents and media the issue could be exploited. In case the SMS marketing issues fit the needs of this age group, for example, employment, education, small investments, further audience could be attracted in this marketing method. However, the group who was more than 40 years old, showed less interest at the time the questionnaires were collected, which could also have earned with the
concern issues. The identification topics were possible through scientific research, such as buying a house, household commodity basket, discount prices, etc.
3. College-educated of the sample showed less interest in SMS marketing. In this study, the reason for this subject was not investigated. It seemed that those with a higher education probably had better options such as the Internet, social networking for communicating and satisfying their needs by this, using SMS marketing being less attractive for them. In these cases, by providing useful links and adding media files to SMS, a simple message could be transformed into a hypertext page, in addition targeting this group as well as providing technical facilities. But, the enthusiasm of people who were not yet highly educational should not be ignored, because usually the main volume market is not the first and the last deciles, but the medium level makes the mass market [17]. Therefore, the needs and interests of these groups have been clearly identified, being the main mobile marketing issue.
4. Recognition and familiarity with the SMS sender was important and was related to an issue (trust) which is one of the main concepts in the business. Companies and successful business keep their relationship with customers via SMS. The concept of CRM (Customer Relationship Management) refers to the set of tasks that involve long-term relationships with companies and customers through strategic relationships, which will lead to the loyalty of consumers and the survival of the company. The use of a dedicated phone number and company name in the text message can help identifying the SMS marketing sender.
5. If the contents of the SMS were synchronized with the interest of the audience, they would have had an effect on the adoption and embrace the SMS advertising. Therefore, one of the main responsibilities of the marketer was to identify the target market needs and develop the marketing list to send SMS with relevant data. Preparing this list was possible through submits on the Internet or during the purchase time through barcodes. Today, barcodes and electronic sales systems can help us to divide the target market. Obviously, the purchase of the other company’s customer lists or the selling of personal information to others or the purchase of customer lists from brokers could reduce public trust and unwillingness of customers to provide their personal information (Marketing Management).
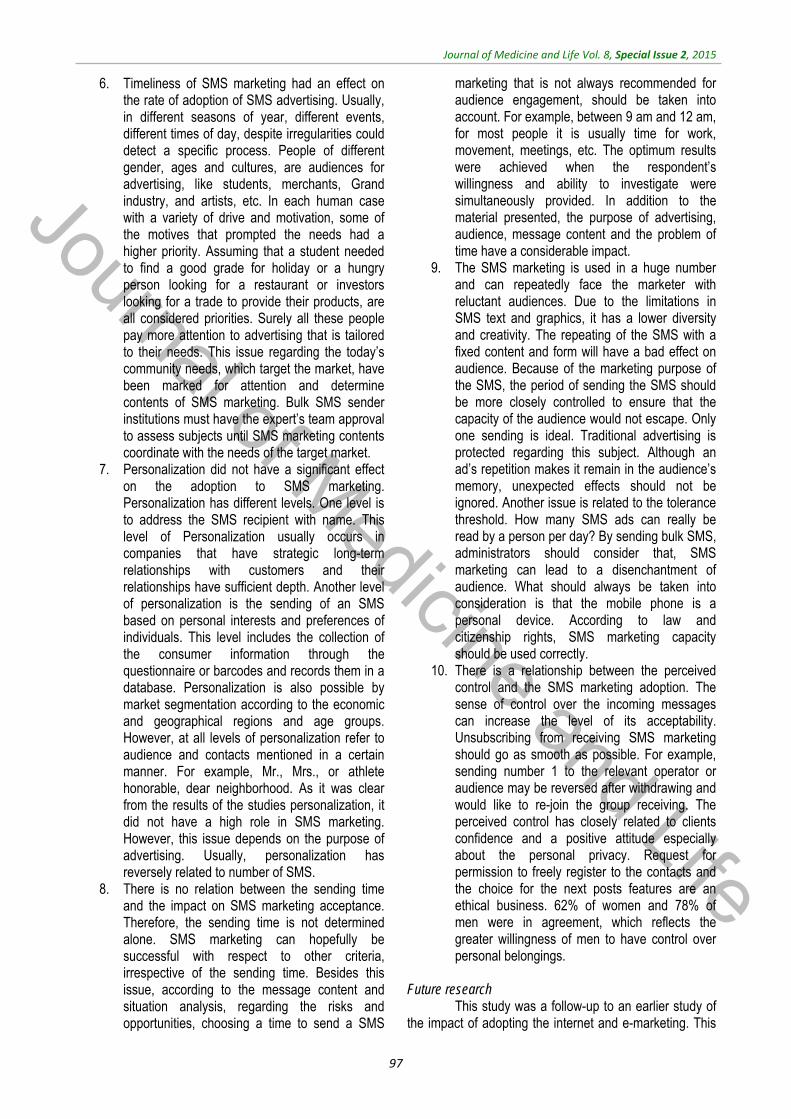
Journal of Medicine and Life
Journal of Medicine and Life Vol. 8, Special Issue 2, 2015
97
6. Timeliness of SMS marketing had an effect on the rate of adoption of SMS advertising. Usually, in different seasons of year, different events, different times of day, despite irregularities could detect a specific process. People of different gender, ages and cultures, are audiences for advertising, like students, merchants, Grand industry, and artists, etc. In each human case with a variety of drive and motivation, some of the motives that prompted the needs had a higher priority. Assuming that a student needed to find a good grade for holiday or a hungry person looking for a restaurant or investors looking for a trade to provide their products, are all considered priorities. Surely all these people pay more attention to advertising that is tailored to their needs. This issue regarding the today’s community needs, which target the market, have been marked for attention and determine contents of SMS marketing. Bulk SMS sender institutions must have the expert’s team approval to assess subjects until SMS marketing contents coordinate with the needs of the target market.
7. Personalization did not have a significant effect on the adoption to SMS marketing. Personalization has different levels. One level is to address the SMS recipient with name. This level of Personalization usually occurs in companies that have strategic long-term relationships with customers and their relationships have sufficient depth. Another level of personalization is the sending of an SMS based on personal interests and preferences of individuals. This level includes the collection of the consumer information through the questionnaire or barcodes and records them in a database. Personalization is also possible by market segmentation according to the economic and geographical regions and age groups. However, at all levels of personalization refer to audience and contacts mentioned in a certain manner. For example, Mr., Mrs., or athlete honorable, dear neighborhood. As it was clear from the results of the studies personalization, it did not have a high role in SMS marketing. However, this issue depends on the purpose of advertising. Usually, personalization has reversely related to number of SMS.
8. There is no relation between the sending time and the impact on SMS marketing acceptance. Therefore, the sending time is not determined alone. SMS marketing can hopefully be successful with respect to other criteria, irrespective of the sending time. Besides this issue, according to the message content and situation analysis, regarding the risks and opportunities, choosing a time to send a SMS
marketing that is not always recommended for audience engagement, should be taken into account. For example, between 9 am and 12 am, for most people it is usually time for work, movement, meetings, etc. The optimum results were achieved when the respondent’s willingness and ability to investigate were simultaneously provided. In addition to the material presented, the purpose of advertising, audience, message content and the problem of time have a considerable impact.
9. The SMS marketing is used in a huge number and can repeatedly face the marketer with reluctant audiences. Due to the limitations in SMS text and graphics, it has a lower diversity and creativity. The repeating of the SMS with a fixed content and form will have a bad effect on audience. Because of the marketing purpose of the SMS, the period of sending the SMS should be more closely controlled to ensure that the capacity of the audience would not escape. Only one sending is ideal. Traditional advertising is protected regarding this subject. Although an ad’s repetition makes it remain in the audience’s memory, unexpected effects should not be ignored. Another issue is related to the tolerance threshold. How many SMS ads can really be read by a person per day? By sending bulk SMS, administrators should consider that, SMS marketing can lead to a disenchantment of audience. What should always be taken into consideration is that the mobile phone is a personal device. According to law and citizenship rights, SMS marketing capacity should be used correctly.
10. There is a relationship between the perceived control and the SMS marketing adoption. The sense of control over the incoming messages can increase the level of its acceptability. Unsubscribing from receiving SMS marketing should go as smooth as possible. For example, sending number 1 to the relevant operator or audience may be reversed after withdrawing and would like to re-join the group receiving. The perceived control has closely related to clients confidence and a positive attitude especially about the personal privacy. Request for permission to freely register to the contacts and the choice for the next posts features are an ethical business. 62% of women and 78% of men were in agreement, which reflects the greater willingness of men to have control over personal belongings.
Future research
This study was a follow-up to an earlier study of the impact of adopting the internet and e-marketing. This
Journal of Medicine and Life
Journal of Medicine and Life Vol. 8, Special Issue 2, 2015
98
would enable future researchers establish the changes that have occurred and the other consequences they have experienced. Some recommended titles are the following: Identifying interest topics for men and women that by addressing them can increase attractiveness of SMS marketing. How to identify social trends and ways to use SMS in addressing them?
What are the factors affecting the consumer’s confidence in SMS marketing? In which status does SMS marketing have a more important role, awareness, persuasion, reminding, or support? In which stage of the product’s life should SMS marketing be used?
References
1. Anderson, Kupp. Serving the poor: drivers of business model innovation in mobile. 2008, Emerald Group Publishing. doi: 10.1108/14636690810850120.
2. Taheri A. Methodology and sourcing. 2th ed., 2010, Tehran Press.
3. Chhryy A. Statistical analysis in medical research. 5th ed., Vol. 1, 2011, Tehran Press.
4. Bamba F, Stuart J. SMS advertising, permission and the consumer: a study. 2007. www.emeraldinsight.com/1463-7154.htm.
5. Gilmore, Gallagher, Henry. E-marketing and SMEs: operational lessons for the future. 2007. www.emeraldinsight.com/0955-534X.htm.
6. Roach G. Consumer perceptions of mobile phone marketing: a direct marketing innovation. 2009. www.emeraldinsight.com/1750-5933.htm.
7. Hede, Kellett. Marketing communications for special events. 2011. www.emeraldinsight.com/0309-0566.htm.
8. http://ads-link.marketingfa- SPSS Training Site.
9. Phau I, Teah M. Young consumers’ motives for using SMS and perceptions towards SMS. 2009. advertising.www.emeraldinsight.com/1750-5933.htm.
10. Sinisalo J, Salo J, Karjaluoto H, Niemi MN. Mobile customer relationship management: underlying issues and challenges. 2007. www.emeraldinsight.com/1463-7154.htm.
11. Mobile_ marketing. Jenkins. 2006. 12. Kerckhove E. Building brand dialogue
with mobile marketing. Young Consumers. 2002; 3,4:37–42. doi: http://dx.doi.org/10.1108/17473610210813600.
13. Lee, Jun. Contextual perceived value?. Investigating the role of contextual marketing for customer relationship management in a mobile commerce context. Business Process Management Journal. 2007; 13, 6:798–814. http://www.emeraldinsight.com/doi/abs/10.1108/14637150710834569.
14. Petruzzellis L. Mobile phone choice: technology versus marketing. 2010. www.emeraldinsight.com/0309-0566.htm.
15. Electronic marketing, the new kid on the block. March 2004. www.emeraldinsight .com/0263-4503. htm.
16. Nvfrsty M. Statistics in Economics and Business.
17. Kotler P. Marketing Management. Analysis, planning, implementation and control. 9th ed., Chapter 21, 1997.
18. Momeni M. Temptation SMS. Cancer Epidemiol Biomarkers Prev. 2012; 18(10), 69-78. doi: 10.1158/1055-9965.EPI-09-0372.
19. Saren M. Marketing empowerment and exclusion in the information age. Marketing Intelligence & Planning. 2011; 29,1:39–48. http://dx.doi.org/10.1108/02634501111102733.
20. Tsang PM, Tse S. A hedonic model for effective web marketing: an empirical examination. Industrial Management & Data Systems. 2005; 105, 8:1039 –1052. http://www.emeraldinsight.com/doi/abs/10.1108/02635570510624437.
21. Telecommunication Company site in Kerman province. 2014, www.kermantel.ir.
Journal of Medicine and Life
Journal of Medicine and Life Vol. 8, Special Issue 2, 2015, pp.99-104
Spatial distribution and the prevalence of speech disorders in the provinces of Iran
Abbastabar H*, Alizadeh A**, Darparesh M***, Mohseni S****, Roozbeh N*****
*Islamshahr Health and Treatment Network, Department of Health, Tehran University of Medical Sciences, Tehran, Iran **Department of Public Health, Faculty of Health, Hormozgan University of Medical Sciences, Bandar Abbas, Iran ***Research Center for Social Determinants in Health Promotion, Department of Research and Technology, Hormozgan University of Medical Sciences, Bandar-e-Abbas, Iran ****Department of Public Health, Faculty of Health, Hormozgan University of Medical Sciences, Bandar Abbas, Iran ******Reproductive Health, Shahid Beheshti University of Medical Science, Tehran, Iran
Correspondance to: Ali Alizadeh, MD Department of Public Health, Faculty of Health, Hormozgan University of Medical Sciences, Shahid Chamran Blvd.,Hormozgan, Bandar Abbas, Iran, Postal code: 79166-13885, Phone: (+98) 7633336202, E-mail: [email protected] Received: May 24th, 2015 – Accepted: July 27th, 2015
Abstract Objective: To identify the spatial distribution and prevalence of speech disorder in Iran. Materials and methods: First, the prevalence of speech disorder in 2006 and 2011 was mapped via GIS for each province. Moreover, the prevalence of this disorder was calculated and classified according to age, sex, and residential area. Results: The prevalence in the majority of provinces indicated an overall decrease. Furthermore, its prevalence among the whole population of Iran in 2006 and 2011 was 2.2 and 2 per 1000 people, respectively. The highest prevalence was observed among people aged 75 years and older. Results showed that speech disorders are more prevalent among men compared to women and also among rural residents compared to those in urban areas. Conclusion: It is necessary to identify the high-risk areas in order to well organize the limited facilities to meet the actual needs of patients with speech disorder.
Keywords: developing countries, Iran, prevalence, spatial distribution, speech disorder
Introduction
Speech disorders are communicative disabilities in which natural speaking faces difficulty. These disorders could be in the forms of stammering or lisping and so on. An individual afflicted with speech disorder is not able to produce perfect conversations. Due to speech problems, this person is considered to be dumb [1]. Classifying speech into “normal” and “disordered” is harder than it seems to be. According to precise classification attempts, only 5 to 10% of the world population are capable of speaking perfectly and produce proper speech sounds. The rest suffer from a sort of speech disorder [1,2].
Speech disorders are more common during childhood but they could possibly occur at any age. A recent research in Australia revealed that the occurrence of speech disorder among children at elementary school age and above could reach 13% [3]. In the majority of cases, the reason behind such disorders is unclear. However, among the known reasons are hearing loss, neural disorders, brain stroke, mental retardation, drug abuse, physical impairment such as cleft lip and palate, voice abuse and also child abuse [4].
In a systematic review study carried out in 2000 by Law et al., an average 5.95% (range: 2.28-6.68) of children at the age of growth suffered from both speech
disorders and language impairment. The estimated prevalence of language impairment was of only 2.02-19%. The prevalence range for speech disorder was merely 2.30-24.60% [4]. McLeod & McKinnon reported that 13% of children at primary school and junior high school age were recognized by their teachers to suffer from speech disorders. The prevalence of communicative disorders was found to be higher than that of behavioral, mental, hearing and speaking disorders [3].
Harasty and Reed assessed the speaking ability of 437 nursery school children until the age of 6 in terms of speech and language impairments. 15.3% of the children were found to suffer from speech disorder while 20.6% of them had language impairment [5]. In Lawrence, the prevalence of delayed speech among children of 6 years of age was found to be 3.8%. The same prevalence, among boys, was observed to be 1.5 times as much as the girls (4.5% of the boys in contrast to 3.1% of the girls) [6]. The total number of the disabled in Iran in 1986 was of 453090 people. Those with speech disorder comprised 49032 of the population (27985 males and 21047 females). They were actually 10.8% of the whole population of the disabled. The most common reasons for the occurrence of speech disorder include hereditary factors, diseases, and accidents that comprised 61.8, 25.9, and 5.4% of all, respectively. In 2012, the number of
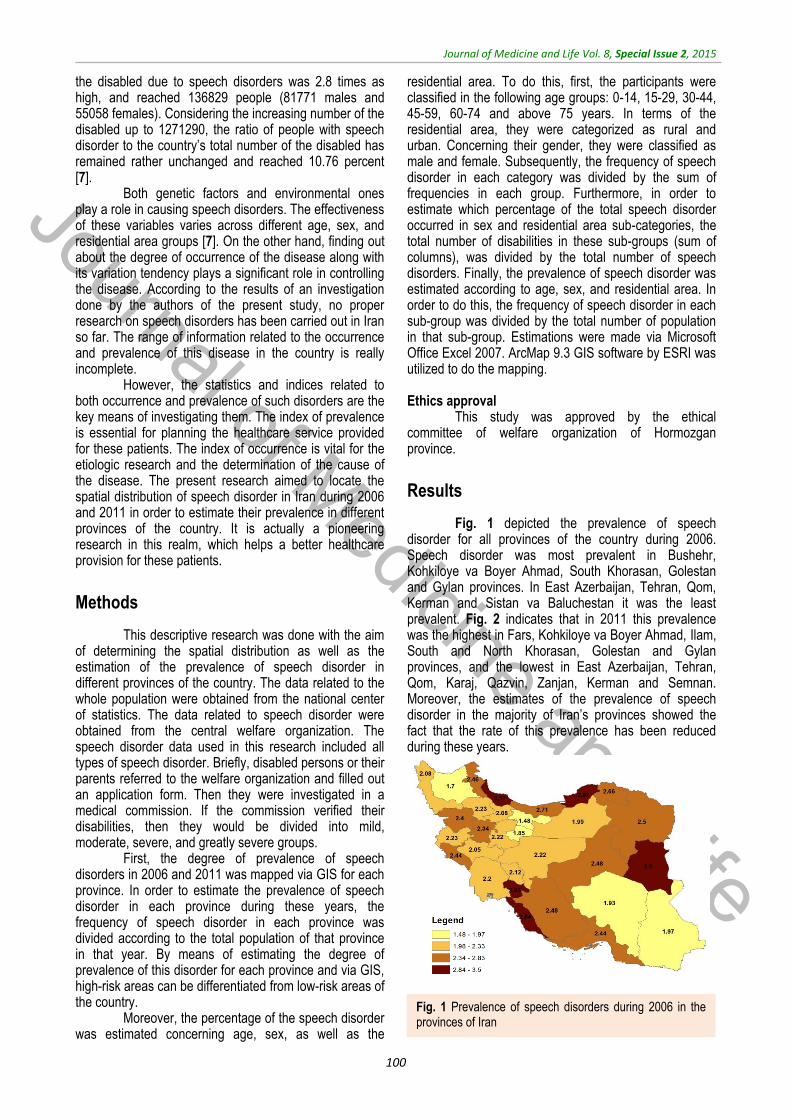
Journal of Medicine and Life
Journal of Medicine and Life Vol. 8, Special Issue 2, 2015
100
the disabled due to speech disorders was 2.8 times as high, and reached 136829 people (81771 males and 55058 females). Considering the increasing number of the disabled up to 1271290, the ratio of people with speech disorder to the country’s total number of the disabled has remained rather unchanged and reached 10.76 percent [7].
Both genetic factors and environmental ones play a role in causing speech disorders. The effectiveness of these variables varies across different age, sex, and residential area groups [7]. On the other hand, finding out about the degree of occurrence of the disease along with its variation tendency plays a significant role in controlling the disease. According to the results of an investigation done by the authors of the present study, no proper research on speech disorders has been carried out in Iran so far. The range of information related to the occurrence and prevalence of this disease in the country is really incomplete.
However, the statistics and indices related to both occurrence and prevalence of such disorders are the key means of investigating them. The index of prevalence is essential for planning the healthcare service provided for these patients. The index of occurrence is vital for the etiologic research and the determination of the cause of the disease. The present research aimed to locate the spatial distribution of speech disorder in Iran during 2006 and 2011 in order to estimate their prevalence in different provinces of the country. It is actually a pioneering research in this realm, which helps a better healthcare provision for these patients.
Methods
This descriptive research was done with the aim of determining the spatial distribution as well as the estimation of the prevalence of speech disorder in different provinces of the country. The data related to the whole population were obtained from the national center of statistics. The data related to speech disorder were obtained from the central welfare organization. The speech disorder data used in this research included all types of speech disorder. Briefly, disabled persons or their parents referred to the welfare organization and filled out an application form. Then they were investigated in a medical commission. If the commission verified their disabilities, then they would be divided into mild, moderate, severe, and greatly severe groups.
First, the degree of prevalence of speech disorders in 2006 and 2011 was mapped via GIS for each province. In order to estimate the prevalence of speech disorder in each province during these years, the frequency of speech disorder in each province was divided according to the total population of that province in that year. By means of estimating the degree of prevalence of this disorder for each province and via GIS, high-risk areas can be differentiated from low-risk areas of the country.
Moreover, the percentage of the speech disorder was estimated concerning age, sex, as well as the
residential area. To do this, first, the participants were classified in the following age groups: 0-14, 15-29, 30-44, 45-59, 60-74 and above 75 years. In terms of the residential area, they were categorized as rural and urban. Concerning their gender, they were classified as male and female. Subsequently, the frequency of speech disorder in each category was divided by the sum of frequencies in each group. Furthermore, in order to estimate which percentage of the total speech disorder occurred in sex and residential area sub-categories, the total number of disabilities in these sub-groups (sum of columns), was divided by the total number of speech disorders. Finally, the prevalence of speech disorder was estimated according to age, sex, and residential area. In order to do this, the frequency of speech disorder in each sub-group was divided by the total number of population in that sub-group. Estimations were made via Microsoft Office Excel 2007. ArcMap 9.3 GIS software by ESRI was utilized to do the mapping. Ethics approval
This study was approved by the ethical committee of welfare organization of Hormozgan province.
Results
Fig. 1 depicted the prevalence of speech disorder for all provinces of the country during 2006. Speech disorder was most prevalent in Bushehr, Kohkiloye va Boyer Ahmad, South Khorasan, Golestan and Gylan provinces. In East Azerbaijan, Tehran, Qom, Kerman and Sistan va Baluchestan it was the least prevalent. Fig. 2 indicates that in 2011 this prevalence was the highest in Fars, Kohkiloye va Boyer Ahmad, Ilam, South and North Khorasan, Golestan and Gylan provinces, and the lowest in East Azerbaijan, Tehran, Qom, Karaj, Qazvin, Zanjan, Kerman and Semnan. Moreover, the estimates of the prevalence of speech disorder in the majority of Iran’s provinces showed the fact that the rate of this prevalence has been reduced during these years.
Fig. 1 Prevalence of speech disorders during 2006 in the provinces of Iran

Journal of Medicine and Life
Journal of Medicine and Life Vol. 8, Special Issue 2, 2015
101
Table 1 indicates the percentage of speech disorder in the subgroups of age, sex, and residential
area in 2006 and 2011. The results in Table 1 A reveal that in 2006, among urban and rural males, the highest percentages of disorder were 0.36 and 0.37 respectively, which occurred in the age range of 15-29. In the group of urban and rural females, the highest rates were 0.34 and 0.36, respectively, which occurred in the age range of 15-29. Moreover, among the total cases of speech disorder concerning sex and residential area, 0.36, 0.25, 0.23 and 0.16 of the cases were urban males, rural males, urban females and rural ones, respectively.
Table 1 B is indicative of the results in percentage in 2011. In the group of urban and rural males, the highest rates were 0.32 and 0.35 respectively, which occurred in the age range of 15-29 years. Among urban and rural females, the highest rates were 0.31 and 0.34, which also occurred in the age range of 15-29. Moreover, among the total cases of speech disorder in the sex and residential area groups, 0.37, 0.23, 0.25 and 0.16 of the cases were urban males, rural males, urban females, and rural females, respectively.
Table 1. Proportion of speech disorders in the subgroups of age, sex and residence location during 2006 and 2011
Table 2 is indicative of the prevalence of speech disorder in subgroups of age, sex, and residential area during 2006 and 2011 among 100 members of the population. The prevalence of the disorder in 2006 is presented in Table 2 A. The highest prevalence rates were observed among urban and rural males: 0.0054 and 0.0050. It occurred in the age category above 75. In the subgroups of urban and rural females, these rates were 0.0044 and 0.0042, which also occurred in the age category above 75. In addition, in the last column of Table 2 A, we can observe the prevalence of speech disorder in terms of age. The highest rate is 0.0048, which occurred
in the age category above 75. The last row of Error! Reference source not found. showed the prevalence of speech disorder regarding sex and residential area. As it can be seen, the prevalence of disorder among urban males, rural males, urban females, and rural females is of 0.0023, 0.0034, 0.0015 and 0.0022, respectively. This prevalence was found to be 0.0022 in the whole population of Iran.
The prevalence of speech disorder in 2011 was indicated in Table 2 B. In the subgroups of urban and rural males, the highest rates were 0.0039 and 0.0041 respectively, which occurred in the age category above
Fig. 2 Prevalence of speech disorders during 2011 in the provinces of Iran
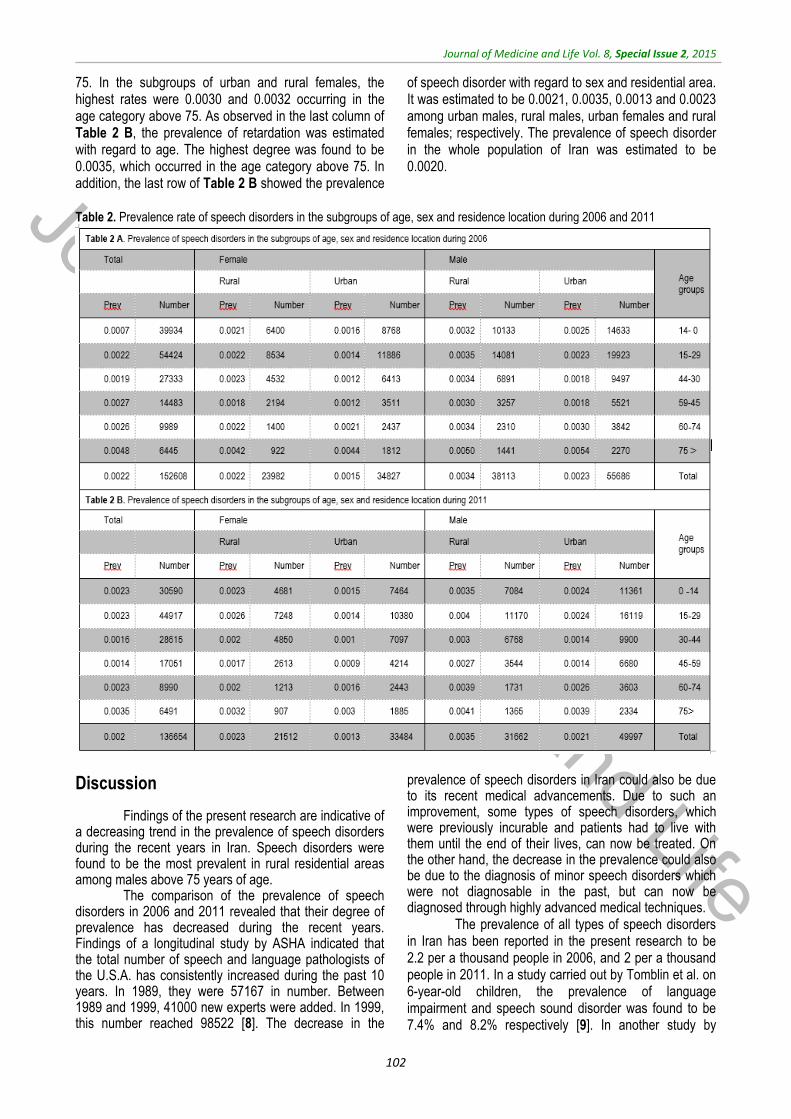
Journal of Medicine and Life
Journal of Medicine and Life Vol. 8, Special Issue 2, 2015
102
75. In the subgroups of urban and rural females, the highest rates were 0.0030 and 0.0032 occurring in the age category above 75. As observed in the last column of Table 2 B, the prevalence of retardation was estimated with regard to age. The highest degree was found to be 0.0035, which occurred in the age category above 75. In addition, the last row of Table 2 B showed the prevalence
of speech disorder with regard to sex and residential area. It was estimated to be 0.0021, 0.0035, 0.0013 and 0.0023 among urban males, rural males, urban females and rural females; respectively. The prevalence of speech disorder in the whole population of Iran was estimated to be 0.0020.
Table 2. Prevalence rate of speech disorders in the subgroups of age, sex and residence location during 2006 and 2011
Discussion
Findings of the present research are indicative of a decreasing trend in the prevalence of speech disorders during the recent years in Iran. Speech disorders were found to be the most prevalent in rural residential areas among males above 75 years of age.
The comparison of the prevalence of speech disorders in 2006 and 2011 revealed that their degree of prevalence has decreased during the recent years. Findings of a longitudinal study by ASHA indicated that the total number of speech and language pathologists of the U.S.A. has consistently increased during the past 10 years. In 1989, they were 57167 in number. Between 1989 and 1999, 41000 new experts were added. In 1999, this number reached 98522 [8]. The decrease in the
prevalence of speech disorders in Iran could also be due to its recent medical advancements. Due to such an improvement, some types of speech disorders, which were previously incurable and patients had to live with them until the end of their lives, can now be treated. On the other hand, the decrease in the prevalence could also be due to the diagnosis of minor speech disorders which were not diagnosable in the past, but can now be diagnosed through highly advanced medical techniques.
The prevalence of all types of speech disorders in Iran has been reported in the present research to be 2.2 per a thousand people in 2006, and 2 per a thousand people in 2011. In a study carried out by Tomblin et al. on 6-year-old children, the prevalence of language impairment and speech sound disorder was found to be 7.4% and 8.2% respectively [9]. In another study by
Journal of Medicine and Life
Journal of Medicine and Life Vol. 8, Special Issue 2, 2015
103
Sheriberg, the prevalence of delayed speech was observed to be 3.8%. Moreover, in this study, such prevalence was found to be 4.5% among boys and 3.1% among girls [6]. In a research conducted by Bietchman et al. on 5-year-old children, 1655 children were participating. 180 of them were diagnosed to have language impairment or speech sound disorder. In this study, the prevalence of speech disorder was estimated to be 16.2 to 21.8% [10]. The reason why there seems to be a divergence between the prevalence found in our study with those of the previously mentioned research could be among the following. Firstly, our study was conducted on all types of speech disorders while each of the previous research was focused on a particular type. Secondly, in our study, the prevalence was found to be, for the whole population of all age groups, of approximately 2 per a thousand people. However, in the other body of research, the prevalence was estimated only for 6-year-old children.
Findings, both as proportions and as prevalence, indicated that the percentage of speech disorders was highest among rural people, and also among the male rather than the female. According to the study conducted by Sheriberg, the prevalence of delayed speech among children was found to be 1.5 times as much as the boys [6]. In another study carried out by Bietchman et al., the prevalence of speech disorders was estimated to be 15.5% to 20.7% among boys and 19.1% to 25.1% among girls [10]. Concerning the contradiction observed between the degrees of prevalence in terms of sex, we could say that firstly, these divergences could be actual. Sex-related distribution of etiologic factors of speech disorder differs from one population to another. Secondly, this divergence could be due to sampling bias, that is, the sample selected for the study is not representative for the real population of adults or children. No research was done to take into account the residential area (rural vs. urban) as related to the prevalence of speech disorders. Concerning the higher prevalence of speech disorder in rural areas it can be said that first of all, the prevalence of common causes of speech disorders such as brain stroke [5,6] due to careers including agriculture and animal raising in these areas is higher in rural areas than in urban ones. Secondly, people living in rural areas have less access to
medical healthcare facilities. Some of their minor speech disorders are curable. However, they are left untreated for the reason just discussed and they remain with patients all throughout their lives.
Findings in proportions revealed that the highest percentage of speech disorders occurred at the age range of 15-29. Findings in prevalence, however, revealed that both among males and females, such disorders were more prevalent at the age above 75. The majority of studies on speech disorders were conducted on children [6,8,9]. No study investigated all the age groups. Concerning the divergences observed between findings in proportion with those in prevalence, it could be said that the numerators of the fractions (in proportions) are similar to the prevalence values and they target all the people with speech disorders in that age group. The denominators of the fractions, however, consist of all the people suffering from speech disorders in all age groups. The denominator of the prevalence fraction, on the other hand, includes all the population at that age. Since the denominator is constant in all age groups, and usually in all age groups the highest percentage of population live between 15 to 29 years old, the numerator of the proportion fraction being increased in this age group compared to that of the others.
Conclusion
Since speech disorders include a wide range of disorders and in the majority of cases engage people from early school age, the determination of their geographical distribution is essential. Among the possible ways of reducing the occurrence, prevalence and rehabilitating the people afflicted with a kind of speech disorder are identifying high-risk regions, identifying social variables affecting speech disorders and organizing the use of the limited sources and facilities in order to meet the actual needs of patients with speech disabilities through focusing on three levels of prevention. Acknowledgements
This study was supported by the state welfare organization of Hormozgan province.
References
1. Pinto JA, Corso RJ, Guilherme AC, Pinho SR, Nóbrega Mde O. Dysprosody nonassociated with neurological diseases--a case report. Journal of Voice. 2004; 18(1):90-96.
2. Lansford KL, Liss JM. Vowel acoustics in dysarthria: speech disorder diagnosis and classification. Journal of Speech Language and Hearing Research. 2014; 57(1):57-67.
3. McLeod S, McKinnon DH. Prevalence of communication disorders compared with other learning needs in 14,500 primary and secondary school students. International Journal of Language and Communication Disorder. 2007; 42 Suppl 1:37-59.
4. Law J, Boyle J, Harris F, Harkness A, Nye C. Prevalence and natural history of primary speech and language delay:
findings from a systematic review of the literature. International Journal of Language and Communication Disorder. 2000; 35(2):165-188.
5. Harasty J, Reed VA. The prevalence of speech and language impairment in two Sydney metropolitan schools. Australian Journal of Human Communication Disorders. 1994; 22: 1-23.

Journal of Medicine and Life
Journal of Medicine and Life Vol. 8, Special Issue 2, 2015
104
6. Shriberg LD, Tomblin JB, McSweeny JL. Prevalence of speech delay in 6-year-old children and comorbidity with language impairment. Journal of Speech Language and Hearing Research. 1999; 42(6):1461-1481.
7. Iran Sco. Iran Statistical Year Book: Statistical center of Iran. http://salnameh.sci.org.ir/AllUser/DirectoryTreeComplete.aspx.
8. The Cecil G. Sheps Center for Health Services Research, UNC-Chapel Hill. Communicating the Trends: The Speech-Language Pathology Workforce in North Carolina. THE COUNCIL FOR ALLIED HEALTH IN NORTH CAROLINA, June 2001.
9. Tomblin JB, Records NL, Buckwalter P, Zhang X, Smith E, O’Brien M. Prevalence of specific language
impairment in kindergarten children. Journal of Speech Language and Hearing Research. 1997; 40(6):1245-1260.
10. Beitchman JH, Nair R, Clegg M, Patel PG, Ferguson B, Pressman E et al. Prevalence of speech and language disorders in 5-year-old kindergarten children in the Ottawa-Carleton region. The Journal of speech and hearing disorders. 1986; 51(2):98-110.
Journal of Medicine and Life
Journal of Medicine and Life Vol. 8, Special Issue 2, 2015, pp.105-110
Spatial distribution and prevalence of physical disabilities in the provinces of Iran
Abbastabar H*, Alizadeh A**, Darparesh M***, Mohseni S****, Roozbeh N***** *Islamshahr Health and Treatment Network, Department of Health, Tehran University of Medical Sciences, Tehran, Iran **Department of Public Health, Faculty of Health, Hormozgan University of Medical Sciences, Bandar Abbas, Iran ***Research Center for Social Determinants in Health Promotion, Department of Research and Technology, Hormozgan University of Medical Sciences, Bandar-e-Abbas, Iran ****Department of Public Health, Faculty of Health, Hormozgan University of Medical Sciences, Bandar Abbas, Iran ******Reproductive Health, Shahid Beheshti University of Medical Science, Tehran, Iran
Correspondence to: Ali Alizadeh, MD Department of Public Health, Faculty of Health, Hormozgan University of Medical Sciences, Bandar Abbas Shahid Chamran Blvd., Hormozgan, Bandar Abbas, Iran, Postal code: 79166-13885, Phone: (+98) 7633336202, E-mail: [email protected] Received: May 19th, 2015 – Accepted: July 27th, 2015
Abstract Introduction: To identify the influential social factors and spatial distribution of physical disabilities in Iran between 2006 and 2011. Materials and Methods: First, the prevalence of physical disability in each province between 2006 and 2011 was mapped via GIS. Moreover, the percentage of physical disability was estimated with regard to age, sex, and residential area. Finally, the prevalence of physical disability was estimated with regard to the afore-mentioned variables. Findings: The findings revealed that in the majority of the provinces of Iran, there was a decreasing trend in the prevalence of physical disability from 2006 to 2011. The prevalence of physical disability in the total population of the country was also decreased during these years. The results were also indicative of a higher prevalence among men than among women and also in rural residential areas than in urban areas. Conclusion: The results of this research can be used to identify the high- and low-risk areas. In addition, this information can be used for the etiology and the specification of the factors that cause the residents of some regions to get afflicted more than the others.
Keywords: physical disabilities, spatial distribution, Iran
Introduction
Since the beginning of his life, the human being has been faced with various diseases, accidents, and hazardous events. These have constantly threatened one’s life and health and have led to different types of physical/ kinetic disabilities.
The physical disability refers to the limitations of the physical performance, movement, skill, or ability of an individual. It includes cases that disable people from carrying out their daily routine activities [1]. Physical disability can also be visualized as losing part or all of one’s body performance (e.g. walking, control over urine, and so on). It can also refer to the loss of one part of the body. In terms of the underlying causes, there are two types of physical disabilities: firstly, the prenatal physical disabilities, which exist from the time of birth throughout one’s life. They could be due to inadequate provision of oxygen, the inspiratory system blockage, brain injury at the time of birth and premature delivery. The second type is the postnatal disabilities, which occur after the birth of the child. The underlying causes could be accidents, infection, or other diseases [2].
Statistics show that about 2 million people who have lost parts of their body live in the U.S.A. [3]. Moreover, about 18500 amputation cases occur in the U.S. [4]. The probability of amputation among African Americans is 4 times as frequent as the white population [5]. The most common reasons for losing part of one’s body are vascular diseases including diabetes along with arterial/ environmental diseases (54%), trauma (45%) and cancer (less than 2%) [3]. About half of the people whose amputation was due to vascular diseases lose their life within 5 years. This has been larger than the frequency of the loss within 5 years for breast cancer, colon cancer and prostate cancer [6]. Among diabetic patients who have had amputation of the lower part of their body, over 55% will be in need of amputation of their other leg within the next 2-3 years [7].
In 1986, there were 288508 physically/ kinetically disabled (199505 men and 89003 women) in Iran. They comprised 63.7% of the total disabled population. The frequency of different types of disability was leg, arm, leg and arm amputation or both of them respectively 188402, 89135 and 10971. Accidents and diseases accounted for
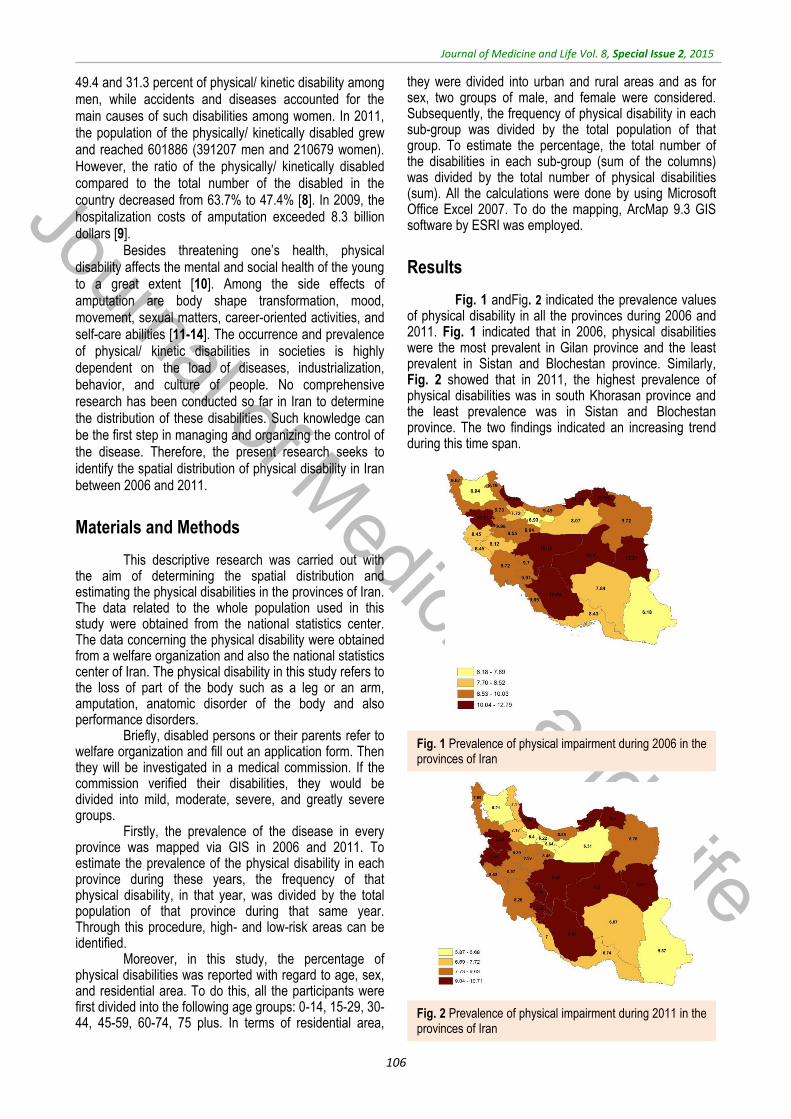
Journal of Medicine and Life
Journal of Medicine and Life Vol. 8, Special Issue 2, 2015
106
49.4 and 31.3 percent of physical/ kinetic disability among men, while accidents and diseases accounted for the main causes of such disabilities among women. In 2011, the population of the physically/ kinetically disabled grew and reached 601886 (391207 men and 210679 women). However, the ratio of the physically/ kinetically disabled compared to the total number of the disabled in the country decreased from 63.7% to 47.4% [8]. In 2009, the hospitalization costs of amputation exceeded 8.3 billion dollars [9].
Besides threatening one’s health, physical disability affects the mental and social health of the young to a great extent [10]. Among the side effects of amputation are body shape transformation, mood, movement, sexual matters, career-oriented activities, and self-care abilities [11-14]. The occurrence and prevalence of physical/ kinetic disabilities in societies is highly dependent on the load of diseases, industrialization, behavior, and culture of people. No comprehensive research has been conducted so far in Iran to determine the distribution of these disabilities. Such knowledge can be the first step in managing and organizing the control of the disease. Therefore, the present research seeks to identify the spatial distribution of physical disability in Iran between 2006 and 2011.
Materials and Methods
This descriptive research was carried out with the aim of determining the spatial distribution and estimating the physical disabilities in the provinces of Iran. The data related to the whole population used in this study were obtained from the national statistics center. The data concerning the physical disability were obtained from a welfare organization and also the national statistics center of Iran. The physical disability in this study refers to the loss of part of the body such as a leg or an arm, amputation, anatomic disorder of the body and also performance disorders.
Briefly, disabled persons or their parents refer to welfare organization and fill out an application form. Then they will be investigated in a medical commission. If the commission verified their disabilities, they would be divided into mild, moderate, severe, and greatly severe groups.
Firstly, the prevalence of the disease in every province was mapped via GIS in 2006 and 2011. To estimate the prevalence of the physical disability in each province during these years, the frequency of that physical disability, in that year, was divided by the total population of that province during that same year. Through this procedure, high- and low-risk areas can be identified.
Moreover, in this study, the percentage of physical disabilities was reported with regard to age, sex, and residential area. To do this, all the participants were first divided into the following age groups: 0-14, 15-29, 30-44, 45-59, 60-74, 75 plus. In terms of residential area,
they were divided into urban and rural areas and as for sex, two groups of male, and female were considered. Subsequently, the frequency of physical disability in each sub-group was divided by the total population of that group. To estimate the percentage, the total number of the disabilities in each sub-group (sum of the columns) was divided by the total number of physical disabilities (sum). All the calculations were done by using Microsoft Office Excel 2007. To do the mapping, ArcMap 9.3 GIS software by ESRI was employed.
Results
Fig. 1 andFig. 2 indicated the prevalence values of physical disability in all the provinces during 2006 and 2011. Fig. 1 indicated that in 2006, physical disabilities were the most prevalent in Gilan province and the least prevalent in Sistan and Blochestan province. Similarly, Fig. 2 showed that in 2011, the highest prevalence of physical disabilities was in south Khorasan province and the least prevalence was in Sistan and Blochestan province. The two findings indicated an increasing trend during this time span.
Fig. 1 Prevalence of physical impairment during 2006 in the provinces of Iran
Fig. 2 Prevalence of physical impairment during 2011 in the provinces of Iran

Journal of Medicine and Life
Journal of Medicine and Life Vol. 8, Special Issue 2, 2015
107
Table 1 is indicative of the percentage of physical disabilities between 2006 and 2011 with regard to age, sex, and residential area. The results presented in Table 1 A showed that in 2006, the highest percentage of physical disabilities among urban and rural men was 22.96 and 27.04 respectively that occurred in the age groups of 30-44 and 15-29. This percentage, among urban and rural women, was 20.25 and 21.83 and occurred in the age group of 15-29. Among the total cases of physical disability, the highest value (23.7%) belonged to the 15-29 age group. From the total cases of physical disability, 41.94% occurred among urban men, 24.24% among rural men, 21.02% among urban women,
and 12.79% among rural women. The results presented in Table 1 B indicated that the highest values among urban and rural men were 27.63% and 26.5% occurring in the age group 15-29. Among urban and rural women, these values were 19.67% and 20.89%, which occurred in the age groups of 30-44 and 15-29. Out of the total cases of physical disabilities with regard to age, the highest value was 24.62%, which occurred in the age group 30-44. As for sex and residential area, 42.82% of the total cases occurred among urban men, 22.18% among rural men, 22.97% among urban women and 12.04 among rural women.
Table 1. Proportion of physical disorder in subgroups of age, sex, and residence location during 2006 and 2011
Table 1 A. Proportion of physical disorder in subgroups of age, sex and residence location during 2006
Age groups
Male Female Total
Urban Rural Urban Rural
Number Percent Number Percent Number Percent Number Percent Number Percent
0-14 21002 8.04 15726 10.41 14695 11.22 11028 13.84 62451 10.02
15-29 62879 24.06 40836 27.04 26525 20.25 17398 21.83 147638 23.7
30-44 78294 29.96 35283 23.36 21999 16.8 11858 14.88 147434 23.67
45-59 46780 17.9 21875 14.48 18204 13.9 10520 13.2 97379 15.63
60-74 31172 11.93 20853 13.81 25774 19.68 15959 20.03 93758 15.05
75 < 21178 8.1 16447 10.89 23779 18.16 12920 16.21 74324 11.93
Total 261305 41.94 151020 24.24 130976 21.02 79683 12.79 622984 100
Table 1 B. Proportion of physical disorder in subgroups of age, sex and residence location during 2011
Age groups
Male Female Total
Urban Rural Urban Rural
Number Percent Number Percent Number Percent Number Percent Number Percent
0-14 19583 7.61 12814 9.61 14501 10.5 9145 12.64 56043 9.32
15-29 54164 21.04 33170 24.87 25382 18.37 15118 20.89 127834 21.26
30-44 71135 27.63 35332 26.5 27170 19.67 14413 19.91 148050 24.62
45-59 64315 24.98 24020 18.01 21836 15.81 11056 15.28 121227 20.16
60-74 28126 10.92 14268 10.7 25718 18.62 11513 15.91 79625 13.24
75 < 20169 7.83 13745 10.31 23527 17.03 11128 15.38 68569 11.4
Total 257492 42.82 133349 22.18 138134 22.97 72373 12.04 601348 100
Table 2 represents the prevalence of physical
disabilities in the sub-groups of age, sex, and residential area between 2006 and 2011 per thousand people. Table 2 A shows this prevalence in 2006. The highest prevalence values among urban and rural men were 50.28 and 57.61 per thousand people occurring in the age range of 75 plus. The highest prevalence among urban and rural women was 57.86 and 58.58 per thousand people, again occurring in the age range of 75 plus. The last column of Table 2 A shows the prevalence of physical disabilities with regard to age. The highest value was 55.54 per thousand people, which occurred in the age group of above 75 years. The last row of Table 2 A shows the prevalence of physical disability with regard to
sex and residential area. The prevalence value was estimated to be 10.63 among urban men, 13.44 among rural men, 5.53 among urban women, and 7.31 among rural women. Besides that, the prevalence of physical disabilities in the whole population of Iran was estimated to be 8.85 per thousand people. Table 2 B is indicative of the prevalence values reported for 2011. The highest values among urban and rural men were 34.38 and 39.29 per thousand people respectively occurring in the age group of 75 plus. The highest values among urban and rural women were 38.96 and 38.16 per thousand people ageing occurring at the age above 75. The last column of Table 2 B shows the prevalence of physical disabilities with regard to age. The highest prevalence value was
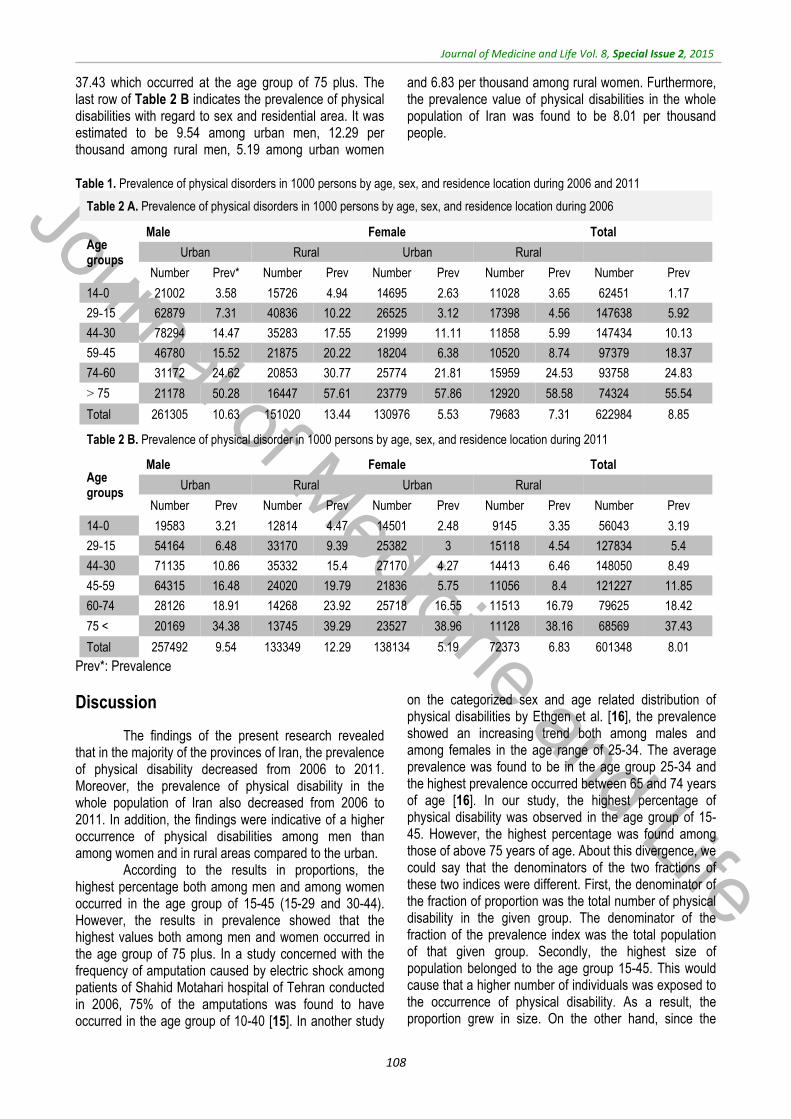
Journal of Medicine and Life
Journal of Medicine and Life Vol. 8, Special Issue 2, 2015
108
37.43 which occurred at the age group of 75 plus. The last row of Table 2 B indicates the prevalence of physical disabilities with regard to sex and residential area. It was estimated to be 9.54 among urban men, 12.29 per thousand among rural men, 5.19 among urban women
and 6.83 per thousand among rural women. Furthermore, the prevalence value of physical disabilities in the whole population of Iran was found to be 8.01 per thousand people.
Table 1. Prevalence of physical disorders in 1000 persons by age, sex, and residence location during 2006 and 2011
Table 2 A. Prevalence of physical disorders in 1000 persons by age, sex, and residence location during 2006
Age groups
Male Female Total
Urban Rural Urban Rural
Number Prev* Number Prev Number Prev Number Prev Number Prev
0-14 21002 3.58 15726 4.94 14695 2.63 11028 3.65 62451 1.17
15-29 62879 7.31 40836 10.22 26525 3.12 17398 4.56 147638 5.92
30-44 78294 14.47 35283 17.55 21999 11.11 11858 5.99 147434 10.13
45-59 46780 15.52 21875 20.22 18204 6.38 10520 8.74 97379 18.37
60-74 31172 24.62 20853 30.77 25774 21.81 15959 24.53 93758 24.83
75 < 21178 50.28 16447 57.61 23779 57.86 12920 58.58 74324 55.54
Total 261305 10.63 151020 13.44 130976 5.53 79683 7.31 622984 8.85
Table 2 B. Prevalence of physical disorder in 1000 persons by age, sex, and residence location during 2011
Age groups
Male Female Total
Urban Rural Urban Rural
Number Prev Number Prev Number Prev Number Prev Number Prev
0-14 19583 3.21 12814 4.47 14501 2.48 9145 3.35 56043 3.19
15-29 54164 6.48 33170 9.39 25382 3 15118 4.54 127834 5.4
30-44 71135 10.86 35332 15.4 27170 4.27 14413 6.46 148050 8.49
45-59 64315 16.48 24020 19.79 21836 5.75 11056 8.4 121227 11.85
60-74 28126 18.91 14268 23.92 25718 16.55 11513 16.79 79625 18.42
75 < 20169 34.38 13745 39.29 23527 38.96 11128 38.16 68569 37.43
Total 257492 9.54 133349 12.29 138134 5.19 72373 6.83 601348 8.01
Prev*: Prevalence
Discussion
The findings of the present research revealed that in the majority of the provinces of Iran, the prevalence of physical disability decreased from 2006 to 2011. Moreover, the prevalence of physical disability in the whole population of Iran also decreased from 2006 to 2011. In addition, the findings were indicative of a higher occurrence of physical disabilities among men than among women and in rural areas compared to the urban.
According to the results in proportions, the highest percentage both among men and among women occurred in the age group of 15-45 (15-29 and 30-44). However, the results in prevalence showed that the highest values both among men and women occurred in the age group of 75 plus. In a study concerned with the frequency of amputation caused by electric shock among patients of Shahid Motahari hospital of Tehran conducted in 2006, 75% of the amputations was found to have occurred in the age group of 10-40 [15]. In another study
on the categorized sex and age related distribution of physical disabilities by Ethgen et al. [16], the prevalence showed an increasing trend both among males and among females in the age range of 25-34. The average prevalence was found to be in the age group 25-34 and the highest prevalence occurred between 65 and 74 years of age [16]. In our study, the highest percentage of physical disability was observed in the age group of 15-45. However, the highest percentage was found among those of above 75 years of age. About this divergence, we could say that the denominators of the two fractions of these two indices were different. First, the denominator of the fraction of proportion was the total number of physical disability in the given group. The denominator of the fraction of the prevalence index was the total population of that given group. Secondly, the highest size of population belonged to the age group 15-45. This would cause that a higher number of individuals was exposed to the occurrence of physical disability. As a result, the proportion grew in size. On the other hand, since the
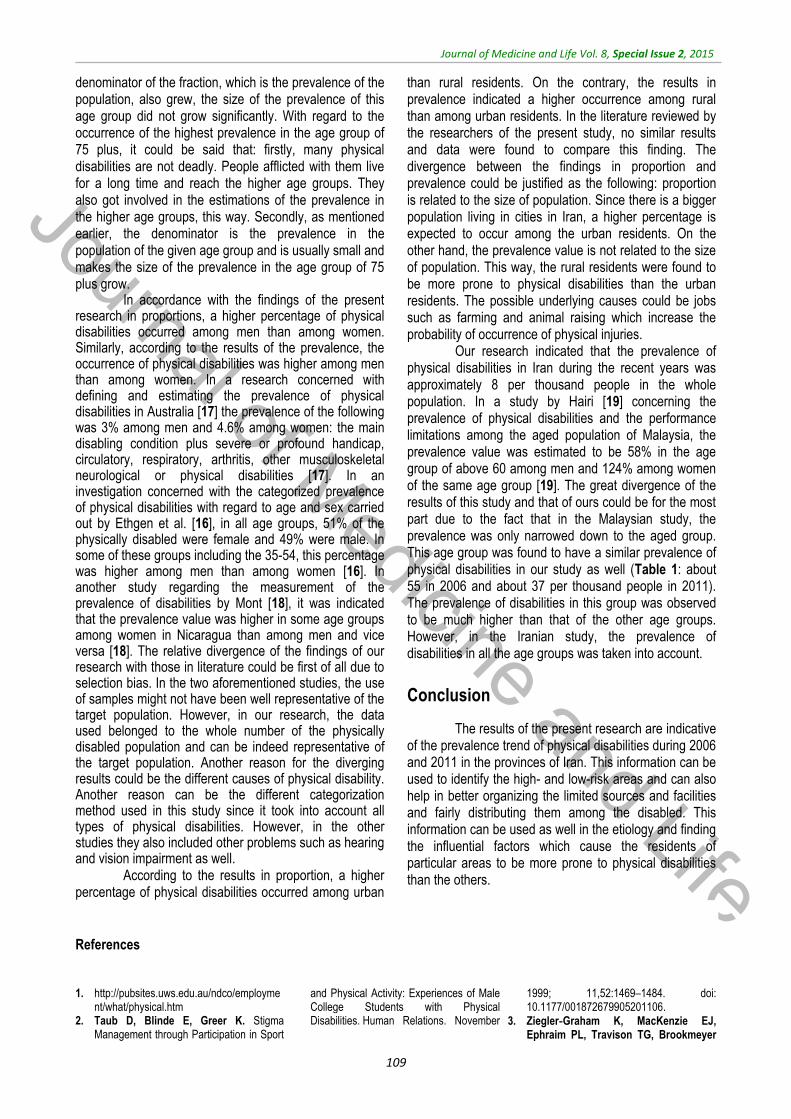
Journal of Medicine and Life
Journal of Medicine and Life Vol. 8, Special Issue 2, 2015
109
denominator of the fraction, which is the prevalence of the population, also grew, the size of the prevalence of this age group did not grow significantly. With regard to the occurrence of the highest prevalence in the age group of 75 plus, it could be said that: firstly, many physical disabilities are not deadly. People afflicted with them live for a long time and reach the higher age groups. They also got involved in the estimations of the prevalence in the higher age groups, this way. Secondly, as mentioned earlier, the denominator is the prevalence in the population of the given age group and is usually small and makes the size of the prevalence in the age group of 75 plus grow.
In accordance with the findings of the present research in proportions, a higher percentage of physical disabilities occurred among men than among women. Similarly, according to the results of the prevalence, the occurrence of physical disabilities was higher among men than among women. In a research concerned with defining and estimating the prevalence of physical disabilities in Australia [17] the prevalence of the following was 3% among men and 4.6% among women: the main disabling condition plus severe or profound handicap, circulatory, respiratory, arthritis, other musculoskeletal neurological or physical disabilities [17]. In an investigation concerned with the categorized prevalence of physical disabilities with regard to age and sex carried out by Ethgen et al. [16], in all age groups, 51% of the physically disabled were female and 49% were male. In some of these groups including the 35-54, this percentage was higher among men than among women [16]. In another study regarding the measurement of the prevalence of disabilities by Mont [18], it was indicated that the prevalence value was higher in some age groups among women in Nicaragua than among men and vice versa [18]. The relative divergence of the findings of our research with those in literature could be first of all due to selection bias. In the two aforementioned studies, the use of samples might not have been well representative of the target population. However, in our research, the data used belonged to the whole number of the physically disabled population and can be indeed representative of the target population. Another reason for the diverging results could be the different causes of physical disability. Another reason can be the different categorization method used in this study since it took into account all types of physical disabilities. However, in the other studies they also included other problems such as hearing and vision impairment as well.
According to the results in proportion, a higher percentage of physical disabilities occurred among urban
than rural residents. On the contrary, the results in prevalence indicated a higher occurrence among rural than among urban residents. In the literature reviewed by the researchers of the present study, no similar results and data were found to compare this finding. The divergence between the findings in proportion and prevalence could be justified as the following: proportion is related to the size of population. Since there is a bigger population living in cities in Iran, a higher percentage is expected to occur among the urban residents. On the other hand, the prevalence value is not related to the size of population. This way, the rural residents were found to be more prone to physical disabilities than the urban residents. The possible underlying causes could be jobs such as farming and animal raising which increase the probability of occurrence of physical injuries.
Our research indicated that the prevalence of physical disabilities in Iran during the recent years was approximately 8 per thousand people in the whole population. In a study by Hairi [19] concerning the prevalence of physical disabilities and the performance limitations among the aged population of Malaysia, the prevalence value was estimated to be 58% in the age group of above 60 among men and 124% among women of the same age group [19]. The great divergence of the results of this study and that of ours could be for the most part due to the fact that in the Malaysian study, the prevalence was only narrowed down to the aged group. This age group was found to have a similar prevalence of physical disabilities in our study as well (Table 1: about 55 in 2006 and about 37 per thousand people in 2011). The prevalence of disabilities in this group was observed to be much higher than that of the other age groups. However, in the Iranian study, the prevalence of disabilities in all the age groups was taken into account.
Conclusion
The results of the present research are indicative of the prevalence trend of physical disabilities during 2006 and 2011 in the provinces of Iran. This information can be used to identify the high- and low-risk areas and can also help in better organizing the limited sources and facilities and fairly distributing them among the disabled. This information can be used as well in the etiology and finding the influential factors which cause the residents of particular areas to be more prone to physical disabilities than the others.
References
1. http://pubsites.uws.edu.au/ndco/employment/what/physical.htm
2. Taub D, Blinde E, Greer K. Stigma Management through Participation in Sport
and Physical Activity: Experiences of Male College Students with Physical Disabilities. Human Relations. November
1999; 11,52:1469–1484. doi: 10.1177/001872679905201106.
3. Ziegler‐Graham K, MacKenzie EJ, Ephraim PL, Travison TG, Brookmeyer
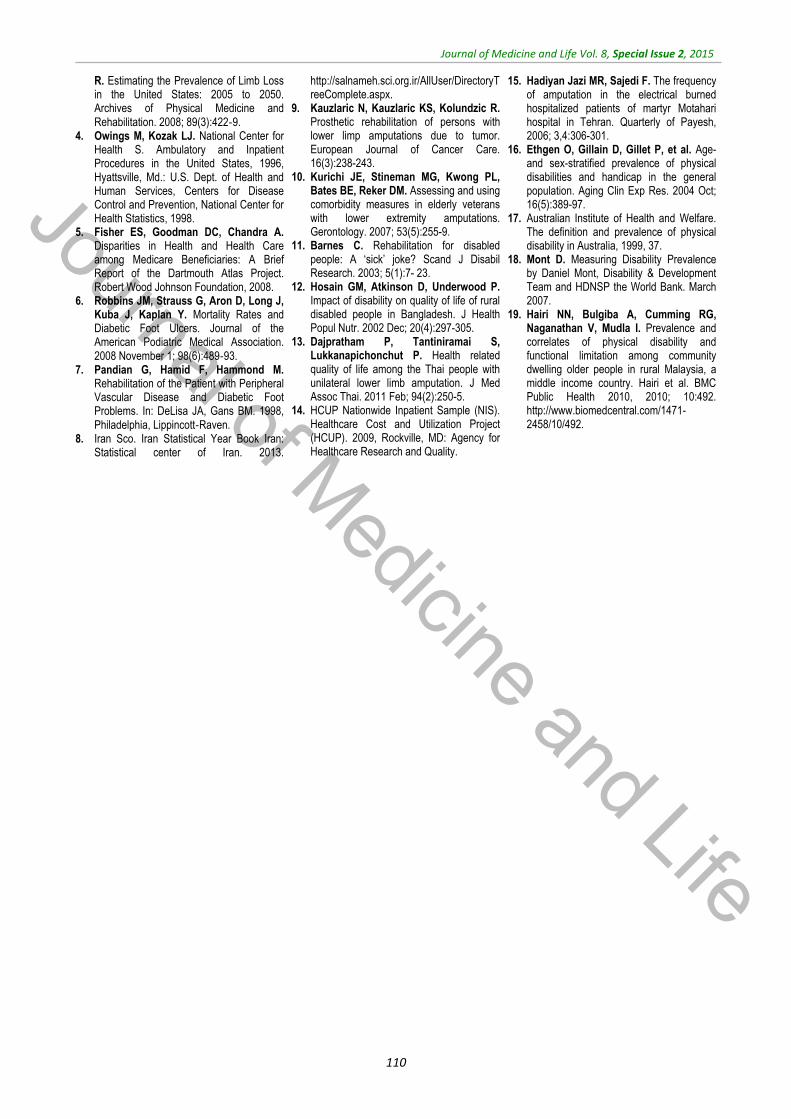
Journal of Medicine and Life
Journal of Medicine and Life Vol. 8, Special Issue 2, 2015
110
R. Estimating the Prevalence of Limb Loss in the United States: 2005 to 2050. Archives of Physical Medicine and Rehabilitation. 2008; 89(3):422‐9.
4. Owings M, Kozak LJ. National Center for Health S. Ambulatory and Inpatient Procedures in the United States, 1996, Hyattsville, Md.: U.S. Dept. of Health and Human Services, Centers for Disease Control and Prevention, National Center for Health Statistics, 1998.
5. Fisher ES, Goodman DC, Chandra A. Disparities in Health and Health Care among Medicare Beneficiaries: A Brief Report of the Dartmouth Atlas Project. Robert Wood Johnson Foundation, 2008.
6. Robbins JM, Strauss G, Aron D, Long J, Kuba J, Kaplan Y. Mortality Rates and Diabetic Foot Ulcers. Journal of the American Podiatric Medical Association. 2008 November 1; 98(6):489‐93.
7. Pandian G, Hamid F, Hammond M. Rehabilitation of the Patient with Peripheral Vascular Disease and Diabetic Foot Problems. In: DeLisa JA, Gans BM. 1998, Philadelphia, Lippincott‐Raven.
8. Iran Sco. Iran Statistical Year Book Iran: Statistical center of Iran. 2013.
http://salnameh.sci.org.ir/AllUser/DirectoryTreeComplete.aspx.
9. Kauzlaric N, Kauzlaric KS, Kolundzic R. Prosthetic rehabilitation of persons with lower limp amputations due to tumor. European Journal of Cancer Care. 16(3):238-243.
10. Kurichi JE, Stineman MG, Kwong PL, Bates BE, Reker DM. Assessing and using comorbidity measures in elderly veterans with lower extremity amputations. Gerontology. 2007; 53(5):255-9.
11. Barnes C. Rehabilitation for disabled people: A ‘sick’ joke? Scand J Disabil Research. 2003; 5(1):7- 23.
12. Hosain GM, Atkinson D, Underwood P. Impact of disability on quality of life of rural disabled people in Bangladesh. J Health Popul Nutr. 2002 Dec; 20(4):297-305.
13. Dajpratham P, Tantiniramai S, Lukkanapichonchut P. Health related quality of life among the Thai people with unilateral lower limb amputation. J Med Assoc Thai. 2011 Feb; 94(2):250-5.
14. HCUP Nationwide Inpatient Sample (NIS). Healthcare Cost and Utilization Project (HCUP). 2009, Rockville, MD: Agency for Healthcare Research and Quality.
15. Hadiyan Jazi MR, Sajedi F. The frequency of amputation in the electrical burned hospitalized patients of martyr Motahari hospital in Tehran. Quarterly of Payesh, 2006; 3,4:306-301.
16. Ethgen O, Gillain D, Gillet P, et al. Age- and sex-stratified prevalence of physical disabilities and handicap in the general population. Aging Clin Exp Res. 2004 Oct; 16(5):389-97.
17. Australian Institute of Health and Welfare. The definition and prevalence of physical disability in Australia, 1999, 37.
18. Mont D. Measuring Disability Prevalence by Daniel Mont, Disability & Development Team and HDNSP the World Bank. March 2007.
19. Hairi NN, Bulgiba A, Cumming RG, Naganathan V, Mudla I. Prevalence and correlates of physical disability and functional limitation among community dwelling older people in rural Malaysia, a middle income country. Hairi et al. BMC Public Health 2010, 2010; 10:492. http://www.biomedcentral.com/1471-2458/10/492.
Journal of Medicine and Life
Journal of Medicine and Life Vol. 8, Special Issue 2, 2015, pp.111-116
Comparing the effectiveness of mindfulness and emotion regulation training in reduction
of marital conflicts
Molajafar H*, Mousavi SM**, Lotfi R***, Seyedeh Madineh Ghasemnejad****, Falah M*****
*Islamic Azad University, Karaj Branch, Karaj, Iran
**Department of Psychology, Rasht Branch, Islamic Azad University, Rasht, Iran ***Gilan University of Medical Sciences, Rasht, Iran ****Department of Nursing and Midwifery, Lahijab Branch, Islamic Azad University, Lahjan, Iran *****Nursing, Mazandaran University of Medical sciences, Ramsar, Iran Correspondence to: Seyedeh Maryam Mousavi, PhD student of Health Psychology Department of Psychology, Rasht Branch, Islamic Azad University, Rasht, Iran, P.O. Box: 3516-41335, Phone: (+98) 1333423153-4, Fax: (+98) 13334247060, E-mail: [email protected] Received: May 16th, 2015 – Accepted: July 27th, 2015
Abstract Introduction: this study aimed to compare the effectiveness of mindfulness and emotion regulation training in the reduction of marital conflicts. Methodology: the present evaluation was a quasi-experimental study with a pretest-posttest design and a control group. The population consisted of all clients who referred to Moein Counseling Center in Alborz province (Spring 2014) due to marital problems. Using the simple random sampling method, 45 married people were selected as the sample and divided into two experimental groups (15 participants in each) and a control group (15 participants). Mindfulness training sessions were held for the first experimental group and emotion regulation training sessions were held for the second experimental group while, the participants in the control group did not receive any training. The Marital Conflicts Questionnaire was used for data collection and the obtained data were analyzed through descriptive statistics and analysis of covariance. Results: the results confirmed the main hypothesis of this study regarding the effectiveness of mindfulness and emotion regulation training in reduction of marital conflicts (p<0.001, F=43.41). Discussion and conclusion: there was a significant difference between mindfulness training and emotion regulation training in the reduction of marital conflicts; thus, compared to the mindfulness training, emotion regulation training can be considered a more effective treatment of marital conflicts.
Keywords: marital conflicts, emotion regulation, mindfulness Introduction
Conflicts and misunderstandings are very common in all families. However, sometimes, these encounters may lead to severe challenges. Today, families are involved in different types of conflicts and intense disputes leading to the distortion of the family as an institution in which the creation of healthy personalities is the main focus. Conflict can be defined as disagreement or incompatibility between people due to different objectives, perceptions, and interests [4]. Marital conflicts are kind of ongoing significant mismatches between married couples who are shown by at least one of them. “Significant” in this definition connotes the effects of the conflicts on married couples’ performance and “ongoing” signifies the conflicts, which will not disappear over time. Conflicting couples are disturbed by their partners’ habits and personality and normally have communication problems in different areas and difficulties
in accepting each other’s differences [26]. Couples in modern societies face several problems in establishing intimate relationships. It is obvious that deficiencies in the emotional quality of the marriage, along with several other factors, adversely affect the couple’s lives. Deriving from the negative responses to the partner’s differences, marital conflicts are invigorated when feelings of anger, hostility, revenge, hatred, and jealousy or verbal and physical abuses dominate the couples’ relationships [9]. Oliver and Miller [22] showed that many of the conflicting couples continue their marriage successfully because they believe that their marital problems are sexual, financial, or even due to their relatives’ interference while, the origin of their problems is actually the absence of healthy emotional behaviors. Marital confusion and conflicts may cause attachment problems for the couples and lead to reduced happiness, life satisfaction, and self-esteem; they also increase symptoms of psychological distress. It has also been confirmed that the biggest predictor of marital dissatisfaction and divorce is neither

Journal of Medicine and Life
Journal of Medicine and Life Vol. 8, Special Issue 2, 2015
112
financial problems nor lack of sexual attraction or love but the method by which couples manage their marital conflicts in challenging situations [16].
Maladaptive emotion regulation can lead to creation or expansion of the conflicts. When people consistently suppress their emotions or react impulsively, they will experience more negative emotions, less positive emotions, relationship problems and reduced quality life [13]. Emotion regulation consists of all conscious and non-conscious strategies used to increase, maintain, or decrease emotional, behavioral, and cognitive components of an emotional response to a challenging situation [14]. It also refers to the ability to understand and express emotions appropriately [12]. Emotion regulation training means teaching techniques to control/ reduce negative emotions and increase/ use positive emotions. Regarding the importance of emotion regulation in relationships, the results have indicated that negative emotion regulation strategies can predict negative emotions and low satisfaction while positive emotion regulation strategies can predict less negative emotions in relationships [21]. Moreover, it has been specified that emotion regulation strategies are associated with reduced negative emotions and conflicts and focus on positive emotion regulation strategies can enhance people’s understanding of emotion management in relationships [10]. Essentially, emotion regulation and its training have been considered important factors in the improvement of the couples’ relationships as well as their lives’ quality and satisfaction [11].
Based on previous studies, emotion regulation refers to the process by which people experience and express their emotions [23,24] Difficulties in emotion regulation may be due to lack of emotion regulation capability [15].
According to the emotion regulation model, emotion regulation is a unique process for the modification of emotional experiences in order to achieve social acceptance and be in an appropriate physical and emotional state to respond properly to both internal and external demands. Emotion regulation also refers to “regulation and adjustment” of emotional processes applied in adaptive performances; therefore, emotional irregularity refers to a process that ultimately disrupts adaptive performances [18]. In a study, Beck [7] found that control and regulation of emotions along with people’s self-awareness of their emotions significantly enhance their marital relationships. In another study [8], it was found that people who had participated in emotion regulation group therapy sessions had a better control over their communication and mood swings.
One way to prevent behavioral and communicational problems is the improvement of the couples’ mental capacity that can be done through mindfulness training [2,5]. Mindfulness-based interventions are considered as one of the third-generation or third-wave cognitive-behavioral therapies. Mindfulness is a type of meditation rooted in Eastern rituals and wisdom, particularly the teachings of Buddha [25]. Mindfulness training can be introduced as a simple
way to train the mind to be in a flexible and adaptive state [17]. For the first time, Linhan [19] put emphasis on the need to consider mindfulness as one of the essential components of psychotherapy. For an individual to be mindful, it is necessary to have non-judgmental awareness of his/ her emotions and thoughts occurring in the present moment. Focused attention on the present moments leads to the processing of all cognitive, physiological, and behavioral aspects of the immediate experience. Through mindfulness-based exercises, people become aware of their daily activities and the automatic function of their minds in the past and the future and through moment-by-moment awareness of thoughts, they can control their thoughts, emotions, and physical statuses and their minds become free from daily issues and automatic focus on the past and the future [27]. Studies have shown that mindfulness increases life quality, positive emotions and life enjoyment and decreases anger in interpersonal relationships [19].
The overall purpose of mindfulness training is to improve people’s compatibility with themselves, their environment, and others.
Today, the increasing rate of marital problems and conflicts has highlighted the importance of considering marital relationships more deeply. Too much conflict between married couples may lead to severe consequences and breakdown of the relationship. Consequently, considering the importance of mindfulness skills and the vital role of emotion regulation in marital relationships and their effects on the reduction of marital conflicts, the following hypotheses were tested in the present study: 1. Both mindfulness and emotion regulation training reduce marital conflicts. 2. Emotion regulation training is more effective than mindfulness training in the reduction of marital conflicts. Methodology
The present evaluation was a quasi-experimental study with a pretest-posttest design and a control group. After the data collection, the obtained data were analyzed through descriptive statistics and analysis of covariance (SPSS software).
The population consisted of all the clients who referred to Moein Counseling Center in Alborz province (Spring 2014) due to marital problems. Using the simple random sampling method, 45 married people were selected as the sample and divided into two experimental groups (15 participants in each) and a control group (15 participants). Instruments The demographic form: this form included information such as gender, age, and educational level of the participants. The Marital Conflicts Questionnaire: this 42-item questionnaire, developed by Sanaii and Barati [3], measured 7 dimensions of marital conflicts including the reduction of the couple’s cooperation, reduction of sexual

Journal of Medicine and Life
Journal of Medicine and Life Vol. 8, Special Issue 2, 2015
113
relationships, increase of emotional reactions, increase of asking for children’s support, increase of personal relationships with their own relatives, reduction of personal relationships with the partners’ relatives and friends and separation of financial issues. Based on the standard T scores, the temporary norm of this questionnaire was calculated separately for the experimental group and men and women control groups. The minimum and maximum scores in this questionnaire were 42 and 210 respectively. Those whose raw scores were in the range of 70 to 114 (equivalent to the standard T scores between 40 and 60) had a normal marital relationship, those whose raw scores were in the range of 115 to 134 (equivalent to the T scores between 60 and 70) had more than normal marital conflicts and those whose raw scores were above 134 (equivalent to T scores above 70) were experiencing severe conflicts in their marriage and their marital relationships were extremely vulnerable. Procedure
Using the simple random sampling method, 45 married people were selected as the sample and divided into two experimental groups (15 participants in each) and a control group (15 participants). At the outset, all participants answered the Marital Conflicts Questionnaire. Then, mindfulness training sessions were held for the first experimental group and emotion regulation training sessions were held for the second experimental group while the participants in the control group did not receive any training. Intervention methods A. mindfulness training: based on the Mindfulness-Based Cognitive Therapy (MBCT) approach, eight 90-minutes sessions of mindfulness training were held for the first experimental group. First session: after the pre-test, the first session started with an explanation of the importance of mindfulness training and the benefits of relaxation exercises. Then, a variety of mindfulness techniques such as focusing on breathing and some cognitive-behavioral techniques were thought. The session ended with an explanation of the homework. Second session: the second session included teaching relaxation exercises for 14 muscles, physical inspection, and mindfulness in daily life, confrontation with obstacles and focus on body and face. Third session: the third session included teaching relaxation exercises for 6 groups of muscles, performing yoga postures and breathing control exercises, discussing ways to confront and control thoughts and thought pattern recognition. Fourth session: in the fourth session, techniques of meditation, being in the present moment and attending to misconceptions, engaging with them and choosing appropriate alternatives for them were thought.
Fifth session: in the fifth session, non-judgmental acceptance of experience as it actually was without trying to change it was explained. Sixth session: the sixth session included mindfulness of thoughts training (i.e. noticing both positive and negative thoughts that come into the mind and then letting them go without judgment) and exercising noticing the coming of thoughts as only thoughts, not parts of the reality. Seventh session: methods of self-protection and a program to prevent or deal with risk factors were explained in the seventh session. Eighth session: finally, in the last session, the ways to relate the learned techniques to daily life activities were explained and a post-test was conducted. B. emotion regulation training Eight 90-minutes sessions of emotion regulation training were held for the second experimental group. First session: after the pre-test, the first session started with an explanation of the importance of emotion regulation training. Second session: in the second session, contents of the first session were reviewed and positive emotion awareness and its types were discussed. Then, ways to notice them were explained through examples and exercises and finally, the homework was assigned. Third session: in the third session, contents of the second session were reviewed and negative emotion awareness and its types (anger, sadness, hatred, anxiety, etc.) were discussed. Then, ways to notice them were explained through examples and mental visualization. Fourth session: the fourth session started with a brief review of the previous session and then ways to non-judgmentally accept positive emotions and their positive and negative consequences were thought. Homework was assigned and close relatives of the participants were questioned regarding the participants’ positive emotions swings. Fifth session: ways to non-judgmentally accept negative emotions and their positive and negative consequences were thought and homework was assigned. Sixth session: two previous sessions were reviewed and then, reassessment, mental visualization, mental inhibition, and appropriate expression of positive emotions were discussed. Seventh session: reassessment, mental visualization, mental inhibition, and appropriate expression of negative emotions were discussed. Eighth session: in the last session, the ways to relate the learned techniques to daily life activities were explained and a post-test was conducted.
Results
The results showed that the average ages of the participants in the three groups of mindfulness training, emotion regulation training, and control were 19.92, 33.93 and 30.73 respectively.

Journal of Medicine and Life
Journal of Medicine and Life Vol. 8, Special Issue 2, 2015
114
Regarding the participants’ educational level, 6.7% did not graduate from high school, 42.2% graduated from high school, 33.3% had BA degree and 17.8% had
MA degree or higher. 68.9% of the participants were female and 31.1% were male (Table 1).
Table 1. Frequency distribution and percentage of participants based on educational level and gender in different groups
Variables Mindfulness group
Emotion regulation group Control group All groups
Freq. % Freq. % Freq. % Freq. %
Educational level
High-school 2 13.33 1 6.66 0 0 3 6.7 High-school Diploma 6 40 6 40 7 46.66 19 42.2
BA 4 26.66 6 40 5 33.33 15 33.3 MA or higher 3 20 2 13.33 3 20 8 17.8
Gender Female 10 66.66 12 80 9 60 31 68.88 Male 5 33.33 3 20 6 40 14 31.11
In Table 2, the pre-test/ posttest, means and standard deviations of marital conflicts are presented in the three
groups. Table 2. Pre-test/posttest means and standard deviations of marital conflicts in the three groups
variable groups Pre-test Posttest
Marital conflicts Mindfulness group 115.13/ 19.64 107.33/ 18.54 Emotion regulation 120.20/ 19.92 100.47/ 15.80 Control 118.40/ 18.68 118.60/ 16.77
To compare the effectiveness of mindfulness
and emotion regulation group training in the reduction of marital conflicts, the analysis of covariance was applied in the present study. Before the analysis, it was necessary to examine its assumption. The interaction between the dispersion variable (pre-test) and the dependent variable (marital conflicts) was not significant; therefore, the data supported the assumption of homogeneity of regression slopes (p>0.05). Likewise, the parallelity and linear relationship between the variables confirmed the mentioned assumption as well. The levene’s test results concerning the variable of marital conflicts did not show any significance (F=0.861; P>0.05), confirming the
homogeneity of variance in the three groups. The Kolmogorov-Smirnov test results were not significant as well (P<0.05), indicating a normal distribution of pre-test variables in all groups. Accordingly, the variables were compared between the three groups, with regard to the assumptions of covariance analysis.
Results presented in Table 3 indicated significant differences between the experimental groups and the control group regarding the amount of marital conflicts (F=43.41; P=0.001). Therefore, the first hypothesis regarding the effectiveness of both training methods in the reduction of marital conflicts was confirmed.
Table 3. Covariance analysis results comparing the effectiveness of the training programs at posttest stage
Change index
Total squares
Degree of freedom
Squares mean
F value P value Significance
level Statistical
power Pre-test 6092.05 1 6092.05 215.18 0.001 0.89 1.00 Group
membership 2458.39 2 1229.19 43.41 0.001 0.77 1.00
The results of Bonferroni test analyzing between-groups differences are presented in Table 4.
Table 4. Bonferroni post hoc test results comparing the mean scores of marital conflicts in the three groups
Groups Means 1 2 3 Mindfulness training 107.74 - P<0.001 P<0.002
Emotion regulation training 100.62 P<0.001 - P<0.001 Control 118.85 P<0.002 P<0.001 -
The results presented in Table 4 indicate
significant differences between the two experimental groups and the control group regarding the amount of marital conflicts. Therefore, compared to the control group, the amount of marital conflicts was significantly
reduced in the two experimental groups, confirming the first hypothesis again. Moreover, a significant difference was observed regarding the amount of marital conflicts between the two experimental groups. Therefore, the second hypothesis of “Emotion regulation training” is
Journal of Medicine and Life
Journal of Medicine and Life Vol. 8, Special Issue 2, 2015
115
more effective than mindfulness training in the reduction of marital conflicts’, was confirmed.
Discussion and conclusion
Martial conflicts significantly lack consistency between married couples, bringing about severe consequences for the families and may lead to breakdown of the marriage [1].
The overall objective of the present study was to compare the effectiveness of two training methods of mindfulness and emotion regulation in the reduction of marital conflicts. Comparing the pre-test and posttest scores of marital conflicts, the results indicated that the marital conflicts scores of married people in the emotion regulation group were reduced compared to the mindfulness group and scores of married people in the mindfulness group were reduced significantly compared to the control group. These findings are consistent with another study done by Denham [11], regarding the effectiveness of emotion regulation in the reduction of marital conflicts and the increase of intimate relationships between married couples. Results of other studies conducted by Kirby [20] and Abbot [6] regarding the impacts of irregularity of emotions on marital satisfaction were also in line with the present study findings.
Staford and Semik [28] found that in unhappy marriages, women showed their negative emotions frequently and men were very defensive leading to a decrease of the marital satisfaction and creation of conflicts.
Many variables directly or indirectly affect the couples’ quality of life and the frequency of conflicts between them. One of these variables is their emotions. The quality of emotions, as the most important factor in the relationships, can predict marital satisfaction.
Various emotion regulation strategies can be used in different stages of an emotional reaction. Even before the occurrence of an emotional outburst, people can feel their coming emotions; therefore, they can avoid it, limit its expression through inhibition, or change the consequences of its expression or non-expression. Thus, it seems that emotion regulation done by couples can increase their adaptive capabilities and enhance their
marital satisfaction. Couples need to learn how to calm down the situation, regain their calmness, and focus on the problem again. They also have to discover how to adjust their intense emotions to different stressful situations. Hence, the attention paid to the role of emotion regulation in peoples’ coping capacity brought about the researcher’s curiosity to examine the effects of emotion regulation strategies on the reduction of marital conflicts.
In line with other studies [16,19] regarding the effectiveness of mindfulness training in reducing marital conflicts, it can be said that mindfulness meditation training is effective in the reduction of anger and anxiety in relationships, improvement of life quality[29] and reduction of interpersonal conflicts. [30]
The bases of MBCT have presence of mind at any moment, preventing mental ruminations, having control over daily events, recognizing automatic thought patterns through focusing on breathing, attending to faulty recognitions and accepting confrontation with coming thoughts. Mindfulness techniques provide a way to deal with daily stressful situations. Stressors within the family are part of life and sometimes impossible to change; however, ways to deal with or respond to them can change. Since marital conflicts are significantly related to daily stresses and faulty automatic thoughts, it gives the impression that regular mindfulness exercises can create positive changes in some of the couples’ relationships and consequently enhance their marriage.
The limitations of the present study included a small number of the previous studies on the effects of mindfulness training on marital conflicts and non-equal numbers of male and female participants (the majority of participants were females).
The results of this study provided important information about the effectiveness of mindfulness and emotion regulation training in the reduction of marital conflicts. It is recommended to pay more attention to the importance of mindfulness and emotion regulation training in the improvement of interpersonal relationships, particularly relationships between married couples. It is also recommended to evaluate the durability of the effects of mindfulness and emotion regulation training on the couples’ marital relationships.
References
1. Afkhami A, Bahrami F, Fatemi Zade M.
Relationship and Marital Conflict in Yazd. J
Family Research. 2007; 9:26.
2. Ahmad Khani H. Effective communication
skills on the social adjustment of mothers
of mentally retarded children in Ardebil.
Master’s Thesis 2011. Tehran University.
3. Sanaii B, Alagheband S, Abasi H.
Measures of family and marriage. 2000,
Tehran, Besat.
4. Hoseyni F. Compared with the parental
marital conflict marital conflict in the
marriage of their children. J New thoughts
training. 2005; 12:81.
5. Fereydoni K, Tabrizi M, Navabi Nejad SH. Even short-term treatment increases the effectiveness of self-regulation of the marriage Mrakhan cultural center city Babolsar. Journal of Family Studies. 2008; 213-229.
6. Abbot B. Emotion Dysregulation and Re-Regulation: predictor of Relationship
Journal of Medicine and Life
Journal of Medicine and Life Vol. 8, Special Issue 2, 2015
116
intimacy and Distress. Doctoral Dissertation, 2005, Texas A&M University.
7. Beck JS. Cognitive therapy: Basics and beyond. 2nd ed. 2012, New York: Guilford Press.
8. Yiend DT, Schweizer J, Dunn BD. Ironic effects of emotion suppression when recovering distressing memories. Emotion. 2009; 9(5):744-749.
9. Diblasio FA, Proctor BB. Therapists and the clinical use of forgiveness American. Journal of Family Therapy. 1993; 21,175-187.
10. Diefendorff JM, Richard EM, Yang J. Linking emotion regulation strategies to affective events and negative emotions at work. Journal of Vocational Behavior. 2008; 73(3):498-508.
11. Dunham SM. Emotional skillfulness in African American marriage: intimate safety AZ a mediator of the relationship between emotional skillfulness and marital satisfaction dissertation of Doctor of Philosophy. 2008, University of Akron.
12. Gratz KL, Gunderson JG. Preliminary data on an acceptance-based emotion regulation group intervention for deliberate self-harm among women with borderline personality disorder. 2006; 37(1):25-35.
13. Gross JJ, John OP. Individual Differences in Two Emotion Regulation processes: Implication for affect, Relationship, and Well-Being. Journal of Personality and Social Psychology. 2003; 85,348-362.
14. Gross JJ. Emotion regulation: affective, cognitive, and social consequences. Psychophysiology. 2002; 39(3):281-91.
15. Harmon-Jones E. Anger and behavioral approach system.personality and Individual Differences. 2003; 35,995-1005.
16. Hawkins DN, Booth A. Unhappily Ever After: Effects of long-term, low- quality marriages on well-being. Social Forces. 2005; 84(1),451-471.
17. Hofmann S, Sawter Witt AD. The Effect of mindfulness therapy on anxiety and depression. A meta-analytic review. Journal of Consulting and Clinical Psychology. 2010.
18. Hwang J. A processing model of emotion regulation: insights from the attachment system. Doctoral dissertation, 2006, College of arts and Sciences, Georgia State University.
19. Kieviet-Stijnen A, Visser A, Garssen B, Huding W. Mindfulness-based stress reduction training for oncology patient: patients’ appraisal and changes in Well-being patient. Educ Couns. 2008; 72(3):436-42.
20. Kirby JS. Treating emotion Dysregulation in a couple’s context: a pilot study of a couple’s skills Group intervention. Journal of Marital and Family Therapy, 2007; 33(3),375-391.
21. Martini TS, Busseri MA. Emotion regulation strategies and goals as predictors of older mothers and adult daughters helping-related subjective well-being. Psychol Aging. 2010; 25(1):48-59.
22. Oliver L, Miller WR. Marriage enrichment philosophy, process, and program. 1994, Bowie MD: Robert S Brady Company.
23. Oliver S, Miller M. Human emotions: A Functional view. 1994, Inp. Ekman RJ.
24. Davidson. The nature of emotion: Fundamental questions. New York: Oxford University Press.
25. Ost LG. Efficacy of the third wave of behavioral therapies: A systematic review and meta-analysis. Behaviour Research and Therapy. 2008; 46,296-321.
26. Qalili Z. Effectiveness of problem-solving learning approach to reduce marital conflict. Journal of Applied Psychology. 2007; 3:31-9.
27. Rygh JL, Sanderson WC. Treating generalized anxiety disorder: Evidence-based strategies, tools, and techniques. 2004, New York: Guilford Press.
28. Staford F, Semik A. Neural bases of emotion regulation in nonhuman primates and humans. Handbook of emotion regulation. 2002, 47-68.
29. Fereshteh F, Jalil Sh, Ghasem A and Farideh R. Assessment of Quality Of Life in Cancer Patients, American Journal of Agricultural and Biological Sciences 2014; 9 (2): 147-152. doi:10.3844/ajabssp.2014.147.152.
30. Ghassem A, Seyyed Hashem D, Asghar N, Farideh R. The Relationship between Quality of Life and Marriage Satisfaction in Infertile Couples Using Path Analysis. J Mazandaran Univ Med Sci 2014; 24(117): 184-193 (Persian).

Journal of Medicine and Life
Journal of Medicine and Life Vol. 8, Special Issue 2, 2015, pp.117-120
Investigating the effects of Hydroalcoholic extract of jujube fruit (Zizyphus vulgaris L.) on second degree
burn wound healing in Balb/c mice
Vafaei F*, Abdollahzadeh F** *Department of Surgery, Imam Ali Hospital, North Khorasan University of Medical Sciences, Bojnurd, Iran **Young Researchers and Elite Club, Boukan Branch, Islamic Azad University, Boukan, Iran Correspondence to: Farzad Abdollahzadeh, MD, Young Researchers and Elite Club, Boukan Branch, Islamic Azad University, Boukan, Iran. Phone: (+98) 9184566334, Email: [email protected] Received: May 15th, 2015 – Accepted: July 27th, 2015
Abstract Background and Objective: Two thirds of all accidents and injuries leading to death all around the world occur in developing countries like Iran. One of these accidents is burn that can have unpleasant effects on the individual’s body and soul. Skin wound healing is a process that happens as a result of coordination between tissues, cells, and different factors. The remaining inflammation and insufficient amount of vessel construction are among the most important causes of delayed wound healing. In recent years, jujube fruit (Zizyphus vulgaris L.) has been reported to have anti-inflammatory effects as a traditional therapeutic agent. Therefore, the present study was conducted in order to investigate the effects of jujube fruit extract on second-degree burn wound among Balb/c mice. Materials and Methods: The present empirical-interventional study included 48 Balb/c mice weighing approximately 30 ± 3 gr. After burn wounds of 1.5 cm2 were created and second-degree burns was affirmed by a pathologist, the mice were divided into four control groups; one treated with Vaseline, one treated with silver sulfadiazine ointment, one treated with jujube fruit extract 1%, and a control group. Results: In treatment groups, 1 gr ointment containing hydroalcoholic extract of jujube fruit was utilized twice a day until complete recovery. Afterwards, the four groups were compared with regard to the wound area and histopathology. The collected data were analyzed through one-way ANOVA and Tukey tests by using SPSS software. Conclusion: There was a significant difference between the intervention group and the Vaseline and control groups with regard to the percentage of wound recovery (P<0.05). The results of the study indicated that the jujube fruit extract could accelerate burn wound healing among Balb/c mice. It is recommended that further research is conducted on the effects of different doses of this medicine on laboratory animals and then on humans.
Keywords: jujube (Zizyphus vulgaris L.), burn, burn healing, Balb/c mouse Introduction
Burn is a type of injury to the skin or mucous membrane (like cover of the mouth, stomach, conjunctiva, and airways) caused by extreme heat, extreme cold, chemicals, and electricity and leads to damage of the skin surface and halts vital functions of the skin (e.g., prevents the transmission of infectious microorganisms, maintains fluid balance, and regulates body temperature) [1]. Burn wound can go beyond these and involve structures under the skin like muscles, bones, nerves, and blood vessels.
Burn is one of the major problems of public health all around the world and especially in developing countries [2]. Injuries in extensive burns not only threaten the patients’ lives but also have serious physical, mental, and economic effects for the individuals, their families, and society [3]. Burn injuries are the third cause of accidental death in all age groups and the second cause of mortality among age groups of up to 4 years [4,5]. In
the USA, 2 million patients are provided with medical services related to burn injuries every year [6,7], and children account for approximately half of these patients [8]. Out of these patients, 500,000 need medical care, 70,000 are hospitalized due to severe injuries, and 6,000 die because of burn injuries [6,7]. In Iran, burn injuries also cause illnesses and a remarkable increase in the mortality rate especially among children. According to the studies conducted during 1995 and 1998 in Tohid Burn Center, Tehran, out of 3341 cases, 1454 individuals (43.5%) were children under 16 and their mortality rate was 16% [2]. Studies conducted in Tabriz indicated that burn is the third cause of hospitalization of children (66%) [9].
Nowadays with advances in critical care, there has been an increase in early surgical intervention, improvement in wound care, prescription of systemic or local antibiotics, and the number of surviving patients [10]. However, in spite of all these advances, there are still a
Journal of Medicine and Life
Journal of Medicine and Life Vol. 8, Special Issue 2, 2015
118
lot of people who experience and die of such accidents every year [4,6]. Infection is the major cause of death among these patients [11-13]. Utilization of local antibacterial medications and quick removal of burned tissues can remarkably reduce the infection [11]. Partial recovery of burn wounds, long-term treatment, high costs of treatment, and secondary complications of burns need conducting research on burn recovery process and quick reconstruction process of epithelialization in burnt patients [14]. Wound healing is a recovery process happening after lesions of the skin and other tissues [15]. One of the goals in medicine is to heal wounds in a short time with fewer complications. Shortening the healing time is highly important due to the decrease in the probability of infection or complications and cutting costs [16].
Since the use of medicinal herbs has been common since ever, one or some herbs or herbal extracts have been used for the treatment of different diseases, and the miraculous role of some herbs in treating specific diseases has been proved, they are increasingly used in treating different diseases [17]. There are numerous herbs that are used in traditional medicine of different nations in order to heal wounds. Using jujube fruit as a therapeutic agent is common among the people of Chaharmahal and Bakhtiari Province, and its anti-inflammatory effects have been reported in recent years [18].
Jujube (zizyphus zizyphus) is a shrub with an average height of 10 meters. It is native from tropical regions and has glabrous oval small green leaves that fall in winters. The olive-like fruit of jujube has many medicinal properties. It is first green, and after ripening, it turns red and wrinkles. In Italy, it is consumed as flavored candies with evening tea. In Korea, China, and Taiwan, the sweet juice of jujube fruit is drunk. In some regions, it is used to make vinegar. In Africa, it is used to make cakes. Canned jujube and tea with jujube flavor are consumed all over the world. However, in Iran, Pakistan, and India, it is consumed in its dried form [19]. Jujube contains a lot of glaze, about 5% proteins, 4% vitamin C, and minerals. Aqueous extracts of jujube wood contain ziziphic acid and ziziphomatic acid [20]. Jujube is relaxing and anti-moodiness. In Chinese and Korean traditional medicine, it is used as a medication that reduces anxiety and strengthens the spleen, the stomach, and digestive system. Jujube refines the blood, removes toxins from the body, makes the skin clear, and prevents cardiac problems [19]. It is laxative, contains a lot of glaze, and softens the chest [21]. Consuming the pith causes wounds and cuts to recover quickly [19]. It also makes the teeth resistant against decay. Jujube tea contains an anticancer agent called saponin. It helps damaged tissues recover and strengthens the muscles [22]. Boiled jujube leaves are used to relieve sore throat and their extract to treat it [23].
The present study was aimed at highlighting a compound that is useful in healing injuries with minimum
side effects and used in quick reconstruction of epithelialization process in burnt patients.
Materials and Methods
The method of preparing Jujube hydroalcoholic extract: Jujube fruit (zizyphus zizyphus) was prepared from one of the herb stories of the town. After the kernels were extracted, the fruit was dried at room temperature and in shade. Afterwards, it was turned into powder by using the electric mill. Then, 75 gr of jujube powder was added to 30% water and 70% methanol alcohol, and after 72 hours, it was smoothed by using Buchner funnel. Afterwards, soxhlet and rotary apparatus were used to conduct the extraction process, which led to obtaining 145 gr of extract. The effect of other methods on burn healing: In the present study, three local burn medications of sulfadiazine, Vaseline, and jujube fruit extract were compared against one another. Sulfadiazine has been used for more than a century and increases wound healing. However, due to its low penetration power, it is less effective in fighting against microorganisms that accumulate in tissue scars [11]. Petroleum jelly, mostly known as Vaseline, is obtained from refining heavy petroleum oils that are distillation remnants at 360˚C. Vaseline is a traditional medication that has been used for a long time, and its applications vary from softening the skin to being used as an oily substance and burn medication. It covers the burnt surface. It does not have the capacity to absorb wound exudates, has low permeability, and is only suitable for superficial burns. However, it is really cheap. Laboratory Animals: In the present experimental study, 48 Balb/c mice weighing approximately 30 ± 3 gr were selected. After they were anesthetized and burn wounds of 1.5 cm2 were created on their backs and the second degree burns were proved, the mice were divided into four equal groups; one treated with jujube fruit extract 1%, one treated with silver sulfadiazine ointment 1%, one treated with Vaseline, and a control group. The animals were kept in 22-25˚C, moisture of 50%, 12-hour cycle of dark and light, with normal diet, and in separate shelves. Conducted Tests: The animals were anesthetized with intraperitoneal injection of mixture of ketamine 50 mg/ kg and xylazine 5 mg/ kg. In order to create the wounds, the back hair of the mice was shaved and the skin was completely cleaned and disinfected with alcohol. Afterwards, by placing a hot round metal surface of 1.5 cm2 on the fifth thoracic vertebra for 10 seconds, second-degree burn wounds were created. The burn day was considered as the zero day, and treatment was started on the first day. For each group, 1 ml of the prepared ointment was used twice a day on the wounds. In doing
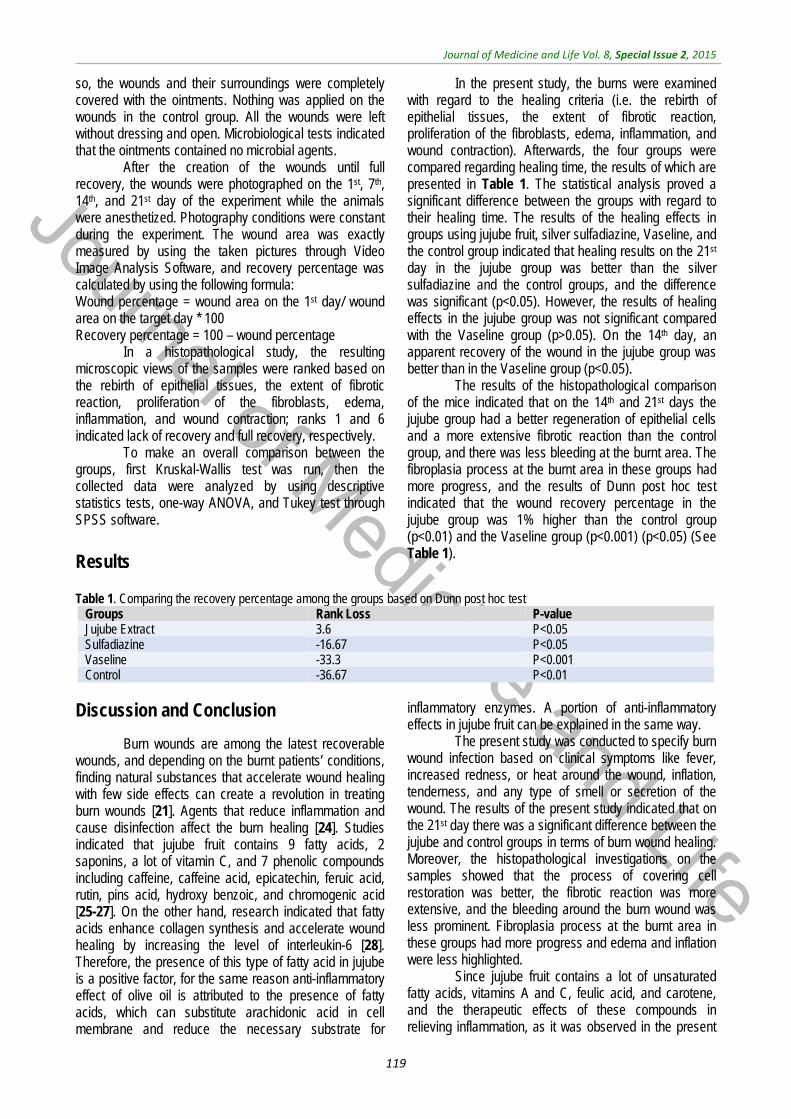
Journal of Medicine and Life
Journal of Medicine and Life Vol. 8, Special Issue 2, 2015
119
so, the wounds and their surroundings were completely covered with the ointments. Nothing was applied on the wounds in the control group. All the wounds were left without dressing and open. Microbiological tests indicated that the ointments contained no microbial agents.
After the creation of the wounds until full recovery, the wounds were photographed on the 1st, 7th, 14th, and 21st day of the experiment while the animals were anesthetized. Photography conditions were constant during the experiment. The wound area was exactly measured by using the taken pictures through Video Image Analysis Software, and recovery percentage was calculated by using the following formula: Wound percentage = wound area on the 1st day/ wound area on the target day * 100 Recovery percentage = 100 – wound percentage
In a histopathological study, the resulting microscopic views of the samples were ranked based on the rebirth of epithelial tissues, the extent of fibrotic reaction, proliferation of the fibroblasts, edema, inflammation, and wound contraction; ranks 1 and 6 indicated lack of recovery and full recovery, respectively.
To make an overall comparison between the groups, first Kruskal-Wallis test was run, then the collected data were analyzed by using descriptive statistics tests, one-way ANOVA, and Tukey test through SPSS software.
Results
In the present study, the burns were examined with regard to the healing criteria (i.e. the rebirth of epithelial tissues, the extent of fibrotic reaction, proliferation of the fibroblasts, edema, inflammation, and wound contraction). Afterwards, the four groups were compared regarding healing time, the results of which are presented in Table 1. The statistical analysis proved a significant difference between the groups with regard to their healing time. The results of the healing effects in groups using jujube fruit, silver sulfadiazine, Vaseline, and the control group indicated that healing results on the 21st day in the jujube group was better than the silver sulfadiazine and the control groups, and the difference was significant (p<0.05). However, the results of healing effects in the jujube group was not significant compared with the Vaseline group (p>0.05). On the 14th day, an apparent recovery of the wound in the jujube group was better than in the Vaseline group (p<0.05).
The results of the histopathological comparison of the mice indicated that on the 14th and 21st days the jujube group had a better regeneration of epithelial cells and a more extensive fibrotic reaction than the control group, and there was less bleeding at the burnt area. The fibroplasia process at the burnt area in these groups had more progress, and the results of Dunn post hoc test indicated that the wound recovery percentage in the jujube group was 1% higher than the control group (p<0.01) and the Vaseline group (p<0.001) (p<0.05) (See Table 1).
Table 1. Comparing the recovery percentage among the groups based on Dunn post hoc test
Groups Rank Loss P-value Jujube Extract 3.6 P<0.05 Sulfadiazine -16.67 P<0.05 Vaseline -33.3 P<0.001 Control -36.67 P<0.01
Discussion and Conclusion
Burn wounds are among the latest recoverable wounds, and depending on the burnt patients’ conditions, finding natural substances that accelerate wound healing with few side effects can create a revolution in treating burn wounds [21]. Agents that reduce inflammation and cause disinfection affect the burn healing [24]. Studies indicated that jujube fruit contains 9 fatty acids, 2 saponins, a lot of vitamin C, and 7 phenolic compounds including caffeine, caffeine acid, epicatechin, feruic acid, rutin, pins acid, hydroxy benzoic, and chromogenic acid [25-27]. On the other hand, research indicated that fatty acids enhance collagen synthesis and accelerate wound healing by increasing the level of interleukin-6 [28]. Therefore, the presence of this type of fatty acid in jujube is a positive factor, for the same reason anti-inflammatory effect of olive oil is attributed to the presence of fatty acids, which can substitute arachidonic acid in cell membrane and reduce the necessary substrate for
inflammatory enzymes. A portion of anti-inflammatory effects in jujube fruit can be explained in the same way.
The present study was conducted to specify burn wound infection based on clinical symptoms like fever, increased redness, or heat around the wound, inflation, tenderness, and any type of smell or secretion of the wound. The results of the present study indicated that on the 21st day there was a significant difference between the jujube and control groups in terms of burn wound healing. Moreover, the histopathological investigations on the samples showed that the process of covering cell restoration was better, the fibrotic reaction was more extensive, and the bleeding around the burn wound was less prominent. Fibroplasia process at the burnt area in these groups had more progress and edema and inflation were less highlighted.
Since jujube fruit contains a lot of unsaturated fatty acids, vitamins A and C, feulic acid, and carotene, and the therapeutic effects of these compounds in relieving inflammation, as it was observed in the present
Journal of Medicine and Life
Journal of Medicine and Life Vol. 8, Special Issue 2, 2015
120
study, jujube extract, accelerates burn wound healing among Balb/c mice. Therefore, jujube can be used in ointment form as an effective medication in healing burn wounds. It is recommended that further long-term studies
should be conducted in order to examine the therapeutic properties of jujube fruit of different density in order to achieve better results.
References
1. Amiralavi S, Mobin MR, Tolou’i M, Noursalehi I, Gholipour A, Gholamalipour N, Mobin AR. Epidemiology and consequences of burn in burned patients in Guilan Province. Journal of Ghom University of Medical Sciences. 2013; 7(5),35-40.
2. Alaghehbandan R, MacKay A et al. Pediatric Burn Injuries in Tehran, Iran. Burn. 2001; 27:115-118.
3. Soltani K, Zand R et al. Epidemiology and mortality of burns in Tehran, Iran. Burns. 1998; 24,325-328.
4. Mollayi R. Investigating patients suffering from burn lesions. The Educational Journal of Baghiatollah University of Medical Sciences. 1997; 3(9),33-46.
5. Marlow. Children nursery. Translated by Sonia Arezumanianes. 1994, Boshra Publication: Tehran.
6. Luckman S. Nursery of skin diseases, burns, and plastic surgery. Translated by Homeira Khodam, 1994, Boshra Publication: Tehran.
7. Kasraee P. Jujube, a unique medication. National Medical Information System Network. Reviewed on 16th November, 2009.
8. Hang MY. Children and Burn Injuries. JAMA. 2000; 238(1):154.
9. Lotfi M, Valizadeh S et al. Children health and burn risk: A case study of burned children hospitalized in Burn Ward. Sina Educational Medical Center, Tabriz. 2002.
10. Gamilli RL. International Society for Burn Injuries Survey: Infection and Infectious Complications in Worldwide Burn Units. Burns. 2004; 30:655-9.
11. Howard P, Cancio L, Mcmanus A, Goodwin C, Kim S, Pruitt B. Mini-Symposium What’s New in Burn-Associated Infections?. Current Surgery. 1999; 56(7/8):397-405.
12. Erol S, Altoparlak U et al. Changes of Microbial Flora and Wound Colonization in Burned Patients. Burns. 2004; 30:357-361.
13. Weber J, Sheridan R et al. Nosocomial Infections in Pediatric Patients with Burns. AJIC. 1997; 25(3):195-201.
14. Heidaribateni M, Alizadeh SA, Hashemiteir A, Almasihashyani A. The effects of autologous platelet adhesive on burn wound healing. Journal of Arak University of Medical Sciences. 2013; 16(3) (72).
15. Ferguson MW, Leigh IM. Wound healing textbook of dermatolog. 6th ed., 1998, London: Blackwell Science, 1:337-43.
16. Sabistan W. Textbook of Surgery. 14th ed., 1991, New York: WB Saunders Company, 1:171-3.
17. Shirdel Z, Madani H, Mirbodlazadeh R. The effect of hydroalcoholic extract of jujube leaves on the level of blood sugar, lipids, and lipoproteins among diabetes rats with alloxan monohydrate. The Iranian Journal of Diabetes and Lipids. 2008; 7(3).
18. Al-Reza SM, Eaglstein WH. The wound healing process. Dermatol Clin. 1993 Oct; 11 (4):629-40.
19. Kasraee P. Jujube, a unique medication. National Medical Information System Network. Reviewed on 16th November, 2009.
20. Rushforth K. Trees of Britain and Europe. 1999, Collins.
21. Ansari R, Arami R. Effect of teucrium polium and boswellia serrata extracts on cotaneus burn wound healing in balb/c mice. Journal of Shahrekord University of Medical Sciences (JSKUMS). 2010; 12(4):49-53.
22. Jujube. Irteb Database of Herbal Medicines. Reviewed on 16th November, 2009.
23. Jujube. Anti-moodiness. Khorasan, Sobh-e Iran Newspaper.
24. Zargari A. Medical plants. Vol 3., 1999, Tehran: University of Tehran Press, 601-5.
25. Bekir S, Adhan NY. Phenolic, alpha-tocopherol, beta-carotene and fatty acid composition of four promising jujube (Zizipus vulgaris L.) selections. J Food Compos Analys. 2010 June.
26. Zhao J, Kang FQ, Wang YT. Simultaneous determination of saponins and fatty acid in Ziziphus by high performance liquid chromatography-evaporative light scattering detection and pressurized liquid extraction. Chromatography. 2006; 1108:188-914.
27. Abedi G, Rostami F, Nikpor B. Analyzing of regression model of environmental health quality of residential in slum areas. International Journal of Collaborative Research on Internal Medicine & Public Health. 2012; 4(2):137-143
28. Lima CC, Pereira AP, Silva JR, Oliveira LS, Resck MC, Grechi CO et al. Ascorbic acid for the healing of skin wounds in rats. Braz J Biol. 2009 Nov; 69(4):1195-201.