Journal of Epidemiology - J-Stage
7
Original Article Pre-pregnancy BMI-specific optimal gestational weight gain for women in Japan Naho Morisaki a, * , Chie Nagata b , Seung Chik Jwa c , Haruhiko Sago c , Shigeru Saito d , Emily Oken e , Takeo Fujiwara a a Department of Social Medicine, National Center for Child Health and Development, Tokyo, Japan b Division of Education for Clinical Research, National Center for Child Health and Development, Tokyo, Japan c Center of Maternal-Fetal, Neonatal and Reproductive Medicine, National Center for Child Health and Development, Tokyo, Japan d Department of Obstetrics and Gynecology, University of Toyama, School of Medicine, Toyama, Japan e Department of Population Medicine, Harvard Medical School, Harvard Pilgrim Health Care Institute, Boston, MA, USA article info Article history: Received 2 June 2016 Accepted 29 September 2016 Available online 31 May 2017 Keywords: Gestational weight gain Body mass index Japanese Pregnancy abstract Background: The Institute of Medicine (IOM) guidelines are the most widely used guidelines on gesta- tional weight gain; however, accumulation of evidence that body composition in Asians differs from other races has brought concern regarding whether their direct application is appropriate. We aimed to study to what extent optimal gestational weight gain among women in Japan differs by pre-pregnancy body mass index (BMI) and to compare estimated optimal gestational weight gain to current Japanese and Institute of Medicine (IOM) recommendations. Methods: We retrospectively studied 104,070 singleton pregnancies among nulliparous women in 2005 e2011 using the Japanese national perinatal network database. In five pre-pregnancy BMI sub-groups (17.0e18.4, 18.5e19.9, 20e22.9, 23e24.9, and 25e27.4 kg/m 2 ), we estimated the association of the rate of gestational weight gain with pregnancy outcomes (fetal growth, preterm delivery, and delivery complications) using multivariate regression. Results: Weight gain rate associated with the lowest risk of adverse outcomes decreased with increasing BMI (12.2 kg,10.9 kg, 9.9 kg, 7.7 kg, and 4.3 kg/40 weeks) for the five BMI categories as described above, respectively. Current Japanese guidelines were lower than optimal gains, with the lowest risk of adverse outcomes for women with BMI below 18.5 kg/m 2 , and current IOM recommendations were higher than optimal gains for women with BMI over 23 kg/m 2 . Conclusion: Optimal weight gain during pregnancy varies largely by pre-pregnancy BMI, and defining those with BMI over 23 kg/m 2 as overweight, as proposed by the World Health Organization, may be useful when applying current IOM recommendations to Japanese guidelines. © 2017 The Authors. Publishing services by Elsevier B.V. on behalf of The Japan Epidemiological Association. This is an open access article under the CC BY license (http://creativecommons.org/licenses/ by/4.0/). Introduction To our knowledge, there is no global consensus on the recom- mended amount of gestational weight gain. The Institute of Med- icine (IOM) guidelines 1 (last revised in 2009) are the most widely used in the world, although they were initially created only for use in the United States. As substantial evidence was included in creating and revising the IOM guidelines, the majority of countries that have national recommendations 2,3 have adapted these guidelines, and research studies based in other countries often refer to them in studies. 4e7 However, as the guidelines were based mainly on research in Caucasians, its generalizability to other races has been a concern among countries with a large population of non-European ancestry. Recent research show many Asian populations are at an increased risk of cardiovascular diseases and diabetes at lower BMI levels than non-Asians, 8 leading to the World Health Organization (WHO) proposal in 2004 to use a “modified” threshold of BMI over 23 kg/m 2 rather than the customary 25 kg/m 2 to define overweight condition for Asians. 9 In 2014, the American Diabetes Association decided to lower the BMI threshold for diabetic screening among Asians * Corresponding author. Department of Social Medicine, National Center for Child Health and Development, 2-10-1, Okura, Setagaya-ku, Tokyo 158-8535, Japan. E-mail address: [email protected] (N. Morisaki). Peer review under responsibility of the Japan Epidemiological Association. Contents lists available at ScienceDirect Journal of Epidemiology journal homepage: http://www.journals.elsevier.com/journal-of-epidemiology/ http://dx.doi.org/10.1016/j.je.2016.09.013 0917-5040/© 2017 The Authors. Publishing services by Elsevier B.V. on behalf of The Japan Epidemiological Association. This is an open access article under the CC BY license (http://creativecommons.org/licenses/by/4.0/). Journal of Epidemiology 27 (2017) 492e498
-
Upload
khangminh22 -
Category
Documents
-
view
0 -
download
0
Transcript of Journal of Epidemiology - J-Stage
Original Article
Pre-pregnancy BMI-specific optimal gestational weight gain forwomen in Japan
Naho Morisaki a, *, Chie Nagata b, Seung Chik Jwa c, Haruhiko Sago c, Shigeru Saito d,Emily Oken e, Takeo Fujiwara a
a Department of Social Medicine, National Center for Child Health and Development, Tokyo, Japanb Division of Education for Clinical Research, National Center for Child Health and Development, Tokyo, Japanc Center of Maternal-Fetal, Neonatal and Reproductive Medicine, National Center for Child Health and Development, Tokyo, Japand Department of Obstetrics and Gynecology, University of Toyama, School of Medicine, Toyama, Japane Department of Population Medicine, Harvard Medical School, Harvard Pilgrim Health Care Institute, Boston, MA, USA
a r t i c l e i n f o
Article history:Received 2 June 2016Accepted 29 September 2016Available online 31 May 2017
Keywords:Gestational weight gainBody mass indexJapanesePregnancy
a b s t r a c t
Background: The Institute of Medicine (IOM) guidelines are the most widely used guidelines on gesta-tional weight gain; however, accumulation of evidence that body composition in Asians differs fromother races has brought concern regarding whether their direct application is appropriate. We aimed tostudy to what extent optimal gestational weight gain among women in Japan differs by pre-pregnancybody mass index (BMI) and to compare estimated optimal gestational weight gain to current Japaneseand Institute of Medicine (IOM) recommendations.Methods: We retrospectively studied 104,070 singleton pregnancies among nulliparous women in 2005e2011 using the Japanese national perinatal network database. In five pre-pregnancy BMI sub-groups(17.0e18.4, 18.5e19.9, 20e22.9, 23e24.9, and 25e27.4 kg/m2), we estimated the association of the rateof gestational weight gain with pregnancy outcomes (fetal growth, preterm delivery, and deliverycomplications) using multivariate regression.Results: Weight gain rate associated with the lowest risk of adverse outcomes decreased with increasingBMI (12.2 kg, 10.9 kg, 9.9 kg, 7.7 kg, and 4.3 kg/40 weeks) for the five BMI categories as described above,respectively. Current Japanese guidelines were lower than optimal gains, with the lowest risk of adverseoutcomes for women with BMI below 18.5 kg/m2, and current IOM recommendations were higher thanoptimal gains for women with BMI over 23 kg/m2.Conclusion: Optimal weight gain during pregnancy varies largely by pre-pregnancy BMI, and definingthose with BMI over 23 kg/m2 as overweight, as proposed by the World Health Organization, may beuseful when applying current IOM recommendations to Japanese guidelines.
© 2017 The Authors. Publishing services by Elsevier B.V. on behalf of The Japan EpidemiologicalAssociation. This is an open access article under the CC BY license (http://creativecommons.org/licenses/
by/4.0/).
Introduction
To our knowledge, there is no global consensus on the recom-mended amount of gestational weight gain. The Institute of Med-icine (IOM) guidelines1 (last revised in 2009) are the most widelyused in the world, although they were initially created only for usein the United States. As substantial evidence was included increating and revising the IOM guidelines, the majority of countries
that have national recommendations2,3 have adapted theseguidelines, and research studies based in other countries often referto them in studies.4e7
However, as the guidelines were based mainly on research inCaucasians, its generalizability to other races has been a concernamong countries with a large population of non-European ancestry.Recent research show many Asian populations are at an increasedrisk of cardiovascular diseases and diabetes at lower BMI levels thannon-Asians,8 leading to the World Health Organization (WHO)proposal in 2004 to use a “modified” threshold of BMI over 23 kg/m2
rather than the customary 25 kg/m2 to define overweight conditionfor Asians.9 In 2014, the American Diabetes Association decided tolower the BMI threshold for diabetic screening among Asians
* Corresponding author. Department of Social Medicine, National Center for ChildHealth and Development, 2-10-1, Okura, Setagaya-ku, Tokyo 158-8535, Japan.
E-mail address: [email protected] (N. Morisaki).Peer review under responsibility of the Japan Epidemiological Association.
Contents lists available at ScienceDirect
Journal of Epidemiology
journal homepage: http: / /www.journals .elsevier .com/journal-of-epidemiology/
http://dx.doi.org/10.1016/j.je.2016.09.0130917-5040/© 2017 The Authors. Publishing services by Elsevier B.V. on behalf of The Japan Epidemiological Association. This is an open access article under the CC BY license(http://creativecommons.org/licenses/by/4.0/).
Journal of Epidemiology 27 (2017) 492e498
from 25 kg/m2 to 23 kg/m2, based on multiple studies that impliedthat a lower threshold would increase sensitivity.10e13 Suchdifferent body composition in Asians could also modify the influ-ence of gestational weight gain on pregnancy outcomes. Followingthe WHO expert panel proposal, New Zealand2,3 and Singapore14
considered adopting the modified BMI thresholds for Asians uponapplying the IOM recommendation of gestational weight gain tomothers of Asian origin (and thus lowering recommended weightgain for Asian women of BMI 23e25 kg/m2); however, due to thelack of studies on gestational weight gain and BMI thresholds inAsians, both countries decided to adapt the recommendationswithout modification.
On the other hand, Japan has not adopted the IOM guidelinesbut developed and adhered to original guidelines, first published in1995 and revised in 2009. These guidelines have been considerablystricter than IOM guidelines, and recent debate in Japan hasquestioned whether such a strict guideline has contributed to theincreasing rate of low-birthweight births in the country.15 One largelimitation of the Japanese guidelines is that they lack evidencefrom a large study in Japan that has looked at the effect of weightgain during pregnancy by simultaneously considering multipleoutcomes, as has been done in the United States,16 Denmark,17
Singapore,18 and elsewhere.19
Therefore, using a national multi-center database of obstetricdepartments in Japan, we investigated how optimal gestationalweight gain varies depending on pre-pregnancy BMI in Japanesewomen and compared estimated optimal gestational weight gain tocurrent Japanese and Institute ofMedicine (IOM) recommendations.
Methods
Study population
We used data from the perinatal database collected by the JapanSociety of Obstetrics and Gynaecology (JSOG), an ongoing multi-center registry for all deliveries, in which 149 tertiary hospitals inJapan are currently participating.20e26 This database is a nationalcollaboration of obstetric departments that started in 2001. Using astandardized format that includes demographic and clinical vari-ables, each hospital provided individual patient data on all livebirths and stillbirths that were delivered at 22 weeks or above. TheJSOG Perinatal Committee reviewed the submitted data for dataquality and contacted institutes for correction if a substantialportion contained erroneous or missing data. The data for2004e2011 was recently linked to vital statistics data that verifiedits accuracy and showed that this registry covered 6.5% of all na-tional births.
As both gestational weight gain and pregnancy outcomes areaffected by underlying medical conditions, and as our databaselacked data on previous cesarean delivery, which is a large riskfactor of cesarean delivery, we restricted our analysis to 118,878nulliparous women with pre-pregnancy BMI of 17.0 kg/m2 to27.5 kg/m2 (the number of women in more extreme BMI categories[BMI �16 kg/m2, n ¼ 832; BMI 16e16.9 kg/m2, n ¼ 3713; BMI27.5e30 kg/m2, n ¼ 1860; and BMI 30e35 kg/m2, n ¼ 1524] weretoo small to calculate stable estimates of the outcomes of interest),and who had no medical conditions (any chronic respiratory,gastrointestinal, hepatic, renal, hematologic, cardiovascular, meta-bolic, mental diseases, pre-gestational hypertension or diabetesmellitus) before or during early pregnancy, did not have gestationaldiabetes (as our database could not differentiate diabetes mellitusfrom gestational diabetes), and gave birth to singletons betweenApril 2005 and December 2011. The number of infants withcongenital anomalies documented at birth was extremely low(<0.1%), suggesting substantial underreporting, and thus were not
excluded. Women with unreliable reports of gestational weightgain (outside ±3 SD above mean, equivalent to >23.3 kg or<�1.9 kg, n¼ 1629) and thosewith missing gestational weight gaindata (n ¼ 10,431) were also excluded. We further excludedextremely preterm deliveries (GA < 28 weeks, n ¼ 511) or partici-pants with missing data on gestational age, maternal age, or de-livery method (n ¼ 1539), and those with missing or unreliablecombinations27 of birthweight and gestational age (n ¼ 309). Allremaining participants had data on all variables of interest, so ourtotal sample for analysis included 104,070 women.
Expected gestational weight gain over 40 weeks
One important limitation of previous studies is themanagementof gestational weight gain in their analyses. As gestational weightgain relies largely on gestational length, studying the effect of totalgestational weight gain, as in many previous studies,5,6,17,28,29
skews results by creating a false association between birth out-comes related to shorter gestational length and lower gestationalweight gain. For example, the mere fact that women with pretermdeliveries have less weight gain is not informative. The true com-parison for studying the effect of weight gain on preterm deliveryshould be based on “rate” of weight gain, or howmuchwomenwithpreterm delivery would have gained if they continued to gainweight until term. An alternative method is to obtain the weeklyrate of weight gain by dividing total gain by number of gestationalweeks16; however, this method is based on an underlyingassumption that weight gain is linear throughout pregnancy, whichhas been reported to be untrue, as gestational weight gain speedturns linear only after the first 3 or 4 months.8
To overcome these methodological challenges, we created amodel using data from a subsample of 1283 mothers, includingtheir detailed measurements from antenatal check-ups, to calculateexpected gestational weight gain over 40 weeks from clinicalmeasurement on admission for delivery and self-reported pre-pregnancy weight, and used this for the main analysis (details onanalysis in eAppendix 1). This methodology enabled us to comparethe effect of gestational weight gain between women who deliv-ered at different gestational ages and to deal with perinatal out-comes, such as preterm delivery.
Birth outcomes
We considered a variety of pregnancy outcomes, both individ-ually as well as combined, and weighted them by clinical impor-tance. Gestational length was based on best obstetric estimate,which is estimated from the last menstrual period (LMP) and cor-rected according to ultrasound measurements. In detail, JSOG rec-ommends LMP estimates of gestational age to be correctedaccording to ultrasound measurements of crown-lump (CRL)length if before 12 weeks gestation and ultrasound and LMP esti-mates differ by over 7 days, or corrected according to ultrasoundmeasurements of bi-parietal diameter if CRL measurements werenot available in the first trimester and ultrasound and LMP esti-mates differ by over 10 days. Infant death was determined from thelinked vital statistics database. Preterm birth was defined as lessthan 37 completed weeks of gestation, and very preterm birth wasdefined as less than 34 completed weeks of gestation. Obstructedlabor was defined as labor of over 30 h, and post-partum hemor-rhage was defined as blood loss of over 500 mL. We additionallydefined a composite outcome of obstructed labor, post-partumhemorrhage, delivery using forceps and vacuum, or cesarean de-livery (labeled as ‘complicated delivery’).
JSOG defines preeclampsia as elevated blood pressure � 140/90 mmHg that emerges after 20 weeks' gestationwith proteinuria,
N. Morisaki et al. / Journal of Epidemiology 27 (2017) 492e498 493
and severe preeclampsia if systolic blood pressure exceeds160 mm Hg, diastolic blood pressure exceeds 110 mm Hg, or pro-teinuria exceeds 2 g/day.30 Clinically, preeclampsia may causeedema, leading to an increase in weight gain; therefore, we con-ducted sensitivity analysis both including and excluding pre-eclampsia from the primary outcome.
Fetal size was defined as small for gestational age (SGA) andlarge for gestational age (LGA) as below 10% or above 90%,respectively, of the birthweight distribution by gestational length ofall births in Japan during the study period. However, as the averagebirthweight in Japan has decreased dramatically over the last 30years, and the current birthweight distribution could have deviatedfrom that of a healthy population,31 we also repeated our analysisusing the WHO reference to define fetal size. Low birthweight, verylow birthweight, and macrosomia were defined as birthweight<2500 g, <1500 g, and �4000 g, respectively.
Upon estimating optimal gestational weight gain, we consid-ered the trade-off between multiple outcomes, and for this, weused weights to account for the fact that certain outcomes havemore clinical importance than others.16 To calculate these weights,we asked 12 neonatologists and 15 obstetricians at the NationalCenter for Child Health and Development to rank SGA, pretermdelivery, complicated delivery, and preeclampsia in order of theiradverse health effects, as well as how many times worse the mostadverse outcomes were compared to the least adverse outcome,and averaged these answers. Obstetricians selected SGA as the leastadverse, with preterm delivery and preeclampsia being 2.3 timesand complicated delivery being 1.2 times more adverse than SGA.Neonatologists also selected SGA as the least adverse, with pretermdelivery being 1.4 times, preeclampsia being 1.2 times, andcomplicated delivery being 1.5 times more adverse than SGA. Intotal, the clinicians selected SGA as the least adverse, with pretermdelivery being 1.8 times, preeclampsia being 1.7 times, andcomplicated delivery being 1.4 times more adverse than SGA.
Statistical analysis
We calculated pre-pregnancy BMI from self-reported heightand pre-pregnancy weight, and stratified women accordingly intofive groups: BMI 17.0e18.4, 18.5e19.9, 20e22.9, 23e24.9, and25e27.4 kg/m2. Further analyses were performed within thesegroups.
First, within each BMI category, we performed a multivariatelogistic regression predicting all outcomes of interest according toexpected gestational weight gain. For these models, expectedgestational weight gainwas categorized by each kilogram and usedas a non-parametric model to avoid forcing the shape of the asso-ciation. For fetal size (SGA, appropriate for gestational age, LGA) andbirthweight (<2500 g, 2500e3999 g, �4000 g), multinomial lo-gistic regression was used. All models were adjusted for maternalage, height, pre-pregnancy BMI, and smoking status duringpregnancy.
Next, we chose preterm delivery, SGA, complicated delivery, andpreeclampsia as the four clinically important outcomes for whichrisks are known to be affected by gestational weight gain. For thesefour main outcomes of interest, another set of multivariate logisticmodels were run concurrently using weight gain rate as a contin-uous variable to correct for correlation among outcomes withineach individual. From these models, the expected gestationalweight gain at 40 weeks (calculated from rate of weight gain) withlowest-risk of adverse outcome was estimated for each BMI cate-gory. The range of expected gestational weight gain within 1%increased risk of adverse outcome was defined as the acceptablerange of gestational weight gain rate. A quadratic term wasincluded to improve the fitness of the model.
For sensitivity analysis, we repeated these models using theWHO growth standard to define SGA instead of the Japanesegrowth standard. Although prevention of preeclampsia has his-torically been an important factor in gestational weight gain rec-ommendations in Japan,15,32 in 2008 the IOM working groupdecided1 there is only weak evidence that excessive weight gaincould cause preeclampsia,33 as the observed association is likelydue to reverse causation (edema due to preeclampsia causingincreased weight gain). Based on this decision, the IOM workinggroup has eliminated preeclampsia from the main outcomes whendetermining optimal weight gain.1 Thus, we repeated our analysisexcluding this outcome.
All descriptive and statistical analyses were performed usingSTATA version 13 (STATA Corp, College Station, TX, USA). Statisticalsignificance was set at 0.05, and all statistical tests were two-tailed.
Results
Among our sample population, 100,772 (96.8%) women wereJapanese, 438 (0.4%) were Korean, 1417 (1.4%) were Chinese, and1443 were of other nationalities.
In Table 1, we present maternal and infant characteristics ac-cording to pre-pregnancy BMI categories. Women with higher BMIwere older and shorter and had less gestational weight gain. Theprevalence of cesarean delivery, forceps or vacuum delivery,obstructed labor, post-partum hemorrhage, and preeclampsia allincreased with higher pre-pregnancy BMI. Similarly, prevalence ofLGA, infant asphyxia, and infant mortality also increased withhigher pre-pregnancy BMI. Prevalence of SGA and early-term de-livery decreased with increasing pre-pregnancy BMI.
In Fig. 1, we present the association between gestational weightgain rate and estimated probability of SGA, preterm delivery, andcomplicated delivery in the parametric model using weight gainrate as a continuous predictor, stratified by pre-pregnancy BMIcategory. The risk of the combination of adverse outcomes (i.e.,weighted combination of SGA, preterm delivery, and complicateddelivery) in relation to weight gain is also shown in Fig. 2. For allBMI categories, risk showed a U-shape curvewith faster gestationalweight gain, which was a result of the tradeoff between decreasingrisk of SGA and increasing risk of complicated delivery, and a U-shape curve of risk of preterm delivery. For example, women withBMI 17e18.5 kg/m2 who gained weight at the rate of 13 kg over 40weeks, had 0.75 (95% confidence interval [CI], 0.71e0.78) times lessrisk of SGA delivery and 0.89 (95% CI, 0.85e0.94) times less risk ofpreterm delivery, at the cost of 1.18 (95% CI,1.04e1.12) times greaterrisk of complicated delivery, compared to those who gained weightat the rate of 10 kg over 40 weeks.
Adjusted relative risk ratios (RRRs) andmarginal risk estimates ofthe risk of adverse pregnancy outcomes according to weight gainrate using the non-parametric model of categorized weight gainrate, after adjusting for maternal background characteristics, areshown in eTable 1 and eFig.1 formotherswith expectedweight gainrate of 3e20 kg over 40 weeks. Similar to the parametric model,faster gestationalweight gainwas associatedwith lower risk of SGA,higher risk of LGA, cesarean delivery, complicated delivery, pre-eclampsia, and severe preeclampsia in all BMI categories. Risk ofpreterm delivery showed a U-shape curve in BMI categories under25 kg/m2, as well as very preterm birth at BMI 20e22.9 kg/m2. Forother BMI categories, faster or slower weight gain did not show adistinct association with very preterm delivery.
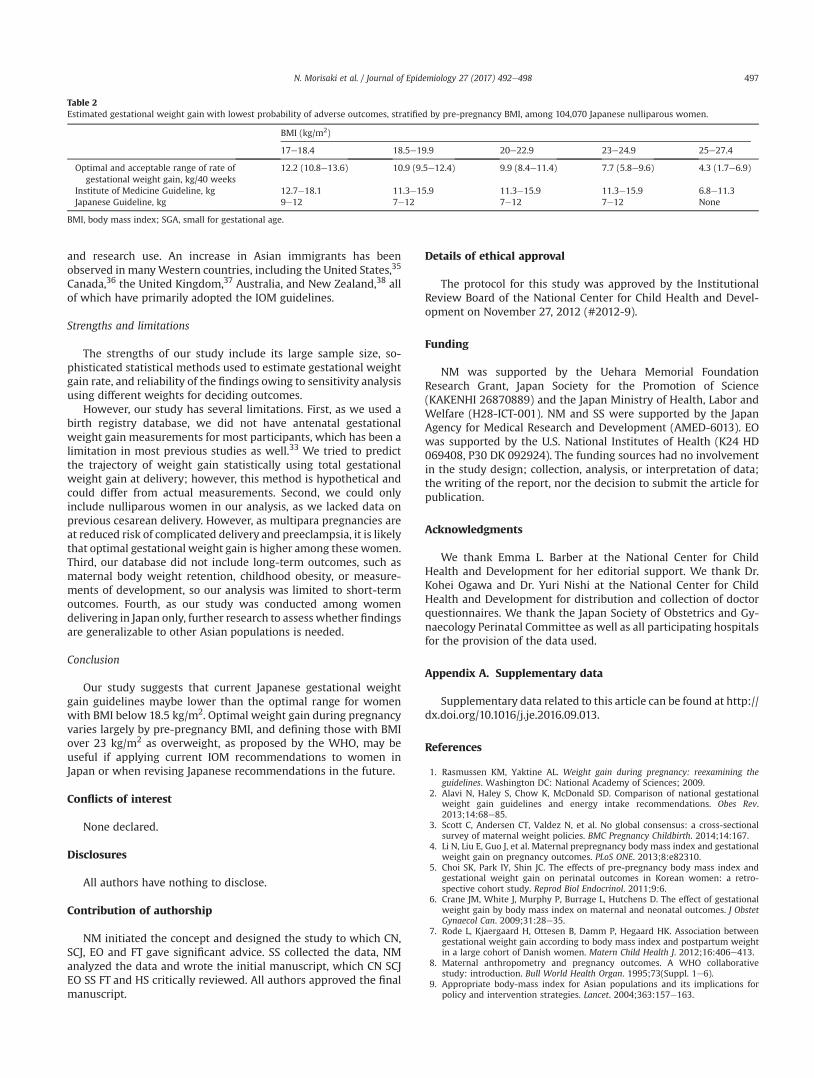
In Table 2, we show “optimal” rate of gestational weight gain(kg/40 weeks) with lowest risk of adverse outcomes, as well asthe “acceptable range” of gestational weight gain defined as anincrease in risk compared to optimal weight gain of less than 1%.Optimal rate of weight gain decreased with increasing BMI. When
N. Morisaki et al. / Journal of Epidemiology 27 (2017) 492e498494

population was limited to womenwith preeclampsia was excludedfrom the clinical weights, or the WHO growth chart used instead ofthe Japanese growth chart, optimal weight gain rate shifted higherfor all estimates by 0.2e2.5 kg. However, in all models, the pointestimate of optimal gestational weight gain for women of BMIunder 18.5 was higher than current Japanese gestational weightgain recommendations, and the point estimate for women of BMIover 23 kg/m2 was lower than current IOM recommendations(Table S2). Estimates and optimal gains minimally changed whenlimited to women with Japanese nationality.
Discussion
Main findings
We found that the impact of gestational weight gain rate onbirth outcomes differed according to pre-pregnancy BMI, to theextent that current Japanese gestational weight gain recommen-dations may be too strict for women with BMI under 18.5 kg/m2
and the IOM recommendations may be too high for Japanese withpre-pregnancy BMI over 23 kg/m2. Japanese women with BMI over23 kg/m2 may benefit from being defined as overweight andapplying lower gestational weight recommendations compared towomen with lower BMI.
Interpretation
This is the first large study in Japan to estimate optimal gesta-tional weight gain among Japanese women by weighting the
importance of multiple outcomes. Determination of the optimalrate of gestational weight gain comes from a trade-off of avoidingadverse events associated with excessive gestational weight gainand those associated with inadequate gestational weight gain. Therelative importance of birth outcomes (such as SGA, preterm de-livery, cesarean delivery) changes as we learn more of their long-term consequences, and the evolution of the IOM guidelines overtime reflects the difficulty in determining the relative importanceof these outcomes. Studies on the impact of gestational weight gainon birth outcomes in Asians are scarce compared to those in Cau-casians,33 with only a few studies stratified by BMI and investi-gating several birth outcomes concurrently, none of them fromJapan.4,5,18,19
We found that Japanese women with pre-pregnancy BMI lowerthan 18.5 kg/m2 may have better outcomes if their gestationalweight gain exceeds current Japanese recommendations. The JSOGguideline created in 1995 ongestationalweight gain hadhistoricallybeen strict (7e10 kg gain for women with BMI of 18e25 kg/m2), asprevention of preeclampsia has been of high priority for obstetri-cians in Japan. The guidelines were revised in 2009 by the Ministryof Health, Labor and Welfare but were still lower than the IOMrecommendations. However, even when preeclampsia was consid-ered in our study, all estimates of the optimal gestational weightgain for underweight women exceeded the Japanese guidelines.Therefore, even if higher gestational weight gain should have acausal relationship with increased risk of preeclampsia, the currentJapanese recommendations for underweight women are too low.
Many studies have shown that the impact of gestational weightgain rate on birth outcomes largely differs according to pre-
Table 1Background characteristics of 104,070 singleton pregnancies in nulliparous Japanese women.
BMI17e18.4 kg/m2
BMI18.5e19.9 kg/m2
BMI20e22.9 kg/m2
BMI23e24.9 kg/m2
BMI25e27.4 kg/m2
P value fortrend
N (%) 19,311 (19) 32,099 (31) 39,636 (38) 8759 (8) 4265 (4)
Maternal age, years, mean (SD) 29.7 (5.0) 30.2 (5.0) 30.4 (5.2) 30.7 (5.4) 30.7 (5.5) <0.001Maternal height, cm, mean (SD) 158.8 (5.4) 158.7 (5.4) 158.1 (5.4) 157.8 (5.5) 157.8 (5.4) <0.001BMI, kg/m2, mean (SD) 17.9 (0.4) 19.3 (0.4) 21.2 (0.8) 23.8 (0.6) 26.1 (0.7) <0.001Maternal smoking, n (%)Yes 573 (3) 858 (3) 1097 (3) 304 (4) 190 (5) <0.001a
No 12,953 (67) 21,528 (67) 26,344 (67) 5824 (67) 2829 (66)Unknown 5785 (30) 9713 (30) 12,195 (31) 2631 (30) 1246 (29) 0.42a
Gestational weight gain rate, kg/40weeks, mean (SD)
11.0 (3.5) 10.9 (3.5) 10.8 (3.8) 10.3 (4.4) 9.5 (4.6) <0.001
Gestational age, weeks, mean (SD) 38.6 (2.0) 38.7 (2.0) 38.7 (2.1) 38.6 (2.2) 38.6 (2.2) <0.001Infant sex, n (%) 0.15Male 9891 (51) 16,503 (51) 20,573 (52) 4460 (52) 2250 (51)Female 9420 (49) 15,596 (49) 19,063 (48) 4299 (49) 2015 (47)
Birthweight, g, mean (SD) 2827 (479) 2881 (481) 2922 (508) 2947 (537) 2966 (552) <0.001Fetal size, n (%)Small for gestational age 3048 (16) 4216 (13) 4458 (11) 890 (10) 436 (10) <0.001a
Appropriate for gestational age 15,115 (78) 25,352 (79) 31,131 (79) 6749 (77) 3193 (75)Large for gestational age 1148 (6) 2531 (8) 4047 (10) 1120 (13) 636 (15) <0.001a
Delivery method, n (%)Normal vaginal delivery 13,877 (72) 22,509 (70) 26,556 (67) 5417 (62) 2539 (60)Elective cesarean section 1396 (7.2) 2412 (7.5) 3156 (8.0) 793 (9.1) 381 (8.9) <0.001a
Emergency cesarean section 2240 (12) 4119 (13) 6089 (15) 1685 (19) 948 (22) <0.001a
Forceps or vacuum delivery 1798 (9.3) 3059 (9.5) 3835 (9.7) 864 (9.9) 397 (9.3) <0.001a
Preeclampsia, n (%) 694 (4) 1228 (4) 2126 (5) 715 (8) 435 (10) <0.001Obstructed labor, n (%) 929 (5) 1891 (6) 2659 (7) 676 (8) 335 (8) <0.001Atonic bleeding, n (%) 788 (4.1) 1364 (4.2) 1815 (4.6) 443 (5.1) 247 (5.8) <0.001Apgar score <8 at 5 min, n (%) 489 (2.6) 881 (2.8) 1148 (2.9) 326 (3.8) 163 (3.9) <0.001Gestational age, n (%)Preterm (<37 weeks) 2104 (10.9) 3178 (9.9) 4016 (10.1) 951 (10.9) 479 (11.2) 0.28a
Early term (37 or 38 weeks) 2104 (27) 3178 (26) 4016 (25) 951 (25) 479 (24) <0.001a
Term/over term delivery (�39 weeks) 11,958 (62) 20,596 (64) 25,886 (65) 5633 (64) 2759 (65)Infant asphyxia, n (%) 399 (2.1) 691 (2.2) 908 (2.3) 251 (2.9) 124 (2.9) <0.001Infant mortality, n (%) 125 (0.6) 196 (0.6) 227 (0.6) 58 (0.7) 24 (0.6) 0.52
BMI, body mass index; SD, standard deviation.a Multinomial logistic regression used for calculation.
N. Morisaki et al. / Journal of Epidemiology 27 (2017) 492e498 495

pregnancy BMI,4e7,16e18 a finding that is consistent with our results.Although a “customized” weight gain chart for specific BMI andheight, such as was created in Chile,34 may provide a more accurateestimate of optimal weight gain for the individual, its complexityhas limited its usability use of simpler BMI-category specific
guidelines is more common.1e3 Thus, recent studies providingoptimal weight gain estimates16,18 used the broad BMI categories ofunderweight (<18.5 kg/m2), normal BMI (18.5e25 kg/m2), over-weight (25e30 kg/m2) and obese (>30 kg/m2).
However, in our study, we re-visited whether these frequentlyused BMI categories are optimal for women in Japan. Recent studiessuggest that Asians have different body composition,9 and theAmerican Diabetes Association decided in 2014 to lower the BMIthreshold for diabetic screening among Asians from 25 kg/m2 to23 kg/m2.10,11 Thus, we used narrower BMI categories in our studyusing the thresholds proposed by WHO, in addition to the tradi-tional thresholds (although it was at the expense of not being ableto provide estimates to women with extreme BMI, such as BMI<17.0 kg/m2 or�27.5 kg/m2, whichwere the lower 4% and upper 3%of the population, respectively), to observe how BMI could be bettercategorized when recommending weight gain.
Through this approach, we found that Japanese with BMI over23 kg/m2 benefit from lower gestational weight gain than recom-mended in current IOM guidelines, so direct application of theseguidelines to East Asian people should be made with care. There-fore, it may be wise to consider using the WHO-modified BMIthreshold to define overweight when applying IOM recommenda-tions to East Asians. Even though the IOM guidelines were notdeveloped for use outside the Unites States or for minority raceswithin the country,1 they are currently widely used for manypopulations that do not have their own national guidelines due tothe lack of any other guideline that is based on as much evidence.2,3
Most Asian countries do not have a national guideline for gesta-tional weight gain, so they refer to the IOM guidelines for clinical
0.4
0.3
00.
10.
50.
60.
2E
stim
ated
pro
babi
lity
5 10 15 20Gestational weight gain (kg/40weeks)
BMI 17-18.4 kg/m2
00.
30.
10.
20.
40.
50.
6E
stim
ated
pro
babi
lity
5 10 15 20Gestational weight gain (kg/40weeks)
BMI 18.5-19.9 kg/m2
00.
10.
20.
30.
40.
50.
6E
stim
ated
pro
babi
lity
5 10 15 20Gestational weight gain (kg/40weeks)
BMI 20-22.9 kg/m20
0.2
0.1
0.4
0.3
0.5
0.6
Est
imat
ed p
roba
bilit
y
5 10 15 20Gestational weight gain (kg/40weeks)
BMI 23-24.9 kg/m20
0.1
0.2
0.3
0.4
0.5
0.6
Est
imat
ed p
roba
bilit
y
5 10 15 20Gestational weight gain (kg/40weeks)
BMI 25-27.4 kg/m2
Small for gestational agecomplicated deliverypreterm deliverypreeclampsia
Fig. 1. Estimated probability of small for gestational age, preterm delivery, complicated delivery, and preeclampsia, by gestational weight gain rate. Analysis of 104,070 singletonpregnancies in nulliparous Japanese women. The probability is shown for the average non-smoking woman of 160 cm, age 30 years, and mean BMI of each stratum. Complicateddelivery includes any of the following: cesarean section, forceps or vacuum delivery, obstructed labor, post-partum hemorrhage. BMI, bodymass index; SGA, small for gestational age.
0.16
0.12
0.14
0.18
0.20
0.22
Est
imat
ed p
roba
bilit
y
4 5 6 7 8 9 10 11 12 13 14 15 16 17 18 19Estimated gestational weight gain over 40 weeks (kg)
BMI 17-18.5 BMI 18.5-20 BMI 20-23 BMI 23-25 BMI 25-27.5
Fig. 2. Weighted probability of adverse pregnancy outcomes by gestational weightgain rate, stratified by pre-pregnancy BMI. Analysis of 104,070 singleton pregnancies innulliparous Japanese women. Complicated delivery includes any of the following:cesarean section, forceps or vacuum delivery, obstructed labor, post-partum hemor-rhage. Probability shown is estimated for women of 30 years of age, 160-cm height,and average BMI of each strata (17.9 kg/m2, 19.3 kg/m2, 21.2 kg/m2, 23.8 kg/m2 and26.1 kg/m2, respectively). BMI, body mass index.
N. Morisaki et al. / Journal of Epidemiology 27 (2017) 492e498496
and research use. An increase in Asian immigrants has beenobserved in manyWestern countries, including the United States,35
Canada,36 the United Kingdom,37 Australia, and New Zealand,38 allof which have primarily adopted the IOM guidelines.
Strengths and limitations
The strengths of our study include its large sample size, so-phisticated statistical methods used to estimate gestational weightgain rate, and reliability of the findings owing to sensitivity analysisusing different weights for deciding outcomes.
However, our study has several limitations. First, as we used abirth registry database, we did not have antenatal gestationalweight gain measurements for most participants, which has been alimitation in most previous studies as well.33 We tried to predictthe trajectory of weight gain statistically using total gestationalweight gain at delivery; however, this method is hypothetical andcould differ from actual measurements. Second, we could onlyinclude nulliparous women in our analysis, as we lacked data onprevious cesarean delivery. However, as multipara pregnancies areat reduced risk of complicated delivery and preeclampsia, it is likelythat optimal gestational weight gain is higher among these women.Third, our database did not include long-term outcomes, such asmaternal body weight retention, childhood obesity, or measure-ments of development, so our analysis was limited to short-termoutcomes. Fourth, as our study was conducted among womendelivering in Japan only, further research to assess whether findingsare generalizable to other Asian populations is needed.
Conclusion
Our study suggests that current Japanese gestational weightgain guidelines maybe lower than the optimal range for womenwith BMI below 18.5 kg/m2. Optimal weight gain during pregnancyvaries largely by pre-pregnancy BMI, and defining those with BMIover 23 kg/m2 as overweight, as proposed by the WHO, may beuseful if applying current IOM recommendations to women inJapan or when revising Japanese recommendations in the future.
Conflicts of interest
None declared.
Disclosures
All authors have nothing to disclose.
Contribution of authorship
NM initiated the concept and designed the study to which CN,SCJ, EO and FT gave significant advice. SS collected the data, NManalyzed the data and wrote the initial manuscript, which CN SCJEO SS FT and HS critically reviewed. All authors approved the finalmanuscript.
Details of ethical approval
The protocol for this study was approved by the InstitutionalReview Board of the National Center for Child Health and Devel-opment on November 27, 2012 (#2012-9).
Funding
NM was supported by the Uehara Memorial FoundationResearch Grant, Japan Society for the Promotion of Science(KAKENHI 26870889) and the Japan Ministry of Health, Labor andWelfare (H28-ICT-001). NM and SS were supported by the JapanAgency for Medical Research and Development (AMED-6013). EOwas supported by the U.S. National Institutes of Health (K24 HD069408, P30 DK 092924). The funding sources had no involvementin the study design; collection, analysis, or interpretation of data;the writing of the report, nor the decision to submit the article forpublication.
Acknowledgments
We thank Emma L. Barber at the National Center for ChildHealth and Development for her editorial support. We thank Dr.Kohei Ogawa and Dr. Yuri Nishi at the National Center for ChildHealth and Development for distribution and collection of doctorquestionnaires. We thank the Japan Society of Obstetrics and Gy-naecology Perinatal Committee as well as all participating hospitalsfor the provision of the data used.
Appendix A. Supplementary data
Supplementary data related to this article can be found at http://dx.doi.org/10.1016/j.je.2016.09.013.
References
1. Rasmussen KM, Yaktine AL. Weight gain during pregnancy: reexamining theguidelines. Washington DC: National Academy of Sciences; 2009.
2. Alavi N, Haley S, Chow K, McDonald SD. Comparison of national gestationalweight gain guidelines and energy intake recommendations. Obes Rev.2013;14:68e85.
3. Scott C, Andersen CT, Valdez N, et al. No global consensus: a cross-sectionalsurvey of maternal weight policies. BMC Pregnancy Childbirth. 2014;14:167.
4. Li N, Liu E, Guo J, et al. Maternal prepregnancy body mass index and gestationalweight gain on pregnancy outcomes. PLoS ONE. 2013;8:e82310.
5. Choi SK, Park IY, Shin JC. The effects of pre-pregnancy body mass index andgestational weight gain on perinatal outcomes in Korean women: a retro-spective cohort study. Reprod Biol Endocrinol. 2011;9:6.
6. Crane JM, White J, Murphy P, Burrage L, Hutchens D. The effect of gestationalweight gain by body mass index on maternal and neonatal outcomes. J ObstetGynaecol Can. 2009;31:28e35.
7. Rode L, Kjaergaard H, Ottesen B, Damm P, Hegaard HK. Association betweengestational weight gain according to body mass index and postpartum weightin a large cohort of Danish women. Matern Child Health J. 2012;16:406e413.
8. Maternal anthropometry and pregnancy outcomes. A WHO collaborativestudy: introduction. Bull World Health Organ. 1995;73(Suppl. 1e6).
9. Appropriate body-mass index for Asian populations and its implications forpolicy and intervention strategies. Lancet. 2004;363:157e163.
Table 2Estimated gestational weight gain with lowest probability of adverse outcomes, stratified by pre-pregnancy BMI, among 104,070 Japanese nulliparous women.
BMI (kg/m2)
17e18.4 18.5e19.9 20e22.9 23e24.9 25e27.4
Optimal and acceptable range of rate ofgestational weight gain, kg/40 weeks
12.2 (10.8e13.6) 10.9 (9.5e12.4) 9.9 (8.4e11.4) 7.7 (5.8e9.6) 4.3 (1.7e6.9)
Institute of Medicine Guideline, kg 12.7e18.1 11.3e15.9 11.3e15.9 11.3e15.9 6.8e11.3Japanese Guideline, kg 9e12 7e12 7e12 7e12 None
BMI, body mass index; SGA, small for gestational age.
N. Morisaki et al. / Journal of Epidemiology 27 (2017) 492e498 497
10. Araneta MR, Kanaya AM, Hsu WC, et al. Optimum BMI cut points to screenasian americans for type 2 diabetes. Diabetes Care. 2015;38:814e820.
11. Palaniappan LP, Wong EC, Shin JJ, Fortmann SP, Lauderdale DS. Asian Ameri-cans have greater prevalence of metabolic syndrome despite lower body massindex. Int J Obes (Lond). 2011;35:393e400.
12. Karter AJ, Schillinger D, Adams AS, et al. Elevated rates of diabetes in PacificIslanders and Asian subgroups: the diabetes study of Northern California(DISTANCE). Diabetes Care. 2013;36:574e579.
13. King GL, McNeely MJ, Thorpe LE, et al. Understanding and addressing uniqueneeds of diabetes in Asian Americans, native Hawaiians, and Pacific Islanders.Diabetes Care. 2012;35:1181e1188.
14. Inoue M, Binns C. Maternal pre-pregnancy body mass index and weight gainduring pregnancy in Asia. In: Advances in medicine and biology. New York: NovaScience; 2013:105e122.
15. Tsukamoto H, Fukuoka H, Inoue K, Koyasu M, Nagai Y, Takimoto H.Restricting weight gain during pregnancy in Japan: a controversial factor inreducing perinatal complications. Eur J Obstet Gynecol Reprod Biol. 2007;133:53e59.
16. Oken E, Kleinman KP, Belfort MB, Hammitt JK, Gillman MW. Associations ofgestational weight gain with short- and longer-term maternal and child healthoutcomes. Am J Epidemiol. 2009;170:173e180.
17. Nohr EA, Vaeth M, Baker JL, Sorensen T, Olsen J, Rasmussen KM. Combinedassociations of prepregnancy body mass index and gestational weight gainwith the outcome of pregnancy. Am J Clin Nutr. 2008;87:1750e1759.
18. Ee TX, Allen Jr JC, Malhotra R, Koh H, Ostbye T, Tan TC. Determining optimalgestational weight gain in a multiethnic Asian population. J Obstet Gynaecol Res.2014;40:1002e1008.
19. Ota E, Haruna M, Suzuki M, et al. Maternal body mass index and gestationalweight gain and their association with perinatal outcomes in Viet Nam. BullWorld Health Organ. 2011;89:127e136.
20. Shiozaki A, Matsuda Y, Hayashi K, Satoh S, Saito S. Comparison of risk factorsfor major obstetric complications between Western countries and Japan: acase-cohort study. J Obstet Gynaecol Res. 2011;37:1447e1454.
21. Nakashima A, Araki R, Tani H, et al. Implications of assisted reproductivetechnologies on term singleton birth weight: an analysis of 25,777 children inthe national assisted reproduction registry of Japan. Fertil Steril. 2013;99:450e455.
22. Morikawa M, Cho K, Yamada T, Sato S, Minakami H. Risk factors for eclampsiain Japan between 2005 and 2009. Int J Gynaecol Obstet. 2012;117:66e68.
23. Morikawa M, Cho K, Yamada T, Sato S, Minakami H. Clinical features and short-term outcomes of triplet pregnancies in Japan. Int J Gynaecol Obstet. 2013;121:86e90.
24. Morikawa M, Cho K, Yamada T, Sato S, Minakami H. Fetal macrosomia inJapanese women. J Obstet Gynaecol Res. 2013;39:960e965.
25. Shiozaki A, Matsuda Y, Satoh S, Saito S. Impact of fetal sex in pregnancy-induced hypertension and preeclampsia in Japan. J Reprod Immunol. 2011;89:133e139.
26. Shiozaki A, Matsuda Y, Satoh S, Saito S. Comparison of risk factors for gesta-tional hypertension and preeclampsia in Japanese singleton pregnancies.J Obstet Gynaecol Res. 2013;39:492e499.
27. Alexander GR, Himes JH, Kaufman RB, Mor J, Kogan M. A United States nationalreference for fetal growth. Obstet Gynecol. 1996:163e168.
28. Margerison Zilko CE, Rehkopf D, Abrams B. Association of maternal gestationalweight gain with short- and long-term maternal and child health outcomes.Am J Obstet Gynecol. 2010;202:574.e1e574.e8.
29. Haugen M, Brantsaeter AL, Winkvist A, et al. Associations of pre-pregnancybody mass index and gestational weight gain with pregnancy outcome andpostpartum weight retention: a prospective observational cohort study. BMCPregnancy Childbirth. 2014;14:201.
30. Watanabe K. Outline of definition and classification of Pregnancy inducedhypertension (PIH). Hypertens Res Pregnancy. 2013;1:3e4.
31. Ohmi H, Hirooka K, Hata A, Mochizuki Y. Recent trend of increase in proportionof low birthweight infants in Japan. Int J Epidemiol. 2001;30:1269e1271.
32. Takimoto H, Yokoyama T, Yoshiike N, Fukuoka H. Increase in low-birth-weightinfants in Japan and associated risk factors, 1980e2000. J Obstet Gynaecol Res.2005;31:314e322.
33. Viswanathan M, Siega-Riz AM, Moos MK, et al. Outcomes of maternal weightgain. Evid Rep Technol Assess (Full Rep). 2008:1e223.
34. Mardones F, Rosso P. A weight gain chart for pregnant women designed inChile. Matern Child Nutr. 2005;1:77e90.
35. Hamilton B, Martin J, Osterman M, Curtain S. Births: preliminary data for 2014.Natl Vital Stat Rep. 2015;64:1e26.
36. Immigration and ethnocultural diversity in Canada. National Household Survey,2011; 2014.
37. Coleman D. Immigration, population and ethnicity: the UK in internationalperspective. University of Oxford; 2013.
38. Anikeeva O, Bi P, Hiller JE, Ryan P, Roder D, Han GS. The health status of mi-grants in Australia: a review. Asia Pac J Public Health. 2010;22:159e193.
N. Morisaki et al. / Journal of Epidemiology 27 (2017) 492e498498