Journal of Computer Networks, Architecture and High ...
12
Journal of Computer Networks, Architecture and High Performance Computing Volume 3, Number 1, January 2021 https://doi.org/10.47709/cnahpc.v3i1.923 Submitted : 19 December 2020 Accepted : 22 December 2020 Published : 22 January 2021 * Corresponding author This is an Creative Commons License This work is licensed under a Creative Commons Attribution-NoDerivatives 4.0 International License. 9 Implementation of Data Mining Using C4.5 Algorithm on Customer Satisfaction in Tirta Lihou PDAM Titin Handayani Sinaga 1)* , Anjar Wanto 2) , Indra Gunawan 3) , Sumarno 4) , Zulaini Masruro Nasution 5) 1)2)3)4)5) STIKOM Tunas Bangsa, Indonesia 1) [email protected], 2) [email protected], 3) [email protected], 4) [email protected], 5) [email protected] Abstract This application applies the C4.5 Algorithm to decide customer satisfaction, the C4.5 algorithm is one of the algorithms used to classify or segment, or group and it is predictive. This type of research is a classification with the concept of data mining involving 150 customers of PDAM Tirta Lihou in Totap Majawa Kab. Simalungun can be categorized as: "Satisfied and Dissatisfied". The meaning of Data Mining is an interdisciplinary subfield of computer science and statistics with the overall objective of extracting information (with intelligent methods) from data sets and converting information into understandable structures for further use. There are 5 criteria that can affect customer satisfaction, among others: Service Facilities (x1), Price Rates (x2), Smooth Water (x3), Corporate Image (x4), and Location (x5). The results of processing the C4.5 method using the RapidMiner Studio 5.3 software mean that Rapid Miner is a solution for analyzing data mining, text mining, and predictive analysis. Rapid Miner uses various descriptive and predictive techniques in providing insight to users so that they can make the best decisions with the level of accuracy, namely, class recall and class precision values, it is explained that the "Satisfied" category produces a class recall of 97.80% and a class precision of 97.80%. 98.89% and the "Not Satisfied" category resulted in a class recall of 98.31% and a class of precision of 96.67%. And the above accuracy results from the calculation of the C4.5 algorithm is 98.0%. Keywords: C4.5 Algorithm, Data Mining, Customer Satisfaction, PDAM Tirta Lihou INTRODUCTION Customer satisfaction is one of the main goals of any company whether it is a product sold or a service offered. This aims to attract and retain its customers so that each company must be able to understand carefully what expectations all its customers want, so this makes every company must be able to know the level of satisfaction of each of its customers. PDAM or Regional Drinking Water Company is one of the regionally owned business units, which is engaged in the distribution of clean water for the general public. PDAMs exist in every province, district, and municipality throughout Indonesia. PDAM Tirta Lihou Totap Majawa Production Unit is one of the regional drinking water companies located and operating in Pagar Jawa, Regency of Simalungun, North Sumatra, According to some parties or service customers at PDAM Tirta Lihou Totap Majawa Production Unit is very good and some parties complain Due to the slow flow of water that enters the house and does not even work, therefore the PDAM must find a solution so that customers can feel satisfied with the services provided to their customers, therefore to overcome the above problems the authors are interested in examining the level of customer satisfaction at PDAM Tirta Lihou with the concept of implementing data mining using the C4.5 algorithm where data mining is the process of looking for patterns or interesting information in selected data using certain techniques or methods. Data mining is a process that employs one or more machine learning techniques for analyzing and extracting knowledge automatically.
-
Upload
khangminh22 -
Category
Documents
-
view
3 -
download
0
Transcript of Journal of Computer Networks, Architecture and High ...

Journal of Computer Networks, Architecture and
High Performance Computing Volume 3, Number 1, January 2021
https://doi.org/10.47709/cnahpc.v3i1.923
Submitted : 19 December 2020
Accepted : 22 December 2020
Published : 22 January 2021
* Corresponding author
This is an Creative Commons License This work is licensed under a Creative
Commons Attribution-NoDerivatives 4.0 International License. 9
Implementation of Data Mining Using C4.5 Algorithm on Customer
Satisfaction in Tirta Lihou PDAM
Titin Handayani Sinaga1)*, Anjar Wanto2), Indra Gunawan3), Sumarno4), Zulaini Masruro
Nasution5) 1)2)3)4)5)STIKOM Tunas Bangsa, Indonesia 1)[email protected],2)[email protected],3)[email protected], 4)[email protected], 5)[email protected]
Abstract
This application applies the C4.5 Algorithm to decide customer satisfaction, the C4.5 algorithm is one of the
algorithms used to classify or segment, or group and it is predictive. This type of research is a classification with
the concept of data mining involving 150 customers of PDAM Tirta Lihou in Totap Majawa Kab. Simalungun can
be categorized as: "Satisfied and Dissatisfied". The meaning of Data Mining is an interdisciplinary subfield of
computer science and statistics with the overall objective of extracting information (with intelligent methods)
from data sets and converting information into understandable structures for further use. There are 5 criteria that
can affect customer satisfaction, among others: Service Facilities (x1), Price Rates (x2), Smooth Water (x3),
Corporate Image (x4), and Location (x5). The results of processing the C4.5 method using the RapidMiner Studio
5.3 software mean that Rapid Miner is a solution for analyzing data mining, text mining, and predictive analysis.
Rapid Miner uses various descriptive and predictive techniques in providing insight to users so that they can make
the best decisions with the level of accuracy, namely, class recall and class precision values, it is explained that
the "Satisfied" category produces a class recall of 97.80% and a class precision of 97.80%. 98.89% and the "Not
Satisfied" category resulted in a class recall of 98.31% and a class of precision of 96.67%. And the above
accuracy results from the calculation of the C4.5 algorithm is 98.0%.
Keywords: C4.5 Algorithm, Data Mining, Customer Satisfaction, PDAM Tirta Lihou
INTRODUCTION
Customer satisfaction is one of the main goals of any company whether it is a product sold or a service offered.
This aims to attract and retain its customers so that each company must be able to understand carefully what
expectations all its customers want, so this makes every company must be able to know the level of satisfaction of
each of its customers. PDAM or Regional Drinking Water Company is one of the regionally owned business units,
which is engaged in the distribution of clean water for the general public. PDAMs exist in every province, district,
and municipality throughout Indonesia. PDAM Tirta Lihou Totap Majawa Production Unit is one of the regional
drinking water companies located and operating in Pagar Jawa, Regency of Simalungun, North Sumatra, According
to some parties or service customers at PDAM Tirta Lihou Totap Majawa Production Unit is very good and some
parties complain Due to the slow flow of water that enters the house and does not even work, therefore the PDAM
must find a solution so that customers can feel satisfied with the services provided to their customers, therefore to
overcome the above problems the authors are interested in examining the level of customer satisfaction at PDAM
Tirta Lihou with the concept of implementing data mining using the C4.5 algorithm where data mining is the
process of looking for patterns or interesting information in selected data using certain techniques or methods. Data
mining is a process that employs one or more machine learning techniques for analyzing and extracting knowledge
automatically.
Journal of Computer Networks, Architecture and
High Performance Computing Volume 3, Number 1, January 2021
https://doi.org/10.47709/cnahpc.v3i1.923
Submitted : 19 December 2020
Accepted : 22 December 2020
Published : 22 January 2021
This is an Creative Commons License This work is licensed under a Creative
Commons Attribution-NoDerivatives 4.0 International License. 10
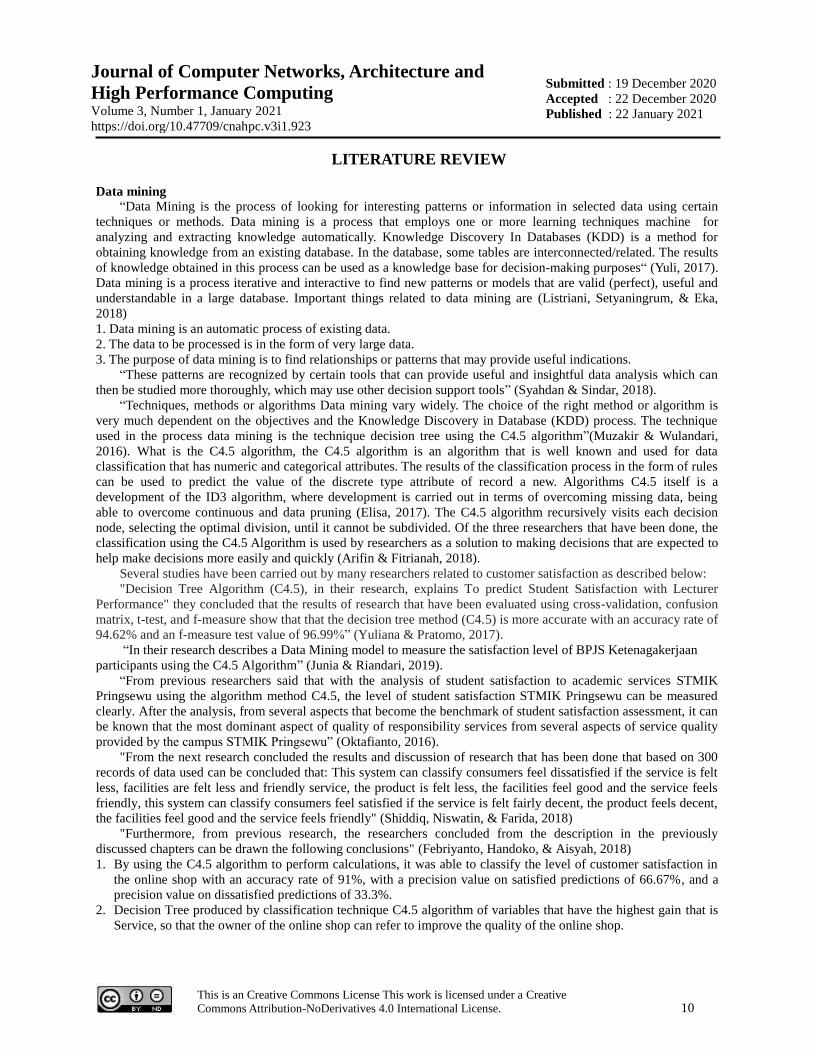
LITERATURE REVIEW
Data mining “Data Mining is the process of looking for interesting patterns or information in selected data using certain
techniques or methods. Data mining is a process that employs one or more learning techniques machine for
analyzing and extracting knowledge automatically. Knowledge Discovery In Databases (KDD) is a method for
obtaining knowledge from an existing database. In the database, some tables are interconnected/related. The results
of knowledge obtained in this process can be used as a knowledge base for decision-making purposes“ (Yuli, 2017).
Data mining is a process iterative and interactive to find new patterns or models that are valid (perfect), useful and
understandable in a large database. Important things related to data mining are (Listriani, Setyaningrum, & Eka,
2018)
1. Data mining is an automatic process of existing data.
2. The data to be processed is in the form of very large data.
3. The purpose of data mining is to find relationships or patterns that may provide useful indications.
“These patterns are recognized by certain tools that can provide useful and insightful data analysis which can
then be studied more thoroughly, which may use other decision support tools” (Syahdan & Sindar, 2018).
“Techniques, methods or algorithms Data mining vary widely. The choice of the right method or algorithm is
very much dependent on the objectives and the Knowledge Discovery in Database (KDD) process. The technique
used in the process data mining is the technique decision tree using the C4.5 algorithm”(Muzakir & Wulandari,
2016). What is the C4.5 algorithm, the C4.5 algorithm is an algorithm that is well known and used for data
classification that has numeric and categorical attributes. The results of the classification process in the form of rules
can be used to predict the value of the discrete type attribute of record a new. Algorithms C4.5 itself is a
development of the ID3 algorithm, where development is carried out in terms of overcoming missing data, being
able to overcome continuous and data pruning (Elisa, 2017). The C4.5 algorithm recursively visits each decision
node, selecting the optimal division, until it cannot be subdivided. Of the three researchers that have been done, the
classification using the C4.5 Algorithm is used by researchers as a solution to making decisions that are expected to
help make decisions more easily and quickly (Arifin & Fitrianah, 2018).
Several studies have been carried out by many researchers related to customer satisfaction as described below:
"Decision Tree Algorithm (C4.5), in their research, explains To predict Student Satisfaction with Lecturer
Performance" they concluded that the results of research that have been evaluated using cross-validation, confusion
matrix, t-test, and f-measure show that that the decision tree method (C4.5) is more accurate with an accuracy rate of
94.62% and an f-measure test value of 96.99%” (Yuliana & Pratomo, 2017).
“In their research describes a Data Mining model to measure the satisfaction level of BPJS Ketenagakerjaan
participants using the C4.5 Algorithm” (Junia & Riandari, 2019).
“From previous researchers said that with the analysis of student satisfaction to academic services STMIK
Pringsewu using the algorithm method C4.5, the level of student satisfaction STMIK Pringsewu can be measured
clearly. After the analysis, from several aspects that become the benchmark of student satisfaction assessment, it can
be known that the most dominant aspect of quality of responsibility services from several aspects of service quality
provided by the campus STMIK Pringsewu” (Oktafianto, 2016).
"From the next research concluded the results and discussion of research that has been done that based on 300
records of data used can be concluded that: This system can classify consumers feel dissatisfied if the service is felt
less, facilities are felt less and friendly service, the product is felt less, the facilities feel good and the service feels
friendly, this system can classify consumers feel satisfied if the service is felt fairly decent, the product feels decent,
the facilities feel good and the service feels friendly" (Shiddiq, Niswatin, & Farida, 2018)
"Furthermore, from previous research, the researchers concluded from the description in the previously
discussed chapters can be drawn the following conclusions" (Febriyanto, Handoko, & Aisyah, 2018)
1. By using the C4.5 algorithm to perform calculations, it was able to classify the level of customer satisfaction in
the online shop with an accuracy rate of 91%, with a precision value on satisfied predictions of 66.67%, and a
precision value on dissatisfied predictions of 33.3%.
2. Decision Tree produced by classification technique C4.5 algorithm of variables that have the highest gain that is
Service, so that the owner of the online shop can refer to improve the quality of the online shop.
Journal of Computer Networks, Architecture and
High Performance Computing Volume 3, Number 1, January 2021
https://doi.org/10.47709/cnahpc.v3i1.923
Submitted : 19 December 2020
Accepted : 22 December 2020
Published : 22 January 2021
This is an Creative Commons License This work is licensed under a Creative
Commons Attribution-NoDerivatives 4.0 International License. 11
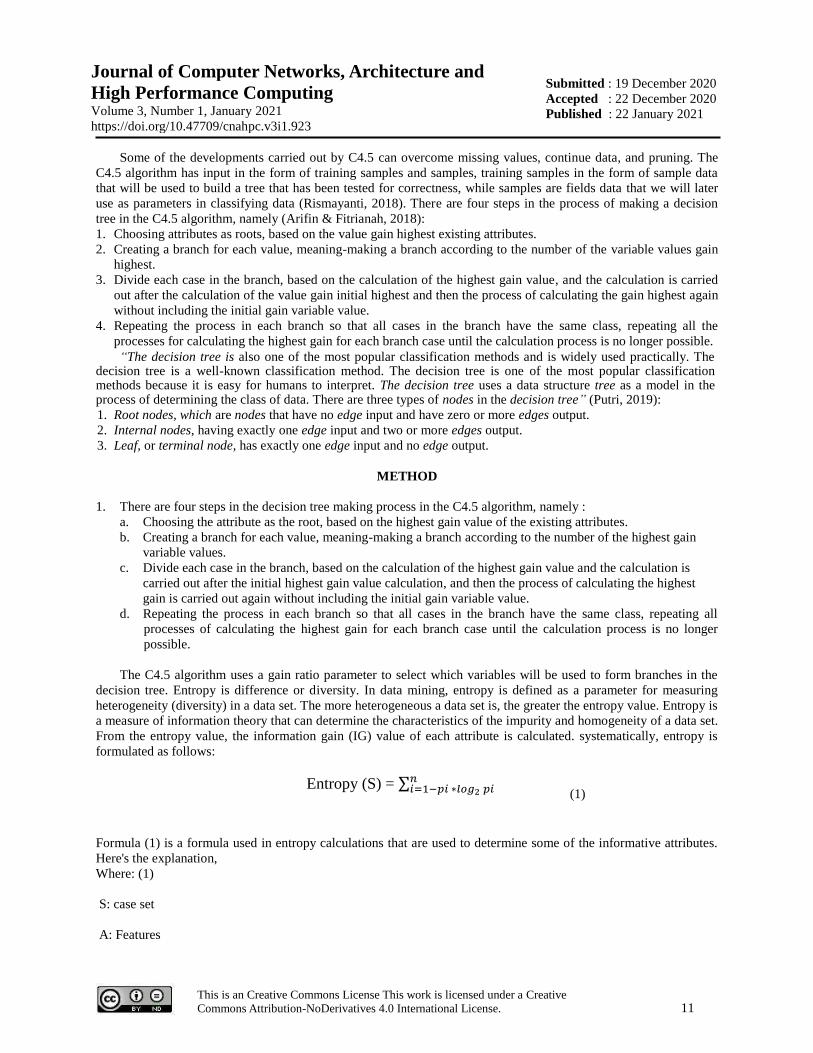
Some of the developments carried out by C4.5 can overcome missing values, continue data, and pruning. The
C4.5 algorithm has input in the form of training samples and samples, training samples in the form of sample data
that will be used to build a tree that has been tested for correctness, while samples are fields data that we will later
use as parameters in classifying data (Rismayanti, 2018). There are four steps in the process of making a decision
tree in the C4.5 algorithm, namely (Arifin & Fitrianah, 2018):
1. Choosing attributes as roots, based on the value gain highest existing attributes.
2. Creating a branch for each value, meaning-making a branch according to the number of the variable values gain
highest.
3. Divide each case in the branch, based on the calculation of the highest gain value, and the calculation is carried
out after the calculation of the value gain initial highest and then the process of calculating the gain highest again
without including the initial gain variable value.
4. Repeating the process in each branch so that all cases in the branch have the same class, repeating all the
processes for calculating the highest gain for each branch case until the calculation process is no longer possible.
“The decision tree is also one of the most popular classification methods and is widely used practically. The decision tree is a well-known classification method. The decision tree is one of the most popular classification methods because it is easy for humans to interpret. The decision tree uses a data structure tree as a model in the process of determining the class of data. There are three types of nodes in the decision tree” (Putri, 2019):
1. Root nodes, which are nodes that have no edge input and have zero or more edges output.
2. Internal nodes, having exactly one edge input and two or more edges output.
3. Leaf, or terminal node, has exactly one edge input and no edge output.
METHOD
1. There are four steps in the decision tree making process in the C4.5 algorithm, namely :
a. Choosing the attribute as the root, based on the highest gain value of the existing attributes.
b. Creating a branch for each value, meaning-making a branch according to the number of the highest gain
variable values.
c. Divide each case in the branch, based on the calculation of the highest gain value and the calculation is
carried out after the initial highest gain value calculation, and then the process of calculating the highest
gain is carried out again without including the initial gain variable value.
d. Repeating the process in each branch so that all cases in the branch have the same class, repeating all
processes of calculating the highest gain for each branch case until the calculation process is no longer
possible.
The C4.5 algorithm uses a gain ratio parameter to select which variables will be used to form branches in the
decision tree. Entropy is difference or diversity. In data mining, entropy is defined as a parameter for measuring
heterogeneity (diversity) in a data set. The more heterogeneous a data set is, the greater the entropy value. Entropy is
a measure of information theory that can determine the characteristics of the impurity and homogeneity of a data set.
From the entropy value, the information gain (IG) value of each attribute is calculated. systematically, entropy is
formulated as follows:
Entropy (S) = ∑𝑛𝑖=1−𝑝𝑖 ∗𝑙𝑜𝑔2 𝑝𝑖
Formula (1) is a formula used in entropy calculations that are used to determine some of the informative attributes.
Here's the explanation,
Where: (1)
S: case set
A: Features
(1)

Journal of Computer Networks, Architecture and
High Performance Computing Volume 3, Number 1, January 2021
https://doi.org/10.47709/cnahpc.v3i1.923
Submitted : 19 December 2020
Accepted : 22 December 2020
Published : 22 January 2021
This is an Creative Commons License This work is licensed under a Creative
Commons Attribution-NoDerivatives 4.0 International License. 12
n: number of partitions S
pi: the proportion of Si to S
In general, the C4.5 algorithm for building a decision tree is as follows:
a. Select attribute as root.
b. Create a branch for each value.
c. Divide cases into branches.
d. Repeat the process for each branch until all cases on the branch have the same class.
After obtaining the entropy value for a data set, we can measure the effectiveness of an attribute in classifying
the data. This measure of effectiveness is called information gain. Can be seen in formula (2).
𝐺𝑎𝑖𝑛(𝑆, 𝐴) = 𝐸𝑛𝑡𝑟𝑜𝑝𝑦(𝑠) − ∑|𝑆𝑖|
|𝑆|
𝑛
𝑖=1
∗ 𝐸𝑛𝑡𝑟𝑜𝑝𝑦(𝑆𝑖) (2)
Formula (2) is the formula used in calculating information gain after performing entropy. The following is a
description, where:
S: Case Collections
A: attribute
n: the number of partitions attributes A
| Si |: Number of cases on the ith partition
| S |: Number of cases in S

Journal of Computer Networks, Architecture and
High Performance Computing Volume 3, Number 1, January 2021
https://doi.org/10.47709/cnahpc.v3i1.923
Submitted : 19 December 2020
Accepted : 22 December 2020
Published : 22 January 2021
This is an Creative Commons License This work is licensed under a Creative
Commons Attribution-NoDerivatives 4.0 International License. 13
2. Flowchart of C4.5 Algorithm Modeling
PROCESS ALGORITHM C4.5
Figure 1. Flowchart of C4.5 Algorithm Modeling
Start Input Customer
Data
Selects attributes as the root, by counting
every Entropy, every attribute, with a formula
Entropy (S) = ∑𝑛𝑖=1−𝑝𝑖 ∗𝑙𝑜𝑔2 𝑝𝑖
Calculate the Gain of each calculated attribute
entropy by the formula
𝐺𝑎𝑖𝑛(𝑆, 𝐴) = 𝐸𝑛𝑡𝑟𝑜𝑝𝑦(𝑠) − ∑|𝑆𝑖|
|𝑆|
𝑛
𝑖=1
∗ 𝐸𝑛𝑡𝑟𝑜𝑝𝑦(𝑆𝑖) (2)
The attribute with thehighest gain value is used as the root
Form a node containing these attributes, then repeat the Information Gain
calculation until all data are included in the same class. Attributes that have
beenselected will not be included.
Generating the Rule
from the decision tree Potentially +
Done
Not Potential-
Journal of Computer Networks, Architecture and
High Performance Computing Volume 3, Number 1, January 2021
https://doi.org/10.47709/cnahpc.v3i1.923
Submitted : 19 December 2020
Accepted : 22 December 2020
Published : 22 January 2021
This is an Creative Commons License This work is licensed under a Creative
Commons Attribution-NoDerivatives 4.0 International License. 14
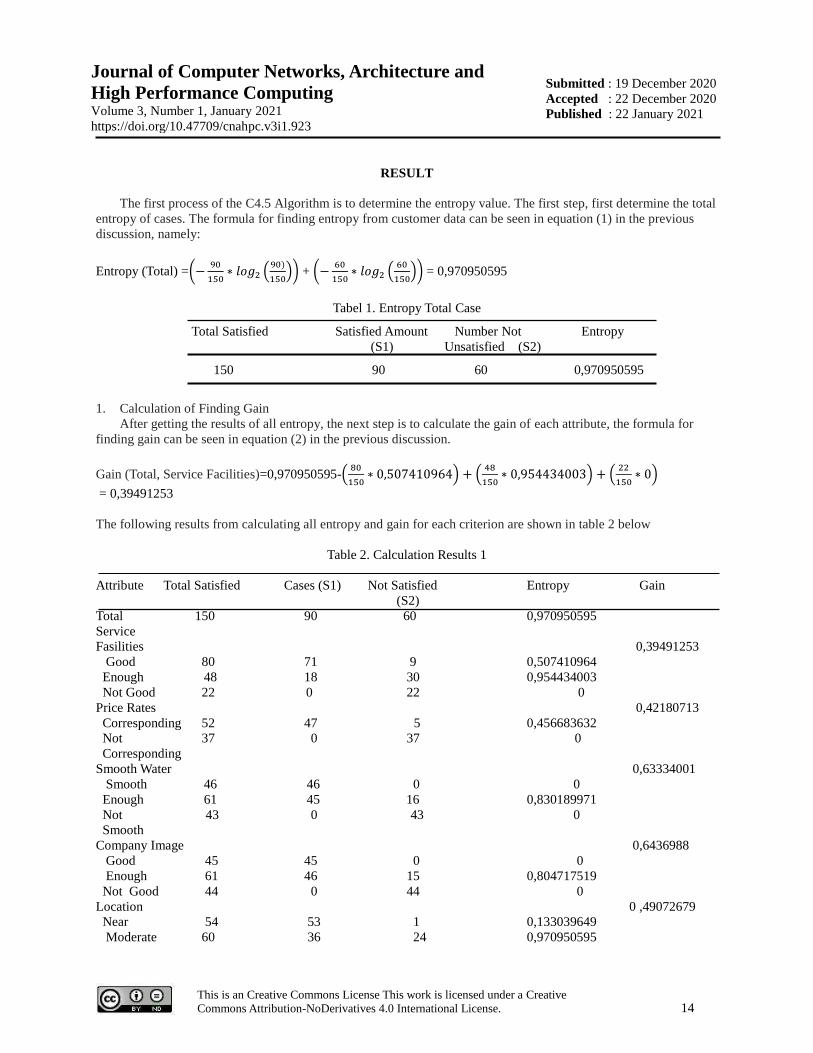
RESULT
The first process of the C4.5 Algorithm is to determine the entropy value. The first step, first determine the total
entropy of cases. The formula for finding entropy from customer data can be seen in equation (1) in the previous
discussion, namely:
Entropy (Total) =(−90
150∗ 𝑙𝑜𝑔2 (
90)
150)) + (−
60
150∗ 𝑙𝑜𝑔2 (
60
150)) = 0,970950595
Tabel 1. Entropy Total Case
Total Satisfied Satisfied Amount Number Not Entropy
(S1) Unsatisfied (S2)
150 90 60 0,970950595
1. Calculation of Finding Gain
After getting the results of all entropy, the next step is to calculate the gain of each attribute, the formula for
finding gain can be seen in equation (2) in the previous discussion.
Gain (Total, Service Facilities)=0,970950595-(80
150∗ 0,507410964) + (
48
150∗ 0,954434003) + (
22
150∗ 0)
= 0,39491253
The following results from calculating all entropy and gain for each criterion are shown in table 2 below
Table 2. Calculation Results 1
Attribute Total Satisfied Cases (S1) Not Satisfied Entropy Gain
(S2)
Total 150 90 60 0,970950595
Service
Fasilities 0,39491253
Good 80 71 9 0,507410964
Enough 48 18 30 0,954434003
Not Good 22 0 22 0
Price Rates 0,42180713
Corresponding 52 47 5 0,456683632
Not 37 0 37 0
Corresponding
Smooth Water 0,63334001
Smooth 46 46 0 0
Enough 61 45 16 0,830189971
Not 43 0 43 0
Smooth
Company Image 0,6436988
Good 45 45 0 0
Enough 61 46 15 0,804717519
Not Good 44 0 44 0
Location 0 ,49072679
Near 54 53 1 0,133039649
Moderate 60 36 24 0,970950595

Journal of Computer Networks, Architecture and
High Performance Computing Volume 3, Number 1, January 2021
https://doi.org/10.47709/cnahpc.v3i1.923
Submitted : 19 December 2020
Accepted : 22 December 2020
Published : 22 January 2021
This is an Creative Commons License This work is licensed under a Creative
Commons Attribution-NoDerivatives 4.0 International License. 15
Far 36 1 35 0,183122068
In the table above, we can see that the attribute of Corporate Image has the highest gain, namely 0.6436988, so
the Corporate Image will be the root node. Company image has 3 values, namely good, enough, not good. Where
good and bad have classified cases into one with a good decision "satisfied" and not good with a "dissatisfied"
decision. Meanwhile, if the value is sufficient, more calculations are needed because it still has resulted between
"satisfied" and "not satisfied", the calculation is carried out to determine the next root node.
Table 3. Calculation Results 2
Attribute Total Satisfied Cases (S1) Not Satisfied Entropy Gain
(S2)
Total Company 61 46 15 0,804717519
Image
= Enough
Servise Fasilities 0,237930421
Good 37 35 2 0,303374836
Enough 18 10 8 0,99107606
Not Good 6 2 4 0,918295834
Price Rates 0,41541344
Corresponding 52 47 5 0,456683632
Not 9 0 9 0
Corresponding
Smooth Water 0,612581382
Smooth 15 14 1 0,549215017
Enough 32 31 1 0,200622324
Not Smooth 14 0 14 0
Location 0,549215017
Near 19 19 0 0
Moderate 29 27 2 0,362051252
Far 13 1 12 0,391243564
In the calculation of entropy and gain in the table above, it can be seen that the highest gain value on Company
Image = Enough is the smoothness of water with a gain value of 0.612581382 where smooth water has a current,
sufficient and non-current value where the Non-current value has classified the case into one with a decision of "Not
satisfied" while the value is sufficient and current is still necessary to recalculate because it still has a value of
"satisfied" and "not satisfied" and is used as the root node with the attributes Enough and Current. Then do the
calculations in the same way as the tables above until all branches have their respective values so that they can make
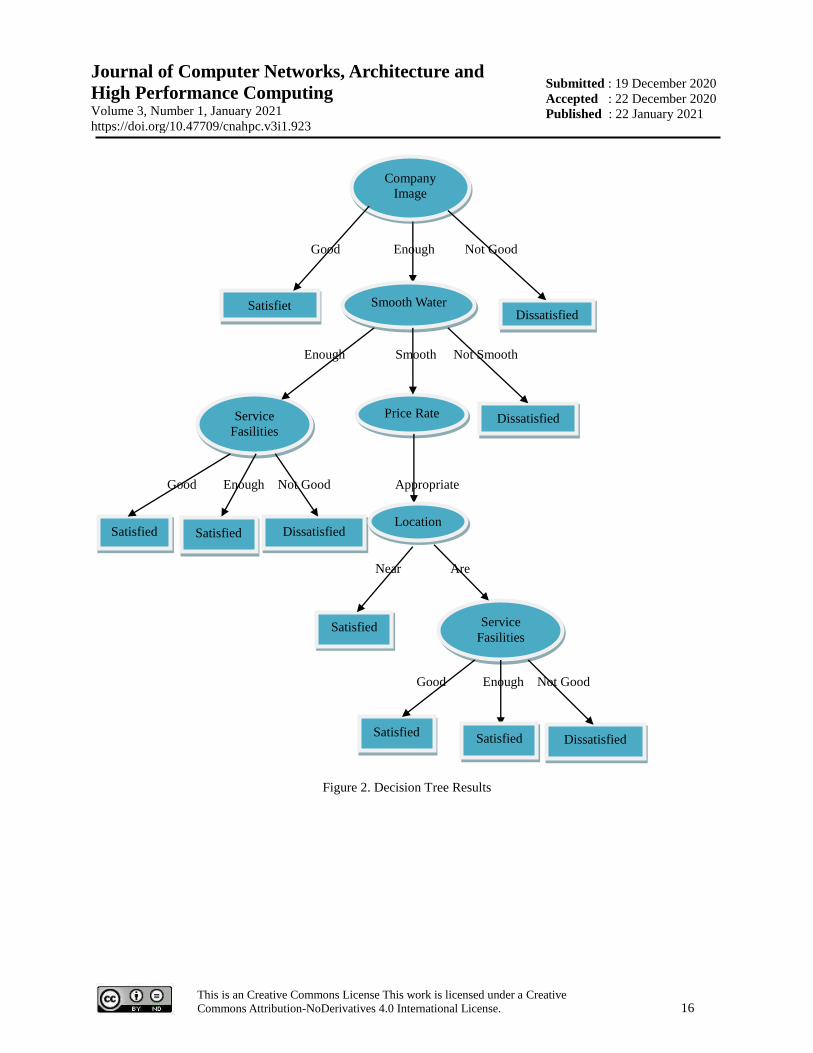
a decision tree as shown in Figure 1 below:
Journal of Computer Networks, Architecture and
High Performance Computing Volume 3, Number 1, January 2021
https://doi.org/10.47709/cnahpc.v3i1.923
Submitted : 19 December 2020
Accepted : 22 December 2020
Published : 22 January 2021
This is an Creative Commons License This work is licensed under a Creative
Commons Attribution-NoDerivatives 4.0 International License. 16
Good Enough Not Good
Enough Smooth Not Smooth
Good Enough Not Good Appropriate
Near Are
Good Enough Not Good
Figure 2. Decision Tree Results
Satisfiet Dissatisfied
Dissatisfied
Satisfied Satisfied Dissatisfied
Smooth Water
Service
Fasilities
Price Rate
Location
Satisfied Service
Fasilities
Satisfied Satisfied
Dissatisfied
Company
Image

Journal of Computer Networks, Architecture and
High Performance Computing Volume 3, Number 1, January 2021
https://doi.org/10.47709/cnahpc.v3i1.923
Submitted : 19 December 2020
Accepted : 22 December 2020
Published : 22 January 2021
This is an Creative Commons License This work is licensed under a Creative
Commons Attribution-NoDerivatives 4.0 International License. 17
Furthermore, you can create a table of rule information in the decision tree above.
Table 3. Description of Graphic Rules
Rule Rule Predicate
1 If the average company image = Good Satisfied satisfied
2 If Company Image = Sufficient and Smooth Water = Sufficient and Satisfied satisfied
FacilitiesService = Good
3 If Company Image = Sufficient and Smooth Water = Sufficient and Satisfied not satisfied
Facilities Service = Enough
4 If Company Image = Sufficient and Smooth Water = Sufficient and Facilities satisfied
Are Not SatisfiedService = Not Good
5 If Company Image = Sufficient and Smooth Water = Current and Price Rate = satisfied
SatisfiedAppropriate and Location = Close
6 If Company Image = Sufficient and Smooth Water = Current and Satisfied Tariff satisfied
Price = appropriate and location = moderate and service facilities = good
7 If Company Image = Sufficient and Smooth Water = Current and Satisfied Tariff not satisfied
Price = appropriate and location = moderate and service facilities = adequate
8 If Company Image = Sufficient and Smooth Water = Current and Tariff Not not satisfied
SatisfiedPrice = appropriate and location = moderate and service facilities = not good
9 If Company Image = Sufficient and Smooth Water = Not Current Not Satisfied not satisfied
10 If Company Image = Not Good Not Satisfied not satisfied
In the table above, it can be explained that the factors that affect the first node are the company's image, the
second node is water smoothness, the third node is service facilities, the fourth node is Price Rates, the fifth node is
the location and the sixth node is Service Facilities.
2. Results From Rapidminer
Figure 3. Display link read excel, apply model and performance
Figure 4 above explains that the validation and accuracy of the C4.5 Algorithm (Decision Tree) will be tested,
the decision tree validation is used to see the accuracy of the C4.5 algorithm rule model in predicting customer
satisfaction with PDAM Tirta Lihou Totap Majawa Unit by using rapidminer software. Looking for the accuracy

Journal of Computer Networks, Architecture and
High Performance Computing Volume 3, Number 1, January 2021
https://doi.org/10.47709/cnahpc.v3i1.923
Submitted : 19 December 2020
Accepted : 22 December 2020
Published : 22 January 2021
This is an Creative Commons License This work is licensed under a Creative
Commons Attribution-NoDerivatives 4.0 International License. 18
value or Accuracy by dragging and dropping Apply Model and Performance on the operator's menu into the process
panel, Apply Model serves to learn the trained ExampleSet information that has been used for prediction using this
model while Performance is used for statistical evaluation of classification performance and provides a list value
criteria of the classification performance.
Figure 4. Display of Accuracy Value
Based on what has been explained above, it can be seen that the data testing was carried out using the apply
model and% performance obtained an accuracy value of 98%, so this C4.5 decision tree algorithm model can be
categorized as excellent.
Figure 5. Decision Tree View
After calculating and testing the data on each attribute manually or using the RapidMiner Studio 5.3 application
with the C4.5 algorithm, the results of the final decision tree pattern are the same.
The results of the accuracy level and AUC can be seen and known by clicking the PerformanceVector
(Performance) tab, the accuracy results will be shown as shown above. Where the model that has been formed is
tested for its level of accuracy by entering or testing the training data from the RapiMiner Studio 5.3 application to
test the level of accuracy. With the RapidMiner Studio, 5.3 application, accuracy, class recall, and precision class
values are generated. It is explained that the "Satisfied" category produces a class recall of 97.80% and a precision
class of 98.31% and the "Not Satisfied" category results in a class recall of 98, 31% and precision class of 96.67%.
And the results of the above accuracy from the calculation of the C4.5 algorithm are 98.00% and the value of the
AUC (Area Under the ROC Curve) is 0.996.

Journal of Computer Networks, Architecture and
High Performance Computing Volume 3, Number 1, January 2021
https://doi.org/10.47709/cnahpc.v3i1.923
Submitted : 19 December 2020
Accepted : 22 December 2020
Published : 22 January 2021
This is an Creative Commons License This work is licensed under a Creative
Commons Attribution-NoDerivatives 4.0 International License. 19
DISCUSSIONS
From the above results it can be seen that where the model that has been formed is tested for its level of
accuracy by entering or testing the training data in the RapiMiner Studio 5.3 application to test the level of accuracy
and the results obtained with the data mining method 98, 31% means that the result of using the C4.5 algorithm
method is almost 100%, so it can be ascertained that with the Data Mining method the C4.5 Algorithm can
determine the level of customer satisfaction.
CONCLUSION
Conclusion In this study is to display the results in the form of customer satisfaction with PDAM Tirta Lihou by
displaying data in the form of the highest value according to the values and criteria provided. The value chosen is
the first highest value, namely the value of Corporate Image with the final result of 0.6436988. The test carried out
with the RapidMiner software using the apply model and% Performance obtained a value of 98.00%. This means
that the resulting rule has a level of truth close to 100%. In manual calculations, the results obtained are accurate
because it can be proven by the system and displays the same highest results both for the difference, entropy and
gain value as well as the highest value for each value.
To get more varied results, maybe this research can be developed with other data mining techniques such as Genetic
Algorithm, KNearest Neigboard Algorithm to find the rules or model approach to be achieved. From the rule model
approach obtained, it needs special attention for PDAM Tirta Lihou Unit Totap Majawa to see and make decisions
which variables should be considered to support the level of customer satisfaction so that customers will feel
satisfied and have no complaints
REFERENCE
Arifin, M. F., & Fitrianah, D. (2018). Penerapan Algoritma Klasifikasi C4.5 Dalam Rekomendasi Penerimaan Mitra
Penjualan Studi Kasus : PT Atria Artha Persada. InComTech, 8(2), 87–102.
https://doi.org/10.22441/incomtech.v8i1.2198
Elisa, E. (2017). Analisa dan Penerapan Algoritma C4.5 Dalam Data Mining Untuk Mengidentifikasi Faktor-Faktor
Penyebab Kecelakaan Kerja Kontruksi PT.Arupadhatu Adisesanti. Jurnal Online Informatika, 2(1), 36.
https://doi.org/10.15575/join.v2i1.71
Febriyanto, D. B., Handoko, L., & Aisyah, H. (2018). Implementasi Algoritma C4 . 5 Untuk Klasifikasi Tingkat
Kepuasan Pembeli Online Shop. 5(6), 569–575.
Junia, A., & Riandari, F. (2019). Data Mining Untuk Mengukur Tingkat Kepuasan Peserta BPJS Ketenagakerjaan.
1(1), 47–51.
Karlena Indriani, / Qonita Tanjung. (2017). Sistem Pendukung Keputusan Kelayakan Kredit Motor Menggunakan
Metode NAÏVE BAYES Pada NSC FINANCE Cikampek. Publikasi Jurnal Penelitian Teknik Informatika
Universitas Prima Indonesia, 1((UNPRI) Medan), 6–11.
Listriani, D., Setyaningrum, A. H., & Eka, F. (2018). Penerapan Metode Asosiasi Menggunakan Algoritma Apriori
pada Aplikasi Analisa Pola Belanja Kosumen (Studi Kasus Toko Buku Gramedia Bintaro). Jurnal Teknik
Informatika, 9(2), 120–127. https://doi.org/10.15408/jti.v9i2.5602
Listriani, D., Setyaningrum, A. H., & Eka, F. (2018). Penerapan Metode Asosiasi menggunakan Algoritma Apriori
pada Aplikasi Analisa Pola Belanja Konsumen (Studi Kasus Toko Buku Gramedia Bintaro). Jurnal Teknik
Informatika, 9(2), 120–127. https://doi.org/10.15408/jti.v9i2.5602

Journal of Computer Networks, Architecture and
High Performance Computing Volume 3, Number 1, January 2021
https://doi.org/10.47709/cnahpc.v3i1.923
Submitted : 19 December 2020
Accepted : 22 December 2020
Published : 22 January 2021
This is an Creative Commons License This work is licensed under a Creative
Commons Attribution-NoDerivatives 4.0 International License. 20
Muzakir, A., & Wulandari, R. A. (2016). Model Data Mining sebagai Prediksi Penyakit Hipertensi Kehamilan
dengan Teknik Decision Tree. Scientific Journal of Informatics, 3(1), 19–26.
https://doi.org/10.15294/sji.v3i1.4610
Oktafianto. (2016). Analisis Kepuasan MAahasiswa Terhadap Pelayanan Akademik Menggunakan Metode
Algoritma C4 . 5. 02(01), 1–11.
Putri, A. D. (2019). Prediksi Kepuasan Mahasiswa terhadap Kinerja Dosen di Kota Batam menggunakan Algoritma
C4 . 5. September, 235–240.
Rismayanti. (2018). Decision Tree Penentuan Masa Studi Mahasiswa Prodi Teknik Informatika ( Studi Kasus :
Fakultas Teknik dan Komputer Universitas Harapan Medan ). Query, 5341(April), 16–24.
Shiddiq, A., Niswatin, R. K., & Farida, I. N. (2018). Analisa Kepuasan Konsumen Menggunakan Klasifikasi
Decision Tree Di Restoran Dapur Solo ( Cabang Kediri ). 2(1), 9–18.
Syahdan, S. Al, & Sindar, A. (2018). Data Mining Penjualan Produk Dengan Metode Apriori Pada Indomaret Galang
Kota. Jurnal Nasional Komputasi Dan Teknologi Informasi (JNKTI), 1(2).
https://doi.org/10.32672/jnkti.v1i2.771.
Yuli, M. (2017). Jurnal Edik Informatika Data Mining : Klasifikasi Menggunakan Algoritma C4 . 5 Data mining
merupakan bagian dari tahapan proses Knowledge Discovery in Database ( KDD ) . Jurnal Edik Informatika.
Jurnal Edik Informatika, 2(2), 213–219.
Yuliana, A., & Pratomo, D. B. (2017). Memprediksi Kepuasan Mahasiswa Terhadap Kinerja Dosen Politeknik
TEDC Bandung. 377–384.