John von Neumann Institute for Computing (NIC) - JuSER
330
Publication Series of the John von Neumann Institute for Computing (NIC) NIC Series Volume 36
-
Upload
khangminh22 -
Category
Documents
-
view
4 -
download
0
Transcript of John von Neumann Institute for Computing (NIC) - JuSER

Publication Series of the John von Neumann Institute for Computing (NIC)
NIC Series Volume 36

John von Neumann Institute for Computing (NIC)
From Computational Biophysicsto Systems Biology (CBSB07)
Celebrating 20 years of NIC
edited by
Ulrich H. E. HansmannJan MeinkeSandipan MohantyOlav Zimmermann
Symposium, 02. - 04. May 2007
Forschungszentrum Julich
Proceedings
organized by
John von Neumann Institute for Computing
NIC Series Volume 36
ISBN: 978-3-9810843-2-0

Die Deutsche Bibliothek – CIP-Cataloguing-in-Publication-DataA catalogue record for this publication is available from Die DeutscheBibliothek.
Publisher: NIC-Directors
Technical Editor: Martina Kamps
Distributor: NIC-SecretariatResearch Centre Julich52425 JulichGermany
Internet: www.fz-juelich.de/nic/
Printer: Graphische Betriebe, Forschungszentrum Julich
c© 2007 by John von Neumann Institute for ComputingPermission to make digital or hard copies of portions of this workfor personal or classroom use is granted provided that the copiesare not made or distributed for profit or commercial advantage andthat copies bear this notice and the full citation on the first page. Tocopy otherwise requires prior specific permission by the publishermentioned above.
NIC Series Volume 36ISBN: 978-3-9810843-2-0Published in full on the internetPersistent Identifier: urn:nbn:de:0001-00422http://nbn-resolving.de/urn/resolver.pl?urn=urn:nbn:de:0001-00422

Preface
In 2007 the John von Neumann Institute for Computing (NIC) celebrates its 20th anniver-sary. During its two decades of existence, computer simulations have become an invalu-able tool for researching biological systems. This was alsothe topic of the second annualworkshop “From Computational Biophysics to Systems Biology” (CBSB07). About 110researchers and students from all over the world met from May2nd to May 4th, 2007 atthe Research Centre Julich and discussed physics-based approaches to systems biology.They emphasized the increasing importance of computing in Biology, Medicine and otherlife sciences. Complex diseases such as cancer or Alzheimer’s, to name only two, can beunderstood only if we obtain an insight in the working of cells on the molecular level. Theanalysis of the huge amount of experimental data, together with the problem that someprocesses or molecules cannot be detected in experiments, require the use of simulations.However, the large number of components in a cell, the difficulties in understanding theirdynamics, and the complex interactions between them, make such simulations extremelychallenging. Problems such as the all-atom simulation of chromatin dynamics or of ribo-somes and other supermolecular systems will require accessto computers with hundreds ofTeraflops. In a ”town hall” meeting the participants emphasized the role of supercomput-ers in obtaining a detailed understanding of the working of cells. They agreed that furtherprogress will require the supercomputer centers to provideboth increased computing ca-pacity and improved support and accessibility.
As in the previous year, the participants explored in scientific presentations and numer-ous informal discussions a wide range of topics ranging fromsingle macromolecules tothe working of entire cells. Topics included protein folding, miss-folding and aggregation;the interaction between proteins and other molecules; the assembly of nano-structures,multi-protein, protein-DNA/RNA complexes; and the modeling of cellular systems at amolecular level. This proceeding volume collects selectedpresentations from the 3-daylong workshop that may serve as starting point for further discussions. It is divided intoarticles by invited speakers and such originally presentedas posters or in contributed talks,as the interdisciplinary nature of the articles often defiesa simple classification accordingto subject areas.
Besides the editors, Thomas Neuhaus, Tatjana Eitrich, Everaldo Arashiro, and XiaolinXiao helped organizing the workshop. For their most valuable help with the local arrange-ments we are greatly indebted to Helga Frank, Erika Wittig and Martina Kamps. We alsowish to thank IBM for generous support.
Julich, July 2007
U. H. E. Hansmann, J. Meinke, S. Mohanty, O. Zimmermann


Contents
Invited Talks
The Slip-Length Effects in Molecular Dynamics of Bead-LikeModels of Pro-teinsP. Szymczak, M. Cieplak 1
Advances in De Novo Protein DesignCh. A. Floudas, H. K. Fung, M. S. Taylor 9
Chromatin Dynamics in silicioJ. Langowski 15
Causality and Correlation Analyses of Molecular Dynamics Simulation DataA. Gorecki, J. Trylska, B. Lesyng 25
Mesoscopic Dynamics with the UNRES Force Field – a Tool for Studying theKinetics and Thermodynamics of Protein FoldingA. Liwo, C. Czaplewski, S. Ołdziej, M. Chinchio, A. V. Rojas,M. Khalili, M.Makowski, S. Kalinowski, U. Kozłowska, R. K. Murarka, H. A. Scheraga 31
Mixed QM/MM Calculations in Biological SystemsG. M. Seabra, J. Torras, R. C. Walker, A. Roitberg 37
Evolution of Experimental and Theoretical Determinations of Protein Struc-ture and Protein Folding PathwaysH. A. Scheraga, A. Liwo, C. Czaplewski, S. Ołdziej 45
The E-Cell Project and Challenges in Computational SystemsBiologyK. Takahashi 55
Stretching RNA HairpinsC. Hyeon, D. Thirumalai 61
Simulation of Linker Histone-Chromatin InteractionsG. V. Pachov, R. R. Gabdoulline, R. C. Wade 69
i

Contributed Talks and Posters
Conformational Study of Amyloid Beta (ABeta) PeptideP. Anand, F. S. Nandel 75
Global Persistence Exponent of the Helix-Coil Transition in PolypeptidesE. Arashiro, J. R. Drugowich de Felıcio, U. H. E. Hansmann 79
Coarse-Grained Lattice Model for Molecular RecognitionH. Behringer, A. Degenhard, F. Schmid 83
Residual Entropy of Ice I from Multicanonical SimulationsB. A. Berg 87
REMD Simulations of Aβ16−22 Peptide Aggregation in Explicit SolventR. R. Burri, D. Paschek, A. Geiger 91
A Molecular Dynamic Study of the Basic Fibroblast Growth Factor - FibroblastGrowth Factor Receptor ComplexL. Degreve, G. H. Brancaleoni 95
Dimensionality Reduction Techniques for Protein Folding TrajectoriesT. Eitrich, S. Mohanty, X. Xiao, U. H. E. Hansmann 99
Chemical Space of Auxins, their Multi-Phenomenology and Multiple ProteinInteractionN. Ferro, P. Bultinck, Th. Bredow, Th. Reinard 103
Crystal Water Molecules and Solvation Effects on Protein-Ligand DockingB. Fischer, W. Wenzel 109
Semiautomatic Workflow for Fold Recognition – Results from the CASP 2006CompetitionF. Fredel, J. Meinke, S. Mohanty, O. Zimmermann, U. H. E. Hansmann 113
Interaction of Biological Matter with Nanomaterials: A Fir st-Principles Ap-proachS. Gowtham, R. H. Scheicher, R. Ahuja, R. Pandey 117
Computational Reconstruction of Macromolecular AssembliesA. Griewel, M. Rarey 121
Verification of Protein-Protein Interactions by Use of Docking TechniquesF. Fink, R. Merkl, W. Gronwald 125
Boundary Element Method (BEM) with Parametric SurfacesS. Grudinin, A. Baumgaertner 129
ii

Parameterization of the Potential Energy Surface of the Double Proton Trans-fer in PorphyrinsM. Hallay-Suszek, P. Grochowski, B. Lesyng 133
A Statistical Approach to Deriving and Analyzing a Propensity Scale for Pre-dicting Exposed Transmembrane Beta Barrel Residues from Protein SequenceS. Hayat, Y. Park, V. Helms 137
Simulation of Small Peptide Using Combined Wang-Landau-Transition MatrixMonte Carlo AlgorithmSh. Hayryan, R. Ghulghazaryan, N. Poklar Ulrih, V.Curin Serbec, C.-K.Hu 141
Conformational Studies of UDP-GlcNAc in Environments of Increasing Com-plexityM. Held, E. Meerbach, St. Hinderlich, W. Reutter, Ch. Schutte 145
Photosensory Proteins as a Tool in Synthetic Biology: Bridging ComputationalBiophysics and Systems BiologyJ. Hendriks, M. Avila Perez, F. Bruggeman, K. J. Hellingwerf 149
Comparing Semi-Empirical versus Classic Charge Assignments inBioMolecules and their Effect on Electrostatic PotentialsP. Kar, M. Seel, U. H. E. Hansmann, S. Hofinger 155
Role of Filopodia in Adhesion Formation During Migration of Epithelial CellsB. Borm, S. Born, R. Merkel, B. Hoffmann 159
Study of Protein Structural Descriptors: Towards Similari ty and ClassificationP. Jain, J. D. Hirst 165
Phase Separation in Peptide Aggregation Processes – Multicanonical Study ofa Mesoscopic ModelCh. Junghans, M. Bachmann, W. Janke 169
Algorithmic Refinements to an Enhanced Poisson-Boltzmann Approach Usedin BioMolecular SimulationP. Kar, M. Seel, U. H. E. Hansmann, S. Hofinger 173
Aggregation of the Amyloid-β Protein: Monte Carlo Optimization StudyS. M. Gopal, K. V. Klenin, W. Wenzel 177
Analysis and Optimization of the Flex-Screen Docking Approach Using DUDBenchmarking DatabaseD. Kokh, B. Fischer, W. Wenzel 181
Folding and Structure Prediction of Proteins Containing Disulfide BridgesI. Kondov, A. Verma, W. Wenzel 185
iii

DNA Packaging and Electrostatic InteractionsN. Korolev, L. Nordenskiold 189
Water Percolation Governs Polymorphic Transition and Conductivity of DNAI. Brovchenko, A. Krukau, A. Oleinikova, A. Mazur 195
Molecular Dynamics in Excited States: Landau-Zener Model of Nitric OxideGeminate Recombination to Nitrile HydrataseK. Kubiak, W. Nowak 199
Exploring Conformational Space and Dynamics of RNA Hairpins by MD Sim-ulations: Structure-Function Correlation of HIV-1 Genome Regulatory Ele-mentsK. Kulinska, T. Kulinski 203
Anisotropic Internucleosome Interactions and Geometrical Constraints Favourthe Two-Start Helical Structure of ChromatinG. La Penna, G. Cinacchi, A. Perico 207
Mechanism of Fibril Formation of A β16−22 PeptidesM. S. Li, P. H. Nguyen, D. Thirumalai 211
Multiple Beta-Sheet Molecular Dynamics of Two Abl-SH3 Domain PeptidesI. Liepina, S. Ventura, C. Czaplewski, A. Liwo 215
Parallelization of ECEPP/3 in SMMPJ. H. Meinke, U. H. E. Hansmann 219
The Role of Metals in Misfolding and Aggregation Processes:X-ray Spec-troscopy and Numerical SimulationsV. Minicozzi, S. Morante, G.C. Rossi, F. Stellato, K. Jansen 223
Folding and Aggregation of Proteins with Monte Carlo SimulationsS. Mohanty, U. H. E. Hansmann 227
Channel Transport and Molecular Motors without Brownian Ra tchetsW. Nadler, W. R. Bauer 231
Aggregate Size and Shape Distributions in Amyloid-β Peptide SolutionsL. Nagel-Steger, B. Demeler, D. Willbold 235
PSO@Autodock : A Novel Bio-Algorithm-Based Fast Flexible Docking Tool forVirtual ScreeningV. Namasivayam, R. Gunther 239
Efficient Parallel Tempering with Multiple Gaussian Modified EnsemblesM. Magiera, T. Neuhaus, U. H. E. Hansmann 243
iv

A Network-Based Approach to Biomolecular DynamicsF. Noe, J. C. Smith, Ch. Schutte 247
Steered Molecular Dynamics as a Virtual Atomic Force MicroscopeW. Nowak, S. Wasilewski, L. Peplowski 251
The Zinc-Finger Motif of T.thermophilus Ribosomal Protein S14 and the Func-tionality of E.coli RibosomesG. Papadopoulos, M. A. Xaplanteri, F. Leontiadou, Th. Choli-Papadopoulou, D. L.Kalpaxis 255
The Locally Enhanced Sampling Study of Large Ligands Diffusion inside En-zyme. Acrylonitrile and Acrylamide Journey in Nitrile Hydr ataseL. Peplowski, K. Kubiak, W. Nowak 259
Receptor Specific Forcefield: Improving Classical Forcefields with QuantumMechanical CalculationsH. E. Perez Sanchez, B. Fischer, H. Merlitz, K. Fukuzawa, W. Wenzel 263
Folding of Two Helical Peptide with Free Energy Methods and Molecular Dy-namicsA. Quintilla, W. Wenzel 267
Multiscale Simulation of Protein Cluster Dynamics – the Encounter ComplexJ. Schluttig, D. Alamanova, V. Helms, U. Schwarz 271
Aggregation of Fragments of the Islet Amyloid Polypeptide as a Phase Transi-tion: A Cluster AnalysisG. Singh, I. Brovchenko, A. Oleinikova, R. Winter 275
A Load Balanced Force-Domain Decomposition Algorithm for Parallel Molec-ular Dynamics SimulationsG. Sutmann, F. Janoschek 279
Forcefield Validation with the Rosetta Protein Decoy SetA. Verma, W. Wenzel 283
Knots in Macromolecular Systems: Concepts and ChallengesP. Virnau 287
Steered Classical and Quantum Path-Integral Molecular Dynamics Simula-tions of Strongly Coupled Protons Motions in PorphyceneŁ. Walewski, P. Bała, B. Lesyng 291
Side-Chain Ordering in HomopolymersY. Wei, W. Nadler, U. H. E. Hansmann 297
v

Dihedral Angle Patterns in Coil Regions of Protein StructuresO. Zimmermann, U. H. E. Hansmann 301
Workshop Program 305
List of Participants 309
vi

The Slip-Length Effects in Molecular Dynamics ofBead-Like Models of Proteins
Piotr Szymczak1 and Marek Cieplak2
1 Institute of Theoretical PhysicsWarsaw University
00-681 Warsaw, ul. Hoza 69, PolandE-mail: [email protected]
2 Institute of Physics, Polish Academy of Sciences02-668 Warsaw, Al. Lotnikow 32/46, Poland
E-mail: [email protected]
We explore the role of the slip- or no-slip boundary condition for beads representing hydropho-bic and hydrophylic amino acids in coarse grained models of proteins with an implicit solvent.The nature of the boundary conditions affects both the hydrodynamic friction forces and theLangevin noise term. We find that various large conformational changes in model proteins,such as folding and streching, are overall fairly stable against making the noise inhomogeneousin this way. However, there are noticeable differences in the scenarios of the processes.
1 Introduction
Coarse-grained models of proteins appear to play an increasingly important role in molecu-lar dynamics studies of large conformational changes in proteins, especially when it comesto big proteins and their complexes. These models allow one to access time scales whichare orders of magnitude longer than those available in all-atom simulations. Among thecoarse-grained models, the Go-like implementations1 link the properties of a protein di-rectly to its native geometry and are probably the easiest touse. In the simplest versionof a Go-like model2–4 the protein is represented by its Cα atoms and the effective Cα–Cα
contact potentials are used with minima at the experimentally established distances in thenative state whereas non-native contacts are usually represented by hard core repulsion inorder to prevent entanglements. Another term in the Hamiltonian takes care of the localstiffness of the backbone either by introducing biases in the bond and dihedral angles5 orby favoring native senses of local chiralities6. Here, we choose the latter.
This description has also to be augmented by interactions with an implicit solventwhich acts as a thermostat and imposes fluctuational forces on the protein. A commonchoice2, 7–9 is to take the Lennard-Jones potential for the interactionsin the native contactsand to account for thermal and hydrodynamic friction forcesusing Langevin dynamics.The equation of motion for the i’th amino acid reads then
miri = −γiri + Fci + Γi . (1)
whereFci is the net force due to the molecular potentials,γi is the friction coefficient and
Γi is a white noise term with the variance obeying〈Γi(t)Γj(t′)〉 = 2kBTγiδ(t − t′)Iδij
whereI is the identity matrix andkB is the Boltzmann constant.The folding and unfolding properties of such a system clearly depend on the native
geometry. But how important are other parameters in this model? Folding is not affected
1

by the precise choice of the contact potential between aminoacidsi and j and in this
respect the Lennard-Jones potential,4ǫ
[
(
σij
rij
)12
−(
σij
rij
)6]
, is almost undistinguishable
from, say, the 10-12 potential12. As to the amplitude,ǫ, of the potential, assuming it to beuniform appears to be optimal since other models correlate with the experimental resultson stretching worse13.
We now consider other parameters in the model. Obviously, the values of the masses,mi, of the amino acids affect the equations of motion for the individual beads. We havefound, however, that using a uniform massmi = m (wherem is a typical amino acid massm ≈ 2 × 10⁻²²g) does not affect the folding times in any noticeable manner10. This isconsistent with both the overall coarse-grained characterof the Go model and the fact thatthe motion is considered in the overdamped regime.
In this paper, we explore the effects of making the damping parametrγ non-uniform.In general, its value depends on the amino acid, especially on its size and position on thehydrophobicity scale. According to the classical Stokes equation, the friction coefficientis given byγ = 6πηa , wherea is the hydrodynamic radius of the bead andη - theviscosity of the solvent. This formula actually applies when no-slip boundary conditionsare in effect. However, the details of molecular interaction at the microscale determinethe nature of boundary conditions used in a continuum description of the drag force. Inparticular, hydrophobicity of the surface at the molecularscale results in an increased sliplength16, 17. In order to account for the slip effects, Stokes’s law may berewritten as18
γ = cπηa wherec is a constant determined by the choice of boundary conditions at itssurface. The limiting cases are 6 for no-slip and 4 for perfect slip boundary conditions. Tostudy the possible impact of friction nonuniformity due to the hydrophobicity we analyzea model, in which all hydrophobic aminoacids are supposed tomove under the perfectslip conditions (c=4) whereas for hydrophilic aminoacids, no-slip boundary conditions areassumed to hold (c=6). Thus in the simplest division of amino acids into two classes onewould have two possible values ofγ. To some extent, hydrophobicity effects are alreadyimplicit in the native geometry and, therefore, in the contact potentials. Here, however, wefocus on the impact of the non-uniform frictional forces andLangevin noise.
Unlike the masses, the values ofγ are relevant in the overdamped regime so one mightexpect sensitivity to their choices. We demonstrate, however, that this sensitivity is weak.We consider several conformational processes in a protein:folding, stretching at a constantvelocity, stretching at a constant force, and stretching bya uniform fluid flow. All detailsof the molecular dynamics simulations are as described in ref.9, including the criteria forselecting native contacts, and the time unit,τ , is of order of a nanosecond19, 20. We find thata non-uniformγ affects the folding times and folding scenarios. It affectsthe stretchingby fluid flow, but not the set of metastable conformations. Finally, it essentially doesnot influence stretching at constant speed, but delays rupture by a constant force. As anillustration, we focus on ubiquitin (the Protein Data Bank code 1ubq) and crambin (1crn).Following ref.15 the residues Ala, Val, Cys, Ile, Leu, Met, Phe, Tyr, and Trp are consideredhydrophobic and the remaining as hydrophylic. The averagec factor inγ is 0.84 and 0.89of the uniform no-slip value for crambin and ubiquitn respectively.
2

2 Folding
When studying folding, we monitor establishment of contacts starting from an unfoldedstate with no contacts. A contact between aminoacidsi and j is said to be establishedwhen the corresponding value of the distance between them,rij , crosses the thresholdvalue of1.5σij (which is close to the inflection point of the Lennard-Jones potential) forthe first time. Folding is considered to be achieved when all contacts are established simul-taneously. The folding time,tfold, of the protein is then determined as a median value in aset of many trajectories.
The kinetics of folding can be quantified with the use of the so-called scenario dia-grams8 in which one plots an average time to establish a contact against the contact order,i.e., against the sequential distance,|j − i|, between the amino acids that form a nativecontact. Figures 1 and 2 compare the folding scenarios for the Go model with uniformγ tothe nonuniform case for ubiquitin and crambin respectively. Making comparisons requiresintroduction of time scaling factors to account for different average values ofγ in the mod-els. It has been established that, in the overdamped regime,folding times vary linearly withγ19, 2, 9 in the uniform model. By introducing a set of hydrophobic aminoacids with lowerγ values we are effectively decreasing the mean friction coefficient, by 16% in crambin,which results in a reduced folding time. This reduction is observed in Figure 1 (although,instead of the 16%, the observed decrease in folding times isonly by∼ 11%). Moreover,in addition to this overall shift, there are some finer differences between the scenarios,the most notable of which is the delay in formation of the longest ranged contacts in thenon-uniform model (cf. the inset of Figure 1).
Figure 1. The dependence oftfold onT for uniform (open circles) and nonuniform (solid circles) friction alongthe chain. The data points are based on at least 200 trajectories and are gathered at the optimal temperature forfolding – 0.3ǫ/kB . The inset shows the similarly denoted average time intervals needed to establish contacts ata sequential distance|j − i| for the first time. The uniform-case data points are reduced by 16% to account forthe shift in< γ >.
3

Figure 2 shows the folding scenario diagram for ubiquitin. It is seen that the non-uniformity in the noise affects essentially the whole scenario, not only at large|j − i| as incrambin, even if one accounts for the shift in< γ >. The optimal folding time decreasesfrom 781 to 693τ in this case.
Figure 2. The folding scenario diagram for ubiquitin. The symbols used are as in Figure 1. The uniform-casedata points are reduced by 12% to account for the shift in< γ >. The inset correlates the nonuniform-case times,tn, to establish a contact with the uniform, or homogeneous, case,th. The timesth are not scaled and are seento be generally larger thantn.
3 Stretching
Next, we consider mechanical stretching of proteins. Figure 3, for ubiquitin, shows thatstretching at constant speed results in a force of resistance, F , that varies only in smalldetails between the uniform and non-uniform models. The force is shown against thedisplacement,d, of a spring that is attached to a terminus of the protein on one end andmoves with a speed of 0.005A/τ at the other end10. It should be noted that, even in theuniformγ case, theF −d curves depend onγ very little10 and, therefore, we do not expectto see any systematic shifts with a changing< γ >.
When stretching protein at constant force21, 22, one applies the stretching force to theprotein terminus and monitors the end-to-end distance,L. The kinetics of the processmay be quantified by determining statistics of the unfoldingtimes23, 21 and by using thescenario diagrams23. Here, we consider the latter. In the unfolding diagrams, one showswhen, on average, a contact at the sequential distance|j − i| is broken for the last time(i.e., it crossed the distance od 1.5σij for good). Figure 4 shows the unfolding scenariosfor ubiquitin. It is seen that the order of rupturing events does not change significantlywhen friction becomes nonuniform. However the specific times of the events get shiftednoticeably: lack of uniformity inγ delays rupture because a local strengthening in the
4

Figure 3. Single-trajectory force-extension curves for the ubiquitin unfolding at a constant speed for uniform(dotted line) and non-uniform (solid line) friction along the chain. The biggest differences are seen around thethird force peak.
Figure 4. Unfolding scenarios at a constant large force for ubiquitin. The open and solid symbols correspondto the uniform and non-uniform friction respectively. The uniform system shown in this figure hasγ equal to< γ > of the non-uniform system. The data points are based on 500 trajectories. The inset on the left showsthe histograms of the unfolding times –P (t) is normalized to 50. The inset on the right shows the average
normalized end-to-end length,L′ =L−Lf
Lu−LfwhereLf andLu stand for the folded and unfolded end-to-end
distances, respectively. In both insets, the dotted (solid) line corresponds to the uniform (non-uniform) system.
damping force generates pinning centers. In order to demonstrate it in a clean fashion,we do not perform any rescaling of unfolding times, but instead compare the non-uniform
5
system to a uniform one in whichγ is reduced by 21% . In this way,< γ > in bothsystems match. The insets of Figure 4 demonstrate that in thecase of nonuniform frictionthe distribution of unfolding times has fatter tail and thatthe sigmoidal trajectory-averagedend-to-end distance acquires larger values at longer times. Both facts are consistent withthe emergence of the delays seen in the scenario diagram.
Finally, we consider stretching of a single protein in a uniform flow through drag onindividual beads (amino acids). Although the process has not yet been realized experi-mentally, the simulations24–26 suggest that uniform flow unfolding leads to a richer set ofmetastable conformations than the constant force pulling and thus may offer potentiallywider diagnostic tools to investigate structure of proteins compared to experiments basedon the atomic force microscopy.
Note that in this case makingγi nonuniform along the chain results in a change in anet hydrodynamic force acting on a protein which is equal to (when one neglects hydro-dynamic interactions)F =
∑Ni=1 γiU whereU is the flow velocity. Thus a reduction in
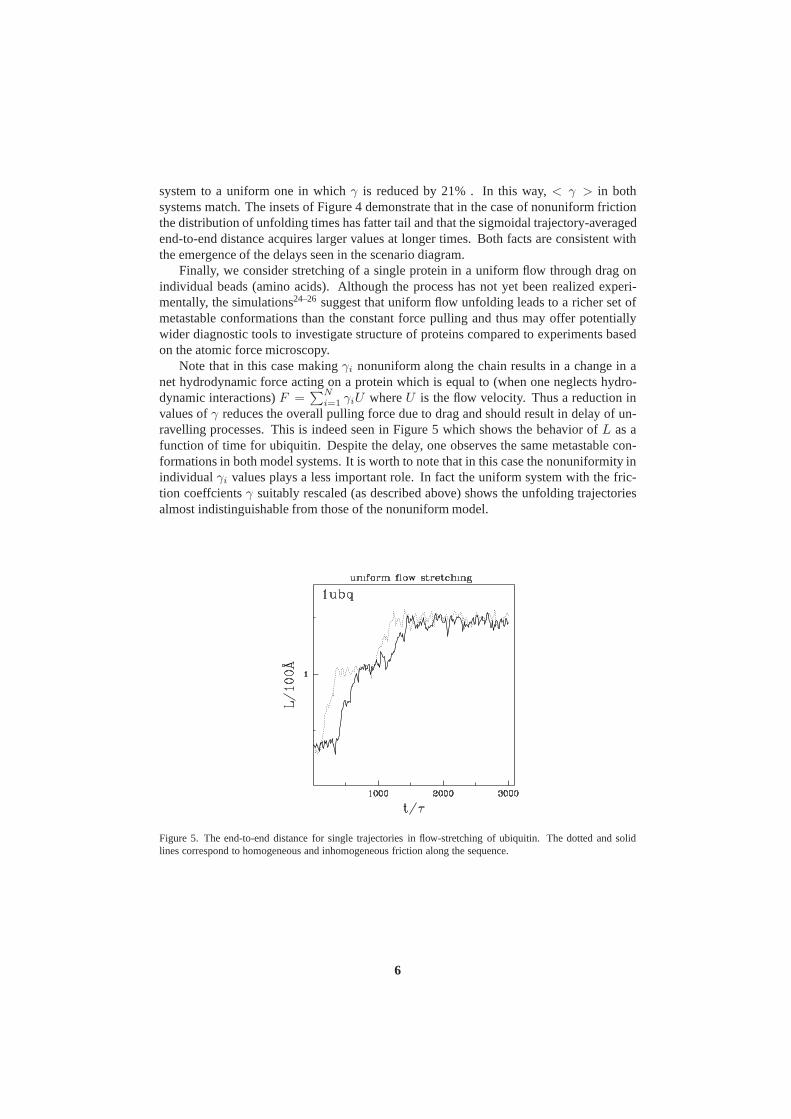
values ofγ reduces the overall pulling force due to drag and should result in delay of un-ravelling processes. This is indeed seen in Figure 5 which shows the behavior ofL as afunction of time for ubiquitin. Despite the delay, one observes the same metastable con-formations in both model systems. It is worth to note that in this case the nonuniformity inindividualγi values plays a less important role. In fact the uniform system with the fric-tion coeffcientsγ suitably rescaled (as described above) shows the unfoldingtrajectoriesalmost indistinguishable from those of the nonuniform model.
Figure 5. The end-to-end distance for single trajectories in flow-stretching of ubiquitin. The dotted and solidlines correspond to homogeneous and inhomogeneous friction along the sequence.
6

Acknowledgements
This work was funded by the European program IP NaPa through Warsaw University ofTechnology.
References
1. S. Takada,Proc. Natl. Acad. Sci. (USA)96, 11698-11700, 1999.2. T. X. Hoang and M. Cieplak,J. Chem. Phys.112, 6851-6862, 2000.3. J. Karanicolas and C. L. Brooks III,Prot. Sci.11, 2351-2361, 2002.4. J. I. Sulkowska and M. Cieplak,J. Phys.: Cond. Mat.19, 283201, 2007.5. C. Clementi, H. Nymeyer, and J. N. Onuchic,J. Mol. Biol. 298, 937, 2000.6. J. I. Kwiecinska and M. Cieplak.J. Phys.: Cond. Mat.17, S1565-S1580, 2005.7. M. Cieplak and T. X. Hoang,J. Biol. Phys.26, 273-294, 2000.8. T. X. Hoang and M. Cieplak,J. Chem. Phys.113, 8319-8328, 2001.9. M. Cieplak and T. X. Hoang,Biophys. J.84, 475-488, 2003.
10. M. Cieplak, T. X. Hoang, and M. O. Robbins,Proteins: Struct. Funct. Bio.56,285-297, 2004.
11. J. Tsai, R. Taylor, C. Chothia, and M. Gerstein,J. Mol. Biol. 290, 253-266, 1999.12. M. Cieplak and T. X. Hoang,Physica A330, 195-205, 2003.13. J. I. Sułkowska and M. Cieplak (submitted).14. D. K. Klimov and D. Thirumalai,Phys. Rev. Lett.79, 317-320, 1997.15. O. D. Monera, T. J. Sereda, N. E. Zhou , C. M. Kay and R. S. Hodges J. Pept. Sci.1,
319-329, 2004.16. M. Cieplak, J. Koplik, J. R. Banavar,Phys. Rev. Lett.86, 803, 2001.17. L. Bocquet and J-L. Barrat,Soft Matter, DOI: 10.1039/b616490k, 2007.18. J. R. Schmidt and J. L. Skinnera J. Chem. Phys.119, 8062-8068, 2004.19. T. Veitshans, D. Klimov, and D. Thirumalai,Folding Des.2, 1-22, 1997.20. P. Szymczak and M. Cieplak,J. Chem. Phys.125, 164903, 2006.21. J. M. Fernandez and H. Li,Science, 303, 1674, 2004.22. M. Schlierf, H. Li, J. M. FernandezProc. Natl. Acad. Sci (USA)101, 7299, 2004.23. P. Szymczak and M. Cieplak,J. Phys.: Cond. Mat.18, L21-L28, 2006.24. A. Lemak, J. R. Lepock, and J. Z. Y. Chen,Proteins: Structure, Function and Genetics
51, 224, 2003.25. A. Lemak, J. R. Lepock, J. Z. Y. Chen,Phys. Rev. E67, 031910, 2003.26. P. Szymczak and M. Cieplak,J. Chem. Phys125, 164903, 2006.
7


Advances in De Novo Protein Design
Christodoulos A. Floudas1, Ho Ki Fung1, and Martin S. Taylor 2
1 Department of Chemical Engineering,Princeton University, Princeton, NJ 08540
E-mail: [email protected]
2 School of Medicine,Johns Hopkins University, Baltimore, MD 21205
E-mail: [email protected]
A new de novo protein design framework and its applications to the redesign of compstatin,human beta defensin-2, and the C-terminal analogs of Complement 3a is presented.
1 Introduction
De novo protein design searches for amino acid sequences that are compatible with athree-dimensional protein backbone template. Traditionally the backbone coordinates weretreated as fixed in order to reduce the search space and make the design problem tractable.However, this is a highly questionable assumption as proteins are known to exhibit back-bone flexibility. In de novo design, backbone flexibility wasincorporated through eitherthe consideration of multiple backbones with sequence search performed on each of themunder the fixed template assumption, or the parameterization of backbone16. Recentlywe have developed a novel framework which performs de novo design on a truly flexiblebackbone template, which is defined by continuous Cα-Cα distances and dihedral anglesbetween upper and lower bounds, through NMR structure refinement.
2 Our De Novo Protein Design Framework
Our two-stage de novo protein design framework not only selects and ranks amino acidsequences for a particular fold using a novel integer linearprogramming (ILP) model, butalso validates the specificity to the fold for these sequences based on the full-atomisticforcefield AMBER1. The two stages are outlined as below:
2.1 Stage One: In Silico Sequence Selection
The ILP model we use for sequence selection into a single template structure, which is themost computationally efficient one among13 equivalent formulations we studied9, takesthe form:
9

minyj
i ,ylk
∑ni=1
∑mi
j=1
∑nk=i+1
∑mk
l=1Ejlik(xi, xk)wjl
ik
subject to∑mi
j=1 yji = 1 ∀ i
∑mi
j=1 wjlik = yl
k ∀ i, k > i, l (1)∑mk
l=1 wjlik = yj
i ∀ i, k > i, j
yji , y
lk , w
jlik = 0 − 1 ∀ i, j, k > i, l
Set i = 1, . . . , n defines the number of residue positions along the template. At eachpositioni there can be a set of mutations represented byji = 1, . . . ,mi, where for thegeneral casemi = 20∀i. The equivalent setsk ≡ i and l ≡ j are defined, andk > iis required to represent all unique pairwise interactions.Binary variablesyj
i andylk are
introduced to indicate the possible mutations at a given position. Specifically, variableyj
i (ylk) will be one if positioni(k) is occupied by amino acidj(l), and zero otherwise.
The composition constraints require that there is exactly one type of amino acid at eachposition. The pairwise energy interaction parametersEjl
ik were empirically derived bysolving a linear programming parameter estimation problem, which restricts the low energyhigh resolution decoys for a large training set of proteins to be ranked energetically lessfavorable than their native conformations2.
Besides the basic model (1), we also developed a weighted average model and a binarydistance bin model10 for de novo design based on a flexible template with multiple crystalor solution structures.
2.2 Stage Two: Approximate Method for Fold Validation
Driven by the full atomistic forcefield AMBER1, simulated annealing calculations are per-formed for an ensemble of several hundred random structuresgenerated for each sequencefrom stage one using CYANA 2.13, 4 within the upper and lower bounds on Cα-Cα dis-tances and dihedral angles input by the user. This feature allows our framework to observetrue backbone flexibility5. The TINKER package6 is subsequently used for local energyminimization of these conformers. A fold specificity factoris finally computed for eachsequence using the following equation:
fspecificity =P
i∈new sequence conformersexp[−βEi]P
i∈native sequence conformersexp[−βEi](2)
3 Case Studies
3.1 Compstatin
Compstatin (PDB code: 1A1P) is a synthetic13-residue cyclic peptide that inhibits thecleavage of C3 to C3a and C3b in the human complement system and thus hinders com-plement activation. It is a novel drug candidate for treating inappropriate complement ac-tivation that has shown highly promising results in numerous pre-clinical trials conductedrecently. The de novo design on compstatin is aimed at acquiring the sequences for the best
10
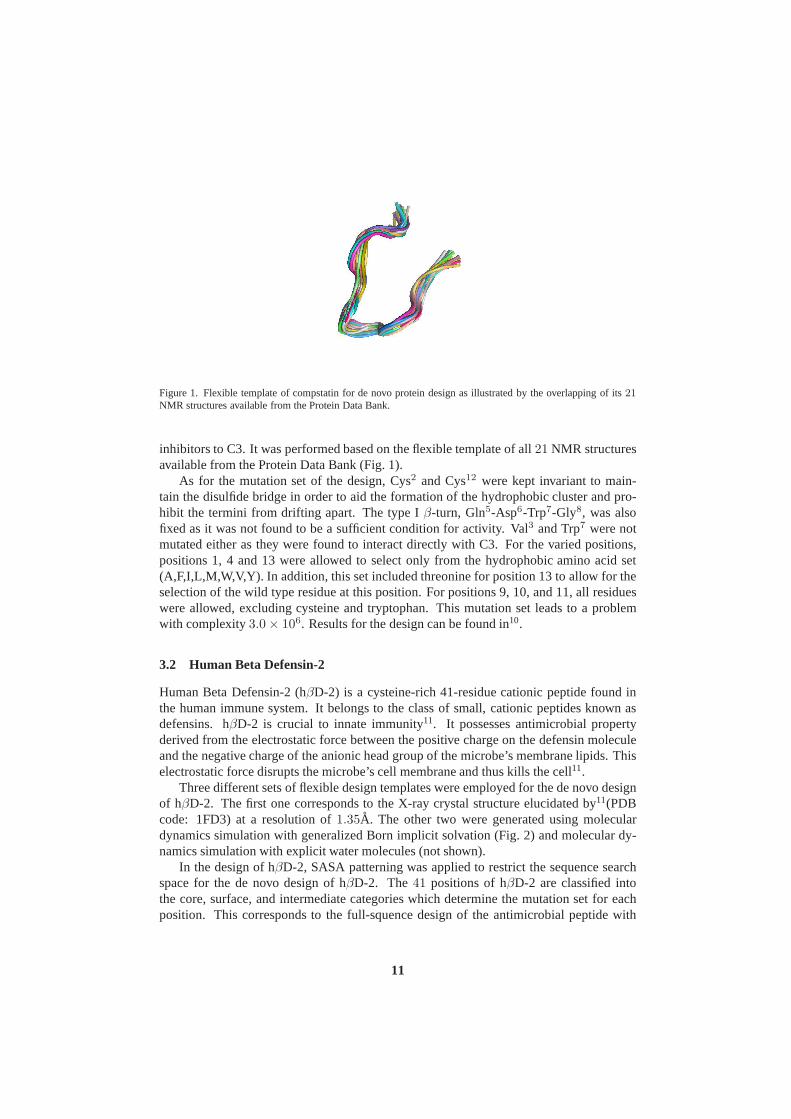
Figure 1. Flexible template of compstatin for de novo protein design as illustrated by the overlapping of its21NMR structures available from the Protein Data Bank.
inhibitors to C3. It was performed based on the flexible template of all21 NMR structuresavailable from the Protein Data Bank (Fig. 1).
As for the mutation set of the design, Cys2 and Cys12 were kept invariant to main-tain the disulfide bridge in order to aid the formation of the hydrophobic cluster and pro-hibit the termini from drifting apart. The type Iβ-turn, Gln5-Asp6-Trp7-Gly8, was alsofixed as it was not found to be a sufficient condition for activity. Val3 and Trp7 were notmutated either as they were found to interact directly with C3. For the varied positions,positions 1, 4 and 13 were allowed to select only from the hydrophobic amino acid set(A,F,I,L,M,W,V,Y). In addition, this set included threonine for position 13 to allow for theselection of the wild type residue at this position. For positions 9, 10, and 11, all residueswere allowed, excluding cysteine and tryptophan. This mutation set leads to a problemwith complexity3.0 × 106. Results for the design can be found in10.
3.2 Human Beta Defensin-2
Human Beta Defensin-2 (hβD-2) is a cysteine-rich 41-residue cationic peptide found inthe human immune system. It belongs to the class of small, cationic peptides known asdefensins. hβD-2 is crucial to innate immunity11. It possesses antimicrobial propertyderived from the electrostatic force between the positive charge on the defensin moleculeand the negative charge of the anionic head group of the microbe’s membrane lipids. Thiselectrostatic force disrupts the microbe’s cell membrane and thus kills the cell11.
Three different sets of flexible design templates were employed for the de novo designof hβD-2. The first one corresponds to the X-ray crystal structureelucidated by11(PDBcode: 1FD3) at a resolution of1.35A. The other two were generated using moleculardynamics simulation with generalized Born implicit solvation (Fig. 2) and molecular dy-namics simulation with explicit water molecules (not shown).
In the design of hβD-2, SASA patterning was applied to restrict the sequence searchspace for the de novo design of hβD-2. The41 positions of hβD-2 are classified intothe core, surface, and intermediate categories which determine the mutation set for eachposition. This corresponds to the full-squence design of the antimicrobial peptide with
11

Figure 2. Overlay of the10 structures of human beta-defensin-2 used for the flexible design template from MDsimulations with the GB implicit solvation model. The structures are snapshots with1 ns increment.
problem complexity of6.40 × 1037.It should be noted that in the sequence selection stage, biological constraints, which
were obtained from a homology search using PSI-BLAST, were imposed to ensure certainconserved properties among the sequence solutions. The constraints added cover chargecharacteristics, hydrophobic content, and amino acid occurrence frequencies of the humanbeta defensin-2 homologs. Results for the de novo design canbe found in12.
3.3 Complement 3a
Complement 3a (C3a) is a77-residue small cationic peptide derived from the cleavage ofthe amino-terminus of theα-chain of complement component C3. It is a potent mediatorwhich controls the pro-inflammatory activities of the complement system13. Having smallmolecular size and high potency, C3a proves to be a strong candidate as a superior ther-apeutic agent. Our de novo design aims at obtaining a potential peptide-drug candidatebased on the C-terminal sequence of the C3a fragment of C3.
Like the design of human beta defensin-2, three different sets of flexible templates wereemployed. One corresponds to the single crystal structure elucidated by14, and the othertwo were generated using molecular dynamics simulations, one with the generalized Bornimplicit solvation model and the other with explicit water molecules (Fig. 3). The basicsequence selection model (1) was used for the single crystalstructure template, whereasboth the weighted average formulation and the binary distance bin formulation10 wereemployed for the flexible templates from molecular dynamicssimulation.
Table 1 shows the mutation set of the de novo design.Results of the de novo design are tabulated in15. Several15-residue peptides were se-
lected to be synthesized based on our predictions from the denovo design framework. Thebest sequence was experimentally validated to be close in performance to the superpotentpeptide synthesized by13 in Ca2+ mobilization assay.
12

Figure 3. Overlay of the10 structures of Complement 3a used for the flexible design template from MD simula-tions with the GB implicit solvation model.
Table 1. Mutation set ofin silico sequence selection of C3a.
Positions Native residue Allowed mutations63 L A,I,L,M,F,Y,W,V64 R all except C and P65 R R,N,D,Q,E,G,H,K,S,T66 Q R,N,D,Q,E,G,H,K,S,T67 H R,N,D,Q,E,G,H,K,S,T68 A all except C and P70 A R,N,D,Q,E,G,H,K,S,T71 S R,N,D,Q,E,G,H,K,S,T72 H R,N,D,Q,E,G,H,K,S,T
4 Conclusions
In this paper, we presented the advances in our de novo protein design models, as well asour predictions on compstatin, human beta defensin-2, and C3a.
Acknowledgments
CAF gratefully acknowledges support from the National Science Foundation, the NationalInstitutes of Health (R01 GM52032, R24 GM069736), and the USEnvironmental Protec-tion Agency (GAD R 832721-010). This work has not been reviewed by and does notrepresent the opinions of USEPA.
References
1. W. D. Cornell, P. Cieplak, C. I. Bayly, I. R. Gould, K. M. Merz, D. M. Ferguson,D. C. Spellmeyer, T. Fox, J. W. Caldwell, and P. A. Kollman,A 2nd Generation
13

Force-Field For The Simulation Of Proteins, Nucleic-Acids, And Organic-Molecules,J. Am. Chem. Soc.117, 5179–5197, 1995.
2. R. Rajgaria, S. R. McAllister, and C. A. Floudas,A Novel High Resolution Cα-Cα
Distance Dependent Force Field Based on a High Quality DecoySet, Proteins65,726–741, 2006.
3. P. Guntert, C. Mumenthaler, and K. Wuthrich,Torsion Angle Dynamics for NMRStructure Calculation with the New Program DYANA, J. Mol. Bio. 273, 283–298,1997.
4. P. Guntert,Automated NMR structure calculation with CYANA. Methods Mol Biol, J.Mol. Bio. 278, 353–378, 2004.
5. C. A. Floudas,Research Challenges, Opportunities and Synergism in Systems Engi-neering and Computational Biology, AIChE Journal51, 1872–1884, 2005.
6. J. Ponder,TINKER, software tools for molecular design. 1998.(Department of Bio-chemistry and Molecular Biophysics, Washington University School of Medicine: St.Louis, MO, 1998).
7. J. L. Klepeis, C. A. Floudas, D. Morikis, C. G. Tsokos, E. Argyropoulos, L. Spruce,and J. D. Lambris,Integrated Structural, Computational and Experimental Approachfor Lead Optimization: Deisgn of Compstatin Variants with Improved Activity, J. Am.Chem. Soc.125, 8422–8423, 2003.
8. J. L. Klepeis, C. A. Floudas, D. Morikis, C. G. Tsokos, and J. D. Lambris,Designof Peptide Analogs with Improved Activity using a Novel de novo Protein DesignApproach, Ind. Eng. Chem. Res.43, 3817–3826, 2004.
9. H. K. Fung, S. Rao, C. A. Floudas, O. Prokopyev, P. M. Pardalos, and F. Rendl,Computational Comparison Studies of Quadratic AssignmentLike Formulations forthe In Silico Sequence Selection Problem in De Novo Protein Design, J. Comb. Optim.10, 41–60, 2005.
10. H. K. Fung, M. S. Taylor, and C. A. Floudas,Novel Formulations for the Sequence Se-lection Problem in De Novo Protein Design with Flexible Templates, Optim. Methods& Software22, 51–71, 2007.
11. D. Hoover, K. Rajashankar, R. Blumenthal, A. Puri, J. Oppenheim, O. Chertov, andJ. Lubkowski,The Structure of Humanβ-Defensin-2 Shows Evidence of Higher OrderOligomeration, J. Biol. Chem.275, 32911–32918, 2000.
12. H. K. Fung, C. A. Floudas, M. S. Taylor, L. Zhang, and D. Morikis, Towards Full-Sequence De Novo Protein Design with Flexible Templates forHuman Beta-Defensin-2, Biophys. J., submitted for publication (2007).
13. J. A. Ember, N. L. Johansen, and T. E. Hugli,Designing Synthetic Superagonists ofC3a Anaphylatoxin, Biochemistry30, 3603–3612, 1991.
14. R. Huber, H. Scholze, E. P. Paques, and J. Deisenhofer,Crystal Structure Analysis andMolecular Model of Human C3a Anaphylatoxin, Hoppe-Seylers Z Physiol Chemie361, 1389–1399, 1980.
15. H. K. Fung, C. A. Floudas, M. S. Taylor, L. Zhang, and D. Morikis, RedesigningComplement 3a based on Flexible Templates from both X-ray Crystallography andMolecular Dynamics Simulation, in preparation (2007).
16. H. K. Fung, and C. A. Floudas,Computational De Novo Peptide and Protein Design:Rigid Template versus Flexible Templates, Curr. Protein & Peptide Sci., submitted forpublication (2007).
14

Chromatin Dynamics in silicio
Jorg Langowski
Division Biophysics of Macromolecules, German Cancer Research CenterIm Neuenheimer Feld 580, D-69120 Heidelberg, Germany
E-mail: [email protected]
The packing of the genomic DNA in the living cell is essentialfor its biological function. Whileindividual aspects of the genome architecture, such as DNA and nucleosome structure or thearrangement of chromosome territories are well studied, much information is missing for a uni-fied description of cellular DNA at all its structural levels. Computer modeling can contributeto such a description. We present here Monte-Carlo and Brownian dynamics simulations ofDNA and the chromatin fiber, using an elastic chain approximation for the DNA and a simplehard-core description for the histone proteins. The model allows for the prediction of possiblehigher-order chromatin structures and their mechanical properties. As examples, we show theunrolling of DNA from the histone core, the response of the 30nm chromatin fiber to mechan-ical stretching and possible regimes of stable and unstablepacking of chromatin.
Further, we show dynamics simulations of the nucleosome on the microsecond time scale, usinga new coarse-grained model. Finally, describing the chromatin fiber as an elastic chain, weimplement models for the transport of proteins in the cell nucleus, reproducing the anomaloussubdiffusion found experimentally.
1 Introduction
One of the major challenges in modern molecular and structural biology is the structuraland dynamical organization of the cell nucleus1. Genomic information is encoded intoDNA, a long filamentous macromolecule which is compacted into chromatin by its asso-ciation with histone proteins. Chromatin also forms a long flexible chain with a diameterof about 30 nm and constitutes about 5 - 10% of the total volumeof the nucleus. In everyhuman cell,6 × 109 base pairs of DNA – that is, a total length of about 2 meters – mustbe packed into a more or less spheroid nuclear volume about 10- 20µm in diameter. Thiscompaction must occur in such a way that the DNA molecule is still easily accessible to en-zymes acting on it, such as replication, transcription and repair machineries, or regulatoryfactors. In addition, more and more supramolecular entities are being identified, includingnucleoli, PML bodies, Cajal bodies, spliceosomes etc. thatfulfill important biological rolesin transcription, splicing, replication or repair mechanisms, but whose structural associa-tion with other parts of the nucleus is hardly understood. Important biological questions,such as the gene distribution inside the interphase nucleus, ’memory’ of chromosome po-sitions during cell division or the flexibility, accessibility of the folded chromatin chain,interaction of distant parts of the genome or the transport of nuclear factors to their bind-ing site can only be understood through a detailed description of the higher order foldingof the DNA molecule in the cell nucleus.
DNA organization in the cell is a phenomenon that needs to be described on manylength and time scales (Fig. 1). Such a multiscale modellingproblem must be approachedby some adequate approximation, in which we will have to define subunits of the moleculethat behave like rigid objects on the size and time scale considered. These objects inter-
15

Figure 1. Overview of time and length scales relevant for genome organization.
act through potentials that may in principle be derived fromthe interatomic force fields;however, in practice one mostly uses potentials that have been determined experimentally.
2 Polymer Chain Models for DNA and Chromatin
The motif of the ’linear elastic filament’ in genome organization is repeated on many lengthscales (Fig. 1): DNA, as well as the chromatin fiber and to someextent its higher orderstructures may be approximated by a flexible wormlike chain (WLC). Thus, we may de-velop models of DNA and the chromatin fiber based on a coarse-grained description usinga linear segmented chain. Segments are assumed to behave like rigid cylinders on the timeand length scale considered; they are connected by elastic joints, with bending, torsionaland stretching potentials approximated by Hookean springswith spring constants that areknown independently.a
2.1 Segmented Wormlike Chain
Fig. 2 schematizes a segmented chain geometry. A vectorsi defines the direction andlength of each segmenti, fi is a unit vector normal to the segment andgi is an auxiliary
a For DNA, the approximation of Hookean bending elasticity has recently been challenged by the finding thatshort DNA fragments have a cyclization probability much higher than expected for a homogeneously elasticwormlike chain2, and atomic force microscopy observations that sharp bendsoccur more frequently than expectedfor a Gaussian distribution of bending angles3.
16

vector that is used to take into account permanent bending ofthe DNA. The details of thischain geometry are given in4.
Figure 2. Section of a segmented polymer chain as used in the DNA and chromatin models described here.
2.2 Intersegment Interactions
Adjacent segments (i andi+1 in Fig. 2) interact with each other through bending, twistingand stretching potentials. Independent of the form of the local intersegment potential, theWLC approximation always holds for sufficiently long chains, as has recently been shownby Wiggins and Nelson5. Thus, if one does not consider tight local bends, the potentialsbetween adjacent segments can be approximated by Hookean springs. Furthermore, po-tentials must be defined for long-range interactions between non-neighboring segments: inthe case of ’naked’ DNA, this interaction is the electrostatic repulsion between the nega-tively charged sugar-phosphate backbones and can be described by a screened Coulombpotential4. If the DNA is associated with proteins as in the case of chromatin, the geom-etry of these complexes and their specific interaction must be taken into account. In thechromatin chain model developed by Wedemann et al.6, nucleosomes are approximatedby rigid ellipsoids and their interaction by a Gay-Berne potential (an anisotropic Lennard-Jones potential7).
2.2.1 Bending Rigidity
In the WLC model the length of the segments should be chosen well below thepersistencelengthLp, which is a measure of the bending flexibility of the chain molecule. It is definedas the correlation length of the direction of the chain measured along its contour:
〈~u (s) ~u (s+ s′)〉 = e−s/Lp (1)
17

Here~u (s) is a unit vector in the direction of the chain (ei in Fig. 2) ands resp. s’ isthe position along the chain contour, the angular brackets indicating the average over allpositions and chain conformations. Molecules shorter thanLp behave approximately likea rigid rod, while longer chains show significant internal flexibility.
The bending elasticity A - the energy required to bend a polymer segment of unit lengththrough an angle of 1 radian - is related to the persistence length by Lp = A/kBT, kB beingBoltzmann’s constant and T the absolute temperature. Thus,the energy required to bendtwo segments of the chain of lengthl by an angleθ with respect to one another is:
Eb =kBT
2
Lp
lθ2 (2)
For DNA, Lp has been determined in a number of experiments (for a compilation, see[2]). While some uncertainties remain as regards the value at very high or low salt concen-trations, the existing data agree on a consensus value of Lp = 45-50 nm (132-147 bp) atintermediate ionic strengths (10-100 mM NaCl and/or 0.1-10µM Mg2+). For high valuesof θ, the potential may deviate from the simple harmonic form (see footnote a and ref.3).
2.2.2 Torsional Rigidity
The torsional rigidity C, defined as the energy required to twist a polymer segment of unitlength through an angle of 1 radian, may be related in an analogous way to atorsionalpersistence lengthLT , defined as the correlation of a vector normal to the chain axis andwith fixed orientation relative to the molecular structure of the polymer chain. The torsionalrigidity C has been measured by various techniques, including fluorescence polarizationanisotropy decay8–10 and DNA cyclization11–13, and the published values converge on avalue of LT = 65 nm (191 bp).
2.2.3 Stretching Rigidity
The stretching elasticity of DNA has been measured by singlemolecule experiments14, 15
and also calculated by molecular dynamics simulations16, 17. The stretching modulusσ ofDNA is about 1500 pN, whereσ = F · L0/∆L (∆L being the extension of a chain oflengthL0 by the forceF ). The stretching energy of a segment of lengthl that is stretchedby ∆l is:
Estr =1
2
σ
l∆l2 (3)
DNA stretching does not play a significant role in chromatin structural transitions, sincemuch smaller forces are already causing large distortions of the 30 nm fiber (see below).
2.2.4 Intrachain Interactions
The average DNA helix diameter used in modeling applications such as the ones describedhere includes the diameter of the atomic-scale B-DNA structure and – approximately –the thickness of the hydration shell and ion layer closest tothe double helix. Both for thecalculation of the electrostatic potential and the hydrodynamic properties of DNA (i.e. thefriction coefficient of the helix for viscous drag) a helix diameter of 2.4 nm describes the
18

chain best18–20, 4. The choice of this parameter is supported by the results of chain knot-ting21 or catenation22, as well as light scattering23 and neutron scattering19 experiments.
As pointed out in4, 24 DNA intrachain electrostatic repulsion can be adequately de-scribed by a Debye-Huckel electrostatic potential between two uniformly charged non-adjacent segments (i, j) in a 1-1 salt solution:
E(e)ij =
ν2
D
∫∫
dλidλje−κrij
rij(4)
Here, the integration is done along the two segments,λi andλj are the distances fromthe segment beginnings,rij is the distance between the current positions at the segmentsto which the integration parametersλi andλj correspond;κ is the inverse of the Debyelength, so thatκ2 = 8πe2I/kBTD, I is the ionic strength,e the proton charge,D thedielectric constant of water,ν the linear charge density which for DNA is equal toνDNA =−2e/∆ where∆ = 0.34 nm is the distance between base pairs. More details as to thenormalization of the linear charge density etc. have been given in our earlier paper4.
Figure 3. Example of a Monte-Carlo equilibrated structure of a chromatin fiber consisting of 100 nucleosomes(red), linker segments (blue) of repeat length l = 205 nm.
3 Monte-Carlo Model of the Chromatin Chain
As an example of the application of a polymer chain model to genome structure, we de-scribe here the simulation of nanomechanical properties ofthe chromatin fiber by a Monte-Carlo model. The flexibility of the chromatin fiber has been measured in a set of exper-iments, either by relating the spatial distance of markers on the DNA to their genomicdistance25–27 or by direct measurements of cyclization probabilities28, 29. The persistenceobtained cover a large range from unrealistically low values of about 30 nm28, 29 to valuesof up to 200 nm26. In our recent work30, we show that depending on the local structure ofthe DNA on the nucleosome, the nucleosome repeat and the presence or absence of linkerhistone H1, this wide range of persistence lengths may be reproduced.
In the model the chromatin fiber is approximated as a flexible polymer chain consistingof rigid ellipsoidal disks, 11 nm in diameter and 5.5 nm in height. These disks are con-nected by linker DNA, represented by two cylindrical segments. Incoming and outgoing
19

linker DNA are set 3.1 nm apart of each other. This geometry used is essentially the “twoangle” model developed earlier by Woodcock et al.31.
Figure 4. Persistence length of modelled 30 nm chromatin fibers with different nucleosomal repeats in the pres-ence and absence of linker histone H1. The twisting angle between adjacent nucleosomes is adjusted to thecanonical value of 360 per 10.5 bp. The persistence lengths of fibers with linker histone (closed symbols,dashed lines) are higher than for fibers without linker histone (open symbols, solid lines). This effect is strongerfor short repeats and weakens with increasing repeat length. The peaks show that the twisting angle stronglyinfluences the stiffness of the fiber, leading to a non-monotonous variation of Lp with nucleosome repeat.
A typical conformation of a 100 nucleosome chain after 3.106 MC steps is shown inFig. 3. Simulations were done with either a condensed fiber asa starting conformation oran initial conformation where all segments are ordered in a straight line.
The bending and stretching rigidities of the modelled chromatin fiber are then com-puted over the trajectory from the fluctuations in the bending angle or the fluctuation inthe overall fiber length. The results show that the bending and the stretching stiffness ofthe chromatin fiber strongly depend on the local geometry of the nucleosome. Both thepersistence lengthLp , characterizing the bending stiffness of the fiber, and the stretch-ing modulusǫ, which describes the stretching stiffness of the fiber, decrease if either thelinker lengths or the opening angle are increased, or the twisting angle is reduced. Thisbehavior is independent of the presence of the linker histone H1. The latter decreases theopening angleα between the entry and exit of the linker DNA and as a result leads to amore condensed fiber structure for high salt concentrations32. This is in agreement withour simulations, since the presence of the linker histone-induced stem motif yields higherpersistence lengths thus stiffer fibers (Fig. 4).
The other major result of the simulation comes from comparing the persistence lengthof the modelled fibers to that of a hypothetical rod from a isotropic elastic material havingthe same stretching rigidity as the chromatin fiber. Such a rod would have a bending rigid-ity 4-10 times higher than that actually measured, or simulated here. Thus, the chromatinfiber is less resistant to bending than to stretching. This property of the chromatin fiberis important for its ability to condense and decondense, forexample to prevent or allowtranscriptional access. Chromatin fibers thus seem to be packed more easily via dense
20

loops than by a linear compression. The formation of such dense loops of hairpin struc-tures of interdigitated chromatin arrays has been recentlysuggested33, and some hairpinconformations could also be seen in our simulations (data not shown).
References
1. T. P. O’Brien, C. J. Bult, C. Cremer, M. Grunze, B. B. Knowles, J. Langowski, J. Mc-Nally, T. Pederson, J. C. Politz, A. Pombo, G. Schmahl, J. P. Spatz, and R. Van Driel,Genome function and nuclear architecture: from gene expression to nanoscience,Genome Res,13, no. 6, 1029–41, 2003.
2. T. E. Cloutier and J. Widom,Spontaneous sharp bending of double-stranded DNA,Molecular Cell,14, no. 3, 355–362, 2004.
3. P. A. Wiggins, T. Van der Heijden, F. Moreno-Herrero, A. Spakowitz, R. Phillips,J. Widom, C. Dekker, and P. C. Nelson,High flexibility of DNA on short length scalesprobed by atomic force microscopy, Nature Nanotechnology,1, no. 2, 137–141, 2006.
4. K. Klenin, H. Merlitz, and J. Langowski,A Brownian dynamics program for the simu-lation of linear and circular DNA and other wormlike chain polyelectrolytes, BiophysJ,74, no. 2 Pt 1, 780–788, 1998.
5. P. A. Wiggins and P. C. Nelson,Generalized theory of semiflexible polymers, PhysRev E Stat Nonlin Soft Matter Phys,73, no. 3 Pt 1, 031906, 2006.
6. G. Wedemann and J. Langowski,Computer simulation of the 30-nanometer chromatinfiber, Biophys J,82, no. 6, 2847–59., 2002.
7. J. G. Gay and B. J. Berne,Modification of the overlap potential to mimic a linearsite–site potential, Journal of Chemical Physics,74, 3316–3319, 1981.
8. M.D. Barkley and B.H. Zimm,Theory of twisting and bending of chain macro-molecules: analysis of the fluorescence depolarization of DNA, Journal of ChemicalPhysics,70, 2991–3007, 1979.
9. B. S. Fujimoto and J. M. Schurr,Dependence of the torsional rigidity of DNA on basecomposition, Nature,344, no. 6262, 175–7., 1990.
10. J.M. Schurr, B.S. Fujimoto, P. Wu, and L. Song, “Fluorescence studies of nucleicacids: dynamics, rigidities and structures.”, in: Topics in Fluorescence Spectroscopy,J.R. Lakowicz, (Ed.), vol. 3, pp. 137–229. Plenum Press, NewYork, 1992.
11. D Shore and R. L. Baldwin,Energetics of DNA twisting. I. Relation between twistand cyclization probability, Journal of Molecular Biology,179, 957–981, 1983.
12. D. S. Horowitz and J. C. Wang,Torsonal Rigidity of DNA and Length Dependence ofthe Free Energy of DNA Supercoiling., J. Mol. Biol.,173, 75–91, 1984.
13. W. H. Taylor and P. J. Hagerman,Application of the method of phage T4 DNA ligase-catalyzed ring-closure to the study of DNA structure I.NaCl-dependence of DNA flex-ibility and helical repeat., J. Mol. Biol.,212, 363–376, 1990.
14. P. Cluzel, A. Lebrun, C. Heller, R. Lavery, J.-L. Viovy, D. Chatenay, and F. Caron,DNA: An extensible molecule, Science,271, 792–794, 1996.
15. S. B. Smith, Y. Cui, and C. Bustamante,Overstretching B-DNA: the elastic responseof individual double-stranded and single-stranded DNA molecules, Science,271, no.5250, 795–799, 1996.
16. F. Lankas, J. Sponer, P. Hobza, and J. Langowski,Sequence-dependent Elastic Prop-erties of DNA, J Mol Biol, 299, no. 3, 695–709, 2000.
21

17. F. Lankas, Iii Te Cheatham, N. Spackova, P. Hobza, J. Langowski, and J. Sponer,Critical effect of the n2 amino group on structure, dynamics, and elasticity of DNApolypurine tracts, Biophys J,82, no. 5, 2592–609., 2002.
18. J. J. Delrow, J. A. Gebe, and J. M. Schurr,Comparison of hard-cylinder and screenedCoulomb interactions in the modeling of supercoiled DNAs, Biopolymers,42, no. 4,455–70, 1997.
19. M. Hammermann, N. Brun, K.V. Klenin, R. May, K. Toth, and J. Langowski,Salt-dependent DNA superhelix diameter studied by small angle neutron scattering mea-surements and Monte Carlo simulations, Biophys J,75, no. 6, 3057–3063, 1998.
20. K. V. Klenin, M. D. Frank-Kamenetskii, and J. Langowski,Modulation of intramolec-ular interactions in superhelical DNA by curved sequences:a Monte Carlo simulationstudy, Biophysical Journal,68, no. 1, 81–88, 1995.
21. V. V. Rybenkov, N. R. Cozzarelli, and A. V. Vologodskii,Probability of DNA knot-ting and the effective diameter of the DNA double helix, Proceedings of the NationalAcademy of Sciences of the USA,90, 5307–5311, 1993.
22. V.V. Rybenkov, A.V. Vologodskii, and N.R. Cozzarelli,The effect of ionic conditionson the conformations of supercoiled DNA .1. Sedimentation analysis, J Mol Biol, 267,no. 2, 299–311, 1997.
23. M. Hammermann, C. Steinmaier, H. Merlitz, U. Kapp, W. Waldeck, G. Chirico,and J. Langowski,Salt effects on the structure and internal dynamics of superheli-cal DNAs studied by light scattering and Brownian dynamics, Biophys J,73, no. 5,2674–87, 1997.
24. H. Merlitz, K. Rippe, K. V. Klenin, and J. Langowski,Looping dynamics of linearDNA molecules and the effect of DNA curvature: a study by Brownian dynamicssimulation, Biophysical Journal,74, no. 2 Pt 1, 773–779, 1998.
25. R. K. Sachs, G. van den Engh, B. Trask, H. Yokota, and J.E. Hearst,A random-walk/giant-loop model for interphase chromosomes, Proceedings of the NationalAcademy of Sciences of the USA,92, 2710–2714, 1995.
26. C. Mnkel, R. Eils, S. Dietzel, D. Zink, C. Mehring, G. Wedemann, T. Cremer, andJ. Langowski,Compartmentalization of interphase chromosomes observedin simula-tion and experiment, Journal of Molecular Biology,285, no. 3, 1053–1065, 1999.
27. K. Bystricky, P. Heun, L. Gehlen, J. Langowski, and S. M. Gasser,Long-range com-paction and flexibility of interphase chromatin in budding yeast analyzed by high-resolution imaging techniques, Proc Natl Acad Sci U S A,101, no. 47, 16495–500,2004.
28. L. Ringrose, S. Chabanis, P. O. Angrand, C. Woodroofe, and A. F. Stewart,Quanti-tative comparison of DNA looping in vitro and in vivo: chromatin increases effectiveDNA flexibility at short distances, The EMBO Journal,18, no. 23, 6630–6641, 1999.
29. J. Dekker, K. Rippe, M. Dekker, and N. Kleckner,Capturing Chromosome Confor-mation, Science,295, no. 5558, 1306–1311, 2002.
30. F. Aumann, F. Lankas, M. Caudron, and J. Langowski,Monte Carlo simulationof chromatin stretching, Physical Review E (Statistical, Nonlinear, and Soft MatterPhysics),73, no. 4, 041927, 2006.
31. C. L. Woodcock, S. A. Grigoryev, R. A. Horowitz, and N. Whitaker,A chromatinfolding model that incorporates linker variability generates fibers resembling the na-tive structures, Proceedings of the National Academy of Sciences of the USA,90, no.
22

19, 9021–9025, 1993.32. K. van Holde and J. Zlatanova,What determines the folding of the chromatin fiber,
Proceedings of the National Academy of Sciences of the USA,93, 10548–10555,1996.
33. S. A. Grigoryev,Keeping fingers crossed: heterochromatin spreading through inter-digitation of nucleosome arrays, Febs Letters,564, no. 1-2, 4–8, 2004.
23


Causality and Correlation Analyses of MolecularDynamics Simulation Data
Adam Gorecki1,2, Joanna Trylska2, and Bogdan Lesyng1
1 Department of Biophysics and CoE BioExploratorium, Faculty of Physics, University of WarsawZwirki i Wigury 93, 02-089 Warsaw, Poland
2 Interdisciplinary Centre for Mathematical and Computational Modelling, University of WarsawPawinskiego 5A, 02-106 Warsaw, Poland
E-mail: agorecki,joanna,[email protected]
The subject of this study is the application and tuning of existing statistical analysis methodsfor molecular dynamics (MD) data analysis. Special attention is focused on detecting causal-ity relationships (time precedence) between events in MD, based on time series derived fromtrajectories. The problems of time-series preprocessing,such as normalization and filtering,and the choise of the most appropriate causality detection method is discussed. Features andcharacteristics of two existing and widely applied methods: Directed Transfer Function3 andconventional Granger causality approaches2 are described. We suggest an adaptation of theconventional Granger method for MD analysis. The adapted Granger method is tested usingthe MD/SCC-DFTB simulation data of the proton transfer reaction in malonaldehyde4 and acoarse-grained MD simulation of HIV-1 protease5.
1 Introduction
Detecting causality relationships between conformational changes in biomolecular sys-tems simulated with molecular dynamics (MD) methods is of crucial importance for de-scribing their mechanisms and understanding the logic of their functioning. An attemptto approach this problem was presented in our recent study1. We followed the Grangercausality methodology2 and applied a Multi-Variate Autoregressive Model (MVAR) withDirected Transfer Function(DTF), which was used successfully in EEG time-series anal-yses3. However, the method still requires some tuning, and in thispresentation we dealmostly with a conventional Granger approach2. We analyse also two following problems -normalization of the data and the noise filtering.
2 The Causality Analysis Model
Classical correlation analysis detects linear coupling between variables at the same time butit cannot detect linear couplings with a time shift or nonlinear couplings. One of the moreadvanced solutions is the MVAR model, which can detect time-shifted linear couplings:
X(t) =
p∑
i=1
A(i)X(t − i) + E(t) (1)
where: X(t) = X1(t), . . . , Xk(t) - vector of analysedk variables at timet, calledalso channels;t − i ≡ t − i · dt - a notation for the time shift ofi steps backward;
25

A(i), i = 1, . . . , p - fitted MVAR coefficients, matrices ofk × k dimension;p - modelorder;E(t) - white noise vector ofk dimension.
TheA(i) are fitted to satisfy condition (1) and keepE(t) components,Ei(t), linearlyuncorrelated, with proper mean and standard deviation. Thestandard deviations ofEi(t)correspond to the white noise levels in each variable and determineA(i) estimation.
The raw MVAR coefficients are usually not representative forour purposes. Results ofthe MVAR fit usually depend on the model order (real signals donot satisfy a strict MVARmodel), they can be also different for subsets of time series. In our purposes the MVARmodel plays a role of a searching engine, not the system parametrization method.
Some time ago we tested1 a more comfortable representation of the MVAR analysisnamely, the Directed Transfer Method3. This method was designed for EEG analysis andit is based on the frequency representation of signal transmission, well optimized for linearsystems with a clear linear filter interpretation, and noiselevel independent. However,the method requires variables of the same units and a similarsignal type (such as electricpotentials recorded as EEG signals). It is sensitive to scaling variables and gives ambiguousresults for variables expressed in different units. This problem is very important in MD dataanalysis because MD simulation observables, such as distances, angles, combinations ofdifferent degrees of freedom, energies, etc., have different units. Normalization of variablesis connected with choosing the appropriate noise level for the rescaled variables, whichdetermines the MVAR fit.
In this study we test an older, but equivalent to DTF, model: the conventional Grangercausality2 approach. This method is based on comparing of the MVAR fit error with andwithout selected variable information. To estimate causal influence of Xj variable onvariableXi, we should select MVAR-model orderp, and perform the following MVAR fits.
From the fit for full variables setX(t) = X1(t), . . . , Xk(t)
X(t) =
p∑
i=1
A(i)X(t− i) + E(t), (2)
we compute the residual variance matrixV = 〈ET (t)E(t)〉.From the fit for variables set withXj excluded:
X(j)(t) = X1(t), ..., Xj−1(t), Xj+1(t), ..., Xk(t)
X(j)(t) =
p∑
i=1
A(j)(i)X(j)(t− i) + E(j)(t), (3)
we compute the residual variance matrix:V(j) = 〈(E(j)(t))T E(j)(t)〉.Note thatdimV = k × k anddimV(j) = k − 1 × k − 1.The causality measure forXj → Xi direction is defined as:
Jij = 1 − Vii
V(j)ii
∈ [0; 1]. (4)
TheJij matrix is usually asymmetric and represents the strength ofa delayed linearcoupling between pairs of variablesXj → Xi, where0 corresponds to no coupling,1 - toXi fully determined byXj with the linear relationship.
26

The conventional Granger method results are not sensitive to rescaling and unit choice,which results from the construction of this method. This feature is very important for ourapplications. Optional renormalization can be applied forbetter numerical MVAR fittingconvergence and accuracy.
3 The Conventional Granger Method - Examples of Applications
3.1 Malonaldehyde Molecular Dynamics Trajectory
Malonaldehyde molecule is shown in Fig.1a. The analysed trajectory was derived from acombined quantum/classical dynamics of the proton transfer between O1 and O2 oxygenatoms4, and contains 1000000 observations probed every 10 fs (every 10 steps of dynam-ics). Previous analyses show that the proton transfer is a cooperative reaction and the
a) b)
O2O1
H1
O1 O2
H1
c) d)X1 X2 X3
X1
X2
X3
1.00
0.01
0.03
0.01
1.00
0.00
0.03
0.00
1.00
X1 X2 X3
X1
X2
X3
1.00
0.00
0.58
0.00
1.00
0.00
0.48
0.00
1.00
e) f) g)
X1 X2
X3
Figure 1. Malonaldehyde example: a) the malonaldehyde molecule; b) relationships between values ofX1, X2, X3 variables in the same timet; c) classical correlation matrix for theX1, X2, X3 variables defined inEqn.5 ; d) the Granger causality matrixJij for theX1, X2, X3; e) causality diagram corresponding toJij withthe shown feedbackX1 ↔ X3; f,g) relationships between values of theX1, X3 variables with the time shift±1.
27

required condition for the proton hopping is the small O1 andO2 distance. We selectedfollowing variables for the causality search:
X1 = |O1O2|, X2 =|HO1| − |HO2||HO1| + |HO2|
, X3 = ( ~vO2 − ~vO1) · ~O1O2/|O1O2| (5)
TheX2 variable is called the ,,reaction coordinate” and in our example describes the rela-tive proton position. TheX3 variable is the projection of relative velocities of O1 and O2atoms on the ~O1O2 direction. Simple correlation matrix (Fig.1c) does not show any inter-esting correlation because the variables measured in the same moment are either indepen-dent or couplings are nonlinear (Fig. 1b). The Granger method applied to malonaldehydedata shows strong bidirectional causality relationship (feedback) between variablesX1 andX3. It is an example of existing of non-instant correlations between the spatial and velocitydegrees of freedom.For automatic detection of theX1 andX2 couplings, we need to applynonlinear and/or instant causality extensions of the conventional Granger approach.
3.2 HIV-1 Protease Molecular Dynamics Trajectory
We have analysed the coarse-grained dynamics trajectory ofHIV-1 protease (Fig.2a) per-formed in the NVE ensemble5. The trajectory contained 10000 frames, delayed by 10 ps.The conformation of the protein was represented by reduced variables: 10 PCA projectionsderived from the Essential Dynamics method7. No instant linear correlations between thevariables were seen in this parametrization because they are already included in the PCAeigenvectors. The Granger method detected only weak couplings (Fig.2b) and for the anal-ysis we have selected those withJij > 0.1 (diagram in Fig.2c).J16 is the largest elementin the first row, which indicates theX6 → X1 coupling. This coupling is strongly non-linear (Fig.2d) and difficult to detect by linear methods, but the Granger method detectedit as a result of some linear correlation. The coupled PCA motions are shown in Fig.2ef -the eigenvector corresponding toX1 is the most significant movement which characterizesthe flap opening. The second one, corresponding toX6, is also a component of flap move-ment. Both components change distance between the 17 and 39 residues of two symmetricchains. The movement inX6 direction is preceding theX1 flap opening movements, butthe Granger method detects it as not very important statistically. A similar correlation wasdescribed in the cited articles5, 6.
4 The Influence of Smoothing
Smoothing algorithms (e.g. Savitzky-Golay filter9), are usually based on linear filters. Theoutput signal at timet is a linear combination of input values over a window of times:X ′
i(t) =∑k=+k0
k=−k0c(k)Xi(t + k). Linear filtering of the signal obviously interferes with
the MVAR model; the MVAR model will detect filter parameters when run on a too denselyprobed data. In some cases, filtering can remove some noise from the signal, and can helpin detecting of the expected couplings. Sampling of the datafor the MVAR analysis shouldhave lower density than the window size used for the preceding smoothing operation.
We applied smoothing of the data by Savitzky-Golay polynomial filter9, with k0 = 4(then window was 9 frames long) and order of polynomial2, then probed data every 10steps. This operation doesn’t improve causal relations visibility.
28

a) b)X1 X2 X3 X4 X5 X6 X7 X8 X9 X10
X1
X2
X3
X4
X5
X6
X7
X8
X9
X10
1.00
0.00
0.03
0.00
0.06
0.04
0.00
0.00
0.00
0.01
0.00
1.00
0.00
0.13
0.00
0.00
0.08
0.04
0.00
0.00
0.02
0.00
1.00
0.00
0.08
0.10
0.00
0.00
0.00
0.02
0.00
0.08
0.00
1.00
0.00
0.00
0.01
0.01
0.01
0.00
0.01
0.00
0.04
0.00
1.00
0.03
0.00
0.00
0.00
0.00
0.11
0.00
0.06
0.00
0.06
1.00
0.00
0.00
0.00
0.02
0.00
0.06
0.00
0.00
0.00
0.00
1.00
0.00
0.04
0.00
0.00
0.02
0.00
0.02
0.00
0.00
0.01
1.00
0.04
0.00
0.00
0.00
0.00
0.01
0.00
0.00
0.03
0.03
1.00
0.00
0.01
0.00
0.01
0.00
0.00
0.01
0.00
0.00
0.00
1.00
c) d)
X3 X6 X1
X2 X4
e) f)
Figure 2. HIV-1 protease example: a) the ribbon model of HIV-1 PR homodimer; b) the Granger causality matrixJij for theX1, . . . , X10 variables (reduced coordinates which result from the projection of the MD coordinateson ten most significant PCA components); c) causality diagram corresponding toJij which shows causalityrelation for Jij ≥ 0.1 ; d) the relationshipX6 → X1 with the time shift of1 e,f) the PCA eigenvectors(movement directions) corresponding to theX1 andX6 projections, respectively. Motions occur from blue tored, and back.
29

5 Conclusions
We have been developing and applying two versions of the causality analyses: theMVAR/DTF and the conventional Granger approaches. MVAR/DTF was presented in1.This study deals mostly with the conventional Granger approach. We analysed MD simu-lation data of malonaldehyde and HIV-1 protease.
The conventional Granger method based on the Multi-VariateAutoregression Modelis a quite efficient tool for the molecular dynamic data analysis, because it is independenton normalization and can be applied for signal channels characterized with different units.We have been developing the generalization of this method for detecting of non-linearcouplings. For the studied examples prefiltering of the databefore the MVAR analysis didnot improve the sensitivity of the method in detecting the expected couplings. It interfereswith the MVAR and should be use with some care.
Acknowledgments
We would like to acknowledge R. KUS from the Department of Biomedical Physics forproviding his very fast MVAR calculation software, L. WALEWSKI of the Departmentof Biophysics of Warsaw University for providing the molecular dynamics trajectories ofproton transfer in the malonaldehyde molecule, V.TOZZINI for providing the moleculardynamics trajectories of HIV-1 protease. We are also grateful to M.KAMINSKI, R.KUSand K.BLINOWSKA from the Department of Biomedical Physics of Warsaw Universityfor helpful discussions and consultations on the applications of the MVAR and DTF meth-ods. The authors were supported by Warsaw University (115/E-343/ICM/BST-1076/2005).JT acknowledges support from University of Warsaw (115/30/E-343/S/2007/ICM BST1255), Polish Ministry of Science and Higher Education (3 T11F 005 30, 2006-2008),Fogarty International Center (NIH Research Grant # R03 TW07318) and Foundation forPolish Science. AG thanks Polish Ministry of Science and Higher Education (N202 07932/1841,2007-2008).
References
1. A. Gorecki, J. Trylska, B. Lesyng, Europhys. Let., 2006, 75, 503-509.2. C. W. J. Granger, Econometrica, 1969, 37, 424-438.3. K.J. Blinowska, R. Kus, M.J. Kaminski, Phys. Rev. E, 2004,70, 050902.4. L. Walewski, P. Bala, M. Elstner, Th. Frauenheim, B. Lesyng, Chem. Phys. Let.,
2004, 397, 45 1-458.5. V. Tozzini, J. Trylska, Chia-en Chang, J. A. McCammon, J. Struct. Biol., 2007, 157,
606-615.6. V. Tozzini, J. A. McCammon, Chem. Phys. Lett., 2005, 413:123-128.7. A.Amadei, A.B.M.Linssen, H.J.C.Berendsen, Proteins:Struct.Funct.Genet., 1993, 17,
412.8. R. Hegger, H. Kantz, and T. Schreiber, CHAOS 9,1999 , 413 .9. Numerical Recipes, chapter 14.8,http://www.nr.com.
30
Mesoscopic Dynamics with the UNRES Force Field – aTool for Studying the Kinetics and Thermodynamics of
Protein Folding
Adam Liwo1,2, Cezary Czaplewski1,2, Stanisław Ołdziej1,2, Maurizio Chinchio 2,Ana V. Rojas2,3,4, Mey Khalili 5, Mariusz Makowski1,2, Sebastian Kalinowski1,
Urszula Kozłowska2, Rajesh K. Murarka 2, and Harold A. Scheraga2
1 Faculty of Chemistry, University of Gdansk, Sobieskiego 18, 80-952 Gdansk, PolandE-mail: adam, czarek, stan, momo, [email protected]
2 Baker Laboratory of Chemistry, Cornell University, Ithaca, NY 14843-1301, USAE-mail: m.chinchio, uad2, rkm25, [email protected]
3 Department of Physics and Astronomy and
4 Center for Computation and Technology, Louisiana State University,Baton Rouge, LA 70803-4001, USA
E-mail: [email protected]
5 University Chemical Laboratories, Lensfield Road, Cambridge, UK CB2 1EWE-mail: [email protected]
All-atom simulations of protein folding starting from arbitrary structures are currently possibleonly for small proteins and, consequently, united-residuemodels of polypeptide chains are usedin the field. The UNRES model and the respective force field developed in our laboratory belongto this class. As opposed to knowledge-based or heuristic coarse-grained force fields, UNRESwas carefully derived as a restricted free energy function of a polypeptide chain, in which finedegrees of freedom not included in the model have been integrated out. This article summarizesrecent developments and applications of the force field.
1 Introduction
United-residue or mesoscopic models of proteins receive considerable attention because,in contrast to all-atom simulations, they enable us to studythe folding of large proteins atmicro- or millisecond time scale. Most of the existing approaches are knowledge-based,which makes explicit use of the information from protein structural databases during theprocess of conformational search. These approaches are very successful in predicting thestructure of proteins1 but their application to study folding dynamics is limited.
During the last few years we have been developing a mesoscopic physics-based forcefield termed UNRES (UNited RESidue)2. Its initial applications were energy-based predic-tions of protein structure defined as the lowest-energy conformation2, 3. Despite consider-able success in this field, we realized that such energy-based prediction does not correspondto the process of formation of the native structure, which, following Anfinsen’s thermody-namic hypothesis4 is a collection of very similar conformations occupying thebasin withthe lowest free energy and, consequently, we changed the approach to ensemble-basedglobal optimization. We also extended the application of UNRES to study the thermody-namics, dynamics, and kinetics of protein folding.
31

2 The UNRES Force Field
In the UNRES model a polypeptide chain is represented as a sequence ofα-carbon atoms(Cα) with attached united side chains (SC) and united peptide groups (p), each of which ispositioned in the middle between two consecutive Cα atoms, as shown in Figure 1.
C i-1
α
C i
α
Cα
i+1
Cα
i+2
Cα
i+3
pi
θi
iγ
βiiSC
α i
Figure 1. The UNRES model of the polypeptide chain. Dark circles represent united peptide groups (p), opencircles represent the Cα atoms, which serve as geometric points. Ellipsoids represent side chains, with theircenters of mass at the SC’s. The p’s are located half-way between two consecutive Cα atoms. The virtual-bondanglesθ, the virtual-bond dihedral anglesγ, and the anglesαSC andβSC that define the location of a side chainwith respect to the backbone are also indicated.
The effective energy function is a sum of different terms corresponding to interac-tions between the SC (USCiSCj
), SC and p (USCipj), and p (Upipj
) sites, as well as localterms corresponding to bending of virtual-bond anglesθ (Ub), side-chain rotamers (Urot),virtual-bond torsional (Utor) and double-torsional (Utord) terms, virtual-bond-stretching(Ubond) terms, correlation terms (U (m)
corr) pertaining to coupling between backbone-localand backbone-electrostatic interactions5 (wherem denotes the order of correlation), and aterm accounting for the energetics of disulfide bonds (USS). Each of these terms is multi-plied by an appropriate weight,w. The energy function is given by equation 1.
U = wSC
∑
i<j
USCiSCj+ wSCp
∑
i6=j
USCipj+ wpp
∑
i<j−1
Upipj
+wtor
∑
i
Utor(γi) + wtord
∑
i
Utord(γi, γi+1)
+wb
∑
i
Ub(θi) + wrot
∑
i
Urot(αSCi, βSCi
) +
6∑
m=3
w(m)corrU
(m)corr
+wbond
nbond∑
i=1
Ubond(di) + wSS
∑
i
USS;i (1)
The prototype of equation 1 is the restricted free energy (RFE) corresponding to agiven coarse-grained conformation of a polypeptide chain in water in which all secondary
32

degrees of freedom, such as the solvent coordinates, internal rotation angles of the sidechains, and the angles for the rotation of the peptide groupsabout the Cα · · ·Cα virtualbonds have been integrated out5. We expressed the RFE5 in terms of Kubo’s cluster cu-mulants6 and the cluster cumulants into a generalized cumulant series. The fact that theUNRES energy function has the sense of a free energy implies its dependence on tempera-ture, which we introduced recently7 by multiplying the energy-term weights by appropriatetemperature factors.
3 Search of Conformational Space with UNRES
In our earlier implementations of UNRES2, we were looking for the global minimum ofthe energy. We developed a global-optimization tool termeda Conformational Space An-nealing (CSA) method8, based on the framework of genetic algorithms. This approachproduces the lowest energy minima and can be identified with finding a “folded” structureat the temperature of 0 K. This approach ignores the conformational entropy and, con-sequently, some proteins whose native-like structures were found as lowest in energy inCSA searches failed to fold to the native structures in canonical MD simulations with theUNRES force field9.
To obtain a protocol closer to the real folding process, we developed9 mesoscopicmolecular dynamics, in which the UNRES energy function (equation 1) plays the role ofthe potential energy; we refer to this approach as UNRES/MD.We use either the equationsof motion with explicit stochastic and friction terms to account for non-conservative forcescoming from the solvent (Langevin dynamics; appropriate tostudy folding dynamics) orcouple the Newton-like equations of motion with the Berendsen thermostat, which resultsin faster search of the conformational space. Recently10, we extended the UNRES/MD ap-proach to study the folding of multichain proteins and also developed a procedure to handledynamic formation and breaking of disulfide bonds during UNRES/MD runs11. For bettersearch of the conformational space we implemented12 the multiplexing replica-exchangemethod13 in UNRES/MD (this algorithm is referred to as UNRES/MREMD).We paral-lelized UNRES/MREMD to run on sytems with 1,000 processors or more; an example ofscalability is shown in Figure 2.
4 Applications of UNRES
4.1 Folding Dynamics
UNRES/MD provides an about 4000- and 200-fold speed-up compared with all-atom MDwith explicit and implicit solvent, respectively9, thus makingab initio folding simulationspossible. We studied9 the folding of a number ofα-helical proteins and anα + β-protein(1E0G). With the version of the UNRES available at that time the simulated folding of theα-helical proteins followed the diffusion-collision model, while the folding of 1E0G startedfrom the formation of all-α-helical structures with subsequent approach, straightening, andfinal packing of the ends into a two-strandedβ-sheet.
33
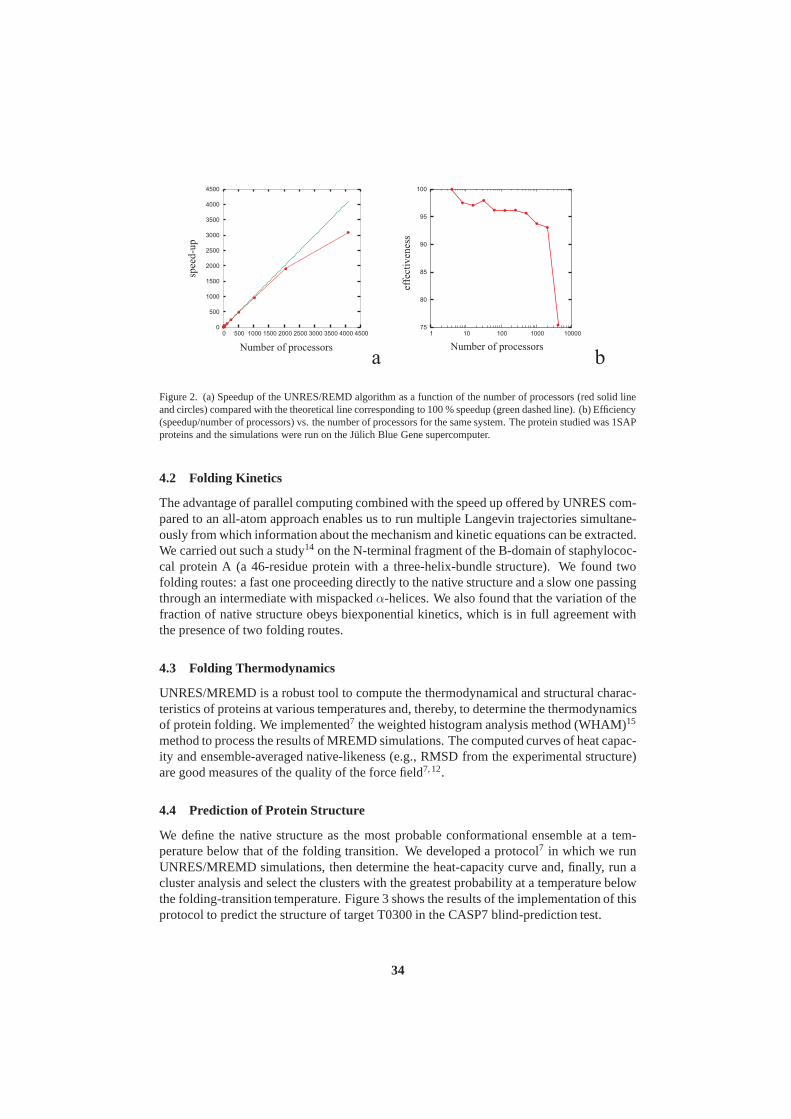
Figure 2. (a) Speedup of the UNRES/REMD algorithm as a function of the number of processors (red solid lineand circles) compared with the theoretical line corresponding to 100 % speedup (green dashed line). (b) Efficiency(speedup/number of processors) vs. the number of processors for the same system. The protein studied was 1SAPproteins and the simulations were run on the Julich Blue Gene supercomputer.
4.2 Folding Kinetics
The advantage of parallel computing combined with the speedup offered by UNRES com-pared to an all-atom approach enables us to run multiple Langevin trajectories simultane-ously from which information about the mechanism and kinetic equations can be extracted.We carried out such a study14 on the N-terminal fragment of the B-domain of staphylococ-cal protein A (a 46-residue protein with a three-helix-bundle structure). We found twofolding routes: a fast one proceeding directly to the nativestructure and a slow one passingthrough an intermediate with mispackedα-helices. We also found that the variation of thefraction of native structure obeys biexponential kinetics, which is in full agreement withthe presence of two folding routes.
4.3 Folding Thermodynamics
UNRES/MREMD is a robust tool to compute the thermodynamicaland structural charac-teristics of proteins at various temperatures and, thereby, to determine the thermodynamicsof protein folding. We implemented7 the weighted histogram analysis method (WHAM)15
method to process the results of MREMD simulations. The computed curves of heat capac-ity and ensemble-averaged native-likeness (e.g., RMSD from the experimental structure)are good measures of the quality of the force field7, 12.
4.4 Prediction of Protein Structure
We define the native structure as the most probable conformational ensemble at a tem-perature below that of the folding transition. We developeda protocol7 in which we runUNRES/MREMD simulations, then determine the heat-capacity curve and, finally, run acluster analysis and select the clusters with the greatest probability at a temperature belowthe folding-transition temperature. Figure 3 shows the results of the implementation of thisprotocol to predict the structure of target T0300 in the CASP7 blind-prediction test.
34

Figure 3. Comparison of the experimental (left) and predicted structure of the 2–65 fragment of the CASP7 targetT0300 (RMSD=6A).
5 Concluding Remarks
The UNRES model has two advantages: it is a coarse-grained model with which to studyprotein folding in real time and is based on clear physical principles. The present UN-RES force field is still in the process of tuning but can already be used to carry out reli-able prediction of protein structure, folding thermodynamics, and folding kinetics. Furtherapplications include studying large-scale motions of proteins and protein complexes andmembrane proteins.
Acknowledgments
This work was supported by grants from the National Institutes of Health (GM-14312),the National Science Foundation (MCB05-41633), the NIH Fogarty International Center(TW7193), and grant DS 8372-4-0138-7 from the Polish Ministry of Science and HigherEducation. This research was conducted by using the resources of (a) our 800-processorBeowulf cluster at the Baker Laboratory of Chemistry and Chemical Biology, Cornell Uni-versity, (b) the National Science Foundation Terascale Computing System at the PittsburghSupercomputer Center, (c) the John von Neumann Institute for Computing at the CentralInstitute for Applied Mathematics, Forschungszentrum Julich, Germany, (d) the Beowulfcluster at the Department of Computer Science, Cornell University, (e) the resources of theCenter for Computation and Technology at Louisiana State University, which is supportedby funding from the Louisiana legislature (f) our 45-processor Beowulf cluster at the Fac-ulty of Chemistry, University of Gdansk, (g) the Informatics Center of the MetropolitanAcademic Network (IC MAN) in Gdansk, and (h) the Interdisciplinary Center of Mathe-matical and Computer Modeling (ICM) at the University of Warsaw.
References
1. J. Moult. Rigorous performance evaluation in protein structure modelling and impli-cations for computational biology.Phil. Trans. R. Soc. B, 361:453–458, 2006.
35

2. H. A. Scheraga, A. Liwo, S. Ołdziej, C. Czaplewski, J. Pillardy, D. R. Ripoll, J. A.Vila, R. Kazmierkiewicz, J. A. Saunders, Y. A. Arnautova, A. Jagielska, M. Chinchio,and M. Nanias. The protein folding problem: global optimization of force fields.Frontiers in Bioscience, 9:3296–3323, 2004.
3. S. Ołdziej, C. Czaplewski, A. Liwo, M. Chinchio, M. Nanias, J. A. Vila, M. Khalili,Y. A. Arnautova, A. Jagielska, M. Makowski, H. D. Schafroth,R. Kazmierkiewicz,D. R. Ripoll, J. Pillardy, J. A. Saunders, Y.-K. Kang, K. D. Gibson, and H. A. Scher-aga. Physics-based protein-structure prediction using a hierarchical protocol basedon the UNRES force field – test with CASP5 and CASP6 targets.Proc. Natl. Acad.Sci. U.S.A., 102:7547–7552, 2005.
4. C. B. Anfinsen. Principles that govern the folding of protein chains. Science,181:223–230, 1973.
5. A. Liwo, C. Czaplewski, J. Pillardy, and H. A. Scheraga. Cumulant-based expressionsfor the multibody terms for the correlation between local and electrostatic interactionsin the united-residue force field.J. Chem. Phys., 115:2323–2347, 2001.
6. R. Kubo. Generalized cumulant expansion method.J. Phys. Soc. Japan, 17:1100–1120, 1962.
7. A. Liwo, M. Khalili, C. Czaplewski, S. Kalinowski, S. Ołdziej, K. Wachucik, andH.A. Scheraga. Modification and optimization of the united-residue (UNRES) po-tential energy function for canonical simulations. I. Temperature dependence of theeffective energy function and tests of the optimization method with single trainingproteins.J. Phys. Chem. B, 111:260–285, 2007.
8. J. Lee, H. A. Scheraga, and S. Rackovsky. New optimizationmethod for confor-mational energy calculations on polypeptides: Conformational space annealing.J.Comput. Chem., 18:1222–1232, 1997.
9. A. Liwo, M. Khalili, and H. A. Scheraga. Molecular dynamics with the united-residue(UNRES) model of polypeptide chains; test of the approach onmodel proteins.Proc.Natl. Acad. Sci. U.S.A., 102:2362–2367, 2005.
10. A. V. Rojas, A. Liwo, and H.A. Scheraga. Molecular dynamics with the united-residue force field: Ab initio folding simulations of multichain proteins. J. Phys.Chem. B., 111:293–309, 2007.
11. M. Chinchio, C. Czaplewski, A. Liwo, S. Ołdziej, and H. A.Scheraga. Dynamicformation and breaking of disulfide bonds in molecular dynamics simulations withthe UNRES force field.J. Chem. Theor. Comput., 2007, submitted.
12. M. Nanias, C. Czaplewski, and H. A. Scheraga. Replica exchange and multicanonicalalgorithms with the coarse-grained united-residue (UNRES) force field. J. Chem.Theor. Comput., 2:513–528, 2006.
13. Y. M. Rhee and V. S. Pande. Multiplexed-replica exchangemolecular dynamicsmethod for protein folding simulation.Biophys J., 84:775–786, 2003.
14. M. Khalili, A. Liwo, and H. A. Scheraga. Kinetic studies of folding of the b-domainof staphylococcal protein a with molecular dynamics and a united-residue (UNRES)model of polypeptide chains.J. Mol. Biol., 355:536–547, 2006.
15. S. Kumar, D. Bouzida, R. H. Swendsen, P. A. Kollman, and J.M. Rosenberg. Theweighted histogram analysis method for free-energy calculations on biomolecules. I.the method.J. Comput. Chem., 13, 1992.
36

Mixed QM/MM Calculations in Biological Systems
Gustavo de M. Seabra1, Juan Torras2, Ross C. Walker3, and Adrian Roitberg1
1 Quantum Theory Project, University of FloridaP.O. Box 118435, Gainesville, FL 32611-8435, USA
E-mail: [email protected]
2 Departament d’Enginyeria Quımica, EUETII, Universitat Politecnica de CatalunyaPca. Rei 15, 08700-Igualada, SPAIN
3 San Diego Supercomputer Center, University of California San Diego9500 Gilman Drive, La Jolla, CA, 92093-0505, USA
The computational study of a variety of important processes, such as processes involving bondbreaking and forming and electron reorganization, requires the application of quantum mechan-ical methods. In biological systems, this situation is further complicated because the influenceof the environment must be taken into account. In these situations, hybrid quantum mechan-ics / molecular mechanics methods can be used. We describe here two new QM/MM imple-mentations based on the Amber Molecular Dynamics packages that make it possible to use of avariety of quantum mechanical methods with any of the techniques available in Amber. Resultsare provided for the application of these implementations to two different systems.
1 Introduction
Due to the large system size, computational studies of biologically relevant systems suchas proteins, nucleic acids and carbohydrates need to resortto approximated MolecularMechanics (MM) methods which apply parameterized force fields to describe molecularproperties such as bond lengths, angles, dihedrals, electrostatic and van der Waals forces.The use of such parameterized methods greatly reduces the computational complexity,allowing the study of processes including ligand binding, enzyme reaction mechanisms,protein folding, refolding, and denaturation, providing invaluable help in the analysis ofcomplex experimental data and structures.
Despite continuous efforts to develop more reliable force fields for use in MM calcula-tions, including the use of QM calculations and genetic algorithms in the parameterizationof the force field, classical mechanics methods lack the ability to treat fundamentally quan-tum processes, such as bond breaking and forming and charge fluctuations as a function ofgeometry, or to describe parts of the potential energy surface far from equilibrium. In somecases, although computationally expensive, it is possibleto treat a model system purely byQM methods, but the effect of the environment must be either neglected or simulated bya continuum dielectric approximation. An alternative thatallows the explicit inclusion ofenvironment effects while treating the most relevant part of the system with full quantummechanics was first explored by Warshel and Levitt as early as1976,1 and is the use ofhybrid quantum mechanics / molecular mechanics (QM/MM) calculations whereby a sub-section of the system is treated by QM methods, the remainder(environment) is treated bystandard molecular mechanics (MM) methods, and a coupling potential is used to connectthe two regions.
37
Recent work in our group has focused in the implementation and application of hybridQM/MM techniques for the study of biologically relevant systems. In particular, discussedhere are two recently developed interfaces: the new native,(semi-empirical) QM/MM sup-port available in Amber 9,2 and the integration of the Amber MD program with a QMprogram through the PUPIL interface. These interfaces offer the advantage of blendingseamlessly with the Amber program, allowing the application of any of the advanced sam-pling methods available in Amber to QM/MM problems.
2 QM/MM
In a hybrid QM/MM calculation, the system is partitioned into two regions: A QM region,typically consisting of a relatively small number of atoms relevant for the specific processbeing studied, and a MM region with all the remaining atoms. The total Hamiltonian (H)for such a system is written as:
H = HQM + HMM + HQM/MM , (1)
whereHQM andHMM are the Hamiltonians for the QM and MM parts of the system,and are calculated using either the QM method chosen or the usual force field equations,respectively. The remaining term,HQM/MM , describes the interaction between the QMand MM parts and typically contains terms for electrostatic, van der Waals and bondedinteractions across the region boundaries:
HQM/MM = HQM/MMvdW + H
QM/MMelect + H
QM/MMbonds . (2)
In the approach used for both Amber QM/MM interfaces presented here, the vander Waals (HQM/MM
vdW ) is treated as usual by the MM program, using the standard 12-6Lennard-Jones parameters from the force field in use. It has been shown that this choicedoes not introduce significant errors in the calculation.3 Also, both interfaces describedhere use a link atom scheme if bonds are broken across the QM–MM boundary. Finally,the remaining term (HQM/MM
elect ), describing the electrostatic interaction between the MMand QM zones, depends on the specific interface.
3 Semi-Empirical QM/MM in Amber
One of the most used programs for MD simulations is thesanderprogram, part of theAmber suite. Thesanderinterface for QM/MM has been recently rewritten, placing strongemphasis on speed and accuracy, allowing the simulation of systems with a reasonablysized quantum mechanical region (around 300 atoms) for long(nanoseconds) timescales. Itnow natively includes a number of semi-empirical Hamiltonians for QM/MM simulationsincluding MNDO,4, 5 AM1,6 PM3,7, 8 PDDG/PM39 and SCC-DFTB.10 Our group has beeninvolved in the implementation of the SCC-DFTB method.
The Self-Consistent-Charge Density-Functional Tight Binding (SCC-DFTB) is an ap-proximate method based on Density Functional Theory (DFT) from a second order expan-sion of the DFT total energy in the charge density fluctuations, and has been described indetail elsewhere.11, 10 It has been successfully applied to the study of a variety of systems,and has been shown to yield results comparable in accuracy toab-initio MP2 calculations
38

with large basis sets.12 (For a recent review on applications of SCC-DFTB to biologicalsystems, the reader is referred to Ref.[13].)
The integration of SCC-DFTB with Amber 9 has been described recently.14 In thisimplementation, the electrostatic interaction energy between the QM and MM regions(HQM/MM
elect in Equation 2) is calculated as a Coulomb interaction between the atomicMulliken charges calculated from the SCC-DFTB (qα) and the classical RESP charges onthe MM atoms (QA), as in Equation 3.
EQM/MMelect =
QM∑
α
MM∑
A
QA qαrαA
. (3)
Showing how the QM/MM implementation can directly tap into the methods in Amber,the free energy surface (FES) for the capped alanine dipeptide (ACE-ALA-NME, AD)in vacuum was generated using Replica Exchange Molecular Dynamics,15 with the ADtreated by SCC-DFTB. 6 replicas were used, at temperatures of 161.2K, 219.9K, 300.0K,419.3K, 558.4K and 761.8K. Exchanges were attempted 10,000times, with 0.5ps betweenattempts, and a time step of 1fs with SHAKE was used. The Langevin thermostat with a
Figure 1. Free Energy Surfaces for alanine dipeptide obtained from the SCC-DFTB/REMD calculation.
39

collision frequency of 2.0ps−1 was used to regulate the temperatures.Figure 1 shows the FES for four different temperatures, as calculated fromG =
−RT ln(P ), where G is the Gibbs free energy, R is the gas constant and T isthe tem-perature, andP is the (normalized) probability P of finding the AD in a conformation ata particular region in (φ,ψ)-space from the MD trajectories. The surfaces show a clearminimum aroundφ/ψ values of (−83,76), which corresponds to the known C7eq mini-mum for AD in vacuum, and other structures are populated as temperature increases. Therelative energies compare well with calculatedab-initio values calculated previously.16
4 Amber-Gaussian QM/MM Through the PUPIL Interface
The interface described in the previous session has the advantage of being convenient andeasy to use, especially for users experienced with the AmberMD program. At the currentstage of development, however, the QM region is fixed throughout the calculation, andlimited to semi-empirical Hamiltonians.
The PUPIL (Program for User Program Interfacing and Linking) is a free, open sourcepackage created to facilitate the interfacing ofarbitrary MD and QM programs.17, 18 Cur-rently, interfaces with DLPOLY, MNDO97 and Siesta have beendeveloped. We have
Figure 2. Work of breaking the N-N bond in Angeli’s salt for 5 different simulations, and the free enrgy obtainedby the Jarzynsky equation.
40
recently included interfaces withsanderand Gaussian03 to the PUPIL system. In PUPIL,the equations of motion are propagated as usually by the MD program and the forces overthe QM region are provided by the QM program, while the PUPIL interface manages exe-cution of the two programs, as well as the required information flow. The influence of theMM atoms on the QM zone is taken into account by electronic embedding, where the MMatoms are considered as point charges fixed at the positions of the MM atoms, and with thecharge values from the force field parameters in use.
In the Gaussian03 interface, the force contribution from the quantum atoms to the totalforce acting upon the classical atoms (FQM
i ) is obtained by dividing the electronic densityinto a grid, and calculating the interaction of the MM chargewith each point in the grid:
FQMi =
cube∑
j
rijqPCi
dqj
|rij |3, (4)
where
dqj = ρj dxdydz. (5)
As an example, the free energy change associated to a specificprocess can be calculatedusing the Jarzynski relationship:19–21
e−β∆G(d) =⟨
e−βW (d)⟩
d=d
, (6)
where the brackets indicate an average taken over a large number of independent realiza-tions of the process (in this case, molecular dynamics trajectories) all starting at differentpoints belonging to the same equilibrated ensemble.
Figure 2 shows work results five trajectories breaking the N-N bond in the monoproto-nated Angeli’s salt (O2N-NHO−) in explicit water, together with the free energy calculatedusing Equation 6. The Angeli’s salt was treated quantum mechanically by Gaussian03 atthe UB3LYP/6-311+G(d) level, and put in a large box of TIP3P water molecules. Thefree energy barrier for breaking the N-N bond is calculated to be 5.84 kcal/mol, which isin good agreement with previous estimations using B3LYP with the same basis set andimplicit solvation.22
5 Conclusions
This communication describes and exemplifies two new QM/MM implementations. Bothhave the advantage of being based on the Amber molecular dynamics package, allowingtheir application in tandem with any of the advanced sampling methods available in Amber.Results of calculations using both implementations are provided.
Acknowledgments
The authors want to acknowledge Erik Deumens and S.B. Trickey for their part in the initialdevelopment of the PUPIL package. Computer resources were provided by the LargeAllocations Resource Committee through TeraGrid grant TG-MCA05S010 to AER, and
41

the TeraGrid grant TG-CHE060072T to GS and JTC, the High-Performance ComputingCenter at the University of Florida and a local cluster builtwith a generous IBM-SURgrant. RCW acknowledges NIH Grant GM57513 for funding this work. RCW and AERwould like to thank the San Diego Supercomputer Center for their continued support ofthis project and future developments in Amber 10 through their Strategic ApplicationsCollaboration program.
References
1. A. Warshel and M. Levitt,Theoretical studies of enzymic reactions: Dielectric, elec-trostatic and steric stabilization of the carbonium ion in the reaction of lysozyme,Journal of Molecular Biology,103, no. 2, 227–249, 1976.
2. “Amber 9”,http://amber.scripps.edu.3. Demian Riccardi, Guohui Li, and Qiang Cui,Importance of van der Waals Inter-
actions in QM/MM Simulations, Journal of Physical Chemistry B,108, 6467–6478,2004.
4. Michael J. S. Dewar and Walter Thiel,Ground states of molecules. 38. The MNDOmethod. Approximations and parameters, J. Am. Chem. Soc.,99, no. 15, 4899–4907,1977.
5. Michael J. S. Dewar and Walter Thiel,Ground states of molecules. 39. MNDO resultsfor molecules containing hydrogen, carbon, nitrogen, and oxygen, J. Am. Chem.Soc.,99, no. 15, 4907–4917, 1977.
6. Michael J. S. Dewar, Eve G. Zoebisch, Eamonn F. Healy, and James J. P. Stewart,Development and use of quantum mechanical molecular models. 76. AM1: a newgeneral purpose quantum mechanical molecular model, J. Am. Chem. Soc.,107, no.13, 3902–3909, 1985.
7. James J. P. Stewart,Optimization of parameters for semiempirical methods I. Method,Journal of Computational Chemistry,10, no. 2, 209–220, 1989.
8. James J. P. Stewart,Optimization of parameters for semiempirical methods II. Appli-cations, Journal of Computational Chemistry,10, no. 2, 221–264, 1989.
9. Matthew P. Repasky, Jayaraman Chandrasekhar, and William L. Jorgensen,PDDG/PM3 and PDDG/MNDO: Improved semiempirical methods, Journal of Com-putational Chemistry,23, no. 16, 1601–1622, 2002.
10. M. Elstner, D. Porezag, G. Jungnickel, J. Elsner, M. Haugk, T. Frauenheim, S. Suhai,and Gotthard Seifert,Self-consistent-charge density-functional tight-binding methodfor simulations of complex materials properties, Physical Review B: Condensed Mat-ter,58, no. 11, 7260–7268, 1998.
11. Thomas Frauenheim, D. Porezag, Marcus Elstner, G. Jungnickel, J. Elsner, M. Haugk,A. Sieck, and Gotthard Seifert,An ab initio two-center tight binding approach tosimulations of complex materials properties, Mat. Res. Soc. Symp. Proc.,491,91–104, 1998.
12. H. G. Bohr, K. J. Jalkanen, M. Elstner, K. Frimand, and S. Suhai,A comparative studyof MP2, B3LYP, RHF and SCC-DFTB force fields in predicting thevibrational spectraof N-acetyl-L-alanine-N ’-methyl amide: VA and VCD spectra, Chemical Physics,246, no. 1-3, 13–36, 1999.
42

13. M. Elstner,The SCC-DFTB method and its application to biological systems, Theoret-ical Chemistry Accounts: Theory, Computation, and Modeling (Theoretica ChimicaActa),116, no. 1-3, 316–325, 2006.
14. Gustavo M. Seabra, Ross C. Walker, Marcus Elstner, DavidA. Case, and Adrian E.Roitberg,Implementation of the SCC-DFTB Method for Hybrid QM/MM Simulationswithin the Amber Molecular Dynamics Package, Journal of Physical Chemistry A,111, no. 26, 5655–5664, 2007.
15. Ulrich H. E. Hansmann,Parallel tempering algorithm for conformational studies ofbiological molecules, Chemical Physics Letters,281, no. 1-3, 140–150, 1997.
16. Rubicelia Vargas, Jorge Garza, Benjamin P. Hay, and David A. Dixon, Conforma-tional Study of the Alanine Dipeptide at the MP2 and DFT Levels, Journal of PhysicalChemistry A,106, no. 13, 3213–3218, 2002.
17. Juan Torras, E. Deumens, and S. B. Trickey,Software Integration in Multi-scale Sim-ulations: the PUPIL System, Journal of Computer-Aided Materials Design,13, no. 1,201–212, 2006.
18. Juan Torras, Yao He, Chao Cao, Krishna Muralidharan, E. Deumens, H. P. Cheng, andS. B. Trickey,PUPIL: A systematic approach to software integration in multi-scalesimulations, Computer Physics Communications,177, no. 3, 265–279, 2007.
19. C. Jarzynski,Nonequilibrium equality for free energy differences, Physical ReviewLetters,78, no. 14, 2690–2693, 1997.
20. A. Crespo, M. A. Marti, D. A. Estrin, and A. E. Roitberg,Multiple-Steering QM-MMCalculation of the Free Energy Profile in Chorismate Mutase, J. Am. Chem. Soc.,127, no. 19, 6940–6941, 2005.
21. Hui Xiong, Alejandro Crespo, Marcelo Marti, Dario Estrin, and Adrian Roitberg,FreeEnergy Calculations with Non-Equilibrium Methods: Applications of the JarzynskiRelationship, Theoretical Chemistry Accounts: Theory, Computation, and Modeling(Theoretica Chimica Acta),116, no. 1-3, 338–346, 2006.
22. A.S. Dutton, J.M. Fukuto, and K.N. Houk,Mechanisms of HNO and NO Productionfrom Angeli’s Salt: Density Functional and CBS-QB3 Theory Predictions, J. Am.Chem. Soc.,126, no. 12, 3795–3800, 2004.
43


Evolution of Experimental and TheoreticalDeterminations of Protein Structure and Protein Folding
Pathways
Harold A. Scheraga, Adam Liwo, Cezary Czaplewski, and Stanisław Ołdziej
Baker Laboratory of Chemistry and Chemical Biology, Cornell University,Ithaca, NY 14853-1301, U.S.A.
E-mail: [email protected]
Physical chemical studies of hydrogen bonding and hydrophobic interactions, and experimentalstudies of the structure and folding pathways of bovine pancreatic ribonuclease A motivatedthe development of a theoretical approach to compute protein structure and protein-foldingpathways.
1 Introduction
This article traces the development of our experimental andtheoretical efforts to gainan understanding of the underlying physics that controls the progression from a newly-synthesized polypeptide chain to the three-dimensional structure of a native biologically-active fibrous or globular protein. Our earliest involvement with this problem was con-cerned with the influence of hydrogen bonds and hydrophobic interactions on protein struc-ture and reactivity. This work led to our efforts to determine protein structure and foldingpathways, first by experimental methods, and subsequently by theoretical methods.
2 Internal Bonding in Proteins
Internal hydrogen bonds influence the observed pKs of ionizable groups1 and even thereactivity of covalent bonds2, e.g., peptide bonds. Figure 1 provides an example of ahydrogen bond between a tyrosyl donor and a glutamate acceptor. The observed pKs of
CH2 CH2 CH2HOCO
O
Helix
Helix−
Figure 1. Example of a tyrosyl· · · glutamate hydrogen bond.
45

these groups are modified by the free energy to form (or break)such a hydrogen bond.Therefore, in comparison with a non-hydrogen-bonded modelcompound, the observedpKs of such hydrogen-bonded tyrosyl and glutamate groups will be raised or lowered,respectively. Consequently, such departures of the pKs from those of model compoundsare diagnostic for the presence of such hydrogen bonds.
Hydrophobic interactions can provide a nonpolar environment which will also influ-ence the pKs of nearby ionizable groups. A theory3 for the thermodynamics of hydropho-bic interactions, based on the structures of liquid water and of aqueous hydrocarbon so-lutions was presented in 1962, and upgraded4 in 2004. By themselves, hydrogen bondsin proteins in water are not very strong because of the necessity to shed water in order toform a hydrogen bond between the polar groups of a protein. However, as illustrated inFigure 2, the presence of nearby nonpolar groups can providehydrophobic interactions5
with the nonpolar parts of residues such as lysine and glutamic acid and also restrict theinternal rotational freedom of the ionizable side chains. In addition, nonpolar groups canrestrict the access of water to the polar parts of ionizable side chains. Thus, the cooperativ-ity of nonpolar groups and hydrogen bonding of ionizable side chains can strengthen thehydrogen bonds.
Figure 2. Illustration of various hydrophobic interactions of a polar side chain with its surroundings. B refers tothe backbone, and P to the polar head.
3 Location of Hydrogen Bonds in Proteins
Before the advent of X-ray crystallography, NMR, and recombinant DNA methods to de-termine protein structure, experimental studies to locatehydrogen bonds between ioniz-able groups, as indicated by the dotted lines in Figure 3, provided distance constraints onthe folding of a protein backbone. Such studies, carried outon the 124-residue proteinbovine pancreatic ribonuclease A (RNase A), showed that 3 ofits 6 tyrosyl residues had
46

Figure 3. Schematic representation of a protein. Solid and dotted lines represent disulfide bonds and non-covalentinteractions, respectively.
abnormally-high6 pKs, and that 3 of its 11 carboxyl groups had abnormally-low7 pKs.Further, the UV absorption spectrum of tyrosine was perturbed8 at low pH where carboxylgroups ionize. This evidence suggested the existence of three tyrosyl· · · carboxylate hy-drogen bonds, and subsequent physical and biochemical experiments7 identified one pair-ing, namely
Tyr25 · · · Asp14Tyr92 · · · Asp38Tyr97 · · · Asp83
out of the 19,800 possible ways to pair 3 of 6 Tyr and 3 of 11 carboxyl groups of RNaseA. The identification of these 3 interactions was subsequently verified by the X-ray struc-ture. These three non-covalent interactions (dotted linesin Figure 3) and the four disulfidebonds (solid-line crosslinks in Figure 3) provide 7 distance constraints on the folding ofthe backbone. However, 7 distance constraints are not sufficient to provide an accuratedescription of the backbone of a 124-residue protein such asRNase A. To determine thebackbone structure, as is now done by NMR, many more distanceconstraints would berequired. In fact, it is possible to specify the number of distance constraints required9 inorder to determine the structure within any desired RMSD from the native structure.
4 Initial Considerations of a Theoretical Approach to StructureSimulation
On the other hand, even 7 known distances could serve as restraints on a potential en-ergy function to compute the native structure of a protein. This provided the motivationto develop10 a theoretical approach to compute protein structure, first by making use ofdistance restraints and, subsequently, to rely on a physics-based potential function withoutthe need to incorporate distance restraints. At about the same time, Anfinsen11 identifiedspontaneous protein folding, and introduced the thermodynamic hypothesis for a theoreti-cal approach, and we expanded our interest from determiningstructure to also determiningfolding pathways (first by experiment, and later by theory).
47

5 Experimental Studies of Oxidative Folding of RNase A
Our experimental study of the oxidative folding of RNase A led to the mechanism shownin Figure 4. Figure 4(a) shows that a pre-equilibrium existsbetween the unfolded forms
Figure 4. (a) Oxidative folding of wild-type RNase A. (b) Oxidative folding of two three-disulfide mutants ofRNase A (C40A/C95A and C65S/C72S).
of reduced RNase A, R, and various ensembles of disulfide-bonded intermediates12. Therate-determining step13 is the reshuffling of the three-disulfide ensemble, 3S, by SH/SSinterchange, to form two main intermediates, des [40-95]N and des [65-72]N which eachcontain three native disulfide bonds but lack the 40-95 and 64-72 disulfide bonds, respec-tively. These two native intermediates14, 15 rapidly form the native structure of the wild-type protein. As shown in Figure 4(b), two very minor pathways exist16, 17 in which the2S ensemble undergoes oxidation to des [40-95]N and des [65-72]N , which could be de-tected only with the aid of mutants which lacked the 40-95 and65-72 disulfide bonds,respectively.
The overall scheme for the oxidative folding of RNase A is shown in Figure 5. Ofthe 28 possible 1S species, 40% have the native 65-72 disulfide bond, and 10% have thenon-native 58-65 disulfide bond, and the remaining 26 species accumulate only to the ex-tent of<10% each in folding of the whole protein18. The 65-72 disulfide bond persistsincreasingly in the remainder of the pathway19 to form des [40-95]N . Interestingly, thesame 40:10 ratio that is found in the protein is also found when a fragment of reducedRNase A from Cys 58 to Cys 72 is oxidized20, 21. This result is attributed to preferentialnative-forming interactions22 and not to entropic effects in the 65-72 loop, since both pos-sible loops (58-65 and 65-72) have the same size; it is this kind of physics that is revealedby such experimental studies, and by our concomitantly developed molecular mechanicsapproach.
6 All-atom Determination of Protein Structure and FoldingPathways
Progressing from our initial work10 in 1965, with a hard-sphere potential, we developed anall-atom ECEPP (Emperical Conformational Energy Program for Peptides) force field23,
48

Figure 5. Overall scheme of oxidative folding of RNase A
and improved it in subsequent years, the latest version of which24 appeared in 2006. TheECEPP force field and various procedures that we developed for global optimization of thepotential energy were described in a recent review25. The largest protein whose structurewe have computed with the all-atom force field is the 46-residue three-helix bundle, proteinA26, and the 36-residue villin headpiece27.
Our initial attempt28 to compute an all-atom folding pathway made use of the stochasticdifference equation method of Elber29. The pathways were computed from each of a largeensemble of unfolded states of protein A to the final folded state, and then averaged. Itwas found that the C-terminal helix folded first, followed bythe N-terminal helix, andthen the middle helix. Various folding pathways have been proposed for protein A, and ithas been found30 that environmental factors and different components in thevarious forcefields used may account for the reported differences.
7 A Hierarchical Approach to Protein Structure and FoldingPathway Prediction
In order to compute protein structures larger than those of protein A, we have developed ahierarchical procedure which initially makes use of a united-residue (UNRES) model of apolypeptide chain31–37 together with a conformational space annealing (CSA) procedure38
to search the UNRES conformational space to find theregionin which the global minimummight lie. Then the lowest-energy structures are convertedfrom the UNRES representation
49

to an all-atom one39, 40 whose ECEPP energy (including hydration) can then be globallyoptimized.
The UNRES model consists of virtual-bond chains for the backbone and side chains,with the less-important degrees of freedom (rotation of thepeptide groups around their vir-tual Cα–Cα bonds, internal rotations about side-chain bonds, etc.) averaged out. The forcecenters are the positions of the averaged-out peptide groups and the ends of the virtualbonds at the center of gravity of the side chains. The UNRES energy consists of interac-tions between these force centers, the energies to vary the positions and rotational statesof side chains, the energies to vary the angle between successive backbone virtual bonds,the torsional angles around the backbone virtual bonds, anddouble torsions around twoneighboring virtual bonds, and multi-body interactions. The CSA procedure is essentiallya genetic algorithm in which a finite set of widely- dispersedUNRES minima are forcedto coalesce to the region of the global minimum.
Performance in successive blind tests from CASP3 to CASP7 has provided sufficientconfidence to encourage us to develop41, 42and apply43–45a molecular dynamics treatmentbased on UNRES. Our recent work with this molecular dynamicsapproach is being dis-cussed at this workshop by A. Liwo46.
8 Conclusions
The evolution of the development of our experimental and theoretical approaches to gainan understanding of the fundamental physics that controls protein structure and foldingpathways has been traced. It is elaborated upon in the accompanying article by Liwo etal46. Current work is focused on the use of the molecular dynamicsapproach with UNRES,and the improvement of this methodology including introduction of entropic effects37.
Acknowledgments
This research was supported by grants from NIH (GM-14312, TW-7193) and NSF(MCB05-41633), and was carried out with resources of (a) our820-processor Beowulfcluster at the Baker Laboratory of Chemistry and Chemical Biology, Cornell University,(b) the National Science Foundation Terascale Computing System at the Pittsburgh Su-percomputer Center, (c) the John von Neumann Institute for Computing at the CentralInstitute for Applied Mathematics, Forschungszentrum Juelich, Germany, (d) the NationalCenter for Supercomputing Applications System at the University of Illinois at Urbana-Champaign, (e) the cluster at the Department of Computer Science, Cornell University, (f)the resources of the Center for Computation and Technology at Louisiana State University,which is supported by funding from the Louisiana legislature’s Information TechnologyInitiative, (g) our 45-processor Beowulf cluster at the Faculty of Chemistry, University ofGdansk, (h) the Informatics Center of the Metropolitan Academic Network (IC MAN) inGdansk, and (i) the Cornell Theory Center which receives funding from Cornell University,New York State, Federal agencies, and corporate partners.
50

References
1. M. Laskowski, Jr. and H.A. ScheragaThermodynamic considerations of protein re-actions. I. Modified reactivity of polar groups, J. Am. Chem. Soc.76, 6305–6319,1954.
2. M. Laskowski, Jr. and H.A. ScheragaThermodynamic considerations of protein re-actions. II. Modified reactivity of primary valence bonds, J. Am. Chem. Soc.78,5793–5798, 1956.
3. G. Nemethy and H.A. ScheragaThe structure of water and hydrophobic bonding inproteins. III. The thermodynamic properties of hydrophobic bonds in proteins, J. Phys.Chem.66, 1773–1789, 1962.
4. J.H. Griffith and H.A. ScheragaStatistical thermodynamics of aqueous solutions.I. Water structure, solutions with non-polar solutes, and hydrophobic interactions,J. Molec. Str. 682, 97–111, 2004.
5. G. Nemethy, I.Z. Steinberg, and H.A. ScheragaThe influence of water structure andof hydrophobic interactions on the strength of side-chain hydrogen bonds in proteins,Biopolymers1, 43–69, 1963.
6. C. Tansford, J.D. Hauenstein, and D.G. RandsPhenolic hydroxyl ionization in pro-teins. II. Ribonuclease, J. Am. Chem. Soc.77, 6409–6413 , 1958.
7. H.A. ScheragaStructural studies of pancreatic ribonuclease, Fed. Proc.26, 1380–1387, 1967.
8. H.A. ScheragaTyrosyl-carboxylate ion hydrogen bonding in ribonuclease, Biochim.Biophys. Acta23, 196–197, 1957.
9. H. Wako and H.A. ScheragaOn the use of distance constraints to fold a protein,Macromolecules14, 961–969 , 1981.
10. G. Nemethy and H.A. ScheragaTheoretical determination of sterically allowed con-formations of a polypeptide chain by a computer method, Biopolymers 3, 155–184,1965.
11. C.B. AnfinsenPrinciples that govern folding of protein chain, Science181, 223–230,1973.
12. D.M. Rothwarf, Y.-J. Li, and H.A. ScheragaRegeneration of bovine pancreatic ri-bonuclease A. Identification of two nativelike three- disulfide intermediates involvedin separate pathways, Biochemistry37, 3760–3766 , 1998.
13. D.M. Rothwarf, Y.-J. Li, and H.A. ScheragaRegeneration of bovine pancreatic ri-bonuclease A. Detailed kinetic analysis of two independentfolding pathways, Bio-chemistry37, 3767–3776 , 1998.
14. S. Shimotakahara, C.B. Rios, J.H. Laity, D.E. Zimmerman, H.A. Scheraga, and G.T.MontelioneNMR structural analysis of an analog of an intermediate formed in therate-determining step of one pathway in the oxidative folding of bovine pancreaticribonuclease A: Automated analysis of 1H, 13C, and 15N resonance assignments forwild-type and [C65S, C72S] mutant forms, Biochemistry36, 6915–6929 , 1997.
15. J.H. Laity, C.C. Lester, S. Shimotakahara, D.E. Zimmerman, G.T. Montelione, and H.A. ScheragaStructural characterization of an analog of the major rate–determiningdisulfide folding intermediate of bovine pancreatic ribonuclease A, Biochemistry36,12683–12699 , 1997.
51
16. M. Iwaoka, D. Juminaga, and H.A. ScheragaRegeneration of three- disulfide mutantsof bovine pancreatic ribonuclease A missing the 65-72 disulfide bond: Characteri-zation of a minor folding pathway of ribonuclease A and kinetic roles of Cys65 andCys72, Biochemistry37, 4490–4501 , 1998.
17. X. Xu and H. A. ScheragaKinetic folding pathway of a three-disulfide mutant ofbovine pancreatic ribonuclease A missing the [40-95] disulfide bond, Biochemistry37, 7561–7571 , 1998.
18. X. Xu, D.M. Rothwarf, and H.A. ScheragaNonrandom distribution of the one-disulfide intermediates in the regeneration of ribonuclease A, Biochemistry35,6406–6417 , 1996.
19. M.J. Volles, X. Xu, and H.A. ScheragaDistribution of disulfide bonds in the two-disulfide intermediates in the regeneration of bovine pancreatic ribonuclease A, Bio-chemistry 38, 7284–7293 , 1999.
20. P.J. Milburn and H.A. ScheragaLocal interactions favor the native 8-residue disulfideloop in the oxidation of a fragment corresponding to the sequence Ser-50-Met-79derived from bovine pancreatic ribonuclease A, J. Protein Chem.7, 377–398 , 1988.
21. K.H. Altmann and H.A. ScheragaLocal structure in ribonuclease A. Effect of aminoacid substitutions on the preferential formation of the native disulfide loop in syntheticpeptides corresponding to residues Cys58-Cys72 of bovine pancreatic ribonuclease A,J. Am. Chem. Soc.112, 4926–4931 , 1990.
22. R.P. Carty, M.R. Pincus, and H.A. ScheragaInteractions that favor the native overthe non-native disulfide bond among residues 58-72 in the oxidative folding of bovinepancreatic ribonuclease A, Biochemistry41, 14815–14819 , 2002.
23. F.A. Momany, R.F. McGuire, A.W. Burgess, and H.A. ScheragaEnergy parameters inpolypeptides. VII. Geometric parameters, partial atomic charges, nonbonded interac-tions, hydrogen bond interactions, and intrinsic torsional potentials for the naturallyoccurring amino acids, J. Phys. Chem.79, 2361–2381 , 1975.
24. Y.A. Arnautova, A. Jagielska, and H.A. ScheragaA new force field (ECEPP-05) forpeptides, proteins and organic molecules, J. Phys. Chem. B.110, 5025–5044 , 2006.
25. H.A. Scheraga, A. Liwo, S. Ołdziej, C Czaplewski, J. Pillardy, D.R. Ripoll, J.A. Vila,R. Kazmierkiewicz, J.A. Saunders, Y.A. Arnautova, A. Jagielski, M. Chinchio, andM. NaniasThe protein folding problem: Global optimization of force fields, Frontiersin Bioscience9, 3296–3323, 2004.
26. J.A. Vila, D.R. Ripoll, and H.A. ScheragaAtomically detailed folding simulation ofthe B domain of staphylococcal protein A from random structures, Proc. Natl. Acad.Sci. U.S.A.100, 14812–14816 , 2003.
27. D.R. Ripoll, J.A. Vila, and H.A. ScheragaFolding of the villin headpiece subdomainfrom random structures. Analysis of the charge distribution as a function of pH, J.Mol. Biol. 339, 915–925 , 2004.
28. A. Ghosh, R. Elber, and H.A. ScheragaAn atomically detailed study of the foldingpathways of protein A with the stochastic difference equation, Proc. Natl. Acad. Sci.U.S.A. 99, 10394–10398 , 2002.
29. R. Elber, A. Ghosh, and A. CardenasLong Time Dynamics of Complex Systems, Acc.Chem. Res.35, 396–403 , 2002.
52

30. A. Jagielska and H.A. ScheragaInfluence of temperature, friction, and random forceson folding of the B-domain of Staphylococcal Protein A: All-atom molecular dynamicsin implicit solvent, J. Comput. Chem.28, 1068–1082 , 2007.
31. A. Liwo, S. Ołdziej, M.R. Pincus, R.J. Wawak, S. Rackovsky, and H.A. ScheragaAunited-residue force field for off-lattice protein- structure simulations. I. Functionalforms and parameters of long-range side-chain interactionpotentials from proteincrystal data, J. Comput. Chem.18, 849–873 , 1997.
32. A. Liwo, M.R. Pincus, R.J. Wawak, S. Rackovsky, S. Ołdziej, and H.A. ScheragaAunited-residue force field for off-lattice protein- structure simulations. II. Parameter-ization of short-range interactions and determination of weights of energy terms byZ-score optimization, J. Comput. Chem.18, 874–887 , 1997.
33. A. Liwo, R. Kazmierkiewicz, C. Czaplewski, M. Groth, S. Ołdziej, R.J. Wawak, S.Rackovsky, M.R. Pincus, and H.A. ScheragaA united-residue force field for off-latticeprotein-structure simulations; III. Origin of backbone hydrogen-bonding cooperativ-ity in united-residue potentials, J. Comput. Chem.19, 259–276 , 1998.
34. A. Liwo, C. Czaplewski, J. Pillardy, and H.A. ScheragaCumulant-based expressionsfor the multibody terms for the correlation between local and electrostatic interactionsin the united-residue force field, J. Chem. Phys.115, 2323–2347 , 2001.
35. A. Liwo, P. Arłukowicz, C. Czaplewski, S. Ołdziej, J. Pillardy, and H.A. ScheragaA method for optimizing potential-energy functions by a hierarchical design of thepotential-energy landscape: Application to the UNRES force field, Proc. Natl. Acad.Sci. U.S.A. 99, 1937–1942, 2002.
36. S. Ołdziej, J. Lagiewka, A. Liwo, C. Czaplewski, M. Chinchio, M. Nanias, andH.A. ScheragaOptimization of the UNRES force field by hierarchical designof thepotential-energy landscape. 3. Use of many proteins in optimization, J. Phys.Chem. B 108, 16950–16959 , 2004.
37. A. Liwo, M. Khalili, C. Czaplewski, S. Kalinowski, S. Ołdziej, K. Wachucik,and H.A. ScheragaModification and optimization of the united-residue (UNRES)potential-energy function for canonical simulations. I. Temperature dependence ofthe effective energy function and tests of the optimizationmethod with single trainingproteins, J. Phys. Chem. B.111, 260–285 , 2007.
38. J. Lee, H.A. Scheraga, and S. RackovskyNew optimization method for confor-mational energy calculations on polypeptides: Conformational space annealing,J. Comput. Chem.18, 1222–1232 , 1997.
39. R. Kazmierkiewicz, A. Liwo, and H.A. ScheragaEnergy-based reconstruction of aprotein backbone from itsα-carbon trace by a Monte-Carlo method, J. Comput.Chem. 23, 715–723 , 2002.
40. R. Kazmierkiewicz, A. Liwo, and H.A. ScheragaAddition of side chains to a knownbackbone with defined side-chain centroids, Biophys. Chem.100, 261–280 , 2003.Erratum: Biophys. Chem.,106, 91 (2003).
41. M. Khalili, A. Liwo, F. Rakowski, P. Grochowski, and H.A.ScheragaMolecular dy-namics with the united-residue model of polypeptide chains. I. Lagrange equations ofmotion and tests of numerical stability in the microcanonical mode, J. Phys. Chem. B.109, 13785–13797 , 2005.
53

42. M. Khalili, A. Liwo, A. Jagielska, and H.A. ScheragaMolecular dynamics with theunited-residue model of polypeptide chains. II. Langevin and Berendsen-bath dynam-ics and tests on modelα-helical systems, J. Phys. Chem. B.109, 13798–13810 ,2005.
43. A. Liwo, M. Khalili, and H.A. ScheragaAb initio simulations of protein-folding path-ways by molecular dynamics with the united-residue model ofpolypeptide chains,Proc. Natl. Acad. Sci. U.S.A.102, 2362–2367 , 2005.
44. M. Khalili, A. Liwo, and H.A. ScheragaKinetic studies of folding of the B-domainof staphylococcal protein A with molecular dynamics and a united-residue (UNRES)model of polypeptide chains, J. Mol. Biol. 355, 536–547 , 2006.
45. A. V. Rojas, A. Liwo, and H.A. ScheragaMolecular dynamics with the united-residueforce field. Ab initio folding simulations of multichain proteins, J. Phys. Chem. B.111, 293–309, 2007.
46. A. Liwo, C. Czaplewski, S. Ołdziej, M. Chinchio, A.V. Rojas, M. Khalili, M.Makowski, S. Kalinowski, U. Kozłowska, R.K. Murarka, and H.A. ScheragaMeso-scopic dynamics with the UNRES force field. A tool for studying the kinetics andthermodynamics of protein folding, in “From Computational Biophysics to SystemsBiology 2007”, in press.
54

The E-Cell Project and Challenges in ComputationalSystems Biology
Koichi Takahashi1,2
1 The Molecular Sciences Institute,2168 Shattuck Avenue, Berkeley, CA 94704, USA.
E-mail: [email protected]
2 Institute for Advanced Biosciences,Keio University, Fujisawa, 252-8520, Japan.
Summarizing our experience in launching and running the E-Cell Project over the past ten years,I will discuss some of major challenges we believe we will face in the next ten years of cell andsystems biological simulation, including the following two; (1) Undeniably the last ten years ofcomputational systems biology has been (re)discovery of the biggest bottleneck in biochemicalmodeling; the lack of high-throughput and reliable means ofobtaining reaction rate coefficients.Computational aids in determination of reaction rate coefficients will be one area in whichfruitful interactions between molecular biology, biophysical chemistry, and supercomputingare highly expected. (2) Macromolecular crowding is ubiquitous and found in all types ofcellular organisms on the earth, which can, when coupled with localization and diffusion, alterbiochemical dynamics, change equilibrium points, slow down and change the manner howbig molecules diffuse, and amplify intrinsic noise. It is also a suspected physico-chemicalfactor behind the emergence of eukaryotic organisms. Development of formal treatment andcomputational methods for crowded intracellular media will be some of the most importanttasks left for computational biologists.
1 Introduction
The E-Cell Projecta was started in 1996 with the aim of establishing technological basesthat will make possible predictive modeling and simulationof cellular systems at themolecular level. Although we are halfway towards the ultimate goal we defined 11 yearsago, I believe we are now at a good position where we can speculate, and, to some extent,predict the next 10 years of cell simulation technology by extrapolating our experience inthe last decade, with the hope that it will be of any help in thinking about challenges ofwhat nature we will encounter and what will have been done if we would be overcomingthese. But before that, in the next section, let us think about why we want to model bio-chemical and cellular systems, and what we could do in the first place. I will then brieflylook back the history of the E-Cell Project and our simulation platform E-Cell System, anddiscuss some challenges I believe we will face in the processof establishing cell simulationtechnology.
2 Simulation and Science
Why do we want to model and simulate biological systems? Why do we want to do it atthe molecular level, and what insight do we expect from it?
ahttp://e-cell.org
55

Figure 1. Physical models, mental models, and how these models are obtained or related by means of predictiveand abstraction powers of modeling and simulation.
Science is a collection of mutually interconnected mental models that are intersubjec-tively verifiable and shared by the community of scientists.As a first approximation, wecould define scientific research as forming of such mental models. In Figure 1, on the righthand side are two examples of such models, a metabolic pathway map and a set of equa-tions for fluid dynamics. Time-space reproduction of molecules constituting the physicalsystems, such as those shown on the left hand side of the figure, do not by themselvesrepresent understanding of how the systems work. Such physical models must somehowundergo a process of abstraction to construct models that have the power to predict and/orto explain behaviors of systems in different states or of different variations of the same type.Simulation allows us to leap forward exactly one step in the level of abstraction, from lowerto higher. For example, equations about inter-atomic forces could be extrapolated to de-pict how proteins fold through the medium of numerical simulation. Or, atmospheric datagathered at a geographically sparse set of observation points for a certain period of timemay lead to a model of a larger area, longer time-scales, and/or finer resolutions. Let uscall this ability of simulation that enables us to interpolate or extrapolate physical modelsat certain levels of abstraction beyond our accessibility to the real-world target systems apredictive powerof numerical simulation.
E-Cell Project is interested in modeling and simulating cellular systems at the level ofthe system-level output, or, physiology. If we want to buildphysiological models of thecell equipped with the predictive power, we have to model thesystem at one step lower inthe hierarchy of abstraction. How big or small this ’one step’ should be is subject to manytechnological factors. In principle, modeling becomes easier as we go lower in the abstrac-tion level, since composite phenomena and complex components in the system tend to bedecomposed to more basic principles and simpler componentsthat are easier to model, andin many cases, less complicated to experimentally measure necessary parameters. This is
56

a crucially important aspect of the picture because the hardest part of cellular modelingand simulation lies in its ontological complexity, rather than emerging complexities seenin many other physical simulations2. On the other hand, how far we can go down givena desired observation frame highly depends on computational capacities and accuracy ofnumerical methods.
3 The E-Cell Project
What we aimed at when we started the E-Cell Project was to bring this predictive abilityof numerical simulation into molecular biology. Our initial aim was to show it is not im-possible to computationally reconstruct inner workings ofcellular organisms at the wholecell-scale, and by doing so, to open a pathway that leads to establishment of cell simulationas a scientific method and as an inter-disciplinary technology that spans from measurementmethods to numerical analysis.
We started the E-Cell project stimulated by the determination of the smallest known580kb genome sequence ofMycoplasma genitalium. By the summer of 1997, we devel-oped an early version of our modeling and simulation platform, the E-Cell System, and amodel of a virtual cell of which 127 genes constitute its basic functions to sustain itself as aliving organism; enzymes in the energy metabolism and phospholipid synthesis, and genetranscription and translation systems1. Since then, the E-Cell Project has been expandingareas of work to construct more detailed and precise models of cellular functions, such asthe bacterial chemotaxis signaling pathway ofEscherichia coliand metabolic pathways ofhuman erythrocytes and mitochondria. Concomitant to the biological modeling projectswas the development of the computational platform, the E-Cell System. We identifiedseven desirable features of cell simulation platforms to betruly useful, which constitute aquite different set of requirements than that of conventional physical simulators, such asthe need for an integrative multi-algorithm, multi-timescale framework, object-orientation,dynamic model structure, and real-time user interactions.Due to the length limitation,interested readers are referred to other E-Cell Project publications2 for more discussions.Since the development of the first version1, our current version is E-Cell System version 33,which meets five of the seven requirements we defined. We have started the developmentof a new generation simulation kernel that will be the core ofthe E-Cell System version4 to address the two remaining features, multi-spatial representations and dynamic modelstructure, in addition to a vastly improved support for parallel computationb.
4 Some Important Challenges in Computational Systems Biology
Numerical simulation, as well as experimental measurementtechnologies, is placed atthe center of disciplines playing important roles in computational systems biology, whichis inter-disciplinary by nature. Here I pick up two (among many) major challenges incomputational systems biology that we believe we will face in the course of pursuing cellsimulation technology development.
bhttp://e-cell.org/developers/e-cell-4
57

4.1 Methods for Determination of Reaction Rate Coefficients
The last ten years have been rediscovery of the lack of high-throughput and reliable meansof obtaining reaction rate coefficients, and this lack formed the biggest bottleneck in thebiochemical modeling and simulation workflow. Many modeling projects got stuck assoon as they faced this lack of input parameters, and a commonfeature of the limited num-ber of successful modeling projects has been the accumulation of a large body of kineticstudies for decades, each determined parameter for a particular enzyme corresponding tosomeone’s doctoral degree.
When we think about these systems, however, we notice that there is no such measur-able physical quantities like ’net reaction rate constants’, but there is only coupling of twodistinct physical occurrences; diffusive encounters of reactants and subsequent interactionsbetween them. Let us think about bimolecular reactions, that are most commonly seen incellular metabolic, signaling and gene expression pathways. Such reactions can formallybe written asA+B− > C. Recall Arrhenius relation
knet = A exp
(
− Ea
kBT
)
, (1)
whereknet is the net reaction rate,A is the frequency factor,Ea is the activation energy,kB is the Boltzmann constant andT is temperature. It can be read that there are twofactors that determine the net rates of reactions, the frequency of molecular collisions andthe activation energy which is related to interactions between molecules. Let us then lookat this from another point of view;
1
knet=
1
4πDσ+
1
kintrinsic, (2)
whereD is the diffusion coefficient,σ is the effective cross section, andkintrinsic is theintrinsic reaction rate. When both ofA andB molecules diffuse,D becomes a relativediffusion coefficient. The first term in the right hand side indicates essentially the same asA, the frequency of collision, and the intrinsic reaction rate in the second term correspondsto the activation energy. Where did this4πDσ come from? It came from the Smoluchowskitheory of diffusion-limited reactions7. In the simplest case where we describe the systemin one dimensional space,
k(t) = 4πσ2D∂C
∂r(3)
wheret is the time since one of the reactive species was injected to the media while theother species was in a well-mixed state,r is the distance between reactants, andC is theconcentration of the reactant. At the equilibrium (t → ∞), and in the low-density limit,
we get;limt→∞ k(t) = limt→∞ 4πσD(
1 + σ√πDt
)
= 4πσD. While this result partially
applies to more complex systems8, when concentration gradients and noise caused by theslow diffusion of macromolecules become relevant, or when density of molecules is high(e.g. see next section), simulation is typically the only way to accurately investigate thesystem. However, this decomposition of net reaction rates into two simpler, physically bet-ter formulated components may be one possible approach for cell simulation to overcomethe bottleneck of reaction rates. An array of experimental methods that can be used to seehow big molecules in the cell diffuse, such as fluorescence correlation spectroscopy and
58

Figure 2. An extended lattice gas automata-like simulationmethod. (a) diffusion of a molecule to one of its 12neighboring spheres in cubic-close packing. (b) a Monte-Carlo bi-molecular reactionA + B → C within themethod with the time step∆t. (c) A sample simulation snapshot of MinD polymerization inEscherichia colimembrane. Reproduced with permission by Satya Arjunan9.
Figure 3. Basic idea used in the Green’s Function Reaction Dynamics. Particles are ’protected’ by protectingdomains (spheres in this figure) to limit interactions up to two bodies. In this figure, the particles 1, 2, and 4,5 form pairs, and the particle 3 remains single. Particles are propagated according to corresponding Green’sfunctions for diffusion.
single particle tracking, are rapidly developing. At the same time, dynamics of protein-protein, protein-ligand, and protein-nucleic acid interactions are some of the areas whereexpected developments in high-performance scientific computing would be found mostuseful, ultimately leading to a high-throughput method of determination of reaction rates,possibly coupled with some form of high-sensitivity biosensors.
4.2 Macromolecular Crowding
Another area where supercomputing may stimulate scientificbreakthroughs may consist inthe striking nature of intracellular media. Extremely highdensities of macromolecules (50-400 mg/ml, compare to 1-10 mg/ml typicalin vitro conditions), called intracellular macro-molecular crowding, is ubiquitous and found in all types of cellular organisms on the earth.Such non-ideal properties of the space in the cell result in different equilibrium points, al-tered reaction rates, slow and anomalous diffusion of macromolecules, and thus modifiedoverall behaviors and dynamical characteristics of biochemical systems. Recently it wasproposed that macromolecular crowding might be the physico-chemical culprit behind theemergence of eukaryotic cells4.
Computational methods that could be used to study diffusion, localization and crowd-ing of proteins in signaling pathways are reviewed somewhere else5. Here I mention twoapproaches the E-Cell Project is currently interested in. First of such approach belongs toa class of methods called cellular automata. Shown in Figure2 is an extended lattice-gasautomata. This class of method discretize the intracellular space with regular lattice, andpropagate molecules to neighboring sites using Monte-Carlo calculations. When lattice
59

resolution is set adequately, the methods can give an approximate reproduction of molec-ular crowding. Lattice-based methods have a great affinity to modern digital computerarchitectures, and have promising scalability to supercomputers. Another class of methodwe are working to implement on the E-Cell System makes use of particles in continuumspace and time6. This method called Green’s Function Reaction Dynamics (GFRD) de-composes the multi-body problem that constitutes the biochemical system into a set ofone and two-body problems (Figure 3), and corresponding Green’s functions for diffusion-reaction are used to propagate the particles. GFRD is an accelerated form of BrownianDynamics (BD) simulation method that is capable of effectively represent crowded space,and is typically up to five orders of magnitude faster than traditional approaches.
5 Conclusion
Understanding cellular systems as systems, not simply as a collection of molecular com-ponents, yet at the molecular level, is undoubtedly one of the most important scientificchallenges in the 21st century, where computation may be thekey to breakthroughs.
Acknowledgments
I thank Satya N.V. Arjunan for the permission to use figures from his work, and NathanAddy for his help in editing. I am a Human Frontier Science Program Fellow. The E-Cell Project is supported by CREST/JST and the MEXT of Japan (Leading Project forBiosimulation and the 21st Century COE Program).
References
1. E-CELL: software environment for whole-cell simulation, M. Tomita, K. Hashimoto,K. Takahashi, T. S. Shimizu, Y. Matsuzaki, F. Miyoshi, K. Saito, S. Tanida, K Yugi,J. C. Venter, and C. Hutchison, Bioinformatics15, 1, 1999.
2. Multi-algorithm and multi-timescale cell biological simulation, K. Takahashi, PhDThesis, Keio University (2004).
3. Multi-algorithm, multi-timescale method for cell simulation, K. Takahashi, K. Kaizu,B. Hu, and M. Tomita, Bioinformatics20, 4, 1999.
4. Genomics and the Irreducible Nature of Eukaryote Cells, C. G. Kurland, L. J. Collins,and D. Penny, Science312, 5776, 2006.
5. Space in systems biology of signaling pathways – intracellular molecular crowding insilico, K. Takahashi, S. Arjunan, and M. Tomita, FEBS Letters579, 8, 2005.
6. Green’s-function reaction dynamics: a particle-based approach for simulating bio-chemical networks in time and space, J. S. van Zon and P. R. tenWolde, J. Chem.Phys.123, 234910, 2005.
7. Diffusion-Limited Reactions, S. A. Rice, in Compr. Chem.Kinet., Vol. 25, editec byC. H. Bamford, C.F.H. Tipper, R.G. Compton, Elsevier, New York, (1985).
8. Theory of reversible diffusion-influenced reactions, N.Agmon and A. Szabo, J.Chem. Phys.92, 5270, 1990.
9. A 3D pole-to-pole oscillation model of MinD on Escherichia coli membrane, S. N. V.Arjunan and M. Tomita, unpublished (2007).
60

Stretching RNA Hairpins
Changbong Hyeon1 and D. Thirumalai 2,3
1 Center for Theoretical Biological Physics, University of California at San DiegoLa Jolla, California 92093, USA
2 Biophysics ProgramInstitute for Physical Science and Technology
3 Department of Chemistry and Biochemistry, University of MarylandCollege Park, MD 20742, USAE-mail: [email protected]
1 Introduction
Optical tweezer experiments have used mechanical force to trigger folding and unfolding ofRNA molecules at a single molecule level1, 2. Application of tension to a specific positionof the molecule, induces sequence and structure-dependentresponse. The measured force-extension curve (FEC) is fit using the worm-like (WLC) model3, 4. The stability of RNAs isinferred by integrating the FECs. For simple motifs, such ashairpins, it has been shown thatthe stability of the native structures can be accurately measured using mechanical unfoldingtrajectories which exhibit multiple transitions between the folded and the unfolded statewhen the force is held constant1.
Mechanical force has also been used to probe unfolding and refolding kinetics of RNA.The cooperative reversible folding of hairpins has been shown by monitoring the end-to-end distance (R), a variable conjugate to the mechanicalf , as a function of time. Thisprocedure works best when RNA folding is described using two-state approximation. Formultidomain ribozymes the folding/unfolding kinetics is complex and new tools are re-quired to interpret the kinetic data. In a pioneering study Onoaet. al.2 showed that therips in FECs for the L-21 derivative ofTetrahymena thermophilaribozyme (T. ribozyme),composed of multiple domains, are a result of unfolding of individual intact domains thatare stabilized in the native state by counterion-dependenttertiary interactions.
In this note, we probe the forced-unfolding dynamics of RNA hairpins using asimple model. Because these simulations can be used to directly monitor structuresin the transition from folded to the fully stretched states,unfolding pathways can beunambiguously resolved. We use aSelf-Organized Polymer (SOP) modelfor RNAthat is based only on the self-avoiding nature of the RNA and the native structure. Weapply the SOP model to probe forced-unfolding of a number of RNA structures ofvarying complexity. Many of the subtle features of the variations in the mechanicalunfolding as a function off andrf can be illustrated using P5GA, a simple RNA. Ourresults show that the response of RNA to force is largely dependent on the architec-ture of the native state. More importantly, we have established that the characterizationof the the energy landscape requires using force values (or loading rates) over a wide range.
61

2 Methods
Model: The SOP model for RNA that retains chain connectivity and favorable attractiveinteractions between sites that stabilize the native fold.Each interaction center representsthe center of mass of a nucleotide. In terms of the coordinatesr i, i = 1, 2, . . .N of RNAwith N nucleotide the total potential energy in the SOP representation is
VT = VFENE + V(att)nb + V
(rep)nb
= −N−1∑
i=1
k
2R2
0 log(1 −(ri,i+1 − ro
i,i+1)2
R20
)
+
N−3∑
i=1
N∑
j=i+3
ǫh[(roij
rij)12 − 2(
roij
rij)6]∆ij
+
N−2∑
i=1
ǫl(σ∗
ri,i+2)6 +
N−3∑
i=1
N∑
j=i+3
ǫl(σ
rij)6(1 − ∆ij). (1)
The first term is for the chain connectivity. The finite extensible nonlinear elastic (FENE)potential5 is used withk = 20kcal/(mol·A2), R0 = 0.2 nm, andri,i+1 is the distancebetween neighboring beads interaction centersi and i + 1, ro
i,i+1 is the distance in thenative structure. The use of FENE potential is more advantageous than the standardharmonic potential especially when considering forced-stretching because the fluctuationsof ri,i+1 are strictly restricted aroundro
i,i+1 with variation of±R0. The Lennard-Jonespotential is used to account for interactions that stabilize the native topology. Nativecontact is defined for the pair of interaction centers whose distance is less thanRC = 1.4nm in the native state for|i − j| > 2. If i andj sites are in contact in the native state,∆ij = 1, otherwise∆ij = 0. We usedǫh = 0.7 kcal/mol for the native pairs,ǫl = 1kcal/mol for non-native pairs. In the current version, we have neglected non-nativeinteractions which will not qualitatively affect the results because, under tension, suchinteractions are greatly destabilized. To ensure the non-crossing of the chain, we setσ = 7A. Only for i, i + 2 pairs we setσ∗ = 3.5 A to prevent the flattening of the helicalstructures when the overall repulsion is large. There are five parameters in the SOP forcefield (k, R0, ǫh, ǫl, andRc)6. Of these the results are sensitive to the precise values ofǫh/ǫl andRc. We have discovered that the quantitative results are insensitive toRc as longas it is in the physical range that is determined by the RNA contact maps. In principle, theratio ǫh/ǫl can be adjusted to obtain realistic values of forces. For simplicity we choosea uniform value ofǫh for all RNA constructs. Surprisingly, the SOP force field, with thesame set of parameters, can be used to obtain near quantitative results for RNA moleculesof varying native topology.
Simulations:Using the SOP model, we simulated the mechanical unfolding and refoldingof P5GA hairpin. In force-clamp simulations a constant force is applied to one end ofthe molecule while the other end is fixed. Finally, in force-quench computations theforce on the molecule is reduced to the final value to initiatemechanical refolding. Inboth force-clamp and force-quench setup the dynamics of thelinker (usually hybridRNA/DNA handles) is not relevant whereas depending on the characteristics of the linkersthe dynamics of linker may play an important role in the force-ramp experiments7.
62

Time scales: Since a typical value for the mass of a nucleotide,m ∼ 300g/mol−400g/mol, the average distance between the adjacent nucleotides in the SOPrepresentation of RNA isa ≈ 5 A, ǫh = 0.7 kcal/mol, the natural time isτL = (ma2
ǫh)1/2 = 3 ∼ 5ps. We useτL = 4.0ps to convert simulation times into
real times. To estimate the time scale for mechanical unfolding dynamics we use aBrownian dynamics algorithm8, 9 for which the natural time for the overdamped motionis τH = ζǫh
kBT hτL (τL = 4ps). We usedζ = 100τ−1L in the overdamped limit, that
approximately corresponds to friction constant of a nucleotide in water. The equations ofmotion in the overdamped limit are integrated using the Brownian dynamics algorithm.
Force-induced transitions in a simple hairpin (P5GA): Liphart et. al. showed thatthe P5ab hairpin, the construct in which P5c stem-loop and the A-rich bulge in P5a areremoved from the P5abc subdomain inT . ribozyme, reversibly folds in an all-or-nonefashion upon application of constant force. The equilibrium between the native basin ofattraction (NBA) and the unfolded basin of attraction (UBA) can be shifted by altering thevalue of the constant force,fc. To probe the two-state behavior of hairpins under force weused a smaller 22-nt hairpin, P5GA (Protein Data Bank (PDB) id: 1eor)10, 11. For the P5GAhairpin simulations over a wide range of forces can be performed in reasonable times. Thetopologically simple hairpin has a single tetra-loop and nine consecutive base pairs. In anearlier study11 we showed, using a minimal three interaction site (TIS) model in whicheach nucleotide is represented by three sites, that the dynamical behavior of P5GA undertension is qualitatively similar to P5ab. The much simpler SOP representation of P5GAallows us to probe exhaustively the folding and unfolding kinetics of the hairpin that ismanipulated by force-ramp, force-quench, and force-clamp.
The hallmark of P5ab1 and P5GA11, when a constant force is applied to either the3’ or the 5’ ends, is the observation of bistable kinetics. When a constantfc is appliedto the 3’ end P5GA makes transitions (Fig. 1-B) between theUBA (R ≈ 8nm) to theNBA (R ≈ 2nm). At fc = 14.0, 15.4, 17.5pN a large number of transitions occur over45ms duration which suggests that the hairpin dynamics is effectively ergodic. As inour previous study11 the equilibrium constant between the folded and unfolded hairpincalculated using a long mechanical unfolding trajectory coincides with an independentensemble average calculation i.e., time averages are roughly equivalent to ensembleaverages. Whenfc = 14 pN the residence time in theNBA is much greater than inthe UBA while at fc = 16.8 pN the UBA is preferentially populated (Fig. 1-B). Thepopulation of P5GA in theNBA changes whenfc is varied can be seen in the histogram(P (R)) of the end-to-end distanceR (Fig. 1). At fc = 15.4 pN , which is slightly abovethe midpoint of theNBA ⇔ UBA transition, several jumps between theNBA andUBAare observed. TheP (R) distribution reflects the bistable nature of the landscape.Thefree energy profile with respect toR is computed using∆F (R) = −kBT logP (R).FromP (R) at fc = 15.4 we can obtain the free energy of stability of the folded hairpinwith respect to the unfolded state using∆G ≈ fc∆RUF where∆RUF is the distancebetween the folded and unfolded states of P5GA. Using∆RUF ≈ 6nm we find that∆G ≈ 13kcal/mol. The Vienna RNA package12, which uses an entirely different freeenergy parameters for RNA, gives∆G ≈ 12.8kcal/mol. This comparison shows that theSOP model can, for simple structures, give accurate resultsfor stability. At fc = 15.4 pN ,the transition barrier is about∼ 1.5kBT . TheUBA is more populated at this value offc.
63

Figure 1. A. The secondary structure of P5GA hairpin and its contact map.B. The time-dependent fluctuationsof P5GA hairpin between the folded (R ≈ 1.5nm) and unfolded (R ≈ 8nm) states. The end-to-end distancechanges spontaneously between two values. The force-clamped dynamics of the P5GA hairpin is probed for∼ 45 ms. The histogramsP (R) atfc = 14.0, 15.4, 16.8 pN are shown in red. The free energy profile∆F (R)as a function ofR for fc = 15.4 pN on the right shows two-state behavior.
The observed transition times are much shorter than the residence times in each basin ofattraction which is also a reflection of the underlying cooperativity of the all-or-none ofnature of hopping betweenUBA andNBA.
Force-ramp:We also performed force-ramp simulations by subjecting theP5GA hairpinto a continuously changing force, i.e., varying the loadingrate (Methods). The simplicityof the SOP model allows us to use values ofrf that are comparable to those used in LOTexperiments. Atrf = 45 pN/s (∼ 10rLOT
f ) the force-extension curves show a transition
64

Figure 2. Force-ramp unfolding of P5GA hairpin.A. An example of FEC at the loading raterf = 45 pN/s(ks = 0.07 pN/nm, v = 0.64 µm/s). The data points are recorded every 50µs (grey color), but for betterillustration the running average is displayed every 500µs (red color). B. The end-to-end distance (R) as afunction of time.C. Time dependence off . The loading raterf = df/dt is nearly a constant.D. Distribution ofunbinding forces from 100 trajectories at four loading rates rf = ro
f, 10
3rof
, 203
rof
, and10rof
(rof
= 4.5 × 10³
pN/s (ks = 0.7 pN/nm, v = 6.4 µm/s)). The red star is the rupture force value (f∗ = 12.5 pN ) atrf = 45
pN/s. E. Plotf∗, the most probable unfolding force, as a function ofrf . The position of transition state∆xTSF
is computed using∆xTSF = kBT
∆ log rf
∆f∗ . The inset shows the variation of∆xTSF as a function ofrf .
to theUBA at aroundf ∼ 13 pN (Fig. 2-A). As the force dynamically increases weobserve bistable fluctuations in the FEC between theNBA and theUBA just as when forceis held constant (Fig. 2-A). The conformational fluctuations between the two states areunambiguously seen in the time-dependence of the end-to-end distance (R(t)) (Fig. 2-B).As time progresses the force is ramped up which results in global unfolding (R ≈ 8 nm)for t > 400ms (Fig. 2-B). During the time scale of simulation we find frequent and sharptransition between theUBA and theNBA (Fig. 2-B).
The location of the unfolding transition state∆xTSF for proteins and RNA is often
estimated from force-ramp experiments using the variationof the most probable rupture
65

force withrf ([f∗, log rf ] plot). The loading rate,rf = df(t)/dt, and can be accuratelyestimated from the slope of the time dependence off(t) as a function of time. The slopeof f(t) as a function oft (Fig. 2-C) is nearly the same asrf ≈ ks × v, wherev is thepulling speed. Strictly speaking,rf = keff × v with k−1
eff = k−1s + k−1
mol + k−1linker andks,
kmol, andklinker are the spring constants of the optical trap, the RNA molecule, and linker,respectively. Typicallyks ≪ kmol, klinker , thuskeff ≈ ks
13. Throughout the paper weobtain the loading rate usingrf = ksv.
From the force distributions, computed at four different loading rates (Fig. 2-D),we observe that the most probable rupture force (f∗) does not increase logarithmicallyover a wide range of loading rates (Fig. 2-E). Only if the range of rf is restrictedf∗ changes linearly withrf 14. The location of the transition state (∆xTS
F ) is usuallycalculated usingf∗ ≈ ( kBT
∆xTSF
) log rf14 which may be reasonable as long asrf range
is small. However, the[f∗, log rf ] plot is highly nonlinear (Fig. 2-E). If we use linearregression to analyze the[f∗, log rf ] plot then∆xTS
F ∼ 0.8 nm for the distance betweenthe NBA and the transition state. The small value of∆xTS
F is a consequence of thelarge variation of∆xTS
F asrf is changed11, 15. If the loading rate is varied over a broadrange, therf -dependence of∆xTS
F is manifested as a pronounced convex curvature7 inthe [f∗, log rf ] plot (Fig. 2-E). Based on the equilibrium free energy profileF (R) as afunction ofR11 we expect that for P5GA∆xTS
F ≈ 3 nm if rf is small. Indeed, fromthe constant force simulation results in Fig. 1-B we find∆xTS
F ≈ RU−RF
2 . Thus, theslope of[f∗, log rf ] should decrease (∆xTS
F increases) asrf decreases. To illustrate thedramatic movement in the transition state we have calculate∆xTS
F usingf∗ values fortwo consecutive values ofrf . For example, usingf∗ ≈ 12.5 pN at rf = 450 pN/s andf∗ ≈ 14.9 pN atrf = 4.5× 10³ pN/s (a value that can be realized in AFM experiments)we obtain∆xTS
F ≈ 4.0 nm. From the values off∗ at five values ofrf we find that∆xTS
F can move dramatically (Fig. 2-E). In particular, we find that∆xTSF changes by
nearly a factor of ten as the loading rate is decreased to values that are accessible inLOT experiments (see inset in Fig. 2-E). Because of the nearly logarithmic variation of∆xTS
F on rf over a narrow range ofrf we do not expect∆xTSF to change appreciably
if rf is lowered from45pN/s to ≈ 5pN/s. At high rf or fc the unfolded state isgreatly stabilized compared to the folded state. From Hammond’s postulate16, general-ized to mechanical unfolding7, it follows that asfc increases∆xTS
F should move closerto the native state. The simulations are, therefore, in accord with the Hammond’s postulate.
3 Conclusions
We have used the self-organized polymer representation of RNA hairpins to predict theirmechanical unfolding trajectories. Constant force and force-ramp simulations show thatdramatic changes in the force profiles take place as the loading rates and the values ofthe force are varied. If the force is varied over a wide range then regions of the energylandscape that cannot be accessed in conventional experiments can be probed. However,in order to realize the full utility of the single molecule force spectroscopy it becomes nec-essary to use force in distinct modes (constant force, force-ramp, and other combinations)along with reliable computations that can mimic the experimental conditions as closely aspossible. We conclude the paper with the following additional remarks.
66

Transition state movements show changes from plastic to brittle behavior:The small sizeand simple architecture of RNA hairpins has allowed us to explore their response to forceover a range ofrf that spans four orders of magnitude. The lowestrf value is close tothose used in LOT experiments. A key prediction of our simulations is that the locationof the transition state for P5GA moves dramatically from about 6 nm at low rf to about0.5 nm at highrf (see inset to Fig. 2-E). The large value of∆xTS
F at low rf suggeststhat P5GA is plastic while the small∆xTS
F at highrf is suggestive of brittle behavior.The mechanical properties of RNA structures can be drastically altered by varying theloading rate which is reminiscent of the changes in the visco-elastic behavior of polymericmaterials that changes with frequency. The transformationfrom plastic to brittle behaviorcan be captured using the fragility index15 used to describe mechanical unfolding ofhairpins. Although we have discussed therf -dependent movement of the transition statesusing P5GA as an example we predict that this result is general and should be observed inother RNA structures as well.
Acknowledgements
This work was supported in part by a grant from the National Science Foundation throughgrant number NSF CHE-05-14056.
References
1. J. Liphardt, B. Onoa, S. B. Smith, I. Tinoco, Jr., and C. Bustamante,Reversible un-folding of single RNA molecules by mechanical force, Science,292, 733–737, 2001.
2. B. Onoa, S. Dumont, J. Liphardt, S. B. Smith, I. Tinoco, Jr., and C. Bustamante,Identifying Kinetic Barriers to Mechanical Unfolding of theT. thermophilaRibozyme,Science,299, 1892–1895, 2003.
3. C. Bustamante, J. F. Marko, E. D. Siggia, and S. Smith,Entropic Elasticity ofλ-PhaseDNA, Science,265, no. 5178, 1599–1600, 1994.
4. J. F. Marko and E. D. Siggia,Bending and Twisting Elasticity of DNA, Macro-molecules,27, 981–988, 1996.
5. K. Kremer and G. S. Grest,Dynamics of entangled linear polymer melts: Amolecular-dynamics simulation, J. Chem. Phys.,92, 5057–5086, 1990.
6. C. Hyeon, R. I. Dima, and D. Thirumalai,Pathways and kinetic barriers in mechani-cal unfolding and refolding of RNA and proteins, Structure,14, 1633–1645, 2006.
7. C. Hyeon and D. Thirumalai,Forced-unfolding and force-quench refolding of RNAhairpins, Biophys. J.,90, 3410–3427, 2006.
8. D. L. Ermak and J. A. McCammon,Brownian dynamics with hydrodynamic interac-tions, J. Chem. Phys.,69, 1352–1369, 1978.
9. T. Veitshans, D.K. Klimov, and D. Thirumalai,Protein folding kinetics: timescales,pathways and energy landscapes in terms of sequence-dependent properties, FoldingDes.,2, 1–22, 1996.
10. S. Rudisser and I. Tinoco, Jr.,Solution Structure of Cobalt(III)Hexammine Complexedto the GAAA Tetraloop, and Metal-ion Binding to GA Mismatches, J. Mol. Biol.,295,1211–1223, 2000.
67

11. C. Hyeon and D. Thirumalai,Mechanical unfolding of RNA hairpins, Proc. Natl.Acad. Sci.,102, 6789–6794, 2005.
12. I. V. Hofacker,Vienna RNA secondary structure server, Nucl. Acids. Res.,31, no.13, 3429–3431, 2003.
13. M. Manosas and F. Ritort,Thermodynamic and Kinetic Aspects of RNA pulling ex-periments, Biophys. J.,88, 3224–3242, 2005.
14. E. Evans and K. Ritchie,Dynamic Strength of Molecular Adhesion Bonds, Biophys.J.,72, 1541–1555, 1997.
15. M. Manosas, D. Collin, and F. Ritort,Force-Dependent Fragility in RNA Hairpins,Phys. Rev. Lett.,96, 218301, 2006.
16. G. S. Hammond,A correlation of reaction rates, J. Am. Chem. Soc.,77, 334–338,1953.
68

Simulation of Linker Histone-Chromatin Interactions
Georgi V. Pachov1, Razif R. Gabdoulline1,2 and Rebecca C. Wade1
1 EML Research gGmbH, Molecular and Cellular Modeling Group,Schloss-Wolfsbrunnenweg 33, 69118 Heidelberg, Germany
2 Center for Modelling and Simulation in the Biosciences (BIOMS),Im Neuenheimer Feld 368, 69120 Heidelberg, Germany
E-mail: georgi.pachov, [email protected]
The dynamics and interactions between protein-protein andprotein-DNA molecules appearingon different time and length scales in the cell are of fundamental interest. In chromatin, linkerhistone binds to the highly charged nucleosome facilitatedby electrostatic attraction. However,its position and orientation with respect to the nucleosomecore are unknown. Using an implicitrepresentation of the solvent, rigid-body docking of a linker histone to the nucleosome has beenperformed by BD simulations. This reveals how the protein binds to DNA on the nucleosome.Two distinct binding sites on the linker histone have been identified by the docking simulation.
1 Introduction
In the cell nucleus, DNA wraps around histone proteins (forming nucleosome particles)and packs to a highly negatively charged structure, called chromatin fiber. The positioningof the nucleosomes within the fiber depends on the presence orlack of a linker histoneprotein1. However, the exact position and orientation of the linker histone with respectto the nucleosome particle is an unresolved problem, although some recent studies haveproposed different binding modes2–4.
Experimentally, it is known that the linker histone binds tothe nucleosomal DNA5 andto at least one of the linker DNAs. This, indicates the important role of the linker DNA’slength in chromatin compaction6. Since the linker histone appears to be crucial for theopening and closing of the chromatin fiber during transcription and many other biologicalprocesses related to the linker histone and nucleosome in the higher order structure of thegenome, we performed molecular docking simulations using aBrownian Dynamics (BD)algorithm7. This study aims to reveal the binding position and orientation of linker histoneto the nucleosome.
2 Method
Using the crystal structure of the nucleosome core particle8 (NCP, Protein Data Bank -PDB code 1kx5) and of the globular domain of the linker histone H59 (GH5, PDB code1hst), we have performed molecular docking simulations with the Simulation of Diffu-sional Association (SDA) software package10.
Chain B of the linker histone was used for the simulation. Since the histone tails andresidues 119-128 in chain C are much floppier than the other parts of the nucleosome theywere removed from it. In order to include linker DNAs, the tetranucleosome structure12
was used. The DNAs from both nucleosome structures, the one without tails and one from
69

the tetranucleosome, were aligned with Pymol13 and an additional 20 bp DNA was addedto the nucleosome without tails. We will refer to this structure as tNCP. In addition, oneof the linker DNAs in the tNCP wasshiftedaway from the other linker DNA allowingmore space for the linker histone to penetrate close to the nucleosomal DNA (see Fig. 1).This structure will be designated as sNCP. Partial charges and atomic radii were assignedwith the PDB2PQR program14 using the Amber force field. The electrostatic potential wascomputed for the NCPs and GH5 by solving the nonlinear Poisson-Boltzmann equationon grids with2573 and2003 points, respectively. The programs used were APBS15 andUHBD16. The temperature was set to 300 K, the solvent dielectric constant to 78, the soluteto 2 and the ionic strength to 100 mM.
tNCP sNCP
dyad
axis
Figure 1. Difference between sNCP andtNCP structures. The linker DNA (ruby) insNCP is shifted away in comparison withthe linker DNA (blue) in tNCP. The red lineshows the dyad axis of the nucleosome.
Figure 2. The picture shows the BD method, in which each trajec-tory of GH5 is started randomly on an inner sphere surface centeredon the NCP and truncated on an outer sphere surface. The con-straint region, where the docking solutions are recorded, is givenin the zoomed picture. The red dot is the dyad point at the nucleo-somal DNA.
To reduce the number of partial charge sites on the biomolecules, the ECM17 programwas applied. It derives effective charges fitted to reproduce the electrostatic potential in auniform dielectric medium. On DNA, the charges were assigned to theP atoms only. Thenet formal charges are -237 e for the NCPs and 11 e for the GH5. An exclusion volumegrid with 0.5A spacing was assigned to avoid van der Waals overlaps. The BDdockingsimulations were carried out with the SDA package modified insuch a way that the dockedcomplexes are recorded only if they satisfy predefined constraints (Fig. 2). For our case, weused two constraints: (i) a center-to-center between both particles (≤ 73 A) and (ii) dyadpoint-center distance between the dyad at the nucleosomal DNA and the center of the GH5(≤ 40 A). In the simulations, the molecules are modeled as rigid bodies with the short-range attractive interactions neglected. The simulation method has been described in detailin the references7, 10, 11. The trajectories start at a center-to-center distanceb=300A andfinish atc= 600A (Fig. 2). The time step was set to 0.25 ps for center-to-center distancesup to 130A and it increased linearly for larger distances. The interaction energies as wellas the coordinates of the complexes satisfying the constraints were recorded.
For both sNCP and tNCP, five different runs with different random generators, i.e. dif-ferent starting positions and orientations, were performed. For each nucleosome structure
70

25000 complexes were recorded and the 2500 lowest energy docked complexes were clus-tered with the programclust18. After clustering the representatives of 5 and 6 clusterswere analyzed for the sNCP and tNCP, respectively.
3 Results and Discussion
The docking solutions for the linker histone GH5 were extensively investigated. Previoustheoretical and experimental studies2–4 identified the most important residues in binding,but the controversial results obtained left the problem open. Therefore, we aimed to findout which residues contribute to binding, how they influencethe position and orientationof the linker histone with respect to the nucleosome and whether the distance betweenthe linker DNAs, their mutual orientation and position affects the linker histone bindingmode. The results are shown in Table 1 and Table 2 for sNCP and tNCP, respectively.The proximity of every residue considered as important to the nucleosome is given in tworelated ways as: (i) general - close to the nucleosomal DNA (nDNA), linker DNA (lDNA)or neither to the nDNA nor to the lDNA (Nn/lDNA) and (ii) average RMSD appearanced to the dyad point at the nucleosomal DNA (from all 5/6 representatives). The averageinteraction energy for each cluster varies between [-168;-104] kT and [-229;-128] kT forsNCP and tNCP, respectively.
Residue/ nDNA (N com) lDNA (N com) Nn/lDNA (N com) d, A
R42 3 (2357) 1 (72) 1 (68) 18.1R94 3 (2357) 2 (140) 0 (0) 20.6K97 3 (2357) 2 (140) 0 (0) 24.3K85 2 (1981) 3 (516) 0 (0) 20.2K40 1 (1676) 0 (0) 4 (821) 26.3R47 1 (72) 3 (749) 1 (1676) 26.1K69 1 (72) 3 (749) 1 (1676) 28.3R73 1 (72) 3 (749) 1 (1676) 29.8R74 1 (72) 2 (373) 2 (2052) 34.6K52 2 (377) 2 (2052) 1 (68) 29.5K55 1 (72) 2 (681) 2 (1744) 29.7K59 0 (0) 1 (1676) 4 (821) 40.2
Table 1. Number of representatives of the clusters according to each residue located within 15A of the nucleo-somal DNA (nDNA), linker DNAs (lDNA) and away (Nn/lDNA,≤ 15A) from either nDNA or nDNA. All 2500docked solutions (in brackets) are presented by 5 representatives. The distanced is the average RMSD from aspecified residue (atom Nζ for K and Cζ for R) to the dyad point on the nucleosomal DNA for all representatives.
It is clearly seen for sNCP and tNCP that the site with residues Arg42, Arg94 and Lys97appears to be closer to the nucleosomal DNA than to any of the linker DNAs (Fig. 3).Moreover, residue Arg42 takes the closest position to either nDNA or lDNA, i.e. less than5 A in comparison with the other residues19. On the other hand, the site with residuesArg47, Lys69, Arg73 and Arg74 shows a preference either for one of the linker DNA orfor being away. This is in contrast to the theoretical model of Brown et al.2. The thirddistinct site in GH5 consisting of residues Lys52, Lys55 andLys59 is mostly directed
71

Residue/ nDNA (N com) lDNA (N com) Nn/lDNA (N com) d, A
R42 4 (1842) 2 (649) 0 (0) 24.6R94 4 (1842) 2 (649) 0 (0) 24.5K97 4 (1842) 1 (74) 1 (575) 24.3K85 2 (480) 2 (1291) 2 (720) 27.5K40 3 (554) 2 (1362) 1 (575) 22.7R47 0 (0) 3 (1743) 3 (748) 31.46K69 0 (0) 3 (1101) 3 (1390) 32.4R73 0 (0) 3 (1101) 3 (1390) 33.7R74 0 (0) 2 (526) 4 (1965) 33.7K52 0 (0) 4 (1965) 2 (526) 27.3K55 0 (0) 3 (1319) 3 (1172) 28.8K59 1 (74) 4 (1965) 1 (452) 30.3
Table 2. The definition of the parameters is the same as in Table 1, but for the tNCP structure.
away from the NCP, although in the sNCP, Lys52 appears close to the nucleosome. Similarbehaviour is observed for Lys40 as well. According to the docking data, it seems that thestrongest contribution to binding close to the dyad point comes from residue Arg42 ratherthan residue Lys85 as stated by Fan and Roberts3. However, the general trend for theresidues participating in the binding sites in both papers2, 3 is conserved in our simulations.It should be noted that there is a slight difference between the linker histone molecule usedin the Brownet al.2 model on one hand and in ours and in the Roberts model3 on the other.In the former model, molecule A of the X-ray structure of GH5 resolved by Ramakrishnanet al.9, has been used for homology modeling of H10 rather than molecule B used hereand by Fan and Roberts3. The main difference is in the orientation of Lys85, which isdirected to the Arg42 site in molecule B, while in molecule A it appears close to the helix3 site. In addition, the relative orientation of Arg42 and Lys40 differs in both moleculesby approximately 90. Therefore, the binding sites identified in both studies do not differ
Arg94
Lys97
Lys85
Lys40
Arg73
Arg74
Lys69
Arg47
Lys59
Lys52
Lys55
Arg42
Figure 3. Representative of the largest (1676 solu-tions) and second lowest energy (-156 kT) cluster ofthe docked structures to sNCP.
Arg42
Arg94
Lys97
Lys85
Arg74
Arg73
Lys69
Arg47
Lys40
Lys52
Lys55
Lys55α2
α3
α1
Figure 4. Linker histone structure with the analysedresidues and binding sites according to Table 1 andTable 2. The orientation is the same as in Fig. 3
72

much from each other, when taking into account the above considerations. In fact, this isthe reason why Fan and Roberts3 consider Lys85 as a separate binding site while Brownetal.2 assign Lys85 to the helix-3 binding site. Another difference in the final results comesfrom the assignment of Lys40 to a binding and nonbinding sitein the Fan and Roberts3
and the Brownet al.2 models, respectively. The latter is deduced from a FRAP experimentperformed with the H10 linker histone and is in agreement with our study only for thesNCPstructure (see Table 1). However, the interpretation of theresults for the tNCP has to betaken with care since this crystal structure does not include the linker histone. Apparently,due to the closeness of both linker DNAs in the tNCP structure, GH5 cannot penetrate tothe nucleosomal DNA with the helix-3 site (see Table 2). On the other hand, bothβ sheetsand the loop between helix-1 and helix-2, which include Arg42, Arg94, Lys97, Lys85 andLys40 residues, need less space than helix-3 to fit in betweenthe linker DNAs as indicatedin Table 2. Therefore, from this point of view our results forsNCP seem more consistentwith the experimental data2.
4 Conclusion
The computational docking of a linker histone to the nucleosome has revealed two distinctbinding sites on GH5 consisting of: (1) Arg42, Arg94, Lys97 with partial contribution ofLys85, which most probably bind to the nucleosomal DNA and (2) Arg47, Lys69, Arg73and Arg74, which seem to contact one of the linker DNAs (see Fig. 4). The site includingLys52, Lys55 and Lys59 appears to be a nonbinding site with respect to the NCP, althoughsome of the residues are located close to the sNCP in some of the solutions. In addition,the docking results clearly indicate the importance of the distance and orientation betweenboth DNA arms, which might change the binding modes significantly. Therefore, includingthe flexibility in future investigations is necessary.
To obtain more insights into the exact contribution and position of each residue to bind-ing, we aim to investigate the effects of single and double mutations in GH5 on binding.Moreover, simulation of diffusional motion of both molecules for computation of the asso-ciation rates and encounter complex formation is under study. All this would be importantfor further development of models regarding the chromatin structure and compaction.
Acknowledgments
The work was supported by the German Research Foundation (DFG), the Center for Mod-elling and Simulation in the Biosciences (BIOMS) and the Klaus Tschira Foundation(KTF).
References
1. P. JJ. Robinson and D. Rhodes,Structure of the ’30 nm’ chromatin fibre: A key rolefor the linker histone, Curr. Opin. Str. Biol.16, 336–343, 2006.
2. D. T. Brown, T. Izard and T. Misteli,Mapping the interaction surface of linker histoneH10 with the nucleosome of native chromatin in vivo, Nat. Str. Mol. Biol. 13, 250–255, 2006.
73

3. L. Fan and V. A. Roberts,Complex of linker histone H5 with the nucleosome and itsimplications for chromatin packing, PNAS103, 8384–8389, 2006.
4. M. M. S. Bharath, N. R. Chandra and M. R. S. Rao,Molecular modeling of the chro-matosome particle, Nucl. Acid Res.31, 4264–4274, 2003.
5. A. A. Travers,The location of linker histone in the nucleosome, Trends Biochem. Sci.24, 4–7, 1999.
6. P. JJ. Robinson and D. Rhodes,EM measurements define the dimension of the ”30-nm” chromatin fiber: Evidence for a compact, interdigitatedstructure, PNAS 103,6506–6511, 2006.
7. D. L. Ermak and J. A. McCammon,Brownian dynamics with hydrodynamic interac-tions, J. Chem. Phys.69, 1352–1360, 1978.
8. C. A. Davey, D. F. Sargent, K. Luger, A. W. Maeder and T. J. Richmond,Solventmediated interactions in the structure of the nucleosome core particle at 1.9A, J.Mol. Biol. 319, 1097–1113, 2002.
9. V. Ramakrishnan, J. T. Finch, V. Graziano, P. L. Lee and R. M. Sweet,Crystal struc-ture of globular domain of histone H5 and its implications for nucleosome binding,Nature362, 219–223, 1993.
10. R. R. Gabdoulline, R. C. Wade,Brownian dynamics simulation of protein-proteindiffusional encounter, Methods.14, 329–341, 1998.http://projects.villa-bosch.de/mcmsoft/sda/4.23/index.html
11. R. R. Gabdoulline, R. C. Wade,Protein-Protein association: Investigation of factorsinfluencing association rates by brownian dynamics simulations, J. Mol. Biol. 306,1139–1155, 2001.
12. T. Schalch, S. Duda, D. F. Sargent, T. J. Richmond,X-ray structure of a tetranucleo-some and its implications for the chromatin fibre, Nature Lett.436, 138–141, 2005.
13. W. L. DeLano,The Pymol Molecular Graphics System (2002).http://www.pymol.org
14. T. J. Dolinsky, J. E. Nielsen, J. A. McCammon, N. A. Baker,PDB2PQR: an auto-mated pipeline for the setup of Poisson-Boltzmann electrostatics calculations, Nucl.Acids Res.32, W665–W667, 2004.
15. N. A. Baker, D. Sept, S. Joseph, M. J. Holst, J. A. McCammonElectrostatics ofnanosystems: application to microtubules and the ribosome, Proc. Natl. Acad. Sci.98, 10037–10041, 2001.
16. M. E. Davis, J. D. Madura, B. A. Luty, J. A. McCammon,Electrostatic and diffu-sion of molecules in solution: simulations with the University-of-Houston- BrownianDynamics program, Comput. Phys. Commun.62, 187–197, 1991.
17. R. R. Gabdoulline, R. C. Wade,Effective charges for macromolecules in solvent, J.Phys. Chem.100, 3868–3878, 1996.
18. Unpublished software developed by Domantas Motiejunas(MCM Group, EML Re-search gGmbH).
19. Unpublished data.
74

Conformational Study of Amyloid Beta (ABeta) Peptide
Priya Anand and F. S. Nandel
Department of Biophysics,Panjab University, Chandigarh-160014, India
E-mail: [email protected]
ALZHEIMER’S DISEASE is the most common cause of senile dementia. Pathological hall-marks of the disease include senile plaques and neurofibrillary tangles. The plaques result fromthe transformation of soluble Aβ protein monomer into insoluble aggregates. Determinationof the molecular structure of Aβ fibrils by using molecular dynamic simulation softwares pro-vide an insight into the precise arrangement of monomers that would allow targeting the criticalsteps in fibrilogenesis process. The optimized geometry forthe (Aβ15−42 ) monomer is aU-like structure.
1 Introduction
Alzheimer’s disease (AD) is a neurological disorder, affecting approximately 12.5 and47.2% of the population in the United States over the ages 65 and 85, respectively. Defin-ing features are formation and progressive deposition of insoluble amyloid plaques andpresence of neurofibrillary tangles. ABeta-peptide is 39-43 amino acids polypeptide withheterogeneous termini that is generated from the cleavage of a larger amyloid precursorprotein (APP), which under appropriate cellular conditions, aggregate as senile plaques,which is a critical step in the neurodegenerative processesassociated with AD.
A detailed understanding of the structural properties of amyloid monomer could play acrucial role in the understanding the molecular mechanism of the disease. Despite the lim-itations of conventional NMR or X-ray in the amyloid fibril structural study, some struc-tural information has emerged from various techniques1, 2 mass spectroscopy, and solidstate NMR spectroscopy. However, the structural characterization of the Abeta monomerstill remains difficult due to its tendency to aggregate.
Complimentary to the experimental studies, computer simulations can yield valuableinformation on structure, and stability, of the monomer resulting in the possible fibril for-mation mechanism of the ABeta protein. We have undertaken molecular dynamics (MD)simulations study on monomer of different short length peptide i.e 1-16 (referred as N-terminal region) and 15-42 residue fragments in aqueous solution to complement, and toadd further extend the experimental solution studies of thebeta-peptides and to explorethe structural stability, hydration and dynamics of peptide fibrils. The N-terminal regionof ABeta has been shown to be flexible and accessible within amyloid fibrils and the re-maining 29-42 hydrophobic is shown to adopts a beta-sheet conformation. N-terminalconstitutes an attractive therapeutic target for active orpassive immunization approaches,as illustrated by the ability of monoclonal antibiotics directed towards this region to disso-ciate amyloid fibrils.
75

2 Material and Methods
The peptide Aβ originally consists of 42 amino-acid residues: [Asp-Ala-Glu-Phe-Arg-His-Asp-Ser-Gly-Tyr-Glu-Val-His-His-Gln-Lys-Leu-Val-Phe-Phe-Ala-Glu-Asp-Val-Gly-Ser-Asn-Lys-Gly-Ala-Ile-Ile-Gly-Leu-Met-Val-Gly-Gly-Val-Val-Ala-Ala], which isusually expressed as Aβ1−42 . The conformational analysis of Aβ1−42 has been firstcarried out using quantum mechanical methods (QM) PCILO program (PertubativeConfiguration Interaction Using Localized Orbitals) on SunW, Ultra 5-10; sparc wasused, for which the Aβ1−42 peptides were fragmented into smaller overlapping fragmentswith both the N- & C- terminal protected by acetyl and dimethylamine group respectively.
The (φ,ψ) values obtained from the quantum mechanical calculationswere used as thestarting geometry for molecular mechanics and molecular dynamics. Another structureused as the starting geometry for molecular dynamics was a linear extended starting struc-ture, minimized structure obtained after running molecular dynamics in vacuum for 50nsat 300K using AMBER8 molecular dynamics.
For Molecular dynamics simulations Aβ1−42 was fragmented into N-terminal regionwith 1-16 residues peptide and C-terminal fragment with 15-42; (where no 1,16,15,42indicates the residue no) peptide utilizing the program theGROMACS 3.3.1.
Energy minimization was carried out using steepest descentfollowed by conjugate gra-dient method. All atoms of the system were considered explicitly, and their interactionswere computed by using the 43a1 force field with periodic boundary conditions. Peptidewas solvated in a box by using SPIC216water molecules. All solute and solvent atomswere treated explicitly. Water molecules were added aroundthe peptide to fill a octahe-dron box with walls at least 9nm, from any peptide atom. All simulations were performedusing periodic boundary conditions to eliminate surface effects. Long-range electrostaticinteractions were handled by using the particle mesh Ewald methodology. The solvatedpeptides were subsequently minimized. Position restraining done using weak coupling toa bath of constant temperature (To = 300 K, coupling time T = 0.1 ps), and the pressurecontrolled using weak coupling to a bath of constant pressure (Po = 1 bar, coupling timeT = 0.5 ps). The production runs were done with the same pressure and temperaturecoupling constants as the restrained runs. From the trajectories obtained we extracted thepotential energy, Root mean square deviation, radius of gyration and Surface area proper-ties and number of hydrogen bonds formed during the simulation. For visualization of thestructures and the interactions RASMOL, and VMD was used.
3 Results and Discussion
Molecular view suggests that optimized geometry for the (Aβ15−42 ) monomer has a U-likestructure (Fig A). Phi, psi values indicate that Aβ15−42 peptide does not adopt any regularsecondary structure, instead a turn is present between residues 26-32. As displayed infigure, its amphipathic character is not lost i.e the longer arm has hydrophilic and chargedamino acid residues while the smaller arm has hydrophobic branched residues exclusively.Side chain of most of the hydrophobic residues are oriented inwards with the exception ofLeu 34, Val 36, Val 40 and Ala 42 which project outwards, that may lead to the associationof one A with another A through hydrophobic interactions involving the C-terminal stretch.Analysis of the interactions stabilizing the U-like structure of Aβ15−42 , and identification
76

Figure 1. A molecular view of optimized (Aβ15−42 ) and (Aβ1−16 )peptide fragment in aqueous medium, FigA and Fig B respectively
of the possible interactive regions in Abeta peptides will be utilized for construction of Aβdimers and high-mers.
Molecular view suggests that optimized geometry for the Aβ1−16 monomer is stabi-lized by hydrogen bonds are formed primarily between the carbonyl oxygen and the aminogroup of the backbone as displayed in Figure B. At 300 K, the peptide is seen to exist 25%in a helical conformation. The phi, psi values of the variousresidues indicate the presenceof gamma turn around the residue Glutamine 7 and Glycine 9. Though residues with po-lar side chains are present only a few of them (ARG5, GLu3, ASP1,TYR10 and Glu15)participate in hydrogen bond formation. From the graphicaldisplay of the molecule, it isapparent that the carbonyl oxygen is of His 6 backbone is nearto the OH group of thearomatic ring of TYR 10 as the distance of the oxygen atom of the carbonyl group and OHmoiety is 1.8 A . This may be interpreted as though the carbonyl moiety is involved in pi-piinteraction with the aromatic ring.
Acknowledgments
PA would like to thank Prof. Dr Fateh Singh Nandel, Department of Biophysics, PanjabUniversity, Chandigarh, India for his kind guidance, and constructive criticism, extendedto complete this project as part of my Ph.D program.
References
1. Barrow CJ, Yasuda A, Kenny PT, and Zagorsk MG,Solution conformations and ag-gregational properties of synthetic Amyloid beta peptidesof AD. Analysis of circulardichrosim spectraJ. Mol. Biol. 825 (4), 1075–93, 1992.
2. Benzinger T.L.S., Gregory DM Burkoth T.S., Miller Auer, H. Lynn D.G. Botto, R.E.and Meredith S.C. (2000) Biochemistry 39, 3941-3499.
77


Global Persistence Exponent of the Helix-Coil Transitionin Polypeptides
Everaldo Arashiro1, Jose Roberto Drugowich de Felıcio2, andUlrich H. E. Hansmann1
1 John von Neumann Institute for Computing,Forschungszentrum Julich, 52425 Julich, GermanyE-mail: e.arashiro, [email protected]
2 Departamento de Fısica e Matematica, FFCLRP, Universidade de Sao Paulo,Ribeirao Preto, Sao Paulo CEP 14040-901, Brazil
E-mail: [email protected]
The dynamical exponentθg that governs the behavior of the global persistence probability isobtained through short-time Monte Carlo simulations of thehelix-coil transition. Our simula-tions are based on a detailed, all-atom representation of the molecules and an implicit solvationmodel to approximate the interaction with the surrounding solvent. Our results obtained for thepolyalanine and the 34-residue human parathyroid fragmentPTH(1-34) are in good agreementeach other, and indicate universality of the helix-coil transition in proteinlike molecules.
1 Introduction
After the works by Janssen, Schaub, and Schmittmann1 and Huse2, much attention hasbeen devoted to study of phase transitions and critical phenomena of dynamical systemsat the early stage of its time evolution. By using renormalization group techniques andnumerical calculations, respectively, they showed that universality and scaling behaviorare already present in this stage (henceforth named as short-time stage) after quenchingfrom high temperatures to the critical one.
The values of the critical indices obtained through this technique3, 4, have shown thatshort-time Monte Carlo simulations are very efficient and can be used to estimate, withgood precision, the statical exponents and the dynamical exponentz.
Far from equilibrium, another dynamic critical exponent was proposed by Majumdaret al.5 studying the behavior of the global persistence probability P (t) that the order pa-rameter has not changed its sign up to the time t. The global persistence probabilityP (t)can be defined as
P (t) = 1 −t∑
t′=1
ρ(t′), (1)
whereρ(t′) is the fraction of the samples that have changed their state for the first time atthe instantt′.
At criticality, P (t) is expected to decay algebraically as
P (t)˜t−θg (2)
whereθg is the global persistence exponent. Since then, the study ofthe persistence be-havior have attracted much interest, playing an important role in the study of systems farfrom equilibrium6–8 .
79

Figure 1. Left: Log-log plot of the time series of the global persistencyP (t) for Ala40 and various initial orderparameter valuesq0
H. Right: Persistence exponent as a functionq0
H. Open symbols are the values for polyalanine
and the filled symbols are the values for PTH(1-34).
In this work, we have studied the dynamic critical behavior of helical proteins via short-time Monte Carlo simulations. We evaluated the dynamic critical exponentθg for (Ala)Nchains (N=10, 20, 30 and 40) to verify the effects of finite size. Our investigation is laterextended toward the 34-residue human parathyroid fragmentPTH(1-34).
2 Model
Our short-time MC simulations of the helix-coil transitionare based on a detailed, all-atomrepresentation of proteins. The interaction between the atoms is described by a standardforce field, ECEPP/2 (Empirical Conformational Energy Program for Peptides) as imple-mented in the program package SMMP (Simple Molecular Mechanics for Proteins)9 . Theinteractions between our polypeptides and surrounding water are approximated by meansof an implicit water model, which assumes that the solvation(free) energy is proportionalto the solvent accessible surface area and utilizes the parameter set of Ref. 10 that is oftenused in conjunction with the ECEPP force field.
Crucial for our analysis is the definition of an order parameter. Our analog to themagnetization in spin systems is the number of helical residuesqH = 2 ∗ 〈nH(T )〉 /(N −2) − 1. Here we define a residue as helical if its backbone dihedral angles(φ, ψ) , takevalues in the range(−70±30,−37±30) (their common values in anα helix), and theresidue exhibits the hydrogen bonding pattern observed inα helices. The normalizationfactorN−2 (N the number of residues) is chosen because the flexible terminal residues areusually not part of anα helix. Our definition ensures that−1 ≤ qH ≤ 1 andqH(Tc) = 0.
3 Results
We start our investigation of dynamic critical exponentθg in the helix-coil transition bysimulating polyalanine chains of lengths N=10, 20, 30, and 40 in your respectively criticaltemperatura Tc = 315, 415, 450 and 470 which were found in our earlier works11, 12. Ourresults are averaged over 5000 independent runs . Errors areestimated by dividing these
80

0.00 0.05 0.100.55
0.60
0.65
0.70
0.75
0.80
0qH
gg = 0.729(6)
Figure 2. The scaling obtained for the 5 smallerq0H
. The persistence exponent found isθg = 0.729(6).
5000 runs in bins of 100 runs and calculating the fluctuation of the averages calculated foreach bin.
In order to estimate the exponentθg one needs to prepare the initial states carefullyto obtain precise values of the initialq0H = qH(t = 0). The exponentq0H is obtainedfrom Eq. 2. Figure 1 (Left) shows the corresponding log-log plots ofP (t) for Ala40 andvarious initial values ofq0H . This value, and the ones corresponding to polyalanine chainsof lenght N= 10, 20 and 30 are listed in Tab. 1.
q0H Ala10 q0H Ala20 q0H Ala30 q0H Ala40
0.25 0.402(6) 0.11 0.687(7) 0.0714 0.708(7) 0.0526 0.710(8)0.50 0.248(7) 0.22 0.469(7) 0.1429 0.626(6) 0.1053 0.696(7)
0.33 0.317(8) 0.2143 0.488(7) 0.1579 0.605(7)0.2857 0.374(7) 0.2105 0.503(7)
Table 1. Global persistence exponentθg for polyalanine chains of length N = 10, 20, 30 and 40.
q0H PTH(1 − 34)
0.0625 0.705(6)0.125 0.658(7)0.1875 0.562(6)0.25 0.395(7)
Table 2. Global persistence exponentθg for the 34-residue human parathyroid fragment PTH(1-34).
The general behavior of the global persistence for each polyalanina indicate that whenq0H decreases, the value for the persistence exponentθg increases. In Fig 1 (Right) weshow theθg of all polyalanine as a function of theq0H . We can observe that the value of
81

θg increase quickly, with the decrease of theq0H , but tends to stabilize byθg = 0.7. Wealso estimate the persistence exponent for the PTH(1-34), Tc = 545 (Tab. 2). In Fig 2we show that the values deθg for PTH(1-34) (closed simbols) have the same behaviorthose the polyalanine (open simbols). From the 5 smallerq0H the persistence exponentsθg = 0.729(6) was estimated for this helical protein.
4 Conclusion
The behavior of exponentθg = 0.729(6) for polyalanine and the 34-residue humanparathyroid fragment PTH(1-34) are in good agreement each other, and indicate univer-sality of the helix-coil transition in proteinlike molecules.
Acknowledgments
Two of the authors (E.A. and J.R.D.F.) acknowledge support by Capes and CNPq (Brazil),and another author (U.H.E.H.) was supported by a research grant from the National ScienceFoundation (CHE-0313618).
References
1. H. K. Janssen, B. Schaub, and B. Schmittmann, Z. Phys. B: Condens. Matter73, 539(1989).
2. D.A. Huse, Phys. Rev. B40, 304 (1989).3. B. Zheng, Int. J. Mod. Phys. B12, 1419 (1998).4. E. Arashiro, J.R. Drugowich de Felicio, Phys. Rev. E 67 046123 (2003).5. S. N. Majumdar, A. J. Bray, S. J. Cornell and C. Sire, Phys. Rev. Lett. 77 3704
(1996).6. S. N. Majumdar and A. J. Bray, Phys. Rev. Lett.91, 030602 (2003).7. H. A. Fernandes, E. Arashiro, J. R. Drugowich de Felicio, A. A. Caparica, Physica A
366, 255 (2006).8. R. da Silva, N. A. Alves, J. R. Drugowich de Felicio, Phys. Rev. E67, 057102 (2003).9. F. Eisenmenger, U. H. E. Hansmann, Sh. Hayryan, and C.-K. Hu, Comput.Phys.
Commun.138, 192 (2001).10. T. Ooi, M. Obatake, G. Nemethy, and H. A. Scheraga, Proc. Natl. Acad., Sci. U.S.A.
8, 3086 (1987).11. E. Arashiro, J. R. Drugowich de Felıcio, and U. H. E. Hansmann, Phys. Rev. E73,
040902 (2006).12. E. Arashiro, J. R. Drugowich de Felıcio, and U. H. E. Hansmann, J. Chem. Phys.126,
045107 (2007).
82

Coarse-Grained Lattice Model for Molecular Recognition
Hans Behringer, Andreas Degenhard, and Friederike Schmid
Fakultat fur Physik, Universitat Bielefeld, D-33615 Bielefeld, GermanyE-mail: behringer, degenhard, [email protected]
Equilibrium aspects of molecular recognition are investigated using coarse-grained models forthe recognition process of two rigid biomolecules. To this end, a two-stage approach consistingof a design and testing step is adopted. Particular attention is paid to the influence of coopera-tive effects accompanying the association of biomolecules. Cooperativity is found to enhanceselectivity. In addition it is discussed that a small numberof strong bonds is favoured in flexiblecomplexes compared to a situation with many but weak bonds.
1 Introduction
An understanding of the basic principles of biomolecular recognition, i. e. the ability of abiomolecule to interact specifically with another moleculein the presence of structurallysimilar rival molecules, is not only important from a scientific point of view but also opensup a wide field of potential biotechnological applications.The recognition process itselfis governed by a complex interplay of non-covalent interactions of strengths comparablewith the thermal energy thus leading to a complex problem1, 3. In this context the study ofidealised models with methods from statistical physics seems to be particularly adequate.
2 Model and General Approach
In this work we consider protein-protein recognition from acoarse-grained point of viewon the level of both the structure of the biomolecules at the mutual interface and the in-teractions stabilising the complex. The biomolecules are assumed to undergo no refoldingduring the association process. This is a justified assumption for most protein-proteinrecognition processes, although notable exceptions do exist1. Motivated by the observa-tion that hydrophobicity is the major driving force in molecular recognition1 we describethe type of the residue at the positioni = 1, . . . , N of the interface by a binary variable2, 3.Denoting the structure of the target molecule byσi ∈ ±1 and that of the interactionpartner byθi ∈ ±1 we model the energetics at the interface by
H(σ, θ;S) = −εN∑
i=1
1 + Si
2σiθi − J
∑
〈ij〉SiSj . (1)
The variableSi takes on the two discrete values±1 and describes the fit of the shapeof the molecules at positioni of the interface (on a microscopic level resulting from arearrangement of the amino acid side chains when the complexis formed1). Apart fromthe direct contact energy with strengthε the model Hamiltonian contains an additionalcooperative interaction term where the quality of a residue-residue contact couples ontothe structure in its neighbourhood. To study the recognition process between two rigid
83

biomolecules we adopt a two-stage approach. For a fixed target structureσ(0) we firstdesign an ensemble of probe moleculesθ at a design temperature1/βD leading to thedistributionP (θ|σ(0)) = 1
ZD
∑
S exp(
−βDH(σ(0), θ;S))
. In a second step the free energydifference of association at temperature1/β is calculated for the interaction of the probeensemble with the target moleculeσ(0) and a structurally different rival moleculeσ(1). Inthis step the free energy of the interaction of the moleculeσ(α) with a particular probestructureθ has to be averaged with respect to the distributionP (θ|σ(0)). This gives finallythe free energy difference∆F = Ftarget− Frival as a function of the similarityQ betweenthese two molecules, whereQ is the number of residuesN at the interface minus twice thenumber of point mutations that have to be carried out to convert the target into the rival. Anegative∆F then signals recognition of the target.
3 Results
It has been argued in the literature for the importance of cooperativity for molecular recog-nition4. In our coarse-grained Hamiltonian (1) cooperativity is taken into account by thesecond interaction term. The cooperative term rewards additional contacts in the neigh-bourhood of an already established one. As a consequence thefit of the two biomoleculesat the interface is optimised and therefore one can expect animproved recognition ability.An investigation of the influence of this second term using our two-stage approach indeedreveals as shown in figure 1 that an increase of the cooperative interaction constantJ sig-nificantly increases the recognition ability, i. e. the freeenergy difference. A value ofJcomparable to the value ofε already leads to the maximum effect of cooperativity (up tominor finite-size effects).
-1 -0.5 0 0.5 1Q/N
-0.5
-0.4
-0.3
-0.2
-0.1
0
∆F(Q
)/N
J/ε = 0.1J/ε = 0.25J/ε = 0.5J/ε = 0.75
Figure 1. Influence of the cooperativityJ on the free energy difference for the association of the probe moleculeswith the target and the rival molecule as a function of the similarity Q between these two molecules. The upperdashed line corresponds toJ = 0, the lower one toJ → ∞ (in the limit N → ∞).
Investigations of highly flexible antibody-antigen complexes showed that only approx-imately one quarter of the residue contacts at the interfacecontribute (significantly) to thebinding energy5 suggesting that in flexible complexes interfaces with a few strong bondsare favoured compared to a situation with many but weak bonds. We address this questionof the role of varying bond strengths within our approach by considering a model which
84

distinguishes only between active residues, i. e. residuesthat contribute to the binding en-ergy, and inactive ones. On the coarse-grained level this amounts to attributing the values 1(active) and 0 (inactive) to the structural variablesσi andθi in the Hamiltonian (1). In thefollowing the uncooperative model withJ = 0 is considered. In order to ensure the stabil-ity of the complex the interaction energy has to overcome thethermal energy barrier. Onthe other hand, however, the interaction energy has to be “small” enough to ensure the re-quired flexibility of the complex. This can be incorporated into our approach by includingthe constraint that the interaction energy has to be fixed to some (suitable) value. Fixingthe number of active residuesA by a Lagrange multiplier, the free energy difference∆Fcan be calculated as a function of the fractionA/N of active residues. Figure 2 demon-strates that the free energy difference indeed has a minimumat small fractionsA/N (fairlyinsensitive to a variation of the interaction parameters).Our simple coarse-grained modelhence predicts that recognition processes which require a certain amount of flexibility aremost efficient if only a small number of fairly strong bonds isestablished across the contactinterface as observed in antibody-antigen complexes.
0 0.2 0.4 0.6 0.8 1A/N
-2
-1.5
-1
-0.5
0
<∆F
>/N
β/βD = 1β/βD = 1/2
Figure 2. Averaged free energy per site as a function of the fractionA/N of active residues.
Acknowledgements
Financial support of the Deutsche Forschungsgemeinschaft(SFB 613) is gratefully ac-knowledged.
References
1. C. Kleanthous, ed.,Protein-Protein Recognition(Oxford University Press, Oxford,2000).
2. H. Behringer, A. Degenhard, and F. Schmid, Phys. Rev. Lett. 97, 128101, 2006.3. H. Behringer, T. Bogner, A. Polotsky, A. Degenhard, and F.Schmid, J. Biotechnol.
129, 268, 2007.4. E. di Cera, Chem. Rev.98, 1563, 1998.5. B. C. Cunningham and J. A. Wells, J. Mol. Biol.234, 554, 1993.
85


Residual Entropy of Ice I from Multicanonical Simulations
Bernd A. Berg1,2
1 Department of Physics, Florida State University,Tallahassee, FL 32306-4350, USA
2 School of Computational Science, Florida State University,Tallahassee, FL 32306-4120, USA
E-mail: [email protected]
We introduce two simple models with nearest neighbor interactions on 3D hexagonal lattices.Each model allows one to calculate the residual entropy of ice I (ordinary ice) by means of mul-ticanonical simulations. This gives the correction to the residual entropy derived by Linus Paul-ing in 1935. Our estimate is found to be within less than 0.1% of an analytical approximationby Nagle which improved on Pauling’s result. In biological applications at room temperaturesmall, ice-like clusters are of importance. Their entropy can be computed by the same method.
1 Introduction
In this talk I report on a novel calculation1 of the residual entropy of ice I. The approachcan as well be used to calculate the entropy of arbitrary cluster of hydrogen bonds ofknown geometry. This is of importance for the interaction ofwater with proteins and otherbiomolecules, because the liquid phase of water differs from simple fluids in that there isa large qualitative remnant of ice structure in the form of local tetrahedral ordering2. Thenext section reviews briefly the residual entropy of ice and in section 3 our calculation issketched.
2 Residual Entropy of Ice
In contrast to liquid water the properties of ice are relatively well understood. Most ofthem have been interpreted in terms of crystal structures, the forces between its constituentmolecules, and the energy levels of the molecules themselves3. A two-dimensional pro-jection of the hexagonal crystal structure of ordinary ice (ice I) is depicted in Fig. 1 (otherforms of ice occur in particular at high pressures). Each oxygen atom is located at thecenter of a tetrahedron and straight lines (bonds) through the sites of the tetrahedron pointtowards four nearest-neighbor oxygen atoms. Hydrogen atoms are distributed according tothe ice rules: (A) There is one hydrogen atom on each bond (then called hydrogen bond).(B) There are two hydrogen atoms near each oxygen atom (thesethree atoms constitute awater molecule).
By experimental discovery it was found that ice has a residual entropy4 S0 =k ln(W ) > 0 for temperatureT → 0 and moderate relaxation times. HereW is the num-ber of configurations forN molecules. Subsequently Linus Pauling5 derived estimates ofW = (W1)
N by two approximate methods based on the ice rules, obtaining
WPauling1 = 3/2 (1)
87

0
2
4
6
8
10
0 2 4 6 8 10 12
y
x
ud123
Figure 1. Lattice structure of one layer of ice I. The up (u) sites are atz = 1/√
24 and the down (d) sites atz = −1/
√24. The dimensions are explained in Ref. [1]. For each site three of its four pointers to nearest
neighbor sites are shown.
in each case. Twenty five years later it was shown by Onsager and Dupuis thatW1 = 1.5is in fact only a lower bound. Onsager’s student Nagle used a series expansion method toderive the estimate6
WNagle1 = 1.50685 (15) . (2)
The error bar is not statistical but reflects higher order corrections of the expansion, whichare not entirely under control. The only independent theoretical value appears to be onefor cubic ice, which is obtained by numerical integration ofMonte Carlo data7 and in goodagreement with Nagle.
3 Multicanonical Calculation
Our calculations are based on two simple statistical models. Each model is defined onthe hexagonal lattice of Fig. 1. In the first model, called 6-state H2O molecule model,ice rule (B) is always enforced and we allow for six distinct orientations of each H2Omolecule. Its energy is defined by
E = −∑
b
h(b, s1b , s2b) . (3)
88

Here, the sum is over all bondsb of the lattice and (s1b ands2b indicate the dependence onthe states of the two H2O molecules, which are connected by the bond)
h(b, s1b , s2b) =
1 for a hydrogen bond,
0 otherwise.(4)
In the second model, called 2-state H-bond model, ice rule (A) is always enforced and weallow for two positions of each hydrogen nucleus on a bond. The energy is defined by
E = −∑
s
f(s, b1s, b2s, b
3s, b
4s) , (5)
where the sum is over all sites (oxygen atoms) of the lattice andf is given by
f(s, b1s, b2s, b
3s, b
4s) =
2 for two hydrogen nuclei close to s,
1 for one or three hydrogen nuclei close to s,
0 for zero or four hydrogen nuclei close to s.
(6)
The groundstates of each model fulfill the ice rules. Atβ = 0 the number of configu-rations is6N for the 6-state model and22N for the 2-state model. Because the normaliza-tions atβ = 0 are known, multicanonical (MUCA) simulations allow us in either case toestimate the number of groundstate configurations8. Using periodic boundary conditions(BCs), our simulations are based on a lattice construction similar to that set up in Ref. [9]for Potts model simulations, while the thermodynamic properties found are entirely differ-ent from those of Potts models.
1.498
1.5
1.502
1.504
1.506
1.508
1.51
1.512
1.514
1.516
3 10-32 10-310-30
W1
1/N
MUCA
2-state H-bond modelQ=0.47
Nagle
Pauling Data and Fit
Figure 2. Fit and estimates ofW1.
89

The results from the 2-state model are more accurate than those from the 6-state model.Apparently, the reason is that theβ = 0 entropy of the 2-state model is smaller. In Fig. 2 afit for the data of the 2-state H-bond model to the form
W1(x) = W1(0) + a1 xθ , x = 1/N (7)
with θ = 0.920 (25) is shown together with the estimates by Nagle and Pauling. Thegoodness of fit (chapter 2.8 of Ref. [9]) isQ = 0.47 as given in the figure. That we haveθ 6= 1 reflects bond correlations in the groundstate ensemble.
Combining this fit with that from the 6-state model leads to our final estimate
WMUCA1 = 1.50738 (16) . (8)
The difference with the estimate of Nagle is 0.035% ofW1. However, the Gaussian differ-ence test9 between the two estimates yieldsQ = 0.016. As the error bar in (8) covers onlystatistical and no systematic errors due to finite size corrections from larger lattices, thesmall discrepancy may be explained in this way. The precision of experimental work10 hasremained insufficient to resolve the difference with Pauling’s original estimates and its the-oretical improvement. Experimental verification of the difference would be an outstandingconfirmation of structures imposed by the ice rules.
References
1. B. A. Berg, C. Muguruma, and Y. Okamoto,Residual Entropy of Ordinary Ice fromMulticanonical Simulations, Phys. Rev. B75, 092202, 2007.
2. Literature is given in Ref. [1].3. D. Eisenberg and W. Kauzmann,The Structure and Properties of Water, Oxford Uni-
versity Press, Oxford 1969; V. F. Petrenko and R.W. Whitworth, Physics of Ice, Ox-ford University Press, Oxford 1999.
4. W. F. Giauque and M. Ashley,Molecular Rotation in Ice at10K. Free Energy ofFormation and Entropy of Water, Phys. Rev.43, 81, 1933.
5. L. Pauling,The Structure and Entropy of Ice and of Other Crystals with Some Ran-domness of Atomic Arrangement, J. Am. Chem. Soc.57, 2680, 1935.
6. J. F. Nagle,Lattice Statistics of Hydrogen Bond Crystals I. The Residual Entropy ofIce, J. Math. Phys.7, 1484, 1966.
7. S. V. Isakov, K. S. Raman, R. Moessner, and S. L. Sondhi,Magnetization Curve ofSpin Ice in a [111] Magnetic Field, Phys. Rev. B70, 104418, 2004.
8. B.A. Berg and T. Celik,New Approach to Spin-Glass Simulations, Phys. Rev. Lett.69, 2292, 1992.
9. B.A. Berg,Markov Chain Monte Carlo Simulations and Their StatisticalAnalysis,World Scientific, Singapore, 2004.
10. W.F. Giauque and J.W. Stout,The Entropy of Water and the Third Law of Thermody-namics. The Heat Capacity of Ice from 15 to273K, J. Am. Chem. Soc.58, 1144,1936; O. Haida, T. Matsuo, H. Suga, and S. Seki,Calometric Study of the GlassyState X. Enthalpy Relaxation at the Glass-Transition Temperature of Hexagonal Ice,J. Chem. Thermodynamics6, 815, 1974.
90

REMD Simulations of Aβ16−22 Peptide Aggregation inExplicit Solvent
Raghunadha Reddy Burri∗, Dietmar Paschek, and Alfons Geiger
Department of Physical Chemistry, University of Dortmund,Otto-Hahn-Strasse 6, 44227 Dortmund, Germany
∗E-mail: [email protected]
Experimental studies show that the short peptide fragmentsAβ16−22 form fibrils as it is knownfrom the full lengthβ-amyloid peptide. This fibril growth is strongly temperature dependent.We report here a simulation study of the temperature dependent Aβ16−22 aggregation in ex-plicit water. We simulated a system of ten Aβ16−22 peptides with 5900 SPC/E water in a cubicbox and used 76 replicas (with20 ns simulation time per replica) distributed over a tempera-ture range from 285.0 to606.3 K. Replica Exchange Molecular Dynamics (REMD) simulationis an efficient way for equilibration and simulation of complex molecular systems at differenttemperatures. The temperature dependence of radius of gyration RG and the solvent accessiblesurface area(SASA) of the aggregates, as well as structuralproperties like mutual orientationand number of peptide-peptide hydrogen bonds can be understood by the different temperaturedependence of hydrogen bond strength, electrostatic, and hydrophobic interactions.
The Aβ16−22 fragment is highly prone to aggregation, and a prototype molecule forthe study of processes of amyloidosis. It contains a centralhydrophobic core, a positivecharge at the N-terminus (Lys16), and a negative charge at the C-terminus (Glu22). Solid-state NMR showed that this segment of the full amyloid-β peptide can form fibrils withan antiparallel strand organization.1 Experimental studies of Aβ fibril formation also re-vealed a strong temperature dependence.2 This could also be obtained in constant pressureMD simulations of Aβ16−22 peptides aggregation.3 Here we present first results of anextension of this study, where we apply Replica Exchange Molecular Dynamics (REMD)simulations. This is an efficient way to simulate complex systems at different temperaturesand is the simplest and most general form of simulated tempering.4 It offers a much-improved approach for determining oligomer distributionsrelevant to aggregation.5 Thebasic idea of REMD is to simulate different copies (replicas) of the system at the sametime but at different temperatures. After a certain time, conformations are exchanged witha Metropolis probability, therefore permitting random walks in the temperature space andescape from local energy traps.6 Recently, Paschek et al.7 published such simulations,providing the first unbiased folding of the Trp-cage in explicit solvent using 40 replicas(100 ns per replica).7
Taking Paschek et al. work as a reference,7 we used REMD to study Aβ16−22 pep-tides aggregation at atomic level in explicit aqueous solution.8 The GROMACS 3.2.19
simulation package was used in both simulation and data processing. The OPLS-All Atomforce field was chosen to represent the peptide in GROMACS. The system is coupled toan external heat bath (Nose-Hoover-thermostat) with a relaxation time of1.5 ps. The elec-trostatic interactions are treated by the smooth particle mesh Ewald summation with a realspace cutoff of0.9 nm. A 2.0 fs timestep was used for all simulations. Solvent constraintswere solved using the SETTLE procedure, while the SHAKE-algorithm was used for thepolymer constraints.
91
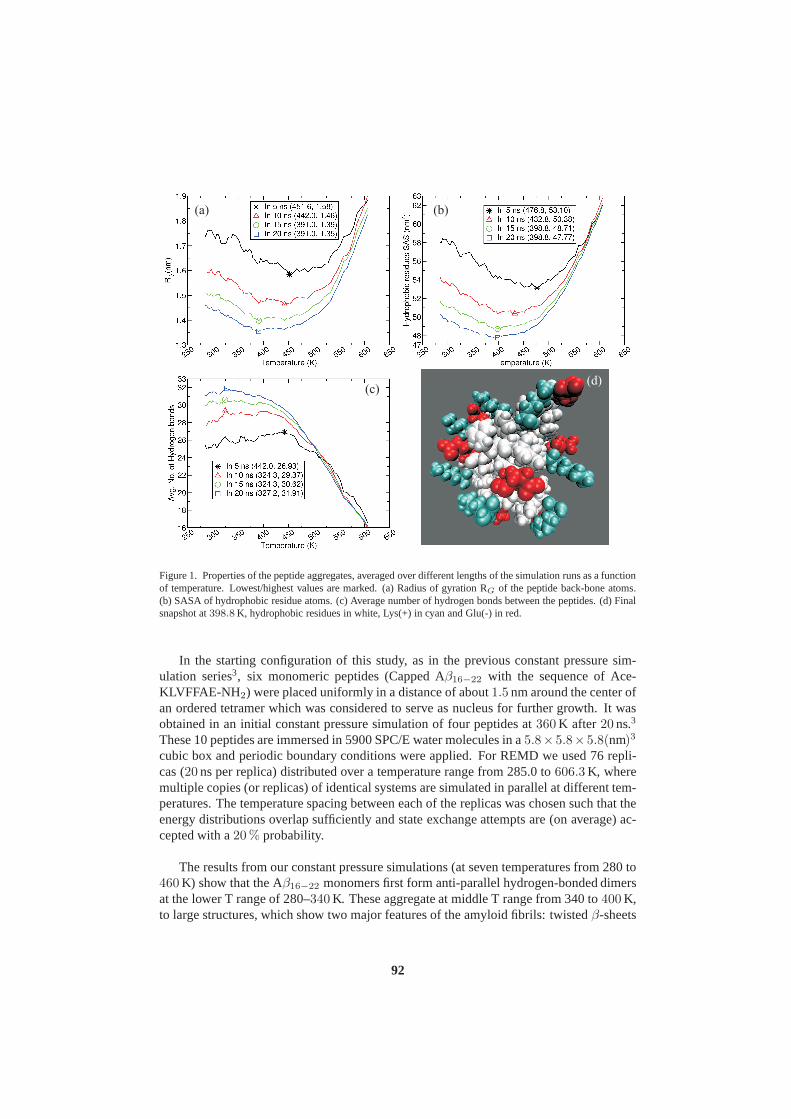
(d)
(a) (b)
(c)
Figure 1. Properties of the peptide aggregates, averaged over different lengths of the simulation runs as a functionof temperature. Lowest/highest values are marked. (a) Radius of gyration RG of the peptide back-bone atoms.(b) SASA of hydrophobic residue atoms. (c) Average number ofhydrogen bonds between the peptides. (d) Finalsnapshot at398.8 K, hydrophobic residues in white, Lys(+) in cyan and Glu(-) in red.
In the starting configuration of this study, as in the previous constant pressure sim-ulation series3, six monomeric peptides (Capped Aβ16−22 with the sequence of Ace-KLVFFAE-NH2) were placed uniformly in a distance of about1.5 nm around the center ofan ordered tetramer which was considered to serve as nucleusfor further growth. It wasobtained in an initial constant pressure simulation of fourpeptides at360 K after 20 ns.3
These 10 peptides are immersed in 5900 SPC/E water moleculesin a5.8×5.8×5.8(nm)3
cubic box and periodic boundary conditions were applied. For REMD we used 76 repli-cas (20 ns per replica) distributed over a temperature range from 285.0 to606.3 K, wheremultiple copies (or replicas) of identical systems are simulated in parallel at different tem-peratures. The temperature spacing between each of the replicas was chosen such that theenergy distributions overlap sufficiently and state exchange attempts are (on average) ac-cepted with a20 % probability.
The results from our constant pressure simulations (at seven temperatures from 280 to460 K) show that the Aβ16−22 monomers first form anti-parallel hydrogen-bonded dimersat the lower T range of 280–340 K. These aggregate at middle T range from 340 to400 K,to large structures, which show two major features of the amyloid fibrils: twistedβ-sheets
92

formed from antiparallely oriented peptides and the onset of formation of a second layer.In the higher temperature range (from 400 to460 K) the twist angle between the monomersincreased probably to protect hydrophobic residues from water.3
From the REMD simulations, properties of interest have beenextracted at 76 tempera-tures. Below391 K, the radius of gyration RG of peptide cluster (calculated from peptidebackbone atoms) decreases with increasing temperature, and started to increase with T be-low 391 K [Figure 1(a)]. Consequently, also the SASA calculated from the hydrophobicresidues, reached a lowest point at a temperature398 K [Figure 1(b)]. Figures 1(a and b)show that the aggregated structures at intermediate temperatures extend and disintegrate athigh temperatures. The maximum number of peptide–peptide hydrogen bonds is observedat around∼ 330 K and decreases at higher temperatures [Figure 1(c)]. The shift of thepositions of the minima of RG and SASA compared to the maximum of the number ofH-bonds can be explained by the fact, that with increasing temperature the H-bonds areweakened, whereas the hydrophobic interaction strength increases. While the H-bondstend to build a planarβ-sheet structure, the increasing hydrophobic interactionproducesmore compact structures [Figure 1(d)]. This may be obtainedby twisting theβ-sheet orby building up a second sheet, as observed in the constant pressure simulation study.3 In-terestingly, Meinke and Hansmann10 also observe for a system of sixβ-amyloid fragmentpeptides (without explicit water) above400 K a strong increase of RG, but do not observea temperature minimum. This is probably due to the lack of water (and the water medi-ated hydrophobic interaction) in their simulations. To demonstrate the convergence of theREMD simulations, in figures 1(a, b and c) averages over different lengths of the simula-tion runs (5, 10, 15 and20 ns) are shown and the minima and maxima are marked. From15 to20 ns the positions of there extrema on the temperature axis stay a constant, revealingthat20 ns time for each replica is reasonable to study early aggregation.
Our results are in good agreement with the previous work doneby Meinke et al.10
and Gnanakaran et al.5. We find that at low temperatures the structure of the aggregatesis largely determined by hydrogen bonding and electrostatic interactions. This leads tothe formation of well ordered antiparallelβ-sheet structures. With increasing temperature,hydrophobic interactions become more important, as indicated by the formation of stackedβ-sheets, as well as less regular ordered collapsed clusters. At highest temperatures theaggregates are found to disintegrate due to the strong thermal motions.
Acknowledgments
Support by a PhD fellowship from the International Max Planck Research School in Chem-ical Biology (IMPRS-CB) to RRB is acknowledged. We appreciate generous computingtime from LiDO, Dortmund, Germany.
References
1. Balbach J. J., Ishii Y., Antzutkin O. N., Leapman R. D., Rizzo N. W., Dyda F., Reed J.,and Tycko R. Amyloid fibril formation by Aβ16−22, a seven residue fragment of thealzheimer’sβ-amyloid peptide, and structural characterization by solid state NMR.Biochemistry, 39:13748–13759, 2000.
93

2. Kusumoto Y., Lomakin A., Teplow D. B., and Benedek G. B. Temperature depen-dence of amyloidβ-protein fibrillization. Proc. Natl. Acad. Sci. USA, 95:12277–12282, 1998.
3. Burri R. R., Paschek D., and Geiger A. Temperature dependence of Aβ16−22 peptideaggregation and fibril growth in aqueous solution.in preparation.
4. Hansmann U. H. E. Parallel tempering algorithm for conformational studies of bio-logical molecules.Chem. Phys. Lett., 281:140–140, 1997.
5. Gnanakaran. S., Nussinov. R., and Garcıa A. E. Atomic-level description of amyloidβ-dimer formation.J. Am. Chem. Soc., 128:2158–2159, 2006.
6. Sugita Y., Kitao A., and Okamoto Y. Multidimensional replica-exchange method forfree-energy calculations.Chem. Phys., 113:6042–6051, 2000.
7. Paschek D., Nymeyer H., and Garcıa A. E. Replica exchangesimulation of reversiblefolding/unfolding of the trp-cage miniprotein in explicitsolvent: On the structure andpossible role of internal water.J. Struct. Biol., 157:524–533, 2007.
8. Burri R. R., Paschek D., and Geiger A. Replica exchange simulations of Aβ16−22
peptides aggregation in explicit solvent.in preparation.9. Lindahl E., Hess B., and van der Spoel D. Gromacs 3.0: A package for molecular
simulation and trajectory analysis.J. Mol. Model., 7:306–317, 2001.10. Meinke J. H. and Hansmann U. H. E. Aggregation ofβ-amyloid fragments.J. Chem.
Phys., 126:014706–014711, 2007.
94

A Molecular Dynamic Study of the Basic FibroblastGrowth Factor - Fibroblast Growth Factor Receptor
Complex
Leo Degreve∗ and Gustavo Henrique Brancaleoni
Departamento de Quimica, FFCLRP,Universidade de Sao Paulo 14040-901, Ribeirao Preto, Brazil
∗E-mail: [email protected]
The basic fibroblast growth factor is a 155 amino acid residues peptide that plays versatile func-tions throughout the human life cycle. It binds to its tyrosine kinase-containing FGF receptor,FGFR1, and to heparan sulfate proteoglycans. The presence of ethanol interferes on the bFGFbiologic activities resulting in numerous anomalies like the fetal alcohol syndrome. Experimen-tal studies suggest that the interaction sites between bFGFand FGFR1 are the target for ethanolmolecules. In order to better understand the interaction between bFGF, FGFR1 and ethanol,molecular dynamics simulations of the complex bFGF-FGFR1-heparin in water and in water-ethanol solutions were carried. Hydrogen bond structures,root mean square deviations andspecific radial distribution functions were employed to identify the role of each component onthe complex stability. Some residues (SER73, TYR112, THR114, TYR115 and SER117) wereidentified as extremely important for the perfect linking between the bFGF and FGFR1. Thereare exactly these residues that are the target of ethanol molecules resulting in the impossibilityto occur the docking of bFGF on its receptor.
1 Introduction
The cell growth is a tightly regulated process controlled byhighly specific proteins, namelythe growth factors1. The bFGF, a mammalian fibroblast growth factor, is a sequence of 155amino acid residues that plays versatile functions throughout the human life cycle. Twotypes of molecules bind bFGF to mediate its response: (1) tyrosine kinase-containing FGFreceptor, FGFR1, and (2) heparan sulfate proteoglycans (heparin and heparan sulfates,HS). FGFR1 is an integral membrane protein composed by an extracellular ligand bind-ing segment consisting of three immunoglobulin-like domains (D1, D2 and D3), a singletransmembrane helix and a cytoplasmic portion that contains a largely split tyrosine kinaseactivity2. The ligand binding and the specificity residues of the FGFR1are located in theD2 and D3 domains and in the linker that connects these domains. The bFGF:FGFR1 com-plex contains a 2:2 dimeric bFGF-FGFR1-HS assemblage. D2 and D3 are sufficient forthe bFGF binding and to determine its specificity3. Experimental studies on bFGF biologicactivities revealed that the presence of ethanol interferes in its activity apparently becausethe interaction sites between bFGF and FGFR are the targets of the ethanol molecules2.The objectives of the present study are (1) to describe the structure of bFGF-FGFR1 inter-actions and (2) to contribute to better understand the structural factors that determine theloss of bFGF activity in the presence of ethanol molecules. Molecular dynamics simula-tions4 conducted with the Gromos96 force field and the GROMACS 3.2 package5 will beused. The simulated systems consisted of one dimer bFGF-FGFR1 (initial guess: pdb code1FQ9) immersed in water or in a mixed water-ethanol medium.The solvent concentrations
95

were adjusted to match, in the pure solvent regions of the simulation systems, their exper-imental densities. Na+ and Cl− ions were added to preserve the local electroneutrality.After an initial phase, the 10.0 ns long simulations were conducted at 298 K and 1 atm ina 13.5 x 13.5 x 13.5 nm3 simulation cell, implementing the PME method with a cut-offapplied at 1.4 nm.
2 Results and Discussion
The structure of the dimer bFGF2-FGFR1 consists of two bFGF molecules (residues 16-144), the dimerized receptor formed by two D2 domains (residues 149-249) linked to twoD3 domains (residues 251-359) and two heparin molecules. The structure of the dimer inaqueous medium undergoes only few changes if compared with the starting X-ray structure(RMSD about 0.25nm) while, in ethanol solution, RMSDs with amean value of 0.60nm are observed when the dimer structure undergoes significant changes suggesting thatsome regions are loosing their structure. The characterization, by molecular dynamicssimulations, of the peptide structures was carried out by identifying, in a first step, theintramolecular hydrogen bonds (iHB) and, a second step, theintermolecular hydrogenbonds (HB). The dimeric bFGF-FGFR1 structure is stabilizedby 20 HB between the dimerand the solvent molecules, 20 between bFGF and FGFR1, 4 between the FGFR1 units, 32between heparin and the bFGF’s and 22 between heparin and theFGFR1’s.
The hydration changes in the bFGF-FGFR1 complex comparing the data in aqueoussolution and in ethanolic medium reveal decreases of 20% forbFGF and 9% for FGFR1.All the affected residues contain a hydroxyl group in the side-chain and are located in theneighborhood of other residues displaying a hydrophobic character6( the bFGF residuessolvated by ethanol are always the same in the presence or notof the receptor) suggest-ing that an energetically favorable situation takes place when the ethanol molecules arehydrogen bonded to hydroxyl groups while their methyl groups are accommodated into ahydrophobic environment. In the case of bFGF, the ethanol molecules form intermolecu-lar hydrogen bonds with TYR33 (β1), SER73 (β5), TYR82 (β6), SER109, TYR112(β9),SER114(β9), TYR115(β9), and SER117(β9) so that two important HB between bFGF andFGFR1 D2 domain are lost: the links between SER109 of bFGF andASP209 of FGFR1and between TYR112 (β9) of bFGF and ALA179 located in the FGFR1 D2 domain.
The solvation by the ethanol molecules shows a more active interference of the ethanolmolecules with the residues belonging to the bFGFβ1,β5, β6, β9, β10, andβ12 strands.The most important interference (i.e., the longer residence times) is observed on theβ1(TYR33),β6 (TYR82),β9 (SER109, TYR112, TYR115 and SER117) residues. The con-sequence is the lost of four bFGF-FGFR1 HB, three between each one of the bFGF’s andthe D2 domains and one HB between each bFGF and the D3 domains.The losses of localstructures are confirmed by the experimental results that also suggest that the interactionbetween bFGF and FGFR is the target for ethanol in its inhibition process. On the basisof the detailed description of the interactions of bFGF-FGFR1 complex with the ethanolmolecules, it can be establish that the residues belonging to theβ1, β6, andβ9 strands,especially TYR33, TYR82, SER109, and TYR112 are extremely important for the perfectlinking between the bFGF and FGFR1.
96

3 Concluding Remarks
The studies by molecular dynamics of the bFGF-FGFR1 complexstructure conclude thatthe ligand binding and specificity require both D2 and D3 domains of FGFR1, that theheparin molecules are a fundamental binding element between bFGF and the receptor, thatthe interaction of bFGF with its membrane receptor must be described by a HB complexnetwork where all HB are essential for the perfect bFGF binding to FGFR1 (the perfectbinding that is an unavoidable step to bFGF exhibits all its biological activities). Thesimulation results confirm the experimental data concerning the importance of the TYR-112 and ASN-113 in the bFGF activity but also are able to identify the SER73, TYR112,THR114, TYR115 and SER117 residues as being probably important to understand theactivity of the bFGF growth factor.
Acknowledgments
The Fundacao de Amparo a Pesquisa do Estado de Sao Paulo and the Conselho Nacional deDesenvolvimento Cientıfico e Tecnologico are acknowledged for supporting the research.
References
1. L. Strayer,Bioquımica, Guanabara Koogan, Sao Paulo, (1995).2. J. Schlessinger, A. N. Plotnikov, O. A. Ibrahimi, A. V. Eliseenkova, B. K. Yeh, A.
Yayon, R. J. Linhardt, and M. Mohammadi, Molecular Cell, 6 , 743 (2000).3. M. Mohammadi , S. K. Olsen, O. A. Ibrahim, Cytokine & GrowthFactor Reviews,
16, 107(2005).4. M.P. Allen, D.J. Tildesley, Computer Simulation of Liquids, Clarendon Press, Oxford,
(1987).5. D. Van Der Spoel,; E. Lindahl,; B. Hess; A.R. Van Buuren, E.Apol, P. J. Eulenhoff, D.
P. Tieleman; A. L. T. M. Sijbers, K. A. Feenstra, R. Van Drunen, H. J. C. Berendsen.Gromacs User Manual, Version 3.2:http://www.gromacs.org.
6. G.H. Brancaleoni, M.R. Lourenzoni and L. Degreve, Genet. Mol. Res. 5 (2): 350(2006).
97


Dimensionality Reduction Techniques for Protein FoldingTrajectories
T. Eitrich, S. Mohanty, X. Xiao, and U. H. E. Hansmann
John von Neumann Institute for Computing,Research Centre Julich, 52425 Julich, Germany
E-mail: t.eitrich, s.mohanty, x.xiao, [email protected]
In our work we analyze large and high dimensional data from protein folding simulations. Themain goals are to extract the underlying dimensionality, tofind a small number of featuresthat describe the data with high accuracy and to find interesting clusters in the data: in thiswork we treat this as a problem of dimensionality reduction.Dimensionality reduction aimsto find a mapping of the original space into a space of a few interesting dimensions, which theuser then can use for interpretation and analysis. We study modern dimensionality reductiontechniques and combine them with promising distance measures, suitable for the description ofdissimilarities between the data points generated by the package ProFASi - a Protein Foldingand Aggregation Simulator.
1 Introduction
Understanding the folding of proteins is one of the most challenging problems in compu-tational biology. We refer to protein folding as the processby which a protein assumesits native state. Protein folding trajectory data is high dimensional and thus hard to inter-pret after the simulation. Dimensionality reduction methods, that map the data into a newspace of fewer dimensions while preserving as much relevantinformation as possible, canbe used to find meaningful low dimensional structures in the original high dimensionaldatasets.
Several techniques do exist, which we may divide into
• linear methods, like principal component analysis (PCA)6 and multi dimensional scal-ing (MDS)2, and
• nonlinear methods, like locally linear embedding (LLE)8, kernel PCA9 and Isomap10.
We refer to this methods as unsupervised embedding algorithms. Supervised embeddingmethods, which take additional properties into account, are discussed in ref 5.
2 Material and Methods
Our dataset for this work consists of a folding trajectory ofa49 residue alpha-beta proteinwith PDB id 2GJH, generated using the program package ProFASi: a Protein Folding andAggregation Simulator4. Each data point represents the conformation of the molecule at acertain Monte Carlo time. Each successive pair of data points are separated by1000 MonteCarlo sweeps. For this analysis, we have used1000 such points, which were selected tospan one particular folding event in the simulations.
We have used two dimensionality reduction methods, MDS and Isomap. The followingare the main steps in the Isomap10 method.
99

• Compute dissimilarities between all points.
• Construct a neighborhood graph according to the number of neighborskn
• Based on the neighborhood information, compute shortest paths between all points.
• Embed the data into a newd-dimensional space using an eigenvalue method.
In the case of MDS, only the first and the last step need to be done (no neighborhoodparameterkn), because the dissimilarity measure is assumed to be uniformly good for allpairs of points.
The success of dimensionality reduction methods highly depends on a reasonablechoice of the dissimilarity measure, since these methods use distances between objectsinstead of the objects themselves. Thus, any information wewant to preserve must be rep-resented by the distance measure. In our study we have used and compared three differentmeasures, i.e.
• the minimized root mean square deviation (RMSD) between atomic coordinates, as itwas used in ref 3,
• the RMSD of the dihedral angels, as introduced in ref 1, and
• a two dimensional structural similarity measure based on dihedral angle distributionsand a Fourier transformation process, described in ref 7.
3 Results and Discussion
In our tests we have applied different dimensionality reduction techniques as well as vari-ous distance measures for our folding trajectory dataset. We observed, that both, MDS andIsomap (using small neighborhood sizes) lead to interesting embedding dimensions. Weobserved, that all three distance measures give results which fit to some of the characteris-tics of the simulation, like energy or RMSD to the native state.
In Fig. 1, we show results using Isomap with10 neighbors and the atomic RMSDdistance measure. Plotted is the RMSD to the native state against the first embeddingdimension - a descriptor for how well the protein has folded in the simulation. Please note,that the colors in all pictures express the time steps. In Fig. 2, results using MDS with thedihedral RMSD distance measure are given. Plotted is the total energy value against thefirst embedding dimension. In Fig. 3, MDS together with the Fourier measure was applied.Given is the helix content against the first embedding dimension.
So far we could not observe huge differences between the linear MDS and the nonlinearIsomap, which leads us to the conclusion, that for the case ofprotein folding trajectories,we have examined, the choice of a reasonable distance measure also leads to adequateresults for linear embedding methods.
4 Summary and Future Work
In our work we studied linear and nonlinear dimensionality reduction techniques. Ourapplication field is protein folding, for which we try to find and analyze new embeddingcoordinates. Future work will concentrate on the analysis of embedding data. Especially,we will use supervised methods to cluster and classify embedded data.
100

−50 −40 −30 −20 −10 0 10 20 300
5
10
15
20
25
30
35
RM
SD
to n
ativ
e
1. dimension
color: time
Figure 1. First embedding coordinate is correlated with theRMSD to native value.
−1 −0.5 0 0.540
60
80
100
120
140
160
180
200
220
1. dimension
color: time
ener
gy
Figure 2. First embedding coordinate is correlated with theenergy.
Acknowledgments
Part of this work are supported by research grants of the National Science Foundation,USA (CHE-0313618) and the National Institutes of Health, USA (GM 62838).
101

−5 −4 −3 −2 −1 0 1 2 30
0.1
0.2
0.3
0.4
0.5
0.6
0.7
1. dimension
helix
con
tent
color: time
Figure 3. First embedding coordinate is correlated with thehelix content.
References
1. A. Collins, R.I. Cooper, and D.J. WatkinStructure matching: measures of similarityand pseudosymmetry. J. Appl. Cryst.39, 842–849, 2006.
2. T.F. Cox and M.A.A. Cox.Multidimensional scaling. Chapman & Hall, London,1994.
3. P. Das, M. Moll, H. Stamati, L.E. Kavraki, and C. ClementiLow-dimensional free-energy landscapes of protein-folding reactions by nonlinear dimensionality reduction.PNAS103(26), 9885–9890, 2006.
4. A. Irback and S. MohantyProFASi: a Monte Carlo simulation package for proteinfolding and aggregation. J. Comput. Chem.27, 1548–1555, 2006.
5. T. Iwata, K. Saito, N. Ueda, S. Stromsten, T.L. Griffiths, and J.B. TenenbaumParamet-ric embedding for class visualization. Advances in Neural Information ProcessingSystems17 (NIPS2004), 617–624, 2005.
6. I.T. JolliffeDiscarding variables in a principal component analysis. I:artificial data.Applied Statistics21, 160–173, 1972.
7. N. Kandiraju, S. Dua, and S. ConradDihedral angle based dimensionality reductionfor protein structural comparison. Proc. Conf. ITCC2005, 14–19, 2005.
8. S.T. Roweis and L.K. Saul.Nonlinear dimensionality reduction by locally linearembedding. Science290(5500), 2323–2326, 2000.
9. B. Scholkopf, A.J. Smola, and K.-R. Muller. Kernel principal component analysis. InAdvances in kernel methods: support vector learning, MIT Press, 327–352, 1999.
10. J.B. Tenenbaum, V. deSilva, and J.C. Langford.A global geometric framework fornonlinear dimensionality reduction. Science290(5500), 2319–2323, 2000.
102

Chemical Space of Auxins, their Multi-Phenomenologyand Multiple Protein Interaction
Noel Ferro1,2, Patrick Bultinck 3, Thomas Bredow1, and Thomas Reinard2
1 Institute for Physical and Theoretical Chemistry,University of Bonn, Wegelerstr. 12, D-53115 Bonn, Germany
E-mail: [email protected]
2 Institute of Plant Genetic,University of Hannover, Herrenhauser Str.2, D-30419, Germany
3 Department of Physical Chemistry,University of Ghent, Krijgslaan 281(S3) B-9000 Gent, Belgium
The irregular net of physiological processes in plants has been the medium for intuitive theories(hypotheses) of structure-activity relationships of auxin molecules, but even now their chemicaldefinition is unclear. Molecular Quantum Similarity Measures (MQSM) scored a conceptualframework to uncover such phenomenon. The quantum objects (auxins) were classified bycluster analysis methods based on a feed-back with a biological consensus variable. Next,standardized multi-screening bioassays of different auxins were carried out and the data analysiswas implemented at multidimensional level. In these scenarios, on the one side, a new activeauxin-like substance without COOH in the side chain (2, 6-dibromo-phenol) was found, andhardness (η) was shown to be a common variable to predict the auxins biological activities. Onthe other side, two sets of molecular properties are postulated to explain different physiologicalprocesses such as growth and morphogenesis. These dual properties of auxins are structurallyconsistent with the two different binding-pocket systems disclosed until now in ABP1 and TIR1,respectively.
1 Introduction
The underlying concept of the structure-activity rule, “auxins act as a kind of co-enzyme orergon at the growth center, which is a protein or enzyme surface of highly specific shape”1
is not consistent with experimental facts anymore.Due to their pleiotropic effects (e.g. organogenesis, cellelongation, cell division) auxinactivity depends on more than one “receptor” and on a new biochemical mechanism of in-teraction of protein – small molecule – protein2. These statistical regularities have not beentaken into account previously for the analysis of the detailed molecular causal properties oftheir biological activities. The physiological role of theAuxin-Binding-Protein 1 (ABP1)is still debated. But definitively, it is not involved in all the different physiological auxineffects3. Furthermore, the speculations about specialized receptor functions for specifictransporters like PIN (PIN-FORMED) proteins should be considered as well4,5. Recentlya new complex of three proteins SCFTIR1 out of which the transport inhibitor response 1(TIR1) has been described as an auxin receptor2. The objective of the present article isto summarise some of our recent results and search for interactions between some meth-ods of molecular biology and computational chemistry in order to analyse the complexphysiological processes related to the auxin phenomena.
103

2 Structure-activity
Different approaches have been postulated:chemical6 , physico-chemical7 binding sitemodels8,9. They can not overcome the structure-activity impasse of auxins. The uncon-nected comprehensions of the chemical and biological view-points have failed to describethe auxin phenomena: first, suppressing ideas of statistical regularities and evaluatingthe assumption, “structure generates properties”, as a dynamic regularity of the hormone-receptor interaction exported from the animal model. Second, distinctiveness of the molec-ular biology and biochemical outcomes in the last twenty years in plants has not beenincorporated into the analysis.
3 Problem Solution
Our chemical computational-biostatistical approach focused on the auxin chemical spacein the biological context. The analysis of the structure of the auxin-like molecules is treatedas the invariant part, to which the the biological tests are relative, but not vice versa10. Thatdoes not mean, that the phytohormone phenomenon depends exclusively on the ligandstructure, but the ligand structure analysis is the point todefine the degrees of freedom ofthe phenomenon. The analysis presented focus on:
1. searching Molecular Quantum Similarities associated with the biological activities;
2. classifying auxin molecules based on the connections of the QMSM and the Biologi-cal Activity;
3. developing standardized bioassay for the screening of selected molecules to confirmthe hypothesis of relation quantum similarity – biologicalactivity;
4. identifying quantum molecular regions responsible for the biological activity.
The statistical treatment of similarity matrices of both, Coulomb and Overlap opera-tors, was preceded by a Principal Component Analysis, minimizing repetitive information.Next, cluster methods analysis were applied. Relationshipbetween clusters and biologicalactivity was confirmed by statistic methods with probability a posteriori. The resultingcluster allowed to recognize different quantum similarityclasses related to the biologicalactivity10. Following, the biological activity of 2,6-Br-Phe (without COOH group), activeas auxin by QMSM predictions10, was experimentally confirmed11.
Functionally, the multi-scaling analysis of the experimental data allowed us to dis-criminate two sets of chemical predictor variables (chemical regions), which distinguishtwo different kind of auxin biological activities: growth,where ABP1-binding activitiesinferred a physiological relation statistically; and morphogenesis events where TIR1 is in-volved (Fig. 1). Structurally, the two sets of accessory binding areas proposed M and G(Fig. 1 A) are closely related to the differences of the binding site requirements of TIR1and ABP1 respectively (the two proposals of auxin receptors) (Fig. 1, B). In TIR1 – crystalis well represented the binding by the N-indole, while a complex binding system appearin the complex with Zn in ABP1. The results of both crystals suggest a duality of auxinproperties: able to bind in two totally different systems. On the one side (ABP1), the
104

Figure 1. Accessory binding areas. (M) morphogenesis, (G) growth, (H-C-H) region buffer important for growthregulation.
molecule-protein interaction via auxin side chain evoke totally different chemical bindingconditions, to which the existence of the sp2 carbon, statistically inferred, could be im-portant. On the other side (TIR1), the interaction via the N-indole in TIR1 was predictedbefore as an important point for morphogenetic events11. Likewise, both crystal auxin –protein do not show any rearrangement of the atoms of the protein, due to the binding. Thestructural information rather suggests electron arrangement, like predicted by our calcu-lations with a common variable influences the biological activity of auxins at every level:the chemical hardness11. This is also able to classify the 240 auxins together with the twoprincipal components obtained by QMSM (Fig. 2). Soft molecules are more active thanhard molecules if electron transfer or rearrangement is necessary for the reaction12. Thisconcept is exactly confirmed by our results. Functional dependence with hardness havingnatural auxins as outliers11, suggests a relation with the limits of reactivity in biologicalsystems; it means toxicity. Contrary to the natural auxins,synthetic auxins like 2,4-Dare potent herbicides and their hardness is very high. Consequently, other sites and/or in-especific interactions in the cellular systems (proteins) are expected, it dependent on themolecular structures. These results, the broad quantity ofactive molecules as auxins andmany of them being almost as active as the standard auxin IAA,indicate controversy be-tween a typical specificity of a hormonal mechanism and the auxin concept in plants. Thestrategies described above are the key of chemical design, which will result in the nextgeneration of new synthetic auxins and/or comprehensive bases of the action mechanism.This may be also extended to the phytohormone context.
105

Figure 2. Influence of hardness in the classification of 241 auxin like molecules with QMSM components.
4 Conclusion
It was demonstrated that a combination of both electronic structure and intermolecular in-teraction descriptors was able to describe this multi-dimensional biological phenomena.The Coulomb matrix, as an electrostatic potential descriptor, was the most important dif-ferentiating auxin activity measure as evidenced by discriminant analysis. A phenol deriva-tive, predicted as active substance, was confirmed to be active in different auxin tests. Themolecular descriptors and regions analyzed functionally,from phenomenological point ofview, are structurally related with the differences of bothbinding sites reported for ABP1and TIR1. The electronic rearrangement in the interaction auxin - receptor predicted byhardness (η) is confirmed by non atoms rearrangements in the both auxin-ABP1 and auxin-TIR1 interactions. The existence of sp2 carbon in the side chain turns the induction ofactivity of such substances at very low concentrations.
References
1. L. J. Audus,Metabolism and mode of action.(In: Ruhland W, ed. Encyclopediea ofPlant Physiology Berlin: Springer, 1961).
2. X. Tan, L A. Calderon Villalobos, M. Sharon et al.Mechanism of auxin perception bythe TIR1 ubiquitin ligase, Nature446, 640, 2007.
3. R. M. Napier, K. M. David, C. Perrot-Rechenmann,A short history of auxin-bindingproteins, Plant Molecular Biology49, 339, 2002.
4. J. Friml, J. Wisniewska, E. Benkova, et al.Lateral relocation of auxin efflux regulatorPIN3 mediates tropism in ArabidopsisNature415, 806, 2002.
5. J. J. Blakeslee, A. Bandyopadhyay, W. A. Peeret, al.Relocalization of the PIN1auxin efflux facilitator plays a role in phototropic responses, Plant Physiology134,28, 2004.
106

6. C. Hansch, R. M. Muir,The Ortho Effect in Plant Growth-Regulators, Plant Physiol-ogy25, 389, 1950.
7. H. Veldstra,The Relation of Chemical Structure to Biological Activity in Growth Sub-stances, Annual Review of Plant Physiology and Plant Molecular Biology 4, 151,1953.
8. G. F. Katekar,Auxins - Nature of the Receptor-Site and Molecular Requirements forAuxin Activity, Phytochemistry18, 223, 1979.
9. S. Tomic, R. R. Gabdoulline, B. Kojic-Prodic, R. C. Wade,Classification of auxinplant hormones by interaction property similarity indices, Journal of Computer-AidedMolecular Design12, 63, 1998.
10. N. Ferro, A. Gallegos, P. Bultinck et al.Coulomb and Overlap Self-Similarities: Acomparative selectivity analysis of structure - function relationships for auxin - likemolecules, Journal of Chemical Information and Modeling46, 1751, 2006.
11. N. Ferro, P.Bultinck, A. Gallegos, H.-J. Jacobsen, R. Carbo-Dorca, T. Reinard,Un-revealed structural requirements for auxin-like molecules by theoretical and experi-mental evidences, Phytochemistry68, 237, 2007.
12. R. G. Pearson,Absolute Electronegativity and Hardness Correlated with Molecular-Orbital Theory, PNAS83, 8440, 1986.
107


Crystal Water Molecules and Solvation Effects onProtein-Ligand Docking
B. Fischer and W. Wenzel
Institute for Nanotechnology,Research Center Karlsruhe, 76344 Eggenstein-Leopoldshafen, Germany
E-mail: fischer-b, [email protected]
In this report, we briefly present our recent study which investigates the influence of solvationenergies and of crystal water molecules on the ligand binding orientation and affinity. Recently,we integrated fully movable water molecules into our docking programFlexScreen. Thesewater molecules have translational and rotational degreesof freedom and if their presence isvery unfavorable at a protein-ligand conformation, they are not considered at all. Additionally,we present our progress in improving our scoring function byincorporating into the functionthe solvation energies of the protein-ligand complex. The solvation energies are also calculatedduring the docking simulation itself.
1 Methods
A high-throughput in-silico screening method likeFlexScreenconsists of three major ele-ments: (1) asuitable virtual representationof existing protein-ligand systems, (2) ascoringfunction that approximates the binding energy (ideally the affinity)of the protein-ligandcomplex as a function of the conformation of this complex1, 2 and (3) an efficientopti-mization methodthat is able to locate the best protein-ligand conformationon the potentialenergy surface3, 4. In this report, we present our progress in points (1) and (2). So far, wehave already developed a simulation approach that allows the protein structure to adaptto the docking ligand by conformational changes in the side chains. This approach hasproved to be successful and results in more accurate and reliable database screens than anapproach using only one rigid protein structure for the simulations2.
1.1 Crystal Water Molecules
An additional important aspect is the influence of water molecules on the ligand bindingaffinity and on the ligand binding orientation. Firstly, we focus on the influence of crystalwater molecules. These water molecules are strongly stabilized in the hydrogen bond net-work of the protein and therefore are well preserved in the crystal structures obtained byX-ray diffraction patterns. Secondly, solvation effects are considered in sec. 1.2.When a ligand binds to a protein, it pushes aside water molecules in the protein cavity. Asa consequence, a part of the water molecules are removed intothe bulk solvent whereasothers are involved in the stabilization of the ligand binding orientation. The spatial dis-tribution of crystal water molecules in the protein cavity differs for bound ligands. Usingone of those distributions as a fixed element in docking simulations, prevents many otherhigh-affinity ligands from binding. Because of this and the already large conformationalprotein-ligand space, changeable water molecules are usually neglected for simulations.In the following, we report our progress and our methodologyfor docking simulations
109

Figure 1. Illustration of two docking simulations with three additional flexible water molecules. Left picture:binding conformation of the ligand idu with the protein thymidine kinase (TK). Right picture: binding conforma-tion of the ligand gcv with TK.
with flexible and movable water molecules in the protein cavity. Before docking, we selectflexible water water molecules which have the degrees of freedom of translation, rotationand of moving into the solvent, if unfavorable. We performeddocking simulations withthe ligand gcv and idu to the protein thymidine kinase (TK). Figure 1 illustrates both re-sulting binding conformations with our new methodology. Inthe left picture of figure 1,the ligand idu is stabilized by two water molecules, whereasin the right picture the ligandgcv is bound to only one crystal water molecule. Our new methodology has the advan-tage that water molecules may actively stabilize a ligand conformation with their updatedorientation. At the same time ligands are not hindered from binding.
1.2 Solvation Effects
The hydrophilic and hydrophobic properties of a ligand do not only influence the bindingaffinity, but also the binding orientation in protein pockets accessible to the bulk solvent. IntheFlexScreenscoring-function we approximate the solvation energies through an implicitsolvation model by calculating the solvent accessible surface areas of each atom (SASA)5
ESolvation =∑
i
γiASASAi , (1)
ASASAi being the solvent accessible surface area of atom i andγi the proportional factor
of the atom type of atom i that relates the surface area to solvation energies. Consider-ing these contributions during a simulation enables us to also reliably predict the bindingorientations in open protein pockets. Figure 2 illustratesthe consequences of neglectingand of considering the solvation effects, described with eq. 1. Docking conformationsclose to the native conformations can only be stabilized by taking solvation energies intoaccount. As a consequence, methods like the thermodynamic cycle approach6 can not beapplied here. This method is only applicable, if the final protein-ligand conformation isindependent of simulations being in vacuum or in solution.
110

Figure 2. ComparingFlexScreendocking results with the experimental binding mode of the protein-ligand com-plex 3cla (pdb-code). The native ligand conformation is colored grey. Left picture: solvation effects are notconsidered and the simulation fails to predict the native binding mode. Right picture: solvation effects are in-cluded and the experimental binding conformation can be reproduced.
2 Conclusion
Crystal water molecules and water molecules from the bulk solvent sometimes have to beconsidered during docking simulations itself. With our approach we have started to studythe effects these water molecules have. Larger quantitative studies are still missing andfurther work has also to be done to refine the parameters for the SASA-solvation energies.
Acknowledgments
We thank the Fond der Chemischen Industrie, the BMBF, the Deutsche Forschungsgemein-schaft (grant WE 1863/13-1) and the Kurt Eberhard Bode Stiftung for financial support.
References
1. H. Merlitz and W. Wenzel,Comparison of stochastic optimization methods forreceptor-ligand docking, Chem. Phys. Lett.362, 271–7, 2002.
2. H. Merlitz and W. Wenzel,Impact of receptor flexibility on in-silico screening perfor-mance, Chem. Phys. Lett.390, 500, 2004.
3. W. Wenzel, K. Hamacher,Stochastic Tunneling Approach for Global Minimization ofComplex Potential Energy Landscapes, Phy. Rev. Lett.82, 3003–07, 1999.
4. A. Schug, B. Fischer, A. Verma, H. Merlitz, W. Wenzel, G. Schon, Biomolecularstructure prediction stochastic optimization methods, Adv. Eng. Mater. 7, 1005–9,2005.
5. D. Eisenberg, A.D. McLachlan,Solvation energy in protein folding and binding, Na-ture319, 199–203, 1986.
6. K.A. Sharp,Virtual Screening in Drug Discovery(Taylor & Francis, 2005).
111


Semiautomatic Workflow for Fold Recognition – Resultsfrom the CASP 2006 Competition
Fabian Fredel1, Jan Meinke1, Sandipan Mohanty1,Olav Zimmermann1, and Ulrich H. E. Hansmann1,2
1 John von Neumann Institute for Computing,Research Centre Julich, 52425 Julich, Germany
E-mail: f.fredel, j.meinke, s.mohanty, olav.zimmermann, [email protected]
2 Department of Physics, Michigan Technological University,1400 Townsend Drive,
Houghton, MI 49931, USAE-mail: [email protected]
We outline a semi-automatic procedure for structure prediction of proteins. A first analysis ofthe performance of this procedure in the CASP 2006 competition is presented.
1 Introduction
In order to test combinations of physics-based simulation techniques and sequence-basedprediction methods, our group participated in the ”Critical Assessment of Techniques forProtein Structure Prediction” (CASP) competition in the summer of 2006. As a first-timeparticipant our goal was to establish a semi-automatic workflow. We combined existingmethods for fold recognition with our refinement algorithmstesting heuristics for the se-lection at each step. In this article, we give an overview of the workflow and the resultsof an in-depth statistical analysis of our results. In particular, we assess the significance ofmeasured performance differences between the prediction methods. Analyzing our work-flow, we try to find the critical points where alternative decisions lead to a significantchange in the results. Our aim is to obtain rules that guide the decision process in theworkflow to optimize our predictions.
2 Workflow
The first step in our workflow is the manual selection of templates from 3D-Jury1 predic-tions. Preference is given to high 3D-Jury-scores and agreement between the secondarystructure of the template and the predicted secondary structure of the target sequence. Fortargets that were obviously not comparative modeling targets, 3D-Jury predictions fromfold recognition servers are preferred.
We search the fold space2 using CABS3. This parallel tempering Monte Carlo programuses constraints from the respective 3D-Jury templates andsecondary structure predictionby PSIpred 2.54. We use 32 replicas for sequences with less than 200 residuesand 64replicas for proteins with longer sequences. The statistics was between 15,000 sweeps forlong sequences and 100,000 sweeps for short sequences.
113

Clustering is performed using hierarchical clustering with HPCM5 using a fixed RMSDof 2.5 A as clustering radius. Structure clusters are selected based on cluster averages ofCABS energy and structure similarity (TM-score6) to the PDB structure on which the 3D-Jury template was based.
Averaged structures from the selected clusters are subjectto regularization by SMMP7.Regularized structures are ranked according to the total and partial energies of the struc-tures in SMMP. In ambiguous cases, the consistency of this ranking with a similar rankingbased on energy terms of PROFASI8 is checked.
The 5 to 10 structures ranked best are selected for refinement. For most structures,refinement involves a set of constrained simulated annealing runs with SMMP, startingfrom very high temperatures. Most structures dissolve and re-form into local minima ofthe potential that are close to the input structures of the refinement procedure. The finalstructures from different annealing trajectories are onceagain ranked following a similarprocedure as for the initial selection for the refinement runs. Final selection and ranking isbased on several energy terms, secondary structure contentand visual inspection.
Figure 1. Grey is the experimental structure (2HE9). Colored is our best structure for T0346.
3 Comparing Prediction Methods
Not all of our predictions are as good as the one in figure 1. In order to assess the signifi-cance of measured performance differences between us and other prediction methods weuse a nonparametric statistical test, the Friedman test9. It has a simple two-way layout fork treatments (groups) andn blocks (target).
GROUP
TARGET A1 A2 A3 ... Ak Ri =k∑
j=1
rij
#1 r11 r12 r13 ... r1k R1
#2 r21 r22 r23 ... r2k R2
#3 r31 r32 r33 ... r3k R3
...#n rn1 rn2 rn3 ... rnk Rn
Rj =n∑
i=1
rij R1 R2 R3 ... Rn
k∑
j=1
Rj =n∑
i=1
Ri
114

For each of then experiments thek results are ranked from1 for the best tok for the worst result. The ranked results are based on TM-score and RMSD forthe predictions to the experimental structure. The Null-hypothesis of the test is:H0 : µ1 = µ2 = · · · = µk ( no treatment differs). The rank of groupj at ex-perimenti is given byrij . Rj is the sum of then ranks of groupj. Rj is the mean of then ranks of groupj andR.. = k+1
2 .Compute
S =12 n
k (k + 1)
k∑
j=1
(Rj −R..)2.
S is an approximation for theχ2 distribution.The Nullhypothesis is rejected in all test cases. Across thefield we find significant
differences between all servers. The best servers areZhang-Server, MetaTasser, Pmod-eller 6 andBayesHHoutperforming our procedure and demonstrating the need forfurtherimprovement of our workflow.
4 Workflow Analysis
For this reason, we have decided to search the workflow for critical points where alternativedecisions lead to significant changes and improvements in our results. We asked ourselvesthe following questions:
• Do we select the best template?
• Do we trust PSIpred for the secondary structure prediction?
• Which structures should be used for clustering?
• Which clusters are the best?
• Is the final ranking of energy terms ideal to find the best structure?
As an example, we show the analysis of the workflow for target T0354 (130 residues):
best template selected ?best template our template
RMSD 3.98 3.89TM-score 0.515 0.395
do we trust PSIpred ? good secondary structure prediction by PSIpredwhich structures for clustering ? good predictions often at the lower replica numbersbest clusters are? average of CABS energy not always the best
ranking of energy terms ideal ?structure ranked 1st TM-score 0.3323best structure ranked 12th TM-score 0.5085
115

5 Conclusion
We have described a method for structure prediction of proteins. While currently not com-petitive with other approaches, we have shown a way to analyze its performance and toexplore possible improvements.
Acknowledgment
The calculations were done on computers of the John von Neumann Institute for Comput-ing, Forschungszentrum Julich, Julich, Germany.
Ulrich H. E. Hansmann is supported by a research grant (GM62838) of the NationalInstitute of Health (USA).
References
1. K. Ginalski, A. Elofsson, D. Fischer and L. Rychlewski, Bioinformatics19, 1015-1018, 2003.
2. U. H. E. Hansmann, Chem. Phys. Lett.281, 140, 1997.3. A. Kolinski and J. M. Bojnicki, Proteins61 Suppl. 7, 84-90, 2005.4. D. T. Jones, J. Mol. Biol.292, 195-202, 1999.5. D. Gront and A. Kolinski, Bioinformatics21, 3179-3180, 2005.6. Y. Zhang and J. Skolnick, Proteins57, 702-710, 2004.7. F. Eisenmenger, U. H. E. Hansmann, S. Hayryan and C. K. Hu, Comp. Phys. Comm.
174, 422, 2006.8. A. Irbaeck and S. Mohanty, J. Comp. Chem.27, 1548, 2006.9. Myles Hollander, Douglas A. Wolfe (1973),Nonparmetric Statistical Methods, John
Wiley & Sons (ISBN 0-471-40635-X).
116

Interaction of Biological Matter with Nanomaterials:A First-Principles Approach
S. Gowtham1, Ralph H. Scheicher1, Rajeev Ahuja2, and Ravindra Pandey1
1 Department of Physics, Michigan Technological University, Houghton, MI USAE-mail: [email protected]
2 Condensed Matter Theory Group, Department of Physics, Uppsala University, Uppsala, SwedenApplied Materials Physics, Department of Materials and Engineering,
Royal Institute of Technology, Stockholm, Sweden
1 Introduction
DNA-coated carbon nanotubes represent a hybrid system which unites the biologicalregime and the nanomaterials world. They possess features which make them attractivefor a broad range of applications, e.g., as an efficient method to separate carbon nanotubes(CNTs) according to their electronic properties1–3, as highly specific nanosensors, or as anin vivo optical detector for ions. It has also been experimentally demonstrated that ssDNAcan be inserted into a CNT5, further enhancing the potential applications of this nano-biosystem. Our specific interest is to assess the subtle differences in the adsorption strengthof these nucleobases on graphene, which in turn will allow usto draw conclusions for theinteraction of DNA and RNA with CNTs as well.
2 Computational Method
Calculations were performed using the plane-wave pseudopotential approach within thelocal density approximation (LDA)6 of density functional theory (DFT)7, as implementedin the Vienna Ab-initio Simulation Package (VASP)8.
A 5 × 5 array of the graphene unit cell in thex-y plane and a separation of 15Abetween adjacent graphene sheets in thez-direction was found to be a suitable choice torepresent the supercell. The base molecules were terminated at the cut bond to the sugarring with a methyl group in order to generate an electronic environment in the nucleobasemore closely resembling the situation in DNA and RNA rather than that of just individualisolated bases by themselves.
For each of the five nucleobases, aninitial force relaxationcalculation step determinedthe preferred orientation and optimum height of the planar base molecule relative to thegraphene sheet. The potential energy surface was then explored by translating the relaxedbase molecules parallel to the graphene plane in steps of 0.246A along the lattice vectors ofgraphene, covering its entire unit cell by a mesh of 10× 10 scan points. The determinationof the minimum total energy configuration was then followed by a 360 rotation of thebase molecules in steps of 5 to probe the dependence of the energy on the orientation ofthe base molecules with respect to the underlying 2-D graphene sheet. The configurationyielding the minimum total energy was used in the final optimization step in which allatoms in the system were free to relax.
117

3 Results and Discussion
From the optimization steps involving the translational and the rotational scan of the energysurface, it is apparent that the energy barriers to lateral movement and to rotation of a givenbase can range from 0.04 to 0.10 eV (Fig. 1(a)), thus considerably affecting the mobilityof the adsorbed nucleobases on the graphene sheet at room temperature, and constrictingtheir movement to certain directions.
In their equilibrium configuration, all five bases tend to position themselves ongraphene in a configuration reminiscent of the Bernal’s AB stacking of two adjacentgraphene layers in graphite (Fig. 2). Virtually no changes in the interatomic structureof the nucleobases were found in their equilibrium configurations with respect to the cor-responding gas-phase geometries, as it could be expected for a weakly interacting systemsuch as the one studied here. A notable exception is the RC−O in guanine which shows a10% contraction upon physisorption of the molecule on graphene.
(a) Surface Scan (b) Rotation Scan
Figure 1. Potential energy surface (PES) plot (in eV) for guanine on graphene. Qualitatively similar PES plotswere obtained for the other four nucleobases.
The binding energy of the system consisting of the nucleobase and the graphene sheet istaken as the energy of the equilibrium configuration with reference to the asymptotic limitobtained by varying the distance between the base and the graphene sheet in thez-direction(Table 1). This table also includes the polarizabilities ofthe nucleobases calculated at theMP2 level of theory. The polarizability of the nucleobase9, which represents the deforma-bility of the electronic charge distribution, is known to arise from the regions associatedwith the aromatic rings, lone pairs of nitrogen and oxygen atoms. Accordingly, the purinebase guanine appears to have the largest value, whereas the pyrimidine base uracil has thesmallest value among the five nucleobases. Our calculationsconfirm this behavior.
118

Figure 2. Equilibrium geometry of nucleobases on top of graphene: (a) guanine, (b) adenine, (c) thymine, (d)cytosine, and (e) uracil.
Base Eb(LDA) [eV] Eb(MP2) [eV] α [e2a20E
−1h ]
G 0.61 1.07 131.2A 0.49 0.94 123.7T 0.49 0.83 111.4C 0.49 0.80 108.5U 0.44 0.74 97.6
Table 1. Binding energyEb of the DNA/RNA nucleobases with graphene as calculated within LDA are comparedwith binding energy and polarizabilityα from MP2 calculations.
4 Conclusions
Our first-principles results clearly demonstrate that the nucleobases exhibit significantlydifferent interaction strengths when physisorbed on graphene. This finding representsan important step towards a better understanding of experimentally observed sequence-dependent interaction of DNA with CNTs3, 4. The calculated trend in the binding energiesstrongly suggests that the polarizability of the base molecules determines the interactionstrength of the nucleobases with graphene. Further studiesinvolving the investigation ofnucleobases interacting with small-diameter CNTs are currently underway.
119

Acknowledgments
S.G., R.H.S., and R.P. would like to thank DARPA for funding.Authors are grateful toCenter for Experimental Computation at MTU and the Swedish National Infrastructure(SNIC) for computing time.
References
1. N. Nakashimaet al., Chem. Lett.32, 456 (2003).2. M. Zhenget al., Nature Mater.2, 338 (2003).3. M. Zhenget al., Science302, 1545 (2003).4. C. Staiiet al., Nano Lett.5, 1774 (2005).5. T. Okadaet al., Chem. Phys. Lett.417, 288 (2006).6. J. P. Perdew and A. Zunger, Phys. Rev. B23, 5048 (1981).7. P. Hohenberg and W. Kohn, Phys. Rev.136, B864 (1964); W. Kohn and L. J. Sham,
ibid. 140, A1133 (1965).8. G. Kresse and J. Furthmuller, Comput. Mater. Sci.6, 15 (1996); G. Kresse and D.
Joubert, Phys. Rev. B59, 1758 (1999).9. Frank Seela, Anup M. Jawalekar, and Ingo Munster, Helevetica Chimica Acta88, 751
(2005).
120

Computational Reconstruction of MacromolecularAssemblies
Axel Griewel and Matthias Rarey
Center for BioinformaticsUniversity of Hamburg
Bundesstr. 4320146 Hamburg, Germany
E-mail: griewel, [email protected]
Cryo electron microscopy (cryo EM) has proven to be an effective technique to gather lowresolution information of macromolecular structures. Methods like X-ray crystallography andNMR spectroscopy on the other hand supply atomic detail structures but tend to fail in the inves-tigation of large specimen. We present a method for elucidating macromolecular structures bycombining atomic detail structures of subunits with overall shape information gathered by cryoEM – a problem for which only few computational methods have been published so far. In ourapproach atomic detail structures are reduced to a set of spheres by computational methods likegift-wrapping and Delaunay triangulation. These describing spheres are then matched to a hardsphere-filtered cryo EM map employing pose clustering, a technique adapted from computervision. Tests were performed using experimental and simulated cryo EM maps. Calculationsyield results within 3.5A rmsd accuracy or better in a runtime of less than 5 minutes.
1 Introduction
Cryo electron microscopy is as a powerful imaging techniquefor the elucidation of macro-molecular structures. The resolution of the resulting density maps, however, does notallow for atomic detail interpretation. For this task methods like X-ray crystallographyand NMR spectroscopy are more suited, while they also tend tofail in the investigation oflarge specimen. Combining atomic detail structures of subunits with cryo EM is a viablemethod for determining macromolecular structures. We developed a fast and accurate toolincorporating information from different sources for the computational reconstruction ofmacromolecular assemblies (CRoMA).
All published methods for this problem except one rely on a sequential scan of thesix dimensional degrees of freedom given by rotation and translation of the two objectsrelative to each other. Only one published approach utilizes topology representing neuralnetworks. Three approaches for a scoring function can be found in literature. One is tocalculate a synthetic cryo EM map of the atomic structure at the desired resolution andto determine the cross correlation of the two maps. Another approach utilizes laplacianfiltered maps yielding a score reflecting the overlap of borders. A third scoring functionuses trilinear interpolation for each atom.1, 2
2 Method
The atomic detail structure as well as the map are preprocessed yielding descriptors con-sisting of spheres of different radii. These descriptors are utilized to determine favourableplacements by a technique adapted from computer vision.
121
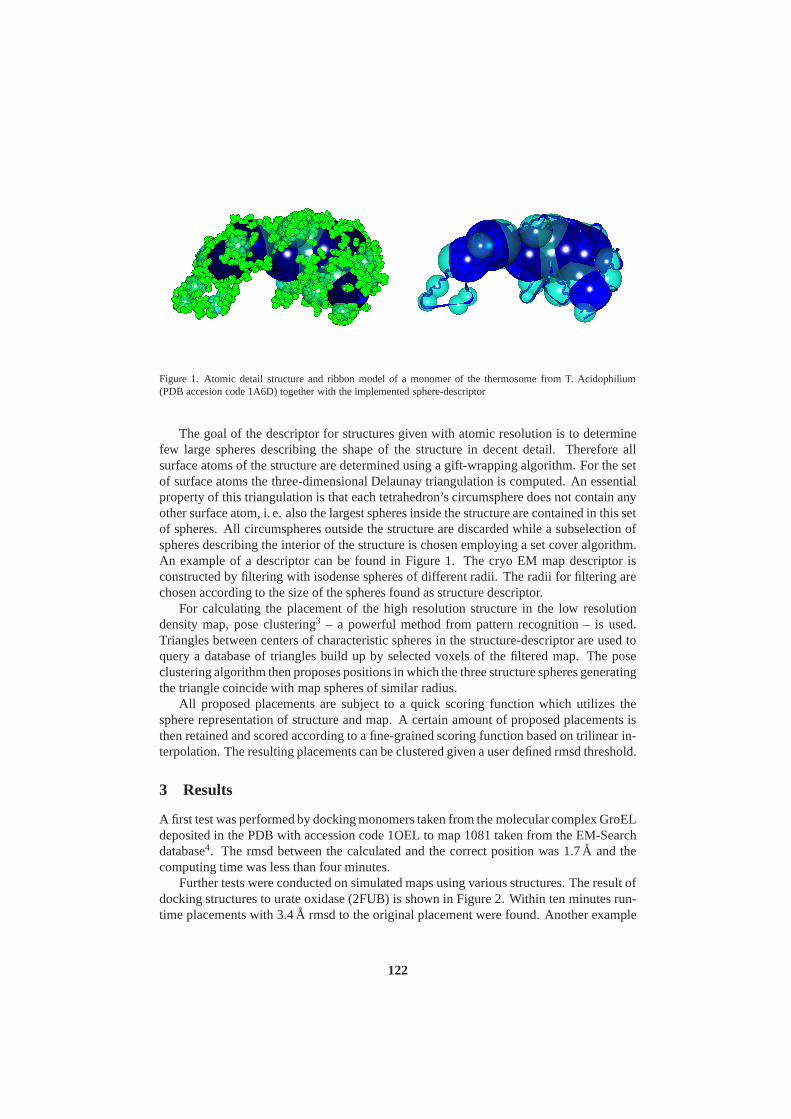
Figure 1. Atomic detail structure and ribbon model of a monomer of the thermosome from T. Acidophilium(PDB accesion code 1A6D) together with the implemented sphere-descriptor
The goal of the descriptor for structures given with atomic resolution is to determinefew large spheres describing the shape of the structure in decent detail. Therefore allsurface atoms of the structure are determined using a gift-wrapping algorithm. For the setof surface atoms the three-dimensional Delaunay triangulation is computed. An essentialproperty of this triangulation is that each tetrahedron’s circumsphere does not contain anyother surface atom, i. e. also the largest spheres inside thestructure are contained in this setof spheres. All circumspheres outside the structure are discarded while a subselection ofspheres describing the interior of the structure is chosen employing a set cover algorithm.An example of a descriptor can be found in Figure 1. The cryo EMmap descriptor isconstructed by filtering with isodense spheres of differentradii. The radii for filtering arechosen according to the size of the spheres found as structure descriptor.
For calculating the placement of the high resolution structure in the low resolutiondensity map, pose clustering3 – a powerful method from pattern recognition – is used.Triangles between centers of characteristic spheres in thestructure-descriptor are used toquery a database of triangles build up by selected voxels of the filtered map. The poseclustering algorithm then proposes positions in which the three structure spheres generatingthe triangle coincide with map spheres of similar radius.
All proposed placements are subject to a quick scoring function which utilizes thesphere representation of structure and map. A certain amount of proposed placements isthen retained and scored according to a fine-grained scoringfunction based on trilinear in-terpolation. The resulting placements can be clustered given a user defined rmsd threshold.
3 Results
A first test was performed by docking monomers taken from the molecular complex GroELdeposited in the PDB with accession code 1OEL to map 1081 taken from the EM-Searchdatabase4. The rmsd between the calculated and the correct position was 1.7A and thecomputing time was less than four minutes.
Further tests were conducted on simulated maps using various structures. The result ofdocking structures to urate oxidase (2FUB) is shown in Figure 2. Within ten minutes run-time placements with 3.4A rmsd to the original placement were found. Another example
122

Human c-reactive protein (1B09) Urate oxidase (2FUB)
Figure 2. Solution structures
is docking monomers to a map generated from human c-reactiveprotein (1B09). Here armsd of 2.3A was achieved in a runtime below one minute. The resulting placements forthe latter two examples can be found in Figure 2.
4 Perspectives
Besides the success in several cases, the algorithm fails ina few docking scenarios. Thisis the case, if the molecular mass of the structure to be docked makes up only a verysmall fraction of the overall mass. Further improvements tothe scoring function will helptackling these cases. Although not yet fully developed, first applications of this approachsuggest that the algorithm is going to be highly efficient andeffective.
References
1. J. Frank,Three-Dimensional Electron Microscopy of MacromolecularAssemblies(Oxford University Press, New York, 2006).
2. M. G. Rossmann, Marc C. Morais, Petr G. Leiman, and Wei Zhang,Combining X-rayCrystallography and Electron Microscopy, Structure13, 355–362, 2005.
3. S. Linnainmaa, D. Harwood, L. S. Davis,Pose determination of a three-dimensionalobject using triangle pairs, IEEE trans. pattern anal. mach. intell.10, 634–647, 1988.
4. A database for EM, Nat Struct Biol10, 313, 2003.
123


Verification of Protein-Protein Interactions by Use ofDocking Techniques
Florian Fink 1, Rainer Merkl 2, and Wolfram Gronwald 1
1 Institute of Functional Genomics,University of Regensburg, Josef-Engert-Strasse 9,
93053 Regensburg, GermanyE-mail: [email protected],[email protected]
2 Institute for Biophysics and Physical Biochemistry,Postfach, 93040 Regensburg, Germany
E-mail: [email protected]
For the understanding of large macromolecular complexes such as ribosomes the analysis ofprotein-protein interactions is essential. These intermolecular interactions are strongly depen-dent on the three-dimensional structures of the corresponding molecules. In case that the struc-tures are known they can be directly used while in many other cases homology modeling tech-niques can be applied. We have developed a novel algorithm for this purpose that allows thecombination with additional experimental data to further improve the structural models. Cur-rently we are developing tools based on a data driven dockingapproach and the 3D structuresof the individual molecules to investigate whether proposed intermolecular interactions can beverified or falsified. In this contribution we will show first results to demonstrate the principalapplicability of our approach.
1 Introduction
Most of the various functions in a cell are mediated by large protein-protein interactionnetworks. For a detailed understanding of these interactions knowledge of the correspond-ing three-dimensional complex structures is required. However, a significant amount ofthese complex structures will be extremely difficult to study by conventional experimen-tal structure determination methods. One avenue to circumvent this problem is to use thestructures of the individual molecules in combination withcomputational docking tech-niques. It has been shown that reliable results can be obtained when data driven dockingtechniques are applied1 and only moderate structural changes occur during complex for-mation. As mentioned above three-dimensional structures of the individual molecules arerequired for the application of docking techniques. If these structures are already availablethey can be directly used. In many other cases the use of homology models is applicable.We have developed for this purpose the homology modeling program PERMOL2 that isbased on restrained molecular dynamics in torsion angle space. For the case that sufficientexperimental data is available to obtain low resolution structures of the single molecules wedeveloped the ISIC3 algorithm to improve the structural quality by combining informationfrom different sources. The key question here is how to combine the available informationensuring that no wrong structural bias is introduced.
Next the 3D-structures of the single molecules are used forin silico complex forma-tion. In this contribution we focus on the question if data driven docking techniques provide
125

Figure 1. Example on the use of docking to query proposed intermolecular interactions. Molecules B, C and Dare forced to interact with the target molecule A for which the interface (shown in yellow) is known.
Interaction A-B Interaction A-C Interaction A-DEinter -2512,2 kJ/mol Einter -1991,4 kJ/mol Einter -1695,6 kJ/mol
Table 1. Average interactions energies for three differenttrial molecules (B, C, and D) docked to the cytoplas-matic A domain (IIA(MTL)) of the mannitol transporter II (A). (B) histidine containing phospocarrier protein(HPr), (C) human cyclin dependent kinase subunit type I (CKSHS1), and (D) apo form of HMA domain ofcopper chaperone for superoxide dismutase.
additional information to query proposed binary protein-protein interactions. More specif-ically we assume that the binding-interface of one moleculeis known and it is investigatedwhich of several proposed partner molecules is the correct interaction partner.
2 Motivation
Over the last few years several high-throughput protein-protein interaction detectionmethods have been developed. However, as shown in the paper by von Mering et al4
the proposed interactions of these methods usually containmany false positives. Andalthough substantially improvements can be obtained by combing several methods itis clear that additional work is required to reduce the amount of false positives. Sinceintermolecular interactions are strongly dependent on thethree-dimensional structures ofthe corresponding molecules, docking techniques should provide additional informationin this regard.
3 Materials and Methods
To query proposed protein-protein interactions differenttrial molecules are forced to bindto the known interface of one target molecule. For this purpose the data-driven dockingalgorithm HADDOCK1 that is based on the use of ambiguous interaction restraintsis used.The known interface information of the target protein is provided as restraint informationto the docking algorithm. This information can be obtained for example from NMRchemical shift perturbation data, mutagenesis data etc. For the proposed trial molecules
126

we assume that nothing is known about their interface and thecomplete surface of thesemolecules is defined as potential binding interface. Separate docking runs are performedfor each of the trial molecules. Results are ordered based onthe obtained interactionenergies. Interaction energies are calculated based on theintermolecular van der Waalsand electrostatic interface energies.
4 Results and Discussion
For testing, two molecules A and B that are known to interact are selected in the exam-ple shown in Fig. 1. Then in addition two molecules C and D, randomly selected fromthe PDB database are used, to perform docking runs with molecule A. For the target thebinding interface shown in yellow in Fig. 1 is assumed to be known while for moleculesB, C, and D the whole molecule is defined as possible interaction site. Results for thisexample demonstrate that the lowest interaction energies shown in Tab. 1 are obtained forthe correctly interacting pair A-B while considerably higher energies are obtained for thenon-interacting pairs A-C and A-D allowing to correctly discriminate between interactingand non-interacting proteins. These tests were repeated for several different test cases toinvestigate the general applicability of the method, wherethe so far obtained data showsimilar results (data not shown).
Therefore, in summary one can say that docking techniques can provide useful addi-tional information to interrogate proposed protein-protein interactions.
Acknowledgments
The authors thank the bavarian genomic network for financialsupport.
References
1. C. Dominguez, R. Boelens and A. M. J. J. Bonvin,HADDOCK: A Protein-ProteinDocking Approach Based on Biochemical or Biophysical Information, J. Am. Chem.Soc.125, 1731–1737, 2003.
2. A. Moglich, D. Weinfurtner, T. Maurer, W. Gronwald and H.R. Kalbitzer,A RestraintMolecular Dynamics and Simulated Annealing Approach for Protein Homology Mod-eling Utilizing Mean angles, BMC-Bioinformatics6, 91, 2005.
3. K. Brunner, W. Gronwald, J. M. Trenner, K.-P. Neidig and H.R. Kalbitzer,A generalMethod for the Unbiased Improvement of Solution NMR Structures By the Use ofRelated X-Ray Data, the AUREMOL-ISIC Algorithm, BMC Struc.Biol.6, 14, 2006.
4. C. von Mering, R. Krause, B. Snel, M. Cornell, S. G. Oliver,S. Fields and P. Bork,Comparative Assessment of Large-Scale Data Sets of Protein-Protein Interactions,Nature417, 399–403, 2002.
127


Boundary Element Method (BEM) with ParametricSurfaces
Sergei Grudinin1,2 and Artur Baumgaertner 1
1 Institute of Solid State Research (IFF),Research Centre Julich, 52425 Julich, Germany
E-mail: S.Grudinin, [email protected]
2 Institute of Neurosciences and Biophysics (INB-2),Research Centre Julich, 52425 Julich, Germany
This work describes a new Boundary Element Method (BEM) implementation for biomolecu-lar solvation with parametric surfaces. First, multi-scale volumetric synthetic electron densitymaps are constructed from parsed atomic location data of biomolecules using Gaussian isotropickernels. Next, three different methods are used to extract triangular meshes for the molecularsurface. They are: marching cubes, marching tetrahedra andmarching tetrahedra with dualcontouring. Then generated meshes are used in BEM electrostatic calculations. In this workwe study: 1) calculation time and accuracy for multipole anddirect electrostatic solvers; 2)energy convergence and calculation time with the density ofboundary points different meshingalgorithms; 3) energy convergence for different iterativelinear solvers.
1 Introduction
Electrostatic interactions are known to play a key role in determining the structure andactivity of biomolecules. Interactions with solvent are very important for biomolecularfunctioning. Here we present a new method for the implicit representation of solvent alongwith algorithms for calculation of electrostatic interactions.
2 Molecular Surface Representation
For our model we have chosen an implicit surface representation. The 3-dimensional scalarfunctionD(~r) (Eq. 1), which is a sum of Gaussians centered at atomic nuclei, is similar tothe electron density function. Then the isosurfaceD = 0 represents a molecular solvent-accessible surface withRi parameters equal to WdV radii of corresponding atoms andai
parameters responsible for surface smoothing1, 2.
D =∑
i
exp−ai(
|~r−~ri|
Ri−1)2 (1)
The Gauss mapS of such a function is given in Eq. 2 and GaussianK and meanHcurvatures6 can be calculated as shown in Eq. 3.
S =1
‖∇D‖3
dxx(d2y + d2
z) −dxdydyy −dxdzdzz
−dydxdxx dyy(d2x + d2
z) −dydzdzz
−dzdxdxx −dzdydyy dzz(d2x + d2
y)
(2)
K = det(S)H = 1/2 Tr(S)
(3)
129
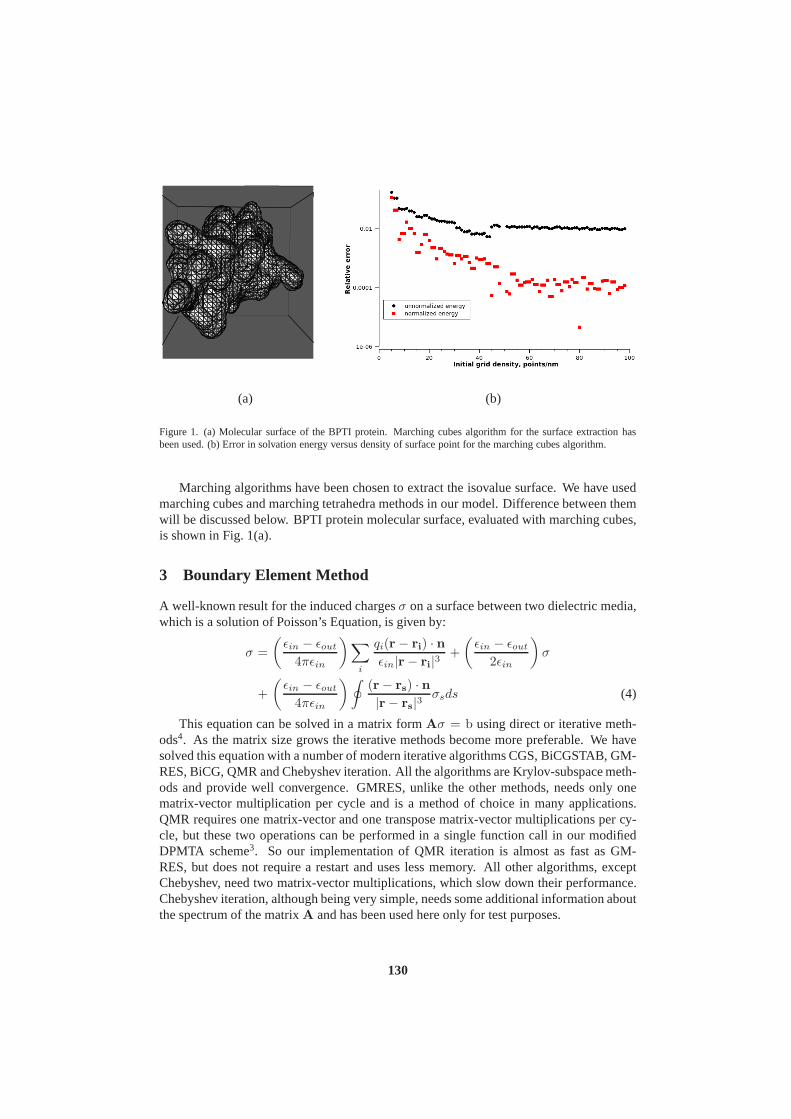
(a) (b)
Figure 1. (a) Molecular surface of the BPTI protein. Marching cubes algorithm for the surface extraction hasbeen used. (b) Error in solvation energy versus density of surface point for the marching cubes algorithm.
Marching algorithms have been chosen to extract the isovalue surface. We have usedmarching cubes and marching tetrahedra methods in our model. Difference between themwill be discussed below. BPTI protein molecular surface, evaluated with marching cubes,is shown in Fig. 1(a).
3 Boundary Element Method
A well-known result for the induced chargesσ on a surface between two dielectric media,which is a solution of Poisson’s Equation, is given by:
σ =
(
ǫin − ǫout
4πǫin
)
∑
i
qi(r − ri) · nǫin|r − ri|3
+
(
ǫin − ǫout
2ǫin
)
σ
+
(
ǫin − ǫout
4πǫin
)∮
(r − rs) · n|r − rs|3
σsds (4)
This equation can be solved in a matrix formAσ = b using direct or iterative meth-ods4. As the matrix size grows the iterative methods become more preferable. We havesolved this equation with a number of modern iterative algorithms CGS, BiCGSTAB, GM-RES, BiCG, QMR and Chebyshev iteration. All the algorithms are Krylov-subspace meth-ods and provide well convergence. GMRES, unlike the other methods, needs only onematrix-vector multiplication per cycle and is a method of choice in many applications.QMR requires one matrix-vector and one transpose matrix-vector multiplications per cy-cle, but these two operations can be performed in a single function call in our modifiedDPMTA scheme3. So our implementation of QMR iteration is almost as fast as GM-RES, but does not require a restart and uses less memory. All other algorithms, exceptChebyshev, need two matrix-vector multiplications, whichslow down their performance.Chebyshev iteration, although being very simple, needs some additional information aboutthe spectrum of the matrixA and has been used here only for test purposes.
130

Since BiCG and QMR methods require a matrix transpose, we have extended DPMTAalgorithm3 to calculate the transpose of matrixA. The multipole expansionMT
n,m has avector form and contains three new components:
~MTn,m(~r) =
k∑
i=1
qisi~niF∗n,m(~ri) (5)
Forces then calculated as:
qi∇ΦT (~r) = Tr
[
qi
∞∑
n=0
n∑
m=−n
~MTn,m∇Gn,m(~r)
]
(6)
Once the polarization chargesσ are calculated, the solvation energy is evaluated as:
U =1
ǫin
∑
i
qi|r − ri|
+∑
k
σk
|r − rk|(7)
Finally the surface charges can be normalized according to Gauss’s law:∑
k
σksk =(ǫin − ǫout)
(ǫin ∗ ǫout)
∑
i
qi (8)
4 Code
The presented algorithm was written as a C/C++ extension to MMTK molecular modellingtoolkit5.
5 Numerical Tests
As a first example we have calculated solvation energies for aspherical cavity and com-pared them with analytical results given by Born equation. Results for this comparison aregiven in Fig. 1(b). Starting at point density5 points/nm the normalized energy error isbelow 1%.
Comparison for different iterative algorithms for the BPTIprotein with 2500 surfaceelements is given in Tab. 1. GMRES and QMR methods perform thebest, while Chebyshevdid not converge due to a poor matrixA eigenvalue estimation.
CGS BiCGSTAB GMRES BiCG QMR Chebysteps 24 23 30 36 37 -
Table 1. Convergence of iterative methods for the BPTI protein with point density 5 points/nm. Tolerance = 1e-6,2500 surface elements, no preconditioner was used.
Numerical results for marching cubes, marching tetrahedraand marching tetrahedradual contouring are given in Fig.2(a). All the methods show similar energy errors. March-ing cubes provide a better mesh spacing and triangular quality, while marching tetrahedra
131

Relative error in solvation
energy, KJ/4πε
-0.1
-0.05
0
0.05
0.1
0.15
0.2
Initial grid density, points/nm5 10 15 20 25 30
marching cubes
marching cubes normalized
marching tetrahedra
marching tetrahedra normalized
marching tetrahedra dual contouring
marching tetrahedra dual contouring normalized
Solvation energy, kJ/4πε
-7.2
-7.1
-7
-6.9
-6.8
-6.7
-6.6
Initial grid density, points/nm5 10 15 20 25
marching cubes
marching cubes normalized
(a) (b)
Figure 2. (a) Three different marching schemes for a spherical cavity are compared. (b) Solvation energy for theBPTI protein at different grid point densities.
algorithm is simpler to implement. Convergence of the marching cubes scheme for theBPTI solvation energy is shown in Fig. 2(b).
6 Concluding Remarks
In the current work we have shown how to use a parametric solvation model together withBEM Poisson’s solver. Three different marching schemes have been implemented andtested. We have also extended the DPMTA multipole algorithm3 to deal with transposematrices, which allowed us to use new iterative schemes4. The method has been codedas an extension to the MMTK molecular modeling toolkit5 and will be soon available fordownload.
Acknowledgments
S.G. is thankful to Prof. Gerhard Gompper for the support in his postdoctoral studies.
References
1. The interpretation of protein structures: estimation ofstatic accessibility. B Lee, FMRichards, J. Mol. Biol.55, 379-400, 1971.
2. Quality Meshing of Implicit Solvation Models of Biomolecular Structures. Y Zhang,G Xu and C Bajaj, Computer Aided Geometric Design23, 510-530, 2006.
3. DPMTA - A Distributed Implementation of the Parallel Multipole Tree Algorithm -Version 3.0. William T. Rankinhttp://www.ee.duke.edu/Research/SciComp/Docs/Dpmta.
4. A Historical Overview of Iterative Methods, D. M. Young, Comp. Phys. Comm.53,1-17, 1989.
5. The molecular modeling toolkit: A new approach to molecular simulations. K. Hin-sen, J. Comp. Chem21(2), 79-85, 2000.
6. Modern Differential Geometry of Curves and Surfaces withMathematica, A. Gray,2nd ed. Boca Raton, FL: CRC Press, 1997.
132

Parameterization of the Potential Energy Surface of theDouble Proton Transfer in Porphyrins
Marta Hallay-Suszek1,3, Pawel Grochowski2,3, and Bogdan Lesyng1,3
1 Department of Biophysics, Institute of Experimental Physics, Warsaw University,Zwirki i Wigury 93, 02-089 Warsaw, Poland
E-mail: [email protected]
2 Interdisciplinary Centre for Mathematical and Computational Modelling, Warsaw University,Pawinskiego 5A, 02-106 Warsaw, Poland
3 CoE BioExploratorium, University of Warsaw, Zwirki i Wigury 93, 02-089 Warsaw, Poland
We present a fast and precise generator of the potential energy surface (PES) for the doubleproton transfer occuring in free-base porphyrin. We propose novel analytical formulae of thePES along with their parameterizations to describe correlated motions of the protons.
1 Introduction
Double proton transfer processes (DPTPs) are commonly observed, from small systemsto large ones, including proteins. For a better understanding of DPTPs and coupled, cor-related atomic motions, we plan to use quantum-classical molecular dynamics (QCMD)simulations. The main problem in the QCMD simulations is thelack of reliable and fastPES generators for the atomic motions. Based on effective quantum-classical models1, 2
and their numerical implementations, we decided to construct PES for model molecularsystems with DPTPs. Drawing experience from our previous research on DPTP in formicacid dimer (a system with two hydrogen bonds), we focused ourresearch on larger andexperimentally well-studied molecules with the intramolecular proton transfer: porphyrinand porphycene. Free-base porphyrin and porphycene are built of four pyrrole rings con-nected by carbon bridges and have two hydrogen atoms (protons) in the inner part of theskeleton. The two inner protons migrate in the molecular scaffold containing four nitro-gen atoms. The double proton transfer could - in principle - proceed either along a syn-chronous pathway orvia a two-step mechanism involving a metastablecis intermediate.All the stationary states presented in Fig. 1. were optimized usingGAUSSIAN 033 with
N
N
N
N
H H
trans
N
N
N
N
H
H
cis
N
N
N
N
H
H
SS
N
N
N
N
H
H
TS
Figure 1. The stationary structural states of the porphyrinmolecule obtained with the DFT/B3LYP method.
the spin-restricted B3LYP density functional method (DFT)and the 6-31G(d,p) basis set.
133

The obtained energy values are presented in Tab. 1, they are in good agreement with theB3LYP/TZ2P values given by Bakeret al.4.
structure energy (V G) energy4 structure energy (V G) energy4
trans (D2h) 0.0 0.0 cis (C2v) 34.3 34.8TS (Cs) 64.0 67.8 SS (D2h) 94.2 102.2
Table 1. Relative energies for the stationary states of the porphyrin PES (energies are given in [kJ/mol], thetransporphyrin is taken as the reference state).
2 Potential Energy Functions
Our aim is to construct a PES generator for the motions of the two inner protons and vibra-tions of the molecular skeleton, occurring in the ground Born-Oppenheimer state. Such agenerator can be parametrized based on theab initio or DFT calculations for the energiesand the geometries of the stationary states (including the minima and the saddle points ofthe PES), and the corresponding Hessians, as well as on the PES scans for proton motionsinside the molecular scaffold. Several models are considered; in one of them, the PES forthe protons and for the skeleton is obtained with the Approximate Valence Bond (AVB)method1 as the lowest eigenstate of the AVB Hamiltonian; in two otherapproaches, thePES for the molecular skeleton is described by a classical force field or by an averageharmonic potential, and a more rigorous analytical representation of the PES for the pro-ton motions is used, allowing for better approximation of the energy scans obtained withGAUSSIAN 03.
3 Mechanical PES Model
The following analytical formulae are used to describe the PES for the inner protons:
VM :=∑
H
(
∑
N
VNH +∑
C
VCH +∑
pairsNC
VHNC +∑
pairsN
VNHN
)
+ VHH +∑
N
VHNH + Vconst(Rskeleton),
where the first sum runs over the two protons and includes the following terms for eachproton:
• two-body interactions with C and N atoms described by the Morse function for thebond length, CH and NH,
VCH := PL1(exp(−PN1rCH) + PN2 exp(−2PN1rCH)),
VNH := PL2(exp(−PN3rNH) + PN4 exp(−2PN3rNH)),
134

• three-body interactions with N and C atoms, ensuring properangles between the NCand NH bonds,
VHNC := PL3 exp(−PN5r2NH)
( ~rNC · ~rNH
|~rNC ||~rNH | + PN6
)2
,
• three-body interactions with pairs of N atoms (computed foreach pair),
VNHN := PL4 exp(−PN7rN1H) exp(−PN7rN2H).
The other terms are:
• a repulsive HH interaction,
VHH :=PL5 + PL6 exp(−PN8r
2HH)
rHH,
• a three-body interaction between the two protons and a nitrogen atom (computed foreach nitrogen),
VHNH := PL7 exp(−PN9rNH1) exp(−PN9rNH2).
3.1 Fitting the Parameters
The mechanical PES model contains a set of parameters:PLi7i=1,PNi9
i=1, which haveto be optimized in order to fit the model to the DFT results. Theoptimization is based onminimization of the root mean square deviation (RMSD) function:
RMSD :=
√
√
√
√
√
∑
geom
(
∑
map I(V G)(VM − V G)2)
∑
geom
(
∑
map I(V G)) ,
where
I =
1 if V G ≤ V S
exp(−V G/V S) if V G > V S ,
andmap represents the set of positions of the protons, used to scan the PES at a fixedgeometry of the skeleton,geom represents the set of all the geometries of the skele-ton (minima and transition states) for which the scans have been performed,V S is anenergy cutoff (e.g.V S=100 kJ/mol for porphyrin). It should be emphasized that optimiza-tion is carried out simultaneously for all geometries that represent stationary states of themolecule.
4 Results
The mechanical PES model was fitted to the DFT calculations with a satisfactory accuracy.In the most important, low energy regions, up to 100 kJ/mol, the discrepancy between themodel and the DFT results does not exceed 8 kJ/mol. In order tovisualize the results ofthe parameterization, the protonic scans for the porphyrinmolecule in thetransminimumstate are presented in Fig 2. From the left to the right are shown: the reference PESscans obtained withGAUSSIAN 03 by moving the right inner proton in the plane of the
135

-100 0 10 20 40 80 100 150 200 250 300 400 500 800 1000
-1.8 -1.2 -0.6 0.0 0.6 1.2 1.8-1.8
-1.2
-0.6
0.0
0.6
1.2
1.8
-30 -20 -10 -8 -6 -4 -2 0 2 4 6 8 10 20 30
-0.7 -0.3 0.1 0.5 0.9 1.3 1.7-1.2
-0.8
-0.4
0.0
0.4
0.8
1.2
-30 -20 -10 -8 -6 -4 -2 0 2 4 6 8 10 20 30
0.9 1.0 1.1 1.1 1.2 1.3-0.4
-0.2
-0.1
0.1
0.2
0.4
Figure 2. Anab initio scan of the PES (left), and the differential energy maps (middle and right) - for details, seethe text.
molecule(x, y) in the region(x, y) ∈ (−1.8; 1.8), while all other atoms were fixed inspace; the differences between the protonic scans obtainedwith GAUSSIAN 03and withthe analytical model in the region limited tox ∈ (−0.7; 1.7), y ∈ (−1.2; 1.2); and theright one tox ∈ (0.9; 1.3), y ∈ (−0.4; 0.4). Note that the (x,y) coordinates of the nitrogenatoms are: (0.00;2.03), (0.00;-2.03), (2.12;0.00), (-2.12;0.00). The NH bond lengths inthe local minima, the transition state and the saddle point of GAUSSIAN 03as well as theparametrized PES (VM ) are summarized in Tab. 2. In the case of the transition states, thedistances between the proton and the two closest nitrogen atoms are given.
structure R1 RG1 R2 RG
2
trans (D2h) 1.0074 1.0145 1.0074 1.0145cis (C2v) 1.0204 1.0277 1.0204 1.0277TS (Cs) 1.0225 1.0273 1.9020 ,1.2982 1.8772, 1.2833SS (D2h) 1.2927 ,1.2927 1.2943,1.2943 1.2927 ,1.2927 1.2943, 1.2943
Table 2. NH bond lengths (given inA) of the stationary states in porphyrin.
Acknowledgments
These studies were partially supported by BST funds and CoE BioExploratorium, Univer-sity of Warsaw.
References
1. P. Bala, P. Grochowski, K. Nowinski, B. Lesyng and J. McCammon, Quantum-Dynamical Picture of a Multi-Step Enzymatic Process Reaction Catalyzed by Phos-pholipase A2, Biophys. J.79, 1253–1262, 2000.
2. P. Grochowski and B. Lesyng,Extended Hellmann-Feynman Forces, Canonical Rep-resentations, and Exponential Propagators in the Mixed Quantum-Classical Molecu-lar Dynamics, J. Chem. Phys.119, 11541–11555, 2003.
3. M. J. Frischet al. GAUSSIAN 03, Gaussian, Inc., Wallingford, CT, 2004.4. J. Baker, P. M. Kozlowski, A. A. Jarzecki and P. Pulay,The inner hydrogen migration
in free base porphyrin, Theor. Chem. Acc.97, 59–66, 1997.
136

A Statistical Approach to Deriving and Analyzing aPropensity Scale for Predicting Exposed Transmembrane
Beta Barrel Residues from Protein Sequence
Sikander Hayat, Yungki Park, and Volkhard Helms
Center for Bioinformatics, Saarland University, 66041 Saarbrucken, GermanyE-mail: s.hayat, [email protected]
In the current study, we implement an algorithm to analytically derive a novel propensity scalefor the Transmembrane Beta barrel (TMB) residues to be exposed to the lipid bilayer. Sinceit is very difficult to experimentally determine their 3D structures and given the fact that theyperform several important functions in the cell proteome ofboth gram-negative bacteria andeukaryotes, it is imperative to developin silico methods for the modeling of their 3D structure.The algorithm previously described by us for TransmembraneAlpha helical proteins takes intoaccount the evolutionary conservation and frequency profile to derive a positional score for agiven Transmembrane residue. The scale, based on ridge regression, is derived such that thepositional score for a given residue is maximally correlated with its relative solvent-accessiblesurface area (rSASA) value. A leave-one-out test with knownstructures demonstrates thecorrelation coefficient between the observed and predictedrSASA values to be around 0.52.Analysis of scales derived for both the interface and the hydrophobic core of the TMBsprovides interesting insights into structural aspects of TMB residues.
Keywords: ridge regression, TM Beta Barrel proteins, frequency profile, propensity scale
1 Introduction
TMBs, composed of antiparallel Transmembrane beta strandsand connected by solubleloop regions are inserted into the outer membrane (OM) of gram-negative bacteria, mi-tochondria and chloroplasts, where they perform a variety of functions, including passivetransport of ions and small hydrophilic molecules, membrane anchoring and a role in bac-terial pathogenicity1–4. The lipid-facing surfaces of the barrels are composed of hydropho-bic residues and the residues facing the interior of the barrel are mostly polar residues5 tofacilitate transfer of small solute molecules. Accurate structure prediction of TMBs stillremains a challenge, as Transmembrane protein structure can not be easily studied usingX-ray crystallographic and NMR methods. As of now, no propensity scale exists that canaccount for the propensities of TMB residues to be exposed tothe lipid bilayer. In thisstudy, we implement an algorithm previously established byus7 for deriving a propensityscale for Transmembrane Alpha helical residues to formulate two propensity scales for theBeta barrel residues to be exposed to the lipid bilayer at thehydrophobic core and at theinterface region, respectively. Briefly, the algorithm tries to maximize the correlation co-efficient between the observed and the predicted rSASA values for a given residue. TherSASA value of a residue describes the extent to which that particular residue is exposedto the lipid bilayer. Previously, it has been observed that polar residues tend to be buriedinside and hence are less exposed to the bilayer in the hydrophobic core region5. The sameis not true for residues at the interfaces, where the distinction between the exposure pat-terns is influenced by the changing nature of the lipid environment. It is also known that
137

the more conserved a residue is, the more it is structurally and/or functionally importantfor the protein. Consequently, the frequency profile of the 20 naturally occurring aminoacids and their positional conservation Index is used as theinput vector.
2 Materials and Methods
A non redundant data set of known TMB structures was compiledprimarily based on thelist provided by Tusnadyet al.6. The final dataset comprises of 25 protein chains with 2305and 1195 TM residues in the hydrophobic core and interface region, respectively. The hy-drophobic region was derived from the OPM database10. The classification of each residueas being buried or exposed to the lipid bilayer was based on its rSASA value. As previ-ously described by us7, the SASA values were calculated with the VOLBL program suiteemploying a probe radius of 2.2A. To prevent the residues lining the internal cavity of theprotein from being classified as exposed, capping with dummyresidues was performed forboth the interfaces and the hydrophobic core. SASA values were normalized to generaterSASA values by considering the SASA values for each amino acid X in the context ofthe tri-peptide G-X-G. The positional frequency for a givenresidue was calculated usingAL2CO program suite. The complexity parameter for ridge regression was found by em-ploying 10 fold cross validation. Calculations performed using R yielded 0.691 and 0.301as complexity parameters for hydrophobic and interface regions, respectively.
3 Results and Discussion
3.1 Implementation of an Optimum Propensity Scale for TMBs
PHE MET TRP ILE VAL LEU ALA PRO ASP GLUHMOB 0.086 -0.086 0.030 0.023 0.077 0.246 0.056 0.068 -0.062 -0.055IMOB 0.096 -0.040 0.094 0.044 0.019 0.100 -0.017 0.030 -0.057 -0.059MO -0.010 -0.230 -0.030 0.050 0.020 0.020 -0.090 -0.100 -0.270 -0.200
CYS ASN GLN THR TYR SER GLY HIS ARG LYSHMOB 0.047 -0.061 -0.060 -0.035 -0.020 -0.075 -0.026 -0.026 -0.062 -0.063IMOB -0.050 -0.043 -0.031 -0.006 0.078 -0.063 -0.038 0.020 -0.038 -0.041MO -0.160 -0.230 -0.220 -0.180 -0.150 -0.190 -0.180 -0.240 -0.210 -0.100
Table 1. The propensity scales for transmembrane Beta-Barrel proteins. HMOB = Hydrophobic MO Beta, IMOB= Interface MO Beta, MO = MO scale for transmembrane alpha helical proteins. The standard deviation ofindividual propensity values with leave-one-out test was found to be less than 0.008 in all cases.
As can be seen in Table 1, the propensity values for TMB residues to be exposed to thebilayer are smaller in magnitude than their counterparts inTransmembrane Alpha helices.This could be due to the less hydrophobic exterior of TMBs, which is necessary for theirtranslocation via the inner membrane8. The affinity for hydrophobic residues to be exposedto the hydrophobic environment of the lipid bilayer is in concert with the experimentalresults4.
138

0.00a (0.44)b 0.01 (0.37) 0.02 (0.35) 0.03 (0.34) 0.04 (0.33) 0.05 (0.33)HMOB CC(0.51) 67.2 73.1 75.0 75.8 76.0 77.4
+CI CC(0.52) 69.9 76.3 78.3 78.7 79.1 79.70.00a (0.49)b 0.01 (0.45) 0.02 (0.44) 0.03 (0.42) 0.04 (0.41) 0.05 (0.39)
IMOB CC(0.48) 76.6 76.6 76.0 76.6 77.0 77.1+CI CC(0.49) 77.2 78.3 77.7 78.0 78.8 78.7
Table 2. Performance comparison of the derived scales at different rSASA values in the hydrophobic core region.Entries reflect the accuracy of prediction, which improves with the inclusion of conservation index as an inputparameter. a = Threshold rSASA, b = fraction of exposed residues, CC =Absolute magnitude of Correlation co-efficient between the observed rSASA and the computed positional score, ACC = Accuracy of correct predictionin percentage, CI = Conservation index.
3.2 Performance Comparison of Propensity Scales
A leave one out test was conducted to measure the performanceof the propensity scales.The performance of the particular scale was assessed by analyzing the correlation betweenpositional score and the observed rSASA values and by the corresponding prediction ac-curacy. A support vector machine in R was used to implement the test. As depicted inTable 2, the choice of the cutoff value for the rSASA value is amajor factor when it comesto predicting the burial status. In the current study, this cutoff was objectively chosenbased on the SVM. The table also shows that inclusion of conservation indices as an inputparameter enhances the performance of the derived scales. The overall weak correlationbetween the observed rSASA and the computed positional score suggests that the lipidprotein interaction might not be the only factor involved inprotein insertion and foldingmechanism8.
3.3 Comparative Analysis and Correlation with Other Scales
Scale (Reference) HMOB IMOBHydrophobicity KD (Kyte et al., 1982) 0.68 0.46
EIS (Eisenberget al., 1984) 0.63 0.61GES (Engelmanet al., 1986) 0.54 0.51WW (Wimbley et al., 1996) 0.56 -Hessa (Hessaet al., 2005) -0.58 -0.52
Size Bulkiness (Zimmermanet al., 1968) 0.53 0.74Packing Partial specific volume (Cohnet al., 1943) 0.60 0.59Others KPROT (Pilpelet al., 1999) 0.61 0.30
Table 3. Correlational analysis with other scales. The propensity scales derived here shows weak correlation withother scales.
As shown in Table 3, one method to discover the other factors involved in TMB fold-ing could be to find other scales that strongly correlate withthe scales derived here. Asexpected, the hydrophobicity scales show a weak correlation with the propensity scalesderived here, which can be atributed to the less hydrophobicexterior of TMBs.
139

4 Conclusion
The current study successfully implements the MO algorithmfor Transmembrane Betabarrel proteins. The propensity scales for both the hydrophobic core and the interfaceregion are presented. The derived scales confirm the less hydrophobic exterior of the TMBsand are weakly correlated with hydrophobicity scales. A further analysis of the scale interms of principal components, distance of the residue fromthe lipid bilayer core andmore advanced statistical methods need to be employed to fully understand the insertionand the folding mechanism of the TMBs in an analytical way. Development of a reliablepredictor for the burial status of TMBs can be used to impose additional constraints onstarting template models while performingab initio structure prediction9. Further analysisof TMB residue propensities might provide important insights into the evolution of themitochondrial OM and the development of its protein biogenesis system8.
References
1. R. Koebnik, K. P. Locher, and Van Gelder P.,Structure and function of bacterial outermembrane proteins: barrels in a nutshell, Mol. Microbiol. 60, 1-4, 2000.
2. G. E. Schulz,Porins: general to specific, native to engineered passive pores,Curr. Opin. Struct. Biol. Mol.6, 485-490, 1996.
3. A. Pautsch, and G. E. Schulz,Structure of the outer membrane protein A transmem-brane domain, Nat. Struct. Biol.5, 1013-1017, 1998.
4. G. E. Schulz,The structure of bacterial outer membrane proteins, Biochim. Bio-phys. Acta.1565, 308-317, 2002.
5. L. K. Tamm, H. Hong, and B. Liang,Folding and assemble of beta barrel membraneproteins, Biochim. Biophys. Acta.1666, 250-263, 2004.
6. http://pdbtm.enzim.hu/ G. E. Tusnady, Z. Dosztanyi, and I. Simon,Trans-membrane proteins in the Protein Data Bank: identification and classification, Bioinf.20, 2964-2972, 2004.
7. Y. Park, and V. Helms,On the Derivation of Propensity Scales for Predicting ExposedTransmembrane Residues of Helical Membrane Proteins, Bioinf. 23, 701-708, 2007.
8. N. Pfanner, N. Wiedemann, C. Meisinger, and T. Lithgow,Assembling the mitochon-drial outer membrane, Nat. Struct. and Mol. Biol.11, 1044-1048, 2004.
9. L. Adamian, and J. Liang,Prediction of transmembrane helix orientation in polytopicmembrane proteins, BMC Struct. Biol.6, 2006.
10. M. A. Lomize, A. L. Lomize, I. D. Pogozheva, and H. I. Mosberg,OPM: Orientationsof Proteins in Membranes database, Bioinf. 22, 623-625, 2006.
140

Simulation of Small Peptide Using CombinedWang-Landau-Transition Matrix Monte Carlo Algorithm
Sh. Hayryan1, R. Ghulghazaryan1,2, N. Poklar Ulrih 3,V. Curin Serbec4, and Chin-Kun Hu 5
1 Institute of Physics, Academia Sinica,Nankang 11529, Taipei, Taiwan
E-mail: shura, [email protected]
2 Yerevan Physics Institute, Alikhanian Brothers 2, 375036 Yerevan, ArmeniaE-mail: [email protected]
3 Department of Food Science and Technology, Biotechnical Faculty,University of Ljubljana, Jamnikarjeva 101, 1000 Ljubljana, Slovenia
4 Blood Transfusion Center of Slovenia,Slajmerjeva 6, School of Medicine, 1000 Ljubljana, Slovenia
5 Department of Physics, Chung-Yuan Christian University,Chungli 320, Taiwan
We applied our recently suggested modification of the Wang-Landau algorithm to study thefolding thermodynamics of13-residue peptide P1 from C-terminalα-helix part of the humanPrion Protein (PrP). Temperature dependencies of the average energy, the specific heat, therelative free energy and entropy have been evaluated for thesingle peptide in gas phase as wellas in the implicit water environment. Simulations of singlemolecule show that this peptide is agood folder and folds into a fully helical conformation. This is consistent with the conformationof this part in the native structure of the mother protein. However, CD spectrum of the watersolution of P1 peptide shows only very small amount ofα-helix. This may indicate that inwater solution the peptide forms aggregates. We used the simulated annealing algorithm todetermine the ground state of the system of two peptides. Theresults show that the ground stateconformation indeed contains a small amount ofα-helix.
1 Introduction
The Monte Carlo method has been an effective tool in protein simulations for a long time.Due to the very complicated energy landscape of the proteinswith high potential barriers,the conventional Metropolis algorithm does not allow to sample the energy space more orless uniformly, especially in simulations with all-atom potentials. The situation has im-proved dramatically when several non-conventional (so called generalized-ensemble) al-gorithms have been introduced1–4. However, even the improved algorithms do not meet allchallenges in protein simulations, and there is a constant quest for new, more sophisticatedand efficient algorithms. Recently we have suggested a new approach which is based onthe combination of the Wang-Landau and Transition Matrix Monte Carlo methods5. It iswell known that the Wang-Landau algorithm allows to easily jump over the energy barriersat the initial stage of simulation and to sample all energy levels uniformly. Nonetheless,at the later stages the statistical errors do not decrease with increasing samples. This isconsidered as a drawback of the algorithm. At the same time, the transition matrix method
141

gives a good estimate of the density of states with small statistical errors but it requires aproper initial guess for the density of states which is usually not available. In our algo-rithm we use the advantages of the two methods within a combined approach whereby thealgorithm behaves like the Wang-Landau method in initial stages and uses the transitionmatrix method to reduce the statistical errors at the later stage. Here we apply our algo-rithm to simulate a small peptide P1 from the C-terminus of human prion protein (PrP).The biological importance of this peptide is that it has beenused as an antigen to produce amonoclonal antibody which recognizes an epitope specific topathological isoform of PrPfrom brain samples of Creutzfeld-Jakob disease patients. As a part of the mother protein inthe native state this peptide has a fullyα-helical structure whereas the CD spectrum of thewater solution shows only a tiny amount ofα-helix. We use the standard geometry modelwith ECEPP/3 forcefield as implemented in protein simulation package SMMP6.
2 Calculation of the Thermodynamical Quantities
The advantage of knowing the density of states is that one cancalculate directly the parti-tion function and all related quantities
Z =∑
E
n(E)e−βE , (1)
whereZ is the partition function andn(E) are the density of states. We performed ouralgorithm to calculate the partition function of P1 peptideboth in gas phase and with im-plicit water environment treated by solvent accessible area method. After calculating thepartition function we obtained the temperature dependencies of the potential energy andthe specific heat:
E(T ) = 〈E〉T = Z−1∑
E
En(E)eE/kBT
C(T ) =
⟨
E2⟩
T− 〈E〉2T
kBT 2. (2)
These quantities are plotted on Fig. (1). One can see that thespecific heat has a welldefined maximum indicating cooperative transition.
3 Modification of the SMMP Code
Since the experiment shows a little amount of theα-helix the suggestion was made thatthe molecules of P1 in solution don’t behave similar to the single molecule. The moststraightforward explanation may be that they aggregate anddo not allow each other toundergo helix-coil transition. We have addressed this problem by finding the ground stateconformation of the system of two peptides. For this purposea minor modification of thecode was necessary because normally it is impossible to simulate more than one moleculein SMMP. We introduced a “fake” residue which consists only of the backbone bondsand contains atoms which do not interact neither with each other nor with other atoms.Thus they don’t contribute into the energy function. The rotations around all bonds of
142

250 300 350 400 450 500 550 600 650 700 750 800T
-130
-120
-110
-100
-90
-80
-70
-60
-50E
(T)
300 400 500 600 700 800C(T)
0.1
0.2
0.3
C(T
)300 400 500 600 700 800
C(T)
0.1
0.2
0.3
C(T
)
Figure 1. The temperature dependence of the potential energy and the specific heat (inlet) of the peptide P1 inimplicit water environment.
virtual residues are completely free. Connecting two peptides with sufficiently long chainof virtual residues allows the two molecules to accept any positions with respect to eachother. We have performed a large number of simulated annealing for such a system andobtained that in more that90% cases the ground state of the system contains only verysmall amount ofα-helix. In all ground states the two peptides are positionedparallel orantiparallel, creating intermolecular hydrogen bonds instead of itramolecular ones.
Acknowledgments
This work was suported by the National Science Council of Taiwan under the grantNo. NSC 95-2112-M 001-008, National Center for TheoreticalSciences in Taiwan, andAcademia Sinica (Taiwan) under Grant Nos. AS-92-TP-A09 andAS-095-TP-A07.
References
1. U. H. E. Hansmann, Y. Okamoto, J Comp Chem14, 1333 (1993).2. Y. Okamoto, U. H. E. Hansmann, J Phys Chem99, 11276 (1995).3. A. Berg, U. H. E. Hansmann, Eur Phys J B6, 395(1998).4. F. G. Wang, D. P. Landau, Phys Rev Lett86, 2050 (2001).5. R. Ghulghazaryan, Sh. Hayryan, C.-K. Hu, J Comp Chem28, 715 (2007).6. F. Eisenmenger, U. H. E. Hansmann, Sh. Hayryan, C.-K. Hu, Comp Phys Comm138,
192 (2001).
143


Conformational Studies of UDP-GlcNAc in Environmentsof Increasing Complexity
Martin Held 1, Eike Meerbach1,3, Stephan Hinderlich2,Werner Reutter2, and Christof Schutte1
1 Fachbereich Mathematik und Informatik,Freie Universitat Berlin
Arnimallee 2-6, 14195 BerlinE-mail: held, meerbach, [email protected]
2 Institut fur Biochemie und MolekularbiologieCampus Benjamin Franklin
Charite Universitatsmedizin BerlinArnimallee 22, 14195 Berlin
E-mail: Stephan.Hinderlich, [email protected]
3 Supported by the DFG research center ”Mathematics for key technologies”.
The ”effective” dynamics of a biomolecular system can oftenbe described by means of aMarkov chain describing ”flipping dynamics” between metastable (geometrical large scale)molecule conformations on ”long” time scales. In this work we present our methods for theidentification of metastable conformations by a study of UDP-GlcNAc - a key substrate in sialicacid synthesis. We investigate the system in different environments of increasing complexity(vacuum, water, peptide) by performing force field based molecular dynamic simulations. Byapplying our analysis techniques to the obtained data we getinsights into the conformationaldynamics of the system. A comparison of the results reveals interesting environment-dependentproperties of UDP-GlcNAc.
1 Introduction
Sialic acids play an important role in various biological processes, e.g., immune response,tumor metastasis or inflammatory reactions. In mammalian cells the key reaction of thesialic acid synthesis pathway is carried out by the bifunctiononal enzyme UDP-GlcNAc-2-Epimerase/ManNAc-Kinase1. In cooperation with researchers at the Charite we investigateUDP-N-Acetylglucosamine (UDP-GlcNAc) (see Fig. 1), the ligand of this key reaction bymeans of molecular dynamic simulations. Thereby, we expectto gain a better understand-ing of the actual reaction and, in the long term, insights that assist in the design of potentialinhibitors.
2 Simulation
By a systematic conformational search in dihedral space we generated 20 initial conformersof UDP-GlcNAc. For each conformer we run molecular dynamic simulationsin vacuoandin explicit water using AMBER 8. Additionally, we simulateda set of possible bindingconformations of UDP-GlcNAc. To derive these, crystallographic data of UDP-GlcNAc-2-Epimerase in complex with UDP was utilized. To compensate for the missing information
145

Figure 1. UDP-N-acetylglucosamine
of the GlcNAc orientation, we generated conformers of UDP-GlcNAc by systematicallyturning the three dihedrals that qualify the orientation ofthe GlcNAc moiety . The forcefield parameters needed for this non-standard residue were obtained from the literature12, 14.
Atoms Sim. Time Step Size Temperature PressureIn Vacuo 64 100 ns (2µs) 1 fs 300 K -Water 3964 10 ns (200 ns) 2 fs 300 K 1 atmProtein 46646 100 ps 2 fs 300 K 1 atm
Table 1. Simulation Parameters
3 Analysis Methods
Our aim is to identify so-calledmetastableconformations of UDP-GlcNAc, i.e., geome-tries which are persistent for long periods of time, from thegenerated trajectory data. Suchidentification corresponds to the set up of a coarse-grainedmodel for the dynamics, as onlong time scales the typical dynamics of biomolecular systems can often be described asa (Markovian) flipping process between such conformations6, 8, 13. The challenge of iden-tification lies in the rich temporal multiscale structure ofthe data, induced by flexibilitywithin the metastable conformations.
The groups of P. Deuflhard and C. Schutte developed the so-calledPerron Cluster Clus-ter Analysis(PCCA) for the identification of metastable conformations2, 3, 5. The approachis based on assuming a Markov dynamics of the observed systemon a certain time scale.Discretization of the state space, e.g., the dihedral anglespace of some molecule, allowsto set up a stochastic matrix, w.r.t. the chosen time scale, by counting transitions betweendiscrete states in the trajectory. The information contained in the spectrum of this matrixallows to aggregate parts of the state space to metastable states, as the number of metastablestates corresponds to the number of eigenvalues close to unity, while information about anappropriate clustering is encoded in the eigenvectors.
In addition a variety of methods based on Hidden Markov Models (HMMs) were re-cently developed in the group of C. Schutte7, 9–11. An intriguing feature of HMM analy-sis is that the chosen set of observables need not to enable a geometric separation of the
146

metastable conformations. Instead, theobservedtime series is used to fit a model for anunobservedMarkov chain, by extracting geometric as well as dynamical properties out ofthe given observation sequences, and thus allowing for separation of overlapping confor-mations.
For our analysis we used a combination of these approaches. First each chosen torsionangle is analyzed separately by using an HMM with gaussian output distributions, result-ing in a discrete time series corresponding to the hidden states for each angle. Then theobtained information is aggregated by superposition of thediscrete one dimensional timeseries. The (combined) discrete time series is then furtheranalyzed by means of PCCA.For more details refer to, e.g.,11.
4 Results
Based on thein vacuosimulation data we identified 5 metastable conformations via ananalysis on the dihedral space. All found conformations arestabilized by intramolecu-lar hydrogen bonds, where the most compact structure corresponds to the metastable setwith the highest weight (66.6%). In the water trajectory data we found 6 metastable sets.Here, the related structures appear to be less stiff, as the effect of inner hydrogen bonds isweakened, due to the shielding effect of the present water molecules.
Figure 2. Transition network of UDP-GlcNAc in explicit water with density plots showing the flexibility withineach metastable set. (in brackets – relative weighting, below brackets – persistence probability, next to pictures –exit probability) – Visualizations using Amira15
Screening the water simulation data for the generated potential protein binding con-formations of UDP-GlcNAc did not result in any match. This leads to the conjecture thatthe binding of the ligand must be accompanied by an induced-fit effect. The protein hasto alter the conformation of the ligand in order to bind it. Incontrast to a conformationalselection scenario, where an available conformation wouldbe ”selected” to bind.
147

References
1. S. Hinderlich, R. Stasche, R. Zeitler, and W. Reutter A bifunctional enzyme catalyzesthe first two steps in N-acetylneuraminic acid biosynthesisof rat liver. Purification andcharacterization of UDP-N-acetylglucosamine2-epimerase/ N-acetylmannosaminekinase.J Biol Chem 272, pages 24313-24318 (1997).
2. F. Cordes, M. Weber, and J. Schmidt-Ehrenberg. Metastable conformations via suc-cessive Perron cluster analysis of dihedrals. ZIB-Report 02-40, Zuse Institute Berlin,2002.
3. P. Deuflhard, W. Huisinga, A. Fischer, and C. Schutte. Identification of almost in-variant aggregates in reversible nearly uncoupled Markov chains. Lin. Alg. Appl.,315:39–59, 2000.
4. P. Deuflhard and Ch. Schutte. Molecular conformation dynamics and computationaldrug design. In J. M. Hill and R. Moore, editors,Applied Mathematics Entering the21st Century, pages 91–119. SIAM, 2004.
5. P. Deuflhard and M. Weber. Robust Perron cluster analysis in conformation dynamics.ZIB-Report 03-19, Zuse Institute Berlin, 2003.
6. R. Elber and M. Karplus. Multiple conformational states of proteins: A moleculardynamics analysis of Myoglobin.Science, 235:318–321, 1987.
7. A. Fischer, S. Waldhausen, I. Horenko, E. Meerbach, and Ch. Schutte Identifica-tion of Biomolecular Conformations from Incomplete Torsion Angle Observations byHidden Markov ModelsJ. Comp. Chem., accepted (2006).
8. C. Schutte and W. Huisinga. Biomolecular Conformationscan be Identified asMetastable Sets of Molecular Dynamics. In P. G. Ciaret and J.-L. Lions, editors,Handbook of Numerical Analysis X, Special Volume Computational Chemistry, pages699–744, 2003.
9. I. Horenko, E. Dittmer, A. Fischer, and Ch. Schutte Automated Model Reduction forComplex Systems exhibiting Metastability,Mult. Mod. Sim. 5 (3), pages 475–491(2006).
10. I. Horenko, E. Dittmer, F. Lankas, J. Maddocks, Ph. Metzner, and Ch. SchutteMacroscopic Dynamics of Complex Metastable Systems: Theory, Algorithms, andApplication to B-DNA Submitted toJ. Appl. Dyn. Syst.(2005).
11. E. Meerbach, E. Dittmer, I. Horenko, and Ch. Schutte.Computer Simulations in Con-densed Matter Systems: From Materials to Chemical Biology, volume 1 ofLectureNotes in Physics, chapter Multiscale Modelling in Molecular Dynamics: Biomolecu-lar Conformations as Metastable States, pages 475–497. Springer, 2006.
12. P. Petrova, J. Koca, and A. Imberty. Potential energy hypersurfaces of nucleotidesugars: Ab initio calculations, force field parametrization and exploration of the flex-ibility. J. Am. Chem. Soc., 121:5535–5547, 1999.
13. C. Schutte, A. Fischer, W. Huisinga, and P. Deuflhard. A direct approach to confor-mational dynamics based on hybrid Monte Carlo.J. Comput. Phys., 151:146–168,1999.
14. Woods Group. GLYCAM Web . 15 January 2007. Complex Carbohydrate ResearchCenter , The University of Georgia , Athens , GA.http://www.glycam.com.
15. Amira—advanced visualization, data analysis and geometry reconstruction, user’sguide and reference manual. Konrad-Zuse-Zentrum fur Informationstechnik Berlin(ZIB), Mercury Computer Systems GmbH and TGS Template Graphics Software Inc.,2000.
148

Photosensory Proteins as a Tool in Synthetic Biology:Bridging Computational Biophysics and Systems Biology
Johnny Hendriks1, Marcela Avila Perez1,Frank Bruggeman2, and Klaas J. Hellingwerf1
1 Laboratory for Microbiology, Swammerdam Institute for Life Sciences,University of Amsterdam, Nieuwe Achtergracht 166, NL-1018WV Amsterdam, The Netherlands
E-mail: [email protected]
2 Molecular Cell Physiology, Faculty of Earth and Life Sciences,Vrije Universiteit, De Boelelaan 1085, NL-1081 HV Amsterdam, The Netherlands
1 Introduction
The systems biology approach to understand basic questionsrelated to health, food and theenvironment can be applied using different levels of molecular detail. Often it is claimedthat systems-biologal descriptions are based on ‘first principles’. Actually it will still takeseveral decades before such an approach may become feasible(that is if ‘first principles’is assumed to have its regular meaning in chemistry). Currently, at best, the most detailedelements of system descriptions are in terms of enzyme-kinetic characteristics (i.e. KM andVmax). This approach, useful as it may be, is poorly suited for usein a synthetic biologyapproach. The latter would ideally integrate molecular dynamics modeling and molecularengineering in a systems description. Inclusion of this level of detail is important forapplications in molecular medicine, e.g. when new enzyme inhibitors are to be designed.
When it comes to analyzing functional sub-states during enzymatic activity, photo-sensory proteins are the “star actors of modern times”1. For important classes of pho-toreceptors both experimental measurements and moleculardynamics simulations of boththe receptor state and the functional signaling state are available and mutually reinforc-ing. ‘Proof of principle’ for this approach has been obtained with e.g. Photoactive YellowProtein2, 3. The predicted structure of the signaling state of this protein, calculated withmolecular dynamics simulations, including the parallel tempering approach, turned out tocorrelate well with the results obtained with NMR measurements of the solution structureof this (sub) state. In ongoing work, transition-path sampling is used to analyze the keyfactors that govern the transitions between the relevant sub-states of this photoreceptor.
Light is a very convenient substrate, not only in photoreceptor studies, but also in ex-perimental work on cellular biological systems. It is therefore surprising that not moresystems biology modeling work has been done on biological systems containing photosen-sory proteins. As a result very little progress has been madein method development toincorporate light in a systems biology approach. Here we have developed a method basedon the Lambert-Beer law. To test this method we used light-regulated gene expression viathe BLUF-domain of the AppA protein fromRhodobacter sphaeroides. The AppA proteinis involved in the blue-light repression of photosynthesisgenes4–6 . In vitro experimenta-tion has shown the photocycle of AppA can be summarized in a simple photocycle schemewith only 2 main components7, 8, the receptor state R and the signaling state S (see Fig. 1a).
149

Figure 1. Panel a: Representation of the AppA photocycle model, with R the receptor state, FAD* the excitedstate upon light absorption, and S the signaling state. Panel b: Rate of excited state formation as function of the Rstate concentration. This plot was generated using equation 3, whereV = 1 cm3; l = 1 cm;I0 = 1 mmol·cm–2·s–1;c is the concentration of R in M. Note that [R] is plotted in mM and thatkil ranges from 2·103 to 2·102 s–1 for [R]is 0.01 to 5 mM.
The signaling state is formed on a nanosecond timescale, whereas the recovery from S toR takes place on a timescale of minutes.
2 Methods
2.1 Kinetic Model of the AppA Photocycle
The model depicted in Fig. 1a was used to test the incorporation of light in the AppAmodel. Herekpe is the photocycle entry rate or the rate with which the signaling stateis formed from the excited state. Qy is the photocycle quantum yield or the fraction ofexcited states that go on to form the signaling state.kre is the recovery rate or the ratewith which the receptor state is formed from the signaling state.kil is the illumination rateconstant. This rate constant is dependent on both the light intensity and the concentrationof the sample. Derivation of this rate equation is shown below. For the other reactions first-order rates were assumed, in accordance with the results of the time-resolved spectroscopyexperiments. Calculations with the differential equations that describe the model depictedin Fig. 1a, were performed in MatLab 7.1.
2.2 Derivation of Illumination Rate Constant (kil )
For the derivation of the illumination rate constant we assumed that for each photon thatis absorbed, a receptor state protein is converted to the excited state. By subtracting theintensity of light used to illuminate the sample (I0) by the intensity of light after it haspassed through the sample (I ) we can determine the amount of light that was absorbed. Bychoosing the unit of light intensity as mmol·cm–2·s–1 (= 10–7 µmol·m–2·s–1) dividing it bythe illuminated sample volume (V) and subsequently multiplying it with the area (a) of thesample that is illuminated, the velocity (v) is obtained with which the excited state of the
150

photoactive protein is formed. From this velocity an illumination rate constant (kil ) can bedetermined.
A = logI0I
= ε · l · c (1)
(I0 − I) = I0 −I0
10ε·l·c = I0 ·(
1 − 1
10ε·l·c
)
(2)
v = c · kil =a
V· I0 ·
(
1 − 1
10ε·l·c
)
(3)
kil =I0 ·
(
1 − 110ε·l·c
)
l · c (4)
Equations 1-4 depict the different steps of the derivation,whereA is absorption;I0
andI are light intensities before and after absorption by sample(mmol·cm–2·s–1); c is thesample concentration (M);ε is the Molar extinction coefficient of the sample (M–1·cm–1);l is the path length of the light through the sample (cm);a is the area of the sample that isilluminated;V is the volume of sample illuminated (V = a·l; cm3); v is the velocity withthe excited state of the sample is formed (M·s–1); kil is the illumination rate constant (s–1).
3 Results and Discussion
The kil is linearly dependant on light intensity, however the dependence on the sampleconcentration is a little more complex as is illustrated in Fig. 1b, where rate of excited stateformationv (c·kil ) is plotted as a function of sample concentration. Note thatv varies inthe concentration range of 0 to 2 mM which is equivalent to a sample OD of 0 to 17 of theflavin absorption peak at 446 nm. This falls not only within the biologically relevant rangebut also within the range in whichin vitro measurements are generally performed.
The model depicted in Fig. 1a was tested on data where the N-terminal 5-125 AppAfragment was placed in a spectrophotometer and bleaching ofthe sample by the spec-trophotometers probe light was followed in time. The model was able to accurately de-scribe the data. The values forkre andI0 were fitted to the data and, within the error of themeasurements, resulted in the same values as those that weremeasured (Data not shown).
Having established that the model can accurately describe the photocycle of AppA, itwas used to simulate the effect ofkre on the light sensitivity of the protein. In Fig. 2 asimulated light titration of the N-terminal 5-125 AppA fragment and the W104A mutantof the same protein fragment is depicted. The major difference here is the value forkre
which is almost 200 times faster for the W104A mutant9. The graph clearly shows thatin the case of the W104A mutant much more light is needed in order to obtain similaramounts of the signaling state. This has implications for studies on the biological functionof such a mutant, as one might mistakenly come to the conclusion that the mutant has lostits function (e.g. by analyzing its function only at 100µmol·m–2·s–1), whereas in realitythe used light intensity was insufficient to activate the mutant.
The essential part of this photocycle model has been incorporated in an overall descrip-tion of light-mediated regulation of gene expression via AppA (see Fig. 3). In ongoingexperiments we are analyzing the light intensity dependence of puf expression in intact
151

Figure 2. Simulation of the light sensitivity of AppA. Fractions of the R and S state of AppA at equilibrium areplotted as function of the used light intensity. This plot was generated with the photocycle model depicted inFig. 1a, witha = 1 cm2; l = 1 cm; Qy = 0.24;kpe = 109 s–1; ε400-700nm= 884 M–1·cm–1; [AppA] = 60 µM. I0was varied from 10–3 to 106 µmol·m–2·s–1. To simulate the N-terminal 5-125 AppA Wild type fragment akre of0.0013 s–1 was used. For the W104A mutant akre of 0.24 s–1 was used.
Figure 3. Model for light-mediated regulation of gene expression via AppA.
cells ofRhodobacter sphaeroides. In this approach we will compare the wild type proteinwith several of its site-directed mutants (including the W104F mutant).
We are also setting up a similar model for the YtvA mediated blue-light induced acti-vation of theσB-dependent stress response ofBacillus subtilis10. This system makes use ofvery large (> 10 MDa) signaling complexes (so-called ‘stressosomes’), which generatesvery interesting questions regarding sensitivity, cooperativity, etc., in this signal transferpathway. Furthermore, the light-sensitivity of YtvA provides an ideal handle to analyzethe linkage of the signal transduction network that activatesσB, with other (late growth)signal transduction networks in this organism.
152

References
1. M. A. Van der Horst and K. J. Hellingwerf, Accounts Chem. Res.,37, 13-20, (2004).2. C. Bernard, K. Houben, N. M. Derix, D. Marks, M. A. van der Horst, K. J. Hellingw-
erf, R. Boelens, R. Kaptein and N. A. J. van Nuland, Structure, 13, 953-962, (2005).3. J. Vreede, W. Crielaard, K. J. Hellingwerf and P. G. Bolhuis, Biophys. J.,88, 3525-
3535, (2005).4. S. Braatsch, M. Gomelsky, S. Kuphal and G. Klug, Mol. Microbiol., 45, 827-836,
(2002).5. M. Gomelsky and S. Kaplan, J. Bacteriol.,179, 128-134, (1997).6. S. Masuda and C. E. Bauer, Cell,110, 613-623, (2002).7. M. Gauden, S. Yeremenko, W. Laan, I. H. M. van Stokkum, J. A.Ihalainen, R.
van Grondelle, K. J. Hellingwerf and J. T. M. Kennis, Biochemistry, 44, 3653-3662,(2005).
8. W. Laan, M. Gauden, S. Yeremenko, R. van Grondelle, J. T. Kennis and K. J. Helling-werf, Biochemistry,45, 51-60, (2006).
9. S. Masuda, K. Hasegawa and T. A. Ono, Plant Cell Physiol.,46, 1894-1901, (2005).10. M. Avila-Perez, K. J. Hellingwerf and R. Kort, J. Bacteriol., 188, 6411-6414, (2006).
153


Comparing Semi-Empirical versus Classic ChargeAssignments in BioMolecules and their Effect on
Electrostatic Potentials
Parimal Kar 1, Max Seel1, Ulrich H. E. Hansmann1,2, and Siegfried Hofinger1
1 Michigan Technological University, Department of Physics,1400 Townsend Drive, 49931 Houghton, MI, USAE-mail: [pkar, seel, hansmann, shoefing]@mtu.edu
2 John von Neumann Institute for Computing, FZ Julich52425 Julich, Germany
E-mail: [email protected]
The program LocalSCF is used to consider an antifungal protein at the semi-empirical QM levelof theory. Model Hamiltonians include AM1, MNDO, PM3 and PM5. The biomolecule is alsostudied with classic charge assignment using the AMBER force field. An important aspect ofclassic biomolecular simulation can thus be addressed, namely to what extent the usual conceptof a single set of static atomic partial charges per type of amino acid will hold in general forthe entire global protein structure. Semi-empirical charges will vary with different chemicalneighborhood inside the protein and the question remains how severely these alterations willaffect global electrostatic properties of the protein. In order to probe this effect we use gridmaps of electrostatic potentials obtained from solutions to the Poisson-Boltzmann equation.Source charges are either the classic AMBER ones, or some setof semi-empirical charges fromthe list of models mentioned above. In comparing different potential maps we aim to recognizesystematic trends as well as to identify a recommended way ofproper charge assignment inproteins.
1 Introduction
Electrostatics plays an integral part in the study of structure and function of proteins atphysiological conditions1. Theoretical considerations of the electrostatics in proteins areusually based on solutions to the Poisson-Boltzmann (PB) equation2, 3. All these theoreticaldescriptions will involve a certain type of charge assignment to the atoms of the protein.Since the result of the PB calculation will inevitably depend on the particular choice madefor the charges, it might be of interest to study the influenceand variation resulting fromdifferent charge assignments. Of particular interest willbe the comparison between a set ofclassic charges, ie from force fields commonly employed in the simulation of biomolecules,and charges derived from ab-inito calculations performed at a certain level of QuantumMechanical (QM) theory.
A convenient method to compare different charge assignments to each other is to studythe shape and appearance of electrostatic potential (ESP) maps. These ESP maps describethe way the protein will represent itself to its environmentin electrostatic terms. Since thesolution to the PB equation is included, ESP maps render a reasonably complete pictureof the protein in its native environment, ie at physiological conditions. Moreover, ESPmaps are a useful tool with many direct applications in structural biology. For example,from ESP maps we can learn whether a protein, (i) is likely to migrate to the membrane4,
155

(ii) will potentially bind RNA or DNA5, 6, (iii) belongs to a certain family7–9, (iv) offers achemically attractive binding site to ligands and other proteins.
In this present study we therefore compare ESP maps based on classic charge assign-ments using AMBER parameters10 with ESP maps resulting from semi-empirical chargescomputed with program LocalSCF11 at several levels of semi-empirical theory, ie AM1,MNDO, PM3 and PM5. The PB program POLCH12 is used throughout.
2 Methods
After download of the protein with pdb code EAFP2 from the pdbdata bank, a PB cal-culation is performed using program POLCH12 and classic AMBER partial charges10. In-ner/outer dielectric constants are set to 1 and 80 respectively. The net charge is +4 dueto the four Arg residues. ESP maps are computed on the molecular surface and on a cu-bic grid superimposing the protein. Only ESP maps directly mapped onto the molecularsurface are used for further analysis. Semi-empirical calculations are then carried out onthe protein EAFP2 using LocalSCF11 and finally computed partial charges are extractedfrom the output. The net charge is +2 due to different treatment of lone-pairs in the semi-empirical models. AM1, MNDO, PM3 and PM5 methods are applied. Classic AMBERpartial charges are then replaced with either charge set derived from the semi-empirical cal-culations and PB calculations are repeated with the changedcharge assignment. ResultingESP maps are compared in the form of difference ESP maps.
3 Results and Conclusions
A structural sketch of the antifungal protein EAFP2 is shownin Table 1 (a) with corre-sponding representation of the molecular surface (b). Herethe N-terminal end is coloredin red while the C-terminus is given in blue. The ESP map basedon classic AMBER chargeassignment after PB calculation is represented in Table 1 (c). ESP levels are color-codedas +5 kT/e (blue), 0 kT/e (green) and -5 kT/e (red). It becomesclear that the major ap-pearance of EAFP2 in aqueous solution is that of a macroscopic particle of largely positiveESP, hence the tendency to migrate to the membrane can be explained straightforwardly4
(which also implies the antifungal mode of action). An initial test regarding the sensi-tivity to counter ions is shown in Table 1 (d). Here explicit Cl− counter ions have beenincluded in the PB calculation and corresponding ESP maps produced. The change in ma-jor ESP patterns introduced by counter ions is only marginal, thus the rest of the analysisis performed without consideration of counter ions. A differential ESP map representingESP(AM1) - ESP(AMBER) is shown in Table 1 (e). Identical color-coding is used asmentioned above. It becomes clear that the AM1-based ESP mapis comparable in sign,but significantly different in magnitude (individual ESP values have become less positive).Extended red patches mark off regions of most severe difference. Contrary to the changeseen in the AM1-AMBER differential map, when comparing AM1 with MNDO we obtainessentially only green patches (see Table 1 (f)). Thus AM1 and MNDO deliver essen-tially the same ESP properties. Comparison of PM3 with AMBERis represented in thedifferential ESP map shown in Table 1 (g).
The trend is similar to the one seen with AM1, but the difference is less severely pro-nounced (ie certain extended red regions turn yellow or green). Switching further to PM5
156

(a) (b)
(c) (d)
(e) (f)
(g) (h)
Table 1. Electrostatic Potential (ESP) maps for the antifungal protein EAFP2 (pdb code). Major structural el-ements are shown in (a) and a corresponding representation of the molecular surface is shown in (b), wherethe N-terminal helix is given in red and the C-terminus is shown in blue. The ESP mapped onto the molecularsurface after solution of the PB equation based on AMBER charge assignment is shown in (c). Blue patchescorrespond to the +5 kT/e level, green regions represent neutral ESP and red domains indicate negative ESP of -5kT/e. The marginal change when including 4 explicit Cl− counter ions is shown in (d). A differential ESP maprepresenting the difference between ESP(AM1) and ESP(AMBER) is shown in (e) with the same color-codingscheme used in (c). Further differential maps are ESP(AM1)-ESP(MNDO) (f), ESP(PM3)-ESP(AMBER) (g)and ESP(PM5)-ESP(AMBER) (h).
157

description is continuing the trend, ie lessening the deviation from the AMBER-based mapagain (see Table 1 (h)). Closer examination of the residues lying beneath the red-coloredpatches (indicating most severe deviation) reveals a specific role of Arg residues and thecharges assigned to the N-atoms of Asn and Gln. In summary, semi-empirical chargeassignments deliver a consistent picture of significant differences seen for the chargedresidues. However, individual semi-empirical models differ considerably amongst eachother. With increasing sophistication of the semi-empirical model the deviation from theclassic AMBER results becomes less severe.
Acknowledgments
This work was supported in part by the National Institutes ofHealth Grant GM62838.
References
1. B. Honig, A. Nicholls,Classical electrostatics in biology and chemistry, Science268,1144–1149, 1995.
2. J. Warwicker, H. C. Watson,Calculation of the electric potential in the active sitecleft due to alpha-helix dipoles, J. Mol. Biol. 157, 671–679, 1982.
3. R. J. Zauhar, R. S. Morgan,A new method for computing the macromolecular electricpotential, J. Mol. Biol. 186, 815–820, 1985.
4. Y. Xiang, R. H. Huang, X. Z. Liu, Y. Zhang, D. C. Wang,Crystal structure of a novelantifungal protein distinct with five disulfide bridges fromEucommia ulmoides Oliverat an atomic resolution, J. Struct. Biol.148, 86–97, 2004.
5. S. S. Kim, R. g. Zhang, S. E. Braunstein, A. Joachimiak, A. Cvekl, R. S. Hegde,Structure of the Retinal Determination Protein Dachshund Reveals a DNA BindingMotif, Structure10, 787–795, 2002.
6. Q. Ye, R. M. Krug, Y. J. Tao,The mechanism by which influenza A virus nucleoproteinforms oligomers and binds RNA, Nature444, 1078–1082, 2006.
7. J. W. Yu, J. M. Mendrola, A. Audhya, S. Singh, D. Keleti, D. B. deWald, D. Mur-ray, S. D. Emr, M. A. Lemon,Genome-Wide Analysis of Membrane Targeting by S.cerevisiae Pleckstrin Homology Domains, Mol. Cell 13, 677–688, 2004.
8. D. Morikis, J. D. Lambrish,Physical methods for structure, dynamics and binding inimmunological research, Trends Immunol.25, 700–707, 2004.
9. K. Schleinkofer, U. Wiedemann, L. Otte, T. Wang, G. Krause, H. Oschkinat, R. C.Wade,Comparative Structural and Energetic Analysis of WW DomainPeptide Inter-actions, J. Mol. Biol. 344, 865-881, 2004.
10. W. D. Cornell, P. Cieplak, C. I. Bayly, I. R. Gould, K. M. Merz, D. M. Ferguson,D. Spellmeyer, T. Fox, J. W. Caldwell, P. A. Kollman,A Second Generation ForceField for the Simulation of Proteins, Nucleic Acids, and Organic Molecules, J. Am.Chem. Soc.117, 5179–5197, 1995.
11. N. A. Anikin, V. M. Anisimov, V. L. Bugaenko, V. V. Bobrikov, A. M. Andreyev,LocalSCF Method for Semi-empirical Quantum-Chemical Calculation of Ultra-largeBio-molecules, J. Chem. Phys.121, 1266–1270, 2004.
12. S. Hofinger,Solving the Poisson-Boltzmann Equation with the Specialized ComputerChip MD-GRAPE-2, J. Comp. Chem.26, 1148–1154, 2005.
158

Role of Filopodia in Adhesion Formation DuringMigration of Epithelial Cells
Bodo Borm, Simone Born, Rudolf Merkel, and Bernd Hoffmann∗
Institute of Bio- and Nanosystems 4: Biomechanics,Research Centre Julich, 52425 Julich, Germany
∗E-mail: [email protected]
Filopodia are a characteristic feature of many motile cells, such as keratinocytes and other ep-ithelial cells. Filopodia are believed to act as guiding cues to direct cell migration, but howtheir specific functionality is implemented still remains elusive. Using live cell imaging andimmunolabeling we show that filopodia are sites of adhesion formation during cell migration.Cell-substrate adhesions formed by migrating epithelial cells strongly depend on filopodia,showing a spatial and temporal correlation between filopodia dynamics and adhesion forma-tion. We observed that: 1) the formation of adhesions depends on the persistence of filopodia.2) Adhesion sites within a certain filopodium contain early adhesion markers such as vinculin orvasp. 3) Adhesions formed within filopodia are additionallydefined by markers for mature ad-hesions such as tensin or zyxin. 4) In the nascent lamellipodium the filopodial adhesions growin size whereas no obvious change in composition takes place. Our results implicate an essen-tial role for filopodia in guiding cell migration by directing the formation of new cell-substrateadhesions.
1 Introduction
Cell adhesion is one of the most essential processes for proper cell function and movementof cells. For example, formation of multicellular organisms or the locomotion of cells ofthe immune system is impossible without cell adhesion and movement. The adhesion it-self depends on protein complexes called focal adhesion sites1. These micrometer-sizedadhesion sites form a connection between the extracellularmatrix surrounding the cell andthe actin cytoskeleton. Focal adhesions are characterizedby a specific set of proteins suchas integrins, spanning the plasma membrane, regulatory kinases or proteins like vinculin,zyxin or VASP, bridging the integrins to actin fibers. Latestadhesion site formation modelsimply for moving cells a formation of focal adhesion sites closely behind the leading edgeof the cell’s lamellipodia (Fig. 1)2, 3. Over time the cell moves over the freshly formed adhe-sion sites transducing them to the rear site of the cell whererelease takes place. Formationand release times are highly dynamic in the range of seconds to minutes. In these modelsfilopodia, i.e. finger like protrusion emanating from the lamellipodium, are mostly ignoredalthough they are present in almost any motile cell. Insteadit is assumed that filopodiamainly sense the environmental conditions without affecting adhesion site formation4.
Our experiments show for the first time an essential role of filopodia in the life cycle ofadhesion sites. Filopodia determine the location of almostall focal adhesion sites upon cellmovement and are the first place of complete adhesion site formation. Such site becomesonly increased in size when reach by the lamellipodium and therefore visible by classicalmicroscopic techniques.
159

Figure 1. Keratinocyte motility was induced by EGF and cellswere analyzed by phase contrast (left) and RICM(right). Note that focal adhesion sites appear as black lines in RICM and describe prolongations of filopodia. 1 =filopodium, 2 = lamellipodium, 3 = leading edge. Scale bar = 10µm.
2 Experimental
Cell analyses were performed using primary human foreskin keratinocytes. Cell biologicalprocedures were performed according to standard protocols. Cells were either analyzed di-rectly by phase contrast microscopy or reflection interference contrast microscopy (RICM)or transfected with GFP-fusion proteins and analyzed by fluorescence microscopy. RICMallows the determination of distances between surface and adhered cell. The darker thesignal is, the smaller the distance. Alternatively, cells were fixed and proteins were stainedby immunolabelling.
3 Results and Discussion
In order to analyze filopodia function in focal adhesion siteformation, keratinocytes wereincubated for one day and subsequently activated by addition of epidermal growth factor(EGF). EGF stimulates cell motility of keratinocytes. Individual moving cells were ana-lyzed by phase contrast and simultaneously by RICM. These data indicated a formationof focal adhesion sites right behind adhered filopodia (Fig.1). Additionally, the shape ofthese adhesion sites resembled the one of filopodia.
The given data indicate a role of filopodia in focal adhesion site formation. Such hy-pothesis was analyzed in more detail. As filopodia are continuously formed ”spikes” sens-ing the substrate conditions in the direction of movement they can either attach to the sub-strate to form temporarily stable connections or become retracted if no connection couldbe formed. By analyzing the leading edge over time we could determine that focal adhe-sion sites were formed only at positions of stable adhered filopodia. Areas of the leadingedge characterized by filopodia unable to attach to the substrate could not respond with theformation of focal adhesion sites (Fig. 2).
The formation of focal adhesion sites always behind stably attached filopodia could beexplained by two adhesion models. First, filopodia could sense the substrate. Their stableadhesion could then function as signal in order to form focaladhesion sites right behindthe filopodia. The alternative would be the formation of small adhesion sites already inthe filopodia. In this case the lamellipodium would just function as enlargement factor as
160

Figure 2. Motile keratinocytes were analyzed by RICM in areas of stable (top) and unstable (bottom) filopodiaformation over time. Focal adhesion sites were only detected at positions of stable filopodia. Scale bar = 5µm.
soon as it has reached the filopodia adhesion site. These models were tested by analyzingthe protein localization of focal adhesion site proteins indetail as the latter model fullydepends on a localization of these proteins already in the filopodia. Therefore variousadhesion site specific proteins were analyzed in fixed samples by immunofluorescenceexperiments (Fig. 3).
The data pointed out that every focal adhesion site specific protein analyzed (in total 8)could be detected in stably adhered filopodia. Even proteinsbelieved to be markers for oldfocal adhesions, as zyxin, were present.
When these proteins were analyzed in living cells using GFP-fusions over time, local-izations of all proteins in filopodia could be confirmed. In addition, upon cell movementfilopodia signals became overgrown by the lamellipodia leading edge. At that momentfilopodia adhesion sites grew in size and became classical focal adhesion sites within afew seconds (Fig. 4). Adhesion site formation at other sitesthan filopodia adhesions werebarely detected.
As given results identified filopodia as origin for focal adhesion site formation, wewere interested how adhesion behaviour would change upon inhibition of filopodia for-mation. Such formation depends on the second messenger PI(4,5)P2 finally triggeringfilopodia outgrowth via Cdc42 and WASP. Sequestering PI(4,5)P2 by neomycin sulphatewe were able to fully block filopodia formation. Such block neither affected actin filamentorganization nor cell polarization but induced formation of small dot like adhesion struc-tures (Fig. 5). Additionally, these adhesion structures were clustered and displaced intothe lamella compared to untreated cells. Therefore the neomycin experiments argue for adirect influence of filopodia in early adhesion site formation right at the leading edge. Assoon as filopodia are blocked in their formation, localization and form of adhesion struc-tures resemble those known from cells naturally characterized by the absence of filopodia.If such morphological switch affects migration efficiency needs to be shown.
In summary, the given data strongly argue for a new adhesion model for motile cells.Sites of first contact to newly explored substrates are filopodia adhesions. Whenever these
161

Figure 3. Motile keratinocytes were fixed and immunofluorescently labelled using antibodies against focal ad-hesion site specific proteins 1 integrin or vasp. Note that both proteins can be found in the filopodia extensions.Scale bar = 10µm.
Figure 4. GFP-VASP transfected keratinocytes were simultaneously analyzed in fluorescence (upper row) andphase contrast (lower row). Note that the filopodia stainingbecomes a focal adhesion site over time. Imageintervals = 10 s.
adhesions can not be built up under regular conditions or areunstable, no subsequent focaladhesion site will be formed and movement in that direction is blocked. In contrast, when-ever a filopodia stably contacts the substrate, such a contact resembles a fully developed,yet very small adhesion site. When reached by the lamellipodium, such site is just built upin size. Therefore, filopodia are the key factors for movement, the direction of movementand finally for the formation and localization of focal adhesion sites in motile cells.
162

Figure 5. Keratinocytes were stimulated with eGF and analyzed for adhesion site formation in the absence (con-trol) or presence of 10 mM Neomycin. Subsequently, cells were fixed and analyzed for vinculin ( red) and actin(green). Cell morphology was additionally determined in phase contrast. Scale bar = 10µm.
References
1. R. Zaidel-Bar, M. Cohen, L. Addadi, and B. Geiger,Hierarchical assembly of cell-matrix adhesion complexes, Biochem. Soc. Trans.32, 416–20, 2004.
2. A. D. Bershadsky, C. Ballestrem, L. Carramusa, Y. Zilberman, B. Gilquin,S. Khochbin, A. Y. Alexandrova, A. B. Verkhovsky, T. Shemesh, and M. M. Kozlov,Assembly and mechanosensory function of focal adhesions: experiments and modelsEur. J. Cell. Biol.85, 165–73, 2006.
3. M. A. Wozniak, K. Modzelewska, L. Kwong, and P. J. Keely,Focal adhesion regula-tion of cell behaviorBiochim. Biophys. Acta1692, 103–19, 2004.
4. J. Faix, and K. Rottner,The making of filopodiaCurr. Opin. Cell. Biol. 18, 18–25,2006.
163


Study of Protein Structural Descriptors: TowardsSimilarity and Classification
Pooja Jain and Jonathan D. Hirst
School of Chemistry,University of Nottingham, Nottingham,
NG7 2RD, United KingdomE-mail: pcxpj1, [email protected]
We have investigated structural descriptors for structural similarity and classification of 77 pro-teins extracted from SCOP. A Support Vector Machine was trained to predict structural sim-ilarity based on paired protein profiles, composed of structural descriptors derived from thegeometric properties of secondary structure elements. Tenfold cross-validation, against thestandard similarity measure from DALI gave a cross-validated correlation coefficient,q2, of0.91. A coefficient of dissimilarity was derived as the Euclidean distance among different de-scriptor types of two proteins. This coefficient was evaluated for the classification of proteinpairs to different levels in SCOP hierarchy.
1 Introduction
Protein structure comparison can provide useful information on the biological function ofa protein1 and can imply evolutionary relationships between proteinswith low sequencesimilarity. This information is crucial in the identification of new protein folds and un-derstanding the organisation of the known universe of protein structures. The aim of thiswork is to perform protein structure analysis and comparison through the use of structuraldescriptors. These are numerical values that characterisethe secondary structure elementsof a protein. For example, they may represent the physico-chemical properties or geomet-ric properties of the secondary structure elements derivedfrom the 3D coordinates. In ourstudy we make use of SCOP, DALI and USM. SCOP is a curated database which aims toprovide a comprehensive description of the structural and evolutionary relationships be-tween all protein structures2. The principal levels in the SCOP hierarchy are class, fold,superfamily and family. DALI is a common and popular structural alignment and compar-ison method1. It represents a protein as a matrix of contact patterns between successivehexapeptide fragments and makes comparisons with such matrices of other proteins. USMis based on the comparison of compressed protein contact maps using the principle ofKolmogorov complexity3.
2 Structural Descriptors
A protein was defined in terms of structural descriptors derived from its secondary structureelements. A set of 77 proteins containing exactly and only threeα helices from the all-α class of SCOP database was used. The descriptors, such as thepairwise separationρbetween the centre of massCOM of any two secondary structure elementsi and j oflengthsn andm in a protein along Cartesian coordinatesA, the relative orientation cosθ,
165

Figure 1. A pictorial representation of structural descriptors and their mathematical definitions.
the individual surface accessibilityδ and the lengthη for each of them were derived fromthe DSSP assignments4. Figure 1 illustrates these descriptors in a protein structure andgive their mathematical definitions.
3 The Protein Profile
The geometric profiles made up of above defined descriptors was used to pair up any twoproteins. Such paired protein profiles included along with the 12 descriptors for each ofthe proteins, the RMS difference between respective descriptor types for that pair. For the77 proteins, 2,926 paired protein profiles containing 28 elements each were generated.
3.1 Profile Based Structural Similarity
Using Support Vector Machines (SVMs) the paired protein profiles were subjected to thenon-linear (multivariate) regression against the proteinsimilarity values assigned by DALIand USM. The model was trained by the Sequential Minimal Optimisation algorithmfor regression analysis (SMOreg)5 from Waikato Environment for Knowledge Analysis(WEKA) software package6. Parameter tuning was performed to choose the best values forcomplexity parameter and kernel function. Finally, the model assessment was performedusing 10-fold cross-validation.
3.2 Profile Based Structural Classification
For a pair of proteinsx andy, a coefficient of dissimilarityΩxy that gives the Euclideandistance between them was derived from the RMS difference ofdifferent descriptor typesas below:
Ωxy =√
ρrmsdxy + θrmsd
xy + ηrmsdxy + δrmsd
xy
The higherΩ more dissimilar are the proteins.
166

4 Results
The outcome of multivariate regression of paired protein profiles against the similarityvalues assigned by USM and DALI was significant with cross-validated correlation coeffi-cients (q2) of 0.74 and 0.91, respectively.
The structural classification of protein pairs was based on the coefficient of dissim-ilarity Ω. The protein pairs belonging to the same family congregatedtowards a lowerdissimilarity threshold, whilst those sharing the same fold were associated with highervalues.
5 Concluding Remarks
The results from multivariate regression of protein profiles suggest their potential as a rep-resentation of protein structures and there further use in the protein structure comparison.Ideally, the profile based structural classification of proteins to different levels in SCOP hi-erarchy should be distinctive. Our results show some bias towards this. Efforts to improvethis are ongoing. Analysis continues on larger datasets comprising proteins containingthree or four secondary structure elements.
Acknowledgements
This work was supported by BIOPTRAIN project MEST-CT-2004-007597 under the Sixthframework program of the European Community. We thank the University of Nottinghamfor providing high performance computational resources.
References
1. L. Holm and C. Sander,Protein-structure comparison by alignment of distance ma-trices, J. Mol. Biol. 233, 123–138, 1993.
2. A. G. Murzin, S. E. Brenner, T. Hubbard and C. Chothia,SCOP: a structural classifi-cation of proteins database for the investigation of sequences and structures, J. Mol.Biol. 247, 536–340, 1995.
3. N. Krasnogor and D. A. Pelta,Measuring the similarity of protein structures by meansof the universal similarity metric, Bioinformatics20, 1015–1021, 2004.
4. W. Kabsch and C. Sander,Dictionary of Protein Secondary Structure: Pattern recog-nition of Hydrogen-bonded and Geometrical Features, Biopolymers22, 2577–2637,1983.
5. G. W. Flake and S. R. Lawrence,Efficient SVM regression training with SMO, Ma-chine Learning46, 271–290, 2002.
6. I. H. Witten and E. Frank,Data Mining: Practical machine learning tools and tech-niques, Morgan Kaufmann, San Francisco, 2nd Edition, 2005.
167


Phase Separation in Peptide Aggregation Processes –Multicanonical Study of a Mesoscopic Model
Christoph Junghans1,2, Michael Bachmann1,3, and Wolfhard Janke1
1 Institut fur Theoretische Physik and Centre for Theoretical Sciences (NTZ),Universitat Leipzig, Postfach 100 920, D-04009 Leipzig, Germany
E-mail: [email protected]
2 Max-Planck-Institut fur Polymerforschung, Ackermannweg 10, D-55128 Mainz, GermanyE-mail: [email protected]
3 Computational Biology & Biological Physics Group, Department of Theoretical Physics,Lunds Universitet, Solvegatan 14A, SE-223 62 Lund, Sweden
E-mail: [email protected]
We have performed multicanonical computer simulations of asmall system of short protein-like heteropolymers and found that their aggregation transition possesses similarities to first-order phase separation processes. Not being a phase transition in the thermodynamic sense, theobserved folding-binding behavior exhibits fascinating features leading to the conclusion thatthe temperature is no suitable control parameter in the transition region. More formally, forsuch small systems the microcanonical interpretation is more favorable than the typically usedcanonical picture.
1 Introduction
Folding-bindingand docking processes between proteins are significant for catalysis, trans-port, and cell stabilization in biological systems. Also, gene replication and expression areimpossible without defined binding mechanisms of molecules. However, the mutual influ-ence of proteins on each other can also result in refolding ofproteins (which often leads tothe loss of their functionality and thus biological activity) or cluster formation. In the lattercase, proteins self-assemble and form aggregates. The effects of plaque can be disastrousand cause heavy diseases: First, the assembled proteins lose their individual functionalityand second, in the passive case, the aggregates hinder transport and signal exchange pro-cesses which are significant for the life of cells. In an active process, specific aggregatesmight be able to bind to cell membranes and to change the membrane morphology, e.g., byforming pores. In the amyloid hypothesis for the onset of Alzheimer’s disease, for exam-ple, aggregates of Aβ proteins are believed to form pores in membranes of neuron cells,thus opening ion channels for neurotoxic calcium.1
We focus here on thermodynamic properties of the aggregation transition of small pep-tides. For this purpose, a simple hydrophobic-polar aggregation model is introduced andemployed in a multicanonical study of a few short heteropolymers.2, 3
2 Aggregation Model
For the aggregation study, we extend the AB model4 by an additional interchain interactionbetween theM heteropolymers. As in the single-chain model, which has proven to be quite
169

useful in qualitative studies of tertiary folding behavior,5 only two types of amino acids areconsidered: hydrophobic residues (A) which avoid contact with the polar environment andpolar residues (B) being favorably attracted by the solvent. The single-chain energy of theµth heteropolymer (µ = 1, . . . ,M ) composed ofNµ monomers is given by4
E(µ)AB =
1
4
∑
iµ
(1 − cosϑiµ) +
∑
jµ>iµ+1
Φ(riµjµ;σiµ
, σjµ), (1)
where0 ≤ ϑiµ≤ π denotes the virtual bending angle between the monomersiµ, iµ + 1,
andiµ + 2. Not discriminating nonbonded interactions between monomers of the same ordifferent polymers, our aggregation model reads2
E =∑
µ
E(µ)AB +
∑
µ<ν
∑
iµ,jν
Φ(riµjν;σiµ
, σjν), (2)
where µ, ν label theM polymers interacting with each other, andiµ, jν index themonomers of the respectiveµth andνth polymer. The nonbonded interresidue pair po-tential Φ(riµjν
;σiµ, σjν
) = 4[r−12iµjν
− C(σiµ, σjν
)r−6iµjν
] depends on distanceriµjνand
residue typeσiµ= A,B. The long-range behavior is attractive for like pairs of residues
[C(A,A) = 1, C(B,B) = 0.5] and repulsive otherwise [C(A,B) = C(B,A) = −0.5].The length of all virtual peptide bonds is unity. In this short note, we focus on a sys-tem of two identical chains with the Fibonacci sequenceAB2AB2ABAB2AB, where thesingle-chain properties are known.6 Our primary interest is devoted to the phase behaviorof the system and for this purpose, the density of statesg(E) is a suitable quantity that weobtained by means of multicanonical computer simulations.7
3 Microcanonical vs. Canonical View
The Hertz definition of the microcanonical entropy is given by S(E) = kB ln Γ(E), wherekB is the Boltzmann constant (kB = 1 in our simulations) andΓ(E) =
∫ E
EmindE′ g(E′)
(whereEmin is the ground-state energy) is the phase-space volume. In Fig. 1, S(E) isshown for our two-peptide system. Interestingly, in the energy region betweenEagg andEfrag the entropy exhibits a convex behavior, which is a strong indication for surface effectswithin this small system.8 Also shown in Fig. 1 is the corresponding concave hullHS(E),i.e., the Gibbs construction. The surface entropy, defined as ∆S(E) = HS(E) − S(E)is maximal at the energyEsep. The reason for the nonvanishing surface entropy is thatthe transition between the fragmented, i.e., separated chains, and the formation of a jointaggregate is a process with phase separation which is “delayed” due to steric surface effectsreducing the entropy of the total system. Since entropy reduction is only achieved byadditional energy consumption, the surprising side effectis that in the transition regime theaggregate becomes colder with increasing system energy. This is verified by consideringthe caloric temperature which is defined viaT−1(E) = ∂S(E)/∂E, also shown in Fig. 1.Actually, in the transition region,T−1(E) bends back with increasing energy.
Consequently, there is no unique mapping between temperature and energy in the tran-sition region (or more precisely, within the boundsT−1
< andT−1> indicated in Fig. 1). Thus
the temperature should not be considered as a suitable external control parameter. Froma statistical point of view this means that for transitions with phase separation in small
170

E
T−
1(E
)S(E
)
8.0
7.0
3.0
2.05.0-15.0
20.0
10.0
0.0
-10.0
-20.0
-30.0
-40.0
-50.0
-60.0
-70.0Eagg Esep Efrag
T−1>
T−1agg
T−1<
HS(E)
S(E)
T−1(E)
Figure 1. Microcanonical Hertz entropyS(E), concave Gibbs hullHS(E), and inverse caloric temperatureT−1(E) as functions of energy. The phase separation regime is bounded by Eagg and Efrag; the tem-perature region, where temperature is no suitable externalcontrol parameter and the canonical interpretationbreaks down, ranges fromT−1
< to T−1> . The slope of the Gibbs hull defines the aggregation temperature,
T−1agg = ∂HS(E)/∂E = const.
systems a microcanonical interpretation is preferred overthe typically used canonical for-malism. Since the backbending effect in the peptide aggregation process is a real physicaleffect, it should also be accessible to experimental verification, as it has indeed alreadybeen observed, for example, in experiments of sodium cluster formation processes.9
Acknowledgments
This work is partially supported by the DFG under Grant No. JA483/24-1/2 and the com-puter time Grant No. hlz11 of NIC, Forschungszentrum Julich. M.B. thanks the DFG andWenner-Gren Foundation for research fellowships. We are also grateful to DAAD-STINTfor a Personnel Exchange Programme with Sweden.
References
1. H. A. Lashuel and P. T. Lansbury jr., Quart. Rev. Biophys.39, 167 (2006).2. C. Junghans, M. Bachmann, and W. Janke, Phys. Rev. Lett.97, 218103 (2006).3. C. Junghans, M. Bachmann, and W. Janke, preprint (2007).4. F. H. Stillinger, T. Head-Gordon, and C. L. Hirshfeld, Phys. Rev. E48, 1469 (1993).5. S. Schnabel, M. Bachmann, and W. Janke, Phys. Rev. Lett.98, 048103 (2007);
J. Chem. Phys.126, 105102 (2007).6. M. Bachmann, H. Arkın, and W. Janke, Phys. Rev. E71, 031906 (2005).7. B. A. Berg and T. Neuhaus, Phys. Lett. B267, 249 (1991); Phys. Rev. Lett.68, 9
(1992).8. D. H. E. Gross,Microcanonical Thermodynamics(World Scientific, Singapore,
2001).9. M. Schmidt, R. Kusche, T. Hippler, J. Donges, W. Kronmuller, B. von Issendorff, and
H. Haberland, Phys. Rev. Lett.86, 1191 (2001).
171


Algorithmic Refinements to an EnhancedPoisson-Boltzmann Approach Used in BioMolecular
Simulation
Parimal Kar 1, Max Seel1, Ulrich H. E. Hansmann1,2, and Siegfried Hofinger1
1 Michigan Technological University,Department of Physics,
1400 Townsend Drive, 49931 Houghton, MI, USAE-mail: [pkar, seel, hansmann, shoefing]@mtu.edu
2 John von Neumann Institute for Computing, FZ Julich52425 Julich, Germany
E-mail: [email protected]
In a series of recent publications we have introduced a very general description of solvationfor biomolecular structure. It was shown that the enhanced continuum electrostatics approachcan be decomposed into a series of individual terms, each of them representing its own portionof distinct physical interaction. Care has been taken to operate the model at conditions thatguaranteed a maximum level of numerical accuracy. However,a number of internal parametersstill need to be optimized further in order to speed up the procedure. Among these factors arei) the exact value of the exit criterion used to terminate thecalculation, ii) the array dimensionregulating the allowed number of consecutive DIIS steps, iii) the switch criterion used to movefrom the pre-DIIS stage to the DIIS stage, iv) the dependenceon system size of the numberof necessary iterations to achieve convergence, v) the dependence on renormalization factorsapplied to the net sum of polarization charges, vi) the influence of very small-sized boundaryelements, or the introduced change when merging these very small-sized elements to largerones from the neighborhood, and vii) the surface resolutionnecessary to calculate the disper-sion term. Therefore in this present study we want to addressthese points and examine theirconsequences on run-time performance. A series of ten proteins of increasing size will be usedas a testbed.
1 Introduction
Biological molecules typically reside in aqueous environments. Reliable consideration ofthe effect of water on structure and dynamics of biomolecules is among the key factorsgoverning accurate descriptions of biological matter1. Here we focus on an implicit sol-vation model. Among other methods, e.g. SASA, GB, FDPB, the Poisson - Boltzmann(PB) approach2 within the Boundary Element Method (BEM)3 is frequently chosen due toits intermediate position regarding computational cost versus achievable accuracy. In ourrecent series of publications4, 5 we have outlined a generalization of the Polarizable Con-tinuum Model (PCM)6 applied to biomolecular structure. Each of the considered termsrepresents a separate portion of distinct physical interaction,
∆Gsol = ∆Gpol + ∆Gdisp,rep + ∆Gcav (1)
which are polarization, dispersion and cavitation. The latter plays an important role in hy-drophobicity related phenomena7. Care has been taken to operate the model at conditions
173

that guaranteed a maximum level of numerical accuracy. However, a number of internalparameters could still profit from further optimization.
2 Methods
2.1 Aims
In this present study, we address the following factors and examine their consequences onrun-time performance with regard to a series of test proteins of increasing size that we havestudied earlier5, (i) the exact value of the exit criterion used to terminate the calculation ofthe polarization term,∆ Gpol, (ii) the array dimension regulating the allowed number ofconsecutive DIIS8 steps, (iii) the switch criterion used to move from the pre-DIIS stage tothe DIIS stage, (iv) the dependence on system size of the number of necessary iterations toachieve convergence, (v) the dependence on renormalization factors applied to the net sumof polarization charges, (vi) the influence of very small-sized boundary elements (BEs), orthe introduced change when merging these very small-sized elements to larger ones fromthe neighborhood, (vii) the necessary degree of surface resolution for accurate calculationof the dispersion term,∆ Gdisp.
2.2 Procedure
We select 10 proteins of different size ( number of residues reaching from 41 to 430 ).Initially we run the PB/BEM program POLCH9 at default conditions. The run time forall the 10 cases is recorded and forms a reference set. At first, we adjust the parameterMAXNIT which defines the maximum number of successive DIIS steps, hence determinesthe size of the DIIS matrix, and compute the run time deviation from the reference set forall the 10 proteins. Once parameter MAXNIT is optimized, we rerun the entire test set andextract net solvation free energies,∆ Gsol, which serve as a new reference. ACCURA is thesecond parameter to be optimized. It defines the threshold criterion used for terminationof the iterative process when computing the polarization term, ∆ Gpol. For optimizingACCURA we require the deviation from the reference set not toexceed± 0.05 kcal/molfor any of the proteins. Once ACCURA is optimized we redo the whole set of test proteinsat optimized conditions for either parameter, ACCURA as well as MAXNIT. We extractthe number of iterations needed for completion and use theseas a new reference. In ournext step we optimize the parameter DSNTRC. This parameter sets the switch criterionused to move from a pre-DIIS stage to the DIIS stage. It represents the mean squaredeviation of two successive sets of polarization charges. We keep changing DSNTRCand optimize for a minimum number of necessary iterations. The next point is concernedwith renormalization of the polarization charges according to Gauss’ Law. We study theeffect this has on net solvation free energies. The solvation free energies obtained afterrenormalization form another reference set for our next investigation. Here, we study theinfluence of very small-sized BEs. We will merge these very small-sized elements to largerones from the neighborhood. We change the parameter REQSZ (the required miniumsize of a BE) and compute the deviation of solvation free energies from the reference set.We again do not allow the energy to change more than by± 0.05 kcal/mol in all testruns. Finally, we use all previously optimized parameters for a final test focusing on the
174

Protein No. Molecular No. ∆ Gsol ∆ Gsol ∆ Gsol
PDB of Charge of Without Including DeviationCode Res. (a.u.) Iter. Normalization Normalization (unsigned)
(kcal/mol) (kcal/mol) (kcal/mol)
1P9GA 41 +3 9 -319.73 -321.54 1.812B97 70 +2 8 -40.22 -39.26 0.961LNI 96 -5 10 -534.64 -536.39 1.751NKI 134 +5 10 -456.20 -454.94 1.261EB6 177 -11 10 -1224.17 -122.75 1.421G66 207 -2 9 -118.26 -119.01 0.751P1X 250 +3 11 -636.41 -636.41 0.001RTQ 297 -16 11 -1998.72 -2011.23 12.511YQS 345 +2 11 -217.22 -217.22 0.041GPI 430 -12 12 -1259.54 -1271.59 12.05
Figure 1. Numerical sensitivity of the employed enhanced Poisson-Boltzmann approach to the threshold criterionused for termination of the iterative sequence to calculatethe polarization term,∆Gpol. A series of 10 proteinsis tested and the threshold criterion is varied between 1.0x10⁻⁶ and 8.0x10⁻⁶. When requiring the results to benumerically accurate at least up to the first digit behind thedecimal point, ie allowing fluctuations< ±0.05 (lightblue patches on the surface) then the optimal value for this termination criterion is identified as 4.0x10⁻⁶.
dispersion term. We change the resolution of the boundary used for calculation of∆ Gdisp
which need not be maintained at such rigorous levels as identified for the polarizationterm4.
175

3 Results and Conclusions
Sensitivity to total system size, total charge and renormalization attempts is represented inTable 3. Variation of the termination criterion is graphically represented in Figure 1. Insummary we find that the following parameters lead to a reasonable degree of numericalaccuracy. (1) Best performance is achieved when the DIIS matrix is dimensioned 7x7, (2)Using a threshold criterion of 4.0x10⁻⁶ for termination of the iterative sequence occurringin ∆Gpol computation leads to stable numerical results. (3) The bestswitch criterionto move from the pre-DIIS stage to the DIIS stage is given whenthe root mean squaredeviation between two successive sets of polarization charges falls below 0.05 a.u. (4) Thenumber of iterations necessary to achieve convergence doesnot depend on system size.(5) A renormalization process will affect the net solvationfree energies,∆Gsol, on theorder of± 1-2 % of their total values. Systems with large net charges are more sensitive torenormalization. (6) If we merge small sized BEs to larger ones then no significant changeswill occur when this procedure is limited to elements smaller than 8 % of the mean size(0.31 A2). A reduction in number of BEs will lower the computational cost and fosternumerical stability. (7) For calculation of the dispersionterm,∆Gdisp, we can reduce thediscretization of the boundary into BEs of average size 0.45A2 without loss of accuracy.
Acknowledgments
This work was supported in part by the National Institutes ofHealth Grant GM62838.
References
1. B. Honig, A. Nicholls,Classical electrostatics in biology and chemistry, Science268,1144–1149, 1995.
2. J. Warwicker, H. C. Watson,Calculation of the electric potential in the active sitecleft due to alpha-helix dipoles, J. Mol. Biol. 157, 671–679, 1982.
3. R. J. Zauhar, R. S. Morgan,A new method for computing the macromolecular electricpotential, J. Mol. Biol. 186, 815–820, 1985.
4. P. Kar, Y. Wei, U. H. E. Hansmann, S. Hofinger,Systematic Study of the BoundaryComposition in Poisson Boltzmann Calculations, J. Comput. Chem., in press, 2007.
5. P. Kar, M. Seel, U. H. E. Hansmann, S. Hofinger,Dispersion Terms and Analysis ofSize- and Charge-Dependence in an Enhanced Poisson-Boltzmann Approach, submit-ted, 2007.
6. J. Tomasi, B. Mennucci, R. Cammi,Quantum Mechanical Continuum Solvation Mod-els, Chem. Rev.105, 2999–3094, 2005.
7. M. Makowski, A. Liwo, H. A. Scheraga,Simple physicsbased analytical formulas forthe potentials of mean force for the interaction of amino acid side chains in water.I.Approximate expression for the free energy of hydrophobic association based on aGaussian overlap modelJ. Phys. Chem. B111, pp 2910–2916, 2007.
8. P. Pulay,Convergence acceleration of iterative sequences. The caseof scf iteration,Chem. Phys. Lett.73, 393–398, 1980.
9. S. Hofinger,Solving the Poisson-Boltzmann Equation with the Specialized ComputerChip MD-GRAPE-2, J. Comp. Chem.26, 1148–1154, 2005.
176

Aggregation of the Amyloid-β Protein: Monte CarloOptimization Study
Srinivasa M. Gopal, Konstantin V. Klenin, and Wolfgang Wenzel
Institut fur Nanotechnologie,Forschungszentrum Karlsruhe, 76021 Karlsruhe, Germany
E-mail: gopal, klenin, [email protected]
The free-energy approach has delivered promising results for protein folding and structure pre-diction in recent years. The native state is found as the global minimum of an all-atom free-energy forcefield. Now, we used this approach to simulate theaggregation of Aβ fragment16-22. This aggregation is believed to be associated with the Alzheimer’s disease. The modelsystem contained 2 polypeptide chains. The obtained structures of the aggregates consisted ofeither parallel or anti-parallelβ-sheets, the latter were preferable.
1 Introduction
The Alzheimer’s disease is associated with misfolding of the amyloid protein. In the func-tional native form, this small protein, of 42 amino acids, has globular structure with twoα-helices. However, under certain conditions, it can form aggregates ofβ-sheets that, ona larger scale, are arranged as long insoluble fibrils3. The resulting fibrils have toxic ef-fects in the extracellular space of the brain of patients with the Alzheimer’s disease. Theamyloid protein in this form is known as Aβ peptide.
This protein has been extensively studied by both experimental and computationalmethods8, 7. The experimental techniques such as solid-state NMR, X-diffraction and elec-tron microscopy were used for characterizing the structureof aggregates8. Most of thecomputational studies were focused on short polypeptide fragments of this protein, suchasLY S16 −LEU − VAL − PHE − PHE − ALA−GLU22
4. This fragment is believedto play a key role in the formation of the aggregates. In the present work, we study thesystems of one and two chains of Aβ16−22 peptide2.
2 Methods and Results
The free-energy approach has delivered promising results for protein folding and structureprediction in recent years. Following Anfisen’s hypothesis1 the native state is postulated tobe the global minimum of a all-atom free-energy function. This minimum can be found byoptimization methods9 including the Monte Carlo procedure. This approach was success-fully used to foldα-, β- and mixed proteins of moderate length10, 12, 5.
This approach requires an accurate, transferable protein free-energy forcefield. In thisstudy we used Protein Force Field (PFF02)6, 11. In our model, all the atoms are explicitlyrepresented (the apolar group CHn is considered as a single atom). The bond angles andthe bond lengths are fixed. The degrees of freedom consideredare the backbone (ψ, φ) andthe sidechain (χi) dihedral angles.
177

Figure 1. Left: The lowest energy structure is an anti-parallelβ-sheet. The polar contacts between side-chainatoms N ofLY S16 and O ofGLU22 are shown explicitly. Right: The energy of the best parallelβ-sheetstructure is higher by 10 kcal/mol.
The energy function contains the following terms: (1) the standard Lennard-Jones po-tential, (2) the Coulomb energy of electrotatic interaction with group specific dielectricconstants, (3) a term for the hydrogen bonding, (4) a SASA-based solvation term that im-plicitly takes into account the influence of the solvent. We used several optimization meth-ods used to find the global minimum of the energy function: (1)basin hopping technique(BHT), (2) parallel tempering, and (3) evolutionary strategies9.
Recently, our protein simulation package, POEM, has been modified to treat multiplepolypeptide chains. In the present study, we simulated the systems of one and two chainsof Aβ16−22 using a modified version of BHT12. In the simulations of a single chain, nospecific unique structure was formed, in agreement with the earlier studies4. In contrast,the system of two chains formed an anti-parallelβ-sheet in most of the cases. The lowestenergy structure is shown in Fig. 1. The main reason for the antiparallel orientation hasbeen much debated in the literature, the two options being the salt bridges7 and the efficientsidechain packing4.
Analysis of the simulations shows the overwhelming preference for the anti-parallelorientation. The free energy surface of the two-chain system is presented in Fig. 2. Thelowest energy structures are the anti-parallelβ-sheets. However, in the simulations theparallel orientation was also observed. The parallelβ-structure with the lowest energy isshown in Fig. 1. The anti-parallel orientation is stabilized by the efficient sidechain packingas well as by the polar interactions between the sidechains of LY S16 andGLU22.
Acknowledgments
We thank the BMBF, the Deutsche Forschungsgemeinschaft (grants WE 1863/10-2,WE1863/14-1) and the Kurt Eberhard Bode Stiftung for financialsupport. We are gratefulto S. Gregurick and J. Moult for parts of code that was used in our simulations. We arethankful to the Barcelona Supercomputer Center for computational resources.
178

0 2 4 6 8 10-1.0
-0.8
-0.6
-0.4
-0.2
0.0
0.2
0.4
0.6
0.8
1.0
Energy, kcal/mol
N
cos
-18.00
-12.57
-7.143
-1.714
3.714
9.143
14.57
18.00
Figure 2. The free energy surface of the two-chain system. The co-ordinates are the number N of the residues intheβ-conformation and the cosine of the angleθ between the two end-to-end vectors.
References
1. C. B. Anfinsen,Principles that govern the Folding of Protein Chains, Science181,223, 1973.
2. J. J. Balbach and Y. Ishii and O. N. Antzutkin and R. D. Leapman and N. W. Rizzoand F. Dyda and J. Reed and R. Tycko,Amyloid fibril formation by A beta 16-22, aseven-residue fragment of the Alzheimer’s beta-amyloid peptide, and structural char-acterization by solid state NMR, Biochemistry39, 13748, 2000.
3. C. M. Dobson,The structural basis of protein folding and its links with human dis-ease, Phil. Trans. R. Soc. Lond. B356, 133, 2001.
4. G. Favrin and A. Irback and S. Mohanty,Oligomerization of amyloid Aβ16−22 pep-tides using hydrogen bonds and hydrophobicity forces, Biophysical Journal87, 3657,2004.
5. S. M. Gopal and W. Wenzel,De Novo Folding of the DNA-Binding ATF-2 Zinc FingerMotif in an All-Atom Free-Energy Forcefield, Angew. Chemie Int.45, 7726, 2006.
6. T. Herges and W. Wenzel,An All-Atom Force Field for Tertiary Structure Predictionof Helical Proteins, Biophysical Journal87, 3100, 2004.
7. D. K. Klimov and D. Thirumalai,Dissecting the assemble ofAβ16−22 amyloid pep-tides into antiparallelβ sheets, Structure11, 295, 2003.
8. T. Luhrs and C. Ritter and M. Adrian and D. Riek-Loher and B. Bohrmann and H.Dobeli and D. Schubert and R. Riek,3D structure of Alzheimer’s amyloid-beta(1-42)fibrils, Proc. Nat. Acad. Sci.102, 17342, 2005.
9. A. Schug, A. Verma, W. Wenzel, and G. Schoen,Biomolecular structure prediction
179

with stochastic optimization methods, Adv. Eng. Materials7, 1005, 2005.10. A. Verma and S. Murthy and K. H. Lee and E. Starikov and W. Wenzel,De novo all
atom folding of helical proteins, NIC Series34, 45, 2006.11. A. Verma and W. Wenzel,Towards a universal Free Energy Forcefield for All atom
Protein Folding, (Submited) 2007.12. W. Wenzel,Predictive folding of aβ hairpin in an all-atom free-energy model, Euro-
phys. Letters76, 156, 2006.
180

Analysis and Optimization of the Flex-Screen DockingApproach Using DUD Benchmarking Database
Daria Kokh 1, Bernhard Fischer2, and Wolfgang Wenzel2
1 FB.C - Mathematik und Naturwissenschaften,Bergische Universitat Wuppertal, 42097 Wuppertal, Germany
E-mail: [email protected]
2 Institut fur Nanotechnologie, Forschungszentrum Karlsruhe, GmbH,Postfach 3640, 76021 Karlsruhe, Germany
E-mail: bernhard.fischer, [email protected]
Screening performance of the all-atom Flex-Screen dockingapproach including receptor flexi-bility is investigated by using of a ”directory of useful decoys”, DUD. DUD is a bias-correctedbenchmarking database based on 40 different target proteins, where each receptor is associatedwith a native ligand, a set of annotated ligands, and a set of decoy molecules that are unlikely tobe binders. The docking performance is evaluated using two criteria: 1) geometrical fidelity ofthe docked poses compared to those of the experimental structures; 2) enrichment of annotatedligands among their decoys, which shows the ability of the docking calculations to distinct be-tween true positives and nonbinder molecules with the same physical properties. Based on theseresults the scoring function and the receptor side-chain rearrangement procedure are optimized.
1 Method
FlexScreen1 is an all-atom docking approach based on the stochastic tunneling methodof the energy minimization and a simple atomistic scoring function that contains a sumof the Van-der-Waals, electrostatic, hydrogen-bond and salvation energies. The VdW andhydrogen-bond parameters are taken from OPLSAA2 and AutoDock3, respectively, thepartial charges of the receptors are computed with MOE, and the atomic salvation param-eters are optimized as described below. The method enables rotation up to 15 side-chainbonds of the receptor.Scoring performance of the Flex-Screen approach is benchmarked by using of the DUDdatabase4 based on 40 target proteins of different classes with available ligand-bound X-ray crystal structures. For each protein the database includes: 1) crystal structures of thereceptor and its native ligand; 2) a set of the annotated ligands that should in principle dockwell (15-450 molecules); 3) a set of the decoys (about 36 molecules for each annotated lig-and) that resemble the particular ligand in physical properties, but differ from the ligandtopologically, so that they are likely to be nonbinders.
2 Results
2.1 Optimization of the Salvation Energy Parameters
Salvation energy is described as a sum of energies for the individual atoms that are assumedto be proportional to the solvent accessible surface area and atomic salvation parameter,ASP5. All atoms are divided into two groups: those responsible for 1) hydrophobic and
181

0.0 0.5 1.0 1.5
0.0
0.2
0.4
0.6
0.8
1.0
RM
S(w
ith
solv
ent)
/nm
RMS /nm(without solvent)
Figure 1. RMS deviation of the docked poses from the crystal ones for optimized ASPs versus the same valuescomputed without salvation energy. 40 protein-ligand structures are included.
b
-100 0E /kJ/mol
-100 0-200 -100 00.0
0.1
0.2
0.3
0.4
0.5
%
a c
Figure 2. Distributions of annotated ligands in percentage(solid lines) and decoys (dashed lines) of the androgenreceptor plotted as a function on their binding energies: (a) receptor is rigid; (b) 10 receptor side chains areflexible; (c) 15 receptor residues are shifted by 0.5 nm away from the cavity centre.
2) hydrophilic effects, so that only two ASPs have to be optimized. As an optimizationcriterion we use the sum of the RMS deviations of the docked conformations of the nativeligands from the experimental ones.Inclusion of the salvation energy in the scoring function ingeneral improves docking posesfor most of the ligands (see Fig.1), although some of them (10%) fail to find correct con-formation regardless salvation effects and, therefore, need additional analysis.
2.2 Receptor Side Chain Rearrangement
Docking screen of the annotated ligand sets has shown that insome cases binding modecannot be found because of high-energy clashes between protein and ligand atoms arisingfrom the VdW term. To improve docking efficiency we enable receptor rearrangementby using of two approaches:1) rotation of up to 15 receptor side-chain bonds, 2) shift (byabout 0.25-0.5 nm) of the receptor residues that are involved in clashes away from thebinding pocket centre. Fig.2 demonstrates how both methodsinfluence docking efficiencyof annotated ligands and their decoys.It is important to note, that receptor flexibility either improves or at least does not changescoring performance of the docking method. Although both approaches help to reducea number of nondocking ligands and increase absolute value of the binding energy, thesecond method has been found to be usually more effective andnotably less expensive.
182

-150 -100 -50 00.0
0.5
1.0
1.5
(EF)-
1EH-b / kJ/mol
Figure 3. EF−1 for 28 receptors plotted as a function of the average energy of hydrogen bonds formed bydocked ligands.
2.3 Enrichment of Annotated Ligands Among their Own Decoys
Efficiency of the docking method selectivity is estimated bycomputing of the inverse en-richment factor,EF−1, for each receptor, described as a relation of the top-scoring decoysto the top-scoring annotated ligands (expressed as a percentage of the total number of thedecoys and ligands, respectively). ”top-scoring” molecule means that the absolute value ofits binding energy is larger than at least 80% of that for the corresponding native ligand. Asmall value ofEF−1 shows that annotated ligands dock notably better than theirdecoysfor the particular receptor, whereasEF−1 > 1 indicates that the docking approach cannotdistinguish between molecules with similar physical but different chemical properties.Docking results of the preliminary calculations without salvation effects, summarized inFig.3, indicate that: 1) the screening performance of the method is quite effective for about70% of the targets, and 2) the docking efficiency depends strongly on the hydrogen-bondenergy, e.g. essentially all molecules can find appropriatebinding mode by unspecific in-teraction. Since most of the receptors with large value ofEF−1 have open binding pock-ets, we expect that inclusion of the salvation energy in the scoring function will improvedocking performance in these cases. These calculations arein progress.
References
1. H. Merlitz and W. Wenzel,High Throughput in-silico Screening against Flexible Pro-tein Receptors, Lecture Notes in Computer Science465, 3045, 2004.
2. W. L. Jorgensen and N. A. McDonald,Development of an all-atomic force field forheterocycles properties of liquid pyridine and diazenes, J. Mol. Struct. 424, 145,1997.
3. G. M. Morris, D. S. Goodsell, R. Halliday, R. Huey, W. E. Hart, R. K. Belew, and A. J.Olson,Automated docking using a Lamarckian genetic algorithm andan empiricalbinding energy function, J. Comptut. Chem.19, 1639, 1998.
4. N. Huang, B. K. Shoichet, and J. J. IrwinBenchmark sets for molecular docking,J. Med. Chem.49, 6789-6801, 2006.http://blaster.docking.org/dud/
5. D. Eisenberg and A. D. McLachlan,Comparison of of stochastic optimization meth-ods for receptor-ligand docking, Nature 319, 199-203, 1986.
183


Folding and Structure Prediction of Proteins ContainingDisulfide Bridges
Ivan Kondov1, Abhinav Verma2, and Wolfgang Wenzel2
1 Institute for Scientific Computing, Forschungszentrum Karlsruhe,Hermann-von-Helmholtz-Platz 1, 76344 Eggenstein-Leopoldshafen, Germany
E-mail: [email protected]
2 Institute for Nanotechnology, Forschungszentrum Karlsruhe,Hermann-von-Helmholtz-Platz 1, 76344 Eggenstein-Leopoldshafen, Germany
A computational study of the proteins 1KVG and 1WQE containing disulfide bridges is pre-sented. The simulation method bases on the protein force field PFF02 and the basin hoppingtechnique. Both proteins were folded correctly from extended conformations with inclusion ofa constraining potential.
1 Introduction
Computational prediction of tertiary structure of proteins with high accuracy on the basisof the primary structure requires development of transferable protein force fields as wellas powerful optimization methods. Particularly, proteinswith disulfide bridges connect-ing cysteine residues represent a major challenge for computational biophysics. Recently,plenty of proteins have been folded to their native conformations within experimental reso-lution using all-atom protein force fields and stochastic optimization methods1–3. However,there are only few works that study the folding behavior of proteins with disulfide bonds,e.g., by means of molecular dynamics4, 5, conformational space annealing with a united-residue force field6, lattice models7, topology-based approach8, distance geometry9, neuralnetworks10 and the island model11. In this paper, we report results of protein folding sim-ulations for proteins containing disulfide bridges: theβ-hairpin 1KVG and the potassiumchannel blocker 1WQE. In particular, we will focus on an approach with inclusion of ad-ditional binding potential to the free energy of the protein.
2 Methods
All-atom force fields PFF011, 2 and PFF0212 have been developed recently to describe theinternal free energy of proteins. Besidesα-helical proteins, the PFF02 enables correctdescription ofβ-sheet regions and allows unbiased comparison of results for proteins ofthe two types. To search for the free energy minimum, corresponding to the protein nativeconformation, the basin hopping technique is employed as outlined in previous work3.
To promote formation of disulfide bridges a constraining Morse potentialVSS(r) = −E0
[
(1 − e−β(r−r0))2 − 1]
was considered, wherer0 is the equilibrium dis-tance between the sulfur atoms of cysteine residues forminga disulfide bridge,E0 is theenergy corresponding tor0, andβ is the spacial extent of the potential. The choice ofMorse potential is motivated by the fact that disulfide bridges are covalent bonds. In whatfollows, r0 = 2 A andβ = 1 A
−1.
185

Figure 1. Cartoons of the folded proteins 1KVG (left) and 1WQE (right), shown in green, superimposed on thecorresponding native structures shown in cyan. Sulfur atoms of cysteine residues forming disulfide bridges aredepicted as spheres in golden color.
3 Results and Discussion
Simulations of thirty independent runs were performed for different values forE0 startingfrom the extended structure, i.e. all backbone dihedral angles were set to 180. Predictionaccuracy of the results was assessed by comparing the simulated structures with naturalstructures determined by NMR. This comparison can be visualized overlaying the simu-lated structure on the reference, as shown in Fig. 1. In addition, the root mean squaredeviation of the backbone (RMSDb), the disulfide bond lengths and secondary structurecontents are summarized in Table 1.
Theα-helical 1WQE could be folded correctly to near-native conformations with andwithout constraining potential. However, the use of constraints increases the efficiencyof the stochastic search for the global minimum significantly13. The other protein, 1KVG,could be folded to native conformation only in presence of the constraining potential. Turn-ing off the constraints, the simulation of 1KVG ends up in allruns with an unstructuredcoil conformation. As can be seen in Table 1 the inclusion of constraining potential sta-bilizes the nativeβ-sheet structure. For both proteins, the larger values forE0 tighten thedisulfide bonds while smaller values yield better overall structure.
4 Concluding Remarks
A constraining Morse potential was adopted to take into account disulfide bonds in pro-teins. For all proteins studied, inclusion of the constraining potential resulted in improved
186
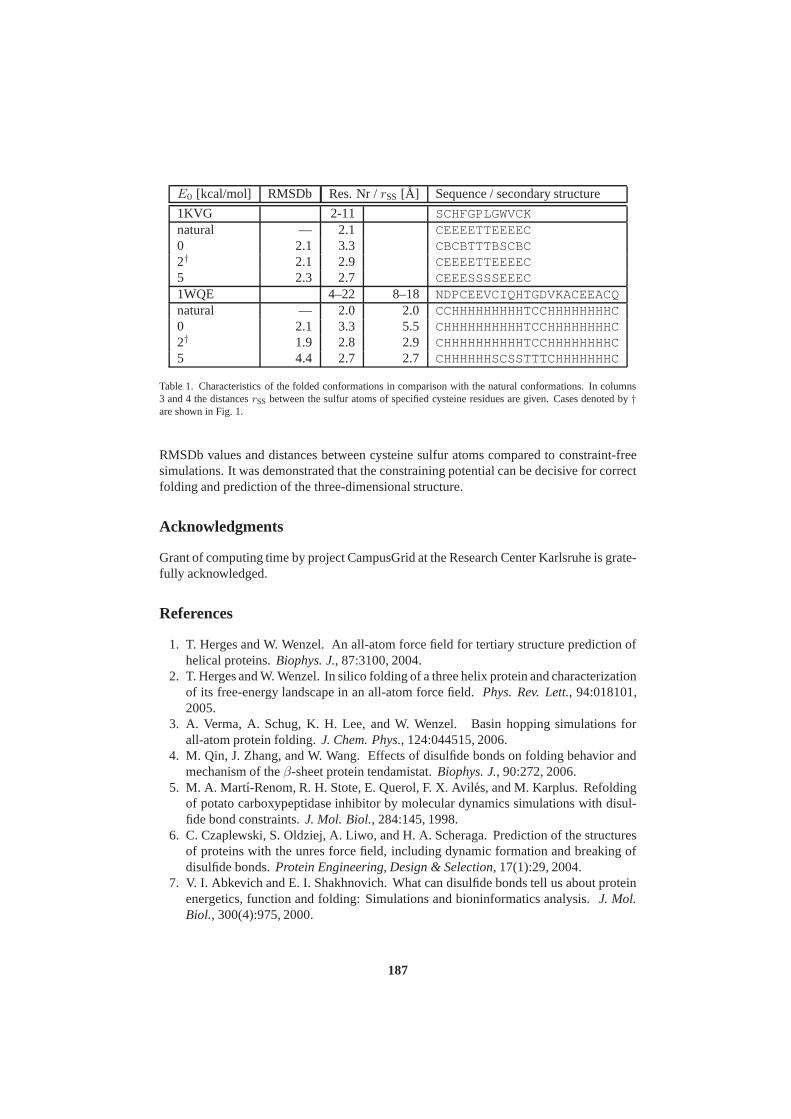
E0 [kcal/mol] RMSDb Res. Nr /rSS [A] Sequence / secondary structure
1KVG 2-11 SCHFGPLGWVCKnatural — 2.1 CEEEETTEEEEC0 2.1 3.3 CBCBTTTBSCBC2† 2.1 2.9 CEEEETTEEEEC5 2.3 2.7 CEEESSSSEEEC1WQE 4–22 8–18 NDPCEEVCIQHTGDVKACEEACQnatural — 2.0 2.0 CCHHHHHHHHHTCCHHHHHHHHC0 2.1 3.3 5.5 CHHHHHHHHHHTCCHHHHHHHHC2† 1.9 2.8 2.9 CHHHHHHHHHHTCCHHHHHHHHC5 4.4 2.7 2.7 CHHHHHHSCSSTTTCHHHHHHHC
Table 1. Characteristics of the folded conformations in comparison with the natural conformations. In columns3 and 4 the distancesrSS between the sulfur atoms of specified cysteine residues are given. Cases denoted by†are shown in Fig. 1.
RMSDb values and distances between cysteine sulfur atoms compared to constraint-freesimulations. It was demonstrated that the constraining potential can be decisive for correctfolding and prediction of the three-dimensional structure.
Acknowledgments
Grant of computing time by project CampusGrid at the Research Center Karlsruhe is grate-fully acknowledged.
References
1. T. Herges and W. Wenzel. An all-atom force field for tertiary structure prediction ofhelical proteins.Biophys. J., 87:3100, 2004.
2. T. Herges and W. Wenzel. In silico folding of a three helix protein and characterizationof its free-energy landscape in an all-atom force field.Phys. Rev. Lett., 94:018101,2005.
3. A. Verma, A. Schug, K. H. Lee, and W. Wenzel. Basin hopping simulations forall-atom protein folding.J. Chem. Phys., 124:044515, 2006.
4. M. Qin, J. Zhang, and W. Wang. Effects of disulfide bonds on folding behavior andmechanism of theβ-sheet protein tendamistat.Biophys. J., 90:272, 2006.
5. M. A. Martı-Renom, R. H. Stote, E. Querol, F. X. Aviles, and M. Karplus. Refoldingof potato carboxypeptidase inhibitor by molecular dynamics simulations with disul-fide bond constraints.J. Mol. Biol., 284:145, 1998.
6. C. Czaplewski, S. Oldziej, A. Liwo, and H. A. Scheraga. Prediction of the structuresof proteins with the unres force field, including dynamic formation and breaking ofdisulfide bonds.Protein Engineering, Design & Selection, 17(1):29, 2004.
7. V. I. Abkevich and E. I. Shakhnovich. What can disulfide bonds tell us about proteinenergetics, function and folding: Simulations and bioninformatics analysis.J. Mol.Biol., 300(4):975, 2000.
187

8. C. Micheletti, V. de Filippis, A. Maritan, and F. Seno. Elucidation of the disulfide-folding pathway of hirudin by a topology-based approach.Proteins, 53:720, 2003.
9. E. S. Huang, R. Samudrala, and J. W. Ponder. Ab initio fold prediction of smallhelical proteins using distance geometry and knowledge-based scoring functions.J.Mol. Biol., 290(1-2):267, 1999.
10. S. M. Muskal, S. R. Holbrook, and S.-H. Kim. Prediction ofthe disulfide-bondingstate of cysteine in proteins.Protein Eng., 3(8):667, 1990.
11. Y. Kobayashi, I. Sasabe, T. Akutsu, and N. Saito. Mechanism of protein folding.iv. forming and breaking of disulfide bonds in bovine pancreatic tripsin inhibitor.Biophys. Chem., 44:113, 1992.
12. A. Verma and W. Wenzel. Towards a universal free-energy approach for all-atomprotein folding and structure prediction. Submitted.
13. I. Kondov, A. Verma, and W. Wenzel. In preparation.
188

DNA Packaging and Electrostatic Interactions
Nikolay Korolev and Lars Nordenskiold
School of Biological Sciences, Nanyang Technological University,60 Nanyang Drive, 637551 Singapore
E-mail: [email protected]
In cell nucleus, all DNA exists as a highly packed nucleoprotein complex called chromatin.DNA is highly negatively charged polyelectrolyte and as consequence DNA-DNA repulsionmust be overcome to form chromatin. The first level of DNA packaging is the nucleosome coreparticle (NCP), composed of 150 bp of DNA wrapped around a histone octamer core and flexi-ble positively N-terminal domains (histone tails) protruding out from the NCP. Linear arrays ofthe NCP are further folded into higher level chromatin structures with the histone tails playingimportant roles in their formation. Theoretical models from Poisson Boltzmann (PB) approxi-mation to all-atom molecular dynamics simulations are usedto describe chromatin/nucleosomestatics and dynamics. Applying the PB theory we show that free energy of NCP formation isextremely favorable that challenges established opinion about marginal stability of the NCP. Todescribe the influence of the histone tails on aggregation and dynamics of the NCPs, we carriedout molecular dynamics simulations with coarse-grained approximation of the NCP. Our resultsare in good agreement with experimental neutron scatteringand X-ray diffraction data. To re-veal molecular details of the histone tail-DNA binding and dynamics, all-atom MD simulationswere undertaken in a system comprising several DNA oligomers and fragments of the histonetails. Correlation between DNA-DNA distance and binding the histone tails to DNA is clearlyobserved. At the same time, binding of the tails does not restrict internal dynamics of the DNA.
In eukaryotic cell, long DNA (roughly 2 m in humans) is packedabout 400,000 timesinside a cell nucleus of 10-20µm in diameter. DNA packaging is performed by nuclearproteins and this specific nucleoprotein complex called chromatin performs contradictoryfunctions keeping DNA compact and protected while remaining selectively accessible anddynamic. About 85% of DNA in chromatin is represented by uniform units, the nucleo-somes, which are the complex of 160-230 base pairs (bp) of DNAdouble helix with fivehistone proteins (H2A, H2B, H3, H4, and H1). The most regularcentral part of the nucle-osome is called the nucleosome core particle (NCP) and consists of 147 bp DNA wrappedas a 1.75 turn superhelix around the histone octamer formed from one (H3/H4)2 tetramerand two H2A/H2B dimers.1, 2 Variable length (10-80 bp) of the DNA (called linker DNA)connects the NCPs to each other and binds to the linker histone H1. Linear arrays of theNCP are further folded into higher level chromatin structures with the histone tails playingimportant roles in their formation. The histones are responsible for the first step of DNAcompaction in chromatin and pose a major obstacle for directaccess to the DNA of pro-teins responsible for DNA replication, transcription, repair, and recombination. Variablelength double stranded linker DNA connects the NCPs with each other to form nucleoso-mal arrays which condense into the 30-nm chromatin fibers.3, 4 Each of the core histoneshas unstructured N-terminal domain called “histone tail” protruding through the DNA su-perhelix. The tails are able to interact with DNA of the NCP, linker DNA and varietyof nuclear proteins. The structure of the histone tails largely escapes detection by X raycrystallography and by other experimental methods, implying that they are highly flexibleand dynamic. The histone tails are essential for maintenance of the higher order compactfolded structures of chromatin and for regulation of transcription and replication.2, 5 These
189

functions of the histone tails are regulated by covalent modifications of the amino acids,which may change the net charge and distribution of the charged groups in the tails.
DNA is highly negatively charged polyelectrolyte and therefore huge repulsive forcebetween the DNA molecules must be overcome to form chromatin. Positively chargedamino acids Lys+ and Arg+ of the “histone-fold” domains form a distinct charged surfacewhich direct DNA wrapping in the NCP. The histone tails are highly basic. One mightimagine that huge forces of electrostatic origin are involved in all transitions of chromatin.However, the role of electrostatic interactions contributing to chromatin/nucleosome struc-ture and dynamics, has received less attention compared to the other phenomena (e.g. DNAbending properties, topological problems related to the DNA unwinding and twisting). Ourwork analyses and models contribution of electrostatic forces to formation of the nucleo-some and ability of the nucleosomes to aggregate and mediation of the charged groups ofthe histone tails in close DNA-DNA contacts.
1 Estimation of the NCP Stability Using Poisson BoltzmannPolyelectrolyte Model
In the process of unwrapping DNA from histones two strongly charged polyelectrolyte en-tities are formed: the negatively charged DNA and positively charged histone core. Elec-trostatic interactions arising in such a case must have a profound influence on the courseof whole process and on equilibrium between the two phases. In a single-molecule ex-periments,6, 7 the electrostatic forces resist the detachment of the DNA from the histonesduring the single-chromatin fiber stretching under the influence of a mechanical pullingforce. The degree of this resistance is dependent not only onthe strength of the individ-ual histone core – DNA contacts but also on the ionic conditions in the solution as wellas on the balance between the positively and negatively charged groups in the chromatin.Other important contributions to the detachment process, the mechanical bending forceand specific short-range DNA-histone interactions, are notdependent on the ionic condi-tions. Despite the fact that the electrostatic interactions must have a significant influenceon DNA unwrapping, their role is rarely discussed in the literature. Recently, we ana-lyze the electrostatic component of the DNA-histone interactions within the NCP.8, 9 Usingthe mean theory (Poisson Boltzmann) approximation, the contribution of the electrostaticforces to a formation of the elementary structural unit of chromatin, the nucleosome wasestimated. Results of the modeling were discussed in relation to the recent DNA stretchingexperiments.6, 7
Figure 1 shows contribution of the electrostatic forces involved in gradual removal ofthe DNA from the histone proteins in chromatin.8, 9 Results from the PB theory challengean established opinion that the free energy of the NCP formation is small and that the forcesrelated to the bending of the DNA double helix plays make the major contribution to theNCP energetics. Instead, calculations within the PB model reveal that of the electrostaticfree energy of the NCP formation is extremely favorable (seeFig. 1). Remarkably, sim-ple polyelectrolyte model is in a semi-quantitative agreement with recent optical tweezersstretching experiments measuring the force necessary to unwrap DNA from the histonecore.6, 7 Our analysis shows that the electrostatic interactions between the highly nega-tively charged polymeric DNA and the positively charged histones play a determining rolein stabilizing the nucleosomes at physiological conditions.
190

Figure 1. (A) Estimation of electrostatic free energy of theNCP dissociation. Degree of the nucleosome unwind-ing (abscissa) is measured as change of the total charge of the NCP (histone octamer + bound DNA). Dash-dottedline shows the free energy contribution from DNA, released from the octamer; dotted line is the electrostaticfree energy of the NCP, approximated as a sphere of 50A radius; solid line is a sum of the two terms. Verticalbar shows the position when one full turn of DNA is wrapped around the histone core. PB cell model has beenapplied with conditions modeling chromatin stretching experiments. Vertical bars 1-3 are estimations of the DNAbending energy given in the literature and are drawn to highlight the importance of the electrostatic interactionsrelative to the DNA bending. (B). Change of the energy of the NCP in the process of the chromatin fiber unwind-ing. The thin line displays a hypothetical equilibrium DNA unwrapping from the histone core; solid and dashedcurves are estimations of energy passes in single-fiber-pulling experiments from refs. and, respectively. Cartoonsillustrate the NCP state at different stages of the DNA fiber stretching. See ref. 8 for details.
2 Coarse-Grained Molecular Dynamics for Salt-DependentNCP-NCP Interaction
Molecular dynamics (MD) computer simulations of charged histone tail–DNA interactionsin systems mimicking nucleosome core particles (NCP) have been conducted using coarse-grained model of the NCP.10 The nucleosome is approximated as a negatively chargedspherical particle with flexible polycationic histone tails attached to it in a dielectric con-tinuum with explicit mobile counterions and added salt. Thesize, charge and distributionof the tails relative to the core were built mimicking real NCP. In this way, attractive ion-ion correlation effects due to fluctuations in the ion cloud and the attractive entropic andenergetic tail bridging effects were incorporated. MD simulations in a dielectric continuummodel containing explicit mobile counterions and various amount of added salt describethe effect of changing experimental conditions were carried out.10 In agreement with ex-perimental data,11, 12 increase of monovalent salt content from salt-free to physiologicalconcentration leads to formation of NCP aggregates; and likewise in the presence of MgCl2
the NCPs form condensed systems via histone tail bridging and accumulation of counte-rions (Fig. 2). The simulations give insight into the tail mediated bridging between coreparticles and are also of relevance for the mechanism of secondary and tertiary condensa-tion of nucleosomal arrays. To our knowledge this is the firsttheoretical demonstration of
191

Figure 2. Top: Snapshots showing distribution of the NCP particles at the end of the four 200 ns coarse-grainedMD simulations with increasing concentration of K+ (3 cartoones to the left) and in the presence of Mg2+ (right).Bottom: RDFs calculated from the last 25% of the four coarse-grained MD simulations. Left: NCP-NCP cor-relation function. Maxima between 100-110A indicate NCP-NCP aggregation. Right: Intermolecular tail-NCPRDF. Appearance of maximum below 60A reveals crosslinking of the histone tails in the aggregated NCPs. Insertdisplays the dependence of the maximum of the RDF on simulation time. See ref. 11 for details.
nucleosome-nucleosome tail bridging attraction within a statistical mechanical treatmentwhich (within the model) gives the equilibrium description(NVT ensemble simulations)for a system whose parameters model the NCP and which explicitly includes all chargedmobile particles taking into account salt dependent ion-ion correlation and flexible chargedtails.
3 All Atom MD Simulation of DNA-DNA Attraction Mediated bythe Histone Tails
To investigate atomic details of the histone-tail mediatedDNA-DNA interaction, two seriesof all-atom MD simulations were performed during 30-50 ns for a system of 3-4 identi-cal DNA 22-mers, 14-20 short fragments of the charged H4 histone tail peptide fragments(amino acids 5-12, [KGGKGLGK]3+,10 and 13-19, [GGAKRHRK]4+ (unpublished work))with K+ counterions and explicit water. The simulation setup mimics the crowded con-ditions of DNA in eukaryotic chromatin. To assess the influence of tail fragments onDNA structure and dynamics, ‘control’ MD simulations were carried for systems with the
192

Figure 3. Distribution of the average DNA-DNA distance in MDsimulations with 3 (left) and 4 (right) DNA22-mers in the simuation cell. Short-dashed lines show DNA-DNA distance in the absence of the H4 histone tailfragments. Thin dotted lines (Tail1, Tail2) in the left graph display DNA-DNA distance in the presence of the5-12 a.a. [KGGKGLGK]3+ fragment. Solid line in the left graph (“3DNA”) and Run1-Run4 curves in the rightgraph show DNA-DNA distance in the presence of the 13-19 a.a.[GGAKRHRK]4+ fragments. In the absenceof the tail fragments DNA-DNA distance is determined by the dimension of the simulation cell; presence of thehistone tail fragments makes DNA-DNA distance 8-10A shorter.
same DNA and water content but in the absence of oligopeptides. DNA structure and dy-namics, DNA-DNA interaction and its interplay with the histone tail fragments bindingare described.10, 13 MD simulations allow capturing typical features of the histone tail-counterion-DNA structure, interaction and dynamics.
Binding of the tail fragments to the DNA is dynamic. The charged side chains ofthe lysines and arginines play a major role in mediating DNA-DNA attraction by formingbridges and coordinating to phosphate groups and electronegative sites in the minor groove.Correlation of the DNA-DNA distance with the presence and association of the histonetail between the DNA molecules is observed. Figure 3 compares distance between DNAmolecules in the absence (dashed lines with maximum at 35-40A) and in the presence ofthe tails (all other data). In the systems without tails DNA molecules tend to distribute asfar as possible from each other. In the systems with the histone tail fragments, the mostpopulated DNA-DNA distances are in the range 24-34A (Fig. 3).
Detailed investigation of the histone tail-DNA interaction shows that tail bridging isperformed through numerous contacts of Lys+ and Arg+ with the phosphate groups com-bined with penetration of the charged lysine side chains into the minor groove of the DNA.Experimental and computational work is in progress which investigates interplay betweencovalent modification of the histone tails and compaction ofchromatin, NCP-NCP andDNA-DNA interaction.
193

References
1. K. Luger, A. W. Mader, R. K. Richmond, D. F. Sargent, T. J. Richmond,Crystalstructure of the nucleosome core particle at 2.8A resolution,Nature389, 251-260,1997.
2. A. P. Wolffe, Chromatin: Structure and function3rd Edition, pp. 447, AcademicPress, San Diego, CA, 1998.
3. C. L. Woodcock, S. Dimitrov,Higher-order structure of chromatin and chromosomes,Curr.Opin.Genet.Dev.11, 130-135, 2001.
4. J. C. Hansen,Conformational dynamics of the chromatin fiber in solution:determi-nants, mechanisms, and functions,Annu.Rev.Biophys.Biomol.Struct.31, 361-392,2002.
5. P. J. Horn, C. L. Peterson,Chromatin higher order folding: Wrapping up transcrip-tion, Science297, 1824-1827, 2002.
6. B. D. Brower-Tolandet al., Mechanical disruption of individual nucleosomes revealsa reversible multistage release of DNA,Proc.Natl.Acad.Sci.U.S.A.99, 1960-1965,2002.
7. M. L. Benninket al., Unfolding individual nucleosomes by streyching single chro-matin fibers with optical tweezers,Nature Struct.Biol.8, 606-610, 2001.
8. N. Korolev, A. P. Lyubartsev, A. Laaksonen,Electrostatic background of chromatinfiber stretching,J.Biomol.Struct.Dyn.22, 215-226, 2004.
9. N. Korolev, O. V. Vorontsova, L. Nordenskiold,Physicochemical analysis of elec-trostatic foundation for DNA-protein interactions in chromatin transformations,Prog.Biophys.Molec.Biol.in press, 2007.
10. N. Korolev, A. P. Lyubartsev, L. Nordenskiold,Computer modeling demonstrates thatelectrostatic attraction of nucleosomal DNA is mediated byhistone tails,Biophys.J.90, 4305-4316, 2006.
11. S. Mangenot, E. Raspaud, C. Tribet, L. Belloni, F. Livolant, Interactions betweenisolated nucleosome core particles. A tail bridging effect?, Eur.Phys.J.E7, 221-231,2002.
12. A. Bertin, A. Leforestier, D. Durand, F. Livolant,Role of histone tails in the confor-mation and interaction of nucleosome core particles,Biochemistry43, 4773-4780,2004.
13. N. Korolev, L. Nordenskiold,H4 histone tail mediated DNA-DNA interaction andeffects on DNA structure, flexibility and counterion binding. A molecular dynamicsstudy,Biopolymersin press, 2007.
194

Water Percolation Governs Polymorphic Transition andConductivity of DNA
Ivan Brovchenko1, Aliaksei Krukau 1, Alla Oleinikova1, and Alexey Mazur2
1 Physical Chemistry Department,University of Dortmund, 44227 Dortmund, Germany
E-mail: brov, alex, [email protected]
2 CNRS UPR9080, Institut de Biologie Physico-Chimique,13, rue Pierre et Marie Curie, Paris, 75005, France
E-mail: [email protected]
We report on the simulation studies of the percolation transition of water at the surface ofthe DNA double helix. At low hydrations, only small water clusters are attached to the DNAsurface, whereas it is homogeneously covered by a spanning water network at high hydrations.Formation of a spanning water network occurs via a percolation transition at the hydrationlevel close to the midpoint of polymorphic transition between A- and B-forms of DNA. Thispercolation transition results in sigmoid like acceleration of long-range ion transport in goodagreement with experiment.
The presence of water at the surface of biomolecules is necessary for their conforma-tional stability and functions. Dynamics and functions of biomolecules are often com-pletely restored, when they are covered by about a monolayerof hydration water1, 2. For-mation of such monolayer occurs via quasi-2D percolation transition between two es-sentially different states of hydration water: ensemble offinite clusters and spanninghydrogen-bonded (HB) network of hydration water, which homogeneously envelopes abiomolecule3, 4. The microscopic origin of the relationship between the percolation of hy-dration water and biological functions is unclear. One may expect that the appearanceof a spanning network of hydration water strongly affects the dynamic properties of thehydrated biomolecule and the charge transport along the biological surfaces.
Water is crucial for the biological functions of the double helical DNA5. Experimentsshow that there is a strict relationship between the state ofDNA and a hydration numberΓ, measured as the number of water molecules per nucleotide. Biologically relevant B-DNA becomes unstable at hydrationsΓ < 20 and midpoint of the transition between A-and B-forms of DNA is aboutΓ = 15.5 In the same hydration range, conductivity DNAshows sigmoid like dependence onΓ.6 To clarify the possible role of water percolation inthe polymorphic transitions of DNA, we performed computer simulations of a rigid, dode-camer fragment of double helical DNA (CGCGAATTCGCG), fixed in space in canonicalB-form, in the range of hydrations12 ≤ Γ ≤ 30.7, 8 The Cornellet. al. force field9
was used for DNA and water was modeled by TIP3P potential.10 The molecular dynam-ics (MD) simulations were carried out with the internal coordinate MD method adoptedfor DNA11 with a time step of 0.01 ps. The standard duration of production runs was 10ns with the coordinates saved every 1 ps. The clustering and percolation of water wereanalyzed by methods earlier developed in our group.3, 4, 12–14
The probability distributionP(Smax) of the sizeSmax of the largest water cluster onthe B-DNA surface under different hydration levels is shownin Figure 1.A. The two peaks
195

0.0 0.2 0.4 0.6 0.8 1.0
0.01
0.02
0.03
0
1
2
n S
= 16
= 14
Smax / Nw
P(S
max
)
= 12
A
1.0
1.5
2.0
2.5
3.0
LNa l
C
1 10 100
10-9
10-7
10-5
10-3
10-1
nS ~ S-2.05
S
B
12 14 16 18 20
1.0
1.5
2.0
2.5
3.0
R
LNa m
Figure 1. A: Probability distributionP (S)max of the sizeSmax of the largest water cluster on DNA surfacewith hydration levelsΓ from 10 to 24. B: Distribution nS of the size of water clusters at the surface of DNAmolecule for representative hydration levelsΓ from 14 (top) to 17 (bottom). The universal power law expectedfor 2D percolation transition is shown by solid lines.C: Upper panel: Relative mobilityLNa
lof ions, in time
interval 200 ps≤ t ≤ 500 ps (open circles, left axis), and percolation probability R of hydration water (dashedline, right axis) as function of the hydration levelΓ. Lower panel: Dependence of the relative mobilityLNa
m ofions, in time interval 50 ps≤ t ≤ 100 ps, on the hydration levelΓ.
at small and largeSmax corresponds to non-spanning and spanning HB networks, respec-tively. The most symmetric distributionP(Smax) is observed at a hydration level wherespanning and non-spanning states of the largest cluster areequally populated, and this hy-dration corresponds to the midpoint of the percolation transition. The spanning probabilityR(Γ) estimated from these distributions7 is shown by dashed line in Figure 1.C (upperpanel, right axes). The midpoint of the percolation transition, that is the position of theinflection point ofR(Γ) being fitted to sigmoid function, is close toΓ ≈ 14.3. The truepercolation threshold can be located by using the cluster size distributionnS , which is aprobability to find a cluster, containingS molecules. At the true percolation threshold,nS ∼ S−2.05 in the widest range ofS. HB water clusters at DNA surface follows thisuniversal power law in the widest range ofS at hydration levelsΓ ≈ 15 and 16 (closedsymbols in Figure 1.B) and the true percolation threshold ofwater occurs atΓ = 15.5±0.5. At the threshold hydration, the minor groove of B-DNA isalready filled with water,and the percolation transition results in formation of a spanning water network in the major
196

groove. The threshold hydration is strikingly close to the midpoint of the low hydrationtransition of DNA from the B-form to other forms.5 This observation suggests that wa-ter percolation may be responsible for the low hydration polymorphism of DNA. So, DNAexists in biologically relevant B-form only when it is covered by a spanning water network.
To explore effect of water percolation on the mobility of Na+ ions in the DNA hy-dration shell, we have analyzed time dependence of their mean square displacements⟨
∆r2⟩
(t). Due to confinement effect and due to heterogeneity of the DNAsurface, suchdependence is non-linear. We characterized ions diffusionby a dimensionless relative mo-bility L(Γ) obtained as the slope of the linear fit of
⟨
∆r2⟩
(t) in a given time intervalnormalized by the corresponding slope forΓ = 12. Mobility LNa
m (Γ) of Na+ ions approx-imately linearly grows with hydration for short-time translations,t ≤ 100ps (Figure 1.C,lower panel), but the relative mobilityLNa
l , evaluated in the time period 200 ps≤ t ≤ 500ps (Figure 1.C, upper panel), corresponding to the ion displacement up to 6.5A, behavesradically different. From hydrationΓ = 12 up toΓ = 18,LNa
l exhibits a sigmoid like de-pendence closely following the spanning probabilityR(Γ). The overall increase ofLNa
l onpassing the percolation threshold is about 100%. The step like increase of ion mobility atΓ = 18 may be attributed to the escape of ions from the DNA surface. Two step increase oftheLNa
l with hydration in our simulations remarkably agrees with the experimentally ob-served dependence of the radiation-induced conductivity of hydrated DNA fibers.6 Abilityof the spanning network of hydration water to provide ion transport along bio-surfaces mayexplain its crucial role in biological function.
References
1. J. A. Rupley, G. Careri, Adv. Protein Chem.41, 37–172, 1991.2. I. D. Kuntz, W. Kauzmann, Adv. Protein Chem.28, 239–345, 1974.3. A. Oleinikova, N. Smolin, I. Brovchenko, A. Geiger and R. Winter, J. Phys. Chem. B
109, 1988-1998, 2005.4. N. Smolin, A. Oleinikova, I. Brovchenko, A. Geiger and R. Winter, J. Phys. Chem. B
109, 10995–11005, 2005.5. W. Saenger,Principles of Nucleic Acid Structure(Springer-Verlag, Berlin, 1984).6. J. M. Warman, M. P. de Haas and A. Rupprecht, Chem. Phys. Lett. 249, 319–322,
1996.7. I. Brovchenko, A. Krukau, A. Oleinikova, and A. K. Mazur, Phys. Rev. Lett. 97,
137801, 2006.8. I. Brovchenko, A. Krukau, A. Oleinikova, and A. K. Mazur, J. Phys. Chem. B111,
3258–3266, 2007.9. W. D. Cornell et. al., J. Am. Chem. Soc.117, 5179–5197, 1995.
10. W. L. Jorgensen, J. Chandreskhar, J. D. Madura, R. W Impeyand M. L. Klein,J. Chem. Phys79, 926–935, 1972.
11. A. K. Mazur, J. Am. Chem. Soc.124, 14707–14715, 2002.12. I. Brovchenko, A. Krukau, N. Smolin, A. Oleinikova, A. Geiger and R. Winter,
J. Chem. Phys.123, 224905, 2005.13. A. Oleinikova, I. Brovchenko, N. Smolin, A. Krukau, A. Geiger and R. Winter,
Phys. Rev. Lett.95, 247802, 2005.14. A. Oleinikova, I. Brovchenko, Mol. Phys104, 3841-3855, 2006.
197

Molecular Dynamics in Excited States: Landau-ZenerModel of Nitric Oxide Geminate Recombination to Nitrile
Hydratase
Karina Kubiak and Wieslaw Nowak∗
Institute of Physics, N. Copernicus University,ul. Grudziadzka 5, 87-100 Torun, Poland
∗E-mail: [email protected]
Molecular dynamics (MD) simulations on two coupled electronic surfaces are employed toinvestigate the geminate recombination of nitric oxide to photoactive biotechnological enzymenitrile hydratase (NHase). NHase enzymatic activity is triggered by photodissociation of NOmolecule1,2. The crossing between the ground and the excited state surfaces is treated using theLandau-Zener model3,4. The NO geminate recombination curve and recombination rate werecalculated. Results suggest that the NO recombination is a picosecond time-scale process.
1 Introduction
The microbial enzyme nitrile hydratase (NHase, EC. 4.2.1.84, CAS registration no. 82391-37-5) is widely used in biotechnological production of amides5, 6 from nitriles. Out of twotypes of NHases (Fe and Co-type) only the Fe-type NHase is photosensitive. This en-zyme loses activity in the dark conditions when the endogenous nitric oxide molecule (NO)blocks the active centre. This process is totally reversible and the enzyme recovers catalyticability upon light irradiation1, 2. The electronic mechanism of NO controlled photoactivityremains unknown, despite several model systems of NHase have been investigated7, 8 andtheoretical models have been calculated9–14. In the earlier study of the photosensitivityphenomenon Nowaket al., described structural changes upon NO ligand binding to theiron center (”inverted doming”)9. The MD calculations of NHase gave an insight into thechannel dynamics15, however the kinetics of recombination is still mysterious.
In this paper the NO recombination kinetics rate is theoretically calculated for the pro-tonated enzyme model. Similarly to Liet al.16 classical Landau-Zener (LZ) MD model ofrecombination is employed.
2 Computational Methods
In the LZ method the system may evolve on two alternative, ground and excited statecrossing hypersurfaces. At the crossing point, the LZ probability P is calculated (1) andthe decision whether to switch the energy surface is made3, 4
P = e− 4πε2
12hν|s1−s2| , (1)
whereV is a velocity,ε212 is energy difference between two energy states and|s1 − s2| isa difference in the energy curves slopes.
199

All computations were performed for Fe-type NHase (2AHJ) inthe MOIL pack-age16, 17. The parametrization of the NHase active site is described elsewhere15. Onlycrystallographic water molecules were present. Initiallyminimized system (the enzymewith NO molecule bounded via Morse potential, 3000 steps) was heated up to 300 K (50ps) and equilibrated for 50 ps. From short 100 ps run 6 random structures were chosen asstarts for production simulations of the NO recombination.For each start a 10 ps trajectoryat 250, 275, 300, 325 and 350 K was generated. In each of 30 trajectories NO moleculewas photodissociated (by excitation) at the very beginning. The SHAKEB protocol wasused, data were collected in each 1 fs step. The temperature was held constant by veloc-ity scaling, cutoffs for electrostatic and van der Waals interactions were 12A and 9A,respectively. The nonbonding interactions were recalculated in each step.
The excited state curveU(r) was modeled by (2) and the binding potentialB(r) wasapproximated by the Morse function (3) (see Fig. 1):
U(r) = Arepe−βr −Brep, (2)
and
B(r) = Dmore−2α(r−req) − 2e−α(r−req). (3)
Parameterreq is the equilibrium Fe–N(NO) bond length of 1.65A, parametersDmor,α,Arep, β andBrep were 30 kcal/mol, 2A−1, 80 kcal/mol, 1A−1 and 4 kcal/mol, respec-tively. Other parameters required for excited state MD wereadopted from16.
3 Results and Discussion
Figure 1. Kinetics of NO recombination to NHase active site.Points indicate a percent of recombined ligands.
A mono-exponential decayy = y0 +A1 exp“
−x−x0t1
”
is fitted. Inset: Potential curves used in simulations of
NO recombination.
For each of 10 ps non-equilibrium trajectories on excited state energy surface the Fe–N(NO) distance, the repulsion energy value (Erep), the switching moment from repulsion
200

to Morse potential and a value of the Morse potential (Emorse) were monitored. If thedistance Fe–N(NO) was smaller than 2.5A or if theEmorse was smaller than−10 kcal/mol,we assumed that the recombination happened. A percent of recombinated ligands vs timegave data for estimation of recombination rate (see Fig. 1).
We assume that these data points are the best described by a mono-exponential decaysince that assumption gives the smallest value of theχ2 (χ2 = 3.3). Two and three expo-nential decays fitted to our MD data gaveχ2 of 4.7 and 8.7, respectively and timest2 andt3 were extremely long (data not shown). Fitted parameters (Fig. 1) indicate that the aver-age lifetime of the free NO is 4.8 ps (the decay rate constant is 0.21 ps−1). NO collisionswith βArg56 or (less frequently) withαGln90 induced the recombination. Other collisionswith the active site-solvent channel walls didn’t result inthe rebinding.
4 Conclusions
For the first time a geminate recombination of the NO moleculeto Fe-type NHase activesite was studied using the Landau-Zener approach and MD in excited state. We found thatthere is perhaps one energy barrier (4 kcal/mol) and the recombination rate is characterizedby 4.8 ps lifetime of free NO. ResiduesβArg56 andαGln90 are critical for NO recombi-nation. Better statistics is required for more quantitative estimates of NHase photophysics.
Acknowledgments
This research was supported by Polish Ministry of Educationand Science, grant no. 2P04A07229 and by UMK grant no. 377-F.
References
1. T. Noguchi, J. Honda, T. Nagamune, H. Sasabe, Y. Inoue, I. Endo,Photosensitive ni-trile hydratase intrinsically possesses nitric oxide bound to the non-heme iron center:evidence by Fourier transform infrared spectroscopy, FEBS Letters358, 9 (1995).
2. M. Odaka, K. Fuji, M. Hoshino, T. Noguchi, M. Tsujimura, S.Nagashima, M. Yohda,T. Nagamune, Y. Inoue, I. Endo,Activity regulation of photoreactive nitrile hydrataseby nitric oxide, J. Am. Chem. Soc.,119, 3785 (1997).
3. L. Landau, Z. Phys. Sov.,2, 46, (1932).4. C. Zener, Proc. Roy. Soc. London, Sect. A (Math. Phys. Sci.), 137, 696, (1932).5. M. Kobayashi, T. Nagasawa, H. Yamada,Enzymatic synthesis of acrylamide: a suc-
cess story not yet over, Tibtech,10, 402 (1991).6. H. Yamada, S. Shimizu, M. Kobayashi,Hydratases involved in nitrile conversion:
screening, characterization and application, Chemical Record1, 152 (2001).7. H. L. Jackson, S. C. Shoner, D. Rittenberg, J. A. Cowen, S. Lovell, D. Barnhart,
J. A. Kovacs,Probing the influence of local coordination environment on the proper-ties of Fe-type nitrile hydratase model complexes, Inorg. Chem.40, 1646 (2001).
8. J. Shearer, H. L. Jackson, D. Schweitzer, D. K. Rittenberg, T. M. Leavy, W. Kaminsky,R. C. Scarrow, J. A. Kovacs,The first example of a nitrile hydratase model complexthat reversibly binds nitriles, J. Am. Chem. Soc.124, 11417 (2002).
201

9. W. Nowak, Y. Ohtsuka, J. Hasegawa, H. Nakatsuji,Density Functional Study on Ge-ometry and Electronic Structure of Nitrile Hydratase Active Site Model, Int. J. Quan-tum Chem.90, 1174 (2002).
10. A. J. Boone, Ch. H. Chang, S. N. Greene, T. Herz, N. G. J. Richards,Modellingthe spin-dependent properties of open-shell Fe(III)-containing systems: towards acomputational description of nitrile hydratase, Coord. Chem. Rev.238–239, 291(2003).
11. T. C. Harrop, P. K. Mascharak,Fe(III) and Co(III) Centers with Carboxamido Nitro-gen and Modified Sulfur Coordination: Lessons Learned from Nitrile Hydratase, Acc.Chem. Res.34, 253 (2004).
12. Ch. Chang, A. J. Boone, R. J. Bartlett, N. G. J. Richards,Toward a ComputationalDescription of Nitrile Hydratase: Studies of the Ground State Bounding and Spin-Dependent Energetics of Mononuclear, Non-Heme Fe(III) Complexes, Inor. Chem.43, 458 (2004).
13. L. Peplowski, K. Kubiak, W. Nowak,Insights into catalytic activity of industrial en-zyme Co-nitrile hydratase. Docking studies of nitriles andamides, J. Mol. Model.13,725 (2007).
14. L. Peplowski, K. Kubiak, S. Zelek, W. Nowak,A Comparative DFT Study of Sub-strates and Products of Industrial Enzyme Nitrile Hydratase Int. J. Quant. Chem.,(2007),in print.
15. K. Kubiak, W. Nowak,Molecular dynamics of photoactive protein nitrile hydratase,Biophys. J.,in preparation.
16. H. Li, R. Elber, J. E. Straub,Molecular dynamics simulation of No recombination tomyoglobin, J. Biol. Chem.268, 17908 (1993).
17. R. Elber, C. Simmerling, R. Goldstein, H. Li, G. Verkhiverer, C. Keasar, J. Zhang,A. Ulitsky, MOIL: A program for simulations of macromolecules, Comput. Phys.Commun.91, 159 (1995).
202

Exploring Conformational Space and Dynamics of RNAHairpins by MD Simulations: Structure-Function
Correlation of HIV-1 Genome Regulatory Elements
K. Kulinska and T. Kulinski
Institute of Bioorganic Chemistry,Polish Academy of Sciences, 61-704 Poznan, Poland
E-mail: kasiak, [email protected]
To assess the reliability of MD derived structural models ofthe dynamic multifunctional RNAhairpin, a comparison between back calculated from MD trajectories and experimentally ob-served proton chemical shifts has been carried out. Our results confirmed coexistence of alter-native conformations of the apical loop of HIV-1 TAR RNA hairpin in a solution. The com-parison between the calculated and observed proton chemical shifts proved to be a good toolfor validation and refinement of MD derived structures of dynamically inter-converting RNAconformational sub states.
1 Introduction
Insight into dynamical behavior of RNA molecules by experimental techniques is limited.Elucidating high-resolution RNA structure of dynamicallyinter-converting conformationalsub states poses significant challenges to NMR spectroscopyand X-ray crystallography,which remain limited in applicability to static average structure determination of wellfolded conformations. Functionally active RNA conformations may not always be mostpopulated in a solution. Transiently populated conformational sub states may be capturedduring protein recognition and stabilized by binding divalent ions or other biomolecularcomplex components. To elucidate structure-function relationships in RNA, it is necessaryto go beyond the static structure and understand the dynamics of RNA in a solution.Molecular modeling and molecular dynamics simulation (MD)methods complementlimitations of experimental techniques. However, the determination of RNA conforma-tional space by simulations is related to limited time and conformation range, whichmay be probed by MD in comparison to real RNA dynamics. Roughness of the foldingenergy surface, kinetic traps and stable misfolds are the factors which require attentionnot only during in vitro RNA folding procedures, but also during computer simulations.Adequately, special consideration of infrequent events instructural transitions is neededfor MD experiments due to relatively low statistics reachable in current status of softwareand hardware available for these calculations. In our exploring of the conformationalspace accessible to the dynamic RNA hairpin by molecular modeling and extensive MDsimulations, we adopted several alternative approaches, which revealed the coexistence oftwo stable conformers. Then we investigated whether our MD derived structural modelsagree with the experimental NMR parameters.
203
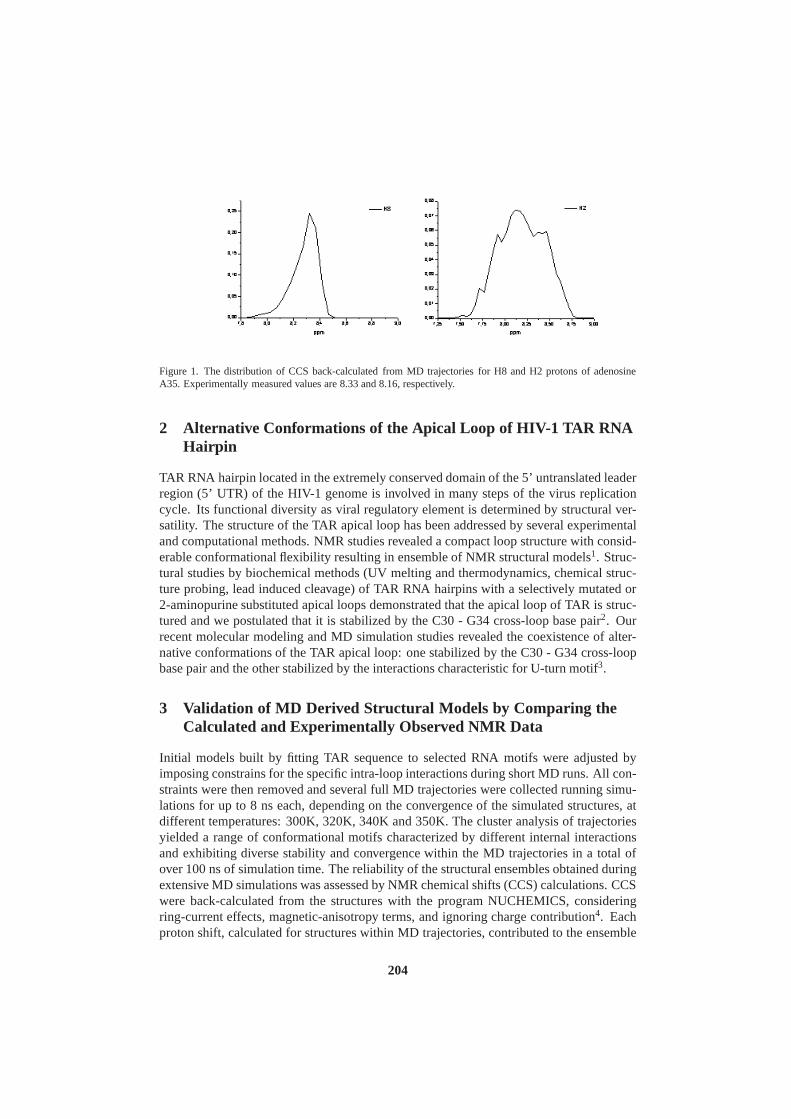
Figure 1. The distribution of CCS back-calculated from MD trajectories for H8 and H2 protons of adenosineA35. Experimentally measured values are 8.33 and 8.16, respectively.
2 Alternative Conformations of the Apical Loop of HIV-1 TAR R NAHairpin
TAR RNA hairpin located in the extremely conserved domain ofthe 5’ untranslated leaderregion (5’ UTR) of the HIV-1 genome is involved in many steps of the virus replicationcycle. Its functional diversity as viral regulatory element is determined by structural ver-satility. The structure of the TAR apical loop has been addressed by several experimentaland computational methods. NMR studies revealed a compact loop structure with consid-erable conformational flexibility resulting in ensemble ofNMR structural models1. Struc-tural studies by biochemical methods (UV melting and thermodynamics, chemical struc-ture probing, lead induced cleavage) of TAR RNA hairpins with a selectively mutated or2-aminopurine substituted apical loops demonstrated thatthe apical loop of TAR is struc-tured and we postulated that it is stabilized by the C30 - G34 cross-loop base pair2. Ourrecent molecular modeling and MD simulation studies revealed the coexistence of alter-native conformations of the TAR apical loop: one stabilizedby the C30 - G34 cross-loopbase pair and the other stabilized by the interactions characteristic for U-turn motif3.
3 Validation of MD Derived Structural Models by Comparing th eCalculated and Experimentally Observed NMR Data
Initial models built by fitting TAR sequence to selected RNA motifs were adjusted byimposing constrains for the specific intra-loop interactions during short MD runs. All con-straints were then removed and several full MD trajectorieswere collected running simu-lations for up to 8 ns each, depending on the convergence of the simulated structures, atdifferent temperatures: 300K, 320K, 340K and 350K. The cluster analysis of trajectoriesyielded a range of conformational motifs characterized by different internal interactionsand exhibiting diverse stability and convergence within the MD trajectories in a total ofover 100 ns of simulation time. The reliability of the structural ensembles obtained duringextensive MD simulations was assessed by NMR chemical shifts (CCS) calculations. CCSwere back-calculated from the structures with the program NUCHEMICS, consideringring-current effects, magnetic-anisotropy terms, and ignoring charge contribution4. Eachproton shift, calculated for structures within MD trajectories, contributed to the ensemble
204

of all calculated structures and was subsequently analyzedin ORIGIN in terms of statisti-cal distribution. The structural analysis and interpretation of the TAR RNA 1H chemicalshifts were carried out by comparing the calculated to experimental values5. Fig. 1 givesan example of the distribution of CCS back-calculated from MD trajectories for H8 andH2 protons of adenosine A35 base. Experimentally measured values are 8.33 and 8.16,respectively.
4 Conclusions
RNA hairpins exhibit remarkable versatility with regard tohow conformational changesare utilized to modulate diverse cellular processes. RNA conformational switching is usu-ally induced by cofactors such as proteins, small molecules, divalent ions or other RNAs.The study of the range of conformations accessible to RNA structural motifs is impor-tant for understanding the mechanisms of recognition processes and regulation by RNA.We observed good agreement between the back-calculated andexperimental CCS for bothMD derived structural models of the apical loop of TAR. Our results validate coexistenceof both conformers of TAR RNA hairpin in a solution. Alternative structures are consistentwith the range of previously obtained diverse experimentalresults. Both conformers can befunctionally important: the conformer stabilized by cross-loop base pair can be responsiblefor TAR-proteins recognition, whereas the conformer stabilized by the interactions char-acteristic for U-turn motif can mediate RNA-RNA and RNA-DNAloop-loop interactions.The comparison between the calculated and observed CCS proved to be a good tool forvalidation and refinement of MD derived structures of dynamically inter-converting RNAconformational sub states.
Acknowledgments
The computations were performed with a grant of computer time provided by the PoznanSupercomputing and Networking Centre.
References
1. F. Aboul-ela, J. Karn, G. Varani,The structure of the human immunodeficiency virustype-1 TAR RNA reveals principles of RNA recognition by Tat protein , J. Mol. Biol.253, 313, (1995).
2. T. Kulinski et al.,The apical loop of the HIV-1 TAR RNA hairpin is stabilized by across-loop base pair ,J. Biol. Chem.278, 38892-38901, (2003).
3. T. Kulinski, K. Kulinska, J. Sarzynska, R.W. Adamiak,Conformational dynamics ofRNA hairpins - regulatory elements of the HIV-1 genome ,Biophysical Journal88,402A, (2005).
4. S.S. Wijmenga, M. Kruithof, C.W. Hilbers,Analysis of H-1 chemical shifts in DNA:Assessment of the reliability of H-1 chemical shift calculations for use in structurerefinement ,Journal of Biomolecular Nmr10, 337-350, (1997).
5. K.S. Long, D.M. Crothers,Characterization of the solution conformations of unboundand Tat peptide-bound forms of HIV-1 TAR RNA,Biochemistry38, 10059-10069,(1999).
205


Anisotropic Internucleosome Interactions andGeometrical Constraints Favour
the Two-Start Helical Structure of Chromatin
Giovanni La Penna1, Giorgio Cinacchi2, and Angelo Perico3
1 Institute for chemistry of organo–metallic compoundsNational research council, via Madonna del Piano 10, 50019 Sesto Fiorentino (FI), Italy
E-mail: [email protected]
2 Department of chemistry and industrial chemistryUniversity of Pisa, via Risorgimento 35, 56126 Pisa, Italy
E-mail: [email protected]
3 Institute for macromolecular studiesNational research council, via De Marini 6, 16149 Genova, Italy
E-mail: [email protected]
The structures of chromatin at the high density characteristic of the silent phase are stronglyinfluenced by the packing of nucleosome core particles (NCPs), the anisotropic attractive inter-actions between two of them and constraints, such as the DNA bending, imposed to the wrappedand linker DNA segments. In this work, coarse–grained models of chromatin are studied. Fora pair of NCPs, a simple single–site anisotropic potential energy function is designed on thebasis of the experimental data reported for the ordered phases of NCPs. This potential energyfunction is employed in random–walks of chromatin models where the NCP DNA wrappingis modulated in length, while the linker segments are modulated in both length and curvature.These models support the two–start helical organization for chromatin in the absence of linkerhistones. The geometry of two-start helical configurationsis characterized by poorly bent link-ers and by a moderate reduction of wrapped DNA in the NCP.
1 Introduction
The investigation of the supramolecular structure and dynamics of chromatin is of extremeimportance to understand gene regulation and cell development. The genetic information ineukaryotic chromosomes is organized in chromatin, a chain–like supramolecular assemblyformed by a long filament of DNA wrapped around globular octameric aggregates of eighthistone proteins1. The repeat unit of this chain includes a nucleosome core particle (i.e. thecomplex of a protein histone octamer with DNA wrapped aroundit, NCP hereafter) anda DNA linker, which connects two NCPs. Other histone proteins in the linker region arepresent in the natural chromatin and absent in several modelsystems studied in vitro.
Two classes of organizations have been proposed for the compact state of chromatin,i.e. the so–called 30 nm fiber2, 3: the one–start solenoidal helix model4; the two–starthelix model5. Recent crystallographic results for the tetra–nucleosome molecule in theabsence of linker histones6, provide strong evidence for the two–start helix organization:the structure of the tetra–nucleosome is consistent with anidealized model where two left–handed twisted ribbons follows a straight fiber axis. These x-ray data are also consistentwith the high propensity of NCPs of forming columns7. Theoretical and computational
207

models of the chromatin fiber have been proposed, but two–start helices with the geometryof the x-ray data were never identified among the proposed structures.
In this work, a single–site anisotropic Lennard–Jones interaction potential, calibratedon the experimental phase transition for NCPs, is used to perform random walks ofchromatin models with a variable amounts of wrapped and linker DNA segments and withlinker DNA with variable curvature.
2 Method
The geometrical construction of regular chains of many NCPsis summarized in the follow-ing. The pathway of DNA is built starting by wrappingnw bp around the disc representingthe histone octamer (radius of 4.5 nm and height of 6 nm). Whenthe DNA finishes to wrap,a straight linker ofns1 bp follows. At a certain point, DNA starts to bend (nb bp) aroundan originO chosen at random within a cubic portion of space. Two curvatures have beentested, with no significant differences in results. The DNA has no kinks. A second straightlinker segment ofns2 bp follows. Before the next NCP particle is generated, a furtherrotation of∆Φ modifies the orientation, otherwise imposed by the equilibrium twisting ofDNA.
Monte Carlo trajectories have been collected using a temperature randomly chosenwithin 0 and 10000 K and using the NCP–NCP interactions only.Among the collectedconfigurations, the linker–linker interactions have been computed by using a Lennard–Jones site for each DNA bp, with aσ parameter of 1 nm. Only those configurations withnegative linker–linker potential energy and with low NCP–NCP interaction and high com-pactness have been selected and analyzed.
3 Results
The distribution of the supplemental bending angle (Θ) and of the torsional angle (Φ)of the selected chains has been analyzed. This distributionalways displays a maximumaroundΘ ∼ 5π/6 andΦ ∼ π/2. Structures representative of this region display the two–start organization, with linker DNA almost perpendicular to the fiber axis. One of thesestructures is compared with the experimental x-ray data andwith a previous simulation inFig. 1.
The structures obtained by previous MC simulations using similar parameters (panel a)could display only a partial two–start organization, because of the low regularity. Therepresentative structure obtained in this work (c) is very close to the construction based onx-ray data (b). The NCP planes are only slightly tilted away from the fiber axis comparedto the tetra–nucleosome. The linker DNA segments are straight, but a local bending can besuggested by linker–NCP interactions that have been ignored so far. The wrapped lengthof the most representative configurations is about 130 bp, that is in close agreement withthe value of 129 bp found in the tetra–nucleosome.
Therefore, this simple chromatin model accounts for most ofthe important features ofthe available structural information for chromatin in the absence of linker histones. Therole of the interactions included in this model can be summarized: NCP–NCP interactions
208

(a) (b) (c)
Figure 1. Comparison between the most representative structure in this model (c), MC simulations (a) and thex-ray data (b): one snapshot of the simulation in Ref.8 (a); the construction obtained from the tetra–nucleosomex-ray data6 (b); one of the structures representative of the maximum population in the two–angles map (this work,c). In (c) the large spheres represent the histone octamers (dark gray the even numbers, light gray the odd numbersto emphasize the two–start organization). The small spheres represent DNA bp. The radii of these latter spheresis 1/2 of the used value for graphical purposes.
favour columns (like those experimentally observed); wrapped and linker DNA favour thecoiling of columns; these columns can not be coiled enough toobtain a dense one–startorganization (solenoid); on the other hand, two less coiledcolumns intercalated allow thetwo–start organization; crossed linkers allow a moderate DNA–NCP overlap; the unfoldingof the two–start organization is not intricate.
Acknowledgments
This work has been done with the financial support of the FIRB 2001 project RBA01Y3SNof MIUR (Italy).
References
1. J. Widom,Structure, dynamics and function of chromatin in vitro, Ann. Rev. Biophys.Biomol. Struct.,27, 285–327, 1998.
2. H. Schiessel,The physics of chromatin, J. Phys.-Cond. Matt.,15, R699–R774, 2003.3. P. J. J. Robinson and D. Rhodes,Structure of the 30 nm chromatin fibre: A key role
for the linker histone, Curr. Op. Struct. Biol.,16, 336–343, 2006.4. J. T. Finch and A. K. Klug,Solenoidal model for superstructure in chromatin, Proc.
Natl. Acad. Sci. USA,73, 1897–1901, 1976.5. C. L. F. Woodcock, L.–L. Y. Frado, and J. B. Rattner,The higher-order structure of
chromatin: Evidence for a helical ribbon arrangment, J. Cell. Biol.,99, 42–52, 1984.6. T. Schalch, S. Duda, D. F. Sargent, and T. J. Richmond,X-ray structure of a tetranu-
cleosome and its implications for the chromatin fibre, Nature,436, 138–141, 2005.7. S. Mangenot, A. Leforestier, D. Durand, and F. Livolant,Phase diagram of nucleo-
some core particles, J. Mol. Biol.,333, 907–916, 2003.8. G. Wedemann and J. Langowski,Computer simulation of the 30-nanometer chromatin
fiber, Biophys. J.,82, 2847–2859, 2002.
209


Mechanism of Fibril Formation of A β16−22 Peptides
Mai Suan Li1, Phuong Hoang Nguyen2, and D. Thirumalai3
1 Institute of Physics, Polish Academy of SciencesAl. Lotnikow 32/46, 02-668 Warsaw, Poland
E-mail: [email protected]
2 Institute of Physical and Theoretical Chemistry, J. W. Goethe University,Marie-Curie-Str. 11, D-60439 Frankfurt, Germany
E-mail: [email protected]
3 Biophysics Program, Institute for Physical Science and Technology andDepartment of Chemistry and Biochemistry,
University of Maryland, College Park, MD 20742E-mail: [email protected]
Using all-atom simulations with the GROMOS96 force field 43a1 in explicit water we havestudied the kinetics of fibril formation of Aβ16−22 peptides. These short peptides are thehydrophobic core of longer amyloid peptides which are believed to play the key role in theAlzheimer’s disease. It is found that the incorporation of anewly added peptide to the pre-formed template obeys the two-stage dock-lock mechanism. This is in the qualitative agreementwith the recent experiments.
1 Introduction
Understanding the mechanism of oligomerization of proteins and peptides remains one ofthe most exciting problems in structural biology because a large body of evidence suggeststhat amyloid fibrils and associated oligomeric intermediates are related to a number of dis-eases, including Alzheimer’s, Parkinson’s, Huntington’s, and prion diseases1. The recentexperiments of different groups (see, e.g. Ref. 2 and references therein) suggest that theaddition of soluble Aβ and Sup35 amyloid monomers to preformed fibril structures isatwo-stage dock-lock process. First the added peptide docksinto the template and at thisstage its structure gets elongated. In the slow lock phase its orientation fluctuates a lot be-fore reaching the fibril state. Motivated by these interesting experiments we have studiedthe process of incorporation of a Aβ16−22 peptide into the preformed template using theall-atom simulations by GROMACS software3. Namely, we have considered4 the reaction(Aβ16−22)n−1 +Aβ16−22 (Aβ16−22)n, wheren = 4, 5 and 6. In this contribution wepresents the results for then = 5 case (pentamer) where a monomer adds to the preformedfibril state of 4 peptides. Our results support the two-stagepicture in which the lock phaseis much slower than the initial dock phase.
2 Method and Results
The procedure of generating the template of 4 preformed peptides (see Fig. 1a) may befound in Ref. 4. The conformation of monomeric Aβ16−22 was extracted from the structureof Aβ10−35 peptide available in the Protein Data Bank (ID: 1hz3). Then we have added it
211

2 1
3
(a) (b)
Figure 1. (a) A initial conformation of the pentamer, where one peptide is randomly added to the template offour ordered monomers. (b) The free energy landscape as a function ofV1 andV2. The typical conformations ofmain local minima are shown.
randomly to the template (1a) and generated four trajectories of 329, 360, 540 and 737 nsusing the GROMOS96 force field 43a1 in explicit water. A typical initial configuration isshown in Fig. 1a. The volume of the simulation box is 128 nm3 which corresponds to thepeptide concentration of 65 mM.
In order to monitor the fibril formation process we use the ”liquid crystal” order param-eterP2. If P ≥ 0.9 then the system is considered to be in the fibril-like state4. We used thedihedral principal component analysis4 to compute the free energy landscapes (FEL) usingthe first two eigenvectorsV1 andV2. To show that the added peptide incorporates into thepreformed monomers by the dock-lock mechanism we monitor the time dependence of theβ-content,β(t), which has been computed using the definition, given in Ref. 4.
Fig. 1b shows the free energy as a function ofV1 andV2. The fibril-like arrangementis found in the basin of the most prominent minimum 1 which has≈ 67% of population.Since three local minima are separated by low barriers of only a fewkBT the system is notstable under thermal fluctuations. The stability gets enhanced as the number of peptidesincreases4.
The time dependence of the order parameterP2 for the entire system and the preformed4 peptides is shown in Fig. 2. Remarkably the template fluctuates a lot to accommodatethe added monomer. This is probably because the number of monomers is lower than thesize of the critical nucleus which remains largely unknown for the Aβ16−22 system but ourrecent analysis has shown that this size should be at least larger than six. If we define thetime for adding a new monomer,tadd as the time needed to getP2 = 0.9 for the entiresystem thentadd ≈ 110 ns for the pentamer (the result is averaged over four trajectories).
From the time dependence of the content of the beta content,β(t) (Fig. 3a), it followsthat the nascent peptide docks into the the preformed subsystem first. Namely, initiallyβ(t)of the disordered monomer is lower than that of the preformedsubsystem and they becomecompatible at the end of the dock phase. In order to get into the fibril state the addedpeptide spends a lot of time on its reorientation while the preformed template fluctuatesto accommodate it. As evident from Fig. 3b the accumulated value β(t) of the nascent
212

0 100 200 300 400500time (ns)
0
0.2
0.4
0.6
0.8
1
P2
0 100 200 300 400500time (ns)
0.2
0.4
0.6
0.8
1
P2
P2 for 5 peptides P
2 for 4 preformed peptides
(a) (b)
Figure 2. (a) Time dependence ofP2 for the whole system of 5 peptides. The arrow refers toP −2 ≈ 0.9 whichcorresponds to the adding time. (b) The same as in (a) but for the preformed template.
(b)(a)
Figure 3. (a) The time dependence of the beta content of the preformed four peptides (black) and the addedmonomer (red). (b) The same as in (a) but forβ(t) = 1
t
R t
0β(x)dx.
monomer approaches the value of the template very slowly, the second lock phase shouldhave much longer time scale compared to the dock stage.
In conclusion, we have shown that the fibril formation of short peptides obeys the two-stage dock-lock mechanism. This may be also valid for longerpeptides and proteins.
Acknowledgments
This work was supported by the Polish Komitet Badan Naukowych grant No 1P03B01827and National Institute of Health Grant R01 GM076688-05.
References
1. F. Chiti, and C. M. Dobson,Protein misfolding, functional amyloid, and human dis-ease, Annual Rev. Biochemistry75, 333–366, 2006.
2. R. S. Collins, A. Douglass, R. D. Vale, and J. S. Weissman,Mechanism of prionpropagation: Amyloid growth occurs by monomer additionPLOS Biol.2, 1582-1590,2004.
3. H. J. C. Berendsen, D. van der Spoel and R. van Drunen,A message-passing parallelmolecular dynamics implementation, Comp. Phys. Comm.91, 43–56, 1995.
213

4. P. H. Nguyen, M. S. Li, G. Stock, J. E. Straub, and D. Thirumalai, Monomer adds topreformed structured oligomers of Aβ-peptides by a two-stage dock-lock mechanism,Proc. Natl. Acad. Sci. USA104, 111–116, 2007.
214
Multiple Beta-Sheet Molecular Dynamics of Two Abl-SH3Domain Peptides
Inta Liepina 1, Salvador Ventura2, Cezary Czaplewski3, and Adam Liwo3
1 Latvian Institute of Organic Synthesis, Riga, LV1006, LatviaE-mail: [email protected]
2 Institut de Biotecnologia i de Biomedicina, Universitat Autonoma de BarcelonaE-08193 Bellaterra, Spain
E-mail: [email protected]
3 Faculty of Chemistry, University of Gdansk, 80-952 Gdansk, PolandE-mail: czarek, [email protected]
Six parallely placed ten stranded antiparallelβ-sheets of DLSFMKGE (10x6xMK), and DLS-FKKGE (10x6xKK) peptides, immersed in periodic water boxes, were subjected to moleculardynamics simulations (MD) for 90 ns and 40 ns respectively, to study the amyloid fibril forma-tion tendencies of the two peptides. MD simulation showed that the 10x6xMKβ-sheet sheetstack is stable, but 10x6xKKβ-sheet stack is not. 10x6xMKβ-sheet is stable because of hy-drophobic interactions of metionine-phenilalanine and leucine of the neighbouring sheets. Met,Phe, Leu make a hydrophobic core for the stack ofβ-sheets. During MD run the Met, Phe, Leuof neighbouring sheets act as conformational switch movingβ-sheets by two amino acid steptowards each other.
1 Introduction
Short protein sequence stretches drive the protein aggregation in amyloid fibrils1–3. Basedon a homology search we have identified an aggregation-proneregion in the Abl-SH3 do-main of Drosophila with sequence DLSFMKGE (MK), and less amyloidogenic human ho-mologous region with sequence DLSFKKGE (KK). The antiparallel flat β-sheets consist-ing of ten strands of MK and KK were constructed. We created two multi-sheet systems:(1) six parallely placed 10-strandβ-sheets of MK (10x6xMK) (Fig.1a), (2) six parallelyplaced 10-strandβ-sheets of KK (10x6xKK) (Fig.2a). Each of theseβ-sheet systems wassurrounded by a 10A layer of water molecules over the solute and subjected to moleculardynamics (MD) simulations with the Amber 8.0 force field in the NPT (constant numberof molecules, pressure, and temperature) scheme. The MD simulations were started fromthe temperature of 10 K and the temperature was gradually raised by the step of the tendegrees till 300 K, then the simulations were run at the constant temperature of 300 K. The10x6xMK system was simulated by 90 ns of MD, the 10x6xKK system was simulated by40 ns of MD.
2 Results
The 10x6xMK system maintainsβ-sheets, and theβ-sheets remained together in a stackduring all the time of MD simulation (Fig.1) and showed strong hydrogen bonding (Fig.3).During the simulation theβ-sheets of the 10x6xMK system shifted towards each other by
215

two amino acids (Fig.1b, Fig.1c). The 10x6xKK system maintainsβ-sheets, butβ-sheetsdo not remain together, they are hanging by a thread (Fig.2b), and moving away each fromother (Fig.2c).
a) b) c)
Figure 1. Multisheet system of DLSFMKGE peptides (10x6xMK)keeps together all the time of MD simulation.The 10x6xMK system at a) 351 ps, b) 21705 ps, c) 74499 ps of MD.
a) b) c)
Figure 2. Multisheet system of DLSFKKGE peptides (10x6xKK)does not remain together during MD simula-tion. The 10x6xKK system at a) 382 ps, b)11408 ps, c) 36771 ps of MD.
216

3 Conclusions
The MD simulation of multisheet systems revealed that: 1.The 10x6xMKβ-sheet stack isstable, but the 10x6xKKβ-sheet stack is not. 2.The 10x6xMKβ-sheet is stable becauseof hydrophobic interactions of metionine and phenylalanine side chains and the leucineside chain of the neighbouring sheets. Met, Phe, Leu make a hydrophobic core for thestack ofβ-sheets. 3.During the MD run, the Met, Phe, and Leu residues of neighbouringsheets act as a conformational switch moving theβ-sheets by two amino acid step towardseach other. 4.Replacement of Met by Lys destroys the hydrophobic core, which is thestability factor of theβ-sheets stack. The 10x6xKK system maintainsβ-sheets, but losesinteractions betweenβ-sheets. 5.The calculations of sixβ-sheets confirm the conclusiondrawn for single sheet systems: parallelly placedβ-sheets stabilize each other.
a) b) c)
Figure 3. DLSFMKGE peptides (10x6xMK) show strong hydrogenbonding during the all MD run: a) 351 ps,b) 21705 ps, c) 74499 ps.
Acknowledgments
This work was supported by NATO Collaborative Linkage GrantLST.CLG.979807, bystipend for I.L. from the “Kasa im. Jozefa Mianowskiego” Fund, Poland, by Latvian Sci-ence Council Grant 05.1768, calculations are carried out atthe Gdansk Academic Com-puter Center TASK.
217

References
1. S. Ventura, J. Zurdo, S. Narayanan, M. Parreno, R. Mangues, B. Reif, F. Chiti, E. Gi-annoni, C.M. Dobson, F.X. Aviles, L. Serrano,Short amino acid stretches can mediateamyloid formation in globular proteins: the Src homology 3 (SH3) case, Proc. Natl.Acad. Sci. USA101, 7258-63, 2004.
2. S. Ventura, E. Lacroix, L. Serrano,Insights into the origin of the tendency of thePI3-SH3 domain to form amyloid fibrils, J.Mol.Biol. 332, 1147-58, 2002.
3. I. Liepina, S. Ventura, C. Czaplewski, A. Liwo,Molecular dynamics study of amyloidformation of two Abl-SH3 domain peptides, J.Pept.Sci.12, 780-9, 2006.
218

Parallelization of ECEPP/3 in SMMP
Jan H. Meinke1 and Ulrich H. E. Hansmann1,2
1 John von Neumann Institute for Computing,Research Centre Julich, 52425 Julich, GermanyE-mail: j.meinke, [email protected]
2 Department of Physics,Michigan Technological University,
Houghton, MI 49931, USA
The power consumption of modern processors makes it difficult to increase their clock speedfurther. Even in the PC market CPU manufacturers now includemultiple compute cores on asingle chip to improve performance and keep up with Moore’s law, a trend likely to continue.This is even more important in high performance computing, where cooling and electricity billsare becoming a large issue. The compactness and low power consumption of an IBM BlueGene,e.g, is only possible because of CPUs with moderate clock rates.
Protein folding is computationally hard. To take advantageof the increasing number of computecores and reduce the time to solution, we need to parallelizeour codes, especially the timeintensive calculation of the energy function, and minimizethe serial portions of the code. We arepresenting the parallelization implemented in SMMP for theECEPP/3 force and the resultingscaling behavior on various platforms including BlueGene/L. Combining the parallel energyfunction with parallel tempering, simulations scale up to thousands of processors.
1 Introduction
Moore predicted that the number of transistors on the cheapest chips doubles every 24months.1 This prediction has held for over 40 years. Combined with increasing clockspeeds, this development let to ever faster CPUs, faster-running serial codes, and largerpower consumption. One way to decrease the power consumption is to run the proces-sor at a lower clockspeed. Using the same chip, doubling the clock speed results in anapproximately 8 times higher power consumption. In the mid 1990s, an Intel Pentium Irunning at 133 MHz used about 11 W. Modern processors can use more than 100 W. Withthe introduction of multi-core processor to the consumer PCmarket in 2005, Intel movedaway from providing processors that run serial code faster and forced many applicationdevelopers to think about parallel programming. In high-performance computing, wherethe number of processors can go into the thousands, power consumption and cooling areimportant factors. With the development of BlueGene/L, IBMdecided to use compara-tively slow processors — with a correspondingly low power consumption — combinedwith fast networking, to build a very compact system that scales to more than a 100000processors and a peak performance of more than 350 TFLOPS. This high performancecomes at a price. Comparing the single processor performance of a BG/L with an AMDOpteron at 2.4 GHz, we find that our application runs more than7 times faster on theOpteron than BG/L. To make up for this loss in performance andtake advantage of ourBlueGene/L JUBL and the increasing size of our smaller PC clusters, we parallelized thecalculation of the energy in our protein simulation packageSMMP.2, 3 In combination withparallel tempering, we now regularly run our simulation on 4096 processors. Here, we
219

present the application scaling on 4 different platforms and give some pointers for efficientparallelization on BlueGene/L.
2 Distributing the Work
For these measurements we used the ECEPP/3 force field.4 The energy function that needsto be calculated is
EECEPP/3 =∑
(i,j)
332qiqjǫrij
+∑
(i,j)
(
Aij
r12ij
− Bij
r6ij
)
+∑
(i,j)
(
Cij
r12ij
− Dij
r10ij
)
+∑
l
Ul(1 ± cos(nlξl)) , (1)
wherei andj are indices of atoms,rij is the distance between atomi and atomj, andlis the index of a dihedral angle in the protein chain. All other variables (qi, Aij , Bij , Cij ,andDij ) are parameters of the force field.
In SMMP, every atom is associated with a dihedral angle. We used this relation todistribute the interactions as evenly across processors aspossible without regard to spatialproximity.
3 Setup and Scaling
We ran our benchmark on 4 different platforms: JUMP, an IBM p690 cluster with 32processors and 112 GB of shared memory per node; JUBL, an IBM BlueGene/L with 8racks and a total of 16384 Power4 processor at 700 MHz; JULI a PC cluster using dual-core PowerPC 970MP processors at 2.5 GHz with an InfiniPath network and NICOLE,an Opteron based PC cluster with a clock speed of 2.4 GHz usingInfiniband networking.Except for the setup of the communicators used for the energycalculation on BG/L, weused the same source code for all measurements. We performed50 sweeps of a MonteCarlo simulation of the designed protein TOP75 starting from a stretched chain. Data waswritten to disk every 10 sweeps. On JUBL, we used multiple replicas in parallel with theindicated number of processors per replica to fill a half plane (512 processors).
Figure 1 shows walltime and scaling for the various machines. The execution time ona single processor ranges from about 18 min on JULI to about 2 hon JUBL. The lowestexecution time ranges from 81 s on JUMP to 269 s on JUBL with 64 processors per replica.The maximum speedup is 25 on JUBL with 64 processors.
For JUMP, JULI, and NICOLE we used MPI’s default processor assignment. OnJUBL, however, this approach leads to a sub-optimal distribution of the processors. BG/Lhas a cubic geometry. By default, the rank of a processors increases first along x, than y,and finally z. This leads to a planar distribution of processors (cf. left picture in figure2). Instead of the default, one should make communicators ascubic as possible (see rightpicture in figure 2) unless the problem geometry suggests a different approach.
4 Conclusions
For protein simulations, distributing the calculation of the interactions evenly across a num-ber of processors can be done efficiently without worrying about the spatial distribution of
220

0
5
10
15
20
25
30
35
0 10 20 30 40 50 60 70
Number of Processors
JULIJUMPJUBL
NICOLE
0
200
400
600
800
1000
1200
1400
1600
1800
2000
0 10 20 30 40 50 60 70
Wallt
ime [s]
Number of Processors
JULIJUMPJUBL
NICOLE
Figure 1. Strong scaling behavior. This figure shows the walltime and corresponding parallel scaling vs. numberof processors on JULI, JUMP, and JUBL. For the benchmark, we performed 50 sweeps of a Monte Carlo simu-lation of Top7,5 a 92 residue protein with 1477 atoms. Data and configurationswere written to disk after every10 sweeps. On JUBL, we used multiple replicas in parallel with the indicated number of processors per replicato fill a half plane.
Figure 2. Two processor arrangements on BG/L. To combine parallel tempering with a parallel calculation of theenergy for each replica, we define our own communicators for the energy calculation. On the left-hand side, weshow the default arrangement for a consecutive number of processors on a4× 4× 4 partition with four replicas.Each replica is assigned to a plane of the partition. On the right, we show the most cubic arrangement possible.The cubic arrangement scales significantly better (up to25×) than the planar one (up to18×).
the atoms involved. The low cost per processor makes BlueGene/L an attractive platformfor protein simulations. Using a cubic arrangement of 64 processors, we achieve a speedupof up to 25× on BG/L. With the large number of processors available on JUBL, we canrun simulations with 64 replicas at a quarter of the cost and at the same speed as on JUMP.
Acknowledgments
Development, computations and measurements were performed on computers of the Johnvon Neumann Institute for Computing (NIC). U.H. received support from the NationalScience Foundation (USA) under grant number CHE-0313618.
221

References
1. Gordon E. Moore,Cramming more components onto integrated circuits, Electronics,38, no. 8, 114–117, 1965.
2. Frank Eisenmenger, Ulrich H. E. Hansmann, Shura Hayryan,and Chin-Kun Hu,[SMMP] A modern package for simulation of proteins, Comput. Phys. Commun.,138, 192–212, aug 2001.
3. Frank. Eisenmenger, Ulrich. H. E. Hansmann, Shura Hayryan, and Chin-Kun Hu,An enhanced version of SMMP—An Open-Source Software Package for Simulation ofProteins, Comput. Phys. Commun.,174, 422–429, 2006.
4. G. Nemethy, K. D. Gibson, K. A. Palmer, C. N. Yoon, G. Paterlini, A. Zagari, S. Rum-sey, and H. A. Scheraga,Energy parameters in polypeptides. 10. Improved geometri-cal parameters and nonbonded interactions for use in the ECEPP/3 algorithm, withapplication to proline-containing peptides, J. Phys. Chem.,96, no. 15, 6472 – 6484,1992.
5. B. Kuhlman, G. Dantas, G. C. Ireton, G. Varani, B. L. Stoddard, and D. Baker,De-sign of a Novel Globular Protein Fold with Atomic-Level Accuracy, Science,302, no.5649, 1364 – 1368, 2003.
222

The Role of Metals in Misfolding and AggregationProcesses: X-ray Spectroscopy and Numerical Simulations
V. Minicozzi1, S. Morante1, G.C. Rossi1, F. Stellato1, and K. Jansen2
1 University of Rome Tor Vergata and INFN, Via della Ricerca Scientifica 1, 00133 Rome, ItalyE-mail: velia.minicozzi, silvia.morante, giancarlo.rossi, [email protected]
2 NIC Desy-Zeuthen, Platanenallee 6, 15738 Zeuthen, GermanyE-mail: [email protected]
Recent X-ray Absorption Spectroscopy experiments designed to study the metal coordinationmode in Cu-Aβ and Zn-Aβ complexes have been able to detect visible differences betweenZn and Cu samples that are suggestive of dissimilar structural roles of the two ions. Thesefindings indicate that metals can bind Abeta-peptides in an intra- as well as in an inter-peptidecoordination mode, hinting at a different aggregation propensity. First principle investigationsof Cu–Aβ and Zn–Aβ complexes, based onab initio molecular dynamics simulations of theCar–Parrinello type are set up to elucidate the molecular basis for this difference.
1 Introduction
Amyloidosis is a family of pathologies caused by the transition of certain endogenous pro-teins and peptides from their physiological soluble configuration to a pathological fibrillarstate. The term describes a heterogeneous group of diseases(more than 20) characterizedby extra-cellular deposition of fibril material1, 2. Among them the Alzheimer disease (AD),a progressive and devastating neuro-degenerative pathology3, characterized by misfoldingof well identified peptides called Aβ-peptides. In AD, like in many other amyloidosis, animportant, but not yet fully elucidated, role seems to be played by transition metals (mainlyCu+2 and Zn+2) present in fairly large amount in neurological plaques. There exist in theliterature conflicting statements about the ability of Cu+2 and Zn+2 in providing protec-tion against or acting as promoters of plaques formation. The interest in elucidating therole of metals strongly increased after noticing that Cu+2 and Zn+2 chelators are capa-ble of solubilizing Aβ-aggregates. It is clear enough that the nature of the metal bindingmechanism has significant consequences on the protein folding/unfolding and aggregationprocesses4. However, the experimental techniques used until very recently were not ableto unambiguously reconstruct the local atomic structure around the metal.
The availability of third generation synchrotron radiation sources has significantly en-larged the range of application of X-ray Absorption Spectroscopy (XAS) in investigatingstructural properties of biological systems. XAS can be profitably used to study the envi-ronment of metal ions complexed with proteins and peptides in physiological conditions,owing to its chemical selectivity and sensitivity to the local atomic structure around theabsorber. Furthermore an accurate analysis of the extendedX-ray absorption fine structure(EXAFS) region of the spectrum in terms of single plus multiple scattering contributionshas been proved to allow a clear-cut identification of the amino acid (a.a.) residues primar-ily bound to the metal5.
At the more fundamental level, describing the peculiar electronic properties of peptide-metal complexes in terms of quantum chemistry is necessary to really clarify the structural
223
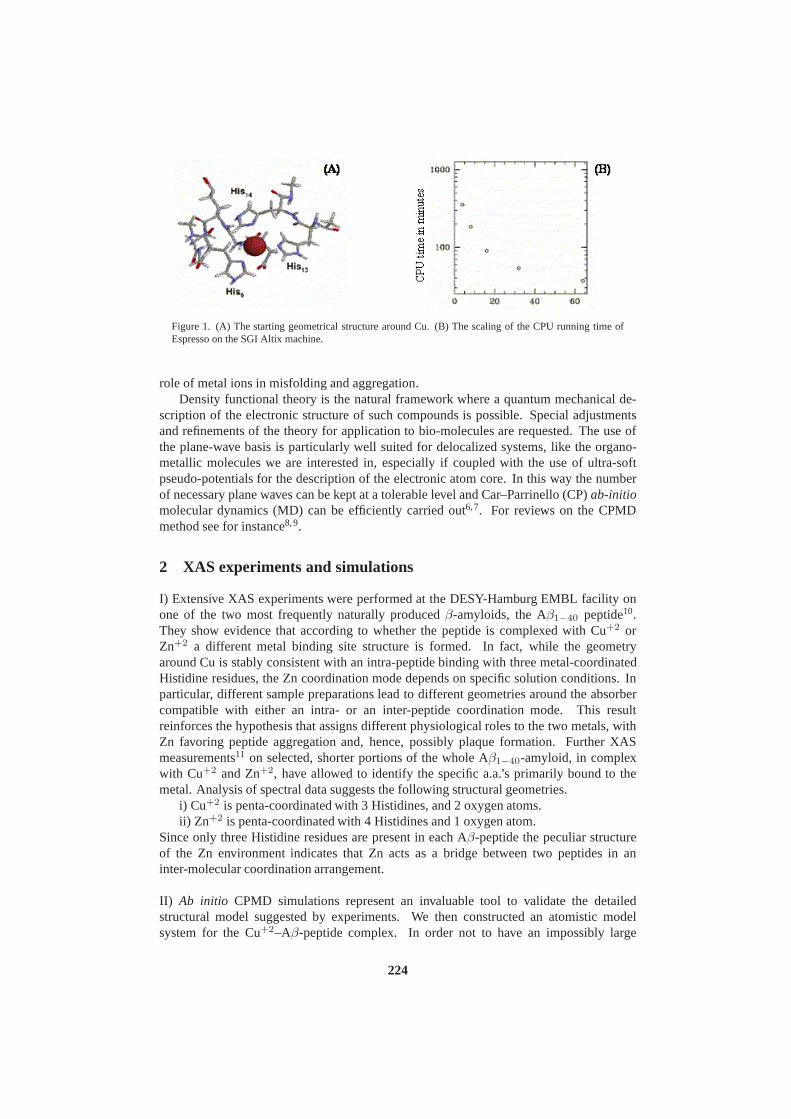
Figure 1. (A) The starting geometrical structure around Cu.(B) The scaling of the CPU running time ofEspresso on the SGI Altix machine.
role of metal ions in misfolding and aggregation.Density functional theory is the natural framework where a quantum mechanical de-
scription of the electronic structure of such compounds is possible. Special adjustmentsand refinements of the theory for application to bio-molecules are requested. The use ofthe plane-wave basis is particularly well suited for delocalized systems, like the organo-metallic molecules we are interested in, especially if coupled with the use of ultra-softpseudo-potentials for the description of the electronic atom core. In this way the numberof necessary plane waves can be kept at a tolerable level and Car–Parrinello (CP)ab-initiomolecular dynamics (MD) can be efficiently carried out6, 7. For reviews on the CPMDmethod see for instance8, 9.
2 XAS experiments and simulations
I) Extensive XAS experiments were performed at the DESY-Hamburg EMBL facility onone of the two most frequently naturally producedβ-amyloids, the Aβ1−40 peptide10.They show evidence that according to whether the peptide is complexed with Cu+2 orZn+2 a different metal binding site structure is formed. In fact,while the geometryaround Cu is stably consistent with an intra-peptide binding with three metal-coordinatedHistidine residues, the Zn coordination mode depends on specific solution conditions. Inparticular, different sample preparations lead to different geometries around the absorbercompatible with either an intra- or an inter-peptide coordination mode. This resultreinforces the hypothesis that assigns different physiological roles to the two metals, withZn favoring peptide aggregation and, hence, possibly plaque formation. Further XASmeasurements11 on selected, shorter portions of the whole Aβ1−40-amyloid, in complexwith Cu+2 and Zn+2, have allowed to identify the specific a.a.’s primarily bound to themetal. Analysis of spectral data suggests the following structural geometries.
i) Cu+2 is penta-coordinated with 3 Histidines, and 2 oxygen atoms.ii) Zn+2 is penta-coordinated with 4 Histidines and 1 oxygen atom.
Since only three Histidine residues are present in each Aβ-peptide the peculiar structureof the Zn environment indicates that Zn acts as a bridge between two peptides in aninter-molecular coordination arrangement.
II) Ab initio CPMD simulations represent an invaluable tool to validate the detailedstructural model suggested by experiments. We then constructed an atomistic modelsystem for the Cu+2–Aβ-peptide complex. In order not to have an impossibly large
224

system, of the first six a.a.’s the lateral chains of only the first (Aspartic acid), third(Glutamic acid) and sixth (Histidine) a.a., as well as of the13th and 14th Histidine residue(His13 and His14) are simulated in full atomic details. For the rest of the 1-6a.a.’s only thebackbone is retained. Furthermore none of the remaining a.a. is included. The C-terminalis capped with an NHCH3 group, while the N-terminal of the 1-6 fragment is left open(with an ending NH group) to allow possible Cu binding with loss of the amide hydrogen.Structural information from XAS10, 11 and NMR12 data were exploited in setting up thegeometry around Cu which is schematically shown in Fig. 1 (panel A). The whole system,solvated with 125 water molecules, is contained in a box witha volume V=15x20x20A3.In this way density is set equal to 1 g/cm3. All in all (i.e. including water) the simulatedsystem comprises 494 atoms and 1369 electrons. A similar system with Zn replacing Cuis under test.
III) Simulations are performed using the CPMD Espresso code7. In the Table we showthe performances of the code, all taken in the16 nodes configuration, on two PC-clusters(Fermi1 in Rome and BEN in Trento) and the SGI Altix 4700 machine (in Munich). Fig. 1
machine nodes tCPU (s)Fermi1 16 5880BEN 16 4560Altix 16 1080
(panel B) shows the scaling with the number of nodes of the CPUtimes on the Altixmachine. The performances are for a not fully optimized code. The interesting outcomeof this feasibility study is that with a moderately large number of nodes (say 64) on theSGI machine a fairly long CP trajectory (3-4 ps) of the large system described before canbe collected in less that two months. Simulations of this length will allow to clarify thepossible involvement of the N-terminal region of the Aβ-peptide in binding the metal, assuggested by XAS data10, 11.
References
1. M.B. Pepys, Philos. Trans. R. Soc. Lond. B Biol. Sci. 356, 203 (2001).2. F. Chiti and C.M. Dobson, Ann. Rev. Biochem. 75, 333 (2006).3. D.J. Selkoe, Physiol. Rev. 81, 741 (2001).4. R.A. Cherny et al., Biometals 16, 91 (2003).5. C. Meneghini and S. Morante, Biophys. J. 75, 1953 (1998); S. Morante, J. Syn-
chrotron Rad. 8, 975 (2001); S. Morante et al., J. Biol. Chem.279, 11753 (2004).6. R. Car and M. Parrinello, Phys. Rev. Lett. 55, 2471 (1985).7. P. Giannozzi, F. de Angelis and R. Car, J. Chem. Phys. 120, 5903 (2004).8. M.C. Payne et al., Rev. Mod. Phys. 64 1045 (1992).9. D. Mark and J. Hutter, in “Modern Methods and Algorithms ofQuantum Chemistry”,
Ed. J. Grotendorst, NIC, Julich,http://www.fz-juelich.de/nic-series.10. F. Stellato et al., Eur. Biophys. J. 35(4), 340 (2006).11. V. Minicozzi et al., in preparation.12. J. Danielsson et al., FEBS J. 274, 46 (2007).
225

Folding and Aggregation of Proteins with Monte CarloSimulations
Sandipan Mohanty1 and Ulrich H. E. Hansmann1,2
1 John von Neumann Institute for Computing,Research Centre Julich, 52425 Julich, GermanyE-mail: s.mohanty,[email protected]
2 Department of Physics, Michigan Technological University, Houghton, Michigan, U.S.A.E-mail: [email protected]
An implicit water all-atom model is used to study folding, aggregation of small proteins. Phys-ically reasonable results obtained for a variety of applications indicate healthy global propertiesof the interaction potential.
1 Introduction
The prevailing picture of the process of protein folding is that proteins fold into their native3D structures because those states have the minimum free energy among all conformationsthe protein chain can take, and hence are thermodynamicallymost probable. However,it has proven to be a considerably greater challenge to explicitly formulate an effectiveinteraction potential, such that for every given protein, the minimum free energy structurecalculated from the force field corresponds to the correct experimental structure. Differentpotentials give very different relative weights to theα-helix andβ-strand regions of theprotein conformation space. A potential that successfullyfolds α-helical peptides oftenhas problems withβ-sheet peptides, andvice versa. Also, proteins fold and unfold atphysiologically relevant temperatures, and most potentials need further callibration in orderto give more realistic temperature dependence of observable quantities.
In this article, folding1, 2 and aggregation3 studies with one particular model for proteinfolding will be summarized. The protein molecules are represented in full atomistic detail,whereas the solvent molecules are left out to reduce the number of degrees of freedomof the system. The potential used was developed through repeated folding simulations ofsmall peptides. It does not use any information about the known experimental structuresof the peptides, and spontaneous folding from random initial conformations, and not thedescription of properties of the folded state through simulations of small perturbationsaround it, has been the chief objective.
2 Model and Methods
The model discussed here includes all atoms of the polypeptide chains, including all hydro-gen atoms. It assumes fixed bond lengths, bond angles and peptide torsion angles (180),so that each amino acid only has the Ramachandran torsion anglesφ, ψ and a number ofside-chain torsion angles as its degrees of freedom.
227

Figure 1. Free-energy estimated from the probability of occurence of different states in high statistics MonteCarlo simulations plotted as a function of energy and backbone RMSD∆b for, (a) For a helical protein 1RIJwhere is one dominating minimum corresponding to the nativestate. Inset: optimal superimposition of simulationstructure on the experimental structure. (b) For a protein with more complex native conformation, the free-energysurface may show many competing minima. The overlap of the global free-energy minimum with the PDBstructure, as well as the 3D shape of some other minima are also shown
The force field consists of four terms, representing an1/r12 excluded volume repulsionbetween every pair of atoms, a weak local electrostatics term along the protein backbone,an orientation dependent hydrogen bond term, and an effective hydrophobic attraction be-tween non-polar side chains. For a detailed description of the model and the force field,the reader is referred to1. The rugged energy landscape of proteins was sampled usingsimulated tempering and parallel tempering Monte Carlo methods. Both single angle anda semi-local multiple-angle updates were employed on protein conformations. In aggrega-tion studies, rigid body translations and rotations of molecules were used additionally. Allsimulations start with random initial conditions of the molecules. The simulations weredone using the program package PROFASI4, a C++ implementation of the model.
3 Results
We studied the folding behaviour of several small proteins of helical (Trp-cage, Fs, 1RIJ),β-sheet (GB1p, GB1m2, GB1m3, betanova, LLM, beta3s) and mixed secondary structureelements (BBA5). Unbiased simulations in the model, starting from random initial con-formations are able to identify the native states of each of these proteins with one and thesame choice of parameters for the energy function. The free-energy surfaces obtained in themodel are found to be of different characters, depending on the eventual native fold of theprotein2. Small proteins like Trp-cage and 1RIJ, with simple helicalsecondary structureshave simple free-energy landscapes with one dominating minimum corresponding to thenative state, as for example, in Fig. 1 (a).β–sheet proteins as well as proteins with mixedsecondary structures show much more complex landscapes with several minima with sig-nificant free-energy barriers between them. One example of such a surface is shown inFig. 1 (b). Estimates of the folding populations at experimental temperatures as well as thechange of stability of peptides due to mutations agrees wellwith experiments.
We have also studied multiple chain systems of the Aβ16−22 peptide, a segment ofthe Alzheimer’sβ-amyloid peptide, that is experimentally known to form amyloid fibrilswith an in-register anti-parallel cross-β organization of the strands. In simulated tempering
228

Figure 2. Oligomers of Aβ16−22 from 9 chain simulations. Many stable oligomeric forms are found, even a9 chain barrel form (bottom right). In simulations, small oligomers show a weak preference towards ordered,anti-parallelβ-strand organization. But such preference is seen to grow for the larger oligomeric species.
simulations of systems of 1, 3, 6 and 9 chains of Aβ16−22 peptides, the Aβ16−22 peptidesself-assemble intoβ–sheet rich oligomers3. The isolated Aβ16−22 peptide is found tobe unstructured, while multi-chain systems develop into a variety of different oligomericspecies with a marked increase inβ–sheet content, cf. Fig. 2. Of particular interest is thespontaneous formation of a 9 strandedβ-barrel as one of the oligomeric species. A studyof the population of parallel vs anti-parallel pairs of strands shows that larger oligomerstend to contain less defects.
4 Concluding Remarks
The simple and physically well motivated form of the interaction potential given in1 ap-pears to result in good global properties of the protein energy landscape. If simulations areinterpreted carefully, keeping in mind the known weaknesses of the model, they could beused to extract meaningful physical predictions about the molecules in a wide variety ofapplications.
Acknowledgments
This work was partly supported by National Science Foundation (USA) grant (CHE-0313618) and the National Institute of Health (USA) grant No. GM62838.
References
1. A. Irback and S. Mohanty : Biophys. J.88, 1560 (2005).2. S. Mohanty and U.H.E. Hansmann : Biophys. J.92, 3573 (2006).3. G. Favrin, A. Irback, and S. Mohanty : Biophys. J.87, 3657 (2004).4. A. Irback and S. Mohanty : J. Comp. Chem.,27,1548 (2006), Internet address:
http://cbbp.thep.lu.se/activities/profasi/.
229


Channel Transport and Molecular Motors withoutBrownian Ratchets
Walter Nadler1 and Wolfgang R. Bauer2
1 Department of Physics, Michigan Technological University, Houghton, MI 49931, USAE-mail: [email protected]
2 Medizinische Universitatsklinik 1, Josef Schneider Straße 2, D-97080 Wurzburg, GermanyE-mail: [email protected]
Brownian rotors are a large and important class of molecularmotors in biological systems.Usually the function of these molecular machines is described as being a Brownian ratchet.However, Brownian ratchets need non-equilibrium fluctuations of an asymmetric potential forits function. We demonstrate that the Brownian ratchet paradigm does not apply to Brownianrotors. Rather, recent analytical results on facilitated transport through biological channels (W.R. Bauer & W. Nadler, PNAS 103, (2006) 11446) can be employed to understand also thesepurely concentration gradient-driven systems.
1 Introduction
Rotary molecular motors play a central role in biological cells where they transduce elec-trochemical or chemical energy into mechanical force. An archetype is the F0 portion ofthe F-ATP synthase which converts the electrochemical energy difference of protons orsodium cations across the inner membrane of mitochondria into a mechanical torque1. Itconsists of a rotary ring, which works as a proton or sodium carrier across the membrane2.
Surprisingly, such rotary molecular motors are usually described as Brownian ratch-ets1, 3. However, Brownian ratchets need non-equilibrium fluctuations of a force field tofunction4, 5. But the only non-equilibrium aspect of biological molecular rotary motors isa concentration gradient across the membrane.
This situation is reminiscent of the problem of facilitatedand asymmetric transportin biological channels6, 7. There also non-equilibrium fluctuations of a force field werediscussed to describe that phenomenon8. However we were able to show that a thoroughanalysis of the diffusive transport is sufficient9. We will sketch that theory and discusshow it can be applied to the situation of Brownian rotors. To compare the basic biologicalsituations, see also Fig. 1.
2 Theory
The dynamics of the density of the molecules inside a channel, ρ(x, t), is determined bythe Smoluchowski equation10,
∂tρ(x, t) = D∂x [∂x − F (x)] ρ(x, t) , (1)
wherex is the channel coordinate andD is the diffusion coefficient.F (x) is the forcethat describes the molecule-channel interaction that can always be derived from a potentialfunction in one dimension,F (x) = −Φ′(x). At the ends of the channel we assume that
231

!!
!"
rotor
H+
- - - - - -
L1
Figure 1. Basic biological situations: (left) A membrane separates two baths with molecular concentrationsc1 andc2. The baths are connected by channels (hatched rectangles) allowing only access of a single molecule.(right) Brownian rotor driven by aH+ gradient. The relevant component of the motor is a ring carrying identicalhairpin-like protomers in which the amino acid Asparagine works as proton carrier. In order to emphasize theanalogy to the channel situation, the rotor is drawn linearly, and periodic boundary conditions are assumed.
baths hold the molecular densities constant atρ(0, t) ≡ c1 andρ(L, t) ≡ c2, respectively,as seen e.g. in Fig. 1a.
Extending an old approach by Hardt11 we have shown recently12 that in very generalsituations described by a Smoluchowski equation (1) the flowJ of non-interacting particlesacross some region is given by a macroscopic version of Fick’s law13
J =n
τ(c1 − c2) (2)
whereτ is the mean first passage time10 to cross the region andn is a measure of the steadystate particle number in that region.
In reality transported molecules are interacting, in particular they cannot pass eachother. In order to allow for that fact the above approach has to be extended. We nowinterpretρ(x, t) as the probability density that a channel contains a particle atx. The emptychannel has to be added as an additional state, the probability of which we will denote asρ0. This additional empty channel state leads to a cyclic statemodel, see Fig. 2, since amolecule can enter the empty channel from either side. The corresponding transition ratesbetween the empty channel state and the states in which a molecule is attached to eitherendρ1 = ρ(0, t), ρ2 = ρ(L, t) are proportional to the concentration of molecules of theadjacent baths which we denote again asc1 andc2. In the steady state the equation system
J0→1 = c1 k(1)+ ρ0 − k
(1)− ρ1 , (3)
J1→2 =n
τ(ρ1 − ρ2) , (4)
J2→0 = k(2)− ρ2 − c2 k
(2)+ ρ0 , (5)
holds, where Eq. (4) derives from Eq. (2).k(i)± , i = 1, 2, are the reaction rate constants
describing attachment of molecules to and dissociation from either end of the channel. Inthe steady state all flows of Eqs. (3-5) are identical. In addition, we have to consider thatthe total probability is conserved. Including such a normalization condition9 we obtain anexpression for the flow similar to Eq. (2) wheren is replaced by a nonlinear function ofn
232

1 n/1 22n/0 0 k+ (2) c2
0 k+(1) c1
1 k-(1)
2 k-(2)
Figure 2. Cyclic state model of molecular transport throughthe channel that allows for interacting particles.Three states of the channel are depicted: 0 refers to the empty channel, 1 and 2 are channel states with a singlemolecule attached either of at one or the other end. The respective unidirectional flows between the states areshown above the corresponding arrows.
(and other parameters),
J =f (n)
τ(c1 − c2) . (6)
This function shows a nonlinear dependence on the concentrationsc1 andc2 that exhibitsanalogies to a Michaelis-Menten-type14 behavior:
f(n) =n
1 + n (c1 + c2) + ∆n (c1 − c2) + nτ
[
1
k(1)−
+ 1
k(2)−
+ 2n
(
c2
k(1)−
+ c1
k(2)−
)] . (7)
Consequences from this expression on transport facilitation, optimality of parameters, andasymmetric transport are analyzed in detail in Ref. 9.
3 Discussion
In Brownian rotors the transport ofH+ bound to the protomers, see Fig. 1b, is coupled di-rectly to the movement of the rotor. Therefore, applying theabove theory for determiningtheH+-current also gives expressions for the rotation. Note, however, that in the aboveconsiderations no potential difference between the baths was assumed. But Brownian ro-tors under workload are best described by an additional macroscopic potential gradient3.Our model can be readily adapted to such a situation whenΦ(0) = Φ1 6= Φ(L) = Φ2.In particular, flow vanishes if the chemical potentials of the bathsµi = Φi + ln(ci) areequal. Using potential corrected specific particle numbersn and first passage timesτ 9,Fick’s diffusion law in Eq. (2) can be generalized to
J =n
τ(eµ1 − eµ2) . (8)
Also all other results Ref. 9, e.g. Eq. (7), can be generalized to this situation by replacingconcentrationsci by the activitieseµi and introducing the corresponding potential cor-rected parameters. In this way a straightforward analysis of Brownian rotors is readilypossible15.
233

Acknowledgments
This research was supported by NSF-grant No. CHE-0313618 and the DFG (SFB 688).
References
1. W. Junge (2004)Photosynth. Res.80197.2. Seehttp://www.biologie.uni-osnabrueck.de/biophysik/junge/
for an illustrative animation.3. H. Wang (2005)J. Phys.: Condens. Matter17, S3997.4. Frey, E. & Kroy, K. (2005)Ann. Phys. (Leipzig)14, 20.5. P. Hanggi, F. Marchesoni, & F. Nori (2005)Ann. Phys. (Leipzig)14, 51.6. Schwarz, G., Danelon, C., & Winterhalter, M. (2003)Biophys. J.84, 2990.7. Alcaraz, A., Nestorovich, E.M., Aguilella-Arzo, M., Aguilella V. M., & Bezrukov,
S.M. (2004)Biophys. J.87, 943.8. Kostin, I. & Schulten, K. (2004)Phys. Rev. Lett.93, 238102.9. Bauer, W.R. & Nadler W. (2006)Proc. Natl. Acad. Sci. USA103, 11446.
10. Gardiner, C.W. (1985)Handbook of Stochastic Methods, 3rd ed. (Springer, Berlin).11. Hardt, S. (1981)Bull. Math. Biol.43, 89.12. Bauer, W.R. & Nadler W. (2005)J. Chem. Phys.122, 244904.13. D A. Fick (1855)Ann. Phys.94, 59.14. L. Michaelis & M. L. Menten (1913)Biochem. Z.49, 333.15. Bauer, W.R. & Nadler W. (2007) manuscript in preparation.
234

Aggregate Size and Shape Distributions in Amyloid-βPeptide Solutions
Luitgard Nagel-Steger1, Borries Demeler2, and Dieter Willbold 1
1 Institute for Neurosciences and Biophysics, INB-2, Research Centre Julich, D-52425 Julich, andInstitut fur Physikalische Biologie & BMFZ, Heinrich-Heine-Universitat Dusseldorf,
D-40225 DusseldorfE-mail: [email protected]
2 Dept. of Biochemistry, University of Texas Health Science Center7703 Floyd Curl Drive, US- San Antonio, Tx, USA
E-mail: [email protected]
A peptide with 42 amino acid residues (Aβ (1–42)) plays a key role in the pathogenesis ofthe Alzheimer’s disease. Aggregation of this peptide leadsto the formation of assemblies ofdifferent sizes and shapes, among which the amyloid fibril isthe most prominent member. Weused sedimentation velocity centrifugation to analyze Aβ (1–42) peptide solutions at differenttime points during aggregation regarding their hydrodynamic properties. New data evaluationsoftware allowed us to determine not only sedimentation coefficients, but also at the same timethe related frictional ratios of species present in a multicomponent system. Shortly after samplepreparation, a sharp peak dominated the measureds-value distribution. Two-dimensional spec-trum analysis assigned this species ans-value of28 · 10−13 s, a molecular weight of1.23 · 106
and a frictional ratio of1.44. Under the assumption of a rigid rod model this structural infor-mation is in good agreement with a fibril of 50 nm length build out of two neighboringβ-sheetswith about 110 monomers each, arranged in a parallel in-register fashion. Incubation for 1, 2and 5 days causes further aggregation, which results in decreasing frictional ratios, implying agrowth to more spherical-like particles.
1 Introduction
A peptide with 42 amino acid residues (Aβ (1–42)) plays a key role in the pathogenesisof the Alzheimer’s disease. It is highly prone to self aggregation, leading to the formationof fibrils which are deposited in amyloid plaques in the brainof affected individuals1. Inprevious years increasing evidence arose that probably smaller oligomeric assemblies2, 3
play a more decisive role as neurotoxic agents than the mature fibril. Information aboutsize and shape of Aβ peptide assemblies formed during aggregation is thereforeof highrelevance.
Analytical ultracentrifugation is a method for retrievingstructural information aboutmacromolecules by direct observation of their hydrodynamic properties in a centrifugalfield. Advanced data analysis permits the determination ofs-value, molecular weight andshape distributions for multicomponent systems.
Our objective is to evaluate the applicability of analytical ultracentrifugation in com-bination with the newly developed data evaluation softwarefor generating size and shapedistributions of solutions of the Aβ peptide. The method shall be used to monitor theeffects of peptide concentration, solvent and added cosolutes upon aggregation.
235

FITCAb(142),0dOD493nm0.100.10.20.30.40.50.6Radius[cm]6.36.46.56.66.76.86.977.17.2vHWExtrapolationPlot
CorrectedSed.Coeff.(1eM13s)020406080100120(Time)0.500.010.020.030.040.050.060.07
G(s)distributionsBoundaryFraction[%]020406080100
020406080100
s20,wvalue0255075100125s20,Wdistributions02004006008001000 RelativeFrequency0246
81012s20,wºvalue0255075100125
Figure 1. Van-Holde-Weischet Analysis. Left: Raw data (top) and corresponding vHW-analysis plot (bottom)for Aβ aggregation mixture 2 h after sample preparation. Sample volume was 300µl. Right: Upper graph: G(s)distribution of sample after 0 d (red), 1 d (blue), 2 d (green), and 5 d (yellow) incubation at 20C. Lower graph:s-value distribution of sample after 0 d (red), 1 d (green), 2 d(blue), and 5 d (yellow) incubation at 20C.
2 Methods
The aggregation mixture contained 70µM unlabeled and 14µM FITC-labeled Aβ (1–42)in 10 mM sodium phosphate buffer, pH 7.4 with 6 % final DMSO concentration. Sedi-mentation velocity experiments were performed with an X-LAanalytical ultracentrifuge(Beckman-Coulter), equipped with absorption optics. Samples were measured in standarddouble-sector aluminum cells at 20,000 rpm, 20C. Radial step size was set to 0.001 cm.
Raw data from the analytical ultracentrifuge were processed and evaluated using theUltraScan software package4 running on a 44 node AMD Opteron cluster under Linux.After determination of suitable start parameters by a van-Holde-Weischet analysis5 the2-dimensional spectrum analysis6 (2DSA), implemented in the software package, wasstarted. 2DSA solves the inverse problem of fitting sedimentation velocity data to a linearcombination of finite element solutions of the Lamm equation. Each term of the linearcombination reflects a solute in the 2-dimensional space over s andf/f0. Finally Monte-Carlo simulations were used to identify statistically significant solutes.
3 Results
Data analysis of sedimentation velocity runs performed at 20,000 rpm, 20C at 4 timepoints during aggregation of Aβ (1–42) according to van-Holde-Weischet as depicted inFig. 1 showed an increase of the means-value over the incubation time of 57 %. Ag-gregation of the amyloid-β peptide starts with a narrow distribution with ansavg-value of30 S. The distribution is dominated by a species of 28 S, a molecular weight of1.22 · 10
6
236

Figure 2. 3D-Plots ofs-value vs f/f0 distributions. Left: Aβ(1–42) after 2 h incubation at 20C.Right: Aβ(1–42) after 5 d incubation at 20C.
and a frictional ratio of 1.44, which comprises about 40 % of the sedimentation boundary(Fig. 2, left). This aggregate species is reproducibly detected in repeated experiments. Itcan be modeled by a rod-like particle with an axial ratio of 8.6. Under the assumption ofa rigid rod model and molecule dimensions forβ-strands this structural information is invery good agreement with a fibril of 50 nm length build out of two neighboringβ-sheetswith about 110 monomers each, arranged in a parallel in-register fashion, as proposed by7.
Upon incubation, the measured distribution is asymmetrically broadening to highers-values with a still distinguishable maximum at about 28 S. During the 5 d incubation of thesample, thef/f0-value of detected solutes decreases from 1.6 to around 1 with s-valuesincreasing from 28 S to 150 S. Particles are becoming more spherical during the incubationtime within the observed growth range (Fig. 2, right). The method is a tool to study theaction of drugs on the aggregation of Aβ (1–42) peptide.
References
1. J.A. Hardy and G.A. Higgins,Alzheimer’s disease: the amyloid cascade hypothesis,Science,256, 184–185, 1992.
2. W.L. Klein, Fibrils, proteofibrils and Aβ-derived diffusible ligands: How Aβ causesneuron dysfunction and death in Alzheimer’s disease, Humana Press, Totowa, NJ, pp.1–49, 2001.
3. D.M. Walsh, J.V. Klyubin, I. Fadeeva, W.K. Cullen, R. Anwyl, M.J. Wolfe,M.S. Rowan, and D.J. Selkoe,Natural secreted oligomers of amyloidβ protein po-tently inhibit hippocampal longterm potentiation in vivo, Nature,416, 535–539, 2002.
4. B. Demeler,UltraScan, http:www.ultrascan.uthscsa.edu, version 9.0.5. B. Demeler, and K.E. van Holde,Sedimentation velocity analysis of highly heteroge-
neous systems, Anal. Biochem.,335, 279–288, 2004.6. E.H. Brookes, R.V. Boppana, and B. Demeler,Computing Large Sparse Multivariate
Optimization Problems with an Application in Biophysics, in: SC ’06: Proceedings ofthe 2006 ACM/IEEE Conference on Supercomputing, vol. 6, p. 81, 2006.
7. A.T. Petkova, W.-M. Yau, and R. Tycko,Experimental Constraints on QuaternaryStructure in Alzheimer’sβ-Amyloid Fibrils, Biochemistry,45, 498–512, 2006.
237


PSO@Autodock : A Novel Bio-Algorithm-Based FastFlexible Docking Tool for Virtual Screening
Vigneshwaran Namasivayam and Robert Gunther
Institute of Biochemistry, University of Leipzig,Bruderstrasse 34, 04103 Leipzig, Germany
E-mail: vignesh, [email protected]
Virtual Screening (VS) has become an essential element in the drug discovery. Based on the 3Dstructure of the receptor, molecular docking studies can beapplied to screen large libraries ofcompounds for candidate molecules specific for the particular target. Molecular docking sim-ulation methods describe protein-ligand interactions at atomic level within a force field-basedapproach. However, due to their high computational costs, molecular docking simulation meth-ods have rarely been applied to VS. We present PSO@Autodock,a novel molecular dockingmolecular tool for virtual screening. It is based on Particle Swarm Optimization (PSO) andhas been implemented in AutoDock3 (AD3), a widely used docking program. In comparisonto standard AD3, PSOAutodock requires less than 20% of computing time for predicting thecorrect protein-ligand complex. Thus, simulating the docking of 2000 compounds with fullflexible treatment of the ligands employing PSO@Autodock can now be finished over night ona standard personal computer.
1 Introduction
Virtual Screening (VS) techniques applying computationalmolecular docking methodshave proven to be a viable alternative to experimental High Throughput Screening (HTS).Given the 3-D structure of the protein target, molecular docking methods allow screeninglarge libraries of compounds and provide detailed information on the protein-ligand inter-actions.Currently, most VS strategies employ geometric matching methods that dock an ensembleof ligands and rank them based on empirical scoring functions. On contrary, simulationmethods apply force fields to describe the molecular dockingprocess in more detail. How-ever, this is computational demanding. Simulation methodsrely on the assumption thatthe protein-inhibitor complex with the lowest calculated binding energy (∆EBind) is theclosest to the native one. Thus, predicting the protein-inhibitor complex can be consideredas multidimensional optimization problem. Various optimization algorithms have beenproposed to solve this flexible docking problem. AutoDock31 (AD3) is one of the widelyused docking programs of this type and utilizes a LamarckianGenetic Algorithm (LGA)solve this optimization problem. It allows flexible dockingof the ligand while treating thereceptor as rigid. In AD3 the binding energy of the ligand is predicted based on Eq. 1
∆EBind = ∆EvdW + ∆Eelec + ∆Ehbond + ∆Edesolv + ∆Etors (1)
2 PSO@Autodock
PSO@Autodock, our fast flexible docking tool for virtual screening is based on ParticleSwarm Optimization2 (PSO) and has been implemented in AD3. It employsvarCPSO-ls
239

(velocity adaptive andregenerativeConstrictionParticleSwarmOptimization with localsearch) algorithm. PSO is a form of swarm intelligence and hasbeen developed to describethe social behavior of flocking birds. If one member of the swarm (particle) sees a desirablepath to go (i.e. the global minimum of∆EBind) the rest of the particles will follow quicklyeven if they are on the opposite side to the particle in the multidimensional hyperspace. InvarCPSO-ls, each particle is initialized at random position inthe real valued search space.The position of the particlei is represented by the vectorxi = (xi1, xi2, . . . ,xiN ) whereNis the dimension of the problem. The velocity of each particle is given by the vectorvi =(vi1, vi2, . . . ,viN ). Furthermore, each particle has two kinds of memory that influence themovement in the search space. The cognitive memorypi = (pi1, pi2, . . . , piN ) stores thebest previous position visited by each individual particle. The social memorypg = (pg1 ,pg2, . . . ,pgN ) contains the position of the best point in search space visited by all particlesin the swarm. In each swarm move, the particle velocity is updated according to Eq. 2
vi(t+ 1) = χ · vi(t) + rand(0, 1) · c1 · (pi − xi(t)) + rand(0, 1) · c2 · (pg − xi(t)),(2)
with the constriction factorχ = 2
2−√
φ2−4. φ is computed with cognitive and social param-
etersc1 andc2, according toφ = c1 + c2, φ > 4.0.After the velocity has been calculated, the positions of theparticles are updated accordingto Eq. 3
xi(t+ 1) = xi(t) + vi(t+ 1) (3)
In varCPSO-ls, the constriction factorχ controls the magnitude of the particle velocityleading to a fast convergence.varCPSO-ls is characterized by three important features,which help to reduce the computational cost while maintaining the diversity of the swarmand preventing from premature convergence in local minima.(i) velocity adaptive: Thevelocity of the particle is updated only if the current fitness of the particle is lower than itsfitness at previous iteration. (ii)regenerative: If a particle moves out of the search space,the particle is removed from the swarm and regenerated with anew random position. (iii)local search: At each swarm move, the best particle of the swarmSbest undergoes localsearch according to Solis and Wets.
3 Performance of PSO@Autodock
We accessed the performance ofvarCPSO-ls implemented in PSO@Autodock employinga suite of seven different protein-ligand complexes and compared it to the default LGA ofAD3 (Table 1). The optimization process was performed with 1.5 million evaluations forLGA and 50,000 evaluations for PSO@Autodock. Fig.( 1) indicates thatvarCPSO-ls ofPSO@Autodock clearly outperforms the default LGA of AD3. Inorder to compare theperformance on VS we selected the complex of HIV protease 1 with XK263 (1hvr.pdb)for screening the NCI diversity data set3 (1990 compounds with unique scaffolds). SincePSO@Autodock uses the same objective function (Eq. 1), the correlation coefficient be-tween the predicted∆EBind of LGA and that ofvarCPSO-ls is 0.94.The performance speed of PSO@Autodock is comparable to docking programs tailored forVS, like Glide (version4.0, Schrodinger Inc, San Diego, CA92122) or GOLD (version3.0,
240

LGA varCPSO-ls Top Hits in VS (varCPSO-ls)∆EBind RMSD ∆EBind RMSD NCI Number ∆EBind
PDB ID kcal/mol A kcal/mol A kcal/mol3ptb -8.15 0.32 -8.15 0.29 NCI371876 -11.342cpp -7.40 1.76 -7.32 1.09 NCI101825 -10.572mcp -5.45 1.09 -5.02 0.95 NCI12181 -10.991stp -10.93 0.46 -10.85 0.39 NCI3354 -11.961hvr -21.31 0.69 -21.34 0.29 NCI343227 -14.624hmg -8.39 0.78 -8.30 0.80 NCI179187 -10.184dfr -13.03 1.10 -12.64 0.96 NCI371884 -13.24
Table 1. Binding energies and rmsd values predicted by LGA and varCPSO-ls. Shown are also the top hit of theNCI diversity data set3 screening employing PSO@Autodock.
number of evaluations
0 10000 20000 30000 40000 50000 1000000 1500000
-20
0
20
40
60
80
100
GA LGA varCPSO-ls
(a) (b)
∆E
Bin
d
[kca
l/m
ol]
3.6
6.23
33.78
137.16
172.29
516.46
0 100 200 300 400 500 600
Glide-HTVS
varCPSO - ls
Glide-SP
LGA-AutoDock
GOLD
Glide -XP
Time taken (in hours) on AMD Opteron 2 GHz
Figure 1. (a) Performance ofvarCPSO-ls and genetic algorithms(GA and LGA) on 1hvr.pdb. (b)Computingtimes for screening the NCI diversity data set on 1hvr.pdb.
CCDC, Cambridge UK). Thus, PSO@Autodock employing the novel varCPSO-ls algo-rithm is well suited for virtual screening of large libraries within an accurate force fieldapproach.
Acknowledgments
We are indebted to SFB 610 for financial support.
References
1. G.M. Morris, D.S. Goodsell, R.S. Halliday, W.E. Hart, R. Belew, A.J. Olson,Auto-mated Docking Using a Lamarckian Genetic Algorithm and an Empirical BindingFree Energy Function, J. Comp. Chem.19, 1639, 1998.
2. J. Kennedy, and R.C. Eberhardt,Particle Swarm Optimization, Proc. IEEE Intl. Conf.Neural Networks, Piscataway, NJ , 1942, 1995.
3. http://dtp.nci.nih.gov/
241

Efficient Parallel Tempering with Multiple GaussianModified Ensembles
M. Magiera1, T. Neuhaus2, and U. H. E. Hansmann2,3
1 Department of Theoretical Physics, University Duisburg-Essen, 47048 Duisburg, Germany
2 John von Neumann Institute for Computing, FZ Julich, D-52425 Julich, GermanyE-mail: t.neuhaus, [email protected]
3 Department of Physics, Michigan Technological University, 1400 Townsend Drive, Houghton,MI 49931-1295, USA
We present some aspects of multiple Gaussian modified ensemble simulations (MGME) for theefficient Monte Carlo studies of temperature driven first order phase transitions.
It is a matter of fact, that most of nature’s phase transitions are of discontinuous i.e.,first order nature. In first order phase transitions one finds mixed phases, which forfinitesizedsystems have finite and possibly small probability to be found in experiments as wellas in computer simulations. Also frequent experimentationwith nano-devices, as well aswith soft matter like proteins, highlights the need for understanding the thermodynamics offinite sized systems1. These systems often are made from mixed phases, inhomogeneousin nature, one example being the aggregation of protein lookalike molecules in a box, orthe simple nucleation of droplets.
In this short note we turn to one of the simplest2d spin models with a mixed phase,namely the2d Potts model at a number of spin statesQ = 20 andQ = 256, which bothdisplay strong first order behaviour. The2d Potts model is a perfect testing ground foralgorithmic developments as due to Baxter’s and others workmany observables at the firstorder phase transition are exactly known. MGME Monte Carlo simulations2 are designedto calculate the density of statesg(E), that is the number of configurations at energy valuesE, for all values of the energyE.
The idea of MGME simulations consists in writing the partition function as a product
Z =
Nrep∏
i=1
Zi (1)
of i = 1, ..., Nrep partition functionsZi in such a way, that the normalised probabilitydistribution functionsPDFi(E) in the energyE of the replicas fulfil
0.63 ≈∑
E
min[PDFi(E), PDFi+1(E)]. (2)
Of course this overlap criterium is taken in-between all neigbouring factorsi and i + 1of the product formZ, which then ensures a broad sampling of all energy values onthe interval−2V, ..., 0, where the Potts energy isE = −∑nn δqi,qj
andV is the vol-ume. Quite naturally also, one will distribute the various partition functionsZi on thenodes of a parallel computer, and, utilising local spin updates, as well as parallel temper-ing swaps3 in-between neighbouring partition functionsZi andZ+1, one will record the
243

multi-histogramMHIST(E), for the probability of energyE occurring inZ. The multi-histogramMHIST(E) is then used to determine a stochastic estimate ofg(E). Modi-fications using Bennett’s method4 will be included into a forthcoming publication. Thepeculiar choice of the constant0.63 in eq.(2) yields swap acceptance ratesPacc ≈ 0.5 forunimodular, that is almost Gaussian PDF’s.
In detail we factoriseZ into Z = ZlowT × ZMGME × ZhighT, where the first andthird factors take care of broad histogram sampling in low and high temperature phases.ZMGME covers the mixed phase atβT for energy valueseoV ≤ E ≤ edV . ForQ = 20we have the energy density valuesed = −0.62652917 andeo = −1.82068443, whileβT = ln[1 +
√Q] generally. All of these three partition functions are itself products ofZi
functions and withβ = 1/T we write
ZlowT =
N1∏
i
ZlowT,i ; ZlowT,i =∑
conf.
e−βiE Θ(eo + ed
2− e) (3)
ZMGME =
N2∏
i
ZMGME,i ; ZMGME,i =∑
conf.
e−βT E−[(E−Ei0)/∆E0]
2
(4)
ZhighT =
N3∏
i
ZhighT,i ; ZhighT,i =∑
conf.
e−βiE Θ(e− eo + ed
2) (5)
with Nrep = N1 +N2 +N3 andΘ denotes the Heaviside step function.One important measure of computational efficiency in broad histogram sampling meth-
ods is the ergodicity time scaleτerg6, 7, sometimes also called tunnelling autocorrelation
time, for the completion - in the mean - of one single “tunnelling event” from the low to
Ergodicity Times at Q=20 and Q=256 in Sweeps
L
τ erg
9080706050403020100
1e+008
1e+007
1e+006
100000
10000
1000
Figure 1. Parallel tempering ergodicity timesτerg for Q = 256 (stars) andQ = 20 (squares) Potts modelswithout MGME improvement. With MGME simulation we obtain the two data sets with small slopes forQ =256 (large crosses) andQ = 20 (somewhat smaller crosses). All straight lines have slopesthat can be calculatedfrom the free energy of a classical lens shaped droplet at thedroplet/strip transition on lattices with p.b.c.5.
244

high - or high to low - temperature regions in phase space. We display our finalτerg re-sults from high statistics simulations, at about 1 Giga-Sweeps for each data point - and ina logarithmic scale, in theQ = 20 andQ = 256 Potts models in Fig.1. The figure containsfour data sets. Two of these, the ones with the largest slopesin the figure, correspond toparallel tempering simulations atQ = 256 andQ = 20 without MGME improvement.They exhibit an asymptotic, that is large system sizeL, supercritical slowing down withτerg diverging as
τerg ∝ e + 1.1346 2 L σ. (6)
The quantityσ hereby denotes the known planar interface tension in-between ordered anddisordered phases atβT in the Potts model. It is clear from these data, why standard par-allel tempering at first order phase transitions does not yield useful information. Howeverwith MGME improvement, see the two data sets with small slopes in the figure, one findsresidual supercritical slowing withτerg diverging as
τerg ∝ e + (1.1346−1) 2 L σ, (7)
and thus:
• MGME simulations for first order phase transition studies have a similar level of com-putational efficiency as Wang Landau8 and multicanonical ensemble simulations9.
In conclusion, we think that MGME simulations are useful forthe study of mixedphases of finite sized thermodynamics systems.
Acknowledgments
The calculations were done on computers of the John von Neumann Institute for Com-puting, Forschungszentrum Julich, Julich, Germany, andon some privately owned (TN)workstations. This work was supported, in part, by a research grant (CHE-0313618) fromthe National Science Foundation (USA).
References
1. D.H.E. Gross,Microcanonical Thermodynamics, (World Scientific, Singapore, 2001).2. T. Neuhaus and J.S. Hager, Phys. Rev. E74 (2006) 036702.3. K. Hukushima and K. Nemoto, J. Phys. Soc. Jpn.65 (1996) 1604.4. C.H. Bennett, J. of Comp. Phys.,22 (1976) 245.5. T. Neuhaus and J.S. Hager, J. Stat. Phys.113(2003) 47.6. W. Nadler and U. Hansmann, Phys. Rev. E75 (2007) 026109.7. S. Trebst, M. Troyer and U. Hansmann, J. Chem. Phys.124(2006) 174903.8. F. Wang and D.P. Landau, Phys. Rev. Lett.86(2001) 2050; F. Wang and D.P. Landau,
Phys. Rev. E64 (2001) 056101.9. B.A. Berg and T. Neuhaus, Phys. Lett. B267(1991) 249; B.A. Berg and T. Neuhaus,
Phys. Rev. Lett.68 (1992) 9.
245


A Network-Based Approach to Biomolecular Dynamics
Frank Noe1, Jeremy C. Smith2, and Christof Schutte1
1 DFG Research Center Matheon,FU Berlin, Arnimallee 6, 14195 Berlin, Germany
E-mail: noe, [email protected]
2 Interdisciplinary Center for Scientific Computing,University of Heidelberg, Im Neuenheimer Feld 368, 69120 Heidelberg, Germany
E-mail: [email protected]
Molecular dynamics simulation generates large quantitiesof data that must be interpreted usingphysically meaningful analysis. A common approach is to describe the system dynamics interms of transitions between coarse partitions of conformational space. In contrast to previouswork that partitions the space according to geometric proximity, we examine here clusteringbased on kinetics, merging configurational microstates together so as to identify long-lived,i.e. dynamically metastable, states. The method is applied to microsecond molecular dynamicssimulations of Ala12 . The system clearly exhibit metastability, with some kinetically distinctmetastable states being geometrically very similar.
1 Introduction
Given the large amount of molecular dynamics (MD) simulation data available for macro-molecules, models are needed to analyze the data that capture the essential dynamicalfeatures and can be physically interpreted. Here we use transition networks which encodethe transitions of the system between a set of discrete states. In a transition network, avertex corresponds to a discrete conformational state, andan edge corresponds to a tran-sition between two states. Each edge may be weighted by the associated transition rate orprobability.
A central question when generating discrete state models ishow best to partition statespace into discrete states. It is often desirable that the partition reflects the dynamicalbehavior of the system. In particular, biomolecular function often depends on the ability toundergo transitions between long-lived, or “metastable” states. These inter-state transitionsare rare events in which a molecular system stays for long periods of time within one state,before rapidly switching to another.
Geometric clustering approaches do generally not fulfill these claims. Therefore, herewe use the Perron Cluster Cluster Analysis (PCCA)2, 3, a dynamical data-based kineticclustering method to partition the state space. The method is applied to a 4-microsecondmolecular dynamics simulation of a 12-mer polyalanine. Using different numbers ofmetastable states, a hierarchical picture for the kineticsis provided.
2 Kinetic Clustering Method
The state space of the system is first partitioned into fine discrete sets, called “micro-states”(typically on the order of103 to 104). This may be done by characterizing the torsion
247

rotamer state or by using a geometric clustering method witha large number of clusters onthe Cartesian coordinates of the molecule with rotation andtranslation removed. See Ref.4
for details.A metastable state is a set of micro-states in which the system stays for a long time
before leaving it. Following this idea, a straightforward definition for a partition intometastable states would be the following: Given a discrete trajectory[i(0), i(τ), i(2τ), ...]in space of micro-states1, ...,m, find a partition of micro-states intoC metastable sets,such that the number of transitions within sets is maximized. This formulation of the prob-lem is known in graph theory as aC-min-cut problem but is, unfortunately, NP hard. Asimilar partition, however, can be obtained very efficiently with the Perron cluster clus-ter analysis (PCCA) method which was first introduced in1. Its basic idea is the follow-ing: The Markov time evolution of the probability distribution of states,p(t), is given byp(t+ τ) = p(t)T(τ). This equation can also be expressed in terms of an expansionin lefteigenvectors ofT, qi, and corresponding eigenvalues,λi, and for longer time increments,nτ :
p(t+ nτ) =∑
i=1..m
ciλni qi. (1)
For systems fulfilling detailed balance there is only a single eigenvalueλ1 = 1, whileλi < 1 for all i > 1. Thus, forn → ∞ (after infinity time), all terms but the first onevanish and Eq. (1) converges to:p(∞) = c1q1, wherec1 is simply a normalization fac-tor. Thus, the left eigenvector with the largest eigenvalue,λ1 = 1, specifies the stationarydistribution (and has therefore only nonnegative entries). All other eigenvectors,q2...qm,are associated with decaying processes, their speed of decay being determined by the mag-nitudes of the associated eigenvalues. As apparent from Eq.(1), eigenvectors associatedwith eigenvalues close to1 correspond to processes which decay very slowly and thus are,by definition, related to transitions between metastable states.
The improved PCCA method2, 3 used here identifiesC representative micro-states withmaximum pairwise distances in the coordinates of the firstC eigenvectors. Each microstatecan then be expressed as a convex combination of these representative micro-states andthus be assigned a degree of similarity with each representative micro-state according tothe convex coordinates. Therefore, clustering is made by assigning each microstate to thecluster containing the representant with which it has the strongest similarity.
3 Results
A complex network of metastable states is identified. Use of only a few metastable states(e.g.2, 3, ...) leads to the distinction between the “main state” (the basin with the globally-minimal energy and several “kinetic traps” which are thermally accessible and have half-life times similar to, or greater than, that of the main state. By increasing the number ofmetastable states the main state is further decomposed intoconformational subsets. Aninteresting feature of the networks is that some states which are structurally very similarare not kinetically contiguous, but rather interchangevia structurally very different inter-mediates. This clearly demonstrates the usefulness of the kinetic clustering method inbiomolecular simulation studies.
248

Figure 1. Hierarchical Transition Network analysis for theAla12 peptide for 4, 6 and 8 metastable sets. Eachbullet and the structure next to it corresponds to one metastable set. The bullets contain the state name (a letter),the free energy in kcal/mol (upper number) and the mean lifetime in picoseconds (lower number). Each structureis shown by a few representative tubes and an overlay of 100 examples randomly drawn from the ensemble ofstructures of each state, shown as line representations of the backbone. A pair of states is connected if at leastone transition between these states was observed in the trajectory. The hierarchical relationship between the threenetworks is indicated by the dotted arrows. Each arrow starts at the metastable state in the higher-order networkwhich contains the majority of micro-states in the state thearrow points to. For example, the micro-states of statea in theC = 4 network are split into three sub-states,a, d ande, in theC = 6 network.
249

References
1. C. Schutte, A. Fischer, W. Huisinga, and P. Deuflhard, “A direct approach to confor-mational dynamics based on hybrid monte carlo,”J. Comp. Phys., vol. 151, pp. 146–168, 1999.
2. M. Weber, “Improved perron cluster analysis,”ZIB Report, vol. 03-04, 2003.3. P. Deuflhard and M. Weber, “Robust perron cluster analysisin conformation dynam-
ics,” ZIB Report, vol. 03-09, 2003.4. F. Noe, I. Horenko, C. Schutte, J.C. Smith, “Hierarchical Analysis of Conformational
Dynamics in Biomolecules: Transition Networks of Metastable States”J. Chem.Phys., vol. 126, p. 155102, 2007.
250

Steered Molecular Dynamics as a Virtual Atomic ForceMicroscope
Wieslaw Nowak∗, Sebastian Wasilewski, and Lukasz Peplowski
Theoretical Molecular Biophysics Group,Institute of Physics,
N. Copernicus University,ul. Grudziadzka 5, 87-100 Torun, Poland
∗E-mail: [email protected]
Two examples of non-standard applications of computer modeling of protein dynamics arediscussed. External harmonic force attached to selected atoms closely simulates a force exertedby a tip in atomic force microscope in single molecule stretching experiments. Preliminaryresults of forced unfolding of oncogenic protein gankyrin and forced ligand undocking fromphotoactive industrial enzyme nitrile hydratase are presented.
1 Introduction
Computer modeling based on simple laws of classical mechanics are successfully usedin interpretation of single molecule atomic force microscopy experiments1–4. The steeredmolecular dynamics (SMD)5 or its variants are more and more popular. However, themethodology of doing effective computer experiments is still far from being well estab-lished. In this paper preliminary results of applications of the steered molecular dynamicsmethod (SMD) to stretching single proteins are presented. Gankyrin (GAN) is recentlydiscovered oncogenic protein which is highly expressed in many tumors6. Its modularstructure is close to ankyrins studied earlier5, but the molecule has only 7 structurally sim-ilar subunits. A small size makes GAN a perfect model system for testing SMD computermodels. No experimental AFM data or MD simulations have beenpublished so far.
In nitrile hydratase (NHase), biotechnological enzyme used for production of acry-lamide, there are two subunits separted by wide channel leading to the unusual active sitecontaining Fe or Co metal ions8. The details how the substrate reaches deeply buried cat-alytic center nor how the product leaves this cavity are not known. The rational modelingnew industrial enzymes, for example, having a better stereoselectivity, requires knowledgeon steric determinants of NHase activity. We propose that forced unfolding of ligands,both substrates and products, using virtual AFM is promising strategy for further studiesof enzymatic mechanisms.
2 Methods
For gankyrin (GAN) simulations the 1TR4 pdb structure was used, for Co-Nhase a 1IREstructure was adopted. NAMD code7 with CHARM27 force field running on a local linuxcluster was used in SMD simulations. To perform Co-Nhase modeling an extensive set ofnew parameters for non-corrine active site has been developed8. Two limiting models ofGAN simulations were tested: (a) GAN in a large TIP3 water boxand periodic boundary
251

conditions, 1.45 ns simulation time,v = 0.1A/ps, spring constantK = 7kcal/mol/Ang2
(b) initial GAN structure surrounded by a droplet of water, 145 ns simulation time,v =0.001A/ps , K = 14kcal/mol/Ang2. A Langevin coupling to the thermal bath at 300 Kwas assumed. External forces were attached to CA atom of LEU G8, while GLY G214 CAatom was held fixed. The pulling speedv seems to be the most critical parameter affectingSMD simulations. We estimated this parameter that the dimension of GAN approximatelydoubled after a period of time planned for the experiment. Data were analyzed usingcomputer graphics and the VMD code9.
3 Results and Discussion
3.1 Forced Unfolding of Gankyrin
Figure 1. Dependence of force-elogation spectra on SMD pulling velocity in gankiryn.
AFM experiments performed for 24 unit ankyrin10 have shown that for the initial unfoldingof this nanospring a force of the 250 pN is sufficient. Consecutive subunits unfold undereven smaller stress of 20-50 pN. Results of our two GAN simulations are shown in Fig. 1.One can immediately see that in 1.45 ns simulation (a) the maximum observed force of 800pN is far too high. When small pulling speed is applied, in 145ns simulation a factor oftwo lower forces are observed. They are still slightly higher than in the related experiment,but this seems to be acceptable. The problem with long simulations is a proper treatmentof water, insets in Fig. 1 show that the in long simulation a strong lag in water position
252

is observed. The water shell becomes quite thin in certain regions of the highly stretchedGAN, and this may also result in artifacts lowering unfolding forces. Our experimentsshow that some algorithms weakly bounding water with the protein undergoing constantelongation (or other large conformational change) have to be developed for effective useof SMD approach. PBC with huge water boxes seem to be too expensive and unpractical.
3.2 Forced Undocking of Nitrile Hydrates Ligands
It is interesting to check what minimal forces are expected if we pull out the well knownligand from the protein interior. This limiting value is perhaps affected not only of thepulling speed, but also by the nature of ligand-protein interactions and an assumed tra-jectory of the extracted ligand. In Fig. 2 force-travel distance curves are presented forundocking of a substrate (nicotinonitrile, NCN) and a product (nicotinoamide, NCA) fromthe best docked position within the NHase interior8. A rather slow pulling out is a differ-ent process for both molecules, despite their similar sizes. We attribute these differencesto H-bonds of NCA with appropriate residues of the NHase channel. Critical positionsin space determined in these two computer experiment shouldbe good starting points forsystematic mutagenesis studies of Co-NHase.
Figure 2. Dependence of SMD force on simulation time and distance traveled by substrate (NCN) and product(NCA) in Co-NHase. Four phases of motion A-D are recognized.
253

4 Conclusions
The model protein GAN unfolding process studied by the SMD method on two time-scales (different by a factor of 100) shows quantitatively distinct features in force-extentioncurves. Forced undocking of NHase ligand gives useful hintsfor determining the bestopportunities for tailored enzyme construction. New methodology of keeping droplet of awater close to the protein is required before a virtual AFM may be used as a common toolfor studying mechanical properties of single biomolecules.
Acknowledgments
This research was supported by Polish Ministry of Educationand Science, grant no. 2P04A07229.
References
1. W. Nowak, P. Marszalek,Molecular Dynamics Simulations of Single Molecule AtomicForce Microscope Experiments, Current Trends in Computational Chemistry, 47-83,2005.
2. G. Lee, W. Nowak, J. Jaroniec, Q. Zhang and P.E. Marszalek,J. Am. Chem. Soc.126, 6218-6219, 2004.
3. G. Lee, W. Nowak, J. Jaroniec, Q. Zhang and P.E. Marszalek,Biophys. J.87(3),1456-65, 2004.
4. Z. Lu, W. Nowak, G. Lee, P. Marszalek and W. Yang, J. Am. Chem. Soc. 126,9033-41, 2004.
5. M. Sotomayor, D.P. Corey and K. Schulten, Structure13, 669-682, 2005.6. S. Dawson, H. Higashitsuji, A.J. Wilkinson, J. Fujita andR.J. Mayer, Trends Cell
Biol. 16, 229-233, 2006.7. J.C. Phillips et al., J. Comp. Chem.26, 1781, 2005.8. L. Peplowski, K. Kubiak and W. Nowak, J. Mol. Modeling13, 725, 2007.9. W. Humphrey et al., J. Molec. Graphics14, 33, 1996.
10. G. Lee, K. Abdi, Y. Jiang, P. Michaely, V. Bennett, P.E. Marszalek, Nature440, 246-9,2006.
254

The Zinc-Finger Motif of T.thermophilus RibosomalProtein S14 and the Functionality ofE.coli Ribosomes
Georgios Papadopoulos1, Maria A. Xaplanteri 2, Fotini Leontiadou3,Theodora Choli-Papadopoulou3, and Dimitrios L. Kalpaxis 2
1 Department of Biochemistry and Biotechnology, Universityof Thessaly,Ploutonos 26, 41221 Larissa, Greece
E-mail: [email protected]
2 Laboratory of Biochemistry, School of Medicine, University of Patras,26500 Patras, Greece
3 Laboratory of Biochemistry, School of Chemistry, Aristotle University of Thessaloniki,54006 Thessaloniki, Greece
Protein S14 (TthS14) of the 30S ribosomal subunit fromThermus thermophiluscontains aCXXC-X12-CXXC motif that coordinates a zinc ion. Here we report the results of experimentsand molecular dynamics simulations (MDS) on the structuraland functional importance of theZn-finger and the commonly conserved cysteine 24 residue at the first position of the motif.We replaced C24 with serine and incorporated the mutants inEscherichia coliribosomes. Themodified ribosomes showed: a) a capability in binding tRNA atthe P-and A-sites equal tothat obtained with ribosomes incorporating wild-type TthS14 (20% lower compared to nativeE.coli ribosomes), b) reduced capability of the 30S subunit for association with 50S subunitsafter replacement of the nativeE.coli S14 by wild-type, and particularly by mutant TthS14,c) a peptidyl transferase activity in the chimeric ribosomes bearing mutant TthS14 which isunexpectedly much lower than that in ribosomes incorporating wild-type TthS14. Since thecatalytic center of the ribosome is located within the 50S subunit, it seems that the perturbingeffect of the S14 mutation on the catalytic center propagates by adjacent inter-subunit bridgesor the P-site tRNA. This hypothesis was verified by MDS, whichrevealed subtle as well as largestructural differences between theE.coli 30S-subunit head with wild type TthS14 and that withC24S mutant TthS14.
1 Introduction
Proteins in all organisms are synthesized by ribosomes. Bacterial ribosomes are assembledfrom two subunits (30S and 50S) with more than 50 different proteins in complex withlarge RNA molecules. The head of the 30S subunit contains theribosomal protein S14 indirect contact with proteins S3 and S10 and 16S rRNA.1 Biochemical and crystallographicstudies2, 3 indicated that S14 inT.thermophilusribosomes binds a zinc ion coordinatedby four cysteine residues (24, 27, 40, 43) in a CXXC-X12-CXXCmotif. Zinc-fingershave been implicated in nucleic acid recognition and binding.4 There are, however, otherbacteria, for exampleE.coli, which lack a Zn-finger motif but demonstrate rRNA binding.
Clearly, a more detailed study is needed on the significance of the Zn-motif in relationto other structural features. Here we investigated the functional importance of the S14 Zn-finger motif and its role in the assembly of the 30S subunit, insubunit association, tRNAbinding and PTase activity. We performedin vivo experiments usingE.coli ribosomes in-corporating wild-type S14 fromT.thermophilus(wtTthS14). We also employed targetedmutagenesis of C24 in the ThS14 Zn-finger motif to probe the role of this element in cell
255

growth and ribosome structure and function. Finally, we used Molecular Dynamics Simu-lations (MDS) to analyze the experimental results and unravel the underlying processes.
2 Materials and Methods
The biochemical methodology of this work was described elsewhere.6 Here we discuss theMDS details. The TthS14 structure was taken from PDB:1FJG and docked in theE.coli30S-subunit head (PDB:2AVY). After solvation in a sphere with 49475 water moleculesand neutralization with 343 Na ions, the structure was relaxed and equilibrated for 500 psat 300 K (NVT). We used NAMD25 and the CHARMM27 force field. Only atoms of thehead of the 30S subunit (A929 to U1390 segment of 16S rRNA, proteins S3, S7, S9, S10,S13, TthS14 and S19, Mg and Zn ions) have been included in the simulation. A Cys patchwith deprotonated -SH groups was applied, adopting a non-bonded model for Zn-ligandinteractions. The same procedure was followed for the replacement of EcoS14 by TthS14-C24S. At the end of each equilibration, an average over the final 50 ps was taken to obtain amore representative structure, which was then used for further analysis. The
∣
∣~rmutgc − ~rwt
gc
∣
∣
distances of the geometrical centers for all residues were calculated for the final structures.
3 Results and Discussion
Table 1 summarizes the results of TthS14 incorporation inE.coli ribosomes and 70S re-construction experiments. The results suggest an S14 role in the association of ribosomalsubunits. Disturbances in the S14 structure apparently induce changes in other compo-nents of the 30S subunit head, for example residues of the S13protein and 16S rRNA,which are directly implicated in subunit association.7 Our MDS results showed significantshifts (Fig. 1) for several 16S rRNA groups in inter-subunitbridges. We found that the Znion moves towards two oxygen residues (O2 and O2’) of U1202, and away from C24. Thisbehavior can be expected only for TthS14-C24S. In the wtTthS14 case, it is rather strik-ing and it may be attributed to the non-bonded model for theZn2+-ligand interactions,adopted in this study. For both species, the Zn ion stays close to C27, C40, and C43.
Assembled protein Degree of incorporation (%) 70S ribosomes (%)EcoS14 100.0 81.6± 5.1
wtTthS14 88.5 75.0± 3.2TthS14-C24S 57.4 66.0± 4.5
Table 1. Degree of incorporation of TthS14 and TthS14-C24S proteins intoE.coli ribosomes and ability of theresulting ribosomes to form 70S complexes.
The tRNA affinity was not affected by the C24S mutation, as confirmed by the MDS.All 16S rRNA residues implicated previously1, 8 in tRNA binding to the P-site, exceptm2G966, relaxed to almost identical geometries. Regarding PTase activity our experimentsshow an eight times smaller value for ribosomes with S14 C24S. Provided that there are notdirect contacts of S14 to the catalytic center, it is tempting to speculate, that the observed
256

Figure 1. Displacements of 16S rRNA groups after mutation ofTthS14 C24 into S24. Regions implicated insubunit association and tRNA binding are in grey.
by MDS conformational changes initiated by the C24S mutation are transmitted throughadjacently located intersubunit bridges (bridge B1a or B1b) or through the P-site boundtRNA and cause a less reactive reorientation in the catalytic center.
Acknowledgments
This work was supported by Grant 99ED-605 from the GSRT, Greece, and the EuropeanSocial Fund. We thank C. M. McCallum for providing the Cys-patch.
References
1. A. Korostelev, S. Trakhanov, M. Laurberg and H. F. Noller,Crystal structure of a70S ribosome-tRNA complex reveals functional interactions and rearrangements, Cell126, 1065–1077, 2006.
2. D. E. Brodersen, W. M. Clemons Jr, A. P. Carter, B. T. Wimberly and V. Ramakr-ishnan,Crystal structure of the 30S ribosomal subunit from Thermusthermophilus:Structure of the proteins and their interactions with 16S rRNA, J. Mol. Biol. 316,725–768, 2002.
3. P. Tsiboli and T. Choli,Studies on S14 protein from Thermus thermophilus possessingzinc finger-like motifs, Biol. Chem. Hoppe Seyler376, 127–130, 1995.
4. W. D. Kohn, C. T. Mant and R. S. Hodges,Alpha-helical protein assembly motifs,J. Biol. Chem.272, 2583–2586, 1997.
5. L. Kale, R. Skeel, M. Bhandarkar, R. Brunner, A. Gursoy, N.Krawetz, J. Phillips,A. Shinozaki, K. Varadarajan and K. Schulten,NAMD2: greater scalability for par-allel molecular dynamics. J. Comput. Phys.151, 283–312, 1999.
6. M. A. Xaplanteri, G. Papadopoulos, F. Leontiadou, T. Choli-Papadopoulou and D. L.Kalpaxis,The Contribution of the Zinc-Finger Motif to the Function ofThermus ther-mophilus Ribosomal Protein S14, J. Mol. Biol., in press, 2007.
7. A. R. Cukras and R. Green,Multiple effects of S13 in modulating the strength ofinter-subunit interactions in the ribosome during translation, J. Mol. Biol. 349, 47–59, 2005.
8. V. Berk, W. Zhang, R. D. Pai and J. H. D. Cate,Structural basis for mRNA and tRNApositioning on the ribosome, Proc. Natl. Acad. Sci. USA103, 15830–15834, 2006.
257


The Locally Enhanced Sampling Study of Large LigandsDiffusion inside Enzyme. Acrylonitrile and Acrylamide
Journey in Nitrile Hydratase
Lukasz Peplowski, Karina Kubiak, and Wieslaw Nowak∗
Institute of Physics, N. Copernicus University,ul. Grudziadzka 5, 87-100 Torun, Poland
∗E-mail: [email protected]
Nitrile Hydratese (NHase) is a metaloenzyme with non-standard active site containing noncorinCo3+. In industry it is used for a large scale conversion of toxic nitriles into useful amides. Inthis research NHase fromPseudonocardia ThermophilaJCM 3095 (1IRE) is investigated. Inorder to understand its excellent catalytic activity the possible transport routes of substrates andproducts have to be determined1. Transient states are not easily elucidated using experimentaltechniques, so computer modeling of molecular dynamics (MD) helps a lot. The main goals offinding cavities inside the protein and entry/exit pathwaysfor a substrate (acrylonitrile) and theproduct (acrylamide) have been achieved. In our opinion a very convenient tool for that typeof study is MD with the Locally Enhanced Sampling (LES) Hamiltonian2. The LES method,by multiplying non-interacting ligand copies, allows for better probing of the conformationalspace than the standard MD method, despite known problems with the energy equipartition3 .
1 Introduction
Nitrile hydratase (NHase) is microbial metaloenzyme containing non-corrin Co3+ or non-heme Fe3+ metal ion in the nonstandard active site. NHases are widely used in biotechnol-ogy for catalysis of the conversion of toxic nitriles to amides4. Products of this enzyme areused in pharmacy (nicotinamide is known as vitamin B3), as soil conditioners, componentsof diapers, paints and in paper industry5.
Several crystallographic articles reported high sequenceand structure similarity be-tween NHases4, 6. All native structures solved with high resolution confirmed that the pro-tein is composed of two subunits -α(23 kDa) andβ(26 kDa). It have nonstandard activecite composed of four residues:αCys109,αCys112,αSer113,αCys114. TheαCys112andαCys114 residues were found to be post-translationally oxidized to cysteine-sulfinicacid CysSO2H (CSD) and cysteine-sulfenic acid CysSOH (CEA), respectively. Metal ionis coordinated by three sulfur atoms fromαCys109, CEA and CSD, and the two amidenitrogen atoms fromαSer113 and CEA4, 6.
Although there are 14 structures of NHase known none of them contains a substrate ora product of the catalysis. Only two theoretical reports areknown about substrate/productinteraction inside protein matrix7, 8 and only one paper presents a comparison of the wholeseries of substrates and corresponding products1. Substrate and products entry/exit pathsare not known either. In the x-ray structure of NHase a wide channel is visible9. Proper un-derstanding of NHase activity requires new data on structural determinants of large ligandstransport within this complex molecular system.
In this paper, for the first time, we describe newtonian molecular dynamics of substrate(acrylonitrile,ACN) and product (acryloamide,ACA ) inside nitrile hydratase protein on50 ns timescale.
259

2 Methods
Molecular dynamics simulations on a complex ofPseudonocardia ThermophilaJCM 3095Co-NHase (pdb code 1IRE)6 and a dockedACA andACN ligands8 were performed usingNAMD 2.610 with Locally Enhanced Sampling (LES) method2. Thus, starting structureshave ligands located in the active site pocket. CHARMM27 force field was applied andthree 6 ns long simulations with LES factor 10 (ACN Les10) or 10 and 15 (ACA Les10,ACA Les15). Periodic boundary conditions and a TIP3 water box with at least 7A distancefrom protein atoms to the border were employed. The cutoffs for electrostatics and van derWaals interactions have been set on 12A. The main simulations were preceded by 100 psof water equilibration at 300K with a frozen protein, 1000 steps of minimization and 50ps of heating from 0K to 300K. During the 6 ns production phasethe Langevin dynamicsprotocol with temperature held at 300K has been used.
The idea of the LES method seems to be quite simple2. The molecular system is dividedinto two subsystems a big one for example a protein with surrounding water and a smallone in our caseACN (7 atoms) orACA (10 atoms). The small subsystem may be clonedgiving several non-interacting copies of ligands. These copies are subject to nonbondingpotential from the protein. The big subsystem feels an average potential from a swarm ofligands. Since ligands don’t interact they may occupy the same place in the space. Due toits large number, a better sampling of the conformational space than the standard one-copyMD is achieved. Thus our 10 copies LES 6ns simulation is equivalent to normal 60 ns MD.In visualization and analysis the VMD 1.8.6 package11 and home made TCL scripts havebeen used.
3 Results and Discussion
In both systems studied only one major ligand diffusion route along the NHase channelwas observed. However, the detailed paths for the nitrile and the amide are different. Closeto the exitACN uses for its motion the upper part of channel, whileACA occupies mainlythe lower part (see Fig. 1, the lower part is closer lying to the metal ion). Interactionsof substrates and ligands with the NHase interior are different. ACN came out to thesolvent after 1.5 ns butACA remained buried in both 6 ns Les10 and Les15 simulations.Differences in ligand-protein interactions are also seen in statistics of collisions (atom-atom distance closer than 2.5A) occurring during simulations. Data are presented in Fig.2.ACN very often interacts withαLeu88,βPhe41 and quite often withβPhe118. It seemsthat these three residues stabilize nitrile on the NHase surface in the neighborhood of thechannel entrance.
In ACA simulationsαGln89, βLeu48,βPhe51 andαTrp52 most often collide withcatalytic product. These residues compose the lower part ofentry to the channel.αGln89is particularly important because this residue stabilize anetwork of hydrogen bonds nearactive site12. Our calculation also shows that this residue very often forms H-bonds withtheACA amide group. In our opinion this is the reason whyACA did not leave the channelduring the simulation despite the presence of the 7A wide passage.
The space exploited by LES copies inside the NHase may be divided into two subcav-ities. The deeper one corresponds to the active site pocket and ligands stay there for about1 ns. In the so calledrez-de-chausseemore shallow cavityACN remains only for 0.5 ns,
260

Figure 1. Diffusion paths of aliphatic ligands: (a) substrateACN Les10, (b) productACA Les10, (c)ACA Les15.
then it goes on the proteins surface and stays there by 4.5 ns interacting withαLeu88 andβPhe41. In both cavities this small aliphatic substrate has avery large conformationalfreedom and 180 deg. rotations are sometimes observed. It isworth to note that inACNsimulations we observe only weak interactions with CSD and CEA but no collisions withthe other parts of the active are noticed. This may suggest that the substrate interacts withthe active center via water molecules.
Figure 2. Statistics of the collisions for theACN Les10 (a) andACA Les10 (b).
In ACA Les10 simulation the product stays only in the deeper subcavity. Since morecopies in the LES method lead to lowering of energy barriers,in Les15 trajectoriesACAvisits alsorez-de-chausseesubcavity, but instantly goes back to deeper one (compare Fig.1b and 1c).
4 Conclusions
LES simulations of the NHase fromPseudonocardia ThermophilaJCM 3095 and its nat-ural ligand reveals differences in the substrate and the product interactions with enzyme.Our calculations show that theACN substrate prefers the upper part of the entrance and is
261

strongly stabilized by surface residuesαLeu88,βPhe41 andβPhe118. The amide prod-uct stays at the other region of the entrance. Strong H-bond interactiona ofACA withαGln89 are clearly observed. Mutational studies show as wellthat this residue is criticalfor enzymatic activity of the NHase12. The LES method is a useful computational tool inqualitative studies of enzyme function.
Acknowledgments
This research was supported by Polish Ministry of Educationand Science, grant no. 2P04A07229 and grant supported by Marszalek Wojewodztwa Kujawsko-Pomorskiego Krok wprzyszlosc stypendia dla doktorantow. We thank Slawomir Orlowski, Msc for writing theTCL script for collision counting.
References
1. L. Peplowski, K. Kubiak, S. Zelek, W. Nowak,A comparative DFT study of sub-strates and products of industrial enzyme Nitrile Hydratase, Int. J. Quantum Chem.,DOI:10.1002/qua.21357, 2007.
2. R. Elber, M. Karplus,Enhanced sampling in molecular dynamics: use of the time-dependent Hartree approximation for a simulation of carbonmonoxide diffusionthrough myoglobin, J. Am. Chem. Soc.112, 9161, 1990.
3. S. Orlowski, W. Nowak,Oxygen Diffusion in Minihemoglobin from Cerebratus Lac-teus a Locally Enhanced Sampling Study, Theoret. Chem. Acc.117, 253, 2007.
4. S. Ngashima,et al., Novel non-heme iron center of nitrile hydratase with a clawsetting of oxygen atoms.Nat. Struc. Biol.5, 347, 1998.
5. H. Yamada, S. Shimizu, M. Kobayashi,Hydratases involved in nitrile conversion:screening, characterization and applicationChem. Rec.1, 152, 2001.
6. A. Miyanaga, S. Fushinobu, K. Ito, T. Wakagi,Crystal structure of cobalt-containingnitrile hydrataseBiochem Biophys Res Commun.288, 1169, 2001.
7. L. V. Desai, M. Zimmer,Substrate selectivity and conformational space availabletobromoxynil and acrylonitrile in iron nitrile hydrataseDalton Trans.6, 872, 2004.
8. L. Peplowski K. Kubiak, W. Nowak,Insights into Catalytic Activity of IndustrialEnzyme Co-Nitrile Hydratase. Docking Studies of Nitriles and AmidesJ. Mol. Model.13, 725, 2007.
9. T. Arakawa,et al., Structure of thiocyanate hydrolase: a new nitrile hydratase familyprotein with a novel five-coordinate cobalt(III) center.J. Mol. Biol. 366, 1497, 2007.
10. J. C. Phillips,et al., Scalable molecular dynamics with NAMDJ. Comp. Chem.26,1781, 2005.
11. W. Humphrey, A. Dalke, K. Schulten,VMD - Visual Molecular DynamicsJ. Molec.Graphics.14, 33, 1996.
12. H. Takarada,et al., Mutational study on alphaGln90 of Fe-type nitrile hydratase fromRhodococcus sp. N771Biosci. Biotechnol. Biochem.70, 881, 2006.
262

Receptor Specific Forcefield: Improving ClassicalForcefields with Quantum Mechanical Calculations
Horacio Emilio Perez Sanchez1, Bernhard Fischer1,Holger Merlitz 2, Kaori Fukuzawa3, and Wolfgang Wenzel1
1 Forschungszentrum Karlsruhe,Institut fur Nanotechnologie, Forschungszentrum Karlsruhe, Germany
E-mail: [email protected]
2 Department of Physics, Xiamen University, China
3 CREST, Japan Science and Technology Agency, Saitama, Japan
We report results for the in-silico screening of a database of 10000 flexible compounds againstvarious crystal structures of the thymidine kinase receptor complexed with 10 known substrates.The ligands were docked using FlexScreen, a recently developed docking tool based on thestochastic tunneling method. We used a first-principle based scoring function. For rigid recep-tor conformations we find large deviations in the rank of the known inhibitors depending onthe choice of receptor conformation. These data demonstrate that the failure to dock originatesfrom the neglect of receptor degrees of freedom and is not attributable to deficiencies in thescoring function or the docking algorithm. We then performed a screen in which critical re-ceptor sidechains were permitted to change their conformation and found improved scores forthose inhibitors that did not dock well in any of the previousscreens. So, the consideration ofreceptor sidechain flexibility in FlexScreen improves the quality of the screening approach. Wealso demonstrate how the inclusion of QM-calculations of receptor-ligand complexes with theFragment Molecular Orbital Method (FMO)1, can be used to improve a classical forcefield. Incomparing this QM-forcefield for protein and ligand with a standard ab-initio forcefield (ESFF)we can demonstrate a performance gain.
1 Methods
Docking Method: Stochastic optimization with STUN2: Non-linear transformation to thepotential energy surface using
ESTUN(x) = ln(
x+√
x2 + 1)
, (1)
with x = γ (E − E0), γ = 0.05 Mol/kJ andE0 is the lowest energy encountered duringthe simulation.
Scoring Function:
S =∑
Protein
∑
Lig.,fl.SC.
(
Rij
r12ij
− Aij
r6ij+qiqjrij
)
+∑
h−bonds
cos Θij
(
Rij
r12ij
− Aij
r10ij
)
(2)
Partial chargesqi are usually evaluated with InsightII and ESFF forcefield, Lennard-JonesparametersRij , Aij from OPLSAA or from AutoDock and Hydrogen bond parametersRij , Aij from AutoDock.
263

2 Results
We investigate the accuracy of the predicted ligand-receptor conformation for 83 com-plexes of the high resolution ASTEX/CCDC dataset for which crystal structures withan experimental accuracy of better than 2A are available. For each receptor-ligandcomplex we perform 10 independent simulations. The resulting conformations are orderedby energy according to the scoring function. The median RMS deviation between thepredicted and the experimental structure is 0.83A, only ten ligands fail to reach thebinding mode within the experimental resolution.
2.1 Astex Data Set Results
With these results and the docking results3 of three other programs (Glide, Gold andFlexX) we compare: 1) RMSD as a sign of the docking accuracy, and 2) The dockingreliability as the percentage of having a RMS better than 2.0A.
FlexScreen Glide Gold FlexX:FlexScreen wins/total 26/56 18/25 44/56Results< 2.0 A in % 80 71 76 57
FlexScreen performed (almost) equally good or better in accuracy and reliability in com-parison with all other automated docking methods for which data is available.
Between the remaining difficulties for our approach we find that: 1) Steric clashesin the experimental X-ray structure between ligand and the receptor, 2) Water moleculeswhich have a direct contact to the ligand are sometimes necessary to find the experimentalbinding mode, 3) Deficiency of the scoring function for solvation energies, 4) Ligandsbinding to metal complexes: Metal complexes have their specific group geometry andshould be considered inFlexScreen.
2.2 Docking Study to Human Estrogenα
The ERα (pdb code 1ERE) was previously characterized at the HF/STO-3G level usingthe fragment molecular orbital (FMO) method1.As QM calculations are computationally very expensive, even with the FMO-technique,the binding energies for the ligands were calculated with respect to the most importantfifty amino acid residues of the receptor and is therefore also used for our docking runs.
In this study we investigated the influence on QM-based basedparameters for the lig-ands and the receptor on the binding energy accuracy.We distinguished three cases; 1) QM partial charges for protein and ligands, 2) ESFF par-tial charges for protein and ligands, 3) QM partial charges for protein and ESFF partialcharges for the ligands.
With only one receptor structureFlexScreencould well reproduce the binding modesof the quantum mechanical calculations. This is possible, becauseFlexScreensupportsside-chain flexibility: the side-chains can accommodate todifferent ligands.
264

Comparison with FMO Binding Energies:With a correlation coefficientR = 0.94 thecorrelation is highest the more parameters are from the qm calculations.
Comparison with Experimental Binding Energies:We also compare the calculated bind-ing energies ofFlexScreenwith experimental relative binding affinities (relative tothebinding affinity of 17-β-Estradiol (RBA)). Also in comparison to the experimental RBAthe correlation is highest the more parameters are from the qm characterization of the pro-tein and the ligands. Case 1 and Case 3 have a higher correlation coefficient than Case 2,for which solely the ESFF-forcefield is used. In overall we get the following correlationcoefficients:
Case 1 Case 2 Case3QM Energies 0.94 0.71 0.79RBA 0.68 0.37 0.52
3 Discussion
A mixed setup as in Case 3 is especially interesting for high-throughput screening, becausea significant part of the improvement is retained, when only the receptor is treated withQM-based parameters, while the ligands are parameterized with a purely classical model.The protein preparation may take days of calculations, but for each ligand the calculationtime is reduced to a minimum. As an additional improvement a setup as in Case 3 seemsalso to improve the docking accuracy for the binding mode.
Acknowledgments
We thank the Fond der Chemischen Industrie, the BMBF, the Deutsche Forschungsgemein-schaft (grant WE) and the Kurt Eberhard Bode Stiftung for financial support.
References
1. K. Fukuzawa, K. Kitaura, M. Uebayasi, K. Nakata, T. Kaminuma, and T. Nakano,Ab initio Quantum Mechanical Study of the Binding Energies of Human Estrogen Re-ceptor alfa with Its Ligands: An Application of Fragment Molecular Orbital Method,J. Comp. Phys.26, 1–10, 2005.
2. W. Wenzel and K. Hamacher,Stochastic Tunneling Approach for Global Minimiza-tion of Complex Potential Energy Landscapes, Phys. Rev. Lett.82, 3003–3007, 1999.
3. R. A. Friesner, and P. S. Shenkin,Glide: A New Approach for Rapid, Accurate Dock-ing and Scoring. 1. Method and Assessment of Docking Accuracy, J. Med. Chem.47,1739–1749, 2004.
265


Folding of Two Helical Peptide with Free Energy Methodsand Molecular Dynamics
Aina Quintilla and Wolfgang Wenzel
Forschungszentrum Karlsruhe, Institute fur Nanotechnologie,Postfach 3640, 76021 Karlsruhe, Germany
E-mail: [email protected]
Studying the folding dynamics of a protein using Molecular Dynamics might require an extracriterium when selecting the studied protein. We present a study of the free energy landscape atwo-helix protein using the free-energy protein forcefieldPFF01.The free energy landscape ofthis protein is very simple, suggesting it as candidate for all-atom molecular dynamics simula-tions. In independent simulations we find the formation of the correct secondary structure andseveral folding events into the tertiary structure.
1 Introduction
The investigation of protein folding mechanism is one of themost important problems ofbiophysical chemistry Manyβ-hairpin systems have been investigated both experimentallyand theoretically of small two-helix peptides that are known to fold experimentally intowell-defined tertiary structure. Since two-helix proteinsconstitute a minimal model, inwhich to investigate the interplay of hydrophobic collapse, secondary structure formationand the formation of native contacts, the identification of such systems may be helpful toelucidate the protein folding mechanism.
In this work we investigate the folding of 1WQE, which exhibits a parallel two-helixbundle. It folds reproducibly with free-energy forcefield into a stable tertiary structure,with very simple free-energy funnel. We demonstrate through molecular dynamics sim-ulation that the lack of competing metastable conformations makes these protein an idealcandidate for folding studies to elucidate the interplay ofsecondary and tertiary structureformation.
2 Method
An all-atom (except apolar CHn groups) free-energy protein forcefield1, 2 (PFF01)parametrizes the internal free energy of the protein (excluding backbone entropy).
The elimination of high energy barriers in the free energy surface is the basis of thebasin hopping technique3, also known as Monte Carlo with minimization.
Starting from the same unfolded conformation as above, we performed all-atom im-plicit water molecular dynamics simulation using AMBER99 forcefield. We generatedfive trajectories with 50 ns total simulation time each, three at 300 K and two at 325 K,after independent minimization and equilibration.
267

Figure 1. Plot of the energy vs the RMSB in all accepted conformations in the free-energy simulations, thetriangles show the best conformations of the 20 simulations. There are only two structural clusters in the free-energy landscape with characteristic RMSB deviations of around 3 and 6A to the experimental model.
3 Results
Figure 1 shows energy versus RMSB for all accepted configurations at the end of basinhopping cycles (from all simulations). The triangles indicate the final configurations of theindividual simulations. We clearly see two broad funnels ofconformations, which termi-nate into low-energy structures with 3.4A and about 7.0A RMSB deviation to the nativeconformation, respectively. The configuration corresponding to the non-native funnel isinconsistent with the formation of the correct number of native disulfide bridges of thispeptide.
There is only one, very broad folding funnel consistent withthe native disulfide bridgetopology. For this reason, the protein studied here may be ideal example to follow thekinetics of protein folding with molecular dynamics or replica exchange methods.
The internal free-energy estimate does not contain backbone entropy; stabilization ofone particular conformation with respect to all others doesnot mean that this conformationis stable with respect to the unfolded ensemble. To settle this question kinetic or thermo-dynamic simulations must be performed.
We have therefore performed all-atom implicit water molecular dynamics simulationsfor this protein as described in the methods section. The results for the deviation of theactual conformation from the native structure and the two helices are shown in Figure 2A.The simulations equilibrate quickly into a rapidly fluctuating ensemble with an averageoverall rmsd deviation between 5 and 8A. When we analyze the rmsd deviation of thehelical segments however (Helix1: 1-11, Helix 2: 15-21), wefind that the entire simulationis dominated with conformations that are within 1-2A of the respective fragment of theprotein.
We have also analyzed the helix propensity as a function of time for each amino acidas a function of time, as measured by DSSP. Figure 2B demonstrates a very strong helicalcontent for both segments, but the propensity of helix formation may be forcefield depen-dent. We also analyze the sulfur-sulfur distance between CYS8-CYS18 and CYS4-22 asa function of time (lower panel in Figure 2A). These distances fluctuate strongly, but on
268

Figure 2. A: Analysis of the molecular dynamics trajectories as a function of simulation time. The top panelshows the rmsd of the actual conformation to the native conformation (black) and for the helical fragments only(red: helix 1-11, blue: helix 15-21). The lower panel alwaysshows the deviation of the sulfur-sulfur distancefor a potential disulfide bridge (at 2 A distance) for the amino acids forming the first (green, CYS8-CYS18)and the second disulfide bridge (brown, CYS4-CYS22).B: Time average over a 100-ps moving window of thehelix propensity of each amino acid in the molecular dynamics simulations. Blue: maximal propensity, yellow:no helical contentIn the native conformation the first helixspans amino acids 1-11, and the second helix spansamino acids 14-21,respectively.
occasion, however, some of the sulfur atoms approach each other to within 3-4A, i.e.,close enough for a disulfide bridge to form. On isolated instances, folding events occur inwhich both pairs of sulfur atoms approach one another, whileboth helices are preformed.In those occurrences (which last several ps), the simulations attain all-atom RMSDs to na-tive smaller than 3.5A. The intrahelix rmsd vary between 2.1 and 2.5A for helix 1 andbetween 0.8 and 1.0A for helix 2 in this time frame.
4 Concluding Remarks
According to our MD simulations, secondary structure formation precedes hydrophobiccollapse. The next step would be to substitue the cysteine residues by hydrophobic residuesleading to hydrophobic collapse of the already formed helical ensemble into a well-definedtertiary structure without need of disulfide bridges for thepeptide to be stable and help toguide the design of stable hydrophobic cores for such small proteins, which would haveimplications for important challenges in protein design, e.g., for zinc-finger design.
References
1. T. Herges, W. Wenzel,Reproducible in-silico folding of a landscape in a transferableall-atom forcefieldPhys. ReV. Lett.94, 018101, 2005.
2. T. Herges, W. Wenzel,An All-Atom Force Field for Tertiary Structure Prediction ofHelical Proteins Biophys. J.87, 3100–3109, 2004.
3. A. Nayeem, J. Vila, H. A. SheragaAcomparative study of the simulated-annealingand monte carlo-with-minimization approaches to the minimum-energy structrues ofpoloypeptides: [met]-enkephalinJ. Comp. Chem.12, 594-605, 1991.
269


Multiscale Simulation of Protein Cluster Dynamics – theEncounter Complex
Jakob Schluttig1, Denitsa Alamanova2, Volkhard Helms2, and Ulrich Schwarz1
1 Interdisciplinary Center for Scientific Computing, Im Neuenheimer Feld 267 (BIOQUANT),Ruprecht-Karls-University of Heidelberg, 69120 Heidelberg, Germany
E-mail: [email protected]
2 Center for Bioinformatics, Saarland University, 66041 Saarbrucken, GermanyE-mail: [email protected]
Most proteins in the cell are active in complexes with two to several hundreds of components.As only very small assemblies can be studied in an all-atom framework, coarse-grained ap-proaches are required to model the association and dissociation dynamics of larger protein as-semblies. We approach this problem by using Langevin equations, which allow us to simulatethe cluster dynamics in a very efficient way. In order to make contact to specific systems ofinterest, we use the concept of an encounter complex and extract the relevant association anddissociation rates from biomolecular simulations.
Today proteomics provides us with almost complete lists of proteins in different bio-logical systems of interest. In order to further advance ourquantitative understanding ofthese biological systems, we now have to address the interactions of their proteins in spaceand time. Indeed most proteins are biologically active in complexes and thus it is crucialto understand their association and dissociation dynamics.
Although very complex if investigated in detail, conceptually the dynamics of proteinassociation can be viewed as a sequence of different steps (see Fig. 1). Initially the bind-ing partners undergo pure diffusion. After reaching a certain proximity, the proteins aresteered towards each other, usually by electrostatic forces. This leads to the formationof the encounter complex, which can be viewed as a local minimum on an effective freeenergy landscape. This minimum results often from the electrostatic and hydrophobic at-traction on the one hand and from the final barrier of desolvation on the other hand. Thisview immediately suggests two important measures to speed up the simulation of proteinassociation: first the diffusion step can be described by a simple Langevin simulation ofa particle with the respective shape. Second, overcoming the final energy barrier can bedescribed by an effective rate of association which in principle can be extracted from aneffective free energy landscape with the help of transitionstate theory. In order to scalethe system to larger complexes, one then has to simulate manycycles of association anddissociation using appropriate Langevin equations.
Although the notion of an encounter complex has been successfully used before todescribe association reactions in chemistry and physics, for specific biological systems ithas to be validated by biomolecular simulation. Moreover, biomolecular simulations arerequired to provide detailed values for the association anddissociation rates for specificsystems of interest. In the following we review some of the work regarding the encountercomplex, with an eye towards the question how it can be used toprovide a bridge betweenLangevin and biomolecular simulations.
271

distance
free e
nerg
y
12
3
4
5
Figure 1. Schematic effective free energy landscape of protein association. 1) free diffusion, 2) electrostaticsteering region, 3) encounter complex, 4) barrier due to desolvation and other effects, 5) final complex.
Analytical considerations with respect to the encounter complex have a long tradi-tion. Early works attempted to find mathematical descriptions for the encounter step, i.e.for the transport part of the reaction. One prominent resultis the rate of encounter be-tween a colloid of finite size and an ensemble of small colloids derived by Smoluchowski(Z. Phys. Chem. 1916). Later, Debye (Trans. Electrochem. Soc. 1942) calculated reactionrates in ionic solutions. Eigen did the first step towards theconsideration of the encountercomplex in a biological context, particularly enzyme physics (Quant. Stat. Mech. 1974).He discussed the classic work by Debye and the two limits of pure electrostatics (Langevin1903, Onsager 1924) and pure geometry (Smoluchowski). Bergand Purcell introduced thestandard model for this field: ligands diffuse to a sphere coated with receptor patches (inthis case disc like) and are immediately captured upon encounter. Interestingly, for typicalvalues from cell receptor applications, already a very low surface coverage (∼ 10−3) leadsto nearly optimal outcome. Later, Zwanzig discussed cooperative effects between the re-ceptor patches (PNAS 1990) and derived a correction to the Berg and Purcell result, whichperfectly matched simulations by Northrup (JPC 1988).
Bell first connected considerations about the formation of the encounter and the finalcomplex with the additional possibility of dissociation ina model for cell adhesion clus-ters (Science 1978). Describing both by using stochastic on- and off-rates, he derived basicexpressions for the rate of the total reaction, which were discussed both in the diffusion-limited and the reaction-limited case. DeLisi and Wiegel discussed the Berg-Purcell modelwith a finite reaction rate as introduced by Bell and including electrostatic interactions(PNAS 1981). They claim that, although the particular kinetics of association and dissoci-ation can be affected, the equilibrium properties remain the same. Shoup and Szabo usedthe concept of a radiation boundary condition to model the formation of the final complexfrom the encounter state in a mathematically rigorous way (BPJ 1982). Their treatmentimplied electrostatic interactions and was not restrictedto the diffusion-limited case. Forthe latter, however, they were able to reproduce the resultsof Berg and Purcell. In thefollowing years, Goldstein and Thompson worked out more details.
In many cases, experimental rates were found to be larger than predicted by the theo-retical work. As a consequence, more specific properties like the particular geometry of
272

the receptor patches were considered in the modelling work.Shoup and Szabo discussedthe influence of rotational diffusion and orientation constraints and found that these effectscan strongly shorten the mean first passage times for a reaction between a ligand and areceptor patch like in the Berg-Purcell model (BPJ 1981). Byusing computer simulations,Northrup (PNAS 1992) showed that the rate enhancement seemsto be caused by an en-trapment of the encounter complex by surrounding water, which makes it possible for thetwo reacting molecules to test a large number of alignments without leaving the encounterstate. Barzykin and Sushin claimed that disk like patches used in the Berg-Purcell modellead to substantially lower reaction rates than the use of hemispherical patches (BPJ 2001).In another paper by the same authors, they suggest that anisotropic diffusion can enhancethe reaction rate (BPJ 2001). Recently Korn and Schwarz1 used the purely geometricalinterpretation of the encounter complex to study the efficiency of cell adhesion in hydro-dynamic flow, where convection competes with diffusion. Erdmann and Schwarz2 used theconcept of a position-dependent rebinding rate to study therole of cell-substrate distancein cell adhesion.
Schlosshauer and Baker extended the work of Shoup and derived the binding rate fortwo spherical molecules which both can only bind with hemispherical reactive patches ata finite reaction rate (JPC B 2002). In a recent study, Alsallaq and Zhou (BPJ 2007) againextended this ’hemisphere’ model by introducing a ’crater’model consisting of a sphericalprotein with a crater to which another spherical protein fitssnugly. There the formation ofa stereospecific complex was disfavored by the loss of translational and rotational freedom,and small translations and rotations between the protein subunits destroyed the interactions,leading to a sharp transition between the bound and the unbound state. The energy lanscapewas described as funnel-like, with the deep well of the boundstate surrounded by a broadshallow basin.
Miyashita et al. (PNAS 2004) investigated the effect of electrostatic interactions on thebinding reaction between cytochrome c2 and a bacterial reaction center. The mechanisminvolved an encounter complex stabilized by electrostaticinteractions, followed by a tran-sition state similar to those found by Zhou, leading to the bound complex active in electrontransfer. The study involved determination of a set of transition state structures by fittingexperimental kinetic data over a wide range of protein-protein configurations. The transi-tion state ensemble, obtained from structures having the highest correlation coefficients incomparison with the experimental data, had the cytochrome displaced by about 10A fromits position in the x-ray crystal structure. The observed similarity between the structuresof the encounter state, transition state, and bound complexaccounted for the rapid rate ofassociation responsible for fast diffusion-controlled electron transfer.
Subsequently, Spaar and Helms3 used Brownian Dynamics simulations in order tostudy the association of barnase and barstar. The individual positions and orientationsof one protein relative to the other were interpreted as a probability distribution allowingthe calculation of the entropy landscape. The free energy landscape was obtained by sum-ming the electrostatic, desolvation, and entropy contributions. A characteristic minimum atabout 10A distance between the two binding patches denoted the position of the encountercomplex.
In summary, biomolecular simulations have identified two systems (cytochrome c : re-action center and barnase : barstar) in which the electrostatic attraction in combination withthe desolvation barrier leads to a well-pronounced funnel-shaped free energy surface with a
273
final transition state barrier between encounter and final complexes. Other protein-proteinpairs may have less pronounced features of this kind. This poses the challenge to biomolec-ular simulations to identify which effective model may apply to particular protein:proteinpairs. Yet if a system of this kind has been identified, then methods from stochastic dy-namics (like transition state theory and Langevin simulations) can be employed to scale upthe system. Only if biomolecular and stochastic simulations are combined, we will be ableto model the association and dissociation kinetics of largemacromolecular complexes.
Acknowledgments
This project is financed by the Volkswagen Foundation (I/80 469 to V.H. and I/80 470 toU.S.).
References
1. C. Korn and U. S. Schwarz., Phys. Rev. Lett.97, 138103-1–4, 2006.2. T. Erdmann and U. S. Schwarz, Eur. Phys. J. E22, 123–137, 2007.3. A. Spaar and V. Helms, J. Chem. Theory Comput.1, 723–736, 2005.
274
Aggregation of Fragments of the Islet AmyloidPolypeptide as a Phase Transition: A Cluster Analysis
Gurpreet Singh, Ivan Brovchenko, Alla Oleinikova, and Roland Winter
Department of Chemistry, Biophysical ChemistryUniversity of Dortmund, D-44227 Dortmund, Germany
E-mail: [email protected]
Aqueous solutions of amyloidogenic polypeptides undergo aphase separation into a water-richand peptide-rich (fibrillar) phase already at very small peptide concentrations. Studies of thefibrillar phase (stable phase or its metastable intermediates) can be performed by simulations ofsolution with peptide concentrations deeply inside the two-phase region. In such states, clus-tering (aggregation) of molecules is extremely sensitive to the system size. We performed MDsimulations of 12 amyloidogenic fragments of IAPP (residues 15-19) in liquid water, startingfrom different random configurations. Analysis of peptide clustering and aggregation evidencesfeatures typical for a phase separation. In some simulationruns, the formation of a stable ag-gregate is hampered by the small system size. We propose to use a clustering analysis to selectthe configurations relevant for macroscopic systems.
Formation of amyloid fibrils may be the cause of various diseases. Understanding ofthe driving forces and molecular mechanisms of the fibril formation should elucidate thepossibilities to inhibit formation of toxic amyloid fibrils. Aggregation of polypeptides is acooperative process, which occurs when their concentration in water exceeds some criticalvalue.1 The critical concentration depends on the characteristicsof the considered polypep-tide, temperature, ionic strength, pH, etc. The kinetics ofaggregation speeds up with in-creasing peptide concentration and can be facilitated by adding seeds of the peptide-richphase. All these features are typical for a first-order phasetransition in binary mixtures.In the two-phase region the system is separated into a water-rich phase with the criticalpeptide concentration mentioned above and a peptide-rich phase, which appears as well-ordered solid-like fibrillar structure.
Currently, simulation studies of the fibrillar phase (as stable phase or its metastable in-termediates) can be performed by simulations of an aqueous solution with constant peptideconcentrations deeply inside the two-phase region. In these states, clustering of moleculesmay be drastically distorted by the finite size of the simulation system,2 however, and mayeven hamper formation of stable peptide aggregates. To explore the importance of thiseffect in simulation studies of peptide aggregation, we have simulated an aqueous solutionof amyloidogenic fragments of IAPP (residues 15-19) atT = 330 K andP = 1 atm pressure.The concentration of peptides in the system was about 120 mg/ml (12 peptides and about3070 to 3087 water molecules), i.e, deeply inside the expected immiscibility region. Sim-ulations were carried out with the GROMACS-3.2.1 software package and TIP3P watermodel. Several starting configurations were generated by random insertion of the peptidesin a cubic box of 125 nm3 such that each peptide is at least 7A away from its nearestneighbor. The duration of production runs taken were from 50to 150 ns.
Two peptides were considered as belonging to the same cluster, when the number ofthe contacts between the atoms of the side chain hydrophobicresidues (hydrophobic con-tacts) exceeds 20. Such contact exists, when a distance between two heavy atoms involved
275

0
10
20
30
40
0 2 4 6 8 10 12
5
10
15
20
25
0 20 40 60 80 100 120 140
0 10 20 30 40
Smax
probab
ility
(%)
probab
ility
(%)
0-2 ns 2-4 ns 4-6 ns
10-150 ns 10-50 ns 50-100 ns 100-150 ns
num
ber o
f con
tact
s, S
ASA
t / ns
t / ns
num
ber o
f con
tact
s, S
ASA
SASA
backbone H-bonds
hydrophobic contacts
SASA
hydrophobic contacts
backbone H-bonds
Figure 1. Left panel: probability distributions of the sizeSmax of the largest peptide cluster, averaged overvarious time intervals of the simulation run. Right panel: Time dependencies of the number of hydrophobiccontacts, number of backbone H-bonds and SASA. The equilibration period (up to about 25 ns, indicated by thevertical line) is shown in an enlarged time scale in the upperright panel.
does not exceed the sum of their VdW radii plus 2.8A. Additionally, we have analyzed H-bonded peptide clusters, with at least 2 inter-peptide backbone H-bonds being a connectiv-ity criterion. Clustering of the peptides was characterized by calculation of the distributionof sizesSof the clusters, measured as a number of peptides in a cluster. This distributiongives, in particular, the average cluster size and allows analysis of the largest peptide clus-ter. The secondary structure to each residue is assigned using SEGNO.3 Each peptide isassigned to a particular secondary structure using the criteria that at least three consecutiveresidues should have the same secondary structure, and no other consecutive secondarystructure is present. Two peptides are considered to be forming β-sheets if both peptidesare assigned asβ-strands and if they are connected by at least two backbone H-bonds.
Upon equilibration, the number of inter-peptide hydrophobic contacts achieve satura-tion already att < 10 ns (see right panel in Fig. 1). During this time interval, the distribu-tion of the sizeSmax of the largest cluster evolves, but in the time interval 10 ns< t < 150ns, it remains almost intact (see left panel in Fig. 1). The number of inter-peptide H-bondsand, accordingly, the solvent accessible surface area (SASA) require a longer simulationtime to achieve their equilibrium values (about 25 ns). In the simulation run considered,the peptides form a rather stable aggregate, which containson average 8.6, i.e, the majority,of the totally 12 peptides. This aggregate should be considered as an analogue to the stablepeptide-rich fibrillar phase, which appears due to the phaseseparation in the macroscopicaqueous solution of peptides. Therefore, simulation studies of such peptide aggregatesmay give useful information concerning the formation of ordered fibrils in experimentalsituations.
276

4
6
8
10
12
2
4
6
8
10
10 20 30 40
2
3
4
5
10 20 30 40
0.1
0.2
0.3
Run A Run B
size of the largest H-bonded peptide cluster
average size of peptide clusterssize of largest peptide cluster
-sheets content
t / nst / ns
Run A Run B
Figure 2. Time dependencies of the size of the largest cluster, of the size of the largest H-bonded cluster, of theaverage cluster size and of theβ-sheet content in two simulation runs: A and B.
However, the large peptide aggregates do not necessarily appear in all simulation runsperformed for the same system starting from different initial configurations. Moreover, insome simulation runs, a large peptide aggregate may dissolve after a long simulation time.In Fig. 2, we show two simulation runs, which yield quite different clustering of peptidesafter an initial equilibration period of about 15 ns. In Run A, there is a large peptidecluster which contains on an average the majority of all peptides. In Run B, the largestcluster contains on an average, less then half of all peptides, and they should be consideredas dissolved in water. Such behavior is typical for simulation studies of a small system,whose density (concentration) is kept deeply inside the two-phase region.2 Namely, thepeptide-rich phase may be in a condensed state or in a dissolved state, but both thesestates arestable in simulations and should substitute each other in the course of a verylong simulation run. Obviously, the structural characteristics of these two states are quitedifferent. In particular,β-sheet content is essentially higher in the condensed state(seeFig. 2). Clearly, only the condensed state is relevant to theordered peptide-rich phaseseen in experiments, whereas the dissolved state of peptides is relevant for extremely smallsystems only. Our results show a strong effect of a small sizeof the simulation system onthe aggregation behavior of peptides. We propose to use a full clustering analysis to selectthe proper condensed state of peptides, which is relevant for large (macroscopic) systemsand, therefore, for comparison with experiments.
Acknowledgments
Financial support from the International Max-Planck Research School in Chemical Biol-ogy and from the Zentrum fur Angewandte Chemische Genomik is gratefully acknowl-edged.
277

References
1. J. D. Harper and P. T. Lansbury, Ann. Rev. Biochem.,66, 385-407(1997).2. L. G. MacDowell, P. Virnau, M. Muller, and K. Binder, J. Chem. Phys.,120,
5293-5308(2004).3. M. V. Cubellis, F. Cailliez, and S. C. Lovell, BMC Bioinformatics,6, S8(2005).
278

A Load Balanced Force-Domain Decomposition Algorithmfor Parallel Molecular Dynamics Simulations
Godehard Sutmann1 and Florian Janoschek2
1 Central Institute for Applied Mathematics andJohn von Neumann Institute for Computing,
Research Centre Julich, 52425 Julich, GermanyE-mail: [email protected]
2 Stuttgart UniversityInstitute for Computational Physics, Pfaffenwaldring 27
D - 70569 Stuttgart, Germany
1 Introduction
Classical molecular dynamics simulations are often considered as themethod par excel-lenceto be ported to parallel computers, promising a good scalingbehavior. On the onehand parallel algorithms exist which enable good scaling1. On the other hand the complex-ity of the problem at hand, often scales likeO(N), enabling a linear increase of problemsize with memory. However, this point of view applies only toa limited class of problemswhich can be tackled by molecular dynamics. E.g. in the case of homogeneous periodicsystems, where particles interact via short range interactions, the most efficient algorithmis a domain decomposition scheme, guaranteeing local communication between proces-sors and therefore allowing good parallel scaling. In combination with linked-cell lists, theproblem scales likeO(N) both in computational complexity and memory demand, so thatan ideal behavior in both strong and weak scaling might be expected.
On the other hand, this ideal behavior breaks down if different problem classes areconsidered, e.g. the case of long range interactions, wherenot only local communica-tions between processors are required. Another class of counter examples is the case ofinhomogenous systems, which occur e.g. in open systems, where the particle density isconsiderably larger in the center of the system than in the diffuse halo or e.g. in sys-tems consisting of different thermodynamic phases as is thecase for the coexistence ofliquid/gas or solid/gas phases. In this case, domain decomposition algorithms often fail.Due to a more or less regular geometric decompoition of space, processors are responsiblefor different numbers of particles, often introducing a strong load-imbalance, which leadsto inefficient CPU usage on some processors and therefore to abad parallel scaling.
For these classes, other parallel decomposition schemes are often applied, like atom-or force-decomposition schemes1. While the former one distributes equally particles ontoprocessors, the latter one decomposes the interaction matrix among processors. It is thelatter case which is considered in the present paper. This method also allows a geometricapproach which consists of equally partitioning of the force-matrixF ∈ R
3N×3N ontoprocessors. Taking into account Newton’s law of action and counteraction either the uppertriangular part ofF may be decomposed into equal areas2, or the whole matrix is decom-posed3, 4, while assigning only a subset of interactions onto each PE,in order to fulfil theskew symmetry of the interactions.
279

0 2000 4000 6000 8000 10000 12000 14000 16000 18000
0 10
20 30
40 50
60 70
0 10
20 30
40 50
60 70
0 2000 4000 6000 8000
10000 12000 14000 16000 18000
0
500
1000
1500
2000
2500
0 10
20 30
40 50
60 70
0 10
20 30
40 50
60 70
0
500
1000
1500
2000
2500
Figure 1. Communication patterns between processors for random distribution of particles (left) and sorted par-ticles according to a space-filling Hilbert curve (right). Note the different magnitudes of data volume. Shownis the case forP = 64. Left part of each figure shows the upper triangular part of the force matrix. Each rowcorresponds to data stored on individual PEs.
In general there are two points in force decomposition methods, where communicationis required:
1. after propagating the particle position in the integration step, the position of particlesmust be transferred to remote processors in order to calculate mutual interactions.
2. after calculating interactions, the partial forces, calculated on different processors act-ing on a tagged particle must be collected onto the host processor of that particle, inorder to propagate its positions and momenta.
2 Method
2.1 Communication
Traditionally, coordinates and forces are transferred by all-to-all communication steps.Positions are usually distributed by anmpi allgatherv command while forces aresummed up simply by anmpi allreduce procedure. This is certainly the most sim-ple way to proceed. Since most MPI implementations internally make use of a tree-wisecommunication protocol, the global communication will scale like O(log2(P )), if P isthe number of processors. However, for a big system and a large number of processors,there will be a lot of redundant data transferred to processors. I.e. global communicationoperations do not take into account whether transferred data are really needed on remoteprocessors. Therefore two alternative methods are considered here.
The first approach still gathers all position coordinates from remote PEs, in order tocalculate interactions with local particles. However, theforces are selected according towhether they have been calculated or not. This avoids sending a lot of redundant infor-mation across the network, although the communication protocoll gets a little bit moreinvolved. In the case of the upper triangular force matrix decomposition, forces must besent from local PEs to the ones with larger rank. In this caseP − ip − 1 communicationsteps have to be performed, ifip is the rank of the local PE. In this case twompi gathervoperations have to be performed: (i) to transfer the non-zero partial forces, (ii) to transferthe particle indices, onto which forces act.
280

1 2 4 8 16 32 64 128 256processors
1
2
4
8
16
32
64
128
256
spee
dup
idealR = 2
1/6σR = 4.6 σ
N = 105
Figure 2. Parallel speedup for the force-domain decomposition method for the case ofN = 105 particles andtwo different cutoff radii for interparticle interactions.
The second approach is more involved. The basic principle isto combine a domaindecomposition with a force decomposition scheme. Domain decomposition is achievedby sorting the particles according to their positions alonga space filling Hilbert curve.This ensures that most particles which are local in space arealso local in memory. Forshort range interactions this implies that most interaction partners are stored already on thesame PE. According to this organisation, the force matrix becomes dominant around thediagonal and off-diagonal areas are sparse. The next step isto calculate interaction lists,which are distributed onto all PEs. Indices of interaction partners are stored in Verlet lists,which are valid for a number of time steps. Therefore, these lists only have to be createdand distributed from time to time (e.g. every 20 time steps5). According to these lists itis known which particles from remote PEs are needed on local PEs. The same is true forcalculated partial forces. Since the amount of data is very small with respect to globalcommunications of positions and forces, the communicationoverhead of this method isstrongly reduced, enabling a very much better parallel scaling. Since randomisation ofparticle positions occur on a diffusive time scale, the space filling curve has to be updatedonly one or two orders of magnitude less than the interactionlists, thus introducing only asmall overhead.
2.2 Load-Balancing
Another contribution of the present paper is to combine the proposed methods with an effi-cient load-balancing strategy. This is developed for the force-stripped row method, whichpartitiones equal areas in the interaction matrix to different processors. For inhomogenoussystems, this approach becomes quite inefficient, since thenumber of interactions withinsuch areas may vary considerably. Therefore, two differentapproaches are discussed andimplemented here. The first consists in distributing the number of interactions equallyonto the pocessors. This may give good results for the case, where particles are locatedrandomly in memory. However, if a subset is random and another subset is ordered (as itmight occur for the case of a solid/liquid system) in memory,cache effects will destroy the
281

equal load on PEs. Therefore, a second approach consists in distributing the work, propor-tional to the time which is spent on every PE. This strategy turns out to be most efficient,leading to a very fast distribution of equal load between theprocessors.
3 Results
The above methods are tested for a simple system consisting of Lennard-Jones parti-cles. Molecular dynamics simulations were carried out for systems withN = 105 par-ticles. Fig. 1 shows the amount of data which has to be communicated between proces-sors for the cases of traditional force-decomposition (FD)methods and the force-domain-decomposition (FDD) technique, which uses the space fillingHilbert curve. In FD inter-acting particles are randomly distributed in memory (at least for long simulations particlesget uncorrelated). Therefore, coordinates have to be sent from a processorpi to all otherprocessorspj < pi, while forces have to be redistributet in the opposite direction frompj to all other processorspi > pj . Sorting reduces significantly the amount of data to besent. First of all the size of the data buffers become smaller, second the matrix becomessparse, i.e. a given processorpi does not send coordinates to all other processorspj < pi,but only to those where these coordinates are really needed to compute interactions. Sincesorting concentrates interaction partners close to the diagonal, only small amounts of datahave to be sent to remote processors. Calculations were carried out for the FDD method,considering a system ofN = 105 particles with different size of the interaction radiusRc. For decreasingRc, the amount of data to be sent to remote PEs gets smaller. On theother hand also the work performed on a single PE decreases, because of a smaller numberof interaction evaluations. Therefore, for smallRc communication becomes a bottleneckfor a large number of processors, because of the accumulation of latency. Therefore, thespeedup curve saturates for 128 processors. In the case of a larger cutoff (Rc = 4.6 σ)the computation dominates communication and the program scales up to 128 processors.Note, that for a global communication, like in traditional FD, communication would havea significant larger contribution and the program would not scale as well as in the presentcase.
References
1. S. Plimpton. Fast parallel algorithms for short range molecular dynamicsJ. Comp.Phys., 117:1, 1995.
2. R. Murty and D. Okunbor. Efficient parallel algorithms formolecular dynamicssimulations.Parall. Comp., 25:217–230, 1999.
3. V. E. Taylor, R. L. Stevens, and K. E. Arnold. Parallel molecular dynamics: Commu-nication requirements for parallel machines. InProc. of the fifth Symposium on theFrontiers of Massively Parallel Computation, pages 156–163, 1994.
4. S. Plimpton and B. Hendrickson. A new parallel method for molecular dynamicssimulation of macromolecules.J. Comp. Chem., 17:326, 1996.
5. G. Sutmann and V. Stegailov. Optimization of neighbor list techniques for moleculardynamics simulations.J. Mol. Liq., 125:197–203, 2006.
282

Forcefield Validation with the Rosetta Protein Decoy Set
Abhinav Verma and Wolfgang Wenzel
Institute for Nanotechnology,Research Center Karlsruhe, 76344 Karlsruhe, Germany
E-mail: verma, [email protected]
We have recently extended our helical protein forcefield PFF01 to a more generalized proteinforcefield PFF02 in our efforts towards a universal free energy forcefield for all atom proteinfolding and prediction. Here we selectivity of various proteins PFF02 with a Rosetta decoyset consisting of 32 proteins. The results conclude good selectivity of PFF02 for structureprediction with an average z-score of -3.46 and an average root mean square deviation of 2.14A.
1 Introduction
All atom protein folding and structure prediction have beenone of the central problemsin biophysical chemistry. Transferable potentials are needed to address these questionsfor a wide range of proteins1. We have recently extended our helical protein forcefieldPFF012 to a more generalized protein forcefield PFF023 following the thermodynamichypothesis4, that most proteins are in thermodynamic equilibrium with the environment.With PFF02, we could demonstrate folding of small hairpin polypeptides into their native-like conformations5, 6.
The accuracy and predictivity of free energy protein forcefields can be investigatedusing decoy sets7, a method that works even for proteins that are too large or too complexto be folded from random initial conformations. For the selectivity of PFF02, we study adecoy set generated using Rosetta8 consisting of 32 proteins.
2 Method
A decoy set is a large library of protein conformations generated to approximately spanall relevant low energy regions of the free energy landscape. To measure the predictivityand selectivity of a forcefield, the conformations in the library (decoy set) must be rankedaccording to their energy. If near native conformations emerge lowest in the free-energyfunction, the force field differentiates between native andnear-native conformations. In thelimit of completeness of the decoy set, which is rarely reached in practice, this test aloneis sufficient to show that the force field stabilizes the native conformation of the proteinagainst all competing metastable conformations and corresponds to the global optimum ofthe free-energy force field.
For decoy sets generated with unbiased methods, the computation of the Z-score (thedifference between energies of near-native decoys to the mean energy of the decoy set inunits of its standard deviation) gives a quantitative measure of the selectivity of the forcefield. The Z-score is defined as
Z =Eref − 〈E〉
σ(1)
283

whereEref is the reference energy,i.e., the energy of the native conformation,〈E〉 is the av-erage energy of the decoy set andσ is the standard deviation of the decoy set. The Z-scoresimply measures the mean energy distance from the native state of protein in terms of thestandard deviations of the decoy set. The lower the Z-score,the better is the discriminationbetween native and non-native conformations in the decoy set. The histograms showingthe distribution of decoys over energy range are shown in Figure 1(inset).
3 Results
For this study we investigated, which of the proteins of the the large all atom Rosettadecoy sets9 could be stabilized by PFF02. The proteins in this decoy set range between32-85 amino acids in size and span all secondary structural classes.
Figure 1. RMSD of the lowest energy conformation (Green) andZ-scores (Blue) of proteins in the Rosetta decoyset. Inset shows a sample distribution of decoys for a protein. The bars in cyan represent the distribution ofnear-native decoys generated from native structure and redbars represent all the decoys from the decoy set.
For the calculation of Z-scores we generated near-native conformations for 32 proteinsof the latest Rosetta decoy library. We excluded only proteins that are stabilized by tran-sition metal clusters or other ligands as such interactionsare yet to be implemented in thepresent force field. The resulting near-native conformations deviate 1-4A from the ex-perimental conformation, except for 1am3 and 1utg, where deviations of 4.05 and 5.4A
284

respectively are observed (top panel of Figure 1, Table 1 forall data). Since both of theseproteins are dimeric, this difference arises because the molecules are relaxed here in isola-tion. The average deviation between experiment and near-native conformation in the forcefield for the set of 32 proteins was 2.14A, the figure also indicates that there is little cor-relation between the size of the protein and the accuracy with which the local minimum ofthe force field agrees with the experimental conformation.
In order to arrive at a meaningful comparison of the energieswe relaxed the approxi-mately 2000 decoys for each of the proteins in the decoy library in PFF02. This proceduremaps each decoy to a local minimum of the force field of similarstructure, the averagechange in RMSD between the starting and relaxed conformation was less than 0.02A.This means that the decoys are not changed in the relaxation process.
PDB ID Z-Score RMSD (A) PDB ID Z-Score RMSD (A)1a32 -3.72 1.57 1nre -4.19 2.691aa3 -3.08 1.71 1orc -3.49 3.821afi -2.41 1.13 1pgx -3.26 0.981ail -5.73 1.49 1pou -4.72 1.581am3 -5.32 4.05 1r69 -5.57 1.481bw6 -2.98 3.32 1res -3.47 2.251cei -4.19 1.17 1sro -0.43 1.511csp -4.01 1.00 1uba -3.19 3.961ctf -4.93 1.10 1utg -4.47 5.411dol -3.54 2.04 1uxd -3.00 1.351gab -3.16 1.81 1vif -2.00 1.011hyp -4.49 3.59 2ezh -3.56 3.701kjs -2.02 3.32 2fow -1.43 1.941lfb -3.69 2.80 2fxb -3.09 1.371mzm -3.75 2.75 2pdd -3.69 2.741nkl -4.77 2.28 5pti 0.58 1.68
Table 1. Zscores and RMSD(lowest energy) for the 32 proteinsof Rosetta decoy set in PFF02.
The Z-scores for 29 out of the 32 proteins in the decoy set are less than -2.0 (top panelof Figure 1). This indicates a good selectivity of the force field for these proteins. Theaverage the score of -3.46 is lower than that of any previously reported alternate scoringfunction for the same decoy set. The average Z-score for the same set of proteins in PFF01was -3.0610. This indicates the improvement of the force field for this set of proteins whichspans all kinds of secondary structural elements, with the only exception of 5PTI. Sincethe Rosetta decoy sets were specifically generated to span a wide range of near-native andnon-native conformations for each protein. These data indicate that PFF02 stabilizes near-native conformations of a large family of small and medium-size proteins of all secondarystructure classes as its global optimum.
285

4 Concluding Remarks
In this work, a 32 protein Rosetta decoy set was used to test the selectivity and predictiv-ity of a recently modified protein forcefield PFF02. The results indicate that PFF02 hasgood selectivity with an average z score of -3.46. Also the average RMSD for the lowestenergy conformation for all these proteins is only 2.14A showing good predictability fora wide range of proteins. PFF02 thus emerges as a positive step towards a universal andtransferable forcefield for all atom protein folding and tertiary structure prediction.
Acknowledgments
We thank the Deutsche Forschungsgemeinschaft (grants WE 1863/10-2,WE 1863/14-1)and the Kurt Eberhard Bode Stiftung for financial support. Part of the simulations wereperformed at the KIST teraflop cluster and at the Barcelona Supercomputer Center.
References
1. D. Baker and A. Sali. Protein structure prediction and structural genomics.Science,294:93–6, 2001.
2. T. Herges and W. Wenzel. An all-atom force field for tertiary structure prediction ofhelical proteins.Biophys. J., 87:3100–9, 2004.
3. A. Verma and W. Wenzel. Towards a universal free-energy approach for all-atomprotein folding and structure prediction. Submitted, 2007.
4. C. B. Anfinsen. Principles that govern the folding of protein chains. Science, 181:223–30, 1973.
5. A. Verma and W. Wenzel. Predictive and reproducible de-novo all-atom folding of aβ-hairpin loop in an improved free energy forcefield.J. Phys. Cond. Matt, in press,2007.
6. W. Wenzel. Predictive folding of aβ-hairpin in an all-atom free-energy model.Eu-rophys. Lett., 76:156–162, 2006.
7. B. Park and M. Levitt. Energy functions that discriminatex-ray and near-native foldsfrom well-constructed decoys.J. Molec. Biol., 258:367, 1996.
8. R. Bonneau, J. Tsai, I. Ruczinski, D. Chivian, C. M. E. Strauss, and D. Baker. Rosettain CASP4: progress in ab-initio protein structure prediction. Proteins, 45:119–126,2001.
9. J. Tsai, R. Bonneau, A. V. Morozov, B. Kuhlman, C. A. Rohl, and D. Baker. An im-proved protein decoy set for testing energy functions for protein structure prediction.Proteins, 53:76–87, 2003.
10. A. Verma and W. Wenzel. Protein structure prediction by all-atom free-energy refine-ment. BMC Structural Biology, 7:12, 2007.
286

Knots in Macromolecular Systems:Concepts and Challenges
Peter Virnau
Institut fur Physik, Johannes Gutenberg–Universitat MainzStaudinger Weg 7, 55099 Mainz, Germany
E-mail: [email protected]
The following survey of computational and experimental research activities on knots in syn-thetic and biological macromolecules outlines previous accomplishments and current chal-lenges in the field.
1 Introduction
Knots are one of mankind’s oldest and most practical devices. Appreciated by fisherman,seafarers, surgeons and rescue professionals around the world, knots have long capturedthe imagination of natural scientists, too. In 1867, Lord Kelvin suggested that atoms mayconsist of knots formed by the ether,1 which inspired physicists like Maxwell and Tait tolay the foundations of knot theory.
In mathematics, knots are only well–defined in closed curvesand usually categorizedaccording to the minimal number of crossings in a projectiononto a plane. The searchfor an algorithm which can distinguish between all knots is ongoing and still one of thegrand challenges in mathematical knot theory. From a practical point of view, however,several algorithms, like the Alexander polynomial or the HOMFLY polynomial, are ableto distinguish between simple knots and suffice for most purposes. In this spirit, openchains can also be analyzed by simply connecting end points in a defined way.
After descending into mathematical obscurity for some time, interest in the subject wasrevived in the 1960s, when Frisch, Wassermann2 and Delbruck conjectured that all suffi-ciently long polymers have to contain knots - experimental length scales were, however,not known at this time. From a theoretical point of view, thisstatement is intriguing be-cause knots are not included in the standard theory for self-avoiding polymers, but affectequilibrium properties and dynamics.
2 Computer Simulations of Knots in Polymers
Simulations are particularly well-suited to address thesequestions because the statisticsof knots can be unveiled by analyzing independent polymer configurations generated bythe computer. Starting with the ground-breaking work of Vologodskii et al.,3 a variety ofcoarse-grained polymer models were tested.
With little or no excluded volume (random walk) and no inherent stiffness, a singlethree-dimensional polymer displays a large number of very small and localized knots.Each monomer can be positioned anywhere around its predecessor which promotes en-tanglements on the local scale. If excluded volume is considered, however, the chain be-comes unknotted.4 A single bead–spring polymer with 1000 monomers in good solvent
287

conditions, e.g, only contains knots in about 1% of all configurations.5 The fraction of thepolymer which is occupied by the knot in one of these rare events is considerably largerthan in random walks, but still small with respect to the total chain–length. If a polymercollapses into a globular state and has enough time equilibrate, or if it is confined into acapsid, knots become frequent again5 and spread out all over the globule.5 In such a densephase, the same bead–spring model contains knots in 80% of all configurations - most ofwhich are already quite complex. In this case, the free energy of the polymer is dominatedby energetic contributions which do not distinguish between unentangled and entangledstates which are otherwise favored by conformational entropy. In the swollen phase, on theother hand, the polymer would like to have access to as many states as possible, and thefree energy is dominated by entropic contributions which disfavor entanglements.
Analogies between microscopically knotted polymers and macroscopically knottedstrings and robes are far reaching. Not only do single polymers and robes become knottedin crowded conditions, they also share similar material properties. A knotted robe, e.g.,withstands only a fraction of the traction which it can withstand if the robe remains un-knotted - a well-known fact among mountaineers and anglers.Knotted polymers are alsofar less stable under tension and tend to break at the entrance to the knot.6
3 Knots in DNA, Proteins and Synthetic Polymers
Knowledge gained from computer simulations is particularly relevant for biological sys-tems whose fundamental constituents are long biopolymers.Knots were first discoveredin bacterial DNA in 1976.7 Since then, many knots were also created artificially, e.g.,bythe action of topoisomerase I on circular DNA. In good solvent conditions, DNA behaveslike a model polymer and contains almost no knots (0.5-4% knots in a 10000 base pairstrand depending on salt concentration.)8 From the simulation of knotted homopolymers,one might expect that DNA also becomes highly knotted in confinement. This condition is,however, problematic for DNA in crowded environments like the cell, and indeed, naturehas developed successful strategies to circumvent this effect. Human DNA, e.g., wrapsaround histone proteins. In ds-DNA viruses, the rather rigid DNA forms a spool when it isfed into the capsid (with one end remaining attached to the loading channel.)
Topology is even more relevant in proteins because the three-dimensional structure ofa protein directly determines its functionality. Once again, knots are rare9–12 although thereason is not well understood. It has been hypothesized thatknotted structures are difficultto fold11 and would essentially preserve their unknotted state afterthe initial collapse.12
However, experiments suggest that certain knotted proteins may fold and unfold reversiblyunder a change of solvent conditions.13 Secondary structure and inherent stiffness of theprotein backbone may also simply shift the length scale at which knots occur in comparisonto globular polymers.12 Overall, the problem remains essentially unsolved. Interestingly,knots in proteins are usually preserved in structural homologs throughout evolution whichindicates that they are relevant for the functionality of the protein and have existed sincethe beginning of life. In our recent comprehensive analysisof the Protein Data Bank,9 wewere also able to identify one counter-example and demonstrate how the presence of a knotmay alter the enzymatic activity of the protein.
The synthesis of man–made molecules with knots has also beenan important topic inthe chemical literature.14 These so-called “knotanes” consist of small knotted moleculesobtained by supramolecular-template techniques.
288

4 Challenges
In the near future, I would expect that closed knotted nanoparticles based on knotted poly-mer globules will be synthesized.15 These particles should be highly knotted, in the orderof 10 nm in size and offer a reactive surface which may turn them into interesting can-didates for the delivery of drugs. Similarly, it should become feasible to genetically alterproteins such that they become knotted. From a theoretical point of view, it would certainlybe interesting to quantify why there are so few knots in proteins and how knotted proteinsactually fold. 140 years after Kelvin, knotty problems persist.
References
1. W. T. Thompson,On vortex atoms, Philos. Mag. 34, 15-24 (1867).2. H. L. Frisch and E. J. Wassermann,Chemical Topology, J.Am.Chem.Soc. 83, 3789-
3795 (1961).3. M.D. Frank-Kamenetskii, A.V. Lukashin, and A.V. Vologodskii, Statistical mechanics
and topology of polymer chains, Nature258, 398-402 (1975).4. K. Koniaris and M. Muthukumar,Knottedness in ring polymers, Phys. Rev. Lett.66,
2211-2214 (1991).5. P. Virnau, Y. Kantor, and M. Kardar,Knots in globule and coil phases of a model
polyethylene, J. Am. Chem. Soc.127, 15102-15106 (2005).6. A. M. Saitta, P. D. Soper, E. Wasserman, and M. L. Klein,Influence of a knot on the
strength of a polymer strand, Nature 399, 46-48 (1999).7. L. F. Liu, R. E. Depew, and J. C. Wang,Knotted single-stranded DNA Rings -
novel topological isomer of circular single-stranded DNA formed by treatment of Es-cherichia Coli omega protein, J.Mol.Biol. 106, 439-452 (1976).
8. V. V. Rybenkov, N. R. Cozzarelli, and A. V. Vologodskii,Probability of DNA knottingand the effective diameter of the DNA double helix, Proc. Natl. Acad. Sci. U.S.A. 90,5307-5311 (1993).
9. P. Virnau, L. Mirny, and M. Kardar,Intricate knots in proteins: Function and evolu-tion, PLOS Comp. Biol.,2, e122 (2006).
10. M. L. Mansfield, Are there knots in proteins?Nat. Struct. Mol. Bio. 1, 213-214(1994).
11. W. R. Taylor,A deeply knotted protein and how it may fold, Nature 406, 916-919(2000).
12. R. C. Lua and A. Y. Grosberg,Statistics of knots, geometry of conformations, andevolution of proteins, PLOS Computational Biology 2, e45 (2006).
13. S. E. Jackson and A. L. Mallam,Folding studies on a knotted protein, J. Mol. Bio.346, 1409-1421 (2005).
14. O. Lukin and F. Vogtle,Knotting and threading of molecules: Chemistry and chiralityof molecular knots and their assemblies, Angew. Chem. Int. Ed. 44, 1456-1477(2005).
15. private communication with Prof. Vogtle.
289


Steered Classical and Quantum Path-Integral MolecularDynamics Simulations of Strongly Coupled Protons
Motions in Porphycene
Ł. Walewski1,2, P. Bała3, and B. Lesyng1
1 Department of Biophysics, Faculty of Physics, University of Warsaw,Zwirki i Wigury 93, 02-089 Warszawa, Poland
E-mail: [email protected]
2 Interdisciplinary Centre for Mathematical and Computational Modelling,Pawinskiego 5a, 02-106 Warszawa, Poland
E-mail: [email protected]
3 Department of Mathematics and Computer Science, N. Copernicus University,Chopina 12/18, 87-100 Torun, Poland
E-mail: [email protected]
MD simulations of many body quantum-classical systems is ofbig importance for the de-scription of functioning of many (bio)molecular and nanosystems. Porphycene containing twostrongly coupled quantum protons in a classical molecular scaffold is a model system which isused by us to develop novel methodological QCMD approaches.The system is also of prac-tical importance for molecular nanotechnologies. Energy profiles for the proton motions inporhycene have already been studied by us using an SCC-DFTB approach1, however, classi-cal MD simulations were not sufficiently precise to determine effective barriers for the protontransfer. Since the quantum dynamical motions of the protons have considerable impact onthe motions of the classical atoms and vice versa, in the current approach the whole system issimulated using a steered Path Integral Molecular Dynamics(PIMD) method with an on thefly Car-Parrinello DFT propagation scheme for all nuclei, and with the adiabatic QD of theelectrons2. Such approach together with thermodynamic sampling of theconformational spaceprovides realistic energy profiles along the reaction pathways for the protons motions. Themethod requires massively parallel computer systems to carry out simulations for real systems.
1 Introduction
In previous studies proton transfer reaction pathways in porphycene were determined3. Thepathwaystrans→ ts-A→ cis-Aandtrans→ ss-A→ transare low energy pathways. Theycontain barriers of 5 kcal/mol and 7.5 kcal/mol, respectively. The former participates in thestepwise mechanism of the double proton transfer reaction that requires two consecutivetransitions of this type. The latter describes the concerted reaction mechanism. They areboth accessible for the system in 300 K. The high energy pathways –trans→ ts-B →cis-Bandtrans→ ss-B→ cis-Bcontain barriers of 43 and 64 kcal/mol, respectively, andare statistically irrelevant at 300 K. The aim of the computations carried out at NIC wasto get mean-field energy profiles for selected proton-transfer pathways and to compareresults of the standard Car-Parrinello Molecular Dynamics(CPMD) method with the PathIntegral Molecular Dynamics (PIMD) approach. This comparison can reveal the influenceof nuclear quantum effects, such as tunneling, on the reaction energy barriers.
291

Table 1. Relative energies between stationary points on theporphycene potential energy surface (PES) computedwith different DFT functionals. Plane wave expansion cutoff (Ecut) is in Ry, energy in kcal/mol. Calculationswith 120 and 70 Ry cutoffs where carried out using the Trouiller-Martins normconserving pseudopotentials, whilethose with 40 and 25 Ry cutoffs with the Vanderbilt ultrasoftones. Structure names follow ref.3, scheme 2 and 3.
Functional EcutStructure
trans cis-A ts-A ss-A cis-B ts-B ss-BB3LYP/TZ2Pa – 0.0 2.4 4.9 7.6 28.8 43.0 64.4PZB 70 0.0 2.5 4.9 7.5 26.9 40.9 29.5
BLYP120 0.0 2.1 3.9 5.9 28.5 40.7 30.740 0.0 2.0 3.7 5.4 28.2 40.3 30.625 0.0 2.4 3.5 5.1 27.9 39.9 30.4
PBE120 0.0 1.5 2.4 3.5 30.3 39.5 32.240 0.0 1.6 2.3 3.1 30.3 39.3 32.225 0.0 1.5 1.9 2.5 30.2 39.0 32.2
BP120 0.0 1.6 2.5 3.6 30.4 39.7 32.340 0.0 1.6 2.4 3.3 30.2 39.6 32.125 0.0 1.8 2.2 2.3 29.7 39.0 31.6
a Values cited from ref.3 for comparison.
2 Selection of the Exchange-Correlation Potential
Locations of known stationary points on the potential energy surface (PES) of porphycenewere optimized using a number of Density Functional Theory (DFT) approximations.Since Perdew, Zunger, Becke4, 5 gradient corrected exchange-correlation functional (PZB)was already successfully applied for the proton transfer reaction in malonaldehyde by othergroup6 it was treated as the most trustworthy one. Other widely usedfunctionals (BLYP,PBE and BP) were also tested. All results were compared with reference values of Ko-zlowski3 et al. Plane wave expansion of valence orbitals and atomic pseudopotentials forthe core electrons were used with different cutoff values. For results see Table 1.
In most cases lowering the expansion cutoff results in lowering the relative energiesof the transition states and local minima of the energy landscape. The energy values withhigher cutoff are closer to the reference values. The PZB functional with 70 Ry cutoffgives nearly the same results as B3LYP with TZ2P basis set in the low energy region,i.e. for the ”A” pathways. In high energy region (the ”B” pathways) the differences of2 kcal/mol occur forcis-B andts-Bstates, which is acceptable, however forss-Ba largedifference of 35 kcal/mol appears. Although the discrepancy is large, the ”B” pathwayis not accessible for the system at room temperature, and we accept the PZB results with70 Ry. The BLYP values with 120 Ry cutoff are also acceptable since the deviation fromthe reference energy is only 1.5 kcal/mol. It should be notedthat reduction of the cutoffvalue causes significant gain in terms of the computing time.With this in mind one mayconsider the BLYP functional with 25 Ry cutoff as a promisingchoice for faster, althoughless accurate computations. The PBE and BP functionals significantly underestimate theenergy barrier values for the ”A” pathways (more than 50%), and are quite accurate in highenergy region, which is however less interesting for our studies.
The PZB functional appeared to be the most accurate in describing the characteristic
292

points on the potential energy surface in comparison to previousab initio studies. There-fore it was chosen for further calculations.
3 Free Energy Profiles
The calculation of the free energy profiles was carried outvia thermodynamic integrationin the “blue moon ensemble”7. In this approach the reaction pathway is divided into stepscovering relevant values of the reaction coordinate. Then for each reaction step a con-strained molecular dynamics run is carried out with the reaction coordinate being fixed atcertain value by molecular constraints. Free energy derivatives are averaged over each runand integrated to give a free energy profile. This procedure was applied twice: with allatomic nuclei treated classically with CPMD, and with all atomic nuclei treated quantum-dynamically with PIMD. In the latter case the nuclei were quantized using 16 imaginarytime-slices (see Figure 1 for visualization). The NVT constrained dynamics simulationswere carried out in a 17A cubic box.
Two low energy reaction pathways in por-
Figure 1. Path integral configuration oftransporphycene. Each nucleus is represented bycyclic polymer of 16beads.
phycene were studied. Calculations fortrans →ts-A→ cis-Aandtrans→ ss-A→ transpathwayswere carried out using the CPMD and PIMD ap-proaches. The former pathway was divided into 17and 9 reaction steps, applying CPMD and PIMD,respectively. For the latter case, 10 reaction stepswere used for only one half of the pathway, becausethetrans→ ss-Atransition is symmetrical to thess-A → transone. The total of number of 4000 stepsof the constrained dynamics simulation was carriedout for each reaction step, in each case. The time-step was 3 a.u. Fictitious electron mass was set to350 a.u. for CPMD, and 300 a.u. for PIMD. Tem-perature of the Nose-Hoover thermostat was set to300 K.
Figure 2 shows free energy profiles for the twopathways in porphycene computed from the averaged constraint forces. Averaging wascarried out over the converged parts of the trajectories in order to avoid nonequilibriumregions.
The static calculations of the barrier height for the doubleproton transfer in porphyceneon thetrans→ ts-A→ cis-Apathway is 4.9 kcal/mol (see Table 1). Inclusion of classicalthermal vibrations at 300 K increases the barrier by 1.4 kcal/mol to 6.3 kcal/mol. This israther unexpected since the thermal vibrations should rather reduce the barrier. This maybe the evidence of larger error of the method originating from poor equilibration of thesystem on one hand and small data set for the statistical averaging on the other. Taking thisinto account one would assume the error bar to be around 1 kcal/mol. Taking into accountthe quantum nature of the nuclei within the PIMD model reduces the barrier height to1.8 kcal/mol (Fig. 2(a)). This can be treated as an expected result.
Interestingly thecis-A configuration turns out to be much more stable in the PIMDmodel than in the CPMD one. The free energy difference is about 3 kcal/mol, which is
293

(a) trans→ ts-A→ cis-A (b) trans→ ss-A→ trans
Figure 2. CPMD and PIMD free energy profiles for two reaction pathways in porphycene.
a significant effect even assumed a 1 kcal/mol error. This results in equal barrier heightsfor the transitions in both directions: thetrans → cis-A barrier is approximately equalto thecis-A→ trans barrier which yields 1.8 kcal/mol. This makes thetrans andcis-Astates practically indistinguishable, which is not the case for the CPMD model where the’forward’ barrier is 6.3 kcal/mol while the ’reverse’ one yields 3.0 kcal/mol.
Thetrans→ ss-A→ transpathway leads through the classical barrier of 7.5 kcal/mol.Applying the CPMD integration the barrier height is slightly higher and equals 7.9 kcal/molwhich is consistent with the tendency observed previously.The PIMD computations showthe low barrier of 4.4 kcal/mol.
4 Conclusions
The obtained so far results show that inclusion of nuclear quantum effects reduces the freeenergy barrier for the proton transfer reaction in porphycene. Thetrans→ ts-A→ cis-Apathway showed a 4.5 kcal/mol reduction of the barrier height. Qualitatively, it is expected,however, exact values of the free energy barriers require further refinement, carrying outlonger simulations. Some difficulties in averaging the freeenergy derivatives in the pro-cess of thermodynamic integration result mostly from not fully equilibrated constraineddynamics trajectories.
The goal of comparing the free energy profiles of the two low-energy proton-transferreactions in porphycene, i.e. concerted vs stepwise one between two symmetricaltransisomers, could not be completed yet, since we were not able tocarry out the PIMD calcu-lations of thetrans→ ss-A→ transpathway based on the NIC granted resources. Compu-tations are being carried out.
The presented results may also suggest that a more precise description of the doubleproton transfer mechanism would require even a more sophisticated approach. This couldaccount for a two-particle quantum state, which is the two-proton wave function definedon a spatial grid. The dynamics of such system should be governed by the time-dependentSchrodinger equation. The Hamiltonian should then contain terms describing the interac-tions between the two-particle, proton wave function and the classical ionic environmentforming the molecular skeleton.
294

Acknowledgments
Computations were carried out at NIC Julich (grant EPL00) and ICM Warsaw University.Authors express their gratitude for granting the access to the computing resources.
References
1. Ł. Walewski, P. Bała, M. Elstner, Th. Frauenheim, and B. Lesyng,Fast QM/MMMethod and Its Application to Molecular Systems, Chem. Phys. Lett.,397, 451–458,2004.
2. The CPMD Consortium, http://www.cpmd.org/,CPMD Consortium page.3. P. M. Kozlowski, M. Z. Zgierski, and J. Baker,The inner-hydrogen migration and
ground-state structure of porphycene, J. Chem. Phys.,109, 5905–5913, 1998.4. J. P. Perdew and A. Zunger,Self-interaction correction to density-functional approxi-
mations for many-electron systems, Phys. Rev. B,23, 5048–5079, 1981.5. A. D. Becke,Density-functional exchange-energy approximation with correct asymp-
totic behavior, Phys. Rev. A,38, 3098–3100, 1988.6. M. E. Tuckerman and D. Marx,Heavy-Atom Skeleton Quantization and Proton Tun-
neling in “Intermediate-Barrier” Hydrogen Bonds, Phys. Rev. Lett.,86, 4946–4949,2001.
7. E. A. Carter, G. Ciccotti, J. T. Hynes, and R. Kapral,Constrained reaction coordinatedynamics for the simulation of rare events, Chem. Phys. Lett.,156, 472–477, 1989.
295


Side-Chain Ordering in Homopolymers
Yanjie Wei1, Walter Nadler1, and Ulrich H. E. Hansmann1,2
1 Department of Physics, Michigan Technological University,Houghton, MI 49931, USA
E-mail: yawei, wnadler, hansmann @mtu.edu
2 John von Neumann Institute for Computing,Forschungszentrum Julich, D-52425 Julich, Germany
E-mail: [email protected]
In order to study the relation between backbone and side-chain ordering in proteins, we haveperformed multicanonical simulations of five amino acid homopolymers. Glu10, Gln10, Asp10,Asn10, and Lys10 were selected to cover a wide variety of possible interactions between theside chains. All polymers undergo helix-coil transitions.We found that peptides with long sidechains that are capable of hydrogen bonding, i.e. Glu10 and Gln10, exhibit a second transitionat lower temperatures connected with side-chain ordering.This occurs in gas phase as well as insolvent. However, in polymers with short side chains capable of hydrogen bonding, i.e. Asp10and Asn10, side-chain ordering takes place over a wide temperature range and exhibits no phasetransition-like character. Again, these results are qualitatively independent of the environment.Side chain ordering in Lys10, whose side groups are long and polar, also takes place over awide temperature range and exhibits no phase transition-like character in both environments.
1 Introduction
In the last two decades, energy landscape and folding funnelparadigms1 have led to anemerging understanding of the protein folding process. However, these concepts describeonly the general characteristics of folding. Many details still remain poorly understood.One aspect is the role of side-chain ordering in the folding process. Since amino acids aredistinguished by the side chains, the study of side-chain ordering can help us understandthe protein folding problem. Using the multicanonical Monte Carlo method2, 3, we havestudied the side-chain ordering of five homopolymers Glu10, Gln10, Asp10, Asn10, andLys10
4, 5. It is found that, besides the helix-coil transition, a side-chain ordering transition istaking place for particular polypeptides only. The de-coupling of side-chain and backboneordering transitions is independent of the environment.
2 Methods
We used the ECEPP/3 force field6 as implemented in the program package SMMP7. Herethe intramolecular interactions are approximated by a sum consisting of electrostatic en-ergy, a Lennard-Jones term, a hydrogen-bonding term and a torsional energy term. Theprotein-solvent interactions are approximated by a solvent accessible surface term8.
The above defined energy function leads to a landscape that ischaracterized by a mul-titude of minima separated by high barriers. In order to enhance sampling we rely onthe multicanonical approach2, 3. Here, configurations are weighted with a termwMU (E)determined iteratively such that the resulting histogram obeys
PMU (E) ∝ n(E)wMU (E) ≈ const , (1)
wheren(E) is the spectral density of the system.
297

3 Results and Discussions
0.00
0.05
0.10
0.15
0.20
0.25
0.30
200 300 400 500 600 700 800 900 1000
C(T
)
T(K)
GluGlnLysAspAsn
Figure 1. Specific heatC(T ) as function of temperatureT for the five homopolymers in gas phase. This figureis taken from Ref. 5.
We first studied the molecules in gas phase. Fig. 1 displays the specific heat permolecule for the five polymers as a function of temperature. In each case one observesa peak at a temperatureT1 in the range450K to 600K. The individual peak temperaturesT1 and other properties are listed in Table 1. These peaks correspond to the helix-coil phasetransitions which separate a high temperature region wherethe backbone has no orderingfrom a region where temperatures are low enough to allow the formation of anα-helix4, 5.
The transition temperatures are largest forGlu10 andGln10, and lowest forAsn10 andAsp10, with the individual values being very close to each other ineach block. The orderingof the transition temperature can be understood from the particular energetic and entropiccontributions of the various side chains5.
Interestingly, a second peak in the specific heat is observedfor Glu10 andGln10. Thepeak temperaturesT2 are around170 K (see table 1). This second peak is related to theside-chain ordering in the form of hydrogen bonding betweenside groups4, 5.
Asn10 and Asp10, whose side chains are only one CH2-group shorter than those ofGlu10 andGln10, show no second peak in the specific heat. The reason for this remarkablydifferent behavior is the apparent existence of a thresholdlength for the side chains. Ifthese chains are not long enough, the number of degrees of freedom is simply too smallto allow for the fluctuations observed forGlu10 andGln10. Consequently, the ordering ofthe side chains inAsn10 andAsp10 does not have a transition-like character but is spreadout over a wide range of temperatures. Side-chain ordering behavior forLys10 is similar toAsn10 andAsp10. Since its side groups can participate only in weak hydrogenbonds, theyact neutrally at the helix-coil transition and finally orderthemselves by wrapping aroundthe helical cylinder5.
The structural features in the low-temperature phase foundhere correspond to earlyresults from theoretical investigations on the ground state structure of such homopolymersin vacuum, performed by H. Scheraga’s group, see e.g. Ref. 9.
298

Table 1. Properties of the helix-coil transitions observedfor the five homopolymers: Transition temperaturesT1
andT2, half width∆T , and the specific heat per molecule at the transition temperatures,C(T1) andC(T2). Thenumber in parenthesis is the uncertainty in the last digit. The data are taken from Ref. 5.
vacuum solvent
T1[K] ∆Ta[K] C(T1)b T1[K] ∆Ta[K] C(T1)
b
Glu10 587(14) 161 0.193(2) 477(7) 88 0.296(3)Gln10 584(14) 163 0.181(1) 484(8) 97 0.268(3)Lys10 538(8) 151 0.216(2) 447(10) 98 0.266(3)Asn10 485(19) 193 0.169(2) 424(9) 105 0.249(4)Asp10 471(19) 170 0.182(2) 415(6) 82 0.300(3)
T2[K] ∆T c[K] C(T2)b T2[K] ∆T c[K] C(T2)
b
Glu10 166(16) 203 0.176(4) 111(10) 166 0.152(2)Gln10 181(23) 187 0.161(6) 120(17) 146 0.133(3)
aDetermined atC = [C(T1) + C(Tmin)] /2, with Tmin from eitherC′(Tmin) = 0 or C′′(Tmin) = 0.bUnit is Kcal/mol.cDetermined atC = [C(T2) + C(Tmin)] /2, with Tmin from C′(Tmin) = 0.
So far, we have focused on the molecules in gas phase. However, in nature proteinsare usually solvated, and their function often depends on the solvent environment. For thisreason we have extended our investigation to that of solvated homopolymers.
As in the case of gas phase simulations we observed for all fivemolecules a helix-coiltransition indicated by peaks in the specific heat, see Fig. 2, their properties also beinglisted in Table 1. As can be seen clearly, the width of these peaks is much narrower, andtheir height is larger than in gas phase, indicating a sharper transition.
0.00
0.05
0.10
0.15
0.20
0.25
0.30
100 200 300 400 500 600 700 800 900 1000
C(T
)
T(K)
GluGlnLysAspAsn
Figure 2. Specific heatC(T ) as function of temperatureT for the five solvated homopolymers. The figure istaken from Ref. 5.
All transition temperatures are shifted to lower values. The reason is the competitionbetween the formation of backbone hydrogen bonds that stabilize theα-helix, and interac-
299

tion between the peptide and the solvent in the coil phase. While in vacuum the transitionto the coil phase is driven solely by entropy, here also the peptide-solvent interaction favorsthe coil phase. These effects collaborate so that the transition takes place at a lower temper-ature and becomes sharper. However, the relative ordering of the transition temperaturesamong the polymers remains practically the same as in the gasphase.
Interestingly, again a second peak in the specific heat is observed forGlu10 andGln10,the exact properties also being listed in Table 1. However, here the reason for such a behav-ior is not the formation of hydrogen bonds among the side chains, because the total numberof hydrogen bonds is limited to those that stabilize the helix backbone. A closer inspectionshows that this second peak in the specific heat of Glu10 is mainly due to fluctuations inthe solvent energy4. For Gln10, it is the interplay of fluctuations in solvent energy with thefluctuations in ECEPP/3 energy that causes the second peak5.
No such second peaks in the specific heat can be observed forAsn10 andAsp10. Theirfluctuations in solvent energy are cancelled by the strong anti-correlations between solventenergy fluctuations and ECEPP/3 energy fluctuations for these two peptides. For similarreasonsLys10 also does not exhibit particular features with respect to side-chain ordering.As before in gas phase, its side-chain ordering does not havea transition-like character butis spread out over a wide range of temperatures.
Detailed reports of this work are available in Refs. 4 and 5.
Acknowledgments
We thank H. Scheraga for motivating this research. Support by a research grant (CHE-0313618) of the National Science Foundation (USA) is acknowledged.
References
1. J. N. Onuchic, Z. Luhey-Schulten, and P. G. Wolynes, Annu.Rev. Phys. Chem.48,545 (1997).
2. B. A. Berg and T. Neuhaus, Phys. Lett. B267, 249 (1991).3. U. H. E. Hansmann and Y. Okamoto, J. Comp. Chem.14, 1333 (1993).4. Y. Wei, W. Nadler, and U. H. E. Hansmann, J. Chem. Phys.125, 164902 (2006).5. Y. Wei, W. Nadler, and U. H. E. Hansmann, J. Phys. Chem. B111, 4244 (2007).6. M. J. Sippl, G. Nemethy, and H. A. Scheraga, J. Phys. Chem.88, 6231 (1984), and
references therein.7. F. Eisenmenger, U. H.E. Hansmann, Sh. Hayryan, and C.-K. Hu, Comp. Phys. Comm.
174, 422 (2006).8. T. Ooi, M. Obatake; G. Nemethy, and H. A. Scheraga, Proc. Natl. Acad. Sci. U.S.A.
84, 3086 (1987).9. J. F. Yan, G. Vanderkooi and H. A. Scheraga, J. Chem. Phys.49, 2713 (1968).
300

Dihedral Angle Patterns in Coil Regions of ProteinStructures
Olav Zimmermann1 and Ulrich H. E. Hansmann1,2
1 John von Neumann Institute for Computing,Research Centre Julich, 52425 Julich, Germany
E-mail: olav.zimmermann, [email protected]
2 Department of Physics,Michigan Technological University, Houghton, MI 49931-1295, USA
E-mail: [email protected]
We report first results on a Decision Tree classifier for subclassifyingβ-turn types from se-quence. It is based on previous work where we developed a software DHPRED that predictsdihedral angle regions for each residue in a polypeptide chain. For 5 out of 8β-turn (sub)classeswe obtain good prediction results with Matthew’s correlation coefficients between 0.3 and 0.6,thus providing additional geometric constraints in those critical regions which determine thefold topology of a protein. Threeβ-turn classes however can not be classified with sufficientaccuracy. We discuss possible sources of misclassifications and outline further research direc-tions.
1 Introduction
Many structure prediction strategies involve the use of dihedral angle constraints from sec-ondary structure prediction. From the usual 3-class predictions useful dihedral bounds canhowever only be derived forα-helices andβ-sheets. We recently developed a program(DHPRED) to predict dihedral angle ranges for all residues,including those in coil re-gions1. The most abundant structural motifs within the coil regions of proteins areβ-turnswhich are defined as tetrapeptide motifs with a maximum C-α distance of 7A. They havebeen originally described by Venkatachalam2 and Lewis3 and classified by the dihedralangle regions of their central two residues.β-turns are of prime importance for the ter-tiary structure of proteins as most of them characterize positions where the peptide chainreverses its direction. Several algorithms have been described to predict the location ofβ-turns from sequence, however to our knowledge there is no prediction program avail-able which can distinguish between the different types ofβ-turns. In this study we usethe dihedral angle regions predicted by DHPRED to develop a classification algorithm forindividualβ-turn classes.
2 Methods
As reference for the training of the classification algorithm we use a nonredundant setof protein structures from the Protein Data Bank (PDB) with pairwise sequence identities≤ 25% and x-ray resolutions≤ 2.0 A. The assignment of the different turn types describedby Lewis is performed by the PROMOTIF software4. The Decision Tree algorithm5 asimplemented in6 is employed for multi-class classification. For this initial study we use
301

only minimal information. For the central two residues we encode (a) the amino acidtype as either Glycine, Proline or all other, (b) the 3-classsecondary structure predictionfrom PSIPRED7 and (c) the dihedral angle regions predicted by DHPRED. We use thedefinitions in Table 1 for prediction outcome types:
Prediction Observation+1 -1
+1 TP (True Positive) FP (False Positive)-1 FN (False Negative) TN (True Negative)
Table 1. Definition of prediction outcome types.
and employ as performance measures the accuracyAcc = (TP + TN)/(TP + TN +FP + FN), specificitySpec = TN/(TN + FP ), sensitivitySens = TP/(TP + FN)
and Matthew’s correlation coefficient MCC= (TP ·TN)−(FP ·FN)√(TP+FP )(TP+FN)(TN+FP )(TN+FN)
.
3 Results and Discussion
For the ca. 1,000 proteins of the nonredundant PDB-set, PROMOTIF assigns about 9,000β-turns. We devide the turns randomly into two sets of same size and use one set for train-ing of the Decision Tree classifier and the other for testing.Table 2 shows the confusionmatrix of the test set and the distribution of the differentβ-turn classes.
predictedβ-turn class I I’ II II’ IV VIa VIb VIII sumI 1099 65 17 5 449 2 1 34 1672II 72 305 26 0 77 0 0 3 483I’ 21 55 89 1 26 0 0 1 193II’ 26 1 8 12 74 1 0 1 123IV 744 104 35 16 697 4 16 50 1666VIa 4 0 0 0 5 10 15 0 34VIb 0 0 0 0 5 2 34 0 41
ob
serv
ed
VIII 107 3 2 2 195 0 0 43 352sum 2073 533 177 36 1528 19 66 1324564
Table 2. Confusion matrix forβ-turn classifier.
Table 3 shows the performance of the Decision Tree classifierusing different mea-sures. While the Matthew’s correlation coefficients for theclasses show reasonable (I,VIa) or good (I’, II, VIb) classification performance, the classes II’, IV and VIII can notbe identified correctly. The confusion matrix shows that thepseudo-class IV, which is justdefined as allβ-turns which do not belong to any other class, is responsiblefor most of themisclassifications.
302

β-turn class Acc Spec Sens MCCI 65.7% 0.66 0.66 0.31I’ 63.1% 0.94 0.63 0.55II 46.1% 0.98 0.46 0.46II’ 9.8% 0.99 0.10 0.17IV 41.8% 0.71 0.42 0.13VIa 29.4% 1.00 0.29 0.39VIb 82.9% 0.99 0.83 0.65VIII 12.2% 0.98 0.12 0.16
Table 3. Performance measures forβ-turn classifier: accuracy (Acc.), specificity (Spec.), sensitivity (Sens.), andMathew’s correlation coefficient (MCC).
Our initial results show the general feasibility to predictβ-turn types from the aminoacid sequence. This study does not address the separation ofβ-turns from other secondarystructure elements but such algorithms are already available8. In the future we will directour research to assemble a comprehensive library for the prediction of local structure fea-tures. For theβ-turn classification we will e.g. use a derivate of the DHPREDsoftwarewhich is targeted to different dihedral regions as used in Lewis’ definition ofβ-turns andemploy Support Vector Machine algorithms for the classification.
Acknowledgments
This work is supported in part by an NIH research grant (GM62838).
References
1. O. Zimmermann and U. H. E. Hansmann,Support Vector Machines for prediction ofdihedral angle regions, Bioinformatics22, 3009–3015, 2006.
2. C. M. Venkatachalam,Stereochemical criteria for polypeptides and proteins V. Con-formation of a system of three linked peptide units., Biopolymers6, 1425–1436, 1968.
3. P. N. Lewis, F. A. Monany, and H. A. Scheraga,Chain reversals in proteins, Biochim.Biophys. Acta303, 211–229, 1973.
4. E. G. Hutchinson and J. M. Thornton,PROMOTIF - A program to identify structuralmotifs in proteins, Protein Science5, 212–220, 1996.
5. S. Russell and P. Norvig,Artificial Intelligence: A Modern Approach, (Prentice Hall,Englewood Cliffs, NJ, 2003).
6. P. Norvig, Python implementation of the Decision Tree algorithm decribed in5,http://aima.cs.berkeley.edu/python/.
7. D. T. Jones,Protein secondary structure prediction based on position-specific scoringmatrices, J Mol Biol 292, 195–202, 1999.
8. Q. Zhang, S. Yoon and W. J. Welsh,Improved method for predictingβ-turn usingsupport vector machine, Bioinformatics21, 2370–2374, 2005.
303


Workshop Program
Wednesday 02.05.2007
07:40 Pick up at Hotels in Julich08:00-09:00 Registration09:00-09:20 Welcome by Prof. Dr. A. Bachem (CEO, FZ Julich)09:20-09:30 Introductory Remarks (Prof. U. H. E. Hansmann,NIC-CBB)
Morning Session (Chair: Ulrich H. E. Hansmann)
09:30-10:15 Harold Scheraga (Cornell University, Ithaca,USA):Evolution of Protein Simulation
10:15-11:00 Robert B. Russell (EMBL, Heidelberg, Germany):Pushing Details into the Interactome
11:00-11:30 Coffee break11:30-12:15 Koichi Takahashi (tMSI, Berkeley, USA):
The E-Cell Project and Challenges in Computational SystemsBiology12:30-14:00 Lunch
Afternoon Session (Chair: Jan H. Meinke)
14:00-14:45 Adrian Roitberg (University of Florida, Gainesville, USA):Mixed Quantum Mechanics/Classical Mechanics Methods for the Studyof Enzymatic Reactions
14:45-15:30 Marek Cieplak (Polish Academy of Sciences, Warsaw, Poland):Stretching to Understand Proteins
15:30-16:00 Coffee break16:00-16:30 Bernd Berg (FSU, Tallahassee, USA):
Residual Entropy of Ice I from Multicanonical Simulations16:30-17:00 Abhinav Verma (FZK, Karlsruhe, Germany):
All-Atom Protein Folding and Structure Prediction in a TransferableUniversal Free-Energy Force-Field
17:00-17:30 Walter Nadler (MTU, Houghton, USA):Channel Transport and Molecular Motors without Brownian Ratchets
17:30-18:00 Inta Liepina (Latvian Institute of Organic Synthesis, Riga, Latvia):Multiple Beta-Sheet Molecular Dynamics of Two Abl-SH3 DomainPeptides
18:00 Welcome Reception and Poster Session20:00 Open Discussion: Supercomputing and the Physics of Cells20:00/21:30 Bus to Hotels in Julich
305

Thursday 03.05.2007
08:10 Pickup at Hotels in Julich
Morning Session (Chair: Olav Zimmermann)
09:00-09:45 Jeffrey Skolnick (Georgia Institute of Technology, Atlanta, USA):Prediction of Protein Structure, Function and Druggability on a Pro-teomic Scale
09:45-10:30 Christodoulos Floudas (Princeton University, Princeton, USA):Advances In De Novo Protein Design
10:30-11:00 Coffee break11:00-11:30 Mai Suan Li (Polish Academy of Sciences, Warsaw, Poland):
Mechanism of Fibril Formation of Short Peptides11:30-12:00 Velia Minicozzi (University of Rome ”Tor Vergata”, Rome, Italy):
The Role of Metals in Misfolding and Aggregation Processes X-raySpectroscopy and Numerical Simulations
12:00-12:30 Wolfhard Janke (University of Leipzig, Leipzig, Germany):Microcanonical Analyses of Peptide Aggregation Processes
12:30-14:00 Lunch
Afternoon Session (Chair: Tatjana Eitrich)
14:00-14:45 Rebecca Wade (EML, Heidelberg, Germany):Bridging from Molecular Simulation to Biochemical Networks
14:45-15:30 Adam Liwo (University of Gdansk, Gdansk, Poland):Mesoscopic Dynamics with the UNRES Force Field – a Tool for Study-ing the Kinetics and Thermodynamics of Protein Folding
15:30-16:00 Coffee break16:00-16:30 Peter Virnau (Johannes Gutenberg-Universit¨at, Mainz, Germany):
Knots in Proteins, DNA and Polymers: Statistics, Function and Evolu-tion
16:30-17:00 Siegfried Hofinger (MTU, Houghton, USA):Comparing Semi-Empirical versus Classic Charge Assignments inBioMolecules and their Effect on Electrostatic Potentials
17:00-17:30 Klaas Hellingwerf (University of Amsterdam, Amsterdam, NL):Photosensory Proteins as Vehicles to Bridge ComputationalBiophysicsand Systems Biology to Initiate the Field of Synthetic Biology
17:30-18:00 Leo Degreve (Universidade de Sao Paulo, Ribeirao Preto, Brazil):A Molecular Dynamics Study of the Basic Fibroblast Growth Factor –Fibroblast Growth Factor Receptor Complex
18:15 Bus to Castle Obbendorf (Hambach) for Dinner18:30 Dinner in Celebration of 20 Years of NIC (sponsored by IBM)
Commemorative Speech by Prof. Dr. Dr. Thomas Lippert, Director ofNIC and ZAM
22:00 Bus to Hotels in Julich
306

Friday 04.05.2007
8:10 Pickup at Hotels in Julich
Morning Session (Chair: Sandipan Mohanty)
09:00-09:45 Dave Thirumalai (University of Maryland, College Park, USA):Measuring Energy Landscape Parameters of Biomolecules andtheirComplexes
09:45-10:30 Bogdan Lesyng (Warsaw University, Warsaw, Poland):Causality and Correlation Analyses of Molecular Dynamics SimulationData
10:30-11:00 Coffee break11:00-11:30 Nikolay Korolev (Nanyang Technological University, Singapore):
DNA Packaging and Electrostatic Interactions11:30-12:00 Georgios Papadopoulos (University of Thessaly, Larisa, Hellas):
The Zinc-Finger Motif of T.thermophilus Ribosomal ProteinS14 andthe Functionality of E.coli Ribosome
12:00-12:30 Giovanni La Penna (National Research Council,Florence, Italy):Anisotropic Internucleosome Interactions and Geometrical ConstraintsFavour the Two-Start Helical Structure of Chromatin
12:30-13:30 Lunch
Afternoon Session (Chair: Ulrich H. E. Hansmann)
13:30-14:15 Jose Onuchic (UCSD, La Jolla, USA):Mechanisms of Protein Assembly and Folding: Lessons from Minimal-ist Models
14:15-15:00 Jorg Langowski (Deutsches Krebsforschungszentrum, Heidelberg, Ger-many):Chromatin Dynamics in Silicio
15:00-15:05 Concluding Remarks (Prof. Ulrich H. E. Hansmann, NIC-CBB)afterwards Bus to Cologne
Social Event: Guided Tour Cologne Cathedral and Treasure Chamber,Visit of a Traditional Brewhouse
21:30 Bus to Julich
307


List of Participants
• Anand, Priya; Panjab University; Chandigarh; India
• Andrews, Maximilian; University of Dortmund; Dortmund; Germany
• Arashiro, Everaldo; FZJ, NIC; Julich; Germany
• Behringer, Hans; Bielefeld University; Bielefeld; Germany
• Berg, Bernd; FSU; Tallahassee; USA
• Bischler, Ulrike; VolkswagenStiftung; Hannover; Germany
• Bisson, Melanie; Heinrich-Heine-Universitat; Dusseldorf; Germany
• Buchen, Elisa; Heinrich-Heine-Universitat; Dusseldorf; Germany
• Burri, Raghunadha Reddy; University of Dortmund; Dortmund; Germany
• Cannavacciuolo, Luigi; FZJ, IFF; Julich; Germany
• Cao, Ye; University of Bonn; Bonn; Germany
• Cieplak, Marek; Polish Academy of Sciences; Warsaw; Poland
• Degreve, Leo; Universidade de Sao Paulo; Ribeirao Preto; Brazil
• Di Fiore, Stefano; RWTH; Aachen; Germany
• Eitrich, Tatjana; FZJ, NIC; Julich; Germany
• Ensikat, Hans Jurgen; University of Bonn; Bonn; Germany
• Ferro, Noel; University of Bonn; Bonn; Germany
• Fink, Florian; University of Regensburg; Regensburg; Germany
• Fischer, Bernhard; FZK; Karlsruhe; Germany
• Floudas, Christodoulos; Princeton University; Princeton; USA
• Fredel, Fabian; FZJ, NIC; Julich; Germany
• Gorecki, Adam; University of Warsaw; Warsaw; Poland
• Gowtham, S.; MTU; Houghton; USA
• Greulich, Philip; Universitat zu Koln; Koln; Germany
• Griewel, Axel; Universitat Hamburg; Hamburg; Germany
309

• Gronwald, Wolfram; University of Regensburg; Regensburg;Germany
• Grudinin, Sergei; FZJ, INB-2; Julich; Germany
• Hallay-Suszek, Marta; Warsaw University; Warsaw; Poland
• Hammen, Volker; UFZ; Halle (Saale); Germany
• Hansmann, Ulrich; FZJ/NIC and MTU; Julich; Germany
• Hayat, Sikander; University of Saarland; Saarbrucken; Germany
• Hayryan, Shura; Academia Sinica; Taipei; Taiwan (ROC)
• Held, Martin; FU-Berlin; Berlin; Germany
• Hellingwerf, Klaas; University of Amsterdam; Amsterdam; NL
• Heuer, Andreas; University of Munster; Munster; Germany
• Hofinger, Siegfried; MTU; Houghton; USA
• Hoffmann, Bernd; FZJ, IBN-4; Julich; Germany
• Hoffmann, Kurt; RWTH; Aachen; Germany
• Hsu, Hsiao-Ping; Johannes Gutenberg-Universitat; Mainz; Germany
• Jain, Pooja; University of Nottingham; Nottingham; UnitedKingdom
• Janke, Wolfhard; University of Leipzig; Leipzig; Germany
• Johnson, Gary; U. S. Department of Energy; Washington, DC; USA
• Kar, Parimal; MTU; Houghton; USA
• Klenin, Konstantin; FZK; Karlsruhe; Germany
• Koch, Kerstin; University of Bonn; Bonn; Germany
• Kokh, Daria; Wuppertal University; Wuppertal; Germany
• Kondov, Ivan; FZK; Karlsruhe; Germany
• Korolev, Nikolay; Nanyang Technological University; Singapore; Singapore
• Krukau, Aliaksei; University of Dortmund; Dortmund; Germany
• Kubiak, Karina; Theoretical Molecular Biophysics Group; Torun; Poland
• Kulinski, Tadeusz; Polish Academy of Sciences; Poznan; Poland
• La Penna, Giovanni; National Research Council; Florence; Italy
• Lammert, Heiko; Universitat Munster; Munster; Germany
310

• Langowski, Jorg; Deutsches Krebsforschungszentrum; Heidelberg; Germany
• Lesyng, Bogdan; Warsaw University; Warsaw; Poland
• Li, Mai Suan; Polish Academy of Sciences; Warsaw; Poland
• Liepina, Inta; Latvian Institute of Organic Synthesis; Riga; Latvia
• Lindgren, Matteus; Umea University; Umea; Sweden
• Liwo, Adam; University of Gdansk; Gdansk; Poland
• Meerbach, Eike; FU-Berlin; Berlin; Germany
• Meinke, Jan; FZJ, NIC; Julich; Germany
• Minicozzi, Velia; University of Rome ”Tor Vergata”; Rome; Italy
• Mohanty, Sandipan; FZJ, NIC; Julich; Germany
• Mohl, Christoph; FZJ, IBN-4; Julich; Germany
• Nadler, Walter; MTU; Houghton; USA
• Nagel-Steger, Luitgard; Heinrich-Heine-Universitat; Dusseldorf; Germany
• Namasivayam, Vigneshwaran; University of Leipzig; Leipzig; Germany
• Neuhaus, Thomas; FZJ, NIC; Julich; Germany
• Noe, Frank; FU Berlin; Berlin; Germany
• Nowak, Wieslaw; Theoretical Molecular Biophysics Group; Torun; Poland
• Noh, Katharina; FZJ, IBT-2; Julich; Germany
• Ołdziej, Stanisław; University of Gdansk; Gdansk; Poland
• Onuchic, Jose; UCSD; La Jolla; USA
• Pachov, Georgi; EML; Heidelberg; Germany
• Papadopoulos, Georgios; University of Thessaly; Larisa; Hellas
• Pentas, Stefanos; Aristotle University of Thessaloniki; Thessaloniki; Hellas
• Peplowski, Lukasz; Theoretical Molecular Biophysics Group; Torun; Poland
• Perez Sanchez, Horacio Emilio; FZK; Karlsruhe; Germany
• Quintilla, Aina; FZK; Karlsruhe; Germany
• Reich, Lothar; MPI for Colloids and Surfaces; Potsdam; Germany
• Roitberg, Adrian; University of Florida; Gainesville; USA
311

• Russell, Robert B.; EMBL; Heidelberg; Germany
• Saufi, Ahmad; Heinrich-Heine-Universitat; Dusseldorf;Germany
• Scharein, Benjamin; Heinrich-Heine-Universitat; Dusseldorf; Germany
• Scheiba, Rafael; Heinrich-Heine-Universitat; Dusseldorf; Germany
• Scheraga, Harold; Cornell University; Ithaca; USA
• Scherer, Nicole; Heinrich-Heine-Universitat; Dusseldorf; Germany
• Schluttig, Jakob; Uni Heidelberg; Heidelberg; Germany
• Singh, Gurpreet; University of Dortmund; Dortmund; Germany
• Singh, Sandesh; University of Bonn; Bonn; Germany
• Skolnick, Jeffrey; Georgia Institute of Technology; Atlanta; USA
• Sulkowska, Joanna I.; Polish Academy of Sciences; Warsaw; Poland
• Sutmann, Godehard; FZJ, ZAM; Julich; Germany
• Szymczak, Piotr; Warsaw University; Warsaw; Poland
• Takahashi, Koichi; tMSI; Berkeley; USA
• Thirumalai, Dave; University of Maryland; College Park; USA
• Verma, Abhinav; FZK; Karlsruhe; Germany
• Virnau, Peter; Johannes Gutenberg-Universitat; Mainz; Germany
• Vollmar, Melanie; Heinrich-Heine-Universitat; Dusseldorf; Germany
• Wade, Rebecca; EML; Heidelberg; Germany
• Walewski, Łukasz; University of Warsaw; Warsaw; Poland
• Wei, Yanjie; MTU; Houghton; USA
• Westlund, Per-Olof; Umea University; Umea; Sweden
• Xiao, Xiaolin; FZJ, NIC; Julich; Germany
• Younesi, Erfan; University of Bonn; Bonn; Germany
• Zimmermann, Olav; FZJ, NIC; Julich; Germany
312

NIC Series John von Neumann Institute for Computing
Already published:
Modern Methods and Algorithms of Quantum Chemistry -ProceedingsJohannes Grotendorst (Editor)Winter School, 21 - 25 February 2000, Forschungszentrum JulichNIC Series Volume 1ISBN 3-00-005618-1, February 2000, 562 pagesout of print
Modern Methods and Algorithms of Quantum Chemistry -Poster PresentationsJohannes Grotendorst (Editor)Winter School, 21 - 25 February 2000, Forschungszentrum JulichNIC Series Volume 2ISBN 3-00-005746-3, February 2000, 77 pagesout of print
Modern Methods and Algorithms of Quantum Chemistry -Proceedings, Second EditionJohannes Grotendorst (Editor)Winter School, 21 - 25 February 2000, Forschungszentrum JulichNIC Series Volume 3ISBN 3-00-005834-6, December 2000, 638 pagesout of print
Nichtlineare Analyse raum-zeitlicher Aspekte derhirnelektrischen Aktivit at von EpilepsiepatientenJochen ArnoldNIC Series Volume 4ISBN 3-00-006221-1, September 2000, 120 pages
Elektron-Elektron-Wechselwirkung in Halbleitern:Von hochkorrelierten koh arenten Anfangszust andenzu inkoh arentem TransportReinhold LovenichNIC Series Volume 5ISBN 3-00-006329-3, August 2000, 146 pages
Erkennung von Nichtlinearit aten undwechselseitigen Abh angigkeiten in ZeitreihenAndreas SchmitzNIC Series Volume 6ISBN 3-00-007871-1, May 2001, 142 pages

Multiparadigm Programming with Object-Oriented Language s -ProceedingsKei Davis, Yannis Smaragdakis, Jorg Striegnitz (Editors)Workshop MPOOL, 18 May 2001, BudapestNIC Series Volume 7ISBN 3-00-007968-8, June 2001, 160 pages
Europhysics Conference on Computational Physics -Book of AbstractsFriedel Hossfeld, Kurt Binder (Editors)Conference, 5 - 8 September 2001, AachenNIC Series Volume 8ISBN 3-00-008236-0, September 2001, 500 pages
NIC Symposium 2001 - ProceedingsHorst Rollnik, Dietrich Wolf (Editors)Symposium, 5 - 6 December 2001, Forschungszentrum JulichNIC Series Volume 9ISBN 3-00-009055-X, May 2002, 514 pages
Quantum Simulations of Complex Many-Body Systems:From Theory to Algorithms - Lecture NotesJohannes Grotendorst, Dominik Marx, Alejandro Muramatsu (Editors)Winter School, 25 February - 1 March 2002, Rolduc Conference Centre,Kerkrade, The NetherlandsNIC Series Volume 10ISBN 3-00-009057-6, February 2002, 548 pages
Quantum Simulations of Complex Many-Body Systems:From Theory to Algorithms- Poster PresentationsJohannes Grotendorst, Dominik Marx, Alejandro Muramatsu (Editors)Winter School, 25 February - 1 March 2002, Rolduc Conference Centre,Kerkrade, The NetherlandsNIC Series Volume 11ISBN 3-00-009058-4, February 2002, 194 pages
Strongly Disordered Quantum Spin Systems in Low Dimensions :Numerical Study of Spin Chains, Spin Ladders andTwo-Dimensional SystemsYu-cheng LinNIC Series Volume 12ISBN 3-00-009056-8, May 2002, 146 pages

Multiparadigm Programming with Object-Oriented Language s -ProceedingsJorg Striegnitz, Kei Davis, Yannis Smaragdakis (Editors)Workshop MPOOL 2002, 11 June 2002, MalagaNIC Series Volume 13ISBN 3-00-009099-1, June 2002, 132 pages
Quantum Simulations of Complex Many-Body Systems:From Theory to Algorithms - Audio-Visual Lecture NotesJohannes Grotendorst, Dominik Marx, Alejandro Muramatsu (Editors)Winter School, 25 February - 1 March 2002, Rolduc Conference Centre,Kerkrade, The NetherlandsNIC Series Volume 14ISBN 3-00-010000-8, November 2002, DVD
Numerical Methods for Limit and Shakedown AnalysisManfred Staat, Michael Heitzer (Eds.)NIC Series Volume 15ISBN 3-00-010001-6, February 2003, 306 pages
Design and Evaluation of a Bandwidth Broker that ProvidesNetwork Quality of Service for Grid ApplicationsVolker SanderNIC Series Volume 16ISBN 3-00-010002-4, February 2003, 208 pages
Automatic Performance Analysis on Parallel Computers withSMP NodesFelix WolfNIC Series Volume 17ISBN 3-00-010003-2, February 2003, 168 pages
Haptisches Rendern zum Einpassen von hochaufgel ostenMolekulstrukturdaten in niedrigaufgel osteElektronenmikroskopie-DichteverteilungenStefan BirmannsNIC Series Volume 18ISBN 3-00-010004-0, September 2003, 178 pages
Auswirkungen der Virtualisierung auf den IT-BetriebWolfgang Gurich (Editor)GI Conference, 4 - 5 November 2003, Forschungszentrum JulichNIC Series Volume 19ISBN 3-00-009100-9, October 2003, 126 pages

NIC Symposium 2004Dietrich Wolf, Gernot Munster, Manfred Kremer (Editors)Symposium, 17 - 18 February 2004, Forschungszentrum JulichNIC Series Volume 20ISBN 3-00-012372-5, February 2004, 482 pages
Measuring Synchronization in Model Systems andElectroencephalographic Time Series from Epilepsy Patien tsThomas KreutzNIC Series Volume 21ISBN 3-00-012373-3, February 2004, 138 pages
Computational Soft Matter: From Synthetic Polymers to Prot eins -Poster AbstractsNorbert Attig, Kurt Binder, Helmut Grubmuller, Kurt Kremer (Editors)Winter School, 29 February - 6 March 2004, Gustav-Stresemann-Institut BonnNIC Series Volume 22ISBN 3-00-012374-1, February 2004, 120 pages
Computational Soft Matter: From Synthetic Polymers to Prot eins -Lecture NotesNorbert Attig, Kurt Binder, Helmut Grubmuller, Kurt Kremer (Editors)Winter School, 29 February - 6 March 2004, Gustav-Stresemann-Institut BonnNIC Series Volume 23ISBN 3-00-012641-4, February 2004, 440 pages
Synchronization and Interdependence Measures and their Ap plicationsto the Electroencephalogram of Epilepsy Patients and Clust ering of DataAlexander KraskovNIC Series Volume 24ISBN 3-00-013619-3, May 2004, 106 pages
High Performance Computing in ChemistryJohannes Grotendorst (Editor)Report of the Joint Research Project:High Performance Computing in Chemistry - HPC-ChemNIC Series Volume 25ISBN 3-00-013618-5, December 2004, 160 pages
Zerlegung von Signalen in unabh angige Komponenten:Ein informationstheoretischer ZugangHarald StogbauerNIC Series Volume 26ISBN 3-00-013620-7, April 2005, 110 pages

Multiparadigm Programming 2003Joint Proceedings of the3rd International Workshop on Multiparadigm Programming w ithObject-Oriented Languages (MPOOL’03)and the1st International Workshop on Declarative Programming in t heContext of Object-Oriented Languages (PD-COOL’03)Jorg Striegnitz, Kei Davis (Editors)NIC Series Volume 27ISBN 3-00-016005-1, July 2005, 300 pages
Integration von Programmiersprachen durch strukturelle T ypanalyseund partielle AuswertungJorg StriegnitzNIC Series Volume 28ISBN 3-00-016006-X, May 2005, 306 pages
OpenMolGRID - Open Computing Grid for Molecular Scienceand EngineeringFinal ReportMathilde Romberg (Editor)NIC Series Volume 29ISBN 3-00-016007-8, July 2005, 86 pages
GALA Grunenthal Applied Life Science AnalysisAchim Kless and Johannes Grotendorst (Editors)NIC Series Volume 30ISBN 3-00-017349-8, November 2006, 204 pages
Computational Nanoscience: Do It Yourself!Lecture NotesJohannes Grotendorst, Stefan Blugel, Dominik Marx (Editors)Winter School, 14. - 22 February 2006, Forschungszentrum JulichNIC Series Volume 31ISBN 3-00-017350-1, February 2006, 528 pages
NIC Symposium 2006 - ProceedingsG. Munster, D. Wolf, M. Kremer (Editors)Symposium, 1 - 2 March 2006, Forschungszentrum JulichNIC Series Volume 32ISBN 3-00-017351-X, February 2006, 384 pages
Parallel Computing: Current & Future Issues of High-EndComputingProceedings of the International Conference ParCo 2005G.R. Joubert, W.E. Nagel, F.J. Peters,O. Plata, P. Tirado, E. Zapata (Editors)NIC Series Volume 33ISBN 3-00-017352-8, October 2006, 930 pages

From Computational Biophysics to Systems Biology 2006ProceedingsU.E.H. Hansmann, J. Meinke, S. Mohanty, O. Zimmermann (Editors)NIC Series Volume 34ISBN-10 3-9810843-0-6, ISBN-13 978-3-9810843-0-6,September 2006, 224 pages
Dreistufig parallele Software zur Parameteroptimierung vo nSupport-Vektor-Maschinen mit kostensensitiven Gutemaß enTatjana EitrichNIC Series Volume 35ISBN 978-3-9810843-1-3, March 2007, 262 pages
All volumes are available online at
http:// www.fz-juelich.de/nic-series/.