Job Vacancies 2021 - Labour Market Statistics and Publications
24
Job Vacancies 2021 By: Chea Hui Jing Manpower Research and Statistics Department Singapore April 2022
-
Upload
khangminh22 -
Category
Documents
-
view
0 -
download
0
Transcript of Job Vacancies 2021 - Labour Market Statistics and Publications

Job Vacancies 2021
By:
Chea Hui Jing
Manpower Research and Statistics Department
Singapore
April 2022

COPYRIGHT NOTICE
JOB VACANCIES 2021
© Manpower Research and Statistics Department Ministry of Manpower Republic of Singapore
All rights reserved. Further reproduction of this material is prohibited without the written permission of the copyright holder. Application to reproduce any part of this publication should be addressed to: Director Manpower Research and Statistics Department Ministry of Manpower 18 Havelock Road #05-01 Singapore 059764 Republic of Singapore
Email: [email protected]
Please cite the source as “MRSD, MOM” when you
extract and use the information/data from the publication.

Statistical activities conducted by the Manpower Research and Statistics Department (MRSD) are
governed by the provisions of the Statistics Act (Chapter 317). The Act guarantees the confidentiality
of information collected from individuals and companies. It spells out the legislative authority and
responsibility of the Director, Manpower Research and Statistics Department.
Statistics compiled and disseminated by the MRSD adhere to international standards on official statistics
set by the International Labour Organisation and International Monetary Fund.
For insights on the labour market, visit us at stats.mom.gov.sg.
MISSION
To provide timely and reliable
national statistical information on the labour market
to facilitate informed decision-making within the government and community-at-large

CONTENTS
Page
1 Introduction................................................................................................................ 1
2 Overall Hiring Trends In 2021 .................................................................................... 2
3 Jobs And Skills In Demand ........................................................................................ 9
4 Concluding Remarks ............................................................................................... 15
Appendix: Survey Coverage And Methodology ……………………………………………….. 16
Abbreviations
Acad Qual : Academic Qualifications
Dipl. & Prof Qual : Diploma & Professional Qualification
Min Qual : Minimum Qualification
PMETs : Professionals, Managers, Executives & Technicians
Pri & Below : Primary & Below
Sec : Secondary
STEM : Science, Technology, Engineering, and Mathematics

1 MANPOWER RESEARCH AND STATISTICS DEPARTMENT, MINISTRY OF MANPOWER
Job Vacancies 2021
1 Introduction
1.1 The Manpower Research and Statistics Department (MRSD) publishes job
vacancy numbers on a quarterly basis in its labour market reports. The number of job
vacancies provides a measure of labour demand. When related to the number of unemployed
persons, it also offers a sense of how easy or hard it is to find employment at any given time.
1.2 Every year, MRSD also releases a detailed report on job vacancies. The report
analyses in detail the type and nature of positions that employers are looking to fill, the type
of jobs in demand, and difficulties in filling these jobs. The findings from the report are based
on a comprehensive survey carried out in September of each year. In the 2021 survey, a total
of 14,340 establishments employing 1,809,900 employees responded to the survey, yielding
a response rate of 85.0%.

2 MANPOWER RESEARCH AND STATISTICS DEPARTMENT, MINISTRY OF MANPOWER
2 Overall Hiring Trends In 2021
Proportion of new positions among job vacancies trended up slightly from 2018
2.1 Newly created positions1 made up 44% of all job vacancies in 2021. This
proportion has been on a slight uptrend from 2018 (42%) when the data was first collected.
The proportion of vacancies for new positions was higher in growth industries (such as
Information & Communications, Financial & Insurance Services, and Professional Services)
than in service or production related industries (such as Manufacturing, Food & Beverage
Services, and Accommodation).
Figure 1: Distribution (%) Of Job Vacancies By Type Of Vacancy
Source: Job Vacancy Survey, Manpower Research & Statistics Department, MOM
1 These are positions that are created as a result of business expansion of its existing functions (e.g. opening of new outlets), or
new roles that the firms are hiring for due to restructuring or development in new business areas.
0%
20%
40%
60%
80%
100%
To
tal
Info
rma
tio
n &
Co
mm
un
ica
tio
ns
Con
str
uctio
n
Tra
nsp
ort
atio
n &
Sto
rag
e
Fin
an
cia
l &
In
su
ran
ce
Se
rvic
es
Cle
an
ing
& L
and
sca
pin
g
Pro
fessio
na
l S
erv
ice
s
Reta
il T
rad
e
Ma
nu
factu
rin
g
Wh
ole
sa
le T
rad
e
Fo
od &
Be
ve
rag
e S
erv
ice
Hea
lth
& S
ocia
l S
erv
ice
s
Art
s,
En
tert
ain
me
nt &
Re
cre
atio
n
Pu
blic A
dm
inis
tra
tio
n &
Ed
uca
tio
n
Se
curi
ty &
In
ve
stig
atio
n
Rea
l E
sta
te S
erv
ice
s
Acco
mm
od
atio
n
New Replacement
To
tal

3 MANPOWER RESEARCH AND STATISTICS DEPARTMENT, MINISTRY OF MANPOWER
Slight uptick in demand for non-PMET roles, reflecting border restrictions
2.2 Among the vacancies, PMET roles formed the majority (53%). However, the
proportion of non-PMET vacancies has crept up since 2020, in particular for construction
labourers and electrical & electronic equipment assemblers. This reflected the closure of
borders which temporarily restricted the inflow of migrant workers who are usually hired to fill
such roles.
Figure 2: Distribution (%) Of Job Vacancies By Broad Occupational Groups
Source: Labour Market Survey, Manpower Research & Statistics Department, MOM
PMETs 40.8 40.2 39.2 43.4 45.4 47.9 48.5 52.7 58.4 56.7 53.0
Non-PMETs 59.2 59.8 60.8 56.6 54.6 52.1 51.5 47.3 41.6 43.3 47.0
2011 2012 2013 2014 2015 2016 2017 2018 2019 2020 2021
Professionals, Managers, Executives & Technicians (PMETs)
Non-PMETs

4 MANPOWER RESEARCH AND STATISTICS DEPARTMENT, MINISTRY OF MANPOWER
Slight decline in vacancies for remote work
2.3 There was a slight decline in the share of vacancies which involved work that
could be done remotely, from 35% to 31%. This reflected the higher proportion of vacancies
from industries and occupations where remote work was not prevalent (e.g. industrial &
production engineers and electrical & electronic equipment assemblers in Manufacturing, and
civil engineers and construction labourers in Construction). At the same time with the
resumption of workplace activities, fewer employers offered remote work options for
occupations which usually require face-to-face interactions or on-site presence
(e.g. operations officers in Food & Beverage Services and commercial & marketing sales
executives).
Figure 3: Distribution (%) Of Job Vacancies By Whether Work Can Be Done Remotely
Source: Job Vacancy Survey, Manpower Research & Statistics Department, MOM
0%
20%
40%
60%
80%
100%
To
tal
Ma
na
ge
rs &
Ad
min
istr
ato
rs
Pro
fessio
na
ls
Cle
rical S
upp
ort
Wo
rke
rs
Asso
cia
te P
rofe
ssio
na
ls&
Tech
nic
ian
s
Cra
ftsm
en
& R
ela
ted
Tra
de
s W
ork
ers
Pla
nt
& M
achin
eO
pe
rato
rs &
Asse
mb
lers
Se
rvic
e &
Sa
les
Wo
rke
rs
Cle
an
ers
, L
ab
oure
rs &
Re
late
d W
ork
ers
Yes No
To
tal

5 MANPOWER RESEARCH AND STATISTICS DEPARTMENT, MINISTRY OF MANPOWER
Reflecting the tight labour market, the share of vacancies unfilled for six months or more rose
2.4 With a tighter labour market, the proportion of job vacancies unfilled for
six months or more increased to 35% in 2021, from 27% in 2020.2 Before this, the
proportion had been on a broad downtrend from 2014.
Figure 4: Proportion (%) Of Job Vacancies Which Were Unfilled For At Least Six Months
Source: Job Vacancy Survey, Manpower Research & Statistics Department, MOM
2.5 The majority (79%) of non-PMET positions that were unfilled for extended
periods were in Manufacturing, Construction, Food & Beverage Services, Cleaning &
Landscaping and the trade-related sectors of Transportation & Storage and Wholesale &
Retail Trade.3 Construction labourers, cleaners, shop sales assistants, waiters, and heavy
truck & lorry drivers were common non-PMET jobs that were harder to fill. In particular,
Manufacturing and Construction (which faced labour shortages due to migrant worker inflow
restrictions) made up 35% of non-PMET vacancies unfilled for extended periods in 2021. This
was up from 24% a year ago. The shortages are expected to abate when border restrictions
ease further.
2.6 For non-PMET positions that have been unfilled for extended periods,
employers usually indicated reasons such as physically strenuous job nature, unattractive pay,
and poor working conditions. This suggests a mismatch in employers’ and job seekers’
expectations on employment conditions. Employers who face difficulties filling vacancies can
tap on schemes such as the Support for Job Redesign under the Productivity Solutions Grant.
These schemes are designed to help businesses transform existing work processes and
improve the pay and working conditions to make jobs more attractive to job seekers.
2 In past years when the ratio of job vacancies to unemployed persons was above 1 (e.g. 2011-2015, 2018), the proportion of
vacancies which were unfilled for extended periods ranged from 34% to 41%. The 2021 percentage remained in this range. 3 Top industries’ share of non-PMET vacancies unfilled for six months or more in 2021: 22% from Construction, 17% from
Transportation & Storage, 13% from Manufacturing, 10% from Food & Beverage Services, 8% from Retail Trade, 6% from
Cleaning & Landscaping, and 4% from Wholesale Trade. The remaining vacancies were distributed across several industries.
Total 34.6 39.9 40.3 41.4 39.0 36.2 33.0 34.1 28.0 27.5 35.0
PMETs 14.5 17.4 17.7 24.3 19.7 19.0 15.9 21.2 18.8 17.2 24.1
Non-PMETs 48.4 55.2 55.2 54.2 54.6 51.6 48.8 49.2 41.2 41.6 48.9
2011 2012 2013 2014 2015 2016 2017 2018 2019 2020 2021
Total
PMETs
Non-PMETs
6 MANPOWER RESEARCH AND STATISTICS DEPARTMENT, MINISTRY OF MANPOWER
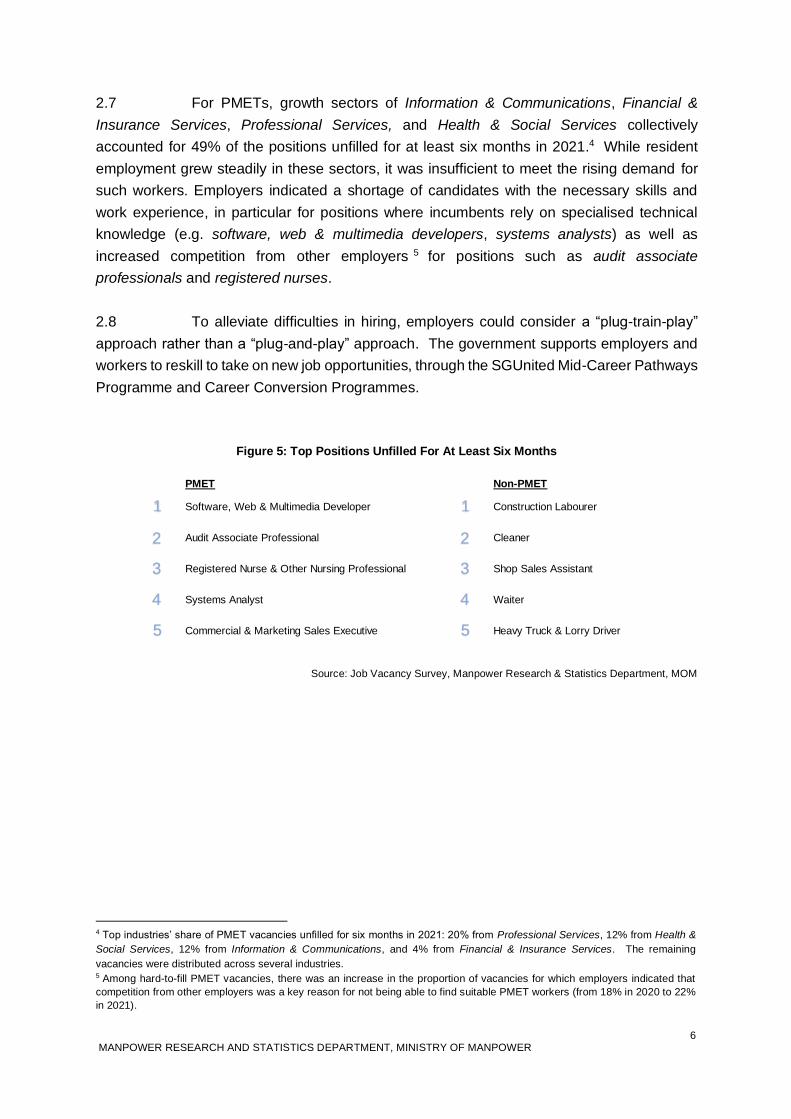
2.7 For PMETs, growth sectors of Information & Communications, Financial &
Insurance Services, Professional Services, and Health & Social Services collectively
accounted for 49% of the positions unfilled for at least six months in 2021.4 While resident
employment grew steadily in these sectors, it was insufficient to meet the rising demand for
such workers. Employers indicated a shortage of candidates with the necessary skills and
work experience, in particular for positions where incumbents rely on specialised technical
knowledge (e.g. software, web & multimedia developers, systems analysts) as well as
increased competition from other employers 5 for positions such as audit associate
professionals and registered nurses.
2.8 To alleviate difficulties in hiring, employers could consider a “plug-train-play”
approach rather than a “plug-and-play” approach. The government supports employers and
workers to reskill to take on new job opportunities, through the SGUnited Mid-Career Pathways
Programme and Career Conversion Programmes.
Figure 5: Top Positions Unfilled For At Least Six Months
Source: Job Vacancy Survey, Manpower Research & Statistics Department, MOM
4 Top industries’ share of PMET vacancies unfilled for six months in 2021: 20% from Professional Services, 12% from Health &
Social Services, 12% from Information & Communications, and 4% from Financial & Insurance Services. The remaining
vacancies were distributed across several industries. 5 Among hard-to-fill PMET vacancies, there was an increase in the proportion of vacancies for which employers indicated that
competition from other employers was a key reason for not being able to find suitable PMET workers (from 18% in 2020 to 22%
in 2021).
PMET Non-PMET
Shop Sales Assistant
Waiter
Heavy Truck & Lorry Driver
Registered Nurse & Other Nursing Professional
Systems Analyst
Commercial & Marketing Sales Executive
Software, Web & Multimedia Developer
Audit Associate Professional
Construction Labourer
Cleaner
1
2
3 3
2
1
4 4
5 5

7 MANPOWER RESEARCH AND STATISTICS DEPARTMENT, MINISTRY OF MANPOWER
Figure 6: Top Reasons For Job Vacancies That Were Hard To Fill By Residents (%)
Source: Job Vacancy Survey, Manpower Research & Statistics Department, MOM
Notes:
(1) Establishments are allowed to indicate more than one reason for vacancies being hard to fill by residents.
(2) Figures are expressed as a proportion of the hard to fill vacancies.
PMET
Non-PMET
43.0
33.8
29.8
22.4
15.3
Lack Necessary Specialised Skills
Lack Necessary Work Experience
Find Pay Unattractive
Competition From Other Employers Too Stiff
Find Job Physically Strenuous
52.4
42.6
36.8
29.3
27.5
Find Job Physically Strenuous
Find Pay Unattractive
Find Working Environment Not Conducive
Prefer Not To Work On Weekends/ Public Holidays
Prefer Not To Do Shift Work
8 MANPOWER RESEARCH AND STATISTICS DEPARTMENT, MINISTRY OF MANPOWER
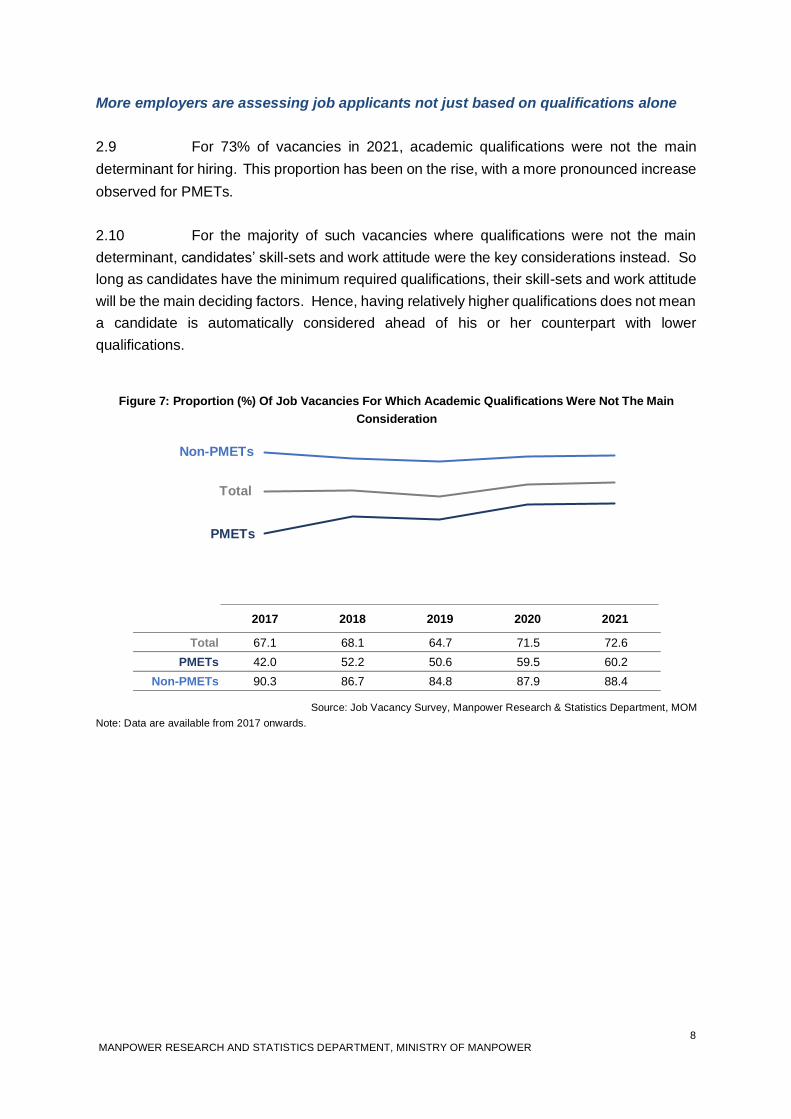
More employers are assessing job applicants not just based on qualifications alone
2.9 For 73% of vacancies in 2021, academic qualifications were not the main
determinant for hiring. This proportion has been on the rise, with a more pronounced increase
observed for PMETs.
2.10 For the majority of such vacancies where qualifications were not the main
determinant, candidates’ skill-sets and work attitude were the key considerations instead. So
long as candidates have the minimum required qualifications, their skill-sets and work attitude
will be the main deciding factors. Hence, having relatively higher qualifications does not mean
a candidate is automatically considered ahead of his or her counterpart with lower
qualifications.
Figure 7: Proportion (%) Of Job Vacancies For Which Academic Qualifications Were Not The Main
Consideration
Source: Job Vacancy Survey, Manpower Research & Statistics Department, MOM
Note: Data are available from 2017 onwards.
Total 67.1 68.1 64.7 71.5 72.6
PMETs 42.0 52.2 50.6 59.5 60.2
Non-PMETs 90.3 86.7 84.8 87.9 88.4
2017 2018 2019 2020 2021
Total
PMETs
Non-PMETs

9 MANPOWER RESEARCH AND STATISTICS DEPARTMENT, MINISTRY OF MANPOWER
3 Jobs And Skills In Demand
Strong growing demand for STEM professionals – in IT and engineering roles
3.1 As digital technologies play a pivotal role in today’s economy, IT and
multimedia development roles such as software, web & multimedia developers (2nd among
top PMET job vacancies) and systems analysts (4th) remained highly sought-after jobs.
Network, communications & infrastructure managers (28th), graphic & multimedia
designers & artists (45th), as well as database designers & administrators (52nd) also saw
a rise in demand. These vacancies typically require the incumbent to possess knowledge of
programming languages (e.g. Java, Python and C#) and common software development
processes to understand, design, monitor and improve technical systems. As such niche skills
were essential for these roles, employers were willing to offer higher pay to fill these positions.6
3.2 Engineering professionals and technicians were also jobs highly in demand.
This cuts across the engineering field spectrum, ranging from electronics engineers (7th) to
civil engineering technicians (14th). These occupations generally require job-specific
working experience, and the minimum wage employers were prepared to offer ranged from
$1,800 for civil engineering technicians to $4,000 for electronics engineers.
3.3 There was a stable and large pool of job openings for business development
and sales, such as commercial & marketing sales executives (1st) and business
development managers (6th). These roles remain crucial as firms adapt to changes and seek
out new business opportunities.
3.4 Albeit modestly, demand rose for administration professionals such as
management & business consultants (8th), human resource consultants (42nd), and
policy administration professionals (65th). Demand for these occupations doubled from
five years ago to make up 3% of all vacancies in 2021.
6 For example, employers were prepared to offer at least $5,000 for software, web & multimedia developers, and database
designers & administrators in 2021.

10
MANPOWER RESEARCH AND STATISTICS DEPARTMENT, MINISTRY OF MANPOWER
Figure 8: Top Ten PMET Job Vacancies, 2021
Source: Job Vacancy Survey, Manpower Research & Statistics Department, MOM
RANK,
2021OCCUPATION
COMMON
MIN QUAL
ACAD QUAL NOT
THE MAIN
CONSIDERATION
TOP SKILLS REQUIRED*
COMMON
WORKING
EXPERIENCE
1 Commercial & Marketing Sales ExecutiveDipl. &
Prof Qual●
Persuasion
Social Perceptiveness
Negotiation
Job Specific
2 Software, Web & Multimedia Developer Degree
Programming
Complex Problem Solving
Judgement and Decision Making
Job Specific
3 Operations Officer (Except Transport Operations)Dipl. &
Prof Qual●
Coordination
Time Management
Management of Personnel Resources
Job Specific
4 Systems Analyst Degree ●
Systems Analysis
Complex Problem Solving
Systems Evaluation
Job Specific
5 Management ExecutiveDipl. &
Prof Qual●
Judgement and Decision Making
Coordination
Complex Problem Solving
None
required
6 Business Development Manager Degree
Complex Problem Solving
Judgement and Decision Making
Active Learning
Job Specific
7 Electronics Engineer Degree
Complex Problem Solving
Systems Analysis
Judgement and Decision Making
Job Specific
8 Management & Business Consultant Degree ●
Complex Problem Solving
Systems Analysis
Judgement and Decision Making
Job Specific
9 Industrial & Production Engineer Degree
Complex Problem Solving
Judgment and Decision Making
Active Learning
Job Specific
10 Teaching & Training Professional Degree
Instructing
Active Learning
Complex Problem Solving
Industry
Specific
* Occupations are mapped to the O*NET database of occupational information. Skills commonly needed across these jobs and not shown separately include critical thinking and active listening skills.
RANGE OF WAGES
ESTABLISHMENTS
PREPARED TO OFFER
● Indicates occupations where academic qualifications were not the main consideration for at least 60.2% (PMET average) of the vacancies in 2021.
2,610 4,000
5,000 8,000
2,360 3,300
4,500 7,500
2,600 5,065
5,575 9,400
4,000 6,500
5,865 9,000
3,400 5,500
2,800 7,800

11
MANPOWER RESEARCH AND STATISTICS DEPARTMENT, MINISTRY OF MANPOWER
Figure 9: PMET Job Vacancies Which Saw An Increase/ Decrease In Demand From 2016 To 2021
Source: Job Vacancy Survey, Manpower Research & Statistics Department, MOM
-30
-20
-10
0
10
20
30
40
50
60
0 200 400 600 800 1000 1200 1400 1600 1800
Rate
Of C
hange (
%p.a
., 2
016
-2021)
Size of bubble represents job vacancies in 2021
Orange bubbles denote top 10 occupations that saw the largest growth
Software, Web & Multimedia Developer
Systems Analyst
Commercial & Marketing Sales Executive
Operations Officer (Except Transport
Operations)
Industrial & Production Engineer
Network, Communications & Infrastructure Manager
Human Resource Consultant (Excl. Executive Search Consultant)
Policy Administration Professional
Draughtsman
Civil Engineering Technician
In-House Legal Counsel (Except Judiciary, Ministries & Statutory Boards)
Database Designer & Administrator
Business Development Manager
Management & Business Consultant
Social Service Professional
Graphic & Multimedia Designer & Artist
ManagementExecutive
Teaching & Training
Professional
Electronics Engineer
Policy & Planning Manager

12 MANPOWER RESEARCH AND STATISTICS DEPARTMENT, MINISTRY OF MANPOWER
3.5 Among non-PMET job openings, construction labourers (1st) were most in
demand in 2021, as border restrictions placed on migrant worker inflows resulted in increased
manpower shortages. Cleaners (3rd) and security guards (6th), occupations covered under
the Progressive Wage Model (PWM), were also common unfilled jobs. To enhance the appeal
of these positions, employers were prepared to offer more, on par with the amount earned by
existing employees. The pay offered for cleaners, in particular, had edged up from 2020.
Consumer-facing roles such as shop sales assistants (2nd) and waiters (5th) also remained
highly in demand. In the longer term, these jobs are expected to attract more applicants, when
wages improve under the expanded sectoral PWMs which will cover the food services and
retail sectors by 2023.
3.6 There was an increase in demand for electrical & electronic equipment
assemblers (9th), packing/bottling/labelling machine operators (21st), and production
clerks (30th), occupations typically found in Manufacturing, where travel restrictions have
constrained the inflow of migrant workers.
3.7 The rise in e-commerce has led to a nascent demand for transport-related
occupations, such as heavy truck & lorry drivers (8th), car, van & light goods vehicle
drivers (11th), and transport clerks (37th). 2021 saw an increase in the salary offered for
driver-related occupations.7
7 The minimum in the range of salaries offered rose from $2,000 to $2,300 over the year for heavy truck & lorry drivers, and rose
from $1,700 to $2,000 for car, van & light goods vehicle drivers.

13
MANPOWER RESEARCH AND STATISTICS DEPARTMENT, MINISTRY OF MANPOWER
Figure 10: Top Ten Non-PMET Job Vacancies, 2021
Source: Job Vacancy Survey, Manpower Research & Statistics Department, MOM
RANK,
2021OCCUPATION
COMMON
MIN QUAL
ACAD QUAL NOT
THE MAIN
CONSIDERATION
TOP SKILLS REQUIRED*
COMMON
WORKING
EXPERIENCE
1 Construction LabourerPri &
Below●
Critical Thinking
Social Perceptiveness
Coordination
General
Working
Experience
2 Shop Sales Assistant Sec ●
Persuasion
Service Orientation
Social Perceptiveness
Negotiation
None
required
3 CleanerPri &
Below● Coordination
None
required
4 Receptionist, Customer Service & Information Clerk Sec
Service Orientation
Social Perceptiveness
Coordination
General
Working
Experience
5 WaiterPri &
Below●
Service Orientation
Social Perceptiveness
Coordination
None
required
6 Security GuardPri &
Below●
Critical Thinking
Coordination
Social Perceptiveness
None
required
7 General Office ClerkDipl. &
Prof Qual
Critical Thinking
Social Perceptiveness
Time Management
General
Working
Experience
8 Heavy Truck & Lorry DriverPri &
Below●
Operation and Control
Operation Monitoring
Time Management
General
Working
Experience
9 Electrical & Electronic Equipment AssemblerPri &
Below●
Judgement and Decision Making
Operation Monitoring
Critical Thinking
Coordination
None
required
10 Kitchen Assistant Pri &
Below●
Social Perceptiveness
Coordination
Service Orientation
Time Management
None
required
* Occupations are mapped to the O*NET database of occupational information. Skills commonly needed across these jobs and not shown separately include active listening skills.
RANGE OF WAGES
ESTABLISHMENTS
PREPARED TO OFFER
● Indicates occupations where academic qualifications were not the main consideration for at least 88.4% (Non-PMET average) of the vacancies in 2021.
1,400 1,838
800 1,600
1,900 2,500
1,700 2,200
2,200 2,600
2,000 2,762
2,300 3,000
1,400 1,700
1,700 2,400
1,200 1,800

14
MANPOWER RESEARCH AND STATISTICS DEPARTMENT, MINISTRY OF MANPOWER
Figure 11: Non-PMET Job Vacancies Which Saw An Increase/ Decrease In Demand From 2016 To 2021
Source: Job Vacancy Survey, Manpower Research & Statistics Department, MOM
bubble
4000
-30
-20
-10
0
10
20
30
40
50
60
0 500 1000 1500 2000 2500 3000 3500 4000 4500
Rate
Of C
hange (
%p.a
., 2
016
-2021)
Size of bubble represents job vacancies in 2021
Construction Labourer
Cleaner
Kitchen Assistant
Waiter
General Office Clerk
Bus Driver
Heavy Truck & Lorry Driver
Shop Sales Assistant
Security Guard
Receptionist, Customer Service & Information Clerk
Electrical & Electronic Equipment Assembler
Car, Van & Light Goods Vehicle Driver
Hand Packer
Packing/ Bottling/ Labelling Machine Operator
Transport Clerk
Masseur (Non-Medical)
Air-Conditioning & Refrigeration Mechanic
Hair Stylist/ Hairdresser
Production Clerk
Orange bubbles denote top 10 occupations that saw the largest growth

15 MANPOWER RESEARCH AND STATISTICS DEPARTMENT, MINISTRY OF MANPOWER
4 Concluding Remarks
4.1 The number of job vacancies reached an all-time high in 2021, as employers
and workers continue to adjust to the easing of safe management measures and rapidly
evolving economic conditions. Like other economies recovering from the impact of the
COVID-19 pandemic, record high job vacancies coincided with a growth in resident
employment and falling unemployment.
4.2 The majority of vacancies were for PMETs, but the proportion of non-PMET
vacancies has trended up since 2020, in particular for construction labourers and electrical &
electronic equipment assemblers. Domestically, the pandemic has accelerated the trend
towards digitalisation, leading to greater demand for technological skills. IT and multimedia
development roles remained highly sought after. Engineering professionals and technicians
were also in demand, and there was firm hiring for business development and sales positions.
4.3 Going forward, with the relaxation of social gathering measures, consumer-
facing industries may face persistent strain as some time is required to bring in the necessary
manpower. For Manufacturing and Construction, labour shortages are expected to abate as
travel restrictions ease further and employment recovers to pre-COVID levels.
16 MANPOWER RESEARCH AND STATISTICS DEPARTMENT, MINISTRY OF MANPOWER
Appendix
SURVEY COVERAGE & METHODOLOGY
Introduction The Job Vacancy Survey, 2021 was conducted by the Manpower Research and Statistics Department of the Ministry of Manpower under the Statistics Act (Chapter 317). The survey was conducted from 3 November 2021 to 21 January 2022. Objective The survey was conducted to collect comprehensive information on job vacancies in the various industries by detailed occupations. The survey also asked employers on (i) the gross monthly wage the establishment is prepared to pay for the job vacancies; (ii) the requirement of skills, relevant working experience, minimum qualification required; and whether the vacancies were (iii) unfilled for at least six months, and (iv) hard to fill by residents. Coverage The survey covered private sector establishments each with at least 25 employees and the public sector comprising government ministries, organs of state and statutory boards. A total of 14,340 establishments employing 1,809,900 employees responded to the survey, yielding a response rate of 85.0%. Methodology The survey was conducted using mail questionnaires. Respondents could submit their returns online or by email, with clarifications made over the phone. Reference Period The reference date for the survey was 30 September 2021. Data Collected Establishments were asked to provide information pertaining to the job vacancies in their establishments:
• Job title
• Number of vacancies
• Minimum qualification required
• Whether the position was newly created
• Whether the position could be done remotely
• Whether academic qualifications were the main consideration in selecting candidates • Whether working experience was required • Whether vacancies were unfilled for at least 6 months • Reasons for vacancies that were hard to fill by residents • Gross wage organisation was prepared to pay

17 MANPOWER RESEARCH AND STATISTICS DEPARTMENT, MINISTRY OF MANPOWER
Classification The industries of the surveyed establishments were classified according to the Singapore Standard Industrial Classification (SSIC) 2015. Descriptions of job vacancies were classified according to the Singapore Standard Occupational Classification (SSOC) 2020, while the classification of minimum qualification was based on the Singapore Standard Educational Classification (SSEC) 2020. CONCEPTS AND DEFINITIONS Job Vacancy This refers to the number of unfilled posts for which the establishment is actively recruiting employees from outside the establishment. It excludes positions for which the employees have been appointed, but not yet commenced duty, and positions open only to internal transfers, promotions, etc. Recruitment action to fill a post includes advertising in newspapers, posting notices on Internet (e.g. online job banks), making ‘word of mouth announcements’, soliciting employees through employment agencies or job fairs, contacting or interviewing job applicants. Gross Monthly Wage This refers to the sum of the basic wage, overtime payments, commissions, allowances, and other regular cash payments. It is before deduction of employee Central Provident Fund (CPF) contributions and personal income tax and excludes employer CPF contributions, bonuses, stock options and other lump sum payments-in-kind. Minimum Qualification Required The minimum qualification required are classified into one of the following categories: Primary & below refers to those who never attended school, have pre-primary/kindergarten education, or primary education with or without Primary School Leaving Examination (PSLE) certificate or equivalent, or Certificate in Basic Education for Skills Training (BEST) 1-4, or at least 3 Workforce Skills Qualifications (WSQ) Statements of Attainment in Workplace Literacy and Numeracy (WPLN) at Level 1 or 2 (e.g. under Employment Skills System (ESS), Employability Skills (ES)). Lower secondary refers to those with secondary education without a General Certificate of Education (GCE) Ordinary (‘O’)/Normal (‘N’) Level pass or equivalent, or have Certificate in Worker Improvement through Secondary Education (WISE) 1-3, or basic vocational certificates (including Institute of Technical Education (ITE) Basic Vocational Training), or at least 3 WSQ Statements of Attainment in WPLN at Level 3 or 4 (e.g. under ESS, ES). Secondary refers to those who have at least 1 GCE ‘N’/’O’ Level pass, or have National ITE Certificate (NITEC) (Intermediate) or equivalent (e.g. National Technical Certificate (NTC) Grade 3, Certificate of Vocational Training, BCA Builder Certificate), or have ITE Skills Certificate (ISC) or equivalent (e.g. Certificate of Competency, Certificate in Service Skills) or at least 3 WSQ Statements of Attainment in WPLN at Level 5 and above (e.g. under ESS, ES), or other certificates/qualifications of equivalent standard.

18 MANPOWER RESEARCH AND STATISTICS DEPARTMENT, MINISTRY OF MANPOWER
Post-secondary (non-tertiary) refers to those who have at least 1 GCE Advanced (‘A’)/ Higher 2 (’H2’) Level pass or other certificates/qualifications of equivalent standard. It also includes those who have NITEC (e.g. Post NITEC, Specialist NITEC, Certificate in Office Skills, National Technical Certificate Grade 2, National Certificate in Nursing, Advanced Builder Certificate), or have Higher NITEC (including Certificate in Business Skills, Industrial Technician Certificate and other polytechnic certificates), or Master NITEC or equivalent (e.g. National Technical Certificate Grade 1). This group also includes WSQ Certificate/Higher Certificate/Advanced Certificate or equivalent, International Baccalaureate/High school diploma or other advanced certificates (e.g. Singapore Institute of Management (SIM) certificates). Diploma & professional qualification refers to those who have Polytechnic diploma, or Polytechnic advanced diploma (including Polytechnic advanced/post/specialist/management/ graduate diploma), and those who have qualifications awarded by professional bodies, or National Institute of Education (NIE) diploma, ITE diploma and other diploma qualifications (e.g. SIM diploma, LaSalle-SIA diploma, Nanyang Academy of Fine Arts (NAFA) diploma, WSQ diploma and WSQ specialist diploma). Degree refers to those who have Bachelor’s Degree, or Postgraduate Diploma (including NIE postgraduate diploma), WSQ graduate certificate, WSQ graduate diploma, Master’s, or Doctorate.

FEEDBACK FORM
TITLE OF REPORT: JOB VACANCIES 2021
1. How would you rate this publication in terms of :
Excellent Good Average Poor
a) Relevance to your work
b) Providing useful insights on prevailinglabour market trends/development
c) Ease of understanding
2. Which area(s) of the report do you find most useful? Please provide reasons.
3. How do you find the length of the report?
Too detailed Just right Too brief
Excellent Good Average Poor
4. Overall, how would you rate this publication?
5. What additional information (if any) would you like us to include in our future issues?
6. Any other comments or suggestions you wish to bring to our attention?
Thank you for your valuable feedback
Name : Designation :
Name and address of organisation :
Please return the above to :
Director Manpower Research and Statistics Department Ministry of Manpower 18 Havelock Road #05-01 Singapore 059764 Republic of Singapore Fax : 6317 1804 Email : [email protected]

More releases are available online @ https://stats.mom.gov.sgYou may also subscribe to our email alert for the latest releases
OTHER RELEASES
Date of ReleaseTitle
UPCOMING . . .
PAST . . .
*The actual date of release will be indicated at least a week before the scheduled publication date.
Labour Force In Singapore Advance Release 2021 1 Dec 2021
Labour Market Advance Release Third Quarter 2021 29 Oct 2021
Job Vacancies 2021 1 Apr 2022
Labour Market Report Third Quarter 2021 15 Dec 2021
Labour Market Report 2021 14 Mar 2022
Labour Market Advance Release 2021 28 Jan 2022
Labour Force In Singapore 2021 28 Jan 2022
Report On Wage Practices 2021 25-31 May 2022*
Labour Market Advance Release First Quarter 2022 28-29 Apr 2022*
Labour Market Report First Quarter 2022 13-17 Jun 2022*
Singapore Yearbook Of Manpower Statistics 2022 30 Jun 2022