jingwei ma - CiteSeerX
150
MECHANISM, KINETICS AND MICROBIOLOGY OF SELECTION PRESSURE DRIVEN BIOMASS RETENTION IN SOLIDS CONTAINING AGRICULTURAL WASTE TREATMENT By JINGWEI MA A dissertation submitted in partial fulfillment of the requirements for the degree of DOCTOR OF PHILOSOPHY WASHINGTON STATE UNIVERSITY Department of Biological Systems Engineering December 2012
-
Upload
khangminh22 -
Category
Documents
-
view
0 -
download
0
Transcript of jingwei ma - CiteSeerX
MECHANISM, KINETICS AND MICROBIOLOGY OF SELECTION
PRESSURE DRIVEN BIOMASS RETENTION IN SOLIDS
CONTAINING AGRICULTURAL WASTE TREATMENT
By
JINGWEI MA
A dissertation submitted in partial fulfillment of the requirements for the degree of
DOCTOR OF PHILOSOPHY
WASHINGTON STATE UNIVERSITY Department of Biological Systems Engineering
December 2012

ii
To the Faculty of Washington State University:
The members of the Committee appointed to examine the dissertation of JINGWEI MA find
it satisfactory and recommend that it be accepted.
___________________________________ Shulin Chen, Ph.D., Chair
___________________________________ Birgitte Ahring, Ph.D.
___________________________________ Pius Ndegwa, Ph.D.
___________________________________ Haluk Beyenal, Ph.D.

iii
ACKNOWLEDGMENTS
I would like to express my deep appreciation and sincerity to Dr. Shulin Chen, for his direction,
advice and funding support on my dissertation research. He invested me plenty of time and effort
to make me what a Ph.D. should be. He critiqued my study and challenged my thought to
achieve higher goals, and he also encouraged me when I faced the frustration. I sincerely thank
the other committee members, Dr. Birgitte K. Ahring, Dr. Pius M. Ndegwa, and Dr. Haluk
Beyenal, for their professional guidance and support in completion of this study.
I would like to thank Dr. Craig Frear who has generously provided the invaluable mentorship
and funding support. Many thanks go to my fellow colleagues: Zhiwu Wang, Baisuo Zhao, Yu
Liang, Quanbao Zhao, Zhanyou Chi, Yubin Zheng, Tingting Li, Jie Liu, Chenlin Li, Anping
Jiang, Nick Kennedy, Timothy Ewing, Paul Gamble and all group members. Thanks are also
extended to Jonathan Lomber, Kathy Dorgan, John Anderson, Joan Hagerdorn, Cindy Alwine,
Pat Huggins, and Pat King for their laboratory and administrative support.
I would like to thank China Scholarship Council (CSC) for providing me with this precious
opportunity to pursue Ph.D. degree aboard and thank for their funding support throughout my
dissertation research. I also would like to thank Washington State University Agriculture
Research Center, WA DOE, WSDA, and USDA for providing the financial support.
My deepest gratitude goes to my parents and family as well. Their unconditional love and
unending support gave me the strength to complete my PhD program.
I would like to express my sincere gratitude to all the people that contribute to the completion of
this thesis. With you all, living and studying in Washington State University was a great
experience!
iv
MECHANISM, KINETICS AND MICROBIOLOGY OF SELECTION
PRESSURE DRIVEN BIOMASS RETENTION IN SOLIDS
CONTAINING AGRICULTURAL WASTE TREATMENT
Abstract
by Jingwei Ma, Ph.D.
Washington State University
December 2012
Chair: Shulin Chen
The aims of this dissertation were to explore the mechanism of biomass retention in
solids containing waste under selection pressure, and to develop a high-rate anaerobic digester
treating agricultural waste containing solids. Active biomass retention is a cost-effective strategy
for uncompromised anaerobic digestion rate at lower temperature without requiring heating
energy. This is especially crucial for the anaerobic digestion of flushing diary manure in large-
scale dairies where flushing manure management system is employed.
A methodology for determining rate-limiting step in anaerobic digestion of complex
substrates was developed by supplementation of metabolic intermediates from each step of the
digestion process. The concept of microbial community ratio (r) in the anaerobic degradation
system was introduced and investigated in this study. The results revealed that the rate-limiting
step changed according to the variation of r.

v
The dissertation study was also designed to test both Gravity settling (GS) and selection
pressure (SP) theories applied for biomass retention, and to investigate their effects on active
biomass retention in Anaerobic Sequencing Batch Reactor (ASBR) treating flushing dairy
manure. The mechanism behind the opposing roles of GS and SP in settling time was also
studied. Results revealed that both short and long settling time were able to retain high
concentration of active microbes, though in disparate living forms.
A new strategy, improving biomass retention with fiber material presented within dairy
manure as biofilm carriers, was then developed and evaluated for treating flushing dairy manure
in a psychrophilic ASBR. A kinetic model for the process was also derived. It was proved that
ASBR using manure fiber as support media not only improved methane production but also
reduced the required HRT and temperature to achieve a similar treating efficiency compared
with current technologies.
The methanogenic community from ASBR was evaluated by Terminal Restriction
Fragment Length Polymorphism (T-RFLP) and clone libraries for both 16S rRNA gene and
mcrA gene. Results revealed that a Methanosarcina dominated methanogenic community was
successfully established in the ASBR digesters at short HRT. Diversity of methanogenic
community changed with variation of HRT. The performance of the digester was also related to
the diversity of microbial community.

vi
TABLE OF CONTENTS
Page
ACKNOWLEDGMENTS ·················································································· iii
ABSTRACT··································································································· iv
LIST OF TABLES ··························································································· xi
LIST OF FIGURES ·························································································· xii
CHAPTER ONE
INTRODUCTION ···························································································· 1
1.1. Introduction ························································································· 1
1.2. Dairy Waste management in US ································································· 4
1.3. Anaerobic digestion ················································································ 6
1.4. Flushing manure treatment technology ························································· 9
1.5. Biomass retention practice in dairy manure AD ·············································· 11
1.6. Biomass retention mechanisms·································································· 13
1.7. Selection pressure driven biomass retention ·················································· 14
1.8. Conclusion ························································································· 15
1.9. References ·························································································· 17
CHAPTER TWO
DEVELOPMENT OF A SIMPLE METHODOLOGY FOR RATE-LIMITING STEP
DETERMINATION FOR ANAEROBIC DIGESTION OF SOLIDS CONTAINING
SUBSTRATE AND EFFECT OF MICROBIAL COMMUNITY RATIO ·························· 22
2.1. Abstract ····························································································· 22
2.2. Introduction ························································································ 23

vii
2.3. Methods ····························································································· 24
2.3.1. Substrate and inoculum ····································································· 25
2.3.2. Rate-limiting step evaluation ······························································· 25
2.3.3. Effect of microbial community ratio ······················································ 27
2.3.4. Analytical methods ·········································································· 27
2.3.5. Kinetics model ················································································ 29
2.3.5.1. Biogas production simulation ························································ 29
2.3.5.2. Kinetic model for microbial community ratio (r) affecting rate-limiting step 29
2.4. Results and discussion ············································································ 31
2.4.1. Rate-limiting step evaluation during the anaerobic digestion ························· 31
2.4.2. Effect of microbial community ratio on kinetics of anaerobic digesting dairy
manure ························································································· 35
2.4.3. Implications for anaerobic co-digestion ·················································· 38
2.5. Conclusion ························································································· 39
2.6. References ·························································································· 40
2.7. Nomenclature ······················································································ 44
CHAPTER THREE
BIPOLAR EFFECTS OF SETTLING TIME ON ACTIVE BIOMASS RETENTION IN
ANAEROBIC SEQUENCING BATCH REACTORS DIGESTING FLUSHING DAIRY
MANURE ····································································································· 46
3.1. Abstract ····························································································· 46
3.2. Introduction ························································································ 47
3.3. Materials and methods ············································································ 49

viii
3.3.1. Experimental setup and operation ························································· 49
3.3.2. Microscopic visualization of microbial distribution ···································· 50
3.3.3. ATP determination ··········································································· 51
3.3.4. Methanogens activity measurement ······················································· 51
3.3.5. Other analytical methods···································································· 52
3.4. Results and discussion ············································································ 52
3.4.1. Process of active biomass retention in ASBRs at various settling time ·············· 52
3.4.2. Effect of settling time on active biomass retention ····································· 53
3.4.3. Active microbial response to settling time ··············································· 55
3.4.4. Living form of retained microorganisms. ················································ 57
3.4.5. Mechanism behind bipolar effects of settling time on active biomass retention ···· 59
3.4.5.1. Model development ··································································· 60
3.4.5.2. Model verification ····································································· 61
3.4.5.3. Model limitation ······································································· 62
3.5. Conclusions ························································································ 65
3.6. References ·························································································· 67
CHAPTER FOUR
KINETICS OF PSYCHROPHILIC ANAEROBIC DIGESTER WITH BIOFILM SUPPORTED
BY SOLIDS FROM FLUSHING DAIRY MANURE ················································· 70
4.1. Abstract ····························································································· 70
4.2. Introduction ························································································ 71
4.3. Materials and methods ············································································ 74
4.3.1. Feedstock and seed ·········································································· 74

ix
4.3.2. Experimental setup and operation ························································· 74
4.3.3. Chemical analytical methods ······························································· 75
4.3.4. Development of kinetic model ····························································· 77
4.4. Results and discussion ············································································ 82
4.4.1. Effect of HRT on biogas production ······················································ 82
4.4.2. Effect of OLR on biogas production ······················································ 87
4.4.3. Kinetic modeling ············································································· 87
4.4.3.1. Evaluation of Kinetic models ························································ 87
4.4.3.2. Model simulation ······································································ 88
4.4.3.3. Model prediction ······································································· 91
4.4.4. Process performance comparison ·························································· 93
4.4.5. Implications for dairy AD process design ················································ 93
4.5. Conclusion ························································································· 94
4.6. References ·························································································· 96
4.7. Nomenclature ···················································································· 100
CHAPTER FIVE
METHANOSARCINA DOMINATION IN ASBR DIGESTER AT SHORT HRT ··············· 102
5.2. Introduction ······················································································ 103
5.3 Materials and methods ·········································································· 107
5.3.1 Feedstock and seed ········································································ 107
5.3.2 Experimental setup and operation ······················································· 107
5.3.3 DNA extraction············································································· 108
5.3.4 PCR amplification of the 16S rRNA gene for T-RFLP ······························ 108

x
5.3.5 PCR Amplification of Functional Gene Marker for T-RFLP························ 109
5.3.6 T-RFLP analysis ··········································································· 109
5.3.7 Clone Library of the 16S rRNA Gene ·················································· 110
5.3.8 Clone Library of Functional Gene Marker ············································· 110
5.3.9 Phylogenetic analysis ······································································ 111
5.3.10 Nucleotide sequence accession numbers ··············································· 111
5.4 Results and discussions ········································································· 112
5.4.1 Digesters performance ···································································· 112
5.4.2 Methanogenic community diversity ····················································· 113
5.4.3 Phylogenetic analysis ······································································ 116
5.4.3.1 16S rRNA clone library ····························································· 116
5.4.3.2 mcrA gene clone library ···························································· 117
5.4.3.3 Statistical analysis of clone libraries ·············································· 121
5.4.3.4 Comparison of clone library for 16S rRNA gene and mcrA gene ············ 122
5.4.4 Methanogenic pathway in psychrophilic ASBR ······································· 124
5.5 Conclusion ······················································································· 127
5.6 Reference ························································································· 128
CHAPTER SIX
CONCLUSIONS AND RECOMMENDATIONS FOR FUTURE WORK ······················· 133

xi
LIST OF TABLES
Table 1.1 Dairy Manure Collection Systems .................................................................................. 5
Table 2.1 Experimental design for rate-limiting step evaluation .................................................. 26
Table 2.2 Microbial community ratio experimental design. ......................................................... 28
Table 2.3 Kinetics parameters for methane production with metabolic intermediates
supplementation ............................................................................................................ 34
Table 4.1 Operating condition for ASBR ..................................................................................... 76
Table 4.2 Kinetics models used in this study ................................................................................ 81
Table 4.3 Summary of model comparison with kinetic coefficients and goodness of fit ............. 90
Table 4.4 Performance data for different anaerobic biofilm reactors treating dairy manure ....... 92
Table 5.1 Typical competitive microbes in anaerobic digester .................................................. 105
Table 5.2 Diversity and richness indices for 16S rRNA and mcrA clone libraries .................... 120
Table 5.3 Cluster of Archaea clone sequences for 16S rRNA clone libraries and its affiliation
regarding BLAST search ............................................................................................ 121
Table 5.4 Cluster of Archaea clone sequences obtained for mcrA gene clone libraries and its
affiliation regarding BLAST search ........................................................................... 123
Table 5.5 Gibbs free energy of reactions associated with methane generation .......................... 125

xii
LIST OF FIGURES
Figure 1.1 Anaerobic Digestion Process ......................................................................................... 7
Figure 2.1 Cumulative methane productions with metabolic intermediates supplementation.
Profiles are from triplicated experiments; values represent average and error bars
mean standard deviation ............................................................................................. 32
Figure 2.2 Maximum methane production rate changes against NS to HS ratio R, (●)
experimental results, and (—) simulation profile ....................................................... 36
Figure 2.3 Maximum methane production rate changes against H to M ratio r, (●) experimental
results, and (—) simulation profile ............................................................................. 38
Figure 3.1 Schematic of ASBR operation in a serum bottle ......................................................... 50
Figure 3.2 volumetric biogas production profiles in ASBRs operated at various settling time ... 53
Figure 3.3 Effect of settling time on steady state volumetric biogas production rate (a), mixed
liquor ATP concentration (b) and methanogenic activity (c) ..................................... 54
Figure 3.4 Effect of settling time on washout coefficients for abiotic and biotic particles,
respectively ................................................................................................................. 57
Figure 3.5 Confocal visualization of rod and coccoid microbial cells (green), a) attaching on
manure fiber surface in steady state ASBR running at settling time of 0.5 min and b)
remaining suspended in the bulk solution of steady state ASBR running at settling
time of 60 min, respectively. c) SEM image showing the detail of rod and coccoid
microbial cells attachment on fiber surface in steady state ASBR running at settling
time of 0.5 min ............................................................................................................ 58

xiii
Figure 3.6 Eq. (3.6) simulated active biomass retention (a), inactive biomass retention (b),
volumetric biogas production rate (c), ATP concentration (d) and methanogentic
activity (e), (●) experimental results, (—) simulation profile .................................... 65
Figure 4.1 Volumetric biogas production rate at various HRT .................................................... 83
Figure 4.2 Changes of volumetric methane production rate and specific methane productivity
against HRT and OLR, (●) experimental results, and (—) simulation profile ........... 86
Figure 4.3 Comparison of simulation with different kinetics models .......................................... 89
Figure 4.4 Changes of effluent substrate concentration and treatment efficiency with derived
model, (●) effluent VS data, () VS removal efficiency data, and (—) predicted
profile .......................................................................................................................... 91
Figure 5.1 Relationship between digester performance and microbial community diversity .... 114
Figure 5.2 Relative abundance of the Archaea 16S rRNA gene fragments (A) and mcrA gene
fragments (B) retrieved from the biomass in ASBR. The length of T-RFs in base pairs
(bp) is indicated in parenthesis ................................................................................. 115
Figure 5.3 Phylogenetic relationship among 18 OTUs with partial 16S rRNA gene sequences of
known methanogenic Archaea based on the neighbor-joining analysis ................... 118
Figure 5.4 Phylogenetic relationship among 21 OTUs with partial mcrA gene sequences of
known methanogenic Archaea based on the neighbor-joining analysis ................... 119
Figure 5.5 Rarefaction curves generated for 16S rRNA genes and mcrA genes clone libraries.
Dotted lines indicate the 95% confidence intervals .................................................. 120
Figure 5.6 Speculated Methanogenic Pathway in ASBR ........................................................... 126

xiv
Dedication
This dissertation is dedicated to my family, especially father, mother and my wife, who were
always willing to support me in whatever way necessary.

1
CHAPTER ONE
INTRODUCTION
1.1. Introduction
With the anticipated decline of fossil fuel, there is a great opportunity for renewable energy,
especially biomass derived energy, to play an important role in near future. Anaerobic digestion
(AD) technology is gaining more and more attentions and has been widely implemented for the
treatment of animal manure, energy crop, industrial wastewaters, organic fraction of municipal
solid waste, and other biomasses for both energy generation and biodegradable organic waste
mineralization at the meantime.
AD as a mean for stabilization of livestock manure has been carried out for many years. This
practice involves a mixed culture of symbiotic bacteria that mediate the degradation of organic
matter in manure solids ultimately to methane, carbon dioxide and mineralized nutrients. This
microbial mixture includes symbiotic groups of hydrolytic, acidogenic and methanogenic
bacteria. The performance of AD thus depends on the availability and activity of these symbiotic
bacteria. Hydrolysis and methanogenesis are two crucial steps in the course of anaerobic
digestion of solids wastes. Hydrolysis rate has been found correlated to the coverage of
hydrolytic bacteria grown on solids substrate surface (Sanders 2001). Immobilization of
hydrolytic bacteria on solids substrate thus directly promotes hydrolysis progress. Due to the
slow growing nature of methanogenic bacteria and their limited numbers presented in fresh
manure (Griffin, McMahon et al. 1998; McMahon, Stroot et al. 2001; Stroot, McMahon et al.
2001), the intermediates products in the course of anaerobic digestion which are volatile and

2
often a source of odors will become accumulated, leading to low methane gas production and
odor emission. Therefore, an effective anaerobic digester should have capacity to immobilize
high symbiotic biomass concentration on solids surface so that a faster and more complete solids
to biogas conversion efficiency can be achieved, and the odor potential of the manure is also
greatly reduced.
In order to achieve an enhanced solids wastes to biogas conversion efficiency, three major
approaches have been implemented so far for anaerobic digestion of livestock manure, i.e. (i)
prolong digestion time; (ii) maintain high temperature; and (iii) retain high biomass.
Corresponding digester types that have been developed include various plug-flow digesters,
complete-mix digesters, covered lagoons, biofilm reactors and some forms of their
hybridizations (Dennis and Burke 2001).
Hydraulic retention time (HRT) has been manipulated to prolong the digestion time in plug-flow
and complete mixed manure digesters. It is a very common practice to design a 20 to 40 days
HRT for complete anaerobic digestion of dairy manure in these two types of digesters. However,
one should be realized that the volume of the digester is directly proportional to the designed
HRT, i.e. a greater HRT leads to large digester volume. This requires that feedstock should have
as high TS content as possible to minimize the excess water volume that takes up digester
volume.
To minimize HRT, plug-flow and complete mixed digesters are usually operated at mesophilic
temperatures (usually 35 oC) to have a faster anaerobic digestion rate. This approach inevitably
3
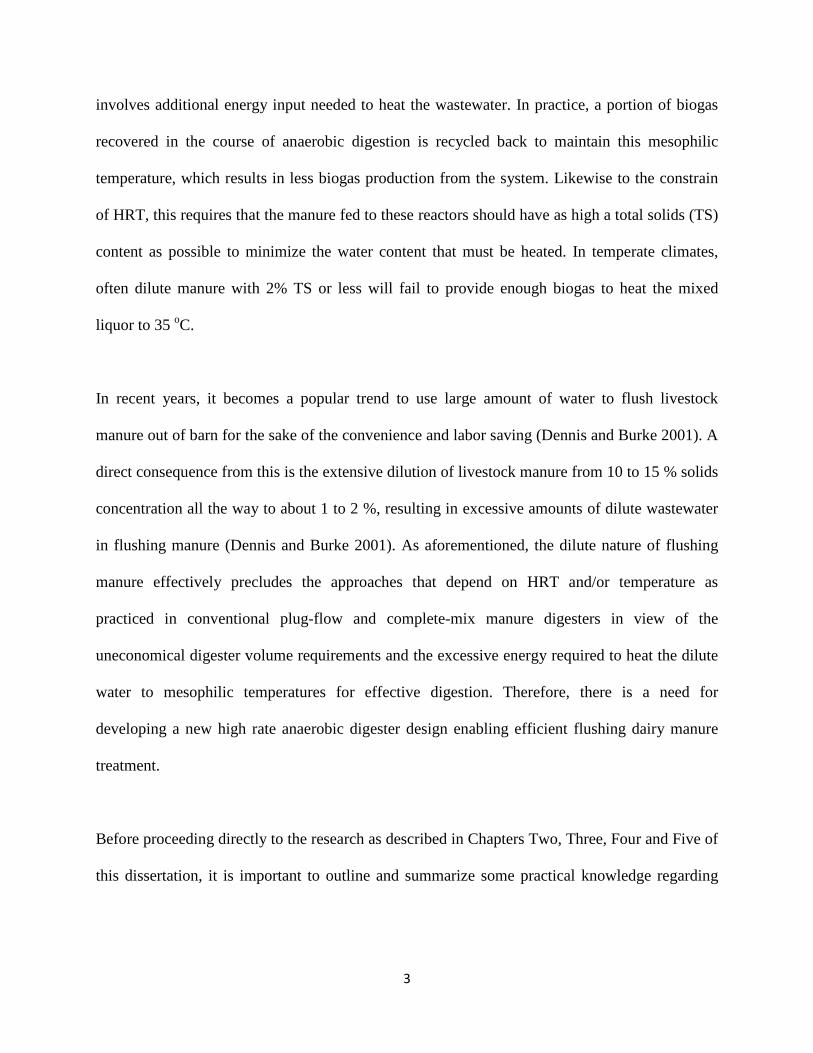
involves additional energy input needed to heat the wastewater. In practice, a portion of biogas
recovered in the course of anaerobic digestion is recycled back to maintain this mesophilic
temperature, which results in less biogas production from the system. Likewise to the constrain
of HRT, this requires that the manure fed to these reactors should have as high a total solids (TS)
content as possible to minimize the water content that must be heated. In temperate climates,
often dilute manure with 2% TS or less will fail to provide enough biogas to heat the mixed
liquor to 35 oC.
In recent years, it becomes a popular trend to use large amount of water to flush livestock
manure out of barn for the sake of the convenience and labor saving (Dennis and Burke 2001). A
direct consequence from this is the extensive dilution of livestock manure from 10 to 15 % solids
concentration all the way to about 1 to 2 %, resulting in excessive amounts of dilute wastewater
in flushing manure (Dennis and Burke 2001). As aforementioned, the dilute nature of flushing
manure effectively precludes the approaches that depend on HRT and/or temperature as
practiced in conventional plug-flow and complete-mix manure digesters in view of the
uneconomical digester volume requirements and the excessive energy required to heat the dilute
water to mesophilic temperatures for effective digestion. Therefore, there is a need for
developing a new high rate anaerobic digester design enabling efficient flushing dairy manure
treatment.
Before proceeding directly to the research as described in Chapters Two, Three, Four and Five of
this dissertation, it is important to outline and summarize some practical knowledge regarding

4
dairy manure management, AD process, the dairy manure AD practice and biomass retention for
high rate digester for background purposes.
1.2. Dairy Waste management in US
Dairy farming has been cited as the largest agricultural source for greenhouse gas (CH4) mission
(Weiske, Vabitsch et al. 2006). It has been estimated that, if AD process is exploited to recover
methane energy from dairy manure, around 222,142 MMBtu thermal energy can be annually
recycled from each head of dairy cattle (Garrison and Richard 2005). Among the 9,000,000
heads milk cows raised in United States (USDA 2005), only 150,000 heads are currently served
with AD system (U.S. EPA 2007), implying a 98.3% shortage in AD application for dairy. Poor
cost-effectiveness of current AD design pertaining to the characteristics of dairy manure is
responsible for limited adoption of AD. Manure characteristics are closely associated with the
way it is collected. There are mainly two types of manure collection systems employed in dairy,
namely scraped and flushing systems (Dennis and Burke 2001). Dry manure collection systems,
resulted to 20-25 % of total solids, also been used under certain circumstance. Flushing system
has been considered to be the more economical and less labor-intensive means over scraped
system for dairy manure collection (Dennis and Burke 2001). Dairy management survey in
California revealed that flushing system is the major means for dairy manure collection, and its
adoption popularity has kept a increasing trend from 61.7 % in 1985 to 77.1% in 1997 (Fairbank
1986; Meyer, Garnett et al. 1997). Similar predominant usage of flushing system was also
reported for Florida (Wilkie, Castro et al. 2004).

5
Unsafe and improper disposal of animal and farm wastes results in land and surface and ground
water pollution, ammonia emission, methane causing greenhouse gas effect, and odors; while
treatment of these wastes by anaerobic degradation produces biogas, bio-fertilizer, reduced
pollution, reduced GHG emission, and reduced odor. Adopted AD process varies with the
feedstock generated by different manure collection systems. Solid digester was employed for
high solids containing dry manure. Scraped manure could be effective treated by conventional
plug flow digester or complete mix digester. Flushing manure challenges conventional digesters
due to the large amount of water usage, and covered lagoon is the most prevalent technology
treating flushing dairy manure.
Table 1.1 Dairy Manure Collection Systems
Options Dry system Scrape system Flush system
Total solids 20 – 25 % 8 – 10 % 1 – 2 %
Classification Solid Slurry Liquid
Treatment Solid digester Plug flow digester or complete mix digester
Covered lagoon
Cattle manure is a complex type of substrate, composed of carbohydrates, proteins and fats, and
anaerobic digestion process has been successfully be applied to treat cattle manure. Application
of AD process for dairy manure treatment resulted in both environmental and economic benefits.
First, AD process stabilizes volatile organic waste through BOD/COD reductions, which helps

6
enhancing water quality; second, volume of solids waste is reduced, contributing to water quality
protection and reduction of farm lagoon maintenance; third, manure associated odor problem is
controlled because of volatile solids and volatile fatty acids (VFA) reductions, which improved
community relations and air quality; fourth, pathogen reduction is another contribution of AD
process, caused by partial zoonotic destruction from extended anaerobic and temperature
conditions; moreover, application of AD process will bring extra CHP and carbon, energy and
tax credits, making AD process more compelling than other manure management technologies.
1.3. Anaerobic digestion
The anaerobic digestion of complex organic material has been described as a multi-step process
that consists of four stages in series: hydrolysis, acidogenesis, acetogenesis and methanogenesis
(Pavlostathis and Giraldogomez 1991; Batstone, Keller et al. 2002). This process involves a
number of microorganisms such as fermentative bacteria, hydrogen-producing acetogenic
bacteria, hydrogen-consuming acetogenic bacteria, carbon dioxide-reducing methanogens, and
aceticlastic methanogens (methane-forming bacteria) and enzyme secreted by some bacteria
(Chynoweth and Isaacson 1987; Appels, Baeyens et al. 2008).
Disintegration and hydrolysis
The first step of AD process can be further differentiated into disintegration and hydrolysis two
steps. Disintegration is the degradation of the whole biomass. Disintegration occurs primarily by
physicochemical processes and is dependent primarily on the physical characteristics of the
system including temperature and pH. This process breaks down the initial solid biomass into
separate components, namely carbohydrates, lipids, proteins, soluble inerts, and particulate inerts.

7
Hydrolysis is the breakdown of relatively large organic compounds, lipids, carbohydrates and
proteins to long chain fatty acids, monosaccharides, and amino acids, respectively (Bagi, Acs et
al. 2007). Hydrolysis is carried out by both physicochemical means as well as by break down
from extra-cellular enzymes.
Figure 1.1 Anaerobic Digestion Process
Acidogenesis/fermentation
Acidogenesis, also known as acid fermentation, involves acid-forming fermenters and hydrogen
producers. Monomer or oligomer from hydrolysis step are further degraded to volatile fatty acid,

8
hydrogen and carbon dioxide. Degradation of monosaccharides follows glycolytic pathway,
while Stickland oxidation-reduction paired fermentation governs the conversion of amino acids
(Batstone, Keller et al. 2002). Degradation of long chain fatty acids is through beta-oxidation
pathway.
Acetogenesis
Acetogenesis is syntrophic process and need collaboration with intermediate consumer,
methanogens for example. Volatile fatty acids other than acetate, such as propionate and butyrate,
are converted to acetate and produce hydrogen at the same time. To make these reactions
thermodynamically favorable, a low hydrogen partial pressure is required (Zinder 1993). The
presence of hydrogenotrophic methanogen and other hydrogen utilizers could maintain a low
hydrogen concentration for the oxidation reaction to be thermodynamically possible.
Methanogenesis
Methanogenesis is the last step of the anaerobic conversion of organic wastes to methane.
Formic acid, acetic acid, methanol, and hydrogen can all be used as energy sources by the
various methanogens. Methane formation is generally accomplished by two main pathways, i.e.
aceticlastic methanogenesis and hydrogenotrophic methanogenesis. Aceticlastic methanogenesis
is the primary route converting the major fermentation product of the acid forming phase, acetic
acid, to methane and carbon dioxide, which account for about 70% of methane productions. So
far, only the Methanosarcinales, specifically Methanosarcina and Methanosaeta, have been
shown to be capable of utilizing acetate with Methanasarcina being uniquely capable of utilizing
all three forms of substrate for methane production and as such is not an obligatory acetotroph

9
(Boone, Whitman et al. 1993). Methanogens from orders, Methanobacterials, Methanococcales,
and Methanomicrobiales reduce CO2 to CH4 using H2 or formate through hydrogenotrophic
methanogenesis pathway.
In such a multi-step complex process, the kinetics of the slowest step will account for the overall
kinetics. Anaerobic digestion systems are limited by two major steps depending on the nature of
the substrate. Hydrolysis is often limited if the substrate is complex organic solids while in the
digestion of soluble organic matter, the rate-limiting step has been identified as methanogenesis
(Vavilin, Rytov et al. 1996; Tomei, Braguglia et al. 2009). Determination of rate-limiting step is
critical for a new anaerobic digestion process design treating specific feedstock, establishment of
a stable process performance, and management for full scale of application of anaerobic
digestion processes. Hence, there is an important need for an experimental method capable of
determining precisely which of the different steps is limiting for a complex substrate.
1.4. Flushing manure treatment technology
The efficiency of anaerobic digestion is controlled by several factors. For a given type of
feedstock, the rate of anaerobic digestion increases with the amount of active biomass retained in
the digester as well as temperature (Lettinga, Rebac et al. 2001; Batstone, Keller et al. 2002).
Active biomass retention provides a cost-effective method for uncompromised anaerobic
digestion rate at lower temperature with less heating energy consumption (Lettinga, Rebac et al.
2001; Connaughton, Collins et al. 2006). This is especially critical for the anaerobic digestion of
flushing diary manure in large-scale dairies where flushing system is employed.
10
The huge dilute water flow from flushing system makes conventional dairy AD design
inapplicable owing to the requirements of massive digester size and heating energy consumption.
For this account, solids/liquid separation prior to AD strategy has been approached for AD of
flushing dairy manure. Following conventional AD design for scraped manure, two modified
plug-flow digesters have been practiced in north America to concentrate flushing dairy manure
form 1-2 % back to a desired solids concentration of 8-10% within the capacity of conventional
plug-flow digester through discarding flushing water prior to AD. Although this approach
considerably saved digester space and heating energy, evidence showed that a great proportion of
readily digestible organic matter is actually dissolved in the liquid phase of flushing dairy
manure (Mackie, Stroot et al. 1998), and thus discarding flushing water will inevitably reduce
methane recovery efficiency and emit greenhouse gas (Wilkie, Castro et al. 2004). Accordingly,
an alternative approach based on biofilm driven high rate AD process has been taken towards the
methanation of flushing dairy manure (Wilkie, Castro et al. 2004). This approach allows rapid
digestion of large flow of flushing dairy manure at psychrophilic temperature with comparable
digester size (Vartak, Engler et al. 1997). However, costly biofilm carrying media have to be
applied in this approach to retain high biomass concentration in digester (Vartak, Engler et al.
1997). Clogging of these media by manure solids seems unavoidable in the course of AD
operation, which reduces digester robustness, displacing reactor volume and short-circuiting
wastewater around the biofilm media (Wilkie, Castro et al. 2004). Consequently, a solids/liquid
separator has to be installed to remove coarse manure solids for a steady biofilm reactor
performance. It was held that these cattle rumen indigestible solids should own a low
biodegradability, and thus their disposal should not cause much reduction in methane production
(Wilkie, Castro et al. 2004). However, accumulated evidences show that considerable amount of

11
readily digestible COD is actually mingled with those manure solids and removed in separator,
e.g. approximately 54 % and 80 % of methane production potentials were found to be carried in
discarded manure solids (Hills and Kayhanian 1985; Chastain, Vanotti et al. 2001). Thus,
current high rate AD process is also subjected to recoverable energy lost, and the high cost for
expensive biofilm media impede the popularity of the approach in dairy as well. Latest EPA
census shows that there is merely one full-scale biofilm based AD reactor in service for flushing
dairy manure throughout United States (U.S. EPA 2007). Apparently, a process with no need of
exotic media addition would be preferred for flushing dairy manure anaerobic digestion.
1.5. Biomass retention practice in dairy manure AD
High biomass retention would be the best means for anaerobic digestion of dilute livestock
manure in an efficient and economical way. Biofilm formation on support media with large
surface area for bacterial attachment offers a greater concentration of bacteria for accelerated
digestion of organic matter. Moreover, retaining these support media in digester through gravity
settling and/or mechanical screening methods is able to uncouple bacterial retention time from
mixed liquor HRT. Therefore, biofilm based high biomass retention reactor offers a possibility to
operate anaerobic digester at much shorter HRTs and lower temperatures while achieving similar
treatment efficiencies as those in conventional plug-flow and complete-mix systems.
Currently, there are designs available for high-rate anaerobic digestion using biofilm based
biomass retention strategy. With different morphology and physical characteristics of supporting
media, these biofilm based anaerobic digester are known as fixed-, fluidized- or expanded-bed
reactors, in which microorganisms are retained by attachment to support media in fixed-,
12
fluidized- or expended- state within the processing system (Borja, Sanchez et al. 1994; Wilkie,
Castro et al. 2004; Demirer and Chen 2005; Umana, Nikolaeva et al. 2008; Zaher, Frear et al.
2008). However, although a wide variety of supporting media including sand, anthracite,
activated carbon, PVC materials, or diatomaceous earth have been practiced, none of those
support materials can work with wastewater having significant levels of suspended solids such as
those found in livestock manure.
Livestock manure often includes rumen indigestible forage fibers as well as materials used for
bedding, such as hay, sawdust or sand. These large solids particles contribute to clogging of all
aforementioned packing material. They also hinder the attachment of bacteria to the media,
ultimately, lead to short-circuiting of the anaerobic system, which reduces the effectiveness of
the biological treatment system and results in the failure of anaerobic digester. For these reasons,
a gravity settling and/or mechanical screening based separator has to be placed in front of all
existing biofilm manure digesters to exclude large solids from entering anaerobic digestion. It is
obvious that this separator increases the complexity of digester apparatus. Moreover, it has been
estimated that about 54 to 80 % of readily methane recoverable organics mingling with separated
solids will be lost after separator (Hills and Kayhanian 1985; Chastain, Vanotti et al. 2001). It
should be pointed out that all existing biofilm reactors rely on exogenous support media and thus
cannot work in harmony with high solids containing wastewater. In addition, expensive capital
investment in support media also possesses an impediment to the implementation of existing
biofilm digester, in that support media used in biofilm digesters accounts for a significant portion
of the capital investment.

13
1.6. Biomass retention mechanisms
Gravity settling is a conventional method for biomass retention with no requirement for addition
of supporting materials. It takes advantage of a prolonged settling time to separate bacterial cells
from the supernatant. Based on Eq. (1.1), a gravity settling theory (GS) was established
𝑉𝑐 =𝐿𝑑𝑡𝑠
(1.1)
in which Vc represents a critical settling velocity created by the depth of discharge zone (Ld) and
the settling time (ts) (Vesilind 2003). It means that all particles with settling velocity (Vp) greater
than Vc will settle beneath the discharge zone together with their surface attached cells and be
retained (Vesilind 2003). Due to the minor settling velocity of planktonic bacterial mass, a rather
long ts of 1 to 3 hours is typically needed to retain bacterial cells at a given Ld (Lee 2000;
Wilderer, Irvine et al. 2001). It should be noted that influent solids, e.g. undigested dairy manure
fibers, may have settling velocities greater than those of planktonic bacterial cells, and thus
application of GS in an anaerobic digester may retain not only active but also inactive biomass
(Lott, Loch et al. 1994). Obviously, inactive biomass retention is undesirable, as it takes up
reactor volume. Selection pressure (SP) driven cells immobilization is another theory developed
in recent years for active biomass retention with no need of external media (Liu, Wang et al.
2005). SP theory is based on an equation similar to Eq. (1.1), but it requires an extremely short ts,
typically less than 5 min, to create a large Vc to drive cellular self-immobilization for retention
(Qin, Liu et al. 2004). According to SP theory, microorganisms are able to actively respond to a
short ts to avoid being washed out of a reactor (Qin, Tay et al. 2004). In support of this theory,
successful bacterial retention has been achieved in solids containing dairy wastewater
(Schwarzenbeck, Borges et al. 2005). SP theory takes advantage of bacterial initiative behavior,
14
and thus has the potential to selectively favor the retention of active biomass over inactive
biomass. Such a possibility has yet been studied in solids wastes anaerobic digestion.
1.7. Selection pressure driven biomass retention
Ideally, a successful anaerobic digestion reactor should not only be able to operate at lower
temperatures and shorter HRT, but also capable of tolerating high level influent solids for long
term operation. As a matter of fact, the influent solids themselves have the potential to work as
in-situ support media for biomass immobilization. This is the exact mechanism that is working in
animal rumen digestion, i.e. retention of rumen bacteria is realized through establishing biofilm
on the surface of fed forage for accelerated rumen digestion (Cheng, Fay et al. 1981). In order to
drive bacterial immobilization on solids surface, a selection pressure that suppress suspended
bacteria growth has to be applied in reactor to favor immobilized biofilm growth (Hulshoff Pol,
Heijnekamp et al. 1988; Liu, Wang et al. 2005). Recent development in selection pressure
driven cells immobilization technology offers practical means to realize such a biomass
immobilization process in bioreactors such as anaerobic sequencing batch reactor (ASBR) and
upflow anaerobic sludge blanket reactor (UASB) (Hulshoff Pol, Heijnekamp et al. 1988; Liu,
Wang et al. 2005). Both types of operations have capacities of uncoupling SRT from HRT so
that a minimized reactor volume can be achieved with maximized digestion performance
(Hulshoff Pol, Heijnekamp et al. 1988; Liu, Wang et al. 2005). Further, by virtue of the high
biomass retention in ASBR and UASB, they have been proved applicable even at psychrophilic
condition for high rate anaerobic digestion. Therefore, implementing selection pressure in ASBR
for biomass immobilization on influent solids allows anaerobic digestion of diluted solids wastes
15
at low temperature and short HRT with no need of pretreatment as well as exogenous support
media.
1.8. Conclusion
To date, there remain technological deficiencies in the economical anaerobic digestion of the
entire flow of flushing dairy manure on farms within cold climates. The huge dilute water flow
from flushing dairy manure system makes conventional dairy AD design inapplicable owing to
the requirements of massive digester size and heating energy consumption. Flushing dairy
manure possesses challenges to conventional high temperature anaerobic digesters because of the
large volume of flushing water that must be heated. To address this issue, fixed-film digesters
with submerged high specific surface area media were introduced to retain active biomass
through bacterial attachment (Vartak, Engler et al. 1996; Wilkie, Castro et al. 2004; Umana,
Nikolaeva et al. 2008; Nikolaeva, Sanchez et al. 2009). Nevertheless, fixed-film was classified as
an inappropriate process for dairy manure anaerobic digestion due to its vulnerability to media
clogging (Burke 2001). Apparently, a new process for flushing dairy manure anaerobic digestion
should be developed and the following criteria need to be satisfied:
• With no need of expensive exotic biofilm support media addition to save capital
cost and reduce digester volume;
• Capable of treating both solids part and liquid part of dairy manure in one single
digester without prior separation;
• Without concerns about clogging hazards caused by fibrous solids presented
within dairy manure.
16
The high affinity of microbes to dairy manure fibrous solids seems to point to an alternative for
biomass retention in an anaerobic digester providing a natural biofilm support medium for high
biomass retention as opposed to using external media that might clog and add cost. As a matter
of fact, forage like straw fibers have been evaluated as excellent support medium for
methanogenic biofilm establishment. Dairy manure fibrous solids have the potential to act as
effective natural biomass carriers for high rate digester.
Therefore, a new strategy, improving biomass retention with fiber material present within the
dairy manure as biofilm carriers, was proposed and the biofilm formation mechanism under
selection pressure was investigated in this research. The performance of this technology was then
evaluated for treating flushing dairy manure in a psychrophilic anaerobic sequencing batch
reactor (ASBR) with a derived kinetic model. The unique Methanoarchaea community structure
and methanogenic pathway were also elucidated in this study.
17
1.9. References
Appels, L., J. Baeyens, et al. (2008). "Principles and potential of the anaerobic digestion of
waste-activated sludge." Progress in Energy and Combustion Science 34(6): 755-781.
Bagi, Z., N. Acs, et al. (2007). "Biotechnological intensification of biogas production." Applied
Microbiology and Biotechnology 76(2): 473-482.
Batstone, D., J. Keller, et al. (2002). Anaerobic digestion model no. 1 (ADM1), IWA Task
Group for mathematical modelling of anaerobic digestion processes. London, UK, IWA
Publishing.
Boone, D. R., W. B. Whitman, et al. (1993). Diversity and Taxonomy of Methanogens.
Methanogenesis: Ecology, Physiology, Biochemistry and Genetics. J. G. Ferry. New
York, Chapman & Hall: 35–80.
Borja, R., E. Sanchez, et al. (1994). "Kinetics of anaerobic degestion of cow manure with
biomass immobilized on zeolite." The Chemical Engineering Journal and the
Biochemical Engineering Journal 54(1): B9-B14.
Burke, D. A. (2001). Dairy waste anaerobic digestion handbook. 6007 Hill Street, Olympia, WA
98516, Environmental Energy Company.
Chastain, J. P., M. B. Vanotti, et al. (2001). "Effectiveness of liquid-solid separation for
treatment of flushing dairy manure: A case study." Applied Engineering in Agriculture
17(3): 343-354.
Cheng, K. J., J. P. Fay, et al. (1981). "Formation of Bacterial Microcolonies on Feed Particles in
the Rumen." Appl Environ Microbiol 41(1): 298-305.
Chynoweth, D. P. and R. Isaacson (1987). Anaerobic Digestion of Biomass. London and New
York, Elsevier Applied Science.
18
Connaughton, S., G. Collins, et al. (2006). "Psychrophilic and mesophilic anaerobic digestion of
brewery effluent: A comparative study." Water Research 40(13): 2503-2510.
Demirer, G. N. and S. L. Chen (2005). "Anaerobic digestion of dairy manure in a hybrid reactor
with biogas recirculation." World Journal of Microbiology & Biotechnology 21(8-9):
1509-1514.
Dennis, A. and P. E. Burke (2001). Dairy waste anaerobic digestion handbook. 6007 Hill Street,
Olympia, WA 98516, Environmental Energy Company.
Fairbank, W. C. (1986). Dairy design and waste management practices in southern California,
San Luis Obispo, CA, USA, ASAE, St. Joseph, MI, USA.
Garrison, A. V. and T. L. Richard (2005). "Methane and manure: Feasibility analysis of price
and policy alternatives." Transactions of the Asae 48(3): 1287-1294.
Griffin, M. E., K. D. McMahon, et al. (1998). "Methanogenic population dynamics during start-
up of anaerobic digesters treating municipal solid waste and biosolids." Biotechnology
and Bioengineering 57(3): 342-355.
Hills, D. J. and M. Kayhanian (1985). "Methane from settled and filtered flushing dairy wastes."
Transactions of the ASAE 28(3): 865-869.
Hulshoff Pol, L. W., K. Heijnekamp, et al. (1988). The selection pressure as a driving force
behind the granulation of anaerobic sludge. Granular anaerobic sludge: microbiology and
technology. G. Lettinga, A. J. B. Zehnder, J. T. C. Grotenhuis and L. W. Hulshoff Pol.
Netherlands, Wageningen: 153-161.
Lee, C. C. (2000). Handbook of environmental engineering calculations. New York, McGraw-
Hill.

19
Lettinga, G., S. Rebac, et al. (2001). "Challenge of psychrophilic anaerobic wastewater
treatment." Trends in Biotechnology 19(9): 363-370.
Liu, Y., Z. W. Wang, et al. (2005). "Selection pressure-driven aerobic granulation in a
sequencing batch reactor." Appl Microbiol Biotechnol 67(1): 26-32.
Lott, S. C., R. J. Loch, et al. (1994). "Settling characteristics of feedlot cattle feces and manure."
Transactions of the American Society of Agricultural Engineers 37(1): 281-285.
Mackie, R. I., P. G. Stroot, et al. (1998). "Biochemical identification and biological origin of key
odor components in livestock waste." Journal of Animal Science 76(5): 1331-1342.
McMahon, K. D., P. G. Stroot, et al. (2001). "Anaerobic codigestion of municipal solid waste
and biosolids under various mixing conditions - II: Microbial population dynamics."
Water Research 35(7): 1817-1827.
Meyer, D. M., I. Garnett, et al. (1997). "A survey of dairy manure management practices in
California." Journal of Dairy Science 80(8): 1841-1845.
Nikolaeva, S., E. Sanchez, et al. (2009). "Kinetics of anaerobic degradation of screened dairy
manure by upflow fixed bed digesters: Effect of natural zeolite addition." Journal of
Environmental Science and Health Part a-Toxic/Hazardous Substances & Environmental
Engineering 44(2): 146-154.
Pavlostathis, S. G. and E. Giraldogomez (1991). "KINETICS OF ANAEROBIC TREATMENT
- A CRITICAL-REVIEW." Critical Reviews in Environmental Control 21(5-6): 411-490.
Qin, L., Y. Liu, et al. (2004). "Effect of settling time on aerobic granulation in sequencing batch
reactor." Biochemical Engineering Journal 21(1): 47-52.
Qin, L., J. H. Tay, et al. (2004). "Selection pressure is a driving force of aerobic granulation in
sequencing batch reactors." Process Biochemistry 39(5): 579-584.
20
Sanders, W. (2001). Anaerobic Hydrolysis During Digestion of Complex Substrates. Ph.D.,
Wageningen University, The Netherlands.
Schwarzenbeck, N., J. M. Borges, et al. (2005). "Treatment of dairy effluents in an aerobic
granular sludge sequencing batch reactor." Applied Microbiology and Biotechnology
66(6): 711-718.
Stroot, P. G., K. D. McMahon, et al. (2001). "Anaerobic codigestion of municipal solid waste
and biosolids under various mixing conditions - I. Digester performance." Water
Research 35(7): 1804-1816.
Tomei, M., C. Braguglia, et al. (2009). "Modeling of Anaerobic Digestion of Sludge." Critical
Reviews in Environmental Science and Technology 39(12): 1003-1051.
U.S. EPA (2007) " Guide to Anaerobic Digesters." Anaerobic Digester Database DOI:
http://www.epa.gov/agstar/operational.html.
Umana, O., S. Nikolaeva, et al. (2008). "Treatment of screened dairy manure by upflow
anaerobic fixed bed reactors packed with waste tyre rubber and a combination of waste
tyre rubber and zeolite: Effect of the hydraulic retention time." Bioresource Technology
99(15): 7412-7417.
USDA (2005). Agricultural Statistics, National Agricultural Statistics Service, States
Government Printing Office, Washington, DC.
Vartak, D. R., C. R. Engler, et al. (1996). Attached-film media performance in psychrophilic
anaerobic treatment of dairy cattle wastewater. 7th National Bioenergy Conference,
Nashville, Tennessee.
Vartak, D. R., C. R. Engler, et al. (1997). "Attached-film media performance in psychrophilic
anaerobic treatment of dairy cattle wastewater." Bioresource Technology 62(3): 79-84.

21
Vavilin, V. A., S. V. Rytov, et al. (1996). "A description of hydrolysis kinetics in anaerobic
degradation of particulate organic matter." Bioresource Technology 56(2–3): 229-237.
Vesilind, P. A. (2003). Wastewater treatment plant design. London, IWA Pub.
Weiske, A., A. Vabitsch, et al. (2006). "Mitigation of greenhouse gas emissions in European
conventional and organic dairy farming." Agriculture Ecosystems & Environment 112(2-
3): 221-232.
Wilderer, P. A., R. L. Irvine, et al. (2001). Sequencing Batch Reactor Technology. London, UK,
IWA.
Wilkie, A. C., H. F. Castro, et al. (2004). "Fixed-film anaerobic digestion of flushing dairy
manure after primary treatment: Wastewater production and characterisation."
Biosystems Engineering 89(4): 457-471.
Zaher, U., C. Frear, et al. (2008). "Evaluation of a new fixed-bed digester design utilizing large
media for flush dairy manure treatment." Bioresour Technol 99(18): 8619-8625.
Zinder, S. H. (1993). Physiological ecology of methanogens. Methanogenesis: Ecology,
Physiology, Biochemistry and Genetics. J. G. Ferry. New York, Chapman & Hall: 128–
206.

22
CHAPTER TWO
DEVELOPMENT OF A SIMPLE METHODOLOGY FOR RATE-LIMITING STEP
DETERMINATION FOR ANAEROBIC DIGESTION OF SOLIDS CONTAINING
SUBSTRATE AND EFFECT OF MICROBIAL COMMUNITY RATIO
2.1. Abstract
Anaerobic digestion of complex substrates is a multi-step process, which is kinetically controlled
by an individual rate-limiting step. Balanced anaerobic microbial community structure plays a
pivotal role in an efficient anaerobic digestion process. A methodology for rate-limiting step
determination for anaerobic digestion of complex substrates was developed by supplementation
of metabolic intermediates from each step of the digestion process. This method elucidated that
hydrolysis of dairy manure was the rate-limiting step when normal anaerobic sludge was used as
inoculum. Furthermore, the concept of microbial community ratio in the anaerobic degradation
system was first introduced in this study and investigated by manipulating two different inocula,
i.e. normal anaerobic sludge (NS) and heated anaerobic sludge (HS). The results revealed that
the rate-limiting step changed according to the variation of microbial community ratio (r).
Results indicated a critical ratio r*=24 between hydrolytic bacteria (H) to methanogens (M) at
which as r decreased or exceeded from this value, hydrolysis or methanogenesis limited the
anaerobic digestion process, respectively.
Key words: Rate-limiting step, kinetics, microbial community ratio, anaerobic digestion, dairy
manure

23
2.2. Introduction
The anaerobic digestion of complex organic material is a multi-step process that consists of four
stages in series: hydrolysis, acidogenesis, acetogenesis and methanogenesis (Batstone et al.,
2002;Pavlostathis and Giraldogomez, 1991). In such a multi-step complex process, the kinetics
of the slowest step will account for the overall kinetics. Anaerobic digestion systems are limited
by two major steps depending on the nature of the substrate. Hydrolysis is often limited if the
substrate is complex organic solids while the rate-limiting step in the digestion of soluble organic
matter is methanogenesis (Tomei et al., 2009;Vavilin et al., 1996). Determination of rate-limiting
step is critical for anaerobic digestion process design treating a specific feedstock, establishment
of a stable process performance, and management anaerobic digestion processes. Hence, there is
a need for an experimental method capable of determining precisely which of the different steps
is limiting for a complex substrate.
Anaerobic degradation process is dependent not only on the physic-chemical characteristics of
the substrates, but also on the concentration and quality of anaerobic microbial community
composed of symbiotic microbes responsible for each disparate metabolic step. The stability of
the process is dependent on the inoculum mass and critical balance of different trophic groups
(Angelidaki et al., 2009). The impact of inoculum concentration on biochemical methane
potential (BMP) for various organic wastes has been widely studied (Chen and Hashimoto,
1996;Eskicioglu and Ghorbani, 2011;Gonzalez-Fernandez and Garcia-Encina, 2009;Hashimoto,
1989;Koksoy and Sanin, 2010;Liu et al., 2009;Lopes et al., 2004;Neves et al., 2004;Raposo et al.,
2006;Raposo et al., 2009;Zhou et al., 2011). Relatively high hydrolysis rates were reached in
anaerobic biodegradability tests with a high inoculum to substrate ratio, showing some degree of

24
dependence of hydrolysis to biomass concentration or activity (Fernandez et al., 2001). Similarly,
it is believed that inoculum concentration has influence on methane production rate and methane
yield. Equally important is the population or composition of the microbial community. For
examples, the microbial community ratio, defining the ratio of microbial concentration of each
symbiotic growth group, is a key parameter governing the anaerobic digestion process. Balanced
microbial population can be translated into proper microbial community ratio. However, research
on microbial community ratio and its effect on kinetics of anaerobic degradation process is
limited and is the focus of this research paper.
Therefore, the aim of the present work was to develop a simple method for rate-limiting step
evaluation through kinetic characteristics of a series batch tests with metabolic intermediates
generated from the conversion of macro-molecule to methane and carbon dioxide. Moreover, a
new concept, microbial community ratio, i.e. hydrolytic bacteria to methanogens ratio, was first
proposed in this paper, and its effect on the kinetics of anaerobic digestion process was
investigated with two different sources of inocula.
2.3. Methods
The methodology developed for rate-limiting step identification is based on a modified
biochemical methane potential (BMP) assay. Except for substrate and inoculum, metabolic
intermediates produced from each step were also supplemented into closed vessels which were
incubated at 35ºC and daily methane production was monitored. Experiments were conducted for
as long as required to reach a plateau in methane production. The rate-limiting step was then
evaluated based on BMP data and some assumptions (see descriptions in Section 2.3.2).

25
2.3.1. Substrate and inoculum
Flushing dairy manure, a representative of complex substrate with undetermined
hydrolysis/methanogenesis rate-limiting step, was collected from the Washington State
University Dairy Center in Pullman, WA, USA and stored at 4ºC prior to use. Before adding into
reactors, manure was screened through a 2 mm sieve to remove coarse solids, which resulted in
mixed liquor containing 9.1 g/L total solids (TS) and 7.6 g/L total volatile solids (VS). Anaerobic
sludge was sampled from an anaerobic digester at the Pullman Wastewater Treatment Facility
with TS of 17.1 g/L and VS of 11.7 g/L. Two different inocula, namely normal anaerobic
digester sludge (NS) and heated anaerobic digester sludge (HS), were used in this study. The HS
was anaerobic digester sludge heated in an oven at 105 ºC for 2 h in order to kill non-spore-
forming methanogens (Logan et al., 2002) then cooled to room temperature in a desiccator. As a
result, NS included all three groups of microorganisms, namely hydrolytic bacteria, acidogens,
and methanogens while HS consisted of hydrolytic bacteria and acidogens only.
2.3.2. Rate-limiting step evaluation
The aforementioned dairy manure, the basic substrate, was added to serum bottles with working
volume of 200 mL. Glucose was considered as the main intermediate of hydrolysis of
carbohydrate complex organics while sodium acetate was used as model intermediate of
acidification. Dairy manure, glucose, sodium acetate and NS were added into bottles according
to the experimental design summarized in Table 2.1. The concentration of glucose, sodium
acetate, and NS were 3 gCOD/L, 3 gCOD/L, and 1 gVS/L, respectively. A bottle filled with
dairy manure only served as a control while a bottle with NS only served as a blank. Each bottle
was magnetically stirred at a speed of 300 rpm and maintained at 35 ºC. Methane production was

26
monitored using a respirometer (Challenge technology AER-200 respirometer, Springdale, AR,
USA). Sodium hydroxide was used as scrubbing media to purify methane by adsorbing carbon
dioxide and hydrogen sulfide, so that only methane production was recorded. Triplicate analysis
was carried out to ensure reproducibility of results. To identify the rate-limiting step in anaerobic
digestion of dairy manure, the following assumptions were made: (1) if glucose increased
methane production rate while acetate did not, then hydrolysis would be the rate-limiting step; (2)
if acetate increased methane production rate while glucose did not, then acidification would be
the limiting step; and (3) if both glucose and acetate did not affect methane production rate, then
methanogenesis limits the overall process. Usually, the anaerobic digestion process was
considered either limited by hydrolysis or methanogenesis, while acidification step was not
expected as rate-limiting step since acidogenesis is usually the fastest reaction in the anaerobic
conversion of complex substrates during digestion (Mosey and Fernandes, 1989).
Table 2.1 Experimental design for rate-limiting step evaluation*
No 1 2 3 4 5 6 7
Substrate DM DM DM DM DM DM -
Inoculum - - - NS NS NS NS
Intermediates - GL SA GL SA -
* All experiments were conducted in triplicate.

27
2.3.3. Effect of microbial community ratio
Experiments for the influence of microbial community ratio on anaerobic digestion of dairy
manure were conducted in a series of serum bottles with working volume of 200 mL. Methane
production was monitored using a respirometer and maintained at the same operating conditions
as the rate-limiting step evaluation experiment. Dairy manure was autoclaved at 121 ºC and 15
psi for 30 min (PB-series Steam Sterilizers, Consolidated Stills & Sterilizers, Boston, MA, USA)
in order to sterilize all of the microorganisms. Different volumes of NS and HS were added into
bottles 1 to 22 giving rise to a wide spectrum of NS to HS ratios according to the experimental
design presented in Table 2.2. Bottle 23 and 24 were used as blanks. The total sludge
concentration in each bottle was 2 gVS/L. Triplicate analysis was also carried out to ensure
reproducibility of results.
2.3.4. Analytical methods
Total solids, VS analyses were done according to Standard Methods (APHA, 1998). Biomass
concentration was indirectly determined by measuring adenosine 5’-triphosphate (ATP)
concentration using a method detailed in (Wang et al., 2011). Briefly, samples were mixed with
Tris/EDTA buffer in 1:10 volumetric ratio and boiled for 90 seconds to extract ATP. After
equilibration to room temperature, the ATP extract was reacted with an ATP determination kit
(A-22066, Molecular Probes, Eugene, OR) and the luminescence intensity was measured with a
SpectraMax L microplate luminometer (MDS Analytical Technologies, USA).

28
Table 2.2 Microbial community ratio experimental designa.
No NS
(gVS/L)
HS
(gVS/L)
R r
1 2.00 0.00 - 2.65
2 1.60 0.40 4.00 3.32
3 1.33 0.67 2.00 3.98
4 1.00 1.00 1.00 5.30
5 0.67 1.33 0.50 7.96
6 0.50 1.50 0.33 10.61
7 0.40 1.60 0.25 13.26
8 0.33 1.67 0.20 15.91
9 0.29 1.71 0.17 18.57
10 0.25 1.75 0.14 21.22
11 0.22 1.78 0.13 23.87
12 0.18 1.82 0.10 29.17
13 0.15 1.85 0.08 34.48
14 0.13 1.87 0.07 39.78
15 0.12 1.88 0.06 45.09
16 0.11 1.89 0.06 50.39
17 0.10 1.90 0.05 55.70
18 0.08 1.92 0.04 68.96
19 0.07 1.93 0.03 79.57
20 0.04 1.96 0.02 135.26
21 0.02 1.98 0.01 267.87
22 0.00 2.00 0.00 -
23 0.00 0.00 - -
24b 2.00 0.00 - - a All experiments were conducted in triplicate.
b manure was added into each bottle except for bottle 24.

29
2.3.5. Kinetics model
The modified Gompertz model was adopted to characterize methane production and microbial
community ratio model was developed to investigate microbial community ratio on rate-limiting
step. The values of parameters for each experiment were estimated using the solver function in
Microsoft Office Excel (2007, Microsoft) with a Newtonian algorithm.
2.3.5.1. Biogas production simulation
The modified Gompertz equation 2.1 was developed to describe the cumulative methane
production curve in a batch culture (Lay et al., 1997;Zwietering et al., 1990).
𝐺 = 𝑃 exp �−exp �𝑅𝑚𝑒𝑃
(𝜆 − 𝑡) + 1�� (2.1)
When glucose was supplemented, a biphasic methane production curve was presented. To
characterize each phase, eq. (2.1) was used twice to separately best-fit the two methane
production phases which resulted in two sets of kinetic parameters. Cumulative methane
production exceeding 95% of methane potential (P1) for the first phase was taken to be the end
of the first phase and as well as the beginning of the second phase.
2.3.5.2. Kinetic model for microbial community ratio (r) affecting rate-limiting step
The ratio of two inocula, which contain different proportion of hydrolytic bacteria and
methanogens, may affect the anaerobic digestion process. There should be a critical R* of the NS
to HS ratio; when R < R*, methanogenesis could be rate-limiting step; while when R > R*,
hydrolysis could be rate-limiting step, which can be represented as eq. (2.2)

30
𝑣 = � 𝑞𝑀 ∙ 𝑋𝑀, 𝑅 < 𝑅∗ 𝑞𝐻 ∙ 𝑋𝐻, 𝑅 > 𝑅∗ (2.2)
in which
𝑋𝑀 =𝑅
1 + 𝑅𝛼𝑀𝑋 (2.3)
𝑋𝐻 = 𝛼𝐻𝑋 (2.4)
𝑞𝑀 =𝜇𝑀𝑌𝑀
(2.5)
𝑞𝐻 =𝜇𝐻𝑌𝐻
(2.6)
Substitute eq. (3) – (6) into (2) yields:
𝑣 = �
𝑅1 + 𝑅
𝛼𝑀𝑋𝜇𝑀𝑌𝑀
, 𝑅 < 𝑅∗
𝛼𝐻𝑋𝜇𝐻𝑌𝐻
, 𝑅 > 𝑅∗ (2.7)
By definition, r represents the true ratio of hydrolytic bacteria to methanogens in the digester and
significantly affects the anaerobic digestion process. The critical r* for the H to M ratio was
hypothesized here. When r < r*, hydrolysis should be rate-limiting step while when r > r*,
methanogenesis should be rate-limiting step, which can be represented as eq. (8)
𝑣 = � 𝑞𝐻 ∙ 𝑋𝐻, 𝑟 < 𝑟∗ 𝑞𝑀 ∙ 𝑋𝑀, 𝑟 > 𝑟∗ (2.8)

31
in which
𝑋𝑀 =1𝑟𝛼𝐻𝑋 (2.9)
Substitute eq. (4) – (6) and (9) into (8) yielding:
𝑣 =
⎩⎨
⎧𝛼𝐻𝑋𝜇𝐻𝑌𝐻
, 𝑟 < 𝑟∗
1𝑟𝛼𝐻𝑋
𝜇𝑀𝑌𝑀
, 𝑟 > 𝑟∗ (2.10)
2.4.Results and discussion
2.4.1. Rate-limiting step evaluation during the anaerobic digestion
The methane production profile in each bottle was closely related to substrate and metabolic
intermediates supplementation. The two tests with glucose supplementation experienced a
biphasic methane production process. As Figure 2.1 shows, the steep slope of methane
production rate at the beginning indicated significant increase of methane production with
degradation of glucose. Gas production started immediately without lag phase after incubation.
Theoretically, total glucose or acetate supplemented in bottles can be converted to 217 mL
methane at 35 ºC. The experimental data shows a good agreement with theoretical calculation.
When glucose was depleted, methane production stopped before manure degradation. The
methane production rate elevated again when the microbes were adapted to the manure, with the
highest total methane production compared with other tests. The methane production process
with acetate supplementation exhibited a similar trend as that of manure control but with higher
maximum methane production rate and higher total methane production as expected with the
theoretical calculation. Sludge supplementation shortened the lag phase prominently. Moreover,

32
the total methane production was enhanced, which indicated that high microbial concentration
can help to overcome process inhibition, or anaerobic sludge microbe is capable of consuming
certain substrate that manure microbes are unable to consume. Chen and Hashimoto reported a
similar result that increase of inoculum improved both methane production rate and ultimate
methane yield (Chen and Hashimoto, 1996;Hashimoto, 1989).
Figure 2.1 Cumulative methane productions with metabolic intermediates supplementation.
Profiles are from triplicated experiments; values represent average and error bars mean standard
deviation
Time (d)
0 10 20 30 40
Acc
umul
ated
met
han
prod
uctio
n (m
l)
0
200
400
600
800
1000
1200
DMDM+NSDM+GL DM+SA DM+NS+GLDM+NS+SANS

33
The kinetics parameters varied dramatically due to metabolic intermediates supplementation.
Table 2.3 compared the kinetics parameters calculated with eq. (2.1) for each condition. As
regards P1, it seems nearly all of the glucose was converted into methane and carbon dioxide on
the basis of this calculation (in Table 2.3, 185 mL increase from DM+GL vial compared with
DM vial, and 198 mL increase from DM+NS+GL vial compared with DM+NS vial). Since
glucose was consumed at the very beginning of the test, Rm1 was affected by glucose
supplementation. Rm1 increased dramatically (almost 3 times increase compared with that of
control) when glucose was supplemented. However, Rm only rose about one fourth by sodium
acetate and sludge supplementation. In accordance with the given assumptions, it can be
concluded that the hydrolysis of carbohydrate could be limiting the overall anaerobic digestion
rate. Noike et al. (Noike et al., 1985) studied the characteristics of carbohydrate degradation and
found the rate of cellulose hydrolysis was so low that it was shown to be the rate-limiting step in
overall anaerobic digestion.
This study demonstrated a simple and fast approach to identify the rate-limiting step in anaerobic
digestion of a complex substrate. First, metabolic intermediates produced from each step of the
anaerobic digestion process are supplemented into BMP test vials containing the testing substrate.
Then based on the methane production profile, a maximum methane production rate (Rm) is
calculated. The rate-limiting step can be identified according to the notably increased methane
production rate. The step that produced the particular intermediate which elevate Rm, limits the
overall digestion process. The prerequisite of this method is to understand the major composition
of the substrate, such as carbohydrate, protein and lipid, so that possible intermediates can be
chosen as candidates for each step of degradation. The results also showed that the lag phase (𝜆)

34
was considerably affected by microbe concentration. In each test when sludge was supplemented,
𝜆 was shortened to half of that from control, which indicates anaerobic digestion of dairy manure
can be accelerated by dosing anaerobic sludge seed and potentially can reduce hydraulic
retention time (HRT) of digester. Additionally, the ultimate biogas yield was also augmented by
sludge supplementation, showing the possibility of more energy yield in a biogas plant when
operated with higher biomass concentration.
Table 2.3 Kinetics parameters for methane production with metabolic intermediates
supplementation
Substrate λ Rm P
(d) (mL/d) (mL)
DM 11.6 44.7 716
DM+NS 6.4 55.3 751a
DM+GL 0.0 (λ1)b
11.3 (λ2) b
173.6 ( Rm1) b
56.7 ( Rm2) b
212 (P1) b
689 (P2) b
DM+SA 11.5 56.7 852
DM+NS+GL 0.0 (λ1) b
6.9 (λ2) b
191.2 ( Rm1) b
56.4 ( Rm2) b
242 (P1) a, b
707 (P2) b
DM+NS+SA 6.5 54.3 853 a a The methane production potential has been deducted with that from NS;
b λ1, Rm1, and P1 represent parameters for first phase; λ2, Rm2, and P2 represent parameters for
second phase.

35
2.4.2. Effect of microbial community ratio on kinetics of anaerobic digesting dairy manure
The maximum methane production rate was obviously affected by the ratio of two inocula as
shown in Figure 2.2. The concentration of methanogens elevated with growth of R while
concentration of hydrolytic bacteria remained unchanged. As a result of that, the maximum
methane production rate increased with the NS to HS ratio (R) before a plateau was reached. It
seems that a concentration enhancement of one species may not always ensure a rate elevation of
anaerobic digestion process, or a balanced microbial structure is desired. The relationship
between the maximum methane production rate and R was simulated with eq. (2.7). As Figure
2.2 shows, the simulated curve exhibits a good agreement with experimental data. The
simulation profile revealed that there existed a critical R* at 0.13. When R < R*, methane
production rate was hyperbolically related to R, where the whole process was governed by
methanogenesis; when R > R*, methane production rate remained unchanged with the raise of R,
where hydrolysis limits the anaerobic digestion process.
Effects of H to M ratio r on rate-limiting step can be derived from above results. ATP analysis
indicated that 𝛼𝐻 and 𝛼𝑀 in NS was 72.6% and 27.4%, respectively, giving rise to an H to M
ratio of 2.65 in NS. Thus it is possible to obtain a wide range of r from 2.65 to infinity via
blending certain proportions of NS and HS as inocula. Concentration of methanogens decreased
with a raise in r but concentration of hydrolytic bacteria stayed the same. The maximum methane
production rate kept constant as r was raised to a certain value then decreased until approaching
zero. The simulation of eq. (2.10) with experimental data is shown in Figure 2.3. A critical r* of
24 was found from the curve. When r < r*, methane production rate held the line with the
increase of r, where hydrolysis limits the anaerobic digestion process; when r > r*, methane
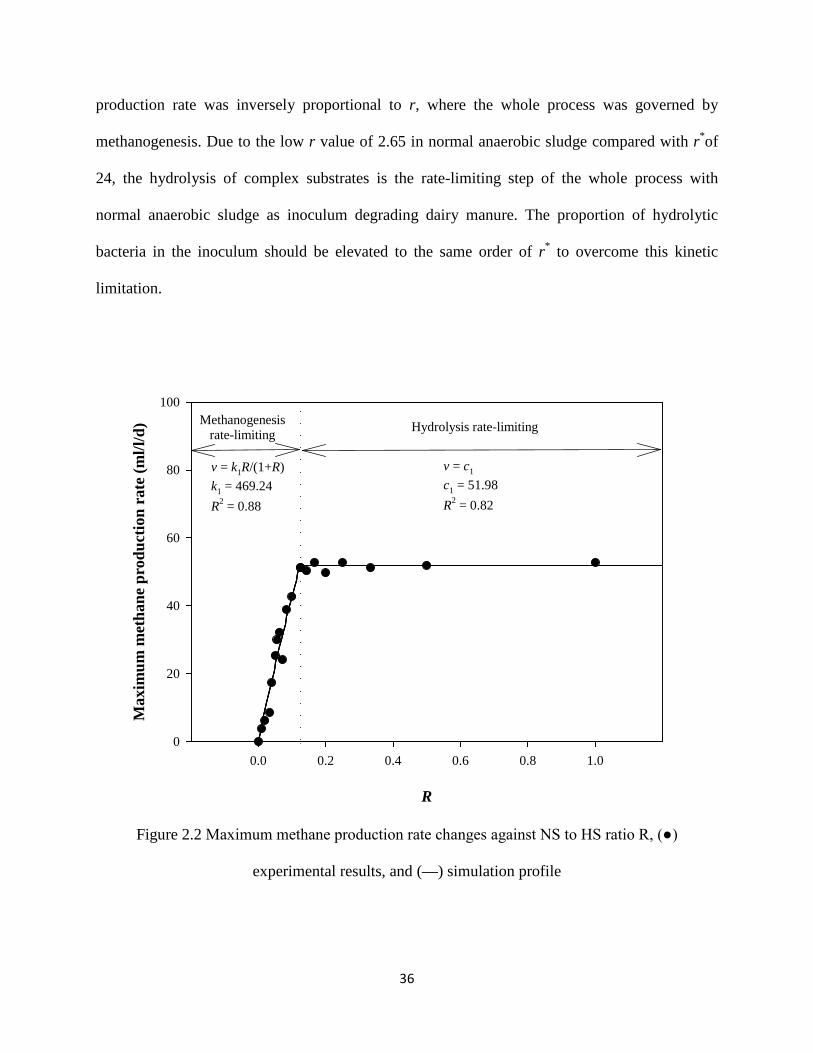
36
production rate was inversely proportional to r, where the whole process was governed by
methanogenesis. Due to the low r value of 2.65 in normal anaerobic sludge compared with r*of
24, the hydrolysis of complex substrates is the rate-limiting step of the whole process with
normal anaerobic sludge as inoculum degrading dairy manure. The proportion of hydrolytic
bacteria in the inoculum should be elevated to the same order of r* to overcome this kinetic
limitation.
Figure 2.2 Maximum methane production rate changes against NS to HS ratio R, (●)
experimental results, and (—) simulation profile
R
0.0 0.2 0.4 0.6 0.8 1.0
Max
imum
met
hane
pro
duct
ion
rate
(ml/l
/d)
0
20
40
60
80
100
Hydrolysis rate-limitingMethanogenesisrate-limiting
v = k1R/(1+R)k1 = 469.24R2 = 0.88
v = c1
c1 = 51.98R2 = 0.82

37
This study showed that the microbial community ratio has a strong effect on the anaerobic
digestion rate. The kinetics of methane production is determined by both the quantity and the
characteristics of microorganisms. Hydrolysis and methanogenesis are usually considered as the
major rate-limiting steps during anaerobic digestion of complex substrate. The volatile fatty
acids (VFA) produced by hydrolysis/acidogenesis can depress the acetogenesis and
methanogenesis (Vavilin and Angelidaki, 2005). To balance the VFA production and
consumption, a balanced population of these two groups of microorganisms (hydrolytic bacteria
and methanogens) is indispensable. This balance may be affected by type of feedstock, organic
loading rate, temperature, pH, inhibitors, etc. If the rates of hydrolysis and methanogenesis are
unbalanced, the system either accumulates VFA or suffers a low methane production.
A balanced microbial community could be reached by adding other sources of biomass to adjust
r back to a proper range. Addition of cellulolytic bacteria enriched culture, cow rumen
microorganisms for instance, could improve r when hydrolysis of cellulosic substrate is limiting
the process (Weimer et al., 2009). If methanogenesis is the rate-limiting step or amount of
methanogens is not enough to consume the VFA produced during acetogenesis, accumulation of
VFA and pH drop will inhibit hydrolysis step, and subsequently limit the overall anaerobic
biodegradation (Angelidaki et al., 1993;Salminen and Rintala, 2002;Vavilin, 2010). Then acetate
feeding sludge abundant with methanogens could be added to the digester so that r would be
regulated to the appropriate point, resulting in an accelerated VFA consumption and mitigated
inhibition. Hence, the modification of microbial community structure in terms of H to M ratio
could promote both hydrolysis and methanogenesis and speed up the anaerobic digestion process.

38
Figure 2.3 Maximum methane production rate changes against H to M ratio r, (●) experimental
results, and (—) simulation profile
2.4.3. Implications for anaerobic co-digestion
Anaerobic co-digestion studies have gained momentum in recent years (Li et al., 2009;Romano
and Zhang, 2008;Yen and Brune, 2007). It is believed that the dilution of potential toxic
compounds, improved balance of nutrients, and synergistic effects of microorganisms by co-
digestion enhance biogas yield (Labatut et al., 2011). In addition, microbial community ratio
would be another factor important to co-digestion and biogas yield. Mono-digestion of dairy
manure was limited by hydrolysis step so that an inoculum with higher hydrolytic bacteria
concentration (i.e., higher r value) is preferred to balance the digestion process. Food waste is
r
0 20 40 60 80
Max
imum
met
hane
pro
duct
ion
rate
(ml/l
/d)
0
20
40
60
80
100
Methanogenesis rate-limitingHydrolysis rate-limiting
v = k2/rk2 = 1248.71R2 = 0.88
v = c2
c2 = 51.98R2 = 0.61

39
relatively easily degradable and therefore high methanogens concentration (i.e., lower r value) is
required to convert VFA as soon as possible and prevent digester from souring. When co-
digestion of dairy manure and food waste was employed, characteristics of feedstock can be
adjusted to fit for a certain inoculum, or a certain microbial community ratio. Therefore, an
enhanced digester performance could be accomplished by the co-digestion of two substrates with
suitable proportion, which could be derived based on microbial community ratio of inoculum
used.
2.5. Conclusion
A methodology described in this research showed that a simple procedure, namely revised BMP
test with metabolic intermediates supplementation, could be used to determine the rate-limiting
steps in the degradation of complex substrates. With this method, it was illustrated that
hydrolysis of dairy manure was the rate-limiting step when anaerobic sludge was used as
inoculum. The results also showed that an increase of microbial concentration could shorten the
digester start-up time and elevate the efficiency of the anaerobic digestion process.
The effects of microbial community ratio on the anaerobic degradation of dairy manure were
investigated by manipulating two different inocula. Results revealed that the rate-limiting step
changed with the variation of microbial community ratio. The relationship between methane
production rate and ratio of H to M was further derived with ATP data. It showed that there
exists a critical ratio r* at 24 regarding dairy manure; a value below which yields hydrolysis as a
potential rate-limiting step; conversely, when r exceeded this value, methanogenesis limits the
anaerobic digestion process.

40
2.6. References
Angelidaki, I., Ellegaard, L. and Ahring, B.K. (1993) A mathematical model for dynamic
simulation of anaerobic digestion of complex substrates: Focusing on ammonia inhibition.
Biotechnology and Bioengineering 42(2), 159-166.
Angelidaki, I., Alves, M., Bolzonella, D., Borzacconi, L., Campos, J.L., Guwy, A.J., Kalyuzhnyi,
S., Jenicek, P. and van Lier, J.B. (2009) Defining the biomethane potential (bmp) of solid
organic wastes and energy crops: A proposed protocol for batch assays. Water Sci
Technol 59(5), 927-934.
APHA (1998) Methods for examination of water and wasterwater, American Public Health
Association/American Water Works Association/Water Environment Federation,
Washington, DC, USA.
Batstone, D.J., Keller, J., Angelidaki, I., Kalyuzhnyi, S.V., S.G., P., A., R., WTM., S., H., S. and
V.A., V. (2002) The iwa anaerobic digestion model no 1 (adm1). Water Science and
Technology 45(10), 9
Chen, T.-H. and Hashimoto, A.G. (1996) Effects of ph and substrate:Inoculum ratio on batch
methane fermentation. Bioresource Technology 56(2-3), 179-186.
Eskicioglu, C. and Ghorbani, M. (2011) Effect of inoculum/substrate ratio on mesophilic
anaerobic digestion of bioethanol plant whole stillage in batch mode. Process
Biochemistry 46(8), 1682-1687.
Fernandez, B., Porrier, P. and Chamy, R. (2001) Effect of inoculum-substrate ratio on the start-
up of solid waste anaerobic digesters. Water Science and Technology 44(4), 103-108.
Gonzalez-Fernandez, C. and Garcia-Encina, P.A. (2009) Impact of substrate to inoculum ratio in
anaerobic digestion of swine slurry. Biomass & Bioenergy 33(8), 1065-1069.

41
Hashimoto, A.G. (1989) Effect of inoculum/substrate ratio on methane yield and production rate
from straw. Biological Wastes 28(4), 247-255.
Koksoy, G.T. and Sanin, F.D. (2010) Effect of digester f/m ratio on gas production and sludge
minimization of ultrasonically treated sludge. Water Science and Technology 62(7),
1510-1517.
Labatut, R.A., Angenent, L.T. and Scott, N.R. (2011) Biochemical methane potential and
biodegradability of complex organic substrates. Bioresource Technology 102(3), 2255-
2264.
Lay, J.-J., Li, Y.-Y. and Noike, T. (1997) Influences of ph and moisture content on the methane
production in high-solids sludge digestion. Water Research 31(6), 1518-1524.
Li, R., Chen, S., Li, X., Saifullah Lar, J., He, Y. and Zhu, B. (2009) Anaerobic codigestion of
kitchen waste with cattle manure for biogas production. Energy & Fuels 23(4), 2225-
2228.
Liu, G., Zhang, R., El-Mashad, H.M. and Dong, R. (2009) Effect of feed to inoculum ratios on
biogas yields of food and green wastes. Bioresource Technology 100(21), 5103-5108.
Logan, B.E., Oh, S.-E., Kim, I.S. and Van Ginkel, S. (2002) Biological hydrogen production
measured in batch anaerobic respirometers. Environmental Science & Technology 36(11),
2530-2535.
Lopes, W.S., Leite, V.D. and Prasad, S. (2004) Influence of inoculum on performance of
anaerobic reactors for treating municipal solid waste. Bioresource Technology 94(3),
261-266.
Mosey, F.E. and Fernandes, X.A. (1989) Patterns of hydrogen in biogas from the anaerobic
digestion of milk sugars. Water Science and Technology 21, 10.
42
Neves, L., Oliveira, R. and Alves, M.M. (2004) Influence of inoculum activity on the bio-
methanization of a kitchen waste under different waste/inoculum ratios. Process
Biochemistry 39(12), 2019-2024.
Noike, T., Endo, G., Chang, J.-E., Yaguchi, J.-I. and Matsumoto, J.-I. (1985) Characteristics of
carbohydrate degradation and the rate-limiting step in anaerobic digestion. Biotechnology
and Bioengineering 27(10), 1482-1489.
Pavlostathis, S.G. and Giraldogomez, E. (1991) Kinetics of anaerobic treatment - a critical
review. Critical Reviews in Environmental Control 21(5-6), 411-490.
Raposo, F., Banks, C.J., Siegert, I., Heaven, S. and Borja, R. (2006) Influence of inoculum to
substrate ratio on the biochemical methane potential of maize in batch tests. Process
Biochemistry 41(6), 1444-1450.
Raposo, F., Borja, R., Martin, M.A., Martin, A., de la Rubia, M.A. and Rincon, B. (2009)
Influence of inoculum-substrate ratio on the anaerobic digestion of sunflower oil cake in
batch mode: Process stability and kinetic evaluation. Chemical Engineering Journal
149(1-3), 70-77.
Romano, R.T. and Zhang, R. (2008) Co-digestion of onion juice and wastewater sludge using an
anaerobic mixed biofilm reactor. Bioresource Technology 99(3), 631-637.
Salminen, E.A. and Rintala, J.A. (2002) Semi-continuous anaerobic digestion of solid poultry
slaughterhouse waste: Effect of hydraulic retention time and loading. Water Research
36(13), 3175-3182.
Tomei, M., Braguglia, C., Cento, G. and Mininni, G. (2009) Modeling of anaerobic digestion of
sludge. Critical Reviews in Environmental Science and Technology 39(12), 1003-1051.

43
Vavilin, V. (2010) Anaerobic degradation of organic waste: An experience in mathematical
modeling. Microbiology 79(3), 334-341.
Vavilin, V.A., Rytov, S.V. and Lokshina, L.Y. (1996) A description of hydrolysis kinetics in
anaerobic degradation of particulate organic matter. Bioresource Technology 56(2–3),
229-237.
Vavilin, V.A. and Angelidaki, I. (2005) Anaerobic degradation of solid material: Importance of
initiation centers for methanogenesis, mixing intensity, and 2d distributed model.
Biotechnology and Bioengineering 89(1), 113-122.
Wang, Z.-W., Ma, J. and Chen, S. (2011) Bipolar effects of settling time on active biomass
retention in anaerobic sequencing batch reactors digesting flushing dairy manure.
Bioresource Technology 102(2), 697-702.
Weimer, P.J., Russell, J.B. and Muck, R.E. (2009) Lessons from the cow: What the ruminant
animal can teach us about consolidated bioprocessing of cellulosic biomass. Bioresource
Technology 100(21), 5323-5331.
Yen, H.-W. and Brune, D.E. (2007) Anaerobic co-digestion of algal sludge and waste paper to
produce methane. Bioresource Technology 98(1), 130-134.
Zhou, Y., Zhang, Z., Nakamoto, T., Li, Y., Yang, Y., Utsumi, M. and Sugiura, N. (2011)
Influence of substrate-to-inoculum ratio on the batch anaerobic digestion of bean curd
refuse-okara under mesophilic conditions. Biomass and Bioenergy 35(7), 3251-3256.
Zwietering, M.H., Jongenburger, I., Rombouts, F.M. and Van 'T Riet, K. (1990) Modeling of the
bacterial growth curve. Appl. Environ. Microbiol. 56(6), 1875-1881.

44
2.7. Nomenclature
DM – dairy manure
GL – glucose
SA – sodium acetate
NS – normal anaerobic sludge
HS – heated anaerobic sludge
H – hydrolytic bacteria
M − methanogens
G – cumulative methane production (mL)
λ – lag time (d)
P – methane production potential (mL)
Rm – maximum methane production rate (mL/d)
e – 2.718281828
R – NS to HS ratio
r – H to M ratio
𝑣 – methane production rate (mL/L/d)
𝑞𝐻 – specific substrate utilization rate when hydrolysis is rate-limiting step (gCOD/gVS)
𝑞𝑀 − specific substrate utilization rate when methanogenesis is rate-limiting step (gCOD/gVS)
𝑋 − total biomass concentration (gVS)
𝑋𝐻 − concentration of hydrolytic bacteria (gVS)
𝑋𝑀 − concentration of methanogens (gVS)
𝛼𝐻 − percentage of hydrolytic bacteria in biomass
𝛼𝑀 − percentage of methanogens in biomass

45
𝜇𝐻 – specific hydrolytic bacteria growth rate (/d)
𝜇𝑀 – specific methanogens growth rate (/d)
𝑌𝐻 – yield coefficient of hydrolytic bacteria (gVS/gCOD)
𝑌𝑀 – yield coefficient of methanogens (gVS/gCOD)

46
CHAPTER THREE
BIPOLAR EFFECTS OF SETTLING TIME ON ACTIVE BIOMASS RETENTION IN
ANAEROBIC SEQUENCING BATCH REACTORS DIGESTING FLUSHING DAIRY
MANURE
3.1. Abstract
Active biomass retention is a technical challenge in anaerobic digester treating dilute animal
manure. A strategy was tested using fibers in the dairy manure as biomass carriers by controlling
settling time. Settling time ranging from 0.5 to 60 min were applied to eight anaerobic
sequencing batch reactors to investigate their effects on active biomass retention in anaerobic
digestion of flushing dairy manure. Results revealed a critical settling time of 2 min at which
only minimum amount of active biomass was retained, while biomass retention improved on
either lower or higher settling time. Gravity settling and selection pressure theories were
suggested to account for the results. A model integrating these two effects was developed and
verified with the experimental data. Knowledge derived from this study may lead to innovative
bacterial retention technology for cost-effective anaerobic digestion of dairy wastes.
Key words: biomass retention, dairy manure, gravity settling, selection pressure, biofilm

47
3.2. Introduction
Anaerobic digestion converts organic matter in dairy manure to biogas that can be used as
renewable energy to reduce greenhouse and odor gas emission (US EPA, 2007). For a given type
of feedstock, the rate of anaerobic digestion increases with the amount of active biomass retained
in the digester as well as the temperature (Batstone et al., 2001; Lettinga et al., 2001). Active
biomass retention provides a cost-effective method for uncompromised anaerobic digestion rate
at lower temperature with less heating energy consumption (Connaughton et al., 2006; Lettinga
et al., 2001). This is especially critical for the anaerobic digestion of flushing diary manure in
large-scale dairies where flushing system is employed as a major means of manure collection for
the sake of its efficiency and less labor requirements (Burke, 2001). As pointed by Wilkie et al.
(2004), flushing dairy manure poses challenges to conventional high temperature anaerobic
digesters because of the large volume of flushing water that must be heated. To address this issue,
fixed-film digesters with submerged high specific surface area media were introduced to retain
active biomass through bacterial attachment (Nikolaeva et al., 2009; Umana et al., 2008; Vartak
et al., 1996; Wilkie et al., 2004). Nevertheless, fixed-film was classified as an inappropriate
process for dairy manure anaerobic digestion due to its vulnerability to media clogging (Burke,
2001). Apparently, a process with no need of exotic media addition would be preferred for
anaerobic digestion of flushing dairy manure.
Gravity settling is a conventional method for biomass retention with no requirement for addition
of supporting materials. It takes advantage of a prolonged settling time to separate bacterial cells
from the supernatant. Based on Eq. (3.1), a gravity settling theory (GS) was established
48
𝑉𝑐 =𝐿𝑑𝑡𝑠
(3.3)
in which Vc represents a critical settling velocity created by the depth of discharge zone (Ld) and
the settling time (ts) (Vesilind, 2003). According to this equation, all particles with settling
velocity (Vp) greater than Vc will settle beneath the discharge zone together with their surface
attached cells and be retained (Vesilind, 2003). Due to the minor settling velocity of planktonic
bacterial mass, a rather long ts of 1 to 3 hours is typically needed to retain bacterial cells at a
given Ld (Lee, 2000; Wilderer et al., 2001). Influent solids, e.g. undigested dairy manure fibers,
may have settling velocities greater than those of planktonic bacterial cells, and thus application
of GS in an anaerobic digester may retain not only active but also inactive biomass (Lott et al.,
1994). Inactive biomass retention is undesirable, as it takes up reactor volume. Selection pressure
(SP) driven cells immobilization is another theory developed in recent years for active biomass
retention with no need of external media (Liu et al., 2005). Selection pressure theory is based on
an equation similar to Eq.(3.1), but it requires an extremely short ts, typically less than 5 min, to
create a large Vc to drive cellular self-immobilization for retention (Qin et al., 2004). According
to SP theory, microorganisms are able to actively respond to a short ts to avoid being washed out
of a reactor (Qin et al., 2004). In support of this theory, successful bacterial retention has been
achieved in solids containing dairy wastewater (Schwarzenbeck et al., 2005). SP theory takes
advantage of bacterial initiative behavior, and thus has the potential to selectively favor the
retention of active biomass over inactive biomass. Such a possibility has yet been studied in
solids wastes anaerobic digestion. This study is designed to test and compare GS and SP theories
in terms of active biomass retention in anaerobic digestion of flushing dairy manure by using
anaerobic sequencing batch reactor (ASBR) as a platform. For this purpose, a wide spectrum of ts

49
ranging from 0.5 to 60 min was employed to test their effect on active biomass retention. The
mechanism behind the opposing roles of GS and SP in settling time was also investigated.
3.3. Materials and methods
3.3.1. Experimental setup and operation
Flushing dairy manure and anaerobic digester sludge were inoculated at a 1:1 volume ratio in
eight identical serum bottles each with 1 L working volume. The source of flushing dairy manure
was from the Washington State University Dairy Center in Pullman, WA, USA. Manure was
flushing hydraulically from the concrete feeding lots to alley boxes, giving rise to 9.58 g L-1 total
suspended solids (TS) mixed liquor. Anaerobic sludge was sampled from a 35oC anaerobic
digester operating in the City of Pullman wastewater treatment plant.
These serum bottles were sparged with nitrogen gas for 5 min before incubation at 37ºC on a 150
rpm shaker. The operation was in a sequential batch mode consisting of 5 steps, i.e., (i) filling, (ii)
reaction, (iii) discharging mixed liquor, (iv) settling and (v) discharging supernatant. The cycle
time was set at 3 days, at the end of which 3 cm of the total 10 cm working height of mixed
liquor was removed in a homogenous state (Figure 3.1), followed by 0.5, 1, 2, 5, 10, 20, 30 or 60
min of settling in respective bottles, and then a 2 cm height of supernatant was dispensed out of
each bottle before refilling with flushing dairy manure (Figure 3.1) and starting the next cycle.
This operation resulted in a 50% volume exchange ratio, 6 days hydraulic retention time and 10
days designed solids retention time (SRT).

50
3.3.2. Microscopic visualization of microbial distribution
Confocal laser scanning microscopy (CLSM; Zeiss LSM 510, Germany) was employed to
visualize the distribution of microorganisms in samples collected from aforementioned ASBRs.
SYTO 9 (Invitrogen, USA), which is a cell-permeative nucleic acid dye, was dripped onto
samples, allowed to stand for 15 min to label the microorganisms and then rinsed twice with
deionized water. SYTO 9 fluorescence was detected with CLSM at excitation/emission of
480/500 nm. Scanning electron microscopy (SEM) (Hitachi S-570, Japan) was employed to
study the morphology of fiber surface attached cells. Sample was prepared with lyophilizer and
coated with gold sputter coater. Fixation was with 2% glutaraldehyde and 2% paraformaldehyde
in 0.1 M phosphate buffer followed by 1% osmium tetroxide in 25 mM phosphate buffer for
overnight.
Figure 3.1 Schematic of ASBR operation in a serum bottle
10 c
m
3 cm
2
cm
Mixed liquor
Supernatant
51
3.3.3. ATP determination
Since the quantity of adenosine 5’-triphosphate (ATP) per cell remains fairly constant, and ATP
is stable only in living cells with functioning catabolic and anabolic processes, ATP
concentration has been used as a standard method for quantifying living microorganisms (ASTM,
2002). In this study, the method of microbial ATP extraction was adopted from that of Lundin
and Thore (1975). Briefly, 1 volume of sample was mixed with 9 volumes of boiling Tris/EDTA
buffer for 90 seconds. Tris/EDTA buffer was made of 0.1 M Tris and 3 mM EDTA titrated to pH
7.8 with acetic acid. After cooling, the extract was assayed using an ATP determination kit (A-
22066, Molecular Probes, Eugene, OR). This assay is based on luciferase’s reaction with the
available ATP, producing light with maximum 560 nm emission at pH 7.8 (ASTM, 2002). The
SpectraMax L microplate luminometer (MDS Analytical Technologies, USA) was used to
quantify luminescence. Triplicate analysis was carried out to ensure results reproducibility.
3.3.4. Methanogens activity measurement
A respirometer (AER-200, CES Inc., USA) was employed to determine the methanogenic
activity in the manure samples. 3000 mg COD L-1 equivalent glucose was added as substrate to
200 mL of fresh sample and incubated at 35 ºC and 300 rpm in serum bottle submerged in a
thermal water bath. Potassium hydroxide was used as a scrubbing medium to purify produced
methane gas by adsorbing carbon dioxide and hydrogen sulfide, and its effectiveness was
verified using gas chromatography (GC, CP-3800, Varian, Inc., USA). Homogenous mixing was
provided with magnetic stirring bars. Methane gas production was automatically measured and
logged in 5 min intervals using a monitoring computer. Control tests with no glucose addition
were carried out in parallel to offset any possible background noise. All measurements were
52
done in triplicates. Methanogenic activity was defined as methane production per sample volume
per day.
3.3.5. Other analytical methods
Daily headspace biogas productions were measured using a glass syringe. TS and chemical
oxygen demand (COD) analyses were done according to standard methods (APHA, 1998). All
samples were measured at the end of each cycle.
3.4. Results and discussion
3.4.1. Process of active biomass retention in ASBRs at various settling time
The rate of volumetric biogas production is associated with the amount of active biomass
retained in a bioreactor. As shown in Figure 3.2, the entire microbial retention process can be
divided into four phases based on the trends in biogas production rates during 90 days (about 30
cycles) operation. The first phase is characterized by a decreasing biogas production rate,
indicating a continuous washout of inoculums. This phase took about 30 days to reach a minimal
value which remained stable for another 10 days in the transitional phase, in which microbial
washout was offset by growth. By about the 40th day, the remaining microorganisms seemed to
have adapted to ASBR operation, entering a rapid growth phase with a steep increase in the
volumetric biogas production rate. In comparison with the washout phase, this growth phase
indicates successful active biomass retention in ASBR serum bottles. After 65 days, stationary
phase was reached in all ASBRs with stabilized biogas production rates; the difference in these
stabilized rates indicate that settling time affects the amount of active biomass retention (Figure
3.2).

53
Figure 3.2 volumetric biogas production profiles in ASBRs operated at various settling time
3.4.2. Effect of settling time on active biomass retention
So far, there is no standard method available for measuring active biomass concentration in
solids wastes, especially when dealing with complicated samples like dairy manure (Grady et al.,
1999). In order to have a better estimation, three parameters were employed in parallel in this
study to assess the actual level of active biomass retention in stationary phase after 90 days
cultivation, i.e., (i) volumetric biogas production rate; (ii) ATP concentration and (iii)
methanogenic activity. Volumetric biogas production rate strongly relies on the amount of
fermentative and methanogenic microorganisms retained in the bioreactor. Its relationship with
settling time in Figure 3.3a shows a “tick” curve with a minimum at 2 min and peaks at both the
Washout Transitional Growth Stationary
Time (days)
0 20 40 60 80
Vol
umet
ric
biog
as p
rodu
ctio
n ra
te (m
L L
-1 d
-1)
50
100
150
200
250
0.5 min 1 min 2 min 5 min10 min20 min30 min60 min

54
Figure 3.3 Effect of settling time on steady state volumetric biogas production rate (a), mixed
liquor ATP concentration (b) and methanogenic activity (c)
Settling time (min)
0.5 1.0 2.0 5.0 10.0 20.0 30.0 60.0
Vol
umet
ric b
ioga
s pro
duct
ion
rate
(mL
L-1 d
-1)
180
195
210
225
240
255a
Settling time (min)
0.5 1 2 5 10 20 30 60
ATP
( m
ol L
-1)
0.15
0.18
0.21
0.24
0.27
0.30
0.33b
Settling time (min)
0.5 1.0 2.0 5.0 10.0 20.0 30.0 60.0
Met
hano
geni
c act
ivity
(L C
H4 L
-1 m
ixed
liqu
or d
-1)
8.0
8.5
9.0
9.5
10.0
10.5 c

55
shortest and longest settling time. This “tick” curve implies the existence of a critical settling
time (ts)c at which ASBR retained the minimum amount of active microorganisms. It is
interesting to see that retention of active biomass increased in both directions away from this (ts)c
to the two extreme ends (Figure 3.3a). Since ATP is mainly found in living cells (Lundin and
Thore, 1975), ATP concentration was used here as an indicator of active biomass. It can yet be
regarded as a better tool for dairy manure full of dead biomass debris. ATP profile in Figure 3.3b
appears to be in line with that of the Figure 3.3a, i.e., a “tick” curve with (ts)c at 2 min settling
time and maximum retention at both poles. Comparing to the ATP content in original flushing
dairy manure which is as low as 0.07 µmol L-1, it is obvious to see the ASBR operation and
settling effects on active biomass retention in Figure 3.3b. Methanogens are the slowest growing
organisms in anaerobic digester. Their retention can be regarded as a good sign of successful
active biomass retention, and thus mixed liquor methanogenic activity was determined in Figure
3.3c. Once again, the profile resembles those in Figure 3.3a and b, exhibiting a “tick” curve with
(ts)c at 2 min settling time (Figure 3.3c). This consistency across three different measures of
active biomass retention indicates that settling time exerts bipolar effects on active biomass
retention, and that either long or short (but not intermediate) settling time may be favorable for
anaerobic digestion in ASBRs.
3.4.3. Active microbial response to settling time
According to the GS theory, a long settling time is favorable for biomass retention because it
allows physical retention of whatever settles beneath the effluent zone during the time. However,
the substantial active biomass retention at very short settling time in Figure 3.3 implies a possible
microbial initiative response to settling time in favor of their own retention. In order to examine
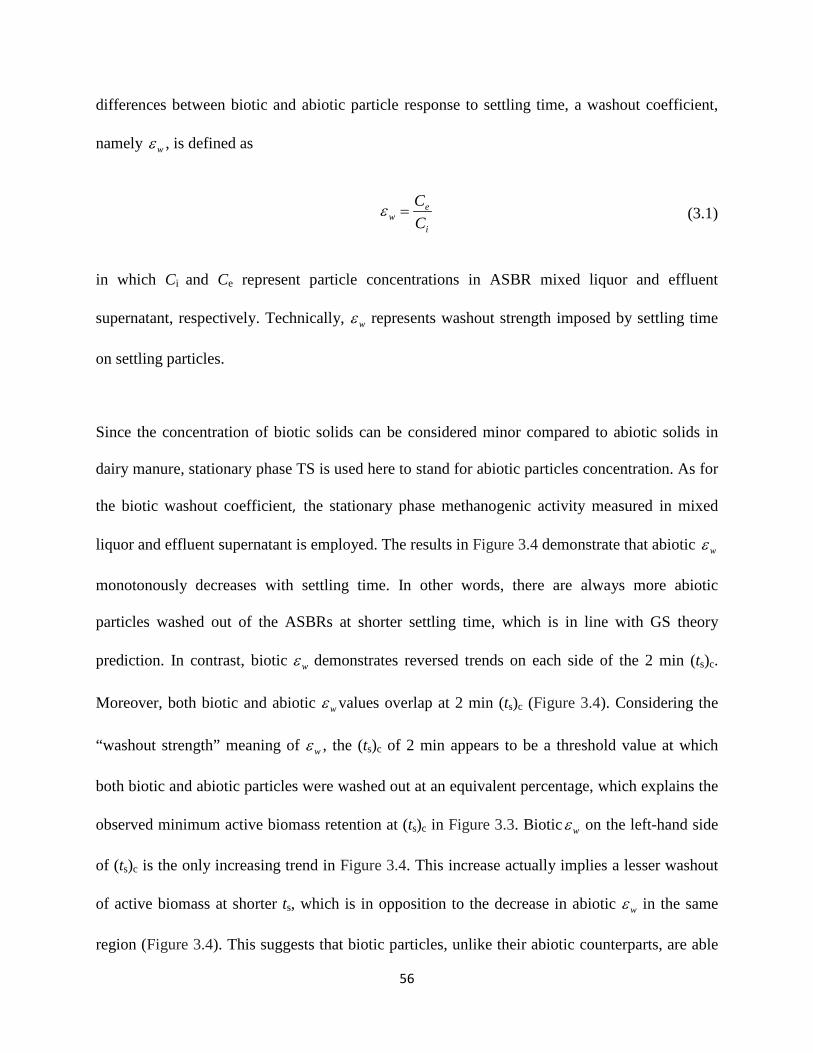
56
differences between biotic and abiotic particle response to settling time, a washout coefficient,
namely wε , is defined as
i
ew C
C=ε (3.1)
in which Ci and Ce represent particle concentrations in ASBR mixed liquor and effluent
supernatant, respectively. Technically, wε represents washout strength imposed by settling time
on settling particles.
Since the concentration of biotic solids can be considered minor compared to abiotic solids in
dairy manure, stationary phase TS is used here to stand for abiotic particles concentration. As for
the biotic washout coefficient, the stationary phase methanogenic activity measured in mixed
liquor and effluent supernatant is employed. The results in Figure 3.4 demonstrate that abiotic wε
monotonously decreases with settling time. In other words, there are always more abiotic
particles washed out of the ASBRs at shorter settling time, which is in line with GS theory
prediction. In contrast, biotic wε demonstrates reversed trends on each side of the 2 min (ts)c.
Moreover, both biotic and abiotic wε values overlap at 2 min (ts)c (Figure 3.4). Considering the
“washout strength” meaning of wε , the (ts)c of 2 min appears to be a threshold value at which
both biotic and abiotic particles were washed out at an equivalent percentage, which explains the
observed minimum active biomass retention at (ts)c in Figure 3.3. Biotic wε on the left-hand side
of (ts)c is the only increasing trend in Figure 3.4. This increase actually implies a lesser washout
of active biomass at shorter ts, which is in opposition to the decrease in abiotic wε in the same
region (Figure 3.4). This suggests that biotic particles, unlike their abiotic counterparts, are able

57
to actively respond to settling time, i.e., more active biomass is actually going to be retained at
stronger abiotic washout strength (Figure 3.4).
Settling time (min)
0.5 1.0 2.0 5.0 10.0 20.0 30.0 60.0
ε w
0.70
0.75
0.80
0.85
0.90
0.95
1.00
1.05
1.10
AbioticBiotic
Figure 3.4 Effect of settling time on washout coefficients for abiotic and biotic particles,
respectively
3.4.4. Living form of retained microorganisms.
The reversed retention trends on both sides of the (ts)c of 2 min, and the maximal retention of
active biomass at 0.5 and 60 min settling time, imply that there might be different living form of
microorganisms in each case (Figure 3.2 to Figure 3.4). CLSM and SEM images indicate that
biofilm attaching on dairy manure fiber is the major living form of retain microorganisms at ts =
0.5 min, while ASBR running at 60 min settling is dominated with planktonic bioflocs (Figure
3.5).

58
Figure 3.5 Confocal visualization of rod and coccoid microbial cells (green), a) attaching on
manure fiber surface in steady state ASBR running at settling time of 0.5 min and b) remaining
suspended in the bulk solution of steady state ASBR running at settling time of 60 min,
respectively. c) SEM image showing the detail of rod and coccoid microbial cells attachment on
fiber surface in steady state ASBR running at settling time of 0.5 min
a b
c

59
3.4.5. Mechanism behind bipolar effects of settling time on active biomass retention
Figure 3.3 to Figure 3.5 clearly demonstrated that settling time is indeed playing bipolar effects
on microorganisms retention in ASBRs, i.e., both extremely long and short settling time were
able to help retain active microbial biomass. The major difference between the two extremes lies
in the living form of those retained microorganisms: long settling time retains bioflocs, and the
short settling time promotes biofilm formation. For decades of conventional ASBR application in
biological wastewater treatment, settling time is usually set at greater than 45 min (Irvine et al.,
1977; Lo et al., 1985; Woolard and Irvine, 1995). Like other gravity settling devices, the design
of ASBR settling time is guided by Eq. (3.1), according to which ASBR discharge height (Ld)
and settling time (ts) create a designed critical settling velocity (Vc) (Figure 3.1). Particles with
settling velocity Vp > Vc are completely retained in ASBR (Vesilind, 2003). Accordingly, a minor
Vc, or in other words a longer ts, should be favorable for particle retention. This holds true for
both biotic and abiotic particles. At least two important points are conveyed from Eq. (3.1): i) ts
actually plays its particle retention role via Vc; and ii) ts should be positively related to particle
retention, so that a maximum retention would be achieved at ts → +∞. This description fits with
data on ts > (ts)c side in Figure 3.3; however, it does not explain the retention downturn at ts <
(ts)c (Figure 3.3).
Extremely short settling time has been be applied in ASBR since 1999 (Beun et al., 1999). It was
found that microorganisms were able to retain themselves in such a strong washout strength, but
they were only retained in the form of biofilm (Beun et al., 1999). Later studies indicated that
short settling time was also playing its retention role via Vc as defined in Eq. (3.1) (Wang et al.,
2006), but in this case, it showed a totally reversed relationship with reference to GS theory, i.e.,

60
short ts turns out to be a positive factor for microbial retention. Thereupon, the SP theory was
established to interpret this microbial active response to washout selection phenomenon, i.e., a
selection pressure will be created by Vc as defined in Eq. (3.1) to wash out slow settling
bioparticles; only those capable of immobilizing themselves in the form of biofilm can become
retained and dominant at short-settling time (Liu et al., 2005). In fact, this mechanism also
explains retention of fermentative microorganisms in animal rumen, where there is a fairly short
hydraulic retention time (McAllister et al., 1994). Thus, the SP theory provides an appropriate
explanation for our observations on ts < (ts)c side in Figure 3.3. It should be emphasized that the
SP theory only applies to active bioparticles capable of self-retention in response to selection
pressure, and not to inactive abiotic particles. Instead, abiotic particles should presumably always
follow GS theory regardless of the range of ts. This integrated interpretation of GS and SP sheds
light on the observations reported in Figure 3.4.
3.4.5.1. Model development
As discussed above, the extent of active biomass retention is governed by two individual theories
on the left- and right- hand sides of (ts)c, respectively. It should be a reasonable assumption that
these two mechanisms always exist and jointly function together in ASBR, and the only
difference is that one may gradually overtake the other as Vc in Eq. (3.) strays from a critical
settling velocity (Vc)c at (ts)c. At Vc = (Vc)c, the two effects just trade off each other giving rise to
a minimum active biomass retention (Figure 3.3). This collective effect can be described as
( ) ( )ccr VSPVGSX += (3.2)
where Xr represents the extent of active biomass retention, and GS(Vc) and SP(Vc) represent the
Vc on Xr effect predicted by GS and SP theories, respectively. According to GS theory (Metcalf

61
and Eddy, 2003), the extent of biomass retention is always inversely related to Vc, and a
maximum retention would be thus achieved when Vc approaches zero, namely infinite ts. This
relationship can be expressed by,
( )
bVaVGS
cc += (3.3)
where a and b are constants. At Vc = 0, a maximum retention, namely a/b, would be
accomplished, and when Vc >> b, the magnitude of retention would approach a/Vc. The unit of “a”
should be the product of the units of the biomass retention and Vc, and “b” should be in Vc unit.
In spite of the novelty of SP theory, all results so far derived from it point to a first-order
dependence of biofilm formation on Vc (Li et al., 2008; Liu et al., 2005; Wang et al., 2006), i.e.,
( ) cc cVVSP = (3.4)
where c is a constant. Its unit should be the quotient of the units of biomass retention over Vc.
Substitution of Eqs. (3.3) and (3.4) into (3.2) gives
c
cr cV
bVaX ++
= (3.5)
Eq. (3.5) describes the integrated effect of Vc on Xr by GS and SP theories, respectively. It has a
minimum value at ( ) bcaV cc −= , which gives ( ) bcacX r −= 2min .
3.4.5.2. Model verification
In order to verify the fitness of Eq. (3.5) for description of the joint effects of GS and SP theories,
the extent of active methanogen retention in Figure 3.4 is expressed by wε−1 , and its
62
relationship with Vc is simulated in Figure 3.6a using Matlab 7.0. The simulated profile exhibits
a “tick” curve in good agreement with experimental data. Since a maximum wε−1 , namely 1,
will be obtained at Vc = 0 m h-1, the “a” value become equal to “b” in this case (Figure 3.6a). Eq.
(3.5) is also applied to the TS retention data, which represents abiotic particles. This simulation
in Figure 3.6b shows a best fit at c = 0, i.e., no SP effect, in agreement with the conjecture that
SP theory does not apply to abiotic particles at all. To further confirm the fitness of Eq. (3.5), it
is also applied to simulate the active biomass retention in terms of other parameters such as
volumetric biogas production rate, ATP concentration and methanogenic activity. The good
agreement between simulation profiles and experimental results in Figure 3.6c, d and e further
confirms the fitness of the Eq. (3.5) model developed above in description of the Vc dependent
active biomass retention. And moreover, it verifies for the first time the speculation that bipolar
effects of settling time on active biomass retention observed in this study are in fact the
integrated results of GS and SP theories in one system.
3.4.5.3. Model limitation
Eq. (3.5) has its limitations, especially at high Vc values. Eq. (3.5) predicts infinite active
biomass retention at Vc → +∞, which is certainly untrue. This false prediction can be ascribed to
the immature development of SP theory at the moment. Little is currently known about what will
happen to active biomass retention at ts = 0, or Vc → +∞ in ASBR. It is expected that the
proposed active biomass retention model will be further improved with the development of the
SP theory in the future.

63
Vc (m/h)
0.0 0.5 1.0 1.5 2.0 2.5 3.0
1- w
-0.1
0.0
0.1
0.2
0.3a = 0.01b = 0.01c = 0.04R2 = 0.92
a
Vc (m/h)
0.0 0.5 1.0 1.5 2.0 2.5 3.0
1- w
-0.02
0.00
0.02
0.04
0.06
0.08
0.10a = 0.002b = 0.002c = 0.000R2 = 0.96
b

64
Vc (m/h)
0.0 0.5 1.0 1.5 2.0 2.5
Vol
umet
ric b
ioga
s pro
duct
ion
rate
(mL/
L/d)
160
180
200
220
240
260a = 273.31b = 1.13c = 63.39R2 = 0.94
c
Vc (m/h)
0.0 0.5 1.0 1.5 2.0 2.5
ATP
( m
ol/L
)
0.15
0.20
0.25
0.30 a = 0.08 b = 0.28c = 0.10R2 = 0.88
d

65
Figure 3.6 Eq. (3.5) simulated active biomass retention (a), inactive biomass retention (b),
volumetric biogas production rate (c), ATP concentration (d) and methanogentic activity (e), (●)
experimental results, (—) simulation profile
3.5. Conclusions
This study revealed bipolar effects of settling time on active biomass retention in ASBR; both
short and long settling time were able to retain high concentrations of active microbes, though in
disparate living forms. Settling time affected active biomass retention through the combined and
opposing effects of gravity settling and selection pressure theories. This observation is supported
by a model integrating the effects of gravity settling and selection pressure which shows good
agreement with experimental results. The effects of gravity settling gradually overtook those of
Vc (m/h)
0.0 0.5 1.0 1.5 2.0 2.5
Met
hano
geni
c ac
itivi
ty (L
CH
4/L/
d)
8
9
10
11
a = 14.52 b = 1.43 c = 2.56R2 = 0.98
e

66
selection pressure as settling time exceeded a critical point; below that critical point, selection
pressure dominated.

67
3.6. References
APHA, 1998. Standard methods for the examination of water and wastewater. 20th ed. American
Public Health Association, Washington DC, USA.
ASTM, 2002. Standard test method for adenosine triphosphate (ATP) content of microorganisms
in water. in: American Society for Testing and Materials (Ed.), ASTM D4012 -81.
Batstone, D.J., Keller, J., Angelidaki, I., Kalyuzhnyi, S.V., Pavlostathis, S.G., Rozzi, A., Sanders,
W.T.M., Siegrist, H., Vavilin, V.A., 2001. The IWA Anaerobic Digestion Model No. 1
(ADM1) 9th World Congress on Anaerobic Digestion, Antwerp, Belgium, pp. 65-73.
Beun, J.J., Hendriks, A., Van Loosdrecht, M.C.M., Morgenroth, E., Wilderer, P.A., Heijnen, J.J.,
1999. Aerobic granulation in a sequencing batch reactor. Water Res. 33, 2283-2290.
Burke, D.A., 2001. Dairy waste anaerobic digestion handbook. Environmental Energy Company,
6007 Hill Street, Olympia, WA 98516.
Connaughton, S., Collins, G., O'Flaherty, V., 2006. Psychrophilic and mesophilic anaerobic
digestion of brewery effluent: A comparative study. Water Res. 40, 2503-2510.
Grady, C.P.L., Daigger, G.T., Lim, H.C., NetLibrary Inc., 1999. Biological wastewater treatment.
2nd edn ed. Marcel Dekker, New York.
Irvine, R.L., Fox, T.P., Richter, R.O., 1977. Investigation of fill and batch periods of sequencing
batch biological reactors. Water Res. 11, 713-717.
Lee, C.C., 2000. Handbook of environmental engineering calculations. McGraw-Hill, New York.
Lettinga, G., Rebac, S., Zeeman, G., 2001. Challenge of psychrophilic anaerobic wastewater
treatment. Trends Biotechnol. 19, 363-370.
Li, Y., Liu, Y., Xu, H.L., 2008. Is sludge retention time a decisive factor for aerobic granulation
in SBR? Bioresour. Technol. 99, 7672-7677.
68
Liu, Y., Wang, Z.W., Qin, L., Liu, Y.Q., Tay, J.H., 2005. Selection pressure-driven aerobic
granulation in a sequencing batch reactor. Appl. Microbiol. Biotechnol. 67, 26-32.
Lo, K.V., Bulley, N.R., Kwong, E., 1985. Sequencing aerobic batch reactor treatment of milking
parlor wastewater. Agr. Wastes. 13, 131-136.
Lott, S.C., Loch, R.J., Watts, P.J., 1994. Settling characteristics of feedlot cattle feces and
manure. Trans. ASAE. 37, 281-285.
Lundin, A., Thore, A., 1975. Comparison of Methods for Extraction of Bacterial Adenine
Nucleotides Determined by Firefly Assay. Appl. Environ. Microbiol. 30, 713-721.
McAllister, T.A., Bae, H.D., Jones, G.A., Cheng, K.J., 1994. Microbial attachment and feed
digestion in the rumen. J. Anim. Sci. 72, 3004-3018.
Metcalf and Eddy, 2003. Wastewater engineering: treatment and reuse. 4th edn ed. McGraw-Hill,
Boston.
Nikolaeva, S., Sanchez, E., Borja, R., Raposo, F., Colmenarejo, M.F., Montalvo, S., Jimenez-
Rodriguez, A.M., 2009. Kinetics of anaerobic degradation of screened dairy manure by
upflow fixed bed digesters: Effect of natural zeolite addition. J. Environ. Sci. Health, Part
A: Toxic/Hazard. Subst. Environ. Eng. 44, 146-154.
Qin, L., Liu, Y., Tay, J.H., 2004. Effect of settling time on aerobic granulation in sequencing
batch reactor. Biochem. Eng. J. 21, 47-52.
Qin, L., Tay, J.H., Liu, Y., 2004. Selection pressure is a driving force of aerobic granulation in
sequencing batch reactors. Process Biochem. 39, 579-584.
Schwarzenbeck, N., Borges, J.M., Wilderer, P.A., 2005. Treatment of dairy effluents in an
aerobic granular sludge sequencing batch reactor. Appl. Microbiol. Biotechnol. 66, 711-
718.

69
Umana, O., Nikolaeva, S., Sanchez, E., Borja, R., Raposo, F., 2008. Treatment of screened dairy
manure by upflow anaerobic fixed bed reactors packed with waste tyre rubber and a
combination of waste tyre rubber and zeolite: Effect of the hydraulic retention time.
Bioresour. Technol. 99, 7412-7417.
US EPA, 2007. Guide to Anaerobic Digesters. Anaerobic Digester Database.
Vartak, D.R., Engler, C.R., McFarland, M.J., Ricke, S.C., 1996. Attached-film media
performance in psychrophilic anaerobic treatment of dairy cattle wastewater 7th National
Bioenergy Conference, Nashville, Tennessee, pp. 79-84.
Vesilind, P.A., 2003. Wastewater treatment plant design. IWA Pub, London.
Wang, Z.W., Liu, Y., Tay, J.H., 2006. The role of SBR mixed liquor volume exchange ratio in
aerobic granulation. Chemosphere 62, 767-771.
Wilderer, P.A., Irvine, R.L., Goronszy, M.C., 2001. Sequencing Batch Reactor Technology.
IWA, London, UK.
Wilkie, A.C., Castro, H.F., Cubinski, K.R., Owens, J.M., Yan, S.C., 2004. Fixed-film anaerobic
digestion of flushing dairy manure after primary treatment: Wastewater production and
characterisation. Biosystems Eng. 89, 457-471.
Woolard, C.R., Irvine, R.L., 1995. Treatment of hypersaline waste-water in the sequencing batch
reactor. Water Res. 29, 1159-1168.

70
CHAPTER FOUR
KINETICS OF PSYCHROPHILIC ANAEROBIC DIGESTER WITH BIOFILM
SUPPORTED BY SOLIDS FROM FLUSHING DAIRY MANURE
4.1.Abstract
Microbial biomass retention is critical for ensuring the performance of an anaerobic digester. In
applications such as treatment of animal waste, however, the current biomass retention
technologies using artificial biofilm support media are vulnerable to clogging caused by manure
fiber. In this study, a new strategy, improved biomass retention with fiber material present within
the dairy manure as biofilm carriers, was evaluated for treating flushing dairy manure in a
psychrophilic anaerobic sequencing batch reactor (ASBR). A kinetic study was carried out for
process control and design by comparing four microbial growth kinetic models, i.e. first-order,
Grau, Monod and Chen & Hashimoto models. A volumetric methane production rate of 0.24
L/L/d of and specific methane productivity of 0.19 L/gVSloaded were achieved at 6 days HRT. It
was proved that ASBR using manure fiber as support media not only improved methane
production but also reduced the necessary HRT and temperature to achieve a similar treating
efficiency compared with current technologies. The kinetic model can be used for design and
optimization of the process.
Keywords: psychrophilic, kinetics, ASBR, anaerobic digestion, dairy manure

71
4.2. Introduction
Livestock farms in US produce a total of about 2 billion tons of manure each year (Gillespie &
Flanders, 2010), which accounts for 8% of the total US anthropogenic bio-methane emissions
(USEPA, 2010). Anaerobic digestion (AD) is an alternative to livestock waste management that
offers economic and environmental benefits. Besides alleviating manure-associated greenhouse
gas (GHG) emissions and farm-generated odors, AD of animal waste provides fertilizers rich in
nutrient, and biogas as renewable energy.
Wider adoption of AD for animal manure management has been limited primarily by economics.
This is especially true in some applications where the wastewater is relatively dilute such as in
flushing dairies. Flushing manure handling systems are widely employed within large-scale dairy
farms due to their reduced labor and mechanical failures (Powers et al., 1997). However,
flushing systems produce a waste stream with total solids of 1–2 %, negatively impacting
conventional AD treatment processes due to the fact that diluted manure increases digester size
and heating requirements. Anaerobic digestion at psychrophilic temperature can alleviate this
concern, if corresponding losses in biogas production rates due to the lower utilized temperature
can be overcome through high microbial accumulation (Kashyap et al., 2003). By inference,
assuming adequate psychrophilic operation, the main concerns with using an anaerobic digester
for dilute manure treatment is the challenges in achieving higher solids retention time (SRT)
required to retain microbial biomass and reducing required size. Typical designs such as
continuous stirred-tank reactor (CSTR) or plug flow (PF) digesters cannot accomplish such
decoupling of SRT and HRT (hydraulic retention time) (Zaher et al., 2008).

72
Many efforts have been made to increase microbial biomass retention with different digester
configurations, such as fixed-bed and hybrid reactors (Borja et al., 1994; Demirer & Chen, 2005;
Umana et al., 2008; Wilkie et al., 2004; Zaher et al., 2008). A variety of external artificial
biofilm support media, such as spherical plastic trickling filter media, floating support media,
automobile tires, and zeolite have been employed in anaerobic biofilm digesters to enhance
biomass retention. The addition of artificial support media occupies substantial digester volume,
which automatically lowers the digester efficiency. Moreover, the artificial biofilm support
media are vulnerable to clogging caused by manure fiber, which impedes commercialization.
A concept of biofilm retention with influent solids was presented in the authors’ previous studies
(Frear et al., 2010; Wang et al., 2011). It was reported that anaerobic microorganisms have a
strong affinity to manure fiber and they can serve as natural biomass support media in a high rate
digester. Biomass retention using manure fiber as natural support media seems a promising
approach for anaerobic treatment of flushing dairy manure. In virtue of no artificial biofilm
support media, the concern regarding mechanical failure caused by media clogging is removed.
Along with low maintenance, the required digester size and cost are reduced. Anaerobic
sequencing batch reactors (ASBR) are known to be capable of uncoupling HRT with SRT for
biomass retention with particular sequence of operation of ASBR exerting selection pressures to
microbes for immobilization (Liu et al., 2005; Wang et al., 2011). Wang et al. (2011) showed
that an ASBR digester, which retained high concentration of biomass in the form of fiber-
attached biofilm by selection pressure, exhibited comparatively high methane yield and
production rate. However, applications of this technology require technical information for
process design and optimization.

73
Although simple, ASBR operation involves complex processes whose design and optimization
can be facilitated using mathematical models. Kinetic modeling, being a useful tool in process
analysis, design, and system control can be established by precise determination of kinetic
coefficients. Process kinetics also details the effects of operational and environmental factors on
substrate utilization rates. A variety of kinetic models have been developed to describe microbial
growth kinetics. First order model is the simplest model for microbial growth with the
assumption of first-order degradation, which has been used often to describe hydrolysis limited
digestion with respect to particulate substrate (Gavala et al., 2003). Monod model is the most
widely used kinetic model which was developed as a result of empirical analysis (Monod, 1949).
Grau et al. (1975) and Chen and Hashimoto (1978) improved the Monod model by predicting
that effluent substrate concentration is proportional to influent substrate concentration. However,
it was assumed that microbial growth kinetics in anaerobic biofilm reactors followed Monod or
first-order models in most literature (Batstone et al., 2002; Buffière et al., 1998; Huang & Jih,
1997; Rittmann & McCarty, 2001). The lack of appropriate models in the literature though
shows that improvements can still be made. For example, it has been hypothesized that the Chen
& Hashimoto model is capable of characterizing biofilm growth kinetics with an improved
performance, compared to the Monod model, due to dependence on influent substrate
concentration.
The main objective of this study was to evaluate the performance and kinetics of the new
biomass retention strategy during psychrophilic ASBR digestion of flushing dairy manure. A
kinetic model with aim to find a more appropriate biofilm growth model was derived and
assessed for substrate utilization and methane production. Both HRT and OLR (organic loading

74
rate) are considered as the most important parameters for digester operation. Hence, the effects
of HRT and OLR on methane production were the primary output of the kinetic model.
4.3. Materials and methods
The aforementioned biomass retention technology for treating flushing dairy manure at
psychrophilic temperature were evaluated in five lab scale digesters operated in sequencing batch
mode. Kinetic properties of psychrophilic ASBR digesters were then analyzed and a kinetic
model was derived for system optimization.
4.3.1. Feedstock and seed
Fresh dairy manure was collected from the Washington State University Knott Dairy Center in
Pullman, WA, USA and stored at 4 °C prior to use. Before addition to digesters, manure was
diluted with tap water to mimic flushing dairy manure, which resulted in mixed liquor containing
9.1 g/L total solids (TS) and 7.6 g/L total volatile solids (VS). Anaerobic sludge was sampled
from an anaerobic digester in Pullman Wastewater Treatment Facility with TS of 17.1 g/L and
VS of 11.7 g/L.
4.3.2. Experimental setup and operation
Five digesters (64 cm in height and 10 cm in diameter) with working volume of 6 L were
operated as ASBR at respective cycle times of 2, 4, 6, 8, and 10 days while the other operation
conditions remained constant (50% exchange ratio, 5 min settling time and 20 days SRT). This
operation produced HRT of 4, 8, 12, 16, and 20 days in each digester (Table 4.1). Settling time
was determined based on the authors’ previous study to form biofilm which attached on the

75
surface of manure fiber (Wang et al., 2011). Each digester was mixed with a separate impeller
driven by a respective motor at 100 rpm. Intermittent mixing was carried out for 10 min every 2h.
Manure and anaerobic sludge were introduced to each digester at 1:1 volume ratio when
experiments started. Digesters were then placed in a low temperature chamber (22 °C) and
operated in sequencing batch mode which consists of 5 stages: filling, reaction, desludge, settling
and discharging in one cycle. At the end of the reaction stage, mixed liquor was discharged under
complete mixed state to control SRT then supernatant was discharged after settling stage to
control HRT in each digester. Evaluation of system performance for each HRT was carried out
during pseudo steady state conditions, when biogas production, methane content and effluent
COD variations were less than 10% (Karim et al., 2005).
4.3.3. Chemical analytical methods
TS, VS and COD analyses were done according to Standard Methods (APHA, 1998). The
volume of biogas from the digester was determined by water displacement method. Content of
CH4 and CO2 were determined using a Varian gas chromatograph (Palo Alto, CA, USA)
equipped with a thermal conductivity detector. A Restek (Bellefonte, PA, USA) shincarbon
column (2 × 1/16 inch) with silcosteel packing material (100/120 mesh) was used, and nitrogen
served as the carrier gas. Each type of gas was quantified based on a calibration curve. All
samples were measured at the end of each cycle.
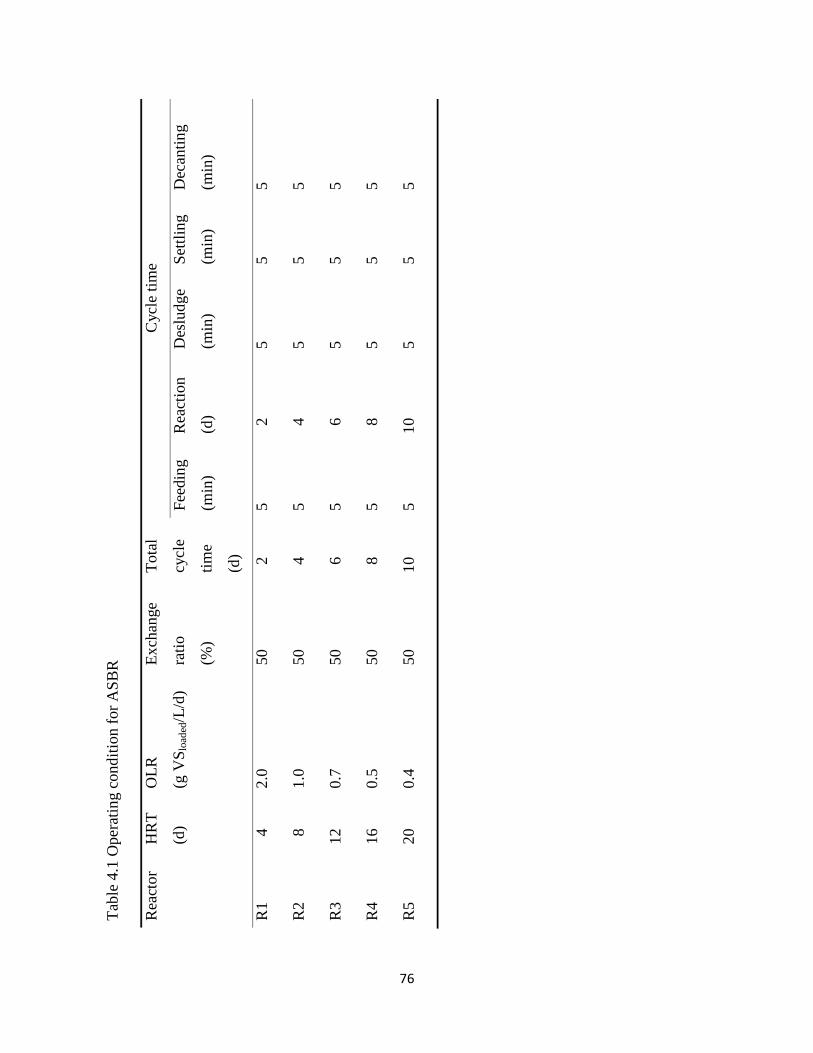
76
Tabl
e 4.
1 O
pera
ting
cond
ition
for A
SBR
Rea
ctor
H
RT
(d)
OLR
(g V
S loa
ded/L
/d)
Exch
ange
ratio
(%)
Tota
l
cycl
e
time
(d)
C
ycle
tim
e
Feed
ing
(min
)
Rea
ctio
n
(d)
Des
ludg
e
(min
)
Settl
ing
(min
)
Dec
antin
g
(min
)
R1
4
2.0
50
2
5 2
5
5 5
R2
8
1.0
50
4
5 4
5
5 5
R3
12
0.7
50
6
5 6
5
5 5
R4
16
0.5
50
8
5 8
5
5 5
R5
20
0.4
50
10
5 10
5
5 5

77
4.3.4. Development of kinetic model
Kinetic models predicting methane production were derived assuming digesters operated at
steady state conditions. Four model types were considered in this study in order to choose a
model with appropriate fit for microbial growth kinetics during anaerobic digestion of flushing
dairy manure in ASBR digester.
First order: 𝜇 =𝑘𝑘
𝑘0 − 𝑘− 𝑏 (4.1)
Grau: 𝜇 =𝜇𝑚𝑘𝑘0
− 𝑏 (4.2)
Monod: 𝜇 =𝜇𝑚𝑘𝐾𝑠 + 𝑘
− 𝑏 (4.3)
Chen & Hashimoto: 𝜇 =𝜇𝑚𝑘
𝐾𝑘0 + (1 − 𝐾)𝑘− 𝑏 (4.4)
Microbial growth mass balance was considered as the basis for model derivation, and rate of
microbial growth can be written as:
𝑟𝑚 =𝑑𝑋𝑑𝑡
= 𝜇𝑋 (4.5)
Thus, mass balance equation for microbial growth can be given as follows:
𝑉𝑑𝑋𝑑𝑡
= 𝑄𝑋0 − 𝑄𝑋 + 𝑟𝑚𝑉 (4.6)
78
At steady state (𝑑𝑋𝑑𝑡
= 0), the above equation can be simplified as:
𝜇 =1𝑏
(4.7)
By use of each of the above models, steady state effluent substrate concentrations were derived
and are listed in Table 4.2. Taking Chen & Hashimoto model as an example, by substituting Eq.
(4.4) in Eq. (4.7), effluent substrate concentration can be expressed as
𝑘 =𝐾𝑘0(1 + 𝑏𝑏)
(𝐾 − 1)(1 + 𝑏𝑏) + 𝜇𝑚𝑏 (4.8)
If B denotes the volume of methane produced at standard condition per gram of substrate loaded
to the digester, and B0 is the volume of methane produced at standard condition per gram of
substrate loaded at infinite retention time, then the biodegradable substrate in the digester will be
directly proportional to B0 – B, and B0 will be directly proportional to the biodegradable substrate
loading (Chen & Hashimoto, 1978). Therefore, the following relationship can be derived:
𝑘𝑘0
=𝐵0 − 𝐵𝐵0
(4.9)
The above equation can be rearranged to give:
𝐵 = 𝐵0 �𝑘0 − 𝑘𝑘0
� (4.10)
The volumetric methane production rate equals B times OLR:
𝑀 =𝐵𝑘0𝑏
(4.11)

79
By use of Eq. (4.10), Eq. (4.11) can be expressed as:
𝑀 =𝐵0𝑏
(𝑘0 − 𝑘) (4.12)
The volumetric methane production rate with respect to HRT can be derived by substituting
steady state substrate concentration of effluent into Eq. (4.12). Using Chen & Hashimoto model
as an example, Eq. (4.12) can be written as follows:
𝑀 =𝐵0𝑏�𝑘0 −
𝐾𝑘0(1 + 𝑏𝑏)(𝐾 − 1)(1 + 𝑏𝑏) + 𝜇𝑚𝑏
� (4.13)
The volumetric methane production rate with respect to OLR can be expressed as:
𝑀 = 𝐵0 �𝐿 −𝐾𝐿(𝐿 + 𝑏𝑘0)
(𝐾 − 1)(𝐿 + 𝑏𝑘0) + 𝜇𝑚𝑘0� (4.14)
The specific methane productivity with respect to HRT can be expressed as:
𝑃 = 𝐵0 �1 −𝐾(1 + 𝑏𝑏)
(𝐾 − 1)(1 + 𝑏𝑏) + 𝜇𝑚𝑏� (4.15)
The specific methane productivity with respect to OLR can be expressed as:
𝑃 = 𝐵0 �1 −𝐾(𝐿 + 𝑏𝑘0)
(𝐾 − 1)(𝐿 + 𝑏𝑘0) + 𝜇𝑚𝑘0� (4.16)
The VS removal efficiency with respect to HRT can be written as:
𝐸 = 1 −𝐾(1 + 𝑏𝑏)
(𝐾 − 1)(1 + 𝑏𝑏) + 𝜇𝑚𝑏 (4.17)

80
The volumetric methane production rate, specific methane productivity and removal efficiency
with respect to the other three models were also derived for model comparison and listed in
Table 4.2.
In order to determine B0, mass balance equation of substrate consumption can be written as:
𝑉𝑑𝑘𝑑𝑡
= 𝑄𝑘0 − 𝑄𝑘 + 𝑟𝑠𝑉 (4.18)
Rate of substrate consumption
𝑟𝑠 =𝑑𝑋𝑑𝑡
= −𝑘′𝑘 (4.19)
At steady state (𝑑𝑆𝑑𝑡
= 0), effluent substrate concentration can be expressed as:
𝑘 =𝑘0
(𝑏𝑘′ + 1) (4.20)
Substituting Eq. (4.20) into Eq. (4.12) yields:
𝑘0𝑀
=𝑏𝐵0
+1
𝐵0𝑘′ (4.21)

81
Ta
ble
4.2
Kin
etic
s mod
els u
sed
in th
is st
udy
Kin
etic
coef
ficie
nts
Firs
t-ord
er
Gra
u M
onod
C
hen
& H
ashi
mot
o
Spec
ific
grow
th ra
te
𝜇=
𝑘𝑘𝑘 0−𝑘−𝑏
𝜇=𝜇 𝑚
𝑘𝑘 0
−𝑏
𝜇=
𝜇 𝑚𝑘
𝐾 𝑠+𝑘−𝑏
𝜇=
𝜇 𝑚𝑘
𝐾𝑘 0
+(1−𝐾
)𝑘−𝑏
Efflu
ent
subs
trate
conc
entra
tion
𝑘=
𝑘 0(1
+𝑏𝑏
)𝑏(𝑘
+𝑏)
+1
𝑘=𝑘 0
(1+𝑏𝑏
)𝜇 𝑚
𝑏
𝑘=
𝐾 𝑠(1
+𝑏𝑏
)𝑏(𝜇 𝑚
−𝑏)−
1 𝑘
=𝐾𝑘 0
(1+𝑏𝑏
)(𝐾
−1)
( 1+𝑏𝑏
) +𝜇 𝑚
𝑏
Vol
umet
ric
met
hane
prod
uctio
n ra
te
𝑀=𝐵 0 𝑏
(𝑘0−
𝑘 0(1
+𝑏𝑏
)𝑏(𝑘
+𝑏)
+1)
𝑀=𝐵 0 𝑏
(𝑘0−𝑘 0
( 1+𝑏𝑏
)𝜇 𝑚
𝑏)
𝑀=𝐵 0 𝑏
(𝑘0−
𝐾 𝑠( 1
+𝑏𝑏
)𝑏(𝜇 𝑚
−𝑏)−
1) 𝑀
=𝐵 0 𝑏
(𝑘0−
𝐾𝑘 0
( 1+𝑏𝑏
)( 𝐾
−1)
( 1+𝑏𝑏
) +𝜇 𝑚
𝑏)
Spec
ific
met
hane
prod
uctiv
ity
𝑃=𝐵 0
(1−
1+𝑏𝑏
𝑏(𝑘
+𝑏)
+1)
𝑃=𝐵 0
(1−
1+𝑏𝑏
𝜇 𝑚𝑏
) 𝑃
=𝐵 0
(1−
𝐾 𝑠( 1
+𝑏𝑏
)𝑘 0𝑏(𝜇 𝑚
−𝑏)−𝑘 0
) 𝑃
=𝐵 0�1
−𝐾
(1+𝑏𝑏
)( 𝐾
−1)
(1+𝑏𝑏
)+𝜇 𝑚
𝑏�
Rem
oval
effic
ienc
y 𝐸
=1−
1+𝑏𝑏
𝑏(𝑘
+𝑏)
+1
𝐸=
1−
1+𝑏𝑏
𝜇 𝑚𝑏
𝐸
=1−
𝐾 𝑠( 1
+𝑏𝑏
)𝑘 0𝑏(𝜇 𝑚
−𝑏)−𝑘 0
𝐸
=1−
𝐾(1
+𝑏𝑏
)(𝐾
−1)
( 1+𝑏𝑏
) +𝜇 𝑚
𝑏

82
B0 of manure depends on the species, ration, age of the manure, collection, and storage and
bedding material. Values of B0 for dairy manure range from 0.21 to 0.27 (Chen & Hashimoto,
1978; Husain, 1998). B0 of flushing dairy manure used in this present study was determined by
plotting HRT versus S0/M according to Eq. (4.21). The slope of the curve was used to calculate
B0 as 0.24 L CH4/gVSloaded.
An endogenous decay constant b of 0.03 /d was used for the model simulations (Husain, 1998).
Values of kinetic parameters for each model were estimated using the Curve Fitting function in
SigmaPlot 11 (Systat Software, Inc.) using the Marquardt-Levenberg algorithm with 200
iterations.
4.4. Results and discussion
4.4.1. Effect of HRT on biogas production
Biogas generation in the ASBR digesters with different HRT is represented in Figure 4.1. It can
be seen that the time needed to reach steady state condition is associated with HRT. The longer
the HRT, the more time required for start-up. After operating periods of 34, 62, 72, and 80 days,
digesters R1, R2, R3, R4 and R5 corresponding to HRT of 4, 8, 12, 16, 20 days reached steady
state condition, respectively.

83
Figure 4.1 Volumetric biogas production rate at various HRT
The volumetric biogas productivity during manure bio-methanization was also related to HRT in
each digester. The highest volumetric biogas production was observed at the shortest HRT of 4
days (digester R1) with rate of 0.37 L/L/d, while digester R5, running at the longest HRT of 20
days, showed the lowest rate of 0.14 L/L/d. Zaher et al. (2008) reported similar results
(volumetric methane production rate of 0.20 L/L/d at 5 day HRT and 0.10 L/L/d at 17 day HRT)
from a tire supported fixed-bed digester treating flushing dairy manure but under mesophilic
temperature. A much lower rate using a zeolite supported CSTR digester even at mesophilic
conditions was obtained by Borja et al. (1994). Powers et al. (1997) reported a fixed-bed digester

84
with a low methane production at 2.3 day HRT. The manure fiber supported psychrophilic
ASBR digester showed good performance as compared against these other technologies.
Biofilm was expected to be formed in all digesters due to selection pressure in terms of settling
time (Wang, Ma et al. 2011). However, washout of biomass was present and digester failure
occurred when the HRT was further shortened to 2 days, which is because too short of an HRT at
start-up period exceeded the microorganism growth limits (Rittmann & McCarty, 2001). A
practical limit with a minimum HRT of 4 days was required at the start-up period for biomass
retention within the digester.
Compared with our previous studies, the present study was conducted under psychrophilic
temperature (22 °C) instead of mesophilic condition (35 °C). However, the digester in this study
showed a comparable performance with that of a mesophilic digester (volumetric biogas
production rate of 0.25 L/L/d and specific methane productivity of 0.20 L/gVSloaded), indicating
that biomass retention provides a cost-effective method for uncompromised anaerobic digestion
rate at lower temperature with less energy consumption due to the reduction of heat required
(Connaughton et al., 2006; Lettinga et al., 2001).
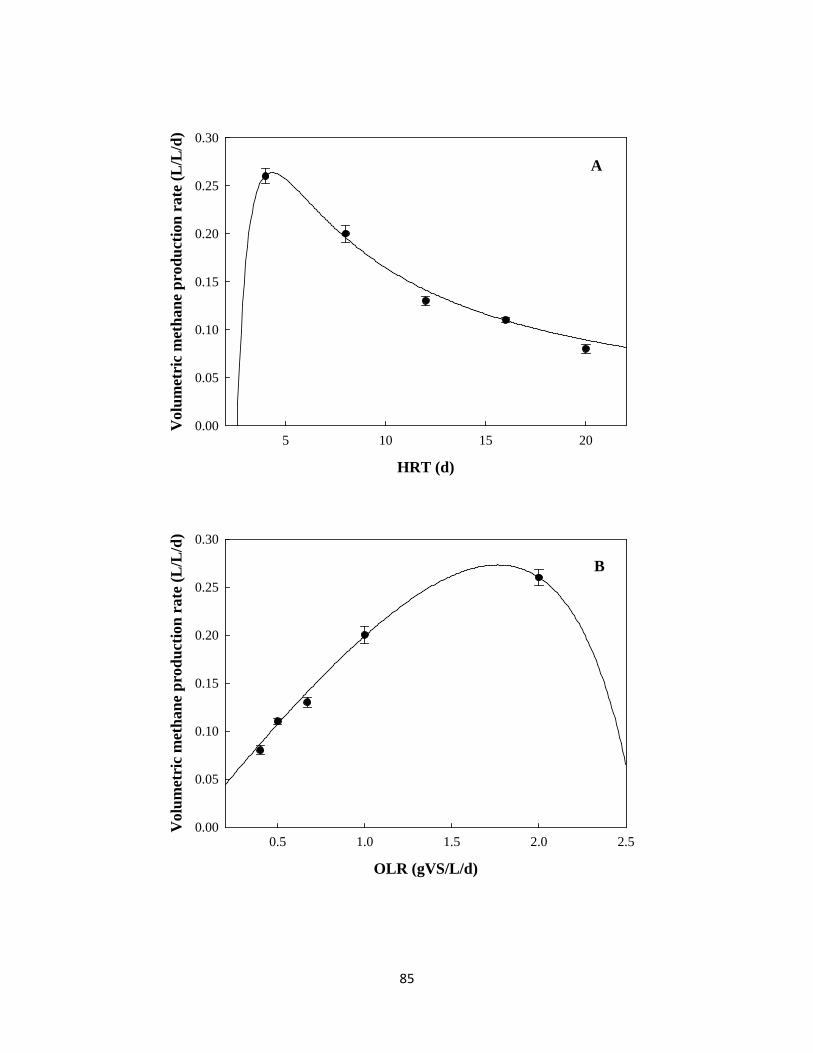
85
HRT (d)
5 10 15 20
Vol
umet
ric
met
hane
pro
duct
ion
rate
(L/L
/d)
0.00
0.05
0.10
0.15
0.20
0.25
0.30
A
OLR (gVS/L/d)
0.5 1.0 1.5 2.0 2.5
Vol
umet
ric
met
hane
pro
duct
ion
rate
(L/L
/d)
0.00
0.05
0.10
0.15
0.20
0.25
0.30
B

86
Figure 4.2 Changes of volumetric methane production rate and specific methane productivity
against HRT and OLR, (●) experimental results, and (—) simulation profile
HRT (d)
5 10 15 20
Spec
ific
met
hane
pro
duct
ivity
(L/g
VS
load
ed)
0.00
0.05
0.10
0.15
0.20
0.25
0.30
C
OLR (gVS/L/d)
0.5 1.0 1.5 2.0
Spec
ific
met
hane
pro
duct
ivity
(L/g
VS
load
ed)
0.10
0.12
0.14
0.16
0.18
0.20
0.22
0.24
D

87
4.4.2. Effect of OLR on biogas production
OLR in each digester varied according to different HRT since influent substrate concentration is
fixed. The effects of OLR on volumetric methane production rate and specific methane
productivity were plotted in Figure 4.2, C and D. Specific methane productivity showed an
inverse relationship with respect to OLR, reducing slightly until OLR reached 1 g VSloaded/L/d at
which point further OLR extension led to steep drops in specific methane productivity.
The volumetric methane production rate and specific methane productivity are often two
competing performance parameters. An increasing of OLR favors volumetric methane
production rate but leads to impaired specific methane productivity. It seems a compromise in
OLR should be employed with an OLR of around 1 g VSloaded/L/d yielding high values for both
parameters. The same situation is applied HRT with a HRT around 4–6 days being favored for
both parameters.
4.4.3. Kinetic modeling
4.4.3.1.Evaluation of Kinetic models
First-order, Grau, Monod and Chen & Hashimoto models were chosen to determine the most
appropriate model for the kinetics of methane production from flushing dairy manure in an
ASBR digester. Results are presented in Figure 4.3 and goodness of fitting is listed in Table 4.3.
On the account of poor correlation with data sets, Monod model was not recommended for
kinetic analysis. Furthermore, the Monod and first-order model failed to predict volumetric
methane production rate decreases at extremely short HRT, which led to reduced accuracy in the
simulation. The limitation of the Monod model resides in the effluent substrate concentration (S)
being independent of the influent substrate concentration (S0), with organic loading notably
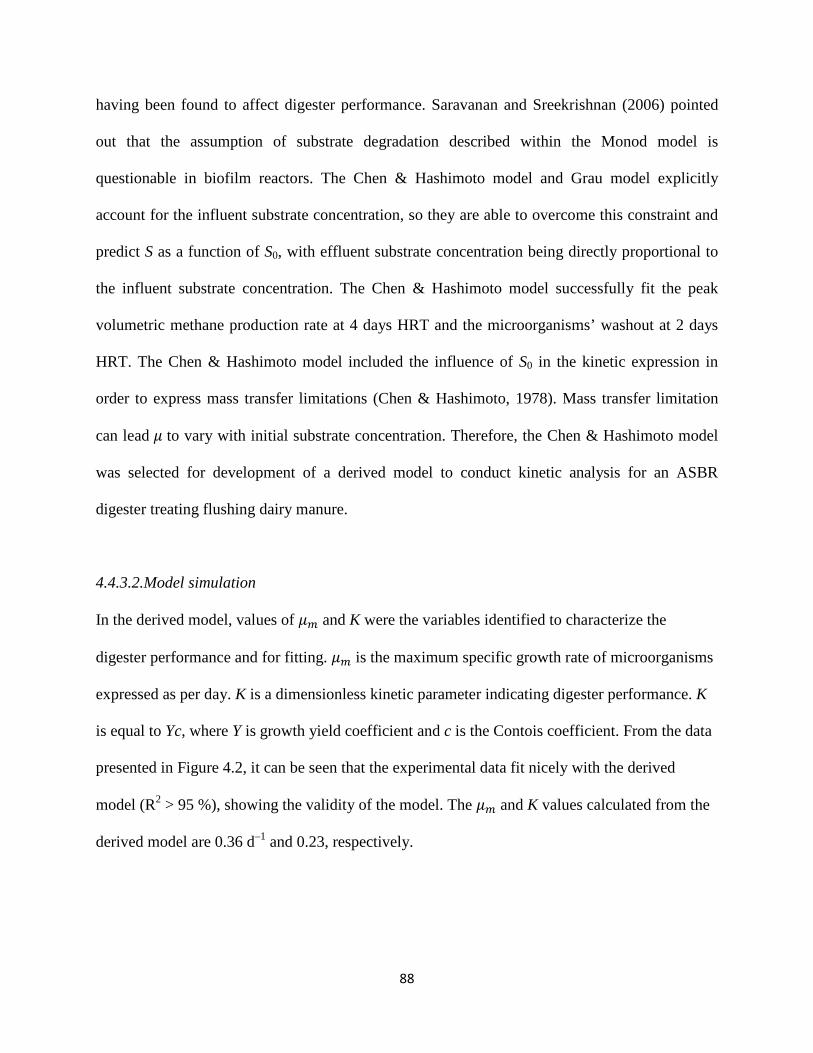
88
having been found to affect digester performance. Saravanan and Sreekrishnan (2006) pointed
out that the assumption of substrate degradation described within the Monod model is
questionable in biofilm reactors. The Chen & Hashimoto model and Grau model explicitly
account for the influent substrate concentration, so they are able to overcome this constraint and
predict S as a function of S0, with effluent substrate concentration being directly proportional to
the influent substrate concentration. The Chen & Hashimoto model successfully fit the peak
volumetric methane production rate at 4 days HRT and the microorganisms’ washout at 2 days
HRT. The Chen & Hashimoto model included the influence of S0 in the kinetic expression in
order to express mass transfer limitations (Chen & Hashimoto, 1978). Mass transfer limitation
can lead 𝜇 to vary with initial substrate concentration. Therefore, the Chen & Hashimoto model
was selected for development of a derived model to conduct kinetic analysis for an ASBR
digester treating flushing dairy manure.
4.4.3.2.Model simulation
In the derived model, values of 𝜇𝑚 and K were the variables identified to characterize the
digester performance and for fitting. 𝜇𝑚 is the maximum specific growth rate of microorganisms
expressed as per day. K is a dimensionless kinetic parameter indicating digester performance. K
is equal to Yc, where Y is growth yield coefficient and c is the Contois coefficient. From the data
presented in Figure 4.2, it can be seen that the experimental data fit nicely with the derived
model (R2 > 95 %), showing the validity of the model. The 𝜇𝑚 and K values calculated from the
derived model are 0.36 d–1 and 0.23, respectively.
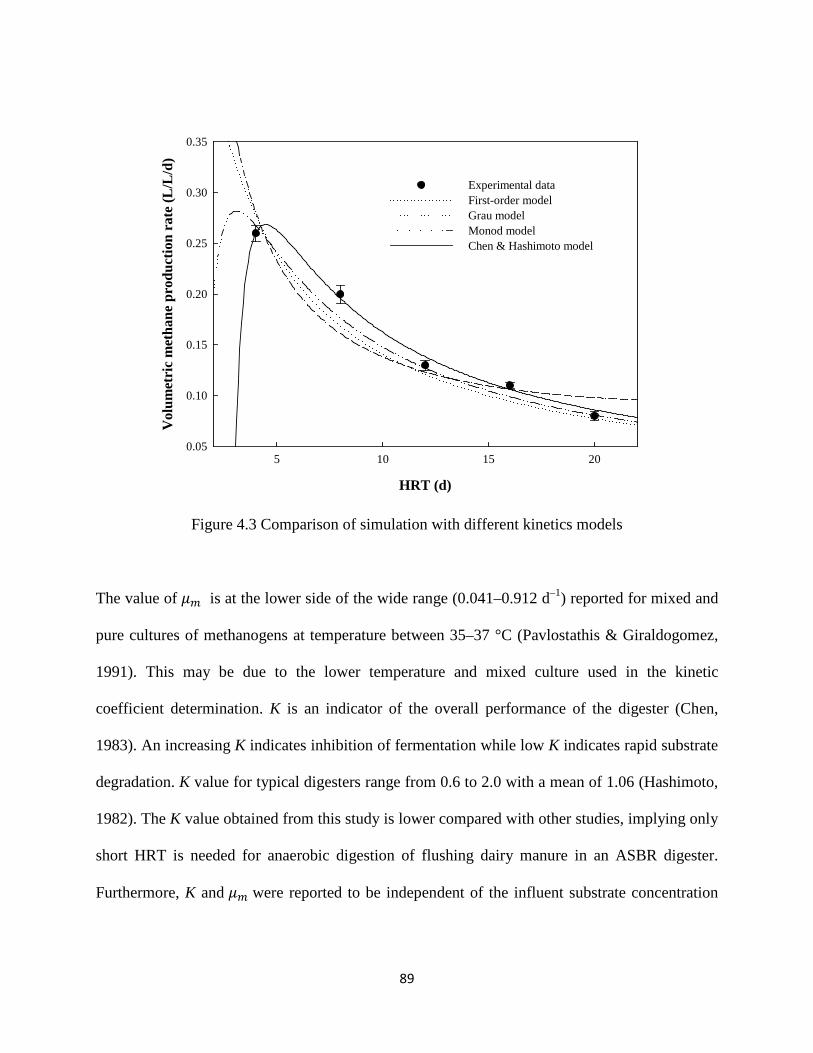
89
Figure 4.3 Comparison of simulation with different kinetics models
The value of 𝜇𝑚 is at the lower side of the wide range (0.041–0.912 d–1) reported for mixed and
pure cultures of methanogens at temperature between 35–37 °C (Pavlostathis & Giraldogomez,
1991). This may be due to the lower temperature and mixed culture used in the kinetic
coefficient determination. K is an indicator of the overall performance of the digester (Chen,
1983). An increasing K indicates inhibition of fermentation while low K indicates rapid substrate
degradation. K value for typical digesters range from 0.6 to 2.0 with a mean of 1.06 (Hashimoto,
1982). The K value obtained from this study is lower compared with other studies, implying only
short HRT is needed for anaerobic digestion of flushing dairy manure in an ASBR digester.
Furthermore, K and 𝜇𝑚 were reported to be independent of the influent substrate concentration
HRT (d)
5 10 15 20
Vol
umet
ric
met
hane
pro
duct
ion
rate
(L/L
/d)
0.05
0.10
0.15
0.20
0.25
0.30
0.35
Experimental dataFirst-order modelGrau modelMonod modelChen & Hashimoto model

90
for diluted organic waste stream (Chen & Hashimoto, 1978). Hence, the lower K value could be
attributed to high amount of biomass retained within ASBR digester.
From simulated profiles, digestion performance, as indicated by volumetric methane production
rate, was highest at near 4 days or at an organic loading rate of 2 g VSloaded/L/d (Figure 4.2, A
and C). Digester performance can also be represented by specific methane productivity with this
indicator pointing to maximums at 5–20 days and OLR of between 0.5–1.3 g VSloaded/L/day
(Figure 4.2, B and D). Comparison of the two performance indicators shows that an ideal HRT
for ASBR feeding with flushing dairy manure would be around 4–6 days while OLR can either
be limited for enhanced specific methane productivity or slightly increased for improved
volumetric performance.
Table 4.3 Summary of model comparison with kinetic coefficients and goodness of fit
Models Kinetic coefficients R2 SRSE*
First-order 𝑘= 0.43 0.92 0.073
Grau 𝜇𝑚= 0.67 day-1 0.96 0.032
Monod 𝜇𝑚= 0.07 day-1
𝐾𝑠= 0.24 g VS 0.76 0.102
Chen & Hashimoto 𝜇𝑚= 0.36 day-1
𝐾= 0.23 0.99 0.011
*The sum of residual squared error
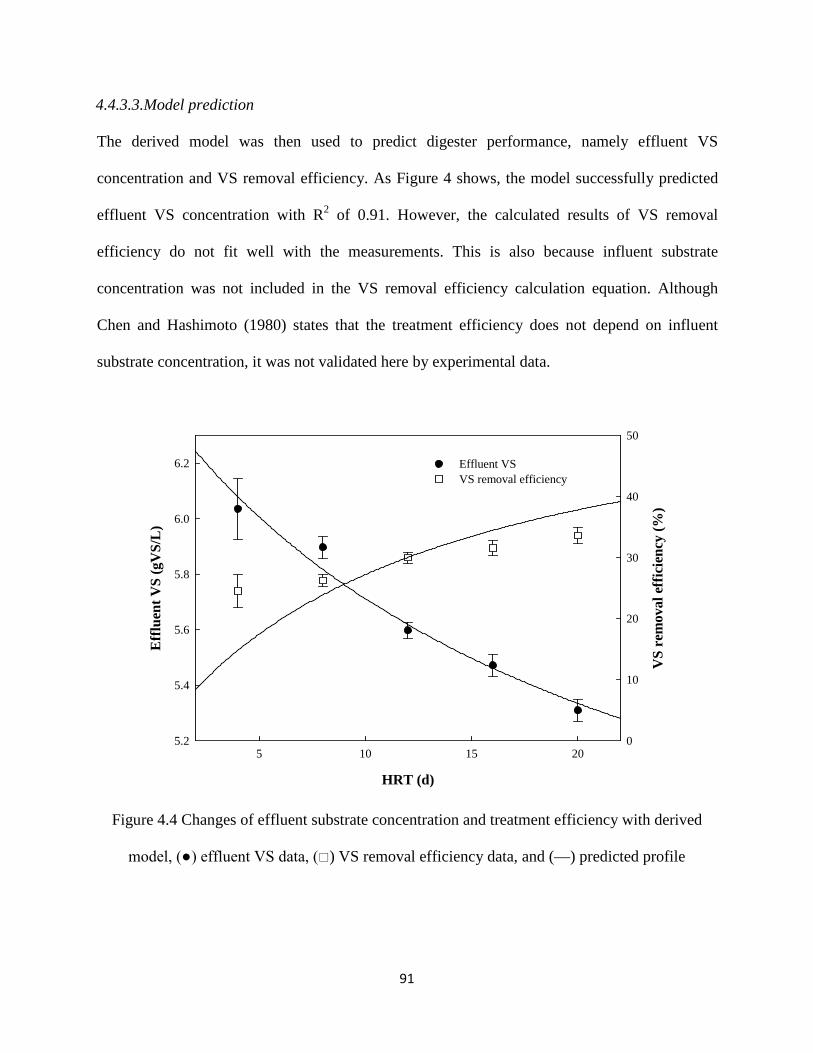
91
4.4.3.3.Model prediction
The derived model was then used to predict digester performance, namely effluent VS
concentration and VS removal efficiency. As Figure 4 shows, the model successfully predicted
effluent VS concentration with R2 of 0.91. However, the calculated results of VS removal
efficiency do not fit well with the measurements. This is also because influent substrate
concentration was not included in the VS removal efficiency calculation equation. Although
Chen and Hashimoto (1980) states that the treatment efficiency does not depend on influent
substrate concentration, it was not validated here by experimental data.
Figure 4.4 Changes of effluent substrate concentration and treatment efficiency with derived
model, (●) effluent VS data, () VS removal efficiency data, and (—) predicted profile
HRT (d)
5 10 15 20
Eff
luen
t VS
(gV
S/L
)
5.2
5.4
5.6
5.8
6.0
6.2
VS
rem
oval
eff
icie
ncy
(%)
0
10
20
30
40
50
Effluent VS VS removal efficiency
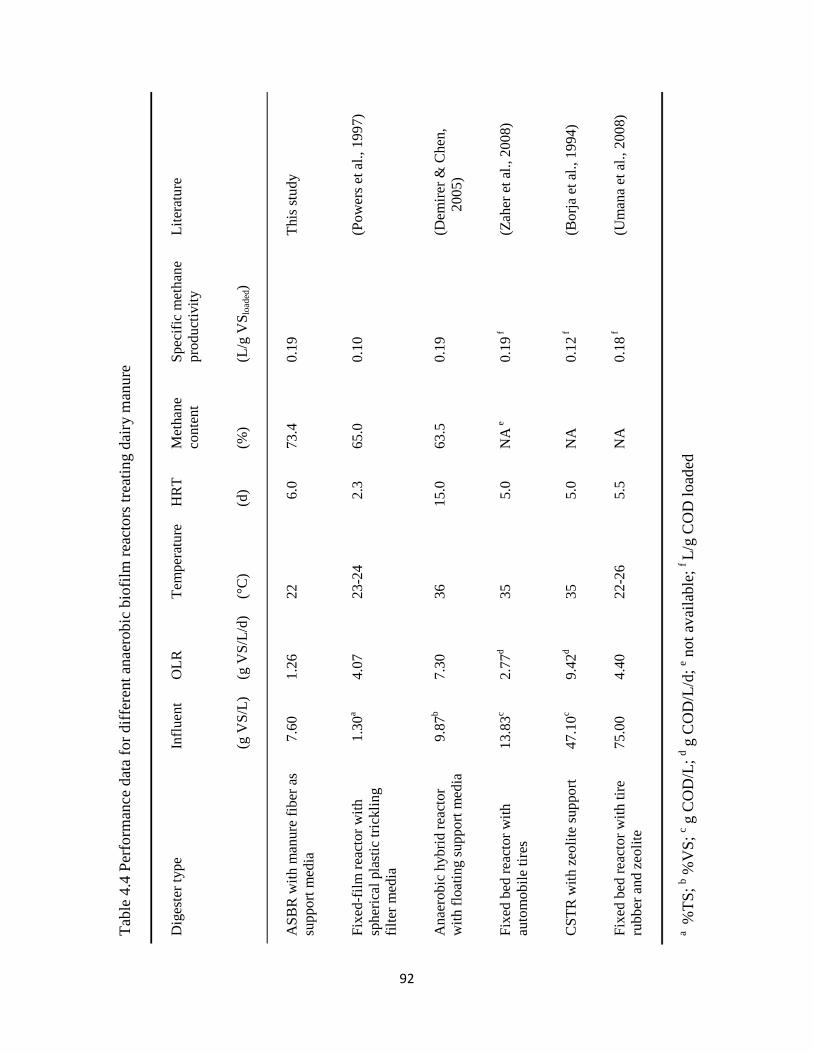
92
Tabl
e 4.
4 Pe
rfor
man
ce d
ata
for d
iffer
ent a
naer
obic
bio
film
reac
tors
trea
ting
dairy
man
ure
Dig
este
r typ
e In
fluen
t O
LR
Tem
pera
ture
H
RT
Met
hane
co
nten
t Sp
ecifi
c m
etha
ne
prod
uctiv
ity
Lite
ratu
re
(g V
S/L)
(g
VS/
L/d)
(°
C)
(d)
(%)
(L/g
VS l
oade
d)
ASB
R w
ith m
anur
e fib
er a
s su
ppor
t med
ia
7.6
0 1.
26
22
6.0
73
.4
0.19
Th
is st
udy
Fixe
d-fil
m re
acto
r with
sp
heric
al p
last
ic tr
ickl
ing
filte
r med
ia
1.3
0a 4.
07
23-2
4 2
.3
65.0
0.
10
(Pow
ers e
t al.,
199
7)
Ana
erob
ic h
ybrid
reac
tor
with
floa
ting
supp
ort m
edia
9
.87b
7.30
36
15
.0
63.5
0.
19
(Dem
irer &
Che
n,
2005
)
Fixe
d be
d re
acto
r with
au
tom
obile
tire
s 13
.83c
2.77
d 35
5
.0
NA
e
0.19
f (Z
aher
et a
l., 2
008)
CST
R w
ith z
eolit
e su
ppor
t 47
.10c
9.42
d 35
5
.0
NA
0.
12 f
(Bor
ja e
t al.,
199
4)
Fixe
d be
d re
acto
r with
tire
ru
bber
and
zeo
lite
75.0
0 4.
40
22-2
6 5
.5
NA
0.
18 f
(Um
ana
et a
l., 2
008)
a %
TS; b %
VS;
c g C
OD
/L; d g
CO
D/L
/d; e n
ot a
vaila
ble;
f L/g
CO
D lo
aded

93
4.4.4. Process performance comparison
Comparisons of the operation parameters and the methane productivities obtained in this study
with the performance data from other anaerobic biofilm reactors treating dairy manure are
presented in Table 4.4. As can be seen, except for this study, a variety of different types of
external artificial biofilm support media were employed in those anaerobic biofilm digesters to
enhance biomass retention. It is clear from Table 4.4 that ASBR using manure fiber as support
media not only improved methane production but also reduced the necessary HRT and
temperature to achieve a comparable treating efficiency. This digester expanded the capacity of
anaerobic digestion to dilute solid wastes treatment with no requirement of prior solids
separation or the risk of biofilm support media clogging. The specific methane productivity
obtained in this study was higher than most of others as shown in Table 4.4. High performance
was attained at relatively low HRT and low temperature so that this digester may be more cost-
effectiveness than others.
4.4.5. Implications for dairy AD process design
A high rate AD process driven by high biomass retention instead of mesophilic temperature (35
◦C) appears to be an economical approach for methane recovery from flushing dairy manure
(Frear et al., 2010). This study demonstrated a new biomass retention strategy with biofilm
supported by manure fiber. Fibrous solids content in flushing dairy manure act as a natural
biofilm support medium for high biomass retention as opposed to using external media that
might clog and add cost. As attributed to high concentration of biomass, the performance of this
technology at psychrophilic temperature is comparable to that of other technology under
mesophilic conditions. Taking advantage of successful in vitro biomass immobilization on dairy
94
manure fibrous solids, ASBR might be employed as an optimum means to achieve high rate AD
in flushing dairy manure.
This novel biomass immobilization process expands the capacity of anaerobic digestion to dilute
solids wastes with no need for prior solids separation and no hazard for media clogging. As a
result of no artificial biofilm support media, the digester structure will be very simple and of
lower cost. Sequencing batch mode operation procedures of ASBR are tailored to cater to non-
continuous manure production and collection practices. The multi-feeding procedures are well
adapted to infrequent barn flushing. Owing to simple digester configuration and low
maintenance requirement, this technology is suitable for application to both small farms and
large CAFOs (confined animal feeding operations). This technology is also able to handle a wide
range of TS from 1% to 5% caused by varying flushing intensity and water usage. The kinetic
model and kinetic parameters obtain from this study can be used for design and optimization of
the process. A six-day HRT and an OLR of 1.0–1.5 g VSloaded/L/day are recommended by the
kinetic model prediction. At optimized conditions, a volumetric methane production rate of 0.24
L/L/d of and specific methane productivity of 0.19 L/gVSloaded are expected.
4.5.Conclusion
A successful biomass retention technology for treating flushing dairy manure at psychrophilic
temperature was presented in this study. A Chen & Hashimoto based model gave the best
simulation with R2 of 0.99. The simulation of kinetic modeling indicated the best HRT and OLR
were 4–6 days and 0.5–1.3 g VSloaded/L/day, respectively. Extended SRT was important to retain
high concentration of biomass at low temperature, and to enhance the digester performance.

95
When compared with other research, this technology exhibited a better performance in terms of
specific methane productivity while at shorter HRT and lower temperature.

96
4.6.References
APHA. 1998. Methods for Examination of Water and Wasterwater. 20th ed. American Public
Health Association/American Water Works Association/Water Environment Federation,
Washington, DC, USA.
Batstone, D., Keller, J., Angelidaki, I., Kalyuzhnyi, S., Pavlostathis, S., Rozzi, A., Sanders, W.,
Siegrist, H., Vavilin, V. 2002. Anaerobic digestion model no. 1 (ADM1), IWA Task
Group for mathematical modelling of anaerobic digestion processes. IWA Publishing,
London, UK.
Borja, R., Sanchez, E., Weiland, P., Travieso, L., Martin, A. 1994. Kinetics of anaerobic
degestion of cow manure with biomass immobilized on zeolite. The Chemical
Engineering Journal and the Biochemical Engineering Journal, 54(1), B9-B14.
Buffière, P., Steyer, J.P., Fonade, C., Moletta, R. 1998. Modeling and experiments on the
influence of biofilm size and mass transfer in a fluidized bed reactor for anaerobic
digestion. Water Research, 32(3), 657-668.
Chen, Y.R. 1983. Kinetic analysis of anaerobic digestion of pig manure and its design
implications. Agricultural Wastes, 8(2), 65-81.
Chen, Y.R., Hashimoto, A.G. 1978. Kinetics of methane fermentation. in: Biotechnol. Bioeng.
Symp. 8, pp. Pages: 269-282.
Chen, Y.R., Hashimoto, A.G. 1980. Substrate utilization kinetic model for biological treatment
process. Biotechnology and Bioengineering, 22(10), 2081-2095.
Connaughton, S., Collins, G., O'Flaherty, V. 2006. Psychrophilic and mesophilic anaerobic
digestion of brewery effluent: A comparative study. Water Research, 40(13), 2503-2510.
97
Demirer, G.N., Chen, S.L. 2005. Anaerobic digestion of dairy manure in a hybrid reactor with
biogas recirculation. World Journal of Microbiology & Biotechnology, 21(8-9), 1509-
1514.
Frear, C., Wang, Z.-W., Li, C., Chen, S. 2010. Biogas potential and microbial population
distributions in flushing dairy manure and implications on anaerobic digestion technology.
Journal of Chemical Technology & Biotechnology, 86(1), 145-152.
Gavala, H., Angelidaki, I., Ahring, B. 2003. Kinetics and Modeling of Anaerobic Digestion
Process. in: Biomethanation I, (Eds.) B. Ahring, I. Angelidaki, E.C. Macario, H.N.
Gavala, J. Hofman-Bang, A.J.L. Macario, S.J.W.H.O. Elferink, L. Raskin, A.J.M. Stams,
P. Westermann, D. Zheng, Vol. 81, Springer Berlin Heidelberg, pp. 57-93.
Gillespie, J.R., Flanders, F.B. 2010. Modern Livestock and Poultry Production. 8th ed, Clifton
Park, NY.
Grau, P., Dohányos, M., Chudoba, J. 1975. Kinetics of multicomponent substrate removal by
activated sludge. Water Research, 9(7), 637-642.
Hashimoto, A.G. 1982. Methane from cattle waste: Effects of temperature, hydraulic retention
time, and influent substrate concentration on kinetic parameter (k). Biotechnology and
Bioengineering, 24(9), 2039-2052.
Huang, J.-S., Jih, C.-G. 1997. Deep-biofilm kinetics of substrate utilization in anaerobic filters.
Water Research, 31(9), 2309-2317.
Husain, A. 1998. Mathematical models of the kinetics of anaerobic digestion--a selected review.
Biomass and Bioenergy, 14(5-6), 561-571.

98
Karim, K., Thomas Klasson, K., Hoffmann, R., Drescher, S.R., DePaoli, D.W., Al-Dahhan, M.H.
2005. Anaerobic digestion of animal waste: Effect of mixing. Bioresource Technology,
96(14), 1607-1612.
Kashyap, D.R., Dadhich, K.S., Sharma, S.K. 2003. Biomethanation under psychrophilic
conditions: a review. Bioresource Technology, 87(2), 147-153.
Lettinga, G., Rebac, S., Zeeman, G. 2001. Challenge of psychrophilic anaerobic wastewater
treatment. Trends in Biotechnology, 19(9), 363-370.
Liu, Y., Wang, Z.-W., Qin, L., Liu, Y.-Q., Tay, J.-H. 2005. Selection pressure-driven aerobic
granulation in a sequencing batch reactor. Applied Microbiology and Biotechnology,
67(1), 26-32.
Monod, J. 1949. The Growth of Bacterial Cultures. Annual Review of Microbiology, 3(1), 371-
394.
Pavlostathis, S.G., Giraldogomez, E. 1991. KINETICS OF ANAEROBIC TREATMENT - A
CRITICAL-REVIEW. Critical Reviews in Environmental Control, 21(5-6), 411-490.
Powers, W.J., Wilkie, A.C., VanHorn, H.H., Nordstedt, R.A. 1997. Effects of hydraulic retention
time on performance and effluent odor of conventional and fixed-film anaerobic digesters
fed dairy manure wastewaters. Transactions of the Asae, 40(5), 1449-1455.
Rittmann, B.E., McCarty, P.L. 2001. Environmental biotechnology: principles and applications.
McGraw-Hill, Boston.
Saravanan, V., Sreekrishnan, T.R. 2006. Modelling anaerobic biofilm reactors--a review. J
Environ Manage, 81(1), 1-18.
Umana, O., Nikolaeva, S., Sanchez, E., Borja, R., Raposo, F. 2008. Treatment of screened dairy
manure by upflow anaerobic fixed bed reactors packed with waste tyre rubber and a

99
combination of waste tyre rubber and zeolite: Effect of the hydraulic retention time.
Bioresource Technology, 99(15), 7412-7417.
USEPA. 2010. Draft Inventory of US Greenhouse Gas Emissions and Sinks: 1990–2008, (Ed.)
h.w.e.g.a. 09.18.2012).
Wang, Z.-W., Ma, J., Chen, S. 2011. Bipolar effects of settling time on active biomass retention
in anaerobic sequencing batch reactors digesting flushing dairy manure. Bioresource
Technology, 102(2), 697-702.
Wilkie, A.C., Castro, H.F., Cubinski, K.R., Owens, J.M., Yan, S.C. 2004. Fixed-film anaerobic
digestion of flushing dairy manure after primary treatment: Wastewater production and
characterisation. Biosystems Engineering, 89(4), 457-471.
Zaher, U., Frear, C., Pandey, P., Chen, S. 2008. Evaluation of a new fixed-bed digester design
utilizing large media for flush dairy manure treatment. Bioresour Technol, 99(18), 8619-
25.

100
4.7.Nomenclature
𝜇 specific microbial growth rate (/d)
𝜇𝑚 maximum specific microbial growth rate (/d)
𝑟𝑚 microbial growth rate (g/L/d)
X0 influent biomass concentration (g/L)
X effluent biomass concentration (g/L)
V digester working volume (L)
Q flow rate (L/d)
S0 influent substrate concentration (g/L)
S effluent substrate concentration (g/L)
𝑏 hydraulic retention time (d)
b endogenous decay constant (/d)
k maximum specific substrate utilization rate (gVS/g/d)
k′ first order rate constant (/d)
Ks half-saturation constant (gVS/L)
K dimensionless kinetic parameter of Chen & Hashimoto model
Y growth yield coefficient
c Contois coefficient
B volume of methane produced under standard condition per gram of substrate loaded (L
CH4 STP/gVSloaded)
B0 volume of methane produced under standard condition per gram of substrate loaded at
infinite retention time (L CH4 STP/gVSloaded)
M volumetric methane production rate (L CH4/L/d)

101
P specific methane productivity (L CH4/gVSloaded)
L organic loading rate (gVSloaded/L/d)

102
CHAPTER FIVE
METHANOSARCINA DOMINATION IN ASBR DIGESTER AT SHORT HRT
5.1. Abstract
The microbial population of Anaerobic sequential batch reactor (ASBR) featuring cycle
operations operated under short HRT and low OLR was evaluated for treating a dilute waste
stream. T-RFLP and clone libraries for both 16S rRNA gene and mcrA gene were employed to
characterize the methanogenic community structure. Results revealed that a Methanosarcina
dominated methanogenic community was successfully established when using an ASBR digester
at short HRT. Also the Diversity of the methanogenic community increased as the ASBR was
operated at shorter HRT. It was revealed that both 16S rRNA and mcrA clone library could not
provide complete community structure, while combination of two different clone libraries could
capture more archaea diversity. Thermodynamic calculations confirmed a preference for the
observed population structure. The results both experimentally and theoretically confirmed that
Methanosarcina dominance emphasizing the important role ASBR’s in treating low strength
wastewater as Methanosarcina will be more adaptable at overcoming temperature and shock
loadings experienced with treating this type of wastewater.
Keywords: microbial community structure, ASBR, clone library, T-RFLP, methanogenic
pathway

103
5.2. Introduction
High activity of methanogens is important for maintaining efficient anaerobic digestion and
avoiding accumulation of volatile fatty acids (acetate) and hydrogen, two of the most important
methanation substrates. Methanoarchaea, or methanogens involved in anaerobic digestion, cover
four orders (Liu & Whitman, 2008). All species within three of these orders, Methanobacteriales,
Methanococcales, and Methanomicrobiales, are hydrogenotrophic methanogens reducing CO2 to
CH4 using H2 or formate. The other order, Methanosarcinales, comprising two families,
Methanosaetaceae and Methanosarcinaceae, is unique. The former family contains a single
genus, Methanosaeta, an exclusively acetotrophic species which utilizes acetate as its sole
energy source, while the latter one, including Methanosarcina and several other genuses, can
metabolize both hydrogen and acetate as energy source (Boone et al., 1993).
Methanogens, along with other hydrogenotrophs and acetotrophs compete for acetate and
hydrogen, forming complex Archaea community structures, which vary under different
anaerobic environments (Table 5.1). Affinity to substrate (Ks), growth rate (µmax), and substrate
utilization rate are the key factors governing the dominance of species within a microbial
community. As noted, Methanosarcina are the most versatile methanogens (Zinder, 1993),
offering methanation processes, which when compared to hydrogenotrophic as well as
aceticlastic methanogens (Methanosaeta), are higher in substrate utilization rate, growth rate and
cell yield while exposed to an environment with relatively high acetate and hydrogen
concentration (Daniels et al., 1984). Thus Methanosarcina is favored under conditions in which a
high input of organic matter leads to rapid accumulation of acetate and hydrogen (Zinder, 1993).
consequenctly, digesters dominated by Methanosarcina are more capable of handling increased
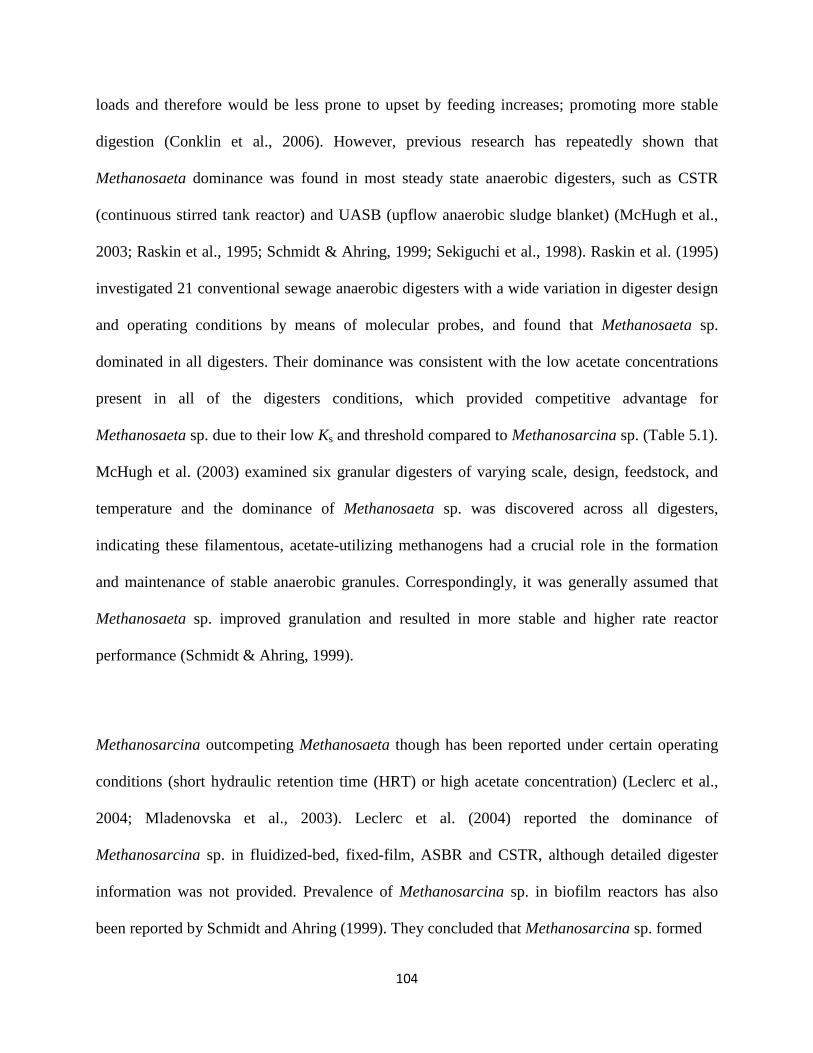
104
loads and therefore would be less prone to upset by feeding increases; promoting more stable
digestion (Conklin et al., 2006). However, previous research has repeatedly shown that
Methanosaeta dominance was found in most steady state anaerobic digesters, such as CSTR
(continuous stirred tank reactor) and UASB (upflow anaerobic sludge blanket) (McHugh et al.,
2003; Raskin et al., 1995; Schmidt & Ahring, 1999; Sekiguchi et al., 1998). Raskin et al. (1995)
investigated 21 conventional sewage anaerobic digesters with a wide variation in digester design
and operating conditions by means of molecular probes, and found that Methanosaeta sp.
dominated in all digesters. Their dominance was consistent with the low acetate concentrations
present in all of the digesters conditions, which provided competitive advantage for
Methanosaeta sp. due to their low Ks and threshold compared to Methanosarcina sp. (Table 5.1).
McHugh et al. (2003) examined six granular digesters of varying scale, design, feedstock, and
temperature and the dominance of Methanosaeta sp. was discovered across all digesters,
indicating these filamentous, acetate-utilizing methanogens had a crucial role in the formation
and maintenance of stable anaerobic granules. Correspondingly, it was generally assumed that
Methanosaeta sp. improved granulation and resulted in more stable and higher rate reactor
performance (Schmidt & Ahring, 1999).
Methanosarcina outcompeting Methanosaeta though has been reported under certain operating
conditions (short hydraulic retention time (HRT) or high acetate concentration) (Leclerc et al.,
2004; Mladenovska et al., 2003). Leclerc et al. (2004) reported the dominance of
Methanosarcina sp. in fluidized-bed, fixed-film, ASBR and CSTR, although detailed digester
information was not provided. Prevalence of Methanosarcina sp. in biofilm reactors has also
been reported by Schmidt and Ahring (1999). They concluded that Methanosarcina sp. formed

105
Tabl
e 5.
1 Ty
pica
l com
petit
ive
mic
robe
s in
anae
robi
c di
gest
er
Com
petit
ive
subs
trate
A
ceta
te
H2
Mic
robe
s M
etha
nosa
rcin
a
Met
hano
saet
a
Synt
roph
ic
acet
ate-
oxid
izin
g ba
cter
ia
Hom
oace
toge
ns
Hyd
roge
ntro
phic
m
etha
noge
ns
Sulfa
te re
duci
ng
bact
eria
Ksb
3.0–
4.5
0.49
–0.8
6 —
6
μM o
r 800
Pa
4–8
μM o
r 550
–110
0 Pa
2
μM o
r 250
Pa
Thre
shol
d (m
M)
0.62
–1.2
0.
005–
0.06
9 >
0.2
320–
710
nM o
r 43–
95
Pa
23–7
5 nM
or 3
–10
Pa
6.8
nM o
r 0.9
Pa
Yc 1.
1–3.
1 1.
1–1.
4 —
—
0.
6–6.
4 5.
8 kd
11
.4
9.4
—
—
—
—
μ max
e
0.55
–2.0
4 0.
08-0
.69
—
—
0.70
–3.4
6 1.
44
Prod
ucts
C
H4,
CO
2 C
H4,
CO
2 H
2, C
O2
Ace
tate
C
H4
H2S
ΔG
0’f
–31.
0 –3
1.0
+104
.6
–104
.6
–135
.6
–152
.0
Favo
red
cond
ition
s H
igh
acet
ate
conc
entra
tion
Low
ace
tate
co
ncen
tratio
n
Hig
h hy
drog
en
conc
entra
tion,
low
te
mpe
ratu
re.
Low
hyd
roge
n co
ncen
tratio
n, h
igh
tem
pera
ture
.
Not
e
Met
hano
sarc
ina
will
out
com
pete
Met
hano
saet
a w
ith a
vera
ge a
ceta
te c
once
ntra
tions
hig
her t
han
1.9
mM
.
Hom
oace
toge
ns a
re b
ette
r ada
pted
to g
row
at l
ower
tem
pera
ture
s. Th
e cr
itica
l tem
pera
ture
is 2
0–25
°C.
Met
hano
gens
will
be
inhi
bite
d by
sulfa
te re
duci
ng b
acte
ria w
hen
H2
conc
entra
tion
is b
elow
5μM
. a D
ata
from
Rob
inso
n an
d Ti
edje
(198
4), D
anie
ls e
t al.
(198
4), C
ord-
Ruw
isch
et a
l. (1
988)
, Zin
der (
1993
), C
onkl
in e
t al.
(200
6),
Dem
irel a
nd S
cher
er (2
008)
; b H
alf-
satu
ratio
n co
nsta
nt (m
M);
c Cel
l yie
ld (g
cel
l/rnx
); d M
axim
um sp
ecifi
c su
bstra
te u
tiliz
atio
n ra
te (g
CO
D/g
cel
l·d);
e Max
imum
spec
ific
mic
robi
al g
row
th ra
te (d
–1);
f G
ibbs
free
ene
rgy
unde
r sta
ndar
d co
nditi
ons (
kJ/rn
x).

106
biomass clumps consisting of large numbers of individual cells surrounded by a thick polymeric
wall, as opposed to the filamentous type biofilm consisting of long multicellular rod-shaped
Methanosaeta sp.; noting that the immobilization process of Methanosarcina sp. was even faster
than that of Methanosaeta sp. The stratification of methanogens along the height of an UASB
reactor was noticed with Methanosaeta sp. predominating in the top of the granular layer while
Methanosarcina sp. primarily presented in the bottom of the reactor, concepts which are
consistent with acetate concentration distribution in an UASB (Schmidt & Ahring, 1999). The
presence of Methanosaeta ensured a better performance due to their low acetate threshold,
however, in granules where Methanosarcina sp. were the only acetate-utilizing methanogen
present, a syntrophic acetate-oxidizing system was found (Schmidt & Ahring, 1993).
Operation of an ASBR, with its infrequent feeding and intermittent mixing protocol, creates a
high acetate concentration and dynamic condition within each cycle. Additionally by being able
to uncouple HRT and SRT (sludge retention time), ASBR often employ uniquely short HRT,
adapted to treat low strength waste streams while still treating high flow rates. Although above
advantages for Methanosarcina dominance have been studied in UASB and CSTR, limited data
exists showing methanogenic community dynamics in ASBR digester. The goal of this research
was to investigate that if the unique hydraulic regime of ASBR may select Methanosarcina as
the dominant species, which can lead to a more efficient and more stable anaerobic digestion
process. In this study, the diversities of methanogens in an ASBR digester operated at different
HRT were compared with T-RFLP. The composition of the methanogenic community of the
digester with the best methane production performance was then revealed by sequence analysis
of the partial 16S rRNA gene (~800 base pairs (bp)) and functional gene marker (mcrA gene,
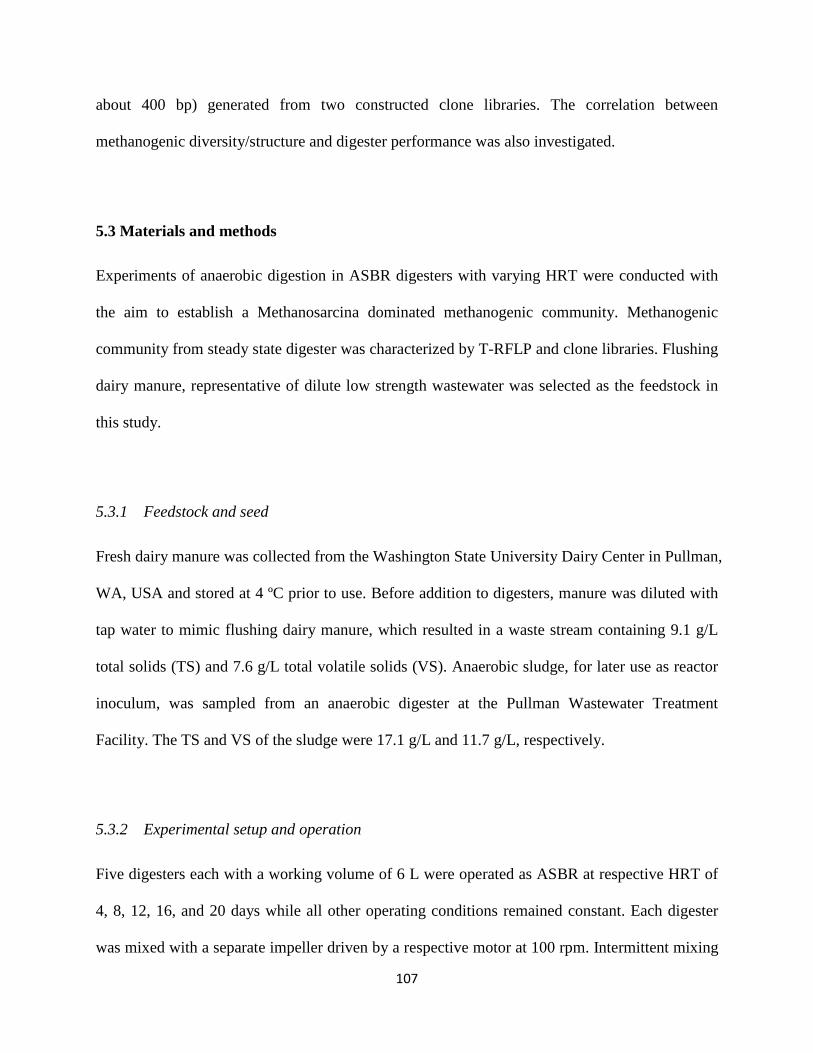
107
about 400 bp) generated from two constructed clone libraries. The correlation between
methanogenic diversity/structure and digester performance was also investigated.
5.3 Materials and methods
Experiments of anaerobic digestion in ASBR digesters with varying HRT were conducted with
the aim to establish a Methanosarcina dominated methanogenic community. Methanogenic
community from steady state digester was characterized by T-RFLP and clone libraries. Flushing
dairy manure, representative of dilute low strength wastewater was selected as the feedstock in
this study.
5.3.1 Feedstock and seed
Fresh dairy manure was collected from the Washington State University Dairy Center in Pullman,
WA, USA and stored at 4 ºC prior to use. Before addition to digesters, manure was diluted with
tap water to mimic flushing dairy manure, which resulted in a waste stream containing 9.1 g/L
total solids (TS) and 7.6 g/L total volatile solids (VS). Anaerobic sludge, for later use as reactor
inoculum, was sampled from an anaerobic digester at the Pullman Wastewater Treatment
Facility. The TS and VS of the sludge were 17.1 g/L and 11.7 g/L, respectively.
5.3.2 Experimental setup and operation
Five digesters each with a working volume of 6 L were operated as ASBR at respective HRT of
4, 8, 12, 16, and 20 days while all other operating conditions remained constant. Each digester
was mixed with a separate impeller driven by a respective motor at 100 rpm. Intermittent mixing

108
was carried out for 10 min every 2h. Manure and anaerobic sludge were introduced to each
digester at a 1:1 volume ratio when experiments started. Digesters were then placed in a low
temperature chamber (22 ºC) and operated in sequencing batch mode, which consisted of 5
stages: filling, reaction, desludge, settling and discharging in one cycle. Steady state conditions
were defined as biogas production, methane content and effluent COD variations less than 10%.
The experiments were conducted for over 120 days.
5.3.3 DNA extraction
Samples of mixed liquor were collected from the five steady-state digesters. Genomic DNA was
extracted and purified using the PowerSoil DNA isolation kit (Mo Bio Laboratories, Inc.,
California) according to the manufacturer’s instructions.
5.3.4 PCR amplification of the 16S rRNA gene for T-RFLP
A fragment of 822 bp length of the DNA was amplified using primers Ar109f and 6-FAM
labeled Ar915r (Grosskopf et al., 1998). PCR amplification was carried out using standard buffer
conditions, DNA template and GoTaq DNA Polymerase (Promega, WI, USA) with a total
volume of 50 μl in a PTC-200 DNA Engine Peltier Thermal Cycler (Bio-Rad Laboratories, Inc.,
CA, USA) with initial denaturation at 95°C for 5 min, 25 cycles of denaturing at 95°C for 0.5
min, annealing at 55°C for 0.5 min and extension at 72°C for 1.5 min, plus a final extension at
72°C for 10 min. Amplified DNA was verified by electrophoresis of aliquots of PCR mixtures (5
µl) in 1.0% agarose in 1× TAE buffer and EtBr staining.

109
5.3.5 PCR Amplification of Functional Gene Marker for T-RFLP
Fragments of mcrA gene encoding methyl coenzyme M Reductase in methanogenic Archaea was
amplified with primers MCRf and 6-FAM labeled MCRr (Springer et al., 1995). PCR
amplification was performed with the same procedures for 16S rRNA gene.
5.3.6 T-RFLP analysis
After purification with QIAquick spin columns (Qiagen, Alameda, CA), approximately 100 ng
of the amplicons was digested separately with 15 U of the restriction endonucleases TaqI
(Thermo Fisher Scientific Inc., Rockford, IL) for 16S rRNA PCR products (Lueders & Friedrich,
2000) and Sau96I (New England Biolabs, Ipswich, MA) for mcrA gene PCR products (Lueders
et al., 2001). The digestions were carried out in a total volume of 30 µl incubating at 37°C
overnight. Subsequent electrophoresis was performed on an ABI 3730xl sequencer (Applied
Biosystems, Carlsbad, CA) by GENEWIZ Inc. (South Plainfield, NJ). Based on the internal LIZ-
500 size standard, the terminal restriction fragments (T-RFs) were sized using GeneMarker V 2.2
(SoftGenetics LLC., USA).
Fragments with a peak height below 0.5 % (regarded as background noise) as well as those with
a size less than 50 bp were excluded from the analysis. Peaks over a threshold of 50 relative
fluorescent units above background fluorescence were analyzed by manually aligning fragments
to the size standard. To avoid detection of primers and uncertainties of size determination,
terminal fragments smaller than 50 bp and larger than 500 bp were excluded from the analysis.
Peaks with less than 0.5 bases differences were merged. The T-RFs profiles were normalized by

110
calculating the relative abundance (percentage) of each fragment (each T-RF peak area divided
by the total peak area of each sample). The predicted T-RF lengths of known Archaea species
were obtained using the Phylogenetic Assignment Tool (PAT) (Kent et al., 2003), with a
modified database from the Ribosomal Database Project (Cole et al., 2009) and our database
from either the 16S rRNA gene or mcrA gene clone libraries generated by using the ISPaR tool
of MiCA, a web-based tool for the analysis of microbial communities (Shyu et al., 2007).
5.3.7 Clone Library of the 16S rRNA Gene
For clone library construction and phylogenetic analysis, PCR products were obtained in
triplicate as described for PCR of 16S rRNA gene except that the Ar915r primer was not labeled
with 6-FAM. The purified amplified products were pooled, cloned into pGEM-T Easy vector
using the TA cloning kit (Promega, USA), and transformed into competent Escherichia coli
JM109 for sequencing. Random selection of white colonies were performed after E. coli M109
cells grown at 37°C overnight on LB plates containing 100 µg/ml ampicillin, 0.5mM IPTG, and
40 µg/ml X-Gal. The colonies that contained an appropriately sized insert were sequenced using
primers SP6 by GENEWIZ Inc (South Plainfield, NJ).
5.3.8 Clone Library of Functional Gene Marker
For clone library construction and phylogenetic analysis, PCR products were obtained in
triplicate as described for PCR of mcrA gene except that the MCRr primer was not labeled with
6-FAM. The rest of the procedure followed the same as the clone library of the 16S rRNA gene.

111
5.3.9 Phylogenetic analysis
All sequences in each clone library were compared to entries of the NCBI nucleotide sequence
database using BLAST. The 16S rRNA amplicon sequences and deduced amino acid sequences
from mcrA sequences were respectively aligned with selected known sequences from reference
strains by means of software tool MEGA 5 (Tamura et al., 2011). Subsequently, sequences were
assigned to operational taxonomic units (OTUs) by comparing sequences on the basis of 97%
similarity between sequences. Diversity indices, such as the Shannon, the Evenness, the Chao1,
ACE and coverage were used to measure the diversity of each library. Diversity indices, OTU
clustering, rarefaction analysis of library structure and multiple sample statistics were computed
using the MOTHUR programs package (Schloss et al., 2009). The steepness (θ) of rarefaction
curve was calculated from the equation y = mx + c where ‘x’ and ‘y’ are the coordinates of the
points ‘m’ is the gradient and ‘c’ is the ‘y intercept’ of the straight line. Phylogenetic trees were
constructed by means of the MEGA 5 (Tamura et al., 2011) using the Neighbor-Joining method
and Bootstrap resampling analysis for 1000 repeats. The scale bar represents 5% substitutions
per nucleotide sequence position. Numbers at nodes represent bootstrap values. Only bootstrap
values above 50% are displayed.
5.3.10 Nucleotide sequence accession numbers
The nucleotide sequences reported in this paper have been deposited in the Genbank, EMBL, and
DDBJ nucleotide sequence database under the accession numbers JQ684533-JQ684646 (16S
rRNA gene) and JQ697374-JQ697491 (mcrA gene). Accession numbers of clones representing
OTUs are depicted in Figure 5.3 and 5.4.

112
5.4 Results and discussions
5.4.1 Digesters performance
The experiments of anaerobic digestion of flushing dairy manure in ASBR digesters were
conducted for over 120 days, and all digesters reached respective steady-state after 80 days. The
amount of methane production was affected by HRT as shown in Figure 5.1A. The longer the
HRT, the more methane production was achieved. However, the highest volumetric methane
production was observed at the shortest HRT of 4 days at a rate of 0.26 L/L/d, while the longest
HRT of 20 days resulted in the lowest rate of 0.08 L/L/d.
A relatively high acetate concentration (above 1 mM) and hydrogen partial pressure (about 60 pa)
was detected within the ASBR at an HRT of 4 days. With the extension of HRT, concentrations
for both acetate and hydrogen in the digesters approached to zero. Methanosaeta grows at low
acetate concentration, whereas Methanosarcina consumes acetate only at high acetate
concentrations (Boone et al., 1993; Zinder, 1993). Methanosarcina have a higher threshold and
maximum substrate utilization rate compared to Methanosaeta (Table 5.1), due to different
mechanisms of acetate metabolism, i.e., by acetate kinase/phosphotransacetylase versus acetyl-
CoA synthetase, respectively (Jetten et al., 1992). During each cycle of the digester running at 4-
day HRT, the overall high acetate concentration varied from 6 mM after feeding to 1 mM at the
end of cycle, favoring growth of Methanosarcina, leading to a Methanosarcina dominated
community. The digesters with longer HRT functioned like a regular plug flow digester; since
acetate concentration was not detected at most of cycle times in these digesters. Under these high
HRT conditions, Methanosaeta could outcompete over Methanosarcina by taking advantage of
high acetate affinity and dominated in Archaea community.

113
5.4.2 Methanogenic community diversity
Methanogenic community diversities at different HRT were revealed by T-RFLP. The number of
T-RFs represents the community diversity. As Figure 5.1A shows, the number of T-RFs
decreased with the extension of HRT, indicating low community diversity within ASBR
digesters at long HRT. The reason for this result could be limited carbon source. As the dilute
organic waste stream was used as a feedstock, the available substrate for microbes was reduced
while conducting anaerobic digestion at a longer HRT. Presumably, with limited substrate
availability, some species disappeared at the longer HRT, which led to decrease in diversity of
microbial community.
When plotting the number of T-RFs and the methane production rate together in Figure 5.1B, a
high correlation between the two was found, which revealed that digester performance was
related to community diversity. A digester with high microbial community diversity showed
somewhat high methane production rate, while a digester of low performance was associated
with low diversity of microbial community. The enhanced performance with high community
diversity might be due to the presence of multiple pathways conducted by a more complex
community. Krakat et al. (2010) reported that HRT decrease not only resulted in increased
species diversity, but also led to slightly higher specific methane production rate. Presumably, as
availability of organic substrate increased with HRT reduction, proliferation of underrepresented
or rare methanogens occurred, leading to enhanced Archaea diversity.

114
Figure 5.1 Relationship between digester performance and microbial community diversity
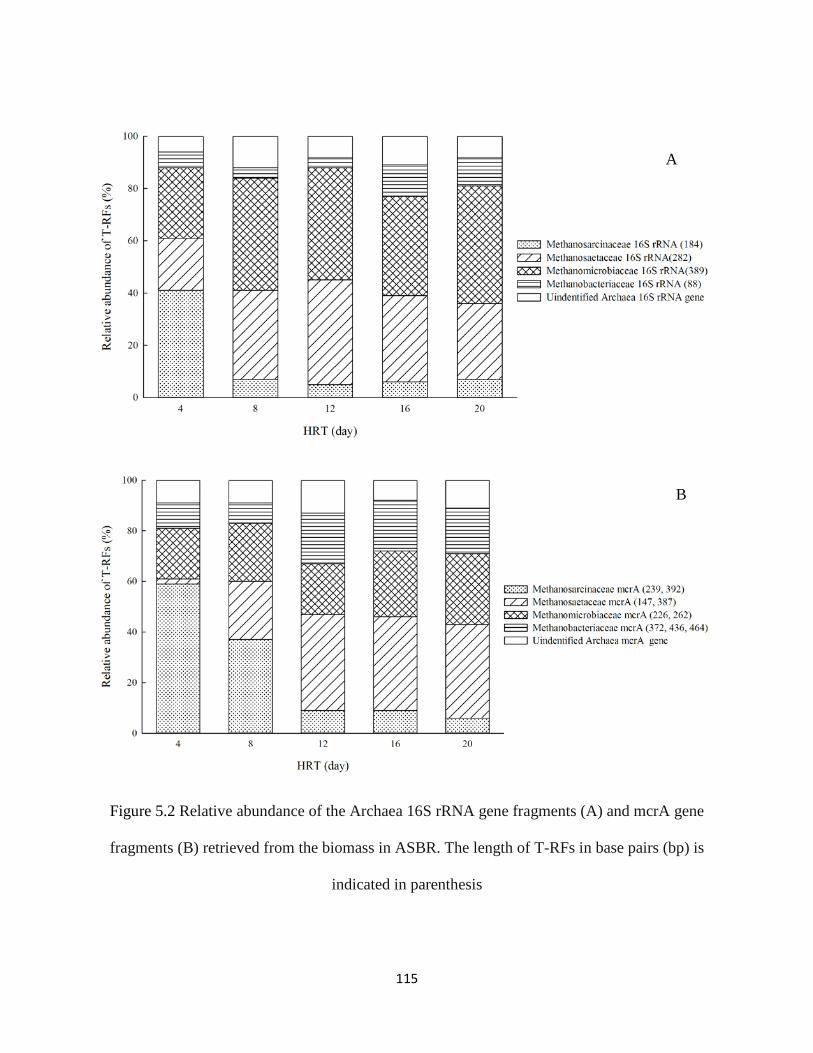
115
Figure 5.2 Relative abundance of the Archaea 16S rRNA gene fragments (A) and mcrA gene
fragments (B) retrieved from the biomass in ASBR. The length of T-RFs in base pairs (bp) is
indicated in parenthesis
A
B

116
Figure 5.2 clearly showed an Archaea community shift with change in HRT. At short HRTs,
substrate concentration and acetate concentration varied rapidly during each cycle, resulting in a
stressed condition for microbial community. Species affiliated to Methanosarcinaceae displaying
competitive advantage via high growth rate and high substrate utilization rate predominated in
the Archaea community. With long HRT, the performance of ASBR tended to be similar to a
steady state CSTR or plug-flow digester featuring low acetate concentration in the effluent;
leading to Methanosaeta outcompeting Methanosarcina. The growth of hydrogen-oxidizing
methanogens from Methanomicrobiales and Methanobacteriales were promoted by the
proliferation of exclusive acetate utilizing Methanosaeta, so that hydrogen methanogenesis was
significant at long HRT (Figure 5.2). Hydrogenotrophic methanogen dominated biogas plants
have been reported by several studies (Nettmann et al., 2008; Rastogi et al., 2008), which mostly
included Methanomicrobiales, while Zhu et al. (2011) reported that Methanobacteriales were
the dominant species in digester fed with swine manure.
5.4.3 Phylogenetic analysis
5.4.3.1 16S rRNA clone library
The results of the phylogenetic cluster of assigned OTUs indicated that Methanosarcina was the
dominant methane producing Archaea in the ASBR digester (Figure 5.3). A total of 114 16S
rRNA clone sequences were analyzed and a total of 18 OTUs generated were affiliated to
Methanobacteriales, Methanomicrobiales, and Methanosarcinales, while Methanococcales was
absent. Five OTUs (68.42%) were assigned to Methanosarcinales which included aceticlastic
strains of Methanosaeta sp. (23.68%) and the most metabolically diverse Methanosarcina sp.
(44.74%). Obligate hydrogenotrophic Methanobacteriales and Methanomicrobiales included a

117
total of 9 clones (7.89%) in 5 OTUs and 27 clones (23.68%) in 8 OTUs, respectively (Table 5.3).
Methanomicrobiales showed a high diversity with 8 OTUs covering Methanomicrobiaceae and
Methanospirillaceae. Only 9% of clone was assigned to Methanobacteriales, which mainly
consisted of Methanobacteriaceae.
5.4.3.2 mcrA gene clone library
A similar result was obtained from the mcrA clone library while more OTUs were detected
compared to the 16S rRNA clone library (Figure 5.4). A total of 118 mcrA clone sequences
were analyzed and a total of 21 OTUs were generated that were affiliated to Methanobacteriales,
Methanomicrobiales, and Methanosarcinales. 60.17% of clones (3 OTUs) were allocated to the
order of Methanosarcinales, while 13.56% (5 OTUs) and 26.26% (13 OTUs) of clones were
assigned to hydrogen-oxidizing Methanobacteriales, Methanomicrobiales, respectively (Table
5.4). No Methanosaeta sp. was detected in Methanosarcinales and all clones belong to the
family Methanosarcinaceae. Methanobacteriales, Methanomicrobiales showed a similar
diversity and proportion to results from to16S rRNA clone library.

118
Figure 5.3 Phylogenetic relationship among 18 OTUs with partial 16S rRNA gene sequences of
known methanogenic Archaea based on the neighbor-joining analysis
OTU-03 (JQ684535) (5 clones) uncultured Methanomicrobiales (AB236081.1)
OTU-04 (JQ684592) (11 clones) Methanolinea sp. (JN836394.1)
Methanolinea sp. (AB447467.1)
Methanosphaerula palustris (EU156000.1) OTU-11 (JQ684579)
Methanomicrobiales (JN836393.1)
OTU-08 (JQ684598) (4 clones) Methanospirillum hungatei (AY196683.1)
OTU-12 (JQ684583) OTU-13 (JQ684585)
OTU-09 (JQ684568) (4 clones) Methanospirillum lacunae (AB517986.1)
OTU-05 (JQ684537) (12 clones) Methanosaeta sp. (HQ133141.1) OTU-07 (JQ684558) (15 clones) uncultured Methanosarcinales (CU917405.1)
Methanosaeta thermophila (AB071701.1)
Methanosarcina lacustris (AF432127.1) Methanosarcina mazei (DSM 2053)
Methanosarcina siciliae (FR733698.1) uncultured Methanosarcina sp. (AB636574.1) OTU-01 (JQ684634) (49 clones)
OTU-15 (JQ684610) uncultured Methanosarcinaceae (AJ879017.1)
Methanotorris formicicus (AB100884.1) OTU-16 (JQ684623)
Methanobacterium alcaliphilum (AB496639.1) OTU-18 (JQ684644)
OTU-06 (JQ684539) uncultured Methanobacteriaceae (FJ579962.1)
OTU-14 (JQ684593) uncultured Methanobacteriaceae (FJ579348.1)
Methanobacterium beijingense (AY552778.3) OTU-17 (JQ684635) (3 clones)
OTU-02 (JQ684557) (2 clones) Methanobacterium formicicum (DSMZ1535) Methanobacterium petrolearium (AB542742.1) OTU-10 (JQ684560)
Methanobacterium kanagiense (AB368917.1)
100
100
100
100
100
99
100
100
92
99
90
82
88
61
100
100
71
93 97
100
100
58
99
100
100 99
71 96
50
100
100 97
98
99
99 99
71
0.05
Methanomicrobiales 23.68%
Methanosarcinales
68.42%
Methanobacteriales 7.89%

119
Figure 5.4 Phylogenetic relationship among 21 OTUs with partial mcrA gene sequences of
known methanogenic Archaea based on the neighbor-joining analysis
OTU-16 (JQ697474) OTU-20 (JQ697481)
OTU-11 (JQ697443) Methanospirillum hungatei (AAK16835) OTU-21 (JQ697486) (3 clones) OTU-12 (JQ697450)
uncultured archaeon (ACL80596)
OTU-15 (JQ697462) (2 clones)
OTU-9 (JQ697430) (11 clones)
Methanoculleus thermophilus (AAK16834) Methanoculleus bourgensis (AAL29285)
Methanomicrobiaceae strain (AAC43430)
OTU-18 (JQ697477) (2 clones) OTU-6 (JQ697405)
OTU-14 (JQ697485)
Methanomicrobium mobile BP (AAL29293) Methanocorpusculum bavaricum (AAL29298)
Methanocorpusculum labreanum (AAP20896) uncultured methanogenic archaeon (ABI18566)
Methanocorpusculum aggregans (AAL29283) Methanocorpusculum parvum (AAP20900)
OTU-3 (JQ697396)
OTU-2 (JQ697389) (5 clones) OTU-8 (JQ697419)
Methanosaeta concilii (AAK16832) Methanosaeta concilii (AAL29286) Methanosaeta concilii (AAK16833)
Methanolobus bombayensis (AAC43407) Methanosarcina vacuolata (AAC43428)
Methanosarcina acetivorans (AAC43405) Methanosarcina barkeri (CAA68357)
Methanosarcina mazei (AAC43413)
OTU-7 (JQ697418) Methanocaldococcus jannaschii DSM 2661 (AAB98063)
Methanococcus voltae PS (CAA30633) Methanothermobacter thermautotrophicus (AAA73439)
uncultured archaeon (ACL80573)
Methanopyrus kandleri (AAB02003) Methanothermus fervidus (AAA72197)
OTU-1 (JQ697374) Methanobacterium bryantii (AAK16836) Methanothermobacter thermautotrophicus (CAA30639)
Methanothermobacter wolfeii (BAF56659) OTU-5 (JQ697404) Methanobrevibacter arboriphilus (AAL29284)
Methanobacterium formicicum (AAL29299) OTU-17 (JQ697476) (10 clones)
OTU-4 (JQ697398) (3 clones)
95
76
100
96
76
74 92
87
96
54 56
84
75
95
96 99
93
61 81
61
87 96
99
67 53
78
86 73
97 98 60
65
0.05
OTU-13 (JQ697460)
OTU-19 (JQ697381) (3 clones)
OTU-10 (JQ697431) (67 clones)
Methanomicrobiales 26.26%
Methanosarcinales 60.17%
Methanobacteriales 13.56%

120
Figure 5.5 Rarefaction curves generated for 16S rRNA genes and mcrA genes clone libraries.
Dotted lines indicate the 95% confidence intervals
Table 5.2 Diversity and richness indices for 16S rRNA and mcrA clone libraries
Clone library Na nb Shannon (H) Evenness (E)c Coveraged Chao1 ACE
16S rRNA 114 18 2.01 0.69 0.93 36 33
mcrA gene 118 21 1.80 0.60 0.90 34 55
aN: number of clones in library;
bn: detected OTUs defined at 97% sequence identity;
cE: evenness calculated based on the formula of H/Hmax;
dCoverage: calculated by the formula of [1-(n/N)].

121
5.4.3.3 Statistical analysis of clone libraries
The rarefaction curves for both 16S rRNA and mcrA clone libraries were generated in Figure 5.5.
The curve steepness is a function of the community taxon evenness, while its height indicates its
taxon richness. The sequence population was more diverse for the mcrA gene than for the 16S
rRNA gene, as the rarefaction curve of the mcrA gene clone library showed a higher slope than
the curve for 16S rRNA gene. The steepness for 16S rRNA and mcrA clone libraries was 7.31°
and 8.85°, respectively. As revealed by rarefaction analysis, both curves reached plateau, an
indicator that each library size was sufficient.
Table 5.3 Cluster of Archaea clone sequences for 16S rRNA clone library and its affiliation
regarding BLAST search
OTUs clones % Methanobacteriales 5 9 7.89 Methanobacteriaceae 5 9 7.89 Uncultured Methanobacteriaceae 2 2 1.75 Methanobacterium sp. 2 6 5.26 Methanobrevibacter sp. 1 1 0.88 Methanomicrobiales 8 27 23.68 Methanomicrobiaceae 3 17 Methanolinea sp. 1 5 4.39 Uncultured Methanomicrobiaceae 2 12 10.53 Methanospirillaceae 5 10 8.77 Methanospirillum sp. 5 10 8.77 Methanosarcinales 5 78 68.42 Methanosaetaceae 2 27 23.68 Methanosaeta sp. 2 27 23.68 Methanosarcinaceae 3 51 44.74 Methanosarcina sp. 1 49 42.98 Uncultured Methanosarcinaceae 2 2 1.75

122
Richness of the two libraries was assessed by two nonparametric richness estimators, Chao1 and
ACE, to determine whether the library was of sufficient size to obtain meaningful stable richness
estimates. Chao1 and ACE showed higher estimation values of expected OTUs for the available
clone number. The respective coverage for 16S rRNA and mcrA clone libraries were 0.93 and
0.90, which also confirmed that the major part of diversity in each library was detected, leaving
some rare species from the digester unrevealed (Table 5.2). The Shannon index (H) and the
evenness (E) are commonly used to characterize species diversity in a community. The Shannon
indices for the 16S rRNA clone library (H = 2.01) was higher than that for the mcrA clone
library (1.80). H accounts for both diversity and uniformity of the species and is maximum only
when all species have perfectly even distribution of abundances thus indicating that detected
species are more uniformly distributed in the 16S rRNA clone library than in the mcrA clone
library. The evenness of 0.60 of the mcrA clone library was lower than the evenness of the 16S
rRNA clone library (E = 0.69), which also confirmed that the species in the 16S rRNA clone
were distributed more equitably among Archaea community compared to the mcrA clone library.
5.4.3.4 Comparison of clone library for 16S rRNA gene and mcrA gene
Comparative study of the two clone libraries constructed for 16S rRNA gene and mcrA gene
revealed that the gene of mcrA is capable of detecting more diversity of overall methanogenic
communities, especially for the orders Methanomicrobiales and Methanobacteriales. However, it
explored few OTUs in the order Methanosarcinales, and even failed to detect Methanosaeta sp.
This result was consistent with the observation of other researchers (Chin et al., 2004; Nettmann
et al., 2008). Nettmann et al. (2008) evaluated the archaea community diversity of a biogas plant
utilizing herbal biomass with 16S rRNA and mcrA clone library. The results showed that the

123
mcrA clone library explored 3 times the number of OTUs that of 16S rRNA clone library, while
the mcrA clone library could not detect Methanosaeta sp., which led to a low diversity in
Methanosarcinales. Chin et al. (2004) analyzed archaea community structure on rice roots and
found that only 1 OTU (1 clone) of mcrA clone was assigned to Methanosaetaceae while 16S
rRNA gene revealed 4 OTUs (7 clone) were affiliated to Methanosaetaceae, since the mcrA
primer set was not be able to detect Methanosaetaceae (Lueders et al., 2001). As this study as
well as previous research revealed that, neither 16S rRNA none mcrA clone library could not
provide complete community structure. It is possible to capture the whole spectrum of archaea
diversity of an environmental sample by combining two different clone libraries.
Table 5.4 Cluster of Archaea clone sequences obtained for mcrA gene clone library and its
affiliation regarding BLAST search
OTUs clones % Methanobacteriales 5 16 13.56 Methanobacteriaceae 5 16 13.56 Methanobacterium sp. 4 15 12.71 Uncultured Methanobacteriaceae 1 1 0.85 Methanomicrobiales 13 31 26.26 Methanomicrobiaceae 6 10 8.47 Methanolinea sp. 2 6 5.08 Uncultured Methanomicrobiaceae 4 4 3.39 Methanospirillaceae 7 21 17.79 Methanospirillum sp. 7 21 17.79 Methanosarcinales 3 71 60.17 Methanosarcinaceae 3 71 60.17 Methanosarcina sp. 3 71 60.17
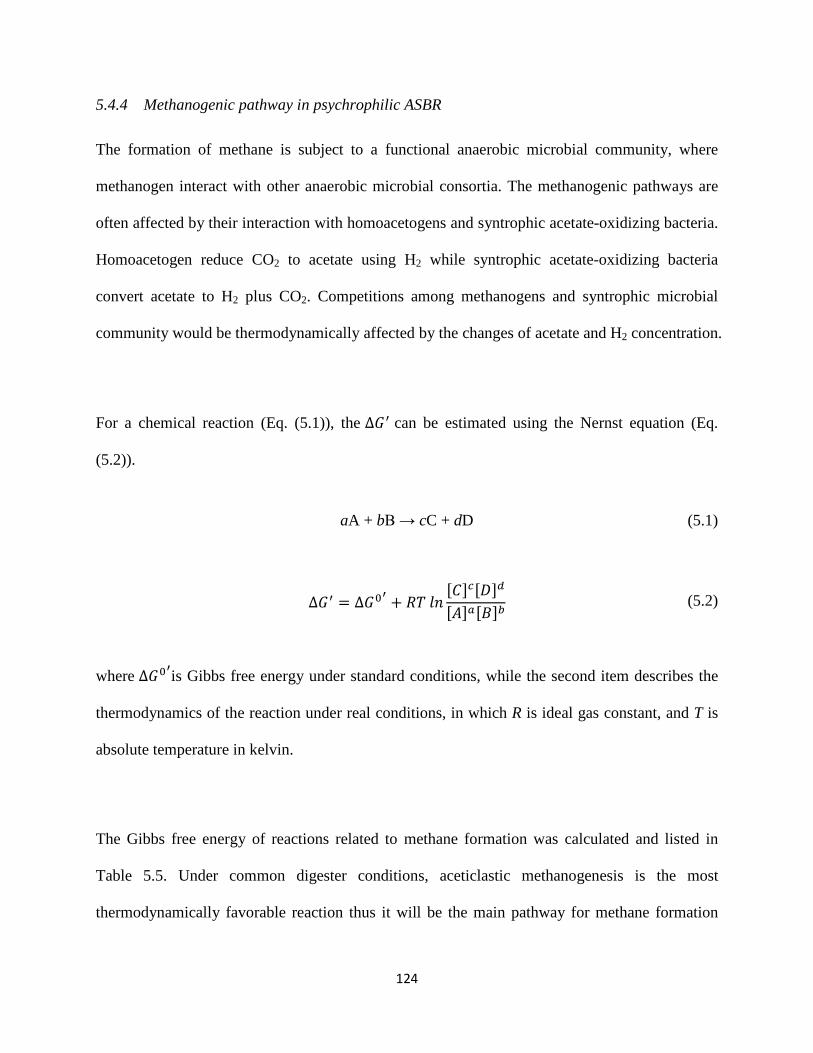
124
5.4.4 Methanogenic pathway in psychrophilic ASBR
The formation of methane is subject to a functional anaerobic microbial community, where
methanogen interact with other anaerobic microbial consortia. The methanogenic pathways are
often affected by their interaction with homoacetogens and syntrophic acetate-oxidizing bacteria.
Homoacetogen reduce CO2 to acetate using H2 while syntrophic acetate-oxidizing bacteria
convert acetate to H2 plus CO2. Competitions among methanogens and syntrophic microbial
community would be thermodynamically affected by the changes of acetate and H2 concentration.
For a chemical reaction (Eq. (5.1)), the ∆𝐺′ can be estimated using the Nernst equation (Eq.
(5.2)).
aA + bB → cC + dD (5.1)
∆𝐺′ = ∆𝐺0′ + 𝑅𝑇 𝑙𝑛[𝐶]𝑐[𝐷]𝑑
[𝐴]𝑎[𝐵]𝑏 (5.2)
where ∆𝐺0′is Gibbs free energy under standard conditions, while the second item describes the
thermodynamics of the reaction under real conditions, in which R is ideal gas constant, and T is
absolute temperature in kelvin.
The Gibbs free energy of reactions related to methane formation was calculated and listed in
Table 5.5. Under common digester conditions, aceticlastic methanogenesis is the most
thermodynamically favorable reaction thus it will be the main pathway for methane formation
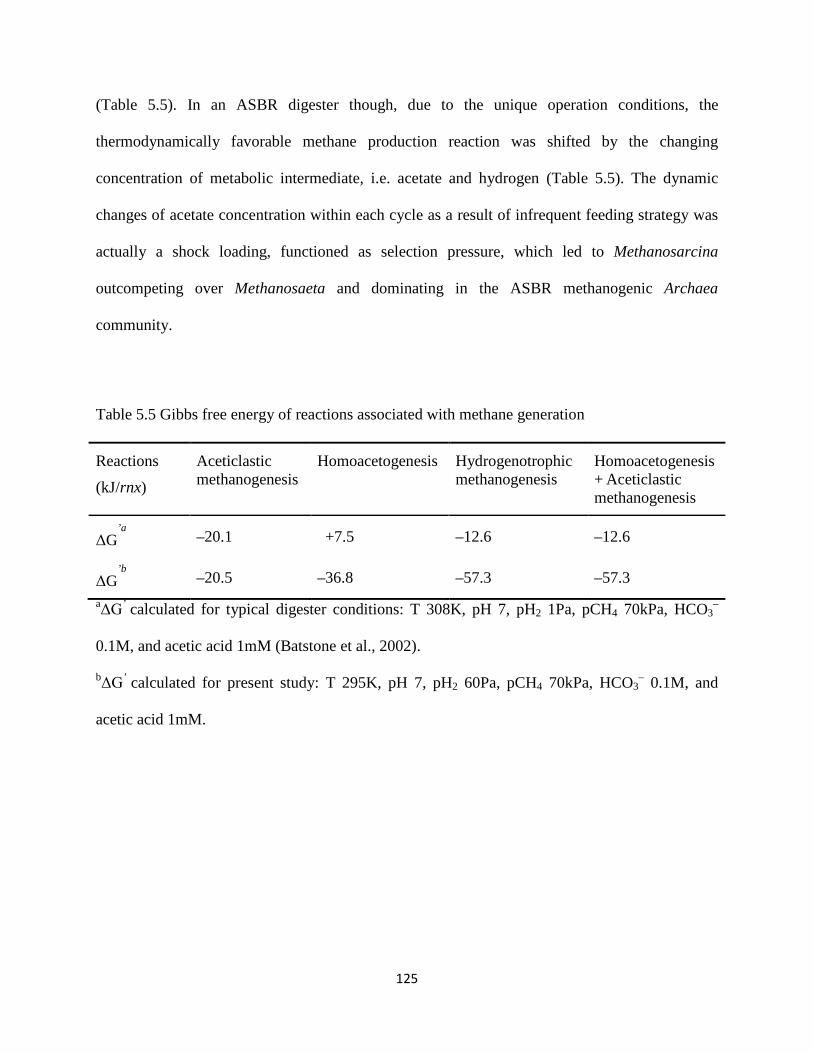
125
(Table 5.5). In an ASBR digester though, due to the unique operation conditions, the
thermodynamically favorable methane production reaction was shifted by the changing
concentration of metabolic intermediate, i.e. acetate and hydrogen (Table 5.5). The dynamic
changes of acetate concentration within each cycle as a result of infrequent feeding strategy was
actually a shock loading, functioned as selection pressure, which led to Methanosarcina
outcompeting over Methanosaeta and dominating in the ASBR methanogenic Archaea
community.
Table 5.5 Gibbs free energy of reactions associated with methane generation
Reactions
(kJ/rnx)
Aceticlastic methanogenesis
Homoacetogenesis Hydrogenotrophic methanogenesis
Homoacetogenesis + Aceticlastic methanogenesis
ΔG’a
–20.1 +7.5 –12.6 –12.6
ΔG’b
–20.5 –36.8 –57.3 –57.3 aΔG’ calculated for typical digester conditions: T 308K, pH 7, pH2 1Pa, pCH4 70kPa, HCO3
–
0.1M, and acetic acid 1mM (Batstone et al., 2002).
bΔG’ calculated for present study: T 295K, pH 7, pH2 60Pa, pCH4 70kPa, HCO3– 0.1M, and
acetic acid 1mM.

126
Figure 5.6 Speculated Methanogenic Pathway in ASBR
Homoacetogens and hydrogenotrophic methanogens are competitors for hydrogen consumption.
Homoacetogens growth is fast but requires a high hydrogen threshold, while hydrogenotrophic
methanogens can utilize hydrogen at much lower concentration and at a considerably lower rate
(Table 5.5). High hydrogen partial pressure was detected in the ASBR digester headspace at
short HRTs, which favored the growth of homoacetogens over hydrogenotrophic methanogens,
therefore homoacetogens became the main hydrogen-consuming microorganism. Low
temperature was another factor accounting for the prevalence of homoacetogens, due to
decreased affinity of methanogens for hydrogen at low temperature (Kotsyurbenko, 2005). As

127
Table 5.5 shows at the above mentioned ASBR conditions, homoacetogenesis plus aceticlastic
methanogenesis is the most thermodynamically favorable pathway. Homoacetogenic bacteria,
together with aceticlastic methanogens, especially Methanosarcina, predominated for hydrogen
and acetate consumption, so that played a key role in the ultimate degradation of organic
substrate and production of methane. It could be speculated that the main pathway for methane
formation in ASBR at short HRT was homoacetogenesis plus aceticlastic methanogenesis
(Figure 5.6).
5.5 Conclusion
As revealed by phylogenetic analysis of constructed clone libraries in this study, the ASBR at
short HRTs was capable of establishing a Methanosarcina predominated methanogenic Archaea
population, which led to a more stable and efficient anaerobic digestion process. This study also
proved that reactor performance was related to microbial community diversity; the community
showed higher diversity when reactor performance was superior. The comparison study showed
that the mcrA clone library detected more Archaea diversity, especially in Methanomicrobiales,
while failed to detect Methanosaeta sp., compared to 16S rRNA clone library. The
experimentally shown dominance of Methanosarcina was explained by thermodynamic
calculation by assessing different digester conditions. It was speculated that homoacetogenesis
plus aceticlastic methanogenesis are the main pathways for methane production in the ASBR
digester.

128
5.6 Reference
Batstone, D., Keller, J., Angelidaki, I., Kalyuzhnyi, S., Pavlostathis, S., Rozzi, A., Sanders, W.,
Siegrist, H., Vavilin, V. 2002. Anaerobic digestion model no. 1 (ADM1), IWA Task
Group for mathematical modelling of anaerobic digestion processes. IWA Publishing,
London, UK.
Boone, D.R., Whitman, W.B., Rouviere, P. 1993. Diversity and Taxonomy of Methanogens. in:
Methanogenesis: Ecology, Physiology, Biochemistry and Genetics, (Ed.) J.G. Ferry,
Chapman & Hall. New York, pp. 35–80.
Chin, K.J., Lueders, T., Friedrich, M.W., Klose, M., Conrad, R. 2004. Archaeal Community
Structure and Pathway of Methane Formation on Rice Roots. Microbial Ecology, 47(1),
59-67.
Cole, J.R., Wang, Q., Cardenas, E., Fish, J., Chai, B., Farris, R.J., Kulam-Syed-Mohideen, A.S.,
McGarrell, D.M., Marsh, T., Garrity, G.M., Tiedje, J.M. 2009. The Ribosomal Database
Project: improved alignments and new tools for rRNA analysis. Nucleic Acids Research,
37(suppl 1), D141-D145.
Conklin, A., Stensel, H.D., Ferguson, J. 2006. Growth Kinetics and Competition Between
Methanosarcina and Methanosaeta in Mesophilic Anaerobic Digestion. Water
Environment Research, 78(5), 486-496.
Cord-Ruwisch, R., Seitz, H.-J., Conrad, R. 1988. The capacity of hydrogenotrophic anaerobic
bacteria to compete for traces of hydrogen depends on the redox potential of the terminal
electron acceptor. Archives of Microbiology, 149(4), 350-357.
Daniels, L., Sparling, R., Sprott, G.D. 1984. The bioenergetics of methanogenesis. Biochimica et
biophysica acta, 768(2), 113-163.

129
Demirel, B., Scherer, P. 2008. The roles of acetotrophic and hydrogenotrophic methanogens
during anaerobic conversion of biomass to methane: a review. Reviews in Environmental
Science and Biotechnology, 7(2), 173-190.
Grosskopf, R., Janssen, P.H., Liesack, W. 1998. Diversity and Structure of the Methanogenic
Community in Anoxic Rice Paddy Soil Microcosms as Examined by Cultivation and
Direct 16S rRNA Gene Sequence Retrieval. Appl. Environ. Microbiol., 64(3), 960-969.
Jetten, M.S.M., Stams, A.J.M., Zehnder, A.J.B. 1992. Methanogenesis from acetate: a
comparison of the acetate metabolism in Methanothrix soehngenii and Methanosarcina
spp. FEMS Microbiology Letters, 88(3–4), 181-197.
Kent, A.D., Smith, D.J., Benson, B.J., Triplett, E.W. 2003. Web-Based Phylogenetic Assignment
Tool for Analysis of Terminal Restriction Fragment Length Polymorphism Profiles of
Microbial Communities. Applied and Environmental Microbiology, 69(11), 6768-6776.
Kotsyurbenko, O.R. 2005. Trophic interactions in the methanogenic microbial community of
low-temperature terrestrial ecosystems. FEMS Microbiol Ecol, 53(1), 3-13.
Krakat, N., Schmidt, S., Scherer, P. 2010. Mesophilic Fermentation of Renewable Biomass:
Does Hydraulic Retention Time Regulate Methanogen Diversity? Applied and
Environmental Microbiology, 76(18), 6322-6326.
Leclerc, M., Delgènes, J.-P., Godon, J.-J. 2004. Diversity of the archaeal community in 44
anaerobic digesters as determined by single strand conformation polymorphism analysis
and 16S rDNA sequencing. Environmental Microbiology, 6(8), 809-819.
Liu, Y., Whitman, W.B. 2008. Metabolic, Phylogenetic, and Ecological Diversity of the
Methanogenic Archaea. Annals of the New York Academy of Sciences, 1125(1), 171-
189.
130
Lueders, T., Chin, K.-J., Conrad, R., Friedrich, M. 2001. Molecular analyses of methyl-
coenzyme M reductase α-subunit (mcrA) genes in rice field soil and enrichment cultures
reveal the methanogenic phenotype of a novel archaeal lineage. Environmental
Microbiology, 3(3), 194-204.
Lueders, T., Friedrich, M. 2000. Archaeal Population Dynamics during Sequential Reduction
Processes in Rice Field Soil. Appl. Environ. Microbiol., 66(7), 2732-2742.
McHugh, S., Carton, M., Mahony, T., O'Flaherty, V. 2003. Methanogenic population structure in
a variety of anaerobic bioreactors. FEMS Microbiology Letters, 219(2), 297-304.
Mladenovska, Z., Dabrowski, S., Ahring, B.K. 2003. Anaerobic digestion of manure and mixture
of manure with lipids: biogas reactor performance and microbial community analysis.
Water Science & Technology, 48(6), 271-278.
Nettmann, E., Bergmann, I., Mundt, K., Linke, B., Klocke, M. 2008. Archaea diversity within a
commercial biogas plant utilizing herbal biomass determined by 16S rDNA and mcrA
analysis. Journal of Applied Microbiology, 105(6), 1835-1850.
Raskin, L., Zheng, D., Griffin, M.E., Stroot, P.G., Misra, P. 1995. Characterization of microbial
communities in anaerobic bioreactors using molecular probes. Antonie van Leeuwenhoek,
68(4), 297-308.
Rastogi, G., Ranade, D.R., Yeole, T.Y., Patole, M.S., Shouche, Y.S. 2008. Investigation of
methanogen population structure in biogas reactor by molecular characterization of
methyl-coenzyme M reductase A (mcrA) genes. Bioresource Technology, 99(13), 5317-
5326.

131
Robinson, J.A., Tiedje, J.M. 1984. Competition between sulfate-reducing and methanogenic
bacteria for H<sub>2</sub> under resting and growing conditions. Archives
of Microbiology, 137(1), 26-32.
Schloss, P.D., Westcott, S.L., Ryabin, T., Hall, J.R., Hartmann, M., Hollister, E.B., Lesniewski,
R.A., Oakley, B.B., Parks, D.H., Robinson, C.J., Sahl, J.W., Stres, B., Thallinger, G.G.,
Van Horn, D.J., Weber, C.F. 2009. Introducing mothur: Open-Source, Platform-
Independent, Community-Supported Software for Describing and Comparing Microbial
Communities. Applied and Environmental Microbiology, 75(23), 7537-7541.
Schmidt, J.E., Ahring, B.K. 1993. Effects of magnesium on thermophilic acetate-degrading
granules in upflow anaerobic sludge blanket (UASB) reactors. Enzyme and Microbial
Technology, 15(4), 304-310.
Schmidt, J.E., Ahring, B.K. 1999. Immobilization Patterns and Dynamics of Acetate-Utilizing
Methanogens Immobilized in Sterile Granular Sludge in Upflow Anaerobic Sludge
Blanket Reactors. Applied and Environmental Microbiology, 65(3), 1050-1054.
Sekiguchi, Y., Kamagata, Y., Syutsubo, K., Ohashi, A., Harada, H., Nakamura, K. 1998.
Phylogenetic diversity of mesophilic and thermophilic granular sludges determined by
16S rRNA gene analysis. Microbiology, 144(9), 2655-2665.
Shyu, C., Soule, T., Bent, S., Foster, J., Forney, L. 2007. MiCA: A Web-Based Tool for the
Analysis of Microbial Communities Based on Terminal-Restriction Fragment Length
Polymorphisms of 16S and 18S rRNA Genes. Microbial Ecology, 53(4), 562-570.
Springer, E., Sachs, M.S., Woese, C.R., Boone, D.R. 1995. Partial Gene Sequences for the A
Subunit of Methyl-Coenzyme M Reductase (mcrI) as a Phylogenetic Tool for the Family
Methanosarcinaceae. International Journal of Systematic Bacteriology, 45(3), 554-559.

132
Tamura, K., Peterson, D., Peterson, N., Stecher, G., Nei, M., Kumar, S. 2011. MEGA5:
Molecular Evolutionary Genetics Analysis Using Maximum Likelihood, Evolutionary
Distance, and Maximum Parsimony Methods. Molecular Biology and Evolution, 28(10),
2731-2739.
Zhu, C., Zhang, J., Tang, Y., Zhengkai, X., Song, R. 2011. Diversity of methanogenic archaea in
a biogas reactor fed with swine feces as the mono-substrate by mcrA analysis.
Microbiological Research, 166(1), 27-35.
Zinder, S.H. 1993. Physiological ecology of methanogens. in: Methanogenesis: Ecology,
Physiology, Biochemistry and Genetics, (Ed.) J.G. Ferry, Chapman & Hall. New York,
pp. 128–206.

133
CHAPTER SIX
CONCLUSIONS AND RECOMMENDATIONS FOR FUTURE WORK
In this study, a novel strategy, improved biomass retention with fiber material present within the
dairy manure as biofilm carriers under selection pressure, was developed and evaluated for
treating flushing dairy manure in a psychrophilic ASBR. The main conclusions from this
research are summarized below:
1. Methodology for rate-limiting step determination for anaerobic digestion of solids
containing substrate and effect of microbial community ratio
A simple and fast procedure, revised BMP test with metabolic intermediates supplementation
was developed in this study to determine the rate-limiting steps in the degradation of complex
substrates. With this method, it was illustrated that hydrolysis of dairy manure was the rate-
limiting step when anaerobic sludge was used as inoculum. The results also showed that an
increase of microbial concentration could shorten the lag phase at the beginning of digestion
process, which indicates anaerobic digestion of dairy manure can be accelerated by dosing
anaerobic sludge seed and potentially can reduce HRT of digester. Additionally, the ultimate
biogas yield was also augmented by sludge supplementation, showing the possibility of more
energy yield in a biogas plant when operated with higher biomass concentration.
This study revealed that the microbial community ratio has a strong effect on the anaerobic
digestion rate. Results showed that the rate-limiting step changed with the variation of microbial
community ratio. It showed that there exists a critical ratio r* at 24 regarding dairy manure; a
134
value below which yields hydrolysis as a potential rate-limiting step; conversely, when r
exceeded this value, methanogenesis limits the anaerobic digestion process. This study opened a
new way to enhance anaerobic digestion process by manipulating microbial community ratio to
fit for a particular feedstock.
2. Bipolar effects of settling time on active biomass retention in anaerobic sequencing
batch reactors digesting flushing dairy manure
Settling time exerts bipolar effects on active biomass retention in ASBR. Both short and long
settling time were able to retain high concentrations of active microbes, though in disparate
living forms. Biofilm attaching on dairy manure fiber is the major living form of retain
microorganisms at short settling time, while ASBR running at longer settling is dominated with
planktonic bioflocs.
Gravity settling and selection pressure theories were accounted for the results. These two
mechanisms always exist and jointly function together in ASBR, and the only difference is that
one may gradually overtake the other strays from a critical settling velocity, in which the two
effects just trade off each other giving rise to minimum active biomass retention. The effects of
gravity settling gradually overtook those of selection pressure as settling time exceeded a critical
point; below that critical point, selection pressure dominated.

135
3. Psychrophilic anaerobic digester with biofilm supported by solids from flushing dairy
manure
A successful biomass retention technology with fiber material present within the dairy manure as
biofilm carriers was developed in this study. ASBR using manure fiber as support media not only
improved methane production but also reduced the necessary HRT and temperature to achieve a
comparable treating efficiency. This technology expanded the capacity of anaerobic digestion to
dilute solid wastes treatment with no requirement of prior solids separation or the risk of biofilm
support media clogging.
A kinetic model was derived for process control and design by comparing four microbial growth
kinetic models, i.e. first-order, Grau, Monod and Chen & Hashimoto models. Chen & Hashimoto
model was proved capable of characterizing biofilm growth kinetics with an improved
performance, compared to the Monod model, due to dependence on influent substrate
concentration. At optimized conditions, a volumetric methane production rate of 0.24 L/L/d of
and specific methane productivity of 0.19 L/gVSloaded are expected.
4. Methanosarcina dominated in ASBR digester at short HRT
The ASBR at short HRT was capable of establishing a Methanosarcina predominated
methanogenic Archaea population. Reactor performance might be related to microbial
community diversity, the community shows higher diversity when reactor performance is
superior. The comparison study showed that the mcrA clone library detected more Archaea
diversity, especially in Methanomicrobiales, while failing to detect Methanosaeta sp., compared
to 16S rRNA clone library, indicating a combination of two different clone libraries could be

136
able to capture more archaea diversity. The experimentally shown dominance of
Methanosarcina was explained by thermodynamic calculation by assessing different digester
conditions. It was speculated that homoacetogenesis plus aceticlastic methanogenesis are the
main pathways for methane production in ASBR digester.
5. Future work
This technology needs to be applied to even lower temperature (10–15°C) to yield more net
energy in cold region during the winter. Psychrophilic microorganism culture sourced from low
temperature environment could be used as inoculum for psychrophilic digester. Biofilm
formation mechanism at such low temperature needs to be investigated. In addition, quantitative
PCR and high throughput pyrosequencing could be used to better understand the function of
microbial community. The speculated methanogenic pathway needs to be confirmed by methods
such as stable-isotope technique. Further research on the syntrophic relationships between
methanogenic archaea and bacteria are also needed.