Jigsaw: Investigative Analysis on Text Document Collections through Visualization
7
Jigsaw: Investigative Analysis on Text Document Collections through Visualization Carsten G ¨ org and John Stasko School of Interactive Computing & GVU Center Georgia Institute of Technology Atlanta, GA 30332 {goerg,stasko}@cc.gatech.edu ABSTRACT This article describes the Jigsaw system for helping inves- tigative analysis across collections of text documents. Jig- saw provides multiple visualizations of the documents and the entities within them to help investigators discern embed- ded stories and plots. Our early focus within Jigsaw has not been on legal documents and E-discovery, but we feel that the system may have potential in these areas as well. This article illustrates Jigsaw’s views and operations using Enron email archives as example documents. Author Keywords Sensemaking, investigative analysis, information foraging, information visualization, multiple views. INTRODUCTION We have been developing a system called Jigsaw to help in- vestigative analysts explore and make sense of collections of text documents. In particular, we have designed Jigsaw to help investigators uncover stories, plots, and threats embed- ded across the documents. While our focus has not been on legal documents or E-discovery, we are curious to explore whether Jigsaw might be useful in these areas as well. This article provides a brief overview of Jigsaw and its capabili- ties, using a subset of the Enron email archive as an example document collection. Jigsaw has been developed to help people with sensemaking, exploration, and analysis activities on collections of unstruc- tured, plain text documents, in particular, relatively short documents (approximately 1-10 paragraphs) in loose narra- tive form. Examples of such documents include police case reports, short news articles, or email notes. While Jigsaw can process longer documents, its utility degrades in these cases (reasons will be illustrated later in the article). The email shown below, taken from the Enron data set, is a good example of the kind of document ideal for Jigsaw. Email 114844 Message-ID: <22094025.1075842958662. JavaMail.evans@thyme> Date: Fri, 1 Sep 2000 00:43:00 -0700 (PDT) From: [email protected] To: [email protected], [email protected], [email protected], [email protected], [email protected] Subject: Cc: [email protected], [email protected], [email protected] Mime-Version: 1.0 Content-Type: text/plain; charset=us-ascii Content-Transfer-Encoding: 7bit Bcc: [email protected], [email protected], [email protected] X-From: Steven J Kean X-To: Jeff Dasovich, Susan J Mara, Mona L Petrochko, Tim Belden, Mary Hain X-cc: Paul Kaufman, Richard Shapiro, James D Steffes X-bcc: X-Folder: \Jeff Dasovich Dec2000\Notes Folders \All documents X-Origin: DASOVICH-J X-FileName: jdasovic.nsf When we have described the problems and solutions for California we have focussed on generation siting and flexibility to hedge. We have stayed away from transmission issues on the assumption that California, with its ISO and PX, does not suffer from the same discrimination issues as other parts of the country. Is this true? Does California’s system layer in priorities for utility use of the system -- eg doesn’t PG&E control "path 15"? Does that control provide advantageous access to PG&E? Are there other examples and are there links between these "preferences" and the current problems in California? As we are trying to convert reliability and pricing concerns into FERC action these would be helpful arguments to have available to us. Investigators may seek to connect the individual facts and events described in specific documents into a larger, more coherent thread or story. Putting the pieces together in this way can lead to a better understanding of the broader, more general notions and implications of the document collection. Jigsaw’s particular focus is on illuminating connections be- tween the entities in the documents—the people, organiza- tions, places, and so on. Jigsaw visualizes the documents 1
-
Upload
independent -
Category
Documents
-
view
0 -
download
0
Transcript of Jigsaw: Investigative Analysis on Text Document Collections through Visualization

Jigsaw: Investigative Analysis on Text DocumentCollections through Visualization
Carsten Gorg and John StaskoSchool of Interactive Computing & GVU Center
Georgia Institute of TechnologyAtlanta, GA 30332
{goerg,stasko}@cc.gatech.edu
ABSTRACTThis article describes the Jigsaw system for helping inves-tigative analysis across collections of text documents. Jig-saw provides multiple visualizations of the documents andthe entities within them to help investigators discern embed-ded stories and plots. Our early focus within Jigsaw has notbeen on legal documents and E-discovery, but we feel thatthe system may have potential in these areas as well. Thisarticle illustrates Jigsaw’s views and operations using Enronemail archives as example documents.
Author KeywordsSensemaking, investigative analysis, information foraging,information visualization, multiple views.
INTRODUCTIONWe have been developing a system called Jigsaw to help in-vestigative analysts explore and make sense of collectionsof text documents. In particular, we have designed Jigsaw tohelp investigators uncover stories, plots, and threats embed-ded across the documents. While our focus has not been onlegal documents or E-discovery, we are curious to explorewhether Jigsaw might be useful in these areas as well. Thisarticle provides a brief overview of Jigsaw and its capabili-ties, using a subset of the Enron email archive as an exampledocument collection.
Jigsaw has been developed to help people with sensemaking,exploration, and analysis activities on collections of unstruc-tured, plain text documents, in particular, relatively shortdocuments (approximately 1-10 paragraphs) in loose narra-tive form. Examples of such documents include police casereports, short news articles, or email notes. While Jigsawcan process longer documents, its utility degrades in thesecases (reasons will be illustrated later in the article). Theemail shown below, taken from the Enron data set, is a goodexample of the kind of document ideal for Jigsaw.
Email 114844Message-ID: <22094025.1075842958662.
JavaMail.evans@thyme>
Date: Fri, 1 Sep 2000 00:43:00 -0700 (PDT)
From: [email protected]
To: [email protected],
[email protected], [email protected],
[email protected], [email protected]
Subject:
Cc: [email protected],
Mime-Version: 1.0
Content-Type: text/plain; charset=us-ascii
Content-Transfer-Encoding: 7bit
Bcc: [email protected],
X-From: Steven J Kean
X-To: Jeff Dasovich, Susan J Mara,
Mona L Petrochko, Tim Belden, Mary Hain
X-cc: Paul Kaufman, Richard Shapiro,
James D Steffes
X-bcc:
X-Folder: \Jeff Dasovich Dec2000\Notes Folders
\All documents
X-Origin: DASOVICH-J
X-FileName: jdasovic.nsf
When we have described the problems and
solutions for California we have focussed on
generation siting and flexibility to hedge. We
have stayed away from transmission issues on the
assumption that California, with its ISO and PX,
does not suffer from the same discrimination
issues as other parts of the country. Is this
true? Does California’s system layer in
priorities for utility use of the system -- eg
doesn’t PG&E control "path 15"? Does that
control provide advantageous access to PG&E? Are
there other examples and are there links between
these "preferences" and the current problems in
California? As we are trying to convert
reliability and pricing concerns into FERC
action these would be helpful arguments to have
available to us.
Investigators may seek to connect the individual facts andevents described in specific documents into a larger, morecoherent thread or story. Putting the pieces together in thisway can lead to a better understanding of the broader, moregeneral notions and implications of the document collection.
Jigsaw’s particular focus is on illuminating connections be-tween the entities in the documents—the people, organiza-tions, places, and so on. Jigsaw visualizes the documents
1
and the entities within them in a number of different rep-resentations, each one specifically created to communicatesome different aspect of the data. For instance, Jigsaw canhelp to understand social networks of people, connectionsbetween people and places, and the evolution of events intime.
Within our research communities, these types of activitiesare know as sensemaking [3, 4, 5]. Investigative reporters,law enforcement officials, and intelligence analysts all rou-tinely perform these types of activities. Clearly, as the num-ber of documents being examined grows, the sensemakingactivities become more challenging.
A variety of approaches to support people in sensemakingscenarios like the ones we describe do exist. Some use auto-mated techniques and tools that examine a document collec-tion without human intervention and report on discoveredplots or narratives. These approaches typically use tech-niques and algorithms from the fields of artificial intelli-gence, data mining, and machine learning.
Our approach is quite different, instead involving human-centered investigations where we provide human analystswith computational tools to assist them while conductinginvestigations. Our tools seek to enable the powerful per-ceptual capabilities of people and bring those capabilities tobear throughout the sensemaking process. We firmly believethat human analysts harbor tremendous investigative skills,but the masses of data and documents typically present to-day can overwhelm the analysts’ investigative capabilities.Thus, we provide visualization tools that transform the data(text documents in our case) into visual representations thatcan more easily be surveyed, scanned, examined, reviewed,and studied.
In order to facilitate the powerful exploratory, investigativeskills of people, our tools are highly interactive and flexible.We seek to help analysts browse the document collectionrapidly and to more deeply explore “interesting” avenues ofinvestigations. Analysts must uncover whether the agentsand events in question relate to potential plots being devel-oped. Our approach also hinges upon multiple visual repre-sentations of the documents and entities within them. Anyone visualization simply may not provide the right perspec-tive onto the data to allow an analyst to perceive an importantconnection. By supplying multiple visual representations ofthe data, each providing a view onto some important charac-teristic, we are more likely to help the analyst discover theunknown connections that weave a larger narrative together.
Thus, Jigsaw espouses an information visualization [1, 6]approach to investigative and exploratory data analysis. Morespecifically, when visual approaches like this are combinedwith computational techniques to manage and filter the ex-tremely large data sets that may be present, the resulting sys-tem illustrates visual analytics [8] principles.
Clearly, many different types of investigations occur withinthe legal community. Realistically, we speculate that Jig-
saw’s utility is limited for typical E-discovery type tasks thatmay involve millions of documents. Instead, Jigsaw’s valuelikely rises when a document collection has been narroweddown to a few thousand documents and an investigator wantsto understand how the people, organizations, and events inthose documents interact to reveal the “big picture.”
JIGSAWJigsaw [7] is a system for helping analysts with the kinds ofinvestigative scenarios discussed above. It is a multi-viewsystem, including a number of different visualizations of thedocuments in the collection and the entities (people, places,dates, organizations, etc.) within those documents. Accom-panying the visualizations is a textual search query interfaceso that particular entities can be examined directly. Whenused in this way, Jigsaw acts like a search engine that simplydisplays results through visualizations rather than text lists.
Jigsaw is much more than a search engine with visual results,however. Once views show documents and their entities,users can explore the collection by interactions with thoseobjects. For instance, new entities can be displayed and ex-plored by simple user interface operations in the views thatexpand the context of entities and documents. In fact, farmore entities and documents are initially displayed via userinteraction than by textual search queries. Search queries of-ten serve to jump-start an exploration, but view interactionyields richer representations and exploration.
Most of the views in Jigsaw illustrate connections betweendocuments and entities or between entities and other enti-ties. Jigsaw uses a simple model of “connection” — an en-tity is connected to a document if it appears in that document(and vice versa) and two entities are connected if they appearin at least one document together. Entities that appear inmore than one document together are considered to be morestrongly connected with the connection value dependent onthe total number of documents of co-occurrence. This sim-ple model of connection is easy to implement, is easy forpeople to understand, and we have found it to be powerfulfor helping exploration of document collection.
The views in Jigsaw are linked so that actions in one viewpropagate to the other views whose visual state updates toreflect that action. For example, the most common operationon a view is to mouse-click on an entity or document whichselects that object, and then the rendering of other objects inthe view updates to reflect their relation to the selected ob-ject. In Jigsaw this action is propagated to other views whichthen also select that same object and update their displaysappropriately. Another common operation is to “expand” anentity or document which typically displays a new set of en-tities and documents that are connected to this object. Thisoperation is usually invoked by a double-click on an objector a click-activated menu.
The person using Jigsaw also can decouple a view from eventlistening so that its visual state only changes via explicit op-erations in that view. We have found this capability to bevery useful when an analysis process yields a view configu-
2
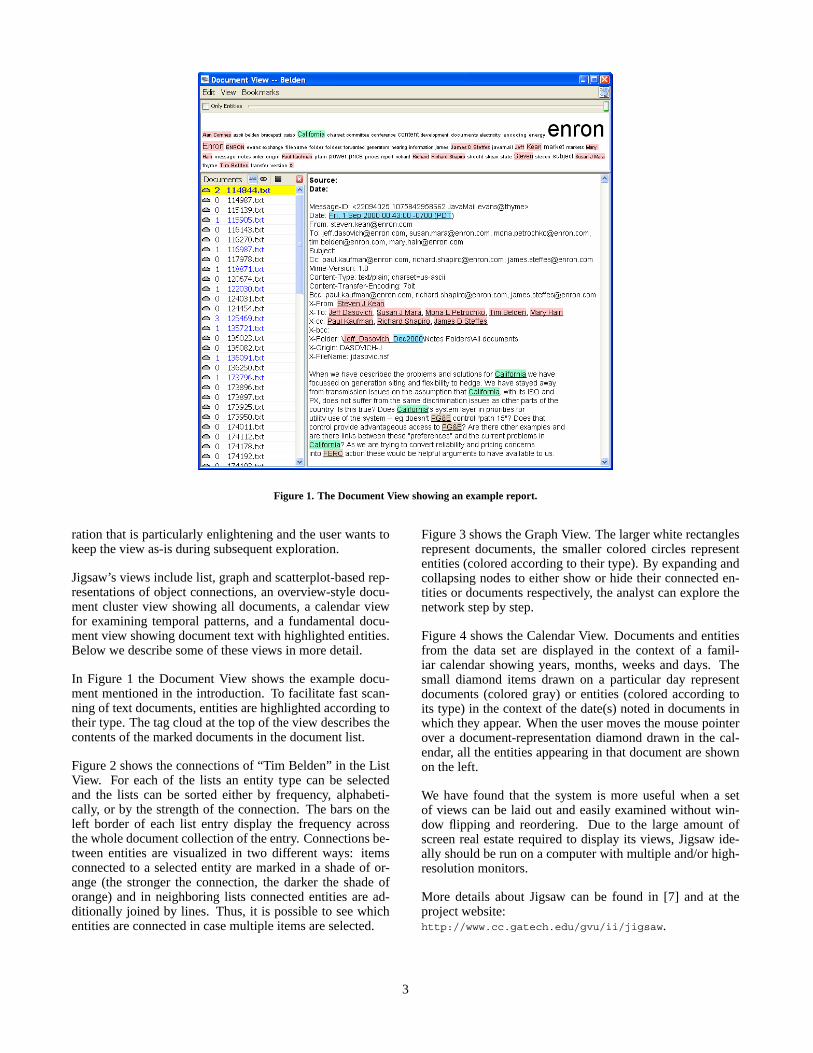
Figure 1. The Document View showing an example report.
ration that is particularly enlightening and the user wants tokeep the view as-is during subsequent exploration.
Jigsaw’s views include list, graph and scatterplot-based rep-resentations of object connections, an overview-style docu-ment cluster view showing all documents, a calendar viewfor examining temporal patterns, and a fundamental docu-ment view showing document text with highlighted entities.Below we describe some of these views in more detail.
In Figure 1 the Document View shows the example docu-ment mentioned in the introduction. To facilitate fast scan-ning of text documents, entities are highlighted according totheir type. The tag cloud at the top of the view describes thecontents of the marked documents in the document list.
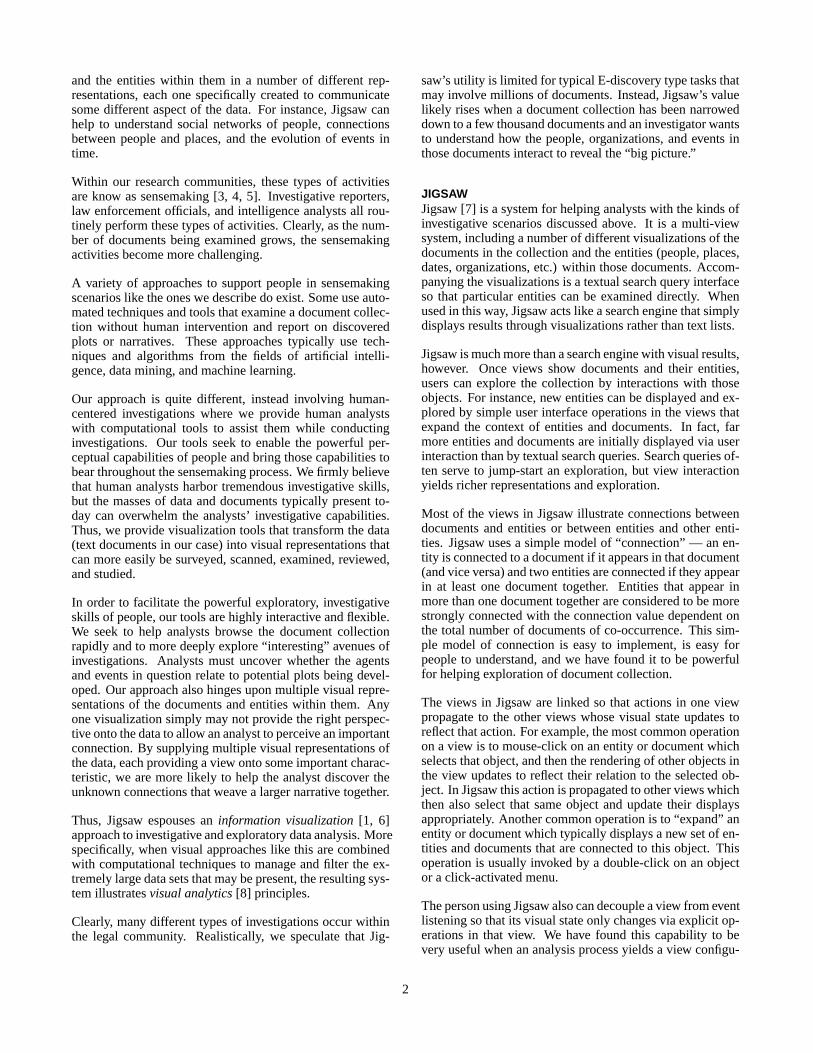
Figure 2 shows the connections of “Tim Belden” in the ListView. For each of the lists an entity type can be selectedand the lists can be sorted either by frequency, alphabeti-cally, or by the strength of the connection. The bars on theleft border of each list entry display the frequency acrossthe whole document collection of the entry. Connections be-tween entities are visualized in two different ways: itemsconnected to a selected entity are marked in a shade of or-ange (the stronger the connection, the darker the shade oforange) and in neighboring lists connected entities are ad-ditionally joined by lines. Thus, it is possible to see whichentities are connected in case multiple items are selected.
Figure 3 shows the Graph View. The larger white rectanglesrepresent documents, the smaller colored circles represententities (colored according to their type). By expanding andcollapsing nodes to either show or hide their connected en-tities or documents respectively, the analyst can explore thenetwork step by step.
Figure 4 shows the Calendar View. Documents and entitiesfrom the data set are displayed in the context of a famil-iar calendar showing years, months, weeks and days. Thesmall diamond items drawn on a particular day representdocuments (colored gray) or entities (colored according toits type) in the context of the date(s) noted in documents inwhich they appear. When the user moves the mouse pointerover a document-representation diamond drawn in the cal-endar, all the entities appearing in that document are shownon the left.
We have found that the system is more useful when a setof views can be laid out and easily examined without win-dow flipping and reordering. Due to the large amount ofscreen real estate required to display its views, Jigsaw ide-ally should be run on a computer with multiple and/or high-resolution monitors.
More details about Jigsaw can be found in [7] and at theproject website:http://www.cc.gatech.edu/gvu/ii/jigsaw.
3
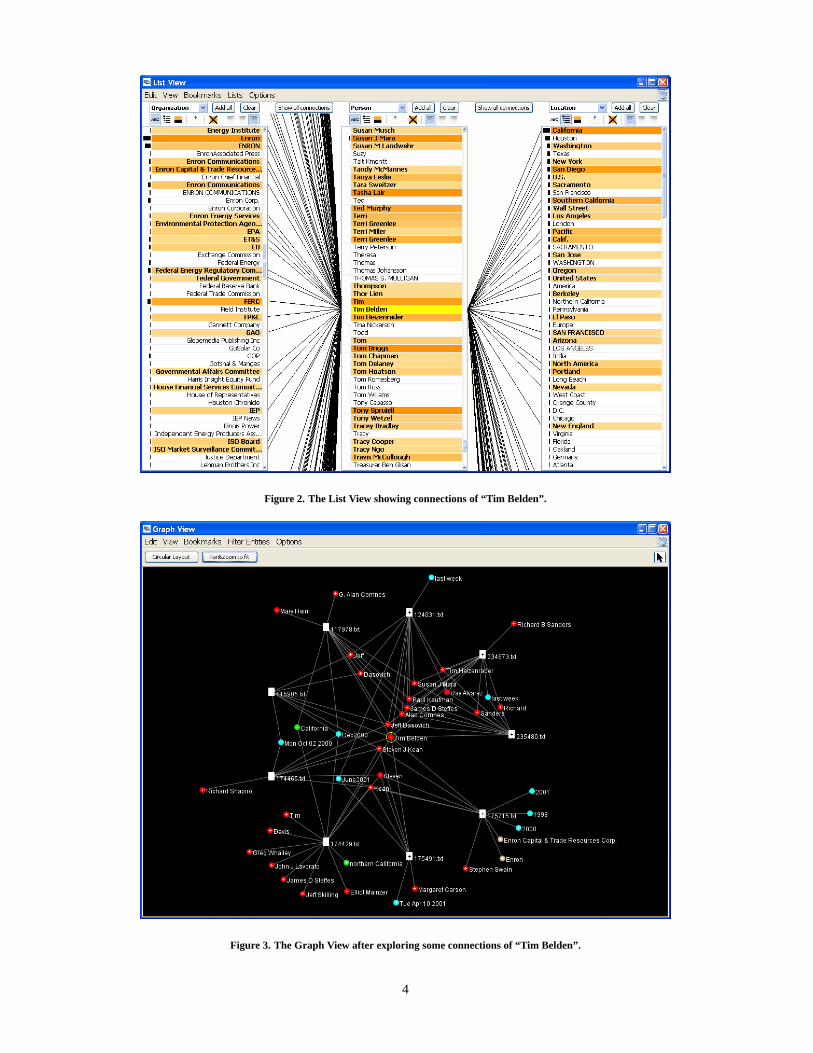
Figure 2. The List View showing connections of “Tim Belden”.
Figure 3. The Graph View after exploring some connections of “Tim Belden”.
4
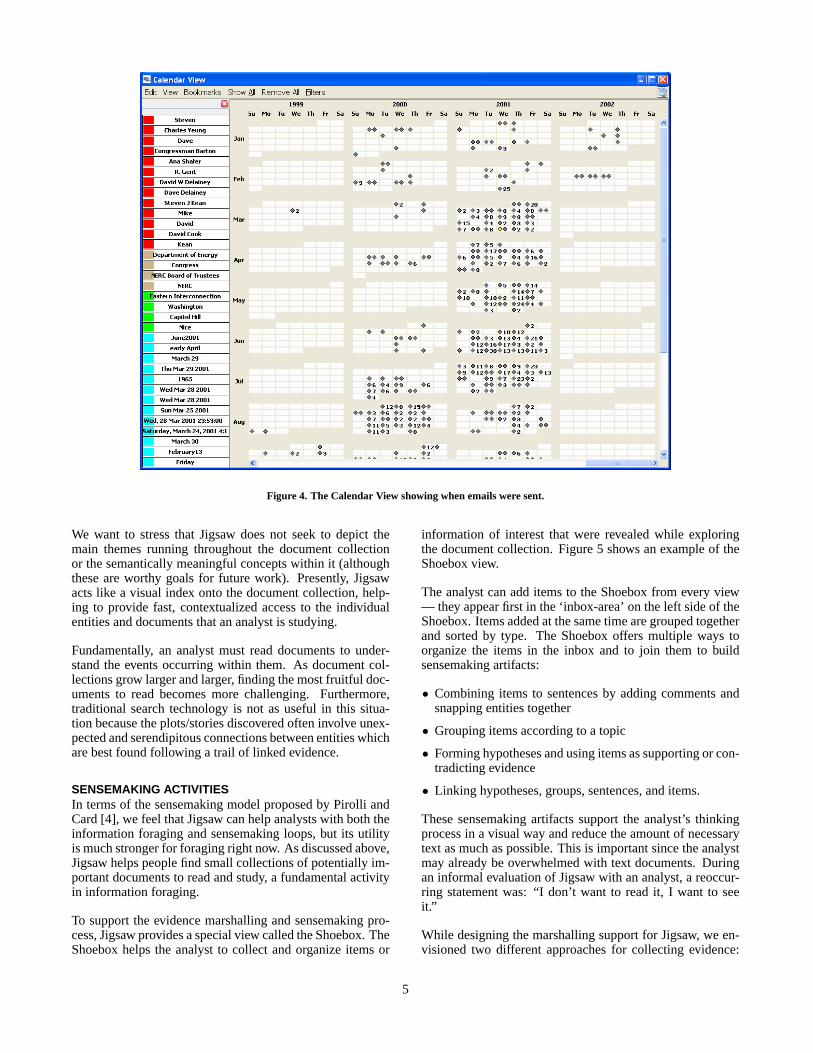
Figure 4. The Calendar View showing when emails were sent.
We want to stress that Jigsaw does not seek to depict themain themes running throughout the document collectionor the semantically meaningful concepts within it (althoughthese are worthy goals for future work). Presently, Jigsawacts like a visual index onto the document collection, help-ing to provide fast, contextualized access to the individualentities and documents that an analyst is studying.
Fundamentally, an analyst must read documents to under-stand the events occurring within them. As document col-lections grow larger and larger, finding the most fruitful doc-uments to read becomes more challenging. Furthermore,traditional search technology is not as useful in this situa-tion because the plots/stories discovered often involve unex-pected and serendipitous connections between entities whichare best found following a trail of linked evidence.
SENSEMAKING ACTIVITIESIn terms of the sensemaking model proposed by Pirolli andCard [4], we feel that Jigsaw can help analysts with both theinformation foraging and sensemaking loops, but its utilityis much stronger for foraging right now. As discussed above,Jigsaw helps people find small collections of potentially im-portant documents to read and study, a fundamental activityin information foraging.
To support the evidence marshalling and sensemaking pro-cess, Jigsaw provides a special view called the Shoebox. TheShoebox helps the analyst to collect and organize items or
information of interest that were revealed while exploringthe document collection. Figure 5 shows an example of theShoebox view.
The analyst can add items to the Shoebox from every view— they appear first in the ‘inbox-area’ on the left side of theShoebox. Items added at the same time are grouped togetherand sorted by type. The Shoebox offers multiple ways toorganize the items in the inbox and to join them to buildsensemaking artifacts:
• Combining items to sentences by adding comments andsnapping entities together
• Grouping items according to a topic
• Forming hypotheses and using items as supporting or con-tradicting evidence
• Linking hypotheses, groups, sentences, and items.
These sensemaking artifacts support the analyst’s thinkingprocess in a visual way and reduce the amount of necessarytext as much as possible. This is important since the analystmay already be overwhelmed with text documents. Duringan informal evaluation of Jigsaw with an analyst, a reoccur-ring statement was: “I don’t want to read it, I want to seeit.”
While designing the marshalling support for Jigsaw, we en-visioned two different approaches for collecting evidence:
5
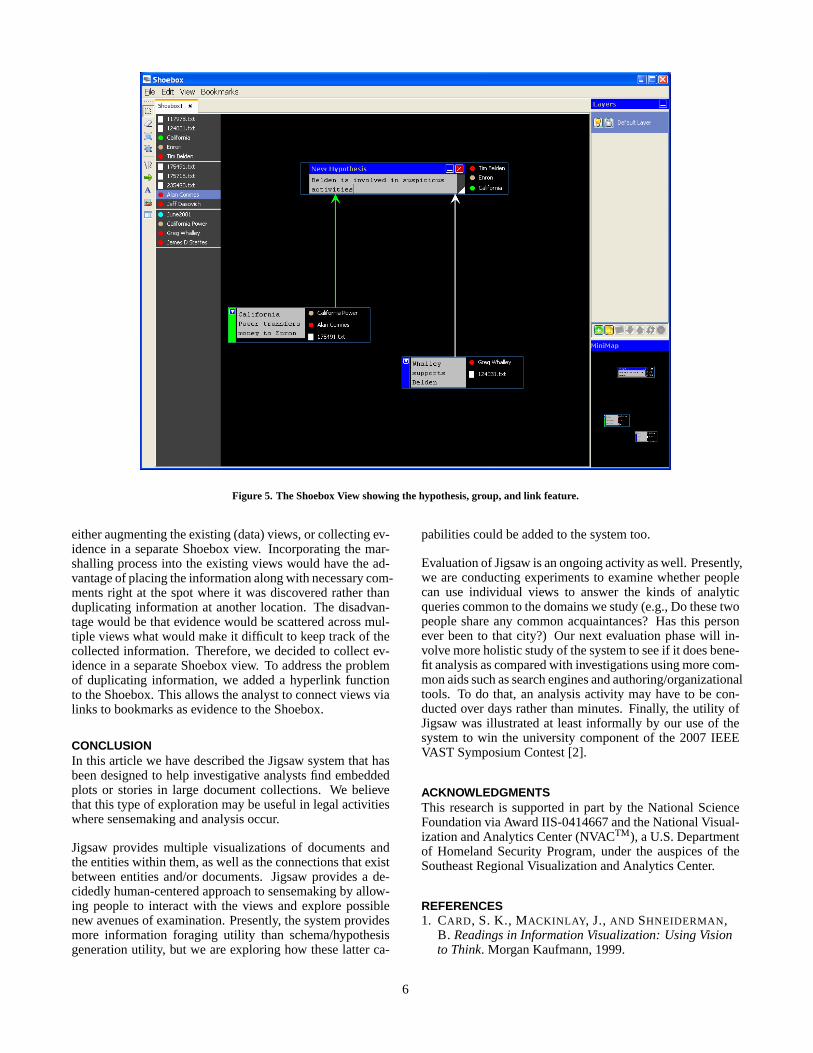
Figure 5. The Shoebox View showing the hypothesis, group, and link feature.
either augmenting the existing (data) views, or collecting ev-idence in a separate Shoebox view. Incorporating the mar-shalling process into the existing views would have the ad-vantage of placing the information along with necessary com-ments right at the spot where it was discovered rather thanduplicating information at another location. The disadvan-tage would be that evidence would be scattered across mul-tiple views what would make it difficult to keep track of thecollected information. Therefore, we decided to collect ev-idence in a separate Shoebox view. To address the problemof duplicating information, we added a hyperlink functionto the Shoebox. This allows the analyst to connect views vialinks to bookmarks as evidence to the Shoebox.
CONCLUSIONIn this article we have described the Jigsaw system that hasbeen designed to help investigative analysts find embeddedplots or stories in large document collections. We believethat this type of exploration may be useful in legal activitieswhere sensemaking and analysis occur.
Jigsaw provides multiple visualizations of documents andthe entities within them, as well as the connections that existbetween entities and/or documents. Jigsaw provides a de-cidedly human-centered approach to sensemaking by allow-ing people to interact with the views and explore possiblenew avenues of examination. Presently, the system providesmore information foraging utility than schema/hypothesisgeneration utility, but we are exploring how these latter ca-
pabilities could be added to the system too.
Evaluation of Jigsaw is an ongoing activity as well. Presently,we are conducting experiments to examine whether peoplecan use individual views to answer the kinds of analyticqueries common to the domains we study (e.g., Do these twopeople share any common acquaintances? Has this personever been to that city?) Our next evaluation phase will in-volve more holistic study of the system to see if it does bene-fit analysis as compared with investigations using more com-mon aids such as search engines and authoring/organizationaltools. To do that, an analysis activity may have to be con-ducted over days rather than minutes. Finally, the utility ofJigsaw was illustrated at least informally by our use of thesystem to win the university component of the 2007 IEEEVAST Symposium Contest [2].
ACKNOWLEDGMENTSThis research is supported in part by the National ScienceFoundation via Award IIS-0414667 and the National Visual-ization and Analytics Center (NVACTM), a U.S. Departmentof Homeland Security Program, under the auspices of theSoutheast Regional Visualization and Analytics Center.
REFERENCES1. CARD, S. K., MACKINLAY, J., AND SHNEIDERMAN,
B. Readings in Information Visualization: Using Visionto Think. Morgan Kaufmann, 1999.
6
2. GORG, C., LIU, Z., PAREKH, N., SINGHAL, K., ANDSTASKO, J. Jigsaw meets Blue Iguanodon - The VAST2007 Contest. In IEEE Symposium on Visual AnalyticsScience and Technology (2007), pp. 201–202.
3. KLEIN, G., MOON, B., AND HOFFMAN, R. Makingsense of sensemaking 1: Alternative perspectives. IEEEIntelligent Systems 21, 4 (July 2006), 70–73.
4. PIROLLI, P., AND CARD, S. Sensemaking processes ofintelligence analysts and possible leverage points asidentified through cognitive task analysis. In 2005International Conference on Intelligence Analysis (May2005).
5. RUSSELL, D. M., STEFIK, M. J., PIROLLI, P., ANDCARD, S. K. The cost structure of sensemaking. In CHI’93: Proceedings of the INTERACT ’93 and CHI ’93Conference on Human Factors in Computing Systems(New York, NY, USA, 1993), ACM, pp. 269–276.
6. SPENCE, R. Information Visualization. ACM Press,2001.
7. STASKO, J., GORG, C., LIU, Z., AND SINGHAL, K.Supporting investigative analysis through interactivevisualization. In IEEE Symposium on Visual AnalyticsScience and Technology (2007), pp. 131–138.
8. THOMAS, J. J., AND COOK, K. A. Illuminating thePath. IEEE Computer Society, 2005.
7