Jewish families and Jewish households. Census insights about how we live
51
Jewish families and Jewish households Census insights about how we live David Graham with Maria Luisa Caputo Institute for Jewish Policy Research March 2015 jpr / report
Transcript of Jewish families and Jewish households. Census insights about how we live

Jewish families and Jewish households
Census insights about how we live
David Graham with Maria Luisa Caputo
Institute for Jewish Policy Research March 2015
jpr / report

The Institute for Jewish Policy Research (JPR) is a London-based independent research organisation, consultancy and think-tank. It aims to advance the prospects of Jewish communities in Britain and across Europe by conducting research and developing policy in partnership with those best placed to influence Jewish life.
Author
Dr David Graham is a Senior Research Fellow at JPR and Honorary Associate at the Department of Hebrew, Biblical and Jewish Studies, University of Sydney. He has spent many years writing about Jewish identity and the demography of Jews in Britain, and has published widely for academic, professional and general interest audiences both nationally and internationally. His most recent publications include a series of papers examining the Jewish population of the UK based on 2011 UK Census data, two major studies of Australian Jewry based on the 2011 Australian Census, and a flagship report on Jews in the UK based on data from JPR’s 2013 National Jewish Community Survey. He holds a DPhil in Geography from the University of Oxford.
Research Assistant
Maria Luisa Caputo is a doctoral candidate and lecturer in Geography at the University of Paris (Sorbonne) and associate researcher at the Centre on Migration, Policy and Society (COMPAS), University of Oxford. Her research focuses on comparative work between the Jewish communities of London and Paris relating to integration, residential concentration and identity maintenance. She has also worked on research with the Italian embassy at UNESCO and at the French scientific agency National Scientific Research Centre (CNRS) examining poverty and economic stress. She is currently a research intern at JPR.
The production of this report has been made possible thanks to the generous support of an anonymous donor.

JPR Report March 2015 Jewish families and households: Census insights about how we live 1
Contents
Summary 3
Background 5
Technical notes 5
What is a Jewish household? 6
Household dynamics 7
Total number and average size of Jewish households 7
Jewish household dynamics at the local level 8
Jewish household change and communal evolution 9
Household size and religiosity 12
Jewish household composition – an overview 13
The family lifecycle 17
Student households 18
Young adults 21
Families with children 22
Lone parent households 24
Households with older people 25
Jews living in medical and care facilities 27
Living arrangements among other religious and ethnic groups 28
Living conditions 29
Home ownership and renting 29
Home ownership by location 30
Home ownership by age 31
Accommodation type 32
Household overcrowding 33
Overcrowding by location 34
Policy implications 36

2 JPR Report March 2015 Jewish families and households: Census insights about how we live
Appendices 39
I Alternative approaches to defining ‘Jewish households’ 39
II Living arrangements for Jewish households by religious makeup 41
III Age and sex of Jewish one person householders 42
IV Separating out data on haredi households from all other Jewish households 44
ONS Census table code identifier 45
Glossary 46
JPR Report March 2015 Jewish families and households: Census insights about how we live 3
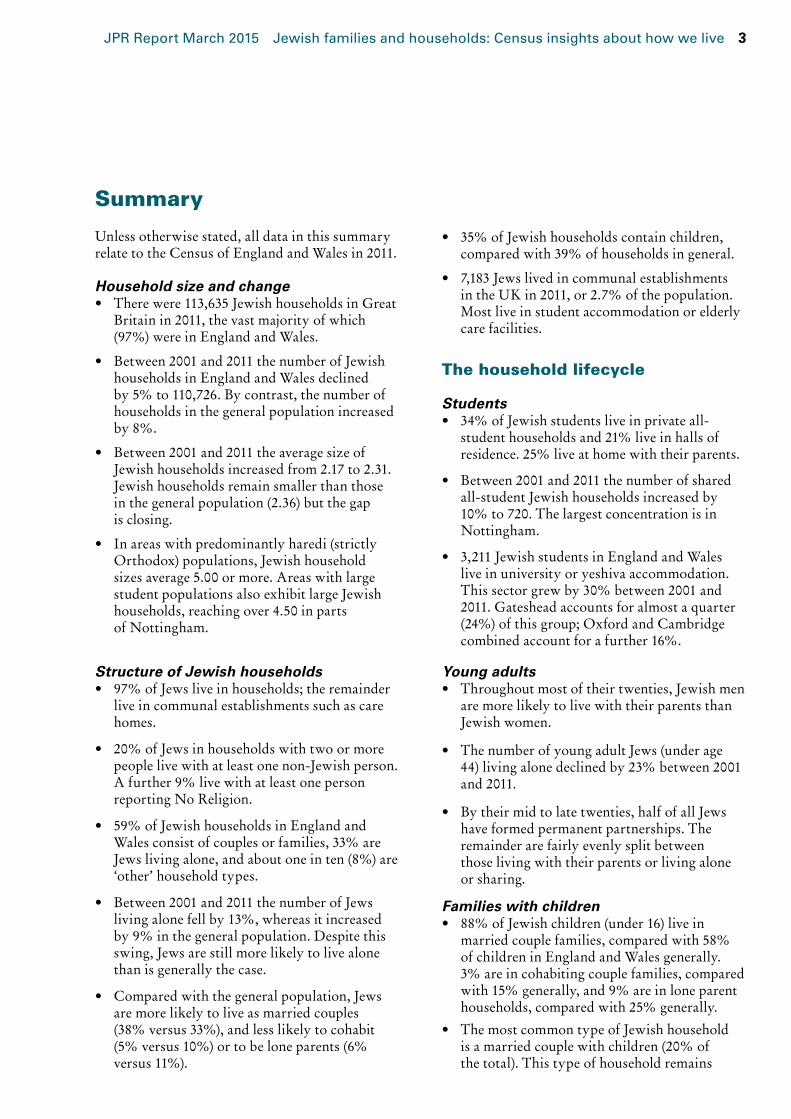
Summary
Unless otherwise stated, all data in this summary relate to the Census of England and Wales in 2011.
Household size and change• Therewere113,635JewishhouseholdsinGreat
Britain in 2011, the vast majority of which (97%) were in England and Wales.
• Between2001and2011thenumberofJewishhouseholds in England and Wales declined by5%to110,726.Bycontrast,thenumberofhouseholds in the general population increased by8%.
• Between2001and2011theaveragesizeofJewishhouseholdsincreasedfrom2.17to2.31.Jewishhouseholdsremainsmallerthanthoseinthegeneralpopulation(2.36)butthegapis closing.
• Inareaswithpredominantlyharedi(strictlyOrthodox)populations,Jewishhouseholdsizesaverage5.00ormore.AreaswithlargestudentpopulationsalsoexhibitlargeJewishhouseholds,reachingover4.50inpartsof Nottingham.
Structure of Jewish households• 97%ofJewsliveinhouseholds;theremainder
liveincommunalestablishmentssuchascarehomes.
• 20%ofJewsinhouseholdswithtwoormorepeoplelivewithatleastonenon-Jewishperson.Afurther9%livewithatleastonepersonreporting No Religion.
• 59%ofJewishhouseholdsinEnglandandWalesconsistofcouplesorfamilies,33%areJewslivingalone,andaboutoneinten(8%)are‘other’ household types.
• Between2001and2011thenumberofJewslivingalonefellby13%,whereasitincreasedby9%inthegeneralpopulation.Despitethisswing,Jewsarestillmorelikelytolivealonethan is generally the case.
• Comparedwiththegeneralpopulation,Jewsaremorelikelytoliveasmarriedcouples(38%versus33%),andlesslikelytocohabit(5%versus10%)ortobeloneparents(6%versus 11%).
• 35%ofJewishhouseholdscontainchildren,comparedwith39%ofhouseholdsingeneral.
• 7,183Jewslivedincommunalestablishmentsin the UK in 2011, or 2.7% of the population. Most live in student accommodation or elderly care facilities.
The household lifecycle
Students• 34%ofJewishstudentsliveinprivateall-
student households and 21% live in halls of residence.25%liveathomewiththeirparents.
• Between2001and2011thenumberofsharedall-studentJewishhouseholdsincreasedby10%to720.ThelargestconcentrationisinNottingham.
• 3,211JewishstudentsinEnglandandWaleslive in university or yeshiva accommodation. Thissectorgrewby30%between2001and2011.Gatesheadaccountsforalmostaquarter(24%)ofthisgroup;OxfordandCambridgecombinedaccountforafurther16%.
Young adults• Throughoutmostoftheirtwenties,Jewishmen
aremorelikelytolivewiththeirparentsthanJewishwomen.
• ThenumberofyoungadultJews(underage44)livingalonedeclinedby23%between2001and 2011.
• Bytheirmidtolatetwenties,halfofallJewshaveformedpermanentpartnerships.Theremainderarefairlyevenlysplitbetweenthose living with their parents or living alone or sharing.
Families with children• 88%ofJewishchildren(under16)livein
marriedcouplefamilies,comparedwith58%of children in England and Wales generally. 3%areincohabitingcouplefamilies,comparedwith15%generally,and9%areinloneparenthouseholds,comparedwith25%generally.
• ThemostcommontypeofJewishhouseholdis a married couple with children (20% of thetotal).Thistypeofhouseholdremains

4 JPR Report March 2015 Jewish families and households: Census insights about how we live
strongamongJewsdespitetheerosionofthisstructure in the general population.
• Jewswhocohabitarehalfaslikelytohavechildren in such households as the general population(26%versus41%generally).
• Thereare3,437Jewishloneparenthouseholdswithdependentchildren.About4,600Jewishchildrenagedunder16liveinloneparenthouseholds.
Living arrangements for older people• 27%ofJewishhouseholdsconsistsolelyof
peopleaged65andabove.
• WomenmakeupadisproportionatelylargepartoftheseniorJewishonepersonhousehold sector.
• Between2001and2011thenumberofseniorJewishonepersonhouseholdsoveralldeclinedby15%,comparedwithariseof2%inthegeneral population.
• 70%ofpeopleaged65-74arelivingasmarriedcouples;thisisthecaseforjust44%forthoseaged75andabove.
• 3,271Jewslivedinmedicalandcareestablishmentsin2011;34%wereinacarehomewithnursingand56%wereinacarehomewithoutnursing.Womenoutnumbermenbytwotoone.Thissectorcontractedby22%between2001and2011.
Comparison of living arrangements with other groups• Comparedtootherreligiousandethnic
groupsintheUK,JewishhouseholdstructuremostcloselyresemblesChristianhouseholds. Both groups share older than average age structures and therefore have large proportions of all-senior households (27%each),astrikingcontrasttothe3%
foundinbothMuslimandArabhouseholds,for example.
• AlthoughJewsaremorelikelythanaveragetoliveinmarriedcouplehouseholds(38%versus33%average),theyaremarkedlylesslikelytodosothanHindus(53%).
• Comparedtothenationalaverage,Jewsarehalfaslikelytocohabit(5%versus10%average),andmuchlesslikelytodosothan‘NoReligion’ households, where the rate is 17%.
• JewsandHindusexhibitthelowestlevelsofloneparenthouseholds(6%);thesearehighestamongBlack(24%),Mixed(19%),andMuslimhouseholds(13%).
Living conditions• Jewsaremorelikelytoowntheirhomesthan
thegeneralpopulation(73%versus64%).
• Between2001and2011Jewishhomeownershipdeclinedby9%(8,078households)andrentingincreasedby9%(2,474households).
• Between2001and2011,thenumberofJewishhouseholdsownedoutrightfellby6%,andthoserentedfromthecouncilfellby39%to3,143households.Bycontrast,privaterentingincreasedby36%to4,836households.
• 14,873Jewsliveinaccommodationrentedfromthecouncil(8,384Jewishhouseholds).
• Between2001and2011,thenumberofJewishhouseholdsindetachedhomesdeclinedby5%;thenumberinterracedhomesincreasedby7%.
• 8%(i.e.8,850)ofJewishhouseholdsareovercrowded(basedonavailablerooms),whichis similar to the general population (9%). ThenumberofovercrowdedJewishhomesincreasedby8%between2001and2011.Measuredintermsofavailablebedrooms,3,744Jewishhouseholdswereovercrowded.

JPR Report March 2015 Jewish families and households: Census insights about how we live 5
Background
In2001,thenationalcensusproducedthelargestdatasetevercompiledonJewsinBritain.In2011,it produced an even larger dataset, rendered all the morevaluablebecauseofthecomparisonsthatcanbedrawnwiththe2001data.
ThispublicationformspartofJPR’sefforttodrawattention to, and provide understanding of, this crucialinformation.ItformspartofaseriesofreportsJPRhasproducedonthe2011CensusasnewdataaregraduallyreleasedbytheOfficeforNational Statistics (ONS).1
Thesedatacaninformcommunalplanningatall levels—national, regional and local—and in a hostofdifferentsectors.EquivalentdataremainunavailabletoanumberofotherlargeJewishcommunitiesaroundtheworld(notablytheUnited States and France), so it is all the more important that leaders in the UK are made aware ofthisuniqueandvaluableresource.
ThefullsetofcensusdatawillcontinuetobereleasedbyONSinstagesthroughout2014andinto2015.JPRwillcontinuetospearheadthedataanalysisanddisseminationprocess.JPR’sresearchteamisavailabletoproducecommissionedbespokereportsforcharitiesandorganisationsinterested in examining how census data can help them develop policy and plan for the future.
Technical notesThe2011CensuswasconductedbyONSon27thMarch2011.TheCensusincludedanoptionalquestiononreligionforonlythesecondtime,thefirstoccasionbeingin2001.
ReligiondatawerefirstreleasedbyONSinDecember2012,anddataonhouseholdsbegantobereleasedinOctober2013.Unlessotherwisestated, all data in this report relate to England and Wales;onlylimiteddataforScotlandarecurrentlyavailable.2AllcensusdataareCrownCopyright.
1 Seewww.jpr.org.uk.2 DataforNorthernIrelandwereunavailable.Note,
however,that335Jewswereenumeratedinthe2011CensusofNorthernIrelandandthereforethisomissionwillnotimpacttheoverallfindings.(Source:NorthernIrelandStatisticsandResearchAgency(NISRA)Table:QS218NIReligion,FullDetail).
Between2001and2011thedefinitionofcertainhouseholdswaschangedbyONS.Thishasimplications for comparative purposes and, where possible,adjustmentshavebeenmadeto2001data.Thisisnotedinthereportwhereveritoccurs.Themain impact of this change is on age data relating to one person households.3
Aglossarycanbefoundattheendofthisreport.
3 In2001theoldercategorywaslabelled‘lonepensioners’whichformalesincludedthoseaged65yearsandoverbutforfemalesincludedthoseaged60yearsandover.In2011thisdifferentiationwasremovedandrelabelled‘Onepersonhousehold:Aged65andover’(ONS2004Census2001Definitions:Chapter6Part2p105;ONSJan20142011CensusVariableandClassificationInformation:Part4p36).Assumingthatthe2011definitionwillbeusedgoingforward,2001figureshavebeenadjustedtoalignwiththe2011definitions.Todosoweestimatedthenumberofwomenaged60-64livingalonein2001,i.e.thetotalnumbertoberemovedfromtheoldergroupandaddedtotheyoungergroupin2001.Datafromthe2001SARandONSTableS151indicatedthatabout22.7%(outof6,662enumeratedJewishwomenaged60-64)livedalonein2001.Thereforeweestimated1,516Jewishwomenneededtoberemovedfrom the ‘lone pensioner’ group and added to the ‘non-pensioner’2001grouptomakecomparisonswith2011meaningful.Asimilaradjustmentwasmadetothegeneral population.

6 JPR Report March 2015 Jewish families and households: Census insights about how we live
What is a Jewish household?Alongsidetheindividual,thehouseholdisoneof the most important units of society. Since most people spend most of their lives living communally, and all people spend their childhood communally, the household is a central measure for understanding how we live.Althoughthisunitincorporates other important concepts such as home, family and dwelling place, to analyse it we needtodefinewhatahouseholdconstitutes.The2011Censusdefinedahouseholdas:
“… one person living alone, or a group of people (not necessarily related) living at the same address who share cooking facilities and share a living room or sitting room or dining area.” 4
What then is a Jewish household? While this maynotsoundlikeadifficultquestion,itisfarfromstraightforwardand,arguably,isevenmorechallengingthantheperennialissueofdefining‘whoisaJew?’AreportonJewishhouseholdsnotonlyrequiresthatquestiontobemeaningfullyanswered,butalsobegsafurtherquestionabouthowJewishahouseholdneedstobetobelabelledas such. For example, is it necessary for all householdmemberstobeJewish,orisitsufficientforjustpartofthehouseholdtobeJewish?Should
4 ONSJan2014‘2011CensusGlossaryofTerms’p20;notethisisaslightlydifferentdefinitionfromthatused in 2001 (though we do not consider that this impactsthecomparativefindingspresentedhere).
therebesomeoutwardsignofJewishpracticebeingobservedsuchasamezuzah on doorframes? Indeed,canahousehold,anabstractconcept,evenpossessaJewishidentity?
From an analytical and certainly from a planning point of view, it is necessary to delimit the boundariesofaJewishhousehold.Thecensusprovidesanumberofalternatives,butingeneral,ahousehold’sreligionisallocatedbasedonthereligionoftheHouseholdReferencePerson(HRP)whose religion, if any, is used as a proxy for all otherhouseholdmembers(seeGlossaryforhowtheHRPisidentified).Itfollows,therefore,thata ‘Jewish household’ is any household in which the HRP is Jewish. Unless otherwise stated, this is the definitiononwhichthemajorityofdatainthisreportisbasedsinceitconstitutesthemajorityofavailablecensusdata.
Evenso,itisimmediatelyclearthattheHRPapproachhasitslimitations.WhataboutJewslivinginhouseholdswheretheHRPdidnotreportJewishinthecensus?WhathappensifotherhouseholdmembersreportadifferentreligiontotheJewishHRP?Moreover,sincetheHRPisfarmorelikelytobemalethanfemaleandmenaremorelikelytoreportNoReligion,5theHRPapproachtendstounderestimatethetotalnumberofhouseholdsinwhichJewsdwell.Alternativeapproachestodefining‘Jewishhouseholds’arediscussedinAppendixI(page39).
5 62%ofJewishHRPsaremale,andthisrisesto73%when one person households are excluded (ONS 2011 SAR).Further,55%ofpeoplewhoreportNoReligionaremaledespitemenmakingup49%ofthepopulation(ONSTableDC2107).
The household unit is central to understanding how we live.

JPR Report March 2015 Jewish families and households: Census insights about how we live 7
Household dynamics
Total number and average size of Jewish householdsAtotalof113,635Jewishhouseholds6 were enumerated in the UK in 20117 with the vast majorityofthese(97%)beinginEnglandandWales.Between2001and2011thenumberofJewishhouseholdsinEnglandandWalesdecreasedby5,600to110,726households(Table1).Thisrepresentsafallof5%inthedecade,despitethetotalJewishpopulationwithin those households(the‘Jewishhouseholdpopulation’)increasingby2%.8Bycontrast,thenumberofhouseholds in general in England and Wales increasedby8%,suggestingthatratherdifferenthouseholddynamicsareoperatingamongJewscompared with the general population.
6 Asdiscussedintheprevioussection,thisisbasedontheHRPdefinition.
7 NotincludingNorthernIreland.2,909Jewishhouseholds were enumerated in Scotland in 2011 or2.6%ofthetotal(Source:NRSTableAT052).Equivalentdatafor2001wereunavailable.
8 SeeGraham,D,Boyd,J.andVulkan,D.(2012).2011Census results (England and Wales): Initial insights about the UK Jewish population.London:InstituteforJewishPolicyResearch.
Thisdifferencecanalsobeseenindataonaveragehouseholdsize.Between2001and2011,theaverageJewishhouseholdsizeinEnglandandWalesincreasedby7%,from2.17personsperhousehold(pph)to2.31pph(Table1).Bycontrast, in the general population, it decreased, albeitslightly,from2.37to2.36pph.TheJewishhouseholdincreaseshouldalsobeseeninthecontextofacenturyofdiminishinghouseholdsizegenerally,andanotableflatteningsincethe1990s(Figure 2).
Tosummarise,Jewishhouseholdsareagainseentobebuckingthenationaltrend;notonlyistheoverallnumberofJewishhouseholdsdecliningwhilstthenumberofgeneralhouseholdsisincreasing,butalso(andnotunrelated),averageJewishhouseholdsizeisincreasingasaveragehouseholdsizegenerallyisdecreasing.Thus,althoughJewishhouseholdsin2011weresmallerthanaverage(notleastduetotheolderageprofile
oftheJewishpopulation),thesubstantialgapthatexistedin2001isevidentlyshrinkingandmay,bynow, have already disappeared.
Household population
Total households Average household size (pph)
2001Jewish
All 51,359,721 21,660,475 2.37
252,082 116,330 2.17
2011Jewish
All 55,071,113 23,366,044 2.36
256,037 110,726 2.31
Change 2001 to
2011
TotalAll +3,711,392 +1,705,569 -0.01
Jewish +3,955 -5,604 +0.15
PercentAll +7.2% +7.9% -0.6%
Jewish +1.6% -4.8% +6.7%
Table 1. Total household population and average household size, Jews versus general population,* England and Wales, 2001 to 2011
* The calculations exclude people in communal establishments; pph = persons per household.Source: ONS 2011 Tables LC4417, LC4202; ONS 2001 Tables S159, S151).
Jewish households are getting bigger as households generally are getting smaller.
There were 5,600 fewer Jewish households in 2011 than in 2001, despite a rise in the number of Jews living in households.

8 JPR Report March 2015 Jewish families and households: Census insights about how we live
Jewish household dynamics at the local levelAsisoftenthecase,amorerevealingpictureemergesatthelocallevel.Outof349LocalAuthoritiesinEnglandandWales,BarnethasbyfarthelargestconcentrationofJewishhouseholdswith18%ofthetotal.Thesecondlargest
concentrationcannowbefoundinHertsmere,whichin2001wasrankedsixth,reflectingthesignificantgrowth(35%)ofJewishhouseholdsinthisarea(Table2).Bycontrast,Redbridge,nowrankedthird,experienceda25%declineinthenumberofJewishhouseholdsinthedecade.ThisisalsoredolentofthechangesintheJewish
0
1
2
3
4
5
20112001199119811971196119511941*193119211911
Pers
on
s p
er h
ou
seh
old
4.34.1
3.7
3.23
Figure 2. Average household size in the general population, 1911 to 2011, England and Wales
* There was no census in 1941 due to the Second World War.Source: ONS 2012 Statistical Bulletin: 2011 Census – Population and Household Estimates for England and Wales, March 2011, p.33.
2.92.7
2.4 2.4 2.4
Jewish = 2.31
Rank Area Total households Household change2001 to 2011
2011 2001 2001 2011 Total Percent
1 1 Barnet 18,925 20,212 +1,287 +7%
2 6 Hertsmere 3,979 5,369 +1,390 +35%
3 2 Redbridge 6,486 4,833 -1,653 -25%
4 4 Harrow 5,729 4,815 -914 -16%
5 3 Camden 5,774 4,758 -1,016 -18%
6 8 Hackney 3,666 4,150 +484 13%
7 5 Westminster 4,449 3,928 -521 -12%
8 9 Bury 3,498 3,819 +321 +9%
9 7 Leeds 3,820 3,269 -551 -14%
10 12 Haringey 2,478 2,458 -20 -1%
England & Wales 116,330 110,726 -5,604 -5%
Table 2. Areas with the most Jewish households and change from 2001 to 2011*
* Based on the Jewish household population i.e. excluding Jews living in communal establishments.Source: ONS Tables DC1202 and S151

JPR Report March 2015 Jewish families and households: Census insights about how we live 9
population itself,9 and highlights the new central position Hertsmere now holds for Britain’s Jewishpopulation.
Asrevealingasthisisaboutconcentrationattheneighbourhoodlevel,themoreimportantindicatorisarguablyJewishhouseholdsize,i.e.concentration at the household level. Nationally, wesawthattheaverageJewishhouseholdsizeis2.31personsperhousehold(Table1).AreaswiththelargestJewishhouseholdstendtohavemajority haredi (Strictly Orthodox) populations. Infact,thisisthecaseforthetopthreelocalauthoritieswithlargeconcentrationsofJewishhouseholds:Hackney(3.71),Salford(3.44),andHaringey(3.10)(Table3).
AverageJewishhouseholdsizeisgreatestwhenexamined at the level of the ward. For example, it is7.01inBridgeswardinGatesheadandover5.0inSaltwell(Gateshead)andBroughton(Salford)(Table3).Whilesevenofthesetenwardsareinharediareas,three(SellyOak,DunkirkandLenton,andRadfordandPark)areinuniversitytownsandmostlikelyconsistof(non-haredi)
9 See:Graham,D.(2013).Thinning and Thickening. Geographical change in the UK’s Jewish population, 2001-2011.London:InstituteforJewishPolicyResearch.
Jewishstudentssharingwithotherstudents(Jewishorotherwise).
Further,byseparatingoutareaswhicharepredominatelyorsignificantlyharedi,10wefindthatnationally,averageJewishhouseholdsizeisjust2.16,comparedwith3.54intheharediareas.11
InScotland,averageJewishhouseholdsizewaseven smaller at 1.94.12Indeed,itisstrikinghowsmallnon-harediJewishhouseholdsare,andthedifferencetheharedipopulationmakestothisfacetofthenationalJewishdemographicprofile(seeAppendixIV).
Jewish household change and communal evolution Twofundamentaltypesofchangeinaneighbourhoodcannowbeidentifiedinthe
10 ThesearethelocalauthoritiesofHackney,Haringey,andGateshead,andthewardsofBroughtonandKersalinSalford,SedgleyinBuryandGoldersGreenin Barnet.
11 AverageJewishhouseholdsizeacrosstheUKis2.31,i.e. the same as for England and Wales.
12 Source:NRSTableAT051andAT052
Table 3. Areas with the largest Jewish households, LA and ward level, 2011*
Rank 10 largest areas based on local authority
10 largest areas based on ward
Area Persons per household
LA Ward* Persons per household
1 Hackney 3.71 Gateshead Bridges 7.01
2 Salford 3.44 Gateshead Saltwell 5.80
3 Haringey 3.10 Salford Broughton 5.13
4 Hertsmere 2.64 Haringey Seven Sisters 4.98
5 Barnet 2.64 Birmingham Selly Oak 4.72
6 Bury 2.63 Nottingham Dunkirk and Lenton 4.63
7 St Albans 2.49 Hackney Cazenove 4.55
8 Three Rivers 2.44 Nottingham Radford and Park 4.51
9 Epping Forest 2.44 Hackney Springfield 4.31
10 Birmingham 2.33 Hackney New River 3.94
* For all Local Authorities with a minimum of 500 Jewish households and all wards with a minimum of 25 Jewish households. Calculations exclude Jews living in communal establishments.Source: ONS 2011 Tables LC4417, LC4204, S159 and S151.
The average household size in strictly Orthodox areas is 3.5 compared with 2.2 in the remainder of the Jewish population.

10 JPR Report March 2015 Jewish families and households: Census insights about how we live
census data. On the one hand, we see changes in thetotalnumberofJewishhouseholdsinanarea;ontheotherhand,therearechangesinthesizeoftheJewishpopulationinanarea.Oftenthesetwotrends diverge, and in doing so, they illuminate themultiplewaysinwhichdifferentJewishcommunities are evolving.
InTable4wecomparethemagnitudeofJewishhouseholdchangewiththesizeofJewishpopulation change for the ten areas in the UK that havethelargestnumberofJewishhouseholds.Inmost places, a rise in one metric is accompanied byariseintheother,andviceversa.However,none of these examples match exactly, and only in Hertsmere and Leeds are the changes very similar.Inallotherplacesthefiguresdiverge.Forexample,inHertsmere,stronggrowthinJewishhouseholds(+35%)andtheJewishpopulation(+33%)wererecordedintandem,whereasinBarnet the household change (+7%) was fairly modest compared with the population change (+17%).InHaringeythedifferenceisstark:theJewishhouseholdpopulationmarginallycontracted(-1%),yetthetotalJewishpopulationsoared(+35%).Whatisallthistellingus?
Thesedivergentsocio-demographicprocessesrevealvitalinformationaboutJewishpopulation
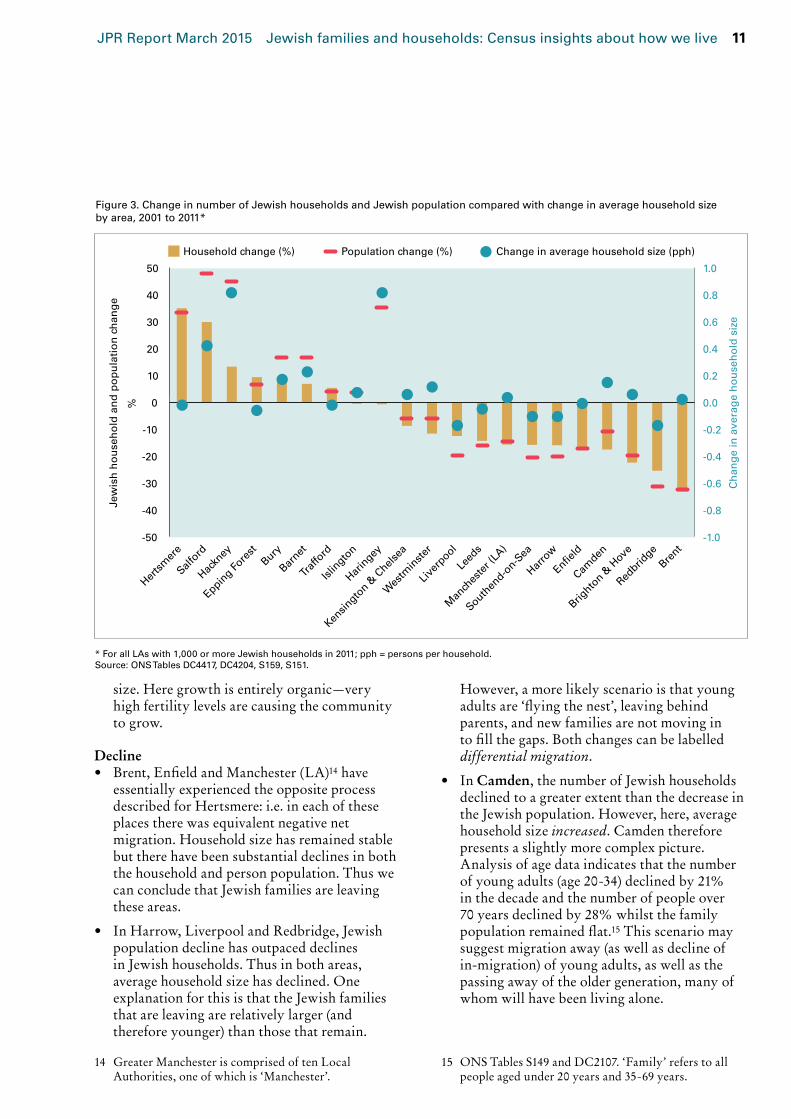
dynamics.Inotherwords,theytellusnotjustthedirectionofchange,butalsohowthesecommunitiesarechanging.ThisisdemonstratedbyFigure3,wherethemagnitudeofJewishhouseholdchange(yellowcolumns)hasbeenplottedagainstJewishpopulationchange(bluemarkers)forallplaceswithatleast1,000Jewishhouseholds.Theratioofthetwoindicateschangeinaveragehouseholdsize(redmarkers,righthandaxis)whichenablesustohypothesiseaboutchangeat the local level, and identify different types of growth and decline.
Growth• InHertsmere,theJewishcommunityhas
clearlyexpandedbothintermsofhouseholdsandpopulation,butaveragehouseholdsizehasremainedstable.Thus,thisexpansionmustbetheresultofhousehold migration. MoreJewishfamiliesaremovingintothisareathan are leaving it,13 and further, they have a similar household composition to the existing Jewishpopulation.InotherwordsHertsmereisexperiencing equivalent migration.
• InBarnet, Salford and Hackney, whilst thenumberofadditionalJewishhouseholdsincreased,thisgrowthwassignificantlyoutpacedbyincreasesintheJewishpopulationineachoftheseareas.Asaresult,averagehouseholdsizeincreased.WhilstthechangeisproportionallygreaterinHackneythaninBarnet,theprocessesaresimilar.Theseareas have experienced positive net migration, possiblyoffamiliesthatarelargerthanthosein the existing populations. But there has also been‘organic’growth,aresultofhighJewishbirthratesintheseareas,whichhasledtoincreasedaveragehouseholdsize.
• Haringeypresentsanextremeexampleofthistrend:virtuallynonetchangeinthenumberofhouseholds,butaverylargeincreaseinpopulation and therefore in average household
13 IndeedtheproportionofallhouseholdsinHertsmerethatareJewishrosefrom10.5%in2001to13.5%in2011.
More than growth and decline, household change reveals how Jewish communities are changing.
Table 4. Jewish household and Jewish population change in the ten largest Jewish communities, 2001 to 2011*
Rank Area Household change
Population change
1 Barnet +7% +17%
2 Hertsmere +35% +33%
3 Redbridge -25% -31%
4 Harrow -16% -20%
5 Camden -18% -11%
6 Hackney +13% +45%
7 Westminster -12% -6%
8 Bury +9% +17%
9 Leeds -14% -16%
10 Haringey -1% +35%
England & Wales
-5% +1.3%
* Based on the largest Jewish household populations, excluding Jews living in communal establishments.Source: ONS Tables DC4417, DC4204, S159, S151
JPR Report March 2015 Jewish families and households: Census insights about how we live 11
size.Heregrowthisentirelyorganic—veryhigh fertility levels are causing the community to grow.
Decline• Brent,EnfieldandManchester(LA)14 have
essentially experienced the opposite process describedforHertsmere:i.e.ineachoftheseplacestherewasequivalentnegativenetmigration.Householdsizehasremainedstablebuttherehavebeensubstantialdeclinesinboththehouseholdandpersonpopulation.ThuswecanconcludethatJewishfamiliesareleavingthese areas.
• InHarrow,LiverpoolandRedbridge,Jewishpopulation decline has outpaced declines inJewishhouseholds.Thusinbothareas,averagehouseholdsizehasdeclined.OneexplanationforthisisthattheJewishfamiliesthat are leaving are relatively larger (and therefore younger) than those that remain.
14 GreaterManchesteriscomprisedoftenLocalAuthorities,oneofwhichis‘Manchester’.
However,amorelikelyscenarioisthatyoungadultsare‘flyingthenest’,leavingbehindparents, and new families are not moving in tofillthegaps.Bothchangescanbelabelleddifferential migration.
• InCamden,thenumberofJewishhouseholdsdeclined to a greater extent than the decrease in theJewishpopulation.However,here,averagehouseholdsizeincreased. Camden therefore presents a slightly more complex picture. Analysisofagedataindicatesthatthenumberofyoungadults(age20-34)declinedby21%inthedecadeandthenumberofpeopleover70yearsdeclinedby28%whilstthefamilypopulationremainedflat.15Thisscenariomaysuggest migration away (as well as decline of in-migration) of young adults, as well as the passing away of the older generation, many of whomwillhavebeenlivingalone.
15 ONSTablesS149andDC2107.‘Family’referstoallpeopleagedunder20yearsand35-69years.
-50
-40
-30
-20
-10
0
10
20
30
40
50
BrentRedbridgeBrighton & HoveCamdenEnfieldHarrowSouthend-on-SeaManchester (LA)LeedsLiverpoolWestminsterKensington & ChelseaHaringeyIslingtonTraffordBarnetBuryEpping ForestHackneySalfordHertsmere
Jew
ish
ho
use
ho
ld a
nd
po
pu
lati
on
ch
ang
e
-50
-40
-30
-20
-10
0
10
20
30
40
50
Brent
Redbrid
ge
Brighto
n & H
ove
Camden
Enfield
Harro
w
Southen
d-on-S
ea
Man
ches
ter (
LA)
Leed
s
Live
rpool
Wes
tmin
ster
Kensin
gton &
Chels
ea
Harin
gey
Islin
gton
Traf
ford
Barnet
Bury
Epping Fo
rest
Hackn
ey
Salford
Hertsm
ere
-1.0
-0.8
-0.6
-0.4
-0.2
0.0
0.2
0.4
0.6
0.8
1.0
Ch
ang
e in
ave
rag
e h
ou
seh
old
siz
e
%
Figure 3. Change in number of Jewish households and Jewish population compared with change in average household size by area, 2001 to 2011*
* For all LAs with 1,000 or more Jewish households in 2011; pph = persons per household.Source: ONS Tables DC4417, DC4204, S159, S151.
Household change (%) Population change (%) Change in average household size (pph)

12 JPR Report March 2015 Jewish families and households: Census insights about how we live
Insummary,theextenttowhichanarea’sJewishpopulationchangestendsnottocorrelatewiththechangesthatoccurtothenumberofJewishhouseholdsinthatarea.Rather,thisisdrivenbyacomplexsetofdemographicprocesses which includes the migration (in and out) of whole households, the migration (in andout)ofJewishindividualsandpopulationchangedrivenbymortalityandfertility.Anyparticularareacanbeimpactedbyoneormoreof these processes.
Household size and religiosityAlthougharelationshipbetweenhouseholdsizeandreligiosityhasalreadybeendemonstratedhere(areaswiththelargesthouseholdstendtobe
predominantly haredi), the precise relationship betweenreligiosityandhouseholdsizecannotbeexploredusingcensusdataalone.However,JPR’s2013NationalJewishCommunitySurvey(NJCS)providessomeinsightintothisrelationship.16AveragehouseholdsizeinSecular/culturalhouseholdsis2.13pph,orjustbelowthenationallevelof2.31pph(yellowdottedline).Traditionalhouseholdsareslightlylargerthantheaverage(2.45pph)andOrthodoxhouseholdsareconsiderablylargerat3.60pph.Aswehaveseen,byfarthelargestinthesurveyareharedihouseholds at 4.40pph17(Figure4).Thus,themore secular respondents are, the smaller their households, and the more religious they are, the larger their households.
16 NJCSPaneldata(usedhere)representthemoreengagedsectionsoftheJewishcommunity.TheyalsoundersampleJewishonepersonhouseholds,henceaveragehouseholdsizesaresomewhathigherthanthecensusindicatestheyoughttobe.
17 Duetosmallcounts,thesefiguresshouldonlybeseenas indicative of the differences.
0
1
2
3
4
5
Haredi*Orthodox*TraditionalJust JewishReform/Progressive
Secular/cultural*
Pers
on
s p
er h
ou
seh
old
2.13 2.26 2.29 2.45
3.60
Figure 4. Average household size by self-defined Jewish religious practice, UK*
* Data are previously unpublished weighted NJCS Panel data N=305. Secular/cultural = Non-practising (i.e. Secular/cultural); Mixed = ‘Mixed (both Jewish and another religion)’; Orthodox = ‘Orthodox (e.g. would not turn on light on Shabbat)’; Haredi = ‘Haredi (strictly Orthodox, Hasidic)’. These findings assume that the respondent’s religiosity is a proxy for the whole household.
4.40
2011 Census

JPR Report March 2015 Jewish families and households: Census insights about how we live 13
Jewish household composition – an overviewThevastmajority(97%)oftheUK’sJewishpopulation lives in a household, with the remaining3%livingincommunalestablishmentssuch as care homes and university accommodation. Focusingontheformergroup,broadlyspeaking,wecanidentifythreetypesofhousehold:
• peoplelivingalone(onepersonhouseholds);
• families(usuallyacouplewithorwithoutchildren);
• otherhouseholds(oftenunrelatedpeoplesharing, or more than one family, or multiple generations living at the same address).
In2011inEnglandandWales,themajority(59%)ofJewslivedinfamilyhouseholdsanda
further33%livedalone(Table5).18 Compared withthegeneralpopulation,Jewsaremorelikelytolivealoneandlesslikelytoliveinfamilyhouseholds,aresultofJewsbeingolderthan average.
Between 2001 and 2011 there was a slight shift awayfromJewslivingalone(downfrom36%to33%),andtowardsfamilialandmorecomplex(or‘other’)householdarrangements(Table5).Thisview,however,disguisesconsiderabledynamism,particularlyintermsofthenumberofJewslivingalone(Table6).Indeed,therewere5,509fewerJewishonepersonhouseholdsin 2011 than in 2001, a fall of 13% in the decade,whereastheoverallnumberofJewishhouseholdsfellbylessthanhalfthisamount(down5%)(Table7).Furthermore,thedecreaseinJewishonepersonhouseholdsoccurredwhilsttheequivalentnumberinthegeneralpopulationincreasedby9%,yetanotherexampleofJewishhouseholdsbuckingnationaltrends.
ThestrikingdeclineinthenumberofJewishoneperson households partly explains why average Jewishhouseholdsizeincreasedoverthe2001to2011periodand,presumably,whythereare5%fewerJewishhouseholdsoverall,despiteaslightincrease(up2%)inthesizeoftheJewishpopulationlivinginhouseholds(Table1,p.7).Further,itseemslikelythatthegapbetweenJewsandthegeneralpopulationlivingalonewill
18 Removingharediareasfromtheequationmakesverylittledifferencetothesefigures:Oneperson(34%),Onefamily(58%)andOther(8%).InScotland,ahigherproportionofJewishhouseholdsconsistsofpeople living alone (40%).
2001 2011
Jewish General population Jewish General population
One person 36% 30% 33% 30%
One family 57% 63% 59% 62%
Other 7% 7% 8% 8%
Total 100% 100% 100% 100%
N 116,330 21,660,475 110,726 23,366,044
Source: ONS Tables DC1202, S151
Table 5. Change in household composition by type, Jewish versus general population, England and Wales, 2001 and 2011
Table 6. Total Jewish household change by type, 2001 to 2011, England and Wales
Source: ONS Tables DC1202EW, S151
2001 2011
Count % Count %
One person household
42,046 36% 36,537 33%
One family only 66,217 57% 65,859 59%
Other household types
8,067 7% 8,330 8%
Total 116,330 100% 110,726 100%
One in three Jewish households consists of one person living alone.

14 JPR Report March 2015 Jewish families and households: Census insights about how we live
continuetoclose.AlthoughJewsremainmorelikelytolivealoneoverall,(andconcomitantlylesslikelytoliveinfamilies),thisgaphasbeensteadilyclosing with a six percentage point difference in 2001 compared with a three percentage point differencein2011(Table5).
ItisalsoimportanttonotethatthemakeupofJewishfamilyhouseholdsvariesquitesubstantiallyfromthegeneralpattern.Jewishfamiliesaremorelikelytoconsistofmarriedcouples(64%versus54%generally)andofhouseholdswhereallmembersareaged65andover(allseniors),buttheyarelesslikelytobecohabiteesorloneparents(Figure5).
WhilstthehighernumberofJewishallseniorhouseholds is mainly due to the older age structure oftheJewishpopulation,theotherdifferencesaremostlikelyareflectionofmoretraditionalattitudestowardsfamilyformationamongJewsthan is generally the case.
Aswithonepersonhouseholds,thechangingtrendsinJewishfamilyhouseholdsoverthe2001
to 2011 period are rather different from the general trend.19Inthegeneralpopulation,therehasbeena relative movement away from married couple householdsandtowardscohabitatingcouple(up28%)andloneparenthouseholds(up21%)(Table8).Bycontrast,Jewishfamilyhouseholdshavechanged little in relative terms, although the total numberofallseniorJewishhouseholdsandJewishloneparenthouseholdshasdecreased(by7%and4% respectively).
19 Between 2001 and 2011, we are again presented withaproblemofdefinitionalchangerelatingtotheageofolderwomen(seefootnotes3and23).Therefore,toexaminechangeinfamilyhouseholds,anadjustmenthasbeenmadetothe2001data.Buttherearefurtherdifficultiessincethe2001‘Pensionersonly’ category provides no clear indication of the relationshipbetweenthepeopleinthesehouseholds;married,cohabiting,siblingsetc.(SeeGraham,D.(2008).“Thesocio-spatialboundariesofan‘invisible’minority:aquantitative(re)appraisalofBritain’sJewishpopulation.”DPhilthesis,OxfordUniversity,p.339.)Althoughanadjustmenthasbeenmadetothe2001datainordertoexpeditecomparisons,itmustbeacceptedthattheresultingfiguresremainimperfect.
Jewish All
Total Percent Total Percent
One person household -5,509 -13% +564,649 +9%
One family only -358 -1% +732,657 +5%
Other household types +263 +3% +408,263 +28%
Total -5,604 -5% +1,705,569 +8%
Table 7. Change in household composition, Jewish and general population, 2001 to 2011, England and Wales
%
0
10
20
30
40
50
60
70
All (14.5m)
Jewish (N=65,859)
Cohabiting coupleLone parentAll aged 65 and overMarried couple
Figure 5. Family households, Jews versus general population 2011, England and Wales
Source: ONS Tables DC1202 and S151
64%
54%
18%13%
8%
16%
9%
17% All (14.5m)
Jewish (N=65,859)

JPR Report March 2015 Jewish families and households: Census insights about how we live 15
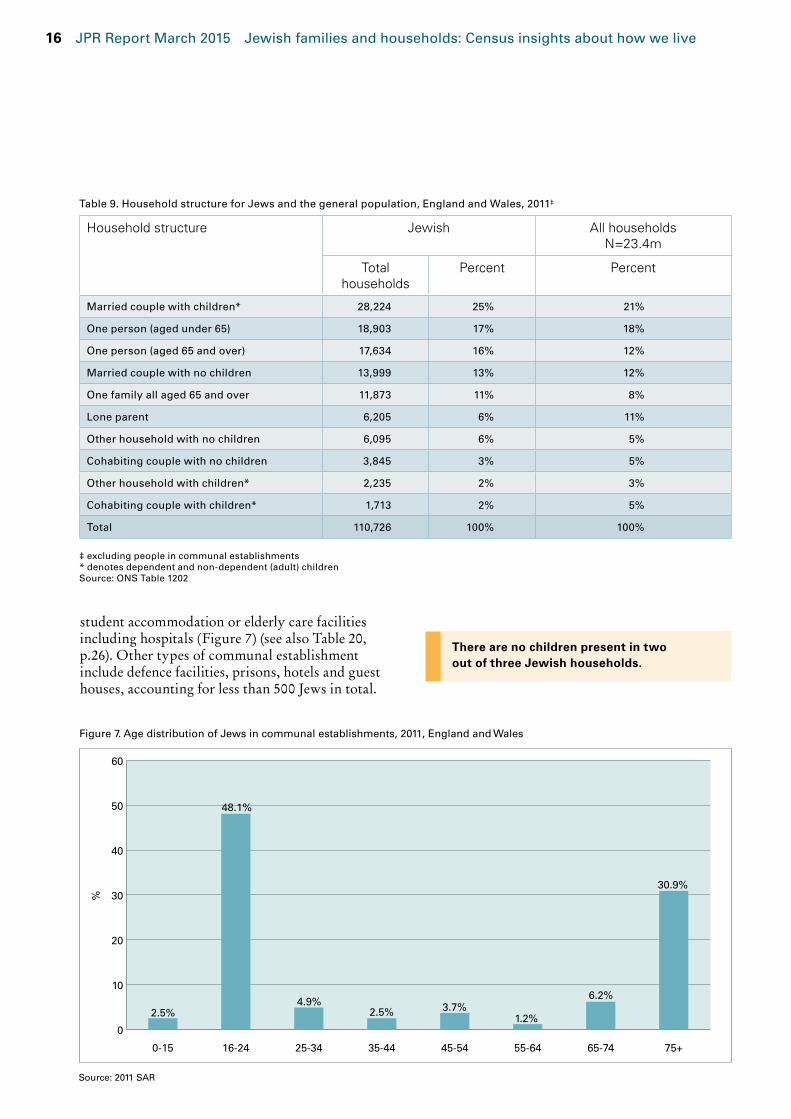
TosummarisetheoverallpictureofJewishhouseholdsin2011,35%containchildren(including adult children), which is slightly less
thanthecasegenerally,andathird(33%)consistsofJewslivingalone(Figure6).Inotherwords,no children are present in almost two out of three (65%) Jewish households, of which 36,500 consist of Jews living alone and a further 35,800 are Jews in couples and others who share.
Ontheotherhand,Jewsarelesslikelytocohabit,lesslikelytobesingleparentsandmorelikelyto
live in married couple households with children (Table9).
One other form of living arrangement is recorded inthecensus:communalestablishments.Theseareindependentofhouseholdsanddefinedas places “providing managed residential accommodation”.20Atotalof7,183JewslivedincommunalestablishmentsintheUKin2011,or2.7%ofthepopulation.Thisgroupexhibitsaveryparticularageprofile,anddataforEnglandandWales show that eight out of ten (79%) are aged either16to24or75andover.ThisreflectsthefactthatmostJewsinsuchinstitutionsareeitherin
20 ONS2014Glossarypp.10-11;Sincecommunalestablishmentsarenothouseholds,residentsoftheseplaces are not included in household calculations.
Jewish household change is driven by both demography and Jewish cultural attitudes.
2001 2011 Change 2001 to 2011
AllN=13.7m
JewishN=66,217
AllN=14.5m
JewishN=65,859
All Jewish
Married couple§ 58%* 63%* 54% 64% -3% +1%
Cohabiting couple 13% 8% 16% 8% +28% +3%
Lone parent 15% 10% 17% 9% +21% -4%
All aged 65 and over 13%* 19%* 13% 18% +4% -7%
Total 100% 100% 100% 100% +5% -1%
Table 8. Family households, 2001 and 2011, England and Wales*
§ Married couples include a relatively small number of people in same-sex civil partnerships* 2001 data have been adjusted to facilitate comparisons between 2001 and 201122 Source: ONS Tables DC1202 and S151
%
0
5
10
15
20
25
30
35
40
45
All households
Jewish households
Other (no children present)
Couple (no children present)
Lone personHousehold with children*
Figure 6. Household structure for Jews and the general population, England and Wales, 2011‡
‡ excluding people in communal establishments* denotes dependent and non-dependent childrenSource: ONS Table 1202
35%39%
33%30%
6% 5%
27% 26%
All households
Jewish households
16 JPR Report March 2015 Jewish families and households: Census insights about how we live
student accommodation or elderly care facilities includinghospitals(Figure7)(seealsoTable20,p.26).Othertypesofcommunalestablishmentinclude defence facilities, prisons, hotels and guest houses,accountingforlessthan500Jewsintotal.
Household structure Jewish All householdsN=23.4m
Total households
Percent Percent
Married couple with children* 28,224 25% 21%
One person (aged under 65) 18,903 17% 18%
One person (aged 65 and over) 17,634 16% 12%
Married couple with no children 13,999 13% 12%
One family all aged 65 and over 11,873 11% 8%
Lone parent 6,205 6% 11%
Other household with no children 6,095 6% 5%
Cohabiting couple with no children 3,845 3% 5%
Other household with children* 2,235 2% 3%
Cohabiting couple with children* 1,713 2% 5%
Total 110,726 100% 100%
Table 9. Household structure for Jews and the general population, England and Wales, 2011‡
‡ excluding people in communal establishments* denotes dependent and non-dependent (adult) childrenSource: ONS Table 1202
There are no children present in two out of three Jewish households.
0
10
20
30
40
50
60
75+65-7455-6445-5435-4425-3416-240-15
%
Figure 7. Age distribution of Jews in communal establishments, 2011, England and Wales
Source: 2011 SAR
2.5%
48.1%
4.9%2.5% 3.7%
1.2%
6.2%
30.9%

JPR Report March 2015 Jewish families and households: Census insights about how we live 17
The family lifecycle
Thewayweliveisgenerallyrelatedtothestagewefindourselveswithinthefamilylifecycle.Everyone experiences several different types of living arrangement throughout their lives, which is afunctionofdemography(familysize),economics(income), health (care homes) and so on. Lifestyle choices and cultural preferences are also important factorsand,ingeneral,therehasbeena“growingdiversity in living arrangements” in Britain where “conventional” or nuclear households have given waytonewandmorecomplexarrangements.Ithasbeenarguedthatmorepeopleandfamiliesare living together in one household for reasons relating to increased economic pressures such as higher property prices and living costs, and in some communities, cultural factors.21 Whilst
21 ONS 2014 Households and Household Composition in England and Wales, 2001-11 p10
thesegeneraltrendspresumablyimpactJews,theroleJewishculturalattitudesplaywithrespecttolivingarrangementsissignificant.
ThefamilylifecycleofJewsissummarisedinFigure8.ItshowsthatthevastmajorityofJewishchildren(92%)livewithtwoparents.Astheygrowoldertheyaremorelikelytolivein a lone parent family and in their late teens many leave the family home to study and live incommunalestablishmentssuchasuniversityhallsofresidence.Themostvariedandunstableperiod for most people is during their twenties. Somestillremainathome(22%)but25%sharewithotherunrelatedpeopleand36%havebeguntoformpermanentpartnerships.Bytheirthirties,lifesettlesdownconsiderablyand73%aremarriedorcohabiting.Familyformationandparentingbeginsandalthoughsomere-partneringtakesplace,itisnotuntilpeoplereach their seventies that the period of household stabilitybeginstoerodeandconsiderablechangeoccurs again.
Life-stage dictates the type of household we live in. Most Jewish children live in married couple households, whereas almost half of Jews aged 75 or older live alone, and most of these are women.
0
10
20
30
40
50
60
70
80
90
100
Communal establishment
Married
Cohabiting
Sharing
Living alone
Lone parent family
Living with parent(s)90+80-8970-7960-6950-5940-4930-3920-2910-190-9
Figure 8. Jewish individuals by age and living arrangement, England and Wales, 2011
Source: ONS 2011 SAR (N=13,277)
%
Age group
Communal establishmentMarriedCohabitingSharingLiving
alone
Lone parent family
Living with parent(s)

18 JPR Report March 2015 Jewish families and households: Census insights about how we live
Drivenmainlybymortality,thepropensitytolivealoneincreasesconsiderablyonceJewsentertheirsixties,andbytheireightiesmoreJewslivealone(45%)thanaremarried(42%).Amajority(77%)of those living alone are women. By their nineties, 46%ofJewslivealonebutbythistime31%arelivingincarefacilities(Figure8).
Theremainderofthissectionbroadlyexploreseachofthesestagesinturn,fromthefirstmoments when people leave their childhood home andbegintocreatetheirownJewishhouseholds,to the care they receive at the end of their lives.
Student householdsThefirsttimemanyJewsexperienceindependentliving is when they are students, especially if they attend universities in towns or cities away from wheretheywerebroughtup.ThecensusrevealsthatoneinthreeJewishstudents(34%)livesinasharedprivatehouseorflat,oneinfour(25%)livesathomewiththeirparents,andoneinfivelivesinuniversity accommodation (21%) (Figure 9).
InEnglandandWales,the2011Censusrecorded720Jewishhouseholdsinwhichallmemberswere full-time students. However, not all of these householdsarehomogenouslyJewish(i.e.JewslivingexclusivelywithotherJews)andsurveydata reveal that of students living in shared
(private)accommodation,45%liveinhomogenousJewishhouseholdsand55%liveinheterogeneoushouseholdswheretheJewishrespondentliveswithatleastonenon-Jewishperson.22
Between2001and2011thenumberofsharedhouseholdswithatleastoneJewishstudentincreasedby10%(upfrom654households).Thiswas primarily a result of the fact that there were alargernumberofstudent-agedJewsin2011thanin2001(therewere6%moreJewsaged18-21 years),23butinrelativeterms,therewaslittleincrease(8.1%of‘Other’Jewishhouseholdswereall-studentin2001comparedwith8.6%in2011).Bycontrast,thenumberofall-studenthouseholdsingeneralincreasedby57%,atleastpartofwhichis due to a higher proportion of people generally in full-time education.
SignificantchangeshavealsooccurredtothelocationofJewishstudenthouseholds.For
22 Source:JPRNationalJewishStudentSurvey2011,N=822.
23 Source:ONSTablesM277andCT0291
0 5 10 15 20 25 30 35 40
Other
Living with spouse/partner/children
Living alone
Other household type
Living in halls/student accomodation
Living at home with parents
All student household 34%
25%
21%
10%
4%
2%
5%
Figure 9 Living arrangements for Jewish students aged 19-24, England and Wales, 2011
Source: ONS 2011 SAR (N=432)
%
Over half of Jewish students in private households away from home live with non-Jews.

JPR Report March 2015 Jewish families and households: Census insights about how we live 19
example, in 2001, Birmingham had the largest all-studentJewishhouseholdpopulation(outsideLondon)followedbyManchester(LA).Buttenyearslater,ashiftawayfromManchesterLAandtowardsNottinghamoccurred;indeed,in2011,Nottinghamhadthelargestconcentration(13%comparedwith4%in2001)(Table10).Asaresultof this growth, Nottingham also had the largest ‘non-haredi’Jewishhouseholds(2.73pph)(seeTable3,p.9).
Thecensusalsorecorded3,211Jewishstudentsliving in university and other educational establishments.24 More detailed examination revealssignificantgeographicaldifferencesbetweenthesestudentsandthosewholiveinshared, private all-student households. For example,inOxfordandCambridge,relativelyhighproportionsofJewishstudentsliveinuniversity accommodation rather than private households(compareTable10withTable11).ThesefiguresalsoconfirmthesubstantialriseofNottingham(quadrupling)aswellasBirmingham(doubling)asJewishstudentcentressinceatleast 2001.
24 ONSTableDC4409.ThisalsoincludesasmallnumberofJewishchildreninboardingschools.Therewereafurther162studentsincommunalestablishmentsinScotland(NRSTableAT060).
ButofparticularinteresthereisGatesheadwhichaccountsforalmostaquarter(24%)ofallJewslivingineducationalestablishmentsinEnglandandWales.Further,noJewishstudents are recorded as living in shared all-student private accommodation in the area. ThisisbecauseGatesheadhostsseveralStrictlyOrthodoxTorahstudycentresandthevastmajority of the students who attend these institutionscomefromoutsidethetown.ThesefiguressuggestthatstudentsaccountforatleastaquarterofGateshead’sentireJewishpopulation.25ItisalsonotablethatthetotalnumberofstudentsinGatesheadmorethandoubledbetween2001and2011.(Asimilar,
25 WeunderstandthatGatesheadhastworeligiousseminariesforgirlsaged16-19withabout600studentsandsevenyeshivasforboysaged16-21withabout1,000students.Thusupto1,600OrthodoxJewishstudentsmaystudythere.Thisaccordswitharecentreportonthecommunity(GatesheadCouncil,June2011,GatesheadJewishCommunityHouseholdSurvey2010:SummaryofKeyFindings)whichstatesthereisapermanentJewishcommunityof3,000aswellas1,500Jewishstudents.However,thecensusrecorded2,247JewslivinginhouseholdsinGateshead(ONSTableLC4417)aswellas755Jewishstudentsincommunalestablishments,i.e.justover3,000Jewsin total.Thesignificantdisparitybetweenthecensusandthis communal source warrants further investigation.
2001 Rank 2011 Rank Area 2001%(N=654)
2011%(N=720)
5 1 Nottingham 4.4% 12.9%
1 2 Birmingham 12.5% 11.3%
3 3 Leeds 11.6% 9.4%
2 4 Manchester (LA) 11.8% 8.2%
4 5 Camden 4.7% 3.9%
11 6 Barnet 2.8% 3.5%
10 7 Brighton and Hove 3.2% 3.5%
7 8 Bristol, City of 3.4% 2.6%
8 9 Oxford 3.2% 2.5%
9 10 Westminster 3.2% 2.2%
- - Remainder 39.1% 40.0%
Total 100.0% 100.0%
Table 10. Jewish students in shared households*
* Not including students in halls of residence or students living alone or at home with their families.Source: ONS Table DC1202

20 JPR Report March 2015 Jewish families and households: Census insights about how we live
thoughlesssizeable,scenarioisexhibitedbythedata for Salford.)
Thepresenceoflarge,butnevertheless,temporaryJewishstudentpopulationscanhave a rather distorting effect in some areas. Forexample,Nottingham’sJewishpopulationgrowsbyalmostahalfduringterm-timeduetostudentslivinginthecity,andGateshead,
Birmingham,OxfordandCambridgeareeachinflatedbyuptoaquarter(Table12).
Rank2011
LA 2011 Percent of total2011
2001 Total change 2001 to 2011
1 Gateshead 755* 23.5% 348 +117%
2 Oxford 270 8.4% 172 +57%
3 Cambridge 258 8.0% 169 +53%
4 Birmingham 198 6.2% 97 +104%
5 Nottingham 192 6.0% 47 +309%
6 Salford 158 4.9% 102 +55%
7 Leeds 152 4.7% 103 +48%
8 Manchester 135 4.2% 142 -5%
9 Camden 49 1.5% 91 -46%
10 Bristol, City of 44 1.4% 94 -53%
All others 1,000 31.1% 1,098 -9%
Total 3,211 100.0% 2,463 +30%
Table 11. Jews in student communal establishments, 2011 by LA, England and Wales
* The accuracy of this figure is uncertain (see footnote 28).Source: ONS Table DC4409
Area Size of community without students
Growth due to temporary student population
Percent increase in community size
Gateshead 2,279 725 24.1%
Nottingham 552 517 48.4%
Birmingham 1,693 512 23.2%
Manchester (LA) 2,312 301 11.5%
Oxford 800 272 25.4%
Leeds 6,603 244 3.6%
Cambridge 664 206 23.7%
Bristol, City of 643 134 17.2%
Liverpool 2,043 114 5.3%
Brighton and Hove 2,587 83 3.1%
Table 12. Impact of temporary (term-time) Jewish student populations on the size of local permanent Jewish communities (top ten increases)
Source: ONS Table OT210 and KS209EW
Gateshead’s position as a centre of Orthodox Jewish study means that at least one quarter of its Jewish population is students living in yeshivas and seminaries.
JPR Report March 2015 Jewish families and households: Census insights about how we live 21
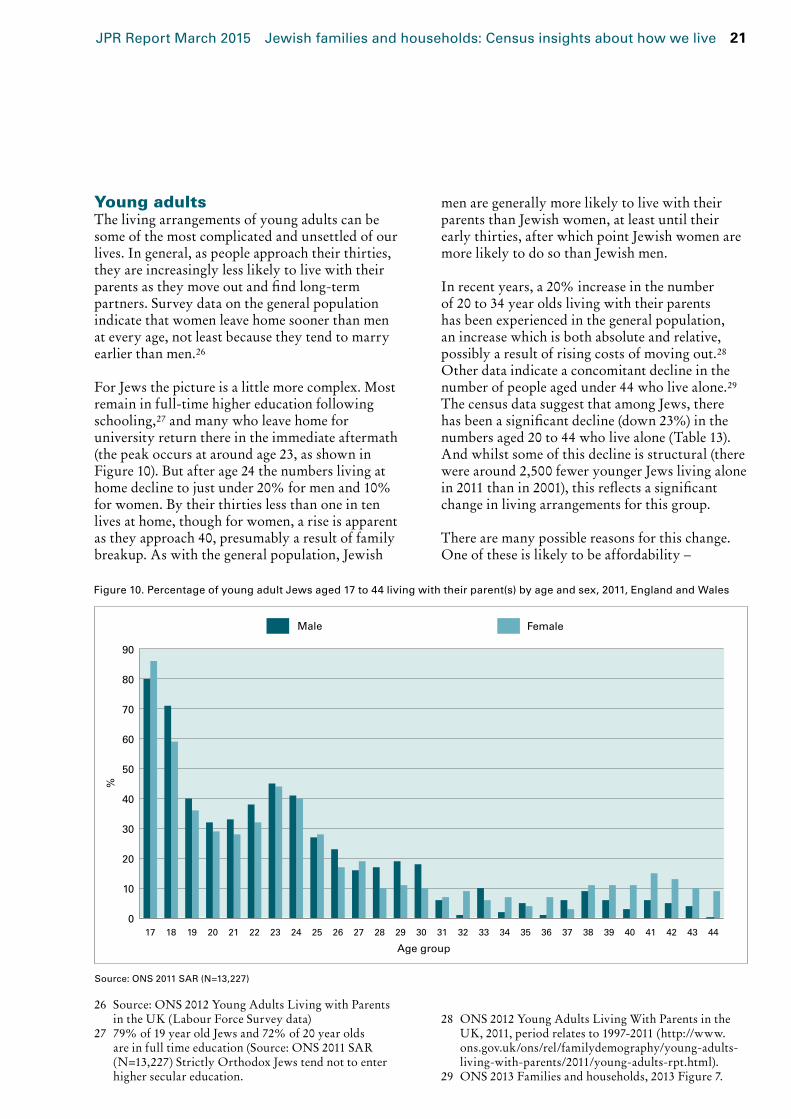
Young adultsThelivingarrangementsofyoungadultscanbesome of the most complicated and unsettled of our lives.Ingeneral,aspeopleapproachtheirthirties,theyareincreasinglylesslikelytolivewiththeirparentsastheymoveoutandfindlong-termpartners. Survey data on the general population indicate that women leave home sooner than men ateveryage,notleastbecausetheytendtomarryearlier than men.26
ForJewsthepictureisalittlemorecomplex.Mostremain in full-time higher education following schooling,27 and many who leave home for university return there in the immediate aftermath (thepeakoccursataroundage23,asshowninFigure10).Butafterage24thenumberslivingathome decline to just under 20% for men and 10% for women. By their thirties less than one in ten lives at home, though for women, a rise is apparent astheyapproach40,presumablyaresultoffamilybreakup.Aswiththegeneralpopulation,Jewish
26 Source:ONS2012YoungAdultsLivingwithParentsintheUK(LabourForceSurveydata)
27 79%of19yearoldJewsand72%of20yearoldsareinfulltimeeducation(Source:ONS2011SAR(N=13,227)StrictlyOrthodoxJewstendnottoenterhigher secular education.
menaregenerallymorelikelytolivewiththeirparentsthanJewishwomen,atleastuntiltheirearlythirties,afterwhichpointJewishwomenaremorelikelytodosothanJewishmen.
Inrecentyears,a20%increaseinthenumberof20to34yearoldslivingwiththeirparentshasbeenexperiencedinthegeneralpopulation,anincreasewhichisbothabsoluteandrelative,possiblyaresultofrisingcostsofmovingout.28 Other data indicate a concomitant decline in the numberofpeopleagedunder44wholivealone.29 ThecensusdatasuggestthatamongJews,therehasbeenasignificantdecline(down23%)inthenumbersaged20to44wholivealone(Table13).Andwhilstsomeofthisdeclineisstructural(therewerearound2,500feweryoungerJewslivingalonein2011thanin2001),thisreflectsasignificantchange in living arrangements for this group.
Therearemanypossiblereasonsforthischange.Oneoftheseislikelytobeaffordability–
28 ONS2012YoungAdultsLivingWithParentsintheUK,2011,periodrelatesto1997-2011(http://www.ons.gov.uk/ons/rel/familydemography/young-adults-living-with-parents/2011/young-adults-rpt.html).
29 ONS2013Familiesandhouseholds,2013Figure7.
Figure 10. Percentage of young adult Jews aged 17 to 44 living with their parent(s) by age and sex, 2011, England and Wales
Source: ONS 2011 SAR (N=13,227)
%
Age group
0
10
20
30
40
50
60
70
80
90
FemaleMale
44434241403938373635343332313029282726252423222120191817

22 JPR Report March 2015 Jewish families and households: Census insights about how we live
increased costs of living outside the parental homemaybedelayingyoungadultsfrommovingout–and,whentheydotakethisdecision,theymaybemorelikelytochoosetolivewithfriendsorflatmatestohelpkeepcostsdown, rather than to live alone. But it is also possiblethatJewishdemographicchangesmaybeinvolved–adeclineintheaverageageofJewsatthetimeoffirstmarriage(theinevitableresult of haredi growth) would decrease the proportionsofyoungerpeopleseekingtolive alone.30
30 Seefurther:Graham2013‘2011CensusResults(EnglandandWales):ataleoftwoJewishPopulations’,InstituteforJewishPolicyResearch,London.
Thecensussuggeststhat18%ofJewsintheirlatetwentiessharebutbytheirearlythirtiesmorethanhalf(55%)aremarriedandafurther13%arecohabiting(Figure11).Bythisagejust8%arestilllivingathomeandmanyofthesemay have returned following the termination of relationships.
Families with childrenThemostcommontypeofJewishhouseholdstructure is a married couple with dependent childrenunderage16(20%ofallJewishhouseholds)(seealsoTable9,p.16).Overall,27%ofallJewishhouseholdscontaindependentchildren, similar to the national proportion (29%).31 However, there are few other similarities
31 Source:ONS2011TableDC1202
Nine out of ten Jewish children live in married couple households compared with six out of ten generally. That is because Jews are less likely to be single parents or to cohabit than the general population.
%
0
10
20
30
40
50
60
Age 30-34
Age 25-29
OtherMarriedCohabitingSharingLiving aloneLiving with parent(s)
Figure 11. Living arrangements for Jews aged 25 to 34, 2011, England and Wales
Source: ONS 2011 SAR (N=13,277)
19%
8%11%
15% 16%13%
18%
8%3% 2%
34%
55%
Age 30-34
Age 25-29
Table 13. Number of people aged 20 to 44 living alone, 2001 and 2011, Jewish and general population, England and Wales
Source: ONS 2001 SAR (N=1.8m); ONS SAR 2011 (N=2.8m)
2001 2011 Change 2001 to 2011
Total percentage change
JewishNumber living alone (estimated) 10,893 8,424 -2,468 -22.7%
Living alone as % of all people aged 20-44 14% 11% -2.8% x
GeneralNumber living alone (estimated) 1.9m 1.9m -34,918 -1.8%
Living alone as % of all people aged 20-44 11% 10% -0.7% x
Between 2001 and 2011 the number of Jews aged 20-44 living alone declined by a quarter. This significant fall is due not least to the increasing unaffordability of independent living.
JPR Report March 2015 Jewish families and households: Census insights about how we live 23
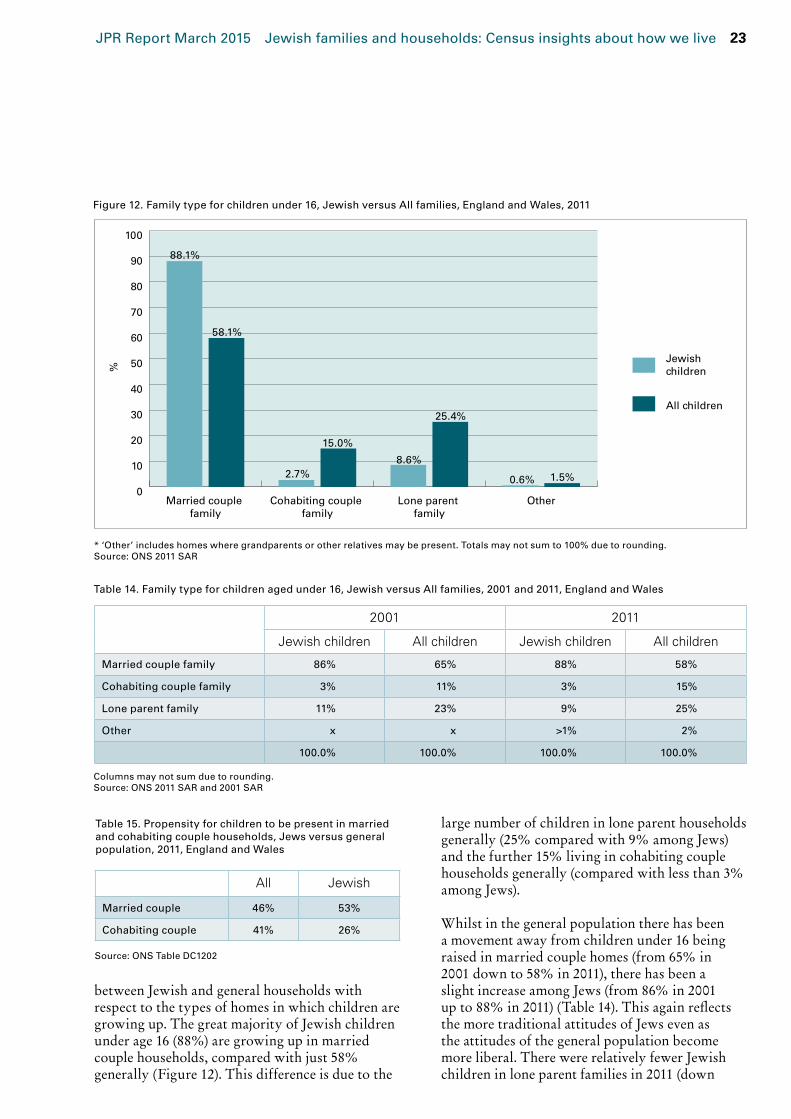
betweenJewishandgeneralhouseholdswithrespect to the types of homes in which children are growingup.ThegreatmajorityofJewishchildrenunderage16(88%)aregrowingupinmarriedcouplehouseholds,comparedwithjust58%generally(Figure12).Thisdifferenceisduetothe
largenumberofchildreninloneparenthouseholdsgenerally(25%comparedwith9%amongJews)andthefurther15%livingincohabitingcouplehouseholdsgenerally(comparedwithlessthan3%amongJews).
Whilstinthegeneralpopulationtherehasbeenamovementawayfromchildrenunder16beingraisedinmarriedcouplehomes(from65%in2001downto58%in2011),therehasbeenaslightincreaseamongJews(from86%in2001upto88%in2011)(Table14).ThisagainreflectsthemoretraditionalattitudesofJewsevenastheattitudesofthegeneralpopulationbecomemoreliberal.TherewererelativelyfewerJewishchildren in lone parent families in 2011 (down
%
0
10
20
30
40
50
60
70
80
90
100
All children
Jewish children
OtherLone parent family
Cohabiting couple family
Married couple family
Figure 12. Family type for children under 16, Jewish versus All families, England and Wales, 2011
* ‘Other’ includes homes where grandparents or other relatives may be present. Totals may not sum to 100% due to rounding.Source: ONS 2011 SAR
88.1%
58.1%
2.7%
15.0%
0.6% 1.5%
8.6%
25.4%All children
Jewish children
2001 2011
Jewish children All children Jewish children All children
Married couple family 86% 65% 88% 58%
Cohabiting couple family 3% 11% 3% 15%
Lone parent family 11% 23% 9% 25%
Other x x >1% 2%
100.0% 100.0% 100.0% 100.0%
Table 14. Family type for children aged under 16, Jewish versus All families, 2001 and 2011, England and Wales
Columns may not sum due to rounding.Source: ONS 2011 SAR and 2001 SAR
All Jewish
Married couple 46% 53%
Cohabiting couple 41% 26%
Table 15. Propensity for children to be present in married and cohabiting couple households, Jews versus general population, 2011, England and Wales
Source: ONS Table DC1202

24 JPR Report March 2015 Jewish families and households: Census insights about how we live
from 11% in 2001 to 9% in 2011), whereas this increasedfrom23%to25%generally.Anevenlargerswingoccurredintermsofcohabitation,upfrom11%to15%ofallchildrengenerally,comparedwithaslightdeclineamongJewsfrom3.3%to2.7%.
EvidenceofthepreferenceamongJewstoformnuclearfamiliesisalsoreflectedinaveragehouseholdsize.Inthegeneralpopulation,theaveragesizeofhouseholdswithchildrenis3.77personsperhousehold.AlthoughrelevantcensusdataforJewsarenotcurrentlyavailable,surveydataindicatetheJewishequivalentisprobablyratherhigherat4.35.32
ItalsoappearstobethecasethattheJewishtendency towards more traditional household structuresisaconsciousanddeliberatechoice.Forexample,notonlydoweseethatJewsarefarlesslikelytoformcohabitingpartnerships(Table8),butwhentheydoso,theyarealmosthalfaslikelyasthegeneralpopulationtohavechildreninsuchrelationships(Table15).Conversely,Jewsinmarriedcouplesaremorelikelytohavechildrenthanisgenerallythe case.
32 ONS 2014 Households and Household Composition inEnglandandWales,2001-11p20;2013NJCSPaneldata(weighted)N=305.Notethecensusfigureisbasedon‘dependentchildren’,whereastheNJCSfigureisbasedonanychildaged18orunder.
Lone parent householdsJewishloneparentsarelesslikelytohavedependent children living at home than is generallythecase(55%ofJewishloneparentshaddependentchildrencomparedwith67%generally)(Table16).33 Nevertheless, there were 3,437JewishloneparenthouseholdsinEnglandand Wales in 2011 with dependent children. Otherdatashowtherewereabout4,562Jewishchildrenagedunder16livinginloneparent families.34
Proportionately,therewaslittlechangeintheJewishloneparenthouseholdpopulationbetween2001and2011,butthetotalnumberofJewishloneparenthouseholdsdeclinedslightly(down4%),whereasitincreasedby21%inthegeneral population—another indication not onlyofJewishdifferencebutalsoofdivergence(Table16).35
In2001,thevastmajority(82%)ofJewishloneparentswerefemale,andthiscontinuestobethecase,with80%recordedin2011comparedwithanaverageof87%inthegeneralpopulation.36 ThissuggeststhatJewishmenareslightlymorelikelytobeloneparentsthanisgenerallythe case.
33 Itshouldbenotedthatagecategoriesusedbythecensus are not mutually exclusive—some lone parent householdshavebothdependentandnon-dependentchildren—survey data indicate that this is the case for 13%ofallJewishoneparenthouseholds(NJCS2013,N=98).
34 ONS2011SARandONSTableDC2107.35 Unlikeotherfamilyhouseholdchange,this
comparisoncanbemadeasthecategoryislargelyindependentofthe65andabovegrouping.
36 ONS2001SAR,ONS2011SAR
Over 4,500 Jewish children live with a lone, usually female, parent.
2001 2011 Total change 2001 to 2011
All (N=2.1m)
Jewish (N=6,449)
All (N=2.5m)
Jewish (N=6,205)
All (N=2.5m)
Jewish (N=6,205)
With at least one dependent child
68% 55% 67% 55% +19.4% -3.8%
With non-dependent children only
32% 45% 33% 45% +23.0% -3.8%
Total 100% 100% 100% 100% +20.6% -3.8%
Table 16. Makeup of lone parent households, 2001 and 2011 and change, Jewish versus general population, England and Wales
Source: ONS Table DC1202 and S151

JPR Report March 2015 Jewish families and households: Census insights about how we live 25
Fewer older Jews are living alone. This is partly because there were fewer older Jewish women in 2011 than in 2001, and partly because Jewish men are living longer.
Households with older peopleAlthoughJewishfamilyhouseholdswithchildrenarethelargestsinglecategory,Jewishhouseholdsconsistingsolelyofpeopleaged65andaboveaccount for an even larger proportion overall (27%),althoughthisismadeupofbothcouplehouseholds and people who live alone.
AsexplainedinAppendixIII,olderJewishwomenmakeupadisproportionatelylargepartoftheJewishonepersonhouseholdsector,andthisisdespitea14%(orabout4,000person)declineinthenumberofJewishwomenaged70andabove
between2001and2011.37Atthesametimetherewasa10%increaseinthenumberofJewishmenagedover80years.Togetherthesestructuralchanges explain at least some, if not most, of the declineinolderJewishonepersonhouseholdsoverall(down15%between2001and2011)(Table17).Thisstandsincontrasttothegrowthof2%
37 Source:ONS2011TableCT0291andONS2001TableM277
Jewish General
Total Percent of all households Total Percent of all households
2001 20,781 18% 2,847,862 13%
2011 17,634 16% 2,903,930 12%
Total change -3,147 x +56,068 x
Percent change -15% x +2% x
Table 17. Change in older one person households (age 65 and over), Jewish and general population, 2001 to 2011, England and Wales
* due to the change in definition of age of one person households between 2001 and 2011, 2001 data have been adjusted to align with the 2011 definitionSource: ONS Table DC1202, S151, S149, 2001 SAR
Rank LA Absolute change
Relative change
1 Hackney -461 -51%
2 Barnet -447 -13%
3 Brent -420 -43%
4 Camden -410 -40%
5 Westminster -359 -30%
6 Tower Hamlets -311 -63%
7 Brighton and Hove -205 -37%
8 Redbridge -191 -14%
9 Manchester -158 -35%
10 Leeds -157 -18%
Table 19. Largest contraction of Jewish one person households age 65 and above by area, 2001 to 2011
* Limited to areas with at least 100 Jewish one person households aged 65+.
Older (age 65 and above)
Area % of all Jewish households in area
1 Bournemouth 28.3%
2 Southend-on-Sea 24.8%
3 Brent 24.8%
4 Redbridge 24.5%
5 Brighton and Hove 24.4%
6 Tower Hamlets 24.1%
7 Manchester (LA) 23.3%
8 Enfield 22.9%
9 Harrow 22.8%
10 Westminster 21.3%
England and Wales 15.9%
Table 18. Highest proportions of older (65 and over) Jewish one person households by area, 2011, England and Wales
* Limited to Local Authorities with a minimum of 500 Jewish households.Source: DC1202

26 JPR Report March 2015 Jewish families and households: Census insights about how we live
exhibitedinthissectorgenerally.Asaresultofthiscontraction,olderJewishonepersonhouseholds now account for a smaller proportion ofallJewishhouseholds(downfrom18%to16%in the decade).
Spatially we would expect to see an average of 16%ofolderonepersonJewishhouseholdsinanyarea,butincoastalretirementtownstheproportionsarefarhigher(Bournemouth28%,Southend25%,andBrighton24%),astheyareinJewishdemographicallydeclining/ageingsuburbs(Brent25%,Redbridge25%,andHarrow23%)(Table18).
The15%contractionoftheseniorJewishonepersonhouseholdsectoroverall(Table17),canbecontrastedwithchangeatthelocallevel.Forexample,Hackneyexperiencedthelargestabsolutedeclineofthisgroup(down461or51%)andneighbouringTowerHamletsexperienced the largest proportionate decline
(down331or63%)(Table19).Giventherolethattheolder,especiallyfemale,Jewishpopulation has played in the overall contraction inthenumberofJewishonepersonhouseholds,it is tempting to surmise that the main driver behindthesechangesisduetomortality,i.e.thedyingoffofnon-harediJewswhobelongedto communities predating the current local haredi populations.38
Inadditiontotheonepersonhouseholds,therewere11,873Jewishfamilyhouseholdsinwhichallmembersareaged65andabove.39Duetomortality,thesehouseholdsbecomerapidlyrarerwithage.Whilstmost(70%)peopleaged65-74
38 KosminB.andGrizzardN.(1975).JewsinanInnerLondonBorough(Hackney):AStudyoftheJewishPopulation.London:BoardofDeputiesofBritishJews.ThisstudynotedthefarmorediversereligiousnatureoftheJewishcommunityinthisareaintheearly 1970s.
39 ONSTableDC1202
%
0
10
20
30
40
50
60
70
80
Age 75 and over
Age 65 to 74
OtherMarried coupleLiving alone/sharingCare facility
Figure 13. Family composition for Jews aged 65 and above, 2011, England and Wales
Source: 2011 SAR
2%
9%
21%
41%
7% 6%
70%
44%
Age 75 and over
Age 65 to 74
2001 2011 Percent change
Care home with nursing 1,512 1,104 -27%
Care home without nursing 1,985 1,831 -8%
Medical other (not care home) 695 336 -52%
Total 4,192 3,271 -22%
Table 20. Jews in communal care establishments,* change 2001 to 2011, England and Wales
* Note this relates to Jewish and non-Jewish facilitiesSource: ONS Table S161 and DC4409

JPR Report March 2015 Jewish families and households: Census insights about how we live 27
are living as married couples, this is the case for just44%forthoseaged75andabove(Figure13).Meanwhile,thenumberslivingaloneandlivingincarefacilitiesrisesubstantially.
Jews living in medical and care facilitiesOfthe3,271Jewsinmedicalandcareestablishments,34%areina‘Carehomewithnursing’and56%areina‘Carehomewithoutnursing’,thesmallremainderbeinginothertypesofcarefacilitysuchashospitals.Thereare
twiceasmanyJewishwomenasJewishmeninthese facilities due to greater female longevity.
Between 2001 and 2011 there was a 22% decline inthetotalnumberofJewslivinginsuchestablishments(Table20).Nevertheless,thelevelofpenetrationortake-up(i.e.theproportionofthe age cohort in such facilities) seems not to have changed, remaining at around 9% of those aged 75andabove.40Obviouslytheproportionsarefarhigher at older ages.
40 2001SARdatashowthat9%ofJewsaged75andoverlivedinacommunalestablishment(presumablycarerelated)and2011SARdatashowthat8.8%ofJewsinthisagebracketdidso.

28 JPR Report March 2015 Jewish families and households: Census insights about how we live
Living arrangements among other religious and ethnic groups
Oneofthesignificantadvantagesofthecensusis that it affords an opportunity to compare the Jewishsituationdirectlywiththatofothergroups.Itoffersaviewofthediversityofhouseholdcompositionthatexistsamongdifferentsub-populations,eachofwhichisinfluencedbydifferent cultural and value systems, as well as varying demographic structures often resulting fromuniquemigratoryhistories.
Asdiscussed,Jewishhouseholdsaremorelikelythanaveragetoconsistofmarriedcouples(38%),butother,especiallyyoungerreligiousandethnicgroups,haveconsiderablyhigherlevels.Forexample,overhalf(53%)ofHinduhouseholdsaremarriedcouples,areflectionoftraditionalattitudes to family formation. Note also that a quarteroftheHindugroupfallsunderthe‘Other’householdcategory—mostlikelyareflectionofmulti-generationalstructures.Conversely,Jewsarelesslikelytoliveincohabitingcouplehouseholdsthanmostgroups.Indeed,whilstthisisthecasefor5%ofJewishhouseholds,amongMixedethnichouseholds it is 11% and among No Religion households,17%cohabit,indicatingarelationship
betweentherejectionoftraditionalreligiouslabelsand the rejection of traditional attitudes towards family formation (Figure 14).
TheJewishtendencytowardsmoretraditionalstructures is also evident in terms of lone parent households.Thisisthecasefor6%ofJewishhouseholds,butamongMuslimhouseholdsitis13%andamongMixedethnicitis19%.However,loneparenthoodislargestamongBlackhouseholds:herefullyonequarter(24%)arelone parents.
HavinganolderagestructureexposesJewstohaving large proportions of all senior and lone seniorhouseholds(27%intotal),atraitJewssharewiththeageingChristianpopulation.ThisisinstarkcontrasttothefaryoungerArabandMuslimgroups,wherejust3%ofhouseholdsfallintothese categories.
Finally,thenumberofJewsagedunder65wholive alone is similar to the national average (17%), butamongArabandMixedethnichouseholdsthesearemuchhigher(29%and31%respectively).
The census data enable us to directly compare the way Jews live with other religious and ethnic groups.
0
10
20
30
40
50
60
70
80
90
100 Other
One person (age under 65)
One person (age 65+)
Couple (all age 65+)
Lone parent
Cohabiting couple
Married couple
Mixed* 301k
Black* 731k
No Religion 5.6m
Christian 14.6m
Jewish 110k
Arab* 81k
Muslim 750k
Hindu 260k
Total 22.4 m
Figure 14. Household structure among other religious and ethnic groups, 2011, England and Wales
* Denotes a self-defined ethnic groupSource: ONS Table DC1202
%
Age group
18%
8%
12%
33%
8%
11%
10%
11%
21%
3%
53%
8%6%2%
16%
19%
2%
45%
1%13%
3%
29%
14%
2%
40%
1%10%
4%
17%
8%
16%
38%
11%
6%5%
15%
6%
16%
34%
11%
10%
8%
23%
9%
4%
31%
3%
12%
17%
26%
14%
6%
22%
2%
24%
7%
31%
13%
4%
20%
2%
19%
11%
Other
One person (age under 65)
One person (age 65+)
Couple (all age 65+)
Lone parent
Cohabiting couple
Married couple

JPR Report March 2015 Jewish families and households: Census insights about how we live 29
Living conditions
Home ownership and rentingThecensusprovidesanopportunitytoexplorehousing tenure, i.e. the ways in which we own, or pay for, our homes. Over the last century the proportion of people who owned, as opposed to rented,theirhomerosesteadily,butitwasnotuntilthe1970sthatthenumberofhomeownersformed a majority of all households. However, this steady upward trend has stalled dramatically, and, afterpeakingat69%in2001,homeownershipbegantodeclineforthefirsttimeinacentury,withtheownership/rentalpendulumswingingbacktowardsrentingin2011.Possiblereasonsforthisreversal,whichhasbeendrivenbyareductioninthenumberofhomespurchasedwitha mortgage, include high house prices, low wage growthandtighterlendingrequirements.41
Nonetheless, compared with the general population,Jewishhouseholdersaremorelikelytoowntheirownhome(73%versus64%generally)(Table21).Inpart,thisisduetotheolderJewishage structure (older people have had more time to payoffmortgagesetc.),butitalsorelatestothehighersocio-economiccircumstancesmostJewsenjoy.42Nevertheless,likethegeneralpopulation,theproportionofJewishhouseholdsthatownstheirhomehasdeclined(from77%in2001to73%in2011).Indeed,Jewishhomeownershipdeclined
41 OfficeforNationalStatistics(2013).“ACenturyofHome Ownership and Renting in England and Wales (fullstory).”Downloadedfrom:http://www.ons.gov.uk/ons/rel/census/2011-census-analysis/a-century-of-home-ownership-and-renting-in-england-and-wales/short-story-on-housing.html
42 SeeGraham,et.al.(2007)andJPRcensusreportonsocio-economics (forthcoming).
by8,078households,whereasJewishrentingincreasedby2,474households.
More detailed analysis shows that two out offive(39%)Jewishhouseholdsowntheirhomes‘outright’,atotaldeclineof6%overthedecade(Table22).43Andalthough3,143Jewishhouseholders rent from the local council, this is 39%fewerthanin2001.Furthermore,therearethreetimesfewerJewishhouseholdslivingincouncil homes than the general population.
However, the most important change is highlightedinFigure15.Thisshowsthatbetween2001and2011,therewasadeclineinallformsofJewishhousingtenureexceptone:rentingfromaprivatelandlordorlettingagency.Thisincreasedby4,836units,or36%,despitethetotalnumberofJewishhouseholdsdecliningby5%.Thisincreaseisinlinewiththe growth in this sector generally which almostdoubled(up89%–seeTable22),buttheprocessesbehinditarelikelytoberatherdifferent to the ones operating in the wider population.Evidenceforthisisexploredbelow.
43 IntermsofJewishindividuals,thisproportionislower(33%)duetoolderpeoplebeingmorelikelytoownpropertyoutrightbutalsotoexhibitsmalleraveragehouseholdsizes.(ONSTableLC4417)
2001 2011 Total change 2001 to 2011
AllN=21.7m
JewishN=116,330
AllN=23.4m
JewishN=110,726
All Jewish
Owned 69% 77% 64% 73% 1% -9%
Rented 31% 23% 36% 27% 24% 9%
Total 100% 100% 100% 100% 8% -5%
Table 21. Type of home ownership, Jews versus general population, England and Wales, 2001 and 2011
Source: ONS 2011 Table DC4204 and ONS 2001 Table S156
Jewish home ownership fell between 2001 and 2011 whilst Jews renting increased, especially in the Jewish private sector which rose by over 4,800 households.

30 JPR Report March 2015 Jewish families and households: Census insights about how we live
Home ownership by locationThetypeoftenurearrangementspeopleenterintoisdictatedbymultiplefactorsincludingwealth, income, life stage, cultural norms and lifestylepreferences.Itwillalsobeinfluencedbytheavailabilityofparticulartypesofhousingstockinparticularareas.Buteconomicsanddemography are also important factors, since olderpeoplearemorelikelytoowntheirhomesoutright,andJewsare,onaverage,olderthanthegeneralpopulation.Indeed,giventhatJewsaregeographically concentrated in London, and, in
general,householdsinLondonaremorelikelytoberentedthananywhereelseinthecountry,44 the tendencyofJewstoowntheirownhomesisallthemorestriking.
However, as noted, 27% of the properties containingJewishhouseholdsarerented.Thisequatesto29,564Jewishhouseholds(and,though
44 InthegeneralpopulationofLondon,20%ofhouseholdsrentbutonly15%ofthepopulationlivesthere(ONSTablesLC4204andKS209)
2011 total households 2011 percent of total households
Total change 2001 to 2011
All Jewish All Jewish All Jewish
Owned outright 7,206,954 43,482 31% 39% +13% -6%
Owned with a mortgage* 7,824,960 37,680 33% 34% -8% -13%
Rented from council 2,208,080 3,143 9% 3% -23% -39%
Other social rented 1,910,381 5,241 8% 5% +48% -2%
Private landlord or letting agency 3,566,467 18,265 15% 16% +89% +36%
Other 649,202 2,915 3% 3% -7% -9%
Total 23,366,044 110,726 100% 100% +8% -5%
Table 22. Detailed tenure type, Jews versus general population, England and Wales, 2011 and change
* Including loans and shared ownership.Source: ONS Table DC4204
-8,000
-6,000
-4,000
-2,000
0
2,000
4,000
6,000
Other private rented
Rented from private landlord or
letting agency
Other social rented
Rented from council (LA)
Owned with a mortgage
Owned outright
Ch
ang
e in
nu
mb
er o
f J
ewis
h h
ou
seh
old
s
Figure 15. Change in Jewish home ownership 2001 to 2011, England and Wales
Source: ONS Table DC4204
-2,572
-5,506
-1,974
-113
4,836
-275

JPR Report March 2015 Jewish families and households: Census insights about how we live 31
notperfectlyoverlapping,68,584Jewishpeopleliving in rented accommodation).45GiventhepreferenceamongJewsforhomeownershipcompared to the general population, it is importanttoaskwhichJewsrentandwhy?
Thecensusprovidesgeographicallydetailedinformationaboutprivateandsocialrenting.Asregardstheprivaterentalsector,twoverydistinctJewishsub-groupsemerge.Ontheonehand are four adjacent, predominantly haredi areasinHackney,plusoneotherinSalford.Whilstwewouldexpectabout18%ofJewishhouseholdsinanyonewardtobeprivatelyrented,thisisthecasefor60%ofJewishhouseholdsinCazenovewardinHackney,andaround50%inotherharediwards(Table23).Intheseareas,organisationssuchastheAgudasIsraelHousingAssociationoperatetohelpfinanciallyimpoverishedOrthodoxfamilies.46 Ontheotherhand,therearefivewardsintheMayfair area of central London, (four of which areadjacent)andoneinnearbyWestminsterwhich are some of the wealthiest areas in the countryandwhererentingiscommonbutwhererental prices are very high.
45 ONSTableLC441746 Boyd,J.(2011).Child poverty & deprivation in the
British Jewish community.London:InstituteforJewishPolicyResearch.
Incontrasttoprivaterenting,whichattractsa socially and economically diverse group, social renting is almost always an indicator of somelevelofeconomichardship.Thereare14,873Jewswholiveincouncilaccommodation(8,384Jewishhouseholds).TheplaceswiththehighestlevelsofJewishsocialrentingsharefewcommonfactorsotherthanbeinginpoorerpartsofinnerurbanareas.Thus,althoughwewouldexpect,onaverage,about6%ofJewishhouseholdsinanywardtobesociallyrenting,wefindthatinBrownswoodinHackneynolessthan54%ofhouseholdsaresociallyrented(incontrast to adjacent wards where private renting dominates).Threeoutofthetoptenwardsarein predominantly haredi areas (Brownswood, LordshipandBroughton)butsevenarenot.Ofthese,Whitechapel,Moortown,GreenbankandFryenthaverelativelylargeJewishpopulationsaged75andabove.ButinColindale,BurntOak,and Crumpsall, the relatively high levels of social renting appear simply to correlate with social deprivation of these areas.
Home ownership by ageDatafor2001revealaclearrelationshipbetweenthetypeoftenureandage.Thepropensitytorentpeaksforpeopleintheirtwenties—aboutathirdofthis age group rents, the majority privately (Figure 16).Rentingdeclinesaspeopleformfamiliesandachieve more senior employment positions (with higherincomes)and,possibly,inheritmoney.
Private renting or living rent free Social renting
LA Ward name Percent of ward LA Ward name Percent of ward
1 Hackney Cazenove 60% Hackney Brownswood 54%
2 Kensington and Chelsea Queen’s Gate 55% Tower Hamlets Whitechapel 42%
3 Kensington and Chelsea Brompton 54% Leeds Moortown 40%
4 Hackney New River 54% Liverpool Greenbank 39%
5 Haringey Seven Sisters 51% Barnet Burnt Oak 37%
6 Kensington and Chelsea Courtfield 50% Barnet Fryent 27%
7 Kensington and Chelsea Hans Town 47% Hackney Lordship 25%
8 Hackney Lordship 47% Manchester Crumpsall 23%
9 Salford Broughton 46% Barnet Colindale 20%
10 Westminster West End 46% Salford Broughton 20%
England and Wales average 18% England and Wales average 6%
Table 23. Jewish households by tenure type by area (ten greatest concentrations), 2011*
* Minimum of 100 Jewish households per ward.

32 JPR Report March 2015 Jewish families and households: Census insights about how we live
Thus,outrighthomeownershipincreaseswithage,peakingat67%amongpeopleaged60-74.Thisismatchedbyaconcomitantdecreaseinthenumberofpeoplewithmortgages.
Butitisnotablethatrentingincreasesagainaspeoplereachtheir60sandbeyond,presumablyrelatedtoreducedfinancialmeansasbreadwinnersretireanddie.Itisalsoclearthatalongsidethisincreaseisasignificantshiftaway
from private renting into renting from housing associations and councils, especially for those aged 75andabove,whichagainindicatesareductioninfinancialmeansforthesepeople.(Datafor2011arecurrentlyunavailable.)
Accommodation typeComparedwiththegeneralpopulation,Jewsaremorelikelytoliveinflatsbutlesslikelytoliveinsemi-detachedandterracedhomes(Table24).AquarterofJewsliveindetachedhouses,thesameproportion found in the general population.
Inrelativeterms,therehasbeenlittlechangeinaccommodationtypeforJews,butinabsolute
There has been a marked shift among Jews towards living in smaller, more compact types of property such as terraces and flats.
0
10
20
30
40
50
60
70
80
90
100 Rented (private)
Rented (Housing Association)
Rented (council)
Owned with mortgage
Owned outright
75 and above60-7445-5930-4415-290-14
Figure 16 Jewish home ownership by age, 2001, England and Wales
Source: ONS 2001 SAR
%
Age group
3%
13%
2%
20%
63%
2%
29%
2%
20%
47%
3%
13%
3%
19%
62%
3%7%
3%
34%
53%
4%
9%
4%
67%
16%
8%
12%
6%
66%
7%
Rented (private)
Rented (Housing Association
Rented (council)
Owned with mortgage
Owned outright
2001 2011 Change 2001 to 2011
AllN=51m
JewishN=251,537
All N=55.1m
Jewish N=256,037
All Jewish
Detached house 25% 27% 25% 25% +5% -5%
Semi-detached house 35% 28% 34% 28% +5% +4%
Terraced house 27% 18% 26% 19% +4% +7%
Flat/maisonette 13% 27% 16% 27% +30% +2%
Total 100% 100% 100% 100% +8% +2%
Table 24. Accommodation type by persons in households, Jewish versus general population*, England and Wales
* For people in unshared dwellings.Source: ONS 2011 Table LC2120; ONS 2001 Table C0301

JPR Report March 2015 Jewish families and households: Census insights about how we live 33
terms,therehasbeenamarkedshifttowardsmorecompactpropertytypes.Forexample,thenumberofJewslivingindetachedhousesdeclinedby5%between2001and2011,whilstthenumberlivinginterracedhousesincreasedby7%.
Themovementtowardssmallerpropertiesalsooccurred in the general population, although in aratherdifferentway.Inparticular,therewasasubstantialriseinthenumberofpeoplelivinginflats(up30%comparedwith2%forJews)(Table24).
Liketenure,accommodationtypeislargelya product of location, life stage and wealth. InGateshead,wheretheJewishpopulationisyoungandurban,83%ofthosewholiveinhouseholdsliveinterracedhouses.IninnerurbanareassuchasTowerHamlets,wherethepopulationtendstobeelderlyandofmoderatewealth,81%liveinflats.ThisisalsothecaseininnerurbanWestminster,wheretheproportionlivinginflatsis71%,butheretheJewishpopulationislargelywealthy.Inwealthieroutersuburbanareas,Jewscommonlyliveindetachedhomes,forexampleinStockportsouthofManchester(61%oftheJewishpopulation),andinThreeRiversinHertfordshire(60%).
Household overcrowdingThemostimportantindicatoroflivingconditions which the census offers us today is ‘occupancy rating’ or the level of overcrowding. Thisisbasedonameasurementofthenumberofhouseholdoccupantsandthenumberofroomsavailabletothem.Ingeneral,mostJewishhouseholdsarenotovercrowdedusingthisdefinition.However,9%areovercrowded,
amountingto8,850Jewishhouseholds(Table25).Overall,Jewsarealmostaslikelytolivein overcrowded conditions as people generally (8%versus9%generally)butthisissomewhatdistortedbythefactthatJewsarefarmoreurbanthanaverage.Forexample,inGreaterLondonwheretwooutofthreeJewishhouseholdsarelocated, 9% are overcrowded, compared with 19% generally.
BothJewsandthegeneralpopulationexperiencedincreasedovercrowdingbetween2001and2011.AmongJewstherewere8%moreovercrowdedhouseholdsanda6%declineinthenumberofJewishhouseholdswithsufficientorsparespace(Table25).Althoughthisislessthanthe32%increaseinovercrowdingrecordedgenerally(reflectiveofthesignificantincreaseinthenumberofpeoplelivinginflats(Table24)),itstillsuggeststhatoverall,Jewishlivingconditionshavedeclinedoverthedecade.Itislikelythatthisismainly,thoughnotexclusively,a result of the growth of the haredi population (seebelow).
Overcrowding is sensitive to household type. Datafrom2001indicatethatJewishhouseholdswithsixormoreresidentswerealmost2.5timesmorelikelythanaveragetobeovercrowded(seeAppendixIV).Similarly,Jewishloneparent households and ‘unconventional’ couplehouseholdswerealsomorelikelytobeovercrowded than average.
2001 2011 Total change 2001 to 2011
AllN=23.4m
JewishN=116,330
AllN=21.7m
JewishN=110,726
All Jewish
Occupancy rating*(rooms)
Surplus rooms 75% 76% 73% 76% +5% -6%
Neither spare space nor overcrowded
18% 17% 18% 16% +10% -7%
Overcrowded 7% 7% 9% 8% +32% +8%
Total 100% 100% 100% 100% +8% -5%
Table 25. Overcrowding based on room availability, Jews versus general population 2001 versus 2011, England and Wales*
* See GlossarySource: ONS 2011 Table DC4207; ONS 2001 Table S160
Increases in Jewish overcrowding suggest that overall, Jewish living conditions have declined since 2001.

34 JPR Report March 2015 Jewish families and households: Census insights about how we live
Itshouldbenotedthattwodefinitionsofovercrowdingareavailablefromthe2011Census:onebasedonroomsinthehousehold(shownaboveandusedin2001)andonebasedonthenumberofbedroomsinahousehold,anewmeasure introduced in 2011. Measured in terms of bedrooms,theapparentextentofovercrowdingislessened(intotal3%or3,744overcrowdedJewishhouseholdscomparedwith8%or8,850
basedon‘rooms’)(Figure17).(Therelativevalueof the two different measures is explored in more detailbelow.)
Overcrowding by location Lookingatovercrowdingbyarea,aslightlydifferent picture emerges depending on the type ofmeasureused(i.e.roomsorbedrooms).Forexample,whilstJewishhouseholdovercrowding
%
0
10
20
30
40
50
60
70
80
Measure based on rooms
Measure based on bedrooms
Overcrowded (Occupancy rating =
-1 or less)
Neither spare room nor overcrowded
(Occupancy rating = 0)
Surplus rooms (Occupancy rating =
+1 or more)
Figure 17. Overcrowding in Jewish households based on available ‘rooms’ and ‘bedrooms’, 2011 England and Wales
Source: ONS 2011 Table DC4207 and DC4208
74% 76%
23%
3%8%
16%Measure based on rooms
Measure based on bedrooms
Rooms measure Bedrooms measure
Area Number of households
% Over-crowded*
Area Number of households
% Over-crowded*
1 Hackney 931 22.4% Hackney 634 15.3%
2 Nottingham 67 22.0% Gateshead 43 10.3%
3 Southwark 103 21.6% Southwark 43 9.0%
4 Islington 193 19.3% Waltham Forest 57 9.0%
5 Tower Hamlets 145 19.2% Haringey 201 8.2%
6 Bristol, City of 54 16.9% Salford 154 7.2%
7 Waltham Forest 101 15.9% Nottingham 21 6.9%
8 Hammersmith & Fulham
96 15.9% Croydon 23 6.2%
9 Kensington & Chelsea 270 15.8% Tower Hamlets 44 5.8%
10 Lambeth 91 15.8% Lambeth 31 5.4%
England and Wales average
8,850 8.0% England and Wales average
3,744 3.4%
Table 26. Overcrowding in Jewish households, by LA, measured by rooms and bedrooms, 2011
* Occupancy rating = -1 or less; areas with at least 250 Jewish householdsSource: ONS 2011 Table DC4207 and DC4208

JPR Report March 2015 Jewish families and households: Census insights about how we live 35
isgreatestinHackneyregardlessofthemeasureused,onlyfivelocationsareinthetoptenofbothmeasures(Table26).Itisapparentthatthebroader‘rooms’measureidentifiesovercrowdinginplaceswhereJewishstudents(Nottingham,Bristol)andyoungadults(Islington,HammersmithandFulham, Kensington and Chelsea) are living and whicharemissinginthe‘bedrooms’measure.Thisisbecausestudentsandyoungadultsaremorelikelytoshareaccommodationyetstillhaveprivatebedrooms.Thus,intermsofmeasuringdeprivation, it seems that the more restrictive bedroomsdefinitionismorerevealing(sharingaccommodation, in and of itself, is not necessarily anindicationofdeprivationandcouldratherbereflectiveoflifestage/lifestyle).
Thus,basedonthebedroomsmeasureofovercrowding,weseethatGateshead,Haringeyand Salford enter the top ten list alongside Hackney—allareaswithlargeharedipopulations.Indeed,thesefourareasaccountforoveraquarter(26%)ofallovercrowdedJewishhouseholdsinthecountrybutonly8%Jewishhouseholdsintotal.Inotherwords,Jewsintheseareasareoverthreetimesmorelikelytoliveinovercrowdedconditionsthanexpected(seeAppendixIV).
Overcrowding(measuredbybedrooms)isevengreater when the data are examined at ward level (Table27).Eightofthetoptenovercrowdedwards are in predominantly haredi areas, reaching almostoneinfivehouseholdsinsomeplaces.ApplyingaverageJewishhouseholdsizestothesefiguresrevealsover3,300peopleinthesewardswho are living in overcrowded conditions, or in houseswherethereareaninsufficientnumberofbedroomsforalloccupants.Almostallofthesepeople are in haredi areas.
LA Ward Number of overcrowded
Jewish households
% overcrowded (England and
Wales = 3.2%)
Persons per household
Estimated number of people
Birmingham Selly Oak 16 19.5% 4.72 76
Haringey Seven Sisters 110 19.0% 4.98 548
Hackney Cazenove 114 18.1% 4.55 519
Hackney Lordship 138 17.4% 3.94 544
Hackney Springfield 143 17.1% 4.31 616
Hackney New River 152 16.7% 3.94 599
Salford Broughton 60 15.9% 5.13 308
Hackney Brownswood 16 14.8% 2.69 43
Westminster Westbourne 8 14.8% 2.07 17
Gateshead Bridges 11 14.7% 7.01 77
Table 27. Overcrowding in Jewish households, by ward, measured by bedrooms, 2011
* Areas with at least 50 Jewish households.Source: ONS Table DC4208, LC4417
Over 3,300 Jews live in homes which do not have enough bedrooms for all their occupants. The majority of these people live in strictly Orthodox areas.

36 JPR Report March 2015 Jewish families and households: Census insights about how we live
Policy implications
Acknowledge the diversity of Jewish living arrangements – there is no such thing as a ‘typical’ Jewish householdJewishhouseholddataofferusalensthroughwhichtoexaminethewayJewslive,and,inmany respects, the household or family is a morefamiliarunitofJewishcommunitythantheindividual.SuchdatatelluswithwhomJewslive, the nature of their family set-up and their socio-economiccircumstances.And,timeandagain,thedatashowhowtheJewishfamilydoesnotconformtostereotypes,howitcannotbedescribedsimplistically,andhowitdivergesfromtrends in the general population.
Jewslivewithinawidevarietyofdifferenttypesof household types—some with a traditional set-up of parents with children, some live alone, others in empty nester couples, still others in communal establishmentsofvariousforms.ViewingtheJewishcommunityfromtheperspectiveofthehouseholdcompelsonenotonlytoacknowledgethisdiversity,butalsoalertscommunityleadersandpolicymakerstotheneedtocarefullyconsider this reality when developing programmes andinitiatives.ItpromptsustoaskabouttheextenttowhichJewishorganisationsareconsciousof the variety of household structures that exist withintheJewishcommunity,and,whether,whentheyseektoprovideforthecommunity,theyareconceiving of it as it actually is, rather than how theyimagineittobe.
Think beyond the traditional nuclear family – two-thirds of Jewish households have no children living in themIncommunaldiscourseandpolicythinking,themostcommonviewoftheJewishhouseholdisthe stereotypical nuclear set-up with a mum, dad andkids.Inreality,however,thisistheexceptionratherthantherule.In2011,twooutofthreeJewishhouseholdshadnochildrenpresent,andoverall,Jewsarelesslikelytohavechildrenofany age living at home than is generally the case. Whilst it is essential that community organisations continue to focus their attention on families with children,thisfindinghighlightstheimportanceofraisingtheprofileofothertypesofJewishhousehold, and ensuring that all groups are catered for in an appropriate fashion.
Focus on the older generation – 17,600 Jews aged 65 and above live aloneIfweweretoknockonthefrontdoorsofthreeJewishhouseholdsselectedatrandom,wewouldfindthatinoneofthose,someonewouldbelivingalone.Alittleunderhalfofthisgroupconsistsofpeopleaged65andover,adisproportionatenumberofwhomisfemale.Thehouseholddatashowusthescaleofthisphenomenon,andcallforfurtherenquiryinto the extent to which these older and more vulnerablepartsoftheJewishpopulationarebeingsupported,aswellasthesizeandnatureofissuessuchassocialisolation.Thisisbecomingincreasinglyimportantgiventhatthebabyboomergenerationisnowbeginningtoretire,andtherewillsoonbeanincreaseddemandforleisureandcareservicesfortheelderly.ThetimemaywellberighttoundertakeareviewofthefutureneedsoftheelderlyJewishpopulation,andthecapacityrequiredtosupportthem.
There is a sizeable generation of working age people living alone – focus on its needs and interestsAlmost19,000Jewsagedunder65livealone,andwhilstformanyofthemthisisadeliberatelifestyle choice, for others it is involuntary, the result, perhaps, of separation, divorce, or simply beingunabletofindasuitablepartner.Whilstthiscanbeatemporarysituation,formanyitcanbecomeenduringandunwelcome.GiventhatmuchofJewishlifeandpracticerestsontheprincipleofcommunality,thisfindingpromptsustoaskwhetherJewishcommunityorganisationsaresufficientlyawareofthenumbersofJewsliving in such circumstances, whether they are beingappropriatelycateredfor,andwhetherthoselivinginfamiliesareactivelylookingtoincludethoselivingaloneintheirJewishlivesand activities.
Quantify and address the challenges facing the haredi community – overcrowding is an indicator of economic stressJewishhouseholdsizeinplaceslikeStamfordHillinHackneyandBroughtonParkinManchester,which was already large in 2001, was even larger

JPR Report March 2015 Jewish families and households: Census insights about how we live 37
in2011.Althoughthedemographictrendsoperating in this soaring haredi population are entirely different to those operating in the majorityJewishgroup,haredimstillrepresentarelativelysmallproportionofthetotalJewishpopulation(around15%),thustheoverallimpactontheJewishcommunity’shouseholdstatisticsislimited. Nonetheless, the challenging dynamics withinharediareasbecomeapparentthroughthelensofthehouseholddata.Populationgrowthratessignificantlyoutpacedhouseholdgrowth rates in these places, so whilst the household density increased within these areas, so too did the overcrowding within individual homes.Thedataonlyservetostresstwomajorpolicyissuesinrelationtotheharedisector:theincreasinglyproblematicissueofovercrowdingand the allied need to systematically address the economicdeprivationofwhichitisasymptom;andtheconstantrequirementformorelow-costlocalhousingtoaccommodatetheburgeoningharedi population.
Average level of wealth in the community in decline? Review and analyse the economics of the Jewish populationThedataonJewishhouseholdsgivethe overall impression of a community getting poorer. Whilst itwouldbewhollyinaccuratetosuggestthatJewsin general are living in poverty, the data suggest thatnotonlydoesJewishdeprivationexistbutitmaybebecomingmorewidespread.Over the decade,thenumberofJewishhomesownedoutrightdeclined,thenumbersofJewsrentinginaprivatecapacityincreased,thenumbersofJewslivinginterracedhomesgrew,andthenumbersliving in detached homes decreased. Meanwhile, averageJewishhouseholdsizeincreased.Althoughthesechangescanbelargelylinkedtothegrowthof the haredi population, they are also a result of demographicstructuralchange(fewerolderJews)andeconomicfactors,suchasthe2008globalfinancialcrisis.
AllofthesetrendscouldinferadeclineintheaveragelevelofwealthintheJewishpopulation,thoughtheydonotconfirmit.Nonetheless,from a policy perspective, this inference strongly suggests that a thorough analysis of economic datafromthecensusandJPR’sNationalJewishCommunitySurveyisurgentlyrequired.Reducedwealth clearly has implications for a communal infrastructure dependent on voluntary donations.
Do Jews stand apart? Pay attention to Jewish cultural divergence from national patternsAsidefromdemography,theothermaindriversofJewishhouseholdstructureareJewishcultureand values. Compared with most other groups, Jewishfamilyforminghabitsaremoretraditional.Forexample,Jewstendtoavoidmoreliberallivingarrangementssuchascohabitation,andevenwhentheydoformcohabitinghouseholds,theyarefarlesslikelythanthepopulationingeneraltohavechildreninsucharrangements.Ingeneral,Jewsaremorelikelytoliveasmarriedcouples,especiallywhentakingintoaccounttheolderJewishageprofile;indeed,thesinglemostcommonJewishhousehold type remains a married couple with children.Andlinkedtothepro-maritaltradition,Jewsunderage65arelesslikelytolivealoneandthereareconsiderablylowerlevelsofsingleparenthoodamongJewishhouseholdsthanothergroups. Finally, compared with other single parents,Jewishsingleparentsaremorelikelytoberaisingolderchildrenthanyoungchildren.Allofthis is less a result of religious tendencies and more to do with Jewishculturalnormsandvalues.
How are these traditional patterns of family formationlikelytochangeinthefutureandwhatimpact could this have on the community? Whilst itisimpossibletopredictwhetherJewishattitudesto family formation will change, demographic datashowthattheproportionofJewswithmore traditional attitudes (especially haredim) is increasing, so one might expect to see a parallel increase in the proportion of such households overtime.Thus,giventhatwidersocietaltrendsruncontrarytoJewishtrends,Jewishhouseholdsarelikelytobecomeincreasinglyatvariancefromthe average household in contemporary British society.Whetherthisisagoodorabadsituationis moot.
However,withtheharediandnon-harediJewishcommunities moving along two very different demographic trajectories, communal policy willneedtobefine-tunedtomeettheneedsofbothgroups.Ontheonehand,thereareissuesofhowbesttocaterforacommunityofageingbabyboomersandsignificantnumbersofpeoplelivingalone;ontheother,thereareissuesofsustainability,socialintegrationandinter-ethnicrelations.Eitherway,thefuturewillbeshapedmainlybythedemographicstructureofthe

38 JPR Report March 2015 Jewish families and households: Census insights about how we live
communityoverandabovepeople’ssocialchoices,and the majority of communal planning decisions will need to factor this in going forward.
Pay close attention to demography – these data reveal key dynamics within Jewish lifeDemographyis,withoutdoubt,themostimportantshaperofchangeinJewish,andindeedallother,households.ThedemographicstructureoftheJewishpopulation,meaningtherelativesizeofeachgeneration,largelydeterminesthecurrentandfuturepictureofthemakeupofJewishhouseholds.Whilstdemographydoesnotequaldestiny—culturalnorms,valuesandidentificationalsoinfluencethechoicesJewsmakeaboutlivingarrangements—it remains the single
bestindicatorofdestinythatwehave.ButinthepolicydiscussionanddebatesthattakeplaceintheboardroomsofJewishcharitiesandcommunal organisations across the country, demographicresearchoftenplayssecondfiddleto social research, and even to anecdote, despite thewealthofdemographicdatanowavailablefromboththe2001and2011censuseswhichispointing the way forward. For anyone concerned withplanningthefutureoftheJewishcommunity, paying close attention to these data isessentialformakingsounddecisionsaboutkeyissuesaffectingJewsofalltypesandatallstagesoflife.Thiswillensurethatcommunalbodiesandplayersremainonestepahead,abletocaterforJewishfamiliesandhouseholds,wherever and however they live.

JPR Report March 2015 Jewish families and households: Census insights about how we live 39
Appendices
I. Alternative approaches to defining ‘Jewish households’Inthemajorityofthisreport,wehaveappliedthe‘HRP’approachtodefining‘Jewishhouseholds’(seepage6).Thisfocusesontheunitofthehouseholditself,butothermethods,basedonindividualsinhouseholds,canalsobeused to provide alternative perspectives on the makeupofJewishhouseholds.Oneimportantapproachisbasedonthereligiousmakeupor‘religious homogeneity’ of the household. By distinguishingbetweenhouseholdsinwhichallmembersareJewish(homogeneoushouseholds)and households in which this is not the case (heterogeneous households) a more complex picturearises.Ingeneral,fourmaingroupingscanbeidentified:
A.HomogeneousJewishhouseholdswith
i. oneJewishpersonlivingalone,or;
ii. more than one person where all household membersareJewish.
B. Heterogeneous households with at least one Jewishpersonand
i. atleastonepersonwithNoReligionand/ orNotstatedreligion,or;
ii. at least one other person with a non- Jewishreligion.
TheHRPapproachindicatesthat25%ofJewishhouseholdsinEnglandandWalesareheterogeneous.Italsoshowsthatin15%(orabout16,250households)Jewsarelivingwithnon-Jews.47However,thishousehold-basedapproachtends to provide a conservative estimate of the numberofheterogeneousJewishhouseholds.Basedonindividuals,wefindthat30%ofJewslive in heterogeneous households and 17% (or 43,729individuals)livewithnon-Jews(Figure18).ExcludingJewswholivealoneandthoselivingincommunalestablishments(suchascarehomes),wefindthatoneinfiveJews(20%)livewithnon-Jewsandafurther15%livewithpeoplewhodidnotreport a religion.48
47 Source:ONS2011SAR(N=13,277)andONSTableDC1202.
48 I.e.peoplewhomay,ormaynot,beJewishinothercontexts.
Multi-person:At least one Jewish,
at least one not Jewish43,729
17%
Multi-person:At least one Jewish,
all others No Religion21,808
9%
Multi-person:At least one Jewish,
all others Not Stated11,966
5% Multi-person: All Jewish 141,997 55%
One person: Jewish 36,537 14%
Figure 18. Religious composition of Jewish households, England and Wales, 2011 (N=256,037 Jewish individuals)
Source: ONS 2011 Table CT0309
Heterogeneous Homogeneous
Of the 220,000 Jews who live in a household with more than one person, one in five (20%) lives with a non-Jew.

40 JPR Report March 2015 Jewish families and households: Census insights about how we live
Itwasshownabove(Table7,page14)thatbetween2001and2011,thenumberofJewslivingalonedeclinedby13%.Bycomparison,andbasedontheHRPapproach,thenumberofhomogeneous,multi-person,householdswithaJewishHRPdeclinedby2%.Andthisoccurredalongsidean11%declineinthenumberofheterogeneoushouseholdsinwhichJewslivewithnon-Jews.However,therewasa33%riseinthenumberofheterogeneoushouseholdsconsistingofJewsliving with persons of No Religion or who did not state a religion (Figure 19).
Finally, one other approach to enumerating Jewishhouseholdsshouldbeconsidered.ThisisanalternativetotheHRPapproach,butitisalsobasedonthehouseholdunitandmeasuresthenumberofhouseholdscontainingatleastoneJewishperson.In2001,therewere143,071suchhouseholdsinEnglandandWales.Importantly,
thisis23%morehouseholdsthanwasenumeratedusingtheHRPapproach(116,330households).49Althoughequivalentdatafor2011havenotbeenobtaineddirectly,wecanneverthelessmakeareasonableestimatebasedonthefiguresalreadyavailable.Thecalculationssuggesttheremayhavebeenabout138,400householdsinEnglandandWalesin2011withatleastoneJewishperson.Thatimpliesabout28,000(or25%)more‘Jewishhouseholds’inEnglandandWalesthantheHRPmethod indicates.
Insum,theconceptofthe‘Jewishhousehold’iscomplex,andanysingledefinitionisultimatelyacompromise.ThiscomplexitytranslatesontotheJewishcommunityitselfgiventhefactthatsignificantnumbersofpeoplewithNoReligionornon-JewishreligionslivewithJewsinJewishhouseholds.
49 ONS2001CensusTableC0478andTableS151.
0
5,000
10,000
15,000
20,000
25,000
30,000
35,000
40,000
45,000
50,000
2011 (N=110,726)
2001 (N=116,330)
Heterogenous (At least one Jewish,
others not Jewish)
Heterogenous (At least one Jewish,
others No Religion/Not stated)
Homogenous (multi-person –
All members Jewish)
Figure 19. Change in Jewish household homogeneity based on households with a Jewish HRP, 2001 and 2011, England and Wales
Source: ONS 2001 Table C0403; ONS 2011 SAR (N=13,277) and ONS 2011 Table DC1202
47,330 46,290
8,729
18,22516,253
11,646 2011 (N=110,726)
2001 (N=116,330)

JPR Report March 2015 Jewish families and households: Census insights about how we live 41
II. Living arrangements for Jewish households by religious makeupAdetailedanalysisof2011CensusdatarevealssignificantdifferencesbetweenthereligioushomogeneityofJewishhouseholdsbasedontypeof living arrangement. Heterogeneity is highest amongJewishstudentslivinginall-studenthouseholdswhere61%livewithatleastonenon-Jewishpersonandafurther23%livewithsomeone reporting No Religion (Figure 20).
HeterogeneityisalsohighamongcohabitingJews.Forexample,amongcohabitingJewswithadultchildren,41%livewithanon-Jewishpersonandafurther31%livewithsomeonereportingNo Religion.50Amongmarriedcouples—wherethenumbersofJewsinvolvedaremuchlarger—thelevelsofheterogeneityarefarlower;oneinfive(19%)Jewsinamarriedcouplewithnochildrenathomehasanon-Jewishspouseandthisfallsto13%whendependentchildrenarepresent.
50 Thedatadonotpermitustoconcludeifthisrelatestothe partner’s religion.
0 20 40 60 80 100
At least one Jewish; at least one not Jewish At least one Jewish; all others No religion or Not stated
One family only: All aged 65 and over
Married couple: At least one dependent child
Lone parent: All children non-dependent
Lone parent: At least one dependent child
Married couple: All children non-dependent
Other: All aged 65 and over
Married couple: No children
Other: At least one dependent child
Cohabiting couple: All children non-dependent
Cohabiting couple: No children
Other
Cohabiting couple: At least one dependent child
All full-time students
41%
61%
64%
47%
84%
68%
62%
27%
45%
51%
21%
10%
61%
19%
14%
21%
28%
22%
Figure 20. Religious heterogeneity of Jewish households by type of living arrangement, England and Wales, 2011*
* The data are based on Jewish individuals. Bars may not sum due to rounding.Source: ONS 2011 Table CT0309
25%
23%
22%
16%7%
12%
11%
13%
11%
71%
(95,090)
(27,422)
(23,459)
(17,851)
(13,591)
(10,513)
(8,753)
(7,616)
(5,486)
(4,828)
(3,115)
(1,001)
(775)
37%
23%
31%
21%
16%
10%
10%
3%
3%
8%
10%
%

42 JPR Report March 2015 Jewish families and households: Census insights about how we live
III. Age and sex of Jewish one person householdersAfullunderstandingofonepersonhouseholdsrequiresananalysisoftheinterplaybetweenage and sex in this seemingly simple living arrangement.Overall,JewishwomenaremorelikelytolivealonethanJewishmen—59%ofallJewswholivealonearefemale.However,livingalonecanberoughlysplitintotwodistinctlifestages.Intheyoungerstage(uptoage54)menareactuallymorelikelytolivealonethanwomen(57%ofJewslivingalonearemale),butafterthisage the pendulum swings and women are far more likelytolivealonethanmen(68%ofJewsover54yearsandlivingalonearefemale).Indeed,womenage75andabovemakeup12%oftheJewishpopulationbut24%ofJewswholivealone.Thesedifferences are shown in Figure 21.
Thereareseveralreasonsforthesedifferences.Intheyoungerlifestage,livingaloneismorelikelytobeamatterofchoicethanattheolderlifestage.Whenthisiscombinedwiththerealities of demography and social norms, the
resultisthatolderJewishwomenconstituteadisproportionatelylargesegmentofallJewishpeople who live alone. For example, at younger ages, women tend to marry older men and vice versa,hencemenaremorelikelytolivealone;while at older ages, women tend to outlive their husbands,andmenwhodooutlivetheirwivesaremorelikelytoremarryyoungerwomen.51
Thelikelihoodoflivingalonealsovariesoverthe course of a person’s life and, again, age and sexareimportantfactors.Thechancesoflivingalonearelessthanoneinfiveformostofourlives,butforwomenthisincreasessubstantiallyatolderages.MorethanhalfofallJewishwomen in their eighties live alone (Figure 22). AsJewishwomenentertheirnineties,theproportionlivingalonedeclines,probablydue
51 Seefurther:ONS2013FamiliesandHouseholds,2013p12, op. cit.
Figure 21. Jews who live alone by age and sex, 2011, England and Wales
* Data have been inferred using a combination of census sample data and enumerated data. Source: ONS 2011 SAR (N=13,277) and ONS table CT0291
Nu
mb
er o
f Je
ws
livin
g a
lon
e (e
stim
ated
*)
Age group
0
500
1,000
1,500
2,000
2,500
3,000
FemalesMales
90+85-8980-8475-7970-7465-6960-6455-5950-5445-4940-4435-3930-3425-2920-2415-19
Women aged 75 and above make up 12% of the Jewish population but 24% of Jews who live alone

JPR Report March 2015 Jewish families and households: Census insights about how we live 43
to the necessity, for some, of carers moving in, for others, of moving to live with other relatives, and for still others, of moving into a residential
carefacility.Althoughthelikelihoodformenof living alone increases at older ages, it never approaches the female levels.
Figure 22. Proportion of each cohort that lives alone by age and sex, Jewish population, 2011, England and Wales
Source: ONS 2011 SAR (N=13,277)
%
Age group
0
10
20
30
40
50
60
70
FemaleMale
90+85-8980-8475-7970-7465-6960-6455-5950-5445-4940-4435-3930-3425-2920-2415-19

44 JPR Report March 2015 Jewish families and households: Census insights about how we live
IV Separating out data on haredi households from all other Jewish householdsStrictlyOrthodoxJews(haredim)practisevery different family formation norms to Jewsgenerally,particularlywithearlyandnear-universal marriage and very high birthrates.ThisresultsinquitedifferenthouseholdstructurestotherestoftheJewishpopulation.Giventhesignificantincreaseintheharedipopulationbetween2001and2011,52wearemindedtoasktowhatextentthismaybeimpactingonthenationalJewishhouseholdprofile?
Using geographical data to identify areas with predominantly haredi populations (i.e. in the LocalAuthoritiesofHackney,Haringey,and
52 Graham2013‘2011CensusResults(EnglandandWales):ataleoftwoJewishPopulations,op.cit.
GatesheadandthewardsofBroughtonandKersalinSalford,SedgleyinBuryandGoldersGreeninBarnet)wefindthatalthoughtheharediprofileisindeedverydifferenttothenationalJewishpicture,becauseharedimareaminorityJewishsub-group—theseareasaccountfor11%ofallJewishhouseholds—there is generally little impact on the national Jewishhouseholdprofile(Table28).ThemaininfluenceisonaverageJewishhouseholdsize—whichisinflatedfrom2.16to2.31bytheharedipresence—andovercrowdingasmeasuredbybedrooms—inflatedfrom2.6%to3.4%.Interms of household composition, the impact is small:thelargestdifferencerelatestoJewishmarried couple households which constitute 38%ofallJewishhouseholds,and36%afterharedimhavebeenremovedfromthedata.
Household type All Jewish households
Jewish households excluding haredi areas
Jewish households in areas with predominantly haredi populations
N (households) 110,726 98,494 12,232
Average household size (pph) 2.31 2.16 3.54
One person (aged 65 and above) 15.9% 16.5% 11.1%
One person (aged under 65) 17.1% 17.6% 13.0%
One family all aged 65 and above 10.7% 11.3% 5.9%
Married couple 38.1% 36.1% 54.3%
Cohabiting couple 5.0% 5.2% 3.6%
Lone parent 5.6% 5.7% 4.7%
Other household 7.5% 7.5% 7.4%
Total 100.0% 100.0% 100.0%
Overcrowded* (rooms) 8.0% 7.3% 13.2%
Overcrowded* (bedrooms) 3.4% 2.6% 9.8%
Table 28 Profile of Jewish households, with and without haredi areas included
* Occupancy rating of -1 or lessSource: ONS Table LC4417 and LC4204

JPR Report March 2015 Jewish families and households: Census insights about how we live 45
ONS Census table code identifier
2011 Census
LC and/or DC tables:1202 Householdcompositionbyreligionof
HouseholdReferencePerson(HRP)
2107 Religionbysexbyage
2120 Religionbyaccommodationtype(LConly)
4204 TenurebycarorvanavailabilitybyreligionofHouseholdReferencePerson(HRP)
4207 Occupancyrating(rooms)byreligionofHouseholdReferencePerson(HRP)
4208 Occupancyrating(bedrooms)byreligionofHouseholdReferencePerson(HRP)
4409 Communalestablishmentmanagementandtypebyreligionbysex(DConly)
4417 Tenurebycarorvanavailabilitybyreligion (LC only)
Other tables:KS101 Usual resident population (Key Statistics)
KS209 Religion (Key Statistics)
OT210 Religion(Outofterm-timepopulation)
CT0291 Sexbyagebyreligion
CT0309Householdcompositionbyreligionofpersons in household
Additional Tables (National Records of Scotland (NRS)) (Scotland only):AT051 Religionbyhouseholdtype
AT052 ReligionofHouseholdReferencePerson(HRP)byhouseholdlifestage
AT060 Religionbycommunalestablishmenttype
2001 Census
Standard (or ‘S’) tables:149 Sexandagebyreligion
151 Householdcompositionbyreligionofhouseholdreferenceperson(HRP)
156 Tenureandnumberofcarsorvansbyreligion of household reference person (HRP)
159 Shared/unshareddwellingandcentralheatingandoccupancyratingbyreligion
160 Shared/unshareddwellingandcentralheatingandoccupancyratingbyreligionofHRP
161 Sexandtypeofcommunalestablishmentbyresidenttypeandreligion
Key Statistics (KS) tables:07 Religion
Commissioned (C) tables:0302 Dwellingtypeandaccommodation
typebytenure(households)andreligion(persons)
0403 MultiplereligiousidentifierbyreligionofHRP
0478 Themetableonhouseholds
M277 Ageandsexbyreligion

46 JPR Report March 2015 Jewish families and households: Census insights about how we live
Glossary
Average household size (pph) Theratioofpersonsperhouseholdunitin particular area, in effect, the average numberofpeopleperhousehold(pph).
Census Tables, DC, LC, KS, S, and C ONSprovidecensusdataintableformat.In2011theywereavailableasdetailedcharacteristics(‘DC’tables—providingawideselectionofvariablesubcategoriesbutlimitedgeographicalbreakdown),andlocalcharacteristics(‘LC’tables—providingadetailedgeographicalbreakdownbutlimitedvariablesubcategories).In2001censustableswerelabelledKeyStatistics(KS), Standard (S) and Commissioned (C).
Communal establishment Anyestablishmentprovidingmanagedresidentialaccommodation.Thisincludes:shelteredaccommodation,care homes, small hotels, and student (term-time)accommodation.Apersonis considered a ‘usual resident’ of a communalestablishmentiftheyhadbeenliving, or were expecting to live, in that establishmentforsixmonthsormore.(ONS2014Glossaryp9-10)
Dependent child (‘children’) Adependentchildisanypersonaged0to15inahouseholdorapersonaged16to18in full-time education and living at home. Itexcludesanyoneaged16to18whohasa spouse or child in the same household. (ONS2014Glossaryp12)
Family Thecensusdistinguishesbetweenhouseholds and families. Whilst householdreferstoaspecificdwelling,a family is a group of related individuals wholiveinthesamehousehold.Theymaybe:amarried,same-sexcivilpartnership,orcohabitingcouple,withorwithoutchild(ren);aloneparentwithchild(ren);anysinglepersonorcouplewithgrandchild(ren)presentbutnootherchildren present. Children in couple familiesneednotbelongtobothmembersofthecouple.(ONS2014Glossaryp16)
FRP (Family Reference Person) TheFRPisthesameastheHRPbutisrestricted to family households only.
Haredi (pl. haredim) AdenominationofJudaismrelatingtostrictlyOrthodoxand/orHasidicJews
Heterogeneous Jewish household Ahouseholdinwhichatleastone,butnotall,householdmembersareJewish,i.e.mixed.
Homogeneous Jewish household AhouseholdinwhichallmembersareexclusivelyJewish.
Household (2001 census definition) Ahouseholdcomprisesonepersonlivingalone,or a group of people (not necessarily related) living at the same address with common housekeeping–thatis,sharingeitheralivingroom or sitting room or at least one meal a day. (ONS2004Definitionsp34)
Household (2011 census definition) Ahouseholdisdefinedas:onepersonlivingalone, or a group of people (not necessarily related) living at the same address who share cookingfacilitiesandsharealivingroomorsittingroomordiningarea.Ahouseholdmustcontain at least one person whose place of usual residenceisattheaddress.Agroupofshort-termresidentslivingtogetherisnotclassifiedas a household, and neither is a group of people at an address where only visitors are staying. (ONS2014Glossaryp19-20)
Household population Thehouseholdpopulationreferstoallindividualslivinginhouseholds.Itshouldbedistinguished from the total population which also includes all people living in communal establishments(q.v.)
HRP (Household Reference Person) TheconceptofaHouseholdReferencePerson(HRP)wasintroducedinthe2001Censustoreplace the traditional concept of the ‘head of thehousehold’.HRPsprovideanindividualperson within a household to act as a reference point for producing further derived statistics

JPR Report March 2015 Jewish families and households: Census insights about how we live 47
and for characterising a whole household. For a person living alone, it follows that this personistheHRP.OtherwisetheHRPisselectedonthebasisoftheireconomicactivity,inthefollowingorderofpriority:economically active, employed, full-time, non-student. Where this is the same as other people in the household, other criteria such as ageareused.(ONS2014Glossaryp22)
JPR InstituteforJewishPolicyResearch,London
LA LocalAuthority-in2011therewere348localauthorities in England and Wales
Married couple (Marital and civil partnership status) Thisistheequivalenttothe2001Censustopic‘Maritalstatus’,buthasundergonesignificantrevisiontotakeaccountoftheCivilPartnershipActwhichcameintoforceon5December2005.Maritalandcivilpartnershipstatesinclude:married/inaregisteredsame-sexcivilpartnership;separated(butstilllegallymarried/inaregisteredsame-sexcivilpartnership);divorced/formerlyinaregisteredsame-sexcivilpartnership,or;widowed/surviving same-sex civil partner. (ONS 2014 Glossaryp29)
NJCS NationalJewishCommunitySurvey.UK-widestudycarriedoutbyJPRin2013N=3,736
NJSS NationalJewishStudentSurvey.UK-widestudycarriedoutbyJPRin2011N=925
NRS National Records of Scotland (formerly theGeneralRegisterOfficeforScotland(GROS)),thebodyresponsiblefortheCensusin Scotland.
Nuclear family Animpreciseexpressionwhichgenerallyreferstowhatmanymaynowconsidertobea ‘traditional’ family structure consisting of a married couple with children.
Occupancy rating Occupancy rating provides a measure of whether a household’s accommodation is overcrowdedorunder-occupied.Therearetwomeasuresofoccupancyrating,onebasedonthetotalnumberofroomsinahousehold’saccommodation,andonebasedonlyonthenumberofbedrooms.Theagesofthehouseholdmembersandtheirrelationshipstoeachotherareusedtoderivethenumberofrooms/bedroomstheyrequire,basedonastandardformula.Anoccupancyratingof-1impliesthatahouseholdhasonefewerroom/bedroomthanrequired,whereas+1impliesthattheyhaveonemoreroom/bedroomthanthestandardrequirement.(ONS2014Glossaryp35)
ONS TheOfficeforNationalStatistics(ONS)isthebodythatcarriedoutthecensuson27thMarch2011 and owns the data.
Pensioner household Inthe2001censusapensionerwasshorthandfor‘personofpensionableage’.Pensionableagewas65andoverformalesand60andoverforfemales.(ONS2001Definitionsp39)Apensionerhouseholdonlycontainedpensioners.In2011thisdistinctionwasdropped and such households were designated ‘peopleaged65andover’,makingtimecomparisonsproblematic.
SAR ASampleofAnonymisedRecords(SAR)referstoafileofrandomlyselectedandanonymisedcensusrecordsthatcanbeanalysedmoreextensivelythanenumeratedcensusdata.The2011‘safeguarded’microdatarelatestoa5%sample for England and Wales and contains 2,848,155records.Asmaller1%‘Teachingfile’hasalsobeenaccessedforthisreport.Asimilar dataset from the 2001 census relates to a3%sample(IndividualLicensedSAR(2001I-SAR))andcontainsapproximately1.84million records.
Traditional household Animpreciseexpressionreferringtohouseholds consisting of married, as opposed tocohabiting,couples,andwherebothparentsare present if there are any children in the

48 JPR Report March 2015 Jewish families and households: Census insights about how we live
household.Alsoreferredtoasconventionalhouseholds.Theoppositeistheequallyimprecise expression ‘unconventional’. See also nuclear family.
Usual resident Aperson’splaceofusualresidenceistheaddress in the UK at which they spend the majority of time, their permanent or family home.Thisisthecaseeveniftheywereaway on holiday or staying at a second UK residence on census night. Students, and childrenatboardingschool,arecountedas
usually resident at their term-time address andtheirpermanent/familyaddress(ifdifferent).Childrenwhoare‘shared’betweenparents living apart are counted as usually resident at the address at which the child spends the majority of their time. (ONS 2009 FinalPopulationDefinitionsforthe2011Censusp6)
Ward Asubregionofalocalauthority.Thereareanaverageof25wardsperLAandjustover8,800wards in England and Wales.

Institute for Jewish Policy Research
© Institute for Jewish Policy Research 2015
All rights reserved. No part of this publication may be reprinted or reproduced or utilized in any form or by any means, now known or hereinafter invented, including photocopying and recording or in any information storage or retrieval system, without the permission in writing of the publisher.
jpr / report
Published by Institute for Jewish Policy Research
ORT House, 126 Albert Street, London NW1 7NEtel +44 (0)20 7424 9265 e-mail [email protected] website www.jpr.org.uk
Registered Charity No. 252626