jala vaaiYa-kI - Central Water Commission
278
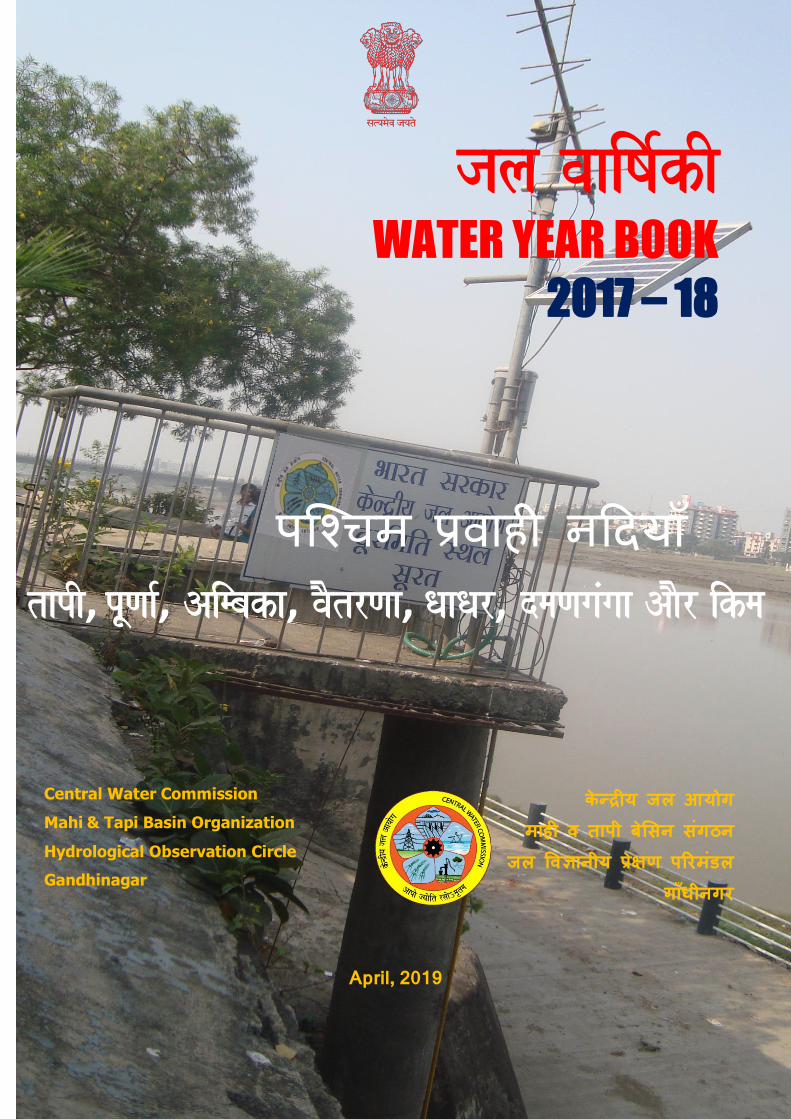
jala vaaiYa-kI WATER YEAR BOOK 2017 – 18 पचिम वाही नदिया tapI , pUNaa- , Aimbaka , vaOtrNaa, QaaQar , dmaNagaMgaa AaOr ikma April , 2019 Central Water Commission Mahi & Tapi Basin Organization Hydrological Observation Circle Gandhinagar के रीय जल आयोग माही व तापी बेसिन िंगठन जल ववानीय ेण परिमंडल गाधीनगि
-
Upload
khangminh22 -
Category
Documents
-
view
0 -
download
0
Transcript of jala vaaiYa-kI - Central Water Commission
jala vaaiYa-kI
WATER YEAR BOOK 2017 – 18
पश्चिम प्रवाही नदियााँ tapI, pUNaa-, Aimbaka, vaOtrNaa, QaaQar, dmaNagaMgaa AaOr ikma
April, 2019
Central Water Commission
Mahi & Tapi Basin Organization
Hydrological Observation Circle
Gandhinagar
केन्द्रीय जल आयोग
माही व तापी बेसिन िंगठन
जल ववज्ञानीय प्रेक्षण परिमंडल
गााँधीनगि
i
C o n t e n t s
Section
No
Particulars Page
No
List of Plates & Figures vii
List of Tables ix
Abbreviations & Symbols xi
1. Introduction
1.1 General 1
1.2 Jurisdiction map of Tapi Division, CWC, Surat 3
2. Basin Description 4
2.1 Tapi Basin 4
2.1.1 Geographical setting of Tapi Basin 4
2.1.2 The River System 5
2.1.3 Major Tributaries of the Tapi River System 6
2.1.4 Tapi Basin as per the Water Shed Atlas of India 7
2.1.5 The Climate 11
2.1.5.1 Temperature 11
2.1.5.2 Rainfall 12
2.1.5.3 Wind 14
2.1.5.4 Humidity 15
2.1.6 Geology 16
2.1.7 Soil 20
2.1.8 Forest 21
2.1.9 Major / Medium / Multipurpose / Irrigation Projects 23
2.1.9.1 Important Projects in Tapi Basin 25
2.2 Purna Basin 27
2.2.1 Geographical setting of river basin 27
2.2.2 River System 27
2.2.3 Basin as per Watershed Atlas of India 28
2.2.4 Climate 29
2.2.5 Geology 32
2.2.6 Soil 32
2.3 Ambica Basin 33
2.3.1 Geographical setting of river basin 33
2.3.2 River System 33
2.3.3 Basin as per Watershed Atlas of India 35
2.3.4 Climate 35
ii
2.3.5 Geology 38
2.3.6 Soil 38
2.4 Vaitarna Basin 39
2.4.1 Geographical setting of river basin 39
2.4.2 River System 39
2.4.3 Basin as per Watershed Atlas of India 41
2.4.4 Climate 41
2.4.5 Geology 44
2.4.6 Soil 45
2.4.7 Major / Medium/multipurpose/irrigation projects 45
2.5 Dhadhar Basin 47
2.5.1 Geographical setting of river basin 47
2.5.2 River System 47
2.5.3 Basin as per Watershed Atlas of India 48
2.5.4 Climate 49
2.5.5 Geology 53
2.5.6 Major / Medium/multipurpose/irrigation projects 53
2.6 Damanganga Basin 54
2.6.1 Geographical setting of river basin 54
2.6.2 River System 54
2.6.3 Basin as per Watershed Atlas of India 56
2.6.4 Climate 56
2.6.5 Geology 59
2.6.6 Soil 60
2.6.7 Major / Medium/multipurpose/irrigation projects 60
2.7 Kim Basin 61
2.7.1 Geographical setting of river basin 61
2.7.2 River System 61
2.7.3 Basin as per Watershed Atlas of India 63
2.7.4 Climate 63
2.7.5 Soil 66
2.7.6 Major / Medium/multipurpose/irrigation projects 67
3. Methodology Stream flow measurement 69
3.1 Gauge measurement 69
3.2 Discharge observation 69
3.3 Explanatory note 71
3.4 Method of presentation 72
4.0 Hydrological data 72
4.1 Tapi Basin 74
4.1.1 Tapi at Dedtalai 74

iii
4.1.1.1 History Sheet 74
4.1.1.2 Annual Maximum Flood Peak 75
4.1.1.3 Summary of Data 76
4.1.1.4 Stage discharge Curve 80
4.1.1.5 Annual Runoff 81
4.1.1.6 Monthly Average Runoff 82
4.1.1.7 Superimposed Cross Section 83
4.1.1.8 WL Vs Time Graph of I, II, & III peak 84
4.1.2 Tapi at Burhanpur 85
4.1.2.1 History Sheet 85
4.1.2.2 Annual Maximum Flood Peak 87
4.1.2.3 Summary of Data 88
4.1.2.4 Stage discharge Curve 92
4.1.2.5 Annual Runoff 94
4.1.2.6 Monthly Average Runoff 95
4.1.2.7 Superimposed Cross Section 96
4.1.2.8 WL Vs Time Graph of I, II, & III peak 97
4.1.3 Purna at Gopalkheda 98
4.1.3.1 History Sheet 98
4.1.3.2 Annual Maximum Flood Peak 100
4.1.3.3 Summary of Data 101
4.1.3.4 Stage discharge Curve 105
4.1.3.5 Annual Runoff 106
4.1.3.6 Monthly Average Runoff 107
4.1.3.7 Superimposed Cross Section 108
4.1.3.8 WL Vs Time Graph of I, II, & III peak 109
4.1.4 Purna at Yerli 110
4.1.4.1 History Sheet 110
4.1.4.2 Annual Maximum Flood Peak 112
4.1.4.3 Summary of Data 113
4.1.4.4 Stage discharge Curve 117
4.1.4.5 Annual Runoff 118

iv
4.1.4.6 Monthly Average Runoff 119
4.1.4.7 Superimposed Cross Section 120
4.1.4.8 WL Vs Time Graph of I, II, & III peak 121
4.1.5 Panjhara at Morane 122
4.1.5.1 History Sheet 122
4.1.5.2 Annual Maximum Flood Peak 123
4.1.5.3 Summary of Data 124
4.1.5.4 Stage discharge Curve 128
4.1.5.5 Annual Runoff 130
4.1.5.6 Monthly Average Runoff 131
4.1.5.7 Superimposed Cross Section 132
4.1.5.8 WL Vs Time Graph of I, II, & III peak 133
4.1.6 Tapi at Gidhade 134
4.1.6.1 History Sheet 134
4.1.6.2 Annual Maximum Flood Peak 136
4.1.6.3 Summary of Data 137
4.1.6.4 Stage discharge Curve 141
4.1.6.5 Annual Runoff 142
4.1.6.6 Monthly Average Runoff 143
4.1.6.7 Superimposed Cross Section 144
4.1.6.8 WL Vs Time Graph of I, II, & III peak 145
4.1.7. Tapi at Sarangkheda 146
4.1.7.1 History Sheet 146
4.1.7.2 Annual Maximum Flood Peak 148
4.1.7.3 Summary of Data 149
4.1.7.4 Stage discharge Curve 153
4.1.7.5 Annual Runoff 154
4.1.7.6 Monthly Average Runoff 155
4.1.7.7 Superimposed Cross Section 156
4.1.7.8 WL Vs Time Graph of I, II, & III peak 157
4.1.8 Gomai at Prakasha 158
4.1.8.1 History Sheet 158
v
4.1.8.2 Annual Maximum Flood Peak 159
4.1.8.3 Summary of Data 160
4.1.8.4 Stage discharge Curve 164
4.1.8.5 Annual Runoff 165
4.1.8.6 Monthly Average Runoff 166
4.1.8.7 Superimposed Cross Section 167
4.1.8.8 WL Vs Time Graph of I, II, & III peak 168
4.1.9 Tapi at Ghala 169
4.1.9.1 History Sheet 169
4.1.9.2 Annual Maximum Flood Peak 170
4.1.9.3 Summary of Data 171
4.1.9.4 Stage discharge Curve 175
4.1.9.5 Annual Runoff 176
4.1.9.6 Monthly Average Runoff 178
4.1.9.7 Superimposed Cross Section 178
4.1.9.8 WL Vs Time Graph of I, II, & III peak 179
4.2 Purna Basin 180
4.2.1 Purna at Mahuwa 180
4.2.1.1 History Sheet 180
4.2.1.2 Annual Maximum Flood Peak 182
4.2.1.3 Summary of Data 183
4.2.1.4 Stage discharge Curve 187
4.2.1.5 Annual Runoff 188
4.2.1.6 Monthly Average Runoff 189
4.2.1.7 Superimposed Cross Section 190
4.2.1.8 WL Vs Time Graph of I, II, & III peak 191
4.3 Ambica Basin 192
4.3.1 Ambica at Gadat 192
4.3.1.1 History sheet 192
4.3.1.2 Annual Maximum Flood Peak 194
4.3.1.3 Summary of Data 195
4.3.1.4 Stage discharge Curve 199
4.3.1.5 Annual Runoff 200
vi
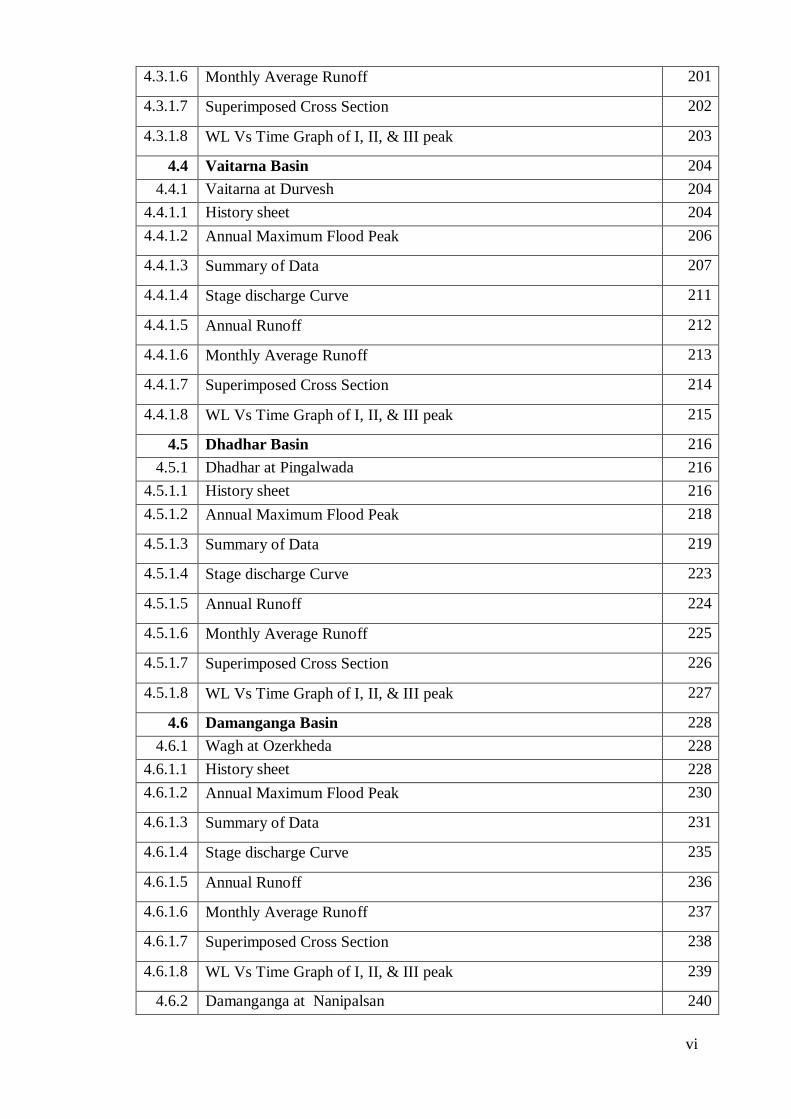
4.3.1.6 Monthly Average Runoff 201
4.3.1.7 Superimposed Cross Section 202
4.3.1.8 WL Vs Time Graph of I, II, & III peak 203
4.4 Vaitarna Basin 204
4.4.1 Vaitarna at Durvesh 204
4.4.1.1 History sheet 204
4.4.1.2 Annual Maximum Flood Peak 206
4.4.1.3 Summary of Data 207
4.4.1.4 Stage discharge Curve 211
4.4.1.5 Annual Runoff 212
4.4.1.6 Monthly Average Runoff 213
4.4.1.7 Superimposed Cross Section 214
4.4.1.8 WL Vs Time Graph of I, II, & III peak 215
4.5 Dhadhar Basin 216
4.5.1 Dhadhar at Pingalwada 216
4.5.1.1 History sheet 216
4.5.1.2 Annual Maximum Flood Peak 218
4.5.1.3 Summary of Data 219
4.5.1.4 Stage discharge Curve 223
4.5.1.5 Annual Runoff 224
4.5.1.6 Monthly Average Runoff 225
4.5.1.7 Superimposed Cross Section 226
4.5.1.8 WL Vs Time Graph of I, II, & III peak 227
4.6 Damanganga Basin 228
4.6.1 Wagh at Ozerkheda 228
4.6.1.1 History sheet 228
4.6.1.2 Annual Maximum Flood Peak 230
4.6.1.3 Summary of Data 231
4.6.1.4 Stage discharge Curve 235
4.6.1.5 Annual Runoff 236
4.6.1.6 Monthly Average Runoff 237
4.6.1.7 Superimposed Cross Section 238
4.6.1.8 WL Vs Time Graph of I, II, & III peak 239
4.6.2 Damanganga at Nanipalsan 240

vii
4.6.2.1 History sheet 240
4.6.2.2 Annual Maximum Flood Peak 242
4.6.2.3 Summary of Data 243
4.6.2.4 Stage discharge Curve 247
4.6.2.5 Annual Runoff 248
4.6.2.6 Monthly Average Runoff 249
4.6.2.7 Superimposed Cross Section 250
4.6.2.8 WL Vs Time Graph of I, II, & III peak 251
4.7 Kim Basin 252
4.7.1 Kim at Motinaroli 252
4.7.1.1 History sheet 252
4.7.1.2 Annual Maximum Flood Peak 254
4.7.1.3 Summary of Data 255
4.7.1.4 Stage discharge Curve 259
4.7.1.5 Annual Runoff 261
4.7.1.6 Monthly Average Runoff 262
4.7.1.7 Superimposed Cross Section 263
4.7.1.8 WL Vs Time Graph of I, II, & III peak 264
List of Plates and Figures
Sl no. Particulars Page
No.
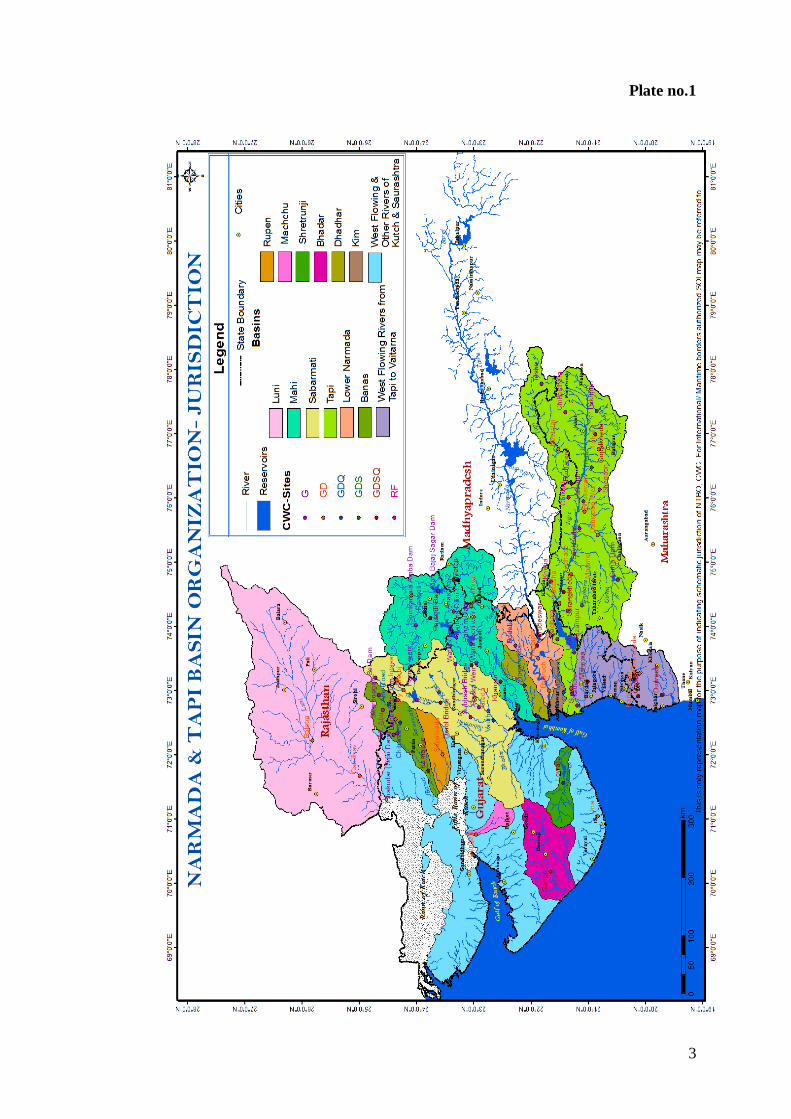
Plate-1 Jurisdiction map of Tapi Division, CWC, Surat 3
Plate -2.1.1 River Basin Map of Tapi Basin 5
Plate -2.1.2 Catchment area of Tapi Basin as per water shed Atlas of India. 9
Plate -2.1.3 Line diagram of River Tapi Basin 10
Plate -2.2.1 River Basin map of Purna Basin 27
Plate -2.2.2 Line diagram of River Basin Purna 28
Plate -2.3.1 River Basin map of Ambica Basin 33
Plate -2.3.2 Line diagram of River Basin Ambica 34
Plate -2.4.1 River Basin map of Vaitarna Basin 39
viii
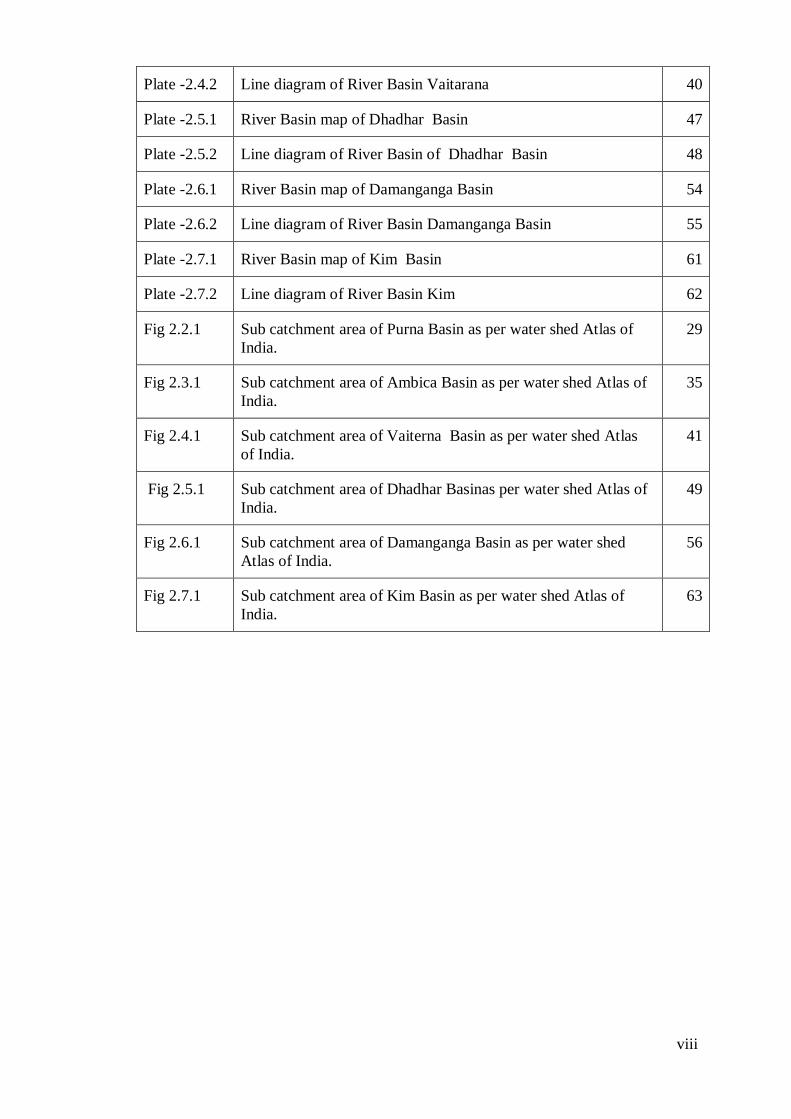
Plate -2.4.2 Line diagram of River Basin Vaitarana 40
Plate -2.5.1 River Basin map of Dhadhar Basin 47
Plate -2.5.2 Line diagram of River Basin of Dhadhar Basin 48
Plate -2.6.1 River Basin map of Damanganga Basin 54
Plate -2.6.2 Line diagram of River Basin Damanganga Basin 55
Plate -2.7.1 River Basin map of Kim Basin 61
Plate -2.7.2 Line diagram of River Basin Kim 62
Fig 2.2.1 Sub catchment area of Purna Basin as per water shed Atlas of
India.
29
Fig 2.3.1 Sub catchment area of Ambica Basin as per water shed Atlas of
India.
35
Fig 2.4.1 Sub catchment area of Vaiterna Basin as per water shed Atlas
of India.
41
Fig 2.5.1 Sub catchment area of Dhadhar Basinas per water shed Atlas of
India.
49
Fig 2.6.1 Sub catchment area of Damanganga Basin as per water shed
Atlas of India.
56
Fig 2.7.1 Sub catchment area of Kim Basin as per water shed Atlas of
India.
63
ix
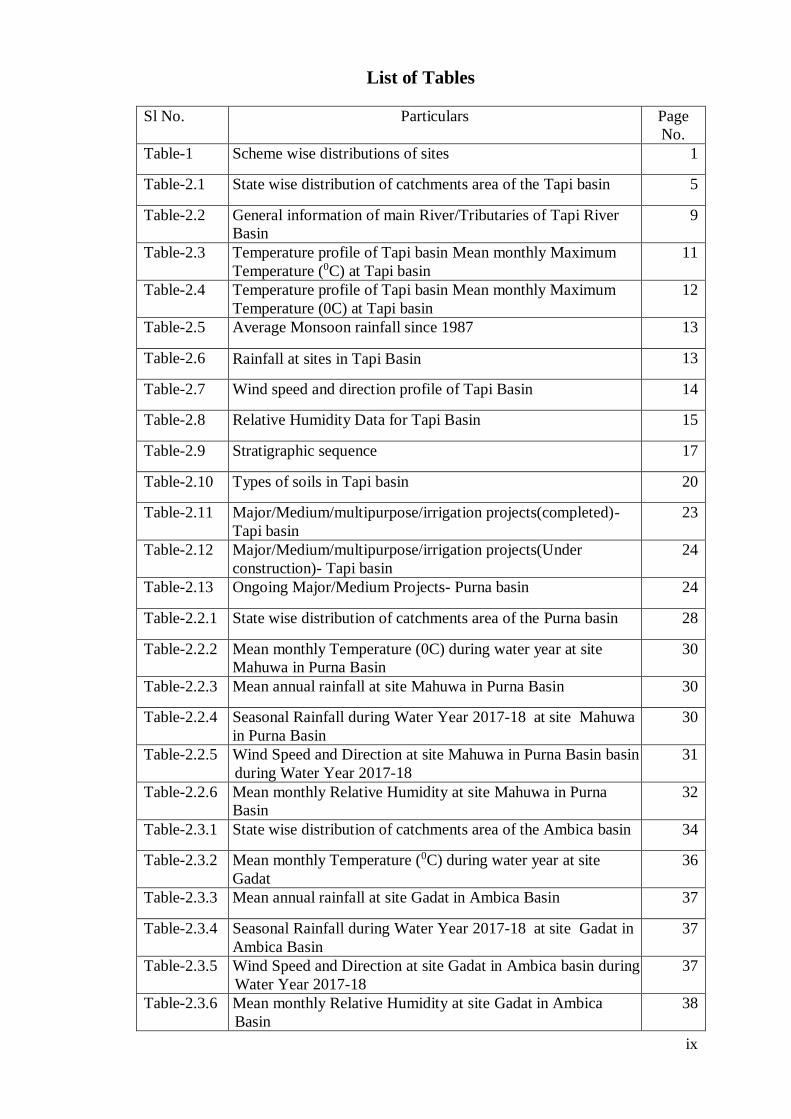
List of Tables
Sl No. Particulars Page
No.
Table-1 Scheme wise distributions of sites 1
Table-2.1 State wise distribution of catchments area of the Tapi basin 5
Table-2.2 General information of main River/Tributaries of Tapi River
Basin
9
Table-2.3 Temperature profile of Tapi basin Mean monthly Maximum
Temperature (0C) at Tapi basin
11
Table-2.4 Temperature profile of Tapi basin Mean monthly Maximum
Temperature (0C) at Tapi basin
12
Table-2.5 Average Monsoon rainfall since 1987 13
Table-2.6 Rainfall at sites in Tapi Basin 13
Table-2.7 Wind speed and direction profile of Tapi Basin 14
Table-2.8 Relative Humidity Data for Tapi Basin 15
Table-2.9 Stratigraphic sequence 17
Table-2.10 Types of soils in Tapi basin 20
Table-2.11 Major/Medium/multipurpose/irrigation projects(completed)-
Tapi basin
23
Table-2.12 Major/Medium/multipurpose/irrigation projects(Under
construction)- Tapi basin
24
Table-2.13 Ongoing Major/Medium Projects- Purna basin 24
Table-2.2.1 State wise distribution of catchments area of the Purna basin 28
Table-2.2.2 Mean monthly Temperature (0C) during water year at site
Mahuwa in Purna Basin
30
Table-2.2.3 Mean annual rainfall at site Mahuwa in Purna Basin 30
Table-2.2.4 Seasonal Rainfall during Water Year 2017-18 at site Mahuwa
in Purna Basin
30
Table-2.2.5 Wind Speed and Direction at site Mahuwa in Purna Basin basin
during Water Year 2017-18
31
Table-2.2.6 Mean monthly Relative Humidity at site Mahuwa in Purna
Basin
32
Table-2.3.1 State wise distribution of catchments area of the Ambica basin 34
Table-2.3.2 Mean monthly Temperature (0C) during water year at site
Gadat
36
Table-2.3.3 Mean annual rainfall at site Gadat in Ambica Basin 37
Table-2.3.4 Seasonal Rainfall during Water Year 2017-18 at site Gadat in
Ambica Basin
37
Table-2.3.5 Wind Speed and Direction at site Gadat in Ambica basin during
Water Year 2017-18
37
Table-2.3.6 Mean monthly Relative Humidity at site Gadat in Ambica
Basin
38

x
Table-2.4.1 Mean monthly Temperature (0C) during water year at site
Durvesh
42
Table-2.4.2 Mean annual rainfall at site Durvesh in Vaitarna Basin 43
Table-2.4.3 Seasonal Rainfall during Water Year 2017-18 at site Durvesh
in Vaitarna Basin
43
Table-2.4.4 Wind Speed and Direction at site Durvesh in Vaitarna basin
during Water Year 2017-18
43
Table-2.4.5 Mean monthly Relative Humidity at site Durvesh in Vaitarna
Basin
44
Table-2.4.6 List of major and medium projects completed / on going on
Vaitarna river basin
45
Table-2.5.1 Mean monthly Temperature (0C) during water year at site
Pingalwada
50
Table-2.5.2 Mean annual rainfall at site Pingalwada in Dhadhar Basin 51
Table-2.5.3 Seasonal Rainfall during Water Year 2017-18 at site
Pingalwada in Dhadar basin
51
Table-2.5.4 Wind Speed and Direction at site Pingalwada in Dhadhar basin
during Water Year 2017-18
52
Table-2.5.5 Mean monthly Relative Humidity at site Pingalwada in
Dhadhar Basin
52
Table-2.6.1 State wise distribution of catchments area of the Damanganga
basin
55
Table-2.6.2 Mean monthly Temperature (0C) during water year at site
Wagh at Ozerkheda & Damanganga at Nanipalsan
57
Table-2.6.3 Mean annual rainfall at site Wagh at Ozerkheda &
Damanganga at Nanipalsan in Damanganga Basin
57
Table-2.6.4 Seasonal Rainfall during Water Year 2017-18 at Wagh at
Ozerkheda & Damanganga at Nanipalsan
58
Table-2.6.5 Wind Speed and Direction at2017-18 site at Ozerkheda &
Nanipalsan basin during Water Year 2017-18
58
Table-2.6.6 Mean monthly Relative Humidity at site Wagh at Ozerkheda &
Damanganga at Nanipalsan in Damanganga basin
59
Table-2.7.1 Mean monthly Temperature (0C) during water year at site Kim
at Motinaroli
64
Table-2.7.2 Mean annual rainfall at site Motinaroli in Kim basin 65
Table-2.7.3 Seasonal Rainfall during Water Year 2017-18 site Kim at
Motinaroli
65
Table-2.7.4 Wind Speed and Direction at site Motinaroli in Kim basin
during Water Year 2017-18
65
Table-2.7.5 Mean monthly Relative Humidity at site Motinaroli in Kim
basin
66
Table-2.7.6 Major and medium projects completed / ongoing in Kim basin 67
Table-3.1.1 Equipments used for observation 70

xi
Abbreviations and symbols
Av : Average
Ann : Annual
A.G.R. : Automatic Gauge Recorder
C : Centigrate
Cum : Cubic meter
Cumec : Cubic meter per second
c/s : Cross section
C.W.C. : Central Water Commission
D : Days
Dis : Discharge
F : Float Observation
F.F. : Flood Forecasting
G : Gauge
GD : Gauge and Discharge
GDS : Gauge, Discharge and Sediment
GDWQ : Gauge, Discharge and Water Quality
GDSWQ : Gauge, Discharge, Sediment and Water Quality
GTS : Great Trigonometrical Survey
Hrs. : Hours
IWYB : Integrated Water Year Book
WYB : Water Year Book
km : Kilo meter
M : Million
m : Meter
mm : milli meter
m3 /s : Cubic meter per second
Mm3 / MCM : Million Cubic meter
Max. : Maximum
Min. : Minimum
m.s.l. : Mean sea level
MD : Mahi Division, CWC, Gandhinagar
neg. : Negligible
NNW : National Net Work
R.Days : Remaining days
R.L. : Reduced Level
R.D. : Reduced Distance
R.C.C. : Reinforced Cement Concrete
sq km : Square Kilometer
TD : Tapi Division, CWC, Surat
WQ : Water Quality
W.L. : Water Level
W.Year : Water Year
WRID : Water Resources Investigation Division, Ahmadabad
WRI C : Water Resources Investigation Circle, Ahmadabad
80 Key : 80 Key Hydrological Station Scheme
163 Key : 163 Key Hydrological Station Scheme 0, ‘ . “ : Degree (300) Minutes(56’) Seconds (35”)
* : Estimated Discharge
# : Discarded and estimated discharge
1
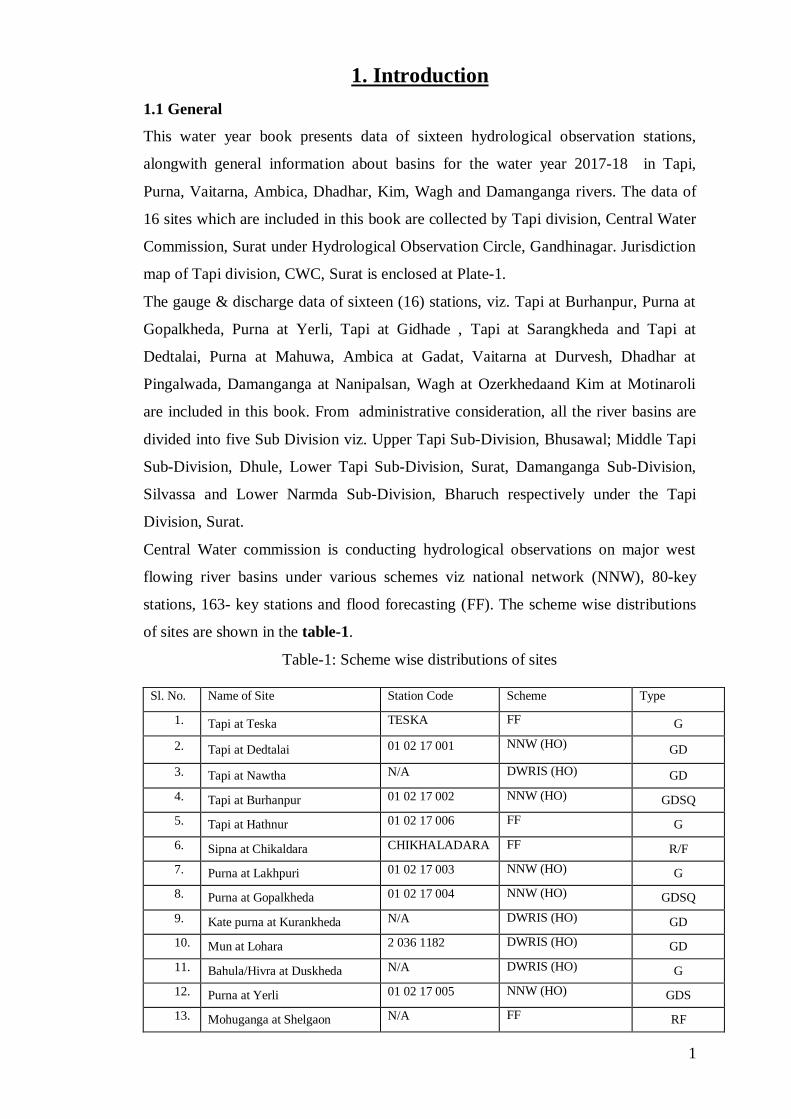
1. Introduction
1.1 General
This water year book presents data of sixteen hydrological observation stations,
alongwith general information about basins for the water year 2017-18 in Tapi,
Purna, Vaitarna, Ambica, Dhadhar, Kim, Wagh and Damanganga rivers. The data of
16 sites which are included in this book are collected by Tapi division, Central Water
Commission, Surat under Hydrological Observation Circle, Gandhinagar. Jurisdiction
map of Tapi division, CWC, Surat is enclosed at Plate-1.
The gauge & discharge data of sixteen (16) stations, viz. Tapi at Burhanpur, Purna at
Gopalkheda, Purna at Yerli, Tapi at Gidhade , Tapi at Sarangkheda and Tapi at
Dedtalai, Purna at Mahuwa, Ambica at Gadat, Vaitarna at Durvesh, Dhadhar at
Pingalwada, Damanganga at Nanipalsan, Wagh at Ozerkhedaand Kim at Motinaroli
are included in this book. From administrative consideration, all the river basins are
divided into five Sub Division viz. Upper Tapi Sub-Division, Bhusawal; Middle Tapi
Sub-Division, Dhule, Lower Tapi Sub-Division, Surat, Damanganga Sub-Division,
Silvassa and Lower Narmda Sub-Division, Bharuch respectively under the Tapi
Division, Surat.
Central Water commission is conducting hydrological observations on major west
flowing river basins under various schemes viz national network (NNW), 80-key
stations, 163- key stations and flood forecasting (FF). The scheme wise distributions
of sites are shown in the table-1.
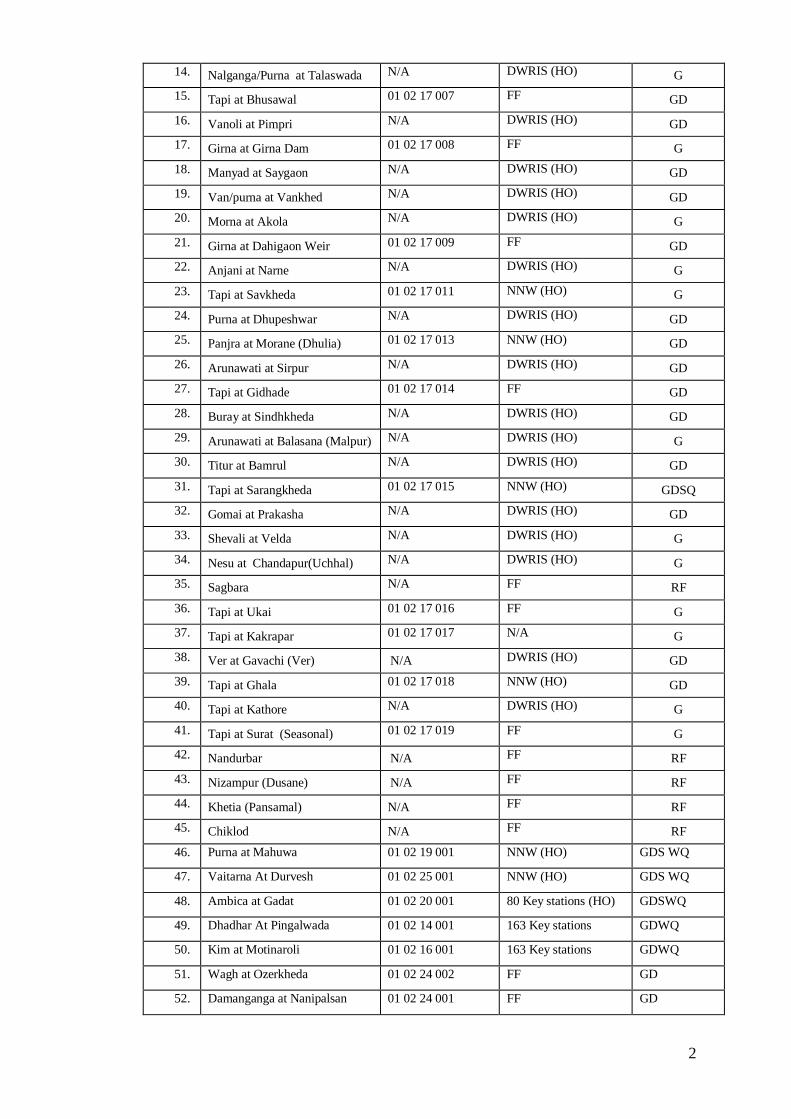
Table-1: Scheme wise distributions of sites
Sl. No. Name of Site Station Code Scheme Type
1. Tapi at Teska TESKA FF G
2. Tapi at Dedtalai 01 02 17 001 NNW (HO) GD
3. Tapi at Nawtha N/A DWRIS (HO) GD
4. Tapi at Burhanpur 01 02 17 002 NNW (HO) GDSQ
5. Tapi at Hathnur 01 02 17 006 FF G
6. Sipna at Chikaldara CHIKHALADARA FF R/F
7. Purna at Lakhpuri 01 02 17 003 NNW (HO) G
8. Purna at Gopalkheda 01 02 17 004 NNW (HO) GDSQ
9. Kate purna at Kurankheda N/A DWRIS (HO) GD
10. Mun at Lohara 2 036 1182 DWRIS (HO) GD
11. Bahula/Hivra at Duskheda N/A DWRIS (HO) G
12. Purna at Yerli 01 02 17 005 NNW (HO) GDS
13. Mohuganga at Shelgaon N/A FF RF
2
14. Nalganga/Purna at Talaswada N/A DWRIS (HO) G
15. Tapi at Bhusawal 01 02 17 007 FF GD
16. Vanoli at Pimpri N/A DWRIS (HO) GD
17. Girna at Girna Dam 01 02 17 008 FF G
18. Manyad at Saygaon N/A DWRIS (HO) GD
19. Van/purna at Vankhed N/A DWRIS (HO) GD
20. Morna at Akola N/A DWRIS (HO) G
21. Girna at Dahigaon Weir 01 02 17 009 FF GD
22. Anjani at Narne N/A DWRIS (HO) G
23. Tapi at Savkheda 01 02 17 011 NNW (HO) G
24. Purna at Dhupeshwar N/A DWRIS (HO) GD
25. Panjra at Morane (Dhulia) 01 02 17 013 NNW (HO) GD
26. Arunawati at Sirpur N/A DWRIS (HO) GD
27. Tapi at Gidhade 01 02 17 014 FF GD
28. Buray at Sindhkheda N/A DWRIS (HO) GD
29. Arunawati at Balasana (Malpur) N/A DWRIS (HO) G
30. Titur at Bamrul N/A DWRIS (HO) GD
31. Tapi at Sarangkheda 01 02 17 015 NNW (HO) GDSQ
32. Gomai at Prakasha N/A DWRIS (HO) GD
33. Shevali at Velda N/A DWRIS (HO) G
34. Nesu at Chandapur(Uchhal) N/A DWRIS (HO) G
35. Sagbara N/A FF RF
36. Tapi at Ukai 01 02 17 016 FF G
37. Tapi at Kakrapar 01 02 17 017 N/A G
38. Ver at Gavachi (Ver) N/A DWRIS (HO) GD
39. Tapi at Ghala 01 02 17 018 NNW (HO) GD
40. Tapi at Kathore N/A DWRIS (HO) G
41. Tapi at Surat (Seasonal) 01 02 17 019 FF G
42. Nandurbar N/A FF RF
43. Nizampur (Dusane) N/A FF RF
44. Khetia (Pansamal) N/A FF RF
45. Chiklod N/A FF RF
46. Purna at Mahuwa 01 02 19 001 NNW (HO) GDS WQ
47. Vaitarna At Durvesh 01 02 25 001 NNW (HO) GDS WQ
48. Ambica at Gadat 01 02 20 001 80 Key stations (HO) GDSWQ
49. Dhadhar At Pingalwada 01 02 14 001 163 Key stations GDWQ
50. Kim at Motinaroli 01 02 16 001 163 Key stations GDWQ
51. Wagh at Ozerkheda 01 02 24 002 FF GD
52. Damanganga at Nanipalsan 01 02 24 001 FF GD
3
Plate no.1

4
2. Basin Description
There are 7 West flowing river basins as given below under the jurisdiction of Tapi
Division, Central Water Commission, Surat,
1. Tapi Basin
2. Purna Basin
3. Ambica Basin
4. Vaitarna Basin
5. Dhadhar Basin
6. Damanganga Basin
7. Kim Basin
Description of these river basin is given in subsequent sections of this year book.
2.1 Tapi Basin
2.1.1 Geographical setting of Tapi Basin
The Tapi Basin is situated in the northern part of the Deccan Plateau and extends over
an area of 65145 sqkm which is nearly 2% of the total geographical area of the
country. Nearly 80% of the basin lies in the State of Maharashtra. The basin lies
between east longitudes of 720 38’ to 780 17’ and north latitudes of 200 05’ to 220 03’.
It is bound in the north by the Satpura range in the east by the Mahadeo hills, in the
south by the Ajanta range and Satmala hills and in the west by the Arabian Sea. The
river is bound on the three sides by the hill ranges. The Tapi River along with its
tributaries flows over the plains of Vidharbha, Khandesh and Gujarat, its cover a large
area in the state of Maharashtra and a small area in Madhya Pradesh and Gujarat. The
basin has an elongated shape with a maximum length of 587 km from east to west and
the maximum width of 210 km from north to south. Perimeter of the basin is about
1840 km. There are two well defined physical regions in the basin, viz. hilly region
and plains; the hilly regions comprising Satpura, Satmala, Mahadeo, Ajanta and
Gawilgarh hills are well forested. The plain covers the Khandesh areas which are
broad and fertile suitable for cultivation primarily. The basin consists of black soils.
The coastal plains of Gujarat are composed of alluvial clays with a layer of black soil
above. The culturable area of the basin is about 4.29 Mha which is 2.2% of the total
culturable area of the country. The forest cover is about 25% of the area in the asin.
Physiographical, the area is a basaltic landscape with major physiographic units of
plateau lands, escarpments, hills, piedmont plains, colluvio-alluvial plains and valley
plains. The entire Tapi basin can be divided in three sub basins: Upper Tapi Basin up
to Hathnur (confluence of Purna with the main Tapi (29,430 sq km), Middle Tapi
Basin from Hathnur up to the Sarangkheda gauging site (28,970 sqkm), and the Lower
5
Tapi Basin from Sarangkheda up to Sea (6,745 sq km). The annual rainfall for the
upper, middle and lower Tapi basins for an average year is 931.90 mm, 713.05 mm
and 1407.9 mm respectively.
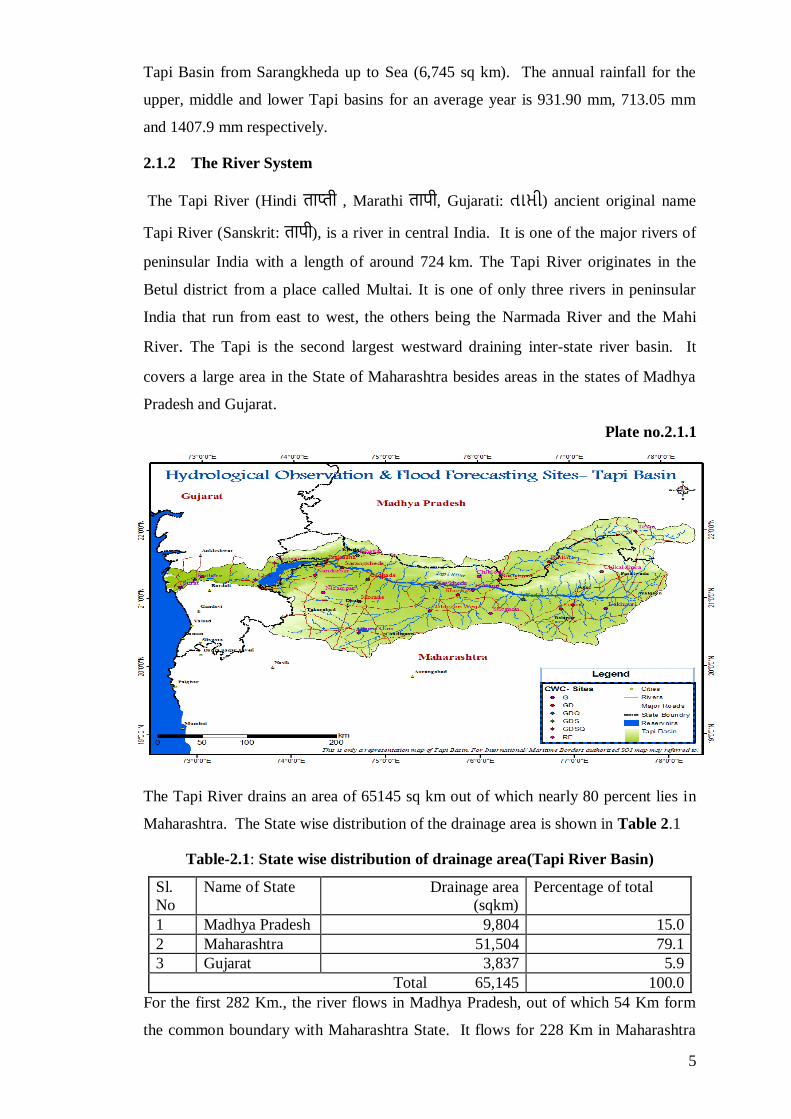
2.1.2 The River System
The Tapi River (Hindi ताप्ती , Marathi तापी, Gujarati: તાપ્તી) ancient original name
Tapi River (Sanskrit: तापी), is a river in central India. It is one of the major rivers of
peninsular India with a length of around 724 km. The Tapi River originates in the
Betul district from a place called Multai. It is one of only three rivers in peninsular
India that run from east to west, the others being the Narmada River and the Mahi
River. The Tapi is the second largest westward draining inter-state river basin. It
covers a large area in the State of Maharashtra besides areas in the states of Madhya
Pradesh and Gujarat.
Plate no.2.1.1
The Tapi River drains an area of 65145 sq km out of which nearly 80 percent lies in
Maharashtra. The State wise distribution of the drainage area is shown in Table 2.1
Table-2.1: State wise distribution of drainage area(Tapi River Basin)
Sl.
No
Name of State Drainage area
(sqkm)
Percentage of total
1 Madhya Pradesh 9,804 15.0
2 Maharashtra 51,504 79.1
3 Gujarat 3,837 5.9
Total 65,145 100.0
For the first 282 Km., the river flows in Madhya Pradesh, out of which 54 Km form
the common boundary with Maharashtra State. It flows for 228 Km in Maharashtra
6
before entering Gujarat. Traversing a length of 214 Km in Gujarat, the Tapi joins
Arabian sea in Gulf of Cambay after flowing past the Surat city. The river receives
tidal influence for a length of about 20 Km upstream from mouth i.e. up to
Singanapore weir.
The Tapi receives several tributaries on both banks. There are 14 major tributaries
having a length more than 50 Km. On the right bank 4 tributaries namely, the Vaki,
the Gomai, the Arunavati and the Aner join the Tapi. On the left bank, 10 important
tributaries namely the Nesu, the Arunavati, the Buray, the Panjhra, the Bori, the
Girna, the Vaghur, the Purna, the Mona and the Sipna drain into the main channel.
The drainage system on the left bank of the Tapi is therefore, more extensive as
compared to the right bank area.
The Purna and the Girna, the two important left bank tributaries together account for
nearly 45 percent of the total catchment area of the Tapi. The Purna is one of the
principal tributaries of the Tapi, starts in Betul district in Gawilgar hills of the Satpura
range and mostly drains through three districts of Vidharbha namely Amravati, Akola
and Buldhana. The Girna another Major tributary rises in the Western Ghats and
drains Nasik and Jalgaon districts of Maharashtra.
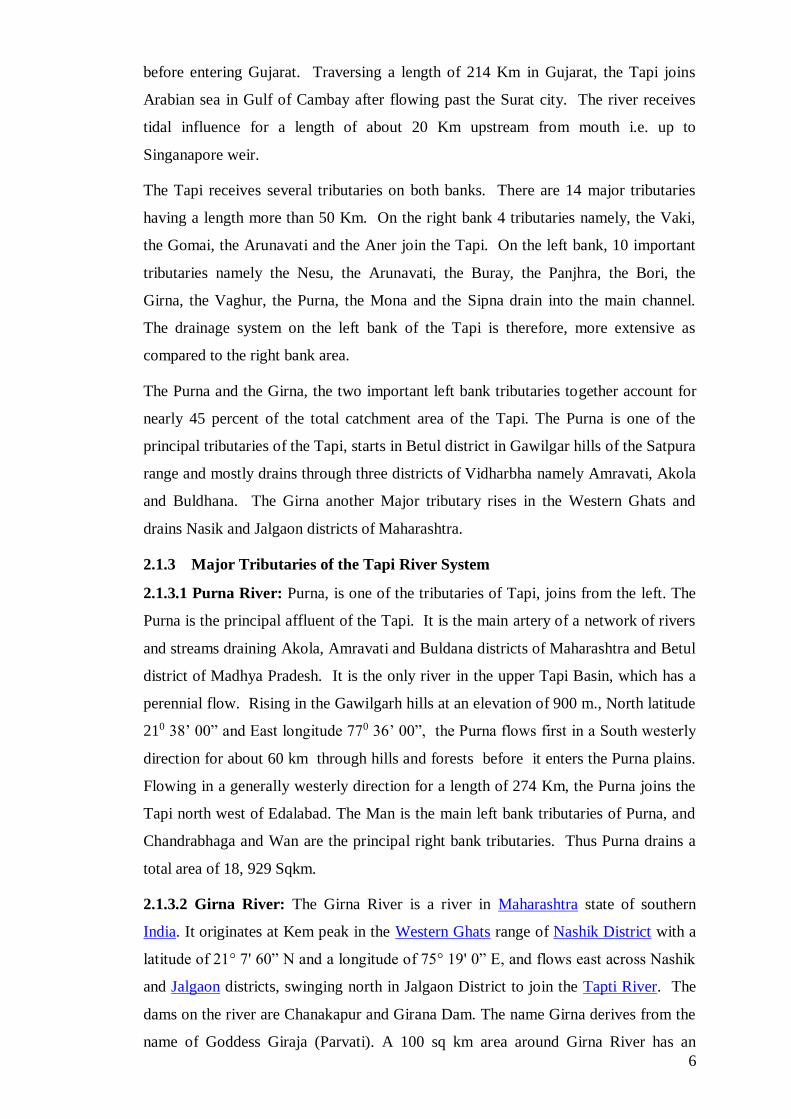
2.1.3 Major Tributaries of the Tapi River System
2.1.3.1 Purna River: Purna, is one of the tributaries of Tapi, joins from the left. The
Purna is the principal affluent of the Tapi. It is the main artery of a network of rivers
and streams draining Akola, Amravati and Buldana districts of Maharashtra and Betul
district of Madhya Pradesh. It is the only river in the upper Tapi Basin, which has a
perennial flow. Rising in the Gawilgarh hills at an elevation of 900 m., North latitude
210 38’ 00” and East longitude 770 36’ 00”, the Purna flows first in a South westerly
direction for about 60 km through hills and forests before it enters the Purna plains.
Flowing in a generally westerly direction for a length of 274 Km, the Purna joins the
Tapi north west of Edalabad. The Man is the main left bank tributaries of Purna, and
Chandrabhaga and Wan are the principal right bank tributaries. Thus Purna drains a
total area of 18, 929 Sqkm.
2.1.3.2 Girna River: The Girna River is a river in Maharashtra state of southern
India. It originates at Kem peak in the Western Ghats range of Nashik District with a
latitude of 21° 7' 60” N and a longitude of 75° 19' 0” E, and flows east across Nashik
and Jalgaon districts, swinging north in Jalgaon District to join the Tapti River. The
dams on the river are Chanakapur and Girana Dam. The name Girna derives from the
name of Goddess Giraja (Parvati). A 100 sq km area around Girna River has an
7
approximate population of 979337 (0.009793 persons per square meter) and an
average elevation of 246 meters above the sea. The basin of the Girna lies on the
Deccan Plateau, and its valley has fertile soils which are intensively farmed.
2.1.3.3 Gomai: Gomai River is tributary of Tapti River. It originates in Satpura
Mountain Range and merge in Tapi River around 2 km east of Prakasha. Gomai river
itself has many small tributary rivers like Susri river (passing by Sultanpur), Tipria
river (passing by Mandane), Umri river, Sukhi river
2.1.3.4 Panzara: The Panzara-Kan or Panjhra is a river in Khandesh region of
Maharashtra state of India. It is a tributary of the Tapi River. Panjhra River originates
just few kilometers from a small town Pimpalner, Tal-Sakri in Dhule District. One
small reservoir named Latipada dam is constructed just after its origin.
2.1.3.5 Pedhi: The only important left bank tributary of the Purna is the Pedhi. It
rises in the low hills near Rithpur and receives a number of small affluent both from
the east and the west, the chief on the west being the Naghira river.
2.1.3.6 Arna: The first of the principal right bank affluent of the Purna is the Arna
which emerges from the Satpuda hills in Betul district and flows in a south and south-
easterly direction passing by Sirasgaon to join the Purna just below Deurwada.
2.1.4 Tapi Basin as per the Watershed Atlas of India
As per the watershed atlas of India, Published by Department of Agriculture and
cooperation, Ministry of agriculture, Krishi Bhavan New Delhi (1990),
The sub-catchments from 5C1A to 5C5B pertain to Tapi Basin as shown in plate-3.
2.1.4.1 Sub-catchment -5C1A (5C1A1 to 5C1A4) : This catchment is situated in the
Surat district of Gujarat drained by lower Tapi River near to its confluence with and
some small tributary like Ver and Anjana. The catchment area of this sub catchment is
2140 sq.km.
2.1.4.2 Sub-catchment 5C1B ( 5C1B1 to 5C1B4): This Catchment is situated in the
plain region of Surat and Bharuch District of Gujarat drained by Kim, Sena, Kini and
Ghanta River. The total catchment area of this Catchment is 2580 sq.km
2.1.4.3 Sub-catchment -5C2A (5C2A1 to 5C2A7): This catchment is situated in the
hilly and plane region of Gujarat, Maharashtra State and Madhya Pradesh (MP)
drained by small tributaries such as Godada nadi, Dadan khadi, Dudhi, khadi, Kanji
nadi, Dehli nadi, Vatkaada nadi, Valhari nadi,Vaki, Gomai, Umri, Lendi-Kordi,
8
covered under Bharuch and Surat districts in Gujarat, Dhulia in Maharashtra and
Khargone in MP with the catchment area of 3890 sq.km.
2.1.4.4 Sub-catchment 5C2B (5C2B1 to 5C2B7): This catchment is situated in the
hilly and plain region of Maharashtra State and Madhya Pradesh drained by small
tributaries such as Arunavati, Aner, Dhudkheda, Guli Bhaurak, Mor and Suki on the
Right Bank of Tapi River. The total catchment area of this catchment is 4890 sq.km.
2.1.4.5 Sub-catchment - 5C3A (5C3A1 to 5C3A5): This is situated in the plain
region of Gujarat and Maharashtra State, drained by Main tributaries such as
Rangavali, Nesu, Kordi, Shivnad, Bhad and Amravti in Sub-catchment on the Left
Bank of Tapi River. The total catchment area of this Catchment is 3200 sq.km.
2.1.4.6 Sub-catchment- 5C3B (5C3B1 to 5C3B8): This is situated in the plain
region of Maharashtra State, drained by Buray, Sur, Pan, Panjhara, Kanehr, Mokti,
Hinasan, Jamkheri Kan, Bori Chikli, Sugran and Kanoli covered under Dhulia,
Jalgaon and Nasik district and falls in the Sub-catchment on the Left Bank of Tapi
River. The total catchment area of this catchment is 6480 sq.km.
2.1.4.7 Sub-catchment- 5C3C (5C3C1 to 5C3C9): This is situated in the plain
region of Maharashtra State, drained by Anjani, Girna, Bahula, Tittut, Nanyad,
Panjhari, Sukhi, Masam, Kanjari, Aram and Punand in sub-catchment on the Left
Bank of Tapi River covered most of the part of Jalgaon Nasik, Aurangabad and
Dhulia. The total catchment area of this catchment is 10100 sqkm
2.1.4.8 Sub-catchment-5C3D (5C3D1 to 5C3D4): This is situated in the plain region
of Maharashtra State, drained by Main tributaries such as Vaghursur, Kag, Khadki,
Koka and Bhogavati in the sub-catchment on the Left Bank of Tapi River. The total
catchment area of this catchment is 2800 sq.km
2.1.4.9 Sub-catchment -5C4A (5C4A1 to 5C3A6): This sub catchment is situated in
the plain region of Maharashtra State, drained by the Tributaries of Purna River such
as Nalganga, Biswa, Ghan nadi, Mas, Nirgana and Mun. Catchment area of this sub-
catchment is 5950 sq.km.
2.1.4.10 Sub-catchment -5C4B (5C3B1 to 5C3B6): This sub-catchment is situated
in the plain region of Maharashtra State, drained by the Tributaries of Purna River
such as Ban, Shahnur and Bodli km. Catchment area of this sub- catchment is 4020
sq.km
9
2.1.4.11 Sub-catchment -5C4C (5C4C1 to 5C4C6): This is situated in the plain
region of Maharashtra State, drained by the Tributaries of Purna River such as Murna,
Purna, Katapurna, Uma and Pedhi Catchment area of this sub-catchment is 5950
sq.km.
2.1.4.12 Sub-catchment -5C4D (5C4D1 to 5C3D4): This Sub Catchment area is
situated in the plain region of Maharashtra State, drained by the Tributaries of Purna
River such as Chanrabhaga, Sapna, and Arna. The total catchment area is 3370 sq.km
2.1.4.13 Sub-catchment -5C5A (5C5A1 to 5C5A8): This Catchment is situated in
the plain and hills region of Maharashtra and Madhya Pradesh State, drained by the
Bokad river, Mona river, Utaoli, Tapi and Garg. The total catchment area is 4650
sq.km.
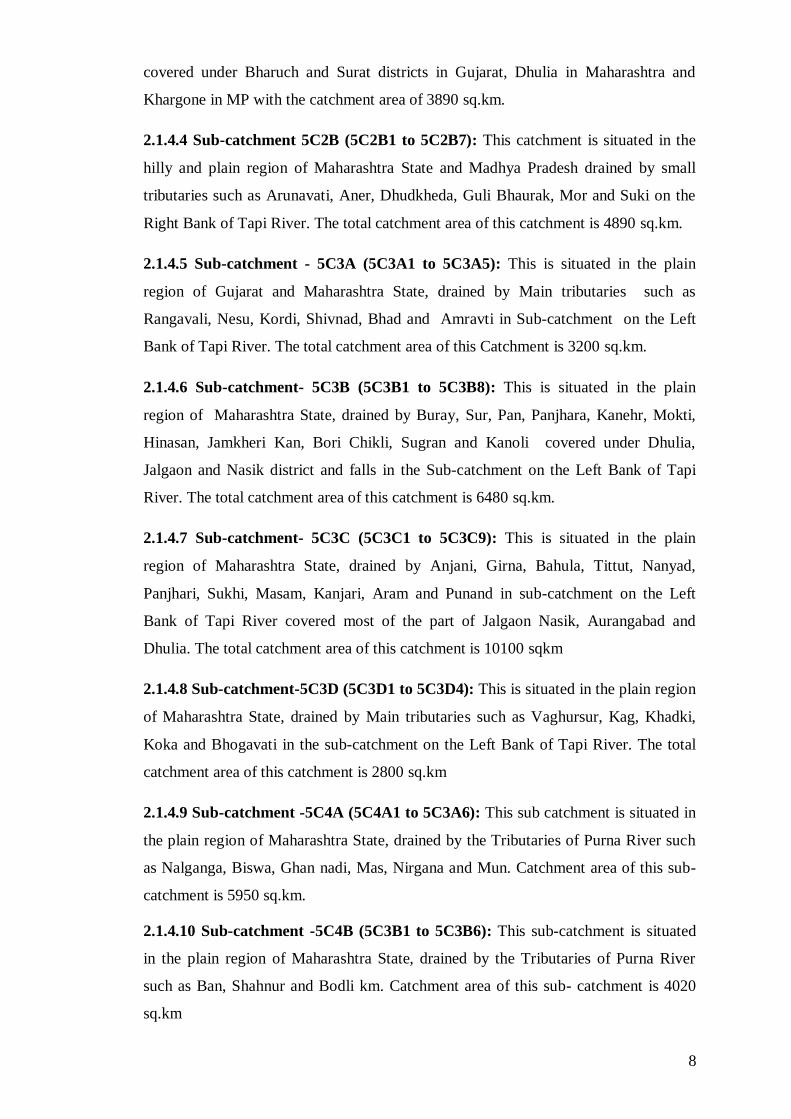
2.1.4.14 Sub-catchment - 5C5B ( 5C5B1 to 5C1B8): This Catchment is situated in
the plain and hills region of Maharashtra and Madhya Pradesh State, drained by
Sipna, Kharpra, Dahsana, Khandu, Baki, Betul and Ambora in Sub-catchment. The
total catchment area of this sub-catchment is 5980 sq.km.
Source: Watershed Atlas of India, Department of Agriculture and Cooperation, Ministry of
agriculture, Krishi Bhavan New Delhi (1990).
Plate no-2.1.2
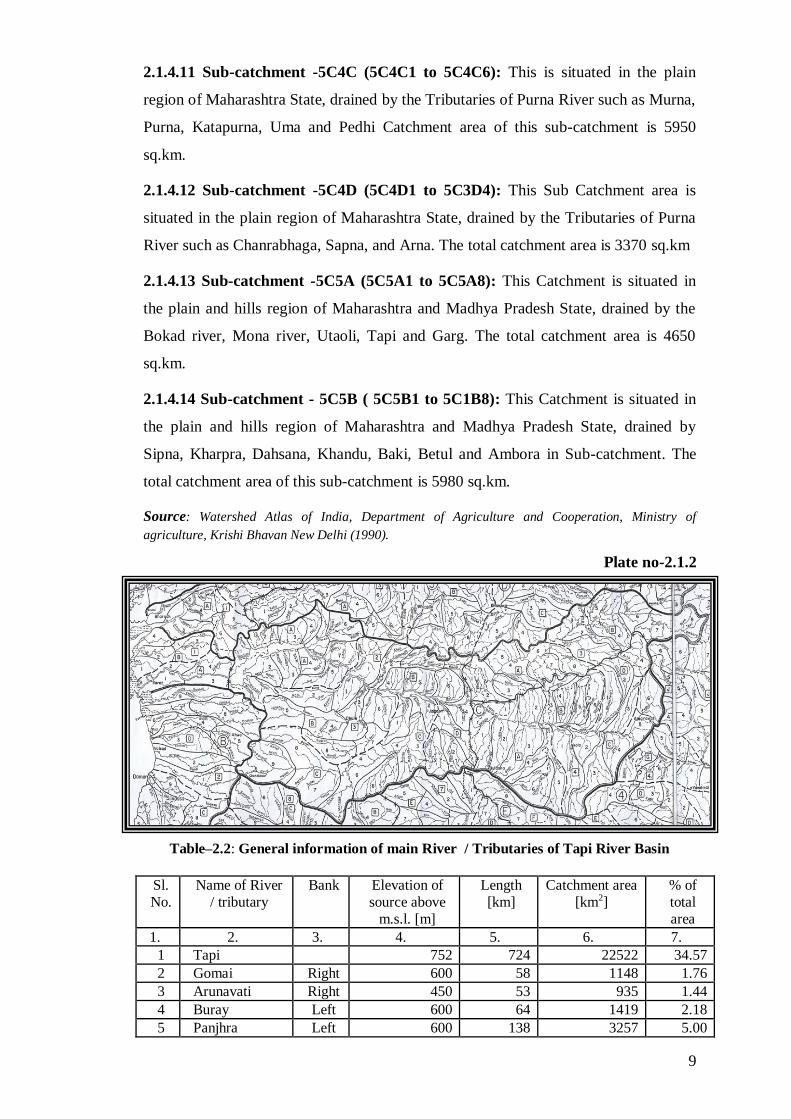
Table–2.2: General information of main River / Tributaries of Tapi River Basin
Sl.
No.
Name of River
/ tributary
Bank Elevation of
source above
m.s.l. [m]
Length
[km]
Catchment area
[km2]
% of
total
area
1. 2. 3. 4. 5. 6. 7.
1 Tapi 752 724 22522 34.57
2 Gomai Right 600 58 1148 1.76
3 Arunavati Right 450 53 935 1.44
4 Buray Left 600 64 1419 2.18
5 Panjhra Left 600 138 3257 5.00
10
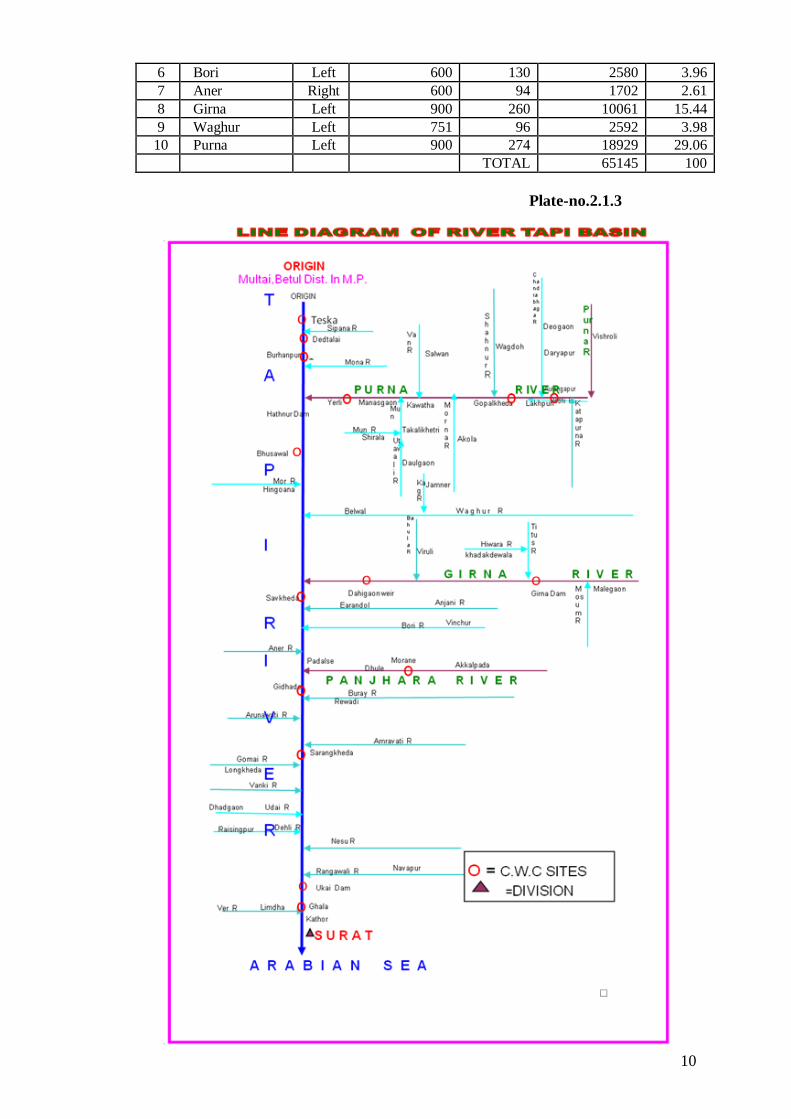
6 Bori Left 600 130 2580 3.96
7 Aner Right 600 94 1702 2.61
8 Girna Left 900 260 10061 15.44
9 Waghur Left 751 96 2592 3.98
10 Purna Left 900 274 18929 29.06
TOTAL 65145 100
Plate-no.2.1.3

11
2.1.5 The Climate
The climate of the Tapi Basin is characterized by a hot summer and general dryness
throughout the year except during the south-west monsoon season in the upper and
middle part of basin but the lower part of the Tapi River Basin shows variation in
temperature, rainfall, humidity and other climatic parameters.
The year may be divided into four periods. The winter from December to February,
the summer from March to May, the south-west monsoon season from June to
September and the post-monsoon period from the October to November
2.1.5.1 Temperature
Temperature of Tapi basin is like any other part of central India, the temperature is
maximum in the month of May and minimum in the month of December to January.
In general, upper and middle part of Tapi basin record lower temperature as compared
to the lower Tapi basin where the influence of the sea is prominent, and temperature
fluctuation is lower than the upper and middle basin. The temperature profile in the
basin is given in the table-2.3.
Table-2.3: Temperature profile of Tapi basin Mean Monthly Maximum Temperature
(oC)
Month Mean Monthly Maximum Temperature (oC)
Loca
tion /
Nam
e of
Sit
e
Bhusa
wal
Yer
li
Hat
hnur
Ded
tala
i
Gopal
khed
a
Lak
hpuri
Burh
anpur
Sav
khed
a
Mora
ne
Gid
had
e
Sar
angkhed
a
Jun-17 37.6 34.6 38.3 35.4 31.6 36.8 34.2 28.1 - 38.0 38.1
Jul-17 * 27.9 31.5 29.5 33.1 31.7 30.0 26.2 - 33.7 31.8
Aug-17 31.1 30.1 31.2 30.4 30.9 28.8 28.3 25.1 - 33.5 31.4
Sep-17 33.0 31.4 32.4 30.1 34.1 29.8 29.5 25.6 - 36.3 34.4
Oct-17 34.4 32.9 33.6 30.5 33.7 29.8 30.6 22.7 - 37.7 37.2
Nov-17 31.9 30.9 30.6 27.8 33.6 29.3 29.1 20.3 - 33.6 33.8
Dec-17 29.8 28.9 28.6 27.0 31.9 27.7 27.5 22.5 - 31.4 29.8
Jan-18 30.3 29.6 28.6 26.8 32.5 28.7 27.7 23.5 - 32.9 31.5
Feb-18 33.6 32.1 33.1 30.0 34.3 31.7 31.5 23.8 - 35.8 35.1
Mar-18 38.1 37.1 37.4 33.9 39.8 34.4 35.7 34.4 - 39.3 39.2
Apr-18 41.8 41.7 41.7 38.4 43.2 39.6 39.9 28.5 - 41.7 42.3
May-18 34.3 44.2 43.7 41.1 45.5 42.5 42.3 31.4 - 41.7 43.4
Annual
Mean 31.3 34.3 34.2 31.7 35.4 32.6 32.2 26.0 - 36.3 35.7
Note:- * Instrument is not working
12
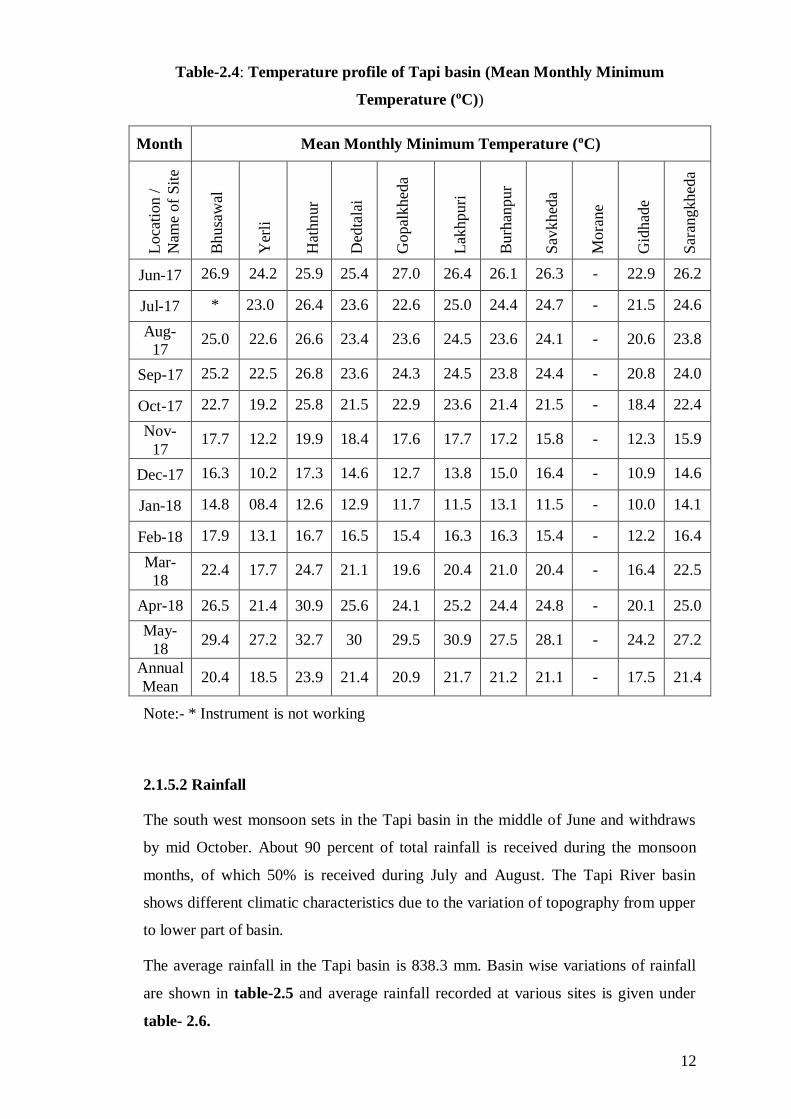
Table-2.4: Temperature profile of Tapi basin (Mean Monthly Minimum
Temperature (oC))
Month Mean Monthly Minimum Temperature (oC) L
oca
tion /
Nam
e of
Sit
e
Bhusa
wal
Yer
li
Hat
hnur
Ded
tala
i
Gopal
khed
a
Lak
hpuri
Burh
anpur
Sav
khed
a
Mora
ne
Gid
had
e
Sar
angkhed
a
Jun-17 26.9 24.2 25.9 25.4 27.0 26.4 26.1 26.3 - 22.9 26.2
Jul-17 * 23.0 26.4 23.6 22.6 25.0 24.4 24.7 - 21.5 24.6
Aug-
17 25.0 22.6 26.6 23.4 23.6 24.5 23.6 24.1 - 20.6 23.8
Sep-17 25.2 22.5 26.8 23.6 24.3 24.5 23.8 24.4 - 20.8 24.0
Oct-17 22.7 19.2 25.8 21.5 22.9 23.6 21.4 21.5 - 18.4 22.4
Nov-
17 17.7 12.2 19.9 18.4 17.6 17.7 17.2 15.8 - 12.3 15.9
Dec-17 16.3 10.2 17.3 14.6 12.7 13.8 15.0 16.4 - 10.9 14.6
Jan-18 14.8 08.4 12.6 12.9 11.7 11.5 13.1 11.5 - 10.0 14.1
Feb-18 17.9 13.1 16.7 16.5 15.4 16.3 16.3 15.4 - 12.2 16.4
Mar-
18 22.4 17.7 24.7 21.1 19.6 20.4 21.0 20.4 - 16.4 22.5
Apr-18 26.5 21.4 30.9 25.6 24.1 25.2 24.4 24.8 - 20.1 25.0
May-
18 29.4 27.2 32.7 30 29.5 30.9 27.5 28.1 - 24.2 27.2
Annual
Mean 20.4 18.5 23.9 21.4 20.9 21.7 21.2 21.1 - 17.5 21.4
Note:- * Instrument is not working
2.1.5.2 Rainfall
The south west monsoon sets in the Tapi basin in the middle of June and withdraws
by mid October. About 90 percent of total rainfall is received during the monsoon
months, of which 50% is received during July and August. The Tapi River basin
shows different climatic characteristics due to the variation of topography from upper
to lower part of basin.
The average rainfall in the Tapi basin is 838.3 mm. Basin wise variations of rainfall
are shown in table-2.5 and average rainfall recorded at various sites is given under
table- 2.6.

13
Table-2.5: Average Monsoon rainfall since 1987
Table -2.6: Rainfall at sites in Tapi Basin
Average Annual Rainfall for the period, since inception
Sl
No
Name of Site District Seasonal Average Rainfall (mm) Total
Annual
Average
Rainfall
Winter
monsoon
Pre
monsoon
South-
west
monsoon
post
monsoon
(Jan-Feb)
(Mar-
May)
(June-
Sept)
(Oct-
Dec)
1 Teska Betul (MP) 10.7 15.2 1079.8 19.9 1125.7
2 Lakhpuri Akola (MS) 16.2 28.8 659.5 77.3 781.8
3 Chikhaldara Amarawati (MS) 20.8 31.8 1465.5 113.2 1631.3
4 Gopalkheda Akola (MS) 16.5 23.0 643.3 55.0 737.8
5 Dedtalai Burhanpur (MP) 12.5 18.3 824.8 54.7 910.2
6 Burhanpur Burhanpur (MP) 14.4 24.6 777.3 64.8 881.1
7 Yerli Buldana (MS) 13.1 20.3 605.3 76.7 715.4
Sr.
No
.
Name of Sub Basin Bank Length
in Km
Catchment
Area
(sqkm)
% with
reference
to total
area.
average of
Monsoon
rainfall
(mm) since
1987
1. Upper Tapi up to
Hathnur
Main 290 10471 16.1 987.7
2. Purna Left 274 18929 29.1 704.1
3. Middle Tapi, Hathnur
to Ukai excluding
Girna.
Main 305 22734 34.9 573.1
4. Girna Left 260 10061 15.4 653.5
5. Lower Tapi-from
Ukai to confluence to
sea near Surat
Main 129 2920 4.5 1186.6
14
8 Hathnur-
Dam
Jalgaon (MS)
12.0 13.3 613.7 65.2 704.2
9 Bhusawal Jalgaon (MS) 8.6 18.8 643.0 60.2 730.6
10 Girna Nasik (MS) 18.9 77.7 2365.4 58.4 665.6
11 Dahigaon Jalgaon(MS) 7.8 23.2 679.8 62.5 773.3
12 Savkheda Jalgaon (MS) 4.7 17.9 599.3 50.9 672.9
13 Morane Dhule(MS) 6.7 14.2 486.9 60.7 568.4
14 Gidhade Dhule(MS) 3.8 9.3 535.5 42.0 589.5
15 Sarangkheda Nandurbar (MS) 2.7 14.5 568.3 45.1 630.5
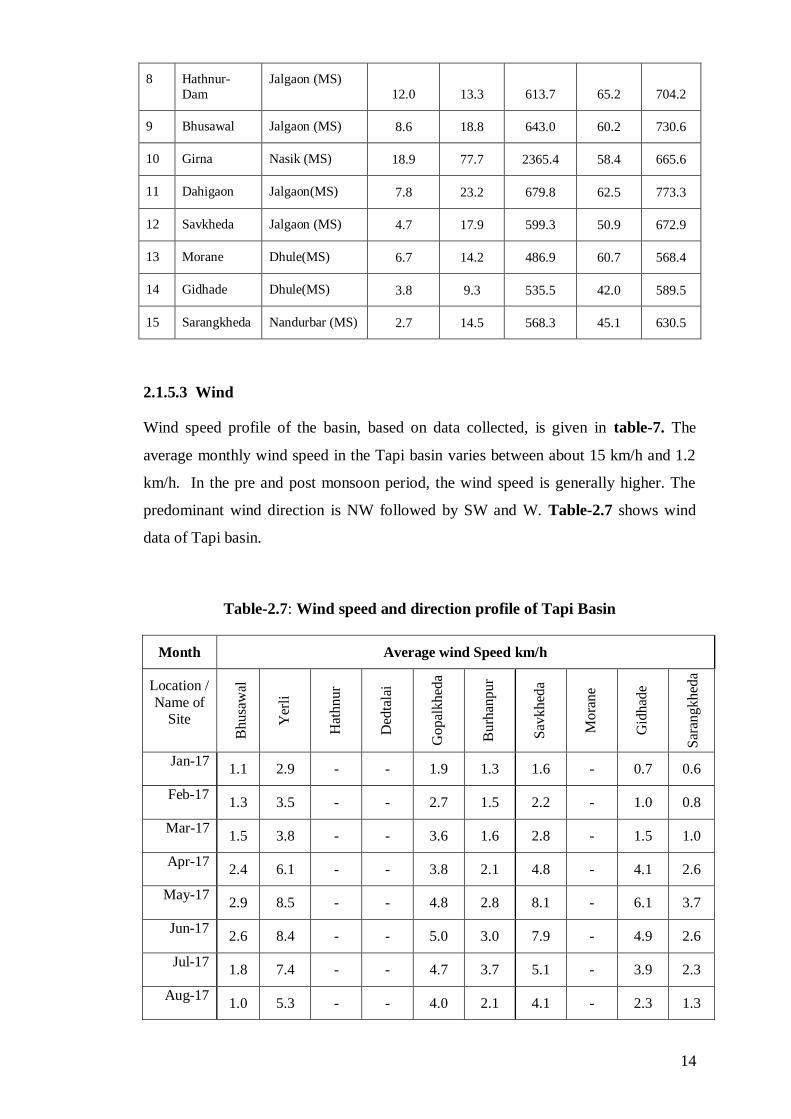
2.1.5.3 Wind
Wind speed profile of the basin, based on data collected, is given in table-7. The
average monthly wind speed in the Tapi basin varies between about 15 km/h and 1.2
km/h. In the pre and post monsoon period, the wind speed is generally higher. The
predominant wind direction is NW followed by SW and W. Table-2.7 shows wind
data of Tapi basin.
Table-2.7: Wind speed and direction profile of Tapi Basin
Month Average wind Speed km/h
Location /
Name of Site
Bhusa
wal
Yer
li
Hat
hnur
Ded
tala
i
Gopal
khed
a
Burh
anpur
Sav
khed
a
Mora
ne
Gid
had
e
Sar
angkhed
a
Jan-17 1.1 2.9 - - 1.9 1.3 1.6 - 0.7 0.6
Feb-17 1.3 3.5 - - 2.7 1.5 2.2 - 1.0 0.8
Mar-17 1.5 3.8 - - 3.6 1.6 2.8 - 1.5 1.0
Apr-17 2.4 6.1 - - 3.8 2.1 4.8 - 4.1 2.6
May-17 2.9 8.5 - - 4.8 2.8 8.1 - 6.1 3.7
Jun-17 2.6 8.4 - - 5.0 3.0 7.9 - 4.9 2.6
Jul-17 1.8 7.4 - - 4.7 3.7 5.1 - 3.9 2.3
Aug-17 1.0 5.3 - - 4.0 2.1 4.1 - 2.3 1.3
15
Sep-17 0.9 3.1 - - 2.5 1.1 2.8 - 1.1 0.8
Oct-17 1.3 2.4 - - 1.7 0.9 1.6 - 0.7 0.2
Nov-17 1.8 2.4 - - 2.2 1.0 1.2 - 0.6 0.0
Dec-17 3.0 3.2 - - 1.9 1.1 1.5 - 0.9 0.1
Annual
Mean 1.8 4.8 0.0 0.0 3.2 1.9 3.6 0.0 2.3 1.3
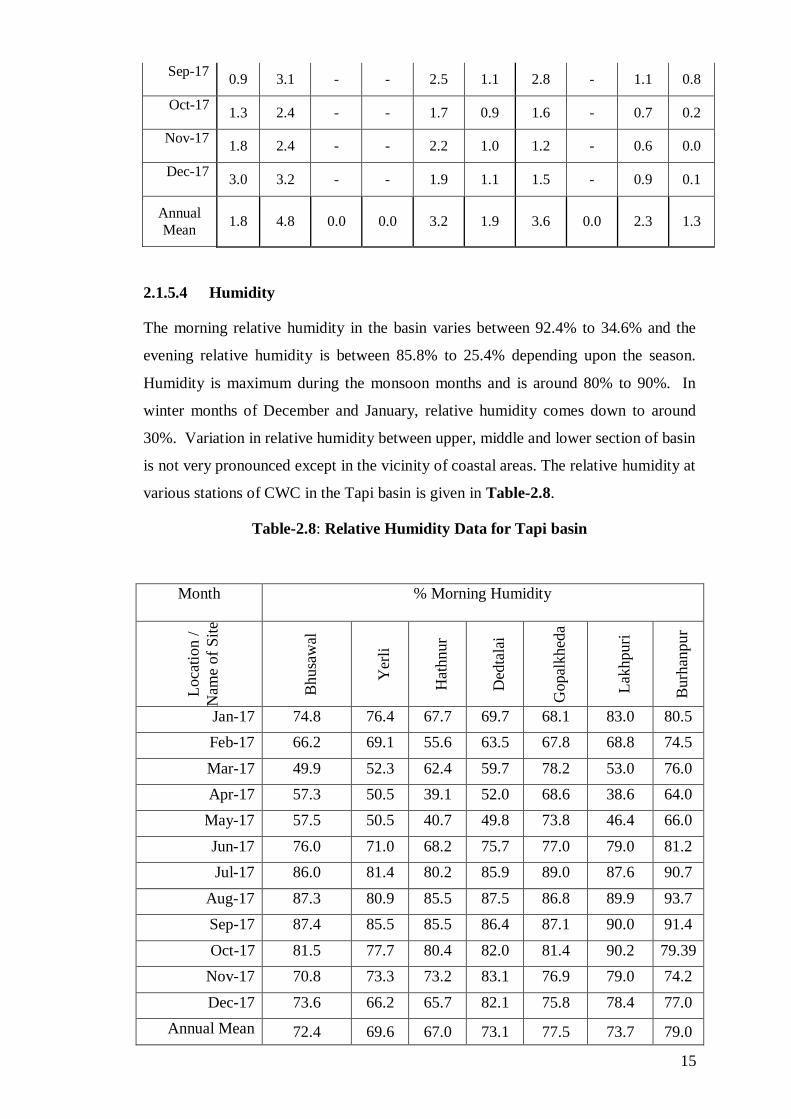
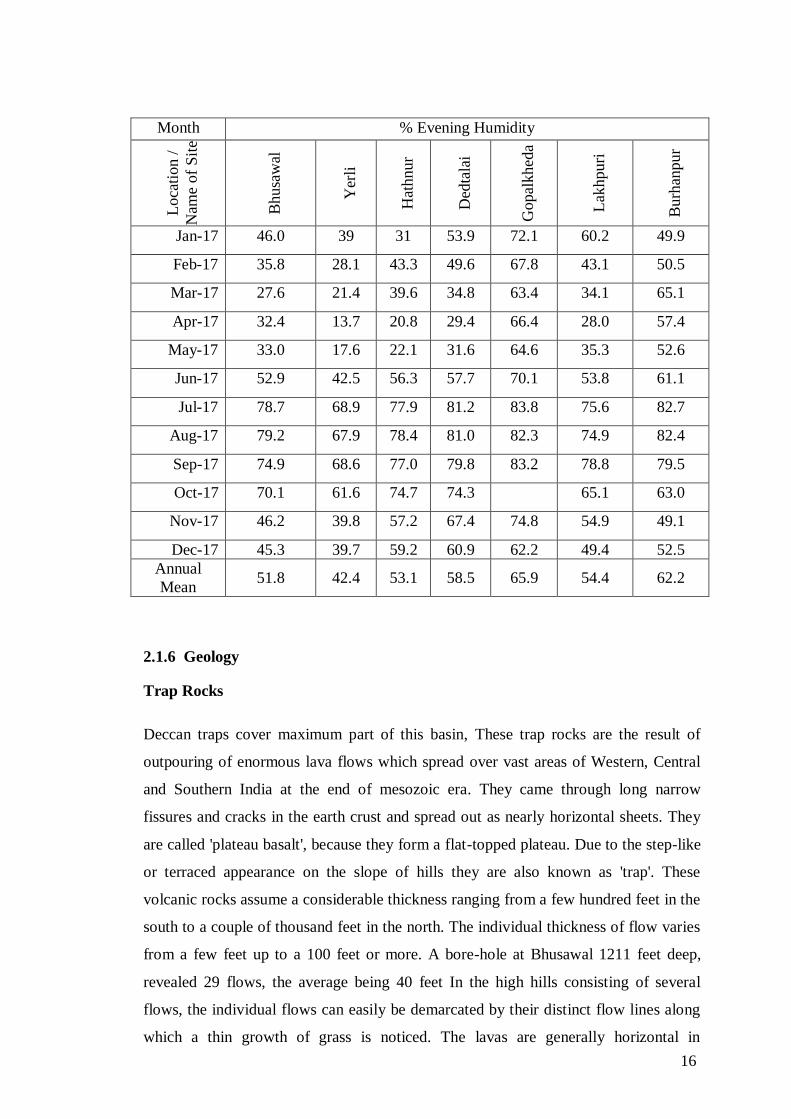
2.1.5.4 Humidity
The morning relative humidity in the basin varies between 92.4% to 34.6% and the
evening relative humidity is between 85.8% to 25.4% depending upon the season.
Humidity is maximum during the monsoon months and is around 80% to 90%. In
winter months of December and January, relative humidity comes down to around
30%. Variation in relative humidity between upper, middle and lower section of basin
is not very pronounced except in the vicinity of coastal areas. The relative humidity at
various stations of CWC in the Tapi basin is given in Table-2.8.
Table-2.8: Relative Humidity Data for Tapi basin
Month % Morning Humidity
Loca
tion /
Nam
e of
Sit
e
Bhusa
wal
Yer
li
Hat
hnur
Ded
tala
i
Gopal
khed
a
Lak
hpuri
Burh
anpur
Jan-17 74.8 76.4 67.7 69.7 68.1 83.0 80.5
Feb-17 66.2 69.1 55.6 63.5 67.8 68.8 74.5
Mar-17 49.9 52.3 62.4 59.7 78.2 53.0 76.0
Apr-17 57.3 50.5 39.1 52.0 68.6 38.6 64.0
May-17 57.5 50.5 40.7 49.8 73.8 46.4 66.0
Jun-17 76.0 71.0 68.2 75.7 77.0 79.0 81.2
Jul-17 86.0 81.4 80.2 85.9 89.0 87.6 90.7
Aug-17 87.3 80.9 85.5 87.5 86.8 89.9 93.7
Sep-17 87.4 85.5 85.5 86.4 87.1 90.0 91.4
Oct-17 81.5 77.7 80.4 82.0 81.4 90.2 79.39
Nov-17 70.8 73.3 73.2 83.1 76.9 79.0 74.2
Dec-17 73.6 66.2 65.7 82.1 75.8 78.4 77.0
Annual Mean 72.4 69.6 67.0 73.1 77.5 73.7 79.0
16
Month % Evening Humidity
Loca
tion /
Nam
e of
Sit
e
Bhusa
wal
Yer
li
Hat
hnur
Ded
tala
i
Gopal
khed
a
Lak
hpuri
Burh
anpur
Jan-17 46.0 39 31 53.9 72.1 60.2 49.9
Feb-17 35.8 28.1 43.3 49.6 67.8 43.1 50.5
Mar-17 27.6 21.4 39.6 34.8 63.4 34.1 65.1
Apr-17 32.4 13.7 20.8 29.4 66.4 28.0 57.4
May-17 33.0 17.6 22.1 31.6 64.6 35.3 52.6
Jun-17 52.9 42.5 56.3 57.7 70.1 53.8 61.1
Jul-17 78.7 68.9 77.9 81.2 83.8 75.6 82.7
Aug-17 79.2 67.9 78.4 81.0 82.3 74.9 82.4
Sep-17 74.9 68.6 77.0 79.8 83.2 78.8 79.5
Oct-17 70.1 61.6 74.7 74.3 65.1 63.0
Nov-17 46.2 39.8 57.2 67.4 74.8 54.9 49.1
Dec-17 45.3 39.7 59.2 60.9 62.2 49.4 52.5
Annual
Mean 51.8 42.4 53.1 58.5 65.9 54.4 62.2
2.1.6 Geology
Trap Rocks
Deccan traps cover maximum part of this basin, These trap rocks are the result of
outpouring of enormous lava flows which spread over vast areas of Western, Central
and Southern India at the end of mesozoic era. They came through long narrow
fissures and cracks in the earth crust and spread out as nearly horizontal sheets. They
are called 'plateau basalt', because they form a flat-topped plateau. Due to the step-like
or terraced appearance on the slope of hills they are also known as 'trap'. These
volcanic rocks assume a considerable thickness ranging from a few hundred feet in the
south to a couple of thousand feet in the north. The individual thickness of flow varies
from a few feet up to a 100 feet or more. A bore-hole at Bhusawal 1211 feet deep,
revealed 29 flows, the average being 40 feet In the high hills consisting of several
flows, the individual flows can easily be demarcated by their distinct flow lines along
which a thin growth of grass is noticed. The lavas are generally horizontal in
17
disposition but at places they dip at very small angles. The traps that are commonly
found in the plateau or cliff faces are compact and harder, often characterized by
vertical prismatic or columnar jointing. They are dark grey or dark greenish grey to
brownish grey in color. The amygdaloidal variety, which is greenish to purplish in
color and comparatively softer, generally forms the slopes and valley floors. They
contain innumerable cavities which are usually filled with secondary minerals such as
quartz, chalcedony, agate, jasper, rock crystal, Zeolites and calcite: The ash or
Scoriaceous beds and red bole beds are sometimes noticed. The main minerals
constituent in the trap rocks are abundant in Labradorite and Enstatite-augite with
varying proportion of interstitial glass which on alteration gives rise to secondary
minerals like Palagonite, Chlorophaete Iddingsite, etc. Sometimes Porphyritic basalt is
seen showing Phenocrysts of Felspars and glassy matters. Magnetite occurs as minute
discreet grains amidst other minerals as well as in the glassy groundmass. In a few
cases, olivine is also present.
The other formations found in the basin are Alluvium , lower Gondwana, Cuddapah
system Bijwara series and granites gneiss. Most of the area of Tapi basin falling in the
Maharashtra state is full of cuts and valleys, land on the right side of the basin lying on
southern slopes of Satpura hills consist of black soils the soil cover is deep and rock is
found at greater depths. Lands on the left of the basin on northern slopes of Sahyadri
consist mainly of dykes and red Murrum soil and are rocky in most parts.
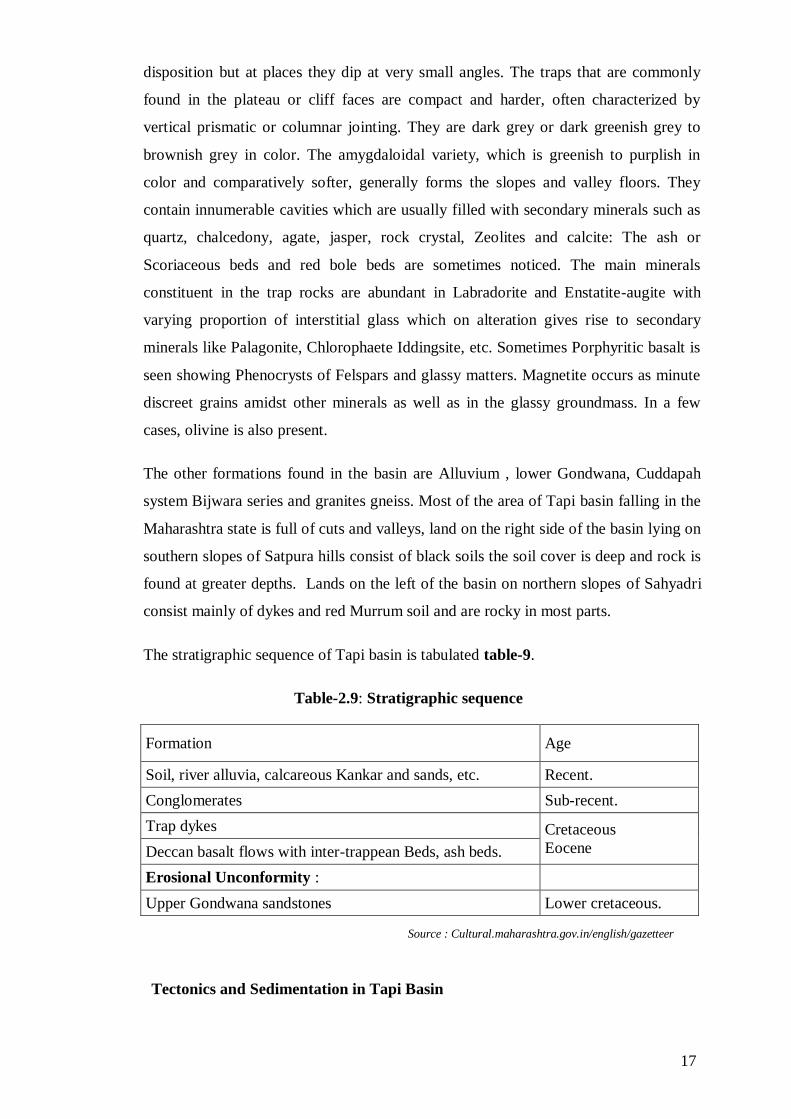
The stratigraphic sequence of Tapi basin is tabulated table-9.
Table-2.9: Stratigraphic sequence
Formation Age
Soil, river alluvia, calcareous Kankar and sands, etc. Recent.
Conglomerates Sub-recent.
Trap dykes Cretaceous
Eocene Deccan basalt flows with inter-trappean Beds, ash beds.
Erosional Unconformity :
Upper Gondwana sandstones Lower cretaceous.
Source : Cultural.maharashtra.gov.in/english/gazetteer
Tectonics and Sedimentation in Tapi Basin
18
The Late Cenozoic period in the Central Indian Tectonic Zone (CITZ) was marked
by several episodes of crustal adjustments which are reflected in terms of various
tectonic landforms, repeated adjustments in the drainage systems and sedimentation
pattern in the Tapi basin which is a half graben structure. The northern margin of
the basin is bound by ENE-WSW trending Tapi Fault Zone (TFZ) while the
southern margin gradually merges with the Ajanta-Buldhana plateau.
The Tapi in the initial eastern part runs along a narrow intermontane valley carved
into the lower middle level plateau of the south Satpuras. The course of the river is
dominantly straight to sinuous with resistant channel boundaries and coarse bed
material. Here, majority of the fluvial deposition has been in the form of overbank
deposits with restricted flood plain development. The river here flows through a
fault controlled valley cut into Deccan Traps and the river terraces on either bank
are unpaired. The episode of faulting appears to have been preceded by a high
rainfall phase and development of ash associated red paleosol horizon. Post
uplift sedimentation in this part of the basin has been in form of buff coloured
slack water deposits, dominantly finer grained during uppermost part of Late
Pleistocene. Possible inset of transient arid phase (~LGM) had led to preservation
of lithified grit beds. The last phase of sedimentation in this part of the basin is in
form of grey silt bearing inset terraces of Holocene period derived from older
sediments. This phase appears to have witnessed a major episode of faulting as
evident by presence of massive, meter scale bank collapse structures in the
sediments. At present the river has set into a denudational phase, engaging into
deep incision of its older sediment package and intense undercutting of the
exposed sections. Intense vertical erosive activity influenced by slow tectonic uplift
is manifest in form of fresh scarp sections, presence of giant pot holes and talus
scree and block falls from the sections along the river course. The imprints of
ongoing tectonic activity in this part have been in the form of tilting, crushing and
brecciation of Deccan Traps and alignment of hot and cold springs along the river
course.
The Tapi River after traversing this intermontane valley descends onto the foothills
which has a different set up of tectonic landforms and sedimentation history. Here
the river course is having dominantly wide and open meander bends with
occasional presence of point bars and channel bars. This part represents the
deeper part of the basin and sedimentation here has been under the influence of two
19
regional scale faults: Tapi North Fault (TNF) traversing the lower plateau parts of
the Satpura ranges and its margin and Tapi River Fault (TRF) which as the name
suggests, runs along the course of the Tapi river and has governed the
sedimentation pattern in the basin. Several first order transverse tributaries emerge
from the Satpura foothills and join the Tapi River course in this stretch.
Chronological data supports that the sedimentation in this part of the basin was
initiated at least during middle Pleistocene. Episodic uplift of the reactivated
segments of old crustal scale discontinuities has provided loci for sedimentation in
the basin. The flood plain (red palaeosol) sediments of this part also show
signatures of high rainfall phase caused by intensification of monsoon and episodic
uplift of the northern footwall block of TNF. Climatic amelioration caused
development of multiple bedded calcrete horizons and flash flood deposit.
Rejuvenation of the main river and its tributaries has also introduced channel
deposits along the river courses at a later phase possibly during upper part of Late
Pleistocene. The youngest Holocene deposit occur as inset terraces along the river
course. The sedimentary pile in this part is appreciably thick and the base
rock/Quaternary contact is not seen along the river course except for the parts
which have witnessed contemporary uplift along TRF.
Both TNF and TRF have been active during the deposition of sediments in this part
of the basin. The imprints of TNF activity have been in the form of zones of high
geothermal gradient, accelerated denudation even along the juvenile first
order streams and deformation of sediments. TRF on the other hand, has preserved
the evidences of active tectonic activity in the form of paleoliquefaction features,
deformation of sediments, development of coalesced colonies of potholes resulting
from intense scouring of the Deccan Trap base rock along the uplifted segments of
the TRF and development of alluvial fans. The episodic faulting in the basin
created the depocentre for initiation of sedimentation and seismicity in the basin.
(Source: Snigdha Ghatak, Mriganka Ghatak , Tectono-climatic controls on fluvial sedimentation of upper and middle reaches of Tapi River basin, Central India, 2011, Second National Working Group Meeting, Geological Survey Of India)
Purna Basin
Part of the basin is covered by rocks of the Deccan volcanics of Creteceo-Eocene age,
and a few alluvium patches of the Purna and Penganga basin, respectively. The trap
rocks are usually fine to coarse-grained, dark grey to greenish-black basalts of
vesicular and massive types. The hard compact massive flows are generally noticed on
20
the hill tops, e.g., Melghat section whereas comparatively soft and amygdular varieties
usually occupy the flanks of the hill or valley floors. Spheroidal exfoliation is a
characteristic feature of weathering in the traps. Besides vertical and inclined jointing,
columnar jointing is also well seen in more massive types. The vesicular and non-
vesicular flows are at places separated by thin beds of ash or scoriae, but typical inter-
trappean sedimentary rocks have not been recognised in the area. The amygdular
varieties of flows carry secondary minerals like zeolites (mostly heulandite), calcite
and chalcedony. No dykes have been found associated with the trap flows in the
district where a lava pile of approximately 800 metres is preserved.
Alluvium
The Purna valley alluvium occupies an extensive stretch of low lying ground between
Paturda and the confluence of Purna river with that of Tapi in Jalgaon district. In the
river valleys and where superficial rain-wash has accumulated, a mixture of black
cotton soil associated with sub-recent conglomeratic formation or light brown laterite
material is noticeable at places, but otherwise, there is little variation in the nature and
extent of soil or any variety of geological interest. The alluvium of the plains is usually
of considerable depth. Much on the alluvium produces effervescence of sodium salts.
Majority of the wells sunk in the area have brackish water.
Source : Cultural.maharashtra.gov.in/english/gazetteer
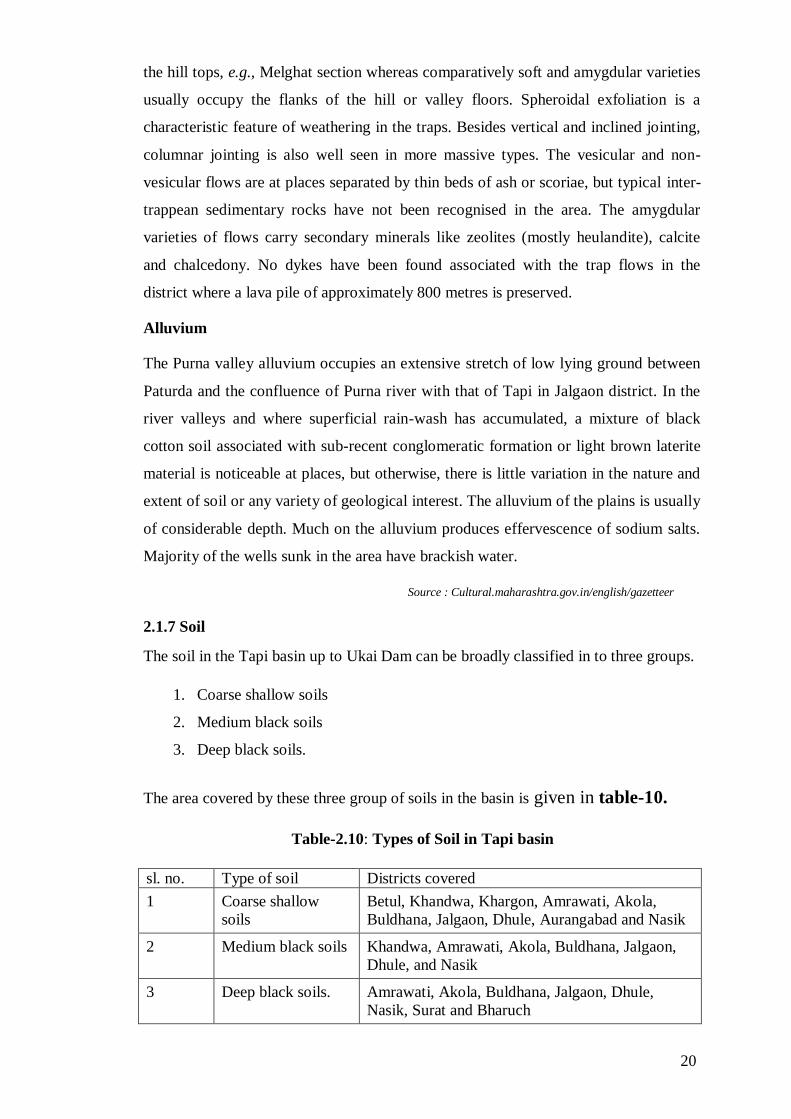
2.1.7 Soil
The soil in the Tapi basin up to Ukai Dam can be broadly classified in to three groups.
1. Coarse shallow soils
2. Medium black soils
3. Deep black soils.
The area covered by these three group of soils in the basin is given in table-10.
Table-2.10: Types of Soil in Tapi basin
sl. no. Type of soil Districts covered
1 Coarse shallow
soils
Betul, Khandwa, Khargon, Amrawati, Akola,
Buldhana, Jalgaon, Dhule, Aurangabad and Nasik
2 Medium black soils Khandwa, Amrawati, Akola, Buldhana, Jalgaon,
Dhule, and Nasik
3 Deep black soils. Amrawati, Akola, Buldhana, Jalgaon, Dhule,
Nasik, Surat and Bharuch

21
Coarse shallow soils
These soils have developed primarily from the basaltic Deccan trap and have been
considerably affected by natural processes of weathering and erosion. Their depth is
generally between 25cm to 50 cm and seldom more, their texture from surface to sub
surface varies from silty loam to clay. Their organic matter content is usually poor and
they are moderately drained.
Medium black soils
These soils have developed from Deccan traps and cover the largest area of the basin.
Their depth is generally between 50cm to 1m. these soils contain higher lime reserve
and are alkaline in reaction. These soils are fair in their contents of phosphates and
potash but low in organic matter and nitrogen.
Deep black soils
These soils are found along the Purna river and in the middle and lower reaches of
Tapi River. These soils have originated primarily from decomposition of trap rocks of
hilly ranges. The depth of this soil varies from 1m to 6m. The soil have very high clay
content Montmorillonite predominating and not easily workable during monsoon. The
soil reaction varies from neutral to alkaline.
Source: Hydrology and Water Resources of India, Water Science and Technology Library Volume 57, 2007, pp 561-595 Tapi, Sabarmati and Mahi Basins, Sharad K. Jain, Pushpendra K. Agarwal, Vijay P. Singh (http://link.springer.com/chapter/10.1007%2F1-4020-5180-8_12)
2.1.8 Forest
The Tapi basin exhibits two distinct geographical regions, viz., the plain regions in the
east and south-east and the hilly regions of the Satpura ranges in north and north-west.
The plain region is extensively cultivated and forests appear only in dotted, scattered
patches. The hilly region is an extensive block of compact forests and contains an
abundance of rich teak trees. The percentage of the forest area to total area in the Tapi
basin is approximately 25% of the total area, and is unevenly distributed.
Tree Forests
These include the forests of producing big-size teak and timber of other type.
Minor Forests
These include the forests in the plain regions, which are capable of producing small-
size timber poles of teak, etc. These forests also supply fire-wood, thorns and grass and
serve as good pastures for grazing the cattle.

22
Babul Bans.
These are artificially created forests of Babul (Acacia arabica) in the cultivated plain
tracts and lie dotted over the area.
Ramnas and Pasture Forests
These include open forests with sparse tree growth and lie mostly in the plain regions,
where an intense demand exists for grass and grazing.
Utilization
The forests are managed under regular working plans, the object being the supply of
large-size timber for commercial use. The minor forests like Babul Bans and the
Ramnas and pasture lands are being maintained to supply the local demand for small-
size timber, fuel, grass and grazing.
Forest Produce
The major forest produce is timber. The minor forest produce constitutes various
items, such as bamboo, fuel, Rosha grass, fodder grass, minerals, horns and hides,
Tendu leaves and gum.
Forest Trees
The most useful trees and plants found in these forests, are given below: -
Teak (Tectona grandis), Tiwas (Ougenia dalbergioides), Shisham (Dalbergia
latifolia)., Bija (Pterocarpus marsupium)., Haldu (Adina cordifolia), Saj
(Terminalia tomenlosa), Dhawda (Anogeissus latifolia), Dhaman
(Grewia tiliaefolia), Semal (Bombax malabaricum; Silk cotton tree), Siivan
(Gmelina arborea), Kusum (Schleichera trijuga), Kalam (Stephegyne parvifolia),
Kahu (Terminalia arjuna), Landia (Lagerstroemia parviflora), Harra
(Terminalia chebula), Bhormal (Hymenodictyon excelsum), Salai (Boswellia serrata),
Moyen (Odina nodier), Kekda (Garuga pinnata), Maharukh (Ailanthus excelsa),
Moha (Madhuca latifolia),Tendu (Diospyros melanoxylon
Achar (Buchanania lanzan), Aonla (Emblica officinalis) Beheda
(Terminalia belerica), Bhilawa (Semecarpus anacardium) Amba (Mangifera indica)
Bor (Zizyphus jujuba) Palas (Butea frondosa) Babul (Acacia arabica)
Khair (Acacia calechu), Anjan (Hardwickia binata), Jamun (Eugenia jambolana),
Bhosa (Bauhiniarecemosa), Rohan (Soymida febrifuga), Amalatas (Cassia fistula),
Bel (Aeglemarmelos), Kumbhi (Careya arborea), Gular (Ficus species), Dahi-
palas (Cordias), Mokha (Schrebera swietenioides), Bhirra (Chlo-roxylon swietenia),
Hiwar (Acacialeucophloea), Kulu (Sterculia urens), Gongal
(Cochlospermum gossypium) Dudhi (Wrightia tinctoria), Arang (Kydia calycina)
Pangra (Exythrina Indica), Bamboos (Dendrocalamus strictus).
Source: cultural.maharashtra.gov.in/english/gazetteer
23
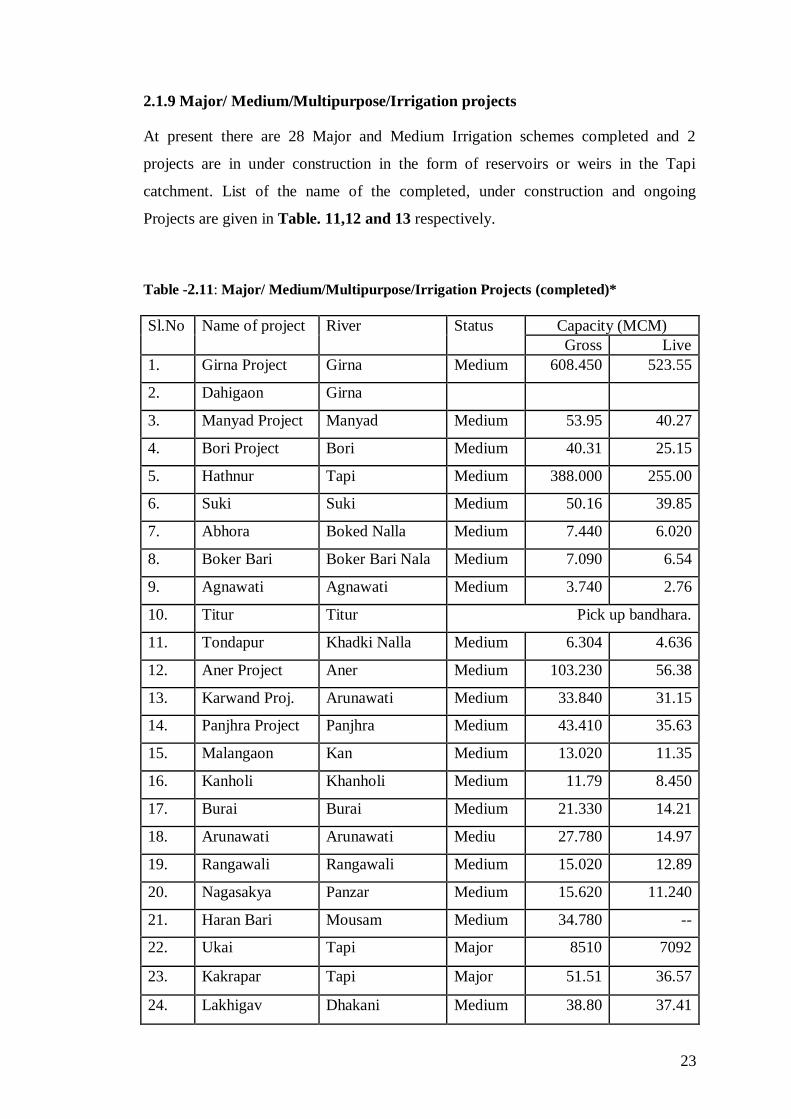
2.1.9 Major/ Medium/Multipurpose/Irrigation projects
At present there are 28 Major and Medium Irrigation schemes completed and 2
projects are in under construction in the form of reservoirs or weirs in the Tapi
catchment. List of the name of the completed, under construction and ongoing
Projects are given in Table. 11,12 and 13 respectively.
Table -2.11: Major/ Medium/Multipurpose/Irrigation Projects (completed)*
Sl.No Name of project River Status Capacity (MCM)
Gross Live
1. Girna Project Girna Medium 608.450 523.55
2. Dahigaon Girna
3. Manyad Project Manyad Medium 53.95 40.27
4. Bori Project Bori Medium 40.31 25.15
5. Hathnur Tapi Medium 388.000 255.00
6. Suki Suki Medium 50.16 39.85
7. Abhora Boked Nalla Medium 7.440 6.020
8. Boker Bari Boker Bari Nala Medium 7.090 6.54
9. Agnawati Agnawati Medium 3.740 2.76
10. Titur Titur Pick up bandhara.
11. Tondapur Khadki Nalla Medium 6.304 4.636
12. Aner Project Aner Medium 103.230 56.38
13. Karwand Proj. Arunawati Medium 33.840 31.15
14. Panjhra Project Panjhra Medium 43.410 35.63
15. Malangaon Kan Medium 13.020 11.35
16. Kanholi Khanholi Medium 11.79 8.450
17. Burai Burai Medium 21.330 14.21
18. Arunawati Arunawati Mediu 27.780 14.97
19. Rangawali Rangawali Medium 15.020 12.89
20. Nagasakya Panzar Medium 15.620 11.240
21. Haran Bari Mousam Medium 34.780 --
22. Ukai Tapi Major 8510 7092
23. Kakrapar Tapi Major 51.51 36.57
24. Lakhigav Dhakani Medium 38.80 37.41

24
25. Ver Ver Medium 4.90 4.61
26. Sulwada Barrage Tapi Medium 65.06 64.642
27. Sarangkheda
Barrage
Tapi Medium 92.20 91.82
28. Prakasha
Barrage
Tapi Medium 63.64 62.11
29. Kate Purna Kate Purna Major 97.670 86.350
30. Nal ganga Nal ganga Major 76.200 69.320
31. Uma Uma Medium 14.000 11.680
32. Nirguna Nirguna Medium 32.290 28.850
33. Morna Morna Medium 44.740 41.460
34. Gyan ganga Gyan ganga Medium 36.260 33.930
35. Mos Mos Medium 17.504 15.140
36. Paltag Vishvganga Medium 9.090 7.510
37. Man Man Medium 39.760 36.830
38. Thoran Tributary of
Purna
Medium 8.480 7.900
Table -2.12: Major/ Medium/Multipurpose/Irrigation Projects (Under
construction)-Tapi basin *
Under Construction projects
Sl
No
Name of Project River Classificati
on
Gross
Capacity
(MCM)
Live storage
(MCM)
1 Shelgaon
Barrage
Tapi Medium 116.37 110.35
2 Padelsa Dam Tapi Medium 420.56 407.59
Table -2.13: Ongoing Major /Medium Projects- Purna basin *
Sl. No Name of Project River Classificatio
n
Gross Capacity
(MCM)
Live storage
(MCM)
1 Ghungshi
Project
Purna Medium 17.444 17.269
2 Purna Barrage
II
Purna
Medium
8.1743
8.1126
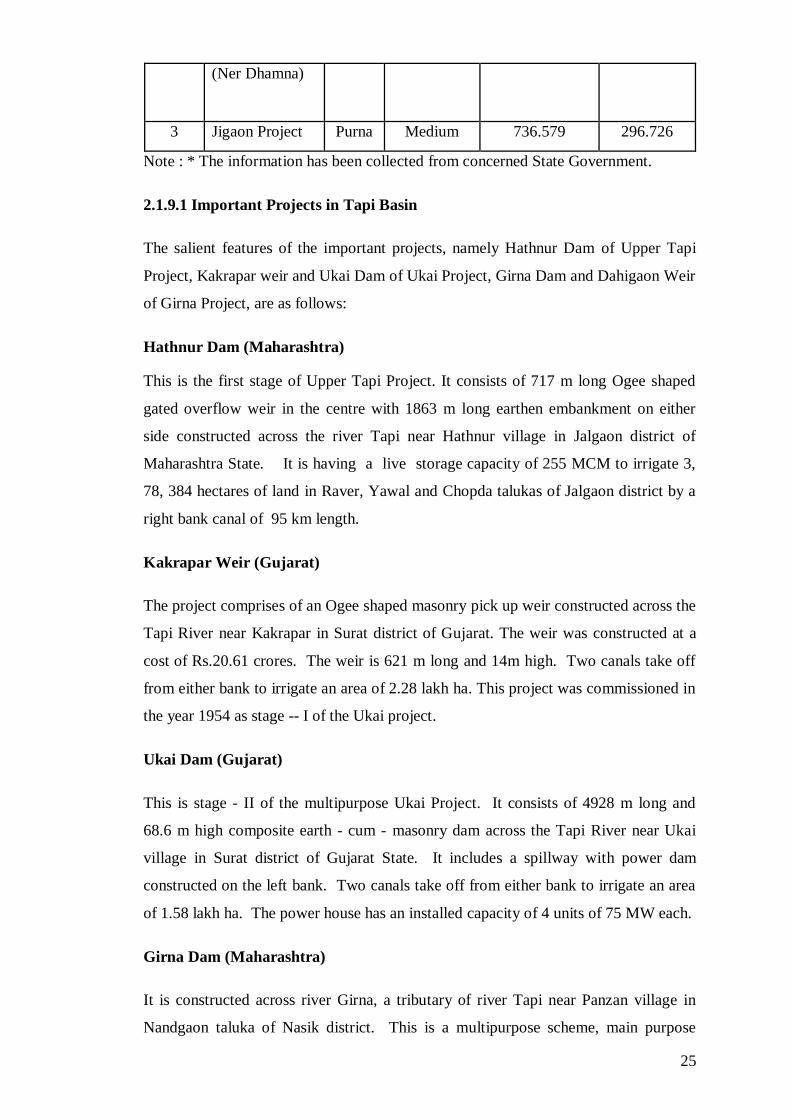
25
(Ner Dhamna)
3 Jigaon Project Purna Medium 736.579 296.726
Note : * The information has been collected from concerned State Government.
2.1.9.1 Important Projects in Tapi Basin
The salient features of the important projects, namely Hathnur Dam of Upper Tapi
Project, Kakrapar weir and Ukai Dam of Ukai Project, Girna Dam and Dahigaon Weir
of Girna Project, are as follows:
Hathnur Dam (Maharashtra)
This is the first stage of Upper Tapi Project. It consists of 717 m long Ogee shaped
gated overflow weir in the centre with 1863 m long earthen embankment on either
side constructed across the river Tapi near Hathnur village in Jalgaon district of
Maharashtra State. It is having a live storage capacity of 255 MCM to irrigate 3,
78, 384 hectares of land in Raver, Yawal and Chopda talukas of Jalgaon district by a
right bank canal of 95 km length.
Kakrapar Weir (Gujarat)
The project comprises of an Ogee shaped masonry pick up weir constructed across the
Tapi River near Kakrapar in Surat district of Gujarat. The weir was constructed at a
cost of Rs.20.61 crores. The weir is 621 m long and 14m high. Two canals take off
from either bank to irrigate an area of 2.28 lakh ha. This project was commissioned in
the year 1954 as stage -- I of the Ukai project.
Ukai Dam (Gujarat)
This is stage - II of the multipurpose Ukai Project. It consists of 4928 m long and
68.6 m high composite earth - cum - masonry dam across the Tapi River near Ukai
village in Surat district of Gujarat State. It includes a spillway with power dam
constructed on the left bank. Two canals take off from either bank to irrigate an area
of 1.58 lakh ha. The power house has an installed capacity of 4 units of 75 MW each.
Girna Dam (Maharashtra)
It is constructed across river Girna, a tributary of river Tapi near Panzan village in
Nandgaon taluka of Nasik district. This is a multipurpose scheme, main purpose
26
being irrigation and subsidiary power generation (power generation yet to be started).
This is a composite dam having total length of 963.17 m, masonry dam with gated
spillway for a length of 426.72 m and earthen dam of length of 536.45 m respectively.
Dahigam Weir (Maharashtra)
It is constructed across river Girna near Dahigaon village in Pachora Taluka of
Jalgaon district of Maharashtra. It consists of a Ogee shaped Weir having a length of
422.76m and a maximum height of 8.82m. It irrigates an area of 57797 ha land
through left bank canal of 45.06 Km. length.
27
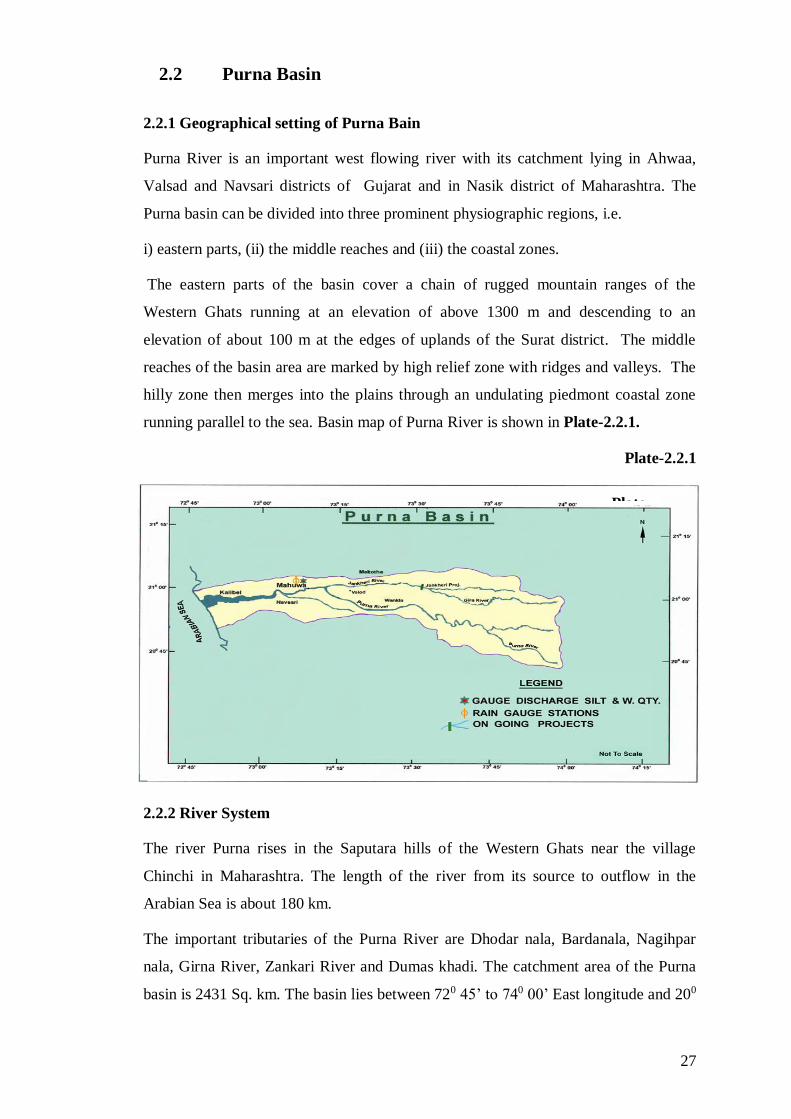
2.2 Purna Basin
2.2.1 Geographical setting of Purna Bain
Purna River is an important west flowing river with its catchment lying in Ahwaa,
Valsad and Navsari districts of Gujarat and in Nasik district of Maharashtra. The
Purna basin can be divided into three prominent physiographic regions, i.e.
i) eastern parts, (ii) the middle reaches and (iii) the coastal zones.
The eastern parts of the basin cover a chain of rugged mountain ranges of the
Western Ghats running at an elevation of above 1300 m and descending to an
elevation of about 100 m at the edges of uplands of the Surat district. The middle
reaches of the basin area are marked by high relief zone with ridges and valleys. The
hilly zone then merges into the plains through an undulating piedmont coastal zone
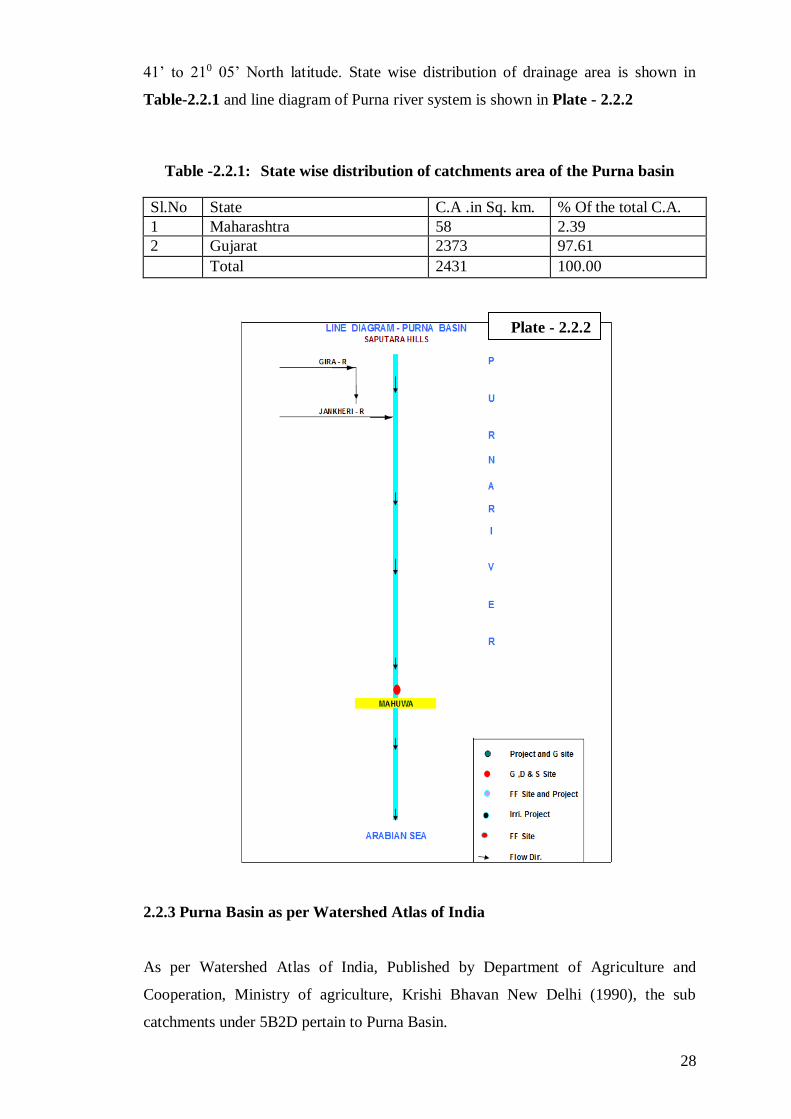
running parallel to the sea. Basin map of Purna River is shown in Plate-2.2.1.
Plate-2.2.1
2.2.2 River System
The river Purna rises in the Saputara hills of the Western Ghats near the village
Chinchi in Maharashtra. The length of the river from its source to outflow in the
Arabian Sea is about 180 km.
The important tributaries of the Purna River are Dhodar nala, Bardanala, Nagihpar
nala, Girna River, Zankari River and Dumas khadi. The catchment area of the Purna
basin is 2431 Sq. km. The basin lies between 720 45’ to 740 00’ East longitude and 200
Plate-
2.1.1
28
41’ to 210 05’ North latitude. State wise distribution of drainage area is shown in
Table-2.2.1 and line diagram of Purna river system is shown in Plate - 2.2.2
Table -2.2.1: State wise distribution of catchments area of the Purna basin
Sl.No State C.A .in Sq. km. % Of the total C.A.
1 Maharashtra 58 2.39
2 Gujarat 2373 97.61
Total 2431 100.00
2.2.3 Purna Basin as per Watershed Atlas of India
As per Watershed Atlas of India, Published by Department of Agriculture and
Cooperation, Ministry of agriculture, Krishi Bhavan New Delhi (1990), the sub
catchments under 5B2D pertain to Purna Basin.
Plate - 2.2.2

29
2.2.3.1 Sub catchment -5B2D (5B2D7 & 5B2D8)
This Sub Catchment is situated in the plain and hilly region of Gujarat, and
Maharashtra drained by Dhodar nala, Bardanala, Nagihpar nala, Girna River, Zankari
River and Dumas khadi. The total area of this Sub-Catchment is 2431 Sqkm.
Subcatchment area of Purna Basin is shown in Fig.-2.2.1
Fig-2.2.1: Sub catchment area of Purna Basin as per water shed Atlas of India.
Source: Watershed Atlas of India, Published by Department of Agriculture and Cooperation, Ministry
of agriculture, Krishi Bhavan New Delhi (1990)
2.2.4 Climate
Accordingly to Koeppan’s Scheme, the climate of the basin is classified as AW-
Tropical Savannah as most of the peninsular plateau, south of Tropic of Cancer is
classified. In the initial reaches, the climate is influenced by the Western Ghats which
becomes continued as the river reaches the coastal plains. The climatic variations are
experienced in the patterns of temperature, rainfall & winds, rhythm of seasons and
degree of wetness or dryness. These are described as follows:
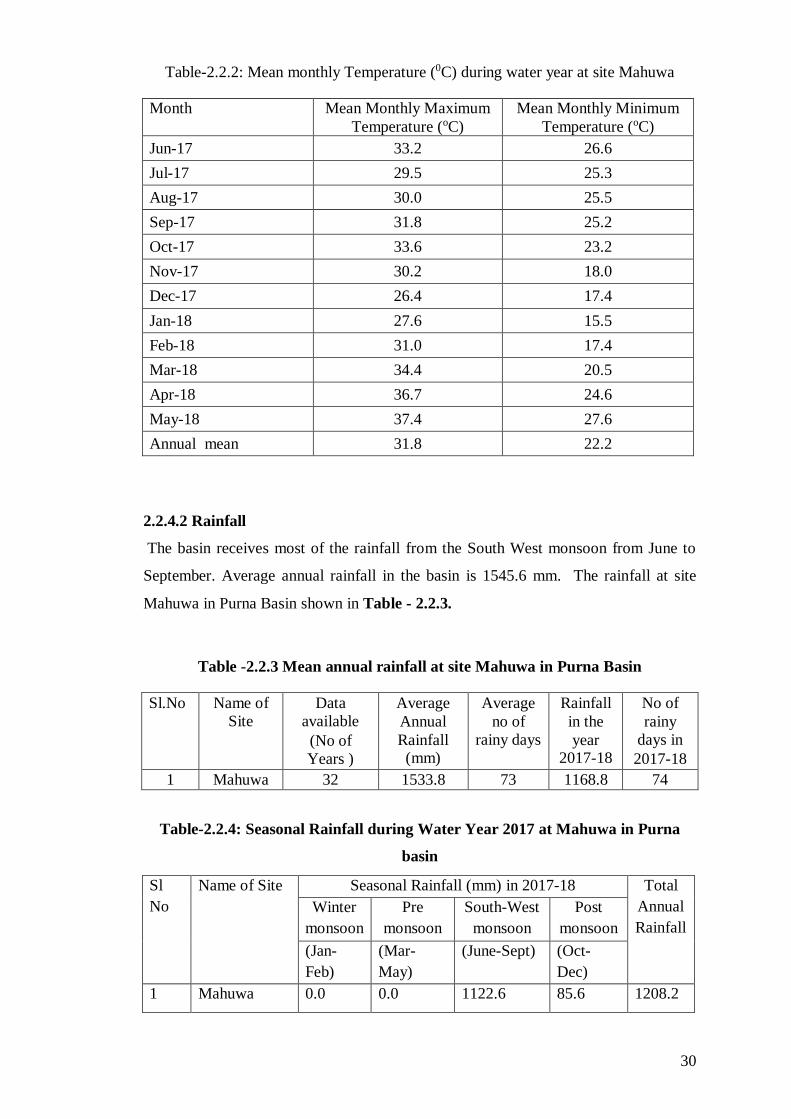
2.2.4.1 Temperature
The Temperature is maximum in the month of May and Minimum in the month of
December to January. The maximum, minimum temperatures observed at site
Mahuwa varies from 270 C to 460 C and 300 C to 100 C respectively. The temperature
profile in the basin is given in the Table -2.2.2
30
Table-2.2.2: Mean monthly Temperature (0C) during water year at site Mahuwa
Month Mean Monthly Maximum
Temperature (oC)
Mean Monthly Minimum
Temperature (oC)
Jun-17 33.2 26.6
Jul-17 29.5 25.3
Aug-17 30.0 25.5
Sep-17 31.8 25.2
Oct-17 33.6 23.2
Nov-17 30.2 18.0
Dec-17 26.4 17.4
Jan-18 27.6 15.5
Feb-18 31.0 17.4
Mar-18 34.4 20.5
Apr-18 36.7 24.6
May-18 37.4 27.6
Annual mean 31.8 22.2
2.2.4.2 Rainfall
The basin receives most of the rainfall from the South West monsoon from June to
September. Average annual rainfall in the basin is 1545.6 mm. The rainfall at site
Mahuwa in Purna Basin shown in Table - 2.2.3.
Table -2.2.3 Mean annual rainfall at site Mahuwa in Purna Basin
Sl.No Name of
Site
Data
available
(No of
Years )
Average
Annual
Rainfall (mm)
Average
no of
rainy days
Rainfall
in the
year 2017-18
No of
rainy
days in
2017-18
1 Mahuwa 32 1533.8 73 1168.8 74
Table-2.2.4: Seasonal Rainfall during Water Year 2017 at Mahuwa in Purna
basin
Sl
No
Name of Site
Seasonal Rainfall (mm) in 2017-18 Total
Annual
Rainfall
Winter
monsoon
Pre
monsoon
South-West
monsoon
Post
monsoon
(Jan-
Feb)
(Mar-
May)
(June-Sept) (Oct-
Dec)
1 Mahuwa 0.0 0.0 1122.6 85.6 1208.2
31
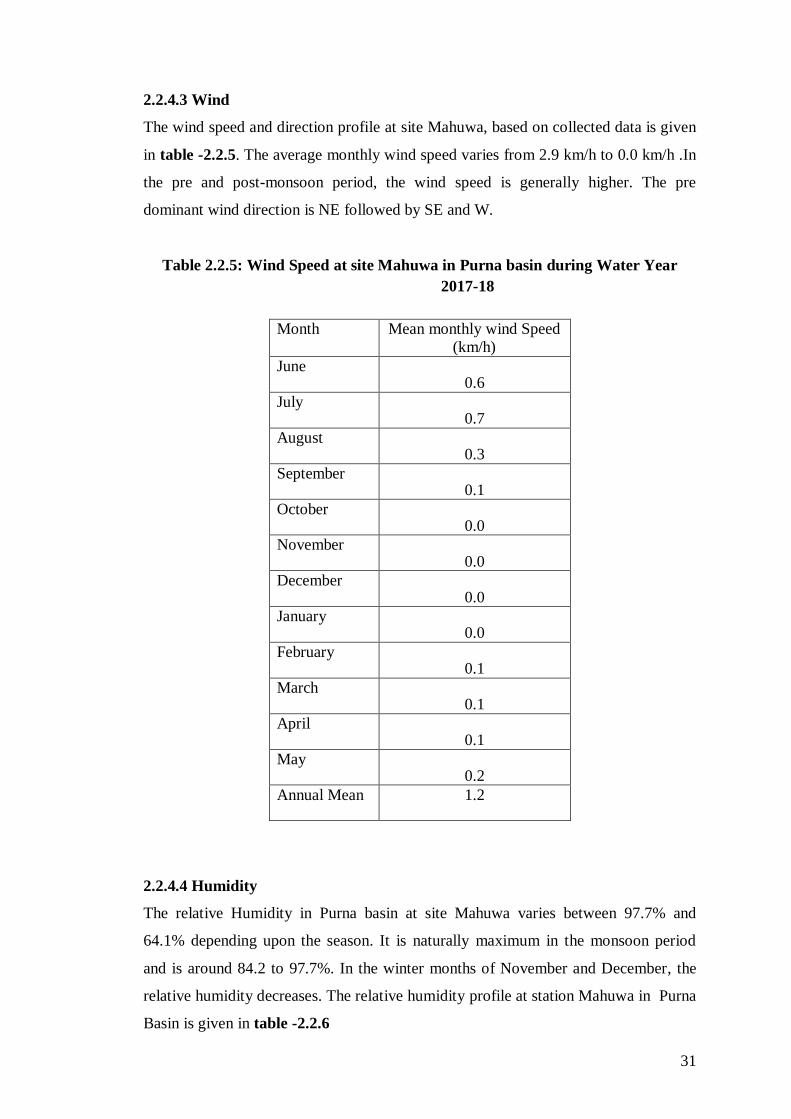
2.2.4.3 Wind
The wind speed and direction profile at site Mahuwa, based on collected data is given
in table -2.2.5. The average monthly wind speed varies from 2.9 km/h to 0.0 km/h .In
the pre and post-monsoon period, the wind speed is generally higher. The pre
dominant wind direction is NE followed by SE and W.
Table 2.2.5: Wind Speed at site Mahuwa in Purna basin during Water Year
2017-18
Month Mean monthly wind Speed
(km/h)
June 0.6
July 0.7
August 0.3
September 0.1
October 0.0
November 0.0
December 0.0
January 0.0
February 0.1
March 0.1
April 0.1
May 0.2
Annual Mean 1.2
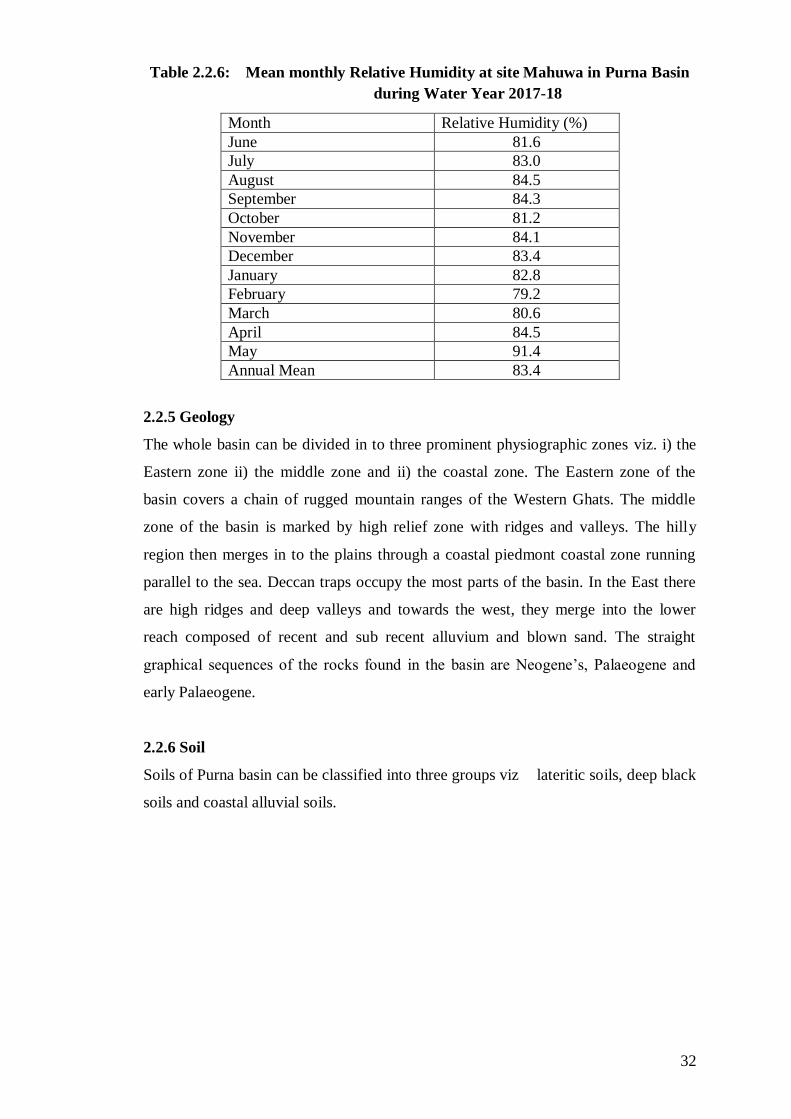
2.2.4.4 Humidity
The relative Humidity in Purna basin at site Mahuwa varies between 97.7% and
64.1% depending upon the season. It is naturally maximum in the monsoon period
and is around 84.2 to 97.7%. In the winter months of November and December, the
relative humidity decreases. The relative humidity profile at station Mahuwa in Purna
Basin is given in table -2.2.6
32
Table 2.2.6: Mean monthly Relative Humidity at site Mahuwa in Purna Basin
during Water Year 2017-18
Month Relative Humidity (%)
June 81.6
July 83.0
August 84.5
September 84.3
October 81.2
November 84.1
December 83.4
January 82.8
February 79.2
March 80.6
April 84.5
May 91.4
Annual Mean 83.4
2.2.5 Geology
The whole basin can be divided in to three prominent physiographic zones viz. i) the
Eastern zone ii) the middle zone and ii) the coastal zone. The Eastern zone of the
basin covers a chain of rugged mountain ranges of the Western Ghats. The middle
zone of the basin is marked by high relief zone with ridges and valleys. The hilly
region then merges in to the plains through a coastal piedmont coastal zone running
parallel to the sea. Deccan traps occupy the most parts of the basin. In the East there
are high ridges and deep valleys and towards the west, they merge into the lower
reach composed of recent and sub recent alluvium and blown sand. The straight
graphical sequences of the rocks found in the basin are Neogene’s, Palaeogene and
early Palaeogene.
2.2.6 Soil
Soils of Purna basin can be classified into three groups viz lateritic soils, deep black
soils and coastal alluvial soils.

33
2.3 Ambica Basin
2.3.1 Geographical setting of Ambica Basin
Ambica River is one of the important west flowing rivers with its catchment in
Gujarat and Maharashtra. The Ambica basin which is adjacent to the Auranga basin
can be divided in to two prominent physiographic zones. The eastern part comes
under a rugged mountain chain of the Sahyadri Western Ghats and descending on the
western side to the edge of the uplands of Surat district. This region is situated at
general elevation ranging from 1050 m to 100 m. The western part consists of hills
and valleys which generally lie below 100 m elevation. Its basin map is shown in
Plate -2.3.1.
2.3.2 River System
It originates from Saputara Hill ranges near village Kotambi of Surgana taluka in the
Nasik district of Maharashtra. After flowing for a length of 136 km it drains in to the
Arabian Sea. The important tributaries of the Ambica River are Kapri, Wallan, Kaveri
and Kharera. The river Ambica basin lies between 20 31’ and 20 57’ North latitude
Plate -.2.3.1
34
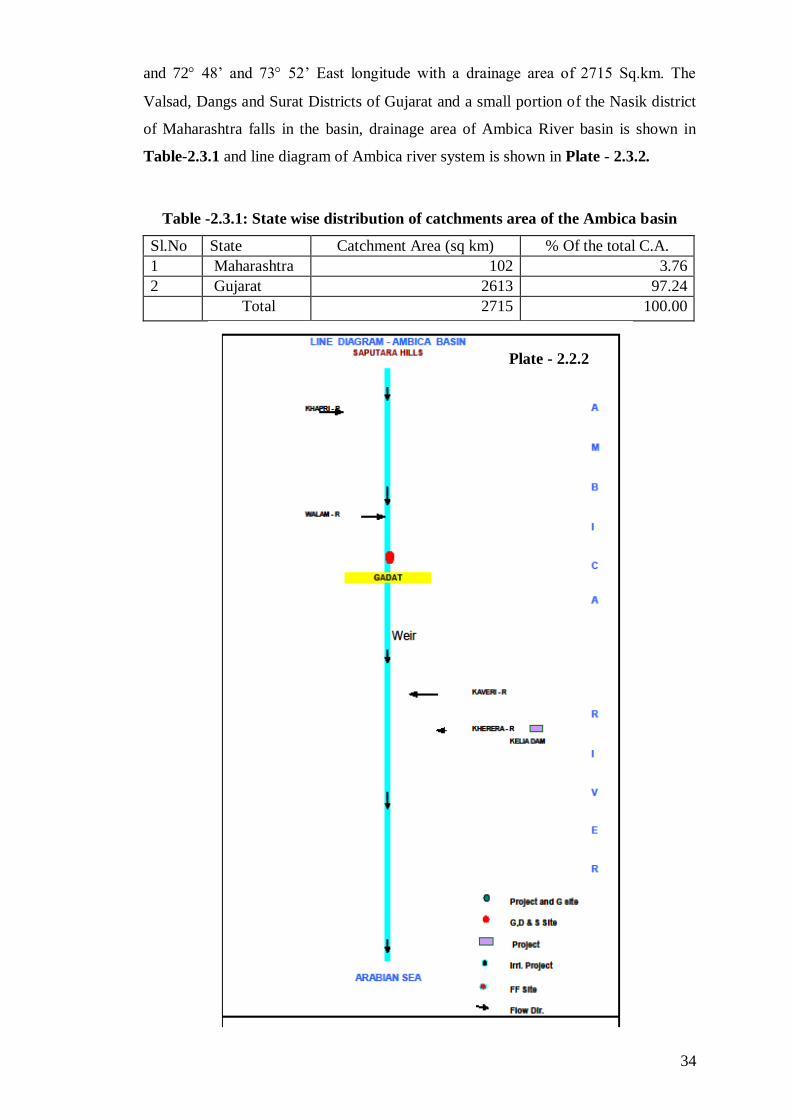
and 72 48’ and 73 52’ East longitude with a drainage area of 2715 Sq.km. The
Valsad, Dangs and Surat Districts of Gujarat and a small portion of the Nasik district
of Maharashtra falls in the basin, drainage area of Ambica River basin is shown in
Table-2.3.1 and line diagram of Ambica river system is shown in Plate - 2.3.2.
Table -2.3.1: State wise distribution of catchments area of the Ambica basin
Sl.No State Catchment Area (sq km) % Of the total C.A.
1 Maharashtra 102 3.76
2 Gujarat 2613 97.24
Total 2715 100.00
Plate - 2.2.2
35
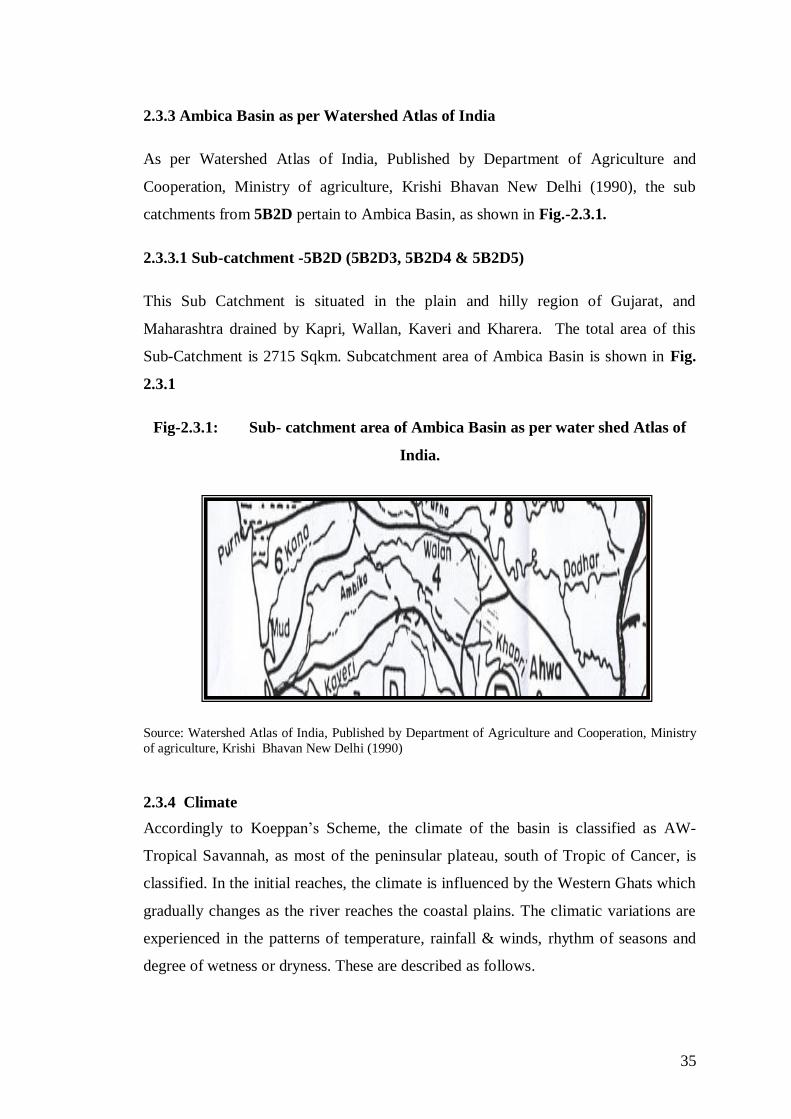
2.3.3 Ambica Basin as per Watershed Atlas of India
As per Watershed Atlas of India, Published by Department of Agriculture and
Cooperation, Ministry of agriculture, Krishi Bhavan New Delhi (1990), the sub
catchments from 5B2D pertain to Ambica Basin, as shown in Fig.-2.3.1.
2.3.3.1 Sub-catchment -5B2D (5B2D3, 5B2D4 & 5B2D5)
This Sub Catchment is situated in the plain and hilly region of Gujarat, and
Maharashtra drained by Kapri, Wallan, Kaveri and Kharera. The total area of this
Sub-Catchment is 2715 Sqkm. Subcatchment area of Ambica Basin is shown in Fig.
2.3.1
Fig-2.3.1: Sub- catchment area of Ambica Basin as per water shed Atlas of
India.
Source: Watershed Atlas of India, Published by Department of Agriculture and Cooperation, Ministry
of agriculture, Krishi Bhavan New Delhi (1990)
2.3.4 Climate
Accordingly to Koeppan’s Scheme, the climate of the basin is classified as AW-
Tropical Savannah, as most of the peninsular plateau, south of Tropic of Cancer, is
classified. In the initial reaches, the climate is influenced by the Western Ghats which
gradually changes as the river reaches the coastal plains. The climatic variations are
experienced in the patterns of temperature, rainfall & winds, rhythm of seasons and
degree of wetness or dryness. These are described as follows.
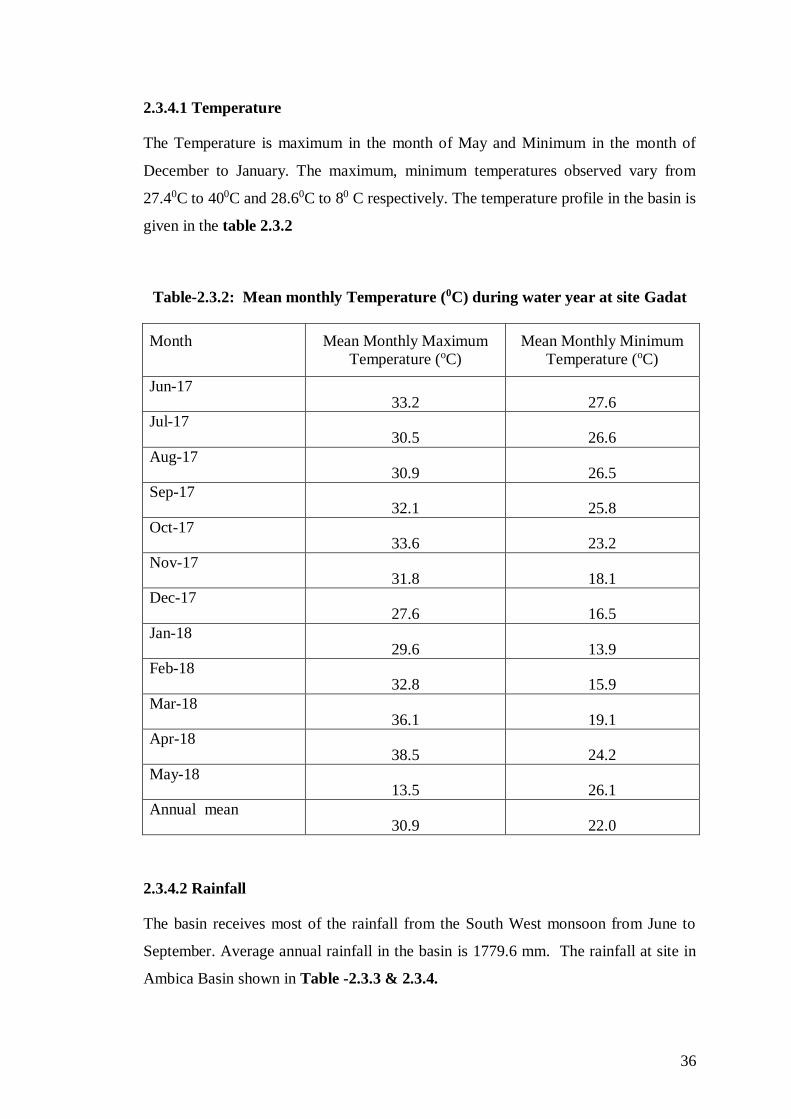
36
2.3.4.1 Temperature
The Temperature is maximum in the month of May and Minimum in the month of
December to January. The maximum, minimum temperatures observed vary from
27.40C to 400C and 28.60C to 80 C respectively. The temperature profile in the basin is
given in the table 2.3.2
Table-2.3.2: Mean monthly Temperature (0C) during water year at site Gadat
Month Mean Monthly Maximum
Temperature (oC)
Mean Monthly Minimum
Temperature (oC)
Jun-17 33.2 27.6
Jul-17 30.5 26.6
Aug-17 30.9 26.5
Sep-17 32.1 25.8
Oct-17 33.6 23.2
Nov-17 31.8 18.1
Dec-17 27.6 16.5
Jan-18 29.6 13.9
Feb-18 32.8 15.9
Mar-18 36.1 19.1
Apr-18 38.5 24.2
May-18 13.5 26.1
Annual mean 30.9 22.0
2.3.4.2 Rainfall
The basin receives most of the rainfall from the South West monsoon from June to
September. Average annual rainfall in the basin is 1779.6 mm. The rainfall at site in
Ambica Basin shown in Table -2.3.3 & 2.3.4.
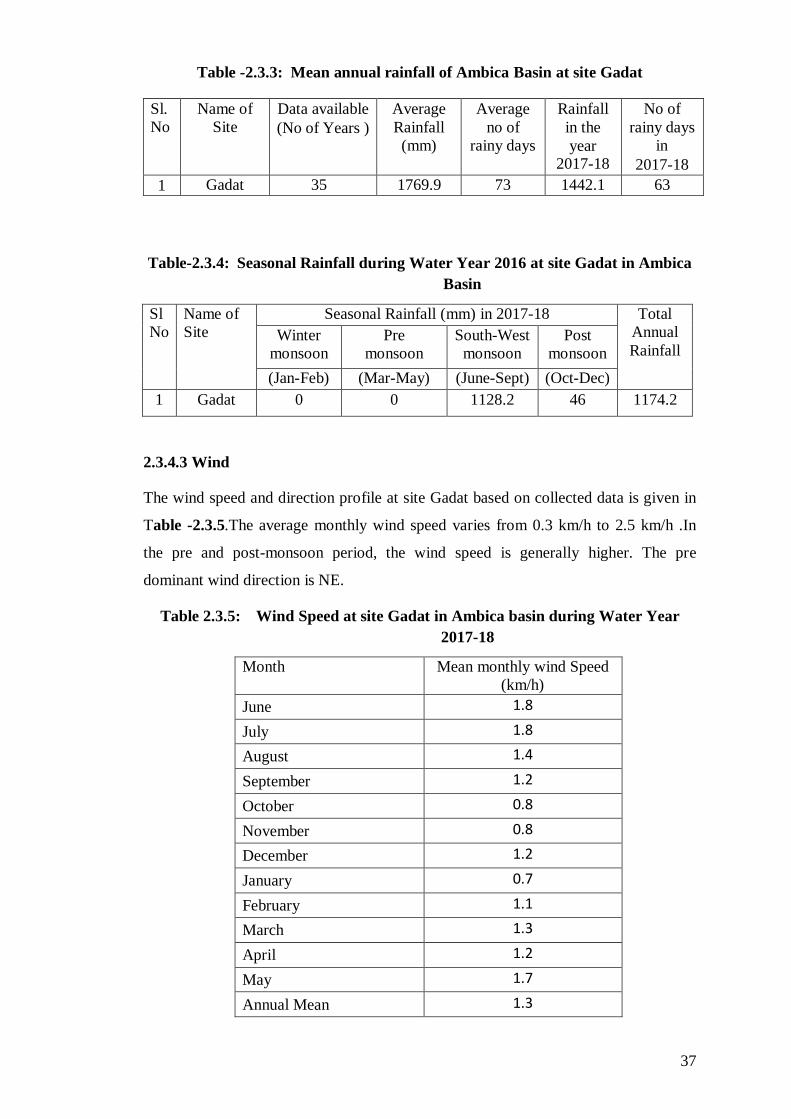
37
Table -2.3.3: Mean annual rainfall of Ambica Basin at site Gadat
Sl.
No
Name of
Site
Data available
(No of Years )
Average
Rainfall
(mm)
Average
no of
rainy days
Rainfall
in the
year 2017-18
No of
rainy days
in
2017-18
1 Gadat 35 1769.9 73 1442.1 63
Table-2.3.4: Seasonal Rainfall during Water Year 2016 at site Gadat in Ambica
Basin
Sl
No
Name of
Site
Seasonal Rainfall (mm) in 2017-18 Total
Annual
Rainfall Winter
monsoon
Pre
monsoon
South-West
monsoon
Post
monsoon
(Jan-Feb) (Mar-May) (June-Sept) (Oct-Dec)
1 Gadat 0 0 1128.2 46 1174.2
2.3.4.3 Wind
The wind speed and direction profile at site Gadat based on collected data is given in
Table -2.3.5.The average monthly wind speed varies from 0.3 km/h to 2.5 km/h .In
the pre and post-monsoon period, the wind speed is generally higher. The pre
dominant wind direction is NE.
Table 2.3.5: Wind Speed at site Gadat in Ambica basin during Water Year
2017-18
Month Mean monthly wind Speed
(km/h)
June 1.8
July 1.8
August 1.4
September 1.2
October 0.8
November 0.8
December 1.2
January 0.7
February 1.1
March 1.3
April 1.2
May 1.7
Annual Mean 1.3

38
2.3.4.4 Humidity
The relative Humidity in Ambica basin varies between 93.3 % to 74.0 % depending
upon the season the humidity is naturally maximum in the monsoon period and is
around 93.3 to 89.9 %. In the winter months of November and December the relative
humidity comes down. The relative humidity at station of CWC representative of
Purna Basin is given in Table- 2.3.6
Table -2.3.6: Mean monthly Relative Humidity at site Gadat in Ambica Basin
during Water Year 2017-18
Month Relative Humidity (%)
June 91.7
July 91.5
August 91.7
September 91.6
October 91.3
November 89.7
December 89.3
January 88.5
February 88.7
March 89.8
April 91.0
May 91.1
Annual Mean 90.5
2.3.5 Geology
The basin can be divided into two prominent physiographic zones. The eastern part
comes under rugged mountain chains of the Saputara Hills and descends on the
western side to the edge of the uplands of Surat district. This region is placed at a
general elevation of 1050 m to 100 m. The western part, barring the coastal plain, is
essentially in the sub Sahyadrin zone of hills and valleys generally below 100 m
elevation. Deccan traps and intermediate amphitheatres have developed out of the
alluvial debris washed from the hills. The lower reaches of the basin upto the coastal
margins are mainly alluvial plains
2.3.6 Soil
Soil of Ambica basin can be broadly classified into three group viz. Laterite soil, deep
black soil and alluvial soil.
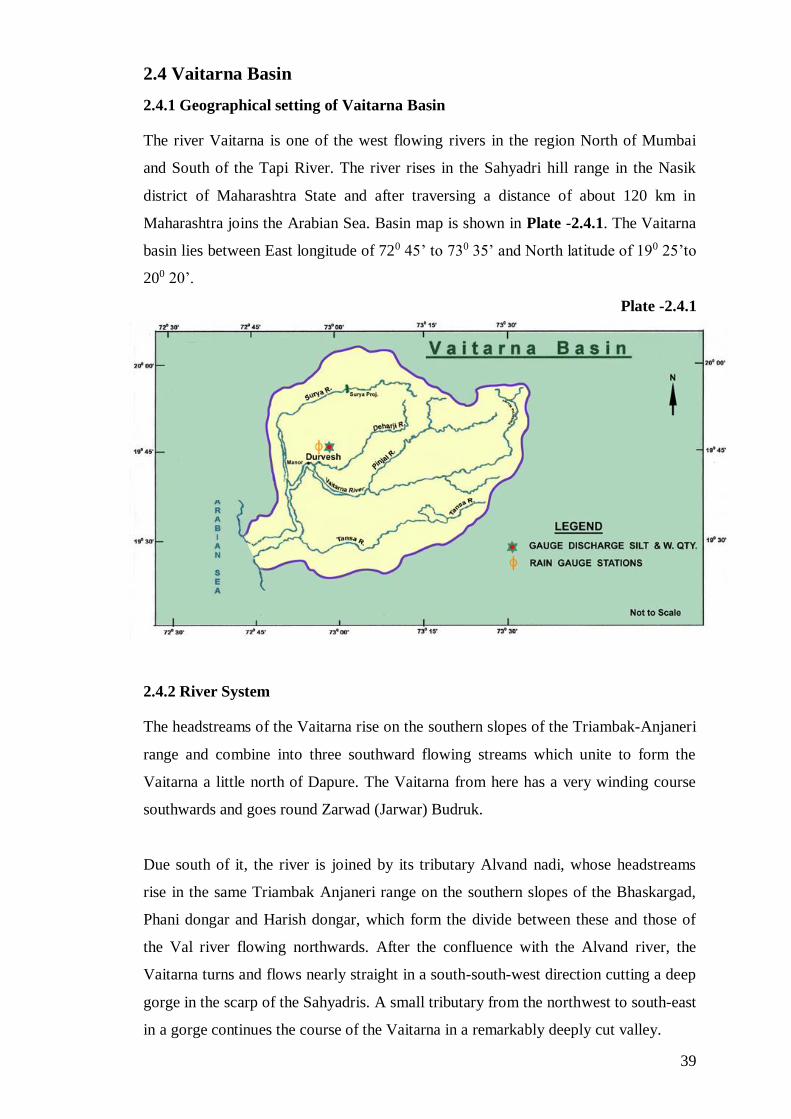
39
2.4 Vaitarna Basin
2.4.1 Geographical setting of Vaitarna Basin
The river Vaitarna is one of the west flowing rivers in the region North of Mumbai
and South of the Tapi River. The river rises in the Sahyadri hill range in the Nasik
district of Maharashtra State and after traversing a distance of about 120 km in
Maharashtra joins the Arabian Sea. Basin map is shown in Plate -2.4.1. The Vaitarna
basin lies between East longitude of 720 45’ to 730 35’ and North latitude of 190 25’to
200 20’.
Plate -2.4.1
2.4.2 River System
The headstreams of the Vaitarna rise on the southern slopes of the Triambak-Anjaneri
range and combine into three southward flowing streams which unite to form the
Vaitarna a little north of Dapure. The Vaitarna from here has a very winding course
southwards and goes round Zarwad (Jarwar) Budruk.
Due south of it, the river is joined by its tributary Alvand nadi, whose headstreams
rise in the same Triambak Anjaneri range on the southern slopes of the Bhaskargad,
Phani dongar and Harish dongar, which form the divide between these and those of
the Val river flowing northwards. After the confluence with the Alvand river, the
Vaitarna turns and flows nearly straight in a south-south-west direction cutting a deep
gorge in the scarp of the Sahyadris. A small tributary from the northwest to south-east
in a gorge continues the course of the Vaitarna in a remarkably deeply cut valley.
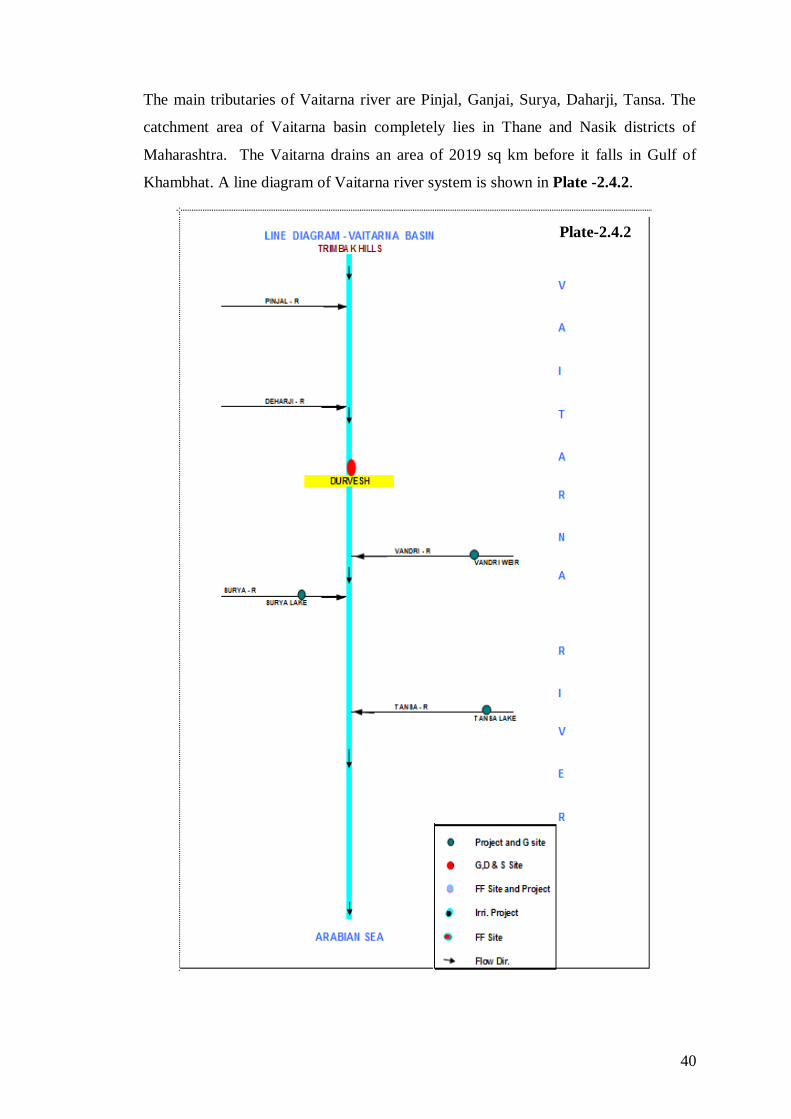
40
The main tributaries of Vaitarna river are Pinjal, Ganjai, Surya, Daharji, Tansa. The
catchment area of Vaitarna basin completely lies in Thane and Nasik districts of
Maharashtra. The Vaitarna drains an area of 2019 sq km before it falls in Gulf of
Khambhat. A line diagram of Vaitarna river system is shown in Plate -2.4.2.
Plate-2.4.2
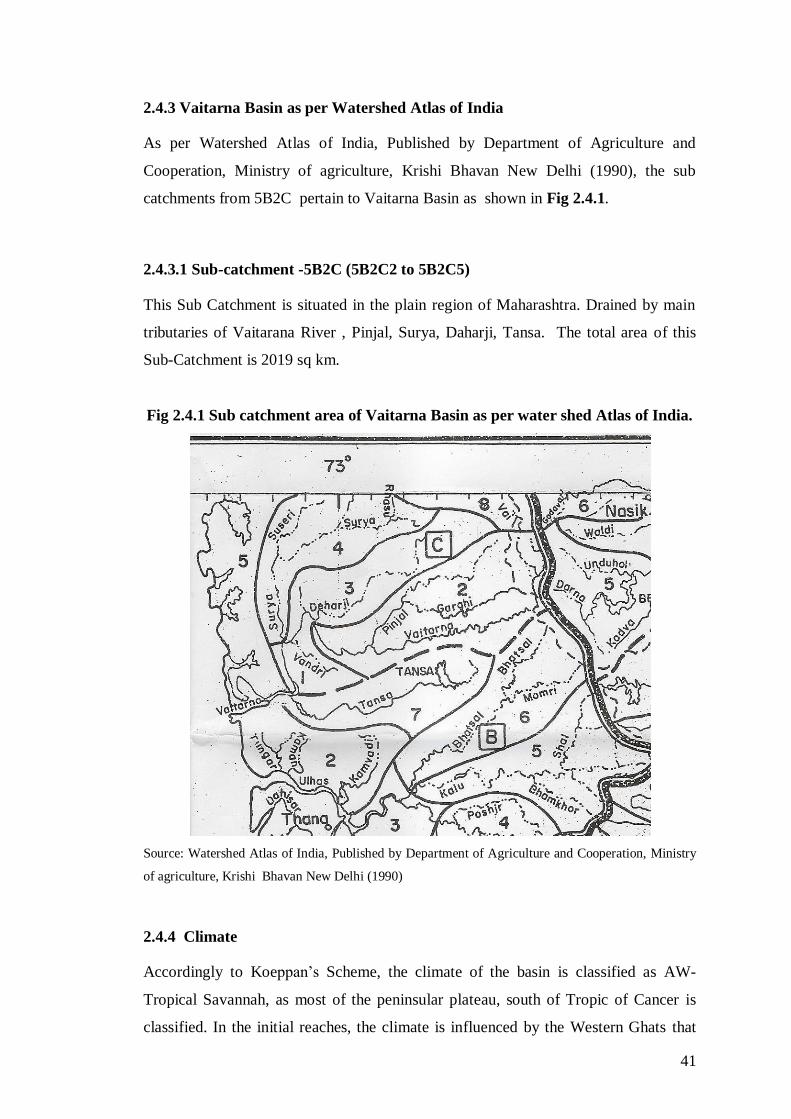
41
2.4.3 Vaitarna Basin as per Watershed Atlas of India
As per Watershed Atlas of India, Published by Department of Agriculture and
Cooperation, Ministry of agriculture, Krishi Bhavan New Delhi (1990), the sub
catchments from 5B2C pertain to Vaitarna Basin as shown in Fig 2.4.1.
2.4.3.1 Sub-catchment -5B2C (5B2C2 to 5B2C5)
This Sub Catchment is situated in the plain region of Maharashtra. Drained by main
tributaries of Vaitarana River , Pinjal, Surya, Daharji, Tansa. The total area of this
Sub-Catchment is 2019 sq km.
Fig 2.4.1 Sub catchment area of Vaitarna Basin as per water shed Atlas of India.
Source: Watershed Atlas of India, Published by Department of Agriculture and Cooperation, Ministry
of agriculture, Krishi Bhavan New Delhi (1990)
2.4.4 Climate
Accordingly to Koeppan’s Scheme, the climate of the basin is classified as AW-
Tropical Savannah, as most of the peninsular plateau, south of Tropic of Cancer is
classified. In the initial reaches, the climate is influenced by the Western Ghats that
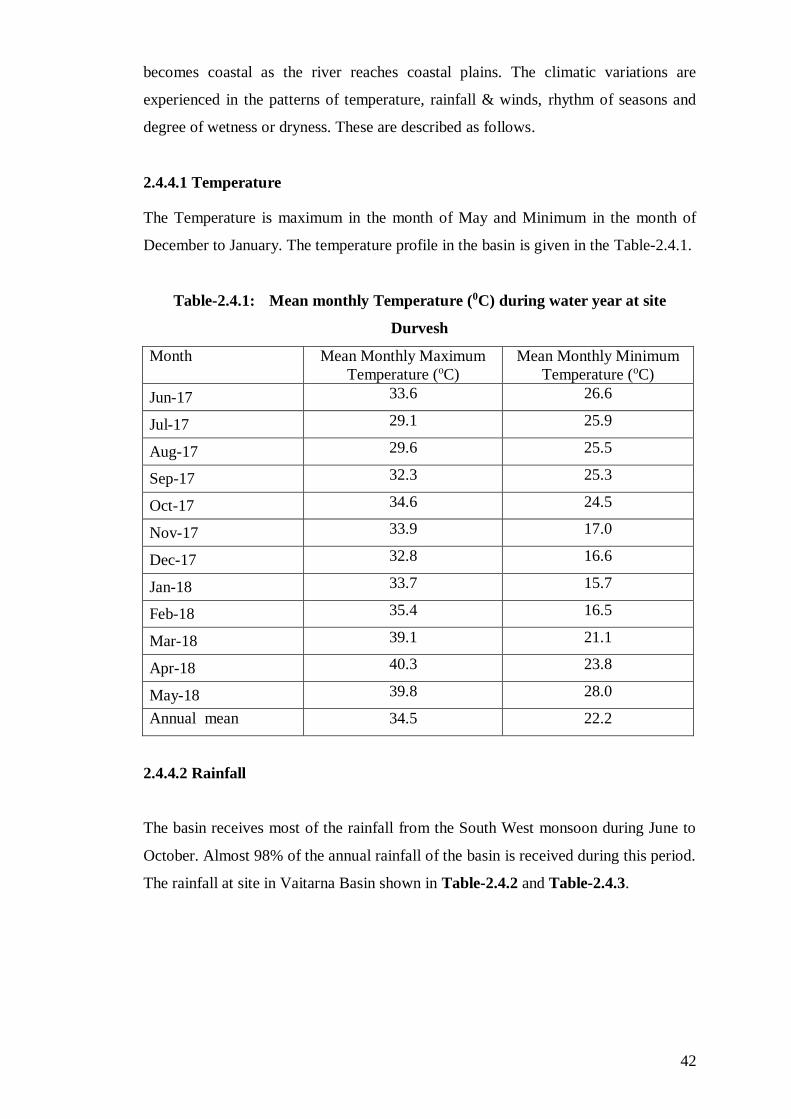
42
becomes coastal as the river reaches coastal plains. The climatic variations are
experienced in the patterns of temperature, rainfall & winds, rhythm of seasons and
degree of wetness or dryness. These are described as follows.
2.4.4.1 Temperature
The Temperature is maximum in the month of May and Minimum in the month of
December to January. The temperature profile in the basin is given in the Table-2.4.1.
Table-2.4.1: Mean monthly Temperature (0C) during water year at site
Durvesh
Month Mean Monthly Maximum
Temperature (oC)
Mean Monthly Minimum
Temperature (oC)
Jun-17 33.6 26.6
Jul-17 29.1 25.9
Aug-17 29.6 25.5
Sep-17 32.3 25.3
Oct-17 34.6 24.5
Nov-17 33.9 17.0
Dec-17 32.8 16.6
Jan-18 33.7 15.7
Feb-18 35.4 16.5
Mar-18 39.1 21.1
Apr-18 40.3 23.8
May-18 39.8 28.0
Annual mean 34.5 22.2
2.4.4.2 Rainfall
The basin receives most of the rainfall from the South West monsoon during June to
October. Almost 98% of the annual rainfall of the basin is received during this period.
The rainfall at site in Vaitarna Basin shown in Table-2.4.2 and Table-2.4.3.
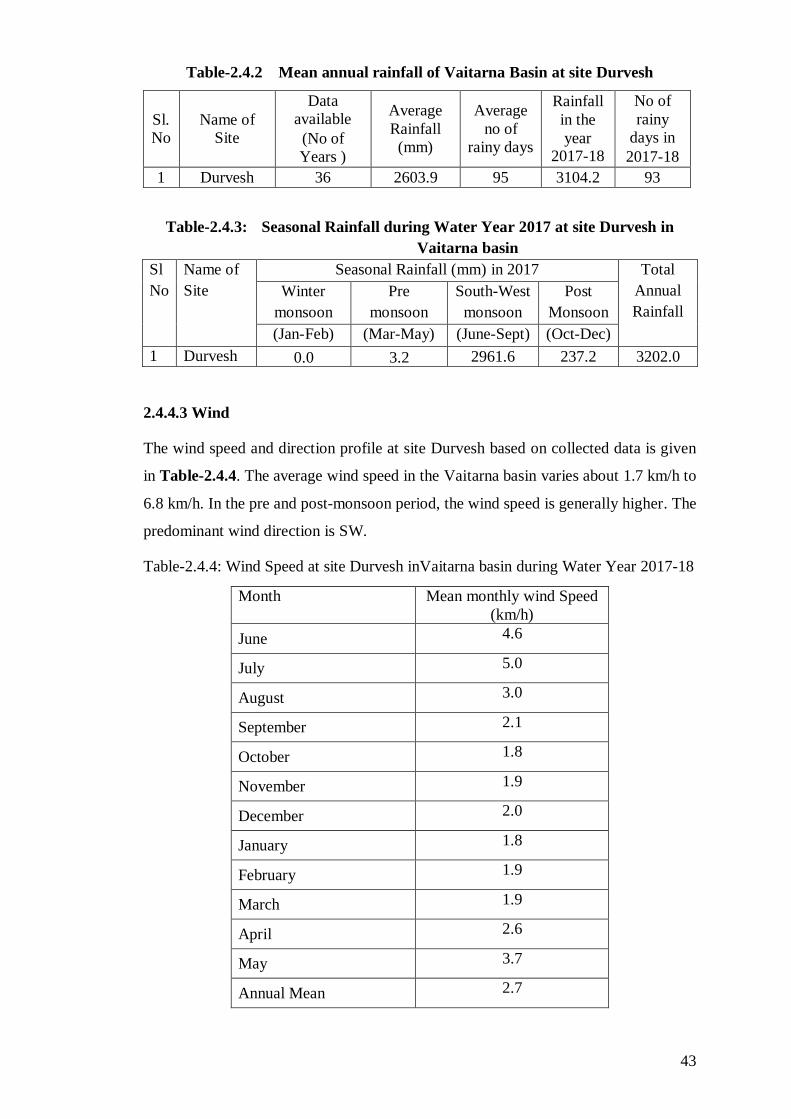
43
Table-2.4.2 Mean annual rainfall of Vaitarna Basin at site Durvesh
Sl.
No
Name of
Site
Data
available
(No of
Years )
Average
Rainfall
(mm)
Average
no of
rainy days
Rainfall
in the
year 2017-18
No of
rainy
days in
2017-18
1 Durvesh 36 2603.9 95 3104.2 93
Table-2.4.3: Seasonal Rainfall during Water Year 2017 at site Durvesh in
Vaitarna basin
Sl
No
Name of
Site
Seasonal Rainfall (mm) in 2017 Total
Annual
Rainfall
Winter
monsoon
Pre
monsoon
South-West
monsoon
Post
Monsoon
(Jan-Feb) (Mar-May) (June-Sept) (Oct-Dec)
1 Durvesh 0.0 3.2 2961.6 237.2 3202.0
2.4.4.3 Wind
The wind speed and direction profile at site Durvesh based on collected data is given
in Table-2.4.4. The average wind speed in the Vaitarna basin varies about 1.7 km/h to
6.8 km/h. In the pre and post-monsoon period, the wind speed is generally higher. The
predominant wind direction is SW.
Table-2.4.4: Wind Speed at site Durvesh inVaitarna basin during Water Year 2017-18
Month Mean monthly wind Speed
(km/h)
June 4.6
July 5.0
August 3.0
September 2.1
October 1.8
November 1.9
December 2.0
January 1.8
February 1.9
March 1.9
April 2.6
May 3.7
Annual Mean 2.7
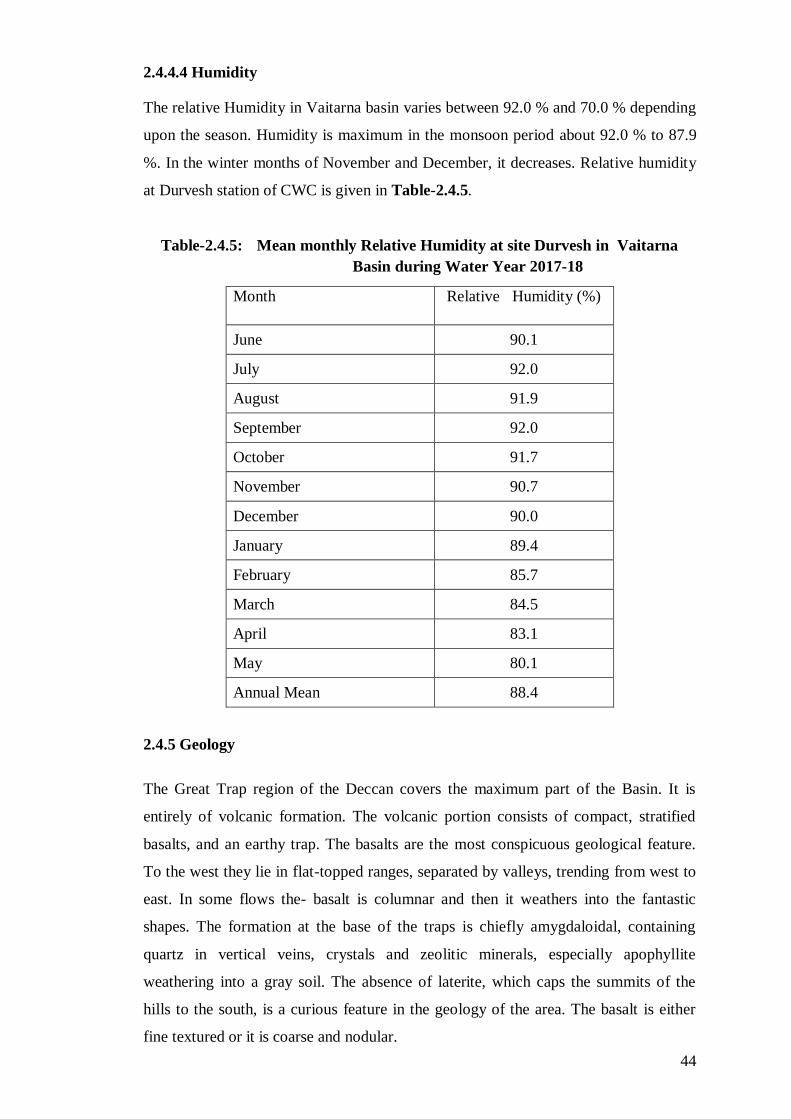
44
2.4.4.4 Humidity
The relative Humidity in Vaitarna basin varies between 92.0 % and 70.0 % depending
upon the season. Humidity is maximum in the monsoon period about 92.0 % to 87.9
%. In the winter months of November and December, it decreases. Relative humidity
at Durvesh station of CWC is given in Table-2.4.5.
Table-2.4.5: Mean monthly Relative Humidity at site Durvesh in Vaitarna
Basin during Water Year 2017-18
Month Relative Humidity (%)
June 90.1
July 92.0
August 91.9
September 92.0
October 91.7
November 90.7
December 90.0
January 89.4
February 85.7
March 84.5
April 83.1
May 80.1
Annual Mean 88.4
2.4.5 Geology
The Great Trap region of the Deccan covers the maximum part of the Basin. It is
entirely of volcanic formation. The volcanic portion consists of compact, stratified
basalts, and an earthy trap. The basalts are the most conspicuous geological feature.
To the west they lie in flat-topped ranges, separated by valleys, trending from west to
east. In some flows the- basalt is columnar and then it weathers into the fantastic
shapes. The formation at the base of the traps is chiefly amygdaloidal, containing
quartz in vertical veins, crystals and zeolitic minerals, especially apophyllite
weathering into a gray soil. The absence of laterite, which caps the summits of the
hills to the south, is a curious feature in the geology of the area. The basalt is either
fine textured or it is coarse and nodular.
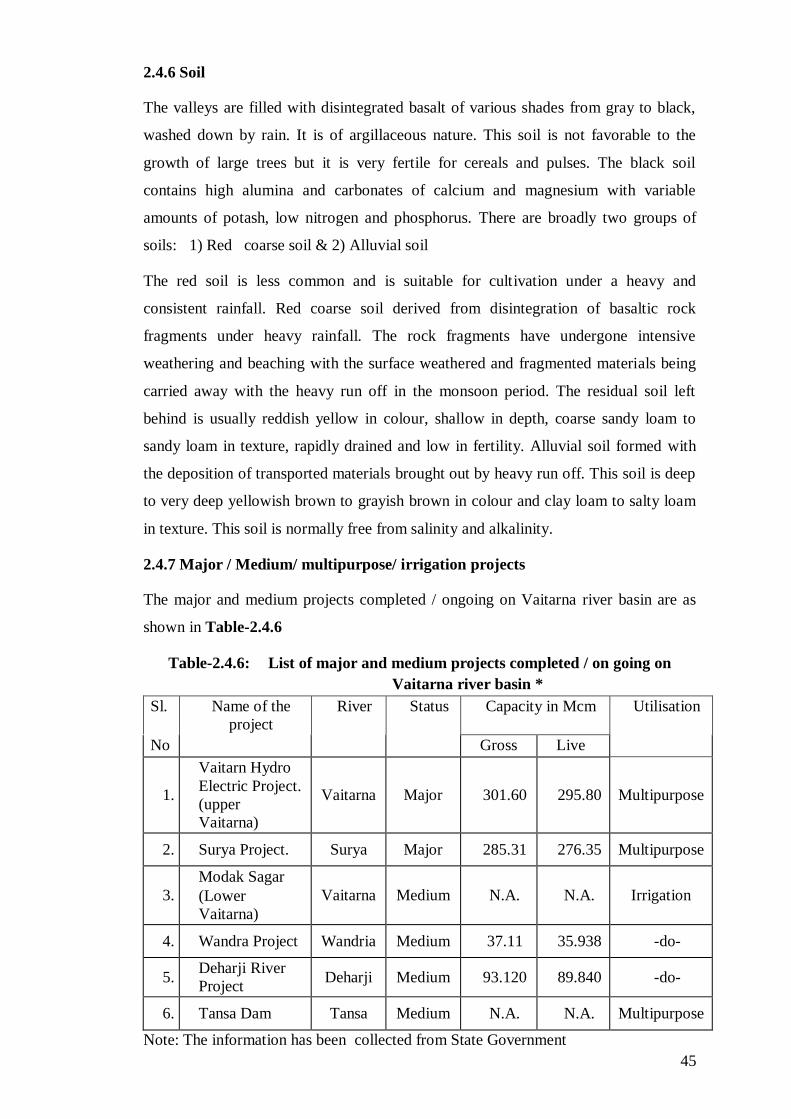
45
2.4.6 Soil
The valleys are filled with disintegrated basalt of various shades from gray to black,
washed down by rain. It is of argillaceous nature. This soil is not favorable to the
growth of large trees but it is very fertile for cereals and pulses. The black soil
contains high alumina and carbonates of calcium and magnesium with variable
amounts of potash, low nitrogen and phosphorus. There are broadly two groups of
soils: 1) Red coarse soil & 2) Alluvial soil
The red soil is less common and is suitable for cultivation under a heavy and
consistent rainfall. Red coarse soil derived from disintegration of basaltic rock
fragments under heavy rainfall. The rock fragments have undergone intensive
weathering and beaching with the surface weathered and fragmented materials being
carried away with the heavy run off in the monsoon period. The residual soil left
behind is usually reddish yellow in colour, shallow in depth, coarse sandy loam to
sandy loam in texture, rapidly drained and low in fertility. Alluvial soil formed with
the deposition of transported materials brought out by heavy run off. This soil is deep
to very deep yellowish brown to grayish brown in colour and clay loam to salty loam
in texture. This soil is normally free from salinity and alkalinity.
2.4.7 Major / Medium/ multipurpose/ irrigation projects
The major and medium projects completed / ongoing on Vaitarna river basin are as
shown in Table-2.4.6
Table-2.4.6: List of major and medium projects completed / on going on
Vaitarna river basin *
Sl. Name of the
project
River Status Capacity in Mcm Utilisation
No Gross Live
1.
Vaitarn Hydro
Electric Project.
(upper
Vaitarna)
Vaitarna Major 301.60 295.80 Multipurpose
2. Surya Project. Surya Major 285.31 276.35 Multipurpose
3.
Modak Sagar
(Lower
Vaitarna)
Vaitarna Medium N.A. N.A. Irrigation
4. Wandra Project Wandria Medium 37.11 35.938 -do-
5. Deharji River
Project Deharji Medium 93.120 89.840 -do-
6. Tansa Dam Tansa Medium N.A. N.A. Multipurpose
Note: The information has been collected from State Government
46
2.4.7.1 Vaitarna hydropower project
Vaitarna hydropower project is located near Vaitarna and Alwandi masonry and
earthen dam on Vaitarna and Alwandi Rivers, 30 km from Ghoti, in Nashik District,
Maharashtra. The catchment area at the dam is 160.8 km2. The height and length of
the dam is 47 m and 555 m respectively. The reservoir has a live storage capacity of
35 MCM at FRL 603.5 m and the MDDL is at 580 m. The power house has a unit of
60 MW. It has a firm power of 11 MW with mean annual inflow of 635 MCM. MSEB
commissioned the project in 1976.
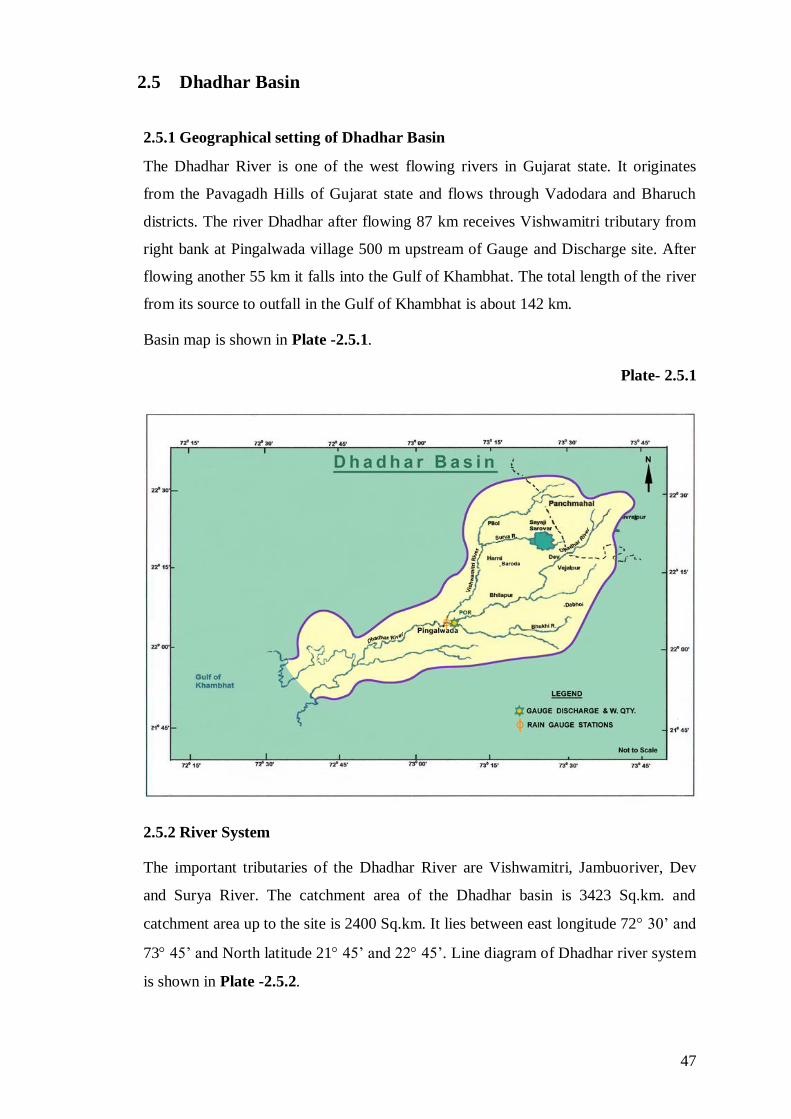
47
2.5 Dhadhar Basin
2.5.1 Geographical setting of Dhadhar Basin
The Dhadhar River is one of the west flowing rivers in Gujarat state. It originates
from the Pavagadh Hills of Gujarat state and flows through Vadodara and Bharuch
districts. The river Dhadhar after flowing 87 km receives Vishwamitri tributary from
right bank at Pingalwada village 500 m upstream of Gauge and Discharge site. After
flowing another 55 km it falls into the Gulf of Khambhat. The total length of the river
from its source to outfall in the Gulf of Khambhat is about 142 km.
Basin map is shown in Plate -2.5.1.
Plate- 2.5.1
2.5.2 River System
The important tributaries of the Dhadhar River are Vishwamitri, Jambuoriver, Dev
and Surya River. The catchment area of the Dhadhar basin is 3423 Sq.km. and
catchment area up to the site is 2400 Sq.km. It lies between east longitude 72 30’ and
73 45’ and North latitude 21 45’ and 22 45’. Line diagram of Dhadhar river system
is shown in Plate -2.5.2.
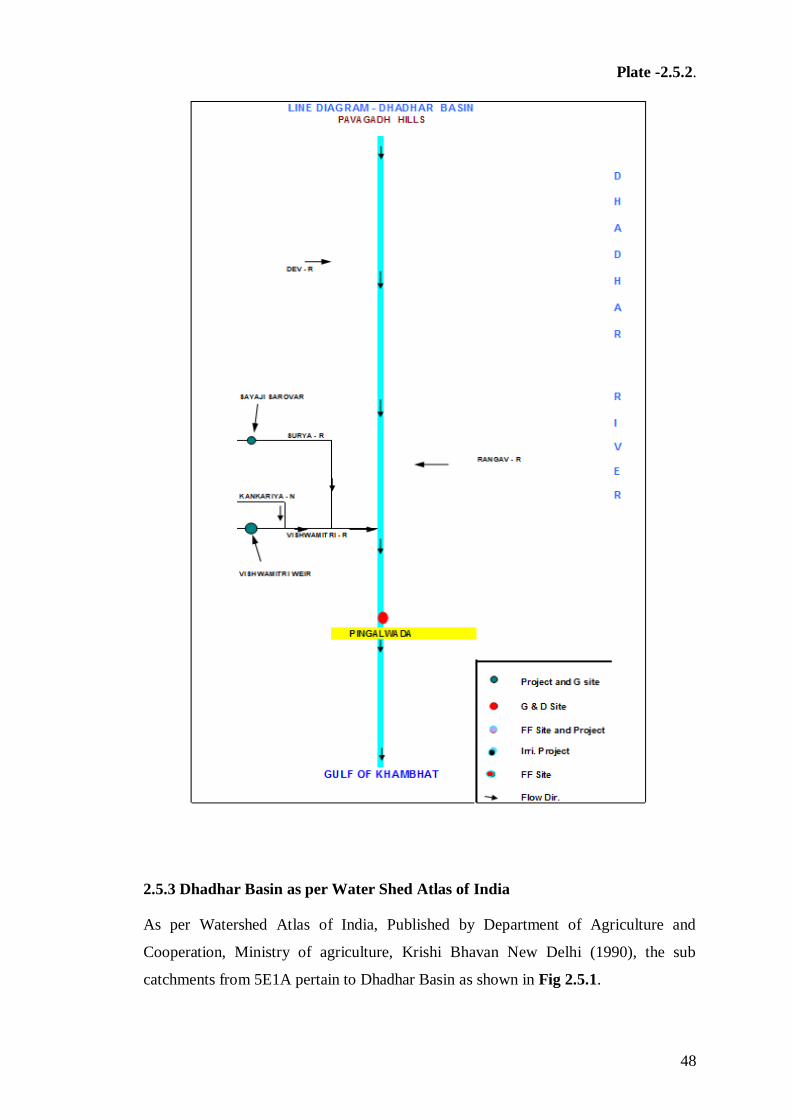
48
Plate -2.5.2.
2.5.3 Dhadhar Basin as per Water Shed Atlas of India
As per Watershed Atlas of India, Published by Department of Agriculture and
Cooperation, Ministry of agriculture, Krishi Bhavan New Delhi (1990), the sub
catchments from 5E1A pertain to Dhadhar Basin as shown in Fig 2.5.1.
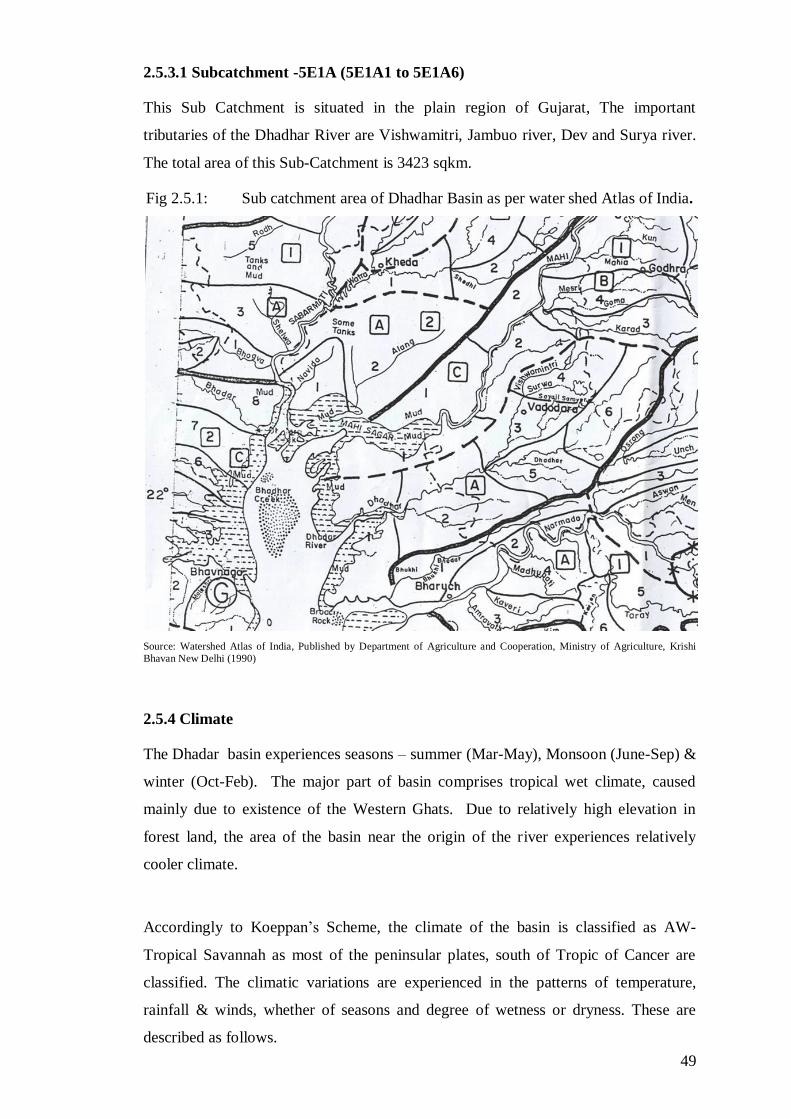
49
2.5.3.1 Subcatchment -5E1A (5E1A1 to 5E1A6)
This Sub Catchment is situated in the plain region of Gujarat, The important
tributaries of the Dhadhar River are Vishwamitri, Jambuo river, Dev and Surya river.
The total area of this Sub-Catchment is 3423 sqkm.
Fig 2.5.1: Sub catchment area of Dhadhar Basin as per water shed Atlas of India.
Source: Watershed Atlas of India, Published by Department of Agriculture and Cooperation, Ministry of Agriculture, Krishi
Bhavan New Delhi (1990)
2.5.4 Climate
The Dhadar basin experiences seasons – summer (Mar-May), Monsoon (June-Sep) &
winter (Oct-Feb). The major part of basin comprises tropical wet climate, caused
mainly due to existence of the Western Ghats. Due to relatively high elevation in
forest land, the area of the basin near the origin of the river experiences relatively
cooler climate.
Accordingly to Koeppan’s Scheme, the climate of the basin is classified as AW-
Tropical Savannah as most of the peninsular plates, south of Tropic of Cancer are
classified. The climatic variations are experienced in the patterns of temperature,
rainfall & winds, whether of seasons and degree of wetness or dryness. These are
described as follows.
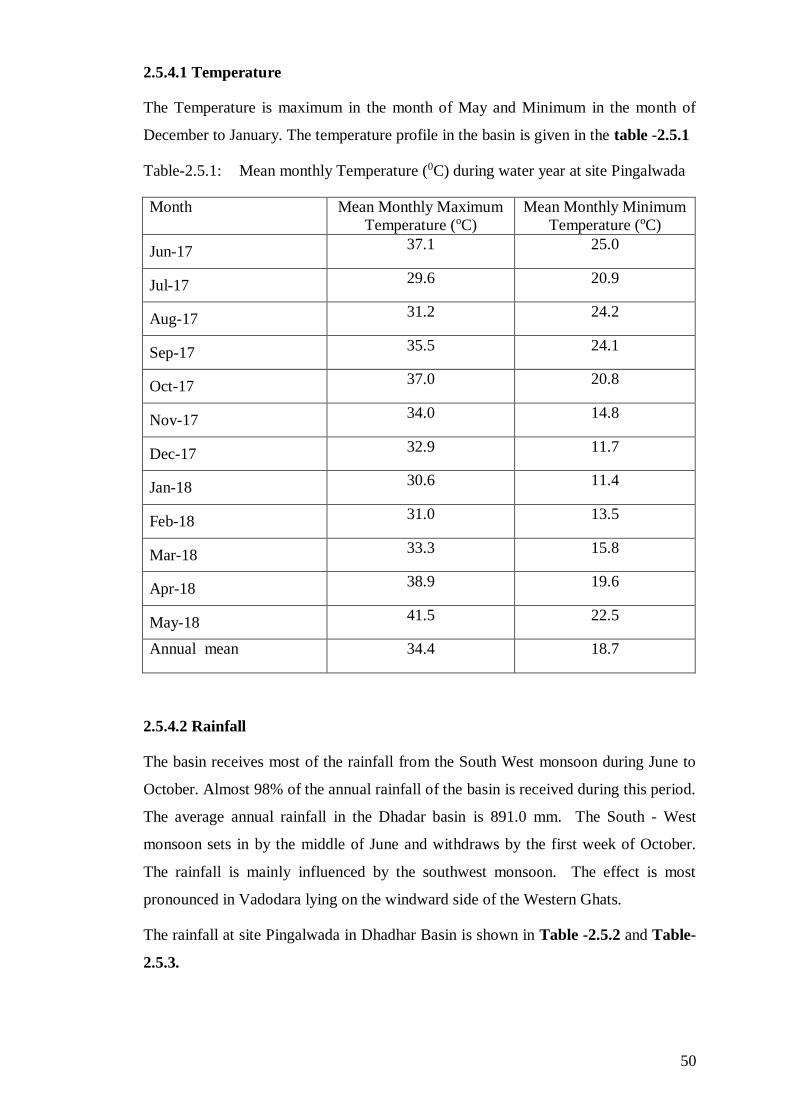
50
2.5.4.1 Temperature
The Temperature is maximum in the month of May and Minimum in the month of
December to January. The temperature profile in the basin is given in the table -2.5.1
Table-2.5.1: Mean monthly Temperature (0C) during water year at site Pingalwada
Month Mean Monthly Maximum
Temperature (oC)
Mean Monthly Minimum
Temperature (oC)
Jun-17 37.1 25.0
Jul-17 29.6 20.9
Aug-17 31.2 24.2
Sep-17 35.5 24.1
Oct-17 37.0 20.8
Nov-17 34.0 14.8
Dec-17 32.9 11.7
Jan-18 30.6 11.4
Feb-18 31.0 13.5
Mar-18 33.3 15.8
Apr-18 38.9 19.6
May-18 41.5 22.5
Annual mean 34.4 18.7
2.5.4.2 Rainfall
The basin receives most of the rainfall from the South West monsoon during June to
October. Almost 98% of the annual rainfall of the basin is received during this period.
The average annual rainfall in the Dhadar basin is 891.0 mm. The South - West
monsoon sets in by the middle of June and withdraws by the first week of October.
The rainfall is mainly influenced by the southwest monsoon. The effect is most
pronounced in Vadodara lying on the windward side of the Western Ghats.
The rainfall at site Pingalwada in Dhadhar Basin is shown in Table -2.5.2 and Table-
2.5.3.
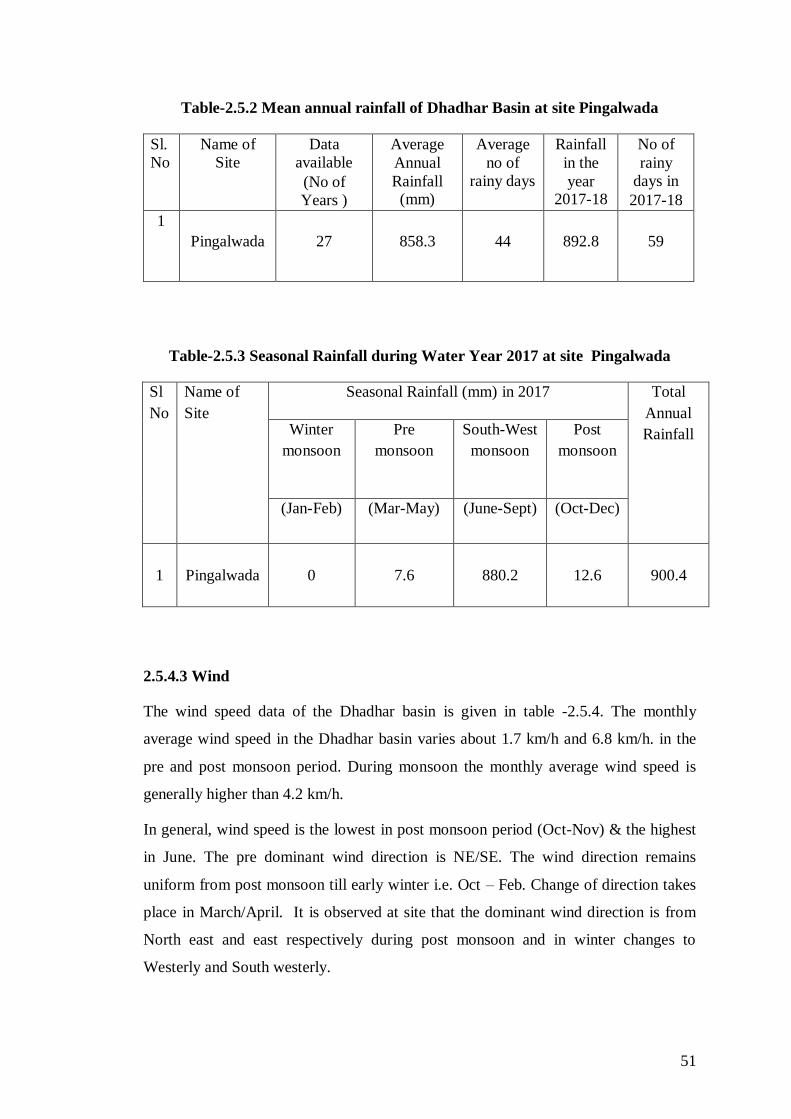
51
Table-2.5.2 Mean annual rainfall of Dhadhar Basin at site Pingalwada
Sl.
No
Name of
Site
Data
available
(No of
Years )
Average
Annual
Rainfall (mm)
Average
no of
rainy days
Rainfall
in the
year 2017-18
No of
rainy
days in
2017-18
1
Pingalwada 27 858.3 44 892.8 59
Table-2.5.3 Seasonal Rainfall during Water Year 2017 at site Pingalwada
Sl
No
Name of
Site
Seasonal Rainfall (mm) in 2017 Total
Annual
Rainfall Winter
monsoon
Pre
monsoon
South-West
monsoon
Post
monsoon
(Jan-Feb) (Mar-May) (June-Sept) (Oct-Dec)
1 Pingalwada 0 7.6 880.2 12.6 900.4
2.5.4.3 Wind
The wind speed data of the Dhadhar basin is given in table -2.5.4. The monthly
average wind speed in the Dhadhar basin varies about 1.7 km/h and 6.8 km/h. in the
pre and post monsoon period. During monsoon the monthly average wind speed is
generally higher than 4.2 km/h.
In general, wind speed is the lowest in post monsoon period (Oct-Nov) & the highest
in June. The pre dominant wind direction is NE/SE. The wind direction remains
uniform from post monsoon till early winter i.e. Oct – Feb. Change of direction takes
place in March/April. It is observed at site that the dominant wind direction is from
North east and east respectively during post monsoon and in winter changes to
Westerly and South westerly.
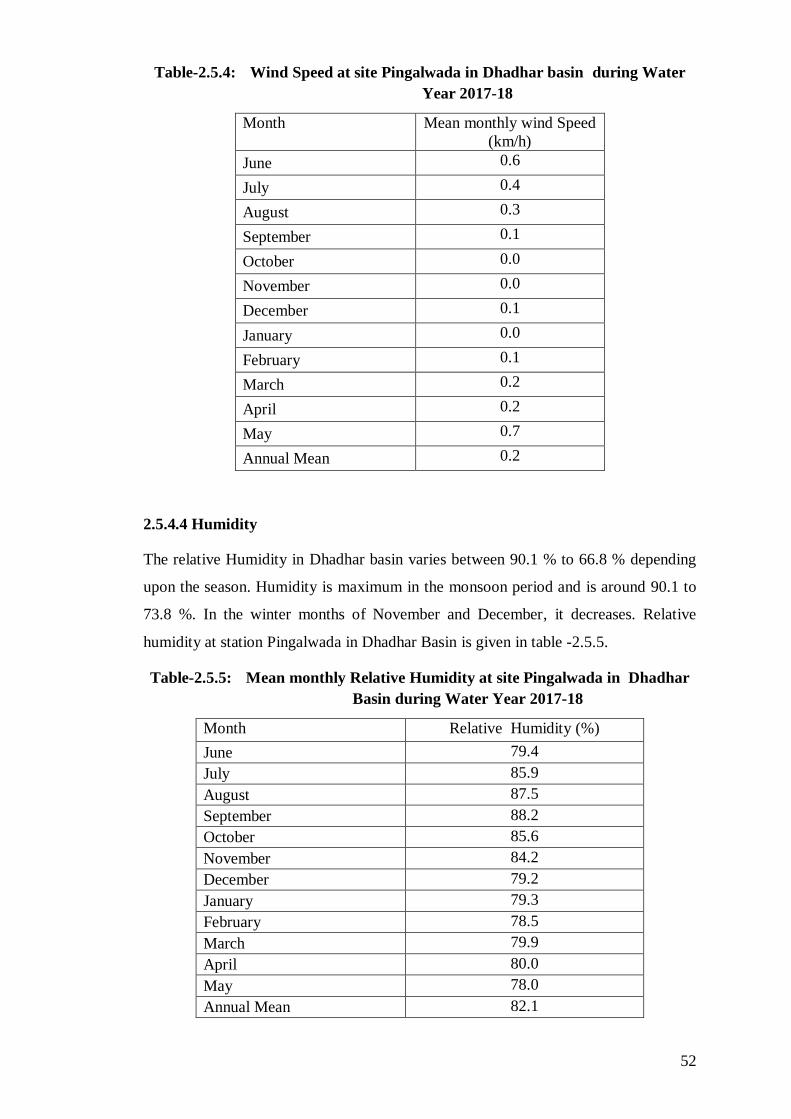
52
Table-2.5.4: Wind Speed at site Pingalwada in Dhadhar basin during Water
Year 2017-18
Month Mean monthly wind Speed
(km/h)
June 0.6
July 0.4
August 0.3
September 0.1
October 0.0
November 0.0
December 0.1
January 0.0
February 0.1
March 0.2
April 0.2
May 0.7
Annual Mean 0.2
2.5.4.4 Humidity
The relative Humidity in Dhadhar basin varies between 90.1 % to 66.8 % depending
upon the season. Humidity is maximum in the monsoon period and is around 90.1 to
73.8 %. In the winter months of November and December, it decreases. Relative
humidity at station Pingalwada in Dhadhar Basin is given in table -2.5.5.
Table-2.5.5: Mean monthly Relative Humidity at site Pingalwada in Dhadhar
Basin during Water Year 2017-18
Month Relative Humidity (%)
June 79.4
July 85.9
August 87.5
September 88.2
October 85.6
November 84.2
December 79.2
January 79.3
February 78.5
March 79.9
April 80.0
May 78.0
Annual Mean 82.1
53
2.5.5 Geology
The Late Pleistocene fluvial succession is exposed as 18–20 m high incised vertical
cliffs all along the Dhadhar River basin in western India. The major fluvial
sedimentary facies of the Late Pleistocene deposits in the Dhadhar River basin have
preserved evidence of palaeo-drainage and could provide an important link between
the sub-humid Narmada basin in the south and the semi-arid Mahi basin in the north.
The sedimentary facies documented include overbank fines, which are associated with
crevasse splays. Fine grained overbank sediments are interpreted as having formed by
sheet flow of sediments over the banks of minor distributary channels during the flood
stage. The overlying thinly stratified fluvial sands and silts, at the top of the exposed
sediment succession show a thin cap of aeolian sediments suggesting less intense
aeolian activity than that observed in Sabarmati, Mahi and Orsang basins, though a
significant reduction in fluvial activity is suggested during the arid phase of the LGM.
However, the river may still have been perennial assuming that it retained the larger
part of the catchment.
2.5.6 Major/Medium/Multipurpose/Irrigation projects
Ajwa tank, Pratap pura, Uma Bhariara, Dhanora, Ghansarva, Haripura, Vadodara,
Deo Dam are the medium existing/ongoing projects in the basin.
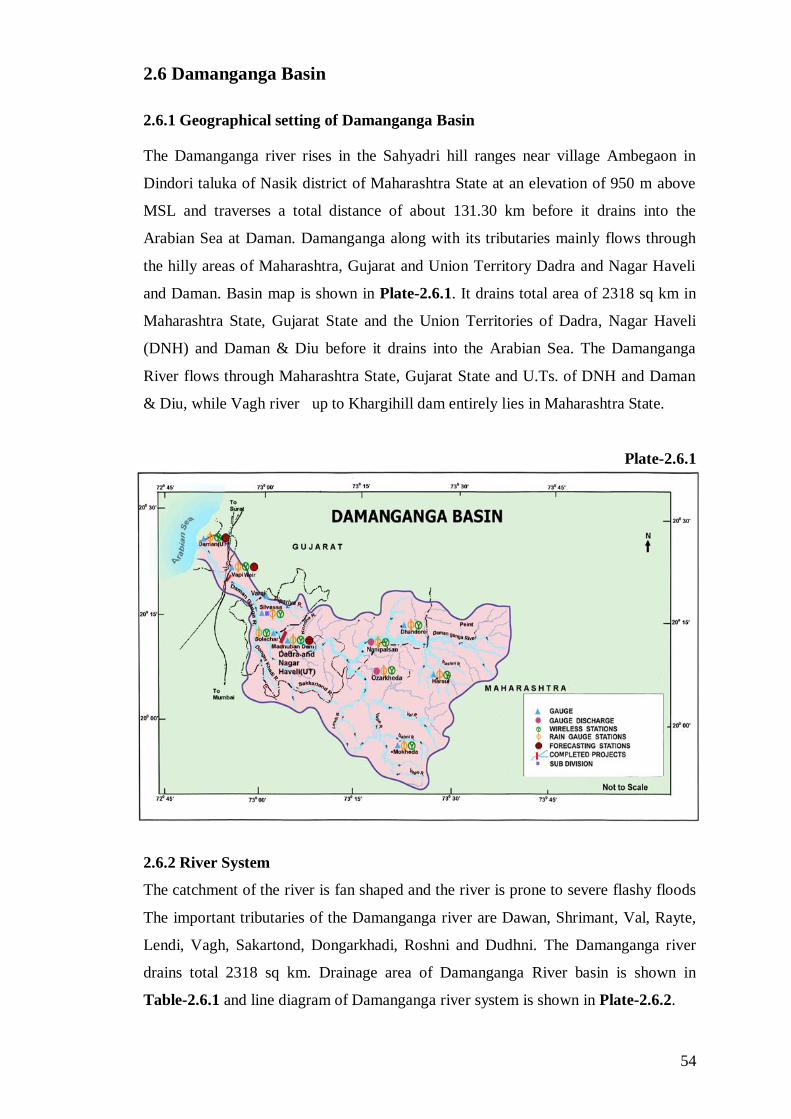
54
2.6 Damanganga Basin
2.6.1 Geographical setting of Damanganga Basin
The Damanganga river rises in the Sahyadri hill ranges near village Ambegaon in
Dindori taluka of Nasik district of Maharashtra State at an elevation of 950 m above
MSL and traverses a total distance of about 131.30 km before it drains into the
Arabian Sea at Daman. Damanganga along with its tributaries mainly flows through
the hilly areas of Maharashtra, Gujarat and Union Territory Dadra and Nagar Haveli
and Daman. Basin map is shown in Plate-2.6.1. It drains total area of 2318 sq km in
Maharashtra State, Gujarat State and the Union Territories of Dadra, Nagar Haveli
(DNH) and Daman & Diu before it drains into the Arabian Sea. The Damanganga
River flows through Maharashtra State, Gujarat State and U.Ts. of DNH and Daman
& Diu, while Vagh river up to Khargihill dam entirely lies in Maharashtra State.
Plate-2.6.1
2.6.2 River System
The catchment of the river is fan shaped and the river is prone to severe flashy floods
The important tributaries of the Damanganga river are Dawan, Shrimant, Val, Rayte,
Lendi, Vagh, Sakartond, Dongarkhadi, Roshni and Dudhni. The Damanganga river
drains total 2318 sq km. Drainage area of Damanganga River basin is shown in
Table-2.6.1 and line diagram of Damanganga river system is shown in Plate-2.6.2.
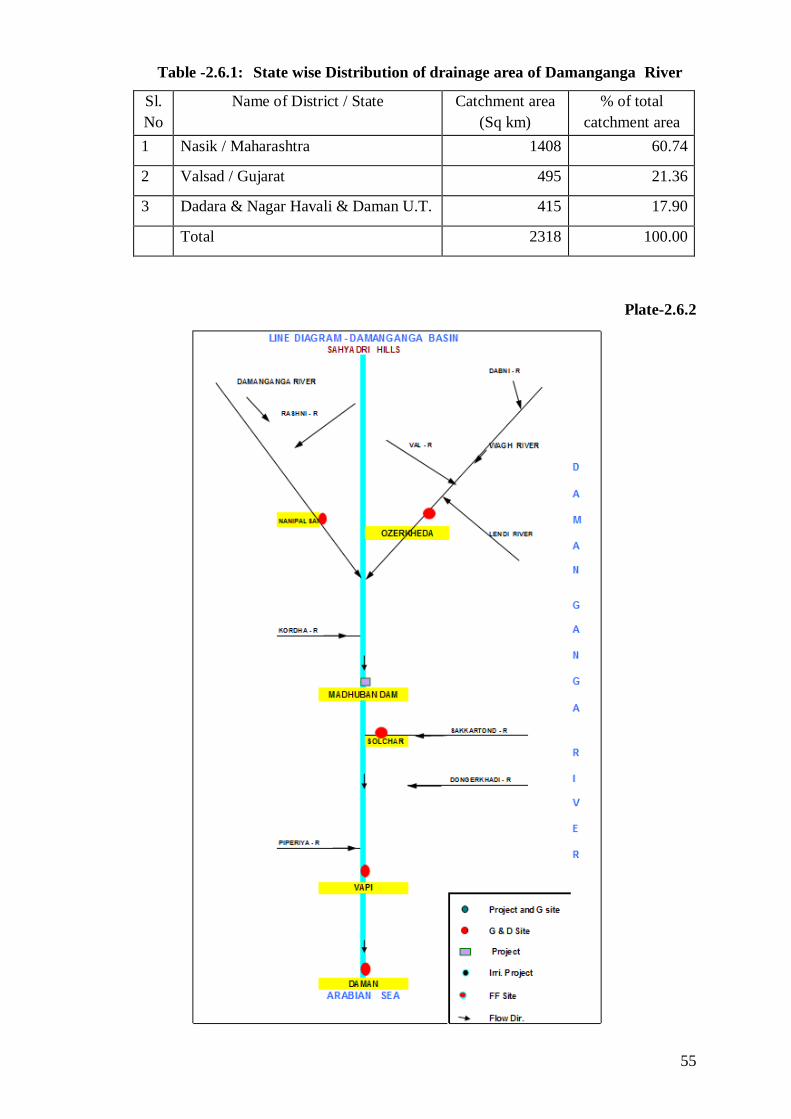
55
Table -2.6.1: State wise Distribution of drainage area of Damanganga River
Sl.
No
Name of District / State Catchment area
(Sq km)
% of total
catchment area
1 Nasik / Maharashtra 1408 60.74
2 Valsad / Gujarat 495 21.36
3 Dadara & Nagar Havali & Daman U.T. 415 17.90
Total 2318 100.00
Plate-2.6.2
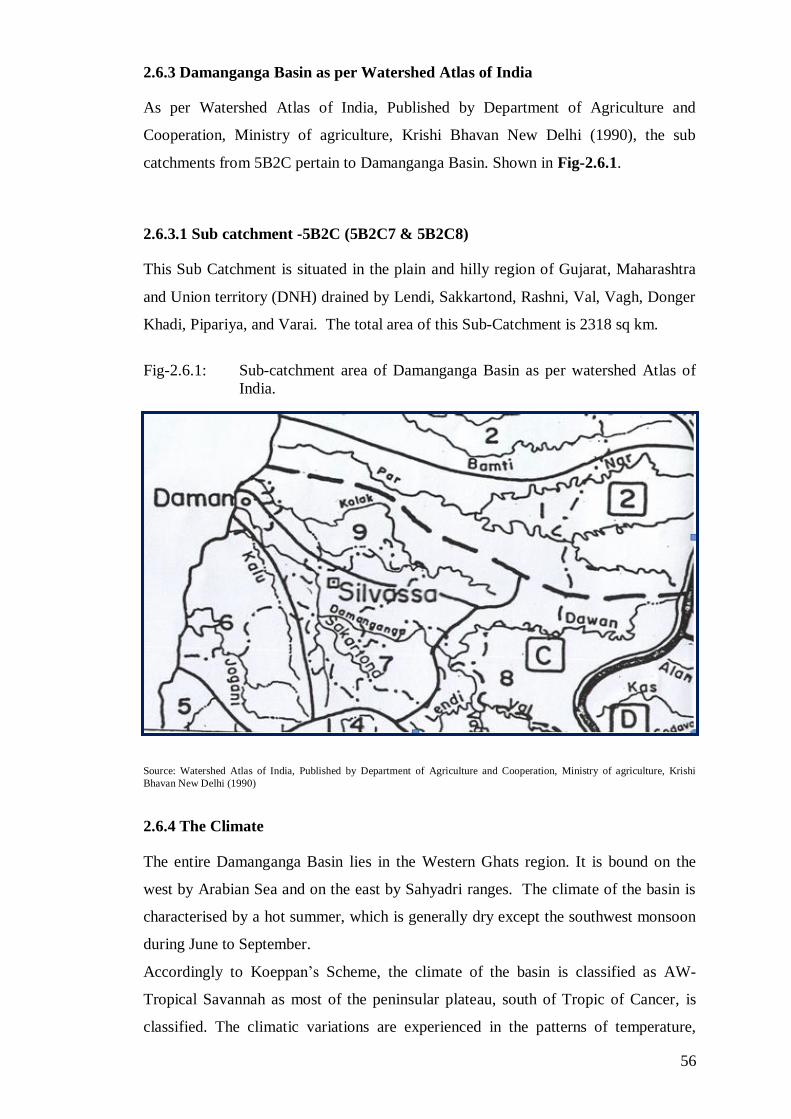
56
2.6.3 Damanganga Basin as per Watershed Atlas of India
As per Watershed Atlas of India, Published by Department of Agriculture and
Cooperation, Ministry of agriculture, Krishi Bhavan New Delhi (1990), the sub
catchments from 5B2C pertain to Damanganga Basin. Shown in Fig-2.6.1.
2.6.3.1 Sub catchment -5B2C (5B2C7 & 5B2C8)
This Sub Catchment is situated in the plain and hilly region of Gujarat, Maharashtra
and Union territory (DNH) drained by Lendi, Sakkartond, Rashni, Val, Vagh, Donger
Khadi, Pipariya, and Varai. The total area of this Sub-Catchment is 2318 sq km.
Fig-2.6.1: Sub-catchment area of Damanganga Basin as per watershed Atlas of
India.
Source: Watershed Atlas of India, Published by Department of Agriculture and Cooperation, Ministry of agriculture, Krishi
Bhavan New Delhi (1990)
2.6.4 The Climate
The entire Damanganga Basin lies in the Western Ghats region. It is bound on the
west by Arabian Sea and on the east by Sahyadri ranges. The climate of the basin is
characterised by a hot summer, which is generally dry except the southwest monsoon
during June to September.
Accordingly to Koeppan’s Scheme, the climate of the basin is classified as AW-
Tropical Savannah as most of the peninsular plateau, south of Tropic of Cancer, is
classified. The climatic variations are experienced in the patterns of temperature,
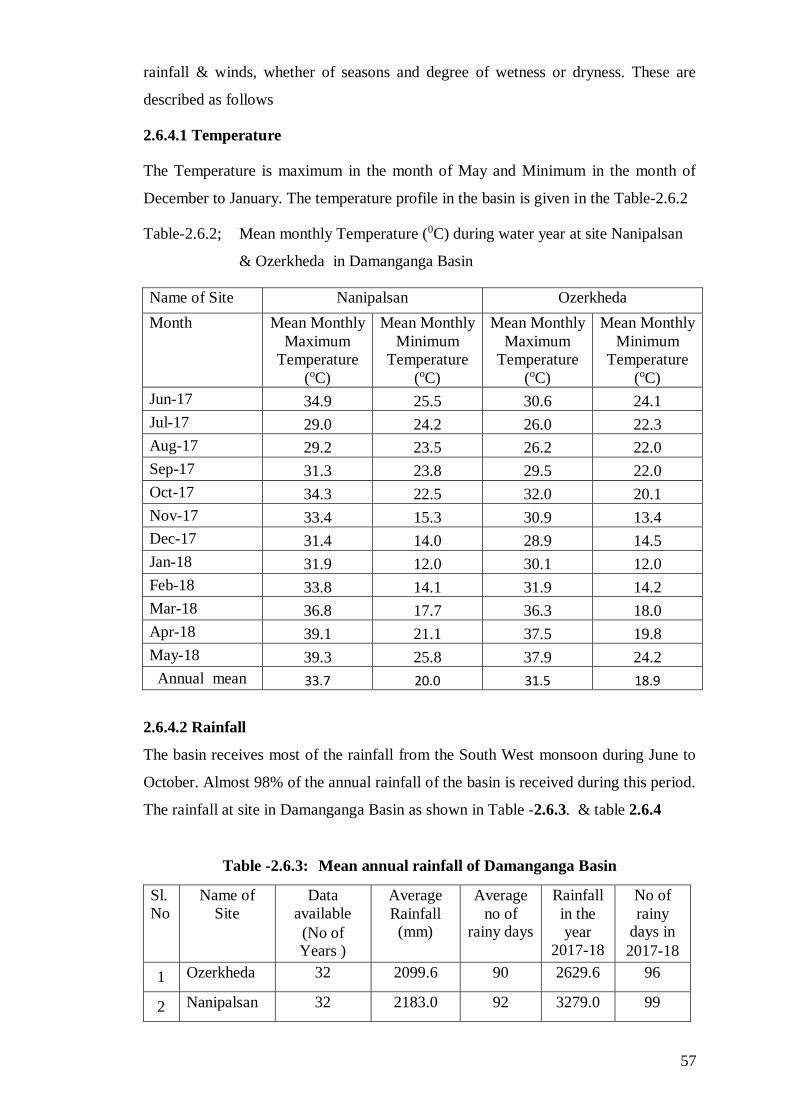
57
rainfall & winds, whether of seasons and degree of wetness or dryness. These are
described as follows
2.6.4.1 Temperature
The Temperature is maximum in the month of May and Minimum in the month of
December to January. The temperature profile in the basin is given in the Table-2.6.2
Table-2.6.2; Mean monthly Temperature (0C) during water year at site Nanipalsan
& Ozerkheda in Damanganga Basin
Name of Site Nanipalsan Ozerkheda
Month Mean Monthly
Maximum
Temperature
(oC)
Mean Monthly
Minimum
Temperature
(oC)
Mean Monthly
Maximum
Temperature
(oC)
Mean Monthly
Minimum
Temperature
(oC)
Jun-17 34.9 25.5 30.6 24.1
Jul-17 29.0 24.2 26.0 22.3
Aug-17 29.2 23.5 26.2 22.0
Sep-17 31.3 23.8 29.5 22.0
Oct-17 34.3 22.5 32.0 20.1
Nov-17 33.4 15.3 30.9 13.4
Dec-17 31.4 14.0 28.9 14.5
Jan-18 31.9 12.0 30.1 12.0
Feb-18 33.8 14.1 31.9 14.2
Mar-18 36.8 17.7 36.3 18.0
Apr-18 39.1 21.1 37.5 19.8
May-18 39.3 25.8 37.9 24.2
Annual mean 33.7 20.0 31.5 18.9
2.6.4.2 Rainfall
The basin receives most of the rainfall from the South West monsoon during June to
October. Almost 98% of the annual rainfall of the basin is received during this period.
The rainfall at site in Damanganga Basin as shown in Table -2.6.3. & table 2.6.4
Table -2.6.3: Mean annual rainfall of Damanganga Basin
Sl.
No
Name of
Site
Data
available
(No of Years )
Average
Rainfall (mm)
Average
no of rainy days
Rainfall
in the
year
2017-18
No of
rainy days in
2017-18
1 Ozerkheda 32 2099.6 90 2629.6 96
2 Nanipalsan 32 2183.0 92 3279.0 99
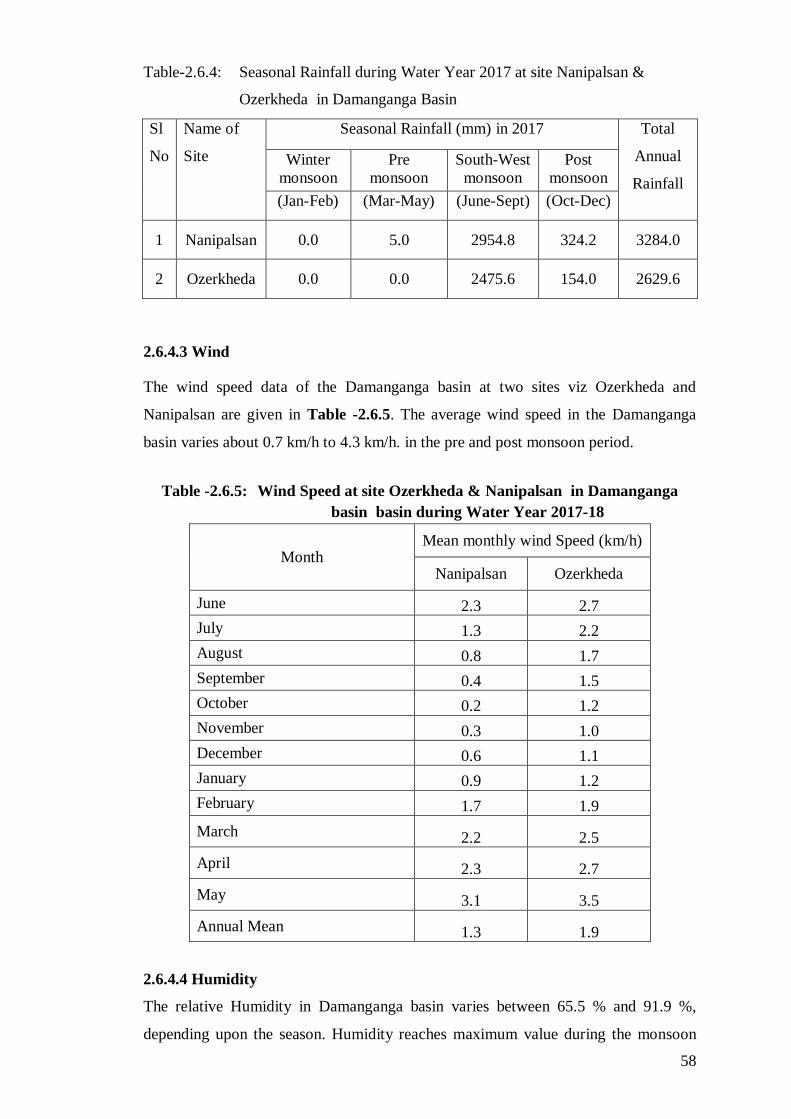
58
Table-2.6.4: Seasonal Rainfall during Water Year 2017 at site Nanipalsan &
Ozerkheda in Damanganga Basin
Sl
No
Name of
Site
Seasonal Rainfall (mm) in 2017 Total
Annual
Rainfall
Winter
monsoon
Pre
monsoon
South-West
monsoon
Post
monsoon
(Jan-Feb) (Mar-May) (June-Sept) (Oct-Dec)
1 Nanipalsan 0.0 5.0 2954.8 324.2 3284.0
2 Ozerkheda 0.0 0.0 2475.6 154.0 2629.6
2.6.4.3 Wind
The wind speed data of the Damanganga basin at two sites viz Ozerkheda and
Nanipalsan are given in Table -2.6.5. The average wind speed in the Damanganga
basin varies about 0.7 km/h to 4.3 km/h. in the pre and post monsoon period.
Table -2.6.5: Wind Speed at site Ozerkheda & Nanipalsan in Damanganga
basin basin during Water Year 2017-18
Month Mean monthly wind Speed (km/h)
Nanipalsan Ozerkheda
June 2.3 2.7
July 1.3 2.2
August 0.8 1.7
September 0.4 1.5
October 0.2 1.2
November 0.3 1.0
December 0.6 1.1
January 0.9 1.2
February 1.7 1.9
March 2.2 2.5
April 2.3 2.7
May 3.1 3.5
Annual Mean 1.3 1.9
2.6.4.4 Humidity
The relative Humidity in Damanganga basin varies between 65.5 % and 91.9 %,
depending upon the season. Humidity reaches maximum value during the monsoon
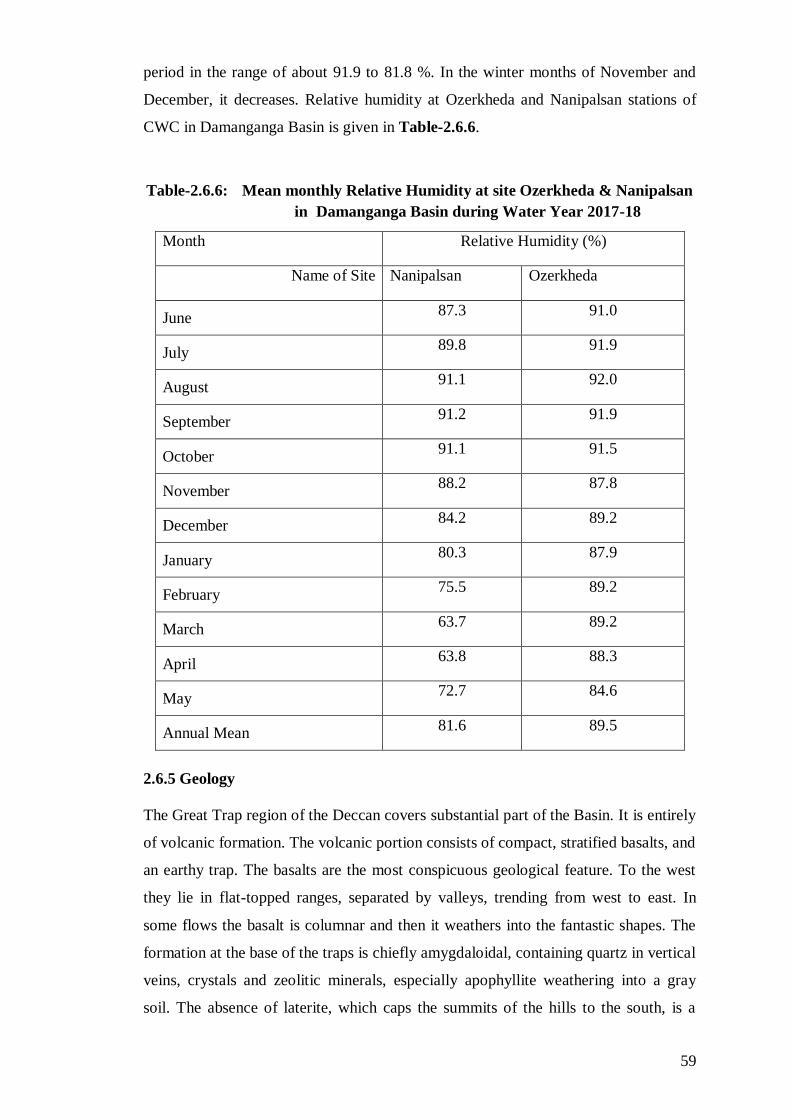
59
period in the range of about 91.9 to 81.8 %. In the winter months of November and
December, it decreases. Relative humidity at Ozerkheda and Nanipalsan stations of
CWC in Damanganga Basin is given in Table-2.6.6.
Table-2.6.6: Mean monthly Relative Humidity at site Ozerkheda & Nanipalsan
in Damanganga Basin during Water Year 2017-18
Month Relative Humidity (%)
Name of Site Nanipalsan Ozerkheda
June 87.3 91.0
July 89.8 91.9
August 91.1 92.0
September 91.2 91.9
October 91.1 91.5
November 88.2 87.8
December 84.2 89.2
January 80.3 87.9
February 75.5 89.2
March 63.7 89.2
April 63.8 88.3
May 72.7 84.6
Annual Mean 81.6 89.5
2.6.5 Geology
The Great Trap region of the Deccan covers substantial part of the Basin. It is entirely
of volcanic formation. The volcanic portion consists of compact, stratified basalts, and
an earthy trap. The basalts are the most conspicuous geological feature. To the west
they lie in flat-topped ranges, separated by valleys, trending from west to east. In
some flows the basalt is columnar and then it weathers into the fantastic shapes. The
formation at the base of the traps is chiefly amygdaloidal, containing quartz in vertical
veins, crystals and zeolitic minerals, especially apophyllite weathering into a gray
soil. The absence of laterite, which caps the summits of the hills to the south, is a
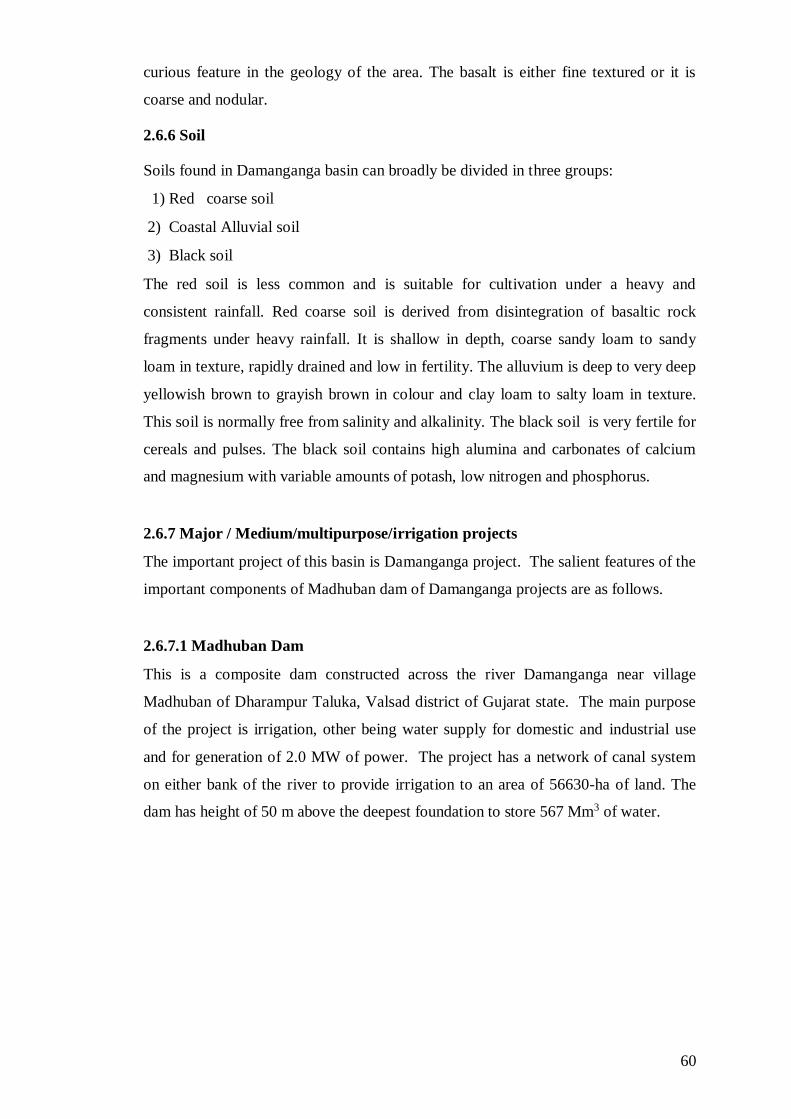
60
curious feature in the geology of the area. The basalt is either fine textured or it is
coarse and nodular.
2.6.6 Soil
Soils found in Damanganga basin can broadly be divided in three groups:
1) Red coarse soil
2) Coastal Alluvial soil
3) Black soil
The red soil is less common and is suitable for cultivation under a heavy and
consistent rainfall. Red coarse soil is derived from disintegration of basaltic rock
fragments under heavy rainfall. It is shallow in depth, coarse sandy loam to sandy
loam in texture, rapidly drained and low in fertility. The alluvium is deep to very deep
yellowish brown to grayish brown in colour and clay loam to salty loam in texture.
This soil is normally free from salinity and alkalinity. The black soil is very fertile for
cereals and pulses. The black soil contains high alumina and carbonates of calcium
and magnesium with variable amounts of potash, low nitrogen and phosphorus.
2.6.7 Major / Medium/multipurpose/irrigation projects
The important project of this basin is Damanganga project. The salient features of the
important components of Madhuban dam of Damanganga projects are as follows.
2.6.7.1 Madhuban Dam
This is a composite dam constructed across the river Damanganga near village
Madhuban of Dharampur Taluka, Valsad district of Gujarat state. The main purpose
of the project is irrigation, other being water supply for domestic and industrial use
and for generation of 2.0 MW of power. The project has a network of canal system
on either bank of the river to provide irrigation to an area of 56630-ha of land. The
dam has height of 50 m above the deepest foundation to store 567 Mm3 of water.
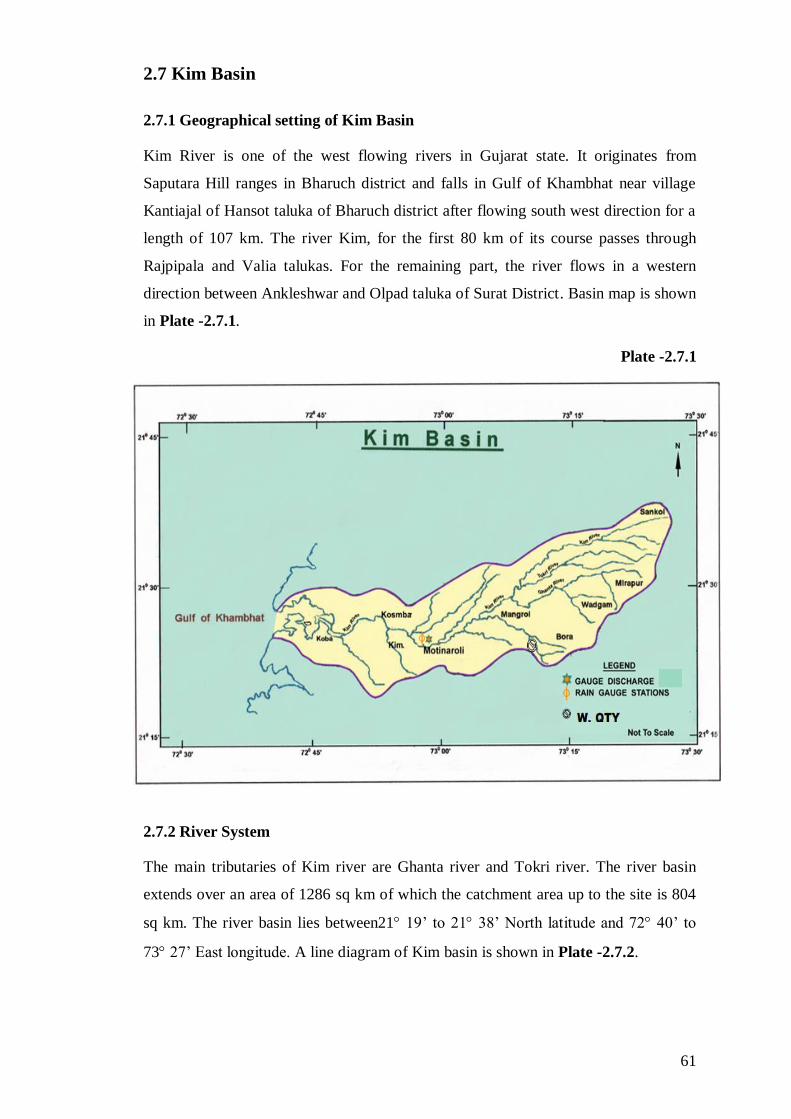
61
2.7 Kim Basin
2.7.1 Geographical setting of Kim Basin
Kim River is one of the west flowing rivers in Gujarat state. It originates from
Saputara Hill ranges in Bharuch district and falls in Gulf of Khambhat near village
Kantiajal of Hansot taluka of Bharuch district after flowing south west direction for a
length of 107 km. The river Kim, for the first 80 km of its course passes through
Rajpipala and Valia talukas. For the remaining part, the river flows in a western
direction between Ankleshwar and Olpad taluka of Surat District. Basin map is shown
in Plate -2.7.1.
Plate -2.7.1
2.7.2 River System
The main tributaries of Kim river are Ghanta river and Tokri river. The river basin
extends over an area of 1286 sq km of which the catchment area up to the site is 804
sq km. The river basin lies between21 19’ to 21 38’ North latitude and 72 40’ to
73 27’ East longitude. A line diagram of Kim basin is shown in Plate -2.7.2.
62
Plate -2.7.2
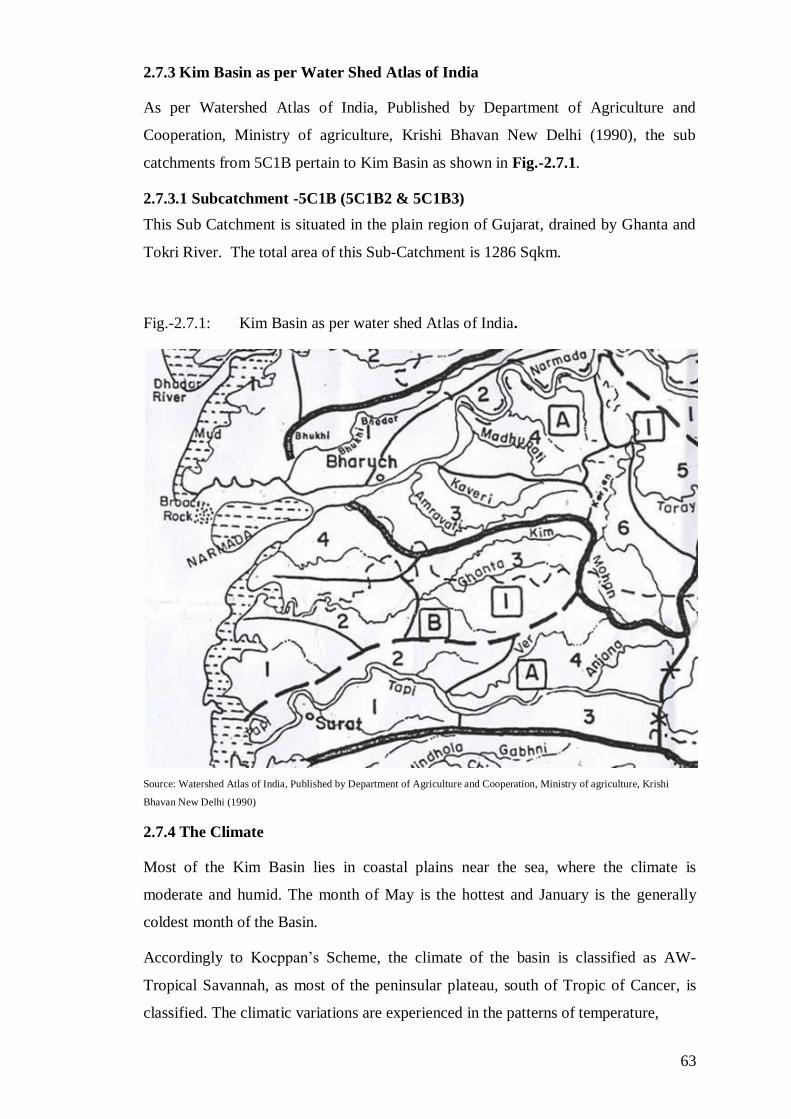
63
2.7.3 Kim Basin as per Water Shed Atlas of India
As per Watershed Atlas of India, Published by Department of Agriculture and
Cooperation, Ministry of agriculture, Krishi Bhavan New Delhi (1990), the sub
catchments from 5C1B pertain to Kim Basin as shown in Fig.-2.7.1.
2.7.3.1 Subcatchment -5C1B (5C1B2 & 5C1B3)
This Sub Catchment is situated in the plain region of Gujarat, drained by Ghanta and
Tokri River. The total area of this Sub-Catchment is 1286 Sqkm.
Fig.-2.7.1: Kim Basin as per water shed Atlas of India.
Source: Watershed Atlas of India, Published by Department of Agriculture and Cooperation, Ministry of agriculture, Krishi
Bhavan New Delhi (1990)
2.7.4 The Climate
Most of the Kim Basin lies in coastal plains near the sea, where the climate is
moderate and humid. The month of May is the hottest and January is the generally
coldest month of the Basin.
Accordingly to Kocppan’s Scheme, the climate of the basin is classified as AW-
Tropical Savannah, as most of the peninsular plateau, south of Tropic of Cancer, is
classified. The climatic variations are experienced in the patterns of temperature,
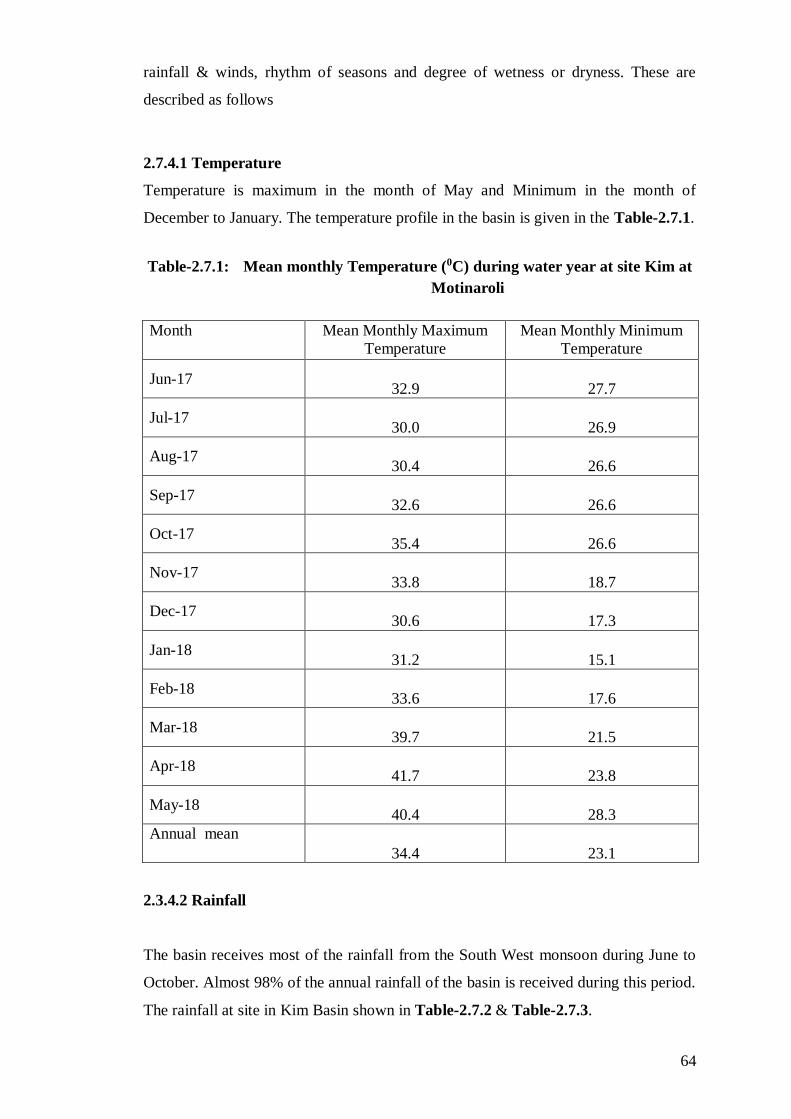
64
rainfall & winds, rhythm of seasons and degree of wetness or dryness. These are
described as follows
2.7.4.1 Temperature
Temperature is maximum in the month of May and Minimum in the month of
December to January. The temperature profile in the basin is given in the Table-2.7.1.
Table-2.7.1: Mean monthly Temperature (0C) during water year at site Kim at
Motinaroli
Month Mean Monthly Maximum
Temperature
Mean Monthly Minimum
Temperature
Jun-17 32.9 27.7
Jul-17 30.0 26.9
Aug-17 30.4 26.6
Sep-17 32.6 26.6
Oct-17 35.4 26.6
Nov-17 33.8 18.7
Dec-17 30.6 17.3
Jan-18 31.2 15.1
Feb-18 33.6 17.6
Mar-18 39.7 21.5
Apr-18 41.7 23.8
May-18 40.4 28.3
Annual mean
34.4 23.1
2.3.4.2 Rainfall
The basin receives most of the rainfall from the South West monsoon during June to
October. Almost 98% of the annual rainfall of the basin is received during this period.
The rainfall at site in Kim Basin shown in Table-2.7.2 & Table-2.7.3.
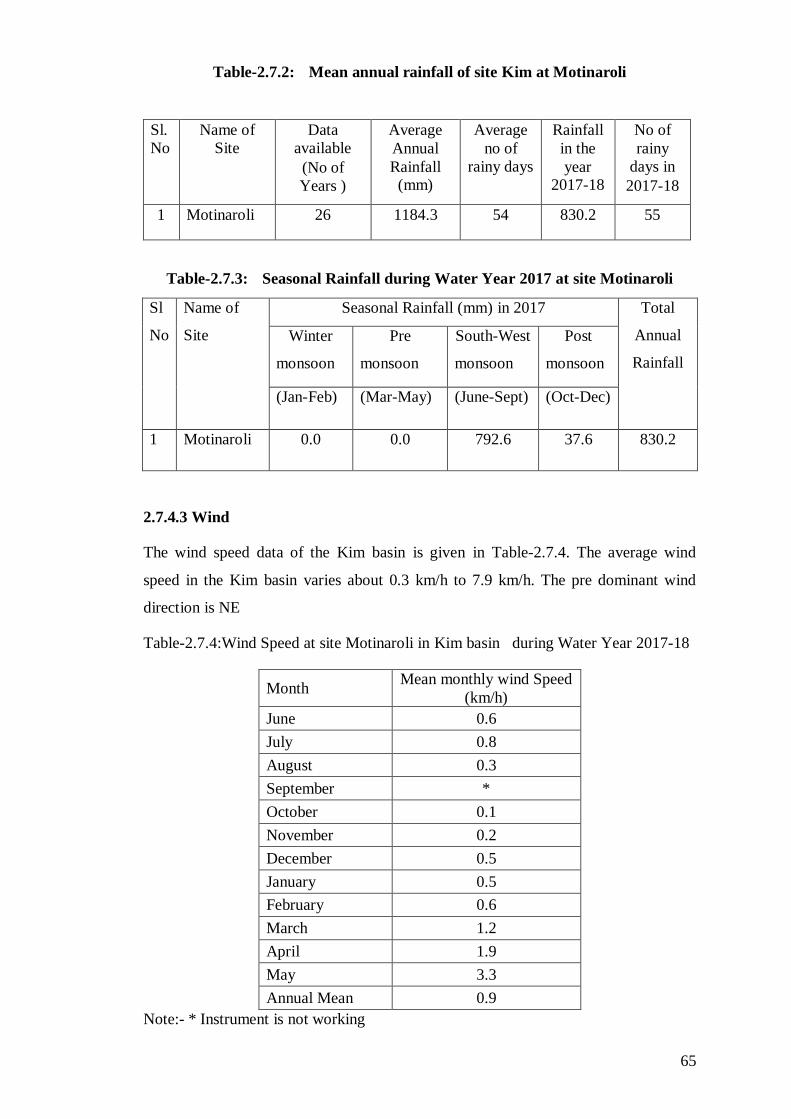
65
Table-2.7.2: Mean annual rainfall of site Kim at Motinaroli
Sl.
No
Name of
Site
Data
available
(No of
Years )
Average
Annual
Rainfall (mm)
Average
no of
rainy days
Rainfall
in the
year 2017-18
No of
rainy
days in
2017-18
1 Motinaroli 26 1184.3 54 830.2 55
Table-2.7.3: Seasonal Rainfall during Water Year 2017 at site Motinaroli
Sl
No
Name of
Site
Seasonal Rainfall (mm) in 2017 Total
Annual
Rainfall
Winter
monsoon
Pre
monsoon
South-West
monsoon
Post
monsoon
(Jan-Feb) (Mar-May) (June-Sept) (Oct-Dec)
1 Motinaroli 0.0 0.0 792.6 37.6 830.2
2.7.4.3 Wind
The wind speed data of the Kim basin is given in Table-2.7.4. The average wind
speed in the Kim basin varies about 0.3 km/h to 7.9 km/h. The pre dominant wind
direction is NE
Table-2.7.4:Wind Speed at site Motinaroli in Kim basin during Water Year 2017-18
Month Mean monthly wind Speed
(km/h)
June 0.6
July 0.8
August 0.3
September *
October 0.1
November 0.2
December 0.5
January 0.5
February 0.6
March 1.2
April 1.9
May 3.3
Annual Mean 0.9
Note:- * Instrument is not working
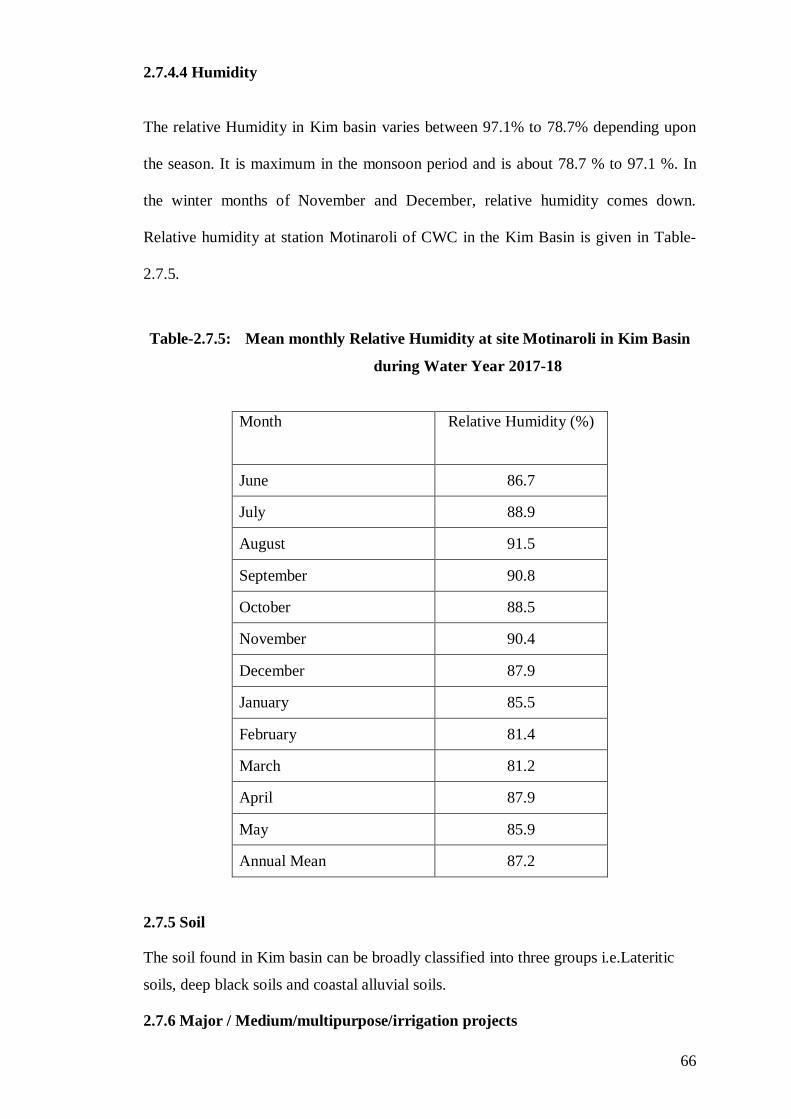
66
2.7.4.4 Humidity
The relative Humidity in Kim basin varies between 97.1% to 78.7% depending upon
the season. It is maximum in the monsoon period and is about 78.7 % to 97.1 %. In
the winter months of November and December, relative humidity comes down.
Relative humidity at station Motinaroli of CWC in the Kim Basin is given in Table-
2.7.5.
Table-2.7.5: Mean monthly Relative Humidity at site Motinaroli in Kim Basin
during Water Year 2017-18
Month Relative Humidity (%)
June 86.7
July 88.9
August 91.5
September 90.8
October 88.5
November 90.4
December 87.9
January 85.5
February 81.4
March 81.2
April 87.9
May 85.9
Annual Mean 87.2
2.7.5 Soil
The soil found in Kim basin can be broadly classified into three groups i.e.Lateritic
soils, deep black soils and coastal alluvial soils.
2.7.6 Major / Medium/multipurpose/irrigation projects
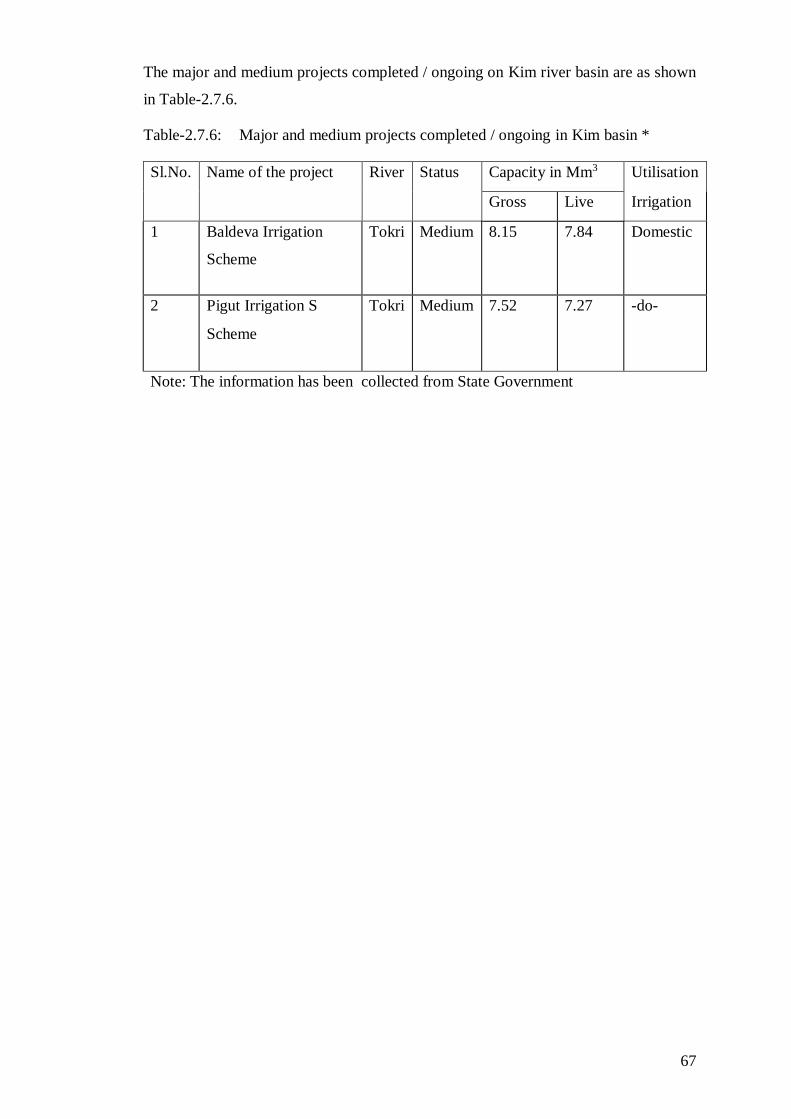
67
The major and medium projects completed / ongoing on Kim river basin are as shown
in Table-2.7.6.
Table-2.7.6: Major and medium projects completed / ongoing in Kim basin *
Sl.No. Name of the project River Status Capacity in Mm3 Utilisation
Gross Live Irrigation
1 Baldeva Irrigation
Scheme
Tokri Medium 8.15 7.84 Domestic
2 Pigut Irrigation S
Scheme
Tokri Medium 7.52 7.27 -do-
Note: The information has been collected from State Government
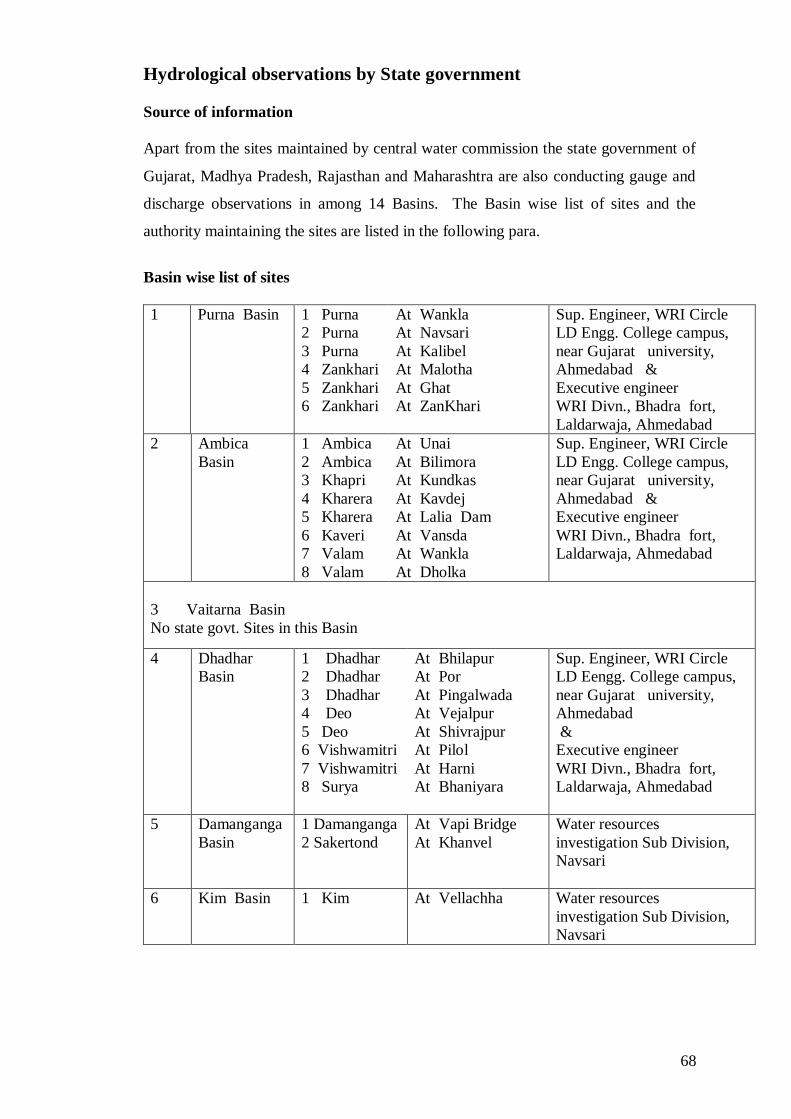
68
Hydrological observations by State government
Source of information
Apart from the sites maintained by central water commission the state government of
Gujarat, Madhya Pradesh, Rajasthan and Maharashtra are also conducting gauge and
discharge observations in among 14 Basins. The Basin wise list of sites and the
authority maintaining the sites are listed in the following para.
Basin wise list of sites
1 Purna Basin 1 Purna
2 Purna
3 Purna
4 Zankhari
5 Zankhari
6 Zankhari
At Wankla
At Navsari
At Kalibel
At Malotha
At Ghat
At ZanKhari
Sup. Engineer, WRI Circle
LD Engg. College campus,
near Gujarat university,
Ahmedabad &
Executive engineer
WRI Divn., Bhadra fort,
Laldarwaja, Ahmedabad
2 Ambica
Basin
1 Ambica
2 Ambica
3 Khapri
4 Kharera
5 Kharera
6 Kaveri
7 Valam
8 Valam
At Unai
At Bilimora
At Kundkas
At Kavdej
At Lalia Dam
At Vansda
At Wankla
At Dholka
Sup. Engineer, WRI Circle
LD Engg. College campus,
near Gujarat university,
Ahmedabad &
Executive engineer
WRI Divn., Bhadra fort,
Laldarwaja, Ahmedabad
3 Vaitarna Basin
No state govt. Sites in this Basin
4 Dhadhar
Basin
1 Dhadhar
2 Dhadhar
3 Dhadhar
4 Deo
5 Deo
6 Vishwamitri
7 Vishwamitri
8 Surya
At Bhilapur
At Por
At Pingalwada
At Vejalpur
At Shivrajpur
At Pilol
At Harni
At Bhaniyara
Sup. Engineer, WRI Circle
LD Eengg. College campus,
near Gujarat university,
Ahmedabad
&
Executive engineer
WRI Divn., Bhadra fort,
Laldarwaja, Ahmedabad
5 Damanganga
Basin
1 Damanganga
2 Sakertond
At Vapi Bridge
At Khanvel
Water resources
investigation Sub Division,
Navsari
6 Kim Basin 1 Kim At Vellachha Water resources
investigation Sub Division,
Navsari
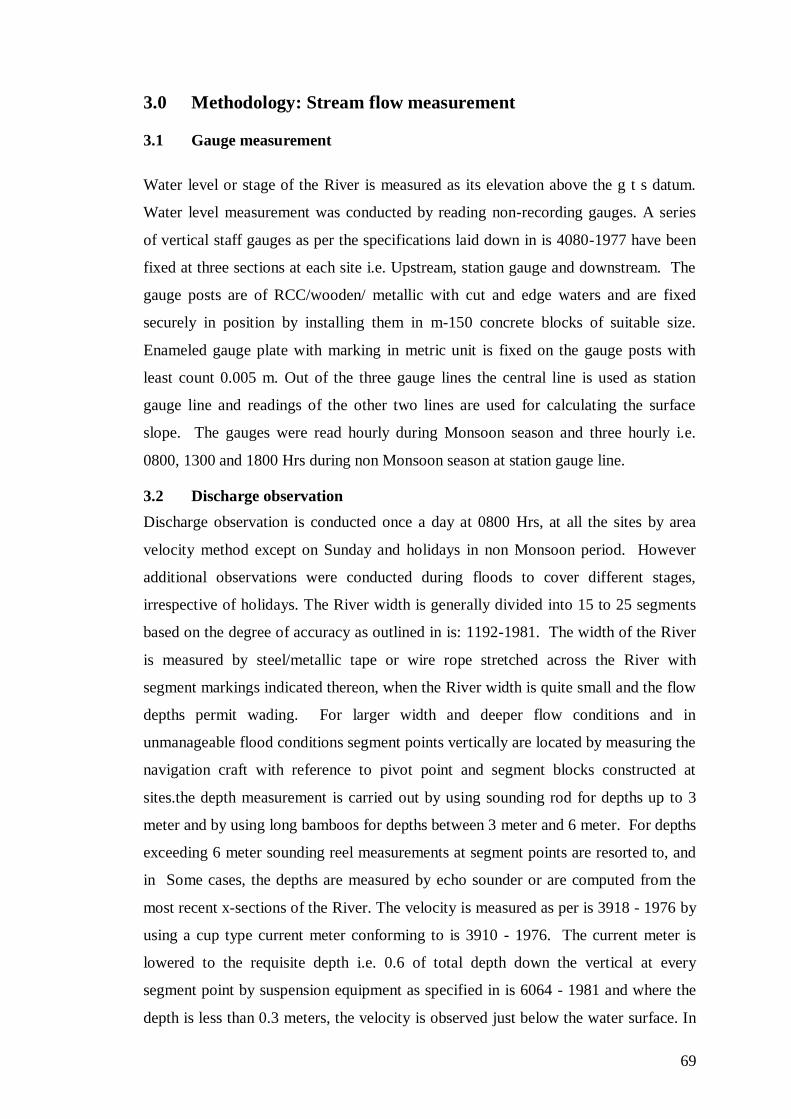
69
3.0 Methodology: Stream flow measurement
3.1 Gauge measurement
Water level or stage of the River is measured as its elevation above the g t s datum.
Water level measurement was conducted by reading non-recording gauges. A series
of vertical staff gauges as per the specifications laid down in is 4080-1977 have been
fixed at three sections at each site i.e. Upstream, station gauge and downstream. The
gauge posts are of RCC/wooden/ metallic with cut and edge waters and are fixed
securely in position by installing them in m-150 concrete blocks of suitable size.
Enameled gauge plate with marking in metric unit is fixed on the gauge posts with
least count 0.005 m. Out of the three gauge lines the central line is used as station
gauge line and readings of the other two lines are used for calculating the surface
slope. The gauges were read hourly during Monsoon season and three hourly i.e.
0800, 1300 and 1800 Hrs during non Monsoon season at station gauge line.
3.2 Discharge observation
Discharge observation is conducted once a day at 0800 Hrs, at all the sites by area
velocity method except on Sunday and holidays in non Monsoon period. However
additional observations were conducted during floods to cover different stages,
irrespective of holidays. The River width is generally divided into 15 to 25 segments
based on the degree of accuracy as outlined in is: 1192-1981. The width of the River
is measured by steel/metallic tape or wire rope stretched across the River with
segment markings indicated thereon, when the River width is quite small and the flow
depths permit wading. For larger width and deeper flow conditions and in
unmanageable flood conditions segment points vertically are located by measuring the
navigation craft with reference to pivot point and segment blocks constructed at
sites.the depth measurement is carried out by using sounding rod for depths up to 3
meter and by using long bamboos for depths between 3 meter and 6 meter. For depths
exceeding 6 meter sounding reel measurements at segment points are resorted to, and
in Some cases, the depths are measured by echo sounder or are computed from the
most recent x-sections of the River. The velocity is measured as per is 3918 - 1976 by
using a cup type current meter conforming to is 3910 - 1976. The current meter is
lowered to the requisite depth i.e. 0.6 of total depth down the vertical at every
segment point by suspension equipment as specified in is 6064 - 1981 and where the
depth is less than 0.3 meters, the velocity is observed just below the water surface. In

70
medium and high stages with significant flow velocities, boats fitted with power
engines are used. Measurements of velocity are sometimes carried out from the
bridges when the River flow condition does not permit the boat to be kept stable for
velocity observation. When none of the above procedures are possible, the velocity is
measured by float observations.
The data observed as above at the site is entered in the prescribed standard format to
compute the total River discharge and it is further scrutinised at various levels before
finalisation.
The daily observed/estimated discharge data is presented in this book.
Table-3.1.1 : Equipment used for observation
Sl. No Name of equipment By
wading
By boat Bridge By float
1 Current meter √ √ √ X
2 Pigmy current meter √ X X X
3 Stop watch √ √ √ √
4 Wading rod √ X X X
5 Nylon rope & tag √ X X X
6 Measuring tape √ X X X
7 Protractor √ √ √ X
8 Ranging rod √ √ X √
9 Sounding rod √ √ X X
10 Automatic battery
counter
√ √ √ X
11 Thermometer √ √ √ √
12 Prismatic compass X X X √
13 Balloon X X X √
14 Sounding cable with
fish weight
X √ X X
15 Echo sounder X √ √ X
16 Bridge out fit X X √ X
17 Boat out fit X √ X X

71
3.3 Explanatory notes
Explanatory notes given here have been designed to assist in the data interpretation of
hydrological parameters contained in the data presented. The notes are therefore,
applicable in so far as the data presented in this book.
1. Water Year covers the period from June 1st of one calendar year to may 31st of
next calendar year and includes one complete hydrological cycle.
2. Discharge is given in cubic meters per second.
3. Discharges given are daily observed / estimated discharges.
4. The zero of gauge is a datum level / RL Fixed for a given site, which is kept 1
or 2 m lower than the lowest water level recorded in a perennial stream. In a
non - perennial stream, it is kept 1 or 2 m lower than the lowest bed level of
the stream.
5. Maximum and minimum discharges are taken from the daily observed flows /
estimated.
6. Runoff in “mm” is the notional depth of water in millimeters over the
catchment area equivalent to annual runoff calculated at the discharge
measurement station.
Annual runoff (Mm3)
Runoff (mm) = -------------------------------------- x 1000
Catchment area (km2)
7. Peak and lowest flows correspond to the highest and lowest water levels
recorded during the period of record.
8. Measuring authority refers to the field division responsible for the operation of
the gauge station. The name of the division is abbreviated by taking first
alphabet of the River name followed by alphabets “DN” for division. For
example Mahi division is denoted by MDN and Tapi division is denoted as
TDN. These abbreviations are given cross-reference in the list of
abbreviations and symbols.

72
9. Gauging station code number is a unique nine-digit reference number, which
facilitates retrieval of flow data in data bank. The first two digits denote the
measuring authority. The third and fourth digits are the Basin/zone identifier
and fifth and sixth digits are the independent River Basin identifier. The last
three digits of the code number indicate gauging site no. which is given from
origin to mouth.
11. The month and the year from which data are available in the data bank are
indicated against the record available.
3.4 Method of presentation
The data presented in this book is processed discharge data obtained from application
of SWDES/HYMOS software.
The station wise hydrological data is presented comprising history sheet, daily flow
table and pictorial summary. The sequence of hydrological station arranged from its
outfall to origin giving inter-priority to an intermediate tributary station.
4.0 Hydrological data
The hydrological data presented hereby mainly consist of the following
History sheet
Its manly consist of some salient features of particular site as Site name, state, district,
River Basin, tributary, catchment area, latitude / longitude, opening / closing date for
various types of data& maximum –minimum discharge values.
Data sheet
It consists of stage- discharge data (both observed & estimated from stage discharge
curve for the season), for the current year with mean water level during the discharge
observation and peak observed and computed discharge with corresponding water
level with date during the year, Lowest discharge with corresponding water level with
date during the year, Peak discharge with corresponding water level with date since
inception, Lowest discharge with corresponding water level with date since inception.
Stage discharge curve
It gives a relationship between the stage of the river and the corresponding discharge.
73
Annual run-off
It gives the value of Annual run off in MCM for all the years from the opening of the
site.
Water level v/s time graph
Hourly observed water level for one to three important highest peak flood events of
current Water Year covering the period well before the start and upto well beyond the
completion of these flood events.
Charts / Maps
Basin map showing sites / projects
The site-wise pre – Monsoon and post – Monsoon cross sections
The site-wise pie chart
Site-wise bar charts
The site-wise hydrographs (flood events)
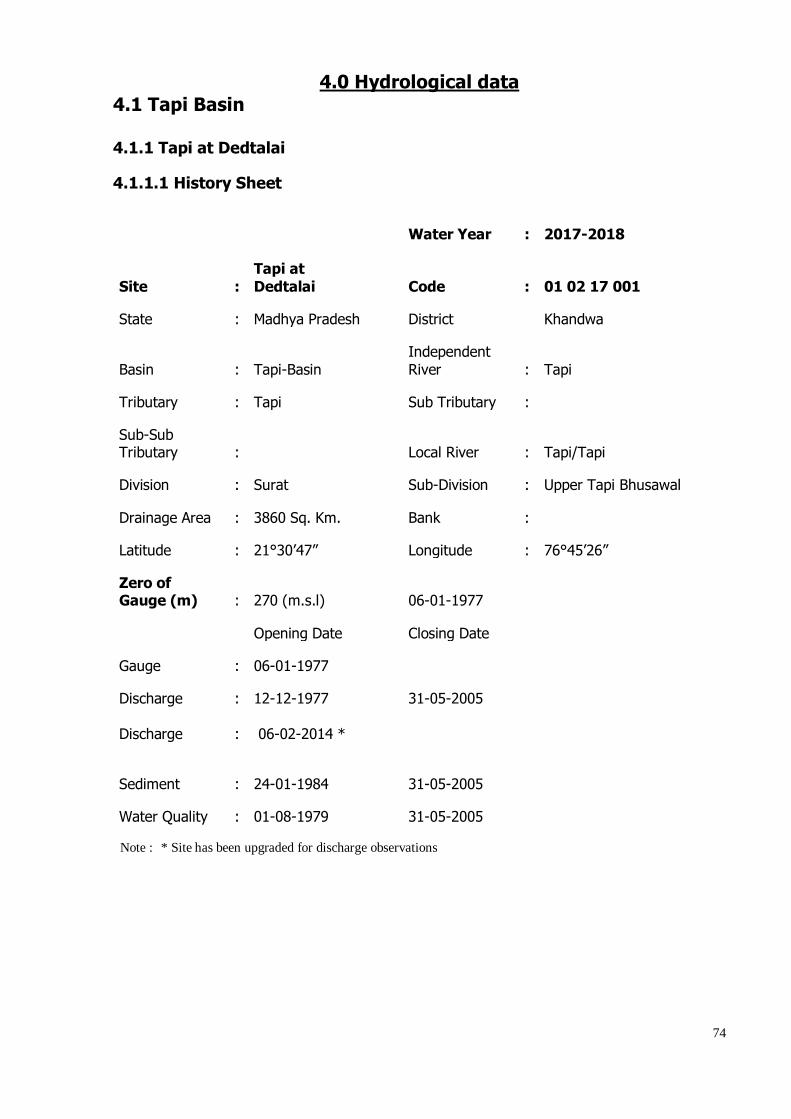
74
4.0 Hydrological data
4.1 Tapi Basin
4.1.1 Tapi at Dedtalai
4.1.1.1 History Sheet
Water Year : 2017-2018
Site :
Tapi at
Dedtalai
Code : 01 02 17 001
State : Madhya Pradesh
District
Khandwa
Basin : Tapi-Basin
Independent
River : Tapi
Tributary : Tapi
Sub Tributary :
Sub-Sub Tributary :
Local River : Tapi/Tapi
Division : Surat
Sub-Division : Upper Tapi Bhusawal
Drainage Area : 3860 Sq. Km.
Bank :
Latitude : 21°30’47”
Longitude : 76°45’26”
Zero of Gauge (m) : 270 (m.s.l)
06-01-1977
Opening Date
Closing Date
Gauge : 06-01-1977
Discharge
Discharge
:
:
12-12-1977
06-02-2014 *
31-05-2005
Sediment : 24-01-1984
31-05-2005
Water Quality : 01-08-1979
31-05-2005
Note : * Site has been upgraded for discharge observations
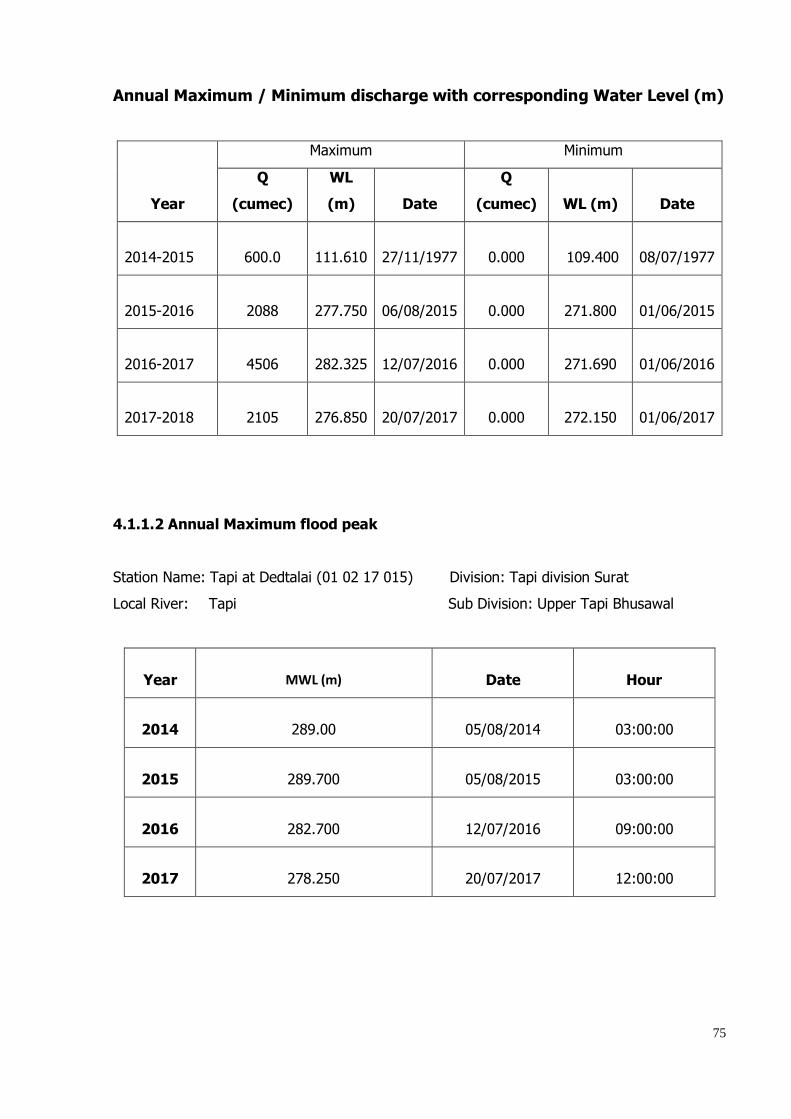
75
Annual Maximum / Minimum discharge with corresponding Water Level (m)
Year
Maximum Minimum
Q
(cumec)
WL
(m) Date
Q
(cumec) WL (m) Date
2014-2015 600.0 111.610 27/11/1977 0.000 109.400 08/07/1977
2015-2016 2088 277.750 06/08/2015 0.000 271.800 01/06/2015
2016-2017 4506 282.325 12/07/2016 0.000 271.690 01/06/2016
2017-2018 2105 276.850 20/07/2017 0.000 272.150 01/06/2017
4.1.1.2 Annual Maximum flood peak
Station Name: Tapi at Dedtalai (01 02 17 015) Division: Tapi division Surat
Local River: Tapi Sub Division: Upper Tapi Bhusawal
Year MWL (m) Date Hour
2014 289.00 05/08/2014 03:00:00
2015 289.700 05/08/2015 03:00:00
2016 282.700 12/07/2016 09:00:00
2017 278.250 20/07/2017 12:00:00

76
4.1.1.3 Summary of Data Stage Discharge data for the period 2017 to 2018
Station Name: Tapi at Dedtalai (01 02 17 01) Division: Tapi Division Surat Local River:Tapi Sub Division: : Upper Tapi Bhusawal
Day Jun Jul Aug Sep Oct Nov
W.L Q W.L Q W.L Q W.L Q W.L Q W.L Q
1 272.150 0.000 272.110 0.000 274.840 0.000 275.000 299.2 274.610 0.000 272.940 0.000
2 272.150 0.000 272.110 0.000 274.760 0.000 274.850 209.0 * 274.590 0.000 273.080 0.000
3 272.150 0.000 272.110 0.000 274.740 0.000 274.770 171.3 * 274.560 0.000 273.140 0.000
4 272.150 0.000 272.100 0.000 274.690 0.000 274.730 0.000 274.510 0.000 273.180 0.000
5 272.150 0.000 272.140 0.000 274.600 0.000 274.680 0.000 274.460 0.000 273.130 0.000
6 272.150 0.000 272.160 0.000 274.550 0.000 274.610 0.000 274.240 0.000 273.030 0.000
7 272.140 0.000 272.140 0.000 274.520 0.000 274.600 0.000 274.250 0.000 272.970 0.000
8 272.140 0.000 272.130 0.000 274.470 0.000 274.610 0.000 274.320 0.000 272.850 0.000
9 272.140 0.000 272.120 0.000 274.430 0.000 274.570 0.000 274.580 0.000 272.690 0.000
10 272.140 0.000 272.120 0.000 274.400 0.000 274.530 0.000 274.670 0.000 272.630 0.000
11 272.160 0.000 272.120 0.000 274.200 0.000 274.590 0.000 274.875 255.1 272.530 0.000
12 272.450 0.000 272.140 0.000 273.770 0.000 274.770 167.2 274.720 0.000 272.440 0.000
13 272.130 0.000 272.150 0.000 273.480 0.000 274.750 160.7 274.630 0.000 272.350 0.000
14 272.100 0.000 273.160 0.000 273.250 0.000 274.980 380.3 274.805 206.5 272.400 0.000
15 272.100 0.000 275.070 0.000 272.970 0.000 274.850 201.0 274.720 0.000 * 272.500 0.000
16 272.100 0.000 274.630 0.000 272.750 0.000 275.160 448.1 274.640 0.000 * 272.590 0.000
17 272.200 0.000 274.610 0.000 * 272.270 0.000 275.100 347.8 * 274.590 0.000 * 272.650 0.000
18 272.160 0.000 274.590 0.000 * 272.110 0.000 275.110 467.2 274.520 0.000 * 272.750 0.000
19 272.140 0.000 275.500 632.1 # 272.080 0.000 # 275.555 802.7 274.400 0.000 * 272.840 0.000
20 272.120 0.000 276.850 2105 272.150 0.000 275.050 372.4 274.160 0.000 * 272.900 0.000
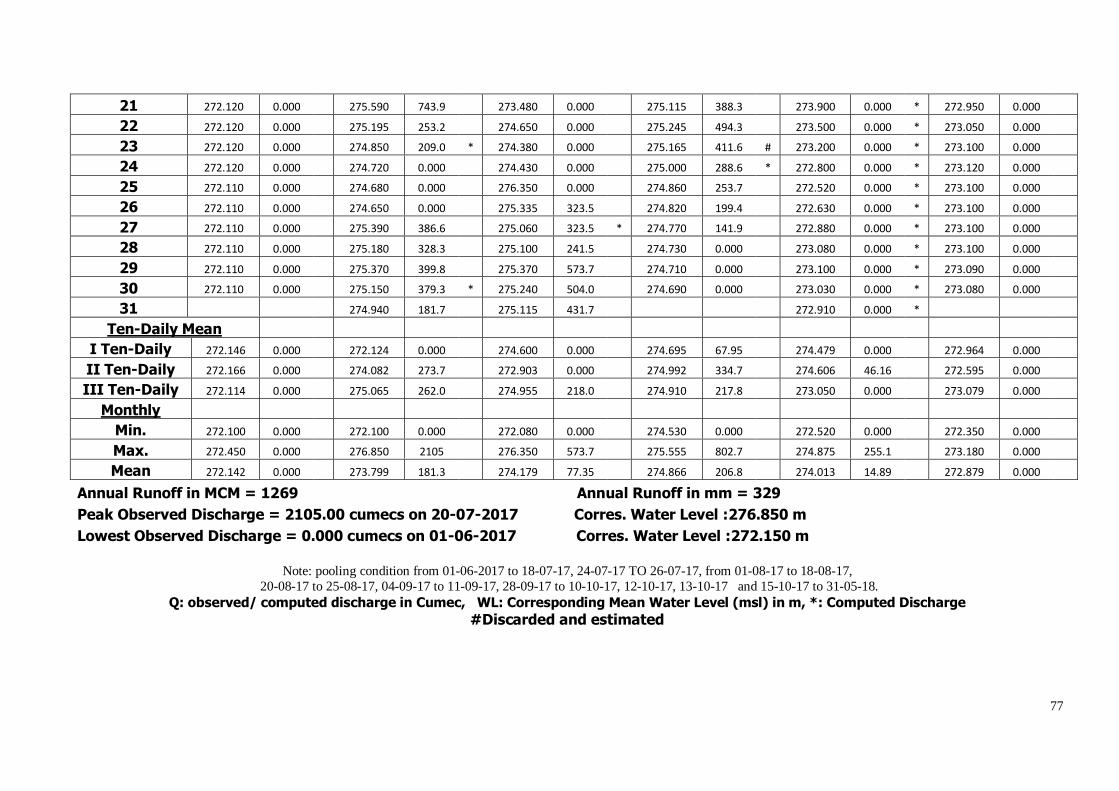
77
21 272.120 0.000 275.590 743.9 273.480 0.000 275.115 388.3 273.900 0.000 * 272.950 0.000
22 272.120 0.000 275.195 253.2 274.650 0.000 275.245 494.3 273.500 0.000 * 273.050 0.000
23 272.120 0.000 274.850 209.0 * 274.380 0.000 275.165 411.6 # 273.200 0.000 * 273.100 0.000
24 272.120 0.000 274.720 0.000 274.430 0.000 275.000 288.6 * 272.800 0.000 * 273.120 0.000
25 272.110 0.000 274.680 0.000 276.350 0.000 274.860 253.7 272.520 0.000 * 273.100 0.000
26 272.110 0.000 274.650 0.000 275.335 323.5 274.820 199.4 272.630 0.000 * 273.100 0.000
27 272.110 0.000 275.390 386.6 275.060 323.5 * 274.770 141.9 272.880 0.000 * 273.100 0.000
28 272.110 0.000 275.180 328.3 275.100 241.5 274.730 0.000 273.080 0.000 * 273.100 0.000
29 272.110 0.000 275.370 399.8 275.370 573.7 274.710 0.000 273.100 0.000 * 273.090 0.000
30 272.110 0.000 275.150 379.3 * 275.240 504.0 274.690 0.000 273.030 0.000 * 273.080 0.000
31 274.940 181.7 275.115 431.7 272.910 0.000 *
Ten-Daily Mean
I Ten-Daily 272.146 0.000 272.124 0.000 274.600 0.000 274.695 67.95 274.479 0.000 272.964 0.000
II Ten-Daily 272.166 0.000 274.082 273.7 272.903 0.000 274.992 334.7 274.606 46.16 272.595 0.000
III Ten-Daily 272.114 0.000 275.065 262.0 274.955 218.0 274.910 217.8 273.050 0.000 273.079 0.000
Monthly
Min. 272.100 0.000 272.100 0.000 272.080 0.000 274.530 0.000 272.520 0.000 272.350 0.000
Max. 272.450 0.000 276.850 2105 276.350 573.7 275.555 802.7 274.875 255.1 273.180 0.000
Mean 272.142 0.000
273.799 181.3
274.179 77.35
274.866 206.8
274.013 14.89
272.879 0.000
Annual Runoff in MCM = 1269 Annual Runoff in mm = 329 Peak Observed Discharge = 2105.00 cumecs on 20-07-2017 Corres. Water Level :276.850 m
Lowest Observed Discharge = 0.000 cumecs on 01-06-2017 Corres. Water Level :272.150 m
Note: pooling condition from 01-06-2017 to 18-07-17, 24-07-17 TO 26-07-17, from 01-08-17 to 18-08-17,
20-08-17 to 25-08-17, 04-09-17 to 11-09-17, 28-09-17 to 10-10-17, 12-10-17, 13-10-17 and 15-10-17 to 31-05-18.
Q: observed/ computed discharge in Cumec, WL: Corresponding Mean Water Level (msl) in m, *: Computed Discharge
#Discarded and estimated
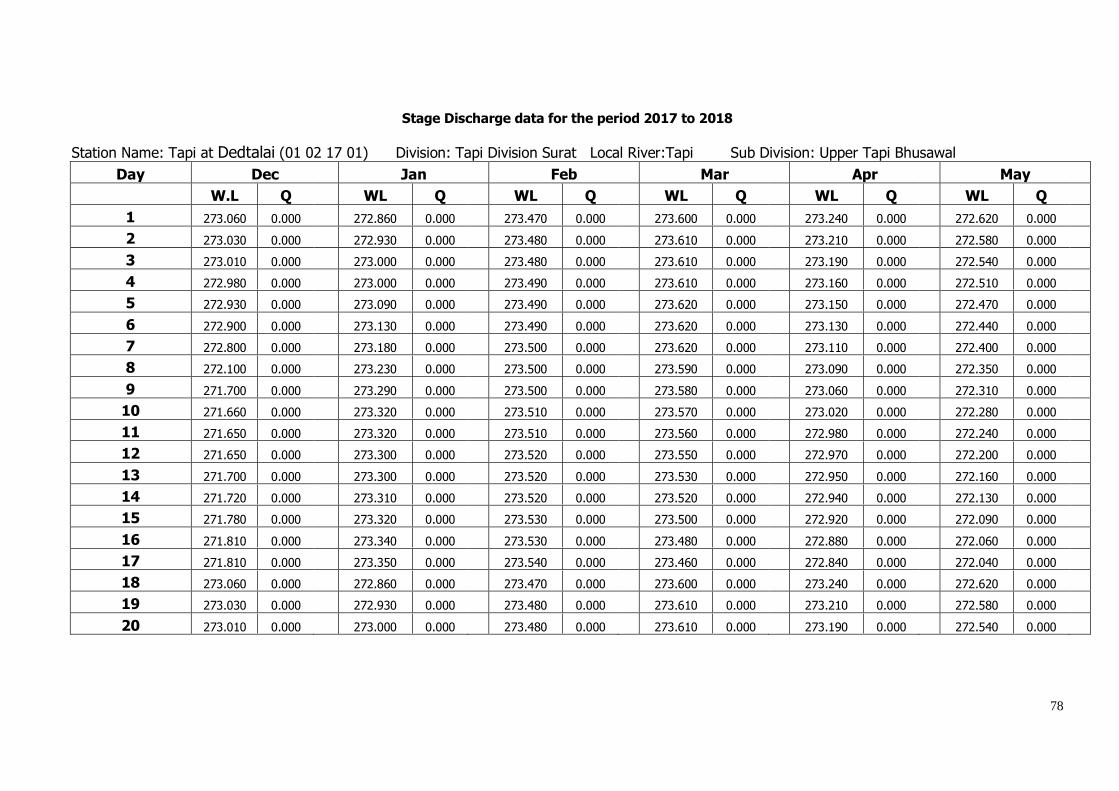
78
Stage Discharge data for the period 2017 to 2018
Station Name: Tapi at Dedtalai (01 02 17 01) Division: Tapi Division Surat Local River:Tapi Sub Division: Upper Tapi Bhusawal
Day Dec Jan Feb Mar Apr May
W.L Q WL Q WL Q WL Q WL Q WL Q
1 273.060 0.000 272.860 0.000 273.470 0.000 273.600 0.000 273.240 0.000 272.620 0.000
2 273.030 0.000 272.930 0.000 273.480 0.000 273.610 0.000 273.210 0.000 272.580 0.000
3 273.010 0.000 273.000 0.000 273.480 0.000 273.610 0.000 273.190 0.000 272.540 0.000
4 272.980 0.000 273.000 0.000 273.490 0.000 273.610 0.000 273.160 0.000 272.510 0.000
5 272.930 0.000 273.090 0.000 273.490 0.000 273.620 0.000 273.150 0.000 272.470 0.000
6 272.900 0.000 273.130 0.000 273.490 0.000 273.620 0.000 273.130 0.000 272.440 0.000
7 272.800 0.000 273.180 0.000 273.500 0.000 273.620 0.000 273.110 0.000 272.400 0.000
8 272.100 0.000 273.230 0.000 273.500 0.000 273.590 0.000 273.090 0.000 272.350 0.000
9 271.700 0.000 273.290 0.000 273.500 0.000 273.580 0.000 273.060 0.000 272.310 0.000
10 271.660 0.000 273.320 0.000 273.510 0.000 273.570 0.000 273.020 0.000 272.280 0.000
11 271.650 0.000 273.320 0.000 273.510 0.000 273.560 0.000 272.980 0.000 272.240 0.000
12 271.650 0.000 273.300 0.000 273.520 0.000 273.550 0.000 272.970 0.000 272.200 0.000
13 271.700 0.000 273.300 0.000 273.520 0.000 273.530 0.000 272.950 0.000 272.160 0.000
14 271.720 0.000 273.310 0.000 273.520 0.000 273.520 0.000 272.940 0.000 272.130 0.000
15 271.780 0.000 273.320 0.000 273.530 0.000 273.500 0.000 272.920 0.000 272.090 0.000
16 271.810 0.000 273.340 0.000 273.530 0.000 273.480 0.000 272.880 0.000 272.060 0.000
17 271.810 0.000 273.350 0.000 273.540 0.000 273.460 0.000 272.840 0.000 272.040 0.000
18 273.060 0.000 272.860 0.000 273.470 0.000 273.600 0.000 273.240 0.000 272.620 0.000
19 273.030 0.000 272.930 0.000 273.480 0.000 273.610 0.000 273.210 0.000 272.580 0.000
20 273.010 0.000 273.000 0.000 273.480 0.000 273.610 0.000 273.190 0.000 272.540 0.000
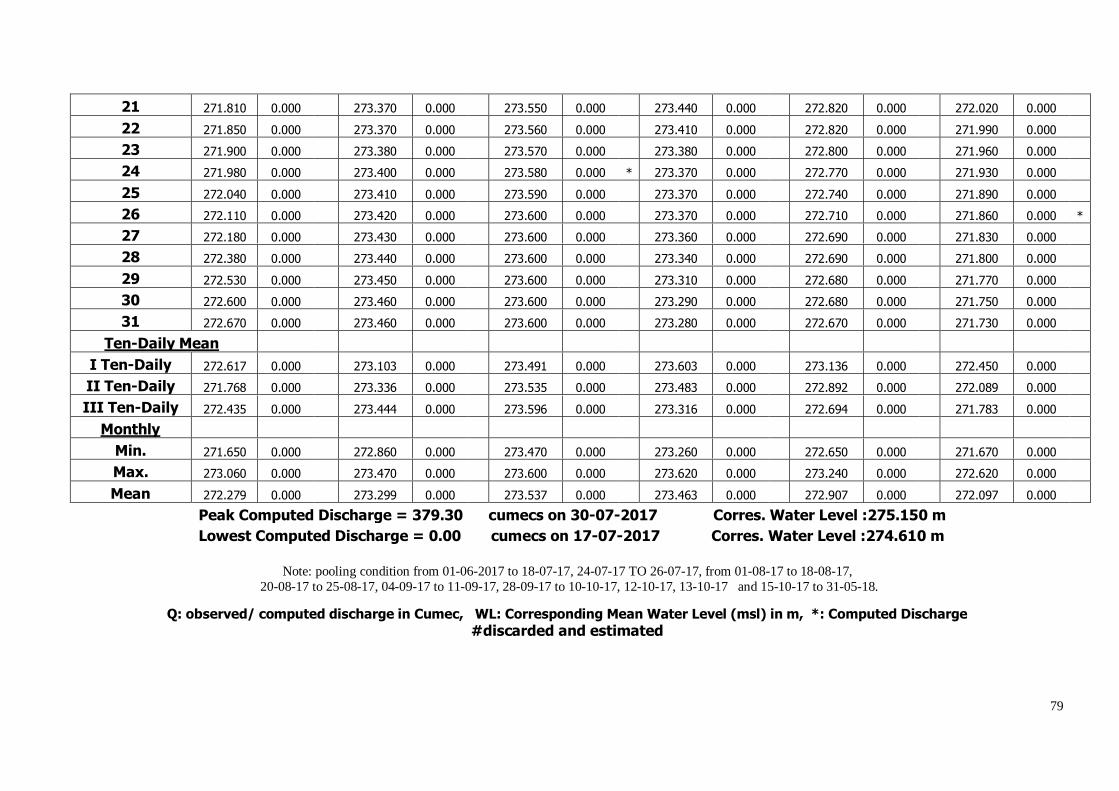
79
21 271.810 0.000 273.370 0.000 273.550 0.000 273.440 0.000 272.820 0.000 272.020 0.000
22 271.850 0.000 273.370 0.000 273.560 0.000 273.410 0.000 272.820 0.000 271.990 0.000
23 271.900 0.000 273.380 0.000 273.570 0.000 273.380 0.000 272.800 0.000 271.960 0.000
24 271.980 0.000 273.400 0.000 273.580 0.000 * 273.370 0.000 272.770 0.000 271.930 0.000
25 272.040 0.000 273.410 0.000 273.590 0.000 273.370 0.000 272.740 0.000 271.890 0.000
26 272.110 0.000 273.420 0.000 273.600 0.000 273.370 0.000 272.710 0.000 271.860 0.000 *
27 272.180 0.000 273.430 0.000 273.600 0.000 273.360 0.000 272.690 0.000 271.830 0.000
28 272.380 0.000 273.440 0.000 273.600 0.000 273.340 0.000 272.690 0.000 271.800 0.000
29 272.530 0.000 273.450 0.000 273.600 0.000 273.310 0.000 272.680 0.000 271.770 0.000
30 272.600 0.000 273.460 0.000 273.600 0.000 273.290 0.000 272.680 0.000 271.750 0.000
31 272.670 0.000 273.460 0.000 273.600 0.000 273.280 0.000 272.670 0.000 271.730 0.000
Ten-Daily Mean
I Ten-Daily 272.617 0.000 273.103 0.000 273.491 0.000 273.603 0.000 273.136 0.000 272.450 0.000
II Ten-Daily 271.768 0.000 273.336 0.000 273.535 0.000 273.483 0.000 272.892 0.000 272.089 0.000
III Ten-Daily 272.435 0.000 273.444 0.000 273.596 0.000 273.316 0.000 272.694 0.000 271.783 0.000
Monthly
Min. 271.650 0.000 272.860 0.000 273.470 0.000 273.260 0.000 272.650 0.000 271.670 0.000
Max. 273.060 0.000 273.470 0.000 273.600 0.000 273.620 0.000 273.240 0.000 272.620 0.000
Mean 272.279 0.000
273.299 0.000
273.537 0.000
273.463 0.000
272.907 0.000
272.097 0.000
Peak Computed Discharge = 379.30 cumecs on 30-07-2017 Corres. Water Level :275.150 m
Lowest Computed Discharge = 0.00 cumecs on 17-07-2017 Corres. Water Level :274.610 m
Note: pooling condition from 01-06-2017 to 18-07-17, 24-07-17 TO 26-07-17, from 01-08-17 to 18-08-17,
20-08-17 to 25-08-17, 04-09-17 to 11-09-17, 28-09-17 to 10-10-17, 12-10-17, 13-10-17 and 15-10-17 to 31-05-18.
Q: observed/ computed discharge in Cumec, WL: Corresponding Mean Water Level (msl) in m, *: Computed Discharge
#discarded and estimated
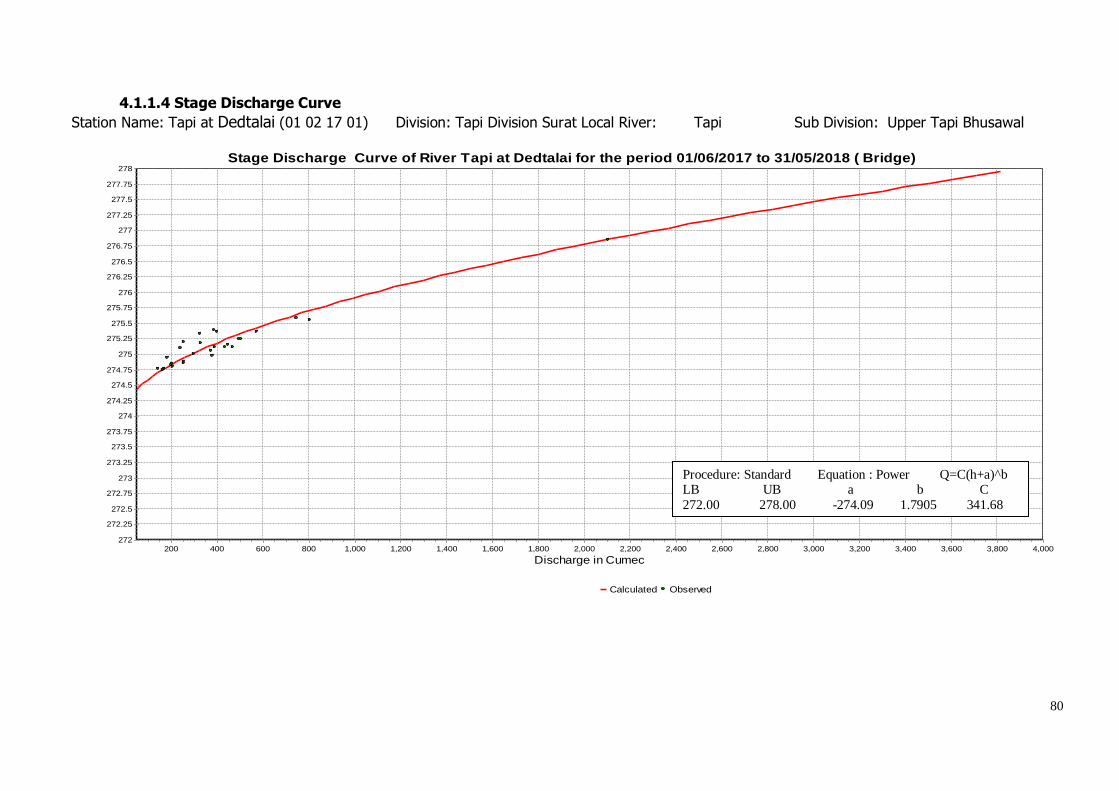
80
4.1.1.4 Stage Discharge Curve
Station Name: Tapi at Dedtalai (01 02 17 01) Division: Tapi Division Surat Local River: Tapi Sub Division: Upper Tapi Bhusawal
Stage Discharge Curve of River Tapi at Dedtalai for the period 01/06/2017 to 31/05/2018 ( Bridge)
Calculated Observed
Discharge in Cumec4,0003,8003,6003,4003,2003,0002,8002,6002,4002,2002,0001,8001,6001,4001,2001,000800600400200
Sta
ge
in m
278
277.75
277.5
277.25
277
276.75
276.5
276.25
276
275.75
275.5
275.25
275
274.75
274.5
274.25
274
273.75
273.5
273.25
273
272.75
272.5
272.25
272
Procedure: Standard Equation : Power Q=C(h+a)^b LB UB a b C
272.00 278.00 -274.09 1.7905 341.68
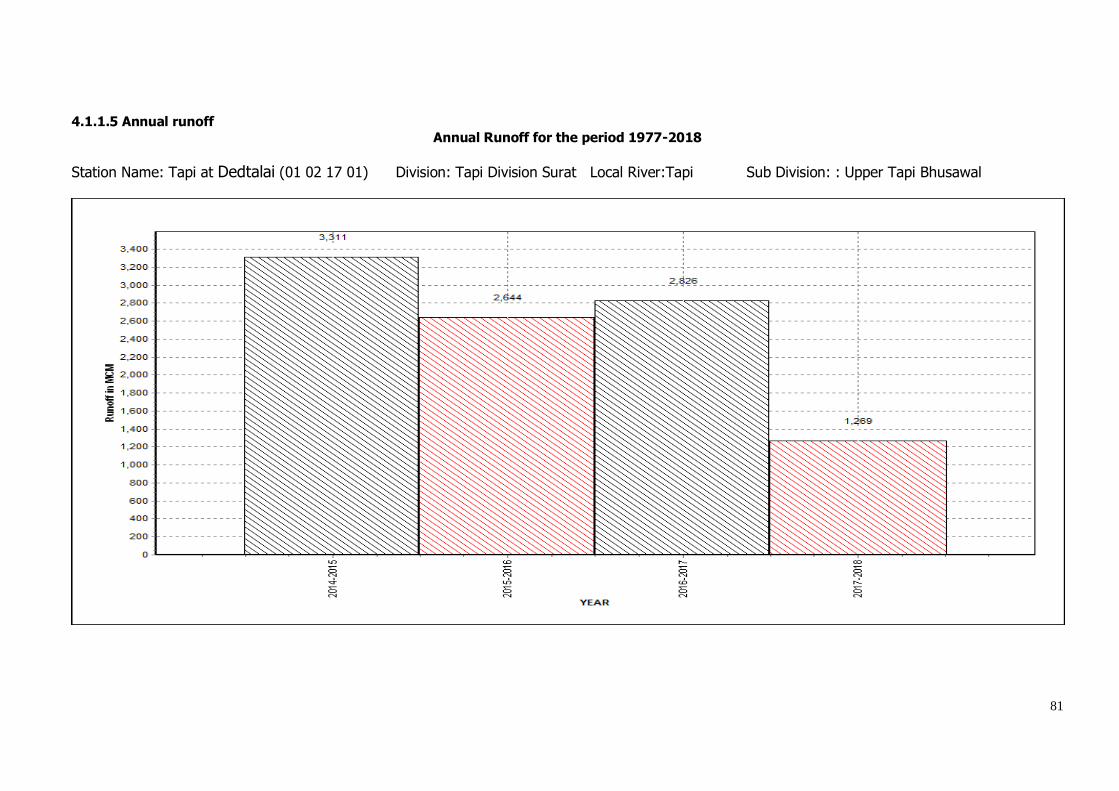
81
4.1.1.5 Annual runoff
Annual Runoff for the period 1977-2018
Station Name: Tapi at Dedtalai (01 02 17 01) Division: Tapi Division Surat Local River:Tapi Sub Division: : Upper Tapi Bhusawal
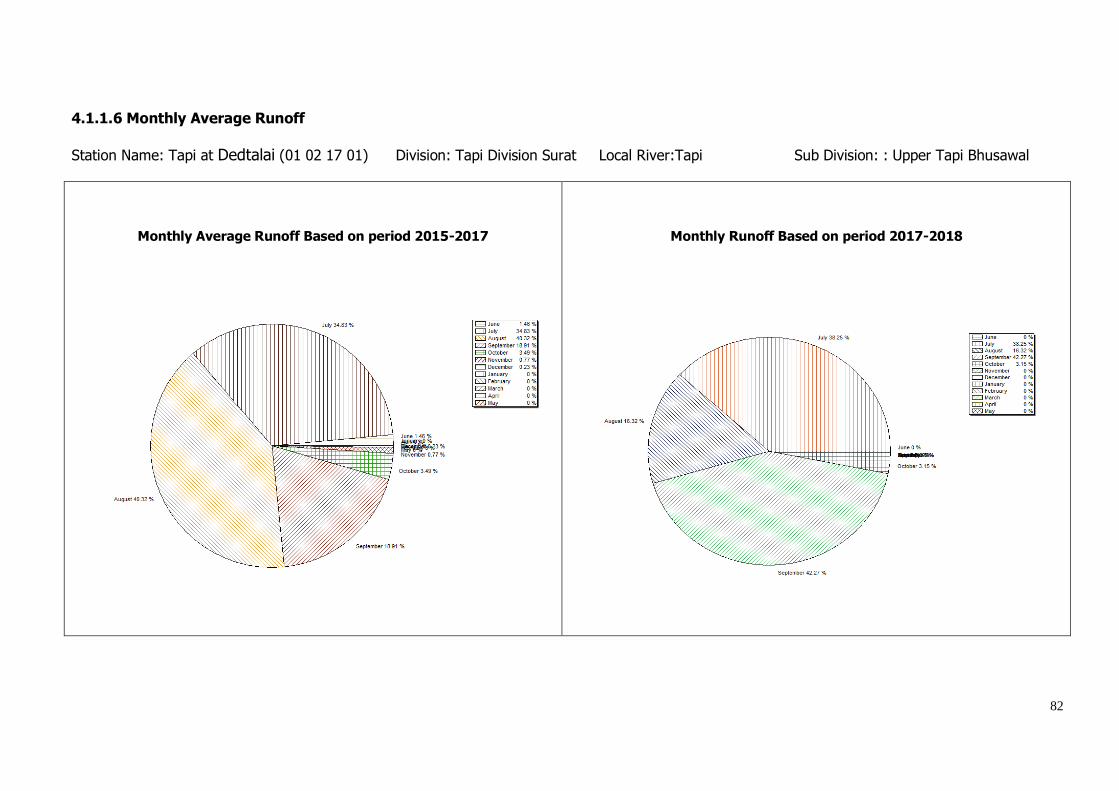
82
4.1.1.6 Monthly Average Runoff
Station Name: Tapi at Dedtalai (01 02 17 01) Division: Tapi Division Surat Local River:Tapi Sub Division: : Upper Tapi Bhusawal
Monthly Average Runoff Based on period 2015-2017
Monthly Runoff Based on period 2017-2018

83
4.1.1.7 Superimposed cross section
Station Name: Tapi at Dedtalai (01 02 17 01) Division: Tapi Division Surat Local River: Tapi Sub Division: : Upper Tapi Bhusawal
HFL 295.000 m on 08/07/2007 at 1700 hrs
0200 hrs to 03:00hrs
Max WL 278.250 on 20/07/2017
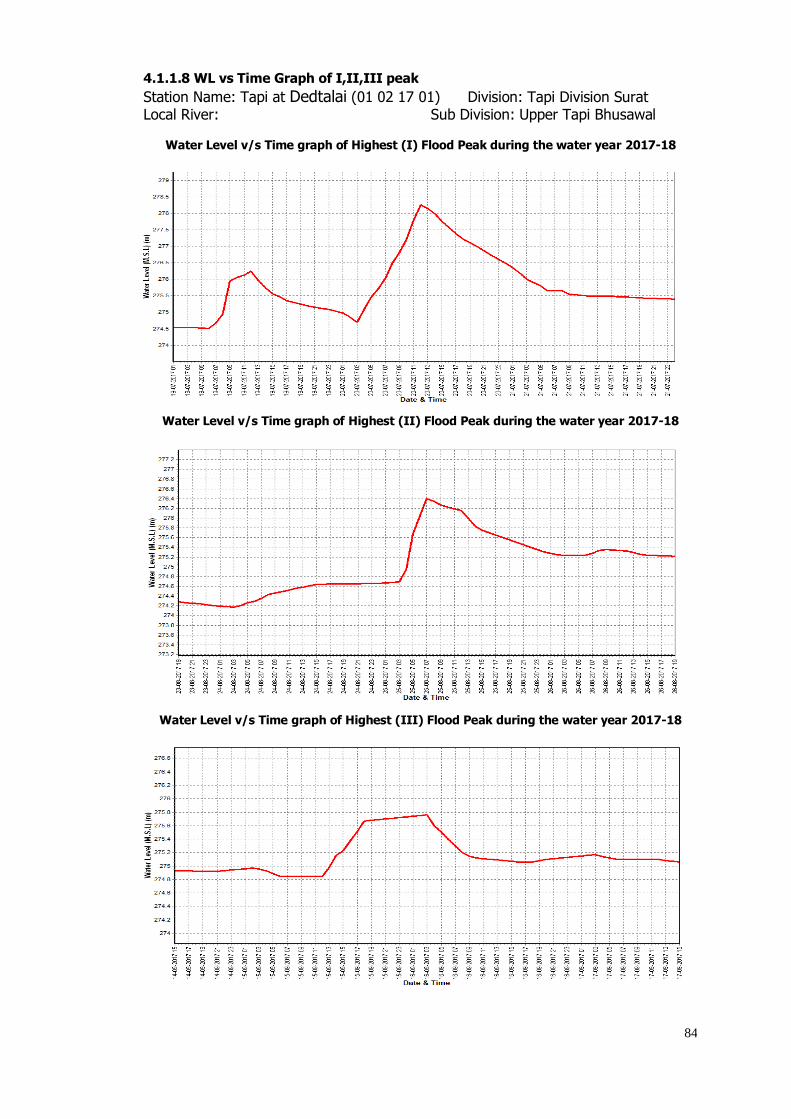
84
4.1.1.8 WL vs Time Graph of I,II,III peak
Station Name: Tapi at Dedtalai (01 02 17 01) Division: Tapi Division Surat Local River: Sub Division: Upper Tapi Bhusawal
Water Level v/s Time graph of Highest (I) Flood Peak during the water year 2017-18
Water Level v/s Time graph of Highest (II) Flood Peak during the water year 2017-18
Water Level v/s Time graph of Highest (III) Flood Peak during the water year 2017-18
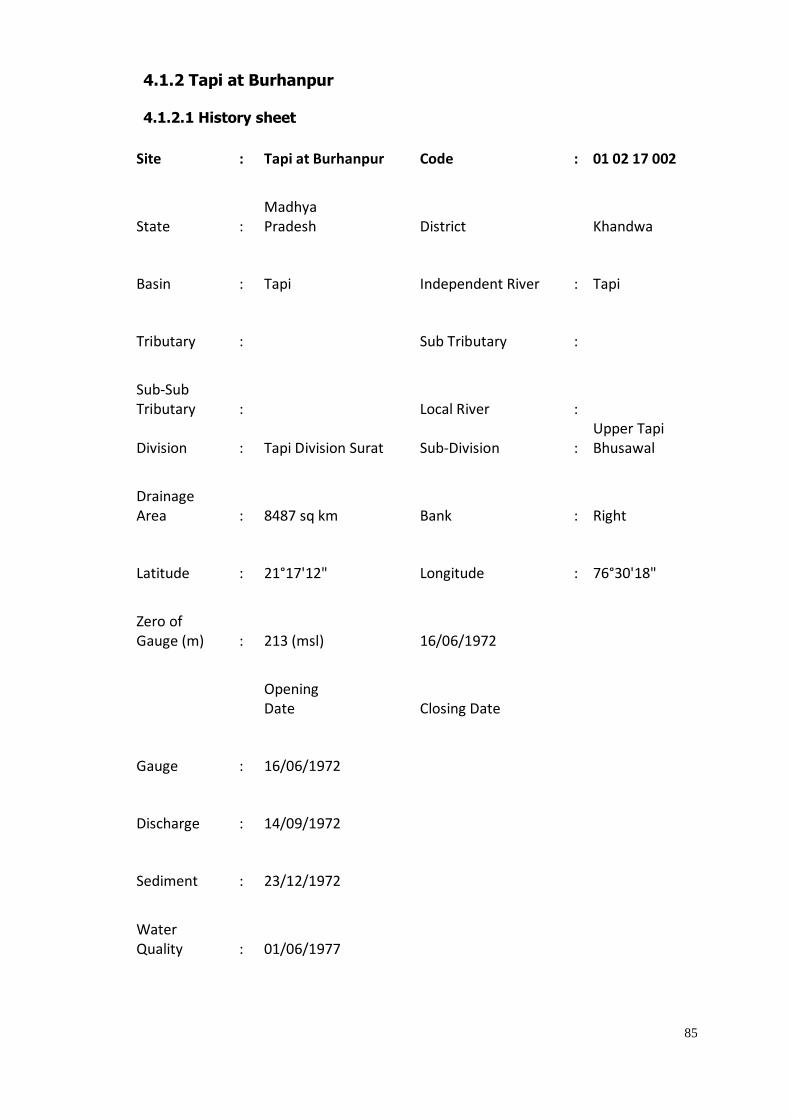
85
4.1.2 Tapi at Burhanpur
4.1.2.1 History sheet
Site : Tapi at Burhanpur Code : 01 02 17 002
State : Madhya Pradesh District Khandwa
Basin : Tapi Independent River : Tapi
Tributary : Sub Tributary :
Sub-Sub Tributary : Local River :
Division : Tapi Division Surat Sub-Division : Upper Tapi Bhusawal
Drainage Area : 8487 sq km Bank : Right
Latitude : 21°17'12" Longitude : 76°30'18"
Zero of Gauge (m) : 213 (msl) 16/06/1972
Opening Date Closing Date
Gauge : 16/06/1972
Discharge : 14/09/1972
Sediment : 23/12/1972
Water Quality : 01/06/1977
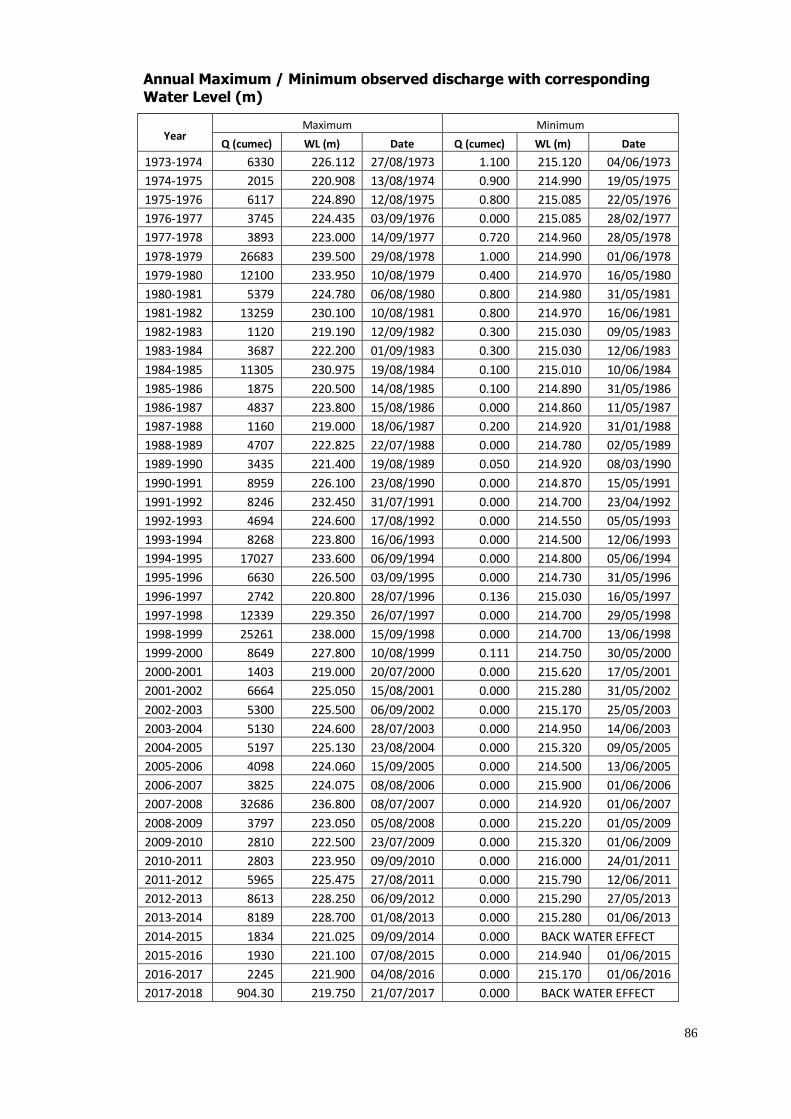
86
Annual Maximum / Minimum observed discharge with corresponding
Water Level (m)
Year
Maximum Minimum
Q (cumec) WL (m) Date Q (cumec) WL (m) Date
1973-1974 6330 226.112 27/08/1973 1.100 215.120 04/06/1973
1974-1975 2015 220.908 13/08/1974 0.900 214.990 19/05/1975
1975-1976 6117 224.890 12/08/1975 0.800 215.085 22/05/1976
1976-1977 3745 224.435 03/09/1976 0.000 215.085 28/02/1977
1977-1978 3893 223.000 14/09/1977 0.720 214.960 28/05/1978
1978-1979 26683 239.500 29/08/1978 1.000 214.990 01/06/1978
1979-1980 12100 233.950 10/08/1979 0.400 214.970 16/05/1980
1980-1981 5379 224.780 06/08/1980 0.800 214.980 31/05/1981
1981-1982 13259 230.100 10/08/1981 0.800 214.970 16/06/1981
1982-1983 1120 219.190 12/09/1982 0.300 215.030 09/05/1983
1983-1984 3687 222.200 01/09/1983 0.300 215.030 12/06/1983
1984-1985 11305 230.975 19/08/1984 0.100 215.010 10/06/1984
1985-1986 1875 220.500 14/08/1985 0.100 214.890 31/05/1986
1986-1987 4837 223.800 15/08/1986 0.000 214.860 11/05/1987
1987-1988 1160 219.000 18/06/1987 0.200 214.920 31/01/1988
1988-1989 4707 222.825 22/07/1988 0.000 214.780 02/05/1989
1989-1990 3435 221.400 19/08/1989 0.050 214.920 08/03/1990
1990-1991 8959 226.100 23/08/1990 0.000 214.870 15/05/1991
1991-1992 8246 232.450 31/07/1991 0.000 214.700 23/04/1992
1992-1993 4694 224.600 17/08/1992 0.000 214.550 05/05/1993
1993-1994 8268 223.800 16/06/1993 0.000 214.500 12/06/1993
1994-1995 17027 233.600 06/09/1994 0.000 214.800 05/06/1994
1995-1996 6630 226.500 03/09/1995 0.000 214.730 31/05/1996
1996-1997 2742 220.800 28/07/1996 0.136 215.030 16/05/1997
1997-1998 12339 229.350 26/07/1997 0.000 214.700 29/05/1998
1998-1999 25261 238.000 15/09/1998 0.000 214.700 13/06/1998
1999-2000 8649 227.800 10/08/1999 0.111 214.750 30/05/2000
2000-2001 1403 219.000 20/07/2000 0.000 215.620 17/05/2001
2001-2002 6664 225.050 15/08/2001 0.000 215.280 31/05/2002
2002-2003 5300 225.500 06/09/2002 0.000 215.170 25/05/2003
2003-2004 5130 224.600 28/07/2003 0.000 214.950 14/06/2003
2004-2005 5197 225.130 23/08/2004 0.000 215.320 09/05/2005
2005-2006 4098 224.060 15/09/2005 0.000 214.500 13/06/2005
2006-2007 3825 224.075 08/08/2006 0.000 215.900 01/06/2006
2007-2008 32686 236.800 08/07/2007 0.000 214.920 01/06/2007
2008-2009 3797 223.050 05/08/2008 0.000 215.220 01/05/2009
2009-2010 2810 222.500 23/07/2009 0.000 215.320 01/06/2009
2010-2011 2803 223.950 09/09/2010 0.000 216.000 24/01/2011
2011-2012 5965 225.475 27/08/2011 0.000 215.790 12/06/2011
2012-2013 8613 228.250 06/09/2012 0.000 215.290 27/05/2013
2013-2014 8189 228.700 01/08/2013 0.000 215.280 01/06/2013
2014-2015 1834 221.025 09/09/2014 0.000 BACK WATER EFFECT
2015-2016 1930 221.100 07/08/2015 0.000 214.940 01/06/2015
2016-2017 2245 221.900 04/08/2016 0.000 215.170 01/06/2016
2017-2018 904.30 219.750 21/07/2017 0.000 BACK WATER EFFECT

87
4.1.2.2 Annual Maximum flood peak
Year MWL (m) Date Hour
1973 227.075 15/07/1973 03:00:00
1974 221.750 13/08/1974 02:00:00
1975 225.850 11/09/1975 20:00:00
1976 224.850 03/09/1976 08:00:00
1977 223.325 14/09/1977 15:00:00
1978 239.500 29/08/1978 18:00:00
1979 233.172 10/08/1979 09:00:00
1980 227.350 06/08/1980 14:00:00
1981 229.800 10/08/1981 00:00:00
1982 218.100 12/09/1982 00:00:00
1983 222.250 02/09/1983 17:00:00
1984 230.600 19/08/1984 02:00:00
1985 219.500 14/08/1985 00:00:00
1986 225.200 15/08/1986 00:00:00
1987 219.600 21/08/1987 06:00:00
1988 223.950 03/10/1988 07:00:00
1989 222.990 23/08/1989 21:00:00
1990 232.150 23/08/1990 17:00:00
1991 233.350 31/07/1991 05:00:00
1992 225.850 16/08/1992 21:00:00
1993 230.200 16/07/1993 22:00:00
1994 236.700 06/09/1994 17:00:00
1995 226.600 03/09/1995 10:00:00
1996 223.600 26/07/1996 19:00:00
1997 229.500 26/07/1997 10:00:00
1998 238.800 15/09/1988 12:00:00
1999 229.800 10/08/1999 03:00:00
2000 223.200 19/07/2000 15:00:00
2001 229.900 15/08/2001 23:00:00
2002 227.800 06/09/2002 01:00:00
2003 228.450 28/07/2003 02:00:00
2004 226.500 23/08/2004 05:00:00
2005 224.400 02/08/2005 13:00:00
2006 225.700 06/08/2006 22:00:00
2007 239.950 08/07/2007 17:00:00
2008 227.000 05/08/2008 21:00:00
2009 225.700 23/07/2009 01:00:00
2010 225.300 30/07/2010 19:00:00
2011 226.100 27/08/2011 09:00:00
2012 238.000 05/09/2012 23:00:00
2013 234.000 01/08/2013 14:00:00
2014 236.700 23/07/2014 18:00:00
2015 235.500 05/08/2015 06:00:00
2016 227.700 12/07/2016 16:00:00
2017 221.550 20/07/2017 19:00:00
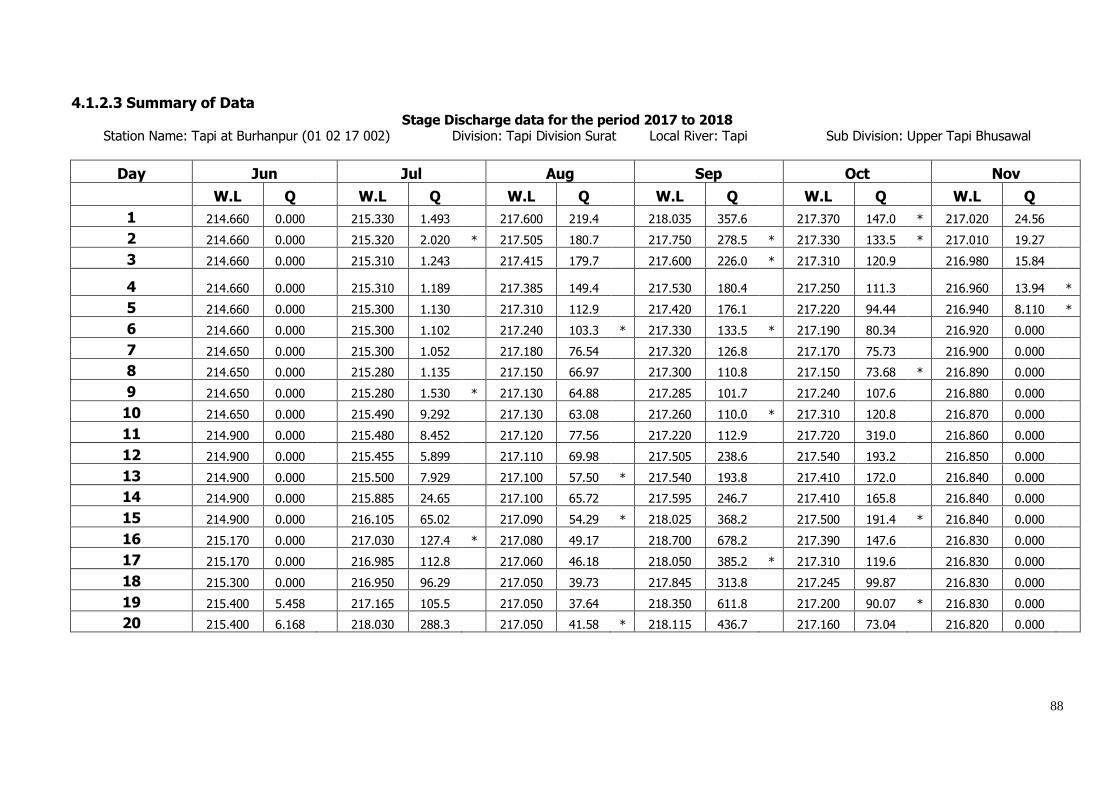
88
4.1.2.3 Summary of Data Stage Discharge data for the period 2017 to 2018
Station Name: Tapi at Burhanpur (01 02 17 002) Division: Tapi Division Surat Local River: Tapi Sub Division: Upper Tapi Bhusawal
Day Jun Jul Aug Sep Oct Nov
W.L Q W.L Q W.L Q W.L Q W.L Q W.L Q
1 214.660 0.000 215.330 1.493 217.600 219.4 218.035 357.6 217.370 147.0 * 217.020 24.56
2 214.660 0.000 215.320 2.020 * 217.505 180.7 217.750 278.5 * 217.330 133.5 * 217.010 19.27
3 214.660 0.000 215.310 1.243 217.415 179.7 217.600 226.0 * 217.310 120.9 216.980 15.84
4 214.660 0.000 215.310 1.189 217.385 149.4 217.530 180.4 217.250 111.3 216.960 13.94 *
5 214.660 0.000 215.300 1.130 217.310 112.9 217.420 176.1 217.220 94.44 216.940 8.110 *
6 214.660 0.000 215.300 1.102 217.240 103.3 * 217.330 133.5 * 217.190 80.34 216.920 0.000
7 214.650 0.000 215.300 1.052 217.180 76.54 217.320 126.8 217.170 75.73 216.900 0.000
8 214.650 0.000 215.280 1.135 217.150 66.97 217.300 110.8 217.150 73.68 * 216.890 0.000
9 214.650 0.000 215.280 1.530 * 217.130 64.88 217.285 101.7 217.240 107.6 216.880 0.000
10 214.650 0.000 215.490 9.292 217.130 63.08 217.260 110.0 * 217.310 120.8 216.870 0.000
11 214.900 0.000 215.480 8.452 217.120 77.56 217.220 112.9 217.720 319.0 216.860 0.000
12 214.900 0.000 215.455 5.899 217.110 69.98 217.505 238.6 217.540 193.2 216.850 0.000
13 214.900 0.000 215.500 7.929 217.100 57.50 * 217.540 193.8 217.410 172.0 216.840 0.000
14 214.900 0.000 215.885 24.65 217.100 65.72 217.595 246.7 217.410 165.8 216.840 0.000
15 214.900 0.000 216.105 65.02 217.090 54.29 * 218.025 368.2 217.500 191.4 * 216.840 0.000
16 215.170 0.000 217.030 127.4 * 217.080 49.17 218.700 678.2 217.390 147.6 216.830 0.000
17 215.170 0.000 216.985 112.8 217.060 46.18 218.050 385.2 * 217.310 119.6 216.830 0.000
18 215.300 0.000 216.950 96.29 217.050 39.73 217.845 313.8 217.245 99.87 216.830 0.000
19 215.400 5.458 217.165 105.5 217.050 37.64 218.350 611.8 217.200 90.07 * 216.830 0.000
20 215.400 6.168 218.030 288.3 217.050 41.58 * 218.115 436.7 217.160 73.04 216.820 0.000
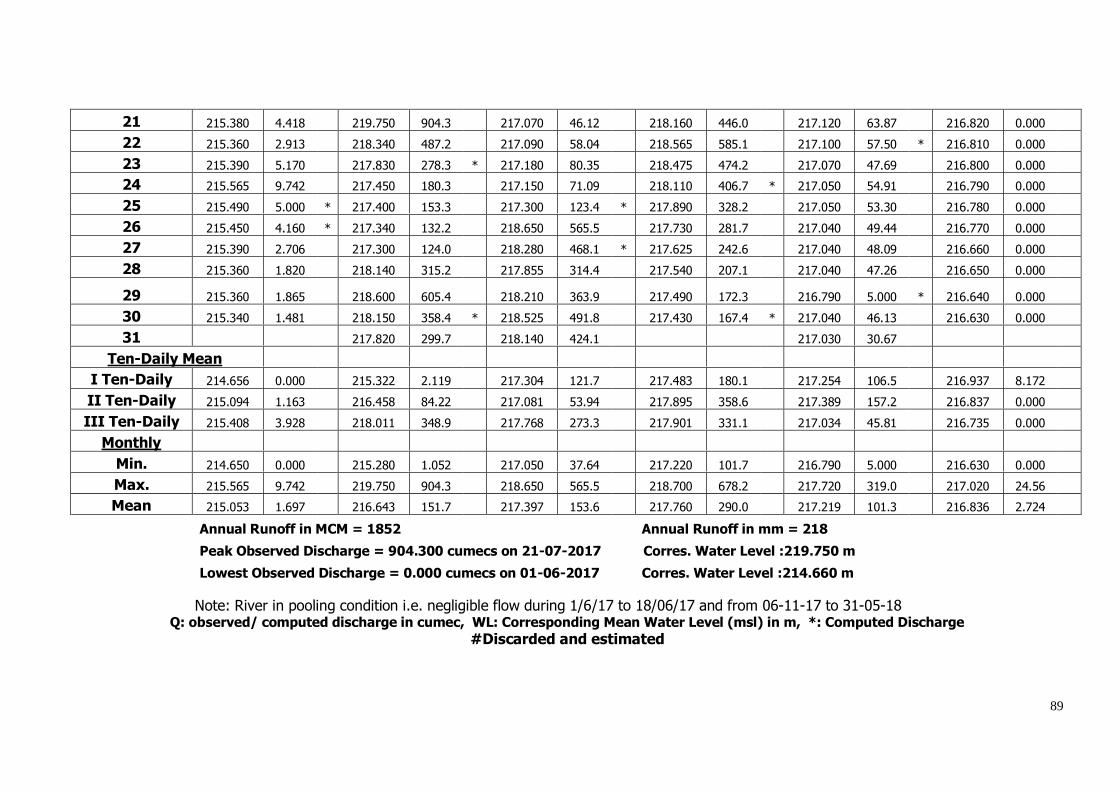
89
21 215.380 4.418 219.750 904.3 217.070 46.12 218.160 446.0 217.120 63.87 216.820 0.000
22 215.360 2.913 218.340 487.2 217.090 58.04 218.565 585.1 217.100 57.50 * 216.810 0.000
23 215.390 5.170 217.830 278.3 * 217.180 80.35 218.475 474.2 217.070 47.69 216.800 0.000
24 215.565 9.742 217.450 180.3 217.150 71.09 218.110 406.7 * 217.050 54.91 216.790 0.000
25 215.490 5.000 * 217.400 153.3 217.300 123.4 * 217.890 328.2 217.050 53.30 216.780 0.000
26 215.450 4.160 * 217.340 132.2 218.650 565.5 217.730 281.7 217.040 49.44 216.770 0.000
27 215.390 2.706 217.300 124.0 218.280 468.1 * 217.625 242.6 217.040 48.09 216.660 0.000
28 215.360 1.820 218.140 315.2 217.855 314.4 217.540 207.1 217.040 47.26 216.650 0.000
29 215.360 1.865 218.600 605.4 218.210 363.9 217.490 172.3 216.790 5.000 * 216.640 0.000
30 215.340 1.481 218.150 358.4 * 218.525 491.8 217.430 167.4 * 217.040 46.13 216.630 0.000
31 217.820 299.7 218.140 424.1 217.030 30.67
Ten-Daily Mean
I Ten-Daily 214.656 0.000 215.322 2.119 217.304 121.7 217.483 180.1 217.254 106.5 216.937 8.172
II Ten-Daily 215.094 1.163 216.458 84.22 217.081 53.94 217.895 358.6 217.389 157.2 216.837 0.000
III Ten-Daily 215.408 3.928 218.011 348.9 217.768 273.3 217.901 331.1 217.034 45.81 216.735 0.000
Monthly
Min. 214.650 0.000 215.280 1.052 217.050 37.64 217.220 101.7 216.790 5.000 216.630 0.000
Max. 215.565 9.742 219.750 904.3 218.650 565.5 218.700 678.2 217.720 319.0 217.020 24.56
Mean 215.053 1.697
216.643 151.7
217.397 153.6
217.760 290.0
217.219 101.3
216.836 2.724
Annual Runoff in MCM = 1852 Annual Runoff in mm = 218
Peak Observed Discharge = 904.300 cumecs on 21-07-2017 Corres. Water Level :219.750 m
Lowest Observed Discharge = 0.000 cumecs on 01-06-2017 Corres. Water Level :214.660 m
Note: River in pooling condition i.e. negligible flow during 1/6/17 to 18/06/17 and from 06-11-17 to 31-05-18 Q: observed/ computed discharge in cumec, WL: Corresponding Mean Water Level (msl) in m, *: Computed Discharge
#Discarded and estimated
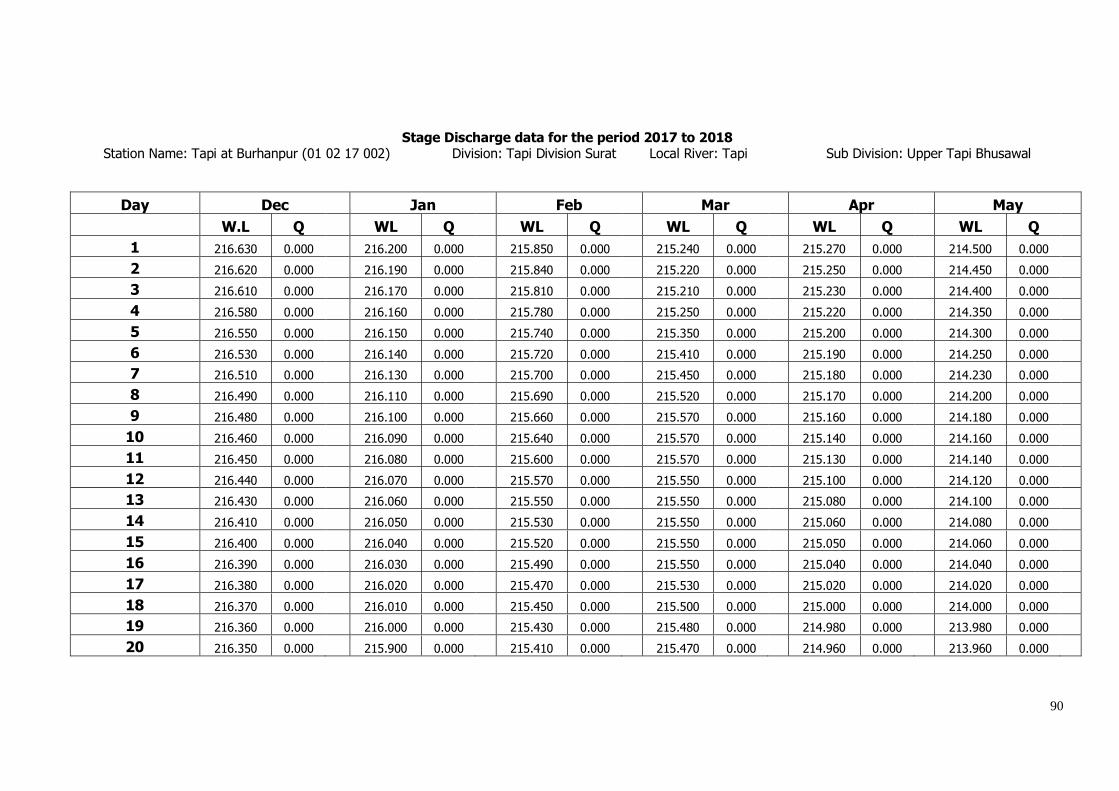
90
Stage Discharge data for the period 2017 to 2018
Station Name: Tapi at Burhanpur (01 02 17 002) Division: Tapi Division Surat Local River: Tapi Sub Division: Upper Tapi Bhusawal
Day Dec Jan Feb Mar Apr May
W.L Q WL Q WL Q WL Q WL Q WL Q
1 216.630 0.000 216.200 0.000 215.850 0.000 215.240 0.000 215.270 0.000 214.500 0.000
2 216.620 0.000 216.190 0.000 215.840 0.000 215.220 0.000 215.250 0.000 214.450 0.000
3 216.610 0.000 216.170 0.000 215.810 0.000 215.210 0.000 215.230 0.000 214.400 0.000
4 216.580 0.000 216.160 0.000 215.780 0.000 215.250 0.000 215.220 0.000 214.350 0.000
5 216.550 0.000 216.150 0.000 215.740 0.000 215.350 0.000 215.200 0.000 214.300 0.000
6 216.530 0.000 216.140 0.000 215.720 0.000 215.410 0.000 215.190 0.000 214.250 0.000
7 216.510 0.000 216.130 0.000 215.700 0.000 215.450 0.000 215.180 0.000 214.230 0.000
8 216.490 0.000 216.110 0.000 215.690 0.000 215.520 0.000 215.170 0.000 214.200 0.000
9 216.480 0.000 216.100 0.000 215.660 0.000 215.570 0.000 215.160 0.000 214.180 0.000
10 216.460 0.000 216.090 0.000 215.640 0.000 215.570 0.000 215.140 0.000 214.160 0.000
11 216.450 0.000 216.080 0.000 215.600 0.000 215.570 0.000 215.130 0.000 214.140 0.000
12 216.440 0.000 216.070 0.000 215.570 0.000 215.550 0.000 215.100 0.000 214.120 0.000
13 216.430 0.000 216.060 0.000 215.550 0.000 215.550 0.000 215.080 0.000 214.100 0.000
14 216.410 0.000 216.050 0.000 215.530 0.000 215.550 0.000 215.060 0.000 214.080 0.000
15 216.400 0.000 216.040 0.000 215.520 0.000 215.550 0.000 215.050 0.000 214.060 0.000
16 216.390 0.000 216.030 0.000 215.490 0.000 215.550 0.000 215.040 0.000 214.040 0.000
17 216.380 0.000 216.020 0.000 215.470 0.000 215.530 0.000 215.020 0.000 214.020 0.000
18 216.370 0.000 216.010 0.000 215.450 0.000 215.500 0.000 215.000 0.000 214.000 0.000
19 216.360 0.000 216.000 0.000 215.430 0.000 215.480 0.000 214.980 0.000 213.980 0.000
20 216.350 0.000 215.900 0.000 215.410 0.000 215.470 0.000 214.960 0.000 213.960 0.000
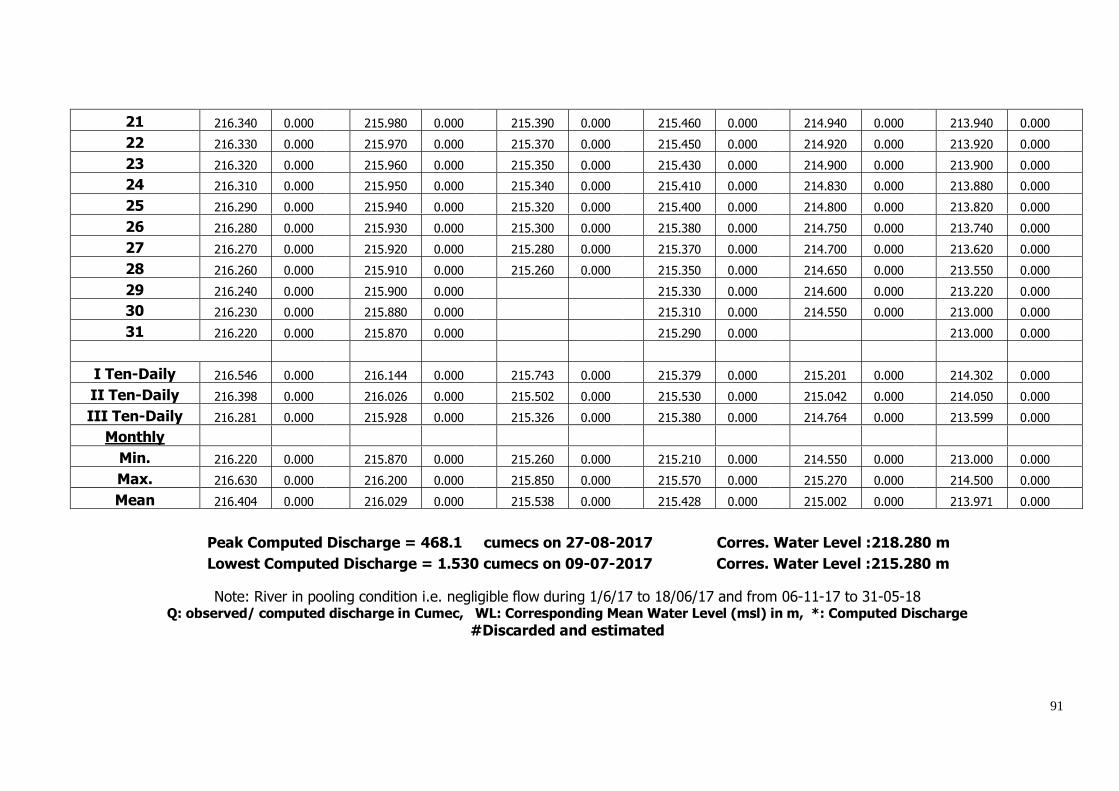
91
21 216.340 0.000 215.980 0.000 215.390 0.000 215.460 0.000 214.940 0.000 213.940 0.000
22 216.330 0.000 215.970 0.000 215.370 0.000 215.450 0.000 214.920 0.000 213.920 0.000
23 216.320 0.000 215.960 0.000 215.350 0.000 215.430 0.000 214.900 0.000 213.900 0.000
24 216.310 0.000 215.950 0.000 215.340 0.000 215.410 0.000 214.830 0.000 213.880 0.000
25 216.290 0.000 215.940 0.000 215.320 0.000 215.400 0.000 214.800 0.000 213.820 0.000
26 216.280 0.000 215.930 0.000 215.300 0.000 215.380 0.000 214.750 0.000 213.740 0.000
27 216.270 0.000 215.920 0.000 215.280 0.000 215.370 0.000 214.700 0.000 213.620 0.000
28 216.260 0.000 215.910 0.000 215.260 0.000 215.350 0.000 214.650 0.000 213.550 0.000
29 216.240 0.000 215.900 0.000 215.330 0.000 214.600 0.000 213.220 0.000
30 216.230 0.000 215.880 0.000 215.310 0.000 214.550 0.000 213.000 0.000
31 216.220 0.000 215.870 0.000 215.290 0.000 213.000 0.000
I Ten-Daily 216.546 0.000 216.144 0.000 215.743 0.000 215.379 0.000 215.201 0.000 214.302 0.000
II Ten-Daily 216.398 0.000 216.026 0.000 215.502 0.000 215.530 0.000 215.042 0.000 214.050 0.000
III Ten-Daily 216.281 0.000 215.928 0.000 215.326 0.000 215.380 0.000 214.764 0.000 213.599 0.000
Monthly
Min. 216.220 0.000 215.870 0.000 215.260 0.000 215.210 0.000 214.550 0.000 213.000 0.000
Max. 216.630 0.000 216.200 0.000 215.850 0.000 215.570 0.000 215.270 0.000 214.500 0.000
Mean 216.404 0.000
216.029 0.000
215.538 0.000
215.428 0.000
215.002 0.000
213.971 0.000
Peak Computed Discharge = 468.1 cumecs on 27-08-2017 Corres. Water Level :218.280 m
Lowest Computed Discharge = 1.530 cumecs on 09-07-2017 Corres. Water Level :215.280 m
Note: River in pooling condition i.e. negligible flow during 1/6/17 to 18/06/17 and from 06-11-17 to 31-05-18 Q: observed/ computed discharge in Cumec, WL: Corresponding Mean Water Level (msl) in m, *: Computed Discharge
#Discarded and estimated

92
4.1.2.4 Stage Discharge Curve Station Name: Tapi at Burhanpur (01 02 17 002) Division: Tapi Division Surat Local River: Tapi Sub Division: Upper Tapi Bhusawal
Stage Discharge Curve of river Tapi at Burhanpur for the period 01/06/2017 to 31/07/2017
Calculated Observed
Discharge in Cumec1,0501,000950900850800750700650600550500450400350300250200150100500
Sta
ge
in m
220
219
218
217
216
215
Procedure: Standard Equation : Power Q=C(h+a)^b
LB UB a b C
215.000 220.000 -214.950 2.401 21.953
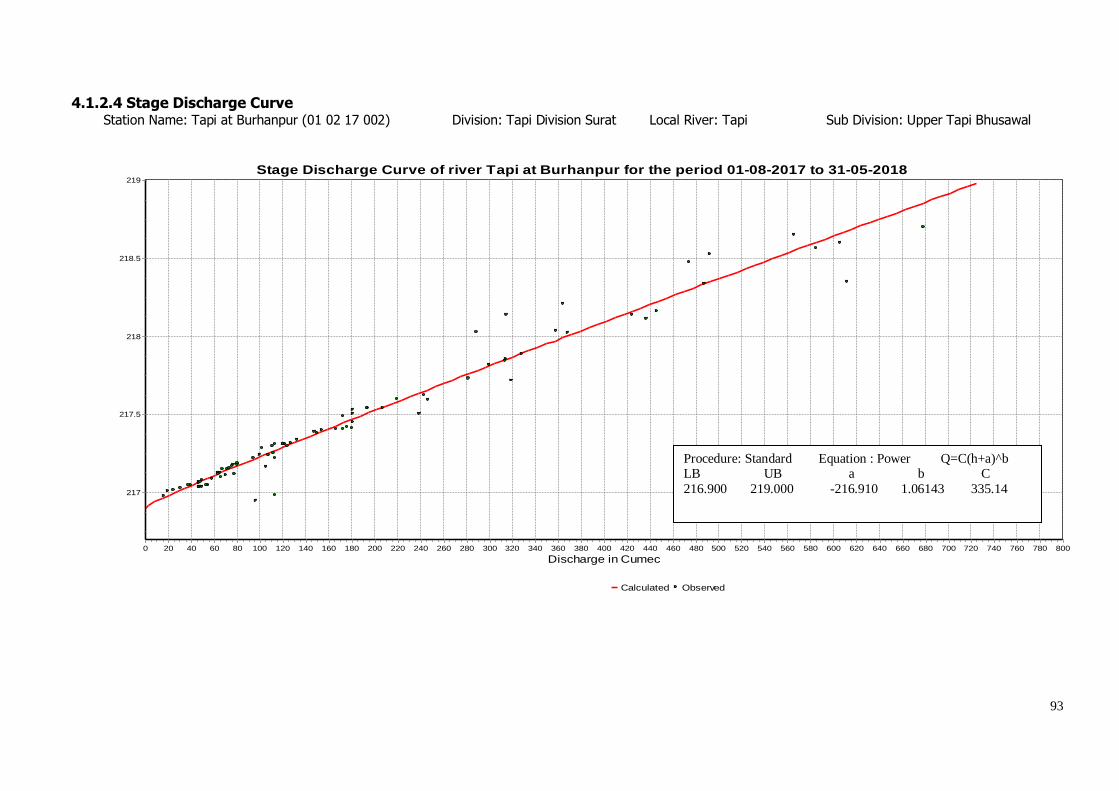
93
4.1.2.4 Stage Discharge Curve Station Name: Tapi at Burhanpur (01 02 17 002) Division: Tapi Division Surat Local River: Tapi Sub Division: Upper Tapi Bhusawal
Stage Discharge Curve of river Tapi at Burhanpur for the period 01-08-2017 to 31-05-2018
Calculated Observed
Discharge in Cumec800780760740720700680660640620600580560540520500480460440420400380360340320300280260240220200180160140120100806040200
Sta
ge in
m
219
218.5
218
217.5
217
Procedure: Standard Equation : Power Q=C(h+a)^b LB UB a b C
216.900 219.000 -216.910 1.06143 335.14
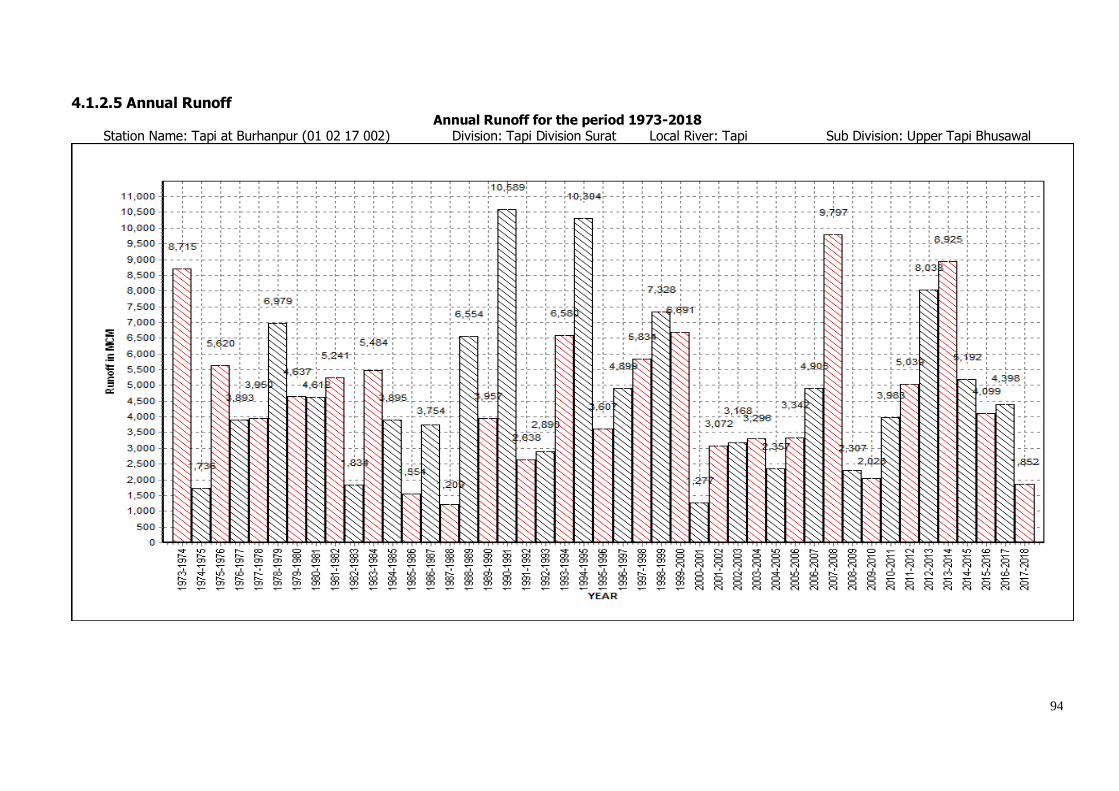
94
4.1.2.5 Annual Runoff Annual Runoff for the period 1973-2018
Station Name: Tapi at Burhanpur (01 02 17 002) Division: Tapi Division Surat Local River: Tapi Sub Division: Upper Tapi Bhusawal
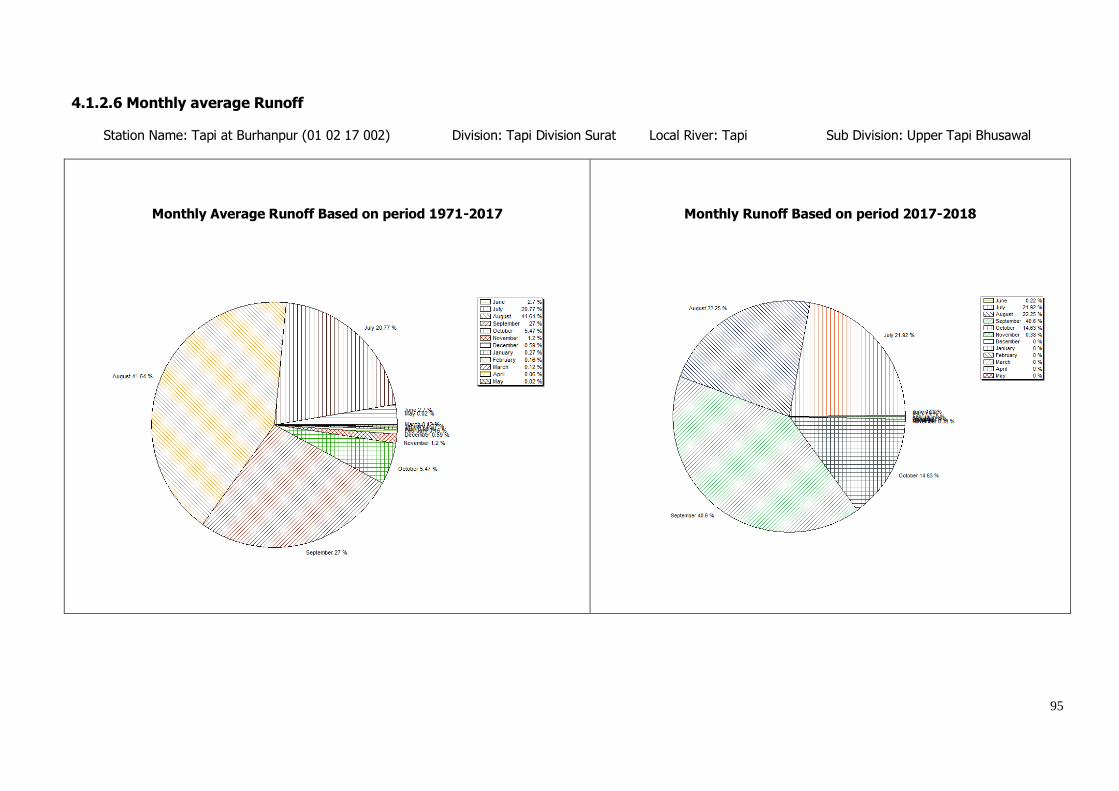
95
4.1.2.6 Monthly average Runoff
Station Name: Tapi at Burhanpur (01 02 17 002) Division: Tapi Division Surat Local River: Tapi Sub Division: Upper Tapi Bhusawal
Monthly Average Runoff Based on period 1971-2017
Monthly Runoff Based on period 2017-2018
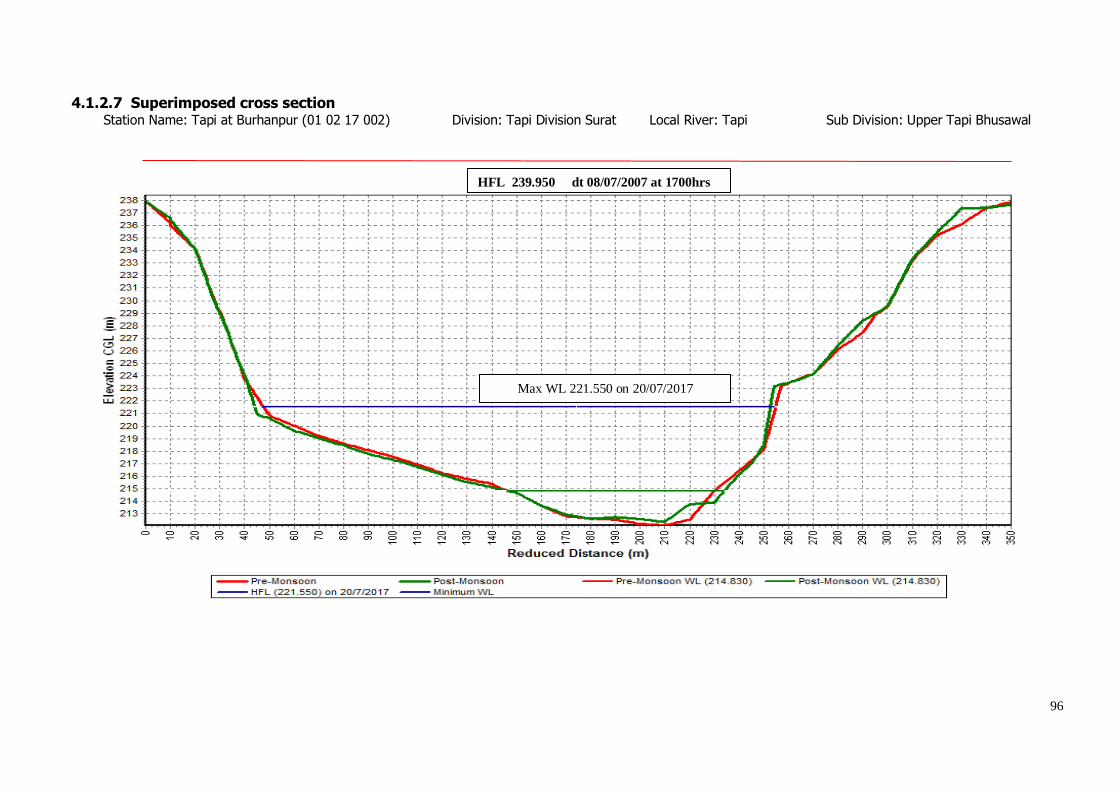
96
4.1.2.7 Superimposed cross section Station Name: Tapi at Burhanpur (01 02 17 002) Division: Tapi Division Surat Local River: Tapi Sub Division: Upper Tapi Bhusawal
HFL 239.950 dt 08/07/2007 at 1700hrs
Max WL 221.550 on 20/07/2017
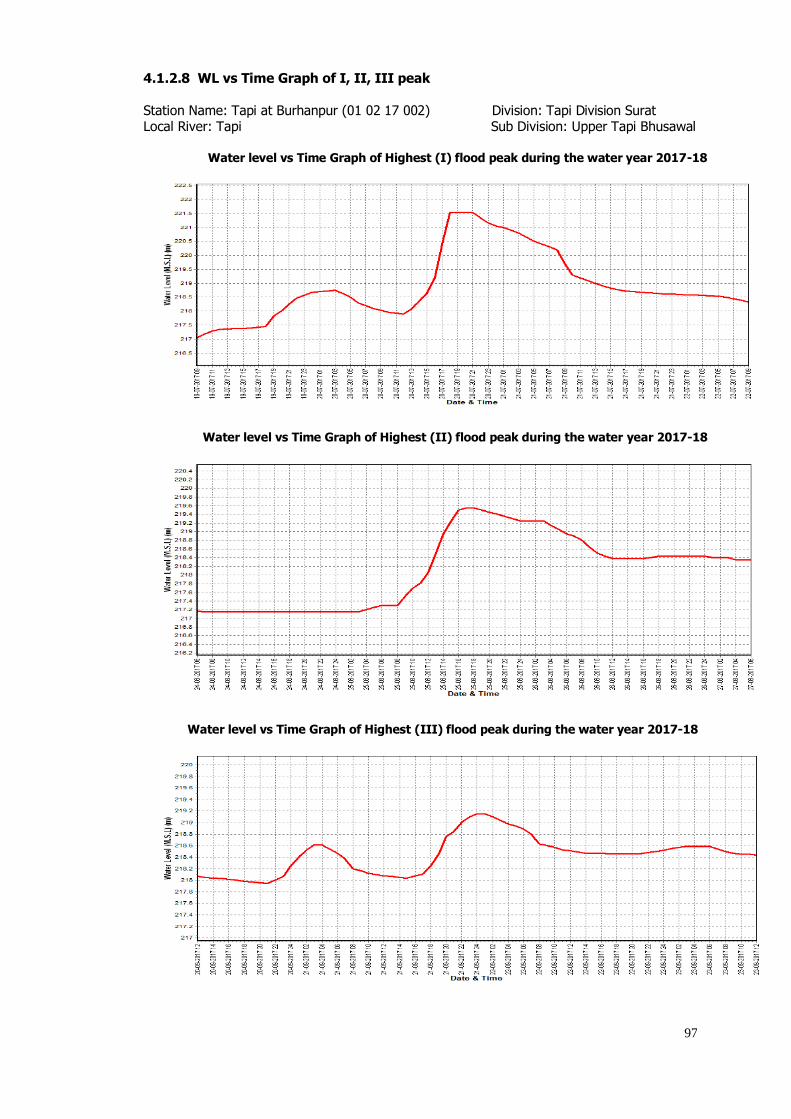
97
4.1.2.8 WL vs Time Graph of I, II, III peak Station Name: Tapi at Burhanpur (01 02 17 002) Division: Tapi Division Surat Local River: Tapi Sub Division: Upper Tapi Bhusawal
Water level vs Time Graph of Highest (I) flood peak during the water year 2017-18
Water level vs Time Graph of Highest (II) flood peak during the water year 2017-18
Water level vs Time Graph of Highest (III) flood peak during the water year 2017-18
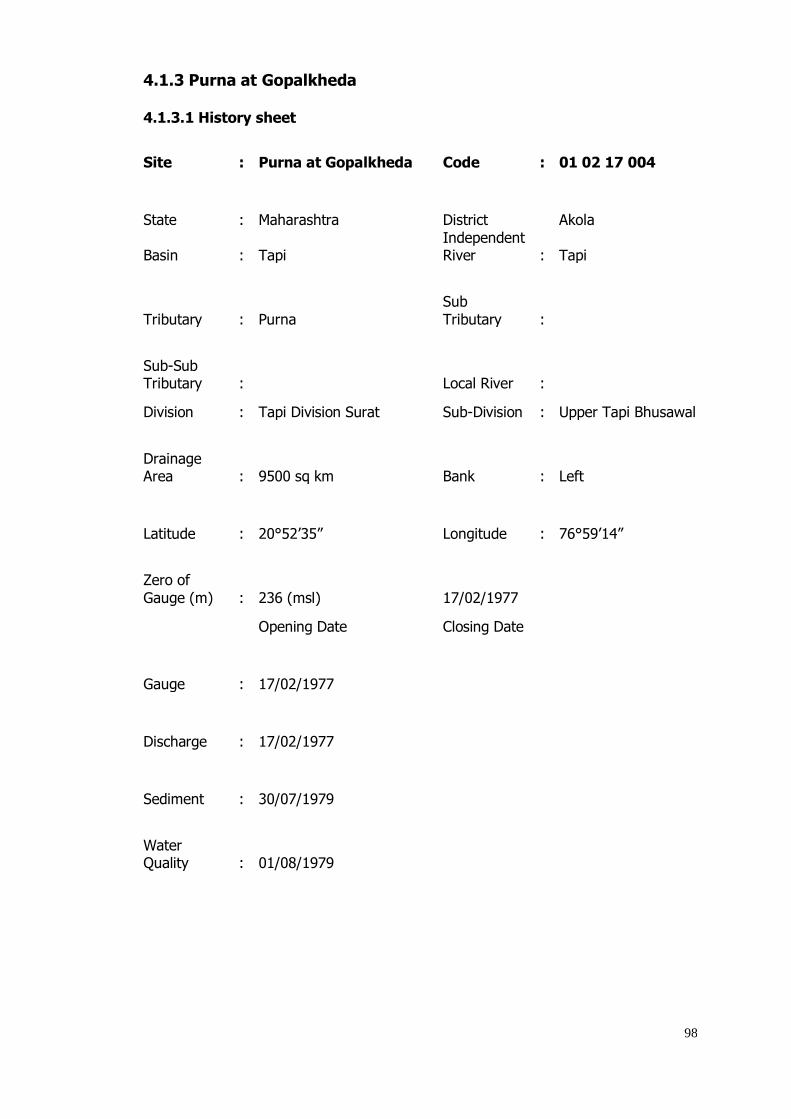
98
4.1.3 Purna at Gopalkheda
4.1.3.1 History sheet
Site : Purna at Gopalkheda Code : 01 02 17 004
State : Maharashtra District Akola
Basin : Tapi Independent River : Tapi
Tributary : Purna
Sub
Tributary :
Sub-Sub Tributary : Local River :
Division : Tapi Division Surat Sub-Division : Upper Tapi Bhusawal
Drainage Area : 9500 sq km Bank : Left
Latitude : 20°52’35” Longitude : 76°59’14”
Zero of
Gauge (m) : 236 (msl) 17/02/1977
Opening Date Closing Date
Gauge : 17/02/1977
Discharge : 17/02/1977
Sediment : 30/07/1979
Water Quality : 01/08/1979
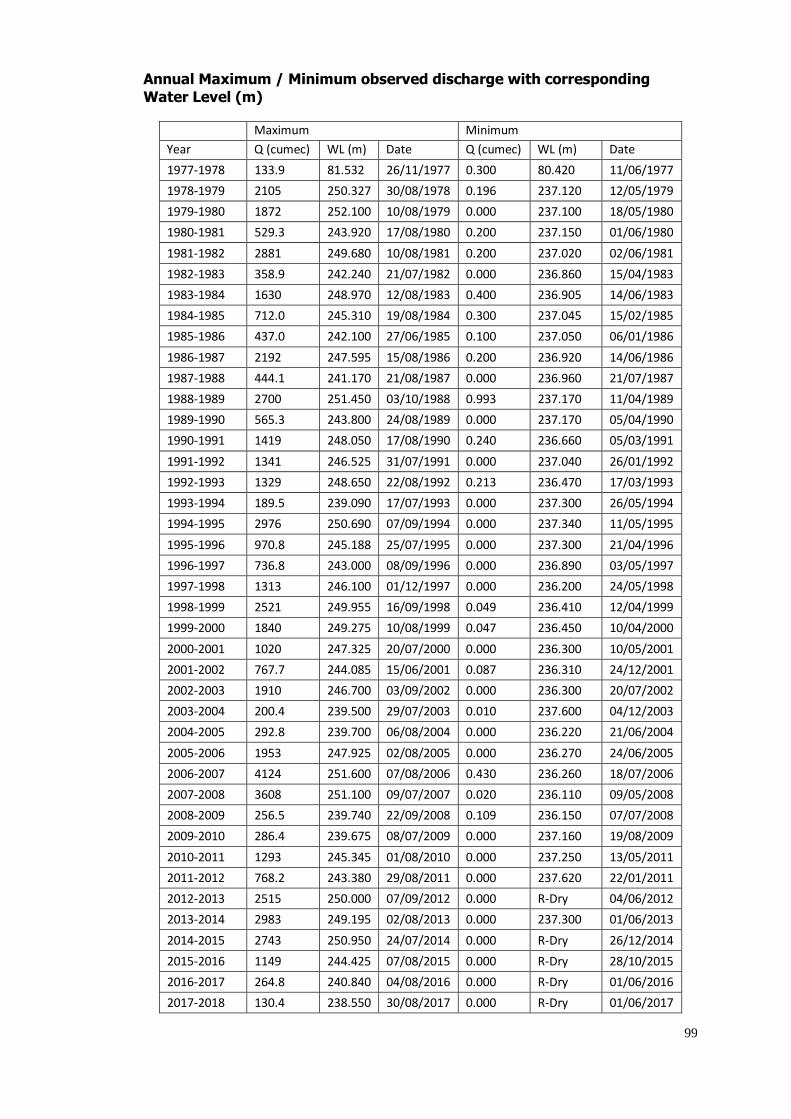
99
Annual Maximum / Minimum observed discharge with corresponding
Water Level (m)
Maximum Minimum
Year Q (cumec) WL (m) Date Q (cumec) WL (m) Date
1977-1978 133.9 81.532 26/11/1977 0.300 80.420 11/06/1977
1978-1979 2105 250.327 30/08/1978 0.196 237.120 12/05/1979
1979-1980 1872 252.100 10/08/1979 0.000 237.100 18/05/1980
1980-1981 529.3 243.920 17/08/1980 0.200 237.150 01/06/1980
1981-1982 2881 249.680 10/08/1981 0.200 237.020 02/06/1981
1982-1983 358.9 242.240 21/07/1982 0.000 236.860 15/04/1983
1983-1984 1630 248.970 12/08/1983 0.400 236.905 14/06/1983
1984-1985 712.0 245.310 19/08/1984 0.300 237.045 15/02/1985
1985-1986 437.0 242.100 27/06/1985 0.100 237.050 06/01/1986
1986-1987 2192 247.595 15/08/1986 0.200 236.920 14/06/1986
1987-1988 444.1 241.170 21/08/1987 0.000 236.960 21/07/1987
1988-1989 2700 251.450 03/10/1988 0.993 237.170 11/04/1989
1989-1990 565.3 243.800 24/08/1989 0.000 237.170 05/04/1990
1990-1991 1419 248.050 17/08/1990 0.240 236.660 05/03/1991
1991-1992 1341 246.525 31/07/1991 0.000 237.040 26/01/1992
1992-1993 1329 248.650 22/08/1992 0.213 236.470 17/03/1993
1993-1994 189.5 239.090 17/07/1993 0.000 237.300 26/05/1994
1994-1995 2976 250.690 07/09/1994 0.000 237.340 11/05/1995
1995-1996 970.8 245.188 25/07/1995 0.000 237.300 21/04/1996
1996-1997 736.8 243.000 08/09/1996 0.000 236.890 03/05/1997
1997-1998 1313 246.100 01/12/1997 0.000 236.200 24/05/1998
1998-1999 2521 249.955 16/09/1998 0.049 236.410 12/04/1999
1999-2000 1840 249.275 10/08/1999 0.047 236.450 10/04/2000
2000-2001 1020 247.325 20/07/2000 0.000 236.300 10/05/2001
2001-2002 767.7 244.085 15/06/2001 0.087 236.310 24/12/2001
2002-2003 1910 246.700 03/09/2002 0.000 236.300 20/07/2002
2003-2004 200.4 239.500 29/07/2003 0.010 237.600 04/12/2003
2004-2005 292.8 239.700 06/08/2004 0.000 236.220 21/06/2004
2005-2006 1953 247.925 02/08/2005 0.000 236.270 24/06/2005
2006-2007 4124 251.600 07/08/2006 0.430 236.260 18/07/2006
2007-2008 3608 251.100 09/07/2007 0.020 236.110 09/05/2008
2008-2009 256.5 239.740 22/09/2008 0.109 236.150 07/07/2008
2009-2010 286.4 239.675 08/07/2009 0.000 237.160 19/08/2009
2010-2011 1293 245.345 01/08/2010 0.000 237.250 13/05/2011
2011-2012 768.2 243.380 29/08/2011 0.000 237.620 22/01/2011
2012-2013 2515 250.000 07/09/2012 0.000 R-Dry 04/06/2012
2013-2014 2983 249.195 02/08/2013 0.000 237.300 01/06/2013
2014-2015 2743 250.950 24/07/2014 0.000 R-Dry 26/12/2014
2015-2016 1149 244.425 07/08/2015 0.000 R-Dry 28/10/2015
2016-2017 264.8 240.840 04/08/2016 0.000 R-Dry 01/06/2016
2017-2018 130.4 238.550 30/08/2017 0.000 R-Dry 01/06/2017
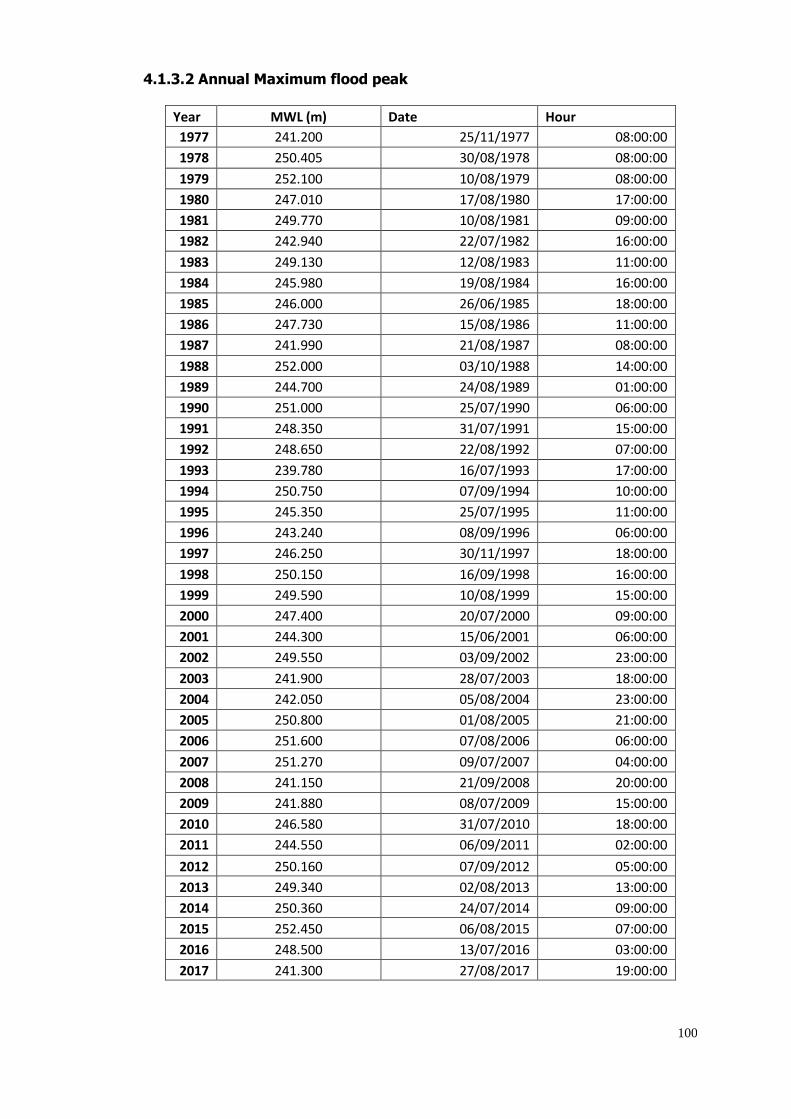
100
4.1.3.2 Annual Maximum flood peak
Year MWL (m) Date Hour
1977 241.200 25/11/1977 08:00:00
1978 250.405 30/08/1978 08:00:00
1979 252.100 10/08/1979 08:00:00
1980 247.010 17/08/1980 17:00:00
1981 249.770 10/08/1981 09:00:00
1982 242.940 22/07/1982 16:00:00
1983 249.130 12/08/1983 11:00:00
1984 245.980 19/08/1984 16:00:00
1985 246.000 26/06/1985 18:00:00
1986 247.730 15/08/1986 11:00:00
1987 241.990 21/08/1987 08:00:00
1988 252.000 03/10/1988 14:00:00
1989 244.700 24/08/1989 01:00:00
1990 251.000 25/07/1990 06:00:00
1991 248.350 31/07/1991 15:00:00
1992 248.650 22/08/1992 07:00:00
1993 239.780 16/07/1993 17:00:00
1994 250.750 07/09/1994 10:00:00
1995 245.350 25/07/1995 11:00:00
1996 243.240 08/09/1996 06:00:00
1997 246.250 30/11/1997 18:00:00
1998 250.150 16/09/1998 16:00:00
1999 249.590 10/08/1999 15:00:00
2000 247.400 20/07/2000 09:00:00
2001 244.300 15/06/2001 06:00:00
2002 249.550 03/09/2002 23:00:00
2003 241.900 28/07/2003 18:00:00
2004 242.050 05/08/2004 23:00:00
2005 250.800 01/08/2005 21:00:00
2006 251.600 07/08/2006 06:00:00
2007 251.270 09/07/2007 04:00:00
2008 241.150 21/09/2008 20:00:00
2009 241.880 08/07/2009 15:00:00
2010 246.580 31/07/2010 18:00:00
2011 244.550 06/09/2011 02:00:00
2012 250.160 07/09/2012 05:00:00
2013 249.340 02/08/2013 13:00:00
2014 250.360 24/07/2014 09:00:00
2015 252.450 06/08/2015 07:00:00
2016 248.500 13/07/2016 03:00:00
2017 241.300 27/08/2017 19:00:00
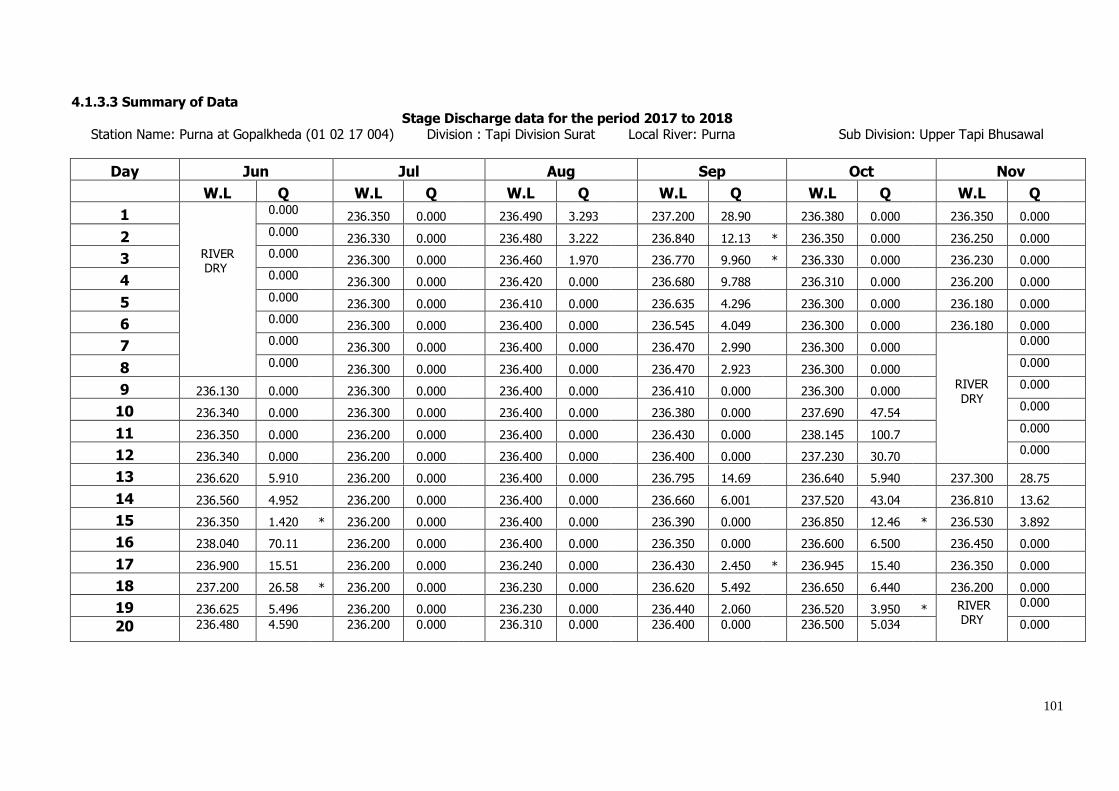
101
4.1.3.3 Summary of Data
Stage Discharge data for the period 2017 to 2018 Station Name: Purna at Gopalkheda (01 02 17 004) Division : Tapi Division Surat Local River: Purna Sub Division: Upper Tapi Bhusawal
Day Jun Jul Aug Sep Oct Nov
W.L Q W.L Q W.L Q W.L Q W.L Q W.L Q
1
RIVER DRY
0.000 236.350 0.000 236.490 3.293 237.200 28.90 236.380 0.000 236.350 0.000
2 0.000 236.330 0.000 236.480 3.222 236.840 12.13 * 236.350 0.000 236.250 0.000
3 0.000 236.300 0.000 236.460 1.970 236.770 9.960 * 236.330 0.000 236.230 0.000
4 0.000 236.300 0.000 236.420 0.000 236.680 9.788 236.310 0.000 236.200 0.000
5 0.000 236.300 0.000 236.410 0.000 236.635 4.296 236.300 0.000 236.180 0.000
6 0.000 236.300 0.000 236.400 0.000 236.545 4.049 236.300 0.000 236.180 0.000
7 0.000 236.300 0.000 236.400 0.000 236.470 2.990 236.300 0.000
RIVER DRY
0.000
8 0.000 236.300 0.000 236.400 0.000 236.470 2.923 236.300 0.000
0.000
9 236.130 0.000 236.300 0.000 236.400 0.000 236.410 0.000 236.300 0.000 0.000
10 236.340 0.000 236.300 0.000 236.400 0.000 236.380 0.000 237.690 47.54 0.000
11 236.350 0.000 236.200 0.000 236.400 0.000 236.430 0.000 238.145 100.7 0.000
12 236.340 0.000 236.200 0.000 236.400 0.000 236.400 0.000 237.230 30.70 0.000
13 236.620 5.910 236.200 0.000 236.400 0.000 236.795 14.69 236.640 5.940 237.300 28.75
14 236.560 4.952 236.200 0.000 236.400 0.000 236.660 6.001 237.520 43.04 236.810 13.62
15 236.350 1.420 * 236.200 0.000 236.400 0.000 236.390 0.000 236.850 12.46 * 236.530 3.892
16 238.040 70.11 236.200 0.000 236.400 0.000 236.350 0.000 236.600 6.500 236.450 0.000
17 236.900 15.51 236.200 0.000 236.240 0.000 236.430 2.450 * 236.945 15.40 236.350 0.000
18 237.200 26.58 * 236.200 0.000 236.230 0.000 236.620 5.492 236.650 6.440 236.200 0.000
19 236.625 5.496 236.200 0.000 236.230 0.000 236.440 2.060 236.520 3.950 * RIVER DRY
0.000
20 236.480 4.590 236.200 0.000 236.310 0.000 236.400 0.000 236.500 5.034 0.000

102
21 236.410 0.000 236.800 12.50 236.430 0.000 236.380 0.000 236.500 4.251
RIVER DRY
0.000
22 236.340 0.000 236.720 6.173 236.580 4.241 236.475 2.116 236.490 3.410 * 0.000
23 236.300 0.000 236.570 4.940 * 236.630 8.575 238.055 80.33 236.490 3.941 0.000
24 236.290 0.000 236.535 4.093 236.550 3.314 236.730 9.981 236.480 3.476 0.000
25 236.270 0.000 236.520 3.690 236.600 5.580 * 236.640 4.291 236.460 2.474 0.000
26 236.260 0.000 236.495 3.533 236.580 4.095 236.950 15.04 236.350 0.000 0.000
27 236.250 0.000 236.480 3.920 236.520 3.950 * 236.810 13.17 236.310 0.000 0.000
28 236.240 0.000 236.530 3.725 236.625 8.508 236.740 12.25 237.200 28.84 0.000
29 236.580 6.540 236.500 3.550 238.370 114.5 236.490 4.390 236.630 6.270 * 0.000
30 236.470 3.880 236.500 3.590 238.550 130.4 236.430 2.450 * 236.390 0.000 0.000
31 236.490 3.360 237.850 55.52 236.360 0.000
Ten-Daily Mean
I Ten-Daily 236.235 0.000 236.308 0.000 236.426 0.849 236.640 7.503 236.456 4.754 236.232 0.000
II Ten-Daily 236.746 13.46 236.200 0.000 236.341 0.000 236.492 3.069 236.960 23.02 236.607 7.711
III Ten-Daily 236.341 1.042 236.558 4.825 237.026 30.79 236.770 14.40 236.515 4.787
Monthly
Min. 236.130 0.000 236.200 0.000 236.230 0.000 236.350 0.000 236.300 0.000 236.180 0.000
Max. 238.040 70.11 236.800 12.50 238.550 130.4 238.055 80.33 238.145 100.7 237.300 28.75
Mean 236.516 6.590
236.362 1.712
236.611 11.20
236.634 8.325
236.639 10.66
236.419 3.856
Annual Runoff in MCM = 101 Annual Runoff in mm = 11
Peak Observed Discharge = 130.400 cumecs on 30-08-2017 Corres. Water Level :238.550 m Lowest Observed Discharge = 0.000 cumecs on 09-06-2017 Corres. Water Level :236.130 m
Note: River Dry from 01/06/2017 to 08/06/2017, 07/11/17 to 12/11/17 and from 19/11/2017 to 31/05/2018 no flow from 09/06/2017 to 12/06/2017, 21/06/17 to 28/06/17, 01/07/17 to 20/07/17, 04/08/17 to 21/08/17, 09/09/17 to 12/09/17, 15/09/17 to 16/09/17, 20/09/17, 21/09/17,
01/10/17 to 09/10/17,30/10/17 to 06/11/17, 16/11/17 to 18/11/17 and 19/11/2017 to 31/05/2018 Q: observed/ computed discharge in Cumec, WL: Corresponding Mean Water Level (msl) in m, *: Computed Discharge
#Discarded and estimate

103
Stage Discharge data for the period 2016 to 2017
Station Name: Purna at Gopalkheda (01 02 17 004) Division : Tapi Division Surat Local River: Purna Sub Division: Upper Tapi Bhusawal
Day Dec Jan Feb Mar Apr May
W.L Q WL Q WL Q WL Q WL Q WL Q
1
RIVER DRY
0.000
RIVER DRY
0.000
RIVER DRY
0.000
RIVER DRY
0.000
RIVER DRY
0.000
RIVER DRY
0.000
2 0.000
0.000
0.000
0.000
0.000
0.000
3 0.000
0.000
0.000
0.000
0.000
0.000
4 0.000
0.000
0.000
0.000
0.000
0.000
5 0.000
0.000
0.000
0.000
0.000
0.000
6 0.000
0.000
0.000
0.000
0.000
0.000
7 0.000
0.000
0.000
0.000
0.000
0.000
8 0.000
0.000
0.000
0.000
0.000
0.000
9 0.000
0.000
0.000
0.000
0.000
0.000
10 0.000
0.000
0.000
0.000
0.000
0.000
11 0.000
0.000
0.000
0.000
0.000
0.000
12 0.000
0.000
0.000
0.000
0.000
0.000
13 0.000
0.000
0.000
0.000
0.000
0.000
14 0.000
0.000
0.000
0.000
0.000
0.000
15 0.000
0.000
0.000
0.000
0.000
0.000
16 0.000
0.000
0.000
0.000
0.000
0.000
17 0.000
0.000
0.000
0.000
0.000
0.000
18 0.000
0.000
0.000
0.000
0.000
0.000
19 0.000
0.000
0.000
0.000
0.000
0.000
20 0.000
0.000
0.000
0.000
0.000
0.000
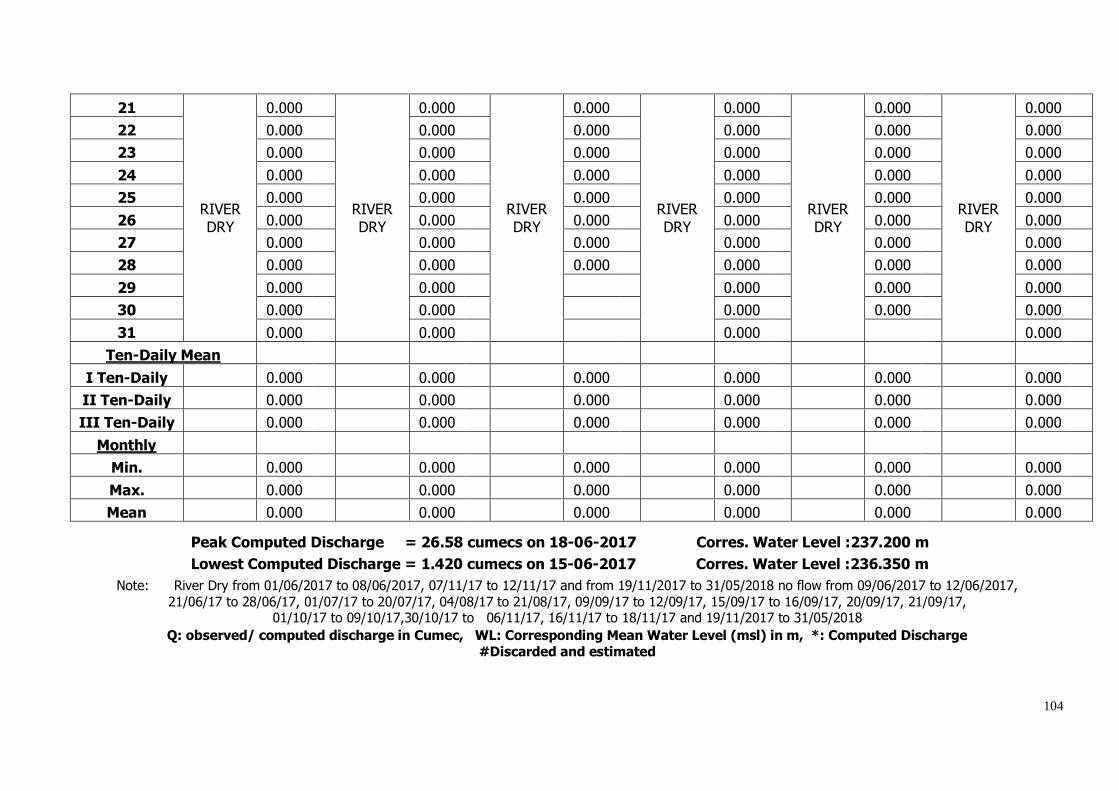
104
21
RIVER
DRY
0.000
RIVER
DRY
0.000
RIVER
DRY
0.000
RIVER
DRY
0.000
RIVER
DRY
0.000
RIVER
DRY
0.000
22 0.000
0.000
0.000
0.000
0.000
0.000
23 0.000
0.000
0.000
0.000
0.000
0.000
24 0.000
0.000
0.000
0.000
0.000
0.000
25 0.000
0.000
0.000
0.000
0.000
0.000
26 0.000
0.000
0.000
0.000
0.000
0.000
27 0.000
0.000
0.000
0.000
0.000
0.000
28 0.000
0.000
0.000
0.000
0.000
0.000
29 0.000
0.000
0.000
0.000
0.000
30 0.000
0.000
0.000
0.000
0.000
31 0.000
0.000
0.000
0.000
Ten-Daily Mean
I Ten-Daily
0.000
0.000
0.000
0.000
0.000
0.000
II Ten-Daily
0.000
0.000
0.000
0.000
0.000
0.000
III Ten-Daily
0.000
0.000
0.000
0.000
0.000
0.000
Monthly
Min.
0.000
0.000
0.000
0.000
0.000
0.000
Max.
0.000
0.000
0.000
0.000
0.000
0.000
Mean
0.000
0.000
0.000
0.000
0.000
0.000
Peak Computed Discharge = 26.58 cumecs on 18-06-2017 Corres. Water Level :237.200 m
Lowest Computed Discharge = 1.420 cumecs on 15-06-2017 Corres. Water Level :236.350 m
Note: River Dry from 01/06/2017 to 08/06/2017, 07/11/17 to 12/11/17 and from 19/11/2017 to 31/05/2018 no flow from 09/06/2017 to 12/06/2017, 21/06/17 to 28/06/17, 01/07/17 to 20/07/17, 04/08/17 to 21/08/17, 09/09/17 to 12/09/17, 15/09/17 to 16/09/17, 20/09/17, 21/09/17,
01/10/17 to 09/10/17,30/10/17 to 06/11/17, 16/11/17 to 18/11/17 and 19/11/2017 to 31/05/2018
Q: observed/ computed discharge in Cumec, WL: Corresponding Mean Water Level (msl) in m, *: Computed Discharge
#Discarded and estimated

105
4.1.3.4 Stage Discharge Curve
Station Name: Purna at Gopalkheda (01 02 17 004) Division : Tapi Division Surat Local River: Purna Sub Division: Upper Tapi Bhusawal
Stage Discharge Curve of River Purna at Gopalkheda for the period 01/06/2017 to 31/05/2018
Calculated Observed
Discharge in Cumec3503403303203103002902802702602502402302202102001901801701601501401301201101009080706050403020100
Sta
ge
in m
240.5
240.25
240
239.75
239.5
239.25
239
238.75
238.5
238.25
238
237.75
237.5
237.25
237
236.75
236.5
236.25
236
Procedure: Standard Equation : Power Q=C(h+a)^b
LB UB a b C 236.10 240.000 -236.100 1.979 22.01
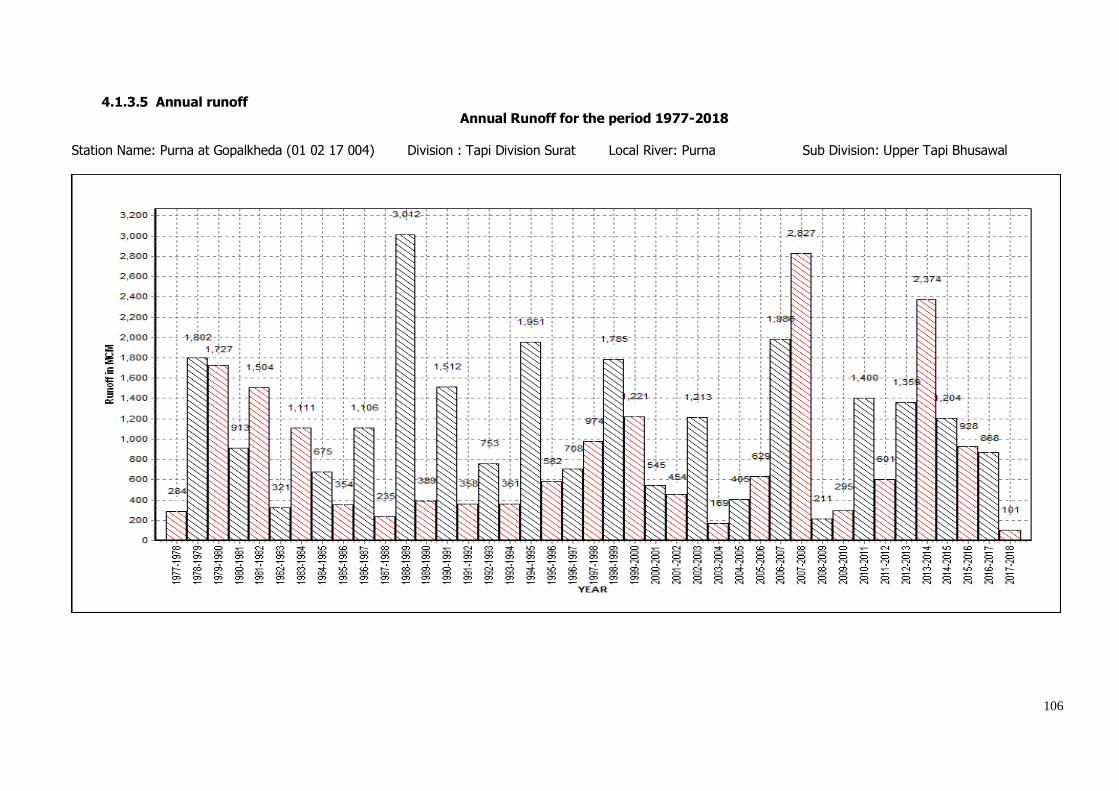
106
4.1.3.5 Annual runoff
Annual Runoff for the period 1977-2018
Station Name: Purna at Gopalkheda (01 02 17 004) Division : Tapi Division Surat Local River: Purna Sub Division: Upper Tapi Bhusawal
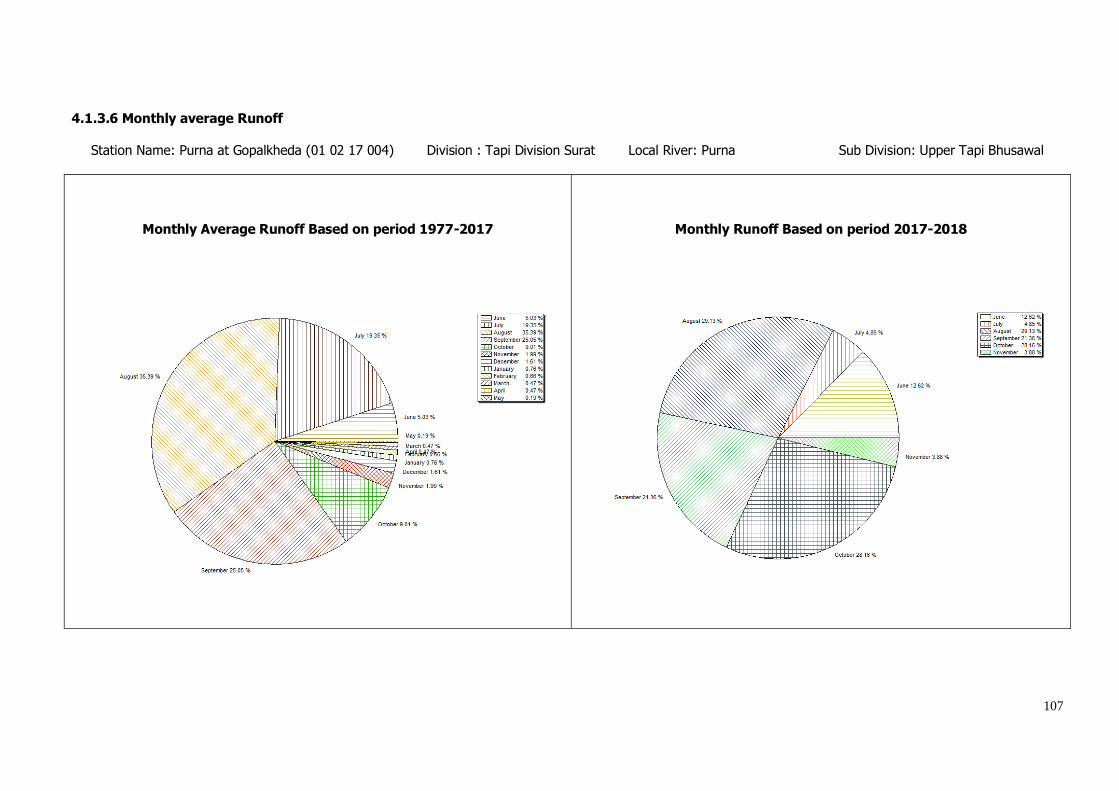
107
4.1.3.6 Monthly average Runoff
Station Name: Purna at Gopalkheda (01 02 17 004) Division : Tapi Division Surat Local River: Purna Sub Division: Upper Tapi Bhusawal
Monthly Average Runoff Based on period 1977-2017
Monthly Runoff Based on period 2017-2018
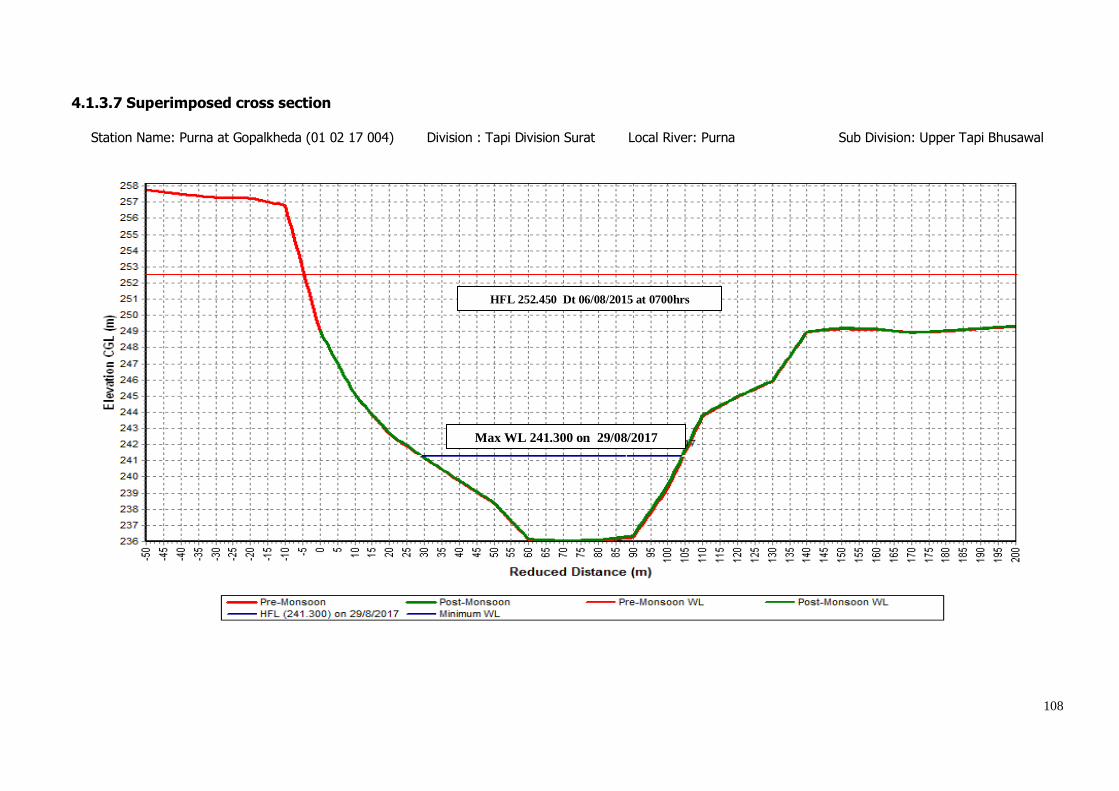
108
4.1.3.7 Superimposed cross section
Station Name: Purna at Gopalkheda (01 02 17 004) Division : Tapi Division Surat Local River: Purna Sub Division: Upper Tapi Bhusawal
HFL 252.450 Dt 06/08/2015 at 0700hrs
Max WL 241.300 on 29/08/2017
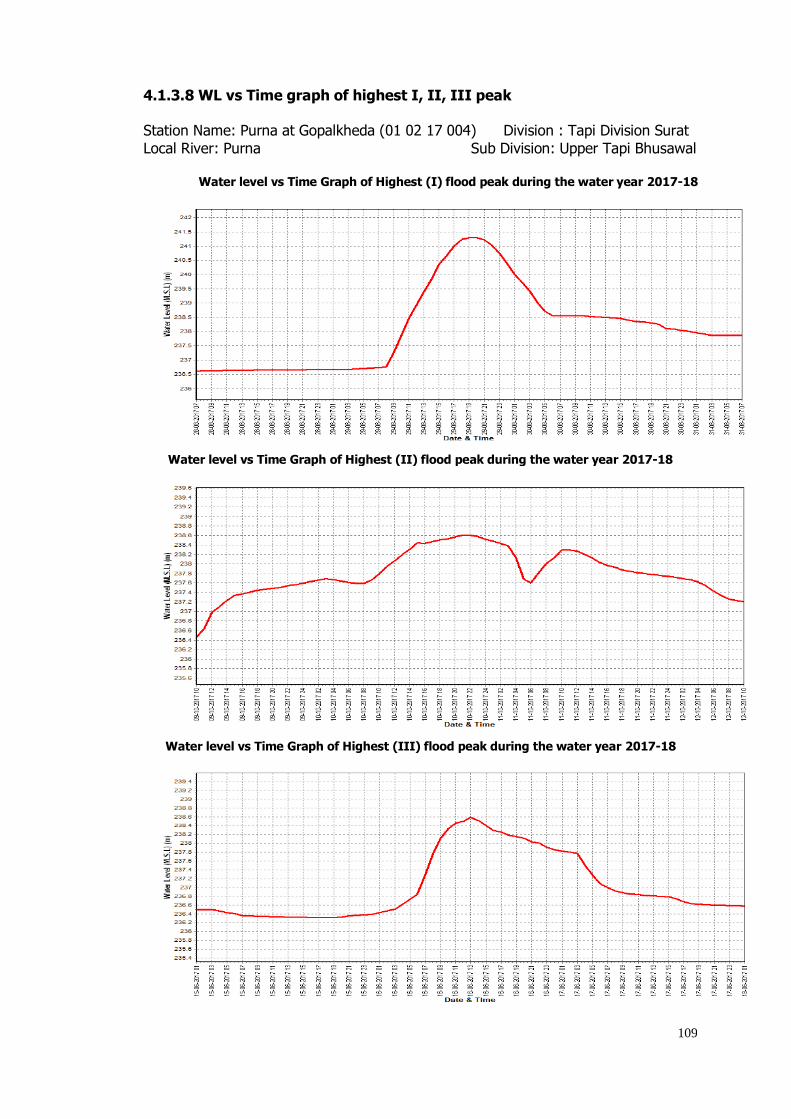
109
4.1.3.8 WL vs Time graph of highest I, II, III peak Station Name: Purna at Gopalkheda (01 02 17 004) Division : Tapi Division Surat
Local River: Purna Sub Division: Upper Tapi Bhusawal
Water level vs Time Graph of Highest (I) flood peak during the water year 2017-18
Water level vs Time Graph of Highest (II) flood peak during the water year 2017-18
Water level vs Time Graph of Highest (III) flood peak during the water year 2017-18
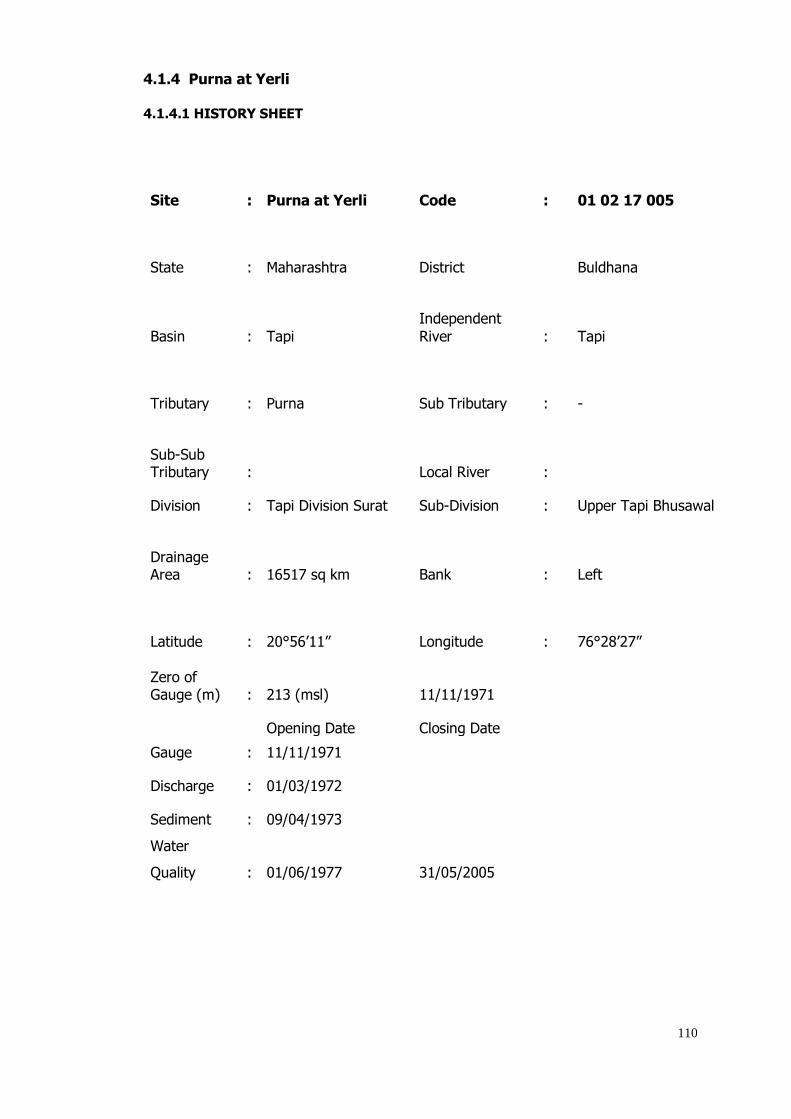
110
4.1.4 Purna at Yerli
4.1.4.1 HISTORY SHEET
Site : Purna at Yerli Code : 01 02 17 005
State : Maharashtra District Buldhana
Basin : Tapi
Independent
River : Tapi
Tributary : Purna Sub Tributary : -
Sub-Sub Tributary : Local River :
Division : Tapi Division Surat Sub-Division : Upper Tapi Bhusawal
Drainage Area : 16517 sq km Bank : Left
Latitude : 20°56’11” Longitude : 76°28’27”
Zero of Gauge (m) : 213 (msl) 11/11/1971
Opening Date Closing Date
Gauge : 11/11/1971
Discharge : 01/03/1972
Sediment : 09/04/1973
Water
Quality : 01/06/1977 31/05/2005

111
Annual Maximum / Minimum discharge with corresponding Water Level (above msl)
Year
Maximum Minimum
Q (cumec) WL (m) Date Q cumec) WL (m) Date
1973-1974 3060 226.210 28/08/1973 0.000 228.370 27/08/1973
1974-1975 2005 220.882 13/08/1974 0.200 214.400 28/05/1975
1975-1976 2493 222.883 05/09/1975 0.200 214.580 13/05/1976
1976-1977 2580 222.800 04/09/1976 0.200 214.630 02/06/1976
1977-1978 1885 220.965 14/06/1977 0.500 214.553 12/06/1977
1978-1979 4154 225.200 31/08/1978 1.200 214.805 29/05/1979
1979-1980 10380 230.510 11/08/1979 0.916 214.785 14/06/1979
1980-1981 1842 221.532 18/08/1980 1.200 214.815 31/05/1981
1981-1982 3350 224.780 11/08/1981 0.800 214.755 02/06/1981
1982-1983 651.6 219.485 21/07/1982 0.100 214.650 20/04/1983
1983-1984 6055 229.850 12/08/1983 1.243 214.695 31/05/1984
1984-1985 1611 220.595 10/10/1984 0.000 214.475 26/05/1985
1985-1986 3146 223.650 27/06/1985 0.000 214.570 30/05/1986
1986-1987 3073 224.240 07/08/1986 0.100 214.610 01/06/1986
1987-1988 1122 219.825 21/08/1987 0.000 214.620 21/04/1988
1988-1989 6700 228.500 04/10/1988 0.000 214.360 07/06/1988
1989-1990 1298 220.780 24/08/1989 0.000 214.730 17/05/1990
1990-1991 4501 227.150 25/07/1990 0.000 214.880 11/05/1991
1991-1992 1480 221.540 01/08/1991 0.000 214.730 03/03/1992
1992-1993 1974 222.445 22/08/1992 0.000 214.435 17/06/1992
1993-1994 2269 223.820 16/07/1993 0.000 214.650 07/05/1994
1994-1995 3785 225.550 08/09/1994 0.000 214.600 10/06/1994
1995-1996 1538 221.510 03/09/1995 0.000 214.600 16/04/1996
1996-1997 747.2 219.650 24/10/1996 0.000 214.655 23/04/1997
1997-1998 1294 221.350 01/12/1997 0.000 214.600 16/05/1998
1998-1999 3059 224.710 17/09/1998 0.000 214.550 22/05/1999
1999-2000 3020 224.150 11/08/1999 0.000 214.700 30/04/2000
2000-2001 680.0 220.200 20/07/2000 0.000 214.620 27/11/2000
2001-2002 1659 222.260 15/06/2001 0.000 214.600 18/05/2002
2002-2003 2750 225.870 04/09/2002 0.000 214.580 03/02/2003
2003-2004 443.4 218.095 29/09/2003 0.000 214.580 04/06/2003
2004-2005 407.8 217.425 06/08/2004 0.000 214.620 07/03/2005
2005-2006 3046 224.550 02/08/2005 0.000 214.690 07/06/2005
2006-2007 8703 233.540 07/08/2006 0.000 214.600 03/03/2007
2007-2008 3132 225.615 02/07/2007 0.000 214.620 18/05/2008
2008-2009 542.8 218.645 22/09/2008 0.000 214.410 23/04/2009
2009-2010 369.0 217.395 04/09/2009 0.000 River Dry 04/11/2009
2010-2011 1757 223.005 01/08/2010 0.257 214.760 31/12/2010
2011-2012 989.3 219.000 06/09/2012 0.000 214.970 01/06/2011
2012-2013 2348 223.750 08/09/2012 0.000 River Dry 01/06/2012
2013-2014 2814 225.430 03/08/2013 0.000 214.300 17/12/2013
2014-2015 2434 224.050 25/07/2014 0.000 214.070 01/06/2014
2015-2016 673.0 217.900 08/08/2015 0.000 River Dry 01/06/2015
2016-2017 1525 221.385 28/07/2016 0.000 River Dry 01/06/2016
2017-2018 416. 7 217.380 30/08/2017 0.000 River Dry 01/06/2017
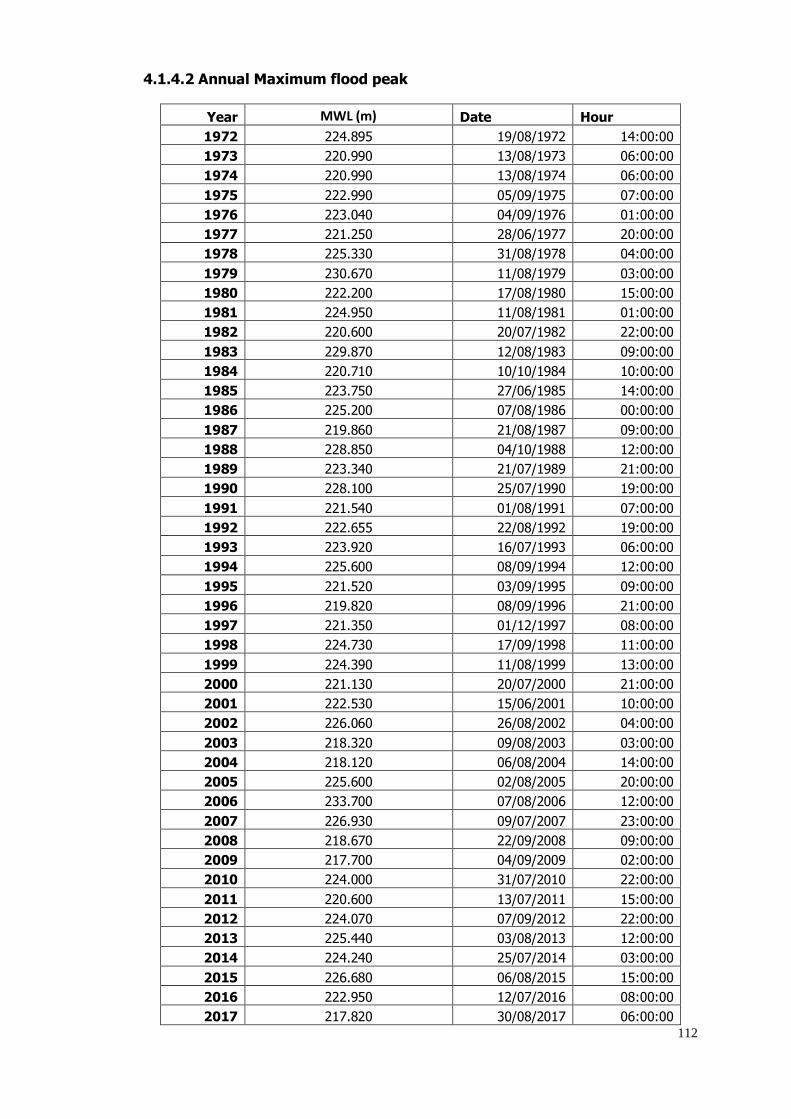
112
4.1.4.2 Annual Maximum flood peak
Year MWL (m) Date Hour
1972 224.895 19/08/1972 14:00:00
1973 220.990 13/08/1973 06:00:00
1974 220.990 13/08/1974 06:00:00
1975 222.990 05/09/1975 07:00:00
1976 223.040 04/09/1976 01:00:00
1977 221.250 28/06/1977 20:00:00
1978 225.330 31/08/1978 04:00:00
1979 230.670 11/08/1979 03:00:00
1980 222.200 17/08/1980 15:00:00
1981 224.950 11/08/1981 01:00:00
1982 220.600 20/07/1982 22:00:00
1983 229.870 12/08/1983 09:00:00
1984 220.710 10/10/1984 10:00:00
1985 223.750 27/06/1985 14:00:00
1986 225.200 07/08/1986 00:00:00
1987 219.860 21/08/1987 09:00:00
1988 228.850 04/10/1988 12:00:00
1989 223.340 21/07/1989 21:00:00
1990 228.100 25/07/1990 19:00:00
1991 221.540 01/08/1991 07:00:00
1992 222.655 22/08/1992 19:00:00
1993 223.920 16/07/1993 06:00:00
1994 225.600 08/09/1994 12:00:00
1995 221.520 03/09/1995 09:00:00
1996 219.820 08/09/1996 21:00:00
1997 221.350 01/12/1997 08:00:00
1998 224.730 17/09/1998 11:00:00
1999 224.390 11/08/1999 13:00:00
2000 221.130 20/07/2000 21:00:00
2001 222.530 15/06/2001 10:00:00
2002 226.060 26/08/2002 04:00:00
2003 218.320 09/08/2003 03:00:00
2004 218.120 06/08/2004 14:00:00
2005 225.600 02/08/2005 20:00:00
2006 233.700 07/08/2006 12:00:00
2007 226.930 09/07/2007 23:00:00
2008 218.670 22/09/2008 09:00:00
2009 217.700 04/09/2009 02:00:00
2010 224.000 31/07/2010 22:00:00
2011 220.600 13/07/2011 15:00:00
2012 224.070 07/09/2012 22:00:00
2013 225.440 03/08/2013 12:00:00
2014 224.240 25/07/2014 03:00:00
2015 226.680 06/08/2015 15:00:00
2016 222.950 12/07/2016 08:00:00
2017 217.820 30/08/2017 06:00:00
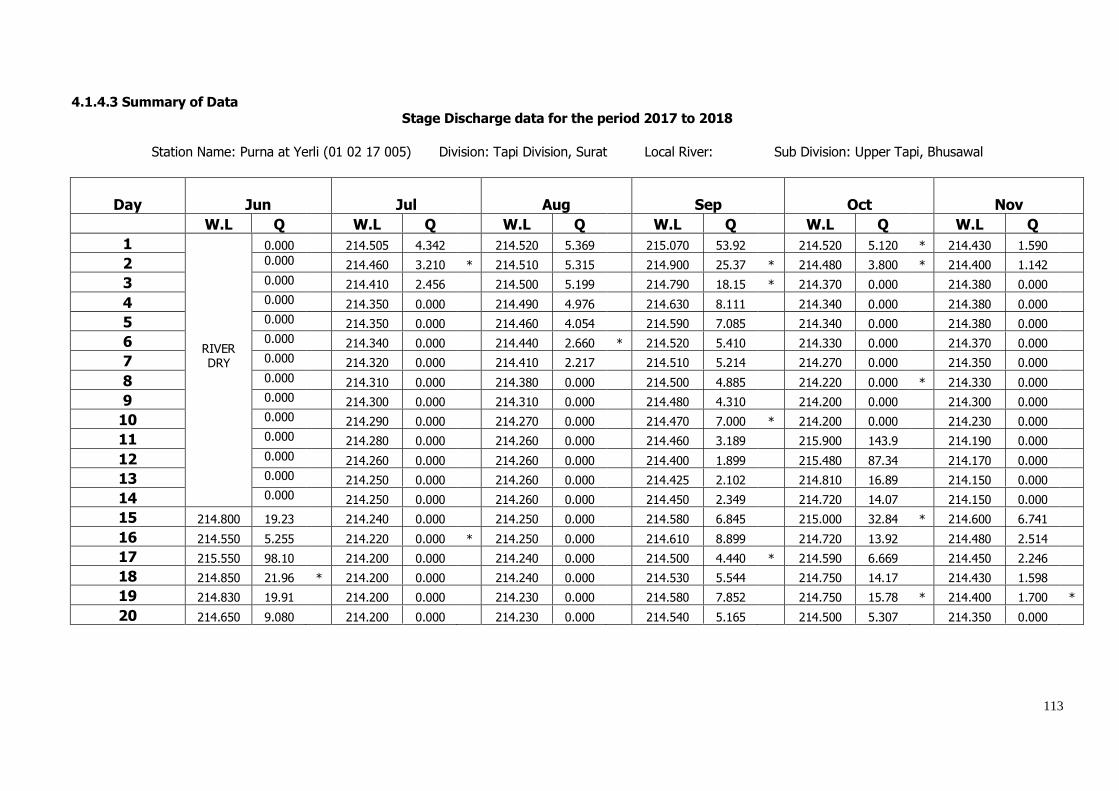
113
4.1.4.3 Summary of Data
Stage Discharge data for the period 2017 to 2018
Station Name: Purna at Yerli (01 02 17 005) Division: Tapi Division, Surat Local River: Sub Division: Upper Tapi, Bhusawal
Day Jun Jul Aug Sep Oct Nov
W.L Q W.L Q W.L Q W.L Q W.L Q W.L Q
1
RIVER DRY
0.000 214.505 4.342 214.520 5.369 215.070 53.92 214.520 5.120 * 214.430 1.590
2 0.000 214.460 3.210 * 214.510 5.315 214.900 25.37 * 214.480 3.800 * 214.400 1.142
3 0.000 214.410 2.456 214.500 5.199 214.790 18.15 * 214.370 0.000 214.380 0.000
4 0.000 214.350 0.000 214.490 4.976 214.630 8.111 214.340 0.000 214.380 0.000
5 0.000 214.350 0.000 214.460 4.054 214.590 7.085 214.340 0.000 214.380 0.000
6 0.000 214.340 0.000 214.440 2.660 * 214.520 5.410 214.330 0.000 214.370 0.000
7 0.000 214.320 0.000 214.410 2.217 214.510 5.214 214.270 0.000 214.350 0.000
8 0.000 214.310 0.000 214.380 0.000 214.500 4.885 214.220 0.000 * 214.330 0.000
9 0.000 214.300 0.000 214.310 0.000 214.480 4.310 214.200 0.000 214.300 0.000
10 0.000 214.290 0.000 214.270 0.000 214.470 7.000 * 214.200 0.000 214.230 0.000
11 0.000 214.280 0.000 214.260 0.000 214.460 3.189 215.900 143.9 214.190 0.000
12 0.000 214.260 0.000 214.260 0.000 214.400 1.899 215.480 87.34 214.170 0.000
13 0.000 214.250 0.000 214.260 0.000 214.425 2.102 214.810 16.89 214.150 0.000
14 0.000 214.250 0.000 214.260 0.000 214.450 2.349 214.720 14.07 214.150 0.000
15 214.800 19.23 214.240 0.000 214.250 0.000 214.580 6.845 215.000 32.84 * 214.600 6.741
16 214.550 5.255 214.220 0.000 * 214.250 0.000 214.610 8.899 214.720 13.92 214.480 2.514
17 215.550 98.10 214.200 0.000 214.240 0.000 214.500 4.440 * 214.590 6.669 214.450 2.246
18 214.850 21.96 * 214.200 0.000 214.240 0.000 214.530 5.544 214.750 14.17 214.430 1.598
19 214.830 19.91 214.200 0.000 214.230 0.000 214.580 7.852 214.750 15.78 * 214.400 1.700 *
20 214.650 9.080 214.200 0.000 214.230 0.000 214.540 5.165 214.500 5.307 214.350 0.000

114
21 214.470 5.592 214.400 2.042 214.230 0.000 214.600 6.983 214.370 0.000 214.320 0.000
22 214.450 3.833 214.800 19.54 214.230 0.000 214.790 16.20 214.350 0.000 * 214.290 0.000
23 214.350 0.000 214.760 16.36 * 214.230 0.000 214.815 17.31 214.340 0.000 214.250 0.000
24 214.550 5.851 214.590 7.339 214.465 5.865 215.180 48.35 * 214.340 0.000 214.220 0.000
25 214.480 3.800 * 214.525 5.529 214.500 4.440 * 214.720 11.96 214.340 0.000 214.200 0.000
26 214.350 0.780 * 214.510 5.334 214.500 5.917 214.570 5.959 214.330 0.000 214.180 0.000
27 214.545 5.752 214.510 5.278 214.500 4.440 * 214.560 5.648 214.330 0.000 214.170 0.000
28 214.410 2.733 214.600 7.348 214.500 5.700 214.600 6.870 214.320 0.000 214.170 0.000
29 214.510 5.158 214.565 5.780 214.490 5.476 214.570 5.962 214.300 0.000 214.150 0.000
30 214.600 7.943 214.530 5.470 * 217.380 414.7 214.560 6.600 * 214.600 6.559 214.140 0.000
31 214.530 5.388 215.725 140.5 214.450 2.306
I Ten-Daily 214.363 1.001 214.429 2.979 214.646 13.95 214.327 0.892 214.355 0.273
II Ten-Daily 214.872 28.92 214.230 0.000 214.248 0.000 214.507 4.828 214.922 35.09 214.337 1.480
III Ten-Daily 214.472 4.144 214.575 7.764 214.795 53.36 214.697 13.18 214.370 0.806 214.209 0.000
Monthly
Min. 214.350 0.000 214.200 0.000 214.230 0.000 214.400 1.899 214.200 0.000 214.140 0.000
Max. 215.550 98.10 214.800 19.54 217.380 414.7 215.180 53.92 215.900 143.9 214.600 6.741
Mean 214.622 13.44
214.395 3.078
214.501 19.90
214.617 10.65
214.534 11.89
214.300 0.584
Annual Runoff in MCM = 141 Annual Runoff in mm = 9
Peak Observed Discharge = 414.700 cumecs on 30-08-2017 Corres. Water Level :217.380 m
Lowest Observed Discharge = 0.000 cumecs on 23-06-2017 Corres. Water Level :214.350 m
Note: 23/06/17, 04/07/2017 to 20/07/2017, 08/08/17 to 23/08/17,03/10/17 to 10/10/17, 21/10/17 to 29/10/17, 03/11/17 to 14/11/17 and from 20/11/17 to 07/02/18
Negligible Flow. River Dry from 01/06/2017 to 14/06/16 and 08/02/18 to 31/05/18
Q: observed/ computed discharge in Cumec, WL: Corresponding Mean Water Level (msl) in m, *: Computed Discharge
#Discarded and estimated
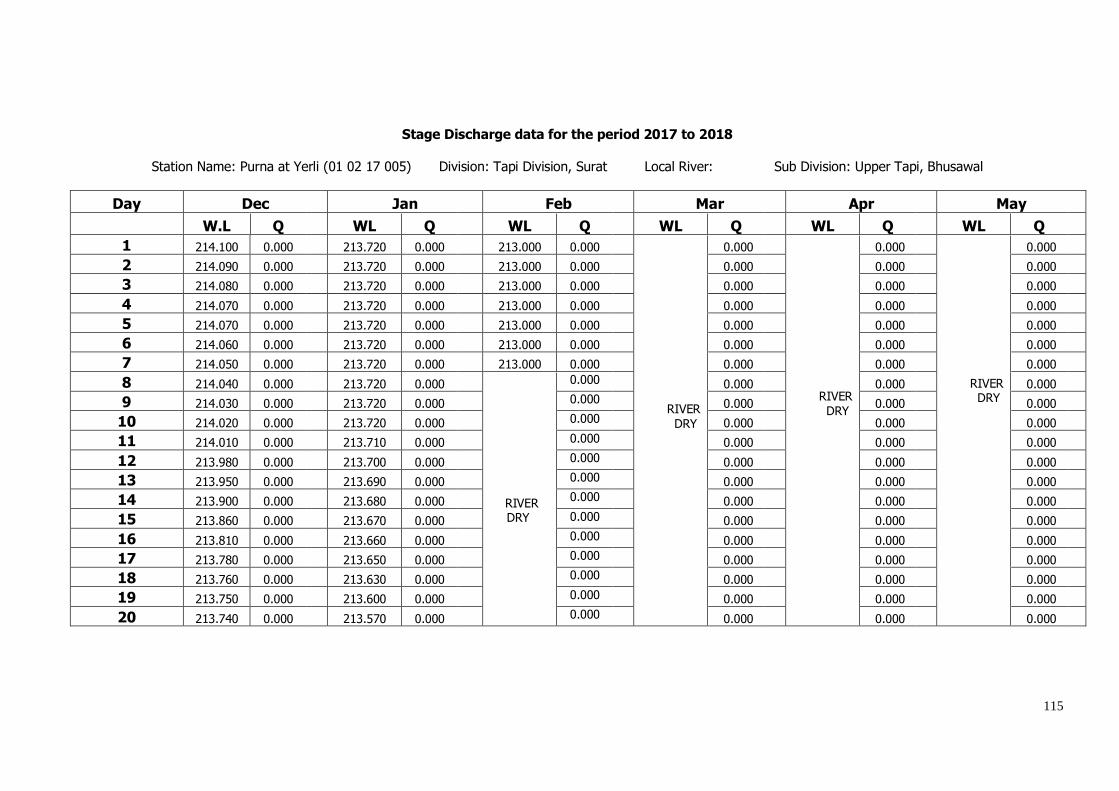
115
Stage Discharge data for the period 2017 to 2018
Station Name: Purna at Yerli (01 02 17 005) Division: Tapi Division, Surat Local River: Sub Division: Upper Tapi, Bhusawal
Day Dec Jan Feb Mar Apr May
W.L Q WL Q WL Q WL Q WL Q WL Q
1 214.100 0.000 213.720 0.000 213.000 0.000
RIVER DRY
0.000
RIVER DRY
0.000
RIVER DRY
0.000
2 214.090 0.000 213.720 0.000 213.000 0.000 0.000 0.000 0.000
3 214.080 0.000 213.720 0.000 213.000 0.000 0.000 0.000 0.000
4 214.070 0.000 213.720 0.000 213.000 0.000 0.000 0.000 0.000
5 214.070 0.000 213.720 0.000 213.000 0.000 0.000 0.000 0.000
6 214.060 0.000 213.720 0.000 213.000 0.000 0.000 0.000 0.000
7 214.050 0.000 213.720 0.000 213.000 0.000 0.000 0.000 0.000
8 214.040 0.000 213.720 0.000
RIVER DRY
0.000 0.000 0.000 0.000
9 214.030 0.000 213.720 0.000 0.000 0.000 0.000 0.000
10 214.020 0.000 213.720 0.000 0.000 0.000 0.000 0.000
11 214.010 0.000 213.710 0.000 0.000 0.000 0.000 0.000
12 213.980 0.000 213.700 0.000 0.000 0.000 0.000 0.000
13 213.950 0.000 213.690 0.000 0.000 0.000 0.000 0.000
14 213.900 0.000 213.680 0.000 0.000 0.000 0.000 0.000
15 213.860 0.000 213.670 0.000 0.000 0.000 0.000 0.000
16 213.810 0.000 213.660 0.000 0.000 0.000 0.000 0.000
17 213.780 0.000 213.650 0.000 0.000 0.000 0.000 0.000
18 213.760 0.000 213.630 0.000 0.000 0.000 0.000 0.000
19 213.750 0.000 213.600 0.000 0.000 0.000 0.000 0.000
20 213.740 0.000 213.570 0.000 0.000 0.000 0.000 0.000

116
21 213.730 0.000 213.520 0.000
RIVER DRY
0.000
RIVER DRY
0.000
RIVER DRY
0.000
RIVER DRY
0.000
22 213.720 0.000 213.450 0.000 0.000
0.000
0.000
0.000
23 213.720 0.000 213.400 0.000 0.000
0.000
0.000
0.000
24 213.720 0.000 213.350 0.000 0.000
0.000
0.000
0.000
25 213.720 0.000 213.300 0.000 0.000
0.000
0.000
0.000
26 213.720 0.000 213.250 0.000 0.000
0.000
0.000
0.000
27 213.720 0.000 213.200 0.000 0.000
0.000
0.000
0.000
28 213.720 0.000 213.150 0.000 0.000
0.000
0.000
0.000
29 213.720 0.000 213.100 0.000
0.000
0.000
0.000
30 213.720 0.000 213.050 0.000
0.000
0.000
0.000
31 213.720 0.000 213.000 0.000
0.000
Ten-Daily
Mean I Ten-Daily 214.061 0.000 213.720 0.000 213.000 0.000
0.000
0.000
0.000
II Ten-Daily 213.854 0.000 213.656 0.000
0.000
0.000
0.000
III Ten-Daily 213.721 0.000 213.252 0.000
0.000
0.000
0.000
Monthly
Min. 213.720 0.000 213.000 0.000 213.000 0.000
0.000
0.000
0.000
Max. 214.100 0.000 213.720 0.000 213.000 0.000
0.000
0.000
0.000
Mean 213.874 0.000
213.533 0.000
213.000 0.000
0.000
0.000
0.000
Peak Computed Discharge = 48.35 cumecs on 24/09/2017 Corres. Water Level :215.180 m
Lowest Computed Discharge =0.000 cumecs on 16/07/2017 Corres. Water Level :214.220 m
Note: 23/06/17, 04/07/2017 to 20/07/2017, 08/08/17 to 23/08/17,03/10/17 to 10/10/17, 21/10/17 to 29/10/17, 03/11/17 to 14/11/17 and from 20/11/17 to 07/02/18
Negligible Flow. River Dry from 01/06/2017 to 14/06/16 and 08/02/18 to 31/05/18
Q: observed/ computed discharge in Cumec, WL: Corresponding Mean Water Level (msl) in m, *: Computed Discharge
#Discarded and estimated
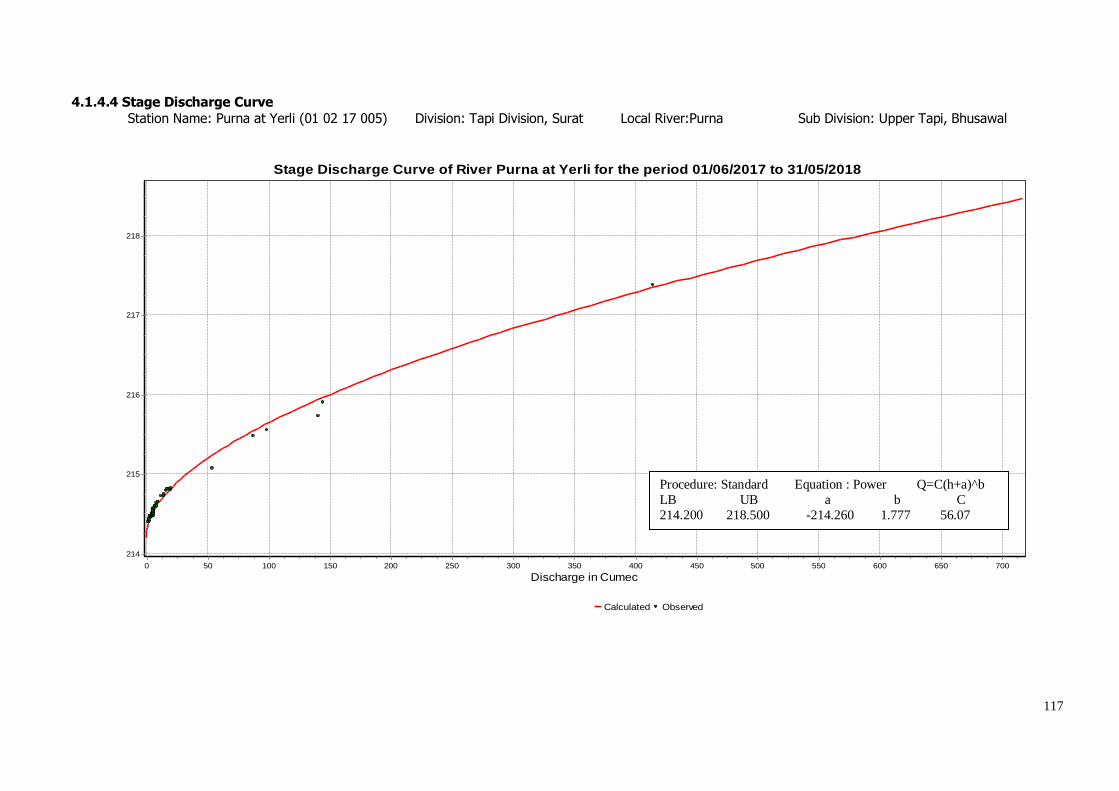
117
4.1.4.4 Stage Discharge Curve
Station Name: Purna at Yerli (01 02 17 005) Division: Tapi Division, Surat Local River:Purna Sub Division: Upper Tapi, Bhusawal
Stage Discharge Curve of River Purna at Yerli for the period 01/06/2017 to 31/05/2018
Calculated Observed
Discharge in Cumec700650600550500450400350300250200150100500
Sta
ge
in m
218
217
216
215
214
Procedure: Standard Equation : Power Q=C(h+a)^b
LB UB a b C
214.200 218.500 -214.260 1.777 56.07
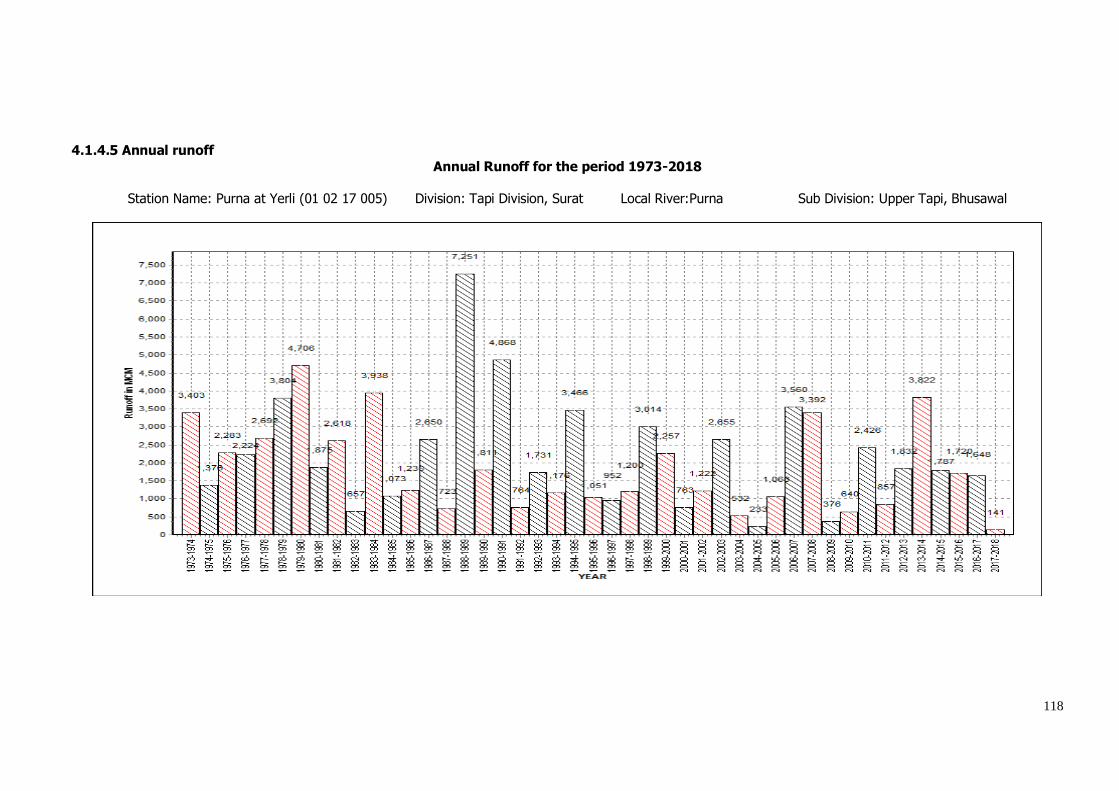
118
4.1.4.5 Annual runoff
Annual Runoff for the period 1973-2018
Station Name: Purna at Yerli (01 02 17 005) Division: Tapi Division, Surat Local River:Purna Sub Division: Upper Tapi, Bhusawal
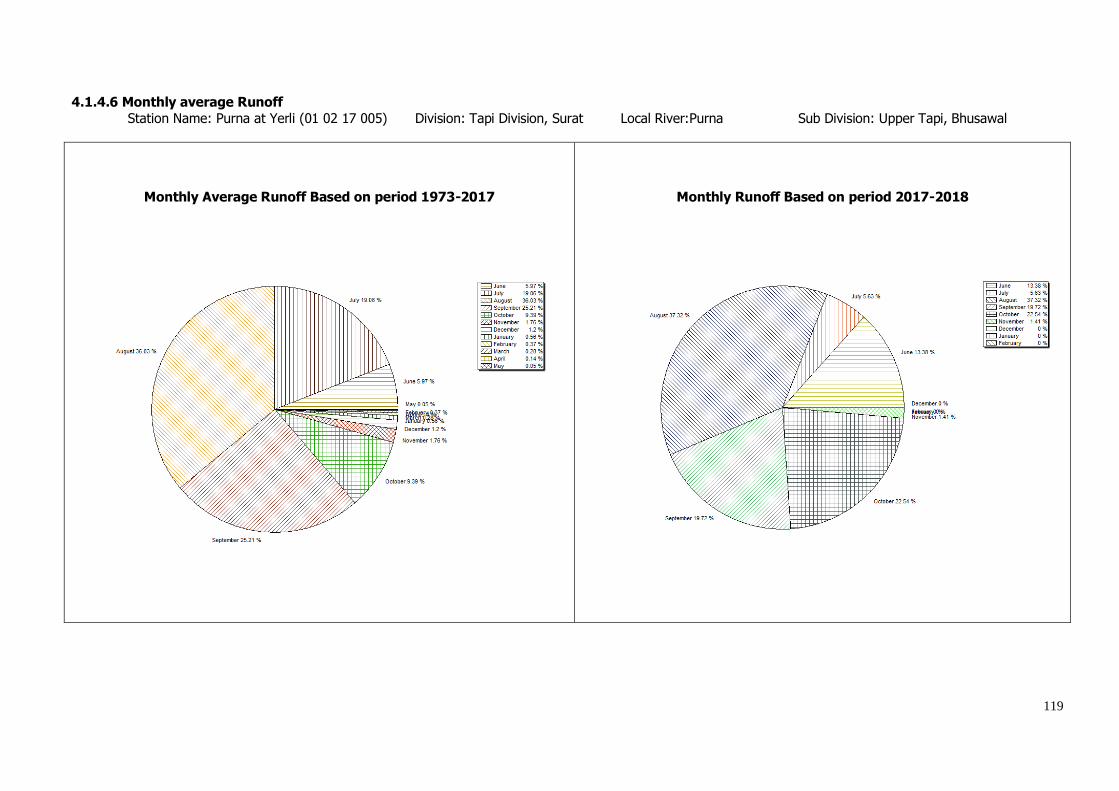
119
4.1.4.6 Monthly average Runoff
Station Name: Purna at Yerli (01 02 17 005) Division: Tapi Division, Surat Local River:Purna Sub Division: Upper Tapi, Bhusawal
Monthly Average Runoff Based on period 1973-2017
Monthly Runoff Based on period 2017-2018
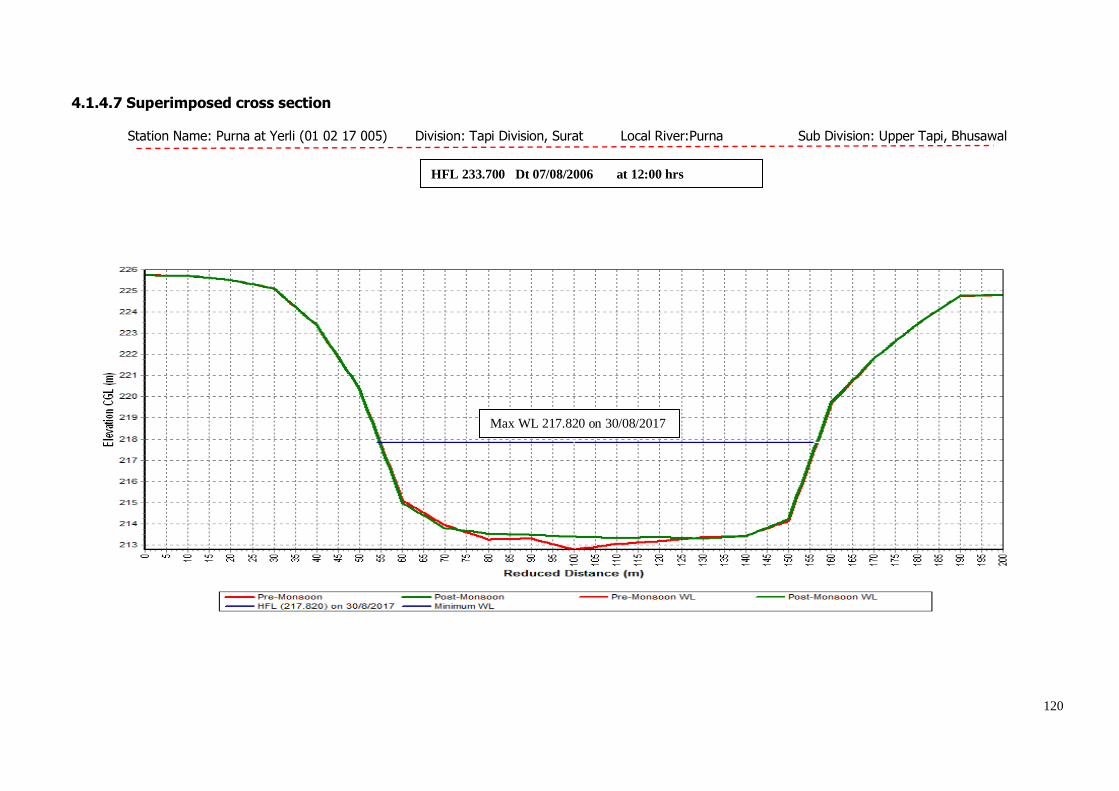
120
4.1.4.7 Superimposed cross section
Station Name: Purna at Yerli (01 02 17 005) Division: Tapi Division, Surat Local River:Purna Sub Division: Upper Tapi, Bhusawal
HFL 233.700 Dt 07/08/2006 at 12:00 hrs
Max WL 217.820 on 30/08/2017
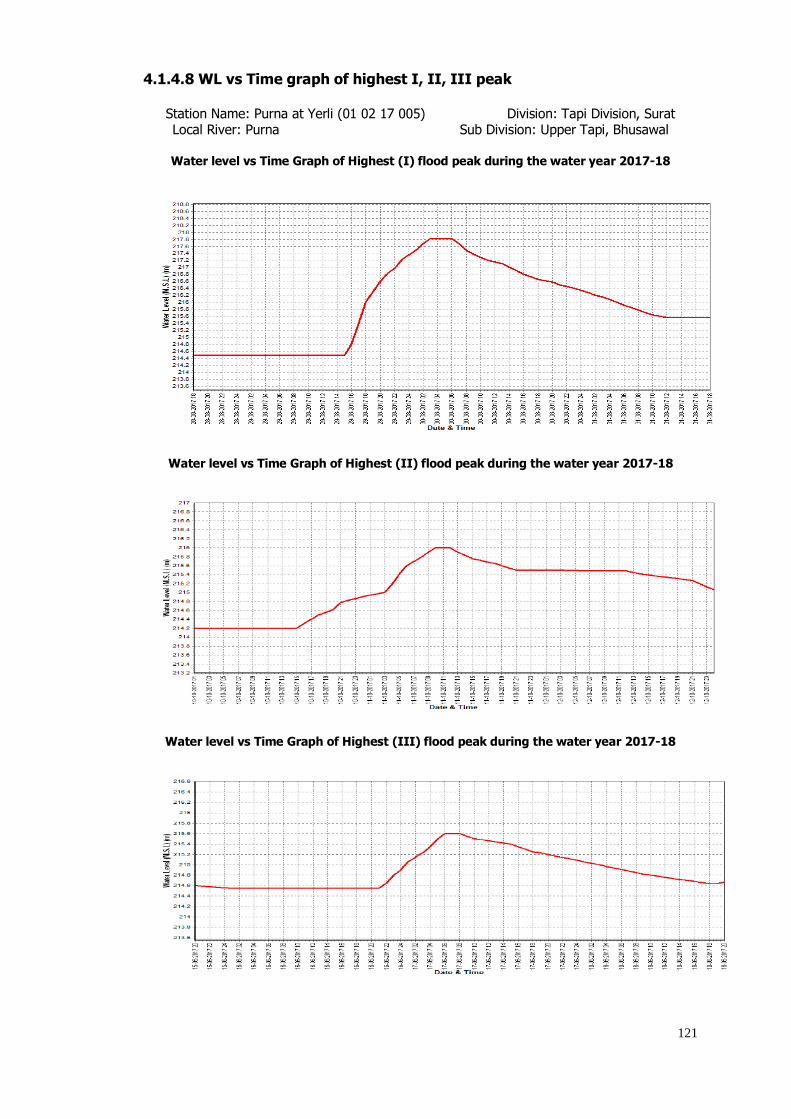
121
4.1.4.8 WL vs Time graph of highest I, II, III peak
Station Name: Purna at Yerli (01 02 17 005) Division: Tapi Division, Surat Local River: Purna Sub Division: Upper Tapi, Bhusawal
Water level vs Time Graph of Highest (I) flood peak during the water year 2017-18
Water level vs Time Graph of Highest (II) flood peak during the water year 2017-18
Water level vs Time Graph of Highest (III) flood peak during the water year 2017-18
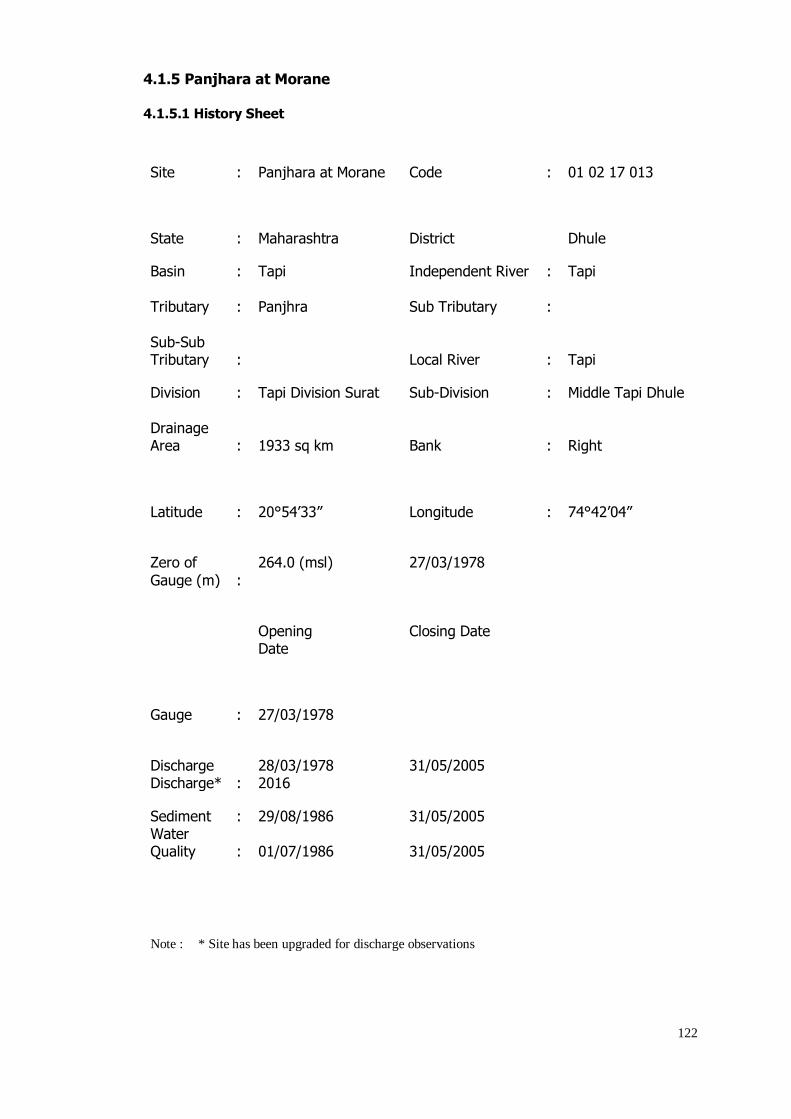
122
4.1.5 Panjhara at Morane
4.1.5.1 History Sheet
Site : Panjhara at Morane Code : 01 02 17 013
State : Maharashtra District Dhule
Basin : Tapi Independent River : Tapi
Tributary : Panjhra Sub Tributary :
Sub-Sub Tributary : Local River : Tapi
Division : Tapi Division Surat Sub-Division : Middle Tapi Dhule
Drainage Area : 1933 sq km Bank : Right
Latitude : 20°54’33” Longitude : 74°42’04”
Zero of
Gauge (m) :
264.0 (msl)
27/03/1978
Opening Date
Closing Date
Gauge : 27/03/1978
Discharge Discharge* :
28/03/1978 2016
31/05/2005
Sediment : 29/08/1986 31/05/2005 Water Quality : 01/07/1986 31/05/2005
Note : * Site has been upgraded for discharge observations
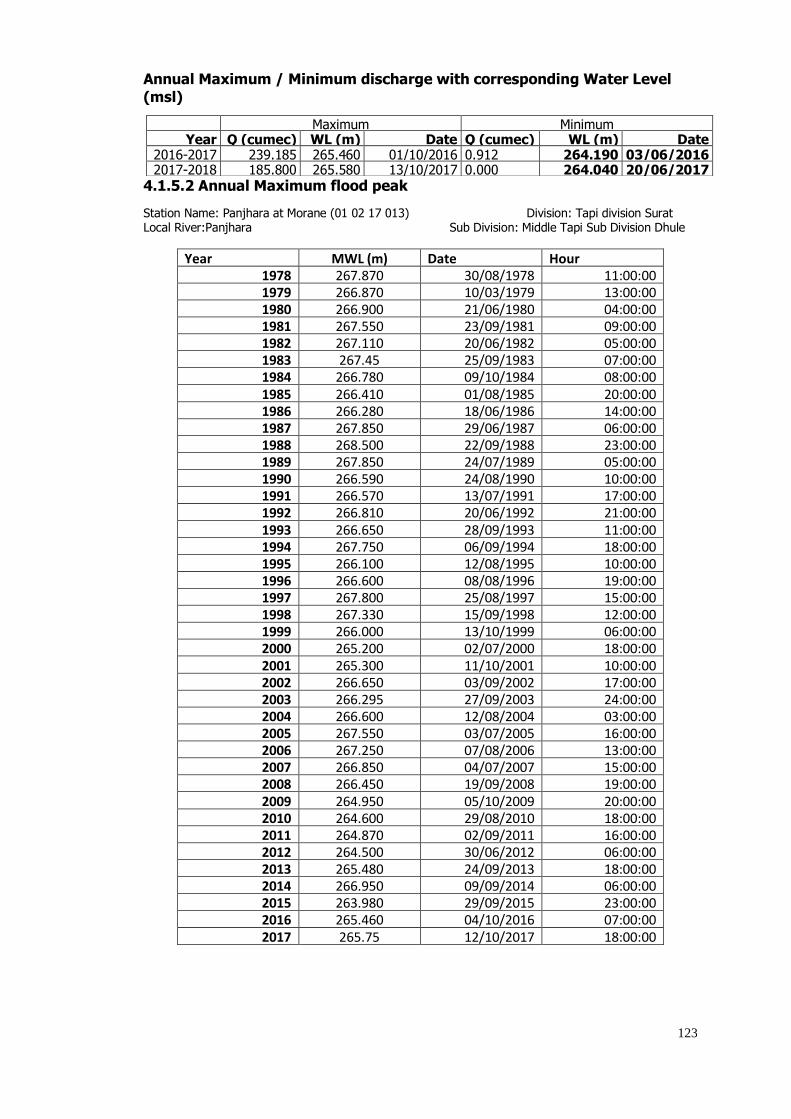
123
Annual Maximum / Minimum discharge with corresponding Water Level
(msl)
4.1.5.2 Annual Maximum flood peak
Station Name: Panjhara at Morane (01 02 17 013) Division: Tapi division Surat Local River:Panjhara Sub Division: Middle Tapi Sub Division Dhule
Year MWL (m) Date Hour 1978 267.870 30/08/1978 11:00:00
1979 266.870 10/03/1979 13:00:00
1980 266.900 21/06/1980 04:00:00
1981 267.550 23/09/1981 09:00:00
1982 267.110 20/06/1982 05:00:00
1983 267.45 25/09/1983 07:00:00
1984 266.780 09/10/1984 08:00:00 1985 266.410 01/08/1985 20:00:00 1986 266.280 18/06/1986 14:00:00 1987 267.850 29/06/1987 06:00:00 1988 268.500 22/09/1988 23:00:00 1989 267.850 24/07/1989 05:00:00 1990 266.590 24/08/1990 10:00:00 1991 266.570 13/07/1991 17:00:00 1992 266.810 20/06/1992 21:00:00 1993 266.650 28/09/1993 11:00:00 1994 267.750 06/09/1994 18:00:00 1995 266.100 12/08/1995 10:00:00 1996 266.600 08/08/1996 19:00:00 1997 267.800 25/08/1997 15:00:00 1998 267.330 15/09/1998 12:00:00 1999 266.000 13/10/1999 06:00:00 2000 265.200 02/07/2000 18:00:00 2001 265.300 11/10/2001 10:00:00 2002 266.650 03/09/2002 17:00:00 2003 266.295 27/09/2003 24:00:00 2004 266.600 12/08/2004 03:00:00 2005 267.550 03/07/2005 16:00:00 2006 267.250 07/08/2006 13:00:00 2007 266.850 04/07/2007 15:00:00 2008 266.450 19/09/2008 19:00:00
2009 264.950 05/10/2009 20:00:00
2010 264.600 29/08/2010 18:00:00
2011 264.870 02/09/2011 16:00:00
2012 264.500 30/06/2012 06:00:00
2013 265.480 24/09/2013 18:00:00
2014 266.950 09/09/2014 06:00:00
2015 263.980 29/09/2015 23:00:00
2016 265.460 04/10/2016 07:00:00
2017 265.75 12/10/2017 18:00:00
Maximum Minimum Year Q (cumec) WL (m) Date Q (cumec) WL (m) Date
2016-2017 239.185 265.460 01/10/2016 0.912 264.190 03/06/2016 2017-2018 185.800 265.580 13/10/2017 0.000 264.040 20/06/2017
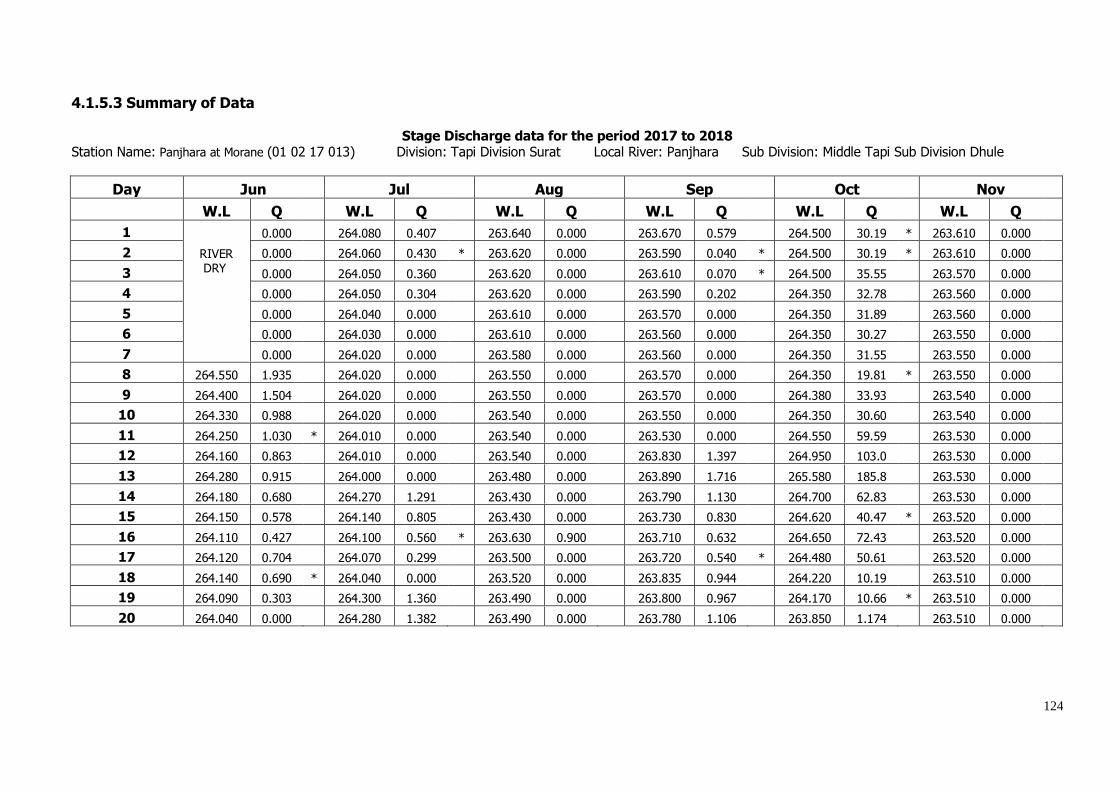
124
4.1.5.3 Summary of Data
Stage Discharge data for the period 2017 to 2018 Station Name: Panjhara at Morane (01 02 17 013) Division: Tapi Division Surat Local River: Panjhara Sub Division: Middle Tapi Sub Division Dhule
Day Jun Jul Aug Sep Oct Nov
W.L Q W.L Q W.L Q W.L Q W.L Q W.L Q
1
RIVER DRY
0.000 264.080 0.407 263.640 0.000 263.670 0.579 264.500 30.19 * 263.610 0.000
2 0.000 264.060 0.430 * 263.620 0.000 263.590 0.040 * 264.500 30.19 * 263.610 0.000
3 0.000 264.050 0.360 263.620 0.000 263.610 0.070 * 264.500 35.55 263.570 0.000
4 0.000 264.050 0.304 263.620 0.000 263.590 0.202 264.350 32.78 263.560 0.000
5 0.000 264.040 0.000 263.610 0.000 263.570 0.000 264.350 31.89 263.560 0.000
6 0.000 264.030 0.000 263.610 0.000 263.560 0.000 264.350 30.27 263.550 0.000
7 0.000 264.020 0.000 263.580 0.000 263.560 0.000 264.350 31.55 263.550 0.000
8 264.550 1.935 264.020 0.000 263.550 0.000 263.570 0.000 264.350 19.81 * 263.550 0.000
9 264.400 1.504 264.020 0.000 263.550 0.000 263.570 0.000 264.380 33.93 263.540 0.000
10 264.330 0.988 264.020 0.000 263.540 0.000 263.550 0.000 264.350 30.60 263.540 0.000
11 264.250 1.030 * 264.010 0.000 263.540 0.000 263.530 0.000 264.550 59.59 263.530 0.000
12 264.160 0.863 264.010 0.000 263.540 0.000 263.830 1.397 264.950 103.0 263.530 0.000
13 264.280 0.915 264.000 0.000 263.480 0.000 263.890 1.716 265.580 185.8 263.530 0.000
14 264.180 0.680 264.270 1.291 263.430 0.000 263.790 1.130 264.700 62.83 263.530 0.000
15 264.150 0.578 264.140 0.805 263.430 0.000 263.730 0.830 264.620 40.47 * 263.520 0.000
16 264.110 0.427 264.100 0.560 * 263.630 0.900 263.710 0.632 264.650 72.43 263.520 0.000
17 264.120 0.704 264.070 0.299 263.500 0.000 263.720 0.540 * 264.480 50.61 263.520 0.000
18 264.140 0.690 * 264.040 0.000 263.520 0.000 263.835 0.944 264.220 10.19 263.510 0.000
19 264.090 0.303 264.300 1.360 263.490 0.000 263.800 0.967 264.170 10.66 * 263.510 0.000
20 264.040 0.000 264.280 1.382 263.490 0.000 263.780 1.106 263.850 1.174 263.510 0.000

125
21 264.000 0.000 264.180 1.096 263.510 0.000 263.790 1.085 264.190 8.140 263.510 0.000
22 264.000 0.000 264.100 0.598 263.530 0.000 263.860 1.334 264.180 11.08 * 263.600 0.000
23 264.000 0.000 264.070 0.470 * 263.610 0.308 263.770 0.775 264.160 5.845 263.620 0.000
24 264.000 0.000 264.050 0.504 263.640 0.334 263.740 0.680 * 264.020 2.518 263.610 0.000
25 264.000 0.000 264.210 0.875 263.650 0.180 * 263.720 0.599 263.970 2.443 263.600 0.000
26 264.000 0.000 264.130 0.569 263.670 0.342 263.680 0.195 264.110 4.170 263.590 0.000
27 264.150 1.453 264.060 0.579 263.640 0.150 * 263.580 0.000 263.900 1.695 263.580 0.000
28 264.250 1.026 264.050 0.458 263.670 0.441 263.570 0.000 263.740 0.418 263.570 0.000
29 264.150 1.256 264.040 0.000 263.780 0.689 264.400 34.83 263.660 0.220 * 263.570 0.000
30 264.115 0.522 263.900 0.000 263.720 0.551 264.500 30.19 * 263.640 0.000 263.560 0.000
31 263.660 0.000 263.670 0.708 263.620 0.000
Ten-Daily Mean
I Ten-Daily 264.427 1.476 264.039 0.150 263.594 0.000 263.584 0.089 264.398 30.68 263.564 0.000
II Ten-Daily 264.152 0.619 264.122 0.570 263.505 0.090 263.762 0.926 264.577 59.68 263.521 0.000
III Ten-Daily 264.066 0.426 264.041 0.468 263.645 0.337 263.861 6.969 263.926 3.321 263.581 0.000
Monthly
Min. 264.000 0.000 263.660 0.000 263.430 0.000 263.530 0.000 263.620 0.000 263.510 0.000
Max. 264.550 1.935 264.300 1.382 263.780 0.900 264.500 34.83 265.580 185.8 263.620 0.000
Mean 264.151 0.647
264.066 0.398
263.583 0.148
263.736 2.662
264.288 30.32
263.555 0.000
Annual Runoff in MCM = 101 Annual Runoff in mm = 52 Peak Observed Discharge = 185.80 cumecs on 13-10-2017 Corres. Water Level :265.580 m
Lowest Observed Discharge = 0.000 cumecs on 20-06-2017 Corres. Water Level :264.040 m
Note: River Dry from 01/06/17 to 07/06/17, 01/01/18 to 31/01/18 ,01/01/18 to 31/01/18and from 01/04/18 to 10/05/18, River remain in pooling condition from.
20/06/2017 to 26/06/17,05/07/17 to 13/07/17, 29/07/17 to 15/08/17, 17/08/17 to 22/08/17, 05/09/17 to 11/09/17, 27/09/17 to 28/09/17, 30/10/17 to 31/12/17,
01/02/18 to 16/02/18, 26/02/18 to 31/03/18 and 11/05/2018 to 31/05/2018
Q: observed/ computed discharge in Cumec, WL: Corresponding Mean Water Level (msl) in m, *: Computed Discharge
#Discarded and estimated

126
Stage Discharge data for the period 2017 to 2018
Station Name: Panjhara at Morane (01 02 17 013) Division: Tapi Division Surat Local River: Panjhara Sub Division: Middle Tapi Sub Division Dhule
Day Dec Jan Feb Mar Apr May
W.L Q WL Q WL Q WL Q WL Q WL Q
1 263.560 0.000
RIVER DRY
0.000 263.520 0.000 263.460 0.000
RIVER DRY
0.000
RIVER DRY
0.000
2 263.550 0.000 0.000
263.520 0.000 263.460 0.000 0.000
0.000
3 263.550 0.000 0.000
263.520 0.000 263.460 0.000 0.000
0.000
4 263.550 0.000 0.000
263.520 0.000 263.530 0.000 0.000
0.000
5 263.550 0.000 0.000
263.520 0.000 263.460 0.000 0.000
0.000
6 263.550 0.000 0.000
263.510 0.000 263.420 0.000 0.000
0.000
7 263.550 0.000 0.000
263.500 0.000 263.470 0.000 0.000
0.000
8 263.550 0.000 0.000
263.500 0.000 263.460 0.000 0.000
0.000
9 263.540 0.000 0.000
263.500 0.000 263.450 0.000 0.000
0.000
10 263.540 0.000 0.000
263.490 0.000 263.460 0.000 0.000
0.000
11 263.540 0.000 0.000
263.490 0.000 263.460 0.000 0.000
264.150 0.000
12 263.540 0.000 0.000
263.490 0.000 263.380 0.000 0.000
264.150 0.000
13 263.530 0.000 0.000
263.480 0.000 263.370 0.000 0.000
264.150 0.000
14 263.530 0.000 0.000
263.480 0.000 263.360 0.000 0.000
264.150 0.000
15 263.530 0.000 0.000
263.480 0.000 263.000 0.000 0.000
264.150 0.000
16 263.530 0.000 0.000
263.500 0.000 263.000 0.000 0.000
264.150 0.000
17 263.530 0.000 0.000
264.200 11.95 * 263.000 0.000 0.000
264.200 0.000
18 263.530 0.000 0.000
264.200 11.95 * 263.000 0.000 0.000
264.200 0.000
19 263.530 0.000 0.000
264.180 11.08 * 263.000 0.000 0.000
264.200 0.000
20 263.530 0.000 0.000
264.240 13.81 * 263.000 0.000 0.000
264.120 0.000

127
21 263.530 0.000
RIVER DRY
0.000 264.310 17.48 * 263.000 0.000
RIVER DRY
0.000 264.190 0.000
22 263.530 0.000 0.000
264.300 16.92 * 263.000 0.000 0.000
264.180 0.000
23 263.530 0.000 0.000
264.290 16.38 * 263.000 0.000 0.000
263.950 0.000
24 263.520 0.000 0.000
264.180 11.08 * 263.000 0.000 0.000
263.860 0.000
25 263.520 0.000 0.000
264.180 11.08 * 263.000 0.000 0.000
263.820 0.000
26 263.520 0.000 0.000
263.650 0.000 263.000 0.000 0.000
263.750 0.000
27 263.520 0.000 0.000
263.500 0.000 263.000 0.000 0.000
263.440 0.000
28 263.510 0.000 0.000
263.460 0.000 263.000 0.000 0.000
263.350 0.000
29 263.510 0.000 0.000
263.000 0.000 0.000
263.350 0.000
30 263.500 0.000 0.000
263.000 0.000 0.000
263.350 0.000
31 263.500 0.000 0.000
263.000 0.000 263.350 0.000
Ten-Daily Mean
I Ten-Daily 263.549 0.000 263.510 0.000 263.463 0.000
II Ten-Daily 263.532 0.000 263.774 4.879 263.157 0.000 264.162 0.000
III Ten-Daily 263.517 0.000 263.984 9.118 263.000 0.000 263.690 0.000
Monthly
Min. 263.500 0.000 263.460 0.000 263.000 0.000 263.350 0.000
Max. 263.560 0.000 264.310 17.48 263.530 0.000 264.200 0.000
Mean 263.532 0.000
263.740 4.348
263.200 0.000
263.915 0.000
Peak Computed Discharge = 40.47 cumecs on 15/10/2017 Corres. Water Level :264.620 m
Lowest Computed Discharge = 0.040 cumecs on 02/09/2017 Corres. Water Level :263.590 m
Note: River Dry from 01/06/17 to 07/06/17, 01/01/18 to 31/01/18 ,01/01/18 to 31/01/18and from 01/04/18 to 10/05/18, River remain in pooling condition from.
20/06/2017 to 26/06/17,05/07/17 to 13/07/17, 29/07/17 to 15/08/17, 17/08/17 to 22/08/17, 05/09/17 to 11/09/17, 27/09/17 to 28/09/17, 30/10/17 to 31/12/17,
01/02/18 to 16/02/18, 26/02/18 to 31/03/18 and 11/05/2018 to 31/05/2018
Q: observed/ computed discharge in Cumec, WL: Corresponding Mean Water Level (msl) in m, *: Computed Discharge
#Discarded and estimated

128
4.1.5.4 Stage Discharge Curve
Station Name: Panjhara at Morane (01 02 17 013) Division: Tapi Division Surat Local River: Panjhara Sub Division: Middle Tapi Sub Division Dhule
Stage Discharge Curve of River Panjhara at Morane for the period 01/06/2017 to 20/07/2017
Calculated Observed
Discharge in Cumec6543210
Sta
ge in
m
266
265.9
265.8
265.7
265.6
265.5
265.4
265.3
265.2
265.1
265
264.9
264.8
264.7
264.6
264.5
264.4
264.3
264.2
264.1
264
263.9
Procedure: Standard Equation : Power Q=C(h+a)^b
LB UB a b C
264.000 266.000 -263.94 0.914 3.009
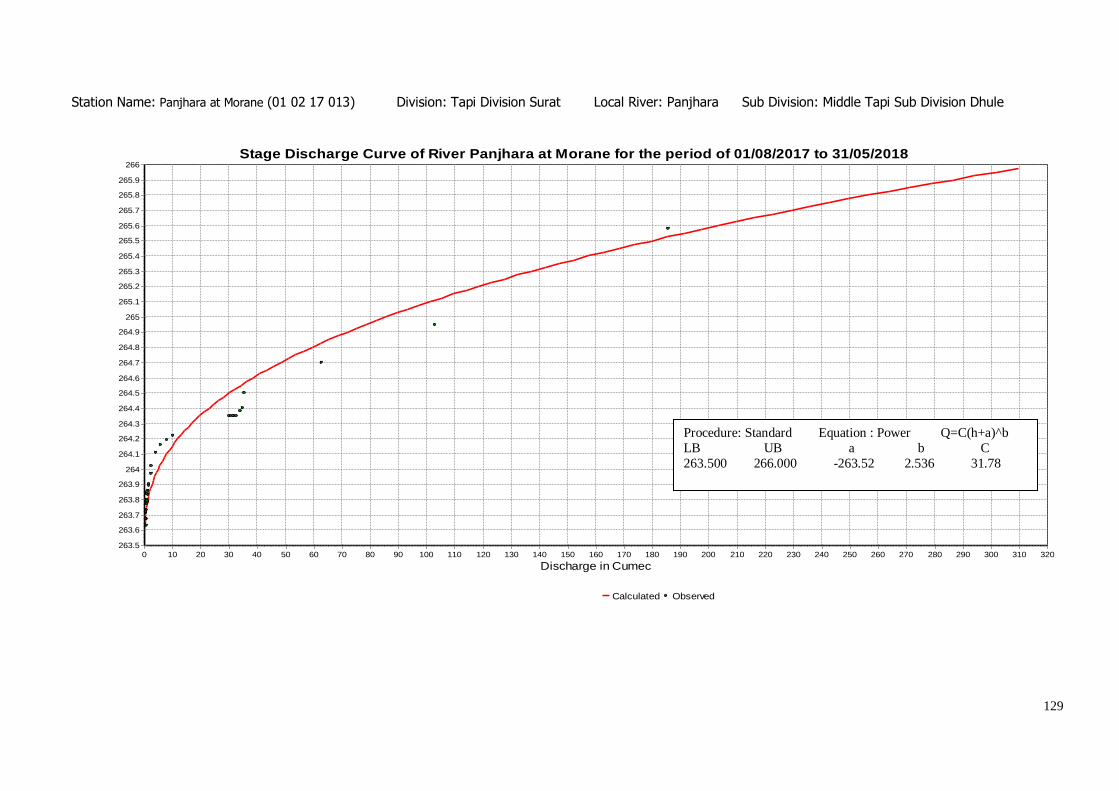
129
Station Name: Panjhara at Morane (01 02 17 013) Division: Tapi Division Surat Local River: Panjhara Sub Division: Middle Tapi Sub Division Dhule
Stage Discharge Curve of River Panjhara at Morane for the period of 01/08/2017 to 31/05/2018
Calculated Observed
Discharge in Cumec3203103002902802702602502402302202102001901801701601501401301201101009080706050403020100
Sta
ge
in m
266
265.9
265.8
265.7
265.6
265.5
265.4
265.3
265.2
265.1
265
264.9
264.8
264.7
264.6
264.5
264.4
264.3
264.2
264.1
264
263.9
263.8
263.7
263.6
263.5
Procedure: Standard Equation : Power Q=C(h+a)^b
LB UB a b C
263.500 266.000 -263.52 2.536 31.78

130
4.1.5.5 Annual Runoff Annual Runoff for the period 2017 to 2018
Station Name: Panjhara at Morane (01 02 17 013) Division: Tapi Division Surat Local River: Panjhara Sub Division: Middle Tapi Sub Division Dhule
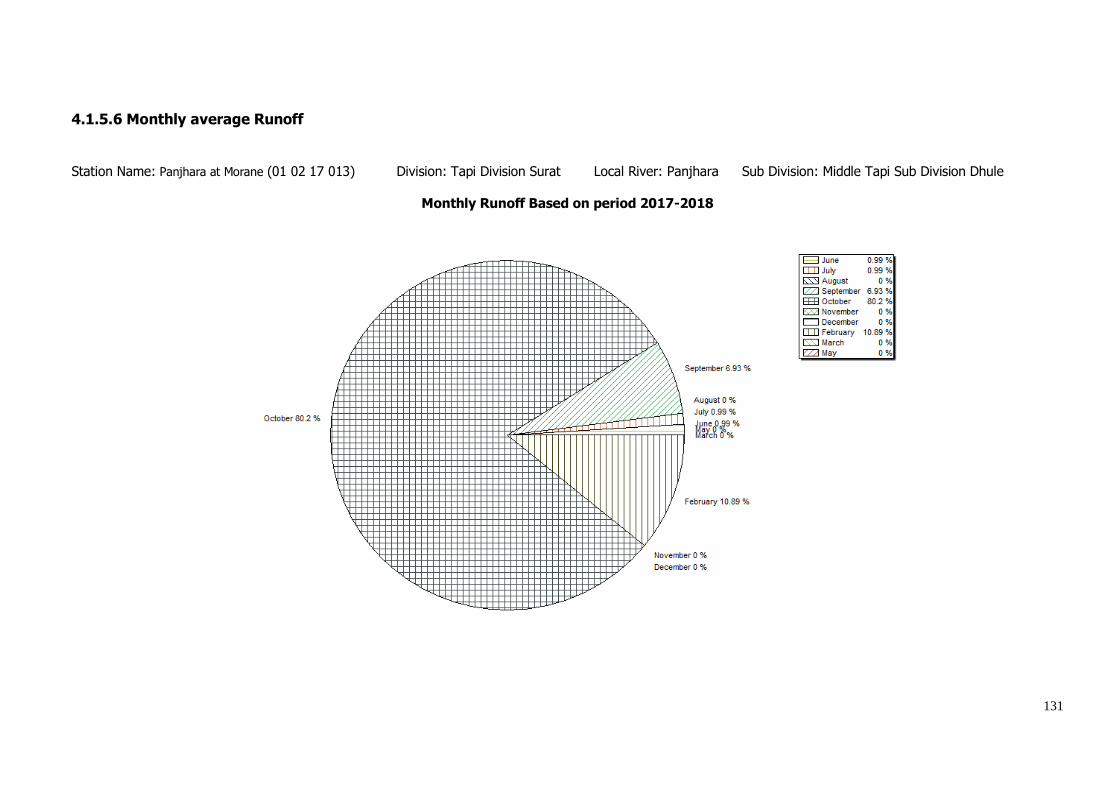
131
4.1.5.6 Monthly average Runoff Station Name: Panjhara at Morane (01 02 17 013) Division: Tapi Division Surat Local River: Panjhara Sub Division: Middle Tapi Sub Division Dhule
Monthly Runoff Based on period 2017-2018
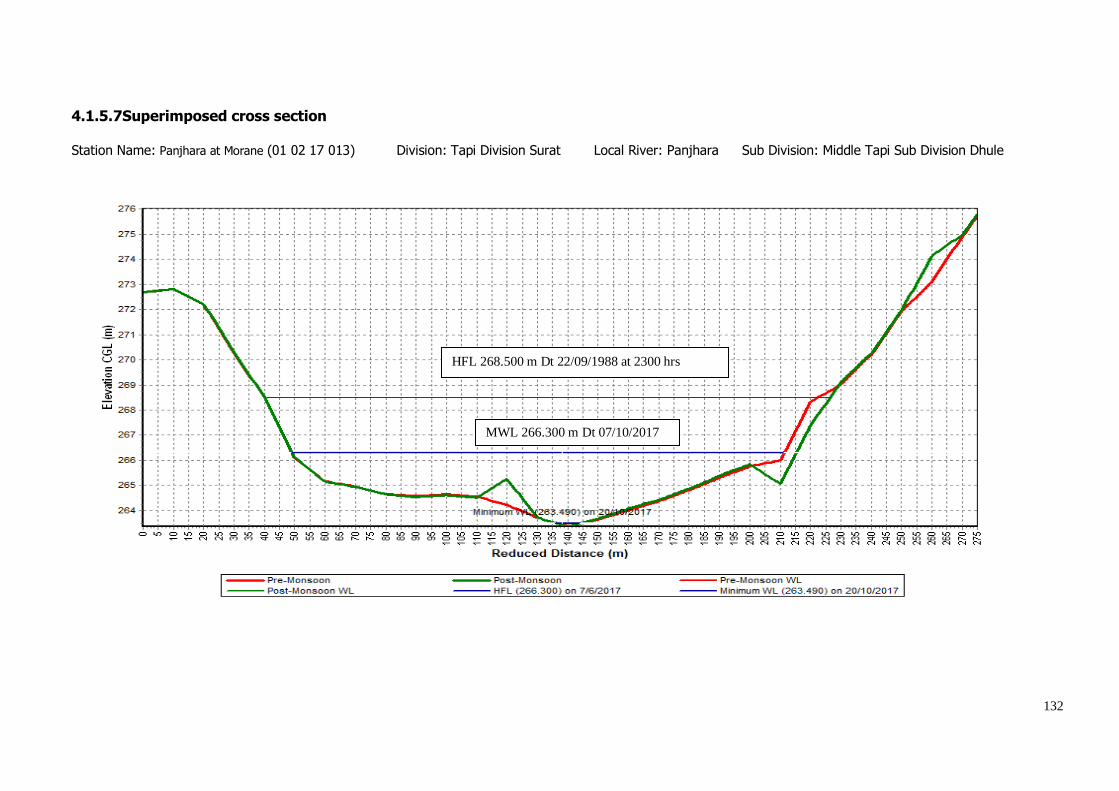
132
4.1.5.7Superimposed cross section
Station Name: Panjhara at Morane (01 02 17 013) Division: Tapi Division Surat Local River: Panjhara Sub Division: Middle Tapi Sub Division Dhule
HFL 268.500 m Dt 22/09/1988 at 2300 hrs
MWL 266.300 m Dt 07/10/2017

133
4.1.5.8WL vs Time Graph of I,II,III peak
Station Name: Panjhara at Morane (01 02 17 013) Division: Tapi Division Surat Local River:Panjhara Sub Division: Middle Tapi Sub Division Dhule
Water level vs Time Graph of Highest (I) flood peak during the water year 2017-18
Water level vs Time Graph of Highest (II) flood peak during the water year 2017-18
Water level vs Time Graph of Highest (III) flood peak during the water year 2017-18

134
4.1.6 Tapi at Gidhade
4.1.6.1 History Sheet
Site : Gidhade Code : 01 02 17 014
State : Maharashtra District Dhule
Basin : Tapi Independent River : Tapi
Tributary : - Sub Tributary : Sub-Sub
Tributary : Local River : Tapi
Division : Tapi Division Surat Sub-Division : Middle Tapi Dhule Drainage
Area :
54750 sq
km Bank : Right
Latitude : 21°17’45” Longitude : 74°48’45”
Zero of Gauge (m) : 119 (m.s.l.) 15/06/1969
Opening Date Closing Date
Gauge : 15/06/1969
Discharge : 19/06/1990
Sediment : Water Quality : 01/09/1990 31/05/2005
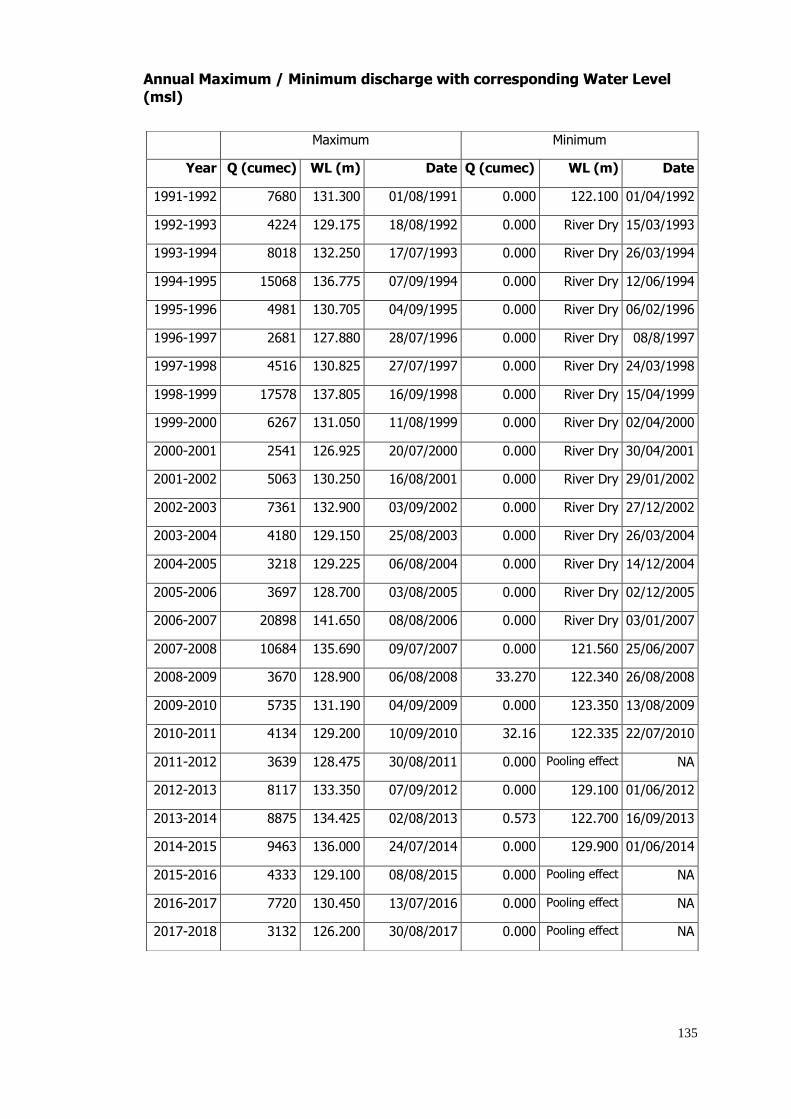
135
Annual Maximum / Minimum discharge with corresponding Water Level
(msl)
Maximum Minimum
Year Q (cumec) WL (m) Date Q (cumec) WL (m) Date
1991-1992 7680 131.300 01/08/1991 0.000 122.100 01/04/1992
1992-1993 4224 129.175 18/08/1992 0.000 River Dry 15/03/1993
1993-1994 8018 132.250 17/07/1993 0.000 River Dry 26/03/1994
1994-1995 15068 136.775 07/09/1994 0.000 River Dry 12/06/1994
1995-1996 4981 130.705 04/09/1995 0.000 River Dry 06/02/1996
1996-1997 2681 127.880 28/07/1996 0.000 River Dry 08/8/1997
1997-1998 4516 130.825 27/07/1997 0.000 River Dry 24/03/1998
1998-1999 17578 137.805 16/09/1998 0.000 River Dry 15/04/1999
1999-2000 6267 131.050 11/08/1999 0.000 River Dry 02/04/2000
2000-2001 2541 126.925 20/07/2000 0.000 River Dry 30/04/2001
2001-2002 5063 130.250 16/08/2001 0.000 River Dry 29/01/2002
2002-2003 7361 132.900 03/09/2002 0.000 River Dry 27/12/2002
2003-2004 4180 129.150 25/08/2003 0.000 River Dry 26/03/2004
2004-2005 3218 129.225 06/08/2004 0.000 River Dry 14/12/2004
2005-2006 3697 128.700 03/08/2005 0.000 River Dry 02/12/2005
2006-2007 20898 141.650 08/08/2006 0.000 River Dry 03/01/2007
2007-2008 10684 135.690 09/07/2007 0.000 121.560 25/06/2007
2008-2009 3670 128.900 06/08/2008 33.270 122.340 26/08/2008
2009-2010 5735 131.190 04/09/2009 0.000 123.350 13/08/2009
2010-2011 4134 129.200 10/09/2010 32.16 122.335 22/07/2010
2011-2012 3639 128.475 30/08/2011 0.000 Pooling effect NA
2012-2013 8117 133.350 07/09/2012 0.000 129.100 01/06/2012
2013-2014 8875 134.425 02/08/2013 0.573 122.700 16/09/2013
2014-2015 9463 136.000 24/07/2014 0.000 129.900 01/06/2014
2015-2016 4333 129.100 08/08/2015 0.000 Pooling effect NA
2016-2017 7720 130.450 13/07/2016 0.000 Pooling effect NA
2017-2018 3132 126.200 30/08/2017 0.000 Pooling effect NA
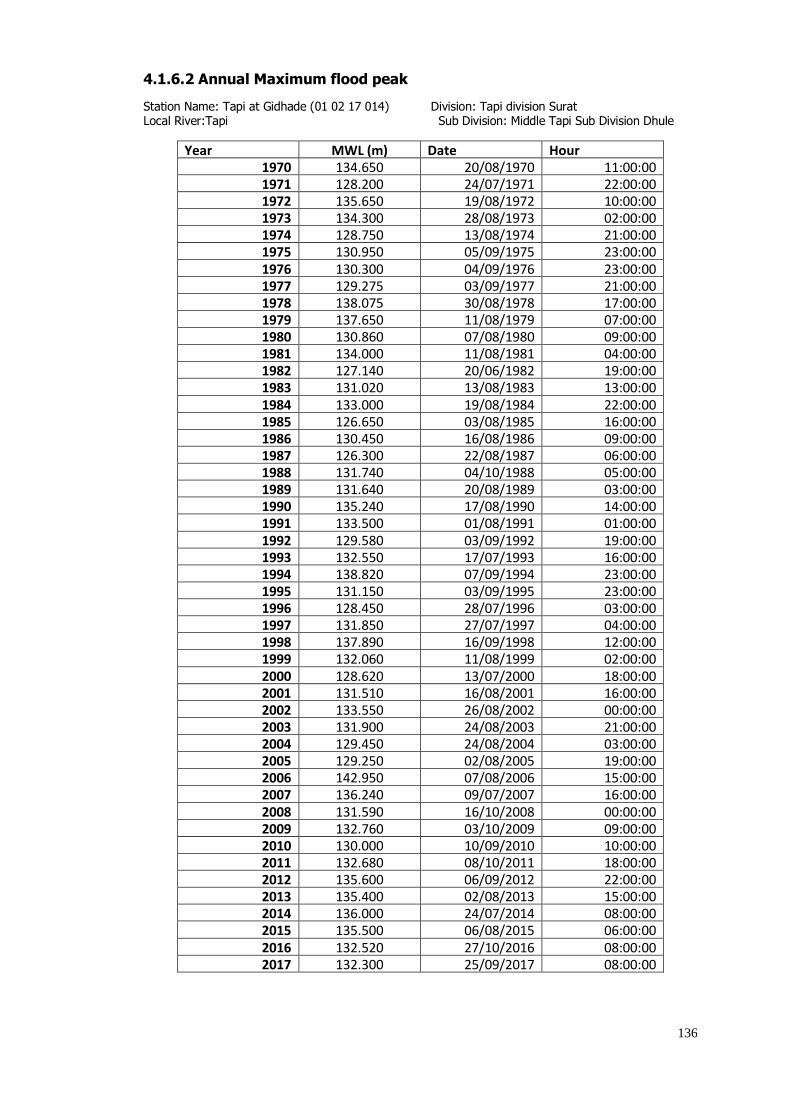
136
4.1.6.2 Annual Maximum flood peak
Station Name: Tapi at Gidhade (01 02 17 014) Division: Tapi division Surat Local River:Tapi Sub Division: Middle Tapi Sub Division Dhule
Year MWL (m) Date Hour 1970 134.650 20/08/1970 11:00:00 1971 128.200 24/07/1971 22:00:00 1972 135.650 19/08/1972 10:00:00 1973 134.300 28/08/1973 02:00:00 1974 128.750 13/08/1974 21:00:00 1975 130.950 05/09/1975 23:00:00 1976 130.300 04/09/1976 23:00:00 1977 129.275 03/09/1977 21:00:00 1978 138.075 30/08/1978 17:00:00 1979 137.650 11/08/1979 07:00:00 1980 130.860 07/08/1980 09:00:00 1981 134.000 11/08/1981 04:00:00 1982 127.140 20/06/1982 19:00:00 1983 131.020 13/08/1983 13:00:00 1984 133.000 19/08/1984 22:00:00 1985 126.650 03/08/1985 16:00:00 1986 130.450 16/08/1986 09:00:00 1987 126.300 22/08/1987 06:00:00 1988 131.740 04/10/1988 05:00:00 1989 131.640 20/08/1989 03:00:00 1990 135.240 17/08/1990 14:00:00 1991 133.500 01/08/1991 01:00:00 1992 129.580 03/09/1992 19:00:00 1993 132.550 17/07/1993 16:00:00 1994 138.820 07/09/1994 23:00:00 1995 131.150 03/09/1995 23:00:00 1996 128.450 28/07/1996 03:00:00 1997 131.850 27/07/1997 04:00:00 1998 137.890 16/09/1998 12:00:00 1999 132.060 11/08/1999 02:00:00 2000 128.620 13/07/2000 18:00:00 2001 131.510 16/08/2001 16:00:00 2002 133.550 26/08/2002 00:00:00 2003 131.900 24/08/2003 21:00:00 2004 129.450 24/08/2004 03:00:00 2005 129.250 02/08/2005 19:00:00 2006 142.950 07/08/2006 15:00:00 2007 136.240 09/07/2007 16:00:00 2008 131.590 16/10/2008 00:00:00 2009 132.760 03/10/2009 09:00:00 2010 130.000 10/09/2010 10:00:00 2011 132.680 08/10/2011 18:00:00 2012 135.600 06/09/2012 22:00:00 2013 135.400 02/08/2013 15:00:00 2014 136.000 24/07/2014 08:00:00 2015 135.500 06/08/2015 06:00:00 2016 132.520 27/10/2016 08:00:00 2017 132.300 25/09/2017 08:00:00

137
4.1.6.3 Summary of Data
Stage Discharge data for the period 2017 to 2018 Station Name: Tapi at Gidhade (01 02 17 014) Division: Tapi Division Surat Local River: Tapi Sub Division: Middle Tapi Sub Division Dhule
Day Jun Jul Aug Sep Oct Nov
W.L Q W.L Q W.L Q W.L Q W.L Q W.L Q
1 127.700 0.000 128.300 0.000 127.000 0.000 130.450 0.000 132.000 0.000 132.270 0.000
2 127.670 0.000 128.500 0.000 125.150 0.000 131.520 0.000 131.150 0.000 132.350 0.000
3 127.580 0.000 128.620 0.000 124.300 0.000 131.250 0.000 131.750 0.000 132.380 0.000
4 127.530 0.000 128.700 0.000 125.800 0.000 130.300 0.000 132.050 0.000 132.380 0.000
5 127.500 0.000 128.700 0.000 126.950 0.000 129.700 0.000 132.050 0.000 132.400 0.000
6 127.480 0.000 128.750 0.000 125.900 0.000 129.250 0.000 132.000 0.000 132.280 0.000
7 127.440 0.000 128.700 0.000 124.750 0.000 129.650 0.000 131.900 0.000 132.270 0.000
8 127.500 0.000 128.720 0.000 125.800 0.000 130.150 0.000 131.980 0.000 132.270 0.000
9 127.560 0.000 128.700 0.000 126.800 0.000 130.280 0.000 132.180 0.000 132.260 0.000
10 127.580 0.000 128.680 0.000 127.230 0.000 130.360 0.000 131.300 0.000 132.260 0.000
11 127.600 0.000 128.660 0.000 127.340 0.000 130.050 0.000 131.700 0.000 132.260 0.000
12 127.600 0.000 128.650 0.000 127.550 0.000 129.950 0.000 130.480 0.000 132.230 0.000
13 128.250 0.000 128.650 0.000 127.700 0.000 129.800 0.000 131.190 452.6 132.200 132.1
14 128.250 0.000 128.630 0.000 127.550 0.000 130.080 0.000 130.050 433.8 132.154 0.000
15 128.270 0.000 129.500 0.000 127.600 0.000 129.200 167.9 129.700 0.000 132.150 0.000
16 128.280 0.000 129.600 0.000 127.650 0.000 129.850 194.2 130.580 0.000 132.120 0.000
17 128.260 0.000 128.500 0.000 127.670 0.000 130.780 180.0 * 131.420 0.000 132.100 0.000
18 128.250 0.000 129.400 0.000 127.680 0.000 130.915 218.5 131.680 0.000 132.080 0.000
19 128.000 0.000 129.700 0.000 127.680 0.000 130.525 205.3 131.600 0.000 132.050 0.000
20 127.850 0.000 129.400 0.000 127.300 0.000 127.950 580.7 131.380 0.000 132.050 0.000
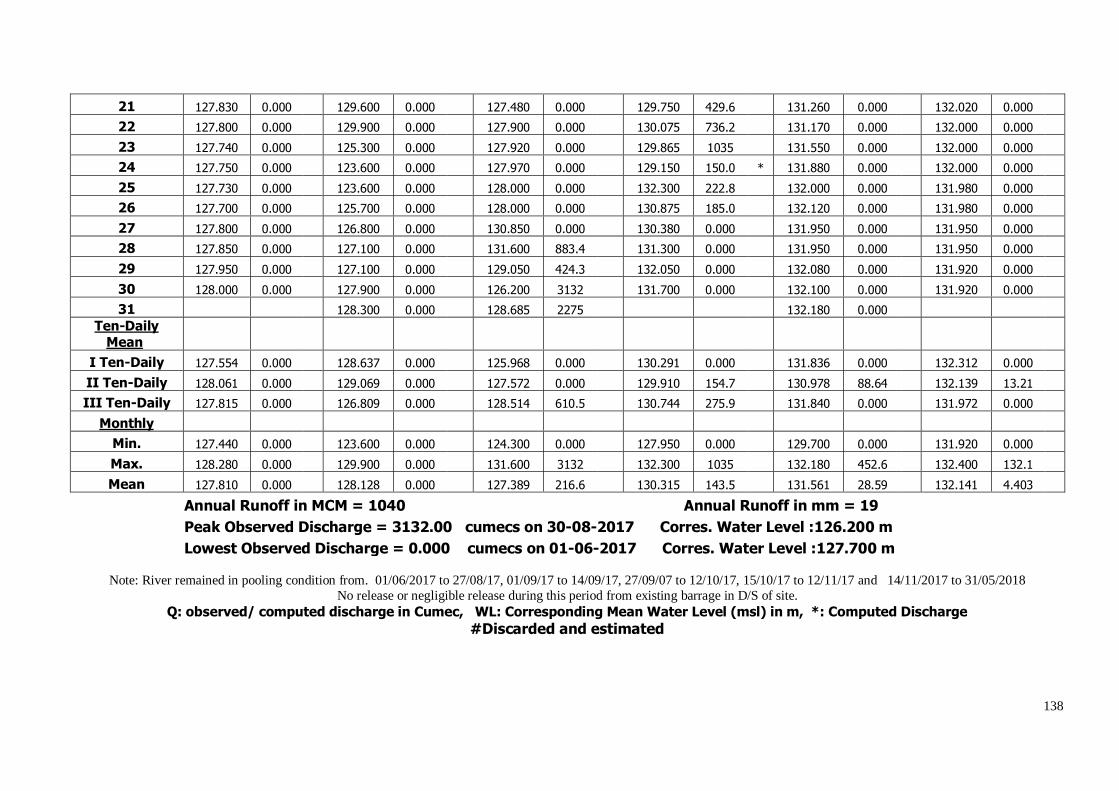
138
21 127.830 0.000 129.600 0.000 127.480 0.000 129.750 429.6 131.260 0.000 132.020 0.000
22 127.800 0.000 129.900 0.000 127.900 0.000 130.075 736.2 131.170 0.000 132.000 0.000
23 127.740 0.000 125.300 0.000 127.920 0.000 129.865 1035 131.550 0.000 132.000 0.000
24 127.750 0.000 123.600 0.000 127.970 0.000 129.150 150.0 * 131.880 0.000 132.000 0.000
25 127.730 0.000 123.600 0.000 128.000 0.000 132.300 222.8 132.000 0.000 131.980 0.000
26 127.700 0.000 125.700 0.000 128.000 0.000 130.875 185.0 132.120 0.000 131.980 0.000
27 127.800 0.000 126.800 0.000 130.850 0.000 130.380 0.000 131.950 0.000 131.950 0.000
28 127.850 0.000 127.100 0.000 131.600 883.4 131.300 0.000 131.950 0.000 131.950 0.000
29 127.950 0.000 127.100 0.000 129.050 424.3 132.050 0.000 132.080 0.000 131.920 0.000
30 128.000 0.000 127.900 0.000 126.200 3132 131.700 0.000 132.100 0.000 131.920 0.000
31 128.300 0.000 128.685 2275 132.180 0.000
Ten-Daily Mean
I Ten-Daily 127.554 0.000 128.637 0.000 125.968 0.000 130.291 0.000 131.836 0.000 132.312 0.000
II Ten-Daily 128.061 0.000 129.069 0.000 127.572 0.000 129.910 154.7 130.978 88.64 132.139 13.21
III Ten-Daily 127.815 0.000 126.809 0.000 128.514 610.5 130.744 275.9 131.840 0.000 131.972 0.000
Monthly
Min. 127.440 0.000 123.600 0.000 124.300 0.000 127.950 0.000 129.700 0.000 131.920 0.000
Max. 128.280 0.000 129.900 0.000 131.600 3132 132.300 1035 132.180 452.6 132.400 132.1
Mean 127.810 0.000
128.128 0.000
127.389 216.6
130.315 143.5
131.561 28.59
132.141 4.403
Annual Runoff in MCM = 1040 Annual Runoff in mm = 19 Peak Observed Discharge = 3132.00 cumecs on 30-08-2017 Corres. Water Level :126.200 m
Lowest Observed Discharge = 0.000 cumecs on 01-06-2017 Corres. Water Level :127.700 m
Note: River remained in pooling condition from. 01/06/2017 to 27/08/17, 01/09/17 to 14/09/17, 27/09/07 to 12/10/17, 15/10/17 to 12/11/17 and 14/11/2017 to 31/05/2018
No release or negligible release during this period from existing barrage in D/S of site.
Q: observed/ computed discharge in Cumec, WL: Corresponding Mean Water Level (msl) in m, *: Computed Discharge
#Discarded and estimated

139
Stage Discharge data for the period 2017 to 2018
Station Name: Tapi at Gidhade (01 02 17 014) Division: Tapi Division Surat Local River: Tapi Sub Division: Middle Tapi Sub Division Dhule
Day Dec Jan Feb Mar Apr May
W.L Q WL Q WL Q WL Q WL Q WL Q
1 131.920 0.000 131.240 0.000 130.560 0.000 129.960 0.000 129.220 0.000 128.500 0.000 *
2 131.900 0.000 131.240 0.000 130.540 0.000 129.930 0.000 129.180 0.000 128.450 0.000
3 131.870 0.000 131.220 0.000 130.520 0.000 129.900 0.000 129.150 0.000 128.460 0.000
4 131.850 0.000 131.200 0.000 130.500 0.000 129.870 0.000 129.120 0.000 128.440 0.000
5 131.820 0.000 131.180 0.000 130.480 0.000 129.850 0.000 129.100 0.000 128.410 0.000
6 131.800 0.000 131.150 0.000 130.460 0.000 129.850 0.000 129.070 0.000 128.400 0.000
7 131.780 0.000 131.120 0.000 130.440 0.000 129.830 0.000 129.050 0.000 128.400 0.000
8 131.760 0.000 131.100 0.000 130.420 0.000 129.800 0.000 129.030 0.000 128.370 0.000
9 131.760 0.000 131.060 0.000 130.400 0.000 129.780 0.000 129.000 0.000 128.350 0.000
10 131.740 0.000 131.040 0.000 130.380 0.000 129.720 0.000 128.970 0.000 128.290 0.000
11 131.700 0.000 131.000 0.000 130.360 0.000 129.720 0.000 128.980 0.000 128.270 0.000
12 131.680 0.000 130.970 0.000 130.340 0.000 129.700 0.000 128.940 0.000 128.250 0.000
13 131.650 0.000 130.950 0.000 130.320 0.000 129.610 0.000 128.900 0.000 128.230 0.000
14 131.650 0.000 130.950 0.000 130.300 0.000 129.650 0.000 128.900 0.000 128.200 0.000
15 131.650 0.000 130.930 0.000 130.270 0.000 129.650 0.000 128.880 0.000 128.170 0.000
16 131.620 0.000 130.900 0.000 130.240 0.000 129.630 0.000 128.850 0.000 128.150 0.000
17 131.600 0.000 130.880 0.000 130.210 0.000 129.600 0.000 128.820 0.000 128.120 0.000
18 131.570 0.000 130.830 0.000 130.180 0.000 129.570 0.000 128.800 0.000 128.100 0.000
19 131.550 0.000 130.850 0.000 130.180 0.000 129.500 0.000 128.800 0.000 128.050 0.000
20 131.530 0.000 130.820 0.000 130.150 0.000 129.520 0.000 128.780 0.000 128.020 0.000

140
21 131.500 0.000 130.800 0.000 130.120 0.000 129.500 0.000 128.750 0.000 128.000 0.000
22 131.470 0.000 130.800 0.000 130.100 0.000 129.470 0.000 128.730 0.000 127.950 0.000
23 131.450 0.000 130.760 0.000 130.080 0.000 129.450 0.000 128.700 0.000 127.950 0.000
24 131.420 0.000 130.740 0.000 130.050 0.000 129.430 0.000 128.700 0.000 127.950 0.000
25 131.400 0.000 130.720 0.000 130.050 0.000 129.400 0.000 128.670 0.000 128.120 0.000
26 131.380 0.000 130.680 0.000 130.020 0.000 129.360 0.000 128.650 0.000 127.850 0.000
27 131.360 0.000 130.680 0.000 129.980 0.000 129.330 0.000 128.600 0.000 127.850 0.000
28 131.340 0.000 130.650 0.000 129.960 0.000 129.300 0.000 128.580 0.000 127.830 0.000
29 131.320 0.000 130.620 0.000 129.300 0.000 128.600 0.000 127.800 0.000
30 131.300 0.000 130.600 0.000 129.280 0.000 128.540 0.000 127.760 0.000
31 131.260 0.000 130.580 0.000 129.250 0.000 127.740 0.000
Ten-Daily Mean
I Ten-Daily 131.820 0.000 131.155 0.000 130.470 0.000 129.849 0.000 129.089 0.000 128.407 0.000
II Ten-Daily 131.620 0.000 130.908 0.000 130.255 0.000 129.615 0.000 128.865 0.000 128.156 0.000
III Ten-Daily 131.382 0.000 130.694 0.000 130.045 0.000 129.370 0.000 128.652 0.000 127.891 0.000
Monthly
Min. 131.260 0.000 130.580 0.000 129.960 0.000 129.250 0.000 128.540 0.000 127.740 0.000
Max. 131.920 0.000 131.240 0.000 130.560 0.000 129.960 0.000 129.220 0.000 128.500 0.000
Mean 131.600 0.000
130.912 0.000
130.272 0.000
129.604 0.000
128.869 0.000
128.143 0.000
Peak Computed Discharge = 180.00 cumecs on 17/10/2017 Corres. Water Level :130.780 m
Lowest Computed Discharge = 0.000 cumecs on 01/05/2018 Corres. Water Level :128.500 m
Note: River remained in pooling condition from. 01/06/2017 to 27/08/17, 01/09/17 to 14/09/17, 27/09/07 to 12/10/17, 15/10/17 to 12/11/17 and 14/11/2017 to 31/05/2018 No release or negligible release during this period from existing barrage in D/S of site.
Q: observed/ computed discharge in Cumec, WL: Corresponding Mean Water Level (msl) in m, *: Computed Discharge
#Discarded and estimated
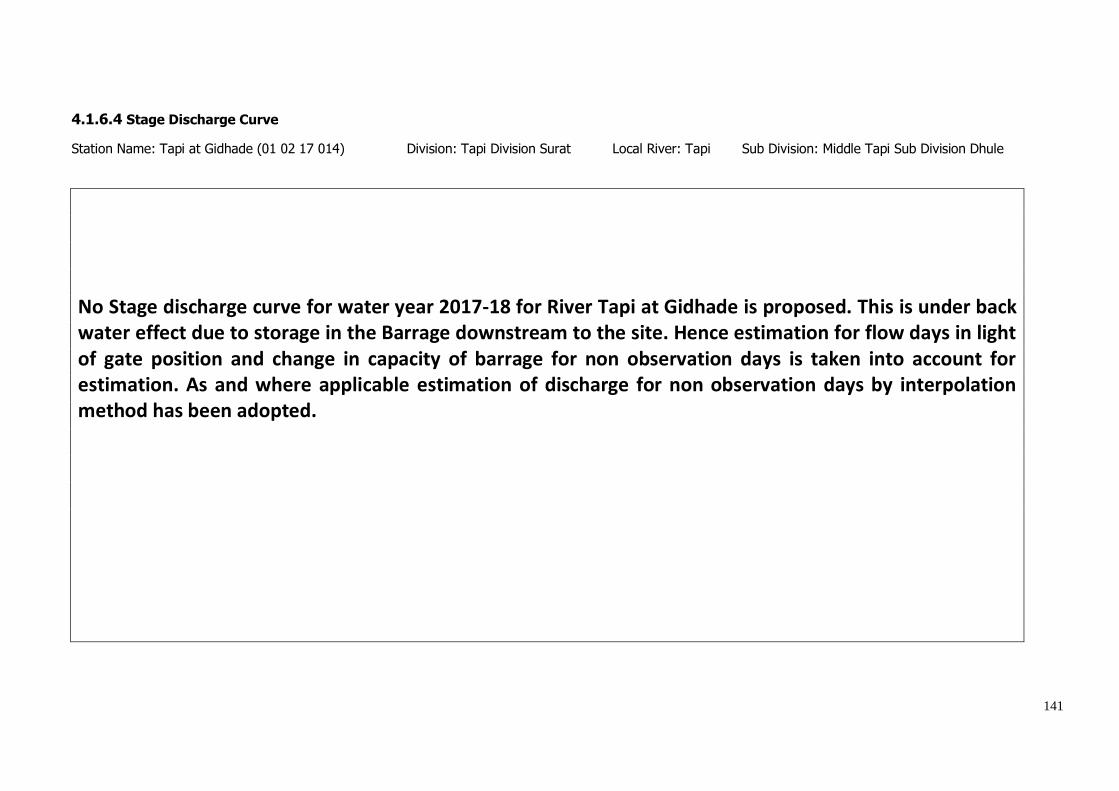
141
4.1.6.4 Stage Discharge Curve
Station Name: Tapi at Gidhade (01 02 17 014) Division: Tapi Division Surat Local River: Tapi Sub Division: Middle Tapi Sub Division Dhule
No Stage discharge curve for water year 2017-18 for River Tapi at Gidhade is proposed. This is under back water effect due to storage in the Barrage downstream to the site. Hence estimation for flow days in light of gate position and change in capacity of barrage for non observation days is taken into account for estimation. As and where applicable estimation of discharge for non observation days by interpolation method has been adopted.
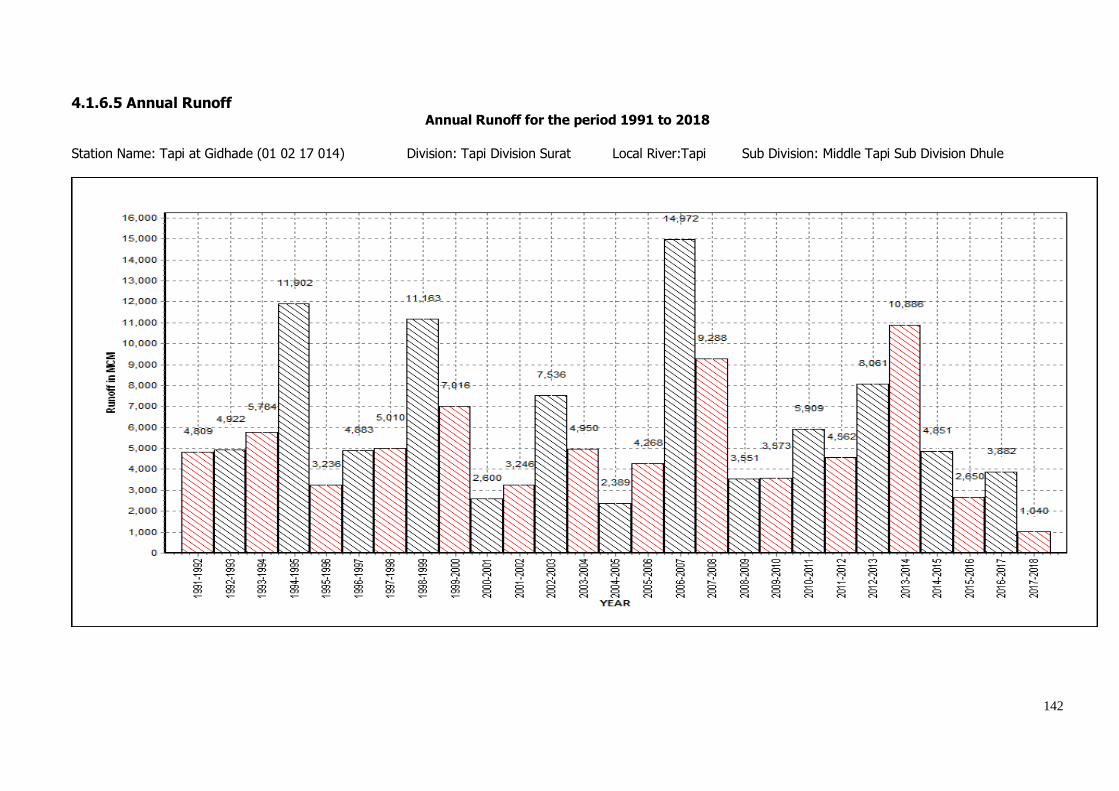
142
4.1.6.5 Annual Runoff Annual Runoff for the period 1991 to 2018
Station Name: Tapi at Gidhade (01 02 17 014) Division: Tapi Division Surat Local River:Tapi Sub Division: Middle Tapi Sub Division Dhule
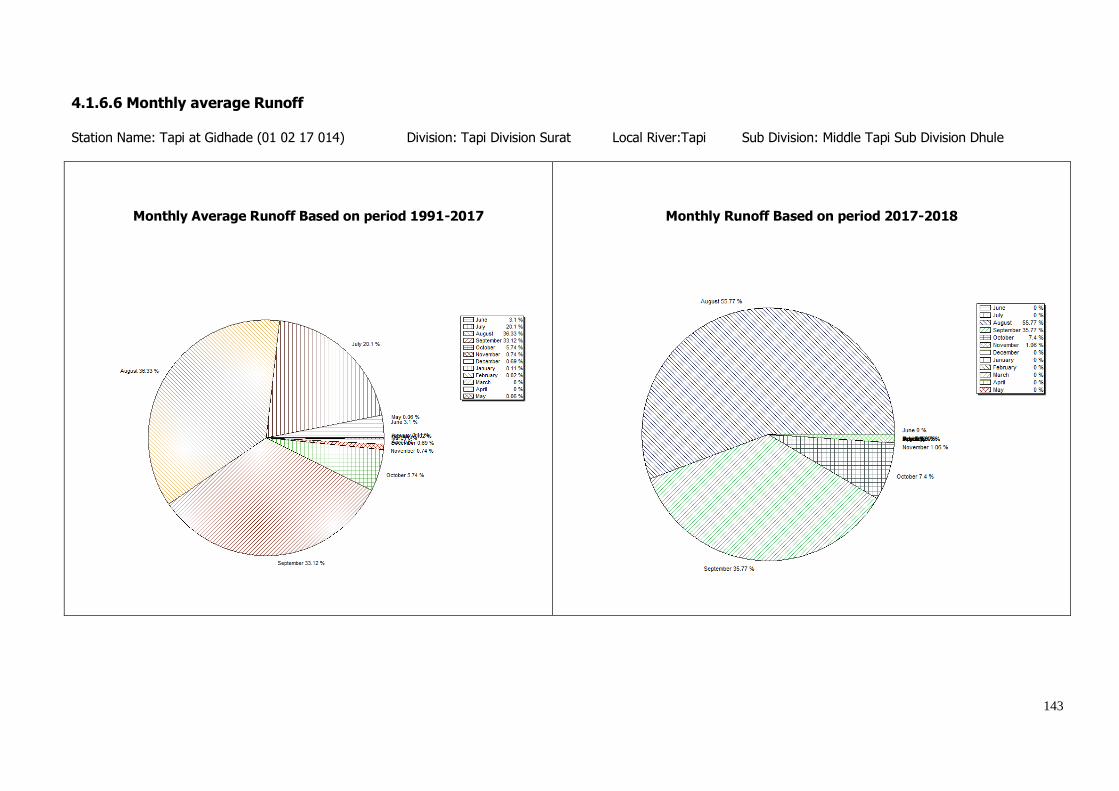
143
4.1.6.6 Monthly average Runoff
Station Name: Tapi at Gidhade (01 02 17 014) Division: Tapi Division Surat Local River:Tapi Sub Division: Middle Tapi Sub Division Dhule
Monthly Average Runoff Based on period 1991-2017
Monthly Runoff Based on period 2017-2018
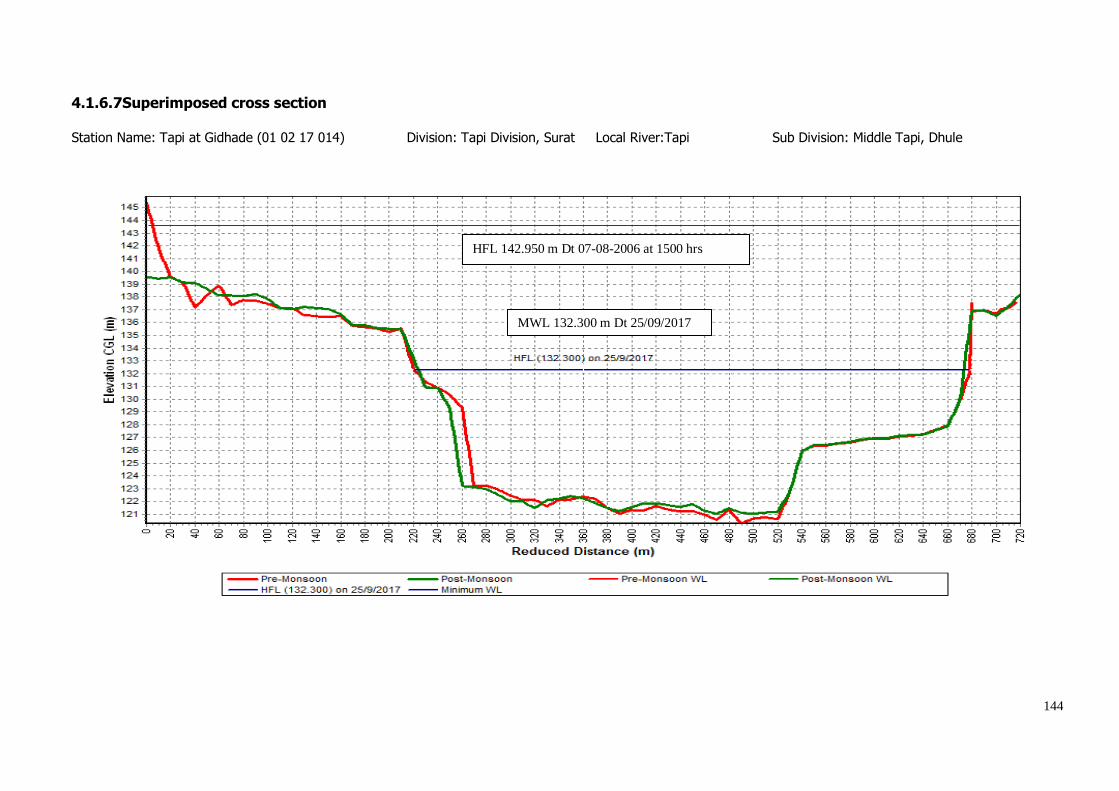
144
4.1.6.7Superimposed cross section
Station Name: Tapi at Gidhade (01 02 17 014) Division: Tapi Division, Surat Local River:Tapi Sub Division: Middle Tapi, Dhule
HFL 142.950 m Dt 07-08-2006 at 1500 hrs
MWL 132.300 m Dt 25/09/2017
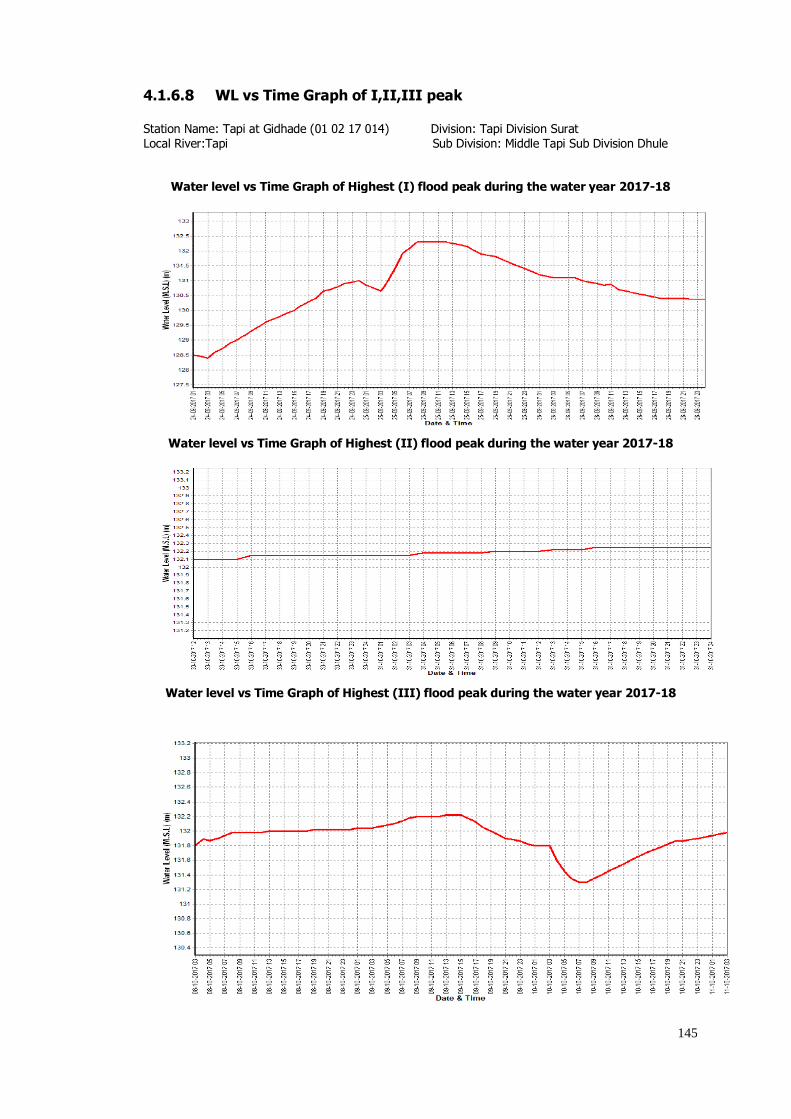
145
4.1.6.8 WL vs Time Graph of I,II,III peak
Station Name: Tapi at Gidhade (01 02 17 014) Division: Tapi Division Surat Local River:Tapi Sub Division: Middle Tapi Sub Division Dhule
Water level vs Time Graph of Highest (I) flood peak during the water year 2017-18
Water level vs Time Graph of Highest (II) flood peak during the water year 2017-18
Water level vs Time Graph of Highest (III) flood peak during the water year 2017-18
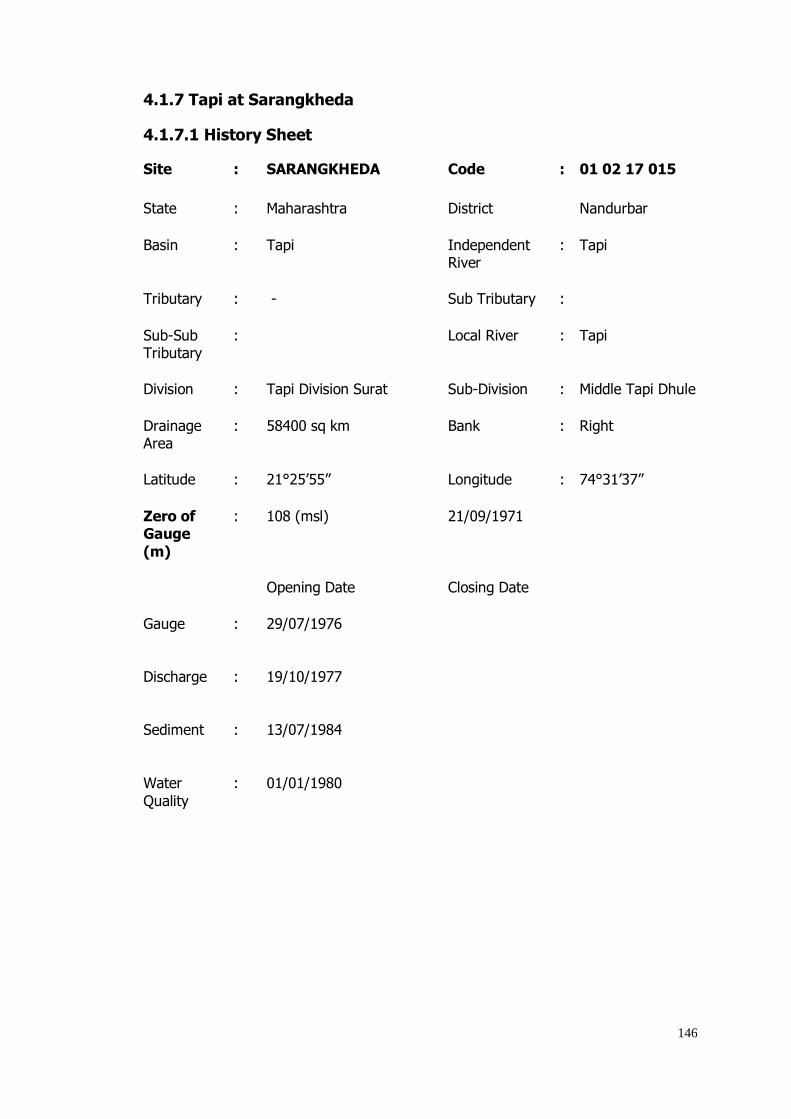
146
4.1.7 Tapi at Sarangkheda
4.1.7.1 History Sheet
Site : SARANGKHEDA Code : 01 02 17 015
State : Maharashtra District Nandurbar
Basin : Tapi Independent River
: Tapi
Tributary : - Sub Tributary :
Sub-Sub Tributary
: Local River : Tapi
Division : Tapi Division Surat Sub-Division : Middle Tapi Dhule
Drainage Area
: 58400 sq km Bank : Right
Latitude : 21°25’55” Longitude : 74°31’37”
Zero of Gauge
(m)
: 108 (msl) 21/09/1971
Opening Date Closing Date
Gauge : 29/07/1976
Discharge : 19/10/1977
Sediment : 13/07/1984
Water
Quality
: 01/01/1980
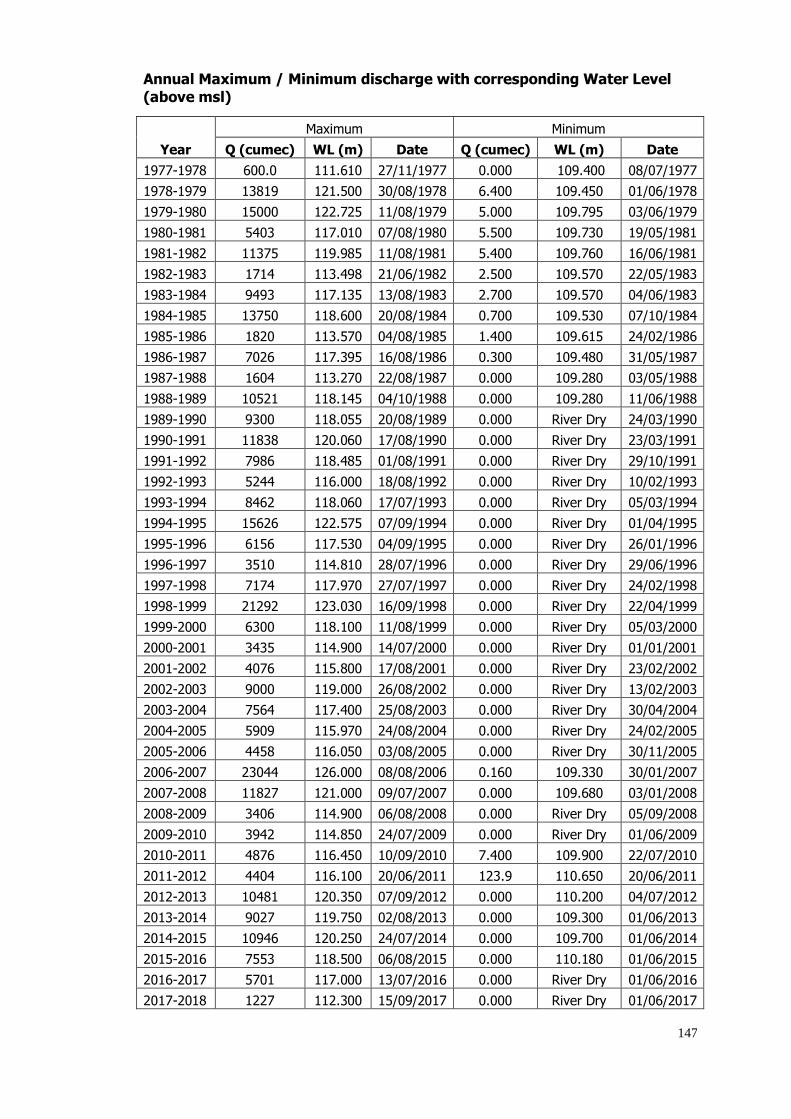
147
Annual Maximum / Minimum discharge with corresponding Water Level
(above msl)
Year
Maximum Minimum
Q (cumec) WL (m) Date Q (cumec) WL (m) Date
1977-1978 600.0 111.610 27/11/1977 0.000 109.400 08/07/1977
1978-1979 13819 121.500 30/08/1978 6.400 109.450 01/06/1978
1979-1980 15000 122.725 11/08/1979 5.000 109.795 03/06/1979
1980-1981 5403 117.010 07/08/1980 5.500 109.730 19/05/1981
1981-1982 11375 119.985 11/08/1981 5.400 109.760 16/06/1981
1982-1983 1714 113.498 21/06/1982 2.500 109.570 22/05/1983
1983-1984 9493 117.135 13/08/1983 2.700 109.570 04/06/1983
1984-1985 13750 118.600 20/08/1984 0.700 109.530 07/10/1984
1985-1986 1820 113.570 04/08/1985 1.400 109.615 24/02/1986
1986-1987 7026 117.395 16/08/1986 0.300 109.480 31/05/1987
1987-1988 1604 113.270 22/08/1987 0.000 109.280 03/05/1988
1988-1989 10521 118.145 04/10/1988 0.000 109.280 11/06/1988
1989-1990 9300 118.055 20/08/1989 0.000 River Dry 24/03/1990
1990-1991 11838 120.060 17/08/1990 0.000 River Dry 23/03/1991
1991-1992 7986 118.485 01/08/1991 0.000 River Dry 29/10/1991
1992-1993 5244 116.000 18/08/1992 0.000 River Dry 10/02/1993
1993-1994 8462 118.060 17/07/1993 0.000 River Dry 05/03/1994
1994-1995 15626 122.575 07/09/1994 0.000 River Dry 01/04/1995
1995-1996 6156 117.530 04/09/1995 0.000 River Dry 26/01/1996
1996-1997 3510 114.810 28/07/1996 0.000 River Dry 29/06/1996
1997-1998 7174 117.970 27/07/1997 0.000 River Dry 24/02/1998
1998-1999 21292 123.030 16/09/1998 0.000 River Dry 22/04/1999
1999-2000 6300 118.100 11/08/1999 0.000 River Dry 05/03/2000
2000-2001 3435 114.900 14/07/2000 0.000 River Dry 01/01/2001
2001-2002 4076 115.800 17/08/2001 0.000 River Dry 23/02/2002
2002-2003 9000 119.000 26/08/2002 0.000 River Dry 13/02/2003
2003-2004 7564 117.400 25/08/2003 0.000 River Dry 30/04/2004
2004-2005 5909 115.970 24/08/2004 0.000 River Dry 24/02/2005
2005-2006 4458 116.050 03/08/2005 0.000 River Dry 30/11/2005
2006-2007 23044 126.000 08/08/2006 0.160 109.330 30/01/2007
2007-2008 11827 121.000 09/07/2007 0.000 109.680 03/01/2008
2008-2009 3406 114.900 06/08/2008 0.000 River Dry 05/09/2008
2009-2010 3942 114.850 24/07/2009 0.000 River Dry 01/06/2009
2010-2011 4876 116.450 10/09/2010 7.400 109.900 22/07/2010
2011-2012 4404 116.100 20/06/2011 123.9 110.650 20/06/2011
2012-2013 10481 120.350 07/09/2012 0.000 110.200 04/07/2012
2013-2014 9027 119.750 02/08/2013 0.000 109.300 01/06/2013
2014-2015 10946 120.250 24/07/2014 0.000 109.700 01/06/2014
2015-2016 7553 118.500 06/08/2015 0.000 110.180 01/06/2015
2016-2017 5701 117.000 13/07/2016 0.000 River Dry 01/06/2016
2017-2018 1227 112.300 15/09/2017 0.000 River Dry 01/06/2017
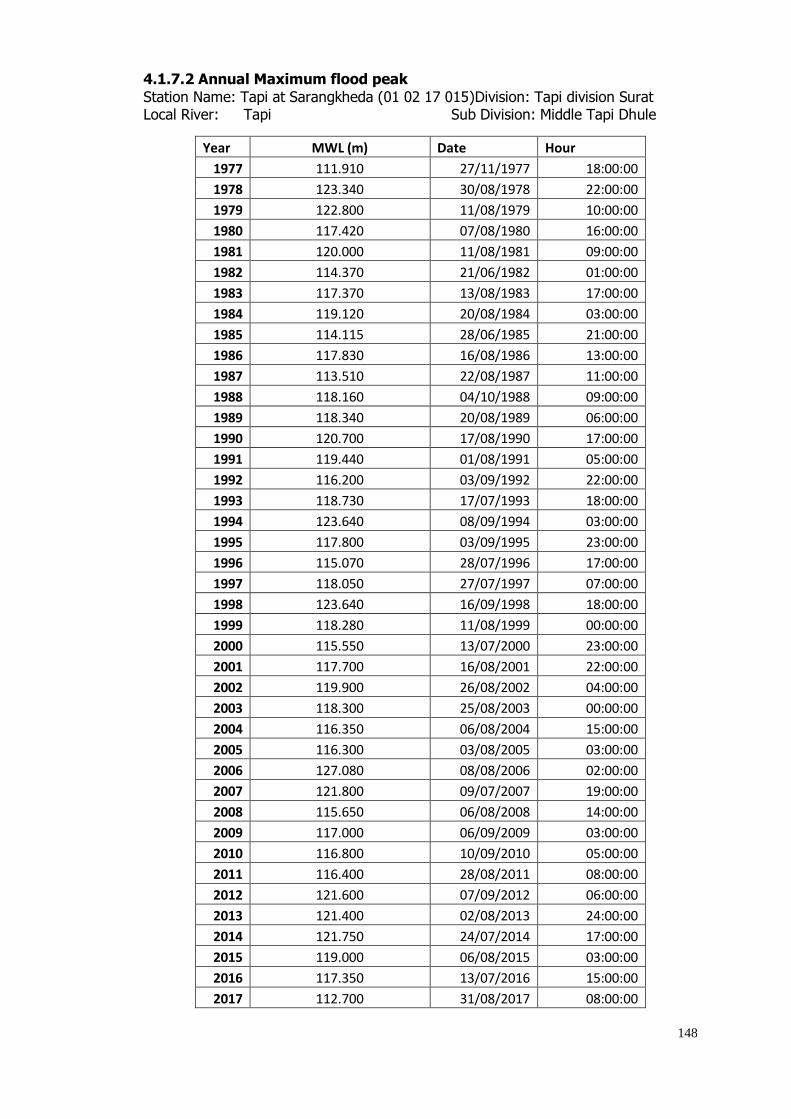
148
4.1.7.2 Annual Maximum flood peak
Station Name: Tapi at Sarangkheda (01 02 17 015)Division: Tapi division Surat Local River: Tapi Sub Division: Middle Tapi Dhule
Year MWL (m) Date Hour
1977 111.910 27/11/1977 18:00:00
1978 123.340 30/08/1978 22:00:00
1979 122.800 11/08/1979 10:00:00
1980 117.420 07/08/1980 16:00:00
1981 120.000 11/08/1981 09:00:00
1982 114.370 21/06/1982 01:00:00
1983 117.370 13/08/1983 17:00:00
1984 119.120 20/08/1984 03:00:00
1985 114.115 28/06/1985 21:00:00
1986 117.830 16/08/1986 13:00:00
1987 113.510 22/08/1987 11:00:00
1988 118.160 04/10/1988 09:00:00
1989 118.340 20/08/1989 06:00:00
1990 120.700 17/08/1990 17:00:00
1991 119.440 01/08/1991 05:00:00
1992 116.200 03/09/1992 22:00:00
1993 118.730 17/07/1993 18:00:00
1994 123.640 08/09/1994 03:00:00
1995 117.800 03/09/1995 23:00:00
1996 115.070 28/07/1996 17:00:00
1997 118.050 27/07/1997 07:00:00
1998 123.640 16/09/1998 18:00:00
1999 118.280 11/08/1999 00:00:00
2000 115.550 13/07/2000 23:00:00
2001 117.700 16/08/2001 22:00:00
2002 119.900 26/08/2002 04:00:00
2003 118.300 25/08/2003 00:00:00
2004 116.350 06/08/2004 15:00:00
2005 116.300 03/08/2005 03:00:00
2006 127.080 08/08/2006 02:00:00
2007 121.800 09/07/2007 19:00:00
2008 115.650 06/08/2008 14:00:00
2009 117.000 06/09/2009 03:00:00
2010 116.800 10/09/2010 05:00:00
2011 116.400 28/08/2011 08:00:00
2012 121.600 07/09/2012 06:00:00
2013 121.400 02/08/2013 24:00:00
2014 121.750 24/07/2014 17:00:00
2015 119.000 06/08/2015 03:00:00
2016 117.350 13/07/2016 15:00:00
2017 112.700 31/08/2017 08:00:00
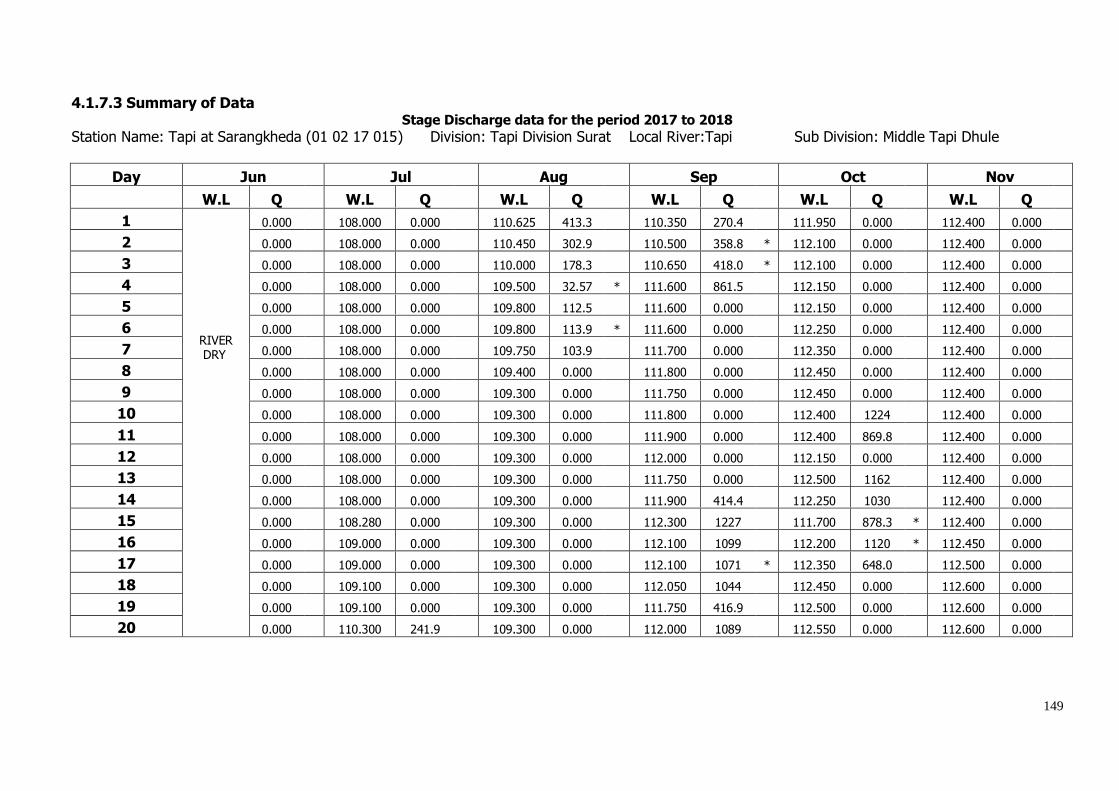
149
4.1.7.3 Summary of Data Stage Discharge data for the period 2017 to 2018
Station Name: Tapi at Sarangkheda (01 02 17 015) Division: Tapi Division Surat Local River:Tapi Sub Division: Middle Tapi Dhule
Day Jun Jul Aug Sep Oct Nov
W.L Q W.L Q W.L Q W.L Q W.L Q W.L Q
1
RIVER DRY
0.000 108.000 0.000 110.625 413.3 110.350 270.4 111.950 0.000 112.400 0.000
2 0.000 108.000 0.000 110.450 302.9 110.500 358.8 * 112.100 0.000 112.400 0.000
3 0.000 108.000 0.000 110.000 178.3 110.650 418.0 * 112.100 0.000 112.400 0.000
4 0.000 108.000 0.000 109.500 32.57 * 111.600 861.5 112.150 0.000 112.400 0.000
5 0.000 108.000 0.000 109.800 112.5 111.600 0.000 112.150 0.000 112.400 0.000
6 0.000 108.000 0.000 109.800 113.9 * 111.600 0.000 112.250 0.000 112.400 0.000
7 0.000 108.000 0.000 109.750 103.9 111.700 0.000 112.350 0.000 112.400 0.000
8 0.000 108.000 0.000 109.400 0.000 111.800 0.000 112.450 0.000 112.400 0.000
9 0.000 108.000 0.000 109.300 0.000 111.750 0.000 112.450 0.000 112.400 0.000
10 0.000 108.000 0.000 109.300 0.000 111.800 0.000 112.400 1224 112.400 0.000
11 0.000 108.000 0.000 109.300 0.000 111.900 0.000 112.400 869.8 112.400 0.000
12 0.000 108.000 0.000 109.300 0.000 112.000 0.000 112.150 0.000 112.400 0.000
13 0.000 108.000 0.000 109.300 0.000 111.750 0.000 112.500 1162 112.400 0.000
14 0.000 108.000 0.000 109.300 0.000 111.900 414.4 112.250 1030 112.400 0.000
15 0.000 108.280 0.000 109.300 0.000 112.300 1227 111.700 878.3 * 112.400 0.000
16 0.000 109.000 0.000 109.300 0.000 112.100 1099 112.200 1120 * 112.450 0.000
17 0.000 109.000 0.000 109.300 0.000 112.100 1071 * 112.350 648.0 112.500 0.000
18 0.000 109.100 0.000 109.300 0.000 112.050 1044 112.450 0.000 112.600 0.000
19 0.000 109.100 0.000 109.300 0.000 111.750 416.9 112.500 0.000 112.600 0.000
20 0.000 110.300 241.9 109.300 0.000 112.000 1089 112.550 0.000 112.600 0.000

150
21
RIVER DRY
0.000 111.950 1185 109.300 0.000 112.100 1097 112.500 0.000 112.600 0.000
22 0.000 111.600 961.5 109.300 0.000 112.000 1123 112.550 0.000 112.600 0.000
23 0.000 111.400 739.6 * 109.300 0.000 112.250 1177 112.600 0.000 112.600 0.000
24 0.000 110.575 384.2 109.180 0.000 112.050 1046 * 112.600 0.000 112.550 0.000
25 0.000 110.200 231.2 109.000 0.000 112.050 0.000 112.650 0.000 112.500 0.000
26 0.000 109.650 70.58 * 109.000 0.000 112.050 1119 112.500 0.000 112.500 0.000
27 0.000 109.750 110.1 109.000 0.000 112.100 0.000 112.400 0.000 112.500 0.000
28 0.000 109.900 151.5 109.000 0.000 112.050 0.000 112.500 0.000 112.500 0.000
29 0.000 110.100 223.9 112.000 1180 112.050 0.000 112.400 0.000 112.500 0.000
30 0.000 110.700 438.1 * 111.050 441.3 111.300 0.000 112.400 0.000 112.500 0.000
31 0.000 110.700 439.6 * 112.000 341.4 112.400 0.000
Ten-Daily Mean
I Ten-Daily 0.000
108.000 0.000
109.793 125.7
111.335 190.9
112.235 122.4
112.400 0.000 II Ten-Daily 0.000
108.678 24.19
109.300 0.000
111.985 636.1
112.305 570.9
112.475 0.000
III Ten-Daily 0.000
110.593 448.7
109.830 178.4
112.000 556.3
112.500 0.000
112.535 0.000 Monthly
Min. 0.000
108.000 0.000
109.000 0.000
110.350 0.000
111.700 0.000
112.400 0.000 Max. 0.000
111.950 1185
112.000 1180
112.300 1227
112.650 1224
112.600 0.000
Mean 0.000
109.139 167.0
109.647 103.9
111.773 461.1
112.352 223.6
112.470 0.000
Annual Runoff in MCM = 2520 Annual Runoff in mm = 43
Peak Observed Discharge = 1227.00 cumecs on 15-09-2017 Corres. Water Level :112.300 m Lowest Observed Discharge = 0.000 cumecs on 01-07-2017 Corres. Water Level :108.000 m
River Dry from 01/06/17 to 30/06/17 All Gates of Sarangkheda Barrage closed /river in pooling condition from 01/07/17 to 19/07/17, 29/07/17, 08/08/17 to 28/08/17,05/09/17 to
13/09/17, 25/09/17, 27/09/17 to 09/10/17, 12/10/17, and 18/10/17 to 31/05/18.
Q: observed/ computed discharge in Cumec, WL: Corresponding Mean Water Level (msl) in m, *: Computed Discharge
#Discarded and estimated
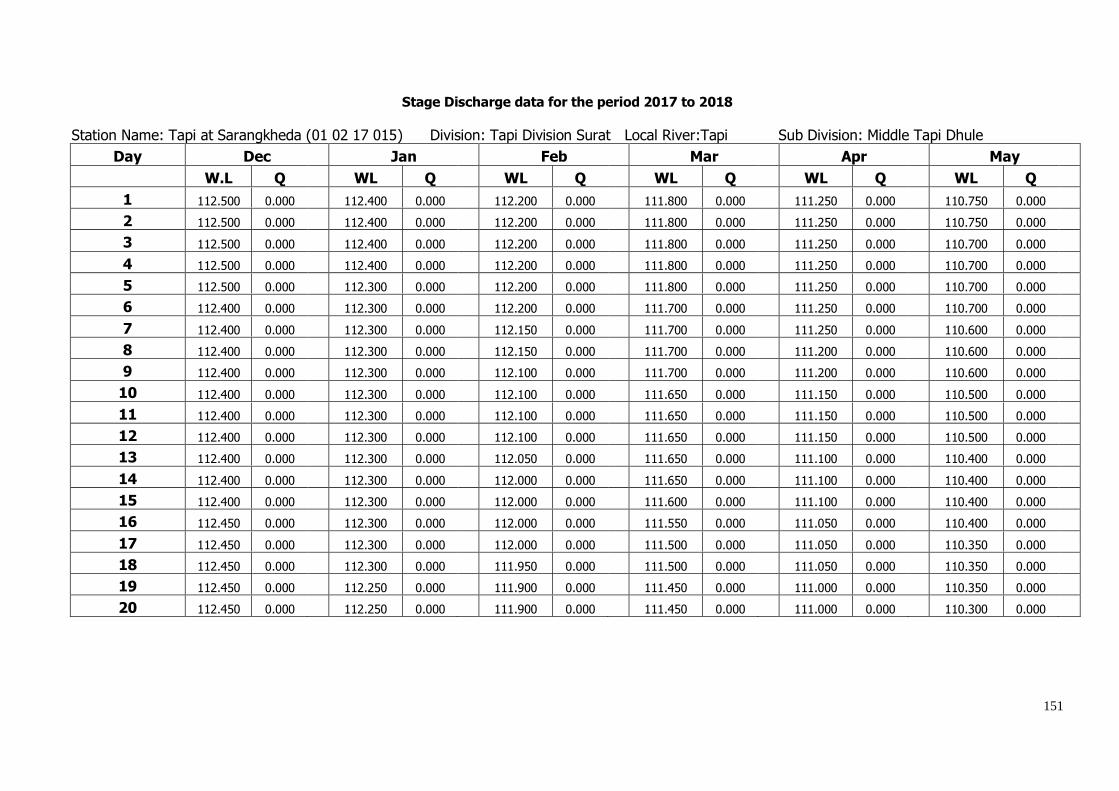
151
Stage Discharge data for the period 2017 to 2018
Station Name: Tapi at Sarangkheda (01 02 17 015) Division: Tapi Division Surat Local River:Tapi Sub Division: Middle Tapi Dhule
Day Dec Jan Feb Mar Apr May
W.L Q WL Q WL Q WL Q WL Q WL Q
1 112.500 0.000 112.400 0.000 112.200 0.000 111.800 0.000 111.250 0.000 110.750 0.000
2 112.500 0.000 112.400 0.000 112.200 0.000 111.800 0.000 111.250 0.000 110.750 0.000
3 112.500 0.000 112.400 0.000 112.200 0.000 111.800 0.000 111.250 0.000 110.700 0.000
4 112.500 0.000 112.400 0.000 112.200 0.000 111.800 0.000 111.250 0.000 110.700 0.000
5 112.500 0.000 112.300 0.000 112.200 0.000 111.800 0.000 111.250 0.000 110.700 0.000
6 112.400 0.000 112.300 0.000 112.200 0.000 111.700 0.000 111.250 0.000 110.700 0.000
7 112.400 0.000 112.300 0.000 112.150 0.000 111.700 0.000 111.250 0.000 110.600 0.000
8 112.400 0.000 112.300 0.000 112.150 0.000 111.700 0.000 111.200 0.000 110.600 0.000
9 112.400 0.000 112.300 0.000 112.100 0.000 111.700 0.000 111.200 0.000 110.600 0.000
10 112.400 0.000 112.300 0.000 112.100 0.000 111.650 0.000 111.150 0.000 110.500 0.000
11 112.400 0.000 112.300 0.000 112.100 0.000 111.650 0.000 111.150 0.000 110.500 0.000
12 112.400 0.000 112.300 0.000 112.100 0.000 111.650 0.000 111.150 0.000 110.500 0.000
13 112.400 0.000 112.300 0.000 112.050 0.000 111.650 0.000 111.100 0.000 110.400 0.000
14 112.400 0.000 112.300 0.000 112.000 0.000 111.650 0.000 111.100 0.000 110.400 0.000
15 112.400 0.000 112.300 0.000 112.000 0.000 111.600 0.000 111.100 0.000 110.400 0.000
16 112.450 0.000 112.300 0.000 112.000 0.000 111.550 0.000 111.050 0.000 110.400 0.000
17 112.450 0.000 112.300 0.000 112.000 0.000 111.500 0.000 111.050 0.000 110.350 0.000
18 112.450 0.000 112.300 0.000 111.950 0.000 111.500 0.000 111.050 0.000 110.350 0.000
19 112.450 0.000 112.250 0.000 111.900 0.000 111.450 0.000 111.000 0.000 110.350 0.000
20 112.450 0.000 112.250 0.000 111.900 0.000 111.450 0.000 111.000 0.000 110.300 0.000
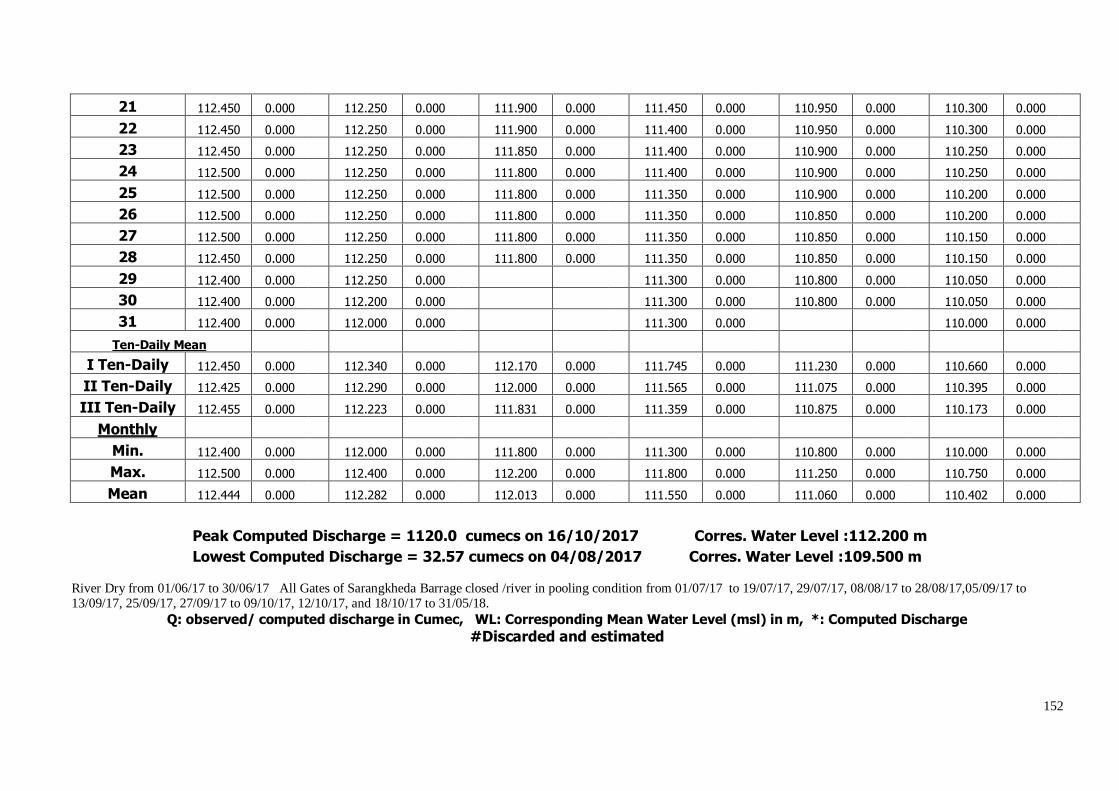
152
21 112.450 0.000 112.250 0.000 111.900 0.000 111.450 0.000 110.950 0.000 110.300 0.000
22 112.450 0.000 112.250 0.000 111.900 0.000 111.400 0.000 110.950 0.000 110.300 0.000
23 112.450 0.000 112.250 0.000 111.850 0.000 111.400 0.000 110.900 0.000 110.250 0.000
24 112.500 0.000 112.250 0.000 111.800 0.000 111.400 0.000 110.900 0.000 110.250 0.000
25 112.500 0.000 112.250 0.000 111.800 0.000 111.350 0.000 110.900 0.000 110.200 0.000
26 112.500 0.000 112.250 0.000 111.800 0.000 111.350 0.000 110.850 0.000 110.200 0.000
27 112.500 0.000 112.250 0.000 111.800 0.000 111.350 0.000 110.850 0.000 110.150 0.000
28 112.450 0.000 112.250 0.000 111.800 0.000 111.350 0.000 110.850 0.000 110.150 0.000
29 112.400 0.000 112.250 0.000 111.300 0.000 110.800 0.000 110.050 0.000
30 112.400 0.000 112.200 0.000 111.300 0.000 110.800 0.000 110.050 0.000
31 112.400 0.000 112.000 0.000 111.300 0.000 110.000 0.000
Ten-Daily Mean
I Ten-Daily 112.450 0.000 112.340 0.000 112.170 0.000 111.745 0.000 111.230 0.000 110.660 0.000
II Ten-Daily 112.425 0.000 112.290 0.000 112.000 0.000 111.565 0.000 111.075 0.000 110.395 0.000
III Ten-Daily 112.455 0.000 112.223 0.000 111.831 0.000 111.359 0.000 110.875 0.000 110.173 0.000
Monthly
Min. 112.400 0.000 112.000 0.000 111.800 0.000 111.300 0.000 110.800 0.000 110.000 0.000
Max. 112.500 0.000 112.400 0.000 112.200 0.000 111.800 0.000 111.250 0.000 110.750 0.000
Mean 112.444 0.000
112.282 0.000
112.013 0.000
111.550 0.000
111.060 0.000
110.402 0.000
Peak Computed Discharge = 1120.0 cumecs on 16/10/2017 Corres. Water Level :112.200 m
Lowest Computed Discharge = 32.57 cumecs on 04/08/2017 Corres. Water Level :109.500 m
River Dry from 01/06/17 to 30/06/17 All Gates of Sarangkheda Barrage closed /river in pooling condition from 01/07/17 to 19/07/17, 29/07/17, 08/08/17 to 28/08/17,05/09/17 to 13/09/17, 25/09/17, 27/09/17 to 09/10/17, 12/10/17, and 18/10/17 to 31/05/18.
Q: observed/ computed discharge in Cumec, WL: Corresponding Mean Water Level (msl) in m, *: Computed Discharge
#Discarded and estimated

153
4.1.7.4 Stage Discharge Curve
Station Name: Tapi at Sarangkheda (01 02 17 015) Division: Tapi Division Surat Local River: Tapi Sub Division: Middle Tapi Dhule
Stage Discharge Curve of River Tapi at Sarangkheda for the period 01/06/2017 to 31/05/2018
Calculated Observed
Discharge in Cumec2,2002,1002,0001,9001,8001,7001,6001,5001,4001,3001,2001,1001,0009008007006005004003002001000
Sta
ge
in m
114
113.75
113.5
113.25
113
112.75
112.5
112.25
112
111.75
111.5
111.25
111
110.75
110.5
110.25
110
109.75
109.5
109.25
109
Procedure: Standard Equation : Power Q=C(h+a)^b
LB UB a b C
109.500 114.000 -109.320 1.2761 290.47

154
4.1.7.5 Annual runoff
Annual Runoff for the period 1977-2018
Station Name: Tapi at Sarangkheda (01 02 17 015) Division: Tapi Division Surat Local River:Tapi Sub Division: Middle Tapi Dhule
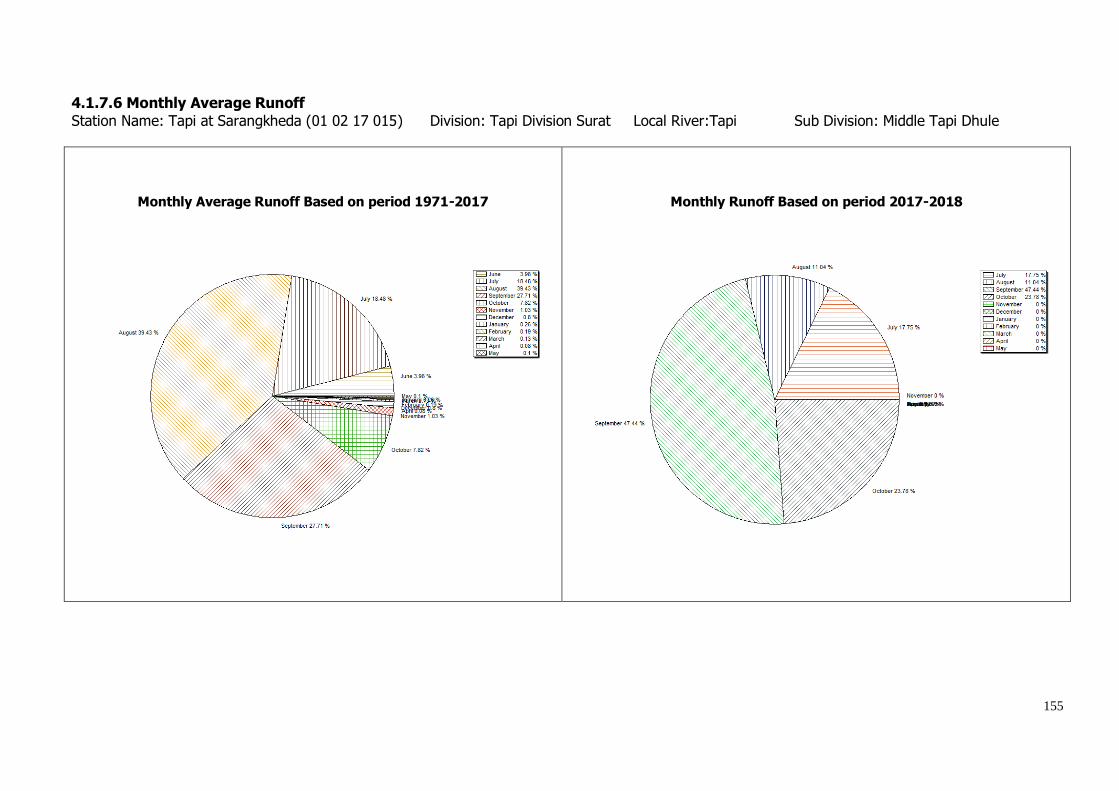
155
4.1.7.6 Monthly Average Runoff
Station Name: Tapi at Sarangkheda (01 02 17 015) Division: Tapi Division Surat Local River:Tapi Sub Division: Middle Tapi Dhule
Monthly Average Runoff Based on period 1971-2017
Monthly Runoff Based on period 2017-2018
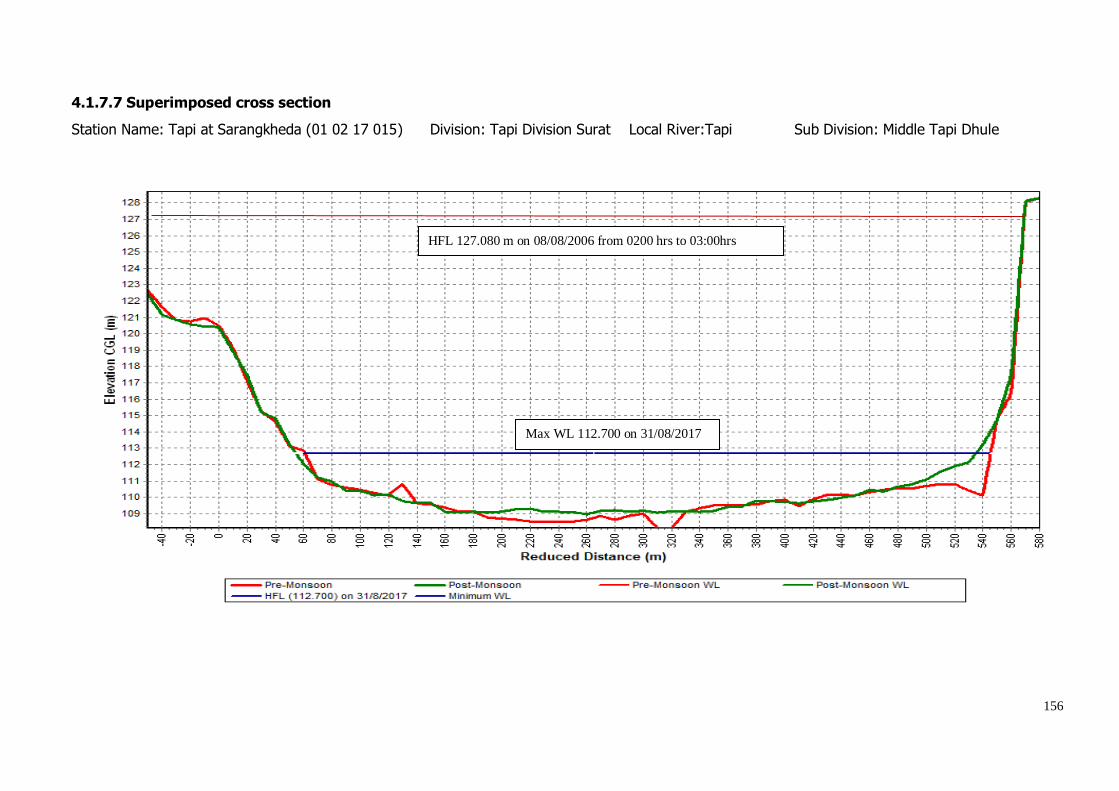
156
4.1.7.7 Superimposed cross section
Station Name: Tapi at Sarangkheda (01 02 17 015) Division: Tapi Division Surat Local River:Tapi Sub Division: Middle Tapi Dhule
HFL 127.080 m on 08/08/2006 from 0200 hrs to 03:00hrs
Max WL 112.700 on 31/08/2017

157
4.1.7.8 WL vs Time Graph of I,II,III peak
Station Name: Tapi at Sarangkheda (01 02 17 015) Division: Tapi Division Surat Local River: Tapi Sub Division: Middle Tapi Dhule
Water Level v/s Time graph of Highest (I) Flood Peak during the water year 2017-18
Water Level v/s Time graph of Highest (II) Flood Peak during the water year 2017-18
Water Level v/s Time graph of Highest (III) Flood Peak during the water year 2017-18
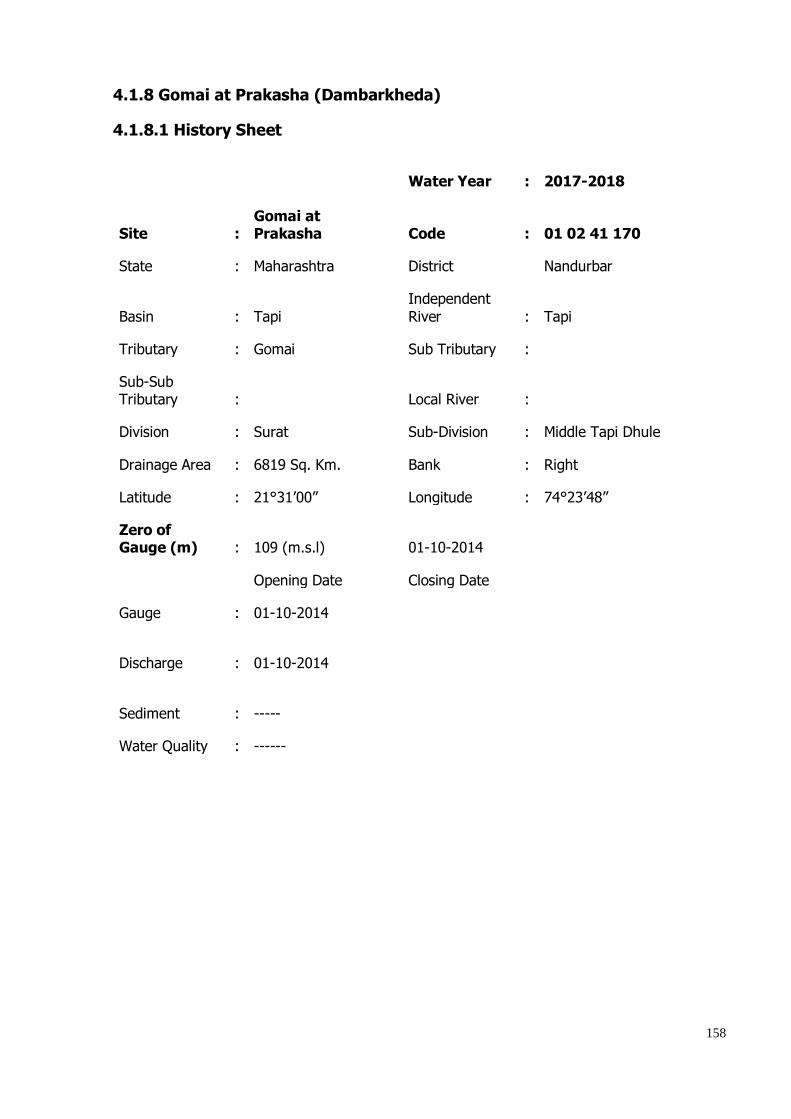
158
4.1.8 Gomai at Prakasha (Dambarkheda)
4.1.8.1 History Sheet
Water Year : 2017-2018
Site :
Gomai at Prakasha
Code : 01 02 41 170
State : Maharashtra
District
Nandurbar
Basin : Tapi
Independent
River : Tapi
Tributary : Gomai
Sub Tributary :
Sub-Sub Tributary :
Local River :
Division : Surat
Sub-Division : Middle Tapi Dhule
Drainage Area : 6819 Sq. Km.
Bank : Right
Latitude : 21°31’00”
Longitude : 74°23’48”
Zero of Gauge (m) : 109 (m.s.l)
01-10-2014
Opening Date
Closing Date
Gauge : 01-10-2014
Discharge
: 01-10-2014
Sediment : -----
Water Quality : ------
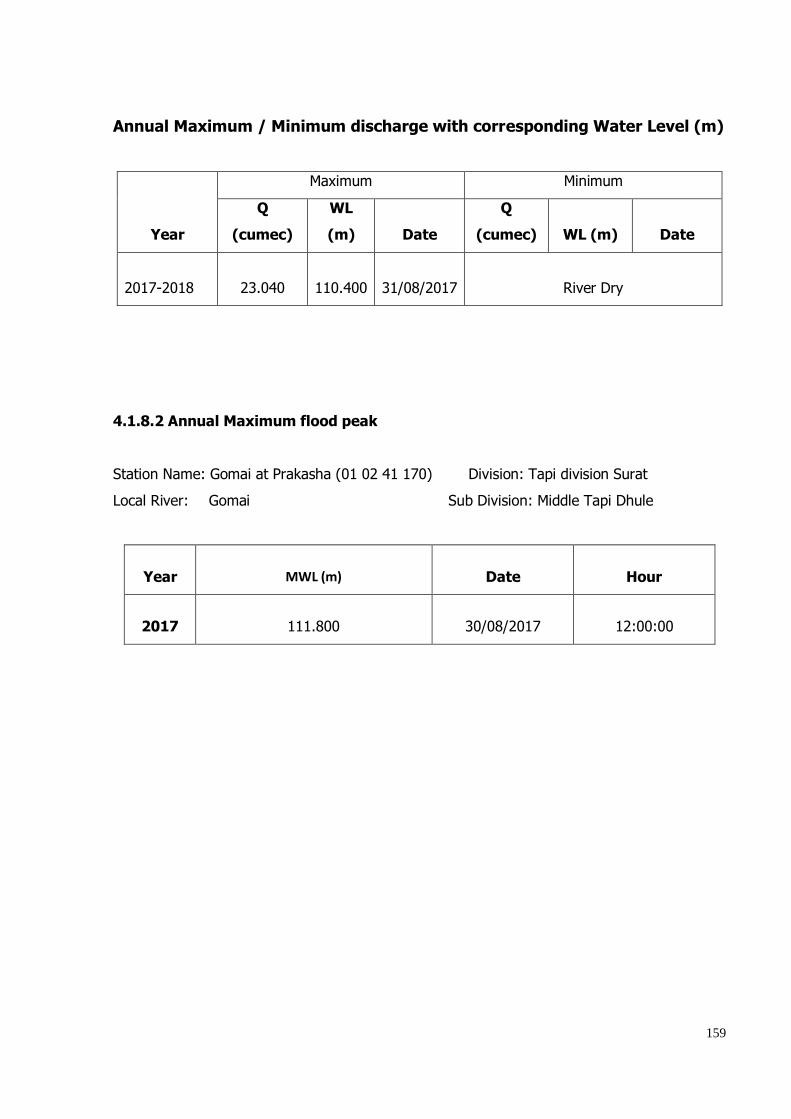
159
Annual Maximum / Minimum discharge with corresponding Water Level (m)
Year
Maximum Minimum
Q
(cumec)
WL
(m) Date
Q
(cumec) WL (m) Date
2017-2018 23.040 110.400 31/08/2017 River Dry
4.1.8.2 Annual Maximum flood peak
Station Name: Gomai at Prakasha (01 02 41 170) Division: Tapi division Surat
Local River: Gomai Sub Division: Middle Tapi Dhule
Year MWL (m) Date Hour
2017 111.800 30/08/2017 12:00:00

160
4.1.8.3 Summary of Data Stage Discharge data for the period 2017 to 2018
Station Name: Gomai at Prakasha (01 02 41 170) Division: Tapi Division Surat Local River:Gomai Sub Division: : Middle Tapi Dhule
Day Jun Jul Aug Sep Oct Nov
W.L Q W.L Q W.L Q W.L Q W.L Q W.L Q
1 109.850 6.911 110.250 18.20 110.760 0.000 111.150 0.000
2 109.800 6.039 110.150 13.50 * 110.780 0.000 111.150 0.000
3 109.800 6.073 110.150 13.50 * 110.780 0.000 111.150 0.000
4 109.450 1.590 * 109.850 6.707 110.100 11.67 110.800 0.000 111.150 0.000
5 109.700 2.278 109.750 4.077 110.000 8.073 110.800 0.000 111.200 0.000
6 109.050 0.000 109.700 4.100 * 110.000 0.000 110.900 0.000 111.200 0.000
7 109.030 0.000 109.550 0.000 110.000 0.000 110.980 0.000 111.200 0.000
8 109.010 0.000 109.300 0.000 110.350 0.000 111.000 0.000 111.200 0.000
9 109.250 0.000 110.350 0.000 111.130 0.000 111.200 0.000
10 109.750 0.000 109.100 0.000 110.350 0.000 111.100 0.000 111.200 0.000
11 109.100 0.000 109.050 0.000 110.400 0.000 111.140 0.000 111.200 0.000
12 109.050 0.000 109.050 0.000 110.600 0.000 111.950 0.000 111.200 0.000
13 109.050 0.000 109.050 0.000 110.600 0.000 111.050 0.000 111.250 0.000
14 109.050 0.000 109.000 0.000 110.350 0.000 111.000 0.000 111.250 0.000
15 109.000 0.000 110.450 0.000 110.650 0.000 111.250 0.000
16 109.100 0.000 110.550 0.000 110.550 0.000 111.250 0.000
17 109.050 0.000 110.600 0.000 110.900 0.000 111.250 0.000
18 110.600 0.000 111.100 0.000 111.250 0.000
19 110.650 0.000 111.200 0.000 111.250 0.000
20 110.670 0.000 111.250 0.000 111.250 0.000

161
21 110.700 0.000 111.200 0.000 111.300 0.000
22 110.670 0.000 111.200 0.000 111.300 0.000
23 110.700 0.000 111.300 0.000 111.300 0.000
24 110.720 0.000 111.300 0.000 111.300 0.000
25 109.900 7.210 110.720 0.000 111.250 0.000 111.300 0.000
26 110.950 43.49 * 110.000 11.74 110.600 0.000 111.150 0.000 111.300 0.000
27 110.100 11.16 110.200 15.58 110.740 0.000 111.050 0.000 111.250 0.000
28 109.950 7.824 110.250 15.58 110.750 0.000 111.050 0.000 111.250 0.000
29 110.050 11.59 110.400 21.51 110.750 0.000 111.100 0.000 111.250 0.000
30 110.050 10.76 * 110.200 14.59 110.740 0.000 111.100 0.000 111.250 0.000
31 109.900 7.081 110.400 23.04 111.150 0.000
Ten-Daily Mean
I Ten-Daily 109.750 0.000
109.248 0.774
109.595 3.391
110.170 6.494
110.903 0.000
111.180 0.000 II Ten-Daily 109.063 0.000
109.043 0.000
110.547 0.000
111.079 0.000
111.240 0.000
III Ten-Daily
110.129 14.16
110.242 17.01
110.709 0.000
111.168 0.000
111.280 0.000 Monthly
Min. 109.050 0.000
109.010 0.000
109.000 0.000
110.000 0.000
110.550 0.000
111.150 0.000 Max. 109.750 0.000
110.950 43.49
110.400 23.04
110.750 18.20
111.950 0.000
111.300 0.000
Mean 109.200 0.000
109.762 8.581
109.596 5.911
110.475 2.165
111.054 0.000
111.233 0.000 Annual Runoff in MCM = 26 Annual Runoff in mm = 4
Peak Observed Discharge = 23.04 cumecs on 31-08-2017 Corres. Water Level :110.400 m Lowest Observed Discharge = 0.000 cumecs on 10-06-2017 Corres. Water Level :109.750 m
Note: River Dry from 01-06-17 to 009-06-17, 15-06-17 to 03-07-17,09-07-17 to 24-07-17, 18-08-17 to 25-08-17 and 19-04-18 to 31-05-18,
River in pooling condition from 10-06-2017 to 14-06-17, 06-07-17 to 08-07-17, 07-08-17 to 17-08-17 and 06-09-17 to 18-04-18.
Q: observed/ computed discharge in Cumec, WL: Corresponding Mean Water Level (msl) in m, *: Computed Discharge
#Discarded and estimated
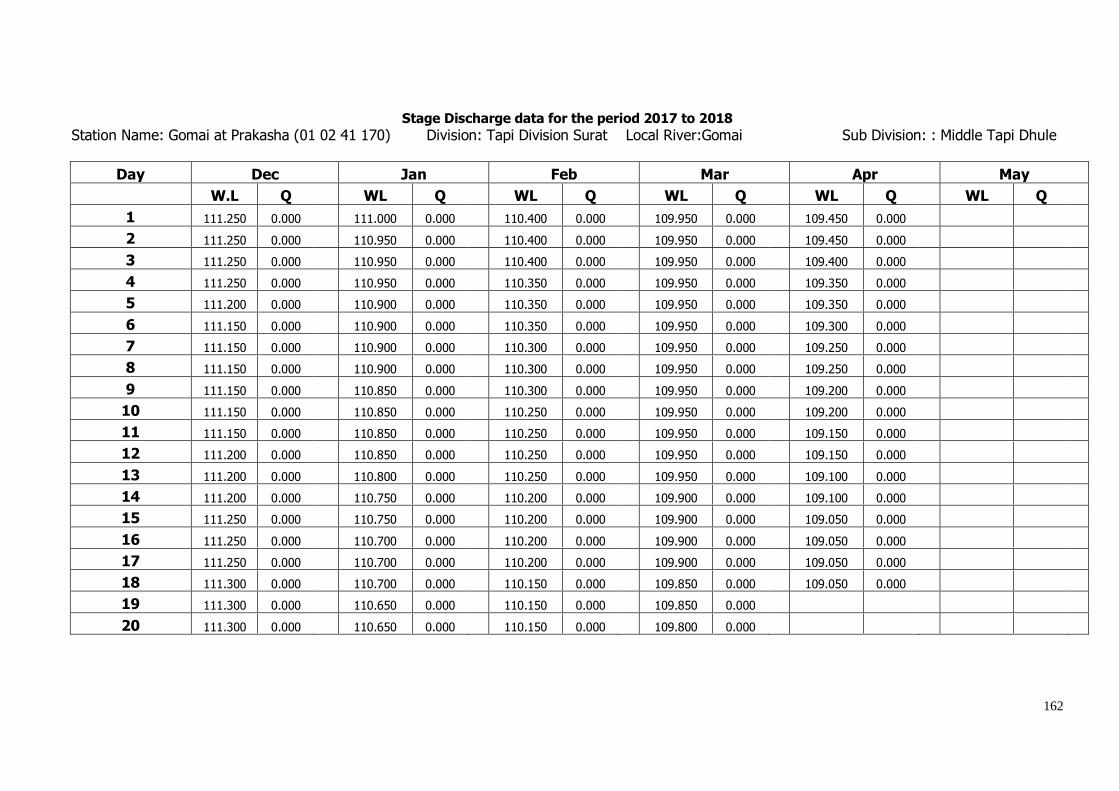
162
Stage Discharge data for the period 2017 to 2018
Station Name: Gomai at Prakasha (01 02 41 170) Division: Tapi Division Surat Local River:Gomai Sub Division: : Middle Tapi Dhule
Day Dec Jan Feb Mar Apr May
W.L Q WL Q WL Q WL Q WL Q WL Q
1 111.250 0.000 111.000 0.000 110.400 0.000 109.950 0.000 109.450 0.000
2 111.250 0.000 110.950 0.000 110.400 0.000 109.950 0.000 109.450 0.000
3 111.250 0.000 110.950 0.000 110.400 0.000 109.950 0.000 109.400 0.000
4 111.250 0.000 110.950 0.000 110.350 0.000 109.950 0.000 109.350 0.000
5 111.200 0.000 110.900 0.000 110.350 0.000 109.950 0.000 109.350 0.000
6 111.150 0.000 110.900 0.000 110.350 0.000 109.950 0.000 109.300 0.000
7 111.150 0.000 110.900 0.000 110.300 0.000 109.950 0.000 109.250 0.000
8 111.150 0.000 110.900 0.000 110.300 0.000 109.950 0.000 109.250 0.000
9 111.150 0.000 110.850 0.000 110.300 0.000 109.950 0.000 109.200 0.000
10 111.150 0.000 110.850 0.000 110.250 0.000 109.950 0.000 109.200 0.000
11 111.150 0.000 110.850 0.000 110.250 0.000 109.950 0.000 109.150 0.000
12 111.200 0.000 110.850 0.000 110.250 0.000 109.950 0.000 109.150 0.000
13 111.200 0.000 110.800 0.000 110.250 0.000 109.950 0.000 109.100 0.000
14 111.200 0.000 110.750 0.000 110.200 0.000 109.900 0.000 109.100 0.000
15 111.250 0.000 110.750 0.000 110.200 0.000 109.900 0.000 109.050 0.000
16 111.250 0.000 110.700 0.000 110.200 0.000 109.900 0.000 109.050 0.000
17 111.250 0.000 110.700 0.000 110.200 0.000 109.900 0.000 109.050 0.000
18 111.300 0.000 110.700 0.000 110.150 0.000 109.850 0.000 109.050 0.000
19 111.300 0.000 110.650 0.000 110.150 0.000 109.850 0.000
20 111.300 0.000 110.650 0.000 110.150 0.000 109.800 0.000
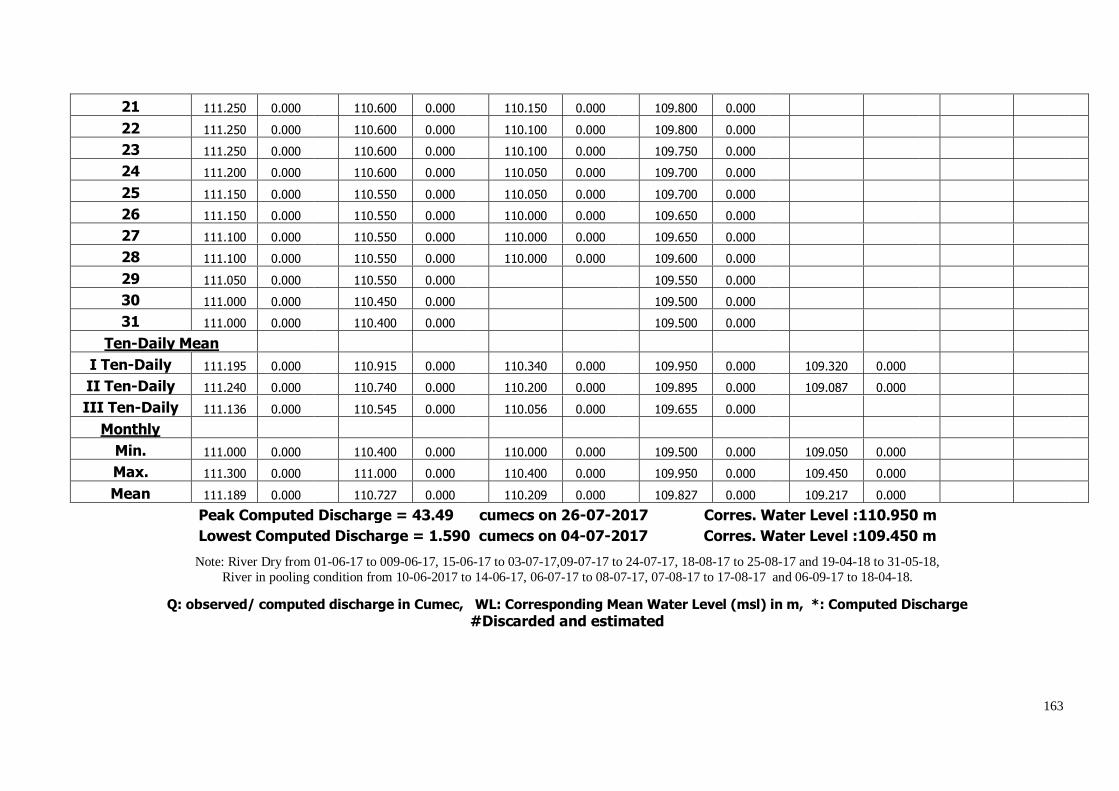
163
21 111.250 0.000 110.600 0.000 110.150 0.000 109.800 0.000
22 111.250 0.000 110.600 0.000 110.100 0.000 109.800 0.000
23 111.250 0.000 110.600 0.000 110.100 0.000 109.750 0.000
24 111.200 0.000 110.600 0.000 110.050 0.000 109.700 0.000
25 111.150 0.000 110.550 0.000 110.050 0.000 109.700 0.000
26 111.150 0.000 110.550 0.000 110.000 0.000 109.650 0.000
27 111.100 0.000 110.550 0.000 110.000 0.000 109.650 0.000
28 111.100 0.000 110.550 0.000 110.000 0.000 109.600 0.000
29 111.050 0.000 110.550 0.000 109.550 0.000
30 111.000 0.000 110.450 0.000 109.500 0.000
31 111.000 0.000 110.400 0.000 109.500 0.000
Ten-Daily Mean
I Ten-Daily 111.195 0.000
110.915 0.000
110.340 0.000
109.950 0.000
109.320 0.000 II Ten-Daily 111.240 0.000
110.740 0.000
110.200 0.000
109.895 0.000
109.087 0.000
III Ten-Daily 111.136 0.000
110.545 0.000
110.056 0.000
109.655 0.000 Monthly
Min. 111.000 0.000
110.400 0.000
110.000 0.000
109.500 0.000
109.050 0.000 Max. 111.300 0.000
111.000 0.000
110.400 0.000
109.950 0.000
109.450 0.000
Mean 111.189 0.000
110.727 0.000
110.209 0.000
109.827 0.000
109.217 0.000
Peak Computed Discharge = 43.49 cumecs on 26-07-2017 Corres. Water Level :110.950 m
Lowest Computed Discharge = 1.590 cumecs on 04-07-2017 Corres. Water Level :109.450 m
Note: River Dry from 01-06-17 to 009-06-17, 15-06-17 to 03-07-17,09-07-17 to 24-07-17, 18-08-17 to 25-08-17 and 19-04-18 to 31-05-18,
River in pooling condition from 10-06-2017 to 14-06-17, 06-07-17 to 08-07-17, 07-08-17 to 17-08-17 and 06-09-17 to 18-04-18.
Q: observed/ computed discharge in Cumec, WL: Corresponding Mean Water Level (msl) in m, *: Computed Discharge
#Discarded and estimated
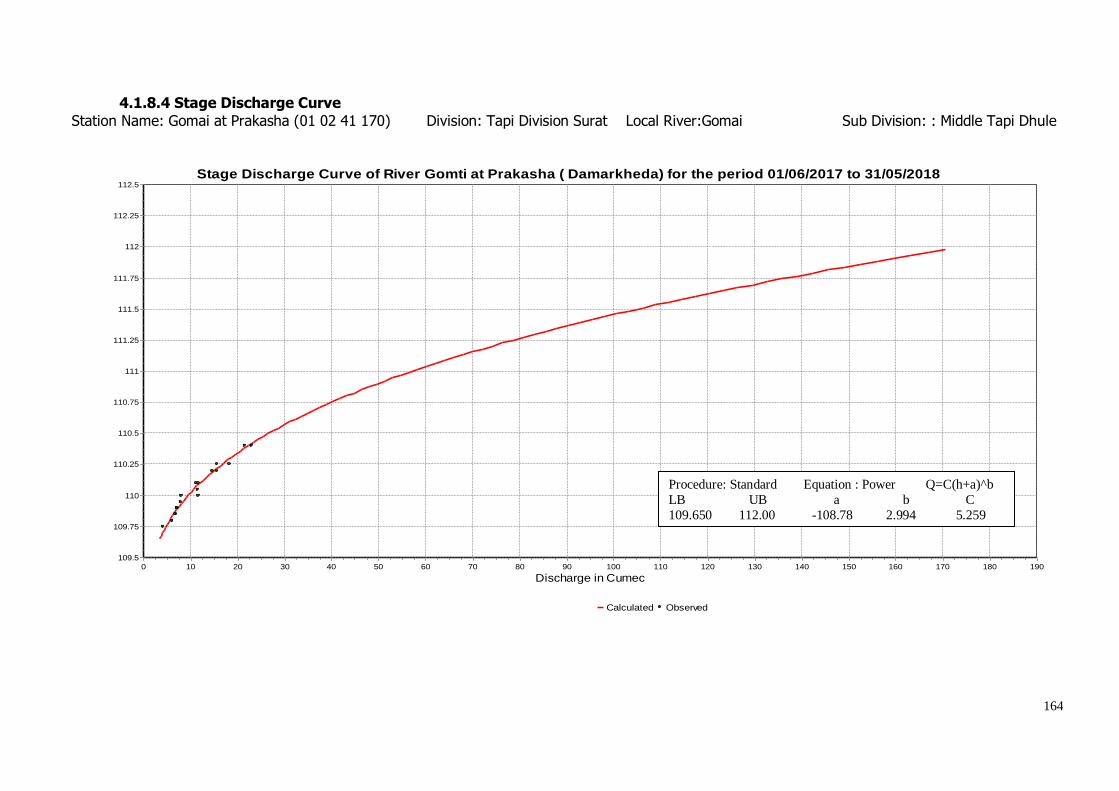
164
4.1.8.4 Stage Discharge Curve
Station Name: Gomai at Prakasha (01 02 41 170) Division: Tapi Division Surat Local River:Gomai Sub Division: : Middle Tapi Dhule
Stage Discharge Curve of River Gomti at Prakasha ( Damarkheda) for the period 01/06/2017 to 31/05/2018
Calculated Observed
Discharge in Cumec1901801701601501401301201101009080706050403020100
Sta
ge
in m
112.5
112.25
112
111.75
111.5
111.25
111
110.75
110.5
110.25
110
109.75
109.5
Procedure: Standard Equation : Power Q=C(h+a)^b
LB UB a b C
109.650 112.00 -108.78 2.994 5.259
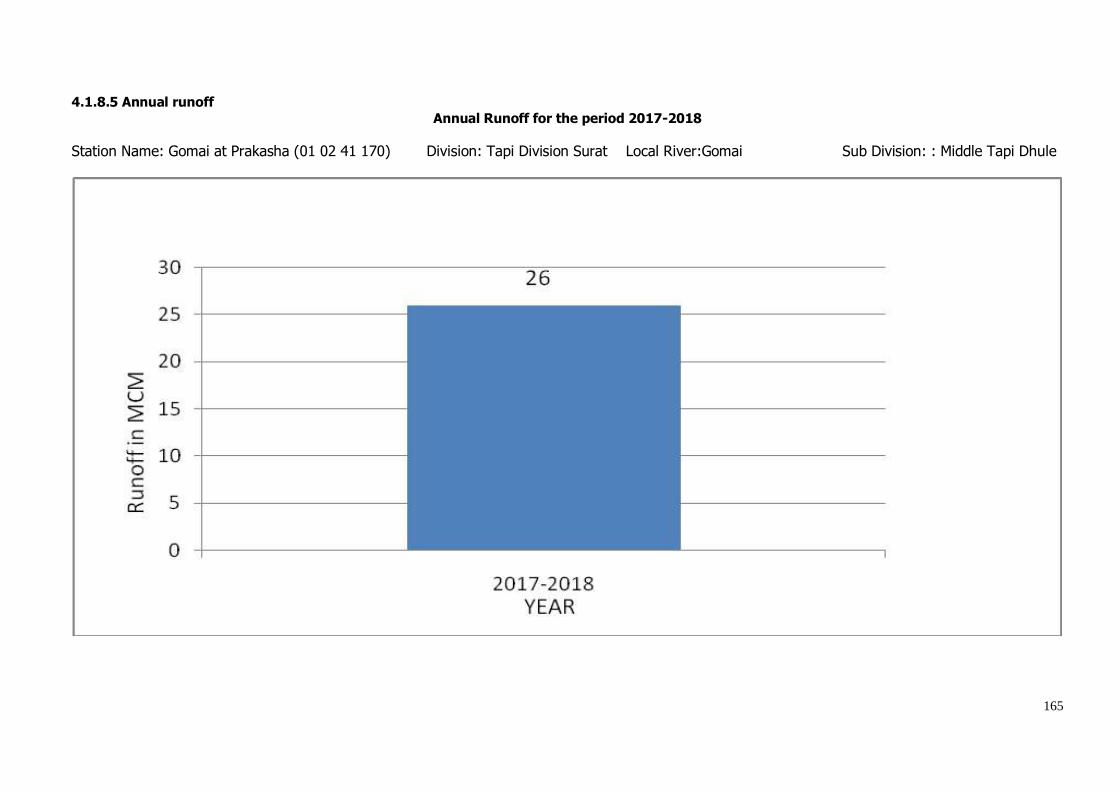
165
4.1.8.5 Annual runoff
Annual Runoff for the period 2017-2018
Station Name: Gomai at Prakasha (01 02 41 170) Division: Tapi Division Surat Local River:Gomai Sub Division: : Middle Tapi Dhule
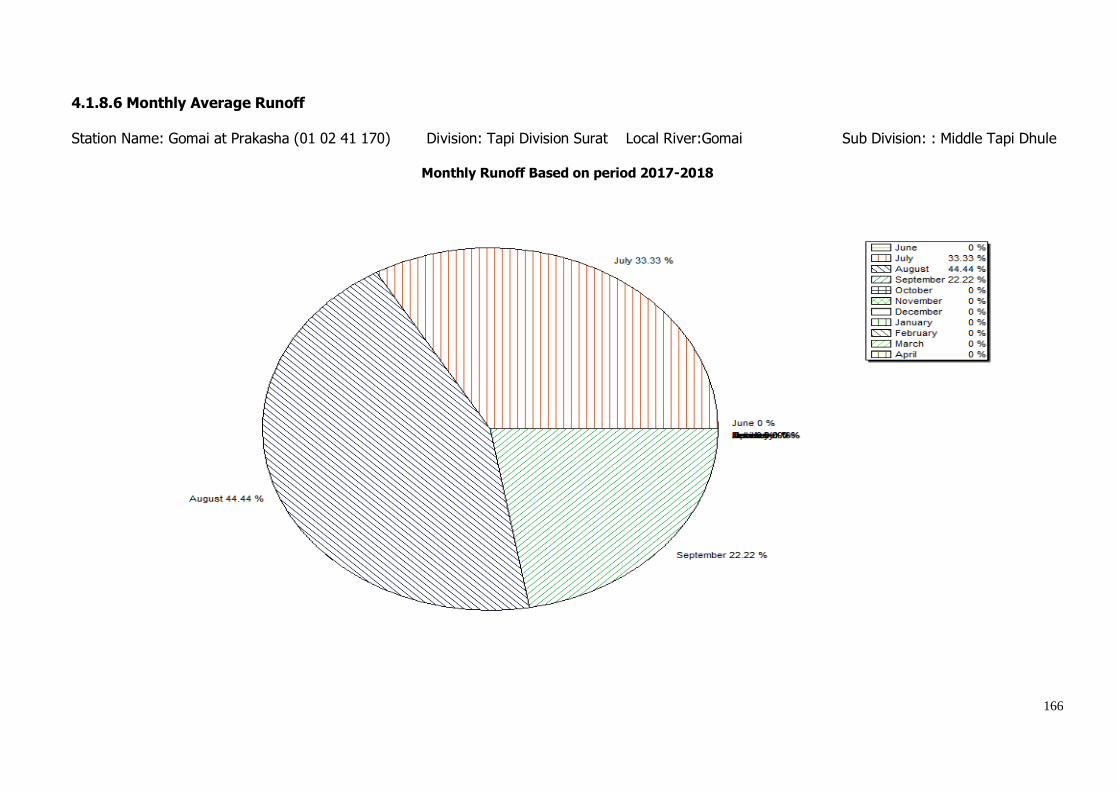
166
4.1.8.6 Monthly Average Runoff
Station Name: Gomai at Prakasha (01 02 41 170) Division: Tapi Division Surat Local River:Gomai Sub Division: : Middle Tapi Dhule
Monthly Runoff Based on period 2017-2018
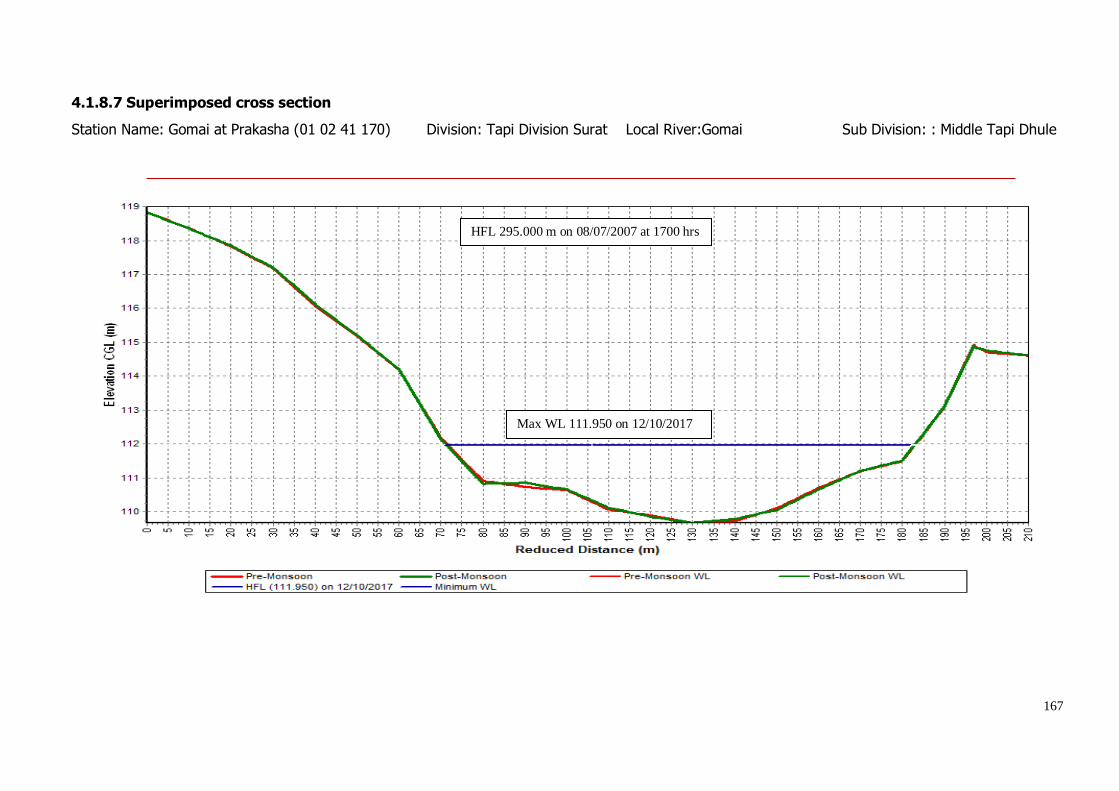
167
4.1.8.7 Superimposed cross section
Station Name: Gomai at Prakasha (01 02 41 170) Division: Tapi Division Surat Local River:Gomai Sub Division: : Middle Tapi Dhule
HFL 295.000 m on 08/07/2007 at 1700 hrs
0200 hrs to 03:00hrs
Max WL 111.950 on 12/10/2017
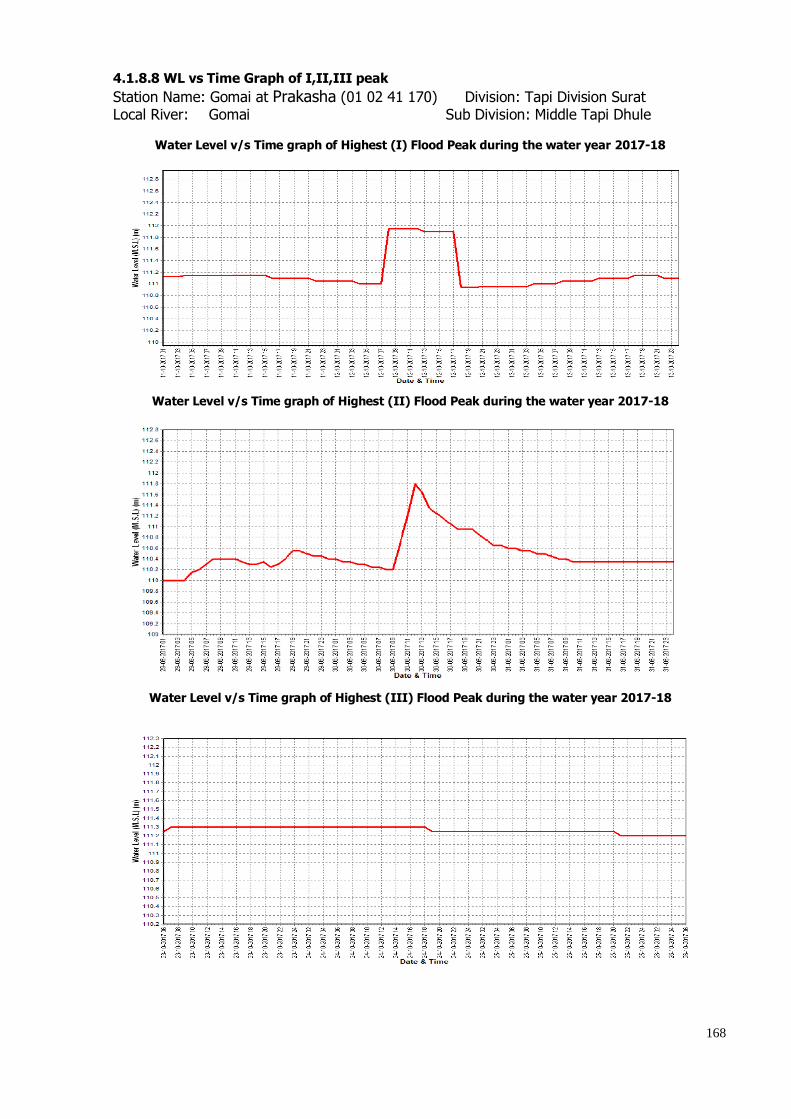
168
4.1.8.8 WL vs Time Graph of I,II,III peak
Station Name: Gomai at Prakasha (01 02 41 170) Division: Tapi Division Surat Local River: Gomai Sub Division: Middle Tapi Dhule
Water Level v/s Time graph of Highest (I) Flood Peak during the water year 2017-18
Water Level v/s Time graph of Highest (II) Flood Peak during the water year 2017-18
Water Level v/s Time graph of Highest (III) Flood Peak during the water year 2017-18
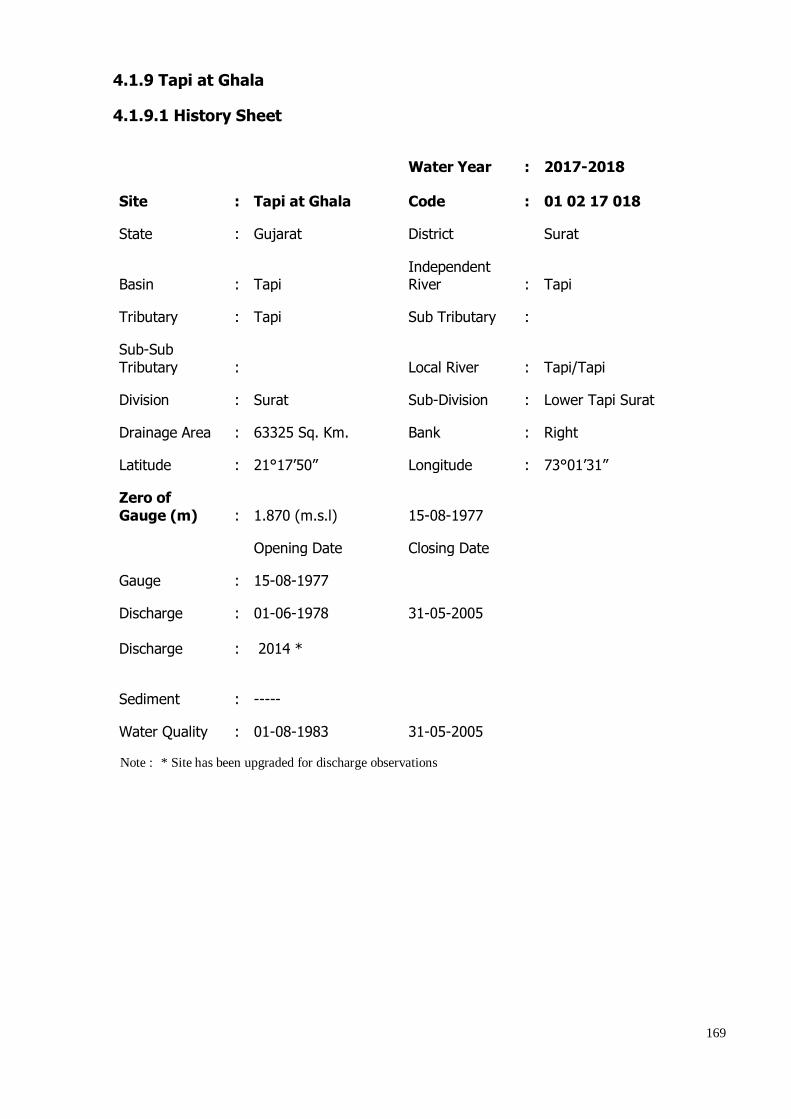
169
4.1.9 Tapi at Ghala
4.1.9.1 History Sheet
Water Year : 2017-2018
Site : Tapi at Ghala
Code : 01 02 17 018
State : Gujarat
District
Surat
Basin : Tapi
Independent River : Tapi
Tributary : Tapi
Sub Tributary :
Sub-Sub
Tributary :
Local River : Tapi/Tapi
Division : Surat
Sub-Division : Lower Tapi Surat
Drainage Area : 63325 Sq. Km.
Bank : Right
Latitude : 21°17’50”
Longitude : 73°01’31”
Zero of
Gauge (m) : 1.870 (m.s.l)
15-08-1977
Opening Date
Closing Date
Gauge : 15-08-1977
Discharge
Discharge
:
:
01-06-1978
2014 *
31-05-2005
Sediment : -----
Water Quality : 01-08-1983
31-05-2005
Note : * Site has been upgraded for discharge observations
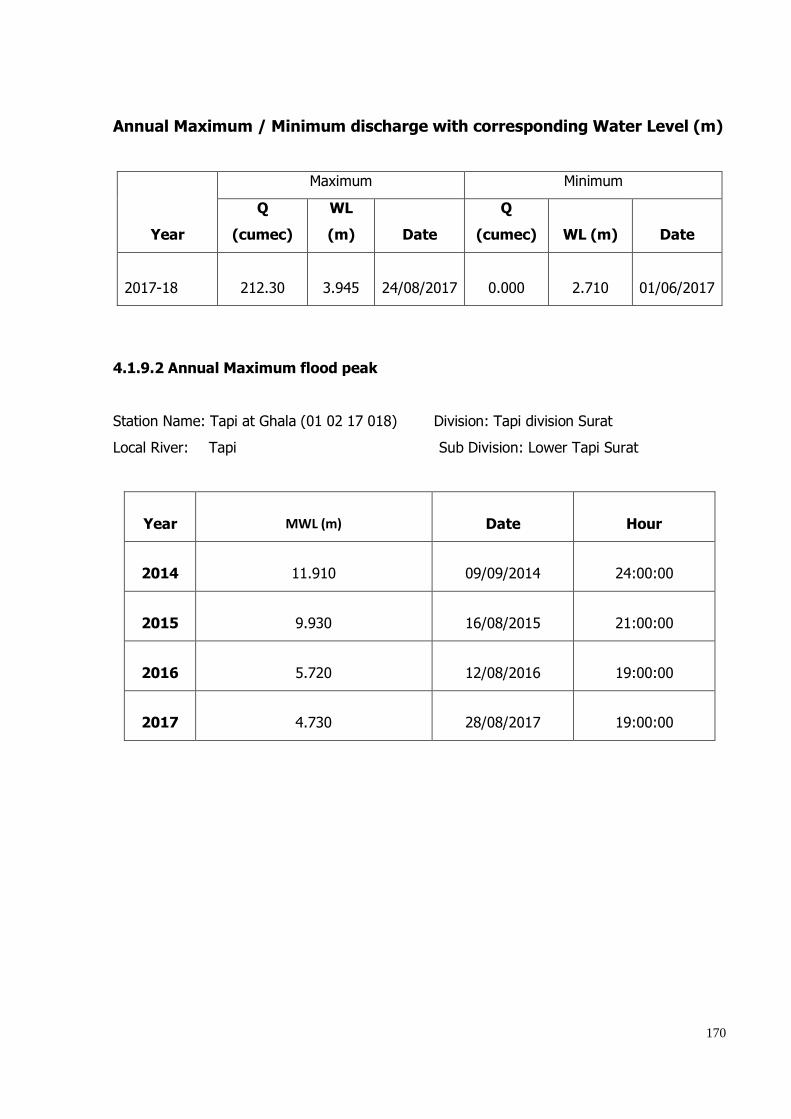
170
Annual Maximum / Minimum discharge with corresponding Water Level (m)
Year
Maximum Minimum
Q
(cumec)
WL
(m) Date
Q
(cumec) WL (m) Date
2017-18 212.30 3.945 24/08/2017 0.000 2.710 01/06/2017
4.1.9.2 Annual Maximum flood peak
Station Name: Tapi at Ghala (01 02 17 018) Division: Tapi division Surat
Local River: Tapi Sub Division: Lower Tapi Surat
Year MWL (m) Date Hour
2014 11.910 09/09/2014 24:00:00
2015 9.930 16/08/2015 21:00:00
2016 5.720 12/08/2016 19:00:00
2017 4.730 28/08/2017 19:00:00
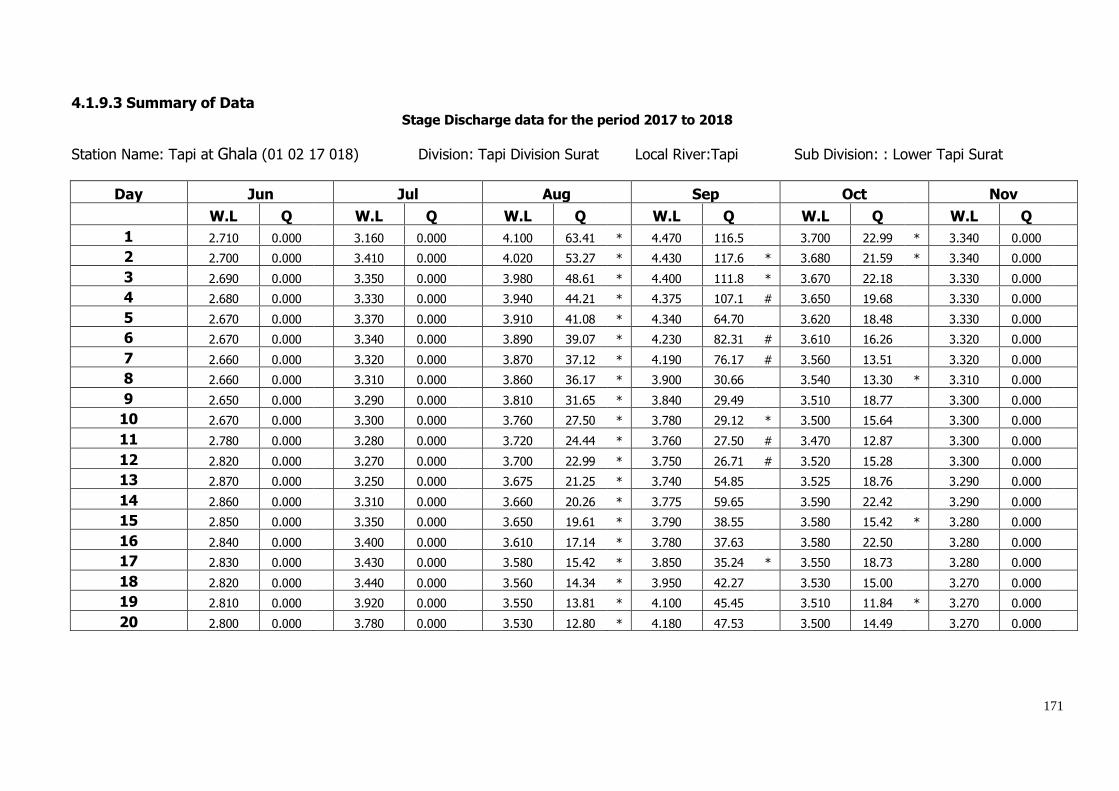
171
4.1.9.3 Summary of Data Stage Discharge data for the period 2017 to 2018
Station Name: Tapi at Ghala (01 02 17 018) Division: Tapi Division Surat Local River:Tapi Sub Division: : Lower Tapi Surat
Day Jun Jul Aug Sep Oct Nov
W.L Q W.L Q W.L Q W.L Q W.L Q W.L Q
1 2.710 0.000 3.160 0.000 4.100 63.41 * 4.470 116.5 3.700 22.99 * 3.340 0.000
2 2.700 0.000 3.410 0.000 4.020 53.27 * 4.430 117.6 * 3.680 21.59 * 3.340 0.000
3 2.690 0.000 3.350 0.000 3.980 48.61 * 4.400 111.8 * 3.670 22.18 3.330 0.000
4 2.680 0.000 3.330 0.000 3.940 44.21 * 4.375 107.1 # 3.650 19.68 3.330 0.000
5 2.670 0.000 3.370 0.000 3.910 41.08 * 4.340 64.70 3.620 18.48 3.330 0.000
6 2.670 0.000 3.340 0.000 3.890 39.07 * 4.230 82.31 # 3.610 16.26 3.320 0.000
7 2.660 0.000 3.320 0.000 3.870 37.12 * 4.190 76.17 # 3.560 13.51 3.320 0.000
8 2.660 0.000 3.310 0.000 3.860 36.17 * 3.900 30.66 3.540 13.30 * 3.310 0.000
9 2.650 0.000 3.290 0.000 3.810 31.65 * 3.840 29.49 3.510 18.77 3.300 0.000
10 2.670 0.000 3.300 0.000 3.760 27.50 * 3.780 29.12 * 3.500 15.64 3.300 0.000
11 2.780 0.000 3.280 0.000 3.720 24.44 * 3.760 27.50 # 3.470 12.87 3.300 0.000
12 2.820 0.000 3.270 0.000 3.700 22.99 * 3.750 26.71 # 3.520 15.28 3.300 0.000
13 2.870 0.000 3.250 0.000 3.675 21.25 * 3.740 54.85 3.525 18.76 3.290 0.000
14 2.860 0.000 3.310 0.000 3.660 20.26 * 3.775 59.65 3.590 22.42 3.290 0.000
15 2.850 0.000 3.350 0.000 3.650 19.61 * 3.790 38.55 3.580 15.42 * 3.280 0.000
16 2.840 0.000 3.400 0.000 3.610 17.14 * 3.780 37.63 3.580 22.50 3.280 0.000
17 2.830 0.000 3.430 0.000 3.580 15.42 * 3.850 35.24 * 3.550 18.73 3.280 0.000
18 2.820 0.000 3.440 0.000 3.560 14.34 * 3.950 42.27 3.530 15.00 3.270 0.000
19 2.810 0.000 3.920 0.000 3.550 13.81 * 4.100 45.45 3.510 11.84 * 3.270 0.000
20 2.800 0.000 3.780 0.000 3.530 12.80 * 4.180 47.53 3.500 14.49 3.270 0.000

172
21 2.800 0.000 3.740 0.000 3.700 22.99 * 4.210 62.33 3.490 12.29 3.270 0.000
22 2.790 0.000 4.120 66.12 * 3.810 31.65 * 4.120 46.06 3.480 10.48 * 3.260 0.000
23 2.790 0.000 4.110 64.76 * 3.820 32.52 * 4.100 44.71 3.470 9.995 3.260 0.000
24 2.810 0.000 4.030 54.48 * 3.945 44.74 # 4.040 55.70 * 3.460 7.571 3.260 0.000
25 2.820 0.000 3.900 40.06 * 4.000 50.91 * 4.000 39.41 3.430 4.582 3.260 0.000
26 2.840 0.000 3.880 38.09 * 3.965 128.2 3.975 48.04 # 3.420 4.392 3.260 0.000
27 2.850 0.000 3.980 48.61 * 4.050 56.95 * 3.870 37.12 # 3.400 4.174 3.260 0.000
28 2.880 0.000 4.610 156.4 * 4.525 191.2 3.840 34.32 # 3.370 2.025 3.250 0.000
29 2.920 0.000 4.450 121.6 * 4.680 144.7 3.800 24.63 3.360 6.040 * 3.250 0.000
30 2.980 0.000 4.270 88.76 * 4.550 143.9 3.740 25.94 * 3.350 0.000 3.250 0.000
31 4.150 70.32 * 4.630 144.7 3.350 0.000
Ten-Daily Mean
I Ten-Daily 2.676 0.000
3.318 0.000
3.914 42.21
4.195 76.56
3.604 18.24
3.322 0.000 II Ten-Daily 2.828 0.000
3.443 0.000
3.624 18.21
3.867 41.54
3.536 16.73
3.283 0.000
III Ten-Daily 2.848 0.000
4.113 68.11
4.152 90.23
3.970 41.83
3.416 5.595
3.258 0.000 Monthly
Min. 2.650 0.000
3.160 0.000
3.530 12.80
3.740 24.63
3.350 0.000
3.250 0.000 Max. 2.980 0.000
4.610 156.4
4.680 191.2
4.470 117.6
3.700 22.99
3.340 0.000
Mean 2.784 0.000
3.640 24.17
3.905 51.50
4.011 53.31
3.515 13.27
3.288 0.000 Annual Runoff in MCM = 376 Annual Runoff in mm = 6
Peak Observed Discharge = 191.20 cumecs on 28-08-2017 Corres. Water Level :4.525 m Lowest Observed Discharge = 0.000 cumecs on 01-06-2017 Corres. Water Level :2.71 m
Note: pooling condition from 01-06-2017 to 21-07-2017 and 30/10/17 to 31/05/18
Q: observed/ computed discharge in Cumec, WL: Corresponding Mean Water Level (msl) in m, *: Computed Discharge
#Discarded and estimated

173
Stage Discharge data for the period 2017 to 2018
Station Name: Tapi at Ghala (01 02 17 018) Division: Tapi Division Surat Local River:Tapi Sub Division: : Lower Tapi Surat
Day Dec Jan Feb Mar Apr May
W.L Q WL Q WL Q WL Q WL Q WL Q
1 3.250 0.000 3.200 0.000 3.220 0.000 3.820 0.000 3.450 0.000 3.460 0.000
2 3.250 0.000 3.200 0.000 3.220 0.000 3.820 0.000 3.450 0.000 3.450 0.000
3 3.240 0.000 3.190 0.000 3.210 0.000 3.800 0.000 3.430 0.000 3.440 0.000
4 3.240 0.000 3.190 0.000 3.210 0.000 3.790 0.000 3.420 0.000 3.420 0.000
5 3.240 0.000 3.190 0.000 3.200 0.000 3.780 0.000 3.400 0.000 3.400 0.000
6 3.260 0.000 3.190 0.000 3.200 0.000 3.760 0.000 3.400 0.000 3.390 0.000
7 3.280 0.000 3.220 0.000 3.190 0.000 3.760 0.000 3.390 0.000 3.390 0.000
8 3.270 0.000 3.220 0.000 3.180 0.000 3.750 0.000 3.370 0.000 3.370 0.000
9 3.270 0.000 3.220 0.000 3.170 0.000 3.740 0.000 3.370 0.000 3.470 0.000
10 3.260 0.000 3.230 0.000 3.170 0.000 3.740 0.000 3.360 0.000 3.340 0.000
11 3.250 0.000 3.230 0.000 3.170 0.000 3.720 0.000 3.380 0.000 3.320 0.000
12 3.250 0.000 3.230 0.000 3.170 0.000 3.720 0.000 3.380 0.000 3.300 0.000
13 3.250 0.000 3.240 0.000 3.160 0.000 3.710 0.000 3.440 0.000 3.290 0.000
14 3.250 0.000 3.240 0.000 3.160 0.000 3.680 0.000 3.420 0.000 3.290 0.000
15 3.240 0.000 3.240 0.000 3.150 0.000 3.610 0.000 3.410 0.000 3.290 0.000
16 3.240 0.000 3.250 0.000 3.150 0.000 3.570 0.000 3.400 0.000 3.290 0.000
17 3.240 0.000 3.250 0.000 3.140 0.000 3.560 0.000 3.350 0.000 3.280 0.000
18 3.230 0.000 3.250 0.000 3.140 0.000 3.540 0.000 3.320 0.000 3.260 0.000
19 3.230 0.000 3.250 0.000 3.130 0.000 3.520 0.000 3.290 0.000 3.240 0.000
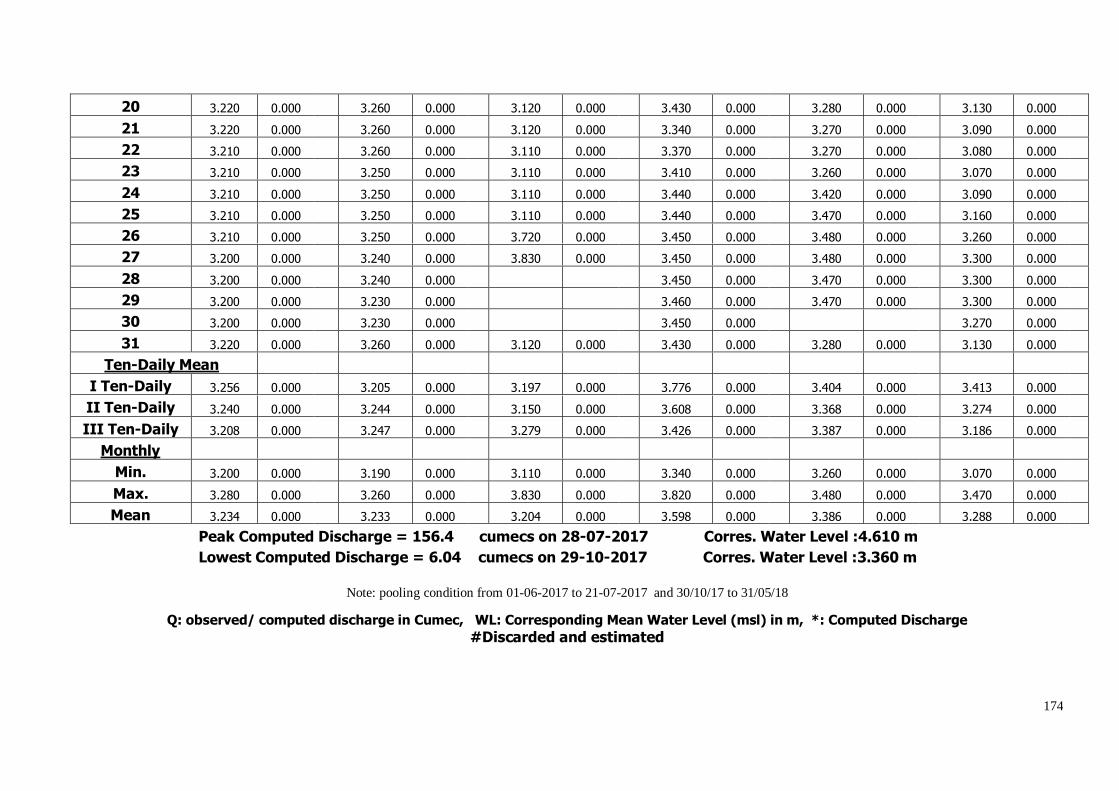
174
20 3.220 0.000 3.260 0.000 3.120 0.000 3.430 0.000 3.280 0.000 3.130 0.000
21 3.220 0.000 3.260 0.000 3.120 0.000 3.340 0.000 3.270 0.000 3.090 0.000
22 3.210 0.000 3.260 0.000 3.110 0.000 3.370 0.000 3.270 0.000 3.080 0.000
23 3.210 0.000 3.250 0.000 3.110 0.000 3.410 0.000 3.260 0.000 3.070 0.000
24 3.210 0.000 3.250 0.000 3.110 0.000 3.440 0.000 3.420 0.000 3.090 0.000
25 3.210 0.000 3.250 0.000 3.110 0.000 3.440 0.000 3.470 0.000 3.160 0.000
26 3.210 0.000 3.250 0.000 3.720 0.000 3.450 0.000 3.480 0.000 3.260 0.000
27 3.200 0.000 3.240 0.000 3.830 0.000 3.450 0.000 3.480 0.000 3.300 0.000
28 3.200 0.000 3.240 0.000 3.450 0.000 3.470 0.000 3.300 0.000
29 3.200 0.000 3.230 0.000 3.460 0.000 3.470 0.000 3.300 0.000
30 3.200 0.000 3.230 0.000 3.450 0.000 3.270 0.000
31 3.220 0.000 3.260 0.000 3.120 0.000 3.430 0.000 3.280 0.000 3.130 0.000
Ten-Daily Mean
I Ten-Daily 3.256 0.000
3.205 0.000
3.197 0.000
3.776 0.000
3.404 0.000
3.413 0.000 II Ten-Daily 3.240 0.000
3.244 0.000
3.150 0.000
3.608 0.000
3.368 0.000
3.274 0.000
III Ten-Daily 3.208 0.000
3.247 0.000
3.279 0.000
3.426 0.000
3.387 0.000
3.186 0.000 Monthly
Min. 3.200 0.000
3.190 0.000
3.110 0.000
3.340 0.000
3.260 0.000
3.070 0.000 Max. 3.280 0.000
3.260 0.000
3.830 0.000
3.820 0.000
3.480 0.000
3.470 0.000
Mean 3.234 0.000
3.233 0.000
3.204 0.000
3.598 0.000
3.386 0.000
3.288 0.000
Peak Computed Discharge = 156.4 cumecs on 28-07-2017 Corres. Water Level :4.610 m
Lowest Computed Discharge = 6.04 cumecs on 29-10-2017 Corres. Water Level :3.360 m
Note: pooling condition from 01-06-2017 to 21-07-2017 and 30/10/17 to 31/05/18
Q: observed/ computed discharge in Cumec, WL: Corresponding Mean Water Level (msl) in m, *: Computed Discharge
#Discarded and estimated
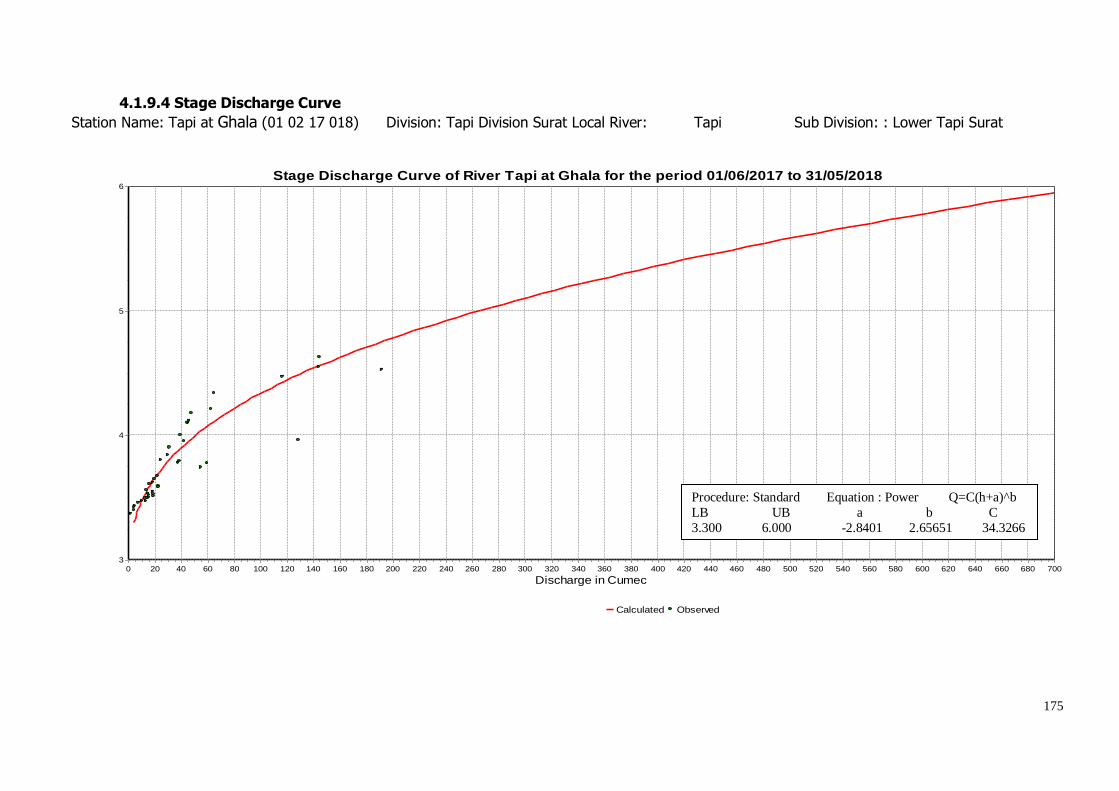
175
4.1.9.4 Stage Discharge Curve
Station Name: Tapi at Ghala (01 02 17 018) Division: Tapi Division Surat Local River: Tapi Sub Division: : Lower Tapi Surat
Stage Discharge Curve of River Tapi at Ghala for the period 01/06/2017 to 31/05/2018
Calculated Observed
Discharge in Cumec700680660640620600580560540520500480460440420400380360340320300280260240220200180160140120100806040200
Sta
ge
in m
6
5
4
3
Procedure: Standard Equation : Power Q=C(h+a)^b
LB UB a b C
3.300 6.000 -2.8401 2.65651 34.3266
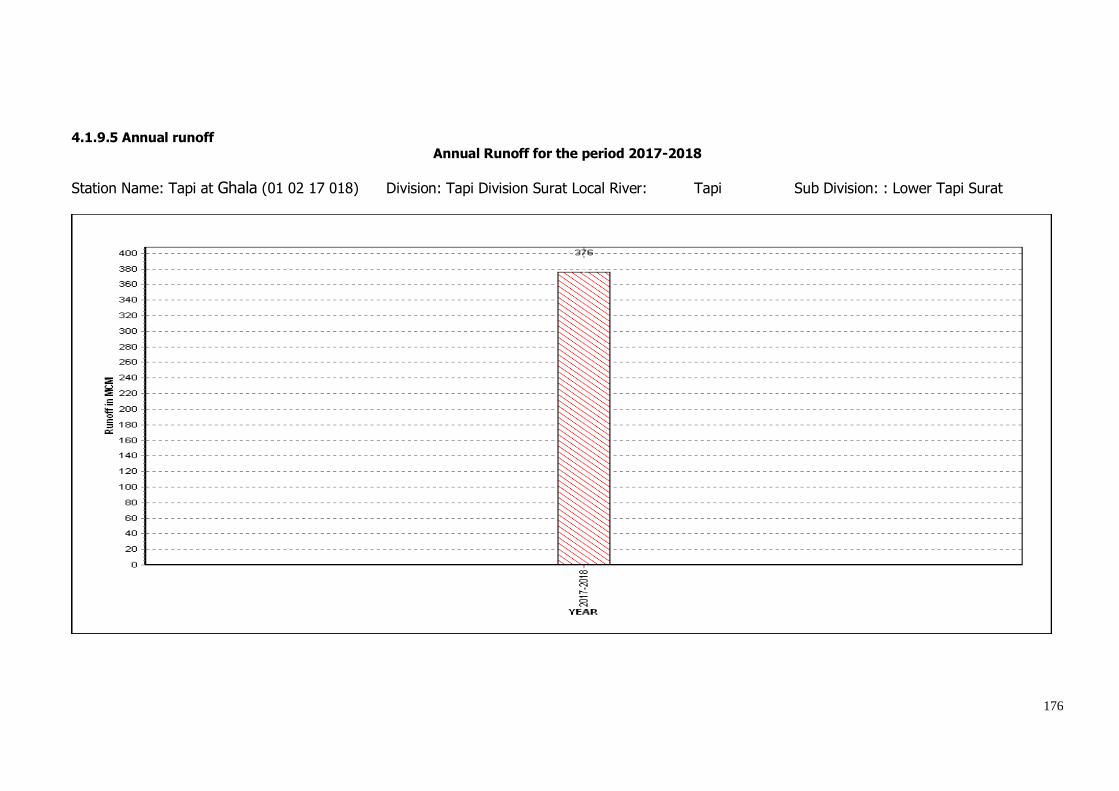
176
4.1.9.5 Annual runoff
Annual Runoff for the period 2017-2018
Station Name: Tapi at Ghala (01 02 17 018) Division: Tapi Division Surat Local River: Tapi Sub Division: : Lower Tapi Surat
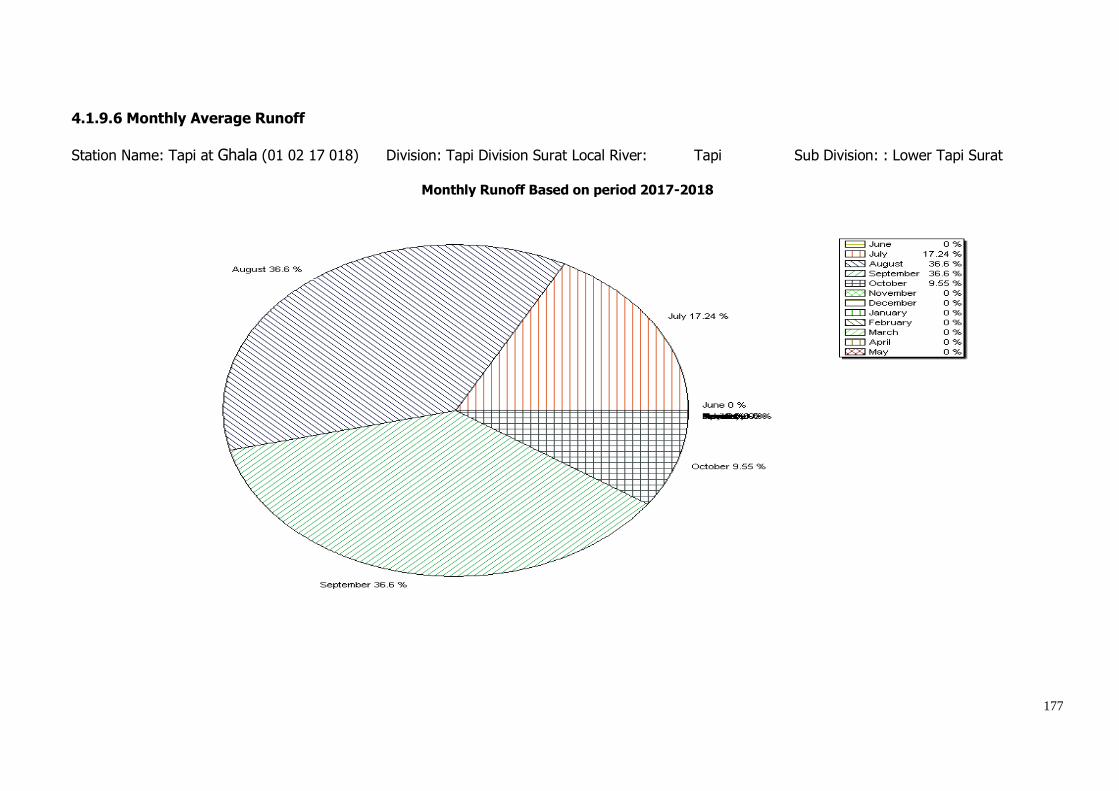
177
4.1.9.6 Monthly Average Runoff
Station Name: Tapi at Ghala (01 02 17 018) Division: Tapi Division Surat Local River: Tapi Sub Division: : Lower Tapi Surat
Monthly Runoff Based on period 2017-2018
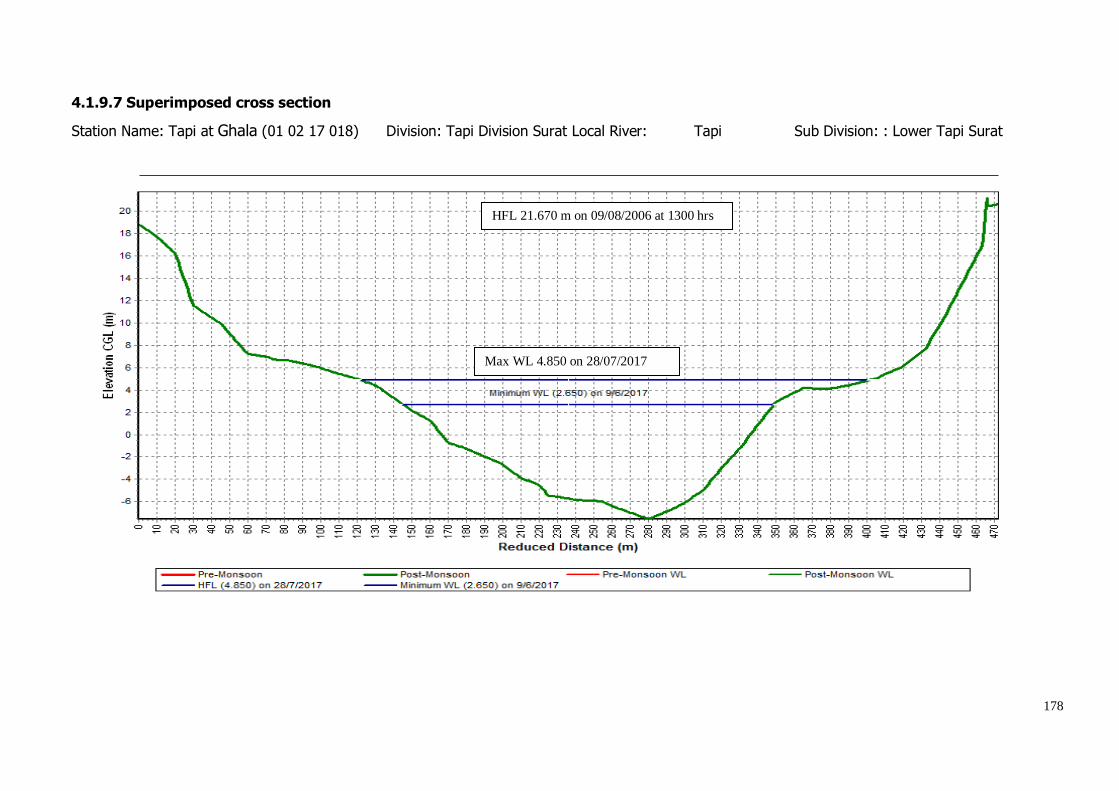
178
4.1.9.7 Superimposed cross section
Station Name: Tapi at Ghala (01 02 17 018) Division: Tapi Division Surat Local River: Tapi Sub Division: : Lower Tapi Surat
HFL 21.670 m on 09/08/2006 at 1300 hrs
0200 hrs to 03:00hrs
Max WL 4.850 on 28/07/2017
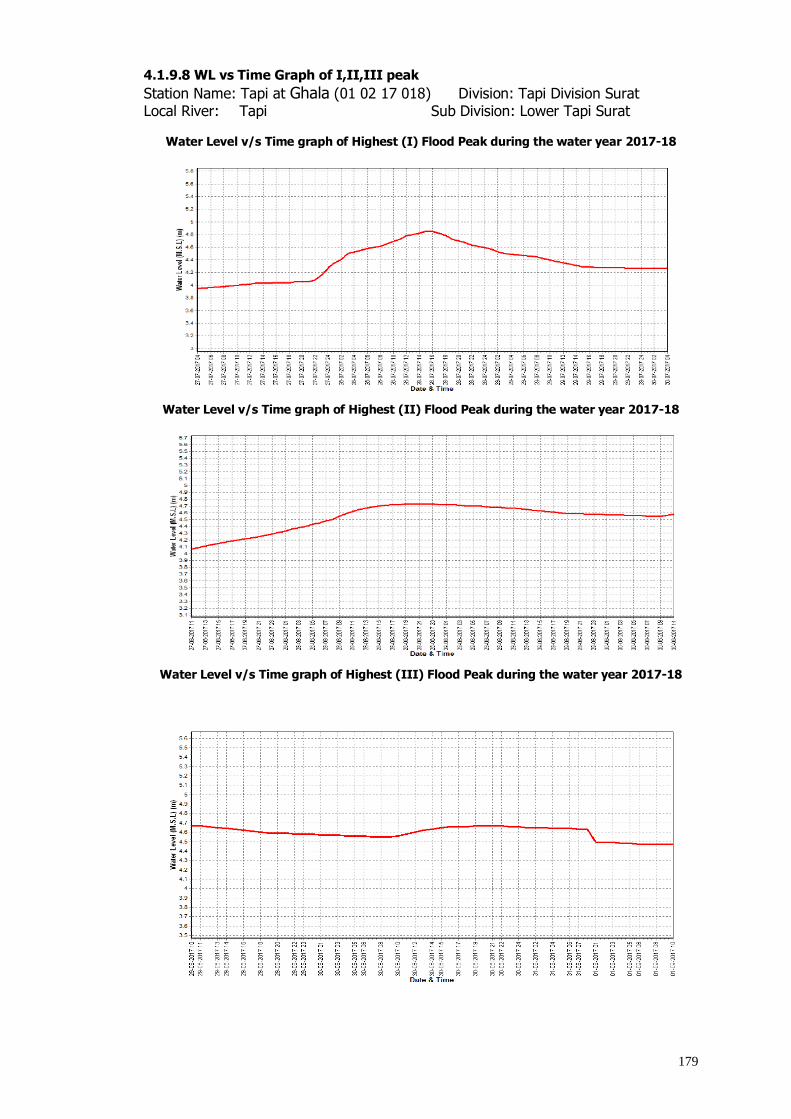
179
4.1.9.8 WL vs Time Graph of I,II,III peak
Station Name: Tapi at Ghala (01 02 17 018) Division: Tapi Division Surat Local River: Tapi Sub Division: Lower Tapi Surat
Water Level v/s Time graph of Highest (I) Flood Peak during the water year 2017-18
Water Level v/s Time graph of Highest (II) Flood Peak during the water year 2017-18
Water Level v/s Time graph of Highest (III) Flood Peak during the water year 2017-18
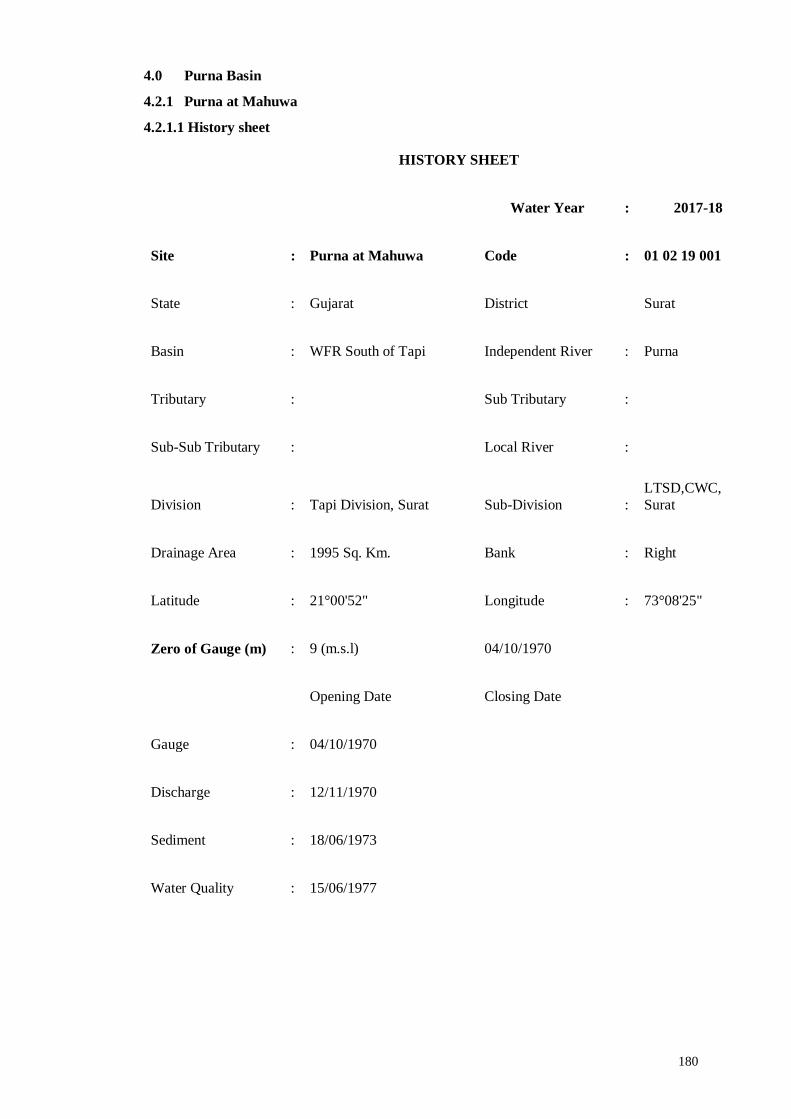
180
4.0 Purna Basin
4.2.1 Purna at Mahuwa
4.2.1.1 History sheet
HISTORY SHEET
Water Year : 2017-18
Site : Purna at Mahuwa Code : 01 02 19 001
State : Gujarat District Surat
Basin : WFR South of Tapi Independent River : Purna
Tributary : Sub Tributary :
Sub-Sub Tributary : Local River :
Division : Tapi Division, Surat Sub-Division :
LTSD,CWC,
Surat
Drainage Area : 1995 Sq. Km. Bank : Right
Latitude : 21°00'52" Longitude : 73°08'25"
Zero of Gauge (m) : 9 (m.s.l) 04/10/1970
Opening Date Closing Date
Gauge : 04/10/1970
Discharge : 12/11/1970
Sediment : 18/06/1973
Water Quality : 15/06/1977
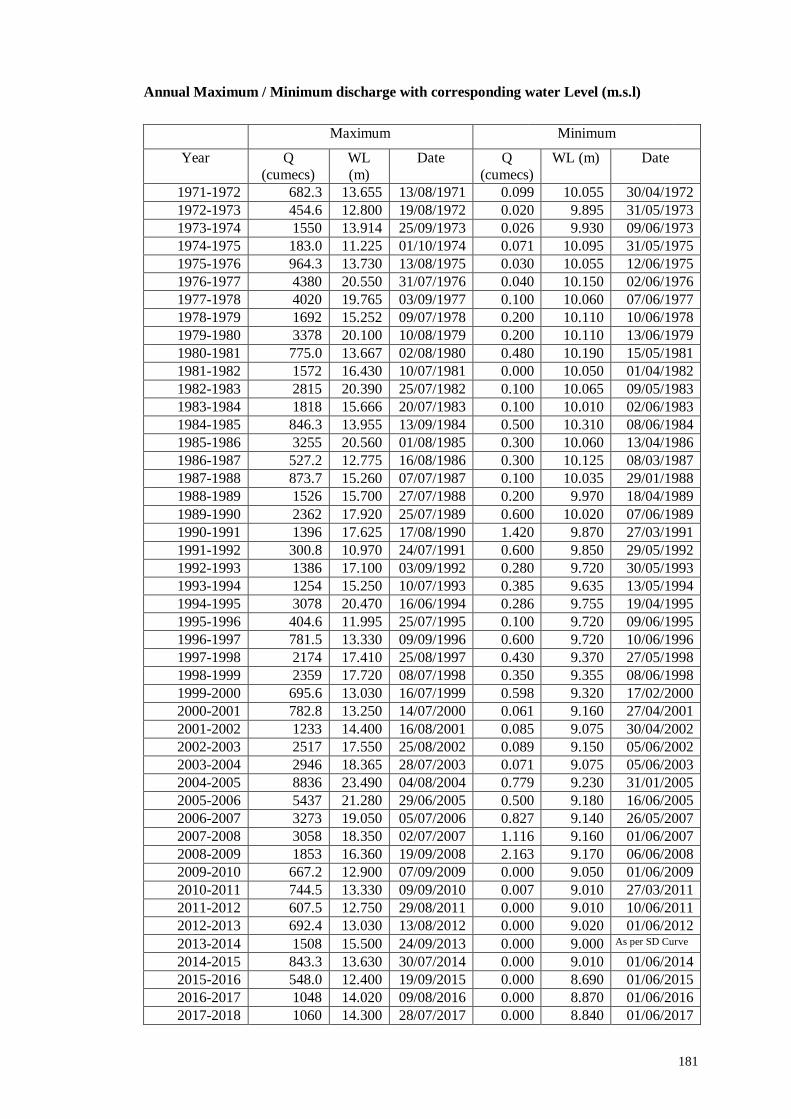
181
Annual Maximum / Minimum discharge with corresponding water Level (m.s.l)
Maximum Minimum
Year Q
(cumecs)
WL
(m)
Date Q
(cumecs)
WL (m) Date
1971-1972 682.3 13.655 13/08/1971 0.099 10.055 30/04/1972
1972-1973 454.6 12.800 19/08/1972 0.020 9.895 31/05/1973
1973-1974 1550 13.914 25/09/1973 0.026 9.930 09/06/1973
1974-1975 183.0 11.225 01/10/1974 0.071 10.095 31/05/1975
1975-1976 964.3 13.730 13/08/1975 0.030 10.055 12/06/1975
1976-1977 4380 20.550 31/07/1976 0.040 10.150 02/06/1976
1977-1978 4020 19.765 03/09/1977 0.100 10.060 07/06/1977
1978-1979 1692 15.252 09/07/1978 0.200 10.110 10/06/1978
1979-1980 3378 20.100 10/08/1979 0.200 10.110 13/06/1979
1980-1981 775.0 13.667 02/08/1980 0.480 10.190 15/05/1981
1981-1982 1572 16.430 10/07/1981 0.000 10.050 01/04/1982
1982-1983 2815 20.390 25/07/1982 0.100 10.065 09/05/1983
1983-1984 1818 15.666 20/07/1983 0.100 10.010 02/06/1983
1984-1985 846.3 13.955 13/09/1984 0.500 10.310 08/06/1984
1985-1986 3255 20.560 01/08/1985 0.300 10.060 13/04/1986
1986-1987 527.2 12.775 16/08/1986 0.300 10.125 08/03/1987
1987-1988 873.7 15.260 07/07/1987 0.100 10.035 29/01/1988
1988-1989 1526 15.700 27/07/1988 0.200 9.970 18/04/1989
1989-1990 2362 17.920 25/07/1989 0.600 10.020 07/06/1989
1990-1991 1396 17.625 17/08/1990 1.420 9.870 27/03/1991
1991-1992 300.8 10.970 24/07/1991 0.600 9.850 29/05/1992
1992-1993 1386 17.100 03/09/1992 0.280 9.720 30/05/1993
1993-1994 1254 15.250 10/07/1993 0.385 9.635 13/05/1994
1994-1995 3078 20.470 16/06/1994 0.286 9.755 19/04/1995
1995-1996 404.6 11.995 25/07/1995 0.100 9.720 09/06/1995
1996-1997 781.5 13.330 09/09/1996 0.600 9.720 10/06/1996
1997-1998 2174 17.410 25/08/1997 0.430 9.370 27/05/1998
1998-1999 2359 17.720 08/07/1998 0.350 9.355 08/06/1998
1999-2000 695.6 13.030 16/07/1999 0.598 9.320 17/02/2000
2000-2001 782.8 13.250 14/07/2000 0.061 9.160 27/04/2001
2001-2002 1233 14.400 16/08/2001 0.085 9.075 30/04/2002
2002-2003 2517 17.550 25/08/2002 0.089 9.150 05/06/2002
2003-2004 2946 18.365 28/07/2003 0.071 9.075 05/06/2003
2004-2005 8836 23.490 04/08/2004 0.779 9.230 31/01/2005
2005-2006 5437 21.280 29/06/2005 0.500 9.180 16/06/2005
2006-2007 3273 19.050 05/07/2006 0.827 9.140 26/05/2007
2007-2008 3058 18.350 02/07/2007 1.116 9.160 01/06/2007
2008-2009 1853 16.360 19/09/2008 2.163 9.170 06/06/2008
2009-2010 667.2 12.900 07/09/2009 0.000 9.050 01/06/2009
2010-2011 744.5 13.330 09/09/2010 0.007 9.010 27/03/2011
2011-2012 607.5 12.750 29/08/2011 0.000 9.010 10/06/2011
2012-2013 692.4 13.030 13/08/2012 0.000 9.020 01/06/2012
2013-2014 1508 15.500 24/09/2013 0.000 9.000 As per SD Curve
2014-2015 843.3 13.630 30/07/2014 0.000 9.010 01/06/2014
2015-2016 548.0 12.400 19/09/2015 0.000 8.690 01/06/2015
2016-2017 1048 14.020 09/08/2016 0.000 8.870 01/06/2016
2017-2018 1060 14.300 28/07/2017 0.000 8.840 01/06/2017
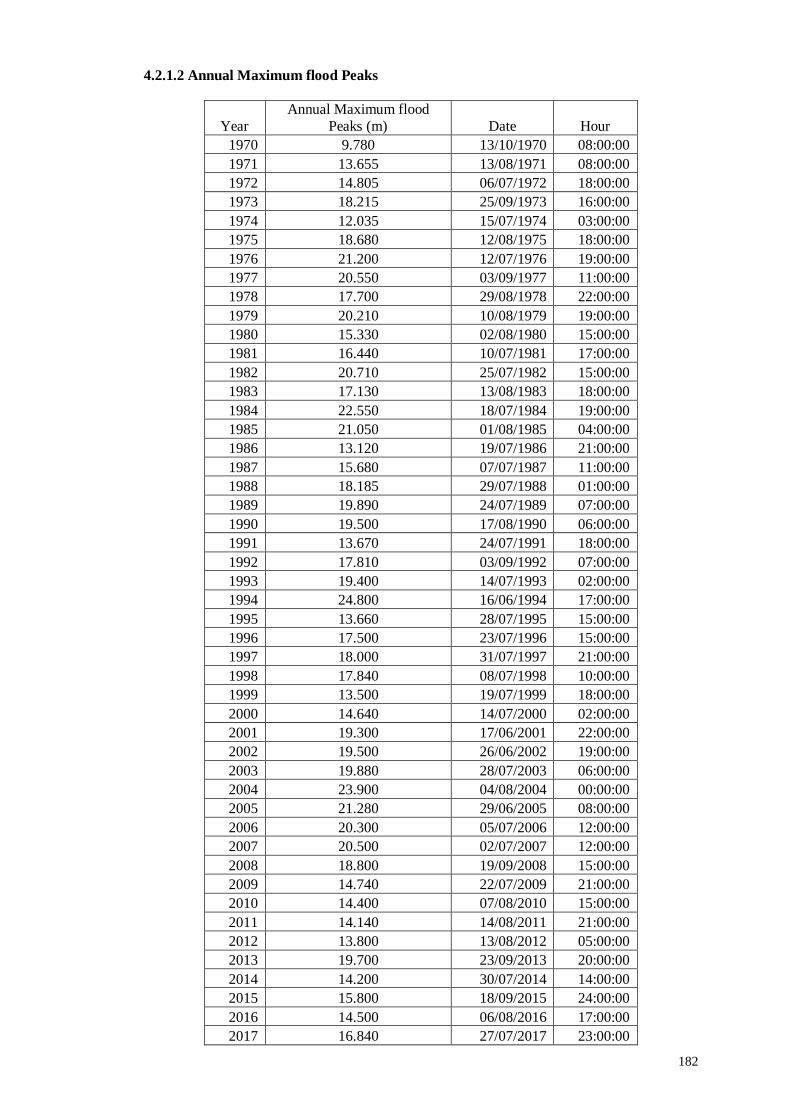
182
4.2.1.2 Annual Maximum flood Peaks
Year
Annual Maximum flood
Peaks (m) Date Hour
1970 9.780 13/10/1970 08:00:00
1971 13.655 13/08/1971 08:00:00
1972 14.805 06/07/1972 18:00:00
1973 18.215 25/09/1973 16:00:00
1974 12.035 15/07/1974 03:00:00
1975 18.680 12/08/1975 18:00:00
1976 21.200 12/07/1976 19:00:00
1977 20.550 03/09/1977 11:00:00
1978 17.700 29/08/1978 22:00:00
1979 20.210 10/08/1979 19:00:00
1980 15.330 02/08/1980 15:00:00
1981 16.440 10/07/1981 17:00:00
1982 20.710 25/07/1982 15:00:00
1983 17.130 13/08/1983 18:00:00
1984 22.550 18/07/1984 19:00:00
1985 21.050 01/08/1985 04:00:00
1986 13.120 19/07/1986 21:00:00
1987 15.680 07/07/1987 11:00:00
1988 18.185 29/07/1988 01:00:00
1989 19.890 24/07/1989 07:00:00
1990 19.500 17/08/1990 06:00:00
1991 13.670 24/07/1991 18:00:00
1992 17.810 03/09/1992 07:00:00
1993 19.400 14/07/1993 02:00:00
1994 24.800 16/06/1994 17:00:00
1995 13.660 28/07/1995 15:00:00
1996 17.500 23/07/1996 15:00:00
1997 18.000 31/07/1997 21:00:00
1998 17.840 08/07/1998 10:00:00
1999 13.500 19/07/1999 18:00:00
2000 14.640 14/07/2000 02:00:00
2001 19.300 17/06/2001 22:00:00
2002 19.500 26/06/2002 19:00:00
2003 19.880 28/07/2003 06:00:00
2004 23.900 04/08/2004 00:00:00
2005 21.280 29/06/2005 08:00:00
2006 20.300 05/07/2006 12:00:00
2007 20.500 02/07/2007 12:00:00
2008 18.800 19/09/2008 15:00:00
2009 14.740 22/07/2009 21:00:00
2010 14.400 07/08/2010 15:00:00
2011 14.140 14/08/2011 21:00:00
2012 13.800 13/08/2012 05:00:00
2013 19.700 23/09/2013 20:00:00
2014 14.200 30/07/2014 14:00:00
2015 15.800 18/09/2015 24:00:00
2016 14.500 06/08/2016 17:00:00
2017 16.840 27/07/2017 23:00:00
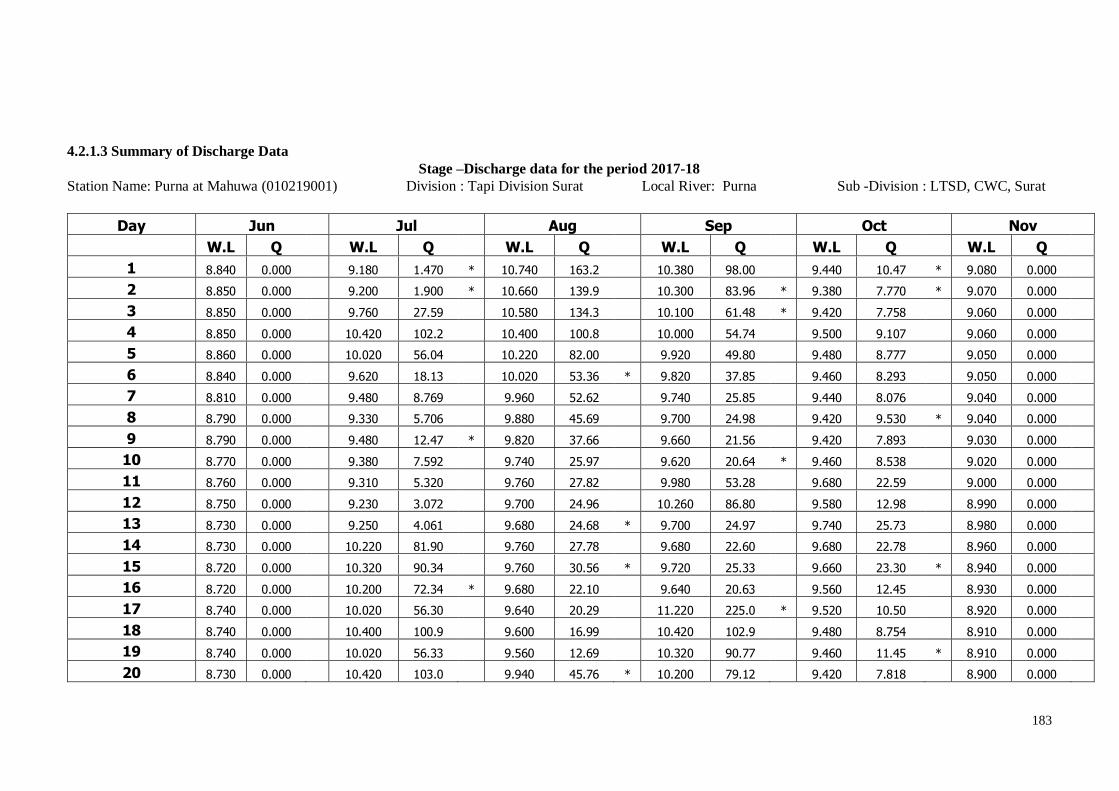
183
4.2.1.3 Summary of Discharge Data
Stage –Discharge data for the period 2017-18
Station Name: Purna at Mahuwa (010219001) Division : Tapi Division Surat Local River: Purna Sub -Division : LTSD, CWC, Surat
Day Jun Jul Aug Sep Oct Nov
W.L Q W.L Q W.L Q W.L Q W.L Q W.L Q
1 8.840 0.000 9.180 1.470 * 10.740 163.2 10.380 98.00 9.440 10.47 * 9.080 0.000
2 8.850 0.000 9.200 1.900 * 10.660 139.9 10.300 83.96 * 9.380 7.770 * 9.070 0.000
3 8.850 0.000 9.760 27.59 10.580 134.3 10.100 61.48 * 9.420 7.758 9.060 0.000
4 8.850 0.000 10.420 102.2 10.400 100.8 10.000 54.74 9.500 9.107 9.060 0.000
5 8.860 0.000 10.020 56.04 10.220 82.00 9.920 49.80 9.480 8.777 9.050 0.000
6 8.840 0.000 9.620 18.13 10.020 53.36 * 9.820 37.85 9.460 8.293 9.050 0.000
7 8.810 0.000 9.480 8.769 9.960 52.62 9.740 25.85 9.440 8.076 9.040 0.000
8 8.790 0.000 9.330 5.706 9.880 45.69 9.700 24.98 9.420 9.530 * 9.040 0.000
9 8.790 0.000 9.480 12.47 * 9.820 37.66 9.660 21.56 9.420 7.893 9.030 0.000
10 8.770 0.000 9.380 7.592 9.740 25.97 9.620 20.64 * 9.460 8.538 9.020 0.000
11 8.760 0.000 9.310 5.320 9.760 27.82 9.980 53.28 9.680 22.59 9.000 0.000
12 8.750 0.000 9.230 3.072 9.700 24.96 10.260 86.80 9.580 12.98 8.990 0.000
13 8.730 0.000 9.250 4.061 9.680 24.68 * 9.700 24.97 9.740 25.73 8.980 0.000
14 8.730 0.000 10.220 81.90 9.760 27.78 9.680 22.60 9.680 22.78 8.960 0.000
15 8.720 0.000 10.320 90.34 9.760 30.56 * 9.720 25.33 9.660 23.30 * 8.940 0.000
16 8.720 0.000 10.200 72.34 * 9.680 22.10 9.640 20.63 9.560 12.45 8.930 0.000
17 8.740 0.000 10.020 56.30 9.640 20.29 11.220 225.0 * 9.520 10.50 8.920 0.000
18 8.740 0.000 10.400 100.9 9.600 16.99 10.420 102.9 9.480 8.754 8.910 0.000
19 8.740 0.000 10.020 56.33 9.560 12.69 10.320 90.77 9.460 11.45 * 8.910 0.000
20 8.730 0.000 10.420 103.0 9.940 45.76 * 10.200 79.12 9.420 7.818 8.900 0.000
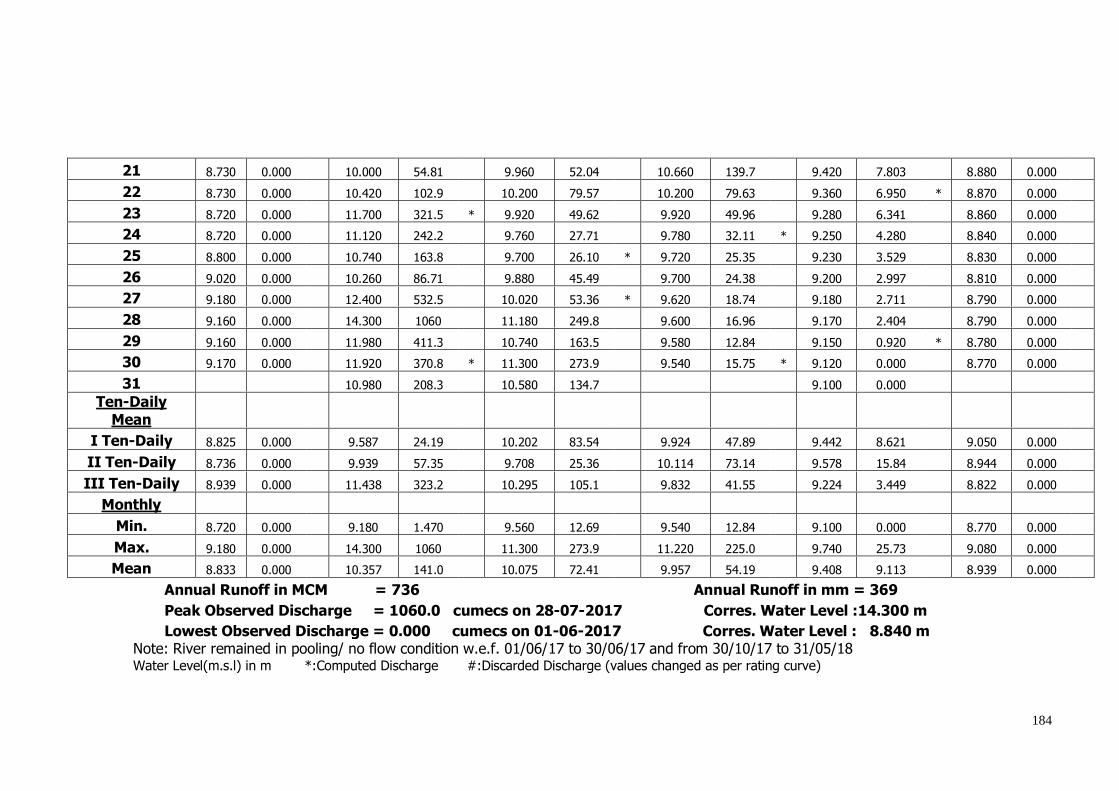
184
21 8.730 0.000 10.000 54.81 9.960 52.04 10.660 139.7 9.420 7.803 8.880 0.000
22 8.730 0.000 10.420 102.9 10.200 79.57 10.200 79.63 9.360 6.950 * 8.870 0.000
23 8.720 0.000 11.700 321.5 * 9.920 49.62 9.920 49.96 9.280 6.341 8.860 0.000
24 8.720 0.000 11.120 242.2 9.760 27.71 9.780 32.11 * 9.250 4.280 8.840 0.000
25 8.800 0.000 10.740 163.8 9.700 26.10 * 9.720 25.35 9.230 3.529 8.830 0.000
26 9.020 0.000 10.260 86.71 9.880 45.49 9.700 24.38 9.200 2.997 8.810 0.000
27 9.180 0.000 12.400 532.5 10.020 53.36 * 9.620 18.74 9.180 2.711 8.790 0.000
28 9.160 0.000 14.300 1060 11.180 249.8 9.600 16.96 9.170 2.404 8.790 0.000
29 9.160 0.000 11.980 411.3 10.740 163.5 9.580 12.84 9.150 0.920 * 8.780 0.000
30 9.170 0.000 11.920 370.8 * 11.300 273.9 9.540 15.75 * 9.120 0.000 8.770 0.000
31 10.980 208.3 10.580 134.7 9.100 0.000
Ten-Daily
Mean
I Ten-Daily 8.825 0.000 9.587 24.19 10.202 83.54 9.924 47.89 9.442 8.621 9.050 0.000
II Ten-Daily 8.736 0.000 9.939 57.35 9.708 25.36 10.114 73.14 9.578 15.84 8.944 0.000
III Ten-Daily 8.939 0.000 11.438 323.2 10.295 105.1 9.832 41.55 9.224 3.449 8.822 0.000
Monthly
Min. 8.720 0.000 9.180 1.470 9.560 12.69 9.540 12.84 9.100 0.000 8.770 0.000
Max. 9.180 0.000 14.300 1060 11.300 273.9 11.220 225.0 9.740 25.73 9.080 0.000
Mean 8.833 0.000
10.357 141.0
10.075 72.41
9.957 54.19
9.408 9.113
8.939 0.000
Annual Runoff in MCM = 736 Annual Runoff in mm = 369
Peak Observed Discharge = 1060.0 cumecs on 28-07-2017 Corres. Water Level :14.300 m
Lowest Observed Discharge = 0.000 cumecs on 01-06-2017 Corres. Water Level : 8.840 m Note: River remained in pooling/ no flow condition w.e.f. 01/06/17 to 30/06/17 and from 30/10/17 to 31/05/18
Water Level(m.s.l) in m *:Computed Discharge #:Discarded Discharge (values changed as per rating curve)
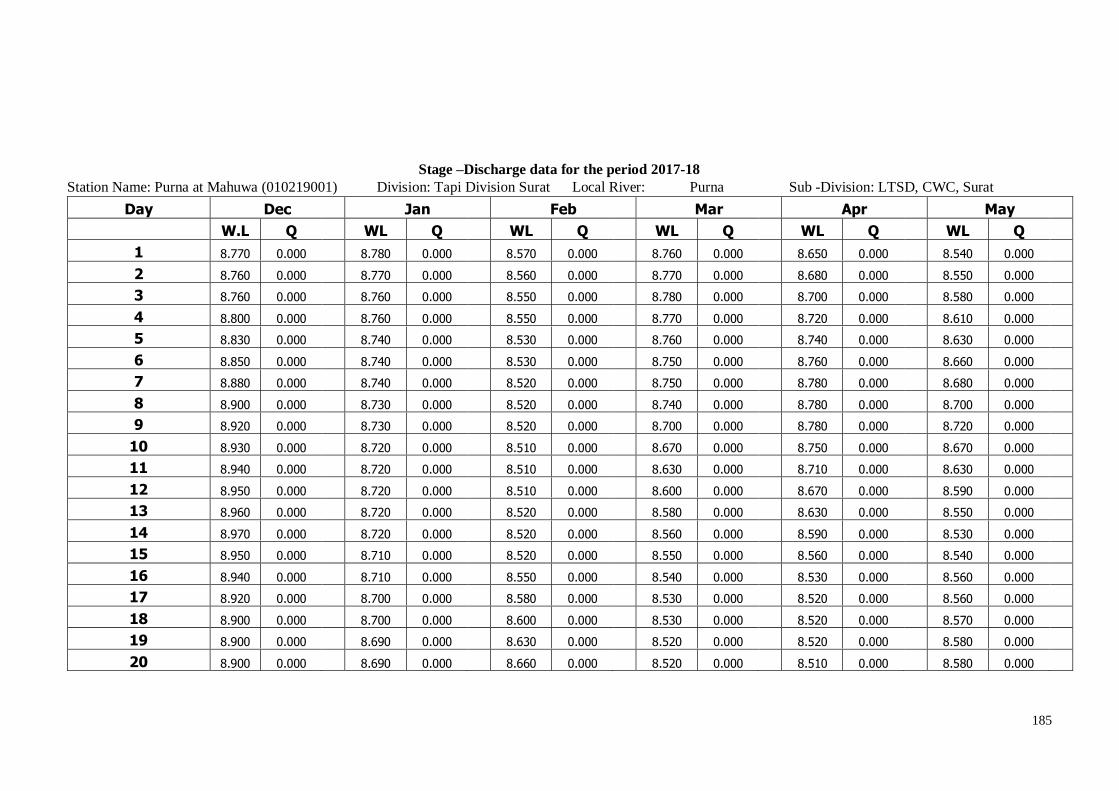
185
Stage –Discharge data for the period 2017-18
Station Name: Purna at Mahuwa (010219001) Division: Tapi Division Surat Local River: Purna Sub -Division: LTSD, CWC, Surat
Day Dec Jan Feb Mar Apr May
W.L Q WL Q WL Q WL Q WL Q WL Q
1 8.770 0.000 8.780 0.000 8.570 0.000 8.760 0.000 8.650 0.000 8.540 0.000
2 8.760 0.000 8.770 0.000 8.560 0.000 8.770 0.000 8.680 0.000 8.550 0.000
3 8.760 0.000 8.760 0.000 8.550 0.000 8.780 0.000 8.700 0.000 8.580 0.000
4 8.800 0.000 8.760 0.000 8.550 0.000 8.770 0.000 8.720 0.000 8.610 0.000
5 8.830 0.000 8.740 0.000 8.530 0.000 8.760 0.000 8.740 0.000 8.630 0.000
6 8.850 0.000 8.740 0.000 8.530 0.000 8.750 0.000 8.760 0.000 8.660 0.000
7 8.880 0.000 8.740 0.000 8.520 0.000 8.750 0.000 8.780 0.000 8.680 0.000
8 8.900 0.000 8.730 0.000 8.520 0.000 8.740 0.000 8.780 0.000 8.700 0.000
9 8.920 0.000 8.730 0.000 8.520 0.000 8.700 0.000 8.780 0.000 8.720 0.000
10 8.930 0.000 8.720 0.000 8.510 0.000 8.670 0.000 8.750 0.000 8.670 0.000
11 8.940 0.000 8.720 0.000 8.510 0.000 8.630 0.000 8.710 0.000 8.630 0.000
12 8.950 0.000 8.720 0.000 8.510 0.000 8.600 0.000 8.670 0.000 8.590 0.000
13 8.960 0.000 8.720 0.000 8.520 0.000 8.580 0.000 8.630 0.000 8.550 0.000
14 8.970 0.000 8.720 0.000 8.520 0.000 8.560 0.000 8.590 0.000 8.530 0.000
15 8.950 0.000 8.710 0.000 8.520 0.000 8.550 0.000 8.560 0.000 8.540 0.000
16 8.940 0.000 8.710 0.000 8.550 0.000 8.540 0.000 8.530 0.000 8.560 0.000
17 8.920 0.000 8.700 0.000 8.580 0.000 8.530 0.000 8.520 0.000 8.560 0.000
18 8.900 0.000 8.700 0.000 8.600 0.000 8.530 0.000 8.520 0.000 8.570 0.000
19 8.900 0.000 8.690 0.000 8.630 0.000 8.520 0.000 8.520 0.000 8.580 0.000
20 8.900 0.000 8.690 0.000 8.660 0.000 8.520 0.000 8.510 0.000 8.580 0.000
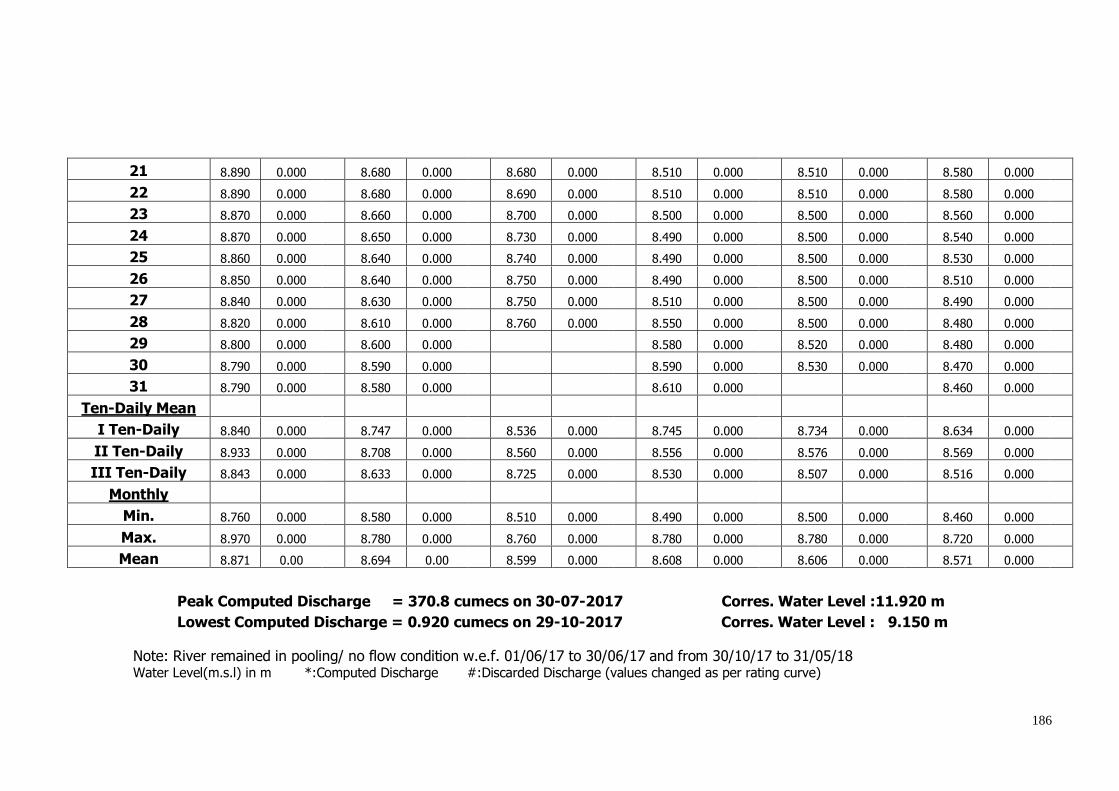
186
21 8.890 0.000 8.680 0.000 8.680 0.000 8.510 0.000 8.510 0.000 8.580 0.000
22 8.890 0.000 8.680 0.000 8.690 0.000 8.510 0.000 8.510 0.000 8.580 0.000
23 8.870 0.000 8.660 0.000 8.700 0.000 8.500 0.000 8.500 0.000 8.560 0.000
24 8.870 0.000 8.650 0.000 8.730 0.000 8.490 0.000 8.500 0.000 8.540 0.000
25 8.860 0.000 8.640 0.000 8.740 0.000 8.490 0.000 8.500 0.000 8.530 0.000
26 8.850 0.000 8.640 0.000 8.750 0.000 8.490 0.000 8.500 0.000 8.510 0.000
27 8.840 0.000 8.630 0.000 8.750 0.000 8.510 0.000 8.500 0.000 8.490 0.000
28 8.820 0.000 8.610 0.000 8.760 0.000 8.550 0.000 8.500 0.000 8.480 0.000
29 8.800 0.000 8.600 0.000 8.580 0.000 8.520 0.000 8.480 0.000
30 8.790 0.000 8.590 0.000 8.590 0.000 8.530 0.000 8.470 0.000
31 8.790 0.000 8.580 0.000 8.610 0.000 8.460 0.000
Ten-Daily Mean
I Ten-Daily 8.840 0.000
8.747 0.000
8.536 0.000
8.745 0.000
8.734 0.000
8.634 0.000 II Ten-Daily 8.933 0.000
8.708 0.000
8.560 0.000
8.556 0.000
8.576 0.000
8.569 0.000
III Ten-Daily 8.843 0.000
8.633 0.000
8.725 0.000
8.530 0.000
8.507 0.000
8.516 0.000 Monthly
Min. 8.760 0.000
8.580 0.000
8.510 0.000
8.490 0.000
8.500 0.000
8.460 0.000 Max. 8.970 0.000
8.780 0.000
8.760 0.000
8.780 0.000
8.780 0.000
8.720 0.000
Mean 8.871 0.00
8.694 0.00
8.599 0.000
8.608 0.000
8.606 0.000
8.571 0.000
Peak Computed Discharge = 370.8 cumecs on 30-07-2017 Corres. Water Level :11.920 m
Lowest Computed Discharge = 0.920 cumecs on 29-10-2017 Corres. Water Level : 9.150 m
Note: River remained in pooling/ no flow condition w.e.f. 01/06/17 to 30/06/17 and from 30/10/17 to 31/05/18 Water Level(m.s.l) in m *:Computed Discharge #:Discarded Discharge (values changed as per rating curve)
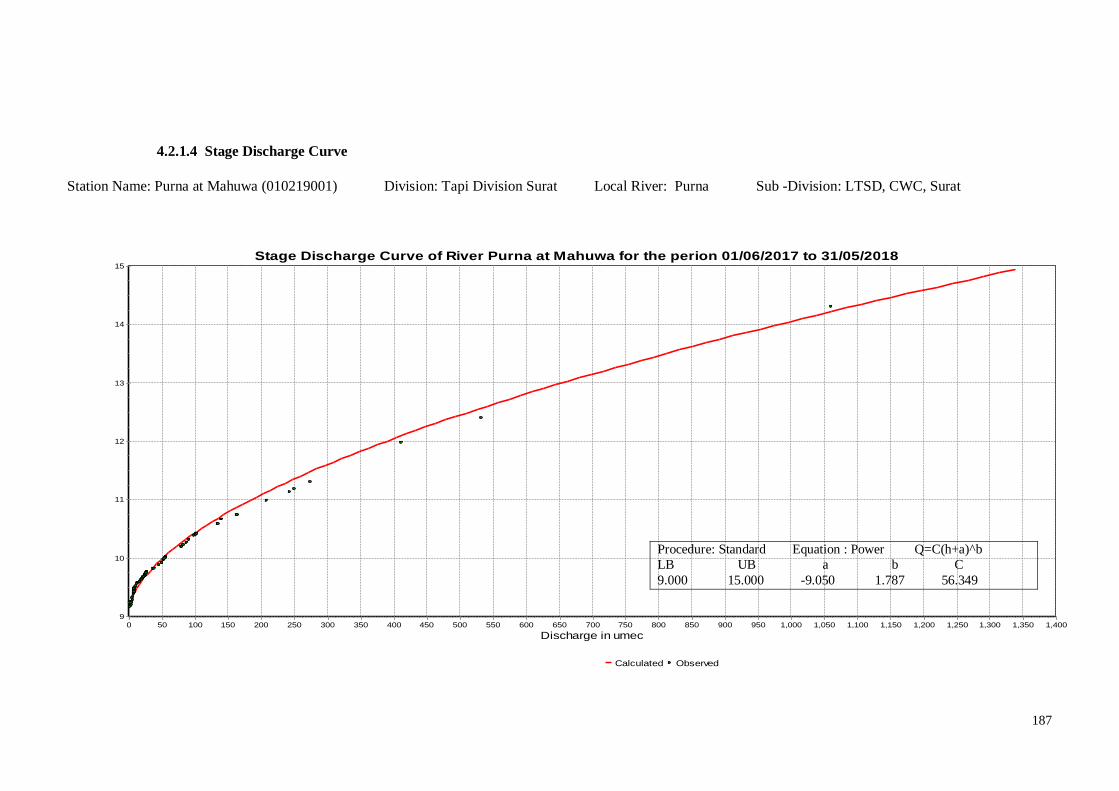
187
4.2.1.4 Stage Discharge Curve
Station Name: Purna at Mahuwa (010219001) Division: Tapi Division Surat Local River: Purna Sub -Division: LTSD, CWC, Surat
Stage Discharge Curve of River Purna at Mahuwa for the perion 01/06/2017 to 31/05/2018
Calculated Observed
Discharge in umec1,4001,3501,3001,2501,2001,1501,1001,0501,000950900850800750700650600550500450400350300250200150100500
Sta
ge in
m
15
14
13
12
11
10
9
Procedure: Standard Equation : Power Q=C(h+a)^b
LB UB a b C
9.000 15.000 -9.050 1.787 56.349
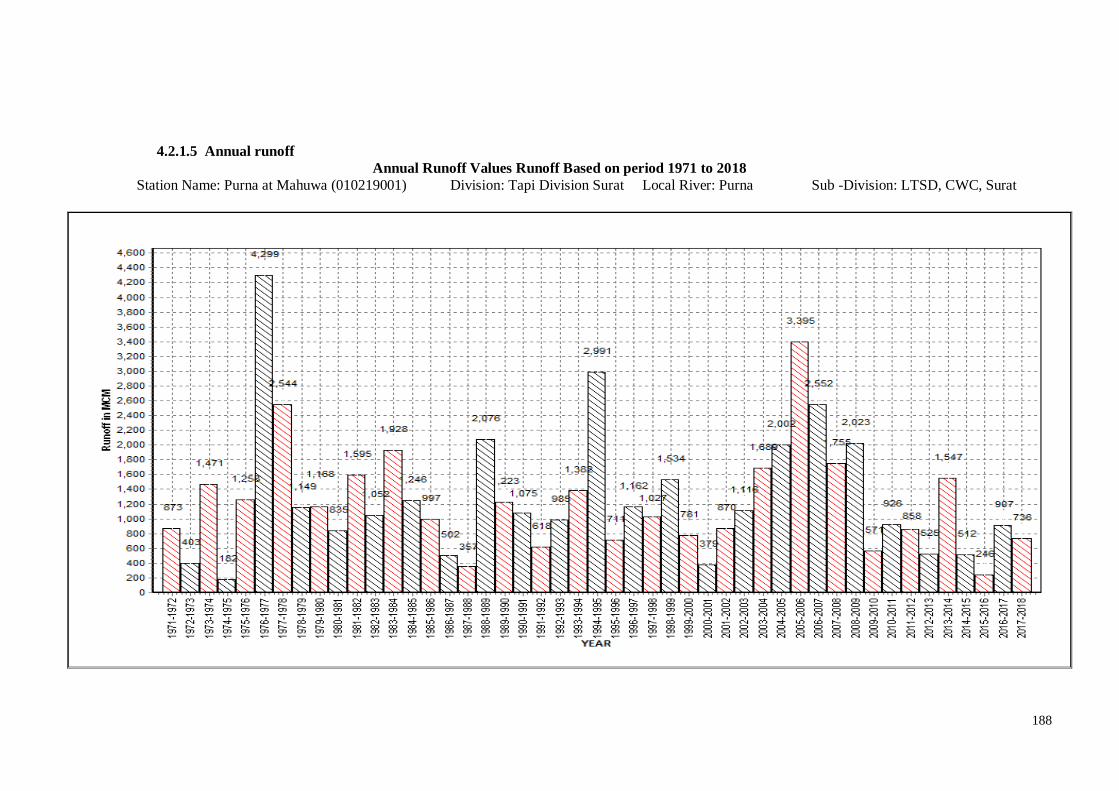
188
4.2.1.5 Annual runoff
Annual Runoff Values Runoff Based on period 1971 to 2018
Station Name: Purna at Mahuwa (010219001) Division: Tapi Division Surat Local River: Purna Sub -Division: LTSD, CWC, Surat
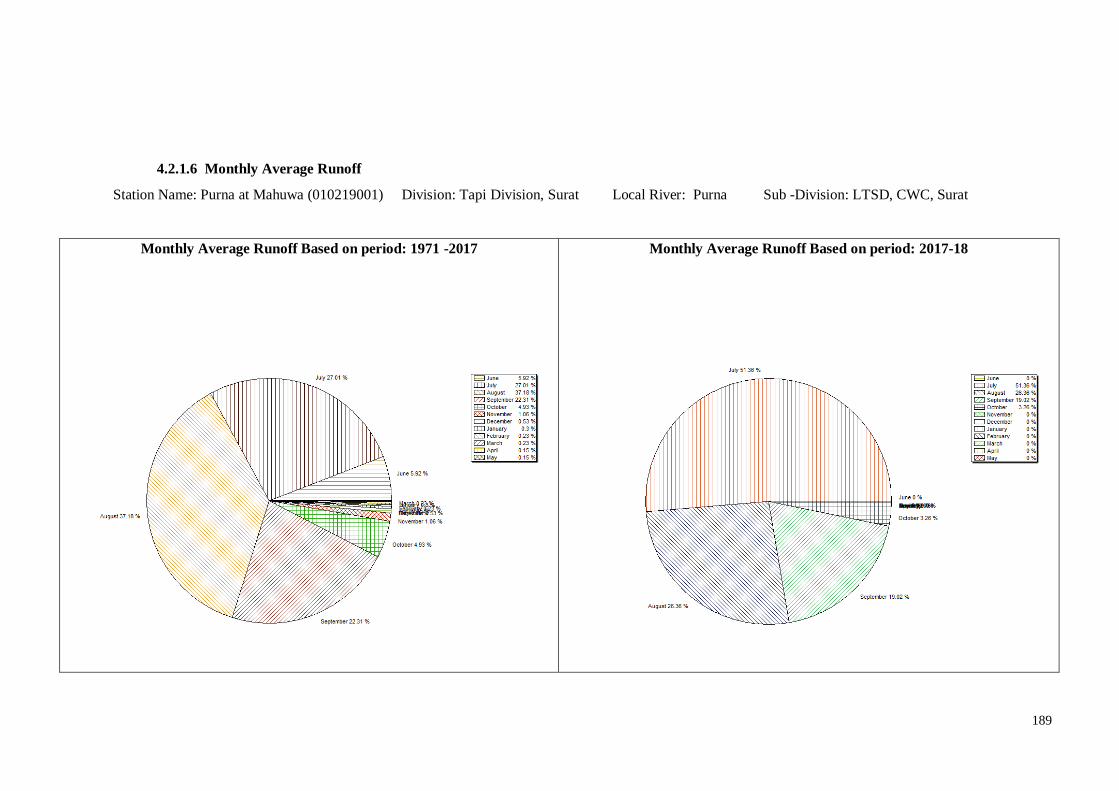
189
4.2.1.6 Monthly Average Runoff
Station Name: Purna at Mahuwa (010219001) Division: Tapi Division, Surat Local River: Purna Sub -Division: LTSD, CWC, Surat
Monthly Average Runoff Based on period: 1971 -2017
Monthly Average Runoff Based on period: 2017-18
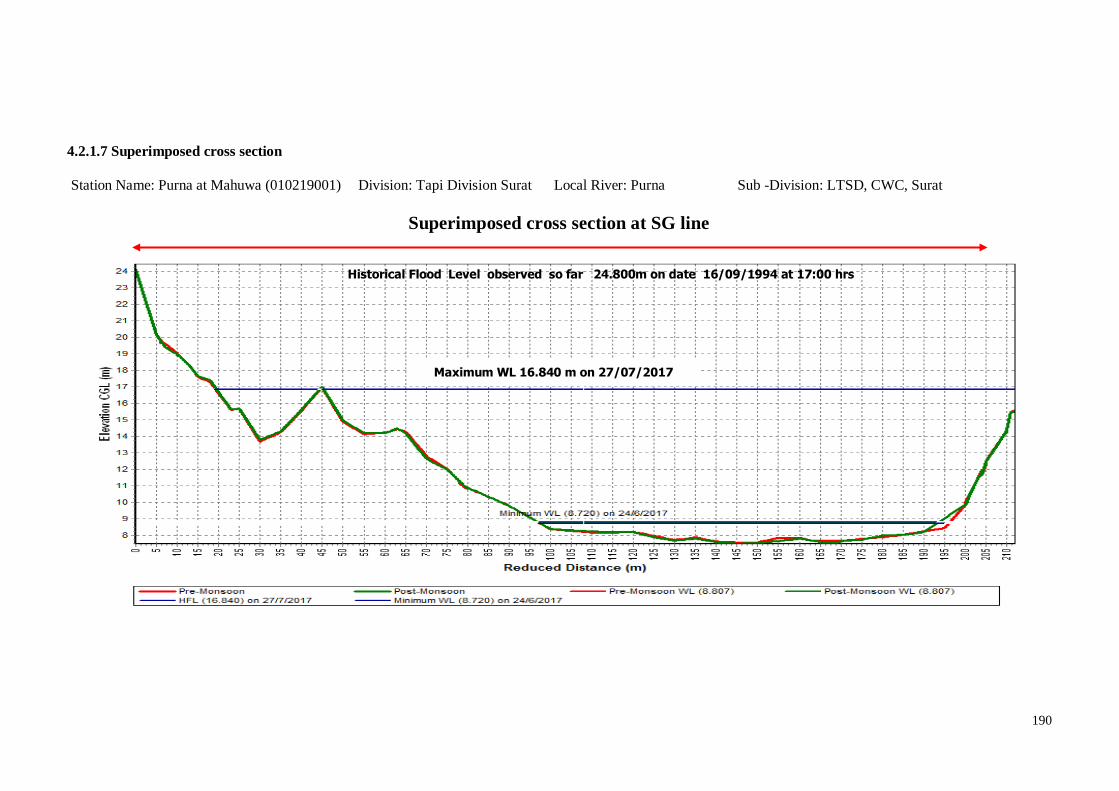
190
4.2.1.7 Superimposed cross section
Station Name: Purna at Mahuwa (010219001) Division: Tapi Division Surat Local River: Purna Sub -Division: LTSD, CWC, Surat
Superimposed cross section at SG line
Max. WL 14.140 m on 14/08/2011 at 2100 hours
Historical Flood Level observed so far 24.800m on date 16/09/1994 at 17:00 hrs
Maximum WL 16.840 m on 27/07/2017

191
4.2.1.8 Water Level vs. Time- Graph of Highest Flood Peaks during 2017-18
Station Name: Purna at Mahuwa (010219001) Division : Tapi Division Surat
Local River : Purna Sub -Division : LTSD, CWC, Surat
Water Level Vs. Time –Graph of I peak during the year 2017-18
Water Leel Vs. Time –Graph of II peak during the year 2017-18
Water Level Vs. Time –Graph of III peak during the year 2017-18

192
4.3 Ambica Basin
4.3.1 Ambica at Gadat
4.3.1.1 History sheet
HISTORY SHEET
Water Year : 2017-18
Site : Ambica at Gadat Code : 01 02 20 001
State : Gujarat District Valsad
Basin : WFR South of Tapi Independent River : Ambika
Tributary : Sub Tributary :
Sub-Sub Tributary : Local River :
Division : Surat Sub-Division : Surat
Drainage Area : 1510 Sq. Km. Bank :
Latitude : 20°51’22” Longitude : 72°59’05”
Zero of Gauge (m) : 1.5 (m.s.l) 14/01/1979
Opening Date Closing Date
Gauge : 14/01/1979
Discharge : 12/03/1979
Sediment : 01/02/1985
Water Quality : 01/04/1980
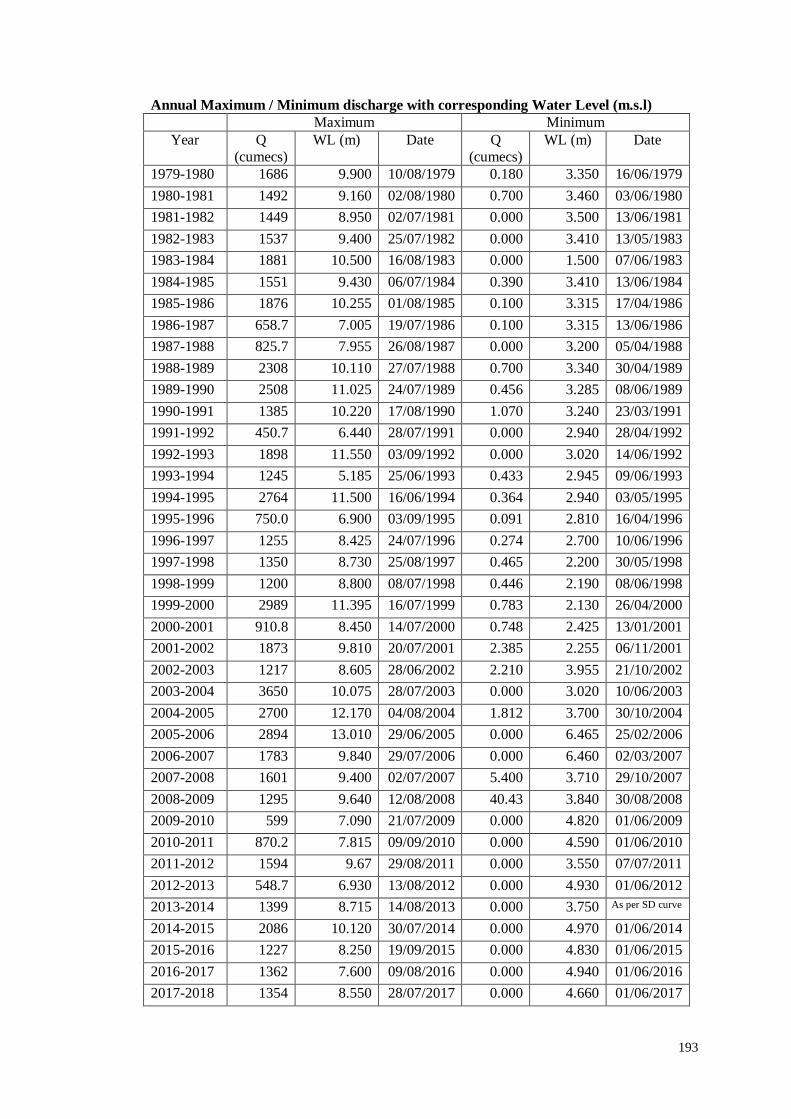
193
Annual Maximum / Minimum discharge with corresponding Water Level (m.s.l)
Maximum Minimum
Year Q
(cumecs)
WL (m) Date Q
(cumecs)
WL (m) Date
1979-1980 1686 9.900 10/08/1979 0.180 3.350 16/06/1979
1980-1981 1492 9.160 02/08/1980 0.700 3.460 03/06/1980
1981-1982 1449 8.950 02/07/1981 0.000 3.500 13/06/1981
1982-1983 1537 9.400 25/07/1982 0.000 3.410 13/05/1983
1983-1984 1881 10.500 16/08/1983 0.000 1.500 07/06/1983
1984-1985 1551 9.430 06/07/1984 0.390 3.410 13/06/1984
1985-1986 1876 10.255 01/08/1985 0.100 3.315 17/04/1986
1986-1987 658.7 7.005 19/07/1986 0.100 3.315 13/06/1986
1987-1988 825.7 7.955 26/08/1987 0.000 3.200 05/04/1988
1988-1989 2308 10.110 27/07/1988 0.700 3.340 30/04/1989
1989-1990 2508 11.025 24/07/1989 0.456 3.285 08/06/1989
1990-1991 1385 10.220 17/08/1990 1.070 3.240 23/03/1991
1991-1992 450.7 6.440 28/07/1991 0.000 2.940 28/04/1992
1992-1993 1898 11.550 03/09/1992 0.000 3.020 14/06/1992
1993-1994 1245 5.185 25/06/1993 0.433 2.945 09/06/1993
1994-1995 2764 11.500 16/06/1994 0.364 2.940 03/05/1995
1995-1996 750.0 6.900 03/09/1995 0.091 2.810 16/04/1996
1996-1997 1255 8.425 24/07/1996 0.274 2.700 10/06/1996
1997-1998 1350 8.730 25/08/1997 0.465 2.200 30/05/1998
1998-1999 1200 8.800 08/07/1998 0.446 2.190 08/06/1998
1999-2000 2989 11.395 16/07/1999 0.783 2.130 26/04/2000
2000-2001 910.8 8.450 14/07/2000 0.748 2.425 13/01/2001
2001-2002 1873 9.810 20/07/2001 2.385 2.255 06/11/2001
2002-2003 1217 8.605 28/06/2002 2.210 3.955 21/10/2002
2003-2004 3650 10.075 28/07/2003 0.000 3.020 10/06/2003
2004-2005 2700 12.170 04/08/2004 1.812 3.700 30/10/2004
2005-2006 2894 13.010 29/06/2005 0.000 6.465 25/02/2006
2006-2007 1783 9.840 29/07/2006 0.000 6.460 02/03/2007
2007-2008 1601 9.400 02/07/2007 5.400 3.710 29/10/2007
2008-2009 1295 9.640 12/08/2008 40.43 3.840 30/08/2008
2009-2010 599 7.090 21/07/2009 0.000 4.820 01/06/2009
2010-2011 870.2 7.815 09/09/2010 0.000 4.590 01/06/2010
2011-2012 1594 9.67 29/08/2011 0.000 3.550 07/07/2011
2012-2013 548.7 6.930 13/08/2012 0.000 4.930 01/06/2012
2013-2014 1399 8.715 14/08/2013 0.000 3.750 As per SD curve
2014-2015 2086 10.120 30/07/2014 0.000 4.970 01/06/2014
2015-2016 1227 8.250 19/09/2015 0.000 4.830 01/06/2015
2016-2017 1362 7.600 09/08/2016 0.000 4.940 01/06/2016
2017-2018 1354 8.550 28/07/2017 0.000 4.660 01/06/2017
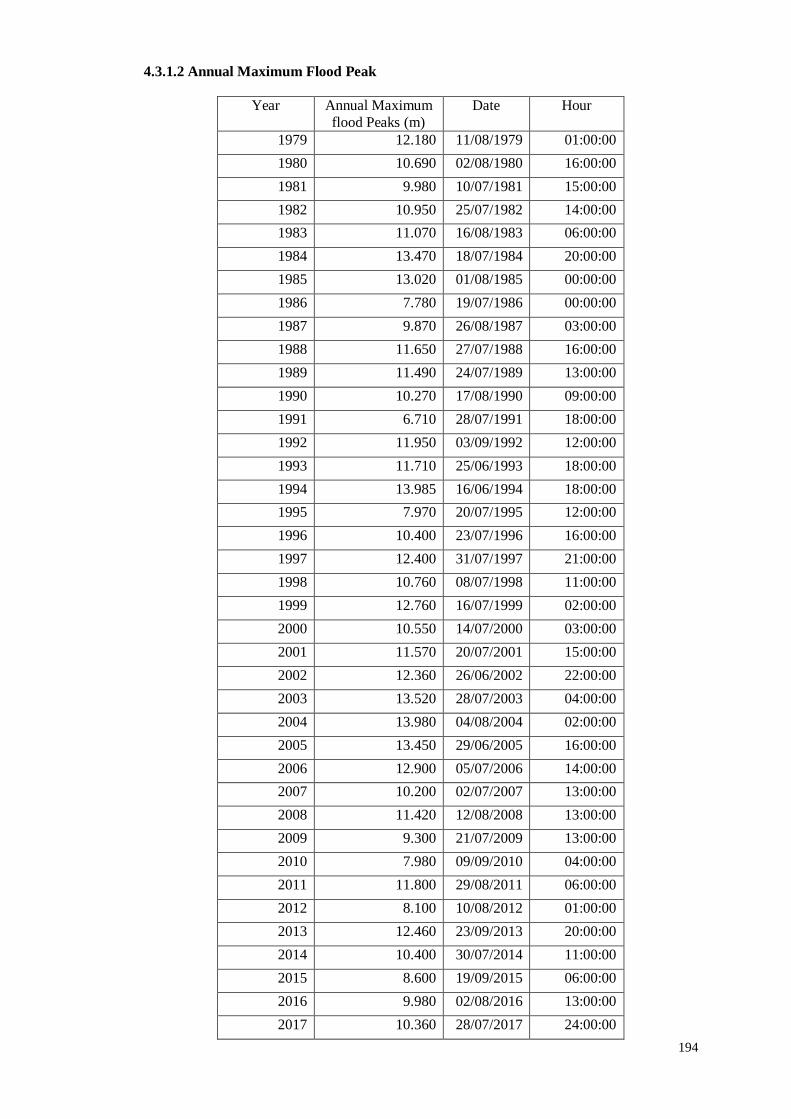
194
4.3.1.2 Annual Maximum Flood Peak
Year Annual Maximum
flood Peaks (m)
Date Hour
1979 12.180 11/08/1979 01:00:00
1980 10.690 02/08/1980 16:00:00
1981 9.980 10/07/1981 15:00:00
1982 10.950 25/07/1982 14:00:00
1983 11.070 16/08/1983 06:00:00
1984 13.470 18/07/1984 20:00:00
1985 13.020 01/08/1985 00:00:00
1986 7.780 19/07/1986 00:00:00
1987 9.870 26/08/1987 03:00:00
1988 11.650 27/07/1988 16:00:00
1989 11.490 24/07/1989 13:00:00
1990 10.270 17/08/1990 09:00:00
1991 6.710 28/07/1991 18:00:00
1992 11.950 03/09/1992 12:00:00
1993 11.710 25/06/1993 18:00:00
1994 13.985 16/06/1994 18:00:00
1995 7.970 20/07/1995 12:00:00
1996 10.400 23/07/1996 16:00:00
1997 12.400 31/07/1997 21:00:00
1998 10.760 08/07/1998 11:00:00
1999 12.760 16/07/1999 02:00:00
2000 10.550 14/07/2000 03:00:00
2001 11.570 20/07/2001 15:00:00
2002 12.360 26/06/2002 22:00:00
2003 13.520 28/07/2003 04:00:00
2004 13.980 04/08/2004 02:00:00
2005 13.450 29/06/2005 16:00:00
2006 12.900 05/07/2006 14:00:00
2007 10.200 02/07/2007 13:00:00
2008 11.420 12/08/2008 13:00:00
2009 9.300 21/07/2009 13:00:00
2010 7.980 09/09/2010 04:00:00
2011 11.800 29/08/2011 06:00:00
2012 8.100 10/08/2012 01:00:00
2013 12.460 23/09/2013 20:00:00
2014 10.400 30/07/2014 11:00:00
2015 8.600 19/09/2015 06:00:00
2016 9.980 02/08/2016 13:00:00
2017 10.360 28/07/2017 24:00:00

195
4.3.1.3 Summary of Data
Stage –Discharge data for the period 2017-18
Station Name: Ambica at Gadat (01 02 20 001) Division : Tapi Division Surat Local River: Ambica Sub -Division : LTSD, CWC, Surat
Day Jun Jul Aug Sep Oct Nov
W.L Q W.L Q W.L Q W.L Q W.L Q W.L Q
1 4.660 0.000 3.830 0.000 5.190 311.7 4.950 260.3 3.870 27.05 * 3.710 0.000
2 4.680 0.000 4.130 0.000 4.970 269.5 4.630 177.0 * 3.860 25.55 * 3.860 0.000
3 4.680 0.000 4.480 111.2 4.850 205.5 4.450 136.7 * 3.870 26.59 3.920 0.000
4 4.670 0.000 4.530 133.7 4.665 182.1 4.380 129.6 3.855 23.64 3.970 0.000
5 4.670 0.000 4.050 77.50 4.480 148.0 4.295 119.7 3.845 20.91 4.010 0.000
6 4.650 0.000 4.000 76.11 4.360 117.5 * 4.215 88.90 3.830 17.29 4.100 0.000
7 4.650 0.000 3.895 40.22 4.280 102.0 4.135 79.50 3.810 15.00 4.270 0.000
8 4.640 0.000 3.880 39.80 4.215 89.21 4.100 76.56 3.800 16.96 * 4.400 0.000
9 4.660 0.000 3.860 25.55 * 4.165 87.37 4.065 60.49 3.770 10.04 4.550 0.000
10 4.790 0.000 3.990 79.69 4.110 77.65 4.030 53.38 * 3.815 16.44 4.610 0.000
11 5.010 0.000 3.890 38.81 4.105 77.26 4.135 79.58 4.015 36.18 4.750 0.000
12 5.020 0.000 3.860 30.11 4.145 82.99 4.095 68.11 3.975 46.85 4.920 0.000
13 5.000 0.000 3.860 30.38 4.110 67.86 * 4.100 75.30 4.045 51.28 5.000 0.000
14 4.990 0.000 4.335 116.7 4.090 71.20 4.095 65.90 4.005 40.45 5.100 0.000
15 4.980 0.000 4.960 219.3 4.160 77.29 * 4.055 62.12 3.890 30.12 * 5.000 0.000
16 4.970 0.000 5.160 307.4 * 4.150 79.56 4.060 62.90 3.990 41.90 5.000 0.000
17 4.980 0.000 5.045 229.9 4.075 60.36 4.040 55.14 * 3.935 33.99 5.000 0.000
18 4.970 0.000 5.775 498.1 4.005 51.86 4.315 110.5 3.865 26.59 5.000 0.000
19 4.200 0.000 5.125 186.9 3.980 48.32 4.120 62.60 3.840 22.60 * 5.000 0.000
20 4.060 0.000 5.525 471.5 4.060 58.72 * 4.200 78.30 3.820 16.82 4.990 0.000
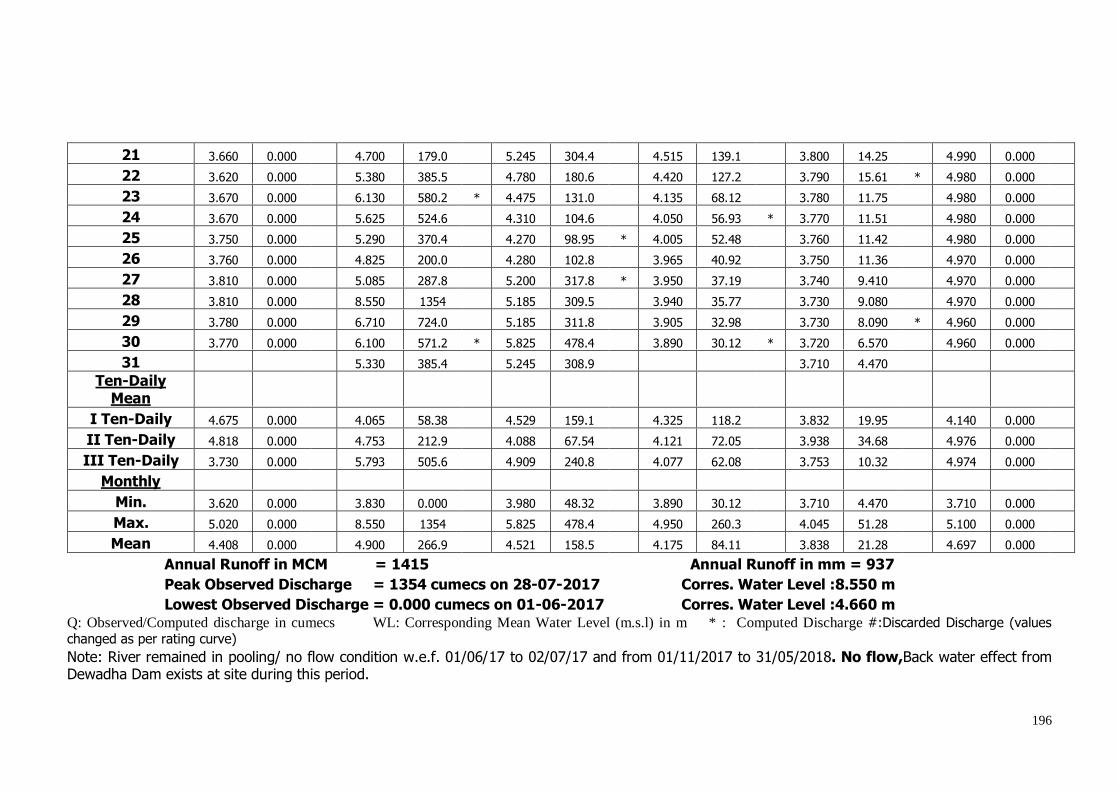
196
21 3.660 0.000 4.700 179.0 5.245 304.4 4.515 139.1 3.800 14.25 4.990 0.000
22 3.620 0.000 5.380 385.5 4.780 180.6 4.420 127.2 3.790 15.61 * 4.980 0.000
23 3.670 0.000 6.130 580.2 * 4.475 131.0 4.135 68.12 3.780 11.75 4.980 0.000
24 3.670 0.000 5.625 524.6 4.310 104.6 4.050 56.93 * 3.770 11.51 4.980 0.000
25 3.750 0.000 5.290 370.4 4.270 98.95 * 4.005 52.48 3.760 11.42 4.980 0.000
26 3.760 0.000 4.825 200.0 4.280 102.8 3.965 40.92 3.750 11.36 4.970 0.000
27 3.810 0.000 5.085 287.8 5.200 317.8 * 3.950 37.19 3.740 9.410 4.970 0.000
28 3.810 0.000 8.550 1354 5.185 309.5 3.940 35.77 3.730 9.080 4.970 0.000
29 3.780 0.000 6.710 724.0 5.185 311.8 3.905 32.98 3.730 8.090 * 4.960 0.000
30 3.770 0.000 6.100 571.2 * 5.825 478.4 3.890 30.12 * 3.720 6.570 4.960 0.000
31 5.330 385.4 5.245 308.9 3.710 4.470
Ten-Daily Mean
I Ten-Daily 4.675 0.000
4.065 58.38
4.529 159.1
4.325 118.2
3.832 19.95
4.140 0.000 II Ten-Daily 4.818 0.000
4.753 212.9
4.088 67.54
4.121 72.05
3.938 34.68
4.976 0.000
III Ten-Daily 3.730 0.000
5.793 505.6
4.909 240.8
4.077 62.08
3.753 10.32
4.974 0.000 Monthly
Min. 3.620 0.000
3.830 0.000
3.980 48.32
3.890 30.12
3.710 4.470
3.710 0.000 Max. 5.020 0.000
8.550 1354
5.825 478.4
4.950 260.3
4.045 51.28
5.100 0.000
Mean 4.408 0.000
4.900 266.9
4.521 158.5
4.175 84.11
3.838 21.28
4.697 0.000 Annual Runoff in MCM = 1415 Annual Runoff in mm = 937
Peak Observed Discharge = 1354 cumecs on 28-07-2017 Corres. Water Level :8.550 m
Lowest Observed Discharge = 0.000 cumecs on 01-06-2017 Corres. Water Level :4.660 m Q: Observed/Computed discharge in cumecs WL: Corresponding Mean Water Level (m.s.l) in m * : Computed Discharge #:Discarded Discharge (values changed as per rating curve)
Note: River remained in pooling/ no flow condition w.e.f. 01/06/17 to 02/07/17 and from 01/11/2017 to 31/05/2018. No flow,Back water effect from Dewadha Dam exists at site during this period.
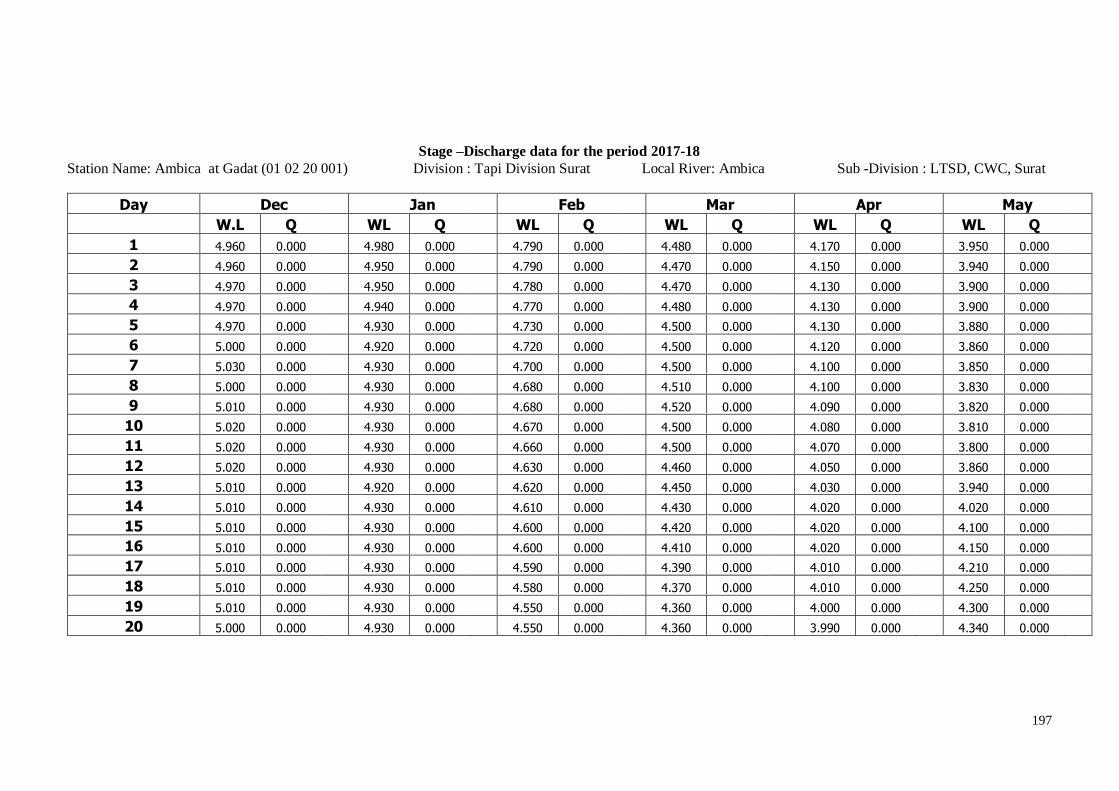
197
Stage –Discharge data for the period 2017-18
Station Name: Ambica at Gadat (01 02 20 001) Division : Tapi Division Surat Local River: Ambica Sub -Division : LTSD, CWC, Surat
Day Dec Jan Feb Mar Apr May
W.L Q WL Q WL Q WL Q WL Q WL Q
1 4.960 0.000 4.980 0.000 4.790 0.000 4.480 0.000 4.170 0.000 3.950 0.000
2 4.960 0.000 4.950 0.000 4.790 0.000 4.470 0.000 4.150 0.000 3.940 0.000
3 4.970 0.000 4.950 0.000 4.780 0.000 4.470 0.000 4.130 0.000 3.900 0.000
4 4.970 0.000 4.940 0.000 4.770 0.000 4.480 0.000 4.130 0.000 3.900 0.000
5 4.970 0.000 4.930 0.000 4.730 0.000 4.500 0.000 4.130 0.000 3.880 0.000
6 5.000 0.000 4.920 0.000 4.720 0.000 4.500 0.000 4.120 0.000 3.860 0.000
7 5.030 0.000 4.930 0.000 4.700 0.000 4.500 0.000 4.100 0.000 3.850 0.000
8 5.000 0.000 4.930 0.000 4.680 0.000 4.510 0.000 4.100 0.000 3.830 0.000
9 5.010 0.000 4.930 0.000 4.680 0.000 4.520 0.000 4.090 0.000 3.820 0.000
10 5.020 0.000 4.930 0.000 4.670 0.000 4.500 0.000 4.080 0.000 3.810 0.000
11 5.020 0.000 4.930 0.000 4.660 0.000 4.500 0.000 4.070 0.000 3.800 0.000
12 5.020 0.000 4.930 0.000 4.630 0.000 4.460 0.000 4.050 0.000 3.860 0.000
13 5.010 0.000 4.920 0.000 4.620 0.000 4.450 0.000 4.030 0.000 3.940 0.000
14 5.010 0.000 4.930 0.000 4.610 0.000 4.430 0.000 4.020 0.000 4.020 0.000
15 5.010 0.000 4.930 0.000 4.600 0.000 4.420 0.000 4.020 0.000 4.100 0.000
16 5.010 0.000 4.930 0.000 4.600 0.000 4.410 0.000 4.020 0.000 4.150 0.000
17 5.010 0.000 4.930 0.000 4.590 0.000 4.390 0.000 4.010 0.000 4.210 0.000
18 5.010 0.000 4.930 0.000 4.580 0.000 4.370 0.000 4.010 0.000 4.250 0.000
19 5.010 0.000 4.930 0.000 4.550 0.000 4.360 0.000 4.000 0.000 4.300 0.000
20 5.000 0.000 4.930 0.000 4.550 0.000 4.360 0.000 3.990 0.000 4.340 0.000
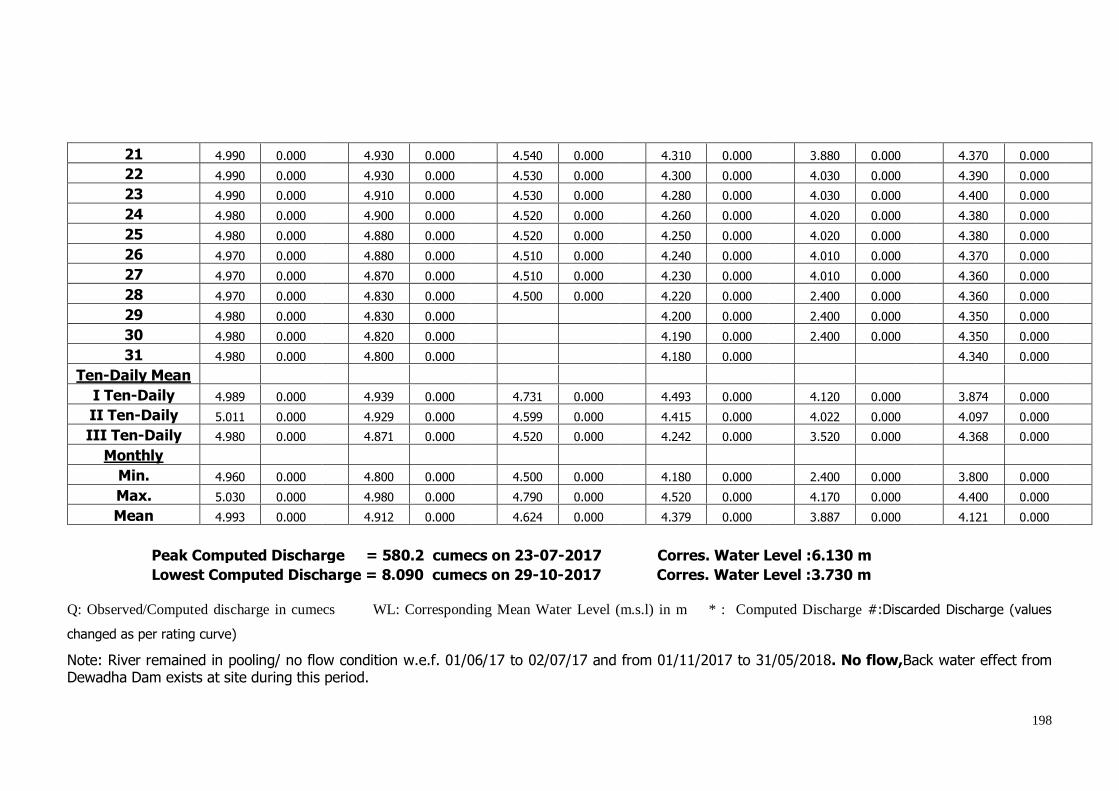
198
21 4.990 0.000 4.930 0.000 4.540 0.000 4.310 0.000 3.880 0.000 4.370 0.000
22 4.990 0.000 4.930 0.000 4.530 0.000 4.300 0.000 4.030 0.000 4.390 0.000
23 4.990 0.000 4.910 0.000 4.530 0.000 4.280 0.000 4.030 0.000 4.400 0.000
24 4.980 0.000 4.900 0.000 4.520 0.000 4.260 0.000 4.020 0.000 4.380 0.000
25 4.980 0.000 4.880 0.000 4.520 0.000 4.250 0.000 4.020 0.000 4.380 0.000
26 4.970 0.000 4.880 0.000 4.510 0.000 4.240 0.000 4.010 0.000 4.370 0.000
27 4.970 0.000 4.870 0.000 4.510 0.000 4.230 0.000 4.010 0.000 4.360 0.000
28 4.970 0.000 4.830 0.000 4.500 0.000 4.220 0.000 2.400 0.000 4.360 0.000
29 4.980 0.000 4.830 0.000 4.200 0.000 2.400 0.000 4.350 0.000
30 4.980 0.000 4.820 0.000 4.190 0.000 2.400 0.000 4.350 0.000
31 4.980 0.000 4.800 0.000 4.180 0.000 4.340 0.000
Ten-Daily Mean
I Ten-Daily 4.989 0.000
4.939 0.000
4.731 0.000
4.493 0.000
4.120 0.000
3.874 0.000 II Ten-Daily 5.011 0.000
4.929 0.000
4.599 0.000
4.415 0.000
4.022 0.000
4.097 0.000
III Ten-Daily 4.980 0.000
4.871 0.000
4.520 0.000
4.242 0.000
3.520 0.000
4.368 0.000 Monthly
Min. 4.960 0.000
4.800 0.000
4.500 0.000
4.180 0.000
2.400 0.000
3.800 0.000 Max. 5.030 0.000
4.980 0.000
4.790 0.000
4.520 0.000
4.170 0.000
4.400 0.000
Mean 4.993 0.000
4.912 0.000
4.624 0.000
4.379 0.000
3.887 0.000
4.121 0.000
Peak Computed Discharge = 580.2 cumecs on 23-07-2017 Corres. Water Level :6.130 m
Lowest Computed Discharge = 8.090 cumecs on 29-10-2017 Corres. Water Level :3.730 m
Q: Observed/Computed discharge in cumecs WL: Corresponding Mean Water Level (m.s.l) in m * : Computed Discharge #:Discarded Discharge (values
changed as per rating curve)
Note: River remained in pooling/ no flow condition w.e.f. 01/06/17 to 02/07/17 and from 01/11/2017 to 31/05/2018. No flow,Back water effect from Dewadha Dam exists at site during this period.
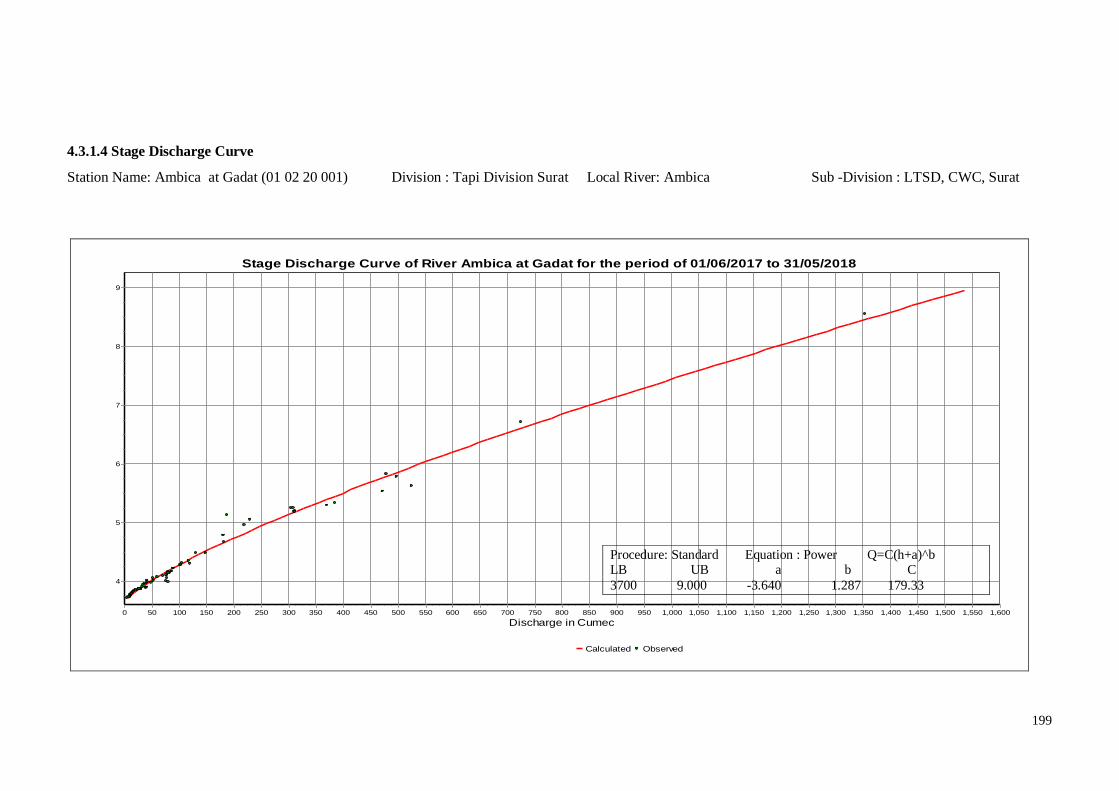
199
4.3.1.4 Stage Discharge Curve
Station Name: Ambica at Gadat (01 02 20 001) Division : Tapi Division Surat Local River: Ambica Sub -Division : LTSD, CWC, Surat
Stage Discharge Curve of River Ambica at Gadat for the period of 01/06/2017 to 31/05/2018
Calculated Observed
Discharge in Cumec1,6001,5501,5001,4501,4001,3501,3001,2501,2001,1501,1001,0501,000950900850800750700650600550500450400350300250200150100500
Sta
ge in
m
9
8
7
6
5
4
Procedure: Standard Equation : Power Q=C(h+a)^b LB UB a b C
3700 9.000 -3.640 1.287 179.33

200
4.3.1.5 Annual runoff
Annual Runoff Values Runoff Based on period 1979 to 2018
Station Name: Ambica at Gadat (01 02 20 001) Division : Tapi Division, Surat Local River: Ambica Sub -Division : LTSD, CWC, Surat
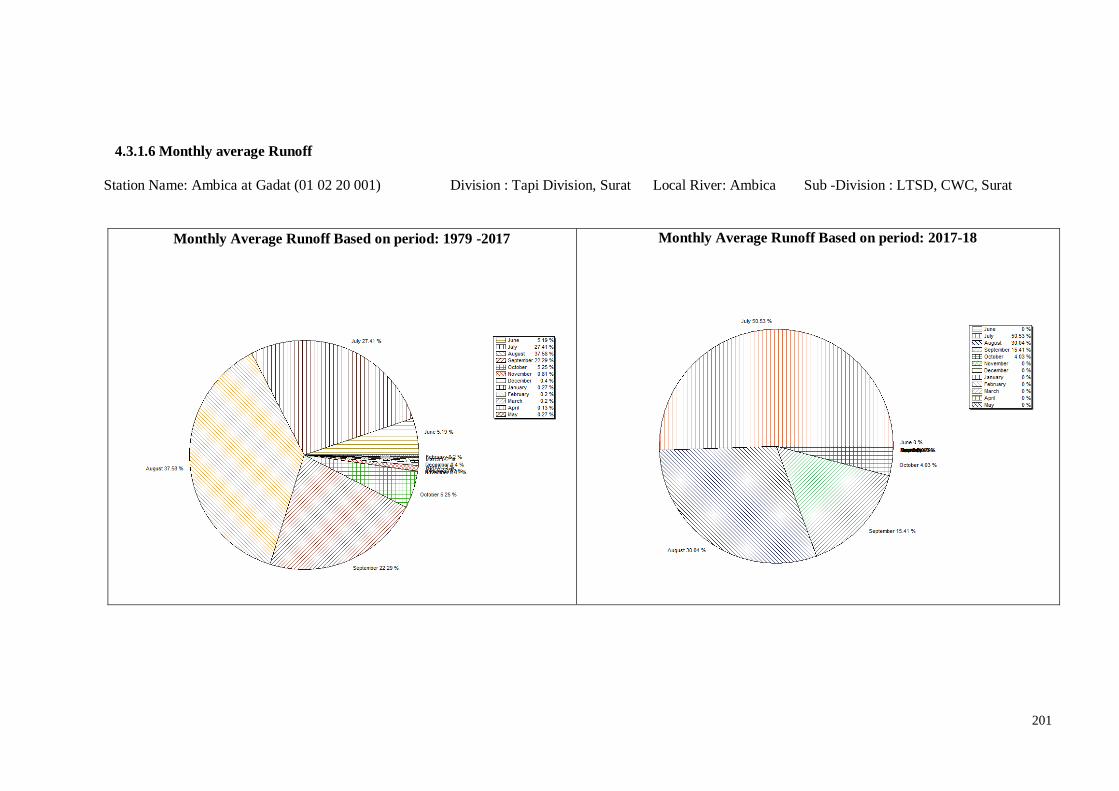
201
4.3.1.6 Monthly average Runoff
Station Name: Ambica at Gadat (01 02 20 001) Division : Tapi Division, Surat Local River: Ambica Sub -Division : LTSD, CWC, Surat
Monthly Average Runoff Based on period: 1979 -2017
Monthly Average Runoff Based on period: 2017-18
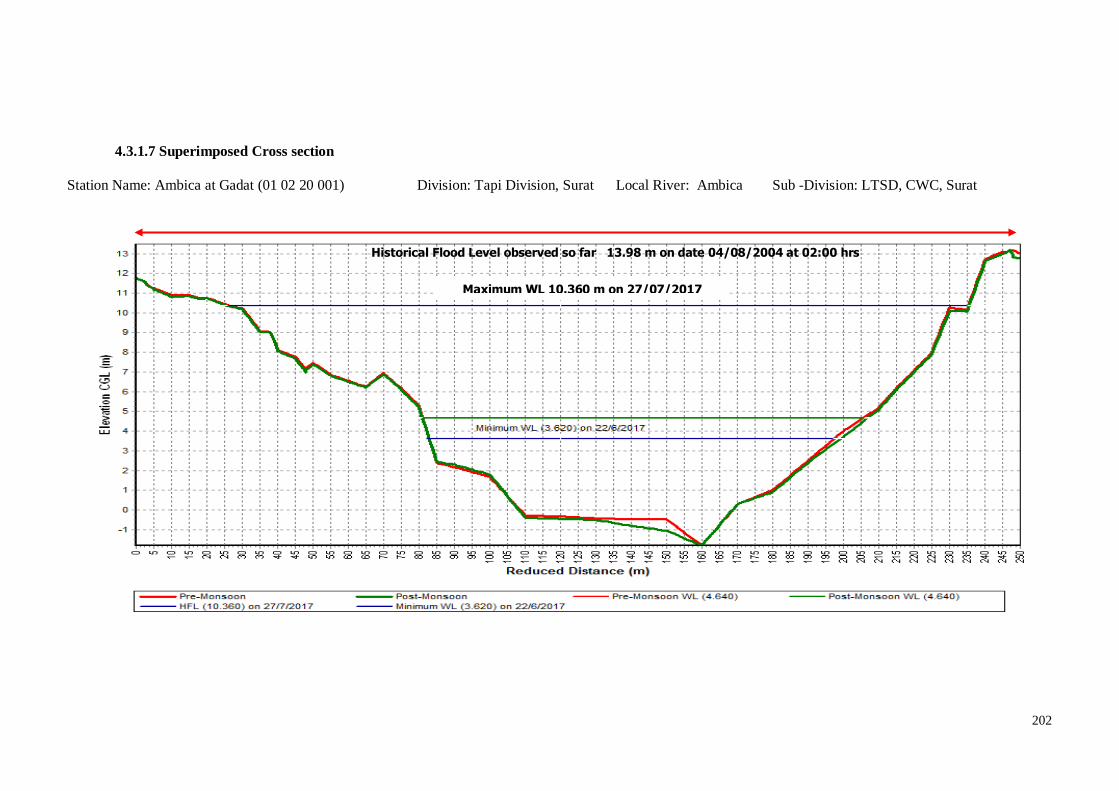
202
4.3.1.7 Superimposed Cross section
Station Name: Ambica at Gadat (01 02 20 001) Division: Tapi Division, Surat Local River: Ambica Sub -Division: LTSD, CWC, Surat
Historical Flood Level observed so far 13.98 m on date 04/08/2004 at 02:00 hrs
Maximum WL 10.360 m on 27/07/2017
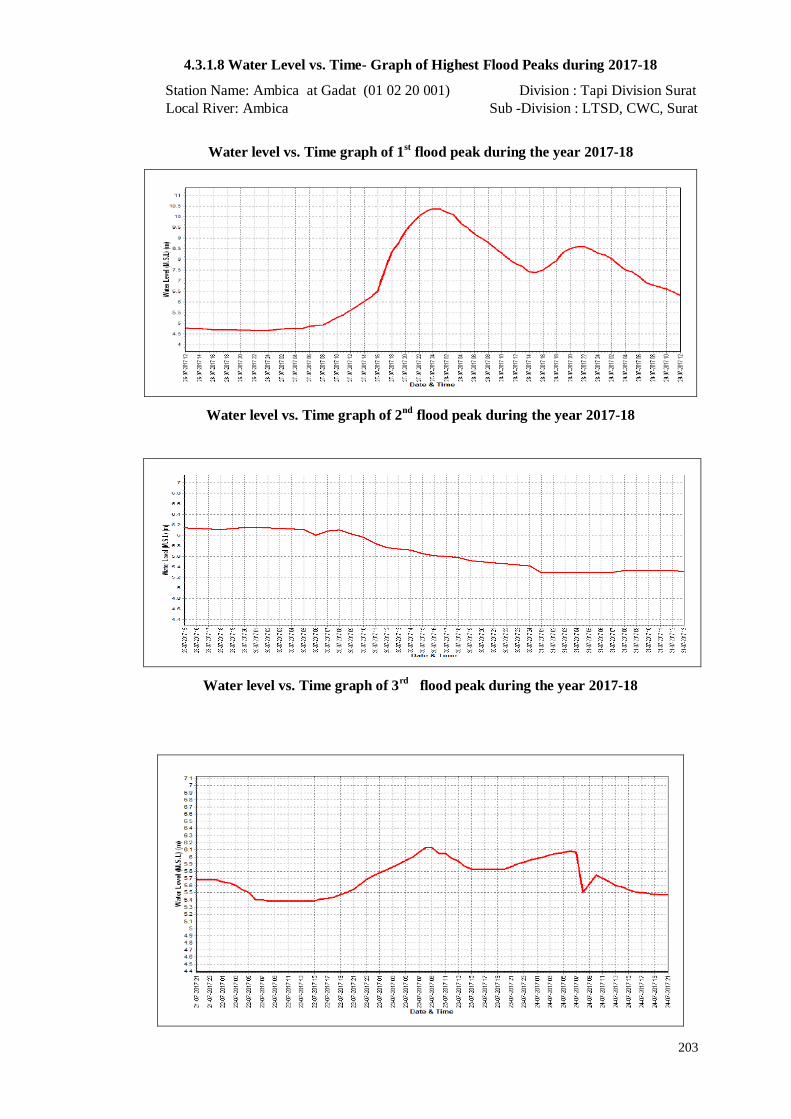
203
4.3.1.8 Water Level vs. Time- Graph of Highest Flood Peaks during 2017-18
Station Name: Ambica at Gadat (01 02 20 001) Division : Tapi Division Surat
Local River: Ambica Sub -Division : LTSD, CWC, Surat
Water level vs. Time graph of 1st flood peak during the year 2017-18
Water level vs. Time graph of 2nd
flood peak during the year 2017-18
Water level vs. Time graph of 3rd
flood peak during the year 2017-18
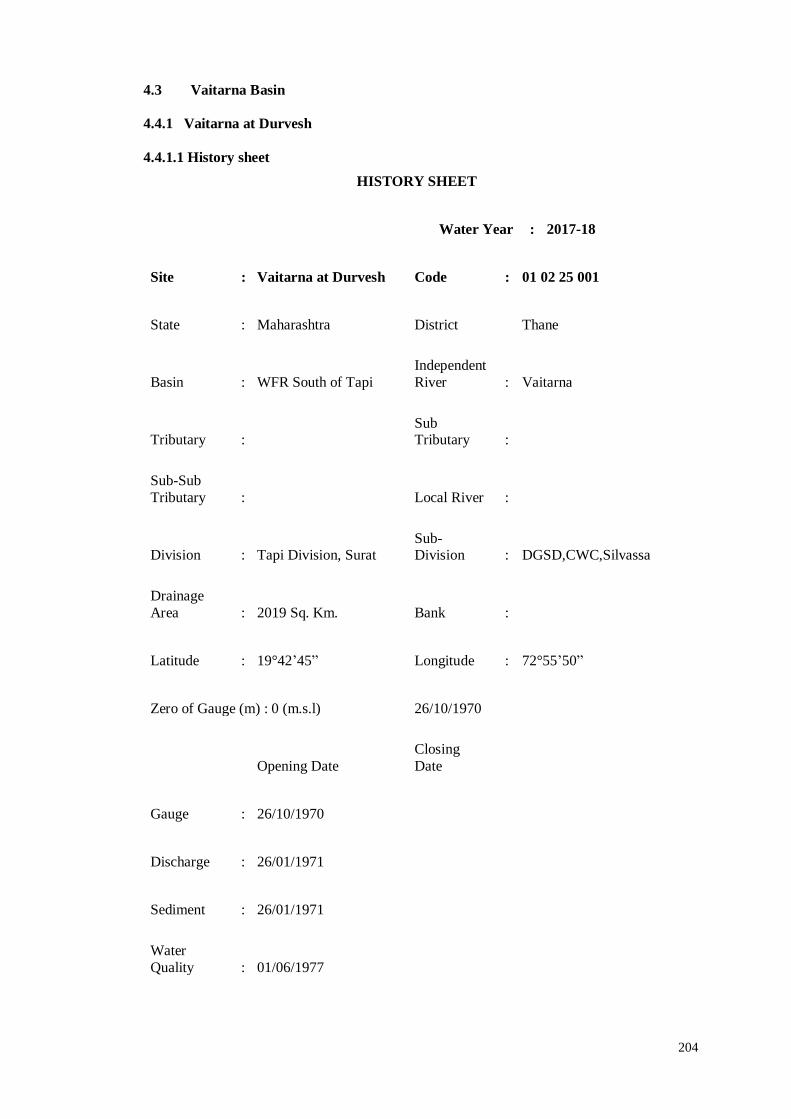
204
4.3 Vaitarna Basin
4.4.1 Vaitarna at Durvesh
4.4.1.1 History sheet
HISTORY SHEET
Water Year : 2017-18
Site : Vaitarna at Durvesh Code : 01 02 25 001
State : Maharashtra District Thane
Basin : WFR South of Tapi
Independent
River : Vaitarna
Tributary : Sub Tributary :
Sub-Sub
Tributary : Local River :
Division : Tapi Division, Surat Sub-Division : DGSD,CWC,Silvassa
Drainage
Area : 2019 Sq. Km. Bank :
Latitude : 19°42’45” Longitude : 72°55’50”
Zero of Gauge (m) : 0 (m.s.l) 26/10/1970
Opening Date
Closing
Date
Gauge : 26/10/1970
Discharge : 26/01/1971
Sediment : 26/01/1971
Water
Quality : 01/06/1977
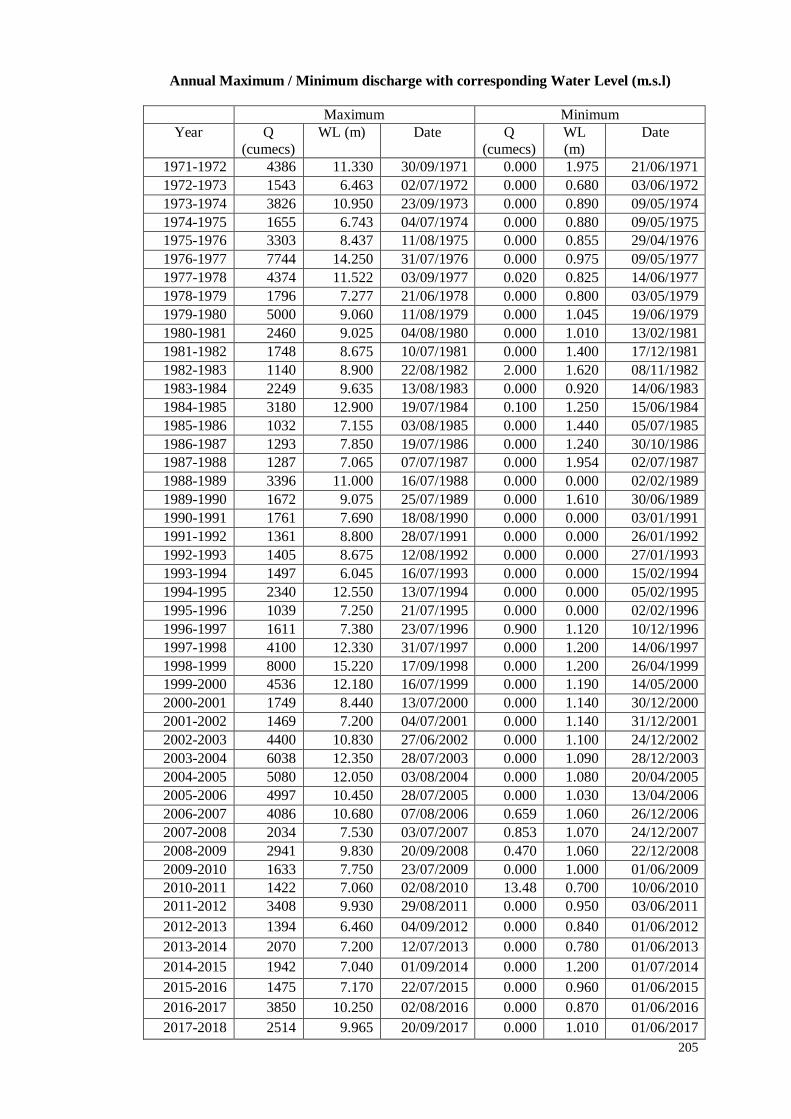
205
Annual Maximum / Minimum discharge with corresponding Water Level (m.s.l)
Maximum Minimum
Year Q
(cumecs)
WL (m) Date Q
(cumecs)
WL
(m)
Date
1971-1972 4386 11.330 30/09/1971 0.000 1.975 21/06/1971
1972-1973 1543 6.463 02/07/1972 0.000 0.680 03/06/1972
1973-1974 3826 10.950 23/09/1973 0.000 0.890 09/05/1974
1974-1975 1655 6.743 04/07/1974 0.000 0.880 09/05/1975
1975-1976 3303 8.437 11/08/1975 0.000 0.855 29/04/1976
1976-1977 7744 14.250 31/07/1976 0.000 0.975 09/05/1977
1977-1978 4374 11.522 03/09/1977 0.020 0.825 14/06/1977
1978-1979 1796 7.277 21/06/1978 0.000 0.800 03/05/1979
1979-1980 5000 9.060 11/08/1979 0.000 1.045 19/06/1979
1980-1981 2460 9.025 04/08/1980 0.000 1.010 13/02/1981
1981-1982 1748 8.675 10/07/1981 0.000 1.400 17/12/1981
1982-1983 1140 8.900 22/08/1982 2.000 1.620 08/11/1982
1983-1984 2249 9.635 13/08/1983 0.000 0.920 14/06/1983
1984-1985 3180 12.900 19/07/1984 0.100 1.250 15/06/1984
1985-1986 1032 7.155 03/08/1985 0.000 1.440 05/07/1985
1986-1987 1293 7.850 19/07/1986 0.000 1.240 30/10/1986
1987-1988 1287 7.065 07/07/1987 0.000 1.954 02/07/1987
1988-1989 3396 11.000 16/07/1988 0.000 0.000 02/02/1989
1989-1990 1672 9.075 25/07/1989 0.000 1.610 30/06/1989
1990-1991 1761 7.690 18/08/1990 0.000 0.000 03/01/1991
1991-1992 1361 8.800 28/07/1991 0.000 0.000 26/01/1992
1992-1993 1405 8.675 12/08/1992 0.000 0.000 27/01/1993
1993-1994 1497 6.045 16/07/1993 0.000 0.000 15/02/1994
1994-1995 2340 12.550 13/07/1994 0.000 0.000 05/02/1995
1995-1996 1039 7.250 21/07/1995 0.000 0.000 02/02/1996
1996-1997 1611 7.380 23/07/1996 0.900 1.120 10/12/1996
1997-1998 4100 12.330 31/07/1997 0.000 1.200 14/06/1997
1998-1999 8000 15.220 17/09/1998 0.000 1.200 26/04/1999
1999-2000 4536 12.180 16/07/1999 0.000 1.190 14/05/2000
2000-2001 1749 8.440 13/07/2000 0.000 1.140 30/12/2000
2001-2002 1469 7.200 04/07/2001 0.000 1.140 31/12/2001
2002-2003 4400 10.830 27/06/2002 0.000 1.100 24/12/2002
2003-2004 6038 12.350 28/07/2003 0.000 1.090 28/12/2003
2004-2005 5080 12.050 03/08/2004 0.000 1.080 20/04/2005
2005-2006 4997 10.450 28/07/2005 0.000 1.030 13/04/2006
2006-2007 4086 10.680 07/08/2006 0.659 1.060 26/12/2006
2007-2008 2034 7.530 03/07/2007 0.853 1.070 24/12/2007
2008-2009 2941 9.830 20/09/2008 0.470 1.060 22/12/2008
2009-2010 1633 7.750 23/07/2009 0.000 1.000 01/06/2009
2010-2011 1422 7.060 02/08/2010 13.48 0.700 10/06/2010
2011-2012 3408 9.930 29/08/2011 0.000 0.950 03/06/2011
2012-2013 1394 6.460 04/09/2012 0.000 0.840 01/06/2012
2013-2014 2070 7.200 12/07/2013 0.000 0.780 01/06/2013
2014-2015 1942 7.040 01/09/2014 0.000 1.200 01/07/2014
2015-2016 1475 7.170 22/07/2015 0.000 0.960 01/06/2015
2016-2017 3850 10.250 02/08/2016 0.000 0.870 01/06/2016
2017-2018 2514 9.965 20/09/2017 0.000 1.010 01/06/2017

206
4.4.1.2 Annual Maximum Flood Peak
Year
Annual Maximum flood Peaks (m) Date Hour
1974 7.690 04/07/1974 15:00:00
1975 9.860 30/07/1975 03:00:00
1976 14.700 31/07/1976 15:00:00
1977 12.075 03/09/1977 06:00:00
1978 7.720 21/06/1978 10:00:00
1979 9.510 11/08/1979 06:00:00
1980 10.830 04/08/1980 00:00:00
1981 10.500 10/07/1981 20:00:00
1982 9.200 22/08/1982 09:00:00
1983 12.000 15/08/1983 19:00:00
1984 14.460 18/07/1984 18:00:00
1985 8.050 03/08/1985 18:00:00
1986 8.300 15/07/1986 20:00:00
1987 10.800 20/08/1987 15:00:00
1988 13.800 16/07/1988 16:00:00
1989 11.540 25/07/1989 01:00:00
1990 10.250 03/07/1990 20:00:00
1991 10.500 28/07/1991 00:00:00
1992 10.500 03/09/1992 21:00:00
1993 11.900 17/07/1993 00:00:00
1994 12.800 13/07/1994 08:00:00
1995 8.100 21/07/1995 18:00:00
1996 8.220 23/07/1996 18:00:00
1997 12.920 31/07/1997 13:00:00
1998 16.130 17/09/1998 13:00:00
1999 12.500 16/07/1999 09:00:00
2000 8.670 13/07/2000 14:00:00
2001 8.300 09/07/2001 18:00:00
2002 14.500 26/06/2002 18:00:00
2003 12.400 28/07/2003 09:00:00
2004 15.120 02/08/2004 22:00:00
2005 11.340 02/08/2005 14:00:00
2006 11.300 08/08/2006 16:00:00
2007 9.680 05/08/2007 19:00:00
2008 14.220 11/08/2008 20:00:00
2009 9.600 22/07/2009 15:00:00
2010 8.160 31/08/2010 19:00:00
2011 12.720 28/08/2011 19:00:00
2012 7.480 04/09/2012 18:00:00
2013 8.260 02/08/2013 04:00:00
2014 11.950 29/07/2014 14:00:00
2015 7.480 22/07/2015 14:00:00
2016 10.550 02/08/2016 18:00:00
2017 10.620 25/06/2017 10:00:00
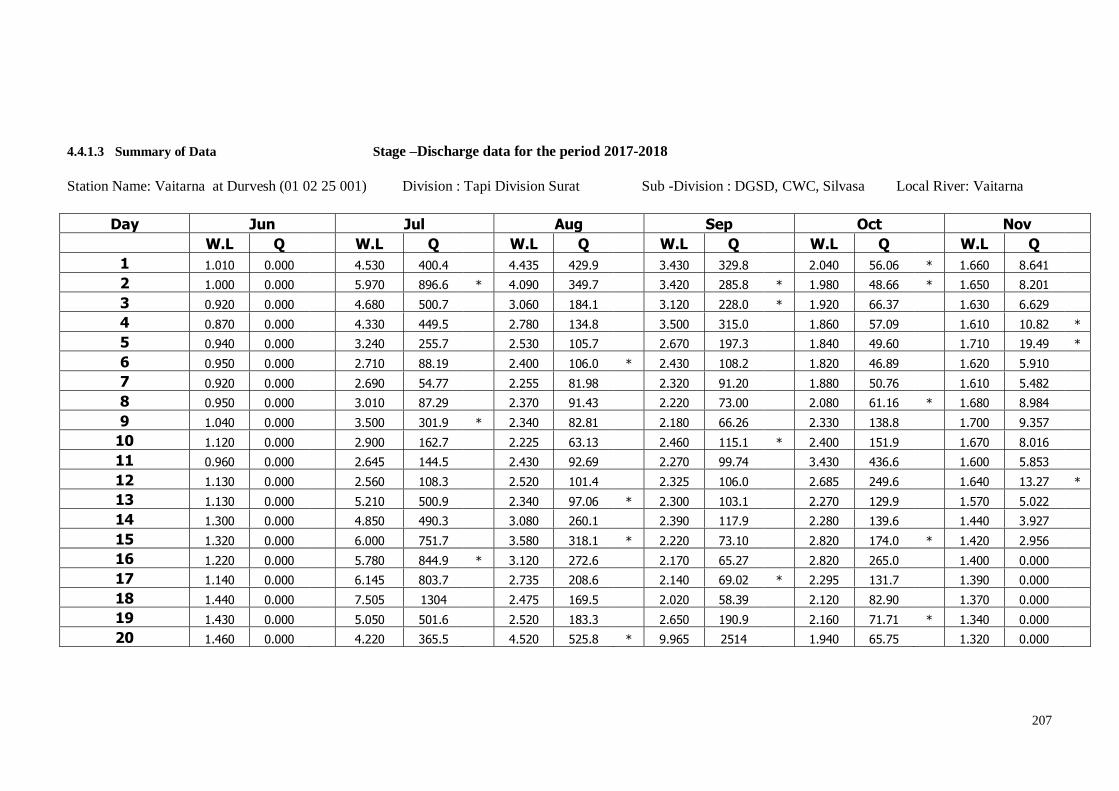
207
4.4.1.3 Summary of Data Stage –Discharge data for the period 2017-2018
Station Name: Vaitarna at Durvesh (01 02 25 001) Division : Tapi Division Surat Sub -Division : DGSD, CWC, Silvasa Local River: Vaitarna
Day Jun Jul Aug Sep Oct Nov
W.L Q W.L Q W.L Q W.L Q W.L Q W.L Q
1 1.010 0.000 4.530 400.4 4.435 429.9 3.430 329.8 2.040 56.06 * 1.660 8.641
2 1.000 0.000 5.970 896.6 * 4.090 349.7 3.420 285.8 * 1.980 48.66 * 1.650 8.201
3 0.920 0.000 4.680 500.7 3.060 184.1 3.120 228.0 * 1.920 66.37 1.630 6.629
4 0.870 0.000 4.330 449.5 2.780 134.8 3.500 315.0 1.860 57.09 1.610 10.82 *
5 0.940 0.000 3.240 255.7 2.530 105.7 2.670 197.3 1.840 49.60 1.710 19.49 *
6 0.950 0.000 2.710 88.19 2.400 106.0 * 2.430 108.2 1.820 46.89 1.620 5.910
7 0.920 0.000 2.690 54.77 2.255 81.98 2.320 91.20 1.880 50.76 1.610 5.482
8 0.950 0.000 3.010 87.29 2.370 91.43 2.220 73.00 2.080 61.16 * 1.680 8.984
9 1.040 0.000 3.500 301.9 * 2.340 82.81 2.180 66.26 2.330 138.8 1.700 9.357
10 1.120 0.000 2.900 162.7 2.225 63.13 2.460 115.1 * 2.400 151.9 1.670 8.016
11 0.960 0.000 2.645 144.5 2.430 92.69 2.270 99.74 3.430 436.6 1.600 5.853
12 1.130 0.000 2.560 108.3 2.520 101.4 2.325 106.0 2.685 249.6 1.640 13.27 *
13 1.130 0.000 5.210 500.9 2.340 97.06 * 2.300 103.1 2.270 129.9 1.570 5.022
14 1.300 0.000 4.850 490.3 3.080 260.1 2.390 117.9 2.280 139.6 1.440 3.927
15 1.320 0.000 6.000 751.7 3.580 318.1 * 2.220 73.10 2.820 174.0 * 1.420 2.956
16 1.220 0.000 5.780 844.9 * 3.120 272.6 2.170 65.27 2.820 265.0 1.400 0.000
17 1.140 0.000 6.145 803.7 2.735 208.6 2.140 69.02 * 2.295 131.7 1.390 0.000
18 1.440 0.000 7.505 1304 2.475 169.5 2.020 58.39 2.120 82.90 1.370 0.000
19 1.430 0.000 5.050 501.6 2.520 183.3 2.650 190.9 2.160 71.71 * 1.340 0.000
20 1.460 0.000 4.220 365.5 4.520 525.8 * 9.965 2514 1.940 65.75 1.320 0.000
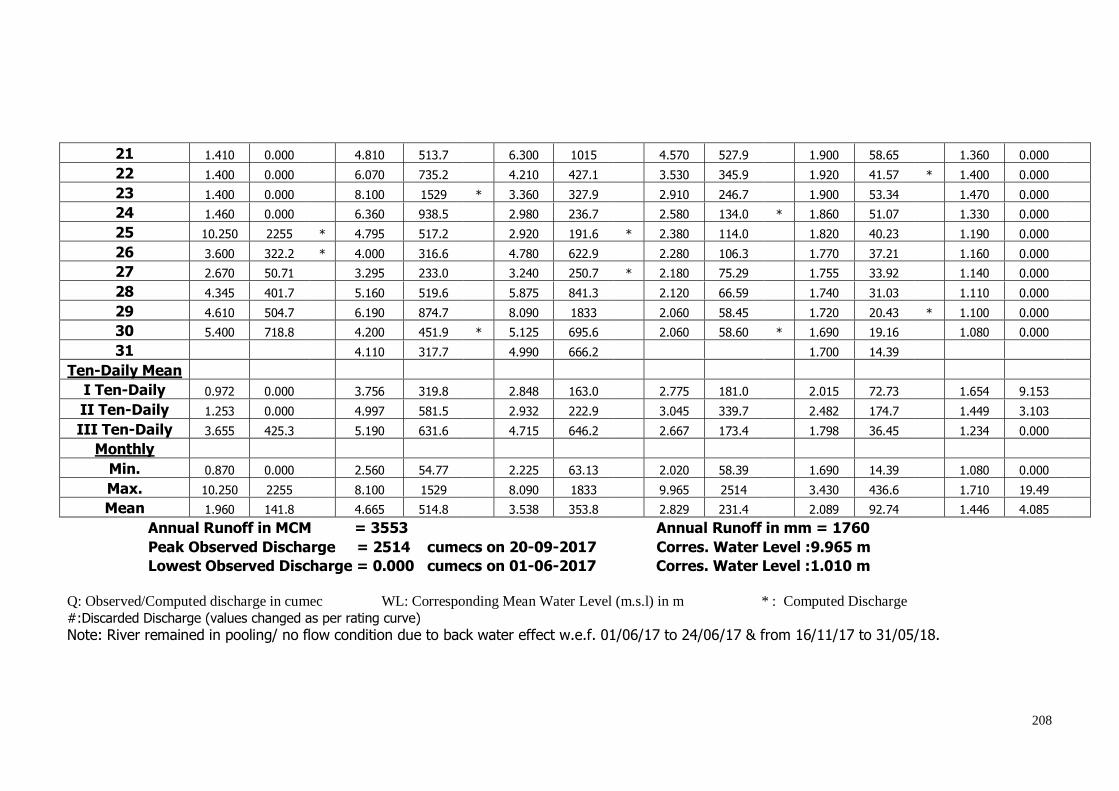
208
21 1.410 0.000 4.810 513.7 6.300 1015 4.570 527.9 1.900 58.65 1.360 0.000
22 1.400 0.000 6.070 735.2 4.210 427.1 3.530 345.9 1.920 41.57 * 1.400 0.000
23 1.400 0.000 8.100 1529 * 3.360 327.9 2.910 246.7 1.900 53.34 1.470 0.000
24 1.460 0.000 6.360 938.5 2.980 236.7 2.580 134.0 * 1.860 51.07 1.330 0.000
25 10.250 2255 * 4.795 517.2 2.920 191.6 * 2.380 114.0 1.820 40.23 1.190 0.000
26 3.600 322.2 * 4.000 316.6 4.780 622.9 2.280 106.3 1.770 37.21 1.160 0.000
27 2.670 50.71 3.295 233.0 3.240 250.7 * 2.180 75.29 1.755 33.92 1.140 0.000
28 4.345 401.7 5.160 519.6 5.875 841.3 2.120 66.59 1.740 31.03 1.110 0.000
29 4.610 504.7 6.190 874.7 8.090 1833 2.060 58.45 1.720 20.43 * 1.100 0.000
30 5.400 718.8 4.200 451.9 * 5.125 695.6 2.060 58.60 * 1.690 19.16 1.080 0.000
31 4.110 317.7 4.990 666.2 1.700 14.39
Ten-Daily Mean
I Ten-Daily 0.972 0.000
3.756 319.8
2.848 163.0
2.775 181.0
2.015 72.73
1.654 9.153 II Ten-Daily 1.253 0.000
4.997 581.5
2.932 222.9
3.045 339.7
2.482 174.7
1.449 3.103
III Ten-Daily 3.655 425.3
5.190 631.6
4.715 646.2
2.667 173.4
1.798 36.45
1.234 0.000 Monthly
Min. 0.870 0.000
2.560 54.77
2.225 63.13
2.020 58.39
1.690 14.39
1.080 0.000 Max. 10.250 2255
8.100 1529
8.090 1833
9.965 2514
3.430 436.6
1.710 19.49
Mean 1.960 141.8
4.665 514.8
3.538 353.8
2.829 231.4
2.089 92.74
1.446 4.085 Annual Runoff in MCM = 3553 Annual Runoff in mm = 1760
Peak Observed Discharge = 2514 cumecs on 20-09-2017 Corres. Water Level :9.965 m
Lowest Observed Discharge = 0.000 cumecs on 01-06-2017 Corres. Water Level :1.010 m
Q: Observed/Computed discharge in cumec WL: Corresponding Mean Water Level (m.s.l) in m * : Computed Discharge
#:Discarded Discharge (values changed as per rating curve)
Note: River remained in pooling/ no flow condition due to back water effect w.e.f. 01/06/17 to 24/06/17 & from 16/11/17 to 31/05/18.

209
Stage –Discharge data for the period 2017-2018
Station Name: Vaitarna at Durvesh (01 02 25 001) Division : Tapi Division, Surat Sub -Division : DGSD, CWC, Silvassa Local River: Vaitarna
Day Dec Jan Feb Mar Apr May
W.L Q WL Q WL Q WL Q WL Q WL Q
1 1.150 0.000 1.340 0.000 1.410 0.000 1.360 0.000 1.640 0.000 1.380 0.000
2 1.210 0.000 1.370 0.000 1.360 0.000 1.440 0.000 1.480 0.000 1.360 0.000
3 1.220 0.000 1.260 0.000 1.460 0.000 1.470 0.000 1.440 0.000 1.310 0.000
4 1.400 0.000 1.300 0.000 1.387 0.000 1.460 0.000 1.380 0.000 1.180 0.000
5 1.430 0.000 1.410 0.000 1.520 0.000 1.480 0.000 1.260 0.000 1.100 0.000
6 1.600 0.000 1.550 0.000 1.550 0.000 1.500 0.000 1.120 0.000 1.060 0.000
7 1.630 0.000 1.410 0.000 1.310 0.000 1.420 0.000 0.720 0.000 1.070 0.000
8 1.660 0.000 1.340 0.000 1.040 0.000 1.160 0.000 0.670 0.000 0.940 0.000
9 1.670 0.000 1.310 0.000 1.010 0.000 1.040 0.000 0.690 0.000 0.910 0.000
10 1.650 0.000 1.260 0.000 1.000 0.000 0.900 0.000 0.750 0.000 0.850 0.000
11 1.440 0.000 1.280 0.000 0.990 0.000 0.900 0.000 0.750 0.000 0.890 0.000
12 1.360 0.000 1.290 0.000 1.000 0.000 0.800 0.000 0.670 0.000 1.110 0.000
13 1.320 0.000 1.170 0.000 1.040 0.000 0.820 0.000 1.060 0.000 1.170 0.000
14 1.360 0.000 1.160 0.000 1.120 0.000 0.890 0.000 1.240 0.000 1.250 0.000
15 1.410 0.000 1.250 0.000 1.280 0.000 1.050 0.000 1.440 0.000 1.320 0.000
16 1.370 0.000 1.330 0.000 1.340 0.000 1.260 0.000 1.480 0.000 1.360 0.000
17 1.460 0.000 1.400 0.000 1.400 0.000 1.340 0.000 1.300 0.000 1.390 0.000
18 1.420 0.000 1.410 0.000 1.410 0.000 1.420 0.000 1.320 0.000 1.420 0.000
19 1.440 0.000 1.410 0.000 1.250 0.000 1.390 0.000 1.420 0.000 1.430 0.000
20 1.450 0.000 1.450 0.000 1.220 0.000 1.440 0.000 1.440 0.000 1.300 0.000

210
21 1.460 0.000 1.440 0.000 1.300 0.000 1.470 0.000 1.280 0.000 1.260 0.000
22 1.480 0.000 1.400 0.000 1.370 0.000 1.450 0.000 1.080 0.000 1.320 0.000
23 1.480 0.000 1.520 0.000 1.190 0.000 1.320 0.000 0.980 0.000 1.280 0.000
24 1.430 0.000 1.330 0.000 1.210 0.000 1.140 0.000 1.020 0.000 1.260 0.000
25 1.360 0.000 1.200 0.000 1.270 0.000 1.100 0.000 1.060 0.000 1.390 0.000
26 1.260 0.000 1.170 0.000 1.310 0.000 1.080 0.000 1.080 0.000 1.150 0.000
27 1.230 0.000 1.100 0.000 1.160 0.000 0.950 0.000 1.220 0.000 1.320 0.000
28 1.240 0.000 1.180 0.000 1.300 0.000 1.140 0.000 1.310 0.000 1.180 0.000
29 1.210 0.000 1.300 0.000 1.260 0.000 1.420 0.000 1.220 0.000
30 1.250 0.000 1.340 0.000 1.320 0.000 1.360 0.000 1.190 0.000
31 1.670 0.000 1.370 0.000 1.350 0.000 1.210 0.000
Ten-Daily Mean
I Ten-Daily 1.462 0.000
1.355 0.000
1.305 0.000
1.323 0.000
1.115 0.000
1.116 0.000 II Ten-Daily 1.403 0.000
1.315 0.000
1.205 0.000
1.131 0.000
1.212 0.000
1.264 0.000
III Ten-Daily 1.370 0.000
1.305 0.000
1.264 0.000
1.235 0.000
1.181 0.000
1.253 0.000 Monthly
Min. 1.150 0.000
1.100 0.000
0.990 0.000
0.800 0.000
0.670 0.000
0.850 0.000 Max. 1.670 0.000
1.550 0.000
1.550 0.000
1.500 0.000
1.640 0.000
1.430 0.000
Mean 1.410 0.000
1.324 0.000
1.257 0.000
1.230 0.000
1.169 0.000
1.212 0.000
Peak Computed Discharge = 2255 cumecs on 25-06-2017 Corres. Water Level :10.250 m
Lowest Computed Discharge = 10.820 cumecs on 04-11-2017 Corres. Water Level : 1.610 m
Q: Observed/Computed discharge in cumec WL: Corresponding Mean Water Level (m.s.l) in m * : Computed Discharge #:Discarded Discharge (values changed as per rating curve)
Note: River remained in pooling/ no flow condition due to back water effect w.e.f. 01/06/17 to 24/06/17 & from 16/11/17 to 31/05/18.
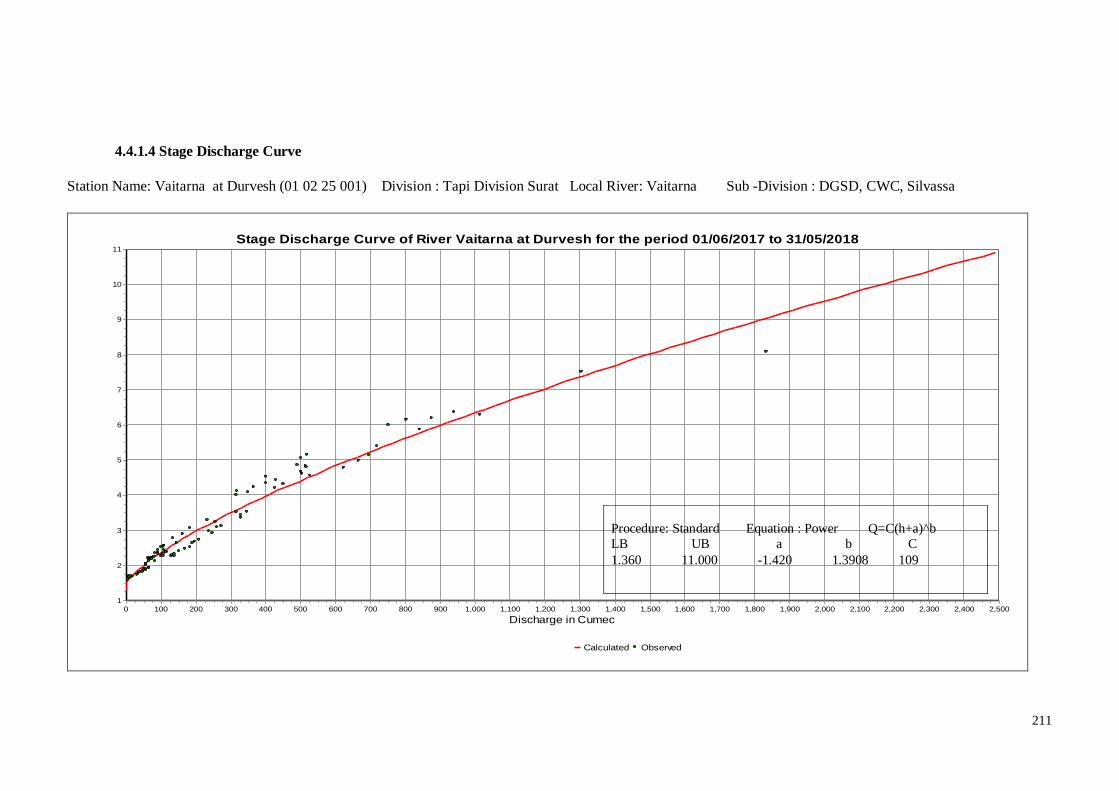
211
4.4.1.4 Stage Discharge Curve
Station Name: Vaitarna at Durvesh (01 02 25 001) Division : Tapi Division Surat Local River: Vaitarna Sub -Division : DGSD, CWC, Silvassa
Stage Discharge Curve of River Vaitarna at Durvesh for the period 01/06/2017 to 31/05/2018
Calculated Observed
Discharge in Cumec2,5002,4002,3002,2002,1002,0001,9001,8001,7001,6001,5001,4001,3001,2001,1001,0009008007006005004003002001000
Sta
ge
in m
11
10
9
8
7
6
5
4
3
2
1
Procedure: Standard Equation : Power Q=C(h+a)^b
LB UB a b C
1.360 11.000 -1.420 1.3908 109
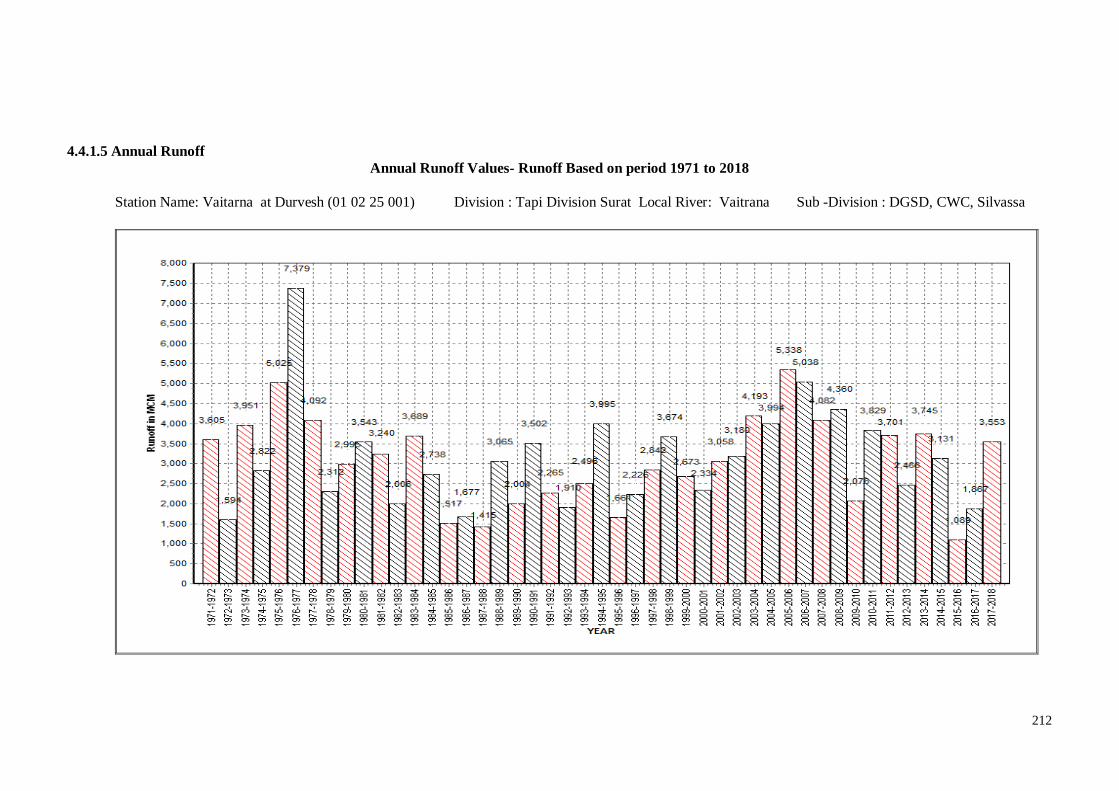
212
4.4.1.5 Annual Runoff
Annual Runoff Values- Runoff Based on period 1971 to 2018
Station Name: Vaitarna at Durvesh (01 02 25 001) Division : Tapi Division Surat Local River: Vaitrana Sub -Division : DGSD, CWC, Silvassa

213
4.4.1.6 Monthly Average Runoff
Station Name: Vaitarna at Durvesh (01 02 25 001) Division : Tapi Division Surat Local River: Vaitarna Sub -Division : DGSD, CWC, Silvassa
Monthly Average Runoff Based on period: 1971 -2017
Monthly Average Runoff Based on period: 2017-18
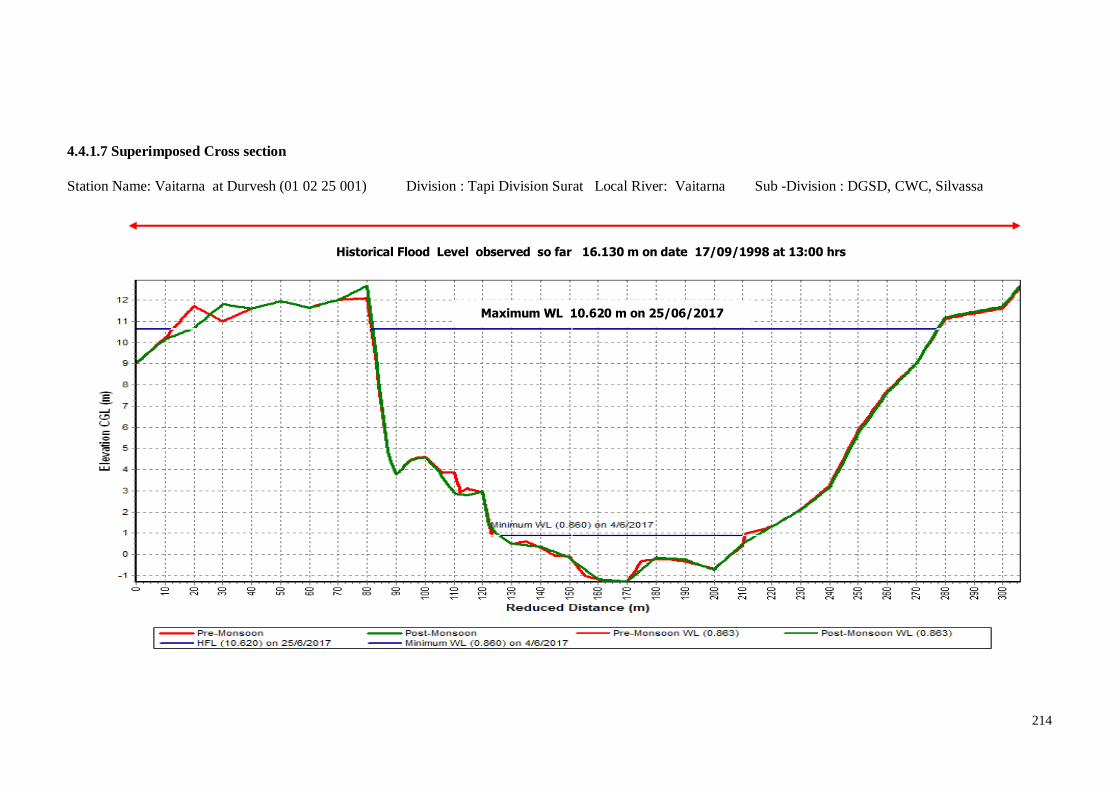
214
4.4.1.7 Superimposed Cross section
Station Name: Vaitarna at Durvesh (01 02 25 001) Division : Tapi Division Surat Local River: Vaitarna Sub -Division : DGSD, CWC, Silvassa
Historical Flood Level observed so far 16.130 m on date 17/09/1998 at 13:00 hrs
Maximum WL 10.620 m on 25/06/2017

215
4.4.1.8 Water Level vs. Time- Graph of Highest Flood Peaks during 2017-18
Station Name: Vaitarna at Durvesh (01 02 25 001) Division : Tapi Division Surat
Local River: Vaitarna Sub -Division : DGSD, CWC, Silvassa
Water level vs. Time graph of I flood peak during the year 2017-18
Water level vs. Time graph of II flood peak during the year 2017-18
Water level vs. Time graph of III flood peak during the year 2017-18
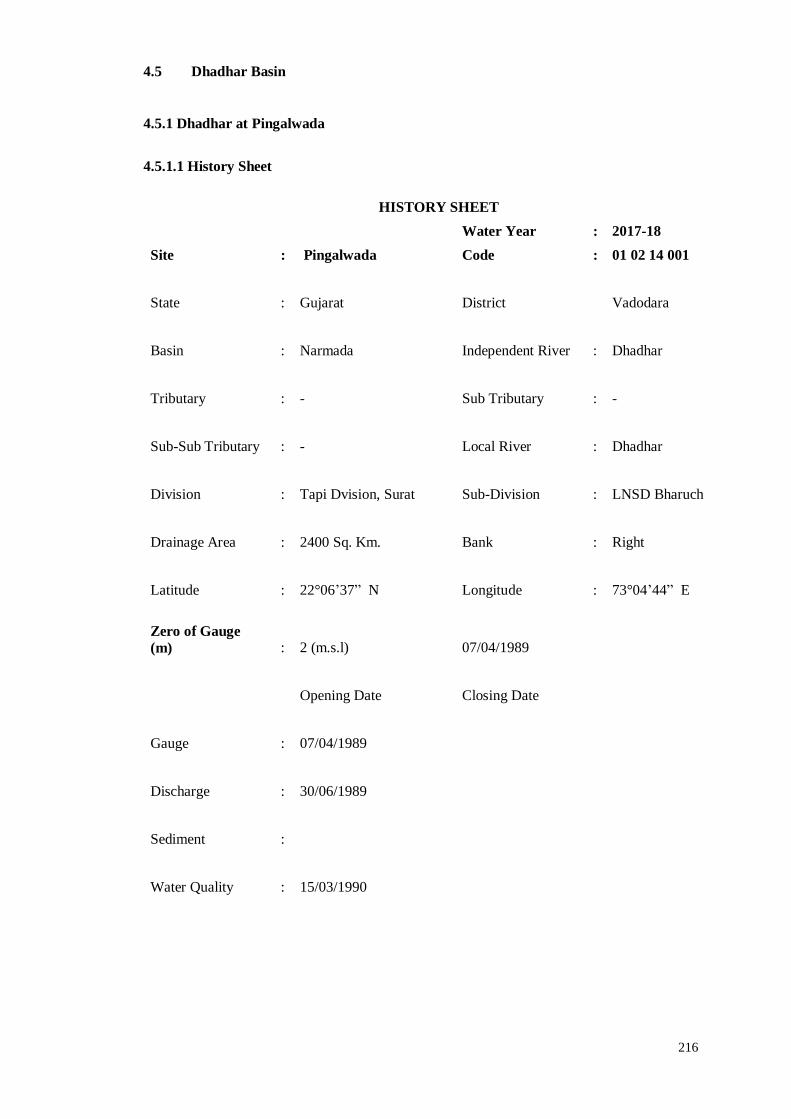
216
4.5 Dhadhar Basin
4.5.1 Dhadhar at Pingalwada
4.5.1.1 History Sheet
HISTORY SHEET
Water Year : 2017-18
Site : Pingalwada Code : 01 02 14 001
State : Gujarat District Vadodara
Basin : Narmada Independent River : Dhadhar
Tributary : - Sub Tributary : -
Sub-Sub Tributary : - Local River : Dhadhar
Division : Tapi Dvision, Surat Sub-Division : LNSD Bharuch
Drainage Area : 2400 Sq. Km. Bank : Right
Latitude : 22°06’37” N Longitude : 73°04’44” E
Zero of Gauge
(m) : 2 (m.s.l) 07/04/1989
Opening Date Closing Date
Gauge : 07/04/1989
Discharge : 30/06/1989
Sediment :
Water Quality : 15/03/1990
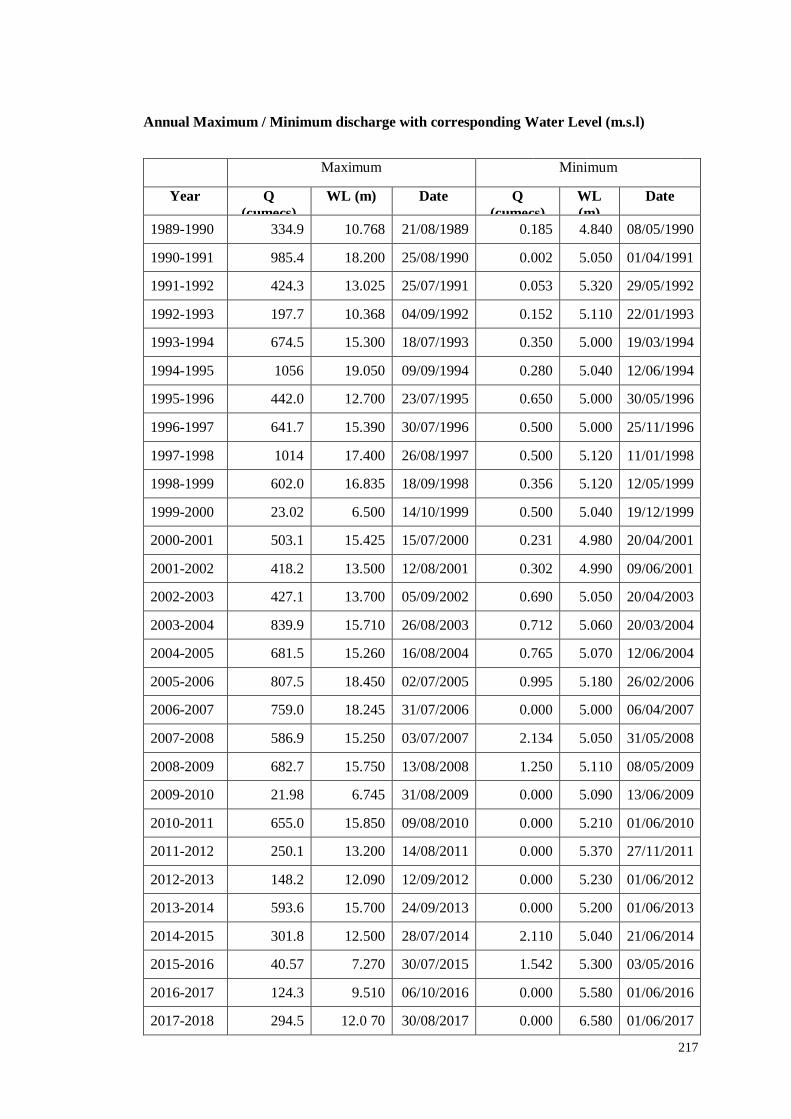
217
Annual Maximum / Minimum discharge with corresponding Water Level (m.s.l)
Maximum Minimum
Year Q
(cumecs)
WL (m) Date Q
(cumecs)
WL
(m)
Date
1989-1990 334.9 10.768 21/08/1989 0.185 4.840 08/05/1990
1990-1991 985.4 18.200 25/08/1990 0.002 5.050 01/04/1991
1991-1992 424.3 13.025 25/07/1991 0.053 5.320 29/05/1992
1992-1993 197.7 10.368 04/09/1992 0.152 5.110 22/01/1993
1993-1994 674.5 15.300 18/07/1993 0.350 5.000 19/03/1994
1994-1995 1056 19.050 09/09/1994 0.280 5.040 12/06/1994
1995-1996 442.0 12.700 23/07/1995 0.650 5.000 30/05/1996
1996-1997 641.7 15.390 30/07/1996 0.500 5.000 25/11/1996
1997-1998 1014 17.400 26/08/1997 0.500 5.120 11/01/1998
1998-1999 602.0 16.835 18/09/1998 0.356 5.120 12/05/1999
1999-2000 23.02 6.500 14/10/1999 0.500 5.040 19/12/1999
2000-2001 503.1 15.425 15/07/2000 0.231 4.980 20/04/2001
2001-2002 418.2 13.500 12/08/2001 0.302 4.990 09/06/2001
2002-2003 427.1 13.700 05/09/2002 0.690 5.050 20/04/2003
2003-2004 839.9 15.710 26/08/2003 0.712 5.060 20/03/2004
2004-2005 681.5 15.260 16/08/2004 0.765 5.070 12/06/2004
2005-2006 807.5 18.450 02/07/2005 0.995 5.180 26/02/2006
2006-2007 759.0 18.245 31/07/2006 0.000 5.000 06/04/2007
2007-2008 586.9 15.250 03/07/2007 2.134 5.050 31/05/2008
2008-2009 682.7 15.750 13/08/2008 1.250 5.110 08/05/2009
2009-2010 21.98 6.745 31/08/2009 0.000 5.090 13/06/2009
2010-2011 655.0 15.850 09/08/2010 0.000 5.210 01/06/2010
2011-2012 250.1 13.200 14/08/2011 0.000 5.370 27/11/2011
2012-2013 148.2 12.090 12/09/2012 0.000 5.230 01/06/2012
2013-2014 593.6 15.700 24/09/2013 0.000 5.200 01/06/2013
2014-2015 301.8 12.500 28/07/2014 2.110 5.040 21/06/2014
2015-2016 40.57 7.270 30/07/2015 1.542 5.300 03/05/2016
2016-2017 124.3 9.510 06/10/2016 0.000 5.580 01/06/2016
2017-2018 294.5 12.0 70 30/08/2017 0.000 6.580 01/06/2017
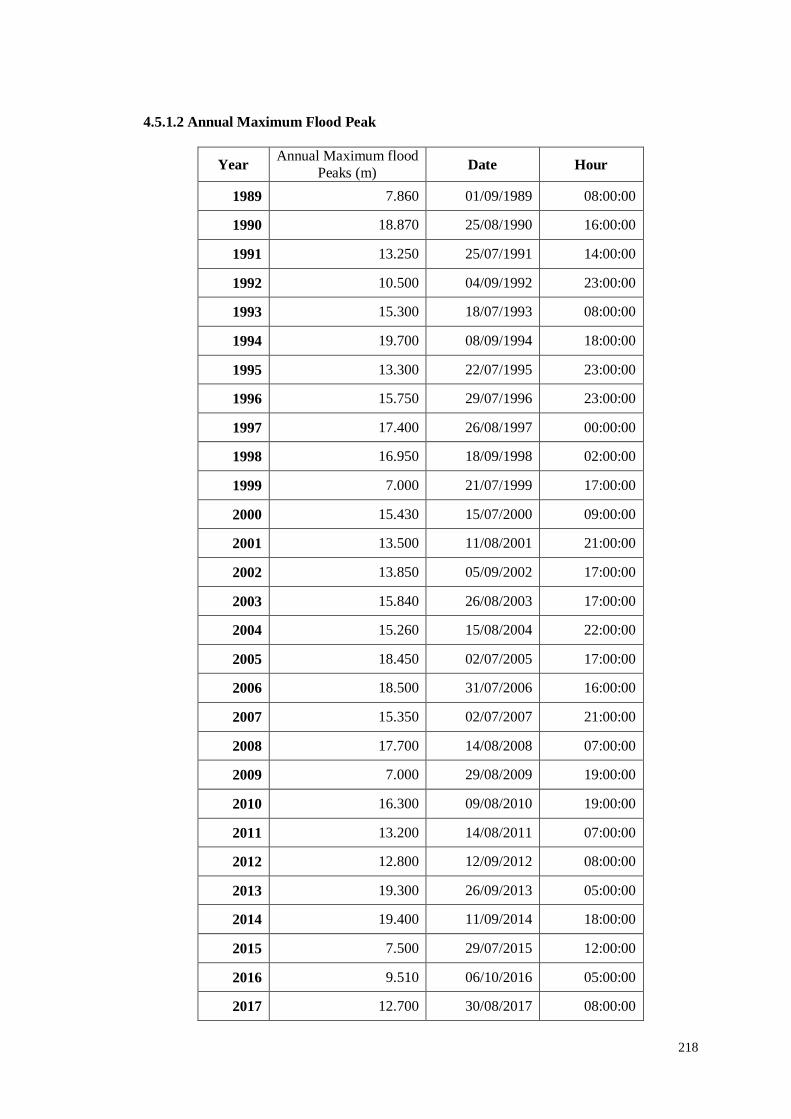
218
4.5.1.2 Annual Maximum Flood Peak
Year Annual Maximum flood
Peaks (m) Date Hour
1989 7.860 01/09/1989 08:00:00
1990 18.870 25/08/1990 16:00:00
1991 13.250 25/07/1991 14:00:00
1992 10.500 04/09/1992 23:00:00
1993 15.300 18/07/1993 08:00:00
1994 19.700 08/09/1994 18:00:00
1995 13.300 22/07/1995 23:00:00
1996 15.750 29/07/1996 23:00:00
1997 17.400 26/08/1997 00:00:00
1998 16.950 18/09/1998 02:00:00
1999 7.000 21/07/1999 17:00:00
2000 15.430 15/07/2000 09:00:00
2001 13.500 11/08/2001 21:00:00
2002 13.850 05/09/2002 17:00:00
2003 15.840 26/08/2003 17:00:00
2004 15.260 15/08/2004 22:00:00
2005 18.450 02/07/2005 17:00:00
2006 18.500 31/07/2006 16:00:00
2007 15.350 02/07/2007 21:00:00
2008 17.700 14/08/2008 07:00:00
2009 7.000 29/08/2009 19:00:00
2010 16.300 09/08/2010 19:00:00
2011 13.200 14/08/2011 07:00:00
2012 12.800 12/09/2012 08:00:00
2013 19.300 26/09/2013 05:00:00
2014 19.400 11/09/2014 18:00:00
2015 7.500 29/07/2015 12:00:00
2016 9.510 06/10/2016 05:00:00
2017 12.700 30/08/2017 08:00:00
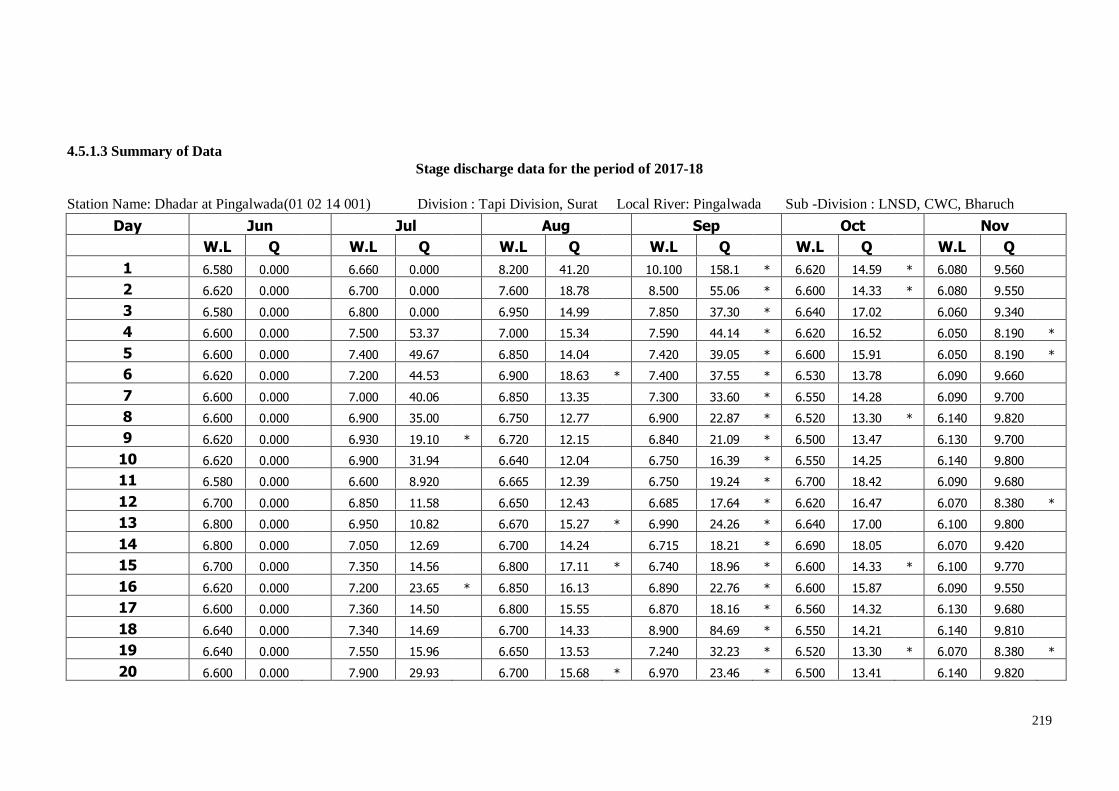
219
4.5.1.3 Summary of Data
Stage discharge data for the period of 2017-18
Station Name: Dhadar at Pingalwada(01 02 14 001) Division : Tapi Division, Surat Local River: Pingalwada Sub -Division : LNSD, CWC, Bharuch
Day Jun Jul Aug Sep Oct Nov
W.L Q W.L Q W.L Q W.L Q W.L Q W.L Q
1 6.580 0.000 6.660 0.000 8.200 41.20 10.100 158.1 * 6.620 14.59 * 6.080 9.560
2 6.620 0.000 6.700 0.000 7.600 18.78 8.500 55.06 * 6.600 14.33 * 6.080 9.550
3 6.580 0.000 6.800 0.000 6.950 14.99 7.850 37.30 * 6.640 17.02 6.060 9.340
4 6.600 0.000 7.500 53.37 7.000 15.34 7.590 44.14 * 6.620 16.52 6.050 8.190 *
5 6.600 0.000 7.400 49.67 6.850 14.04 7.420 39.05 * 6.600 15.91 6.050 8.190 *
6 6.620 0.000 7.200 44.53 6.900 18.63 * 7.400 37.55 * 6.530 13.78 6.090 9.660
7 6.600 0.000 7.000 40.06 6.850 13.35 7.300 33.60 * 6.550 14.28 6.090 9.700
8 6.600 0.000 6.900 35.00 6.750 12.77 6.900 22.87 * 6.520 13.30 * 6.140 9.820
9 6.620 0.000 6.930 19.10 * 6.720 12.15 6.840 21.09 * 6.500 13.47 6.130 9.700
10 6.620 0.000 6.900 31.94 6.640 12.04 6.750 16.39 * 6.550 14.25 6.140 9.800
11 6.580 0.000 6.600 8.920 6.665 12.39 6.750 19.24 * 6.700 18.42 6.090 9.680
12 6.700 0.000 6.850 11.58 6.650 12.43 6.685 17.64 * 6.620 16.47 6.070 8.380 *
13 6.800 0.000 6.950 10.82 6.670 15.27 * 6.990 24.26 * 6.640 17.00 6.100 9.800
14 6.800 0.000 7.050 12.69 6.700 14.24 6.715 18.21 * 6.690 18.05 6.070 9.420
15 6.700 0.000 7.350 14.56 6.800 17.11 * 6.740 18.96 * 6.600 14.33 * 6.100 9.770
16 6.620 0.000 7.200 23.65 * 6.850 16.13 6.890 22.76 * 6.600 15.87 6.090 9.550
17 6.600 0.000 7.360 14.50 6.800 15.55 6.870 18.16 * 6.560 14.32 6.130 9.680
18 6.640 0.000 7.340 14.69 6.700 14.33 8.900 84.69 * 6.550 14.21 6.140 9.810
19 6.640 0.000 7.550 15.96 6.650 13.53 7.240 32.23 * 6.520 13.30 * 6.070 8.380 *
20 6.600 0.000 7.900 29.93 6.700 15.68 * 6.970 23.46 * 6.500 13.41 6.140 9.820
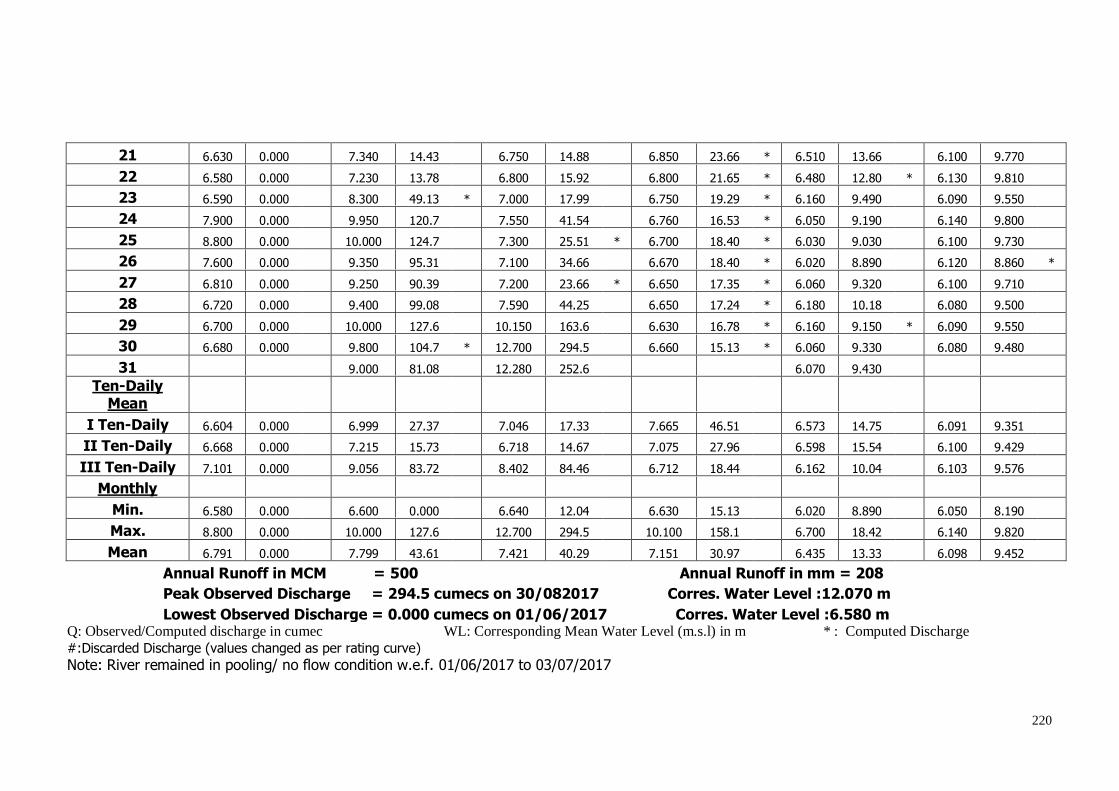
220
21 6.630 0.000 7.340 14.43 6.750 14.88 6.850 23.66 * 6.510 13.66 6.100 9.770
22 6.580 0.000 7.230 13.78 6.800 15.92 6.800 21.65 * 6.480 12.80 * 6.130 9.810
23 6.590 0.000 8.300 49.13 * 7.000 17.99 6.750 19.29 * 6.160 9.490 6.090 9.550
24 7.900 0.000 9.950 120.7 7.550 41.54 6.760 16.53 * 6.050 9.190 6.140 9.800
25 8.800 0.000 10.000 124.7 7.300 25.51 * 6.700 18.40 * 6.030 9.030 6.100 9.730
26 7.600 0.000 9.350 95.31 7.100 34.66 6.670 18.40 * 6.020 8.890 6.120 8.860 *
27 6.810 0.000 9.250 90.39 7.200 23.66 * 6.650 17.35 * 6.060 9.320 6.100 9.710
28 6.720 0.000 9.400 99.08 7.590 44.25 6.650 17.24 * 6.180 10.18 6.080 9.500
29 6.700 0.000 10.000 127.6 10.150 163.6 6.630 16.78 * 6.160 9.150 * 6.090 9.550
30 6.680 0.000 9.800 104.7 * 12.700 294.5 6.660 15.13 * 6.060 9.330 6.080 9.480
31 9.000 81.08 12.280 252.6 6.070 9.430
Ten-Daily Mean
I Ten-Daily 6.604 0.000
6.999 27.37
7.046 17.33
7.665 46.51
6.573 14.75
6.091 9.351 II Ten-Daily 6.668 0.000
7.215 15.73
6.718 14.67
7.075 27.96
6.598 15.54
6.100 9.429
III Ten-Daily 7.101 0.000
9.056 83.72
8.402 84.46
6.712 18.44
6.162 10.04
6.103 9.576 Monthly
Min. 6.580 0.000
6.600 0.000
6.640 12.04
6.630 15.13
6.020 8.890
6.050 8.190 Max. 8.800 0.000
10.000 127.6
12.700 294.5
10.100 158.1
6.700 18.42
6.140 9.820
Mean 6.791 0.000
7.799 43.61
7.421 40.29
7.151 30.97
6.435 13.33
6.098 9.452 Annual Runoff in MCM = 500 Annual Runoff in mm = 208
Peak Observed Discharge = 294.5 cumecs on 30/082017 Corres. Water Level :12.070 m
Lowest Observed Discharge = 0.000 cumecs on 01/06/2017 Corres. Water Level :6.580 m Q: Observed/Computed discharge in cumec WL: Corresponding Mean Water Level (m.s.l) in m * : Computed Discharge
#:Discarded Discharge (values changed as per rating curve)
Note: River remained in pooling/ no flow condition w.e.f. 01/06/2017 to 03/07/2017
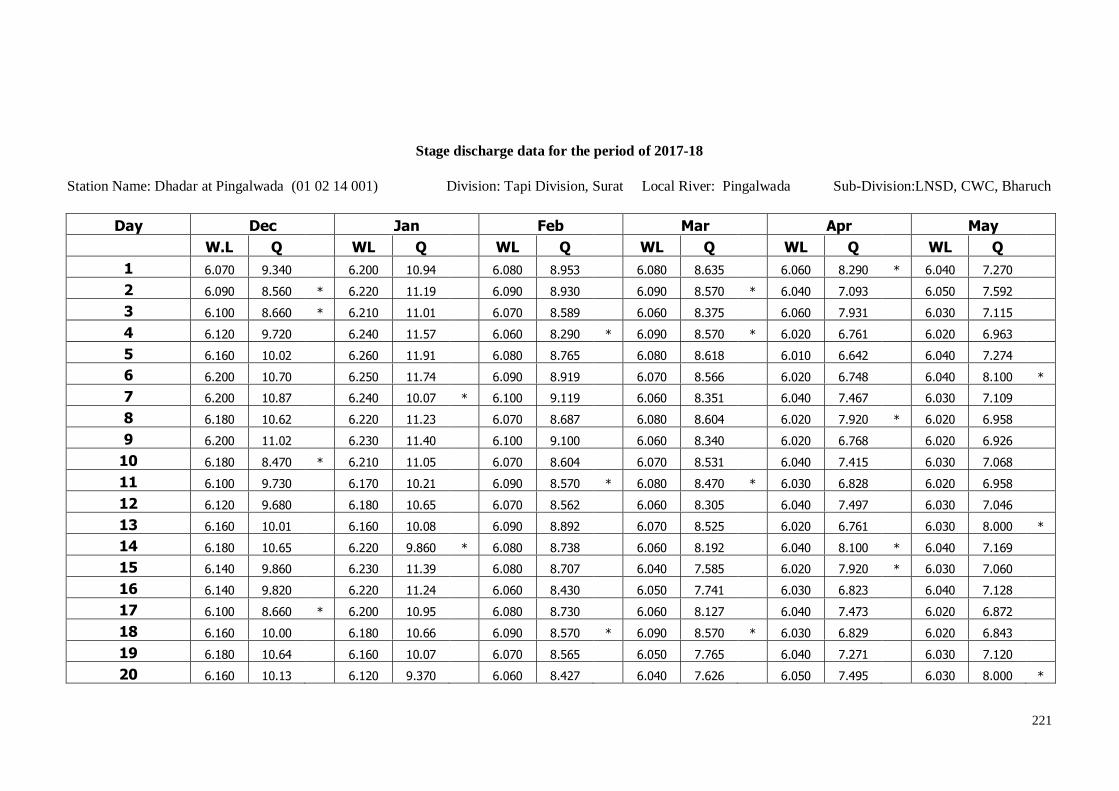
221
Stage discharge data for the period of 2017-18
Station Name: Dhadar at Pingalwada (01 02 14 001) Division: Tapi Division, Surat Local River: Pingalwada Sub-Division:LNSD, CWC, Bharuch
Day Dec Jan Feb Mar Apr May
W.L Q WL Q WL Q WL Q WL Q WL Q
1 6.070 9.340 6.200 10.94 6.080 8.953 6.080 8.635 6.060 8.290 * 6.040 7.270
2 6.090 8.560 * 6.220 11.19 6.090 8.930 6.090 8.570 * 6.040 7.093 6.050 7.592
3 6.100 8.660 * 6.210 11.01 6.070 8.589 6.060 8.375 6.060 7.931 6.030 7.115
4 6.120 9.720 6.240 11.57 6.060 8.290 * 6.090 8.570 * 6.020 6.761 6.020 6.963
5 6.160 10.02 6.260 11.91 6.080 8.765 6.080 8.618 6.010 6.642 6.040 7.274
6 6.200 10.70 6.250 11.74 6.090 8.919 6.070 8.566 6.020 6.748 6.040 8.100 *
7 6.200 10.87 6.240 10.07 * 6.100 9.119 6.060 8.351 6.040 7.467 6.030 7.109
8 6.180 10.62 6.220 11.23 6.070 8.687 6.080 8.604 6.020 7.920 * 6.020 6.958
9 6.200 11.02 6.230 11.40 6.100 9.100 6.060 8.340 6.020 6.768 6.020 6.926
10 6.180 8.470 * 6.210 11.05 6.070 8.604 6.070 8.531 6.040 7.415 6.030 7.068
11 6.100 9.730 6.170 10.21 6.090 8.570 * 6.080 8.470 * 6.030 6.828 6.020 6.958
12 6.120 9.680 6.180 10.65 6.070 8.562 6.060 8.305 6.040 7.497 6.030 7.046
13 6.160 10.01 6.160 10.08 6.090 8.892 6.070 8.525 6.020 6.761 6.030 8.000 *
14 6.180 10.65 6.220 9.860 * 6.080 8.738 6.060 8.192 6.040 8.100 * 6.040 7.169
15 6.140 9.860 6.230 11.39 6.080 8.707 6.040 7.585 6.020 7.920 * 6.030 7.060
16 6.140 9.820 6.220 11.24 6.060 8.430 6.050 7.741 6.030 6.823 6.040 7.128
17 6.100 8.660 * 6.200 10.95 6.080 8.730 6.060 8.127 6.040 7.473 6.020 6.872
18 6.160 10.00 6.180 10.66 6.090 8.570 * 6.090 8.570 * 6.030 6.829 6.020 6.843
19 6.180 10.64 6.160 10.07 6.070 8.565 6.050 7.765 6.040 7.271 6.030 7.120
20 6.160 10.13 6.120 9.370 6.060 8.427 6.040 7.626 6.050 7.495 6.030 8.000 *
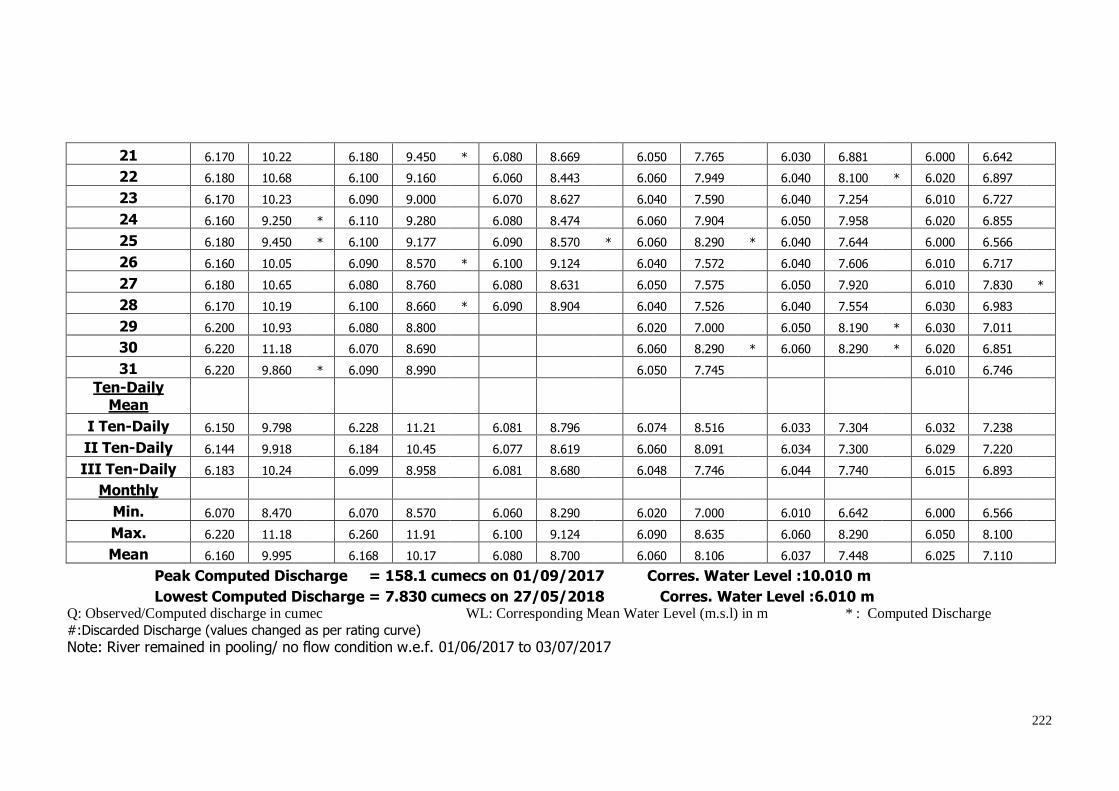
222
21 6.170 10.22 6.180 9.450 * 6.080 8.669 6.050 7.765 6.030 6.881 6.000 6.642
22 6.180 10.68 6.100 9.160 6.060 8.443 6.060 7.949 6.040 8.100 * 6.020 6.897
23 6.170 10.23 6.090 9.000 6.070 8.627 6.040 7.590 6.040 7.254 6.010 6.727
24 6.160 9.250 * 6.110 9.280 6.080 8.474 6.060 7.904 6.050 7.958 6.020 6.855
25 6.180 9.450 * 6.100 9.177 6.090 8.570 * 6.060 8.290 * 6.040 7.644 6.000 6.566
26 6.160 10.05 6.090 8.570 * 6.100 9.124 6.040 7.572 6.040 7.606 6.010 6.717
27 6.180 10.65 6.080 8.760 6.080 8.631 6.050 7.575 6.050 7.920 6.010 7.830 *
28 6.170 10.19 6.100 8.660 * 6.090 8.904 6.040 7.526 6.040 7.554 6.030 6.983
29 6.200 10.93 6.080 8.800 6.020 7.000 6.050 8.190 * 6.030 7.011
30 6.220 11.18 6.070 8.690 6.060 8.290 * 6.060 8.290 * 6.020 6.851
31 6.220 9.860 * 6.090 8.990 6.050 7.745 6.010 6.746
Ten-Daily Mean
I Ten-Daily 6.150 9.798
6.228 11.21
6.081 8.796
6.074 8.516
6.033 7.304
6.032 7.238 II Ten-Daily 6.144 9.918
6.184 10.45
6.077 8.619
6.060 8.091
6.034 7.300
6.029 7.220
III Ten-Daily 6.183 10.24
6.099 8.958
6.081 8.680
6.048 7.746
6.044 7.740
6.015 6.893 Monthly
Min. 6.070 8.470
6.070 8.570
6.060 8.290
6.020 7.000
6.010 6.642
6.000 6.566 Max. 6.220 11.18
6.260 11.91
6.100 9.124
6.090 8.635
6.060 8.290
6.050 8.100
Mean 6.160 9.995
6.168 10.17
6.080 8.700
6.060 8.106
6.037 7.448
6.025 7.110 Peak Computed Discharge = 158.1 cumecs on 01/09/2017 Corres. Water Level :10.010 m
Lowest Computed Discharge = 7.830 cumecs on 27/05/2018 Corres. Water Level :6.010 m Q: Observed/Computed discharge in cumec WL: Corresponding Mean Water Level (m.s.l) in m * : Computed Discharge
#:Discarded Discharge (values changed as per rating curve)
Note: River remained in pooling/ no flow condition w.e.f. 01/06/2017 to 03/07/2017

223
4.5.1.4 Stage Discharge curve
Station Name: Dhadar at Pingalwada(01 02 14 001) Division : Tapi Division, Surat Local River: Pingalwada Sub -Division : LNSD, CWC, Bharuch
Stage Discharge Curve of River Dhadar at PIngalwada for the period 01/06/2017 to 31/05/2018
Calculated Observed
Discharge in Cumecs
500
490
480
470
460
450
440
430
420
410
400
390
380
370
360
350
340
330
320
310
300
290
280
270
260
250
240
230
220
210
200
190
180
170
160
150
140
130
120
110
100
90
80
70
60
50
40
30
20
100
Sta
ge
in m
15
14
13
12
11
10
9
8
7
6
5
Procedure: Standard Equation : Power Q=C(h+a)^b LB UB a b C
5.00 14.00 -3.6562 2.703 0.774
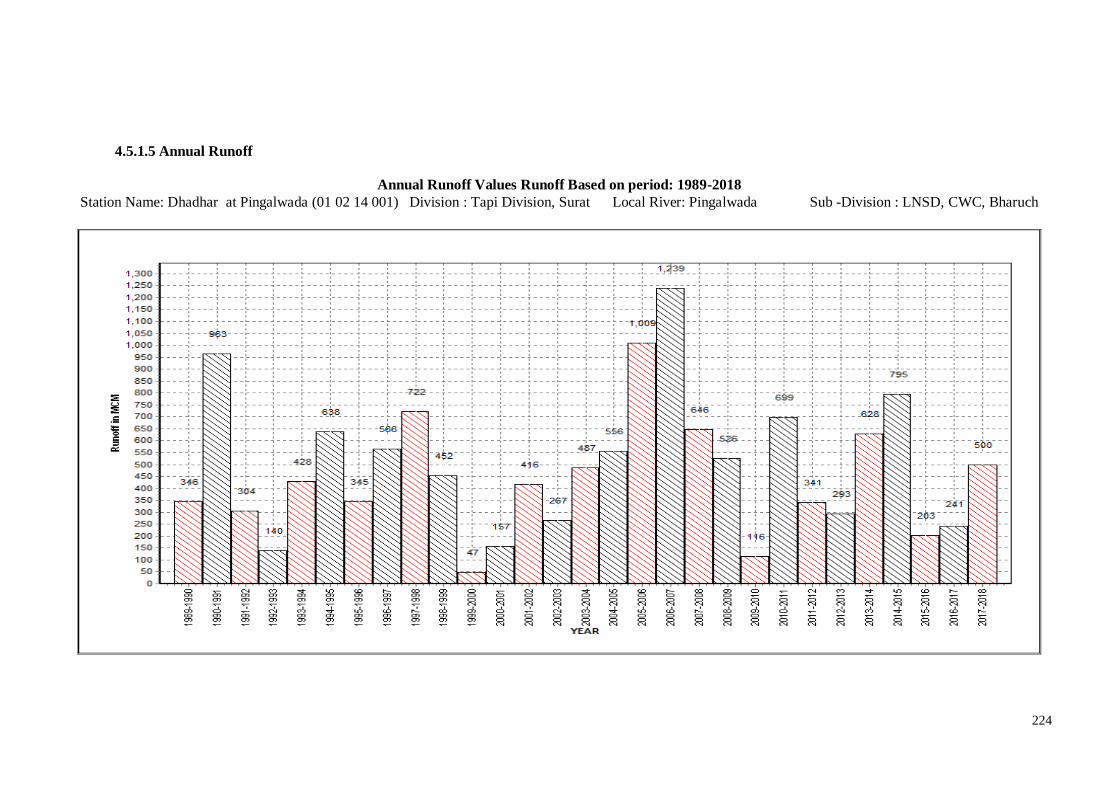
224
4.5.1.5 Annual Runoff
Annual Runoff Values Runoff Based on period: 1989-2018
Station Name: Dhadhar at Pingalwada (01 02 14 001) Division : Tapi Division, Surat Local River: Pingalwada Sub -Division : LNSD, CWC, Bharuch
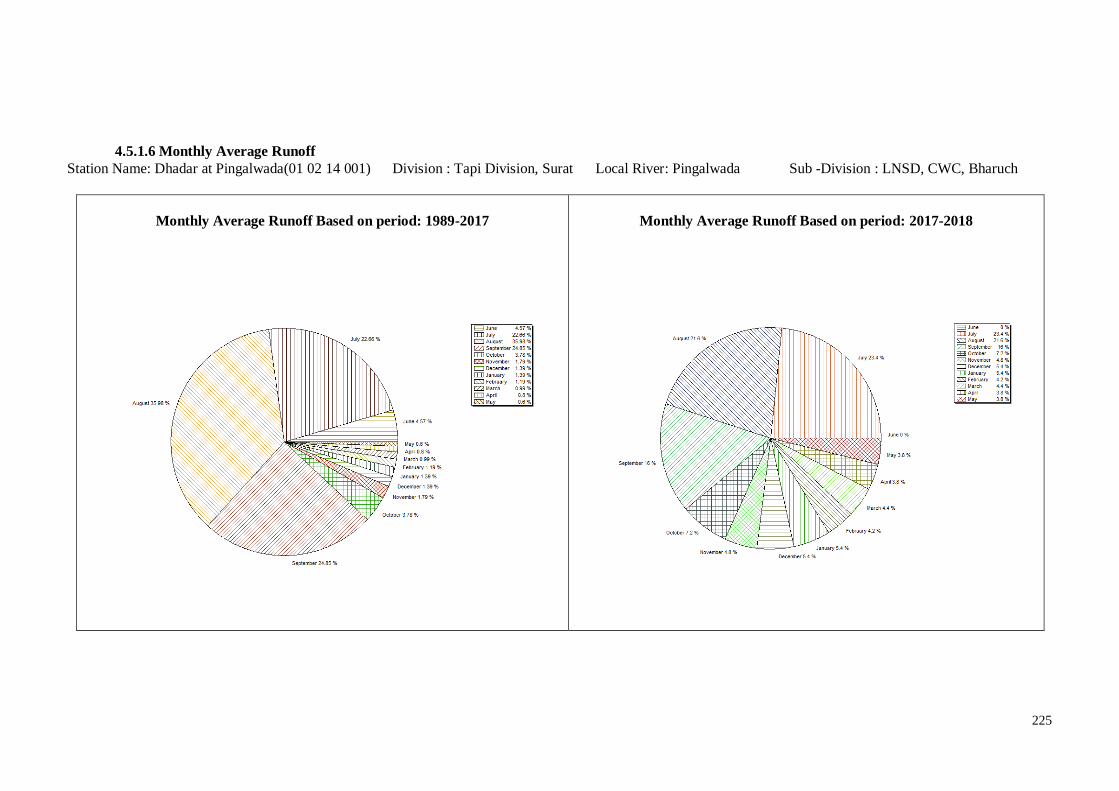
225
4.5.1.6 Monthly Average Runoff
Station Name: Dhadar at Pingalwada(01 02 14 001) Division : Tapi Division, Surat Local River: Pingalwada Sub -Division : LNSD, CWC, Bharuch
Monthly Average Runoff Based on period: 1989-2017
Monthly Average Runoff Based on period: 2017-2018
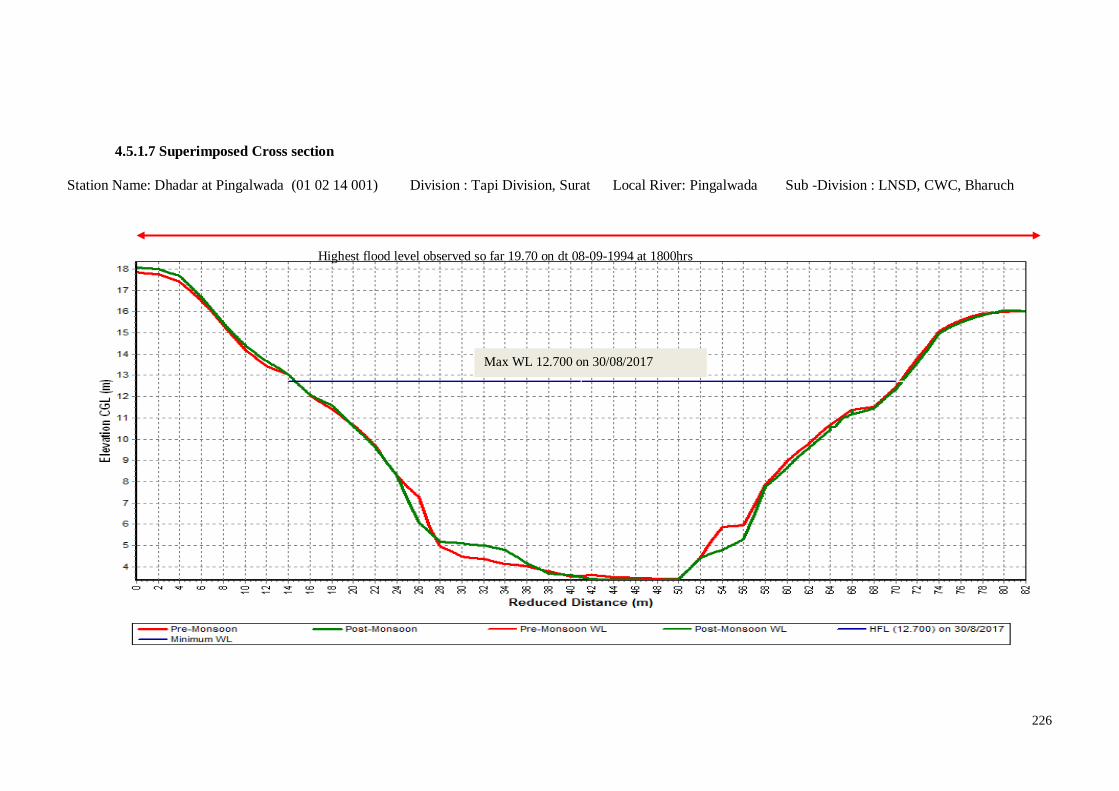
226
4.5.1.7 Superimposed Cross section
Station Name: Dhadar at Pingalwada (01 02 14 001) Division : Tapi Division, Surat Local River: Pingalwada Sub -Division : LNSD, CWC, Bharuch
Highest flood level observed so far 19.70 on dt 08-09-1994 at 1800hrs
Max WL 12.700 on 30/08/2017
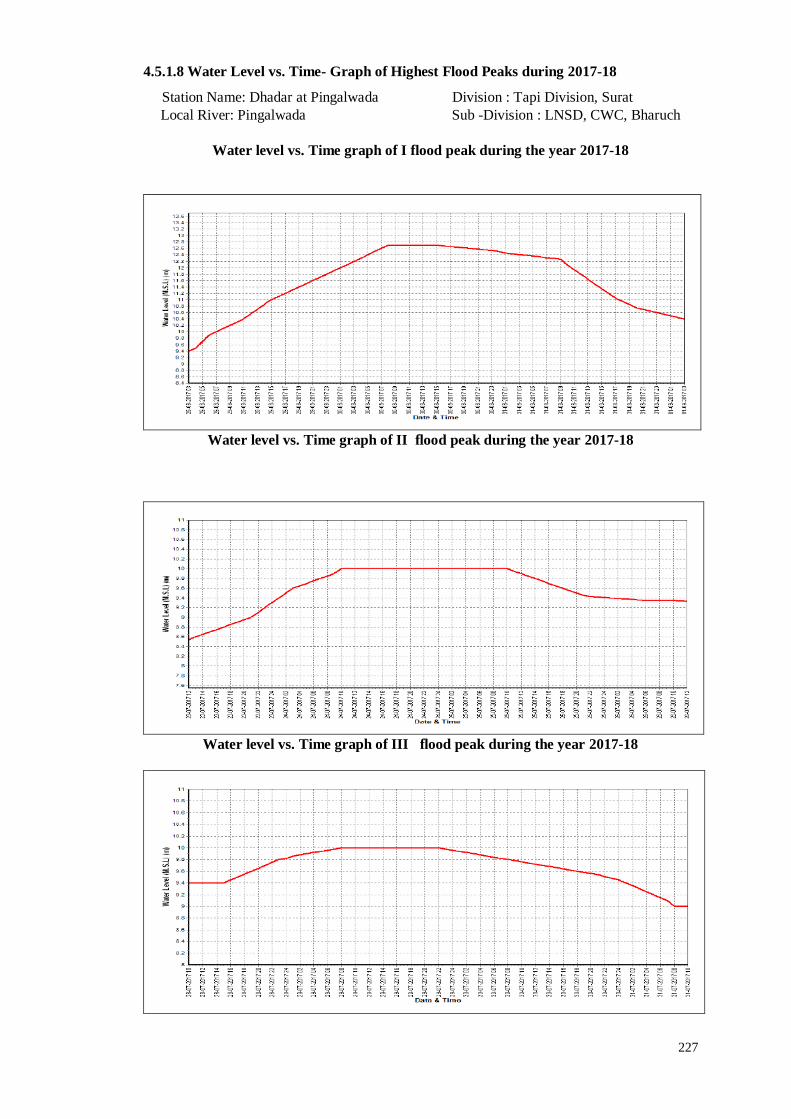
227
4.5.1.8 Water Level vs. Time- Graph of Highest Flood Peaks during 2017-18
Station Name: Dhadar at Pingalwada Division : Tapi Division, Surat
Local River: Pingalwada Sub -Division : LNSD, CWC, Bharuch
Water level vs. Time graph of I flood peak during the year 2017-18
Water level vs. Time graph of II flood peak during the year 2017-18
Water level vs. Time graph of III flood peak during the year 2017-18
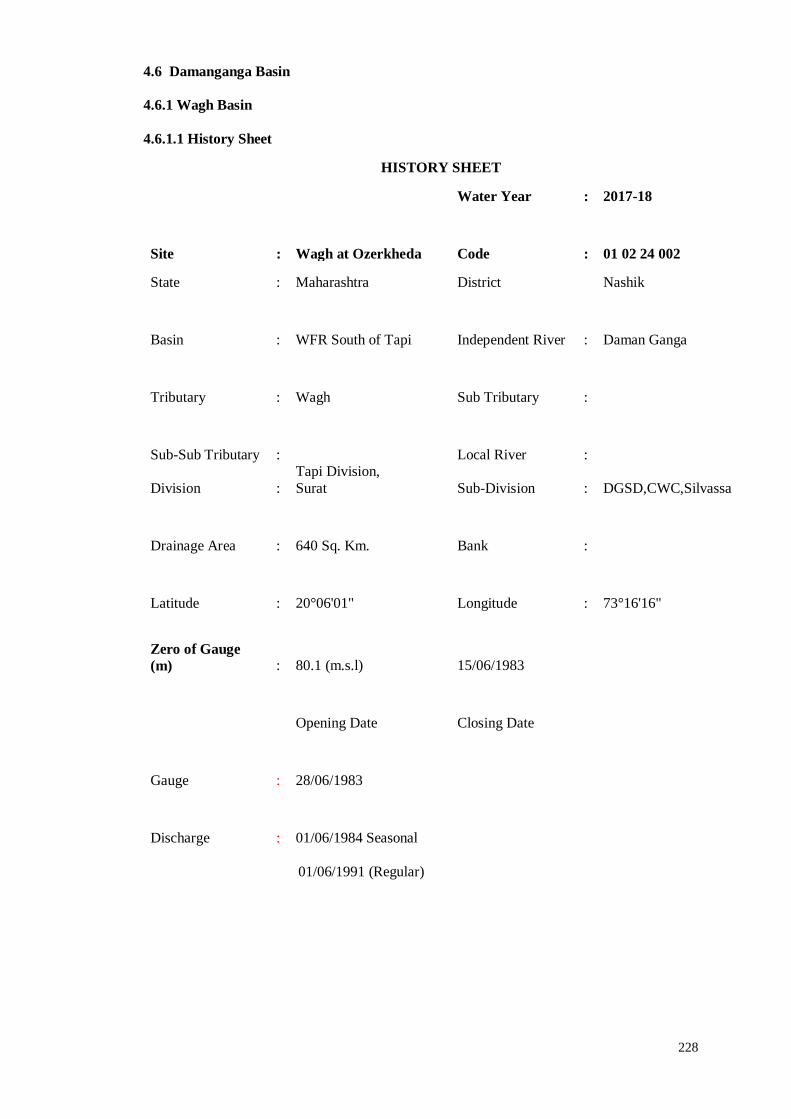
228
4.6 Damanganga Basin
4.6.1 Wagh Basin
4.6.1.1 History Sheet
HISTORY SHEET
Water Year : 2017-18
Site : Wagh at Ozerkheda Code : 01 02 24 002
State : Maharashtra District Nashik
Basin : WFR South of Tapi Independent River : Daman Ganga
Tributary : Wagh Sub Tributary :
Sub-Sub Tributary : Local River :
Division :
Tapi Division,
Surat Sub-Division : DGSD,CWC,Silvassa
Drainage Area : 640 Sq. Km. Bank :
Latitude : 20°06'01" Longitude : 73°16'16"
Zero of Gauge
(m) : 80.1 (m.s.l) 15/06/1983
Opening Date Closing Date
Gauge : 28/06/1983
Discharge : 01/06/1984 Seasonal
01/06/1991 (Regular)
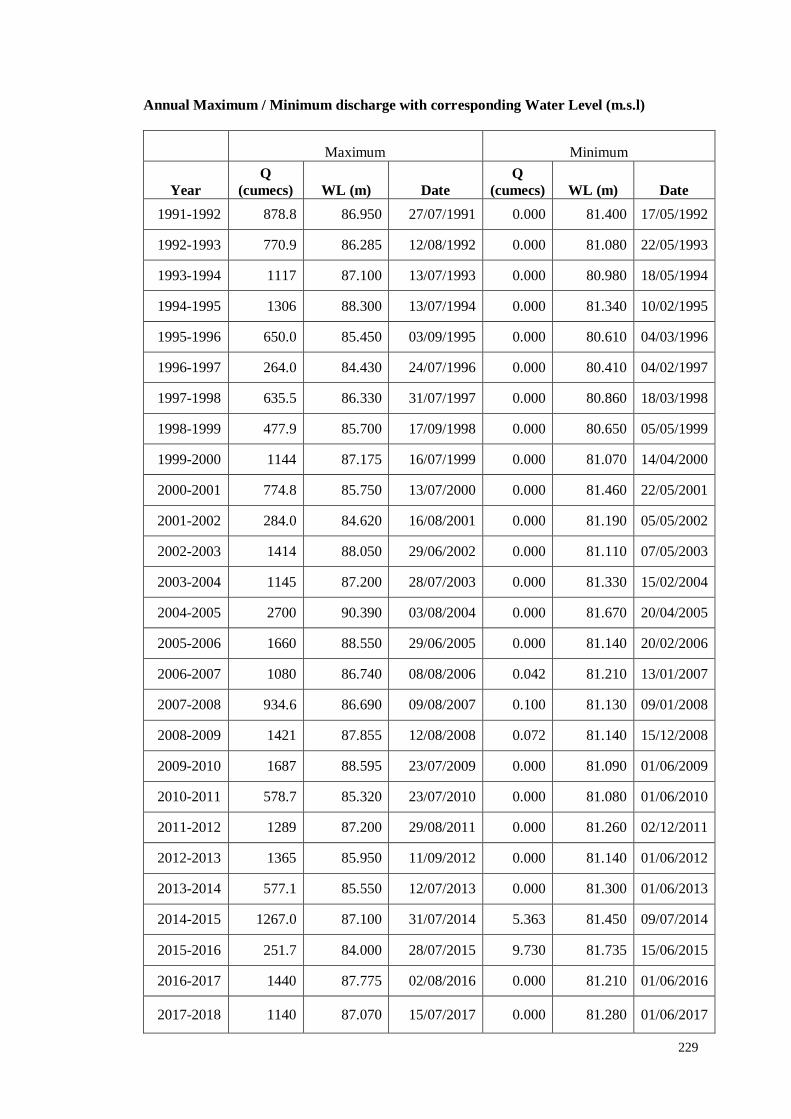
229
Annual Maximum / Minimum discharge with corresponding Water Level (m.s.l)
Maximum Minimum
Year
Q
(cumecs) WL (m) Date
Q
(cumecs) WL (m) Date
1991-1992 878.8 86.950 27/07/1991 0.000 81.400 17/05/1992
1992-1993 770.9 86.285 12/08/1992 0.000 81.080 22/05/1993
1993-1994 1117 87.100 13/07/1993 0.000 80.980 18/05/1994
1994-1995 1306 88.300 13/07/1994 0.000 81.340 10/02/1995
1995-1996 650.0 85.450 03/09/1995 0.000 80.610 04/03/1996
1996-1997 264.0 84.430 24/07/1996 0.000 80.410 04/02/1997
1997-1998 635.5 86.330 31/07/1997 0.000 80.860 18/03/1998
1998-1999 477.9 85.700 17/09/1998 0.000 80.650 05/05/1999
1999-2000 1144 87.175 16/07/1999 0.000 81.070 14/04/2000
2000-2001 774.8 85.750 13/07/2000 0.000 81.460 22/05/2001
2001-2002 284.0 84.620 16/08/2001 0.000 81.190 05/05/2002
2002-2003 1414 88.050 29/06/2002 0.000 81.110 07/05/2003
2003-2004 1145 87.200 28/07/2003 0.000 81.330 15/02/2004
2004-2005 2700 90.390 03/08/2004 0.000 81.670 20/04/2005
2005-2006 1660 88.550 29/06/2005 0.000 81.140 20/02/2006
2006-2007 1080 86.740 08/08/2006 0.042 81.210 13/01/2007
2007-2008 934.6 86.690 09/08/2007 0.100 81.130 09/01/2008
2008-2009 1421 87.855 12/08/2008 0.072 81.140 15/12/2008
2009-2010 1687 88.595 23/07/2009 0.000 81.090 01/06/2009
2010-2011 578.7 85.320 23/07/2010 0.000 81.080 01/06/2010
2011-2012 1289 87.200 29/08/2011 0.000 81.260 02/12/2011
2012-2013 1365 85.950 11/09/2012 0.000 81.140 01/06/2012
2013-2014 577.1 85.550 12/07/2013 0.000 81.300 01/06/2013
2014-2015 1267.0 87.100 31/07/2014 5.363 81.450 09/07/2014
2015-2016 251.7 84.000 28/07/2015 9.730 81.735 15/06/2015
2016-2017 1440 87.775 02/08/2016 0.000 81.210 01/06/2016
2017-2018 1140 87.070 15/07/2017 0.000 81.280 01/06/2017
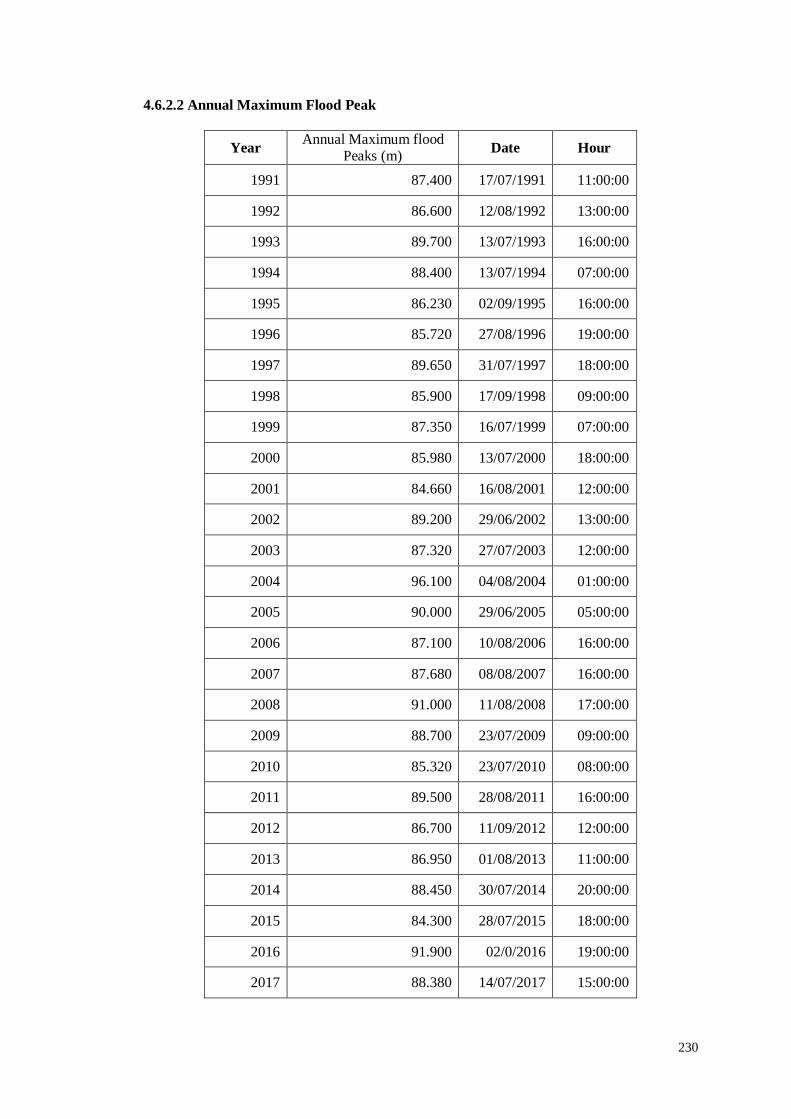
230
4.6.2.2 Annual Maximum Flood Peak
Year Annual Maximum flood
Peaks (m) Date Hour
1991 87.400 17/07/1991 11:00:00
1992 86.600 12/08/1992 13:00:00
1993 89.700 13/07/1993 16:00:00
1994 88.400 13/07/1994 07:00:00
1995 86.230 02/09/1995 16:00:00
1996 85.720 27/08/1996 19:00:00
1997 89.650 31/07/1997 18:00:00
1998 85.900 17/09/1998 09:00:00
1999 87.350 16/07/1999 07:00:00
2000 85.980 13/07/2000 18:00:00
2001 84.660 16/08/2001 12:00:00
2002 89.200 29/06/2002 13:00:00
2003 87.320 27/07/2003 12:00:00
2004 96.100 04/08/2004 01:00:00
2005 90.000 29/06/2005 05:00:00
2006 87.100 10/08/2006 16:00:00
2007 87.680 08/08/2007 16:00:00
2008 91.000 11/08/2008 17:00:00
2009 88.700 23/07/2009 09:00:00
2010 85.320 23/07/2010 08:00:00
2011 89.500 28/08/2011 16:00:00
2012 86.700 11/09/2012 12:00:00
2013 86.950 01/08/2013 11:00:00
2014 88.450 30/07/2014 20:00:00
2015 84.300 28/07/2015 18:00:00
2016 91.900 02/0/2016 19:00:00
2017 88.380 14/07/2017 15:00:00
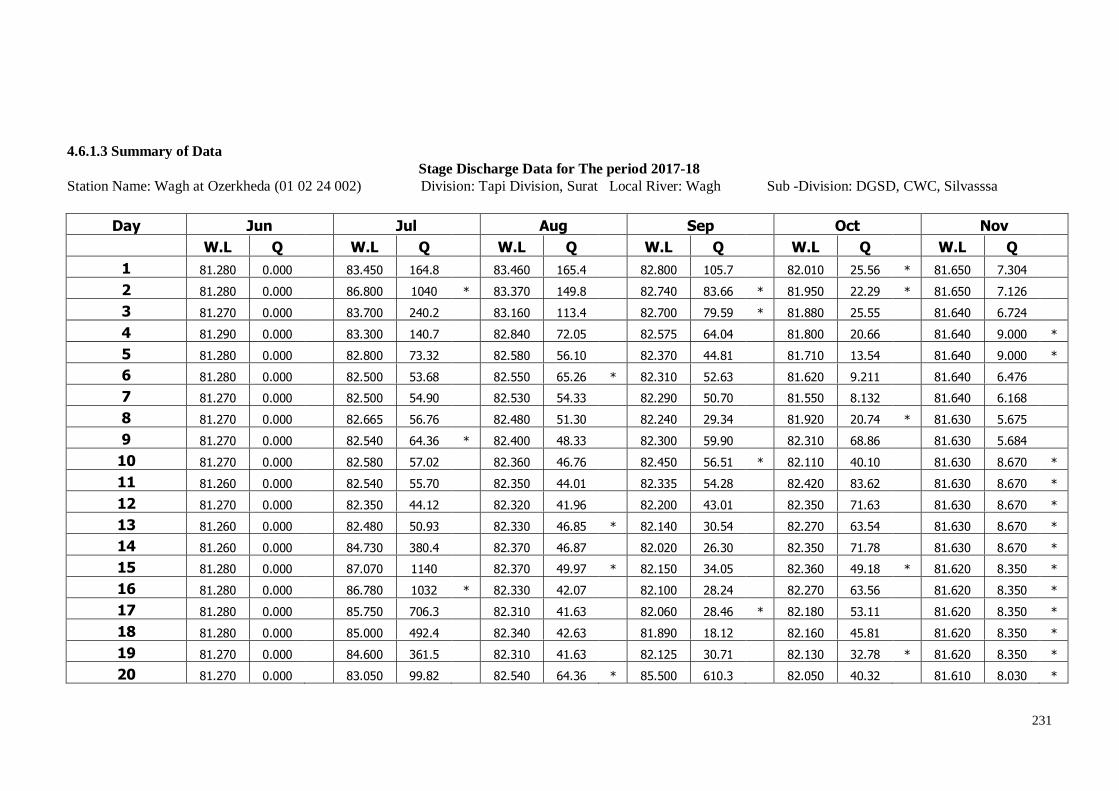
231
4.6.1.3 Summary of Data
Stage Discharge Data for The period 2017-18
Station Name: Wagh at Ozerkheda (01 02 24 002) Division: Tapi Division, Surat Local River: Wagh Sub -Division: DGSD, CWC, Silvasssa
Day Jun Jul Aug Sep Oct Nov
W.L Q W.L Q W.L Q W.L Q W.L Q W.L Q
1 81.280 0.000 83.450 164.8 83.460 165.4 82.800 105.7 82.010 25.56 * 81.650 7.304
2 81.280 0.000 86.800 1040 * 83.370 149.8 82.740 83.66 * 81.950 22.29 * 81.650 7.126
3 81.270 0.000 83.700 240.2 83.160 113.4 82.700 79.59 * 81.880 25.55 81.640 6.724
4 81.290 0.000 83.300 140.7 82.840 72.05 82.575 64.04 81.800 20.66 81.640 9.000 *
5 81.280 0.000 82.800 73.32 82.580 56.10 82.370 44.81 81.710 13.54 81.640 9.000 *
6 81.280 0.000 82.500 53.68 82.550 65.26 * 82.310 52.63 81.620 9.211 81.640 6.476
7 81.270 0.000 82.500 54.90 82.530 54.33 82.290 50.70 81.550 8.132 81.640 6.168
8 81.270 0.000 82.665 56.76 82.480 51.30 82.240 29.34 81.920 20.74 * 81.630 5.675
9 81.270 0.000 82.540 64.36 * 82.400 48.33 82.300 59.90 82.310 68.86 81.630 5.684
10 81.270 0.000 82.580 57.02 82.360 46.76 82.450 56.51 * 82.110 40.10 81.630 8.670 *
11 81.260 0.000 82.540 55.70 82.350 44.01 82.335 54.28 82.420 83.62 81.630 8.670 *
12 81.270 0.000 82.350 44.12 82.320 41.96 82.200 43.01 82.350 71.63 81.630 8.670 *
13 81.260 0.000 82.480 50.93 82.330 46.85 * 82.140 30.54 82.270 63.54 81.630 8.670 *
14 81.260 0.000 84.730 380.4 82.370 46.87 82.020 26.30 82.350 71.78 81.630 8.670 *
15 81.280 0.000 87.070 1140 82.370 49.97 * 82.150 34.05 82.360 49.18 * 81.620 8.350 *
16 81.280 0.000 86.780 1032 * 82.330 42.07 82.100 28.24 82.270 63.56 81.620 8.350 *
17 81.280 0.000 85.750 706.3 82.310 41.63 82.060 28.46 * 82.180 53.11 81.620 8.350 *
18 81.280 0.000 85.000 492.4 82.340 42.63 81.890 18.12 82.160 45.81 81.620 8.350 *
19 81.270 0.000 84.600 361.5 82.310 41.63 82.125 30.71 82.130 32.78 * 81.620 8.350 *
20 81.270 0.000 83.050 99.82 82.540 64.36 * 85.500 610.3 82.050 40.32 81.610 8.030 *
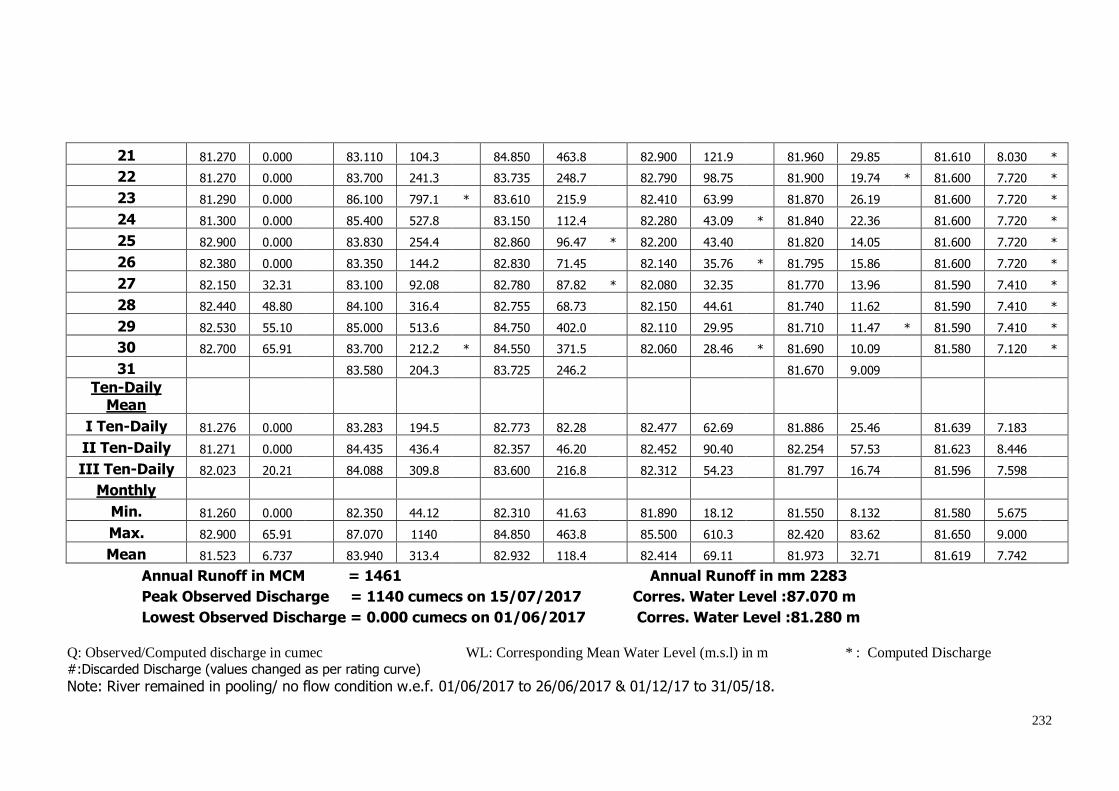
232
21 81.270 0.000 83.110 104.3 84.850 463.8 82.900 121.9 81.960 29.85 81.610 8.030 *
22 81.270 0.000 83.700 241.3 83.735 248.7 82.790 98.75 81.900 19.74 * 81.600 7.720 *
23 81.290 0.000 86.100 797.1 * 83.610 215.9 82.410 63.99 81.870 26.19 81.600 7.720 *
24 81.300 0.000 85.400 527.8 83.150 112.4 82.280 43.09 * 81.840 22.36 81.600 7.720 *
25 82.900 0.000 83.830 254.4 82.860 96.47 * 82.200 43.40 81.820 14.05 81.600 7.720 *
26 82.380 0.000 83.350 144.2 82.830 71.45 82.140 35.76 * 81.795 15.86 81.600 7.720 *
27 82.150 32.31 83.100 92.08 82.780 87.82 * 82.080 32.35 81.770 13.96 81.590 7.410 *
28 82.440 48.80 84.100 316.4 82.755 68.73 82.150 44.61 81.740 11.62 81.590 7.410 *
29 82.530 55.10 85.000 513.6 84.750 402.0 82.110 29.95 81.710 11.47 * 81.590 7.410 *
30 82.700 65.91 83.700 212.2 * 84.550 371.5 82.060 28.46 * 81.690 10.09 81.580 7.120 *
31 83.580 204.3 83.725 246.2 81.670 9.009
Ten-Daily Mean
I Ten-Daily 81.276 0.000
83.283 194.5
82.773 82.28
82.477 62.69
81.886 25.46
81.639 7.183 II Ten-Daily 81.271 0.000
84.435 436.4
82.357 46.20
82.452 90.40
82.254 57.53
81.623 8.446
III Ten-Daily 82.023 20.21
84.088 309.8
83.600 216.8
82.312 54.23
81.797 16.74
81.596 7.598 Monthly
Min. 81.260 0.000
82.350 44.12
82.310 41.63
81.890 18.12
81.550 8.132
81.580 5.675 Max. 82.900 65.91
87.070 1140
84.850 463.8
85.500 610.3
82.420 83.62
81.650 9.000
Mean 81.523 6.737
83.940 313.4
82.932 118.4
82.414 69.11
81.973 32.71
81.619 7.742 Annual Runoff in MCM = 1461 Annual Runoff in mm 2283
Peak Observed Discharge = 1140 cumecs on 15/07/2017 Corres. Water Level :87.070 m
Lowest Observed Discharge = 0.000 cumecs on 01/06/2017 Corres. Water Level :81.280 m
Q: Observed/Computed discharge in cumec WL: Corresponding Mean Water Level (m.s.l) in m * : Computed Discharge #:Discarded Discharge (values changed as per rating curve)
Note: River remained in pooling/ no flow condition w.e.f. 01/06/2017 to 26/06/2017 & 01/12/17 to 31/05/18.
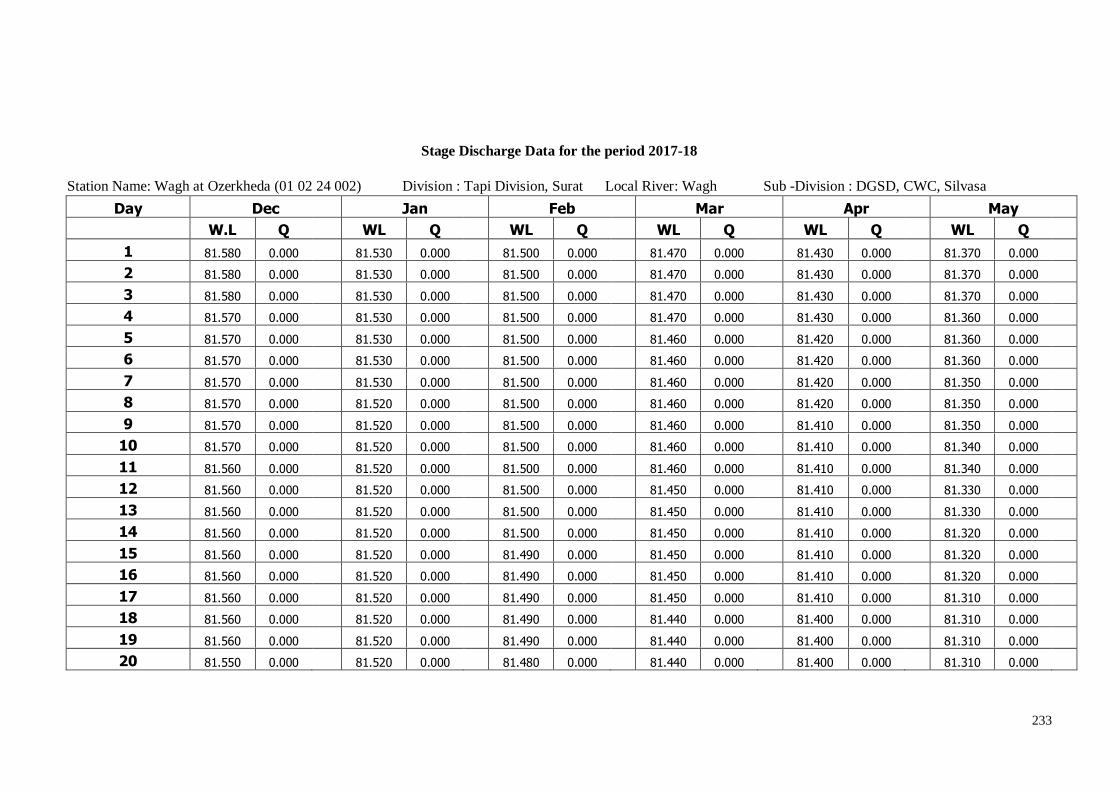
233
Stage Discharge Data for the period 2017-18
Station Name: Wagh at Ozerkheda (01 02 24 002) Division : Tapi Division, Surat Local River: Wagh Sub -Division : DGSD, CWC, Silvasa
Day Dec Jan Feb Mar Apr May
W.L Q WL Q WL Q WL Q WL Q WL Q
1 81.580 0.000 81.530 0.000 81.500 0.000 81.470 0.000 81.430 0.000 81.370 0.000
2 81.580 0.000 81.530 0.000 81.500 0.000 81.470 0.000 81.430 0.000 81.370 0.000
3 81.580 0.000 81.530 0.000 81.500 0.000 81.470 0.000 81.430 0.000 81.370 0.000
4 81.570 0.000 81.530 0.000 81.500 0.000 81.470 0.000 81.430 0.000 81.360 0.000
5 81.570 0.000 81.530 0.000 81.500 0.000 81.460 0.000 81.420 0.000 81.360 0.000
6 81.570 0.000 81.530 0.000 81.500 0.000 81.460 0.000 81.420 0.000 81.360 0.000
7 81.570 0.000 81.530 0.000 81.500 0.000 81.460 0.000 81.420 0.000 81.350 0.000
8 81.570 0.000 81.520 0.000 81.500 0.000 81.460 0.000 81.420 0.000 81.350 0.000
9 81.570 0.000 81.520 0.000 81.500 0.000 81.460 0.000 81.410 0.000 81.350 0.000
10 81.570 0.000 81.520 0.000 81.500 0.000 81.460 0.000 81.410 0.000 81.340 0.000
11 81.560 0.000 81.520 0.000 81.500 0.000 81.460 0.000 81.410 0.000 81.340 0.000
12 81.560 0.000 81.520 0.000 81.500 0.000 81.450 0.000 81.410 0.000 81.330 0.000
13 81.560 0.000 81.520 0.000 81.500 0.000 81.450 0.000 81.410 0.000 81.330 0.000
14 81.560 0.000 81.520 0.000 81.500 0.000 81.450 0.000 81.410 0.000 81.320 0.000
15 81.560 0.000 81.520 0.000 81.490 0.000 81.450 0.000 81.410 0.000 81.320 0.000
16 81.560 0.000 81.520 0.000 81.490 0.000 81.450 0.000 81.410 0.000 81.320 0.000
17 81.560 0.000 81.520 0.000 81.490 0.000 81.450 0.000 81.410 0.000 81.310 0.000
18 81.560 0.000 81.520 0.000 81.490 0.000 81.440 0.000 81.400 0.000 81.310 0.000
19 81.560 0.000 81.520 0.000 81.490 0.000 81.440 0.000 81.400 0.000 81.310 0.000
20 81.550 0.000 81.520 0.000 81.480 0.000 81.440 0.000 81.400 0.000 81.310 0.000

234
21 81.550 0.000 81.520 0.000 81.480 0.000 81.440 0.000 81.400 0.000 81.300 0.000
22 81.550 0.000 81.510 0.000 81.480 0.000 81.440 0.000 81.400 0.000 81.300 0.000
23 81.550 0.000 81.510 0.000 81.480 0.000 81.440 0.000 81.400 0.000 81.300 0.000
24 81.550 0.000 81.510 0.000 81.480 0.000 81.440 0.000 81.390 0.000 81.300 0.000
25 81.550 0.000 81.510 0.000 81.470 0.000 81.440 0.000 81.390 0.000 81.310 0.000
26 81.540 0.000 81.510 0.000 81.470 0.000 81.430 0.000 81.390 0.000 81.290 0.000
27 81.540 0.000 81.510 0.000 81.470 0.000 81.430 0.000 81.380 0.000 81.280 0.000
28 81.530 0.000 81.510 0.000 81.430 0.000 81.380 0.000 81.280 0.000
29 81.530 0.000 81.510 0.000 81.430 0.000 81.380 0.000 81.280 0.000
30 81.530 0.000 81.510 0.000 81.430 0.000 81.380 0.000 81.280 0.000
31 81.530 0.000 81.510 0.000 81.430 0.000 81.280 0.000
Ten-Daily Mean
I Ten-Daily 81.573 0.000
81.527 0.000
81.500 0.000
81.464 0.000
81.422 0.000
81.358 0.000 II Ten-Daily 81.559 0.000
81.520 0.000
81.493 0.000
81.448 0.000
81.407 0.000
81.320 0.000
III Ten-Daily 81.541 0.000
81.511 0.000
81.476 0.000
81.435 0.000
81.389 0.000
81.291 0.000 Monthly
Min. 81.530 0.000
81.510 0.000
81.470 0.000
81.430 0.000
81.380 0.000
81.280 0.000 Max. 81.580 0.000
81.530 0.000
81.500 0.000
81.470 0.000
81.430 0.000
81.370 0.000
Mean 81.557 0.000
81.519 0.000
81.491 0.000
81.448 0.000
81.406 0.000
81.322 0.000
Peak Computed Discharge = 1040 cumecs on 02/07/2017 Corres. Water Level :86.800 m
Lowest Computed Discharge = 7.120 cumecs on 30/11/2017 Corres. Water Level :81.580 m Q: Observed/Computed discharge in cumec WL: Corresponding Mean Water Level (m.s.l) in m * : Computed Discharge
#:Discarded Discharge (values changed as per rating curve)
Note: River remained in pooling/ no flow condition w.e.f. 01/06/2017 to 26/06/2017 & 01/12/17 to 31/05/18.
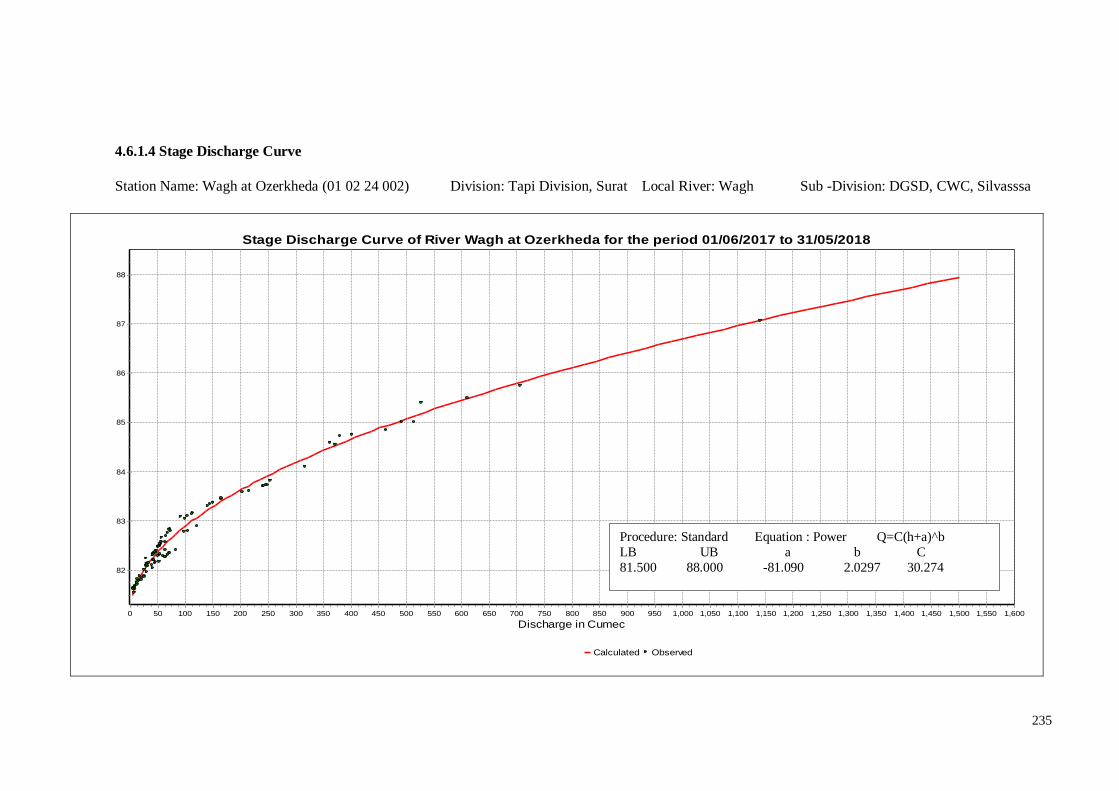
235
4.6.1.4 Stage Discharge Curve
Station Name: Wagh at Ozerkheda (01 02 24 002) Division: Tapi Division, Surat Local River: Wagh Sub -Division: DGSD, CWC, Silvasssa
Stage Discharge Curve of River Wagh at Ozerkheda for the period 01/06/2017 to 31/05/2018
Calculated Observed
Discharge in Cumec1,6001,5501,5001,4501,4001,3501,3001,2501,2001,1501,1001,0501,000950900850800750700650600550500450400350300250200150100500
Sta
ge
in m
88
87
86
85
84
83
82
Procedure: Standard Equation : Power Q=C(h+a)^b
LB UB a b C
81.500 88.000 -81.090 2.0297 30.274

236
4.6.1.5 Annual Runoff
Annual Runoff Values Runoff Based on period 1991-2018
Station Name: Wagh at Ozerkheda (01 02 24 002) Division: Tapi Division, Surat Local River: Wagh Sub -Division: DGSD, CWC, Silvasssa
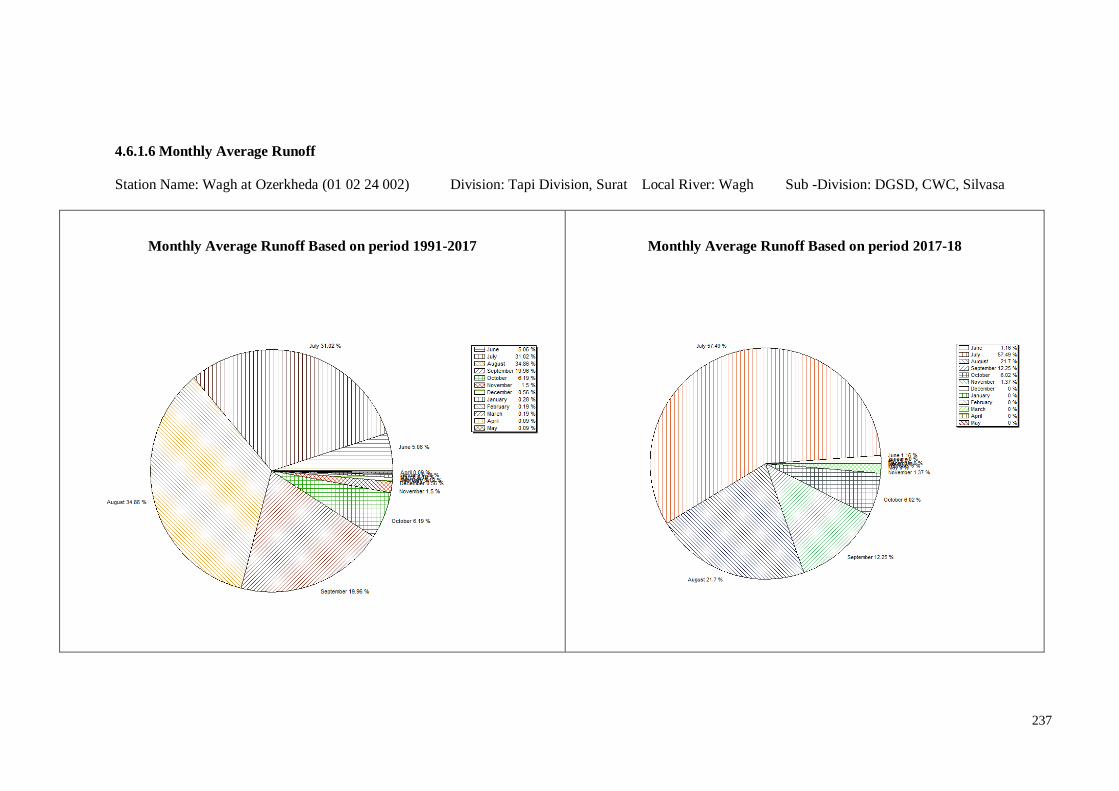
237
4.6.1.6 Monthly Average Runoff
Station Name: Wagh at Ozerkheda (01 02 24 002) Division: Tapi Division, Surat Local River: Wagh Sub -Division: DGSD, CWC, Silvasa
Monthly Average Runoff Based on period 1991-2017
Monthly Average Runoff Based on period 2017-18

238
4.6.1.7 Superimposed cross section
Station Name: Wagh at Ozerkheda (01 02 24 002) Division: Tapi Division, Surat Local River: Wagh Sub -Division: DGSD, CWC, Silvasa
Highest flood level observed so far 96.100 on dt 04/08/2004 at 0100hrs
Max WL 89.200 m on 23/07/2017

239
4. 6.1.8 Water Level vs. Time- Graph of Highest Flood Peaks during 2017-18
Station Name: Wagh at Ozerkheda Division : Tapi Division, Surat
Local River: Wagh Sub -Division : DGSD, CWC, Silvasssa
Water level vs. Time graph of I flood peak during the year 2017-18
Water level vs. Time graph of II flood peak during the year 2017-18
Water level vs. Time graph of III flood peak during the year 2017-18

240
4.6.2 Damanganga Basin
4.6.2.1 History sheet
History Sheet
Water Year : 2017-18
Site : Damanganga at Nanipalsan Code : 01 02 24 001
State : Gujarat District Valsad
Basin : WFR South of Tapi
Independent River : Daman Ganga
Tributary : Sub Tributary :
Sub-Sub Tributary : Local River :
Division : Tapi Division,
Surat Sub-Division : DGSD,CWC,Silvasa
Drainage Area : 764 Sq. Km. Bank :
Latitude : 20°12’00” N Longitude : 73°17’00” E
Zero of
Gauge (m) : 95 (m.s.l) 6/15/1982
Opening Date Closing Date
Gauge : 15/06/1982
Discharge : 13/10/1983
01/06/1991
Seasonal
regular
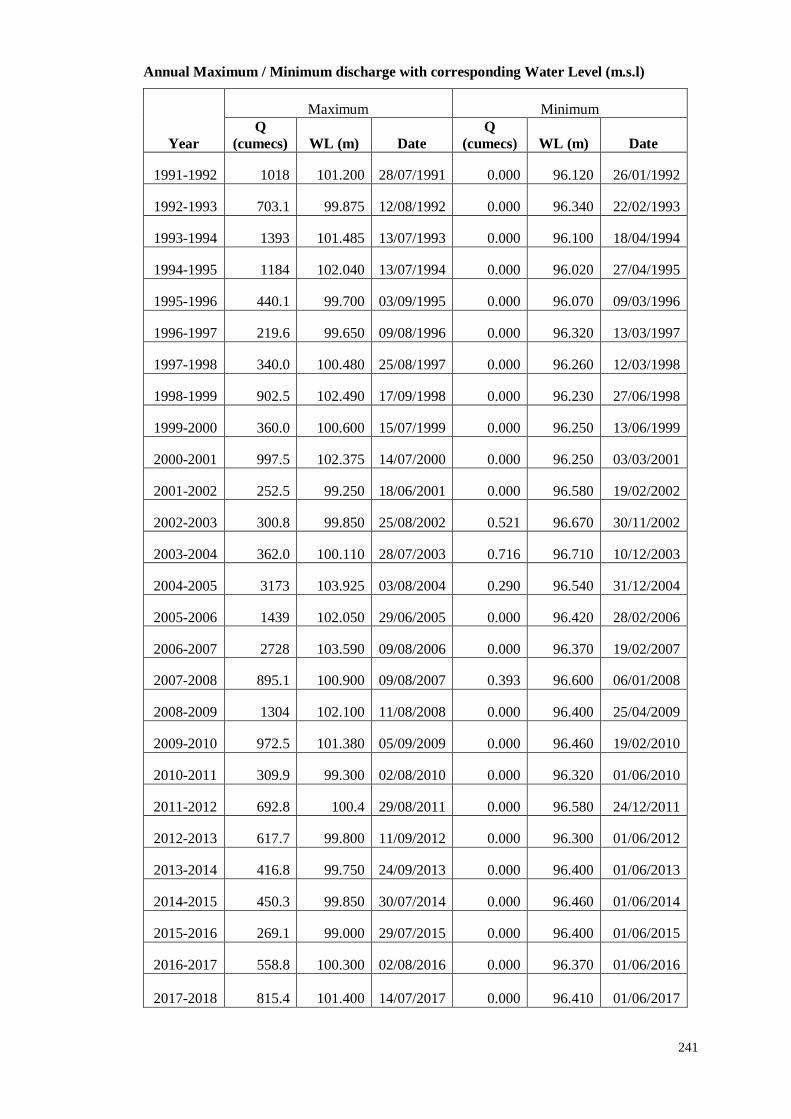
241
Annual Maximum / Minimum discharge with corresponding Water Level (m.s.l)
Year
Maximum Minimum
Q
(cumecs) WL (m) Date
Q
(cumecs) WL (m) Date
1991-1992 1018 101.200 28/07/1991 0.000 96.120 26/01/1992
1992-1993 703.1 99.875 12/08/1992 0.000 96.340 22/02/1993
1993-1994 1393 101.485 13/07/1993 0.000 96.100 18/04/1994
1994-1995 1184 102.040 13/07/1994 0.000 96.020 27/04/1995
1995-1996 440.1 99.700 03/09/1995 0.000 96.070 09/03/1996
1996-1997 219.6 99.650 09/08/1996 0.000 96.320 13/03/1997
1997-1998 340.0 100.480 25/08/1997 0.000 96.260 12/03/1998
1998-1999 902.5 102.490 17/09/1998 0.000 96.230 27/06/1998
1999-2000 360.0 100.600 15/07/1999 0.000 96.250 13/06/1999
2000-2001 997.5 102.375 14/07/2000 0.000 96.250 03/03/2001
2001-2002 252.5 99.250 18/06/2001 0.000 96.580 19/02/2002
2002-2003 300.8 99.850 25/08/2002 0.521 96.670 30/11/2002
2003-2004 362.0 100.110 28/07/2003 0.716 96.710 10/12/2003
2004-2005 3173 103.925 03/08/2004 0.290 96.540 31/12/2004
2005-2006 1439 102.050 29/06/2005 0.000 96.420 28/02/2006
2006-2007 2728 103.590 09/08/2006 0.000 96.370 19/02/2007
2007-2008 895.1 100.900 09/08/2007 0.393 96.600 06/01/2008
2008-2009 1304 102.100 11/08/2008 0.000 96.400 25/04/2009
2009-2010 972.5 101.380 05/09/2009 0.000 96.460 19/02/2010
2010-2011 309.9 99.300 02/08/2010 0.000 96.320 01/06/2010
2011-2012 692.8 100.4 29/08/2011 0.000 96.580 24/12/2011
2012-2013 617.7 99.800 11/09/2012 0.000 96.300 01/06/2012
2013-2014 416.8 99.750 24/09/2013 0.000 96.400 01/06/2013
2014-2015 450.3 99.850 30/07/2014 0.000 96.460 01/06/2014
2015-2016 269.1 99.000 29/07/2015 0.000 96.400 01/06/2015
2016-2017 558.8 100.300 02/08/2016 0.000 96.370 01/06/2016
2017-2018 815.4 101.400 14/07/2017 0.000 96.410 01/06/2017
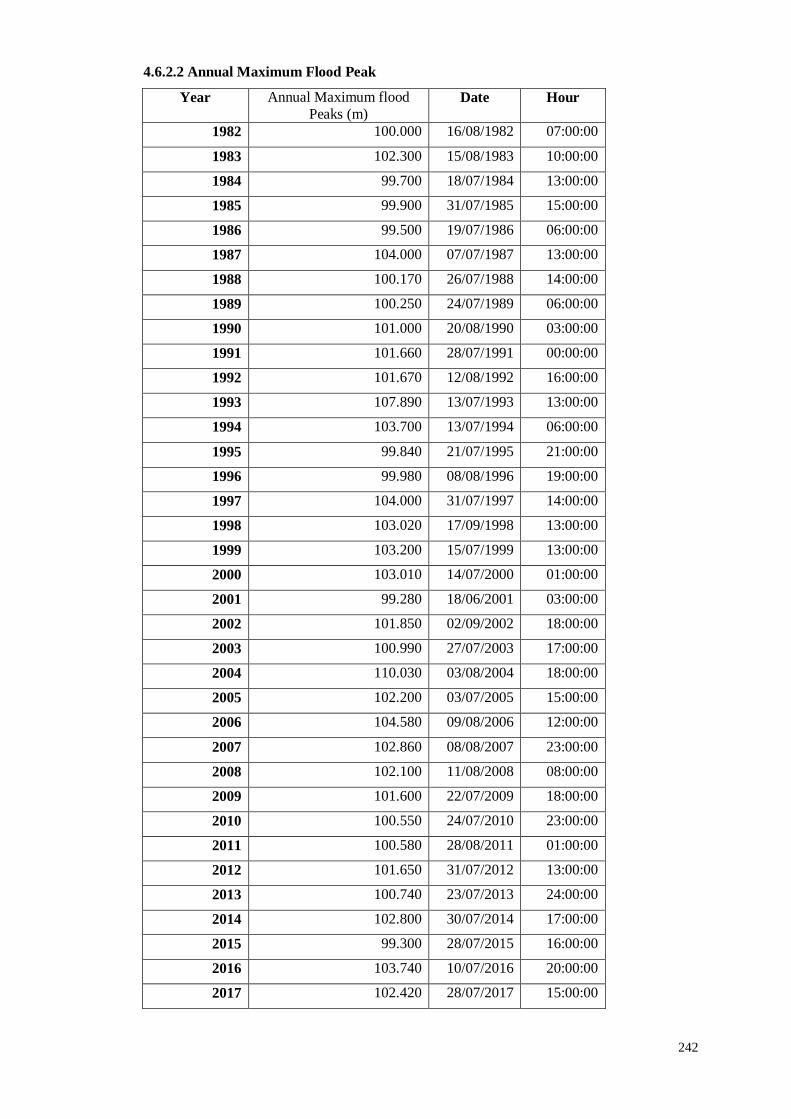
242
4.6.2.2 Annual Maximum Flood Peak
Year Annual Maximum flood
Peaks (m) Date Hour
1982 100.000 16/08/1982 07:00:00
1983 102.300 15/08/1983 10:00:00
1984 99.700 18/07/1984 13:00:00
1985 99.900 31/07/1985 15:00:00
1986 99.500 19/07/1986 06:00:00
1987 104.000 07/07/1987 13:00:00
1988 100.170 26/07/1988 14:00:00
1989 100.250 24/07/1989 06:00:00
1990 101.000 20/08/1990 03:00:00
1991 101.660 28/07/1991 00:00:00
1992 101.670 12/08/1992 16:00:00
1993 107.890 13/07/1993 13:00:00
1994 103.700 13/07/1994 06:00:00
1995 99.840 21/07/1995 21:00:00
1996 99.980 08/08/1996 19:00:00
1997 104.000 31/07/1997 14:00:00
1998 103.020 17/09/1998 13:00:00
1999 103.200 15/07/1999 13:00:00
2000 103.010 14/07/2000 01:00:00
2001 99.280 18/06/2001 03:00:00
2002 101.850 02/09/2002 18:00:00
2003 100.990 27/07/2003 17:00:00
2004 110.030 03/08/2004 18:00:00
2005 102.200 03/07/2005 15:00:00
2006 104.580 09/08/2006 12:00:00
2007 102.860 08/08/2007 23:00:00
2008 102.100 11/08/2008 08:00:00
2009 101.600 22/07/2009 18:00:00
2010 100.550 24/07/2010 23:00:00
2011 100.580 28/08/2011 01:00:00
2012 101.650 31/07/2012 13:00:00
2013 100.740 23/07/2013 24:00:00
2014 102.800 30/07/2014 17:00:00
2015 99.300 28/07/2015 16:00:00
2016 103.740 10/07/2016 20:00:00
2017 102.420 28/07/2017 15:00:00
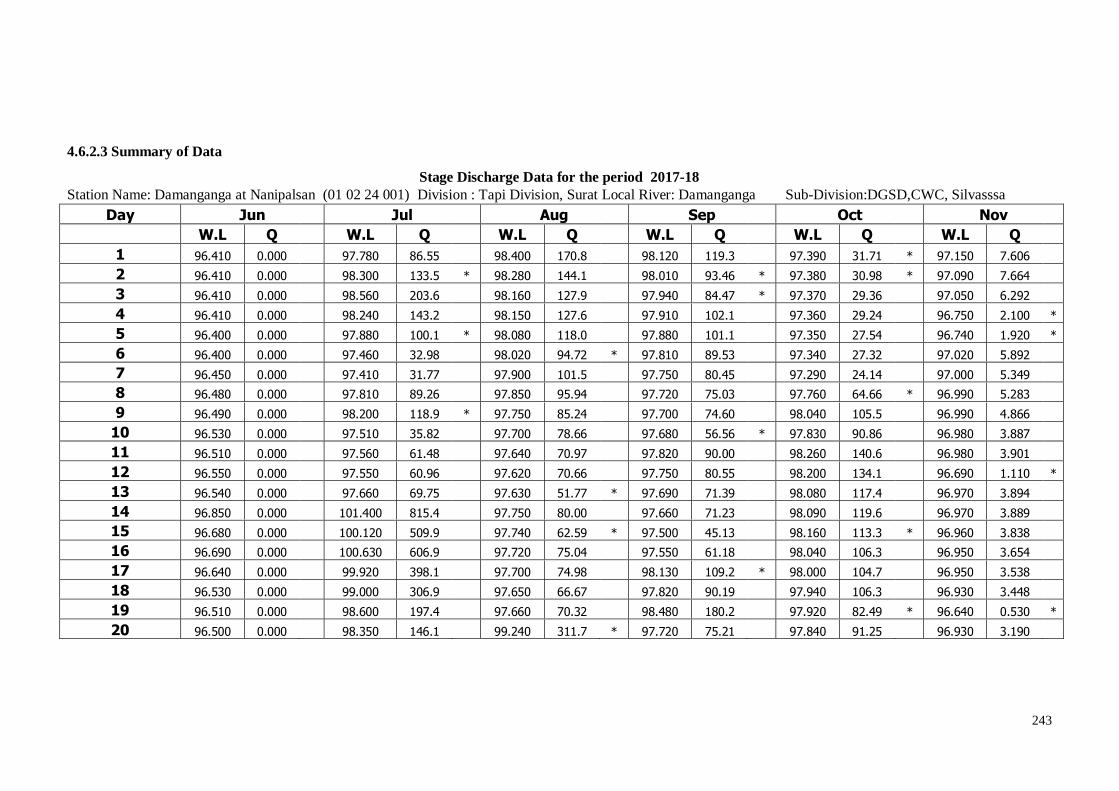
243
4.6.2.3 Summary of Data
Stage Discharge Data for the period 2017-18
Station Name: Damanganga at Nanipalsan (01 02 24 001) Division : Tapi Division, Surat Local River: Damanganga Sub-Division:DGSD,CWC, Silvasssa
Day Jun Jul Aug Sep Oct Nov
W.L Q W.L Q W.L Q W.L Q W.L Q W.L Q
1 96.410 0.000 97.780 86.55 98.400 170.8 98.120 119.3 97.390 31.71 * 97.150 7.606
2 96.410 0.000 98.300 133.5 * 98.280 144.1 98.010 93.46 * 97.380 30.98 * 97.090 7.664
3 96.410 0.000 98.560 203.6 98.160 127.9 97.940 84.47 * 97.370 29.36 97.050 6.292
4 96.410 0.000 98.240 143.2 98.150 127.6 97.910 102.1 97.360 29.24 96.750 2.100 *
5 96.400 0.000 97.880 100.1 * 98.080 118.0 97.880 101.1 97.350 27.54 96.740 1.920 *
6 96.400 0.000 97.460 32.98 98.020 94.72 * 97.810 89.53 97.340 27.32 97.020 5.892
7 96.450 0.000 97.410 31.77 97.900 101.5 97.750 80.45 97.290 24.14 97.000 5.349
8 96.480 0.000 97.810 89.26 97.850 95.94 97.720 75.03 97.760 64.66 * 96.990 5.283
9 96.490 0.000 98.200 118.9 * 97.750 85.24 97.700 74.60 98.040 105.5 96.990 4.866
10 96.530 0.000 97.510 35.82 97.700 78.66 97.680 56.56 * 97.830 90.86 96.980 3.887
11 96.510 0.000 97.560 61.48 97.640 70.97 97.820 90.00 98.260 140.6 96.980 3.901
12 96.550 0.000 97.550 60.96 97.620 70.66 97.750 80.55 98.200 134.1 96.690 1.110 *
13 96.540 0.000 97.660 69.75 97.630 51.77 * 97.690 71.39 98.080 117.4 96.970 3.894
14 96.850 0.000 101.400 815.4 97.750 80.00 97.660 71.23 98.090 119.6 96.970 3.889
15 96.680 0.000 100.120 509.9 97.740 62.59 * 97.500 45.13 98.160 113.3 * 96.960 3.838
16 96.690 0.000 100.630 606.9 97.720 75.04 97.550 61.18 98.040 106.3 96.950 3.654
17 96.640 0.000 99.920 398.1 97.700 74.98 98.130 109.2 * 98.000 104.7 96.950 3.538
18 96.530 0.000 99.000 306.9 97.650 66.67 97.820 90.19 97.940 106.3 96.930 3.448
19 96.510 0.000 98.600 197.4 97.660 70.32 98.480 180.2 97.920 82.49 * 96.640 0.530 *
20 96.500 0.000 98.350 146.1 99.240 311.7 * 97.720 75.21 97.840 91.25 96.930 3.190

244
21 96.490 0.000 98.290 138.0 99.870 410.4 97.730 76.85 97.810 89.53 96.900 3.141
22 96.450 0.000 99.160 286.3 98.470 181.9 97.760 80.91 97.780 66.77 * 96.880 3.235
23 96.440 0.000 100.400 623.0 97.980 109.4 97.720 75.47 97.700 74.77 96.870 3.046
24 96.430 0.000 100.350 602.6 97.910 101.9 97.670 55.58 * 97.630 72.30 96.860 2.741
25 97.760 0.000 99.280 324.2 98.430 153.7 * 97.650 75.09 97.560 66.55 96.850 2.348
26 97.360 0.000 98.130 123.6 98.470 182.2 97.610 70.35 97.470 35.39 96.590 0.160 *
27 96.970 0.000 98.030 105.6 98.350 141.1 * 97.440 31.58 97.320 27.32 96.840 2.268
28 97.200 18.94 100.200 536.6 98.200 136.4 97.420 31.26 97.290 24.79 * 96.830 2.137
29 97.430 31.76 100.300 589.2 99.910 419.1 97.400 30.88 97.280 24.15 * 96.820 1.951
30 97.560 64.70 99.200 302.6 * 99.100 285.0 97.390 31.71 * 97.270 23.51 * 96.820 1.952
31 99.020 277.5 98.670 204.3 97.190 18.72 *
Ten-Daily Mean
I Ten-Daily 96.439 0.000 97.915 97.55 98.029 114.4 97.852 87.66 97.511 46.13 96.976 5.086
II Ten-Daily 96.600 0.000 99.079 317.3 97.835 93.47 97.812 87.42 98.053 111.6 96.897 3.099
III Ten-Daily 97.009 11.54 99.305 355.4 98.669 211.4 97.579 55.97 97.482 47.62 96.826 2.298
Monthly
Min. 96.400 0.000 97.410 31.77 97.620 51.77 97.390 30.88 97.190 18.72 96.590 0.160
Max. 97.760 64.70 101.400 815.4 99.910 419.1 98.480 180.2 98.260 140.6 97.150 7.664
Mean 96.683 3.847
98.784 259.9
98.194 142.1
97.748 77.02
97.675 67.77
96.900 3.494
Annual Runoff in MCM = 1479 Annual Runoff in mm = 1936
Peak Observed Discharge = 815.4 cumecs on 14-07-2017 Corres. Water Level :101.400 m
Lowest Observed Discharge = 0.000 cumecs on 01-06-2017 Corres. Water Level : 96.410 m
Q: Observed/Computed discharge in cumec WL: Corresponding Mean Water Level (m.s.l) in m * : Computed Discharge #:Discarded Discharge (values changed as per rating curve)
Note: River remained in pooling/ no flow condition w.e.f. 01/06/17 to 22/06/17 & 01/11/2018 to 31/05/2018.
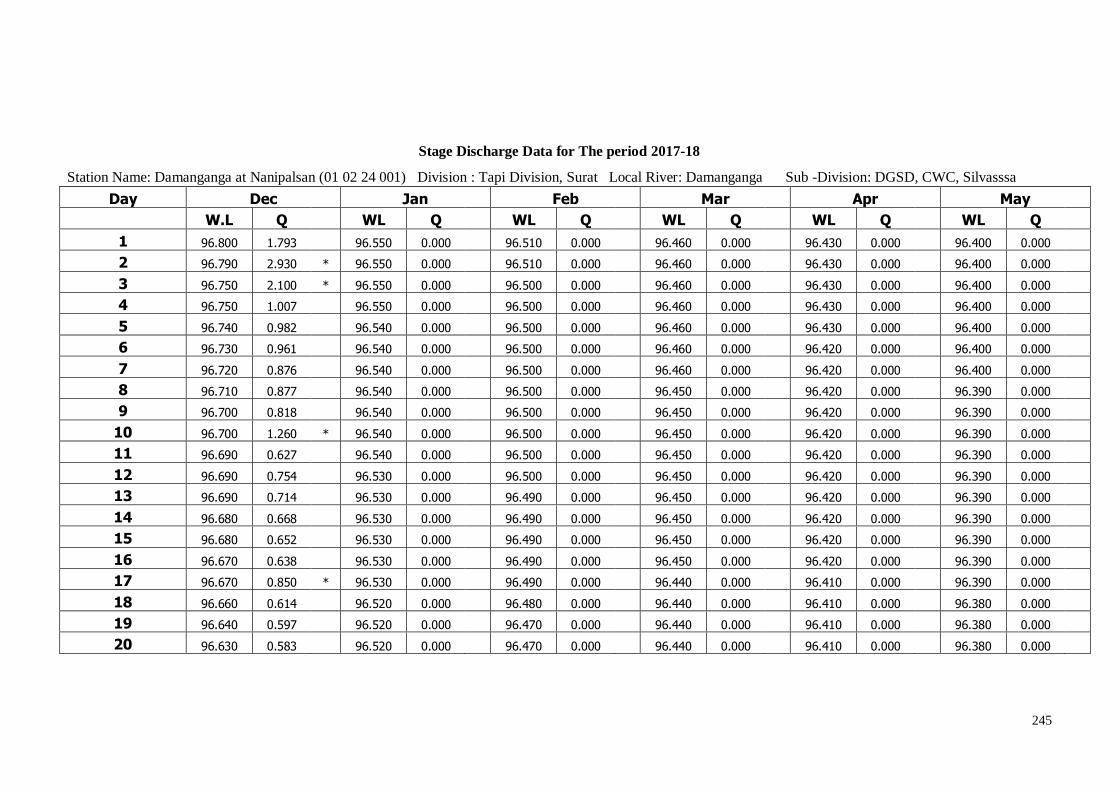
245
Stage Discharge Data for The period 2017-18
Station Name: Damanganga at Nanipalsan (01 02 24 001) Division : Tapi Division, Surat Local River: Damanganga Sub -Division: DGSD, CWC, Silvasssa
Day Dec Jan Feb Mar Apr May
W.L Q WL Q WL Q WL Q WL Q WL Q
1 96.800 1.793 96.550 0.000 96.510 0.000 96.460 0.000 96.430 0.000 96.400 0.000
2 96.790 2.930 * 96.550 0.000 96.510 0.000 96.460 0.000 96.430 0.000 96.400 0.000
3 96.750 2.100 * 96.550 0.000 96.500 0.000 96.460 0.000 96.430 0.000 96.400 0.000
4 96.750 1.007 96.550 0.000 96.500 0.000 96.460 0.000 96.430 0.000 96.400 0.000
5 96.740 0.982 96.540 0.000 96.500 0.000 96.460 0.000 96.430 0.000 96.400 0.000
6 96.730 0.961 96.540 0.000 96.500 0.000 96.460 0.000 96.420 0.000 96.400 0.000
7 96.720 0.876 96.540 0.000 96.500 0.000 96.460 0.000 96.420 0.000 96.400 0.000
8 96.710 0.877 96.540 0.000 96.500 0.000 96.450 0.000 96.420 0.000 96.390 0.000
9 96.700 0.818 96.540 0.000 96.500 0.000 96.450 0.000 96.420 0.000 96.390 0.000
10 96.700 1.260 * 96.540 0.000 96.500 0.000 96.450 0.000 96.420 0.000 96.390 0.000
11 96.690 0.627 96.540 0.000 96.500 0.000 96.450 0.000 96.420 0.000 96.390 0.000
12 96.690 0.754 96.530 0.000 96.500 0.000 96.450 0.000 96.420 0.000 96.390 0.000
13 96.690 0.714 96.530 0.000 96.490 0.000 96.450 0.000 96.420 0.000 96.390 0.000
14 96.680 0.668 96.530 0.000 96.490 0.000 96.450 0.000 96.420 0.000 96.390 0.000
15 96.680 0.652 96.530 0.000 96.490 0.000 96.450 0.000 96.420 0.000 96.390 0.000
16 96.670 0.638 96.530 0.000 96.490 0.000 96.450 0.000 96.420 0.000 96.390 0.000
17 96.670 0.850 * 96.530 0.000 96.490 0.000 96.440 0.000 96.410 0.000 96.390 0.000
18 96.660 0.614 96.520 0.000 96.480 0.000 96.440 0.000 96.410 0.000 96.380 0.000
19 96.640 0.597 96.520 0.000 96.470 0.000 96.440 0.000 96.410 0.000 96.380 0.000
20 96.630 0.583 96.520 0.000 96.470 0.000 96.440 0.000 96.410 0.000 96.380 0.000

246
21 96.630 0.557 96.520 0.000 96.470 0.000 96.440 0.000 96.410 0.000 96.380 0.000
22 96.630 0.553 96.520 0.000 96.470 0.000 96.440 0.000 96.410 0.000 96.380 0.000
23 96.620 0.513 96.520 0.000 96.470 0.000 96.440 0.000 96.410 0.000 96.380 0.000
24 96.620 0.350 * 96.520 0.000 96.470 0.000 96.440 0.000 96.410 0.000 96.380 0.000
25 96.610 0.280 * 96.520 0.000 96.470 0.000 96.440 0.000 96.410 0.000 96.370 0.000
26 96.590 0.493 96.510 0.000 96.470 0.000 96.440 0.000 96.410 0.000 96.370 0.000
27 96.585 0.427 96.510 0.000 96.470 0.000 96.430 0.000 96.410 0.000 96.370 0.000
28 96.580 0.405 96.510 0.000 96.460 0.000 96.430 0.000 96.400 0.000 96.370 0.000
29 96.560 0.394 96.510 0.000 96.430 0.000 96.400 0.000 96.370 0.000
30 96.560 0.319 96.510 0.000 96.430 0.000 96.400 0.000 96.370 0.000
31 96.560 0.040 * 96.510 0.000 96.430 0.000 96.370 0.000
Ten-Daily Mean
I Ten-Daily 96.739 1.360
96.544 0.000
96.502 0.000
96.457 0.000
96.425 0.000
96.397 0.000 II Ten-Daily 96.670 0.670
96.528 0.000
96.487 0.000
96.446 0.000
96.416 0.000
96.387 0.000
III Ten-Daily 96.595 0.394
96.515 0.000
96.469 0.000
96.435 0.000
96.407 0.000
96.374 0.000 Monthly
Min. 96.560 0.040
96.510 0.000
96.460 0.000
96.430 0.000
96.400 0.000
96.370 0.000 Max. 96.800 2.930
96.550 0.000
96.510 0.000
96.460 0.000
96.430 0.000
96.400 0.000
Mean 96.666 0.795
96.528 0.000
96.487 0.000
96.446 0.000
96.416 0.000
96.385 0.000
Peak Computed Discharge = 311.7 cumecs on 20-08-2017 Corres. Water Level :99.240 m
Lowest Computed Discharge = 0.040 cumecs on 31-12-2017 Corres. Water Level :96.560 m Q: Observed/Computed discharge in cumec WL: Corresponding Mean Water Level (m.s.l) in m * : Computed Discharge
#:Discarded Discharge (values changed as per rating curve)
Note: River remained in pooling/ no flow condition w.e.f. 01/06/17 to 22/06/17 & 01/11/2018 to 31/05/2018.
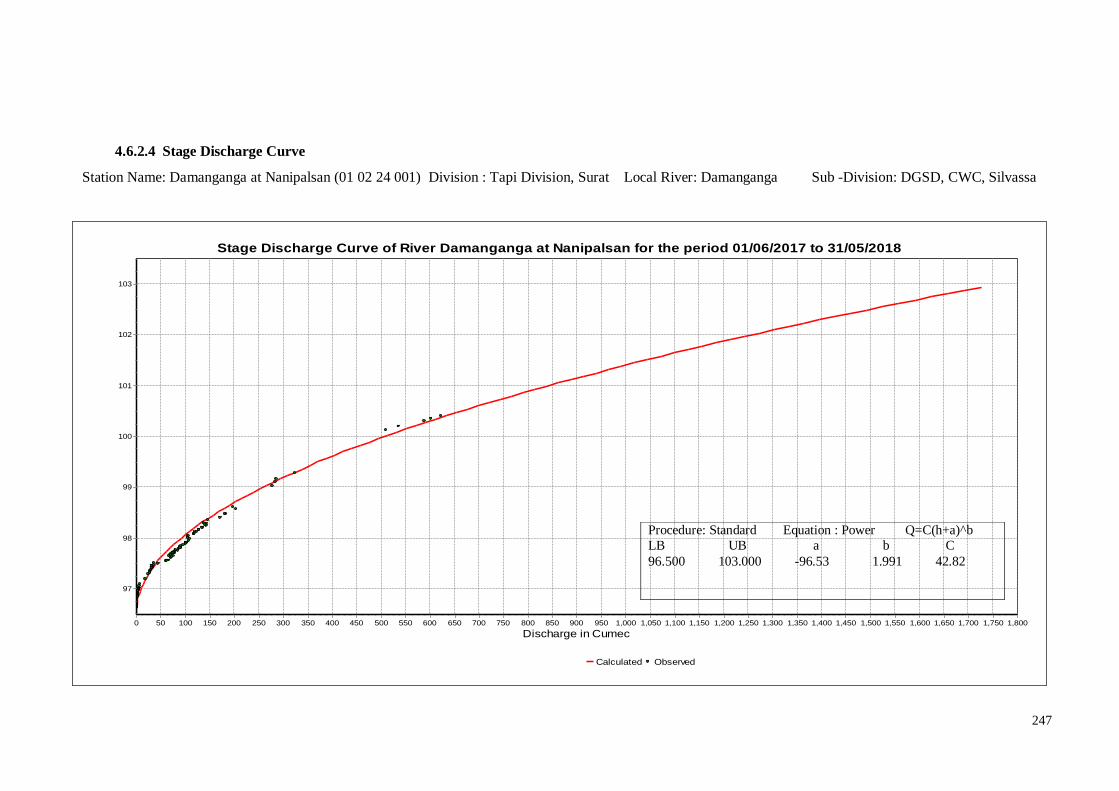
247
4.6.2.4 Stage Discharge Curve
Station Name: Damanganga at Nanipalsan (01 02 24 001) Division : Tapi Division, Surat Local River: Damanganga Sub -Division: DGSD, CWC, Silvassa
Stage Discharge Curve of River Damanganga at Nanipalsan for the period 01/06/2017 to 31/05/2018
Calculated Observed
Discharge in Cumec1,8001,7501,7001,6501,6001,5501,5001,4501,4001,3501,3001,2501,2001,1501,1001,0501,000950900850800750700650600550500450400350300250200150100500
Sta
ge
in m
103
102
101
100
99
98
97
Procedure: Standard Equation : Power Q=C(h+a)^b
LB UB a b C
96.500 103.000 -96.53 1.991 42.82
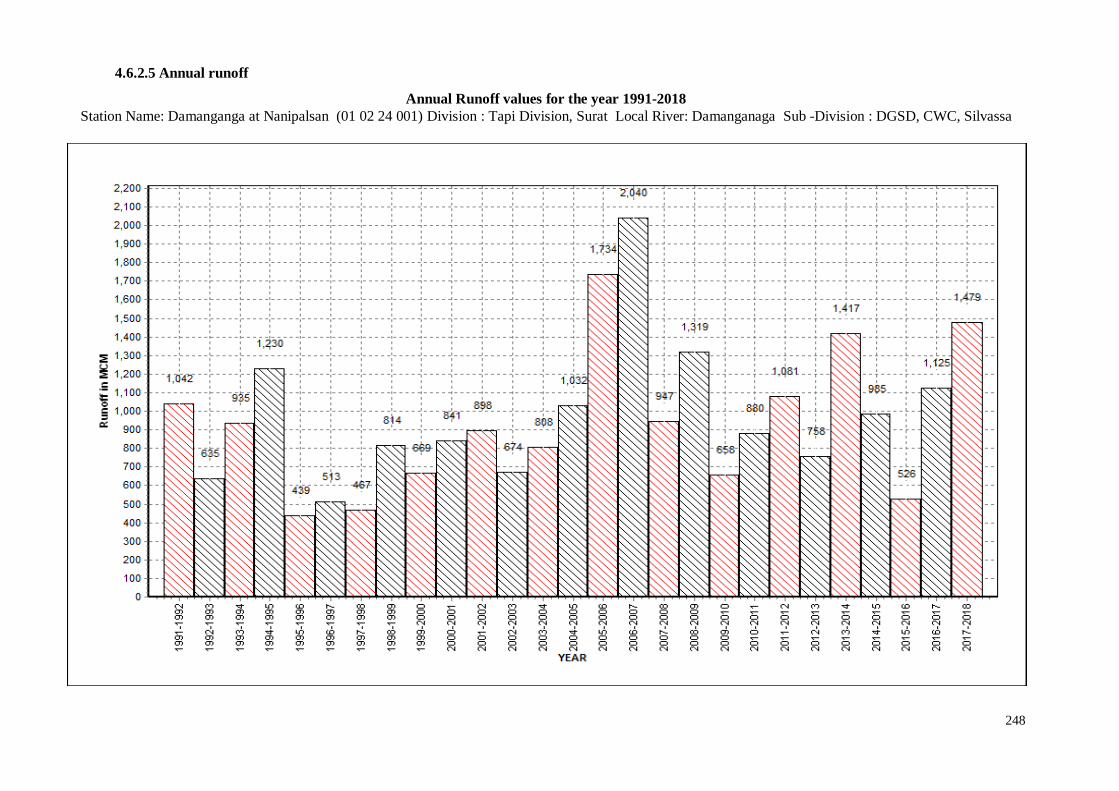
248
4.6.2.5 Annual runoff
Annual Runoff values for the year 1991-2018
Station Name: Damanganga at Nanipalsan (01 02 24 001) Division : Tapi Division, Surat Local River: Damanganaga Sub -Division : DGSD, CWC, Silvassa
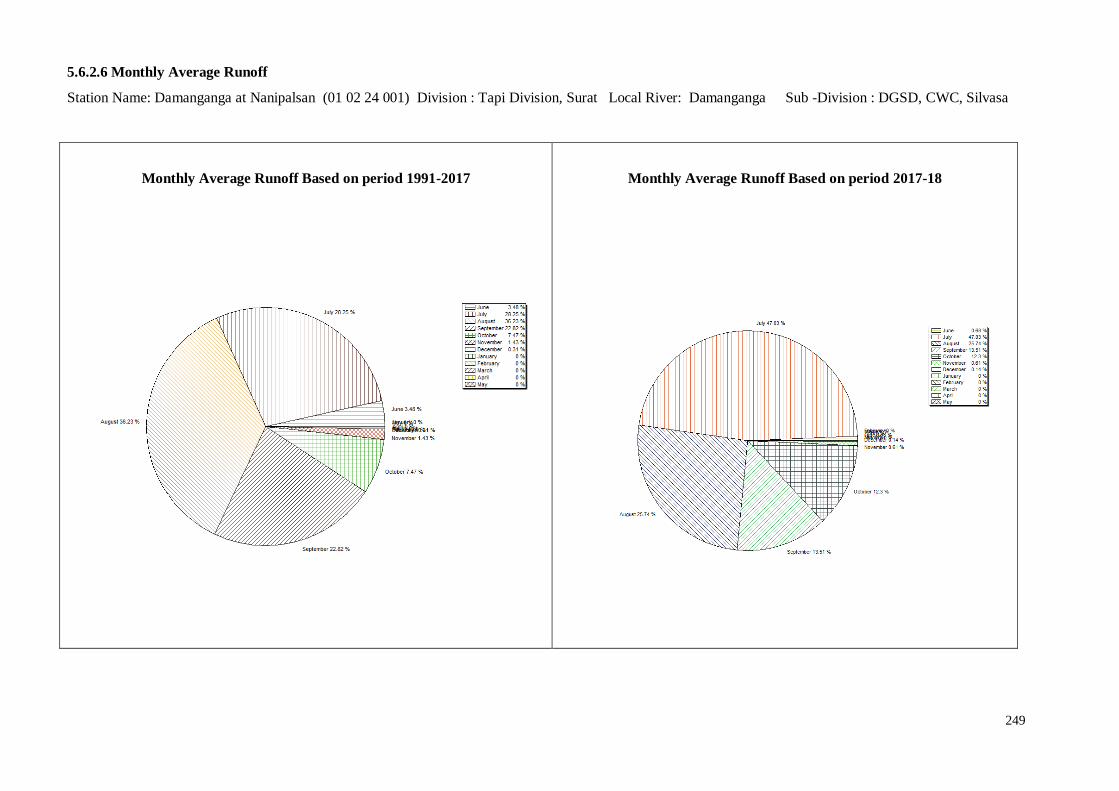
249
5.6.2.6 Monthly Average Runoff
Station Name: Damanganga at Nanipalsan (01 02 24 001) Division : Tapi Division, Surat Local River: Damanganga Sub -Division : DGSD, CWC, Silvasa
Monthly Average Runoff Based on period 1991-2017
Monthly Average Runoff Based on period 2017-18

250
4.6.2.7 Superimposed cross section
Station Name: Damanganga at Nanipalsan (01 02 24 001) Division : Tapi Division, Surat Local River: Damanganga Sub-Division:DGSD, CWC, Silvasa
Highest flood level observed so far 110.030 on dt 03/08/2004 at 18: 00hrs
Max WL 102.420 m on 28/07/2017
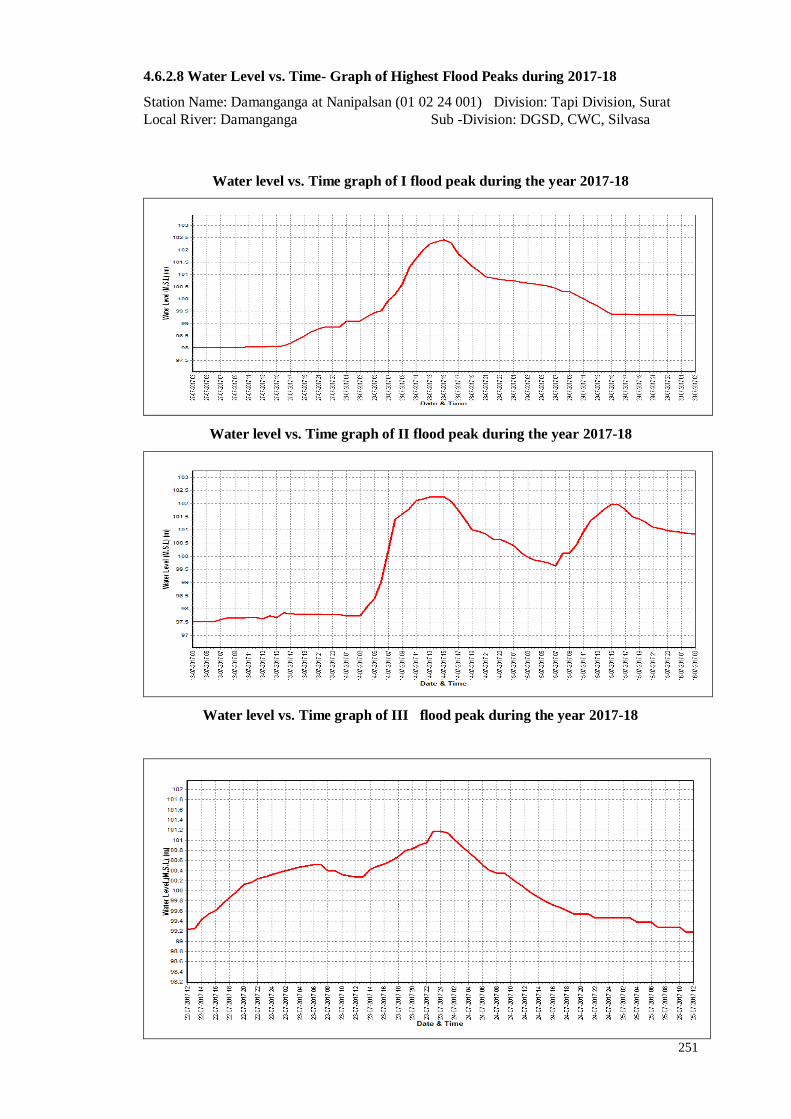
251
4.6.2.8 Water Level vs. Time- Graph of Highest Flood Peaks during 2017-18
Station Name: Damanganga at Nanipalsan (01 02 24 001) Division: Tapi Division, Surat
Local River: Damanganga Sub -Division: DGSD, CWC, Silvasa
Water level vs. Time graph of I flood peak during the year 2017-18
Water level vs. Time graph of II flood peak during the year 2017-18
Water level vs. Time graph of III flood peak during the year 2017-18

252
4.7 Kim basin
4.7.1
4.7.1.1 History sheet
HISTORY SHEET
Water Year : 2017-18
Site : Motinaroli Code : 01 02 16 001
State : Gujarat District Surat
Basin : Narmada Independent River : Kim
Tributary : - Sub Tributary : -
Sub-Sub Tributary : - Local River : Kim
Division : Tapi Dvision, Surat Sub-Division : LNSD Bharuch
Drainage Area : 804 Sq. Km. Bank : Right
Latitude : 21°24’16” Longitude : 72°57’48”
Zero of Gauge m : 5 (m.s.l) 17/10/1990
Opening Date Closing Date
Gauge : 17/10/1990
Discharge : 17/10/1990
Sediment :
Water Quality : 1/7/1991

253
Annual maximum/minimum discharge with corresponding Water level (above m.s.l)
Year
Maximum Minimum
Q
(cumecs) WL (m) Date
Q
(cumecs) WL (m) Date
1991-1992 58.73 10.140 01/08/1991 0.000 6.245 06/05/1992
1992-1993 736.4 17.510 22/06/1992 0.191 7.515 30/03/1993
1993-1994 426.3 13.890 16/07/1993 0.170 7.520 17/05/1994
1994-1995 700.5 13.750 22/07/1994 0.000 7.350 04/04/1995
1995-1996 668.6 15.700 21/07/1995 0.240 7.280 05/04/1996
1996-1997 676.0 16.800 24/07/1996 0.112 7.470 23/04/1997
1997-1998 372.0 16.355 24/08/1997 0.080 7.300 10/03/1998
1998-1999 404.0 15.900 16/09/1998 0.099 7.230 26/03/1999
1999-2000 282.5 13.500 20/07/1999 0.170 7.360 26/03/2000
2000-2001 296.2 13.625 14/07/2000 0.041 7.200 28/05/2001
2001-2002 377.1 14.650 16/08/2001 0.000 7.220 07/05/2002
2002-2003 526.8 14.930 04/09/2002 0.000 7.100 13/04/2003
2003-2004 649.0 14.640 25/07/2003 0.000 7.190 29/05/2004
2004-2005 1288 17.200 04/08/2004 0.000 7.340 14/02/2005
2005-2006 720.2 16.380 30/06/2005 0.000 7.310 22/06/2005
2006-2007 923.2 17.650 29/07/2006 0.956 7.710 27/02/2007
2007-2008 851.7 16.815 02/07/2007 0.280 7.530 08/03/2008
2008-2009 735.6 15.985 12/08/2008 0.500 7.440 25/03/2009
2009-2010 206.8 13.660 07/09/2009 0.000 7.550 25/01/2010
2010-2011 384.2 14.625 10/09/2010 0.770 7.620 04/01/2011
2011-2012 497.8 14.425 26/08/2011 0.000 7.630 19/12/2012
2012-2013 47.64 13.480 04/09/2012 0.000 7.720 07/01/2013
2013-2014 399.3 15.150 23/09/2013 0.000 7.790 09/10/2014
2014-2015 498.0 13.740 01/08/2014 0.000 7.660 02/06/2014
2015-2016 538.4 15.000 28/07/2015 0.000 7.840 21/12/2015
2016-2017 33.46 10.480 19/09/2016 0.000 7.720 07/06/2016
2017-2018 188.1 12.700 28/08/2017 0.000 7.730 11/01/2018
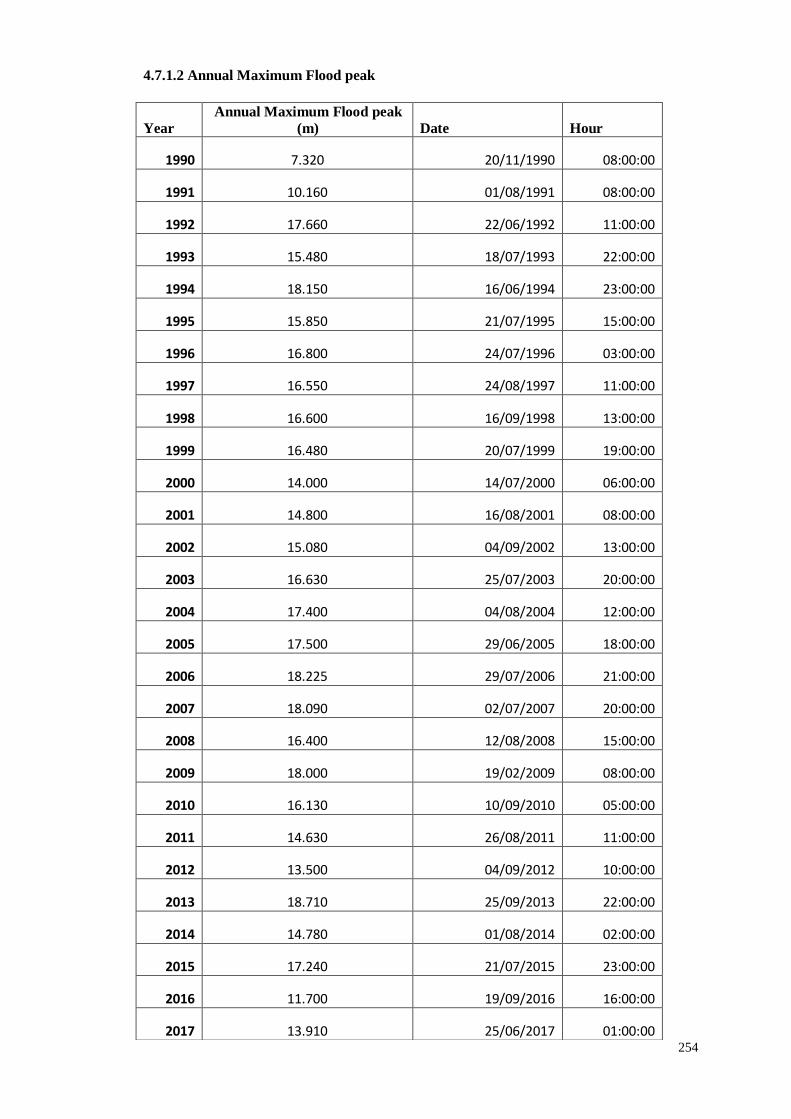
254
4.7.1.2 Annual Maximum Flood peak
Year
Annual Maximum Flood peak
(m) Date Hour
1990 7.320 20/11/1990 08:00:00
1991 10.160 01/08/1991 08:00:00
1992 17.660 22/06/1992 11:00:00
1993 15.480 18/07/1993 22:00:00
1994 18.150 16/06/1994 23:00:00
1995 15.850 21/07/1995 15:00:00
1996 16.800 24/07/1996 03:00:00
1997 16.550 24/08/1997 11:00:00
1998 16.600 16/09/1998 13:00:00
1999 16.480 20/07/1999 19:00:00
2000 14.000 14/07/2000 06:00:00
2001 14.800 16/08/2001 08:00:00
2002 15.080 04/09/2002 13:00:00
2003 16.630 25/07/2003 20:00:00
2004 17.400 04/08/2004 12:00:00
2005 17.500 29/06/2005 18:00:00
2006 18.225 29/07/2006 21:00:00
2007 18.090 02/07/2007 20:00:00
2008 16.400 12/08/2008 15:00:00
2009 18.000 19/02/2009 08:00:00
2010 16.130 10/09/2010 05:00:00
2011 14.630 26/08/2011 11:00:00
2012 13.500 04/09/2012 10:00:00
2013 18.710 25/09/2013 22:00:00
2014 14.780 01/08/2014 02:00:00
2015 17.240 21/07/2015 23:00:00
2016 11.700 19/09/2016 16:00:00
2017 13.910 25/06/2017 01:00:00
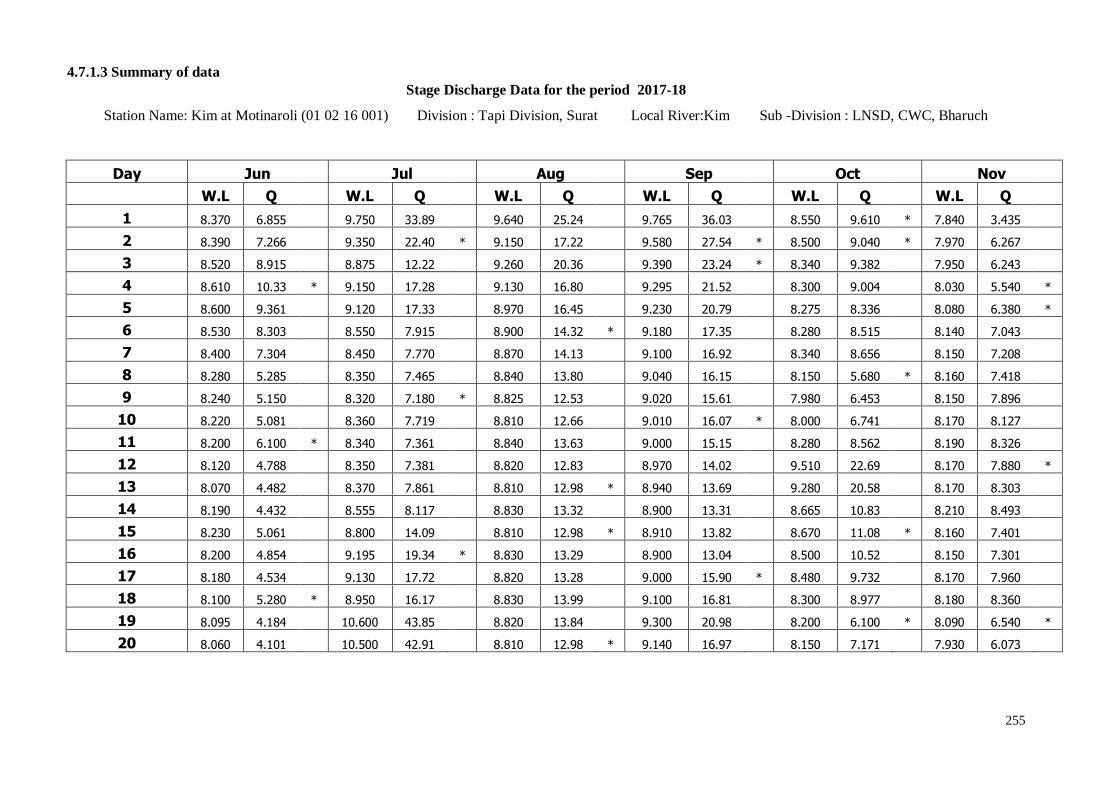
255
4.7.1.3 Summary of data
Stage Discharge Data for the period 2017-18
Station Name: Kim at Motinaroli (01 02 16 001) Division : Tapi Division, Surat Local River:Kim Sub -Division : LNSD, CWC, Bharuch
Day Jun Jul Aug Sep Oct Nov
W.L Q W.L Q W.L Q W.L Q W.L Q W.L Q
1 8.370 6.855 9.750 33.89 9.640 25.24 9.765 36.03 8.550 9.610 * 7.840 3.435
2 8.390 7.266 9.350 22.40 * 9.150 17.22 9.580 27.54 * 8.500 9.040 * 7.970 6.267
3 8.520 8.915 8.875 12.22 9.260 20.36 9.390 23.24 * 8.340 9.382 7.950 6.243
4 8.610 10.33 * 9.150 17.28 9.130 16.80 9.295 21.52 8.300 9.004 8.030 5.540 *
5 8.600 9.361 9.120 17.33 8.970 16.45 9.230 20.79 8.275 8.336 8.080 6.380 *
6 8.530 8.303 8.550 7.915 8.900 14.32 * 9.180 17.35 8.280 8.515 8.140 7.043
7 8.400 7.304 8.450 7.770 8.870 14.13 9.100 16.92 8.340 8.656 8.150 7.208
8 8.280 5.285 8.350 7.465 8.840 13.80 9.040 16.15 8.150 5.680 * 8.160 7.418
9 8.240 5.150 8.320 7.180 * 8.825 12.53 9.020 15.61 7.980 6.453 8.150 7.896
10 8.220 5.081 8.360 7.719 8.810 12.66 9.010 16.07 * 8.000 6.741 8.170 8.127
11 8.200 6.100 * 8.340 7.361 8.840 13.63 9.000 15.15 8.280 8.562 8.190 8.326
12 8.120 4.788 8.350 7.381 8.820 12.83 8.970 14.02 9.510 22.69 8.170 7.880 *
13 8.070 4.482 8.370 7.861 8.810 12.98 * 8.940 13.69 9.280 20.58 8.170 8.303
14 8.190 4.432 8.555 8.117 8.830 13.32 8.900 13.31 8.665 10.83 8.210 8.493
15 8.230 5.061 8.800 14.09 8.810 12.98 * 8.910 13.82 8.670 11.08 * 8.160 7.401
16 8.200 4.854 9.195 19.34 * 8.830 13.29 8.900 13.04 8.500 10.52 8.150 7.301
17 8.180 4.534 9.130 17.72 8.820 13.28 9.000 15.90 * 8.480 9.732 8.170 7.960
18 8.100 5.280 * 8.950 16.17 8.830 13.99 9.100 16.81 8.300 8.977 8.180 8.360
19 8.095 4.184 10.600 43.85 8.820 13.84 9.300 20.98 8.200 6.100 * 8.090 6.540 *
20 8.060 4.101 10.500 42.91 8.810 12.98 * 9.140 16.97 8.150 7.171 7.930 6.073
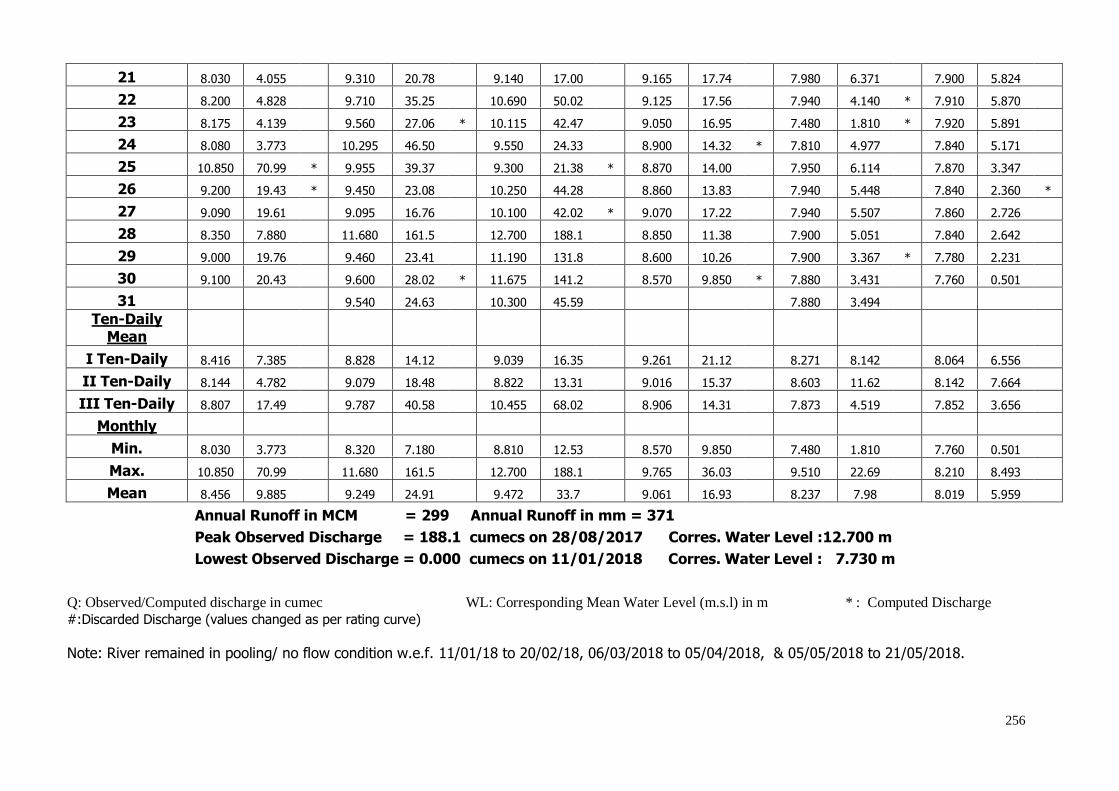
256
21 8.030 4.055 9.310 20.78 9.140 17.00 9.165 17.74 7.980 6.371 7.900 5.824
22 8.200 4.828 9.710 35.25 10.690 50.02 9.125 17.56 7.940 4.140 * 7.910 5.870
23 8.175 4.139 9.560 27.06 * 10.115 42.47 9.050 16.95 7.480 1.810 * 7.920 5.891
24 8.080 3.773 10.295 46.50 9.550 24.33 8.900 14.32 * 7.810 4.977 7.840 5.171
25 10.850 70.99 * 9.955 39.37 9.300 21.38 * 8.870 14.00 7.950 6.114 7.870 3.347
26 9.200 19.43 * 9.450 23.08 10.250 44.28 8.860 13.83 7.940 5.448 7.840 2.360 *
27 9.090 19.61 9.095 16.76 10.100 42.02 * 9.070 17.22 7.940 5.507 7.860 2.726
28 8.350 7.880 11.680 161.5 12.700 188.1 8.850 11.38 7.900 5.051 7.840 2.642
29 9.000 19.76 9.460 23.41 11.190 131.8 8.600 10.26 7.900 3.367 * 7.780 2.231
30 9.100 20.43 9.600 28.02 * 11.675 141.2 8.570 9.850 * 7.880 3.431 7.760 0.501
31 9.540 24.63 10.300 45.59 7.880 3.494
Ten-Daily Mean
I Ten-Daily 8.416 7.385
8.828 14.12
9.039 16.35
9.261 21.12
8.271 8.142
8.064 6.556 II Ten-Daily 8.144 4.782
9.079 18.48
8.822 13.31
9.016 15.37
8.603 11.62
8.142 7.664
III Ten-Daily 8.807 17.49
9.787 40.58
10.455 68.02
8.906 14.31
7.873 4.519
7.852 3.656 Monthly
Min. 8.030 3.773
8.320 7.180
8.810 12.53
8.570 9.850
7.480 1.810
7.760 0.501 Max. 10.850 70.99
11.680 161.5
12.700 188.1
9.765 36.03
9.510 22.69
8.210 8.493
Mean 8.456 9.885
9.249 24.91
9.472 33.7
9.061 16.93
8.237 7.98
8.019 5.959
Annual Runoff in MCM = 299 Annual Runoff in mm = 371
Peak Observed Discharge = 188.1 cumecs on 28/08/2017 Corres. Water Level :12.700 m
Lowest Observed Discharge = 0.000 cumecs on 11/01/2018 Corres. Water Level : 7.730 m
Q: Observed/Computed discharge in cumec WL: Corresponding Mean Water Level (m.s.l) in m * : Computed Discharge
#:Discarded Discharge (values changed as per rating curve)
Note: River remained in pooling/ no flow condition w.e.f. 11/01/18 to 20/02/18, 06/03/2018 to 05/04/2018, & 05/05/2018 to 21/05/2018.
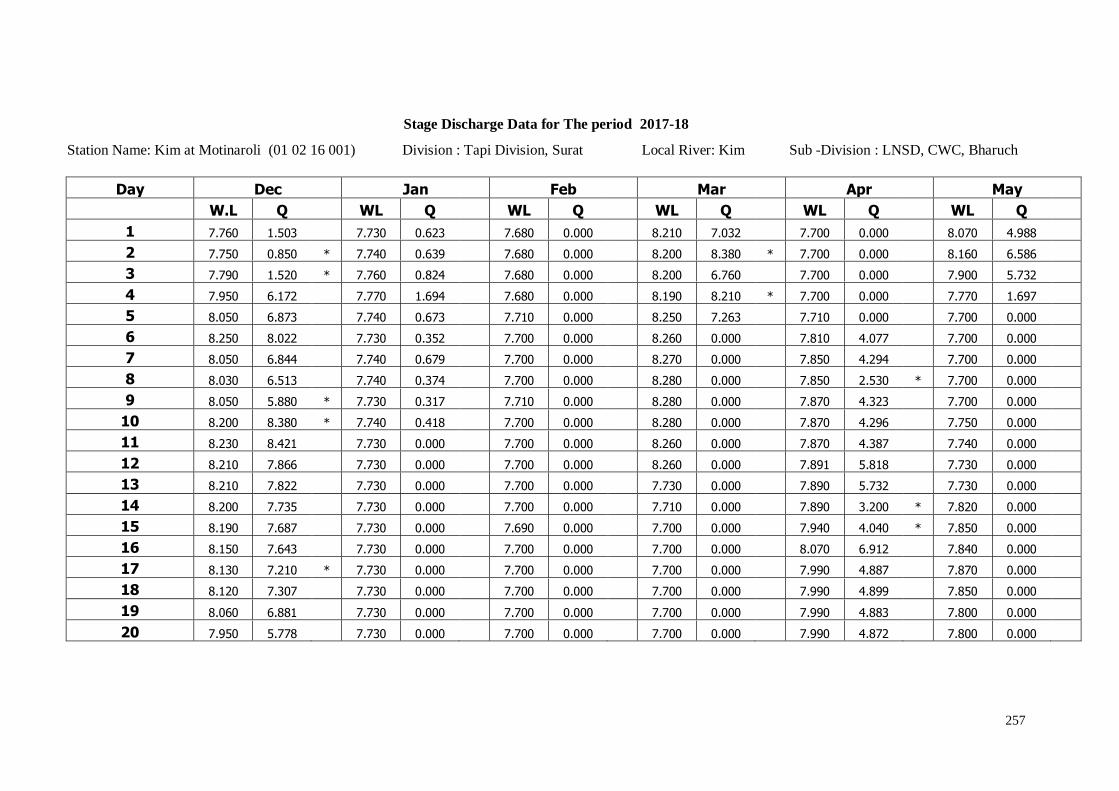
257
Stage Discharge Data for The period 2017-18
Station Name: Kim at Motinaroli (01 02 16 001) Division : Tapi Division, Surat Local River: Kim Sub -Division : LNSD, CWC, Bharuch
Day Dec Jan Feb Mar Apr May
W.L Q WL Q WL Q WL Q WL Q WL Q
1 7.760 1.503 7.730 0.623 7.680 0.000 8.210 7.032 7.700 0.000 8.070 4.988
2 7.750 0.850 * 7.740 0.639 7.680 0.000 8.200 8.380 * 7.700 0.000 8.160 6.586
3 7.790 1.520 * 7.760 0.824 7.680 0.000 8.200 6.760 7.700 0.000 7.900 5.732
4 7.950 6.172 7.770 1.694 7.680 0.000 8.190 8.210 * 7.700 0.000 7.770 1.697
5 8.050 6.873 7.740 0.673 7.710 0.000 8.250 7.263 7.710 0.000 7.700 0.000
6 8.250 8.022 7.730 0.352 7.700 0.000 8.260 0.000 7.810 4.077 7.700 0.000
7 8.050 6.844 7.740 0.679 7.700 0.000 8.270 0.000 7.850 4.294 7.700 0.000
8 8.030 6.513 7.740 0.374 7.700 0.000 8.280 0.000 7.850 2.530 * 7.700 0.000
9 8.050 5.880 * 7.730 0.317 7.710 0.000 8.280 0.000 7.870 4.323 7.700 0.000
10 8.200 8.380 * 7.740 0.418 7.700 0.000 8.280 0.000 7.870 4.296 7.750 0.000
11 8.230 8.421 7.730 0.000 7.700 0.000 8.260 0.000 7.870 4.387 7.740 0.000
12 8.210 7.866 7.730 0.000 7.700 0.000 8.260 0.000 7.891 5.818 7.730 0.000
13 8.210 7.822 7.730 0.000 7.700 0.000 7.730 0.000 7.890 5.732 7.730 0.000
14 8.200 7.735 7.730 0.000 7.700 0.000 7.710 0.000 7.890 3.200 * 7.820 0.000
15 8.190 7.687 7.730 0.000 7.690 0.000 7.700 0.000 7.940 4.040 * 7.850 0.000
16 8.150 7.643 7.730 0.000 7.700 0.000 7.700 0.000 8.070 6.912 7.840 0.000
17 8.130 7.210 * 7.730 0.000 7.700 0.000 7.700 0.000 7.990 4.887 7.870 0.000
18 8.120 7.307 7.730 0.000 7.700 0.000 7.700 0.000 7.990 4.899 7.850 0.000
19 8.060 6.881 7.730 0.000 7.700 0.000 7.700 0.000 7.990 4.883 7.800 0.000
20 7.950 5.778 7.730 0.000 7.700 0.000 7.700 0.000 7.990 4.872 7.800 0.000
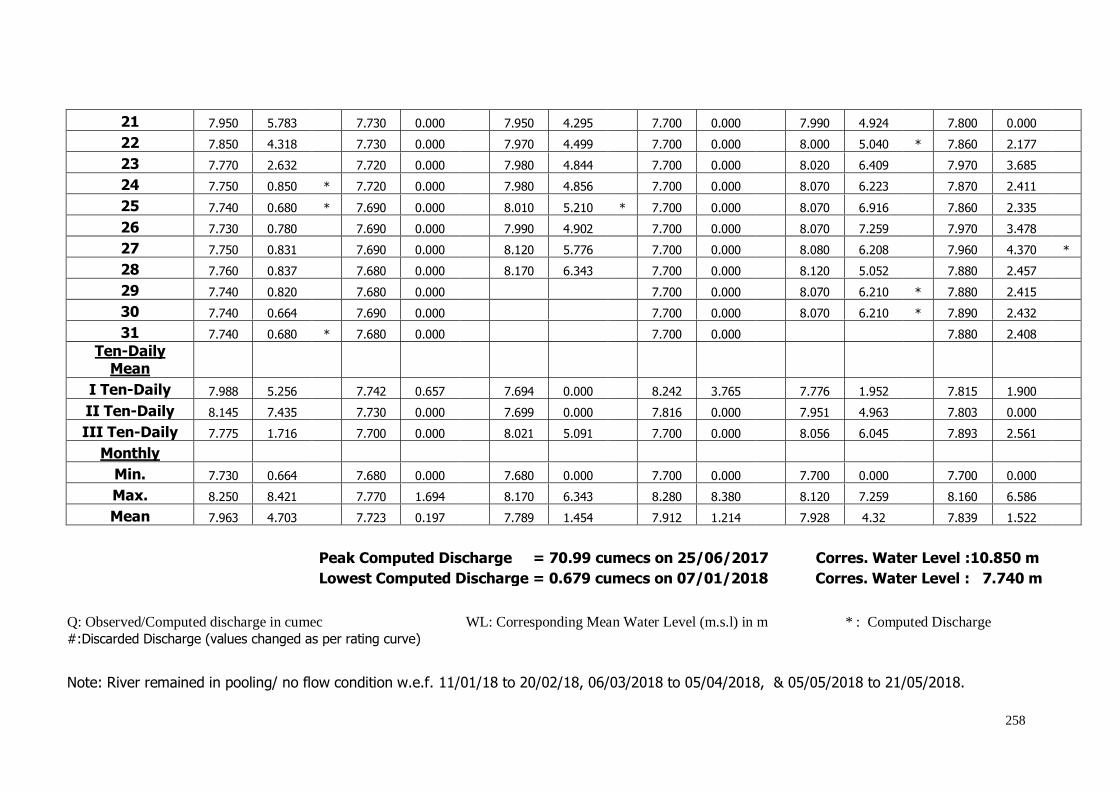
258
21 7.950 5.783 7.730 0.000 7.950 4.295 7.700 0.000 7.990 4.924 7.800 0.000
22 7.850 4.318 7.730 0.000 7.970 4.499 7.700 0.000 8.000 5.040 * 7.860 2.177
23 7.770 2.632 7.720 0.000 7.980 4.844 7.700 0.000 8.020 6.409 7.970 3.685
24 7.750 0.850 * 7.720 0.000 7.980 4.856 7.700 0.000 8.070 6.223 7.870 2.411
25 7.740 0.680 * 7.690 0.000 8.010 5.210 * 7.700 0.000 8.070 6.916 7.860 2.335
26 7.730 0.780 7.690 0.000 7.990 4.902 7.700 0.000 8.070 7.259 7.970 3.478
27 7.750 0.831 7.690 0.000 8.120 5.776 7.700 0.000 8.080 6.208 7.960 4.370 *
28 7.760 0.837 7.680 0.000 8.170 6.343 7.700 0.000 8.120 5.052 7.880 2.457
29 7.740 0.820 7.680 0.000 7.700 0.000 8.070 6.210 * 7.880 2.415
30 7.740 0.664 7.690 0.000 7.700 0.000 8.070 6.210 * 7.890 2.432
31 7.740 0.680 * 7.680 0.000 7.700 0.000 7.880 2.408
Ten-Daily Mean
I Ten-Daily 7.988 5.256
7.742 0.657
7.694 0.000
8.242 3.765
7.776 1.952
7.815 1.900 II Ten-Daily 8.145 7.435
7.730 0.000
7.699 0.000
7.816 0.000
7.951 4.963
7.803 0.000
III Ten-Daily 7.775 1.716
7.700 0.000
8.021 5.091
7.700 0.000
8.056 6.045
7.893 2.561 Monthly
Min. 7.730 0.664
7.680 0.000
7.680 0.000
7.700 0.000
7.700 0.000
7.700 0.000 Max. 8.250 8.421
7.770 1.694
8.170 6.343
8.280 8.380
8.120 7.259
8.160 6.586
Mean 7.963 4.703
7.723 0.197
7.789 1.454
7.912 1.214
7.928 4.32
7.839 1.522
Peak Computed Discharge = 70.99 cumecs on 25/06/2017 Corres. Water Level :10.850 m
Lowest Computed Discharge = 0.679 cumecs on 07/01/2018 Corres. Water Level : 7.740 m
Q: Observed/Computed discharge in cumec WL: Corresponding Mean Water Level (m.s.l) in m * : Computed Discharge
#:Discarded Discharge (values changed as per rating curve)
Note: River remained in pooling/ no flow condition w.e.f. 11/01/18 to 20/02/18, 06/03/2018 to 05/04/2018, & 05/05/2018 to 21/05/2018.

259
4.7.1.4 Stage Discharge Curve
Station Name: Kim at Motinaroli (01 02 16 001) Division : Tapi Division, Surat Local River: Kim Sub -Division : LNSD, CWC, Bharuch
Stage Discharge Curve of River Kim at Motinaroli for the period 01/06/17 to 27/10/2017
Calculated Observed
Discharge in Cumec5004904804704604504404304204104003903803703603503403303203103002902802702602502402302202102001901801701601501401301201101009080706050403020100
Sta
ge
in m
15
14
13
12
11
10
9
8
Procedure: Standard Equation : Power Q=C(h+a)^b LB UB a b C
7.50 15.000 -5.94 3.164 0.462
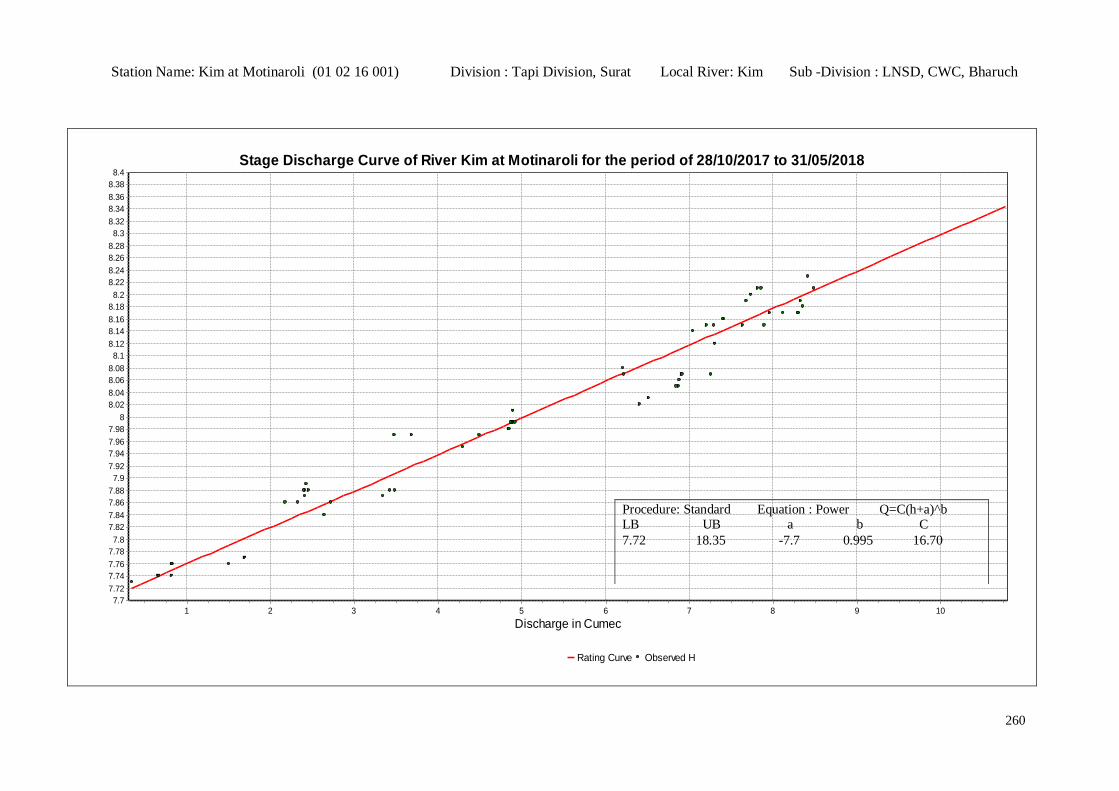
260
Station Name: Kim at Motinaroli (01 02 16 001) Division : Tapi Division, Surat Local River: Kim Sub -Division : LNSD, CWC, Bharuch
Stage Discharge Curve of River Kim at Motinaroli for the period of 28/10/2017 to 31/05/2018
Rating Curve Observed H
Discharge in Cumec10987654321
Sta
ge
in
m
8.4
8.38
8.36
8.34
8.32
8.3
8.28
8.26
8.24
8.22
8.2
8.18
8.16
8.14
8.12
8.1
8.08
8.06
8.04
8.02
8
7.98
7.96
7.94
7.92
7.9
7.88
7.86
7.84
7.82
7.8
7.78
7.76
7.74
7.72
7.7
Procedure: Standard Equation : Power Q=C(h+a)^b LB UB a b C
7.72 18.35 -7.7 0.995 16.70
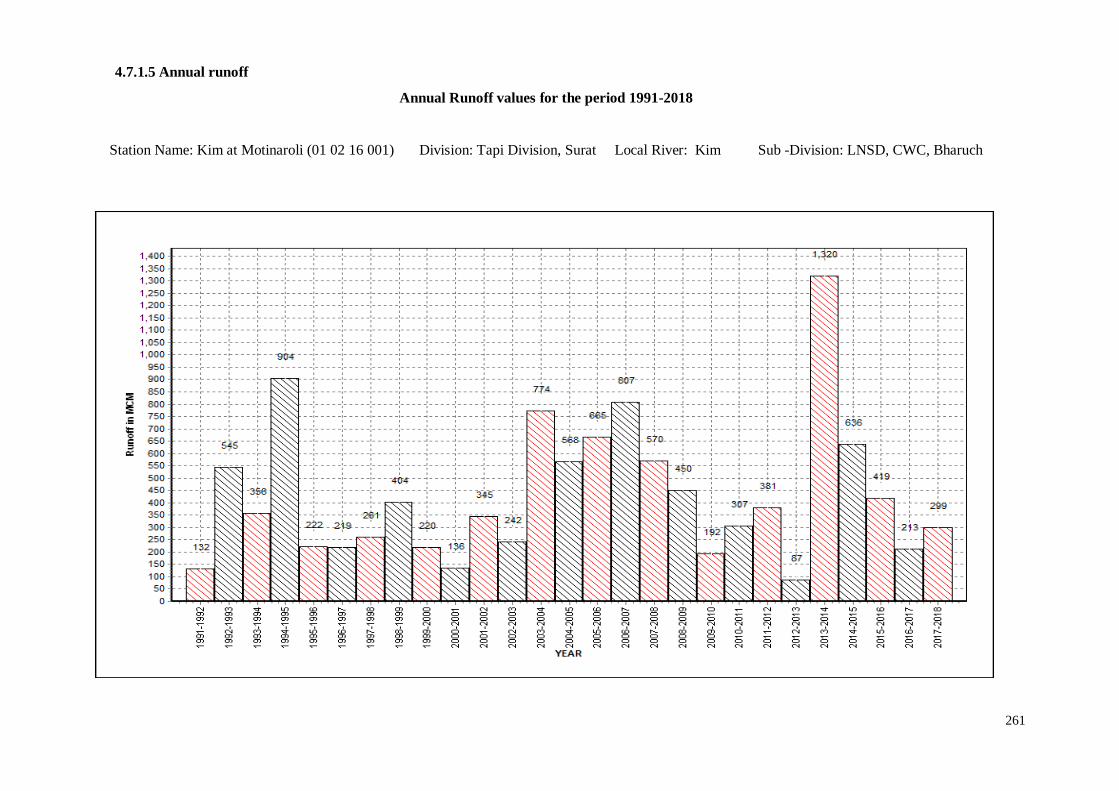
261
4.7.1.5 Annual runoff
Annual Runoff values for the period 1991-2018
Station Name: Kim at Motinaroli (01 02 16 001) Division: Tapi Division, Surat Local River: Kim Sub -Division: LNSD, CWC, Bharuch
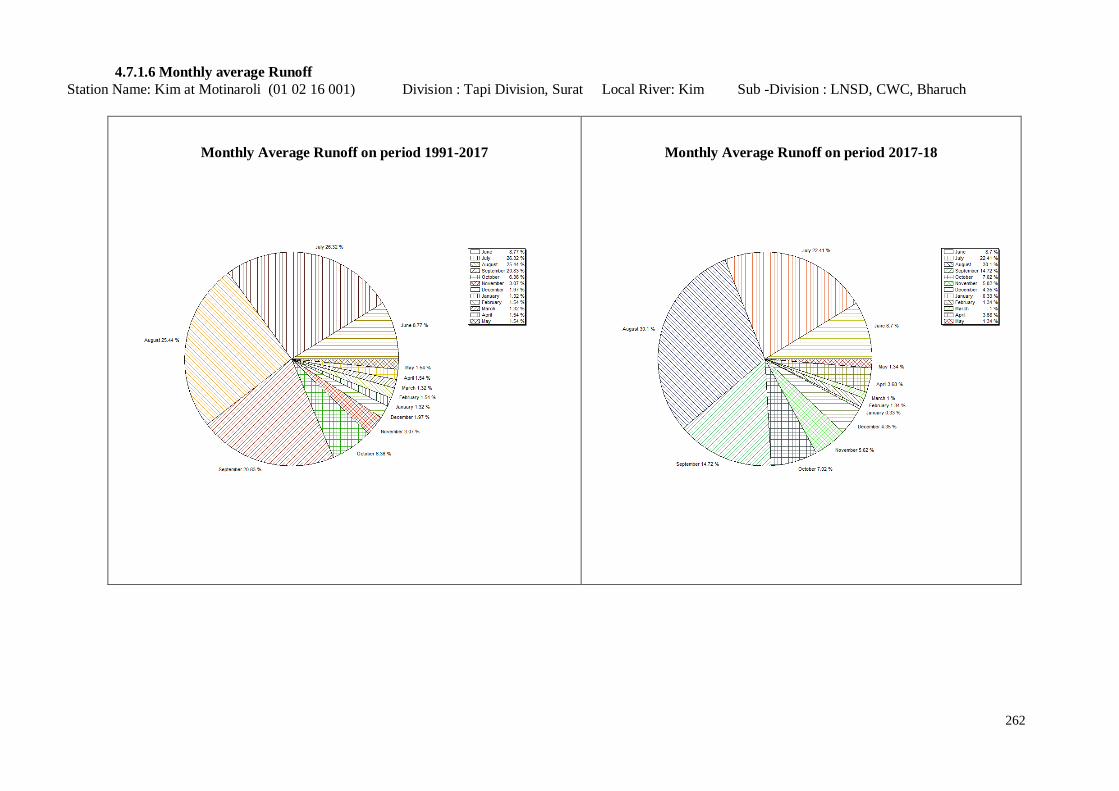
262
4.7.1.6 Monthly average Runoff
Station Name: Kim at Motinaroli (01 02 16 001) Division : Tapi Division, Surat Local River: Kim Sub -Division : LNSD, CWC, Bharuch
Monthly Average Runoff on period 1991-2017
Monthly Average Runoff on period 2017-18
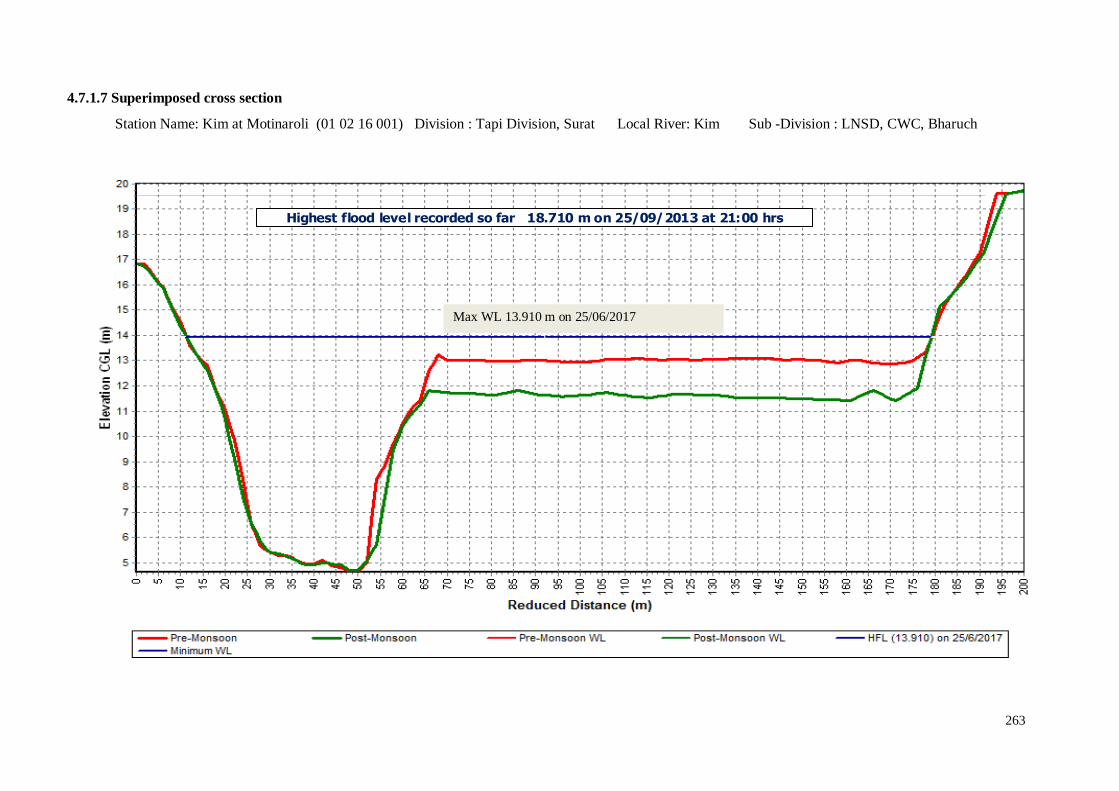
263
4.7.1.7 Superimposed cross section
Station Name: Kim at Motinaroli (01 02 16 001) Division : Tapi Division, Surat Local River: Kim Sub -Division : LNSD, CWC, Bharuch
Highest flood level recorded so far 18.710 m on 25/09/2013 at 21:00 hrs
Max WL 13.910 m on 25/06/2017
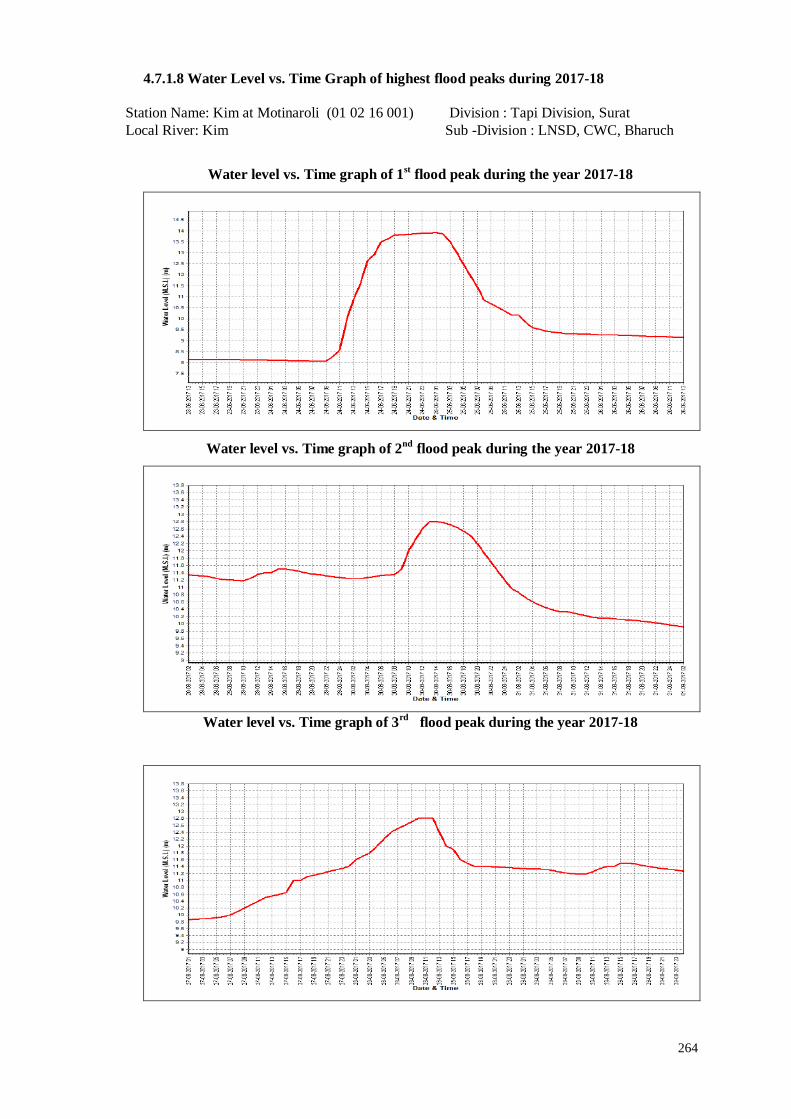
264
4.7.1.8 Water Level vs. Time Graph of highest flood peaks during 2017-18
Station Name: Kim at Motinaroli (01 02 16 001) Division : Tapi Division, Surat
Local River: Kim Sub -Division : LNSD, CWC, Bharuch
Water level vs. Time graph of 1st flood peak during the year 2017-18
Water level vs. Time graph of 2nd
flood peak during the year 2017-18
Water level vs. Time graph of 3
rd flood peak during the year 2017-18