central electricity regulatory commission new delhi
56
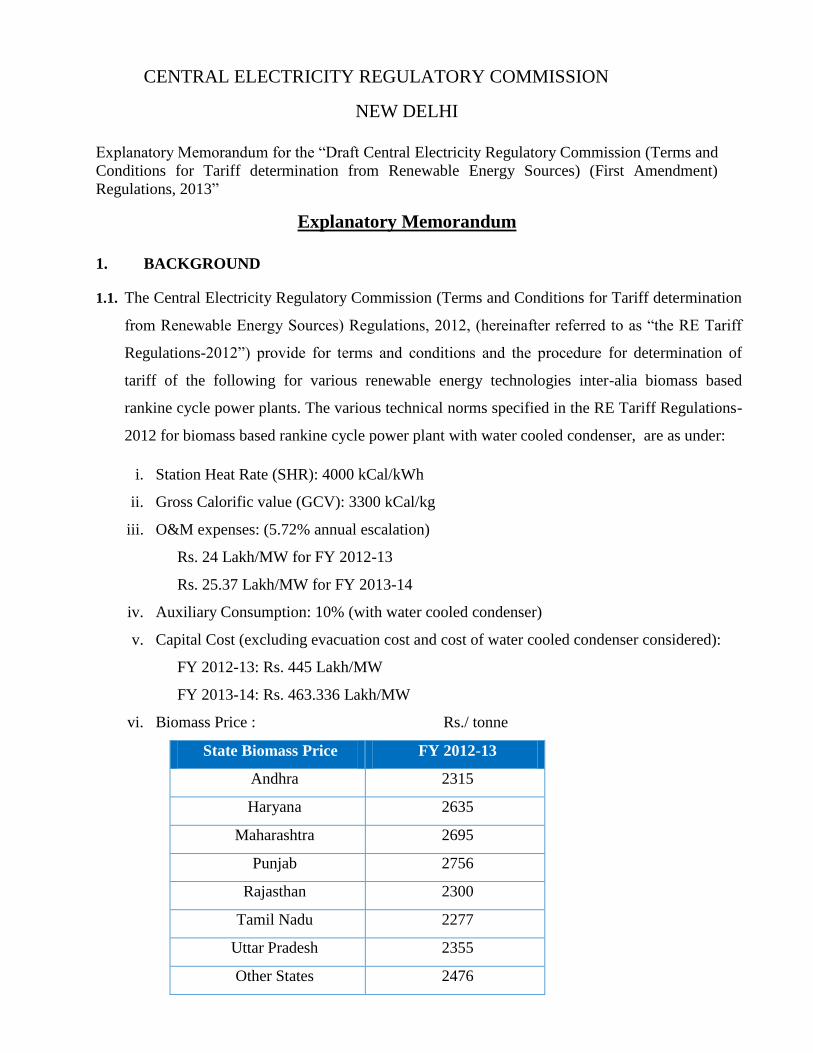
CENTRAL ELECTRICITY REGULATORY COMMISSION NEW DELHI Explanatory Memorandum for the “Draft Central Electricity Regulatory Commission (Terms and Conditions for Tariff determination from Renewable Energy Sources) (First Amendment) Regulations, 2013” Explanatory Memorandum 1. BACKGROUND 1.1. The Central Electricity Regulatory Commission (Terms and Conditions for Tariff determination from Renewable Energy Sources) Regulations, 2012, (hereinafter referred to as “the RE Tariff Regulations-2012”) provide for terms and conditions and the procedure for determination of tariff of the following for various renewable energy technologies inter-alia biomass based rankine cycle power plants. The various technical norms specified in the RE Tariff Regulations- 2012 for biomass based rankine cycle power plant with water cooled condenser, are as under: i. Station Heat Rate (SHR): 4000 kCal/kWh ii. Gross Calorific value (GCV): 3300 kCal/kg iii. O&M expenses: (5.72% annual escalation) Rs. 24 Lakh/MW for FY 2012-13 Rs. 25.37 Lakh/MW for FY 2013-14 iv. Auxiliary Consumption: 10% (with water cooled condenser) v. Capital Cost (excluding evacuation cost and cost of water cooled condenser considered): FY 2012-13: Rs. 445 Lakh/MW FY 2013-14: Rs. 463.336 Lakh/MW vi. Biomass Price : Rs./ tonne State Biomass Price FY 2012-13 Andhra 2315 Haryana 2635 Maharashtra 2695 Punjab 2756 Rajasthan 2300 Tamil Nadu 2277 Uttar Pradesh 2355 Other States 2476
-
Upload
khangminh22 -
Category
Documents
-
view
1 -
download
0
Transcript of central electricity regulatory commission new delhi
CENTRAL ELECTRICITY REGULATORY COMMISSION
NEW DELHI
Explanatory Memorandum for the “Draft Central Electricity Regulatory Commission (Terms and
Conditions for Tariff determination from Renewable Energy Sources) (First Amendment)
Regulations, 2013”
Explanatory Memorandum
1. BACKGROUND
1.1. The Central Electricity Regulatory Commission (Terms and Conditions for Tariff determination
from Renewable Energy Sources) Regulations, 2012, (hereinafter referred to as “the RE Tariff
Regulations-2012”) provide for terms and conditions and the procedure for determination of
tariff of the following for various renewable energy technologies inter-alia biomass based
rankine cycle power plants. The various technical norms specified in the RE Tariff Regulations-
2012 for biomass based rankine cycle power plant with water cooled condenser, are as under:
i. Station Heat Rate (SHR): 4000 kCal/kWh
ii. Gross Calorific value (GCV): 3300 kCal/kg
iii. O&M expenses: (5.72% annual escalation)
Rs. 24 Lakh/MW for FY 2012-13
Rs. 25.37 Lakh/MW for FY 2013-14
iv. Auxiliary Consumption: 10% (with water cooled condenser)
v. Capital Cost (excluding evacuation cost and cost of water cooled condenser considered):
FY 2012-13: Rs. 445 Lakh/MW
FY 2013-14: Rs. 463.336 Lakh/MW
vi. Biomass Price : Rs./ tonne
State Biomass Price FY 2012-13
Andhra 2315
Haryana 2635
Maharashtra 2695
Punjab 2756
Rajasthan 2300
Tamil Nadu 2277
Uttar Pradesh 2355
Other States 2476

1.2. In accordance with the Regulation 8 of the RE Tariff Regulations- 2012, the Commission issued
an Order on determination of generic levellised generation tariff for the above mentioned
categories of RE generating stations. (Petition No. 35/2012 (suo-motu) dated 27th march,
2012.While dealing with the comments received from the various stakeholders regarding
biomass sector, in the above referred Order the Commission observed as under:
“Based on the suggestions received from the projects developers, Industry associations
representing the biomass sector and Ministry of New and Renewable Energy (MNRE), the
Commission has decided to constitute a Committee which will visit existing plants and conduct
a detailed study on the performance/viability of such plants operating in the country including
the prevailing biomass prices.”
1.3. Accordingly, the CERC constituted a Committee on 11th October, 2012 under the
Chairmanship of the Secretary, CERC to undertake a detailed Study on the
“Performance/Viability of Biomass based plants operating in the Country including the
prevailing biomass prices”. The Committee comprised of the following members:
i. Mr. Rajiv Bansal, Secretary, CERC Chairman
ii. Dr. D.K. Khare, Director, MNRE Member
iii. Mr. S.C. Shrivastav, Joint Chief (Engg.), CERC Member
iv. Mr. P.K. Awasthi, Joint Chief (Finance), CERC Member
v. Mr. S.K.Chatterjee, Dy. Chief (Reg. Aff.),CERC Member
vi. Mr. S.K. Kassi, Director (TE &TD) Division, CEA Member
vii. Mr. P. Krshnakumar Indian Biomass Power Association Member
viii. Mr. Rakesh.H.Shah Advisor (Renewable), CERC Member-Convener
1.4. The scope of work of the Committee was as under:
i. Assessment and evaluation of technical parameters like: Heat rate, Auxiliary
Consumption, through performance assessment biomass plants commissioned in various
states of India;
ii. Fuel analysis (both Proximate and ultimate analysis) of different biomass fuel by taking
fuel and ash sample collected from different plants to arrive at representative value of
GCV and moisture variation for different fuel;
iii. Analysis of losses in calorific value of fuel during storage;

iv. Evaluation of trend in the biomass power plant operation like break-up of fuel
consumption (biomass types usage trends), generation v/s specific fuel consumption,
PLF v/s Auxiliary Consumption;
v. Analysis of O &M expenses of the commissioned plants;
vi. Analysis of the Capital cost of the commissioned plants;
vii. Surplus biomass available for energy production;
viii. Study on prevailing Biomass prices and price trend in various states;
ix. Measures for viability of biomass plants.
x. Recommendation for removing the present hurdles coming in the sector for promoting
the growth of the Biomass sector.
1.5. The Committee deliberated and collected information and data from different stake holders
and also visited sites of power developers to understand the issues at stake in different
operation of the biomass based power plants.
1.6. After detailed examination, the Committee felt that the challenges being faced by the biomass
plants primarily stem out of fuel related issues, viz.:- lack of availability of surplus biomass,
poor quality of biomass fuel, inadequate fuel collection, distribution & supply mechanism,
competitive buyers of biomass and price rise, resulting into usage of waste biomass and lower
plant load factor. After extensive deliberations, the Committee finalized its report and
submitted to the Commission on 16th
July, 2013, which is enclosed as Annexure-I.
1.7. The Committee recommended following normative parameters suggested by the Committee
for the consideration of the Commission for determination of generic tariff:
i. Station Heat Rate (SHR):
a. 4200 KCal/kWh for station using travelling grate boilers; and
b. 4125 kCal/kWh for stations using AFBC boilers
ii. Gross Calorific Value (GCV): 3100 kCal/kg
iii. O&M expenses: Rs. 40 Lakh/MW
iv. Auxiliary Consumption:
a. 10% with water cooled condenser, and
b. 12 % for air cooled condenser
v. Capital Cost (excluding evacuation cost and cost of water cooled condenser
considered):

a. For project with water cooled condenser: Rs. 540 Lakh/MW
b. For project with air cooled condenser: Rs. 580 lakh /MW
c. For rice straw based project: Rs. 630 lakh/ MW
vi. Biomass Price: to be decided annually by a committee to be formed at State level
representing State Commission, Nodal Agency, Government
2. A Copy of Report of the Committee is enclosed as Annexure-I. Based on the
recommendation of the Committee, the Commission has proposed amendments to RE Tariff
Regulations-2012, on the basis of recommendations of the Committee as mentioned in Para 1.7
above and has invited comments / suggestions/objections from the stakeholders.
******

1
Central Electricity Regulatory Commission
Report of Committee constituted to undertake a
detailed Study on the “Performance/Viability of
Biomass based plants operating in the Country
including the prevailing biomass prices
July, 2013

2
The Committee to undertake a detailed Study on the “Performance/Viability of
Biomass based plants operating in the Country including the prevailing biomass
prices” presents its report to the Commission
Sd/-
Mr. Rajiv Bansal, Secretary, CERC
Chairman
Sd/-
Dr. D.K. Khare, Director, MNRE
Member
Sd/-
Mr. S.C. Shrivastav, Joint Chief (Engg.), CERC
Member
Sd/-
Mr. P.K. Awasthi, Joint Chief (Finance), CERC
Member
Sd/-
Mr. S.K.Chatterjee, Dy. Chief (Reg. Aff.), CERC
Member
Sd/-
Mr. S.K. Kassi, Director (TE &TD) Division, CEA
Member
Sd/-
Mr. P. Krishna Kumar, Indian Biomass Power Association
Member
Sd/-
Mr. Rakesh Shah Advisor (Renewable), CERC
Member-Convener

3
1. BACKGROUND
1.1. The Central Electricity Regulatory Commission (Terms and Conditions for Tariff
determination from Renewable Energy Sources) Regulations, 2012, (hereinafter
referred to as “the RE Tariff Regulations-2012”) provide for terms and
conditions and the procedure for determination of tariff of the following for
various renewable energy technologies inter-alia biomass based rankine cycle
power plants. The various technical norms specified in the RE Tariff
Regulations-2012 for biomass based rankine cycle power plant with water cooled
condenser, as under:
i. Station Heat Rate (SHR): 4000 kCal/kWh
ii. Gross Calorific value (GCV): 3300 kCal/kg
iii. O&M expenses: (5.72% annual escalation)
Rs. 24 Lakh/MW for FY 2012-13
Rs. 25.37 Lakh/MW for FY 2013-14
iv. Auxiliary Consumption: 10% (with water cooled condenser)
v. Capital Cost (excluding evacuation cost and cost of water cooled
condenser considered):
FY 2012-13: Rs. 445 Lakh/MW
FY 2013-14: Rs. 463.336 Lakh/MW
vi. Biomass Price : Rs./ tonne
State Biomass Price FY 2012-13 FY 2013-14
Andhra 2315 2480.55
Haryana 2635 2823.44
Maharashtra 2695 2887.73
Punjab 2756 2953.09
Rajasthan 2300 2464.48
Tamil Nadu 2277 2439.83
Uttar Pradesh 2355 2523.41
Other States 2476 2635.07

4
1.2. In accordance with the Regulation 8 of the RE Tariff Regulations- 2012, the
Commission issued an Order on determination of generic levellised generation
tariff for the above mentioned categories of RE generating stations. (Petition No.
35/2012 (suo-motu) dated 27th march, 2012.While dealing with the comments
received from the various stakeholders regarding biomass sector, in the above
referred Order the Commission observed as under:
“Based on the suggestions received from the projects developers, Industry
associations representing the biomass sector and Ministry of New and
Renewable Energy (MNRE), the Commission has decided to constitute a
Committee which will visit existing plants and conduct a detailed study on the
performance/viability of such plants operating in the country including the
prevailing biomass prices.”
1.3. Accordingly, the CERC constituted a Committee on 11th October, 2012 under
the Chairmanship of the Secretary, CERC to undertake a detailed Study on the
“Performance/Viability of Biomass based plants operating in the Country
including the prevailing biomass prices”. The Committee comprised of the
following members:
i. Mr. Rajiv Bansal, Secretary, CERC Chairman
ii. Dr. D.K. Khare, Director, MNRE Member
iii. Mr. S.C. Shrivastav, Joint Chief (Engg.), CERC Member
iv. Mr. P.K. Awasthi, Joint Chief (Finance), CERC Member
v. Mr. S.K.Chatterjee, Dy. Chief (Reg. Aff.),CERC Member
vi. Mr. S.K. Kassi, director (TE &TD) Division, CEA Member
vii. Mr. P. Krshnakumar Indian Bio.s Power Association Member
viii. Mr. Rakesh.H.Shah Advisor (Renewable), CERC Member-Convener

5
1.4. The scope of work of the Committee was as under:
i. Assessment and evaluation of technical parameters like: Heat rate,
Auxiliary Consumption, through performance assessment biomass plants
commissioned in various states of India;
ii. Fuel analysis (both Proximate and ultimate analysis) of different biomass
fuel by taking fuel and ash sample collected from different plants to
arrive at representative value of GCV and moisture variation for different
fuel;
iii. Analysis of losses in calorific value of fuel during storage;
iv. Evaluation of trend in the biomass power plant operation like break-up of
fuel consumption (biomass types usage trends), generation v/s specific
fuel consumption, PLF v/s Auxiliary Consumption;
v. Analysis of O &M expenses of the commissioned plants;
vi. Analysis of the Capital cost of the commissioned plants;
vii. Surplus biomass available for energy production;
viii. Study on prevailing Biomass prices and price trend in various states;
ix. Measures for viability of biomass plants.
x. Recommendation for removing the present hurdles coming in the sector
for promoting the growth of the Biomass sector.
The first meeting of the Committee was held on 25th October, 2012. A record of
decision taken and list of participants are annexed as Annexure II
1.5. As discussed in the first meeting the Indian Biomass Association vide its letter
dated 12.11.2012 submitted following details sought by the Committee:
i. Actual annual performance data of 3 years (2009-10 to 2011-12) some of
biomass based power plants and details of operation and maintenance
costs;
ii. Plant characteristics with technical details;

6
iii. Operational details of biomass plants submitted to UNFCCC for
parameters reference to generation, average GCV of fuel and Station
Heat Rate;
iv. Balance sheet of 2010-11 & 2011-12 one of the plant operating in
Rajasthan and one plant in Tamil Nadu.
1.6. The Indian Biomass Association suggested following norms for consideration of
the Committee:
i. SHR: 4631 kCal/kWh as against normative SHR specified at 4000
kCal/kWh;
ii. GCV: 2665 kCal/kg as against normative GCV specified at 3300
kCal/kg;
iii. O&M expenses: Rs. 61 Lakhs/MW as against norm of 24 Lakh/MW.
1.7. Subsequently, it was decided to constitute a sub-Committee to examine the
technical/operational parameters like: SHR, GCV, Auxiliary Consumption and
incidental matters based on the data available from the biomass associations or by
visiting some biomass plants. The sub-Committee comprised of the following
persons:
i. Dr. D.K.Khare, Director, MNRE
ii. Sh. S.C.Shrivastava, Joint Chief (Engg.), CERC
iii. Sh. Chandra Prakash, Deputy Chief (Engg.), CERC
iv. Sh. Rakesh Shah, Advisor (Renewable), CERC
1.8. In this connection, apart from considering the details given by the Indian
Biomass Power Association, field visits of biomass power plants in various states
of the country were undertaken by the sub-Committee for reviewing the
performance of the plants. The facilities visited for the review are as under:

7
i. Biomass power plant at Rangpur, Kota District, Rajasthan (7.5 MW)
operated by M/s Surya chambal Power Limited.
ii. Biomass power plant at Bhaguara, Patiala District, Punjab (12 MW)
operated by M/s Punjab Biomass Private Limited.
iii. Biomass power plant at Pebair, District, Andhra Pradesh (6.0 MW)
operated by M/s Surya Teja Power Project Limited.
iv. Biomass power plant at Ahmedabad District, Gujarat (4.5 MW) operated
by M/s Abellon Clean Energy Limited.
1.9. During the visits basic operations of the facilities were observed. The plant
officials were very co-operative during the visit to the facilities and shared their
experiences and views regarding operation of plants, fuel availability, fuel
quality and fuel processing etc. However, the veracity of data and measurement
of quantity of fuel, its quality etc. could not be ascertained, as such measurement
was not done on scientific basis nor its a regular practice.
1.10. Subsequently, a second meeting of the Committee was held on 9th
July, 2013.
A record of decision taken and list of participants are annexed as Annexure III.
1.11. Findings on each parameter as suggested above are consolidated in subsequent
sections.

8
2. ASSESSMENT AND EVALUATION OF TECHNICAL
PARAMETERS:
2.1. STATION HEAT RATE
2.1.1. Station Heat Rate (SHR) is an important factor to assess the efficiency of
a biomass based power station. Efficiency is a function of Station Heat
Rate and it is inversely proportional to SHR. If SHR reduces, efficiency
increases, resulting in fuel saving. In the RE Tariff Regulations-2012, the
Commission specified SHR of 4000 kCal/kWh. The statement of object
and reasons of 2012 Regulations recorded as under:
“The Commission is of the view that with biomass power
generation projects based on Rankine cycle technologies,
essentially two types of boilers are being used, viz. travelling
grate combustors (stokers) or atmospheric fluidised bed
boilers. However, while fluidised boilers offer higher efficiency
as compared to travelling grate, there are limitations in use of
fluidised bed boilers due to fuel quality and fuel size
requirements.
On the other hand, travelling grate type boilers offer flexibility
as it can handle variety of type/quality of fuel without
significant modifications. Further, it has been observed that
biomass project developers, as industry practice have deployed
predominantly travelling grate type boilers for biomass based
power generation. Considering the same the Commission has
decided to retain the norm of Station Head Rate at 4000
kCal/kWh and the same has been reflected in the final
regulations.”
2.1.2. In the Explanatory Memorandum to the Draft Regulations 2012
circulated for public consultation, the Central Commission dealt with the
Report of the Central Electricity Authority (CEA) Committee, field study
carried by the National Productivity Council (NPC) and the
recommendation of Ministry of New and Renewable Energy (MNRE)

9
before suggesting SHR of 4000 kCal/kWh. The recommendations of
MNRE and NPC and CEA were as follows:
MNRE recommendation on SHR for different Biomass source:
Biomass
Source
IPP
(> 5 MW)
Tail End
(< 2 MW)
kCal/kWh kCal/kWh
Rice Husk 4100 5200
Straw 4400 5500
Others 4150 5200
National Productivity Council recommendation on SHR for different
Boiler technology:
Project with Boiler Type Station Heat Rate
kCal/KWh
AFBC 4000 – 4100
Traveling Grate 4150 - 4250
2.1.3. The Expert Committee of Central Electricity Authority (CEA) in its
report of September, 2005 on “Operational Norms for biomass based
power plants” recommended specific fuel consumption of 1.36 kg/kWh
with average calorific value of fuel as 3300 kCal/kg and implicit
assumption of SHR of 4500 kCal/kWh.
2.1.4. For availing the capital subsidy all the Biomass Power Plants have
conducted a detailed Performance Assessment Study of the plants by
National Productivity Council and as per the Assessment the average
Station Heat Rate for biomass power plants is around 4300 kCal/kWh.

10
Station heat rate data based on performance assessment of biomass
power plants by national productivity council is as under:
Plant
Date
Unit
Generation
(kWh)
Biomass
Consumption
(MT)
SFC
(kg/kWh)
Average
GCV of Fuel
as fired
(kcal/kg)
Station
Heat Rate
(kCal/kWh)
Shriram
Powergen
Limited,
Dindigul
09.11.10 to
10.11.10 148800 280 1.88 2076 3906.45
10.11.10 to
11.11.10 144600 275 1.90 2076 3948.13
11.11.10 to
12.11.10 152900 292 1.91 2076 3964.63
Global
Powertech
Equipments
Limited,
Vandavasi
27.09.10 to
28.09.10 179400 309 1.72 2540 4374.92
28.09.10 to
29.09.10 172200 294 1.71 2568 4384.39
29.09.10 to
30.09.10 178200 294 1.65 2559 4221.92
ShriramNon-
Conventional
Energy
Limited
Pattukottai
26.12.10 to
27.12.10 152400 236.22 1.55 2696 4178.80
27.12.10 to
28.12.10 154500 243.18 1.57 2696 4243.45
28.12.10 to
29.12.10 165300 249.04 1.51 2736 4122.11
Orient Green
Power
Company
Limited
Pollachi
11.02.12 to
12.02.12 236600 455.91 1.93 2379 4584.15
12.02.12 to
13.02.12 236100 431.11 1.83 2379 4343.97
13.02.12 to
14.02.12 236600 433.13 1.83 2379 4355.10
Sanjog
Sugars & Eco
Power
Pvt. Limited
Hanumangarh
07.08.12 227000 281.5 1.24 3495 4334.11
08.08.12 234400 305.55 1.30 3495 4555.88
09.08.12 196200 264.87 1.35 3495 4718.25
Average Station Heat Rate 4282.42
2.1.5. It can be seen that data pertain to two or three days of the year and
cannot be taken as representative number. Further, the specific fuel
consumption has been worked out based on biomass consumption. The
methodology of assessing the biomass consumption has been found to be

11
very sound and not based on scientific measurement. In the light of the
above, it is not feasible to rely upon the above data.
2.1.6. It has also been noticed from the data submitted to the UNFCCC for
claiming the CDM benefits by the Biomass Plants which are in operation
for monitoring purposes that the Station Heat rate is above 4700
kCal/kWh. Station Heat Rate data based on monitoring reports of
biomass power plants available in the official website of UNFCC is as
follows:
Monitoring
Report
Reference
Record
Gross Power
Generation
(kWh)
Biomass
Used
(MT)
SFC
(kg/kWh)
Average
GCV of
Fuel
(Kcal/kg)
Station
Heat Rate
(kCal/kWh)
01.04.2008 to
31.03.2009
58236846
74504
1.28
3538
4526
25.09.2009 to
24.09.2010
46454600
62693
1.35
3354
4526
23.07.2009 to
21.07.2011
64775700
106530
1.64
2936
4829
24.07.2009 to
24.07.2010
28781400
44956
1.56
2898
4526
29.12.2009 to
28.12.2010
40051500
70013
1.75
3318
5799
25.02.2008 to
30.09.2009
75148000
108261
1.44
3167
4562
01.09.2009 to
31.08.2010
56,026,252
70387
1.26
3369
4233
22.09.2010 to
21.09.2011
28,881,184
44323
1.53
3074
4718
01.05.2009 to
30.06.2010
23,392,200
45374
1.94
2860
5548
23.08.2007 to
20.07.2009
46,881,300
81290
1.73
2874
4983

12
01.04.2008 to
31.03.2009
39,548,700
64906
1.64
2758
4526
09.03.2007 to
31.12.2008
65,214,150
88906
1.36
3320
4526
16.02.2010 to
31.03.2011
33375200
44161
1.32
3200
4234
24.08.2008 to
31.03.2009
37,250,500
63874
1.71
2637
4522
18.09.2009 to
24.03.2011
31,067,000
51737
1.67
2877
4791
AVERAGE
STATION
HEAT RATE
45005635 68128 1.55 3079 4723
2.1.7. This data is also not of any assistance for the same reason that it is also
based on biomass consumption and in the absence of technical details of
the plants; it is not possible to take any view.
2.1.8. Design Station Heat Rate has been stated by the Indian Biomass Power
Association based on design data of turbine heat rate and boiler
efficiency as submitted by suppliers are as under:
Plant Steam parameters Enthalpy
of steam
(kCal/kg
Enthalpy
of
Condens
ate
kCal/kg)
Design
Boiler
Effi.
(%)
Design
Specific
Steam
Consum.
(kg/kWh)
Design
Station
Heat
Rate
(kCal/k
Wh)
Flow
TPH
Press
ure
(KSC)
Temp
(°C)
Shriram
Powergen
Limited
Dindigul
35
66
495±5
814.4
50
79.50%
4.49
4317
Global
Powertech
Equipments
Limited
Vandavasi
35
66
495±5
814.4
50
79.50%
4.3
4134

13
Shriram Non-
Conventional
Energy
Limited
Pattukottai
35
66
495±5
814.4
50
79.50%
4.49
4317
Orient Green
Power
Company
Limited
Pollachi
52
66
465±5
796.9
50
76.50%
4.38
4276
Sanjog Sugars
& Eco Power
Pvt. Limited
Hanumangar
47
66
475±5
802.6
50
80%
4.65
4374
OrientGreenP
ower
Company
(Rajasthan)Pvt
. Ltd.
Kishanganj
40
66
480±5
805.6
50
78%
4.275
4141
OrientGreenP
ower
Company
Limited,
Narsingpur
52
66
465±5
796.9
50
75%
4.38
4362
PSR Green
Power
Projects Pvt
Ltd,
Mehbubnagar
40
45
420±5
775.3
50
72%
4.76
4795
S M
Environmental
Technologies
Pvt Ltd,
Chippabarod
40
45
425±5
781.2
50
76.80%
4.34
4132
AVERAGE STATION HEAT RATE 4317

14
Year
Fuel
(MT)
SFC
(kg/kWh)
PLF
(%)
Fuel Rate
(Rs/MT)
Ave.
GCV
(kCal/k
g)
SHR
kcal/kW
h Fuel Mix
2007-08 18299 1.59 65.19% 2970 4628 Maize waste,
Cholam cobs,
Juliflora,
Coconut leaf
stem, Plywood
waste, Wood
chips, Saw dust,
Rice husk
2008-09 68984 1.90 74.07% 984 2552 4790
2009-10 86426 1.93 68.93% 1331 2423 4635
2010-11 89412 1.86 73.28% 1487 2463 4574
2011-12 82993 1.68 74.93% 1831 2782 4681
2012-13 86874 1.70 77.86% 1928 2793 4746
2013-14 18948 1.76 65.66% 1969 2728 4804
2008-09 10660 1.84 37.53% 1138 2662 4695 Cholam cobs,
Juliflora,
Coconut leaf
stem, Casuarina,
Wood chips,
Saw dust, Rice
husk
2009-10 81854 1.73 72.32% 1609 2626 4531
2010-11 79422 1.77 68.46% 1784 2575 4548
2011-12 79306 1.79 67.18% 1864 2684 4814
2012-13 85386 1.79 72.58% 1829 2551 4566
2013-14 23551 1.84 78.52% 2065 2670 4887
2009-10 17132 1.96 82.63% 1680 2357 4611
2010-11 80554 1.76 69.79% 1742 2542 4465
2011-12 62736 1.85 51.60% 1904 2450 4530
2012-13 83488 2.02 62.93% 1984 2275 4594
2013-14 21409 1.93 67.54% 2523 2429 4696
2011-12 40399 2.03 34.22% 1722 2342 4751 Mustard husk,
Cotton stalk,
Rice straw, Cow
dung, Coriander
husk
2012-13 35071 2.10 73.42% 1879 2287 4805
2013-14 33548 2.15 71.96% 1754 2263 4824
2011-12 37923 1.68 51.86% 3020 5071
2012-13 55449 1.45 43.61% 2146 3194 4636
2013-14 4030 2.04 2.27% 1709 2490 4986
2009-10 Mustard husk,
Coriander husk,
Cotton stalk 2010-11 41131.6 1.91 30.01% 1089 2487 4755
2011-12 52193 1.68 44.30% 2924 4906
2012-13 52309 1.56 47.38% 3115 4873
2013-14 19606 1.39 80.69% 1743 3292 4581

15
SMETPL SANJOG SGPPL
8 MW COD FEB.'10 COD OCT.'11 COD AUG’ 11
2010-11 2011-12 2012-13 2011-12 2012-13 2011-12 2012-13
1,41,45,588 3,11,05,760 3,34,40,258 2,25,87,410 3,82,02,600 2,88,48,592 3,44,35,452
16,49,350 37,52,220 39,36,249 17,31,530 28,74,210 34,40,692 41,23,652
1,24,96,238 2,73,53,540 2,95,04,000 2,08,55,880 3,53,28,390 2,54,07,900 3,03,11,800
22665 52193 52309 37923 55449 41052 56049
1.60 1.68 1.56 1.68 1.45 1.42 1.63
2.1.9. The above data filed in case of Global Powertech and S.M.
Environmental could not be reconciled with the balance sheet provided
by the IBPA. Here also the data relating to separate biomass
consumption is based on biomass consumption, which the Committee
found, was not based on sound methodology. Therefore, it is not possible
to rely upon the above data.
2.1.10. The Indian Biomass Association submitted that the fuel
consumption ratio for 5 plants in Rajasthan for the last 2 years and in
some cases last 3 years as shown in the above table reveals that
the average fuel consumption ratio of majority of the plants is above 1.5
kg per unit. They have further submitted that higher SFC is due to the
nature of fuel, which is agriculture waste. The quality of the waste has lot
of variance due to moisture levels, sand-silica and other chemical
characteristics, which cannot be controlled. This parameter is extremely
critical in the operation of Biomass power plants.
2.1.11. The Station Heat Rate of the Biomass Power Plant depends
predominantly on the pressure and temperature rating of the plants, type
of fuel, Fuel Characteristics and variation in fuel quality from the time of
purchase and time of actual use, loading of the units etc. All these
variations in quality of fuel and operational parameters get refleced in the
performance of boiler and its efficiency.

16
2.1.12. The IBPA has stated that most of the Biomass Power Plants are
being operated with different kinds of biomass mix either due to non
availability of the designed fuel or due to higher cost of those fuels. They
are forced to operate the plants with the available Biomass sourced
directly from the fields which quality wise might not meet the design
fuel parameters.
2.1.13. They have further submitted that due to higher moisture content of
the fuels, the Operating Station Heat Rate is always far higher than the
design Station Heat Rate. The Committee members have found these fats
to be true during their visit to various biomass plants. Further, there is
deterioration in the quality of biomass in storage for various reasons such
as rain, loss of heat value etc. and adversely affect the boiler efficiency.
2.1.14. It has also been noticed that the biomass plant due to shortage of
biomass or due to poor quality of biomass are also unable to run on full
load or high load. The data submitted by IBPA also suggest that average
Plant Load Factor (PLF) varies between 65 to 75% in majority of cases.
This adversely affects the boiler efficiency and turbine cycle heat rate.
2.1.15. The Committee has also noticed and appreciated that the Biomass
Power Developers are using only Agro wastes and Residues and it is
practically not possible to achieve and maintain uniform quality of
GCV, considering the characteristics with respect to Moisture and Sand
while collecting , adulteration during handling, and sizing and
processing before feeding into the Boiler. The Committee has noted the
Fuel Sourcing and feeding processes during visit to the power plants.
2.1.16. The details obtained from M/s Suryachambal Power Limited,
during the visit of the Committee are as follows:

17
Description Suryachambal Power Limited
Location Village:Rangpur, District:Kota, State:Rajasthan
Capacity of the plant
7.5 MW
Date of Commissioning
31.03.2006
Biomass sourcing
Major biomass used: Mustard husk, Soya husk
PLF achieved
80.30% Maximum , 70.96% Average from
April 2012 to January 2013
Total power generated so far
2011-12: 46.32 MU
2012-13(up to January 13): 35.12MU
Total fuel used so far
2011-12: 63860MT
2012-13(up to January 13): 47713MT
Specific fuel Consumption
2011-12: 1.38 kg/kWh
2012-13(up to January 13):
1.38 kg/kWh
Average Calorific value of
fuel as fired
3076 kCal/Kg
Average Station Heat Rate
based on GCV as fired
(kCal/kWh)
4183 kCal/kWH (derived)
2.1.17. During the visit of Biomass plant of M/s Abellon Clean Energy
Limited following was stated by them:-
The Station heat rate will vary with the variation in the steam parameters
(pressure and temperature) leading to poor performance of the Boiler.
The SHR of 3850 kCal/kWh may be achieved for a 10 MW capacity
plant if the plant runs at full load for all the time. If the plant is running at
part load, then the SHR could be higher. There are other factors like

18
ageing & degradation of capacity with time due to erosion and corrosion.
The actual SHR may be 7% higher, around 4119 Kcal /kWh due to these
variations.
2.1.18. Design Station Heat Rate as submitted by the Biomass Association
of following plants is as under:
Sr.
No.
Name of
the
biomass
based
power
plant
Turbine
Capacity
(MW)
Turbine
Make
Boiler
efficiency
(%)
Turbine
Cycle heat
rate
(kCal/kWh)
Design
Station
Heat Rate
as HMBD
(kCal/kWh)
1 SPPL,
Merta 10.00 Siemens 79.50% 3137 -
2 SPGEN 07.50 Triveni 79.50% 2897 3658
3 SNCEL 07.50 Triveni 79.50% 2897 3658
4 GPTL 07.50 Qingdao 79.50% - 3702
5 OGPL 10.00 Triveni 78.00% - 3923
6 TGPL 12.00 Triveni 79.50% - 3750
2.1.19. All the above plants have same pressure parameters of 66 bar and
temperature parameters of 490 +/- 50
C and has same boiler efficiency of
the order of 79.5% except in case of OGPL. The reason for variation in
turbine cycle heat rate of Simens and Triveni could be due to ambient
temperature. The boiler efficiency of 79.5% is reflective of inferior
quality of biomass fuel as against 87% for the conventional power plants.
It can be seen that the prevailing norm of 4000 kCal/kWh provide for 2
to 9% variation in heat rate due to operating conditions.

19
2.1.20. The Boiler Manufacturers in India are offering Travelling Grate
and Atmospheric Fluidized Bed Combustion Boilers for the Biomass
Power Plants. The travelling grate boilers can handle multi fuels without
major processing needs and hence most of the Biomass Power Plants
opted for the same due to non availability of single fuel. Hence Station
Heat Rate of the said plants is always high compared to the AFBC boiler
operated Biomass Power Plants.
2.1.21. It is seen that the Biomass Plants are also forced to operate with all
kinds of agro residues irrespective of the moisture content of the fuel due
to seasonal availability. In the case of seasonal fuels, the longer storage
time also affects the performance of the operating Biomass Power
stations during season, and during off season they resort to burning low-
priced, inferior quality fuel with limited combustion efficiency of boilers,
due to unavailability of good quality fuel at affordable prices which also
affects the performance.
2.1.22. In due consideration of above facts, and the discussions held
during the visits to the Biomass Plants it is felt that the Station Heat
Rate of the operating Biomass Plants needs to be prescribed with
reasonable operational margin over the design heat rate. The Committee
is of the view that the average design SHR of 3750 kCal/kWh may be
considered and may be provided with a operating margin of 10-12%
over the design heat rate. This will translate into a station heat rate of
4125-4200 kCal/kWh. Hence it is recommended that the Station Heat
Rate of 4200 Kcal/kWh for station using travelling grate boilers and
4125 kCal/kWh for stations using AFBC boilers be considered for
determination of tariff of bio-mass power plants.

20
2.2. AUXILIARY POWER CONSUMPTION
2.2.1. The Commission in the RE Tariff Regulations-2012 specified norms for
auxiliary consumption for biomass based power project (Rankine Cycle)
with Water Cooled Condenser (WCC) at 10% of gross generation of
electricity.
2.2.2. In addition to the load being consumed by the biomass based power plant
auxiliaries, utilities and various machineries for cutting, chipping and
weighing for in-plant transportation of fuel also consume power. The
auxiliary for Power plants using Juliflora is even more due to operation
of Chippers, shredders and other fuel processing equipments.
2.2.3. The Indian Biomass Power Association represented that currently most
of the Biomass Power Plants are being installed with Air Cooled
Condenser (ACC) mainly to minimize and preserve the naturally
available water for cooling purposes. ACC consumes more power as
compared to WCC by way of the higher KW rating of the Forced draft
fans. The power consumption for the ACC is based on the ambient
temperature and the Steam flow. The ambient temperatures that prevail
in most part of our country being of the order of 30Deg C and above for
most part of the year, the Fans have to be operated at their maximum
design condition.
2.2.4. The Indian Biomass Power Association also submitted that in order to
adhere to the recently stipulated emission norms by the Pollution Control
Boards of 50 mg/Nm3, an additional field has to be incorporated to the
normal 3 fields ESP, which necessitates additional power consumption
apart from additional capital expenditure. Installation of a suitable
Dust suppression System in the fuel preparation area is also an
additional Auxiliary power consumption source.

21
2.2.5. The data collected during the performance Assessment of the plants done
by National Productivity Council and the data from the Monitoring
Reports of operating biomass power plants from the website of UNFCCC
have been used for reference.
2.2.6. Data on the Auxiliary consumption of biomass power plants from the
Monitoring Reports of plants from the website of UNFCCC are as
follows:-
Reference Record
Monitoring Report
available in
UNFCCC website
Gross
Power
Generation
(kWh)
Aux.
Consumptio
n (kWh)
Aux.
Consumptio
n (%)
Export to
Grid
(kWh)
01.04.2008 to
31.03.2009 58236846 5158146 8.86% 53078700
25.09.2009 to
24.09.2010 46454600 5128900 11.04% 41325700
23.07.2009 to
21.07.2011 64775700 8658600 13.37% 56117100
24.07.2009 to
24.07.2010 28781400 3169500 11.01% 25611900
29.12.2009 to
28.12.2010 40051500 4741774 11.84% 35309726
25.02.2008 to
30.09.2009 75148000 10849000 14.44% 64299000
01.09.2009 to
31.08.2010
56,026,252
6,382,752
11.39%
49,643,500
22.09.2010 to
21.09.2011
28,881,184
3,461,084
11.98%
25,420,100
01.05.2009 to
30.06.2010 23,392,200 3,586,630 15.33% 19,805,570
23.08.2007 to
20.07.2009 46,881,300 5,965,800 12.73% 40,915,500
01.04.2008 to
31.03.2009 39,548,700 4,665,150 11.80% 34,883,550

22
09.03.2007 to
31.12.2008
65,214,150
7,875,350
12.08%
57,338,800
16.02.2010 to
31.03.2011
33375200
4119400
12.34%
29255800
24.08.2008 to
31.03.2009 37,250,500 4542200 12.19% 32,708,300
18.09.2009 to
24.03.2011
31,067,000
4034860
12.99%
27,032,140
Average 45005635 5489276 12.23% 39516359
2.2.7. Considering the above, the Indian Biomass Power Association suggested
to consider the Auxiliary Power consumption at 12% for all Biomass
based Power plants installed with ACC with additional equipment for
processing fuel etc. for the fuel preparation and feeding by way of
running wood Chippers and wood Shredder, with unprocessed fuels.
2.2.8. The data collected (Annexure-III) during the plant visits in Rajasthan of
M/s Suryaa Chambal Power Ltd. (SCPL) and Suryachakra Green Power
Pvt Ltd, (SGPPL ) confirms the auxiliary consumption to be in the range
of 10 % for water cooled plant.
2.2.9. As per the M/s Abellon Clean Energy Limited, one of the reasons for
higher auxiliary consumption in the biomass based power plants is that
these plants are of relatively smaller size, second the electricity
requirement for biomass pre-processing before feeding at plant, and
thirdly due to variation in fuel quality (GCV, moisture, chemical
properties). The plant generally does not run on rated capacity due to
which the overall Auxiliary consumption increases. Lower bulk density
& higher moisture will mean higher Auxiliary consumption. The

23
Auxiliary consumption is around 12 %. There will be variation of 2% in
Auxiliary consumption due to variation in load factor & variation in fuel
quality.
2.2.10. The Committee also collected data on Auxiliary Consumption of 6
MW M/s Surya Teja Power Plant in Hyderabad as under:
2.2.11. Considering the above the Committee recommends that the
auxiliary power consumption for the biomass plant using air cooled
plants can be fixed at 12% and for the plant using water cooled plants
can be fixed at 10%. In case of stations using rice straw or Juli Flora, the
auxiliary power consumption may also be kept as 12% to cutting,
shredding and drying operations.
Auxiliary Consumption V/S PLF details
Year Generation Auxiliary
Consumption
Auxiliary
Consumption
kWh kWh %
2007-08 10086234 1159584 11.50%
2008-09 24726700 2743900 11.10%
2009-10 24758200 2770300 11.19%
2010-11 29414000 3330500 11.32%
2011-12 37816700 4201550 11.11%
2012-13 20284400 2235350 11.02%

24
2.3. GROSS CALORIFIC VALUE (GCV):
2.3.1. The Commission specified calorific value for eight States in the RE
Tariff Regulation-2009, which comprises around 70% of estimated
surplus biomass power potential in the country for the mix of biomass
fuel available in a particular State. Further, in order to determine the
weighted average calorific value of biomass fuel mix the calorific values
of individual biomass as maintained by Indian Institute of Science,
Bangalore has been considered. States wherein biomass potential is yet
to be explored, have been considered under „Other State‟ category.
2.3.2. The Biomass Atlas prepared and maintained by the Indian Institute of
Science, Bangalore maps State-wise availability of the different types of
biomass fuel and also presents the power generation potential using each
of the biomass fuels:
Table: State-wise Biomass fuel availability and fuel mix
Type of
Biomass
GCV
kCal/
kg
MAH UP AP T N KAR RAJ PUN MP HAR
Paddy 3000 6% 46% 56% 11% 49% 7% 34%
Wheat 3800 6% 37% 51% 28% 16% 33%
Mustard 3400 28%
Bajra 3950 6% 9%
Maize 3500 10% 10% 18%
Cotton 3636 47% 5% 18% 21% 37% 23%
Groundnut 4200 12% 9%
Coffee 4300 9%
Coconut 3300 6% 13% 16%
Jowar 3500 13% 10% 9%
Gram 3810
Soyabean 3700 9% 19%
Sunflower 2800

25
Share in Total
Biomass Surplus
Available
86% 93% 90% 13% 91% 88% 98% 89% 90%
Share in Total
Biomass Surplus
kT/Yr
12,107 11,696 4,235 1,091 7,652 6,878 24,395 8,957 9,215
Total Biomass
Surplus Available
kT/Yr
14,002 12,537 4,689 8,092 8,442 7,808 24,789 10,080 10,288
Wt. Avg.
Calorific Value
for State kCal/kg
3,611 3,371 3,275 3,300 3,576 3,689 3,368 3,612 3,458
CV of Biomass
kCal/kg 3,476
2.3.3. While specifying the GCV norm in the RE Tariff Regulations-2012, the
Commission considered the norms as suggested in the report of National
productivity Council, Central Electricity Authority (CEA) as well as by
MNRE. Based on the recommendation of MNRE, NPC and CEA, the
Commission has considered the GCV of biomass at 3250 kCal/kg and
after taking into account, use of 15% of coal (average coal GCV at 3600
kCal/kg and 85% uses of Biomass fuel of 3150 kCal/kg), the weighted
average GCV has been considered at 3300 kCal/kg.
2.3.4. CEA in its report on “Operation Norms For Biomass based Power
Plants” September 2005 assumed GCV of 3300 kCal/kg based on the
calculation of weighted average GCV for 16 biomass power plant and
also taking into account large variation in quality and variety of biomass
used including variation in moisture content due to weather conditions.
2.3.5. The National Productivity Council (NPC) in its study mentioned that
based on the fuel analysis report from the different plants, GCV &
moisture variation could be as under:

26
Biomass GCV (kCal / kg) Variation in
Moisture (%)
Rice husk 3000-3200 12-18
Maize Bhutia 3500 21
Cotton Stalk (Air Dried Basis) 3250 8
2.3.6. MNRE vide its letter dated 30th
September, 2011 submitted that the GCV
has to be decided based on the biomass type as per the following:-
Sr.
No.
Name of Biomass Moisture
(%)
Dust
(%)
GCV as on as
received basis
(kCal/kg)
1 Groundnut Shell 4.6 4 3167
2 Jeera Residue 6.8 3.85 3690
3 Saw Dust 30.0 12 2139
4 Sindhi Saunf 16.97 4.66 3186
5 Asalia 6.69 6.31 3505
6 Isabgol 6.79 5.18 3588
7 Mustard Residue 10 4.0 3300
8 Juliflora 13 1.0 2800
9 Paddy Straw 10 4.0 3300
10 Rice Husk 12 1.5 3200
2.3.7. There are other losses which are being encountered during the storage
and handling of biomass, as per survey carried out by Dalkia Energy
services limited under mandate from Rajasthan Renewable Energy
Corporation Ltd. 9RREC) to assess such losses. Findings on various

27
losses being encountered during storage of biomass in the power plant
are shown in the table below.
S.
No.
Type of
Losses
Description Expecte
d Losses
(%)
Targeted
Losses (%)
Remarks
1 Land
Settlement
Grounded
MCR cannot
be lifted due
to mixing
with dust
0.7-1.0 0.4-0.5 MCR at bottom of heap
gets mixed with sand
and cannot be used in
boiler. However, with
leveling of ground and
proper drainage system,
land settlement loss can
be reduced to about
0.4% - 0.5%.
2 Loss of Fuel
during Sand
Storm
Due to high
velocity
sand storm,
MCR
spreads out
in nearby
area up to
half a KM
and cannot
be collected
0.5 0 This loss can be
completely eliminated
by covering the biomass
with tarpaulin.
3 GCV Loss
due to
decaying of
biomass
In rainfall,
biomass gets
wet and
suffers from
GCV loss
due to
decaying
and release
of methane
gas in the
atmosphere.
2 1.25- 1.5 Decaying loss can be
reduced to about 1.5%
by covering the biomass
with tarpaulin and proper
drainage system in
storage yard.
Total Losses during Fuel Storage 3.2-
3.5%
1.65- 2.0%
2.3.8. The Ministry also considering the above report, further submitted that
with better fuel management techniques such as proper leveling of
ground for storage, proper drainage system and covering of fuel with
tarpaulin, the total fuel losses during biomass storage can be targeted at

28
about 1.65%-2%. Thus, there should be provision of loss of fuel during
storage at around 2% in the tariff order of various states for biomass
based power plants. The Ministry finally suggested that the following
general principles can be adopted for the GCV value:
Biomass GCV (kCal / kg)
Rice husk 3200
Straw / Stalks/ Other husks 3300
Plantation 2800
2.3.9. Some of the stakeholders have submitted that none of the above referred
organizations has conducted a study about the degradation of these
seasonal fuels over the non-seasonal period. They have further submitted
that due to the rains, storage, contamination by fuel suppliers and
inherent mud in agricultural residues there is a significant reduction in
GCV of biomass fuels.
2.3.10. As per the interaction and reference of records submitted by the
Biomass Power Plants, it was observed that the most important property
of biomass feed stocks with regard to combustion – is the moisture
content of the fuel, which influences the energy content of the fuel and
also the efficiency, fuel consumption and viability of the Biomass Power
Plant.
2.3.11. It has been observed that the operation of the Biomass Power
plants solely depends on the quality of the fuel received and also on
the quality at the time of usage in the boiler after prolonged storage in

29
the case of seasonal fuels. But it is understood that most of the Biomass
Power plants are being operated with “hand to mouth” fuel situation.
That is, they are forced to buy the available fuels with inferior quality
and fire them in the boiler. It is also noticed by the Committee during
plant visit that the quality of fuel, which is waste is not uniform,
containing varied moisture, sand and inert material, which has direct
relation to GCV, as the waste is coming from different areas, farmers and
soil profiles.
2.3.12. The GCV of fuel is determined based on the Moisture, Sand and
ash content of the Biomass used. For reduction of moisture the only
economical solution is the natural drying. But due to high inventory
levels upon storage in the open space like Coal (which is normally less
hygroscopic than Biomass) seasonal rains makes the fuel further wet.
According to the Indian Biomass Association, on an average the Biomass
plants are to be operated with the minimum moisture content of 25 to 30
%, which affects the heat content (GCV) further and what they get on as
feed basis is only between 2200 to 3000.
2.3.13. The GCV analysis of mustard husk on as fired basis data collected
from M/s Surya Chambal Power Ltd. (SCPL) during the visit is attached
as Annexure-1. As per records verified mustard husk average GCV on as
fired basis found at around 3077 kCal/kg.
2.3.14. As per data collected from M/s Punjab Biomass Power Limited,
the laboratory test report of GCV analysis of rice straw on air dried basis
found at 3236 kCal/kg and moisture content (as received basis) found at
57.02%.

30
2.3.15. The Average GCV of the biomass used in the State of Gujarat, on
dry basis is 3300 Kcal / Kg, as it generally utilizes cotton stalk and
castor stalk as fuel.
Sr.
No.
Biomass
Source
Area
under
cultivation
in Gujarat
as per
Govt. data
Total
Biomass
waste in
Gujarat
Percentage Calorific
Value
Area in Ha
1 Paddy Straw 2,062,500 6,877,406 56% 3000
2 Cotton Stalk 2,422,000 2,422,000 28% 3636
3 Wheat Straw 1,273,900 1,019,120 15% 3600
4 Castor Stalk 358,100 214,860 1% 3200
Total 10,533,386 3300 Source: Gujarat Agriculture department
2.3.16. The Committee also collected GCV details of various fuels used in
6 MW project of M/s Surya Teja Power Project Limited, Hyderabad as
fired basis as under:
GCV details of as fired basis
Type of fuel used
GCV
kCal/kWh
Rice Husk 3032
Ground Nut Shell 3469
Shank (seed less corn) 3580
2.3.17. Upon verification of the operating details of the Biomass Power
Plants the net calorific value of the fuel received are far less than the
GCV of 3400 Kcal/Kg to 4400 kCal/kg on air dried basis. In practice
with the moisture content variation between 10 % in the case of
Mustard Husk and 50 % in the case of cotton stalks and coconut wastes
the actual heat content is almost 20 to 30 % less than the GCV on as
dried basis. This has been observed during the plant visit to the
operating plants. This moisture variation typically affects the
performance of the Boiler and also the viability of the plants with the
current tariff fixed with the High GCV.

31
2.3.18. Based on the data submitted by IBPA, it is also observed that some
of the States like Tamil Nadu, Andhra Pradesh, Madhya Pradesh,
Maharashtra are using predominantly coconut wastes, Cotton stalk,
Bagasse, Sugar Cane Trash apart from Juliflora . It is represented many
times by the IBPA , that the use of Juliflora by other competitive
industries has gone up extensively and availability to the Biomass
Power Plants is not ensured. Hence it is certain that originally
envisaged fuel for the Biomass Power Plant namely Juliflora has
become costlier, forcing the Biomass Power Plants in these states to
look for other Agro Residues with higher moisture content with lower
GCV.
2.3.19. It was seen in the operating plants that a minimum inventory of
three to four months of stocks of various types of fuels are stacked either
in the plant premises or at the collection centers. The following points
were observed based on the visit to the Biomass Power Plants:-
The biomass is procured in a period of 3 months every year and
preserved and used for the entire balance period of 9 months.
In order to reduce the risk of fire, biomass is also stored in depots
away from the plant.
In this process, there are losses due to various reasons like mixing of
sand, mud and foreign materials, losses by wind and small to major
fires and losses in handling.
There is also qualitative loss in terms of GCV due to exposure to wind
and rain. Thus, the losses are between 7-10% for the entire year.
2.3.20. Based on the above factors the Committee recommends that
the normative GCV value for the Biomass Plants for determination
of generic tariff may be kept as 3100 kcal/kg for mustard husk, rice
husk and other kinds of biomass fuel under as fired condition.
2.4. OPERATION AND MAINTENANCE EXPENSES

32
2.4.1. The various heads of accounts coming under O&M expenses are: Labour
Charges, Courier charges, Mobile charges, Telephone charges,
Consultancy charges (LEGAL), Donation, Electric charges, Hire
Charges, Misc Expenses, Testing Charges, Transportation Charges,
Watch & Ward, Comp spares & Consumables, Repair &
Maintenance of equipment, Repairing & maintenance of vehicles,
Printing & Stationary, Rep& Main of Buildings, Rates & Taxes, Other
Bank Charges, Employees Cont to PF, Leave & Salary, Salary & Wages,
Lunch & Tea exp, Medical exp, Pooja exp, Staff Welfare exp, Board&
Lodge, Car Hire charges, Petrol & Diesel exp, Travel exp, Travel other
exp, Insurance other, Rent, Audit fee, Fuel feeding, handling and fuel
preparation expenses etc. all constitute Operation & maintenance
charges. The O&M charges would also affect based on the location of
the power plant if the location is near to the city, the O&M expenses
would be lesser as compared to a rural location, where the O&M
expenses would be a bit higher.
2.4.2. The O&M expenses incurred by various biomass power plants operated
throughout the year for the financial years 2010-11 and 2011-12
submitted by the Indian Biomass Power Association are presented below.
Name of the Unit
Cap.
(MW)
Financial Year
2010-11
Financial year
2011-12
Annual O&M
Expenses
(Rs)
Annual O&M
expenses (Rs./
MW)
Annual O&M
Expenses
(Rs)
Annual O&M
Expenses
(Rs./MW
Shriram Powergen
Limited Dindigul 7.5 52349351 6979913 41063786 5475171
Shriram
Nonconventional
Energy Limited,
7.5 50477018 6730269 37721802 5029574
Global Powertech
Equipments Ltd. 7.5 54332826 7244377 50630790 6750772
SM Environmental
Technoloes Pvt Limited,
Chippabarod
8.0 84250853 10531357 44616142 5577018

33
Amrit Environmental
Technologies
Pvt. Limited, Kotputli
8.0 41785128 5223141 36663533 4582942
Sanjog Sugars & Eco
Power Pvt. Limited,
Hanumangarh
10.0
- - 32653841 3265384
Orient Green, Pollachi 10.0
- - 33157865 3315787
2.4.3. The O &M expenses on current level as per verified details of actual
expenses of the plants visited are as under:
Name of the Unit Capacity
(MW)
FY 2011-12 FY 2010-11
Annual
O & M
Expenses
(Rs Lakhs)
Annual
O&M
expenses (Rs
Lakhs Per
MW)
Annual
O & M
Expenses
(Rs Lakhs)
Annual
O&M
Expenses
(Rs Lakhs /
MW)
Surya Chambal plant,
Kota 7.50 5,36,38,063 71.52 5,50,86,367 73.45
Punjab Power, Patiala 12.00 4,20,66,782 35.06 - -
Surya Teja Power
Project Ltd.
Hyderabad
6.00 4,70,92,800 78.49 5,01,82,975 83.64
2.4.4. It can be seen from the data that average O& M expenses per MW vary
depending on the capacity of the plant. For low capacity plants it is
comparatively higher, the primary reason being that the number of
employees is not related to the capacity. The remote positioning of the
plants adds to higher cost of labour and trained manpower unwilling to
stay in places where minimum amenities of life are not met.
2.4.5. IBPA has further submitted that the financial conditions of the economy
and the current high rate of inflation have direct impact to the O&M
charges increasing rapidly every year. The manpower demands higher
wages and salaries for staying in remote location and the nature of the
Biomass operation is such, where experience and technically qualified

34
manpower is critical and required on 24 hours basis for operation of plant
unlike other RE segment like Wind and Solar, which requires lesser
manpower for O&M compared to Biomass. The data submitted for
various plants by IBPA reflect higher O&M cost. .
2.4.6. The biomass based power plants are relatively smaller in size / capacity
and hence the fixed costs like manpower cost, administration cost,
consumables cost are significantly high in per MW terms. Further, due to
high corrosion and high erosion in the biomass based boilers around 3%
of Capital cost shall be incurred every 3 years against major replacement
/ major repairs / replenishment, such as boiler tubes, super heaters, etc.
This should also be accommodated in the O & M cost. A typical analysis
of O&M of the 10 MW biomass plant as submitted by M/s Abellon
Green Energy Ltd is as follows:
O&M Cost for 9.9 MW Plant
Sr. No. Particular Amount in
Rs. Lakh
1 Spares and consumate 120
2 Material Cost for Shutdown 45
3 Salary Cost 90
4 Mobile Allowance 2
5 Labour Cost (Fuel Handling) 80
6 Labour Cost (Operation+ 36
7 Transportation Allowance for Staff and labour 10
8 General Administration and Misc. 24
9 Total O&M Cost in Rs. Lakh 407
10 Total O&M Cost in Rs. Lakh/MW 41
2.4.7. The data submitted by the Biomass Plants reveals that the O& M
expenses are almost in the range of Rs 35 lakh/MW to 72.44 Lakh/MW
and according to them such expenses are escalating at 10 % year on year.
However, such high variation in O&M expenses of similar capacity
plants is not very clear. Therefore, we are not very comfortable to rely
upon the figures given by the Biomass Association. Nevertheless,
considering the facts that the Biomass Power Plants are being operated

35
with skilled manpower and due to the locational disadvantage are
required to be paid higher salaries to skilled manpower, and higher
wages for the unskilled manpower as well. In addition, O&M expenses
for fuel processing and feeding are comparatively higher when compared
to other similar industries. In consideration of all these facts, there is a
case for increasing the O&M expense norm and it is considered
reasonable to raise it to Rs.40 Lakhs per MW. This would be of the order
of 7 to 10% of the capital cost for the biomass plants.
2.4.8. Regarding Annual escalation of O&M expenses for determination of
tariff, in the Statement of Reasons Order issued while notifying RE
Tariff Regulations 2012, the Commission clarified that the escalation
factor of 5.72% per annum is in line with the escalation factor considered
for conventional power projects as per CERC (Terms and Conditions for
Tariff) Regulation, 2009 for the Control period FY 2009 to FY 2014. As
and when the said 2009 Regulations is amended, during the new Control
period of the Renewable Energy Tariff, the Commission may consider
extending the same prospectively to all the RE projects as well.
36
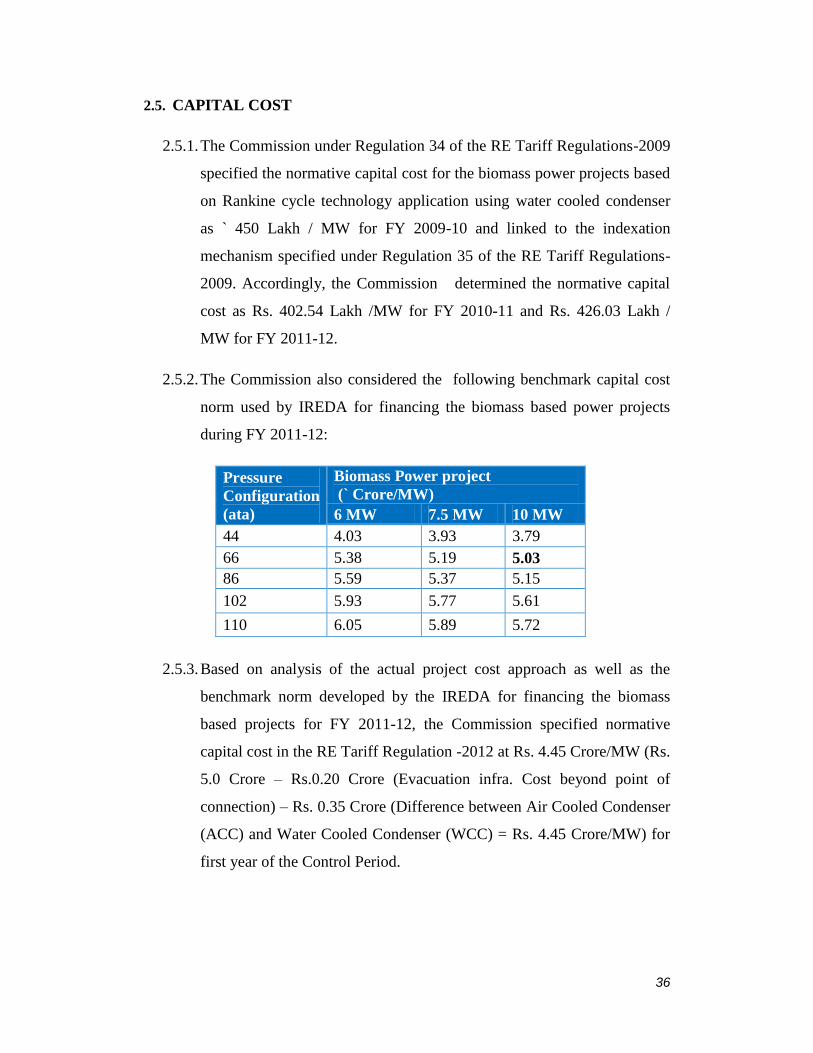
2.5. CAPITAL COST
2.5.1. The Commission under Regulation 34 of the RE Tariff Regulations-2009
specified the normative capital cost for the biomass power projects based
on Rankine cycle technology application using water cooled condenser
as ` 450 Lakh / MW for FY 2009-10 and linked to the indexation
mechanism specified under Regulation 35 of the RE Tariff Regulations-
2009. Accordingly, the Commission determined the normative capital
cost as Rs. 402.54 Lakh /MW for FY 2010-11 and Rs. 426.03 Lakh /
MW for FY 2011-12.
2.5.2. The Commission also considered the following benchmark capital cost
norm used by IREDA for financing the biomass based power projects
during FY 2011-12:
Pressure
Configuration
(ata)
Biomass Power project
(` Crore/MW)
6 MW 7.5 MW 10 MW
44 4.03 3.93 3.79
66 5.38 5.19 5.03
86 5.59 5.37 5.15
102 5.93 5.77 5.61
110 6.05 5.89 5.72
2.5.3. Based on analysis of the actual project cost approach as well as the
benchmark norm developed by the IREDA for financing the biomass
based projects for FY 2011-12, the Commission specified normative
capital cost in the RE Tariff Regulation -2012 at Rs. 4.45 Crore/MW (Rs.
5.0 Crore – Rs.0.20 Crore (Evacuation infra. Cost beyond point of
connection) – Rs. 0.35 Crore (Difference between Air Cooled Condenser
(ACC) and Water Cooled Condenser (WCC) = Rs. 4.45 Crore/MW) for
first year of the Control Period.

37
2.5.4. The Commission under Regulation 34 has specified the normative capital
cost for the biomass power projects based on Rankine cycle technology
application using water cooled condenser as Rs. 445 Lakh/MW for FY
2012-13, which shall be linked to the indexation mechanism specified
under Regulation 35 of the RE Tariff Regulations. In accordance to the
above referred Regulation, the normative capital cost of biomass power
projects based on Rankine cycle technology application using water
cooled condenser would be Rs. 463.336 Lakh/MW for FY 2013-14.
2.5.5. The capital costs of the Biomass Power Projects are unique when
compared to the other renewable sector and the details are reproduced
below.
Plant and Machinery : The past Biomass Power Projects were
completed with the water cooled condenser and without any major
monitoring Equipment on the pollution abatement. The recent
Governmental regulations on the Environment, warrant installation
of Air Cooled Condenser and also the Pollution Control Monitoring
and control equipment. This has increased the Capital cost of
Biomass Projects. Other than this because of the non-availability of
processed fuel for some of the Biomass Power Plants, they are
forced to buy any unsized fuel and process them inside the plants
before feeding into the Boiler. The processing needs additional
chipping and shredding machines apart from the fuel shed for storing
such processed fuel. This also increases the Project cost
considerably.
Civil and Structural Cost: In the recent days apart from the
escalation factors on steel and cement, the Erection, Procurement
and Construction Costs had also increased.
Land Cost : Though the Biomass Projects are planned to be
located in the rural areas , the land costs are high even in the rural

38
areas. The land requirement is about 20 acres per plant for 5 MW to
20 MW . The requirement of land block is more in the case of
plants which depend mostly on the seasonal fuels like Mustard
Husk , Paddy Straw , Wheat and Cotton stalk particularly in the
northern states like Rajasthan and Punjab.
Pre-Operative Expenses: Biomass power projects are established
in rural backward areas of the state. Unlike Solar and Wind, where
plants once established require very less manpower and operation
logistics for operation, Biomass requires both technical manpower
and operation logistics. Biomass plants unlike other RE segment
require 24 hours commitment and presence of technical and
operational staff for running the plant. Building basic infrastructure
for the stay of operational and technical staff at the Biomass plants is
critical and essential and this support infrastructure has to be built. It
is not possible to bring technical and operational staff from distances
of 100 km every day for operations in a remote backward area. This
is additional cost, which has to be taken into account and is very
much part of the cost of the power plant.
Interest During Construction : The interest rate indicated by the
Biomass Power Plants is realistic and the current rate of interest is
around 15 % for the capital cost and also for the working capital.
Transmission Line : Biomass power plants are generally located
in the rural areas where there is limited availability of the
substations. Therefore, the plants needs to be grid connected with
the long lead of transmission lines . The lower voltage connectivity
with 22/33/66 KV is now becoming more unstable because of the
remote access by the Discoms .This has forced most of the Biomass
power plants though located in rural areas, to go for higher voltage
connectivity with the grid to avoid unnecessary outages or
fluctuations, whatever be the distance for the higher voltage

39
substations say 110/132 KV. This in turn has resulted in higher cost
on the transmission lines.
2.5.6. Apart from the above factors , it is understood that the inordinate delay
in getting the Right of way on account of the execution of transmission
lines with most of the Biomass Projects, the projects has suffered time
and cost overrun before completing the project .
2.5.7. The break up data pertaining to some of the operating Biomass
Power plants based on the above factors are reproduced below with the
supportive Balance sheets .
Plant Details
SPGN,
Tamilnadu
GPT,
Tamilnadu
Sanjog,
Rajasthan
OGPL,
Tamilnadu
Transtech
Rajasthan
Year Of
Commissioning 2007 2009 2010 2011 2011
Capacity in MW 7.5 7.5 10 10 12
Particulars Amount
(Rs. Lakh)
Amount
(Rs. Lakh)
Amount
(Rs. Lakh)
Amount
(Rs. Lakh)
Amount
(Rs. Lakh)
Plant & Machinery
Boiler 783 1204 1477 1702 1546
Turbine 650 801 1299 829 838
ACC 397 364 478 400 519
ESP 226 299 240 309

40
Chimeny included in
Boiler 147 47 61 75
Fuel Handling &
Feeding System 40 65 175 146 249
Ash handling system 15 51 204
Other Machinery ** 1297 1597 1448 1912 1099
Plant & Mach. Sub
total 3182 4404 5223 5341 4839
Civil Cost
&Structure 309 359 1066 957 847
Land & Site
Development 45 28 116 320 503
Pre-Operative
Expenses 21 283 38 20 651
Interest During
Construction 373
Total 3557 5074 6443 6638 7213
** (Transformer, Cables, Metering System, LT HT Panel, Control System, Weigh Bridge,
Transmission)
Capital Cost- Lacs
per MW 474.27 676.53 644.30 663.80 601.08
2.5.8. Based on the above data and also verified Financial Documents and as
claimed by the Biomass Power Project Developers that the Capital cost
is more than Rs 600 Lakhs per MW .
2.5.9. The Committee also requested IREDA vide e-mail dated 23.05.2013 to
furnish latest cost data of biomass based rankine cycle projects including
100% rice straw based power project. In this regard, IREDA submitted
that they are following the following cost ceiling bench-marks while
sanctioning the Biomass projects:
Capital Cost of Biomass based power project
Boiler Pressure
Configuration (ata)
Recommended for 2010-11 & 2011-12
6 MW 7.5 MW 10 MW
44 4.03 3.93 3.79
66 5.38 5.19 5.03

41
86 5.59 5.37 5.15
102 5.93 5.77 5.61
110 6.05 5.89 5.72
2.5.10. The above cost ceiling bench-marks were carried out by M/s
MITCON Consultancy Services Ltd. based on escalation factor mainly
on the Wholesale price index for 2009-10, Inflation rate for 2010 and
steel price index, etc. IREDA submitted that the above bench-marks are
under revision for financial year 2013-14. IREDA also submitted that
they have not sanctioned any Biomass projects using 100% rice straw so
far and the cost of such projects are higher than the conventional biomass
project due to additional investment on fuel procurement and collection
equipments like baler, cutters, tractors, trolley, etc. Further, the rice is to
be collected within 2 to 3 months (harvesting season) and the same has to
be stored for the next 9 to 10 month to ensure regular fuel supply for the
plant. This requires huge amount of working capital to procure and store
the rice straw. On a similar basis the cost of Juliflora based power plant
is also higher as they have to also invest in Chippers, Shredder, Cutters,
trolleys for cutting, harvesting and handling Julfilora.
2.5.11. MNRE vide its letter dated 30th September, 2011 submitted that
the Capital cost of the biomass based power project depends upon the
type of fuel, which in turn decides the plant configuration and technology
type. MNRE recommended project cost for various biomass categories
for IPP and tail end projects as given in the table below:
Capital cost of the biomass based power project
Cost Head Project Cost – IPP (` Lakh /MW)
Straw Stalk Plantation Husk
Steam Pressure/ Temperature
(ata/ 0C)
68/435 68/435 87/515 87/515

42
Land Civil and Equipment Cost 545.5 522.6 517.2 517.2
Fuel Logistics equipment 49.6 3.6 5.6 1.5
PDD Charges 4.6 4.2 4.1 4.1
Finance Charges 31.1 28.7 27.4 28.4
Margin Money 19.3 19.2 19.2 18.8
Total Project Cost 650.1 578.3 573.5 570
2.5.12. MNRE finally recommended normative capital cost as shown
below:
Capital Cost of Biomass based Power Plant
Biomass IPP (>5MW)
Rs. in Lakh
Rice husk 570
Straw 650
Others 580
2.5.13. It is important to note that the cost of biomass processing
equipments, Plant & Machinery required in the Power plant and the cost
of interest during construction (IDC) are part of total capital cost. Some
biomass processing equipments like: Shredder, Chippers, balers, etc are
required for sizing of biomass to make it ready to be feed in the Boiler.
Cost of Equipments for preprocessing of Biomass
Sr.
No.
Equipment Unit Cost
(Rs.
Lakh)
Units
required/
10 MW
plant
Cost/MW
(in Rs.
Lakh)
1 Chipping & Shredding 200 2 40.00
2 Bailer 3 2 0.60
3 Loader cum Hydra 8 2 1.60
4 Fork lift truck 12 2 2.40
5 Tilted platform for
unloading
5 2 1.00
45.60

43
2.5.14. Looking to the small size of biomass based power plants the
overall per MW capital cost is higher than the Thermal power plants as
the fixed costs like, DM Plant, Civil work for Turbine house, Boiler
foundation, road & other infrastructure inside the premises will be quite
high. The costs of the pre-processing equipment used for a typical 10
MW size biomass plant are found in the range of Rs. 45 Lakhs/MW. The
same is demonstrated below:
Capital Cost of the 10 MW Plant
Sr. No. Category Cost in
Rs. lakh
1 Land Total 40
2 Civil Work 952
3 Electrification Work 504
4 P&M Indigeneous System 2379
5 BOP System 614
6 Project Management 382
7 Pre-Processing System 456
8 IDC 500
Total Project Cost without Transmission Line 5826
Transmission Line 250
Total Project Cost with Transmission Line 6076
2.5.15. Considering the latest Capital Cost data submitted by the Indian
Biomass Power Association as well as the data submitted by MNRE, we
recommend a Capital Cost for biomass based plant at:
i. Rs. 540 Lakhs/ MW (excluding transmission infrastructure cost and
including cost of water cooled condenser)
ii. Rs. 580 Lakhs/ MW (excluding transmission infrastructure cost and
including cost of air cooled condenser),
iii. Rs. 630 Lakh/MW (excluding transmission infrastructure cost and
including cost of air cooled condenser) for plant other than rice straw
based plant, considering the additional investment on fuel
procurement and collection equipments like baler, cutters, tractors,
trolley, etc.

44
2.6. FUEL PRICE FIXING MECHANISM
2.6.1. IBPA has mentioned and even MNRE during the deliberation of FOR at
Shimla has highlighted that a major problem being faced by the Biomass
developers is the fuel price fixation mechanism. The data submitted by
the IBPA reveals that most of the Biomass Power plants have the Fuel
cost spent with 70 - 90 % on revenue , forcing the plants to shut
down their operations during most of the days in a year and majority of
the plants are operating in losses, with a negative financial view of the
sector developing. This is true as even IREDA has submitted that they
have not funded Biomass power plants in the last 2 years and the view of
the sector is negative. There are also reports of many plants not being
able to meet their loan and interest and have been declared as NPA by
FI‟s.
2.6.2. The Fuel Price Fixation Mechanism for the Biomass Power Plants is
based on the following factors:
Factor Representing Basic Fuel Cost
Factor Representing Processing Cost
Factor Representing Transporting Cost
2.6.3. IBPA has also submitted that some of the SERCs like Rajasthan have
kept fuel price as part of the regulation assuming 5% increase every
annum. Revising regulation to correct the disparity, even if the SERC
wants to do has to be done after following a lengthy process and is time
consuming, which results in stressful condition for Biomass power
plants. The Committee appreciates that fuel price fixation mechanism is
a challenge and unless the fuel prices for Biomass power plants are fixed
properly, the sector would continue to be under stress.

45
2.6.4. Majority of the states followed a fuel price indexation mechanism and a
5 % yearly escalation has been provided. But the current price prevailing
for the Biomass Plants reveals that an annual escalation of around 15 –
18 % has been experienced due to abnormal prevailing financial
conditions, decontrol of diesel and petrol prices and is increasing by
more than 100% in the last 3 years, increase in inflation etc being some
of the factors, which have increased the fuel prices by more than 5% per
annum.
2.6.5. IBPA has opined that the Basic Fuel cost has gone up drastically apart
from the transportation cost due to ever increasing diesel prices. The
sector would not be able to perform and come out of the present stress
unless the fuel price mechanism is properly set.
2.6.6. Considering the above, the Committee is of the view that the fuel pricing
mechanism has to be proper for the operation of the Biomass power
plants, else the sector will not be able operate properly. This is a major
problem and concern of the Industry as also deliberated and submitted on
various occasions. The Committee recommends that the fuel prices be
fixed at the beginning of the year on independent survey, which can be
conducted by State Nodal agency, which is already there in all states.
This would be most transparent and amiable fuel price mechanism.
However the State nodal agency must ensure that the independent fuel
price survey is conducted on time every year. This would end all
confusion and problems currently being faced by the Biomass sector and
is a rational solution to the fuel price fixing mechanism.

46
2.7. CONCLUSION AND RECOMENDATION
2.7.1. The Committee acknowledges and recognizes that Biomass as segment
of renewable energy is facing problems in the country and the objective
of the formation of the working group was to deliberate and identify
those factors, which were hampering the operation of the Biomass sector.
2.7.2. The Committee has deliberated and minutely collected all information
and data from different stake holders and also visited sites of power
developers to understand the practical implication of Biomass operation
and to also understand the factors, which were posing problems to the
sector and the recommendation is based on the actual information
collected from different stakeholders and site visits analyzing the
technical, financial and operational information.
2.7.3. Committee also recognizes that Biomass is an integral part of renewable
energy, which provides firm, reliable and clean power. It also assists in
rural development and creation of employment opportunities in the rural
sector. The optimum operation of the Biomass power plants would assist
in power generation and rural development in the country.
2.7.4. The Committee is of the view that the requirement of higher specific
consumption resulting into relaxed norm of Station Heat Rate and Gross
Calorific Value stem out of fuel related issues, viz.:- lack of availability
of surplus biomass, poor quality of biomass fuel, inadequate fuel
collection, distribution & supply mechanism, competitive buyers of
biomass and price rise, resulting into usage of waste biomass and lower

47
plant load factor. Following normative parameters suggested by the
Committee for the consideration of the Commission for determination of
generic tariff:
i. Station Heat Rate (SHR):
a. 4200 Kcal/kWh for station using travelling grate boilers; and
b. 4125 kCal/kWh for stations using AFBC boilers
ii. Gross Calorific value (GCV): 3100 kCal/kg
iii. O&M expenses: Rs. 40 Lakh/MW
iv. Auxiliary Consumption:
a. 10% with water cooled condenser, and
b. 12 % for air cooled condenser
v. Capital Cost (excluding evacuation cost and cost of water cooled
condenser considered):
a. For project with water cooled condenser: Rs. 540 Lakh/MW
b. For project with air cooled condense: Rs. 580 lakh /MW
c. For rice straw based project: Rs. 630 lakh/ MW
vi. Biomass Price: to be decided annually by a committee to be formed
at State level representing State Commission, Nodal Agency,
Government
2.7.5. The above suggested liberal norms on operating parameters should be
allowed for the short term only. In order to resolve the issue on
sustainable basis, to achieve long term fuel availability and to achieve
biomass price stabilization, plantation backed biomass power plants need
to be promoted. Development of Prosopis - Juliflora / other energy
plantation on Government waste/barren/saline lands, Panchayat waste/
barren/ saline lands, degraded forest land, for use as supplementary fuel
in Biomass Power Plants should be encouraged. The Committee is of the
view that no biomass power plants should be licensed without plantation.
********

48
ANNEXURE-I
A record of decision taken and list of participants in the Committee meeting
held on 25h October, 2012 under Chairmanship of Shri Rajiv Bansal
Secretary , CERC
During the meeting briefly explained the background of the meeting called to
discuss the terms of reference of the Committee as decided by the Commission
and way forward to achieve the objectives.Various issues relating to the Terms
of Reference were discussed and following course of action was suggested:
The Committee should take help of external consultant for evaluating the
parameters.
The Committee should concentrate only immediately on factor affecting
energy charges first like: fuel availability, its quality (Gross Calorific Value
(GCV)) and biomass price, so that the issue can be sorted out immediately.
Relevant data on Biomass prices, GCV, Station Heat Rate, specific fuel
consumption Operation & Maintenance expenses etc of biomass based plants
under operation in various states, to be provided by the Indian Biomass Power
Association (IBPA) to the Committee.
The Committee may co-opt representative of State Electricity Regulatory
Commissions like: Andhra Pradesh, Maharashtra, Rajasthan & Tamil Nadu, as
additional members of the Committee.
Following were present in the meeting:
i. Mr. Rajiv Bansal, Secretary, CERC
ii. Dr. D.K. Khare, Director, MNRE
iii. Mr. S.C. Shrivastav, Joint Chief (Engg.), CERC
iv. Mr. P.K. Awasthi, Joint Chief (Finance), CERC
v. Mr. S.K.Chatterjee, Dy. Chief (Reg. Aff.),CERC
vi. Mr. S.K. Kassi, director (TE &TD) Division, CEA
vii. Mr. Amitabh Tandon, Indian Biomass Power Association

49
viii. Mr. Ranjan Yadav, Indian Biomass Power Association
ix. D Radhakrishna Secretary General Indian Biomass Power Association
x. Mr. R.H. Shah Advisor (Renewable), CERC

50
ANNEXURE-II
GCV kCal/kg
Day Mar-12 Apr-12 May-12 Jun-12 Jul-12 Aug-12 Sep-12 Oct-12
1 3324.23 3297.18 2976.98 2949.57
2 3212.62 3075.47 3095.25 2526.61
3 3276.65 3332.13 2913.06 2792.70
4 3369.55 3414.47 2794.80
5 3357.71 3406.55 2546.27 3302.11 2826.37
6 3291.51 3495.70 2783.07 3146.23 3106.39 2888.33
7 3471.23 2958.18 2870.11 3006.77 2959.70
8 3440.11 3006.35 2881.68 3152.84 3007.14
9 3486.38 2933.35 2857.81 3084.81 3097.22
10 3407.04 2695.72 2838.43 2816.83 2958.90
11 3388.46 2909.23 2923.83 2991.10 3073.08
12 3041.51 2983.18 3071.60 3185.89
13 3063.10 3118.76 2852.28 3039.15
14 3384.27 3032.48 3087.51 2706.93 3252.03
15 3440.51 2998.85 2608.27 2622.92 3090.61
16 3493.35 3469.00 2763.53 3152.11
17 3487.45 2924.67 2842.73 3221.87
18 3387.45 2937.66
19 3468.85 3020.50 3017.35 3150.79
20 3499.02 3090.85 3026.53 3086.52
21 3358.35 3025.24 2959.18 3118.53
22 3110.50 3442.22 3062.24 3100.67 3072.05
23 3477.88 3450.88 296.69 2914.96 2430.55 3073.56
24 3321.12 3492.59 2918.29 3132.55 2460.56 2978.94
25 3445.13 3467.35 2997.66 2765.50 2689.83 3104.39
26 3226.31 3440.32 2911.78 2833.95 2776.84 2971.53
27 3345.13 3006.03 2926.78 2796.14 3072.75
28 3382.13 3412.54 2886.89 2959.13 2865.44 2889.16
29 3352.06 2901.69 3062.26 2736.23 2873.41
30 3445.56 2788.87 2903.82 2820.12 2994.14
31 3008.28 3164.19
Average 3318.50 3434.59 2853.43 2990.08 2850.10 3014.36
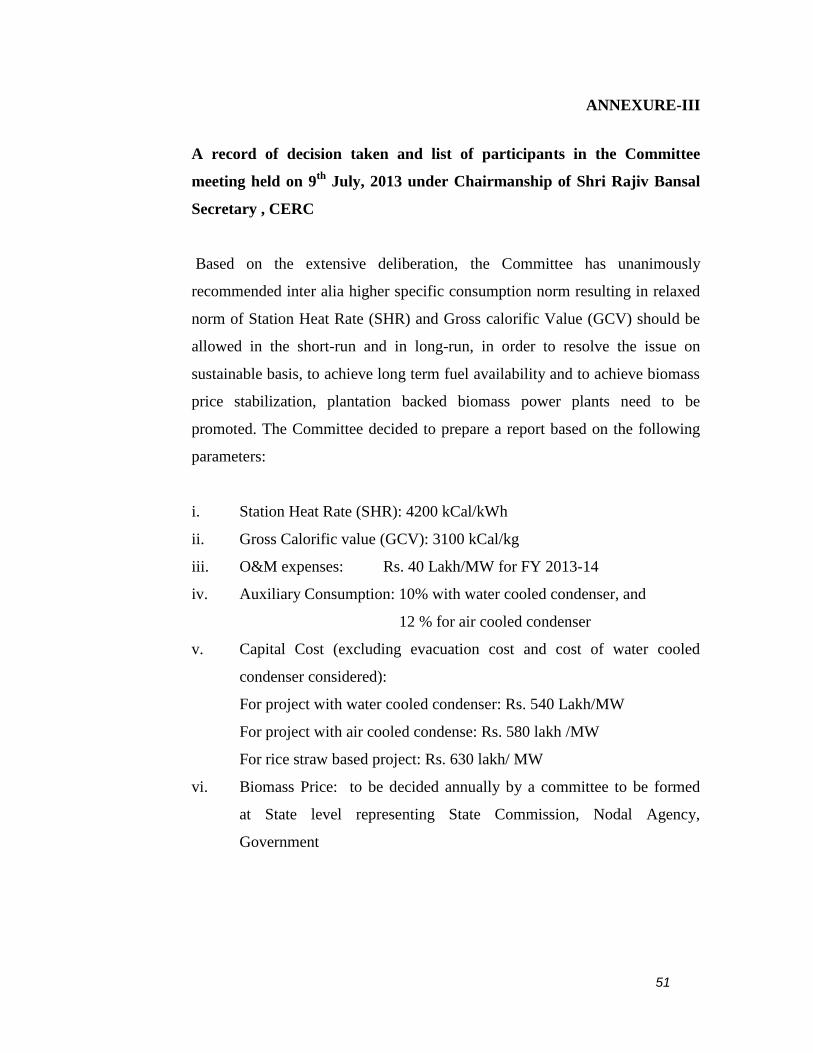
51
ANNEXURE-III
A record of decision taken and list of participants in the Committee
meeting held on 9th
July, 2013 under Chairmanship of Shri Rajiv Bansal
Secretary , CERC
Based on the extensive deliberation, the Committee has unanimously
recommended inter alia higher specific consumption norm resulting in relaxed
norm of Station Heat Rate (SHR) and Gross calorific Value (GCV) should be
allowed in the short-run and in long-run, in order to resolve the issue on
sustainable basis, to achieve long term fuel availability and to achieve biomass
price stabilization, plantation backed biomass power plants need to be
promoted. The Committee decided to prepare a report based on the following
parameters:
i. Station Heat Rate (SHR): 4200 kCal/kWh
ii. Gross Calorific value (GCV): 3100 kCal/kg
iii. O&M expenses: Rs. 40 Lakh/MW for FY 2013-14
iv. Auxiliary Consumption: 10% with water cooled condenser, and
12 % for air cooled condenser
v. Capital Cost (excluding evacuation cost and cost of water cooled
condenser considered):
For project with water cooled condenser: Rs. 540 Lakh/MW
For project with air cooled condense: Rs. 580 lakh /MW
For rice straw based project: Rs. 630 lakh/ MW
vi. Biomass Price: to be decided annually by a committee to be formed
at State level representing State Commission, Nodal Agency,
Government

52
Following were present in the meeting:
i. Mr. Rajiv Bansal, Secretary, CERC
ii. Dr. D.K. Khare, Director, MNRE
iii. Dr. Meshram, Director, MNRE
iv. Dr. V.K. Jain, Director, MNRE
v. Dr. Ramesh Sawant, Director, MNRE
vi. Mr. S.C. Shrivastav, Joint Chief (Engg.), CERC
vii. Mr. P.K. Awasthi, Joint Chief (Finance), CERC
viii. Mr. S.K.Chatterjee, Dy. Chief (Reg. Aff.),CERC
ix. Mr. S.K. Kassi, director (TE &TD) Division, CEA
x. Mr. Amitabh Tandon, Indian Biomass Power Association
xi. Mr. Ranjan Yadav, Indian Biomass Power Association
xii. Mr. R. Kulothungan, Indian Biomass Power Association
xiii. Mr. R.H. Shah Advisor (Renewable), CERC