j2eeprof - a tool for testing multitier applications. - IFIP Digital ...
12
j2eeprof – a tool for testing multitier applications Pawe™ K™aczewski and Jacek Wytrębowicz Institute of Computer Science of Warsaw University of Technology [email protected],[email protected] Abstract. Quality assurance of multitier application is still a challenge. Especially difficult is testing big, distributed applications written by several programmers, with the use of components from different sources. Due to multi threaded and distributed architecture, their ability to be observed and their profiling are extremely difficult. J2eeprof is a new tool developed for testing and profiling multitier applications that run in the J2EE environment. The tool is based on the paradigm of aspect insertion. The main goal of j2eeprof is to help in fixing of integration errors and efficiency errors. This paper presents the concept of j2eeprof and gives some insides of j2eeprof development. On the beginning we give some introduction to the methods of software profiling, and a brief characteristic of existing profilers, i.e., JFluid, Iron Track Sql, OptimizeIt Server Trace and JXInsight. Next we present the architecture of j2eeprof, and we describe how it collects data, what protocols it uses, and what kind of analysis it supports. On the end we demonstrate how j2eeprof works in practice. In conclusions we list the strong and weak points of this tool, which is still in a beta version. J2eeprof is planned to be o↵ered as an open source for the programmer community. 1 Introduction Software testing and software profiling are time consuming tasks, especially during development of multitier, distributed applications. Sometimes these tasks take more time than coding. They are crucial when the target application is safety or business critical. We mean by testing the process of defect discovery in a developed code. We mean by profiling the process of performance analysis of an application. Because Java Platform Enterprise Edition (J2EE) is a widely used programming platform for developing and running distributed multitier architecture applications, we have focused our attention on testing and profiling applications that run in the J2EE environment. The result is j2eeprof [7] - a new tool to help in fixing of integration errors and efficiency errors. Integration testing and profiling need very similar methods and tools. We shortly describe them. To make not frequent or exceptional conditions testable we have to extend the tested application to make controllable its execution flow. During an execution flow a programmer collects selected data for subsequent analysis. Selection of the data depends on programmer aim, it could be: remote function checking, bottleneck discovery, time consumption of selected functions and memory consumption. In general, there are two methods of data gathering: sampling and tracing∞. The advantage of sampling is that this method slightly influences the tested application in contradiction to the tracing
-
Upload
khangminh22 -
Category
Documents
-
view
0 -
download
0
Transcript of j2eeprof - a tool for testing multitier applications. - IFIP Digital ...
j2eeprof – a tool for testing multitier applications
Pawe™ K™aczewski and Jacek Wytr�bowicz
Institute of Computer Science of Warsaw University of [email protected], [email protected]
Abstract. Quality assurance of multitier application is still a challenge. Especiallydi�cult is testing big, distributed applications written by several programmers,with the use of components from di�erent sources. Due to multi threadedand distributed architecture, their ability to be observed and their profiling areextremely di�cult. J2eeprof is a new tool developed for testing and profilingmultitier applications that run in the J2EE environment. The tool is based on theparadigm of aspect insertion. The main goal of j2eeprof is to help in fixingof integration errors and e�ciency errors. This paper presents the concept ofj2eeprof and gives some insides of j2eeprof development. On the beginningwe give some introduction to the methods of software profiling, and a briefcharacteristic of existing profilers, i.e., JFluid, Iron Track Sql, OptimizeIt ServerTrace and JXInsight. Next we present the architecture of j2eeprof, and we describehow it collects data, what protocols it uses, and what kind of analysis it supports.On the end we demonstrate how j2eeprof works in practice. In conclusions we listthe strong and weak points of this tool, which is still in a beta version. J2eeprofis planned to be o↵ered as an open source for the programmer community.
1 Introduction
Software testing and software profiling are time consuming tasks, especially duringdevelopment of multitier, distributed applications. Sometimes these tasks take moretime than coding. They are crucial when the target application is safety or businesscritical. We mean by testing the process of defect discovery in a developed code. Wemean by profiling the process of performance analysis of an application.
Because Java Platform Enterprise Edition (J2EE) is a widely used programmingplatform for developing and running distributed multitier architecture applications, wehave focused our attention on testing and profiling applications that run in the J2EEenvironment. The result is j2eeprof [7] - a new tool to help in fixing of integrationerrors and e�ciency errors. Integration testing and profiling need very similar methodsand tools. We shortly describe them.
To make not frequent or exceptional conditions testable we have to extend thetested application to make controllable its execution flow. During an execution flow aprogrammer collects selected data for subsequent analysis. Selection of the data dependson programmer aim, it could be: remote function checking, bottleneck discovery, timeconsumption of selected functions and memory consumption. In general, there are twomethods of data gathering: sampling and tracing�. The advantage of sampling is thatthis method slightly influences the tested application in contradiction to the tracing
196 Pawe™ K™aczewski, Jacek Wytr¶bowicz
method. The advantage of tracing is the possibility to achieve very high accuracy butwhen accuracy is higher – the execution time is more and more disturbed.
Extensions that make the execution flow controllable are included in the applicationcode by a programmer. Sampling can be performed without any modification of theapplication code. Tracing can be achieved by altering the code or by modification of itsenvironment, or both. The Java Platform Debugger Architecture (JPDA), which is acollection of APIs to debug Java code, is a good example of a tool for environmentmodification. A disadvantage of JPDA is the limited set of low-level events that theprogrammer can observe. The abstraction level of virtual Java machine is not suitablefor J2EE application analysis. The programmer gets too much low level data, which aredi�cult to analyze. Altering of the application code can be done by hand, can beprocessed by a compiler (e.g., as for gprof Unix tool), or after compilation. There areJava libraries, e.g., BCEL1, ASM [3], which allow altering a Java bytecode duringloading. The programmer has to point where and how the automatic code alteringshould be performed.
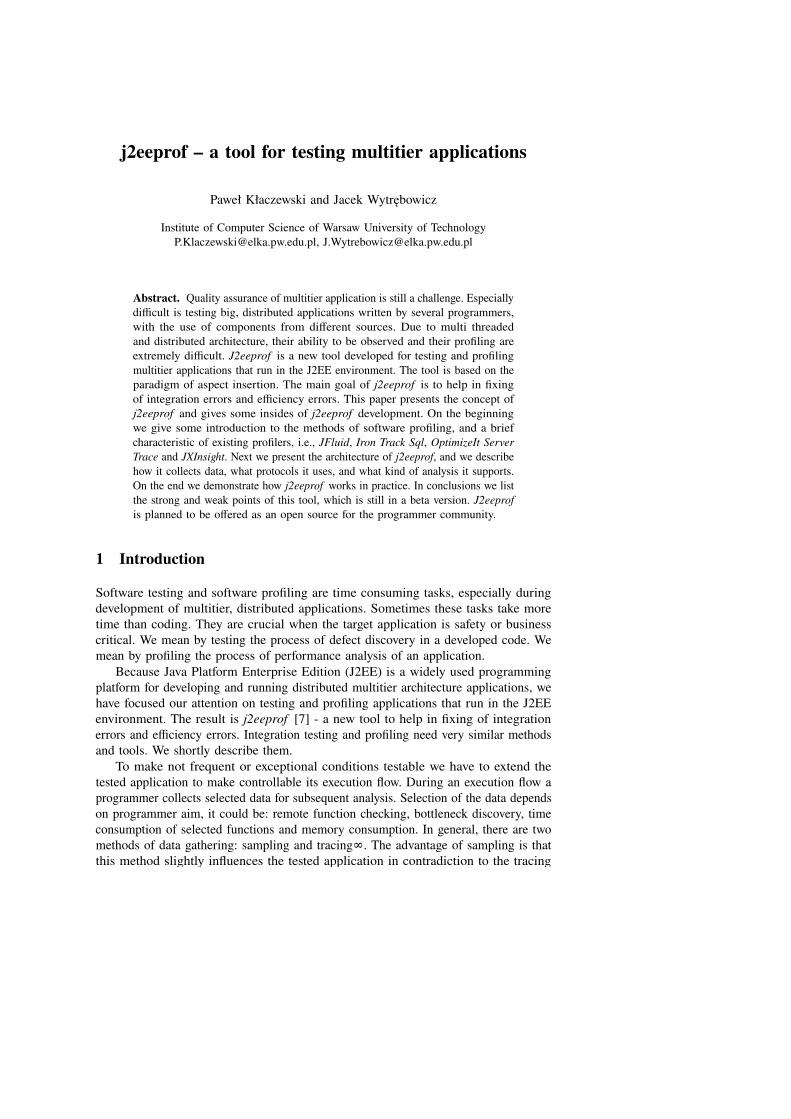
The amount of data collected during an application run is usually huge. Sometimesome compression or aggregation methods have to be used for their collection. Aprogrammer needs to have some tools for filtering the collected data and for theirvisualization in an interactive manner. G. Ammons, T. Ball and J. R. Larus [1] haveproposed to build a structure called Calling Context Tree (CCT) – as an aggregationmethod. Every tree node keeps some measurements of an executed function. Any pathin the tree represents a possible execution sequence of modules (the module can be amethod, a component, a layer, or a node belonging to a distributed system). Figure 1depicts an exemplary execution path of a function X that executes 6 modules (ABnotation means that A module calls B module). A tree representation is more expressive.
Fig. 1. Execution path visualization a) sequential, b) context tree
It helps to find bottlenecks related to di�erent load of data or user connections. Thereare more ways of execution path visualization as Fig 2 shows. Nowadays profilersgenerate a layered representation of full tree of execution calls (Fig 2b). The width ofevery rectangle may depict execution time of relating module. Complex applicationsgive very big trees. To make them more readable reduced graphs can be generated (Fig.2c, 2d). Most profilers allow for simple filtering of presented data with predefinedset of views. However there are exceptions: a programmer using ejp2 can implementown filters. XDSE profiler [2] stores full execution trace in an XML database. Next aprogrammer can define filtering by XQuery language and select a visualization form.
1 http://jakarta.apache.org/bcel2 http://ejp.sourceforge.net

j2eeprof – a tool for testing multitier applications 197
Fig. 2. Execution path visualization a) layered representation, b) full tree of execution calls, c)reduced call graph, d) context call tree. e) trace graph
Profiling of a distributed system is di�cult. Every distinct element has to beobserved independently. Next, a profiler has to correlate collected data before filteringand presentation. A correlation method based on independent clocks is not accurate andleads to interpretation errors. Much e�cient is to include tracing into a communicationmechanism used by separate instances. Authors of [8] describe a tool that traces TCPmessages. For better e�ciency, a profiler could use some marking of messages thatconcern the analyzed application/purpose. Pinpoint project [6] is based on modificationof Jboss3 application server – in this way a distributed application, which works onJboss servers, can be easily and e�ciently traced. When a programmer uses CORBA,then we can take advantage of built in interceptor mechanism for message marking. Theinterceptor is a function written by the programmer and called during communication.
There are several commercial profilers addressed to J2EE environment, but we donot know any such a tool from public domain. Profilers created for Java programmers,not only for those who use J2EE, are more numerous. Let take a look on some of them– the most interesting in our opinion. JFluid profiler [5], from Sun Microsystems,works only with the NetBeans programmer framework. It provides some means foranalysis of: memory consumption, execution time and execution flow. Programmer canpoint some Java methods for analysis. JFluid process the code statically to discoverall methods, which could be executed by those selected. Next it alters them to makethem traceable. It visualizes only the traces that belong to the execution context ofselected methods. The altered code has constant time overhead, that allows subtractingit from measured values, and present more accurate data. Because JFluid co-workswith extended (tuned for it) virtual java machine it is a fast and e�cient tool.
Iron Track Sql4 is a free tool for performance monitoring of java applications thatinteract with databases. It builds a log of every database query, its time and duration. Itallows for some filtering, e.g., to register only these queries whose duration overcomes
3 http://www.jboss.org4 http://www.irongrid.com/catalog/product_info.php?products_id=32
198 Pawe™ K™aczewski, Jacek Wytr¶bowicz
a defined threshold. It is based on a database proxy, which makes all required logs. Theprogrammer has to use the p6spy driver (an element of Iron Track Sql) in place ofstandard jdbc driver.
OptimizeIt Server Trace is a Borland profiler addressed to J2EE. It can gatherdata using probing or tracing. It can monitor memory consumption. With this toolthe programmer can visualize execution paths as a context tree or as a full tree ofexecution calls. OptimizeIt presents j2ee services trace using sets of abstract words. Inexample word ”ejb load” stands for ejb load life cycle method. Tool hides applicationserver internal implementation of ejb load and presents it to user in simplified form.Profiling statistics are then more readable and free of unnecessary information. Thisfeature makes OptimizeIt much more e�ective tool for J2EE application tracing thanstandard profiler. OptimizeIt can point hot spots, can display execution time of everylayer, e.g.: JDBC 23,68%, JNDI 15.31%, servlets and jsp 57.84%, EJB 3,17%. It caneven register and visualize RMI communication.
JInspired company o�ers the JXInsight profiler. This tool is very similar to OptimizeItServer Trace. The di�erence is that JXInsight has more functions for monitoring ofdatabase queries. It can display correlations between distributed events using CORBAinterceptors. Both OptimizeIt and JXInsight are very complex and powerful tools,which allow multitier visualization of execution paths.
There are many other profilers but most of them suit only development of standardJava programs running on a single machine. They are ine�cient for development ofJ2EE applications, which are distributed and use a server code. Usually the programmerdoes not know the server code (it is a black box for him). And the server code isa significant part of the application. The only corrections and optimizations, theprogrammer can make, are inside his code. Hence only tools like OptimizeIt andJXInsight can really help to profile J2EE applications.
2 j2eeprof insides
J2eeprof is profiler designed for applications running in J2EE environment. J2EEprovides variety of services. Programs work in a container i.e., servlet container orejb container. Container provides services, can manage component life cycle andenhance program behavior. The way program uses services can be specified in code orconfiguration descriptor. When configuration is used it is impossible to inspect programbehavior only by reading its code. This makes testing more di�cult to the programmer.Another problem arises, when J2EE application is profiled using standard java profiler.There is huge amount of container implementation code execution registered togetherwith program code. The performance impact is large and results contain plenty ofsuperfluous information.
In order to capture accurate view of execution flow, j2eeprof uses tracing. J2eeprofcomes with ability of selective program tracing. It registers J2EE services and programexecution at high level of detail. By inspecting trace programmer can find out all theinteractions of J2EE services with program. The tool has significant ability to shapeprofiling scope. J2eeprof addresses also distributed nature of ejb components. It is able

j2eeprof – a tool for testing multitier applications 199
to track communication between remote ejb components and deliver distributed systemtrace.
J2eeprof is designed for profiling applications that run in a distributed environment.Thus tool itself is distributed as well. There are three major modules of j2eeprof : datacollection module, transport module and visualization module. The data collection isinstalled on distributed system nodes and acts as client in the client-server j2eeprofarchitecture. Visualization module is responsible for trace analysis and visualizations.The data is transported from remote data collections modules to visualization moduleby transport module.
2.1 Data collection
Data collection module uses tracing method to collect profile data. Its implementationis based on the aspect oriented programming (AOP). Aspect is a program module thatimplements some common functionality and has no dependencies on other programmodules. AOP consists of two elements: aspect weaver and composition language.Aspect weaver is responsible for composition of aspects and other modules into finalapplication. Composition language controls the weaver. J2eeprof uses Aspectwerkz5,open source AOP library, as a basis for data collection module. Aspectwerkz weaver iscapable of dynamic aspect insertion. This feature enables profiler to temporarily modifytested code and change profiling scope on every program execution. Aspectwerkz usesAspectJ6 composition language. The point of program code, where aspect can beinserted, is called join point. It can be i.e., a method or a construction invocation.Pointcut is AspectJ definition that pick out a set of join points. AspectJ gives j2eeprofcapability to define profiling scope with detail. Important feature in J2EE environmentis that a join point can define interface and polymorphic execution. J2EE is specified bya set of interfaces. J2eeprof can profile application server standard services by tracingthem at the interface level. This method provides the right level of abstraction. Tracingimplementation details of application server not only has negative performance impact,but also has no value for the application developer, as he cannot modify server code. Stillthe application code can be traced with much greater detail – up to every method call.
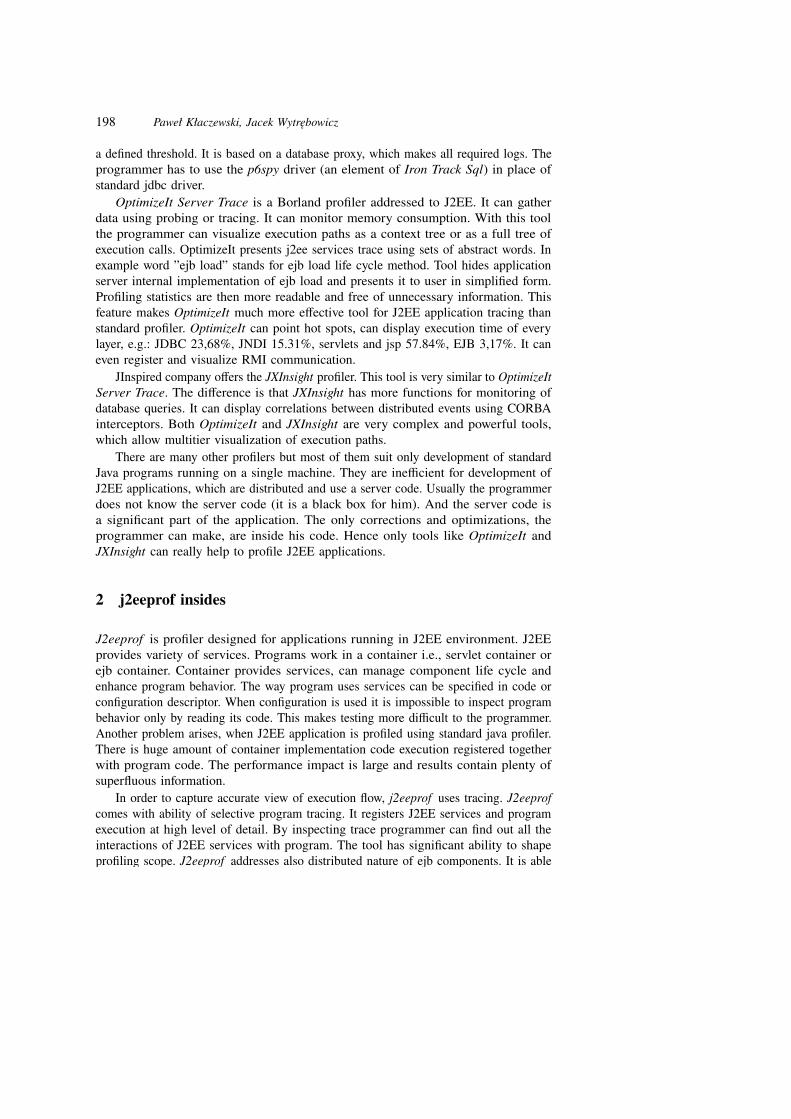
Data collection module implements a set of aspects. Data collection aspect isresponsible for registering information on program execution. AOP compositionlanguage allows mixing of aspects in order to register traces on di↵erent detail level.Data trace representation (see Fig. 3) in j2eeprof consists of 4 elements. PathNodeis a node of trace path. PathNode can contain other PathNode in the way it makecall tree. PathNode is a base class for a concrete node, which may represent methodexecution or distributed call. Nodes belong to an execution thread, which is representedby ThreadNode. SystemNode is a node of distributed system. System abstracts wholeobserved system. The representation can describe nodes on di�erent level of abstraction.
There are 2 generic aspects that trace method executions: MainAspect that registersonly method signatures and ParametersAspect that registers also parameter values. Anaspect collects information about several attributes: start and end time, information on
5 http://aspectwerkz.codehaus.org6 http://www.eclipse.org/aspectj
200 Pawe™ K™aczewski, Jacek Wytr¶bowicz
Fig. 3. Trace model
exception, path node name (e.g. method signature) and execution thread. There is alsoone additional attribute – category that is specified in aspect definition, and it is usedlater for data analysis.
2.2 Data transport
Gathered data are transmitted by transport module. The module consists of three parts:data sender, transport protocol and data receiver. Data transport module can write datato file or send over TCP/IP. The most important element is the protocol. J2eeprof usesbinary protocol that is built in a way to keep network tra�c low. We have executed severaltests to measure j2eeprof overhead. The results (Table 1) have shown that the most timeconsuming is I/O. The more data is sent the more impact on performance is made (seetest 3 and 4 in Table 1). During execution of test 3 all gathered data been discarded,during execution of test 4 the same data have been written into a file. I/O slow downfactor was about 6. Addition of a simple compression method resulted in better overallperformance. J2eeprof uses dictionary compression for most frequently sent data – eventlabels. MainAspect sends approximately 30 bytes per start method event and 22 bytesper exit method event. Executions with tracing turned o� (test 1) and with AspectWerkz(test 2) empty aspect have shown a di�erence of performance overhead. Encodingoverhead (test 3) is 3,232.98 ns but 509.68 ns (test 2) is the e�ect of using AspectWerkzand cannot be avoided. Write to the file (test 4) slows down by 17,421.38 ns. J2eeprofperforms almost twice better as Log4J7 (test 7). The maximum time was taken fromj2eeprof statistics. It indicates that writing into a file gives more stable e�ects comparedto sending over TCP/IP, however the second choice is much more convenient for a user.
Tab. 1. Measured performance overhead
no test mean time[ns/per call] max time[ms/per call]1 no aspects 31.632 NullAspect 509.683 MainAspect (no I/O) 3,232.984 MainAspect (file) 20,654.36 585 MainAspect (tcp local) 33,639.00 3086 MainAspect (tcp) 36,767.00 9497 Log4J (file) 41,199.31
2.3 Distributed tracing
J2eeprof can profile distributed J2EE systems. Execution path on each distinct node ofanalyzed system is recorded. But it is also required to match right local paths and
7 http://logging.apache.org/log4j
j2eeprof – a tool for testing multitier applications 201
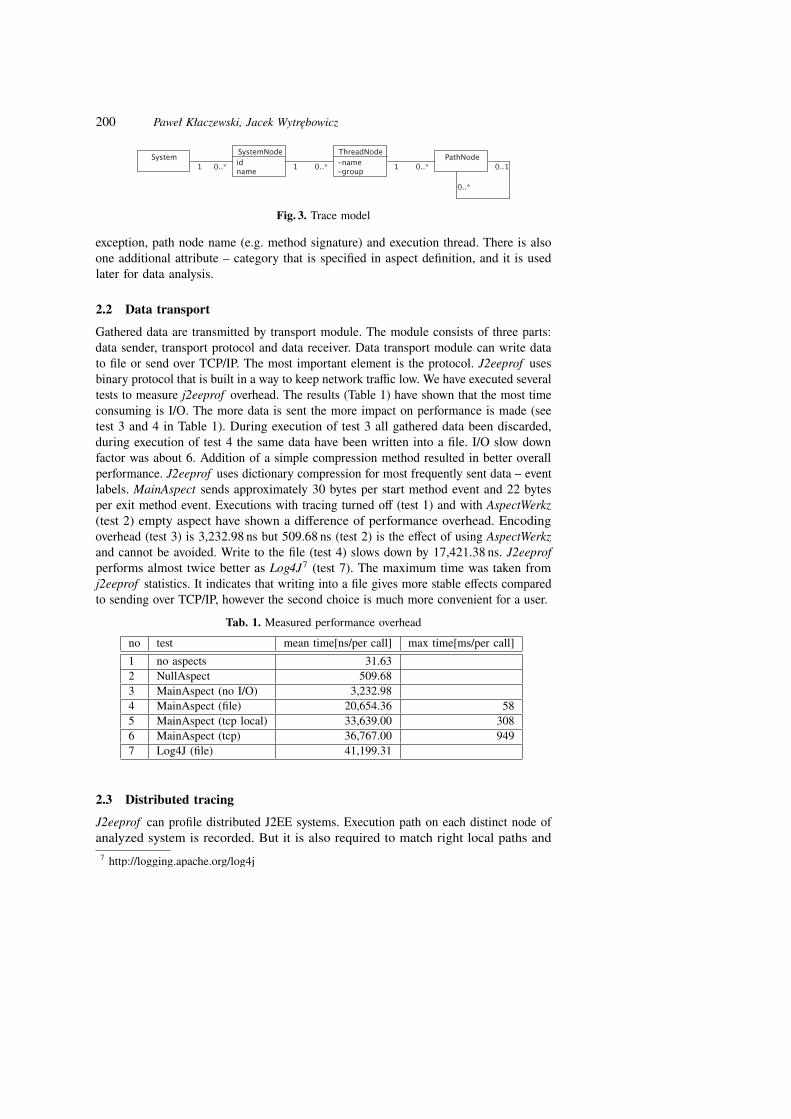
reconstruct distributed path. Tagging messages exchanged between nodes can do this.This method has top accuracy over others, and is not a�ected by time di�erences of thenodes. EJB protocol – RMI/IIOP supports sending additional information in protocoltier, without changing interface on an application tier (Fig. 4). Corba Interceptordocumentation [4] describes this feature. J2eeprof tracing mechanism can be enabledin the configuration file of application server, with no need to modify program orserver code. The method is protocol dependent; j2eeprof comes with implementationfor standard EJB protocol RMI/IIOP and Jboss RMI. But this solution is well suitedfor J2EE environment. J2EE specification requires application servers to providetransaction support and user authentication over remote calls. These services are definedin application configuration descriptors. Thus communication protocols must be able dosupport rpc-level communicates tagging. J2eeprof inject into EJB communication apartof transaction id and user information his own data.
Fig. 4. Protocol tracing
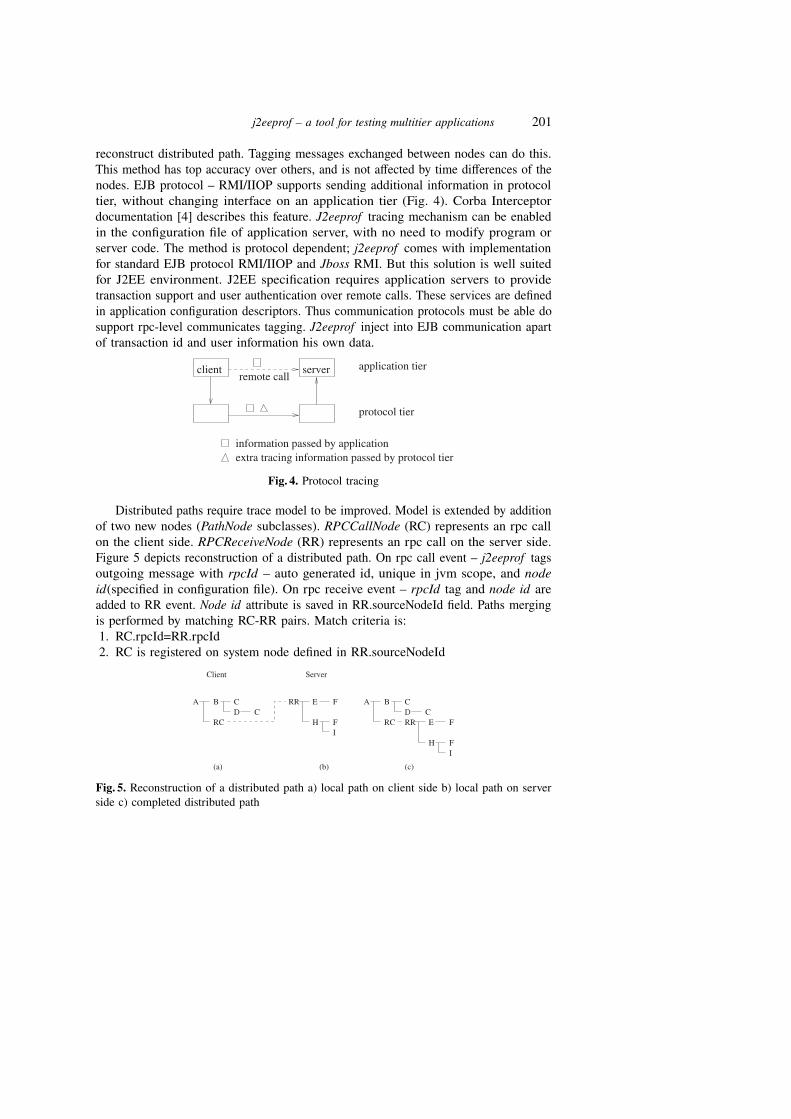
Distributed paths require trace model to be improved. Model is extended by additionof two new nodes (PathNode subclasses). RPCCallNode (RC) represents an rpc callon the client side. RPCReceiveNode (RR) represents an rpc call on the server side.Figure 5 depicts reconstruction of a distributed path. On rpc call event – j2eeprof tagsoutgoing message with rpcId – auto generated id, unique in jvm scope, and nodeid(specified in configuration file). On rpc receive event – rpcId tag and node id areadded to RR event. Node id attribute is saved in RR.sourceNodeId field. Paths mergingis performed by matching RC-RR pairs. Match criteria is:1. RC.rpcId=RR.rpcId2. RC is registered on system node defined in RR.sourceNodeId
Fig. 5. Reconstruction of a distributed path a) local path on client side b) local path on serverside c) completed distributed path
202 Pawe™ K™aczewski, Jacek Wytr¶bowicz
2.4 Visualisations
J2eeprof supports several visualizations. Profiler provides data analysis on summarizedtrace data as well as on raw trace. Many of these visualizations are found in othertools, but distributed trace view is an original extension of them.
J2eeprof can summarize trace in form of CCT and flat list. Both views display totalnumber of invocations, total, mean, minimum and the maximum execution time. CTTview provides ”drill up” and ”drill down” functions. ”Drill up” displays all contexts inwhich selected node was called. ”Drill down” selects all possible executions rooted in aselected node.
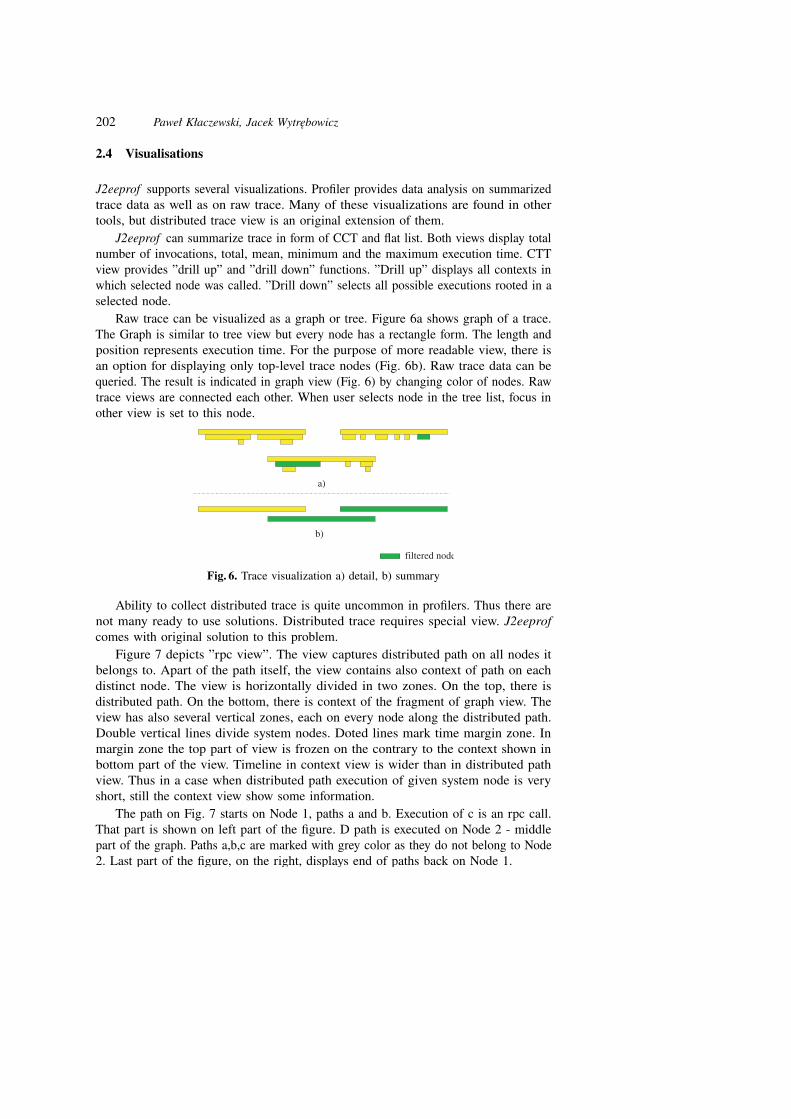
Raw trace can be visualized as a graph or tree. Figure 6a shows graph of a trace.The Graph is similar to tree view but every node has a rectangle form. The length andposition represents execution time. For the purpose of more readable view, there isan option for displaying only top-level trace nodes (Fig. 6b). Raw trace data can bequeried. The result is indicated in graph view (Fig. 6) by changing color of nodes. Rawtrace views are connected each other. When user selects node in the tree list, focus inother view is set to this node.
Fig. 6. Trace visualization a) detail, b) summary
Ability to collect distributed trace is quite uncommon in profilers. Thus there arenot many ready to use solutions. Distributed trace requires special view. J2eeprofcomes with original solution to this problem.
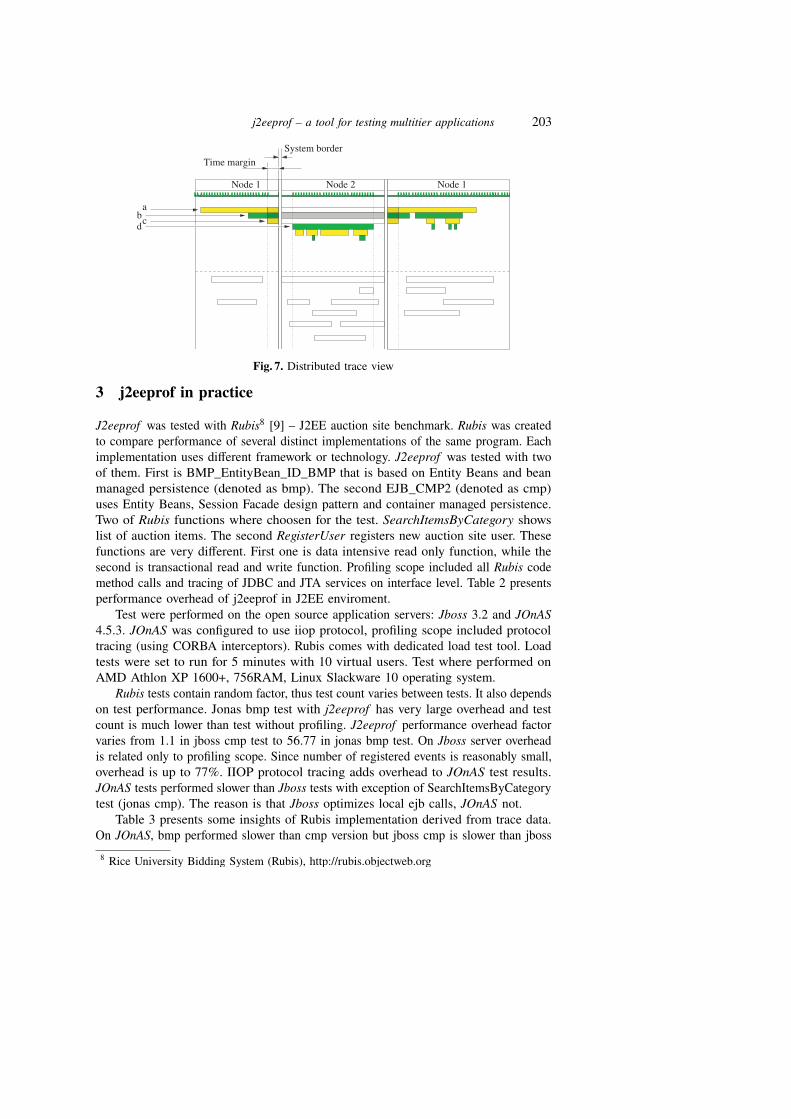
Figure 7 depicts ”rpc view”. The view captures distributed path on all nodes itbelongs to. Apart of the path itself, the view contains also context of path on eachdistinct node. The view is horizontally divided in two zones. On the top, there isdistributed path. On the bottom, there is context of the fragment of graph view. Theview has also several vertical zones, each on every node along the distributed path.Double vertical lines divide system nodes. Doted lines mark time margin zone. Inmargin zone the top part of view is frozen on the contrary to the context shown inbottom part of the view. Timeline in context view is wider than in distributed pathview. Thus in a case when distributed path execution of given system node is veryshort, still the context view show some information.
The path on Fig. 7 starts on Node 1, paths a and b. Execution of c is an rpc call.That part is shown on left part of the figure. D path is executed on Node 2 - middlepart of the graph. Paths a,b,c are marked with grey color as they do not belong to Node2. Last part of the figure, on the right, displays end of paths back on Node 1.
j2eeprof – a tool for testing multitier applications 203
Fig. 7. Distributed trace view
3 j2eeprof in practice
J2eeprof was tested with Rubis8 [9] – J2EE auction site benchmark. Rubis was createdto compare performance of several distinct implementations of the same program. Eachimplementation uses di�erent framework or technology. J2eeprof was tested with twoof them. First is BMP_EntityBean_ID_BMP that is based on Entity Beans and beanmanaged persistence (denoted as bmp). The second EJB_CMP2 (denoted as cmp)uses Entity Beans, Session Facade design pattern and container managed persistence.Two of Rubis functions where choosen for the test. SearchItemsByCategory showslist of auction items. The second RegisterUser registers new auction site user. Thesefunctions are very di�erent. First one is data intensive read only function, while thesecond is transactional read and write function. Profiling scope included all Rubis codemethod calls and tracing of JDBC and JTA services on interface level. Table 2 presentsperformance overhead of j2eeprof in J2EE enviroment.
Test were performed on the open source application servers: Jboss 3.2 and JOnAS4.5.3. JOnAS was configured to use iiop protocol, profiling scope included protocoltracing (using CORBA interceptors). Rubis comes with dedicated load test tool. Loadtests were set to run for 5 minutes with 10 virtual users. Test where performed onAMD Athlon XP 1600+, 756RAM, Linux Slackware 10 operating system.
Rubis tests contain random factor, thus test count varies between tests. It also dependson test performance. Jonas bmp test with j2eeprof has very large overhead and testcount is much lower than test without profiling. J2eeprof performance overhead factorvaries from 1.1 in jboss cmp test to 56.77 in jonas bmp test. On Jboss server overheadis related only to profiling scope. Since number of registered events is reasonably small,overhead is up to 77%. IIOP protocol tracing adds overhead to JOnAS test results.JOnAS tests performed slower than Jboss tests with exception of SearchItemsByCategorytest (jonas cmp). The reason is that Jboss optimizes local ejb calls, JOnAS not.
Table 3 presents some insights of Rubis implementation derived from trace data.On JOnAS, bmp performed slower than cmp version but jboss cmp is slower than jboss
8 Rice University Bidding System (Rubis), http://rubis.objectweb.org

204 Pawe™ K™aczewski, Jacek Wytr¶bowicz
Tab.
2.
Mea
sure
dR
ubis
perf
orm
ance
over
head
Sear
chIte
msB
yCat
egor
yR
egis
terU
ser
test
coun
ttim
e[m
s]av
gov
erhe
adte
stco
unt
time[
ms]
avg
over
head
avg
min
max
avg
min
max
nopr
ofilin
g(R
ubis
perf
orm
ance
stat
istic
s)jb
oss
cmp
8923
314
651
917
6729
279
jbos
sbm
p10
919
672
769
850
1714
4jo
nas
cmp
8619
811
540
610
585
121
2333
jona
sbm
p78
1,03
719
63,
484
534
217
454
6j2
eepr
of(R
ubis
perf
orm
ance
stat
istic
s)jb
oss
cmp
8939
523
51,
329
1.77
774
5219
81.
10jb
oss
bmp
5222
610
052
01.
155
7636
201
1.52
jona
scm
p74
599
211
5,55
43.
0315
5,14
819
719
,813
8.80
jona
sbm
p12
33,0
5116
,426
67,7
0631
.87
119
,415
19,4
1519
,415
56.7
7j2
eepr
of(j2
eepr
ofpe
rfor
man
cest
atis
tics)
jbos
scm
p87
290
175
684
670
4513
4jb
oss
bmp
5014
624
399
542
3055
jona
scm
p72
718
165
4,71
015
5,10
419
319
,252
jona
sbm
p9
42,1
9715
,220
66,2
041
15,8
6415
,864
15,8
64j2
eepr
of(n
oC
OR
BAtra
cing
,Rub
ispe
rfor
man
cest
atis
tics)
jona
scm
p75
557
177
3,16
71.
145
3,52
117
616
,795
jona
sbm
p46
2052
283
5,79
99.
086
2,29
531
46,
847
j2eeprof – a tool for testing multitier applications 205
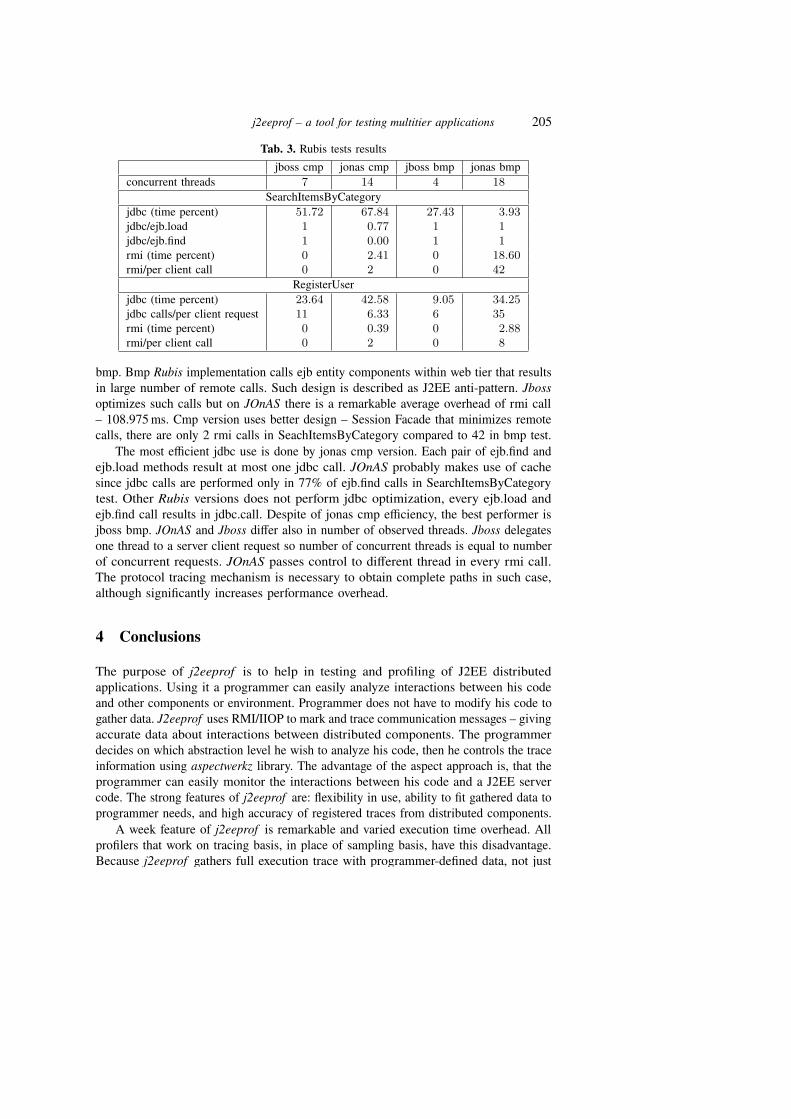
Tab. 3. Rubis tests resultsjboss cmp jonas cmp jboss bmp jonas bmp
concurrent threads 7 14 4 18SearchItemsByCategory
jdbc (time percent) 51.72 67.84 27.43 3.93jdbc/ejb.load 1 0.77 1 1jdbc/ejb.find 1 0.00 1 1rmi (time percent) 0 2.41 0 18.60rmi/per client call 0 2 0 42
RegisterUserjdbc (time percent) 23.64 42.58 9.05 34.25jdbc calls/per client request 11 6.33 6 35rmi (time percent) 0 0.39 0 2.88rmi/per client call 0 2 0 8
bmp. Bmp Rubis implementation calls ejb entity components within web tier that resultsin large number of remote calls. Such design is described as J2EE anti-pattern. Jbossoptimizes such calls but on JOnAS there is a remarkable average overhead of rmi call– 108.975 ms. Cmp version uses better design – Session Facade that minimizes remotecalls, there are only 2 rmi calls in SeachItemsByCategory compared to 42 in bmp test.
The most e�cient jdbc use is done by jonas cmp version. Each pair of ejb.find andejb.load methods result at most one jdbc call. JOnAS probably makes use of cachesince jdbc calls are performed only in 77% of ejb.find calls in SearchItemsByCategorytest. Other Rubis versions does not perform jdbc optimization, every ejb.load andejb.find call results in jdbc.call. Despite of jonas cmp e�ciency, the best performer isjboss bmp. JOnAS and Jboss di�er also in number of observed threads. Jboss delegatesone thread to a server client request so number of concurrent threads is equal to numberof concurrent requests. JOnAS passes control to di�erent thread in every rmi call.The protocol tracing mechanism is necessary to obtain complete paths in such case,although significantly increases performance overhead.
4 Conclusions
The purpose of j2eeprof is to help in testing and profiling of J2EE distributedapplications. Using it a programmer can easily analyze interactions between his codeand other components or environment. Programmer does not have to modify his code togather data. J2eeprof uses RMI/IIOP to mark and trace communication messages – givingaccurate data about interactions between distributed components. The programmerdecides on which abstraction level he wish to analyze his code, then he controls the traceinformation using aspectwerkz library. The advantage of the aspect approach is, that theprogrammer can easily monitor the interactions between his code and a J2EE servercode. The strong features of j2eeprof are: flexibility in use, ability to fit gathered data toprogrammer needs, and high accuracy of registered traces from distributed components.
A week feature of j2eeprof is remarkable and varied execution time overhead. Allprofilers that work on tracing basis, in place of sampling basis, have this disadvantage.Because j2eeprof gathers full execution trace with programmer-defined data, not just

206 Pawe™ K™aczewski, Jacek Wytr¶bowicz
execution statistic, the overhead is higher than other profilers put in. To obtain accuratetime characteristics, the programmer has to take other profiler that works on samplingbasis. J2eeprof is small and simple tool comparing with commercial OptimizeIt andJXInsight profilers. Although it is free, easy to use and we find it very useful.
References
1. G. Ammons, T. Ball and J. R. Larus: Exploiting hardware counters with flow and contextsensitive profiling. In Proceedings of the SIGPLAN ’97 Conference on Programming LanguageDesign and Implementation,pages 85-96, Las Vegas, 1997.
2. C. Anslow, S. Marshall, R. Biddle, J. Noble and K. Jackson: Xml database support for programtrace visualization. In Australian Symposium on Information Visualization, volume 35, 2004.
3. E. Bruneton, R. Lenglet and T. Coupaye: Asm: a code manipulation tool to implementadaptable systems. In Adaptable end extensible component systems, Grenoble, France, 2002.
4. Interceptors Published Draft with CORBA 2.4+ Core Chapters, Document Numberptc/2001-03-04. http://www.omg.org/cgi-bin/doc?ptc/2001-03-04
5. M. Dmitriev: Design of jfluid: A profiling technology and tool based on dynamic bytecodeinstrumentation. Technical report, Sun Microsystems, Nov. 2003.
6. E. Kiciman: Pinpoint: Status and future directions. 2003 www.stanford.edu/˜emrek/pubs/roc-retreat-2003-pinpoint.pdf
7. Pawe� K�aczewski: Testability Issues of Multitier Applications (in polish). Master thesis,Institute of Computer Science of Warsaw University of Technology, 2005.
8. Marcos K. Aguilerai, Je�rey C. Mogul, Janet L. Wiener, Patrick Reynolds and AthichaMuthitacharoen: Performance debugging for distributed systems of black boxes. In Proceedingsof SOSP, Bolton Landing, NY, Oct. 2003.
9. E. Cecchet and A. Chanda and S. Elnikety and J. Marguerite and W. Zwaenepoel: PerformanceComparison of Middleware Architectures for Generating Dynamic Web Content, 4thACM/IFIP/USENIX International Middleware Conference, Rio de Janeiro, Brazil, June, 2003.


![Testing Testing [Read-Only] - Czone - East Sussex](https://static.fdokumen.com/doc/165x107/6327b2a26d480576770d6757/testing-testing-read-only-czone-east-sussex.jpg)