ITS Environmental Sensors: The Houston Experience
188
I. Report No. 2. Government Aecession No. FHW A/TX-02/3986-1 4. Title and Subtitle ITS ENVIRONMENTAL SENSORS: THE HOUSTON EXPERIENCE 7. Author(s) Robert J. Benz, P.E., David W. Fenno, P.E., and Merrell E. Goolsby, P.E. 9. Performing Organization Name and Address Texas Transportation Institute The Texas A&M University System College Station, Texas 77843-3135 12. Sponsoring Agency Name and Address Texas Department of Transportation Research and Technology Implementation Office P. 0. Box 5080 Austin, Texas 78763-5080 15. Supplementary Notes Technical Re ort Documentation Pa e 3. Recipient's Catalog No. 5. Report Date September 200 I Resubmitted: March 2002 6. Performing Organization Code 8. Perfonning Organization Report No. Report 3986-1 10. Work Unit No. (TRAJS) 11. Contract or Grant No. Project No. 7-3986 13. Type of Report and Period Covered Research: August 1998 September 200 I 14. Sponsoring Agency Code Research performed in cooperation with Texas Department of Transportation and the U.S. Department of Transportation, Federal Highway Administration. ! Research Project Title: Evaluation of ITS Environmental Sensors 16. Abstract While ice and snow may affect traffic only every few years in the Houston area, high water and winds from severe storms are more common. Twenty-nine environmental monitoring stations placed at strategic locations on freeways, frontage roads, HOV lanes, and arterial streets will provide advanced warning to government agencies and the traveling public when adverse weather conditions, especially high water, affect travel conditions. The sensor network is based on a similar system operated by Harris County Office of Emergency Management (OEM) that monitors stream and bayou water levels. When the system fully matures, it will be integrated into the traffic management center's control room floor. The system is based on proven technology, and it works well. This project documents the system's capabilities, types of flooding, flood events, and equipment reliability. In addition, an evaluation of the motorist's understanding of the flood warning signs and of the delay impacts of a flood closure was conducted. Some of the most important aspects of the system are the way the storm events are handled, which is guided by the operations plan. Both scheduled and unscheduled maintenance is a key in operating a real-time environmental monitoring system. And the evolution of the system provides opportunities to change and advance the flow of information to public agencies and the traveling public so they can make informed decisions related to all aspects of transportation and mobility. 17. Keywords 18. Distribution Statement Environmental Sensor, Remote Weather Information Systems (RWIS), Flood Sensors No restrictions. This document is available to the public through NTIS: 19. Security Classif.(ofthis report) Unclassified Form DOT F 1700.7 <S-72) National Technical Information Service 5285 Port Royal Road Springfield, Virginia 22161 I 20. Security Classif.( of this page) Unclassified Reproduction of completed page authorized I 22. Price
-
Upload
khangminh22 -
Category
Documents
-
view
0 -
download
0
Transcript of ITS Environmental Sensors: The Houston Experience

I. Report No. 2. Government Aecession No.
FHW A/TX-02/3986-1 4. Title and Subtitle
ITS ENVIRONMENTAL SENSORS: THE HOUSTON EXPERIENCE
7. Author(s)
Robert J. Benz, P.E., David W. Fenno, P.E., and Merrell E. Goolsby, P.E. 9. Performing Organization Name and Address
Texas Transportation Institute The Texas A&M University System College Station, Texas 77843-3135 12. Sponsoring Agency Name and Address
Texas Department of Transportation Research and Technology Implementation Office P. 0. Box 5080 Austin, Texas 78763-5080
15. Supplementary Notes
Technical Re ort Documentation Pa e
3. Recipient's Catalog No.
5. Report Date
September 200 I Resubmitted: March 2002 6. Performing Organization Code
8. Perfonning Organization Report No.
Report 3986-1
10. Work Unit No. (TRAJS)
11. Contract or Grant No.
Project No. 7-3986
13. Type of Report and Period Covered
Research: August 1998 September 200 I 14. Sponsoring Agency Code
Research performed in cooperation with Texas Department of Transportation and the U.S. Department of Transportation, Federal Highway Administration.
! Research Project Title: Evaluation of ITS Environmental Sensors 16. Abstract
While ice and snow may affect traffic only every few years in the Houston area, high water and winds from severe storms are more common. Twenty-nine environmental monitoring stations placed at strategic locations on freeways, frontage roads, HOV lanes, and arterial streets will provide advanced warning to government agencies and the traveling public when adverse weather conditions, especially high water, affect travel conditions. The sensor network is based on a similar system operated by Harris County Office of Emergency Management (OEM) that monitors stream and bayou water levels. When the system fully matures, it will be integrated into the traffic management center's control room floor. The system is based on proven technology, and it works well.
This project documents the system's capabilities, types of flooding, flood events, and equipment reliability. In addition, an evaluation of the motorist's understanding of the flood warning signs and of the delay impacts of a flood closure was conducted.
Some of the most important aspects of the system are the way the storm events are handled, which is guided by the operations plan. Both scheduled and unscheduled maintenance is a key in operating a real-time environmental monitoring system. And the evolution of the system provides opportunities to change and advance the flow of information to public agencies and the traveling public so they can make informed decisions related to all aspects of transportation and mobility. 17. Keywords 18. Distribution Statement
Environmental Sensor, Remote Weather Information Systems (RWIS), Flood Sensors
No restrictions. This document is available to the public through NTIS:
19. Security Classif.(ofthis report)
Unclassified
Form DOT F 1700.7 <S-72)
National Technical Information Service 5285 Port Royal Road Springfield, Virginia 22161
I 20. Security Classif.( of this page)
Unclassified
Reproduction of completed page authorized
I 22. Price


ITS ENVIRONMENTAL SENSORS: THE HOUSTON EXPERIENCE
by
Robert J. Benz, P.E. Assistant Research Engineer
Texas Transportation Institute
David W. Fenno, P.E. Assistant Research Engineer
Texas Transportation Institute
and
Merrell E. Goolsby, P.E. Research Engineer
Texas Transportation Institute
Report 3986-1 Project Number 7-3986
Research Project Title: Evaluation of ITS Environmental Sensors
Sponsored by the Texas Department of Transportation
In Cooperation with the U.S. Department of Transportation
Federal Highway Administration
September 2001 Resubmitted: March 2002
TEXAS TRANSPORTATION INSTITUTE The Texas A&M University System College Station, Texas 77843-3135


DISCLAIMER
The contents of this report reflect the views of the authors, who are responsible for the facts and accuracy of the data presented herein. The contents do not necessarily reflect the official view or policies of the Texas Department of Transportation (TxDOT) or the Federal Highway Administration (FHWA). This report does not constitute a standard, specification, or regulation. The engineer in charge of this project was Robert J. Benz (TX-85382).
v

ACKNOWLEDGMENTS
The authors would like to gratefully acknowledge the assistance of the following individuals in preparing this report: John Gaynor and David Fink of the Houston District, who provided valuable insight and project guidance throughout the project; Frank Gutierrez, Jennifer Sutter, and the Harris County Office of Emergency Management (OEM) staff for background information and database assistance. A special thanks to all the staff ofTxDOT, City of Houston, and Harris County that participated in post event interviews. The authors would also like to thank Andy Detmer, Brooke Durkop, Keith Kostelnik, and Brenda Manak for their assistance in preparing this report. In addition, the authors would like to recognize the support of the Texas Department of Transportation and the U.S. Department of Transportation, Federal Highway Administration for sponsoring this research.
Vl

TABLE OF CONTENTS
DISCLAIMER .................................................................................................................... v ACKNOWLEDGEMENTS ............................................................................................... vi LIST OF FIGURES ............................................................................................................ ix LIST OF TABLES .............................................................................................................. x INTRODUCTION ............................................................................................................... 1
OVERVIEW ............................ : ...................................................................................... 2 TYPES OF ENVIRONMENT AL EVENTS ....................................................................... 5
CAP A CITY FLOODING .............................................................................................. 5 BA YOU FLOODING .................................................................................................... 5 TIDAL EFFECT ............................................................................................................ 7 ICE EVENTS ................................................................................................................. 7 FAST-MOVING WATER ............................................................................................. 7 WIND EVENTS ............................................................................................................. 7
ENVIRONMENTAL MONITORING SYSTEM DESIGN ............................................... 9 EQUIPMENT ............................................................................................................... 12
Standpipe ................................................................................................................. 13 Air Temperature Sensor .......................................................................................... 14 Humidity Sensor ...................................................................................................... 14 Pressure Transducer Sensor .................................................................................... 14 Wind Speed and Direction Sensor .......................................................................... 15 Stream Velocity Sensor ........................................................................................... 16 Road Temperature and Moisture Sensor. ................................................................ 17 Transmitters and Repeaters ..................................................................................... 18 Battery and Solar Panel ........................................................................................... 18 Mounting Type ........................................................................................................ 18
ENVIRONMENTAL SENSOR LOCATION CRITERIA .......................................... 19 Documentation ........................................................................................................ 20 Investigation ............................................................................................................ 20 Alternatives ............................................................................................................. 21 Potential Gain .......................................................................................................... 21
EXPERIENCE WITH THE ENVIRONMENTAL MONITORING SYSTEM ............... 23 OPERATIONAL ANALYSIS ..................................................................................... 23
Harris County OEM ................................................................................................ 23 TxDOT .................................................................................................................... 23 Interim Operations Plan .......................................................................................... 25
ENVIRONMENTAL SENSOR SITE ISSUES ........................................................... 27 ENVIRONMENTAL SENSOR MAINTENANCE EXPERIENCE ........................... 28
Maintenance Intervals ............................................................................................. 29 Transmitter Failures ................................................................................................ 29 Battery Failure ......................................................................................................... 29 Solar Panel Failure .................................................................................................. 30 Pressure Transducer Failure .................................................................................... 30 Rain Gauge Failures ................................................................................................ 31 Maintenance Summary ............................................................................................ 31
Vil

CASE STUDY EVENTS ............................................................................................. 32 December 2000 Ice Event ....................................................................................... 32 Silber Flood Site ...................................................................................................... 33 Other Localized Flood Events ................................................................................. 35 Area-wide Flooding Events ..................................................................................... 35
March 28, 2001 .................................................................................................. 35 April 18, 2001 .................................................................................................... 37 Tropical Storm Allison ....................................................................................... 37 June 5, 2001 ........................................................................................................ 37 June 7, 2001 ........................................................................................................ 37 June 8, 2001 ........................................................................................................ 37 June 9, 2001 ........................................................................................................ 37 Tropical Storm Allison Event Totals ................................................................. 38
INTERNET SURVEY ...................................................................................................... 41 CASE STUDY SIMULATIONS AND BENEFITS ......................................................... 43
I-10 KATY FREEWAY AT SILBER .......................................................................... 43 1-10 KATY FREEWAY AT BELTWAY 8 ................................................................. 46 COSTS ......................................................................................................................... 48 BENEFITS ................................................................................................................... 48
FINDINGS AND RECOMMENDATIONS ..................................................................... 49 OPERATIONS PLAN .................................................................................................. 49
Multilevel Interagency Agreements and Internal TxDOT Agreements .................. 50 Who is Responsible for Closing Roadways During Flood Events? ........................ 51 Clearly Defined Lines of Communications ............................................................. 51 Attitude .................................................................................................................... 51
PREVENTIVE MAINTENANCE ............................................................................... 52 CALENDAR OF EVENTS .......................................................................................... 52 PUBLIC INFORMATION ........................................................................................... 53 TRAINING ................................................................................................................... 53 INSTITUTIONAL ISSUES ......................................................................................... 54
Overtime Policies .................................................................................................... 54 Internet Access ........................................................................................................ 54 Phone Answering Policy and Back Line ................................................................. 55
DOCUMENTATION ................................................................................................... 55 DESIGN IMPROVEMENTS ....................................................................................... 56 ENVIRONMENTAL SENSOR INSTALLATION CRITERIA ................................. 56 LESSONS LEARNED FROM TROPICAL STORM ALLISON ............................... 57
Improvements .......................................................................................................... 57 TxDOT Institutional Issues ..................................................................................... 57
CASE STUDIES AND BENEFITS ............................................................................. 58 REFERENCES .................................................................................................................. 59 APPENDIX A: EXISTING EMERGENCY OPERATIONS PLAN ............................ A-1 APPENDIX B: IH 10 AT SILBER DRAFT OPERATIONS PLAN ............................ B-1 APPENDIX C: ENVIRONMENT AL MONITORING SYSTEM INTERNET
SURVEY AND RESULTS ........................................................................................ C-1
Vlll

LIST OF FIGURES
Figure 1. Bayou Flooding (Scenario 1) - Roadway Above Stream Level ......................... 6 Figure 2. Bayou Flooding (Scenario 2) - Roadway Floods If Bayou Level Rises
Above Roadway Even If No Rainfall ................................................................. 6 Figure 3. TxDOT's Environmental Monitoring System ..................................................... 9 Figure 4. TxDOT and Harris County OEM Combined Environmental Sensor
Network ............................................................................................................ 10 Figure 5. Planned Expansion of the TxDOT Environmental Monitoring System ........... 10 Figure 6. Environmental Monitoring System and the Interrelated Components ............. 11 Figure 7. Full Weather Station with Added Components ................................................ 12 Figure 8. Ground-Mounted Environmental Station ......................................................... 13 Figure 9. Precipitation Sensor Tip Bucket (Rain Gauge) Sensor ..................................... 13 Figure 10. Air Temperature and Humidity Sensor ........................................................... 14 Figure 11. Submersible Pressure Transducer. .................................................................. 15 Figure 12. Curb-Mounted Roadway Water Depth Pressure Transducer ......................... 15 Figure 13. Wind Speed and Direction Sensor .................................................................. 16 Figure 14. Microwave Stream Velocity Sensor ............................................................... 17 Figure 15. Road Temperature and Moisture (Conductivity) Sensor ................................ 17 Figure 16. Example of Barrier-Mounted Standpipe ......................................................... 19 Figure 17. Example of Advanced Warning Sign with Flashing Beacons ........................ 20 Figure 18. Alarm and Message Sent to Alphanumeric Pager .......................................... 24 Figure 19. Operations Plan Outline .................................................................................. 26 Figure 20. Recorded Number of Days Between Scheduled and Non-Scheduled
Maintenance .................................................................................................... 30 Figure 21. Schematic of Silber Flood Location ............................................................... 34 Figure 22. Memorial Drive at Shepherd Drive Full-Size Truck Flooded ........................ 36 Figure 23. Houston Street at Memorial Drive Car Flooded ............................................. 36 Figure 24. Tropical Storm Allison Flooding .................................................................... 39 Figure 25. 1-10 at Silber Synchro 5 Modeling Diagram .................................................. 44 Figure 26. 1-10 at Beltway 8 Synchro 5 Modeling Diagram ............................................ 44
lX
LIST OF TABLES
Table 1. Results of Partial Flooding Simulation, 1-10 Near Silber ................................. .45 Table 2. Results of Flooded Roadways Without Traffic Control Simulation,
1-10 Near Silber .................................................................................................. 45 Table 3. Results of Flooded Roadways With Traffic Control Simulation,
1-10 Near Silber .................................................................................................. 45 Table 4. Results of Flooded Simulation, 1-10 Katy Freeway at Beltway 8 ...................... 47
x

INTRODUCTION
The regional transportation system of the Houston area is often impacted by unpredictable severe weather events. As a result of these severe weather events, heavy rains sometimes cause many freeways, frontage roads, and major arterials to quickly become impassable. While the stream monitoring system currently used by the Harris County Flood Control District (HCFCD) provides information and warnings for potential flooding conditions, it does not have the capability to supply real-time information on roadway flooding on urban freeways, high-occupancy vehicle lanes (HOV), and major arterials. The current system also does not have the capability to report various atmospheric conditions (e.g., ice, high winds) that may have negative impacts on mobility.
Several states have used roadway environmental information systems, termed remote weather information systems (RWIS), to assist in determining real-time roadway conditions. The RWIS has typically been used in two methods: I) to provide real-time road and travel information using dynamic message signs (DMS), highway advisory radio (HAR), and call-in systems, and 2) to support maintenance operations. California, Florida, South Carolina, and Wyoming, among others, have used RWIS to provide updated roadway information to government agencies and roadway users (l).
The California Department of Transportation (Caltrans) uses RWIS in conjunction with DMS to notify motorists of delays and adverse roadway conditions. The Florida Department of Transportation (FDOT) operates wind detection devices and informs the public of dangerous conditions via DMS. The Wyoming Transportation Department (WTD) uses RWIS to detect strong winds and advise motorists via DMS (1).
A 1988 Strategic Highway Research Program (SHRP) project investigated the use ofRWIS. The study was conducted in seven states: Colorado, Minnesota, Washington, Massachusetts, Michigan, Missouri, and New Jersey. This study focused on the methods used by state department of transportations (DOTs) and other agencies to allocate deicing resources in the most efficient manner. The study concluded that a real-time RWIS can be a useful tool in maintenance, allowing crews to determine which roadways are likely to freeze first, sending crews and the correct materials to the most vulnerable roadway sections. The study also found that the overall success of the RWIS is dependent on how well the system is integrated into an agency's existing system and decision processes (1, ~).
Using available technology, a real-time monitoring system was deployed to provide area-wide environmental conditions to Houston TranStar. Combined with real-time National Weather Service radar and advisories, this real-time stream, freeway, frontage road, and major arterial environmental monitoring system provides advanced warning of severe weather conditions that can impact the traveling public. This warning system could be a strategically important component of the regional advanced traveler information system (ATIS), especially considering its advantages during hurricane evacuation. This project documents the system capabilities, types of flooding, flood
I

events, and equipment reliability. In addition, an evaluation of the motorist's understanding of the flood warning signs and of the delay impacts of a flood closure was conducted.
While ice and snow may affect traffic only every few years in the Houston area, high water and winds from severe storms are more common. Environmental monitoring stations placed at strategic locations on freeways, frontage roads, HOV lanes, and arterial streets will provide advanced warning to government agencies and the traveling public when adverse weather conditions, especially high water, affect travel conditions. Information gained from this system will allow traffic management personnel to provide public information, assist METRO dispatchers in rerouting buses around high water areas and congestion, and enable emergency services (i.e., fire, ambulance, police) to reroute vehicles to and around roadways affected by high water, ice, or other adverse conditions.
The Houston Priority Corridor environmental monitoring project deployed environmental sensing devices at 27 sensing sites in Harris County. Remote telemetry is used to transmit real-time information on water level, rainfall rates and quantities, wind speed, and other information from these sites to Houston TranStar, where this information is used for traffic management, traveler information, emergency response, and evacuation.
Flooding can be extremely dangerous and costly, with respect to both loss of life and property. During Tropical Storm Allison in June of 2001, 22 people died and an estimated 4.88 billion dollars worth of damage occurred. High water closed major freeways, arterials, and city streets, devastating mobility in the region. The economic impact of lost time and opportunities for business and the disruption of the normal dayto-day life make these values even higher and the benefit of the environmental monitoring system even greater.
OVERVIEW
The intelligent transportation system (ITS) environmental monitoring system was originally envisioned to bring the pump sensor warnings to TranStar operators and maintenance sections. Low-lying locations will flood if the pumps are not operating properly. In addition, new devices were installed on the roadway in flood prone areas to detect high water. Some of these devices are linked to active warning signs and all are monitored in TranStar and will eventually be integrated to the operator's workstations on the control room floor. The system takes advantage of the existing infrastructure owned by Harris County Office of Emergency Management (OEM), expanding the Harris County OEM sensor network and providing TxDOT with real-time road flooding information. Several challenges and delays were incurred during installation of the system due to changes in the construction contract to expand the capabilities and the system. This system continues to evolve as it is integrated to the traffic operations control room floor.
2

The Harris County Flood Control District and the Harris County OEM started an Automated Local Evaluation in Real-Time (ALERT) flood warning system in 1984 with 12 stream gauges. This system has grown over the years not only increasing the number of sensors but also the size of the infrastructure with radio receivers, transmitters, database, software development, and notification system. TxDOT piggy-backed their network of environmental sensors with this existing infrastructure thus leveraging resources using the county's receivers and database and providing the county with additional sensors creating a more dense network of devices.
The TxDOT environmental monitoring system is a system that contains a variety of field sensors that are relayed back to a central monitoring location. Each of the locations contains one or more of the following sensor types: roadway water depth, rainfall gauge, humidity gauge, wind speed, wind direction, air temperature, pavement temperature, pavement moisture, and stream velocity. The values from the sensors are sent via low frequency radio to Houston TranStar directly to the Harris County OEM ALERT database. This information is written to a database, error checked, and then uploaded to the Internet website.
The information obtained from these sensors is a valuable resource for managing roadways during inclement weather. Currently, alarms triggered by high water are sent to alert floor operators of the condition via pager and e-mail. However, for the majority of the project the Traffic Management Center (TMC) floor operators received no pages or e-mails. The ability to verify some of these high water alarms via closed circuit television (CCTV), as well as communication with other agencies to inform each other of roadway conditions, are all valuable assets, which enhance the capabilities of the system. In addition to these benefits, the system is still evolving with integration to the operator workstations, enhancements to the notification system, and documentation of the incident responses. These actions are all helpful in continually evaluating and monitoring the system.
The research project started slowly due to purchasing, bidding, and contract delays. The evaluation project began in September 1998 but the field equipment was not installed and accepted until Fall 2000. The environmental monitoring system has been integrated into the Harris County ALERT database. Future integration (late 2002) to provide operators with alarms on the traffic operations floor will enhance the system and provide further functionality. Public information is being provided by Harris County through a web page with more features planned for the future. The original research plan had to be altered due to these complications. Initially the evaluation was to determine how the operators used the system and how the public responded to the information. The focus has now shifted to documentation of the system, storm events, and maintenance, and how the system was used noting improvements that could enhance the system.
3


TYPES OF ENVIRONMENTAL EVENTS
Four types of environmental events: flooding, ice, wind, and fast-moving water were monitored during this project. There are two primary types of roadway flooding: capacity flooding and bayou flooding. Both of these types cause the roadway to flood, however the source of that flooding may be very different. In theory, a location can flood even if it is not raining. In addition there are tidal effects that can heighten the bayou flooding. Ice events are rare in the Houston area but can be devastating to mobility. The third type of event is a wind event that mostly affects high-profile vehicles, typically on bridges. The last type of event is fast-moving water and currents on rivers and streams. Fast-moving water can force boats and barges to loose control, run aground, and hit other vessels or structures causing damage to the vessels infrastructure and potentially causing environmental problems if hazardous cargo is spilled.
CAPACITY FLOODING
Roadway flooding is caused by a variety of factors, including excessive rainfall rate, insufficient inlet capacity, and insufficient pipe capacity. The later two could be caused by several factors, including blocked inlets, poorly located inlets, or insufficient inlet capacity for a given rainfall rate. Pipe capacity is a related cause but typically less frequent. Pipe capacity or sometimes channel capacity might be restricted due to insufficient size, blockages, and/or restrictions in the pipe or channel.
It is very important to identify the cause of the flooding to determine the best corrective action. One must understand the cause of the problem to correct the problem. Documentation of flood events and conditions can be used to identify the type of flooding and a systematic approach to identify and correct the problem can be used. Improper identification of the cause may not correct the problem or may lead to costly treatments that only partially improve the problem.
BAYOU FLOODING
A related and sometimes compounding problem is bayou or stream flooding. This phenomenon occurs when a roadway storm water system empties into an over capacity open channel. In scenario 1, even though a roadway may be above the stream or bayou level, the water from the roadway drainage system may not overcome the outflow head as shown in Figure 1, causing slow drainage. The next scenario is where the bayou water level is actually higher than the roadway; water from the bayou actually flows up the storm water sewer pipe flooding the roadway, even in the absence of rainfall. Figure 2 illustrates this condition. These situations are difficult to fix and may require the bayou capacity to be increased. Other solutions might be to use one-way valves, add a pump station, or raise the height of the outfall from the roadway to the stream or bayou.
5

Larger Pipe, _.....,..,. Culvert, Bayou, or Open Channel
r
( f
;
Figure 1. Bayou Flooding (Scenario 1) - Roadway Above Stream Level.
Typical Water Level
Storm Water
Outflow
Bayou Flooding Possible
Figure 2. Bayou Flooding (Scenario 2) - Roadway Floods If Bayou Level Rises Above Roadway Even If No Rainfall.
6

TIDAL EFFECT
In addition to the previously mentioned flooding types, there is also a tidal effect along the Gulf Coast. Typically the tide does not rise so high that it floods inland roadways but rather, as the tide rises it reduces the amount of water that can enter Galveston Bay or the Gulf of Mexico. This is similar to the bayou effect but on a much larger scale. Depending on the timing of the heaviest rains and the capacity of the bayou, the tidal effect can have a significant impact. Tidal waters can travel up the ship channel and even into local bayous raising the levels of these bayous and reducing the amount of water that can be accepted by the drainage system.
ICE EVENTS
Ice events are rare in the Houston area but can be devastating to the mobility of the region. Most drivers are unfamiliar with how to drive in icy conditions, and local agencies do not have extensive equipment and experience to deal with these types of events. Ground temperatures typically do not get below freezing so ice usually forms only on bridges or overpasses. The inexperience of the Houston drivers in icy conditions can be dangerous. TxDOT has been proactive in using anti-icing solutions like magnesium chloride and now has a system in place to monitor these events.
FAST-MOVING WATER
High rainfall intensities and large accumulations of rain can lead to fast-moving water on area streams, bayous, and rivers. These events can be dangerous and cause damage if captains are caught by surprise and lose control of their vessels. One such event caused heavy damage to an interstate bridge, resulting in damage to the structure and traffic delays from the resulting repairs.
WIND EVENTS
Similar to the fast-moving water, wind events can cause big problems for the traveling public and high-profile vehicles, especially in the early stages of hurricane landfall. Wind speeds tend to be greater on high bridges in the Houston area. Highprofile vehicles have a large surface area and act as a sail that could overturn if wind speed and direction are right. The overturning of a truck on a critical link with limited alternate routes could severely limit evacuation capacity. Overturned vehicles can also cause damage to bridge structures. Wind sensors, which measure wind speed and direction, could be used to alert operators to use DMS to warn drivers and notify officials to temporarily close a road to this class of vehicle, improving the safety of the entire motoring public.
7


ENVIRONMENTAL MONITORING SYSTEM DESIGN
Figure 3 shows a deployment of 27 environmental monitoring stations. All stations have rain sensors, 19 have roadway water gauges, three of the 19 have active warning signs, four are full weather stations, five have ice sensors, and one location has a water velocity meter. Figure 3 shows a breakdown of these devices. Most of the ice sensors are located on elevated high-occupancy vehicle lane (HOV) T-ramp facilities.
Figure 3. TxDOT's Environmental Monitoring System.
Houston District CTMS
Environmental Sensors Existing
• Advanc• warning
0 Ice sensor
,, • Flood s•nsors
• Fun w•ilth•r station
August 29. 2001
The TxDOT system adds 23 percent to the existing 118 sites. Figure 4 shows three repeaters currently operated by Harris County OEM. These two systems combined bring the total number of sites to 145 and the total number of sensors to 342. This extensive network will be expanded by 11 locations in the near future as shown in Figure 5. The combination of sensors provides an extensive network ofrainfall, roadway water level, stream and bayou levels information as well as an outlying network of ice sensors. The following sections provide descriptions of the sensor functions and station capabilities.
9

Houston Area Environmental
Sensors
IOH11WOIJ.1lp
• llAOmilf\'1'*1SllfOf l.''I) • ,.~,-~uo•••• ...,.111°'f"Jnll9Du0t9)
... O.SlflJG• (lit A r•••1..n. rs•m1 0) • Aartl'fl•• .. SGl.,,•p
Figure 4. TxDOT and Harris County OEM Combined Environmental Sensor Network.
Houston District CTMS
Weather Station
Installations
A Full Weather Station
A Full Weather Station "'"'Road Ice Sensor
A Full Weether Stetion with River Level Sensor
A Full Weether Stetion with River Level and Road Ice Sensor
IH 45 0 loop 336 No US 59 No. OP sach Creek Hard'( Toll O Spring Creet US 2aD Cl SH 6 IH 10 Q Bretos Rl..et US 59 So Q Bra:r:os River SH 289@ SH ~8 (Brnos: Rivet SH 35 0 Bro:ros Rivet SH 146 Q K &mah Bridge SH 286 G Loop 610 SA. E.6 US 59 SW Q 8alt'My 8
Ir ...
·~ July 17, 2001
Figure 5. Planned Expansion of the TxDOT Environmental Monitoring System.
10

The environmental monitoring system has many components that work together to form the system. Figure 6 shows how all these components are interrelated. First, the environmental sensors at each site gather the data and relay that information to the base station or receivers via low frequency radio. This information is stored in the Harris County OEM ALERT database where quality control checks are conducted and alarm thresholds are checked. If a threshold is met, an alarm is sent out via numeric pager and e-mail. Summarized and searchable data are displayed on the county's website. Both systems (Harris County OEM [118 stations] and TxDOT [27 stations]) operate on the same infrastructure and database. Only the purpose of the sensors is different.
While the two systems are complementary, they also serve different functions. Harris County OEM and the Harris County Flood Control District are primarily interested in flooding of streams, bayous, and waterways. In contrast, TxDOT is concerned with the conditions of their roadway network and regional mobility. These two goals are not mutually exclusive, sometimes a roadway can flood with no bayou flooding because the rainfall rate is too great to accommodate the drainage or the rainfall exceeds the inlet capacity of the storm water sewer system. Other times the bayou may cause a roadway to flood by backing up the storm water runoff network to the point that it floods the roadway. This phenomenon, known as bayou flooding, is explained in more detail later in this report.
-------------------------·- -- ----------·----------------------------------------------·······----- --- ---- -------------·····---------------···1
ALERT System Alarm Condition s Automaltcally Sent to Key Personnel Via Alphanumeric Pager
ALERT System E;i1.po rts Sensor Oala to TranStar Database
TranStar G IS Relrieves Sensor Data from Database
TranSlar Oissemlnales lnformalion to Public
TranStar
---------------- -------- -- ---------------------------------------------- --· -·-------------- ·---·-------------------------------------------------- ------------------·
--· ~
Figure 6. Environmental Monitoring System and the Interrelated Components.
11
EQUIPMENT
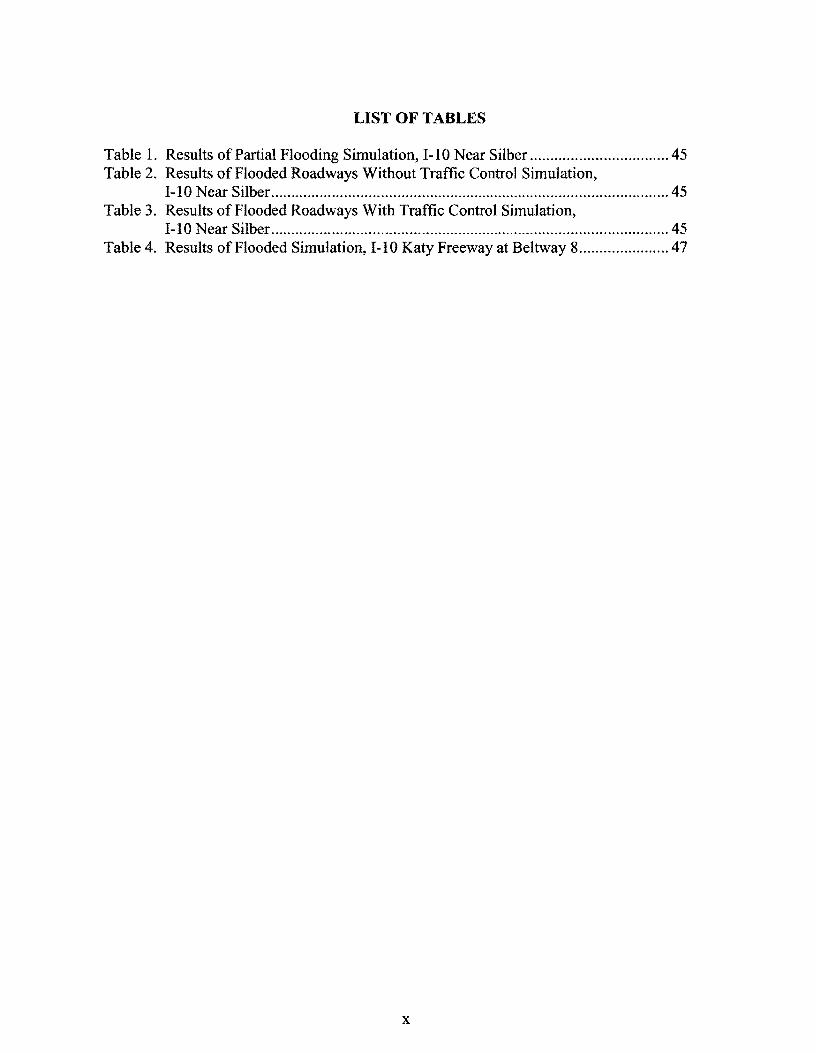
The environmental monitoring system is actually a set of sub-systems typically called stations. These stations have several components that actually measure separate environmental elements and then transmit the data to a central site for permanent storage. Figures 3 and 4 show the current system deployed throughout the region. Figure 7 shows a schematic of a full weather station with some additional environmental sensors. Each station may have one to eight sensors depending on the need and function. All station locations have rainfall gauges or precipitation sensors, and most have at least one other type of device. Several locations are full weather stations consisting of a precipitation gauge, a wind speed and direction gauge, and air temperature and humidity sensor. The information gathered from the sensors is transmitted back to the central site each time a new measurement is taken. The following sections describe each of the components that make up the station subsystems.
Pavement Conductivity and Temperature Sensor
~Transmitter Antenna
Solar Panel
Air i---.:E>--.iii?_.- Temperature
and Humidify Sensor
Battery, Transmitter. and Sensor Connections:
PT
Figure 7. Full Weather Station with Added Components.
12
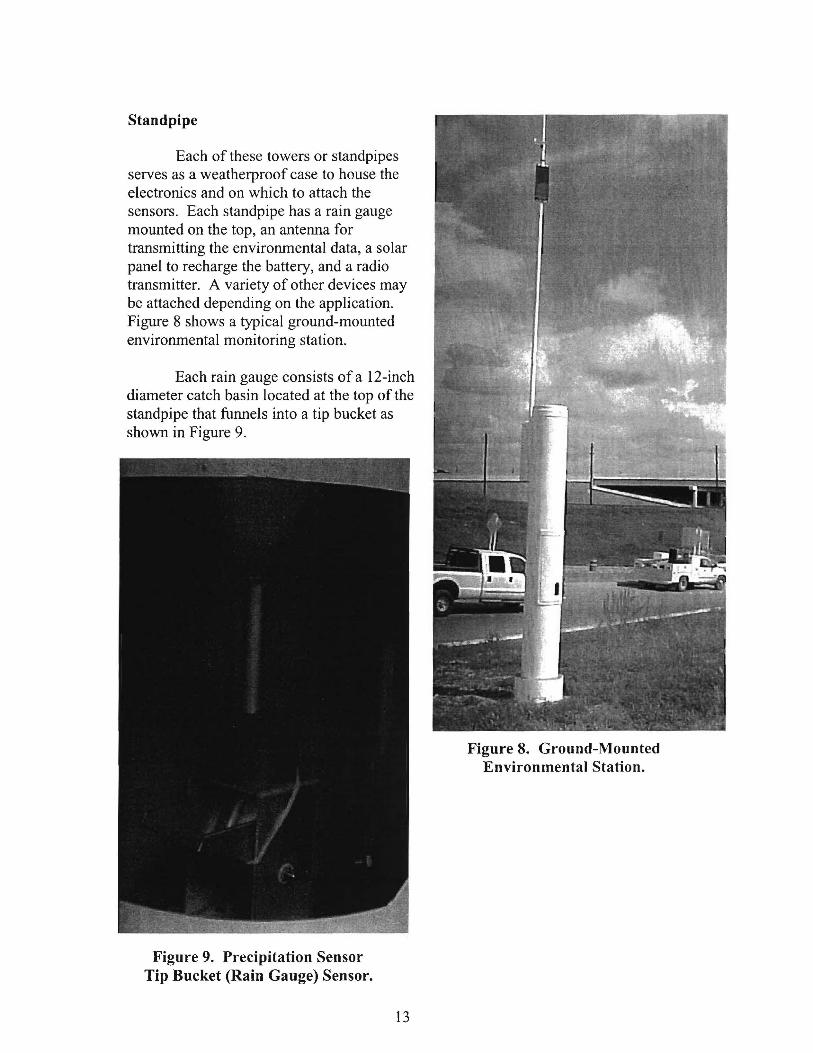
Standpipe
Each of these towers or standpipes serves as a weatherproof case to house the electronics and on which to attach the sensors. Each standpipe has a rain gauge mounted on the top, an antenna for transmitting the environmental data, a solar panel to recharge the battery, and a radio transmitter. A variety of other devices may be attached depending on the application. Figure 8 shows a typical ground-mounted environmental monitoring station.
Each rain gauge consists of a 12-inch diameter catch basin located at the top of the standpipe that funnels into a tip bucket as shown in Figure 9.
Figure 9. Precipitation Sensor Tip Bucket (Rain Gauge) Sensor.
13
Figure 8. Ground-Mounted Environmental Station.

As the water accumulates, it fills the tip bucket. When full, the bucket tips and sends a radio signal indicating that 1 mm, which equals 0.039 inches of rain, has fallen. These messages are time stamped so a rainfall rate can be calculated. A rainfall rate of 1 inch in 30 minutes (2 inches per hour) is used by Harris County OEM as the indicator of street flooding.
Air Temperature Sensor
The air temperature sensor utilizes a thin-film platinum Resistive Thermal Device (RTD) element that provides an accuracy of 0.2 °C and a measuring range of -40 °C to +60 °C. This electronic sensor is typically housed in a radiant shield that is mounted to the standpipe shown in Figure I 0.
Humidity Sensor
Most of the full weather stations contain an air temperature and humidity probe. These probes have low power consumption (0-1 VDC) and measure the full range of relative humidity (0 - I 00 percent) measured by the capacitance change of a thin polymer film as it absorbs or releases moisture. The sensor provides long-term stability and low hysteresis, is not damaged by condensation, and is insensitive to dust or industrial pollutants, which are important features for a sensor located in outside ambient conditions. These sensors are typically located in a solar radiation shield as shown in Figure 10.
Pressure Transducer Sensor
Figure 10. Air Temperature and Humidity Sensor.
Figure 11 shows the submersible pressure transducers (PT) designed to measure water level or water depth. The sensor incorporates a miniature, silicon piezoresistive pressure sensor that features excellent resistance to shock and vibration. A thin tube runs inside the cable and is vented to a box in the standpipe. This tube provides the ambient pressure allowing the sensor to measure the pressure difference and thus the water level. This tube can become kinked or filled with moisture causing faulty readings. The standard accuracy is 0.1 percent. Its typical application is to measure stream or bayou water levels. However, in this project the PT was used to measure the water level on the roadway as shown in Figure 12. The sensor is housed in a 2-inch conduit that is flush with the face of the curb. If the PT is not under water a false reading can occur due to atmospheric temperature and pressure changes.
14

Figure 11. Submersible Pressure Transducer.
Figure 12. Curb-Mounted Roadway Water Depth Pressure Transducer.
Wind Speed and Direction Sensor
This combination device is made of a lightweight carbon fiber thermoplastic, with a helicoid propeller that senses the wind speed. The propeller rotation produces an AC sine wave voltage signal with frequency directly proportional to wind speed. Slip rings and brushes are not used, resulting in improved reliability. The wind direction sensor is a
15
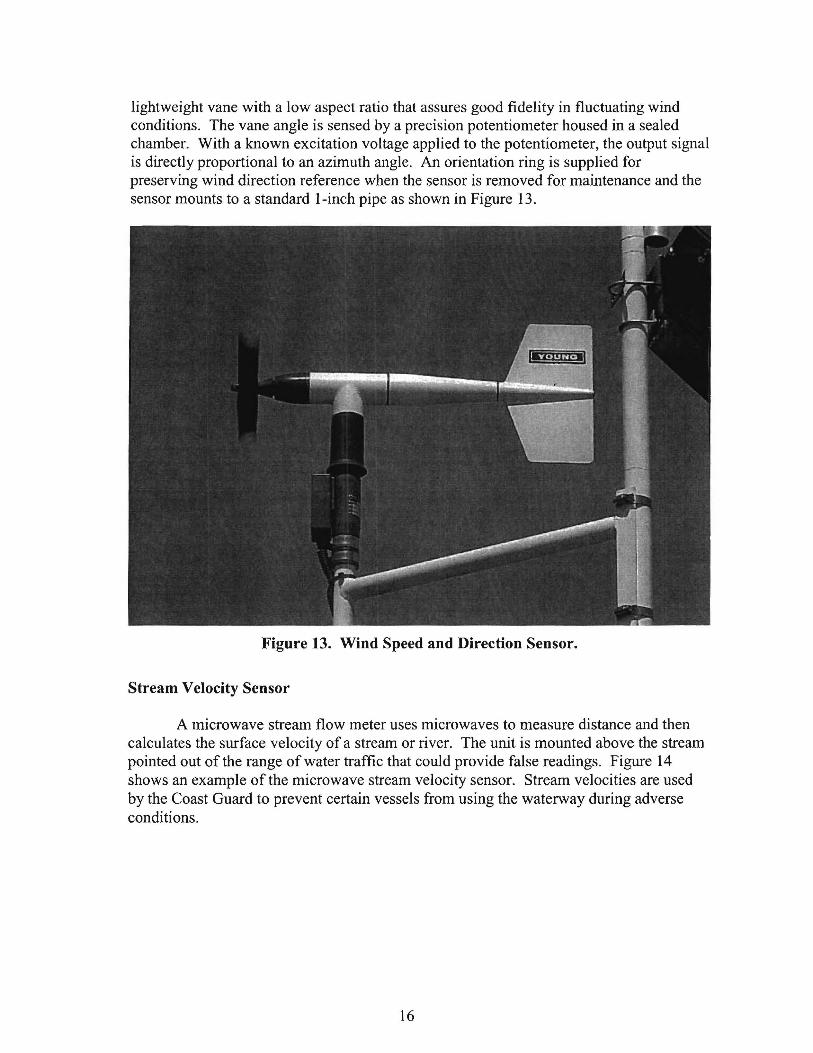
lightweight vane with a low aspect ratio that assures good fidelity in fluctuating wind conditions. The vane angle is sensed by a precision potentiometer housed in a sealed chamber. With a known excitation voltage applied to the potentiometer, the output signal is directly proportional to an azimuth angle. An orientation ring is supplied for preserving wind direction reference when the sensor is removed for maintenance and the sensor mounts to a standard I-inch pipe as shown in Figure 13.
Figure 13. Wind Speed and Direction Sensor.
Stream Velocity Sensor
A microwave stream flow meter uses microwaves to measure distance and then calculates the surface velocity of a stream or river. The unit is mounted above the stream pointed out of the range of water traffic that could provide false readings. Figure 14 shows an example of the microwave stream velocity sensor. Stream velocities are used by the Coast Guard to prevent certain vessels from using the waterway during adverse conditions.
16

Figure 14. Microwave Stream Velocity Sensor.
Road Temperature and Moisture Sensor
Road temperature and moisture sensors are imbedded in the pavement to measure the roadway temperature and the presence of moisture that could indicate ice-forming conditions. In addition to measuring temperature and wetness, the sensor can indicate chemical concentration on the sensor surface based on conductivity. Figure 15 shows an example of the roadway temperature and moisture sensor. The surface of each sensor is slightly larger than a quarter. It will serve as a guide to whether some deicing chemical remains on the road and help in making the decision whether or not to reapply chemical treatments.
17
Figure 15. Road Temperature and Moisture (Conductivity) Sensor.

Transmitters and Repeaters
The radio transmitter transfers the infonnation from the field sensor(s) to the main computer database at Houston TranStar. This is a Very High Frequency (VHF) frequency (136 to 170 Hz) radio band that can travel up to 20 miles and typically needs line of sight transmission. The transmitter is located in the standpipe and is connected to the battery and the external antenna (refer to Figure 8 for location). Three repeaters, located throughout the county, receive the signals from the station locations and retransmit the signals further toward the central site. Cumulative counts are saved in the transmitter and are maintained unless there is a power (battery) failure. In this case, when the power is restored, an existing value must be reentered so the cumulative totals look logical.
The transmitter can be set to transmit in timed mode from five to 45 minutes or one to 12 hours. It also has the capability to transmit every sensor report or for a hold-off time, which will transmit no more than every 20 seconds to conserve power. These transmissions will not be sent more than every 20 seconds. For example, if there is a light rain then the rainfall will accumulate and the bucket may tip once every minute. However, if there is a very heavy rainfall, the bucket may tip four or more times in a minute. The device will transmit every 20 seconds with the cumulative numbers of tips. This way no rainfall accumulation will be lost.
Battery and Solar Panel
The battery supplies all sensors and the transmitter with power. This battery is a 12-volt, 12 amp/hour deep-cycle marine-type battery. The battery also stores the energy that the solar panel produces.
There are two types of solar panels: single crystal silicon cell and polycrystalline cell (multi-cell). The single crystal silicon cells are more efficient than the polycrystalline cells however; there are several tradeoffs between durability, size, efficiency, and cost. Cell coverage, or how closely the cells are packed, depends on their shape: square, semiround, and round. Square cells are the most efficient, but the round cells are the cheapest. Thin-film modules are less fragile than crystalline modules, use much less silicone, and are about half as efficient. Thin-film panels also have a shorter life expectancy. The panels vary by output from 80 to 300 milliamps depending on the types of devices and the demand.
Mounting Type
There are two typical mounting types. The first is a stand-alone or ground-mounted standpipe as shown in Figure 8. The standpipe is anchored to a foundation laid on the ground. The other type of mounting is a barrier mounting, shown in Figure 16. The barrier mount is bolted to a standard Jersey barrier. Both types of mountings have worked without a problem.
18

Figure 16. Example of Barrier-Mounted Standpipe.
Some of the roadway flood sensors are connected to an advanced warning sign with flashing beacons that is activated if water is present on the roadway as shown in Figure 17. The warning signs should be placed in accordance with the Manual on Uniform Traffic Control Devices (MUTCD) specifications with regard to visibility, sign height, etc. The minimum safe stopping distance needed to avoid the hazard also needs to be adhered to, in addition to all other signing standards. The placement of the sign should also consider logical alternate routes, placing the sign in advance of these decision points.
ENVIRONMENTAL SENSOR LOCATION CRITERIA
The environmental sensors are stand-alone units, which do not need power or a phone line to send back weather data. All communications are done via radio transmitters that are powered by a battery that is charged by a solar panel. These sensors can be deployed wherever they are needed and provide good service if properly maintained. The question is how to determine where to place a sensor. The following criteria are some of the considerations and criteria on where the devices should be placed to provide the most benefit with limited resources.
19

Figure 17. Example of Advanced Warning Sign with Flashing Beacons.
Documentation
The first task is to document the locations that flood in an area. These sites could come from a variety of sources such as the city, county, or state agencies as well as citizen input or complaints. Input from website, E-mails, phone, fax, and letter are all possible means of communication and could be reported to a variety of departments or agencies. The input from these sources gives you the general location of the perceived problem area. Further documentation and investigation will result in the frequency, magnitude, and severity of the problem. It should be determined if the rainfall values and rates are within the range of a normal storm. It may be cost prohibitive to plan for a 50- or 100-year flood or storm. Flooding problems may be able to be remedied with an incremental cost if reconstruction is planned for the area.
Investigation
The investigation task involves verifying the reports and attempting to quantify the frequency, magnitude, and severity of the reported flooding. Several sources can be used to check and cross-check the documented flooding reports. Rainfall records and other sensor data from the National Weather Service and other local agencies can be a starting
20

point. Newspaper articles, insurance claims, and personal recollection are some other sources. Large rainfall amounts, and more importantly, high rainfall rates tend to be the larger cause of street flooding. If only rainfall amounts are available, an investigation of the days around the day in question must be made to determine ground saturation. If possible the bayou levels and in some cases, the tidal conditions can be helpful in determining if there is a flooding problem.
Once a site has been determined to be flood prone, the next objective is to determine why the location floods. Several types of flooding have been identified including roadway capacity flooding, bayou flooding, and tidal or storm surge effects. Some site investigation is required to determine if the inlets are clear, drainage grates are clean, and the pipe capacity is sufficient. To determine the type of flooding problem, ongoing monitoring of the location during rain events may be required. In some cases some additional maintenance may be required to clean the grates and inlets. The occurrence of events might lead to a seasonal problem, such as when grass is mowed and the clippings clog the surface grates. The discharge from adjacent properties may add to the problem. Other problems could be a grate design or inlet design problems. If maintenance or surface observational issues are not the problem, further investigation into the hydraulic capacity and the use of cameras to determine pipe blockage can be utilized to diagnose the problem.
Alternatives
Once the flood type has been identified, some counter measures might be applied. However, sometimes the only solution to the problem is a costly reconstruction of the system. In some cases, such as a bayou, these projects are not within the agency's jurisdiction and may be a very large capital cost such as enlarging the capacity of a bayou. A flood monitoring system is beneficial in these cases. In addition to being a tool to prevent life and property loss, the monitoring system can also be used to document the frequency, magnitude, and severity of the problem thus building a case for long-term improvement. Enlarging the drainage grate or increasing the surface area of the grate may make a substantial improvement. Increased maintenance around the affected areas as well as debris fences can also help prevent grates from clogging.
Potential Gain
Some of the potential benefits of the environmental monitoring system are identification and documentation of flood prone areas. This documentation can lead to the justification of making the capital improvements required to prevent the flooding. The system can also be used as a warning device for areas that are prone to flooding but cannot be corrected for a variety of reasons such as funding, agency jurisdiction, or timing of a reconstruction project.
21


EXPERIENCE WITH THE ENVIRONMENTAL MONITORING SYSTEM
This section of the report documents the operational experience with the environmental monitoring system, which includes the current use and operation of the system. This section will also document some of the challenges of the design, installation, and maintenance of the system. The last section documents some of the storm events that occurred during the research project.
OPERATIONAL ANALYSIS
Currently, Harris County OEM and TxDOT share the operations and maintenance activities of the environmental monitoring system. Harris County OEM gathers the field data, processes it through the ALERT system, and distributes the information via digital pager and the Internet. TxDOT currently maintains the roadway environmental monitoring system with the assistance of the Harris County OEM and is in the process of integrating the environmental information to the control room floor. TxDOT also responds to the alarms sent out by the ALERT system. The following sections will provide more detail on the operations and maintenance of the environmental monitoring system.
Harris County OEM
Information from the field is transmitted via low frequency radio transmitters. These transmitters can relay the data via a repeater to Houston TranStar, more specifically to the Harris County OEM ALERT database. This information is deposited into the Harris County OEM ALERT system where some quality control procedures sort out any spikes or erroneous data. The ALERT system also provides the capabilities to set thresholds for different device types and sends out alarms via alphanumeric pagers as shown in Figure 18. The system was recently upgraded to deliver E-mail alerts. This information is also distributed to the public via the Internet on the Harris County OEM web page. Harris County OEM operates and maintains their own rainfall and stream sensor network as well as the repeater and receiver infrastructure. This leveraging of resources allowed TxDOT to implement a system without having to purchase costly infrastructure and software saving tens of thousands of dollars.
TxDOT
TxDOT contractors installed the roadway environmental sensor network. TxDOT personnel are currently maintaining the 27-station sensor network but are investigating maintenance agreements with private contractors and Harris County OEM. Although the sensor data are integrated into TranStar through the ALERT system, further integration is required to get detailed information to the control room floor for use in traffic management. This integration is planned to take place sometime in late 2002.
23

Figure 18. Alarm and Message Sent to Alphanumeric Pager.
Prior to the installation of the envirorunental sensors, limited information about the location and magnitude of flood events was known. Information about flooding was limited to reports from the media and from the traveling public. When possible, these reports were verified via the CCTV network, and traffic operators notified area maintenance departments via phone. Most of the flooding in the Houston area is localized flooding and typically lasts only a short period of time. Typically the floodwaters recede before the flooding report is verified, notification is sent out, and the maintenance section can react and respond, causing a pessimistic attitude at all levels toward flood response.
The original concept of this project was to integrate the pump warning sensors into TranStar, allowing quick response to power failures that could result in flooding. The idea quickly changed to installing flood sensors on the roadway. Discussions with city and district hydraulic personnel led to a list of locations that had flooding problems. Other devices, such as the ice sensor and full weather stations, were concepts brought in from a variety of sources. Several emergency and flood plans were found to have limited distribution and use. Appendix A shows these plans. The research staff interviewed TxDOT operations personnel to determine what actions were taken during envirorunental incidents. Most incidents were handled on an ad hoc basis depending on individual judgment, available resources, current operations floor activity, and experience. The research identified a need for an operations plan to provide a consistent, planned, systematic approach to handling envirorunental incidents.
A draft of an operations plan was developed in the form of a detailed site plan. TxDOT staff who were concerned about its feasibility reviewed this plan. The plan relies heavily on the support of local law enforcement, and it was perceived that the plan would be ineffective. This pilot plan was to be used as a starting point to be presented to the agency managers to develop a more holistic and interagency approach to handling
24

environmental incidents. In the many interviews there were inconsistencies of thought on who was responsible for closing a roadway during a flood event, what events would warrant a road closure or even a public warning of high water in the form ofDMS message. Further plan implementation problems were perceived since many of the environmental sensors were deployed on freeway frontage roads, yet control of the roadways were under the jurisdiction of the city and county, not TxDOT. Many jurisdictional, institutional, and interdepartmental issues were identified.
The following section describes an outline of key elements of a draft operations plan. Appendix B shows a more detailed and site-specific operations plan for the Silber and Beltway 8 locations. This conceptual model was initially thought to have limited value; however, after several environmental incidents, the value of an operation plan was more fully realized.
Interim Operations Plan
The following criteria and thresholds will need to be monitored and adjusted as the system matures. Rainfall amounts, rates, and weather updates or reports could also be used as a secondary measure or determination if the flood event will increase, decrease, or stay constant. Figure 19 shows the outline operations plan.
The outline is meant to be a starting point to work with the agency partners to see what role each would take in the event of a road closure. The operations plan should include and address the concerns of all agencies. The roles and duties of each agency should be defined as well as any internal and external communications required. It is vital to have set activation levels that do not require management decision. Redundancy should be in place so that if one link in the chain cannot be reached the system does not stop. Automation should also be sought in as many areas as possible. Notification through control room alarms, automated dialers, and direct real-time posting of information on the web would allow decision makers to have detailed information to make more informed decisions.
Several emergency and flood plans were reviewed. The plans range from 1994 to 1997 and are a good start in providing the basics of what should be done during a flood event. These plans, however, lack the detail gained from experienced personnel or those who have weathered a storm and learned from their experience. These plans are static in nature, consisting of a call list and some procedures with no mention of periodic review or revision. The lack of redundancy in the plan and the high labor requirement make the plan difficult to follow even under the best conditions. More detail, firm agreements, and understanding within TxDOT and with other agencies, training, and automation would greatly improve the existing plan that is shown in Appendix A.
Automation of the system would greatly improve the use of the plan and greatly enhance its effectiveness. The ever-changing personnel phone numbers and on-call duties might warrant the use of a database to keep track and automate the notification process.
25

I. Water Sensor Infonnation A. Level l - 3 inches of water on the roadway
1. If levels of 3 inches are detected for a duration of 5 minutes a. Activate flashers (automated by the ALERT system) b. Send message to operator the flashers are activated
2. If duration of less than 5 minutes (no action) 3. If time is available verify water on roadway (Alert does not appear to operators prior to
this 5 minute threshold.) B. Level 2 - 6 inches of water on the roadway
l. Verify water on roadway with CCTV 2. Verify traffic backup with CCTV if flood locations is not visible from the camera, or 3. Field verify (MAP, PD, Other) 4. Activate OMS sign in both directions with appropriate message
C. Level 3 - 9 inches of water on the roadway 1. Have Police en route to intersection to close if needed. 2. Notify maintenance section and others about the condition 3. OMS activated 4. Send out notification based on criteria to be determined
a. Schools b. Media c. Local Agencies (TxOOT, METRO, County, etc.)
D. Level 4 - 12 inches of water on the roadway that will make the roadway impassable. This will vary with roadway width due to the crown of the road. l. Have road closed, impassable 2. Set up detours 3. Notify Schools within x distance or time 4. Notify Media 5. Notify Local Agencies (TxDOT, METRO, County, etc.)
II. Wind Speed Information A. 60 mph cross wind gust alarm
I. DMS activated 2. Contact Media
B. 45 mph sustained cross winds alarm 1. Road Closed to high-profile vehicle 2. An officer will be at the location to enforce the closure and direct trucks to a holding
area. (Must know the capacity of the holding area and a way to notify police when it is safe for trucks to continue)
3. OMS's activated 4. Media contacted
Ill. Ice Information A. All indications of ice given by detectors will need a response B. Deicing material and/or sand trucks should be depJoyed depending on conditions
l. Activate OMS 2. Notify METRO 3. Notify Police to slow people down 4. Notify PIO 5. Provide Information to the Public
Figure 19. Operations Plan Outline.
This database could track and automate the contacting, notification, reporting, and response of emergency responders to adverse condition notifications. An Internet or online based system would provide easy access for individuals and supervisors to update the ••on-call" or responsible parties. Information would be updated automatically and can be viewed by all, almost instantaneously. Some redundancy should be in place in case
26

computer, power, or communications are limited. A chain of command should also be established in case a level cannot be reached. A coordinated effort should be made to keep these policies fresh by reviewing and actively participating in the mock hurricane exercises that are held each year. These exercises would be a good time to coordinate with local police and other agencies. The local OEM or state OEM might have a database setup that would plug into the TxDOT and other agencies' response plans and databases.
ENVIRONMENTAL SENSOR SITE ISSUES
The environmental monitoring system raised the awareness of the flooding locations. These devices also allowed flood events to be quantified. During interviews, site visits, and after action investigations the following questions were raised, "Are sensors located properly and why does this location flood?" Some of the sensors were found not to be located at the point of flooding. Better documentation and set criteria to deploy these sensors would create a more efficient system. The simple question of why does this location flood was not fully investigated prior to installation of the environmental sensors. During the process of this project several locations were identified to have deficiencies from external sources.
While these sensors monitor conditions well, the location of the sensors is critical. Not only do roadway flood sensors need to be at the lowest point on the roadway, they need to be where the flooding occurs. Several problems with the existing system have been identified after using the system for only a short while. The contractor, TxDOT, nor any review identified any problems until the system was in place and operational.
The flood sensor at I-10 on Silber is located at the lowest point on the cross street under the freeway overpass. This sensor location seemed logical from the reports; however, the flooding actually occurs on the westbound frontage road prior to Silber and rarely does the intersection flood. After observing the flooding at this location on several occasions, a couple of different remedies were tried. The TxDOT Westside Area maintenance cleaned the curb gutter and used a vacuum truck to clean the inlets. One week later the area flooded again. A closer look at the hydraulics of the area determined that the pipe size appeared to be adequate. A video camera was sent down the storm sewer pipe and a large block of concrete was discovered as well as a collapse in a lateral pipe that could have eventually caused a sinkhole in the frontage road. TxDOT personnel decided to fix the problem by repairing the lateral and removing the blockage. In addition, a back of curb inlet was added as well as several surface drains approximately 50 feet from the back of curb.
Another problem existed at Beltway 8 and I-10. Intermittent pump problems caused the area to flood, but the pump and controls were rebuilt, which solved the problem. Additionally, this location's standpipe and the rainfall sensor are located under a very high direct connect bridge structure. This oversight reduces the overall effectiveness of the site. It is difficult to verify flooding because this location is not visible using an existing CCTV camera. Also without the presence of an effective rain gauge, weather radar verification and ultimately field verification are required.
27
The Katy Freeway (I-1 OW) flooded over 17 feet to the top of the depressed section of freeway inside the 610 loop during Tropical Storm Allison. During this event almost 16 inches of rain (33 percent of average annual rainfall) fell in a 24-hour period, and almost 39 inches of rain (over 80 percent of the average annual rainfall) fell over a 5-day period. The roadway flood sensors worked well; however, the standpipes were located only halfway up the embankment and when the water rose in this area it flooded the standpipe and shorted out this station. The standpipes were subsequently moved to the top of the bank.
The location where the best readings can be obtained while ensuring the longevity of the system would be ideal. While the station components can be replaced, they are not available when they are needed most, during the flood event.
System reliability is extremely important for real-time applications. Most systems require a high degree of monitoring and maintenance to ensure continual operation. The design of a system can enhance or hinder maintenance operations. Careful consideration to design should be employed to ensure ease of maintenance. If a location is not easily maintained or requires costly or dangerous lane closures it is not likely to receive a high degree of maintenance and will typically experience more downtime.
One such example of maintenance is cleaning and calibrating the pressure transducer. In the case of the Silber intersection, the PT is located on the arterial street, but the pull box that would be used to access the PT is located across the frontage road with at least two 90-degree bends in the conduit and over 100 feet away. If the sensor were pulled out, a return line would need to be attached so the sensor could be pulled back to the location. There is a greater probability of damage to the cable or sensor being pulled a long distance. The other method of maintenance would be to block a lane of traffic on the roadway and pull the cable from the curb to perform the maintenance. This method is still less than ideal because the conduit could fill with sediment and be difficult to clean. It would be desirable to have a pull box a couple of feet from the back of the curb so that maintenance could be conducted without a costly and/or potentially dangerous lane closure.
ENVIRONMENTAL SENSOR MAINTENANCE EXPERIENCE
Due to the newness of the TxDOT environmental monitoring system, a true reflection of the maintenance experience could not be gathered. In lieu of using maintenance records from the TxDOT road sensors, the Harris County OEM stream sensors were used as a surrogate. Both systems are made by the same manufacturer and provide a good correlation. All but a few devices have been in use by the county for many years. Two years of field maintenance reports were collected, entered into a database, and tabulated. The researchers collected and entered a total of 1421 reports. These reports represent 115 sites spread over Harris County to record rainfall rates and stream levels. Researchers reviewed data and divided sensors by type in order to determine which components fail and the relative frequency of failure.
28

Maintenance is critical with any real-time system. The system is only useful if it is functional and operational when you need it, typically in times of severe weather. Some problems can be handled by preventive maintenance while failures require nonscheduled maintenance. The first task was to determine how often preventive maintenance was conducted. Next, the task was to determine how often the technicians visited the sites to repair the sensors in addition to the maintenance visits. Another task was to determine which components of the system or sensors fail more often than the others and how TxDOT and TranStar personnel handle these problems.
Maintenance Intervals
The average maintenance periods and service periods of the sensors, which include scheduled and unscheduled maintenance, range from a low of three days to a high of almost 200. The average preventive maintenance period is about 114 days, and the average time between non-scheduled services is 49 days as shown in Figure 20. The ratio of these averages means that almost half of all services are to repair sensors that have failed, need to be reset, etc. As shown in Figure 20, the graph of the service periods by sensor varies greatly. Investigating the cause of these repairs shows some interesting trends. The components that tend to fail are the transmitter, battery, solar panel, and pressure transmitter, as well as clogged or plugged funnel pipes. Each of these components is discussed in detail below.
Transmitter Failures
Although checked regularly, there were 200 transmitter failures in the two-year data set. The failure rate of the TxDOT sensors was lower, which may be a function of the age of the equipment. Some failures occurred because of broken ports or a shorted transmitter (got wet), while other times the transmitter just needed to be reset. In many cases the technicians did not give any reason for the failure but replaced the transmitter. The transmitter seems to be the weakest link of the system. When the power to the transmitter fails or the transmitter is reset the raw historical data for that site must be reentered.
Battery Failure
The battery supplies the entire site with electricity and is recharged by a solar panel. When the battery gets weak, the sensor may not record and stored data might be lost. Batteries had to be replaced 233 times during the two years. Batteries were often changed through preventive maintenance when battery voltage became low. In theory, the solar panel should keep the battery charged but high temperatures, bad cells, cycling of the battery from a discharged state, and many other battery related problems could cause the batteries to fail.
29

250
200
!!!. 1i 0 ., ~ 150
al " : ! 100 Ill ., >-.. c
50
Sensors ID era e
Figure 20. Recorded Number of Days Between Scheduled and Non-Scheduled Maintenance.
Solar Panel Failure
The solar panel supplies the battery with energy. Its failure effects are not instantaneous to the system, but if not detected, the battery will run down and the system fails. The battery also has to be changed or at least recharged if a solar panel becomes defective. While the most common defect is an internal problem requiring the solar panel to be replaced, sometimes there are other problems such as dirt and external influences that change the orientation of the panel that require cleaning or adjustment. Another common problem occurs when the leads from the solar panel break and new leads need to be installed. The solar panel and battery can be replaced preventively when the power gets too low. There are 63 reports dealing with the solar panel.
Pressure Transducer Failure
The PT, which is the main component of the flood sensors, is a device that measures the water depth on the roadway. The PT was mentioned 116 times in the maintenance reports. However, the PT was never the cause of failure of the system. It was always just maintained and cleaned by washing out any sediment and then rinsing it in a bleach solution to clean any mold that might be present. The diaphragm that measures water level on these devices is very sensitive and can be easily damaged if sediment is pushed too hard when cleaning. These sensors have a vent tube that leads back into the transmitter that prevents backpressure on the diaphragm. Moisture can clog this tube, but the tube is typically kept dry by descant crystals. These descant packets need to be replaced periodically.
30

Rain Gauge Failures
Clogged and plugged pipes and gauges were expected to be the main problem with the environmental monitoring system. This was not the case as only 27 reports mentioned a problem with clogged or blocked pipes or sensors. The most frequent problem was plugged rain gauge funnels. The rain gauge may become clogged with spider webs, bark, etc. Another occasional problem occurs when the magnetic switch that measures the number of tips on the tip bucket goes bad. Plugged funnels and gauges cause wrong or even no rainfall reports to be recorded in the database.
Maintenance Summary
The most frequent repair with the environmental sensors is the transmitter. This failure type is compounded by the fact that it cannot be monitored. While the battery and/or the solar panel are problematic, these two devices can be monitored from the central location. Problems with these devices can also be better diagnosed and addressed with preventive maintenance. The components not mentioned in this section do not seem to be problematic. Although problems with the pressure transducer, and clogged pipes and gauges are mentioned quite frequently in the reports, they do not seem to be a major problem.
The accuracy of these data is limited because many of the reports were incomplete. More complete or better maintenance records would be helpful in determining better maintenance practices and identifying faulty equipment. They could also be used to determine better diagnostics and potentially better design of the sensors and/or placement of the sensors.
Field personnel stated that routine maintenance is conducted many times when field visits are made to repair a failed component. Some sites may also be visited many days in a row due to a "replace and see" approach as opposed to a more diagnostic approach. In many cases certain items cannot be replaced because there is not an adequate supply of replacement or spare parts. This often occurs when defective parts are sent back to the manufacturer for repair, and replacement parts are not readily available. Multiple visits to a site may be required if or when adequate time is not available to fully repair the site.
Drawing from the experience of the field technicians who maintain these devices revealed some potential maintenance problems with the roadway flood sensors. Their first concern was the location of the PT along the curb line and the potential for sediment to block the holes in the conduit, preventing the sensor from reading accurately. Another concern was that the fine sediment might damage the PT. Further field experience will determine if these concerns are warranted.
Maintenance personnel cited two design concerns. First, the holes in the conduit cap allow water into the curb sensor, which could easily be clogged. These holes might need to be larger, which could lead to problems with the PT clogging or even becoming damaged. One preventive measure might be to cover the PT with pantyhose. The PT
31

would eventually clog but the pantyhose should protect the sensor. The other problem cited was the difficulty in maintaining some of the sites. Long pulls to remove the PT for cleaning and maintenance would be difficult and therefore might not get done as frequently. Having to pull the PT from the curbside would require a lane closure, which might also reduce the frequency of maintenance to the sensor. Ground boxes located near the curb where the PT could easily be pulled for maintenance would provide an easy way to flush sediment from the conduit.
CASE STUDY EVENTS
The anecdotal benefits were documented by means of after-event interviews as part of this evaluation. The action taken and response to a particular environmental incident varied greatly depending on the level of flooding, intensity of the storm, the operations personnel, and those receiving the request as well as the amount of activity that was taking place in the operations center. Although formal procedures exist for situations such as roadway deficiencies, there is inadequate detail to fully respond to flood events. The highly variable nature of these events points to the need to set priorities, establish agreements, and obtain buy-in from the operations, maintenance, and responding agencies both within and external to TxDOT. fu addition, there are institutional issues about Internet access and the amount of personal contact required to notify, inform, update, and document calls to manage an environmental incident.
After-event interviews were conducted for one near-ice incident, six localized flood events, and four area-wide flood events. The first environmental incident was an ice incident that required maintenance supervisors to acquire futernet access just before the storm. Maintenance personnel did not know how to use the system or how it might benefit them, requiring them to be trained on the system before the storm hit. Maintenance personnel saw the system as favorable. The benefits sited were many potential ice locations could be monitored and did not require a continual field check to determine if ice was present requiring the roadway to be shut down. Air and bridge deck temperature as well as the presence of moisture could be monitored for the possible formation of ice. Several locations could be monitored from one site without requiring maintenance personnel to do periodic field checks for icy conditions.
The localized flooding events were the most difficult to document because the locations did not have CCTV coverage to verify the flooding, and the flooding only lasted for a short period of time, which prevented field verification. The following sections will document each event with respect to the environmental monitoring system.
December 2000 Ice Event
On December 12, 2000, the National Weather Service issued a "Winter Storm Watch" that was expected to hit the Houston area later that night. Temperatures were expected to range from 27 to 32 degrees with ice accumulations of 1110 of an inch likely to form on roadways, trees, and power lines. There was some warning for this event, and on Monday, December 11, TxDOT maintenance department made preparations to deploy the anti-icing agent, magnesium chloride.
32

The maintenance section checked truck and deployment equipment in addition to determining the amount and density of the magnesium chloride. Approval was obtained to utilize Internet access. Central maintenance section supervisors were trained on the environmental monitoring system and interpretation of bridge deck temperature, air temperature, and road conductivity to determine when ice might form.
Overall the event went smoothly and the system performed well. No ice formed in Houston, but ice was reported in Hempstead. The ice sensors were very useful and enthusiastically received by maintenance staff, allowing Tx.DOT to determine if ice had formed on bridges without having to send numerous personnel to the field to monitor conditions. This potentially could reduce the amount of manpower required to handle such an incident. No predetermined plans on how an ice incident is handled were reported.
During this event, which did not fully test the system, only one incident occurred. A pump on one of the trucks failed while trying to disperse the magnesium chloride. It was estimated that the maintenance personnel needed six to 12 hours lead time, depending on traffic conditions and time of day, to assemble staff, ready equipment, and deploy the anti-icing agents such as magnesium chloride. Supervisors stated staffing was adequate, but if events go on for extended periods of time, shortages of supplies, equipment, and personnel might occur. A total of 40 people were on-call including TxDOT maintenance staff during this event. Other staff might potentially be used for office type work or monitoring, but sand trucks and other equipment typically require operators to have a commercial driver's license.
Additional ice sensors are planned at the northern edges of the district (shown in Figure 3) due to the success and enthusiasm of the maintenance staff. These periphery ice sensors will be used to monitor and document the advancement of the storm. A simplified graph and ice alarm system would be helpful due to the infrequent nature of events and the turnover rate of employees. The maintenance personnel indicated that more graphical information would be better than the current tabular form. Adding sensors to the system, improving and adding graphs, and using alarms certainly would be helpful.
Silber Flood Site
The Silber location has the most extensive flooding documentation because of its high frequency of events and the ability to verify the high water using CCTV. This location floods on the westbound frontage road about a quarter mile east of the intersection where the exit ramp meets the frontage road as shown in Figure 21. Over the past year this location has flooded several times. High water typically blocks the right two lanes but one lane can typically squeeze by if the drivers go slow through the area.
33
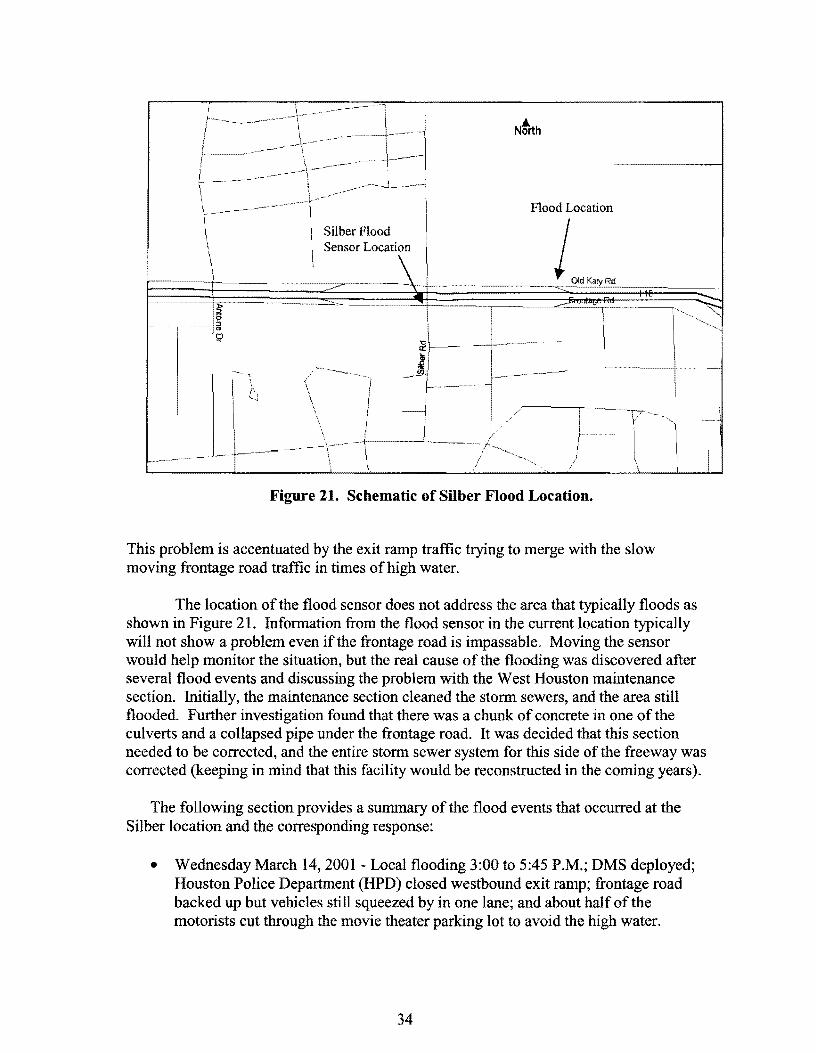
Silber Flood Sensor Location
Flood Location
Figure 21. Schematic of Silber Flood Location.
This problem is accentuated by the exit ramp traffic trying to merge with the slow moving frontage road traffic in times of high water.
The location of the flood sensor does not address the area that typically floods as shown in Figure 21. Information from the flood sensor in the current location typically will not show a problem even ifthe frontage road is impassable. Moving the sensor would help monitor the situation, but the real cause of the flooding was discovered after several flood events and discussing the problem with the West Houston maintenance section. Initially, the maintenance section cleaned the storm sewers, and the area still flooded. Further investigation found that there was a chunk of concrete in one of the culverts and a collapsed pipe under the frontage road. It was decided that this section needed to be corrected, and the entire storm sewer system for this side of the freeway was corrected (keeping in mind that this facility would be reconstructed in the coming years).
The following section provides a summary of the flood events that occurred at the Silber location and the corresponding response:
• Wednesday March 14, 2001 - Local flooding 3:00 to 5:45 P.M.; DMS deployed; Houston Police Department (HPD) closed westbound exit ramp; frontage road backed up but vehicles still squeezed by in one lane; and about half of the motorists cut through the movie theater parking lot to avoid the high water.
34

• March 27, 2001 - 11:00 to 11:30 P.M.; Houston TranStar called West Harris maintenance about standing water on westbound frontage road; and at 11:38 P.M. area maintenance staff reported no water on the roadway.
• March 28, 2001 - 2:00 A.M.; high water was reported by HPD; and West Harris maintenance section was again called and notified about the condition.
• April 18, 2001 - Hailstorm caused area-wide flooding and damage. Slowdowns in the area were observed but no confirmed flooding.
• May 11, 2001 - Local flooding DMS sign deployed and HPD contacted. No response and water receded about 20 minutes after rain slowed.
• June 5, 2001 - Tropical Storm Allison caused area-wide flooding, which receded after about 24 to 36 hours. Silber was not impassable.
• June 8, 2001 - Tropical Storm Allison caused area-wide flooding dumping more than 26 inches of rain in a 24-hour period. High water accumulated in the area but receded quickly once the rain slowed.
• June 9, 2001 - Silber was impassible from midnight to 7:00 A.M. • July 2001 - Rehabilitation of the westbound frontage road.
Other Localized Flood Events
Several other localized flood events were observed from review of the data and confirmed by media coverage. But lack of timely detection, verification via CCTV, or manual inspection led to no response or notification. Several flooding incidents were reported, but the locations could not be verified by any source.
Area-wide Flooding Events
Several area-wide flood events occurred in the Houston area during the study period. During most of these events, operations personnel were actively involved in incident management activities or performing other duties. The environmental sensors were monitored as time permitted.
March 28, 2001 Area-wide flooding caused several intersections in the Houston area to go under
water. Some of these sites retained water long after the rain subsided. The water in these areas was not able to go down due to high bayou conditions. Many vehicles were flooded and large traffic delays were incurred. Some of the flooded sites had sensors (1-10 at Southern Pacific Railroad and Memorial at Houston Street); and many others did not (Memorial at Shepherd and Memorial at Waugh). Flooding at these locations appears to be a direct result of high water levels on Buffalo Bayou. Flooding at most of these sites was verified by the reports on local television media. Figure 22 and Figure 23 show the flooding on Memorial at Shepherd and Memorial at Houston Street.
35
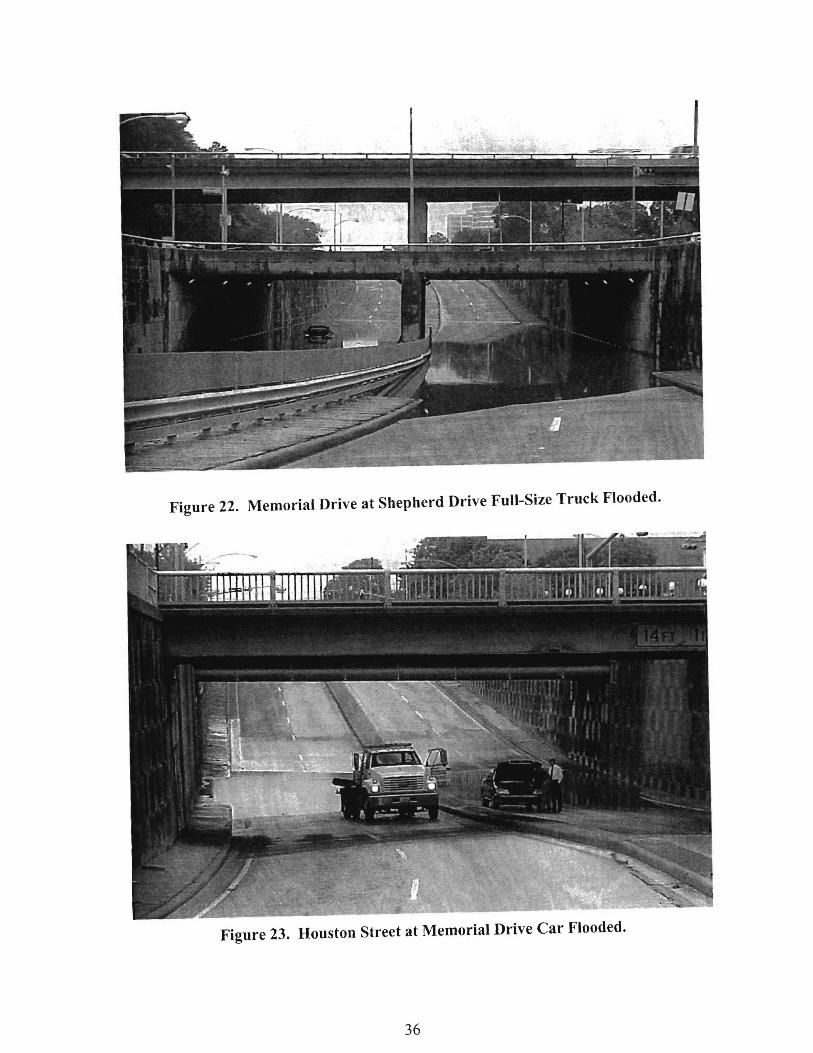
Figure 22. Memorial Drive at Shepherd Drive Full-Size Truck Flooded.
Figure 23. Houston Street at Memorial Drive Car Flooded.
36

April 18, 2001 A hailstorm ripped through the southeast side of Houston causing a lot of damage
with high winds, damaging hail, and area-wide localized flooding. Water quickly receded once the heavy rain stopped in most of these areas.
Tropical Storm Allison Tropical Storm Allison spawned area-wide flooding on several different days.
This was a slow-moving storm, which dumped a lot of rain on the southeast side of the Houston area. The following is a day-by-day account of Tropical Storm Allison (4).
June 5, 2001 Tropical Storm Allison formed in the early morning hours just off the Texas coast
and made landfall about 7:00 P.M. Allison remained nearly stationary over the Friendswood area dropping approximately 12 inches of rain in two hours. It then moved west and north toward downtown and then remained stationary again for about two hours dropping 8 to 10 inches of rain. This slow-moving tropical storm caused area-wide flooding in the south and east parts of town flooding approximately 600 homes. The storm moved to the north near Huntsville with only light rain falling in the Houston area.
June 7, 2001 The remains of Allison started to move south with the outer rain bands gathering
moisture and strength from the Gulf near Freeport. Several bayous overflowed their banks causing flooding, which required approximately 75 people to be rescued from their homes. The Red Cross opened two shelters. Harris County received 4 to 10 inches of rain.
June 8, 2001 Updates and advisories were issued to all county departments, and weather
forecasters predicted rainfall rates of up to 14 inches. Rainfall rates started to increase in the afternoon and the central and eastern portions of the county were fully involved in the storm by sunset. Evacuation and rescue calls started at about 10:30 P.M.
June 9, 2001 Widespread flooding was reported in northern, central, and eastern parts of Harris
County. Many bayous were at the top of or over their banks. A total of 11 inches of rain fell in portions of the county. Harris County 911 dispatch was relocated to Houston TranStar due to flooding of the primary site. Numerous homes and vehicles were lost to flooding or severely damaged due to flooding. Many major roadways, thoroughfares, access roads, and secondary roads were impassible. Some freeways were 17-plus feet underwater. A request was sent to the Governor for assistance, FEMA was contacted, and evacuation and rescue continued. The US Coast Guard rescued 285 people, and the National Guard rescued between 1500 and 2000 people. Rural fire departments rescued 3500 residents, Harris County Marine rescued 1034 people, and Harris County Air Search and Recovery performed 84 aerial extractions.
37

Tropical Storm Allison Event Totals
At the height of the storm, there were 51 shelters housing 30,000 people. By the end of the storm 44,845 homes and 1656 businesses were damaged with an estimated loss of$1.76 billion and $1.08 million, respectively. Other structural losses such as The Houston Medical Center, colleges/universities, water districts, and school districts totaled $2.04 million. The total estimated damage to Harris County was $4.88 billion with 22 confirmed deaths.
Allison taxed the local agencies to their limits. Several lessons learned will be outlined in the Findings section of this report. Allison was unique in several ways. First, Allison did not come with a lot of advanced warning. In a little over 12 hours, it formed and made landfall. This quick formation is highly unusual for tropical weather. Typically there are days, even weeks, of watching and preparing for such a storm. Next, it was long lived. Several times the storm circled counterclockwise from the coast to Huntsville regaining strength and moisture over the Gulf then slowly moving over the Houston area dumping large amounts of rain. This storm was not a severe storm in the sense of high winds, but it was slow-moving storm that dumped a lot of rain in the Houston area as seen in Figure 24. As much as 16 inches of rain fell in a 24-hour period, which is almost a third of the yearly rainfall in one day.
The TxDOT staff at Houston TranStar was inundated with calls. Operators answered approximately 400 calls per hour from the general public. TxDOT policy states that each phone call be answered. During this event, almost all the operators' time was spent answering the phone, limiting the amount of time that could be spent on traffic operations and incident management. Communications and information flow varied depending on the time and agency. The environmental monitoring system documented the rain event, but limited benefits were realized during this storm.
38

Figure 24. Tropical Storm Allison Flooding.
39


INTERNET SURVEY
TxDOT conducted a survey through the environmental sensor website to obtain information on the benefits of an Intelligent Transportation System Environmental Monitoring System. The survey afforded an opportunity to gather information on how people get environmental information, the understanding of the information, and the usefulness of the information.
The survey contained 1 7 questions about how motorists obtain their environmental information and other related topics. It also contained seven additional questions, which were used to distinguish demographic and other background information. Appendix C contains a sample copy of the environmental sensor survey.
A total of 30 surveys were completed on the environmental sensor website. The following paragraphs summarize the major results and findings of the survey. Appendix C shows the response percentages for the survey.
The first seven questions on the survey were related to the warning sign that states "WATCH FOR WATER ON ROAD." Almost three-quarters of the people surveyed indicated they have seen the sign before. Out of all of the survey respondents, all but one stated that they knew what the sign meant. Seventy percent of the respondents actually knew the correct meaning of the sign. Another 17 percent of the respondents stated that the sign meant that there is a low-lying area ahead and that it is prone to flooding. Over three-quarters of the respondents have never seen the beacons on the sign flashing; however, every response to the survey stated that when the beacons are flashing that the sign means to either use caution, there is high water on the roadway, or that the roadway is flooded. A little over half of the respondents said that you should stop or change route because the roadway or intersection is flooded whereas under half of the respondents said that you should be cautious of high water and be prepared to stop when the beacons on the sign are flashing.
Three questions addressed the type of vehicle each respondent drives and whether or not they have ever been flooded in their vehicle. Over 50 percent of the respondents drove either a SUV or a pickup truck, and 41 percent drove a car. Only 17 percent of the survey respondents have ever flooded their vehicles, and half of the people knew that there was high water before entering the section of roadway.
The third part of the survey investigated where drivers get their environmental information and the usefulness of that information. Seventy-four percent of the respondents have seen a manual flood gauge, and 26 percent have seen an electronic flood gauge. Most of the drivers get informed about threatening weather mainly from the television, the Internet, the radio, and finally from a pager. Over 90 percent of the respondents check traffic and weather from their home and work. Out of the 30 surveys, only two people did not know that there was flood and weather information for the Houston area available on the Internet. Ninety-three percent of the respondents found the environmental monitoring website either from a website link or from a friend. Also, 90 percent of the people thought that the website included useful information.
41

Seven questions of the survey pertained to the demographic makeup of the survey respondents. The categories included age, gender, ethnic background, income, occupation, and miles traveled each day. The typical respondent was an Anglo-American who is 36 years of age or older. Almost all of the people surveyed were either a government employee, self-employed, or a corporate employee who makes $50,000 or more each year. Also, 53 percent of the drivers drove more than 30 miles each day. Table C-2 in Appendix C summarizes the characteristics of the survey sample.
Due to the low number of respondents and the fact that the survey was an Internet-based survey could skew the results. Although this was not a scientific survey, it does indicate that the general public understands the flood sensors and warning signs.
42

CASE STUDY SIMULATIONS AND BENEFITS
Simulations were performed at two environmental flood sensor locations. These locations were the westbound frontage road ofl-10 Katy Freeway between Post Oak and Silber and the westbound frontage road ofl-10 Katy Freeway at Beltway 8. Synchro 5, a microscopic simulation software package (~), was used to set up a network around the flood sensor locations, and SimTraffic 5 was used to evaluate motorist delays. Because SimTraffic is a stochastic model, multiple runs were performed for each scenario and the output values averaged. Total network delay was the measure of effectiveness recorded in these simulations. Simulations were performed for the midday off-peak time period and the P.M. peak hour. Turning movement counts were conducted during these periods for all of the intersections within the simulated network. Figure 25 shows the network modeled for the 1-10 Katy Freeway location near Silber while Figure 26 shows the network modeled for the 1-10 Katy Freeway at Beltway 8 location. The networks were designed to accommodate potential diversion routes.
1-10 KATY FREEWAY AT SILBER
The westbound frontage road ofl-10 commonly floods just upstream of the Silber exit ramp gore. Physically, there are two lanes worth of pavement in the area; however, the left lane is striped to taper down to one lane upstream of the exit ramp merge. This location begins to flood in the right lane; however, vehicles are able to proceed around the high water by traveling in the striped off area. Under more intense flooding situations, both lanes become flooded, and the section becomes impassable. Vehicles are then forced to tum around and go back to Post Oak and divert to another route. Four scenarios were evaluated at this location:
• Base Condition - no water on pavement; • Partial Flooding right lane with water on pavement, vehicles able to proceed
at low speeds through the water or drive around to the left; • Flooded without Traffic Control - roadway is impassable, no traffic control at
Post Oak, vehicles travel to flooded section, tum around, and take diversion routes; and
• Flooded with Traffic Control - traffic control at Post Oak diverts vehicles before entering the frontage road west of Post Oak.
Because of the proximity ofWestview to the north ofl-10 and Memorial to the south ofl-10, these streets were seen as the primary diversion routes. For the simulations it was assumed that 50 percent of diverted vehicles traveled Post Oak to Memorial to Silber, and 50 percent of the diverted vehicles traveled Post Oak to Westview to Silber. Tables 1, 2, and 3 present the results of the Silber simulations.
43

:::JI '1ij Ill l:! ~
t N
Figure 25. 1-10 at Silber Synchro 5 Modeling Diagram.
i ff: a: u. N ao ao
>- >-Ill tll
~ it 'i
Conrad al al
Brittmore ffi m Sauer z
' ~ '" ,/
I I
I
li c: ~ Ill 0
Figure 26. 1-10 at Beltway 8 Synchro 5 Modeling Diagram.
44
Old Katy Rd WBHO FR
EB 1-10 FR

Table 1. Results of Partial Flooding Simulation, 1-10 Near Silber.
Time Period Base Average Partial Flooding Increase in Total Percent Increase Delay (hrs) No Diversion Network Delay
Delay (hrs) (hrs) Midday 38.0 40.0 2.0 5% Off-peak P.M. Peak Hour 70.0
I 86.8 16.8 24%
Table 2. Results of Flooded Roadways Without Traffic Control Simulation, 1-10 Near Silber.
• Time Period Base Average Flooded without i
Increase in Delay Percent Increase Delay (hrs) Traffic Control (hrs)
Delay (hrs) Midday 38.0 80 42.0 111% Off-peak P .M. Peak Hour 70.0 352.0 282.0 403%
Table 3. Results of Flooded Roadways With Traffic Control Simulation, 1-10 Near Silber.
Time Period Base Average Flooded with Increase in Delay Percent Increase Delay(hrs) Traffic Control (hrs)
Delay (hrs) Midday 38.0 50.0 12.0 32% Off-peak P.M. Peak Hour 70.0 202.0
I 132.0 189%
The results of the Partial Flooding simulation show very little impact on motorist delay. This is expected as there is no diverting of vehicles and the presence of high water in the right lane simply results in slower speeds through the area as vehicles either drive slowly through the water or veer around the water to the left. There are significantly higher delays associated with the Flooded without Traffic Control and the Flooded with Traffic Control simulations as these simulations involve diverting vehicles through the network. The Flooded without Traffic Control scenario results in the highest delay as motorists incur delay traveling to the flooded section, getting turned around and backtracking to Post Oak as well as delay associated with the diversion route. In the Flooded with Traffic Control scenario, traffic control is assumed to be implemented, whether in the form of a barricade or police officer and car, to physically block vehicles from entering the westbound frontage road at Post Oak.
45

While motorists' delays will always be higher when taking a diversion route that is longer and involves more signals than the original intended route, the benefit of the environmental sensor at this location is being alerted to the condition such that traffic control could be implemented at the Post Oak and westbound frontage road intersection. Looking at Tables 2 and 3, it can be seen that the value of providing traffic control would be the value of delay saved between the without and with scenarios. For example, in the P.M. peak-hour scenario, network delay in the Flooded without Traffic Control scenario totaled 352 hours while the network delay in the Flooded with Traffic Control scenario totaled 202 hours. Thus, traffic control is estimated by the model to save approximately 150 hours under the given conditions. Using the current value of time for 2001 of $16.24 (CPI= 174.0, driver value of time of $12.99, 1.25 percent occupancy), the value of delay saved by traffic control would be approximately $2400 during the peak hour. As flooding at this location could potentially last several hours, the benefit of traffic control could be much higher.
I-10KATYFREEWAYATBELTWAY8
The I-10 Katy Freeway westbound frontage road and Beltway 8 frontage roads flood during major rain events. These two intersections of the box diamond interchange were modeled as flooded and impassable. The network for this simulation included the I-10 Katy Freeway frontage roads and Old Katy Road intersections at and between Wilcrest and Gessner. Being a box diamond interchange, many movements were effected by closing the westbound frontage road intersections with the Beltway 8 frontage roads. Old Katy Road was heavily used in the diversion of vehicles. Traffic was diverted as follows:
• Northbound (NB) Beltway 8 frontage road to NB Beltway 8 frontage road right on Eastbound (EB) Katy frontage road, Gessner U-tum to Westbound (WB) Katy frontage road, right on Conrad Sauer, left on Old Katy Road, right on NB Beltway 8 frontage road;
• NB Beltway 8 frontage road to WB Katy frontage road - right on EB Katy frontage road, Gessner U-turn to WB Katy frontage road, enter Katy Freeway before Beltway 8;
• EB Katy frontage road to NB Beltway 8 frontage road - EB Katy frontage road, Gessner U-turn to WB Katy frontage road, right on Conrad Sauer, left on Old Katy Road, right on NB Beltway 8 frontage road;
• WB Katy frontage road to WB Katy frontage road - assumed would enter the freeway before Beltway 8, not considered in model;
• WB Katy frontage road to NB Beltway 8 frontage road - right on Conrad Sauer, left on Old Katy Road, right on NB Beltway 8 frontage road;
• Southbound (SB) Beltway 8 frontage road to SB Beltway 8 frontage road -right on Old Katy Road, left on Britmore, Wilcrest U-turn to EB Katy frontage road, right on SB Beltway 8 frontage road, also right on Old Katy Road, left on Wilcrest, right on EB Katy frontage road, right on Beltway 8 SB frontage road; and
46

• SB Beltway 8 frontage road to EB Katy frontage road- right on Old Katy Road, left on Britmore, Wilcrest U-turn to EB Katy frontage road, also right on Old Katy Road, left on Wilcrest, right on EB Katy frontage road.
Table 4 shows the results of the 1-10 Katy Freeway and Beltway 8 flooding simulations. As traffic volumes are much higher and more traffic movements are effected by flooding conditions at 1-10 at Beltway 8 compared with 1-10 at Silber, motorist delays incurred by diverting traffic is much greater. Using the value of time of $16.24 per hour, road user costs associated with diversion delay are approximately $6770 per hour for the midday off-peak period and approximately $14,425 for the P .M. peak hour. As mentioned previously, flooding conditions often last for a period of time greater than one hour as simulated here, thus delays and road user costs could be much higher depending on the duration of the flooding event.
Table 4. Results of Flooded Simulation, 1-10 Katy Freeway at Beltway 8.
Time Period Base Average Diversion Delay Increase in Delay Percent Increase Delay (hrs) (hrs) (hrs)
Midday 134.4 551.2 416.8 310% Off-peak P .M. Peak Hour 264.0 1152.4 888.4 337%
The delays shown in Table 4 assume that all vehicles that would normally travel through the flooded intersections see the flooding in the local area and take the closest diversions. It is not known, however, what kind of impact dissemination of the flood event information could have on changing routes or departure times either pre-trip or en route prior to arriving at the local area. The purpose of the environmental sensor system is to provide the capability to promptly detect and identify flooding conditions and locations. The benefits of such a system, however, are directly tied to the performance of other operations, such as providing upstream traffic control and dissemination of information. If these other activities are not carried out in a timely and proper manner, there is no realized benefit of the system to the public even if it functions perfectly. Some benefit might be realized if automated systems are in place such as the active warnmg signs.
Providing traffic control at intersections upstream of flooded locations increases safety. Keeping vehicles out of flooded areas prevents vehicle damage and the potential loss of life. Traffic control at intersections upstream of flooded locations also reduces motorist delay, as motorists do not enter essentially dead-end roadways where they may become blocked by neighboring vehicles or at a minimum forced to tum around and travel back upstream.
Disseminating flood event information in a timely manner can increase safety and reduce motorist delay. Media used may include television, radio traffic reports, Highway Advisory Radio (HAR), Internet websites, and DMS message signs. Motorists informed
47

of a flooded location on their typical travel route might alter their travel route, adjust their departure time, or cancel the trip altogether. Informed motorists may not only avoid the specific location of the flooding but also travel in other corridors to avoid area congestion resulting from vehicles diverting to neighboring facilities.
COSTS
There are many associated costs with the environmental monitoring system. Some of these costs are shared with other agencies and would be spent regardless of whether the system was implemented or not. First, there is the cost to install the environmental monitoring system. This cost includes the price of the sensors and installation. Much of the required infrastructure was already in place and being used by Harris County OEM. This infrastructure includes the repeaters, receivers, database, and software development. Additional costs were incurred to fully integrate the system to the control room floor but this integration provided the most use and benefit. As discussed previously, maintenance of the system is vital. Real-time systems require a lot of time and money to properly monitor and maintain the system to ensure it remains operational. There are also the costs of the individuals required to operate the system and take action when an environmental event occurs. This cost includes the traffic operations personnel that monitor the system, verify the event, and notify staff and other agencies. Each agency has their costs to react to the environmental event. There is a cost to close the road if the road is impassable or the cost to divert buses and emergency services. All of these costs need to be weighed against the benefit of the system and the cost of replacing property that is damaged by rising waters.
BENEFITS
Many of these benefits are difficult to measure or estimate. These intangible benefits are discussed in general terms and with the full understanding that any sort of environmental event will cause some delays or costs. The case studies were conducted to quantify the delays incurred by an environmental event. These costs are conservative because it is unknown how many people would not start a trip or would change route because of the information provided by the system. These benefits are based only on the time savings realized and not the loss of life or property. However, the life and property costs could be substantial. How many people would not flood their car or become injured if they know about a flooding condition? Or how many lives would be saved if a truck did not overturn on a bridge during a hurricane evacuation? How many lives could be saved if emergency services know an area is blocked due to an environmental event and already has the quickest, safest route? And, how much time do motorists and transit patrons save if efficient detours are put in place quickly and prudently? The benefits of the system are almost immeasurable when considering the time saved and the prevention of loss of life that could occur.
48

FINDINGS AND RECOMMENDATIONS
The environmental monitoring system consists not only of the sensors, transmitters, database, and alarms but also the communications system and people who respond to the environmental events. System effectiveness depends on all parts working together. Since the people are such an integral part of the system, a defined operations plan detailing staff responsibilities for maintenance, verification, notification, and response to an incident is vital. Typically, when a storm event is occurring the operators are very busy performing their primary duties. For this reason automating as many functions as possible should be a priority. Due to a broad range of jurisdictions and agency functions, multi-level and multi-agency agreements need to be in place and clear lines of communication defined.
A defined monitoring and preventive maintenance plan and unscheduled repair mechanisms must be in place. In addition to a preventive maintenance program, an operations plan to respond to an environmental event needs to be in place, tested, and exercised.
Event notification information should be provided to decision makers such as the Police Department, the Office of Emergency Management, TxDOT sections, and the traveling public. In addition to making this information available, training with the system and operations plan is important. In addition to interagency agreements, institutional issues will need to be addressed.
A secondary benefit to the system is the documentation of the magnitude and frequency of an environmental event that can be used to assess responses and operations plans and to identify infrastructure improvement needs. Defining the cause of the flooding may lead to some design improvements. This section will document some of the lessons learned from an intense tropical storm rain event. Each of these items is described in detail in the following sections.
Overall the system works well; however, future integration to the control room floor will enhance the system greatly. Many lessons were learned on where and how environmental sensors should be installed to minimize maintenance and maximize their operation. Initial findings based on a small survey sample indicate that the public understands the warning signs.
OPERATIONS PLAN
The operations plan provides guidance on response to incidents, how agencies work together, the chain of command within an agency, timing of maintenance, training, and coordination. Each of these aspects will need to be defined in the plan. The following sections will document and highlight some of the observations made during the research project and through the after-event interviews with the different agencies and staff members.
49

Multilevel Interagency Agreements and Internal TxDOT Agreements
Currently no formal agreements could be found documenting how agencies will interact with each other, with the exception of the mention of a coordination effort. Most of the language in the current plan says TxDOT will coordinate with the Department of Public Safety (DPS). Based on interviews there appears to be discrepancy on who is responsible for closing and maintaining closures during flood events. This is complicated by the fact that the Houston area is serviced by many law enforcement agencies, and the locations where flooding occurs are not always under the jurisdiction of DPS but rather the City of Houston, the Harris County Sheriffs department, or the Constables office. Most local law enforcement agencies do not know an environmental monitoring system exists. Part of the solution is education of the system and its capabilities along with some suggested detour routes based on traffic flow and knowledge of the roadway network. With this preliminary work in hand, formal agreements on how information will be communicated and the response that is expected will need to be made.
Every agency should agree as to who will provide what service or action and when. These formal agreements need to be made at a high enough level that the agreements will command the respect deserved and the longevity required to maintain these arrangements through organizational and personnel changes. Arrangements for the entire area should be made that might include TxDOT, cities in the Houston area, and all law enforcement agencies in the Houston area. Agreements need to be made on what agency will be responsible for each activity and how they might be contacted, keeping in mind that redundancy in communication and personnel are essential. During times of emergency, some communication systems may be affected and certain individuals may not be able to be contacted, requiring alternate means of communication and/or personnel to be utilized.
Some of the major issues that need to be addressed are:
• what agreements are currently in place; • what communication networks can be used; • who is responsible for closing roadways during flood events; • how redundancy and automation can be built into the system; • development of an operations plan so that supervisors can make informed
decisions based on guidelines. • the need for proper training for all levels of the organization on the
environmental monitoring system; • the need for training for field personnel on how and where known flood
sites should be closed and general guidelines on how any site should be closed based on safety, traffic operations with limited manpower and resources;
• establishment of the priority of environmental events compared with other duties; and
• development of agreements on where to detour traffic (jurisdictional concerns).
50
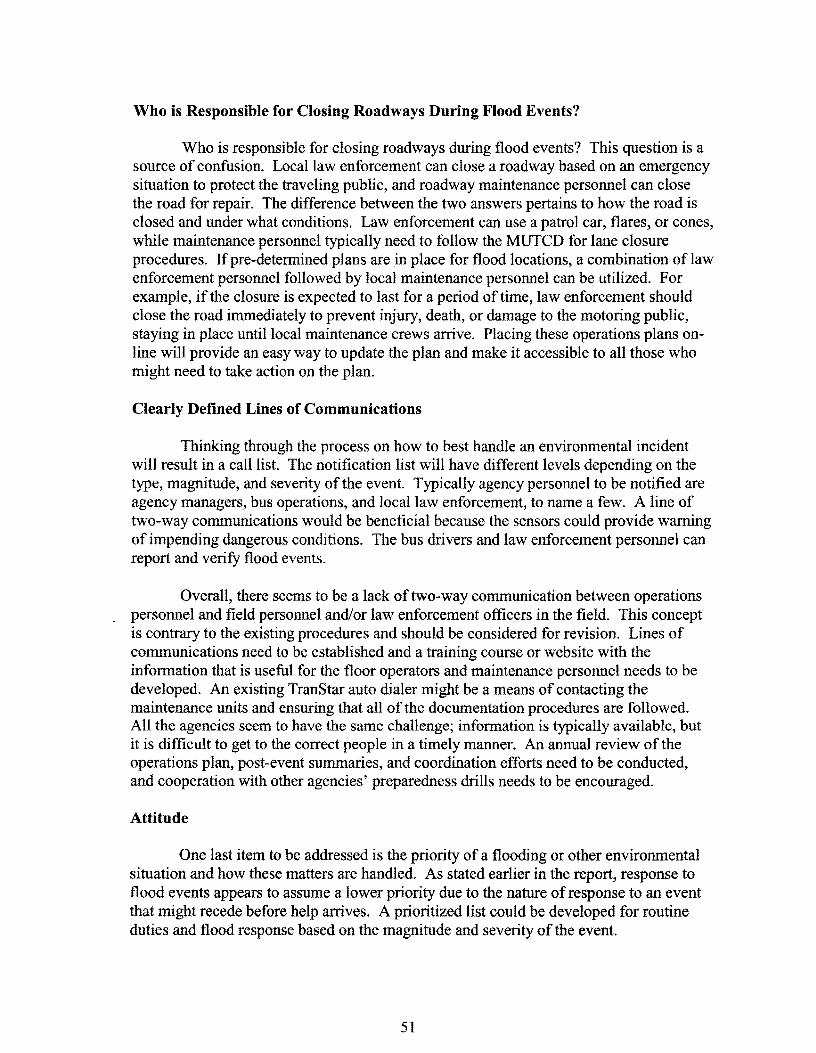
Who is Responsible for Closing Roadways During Flood Events?
Who is responsible for closing roadways during flood events? This question is a source of confusion. Local law enforcement can close a roadway based on an emergency situation to protect the traveling public, and roadway maintenance personnel can close the road for repair. The difference between the two answers pertains to how the road is closed and under what conditions. Law enforcement can use a patrol car, flares, or cones, while maintenance personnel typically need to follow the MUTCD for lane closure procedures. If pre-determined plans are in place for flood locations, a combination of law enforcement personnel followed by local maintenance personnel can be utilized. For example, if the closure is expected to last for a period of time, law enforcement should close the road immediately to prevent injury, death, or damage to the motoring public, staying in place until local maintenance crews arrive. Placing these operations plans online will provide an easy way to update the plan and make it accessible to all those who might need to take action on the plan.
Clearly Defined Lines of Communications
Thinking through the process on how to best handle an environmental incident will result in a call list. The notification list will have different levels depending on the type, magnitude, and severity of the event. Typically agency personnel to be notified are agency managers, bus operations, and local law enforcement, to name a few. A line of two-way communications would be beneficial because the sensors could provide warning of impending dangerous conditions. The bus drivers and law enforcement personnel can report and verify flood events.
Overall, there seems to be a lack of two-way communication between operations personnel and field personnel and/or law enforcement officers in the field. This concept is contrary to the existing procedures and should be considered for revision. Lines of communications need to be established and a training course or website with the information that is useful for the floor operators and maintenance personnel needs to be developed. An existing TranStar auto dialer might be a means of contacting the maintenance units and ensuring that all of the documentation procedures are followed. All the agencies seem to have the same challenge; information is typically available, but it is difficult to get to the correct people in a timely manner. An annual review of the operations plan, post-event summaries, and coordination efforts need to be conducted, and cooperation with other agencies' preparedness drills needs to be encouraged.
Attitude
One last item to be addressed is the priority of a flooding or other environmental situation and how these matters are handled. As stated earlier in the report, response to flood events appears to assume a lower priority due to the nature of response to an event that might recede before help arrives. A prioritized list could be developed for routine duties and flood response based on the magnitude and severity of the event.
51
PREVENTIVE MAINTENANCE
Proper preventive maintenance is required to keep the system operational. Daily checks of the data are needed to ensure that all the system devices are reporting. If a sensor has not reported in the past 12 hours, the proper maintenance should be performed in order to correct the problem. The sensors should be checked to ensure reasonable data are being reported. Review of the report readings should be consistent with the normal readings for the area. Check each device; if a problem is found, perform the maintenance to correct the problem.
Each quarter it is necessary to visit each sight in order to verify the general condition of the sensor. This visit includes cleaning the solar panel, checking battery voltage, and cleaning and verifying the calibration of all environmental devices. Once a year it is necessary to change the battery at each station with a freshly charged one. Changing the battery will prevent possible future failure due to discharging that may occur throughout the year. In addition to these checks, advanced troubleshooting procedures should be documented to aid future employees in maintaining the system in the most efficient way possible.
It was found that the transmitters, batteries, and solar panels had the highest rate of failure. An ample supply of replacement parts should be available for these devices as well as each senor so that components of the system can be changed or replaced in a timely manner.
CALENDAR OF EVENTS
A calendar of events would be helpful in keeping maintenance, training, and review and revision of the operations plan on schedule. Some of the items that might be included in the calendar would be ice event preparation around Thanksgiving, storm event preparation in early spring, and again at the beginning of hurricane season.
At the beginning of the ice season, sometime around Thanksgiving, check supply and condition (density) of the magnesium chloride or other deicing chemicals to determine if they are still viable. Check supply and density each month, November through February. Also determine the sand reserves that might be needed for an ice event. Check and test the equipment required to deploy the magnesium chloride and sand. Complete necessary repairs to this equipment, vehicles, and sprayers, and ensure common replacement parts are on hand. Finally, document which bridges and overpasses have frozen in the past and which are sprayed with deicer.
Early each spring, a detailed check and cleaning of the storm sewer drainage system and drainage grates should be conducted. Document which locations require the most effort since they likely will be clogged off with debris and may require future cleaning or an improved drainage grate design. Pump stations should also be checked to ensure all pumps and backup systems are functioning properly. These same procedures should be performed again in mid-summer at the beginning of hurricane season.
52
Each section will participate in the mock hurricane exercises to ensure that all operators, operation managers, and maintenance supervisors are trained on the environmental monitoring system and that each section is familiar with the procedures of all emergency events, including flood, hurricane, evacuation, and ice events. These mock exercises provide an opportunity to maintain contacts with other agencies, especially law enforcement, and to ensure that agreements are in place to handle and assist in roadway closures or detours due to flood or evacuation.
Quarterly maintenance of the flood sensors should be conducted to ensure that spare parts are available at the beginning of the spring storm season. See the section on preventive maintenance for more detail.
PUBLIC INFORMATION
The current Harris County OEM environmental sensors website provides queriable information on rainfall accumulations. Clicking on these links gives the user some of the detailed information for each sensor at that location. While this information is useful, some more appropriate measures could be added to enhance the website and provide the information required to assist operations personnel in making an informed decision. A more useful and user-friendly interface that includes maps for displaying rainfall rates, current roadway water level, and the highest road water level would provide operators and the public with the information of where it is flooding or was flooded at a glance. Improvements to the detailed information in the form of graphs, tables, and graphical representations of the information would make the information easier to understand and extract the pertinent values or trends. Graphs of rainfall rate vs time of day, roadway water level vs time of day, conductivity vs time, and wind speed averages by time of day overlaid with peak wind gust would all allow the operator to easily understand perspective of the environmental event. Improved tabular data with meaningful table headings and a more user-friendly graphical user interface would improve the usability and understanding of the information.
Having the capability to e-mail alarms to agency personnel, public officials, and the public would provide this valuable information in a timely manner so that they can make informed decisions. During after-hour times, a redundancy in notification for all affected parties may be handled best by telephone communications. Performing this task manually would be very time consuming. Using existing technology, an auto dialer can broadcast the information and document what calls were answered and those that need to be retried and/or an alternate person or phone number called. General information can be provided while working in concert with a detailed web page provides the decision makers with all the information available.
TRAINING
Another issue has been the awareness, training, and use of the environmental monitoring system. It would be helpful for many levels of the organization to know about and have access to the environmental monitoring system including operators, managers, maintenance supervisors, public information officers, and selected law
53
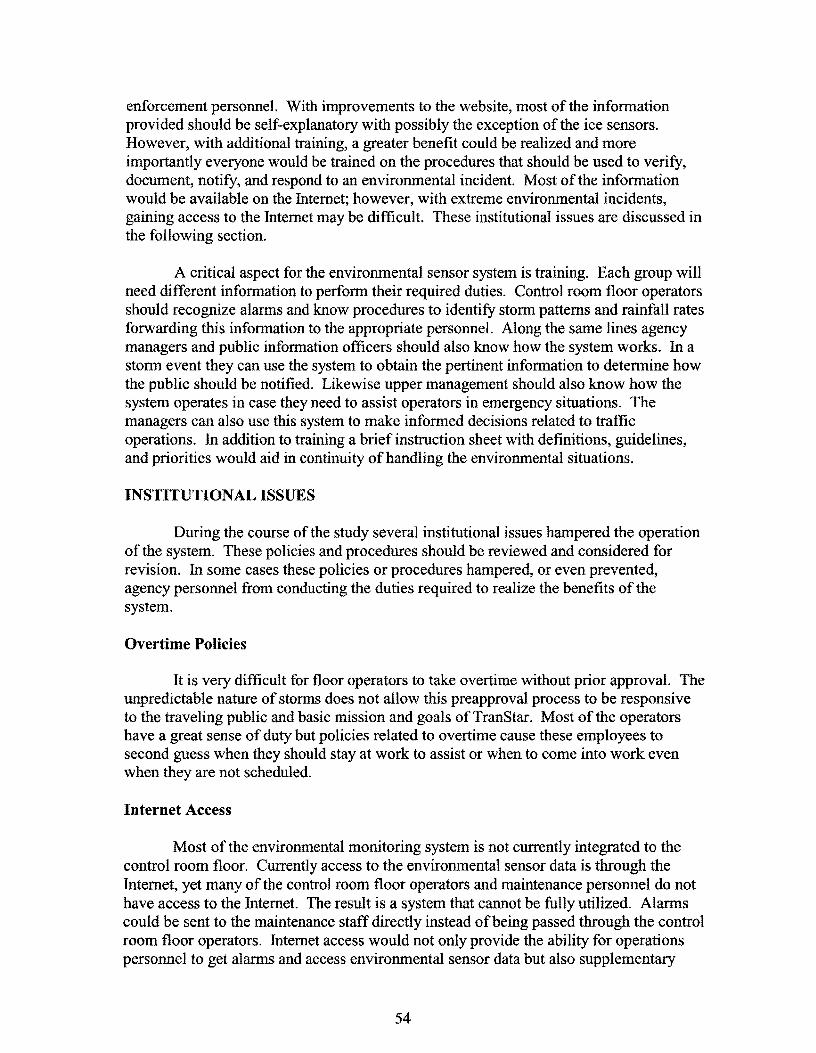
enforcement personnel. With improvements to the website, most of the information provided should be self-explanatory with possibly the exception of the ice sensors. However, with additional training, a greater benefit could be realized and more importantly everyone would be trained on the procedures that should be used to verify, document, notify, and respond to an environmental incident. Most of the information would be available on the Internet; however, with extreme environmental incidents, gaining access to the Internet may be difficult. These institutional issues are discussed in the following section.
A critical aspect for the environmental sensor system is training. Each group will need different information to perform their required duties. Control room floor operators should recognize alarms and know procedures to identify storm patterns and rainfall rates forwarding this information to the appropriate personnel. Along the same lines agency managers and public information officers should also know how the system works. In a storm event they can use the system to obtain the pertinent information to determine how the public should be notified. Likewise upper management should also know how the system operates in case they need to assist operators in emergency situations. The managers can also use this system to make informed decisions related to traffic operations. In addition to training a brief instruction sheet with definitions, guidelines, and priorities would aid in continuity of handling the environmental situations.
INSTITUTIONAL ISSUES
During the course of the study several institutional issues hampered the operation of the system. These policies and procedures should be reviewed and considered for revision. In some cases these policies or procedures hampered, or even prevented, agency personnel from conducting the duties required to realize the benefits of the system.
Overtime Policies
It is very difficult for floor operators to take overtime without prior approval. The unpredictable nature of storms does not allow this preapproval process to be responsive to the traveling public and basic mission and goals of TranStar. Most of the operators have a great sense of duty but policies related to overtime cause these employees to second guess when they should stay at work to assist or when to come into work even when they are not scheduled.
Internet Access
Most of the environmental monitoring system is not currently integrated to the control room floor. Currently access to the environmental sensor data is through the Internet, yet many of the control room floor operators and maintenance personnel do not have access to the Internet. The result is a system that cannot be fully utilized. Alarms could be sent to the maintenance staff directly instead of being passed through the control room floor operators. Internet access would not only provide the ability for operations personnel to get alarms and access environmental sensor data but also supplementary
54

weather information that is useful in determining the potential impact of the event. Ideally, an alarm would be sent by the ALERT system and the responsible personnel would verify the situation, look at the weather information, and take the appropriate action according to the operations plan, providing consistent handling of each environmental incident.
It is recommended that all floor operators, management, public information officers (PIO), and selected maintenance staff have Internet access to needed websites. Providing this tool, allows the above individuals to access the information required to make an informed decision. It will also enable the intended efficient use of the environmental monitoring system.
Phone Answering Policy and Back Line
Two items that had a negative effect on performing the basic operation functions by TxDOT operations floor personnel during Tropical Storm Allison were:
• the policy that all phone calls must be answered, with all TxDOT phones directed to the operations floor; and
• lack of a back line for internal communications.
As understood by operations personnel, TxDOT personnel should answer all calls. The volume of calls kept all telephone lines and personnel busy. More phone system capacity and staffing was needed. A set of back lines would provide a means of internal communications between management, operations, and maintenance personnel. Using an off-the-shelf telephone answering system could provide menu items for general information, reporting deficiencies, and directing the caller to the proper information or person.
DOCUMENTATION
The largest benefit from the environmental monitoring system is the perspective of history. Being able to look at historical data, analyze, and determine trends will help form a decision-making matrix that others will be able to use in the future. The data is currently stored in a database that uses proprietary software. This software provides valuable tools to look at and analyze the environmental monitoring system data. Enhancement of these tools should be sought from the software developer. Further improvement might come from warehousing the data for a longer period of time so that long-term trends can be established. The following list includes some items that should be considered as input for the data warehouse:
• documentation of alarms; • threshold values for flood wind and ice sensor warnings and alarms; • rainfall rates; • rainfall totals; • roadway water depth (totals, highs, and duration);
55


• start time of rain and water rising on roadway; • site-specific operations plans; • number of lanes, cross section, and slope to determine how many lanes might
flood with a given curb water depth; • documentation of roadway direction so that a crosswind vector equation could be
determined; • ice sensor parameters to create a probability curve for ice warnings; • height of water and the corresponding clearance of the bridge; • web-based database input for notification-call lists; and • tabular reports on alarm time, notification time, response time, and clearance
time.
DESIGN IMPROVEMENTS
An improved drainage grate design with a larger surface area will reduce the effect of debris blockage, potentially reducing the magnitude and/or frequency of floods. Several experimental drainage grate designs, such as silt fence around the inlet, fabricated add-on, or a totally new design, are all items that need to be investigated. In some situations adding design elements to the drainage structure, such as a pump station or one-way valve on the outflow of a storm water sewer system, might be the solution to a bayou flooding problem.
The location and design of the site installations need to be improved to enhance operations and maintenance. The placement of the sensors needs to be located where flooding occurs but should be cognizant of obstructions that would affect rainfall amount, longevity of the system, and ease of flood verification (6,7). Location of the sensors should be placed to make maintenance activities as easy as possible. Adding ground boxes or other devices to make maintenance activities easier and safer are paramount.
ENVIRONMENTAL SENSOR INSTALLATION CRITERIA
The documentation of storm events will lead agencies to roadway flood prone areas. These sites will need to be investigated to determine why the area floods. Sometimes debris clogs the inlets and grates, which can be reduced by improved maintenance and grate design. Other times pipe capacity is reduced due to pipe failures and resulting silting or bayou flooding. Once the investigation is complete, a decision is made to correct the problem or monitor the sites with a flood warning device. Monitoring the site may be the best alternative if the conventional solution is extremely costly, reconstruction is planned in the near future, or another agency has jurisdiction of the cause of the flooding ~uch as an over capacity stream, river, or bayou.
56
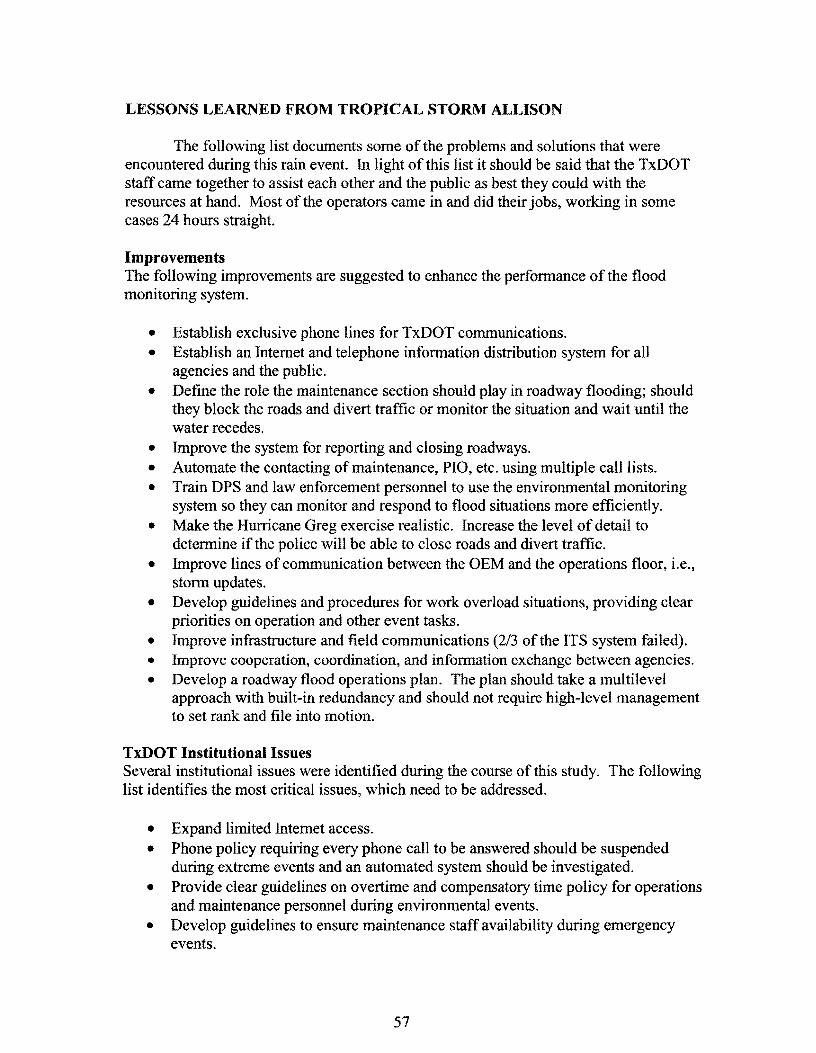
LESSONS LEARNED FROM TROPICAL STORM ALLISON
The following list documents some of the problems and solutions that were encountered during this rain event. In light of this list it should be said that the TxDOT staff came together to assist each other and the public as best they could with the resources at hand. Most of the operators came in and did their jobs, working in some cases 24 hours straight.
Improvements The following improvements are suggested to enhance the performance of the flood monitoring system.
• Establish exclusive phone lines for TxDOT communications. • Establish an Internet and telephone information distribution system for all
agencies and the public. • Define the role the maintenance section should play in roadway flooding; should
they block the roads and divert traffic or monitor the situation and wait until the water recedes.
• Improve the system for reporting and closing roadways. • Automate the contacting of maintenance, PIO, etc. using multiple call lists. • Train DPS and law enforcement personnel to use the environmental monitoring
system so they can monitor and respond to flood situations more efficiently. • Make the Hurricane Greg exercise realistic. Increase the level of detail to
determine if the police will be able to close roads and divert traffic. • Improve lines of communication between the OEM and the operations floor, i.e.,
storm updates. • Develop guidelines and procedures for work overload situations, providing clear
priorities on operation and other event tasks. • Improve infrastructure and field communications (2/3 of the ITS system failed). • Improve cooperation, coordination, and information exchange between agencies. • Develop a roadway flood operations plan. The plan should take a multilevel
approach with built-in redundancy and should not require high-level management to set rank and file into motion.
TxDOT Institutional Issues Several institutional issues were identified during the course of this study. The following list identifies the most critical issues, which need to be addressed.
• Expand limited Internet access. • Phone policy requiring every phone call to be answered should be suspended
during extreme events and an automated system should be investigated. • Provide clear guidelines on overtime and compensatory time policy for operations
and maintenance personnel during environmental events. • Develop guidelines to ensure maintenance staff availability during emergency
events.
57

• Establish guidelines for (maintenance and operations sections) staffing during emergency events.
• Develop a mechanism to address funding shortfalls in the maintenance budget. • Address and correct the reason for high turnover rate for operations personnel. • Develop a mechanism to supply food to employees during emergency situations.
CASE STUDIES AND BENEFITS
The case study example shows that any sort of environmental event will cause some delay by a reduction in speed or detour. However, the benefit of having an efficient means of handling such an event and minimizing the impact is the goal. The cost of the system, operation, and maintenance is offset by the benefits. The benefits include efficient reaction to environmental events and potentially saving life, property, and time.
58

REFERENCES
1. French, K.A. and E.M. Wilson, "Evaluating the Potential of Remote Sensing Rural Road and Travel Conditions," Transportation Research Record 1409, TRB, National Research Council, Washington, D.C., October 1993.
2. Bosselly ill, S.E., "Road Weather Information Systems: What Are They and What Can They Do for You?" Transportation Research Record 1387, TRB, National Research Council, Washington, D.C., July 1993.
3. Smithson, L., "Preserving and Maintaining the Highway System: New Tools and Strategies," TR News Number 188, TRB, National Research Council, Washington, D.C., January-February 1997.
4. White, J.F., "Tropical Storm Allison Mobilization Report," Harris County Office of Emergency Management, Houston, TX, July 2001.
5. Husch, D. and J. Albeck. "Synchro User Guide Version 5.0," Trafficware, Albany, CA, 2001.
6. Haas, C., J. Weissmann, B. McKeever, and Greer, R., "Implementation Guidelines for Road Weather Information Systems," Center for Transportation Research, The University of Texas at Austin, Austin, Texas, November 1997.
7. "Guidelines for the Collection ofHydrologic and Meteorologic Data," ALERT Users Group, July 1995.
59


APPENDIX A:
EXISTING EMERGENCY OPERATIONS PLAN
A-1


HOUSTON DISTRICT FLOOD CONDITION RESPONSE PLAN
1997
The Houston District provides seri.ices which include the responsibility of maintaining more than nine thousand lane-miles of roadways within a six-county area. Because of the imponance of transportation in Houston and the surrounding area, we must ensure that we meet our responsibilities and effectively respond to flood conditions.
Floods are the most common and widespread of all natural hazards. Some floods develop over a period of days. but.flash floods can result in raging waters in just a few m.imltes. The terms used to desaibe flooding are:
FloodWatdl
Flash Flood Watch
Flood W:tmiog
Flash Flood Warning
Urban and Small Stream Advisory
Flooding is possible.
Flash flooding is possi'ble.
Flooding is occurring or will occur soon.
A flash flood is occurring.
Flooding of small streams, streets and low-lying areas is occurring.
Tornadoes are nature•s most violent storms resulting from powerful thunderstorms. The tenns used to desaibe tornado threats are: ,
Tornado Watch Tornadoes are possible.
Tornado Warning A tornado has been sighted.
Severe Thunderstorm Watch Severe thunderstorms are possible.
Severe Thunderstorm Warning Severe thunderstorms are occuni.ng.
Page I
A-3

The following individuals are responsible for securing the work force, materials and equipment to respond to flood conditions:
Field Offices NAME WORK PAGER MOBil...E HOME LOCATION
NUMBER NUMBER NUMBER NUMBER D.Aldredi!e 409-756-4154 xxx-xxx-xxxx xxx-xxx-xxxx xxx-xxx-xxxx Montgomerv G. Hall 713-635-3419 xxx-xxx-xxxx xxx-xxx-xxxx xxx-xxx-xxxx East Harris D.K.Daniet 409-763-2386 xxx-xxx-xxxx xxx-xxx-:xxxx :xxx-:xxx-xxxx Fer:rv Office W.Downs 713-481-1123 :xxx-xxx-xxxx xxx-xxx-xxxx :xxx-:xxx-xxxx South Harris E.Hamett 713-463-2226 xxx-xxx-xxxx xxx-xxx-xxxx xxx-:xxx-xxxx Waller J.Hebert 713-446-2822 xxx-xxx-xxxx xxx-xxx-xxxx xxx-xxx-xxxx North Harris J.Lofland 713-331-3522 xxx-xxx-xxxx xxx-xxx-:xxxx :xxx-xxx-xxx:x North Brazoria R.Moss 409-986-4100 xxx-xxx-xxxx xxx-xxx-xxxx xxx-xxx-xxxx Galveston J: Pavlock 713-342-4547 xxx-xxx-xxxx xxx-xxx-xxxx xxx-xxx-xxxx Special Jobs D.J. Pillar 713-393-1220 xxx-xxx-xxxx xxx-xxx-xxxx xxx-xxx-xxxx South Brazoria E.R.amirez 713-869-1985 xxx-xxx-xxxx xxx-xxx-xxxx xxx-xxx-xxxx Central Houston G. Smith 713-466-6337 xxx-xxx-xxxx xxx-xxx-xxxx xxx-xxx-xxxx West Harris H. Williams 713-342-240 l xxx-xxx-xxxx xxx-xxx-:xxxx xxx-xxx-xxxx Fort Bend
Distri t E c menzency c dint oor a ors NAME WORK PAGER MOBil...E HOME
NUMBER NUMBER NUMBER NUMBER Charles Burlcs 713-802-5573 xxx-xxx-xxxx xxx-xxx-xxxx xxx-xxx-:xxxx Lenert Kurtz 713-802-5281 :xxx-xxx-xxxx xxx-xxx-xxxx xxx-xxx-:xxxx
PRE-FLOOD CONDIDON INITIATIVES
A Area engineers will be responsible for performing the following tasks:
I. Check pump houses in area of responsibility on regular basis to ensure their readiness to perform properly.
A-4
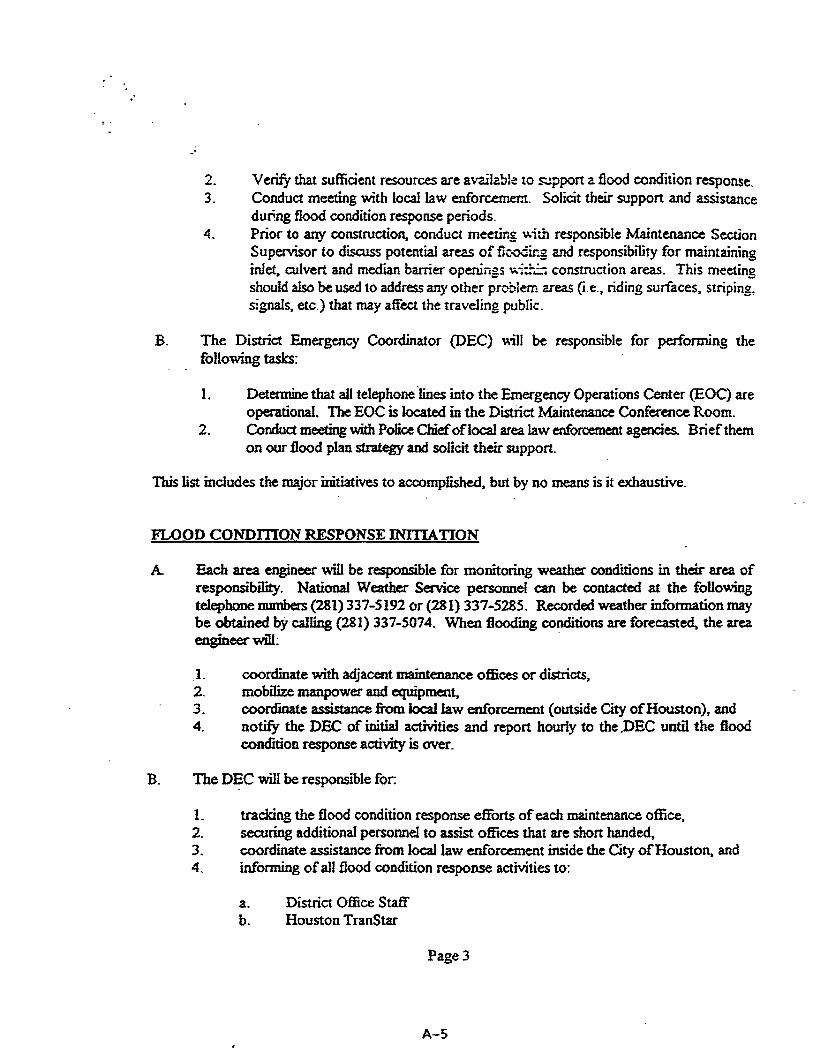
.·
2. Verify that sufficient resources are available to ~pport a flood condition response. 3. Conduct meeting with local law enforcement. Solicit their support and assistance
during flood condition response periods. 4. Prior to any construction. conduct meeting \\ id1 responsible Maintenance Section
Supervisor to discuss potential areas of flc-odir:g and responsibility for maintaining inlet. culvert and median barrier openings v.:i:h.::; c<:>nstruction areas. This meeting should also be used to address any other problem areas (i.e., riding surfaces, striping~ signals, etc.) that may affect the traveling public.
B. The District Emergency Coordinator (DEC) v.ill be responsible for performing the following tasks:
l. Determine that all telephone ·lines into the Emergency Operations Center {EOC) are operational. The BOC is located in the Distnct Maintenance Conference Room.
2. Conduct meeting with Police Chief oflocal area law enforcement agencies. Brief them on our :Oood plan strategy and solicit their support.
This list includes the major initiatives to accomplished, but by no means is it exhaustive.
FLOOD CONDIDON RESPONSE lNITIA TION
A Each are.a engineer will be responsible for monitoring weather conditions in their area of responsil>ility. National Weather Service personnel can be contacted at the following telephone numbelS (281) 337-5192 or (281) 337-5285. Recorded weather information may be obtained by calling (281) 337-5074. When tlooding conditions are forecasted. the area engineer 'Will:
l. coordinate with adjacent maintenance offices or districts, 2. mobilize manpower and equipment, 3. coordinate assistance from local law enforcement (outside City of Houston), and 4. notify the DEC of initial activities and report hourly to the.DEC until the flood
condition response activity is over.
B. The DEC will be responsible for:
1. tracking the flood condition response efforts of each maintenance office, 2. securing additional personnel to assist offices that are short handed, 3. coordinate assistance :from locaJ law enforcement inside the City of Houston, and 4. informing of all flood condition response activities to:
a. District Office Staff b. Houston TranStar
Page3
A-5

c. Area Engineers d. Maintenance Supervisors e. District Shop f. District Warehouse g. Assistant Direaor of 1'.iaintenance
WORK FORCE AND EQUIPMENT
F.ach area engineer will be responsible for identifying the resources that they will need to keep their ar~ _!oadways open during flood conditions. Staffing will also include office personnel to answer phones, monitor radio, and update the Highway Condition Report (HCR). If additional personnel are needed, notify the DEC.
No special equipment is required. Additional equipment can be obtained by contacting the DEC.
When flooding occurs on the.roadway, plans and coordination with local law enforcement should be made so that roadways can be closed to traffic.
The proCedures for using the Automatic Phone Dialers and Alarm Systems on equipped pump stations are outlined in Appendix B.
SUPPORT OPERATIONS AT DISTRICT HEADQUARTERS
The DEC will be responsible for coordinating all activities at the district level. The DEC will secure additional manpower for maintenance offices when needed. The DEC will coordinate all requests for secvices that involve Houston TranStar.
The District Shop will be open to repair equipment throughout the duration of the flood condition response activities. The Shop Supervisor will be responsible for keeping adequate staff on band to repair equipment.
The District Warehouse will be open to procure supplies throughout the duration of the flood condition response effort. The Warehouse Supervisor will be responsible for keeping adequate staff on hand to purchase needed supplies.
The District Public Infonnation Office will be responsible for handling all road condition calls at headquartm and responding to all media inquiries. Highway condition reporting will be as outlined in the HCR Plan. A copy of this plan is provided in Appendix A of this document.
Page4
A-6

LO~G RANGE PLANS
Estiblish a weather information system to be strategically located in the district to assisting in forecasting severe and/or changing weather conditions.
~vekp a training module regarding the implementation of the Flood Condition Respor.se Plan. Tr-~-rir'.g is to be conducted annually and v.ill involve all personnel from offices involved in the plan.
Develop a public education program to inform the public of our flood condition response actions.
Develop a policy statement addressing the High Occupancy Vehicle (HOV) lanes and tollways into our Flood Condition Response Plan. ·
Complete the Drainage Ditch Inventoiy List and incorporate a notification procedure of new drainage ditches into Final Inspections of completed construction projects.
Pages
A-7

..
APPENDIX A
IDGHW AY CONDITION REPORT (HCR)
A-8
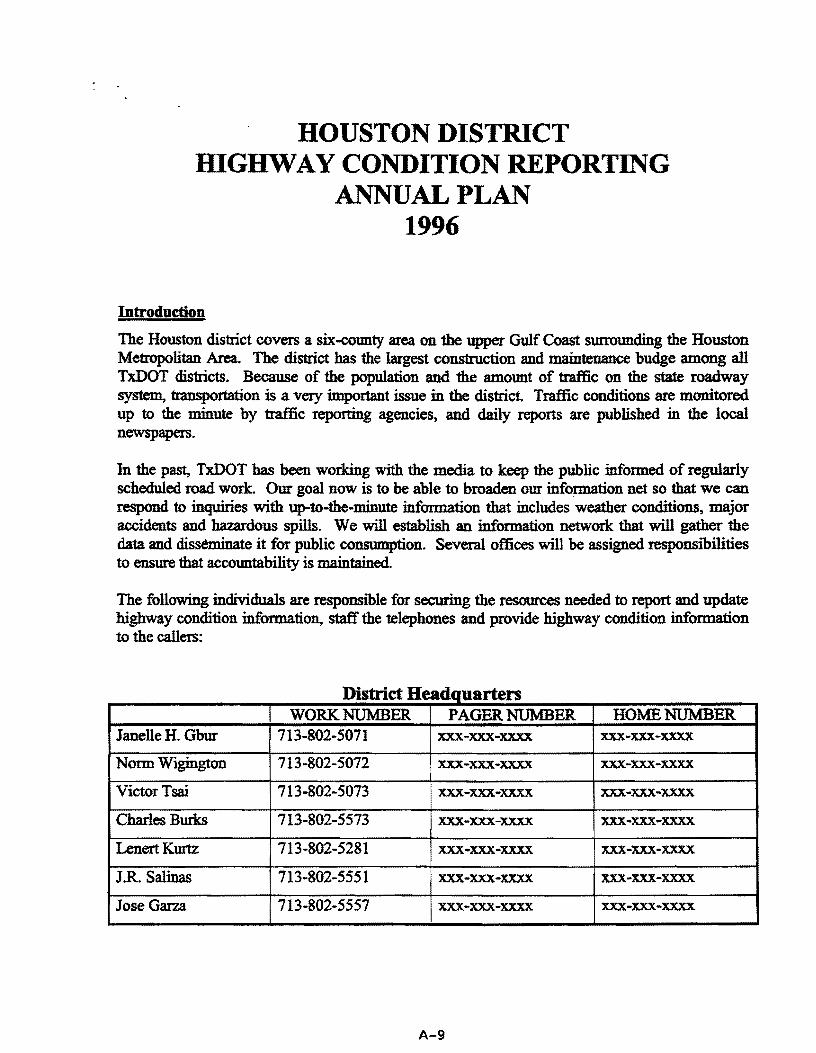
HOUSTON DISTRICT HIGHWAY CONDITION REPORTING
ANNUAL PLAN 1996
Introduction
The Houston district covers a six-co1Dlty area on the upper Gulf Coast surro1D1ding the Houston Metropolitan Area. The district bas the largest construction and maintenance budge among all TxDOT districts. Because of the population and the amo1Dlt of traffic on the state roadway system, transportation is a very important issue in the district Traffic conditions are monitored up to the minute by traffic reporting agencies, and daily reports are published in the local newspapers.
In the past, Tx.DOT bas been working with the media to keep the public informed of regularly scheduled road work. Our goal now is to be able to broaden our information net so that we can respond to inquiries with up-to-the-minute information that includes weather conditions, major accidents and hazardous spills. We will establish an information network that will gather the data and disstmlinate it for public consumption. Several offices will be assigned responsibilities to ensure that accountability is maintained.
The following individuals are responsible for securing the resources needed to report and update highway condition information, staff the telephones and provide highway condition information to the callers:
IS ea lqua ers n· trict H d rt WORK NUMBER PAGER NUMBER HOME NUMBER
Janelle H. Gbur 713-802-5071 xxx-xxx-x.xxx xxx-xxx-x.xxx
Norm Wigington 713-802-5072 xxx-xxx-xxxx xxx-xxx-x.xxx
Victor Tsai 713-802-5073 xxx-xxx-xxxx xxx-xxx-x.xxx
Charles Burks 713-802-5573 xxx-xxx-xxxx xxx-xxx-x.xxx
LenertKmtz 713-802-5281 xxx-xxx-xxxx xxx-xxx-xxxx
J.R.Salinas 713-802-5551 xxx-xxx-xxxx xxx-xxx-xxxx
Jose Garza 713-802-5557 xxx-xxx-xxxx xxx-xxx-x.xxx
A-9
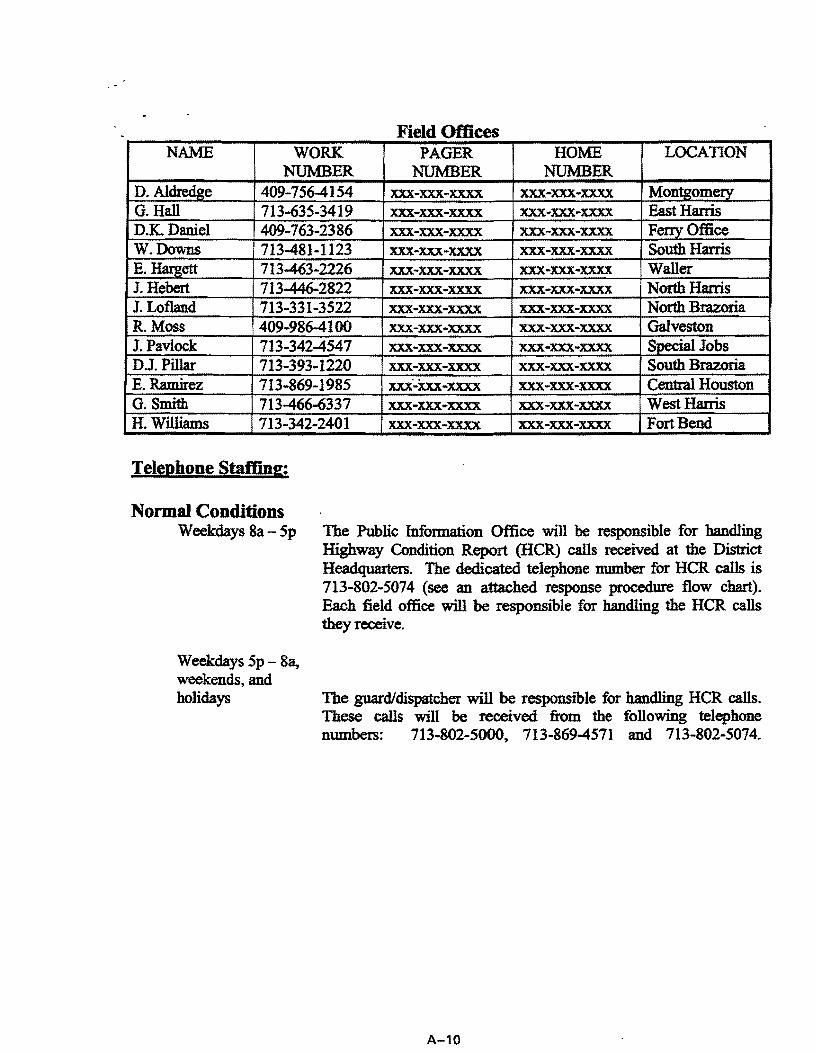
Field Offices NAME WORK PAGER HOME LOCATION
NUMBER NUMBER NUMBER D. Aldred2e 409-756-4154 x:xx-xxx-xxxx xxx-xxx-x:xxx Montszomerv G. Hall 713-635-3419 x:xx-xxx-xxxx xxx-xxx-x:xxx East Harris D.K. Daniel 409-763-2386 xxx-xx.x-xxxx xxx-xxx-x:xxx Ferry Office W.Downs 713-481-1123 xxx-xx.x-xxxx xxx-xxx-x:xxx South Harris E. Hamett 713-463-2226 xxx-xx.x-xxxx xxx-xx.x-x:xxx Waller J. Hebert 713-446-2822 xxx-xx.x-xxxx xxx-xxx-x:xxx North Harris J. Lofland 713-331-3522 xxx-xxx-xxxx xxx-xx.x-x:xxx North Brazoria R. Moss 409-986-4100 xxx-xxx-xxxx xxx-xxx-x:xxx Galveston J. Pavlock 713-342-4547 xxx-xxx-xxxx xxx-xx.x-x:xxx Special Jobs DJ. Pillar 713-393-1220 xxx-xxx-xxxx xxx-xxx-xxxx South Brazoria E. Ramirez 713-869-1985 xxx·-X:xx-xxxx xxx-xxx-xxxx Central Houston G. Smith 713-466-6337 XXX-XXX·XXXX xxx-xxx-xxxx West Harris H. Williams 713-342-2401 xxx-xxx-xxxx xxx-x:xx-xxxx Fort Bend
Telephone Staffing:
Normal Conditions Weekdays 8a - Sp
Weekdays Sp - Sa, weekends, and holidays
The Public Information Office will be responsible for handling Highway Condition Report (HCR) calls received at the District Headquarters. The dedicated telephone number for HCR calls is 713-802-5074 (see an attached response procedure flow chart). Each field office will be responsible for handling the HCR calls they receive.
The guard/dispatcher will be responsible for handling HCR calls. These calls will be received from the following telephone numbers: 713-802-5000, 713-869-4571 and 713-802-5074.
A-10

Telephone Staffing (continued):
Emergency Conditions Weekdays 8a - Sp The P~:::: I:formation Office will be responsible for staffing
telephones a: the District Headquarters. The Public Information Office \;.ill use resources from the District Transportation Operations Office and Administrative Services. Other sections may be called upon to provide assistance should condition warrant additional resources.
Weekdays 5p - 8a, weekends and holidays
Area Engineers will be responsible for the HCR calls received by offices under their supervision and will be responsible for providing the staff necessary to respond to the calls.
The guard/dispatcher wili be responsible for handliiig HCR calls received at the District Headquarters. If demand for HCR ~formation is great, the Public Information Office will be notified. so that additional staff can be secured to respond to the demand.
Area Engineers will be responsible for the HCR calls received by offices under their supervision.
HCR-Nonnal Hi:h1ray Conditions
The Public Infonnation Office will prepare daily the HCR by listing the day's scheduled construction and maintenance activities that require lane closures. Maintenance, ~ Engineer, and Project offices will be responsible for notifying the Public lnfonnation Office of scheduled lane closures, cancellation of any scheduled lane closure, and information on emergency lane closures such as major accidents, hazardous spills, pavement failures, etc. The Public Information Office will be responsible for modifying the HCR to reflect current conditions.
The Public Information Office will update the HCR by 8: 15 a.m. daily. Monday through Friday. Scheduled lane closures and weather forecast infonnation for the weekend will be entered every Friday by 4:00 p.m., except on holidays. Reporting time, for holiday information will be determined on a case by case basis.
The dispatcher will be responsible for notifying the Public Information Office of emergencies that occur after hours, on weekends, or holidays. The Public Information Office will notify the Travel and Information Division.
A-11

The Public Information Office will handle media inquiries c.onceming highway conditio:-.:.S. Media inquiries regarding conditions outside the district will be referred to the appropriate district aid/or the Travel and Information Di 1ision in Austin.
HCR - '\feather-related Highway Conditions
Weather-related high\\'C)' conditions will be entered to the HCR by the mainte::.a.,ce office responsible for responding to the condition. The maintenance office will be responsible for constant monitoring of conditions and updating of the HCR accordingly. The Public Information Office will review the HCR every two hours to verify the accuracy and clarity of the repon.
From time to time the computer access will fail. If this should happen. you are to call (713-802-5073) or fax (713-802-5075) the infonnation to the Public Information Office. If the conditions arise after hours, on a weekend, or holiday, the dispatcher should be notified.
Telephone Access tQ HCR Information
· The district will publish in local telephone directories the toll-free number (1-800-452-9292) to call for statewide highway condition information. The district will also publish a local number (713-802-5074) identified as ~ source for emergency road condition information.
Telephone Responsibilities
See Telephone staffing details.
The district operates 24 hows a day, seve.n days a week. The district will not forward local HCR telephone lines to the toll-free number on evenings, weeke.nds and holidays.
Computer Access to HCR
The Public Information Office will provide the HCR daily on the electronic bulletin board. This information can be reached by modem via telephone line 713-802-5070.

DISTRICT OFFICE RESPONSE PROCEDURE
(normal business hours)
Customer Calls 802-5074
Recording greets customer
Customer needs HCR information
Yes
J
I .
No, caller selects other <_>ption or zeros out to TxDOT representative.
Recorded HCR report is given.
J Customer needs more specific information
1: customer is given the toll-free Nt, call ends. number or zeros out to TxDOT representative.
A-13

: .
:.
APPENDIXB
AUTOMATIC PHONE DIALERS AND
ALARM SYSTEMS
A-14
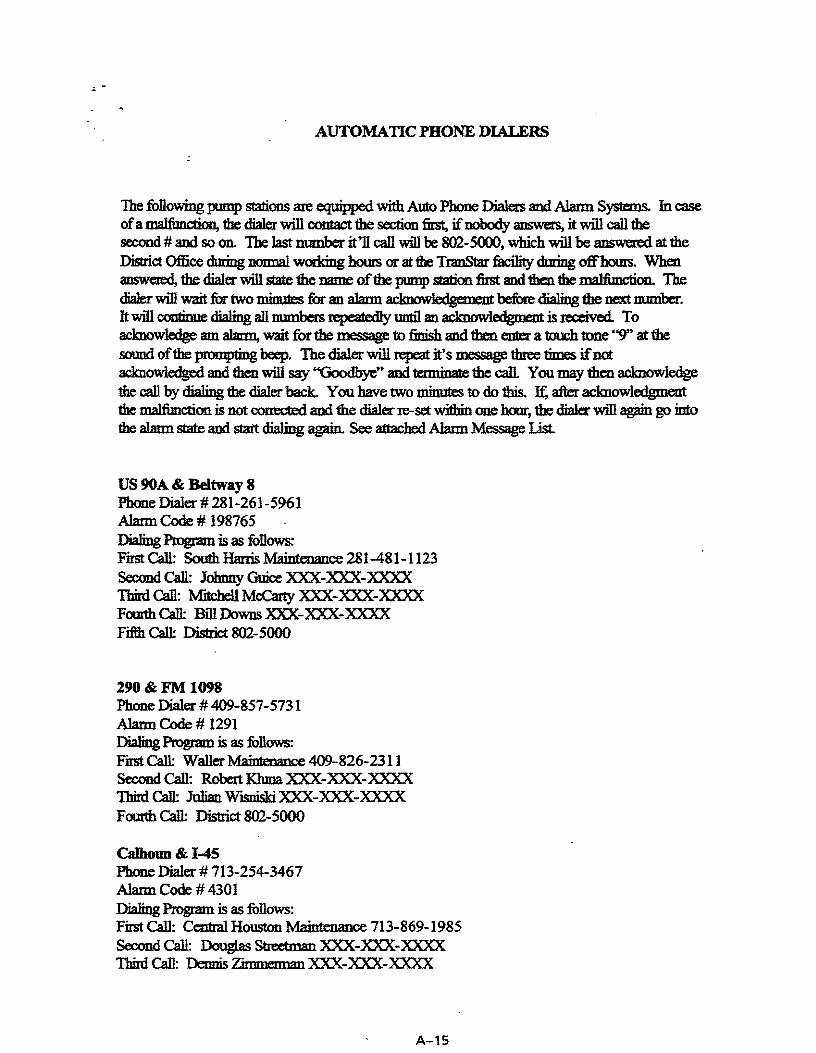
AUTOMATIC PHONE DIALERS
The following pump stations are equipped with Auto Phone Dialers and Alarm Systems. In case of a maifunction, the dialer will contact the section first, if nobody answers, it will call the second# and so on. The 1ast nmnber it'll call will be 802-5000, which will be answered at the District Office dming nonml woddng hows or at the Tl3IlStar facili1y during offhoms. When amwered, the dialer will state 1he name of the pump station first and then the malfunction. The diaJer will wait for two minutes for an alarm acknowledgement before c:tialiog the next nmnber. It will continue maling all numbers repeatedly until an acknowledgment is received. To acknowledge am alann, wait for the message to finish and then enter a touch tone "'9" at 1he somJd of the prompting beep. The ctialer 'Will repeat it's message 1hree times if not acknowledged and 1hen will say "Goodbyen and tennimlte the call. You may then acknowledge the call by dialing the dialer back. You have two minutes to do this. I:t after acknowledgment the malfimction is not OOIIected and the ctialer :re-set within one hour, the dialer will again go into the alarm state and statt dialing again. See attached Alarm Message List.
US 90A & Beltway 8 Phone Dialer# 281-261-5961 Alarm Code # 198765 Dialing Program is as follows: First Call: South Harris Maintenance 281-481-1123 Second Call: Jo1mny Guice XXX-XXX-XXXX Third Call: Mltche1l McCarty XXX-XXX-XX::XX Fourth Call: Bill Downs XXX-XXX-XXXX Fifth Call: District 802-5000
290&FM1098 Pb.one Dialer# 409-857-5731 Alarm Code # 1291 Dialing Program is as follows: First Call: WallerMaintenance 409-826-2311 Second Call: Robert Khma XXX-XXX-XXXX Tbin:l Call: JulUm. WJSDiski XXX-XXX-X:XXX F01.Dth Call: District 802-5000
Calhoon & l-45 Phone Dialer# 713-254-3467 Alarm Code# 4301 Dialing Program is as follows: First Call: Central Houston Maintenance 713-869-1985 Second Call: Douglas Streetman XXX-XXX-:XXXX Thiid Call: Dennis Z'rmmennan XXX-XXX-XXXX
A-15

Fourth Call: Tommie Bosley XXX-XXX-:XXXX Fd.ih Call: Etvin Ramirez XXX-XXX-XXXX Sixth Call: District 802-5000
Lombardy & I-4S Phone Dialer# 713-928-6099 Alarm Code# 4867 Dialing Progmm is as follows: First Call: Central Houston Maintenance 713-869-1985 Secood Call: Douglas Streetman XXX-XXX-XXXX Third Call: Deonis z;, 1111IQ11 tm XXX-XXX-XXXX Fomth Call: Tommie Bosley XXX-XXX-XXXX Fifth Call: Etvin Ramirez XXX-XXX-XXXX Sixth Call: District 802-5000
249&FM1960 Phone Dialer# 281-517-0587 Alarm Code# 249 Dialing Program is as follows: First Call: North Houston Maintenance 281-319-6450 Second Call: .Randall Walker XXX-XXX-XXXX Thinl Call: Bobby Bridges XXX-XXX-XXXX Fomth Call: Iolm Williams XXX-XXX-XXXX Fifth Call: James Hebert XXX-XXX-XXXX Sixth Call: District 802-5000
IF ANY CHANGES TO TIIB PHONE DIALER SYSTEM NEED TO BE MADE, CONf ACT HUGH PAINTER AT 802-5838.
REVISED 27 Mar 97
A-16

. .
HOUSTON DISTRICT FREEZE RESPONSE PLAN
1996
The Houston District provides for more than $500 million a year in transportation projects and services. These services include the responsibility of maintaining more than nine thousand lanemiles of roadways within a six-county area. The size of this investment and the importance of transportation in Houston and the swrounding area, compels us to ensure that we meet om responsibilities and effectively respond to freeze conditions.
The following individuals are responsible for securing the work force, materials and equipment to respond to freezing/icing conditions:
Field Offices NAME WORK PAGER MOBILE HOME LOCATION
NUMBER NUMBER NUMBER NUMBER D.AltlrMm- 409-756-4154 , xxx-xxx-xxxx xxx-xxx-xxxx xxx-xxx-xxxx Monte;omerv G. Hall 713-635-3419 xxx-xxx-xxxx xxx-xxx-xxxx xxx-xxx-xxxx EastHarris D.K. Daniel 409-763-2386 xxx-xxx-xxxx xxx-xxx-xxxx xxx-xxx-xxxx Ferrv Offipe W.Downs 713481-1123 xxx-xx.x-xxxx xxx-xxx-xxxx DPt-xxx-xxxx South Harris E. -- 713463-2226 xxx-xxx-xxxx xxx-xxx-xxxx xxx-xxx-xxxx Waller J. Hebert 713-446-2822 xxx-xx.x-xxxx xxx-xxx-xxxx xxx-xxx-xxxx North Harris J. Lofland 713-331-3522 xxx-xx.x-xxxx xxx-xxx-xxxx xxx-xxx-xxxx North Brazoria R.Moss 409-986-4100 xxx-xxx-xxxx xxx-xxx-xxxx xxx-xxx-xxxx Galveston J. Pavlock 713-3424547 xxx-xxx-xxxx xxx-xxx-xxxx xxx-xxx-xxxx Snecial Jobs DJ. Pillar 713-393-1220 xxx-xxx-xxxx xxx-xxx-xxxx xxx-xxx-xxxx South Brazoria E.Ramirez 713-869-1985 xxx-xx.x-xxxx xxx-xxx-xxxx xxx-xxx-xxxx Central Houston G. Smith 713-466-6337 xxx-xxx-xxxx xxx-xxx-xxxx xxx-xxx-xxxx West Hanis H. Williams 713-342-2401 xxx-xxx-xxxx xxx-xxx-xxxx xxx-xxx-xxxx Fort Bend
n· trictE IS men?ency c di t oor na ors NAME WORK PAGER MOBILE HOME
NUMBER NUMBER NUMBER NUMBER Charles Burks 713-802-5573 xxx-xxx-xx:xx xxx-xxx-xxxx xxx-xxx-xxxx Lenert Kurtz 713-802-5281 xxx-xxx-xxxx xxx-xx.x-xxxx xxx-xxx-xxxx
A-17

PRE-FREEZE INITIATIVES
A. Area engineers will be responsible for performing. annually, the following tasks by November 24:
I. Determine number of hours needed to cover all roadways in area of responsibility so that anti-icing material can be placed prior to icing. Check herbicide ttucks to ensure their readiness to apply this material.
2. Verify that sufficient quantities of anti-icing and de-icing materials are on hand to support a freeze response. Procurement of these materials may take two months, so plan ahead.
3. Conduct meeting with local law enforcement. Solicit their support and assistance during freeze response periods.
4. Open all ''Watch for Ice on Bridge" signs. Close signs after March 8.
B. The District Emergency Coordinator will be responsibie for perfonning, annually, the _following tasks by November 24:
1. Determine that all telephone lines into the Emergency Operation Center (EOC) are operational. The EOC is located in the District Maintenance Conference Room.
2. Conduct meeting with Police Chief oflocal area law enforcement agencies. Brief them on our :freeze plan strategy and solicit their support.
This list includes the major initiatives to accomplished, but by no means i~ it e.xhaustive.
FREEZE RESPONSE INITIATION
A. Each area engineer will be responsi'ble for monitoring weather conditions in their area of responsibility. National Weather Service personnel can be contacted at the. following telephone numbers (281)337-5192 or (281)337-5285. Recorded weather information may be obtained by calling (281)337-5074. When freezing conditions are forecast. the area engineer will:
1. coordinate with adjacent maintenance offices or districts, 2. mobilize manpower and materials, 3. coordinate assistance from local law enforcement (outside City ofHouston), and 4. notify the District Emergency Coordinator (DEC) of initial activities and report
hourly to the DEC until the :freeze response activity is over.
B. The DEC will be responsible for:
L tracking the :freeze response efforts of each maintenance office,
A-18
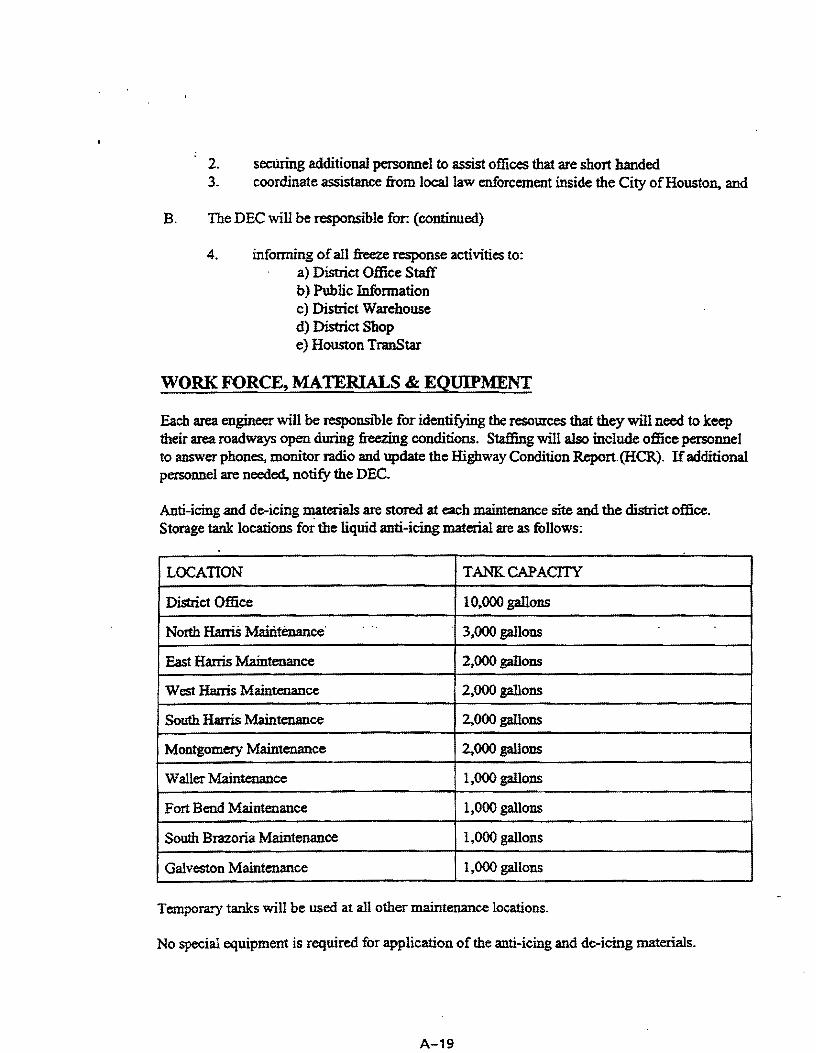
2. secliring additional personnel to assist offices that are short handed 3. coordinate assistance from local law enforcement inside the City ofHouston, and
B. The DEC will be responsible for: (continued)
4. informing of all freeze response activities to: a) District Office Staff b)Publiclnformation c) District Warehouse d) District Shop e) Houston TranStar
WORK FORCE, MATERIALS & EQUIPMENT
Each area engineer will be responsible for identifying the resources that they will need to keep their area roadways open during freezing conditions. Staffing will also include office personnel to answer phones, monitor radio and update the Highway Condition Report. (HCR). If additional personnel are needed, notify the DEC.
Anti-icing and de-icing ~terials are stored at each maintenance site and the district office. Storage tank locations for the liquid anti-icing material are as follows:
LOCATION TANK CAPACITY
District Office 10,000 gallons
North HaniS"Maintenance· . ., 3,000 gallons
East Harris Maintenance 2,000 gallons
West Harris Maintenance 2,000 gallons
South Harris Maintenance 2.000 gallons
Montgomery Maintenance 2,000 gallons
Waller Maintenance 1,000 gallons
Fort Bend Maintenance 1,000 gallons
South Brazoria Maintenance 1,000 gallons
Galveston Maintenance 1,000 gallons
Temporary tanks will be used at all other maintenance locations.
No special equipment is required for application of the anti-icing and de-icing materials.
A-19

..
Granular material will be applied with V-box spreaders and liquid will be applied by herbicide sprayers. Additional equipment can be obtained by contacting the DEC.
In the event that anti-icing and de-icing material supplies run out,. we will use aggregate as our alternate response material. This measure is labor intensive and will require shifting of various roadways to different maintenance offices for handling.
Materials are procured to cover treatment of structures only. When icing occurs on the roadway. plans and coordination with local law enforcement, should be made so that roadways can be closed to traffic.
SUPPORT OPERATIONS AT DISTRICT HEADQUARTERS
The DEC will be responsible for coordinating all activities at the district level. The DEC will secure additional manpower and materials for maintenance offices when needed. The DEC will coordinate all requests for services that involve Houston TranStar.
The District Shop will be open to repair equipment throughout the duration of the freeze response activities. The Shop Supervisor will be responsible for keeping adequate staff on band to repair equipment
The District Warehouse will be open to procure additional supplies throughout the duration of the freeze response effort. The Warehouse Supervisor will be responSiole for keeping adequate staff on hand to purchase needed supplies.
The District Public Information Office will be responsible for handling all road condition calls at headquarters and responding to all media inquiries. Highway condition reporting will be as outlined in the Highway Condition Reporting Plan. A copy of this plan is provided in the Appendix of this document
LONG RANGE PLANS
Establish a weather information system to be strategically located in the district to assisting in forecasting severe and/or changing weather conditions. ·
Develop training module regarding the implementation of the Freeze Response Plan. Training to be conducted annually and will involve all personnel from offices involved in the plan.
Develop a public education program to inform the public of our freeze response actions and use of anti-icing and de-icing materials.
Develop policy statement regarding the treatment HOV lanes and tollways in our freeze response plan.
A-20

Replace temporary storage tanks at maintenance offices with permanent tanks and eliminate storage at district headquarters.
A-21

Df'.S DISTRICT POLICY
:!; TKE EVE?•1' OF SPONTA.NE0l 1S OR RECOMMENDED EVACUATION OF COASTAL AREAS OF ~~GH"JAY PATROL DISTRICT 2~, THE DPS WILL ASSUME RESPONSIBILITY FOR :~ORD!~ATION OF ·PRIORITY FLOW MOVEY.ENT· OF VEHICUL.~ TRAFFIC EVACUATING :!.;'!,.;.J~D TO PLACES Of SAFETY.
:-:::;s~ ;::;:~HWAYS THAT ARE DESIGNATED OR ANTICIPATED TO BE USED AS PRIORITY ~:.>.CUJ..T!ON ROUTES (ANNEX 1) WILL BE THE PRI!-'.A.~Y ROADS U?ON i-."HICH EVACUEES ~!LL TRAVEL. THE PRIORITY FLOW EFFORT WILL BE DIRECTED AT THOSE THOROUGHFARES WITH ATTENTION GIVEN TO SECONDARY ROUTES AS IS NECESSARY.
IN ORDER TO ADEQUATELY MANAGE EVACUATING TRAFFIC ON PRIORITY ROUTES IT WILL BECOME NECESSARY TO ELIMINATE THOSE FACTORS THAT WOULD TEND TO IMPEDE A REASONABLY CONTINUOUS FLOW. THIS CAN BE ACHIEVED BY ALLOWING PRIORITY MOVEMENT OF EVACUATING TRAFFIC THROUGH INTERSECTIONS AND CAW ONLY BE ACCOMPLISHED BY ALTERING THE NORMAL SEQUENCES OF INTERSECTION FLOW THROUGH THE USE OF POINT CONTROL OFFICERS AND/OR BY ADJUSTING TRAFFIC SIGNALS SO THAT PRIORITY IS GIVEN TO EVACUATING VEHICLES.
THE FOLLOWING PROCEDURES ARE ESTABLISHED AS DISTRICT POLICY AND WILL BE 'l'HE GUIDE FOR IMPLEMENTING PRIORITY FLOW IN THE EVENT OF EVACUATION.
1 . EACH HIGHWAY PATROL SERGEANT WILL COMPILE A PROGRESSIVE FLOW LISTING OF INTERSECTING STREETS ON EACH PRIORITY ROUTE WITHIN HIS/HER AREA THAT ARE CONTROLLED BY A STOP AND GO SIGNAL OR BY A STOP OR YIELD SIGN THAT WOULD REQUIRE EVACUEES TO STOP OR YIELD TO CROSS STREETS. (ANNEX 2)
2 • THE SERGEANT WILL MAKE A DETERMINATION AS TO WHAT RESPONSE IS NEEDED TO CONTROL EACH INTERSECTION WHETHER IT BE SIMPLY PLACING SIGNAL LIGHTS ON FLASH TO GIVE EVACUATION ROUTES PRIORITY OR PLACING POINT CONTROL OFFICER(S) TO PHYSICALLY DIRECT TRAFFIC. HE/SHE WILL ALSO DESIGNATE IF EACH INTERSECTION IS RURAL OR LIST THE CITY IT IS LOCATED IN.
3. GENERALLY THOSE INTERSECTIONS LOCATED WITHIN A CITY WHICH WOULD REQUIRE POINT CONTROL WILL BE THE RESPONSIBILITY OF THE CITY POLICE DEPARTMENT.
EACH SERGEANT WILL BE RESPONSIBLE TO ENSURE THAT EACH CITY CAN AND WILL HANDLE THEIR OWN INTERSECTIONS. IN THOSE INSTANCES WHERE CITY MANPOWER IS INADEQUATE, THE SERGEANT WILL COORDINATE FOR SUFFICIENT CONTROL BY USE OF DPS PERSONNEL OR OTHER LOCAL ASSISTANCE (S.O., CONSTABLE, ETC.).
4. RURAL INTERSECTIONS WILL BE ADEQUATELY STAFFED BY OPS OR OTHER AGENCY PERSONNEL AS COORDINATED BY THE SERGEANT.
S. WHILE IT IS NOT REASONABLE TO ESTABLISH A PERM.ANENT RESPONSIBILITY COMMITMENT WITH OTHER AGENCIES DUE TO MANPOWF.R SHORTAGES, CHANGES IN COMMAND PERSONNEL AND OTHER UNKNOWN FACTORS, IT IS IMPORTANT TO BEGIN
A-22
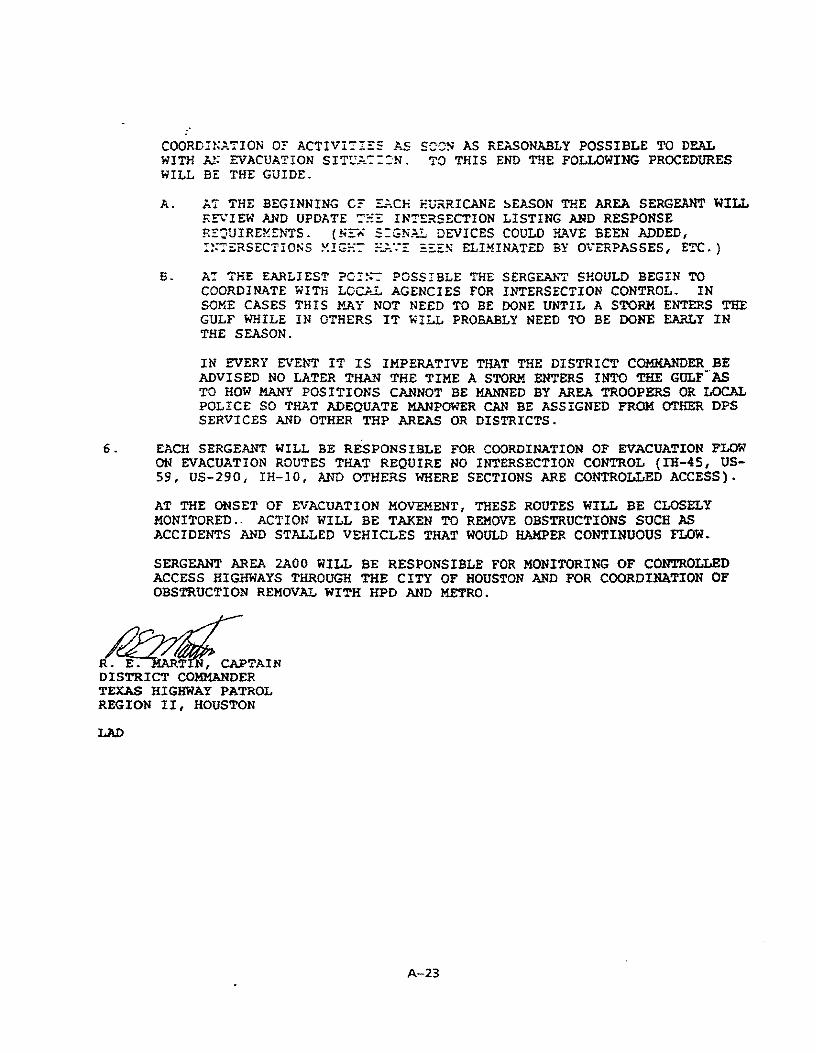
COORD!K~.TION O! ACTIVI':'IES AS S~0N AS REASONABLY POSSIBLE TO DEAL WITH }J: EVACU.:t.TION SIT":r-:-::N. TO THIS END THE FOLLOWING PROCEDURES WILL BE THE GUIDE.
A. J.S: THE BEGINNING c: !-~.CH EU~RICANE SEASON THE AREA SERGEANT WILL REVIEW AND UPDATE ~~::; INTERSECTION LISTING AND RESPONSE REQUIRE~ENTS. (NE""~ 5:GNA!., DEVICES COULD H.~VE BEEN ADDED, ~s:::RSECTIONS ~!G?::- ::_~::::: !:EEN ELIMINATED BY OVERPASSES, ETC.)
B. A! THE EARLIEST ?CZ~7 ?OSS!BLE THE SERGEA1'i"T SHOULD BEGIN TO COORDINATE WITH Loc;..r... AGENCIES FOR INTERSECTION CONTROL. IN SOME CASES THIS MAY NOT NEED TO BE DONE UNTIL A STORM ENTERS THE GULF WHILE IN OTHERS IT WILL PROBABLY NEED TO BE DONE EARLY IN THE SEASON.
IN EVERY EVENT IT IS IMPERATIVE THAT THE DISTRICT COMMANDER BE ADVISED NO LATER THAN THE TIME A STORM ENTERS INTO THE GULF-AS TO HOW MANY POSITIONS CANNOT BE MANNED BY AREA TROOPERS OR LOCAL POLICE SO THAT ADEQUATE MANPOWER CAN BE ASSIGNED FROM OTHER DPS SERVICES AND OTHER THP AREAS OR DISTRICTS.
6. EACH SERGEANT WILL BE RESPONSIBLE FOR COORDINATION OF EVACUATION FLOW ON EVACUATION ROUTES THAT REQUIRE NO INTERSECTION CONTROL (IH-45, US-59, US-290, IH-10, AND OTHERS WHERE SECTIONS ARE CONTROLLED ACCESS).
AT THE ONSET OF EVACUATION MOVEMENT, THESE ROUTES WILL BE CLOSELY MONITORED .. ACTION WILL BE TAKEN TO REMOVE OBSTRUCTIONS SUCH AS ACCIDENTS AND STALLED VEHICLES THAT WOULD HAMPER CONTINUOUS FLOW.
SERGEANT AREA 2AOO WILL BE RESPONSIBLE FOR MONITORING OF CONTROLLED ACCESS HIGHWAYS THROUGH THE CITY OF HOUSTON AND FOR COORDINATION OF OBSTRUCTION REMOVAL WITH HPD AND METRO.
R. E. MART N, CAPTAIN DISTRICT COMMANDER TEXAS HIGHWAY PATROL REGION II, HOUSTON
LAD
A-23

INTERSTATE HIGHWAYS
IH-10 IH-45
PRIMARY EVACUATION ROUTES
U.S. HIGHWAYS
US-59 US-77 US-90 (90A) US-290
A-24
STATE HIGHWAYS
SH-3 SH-6 SH-35 SH-36 SH-60 SH-71 SB-99 SH-146 SH-249 Sli-288 SH-332
-~..!~EX l
= ;._-:u-. TO ?'.i..~RKET
ROADS
=~-359 ?}'.-362 =~~-521 FM-523 FM-723 FM-1301 F'M-2100
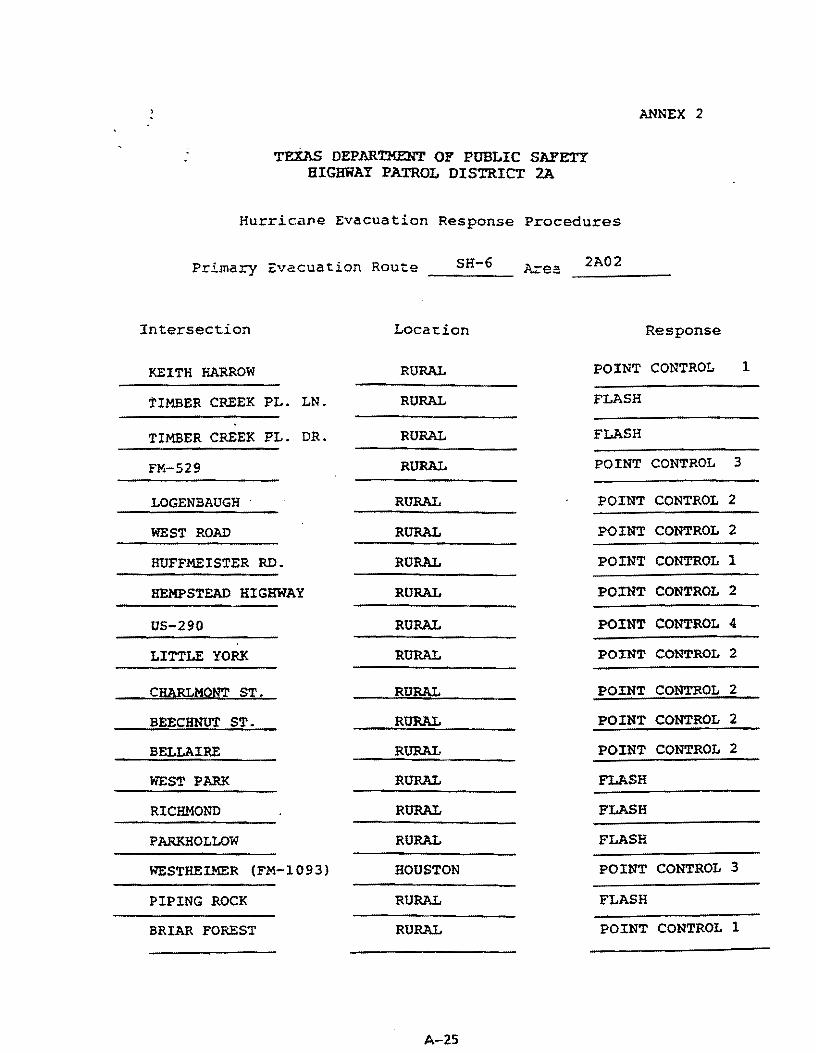
TEXAs DEPARTMENT OF PUBLIC SAFETY HIGBRAY PATROL DISTRICT 2A
ANNEX 2
Hurricane Evacuation Response Procedures
Primary Evacuation Route __ s_a_-_6_ 1! '!"e::. 2A02
Intersection Location Response
KEITH HARROW RURAL POINT CONTROL
TIMBER CREEK PL. LN. RURAL FLASH
TIMBER CREEK PL. DR. RURAL FLASH
FM-529 RURAL POINT CONTROL 3
LOGENBAUGH RURAL POINT CONTROL 2
WEST ROAD RURAL POINT CONTROL 2
HOFFMEISTER RD. RURAL POINT CONTROL 1
HEMPSTEAD HIGHWAY RURAL POINT CONTROL 2
05-290 RURAL POINT CONTROL 4
LITTLE YORK RURAL PO'.INT CONTROL 2
CH.ARLMON'l' ST. RURAL POINT CONTROL 2
BEECHNUT ST. RURAL POINT CONTROL 2
BELLAIRE RURAL POINT CONTROL 2
WEST PARK RURAL FLASH
RICHMOND RURAL FLASH
PARKHOLLOW RURAL FLASH
WESTHEIMER (FM-1093) HOUSTON POINT CONTROL 3
PIPING ROCK RURAL FLASH
BRIAR FOREST RURAL POINT CONTROL 1
A-25
1

TEXAS DEPARTHE.NT OF PUBLIC SAFETY BIGc~AY PAXROL DISTRICT 2A
Hurrican: .::··acuation Respo11se Procedures
SH-6 Area 2A02 Primary Evac-:.?a't.i~n Ro:.?t:e ~~--~- -----~---
Intersection Location Response
BRIARHILLS PARKWAY HOUSTON POINT CONTROL 1
MEMORIAL DR. HOUSTON POINT CONTROL 1
IH-10 RURAL POINT CONTROL 5
PARK ROW DR. RURAL POINT CONTROL
Pl:NE FOREST RD. RURAL FLASH
PATTERSON RD. RURAL FLASH
CLAY RD. RURAL POINT CONTROL 4
CARINWAY RURAL POINT CONTROL l
LOCH KATRINE RURAL FLASH
3
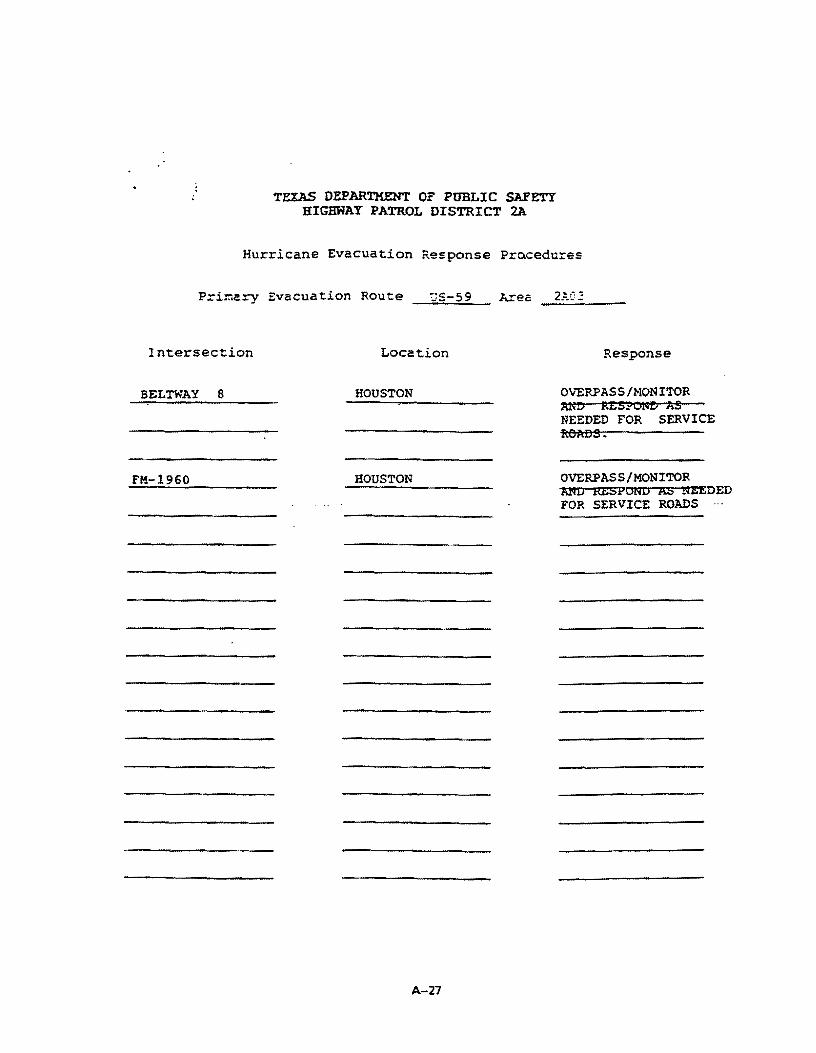
TEXAS DEPARTMENT O? PUBLIC SAFETY HIGBHAY PATROL DISTRICT 2A
Hurricane Evacuation Response Pr~cedures
Primary Evacuation Route :;s-ss
Intersection Location
BELTWAY 8 HOUSTON
FM-1960 HOUSTON
A-27
Response
OVERPASS/~10NITOR JtN1' ttSPOKf> A8 NEEDED FOR SERVICE f:CABS.
OVERPASS/MONITOR ANO RESPOND AS NEEDED FOR SERVICE ROADS

TEXAS DEPART.KENT OF PUBLIC SAFETY HIGHWAY PATROL DISTRICT 2A
Hurrjcane Evacuation Response Procedures
Primary Evacuation Rou~e sH-146 J...rea 2A04 __;;;;,;;,;;.,;;...;;..._ __ Intersection Location Response
TEXAS . BAYTOWN POINT CONTROL
SHEPHERD BAYTOWN POINT CONTROL
.JAMES BAYTOWN POINT CONTROL
FAYLE BAYTOWN POINT CONTROL
WARD BAYTOWN POINT C:ONTROL
LACY BAYTOWN POINT CONTROL
.JAMES BOWIE BAYTOWN POINT CONTROL 1
CEDAR BAYOU BAYTOWN POINT CONTROL l
LOOP 201 SOUTH BAYTOWN POINT CONTROL 2
LOOP 201 NORTH BAYTOWN POINT CONTROL 3
FM-565 BAYTOWN POINT CONTROL 1
TUNNEL WEST RURAL POINT CONTROL 2
TUNNEL EAST RURAL POINT CONTROL 2
A-28
2
l
2
1
3
1

TE.!AS DE.PARTHENT OF PUBLIC SAFETY BIGmiAY PATROL DISTRICT 2A
Hu==iccne Evacuation Response Procedures
Primary ~~acua~!cn Route FM-2100 Area --=2;.:;.;..;;..;;o;.....!:...· __ _
Intersect:ion Location Response
US-90 RURAL POINT CONTROL 2
IH-10 RURAL POINT CONTROL 2
A-29

.· TEXAS DEPAR'll!El."T OF PUBLIC SAFE"l 1
HIGHWAY PATROL DISTRICT 2A
Hurricane Evacuation Respjnse Proce:~res
A.re:. :::.os Primary Evacuation F.c:..:~e SH-3 ----- -----
Intersection Location Response
NASA ROAD 1 WEBSTER POINT CONTROL 2
BAY AREA BLVD. WEBSTER POINT CONTROL 2
EL DORADO RURAL POINT CONTROL 2
BARRINGER LN. RURAL FLASH
PINELOCH RURAL FLASH
FM-2351 HOUSTON POINT CONTROL 2
FM-1959 HOUSTON FLASH
FM-2553 HOUSTON FLASH
BELTWAY 8 HOUSTON FLASH
A-30
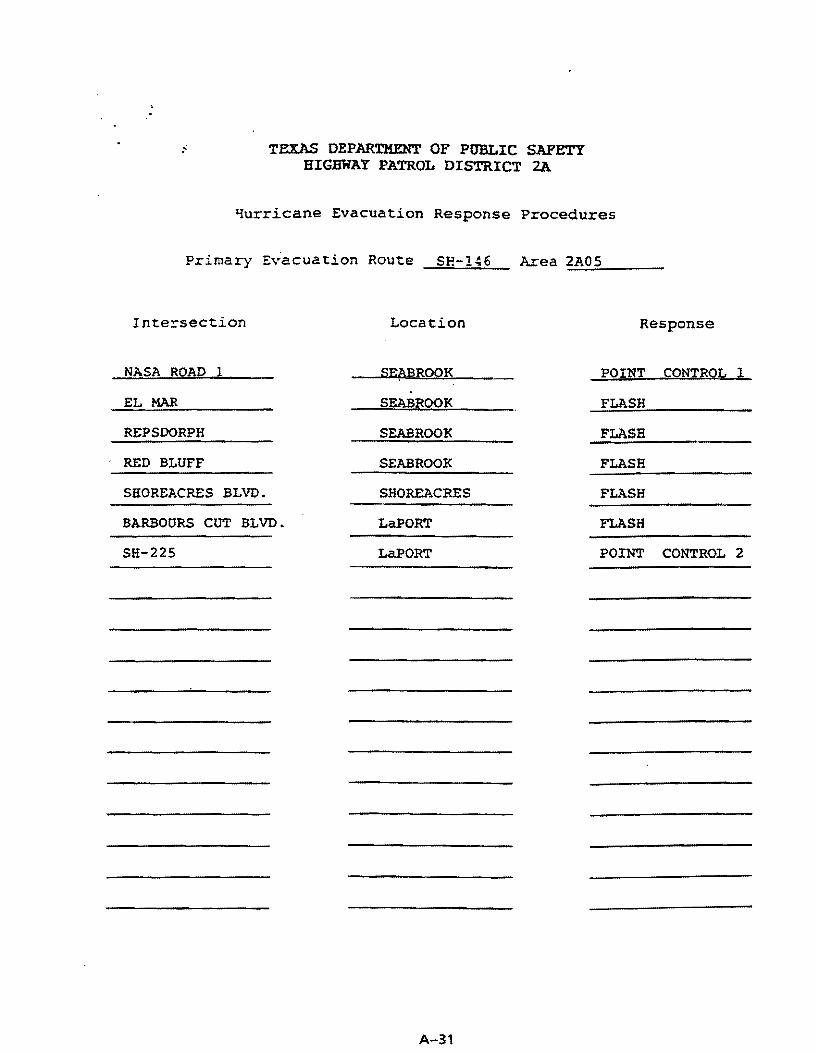
TEXAS OEPARTHENT OF PUBLIC SAFETY BIGHR'AY PATROL DISTRICT 2A
~urricane Evacuation Response Procedures
Primary E> .. ~acuation Route SH-146 Area 2A05 -----
Intersection Location Response
NASA ROAD 1 SEj\BROOK POINT CONTROL
EL MAR §EABROOK FLASH
REPSDORPH SEABROOK FLASH
RED BLUFF SEABROOK FLASH
SHOREACRES BLVD. SHOREACRES FLASH
BARBO ORS CUT BLVD. LaPORT FLASH
1
SH-225 LaPORT POINT CONTROL 2
A-31

TEX.AS DEPARTMENT OF' PUBLIC SAFETY HIGHWAY PATROL DISTRICT 2A
~u:ricane Evacuation Response Procedures
P:::i~:::::· =:·:acua ti on Route c::'I'!- 2 as Area -"°'2 • ..,.:.. o"""s __ _
Intersection Location .Response
FM-1462 RURAL FLASH
SH-6 RURAL OVERPASS-SH-6 PLAN ~DRESSES FEEDER ROAD
FM-518 RURAL POINT CONTROL l (FEEDER ROAD)
FM-2234 RURAL POINT CONTROL 1
(FEEDER ROAD)
A-32

TEXAS DEPARTMENT OF PUBLIC 51-.FETY BIGE"wAY PATROL DISTRICT 2A
Hurricane E~acuation Response ?rocecures
Primacy Evacuation Rout.e SF.-35
Intersection Location Response
FM-2917 RUB7H. FT.ASH
FM-2403 RURAL FI.ASH
FM-1462 RURAL FLASH
MUSTANG ALVIN FLASH
SOUTH ST. . ALVIN FLASH
SH-6 ALVIN NO INTERSECTION*
FM-517 ALVIN FLASH
FM-528 ALVIN FLASH
co RD. 281 RURAL FLASH
co RD. 129 RURAL FLASH
co RD. 128 RURAL FLASH
co RD. 126 RURAL FLASH
JOHN LIZER PEARLAND FLASH
WALNUT PEARLAND FLASH
FM-518 PEARLAND POINT CONTROL l
* SH-35 AND SB-6 ARE BOTH PRIMARY EVACUATION ROUTES. SH-35 CROSSES SH-6
VIA OVERPASS. FEEDER ROAD IS CONTROLLED BY POINT CON1'ROL AS IND1CA1'ED ON SH-6 PROCEDURES.
A-33

TEXAS DEPARTMENT OF PUBLIC SAFETY HIGBHAY PATROL DISTRICT 2A
Hurricane Evacuation Response Procedure;
Primary Evacuation Route SH-6 Area 2A05 _...,,.. ___ _ Intersection Location Response
SH-35 BY PASS AI.VIN POINT CONTROL 2
SH-35 BUSINESS ALVIN POINT CONTROL 2
co RD. 146 RURAL FLASH
CO RD. 99 RURAL FLASH
CO RD. 1128 RURAL FLASH
SH-288 RURAL POINT CONTROL 2
{FOR FEEDER ROAD
A-34

TEXAS DEPARTMENT OF PUBLIC SAFETY HIGBRAY PATROL DISTRICT 2A
Hurricane Evacuation Response Procedures
SH-3 ?::::-i.::'!a:::·y Evacuation Route ----- Area 2A06
Intersection Location Response
FM-519 La.MARQUE F!.ASH
ROSS LaMARQUE FLASH
CEDAR LaMARQUE FLASH
FIRST LaMARQOE FLASH
FM-1765 LaMARQUE POINT CONTROL 2
HUGHES DICKINSON FLASH
FM-517 DICKINSON POINT CONTROL l
DEATS DICKINSON FLASH
FM-646 LEA Gut CITY POINT CONTROL 2
WALKER LEAGUE CITY FLASH
FM-518 LEAGUE CITY POINT CONTROL 2
A-35

TEXAS DEPARTHENT OF PUBLIC SAFETY HIGHWAY PATROL DISTRICT 2A
Hurricane Evac.uition Res?onse Procedures
Primary E~acuation Route -----S ·- ,.. ---.. ..., .::....rea 2A06
Intersection Location
TARPON BAYOU VISTA
FA!RWOOD RURAL
FM-519 HITCHCOC:K
DELANY RD. HITCHCOCK
FM-2004 HITCHCOCK
FM-646 SOUTH SANTA FE
FM-646 NORTH SANTA FE
AVENUE T SANTA FE
JACKSON SANTA FE
TOWER RD. SANTA FE
A-36
Response
FLASH
FLASH
POINT CONTROL 1
FLASH
POINT CONTROL 2
FLASH
POINT CONTROL 1
FLASH
FLASH
FLASH

TEXAS DEPARTMENT OF PUBLIC SAFETY HIGHWAY PATROL DISTRICT 2A
Hurricane Evacuation Response Procedures
Primary Evacuation Route SH-146 Are: 2A06 -----
Intersection Location Response
LOOP 197 SOUTH RURAL POINT CONTROL
FM-519 TEXAS CITY FLASH
FM-1765 TEXAS CITY POINT CONTROL
LOOP 197 NORTH TEXAS CITY POINT CONTROL
FM-517 RURAL. _: FLASH . . . ~·.··. ·:-..... ------·--FM-646 RORAL..: .. POINT CONTROL -T""--FM-SlS KEMAH FLASH
FM-2094 KEMAH FLASH
6TR ST. KEMAH FLASH
A-37
1
1
1
1

TEXAS DEPARTMENT OF PUBLIC SAFETY HIGHWAY PATROL DISTRICT 2A
Hurricane Evacuation Response Procedures
?=imary Evacuation Route s~-288
Intersection Locat:ion
CO RD. 220 RURAL
FM-2004 LAKE JACKSON
CO RD. 44 ANGLETON
SR-288B RURAL
A-38
Area 2A07
Response
POINT CONTROL 1
POINT CONTROL 2 (LIGH~
POINT CONTROL 2
POINT CONTROL 2
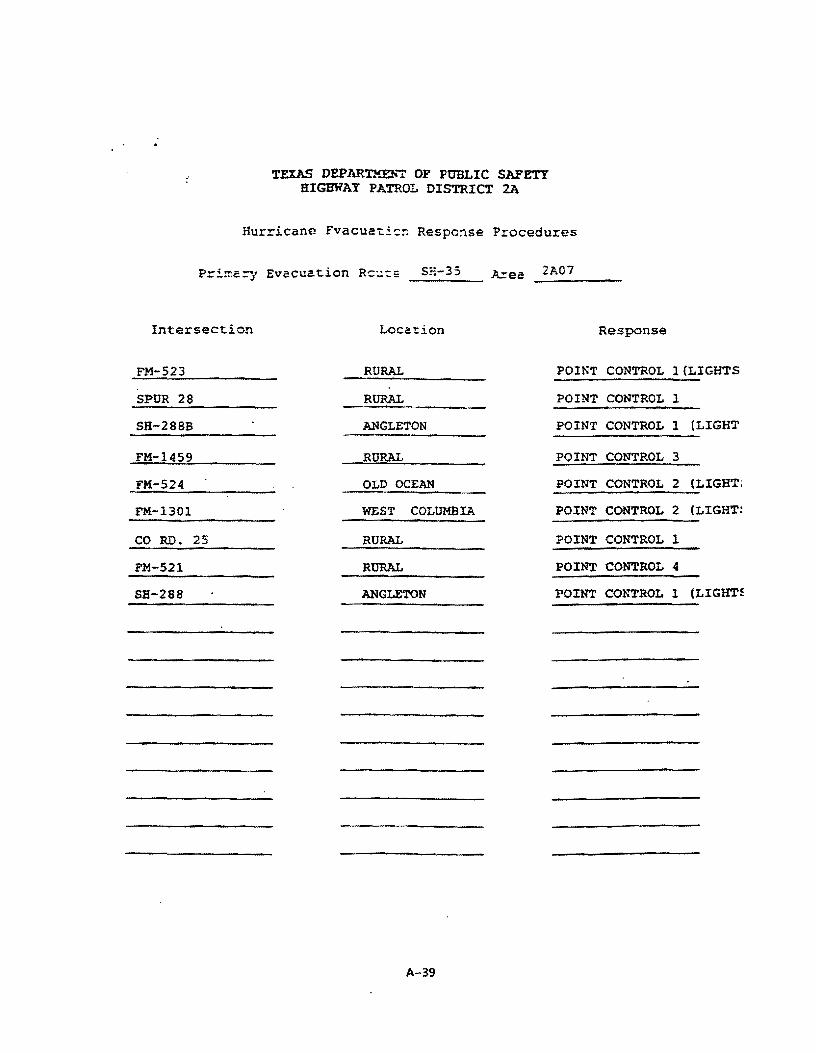
TEXAS DEPAR"l'M:Eh'"T OF PUBLIC SAFETY HIGHWAY PATROL DISTRICT 2A
Hurricane Fvacua~ic~ Respo~se Procedures
Prima=y Evacua~ion Re~~= SH-35 Area 2A07
Intersection Location
F'M-523 RURAL POINT
SPUR 28 RURAL POINT
SH-288B ANGLETON POINT
FM-1459 RURAL POINT
FM-524 OLD OCEAN POINT
Response
CONTROL l(LIGHTS
CONTROL 1
CONTROL 1 (LIGHT
CONTROL 3
CONTROL 2 (LIGHT:
FM-1301 WEST COLUMBIA POINT CONTROL 2 (LIGHT:
CO RD. 25 RURAL POINT CONTROL l
FM-521 RURAL POINT CONTROL 4
SB-288 ANGLETON POINT co:HTROL 1 (LIGHTf
A-39
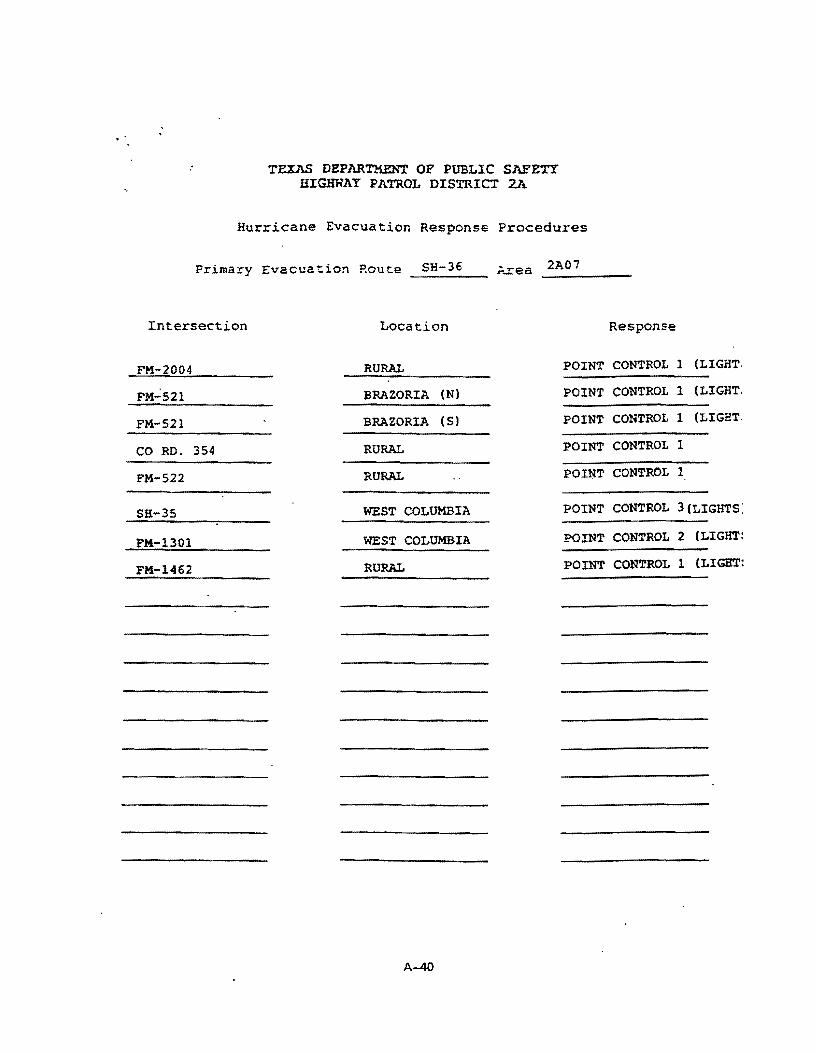
TEXAS DEPART.H.ENT OF PUBLIC SAFETY liIGHH'AY PATROL DISTRICT 2A
Hurricane Evacuation Response Procedures
Primary Evacua~ion Route SH-36 ;..rea 2A07 -----
Intersection Location Response
FM-2004 RURAL POINT CONTROL 1 (LIGHT.
FM-521 BRAZORIA (N) POINT CONTROL 1 (LIGHT.
FM-521 BRAZORIA ( S) POINT CONTROL 1 (LIGHT.
CO RD. 354 RURAL POINT CONTROL 1
FM-522 RURAL POil'~T CONTROL 1
SH-35 WEST COLUMBIA POINT CONTROL 3(LIGHTS:
FM-1301 WEST COLUMBIA POINT CONTROL 2 (LIGHT:
FM-1462 RURAL POINT CONTROL 1 (LIGHT!
A-40

TEXAS DEPART.KENT OF PUBLIC SAFETY HIGBHAY PATROL DISTRICT 2A
Hurricane Evacuation Response Procedures
Primary Evacuation Route FM-523 Area 2A04
Intersection Location Response
SH-332 FREEPORT POINT CONTROL 1 (LIGHT:
co .RD. 226 RURAL POINT CONTROL l
FM-2004 RURAL POINT CONTROL 2
SH-288 B RURAL POINT CONTROL 1 (LIGHT:
A-41

TEX.AS O&P.1·~:;n.t..ENT OF PUBLIC SAFETY HIGHWAY PATROL DISTRICT 2A
Hurriccn9 E"·ac~at:ion Response Procedures
Primary Evacuat:ic;; ?cut: n·i-521 Area 2A07
Intersection Location Response
FM-524 RURAL POINT CONTROL 1
SH-332 RURAL POINT CONTROL 4
FM-523 RURAL POINT CONTROL 1
SH-288 B RURAL POINT CONTROL 2
FM-655 RURAL POINT CONTROL 1
FM-1462 ROSHARON POINT CONTROL 1
A-42
(LIGHT~
(LIGHT)
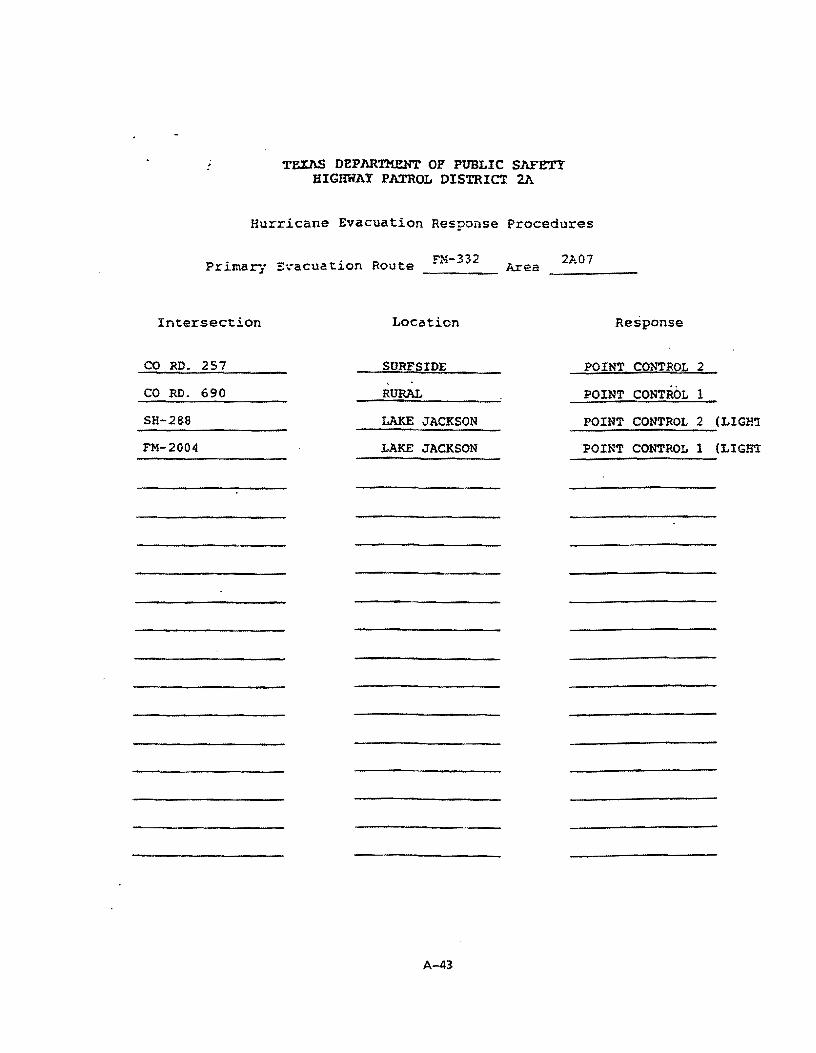
TEXAS DEPJ\.RTHENT OF PUBLIC SAFETY BIGHRAY PATROL DISTRICT 2A
Hurricane Evacuation Response Procedures
Primary ::·.·acuation Route -----FM-332
Intersection Location
CO RD. 257 SURFSIDE
CO RD. 690 RURAL
SH-288 LAKE JACKSON
FM-2004 LAKE JACKSON
A-43
Area 2J..07
Response
POINT CONTROL 2
POINT CONTROL 1
POINT CONTROL 2 (LIGH~
POINT CONTROL 1 (LIGH'I

TEXAS DEPARTMENT OF PUBLIC SAFETY HIGH.HAY PATROL DISTRICT 2A
Hurricane Evacuation Response Procedures
Primary Evacuation Rout.e FM-1301 A::ea 2A07 ~~----
Intersection Location Response
FM-1459 ~URAL POINT CONTROL 1

'rEll.S OEPARmENT OF' PUBLIC SAFETY ..
EIGHRAY PATROL DISTRICT 2A
Hurrica~e Evacuation Response Procedures
Primary E~a=~=~ion Route US 90A Area 2A08 -----
Intersection
*FM 2234
*Sl'AFFORD ROAD(WB)
*FM 1092
*DlJU..ES AvmuE
*SPUR 41
*lNOUSI'RIAL BLVD.
*FM 1876
*SAV<:Jl STREET
*MAIN STREEI'
*SPUR 58
'*UUUCH STREET
*SH 6
*W.IS CREE<
*SH 99
*HARllM ROAD
*PI'ITS ROAD
*™ 359
REM/s_lb
>.;
1cf)ENOI'E.$ SIOP AND GO SIGNAL
Location Response
MISSOURI CrIY POINT a:m:ROL 4
fl POINT a:>NIROL 2
SI AFFORD POINI' OONI'ROL 2
fl " POINT rom:ROL 4
ft " POINT a>NTROL 4
SLK;AR lAND POINT CONIROL 4
" " POINr CONTROL 2
" " POINT CONIROL 4
" " POINT cnrrROL 2
" " POnrr cmIROL 2
" " POINT <X>NIROL 2
.. " POINT a:NJ.'R.OL 2
.. .. RURAL POINT CON1'ROL 2
" " PO!Nt CXNI'ROL 4
" " romr CONIROL 2
" ft POINT CONTROL 2
ti ff POINT CONIROL 2
US 90A PAGE 1
A-45

TEXAS DEPART.MEL'T OF' PUBLIC SAFETY HIGHWAY PATROL DISTRICT 2A
Hurricane Evacuation Response Procec~=es
Primary Evacuation Ro~~e Area2A·:·: --~~--- ----------US 90A
Int:ersect:ion Loc.:t.ion Response
*lOOP 762 RIQIMJND POINT <X>NI'ROL 4
*THIRD STREET " ti POINT COOI'ROL 2
*FIFIH STREET " n POINT CONIROL 2
*FM 762 II ft POINT CONTROL 2
*FM 3155 II fl POnrr~oL 2
*WILSOO DRIVE ROSENBERG POINT CONTROL 2
*SAll.EY ANNE DRIVE >" H It POINT CONTROL 2
*HERNOON DRIVE " " POINT roNI'ROL 2
*RADIO LANE ff " POINT roN'IROL 2
*..JFAN'EITA SIREEI' " n FOINT CXBI'ROL 2
*AlAMJ STREEf ti ff POINT OONTROL 2
*S'IH SIREEr " tt POINI' CONTROL 2
*6nt STREEf ... H POlNI' CONTROL 2
*3RD Sl'REE! ff It POINT CONTROL 2
*SH 36(SEE SH 36) tf " POINr OJNIROL 2
*FM 723 " fl POINT OONTROL 2
*FM 1875 RURAL POINT CON'IROL 2
REM/slb - -*D:ENOTFS STOP AND GO SIGNAL
US 90A PAGE 2
A-46

TEXAS DEPAR'rMEN'l' OF PUBLIC SAFETY BIGBWAY PATROL DISTRICT 2A
Hurricane Evacuation Response Procedures
P:::irnary £vacua t.ion Route SH 6 Area 2A08 ~-=-:...;:;..~ .;;;;...;.::..:.....~~~
Int.ersect.ion Location Response
*FH 521 RURAL POINT a:>NTROL 2
*FLAT BANK Rew> MISSOURI CrIY POINT mNTROL 2
*LAKE OLYMPIA " It POINT CONTROL 2
iQ...EN LAKES II If POINT am'ROL 2
*FM 1092 ti If POINT roNI'ROL 2
*DUl.lES RURAL POINT CQNTI{OL 2
*SEI11...ERS WAY >, SUGAR LAND POINT CXNI'ROL 2
<f:WIU..IAMS TRACE .. " POINT CDNTROL 2
*GRANl'S LAKE BLVD " It POINT CONTROL 2
*I..'EXING'I'OO RURAL POINT roNTROL 2
*US 59 NB SERVICE ROAD " " POINT CX>NIROL 2
'*US 59 SB SERVICE ROAD " " POINT c:cNIROL 2
*SPUR 58 RURAL POINI' a:fiIROL 2
*OS 90A(SEE US 90A) SUGAR lAND POINT OlUROL 4
~-voss ROAD RURAL POINJ;. CONTROL 4
*OLD Riaff'.lID ROAD RURAL POINr CONTROL 4
*BISSOONET STREer RURAL 'EQINT a:>NTROL 4
REM/slb - -*DEtOI'ES STOP A"ID GO SIGNAL
A-47
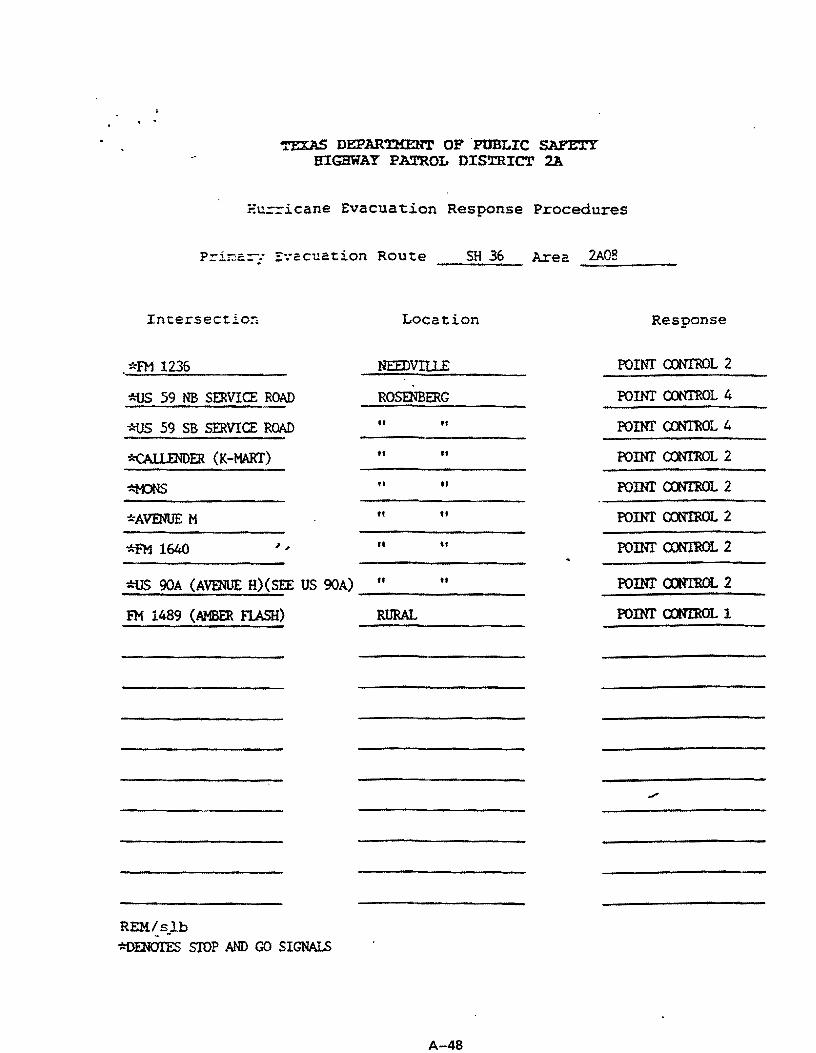
TEXAS DEPARTMENT OF .PUBLIC SAFETY HIGB'WAY PATROL orSTR.ICT 2A
Eu==icane Evacuation Response Procedures
SH 36 Area 2A08 -----
Intersect.io::. Location Response
*FM 1236 NEEDVIUE POINT CONTROL 2
*US 59 NB SERVICE ROAD ROSENBERG POINT CONTROL 4
*US 59 SB SERVICE ROAD " " POINT COOTROL 4
*<'ALLENDER (K-MARI') .. " POINI' CONTROL 2
*M)NS It " POINT CXNI'ROL 2
*AVENUE M H ti POINT c:cmROL 2
*FM 1640 >; It tt POINI' COOTROL 2
*US 90A (AVENUE H)(SEE US 90A) ft ti POINT <rm'ROL 2
FM 1489 (AMBER Fl.ASH) RURAL POINT <XN1'ROL 1
REM/slb - -*DENOI'E.S STOP AND GO SIGNALS
A-48

TEXAS DEPA.~ OF PUBLIC 51-..::"'ETY HIGHWAY PAXROL OIS'l'R.ICT 2A
Hurricane Evacuation Response ?rccedures
Pr~mary EVacuatio~ Route
Intersection
. *US 90A(SEE US 90A)
*HARLEM ROAD
*FM 1093
*I-10
REM/slb - -
Location
RURAL
RURAL
RURAL
HARRIS c.oum:Y
1,
A-49
Response
POOO o::>NTROL 4
PO!Nf rorrROL 4
POINT rorrROL 4
POOO COOTROL 4
-

TEXAS DEPAR'I!MENT OP' PUBLIC SAFETY BJ:GBWAY PATROL DISTRICT 2A
Hurricane Evacuation Response Procedures
Primary Evacua't.ion Route FM 359 Area 2A08 -----
Intersection Location Response
US 90A RURAL( OOVERED ON US 90A PAGE) POINI' CONTROL 2
PLANTATION DRIVE RURAL POINI' roNTROL 1
FM 723 RURAL(OOVERED ON FM 723 PAGE) POINT roNIROL 1
FM 1093 RURAL POINT COOTROL 1
FM 1093 FULSHFAR POINT COOTROL 1
-
REM/s_lb
A-SO

TEXAS DEPARTMENT OP' PUBLIC SAFETY HIGHWAY PATROL DISTRICT 2A
Hurricane Evacuation Response Procedures
==.:..=.ary Evacuation Rout:e fH 723 Area 2A08 -----
I.ntersect.ion Location Response
US 90A
FM 359
FM 1093
REM/s_lb
1,
ROSENBERG(C.OVERED ON US 90A @ FM 723) R>INT CONTROL 1
RURAL(o::MMD .QN fM 359 @ FM 723) R>INI' <X>NTROO 1
RURAL POINT CONTROL 1
A-51
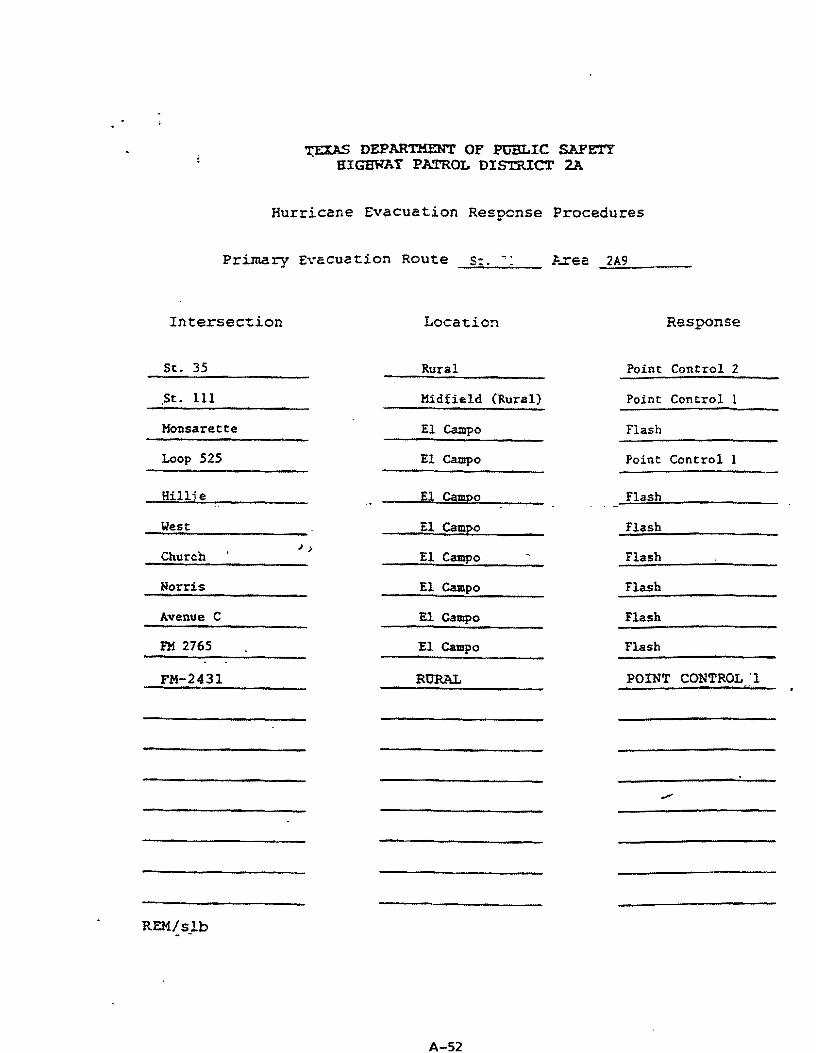
~ DEPAR'l'MENT OF PUBLIC SAFETY HIGHWAY PATROL DISTRICT 2A
Hurricane Evacuation Respcnse Procedures
Primary E'\·acua ti on Route _...;;s .... :..;.._.;:..__ ~..rea 2A9 ._;;:,.;~----
Intersection Location Response
St. 35 Rural Point Control 2
.St. 111 Midfield (Rural) Point Control l
Monsarette El Campo Flash
Loop 525 El Campo Point Control 1
Hillie El Campo Flash
West El Ca~o Flash
Church > >
El Campo Flash
Horris El Campo Flash
Avenue c El Campo Flash
FM 2765 El Campo Flash
FM-2431 RURAL POINT CONTROL'l
REMzs_lb
A-52


TEXAS DEPART.MENT OF PUBLIC SAFETY B.IGBWAY PATROL DISTRICT 2A
Hurricane Evacuation Response Procedures
Primary Evacuation Route St. 60 \.."harton Co.
Area 2A9
Intersection Location
Alabama Road Wharton Point
Rusk Wharton Flash
Fulton Wharton Flash
Houston Wharton Flash
Richmond Wharton Point
Caney Wharton Flash
FM 102 > ; Wharton Point
FM 1301 Wharton Point
l.Oop 183 Bunger ford (Rural) Point
US 90A E. Bernard (Rural) Point:
REM~s).b
A-53
Response
Control 1
Control l
Contro;t l
Control l
Control 1
Control 2

TEXAS DEPARTMENT OF PUBLIC SAFETY HIGHWAY PATROL DISTRICT 2A
Hurricane Evacuation Response Procedures
Primary Evacuation Route St. 60 Area 2A9 Matagorda Co.
Intersection Location
FM 2668 Rural Point
Hamman 'Bay City Flash
Thompson Bay City Flash
Baywood Bay Cit:y Flash
Ybitsoi;i Bay City Flash
Margue Rite Bay City Flash
Matthews I;
Bay City Flash
4th St. Bay City Flash
6th St. Bay City Flash
St. 35 Bax City Point
8th St. Bay City Flash
12th St. Bay City Flash
Grace Bay Cit:y Flash
REM/slb - -
A-54
Response
Control l
Control 2

.. TEX.AS DEPAR"Il!EliT OF PUBLIC SAFETY
JilG.aii.AY PmoL DISTRICT 2A
Hurricane Evacuation Response Procedures
Primary Evacuat:ion Route s:::. 35 Area 2A9
Intersection Loca~ion
4th St. Palacios Flash
Business 35 ~alacios Poi.nt
St. 71 Rural Point
Avenue c Bay City Flash
St. 60 Bay City Point
Avenue G. Bax Citi Flash
H J ;
Bay City Flash Avenue
Avenue L Bay City Flash
Cottonwood Bay City Flash
Sycamore Bay City Flash
FM 2668 Bay City Point
Katy Avenue Bay City Flash
FM 457 Bay Cit:y Point
FM 2540 Rural (Van Vleck) Flash
REM/slb - -
A-55
Response
Control 1
Control 2
Control 2
Control 1
Control 1
.,,..

.. · TEXAS DEPAR"l"HENT OF PUBLIC SAFETY
HIGHWAY PA'l'ROL DISTRICT 2A
Hurricane Evacuation Response Procedures
Primary Evacuation Route us 90
Intersection Location Response
St. 60 East Bernard (Rural) Point Control 2
>,
REM/slb - -
A-56

TEXAS OEP.l't..RTM.ENT OF PUBLIC SAFETY HIGHWAY PATROL DISTRICT 2A
P.t~rricane Evacuation Response Procedures
Primary Evacuation Route FM-1301 Area 2A09 -----
Intersection Location Response
FM-442 RURAL POINT CONTROL l
FM-1728 RURAL POINT CONTROL 1
A-57
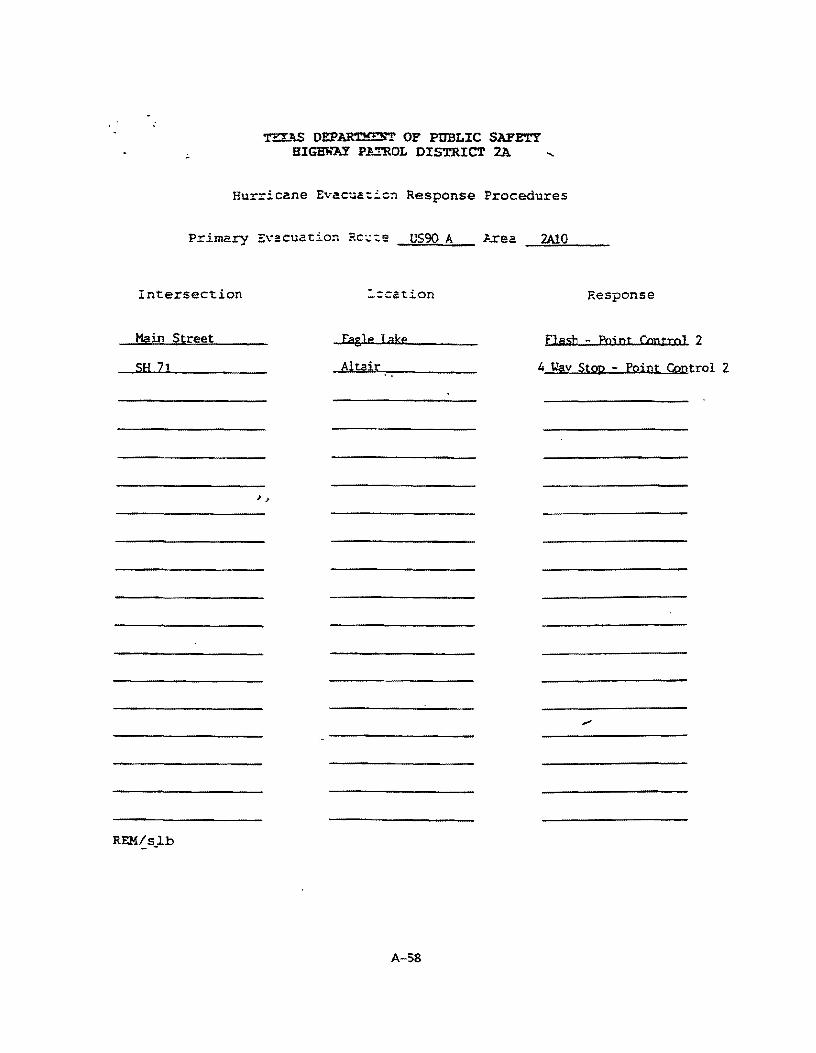
T" x AS DEPAR'.C!!E!rl' OF PUBLIC SAFETY HIGHWAY Pl:=t'ROL DISTRICT 2A
Hurricane Evac~c~~c~ Response Procedures
Primary Evacuation Rc-;;::e US90 A J...rea 2A10
Intersection Response
Main Street Fagle lake flasb - Pojnt Ccntml 2
SH 71 Altair 4 Way Stop - Point C.Ontrol 2
> .>
REM/slb - -
A-58

..
TEXAS DEPART.KENT OF' PUBLIC SAFETY HIGHWAY PATROL DISTRICT 2A
Hurricane Evacuatipn Response Procedure;
Primary Evacuation Route SE-71 Area _2~A""-.l=------
Intersection Location Response
US-90A
IH-10
tJS-71
ALTAIR
COLUMBUS
LaGRANGE
A-59
POINT CONTROL 2
POINT CONTROL 2
POINT CONTROL 2
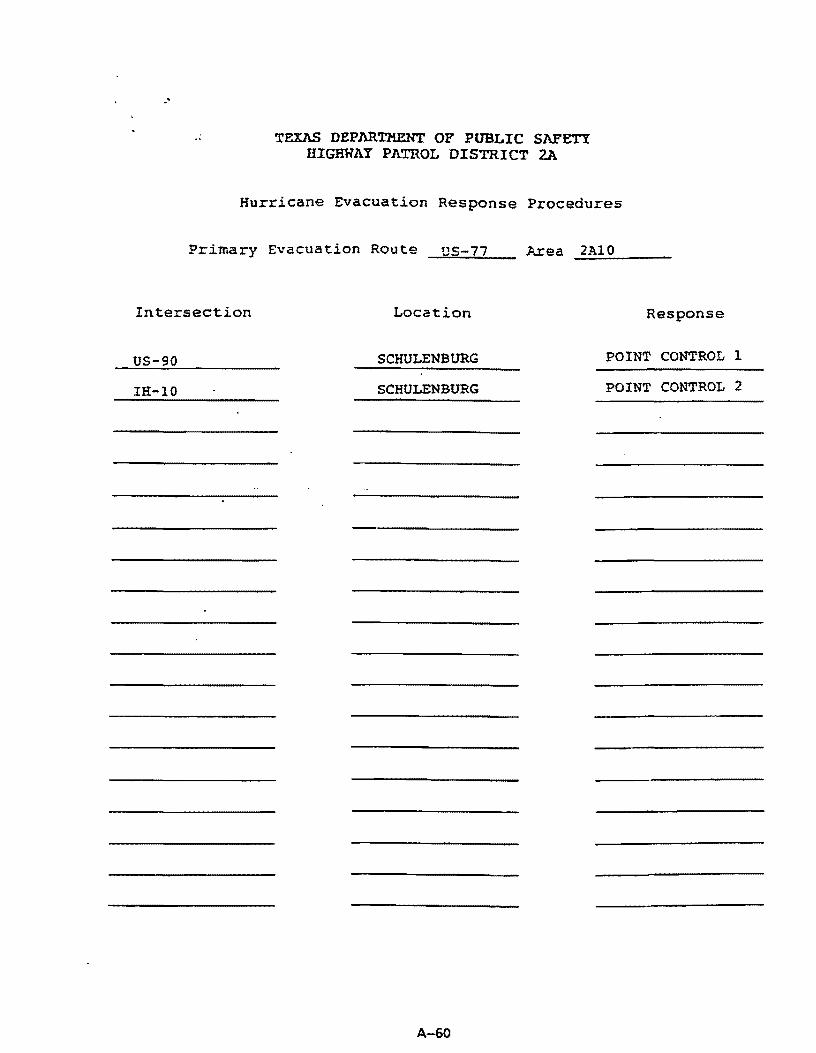
-·
TEXAS DEPARTHE.NT OF PUBLIC SAFETY HIGH'h'AY PATROL DISTRICT 2A
Hurricane Evacuation Response Procedures
Primary Evacuation Route US-77
Intersection Location Response
US-90
IH-10
SCHULENBURG
SCHULENBURG
A-60
POINT CONTROL l
POINT CONTROL 2

TE.US DEPJ\RT.M.EllT OF PU'R-LIC SAFETY HIGHWAY PATROL DISTRICT 2A
Hurricane Evacuation Re~pcnse Procedures
Primary Evacuation Route SE-35 Area --=2-:.:.:1),.:.;ll:.---
Intersection Location Response
FM-109 BRENHAM POINT CONTROI.
US-290 BRENHAM POINT CONTROL
SH-60 WALLIS POINT CONTROL
SP RAILROAD WALLIS POINT CONTROL
ALLEN'S CREEK SEALY POINT CONTROL 2 IF HIGH WATER
IH-10 EASTBOUND SEALY POINT CONTROL 2
IH-10 WESTBOUND. SEALY POINT CONTROL 1
OS-90 UNDERPASS SEALY POINT CONTROL 2 IF tiIGH WATER
LOOP-360. SEALY FLASH
MAIN STREET. SEALY FLASH
PM-1094 SEALY FLASH
SB-159 BELLVILLE POINT CONTROL 2
COURTHOUSE SOUTH BELLVILLE POINT CONTROL l
COURTHOUSE NORTH BELLVILLE POINT CONTROL 1
A-61
1
2
1
1
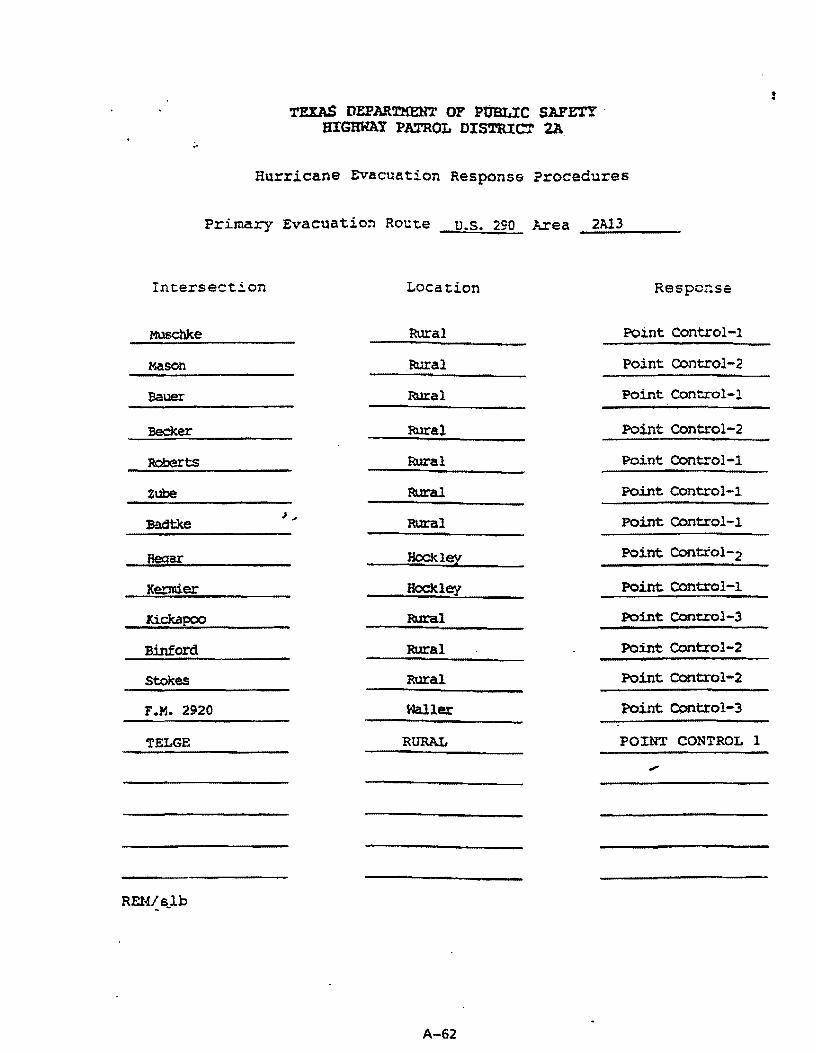
TEXAS DEPARTKENT OF PUBLIC SAFE'l"Y · HIGRHAY PA!t'ROL DISTRICT 2A
Hurricane Evacuation Response ?rocedures
Primary Evacuation Route u.s. 290 Area 2Al3 ..,...;;;;.....;....;....__ __ _ Intersection Locat:ion Respo4se
MUschke Rural Point Control-1
Mason Bural Point COntrol-2
Bauer Bural Point Control-l
Beeker Rural Point Control-2
~rts Rural Point Control-1
Zube Rural Point Control-1
:Badtke J"' RUral Point Control-l
Hegg! Hockl~ Point Control-2
Ke..'l"'Jllier Hockley Point Control-1
Kickapoo RUral Point Control-3
Binford Rural Point Control-2
Stokes Rural Point control-2
1.M. 2920 Nall er Point Ccntrol-3
TELGE RURAL POINT CONTROL
.,,.,,
REM/sll:> ~ -
A-62
1

TEXAS DEPARTMENT OF PUBLIC SAFETY HIGHWAY PATROL DISTRICT 2A
Hurricane Evacuation Response Procedures
Primary Evacuation Route SH- 2 4 9 Area ~2;...cti,~1.._3,__ __
Intersection Location Response
SPRING CYPRESS RURAL POINT CONTROL 2
LOUETTA RURAL POINT CONTROL 2
GRANT ROAD RURAL POINT CONTROL 2
F'M-1960 RURAL POINT CONTROL 3
A-63

TEX.AS DEP ARTHE:h"l.' OY PUBLIC SAFETY HIGHWAY PATROL DISTRICT 2A
Hurricane Evacuation Response Procedures
Primary Evacuation Rou~;: SE-249
Intersection Locat:ion
FM-1774 RURAL
FM-1488 MAGNOLIA
A-64
hrea 2Al4 -----
Response
POINT CONTROL 1
POINT CONTROL 1

: TEXAS DEPARTMENT OF PUBLIC SAFETY HIGHWAY PATROL DISTRICT 2A
Hurricane Evacuation Response Procedures
Primary Evacuation Route F~-359 Area ~2:,£jA~l_,,,,_5'-----
Intersection Location Response
US-90 BROOKSHIRE POINT CONTROL 1
FM-529 MONA VILLE POINT CONTROL 1

TE;XAS DEPARTMENT OF PUBLIC SAFETY HIGHWAY PATROL DISTRICT 2A
Hurricane Evacuation Response Procedures
Primary Evacuation Route us-290 Area 2Al5
Intersection Location Response
FARR STREET WALLER FLASH
FM-362 WALLER POINT CONTROL 2
FM-1098 PRAIRIE VIEW POINT CONTROL 1
FM-359 HEMPSTEAD POINT CONTROL
FM-1488 HEMPSTEAD FLASH
5th STREET HEMPSTEAD FLASH
10th STRE~T HEMPSTEAD FLASH
SB-159 HEMPSTEAD POINT CONTROL 1
A-66
3

TEXAS DEPARnm:NT OF PUBLIC SAFETY BIGB""ft'""AY PATROL DISTRICT 2A
Hurricane Evac~ation Response Procedures
Primary Evacuati~~ ~=~te EM-362 Area 2Al5
Intersection Location Response
US-290
F.M-1488
WALLER
RURAL
A-67
POINT CONTRQL 2
POINT CONTROL 1

Page· No. 1 09/02/94
TRAFFIC SIGNALS l
FOR PROPOSED EVACUATION ROUTE ·•·.
LOCATION CITY.,....,. PHONE COUNTY PHON&; ........ MAINT. PHONE POLICE SHERIFF DY
SH 6 @ TJ\RPON BAYOU VISTA 409-935-0449 GALVESTON 409-766-2322 TX DOT 713 - 802 - 566?.
SH 6 @ FAIRWOOD HITCHCOCK 409-986-5559 GALVESTON 409-766-2322 TXOO'I' 113-802-5662
SH 6 Ci FM 519 HITCHCOCK 409-996-5559 GALVESTON 409-766-2322 TX DOT 713-902-5GG2
SH 6 @ 2ND HITCHCOCK 409-986-5559 GALVESTON 409-766-2322 TX DOT 713-802-5662
SH 6 @ DELANEY HITCHCOCK 409-986-5559 GALVESTON 409-7~6-2322 ·rlmn·1· 711 ·AO?.·· r;,t;t;~ )> I SH 6 !it FM 2004 HITCHCOCK 409-986-5559 GALVESTON 409-766-2322 TX DOT 713-802-5662 °' ()()
SH 6 !it FM 646 (SB) SANTA FE 409-925-2000 GALVESTON 409-766-2322 TX DOT 713-802·SG6?.
SH 6 @ FM 646 (NB) SANTA FE 409-925-2000 GALVESTON 409-766-2322 TX DOT 713-802-5662
SH 6 @ AVE.T SANTA FE 409-925-2000 GALVESTON 409-766-2322 TX DOT 7ll-802-S662
SH 6 @ JACKSON SANTA FE 409-925-2000 GALVESTON 409-766-2322 TX DOT il3-802-5662
SH 6 @ TOWER SANTA FE 409-925-2000 GALVESTON 409-766-2322 TXDO'I' 713-802-S662
SH 6 @ SH 35 ALVIN 713-388-4370 BRAZORIA 409-049-2441 TX DOT '113 · B02 • 5662
SH 6 @ BS 35 C ALVIN 713-389-4370 BRAZORIA 409-849-24111 'l'X 1111·1· ., 11. 110~!. •;r,1, ;~
SH 6 @ SECOND ALVIN 713-388-437.0 BRAZORIA 409-849-21141 'l'Xlll •'I' ·1.1 .•. 1111;:. 11hf1 ••
fl, ..
SH 6 @ CR 149 ALVIN 713-388-4370 BRAZORIA 409-849-2441 'l'XrJO'I' 713-802-5662
SH 6 @ CR 146 ALVIN 713-398-4370 BRAZORIA 409-849-2441 TX DOT 7 l:l -110~! .. •,t,fi;!

Page No. 2 09/02/94
TRAFFIC SIGNALS FOR
PROPOSED EVACUATION ROUTE
LOCATION CITY ...... PHONE COUNTY l?HONR ...... Mf\INT. PHONE POLICE SHERIFF llY
SH 6 ® CR 99 ALVIN 713-388-4370 BRAZORIA 409-849-21141 1'Xl)O'l' 713-802-5662
SH 6 @ FM 1128 A MANVEL 713-489-0630 BRAZORIA 409-849-2441 1'XDOT 713-802-5662
SH 6 <ill SH 288 MANVEL 713-489-0630 BRAZORIA 409-849-2441 TX DOT 713-802-5662
SH 6 @ FM 521 RURAL FORT BEND 713-341-4665 TX DOT 713- 802- 566.2
SH 6 ® HILLCROFT AVE, MISSOURI 713-261-4200 FORT BEND 713 -341-4665 TX DOT 713-802-5669
:r SH 6 @ FLAT BANK MISSOURI O'I
713-261-4200 FORT BEND 713-341-4665 TX DOT 713-802-5662 U>
SH 6 ii LAKE OLYMPIA MISSOURI 713-261-4200 FORT BEND 713-341-4665 TX DOT 713-802-5662
SH 6 @ OLEN LAKES MISSOURI 713-261-4200 FORT BEND 713-341-4665 TX DOT 713-802-5662
SH 6 @ FM 1092 MISSOURI 713-261-4200 FORT BEND 713-341-4665 TX DOT 71:l-002-5662
SH 6 ® DULLES SUGARLAND 713-242-2500 FORT BEND 713-341-4665 'l'XUOT 713-802·5662
SH 6 @ SETTLERS WAY SUGARLAND 713-242-2500 FORT BEND 713-341-4665 1'XDO'I' 713-002-5662
SH 6 @ WILLIAMS TRACE SUGARLAND 713-242-2500 FORT BEND 713-341-4665 1'XOOT 713-002-5662
SH 6 @ GRJ\NTS LAKE SUGARLAND 713-242-2500 FORT BEND 713-341-4665 TX DOT 713-902-5662
SH 6 ® LEXINGTON SUGARLAND 713-242-2500 FORT BEND 713-341-4665 TY. fll l'I' 713-RQ;l.-%1\:! ''·.
SH 6 @ us 59 SUGARLAND 713-242-2500 FORT BBND 713-341-4665 TX DOT 713·802-5662
SH 6 @ FLUOR/DANIAL SUGARLAND 713-242-2500 FORT BEND 713-341-4665 TXOOT "/D-80:>.-5662

Page No. 3 09/02/94
TRAFFIC S IGNl\LS FOR
PROPOSED EVACUATION ROUTE
LOCATION CITY ...... PHONE COUNTY PHONli:• ....... MA INT. PHONE POLICE SHERIFF BY
SH 6 @ SP 59 SUGAR LAND 713-242-2500 FORT BEND 713-3'11-4665 'l'Xl)OT 713-902-566.?.
SH 6 @ US 90 A SUGARLAND 713-242-2500 FORT BEND 713-341-4665 .,. x llll' f' ·111 .. 1un . r;r.r. 1.
SH 6 @ VOSS SUGARLAND 713-242-2500 FORT BEND 713-341-4665 TXllt IT 'I I I .. II II;: 11 (.I,).
SH 6 ® OLD RICHMOND HOUSTON 713-222-3131 HARRIS 713-221-6000 TXDO'J' 713-902-5662
SH 6 @ BISSONETT HOUSTON 713-222-3131 HARRIS 713-221-6000 TX DOT ., l J - f.10#1 '"'" ;i );lo
HOUSTON 713-222-3131 HARRIS I SH 6 @ CHARLMONT 713-221-6000 TXDO'l' 713-802-5662 ..... 0
SH 6 0 BEECHNUT HOUSTON 713-222-3131 HARRIS 713-221-6000 TX DOT 713-802-5662
SH 6 @I BELLAIRE HOUSTON 713-222-3131 HARRIS 713-221-6000 TXOOT 713-902-5662
SH 6 <it ALIEF/CLODIN HOUSTON 713-222-3131 HARRIS '713-221-6000 'rXDO't 713-902-5662
SH 6 !& WESTPARK HOUSTON 713-222-3131 HARRIS 713-221-6000 ·rx 1m1· 713-802-5662
SH 6 @ RICHMOND HOUSTON 713-222-3131 HARRIS 713-221-6000 11 Olll I 'l'ON 713-865-4000
SH 6 @ PARK HOLLOW HOUSTON 713-222-3131 HARRIS 713-221-6000 HOUSTON 713-065-4000
SH 6 @ WESTHEIMER HOUSTON 713-222-3131 HARR:i:S 713-221-6000 HOUSTON '713-865-4000
SH 6 @ PIPING ROCK HOUSTON 713-222-3131 HARRIS 713-221-6000 HOUSTON 713-865-4000 11 •.•
SH 6 @ BRIAR FOREST HOUSTON 713-222-3131 HARRIS 713-221-6000 HOUSTON 713-865-4000
SH 6 @ BRIAR HILLS HOUSTON 713-222-3131 HARRIS 713-221-6000 TX DOT 713-802-5662

Page No. 4 09/02/94
TRAFFIC SIGNALS FOR
PROPOSED EVACUATION ROUTE f•
LOCATION CITY .. ,_. PHONE COUNTY PHONE• ... _.,, MA.lNT. PHONE POLICE SHERIFF DY
SH 6 @ MEMORIAL HOUSTON 713-222-3131 HARRIS 713-221·6000 HOUB'l'ON 113-865-4000
SH 6 @ IH 10/SSR HOUSTON 713-222-3131 HARRIS 713·221-6000 HOUf.TON 713-865-4000
SH 6 @ IH 10/NSR HOUSTON 713-222-3131 HARRIS 713-221-6000 llOW:TnN ·11 J .. n r. ,., · it o o o SH 36 @ FM 2004/2611 FREEPORT 409-239-1121 BRAZORIA 409-849-2441 TXDO'l' 713-802-5662
SH 36 ® FM 521 S. BRAZORIA 409-798-2195 BRAZORIA 409-849-2441 TX DOT 713-802-5662 )> SH 36 @ NEW YORK BRAZORIA 409-798-2195 BRAZORIA 409-849-2441 TX DOT 713-802-5662 I ...... ......
SH 36 @ SH 332/FM 521 N. BRAZORIA 409-798-2195 BRAZORIA 409-849-2441 TX DOT 713-802-5662
SH 36 @ GAINES BRAZORIA 409-798-2195 BRAZORIA 409-849-2441 TX DOT 713-902-5662
SH 36 @ PJ..EASANT BRAZORIA 409-798-2195 BRAZORIA 409-849-2441 TX DOT "11.3-802-5662
SH 36 0 SH 35 W.COLUMBIA 409-345-5121 BRAZORIA 409-849-2441 1·xnm· 713 - 802 - 5662
SH 36 @ FM 1301 W.COLUMBIA 409-345-5121 BRAZORIA 409-849-2441 'l'l(l)OT "Jl)-002-%62
SH 36 @ FM 1236 NEEDVILLE 409-793-4255 FORT BEND 713-341-4()65 'J'XtH ''1' '/I 1 110:! !•lit.:•
SH 36 @ us 59 ROSENBERG 713-342-5566 FORT BEND 713-341-4665 TXDO'I' 713-802-5662
SH 36 @ CALLENDER ROSENBERG 713-342-5566 FORT BEND 713·3'11-4665 TXDO'J' 7 1 3 • 0 0 7. • ~.,Ii Ii:.! Jt, .•
SH 36 @ MONS ROSENBERG 713-342-5566 FORT BEND 713-341-4665 TXOOT 7 l J - 8 0 2 · !°>Ii 6 2
SH 36 @ AVE.M ROSENBERG 713-342-5566 FORT BEND 713-341-4665 TX DOT 713-802-5662

Page No. s 09/02/<.J4
TRAFFIC SIGNALS ·. FOR
PROPOSED EVACUATION ROUTE " . LOCATION CITY ·- PHONE COUNTY PHON£ ....... Ml\ I NT. PHONE
POLI.CE SHERIFF BY
SH 36 @ FM 1640 ROSENBERG 713-342-5566 FORT BEND 713 - 341-4665 TX DOT 713-902-5662
IH 45 @ FM 519 LA MARQUE 409-938-9269 GALVESTON 409-766-2322 TXOOT 713-802-5662
IH 45 @ BAY AREA E. WEBSTER 713-332-2426 HARRIS 713-221-6000 TX DOT 713-802-5662
IH 45 @ FM 1764 TEXAS CITY 409-948-2525 GALVESTON 409-766-2322 TX DOT 713-802-5662
IH 45 @ J.:'M Sl7 DICKINSON 409-337-4700 GALVESTON 409-766-2322 TX DOT 713-902-5662 )> I IH 45 II FM 646 E. DICKINSON 409-337-4700 GALVESTON 409·766-2322 TX DOT 713-802-5662 ......, IV
IH 45 @ FM 646 W. DICKINSON 409-337-4700 GALVESTON 409-766-2322 TX DOT 713-002-5662
IH 45 @ FM 518 LEAGUE CITY 409-332-2566 GALVESTON 409-766-2322 1'XOOT 713-802-5662
rn 45 @ BAY AREA W. WEBSTER PD 713-332-2426 HARRIS 713-221-6000 TXUOT 71J-002-5GG2
IH 45 @ EL DORADO E. WEBSTER PO 713-332-2426 HARRIS 713-221-6000 'fXDO'I' 713-802-5662
IH 45 @ EL DORADO W. WEBSTER PD 713-332-2426 HARRIS 713-221-6000 Txno·r 713-802- 5662
IH 45 @ FM 2351/SSR HOUSTON 713-222-3131 HARRIS 713. 221-6000 11011::·1·ow 713-965-4000
IH 45 I.ii> FM 2351/NSR HOUSTON 713-222-3131 HARRIS .713-221-6000 Hous·roN 713-865-4000
IH 45 ® SCARSDALE SW HOUSTON HOUSTON 713-222-3131 HARRIS 713-221-6000 HOUSTON 713-865-4000 LP .. ii •.•
IH 45 @ SCARSDALE NB HOUSTON HOUSTON 713-222-3131 HARRIS 713-221-6000 HOUSTON 713-865-4000 LP

Page No. 6 ... 09/02/94
TRAFFIC SIGNALS FOR
PROPOSED EVACUATION ROUTE
LOCATION CITY ·-. PHONE COUNTY PHON&: ....... M/\lN'I'. PHONE POLICE SHERIFF nv
IH 45 @ LP 8 (SAM HOUSTON) HOUSTON 713-222-3131 SWI
HARRIS 713-221-6000 11011::·1·• 11·1 '/I'\· IH. 1i ·illlll(l
IH 45 ® LP 8 (SAM HOUSTON) HOUSTON '713-222-3131 HARRIS 713-221-6000 HOUSTON '11J-965dl000 SIU
IH 45 @ LP 0 (SAM HOUSTON) HOUSTON 713-222-3131 HARRIS 713-221-6000 11om;ToN 713-0GS·'IOOO NWI
IH 45 @ LP 0 (SAM HOUSTON) HOUSTON 713-222-3131 HARRIS 113-221-6000 HOUSTON 713-065-4000 NEI
IH 45 @ ALMEDA GENOA HOUSTON 713-222-3131 HARRIS 713-221-6000 llOUSTON 713 ·865-4000
IH 45 @ ALMEDA GENOA HOUSTON 713-222-3131 HARRIS 713-221-6000 llOllfl'l'ON 713-865-4000
IH 45 ® EDGEBROOK/SSR HOUSTON 713-222-3131 HARRIS 713-221-6000 11nw;·roN 713-865-4000
IH 45 @ EDGEBROOK/NSR HOUSTON 113-222-3131 HARRIS 713-221-6000 HOUSTON 713-865-4000
IH 45 @ AIRPORT/ESR HOUSTON 713-222-3131 HARRIS 713-221-6000 HOUS'rON 713-865-4000
IH 45 11 AIRPORT/WSR HOUSTON 713-222-3131 HARRIS 713-221-6000 HOUSTON 713-865-4000
IH 45 @ MONROE/SSR HOUSTON 713-222-3131 HARRIS 713-221-6000 HOUSTON 713-865-4000
IH 45 @ MONROE/NSR HOUSTON 713-222-3131 HARRIS 713-221-6000 HOUSTON 713-865-4000 II,,.
IH 45 @ HOWARD/BELLFORT S. HOUSTON .. 713-222-3131 HARRIS 713-221-6000 HOUSTON 713-865-4000
lH 45 @ HOWJ\RD/NSR HOUSTON 713-222-3131 HARRIS 713-221-6000 HOUSTON 713-865-4000

Page No. 7 09/02/94
TRAFFIC SIGNALS FOR
PROPOSED EVACUATION ROUTE
LOCATION CITY·· .... •. PHONE COUNTY PHONB ... ~.,. Ml\INT. PHONE POLICE SHERIFF BY
IH 45 @ BROADWAY/SW! HOUSTON 713-222-3131 HARRIS 713-221-6000 flOIJHTON 713-065-4000
IH 45 @ BROADWAY/SE! HOUSTON 713-222-3131 HARRIS 713-221-6000 HOUS'l'ON 'llJ-665-4000
IH 45 @ BROADWAY/NE! HOUSTON 713-222-3131 HARRIS 713-221-6000 HOUSTON 713-865-4000
IH 45 @ BROADWAY/NW! HOUSTON 713-222-3131 HARRIS 713-221-6000 HOUSTON 713-865-4000
SH 146 @ FM 519/SH 341 TEXAS CITY 409-948-2525 )>
GALVESTON 409-766-2322 TX DOT 713-802-5662
I SH 146 @ FM 1765/348 TEXAS CITY 409-949-2525 GALVESTON 409-766-2322 TX DOT 713-802-5662 ...... :..
SH 146 @ FM 1764 TEXAS CITY 409-948-2525 GALVESTON 409-766-2322 TX DOT 713-802-5662
SH 146 @ LOOP 197 N. TEXAS CITY 409-948-2525 GALVESTON 409-766-2322 TXDO'I' '713-002-5662
SH 146@ FM 517 S. TEXAS CITY 409-948-2525 GALVESTON 409-766-2322 TXl)(l'I' 713-802-5662
SH 146 ® FM 646 BACLIFF N/'A GALVESTON 409-766-2322 TXl111•1· '/I I· 1111~! 1.,t.r1;!
SH 146 ® FM 518 KEMAH 409-538-1311 GALVESTON 409-766-2322 'l'Xl111•r 'I .LI · 1111 :! · 1, 1, r, ;!
SH 146 @ FM 2094 KEMAH 409-538-1311 GALVESTON 409-766-2322 TXDO'I' 713-802-5662
SH 146 @ TEXAS/6TH KEM AR 409-538-13 ll GALVESTON 409-766-2322 TXDO'I' '113 - 802. ~.1,c,;i
SH 146 @ CAPRI LANE SEABROOK 713-474-4471 HARRIS 713-221-6000 TX DOT 713-802-5662 ''·.
SH 146 @ EL MAR SEABROOK 713-474-4471 HARRIS 713-221-6000 TX DOT 713-802-5662
SH 146 t> REPSDORPH SEABROOK 713-474-4471 HARRIS 713-221-6000 TX DOT 713-802-5662
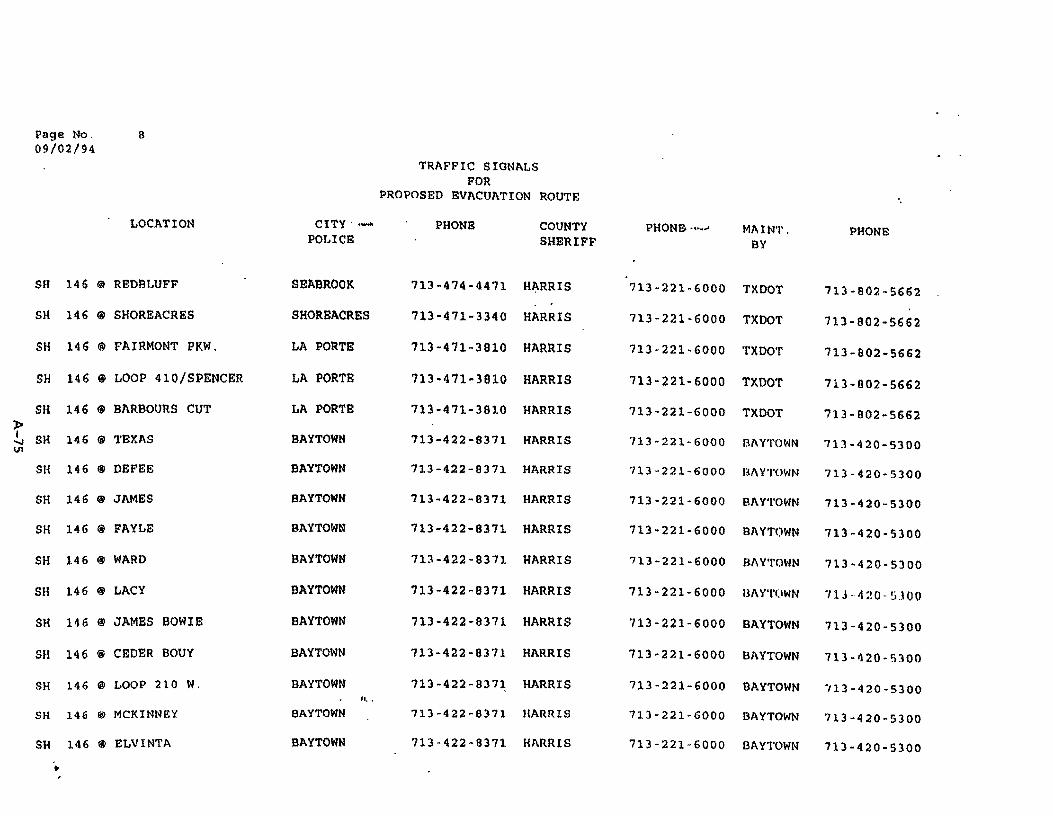
Page No. 8 09/02/94
TRAFFIC SIGNALS FOR
PROPOSED EVACUATION ROUTE
LOCATION CITY··- PHONE COUNTY PHONS ....... Ml\IN'I'. PHONE POLICE SHERIFF BY
SH 146 @ REOBWFF SEABROOK 713-474-4471 HARRIS '113-221-6000 TX DOT 713-802-5662
SH 146 @ SHOREACRES SHOREACRES 713-471-3340 HARRIS 713-221-6000 TX DOT 713-802-5662
SH 146 @ FAIRMONT PKW. LA PORTE 713-471-3910 HARRIS 713·221·6000 TXoo·r 713-802-5662
SH 146 @ LOOP 410/SPENCER LA PORTE 713-471-3910 HARRIS 713-221-6000 TX DOT 713-802-5662
SH 146 0 BARBOURS CUT LA PORTE 713-471-3810 )>
HARRIS '113-221-6000 TX DOT 713-802-5662
,!.i SH 146 @ TEXAS BAYTOWN 713-422-8371 HARRIS 713-221-6000 Rl\YTOWN 713-420-5300 U1
SH 146 @ DEFEE BAYTOWN 713-422-8371 HARRIS 713-221-6000 13/\ Y'l'OWN 713-420-5300
SH 146 @ JAMES BAYTOWN 713-422-8371 HARRIS 713-221-6000 BAYTOWN 713-420-5300
SH 146 @ FAYLE BAYTOWN 713-422-8371 HARRIS 713-221-6000 81\YTOWN 713-420-5300
SH 146 @ WARD BAYTOWN 713-422-8371 HARRIS 713-221-6000 Bl\Y'l'OWN 713·420-5300
SH 146 @ LACY BAYTOWN 713-422-8371 HARRIS 713-221-6000 13/\ Y'l'OWN 'llJ-420 .. !_iJOO
SH 146 @ JAMES BOWIE BAYTOWN 713-422-8371 HARRIS 713-221-6000 BAYTOWN 713-420-5300
SH 146 @ CEDER BOUY BAYTOWN 713-422-8371 HARRIS 713-221-6000 BAYTOWN 713-1120-5300
SH 146 @ LOOP 210 W. BAYTOWN 713-422-937~ HARRIS 713·221-6000 BAYTOWN ·113 - 4 2 0 . s 3 0 0 II,•
SH 146 @ MCKINNEY BAYTOWN 713-422-8371 HARRIS 713·221-6000 BAYTOWN 713-420-5300
SH 146 @ ELVINTA BAYTOWN 713-422-8371 HARRIS 713-221-6000 BAYTOWN 713-420-5300
· ..

Page No. 9 09/02/94
TRAFFIC SIGNALS FOR
PROPOSED EVACUATION ROUTE
LOCATION CITY··- PHONE COUNTY PHONE ...... M/\INT. l'llCINI·: POLICE SHERIFF 11 'I
SH 146 @ LOOP 210 E. BAYTOWN 713-422-8371 HARRIS 713-221-6000 D/\YTOWN .,13-420-5300
SH 146 @ FM 565 BAYTOWN 713-422-8371 HARRIS 713-221-6000 81\Y'l'OWN '113-420 ·!HOO
SH 146 @ FM 565 BAYTOWN 713-422-83 71 HARRIS 713-221-6000 01\YTOWN '713-420-5300
SH 298 @ 2ND/SH36 FREEPORT 409-239-1121 BRAZORIA 409-849-2441 TX DOT 713-802-5662
)> SH 298 @ AVE.I\ FREEPORT 409-239-1121 BRAZORIA 409-849-2441 1'XOOT 713-002-5662
I ...... SH 298 @ FM 523 (GULF) FREEPORT 409-239-1121 BRAZORIA 409-849-2441 TXOOT 713-802-5662 0\
SH 298 @ SKINNER FREEPORT 409-239-1121 BRAZORIA 409-849-2441 ·rxoo-r 713-802-5662
SH 288 @ YELLOWSTONE FREEPORT 409-239-1121 BRAZORIA 409-849-2441 TXlJOT 713-802-5662
SH 288 @ VICTORIA FREEPORT 409-239-1121 BRAZORIA 409-849-2441 TX DOT 713-802-5662
SH 288 @ CHLORINE FREEPORT 409-239-1121 BRAZORIA 409-849-2441 TX DOT 713-002-5662
SH 288 @ ENTRANCE FREEPORT 409-239-1121 BRAZORIA 409-849-2441 TX DOT 713-802-5662
SH 288 @ PARK FREEPORT 409-239-1121 BRAZORIA 409-849-2441 TX DOT 713-802-5662
SH 280 @ MAIN CLUTE 409-265-6194 BRAZORIA 409-849-2441 TX DOT 713-802-5662
SH 288 @ SIM HODGE/LAZY CLUTE 409-265-6194 BRAZORIA 409-849-2441 TX DOT 713-802-5662 ,~ ..
SH 288 @ FLAG LAKE/DIXIE LAKE JACKS,,9N 409-297-1101 BRAZORIA 409-849-2441 TXDO'r 713 ·802. 5662
SH 2ae @ SYCAMORE LAKE JACKSON 409-297-1101 BRAZORIA 409-849-2441 TXDO'I' 713-802-5662

Page No. 10 09/02/94
TRAFFIC SIGNALS FOR
PROPOSED EVACUATION ROUTE .. LOCATION CITY ......... PHONE COUNTY PHONE•·"•·"' MJ\INT. PHONE POLICE SHERIFF DY
SH 288 @ PLANTl\'rION LAKE JACKSON 409-297-1101 B~AZORIA 409-849-2441 TX DOT 713-802-5662
SH 288 @ YAUPON LAKE JACKSON 409-297-1101 BRAZORIA 409-849-2441 TX DOT 713-802-5662
SH 288 ® OAK LAKE JACKSON 409-297-1101 BRAZORIA 409-849-2441 TX DOT '113-802-5662
SH 288 @ THIS WAY LAKE JACKSON 409-297-1101 BRAZORIA 409-949-2441 TX DOT 713-802-5662
SH 288 ~ OYSTER CREEK LAKE JACKSON 409-297-1101 BRAZORIA 409-849-2441 TXDO'f 713-802-5662 J> ~ SH 288 @ FM 2004 LAKE JACKSON 409-297-1101 BRAZORIA 409-849-2441 TX DOT 713-802-5662 .....
SH 2a·e ® FM s10 MANVEL 713-489-0630 BRAZORIA 409-849-2441 TXDO'I' 7 ... 3-902-5662
SH 280 @ ALMEDA/GENOA HOUSTON 713-222-3131 HARRIS 713-221-6000 llOll!:'l'ON 7l3-flG5-4000
SH 289 @ AIRPORT/ESR HOUSTON 713.-222-3131 HARRIS 113-221-6000 IH>ll1:T1·1M 'II.\ ll<i'• •1111111
SH 288 Cl REED/WSR HOUSTON 713.-222-3131 HARRIS 713-221-6000 Hous·roN 713-865-4000
SH 288 Iii REED/ESR HOUSTON 713-222-3131 HARRIS 713-221-6000 HOUSTON 713-865-4000
SH 288 © BELLFORT/ESR HOUSTON 713·-222-3131 HARRIS 713-221-6000 nous·roN 713-865-4000
SH 332 @ CR.257 FREEPORT 4 09·-2 3 9-1121 BRAZORIA 409-049-2441 TX DOT 713-802-5662
SH 332 @ DOW GATE 9 FREEPORT 409-239-1121 BRAZORIA 409-849-2441 TX DOT 713-802-5662 .. I~ .•
SH 332 @ FM 523 FREEPORT 409-239-1121 BRAZORIA 409-849·2441 TXDO'r 713-802-5662
SH 332 @ N.MARKET W.COLUMBIA 409-345-5121 BRAZORIA 409-849-2441 1'Y.ll0'1' 713-802-5662
•
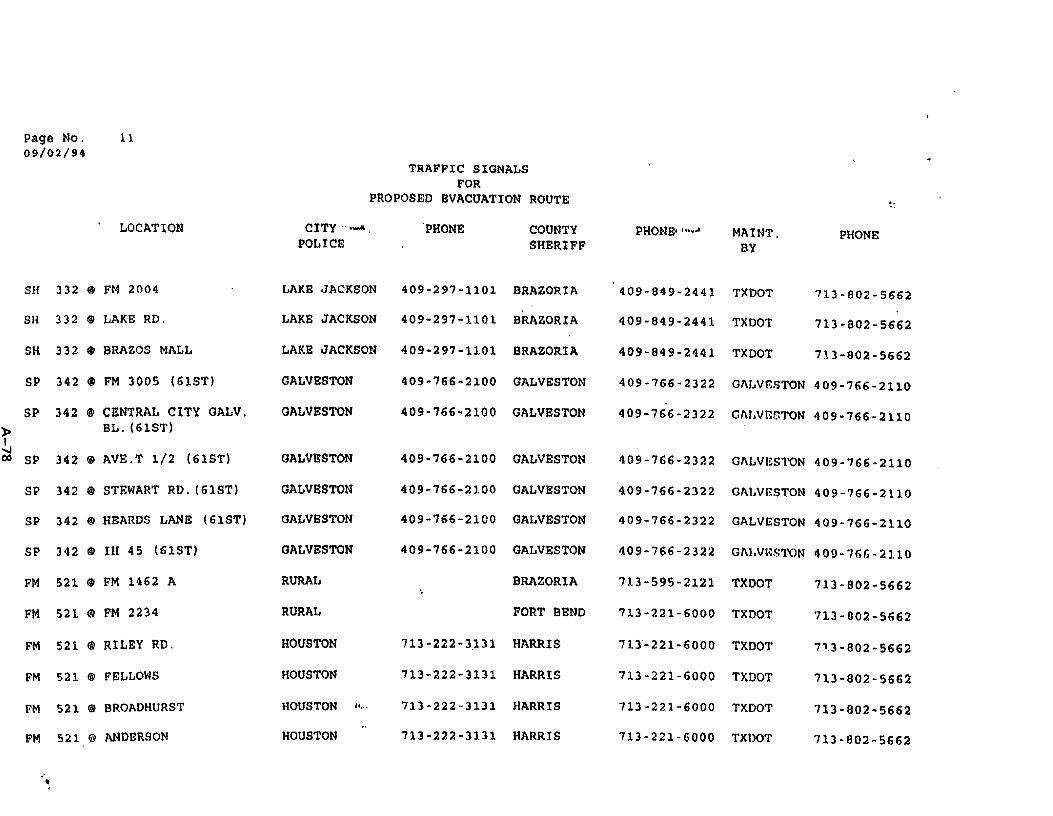
Page No. 11 09/02/94
TRAFFIC SIGNALS FOR
PROPOSED EVACUATION ROUTE .. LOCATION CITY ... -. PHONE COUNTY PHONE>·"•·" MAINT. PHONE
POLICE SHERIFF BY
SH 332 @ FM 2004 LAKE JACKSON 409-297-1101 BRAZORIA 409-849-2441 TX DOT 113-802-51562
SH 332 @ LAKE RD. LAKE JACKSON 409-297-1101 BRAZORIA 409-849-2441 TX DOT 713-802-5662
SH 332 @ BRAZOS MALL LAKE JACKSON 409-297-1101 BRAZORIA 409-849-2441 TX DOT 71.l-802-5662
SP 342 ® FM 3005 (61ST) GALVESTON 409-766-2100 GALVESTON 409-766-2322 GALVRSTON 409-766-2110
SP 342 @ CENTRAL CITY GALV. GALVESTON 409-766-2100 GALVESTON 409-766-2322 Cl\l.VF.STON 4 09 • 766-2 llO )> BL. (6lST) I
""" 342 @ AVE.T l/2 (61ST) GALVESTON co SP 409-766-2100 GALVESTON 409-766-2322 Gl\LVES1'0N 409-766-2110
SP 342 ~ STEWART RD. (61ST) GALVESTON 409-766-2100 GALVESTON 409-766-2322 Gl\INESTON 409-766-2110
SP 342 ® HEAROS LANE (61ST) GALVESTON 409-766-2100 GALVESTON 409-766-2322 GALVESTON 409-766-2110
SP 342 ® IH 45 (61ST) GALVESTON 409-766-2100 GALVESTON 409-766-2322 G/\.1.Vl~S1'0N 409-766-2110
FM 521 @ FM 1462 A RURAL BRAZORIA 713-595-2121 TX DOT 713-802-5662 >
FM 521 @ FM 2234 RURAL FORT BEND 713-221-6000 TX DOT 713-802-5662
FM 521 @ RILEY RD. HOUSTON 713-222-3.131 HARRIS 713-221-6000 TX DOT 71.3-802-5662
FM 521 @ FELLOWS HOUSTON 713-222-3131 HARRIS 713-221-6000 TX DOT 713-802-5662
FM 521 @ BROADHURST HOUSTON , .... 713-222-3131 HARRIS 713-221-6000 TX DOT 713-802-5662
FM 521 @ ANDERSON HOUSTON 713-222-3131 HARRIS 713-221-6000 'rXDOT 713-802-5662
'

Page No. 12 09/02/94 .. e
TRAFFIC SIGNALS FOR
PROPOSED EVACUATION ROUTE .. LOCATION CITY ··.w• PHONE COUNTY PHONE' ...... MAINT. PHONE POLI CB SHERIFF BY
FM 521 ® ALMEDA GENOA HOUSTON 713-222-3131 HARRIS 713-221-6000 HOUSTON 713-865-4000
FM 521 @.OREM HOUSTON 713-222-3131 HARRIS 713-221-6000 HOUSTON 713-865-4000
FM 521 ® ALMEDA PLAZA HOUSTON 713-222-3131 HARRIS 713-221-6000 HOUSTON 713-865-4000
FM 521 ® REED HOUSTON 713-222-3131 HARRIS 713-221-6000 HOUSTON 713 -865-4000
FM 521 @ HOLMES/ESR HOUSTON 713-222-3131 HARRIS 713-22i-6000 ltOUS'J'UN 713-865-4000 )>
.!_i FM 521 ® HOLMES/WSR HOUSTON 713-222-3131 HARRIS 713-221-6000 HOUS1'0N 713-865-4000 ID
FM 521 @ IH 610/SSR HOUSTON 713-222-3131 HARRIS 713-221-6000 HOUSTON 713-865-4000
FM 521 @ IH 610/NSR HOUSTON 713-222-3131 HARRIS 713-221-6000 HOUSTON 713-965-4000
FM 524 @ PHILLIPS REFINE SWEENY 409-549-3111 BRAZORIA 409-849-2441 TX DOT 7'.';.3-802-5662
FM 524 ® ASHLEY/WILSON SWEENY 409-548-3111 BRAZORIA. 409-849-2441 TX DOT 713-002-5662
II ...
II

HURRICANE ALERT PROCEDURES
July, 1996 Houston District
Plan ""ill be initiated by Tx.DOT" s District Emergency Management C.x·::d:::.:::.tor (}. R. Salinas).
Hurricane enters the Gulf of Mexico:
1. Review this plan with your personnel.
2. Begin monitoring the path of the hurricane.
3~. Begin checking all maintenance equipment for proper operation.
4. Begin sending letters of authorization for employees.
5. Check fuel tanks and fill if necessary.
6. Check supplies such as chain saws, batteries. flashlights, rain suits, etc.
7. District warehouse to check and make sure there are adequate supplies.
8. Check auxiliary power units for proper operation.
9. Check evacuation routes for obstructions.
10. DPS may contact the Department to review the Traffic Management Plan.
11. Traffic signals to be checked in flashing mode.
12. Check barricades for Traffic Management Plan.
13. Check plan for securing Department buildings.
Area engineers and maintenance supervisors will be responsible for numbers l. 3, 5, 6, 8. 9, 11. 12 and 13.
District maintenance will be responsib1e for numbers 2 and 4.
All other supervisors should also review this plan with their personnel.
Page l of 3
A-80

HURRICANE "'ARNING PROCEDURES
July, 1996 Houston District
The follov.ing steps should be taken only if authorized by TxDOT's District E:m.:::gency Management Coordinator (J. R. Salinas).
Category 3-5 Hurricane - 48 hours from landfall near the upper Texas Coast:
I. Employees should ~e preparations for their families.
2. Begin placing traffic control devices at locations designated in the Traffic Management Plan.
3. Begin moving equipment and supplies to designated locations.
~
4. Begin preparing Department emergency operation center in Houston.
5. Construction companies notified to cease work and clear any obstructions.
6. Offices not evacuated begin preparing to receive TxDOT employees {no family members).
Page 2 of3
A-81
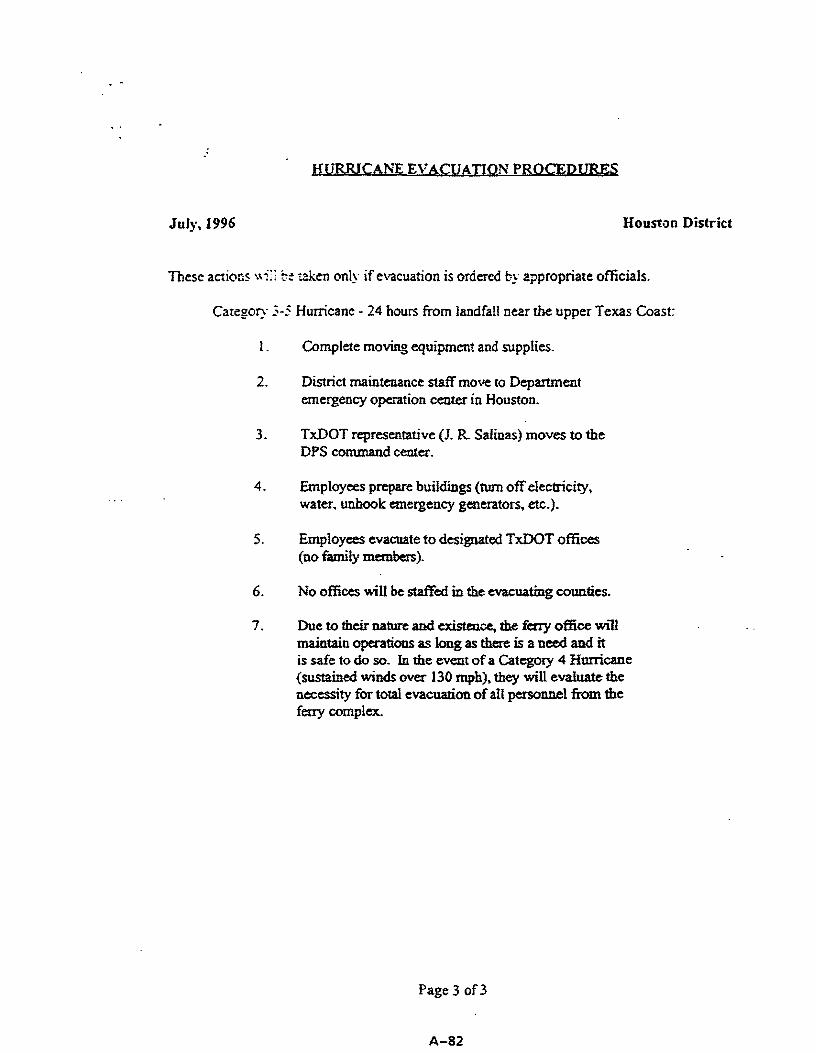
HURRICANE EV ACUAIION PROCEDURES
July, 1996 Houston District
These actions \\i:i bi! taken only if evacuation is ordered by appropriate officials.
Category 3·5 Hurricane • 24 hours from landfall near the upper Texas Coast:
I . Complete moving equipment and supplies.
2. District maintenance staff move to Department emergency operation center in Houston.
3. TxDOT representative (J. R. Salinas) moves to the DPS command center.
4. Employees prepare buildings (tum off electricity, water. unhook emergency generators. etc.).
5. Employees evacuatetodesignated TxDOT offices (no family members).
6. No offices will be staffed in the evacuating counties.
7. Due to their nature and existence, the fc:ay office wtll maintain operations as long as there is a need and it is safe to do so. In the event of a Category 4 Hurricane (sustained winds over 130 mph), they will evaluate the necessity for total evacuation of all personnel from the ferry complex.
Page3 of3
A-82

l\f EM 0 R A ND U l\f
TO: Mr. Guy K. Trietsch, P.E.
FROM: D. K. D::.niel
SUBJECT: Galveston Feny Heavy Weather Bill for 1997
The attached is forwarded for your infonnation.
DKD:lbt Attachment cc: Mr. Clark Titus ,.--
Mr. J. R. Salinas, P .E. · Mr. J. Blankenship, P.E. Mr. John Pinkston. P .E.
A-83
.. : I i ~ 1997 .., -•.. ~ . ..
DATE: July 9, 1997
Originating Office Houston District
JRS/DKD-FERR Y
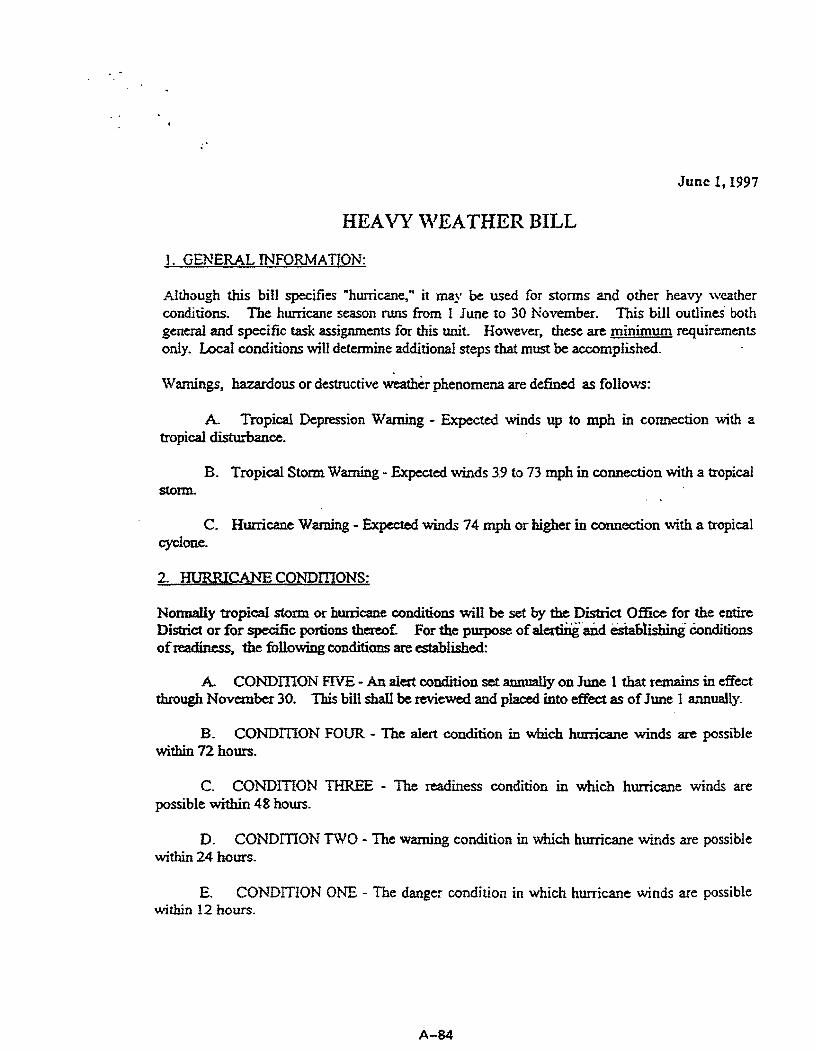
June 1, 1997
HEAVY \VEATHER BILL
J. GENERAL INFORMATION:
Although this bill specifies "hurricane," it may be used for storms and other heavy weather conditions. The hurricane season runs from I June to 30 November. This bill outlines both general and specific task assignments for this unit. However, these are minimum requirements only. Local conditions will determine additional steps that must be accomplished.
Warnings, hazardous or destructive weather phenomena are defined as follows:
A Tropical Depression Warning - Expected winds up to mph in cormection with a tropical disturbance.
B. Tropical Storm Warning - Expected winds 3.9 to 73 mph in connection with a tropical storm.
C. Hurricane Warning - Expected winds 74 mph or higher in connection with a tropical cyclone.
2. HURRICANE CONDIDONS:
Nonnally tropical storm or hwricane conditions will be set by the District Office for the entire District or for specific portions thereof. For the pmpose of alenmg alld establishing eonditions of readiness, the following conditions are established:
A CONDIDON FIVE - An alert condition set annually on June 1 that remains in effect through November 30. This bill shall be reviewed and placed into effect as of June 1 annually.
B. CONDIDON FOUR - The alert condition in which hurricane winds are possible within 72 hours.
C. CONDmON THREE - The readiness condition in which hurricane winds are possible within 48 hoW'S.
D. CONDmON TWO - The warning condition in which hurricane winds are possible within 24 hours.
E. CONDITION Ol\1E - The danger condition in which hurricane winds are possible within 12 hours.
A-84

3. GEl'fERAL PRUDEb'TIAL RULE:
ln the absence of instructions from higher authority. each supervisor is authorized and expected to act on his own initiative in preparing for the protection of employees and property in a heavy weamer c.:-::.:ition in accordance \\ith the long-sta.-:ding policy and tradition of mariners world\\ide.
4. INDIVIDUAL RESPONSIBILITY OF EMPLOYEES:
Upon learning of a hurricane that is approaching or active within the waters of the Gulf of Mexico by any means of communication (e.g. TV, radio, newspaper, etc.). it shall be the responsibility of all employees to contact the Ferry Communications Center (tower) or the administrative office to ensure a current telephone number where they can be reached is on file. When learning that a hurricane may strike the Galveston area within 48 hours, or that CONDffiON 3 has been set for our area, employees not at their normal home telephone number should contact the Feny Commtmications Center (tower) immediately. Employees on authorized absences away ~m Galveston will only be expected to check in once, provimng their contact telephone nwnber has not changed. Recall from an authoriZed absence for those away from the Galveston area will be handled on a case-by-case basis. Upon the setting of CONDffiON 3, all requests for an authorized absence from duty for the pmpose of evacuation or other person.al considerations, will require the exclusive permission of the Ferry Operation Manager. Requests for an authorized absence must be made by the employee. Requests received from persons other than the employee will not be considered except under the most extreme circum$tances.
A Dependents. All employees and dependents are advised to follow the recommendation of local authorities concerning the evacuation of low lying areas. All employees should personally evaluate the available weather information and storm path prediction and arrange for the evacuation of their family members to a safe location. Free pamphlets with information on what to do before and after a hurricane are available at many local area locations.
5. OPERATIONS:
In the event of a hurricane or tropical storm. we are mandated to maintain operations as long as there is a need and it is safe to do so. It will be the responsibility of the Senior Advisory Team to determine when it is no longer safe to operate. The SAT will evaluate all available weather forecasts and detennine whether to deploy any ferries to alternate safe moorings. Once all precautions have been taken," all shore based personnel not needed to maintain a skeleton supervisory and maintenance staff wiU be released. Members of the Senior Advisory Team are denoted on the Heavy Weather Watch Bill. The Houston District Emergency Operations Center and Transportation Management Systems section (for the programmable sign on I-45 south), U.S. Coast Guard Vessel Traffic Service, Group and Marine Safety Unit Galveston, City of Galveston Police. Galveston County Sheriffs Department, Texas Department of Public Safety.
2
A-85

KGBC Radio, KTRH Radio and the Galveston Emergenc:-· Operations Center shall be notified whenever service is terminated or resumed.
It is our duty to protect and safeguard the ferries, as no! cn.!y do we depend upon them for our livelihood, bu~ many thousands of people depend u;xi:: Uie ferries and our crews to carry on daily commerce. We are also considered a prima.;: e•·.::.:u..!:fon route from the Bolivar Peninsula to points out of the storm path.
The Feny Emergency Operations Center will be in the Tower Building. In the event of a severe hurricane {sustained winds over 130 mph) the Senior Advisory Team will evaluate the necessity for total evacuation of all personnel from the ferry complex to the Galveston Area Engineer's Office in La Marque or other suitable location.
It is expected th.at all hands shall maintain their regular watch or work schedules as long as possible. It is suggested and highly recommended that as streets begin to flood, employees bring clothing (including foul weather gear) and non-perishable food for a 2-3 day period. Toiletries and bedding will also be needed. Employees performing stonn watch duties shall be in a cominuous pay status until properly relieved and eligible f<;>r overtiz:ne pay as provid~ by current pay policy rules. Volunteers for storm watch duzy are bigwy desirable. A vohmteer list shall be prepared and made a part of this bill and maintained throughout the hurricane season.
A. Disposition of Feni.es and Crews. In the event that the an:ival of a severe hurricane or tropical storm is imminent, we will strive to maintain operations with as many fetries operating as are needed and for as long as we can. The major determining factors are (I) safety of the vessels, passengers, crews and public properties on board and (2) tide stage and wind velocity. Historically, we have been able to maintain operationi until the .. tide rises· to 5 feet above mean low water andf or a sustained wind speed of 55 mph is reached. As conditions worsen, we will start securing the ferries. The prime eonsidemtion will be to keep the Ray Stoker, Jr. and Dewitt C. Greer in the most ready status. The maximum degree of damage control closure shall be set and mainwned on the ferries at all times in a heavy weather condition. The sequence, locations and readiness status of securing the ferries and tae primacy manning crews shall be as follows:
(1) Moor Gibb Gilchrist in Maintenance Dock 4. Ready status 2 hours. Crew 12.
(2) Moor R. S. Sterling in Maintenance Dock 3. Ready status 2 hours. Crew 11.
(3) Moor E. H Thorn/on, Jr. in Maintenance Dock 2. Ready status 2 hours. Crews 4, 5~ 8, 9, or 10.
( 4) Moor R. C. Lanier in Maintenance Dock I. Ready status-immediate. Crews 5, 6, 7, or 8.
(5) Moor D. C Greer in West Landing. Ready status-immediate. Crews 1,2,3, 4, 5, or 8.
A.-86

(6) Moor Ray Stoker. Jr. in East Landing. Ready status-immediate. Crews I, 2, 3, 4, 5, or 8.
B. Securing of the Ferries: Ferry Captains have total responsibility for all decisions and actions taken to safeguard their assigned ferries and cre,\mernbers at all times. Listed below are the minimum procedures and requirements for securing the fe::les and safely weathering a hea,·y weather condition that shall be observed:
{I) Ferries mooring in the Maintenance Docks will be moored further outboard than usual. They should be far enough out so that regardless of what stage of tide occurs, they will be well clear of the moveable landing ramp. The vessel should get its supplies, crews. etc. on board, then position itself properly. They shall put out lines to the docks on both sides of the vessel. Use a bow, after bow spring, forward quarter spring and stem line as a minimum. These lines should be kept taut enough to keep the feny far enough away from the fixed pier and landing ramp to prevent damage from the rising tide. This cannot be overemphasized: While the workdocks will rise and fall in concert with the ferry, the fixed pier and the landing ramp will not. Any contact at all is likely to cause damage to both the ferry and the ramp. Bow lines to .the fixed pi~r may be used for additional safety but must be kept sla~
(2) captains mooring fenies in the landings should attempt to moor in the same manner, as much as posstole. Captains will have to use their best judgment to afford the most protection from omni-directional winds and prevent damage to the ferry or the landing.
(3) Captains required to moor elsewhere, such as if the vessels are moved to Houston or other safe moorings, when mooring to a single side, shall use: bow, forward bow spring, bow breast, after bOw sprillg. forward quarter spring. quarter breast, after quarter spring and· stein lines.
(4) All storm mooring lines shall have as short of a nm as possible and be made fast as taut as possible. Lines shall be checked for slack or strain frequently. Chafing gear shall be applied as re.quired Double-up lines and/or replacement lines shall be checked and made readily accessible. Any line to be placed on top of another line already at a bitt, bollard or cleat, shall first have the eye dipped through the eye of the other line before placing it around the bitt, bollard or cleat. 1bis is to ensure that any line can be taken in at will without disturbing other lines. All crewmembers shall be instructed in the proper procedures for taking in or letting out slack in lines rigged for a storm.
(5) All weather decks shall be checked and cleared of all materials. small equipment and other loose objects that could be damaged or become airborne in high winds. These items shall be stowed in the car deck equipment lockers or the salon area. This includes car blocks, fire extinguishers, life rings. float lights, trash barrels. rescue boat equipment, etc. In addition to the existing tie down straps. the rescue boats shall be securely lashed down to their cradles with line. All liferafts shall be securely lashed to their cradles. The lids of all car deck life jacket boxes shall be securely lashed down. The box shall also be securely lashed down if
4
A-87

no:. already bolted do\VIl. Fire hoses shall be securely lashed to the fire station mounts. AU emergency equipment taken off the weather decks or out of the rescue boats shall be stowed so to be readily accessible.
(6) All hands shall wear a life jacket at all times when on the car deck throughouc .:. t~·.:y weather condition. In addition., a safety line, using 3 inch circumference rope. shall be rigged from the salon entrances out 90 degrees to the bulwarks then along the bulwarks to the kingposts fore and aft. The safety line shall be used by all hands at all times, ,,·hen on the car deck to check mooring lines or other work reasons.
(7) All fuel oil, lubricating oil, hydraulic oil, Voith oil, and water tanks shall be topped off and kept topped off at intervals, as long as possible. Waste oil (slop) tanks and sewage tanks shall be pumped off.
(8) The main engines, ship's service generators, emergency generator. fire pumps and bilge pumps shall be test run and checked for proper operation. The steering controls, propulsion controls, searchlightS, navigation lights and sbip•s whistle shall also be checked for proper operation.
(9) All communications equipment shall be checked for proper operation and set to the designated frequencies.
(10) The anchor and anchor cable shall be checked for proper rigging.
(11) Toilet supplies (paper) sball be stored on the boats. Cleaning supplies shall be checked and restock~ as lequired.
(12) Hurricane kits containing food coolers, water coolers, sleeping cots, blankets, hot plates and coffee pots shall be placed on board ea.ch feny. Forty gallons (8 each S gallon jugs) drinking water shall be placed on ea.ch ferry. Food and water coolers shall be filled with ice to capacity. Microwave ovens on equipped ferries shall be checked for proper operation.
(13) All first aid kits shall be checked and refilled, as necessary.
(14) All windows shall be taped.
( 15) All deck lights and flood lights shall be set on.
(16) The movable landing ramps shall be raised to maximum height.
(I 7) The safety chains and safety gate ramps shall be raised. A safety net shall be rigged in place of all inoperable safety gate ramps.
5
A-88

( 18) The main engines and all oixrational systems shall be placed on-line.
(I 9) In order to protect the sca.'1..'1er t!Il.its, all radar sets shall be secured if winjs exceed 75 mph.
(20) The maximum degree o:- ~-nage control closure shall be na!::t.a:ned throughout the vessel at all times in a heavy we::.:!:er condition. This includes all we~ther deck doors and hatches, car deck watertight doors and hatches, below deck watertigh< doors and hatches, engine room watertight doors and hatches, smokestack hatches and pilothouse windo\\IS. Captains shall require notification to the pilothouse prior to the breaking of any watertight closure. A report shall also be made '"ilen the watertight closure is reset.
(21) Captains shall ensure that all items outli.ned in the section titled "Additional Provisioning of Ferries" is acoomplished and that their vessel is ready in all respects for the expected storm conditions.
C. Communications. A continuous communications watch shall be maintained between
(1) all fenies and the Feny Communications Center (tower) and
(2) the Feny Communications Center and the District Operations Center and other local, state and federal agencies as required. The following type of communications· is to be expected during heavy weather conditions:
(a) Readiness Reports - When highest degrees of pre-stonn preparations are complete.
(b) Situation Reports - when a change in readiness status occurs or important events occur in the immediate area or when significant weather changes take place. This especially includes the temiination and resumption of feny service.
{c} Deficiency Reports - when any equipment, machinery, systems or components critical to the operation of the ferries, landings, maintenance docks, vehicles or shore facilities is lost, damaged or fails to operate properly. This especially includes communications and emergency power systems.
(d) Post Storm Damage Assessment Reports - Upon completion of initial and final surveys of area of responsibility.
(e) Tide Gauge Readings - Tide gauge readings shall be recorded hourly and passed to local, state or federal authorities upon request. Weather conditions shall be recorded hourly.
6 .
A-89

VHF Marine Band channels 12, 13 and 16 shall be used for primary communications ferry c•her vessels and the U. S. Coast GuarC.:.
VHF State High Band shall be used for primary corru-nunications ferry to ferry and ferry to Fe:::. Communications Center (tower).
VHF State Low Band shall be used for primary corrununications from Ferry Communic2.~io:-..s Center (tower) to Texas Department of Transportation (fxDOT) vehicles (and shore units, if necessary).
Land-line (telephone) communications shall be used to the greatest extent possible for internal oommunications and external (public) communications. Cellular telephone communications shall be utilized to the extent possible in the event land-line service is disrupted. The cellular telephone number shall be given to all local agencies prior to·the stonn.
6. LOGISTICS AND MAINJENANCE SUPPORT:
In addition to the feny watches .. and communications -watch, 'a continuous 2 person Warehouse Watch and a 6 person combination Deck. and Engineering Maintenance Watch will also be maintained throughout a heavy weather condition. Two persons from the Deck and Engineering MainteDance Watch will be assigned as the Bolivar Post Storm Watch. Their primary duties will be to set up and provide emergency c.ommumcations, if required, safeguard Department property and provide a post storm evaluation of all Bolivar :facilities and the operating condition of the Bolivar landings and emergency generator. A radio equipped. heavy truck from the La Marque Maintenance Office will be provided.
A. Additional Provisioning of Fenies:
(1) Spare hydraulic oil and lubricating oil in barrels shall be distributed evenly on the ferries.
(2) Critical spare parts that c.ould be damaged by high water, so designated by the Engineering and Maintenance Manager, shall be stored on the appropriate ferries.
(3) Two portable radios with spare batteries shall be placed on each ferry. These radios shall be kept· dry at all times. Portable radios shall be used only for emergency corrununications.
(4) Fuel filters, rags. required oils (all) and grease (cartridge) shall be distributed to each feny by the specific type required. Spare ship's service generator raw water pump impellers shall be provided to the Gibb Gilchrist. Spare emergency generator raw water pump impellers shall be provided to the R. S. Sterling and E. H Thornton, Jr.
7
A-90

(5) The below listed miscellaneous items shall also be distributed to each ferry:
An asson.ment of spare fuses. 1 dozen spare D-ceU flashlight batteries. 6 rolls 1 lt2 -2 inch masking tape. l coil 3 inch circumference rope. 1 coil 1 I /2 inch circumference rope. 1 coil "small stufr' rope {less than l" circumference). 6 pair gloves. 6 pair safety goggles. 6 "bump" caps. l safety knife.
B. Disposition of Shore Facilities, Materials and Equipment:
(1) The main diesel fuel tank shall be topped off and kept topped off at intervals as long as possible. All portable gasoline ~shall be filled and stowed in the paint locker.
(2) The emergency generators in Galveston and Bolivar shall be test run and checked for proper operation. The diesel fuel tanks shall be topped off and a 55 gallon drum of spare diesel fuel shall be placed in each generator room. The generator rooms shall be secured as best possible for protection from high winds and possibly high water. A trailerized portable ISO KW generator shall be rented or leased for backup electrical power in the event of failure of either emergency generator. ·
(3) The landing hydraulic pumps in Galveston and Bolivar shall be test run and checked for proper operation. The hydraulic oil tanks shall be checked and filled as necessary and a 55 gallon drum of spare hydraulic oil shall be placed in each hydraulic room. The hydraulic rooms shall be secured as best possible for proteCtion from high winds and possibly high water.
(4) The oily water separator tank (OWS) shall be pumped 3/4 full for weight and secured. The OWS room shall be secured as best possible for protection from high winds and possibly high water. The twin waste oil (slop) tanks shall be pumped 3/4 full for weight and secured. The rain water level inside the containment wall surrounding these tanks shall be carefully monitored and drained off as required.. Drain valves shall be closed; NOT left in the open position. The portable waste oil (slop) tank shall be pumped down and secured in the warehouse. "Drip" pans from all locations shall be emptied, wiped clean and stowed in the paint locker.
8
A-91

(5) The sewage treatment plant tank in Bolivar shall be pumped full for weight and secured. The wet \\rells shall be pc.:"11;-ed dry. The \\tater to the rest rooms in Bolivar shall be rumed off and the rest rooms boarded s~u!. The Bolivar tower v.-indo\VS and outside door topside shall be taped. The outside door topsi..:e 2.<id the main entrance door shall be locked tight. An access key will be issued to the Boli,·a: ?,:·st Storm Watch.
(6) All vehicles and other motorized equipment shall be fueled, serviced, and secured in the warehouse. All portable equipment such as air compressors and portable oil carriers shall be serviced and secured in the warehouse. The winch truck, flatbed truck and welding machines shall be made ready for emergency repair use. An adequate supply of assorted welding rods shall be wrapped and stO\\red in dry containers and placed in each truck. These vehicles shall be secured last so they can be first out.
(7) All contractors shall be notified of their.responsibility to properly secure all contractor owned materials and equipment on site from high winds and possibly high water. Tills includes complete removal from the site, if necessacy.
. . (8) All grounds and outside storage areas shall be checked and cleared of all
materials, small equipment and other loose objects that could be damaged by high water or become airborne in high winds. All items that cannot be stowed in the warehouse shall be secured by lashing down to fencing or other embedded objects: All used oil and used oil filter drums shall be removed by the contractor from the premises. All remaining SS gal. drums shall be lashed securely to a fence or other embedded object. Spare oxygen and acetylene bottles shall be securely stowed in their racks or brought into the ware.house.
(9) All maintenance docks and landings shall be checked for proper operation and cleared of all non-essential gear. Miscellaneous equipment such as fire hoses, fUel hoses. water hoses, etc. shall be secw-ely lashed down.
(10) Safety lines using 3 inch circumference rope shall be rigged from:
(a) the end of the fencing on the North side of the public rest area to the movable loading ramp of Maintenance Dock 1 to Maintenance Dock 2 thence 3 thence 4 and,
(b) from the movable loading ramp located closest to the warehouse building to the closest warehouse door and,
( c) from the main warehouse entrance door to the administrative building and,
(d) from the administrative building to the east landing and,
9 .
A-92

(e) from the east landing to the west landing.
The safety l:nes shall be used by ail hands at all times when me.king security rounds or other work reasons in a heavy weather condition. In sddition, all persons going to or from the landings or maintenance docks shall we..:.: a life jacket.
(11) All roll-down shuners on the administrative office building shall be iowered. The Galveston tower windov:s and outside door topside shall be taped. All warehouse windov.'S and outside door panes without wire mesh inserts shall be taped.
(12) All critical electronic, electrical and other spare parts and equipment in the warehouse that could be damaged by high water shall be covered with plastic and secured as high on storage shelves as possible.
(13) All computer equipment in' the warehouse shall be wrapped \vith plastic and secured as high on storage shelves as possible. AU unit records, documents and files shall be placed in file cabinets, locked and stored as high as possible.
(14) Staging area and grounds trash barrels, stop signs, traffic cones, and traffic lane control arms in Bolivar shall be removed and stowed inside the Bolivar rest rooms. Staging area and grounds trash barrels, stop signs, trajlic cones, and traffic lane control arms in Galveston shall be removed and stowed in the warehouse. Traffic lane control anns in Galveston shall also be removed and stowed in the warehouse.
(15) The maintenance dock rescue boat shall be umigged and stowed in the warehouse.
( 16) Life jackets shall be furnished to all employees assigned to storm watch duties ashore.
7. RESPONSIBILITY OF SUPERVISORS:
The Assistant Ferry Operation Manager, as assisted by the Safety Officer, shall have responsibility for the overall implementation of this bill. Department Heads ashore shall have responsibility for the detailed implementation of all aspects of this biU that pertain to their individual departments. Feny Captains shall have responsibility for the detailed implementation of all aspects of this bill that pertain to their assigned ferries. All reports of completion of assigned tasks and final readiness attainment shall be forwarded to the Assistant Ferry Operation Manager.
10
A-93

8. POST STORM ACTION:
A. Tzke muster of all personnel. Conduct initial post storm damage assessment sun·ey of all ferries. landings. maintenance docks, shore facilities, vehicles 2.lld equipment
B. Obtain post storm damage assessment reports for State Highway 87.
C. Dispatch one feny (with Bolivar Post Storm Watch embarked) for inspection of the ferry route from Galveston to Port Bolivar. This shall include observations for hazards to navigation. floating debris, stranded or sunken vessels/barges, damaged or missing aids to navigation and all other conditions that may affect resumption of ferry operations. The Bolivar Post Storm Watch shall be debarked to petform their duties as soon as conditions safely allow.
D. Provide initial post storm damage assessment reports to District Operations Center and other local. state and federal agencies as is pertinent.. Initiate repair work as require<;l. Provide estimated date and time for resumption of ferry service.
E. Resume feny operations to maximum extent possible, as soon as conditions permit.
F. Conduct final post storm damage assessment surveys. Provide reports as required.
G. Provide assistance to Civil Defense authorities to maximum extent possible.
H. Resume normal opemions.
I. Based on experience gained from this storm, submit recommendations for changes to this plan.
LBT Attachment: Expected Sequence of Events
Heavy Weather Watch Bill
11
A-94
I
~';:I?--:- M Assistant eny peratton anager

THE EXPECTED SEQUENCE OF EVENTS IS: (Time line depe::.dent variable based on intensity and forecast details).
I. Storm develops and is fo:ec.:.st to intensify and threaten Texas Coast/Galveston.
A. Department Heads re·-~ew plan and, during normal working hours, start securing their areas.
B. All employees make preparations to provide for their family's safety and well-being, assemble personal items/bedding/non-perishable food for their use if they may be assigned storm duties, and verify their telephone number with the Ad.min Office or the tower.
2. As the storm track becomes better established and it begins to look more likely to hit Galveston:
A. Department Heads and Supervisors meeting. Establish a timetable for events and progress reports. Evaluate the need for overtime and how to deal with any special projects that may be on-going. Advise contractors of their responsibility. Full execution of securing materials, rigging lifelines, etc. Schedule ferries to meet the demand.
B .All emplovees evacuate family or provide for their safety based on all available forecasts and information. Bring personal items to work. ·
3. Prior to the stonn hitting Galveston:
A. Department Heads verify that all preparations are completed. All ferries not needed in service are safely moored, all personnel not needed to maintain security are released, minimal number ferries are operating consistent with traffic and emergency demand. Storm watch personnel on continuous duty. When conditions require, all ferry operations secured. Evaluate need to evacuate additional personnel
4. Storm strikes: maintain radio communications and status of Tx.DOT personne~ resources and facilities.
5. Post storm: conduct survey of all facilities. Resume limited service. Make report to Houston District Maintenance Section. Restore service to normal.
12
A-95

:
HEAVY WEATHER WATCH DILL
EFFECTIVE DA TE: -------
BILLET TITLE NA1\1:E VOLUNTEER
STORM I FOM DANIEL NIA
STORM 2 AFOM TYO NIA
STORM 3 SAFETY LINDSEY NIA
STORM 4 FEMM DECKER NIA
STORMS TECHNICAL WELSH NIA
STORM 6 COMMUNICATIONS
STORM 7 COMMUNICATIONS
STORM 8 WAREHOUSE
STORM 9 WAREHOUSE
STORM 10 SHOREMASTER CRABILL NIA
STORM 11 DECK
STORM 12 MCME
STORM 13 OILER
STORM 14 OILER
STORM 15 OILER
STOR..M' 16 BOAT 6 - CAPTAIN
STORM 17 BOAT 6 - ENGINEER
13
A-96

STORM 18 BOAT6-0ILER
STORM 19 BOAT 6- FIRST
STORM20 BOAT 6 - SECOND
STORM2I BOAT 6 - THIRD
STORM22 BOAT 5 - CAPTAIN
STORM23 BOAT 5 - ENGINEER
STORM24 BOAT 5 - OILER
STORM25 BOAT 5 - FIRST
STORM26 BOAT 5 - SECOND
STORM27 BOAT 5 - THIRD
STORM28 BOAT 4 - CAPTAIN
STORM29 BOAT4-ENGINEER
STORM30 BOAT 4 - Oll..ER
STORM31 BOAT4-FIRST
STORM32 BOAT 4 - SECOND
STORM33 BOAT4-TinRD
STORM34 BOAT 3 - CAPTAIN
STORM35 BOAT 3 - ENGINEER
STORM36 BOAT 3 - OILER
STORM37 BOAT 3 - FIRST
STORM38 BOAT 3 - SECOND
STORM39 BOAT 3-THIRD
14
A-97

'
STOR.M40 BOAT 2 - CAPTAIN
STORM 41 BOAT 2 - ENGINEER
STORM42 BOAT : - OILER
STORM43 BOAT 1 - FIRST
STOR.M44 BOAT 2 - SECOND
STORM45 BOAT 2 - THIRD
STORM46 BOAT 1 - CAPTAIN
STORM47 BOAT 1 - ENGINEER
STORM48 BOAT 1-0ILER
STORM49 BOAT 1 - FIRST
STORM SO BOAT l - SECOND
STORM51 BOAT I - THIRD
NOTE: STORM I, 2, 3, 4, 5, I~ and the Senior Captain Afloat will comprise the Senior Advisory Team. .
15
A-98

APPENDIXB:
IH 10 AT SILBER DRAFT OPERATIONS PLAN
B-1


Site Specific Flood Response Plan Location No. XX-YY 1-10 (Katy Freeway) at Silber
Typical scenario - Rainfall amounts in excess of one-half inch per hour causes the Silber under crossing to be impassable due to high water after one hour.
Detection Level 1. A. When flood sensor indicates a water level of 3 inches, for a duration equal to
or greater than five minutes, warning flashers (where equipped) will be automatically enabled concurrent with notification sent to the floor operators (currently via pager, potentially automated in the future).
B. Operator verifies that notification is not false. This is accomplished by using video camera # 304 Silber pointed west to observe the frontage roads for congestion and standing water. When verified this information could be put into the incident log and then mapped to the Internet.
C. Operator consults the weather radar to determine if condition is on leading or trailing edge of weather system. If leading, another alert could be expected.
D. In the case of a false alert, the floor operator should deactivate the warning and an automatic recordation (automation) of the event is included in the maintenance log.
Detection Level 2. A When flood sensor indicates a water level of 6 inches, another notification
will be sent to the floor operators (currently via pager, potentially automated in the future).
B. Operator verifies that notification is not false. This is accomplished by using video camera # 304 Silber pointed west to observe the frontage roads for congestion and standing water.
C. Operator consults the weather radar to determine if condition is on leading or trailing edge of weather system. If leading, another alert could be expected.
D. Depending on conditions, preparations should be made for closure. HPD is to be notified that a closure scenario is possible (automation with verification).
E. METRO Dispatch is to be notified that Route 72 may need to be put on the Silber flood detour for the southbound direction (automation with verification). (Who should be contacted? Dispatch, supervisor, etc.)
Detection Level 3. A When flood sensor indicates a water level of 9 inches, another notification
will be sent to the floor operators. At this point, the under crossing is nearly impassable by small vehicles.
B. Operator verifies that notification is not false. This is accomplished by using video camera # 304 Silber pointed west to observe the frontage roads for congestion and standing water.
C. Operator consults the weather radar to determine if condition is on leading or trailing edge of weather system. If leading, another alert could be expected.
D. Operator verifies that notification is not false (See Band C above).
B-3

E. The media relation's officer should be contacted in order to keep the local media informed that water is rising and for motorists to be cautious in the area.
F. HPD is notified of the condition and uniformed officers dispatched to the location to prepare for closure.
G. METRO Dispatch is to be notified that Route 72 being put on the Silber flood detour for the southbound direction is imminent.
Detection Level 4. A. When flood sensor indicates a water level of 12 inches, a partial closure
notification is sent to the floor operators. Again the radar needs to be checked to determine if this is the leading or lagging edge of the storm. Regardless, at this point, the HPD officers on the scene will be directed (or will report back METRO Dispatch is to be notified that the roadway is closed and Route 72 being put on the Silber flood detour for the southbound direction is necessary. If this storm has passed, the floodwaters will recede fairly quickly only having a minor impact on traffic. However, if the location is on the leading edge of the rain band, then a longer and possibly more extensive closure may be required.
B. Notify 911 Dispatch (Emergency Medical Service (EMS), HPD, Houston Fire Department (HFD) that Silber is closed. (Who is the contact person?).
C. A message is to be sent to the ENS paging system describing the situation. D. The media relations officer should be contacted in order to keep the local
media informed as necessary. E. The closure will remain in effect until the high water recedes to the
satisfaction of the officers on the scene. The officers will report to the floor operator when the roadway has been reopened.
F. METRO Dispatch is to be notified that the roadway is reopened and the Route 72 Silber flood detour for the southbound direction is no longer necessary.
CLOSURE SCENARIOS
Silber partial closure scenario:
Refer to Figures B-1 and B-2 on page B-6. Access to the under crossing by northbound and southbound vehicles will be prohibited by the location of two police sedans with a minimum of one officer each. When directed (or warranted), the closure will be created by parking their vehicles parallel to the frontage roads in the left-tum lane (but out of the water). This will effectively block left turns as well as close the through traffic on both the westbound frontage road (Old Katy Road) and the eastbound frontage road. Turning movements from the frontage roads will be prohibited and through traffic on Silber will be directed to the frontage roads for alternate routing.
I-10 entrance and exit ramps for this scenario are not affected.
METRO's Route 72 Westview will be impacted in the southbound direction only.
B-4
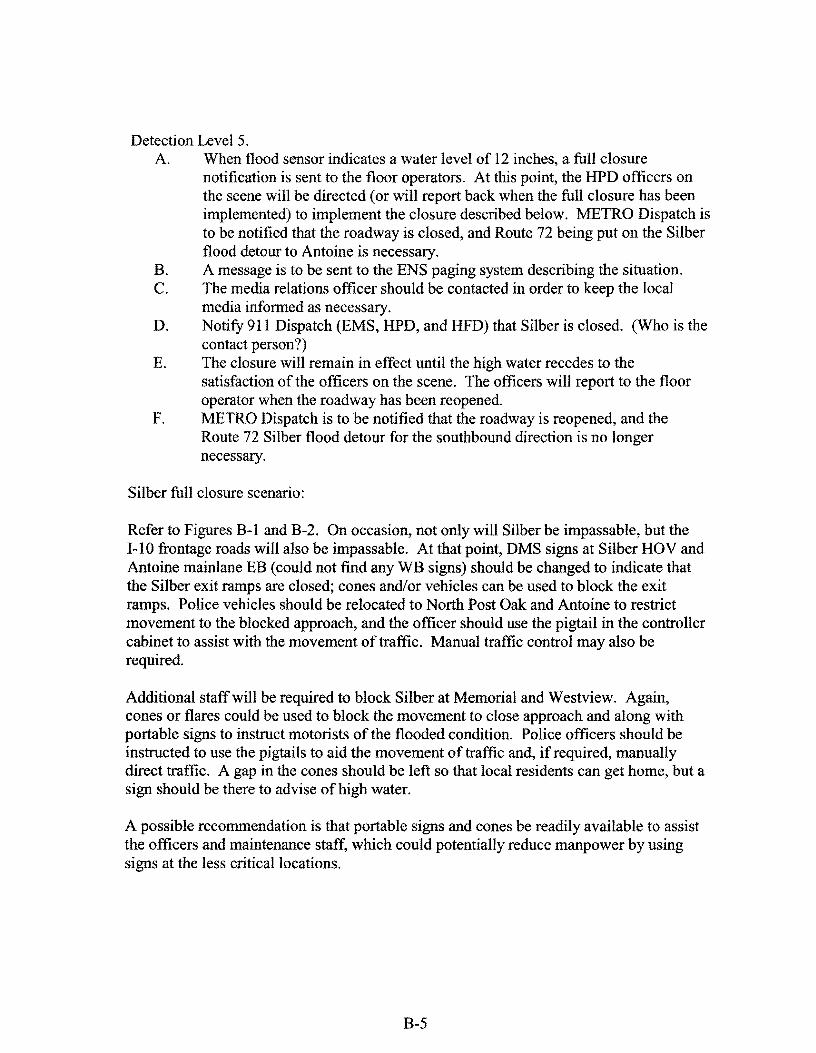
Detection Level 5. A. When flood sensor indicates a water level of 12 inches, a full closure
notification is sent to the floor operators. At this point, the HPD officers on the scene will be directed (or will report back when the full closure has been implemented) to implement the closure described below. METRO Dispatch is to be notified that the roadway is closed, and Route 72 being put on the Silber flood detour to Antoine is necessary.
B. A message is to be sent to the ENS paging system describing the situation. C. The media relations officer should be contacted in order to keep the local
media informed as necessary. D. Notify 91 l Dispatch (EMS, HPD, and HFD) that Silber is closed. (Who is the
contact person?) E. The closure will remain in effect until the high water recedes to the
satisfaction of the officers on the scene. The officers will report to the floor operator when the roadway has been reopened.
F. METRO Dispatch is to be notified that the roadway is reopened, and the Route 72 Silber flood detour for the southbound direction is no longer necessary.
Silber full closure scenario:
Refer to Figures B-1 and B-2. On occasion, not only will Silber be impassable, but the I-10 frontage roads will also be impassable. At that point, DMS signs at Silber HOV and Antoine mainlane EB (could not find any WB signs) should be changed to indicate that the Silber exit ramps are closed; cones and/or vehicles can be used to block the exit ramps. Police vehicles should be relocated to North Post Oak and Antoine to restrict movement to the blocked approach, and the officer should use the pigtail in the controller cabinet to assist with the movement of traffic. Manual traffic control may also be required.
Additional staff will be required to block Silber at Memorial and Westview. Again, cones or flares could be used to block the movement to close approach and along with portable signs to instruct motorists of the flooded condition. Police officers should be instructed to use the pigtails to aid the movement of traffic and, if required, manually direct traffic. A gap in the cones should be left so that local residents can get home, but a sign should be there to advise of high water.
A possible recommendation is that portable signs and cones be readily available to assist the officers and maintenance staff, which could potentially reduce manpower by using signs at the less critical locations.
B-5
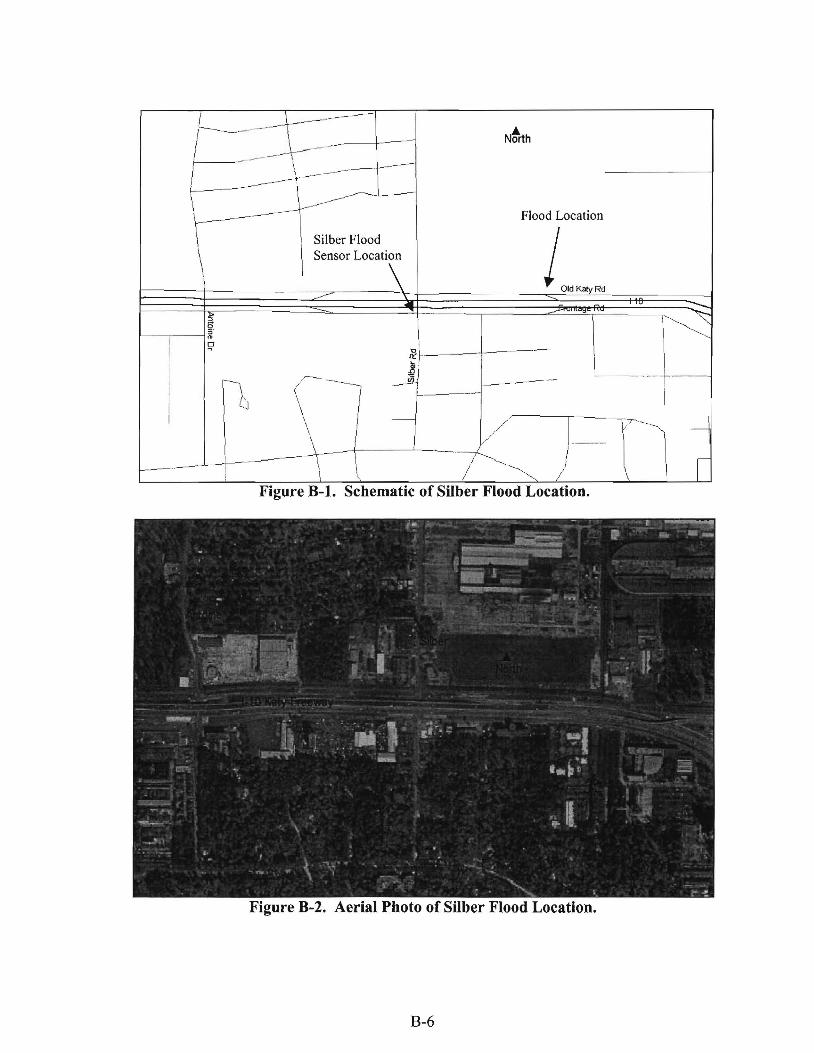
I -~- --c-- Ntrth I -I
1-- -\ :=r--1---------_______ , __ .--- I --' 1-~ Flood Location \---~ - ' Silber Flood
/,.~R· \ \ Sensor Locati\
~ ' ~ -... - -,_
:---. -- ' ,_
"~ ~ I 0 ::r I "'
!:;l I I
~f
I -1 -- - ,__ ___ \-l -
r i I
~/ I I L n ~i -
I I ;-,~ ) I ! \ ~ \ I
Figure B-1. Schematic of Silber Flood Location.
Figure B-2. Aerial Photo of Silber Flood Location.
B-6

APPENDIXC:
ENVIRONMENTAL MONITORING SYSTEM INTERNET SURVEY AND RESULTS
C-1


The Texas Department of Transportation (TxDOT) is conducting a study on the benefits of an Intelligent Transportation System Environmental Monitoring System. There are 19 roadway flood gauges, 5 ice sensors and 5 wind sensors throughout the Houston area. These devices have been implemented to assist TxDOT in making informed decisions with regard to flooding, high wind and icy conditions. This information is also available to the public so they can make informed decisions when traveling in inclement weather.
The purpose of this survey is to determine how people get environmental information, the understanding of the information, and the usefulness of the information. We would like your help by filling out this survey. Please circle the appropriate answer.
1. Have you seen this type of sign?
Yes No If Yes, Where? ____________ _
2. Do you know what the sign means?
Yes No
3. What do you think it means?
A. It's raining. B. Use caution; there is high water on the roadway. C. The roadway is flooded. D. Other __________________ _
4. Have you seen this sign when the beacons are flashing?
Yes No
5. If Yes, Was the street?
A. Flooded/Impassable 8. High water but passable C. No water on roadway
6. What does the sign mean when the beacons are flashing?
A. It's raining. B. Use caution; there is high water on the roadway. C. The roadway is flooded. D. Other _ ______ _ _ _ ________ _
7. What action should you take if the beacons are flashing?
A. Continue driving as normal. B. Be cautious of high water and be prepared to stop. C. Stop or change route because the roadway or intersection is flooded. D. Other ___ ______ ________ _
8. Do you know of any locations that flood repeatedly? (Provide a cross street)
9. What type of vehicle do you drive?
A. Small car B Large car c. Motorcycle D. Small pickup E. Large pickup F. SUV G. Van H. Other
10. Have you ever flooded your vehicle?
Yes Mo _ __ Year __ (offlood) No
11. If yes, did you know there was high water before entering the intersection or section of roadway?
Yes No
C-3

12. Have you seen any other types of flood-monitoring device?
A. Manual Flood Gauge B. Electronic Flood Gauge C. Other -----~.
13. How do you get information about threatening weather? (Please rank in order)
A. TV B. Radio C. Internet D. Pager
14. Do you know that there is flood and weather information in the Houston Area available on the Internet?
Yes No
15. How did you find the environmental monitoring website?
A. Flyer B. Website link C. Email D. Public Service Announcement (PSA) E. Other _____ _
16. Do you check traffic and weather from: (circle all that apply)
A. Home B. Work C. Vehicle D. Other _____ _
17. Do you think the environmental sensor website has useful information?
Yes No How could the website be enhanced? --------------------
DEMOGRAPIDCS
18. GENDER
Male Female
19. AGE
16- 19 20-25 26-35
20. ETHNIC BACKGROUND
African American Hispanic Asian·
21. INCOME
36-49 5o+
White Other _____ _
under $25,000 $25,000 - $50,000 $50,000 - $75,000 $75,000 l 00,000 $I 00,000+
22. OCCUPATION
News Media Government Employee Self Employed Corporate Employee Student
23. HOW MANY MILES A DAY DO YOU TRAVEL?
0-10 l l-20
24. Zip Code of:
SUBMIT
21-30 greater than 30
Home ------ Work
RESET
Professional Driver (delivery,
C-4
Other _____ _
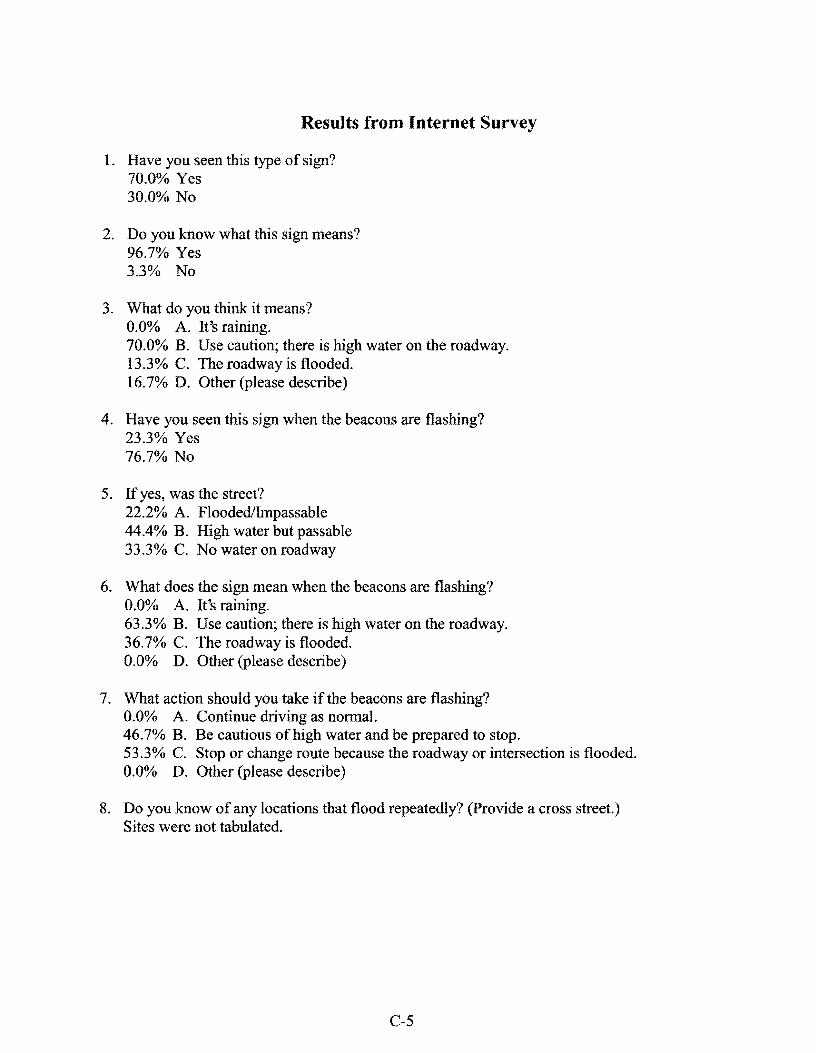
Results from Internet Survey
1. Have you seen this type of sign? 70.0% Yes 30.0% No
2. Do you know what this sign means? 96.7% Yes 3.3% No
3. What do you think it means? 0.0% A It's raining. 70.0% B. Use caution; there is high water on the roadway. 13.3% C. The roadway is flooded. 16.7% D. Other (please describe)
4. Have you seen this sign when the beacons are flashing? 23.3% Yes 76.7% No
5. If yes, was the street? 22.2% A Flooded/hnpassable 44.4% B. High water but passable 33.3% C. No water on roadway
6. What does the sign mean when the beacons are flashing? 0.0% A. It's raining. 63.3% B. Use caution; there is high water on the roadway. 36.7% C. The roadway is flooded. 0.0% D. Other (please describe)
7. What action should you take if the beacons are flashing? 0.0% A. Continue driving as normal. 46.7% B. Be cautious of high water and be prepared to stop. 53.3% C. Stop or change route because the roadway or intersection is flooded. 0.0% D. Other (please describe)
8. Do you know of any locations that flood repeatedly? (Provide a cross street.) Sites were not tabulated.
C-5

9. What type of vehicle do you drive? 31.0% A. Small car 10.3% B. Large car 0.0% C. Motorcycle 6.9% D. Small pickup 17.2% E. Large pickup 27.6% F. SUV 3.4% G. Van 3.4% H. Other (please describe)
10. Have you ever flooded your vehicle? 16.7% Yes 83.3% No
11. If yes, did you know there was high water before entering the intersection or section of roadway? 50.0% Yes 50.0% No
12. Have you seen any other types of flood-monitoring devices? 73.9% A. Manual flood gauge 26.1 % B. Electronic flood gauge 0.0% C. Other
13. How do you get information about threatening weather? (Please rank in order; 1 highest, 4 lowest) A. TV
1 40.0% 2 26.7% 3 16.7% 4 0.0%
B. Radio I 16.7% 2 13.3% 3 36.7% 4 6.7%
c. Internet I 23.3% 2 43.3% 3 16.7% 4 0.0%
D. Pager 1 3.3% 2 0.0% 3 3.3% 4 26.7%
C-6

14. Do you know that there is flood and weather information in the Houston area available on the Internet? 93.3% Yes 6.7% No
15. How did you find the environmental monitoring website? 0.0% A. Flyer 60.0% B. Website link 3.3% C. E-mail 3.3% D. Public Service Announcement (PSA) 33.3% E. Other (please describe)
16. Do you check traffic and weather from: (circle all that apply) 90.0% A. Home 93.3% B. Work 56. 7% C. Vehicle 10.0% D. Other (please describe)
17. Do you think the environmental sensor website has useful information? 89.7% Yes 10.3% No
Flood Survey Demographics
Number Characteristic of Respondents
Gender Male 23 Female 7
Age 16-19 0 20-25 0 26-35 3 36-49 19 50+ 8
Ethnic Background African American 1 Hispanic 0 Asian 0 White 27 Other 2
Income Under $25,000 2 $25,000-$50,000 6 $50,000-$75,000 7 $75,000-$100,000 7 $100,000+ 8
Occupation News Media 0 Government Employee 5 Self-Employed 6 Corporate Employee 14 Student 0 Other 4 Professional Driver 0
Miles Traveled Each Day 0-10 4 11-20 4 21-30 6 Greater than 30 16
C-7
Flood Survey
76.7% 23.3% 0.0% 0.0%
10.0% 63.3% 26.7% 3.3% 0.0% 0.0%
90.0% 6.7% 6.7%
20.0% 23.3% 23.3% 26.7% 0.0%
17.2% 20.7% 48.3% 0.0%
13.8% 0.0%
13.3% 13.3% 20.0% 53.3%