istribution and dynamics of inorganic - EPIC
206
istribution and dynamics of inorganic nitrogen compounds in the troposphere of ontinental, tal, marine and Arctic areas namik anorganischer ngen in der Troposphär der Arktis olores Andres Hernandez Ber. Polarforsch. 184 (1 996) ISSN 0176 - 5027
-
Upload
khangminh22 -
Category
Documents
-
view
1 -
download
0
Transcript of istribution and dynamics of inorganic - EPIC

istribution and dynamics of inorganic nitrogen compounds in the troposphere of ontinental, tal, marine and Arctic areas
namik anorganischer ngen in der Troposphär
der Arktis
olores Andres Hernandez
Ber. Polarforsch. 184 (1 996) ISSN 01 76 - 5027

Marfa Dolores Andres Herniindez Alfred-Wegener-Institut fü Polar- und Meeresforschung D-27568 Bremerhaven
Die vorliegende Arbeit ist die inhaltlich unverändert Fassung einer Dissertation, die 1995 dem Fachbereich 2 (BiologielChemie) der Universitä Bremen vorgelegt wurde.

CONTENTS
SUMMARY I Zusammenfassung IV Resumen VI
1 GENERAL INTRODUCTION 5
2 THEORETICAL 6
2.1. TROPOSPHERIC CHEMISTRY OF INORGANIC NITROGEN COMPOUNDS6
2. I. 1 . Nitrogen monoxide (NO) 2.1.2. Nitrogen dioxide (NO,) 2.1.3. Nitrous acid ( HNO,) 2.1.4. Nitric acid (HNO,)
2.1.4.1. Nitrate particles
2.2. TROPOSPHERIC AEROSOLS
2.2. l . Marine aerosol 2.2.2. Arctic aerosol: Arctic Haze
2.2.2.1. Nitrogen compounds
2.3. CHEMISTRY OF SO, AND SULPHATE IN THE TROPOSPHERE
3 SCIENTIFIC GOALS
4 EXPERIMENTAL PART
4.1. PRINCIPLES OF MEASUREMENT, SAMPLING AND ANALYSIS METHODS
4.1.1. Differential Optical Absorption Spectrometry (DOAS) 4.1.2. Denuders
4.1.2.1. Applications to nitrate aerosol measurements
4.1.3. Ion Chromatography (IC)
4.2. SAMPLING AND ANALYTICAL METHODS
4.2.1. Sampling methods 4.2.2. Analytical method: extraction and analysis 4.2.3. Monitoring methods 4.2.4. Measurement field campaigns
4.2.4.1. Spitsbergen 4.2.4.2. Atlantic Ocean 4.2.4.3. Greenland Sea 4.2.4.4. Bremerhaven 4.2.4.5. Ispra 4.2.4.6. Milan 4.2.4.7. Ticino Valley
4.3. DATA EVALUATION

5 RESULTS AND DISCUSSION
5.1. ARCTIC AND MARINE AREAS
5.1.1. Spitsbergen
5.1 .I. 1. Presentation of data 5.1.1.2. Discussion of results 5.1 .I .3. Comparison with similar studies 5.1 .I .4. Conclusions
5.1.2. Atlantic Ocean
5.1.2.1. Presentation of data 5.1.2.2. Discussion of results 5.1.2.3. Comparison with similar studies 5.1.2.4. Conclusions
5.1.3. Greenland Sea
5.1.3.1. Presentation of data 5.1.3.2. Discussion of results 5.1.3.3. Comparison with other data 5.1.3.4. Conclusions
5.2. SEMIRURAL, COASTAL AND URBAN AREAS AT MIDLATITUDES
5.2.1. Presentation of data
5.2.1.1. Measurement sites
5.2.2. Data evaluation
5.2.2.1. Limitations in the analysis of results 5.2.2.2. Aerosol surface calculation
5.2.3. Discussion of results
5.2.3.1. Ispra 5.2.3.2. Milan 5.2.3.3. Ticino Valley 5.2.3.4. Deviations from the photostationary equilibrium 5.2.3.5. Bremerhaven 5.2.3.6. HNO, formation
5.2.4. Conclusions
6 GENERAL CONCLUSIONS
7 REFERENCES
APPENDICES
A Air trajectories ( Spitsbergen, March 1993 ) B Temperature profiles ( Spitsbergen, March 1993 ) C Air trajectories ( ANT-W5, May - June 1994 ) D Air trajectories ( ARK-W1, July - August 1994 )
Danksagung Agradecimientos

SUMMARY
The present work was focused on the distribution and dynarnics of tropospheric inorganic nitrogen compounds. The study considered three regions: the Arctic environment as receiver, the marine environment as a transport area and midlatitudes as an emission source area. Nitric acid and particulate nitrate were selected as tracers of the emission, transport and sink processes involved in the tropospheric inorganic nitrogen cycle. Due to the known predominance of sulphate in the Arctic aerosol, SO2 and particulate sulphate were simultaneously analysed and used as a reference and indicator of anomalous variations in the background concentrations.
Measurement campaigns were performed in the Arctic in two different seasons of the year under predominantly daylight conditions, in order to exclude from the analysis differences caused by the nighttime chemistry, which also plays a role in the case of the nitrogen oxides (NOã through the reactions initiated by the No3 radical. These campaigns took place in Spitsbergen in March 1993 and in the Greenland Sea in July and August 1994. Observations in the marine troposphere were performed additionally in order to consider the link between all the different environments involved in the global behaviour of the tropospheric inorganic nitrogen compounds. The measurements performed aboard the research vessel Polarstern during the summer campaigns in 1994 (ANT-XI15 and AM-W1) provided information of the HN03 and aerosol nitrate distribution from the tropical to the polar Atlantic Ocean (see figure).
A combination of filter Systems and a virtual impactor for the sampling of aerosol species, and a wet denuder System for the gaseous components were selected and in part modified to improve their performance in these particular environments. Ion chromatography was the analytical technique used. Most of the samples were analysed directly after the sampling. Air masses were characterized by means of meteorological data and back trajectories.
The composition of the atmosphere at midlatitudes was also investigated. From August 1992 to February 1993, NOi, 03 , SO2 and HN02 were measured continuously in Bremerhaven, a coastal area in northern Germany, by using a DOAS (Differential Optical Absorption Spectrometer). Volume and size distribution of particles were obtained with the help of an aerosol spectrometer. The aerosol and gas measurements performed in May 1994 provided additional information about the nitrate, sulphate and HNo3 concentration levels at this site. Furthermore, DOAS data supplied by the Joint Research Center (JRC) in Ispra, corresponding to measurements performed in areas with different levels of pollution (Ispra, Milan and Ticino Valley), were processed and analysed. The principal point of interest was the tropospheric nocturnal formation of HN02, a major source of OH radicals at dawn in polluted tropospheres.
Meteorological conditions favouring the transport between midlatitude anthropogenic sources and the Arctic were observed during the measurement campaigns performed. HN03 and nitrate were found to be present in the Arctic troposphere at different concentrations in late winter and sumrner times. In March the nitrate varied between 0.01 and 0.45 pg/m3 and the HN03 between 0.01 and 0.08 pglm3 (4 - 3 1 pptv). In summer the nitrate and HN03 concentrations ranged from < 0.01 to 0.2 pglm and from < 0.01 to 0.03 pg/m3 (s 2 - 12 pptv), respectively.
The detection of relatively high concentrations of nitrates and HN03 in March associated with different advection Patterns, and the HNo3 /NO3- ratio (0.15 - 0.6), similar to that found at midlatitudes in most of the cases, supported the idea of long range transport of HN03 and aerosol nitrate, accumulation in winter in the Arctic

Geographical regions of sampling
1 NY-Alesund 2 Greenland Sea (ARK-X11) 3 Atlantic Ocean (ANT-XI/5) 4 Bremerhaven 5 Ispra 6 Milan and Ticino Valley

troposphere with minimal losses by dry and wet deposition, and distribution almost homogeneously over large areas of the Arctic. Additionally, the high variability in the concentrations and HNO3 /NO3 ratios observed in summer reflected the higher effectivity of the removal mechanisms at this time of the year. The minimum in the surnmer concentrations, up to one order of magnitude lower than in winter, was partly attributed to the wet removal caused by the quite persistent fog over the pack ice, affecting notably soluble species like UNO3. The stratification of the low troposphere observed in the Arctic areas investigated should prevent the downmixing of air masses with the subsequent input of NOÃ source components like PAN (peroxyacetyl nitrate) from the free troposphere. However, considering the altitude of Greenland, the advection of air masses with this origin could be a source of free tropospheric air.
The HNo3 and nitrate measurements performed in the marine troposphere over the eastern part of the Atlantic Ocean indicated its role in the transport of pollutants and the existence of inputs (biomass burning, Saharan dust, European emissions) which modify the nitrogen budget and the HNO, /NO3 ratio at different latitudes. In the remote marine atmosphere the ratio UNO3 /NO3' had a value around 0.4. Nitrate and HN03 averaged background concentrations were found to be about 3 times higher in the northern than in the southern hemisphere, the transition being marked by the ITCZ (Intertropical Convergence Zone). These background concentrations detected consisted of 0.8 - 1.6 [ig/m3 nitrate and 0.3 (ig/m3 (1 16 pptv) , in the northern hemisphere, and around 0.4 - 0.6 [ig/m3 nitrate and 0.05 - 0.1 (19 - 39 pptv) HNO, in the southern hemisphere.
The HN03 and nitrate concentrations measured in Bremerhaven (0-5 - 2.5 [ig/m3 and 0.5 - 1.5 [ig/m3 respectively) were in agreement with the concentrations detected in marine atmospheres of the Atlantic Ocean influenced by the advection of air masses with European origin. These concentrations represent an increase of about 10 - 15 times for nitrates and 25 - 70 times for UNO3 compared to the observed Arctic levels in winter and summer respectively.
No significant difference in the volume and size distribution of particles ( in the range 0.09 [im < diameter < 0.3 um) was observed during the period of measurements in Bremerhaven. These distributions showed the typical Pattern of areas influenced by an urban aerosol. The number of particles was found to be about 5 orders of magnitude higher than in the Arctic. Due to the few Arctic aerosol data available for the comparison, this must be considered as a rough estimate of the aerosol density in the Arctic areas.
The contribution of the aerosol in the UNO, formation was evaluated by means of correlations in which a Parameter S related to the total surface of the aerosol was included. S was calculated from the light intensity given by the DOAS instmment along the bearn path. The calculation procedure, based On previous work from other authors, was validated with the help of an aerosol monitor. The consistency of the average aerosol densities obtained from the comparison of total aerosol volume and total aerosol mass indicated the suitability of using this method for the calculation of aerosol parameters.The UNOi observations performed at midlatitudes in locations with different levels of pollution indicated the heterogeneous nature of the reaction of formation, influenced by the presence of aerosol particles and also of permanent surfaces (buildings, vegetation), especially in the case of stagnant nocturnal conditions.

ZUSAMMENFASSUNG
Das Hauptthema dieser Arbeit befaßt sich mit der Varianz der Verteilung anorganischer Stickstoffverbindungen in der Troposphare. Dazu wurden speziell drei Regionen behandelt: Die Arktis als Eintragsgebiet, die marine Troposphär als Transportregion und die mittleren Breiten als Emissionsquelle dieser Verbindungen. In dieser Arbeit wurden HNOi und aerosolgebundenes Nitrat als Indikatoren fü die im Stickstoffkreislauf involvierten Emissions-, Transport-, chemische Transformations- und Depositionsprozesse gewählt Aufgrund der bekannten Dominanz von Sulfat im arktischen Aerosol wurden parallel zu den Stickstoffverbindungen SOi und aerosolgebundenes Sulfat analysiert und als Referenz und Indikator fü untypische Veränderunge der Hintergrundkonzentrationen herangezogen.
Die Zeitpunkte der Meßkampagnen die auf Spitzbergen stattfanden, wurden in den Polarfrühlin (Mär 1993) und den Polarsommer (Juli-August 1994) gelegt, so da im wesentlichen permanent Tageslichtbedingungen vorlagen. Damit konnte der komplexe Einfluà der nächtliche Atmosphärenchemi ausgeschlossen werden, die bezüglic der Stickoxide (NOã durch das NO3 Radikal ausgelös wird. Zusätzlic wurden Messungen in der marinen Troposphär durchgerŸhrt die in gewisser Weise ein Bindeglied zwischen den unterschiedlichen Regionen, die den globalen anorganischen Stickstoffkreislauf beeinflussen, dargestellt. Diese Messungen fanden an Bord der FS Polarstern im Sommer 1994 statt (ANT-X/5 und ARK-X11) und lieferten Daten bezüglic der troposphärische HN03- und aerosolgebundenen Nitratverteilung übe einen ausgedehnten meridionalen Bereich, ausgehend vom tropischen Atlantik bis zur polaren Ostgrönlandse .
Zum Sammeln der Aerosole wurden Kombinationen von Filtersystemen und ein virtueller Impaktor eingesetzt, währen ein Naßdenude selektiv die gasförmige Komponenten anreicherte. Diese Instrumente sind teilweise modifiziert worden, um die Leistungsfaigkeit auf die speziellen Meßort zu optimieren. Zur Analyse der Proben, die größtentei direkt nach dem Sammeln stattfand, wurde die Ionenchromatografie eingesetzt. Die Luftmassen wurden mittels meteorologischer Daten und Rückwärtstrajektori charakterisiert.
Unter denselben Aspekten wurde die Zusammensetzung der Atmosphär in den mittleren Breiten untersucht: In Bremerhaven, einer Küstenstad in Norddeutschland, wurden von 1992 bis Februar 1993 kontinuierlich NO2, 03 , SO2 und HNO; mittels eine DOAS (Differential Optical Absorption Spectrometer) gemessen. Gleichzeitig zeichnete ein Aerosolspektrometer Daten übe die Volumen- und Größenverteilu der Partikel auf. Weitere Aerosol- und Spurengasmessungen im Mai 1994 lieferten ergänzend Informationen übe Nitrat, Sulfat und HNO3 Konzentrationen an diesem Meßort Desweiteren konnten frŸher DOAS Messungen des Joint Research Center (JRC, Ispra) in Gebieten mit unterschiedlichen Luftverschmutzungsgraden (Ispra, Mailand, Tessin) ausgewertet und analysiert werden. Hier lag der Schwerpunkt auf der nächtliche HNOi Bildung. Salpetrige Säur ist bei Tagesanbruch in belasteten Gebieten eine wichtige OH-Quelle.
Währen der Meßkampagne in der Arktis waren zeitweise meteorologische Bedingungen gegeben, die den Transport von anthropogenen Quellen in mittleren Breiten in die Arktis ermöglichten Nitrat und HN03 waren währen des Frühjahr und Sommers in unterschiedlichen Konzentrationen in der Arktis zu finden. Währen im Mär die Nitratwerte zwischen 0.01 und 0.45 pg/m3 und HNo3 zwischen 0.01 und 0.08 pg/m3 (4 - 3 1 pptv) lagen, konnten im Sommer lediglich <0.01 - 0.15 pg/m3 Nitrat und < 0.01-0.03 pg/m3 (2-12 pptv) HN03 nachgewiesen werden. Währen unterschiedlicher

Advektionsmuster waren im Mär relativ hohe Nitrat und HN03- Konzentrationen und HN03/N03" - Verhältniss (0.15 - 0.6) vergleichbar mit den in mittleren Breiten gemessenen Werten zu beobachten. Dieser Befund weist auf einen Transport aus diesen Breiten mit minimalen Verlusten durch trockene und nasse Deposition und einer fast homogenen Verteilung und Akkumulation in der winterlichen arktischen Troposphär hin. Im Gegensatz dazu belegt die Variabilitä der gefundenen Konzentrationen und der HN03/N03" - Verhältniss im Sommer die größe Effizienz der genannten Depositionsprozesse zu dieser Jahreszeit. Die bis zu einer Größenordnu geringeren minimalen Sommerkonzentrationen werden nasser Deposition durch den beständige Nebel übe Packeis zugeschrieben, der vor allem die Konzentrationen leicht wasserlösliche Spurengase wie HN03 beeinflußte In den hier untersuchten Regionen der Arktis sollte ein Eindringen von NOy- reichen Luftmassen aus der freien Troposphär , einer potentiellen Quelle fü bodennahes NOã durch die beobachtete stabile Schichtung der unteren Troposphär weitgehend ausgeschlossen gewesen sein. Allerdings könnte die aus dem übe 3000 m erhöhte Zentralgrönlan advehierten Luftmassen teilweise aus der freien Troposhär gestammt haben.
Die HN03- und Nitratmessungen in der marinen Troposphär des östliche Atlantiks weisen auf den Einfluà des Transports dieser Spurenstoffe übe marine Gebiete und auf die Existenz verschiedener Einträg (Biomasseverbrennung, Saharastaub, anthropogene Emissionen aus Europa) hin. Das Stickoxidbudget und das HNOJN03' - Verhältni wurde durch diese Randbedingungen abhängi von der geographischen Breite modifiziert. Die gemittelten Nitrat- und HNO3 - Konzentrationen waren in der nördliche Hemisphär ca. 3 mal höhe als in der südliche Hemisphäre wobei die intertropischen Konvergenzzone die Luftmassengrenze zwischen beiden Hemisphäre markierte. Im einzelnen wurden 0.8 - 1.6 pg/m3 Nitrat und 0.3 pg/m3 (I 16 pptv) HN03 in der nördliche Hemisphär und 0.4 - 0.6 pg/m3 Nitrat und 0.05 - 0.1 pg/m3 (19 - 39 pptv) HNo3 in der südliche Hemisphär gefunden.
Die gemessenen HN03- und Nitratkonzentrationen in Bremerhaven (0.5 - 2.5 pg/m3 bzw. 0.5 - 1.5 pg/m3) stimmen mit den Konzentrationen übe dem Atlantik überein falls diese unter dem Einfluà von Advektion europäische Luftmassen gemessen worden sind. Dies bedeutet 10 mal höher Nitrat- und 15 mal höher HN03- Konzentrationen im Vergleich zur spätwinterliche Arktis, oder aber 25 - bzw. 70 mal höher Werte im Vergleich zu den Sommermessungen auf Spitzbergen. Währen der Meßperiod in Bremerhaven konnte keine signifikante Varianz in der Volumen- und Größenverteilu der Partikel (Durchmesser 0,09 - 0,3 pm) beobachtet werden, die die typische Charakteristik von städtische Aerosolen aufwies. Die Aerosolzahlendichte war 5 Größenordnung höhe als jene in der Arktis, was aber aufgrund der spärliche Aerosolmeßdate aus der Arktis nur als grobe Abschätzun und Vergleich angeführ werden soll.
Durch eine Korrelation der gefundenen HN02 Konzentrationen mit dem Parameter S, der ein Maà fÅ ̧ die Gesamtaerosoloberfläch ist, wurde die Rolle des Aerosols auf die HN02 Bildung untersucht. Der Parameter S wurde von den DOAS Messungen abgeleitet. Diese Berechnungsmethode basiert auf den Arbeiten verschiedener Autoren. Die Ergebnisse konnten näherungsweis durch einen Aerosolmonitor belegt werden. Die Konsistenz der gemittelten spezifischen Dichte des Aerosols mit der aus dem Gesamtaerosolvolumen und der Gesamtaerosolmasse erhaltenen spezifischen Dichte belegt die Brauchbarkeit dieser Methode zur Bestimmung von Aerosolparameter. Die an verschiedenen Meßorte in mittleren Breiten durchgeführte HN02 Messungen weisen auf einen signifikanten Einfluà von Aerosol- und permanenten Oberfläche (Gebäude Vegetation) auf die HN02 Bildung hin. Dies wurde vor allem währen stagnierenden nächtliche Wetterlagen deutlich.

RESUMEN
E1 presente trabajo se centro en el estudio de la distribucion y comportamiento de los compuestos inorgiinicos de nitrogeno en la troposfera. Para ello se consideraron tres regiones principales: el Artico como receptor, la troposfera marina como zona de transporte, y las latitudes medias como principal fuente de contaminantes. E1 acido nitrico y el nitrato aerosol se seleccionaron como trazadores de los procesos de emision, transporte y eliminacion implicados en el ciclo del nitrogeno inorghico en la troposfera. EI sulfato es un componente fundamental del aerosol artico. Por esta razon se determinb simultaneamente el contenido en SO2 y sulfatos de las muestras de aire, Para la identificacion de variaciones anomalas de las concentraciones de fondo.
Se realizaron dos campafias de medida en el ~ r t i c o , en Spitzbergen (marzo 1993) y en el mar de Groenlandia (julio - agosto 1994). Estos dos periodos se seleccionaron con el fin de excluir del analisis las diferencias producidas por la quimica nocturna, que en el caso de los oxidos de nitrogeno tiene lugar fundamentalmente a travis de las reacciones iniciadas por el radical NO3. La troposfera marina fue tambikn objeto de estudio, por constituir el nexo de union entre los distintos medios implicados en el comportarniento global de los compuestos inorghicos de nitrbgeno en la troposfera. Las carnpafias de medidas realizadas a bordo del barco alemiin de investigacion Polarstern (ANT-W5 y ARK-W1) en el verano de 1994, proporcionaron un perfil de distribucion del acido nitrico y del nitrato aerosol desde la zona tropical a la polar del Ockano Atlhtico .
Se seleccionaron distintos sistemas de deteccion y muestreo, que en parte fueron modificados con el fin de adecuar su funcionamiento a las condiciones del entorno de medida. E1 aerosol se muestreo utilizando un impactor virtual y una combinacion de sistemas de filtros, y las especies gaseosas mediante un sistema wet denuder. La mayoria de las muestras fueron analizadas por cromatografia ionica inrnediatamente despuks de su recogida. La caracterizacion de las masas de aire se llevo a cabo con la ayuda de datos meteorol6gicos y de las trayectorias facilitadas por el Institut0 Meteorol6gico alemh (DWD).
Adicionalmente se investigo la composicion atmosfkrica de distintos emplazamientos situados en latitudes medias. Durante el periodo de tiempo comprendido desde agosto de 1992 a febrero de 1993, se utilizo un DOAS (Differential Optical Absorption Spectrometer), Para la medida continua de SO2, NO2, O3 y HN02 en Bremerhaven, una ciudad costera del norte de Alemania. La distribucion del volurnen y tarnafio de las particulas se determino mediante un espectrometro de aerosol. Durante la campGa realizada en Mayo de 1994 se adquirio informacion adicional sobre los niveles de concentracion de nitrato, sulfato y icido nitrico en el citado emplazamiento. Por otra parte, el centro europeo de investigacion JRC en Ispra (Italia) facilito datos de los niveles de concentracion correspondientes a campafias de medida realizadas en zonas con distintos niveles de contaminacion (Ispra, M i l h y el Valle del Ticino) . Estos datos fueron depurados e interpretados, siendo el estudio de la formacion nocturna troposfkrica del acido nitroso el principal punto de interks del analisis. E1 HNOi constituye una de las mayores fuentes de radicales OH durante las primeras horas del dia en atmosferas contaminadas.
Durante las campafias de medidas realizadas, se observaron condiciones meteorologicas favoreciendo e l transporte de masas de aire entre las fuentes antropoginicas a latitudes medias y el Artico. Tanto a finales de invierno como en verano se detectaron m O 3 y nitratos en la tro osfera hrtica. Las respectivas concentraciones oscilaron en marzo entre ? 0.01- 0.08 pglrn (4-31 pptv aproximadamente) y 0.01 - 0.45 pg/m3. Duryte el verano se detectaron niveles de nitfatos comprendidos entre < 0.01 y 0.15 pglm , y de m O 3 desde < 0.01 a 0.03 pglm (2-12 pptv). En marzo, la deteccion de concentraciones

relativamente altas de nitratos y HN03 asociadas a diferentes situaciones de adveccion de masas de aire, asi como la relacion H w / N ^ ' (0.15-0.6), similar a la fiecuentemente encontrada en latitudes medias, apoyaron la idea de transporte a larga distancia de HNO3 y nitrato en forma de aerosol, acumulacion en invierno en la atmosfera artica, con minimas perdidas debidas a sedimentacion seca y humeda, y distribucion practicamente homogenes a 10 largo del Artico. Por otra parte, la variabilidad en las concentraciones de los citados componentes, asi como la relacion nitricolnitratos observados en el verano, reflejaron la superior efectividad de los mecanismos de eliminacion atmosferica en esa ipoca del afio. E1 minimo de concentracion del verano, hasta de un orden de magnitud menor que en el invierno, se atribuyo en parte a la sedimentacion humeda causada por la persistente niebla sobre la Capa de hielo, que puede afectar notablemente a las especies solubles como el Acid0 nitrico.
La estratificacion de la baja troposfera observada en las zonas hrticas de estudio dificulta probablemente el intercambio vertical de masas de aire, y, por tanto, la entrada desde la troposfera libre (free troposphere) de especies reservoir de oxidos de nitrogeno (NOã) como por ejemplo PAN ( nitrato acetil peroxido). Sin embargo, es necesario tener en cuenta que, dada la altitud de Groenlandia, la adveccion de masas de aire con este origen puede ser una fuente de aire troposferico libre.
Las medidas de acido nitrico y nitratos llevadas a cabo en la troposfera marina de la zona oriental del Oceano Atlhtico, indicaron su papel en el transporte de contaminantes y la existencia de fuentes (quema de biomasa, polvo del Sahara, emisiones europeas) que modifican el contenido en compuestos de nitrogeno y la distribucion entre la fase gaseosa y particular a diferentes latitudes. En promedio, las concentraciones de fondo de nitratos y HN03 encontradas en el Hemisferio None (0.8-1.6 [ig/m3 y 0.3pglm3 respectivament$ fueron tres veces superiores a las del Hemisferio Sur (0.4-0.6 pglm y 0.05-0.1 pg/m respectivamente), con la transicion entre niveles de concentracion marcada por la Zona de Interconvergencia Tropical (ITCZ).
Las concentraciones de mo3 y nitratos medidas en Bremerhaven (0.5 - 2.5 pg/m3 y 0.5 - 1.5 ug/m3 ) se encuentran en el rango de concentraciones detectadas en la zona del Oceano Atlantico influida por la adveccion de masas de aire con origen europeo. Estas concentraciones representan un incremento de 10-15 veces, y de 25-70 veces respecto a los niveles de nitratos y de nitrico encontrados en el Artico en invierno y verano respectivamente. No se observo ninguna diferencia significativa en la distribucion de tamafio y volumen de particulas con dikmetro comprendido entre 0.09 y 0.3 pm durante el periodo de medida en Bremerhaven. Estas distribuciones se corresponden con las tipicas de areas influidas por aerosol urbano. E1 numero de particulas detectado h e de cuatro irdenes de magnitud superior al del Artico. Este dato debe considerarse solo como una estimacion de la densidad del aerosol en las zonas articas, dado el pequefio numero de medidas disponible Para establecer una comparacion representativa.
La contribucion del aerosol a la formacion de HNOi se analizo mediante correlaciones en las que se incluyo un parametro S relacionado con la superficie total del aerosol. Dicho parametro se calcul6 a partir de la intensidad de luz obtenida mediante el DOAS a 10 largo de la trayectoria del haz de luz. E1 metodo de calculo, basado en investigaciones previas de otros autores, se evaluo con ayuda de un monitor de aerosol. La consistencia de las densidades medias obtenidas de la comparacion del volumen y masa totales de aerosol con los valores esperados, sefialo este metodo como adecuado Para el calculo de parimetros de aerosoles. Las observaciones de HN02 llevadas a cabo en emplazamientos con diferentes niveles de contaminacion, indicaron la naturaleza heterogenea de la reaccion de formacion, influida por la presencia de aerosoles y tambien de superficies permanentes ( edificios, vegetacion ), especialmente bajo condiciones de poca convectividad atmosferica nocturna.


1 GENERAL INTRODUCTION
Arnong inorganic and organic nitrogen containing compounds, the nitrogen oxides (NO,.) play probably the most important role in both polluted and unpolluted atmospheres, especially due to their direct contribution to the distribution of the OH radical, which is responsible for the initiation of most of the daytime chemistry of the troposphere. Reactions of nitrogen oxides influence the tropospheric oxidizing capacity by consuming the OH radical, and by producing ozone, the primary source of this radical and also an oxidizing species itself.
The distribution of the nitrogen oxides in the troposphere and of the trace gases which result from their interconversion processes (PAN (peroxyacetyl nitrate), N205, HN03, HNOi, etc.) must be known in order to assess the extent to which anthropogenic NOx emissions influence ozone formation on a global scale. However, due to the complexitiy of the processes involved, this subject has still many Open questions which need to be answered.
A study of the tropospheric NOx cycle requires the characterization of the source areas, the transport mechanisms and the composition of the remote troposphere. Although most of the NOx burden is of anthropogenic origin, natural sources, including forest fires, anaerobic processes in soil, oxidation of biogenic NH3 and lightning contribute also to some extent and are more varied and widespread (Wayne, 1991). Major anthropogenic sources are biomass burning, artificial fertilizing, and high temperature combustion of gas, oil or coal in power plants and motor vehicles (Egli,1990). In polluted atmospheres, HNOi, one of the main products of the NOx conversion processes, is an important source of OH radicals at sunrise. Its formation mechanisms are up to now not well established.
The distribution and deposition of nitrogen oxides over the oceans is strongly influenced by the distribution of the anthropogenic sources, which are predominantly (over 80 %) located on land (Duce, 1991). The conversion of NOx to HNO3 and NO3' followed by wet and dry deposition is the principal removal mechanism of NOÃ from the atmosphere. HN03 deterrnines to some extent the acidity of rain and the euthrophication of surface waters. Since nitric acid is involved in many heterogeneous reactions, its atmospheric behaviour is more difficult to model than in the case of other species which exist primarly in the gas phase. More extensive measurements of NOx, HN03 and particuiate nitrate over large areas will lead to a better estimation of their dry and wet deposition rates.
Although the impact of NOx emissions is limited by the short lifetime of these compounds in the troposphere (Liu et al., 1987), long range transport of temporary NOx reservoirs like PAN, seems to play an important role in the NOx distribution in the remote atmosphere (Singh et al., 1986). Until recently the measurements of NOx in remote regions have been considered representative of the natural atmosphere. A more detailed knowledge of their transport and sink mechanisms will help in the evaluation of the NOx anthropogenic influence in the remote troposphere. The Arctic troposphere occasionally presents levels of pollution (gases and aerosols) comparable to those of other areas under the influence of atmospheric emissions. In winter, pollution from

industrial sources, consisting of a variety of aerosols, is transported into the Arctic. The Ar& Haze reaches it maximurn in spring time when the solar radiation increases, favouring the Initiation of photochemical reactions. The amount and chemical composition of the aerosol may have an influence on the clima. Consequently, more information On the chemical constituents of the Arctic Haze is required.
2 THEORETICAL BACKGROUND
2.1. TROPOSPHERIC CHEMISTRY OF INORGANIC NITROGEN COMPOUNDS
The main reactions known of NOÃ compounds and their acids (HN02 and HN03) are briefly discussed in the next paragraphs. More detailed descriptions including the rate constants of the reactions can be found in most of the general reference books of atmospheric chemistry (Finlayson-Pitts and Pitts, 1986; Warneck ,1987; Wayne, 1991).
2.1.1. Nitrogen monoxide (NO)
Nitric oxide NO is mostly emitted and transfonned in the atmosphere into NO2, whose photolysis, as already mentioned, is the only known way of producing O3 in the troposphere, according to the reactions (Finlayson-Pitts and Pitts, 1986):
* However, in the absence of organics, or a very low hydrocarbons to NO ratios, NO is the main sink of O3 :
and these three reactions achieve a steady state ( the Leighton relationship) with a characteristic timescale of minutes, which does not lead to any net formation of 03 .
* If the conversion of NO to NO2 takes place in the presence of organics, deviations of the photostationary equilibrium occur (Nelson, 1990). The organic compounds are attacked by OH, HO2, other oxy- and peroxy-radicals and subsequently oxidized.

In a general case:
where R is a general organic radical and R' has one H less than R.
Thus, the net reaction can be mitten as follows:
The OH radical is not consumed in this process, so the rate is determined essentially by the steady state concentration of OH determined by sources (03) and sinks (largely NO and NO2, See below). In the presence of OH radicals successive oxidations of the organic chain lead to carbon monoxide, which can also be oxidized, involving a hrther NO conversion in the chain of reactions.
In the case of NO poor environrnents, when the ratio of the NO and O3 concentrations is less than about 2. lo4, ozone is consumed and CO2 is generated, as a consequence of the chain of reactions:
This destruction of ozone is observed at nitric oxide mixing ratios in the lower troposphere of about 3 ppbv in the southern hemisphere, 8 pptv in the northern hemisphere, and 20 pptv at the tropopause ( Crutzen and Zimmermann, 199 1).
* It is important to note that the terrnolecular reaction:
although generally too slow to be of importance in the atmosphere, given the second order in NO of the reaction rate, represents a net source of NO2 and consequently of ozone at high NO concentrations (for instance in uncontrolled power plant emissions).

* NO reacts also very rapidly with the NOi radical, whose role in the nocturnal chemistry of the troposphere is explained in the next section.
2.1.2. Nitrogen dioxide (NO-,)
* NO2 is mainly formed from NO oxidation and constitutes a small proportion of the NOÃ emissions. Once in the atmosphere, it can be involved in different processes. During dayiight hours, the most important reactions are the photolysis, already described, together with the reaction with OH yielding nitric acid:
* The nitrate radical is formed from the reaction of NO2 with 03:
NO3 is rapidly photolysed (â < 560 nrn), but, during the night and in the absence of NO, it is an active oxidizing agent. It can react with a variety of organics by addition to unsaturated bonds and by hydrogen abstraction, being in the latter case the precursor of nitric acid:
* The NO2 reaction with the NO3 so generated leads to nitric acid:
The N20s hydrolysis is a rapid process (Russe11 et al., 1985, Wayne et al.,1990) that can take place in the liquid water present in fog or aerosols.
is the radical
One of the most important reservoirs of NO2 is the peroxyacetyl nitrate (PAN). It product of the temperature dependent reaction of NO2 with the peroxyacetyl , formed from the OH attack on acetaldehyde and subsequent oxygen addition:

The rate constant for PAN decomposition is strongly temperature dependent. It is at O° smaller than at 25OC by almost two orders of magnitude, giving a natural lifetime of PAN with respect to decomposition of 50 hours and 46 minutes respectively (Finlayson-Pitts and Pitts, 1986).
PAN is relatively inmune to dry and wet deposition processes, and to chemical attack. Once formed in polluted areas, if transferred above the boundary layer where the temperatures are low enough to prevent its decomposition, it can be transported over long distances. An increase in the temperature as a consequence of downmixing, for instance, causes the release of NO2, which is then effectively transported (Singh, 1987). Other organic nitrate products formed following a similar mechanism are the peroxynitric acid (H02N02), peroxypropionyl nitrate (PPN) and peroxybenzoyl nitrate (PBzN) .
Kinetically the most important processes which lead to a permanent loss of NO2 are the photolysis, and the HN03 forming reactions, with OH during the day and with O3 and NOi at night.
2.1.3. Nitrous acid ( HNO-,)
HN02 plays an important role in the chemistry of the troposphere as a consequence of its rapid photolysis, which can be considered as a major source of OH radicals at sunrise in polluted urban areas:
HNO, + hu (?L< 385 nm) -r OH + NO (23
HN02 is of biological interest because of its reaction with amines to produce toxic nitrosamines (Fahmy and Fahmy, 1976):
All other HN02 loss processes are believed to be negligible
The mechanism of HNO, formation is up to now not completely understood. The high photolysis rate makes the recombination of NO with OH radicals very unlikely. In addition, the homogeneous gas phase reaction:
is very slow under ambient conditions
Although some experimental measurements (Sjödi and Ferm,1985, Notholt et al, 1992) have indicated the possibility of the heterogeneous reaction :

laboratory studies (Pitts et al., 1985; Febo et al., 1987,1988; Jenkin 1988; Drummond et al., 1986) establish the existente of a heterogeneous process which involves only NO2 as precursor, suggesting the predominance of the reaction:
Febo et al.,(1994) consider three steps in the HN02 formation observed in laboratory studies On flow reactors:
a) Adsorption of NO2 on the walls (fast step)
b) HN02 and HNo3 formation in adsorbed phase (slow step, still unclear from a molecular standpoint)
C) Release of HN02 and HNo3 in the gaseous phase, which seems to be dependent On the nature of the surface and the thermodynamic conditions.
Recent measurements of surface fluxes of HN02 (Harrison and Kitto, 1994) suggest that the heterogeneous production at the surface might account for the reported atmospheric HN02 concentration levels.
Some other reactions of NO2 with organics and ozone have also been proposed (Drummond, 1986) but require more detailed laboratory studies to evaluate their participation in the formation.
At least a portion of the HN02 observed in ambient air may be directly emitted from sources rather than being formed by chemical reactions in the air (Rondon and Sanhueza, 1989). The HN02 has been observed in the exhaust of automobiles (Kessler and Platt, 1984, Drummond et al.,1986), representing about 0.2% of the NO, emitted.
2.1.4. Nitric acid (HNo3)
HNO3 is a major end product of nitrogen oxides emissions. As already mentioned (see 2.1.2) it can mainly be formed in the atmosphere through reactions with OH and NO3:
Negligible reactions are the photolysis:
HNO, + hu ( 2 0 0 < X < 3 2 0 n m ) + O H + N 0 2
and the reaction with the OH radical:
both too slow to be important under atmospheric conditions

Nitric acid can also react with bases present in the atmosphere to form salts (see 2.1.4. I), for instance with gaseous ammonia to produce particulate ammonium nitrate:
This reaction is in a dynamic equilibrium, and nitric acid can relatively easy revolatilize after the formation of the ammonium salt. The equilibrium constant varies with temperature, pH and humidity (Harrison et al., 1990a; Mozurkewich, 1993). The ammonium nitrate exists as a solid if the relative humidity is less than that of deliquescence (62% at 25OC). The dissociation constant is smaller for the N h N O , in solution than for the solid.
HNO3 is mainly removed from the atmosphere through dry and wet deposition, though, given its high solubility, the absorption into cloud, fog or rainwater dominates, making it a significant contributor to the acidity of precipitation.
2.1.4.1. Nitrate particles
In spite of their importance, the interconversion processes between gaseous nitric acid and particulate nitrate are still not completely understood.
Nitrate is found in both coarse and fine particle fractions (see 2.2.). Yoshizumi and Hoshi (1985) identified ammonium nitrate in the fme mode and the non volatile sodium nitrate in the coarse mode. Other studies (Wolff, 1984; Wu and Okada, 1994) suggest the reaction of HN03 with cmstal material, given the correlation of nitrate coarse and crustal elements. Heterogeneous processes with sea salt particles have also been reported (Finlyson-Pitts, 1983; Harrison and Pio, 1983; Zetzsch et al,, 1988; Schwikowski et al., 1988) indicating the reactions:
2 NO, + NaCl U NaN03 + NOC1
HNO3 + NaCl <-Ã NaN03 + HC1
also confirmed in laboratory studies (Winkler et al., 1991; Mamane and Gottlieb, 1992).
Diurnal variations in the concentration and size distribution of nitrates found in some urban areas (Willard, 1983), are in agreement with two important formation mechanisms: in the daytime nitrates are formed by photochemical gas phase processes with subsequent reaction normally with ammonia, predominating tlie formation of small particles, while at night, the N205 formed from No3 (see above) reacts with water present in droplets or adsorbed on surfaces to form HN03, which remains as particulate

nitrate if there is sufficient basic material (ammonia, sea-salt aerosol or soil dust), to react with it, frequently leading to large particles.
2.2 .- TROPOSPHERIC AEROSOLS
Particles participate in many processes of the atmosphere, in particular radiative transfer, by their absorption and scattering of radiation, and gas scavenging by offering a surface where molecules can be deposited and react (Charlson et al., 1992). They also play an important role in cloud nucleation processes determining the cloud drop size spectrum and hence the radiative properties and precipitation formation.
Wind btown dust
Panicle diarneier (0) - Tm- nuum W ! Accmtulauon I - Slec..an~caIly gmmfa- Aitken nuclei mnge - ange I aemsoi mnge
Figure 1 - Schematic of an atmospheric aerosol size distribution showing the three modes, the main source of mass for each mode, and the principal processes involved in inserting mass into and removing mass from each mode (from Whitby and Sverdmp, 1980).

The name atmospheric aerosols includes all the suspensions of solid or liquid particles in air. Depending on their origin, these particles present different size and composition. They can be directly emitted (wind erosion, wood burning, volcanic eruptions), or formed as result of chemical gaslparticle reactions like homogeneous or heterogeneous nucleation (secondary particles), and grow by condensation and coagulation processes. The removal of aerosols from the atmosphere is controlled by dry and wet deposition processes (Scriven, 1975; Sehmel, 1980).
In figure 1 are considered the main two distinct groups of particles contributing to the atmospheric aerosol. Particles with diameters bigger than or equal to 2.5 pm are called coarse particles, arise largely from mechanical processes such as wind or erosion and are composed mainly of sand and sea salt. Considering their characteristics, the group of fine particles, with diameters smaller than 2.5 pm, can in turn be divided into the Aitken nuclei range, with the smallest particles (d <: 0.08 pm), which arise from ambient temperature gas -to-particle conversion and condensation of supersaturated vapours, and the accumulation range whose typical origin is the condensation of low volatile vapours and the coagulation of smaller particles. Most of the soluble inorganics, as nitrates and sulphates, are found in this fraction, which presents the longest lifetimes.
Information about aerosol surface and volume is essential when considering reactions occurring at the particle surface or within the particles themselves. It is also necessary to know the surface and volume distributions among various size ranges, which are normally calculated integrating over the discrete interval defined by the maximum and minimum particle diameter available. Generally, because of the wide ranges of magnitude encountered, logarithmic expressions like (33) and (34) are used to obtain a more physically descriptive picture of the size distribution (Graedel and Crutzen, 1994):
S = Â n An(AlogDp)/( AlogDp)
V = Â n 1 6 An(AlogDp)/( AlogDp)
where S and V are the surface and volume of the aerosol respectively, n is the number of particles of a determined size and Dp is the particle diameter.
The following section gives a short description of the two particular types of aerosols most closely related to the data presented in this work, i.e., marine and Arctic aerosol.
2.2.1. Marine aerosol
Marine aerosol particles are good indicators of several atmospheric processes like long- range transport , scavenging, homogeneous nucleation of gases, coagulation, etc., which determine their number, size and composition.
Fresh sea-salt aerosols are alkaline and have a significant buffering capacity which makes them an ideal medium for the oxidation of SO2 by 03, in excess over the most

remote marine boundary layer (Chameides and Stelson, 1992). Furthermore, measurements on the remote marine boundary layer (McInnes et al., 1994), denlonstrate the existente of sea-salt particles depleted in chloride and enriched in nitrate and non-sea-salt (nss) sulphate, confirming the replacement reactions:
HN03(g) + NaCl(p) + HCl (g) + NaN03(p) (3 5)
H2S04(g) + 2 NaCl (p) -Ã 2HC1 (g) + Na2S04 (p) (3 6)
The principal constituents of the marine aerosol are sea salt, mineral dust non-sea-salt sulphate and, generally to a lesser extent, nitrates.
* The sea salt is the result of the agitation of the sea surface by the wind, and therefore, its concentration, which normally ranges from 2 to 100 depends primarily on wind speed. Many studies of the effect of wind speed on the concentration and distribution of sea particles on the ocean surface layer have been performed (Gras and Ayers, 1983; De Leeuw, 1986). Sea salt is, in clean marine air, the main component of the coarse mode, which constitutes about 90-95% of the total mass but only 5-10 % of the total number of particles (Fitzgerald, 1990). During periods of strong winds, the small salt particles formed can also be an important contribution to the fine mode.
* Mineral dust, also belonging to the coarse particle mode, is transported from semiarid and desert regions. Although dust concentration normally does not exceed 0.5 ~ g l r n , it can be measured in even higher concentrations than sea salt in some regions of the North Atlantic, North Pacific and Indian oceans (Raemdonck et al., 1986; Prospero 1979) as a consequence of its transportation from continents.
* Non-sea-salt sulphate has a continental as well as a marine source. Its concentration decreases markedly from coastal regions to the remote areas of oceans, where it constitutes predominantiy the fine mode (Gras and Ayers, 1983; Clarke et al., 1987). Over remote oceans, dimethyl sulphide gas (DMS), produced by metabolic processes in certain algae, is considered to be its most important source by means of an oxidation initiated by several radicals which leads mainly to the formation of SO2, sulphuric and methanesulphonic acid (MSA). Afterwards, gas to particle conversion processes, including heteromolecular nucleation, condensation of MSA and H2S04 On new particles and aqueous-phase oxidation of SO2 by O3 and H202 in cloud droplets, produce the nss-sulphate aerosol (Fitzgerald, 1990). However, recent experiments in the Pacific Ocean (Bandy et al., 1992) have questioned the efficiency of the production of SO2 from DMS, which seems to be lower than previously assumed. Further research is needed to define better the kinetics of the reactions involved.
* Nitrates are mostly found in particles larger than 0.4 um (Savoie et a l . 1982, 1989) and in concentrations in the range of 0.1-0.2 &m3 (Savoie et al., 1987; Parungo et al., 1986). As with nss-sulphates, nitrates have continental and marine origin and are formed by gas to particle conversion. So far the mechanisms of formation are not well

established. It is generally accepted that sea salt is not a source of nitrate given the relative concentrations of nitrate and sodium. Some of the proposed mechanisms of formation are the oxidation of biogenically produced organic nitrogen gases from the ocean and, in more polluted areas, the selective dissolution and subsequent oxidation of NO2 in the more alkaline sea-salt droplets (Parungo et al., 1986).
Sodium nitrates in coarse particles seem to predominate in coastal areas (Wall et al. 1988) due to the reaction (32) The nitrate production rate depends on the NaCl concentration and surface area available for the reaction with HN03. Additionally, some studies (Hildemann et al., 1984; Harrison et al., 1990a; Ottley and Harrison 1992) show the likely evaporation of ammonium nitrate and Chloride in the marine atmosphere due to the low concentration products for [NH3][HN03] and [NH3][HC1] compared to their theoretical values in the presence of the ammonium salts.
2.2.2. Arctic aerosol: Arctic Haze
It is well established that the Arctic region is exposed to anthropogenic air pollution dominated by non marine sulphate, organics and graphitic carbon, essentially during winter and spring periods of the year (Rahn, 1985). In winter, the polar front includes the polar region and a large fraction of the snow covered continental mass of North America and Eurasia. The meteorological conditions favour the coupling between the Arctic and midlatitude areas. Arctic Haze originales mainly as a consequence of the long range transport of polluted air masses with high aerosol concentrations from Eurasian and American sources by intense anticyclonic meteorological Systems (Heintzenberg, 1980,1983, Barrie, 1986). Due to the stability of the troposphere during polar winter, pollutants can persist in stratified layers for relative long times. This phenomenon disappears as the Arctic warms in the early summer, low level Stratus are formed by warm advection over the cold ice-pack and the effectivity of removal processes increases. However, recent studies (Heintzenberg et al., 1991; Honrath and Jaffe, 1992; Talbot et al., 1992; Browell, 1992) indicate that the Arctic troposphere is sometimes also influenced by anthropogenic inputs from long-range transport and regional biomass burning. The chemical composition of Arctic aerosol has often been investigated in the last years (Heintzenberg et al., 1981; 1994; Heidam, 1985; Pacyna and Ottar, 1989) particularly with experiments and models to elucidate the influence of the solar absorption of the Arctic haze on the radiation balance (Valero et al., 1984; Wendling et al., 1985, Emery et al., 1992), and the rise of summer tropospheric O3 observed in the last two decades (Jacob, 1992).
Three sources participate in the formation of Arctic aerosol:
a) the ocean, contributing with sulphates, chlorides and sodium, all in the coarse mode, and of minor influence in winter due to the normally long travel of air masses over Snow and ice-covered areas,
b) the terrestrial surface, with typical soil derived elements like Si, Ca, Ti, Fe, Cr, Mn, etc., also in coarse particles, and

C) the anthropogenic sources, in form of soot, sulphates, nitrates, ammonium and elements like Cu, Zn and Pb, in the accumulation mode of fme particles, indicating the presence of well-aged aerosol,
2.2.2.1. Nitrogen compounds
Despite the short atmospheric lifetimes of NOÃ in midlatitudes (Liu, 1987), the formation of reservoir nitrogen compounds like PAN (see 2.1.2) propitiates their impact in remote areas, affecting ozone and nitric acid concentrations. The concentration and seasonal cycle of nitrogen oxides in the Arctic troposphere have been investigated, especially in Alaska, by some research groups (Jaffe, 1991; Jacob, 1992). Background levels of nitrogen compounds have been observed to be very low. Honrath and Jaffe (1992) reported NOy mixing ratios between 40 pptv in summer and 600 pptv during spring. PAN presents significant concentrations in the Arctic boundary layer during spring (200-600 pptv) and its decomposition as the temperature warms releases sufficient NO;, to increase the rate of nitric acid formation and deposition, and to enhance local O3 levels. Above the boundary layer the lower temperatures prevent the thermal decomposition of PAN, which, at this level, may subsist as a NO, reservoir during the summer (Singh et al. 1992). Stratosphere-troposphere excliange has also been suggested as a source of reactive nitrogen compounds (Sandholm, 1992).
2.3.- CHEMISTRY OF SO2 AND SULPHATE IN THE TROPOSPEERE
Due to the importance of the sulphate aerosol both in marine and Arctic tropospheres, and to the fact that SO2 and sulphate concentrations have been obtained and evaluated together with the nitrogen compounds topic of the present work, it is convenient to include here some aspects of the chemistry of sulfur compounds in the troposphere, with regard to the chemical conversion of sulphur dioxide (SO2) to particulate sulphate.
Sulphur dioxide is emitted by three main sources:
- Anthropogenie, mostly combustion of coal or oil and industrial processes
- Volcanoes, a Part of the SO-, being converted to sulphuric acid upon entering in the atmosphere, as result of the reaction of the hot volcanic gases with oxygen.
- Oxidation of organic sulphides: carbonyl sulphide (COS), carbon disulphide (CS,) and dimethyl sulphide (DMS), by reaction with radicals. The mechanisms and the effectivity of the formation processes are still a subject of investigation.
Gas phase SO2 is removed by deposition, oxidation and heterogeneous reactions with aerosols or clouds.
The oxidation of SO2 can occur in the gas phase, in fog and clouds droplets and on the surface of aerosol particles. Due to the very low vapour pressure of the sulphuric acid produced in this oxidation, it is transferred to the aerosol or cloud phases. These two types of oxidations are briefly described:
a) Gas phase reactions
Potential SO, oxidants are the radicals OH, HO2, RO, and the Crieege intermediates produced in the reaction of ozone with alkenes.
The best known and probably the only fast and efficient of these gas phase processes is the reaction of SO2 with OH radicals:
SO, + OH -> HOSO,
HOSO, + 0, -> SO3 + HO,
So3 + H 2 0 -> H2SO4
The reactions of SO2 with O3 and excited O2 molecules, as well as its direct gas phase photoxidation are insignificant under typical tropospheric conditions.
b) Aqueous phase reactions
Since clouds, fogs and rain have much higher liquid water content than particles, they contribute more to atmospheric aqueous phase oxidations. However, the rate of oxidation can increase in the liquid phase of the particles, as consequence of the possibility of higher concentrations of solutes.
In the presence of a liquid phase, a Part of SO, is dissolved:
SO; (g) + H20 S02.H20
S02.H20<-> H S O 3 ' + ~ +
HSO3" < ̂~0'3'" + H'
and the HS03' and ~ 0 ~ ~ ' formed can be oxidized by 0 2 , 0 3 or H202.
The reaction with oxygen is slow except in the case of being catalyzed by ions of heavy metals such as iron and manganese.
Ozone is moderately soluble in water and can be absorbed into solution from the gas phase. It can be also generated by the Same reaction as in the gas phase, from oxygen

atoms formed in reactions like the photolysis of N O 3 in solution:
H202 is highly soluble and in addition to absorption from the gas phase, it can be produced by both dark and photochemical reactions from organics, normally via the of the superoxide ion 0,:
2 HO, -> H202 + 0, (44)
It is important to note that the decrease in the pH as H2SO4 is formed in the liquid phase will affect both the dissolution of SO2, as expected from tlie equilibria (40-42), and the O3 and meta1 catalysis oxidation rates. The oxidation with H202 will therefore predominate at low pH, being only limited by the amount of H202 available. In contrast, if sufficient buffering species are available to maintain high pH, the reaction with O3 can be much faster than that with H202.
A significant fraction of the tropospheric aerosol mass is estimated to be derived from homogeneous and in cloud oxidation of gaseous sulphur compounds, of anthropogenic (primarily SO2) and biogenic origin (mainly DMS). Considerable uncertainty still surrounds the DMS oxidation pathways and products. However, as already mentioned in 2.2.1 ., the condensation of MSA onto pre-existing aerosol particles seem to represent a major route of non sea salt sulphate formation.
Apart from the sea salt form, sulphate may exist as (NH4)HS04 or (NH4)2S04 depending On the amount of available ammonia. Other sulphate salts, including mixed ammonium nitrate-ammonium sulphate have been also detected and the factors affecting their equilibria widely examined (Tang, 1980; Stelson and Seinfeld, 1982; Spann and Richardson, 1985).

3 SCIENTIFIC GOALS
The aim of the present work is to improve the knowledge about the behaviour and distribution of inorganic nitrogen compounds in the troposphere with regard to the impact of anthropogenic emissions in Arctic areas. Since many processes and components are involved in this atmospheric cycle, it is necessary within the work presented here, to delimit the field of research, and some restrictions, like the choice of representative trace components, the time of the year and the areas of study, are required.
The investigations of this work have focused mainly On nitrous and nitric acids, due to their significant contribution to the chemistry of the troposphere. In polluted areas HNOi is an important source for OH radicals, which drive most of the tropospheric reactions. Since its formation mechanism is still not well understood in detail, fixther studies are needed. On the other hand, the conversion of NOx to HN03 and NO3' followed by wet and dry deposition is known to be the principal NOx removal mechanism. For this reason, HNOi and nitrates were selected as tracers of the tropospheric inorganic nitrogen cycle.
The main objective of this study includes three main scientific goals:
a) Evaluation of the mechanisms which control on a global scale the tropospheric distribution of the nitrogen compounds selected. This implies the acquisition of a representative set of gas and aerosol data from environments involved in the emission, transport and sink processes. The characterization of the aerosol should be achieved by means of the simultaneous measurement of physical Parameters (volume and size distribution of particles) and of the chemical composition (concentration of nitrates and sulphates). This goal should be accomplished by performing different campaigns in Arctic, marine and midlatitude areas:
- Atmospheric measurements in the Arctic during different periods of the year will provide information about the level of concentrations reached in this remote area. These data should enable one to estimate the possible seasonal differences in the parameters influencing the transport and deposition of the compounds of interest and thus determine their contribution to the composition of the Arctic troposphere.
-The investigation of the marine troposphere can establish the link between the emission and receiver areas. Measurements from the subtropical to the polar Atlantic Ocean provide valuable information about the efficiency of the transport of nitrogen compounds over large areas which can be used for the evaluation of global models.
- Measurements at midlatitudes are also required since they constitute the main emission areas of NOx. In reality the distribution of sources, the chemistry and the meteorology over midlatitude areas is more complex than the simplified concepts

meteorology over midiatitude areas is more complex than the simplified concepts of emission and transport used in this study. However, the analysis of selected parameters and the consideration of different scenarios (coastal, continental with different level of pollution) should help in the understanding of the atmospheric circulations involved, and allow the comparison with the levels of concentration found in the remote Arctic areas.
In all these cases the characterization of the air rnasses with the help of trajectories and meteorological parameters will facilitate the assessrnent of the origin of the rneasured cornpounds.
b) Improvement of suitable sampling and analytical methods, paying attention to the following points:
- the low concentrations expected, necessitating a compromise between sampling periods, extraction volurnes and detection limits and the perfbrmance of frequent tests to control at different points the quality of the measurement
- the portability and ease of installation of the instruments, given the convenience of the in situ analysis of the samples, in order to avoid artifacts derived from the delay between sampling and analysis, and, therefore, the requirement of setting up a laboratory close to the measurement site
- the consideration of interferences from local emissions in the detection of the compounds of interest, by means of the installation of wind-controlled sampling devices or by monitoring tracers of local pollution.
C) Evaluation of the possible contribution of the tropospheric aerosol to the HNO, nocturnal formation. Due to the heterogeneous nature of the processes of formation suggested by other researchers, the role played by the tropospheric aerosol deserves further research. The investigation of the HNO, diurnal behaviour in polluted areas in relation with the possible factors involved in its variations will contribute to the clarification of the HNO, formation mechanisrns.

4 EXPERIMENTAL PART
4.1. PRINCIPLES OF MEASUREMENT, SAMPLING AND ANALYSIS METHODS
In this section the principles of the measurement, sampling and analytical methods used in this work are briefly presented.
4.1.1. Differential Optical Absorption Spectrometry (DOAS)
DOAS is a spectroscopic technique for monitoring gaseous substances which present a specific absorption spectrum in the UV and visible. As any other light absorption technique, DOAS is based on the Beer Lambert law:
where I. and I are the incident and transmitted light intensity respectively, c is the absorption Cross section per molecule, N the number of molecules per cm3, and 1 is the path length given in Cm.
The most distinctive characteristic of this technique is the measurement of the difference between the absorption at the wavelength where the compound of interest has a maximum, and at a wavelength aside. This feature is associated with an improvement in the sensitivity and selectivity as a consequence of eliminating the reference light level, and therefore the influence from the larnp, and the broadband absorption.
A DOAS system consists of a UV light source (a high pressure Xe lamp) which radiates a smooth spectrum ranging from 200 nm up to 500 nm. The light is collimated at the emitter and focused onto the analyser by two parabolic mirrors. The intensity of the emitted light at the receiver varies according to its scattering and absorption by molecules and particles. Inside the spectrometer a grating refracts the light into its wavelength components and through a rapid scanning device in front of the photomultiplier, as first developed by Platt et al., (1979), a part of the spectrum, optimized for a certain component, is detected. The output of the detector is converted into digital signals which are stored in a Computer.
In the present work, a commercial DOAS system (OPSIS, Lund - Sweden) was used, for monitoring HN02, NO;, SO2, HCOH and 03, as will be described in 4.2.3. (figure 2). Approximately 100 spectra per second are recorded with a spectral resolution of 0.5 nm in an interval of about 40 nm.

~~1 U V light source 1
Spectrorneter
next slit current slit previous slit
sweep wheel direction
Figure 2.- Schematic diagram of the: a) DOAS (OPSIS) spectrometer. b) rotating heel device of the rapid scanning mechanism used in DOAS Systems.

The software delivered with the System supplies automatically the concentration levels, which are calculated according to the following procedureThe stored digitized spectrum, forrned by 1000 data points, and result of the addition of single spectra during the chosen observation time, is successively divided by the Zero lamp spectmm, pre- recorded regularly in the abscence of absorbing species, and by a fifth degree calculated polynomial which approximates the broadband absorption. The spectra of interfering gases are also subtracted and the final spectmm is compared with a reference computed stored spectrum to deterrnine the concentration. The unknown concentration is varied till the equation (46) presents the best solution minimizing a least-squares fit:
Aa(i) L C = A (i) (46)
where i is the number of channels, Aa(i) are the prestored differential Cross sections and A (i) is the measured spectmm.
The quality of the result is estimated by investigating the residual area between the fitted and the measured spectra. The standard error of the fitting, including noise, unknown interferences, etc., is used to get the accuracy of the measurement. The evaluation calculations are repeated about twenty times, with a shift of 1 channel (0.04 nm), in order to consider the effect of a possible mechanical inaccuracy of the grating. The best result is taken, corresponding to the minimum value of a correlation factor p = (1 - r) '/2 , where r = 1 means a perfect correlation between fitted and recorded spectrum, and r =
0 no correlation at all.
4.1.2. Denuders
Denuders allow one to discriminate gaseous species from particulate matter by means of their different diffusion coefficients, enabling either the rernoval or the sampling of reactive gases in aerosol mixtures. They have been successfully employed for the collection of atmospheric aerosols (Lee et al., 1993; Koutrakis et al., 1988; see 4.1.2.1).
Tubular denuders consist of glass cylindrical tubes, whose inner surface has been coated with a selective absorbent. In annular denuder systems, both surfaces defining the annulus formed by two coaxial tubes are coated, acting as an analyte sink.
If the air sample flows at a rate that ensures laminar conditions, dominated by diffusion processes, only molecular species can diffuse in significant quantities to the active collection surfaces during its short residence time through the denuder. Particulates, with several orders of magnitude lower diffusion coefficients, are not removed from the gas stream and therefore can be collected at the exit on a back-up filter. Brownian difhsion of particles to the walls should be negligible considering the relatively small diffusion coefficient of the particles of size 0.01-10 pm expected to be present in ambient air (from 5.2 X 10⁴ to 2.7 1 0 ' ~ cm2 s", respectively). In addition, the vertical orientation of the denuder excludes the deposition of particles by gravitation. Investigations carried out by Fenn (1986) and Possanzini (1983) have shown that in both tubular and annular denuders, the diffusional, inertial and turbulent mass

deposition of particles On the walls accounts for less than 2-3 %, provided that denuders operate at laminar flow and are kept in a vertical position.
The Gormley and Kennedy expression (Gormley and Kennedy, 1949) for molecular diffusion can give a solution for denuder systems after making some modifications and assumptions. This procedure has already been extensively described in the literature (Possanzini et al.,1983; Allegrini et al., 1987; De Santis et al., 1987; Febo et al., 1989; Zulfiqur et al., 1989). In brief, the modification proposed by Possanzini is the most generally accepted to describe the behaviour of trace gases in tubular and annular denuder systems. It gives the following expressions:
C/Co =aexp (- Ã xDL/F) (tubular denuder) (47)
C/Co =aexp(-ßxDL/ (d,+d2)/(d2-d,)) (annular denuder) (48)
where Co is the mean concentration of the species at the entrance of the denuder, C its concentration averaged over any Cross section, D the diffusion coefficient, L the denuder length, F the flow rate, d, and d2 the internal and external diameters of the annulus, and a , Ã constants, empirically determined with test atmospheres.
It should be noted that the convenience of annular denuders is derived from their greater rnass transfer efficiency, allowing higher flow rates and therefore smaller sampling times than the tubular denuders. Asymptotic conditions C << Co (i.e denuder wall as a perfect sink) are required for removal of gases, while in the case of gaseous sampling only the stability of the penetration efficiency is necessary. Taking into account that this efficiency is a function of the amount of gas sampled, due to the modifications suffered by the surface during the collection, an evaluation of the denuders performance must be carried out at any particular case (Febo et al., 1989).
4.1.2.1. Applications to nitrate aerosol measurements
Filtration techniques for the measurement of atmospheric nitrate aerosol are based normally on the removal of particulate matter, including nitrates, by means of a prefilter, and the collection of gaseous nitric acid in a posterior filter which either absorbs the gas itself (i.e. nylon filters) or is impregnated with a compound forming an involatile salt with it.
However, it has been shown (Appel et al, 1979; 1981a,b) that absorption of NOx, as well as conversion and interchanges between particulate nitrate and HN03 in the filter media under certain conditions can induce erroneous results. Thus, some HNOi can be removed by the first filter OS by the particles collected On it while reactions of particles with strong acids can displace Part of the particulate nitrate as HN03, this being

collected On the second filter. Occurrence of these artifacts depends On the characteristics of the filters (Goldan et al., 1983; Appel et al., 1984; Perrino et al., 1988). Teflon filters retain negligible amounts of nitric acid and other nitrogen components (Anlauf et al., 1986), but they are subject to negative errors, due to losses of nitrates.
In order to minimize these problems, the so called denuder difference method has been widely used for the determination of aerosol nitrate (Appel et al., 1981a; Shaw et al., 1982). It consists mainly of two parallel sampling trains:
a) A filter pack constituted by a teflon and a nylon filter collecting the total inorganic nitrate, i.e. nitrates in the prefilter and HNO, plus the result of nitrates volatilization in the nylon filter.
b) An annular denuder (see 4.1.2) coated with a solution retaining HNO, quantitatively, followed by a filter pack identical to the System described in a), which, in this case, assuming no losses of particulates in the denuder, only collects nitrates in the particulate phase.
Therefore, the difference of the concentrations measured in both filter packs corresponds to the gaseous nitric acid and the denuder acts only as a gaseous trap.
Different combinations of denuders and filter packs series have also been used for the HNO, sampling (Ferm, 1986; Febo et al., 1986; Solomon, 1988; Stevens et al., 1988; EPA, 1989), trying to solve the following problems:
a) HN03 uptake by transfer lines, manifolds and size classifiers (De Santis et al., 1988)
b) Possible oxidation inside the denuder of sampled HN02 in the presence of 0, and other oxidants, leading to the overestimation of HNO,
C) Interference of other nitrogen compounds like NO2 and PAN
Perrino et al., (1990) proposed one of the most widely accepted sequence, formed by one NaCl and two Na2C0, + glycerol coated denuders followed by a filter pack (teflon + nylon + cellulose) for the simultaneous collection of HNO, and HNO;.
Many intercomparison exercises of filter packs, denuder and other nitrate aerosol sampling methods have been performed at locations with different levels of pollution, in order to assess their suitability (Anlauf et al., 1985, 1988, 1991; CEE Air pollution research report 22, 1988; Appel et al., 1988; Hering et al., 1988; Ferm 1988; Harrison and Kitto, 1990b, Sickles et al., 1990; Kitto and Harrison, 1992). Most of them showed a good agreement between methods although with a general tendency for filter packs to overestimate gaseous HNO3 as a consequence of ammonium nitrate volatilization.

4.1.3. Ion Chromatography (IC)
Chromatography basically involves separation of sampling components taking advantage of their different affinities to two phases. the eluent or mobile phase, and the substrate of the column or stationaryphase . The velocity of migration is a function of the equilibrium distribution of the components beiween both phases.
Ion chromatography is an analytical technique for the routine quantification of ionic species in solution.
A typical IC system consists on the following elements:
* The eluerzt is a liquid, constantly pumped through the column by a constant pressure/constant flow pump.
* The sample should be introduced at the head of the column with minimum disturbance of the column packing by means of a loop va/ve injector filled at atmospheric pressure.
* The anaiytical colz~nzn is the most important Part of the IC and must be chosen carefully in order to obtain a good resolution in the separation of the components of a particular matrix. The individual column packings are dependent On the mode of separation, i e , HPIC (High performance ion chromatography), HPICE (high performance ion chromatography exclusion) or MPIC (mobile phase ion chromatography). HPIC is the mode of choice for common inorganic ions, polyvalent anions and carbohydrate analysis, HPICE is the mode for hydrophobic ions and complexes, and MPIC is used in the case of organic and aminoacids, and in the separation of inorganics from organics. All of them consist on a polystyrene resin, made by copolymerizing styrene and divinylbenzene, which supplies the required rigidity to withstand the viscous forces generated by forcing the eluent through the column.
Since the present work was focused on the analysis of Cl", NO2', NO3' and SO? ions , anionic HPIC was required. The anion HPIC Separator resins have an inert polystyrene 1 divinylbence core (PSDVB) with sulphonic groups attached to the surface and also by coulombic and Van der Waals forces to aminated beads. The mechanism of separation is dominated by ion exchange. Injecting the sample means a Change on the existent ion- pair equilibrium between the counterions of the mobile phase (Carbonate normally) and the amino groups of the surface of the resin. The sample anion competes with the eluent ion for these cationic sites and moves with a velocity which is dependent on its a f h i t y for them Therefore, the retention time of a particular ion is a function of its interaction with the resin, which in turn depends proportionally on the ion Charge and size, and on the characteristics of the resin (functional group, rigidity, etc.).
* A detector with high sensitivity, low noise, wide linear response range to most types of ions, and negligible variations with flow and temperature is indispensable. Amongst the possible systems of detection (electrochemical, UV-VIS, fluorescent, etc.),

a conductivity cell combined with a chemical suppressor to improve its sensitivity and selectivity, is the most frequently used in IC. At low concentrations, conductivity shows a linear relationship with ionic concentration, though affected by temperature and total ionic concentration. The objective of the chemical suppression is mainly to maximise the difference between both eluent and sample detector responses. That means reducing the background conductivity by converting the eluent to a low conductive form (for instance carbonate to the low ionized carbonic acid), and increasing the conductivity of sample ions by converting them to their acid or hydroxide form. This is achieved by an ion exchange resin or membrane, which, in a typical case of anion analysis, would work as follows:
2 H'-resin + Na2C03 + 2 ~a'-resin + HiC03 (49)
H'-resin + NaHC03 + Na-resin + H2C03 (50)
H+-resin + cation-X Ñ cation-resin + H X (5 1)
being continuously regenerated by a diluted acid solution, normally sulfuric acid
Retention times allow the identification of sample components by comparison to standards on the same range of concentrations, analysed under the same conditions (column, eluent, flow rate, temperature, etc.). Once the detector linear response range for every component has been determined by means of a calibration curve, the quantification can be achieved by comparing the detector response of the sample component to that of the standard. This detector response can be measured in terms of peak height or peak area, though the first one is more sensitive to changes in chromatographic conditions.
4.2.- SAMPLING AND ANALYTICAL METHODS
4.2.1. Sampling methods
a) For aerosol collection following Systems were used:
- A Dichotomous sampler (GIV, Andersen, Model 244) for aerosol differentiation in fine and coarse particles (see 2.2). As any other virtual impactor it minimizes interferences caused by air motion over the collected particles, making possible longer sampling times. The inertia of the particles carries them into a still air mass which is slowly withdrawn through the filters, where particles are uniformly collected (Figure 3). Air is pumped at a flowrate of lrn3/h.
Due to the design of the impactor, particles bigger than 10 pm settle out while coarse particles and one tenth of the fine particles are collected in one of the filters at a flowrate of 0.1 m3/h. Particles smaller than 2.5 um are deposited on the other filter at a flowrate of 0.9 m3/h. A calibration with an external rotameter showed no significant difference in the performance of the instrument at low temperatures.

Figure 3 .- Schematic diagrarn of a virtual impactor Dichotomous Sarnpler
The device was modified to use two consecutive filters at every particle size: one teflon filter (37 mm diameter, 1.0 pm Pore diameter) for collection of particulate matter and one Nylon filter ( Sartorius, Sartolon-polyamid, 37 mm diameter, 0.5 pm pore diameter) for gas-phase HNO3.
- Filter packs, consisting of a teflon filter ( Whatman, 47 mm diameter, 1.0 pm porosity) and two nylon filters ( Sartorius, Sartolon-polyamid, 47 mm diameter, 0.45 pm porosity). Air is pumped through the System by using a rotary valve pump (Berger, VT 3.6, VT 40), and the sampled air volume is measured with a dry gas meter. During the cruise ARK-XI1 (see 4.2.4,3) two filter pack systems were utilised, sampling almost simultaneously (Figure 4).

PACK
'I' AIR
NYLON
NYLON
TEFLON
'I' AIR
Figure 4.- Filter packs Systems used during the cruise ARK-XI1 of the vessel Polarstern (July- August 1994).
A Na2C03 coated annular denuder (4.6 cm external diameter, 4.2 cm internal diameter, 30 cm length) was placed in front of one of the filter packs, in order to collect particulate nitrate free of the interference from gaseous HN03. According to (48) and considering the values 0.154 c m s " and 0.125 cm2s" for the diffusion coefficients of HN02 and HNo3 respectively (Allegrini, 1987), this geometry ensures laminarity and sorption of analytes higher than 99 % at flowrates between 20 and 30 llmin (Benning, 1994).
b) A wet annular denuder (ECN, Fetten) was used for sampling HN03, SO2 and HN02 in the gas phase. In a commercial wet denuder System (figure 5) air is sucked through a rotating tube which is filled with a thin layer of an absorption liquid. The gases are absorbed in this layer while most of the aerosol pasticles pass through the denuder without being retained. Less than 1% of pasticulate matter in the range 0.1 to 5 um should be collected by the liquid layer (Keuken et al., 1988). After a 35-40 minutes sampling time the solution is pumped off to a fraction collector and the denuder is automatically refilled with fresh absorption solution.

Figure 5.- Schematic diagram of a double wet annular denuder system
The tubes size is calculated in such a way that the airflow through them, which is maintained constant at 30 llmin by means of two critical orifices, is laminar.
In the present work a system formed by two parallel annular tubes was modified to increase automatically the sampling time. For this purpose in 1993 a switch was introduced in the System, which in the second minute of sampling stopped the internal timer for a predefined time interval, without interrupting the air pumping. All tubings were made of teflon and the inlets length was minimized in order to reduce HN03 losses by adsorption. The flow rate was measured at the beginning and the end of the sampling by using a flowmeter (Gilmont Instruments, JGF-1460).
As absorption solution two buffers were used: 1 mM K2C03 and 1mM Na2C03 set at pH 10, which have shown a collection efficiency of > 97% for HN02, SO2 and HNo3 (Wyers et ai., 1992).

4.2.2. Analytical method: extraction and analysis
* After collection, filters were placed in previously washed with high purity milli Q water (conductivity = 10"'' pS cm") Petri dishes (Millipore), stored at 4OC and analysed within a few days after sampling. Filter pack teflon filters were extracted in 8 ml water (after wetting with 100 pl isopropanol) and nylon filters in 8 ml of a 1.8 Na2C03 I 1.7 NaHC03 buffer solution, by using a mechanical shaker for one hour. The same procedure was used for the Dichotomous 37 mm teflon and nylon filters, but with an extraction volume of 6 ml. Nylon filters were extensively washed with milli Q water and the above mentioned Carbonate buffer, and dried prior use, in order to reduce nitrate blanks. A part of the teflon extraction solution, conveniently diluted, was delivered to the atomic absorption spectroscopy laboratory of the Alfred Wegener Institute (AWI), where the sodium present in the samples was determined.
The wet denuder extract solutions were weighed and analysed as soon as possible after sample collection, although even after ten days of storing at 4OC no significant concentration differences in replicate analysis were observed.
* The analytical method used was Ion Chromatography (see 4.1.3). The system consisted of a Dionex ion chromatograph model 4000i equipped with both HPIC-AS4A and Ion Pac AS9-SC anion Separator columns, an anion micromembrane suppressor column model AMMS-11, and a conductivity detector. The corresponding precolumns AG4A and AG9-SC were placed prior the analytical columns to protect them from undesirable contamination. The sample was injected through a 200 (il loop, and a 1.8 Na2C03 I 1.7 NaHC03 buffer solution was the eluent for the isocratic analysis. The suppresant solution was 50 mN sulfuric acid. In 1993 the performance of the system was enhanced with the acquisition of a AS40 automated sampler and a AI-450 workstation, with a suitable software for data processing. Besides, and in order to improve the selectivity and sensitivity for nitrite and nitrate anions, a UV detector (GAT GmbH, LCD 500), set at 215 nm, was installed in line after the conductivity detector.
The concentrations of chloride, nitrite, nitrate and sulphate in the extract solutions were determined by peak area measurement and comparison to calibration curves made regularly from ten different dilutions covering broadly the range of concentration expected On the samples: 2 to 200 ppb for chloride, 5 to 200 ppb for nitrite, 5 to 800 ppb for nitrate, and 6 to 1200 ppb for sulphate. A comparison of home-made standards from high purity salts of the analytes (Merck) with dilutions of the available Dionex combined five anion standard (30-150 ppm), as well as standards from different series, showed an agreement within the observed reproducibility of the method (5 - 8 %), and were therefore equally used. Standard solutions were stored at 4OC and made fresh every two weeks. Some standards series were intercalated between samples during the analysis to control instrument performance.
Most of the samples were injected twice in order to control the reproducibility and to identify possible artifacts. Both injections presented mostly a negligible difference

except in the case of chloride, as a consequence of the interference, later confirmed, caused by one filter located inside the via1 cap used for the analysis. Some tests with standard solutions were made in order to correct this interference in those cases in which a second analysis was impossible. The second and third injection of the Same vial presented a constant concentration comparable to that obtained in later injections using caps without a filter. It was therefore concluded that the interference only affected the first injection of the vial, which should be rejected. This fact must be kept in mind when considering the nss sulphate data of Spitsbergen (see 4.2.4.1), in which the sea salt content was calculated from the chloride data due to the unavailability of sodium data, and only one injection per vial was performed. The data could, to some extent, be corrected by comparison between duplicate analyses made in different days. The agreement found for the rest of the samples between nss sulphate calculated from chloride and from sodium data obtained by absorption spectroscopy ( 5 - 10 %) proved the suitability of the data processing.
4.2.3. Monitoring methods
- A PAH monitor (Gossen. PAS 1030iR) was used for the continuous measurement of polycyclic aromatic hydrocarbons (PAHs), formed during the incomplete combustion of organic matter and condensed on carbon aerosols, as tracer of anthropogenic influence in the measurement site, mainly motor vehicle exhaust.
Combustion aerosols are ionized by using UV light ( â‚ 2 185 nm). The carbon particles which have PAH molecules adsorbed on the surface emit electrons which are subsequently removed by diffusion andlor drained away by applying an electric field, The positive charged particles are collected on a filter inside an aerosol electrometer, where the charge is measured originating the signal of the Sensor. The sensing time constant is in the range of 1s or less and the detection threshold is in the ng/m3 range.
- In some of the field experiments, a laser aerosol spectrometer (Particle measuring Systems Inc., LAS-X-CRT), provided particle population in the size range of 0.09 to 3.0 pm diameter. As can be seen in figure 6 it consists basically of a He-Ne (632.8 nm) source and high reflectivity mirrors.

SCATTERING PHOTODETECTOR MODULE
OUTLET JET
ASPHERIC COLLECTOR - LENS
CURVED MIRROR
FLAT MIRROR
4 -
REFERENCE HYBRID LASER PlioTODETEcTOR MODULE
PARABOLIC MIRROR J 'A' SAMPLE AIR
Figure 6.- Schen-iatic diagram of a LAS-X laser aerosol spectrometei
Particles passing through the laser beam scatter energy into the optics which is collected by the photodetector module, where the signal from each particle is compared with a reference output to classify the particle in one of the size categories. The information is stored in 15 channels, the sizing accuracy being  114 channel. Counting is accurate to 5000 Counts per second and this Count frequency is subject to 10% coincidence loss. The instrument is periodically calibrated with latex particles.
With the help of a Computer connected to the instrument, particle number data were integrated over 10 minute periods and stored for further analysis.
- A commercial DOAS sysfem (OPSIS, Lund- Sweden) provided the NO2, SOi, 0, and HN02 concentrations integrated along a beam path (650-1350 m) in five minute intervals in the campaigns performed at midlatitudes (see 5.2). The principles and calculation procedure of the concentrations have already been described in 4.1.1 For the identification of these compounds the bands of their absorption spectrum around 420, 296, 265 and 360 nm respectively were used. Once per month the spectrum of the System Xe lamp, mounted directly to the entrance of the fiber optic leading to the analyser, was recorded, in order to achieve a background spectrum to consider the possible variations in the response functions of the fiber optic cable, grating and photomultiplier.

4.2.4 Measurement Geld carnpaigns
Following measurement campaigns were accomplished:
4.2.4.1. Spitsbergen
These measurements were taken during the Haze 1993 campaign performed by the Alfred Wegener Institute in esund, und, Spitsbergen (79ON, lZOE) in March 1993, Figure 7 shows the sampling site.
Figure 7.- Measurement site in ~ ~ - A l e s u n d (Spitsbergen)
The electricity requirement restrained the number of possible measurement points. As the prevailing wind direction in the area is from the sector towards south-southeast, instruments were located in a position, situated east from the station, that allowed mostly the sampling of air preceeding its contamination by the local emission sources, mainly the diese1 oil fired central power and heating plant of the station, and the air traffic at the airport (see map). However, as later noticed, the influence of ground traffic was very difficult to avoid especially due to their stochastic nature (see 5.1.1). A PAH

monitor (see 4.2.3) located next to the other instruments eased to some extent the identification of local pollution.
Aerosols were sampled in ten hours intervals by using the dichotomous sampler described in 4.2.1.
A wet denuder collected SO, , HNOg and HNO, gases in threelfour hour periods. During sampling a permanent control of the instrument was essential to prevent two main problems:
- ice formation inside the denuder as a consequence of the low ambient temperatures, which would hinder the laminar flow and break the annulus, and
- the reduction of the liquid volume below ten millilitres, due to the evaporation forced by the temperature difference between the exterior and the room where the instrument was located. The air outside which has a low content in water as a consequence of the lower temperature, is prone to absorb liquid in the moment it enters in a warmer environment like the tubes of the wet denuder. The room was kept unheated in order to minimize this effect.
Additionally, in this first campaign the instrument was adjusted to sample automatically every 45 min and longer sample periods required a manual change of the timer before the start of a second cycle.
Local wind speed and direction data, averaged in three hours intervals, as well as the five days three dimensional back-trajectories supplied by the Deutscher Wetterdienst (DWD), reaching Ny- Alesund at 12:OO UTC, were available for the whole period. Only the trajectories corresponding to ground level pressure ( 975, 950 and 850 hPa) were used in the analysis. Moreover, ozone soundings and preliminary daily average values for selected parameters (CO, , % cloud, SO:', NH~, elemental carbon, etc.) of the Swedish baseline instruments operating in the Norwegian air chemistry station near Ny- Alesund on the Zeppelinfjellet (79ON, 12OE, 474 m asl) were also available.
A laser spectrometer provided further aerosol information during the last week of measurements.
4.2.4.2. Atlantic Ocean
This campaign took place during the cruise ANT-XI15 (2lSt May - 17" June 1994) of the research vessel "Polarstern" operated by Alfred Wegener Institute. The expedition was a south-north transect (Capetown-Bremerhaven) through the Atlantic Ocean. The itinerary followed is shown in figure 8

Figure 8.- Itinerary followed during the cmise ANT-XI/5 of the research vessel Polarstern.
Air was pumped at approximately 20 l Imin through a filter pack (see 4.2.1) for collecting particulate matter and gas phase species in 6-8 hour sampling intervals. The System was located on the upper deck about 20 m above sea level, in order to avoid interferences from sea salt spray. After sampling, filters were placed in Petri dishes and stored at 4OC until analysis in the home laboratory in Bremerhaven. The analytical procedure has been described in 4.2.2.
Sampling was performed under conditions in which influence of the ship exhaust gases was not expected. The connection of the pump to a wind controller used by another research group also on board (Institut fü Bioklimatologie, Universitä Göttingen) allowed the sampling to be automatically interrupted in periods with adverse wind directions.
4.2.4.3. Greenland Sea
During the expedition ARK-XI1 (6th ~ u l ~ - l 5 ' ~ August 1994) of RV "Polarstern" from Bremerhaven to Tromsà (Figure 9), particulate and gaseous species were sampled in the marine Arctic troposphere, by using the following instruments (see 4.2):
- a wet denuder sampler operating in 6-10 hour intervals, depending on the atmospheric conditions,
- a dichotomous sampler for aerosol differentiation in fine and coarse particles,
- two filter packs Systems

Figure 9.- Itinerary followed during the cruise ARK-XI1 of the research vessel Polarstern
The wet denuder samples were weighed on board by using a balance (Sartorius, 1216 W), connected to a integrator (Sartorius, 704201 Animal).
All the samplers were placed on the upper deck, where two containers were mounted to house most of the instruments. Only the inlets, Filter packs and dichotomous sampler stayed outside. It was necessary to isolate the inlet lines and to heat slightly the filter packs to impede condensation on the Filters during episodes of dense fog. In order to prevent possible contamination by smoke emitted from the chimney of the ship, an automatic device made at AWI interrupted the pumping when the local wind direction was not adequate. Wind conditions were checked every 10 seconds by a wind vane (Thies, GmbH) and when the relative wind direction was less than k 80° the Pumps were immediately stopped for five minutes and switched On only after achievement of suitable conditions for more than 20 sec.
Moreover, surface ozone, NO and H202 mixing ratios in ambient air, and daily ozone soundings were also acquired during the cruise. Ozone was measured continuously,

with an accuracy of  2 ppbv, by UV absorption at 253.7 nm ( UV-spectrometer, Environics); NO by chemiluminiscence (ZES, CLD 780 TR), and surface H202 ( Aerolaser, AL 1002) by a fluorimetric method (Lazrus et al., 1985). The surface level 0, concentrations of the soundings agreed within a 10 % with the ozone monitor data, In addition, a PAH's analyzer (see 4.2.3.) and an aethalometer (GIV, AE-9-Air) supplied continuous PAH and black carbon data respectively. A more detailed description of the accuracy and precision of these instrumentation is given elsewhere (Weller and Schrems, 1994).
Auxiliary meteorological information, namely absolute wind speed and direction, air temperature and pressure, as well as relative humidity, was provided by the navigation System of the ship in both cruises. Besides, five days back trajectories arriving at the ship position at 6:00 and 15:00 UTC were available on board. They showed a very good agreement with the posteriorly obtained trajectories calculated with the global model of the DWD.
4.2.4.4. Bremerhaven
Data were taken from August 1992 to February 1993 with the help of a DOAS spectrometer in the city of Bremerhaven, in northern Germany ( 53ON, 8OE approx.). The DOAS was located in a coastal site with a 650 m beam path at an average height of 25 m parallel to the coast and across the city (see figure 43, in 5.2).
A laser aerosol spectrometer (see 4.2.3) located near the DOAS receiver, provided hourly averaged data of the aerosol size distribution (0.9- 3 um diameter) during most of the measurement time.
For some periods, meteorological data were provided by the local environmental ministery together with NO, NO2, SO2, O3 data from the corresponding monitors measuring continuously in a station located some kilometers away from the DOAS Instrument.
4.2.4.5. Ispra
Data were supplied by the Joint Research Centre Ispra (JRC) from the period January to May 1990. The observations were carried out at the site of the Institute (46ON, 9OE approx.). The light beam of the DOAS instrument was set to 729 m at an average height of 30 m above the ground. Meteorological Parameters, including wind speed and direction, temperature, pressure and solar radiation from an EMEP station were available for the whole period (Leyendecker, 1993).
A chemiluminiscent NO monitor situated in the vicinity of the beam path supplied NO data. NO can also be measured by the DOAS system in the UV, by using a short beam path of only 200 m. However, the deterioration of the detection limit associated with this short path length (see 5.2.2) and the necessity of a filter to cut off the light in the visible region would prevent the simultaneous measurement of the other components.

4.2.4.6 Milan
The measurements were performed by the JRC in Milan in the inner city (45ON, 9OE approx.) using a DOAS beam path of 450 m at an average height of 20 m above the ground, during February and March 1991. As in Ispra, meteorological and NO data were available for the whole period.
4.2.4.7. Ticino Valley
The data were taken by the JRC during a campaign for contribution to the TRANSALP project (Transport of pollution over complex terrains) performed in October 1989 in the Ticino Valley (46ON, 9OE approx.). The light beam of the DOAS located near Claro went across the highway E35 Bellinzona-Luzern, the railway line and the national road N2 to the Gotthard. The beam was set to a total path length of 1350 m at an average altitude of 50 m above the ground. NO, NO2, O3 and total mass aerosol data obtained by the corresponding monitors located at some kilometres distance from the beam path were additionally available.
4.3.- DATA EVALUATION
Sampling on board of a ship presents additional problems to the existing difficulties when sampling in remote areas. Therefore, an extremely careful control of the sources of contamination must be accomplished, if avoiding interferences is not possible. That means frequent taking of field blanks during the experimental campaigns and the use of tracers of undesirable contamination, for an subsequent data processing.
Before any Interpretation, and in order to estimate the significance of data variations, a evaluation of the errors must be performed.
* The detection limit for the aerosol sampling was defined considering the sum of the analytes average concentration and three times the standard deviation obtained in the analysis of ten filters not exposed but treated exactly like samples Values are presented in Table 1. The average concentration was subtracted from the corresponding sample values. When considering total particulate nitrate and total inorganic nitrate (see 5.1,3) the detection limit was recalculated as the sum of the teflon and two times the nylon filter detection limits for nitrate. Field filter blanks concentrations were within the range of the detection limits calculated. The error derived from filter handling was estimated to be about k 15-20 %. In table 2 are shown the estimated detection limits corresponding to typical gas sampling volumes for every measurement campaign, calculated considering the average and three times the standard deviation of blank values taken along the sampling and analytical procedure.

Filter
Table 1.- Detection limits for the aerosol sampling. Values are expressed in nglfilter + standard deviation. n.n: not necessary for the interpretation; nd: not detectable
Teflon (47mm) Teflon (37mm) Nylon (47 mm) Nylon (37 mm)
Chloride
V o l u m e o 1 10 1, , . , , , , , , , , , , 5
Total nitrate 1
256 Â 176 300 Â 132
n.n. n.n.
Spitsbergen
Nitrite
n.d. n,d, n.n. n.n.
Atlantic Ocean
I I I I I . .
Table 2.- Detection lirnits (ng/m3) refered to typical sampling volumes (see text). Total nitrate was only considered in the Greenland Sea measurements. In brackets is expressed the corresponding approximate range of concentrations.
Nitrate
Greenland Sea
(teflon+2 nylon) 1
* Detection limits and calibration procedures of other measurement instruments used are given in 4.2. The evaluation of the DOAS data has been included in chapter 5, previous to the discussion of the aerosol surface values calculated at midlatitudes.
Sulphate
1 6 Â ± 12 Â 4
128 + 32 160 Â 56
1 (50-2300) 1 (1 5-1 50) 1 (1 0-50)
(teflon) Nitrate (nylon)
Sulphate (teflon)
* The wet denuder constituted a particular case, in which the data analysis was especially complicated. It happened to have many experimental problems during the measurement campaigns in spite of the several performance tests made in the home laboratory in Bremerhaven. Due to the high blank values observed between samples, every sampling cycle required a particular blank to be subtracted from the sample concentrations. Therefore, after the measurement cycle, tubes were removed and washed several times with milli-Q water. Afterwards, two blanks of different duration were performed before the new sampling period and the average was subtracted from
56 + 27 60 Â 24
n.n. n.n.
Particulate nitrate 1 44 1 176 1 60 1 9 / 6 1 4 (1 80-1400)
129 (25-250)
380 (500-1 500)
(1 0-200) 98
(20-200) 70
(1 00-900)
(500-1 800) 43
(20-650) 126
(50-5000)
(6-650) 32
(30-1 700) 42
(200-4400)
(1-1 50) 11
(1 0-90) 14
(< 5-20)
(2-8) 6
(1 0-30) 8
(< 5-20)

the new sample conccntrations. The averaged blanks represented about 5-10 % of the sample concentrations.
As already mentioned (see 4.2.4.1), ice formation inside the denuder was one of the main problems during the sampling in Spitsbergen. Many samples had to be rejected and as a consequence of the breaking of some spare tubes, it was not possible to have replicate samples. Studies made in the home laboratory in Bremerhaven showed in 80 % of cases a reproducibility 5 10 %.
* Other important factors to be considered in the data processing are the following:
- Normalization of sampling volumes to standard conditions (273K, 10 13.25 hPa)
- Calculation of non sea salt sulphate aerosol with the help of the following expressions :
nss SO:' = SO:' total - 0.25 ~ a +
nss = SO:' total - 0.14 CF
all of them in &m3. The first expression was considered to be more accurate given the possibility of reaction:
which means lost of Chloride from the salt. However, a comparison of non sea salt sulphate calculated by both procedures gave an agreement within 5-10 % as expected from the low &so4 concentrations present in the samples.

5 RESULTS AND DISCUSSION
5.1. ARCTIC AND MARINE AREAS
5.1.1. SPITSBERGEN
The increase of the aerosol content of the atmosphere is believed to have noticeable climatic effects related to the scattering and absorption of the radiation by particles, processes attached to their chemical composition. The global effect of tropospheric aerosols is not well known at the present. The less populated and industrialized high latitudes are especially sensitive to perturbations and it is already widely accepted that Arctic aerosols must be considered in global climate models.
As already mentioned (see 2.2.2.), the Arctic atmosphere presents occasionally levels of pollution comparable to those of other areas under the influence of anthropogenic emissions. The characterization of the so called Arctic haze requires field data taken in spring time, when this phenomenon reaches its maximum.
Anthropogenie gases play an important role in the Arctic air as precursors of particulate matter and as tracers of long range transport episodes from polluted distant areas, whose frequency determines, together with the variations in transformations and deposition of pollutants, the seasonal occurrence of Arctic haze. Sulphur dioxide gas is an important source of sulphate particulate matter, which has proved to be a main component of the Arctic aerosol. The content on sink NOx compounds like HNOi and nitrates has not yet been so extensively studied. It can actually give an indication of the importance of the anthropogenic inputs and of the efficiency of removal mechanisms in the winter Arctic atmosphere.
The aim of the measurement campaign Haze 93 (see 4.2.4.1 .), was to advance in the chemical and physical characterization of the Arctic aerosol. A main point of interest was the observation of the aerosol behaviour under inversion conditions and in the presence of a well mixed troposphere. Furtherrnore, the study of the relationship between inorganic secondary nitrogen compounds in the gas and particulate phase and the tropospheric ozone concentration, as well as the comparison of pollutant concentration levels in spring and winter time were the scientific goals of the project.
5.1.1.1. Presentation of data
From the loth to the 29"' of March 1993 aerosol was sarnpled twice per day when the meteorological conditions were favourable. The measurement site, Set up and analysis procedure has already been described in chapter 4.
Five days three dimensional back trajectories supplied by the DWD were examined to estimate the origin of the air masses arriving at the site at 12:OO UTC. As already

mentioned in 4.2.4.1., only interactions of ground pressure levels were considered. Table 3 gives a short description of the days with measurements.
17 IGreenland jMixture with layer 950 HPa coming from Canada 18 ICanada 1
Table 3.- Summary of the origin of air masses suggested by the DWD back trajectories available during the Spitsbergen campaign (March 1993).
* Figure 10 shows the nss sulphate concentrations observed during the campaign. From the to the 1 8^ of March some samples had to be rejected because of contamination during sample handling.
The average concentration in fine particles was between 0.2 and 1.8 ug/m3. The maximum of the period was reached the 25th March (1.7 - 2 ug/m3). The nss sulphate concentrations in the coarse mode remained very low most of the period (< 0.05 ug/m3) except on the 13*, on which 0.35 ug/rn3 were detected. From the 25th March an slightly increase in the concentrations could be observed, reaching 0.15 ug/m3 at the end of the month.
* As will be discussed later, nitrate concentrations were collected on teflon filters those days suspected of being affected by local pollution (figure 11). As a first approximation only the rest of the days have been considered.

-The typical concentration of nitrate On the coarse varticles varied between 0.01 and 0.05 ug/m3. Higher concentrations showed the 1 8 ~ , 1 9 ~ ~ 21st March around 0.1 &m3, and the 16' and 2 3 nocturnal periods about 0.2 &m3.
- On the f h e mode nitrate concentration was mostly in the range from 0.01 to 0.04 ug/rn3. Higher concentrations were observed the lath, 19th, 231d night, 2sth and 2ath March ( 0.1 - 0.21 pg/m3).
* Nitrous acid concentrations obtained in wet denuder samples were in the range 0.01 - 0.04 ng/m3 with normally no detectable concentrations during daylight periods. However, these data were subject to some error due to the fact that no UV detector was available at the time of sample analysis and the IC identification and quantification of nitrite was complicated by its overlapping with the chloride peak. As a result, the observed variations at these low level concentrations cannot be considered significant and HN02 has not been included in the analysis.
* Nitric acid gas concentrations were calculated from the nitrate obtained on the nylon filters (Figure 12).
- Between 0.03 and 0.07 ug/rn3 nitrate was collected on the nylon filter of the coarse part. Two periods presented remarkable higher concentrations: the 231d night (0.3 ug/m3) and the 19th, with a similar value in both fine and coarse filters (0.17 ug/m3).
- The HNo3 retained On the fine part represented concentrations between 0.02 and 0.05 ug/rn3. Higher values correspond to the night ( 0.1 ug/m3), and to the 19th, both day ( 0.18 ug/m3) and night (0.08 ug/m3) periods.

nss coarse
Figure 10.- Non sea salt sulphate concentrations measured in Spitsbergen in March 1993. Data are not available fiom the 1 6 ' to the 19 ' March (see text), n:night; d: day.
1 coarse
1 fine
date
Figure 11.- Nitrate concentrations measured in Spitsbergen in March 1993. Asterisks mark the pcriods in wich PAH concentrations or unsuitable local wind directions were observed (see text).n: night, d: day


Nitric acid was also measured with a wet denuder System from the 1 4 to the end o f the campaign. In figure 13 are depicted the HNo3 concentrations corresponding to those days in which no direct contribution of local pollution was suspected (see 5.1.1.2). The HNo3 concentrations ranged from 0.01 to 0.08 &m3 (k 4 - 31 pptv ). A slightly increase may be observed in the last days of the campaign.
* Significant amount of sulphate was found in wet denuder samples which was attributed to sulfur dioxide, as will be discussed in 5.1.1.2.. Figure 14 shows the SO, values corresponding to the measurernent period, ranging from 0.4 to 4 ,2 &m3.
~ g . r n - ~ SO2 Wet denuder
date
Figure 14.- Sulphur dioxide concentrations measured by the wet denuder in Spitsbergen (March 1993).

* Other measurements:
- Daily averages of surface ozone concentrations measured in the station in March 1993 were available (Aoki, 1995). The concentrations remained relatively constant around 40 ppbv the whole period, excluding the 1 gth, 1 9 and 2 0 , in which a significant decrease to about 25 ppbv was observed.
- Only a few data of the particle distribution are available, corresponding to the periods 15"'- I gth March and 2 0 ~ - 2 5 ~ ~ March (Debatin, 1995). The results obtained by both a particle Counter and a laser aerosol spectrometer, indicated a slight increment in the concentration of particles of diameter smaller than 2 um from the 2 3 March ( 5 to 15 particles / cm3), suggesting the presence of a more aged aerosol than previous days. Unfortunately no data are available for the last days of the campaign. Figure 15 (a,b) shows the size and volume distribution corresponding to the 2 0 and 25* March.

a) 2oth March 1993
1 10
diameter (um)
b) 25"' March 1993
S - - 12-1 6 hh
diarneter (um)
diameter (um) 1 10
diameter (um)
Figure 15.- Size and volume distribution of the aerosol measured in Spitsbergen in March 1993 (Debatin. 1995), a) 20th March; b) 25th March.

5.1.1.2.- Discussion of results
First of all it was necessary to evaluate the influence of local pollution. It must be noticed that local contamination is not restricted to direct flow from sources to the measurement site because local circulation Systems can transport previous emissions back after a period of time. This indirect interference is very difficult to identify. Direct local pollution was taken into account by:
a) studying the diurnal evolution of the local wind direction and speed, considering the sector in which stationary sources could affect the results (210° 3 3 0°)
b) considering PAH's concentrations monitored continuously by a PAH monitor in the sampling site. The polycyclic aromatic hydrocarbons indicate anthropogenic influence and were used as tracers of local traffic pollution, not negligible during some of the days of the campaign. However, due to the relatively long lifetime of these compounds in the atmosphere, the possibility of their presence as result of long range transport cannot be ruled out.
In figure 11, the periods with detectable PAH concentrations or unsuitable wind directions are marked with an asterisk.
In order to facilitate the discussion, the analysis of results has been divided in two sections, attending to the nature of the different components studied.
a) Particulate phase
The size and volume distribution of particles with diameter between 0.1 and 1.15 um did not present noticeable changes during the day. Two relative maximum could be observed at 0.3 and 0.7 Pm diameter approximately (figure 15). During the few available days of measurements, the total number of particles detected by the laser spectrorneter LAS-X varied between 4 and 8 particles/cm3. Figure 16 shows the total particle concentration versus total nitrate and total sulphate for the periods in which the comparison was possible.

2 1 ,8 1 , 6 1 , 4
E 1 , 2 Figure 16.- Total particle concentration versus d) 1 Sfl.8 total nitrate and total sulphate concentrations in
0 ,6 Spitsbergen (2lSt - 25th March 1993). 0,4 0 2
0
0 1 2 3 4 5 6 7 8
~art icles.crn~
There was a predominance of the analysed compounds in the fine mode. Their presence in coarse particles is normally associated to marine and cmstal sources whose contribution to the Arctic aerosol at this time of the year is diminished due to the still existent abundance of ice and snow covered areas. In fact, total sulphate and non sea sulphate concentrations were found to be very similar.
The nitrate distribution was not so remarkably shifted to the fine mode. This has been observed in different areas by other groups (Wolff, 1984; Mamane and Mehler, 1987), being usually explained by considering the different mechanisms of nitrate and sulphate formation: H2S04 is a liquid aerosol in the Aitken nuclei range, which rapidly coagulates, remaining in the accumulation mode without reacting with coarse particles. On the other hand, m O 3 , which can subsist in the gas phase, reacts either directly with ammonia, producing ammonium nitrates On the accumulation mode, or with basic particles, once it has been formed On their surface by heterogeneous reactions, constituting the coarse mode (see 2.2.2.1).
The ammonium nitrates are quite unstable at high temperatures, low humidities or low concentrations of reactants. Under the conditions of little bacterial activity of the Arctic in winter, not much ammonia is to be expected, and those ammonium nitrates perhaps formed in the source areas at lower latitudes, are prone to be decomposed during the transport. It seems to be more likely that both fine and coarse modes observed are predominantly formed by NaN03 which has been found to dominate in the size range 0.7-3 pm (Mamane, 1987), from the reaction of HN03 with sea sah particles in coastal areas.

a, ) Non sea salt sulphate
The influence of local pollution is not supposed to be of importance in the nss sulphate concentrations. The transformation of the SOi gas emitted by the power plant and in a lesser extent by the local transportation, should be very slow under the atmospheric conditions in which sampling took place, preventing aqueous phase reactions. The contribution of this SO; oxidation to the aerosol sulphate content should be therefore negligible. The similarity of sulphate concentrations in periods with and without local influence (for example from the 19~" to the 24*11) supports this hypothesis.
The 25th of March presented the maximum concentration of the period. According to the trajectories, air masses arriving at noon with wind speeds about 10-15 mls, were coming from Canada. The trajectories of the 26* at noon indicate the arrival of air masses from the Western Part of Russia and Finland. Provided that the change of direction could have taken place during the night, the increase of concentrations observed could be a consequence of the long range transport of pollutants from these areas. A possible influence during the night of 25th - 26th cannot be mied out. Unfortunately no data are available for comparison with the 1 8 also with a similar trajectory but without the additional contact with air masses of Eurasian origin.
The unusual Pattern observed on the 1 3 March, with predominance of the coarse concentration and minimum On the fine mode, could be the result of the stormy conditions of the whole measurement period. Both the 12* and 13* March presented local winds with velocities around 15-20 m/s which could have propitiate air masses advection from areas at 3000 km distance per day. The available trajectories showed Russian origin and could explain the relative increase of SO2 and HNO3 observed, effect probably potentiated in a regional scale by the emissions of the Russian settlement Pyramiden located also in the same wind sector.
As already mentioned, an increase on the nss sulphate concentrations through the month can be observed, together with the appearance of significant sulphate concentrations in the coarse mode. The trajectories showed continental origin suggesting higher probability of cmstal material and anthropogenic contributions. Air masses could also have already had more contact with Open sea areas without ice. The 2 6 ' and 291h March, with lower concentrations, corresponded to days with precipitation episodes.
a, ) Nitrate
The 1 81h, 19th and 2lst March nitrate in concentration around 0.1 pg/m3 was detected on the coarse particles. On the 18 ' the trajectories suggested the air advection from Northern Canada. In contrast, on the 1 9 ' and 21st March the air masses seem to have had only contact with supposedly unpolluted areas of the Arctic sea and Greenland and with the Russian isle Nowaja Semlja.
On the 1 6 ' ~ and 23rd nocturnal periods, concentrations around 0.2 pg/m3 were detected. In both cases air masses proceeded from the Arctic sea without having continental influence, but the stable weather conditions, with very slight wind most of the day could have favoured local circulations over the station, with effects difficult to predict.

The higher concentrations on the fine mode of the 1gth, 19th, 23"' 2sth and 2gth March were all associated with strong surface wind speed periods (8-15 mls). With the exception of the 2 8 ' (middle continental Russian origin) Canada and Greenland were the starting points of the corresponding back trajectories.
b) Gaseous components
b ) Nitric acid
The two main factors that could produce deviations in the determination of HN03 from the nitrate obtained On the nylon filters, mainly the evaporation of ammonium nitrate collected On the teflon filter and the reaction of particulate nitrate with other acidic gases, were considered to have a negligible effect, due to the low concentrations expected for both interferents in the sampling area.
However, it is difficult to predict the behaviour of the HN03 gas contained in the air sample inside a virtual impactor like the dichotomous, due to the relative long travel of the air mass inside the instrument, and the HNo3 tendency to be adsorbed in most of the surfaces. In fact, some studies (John et al., 1988) although made under completely different ambient conditions, had given indications of the removal of HNO3 by the internal surfaces of the dichotomous sampler. Therefore, these observations should only be considered as qualitative approximations to the ambient HN03 mixing ratios.
Due to the continuous control of the wet denuder required during sampling time (to avoid leaks, ice, drying tubes, etc.) and its shorter duration, sources of direct pollution coming from local transportation were better identified than during filter sampling, allowing the in situ sample discardment. However, it was difficult to predict the actual extension of this local contribution due to the lack of information about emissions and concentration of other species present.
The diesel oil fired power plant of the Station probably constitutes a source of HN03 and particulate nitrates. Harris et al., (1987) studied the emissions of different engines and found significant levels of HN03 in diluted diesel exhausts. The measurement at different points of the exhaust line allowed to exclude the HNO3 production by subsequent reaction of the emitted NOx.
On the other hand, the HN03 formation from the reaction of NO2 with 03:
NO, +++ HNO, (1 7- 19)
should be only of importance in those periods in which NOa is not photolysed, which are everyday shorter in duration at that time of the year as the polar day increases in

length. Moreover, under these low temperature conditions the hydrolysis of N205 is not favoured. The reaction of NO2 with OH radicals (15) should predominate. Roughly, considering a OH concentration of lx 1 0 radicals c m ' , within the range of concentrations reported by Sheppard (1983) in the summertime Antarctic tropospheric air and an order of magnitude lower than in moderately polluted areas, and the reaction constant k = 1 . lx 1 0 ' cm3 molec~le '~ s"l calculated at latm and 25OC (Atkinson and Lloyd, 1984), a lifetime of NO2 with respect to reaction (15) of about 12 days is expected. Hence, the effect of NOx emissions should not produce an immediate increase in the HN03 concentrations, although NO2, once formed, is subject to transportation and interaction with other air masses, which could influence the measurement site in a later moment.
A comparison of the wet denuder and nylon filters HN03 data for similar periods is given in figure 17.
It must be borne in mind the difference in sampling time, which can explain, in the presence of local emissions, positive or negative deviations depending on the duration and magnitude of the interference. Thus, a short period contribution of a local source can have an smaller effect in the twelve hours average concentration detected on the filters than in the threelfour hours wet denuder sample. On the other hand, the higher number of wet denuder samples available per day facilitates the discrimination of short periods with favourable conditions for the sampling.
The nitrate collected on the nylon fine filter seems to be more variable and influenced by possible interferences. However, On the 15th, 17t11, 22th, 24th and 25th March, wet denuder and filter values agree with a difference of 0.015 &m3 approximately, in the range of the confidence level. Similar agreement is observed most of the days with the nylon coarse data, with the exception of the 24th, in which the contribution of the local pollution suggested by the observed low wind speeds seems to produce a higher deviation in the HNO, retained on the filter. On the 2oth and 231d the HN03 calculated from the nylon filters is significantly higher than the detected with the wet denuder. On the 21" no significant nitrate was collected in any of the filters.
b2) Sulphur dioxide
Sulphate was identified in most of the wet denuder samples. As already mentioned in 4.2.1, a negligible amount of particles should be retained in the wet denuder. In addition, H2S04 in ambient air exists in solution with an extremely low vapour pressure, so that gas phase concentrations are expected to be negligible. Roughly, it can be considered the work of Russe1 et al.,(1994) in which value for the vapour pressure of H2S04 of approximately 1 0 ' pptv at a relative humidity of 90% and a temperature of 293 K is reported.

I H Wet denuder
i Dichotornous
"E" CM ; U
0>
date
-P-
S Wet denuder
1 l Dichotornous
date
Figure 17,- Comparison of HN03 concentrations obtained by the wet denuder and the dichotomous sampler in Spitsbergen (March 1993) a) filter nylon fine b) filter nylon coarse (see text) ,

The sulphate of the samples should, therefore, correspond to sulphur dioxide ambient concentrations, and the oxidation should take place in the sampling solution inside the denuder according to the slowness of gas phase reactions. A simple calculation was performed to check the viability of this process. Ozone was considered to be the most probable oxidant.
The reaction with SO2 is rapid in the liquid phase, likely involving an ionic reaction:
Considering the concentration of ozone in liquid phase in equilibrium with a typical gas concentration of 40 ppbv as 5 x l 0 " ' , and the rate expression, proved to be valid over the pH range 1.0 - 6.2 (Maahs, 1983):
rate (mole L-1 s") = - d [03]/ dt = (k, + kh [OE] [HSO,' ][03]) (56)
where k, = 3.8 ~ 1 0 ' ~ " ' s" and kh = 1.05 ~ 1 0 ' ~ ~ ~ s", at 25OC, and including the IOH] given by the pH 10 of the buffer solution, the following reaction velocity is obtained:
Since the solubility of SO2 will not be rapidly limited by the buffer solution, it can be then concluded that the oxidation by ozone will be completed during the sampling.
In this case the power station constitutes the main source of direct local contamination. Excluding those intervals with wind direction coming from the town, an increase in the concentrations can be observed in the last days, in which the trajectories showed predominantly Russian origin of the air masses. It is difficult to assess the cause of the much higher concentrations observed on the 1 8 ~ and 1 9 . Since both sampling periods were characterized by suitable wind directions and relatively high wind speeds, local contribution seemed to be negligible. A closer study of the local wind directions indicated transport of the air masses along the Fjord in opposite directions during consecutive days. Therefore, the recirculation could have been possible On the 1 9 of those pollutants injected the previous day, given the small importance of removal processes.
C) Relation between nitric acid and nitrate
Some studies have shown that in most of the cases the dry deposition velocity of HN0, is at least one order of magnitude greater than the corresponding of aerosol particles (Huebert and Robert, 1985, Warneck, 1987). The ratio HN03/N03" will be thus strongly

influenced by losses of HNO3 due to dry deposition at the earth surface, and give some indication of the deposition processes experienced by the air mass detected. The comparison of nitrate concentrations retained on nylon and teflon filters does not permit to draw any definite conclusion, Assuming a complete retention of particles on the teflon filter and of gas on the nylon filter, this relation would indicate the proportion nitric acid Initrates. The gas phase seemed to predominate over the coarse particulate phase in most of the cases but a quite variable relation to the fine mode was observed. However, ratios lower than 0.6 were found most of the days considered to be free of the influence of the local sources: l8&, 21st, 231d, 251h and 281h March.
The HN03/NOi ratio was also estimated using the HNOi concentrations of the wet denuder samples and the total nitrate, i.e., the sum of coarse and fine mode nitrate (Figure 18). This ratio remained typically between 0.15 and 0.6 with higher values (around 0.8) in days sus ected of being influenced by local sources. Lowest ratios (0.1- 0.3) were found the lgt', 2 0 ~ , 231d, 241h and 2sth March, supporting the idea of long range transport with advection of an aged aerosol in the fme mode and losses of most of the HNO? by deposition processes. During the rain event On the 29th March the ratio decreased to0.05 as correiponds to the high solubility of the HNOi.
date
Figure 18.- Relationship between the HN03 measured by a wet denuder and the total nitrate retained in the teflon filters of a dichotomous sampler at Spitsbergen (March 1993).

5.1.1.3. Comparison with similar studies
1993 daily averaged sulphate concentrations were supplied by the Department of Meteorology of the University of Stockholm. Particulate matter was sampled in teflon filters located about 70 m below the mountain top of the Zeppelinfjellet. Values of March ranged from 0.5 ug/m3 to 1.5 pg/m3 with an evident increase in the last week of the month. These concentrations are in agreement with the above presented, supporting the idea of predominance of anthropogenic aerosol import from lower latitudes over local emission and formation, according to the unlikely interference of the station sources at this site.
From the end of March to May 1994 an AWI experimental campaign focused on the determination of MSA (Kleefeld and Schrems, 1994) took place in Spitsbergen. In a sampling site located outside the station, teflon filters were exposed in periods of 12 hours. The average nss sulphate concentration found in March-April was around 0.9 &m3, with isolated peaks of 2 - 2.5 ug/m3, and decreased to about half of this value in May. Background nitrate varied around 0.0 1-0.03 &m3, also presenting peak concentrations up to 1 pg/m3, in the range of the Haze 93 campaign data.
Other studies in Spitsbergen report nss sulphate concentrations around 3 - 4 Lig/m3 in aerosol samples taken in March-April 1979 (Heintzenberg et al., 1981), and in the interval 15 to 60 nmol /m3 (about 1.2 - 5 pg/m3) from January to April 1992 (Heintzenberg and Leck, 1994; Ottar et al., 1994). Nitrate concentrations between 0.006 and 0.1 &m3 are only available for spring 1979. The nitrate averages for periods with and without advection from the sea are 0.022 and 0.055 ug/m3 respectively.
Braathen and Joranger (1 993) evaluated monthly mean concentrations of SO-, and sulphate at ~ ~ - A l e s u n d (1980-1991) finding peak concentrations every year in January - April periods, ranging from 0.13 to 0.3 &m3 sulphate and from 0.3 to 1.4 liig/m3 SO2, and a significant decrease in the mean SO-, concentration in the last years. No data of nitrogen inorganic compounds are presented.
Ground level NOy measurements have been performed in other points of the Arctic, and concentrations between 450 and 700 pptv have been reported for similar periods of the year (Honrath and Jaffe, 1992). Despite the difference in locations a rough comparison can be made if considering that the HN03 values of March 93 in Spitsbergen would represent about 25-30 pptv of this total reactive nitrogen (NOy = NO + NO-, + HNo3 + PAN + NO, + N205 + ..).
At Bear Island (74ON, 19OE), Rahn et al., (1980) observed highly episodic SO, concentrations in winter, with pulses reaching 1 - 6 &m3, attributed to transport from distant pollution sources, probably Eurasian midlatitudes.
As already mentioned Arctic Haze is only perceived in late winter and spring periods. Many observations have shown that the Arctic is not a pristine area in summer, but undergoes anthropogenic influence only occasionally. For establishing a comparison,

values reported by Talbot et al. (1992) from the North American Arctic and sub-Arctic summer troposphere can be considered, with an average composition of 40 pptv H N 0 3 ( Z 0.1 lig/m3), 10 pptv No3' ( Z 0.02 &m3) and 25 pptv ~ 0 ~ ~ ' (s 0.1 j.qg/m3).
5.1.1.4. Conclusions
Measurement of tropospheric trace substances in the Arctic station in ~ ~ - A l e s u n d was found to be severely disturbed by local emissions proceeding from the daily activities of the town. Due to the long sampling times required and the possibility of indirect influence of local sources, even a rigorous control of the wind conditions cannot ruie out the risk of considering contaminated samples.
Nevertheless, the consistency of the results with similar observations, and the comparison of concentrations in different periods, theoretically with and without local influence, allow to establish to some extent a background level of concentration. The assessment of the origin of the pollutants particularly in the peak periods is much more difficult to achieve. Back trajectories are only a rough approximation to the real Course of air masses, especially in the Arctic where only a scarce number of meteorological data is available. Local circulations, although not supposed to play an important role, cannot be followed in detail.
The transport of nitrogen emissions in the troposphere is quite difficult to characterize especially when considering long distances and periods of time without detailed information about sinks. NO emissions in industrial and urban areas should suffer a very rapid oxidation to NO2 and, depending on the composition of the local atmosphere, different transformations leading to HN03, PAN and nitrates, main sinks of nitrogen inorganic compounds. Once formed, probably close to the source area, they can be incorporated to regional and mesoscale circulations. PAN, as already described in 2.1, is a source of NO, in remote areas due to its thermal decomposition. Most of the HN03 can be removed by dry deposition in a few days (Huebert and Lazrus, 1980b). It is a very soluble gas and its atmospheric depletion is also highly controlled by wet deposition processes. However, dry and wet deposition are minimized at that time of the year in the Arctic as a consequence of the low rate of precipitation and the predominance of ice and snow covered areas. Transport is thus favoured. HNo3 forms particles in the presence of bases in the atmosphere. Ammonium nitrate could be formed in coastal areas but at low concentrations and in absence of sources, as is the Gase of the Arctic in winter and early spring, according to its volatility, it should have a low probability to remain a long time in the particulate phase. Other nitrates formed by the interaction with particles of crustal origin, although also subject to deposition processes, could be transported. The influence during transport of salt particles and any other marine source would be minimized by the reasons above mentioned.
In the present study levels of nitrate and HN03 around 0.01-0.45 and from 0.01 to 0.08 ug/m3 (4 - 31 pptv) respectively were detected. Typical concentrations reported in the literature for remote areas are < 0.01 pg/m3 for nitrate and 5 0.08 - 0.28 ug/m3 for HN03 (Finlayson-Pitts and Pitts 1986 ). Downmixing of air layers and intrusion of PAN, with its subsequent decomposition, and of HN03 from the free troposphere seems

to be unlikely, due to the low temperatures and the stable atmospheric stratification expected at this time of the year with the presence of a permanent inversion at the surface (see Appendix B). The formation of nitric acid from local sources has been above discussed and roughly evaluated.
SO-, levels higher than values reported for rernote areas, around 0.07 &rn3 in the Arctic 70-80°N (Ockelman, 1982), and 0.2 pg/m3 in the Antarctic (Nguyen et al,, 1974), were observed. Long range transport of the SO2 emitted in distant areas, suggested by the trajectories of some of the days, could be possible due to the low rate of scavenging mechanisms, as already mentioned, potentiated by the decrease of solubility with the acidity and thus with the age of the air mass. In addition, low temperatures and the small liquid content of the scarce clouds inhibit the heterogeneous oxidation of SO2 in Arctic cloud droplets. Local sources, in the absence of marine biogenic sources (DMS) for the presence of ice and the low production of phytoplancton, are reduced to the emissions of human settlements.
Summarizing, the results above presented are not sufficient to establish definitely or to characterize the direct effect of long range transport of pollutants from Eurasian or American sources in the Arctic. However, there is an evidence of the presence of nitrates and HNOi in the Arctic aerosol in concentrations much higher than the expected in unpolluted areas. SO2 and sulphate concentrations are in the range of the levels typically measured during Arctic Haze periods. In addition, observed increases are normally associated to meteorological conditions favouring the arrival of air masses from lower latitudes. Though, the Arctic pollution is a phenomenon involving pollutants which are not simultaneously emitted, but, once injected in the Arctic troposphere, can remain without experiencing many losses and be accumulated till the end of the spring period. As a consequence of this long lifetime a discontinuous input from anthropogenic areas can affect extensive areas since local circulations can redistribute these contaminants and mix them with fresh local emissions. The local pollution is supposed to play a secondary role in the global characterization of the Arctic troposphere but can interfere in the designation of sources.

5.1.2.- ATLANTIC OCEAN
The tropospheric aerosol results from the mixture of substances of different origin, mainly sea salt, continental soil, gas to particle conversion and anthropogenic emissions. Sampling over large areas affected by different sources permits the comparison of levels and composition and provides the required information to evaluate the importance of individual contributions.
The main components of the marine aerosol are sodium, chloride, magnesium, sulphate, potassium and calcium. As already mentioned (see 2.2.1) sulphate can be found both in coarse particles, if associated with sea salt spray, and in the fine mode normally correlated with ammonium and biogenic emissions. Nitrate is mainly present in coarse particles and is believed to proceed from the gas phase, due to the low amount of nitrate in sea water.
In contrast with the abundance of continuous continental measurements, only a few data relative to extensive marine areas are available. Due to the large number of factors affecting the measure, reiteration of campaigns is a requisite to verify the representativity of results.
During the cruise ANT-XI15 of the German research vessel Polarstern, aerosol samples were taken regularly in order to obtain a profile of HN03 and nitrate concentrations over a marine area covering southern and northern hemispheres.
5.1.2.1. Presentation of data
Before proceeding to the discussion of results (section 5.1.2.3), a short description of the data will be performed, in order to present the general trends of the compounds considered of interest.
Data are available from the 26.05 to the 11.06 1994. The experimental Set up and the followed itinerary South- North have been described in 4.2.4.2..
The atmospheric conditions, characterized with the help of trajectories and meteorological Parameters measured continuously on board, are summarized in table 4

I I I 30.05
31.05
1.06
2.06
3.06
4.06
5.06
I , ,
African continent
South western part of the Atlantic Ocean South western part of the Atlantic Ocean Noriheastern Part of the Atlantic Ocean Sahara
Northern pari of the African continent Northern part of the Atlantic Ocean
I
Table 4.- Atmospheric conditions corresponding to the measurement period during the cmise ANT-XI15 o f the vessel Polarstern.
6.06
8.06
9.06
10.06
11.06
Some of the samples corresponding to stormy days had to be rejected because the strong winds propitiated the sampling of sea sah spray exclusively, Likewise, the data of a carbon monitor situated close to the measurement point were used to identify those periods in which a possible contamination of the exhaust gases of the ship during work stations could not be avoided by the wind controller System as a consequence of its response time. The corresponding filters were not included in the calculations.
6-8
7-3
4-2
1-6
> I 0 night 10-14
13-10
9-10 Northern paii of the Atlantic Ocean
Passing over Canary lslands 0 6 l~or thern paii of the Atlantic Ocean
Most of the time over sea
Marine origin, no contact with the continent
Marine origin, no contact with the continent
The trajectory from 15 h shows cleai contact with Africa From 15 h longer period over the Africar continent The 15 h trajectory shows marine origir from Northern Atlantic Passing over Canary Islands
Passing over Canary Islands
10-11
Northern Spain
France
France
Northern pari of the Atlantic Ocean
11-15
10
8-9
10-15
Long trajectory over sea, affer 15h longer period over Spain Most of the time over the European continent Most of the time over the European continent Long period over Ireland, France and Spain

Nitrate and sulphate concentrations found in particles during the campaign are plotted in figure 19 and 20 respectively. Following tendencies may be drawn:
a) Nitrate
concentrations around 0.5 &m3 were observed from 18's to SOS, increasing to 1.6 Hg/m3 from that point to the Equator, and decreasing to levels around 0.15 - 0.4 Hg/m3 during a rain period which took place dose to SON. With the exception of the higher values observed at 8-10° reaching 3.6 ug/m3, the particulate nitrate concentration varied slightly around 0.7 us/m3 from 8ON to 20°N The change at 20° corresponded to the first contact with air masses of north-eastern origin. At about 30° a new increase in the nitrate concentrations was noticeable, reaching a level of 3.5 ug/m3 and remaining almost constant to the end of the measurement period.
4 0 3,6 3,2
E 2,8 0) 2,4 - 2,o
1,6 2 1,2 z 0,8
0,4 0,o
-20 -15 -10 -5 0 5 10 15 20 25 30 35 40
Latitude
Figure 19.- Nitrate concentrations measured during the cmise ANT-XI15 of the vessel Polarstern in the Atlantic Ocean (May-June 1994).
b) Non sea salt sulphate
The initial nss sulphate concentrations dose to 0.5 &m3 increased suddenly at about 10 S, reaching 1.5 ug/m3 and remaining at that level till the rain period at 5ON. From 8ON to 20° the concentrations presented two maxima at 1 OON and 17ON of 4.5 and 6.5 ug/m3 respectively and an average concentration around 0.8 ug/m3. From 20° the sulphate increased to reach a maximum of 7.5 pg/m3 with background concentrations close to 2.5 ug/m3.

Latitude
Figure 20.- Non sea salt sulphate concentrations measured dusing the cruise ANT-XI15 of the vessel Polarstern (May- June 1994).
C) Nitric acid
As will be discussed later, the nitrate collected on the nylon filters was attributed to gaseous HN03.
Figure 2 1 a and 2 1 b show the mo3 concentrations corresponding to nitrate found in the first and in both nylon filters respectively,
The general mo3 Pattern is in agreement with particulate nitrate. Concentrations varied between 0.1 and 0.3 pg/m3 (40 - 116 pptv) from 20° to 5OS, and increased notably to 0.7 - 0.9 ug/m3 (271 - 348 pptv) in the 5's - 5'N latitudes. From 5ON to 15'N HNo3 ranged between 0.03 and 0.2 Lig/m3 (11 - 77 pptv) with a peak concentration at 8ON of 0.70 ~ g / r n ~ (271 pptv). Latitudes between 15 and 25ON were characterized by HN03 variations from 0.05 to 0.4 ng/m3 (19 - 155 pptv), the lower corresponding to the nocturnal periods, and the highest to the afternoon sampling (13- 19 hours approximately). A drop in the concentrations at 30° was followed by an increase of HNo3 reaching the maximum of the sampling period (0.95 &rn3 = 368 PP~V).

Latitude
-20 -15 -10 -5 0 5 10 15 20 25 30 35 40
Latitude
Figure 21 .- HNO3 concentrations measured during the cmise ANT-XL'5 of the vessel Polarstern (May-June 1994), a) first nylon filter, b) both nylon filters.
d) Other data
CO and C2H6 data measured by FTIR during the cmise were also available. A description of the System and measurement procedure can be found elsewhere (Notholt et al., 1995). Figure 22 (a and b) shows the evolution of the total column concentrations of both components, which can be considered as tracers of combustion processes.

-
-
-
-
- - 3 0 - 2 0 - 1 0 0 1 0 2 0 3 0 4 0 5 0
l a t i t u d e
Figure 22 a) CO total column FTIR measurements perfonned during the cruise ANT-XI/5 of the vessel Polarstern (Notholt et al., 1995).
l a t i t u d e
Figure 22 b) c2H6 normalised respect N20 FTIR measurements performed during the cruise ANT-XI15 of the vessel Polarstern (Notholt et al., 1995).

Surface ozone measured continuously by an ozone monitor on board the Polarstern is shown in figure 23 (Weller, 1995). Concentrations varied between 25 and 30 ppbv from 20° to 15ON and between 35 and 60 ppbv from 15ON to the end of the cruise.
Latitude
Figure 23.- Surface ozone concentrations measured during the cruise ANT-XI15 of the vessel Polarstern (May-June 1994) (Weller, 1995).
Preliminary results from arnmonia and arnrnonium samples taken by the University of Göttinge during the cruise were also available (Schnitzler, 1995).

5.1.2.2.- Discussion o f results
The interpretation of results had some limitations derived from the lack of simultaneous data of other relevant components like ammonia and NOã also involved in the complex chain of formation and removal mechanisms. Besides, concentrations of DMS and some cations like ca2+, ~ g + and K^ would have been very useful as tracers to confirm the air masses movements suggested by the trajectories.
Before analysing the results, it is important to make some comments about the sampling method used. As already mentioned in 5.1.2.1 ., the nitrate collected on the nylon filters was attributed to gaseous HN03. It is important to note that due to the quite high temperatures and humidities present most of the time during sampling, especially around the Equator, interactions HN03/nitrates on the filter media can cause under and overestimations of both components.
The constant of the equilibrium formed by the HNo3 in the presence of ammonia:
is temperature and humidity dependent, and therefore its value will vary with time (Harrison and MacKenzie, 1990~) .
According to Stelson et al. (1979), at 10° and 30° the gas phase equilibrium concentrations of both NHi and HN03 required to sustain the solid phase are 4 and 12 ppb, much higher than the levels expected in remote areas. In the atmosphere, however, the thermodynamic equilibrium is not always reached, and other components (water, organic material) may stabilize ammonium nitrate in aerosols with respect to evaporation (Shaw et al., 1982).
Studies of the chemical equilibrium NH3-HN03-H2S04-H20 (Tang, 1980) indicate that, while the partial pressure depends strongly on relative humidity (especially when r h. 2 90 %) and on the nitrate to sulphate ratio in solution, the NH3 partial pressure varies only slightly with humidity but inversely with the hydrogen concentration.
Considering the expression given by Mozurkewich (1993) for the calculation of the m N 0 3 dissociation constant as a function of temperature, valid over the range -17 to 32 'C:
ln Kp = 118.87 - 24084lT - 6.025 1n (T) (57)
the temperature variations during this Polarstern expedition (16-28OC) would have caused a change of about one order of magnitude (4 - 90) in the value of the constant.
Laboratory tests at ambient levels with a permeation source(Papenbrock and Stuhl, 1992) have shown that between 10 and 30 % of the gaseous HN03 is lost on a seasalt

particle loaded teflon filter. Taking into account that in most of the cases the amount of particulate nitrate was higher than the gaseous HNO3 by a factor of about 4, the measurements of nitrate are probably between 3 and 8 % too high.
In some occasions the amount of nitrate of the second nylon filter was surprisingly high and even greater than in the first filter. According to Goldan et al., (1983), no breakthrough of nylon filters in series at net loadings up to 2.2 ug/cm2 should be expected. Considering the maximum concentrations and the minimum sampling volumes, a much lower value (< 0.1 ug/cm2) is obtained. However, changes in the absorption properties of nylon filters under different conditions had been reported before (Drummond et al., 1986). In the present study the amount of nitrate in both filters have been included in the HN03 calculation.
Different scenarios, supported by the air trajectories, may be identified along the measurement period, corresponding to the following latitudes:
a) 20° to 10"s: Pure marine troposphere without influence of continental air masses
Given the absence of other sources, an aerosol composition more affected by sea salt particles, with concentrations close to background levels should be expected. Nitrate concentrations ranged between 0.38 and 0.65 @m3, HNo3 between 0.1 and 0.3 &rn3 and nss sulphate between 0.4 and 0.7 pg/m3. Galloway et al., (1985) set at 0.1-0.3 pg/m3 nitrate and 0.3-0.9 ug/m3 sulphate the typical values for unpolluted maritime areas.
b) 10° to 5"N: Zone under the influence of air masses coming from the African continent.
Considering that this time of the year belongs to the dry period with its consequent risk of uncontrolled fires, the change observed in the concentrations may be related to the advection of air masses from the tropical and subtropical African continent south of the Equator, affected by biomass burning processes. The corresponding trajectories and the increases observed in the CO and total columns support this hypothesis.
It is known (Crutzen and Andreae, 1990), that in tropical Africa, the emissions from fires will usually travel in a westerly direction and towards the Equator, and will be distributed throughout the lower troposphere as they approach the Intertropical Convergence Zone (ITCZ) and the vertical convection intensifies. These emissions are dominated by CO-, but also contain many products of incomplete combustion like CO and hydrocarbons; HONO (Rondon and Sanhueza, 1989) NO, NH3, SO2 and aerosols consisting of organic matter, black carbon and inorganic materials like K2C03 and Si02 (Crutzen and Andreae, 1990). Therefore, the biomass burning may be a source of NOy compounds and of a significant amount of NHi, probably resulting in the formation of ammonium nitrates. The high temperatures would favour their vaporization with release of HN03, while the transport

over sea would facilitate its combination with sea salt particles and the production of involatile nitrates. During this period the nitrate concentration reached a level of 1.6 1-ig/rn3. The HN03 concentrations increased to 0.75 ug/rn3. This was one of the cases in which a high proportion of nitrates was obtained in the second nylon filter.
Ammonium concentrations measured on board (Schnitzler, 1995) increased also by a factor of 3 during this period reaching values around 0.6 ug/m3.
The nss sulphate, after the increase from 0.5 to 1.5 ug/m3 at 10 OS, prevailed in the range of concentrations between 1.0 and 1.6 ug/m3.
The ozone concentrations were higher than expected at that latitudes (Weller, 1995), and an increase of about 10 ppbv could be observed at 5's ( see figure 23). This ozone production could be related to the input of NO,, and hydrocarbons from biomass burning. The hydrocarbons, exposed to sunlight will be oxidized photochemically to peroxides, aldehydes and CO. In the case of high levels of NOã the oxidation of CO and hydrocarbons is accompained by the formation of ozone (see 2.1). 1t is important to note that higher concentrations of O3 will promote more OH radicals, increasing the photochemical activity of the air mass influenced by biomass burning.
As already mentioned, a period of rain caused a general decrease of the aerosol concentrations at about 5ON. However, high HN03 concentrations were observed at the beginning of the rain event. The increase of HN03 during rain periods has also been observed in other studies in the equatorial Pacific region in summer (LeBel et al., 1990). It has been attributed to an HNO3 release as some of the droplets evaporate during precipitation, provided the former dissolution of HN03 in the clouds of the marine boundary layer.
c) 8ON to 15ON: Arrival of Saharian dust
This transport implies the consequent input of particles of cmstal origin (Losno et al., 1992). Yellow dust was visually identified on the filters. The averaged nitrate and HNOg concentrations were 0.8 and 0.12 ug/m3 (G 46 pptv) respectively. The HNO3 was retained almost quantitatively in the first nylon filter. In absence of other information about the aerosol composition, the advection of air masses still affected by biomass burning processes cannot be ruled out. The combination of both factors, Sahara dust and biomass burning, could explain the sudden increase observed on the 2 " of June in the afternoon corresponding to the first change of air masses from southeastern to northeastern origins.
Non sea salt sulphate concentrations ranged between 1.5 and 4.5 [ig/m3. The concentrations decreased much slower than the nitrate as the Sahara lost its influence, reaching the 0.5 1-ig/rn3 level at around 15ON. Ammonium concentrations followed a similar Pattern (Schnitzler, 1995).

d) 15ON- 25ON : Air masses with Northern Atlantic origin and no contact with the continent.
The influence of coastal areas cannot, however, be mied out due to their proximity. Several periods with high wind speeds and storms favouring the interchange ocean - atmosphere and therefore the influence of oceanic emissions and sea salt spray were observed. Although data for DMS are not available, there was some indication of oceanic production of nss sulphate particularly in periods of local high wind speeds. In this manner, the peak of nss sulphate concentration (6.5 ug/m3) at lSON would support this idea. It was observed during the 4th June nocturnal sampling. The whole day was characterized by stormy weather with strong winds (1 1-13 m/s), favouring the interchange of gas with the water surface and therefore the oceanic emission of DMS (Staubes-Diederich, 1992). Besides, the considerable amount of sulphate found in the nylon filter, indicates a possible sulphate artifact formation on the nylon surface from SO2 under high relative humidity conditions, as suggested by some other studies (Appel et al., 1984; Anlauf et al., 1986). This SO2 could arise from the oxidation of DMS. However, as mentioned in 2.2.1, it should be kept in mind that recent studies (Bandy et al., 1992) have questioned the efficiency of the conversion of DMS to SO2, especially at low NO, levels (< 40 pptv).
In the case of nitrate, the initial concentrations around 0.6 p-g/m3 increased with the arrival of air masses passing over the Canary Islands, and reached a maximum of 1.7 ug/m3 at about 25ON.
HN03 concentrations varied notably during the period (0.05-0.4 ug/rn3 z 19-155 pptv), the lower values corresponding to the nocturnal periods and the highest to the afternoon sampling (13-19 hours approx). This diurnal trend in continental areas is considered to be the result of the reaction:
Unfortunately NO2 or OH radicals data are not available for the period of the measurements. However, in a rough approximation, if considering the NO2 values ( z 20 pptv) of other studies in the Atlantic region (Rohrer and Brüning 1992) at that latitude and similar time of the year (September-October), it must be concluded that the photochemical production cannot be responsible for the amplitude (about 130 pptv) of the HN03 variation observed. This diurnal Pattern was also noticed under similar conditions by Papenbrock et al., (1992), who suggested variations On the ammonium nitrate equilibrium caused by changes in temperature and humidity. The consistency of this explanation however, is difficult to evaluate, due to the fact that the only ammonium data available for the cmise correspond to 24 hours sampling periods and do not show any particular tendency. It is important to note that nocturnal periods were associated with winds of higher speeds and thereby the dilution of HN03 in the sea salt water droplets could have been propitiated. In addition, the higher instability during rain showers, normally in the

evening period, could have facilitated the transport downwards of free tropospheric HN03. Although Part of it will be probably washed out by the rain, it is likely that the neighbouring areas experience an increase in HN03 concentrations (Huebert, 1980a).
e) > 25ON: Area under the influence of anthropogenic sources from the European continent.
The nitrate concentrations ranged from 0.55 to 3.5 pg/m3, with an average concentration of 1.9 k l &m3, while the HN03 presented concentrations between 0.1 and 0.95 ug/m3 (4 - 368 pptv approximately). Non sea salt sulphate concentrations varied between 2 and 7.5 ug/m3.
It is difficult to assign a reason for the low HNO3 concentrations around 0.1 ug/m3 observed the ath in the afternoon and nocturnal periods. According to the trajectories the sampled air masses had experienced a longer transport over sea than the previous and following days. Winds with high velocities were present during the evening. This could have improved the removal of HN03 by favouring its reaction with the more abundant salt particies and the formation of involatile sodium nitrates.
All these values are quite in agreement with the average concentrations of particulate and gaseous species over the North Sea reported by Ottley and Harrison (1992). They studied the atmospheric composition with regard to air mass source areas and found in a typical marine origin 2.63 ug/m3 nitrate, 2.21 &m3 nss sulphate and 0.67 ug/m3 (G
260 pptv) HNo3, and in the case of England origin 4.25, 4.10 and 2.48 ug/m3, respectively.
The ratio HNo3 gas Iparticles, caiculated from the distribution of nitrates on teflon and nylon filters, assuming 100% retention and no loss processes, is depicted in figure 24.
Huebert and Lazrus (1 980b) calculated averages of this ratio between 0 and 3 km altitude for southern and northern hemispheres. The corresponding values for the marine boundary layer are 0.49 (0'-30°N and 1.17 (0-55's). In the present study this ratio remained lower than 0.4 with the exception of the periods affected by biomass burning, Sahara dust and European influence. It must be taken into account that in all these cases, higher amounts of ammonia should be expected and thus, a major proportion of ammonium nitrates. These volatile compounds could release HN03 under variations of the ambient conditions (temperature, humidity) leading to an overestimation of the m O 3 , difficult to evaluate with the present data.
Nevertheless these variations can be analyzed more in detail:
- In the region affected by biomass burning (10's-5ON) this ratio indicated a clear input of HN03, reaching values around 1.4 at the higher concentrations. The 0.2 value predominating during the period of rain agrees with the idea of faster removal of HN03 by wet deposition processes.

0,8
0,7
, 0,6
à 0,5 2 m 0,4 0 z 0,3 X
0 2
0,l
0
-20 -15 -10 -5 0 5 10 15 20 25 30 35 40
Latitude
-20 -15 -10 -5 0 5 10 15 20 25 30 35 40
Latitude
Figure 24.- Ratio mO3/No3 calculated from the measurements performed during the cruise ANT-XV5 of the vessel Polarstern (May-June 1994): a) considering only the nitrate retained in the first nylon filter, b) considering the nitrate retained in both nylon filters.

- From 8 to lSON, i.e., the area influenced by the arrival of Saharian dust, the ratio stayed at tlie 0.2 level with an increase to 0.7 during the peak of the 2nd of June. This supports the idea of HNOi input as a consequence of the arrival of air masses influenced by biomass burning, and of the predominance of involatile nitrates.
- The large fluctuations of the HN03/nitrates ratio (0.07-1.32) corresponding to latitudes higher than 25ON are probably an indication of the heterogeneity of the troposphere in this area, which is the result of the combination of anthropogenic emissions, sea spray and crustal aerosol. HN03 is supposed to be formed near the NOx sources of the European continent. Given the availability of ammonia, cmstal aerosol and sea salt particles in the coastal areas, the formation of volatile and non volatile nitrates is possible. Losses by deposition would shift the distribution to the particles due to their lower deposition rates, but the volatilization of ammonium nitrate can release HN03 during the transport, which will either remain in the gas phase or combine with other basic particles.
5.1.2.3 Comparison with similar studies
In table 5 the HNOi mixing ratios which have been found in similar measurement campaigns are summarized.
- Papenbrock et al., (1989, 1992) measured HN03 by laser-photolysis fragment fluorescence (LPFF) during the cruise ANT-V1111 from Bremerhaven to Brasil (September - October 1988) with a time resolution of about 15 minutes, and in 2-6 hours periods by impregnated nylon filters, after rernoval of particulate nitrate by a teflon filter preceded by a virtual impactor. Generally higher mixing ratios were observed during the late afternoon than at night. The average particulate nitrate concentration reported for 40° to 30° is 0.62 k 0.57 &m3 with much higher concentrations at 42ON (5.66 &m3) and 9-10's (2.01 ̂ ig/m3).
All these data are in a good agreement with the presented above and confirrn the air masses transport suggested by the present study.
- Ibrom et al., (1991) measured the distribution of inorganic nitrogen compounds by using different filter Systems, from Bremerhaven to Argentine and from there to the Antarctic during the Polarstern cmises ANT-VIII/1+2 ( August- October 1989). The nitrate concentrations between 20° and 20° vary from 0.04 to 0.12 l-ig/m3 with higher values around the Equator (0.45 &m3). These values are much lower than the obtained by Papenbrock et al., and in the present work. However, Bürgermeiste (1991) reported higher concentrations of particulate nitrate, also obtained during the same cruise. He found on the average 0.7 ug/m3 nitrate in the 5ON to 20° latitudes, 0.5 to 1 .1 ug/m3 from O0 to 10°S and less than 0.15 &m3 between 20° and 2S0S, in good agreement with the studies above mentioned.

Biomass burning plume NOS-2.01 pg/m3
Antartic Ice 6 pptv HNo3
SE Passat Zone N03- 0.004 - 0.12 p/m3 5 - 8 pptv UNO3 (0.01 3 0.02 pg/m3)
North Atlantic)ackground
NE Passat Zone
Papenbrock et. al. (1 992) ANT-VI I11
Ibrom et al, (1991) ANT-VIIIII +2
Present work ANT-W5

5.1.2.4.- Conclusions
The measurements presented above provided information about the distribution of nitric acid and nitrates over the Atlantic Ocean between 1S0S and 3S0N. According to the available data, the marine troposphere of this eastern Part of the Atlantic Ocean is subject to regular perturbations, mainly caused by the long range transport of emissions from the European and African continents. In spite of these intrusions, probably of temporal character, a relatively clear difference in background concentrations between southern and norihern hemispheres can be observed.
Figure 25 summarizes schematically the distribution of HN03, nitrate and sulphate concentrations found in the area of study. The variation of the HNo3/No3' averaged ratio is also included.
SO;' -0.5 NSS so4'" -1.6 NSS SO: -3 SO;" -2-3 HN03-0.2 HN03-0.75 HN0,-0.12 HN03-0.4 HNO - 0.9 NO3'-0.5 NO, -1.5 NO, -0.8 NO3-? .4 SO;' - 2.5-3
MARINE AFRICA ITCZ SAHARA ATL ANTIC EUROPE
Figure 25 - Schematic Diagram of the HNO3, Nitrate, Sulphate and HNOs / NO3 ratio observed during the cruise ANT-XI5 of the Polarstern in the Atlantic Ocean. Concentrations are expressed in uglm3.
The transition between southeastern to northeastern winds indicating the position of the intertropical convergence Zone seems to correspond also with the change in background evels. In the present study the ITCZ occurred at about 12O N. At latitudes south from this point 0.4-0.6 pg/m3 nitrate, 0.5-1 Hg/m3 nss sulphate, 0.05-0.1 pg/m3 (19-39 pptv) HN03 and around 25 ppbv O3 can be considered as typical background concentrations. In contrast, the northern hemisphere presented around 0.8-1.6 [ig/m3 nitrate, 2.5 pg/m3 nss sulphate, 0 . 3 ~ g l m ~ (1 16 pptv) HN03 and 40 ppbv O3 background concentrations.

5.1.3.- GREENLAND SEA
It has already been pointed out that data on the composition of air over extensive marine areas are scarce as result of the difficulties of measuring during long time periods. In addition, since polar areas are very sensitive to perturbations, the study of the Arctic aerosol composition can be of valuable help to characterize the global effect of tropospheric aerosols. Both factors are combined in the Greenland Sea.
The results discussed in the following sections are a Part of the campaign performed during the cruise ARK-W1 of the research vessel Polarstern in the East Greenland Sea. The objective of the present work was on one hand to complete the profile obtained during the ANT-XI15 cruise (see 5.1.2) and On the other hand to get information about the composition of inorganic nitrogen compounds of this atmosphere which presents both marine and polar characteristics. It is important to note that the conditions were quite different to the observed in the Spitzbergen campaign (see 5.1.1), mainly as a consequence of:
a) the difference in the period of the year in which more hours of daylight, higher temperatures, wet and dry deposition rates, and lower influence of the anthropogenic areas are expected,
b) the difference in local sources of contamination and,
C) the higher influence of oceanic sources, as a consequence of the reduction in the ice and Snow covered areas.
5.1.3.1 .- Presentation of data
Data are available from the 7th of July till the of August 1994. The set up and sampling procedure have been already described in 4.2.4.3. Figure 9 shows the general route of the cruise. As can be observed, the ship remained most of the time around two main areas of work, considered of special interest for the biological investigations accomplished by other groups during the expedition. Due to the small variations in the ship position, any representation as a function of the coordinates would have been too complicated to Interpret. In order to clarify the results, all the data have been plotted as a function of the Julian day. A short description of the meteorological conditions and the origin of the air masses suggested by the back trajectories is given in table 6.
Most of the measurement period was characterized by events of intense fog, which caused some problems during sampling mainly derived from the condensation of this fog on the filters. Although the Isolation of the pumping lines and slightly heating of the filter Systems diminished these problems, some of the samples had to be rejected. This is the reason of the lack of sampling points between 193 and 196 Julian days.

190 [Arctic Sea 191 IArctic Sea 1 192 193 194 195 196
Table 6.- Summary of the information obtained from the trajectories corresponding to the air masses sampled during the cmise ARK-XI1 of the vessel Polarstern (July- August 1994).
-
First o f all, a short description o f the results will be given, in order to introduce the general discussion carried out in the next section.
Arctic Sea North Sea Irland North Sea Greeniand
197 198 199 200
Marine origin. No continental influence
Passing over Iceland during the evening In the evenine Nortli Sea
Iceland Greenland Western part of Atlantic Ocean Greenland
Passing over Iceland

a) Filter pack:
The results are plotted in figures 26 to 28. No data are available for the interval of time between 193-198 days, due to the condensation problems above described which acquired importance when the ship reached 75ON. Before that point, the nitrate concentrations ranged from 0.05 to 0.65 &m3 in the teflon filter, and 0.07 to 1.65 pg/m3 in the nylon filters, and nss sulphate from 0.06 to 4.3 pg/m3. From the 198 to the 224 Julian days nitrate concentrations collected On the teflon filter varied between 0.002 and 0.02 pg/m3 reaching higher values the 209 and 213 with 0.05 and 0.15 pg/m3 respectively. The sum of the corresponding nitrate concentrations On both nylon filters ranged from 0.0 1 to 0.1 pg/m5
Figure 26.- Nitrate concentrations measured with a filter pack (see text) during the cmise ARK- X/ 1 of the Polarstern (July-August 1994).

Julian day
r ^ - m o l o - ~ c " i ' ^ r ~ w ~ m m o - ~ ~ ' ^ r i o w h - m m o - ~ ~ n ~ m C n m O O O O O O O O O O T - - - - - ' t - - - - - N N N N N N N N N N N N N N N C M N C M C M N N N N N N C M N
Julian day
Figure 27.- Nitrate concentrations measured in the nylon filters of a filter pack during the cruise ARK-XI1 of the Polarstern (July-August 1994).

Non sea salt sulphate concentrations ranged On the average from < 0.02 ug/rn3 to 0.3 ug/rn3, presenting higher concentrations on the 210 (0.6 ug/m3) and the 213 (2 &m3) Julian days.
1 +Total sulphate
Ñà Nss sulphate
Julian day
Figure 28.- Sulphate concentrations measured with a filter pack during the cruise ARK-X/1 of the Polarstern (July-August 1994).
b) Filter pack plus annular denuder
As in the case of the filter pack, there are no data for the 193-198 Julian days (Figures 29 - 3 1).
In the first days of the carnpaign, till the 75ON position was reached, the nitrate concentrations ranged between 0.05 and 0.8 ug/m3 in the teflon filter and 0.08 - 0.42 u.g/m3 in the nylon filters, and the nss sulphate concentrations between 0.2 and 3 ug/m3. Frorn that point the teflon nitrate concentrations varied between <0.01 and 0.03 ng/m3, with a peak the 213 Julian day of about 0.08 &m3; and the nylon nitrate between < 0.02 and 0.06 ug/m3.

Figure 29.- Nitrate concentrations obtained with a filter pack preceded by a Na2C03 coated annular denuder during the cruise ARK-W1 of the Polarstern (July-August 1994).
Julian day
Figure 30.- Nitrate concentrations obtained in the nylon filters of a filter pack preceded by a NazC03 coated annular denuder during the cruise ARK-W1 of the Polarstern (July-August 1994).

1 +Total sulphate 1 1 + Nss sulphate 1
Figure 3 1 .- Sulphate concentrations measured with a filter pack preceded by a Na2C03 coated annular denuder during the cmise ARK-XI1 of the Polarstern (July-August 1994).
The nss sulphate concentration presents On the 207, 210 and 213 maxima of 0.28, 0.6 and 1.9 ug/m3 respectively, while the rest of the values varied between 0.04 and 0.2 ug/m3.
C) Dichotomous sampler
Figures 32 to 34 show the corresponding aerosol concentrations found in the coarse and fine modes during the measurement campaign. As in the preceding cases, there is a noticeable difference in the range of concentrations corresponding to the first and the second Part of the cruise:
- From the 188 to the 195 Julian days the fine concentrations varied between 0.01 and 0.2 ug/m3 nitrate and 0.15 and 2.4 ug/m3 nss sulphate in the teflon filter, and between 0.02 and 0.22 ug/m3 nitrate in the nylon filter. In the coarse mode, the range of concentrations was between 0.02 and 0.68 pg/m3, 0.1 and 0.46 ug/m3 and < 0.01 and 0.34 ug/m3 respectively.
- From the 198 to the 224 Julian days the concentration in the fine mode ranged between < 0.01 and 0.05 us/m3 nitrate, < 0.01 - 0.15 ug/m3 nss sulphate in the teflon filter, and between 0.02-0.06 ug/m3 nitrate in the nylon filter. In the coarse mode the range of concentrations were < 0.01-0.02 pg/m3, < 0.01 - 0 . 0 7 ~ g / m ~ , and < 0.01 - 0.02 us/m3 respectively.

+ TF coarse
+ TF fine
Julian day
Figure 32.- Nitrate concentrations in the fine and coarse mode obtained from measurements taken with a dichotomous sarnpler during the cruise ARK-XI1 of the Polarstern (July-August 1994).
1 + NL coarse 1 + NL fine
Julian day
Figure 33.- Nitrate concentrations obtained from the nylon Filter of a dichotomus sampler during the cmise AM-XI1 of the Polarstern (July-August 1994).

Nss sulphate (iig.rn4) 0 0 0 .- .- M .?' o - P a , m N ) 0 1 0 4 ^ 0 0 0 0 0 0 0

HNO (pg.m-3)

ratios were extremely low, between 3-8 pptv, H2O2 varied from around 1000 pptv and O3 values ranged between 23 and 60 ppbv (Figure 37, a-C).
100 pptv to
185 190 195 200 205 210 215 220 225
Julian day
Julian day
185 190 195 200 205 210 215 220 22:
Julian day
Figure 37.- Concentrations measured during the cruise ARK-XI1 of the Polarstern (Weller and Schrems, 1994) a) NO, b) Hz02 ,C) Oa .
87

5.1.3.2 Discussion of results
The comparison of the results obtained with the instruments above mentioned is to some extent limited because of the differences in the sampling intervals. These were caused mainly by the different flow rates of the devices and by the necessity of a determined air volume to allow the sample analysis, given the low concentrations expected. Additionally, the acquisition of enough air volume required in some cases much longer sampling times as a consequence of inadequate relative wind directions, inevitable during most of the stations made to perform other works On board. However, due to the scarcity of adjacent sources of pollutants in the measurement area, sudden punctual changes of the tropospheric composition were not expected, and in the absence of variations in the meteorological conditions, the homogenity of the air sampled was assumed.
Before proceeding to the data analysis it is necessary to make some comments about the sampling methods:
- The reason of the simultaneous use of two filter packs was to calculate more accurately the HN03 concentrations. As already mentioned in 4.1.2.1, the HNO3 concentration is obtained from the difference between the total inorganic nitrate collected in both teflon and nylon filters of one of the filter packs, and the total particulate nitrate obtained by means of an identical filter pack but preceded by an annular denuder which removes quantitatively the acidic gases like SO2 and HNO3.
Although this differential method has been proved to give very acceptable results (Appel and Tokiwa, 1981b; Shaw et al. 1982) its application to the present particular measurement site has some limitations which should be kept in mind when interpreting the results. The frequent periods of persistent fog could have had some influence in the performance of the instruments used, which is difficult to evaluate with the available data. It has been observed, for instance, that the HN03 concentration calculated from the sum of the nitrate retained On both nylon filters agrees within 30 % with the values given by the differential method only in those days not affected by rain and fog events. The difference of 60-85% corresponding with the foggy and rainy days indicates the necessity of an evaluation of the retention of HN03 by nylon surfaces under similar conditions. The differential method has been assumed to be more accurate, because of the subtraction of possible artifacts affecting both filter packs.
Other factor of importance is that the HN03 calculation by means of the differential method required the integration of results over longer periods, diminishing the number of available data. However, as can be seen in the figure 38, there is a notable agreement of the concentrations so calculated and the obtained directly by using the wet denuder System.

Filter pack
Filter pack + annular denuder

-The problem of fog condensation already described was more serious in the case of the dichotomous sampler, due to the difficulties to make offhand an effective System of heating. Many samples had to be rejected while other correspond to very long periods of measurement. These data, although in agreement with the general trend observed with the other samplers give very little information about the variations in particle distribution. The nss sulphate predominated clearly in the fme mode representing more than 80% of the total in all the cases if excluding the nocturnal sampling of the 1 lt" and the 30~" July (192 and 21 1 Julian days) in which the coarse mode represented 70 and 40 % respectively. In the case of nitrate particles the distribution between coarse and fme modes was not so clear and will be analysed in each particular case.
In order to facilitate the interpretation of results, the cruise had been divided in three parts, attending mainly to the difference in the ambient conditions:
a) Typical marine environment in the North Sea area between 58ON and 75ON corresponding to the first days of the campaign - 1 2 ~ ~ July, i.e., 188 to 193 Julian days).
b) Marginal ice Zone to the continental slope of East Greenland. The ship reached this first main operation area at around 7S0N on the 1 2 ~ ~ of July (193 Julian day) and remained surrounded by ice till the 209 Julian day.
C) Transition Zone between Open sea and ice areas. In this third part is included the transect from 75O N 15O W to 7S0N 20° started the 209 Julian day, and the route to the second main operation area at 79ON. Only a few measurements were possible in this last region because of the complicated mooring operations of the Polarstern, which required a continuous change in the trajectory of the ship and obstructed the air sampling.
It should be noted that the results depend On the air sampled and therefore On the origin of the air masses reaching the measurement point. The arbitrary regional division of the cruise chosen here has been made according to the ship itinerary and does not pretend to be a classification of the air masses.
The following trends were observed in the periods above defmed:
a) North Sea area
First of all is important to note that the data of the 188 Julian day should be considered with caution because the wind controller was still not in operation at that time and despite the favourable winds observed, the contamination from the ship cannot be completely ruled out. Besides, the influence of emissions from other ships is also likely

due to the traffic existent in that area. The rapid decrease of the SOz and H N 0 3 concentrations observed seems to confirm this explanation. However, the concentrations are on the range of those observed over the North Sea (Ottley et al., 1992) and of the data obtained in the last part of the expedition ANT-X115 (see 5.1.2.).
Back trajectories are available from the 190 Julian day and indicate the origin of air masses from the Arctic Sea, without having contact with any continent. As can be observed in the corresponding graphs, the particulate nitrate concentrations given by the dichotomus and filter packs are in very good agreement. The particulate nitrate prevailed in the coarse mode the first two days. During the rest of this Part of the campaign nitrate was equally distributed in the fine and the coarse mode, which is in agreement with the possible coexistence of ammonium and sodium nitrates. The proximity of the continent facilitates the existence of several HN03 and NH3 sources, favouring the formation of ammonium nitrate, which would constitute the fine mode. On the other hand, the abundance of sea salt particles On which the HN03 could react may allow the formation of sodium nitrates, predominantly On the coarse mode.
As already mentioned, the non sea salt sulphate was mainly in the f h e mode
The arrival of air masses coming from the southwestern part of the North Sea during the night of the 1 1 of July (192) caused the first period of fog due to the difference of temperature between air and the cooler sea surface. This fog was concurrent with an increase in the nss sulphate, especially in the coarse mode, and in the SO2 concentration. This fact could lead to the erroneous conclusion that fog is favouring the increase in SO, concentration. On the contrary, the presence of fog will promote the SO2 wet deposition and its oxidation in the liquid phase. The trajectories suggest the advection of air masses affected by anthropogenic emissions of the European continent and this advection is probably the reason of the increase in the concentration, although a part of the emissions will be lost by the deposition in fog,
In addition, a higher contribution of the biogenic ocean emissions should be expected in the North Sea at that time of the year. In contrast, polar regions represent an almost negligible source of atmospheric biogenic sulphur, because the lower temperature of the water surface is not adequate for the growing of phytoplancton, and the presence of ice obstructs the gas exchange ocean-atmosphere (Bürgermeister 1991). Here again it is important to consider that the efficiency of SO2 production from DMS in clean areas is still a subject under investigation (Bandy et al., 1992).
On the other hand, a decrease of the H202 mixing ratios in the gas phase (from about 700 to 200 pptv) was observed during that period, as result of its scavenging in the gas phase by fog, propitiated by its high solubility in water. The oxidation of SO2 could have been then facilitated, with the formation of sulphate in fog. It is important to note that if this fog enters in contact with the filters, its posterior vaporisation does not mean liberation of sulphate, like in the case of H202 or HN03, but its retention on the filter, due to the extremely low H2S04 vapour pressure (see 5.1.1).
The concentration of nitrates did not Change substantially and HN03 was not detected, in agreement with the favoured removal of soluble gases in the presence of fog.

The HN03 concentrations calculated by the differential method, were in some cases lower than the concentrations indicated by the wet denuder. Due to the required control of the Instrument as well as to the preconditioning of the tubes before the period of sampling (see 4.2.), the wet denuder did not operate continuously as the filters did, and the comparison of results can only be qualitative.
b) Ice Zone in East Greenland
Once in the first main work area, most of the days presented fog conditions. The trajectories showed Greenland and northern areas of the North Sea passing over Iceland as the main origin of the air masses. The day 208 will be discussed separateiy together with 209-21 5 due to the particular origin of the air masses, with influence from the European continent.
The consideration of the results obtained by the filter pack without annular denuder gives more detailed information, due to their higher resolution result of the shorter sampling times.
The observed variations in the nitrate concentrations are attributed to the removal of the particles in the fog events. Consequently an evident increase in the concentrations of the 198, 204, and 205 samplings (to around 0.02 &m3) can be observed, corresponding just to the days without fog of the period. Also the lower concentration observed in the filter pack on day 206, corresponding to an intense fog event and in contrast with the averaged concentrations of the period given by the other filter pack with annular denuder, might be explained by this removal.
The effect of the fog should be more intense On the HNO3 concentrations, due to its higher solubility. In fact, this can be the case of the increment of concentration observed in the fog free periods of the 204-205 Julian day samples reaching 0.03 ug/m3 (12 pptv approximately). The HNo3 calculated by the differential method gives a value of 0.03 pg/m3 for the corresponding period.
However, a significant HNo3 increase from < 0.01 ^g/rn3 to 0.08 [ig/m3 (2 to 3 1 pptv approximately), not related to any remarkable change in the particulate nitrate concentration, was observed during the sampling of 1 8 and 19~" July (199-200 Julian days). Both days were characterized by several fog and rain events, which should have facilitated the HN03 removal. This increment was also observed in the SO, and in the 0 3 concentrations. In addition, from the 199 to the 205 Julian days the NO had higher mixing ratios, around 5 pptv.
The HN03 could be related to an intrusion of NOy from the free troposphere. Honrath and Jaffe (1992) found in Barrow, Alaska, that NOy and O3 concentrations were positively correlated during summer, possibly indicating long range transport of both components and 1 or the presence of midtropospheric NOy reservoir combined with a stratospheric O3 source.

The 200 Julian day was one of the days of the expedition in which Weller and Schrems (1994) observed an ozone profile suggesting stratospheric ozone intrusion in the troposphere. However, it must be pointed out here one of the most important differences between both measurement sites. In Alaska, the higher temperatures over the Arctic tundra will promote the atmospheric convection and thus the subsidence of NOy enriched masses from the free troposphere. Over the ice covered areas of the Greenland Sea in contrast, more atmospheric stability should be expected. In fact, a strong surface inversion (200-500 m) preventing the downmixing of air masses was observed during most of the days during the ARK-XI1 expedition. The free tropospheric origin seems to be then very unlikely. On the other hand, the transport from anthropogenic sources cannot be assumed either On the basis of the surface trajectories, which indicated most of the period the advection of air masses from continental Greenland. However, considering the elevation of Central Greenland (E 3000 m), the advection of air masses with this origin could perhaps represent an input of free tropospheric air.
C) Transition Zone between main work areas
The horizontal transverse started the 209 and finished the 215 Julian days. Since the 208 the trajectories suggested the arrival of air masses coming from European latitudes with influence mainly from England and Scandinavian countries. With the exception of the 209 Julian day in the evening, the whole period was characterized by foggy and rainy conditions. The highest particulate concentrations of the campaign were reached (0.05 and 0.15 ug/rn3 nitrate and 0.6 and 1.9 ug/m3 nss sulphate).
The SO2 detected in the wet denuder presented a relative maximum of concentration the 208 Julian day (1.2 &m3) and remained around the 0.4 ug/rn3 level the rest of the time.
The increase of HN03 was evident from the day 210 and it reached a maximum of 0.0lug/m3 (about 3 pptv) the 212 and 214 Julian days. The 211 presented a NO maximum around 7 pptv.
The advection of air masses from Iceland the following days (216-217) did not represent any distinct change in the concentrations, although a lower level of pollutants should be expected considering the air origin. The reason for this is probably in the remission of the local fog intensity, and therefore in the variation of the removal efficiency of the atmosphere. From the 218 Julian day bright conditions dominated.
Considering the HN03 calculated from the differential method during these days, variations between < 0.01 and 0.03 ug/m3 (1 - 10 pptv approx.) can be observed. These changes may be attributed to the differences in the intensity of the fog and also in the influence of the precipitation events in the removal of both particulate and gas phases of the compounds studied. This scavenging will be more effective in the case of soluble species like HN03 and H202. In this manner for instance, the H202 concentrations increased notably from the 217 when the bright conditions prevailed (Weller and Schrems, 1994).

The O3 mixing ratios increased in the period 212 - 215 reaching its maximum the 213 Julian day (55 ppbv) as corresponds to the arrival of polluted air masses.
Summarizing, attending to the origin of air masses, three main situations were identified during the expedition in the Greenland Sea:
1.- Air masses coming from northern areas of the Arctic Ocean and Greenland continent; usually accompanied of bright conditions. Nitrate concentrations varied between < 0.01 and 0.02 ug/rn3 and HN03 between < 0.01 and 0.03 pg/m3 (2 - 12 pptv approx.). Typical sulphate concentrations were between 0.02 and 0.1 pg/m3 and SO, presented 0.4 ug/m3 (140 pptv approximately) on the average.
2.- Arrival of air masses from the North Atlantic, often passing over Iceland. The concentration levels detected were in the following intervals: 0.01 ug/m3 nitrate, < 0.01 - 0.02 &m3 (2 - 6 pptv) HN03 ; 0.06 - 0.28 pg/m3 sulphate and 1 - 2 pg/m3 (350 - 700 pptv approximately) SO2.
3.- Advection of warm air masses from southern latitudes especially with influence of England and Scandinavian countries. Generally characterized by frequent periods of fog as a consequence of the difference in temperature between air and sea surface. Nitrate concentrations varied between 0.05 and 0.15 ug/m3 and sulphate between 0.6 and 2 &m3. HN03 reached a maximum of about 0.02 ug/m3 (6 pptv approx.) while SO, maintained its level around 0.4 &m3.
As already mentioned, the presence of fog played an important role in all these situations, causing substantial changes in the concentrations. This supplementary removal especially of the more soluble compounds prevents the clear identification of the influence of the more polluted air masses by means of the variation in concentration of the compounds of interest. It is not possible therefore to establish any correlation between the origin of the air masses and the concentrations detected.
The consistency of the HN03 to nitrates ratio in this limited data set, due to the absence of HN03 most of the time, is not very obvious. In most of the cases the ratio is very low in agreement with the faster removal of the gas phase by the fog.

5.1.3.3,- Comparison with other data
Only an indirect comparison with data obtained under similar conditions is possible, because no identical study has been found in the literature. The North American Arctic summer troposphere has been recently the subject of some experimental campaigns like the Arctic Boundary Layer Expedition (ABLE 3A). Talbot et al. (1992) reported background air with an average composition of 40 pptv HN03 and 10 pptv No3' and 25 pptv SO:' and Jacob et al., (1992), NO,, concentrations between 10 and 50 pptv. Sulphate was found to comprise 75% of the aerosol anionic composition and ammonium 70 - 80 % of the cation species measured. Nitrate and chloride were minor aerosol constituents.
Background NOy concentrations in the Arctic troposphere in Aiaska were measured from March to November 1990 by Honrath and Jaffe (1992). In July and August the NOy concentrations ranged from 35 to 193 pptv and the NO hourly averages mixing ratios varied between 2 and 18 pptv. The NOy and NO concentrations seemed to be influenced by the tundra, possibly due to its biogenic emissions and to a greater vertical mixing over land from the free tropospheric NOy reservoir .
Bürgermeiste (1991) measured nss sulphate in aerosol samples taken during the Polarstern expedition ARK- V1112 in July- August 1990. He reported averaged nss sulphate concentrations of 0.4 ug/m3 corresponding for the Norwegian Sea and 0.25 pg/m3 for the Greenland Sea.
The northern areas are also influenced by the pollution of the European continent in summer. The present study constitutes an example of the direct atmospheric coupling of the Arctic with midlatitude source regions at that time of the year. Removal and mixing processes are, however, more efficient in summer than in winter.
In the Greenland Sea the importance of the fog in the scavenging of the soluble species in the atmosphere must be taken into account. It is probably one of the principal factors controlling the amount of aerosol species in the near surface.
Very low concentrations of HNo3 were observed during this campaign, in agreement with:
a) the ambient conditions favouring the removal by fog and rain
b) the low NO concentrations observed

No clear evidence of the input of HN03 by long range transport was observed. Variations in concentrations had no obvious relation with the origin of air masses and were assumed to be related to the incorporation in fog and release from it. The hygroscopic particles are probably activated as nuclei for fog droplets which efficiently incorporates nitric acid, sulphate and ammonium into the aqueous phase. When the fog evaporates, HN03 will remain as particulate nitrate if there is sufficient alkaline material (ammonia, sea salt aerosol or soll dust), to react with it, or will be again released. The sea salt aerosol is supposed to play an important role due to the abundance of Open sea areas in summer. In addition ammonia can arise from the evolution from surface ocean waters in Open ice leads. The existente of a low-level source of NH3 over the Arctic Ocean from the decay of dead marine organisms on ice surface has been already suggested (Talbot et al., 1992) and that at certain times and locations there may be a flux of ammonia from the ocean (Quinn et al., 1988).
Not enough information was obtained to assign the origin of the obsexved HN03. Fog would ease tWOy Formation from N7o5 in the liquid phase but at that time of the year the nocturnal pathways which could generate this component are not favoured. In addition, according to the very low NO concentrations and the higher removal activity of the atmosphere, the long range transport of NOx from lower latitudes is quite unlikely. Decomposition of PAN subsiding from aloft could account for the HN03 levels but this process could not be documented. Although the low surface inversion layer observed most of the days suggests an atmospheric stratification which would prevent the convective conditions required for downmixing, in the case of air masses of Greenland origin an input of free tropospheric air cannot be mied out.
About 98% of the sulphate was of non sea salt origin. It can be attributed to anthropogenic background although marine biogenic emissions of dimethy sulphide could also have contributed significantly.

5.2- SEMIRURAL, COASTAL AND URBAN AREAS AT MIDLATITUDES
The first Part of this work was mainly focused on the study of the composition of the remote atmosphere in order to gain a deeper insight in the mechanisms which control the distribution of the inorganic nitrogen components in the marine and polar troposphere. The data presented and discussed in previous chapters confirm the importance of the transport of pollutants from midlatitudes to these areas. At this point it is appropriate to study the composition of these more polluted regions not only to establish a comparison but also for a better understanding of the studies described above.
NOx species, predominantly emitted in urban and industrialized areas, enter the atmosphere and start a chain of conversion, transport and deposition processes of central importance in the troposphere, Among these, the tropospheric nocturnal formation of HNO,, whose importance as a source of OH radicals has already been discussed in 2.1., was considered the principal point of interest. This component in polluted areas at night is able to reach concentrations as high as 8 ppbv (Harris et al., 1982) and 14 ppb (Appel et al., 1990).
Due to the need of sufficient HNO, data to draw representative conclusions, information from moderately and heavily polluted areas was required. Thus, measurements were taken in Bremerhaven, a harbour city in Northern Germany, from August 1992 to February 1993. The Joint Research Center in Ispra (JRC) provided data from semirural and urban areas for their analysis whitin the present work (Hjorth, 1993). These data had been obtained in previous campaigns (1989-1991) in Italy (Ispra and Milan) and Switzerland (Ticino Valley). It was therefore possible to acquire information from the tropospheric air composition in four locations with different characteristics and level of pollution: Bremerhaven, a coastal area, Ispra, semimral, Milan, very polluted urban and Ticino Valley, locally influenced by a highway. Most of the sections of this study are included in either published or submitted articles (Andres et al., 1994, 1995).
5.2.1- Presentation of data
Although the particular characteristics of each measurement site will be outlined separately, first of all their common points are briefly described in order to avoid unnecessary repetition:
* The processing of the DOAS data obtained in the corresponding files consisted mainly of:
a) the verification of variations in the concentrations, by analysing the magnitude of changes in consecutive intervals and rejecting artifact peaks,

b) the subsequent calculation of hourly averages and,
C) the consideration for the interpretation only of those concentrations higher than two times the standard deviation given by the instrument, in order to assure the inclusion of values with an adequate signal to noise ratio.
For each trace gas plotted in the following sections, the 10 standard deviation will be given for the typical low and high concentrations observed (figures 47, 48 and 49).
* The Parameter light level given by the DOAS System was used to estimate rough values for the total surface of aerosols S along the beam path, following a procedure that will be described in more detail in 5.2.2.2..
* A NO monitor situated in the vicinity of the beam path supplied the NO data
5.2.1.1 Measurement sites
The characteristics and typical range of concentrations found in the four locations studied are summarized in table 7.
Ispra 1 February 1990 1 729 1 30 1 25-90
1 Ticino V. 1 October 1989 1 1350 5 0 1 100-400 1 100-120
20-150 I I I t ,
Milan
Table 7.- Main characteristics and range of concentrations of the DOAS measurement sites (see text). Gas concentrations are expressed in pg/m3.
I I I I I
February 1990 was the month analysed in more detail for presenting the most complete Set of measurements suitable for comparison with the data available from the other
February 1991
Bremerhaven Aug. 92-Feb. 93
450 10-600 2 0
650
50-500
25 30-80

locations. Typical NO concentrations were around 25-90 ug/m3, but during some nocturnal periods under calm conditions, up to 190 lig/rn3 were observed. NO2 ranged from 20 to 150 lig/rn3, Oi from 50 to 160 ug/m3, and SO2 from 20 to 60 ug/rn3. HN02 nocturnal concentrations reached up to 2.5 ug/rn3. In figure 40 are depicted typical 0 3 , NO2 and NO concentrations corresponding to some of the days of the period.
Ispra, Febmary 1990
16 17 18 19 20 2 1 date
Figurc 40.- Trace gas concentrations measurcd in Ispra (Febmary 1990)
99

b) Milan
Figure 41 shows the existing NO, NO2 and O3 concentrations from the 1 % ~ to the 231d of February 1991. During this month NO reached up to 600 &m3 and NO2 up to 500 pg/m3. With a few exceptions the O3 values were below 50 pg/m3 and always lower than I00 &m3. SO2 presented short peak concentrations around midday up to 500 pg/m3, being practically constant the rest of the time at a level around 150-200 &m3. HN02 reached concentrations up to 12 &m3.
I
I Milan, February 1991
Figure 41 .- Trace gas concentrations measured in Milan in Februaq 1991.

C) Ticino Valley
During the period of measurements (October 1989) the NO maxima diurnal concentrations varied between 100 and 400 &m3, NO2 between 100 and 120 pg/rn3 and O3 between 60 and 130 pg/m3. HN02 presented typical nocturnal values around 1 - 2.5 p g / ~ 3 . In figure 42 are plotted the concentrations observed from to 2lSt October
Ticino Valley, October 1989
17 18 19 20 date 21
120
I00 - 80 . 60
40
20
0
17 18 19 20 date 21
Fig~ire 42.- Trace gas concentrations measured in the Ticino Vdley in October 1989
101

d) Bremerhaven
The measurement site (see map, figure 43) is characterized by the presence of sources of pollution mainly associated with terrestrial and maritime transportation
Figure 43.- Map of the measurement site in Bremerhaven. Thc location of the DOAS system is also indicated.
Figures 44, 45 and 46 showed the NO2, O3 and SO2 concentrations corresponding to three representative periods of August 1992, January and February 1993. NO2 maximum concentrations varied between 30 and 80 &m3 with some isolated peaks in the case of local emissions for a short period of time. Maximum O3 concentrations were detected in sümme time up to 150 pg/m3. SO2 concentrations were aroün 20 pg/m3 during the whoie period of measurernents, with higher peak concentrations normally associated to emissions from maritime traffic. Due to the fact that the DOAS system was delivered with wrong HN02 calibration spectra it was not possible to obtain reliable HN02 data till its modification by the factory in October 1993. Only in a few days in January and February HN02 around 1 - 2 pg/m3 was detected.

Bremerhaven, August 1992
5 6 7 8 date g
5 6 7 8 date 9
5 6 7 8 date g
5 6 7 8 date 9
5 6 7 8 date g
5 6 7 8 date g
Figure 44.- Trace gas concentrations~ number of particles, wind direction and wind speed measured in Bremerhaven in August 1992.
Bremerhaven, January 1993 80 -
V 60 E 2 40
à 20 z 0
40
V- 30 E 6 20 z W
à 10
0
15 16 17 18 date 19
31 5
225
135
15 16 17 I 8 date 19
20
15
10
5
0
15 16 17 18 date 19
Figure 45.- Trace gas concentrations, wind direction m d wind speed measured in Bre~nerhaven in Januap~ 1993.

Bremerhaven, February 1993
17 18 19 date 20
- 100 - 75 1
50 - - 25
0
17 18 19 date 20
17 18 19 date 20
17 18 19 date 20
17 18 19 date 20
- 12 W 10 - E 8 - 6
4 3 2 0
17 18 19 date 20
Figure 46.- Trace gas concentrations, wind direction and wind speed measured in Bremerhaven in Febmary 1993.

5.2.2.- Data evaluation
The analysis of results in the different measurement sites will be preceded by a brief discussion of the limitations derived from the system of detection used and by the description of the procedure used to calculate the surface of aerosol.
5.2.2.1.- Limitations in the analysis of results
* As described above the commercial DOAS used (Opsis) provided SO2, 03, NO2 and HN02 data. It was also prepared to measure CH20 and NO3 at 332 and 651 nm respectively. The detection of several species with the same instrument is accompanied by some restrictions when establishing the measurement conditions, as discussed by Notholt (1 990).
With respect to the sensitivity for instance, it must be considered that the signal to noise ratio and the detection limit are inversely proportional to the measurement time and to the path length respectively. However, an increase in the path length means also a decrease in the light intensity according to the divergence of the beam and the particulate and molecular scattering, modifying the signal to noise ratio. The Rayleigh scattering, proportional to the Square of the light frequency, will affect more those compounds measured at shorter wavelengths, which will then require shorter beam paths. As a consequence, the compromise between both factors determines the length of the beam path, which is normally fixed between 500 and 1000 m for moderately polluted areas.
On the other hand, enlarging the measurement time in a non remote area increases the probability of errors in the integration of the concentrations along the beam path, as a result of heterogeneity caused for instance by time-varying sources of pollutants.
Another shortcoming of the Opsis system is the use of the Same spectral width (35 nm) for the evaluation of the concentration of all compounds, despite their differences in the spectrum. Therefore, for compounds like NO3, which would require a larger interval for the consideration of more than one absorption band and the fitting of the water interference in this part of the spectrum, the detection limit increases notably respect to research DOAS instruments. In all cases studied in the present work the No3 measured values were below the detection limit (40 pptv approximately).
The spectral interferences of other gases absorbing in the Same wavelength region used for the identification of one particular compound are considered by the Opsis system, as explained in 4.1.1. by fitting and subtracting the interfering spectra. The measurement of O3 and SO2, for instance, could be affected by the fact of being both identified in the same region (265 and 292 nm respectively).

Notholt (1 990) has reported good agreement between ozone concentrations obtained by Opsis DOAS and ozone monitors. Nevertheless, it should be borne in mind that in heavily polluted areas the presence of high concentrations of many pollutants absorbing at similar wavelengths can cause inaccuracies in the results.
* It is also important to note here the differences of the two types of instmments used:
a) a DOAS which gives concentrations integrated along a beam path and,
b) monitors giving point measurements only
In the case of an homogeneous distribution of local sources along the beam path, an adequate location of the corresponding monitor and good mixing conditions, the inclusion of both types of data in the calculations should not constitute a big problem, keeping in mind the differences in the nature of data during the interpretation, and performing some tests to check the suitability of any comparison of data (see below, 5.2.3.3).
5.2.2.2. Aerosol surface calculation
Information about the surface of aerosol was required for the discussion of the HNOi formation in terms of heterogeneous processes (see 5.2.3.6.). For this reason a parameter S (see below), related to the total surface of the aerosol, was calculated from the DOAS data for the different measurement sites.
Together with concentrations of different gases, the Opsis DOAS system gives the value of the parameter light level for the wavelength regions where the trace gases are measured. This parameter is taken from the voltage which controls the photomultiplier amplification. A low intensity is compensated by a high photomultiplier amplification and the light level is then set to a low value and viceversa. The current through the photomultiplier is kept constant and the voltage has been empirically found to be inversely proportional to the light intensity (Notholt, 1991).
Using the light intensity obtained from the light level values given by the DOAS System, the optical depth or extinction coefficient for the wavelength regions where the gases are measured can be calculated by using the Beer-Lambert law:
T (X) = in ( Iã(X) I (X)) (58)
where I(X) is the light intensity at the corresponding path length and I,,(X) is the background light intensity at 1 m path length.

The wavelength dependant optical depth is fitted under the assumption of an exponential power law function:
T (L)=Â exp (-CA)
The coefficients a and ß obtained from the experimental data, can be used in a simple Inversion method on the basis of a set of graphs and tables (Box and Lo, 1976), to get the aerosol parameters a and b for the unimodal size distribution assumed:
n(r) = '/2 a b3 r2 exp (-b r)
where r is the particle radius, the geometrical mean diameter is given by D=5/b, and the total number of aerosol particles by a. Due to the focusing optics and the narrow beam, the assumption of single scattering approximation is valid. The whole procedure has already been described in detail (Notholt , 1991, 1992).
The surface is then calculated from:
The inversion method is not suitable for following long term variations of aerosol Parameters, like the total aerosol surface, due to possible changes in the background light intensity caused by long term variations of the lamp emissivity or by changes in the alignment of the optical System. However, short time variations up to some weeks, sufficient for the calculations below presented, can be retrieved to a sufficient degree.
Typical values of the estimated errors in the surface values for cases of high and low light intensity are included in the corresponding figures (47, 48, 49).
5.2.3. Discussion of results
In this section the evaluation of the HN02 formation will be preceded by a short discussion of the particular characteristics presented by every measurement site.
5.2.3.1. Ispra
From the point of view of the concentration of contaminants, this environment can be defined as semirural, characterized by very low speed winds (0 - 1 m/s) during most of the year, and very frequent periods of fog in the first months of the winter time. These stagnant conditions favour the accumulation of the pollutants emitted, leading occassionally to levels much higher than expected according to the nature of the site.

In figure 47 typical HN02, Oi, NO2 and NO concentrations together with the calculated aerosol surface values from to 2oth February 1990 are depicted. It is important to take into account that the high concentrations measured during the night are supposed to be partly caused by the nighttime decrease of the boundary layer. The simultaneity in some cases of NO, NO2 and SOi nocturnal increases supports this idea. The trace gases emitted from sources at the ground are confined to a smaller volume and consequently lead to an increase in the concentrations.
Ispra, February 1990
Figure 47.- Trace gas concentrations and total aerosol surface S measured in Ispra in February 1990. The error bars, displayed above the corresponding data, represented the 10 standard deviation.

Milan, February 1991
Figure 48.- Trace gas concentrations and total aerosol surface S measured in Milan in February 1991. The error bars, displayed above the corresponding data. represented the 10 standard deviation.

Ticino Valley, October 1989
17 18 19 20 date 21
17 18 19 20 date 21
17 18 19 20 date 21
17 18 19 20 date 21
- 0,25 - 0 2 2 20,15 S 3 0,1 ii E0.05 +- - 0 O
17 18 19 20 date 21
17 18 19 20 date 21
Figure 49.- Trace gas concentrations and total aerosol surface S measured in the Ticino Valley in October 1989. The error bars, displayed above the corresponding data, represented the 10 standard deviation.

5.2.3.2. Milan
Milan is one of the most polluted cities in the world. In figure 48 are plotted the 03, NO NO2 and HN02 concentrations found from 1 8 ~ to 23^ February 1991. The level of concentrations is clearly higher than in Ispra as corresponds to the urban characteristics of the location.
The whole period was characterized by low wind speeds (1 - 3 mls) with long periods of calms during the night. As in the case of Ispra, the nocturnal decrease of the boundary layer seems to play an important role in the concentrations observed at nighttime. This influence was analysed by comparing the SO2, NO, NO, and HN02 nighttime evolution as well as by studying SO, and HN02 correlations. With the exception of some short period peaks normally around midday, the emission of SO2 could be considered to be practically constant at this time of the year as result of the permanent heating. The observed positive correlation between SO2 and HN02 nocturnal values indicates that the nighttime HNO, measured concentrations are not only the result of emission or formation, but are influenced by the decrease of the boundary layer, which produces an increase in both SO2 and HNO, concentrations. In Milan, Febo et al., (1994) observed a strong agreement between the concentrations of HN02 and radon, a tracer emitted continuously from the ground, indicating the importance of the nighttime decrease of the boundary layer On the concentration of any species emitted from or close to the ground.
5.2.3.3. Ticino Valley
Typical HNO,, 0 3 , NO2 and NO concentrations together with the calculated aerosol surface values observed frorn the 1 7 to the 2 l S of October are plotted in figure 49.
It has already been mentioned that NO, NO,, O3 and bulk aerosol data were available from a station located at some kilometers distance from the DOAS instrument. However, the wind running continuously through the valley and the similarity of sources of pollutants along the beam path, suggested the suitability of including the NO data in the calculations (see below). In order to evaluate qualitatively the differences between both sites, the O3 and NO2 long path data obtained from the DOAS measurements were compared to the point measurements supplied by O3 and NO2 monitors located at the site of the NO monitor. The NO, and O3 diurnal variations showed a very good agreement. In figure 50 are plotted the correlations between NO2 and O3 measurements obtained by using both instmments.

0 30 60 90 120 150
NO, DOAS (vg/m3)
Figure 50.- Correlation between NO2 and o3 concentrations measured by DOAS and EMEP monitors in Ticino Valley (October 1989).
Likewise the diurnal variations in the total surface of aerosols obtained by the DOAS System corresponded to those of the aerosol concentrations detected by a dust monitor (RAHN), based on the light scattering of aerosol particles. Additionally, the consistency of the total aerosol surface values with the total arnount of aerosols, confirms the suitability of the surface analysis procedure used (Figure 49). In order to evaluate the agreement, the total volume of aerosols was calculated from the DOAS data, by using the expression:
where a and b are calculated as in 5.2.3.2.. Considering the relation between the aerosol mass given by the monitor and the volume calculated from the DOAS (figure SI) , the average density would range from 0.25 to 3 g/cm3, within the values of aerosol densities for continental aerosol given in the literature (Warneck, 1988).

1 Ticino Valley, October 1989 I
I 1 17 18 19 20 date 21
17 18 19 20 date 21
Figure 5 1 .- Comparison between total aerosol volume and total aerosol mass in the Ticino Valley (see text).
On the basis of these results it was concluded that the DOAS and the monitors sites were all sampling an homogeneous air composition. The agreement observed Supports also the suitability of using the total surface of aerosols obtained by the DOAS System to follow the diurnal variations of aerosols. However, it must be borne in mind that differences in the air composition cannot be completely mied out and may lead to errors in the analysis.
It is interesting to note the o3 decrease, correlated with a NO2 increase, that took always place when the sun disappeared suddenly behind the mountains of the valley at about 4 p.m. (figure 49). The increase of NO2 is a consequence of the continuous emission from the highway traffic, the consumption of O3 by the reaction with NO and the missing photolysis of NO2. Due to the permanent wind through the valley, no stagnant conditions and negligible influence of the nocturnal decrease of the boundary layer were expected in this site, in contrast to Ispra and Milan. In fact no similarity between the SO2 and HN02 diurnal evolution was observed in this case.
5.2.3.4. Deviations from the photostationary equilibrium
As mentioned in 2.1.1., in the absence of organic compounds or at very low hydrocarbons to NO ratios, the reactions:
NO2+ hu (< 430 nm) -r 0 ( 3 ~ ) + NO
o(~P) + 0, + M + 0 3 + M
NO + O3 + NO2 + O2
should achieve a steady state in a few minutes

Under these conditions, the equilibrium would be defined by the Leighton relationship:
The validity of this photostationary equilibrium for Ispra, Milan and Ticino Valley was roughly evaluated, by comparing both terms of (64). Bremerhaven was not included in this evaluation due to the lack of NO measurements in the proximity of the DOAS site.
Only the measurements corresponding to clear conditions and to the time interval from 11 to 13 hours, in which a maximum and almost constant value of ki should be expected, were taken into consideration. For the reaction of NO with O3 the constant k3 = 1.8 X 10 cm3 rnolecule" s" (4.43 X loF4 ppb'l s"') given by Finlayson-Pitts and Pitts (1986), was included in the calculations. Brauers and Hofzumahaus (1992) measured kl in September-October 1988 at different latitudes, and reported a midday value of 2.10'~ s ' at 50°N Demerjian et al., (1980) found a NO2 photolysis rate constant in North Carolina (35.8 ON) in October at midday of about 6.10'~ s'l . Considering both values, a quotient ki /k3 of 4.5 ppb and 13.5 ppb respectively is obtained.
In Ispra the [NO][03] / [NO,] ratio ranged from about 2 to 40 ppb in Febmary 1990, though it varied mostly between 6 and 20 ppb with an average value of about 12 ppb. The higher values corresponded also to the higher O3 concentrations. In February 1991 in Milan the ratio varied between 2 and 16 ppb with an average value around 8 ppb. Values of this ratio between 10 and 30 ppb with an average value of about 16 ppb were obtained from the observations in Ticino Valley in October 1989.
Figure 52 (a,b,c) shows the ratios calculated from the DOAS data, corresponding to the weeks above selected in these three measurement sites. Within the error inherent to such an estimation, it may be concluded that no large deviation from the stationary equilibrium is observed in the periods of time considered. These results are in agreement with the observations of Calvert (1982) in Los Angeles, where experimental data consistent with the photoestationary equilibrium were obtained in periods of time between 9 and 14 hours. He reported values of the [N0][03] / [NO2] ratio around 20 ppb. It seems that for some conditions encountered in polluted atmospheres rich in NO, the contribution of the reactions of organics to the formation of ozone plays a secondary role. Unfortunately no information about hydrocarbons or R 0 2 radicals in the measurement sites was available for a closer estimation.

Ispra, February 1990
16 17 18 19 20 2' date
b ) Milan, February 1991
18 19 20 21 22 22 date
Ticino Valley,
17 18 19 20 2 date
Figure 52.- NO*O3/No2 ratios calculated for the interval 11-13 hours: a) Ispra, Febmary 1990; b) Milan, February 1991; C) Ticino Valley. October 1989.

5.2.3.5. Bremerhaven
The comparison of the DOAS data with the values from the monitors of the Ministery of Environment showed generally a very good agreement at background levels but differences in peak periods of SO2 and NO2, as corresponds to the existente of different sources located between bot11 measurement sites.
Distinct periods were chosen to characterize different situations in Bremerhaven in winter and summer time. Hourly averages of the DOAS data are presented in figures 44, 45 and 46. The fraction of aerosol in the fine and coarse mode has been calculated considering the addition of the particles per cm3 given by the LAS-X spectrometer between 0.09 and 2.2 pm and between 2.5 and 3.3 pm diameter respectively.
a) 5th - ath August 1992
The DOAS data (figure 44) showed a typical 03/N02 daily variation with NO2 maxima concentrations (60-80 pg/m3) during the periods associated with more traffic and maximum concentration of ozone (around 100 pg/m3) during the central hours of the day.
The period was characterized by temperatures between 15 and 25 'C and by stronger winds in the central hours of the day (2-7 mls).
During the 5 the wind remained most of the time in the W-SW sector, meaning advection of air masses from the industrialized area of Bremerhaven (see map, figure 43). In the evening the wind changed to SE directions also with the entrance of air masses from inland to the measurement site. The 6 ' of August showed the typical local circulation expected in a coastal area: land to sea (from S to W wind directions) in the first hours of the day, and entrance of the sea breeze (NNW) at about 14 hours. This Pattern has been observed relatively often in this site during the summer period and presents common characteristics with the situation observed in other coastal areas (Güste et al., 1988; Millan et al., 1992). The advection of air masses from the sea concurred with an increase in the ozone concentrations and low NO2 (about 10 u.g/m3). Ozone remained at about 70 pg/m3 till the change of wind direction detected again in the first hours of the 7111 morning.
The 7'" of August was characterized by light winds during the whole day. The wind direction moved in the first hours of the morning from NE to SW over the sectors corresponding to advection from urban air masses inland and to the consequent increment in the NO, concentrations. After 8 a.m. the wind remained in the E-SE sector most of the time till the end of the following day, indicating the advection of air masses from rural areas inland.
It is interesting to note the absence of NO2 maxima in the morning of the saturday 8 ' , probably as result of this wind direction and the decrease in the local traffic during this

day of the week. The wind speed increased during the day (5 mls) allowing the advection of air masses from the more distant urban areas: Hamburg (60 km), Bremen, (40 km), Hannover (150 km),
The SO2 concentrations presented a background level around 5-10 pg/m3 with sudden increases of concentration corresponding mainly to the emission from ships in the proximity of the measurement site.
In August the aerosol detected by the LAS-X comprised only particles in the accumulation mode. The values obtained from the 5t1' to the sth are plotted in figure 44. The maxima in the number of particles correspond to W and SSW wind directions indicating advection of air masses from urban and industrialized areas inland and are also associated to the maxima in NO2 concentrations. The increment in the number of particles observed in the evening of the sth could be the result of the advection of urban air above mentioned.
In figure 53 (a-h) are represented the variations in the size and volume distributions during the mentioned days. Every curve corresponds to the average of six hours of measurements. As can be Seen, the number concentration is determined mainly by the smaller particles with diameter around 0.1 pm. The volume shows an approximately bimodal distribution with the maxima around 0.2 pm and 1 pm diameter respectively. The shape and the range of the this distribution is comparable with the typical distributions found in the literature for areas influenced by urban aerosols (Whitby and Sverdrup, 1980), taking into account that no information is available for particles bigger than 3 pm diameter. The large volumes occurring in the 0.1-0.3 pm diameter can be attributed to the condensation and accumulation of the Aitken nuclei associated to the combustion processes typical of urban areas, while the contribution of the sea salt aerosol should be included in the peak around 1 um diameter.
Both size and volume distributions support the circulations presented above. The difference in the air masses advected is evident on the 6*. During that day the number of small particles is about an order of magnitude higher with the advection of air masses from the industrial area of Bremerhaven in the SW sector than during the sea breeze period. Moreover, the increase observed the sth of August in the contribution of the smaller particles to the volume distribution (simultaneous with a NOz increase) Supports the idea of advection of an aged urban plume in the evening.

!jth August 1992
0,Ol 'L1 1 0 ...:&... 12-18 hc
diameter (um) ... È.. 18-24 hc
diameter (um)
6* August 1992
1E+06 I
0,Ol 0,1 1 10 diameter (um)
0,Ol Oll 1 10
diameter (um)
Figure 53.- a) Number and volume distribution of particles rneasured on the 5th and 6th of August in Bremerhaven (1 992).

7th August 1992
0,01 1 10
diameter (um)
sth August 1992
0,Ol Ol l 1 10 diameter (um)
0,Ol 0,1 1 10 diameter (um)
Figure 53.- b) Number and volume distribution of particles rneasured on the 7"' and 8"' of August in Bremerhaven (1992).

b) 1 51h - 181h January 1993
The Os concentrations detected by the DOAS (25 - 50 ug/m3) are much lower than in the summer time as corresponds to lower photochemical activity (Figure 45).
The most interesting feature of the period are the maxima of O3 concentrations obviously not from photochemical production reached during the 1 ~ ~ " and 17' night. These maxima around 50 ug/m3 ( z 25 ppbv) were also observed in the monitors of the station belonging to the Environment Ministry and were associated with advection of air masses from marine origin.
The 15'' was characterized by NO2 concentrations much higher than the rest of the days (40-60 pg/m3) and a predominance of southwesterly wind directions. As well as during the 16th, high wind speeds (10 - 14 m/s) were detected. The change in the last hours of the evening to WNW directions, meaning the entrance of air masses from the sea, concurred with the increment to 50 ug/rn3 ozone, which changed again with the establishing of the Western wind at about midday influenced by the emissions from the industrial area. A similar circulation could be observed on the 171h. Most of the day presented winds from the WSW sector from inland and the change at about 17 hours to western-norihwestern directions of sea origin was accompained again by a nocturnal increase in the ozone concentrations. The change to WSW and SSW directions occuring the lgth during the evening and night represented an increase of the NO2 concentrations (from 15 to 30 pg/m3 approx.) and the consequent vanishing of ozone.
These variations observed in the concentrations of the studied components indicate that the ozone formed and transporied is not as quickly depleted over the sea as in inland, because of the lack of NO sources and low deposition, and the advection of air masses with marine origin can constitute a pseudo source of ozone during the night.
C) 1 7th - 2oth February
This period included the higher NO, and O3 concentrations of the month. After the frequent fog events of the first two weeks of February, this period was characterized by relative strong winds, reaching speeds of 10 - 15 m/s.
On the 17 ' the wind direction changed at 14 hours from NNW directions, indicating the entrance of air masses with main marine origin, to NNE which implied a longer trajectory over land with likely advection to the measurement site of air masses polluted by the local sources of the city of Bremerhaven. This circulation was reflected in the concentrations, with Os diurnal maximum (80 ug/m3) and NO, minimum (10 pg/m3) during the arrival of marine air (figure 46).
On the 1sth the wind direction after midday (W) and the simultaneity of NO2 and SO, peaks, suggest the influence of the emissions of the industrial area of Bremerhaven On

the air masses detected, probably OS the plume of a chemical factory located in that sector.
The 19"' presented winds of speeds around 10 mls most of the day, suggesting the possibility of transport from more distant areas. Until midday NW was the predominant wind direction, associated with O-; concentrations of about 80 ng/rn3 and low SO2 and NO2 concentrations, in agreement with the likely advection of air masses with marine influence. Despite the variations obsesved in the wind direction after 13 hours, only slight changes were observed in the concentrations once the inland direction was established, supporting the idea mentioned above of transport of background air from other areas. During this period HN02 concentrations around 1-2 [ig/m3 were obsesved even at about midday. Due to the effective HN02 photolysis negligible concentrations of this compound should be expected during the day. However, an HN02 emission in the proximity of the measurement site cannot be mied out.
Winds in the NW-W sector predominated the 2 0 ' OS February most of the day. The NO2 concentrations remained low with the exception of some peaks of about 40 pg/m3, probably f ro~n local temporal sources.
d) gtl' of January 1993
Frequent periods of fog and strong winds in the winter time of 1993 affected notably the pesformance of the LAS-X instsument. As a consequence, only a few complete days OS measurements were available.
The 9''' of January 1993 has been chosen as representative OS the winter aerosol in Bremerhaven. The DOAS concentrations are depicted in figure 54. This day was characterized by winds of moderate speeds (3 - 7 mls) coming from inland in the SW- SSW sector most of the day.
High NO2 concentrations around 80 pg/m3 and negligible O3 concentrations were observed till midday. SO2 peaks up to 200 pg/m3 occurred in the late evening when Western wind directions predominate.

Bremerhaven, January 1993
8 9 10 date 11 --
60 50 40 .
"0 - 20 10 0
8 9 10 date 11
8 9 10 date 11
I I J
8 9 10 date 11
Figure 54.- Trace concentrations, wind direction and speed measured the 9' of Januar\' 1993 in Bremerhaven.

The aerosol size and volume distributions are shown in figure 55. As in the summer period, the aerosol was constituted mainly by particles with diameters around 0.1 um ( lo4 partides ~ m " ~ approximately). Variations in the aerosol characteristics can be better observed in the volume distribution. The number of particles with diameter about 0.2 um increases during the day, reaching its maximum at about midday, in contrast with the diurnal minimum of the particles of l pm diameter. This Pattern is probably in part result of the photochemical production of the smaller particles during the day, which coagulate with the larger ones during the evening. The maxima are smaller than the corresponding to the Summer time perhaps as result of lower photochemical prodution.
Bremerhaven, 9"' January 1993
0,Ol 0,1 1 10
diameter (um)
0,Ol 0'1 1 10 diarneter (um)
Figure 55.- Number and volume distribution of particles corresponding to the measurements On the 9 of January 1993.

In order to obtain more information about the chemical composition of the aerosol, some samples were taken in the last week of May 1994 by means of two filter packs and a wet denuder. All of them corresponded to periods between 12 and 18 hours characterized by advection of air masses from the sea (NNW, 5-1 5 mls). Although the number of samples is not enough to draw any general conclusion, it can be mentioned that the nitrate concentrations remained within 0.5 and 2.5 &m3, nss sulphate between 1 and 2 ug/m3, HNOs on the range 0.5 - 1 .5ug/rn3 and SO2 1.5 - 9.5 pg/m3. These values are in the range of concentrations reported by Ottley and Harrison (1992) over the North Sea in a typical marine origin (see 5.1.2.3 .).
5.2.3.6. HNO, formation
One of the goals of the above presented observations was to gain a deeper knowledge in the formation mechanisms of HN02, present at significant concentrations in most urban areas. Due to the scarcity of reliable HN02 data, the site in Bremerhaven has not been included in this evaluation.
None of the other measuring sites showed any considerable HN02 concentration during the day, as expected from its rapid photolysis by sunlight (23). For completion all the values obtained have been plotted in the graphs although, as already mentioned, those concentrations lower than 20 were not considered in the interpretation.
The origin of HN02 can be studied by looking at the HN02/NOx ratio as function of time. Considering the fact that HN02 and NOÃ have their emission sources at the ground or are formed in the atmosphere, the ratio HN02/NOx should be nearly independent of variations in the nighttime boundary layer. The ratios HN02/N02 and HN02/N0 showed similar trends. As can be seen in figures 47, 48 and 49 an increase in the HNOi/NOx ratio can be observed in all measurement sites during the night, indicating a real formation of HN02.
In order to establish the origin of the HNO, formation observed, a more detailed study of the data set was carried out, attending to the following likely sources and reaction paths:
a) Homogeneous HN02 formation:
A rough estimation of the HN02 originated from the homogeneous gas phase reaction:
was made, considering a rate constant of 4.4 X 10"~' cm-6m0l'~ sec'l at 300 K (Kaiser and Wu, 1977), and similar conditions to the measuring campaigns, i.e., maximum

concentrations of 500 pg/m3 for NO2 and NO and relative humidity of 80 % at 15 ¡C Under these assumptions a HN02 formation of 0.003 pg/m3 per hour should be expected, which cannot be responsible for the observed formation rates (from 0.1 to 1.2 pg/m3 per hour).
b) Direct emission:
NO2 and HN02 are in some cases simultaneously emitted, for example by cars. The HN02 formation in automobile exhaust gases has been investigated by Kessler and Platt (1984), In the mentioned study, an average traffic HN02 emission rate of 0.15 % of NOx was estimated from a 2:3 fraction of Diesel and gasoline fuel consumed while an average rate of 0.5 % was measured near a highway. Further atmospheric measurements in polluted air showed a HN02/N02 ratio of 3 %, which is explained by the authors by further, unknown formation processes ocurring in the atmosphere. In laboratory studies of diluted automobile exhaust the HN02 formed after 3 hours represented 3 to 6 % of NO2, with NO concentrations below 10 % of the total NOx. The authors assigned this high value to a surface dependant HN02 formation, after a rapid NO oxidation.
In addition, Pitts et al.,(1984) have observed HN02 levels at a 2 m distance from the tail pipes of different types of vehicles. The HN02 levels ranged from non detectable (< 12 ppb) up to 300 ppb in the case of old cars with limited emission control devices, suggesting that this HN02 production could account for an important part of the atmospheric concentrations.
The measurements described in this study give typical values for the HN02/NOx ratio of 2 % in Milan, 1 % in Claro and 0.5 % in Ispra at the end of the night (see figures 47, 48 and 49). Since these results are much higher than those expected hy direct emission, a heterogeneous process must be made responsible for the HN02 formation.
C) Heterogeneous processes On surfaces:
The surfaces available for an heterogeneous reaction of formation are provided by either the ground or by particulate matter. Both cases were considered with regard to the possible influence of the nocturnal decrease of the boundary layer.
- Permanent surfaces
In Milan the calculated HNO2/NOX ratio is higher than in Claro or Ispra. It is higher than those found by Sjödi in Götebur (1988) and nearly reaches the values observed by Kessler and Platt, (1984), in polluted air masses and in laboratory studies. An additional formation on permanent surfaces induced by the strong influence of the nighttime Inversion layer in Milan, was assumed to be responsible for these high values. A decrease of the boundary layer depth diminishes the volume in which trace gases, emitted from the ground, are trapped. Under these conditions, the heterogeneous HN02 formation on permanent surfaces, like buildings, should become more important than the heterogeneous formation on atmospheric aerosols. This could lead to an increase in

the slope of the HNO2/NOX ratio. In fact, although the total surface of aerosols was nearly comparable at all three locations, the HN02/NOv ratio increase was much faster in Milan than in Claro and Ispra (see figures 47, 48 and 49).
Jenkin et al., (1988) calculated the rate corresponding to the conversion NO2 Ñ HNO, according to their laboratory studies and considering a bulk surface areahoundary layer height s/v = 3 X 1 0 ' ~ m"' for a typical nighttime boundary layer of 50 m depth, a value of the order of 1 0 " ~ m2 m"3 for the surface area available for reaction on particles in the case of a reasonably polluted air mass, and a H20 concentration of 1.36 X 1 0 ' molecule
(T = 278 K, r.h. = 60 %). Under these conditions a conversion rate of 0.036 % h" was obtained, indicating that the production rates of HN02 observed in the atmosphere at night are only partially explained by the reaction of NO2 and H20 occuring at ground surfaces and on atmospheric particulate. In this calculation the ground was assumed to be smooth and since the surface area available at the ground is related to surface roughness, this should be a lower limit of the real conversion rate. The difference seems to be anyway too high to be caused by this underestimation.
On the other hand, Harrison and Kitto (1994) have reported measurements of both downward and upward surface fluxes of HNO, made above grassland by means of annular denuders. These fluxes indicating surface exchange processes are interpreted in terms of two competing situations. At low NO2 concentrations the deposition of H N 0 2 to vegetative surfaces is dominant while the upward fluxes associated with NO2 concentrations bigger than 10 ppb are attributed to a combination of dry deposition and formation of HN02 at the surface by heterogeneous reactions of NO2. These fluxes would account for a rate HNO, formation with respect to NO2 of 0.7 - 3.4 % assuming a mixing layer depth of 100 m. The authors explained the difference with other laboratory studies (including the above mentioned) in the lesser adsorption of NO2 on the teflon surfaces used than in vegetation, which causes the subsequent lower reactivity observed.
Despite of the differences in the nature of surfaces (grass / buildings) these ratios could account for the nocturnal HN02 production observed in the present work, supporting the idea of main importance of permanent surfaces in the heterogeneous HN02 nocturnal production.
- Aerosol surfaces
The contribution of the surface of the aerosol in the heterogeneous HN02 formation was analysed by means of correlations considering the aerosol surface, calculated following the procedure described in 5.2.2.2., NO, NO2 and their products, and HNO, concentrations. Hourly averages during the period of time in which HN02 formation was expected (i.e., 20:00 to 04:OO hours) were used in the calculations.
In Ispra all correlations considered are improved when including the aerosol surface S in the calculations (Figure 56). This fact seems to indicate the importance of the aerosol in the formation of HN02. HN02 = f (NO *NO2 *S) and HN02 = f (N02*N02*S) give the best correlations.

The graph HN02 = f (NO *NO2 *S) suggests that the heterogeneous reaction:
N O + N 0 2 + M + 2 H N 0 2 + M (26)
participates in the nitrous acid nighttime formation. However, laboratory experiments (Atkinson, 1986; Febo et al., 1987; Jenkin, 1988) indicate that only the heterogeneous reaction:
should be responsible for the HN02 formation
0 1 2
HNO, (Mg.rn-3)
Figure 56.- Correlations between trace gases measured in Ispra (February 1990). r: correlation coefficient.
The influence of NO suggested by the correlations could be caused by the inverse proportionality between NO concentrations and the boundary layer height: when the boundary layer is low, NO emissions will be in a small air volume and there will be no ozone left to oxidize NO to NO2, leading to an increase in the NO concentrations. Furthermore, HNO, may increase since the HNO, formed On surfaces at the ground is trapped in a smaller volume. This could cause a correlation between HN02 and NO which is not due to reaction (26).
This fact leads to the conclusion that all the correlations studied in Ispra may be influenced by the increase in the concentrations as a consequence of the nocturnal decrease of the boundary layer, hindering the correct interpretation of results.
These hypothesisses are supported by the correlations obtained in the Ticino Valley, since at this site, where the lowest influence of the boundary layer is expected, NO seems to play an insignificant role in the HN02 formation, In addition, all correlations are less pronounced than those found in Ispra and Milan, as would correspond to an interfering effect of the boundary layer in these other sites. However, the correlations improve with the introduction of S, indicating the participation of the aerosol in the HN02 formation. The best correlation HN02 = f (S*N02) is plotted in figure 57.
Figure 57.- Correlations between trace gases measured near Claro (October 1989). r: correlation coefficient.

In Milan, a heavily polluted area, correlations do not improve with the introduction of S. That could imply that the aerosol has a weak influence in the HNO, formation. The best correlations found were HN02 = f (N0*N02), HNO, = f (N02*N02) and HN02 = f (NO), all of them with very similar correlation coefficients (figure 58). These results are in agreement with the observations of Appel et al.,(1990), who found a positive correlation between HN02 and NO concentrations (correlation coefficient r =
0.8) during a measure~nent campaign part of the Southern California Air Quality Study. The existente of a common emission source for the two pollutants responsible for this correlation was assumed by these authors, in contrast to the measurements of Kessler and Platt (1 984) and the observations of the present work.
Figure 58 . - Correlations between trace gases measured in Milan. (February 199 1). r: conelation coefficient.

The strong influence of the nighttime boundary layer in Milan is consistent with the weak correlations found when the aerosol surface S is included. The low inversion layer, as discussed above, can increase the importance of permanent surfaces like buildings in the heterogeneous formation of HN02. This is in agreement with the results obtained by Febo et al., (1994) who has studied the influence of different surfaces in the HN02 formation in urban areas and in indoor environments. The continuous increase of HN02 during the night, the high ratio HN02/NOx, the small influence of the aerosol Parameter S in the correlations and the strong influence of the nighttime boundary layer suggested by the HN02 to SO2 correlations, are consistent with the assumed importance of the HNO, formation on permanent surfaces like buildings.
Aerosol and trace gas measurements from four locations with different levels of pollution were analysed. The origin of the measured nighttime HN02 concentrations in the troposphere was investigated by means of the HN02/NOx ratio and correlation studies including HN02, NO2, NO concentrations and a parameter S related to the total surface of aerosols. S is calculated from tlie light intensity data along the beam path of the DOAS.
The following conclusions may be drawn:
- Urban atmospheres under many conditions may present a situation close to the photostationary equilibrium, probably as result of the predominance of the reaction of ozone formation from NO2.
- The HNOi, nitrate and non sea salt sulphate aerosol concentrations obtained during a short campaign in May 1993 in Bremerhaven were within the range of typical particulate and gaseous concentrations over the North Sea.
A closer study of the local atmospheric circulations indicated that Bremerhaven presents the characteristics of a complex coastal area, influenced by sedland circulations, more pronounced during the summer as corresponds to the stronger diurnal heating and cooling cycle, and by the emissions of local sources, of urban character but very heterogeneous in nature and occurrence.
Only small differences were observed in the number and volume distribution of the aerosol in winter and summer time, which seemed to have a maximum for particles with diameter around 0.3 um.
- The consistency of the aerosol average density, obtained considering the total aerosol volume calculated from the DOAS light levels, and the aerosol mass detected by a monitor, support the viability of using a DOAS System to achieve simultaneous information from trace gases and the variation of aerosol Parameters along the beam path.

- Witli respect to the HN02 formation, the increase of the HN02/NOx ratio noticed in Ispra, Milan and Ticino Valley throughout the night, clearly indicated a real formation of HN02, which could not be explained neither by the homogeneous reaction of formation (25) nor by direct HN02 emissions. Therefore it was concluded that the observed HN02 may be attributed to a heterogeneous formation. However, the nighttime decrease of the boundary layer complicates the interpretation, due to the diminution of the air volume below the inversion layer where the gases are trapped, and the likely increase in the importance of permanent surfaces like buildings, in the heterogeneous formation.

6 GENERAL CONCLUSIONS
In this study the HNO;, HN03 and nitrate data obtained in two different campaigns in the Arctic (Spitsbergen and Greenland Sea), in the Atlantic Ocean and in areas with different level of pollution at midlatitudes were analysed and discussed.
On the basis of the obtained results and with regard to the initial scientific aims of this work, the following conclusions may be drawn:
a) The Arctic environment
- Arctic areas are perturbed regularly as a consequence of the long range transport of pollutants from midlatitudes in summer and late winter time. This transport also includes nitrate aerosol and m O 3 , whose presence was detected in the Arctic troposphere, occasionally in concentrations much higher than expected in remote areas.
- Higher concentrations of HNo3 and particulate nitrate were observed in late winter in Spitsbergen than in summer in the Greenland Sea. Although both areas have different characteristics, the similarity of the atmospheric circulations and the long periods of daylight during the Spitsbergen campaign, allow their comparison. The observed results may be considered representative of the seasonal variation of concentrations experienced by the East Greenland Zone of the Arctic troposphere investigated.
i) In March the nitrate varied typically between 0.01 and 0.45 pg/m3 and the HNo3 between 0.01 and 0.08 pg/m3 (4 - 31 pptv). The ratio HN03/N03- remained typically between 0.15 and 0.6, with higher values (around 0.8) on some days suspected of being influenced by local sources. During a rain event the ratio decreased to 0.05, which corresponds with the higher solubility of HN03.
The concentrations of SO-, and sulphate detected were within the range typically found in Arctic Haze episodes.
ii) In summer three different situations were observed, associated with advection of air masses from:
- the Arctic Sea, normally characterized by bright conditions, leading to nitrate and HN03 concentrations between 0.006 and 0.02 pg/m3 and from 0.005 to 0.03 pg /m3 (2-12 pptv) respectively. The HNOJNO," ratio varied between 0.3 and 1.2.
- Northem Atlantic, apparently without influence from the continent, along with frequent periods of fog. The nitrate concentrations were around 0.01 pg/m3 and the HN03 ranged from < 0.01 to 0.015 pg/m3 (2 - 6 pptv approx.)

- Europe (Great Britain and Scandinavia), also characterized by long fog events. The nitrate concentrations varied between 0.05 and 0.15 pg/m3. The maximum HN03 concentration detected during this period was G 0.02 pg/m3.
During periods without fog the HNO3/NOim ratio was in the range 0.2-0.6 in air of European origin and 0.6-1.25 in air of North Atlantic origin. Although the sampling time of the wet denuder and filter packs are different it is to be expected that in remote areas such as this the airmass composition is likely to be quite uniform. Inside fog it is very difficult to ascertain the HN03/N03' ratio in the air prior to fog formation but the measurements strongly suggest that the major part enters the liquid or aerosol phase when fog forms.
-The two main factors affecting the effectiveness of the transport, i.e., meteorological conditions and deposition processes, influence in a different way in the surnrner and late winter periods:
i) In late winter the atmospheric coupling with midlatitudes was often observed and associated with higher aerosol concentrations, supporting the idea of its transport promoted by the lower effectiveness of wet and dry deposition at that time of the year.
However, other meteorological conditions suggesting the advection of air masses which had been more than five days in the Arctic areas, were also sometimes accompained by concentrations of the compounds of interest higher than expected. This confirms the accumulation in the Arctic troposphere of pollutants successively injected during the winter period increasing the background concentrations.
The few rain events observed were associated with lower concentrations as expected from the removal of soluble species.
ii) In surnrner the arrival of air masses from midlatitudes to the Greenland Sea was also documented. However, the greater activity of scavenging process makes Interpretation of data, particularly HN03, more difficult. Moreover, the frequent periods of fog are likely to have been associated with cycling of HNO3 between gas and aerosol phase in liquid fog drops, the balance between HN03 and NO3* aerosol being deterrnined by the availability of neutralising species in the fog.
- While non-sea-salt sulphate was mainly in the fine mode, nitrate was observed in both fine and coarse fractions, indicating their different mechanisms of formation and the reaction of HN03 with alkaline particles (sea salt aerosol or cmstal material).

- Very low HNOi concentrations, not significantly different from the blank values, i.e. less than 0.05 - 0.1 pg/m3, were detected during the spring campaign, partly probably due to the short nocturnal periods in which the measurements were taken.
- In the Arctic areas investigated the stratification of the low troposphere with a permanent surface Inversion makes quite unlikely the dowmnixing of air masses with the consequent input of NOÃ source components like PAN from the free troposphere. However, considering the altitude of Greenland, the advection of air masses with this origin could perhaps represent an input of free tropospheric air.
- Local emissions of the human settlements in the Arctic must be considered in the analysis of results although the influence in the increase of background concentrations should play a secondary role.
b) Marine environment
The results of the measurement campaign accomplished in the marine atmosphere verified the influence of long range transport from European and African emissions in the eastem Part of the Atlantic Ocean. This process influences the nitrate budget of the marine troposphere and its distribution in gas and particulate phase.
- From the view point of the background concentrations the ITCZ seems to delimit both hemispheres. In the southern hemisphere these concentrations were found to be around 0.4-0.6 pg/m3 for nitrate and 0.05-0.1 pg/m3 for HN03 (19-39 pptv approx.), in contrast with the 0.8-1.6 pg/m3 nitrate and 0.3 pg/m3 HNOi (1 16 pptv approx.) of the northern hemisphere.
- In the remote marine atmosphere the ratio H3Q/N03- had a value around 0.4.
- During rain events the concentrations of the components studied decreased to the minimum values observed, i.e., 0.2 us/m3 nitrate and < 0.05 pg/m3 HNO3 (20 pptv approx.).The HN03/N03' ratio decreased by a factor of about 6, in agreement with a quicker removal of HN03 than of particles by wet deposition processes.
- The variations in aerosol nitrate and HN03 concentrations could be attributed to three main sources:
i) Biomass buming, which with the emission among others of NOã hydrocarbons and NH3 and in the presence of sunlight, increases the photochemical activity of the air mass through the formation of ozone and OH radicals, and favours the conversion to HNo3 and nitrates. Transport over the sea promotes the contact with sea salt aerosol and the formation of involatile nitrates. Maximum levels of 1.6 pg/m3 nitrate and 0.75 pg/m3 (290 pptv approx) HN03 were attributed to these processes. The ratio HN03/ NO3 reached values around 1.4.

ii) Saharian dust, with the subsequent input of particles of cmstal origin and probably in combination with biomass buming processes, was associated with nitrate md HNO3 concentrations around 0.8 and 0.12 ug/rn3 respectively and to a typical ratio HN03/N03 around 0.2.
iii) Emissions from Europe, whose arrival to the area investigated implied nitrate concentrations between 0.55 and 3.5 pg/m3 and HN03 between 0.1 and 0.95 ug/rn3 (39-368 pptv approx.), about three times higher than the maximum background concentrations. The ratio HN03/N03" varied notably between 0.07 and 1.32, in agreement with the variety of processes involved in the gas - particle conversion in these heterogeneous air masses.
C) Environment at midlatitudes
- The concentration of the components investigated showed a high diurnal variability associated with local circulations, in contrast with their negligible influence in polar areas.
- The aerosol nitrate and Wo3 concentrations measured in a short campaign in the coastal area of Bremerhaven (0.5 - 2.5 ug/m3 and 0.5 - 1.5 ug/m3 respectively) were within the range of those observed in marine areas of the Atlantic Ocean influenced by European continental emissions. The HN03/N03' ratio remained practically constant between 0.4 and 0.5. On the average these concentrations were about 10-15 times for nitrate and 25 - 70 times for HN03 higher than those observed in Spitsbergen in spring, and in air masses of Europe origin detected in the Greenland Sea in sumrner respectively. Despite the roughness of this estimation, it illustrates again the seasonal difference in the removal conditions of the Arctic.
- In Bremerhaven no significant seasonal difference was found in the volume and size distribution of particles of diameter between 0.09 and 0.3 pm. Both distributions showed the typical pattem of areas influenced by an urban aerosol.
- The study of the HN02 diumal evolution led to the following conclusions:
* The HN02 detected in moderately and polluted areas showed a typical pattem with an increase of concentration during the night and its disappearence after sunrise, in conformity with its effective photolysis.
* The contribution of both the homogeneous reaction of formation and the direct HN02 emission was estimated and found to be much too low to explain the range of concentrations detected.
* The increase during the night of the HNO2/NOX ratio, calculated to exclude the influence in the HN02 variations of changes in meteorological conditions or in the rate of emissions, verified the existence of a nocturnal HN02 formation due to chemical reactions. The existence of an heterogeneous reaction of formation was therefore suggested.

* In order to evaluate the contribution of the aerosol in the implied heterogeneous formation of HNOi, a Parameter S related to the total surface of the aerosol was calculated from the light intensity data of the DOAS. The applicability of the S calculation procedure was estimated by relating volume data, obtained with the same parameters as the surface, with total mass concentrations given by an aerosol monitor in one of the measurement sites. The range of the aerosol averaged densities obtained in this way (0.25 - 3 g/cm3) indicated the suitability of using S to follow the variations of aerosol parameters along the beam path.
* Correlation studies including S and NO, NO2 and HN02 concentrations suggested the participation of the surface of aerosol in the HN02 formation. However, the influence of the nocturnal decrease of the boundary layer seemed to interfere notably in the interpretation of results in those areas with a predominance of stagnant conditions during the night. The participation of permanent surfaces like buildings in the heterogeneous HN02 formation was considered to be important.
These HN02 observations accomplished at midlatitudes can be used to explain, to some extent, the situation to be expected in polar areas. During periods of predominance of daylight like in spring and summer, HN02 will be photolyzed. Due to its rapid depletion after sunrise, the HN02 formed at midlatitudes should not be transported Iong distances. This is in agreement with the results obtained in Spitsbergen, although, given the few measurements available for the short nocturnal periods of the spring campaign, they cannot be considered representative for the winterly troposphere. Additionally, to a first approximation, the low aerosol concentrations and the lack of surfaces like vegetation and buildings, in which the heterogeneous formation would be favoured in the presence of precursors, should limit considerably the probability of the presence of HN02 in the polar troposphere. However, more research would be required to evaluate the extent to which the Arctic Haze and ground surfaces like ice and Snow could influence the HN02 formation.

7 REFERENCES
Allegrini, I, Liberti, A. et al. (1987) Annular denuder method for sampling reactive gases and aerosols in the atmosphere. The Science of the Total Environment, Vol. 67, pp. 1-16.
Andres H., M.D., Notholt, J., Hjorth, J. Schrems, 0. (1994) On the origin of HN02 in semi-rural and polluted areas. Physicochemical behaviour of atmospheric pollutants. Proceedings of the sixth european symposium held in Varese, pp 287-292
Andres H., M.D., Notholt, J., Hjorth, J. Schrems, 0. (1995) A DOAS study of the fonnation of nitrous acid at urban and non-urban sites (accepted in Atmospheric Environment)
Anlauf, K.G., Fellin P., Wiebe, H.A., Schiff, H.I., Mackay G.I. (1985) A comparison of three methods for measurement of atmospheric nitric acid and aerosol nitrate and ammonium. Atmospheric Environment, Vol. 19, No. 2, pp. 325-333.
Anlauf, K.G., Wiebe, H.A., Fellin, P. (1986) Characterization of several integrative sampling methods for nitric acid, sulphur dioxide and atmospheric particles. JAPCA, Vol. 36, No. 6, pp. 715-723
Anlauf, K.G. et al. (1988) Measurement of atmospheric nitric acid by the filter method and comparisons with the tuneable diode laser and other methods. Atrnospheric Environment, Vol. 22, No. 8, pp. 1579-1586.
Anlauf, K.G., Wiebe, H.A., et al. (1991) Intercomparison of atmospheric nitric acid measurements at elevated ambient concentrations. Atmospheric Environment, Vol. 25A, No. 2, pp. 393-399.
Aoki, S. (1995) Unpublished results
Appel, B.R., Wall, S.M., Tokiva, Y., Haik, M. (1979) Interference effects in sampling particulate nitrate in ambient air, Atmospheric Environment, Vol. 13, pp. 3 19-325.

Appel, B.R., Tokiva, Y., Haik, M. (1981a) Sampling of nitrates in ambient air. Atnzospheric Environment, Vol. 15, pp. 283-289.
Appel, B.R. and Tokiwa, Y. (1981b) Atmospheric particulate nitrate sarnpling errors due to reactions with particulate and gaseous strong acids. Atmospheric Environment, Vol. 15, pp. 1087-1089.
Appel, B.R., Tokiwa, Haik, M., Kothny, E.L. (1984) Arifact particulate sulfate and nitrate formation On filter media Ahzospheric Environment, Vol. 18, No. 2, pp. 409-4 16.
Appel, B.R., Tokiwa, Y., Kothny, E.L., Wu, R., Povard, V. (1988) Evaluation of procedures for measuring atmospheric nitric acid and ammonia. Afnzospheric Environment, Vol. 22, No. 8, pp. 1565-1 573.
Appel, B.R., Winer, A.M., Tokiwa, Y., Biermann, H.W. (1990) Comparison of atmospheric nitrous acid measurements by annular denuder and differential optical absorption Systems. Atnzospheric Environment, Vol. 24A, No. 3, pp. 61 1-616.
Atkinson, R and Lloyd, A.C. (1984) Evaluation of kinetic and mechanistic data for modeling photochemical Smog Journal of Phys. Chem. Ref. Data, Vol. 13, pp. 3 15.
Bandy, A.R., Scott, D.L., BIomquist, B.W., Chen, §.M. Thornton, D.C. (1992) Low yields of SO2 from dimethyl sulfide oxidation in the marine boundary layer. Geophysical Research Leiters, Vol. 19, No. 1 1, pp. 1 125- 1 127.
Barrie, L A . (1986) Arctic air pollution: An overview of current knowledge. Atnzospheric Environment, Vol. 20, No. 4, pp. 643-663.
Benning, L. (1994) Die Annular-Denuder-Anreicherung zur Bestimmung von HN02 in der Gasphase. Diplomarbeit: Westfälisch Wilhelms-Universitä Münster Anorganische Chemie. Lehrstuhl fü Analytische Chemie.
Braathen, G.O. and Joranger, E. (1993) Atmospheric chemistry research station on the Zeppelin mountain Svalbard. Poster presented in the 5th. International Symposium on Arctic Air Chemistry
Bürgermeister S. (1991) Atmosphärisch Verteilung von Methanfulsonat und Sulfat als Oxidationsprodukte von Dimethylsulfid. Ph.D.thesis: Berichte des Instituts fü Meteorologie und Geophysik, No. 90. Universitä FrankfurtJMain.

Calvert, J.G. (1982) The chemistry of the polluted troposphere. In: Chemistry of the impollüte and polluted troposphere, pp.425-456. D. Reidel Publishing Company.
Chameides, W.L., Stelson, A.W. (1992) Aqüeous-phas chemical processes in deliquescent seasalt aerosols. Berichte der Bimsen-Gesellschaft fŸ physikalische Chemie, Vol. 96, No. 3, pp. 461- 469.
Charlson, R.J., Schwartz, S.E., Haies, J.M. et al. (1992) Climate forcing by anthropogenic aerosols. Science, Vol. 255, pp. 423-430.
Clarke, A.D., Ahlquist, N.C., Covert, D.S. (1987) The Pacific marine aerosol: evidence for natural acid sulfates. Journal Geophysical Research, Vol. 92, pp. 4 179-4 190.
Crutzen, P.J. and Andreae, M. 0. (1990) Biomass burning in the Tropics: impact on atmospheric chemistry and biogeochemical cycles. Science, Vol. 250, pp. 1669-1 678,
Crutzen, P.J. and Zimmermann, P.H. (1991) The changing photochemistry of the troposphere. Tellz~.t, Vol 43AB, pp. 136-151.
Debatin, S (1995) Unpublished results
De Leeuw, G. (1986) Vertical profiles of giant particles close above the sea suface. Tell~i.~, Vol. 38B, pp. 5 1-61,
De Santis, F., Febo, A., Perrino, C. (1987) Nitrite and nitrate formation on a sodium carbonate layer in the presence of nitrogen dioxide. A d i di Chimica, pp 763-769.
De Santis, F., Febo, A., Perrino, C. (1988) Negative interference of teflon sampling devices in the determination of nitric acid and particulate nitrate. The Science of fhe Total Environment, Vol. 176, pp. 93-99.
Drummond, J. et al. (1986) Bestimmung des chemischen Abbaus der Stickoxide in der Atmosphäre Abschlußberich Vorhaben KBF 52. Gesellschaft fü Strahlen- und Umweltforschung mbH, München

Duce, R.A. et. al., (1991) The atmospheric input of trace species to the world ocean. Global Biochemicul Cycles, Vol. 5, pp. 193-259.
Egli, R.A. (1990) Nitrogen oxide emissions from air traffic. Chimiu, Vol. 44, pp. 369-371.
Emery, C.A., Haberle, R.M., Ackerman, T.P. (1992) A one-dimensional modeling study of carbonaceous haze effects On the springtime Artic environment. Journal of Geophysical Research, Vol. 97, No. D1 8, pp. 20.599-20.613.
EPA (U.S. Environmental Protection Agency) (1989) Determination of reactive acidic and basic gases and particulate matter in indoor air. Compendium chapter IP-9.
Fahmy, O.G. and Fahmy, M.J. (1976) Mutagenicity of N-Acetoxyethyl-N-ethylnitrosmine and N-N-diethylnitrosamine in relation to the mechanismos of metabolic activation of dialkylnitrosamines. Cancer Research, Vol. 36, pp. 4504-45 12.
Febo, A., De Santis, F., Perrino, C. (1986) Measurement of atmospheric nitrous and nitric acid by means of annular denuders. In: Physico-chemical behaviour of atmospheric pollutants, Air Pollution Research, Report 2, pp 121-125.
Febo, A., De Santis, F., Perrino, C., Liberti, A. (1987) The study of the reaction between nitrogen oxides and water vapour by means of annular denuder tubes. In: Proceedings of the workshop "Tropospheric NOx chemistry-gas phase and multiphase aspects". pp 62-67.
Febo, A. and Perrino? C. (1988) Determination of nitric acid and particulate nitrate by the annular denuder thecnique. In: Proceedings of the field intercomparison exercise On nitric acid and nitrate measurement. Air pollution research report 22, pp 142-149.
Febo, A., De Santis, F., Perrino, C., Giusto, M. (1989) Evaluation of laboratory and field performance of denuder tubes: a theoretical approach. Atmospheric Environment, Vol. 23, No. 7, pp. 15 17-1 530.
Febo, A. and Perrino? C. (1991) Prediction and experimental evidence for high air concentration of nitrous acid in indoor environments. Atmospheric Environment, Vol. 25A, No. 516, pp. 1055-1061.

Febo et al., (1994) Nitrous acid in the oxidation processes in urban areas. In: Proceedings of the sixth european symposium of physicochemical behaviour of atmospheric pollutants held in Varese, pp.277-285.
Ferm, M. (1986) A Na2C03-coated denuder and filter for determination of gaseous HN03 and particulate NO3- in the atmosphere, Atniospheric Environment, Vol. 20, No. 6., pp. 1 193- 120 1
Finlayson-Pitts, B.J., (1983) Reaction of NO2 with NaCl and atmospheric implications of NOCl formation Nature, V01 306, pp 676-677
Finlayson-Pitts, B.J. and Pitts, J.N. (1986) Atmospheric Chemistry: Fundamentals and experimental techniques A Wiley - Interscience Publication. John Wiley & Sons. New York.
Fitzgerald, J.A. (1991) Marine aerosols: A review. Atnzospheric Environment, Vol. 25A, No. 314, pp. 533-545
Galloway, J.N. et al. (1985) The deposition of sulfur and nitrogen from the remote atmosphere. In " The biogeochemical cycling of Sulfur and nitrogen in the remote atmosphere" D , Reidel Publ. Comp., Dordrecht, pp. 143-175.
Goldan, P.D., Kuster, W.C., Albritton, D.L., Fehsenfeld, F.C., et al. (1983) Calibration and test of the filter-collection method for measuring clean-air, ambient levels of nitric acid. Atnzospheric Environment, Vol. 17, No, 7, pp, 13 55- 13 64.
Gorrnley, P., Kennedy M. (1949) Diffusion from a stream flowing through a cylindrical tube. Proc. R. Zr. Acad, Vol, 52A, pp. 163-169.
Graedel, T.E. and Crutzen, P.J. (1994) Aerosole und Hydrosole. In "Chemie der Atmosphäre Bedeutung fü Klima und Umwelt" Spektrum, Akademischer Verlag., pp 79-100.
Gras, J.L. and Ayers, G.P. (1983) Marine aerosol at southern midlatitudes. ,Jozmzal Geophysical Research, Vol, 88, pp. 10.66 1 - 10.666
Güsten H. et al. (1988) Photochemical formation and transport of ozone in Athens, Greece Atmo.spheric Environn~ent, Vol. 22, pp, 1855-1 86 1.

Harris, G.W., Carter, W.P.L., Winer, A.M., Pitts, Jr., J.N. (1982) Observations of nitrous acid in the Los Angeles atmosphere and implications for predictions of ozone-precursor relationships. Environmental Science & Technology, Vol. 16, pp, 4 14-41 9.
Harris, G.W., Mackay, G.I., Iguchi, T. et al. (1987) Measurement of NO2 and HN02 in diese1 exhaust gas by tunable diode laser absorption spectrometry. Environmental Science & Technology, Vol. 21, pp, 299-304.
Harrison, R.M. and Pio, C.A. (1983) Size differentiated composition of inorganic atmospheric aerosols of both marine and polluted continental origin, Atmospheric Environnzent, 17, pp. 1733-1 738,
Harriso~~ R. M., Sturges W.T., Kitto A,-M. N., Li, Y. (1990a) Kinetics of evaporation of ammonium chloride and ammonium nitrate aerosols A fmospheric Environnzent, Vol. 24A, pp, 9 I - 102.
Harrison, R.M. and JGtto, A.M. (1990b) Field intercomparison of filter pack and denuder sampling methods for reactive gaseous and particulate pollutants. Atnzospheric Environmenf, Vol. 24A, No, 10, pp. 2633-2640.
Harrison, R.M. and MacKenzie, A.R. (1990~) A numerical simulation of kinetic constraints upon achievement of the ammonium nitrate dissociation equilibrium in the troposphere. Afnzospheric Environnzent, Vol. 24A, pp. 901-102.
Harrison, R.M. and JGtto, A-M. (1994) Evidence for a sudace source of atmospheric nitrous acid Atnzospheric Environnzent, Vol. 28, pp. 1089- 1094.
Heidam, N.Z. (1985) Crustal enrichments in the Arctic aerosol, Atmospheric Environnzent, Vol. 19, No, 12, pp. 2083-2097
Heintzenberg, J. (1980) Particle size distribution and optical properties of Arctic Haze. Tellus, Vol. 32, pp, 251-260.
Heintzenberg, J., Hansson, H.C., Lannefors, H. (1981) The chemical composition of Arctic Haze at esund, und, Spitsbergen Tellz~s, Vol. 33, pp. 162-171.

Heintzenberg, J. and Larssen (1983) SO2 and SO:- in the Arctic; interpretation of observations at 3 Norwegian Arctic- subarctic stations. Z'ell~is, Vol. 35B, pp. 255-265,
Heintzenberg, J., Ström J., Ogren, J.A. (1991) Vertical profiles of aerosol properties in the summer troposphere of Central Europe, Scandinavia and the Svalbard region. A fniospheric E~n~iror7nze~zt, Vol, 25A, No, 314, pp. 621-627,
Heintzenberg, J. and Leck, C. (1994) Seasonal variation of the atmospheric aerosol near the top of the marine boundary layer over Spitsbergen related to the Arctic sulphur cycle. Te//zis, Vol 46B, pp. 52-67.
Hering, S.V., Lawson, D.R., Allegrini I., Febo, A., Perrino, C., et al. (1988) The nitric acid shootout: field comparison of measurement methods. Atniospheric Ein~ironn~ent, Vol. 22, No, 8, pp, 15 19-1539.
Hildemann, L.M., Russell, A.G., Cass, G.R. (1984) Ammonia and nitric acid concentrations in equilibrium with atmospheric aerosols: experiment versus theory. Atniospheric En~~ironment, Vol. 18, No, 9, pp. 1737-1750.
Hjorth, J. (1993) Unpublished results
Honrath, R.E. and Jaffe, D.A. (1992) The seasonal cycle of nitrogen oxides in the Arctic troposphere at Barrow, Alaska ,Jozirnal of Geophysical Research, Vol. 97, No. DIS, pp. 20.6 15-20.630.
Horvath, H., (1993) Atmospheric light absorption. A review. Atnzospheric Emironfiient, Vol. 27A, No 3, pp. 293-3 17.
Huebert, B.J. (1980a) Nitric acid and aerosol nitrate measurements in the Equatorial Pacific region Geophysica/ Research Letters, Vol. 7, No. 5, pp. 325-328,
Huebert, B.J. and Lazrus, A.L. (1980b) Tropospheric gas-phase and particulate nitrate measurements. .Joiirna/ of Geophysical Research, Vol. 85, No. C12, pp, 7322-7328
Huebert, B.J. and Robert (1985) The dry deposition of nitric acid to grass, .Jour~~a/ Geophysical Research, Vol. 90, pp. 2085-2090.

Ibrom, A., Qi, L., Cai, Y.Q., Bredemeier, M., Gravenhorst, G. (1991) Reaktive Stickstoffiompor~enten übe dem Atlantik, Abschlußberich an die DFG.
Jacob, D.J.? Wofsy, S.C., Bakwin, P.S., Fan, S. et al., (1992) Summertime photochemistry of the troposphere at high northern latitudes ,Journa/ of Geophysica/ Research, Vol. 97, No. D 1 5, pp. 1 6,42 1 - 16,43 1 .
Jenkin, M.E., Cox, R. and Williams, D. (1988) Laboratory studies of the kinetics of formation of nitrous acid from the thermal reaction of nitrogen dioxide and water vapor. Atmospheric Environment, Vol. 22, No. 3, pp, 487-498.
Jolin, W., Wall, S.M., Ondo, J.L. (1988) A new method for nitric acid and nitrate aerosol measurement using the dichotomus sampler. Atnzospheric Environment, Vol. 22, No. 8, pp. 1627-1635.
Kaiser? E. and Wu, C. (1977) A kinetic study of the gas phase formation and decomposition reactions of nitrous acid. Journal of Physical Chenzisq, Vol. 8 1, pp, 170 1 - 1706.
Keuken, M.P., Schoonebeek, C., Wensveen-Louter, A. and Slanina, J. (1988) Simultaneous sampling of NH3, HN03, HCl, SO2 and H202 in ambient air by a wet annular denuder system Atmospheric Environment, Vol. 22, No. 1 I, pp. 2541-2548.
Kessler, C. and Platt, U. (1984) Nitrous acid in polluted air masses, Sources and formation pathways. Physicochemical behaviour of atmospheric pollutants. Proceedings of the third european symposium held in Varese, pp. 412-422.
Kitto, A-M. and Harrison, R.M. (1992) Nitrous and nitric acid measurements at sites in south-east England. Afnzospheric Environment, Vol. 26A, No. 2, pp. 235-241.
Kleefeld, Ch., and Schrems, 0. (1995) DMS and aerosol distribution in the boundary layer at Spitsbergen, Poster presented in the European Geophysical Society, General Assembly in Hamburg.
Koutrakis, P., Wolfson, J.M., Slater, J.L., Brauer, M., Spengler, J., et al. (1988) Evaluation of an annular denuderlfilter pack system to collect acidic aerosols and gases. Er~viroiznzental Science & Technology, Vol. 22, P. 1463,
Kritz? M. and Rancher, J. (1980) Circulation of Na, Cl and Br in the tropical marine atmosphere. ,Jozdri~al of Geophysical Research, Vol. 85, pp. 1633- 1639.

Lazrus, A.L. et al., (1985) Automatic method for hydrogen peroxide in atmospheric precipitation. Analytical Chemistry, Vol. 57, pp. 91 7-922.
LeBel, P.J., Huebert, B.J. et al., (1990) Measurements of tropospheric nitric acid over the Western United States and Northeastern Pacific Ocean. Journal of Geophysicul Research, Vol. 95, No. D7, pp. 10.199-10.204.
Lee, H.S., Wadden, R.H., Scheff, P.A. (1993) Measurement and evaluation of acid air pollutants in Chicago using an ammlar denuder System. Atmospheric Environment, Vol. 27A, No. 4, pp. 543-553.
Leyendecker, W. (1993) Unpublished results
Liu, S.C., Trainer, M, Fehsenfeld, F.C. et al., (1987) Ozone production in the rural troposphere and the implications for regional and global ozone distributions. Journal of Geophysical Research, Vol. 92, No. D4, pp. 4191-4207.
Losno, R., Bergametti, G., Carlier, P. (1992) Origins of atmospheric particulate matter over the North Sea and the Atlantic Ocean. Journal of Atmospheric Chemistry, Vol. 15, pp. 333-352.
Maahs, H.G. (1983) Kinetics and mechanism of the oxidation of S (IV) by ozone in aqueous solution with particular reference to SO2 conversion in non urban tropospheric clouds. Journal of Geophysical Research, Vol. 88, pp. 10.721-10.736.
Mamane, Y. and Mehler, M. (1987) On the nature of nitrate particles in a coastal urban area. Atmospheric Environment, Vol. 21, No. 9, pp. 1989-1994.
Mamane, Y., Gottlieb, J. (1992) Nitrate formation on sea-salt and mineral particles. A single particle approach. Atmospheric Environment, Vol. 26A, No. 9, pp. 1763-1769.
Millan Mufioz, M. and Artifiano, B. (1992) Mesometeorological cycles of air polution in the Iberian Peninsula. Air pollution research report 44. Commission of the European Communities.
McInnes, L.M., Covert, D.S., Quinn, P.K., Germani, M.S. (1994) Measurements of chloride depletion and sulfur enrichrnent in individual sea-salt particles collected from the remote marine boundary layer. Journal of Geophysical Research, Vol. 99, No. D4, pp. 8257-8268.

Mozurkewich, M. (1993) The dissociation constant of ammonium nitrate and its dependence On temperature, relative humidity and pasticle size. Atmospheric Environment, Vol. 27A, No. 2, pp. 261-270.
Nguyen, B.C., Bonsang, B., Lambert, G. (1974) The atmospheric concentration of sulfur dioxide and sulfate aerosols over Antarctic and subantartic areas and oceans. Te//us, Vol. 26, pp. 241-248.
Nitrogen species methods comparison study (1988). Afmospheric Environment, Vol. 22, No. 8, pp. 15 17- 1699
Notholt, J. (1990) Measurement of atmospheric pollutants by a differential optical absorption spectrometer. Commission of the European Communities. Joint Research Centre - Ispra. EUR 12673 EN.
Notholt, J. and Raes, F. (1990) Test of in situ measurements of atmospheric aerosols and trace gases by long path transmission spectroscopy. Journal of Aerosol Science, Vol. 19, pp. 193-1 96.
Notholt, J., Hjorth, J., Raes, F. and Schrems, 0. (1991) Simultaneous long path field measurements of HN02, CH20 and aerosol. Berichte der Bimsen-Gesellschaft fiir physikalische Chemie, Vol. 96, No. 3, pp. 291- 293.
Notholt, J., Beninga, L, Schrems, 0 . (1995) Shipborne FTIR measurements of atmospheric trace gases on a south (33 O S ) to north (53 ON) Atlantic traverse. (Submitted to Applied Spectroscopy).
Ockelmann, G. (1982) Untersuchung der Verteilung des atmosphärische Schwefeldioxides übe dem Atlantik und der Arktis. Diplomarbeit, Institut fü Meteorologie und Geophysik der Universitä Frankfurtmain.
Ottar, B., Gotaas, Y. et al., (1986) Air pollutants in the Arctic. Final report of a research Programme conducted on behalf of British petroleum, LTD Norwegian Institute for Air Research.
Ottley, C.J. and Harrison, R.M. (1992) The spatial distribution and pasticle size of some inorganic nitrogen, sulphur and chlorine species over the North Sea. Atmospheric Environment, Vol. 26A, No. 9, pp. 1689-1699.

Pacyna, J.M. and Ottar, B. (1989) Origin of natural constituents in the Arctic aerosol. Atmospheric Environment, Vol. 23, No. 4, pp. 809-8 15
Papenbrock, Th. and Stuhl, F. (1989) Detection of nitric acid in air by a laser-photolysis fragment-fluorescence (LPFF) method. Proceedings of the Fifth European Symposium of physico-chemical behaviour of atmospheric pollutants (1989). Commission of the European Communities. Kluwer Academic Publishers, the Netherlands. pp 65 1-656.
Papenbrock, Th., Stuhl, F., Müller K.P., Rudolph, J. (1992) Measurement of gaseous HN03 over the Atlantic Ocean. Journal of Atmospheric Chemistry, Vol. 15, pp. 3 69-379.
Parungo, F.P., Nagamoto, C.T., Madel, R., Rosinski, J., Haagenson, P.L. (1986) A study of marine aerosols over the Pacific Ocean. Journal of Atmospheric Chemistry, Vol. 4, pp. 199-226.
Perrino, C., De Santis, F., Febo, A. (1988) Uptake of nitrous acid and nitrogen oxides by nylon surfaces: implications for nitric acid measurement. A frnospheric Environment, Vol. 22, No. 9, pp. 1925-1 930.
Perrino, C., De Santis, F., Febo, A. (1990) Criteria for the choice of a denuder sampling technique devoted to the measurement of atmospheric nitrous and nitric acids. Atmospheric Environment, Vol. 24A, No. 3, pp. 617-626.
Pitts, Jr., J.N., Wallington, T.J., Biermann, H.W., Winer, A.M. (1985) Identification and measurement of nitrous acid in an indoor environment. Atmospheric Environment, Vol. 19, pp. 763-767.
Pitts, Jr., J.N., Biermann, H.W., Winer, A.M., Tuazon, E.C. (1984) Spectropic identification and measurement of gaseous nitrous acid in dilute auto exhaust. Afrnospheric Environment, Vol. 18, pp. 847-854.
Platt, U., Ferner, D., Harris, W. and Patz, H.W., (1979) Simultaneous measurement of atmospheric CH20, O3 and NO2 by differential optical absorption. Jozir11al of Geophysical Research, Vol. 84, pp. 6329-6335
Platt, U., Rudolph, J., Brauers, T., Harris, W. (1992) Atmospheric measurements during Polarstern cruise ANT VIIJ1, 54' N to 32O S: An overview. Journal of Atmospheric Chemistry, Vol. 15, pp. 203-214.

Possanzini, M., Febo, A., Liberti, A. (1983) New design of a high-performance denuder for the sampling of atmospheric pollutants. Atmospheric Environment, Vol. 17, No. 12, pp. 2.605-2.610.
Prospero, J.M. (1979) Mineral and sea salt aerosol concentrations in various ocean regions Journal of Geophysical Research, Vol. 84, pp. 725-73 1.
Quinn, P.K., Charlson, R.J., Bates, T.S. (1988) Simultaneous observations of ammonia in the atmosphere and ocean Nature, Vol. 335, pp. 336-338.
Raerndonc, H., Maenhaut, W., Andreae, M.O. (1986) Chemistry of marine aerosols over the tropical and equatorial Pacific. Journal of Geophysical Research, Vol. 9 1, pp. 8.623-8.636.
Rahn, K.A., Joranger, E., Semb, A., Conway, T.J. (1980) High winter concentrations of SO2 in the Norwegian Arctic and transport from Eurasia. Nature, Vol. 287, pp. 824-826. Rahn, K.A., (1985) Progress in Arctic air chemistry, 1980- 1984. Atmospheric Environment, Vol. 19, No. 12, pp. 1987-1994.
Rohrer, F. and Brüning D. (1992) Surface NO and NO, mixing ratios measured between 30' N and 30' S in the Atlantic region. Journal of Atmospheric Chenzistry, Vol. 15, pp. 253-267.
Rondh, A. and Sanhueza, E. (1989) High HONO atmospheric concentrations during vegetation burning in the tropical savannah. Tel/us, Vol. 41B, pp. 474-477.
Russell, A.G., McRae, G.J., Cass, G.R. (1985) The dynamics of nitric acid production and the fate of nitrogen oxides Atmospheric Environment, Vol. 19, No. 6, pp. 893-903.
Russell, L.M., Pandis, S.N., Seinfeld, J.H. (1994) Aerosol production and growth in the marine boundary layer. Journal of Geophysical Research, Vol. 99, No. D10, pp. 20.989-21.003
Savoie, D.L. and Prospero, J.M. (1982) Particle size distributions of nitrate and sulfate in the marine atmosphere. Geophysical Research Letters, Vol. 9, pp. 1207- 12 10.

Savoie, D.L., Prospero, J.M., Nees, R.T., (1987) Nitrate non-sea-salt sulfate, and mineral aerosol over the northwestern Indian Ocean Journal of Gcophysical Research, Vol. 92, pp. 933-942
Savoie, D.L., Prospero, J.M., Merril, J.T., Uematsu, M. (1989) Nitrate in the atmospheric boundary layer of the tropical South Pacific: implications regarding sources and transport. Journal of Afmospheric Chemistry, Vol. 8, pp. 3 19-4 15.
Schnitzler, K. (1995) Unpublished results
Schwikowski, M., Naumann, K., Dannecker, W. (1988) Determination of nitric acid and particulate nitrate in the marine atmosphere employing a diffusion denuder and a filter pack. Journal of Aerosol Science, Vol 19, pp. 13 11 - 13 14.
Sehmel, G.A. (1980) Particle and gas dry deposition: a review. Atmospheric Environment, Vol. 14, pp. 983-101 1
Shaw Jr., R.W., Stevens, R.K., Bovermaster, J. (1982) Measurements of atmospheric nitrate and nitric: the denuder difference experiment. Atmospheric Environment, Vol. 16, No. 4, pp. 845-853.
Sheppard, J.C., Hardy, R.J., Hopper, J.F. (1983) Antarctic hydroxyl radical measurements. Antarctic Journal of the U. S. , Vol. 18, pp. 243-244.
Sickles, J.E., Hodson, L.L, McCIenny, W.A., et al., (1990) Field comparison of methods for the measurement of gaseous and particulate contributors to acidic dry deposition. Afmospheric Environment, Vol. 24A, pp. 155-1 65
Singh, H.B., Salas, L. and Viezee, W. (1986) The global distribution of peroxyacetyl nitrate. Natzire,.Vol.321, pp. 588-591.
Singh, H.B. (1987) Reactive nitrogen in the troposphere. Chemistry and transport of NOx and PAN Environmental Science & Technology,.Vol. 21, No. 4, pp. 320-327.
Singh, H.B., Herlth, D., O'Hara, D. et al. (1992) Relationship of peroxyacetyl nitrate to active and total odd nitrogen at northern high latitudes: Influence of reservoir species on NO,; and 03. Journal of Geophysical Research, Vol. 97, No. D1 5, pp. 16523-16530.

Sjödin A. (1988) Studies of the diurnal variation of nitrous acid in urban air. Environmental Science und Technology, Vol. 22, pp. 1086-1089.
Sjödin A. and Ferm, M. (1985) Measurements of nitrous acid in an urban area. Atmospheric Environment, Vol. 19, No. 6, pp. 985-992
Spann, J.F. and Richardson, C.B. (1985) Measurement of the water cycle in mixed ammonium acid sulphate particles Atmospheric Environment, Vol. 19, pp. 8 19.
Staubes-Diederich, R. (1992) Verteilung von Dimethylsulfid, Carbonylsulfid und Schwefelkohlenstoff in Ozean und mariner Atmosphäre Ph.D. Thesis: Berichte des Instituts fü Meteorologie und Geophysik, No. 93. Universitä Frankfurtmain.
Stelson, A.W. and Seinfeld, J.H. (1982) Thermodynamic prediction of the water activity, dissociation constant, density and refractive index for the NH4, No3 - (NH&S04-H20 System at 25OC. Atmospheric Environment, Vol. 16, p. 2507.
Stelson, A.W., Friedlander, S.K., Seinfeld, J.H. (1979) A note on the equilibrium relationship between ammonia and nitric acid and particulate ammonium nitrate. Atmospheric Environment, Vol. 13, pp. 369-371.
Stevens, R.K., Purdue, L.-J., Barnes, H.M., Sauren, H., Sickles J.E. et al. (1988) Annular denuders and visibility studies. Transactions-Visibility and Fine Particles, A&WMA Publication TR-17, edited by C.V. Mathai, A Peer-Reviewed Publication AWMA Transactions Series, ISSN 1040-8 177; No. 17.
Talbot, R.W., Vijgen, A.S., Harris, R.C. (1992) Soluble species in the Arctic summer troposphere: Acidic gases, aerosols and precipitation. Journal of Geophysical Research, Vol. 97, No. D1 5, pp. 16.53 1- 16.543.
Tang, I.N. (1980) On the equilibrium partial pressure of nitric acid and ammonia in the atmosphere. Atmospheric Environment, Vol, 14, pp. 8 19-828.
Valero, F.P.J., Ackerman, Th.P., Gore, W.J.Y., (1984) The absorption of solar radiation by the Arctic atmosphere during the haze season and its effects On the radiation balance. Geophysical Research Letters, Vol. 1 1, pp 465-468.

Wall, S.M., John, W., Ondo, J.L. (1988) Measurement of aerosol size distribution for nitrate and major ionic species. Atmospheric Environment, Vol. 24, pp. 1649-1 656.
Warneck, P. (1988) Chemistry of the natural atmosphere. International Geophysics Series, Vol. 41. Academic Press, Inc., New York.
Wayne, R.P. et al. (1990) The nitrate radical: physics, chemistry and the atmosphere. Air pollution research report 3 1. Commission of the European Cornrnunities.
Wayne, R.P. (1991) Chemistry of atmospheres Clarendon Press - Oxford
Weller, R. and Schrems, 0 . (1994) Photooxidants in the marine Arctic troposphere in summer. (submiited to Journal of Geophysical Research).
Weller, R. (1995) Unpublished results
Wendling, P., Wendling, R., Renger, W., Covert, D.S., Heintzenberg, J., Moerl, P., (1985) Calculated radiative effects of Arctic Haze during a pollution episode in spring 1983 based On ground-based and airborne measurements. Atmospheric Environment, Vol. 19, No. 12, pp. 21 81 -2193.
Winkler, T., Goschnick, J., Ache, H.J. (1991) Reactions of nitrogen oxides with NaCl as model of sea salt aerosol. Journal ofAerosol Science, Vol. 22, pp. S605-S608.
Whitby, K.T. and Sverdrup, G.M. (1980) California aerosols: their physical and chemical characteristics. Advanced Environrnental Science ant Technology, Vol. 9, pp. 477-525.
Wolff, G.T. (1984) On the nature of nitrate in coarse continental aerosols. Atmospheric Environment, Vol. 18, No. 5, pp. 997-981
Wu, P.-M. and Okada, K. (1994) Nature of coarse nitrate particles in the atmosphere. A single particle approach. Atmospheric Environment, Vol. 28, No. 12, pp. 2.053-2.060.
Wyers, G.P., Otjes, R.P., Kuipers, J., Slanina, J. (1992) Sampling of HN02 in an automated denuder. A contribution to subproject BIATEX.

Yoshizumi, K. and Hoshi, A. (1985) Size distributions of arnmonium nitrate and sodium nitrate in atmospheric aerosol. Environmental Science & Technology, Vol 19, pp. 258-26 1.
Zetzsch, C., Pfahler, G., Behnke, W. (1988) Heterogeneous formation of chlorine atoms from NaCl aerosol in a photosmog System. Journal of Aerosol Science, Vol 19, pp. 1203-1206.
Zulfiqur, A., Thomas, C.L.P., Alder, J.F. (1989) Denuder tubes for sampling of gaseous species. A review. Analyst, Vol. 1 14, pp. 759-769.

APPENDIX A
DWD air trajectories (Spitsbergen, March 1993)
(5 days analysis, 12 hours 1 mark)
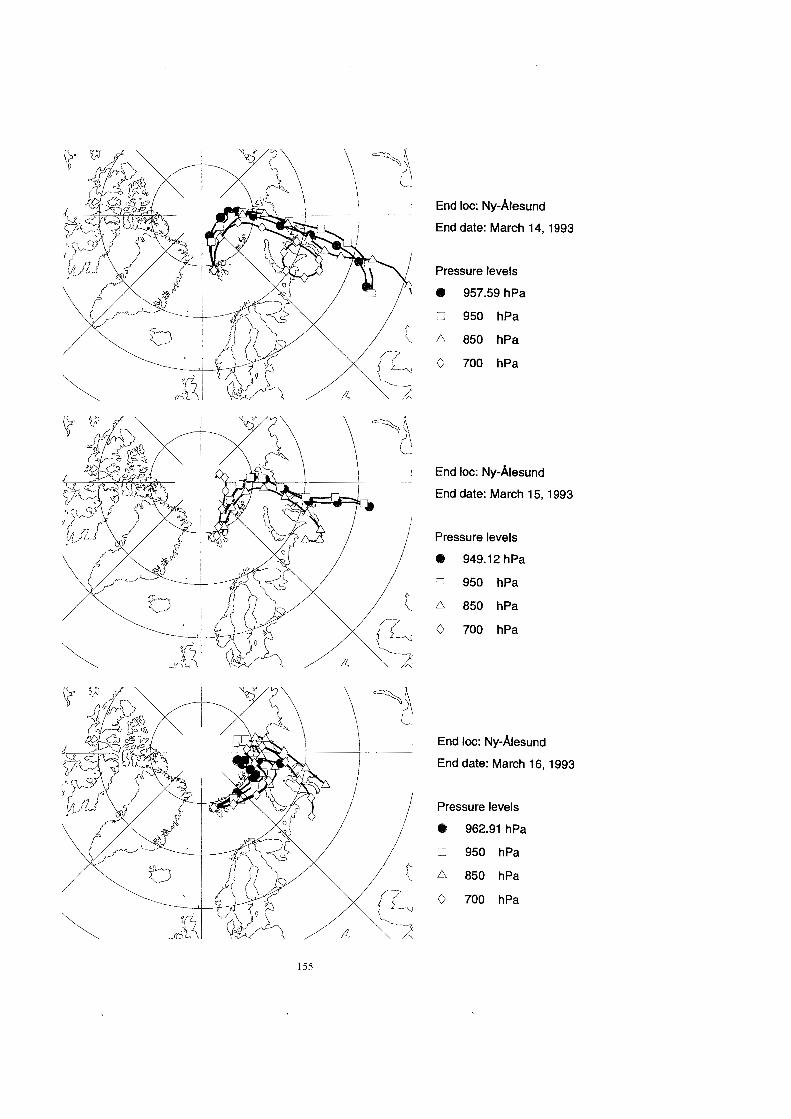
End Ioc: Ny-Alesund
End date: March 14, 1993
Pressure levels
@ 957.59 hPa
1 950 hPa
A 850 hPa
0 700 hPa
I End Ioc: Ny-Alesund
End date: March 15, 1993
Pressure levels
@ 949.12hPa
1 950 hPa
A 850 hPa
0 700 hPa
End Ioc: Ny-Alesund
End date: March 16, 1993
Pressure levels
 962.91 hPa
X 950 hPa
850 hPa
0 700 hPa

End Ioc: Ny-Alesund
End date: March 10, 1993
Pressure levels
 967.15 hPa
1 950 hPa
A 850 hPa
0 700 hPa
End Ioc: Ny-Alesund
End date: March 11, 1993
Pressure levels
fiB 970.24hPa
2 950 hPa
A 850 hPa
0 700 hPa
End Ioc: Ny-Alesund
End date: March 13,
Pressure levels
0 959.80 hPa
950 hPa
A 850 hPa
0 700 hPa

End Ioc: Ny-Alesund
End date: March 17, 1993
Pressure levels
@ 955.57 hPa
1 950 hPa
A 850 hPa
0 700 hPa
End Ioc: Ny-Alesund
End date: March 18, 1993
Pressure levels
@ 972.49 hPa
5 950 hPa
A 850 hPa
0 700 hPa
End Ioc: Ny-Alesund
End date: March 19, 1993
Pressure levels
@ 946.64 hPa
1 950 hPa
A 850 hPa
0 700 hPa

End Ioc: Ny-Alesund
End date: March 20,
Pressure levels
6 960.57 hPa
950 hPa
A 850 hPa
0 700 hPa
End Ioc: Ny-Alesund
End date: March 21,
Pressure levels
6 962.63 hPa
950 hPa
A 850 hPa
0 700 hPa
End Ioc: Ny-Alesund
End date: March 23,
Pressure levels
973.87 hPa
E 950 hPa
A 850 hPa
0 700 hPa

End Ioc: Ny-Alesund
End date: March 24,
Pressure levels
0 992.43 hPa
950 hPa
A 850 hPa
0 700 hPa
End Ioc: Ny-Alesund
End date: March 25, 1993
Pressure levels
0 1003.94 hPa
1 950 hPa
A 850 hPa
0 700 hPa
End Ioc: Ny-Alesund
End date: March 26,
Pressure levels
0 981.15hPa
950 hPa
A 850 hPa
0 700 hPa

End Ioc: NY-hlesund
End date: March 27, 1993
Pressure levels
@ 982.07 hPa
E 950 hPa
A 850 hPa
0 700 hPa
End Ioc: Ny-hlesund
End date: March 28, 1993
Pressure levels
@ 980.67 hPa
950 hPa
A 850 hPa
0 700 hPa
End Ioc: Ny-hlesund
End date: March 29,
Pressure levels
 993.45 hPa
0 950 hPa
A 850 hPa
0 700 hPa

End Ioc: NY-Alesund
End date: March 30, 1993
Pressure levels
6 964.51 hPa
950 hPa
A 850 hPa
0 700 hPa
End Ioc: NY-Alesund
End date: March 31, 1993
Pressure levels
 970.78 hPa
1 950 hPa
A 850 hPa
0 700 hPa

APPENDIX B
Temperature Profiles (Spitsbergen, March 1993)

-20 0
Temperatur / 'C
2 . 0 ' ' " ' 9, Mär 1993 11:05 - 12:42 UT
3 Mär 1993 10:32- 1200 UT m -20 0 -20 0
Temperatur 1° Temperatur 1 ¡
-20 0 -20 0 -20 0
Temperatur / ¡ Temperatur / "C Temperatur / 'C
-20 0 -20 0 -20 0
Temperatur / "C Temperatur / 'C Temperatur / 'C

-20 0
Temperatur / "C
-20 0
Temperatur / 'C Temperatur / ¡
2 . 0 ' I I ' ' 28 Mär 1993 16-02 - 17:51 UT
-20 0 -20 0 -20 0
Temperatur / 'C Temperatur / "C Temperatur / ¡
-20 0
Temperatur / 'C

APPENDIX C
Air trajectories (ANT-Xl5, May-June 1994)

3. OS. 99 AS UTC
Scale: 1:125000000 at Lalitude 0'

Scale: 1:125000000 al Lalilude 0"

Scale: 1:125000000 al Lal~lude O0

Scale: 1:125000000 at Latilude 0'

Scale: 1:125000000 at Laliluda O0

Scale: 1:125000000 at Latttude O0

Scale: 1:125000000 al Latitude 0'

Scale: 1:125000000 at Latilude 0'

Scale: 1:125000000 al Lalitude 0"
174


APPENDIX D
Air trajectories (ARK-X/1, July-August 1994)

Scale: 1:60000000 al Lalilude 906


Scale: 1:60000000 al Latilude 90'

SCale: 1:6OOWOOO al Lalitude 90-


135* -120-
120e -105'
105O
SO' -90'
75"
-75'
45- -60-
24.m 34- AS. UTC
Scale: 1:60000000 at Laliiude 90'


Scaie: 1:60000000 at Latitude 90-


Scaie: 1:60000000 at Lalitude 90'

135'
120Â
1 0 5 ~
so'
75-
60'
45O

Scale: 1:60000000 al Lalilude 90'

Scale: 1:60000000 at Latilude 90Ã

Scale: 1:60000000 al Latitude 90"

Scale: 1:60000000 al Latilude 90"


AGRADECIMIENTOS
Y por fin llegue al final de esta ,,obra". Solo puedo decir 10 que ya saben todos los que han pasado por 10 mismo: es posible acabar una tesis. Todo es posible cuando se tiene la suficiente fuerza de voluntad Para no abandonar en los momentos de ,,desolacion cientifica" y sobre todo, porque, como suele ocurrir en estos casos, ahi estan los compafieros, amigos, familia y el resto de ,,angeles de la guarda" que rodea a todo doctorando.
En este momento quiero dar las gracias a todos los que han estado cerca de mi y de una forma U otra han contribuido a que este trabajo llegara a su termino.
En primer lugar al Ministerio de Educacion y Ciencia por la concesion de la beca de Formacion del Personal Investigador (FPI) que me ha permitido realizar esta tesis doctoral en el Institute Alfred Wegener en Bremerhaven.
Al director de esta tesis, profesor Dr. Schrems, por la revision de mi trabajo y por haberme proporcionado los medios necesarios Para desarrollarlo.
Al profesor Dr. Millan Millhn Mufioz por su apoyo durante estos afios y por estar dispuesto a participar en el tribunal examinador.
A Rolf Weller por su incondicional ayuda, especialmente durante la elaboracion del manuscrito, por sus sugerencias y explicaciones rigurosas (de las que tanto he aprendido), por su paciencia con mis continuos problemas a bordo del ,,Polarstern" a los que siempre encontro una buena solucion, por el tiempo dedicado a leer mi trabajo y a discutirlo conmigo en detalle, por los datos que ha puesto sin dudar a mi disposicion, por las palabras de animo y por tantas otras cosas mas. Muchas gracias Rolf. Contar con tu colaboracion creo que es una de las mayores suertes que puede tener un doctorando.
A mi amigo Peter Clark, no solo por la paciencia con que ha corregido mi texto en ingles sino tambien por todas sus sugerencias cientificas, su confianza en mi y sus consejos en mis momentos de crisis.
A Justus Notholt, entre otras cosas por la toma de muestras en la campafia ANT-XI\5, por sus multiples sugerencias y, en general, por el trabajo en comun que ha permitido la publicacion de parte de este manuscrito.
A Joachim Ronnenberg por su inapreciable ayuda Para darle la forma final al texto y a las graficas y por todas las horas de trabajo que le han supuesto solucionar mis ,,pequeiios" problemas informaticos y explicarme los recursos del software.
Al Departamento de Quimica del AWI, por su carifiosa acogida y en particular a Sieglinde Unverricht y a Thaddäu Bluszcz por su apoyo en los momentos de panico de ultima hora.
A Ruben Lara por sus largas conversaciones cargadas de sabios consejos durante mi estancia en el AWI.

A Wilfried, Peter, Uwe, Gerhard, Torsten, Stefan, Andreas y a todos los que estuvieron en ~ ~ - A l e s u n d en marzo de 1993 por toda la ayuda que me brindaron y la tranquilidad que me supieron transmitir durante la campafia en Spitzbergen.
A la tripulacion del Polarstern y en especial al ingeniero jefe sefior Schulz por todas las soluciones ofrecidas a mis innumerables problemas durante la campaga a bordo del Polarstern.
A todos los que han puesto datos a mi disposicion Para completar mi trabajo: al profesor Dr. G. Restelli, Jens Hjorth y Wolfgang Leyendecker del JRC Ispra, al Ministerio de Medio Ambiente de Bremen, a Andreas Herber y Siegried Debatin del AWI Postdam, a Karl-Heinz Schnitzler de la Universidad de Göttingen a Michael Kriews, Ilsetraut Stölting Silke Wessel y Christoph Kleefeld del departamento de Quimica del AWI.
A rnis amigos Birgit Heese y Georg Hanke por su amistad, apoyo y buenos momentos durante estos afios.
A mi familia por la seguridad que siempre me ha dado, su apoyo y confianza. Y en especial a Vir por todo lo que ha tenido que escuchar, animar, copiar, traducir sin entender, y en una palabra, soportar, durante todo este tiempo.
A Jürge por estar siempre dispuesto a ayudar, por amortiguar rnis histerias, y por decirme tantas veces, justo cuando necesitaba oirlo ,,que soy la mejor y que valgo mucho".
A todos, muchas gracias

DANKSAGUNG
Endlich bin ich zum Ende dieses ,,Werkes" gekommen. Ich kann nur etwas darübe sagen, was jeder, der das gleiche erlebt hat, schon weiß es ist möglich eine Doktorarbeit zu beenden. Alles ist möglich wenn man die genügend Willenskraft hat um in wissenschaftlich ,,trostlosen" Momenten nicht aufzugeben, und vor allem - wie es meistens so ist- , weil es die Kollegen, Freunde die Familie und all die anderen ,,Schutzengel", die jeden Doktoranden begleiten, gibt.
Ich möcht mich bei allen bedanken, die mir nah standen und in einer gewissen Art und Weise mitgeholfen haben, da diese Arbeit zu einem guten Ende kam:
Zuerst danke ich dem spanischen Ministerium fü Bildung und Wissenschaft fü die Genehmigung des Stipendiums zur Bildung der Forscher (FPI), die die Realisierung dieser Doktorarbeit am Alfred Wegener Institut in Bremerhaven ermöglichte
Herrn Prof. Dr. Schrems, Doktorvater meiner Promotion danke ich fü die Themen- stellung, die Begutachtung dieser Arbeit und fü die Bereitstellung aller Mittel, die notwendig waren, um diese Arbeit durchführe zu können
Herrn Prof. Dr. M. Millan Mufioz danke ich sehr fü seine Unterstützun meiner Arbeit im Laufe der Jahre und fü die Übernahm des Korreferates.
Rolf Weller danke ich sehr herzlich fÅ̧ seine bedingungslose Hilfe, vor allem währen der Ausarbeitung des Manuskriptes, fü seine Vorschläg und Erklärunge voller wissenschaftlicher Genauigkeit - von denen ich so vieles lernen konnte - fÅ ̧seine Geduld mit meinen ständige Problemen an Bord der ,,Polarstern", zu denen er immer eine gute Lösun fand, fü die Zeit, die er mit dem Lesen dieser Arbeit und den zahlreichen detallierten Diskussionen mit mir verbracht hat. Fü die Daten, die er mir so selbstverständlic zur Verfügun stellte, fÅ̧ seine tröstliche Worte und fü vieles mehr. ,,Vielen Dank Rolf, Deine Hilfe zu haben, ist das größ Glück das einem Doktoranden widerfahren kann".
Meinem Freund Peter Clark danke ich sehr, nicht nur fü seine Geduld beim Korrigieren meines englischen Textes, sondern auch fü seine wissenschaftliche Denkanstöß fü sein Vertrauen in mich, sowie fü seine weisen Vorschläge
Justus Notholt danke ich fur die gemeinsame Arbeit, die z.B. die Veröffentlichun eines Teils dieses Manuskriptes ermöglich hat, fü seine Vorschläg währen der Ausarbeitung und die weiteren Hilfestellungen wie beispielsweise die Probennahme wtihrend der Meßkampagn ANT-XI\5.
Joachim Ronnenberg danke fü die vielen Stunden die er in meine ,,kleinen Software- Problemchen" und in die daraus resultierenden ,,Nachhilfestunden" investierte sowie fü seine unschätzbar Hilfe beim Layout.

Der Sektion Chemie des AWI danke ich fü die freundliche Aufnahme und hier insbesonders Sieglinde Unverricht und Thaddäu Bluszcz fur ihre Unterstützun in meinen ,,hektischen Phasen".
Ruben Lara, mein Ratgeber in den Jahren meines Aufenhaltes am AWI.danke ich fü seinen Beistand.
Wilfried, Peter, Uwe, Gerhard, Torsten, Stefan, Andreas und allen anderen, die im Mär 1993 mit mir in Ny-Alesund waren, danke ich fur ihre Hilfe und fü die Wärme die sie mir währen der Meßkampagn auf Spitzbergen entgegen brachten.
Der Besatzung der FS ,,Polarstern" und im besonderen Herrn Schulz, sei fü alle seine Lösungsvorschlä zu meinen ,,Schwierigkeitenx wkhrend der Forschungsreise gedankt.
Herrn Prof. Dr. Restelli, Jens Hjorth und Wolfgang Leyendecker vom JRC Ispra, dem Senator fÅ ̧Umwelt in Bremen, Andreas Herber und Siegrid Debatin vom AWI Postdam, Karl-Heinz Schnitzler von der Universitä Göttingen Michael Kriews, Ilsetraut Stölting Silke Wessel und Christoph Kleefeld aus der Sektion Chemie des Am, und allen, die mir Daten zur Ergänzun meiner Arbeit zur Verfügun stellten, danke ich sehr.
Birgit Heese und Georg Hanke fü Ihre Freundschaft, Unterstützun und die guten Momente im Laufe dieser Jahre.
Meiner Familie danke ich fü die Entwicklung meines Selbstvertrauens, fü ihre Unterstützun und ihr Vertrauen in mich.Virginia danke ich fur den Zuspruch und fü die Zeit die sie mir zuhörte da sie mich motivierte und auch fü ihre ganz praktische Unterstützun bei den Übersetzungsarbeiten Schreibarbeiten.. .und. .und. .und.. . - zusammengefkßt fü alles was sie übe sich ergehen lassen mußte
Jürge danke ich fü seine ständig Bereitschaft zu Helfen und fü sein just wenn es nöti war: ,,.. Du bist eh die Beste...".
Allen Vielen Dank.