Is It Getting Better? Evaluation of Recent Developments in Division of Labour in European...
30
Is It Getting Better? Evaluation of Recent Developments in Division of Labour in European Development Aid Provision Author: Ivica Petrikova Institution: University College London (UCL) Address: London, United Kingdom Email: [email protected] Responsible Development in a Polycentric World Inequality, Citizenship and the Middle Classes 14th EADI General Conference 23-26 June 2014, Bonn www.gc2014.org
-
Upload
royalholloway -
Category
Documents
-
view
1 -
download
0
Transcript of Is It Getting Better? Evaluation of Recent Developments in Division of Labour in European...
Is It Getting Better?
Evaluation of Recent Developments in Division of Labour in
European Development Aid Provision
Author: Ivica Petrikova
Institution: University College London (UCL)
Address: London, United Kingdom
Email: [email protected]
Responsible Development in a Polycentric World Inequality, Citizenship and the Middle Classes
14th EADI General Conference 23-26 June 2014, Bonn
www.gc2014.org
Abstract
In September 2012, the European Commission suspended its aid to Rwanda in
response to allegations that the Rwandese government lends support to a rebellion in
neighbouring DRC. However, its ability to use aid as a negotiation stick was curtailed by
other EU Member States, notably the UK, deciding to simultaneously re-instate their aid to
Rwanda. As the Treaty on the Functioning of the European Union specifically mandates the
Commission and the Member States to complement and reinforce each other’s
development policy, this manner of conduct seems disturbing. Was this a one-time
incident or does it exemplify common practice among EU donors, seriously undermining
the overall effectiveness of European aid? It is difficult to answer this question as internal
evaluations of EU’s division of labour in development policy, though relatively positive, are
inherently biased and external evaluations are few and far between.
In this paper, I attempt to fill the empirical gap by analyzing aid data submitted by the
Commission and Member States to the OECD between 1995 and 2010. More specifically,
focusing on the concrete goals agreed to in the EU Code of Conduct on Complementarity
and Division of Labour in Development Policy (2007), I examine the EU donors’
performance in cross-country complementarity, in-country complementarity, and cross-
sector complementarity.
Not unexpectedly, I find that there has been little improvement across the three
categories and that EU aid as a whole is becoming ever more fragmented. A closer look at
individual donors reveals that while the Commission and Nordic donors have made a
conscious effort to improve their coordination, the three largest bilateral donors – France,
UK, and Germany – have largely disregarded their commitments to a better division of
labour in development policy. I conclude by adding my voice to those that advocate for an
overhaul of EU’s development aid architecture.
Keywords
EU development policy, division of labour, cross-country complementarity, in-country
complementarity, cross-sector complementarity
Ivica Petrikova
3
1. Introduction
In September 2012, the European Commission (EC) suspended its aid to Rwanda in
response to allegations that the Rwandese government lent support to a murderous
rebellion in the neighbouring Democratic Republic of Congo. However, the EC’s ability to
use aid as a negotiation stick was curtailed by actions of other European Union (EU)
Member States, notably Belgium and the UK. Belgium referred to the suspension as a ‘bad
idea1,’ while the UK renewed its aid program in Rwanda in November 2012, after having
suspended it in September2. This quagmire is very reminiscent of the situation in Eritrea in
2010, when the Commission could not effectively withdraw its aid from the corrupt
government due to two Member States scaling up their aid programs in the country at
precisely the same time3.
In view of the recent high-level talks on donor coordination, including the Paris
Declaration on Aid Effectiveness (2005) and the Accra Agenda for Action (2008), these
occurrences would seem disturbing even if involving completely unrelated donors.
However, as the European Commission and EU Member States form part of the same
supra-national configuration and have specifically agreed to ‘complement and reinforce
each other’s’ development policy (Art 208, Treaty on the Functioning of the European
Union [TFEU]), their behaviour is even more troublesome. Were these just rare incidents
in an otherwise harmonious collaboration or do they exemplify common practice amongst
EU donors, seriously undermining the overall effectiveness of European aid?
In the past decade, EU Members along with the Commission have adopted several
initiatives aimed at improving their joint aid effectiveness, including the complementarity
and division of labour in development policy. Some development think tanks cautioned
that bringing these initiatives to life was going to be very complicated due to the highly
political nature of development assistance. Recent Commission papers (EC 2009; EC 2011)
report at least moderate levels of success in this regard. Nonetheless, since the reports
based their evaluations on questionnaires completed by Member States rather than on
actual data, their findings are likely to contain a strong positive bias. External empirical
evaluations of European aid generally suggest that the overall aid structure is incoherent
and disjointed; however, most relied on data from prior to 2005 and thus could not yet
capture the potential improvements introduced recently.
1 http://www.newtimes.co.rw/news/index.php?i=15097&a=57544 2 Followed by a second suspension in December 2012 3 EU Country Team meeting, European Commission, December 2009
4
In this paper, I contribute to the existing research by offering a systematic review of the
commitments made by the European Commission and the EU Member States with regard
to division of labour in development policy and their respective compliance using more
recent data. More specifically, focusing on the concrete goals agreed to in the EU Code of
Conduct on Complementarity and Division of Labour in Development Policy (2007), I
examine the EU donors’ performance in cross-country complementarity, in-country
complementarity, and cross-sector complementarity between years 2000 and 2010,
focusing both on the performance of the EU as a whole and on the performance of
individual European donors.
2. Donor Coordination – or the Lack Thereof – and Its Impact on Aid Recipients
Researchers generally agree that donor fragmentation and lack of coordination
negatively impact aid recipients. Morss (1984) was perhaps the first author to point out
that the dramatic increase in the number of development projects in sub-Saharan Africa in
the 1970s had a harmful effect on the recipients’ institutions. Instead of identifying
national development goals in line with populations’ needs, developing countries’
governments concentrated on accommodating the myriad of new donors and their
various requirements.
Knack and Rahman (2004) confirmed this view, demonstrating that the high number of
donors working in most developing countries tends to weaken the countries’
administrative capacity. The underlying reason is that most donors focus only on
maximizing their own projects’ performance and disregard the development of the
recipients’ human and organizational structure, which is, however, essential to long-term
growth. Accordingly, the authors put forward an interesting hypothesis that the Marshall
Plan extended after World War Two to Europe by the United States was so successful
because the recipient countries had to deal with only one donor.
Bigsten (2006) and Lawson (2010) added to the list of afflictions caused by donors’
proliferation and lack of coordination high transaction costs, duplication, cross-purposes,
and a loss of scale. The transaction costs involve the time and energy spent on dealing
with paperwork for all development projects, which significantly increase with the number
of projects regardless of their size. Thus, small projects can end up absorbing more
domestic input than the net output they provide (Bigsten 2006). Duplication refers to the
possibility that uncoordinated donors provide the same services in some sectors while
5
none in others (Lawson 2010). Cross-purposes denote a similar yet more serious
occurrence in which donors actually engage in activities that directly contradict each
other, for instance in the field of child labour (Petrikova 2007). Finally, non-cooperating
individual donors tend to conduct predominantly smaller projects and only a few have the
resources to undertake large schemes such as energy and infrastructure improvements
(Lawson 2010).
Frot and Santiso (2010) concurred that too much aid fragmentation is harmful for the
recipient country but simultaneously warned about too little competition. In case one
donor dominates all the aid provided to one sector in any developing country, the aid is in
their view unlikely to be provided in the most efficient manner possible. A more numerous
range of donors allegedly leads to more ideas, competition and innovation as well as to a
more consistent flow of funding (Lawson 2010).
3. Efforts at Improving Donor Division of Labour in the World and in the EU
In the beginning of the 2000s, research on donor proliferation and fragmentation
provided some frightening statistics. For instance, Acharya et al. (2003:4) mentioned the
example of Vietnam, where in 2002 operated 25 official bilateral donors, 19 official
multilateral donors, and about 350 international NGOs. Together, these accounted for
more than 8000 projects, or approximately one project per 9000 people. Knack and
Rahman (2004) demonstrated that this trend applied globally, by showing that the overall
number of development projects has been increasing ever since 1975.
The effect of the alarming information was strong enough for the global donor
community to respond with several high-level efforts at increasing aid effectiveness, with
improving donor coordination and harmonization amongst the chief goals. The first
initiative was the establishment of the DAC Working Party on Aid Effectiveness (2003),
followed by the Paris Declaration on Aid Effectiveness4 (2005). In it, more than hundred
countries and aid agencies agreed to improve donor division of labour via an increased use
of common arrangements and procedures and of shared analysis. The Accra Agenda for
Action (2008) reiterated these objectives, albeit in a slightly less authoritative tone.
Disappointingly, a DAC progress evaluation (2012) indicated that donors so far achieved
little progress in utilizing either of the two instruments specified more frequently than
before.
4 Result of a High Level Forum on Aid Effectiveness in Paris in 2005
6
From the perspective of donor coordination, the European Union constitutes a special
case as it itself comprises 27 bilateral donors and one multilateral, the European
Commission. In an effort to improve internal division of labour in development policy, in
2007 EU Members jointly adopted the Code of Conduct on Complementarity and Division
of Labour, in 2008 the EU Guidelines for Accra, and in 2010 the Operational Framework on
Aid Effectiveness. The documents discuss several aspects of aid effectiveness5 but their
central focus rests with the effort to strengthen complementarity amongst EU donors.
The Code of Conduct (2007:5), building on the Paris Declaration (2005), defines
complementarity as ‘the optimal division of labour between various actors in order to
achieve optimum use of human and financial resources’. The text recognizes five different
forms of complementarity: in-country, cross-country, cross-sector, vertical, and cross-
modalities and instruments complementarity. In-country complementarity refers to the
division of labour amongst different sectors within each aid recipient, in an effort to make
sure than no sector is either burdened with too many donors or remains donor-less. Cross-
country complementarity tries to discourage a donor practice that leaves some countries
dealing with too many donors (‘aid darlings’) while others are left to fend largely for
themselves (‘aid orphans’). Under cross-sector complementarity, donors should strive to
develop a sectoral specialization across their aid recipients instead of working in a myriad
of different sectors. The last two types of complementarity encourage the creation of
synergies amongst different layers and instruments of development assistance.
Expectations regarding EU donors’ observance of the Code of Conduct (2007) and of
the following EU aid-effectiveness declarations were relatively low, with a view to the
often very political nature of development assistance, which could substantially hinder any
efforts at increasing complementarity (Roeske 2007). However, the first internal
evaluation of compliance with the Code, the Commission paper on Aid Effectiveness after
Accra (EC 2009), reported a significant degree of progress. It indicated that many EU
donors substantially decreased their number of partner countries as well as the number of
sectors in which they operated. Similarly, the Third Monitoring Report and Progress
Review of the EU Fast Track Initiative on Division of Labour6 (2011) suggested that
encouraging progress has been achieved by European donors in improving coordination,
with an upward trend in the use of donor mappings and country-level agreements on
5 On discussion of the other aspects, see for instance Petrikova and Chadha (2011) 6 EU Fast Track Initiative on Division of Labour was an instrument created by the EU in 2007 to help implement the Code of Conduct
7
sector definitions. Nevertheless, since both papers based their conclusions solely on
perceptions by the Member States’ development agencies and field staff, not on any
objective measurement, their validity is somewhat questionable (EU 2011, Annex 3: 11)7
and merits further investigation.
The question which EU donors have improved their development programs and whose
programs actually deteriorated from the viewpoint of division of labour has been
researched to an even lesser degree. Traditionally, Nordic donors including Scandinavian
countries but also the Netherlands, Luxembourg, and sometimes the UK have been
regarded as the least politically driven European donors and thus perhaps the most likely
to implement aid effectiveness strategies (Gates and Hoeffler 2004; Murle 2007).
Conversely, Southern donors (Spain, Portugal, Italy, and Greece) have often been
described as the least conscientious in aid giving and hence the least likely to work
towards a better division of labour (Wanlin 2007). The three largest bilateral donors – the
UK, France, and Germany – are also sometimes singled out as unique in their provision of
development assistance due to historical ties with their former colonies (Murle 2007).
However, the only donors empirically examined in their division-of-labour behaviour were
the Nordic countries in Tanzania, where they were indeed found to be more interested in
donor-harmonisation efforts than other EU donors (Selbervik and Nygaard 2006).
Due to the scarcity of empirical research evaluating the impact of the recent
developments in EU’s developmental division of labour, it is difficult to recognize whether
any success has been achieved in donor coordination and harmonization. The aim of this
paper is to fill the observed gap and evaluate the performance of EU donors in three main
forms of development-aid division of labour: in-country, cross-country, and cross-sector
complementarity8. The lack of relevant research complicates the formulation of
hypotheses. Nevertheless, with a view to the discouraging results in EU donor
coordination in the past on the one hand but the host of recent efforts to remedy the
situation on the other, I expect to find that EU donors as a whole achieved at least a mild
degree of success in the three modes of complementarity examined. With a view to the
7 The 2012 DAC peer review of European development policy, which can be seen as a more reliable evaluation of the state of labour division among EU donors, commended the efforts of European Institutions to restructure European aid architecture but concluded that they still left a significant room for improvement. 8 I do not evaluate the donors’ performance in vertical complementarity and in cross-modalities and instruments complementarity because a) the goals provided in the Code of Conduct would be very hard to measure and b) data suitable for such purpose is not available.
8
perceived ‘exceptionalism’ of Nordic donors, I anticipate the positive findings to be
stronger in their case and weaker in the case of the Southern European donors.
4. Theoretical Framework and Empirical Methodology
4.1 In-Country Complementarity
As the Code of Conduct (2007) posits, donor fragmentation and lack of coordination
lead frequently to a misallocation of resources, whereby certain attractive sectors receive
excessive funding while less attractive ones remain under-funded (Art 2.1). The concrete
goals with regard to this type of complementarity are listed in Guiding Principle 1, which
requests that EU donors focus their activities in any aid recipients to two focal sectors
according to their comparative advantage. Any remaining funds should be provided
through budget support, civil-society support, research funding, or university/school
cooperation. Furthermore, from the viewpoint of various aid sectors in the recipient
countries, no sector should be left without at least one EU donor while no more than
three to five EU donors should be active in any one sector (Guiding Principle 3).
I employ various measures to gauge the performance of EU donors in in-country
complementarity. First, I look at the number of sectors in which different groups of EU
donors are active on average. Second, I examine in how many countries EU donors are
active in more than two focal sectors (excluding budget support and research activities).
Third, I investigate how many EU donors are generally active in each aid recipient’s sector,
in how many no EU donor is active (orphan sectors) and in how many more than five EU
donors are active (darling sectors). For each of the measures, I first provide total number
and then percentages, using 2005 (the year of the Paris Declaration) as baseline, in order
to demonstrate what the recent trends have been.
4.2 Cross-Country Complementarity
Generally, the efforts within cross-country complementarity entail decreasing aid
fragmentation and improving geographical concentration of European donors (Murle
2007). The Code of Conduct (2007) praises in this regard the conduct of the Netherlands,
which in a short span of time decreased its number of core aid recipients from 70 to 20
(Guiding Principle 5). However, the primary focus of cross-country complementarity is to
ensure that all developing countries receive the appropriate amount of aid that they
9
deserve. Consequently, EU donors should strive to decrease the gap between ‘aid darlings’
(countries that receive too much aid or where too many donors are active) and ‘aid
orphans’ (countries that receive too little aid or where too few donors are active).
I begin my empirical analysis in this section by providing an overview of the
developments within EU donors’ aid fragmentation in general and then proceed to assess
the issue of aid darlings and aid orphans. Concerning the matter of aid fragmentation, I
first present two simple measures: the number of active countries per donor and the
average amount of aid disbursed by EU donors per recipient. Second, I utilize a method
employed commonly by researchers assessing aid fragmentation, the Herfindahl index
(Knack and Rahman 2004; Cohen and Jacquet 2008). Traditionally used to assess market
concentration, the index is calculated as follows:
where s represents the share of each recipient i in the total aid provided by the donor and N is the
number of aid recipients.
The final value varies from 1, signifying perfect concentration, to 1/∞ (virtually zero),
denoting perfect dispersion. A higher number in the case of EU donors denotes a smaller
degree of aid-giving fragmentation, a desirable goal when attempting to improve
geographic concentration.
In order to evaluate EU aid giving to ‘darling’ and ‘orphan’ countries it is vital to first
define the two terms. As a first step, I denote as ‘EU aid darlings’ those countries where
more than fourteen out of the sixteen EU DAC donors are active. These are not necessarily
countries that receive overall more aid than they should but they are certainly countries
with extremely, and probably unnecessarily, high concentrations of EU donors. If one of
the Code’s objectives is to improve EU donors’ geographical concentration, a decrease in
the number of EU aid darlings should follow. Since the Code simultaneously urges
European aid to remain universal, I define ‘EU aid orphans’ as those developing countries
where fewer than three EU donors are active.
However, as a second step in this exercise I identify developing countries that globally
receive either more aid than they can safely handle (‘global aid darlings’) or less aid than
they need (‘global aid orphans’). Then I investigate how much EU aid flows to these
10
recipients and whether the amount has increased or decreased over time. In classifying
countries as either darlings or orphans, I use an OECD benchmarking method modified by
Utz (2010). First, I rank all developing countries according to their GDP per capita, net ODA
per capita, and World Governance Indicator (WGI) score. In identifying the orphans, I
focus on the group of countries that fall below the median in their combined rank and
select those countries that have lower than median scores for ODA and GDP per capita but
higher than median scores for WGI. On the other hand, in identifying aid darlings I
concentrate on the group of countries with higher than median combined rank and
choose countries with higher than median ODA and GDP per capita scores but lower than
median WGI scores. Finally, I evaluate the proportion of all aid given to the orphan and
darling countries by the different EU donors throughout time.
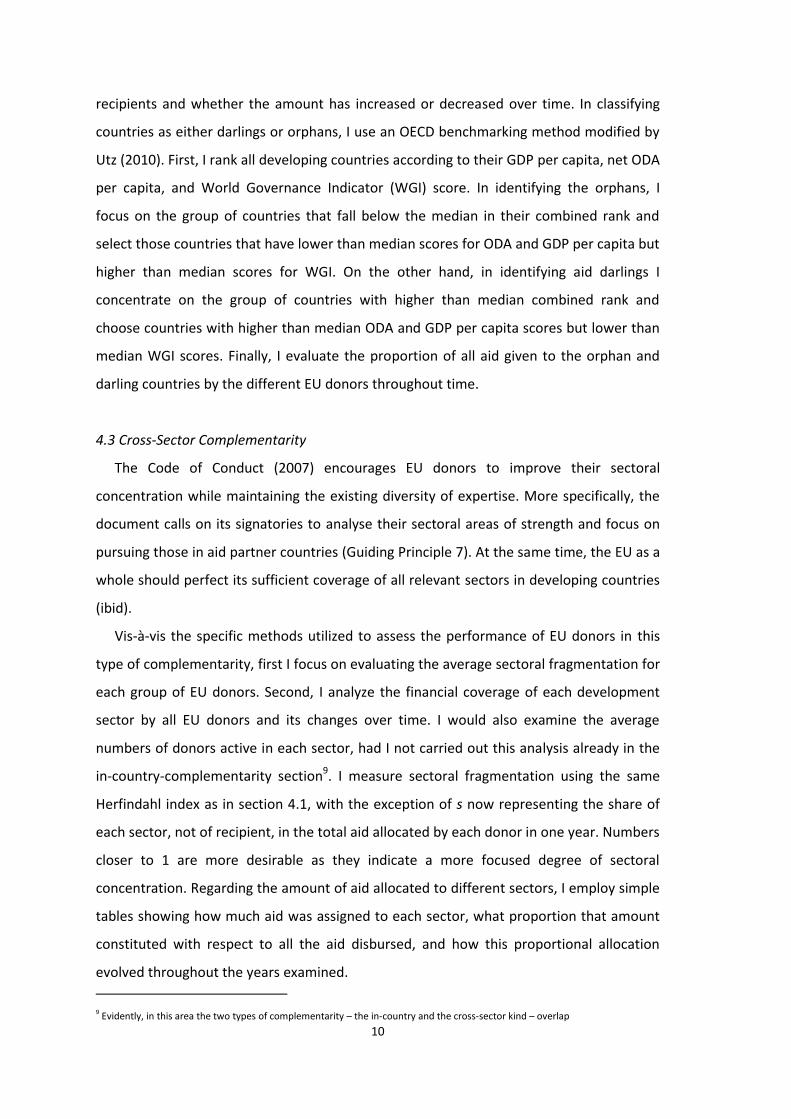
4.3 Cross-Sector Complementarity
The Code of Conduct (2007) encourages EU donors to improve their sectoral
concentration while maintaining the existing diversity of expertise. More specifically, the
document calls on its signatories to analyse their sectoral areas of strength and focus on
pursuing those in aid partner countries (Guiding Principle 7). At the same time, the EU as a
whole should perfect its sufficient coverage of all relevant sectors in developing countries
(ibid).
Vis-à-vis the specific methods utilized to assess the performance of EU donors in this
type of complementarity, first I focus on evaluating the average sectoral fragmentation for
each group of EU donors. Second, I analyze the financial coverage of each development
sector by all EU donors and its changes over time. I would also examine the average
numbers of donors active in each sector, had I not carried out this analysis already in the
in-country-complementarity section9. I measure sectoral fragmentation using the same
Herfindahl index as in section 4.1, with the exception of s now representing the share of
each sector, not of recipient, in the total aid allocated by each donor in one year. Numbers
closer to 1 are more desirable as they indicate a more focused degree of sectoral
concentration. Regarding the amount of aid allocated to different sectors, I employ simple
tables showing how much aid was assigned to each sector, what proportion that amount
constituted with respect to all the aid disbursed, and how this proportional allocation
evolved throughout the years examined.
9 Evidently, in this area the two types of complementarity – the in-country and the cross-sector kind – overlap
11
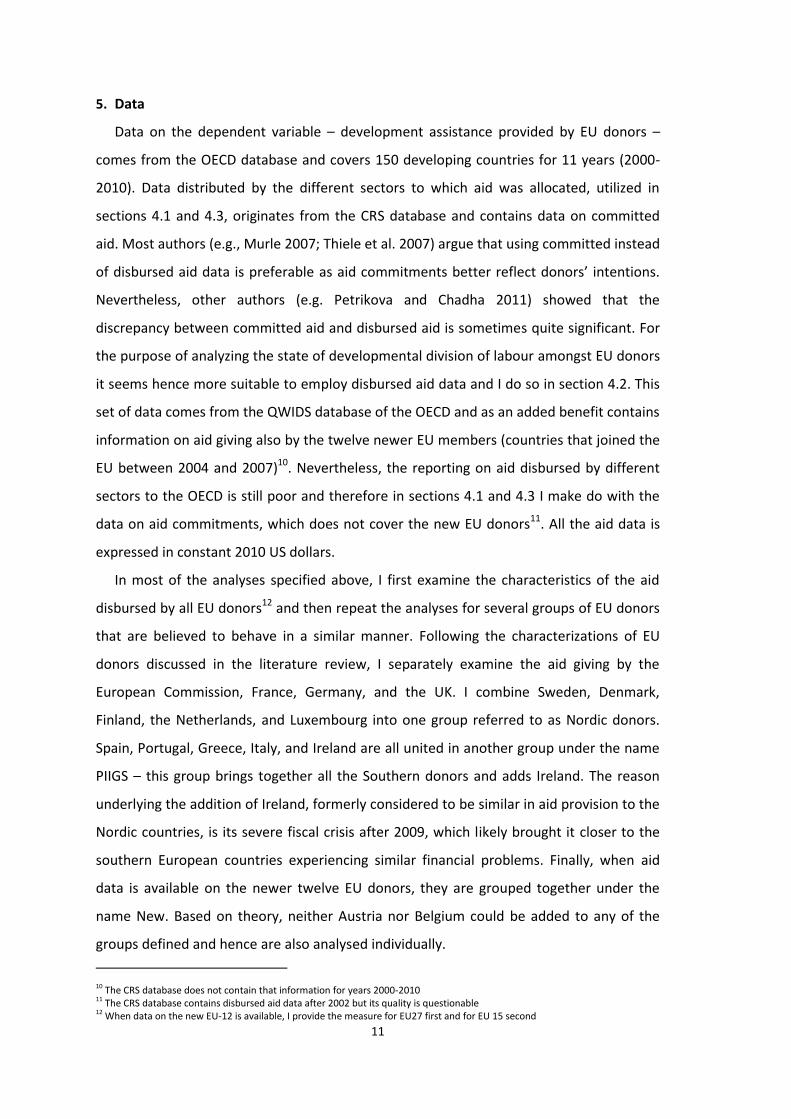
5. Data
Data on the dependent variable – development assistance provided by EU donors –
comes from the OECD database and covers 150 developing countries for 11 years (2000-
2010). Data distributed by the different sectors to which aid was allocated, utilized in
sections 4.1 and 4.3, originates from the CRS database and contains data on committed
aid. Most authors (e.g., Murle 2007; Thiele et al. 2007) argue that using committed instead
of disbursed aid data is preferable as aid commitments better reflect donors’ intentions.
Nevertheless, other authors (e.g. Petrikova and Chadha 2011) showed that the
discrepancy between committed aid and disbursed aid is sometimes quite significant. For
the purpose of analyzing the state of developmental division of labour amongst EU donors
it seems hence more suitable to employ disbursed aid data and I do so in section 4.2. This
set of data comes from the QWIDS database of the OECD and as an added benefit contains
information on aid giving also by the twelve newer EU members (countries that joined the
EU between 2004 and 2007)10. Nevertheless, the reporting on aid disbursed by different
sectors to the OECD is still poor and therefore in sections 4.1 and 4.3 I make do with the
data on aid commitments, which does not cover the new EU donors11. All the aid data is
expressed in constant 2010 US dollars.
In most of the analyses specified above, I first examine the characteristics of the aid
disbursed by all EU donors12 and then repeat the analyses for several groups of EU donors
that are believed to behave in a similar manner. Following the characterizations of EU
donors discussed in the literature review, I separately examine the aid giving by the
European Commission, France, Germany, and the UK. I combine Sweden, Denmark,
Finland, the Netherlands, and Luxembourg into one group referred to as Nordic donors.
Spain, Portugal, Greece, Italy, and Ireland are all united in another group under the name
PIIGS – this group brings together all the Southern donors and adds Ireland. The reason
underlying the addition of Ireland, formerly considered to be similar in aid provision to the
Nordic countries, is its severe fiscal crisis after 2009, which likely brought it closer to the
southern European countries experiencing similar financial problems. Finally, when aid
data is available on the newer twelve EU donors, they are grouped together under the
name New. Based on theory, neither Austria nor Belgium could be added to any of the
groups defined and hence are also analysed individually.
10 The CRS database does not contain that information for years 2000-2010 11 The CRS database contains disbursed aid data after 2002 but its quality is questionable 12 When data on the new EU-12 is available, I provide the measure for EU27 first and for EU 15 second
12
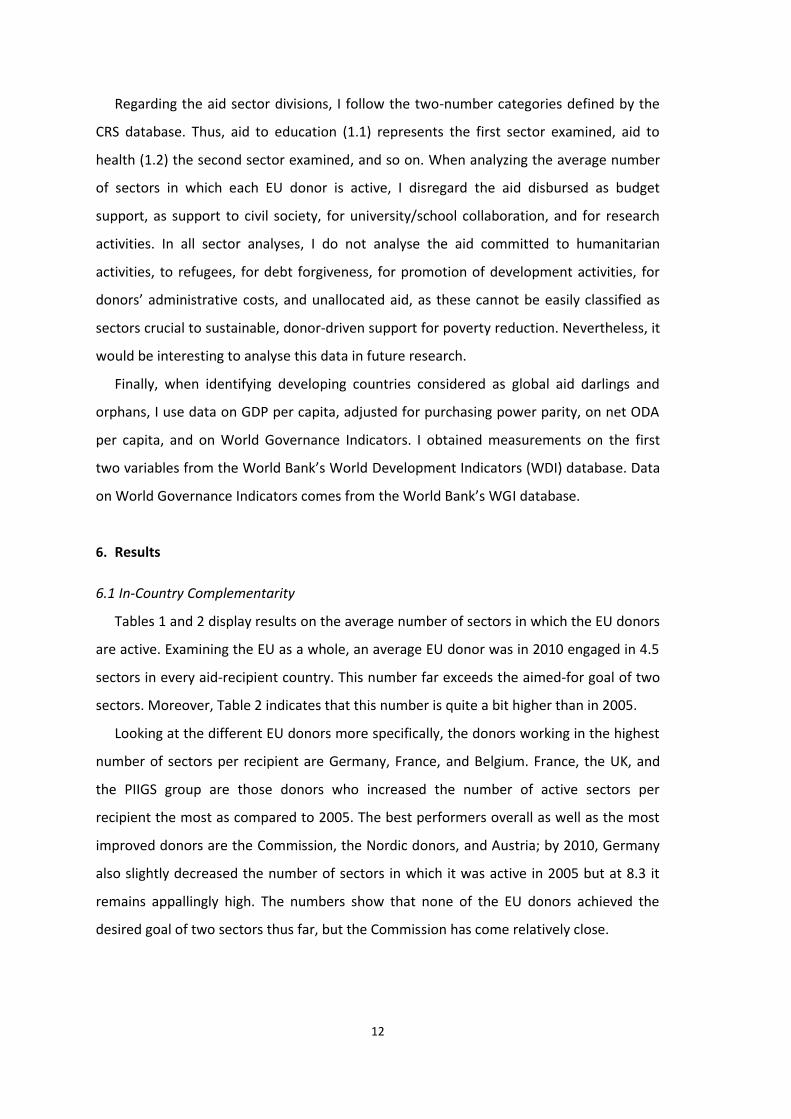
Regarding the aid sector divisions, I follow the two-number categories defined by the
CRS database. Thus, aid to education (1.1) represents the first sector examined, aid to
health (1.2) the second sector examined, and so on. When analyzing the average number
of sectors in which each EU donor is active, I disregard the aid disbursed as budget
support, as support to civil society, for university/school collaboration, and for research
activities. In all sector analyses, I do not analyse the aid committed to humanitarian
activities, to refugees, for debt forgiveness, for promotion of development activities, for
donors’ administrative costs, and unallocated aid, as these cannot be easily classified as
sectors crucial to sustainable, donor-driven support for poverty reduction. Nevertheless, it
would be interesting to analyse this data in future research.
Finally, when identifying developing countries considered as global aid darlings and
orphans, I use data on GDP per capita, adjusted for purchasing power parity, on net ODA
per capita, and on World Governance Indicators. I obtained measurements on the first
two variables from the World Bank’s World Development Indicators (WDI) database. Data
on World Governance Indicators comes from the World Bank’s WGI database.
6. Results
6.1 In-Country Complementarity
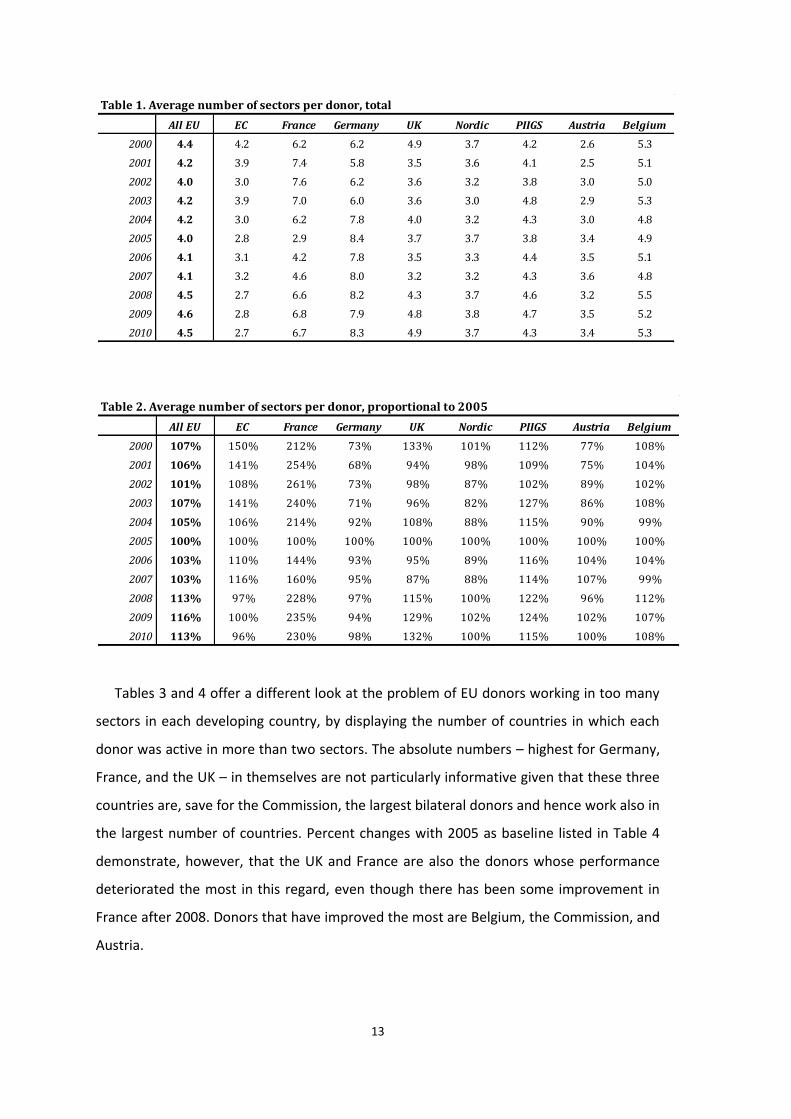
Tables 1 and 2 display results on the average number of sectors in which the EU donors
are active. Examining the EU as a whole, an average EU donor was in 2010 engaged in 4.5
sectors in every aid-recipient country. This number far exceeds the aimed-for goal of two
sectors. Moreover, Table 2 indicates that this number is quite a bit higher than in 2005.
Looking at the different EU donors more specifically, the donors working in the highest
number of sectors per recipient are Germany, France, and Belgium. France, the UK, and
the PIIGS group are those donors who increased the number of active sectors per
recipient the most as compared to 2005. The best performers overall as well as the most
improved donors are the Commission, the Nordic donors, and Austria; by 2010, Germany
also slightly decreased the number of sectors in which it was active in 2005 but at 8.3 it
remains appallingly high. The numbers show that none of the EU donors achieved the
desired goal of two sectors thus far, but the Commission has come relatively close.
13
Tables 3 and 4 offer a different look at the problem of EU donors working in too many
sectors in each developing country, by displaying the number of countries in which each
donor was active in more than two sectors. The absolute numbers – highest for Germany,
France, and the UK – in themselves are not particularly informative given that these three
countries are, save for the Commission, the largest bilateral donors and hence work also in
the largest number of countries. Percent changes with 2005 as baseline listed in Table 4
demonstrate, however, that the UK and France are also the donors whose performance
deteriorated the most in this regard, even though there has been some improvement in
France after 2008. Donors that have improved the most are Belgium, the Commission, and
Austria.
All EU EC France Germany UK Nordic PIIGS Austria Belgium
2000 4.4 4.2 6.2 6.2 4.9 3.7 4.2 2.6 5.3
2001 4.2 3.9 7.4 5.8 3.5 3.6 4.1 2.5 5.1
2002 4.0 3.0 7.6 6.2 3.6 3.2 3.8 3.0 5.0
2003 4.2 3.9 7.0 6.0 3.6 3.0 4.8 2.9 5.3
2004 4.2 3.0 6.2 7.8 4.0 3.2 4.3 3.0 4.8
2005 4.0 2.8 2.9 8.4 3.7 3.7 3.8 3.4 4.9
2006 4.1 3.1 4.2 7.8 3.5 3.3 4.4 3.5 5.1
2007 4.1 3.2 4.6 8.0 3.2 3.2 4.3 3.6 4.8
2008 4.5 2.7 6.6 8.2 4.3 3.7 4.6 3.2 5.5
2009 4.6 2.8 6.8 7.9 4.8 3.8 4.7 3.5 5.2
2010 4.5 2.7 6.7 8.3 4.9 3.7 4.3 3.4 5.3
Table 1. Average number of sectors per donor, total
All EU EC France Germany UK Nordic PIIGS Austria Belgium
2000 107% 150% 212% 73% 133% 101% 112% 77% 108%
2001 106% 141% 254% 68% 94% 98% 109% 75% 104%
2002 101% 108% 261% 73% 98% 87% 102% 89% 102%
2003 107% 141% 240% 71% 96% 82% 127% 86% 108%
2004 105% 106% 214% 92% 108% 88% 115% 90% 99%
2005 100% 100% 100% 100% 100% 100% 100% 100% 100%
2006 103% 110% 144% 93% 95% 89% 116% 104% 104%
2007 103% 116% 160% 95% 87% 88% 114% 107% 99%
2008 113% 97% 228% 97% 115% 100% 122% 96% 112%
2009 116% 100% 235% 94% 129% 102% 124% 102% 107%
2010 113% 96% 230% 98% 132% 100% 115% 100% 108%
Table 2. Average number of sectors per donor, proportional to 2005
14
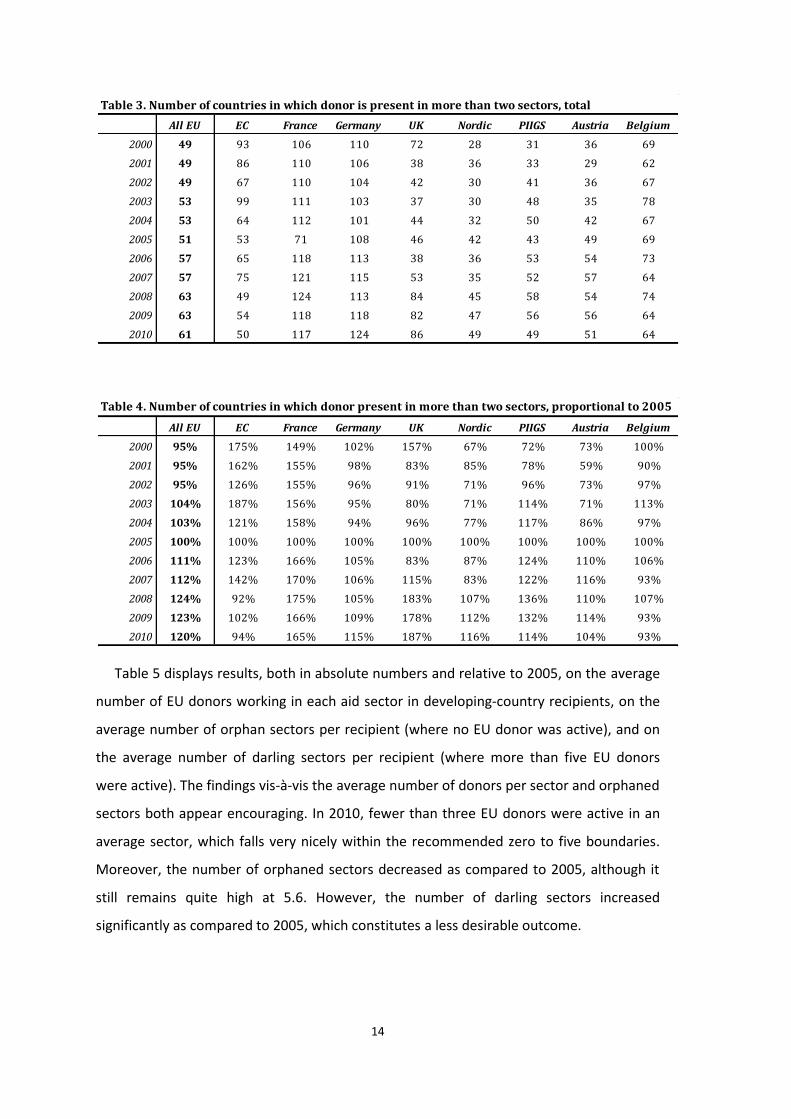
Table 5 displays results, both in absolute numbers and relative to 2005, on the average
number of EU donors working in each aid sector in developing-country recipients, on the
average number of orphan sectors per recipient (where no EU donor was active), and on
the average number of darling sectors per recipient (where more than five EU donors
were active). The findings vis-à-vis the average number of donors per sector and orphaned
sectors both appear encouraging. In 2010, fewer than three EU donors were active in an
average sector, which falls very nicely within the recommended zero to five boundaries.
Moreover, the number of orphaned sectors decreased as compared to 2005, although it
still remains quite high at 5.6. However, the number of darling sectors increased
significantly as compared to 2005, which constitutes a less desirable outcome.
All EU EC France Germany UK Nordic PIIGS Austria Belgium
2000 49 93 106 110 72 28 31 36 69
2001 49 86 110 106 38 36 33 29 62
2002 49 67 110 104 42 30 41 36 67
2003 53 99 111 103 37 30 48 35 78
2004 53 64 112 101 44 32 50 42 67
2005 51 53 71 108 46 42 43 49 69
2006 57 65 118 113 38 36 53 54 73
2007 57 75 121 115 53 35 52 57 64
2008 63 49 124 113 84 45 58 54 74
2009 63 54 118 118 82 47 56 56 64
2010 61 50 117 124 86 49 49 51 64
Table 3. Number of countries in which donor is present in more than two sectors, total
All EU EC France Germany UK Nordic PIIGS Austria Belgium
2000 95% 175% 149% 102% 157% 67% 72% 73% 100%
2001 95% 162% 155% 98% 83% 85% 78% 59% 90%
2002 95% 126% 155% 96% 91% 71% 96% 73% 97%
2003 104% 187% 156% 95% 80% 71% 114% 71% 113%
2004 103% 121% 158% 94% 96% 77% 117% 86% 97%
2005 100% 100% 100% 100% 100% 100% 100% 100% 100%
2006 111% 123% 166% 105% 83% 87% 124% 110% 106%
2007 112% 142% 170% 106% 115% 83% 122% 116% 93%
2008 124% 92% 175% 105% 183% 107% 136% 110% 107%
2009 123% 102% 166% 109% 178% 112% 132% 114% 93%
2010 120% 94% 165% 115% 187% 116% 114% 104% 93%
Table 4. Number of countries in which donor present in more than two sectors, proportional to 2005
15
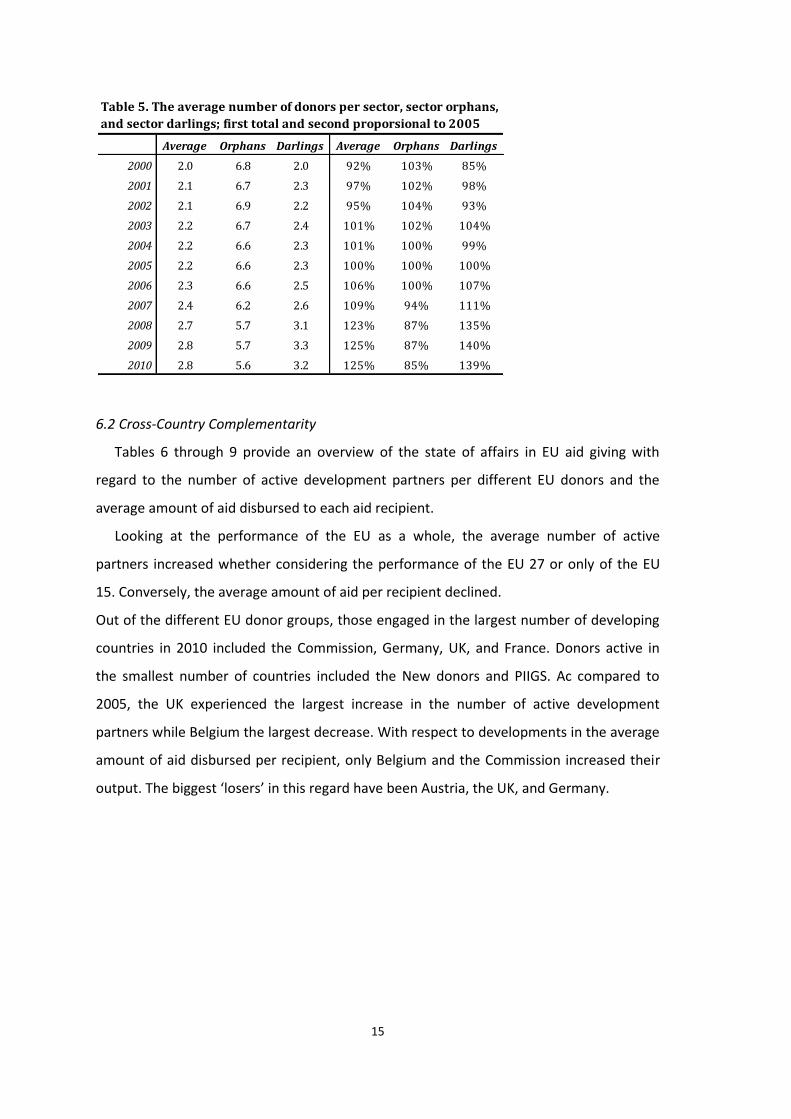
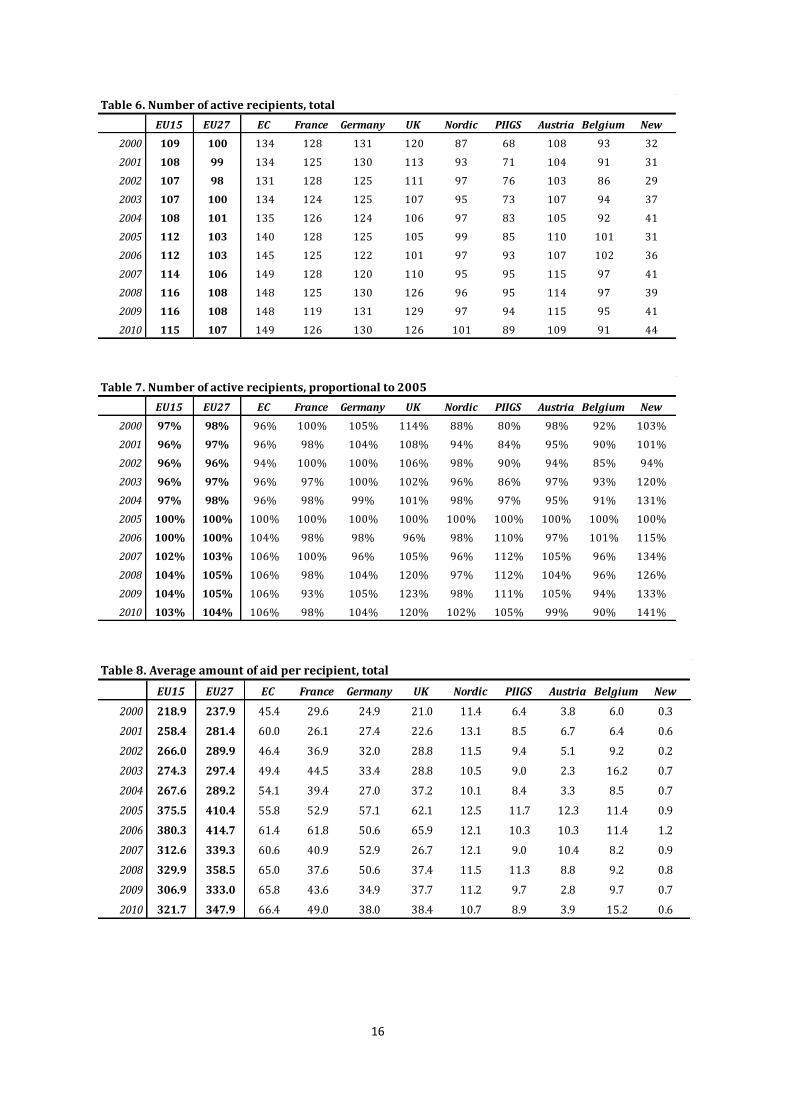
6.2 Cross-Country Complementarity
Tables 6 through 9 provide an overview of the state of affairs in EU aid giving with
regard to the number of active development partners per different EU donors and the
average amount of aid disbursed to each aid recipient.
Looking at the performance of the EU as a whole, the average number of active
partners increased whether considering the performance of the EU 27 or only of the EU
15. Conversely, the average amount of aid per recipient declined.
Out of the different EU donor groups, those engaged in the largest number of developing
countries in 2010 included the Commission, Germany, UK, and France. Donors active in
the smallest number of countries included the New donors and PIIGS. Ac compared to
2005, the UK experienced the largest increase in the number of active development
partners while Belgium the largest decrease. With respect to developments in the average
amount of aid disbursed per recipient, only Belgium and the Commission increased their
output. The biggest ‘losers’ in this regard have been Austria, the UK, and Germany.
Average Orphans Darlings Average Orphans Darlings
2000 2.0 6.8 2.0 92% 103% 85%
2001 2.1 6.7 2.3 97% 102% 98%
2002 2.1 6.9 2.2 95% 104% 93%
2003 2.2 6.7 2.4 101% 102% 104%
2004 2.2 6.6 2.3 101% 100% 99%
2005 2.2 6.6 2.3 100% 100% 100%
2006 2.3 6.6 2.5 106% 100% 107%
2007 2.4 6.2 2.6 109% 94% 111%
2008 2.7 5.7 3.1 123% 87% 135%
2009 2.8 5.7 3.3 125% 87% 140%
2010 2.8 5.6 3.2 125% 85% 139%
Table 5. The average number of donors per sector, sector orphans,
and sector darlings; first total and second proporsional to 2005
16
EU15 EU27 EC France Germany UK Nordic PIIGS Austria Belgium New
2000 109 100 134 128 131 120 87 68 108 93 32
2001 108 99 134 125 130 113 93 71 104 91 31
2002 107 98 131 128 125 111 97 76 103 86 29
2003 107 100 134 124 125 107 95 73 107 94 37
2004 108 101 135 126 124 106 97 83 105 92 41
2005 112 103 140 128 125 105 99 85 110 101 31
2006 112 103 145 125 122 101 97 93 107 102 36
2007 114 106 149 128 120 110 95 95 115 97 41
2008 116 108 148 125 130 126 96 95 114 97 39
2009 116 108 148 119 131 129 97 94 115 95 41
2010 115 107 149 126 130 126 101 89 109 91 44
Table 6. Number of active recipients, total
EU15 EU27 EC France Germany UK Nordic PIIGS Austria Belgium New
2000 97% 98% 96% 100% 105% 114% 88% 80% 98% 92% 103%
2001 96% 97% 96% 98% 104% 108% 94% 84% 95% 90% 101%
2002 96% 96% 94% 100% 100% 106% 98% 90% 94% 85% 94%
2003 96% 97% 96% 97% 100% 102% 96% 86% 97% 93% 120%
2004 97% 98% 96% 98% 99% 101% 98% 97% 95% 91% 131%
2005 100% 100% 100% 100% 100% 100% 100% 100% 100% 100% 100%
2006 100% 100% 104% 98% 98% 96% 98% 110% 97% 101% 115%
2007 102% 103% 106% 100% 96% 105% 96% 112% 105% 96% 134%
2008 104% 105% 106% 98% 104% 120% 97% 112% 104% 96% 126%
2009 104% 105% 106% 93% 105% 123% 98% 111% 105% 94% 133%
2010 103% 104% 106% 98% 104% 120% 102% 105% 99% 90% 141%
Table 7. Number of active recipients, proportional to 2005
EU15 EU27 EC France Germany UK Nordic PIIGS Austria Belgium New
2000 218.9 237.9 45.4 29.6 24.9 21.0 11.4 6.4 3.8 6.0 0.3
2001 258.4 281.4 60.0 26.1 27.4 22.6 13.1 8.5 6.7 6.4 0.6
2002 266.0 289.9 46.4 36.9 32.0 28.8 11.5 9.4 5.1 9.2 0.2
2003 274.3 297.4 49.4 44.5 33.4 28.8 10.5 9.0 2.3 16.2 0.7
2004 267.6 289.2 54.1 39.4 27.0 37.2 10.1 8.4 3.3 8.5 0.7
2005 375.5 410.4 55.8 52.9 57.1 62.1 12.5 11.7 12.3 11.4 0.9
2006 380.3 414.7 61.4 61.8 50.6 65.9 12.1 10.3 10.3 11.4 1.2
2007 312.6 339.3 60.6 40.9 52.9 26.7 12.1 9.0 10.4 8.2 0.9
2008 329.9 358.5 65.0 37.6 50.6 37.4 11.5 11.3 8.8 9.2 0.8
2009 306.9 333.0 65.8 43.6 34.9 37.7 11.2 9.7 2.8 9.7 0.7
2010 321.7 347.9 66.4 49.0 38.0 38.4 10.7 8.9 3.9 15.2 0.6
Table 8. Average amount of aid per recipient, total
17
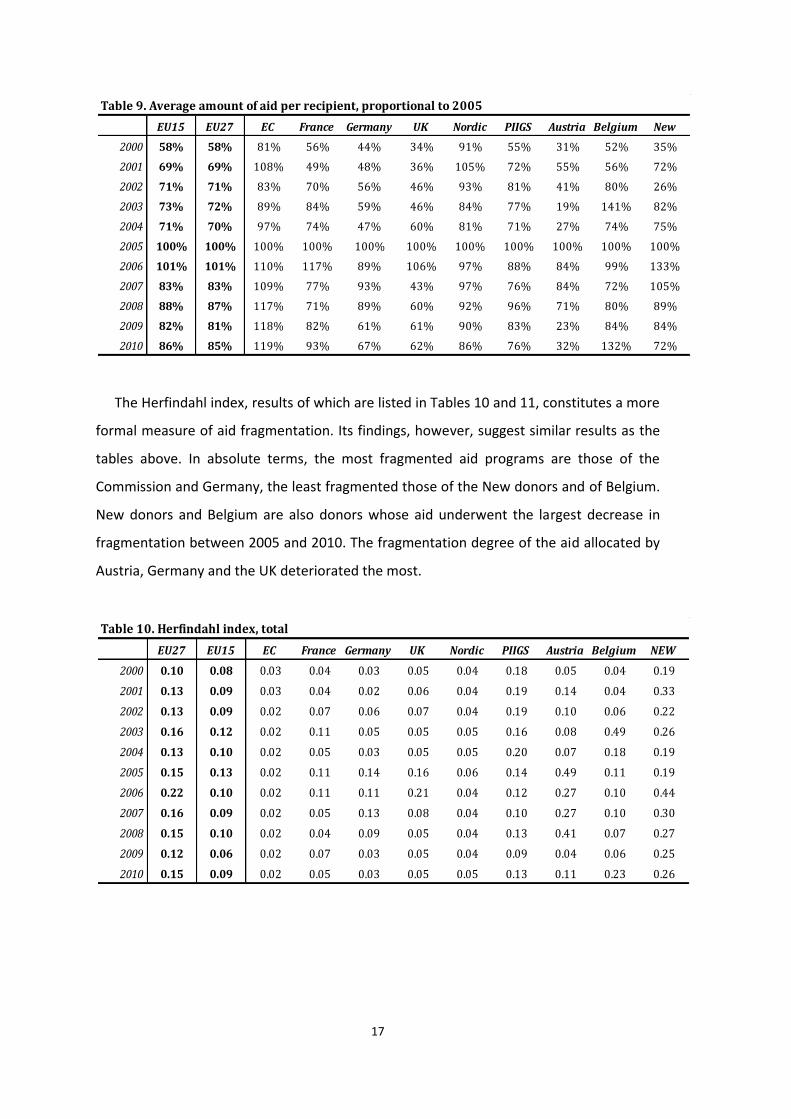
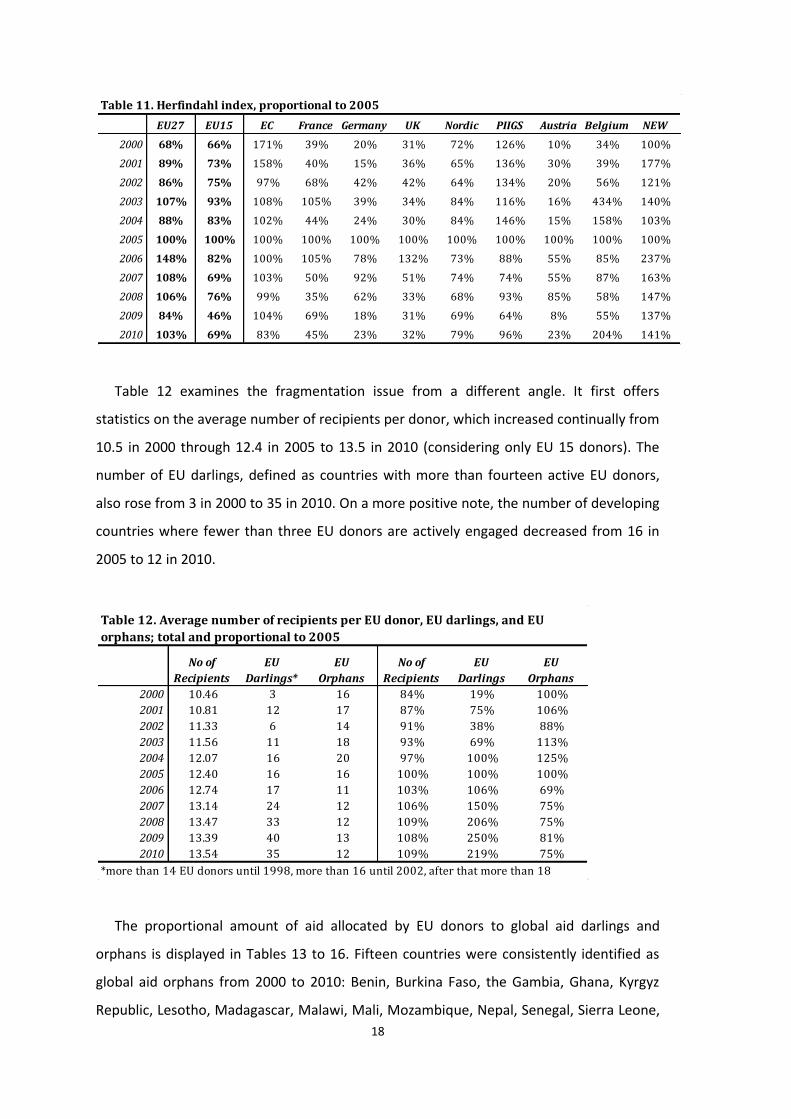
The Herfindahl index, results of which are listed in Tables 10 and 11, constitutes a more
formal measure of aid fragmentation. Its findings, however, suggest similar results as the
tables above. In absolute terms, the most fragmented aid programs are those of the
Commission and Germany, the least fragmented those of the New donors and of Belgium.
New donors and Belgium are also donors whose aid underwent the largest decrease in
fragmentation between 2005 and 2010. The fragmentation degree of the aid allocated by
Austria, Germany and the UK deteriorated the most.
EU15 EU27 EC France Germany UK Nordic PIIGS Austria Belgium New
2000 58% 58% 81% 56% 44% 34% 91% 55% 31% 52% 35%
2001 69% 69% 108% 49% 48% 36% 105% 72% 55% 56% 72%
2002 71% 71% 83% 70% 56% 46% 93% 81% 41% 80% 26%
2003 73% 72% 89% 84% 59% 46% 84% 77% 19% 141% 82%
2004 71% 70% 97% 74% 47% 60% 81% 71% 27% 74% 75%
2005 100% 100% 100% 100% 100% 100% 100% 100% 100% 100% 100%
2006 101% 101% 110% 117% 89% 106% 97% 88% 84% 99% 133%
2007 83% 83% 109% 77% 93% 43% 97% 76% 84% 72% 105%
2008 88% 87% 117% 71% 89% 60% 92% 96% 71% 80% 89%
2009 82% 81% 118% 82% 61% 61% 90% 83% 23% 84% 84%
2010 86% 85% 119% 93% 67% 62% 86% 76% 32% 132% 72%
Table 9. Average amount of aid per recipient, proportional to 2005
EU27 EU15 EC France Germany UK Nordic PIIGS Austria Belgium NEW
2000 0.10 0.08 0.03 0.04 0.03 0.05 0.04 0.18 0.05 0.04 0.19
2001 0.13 0.09 0.03 0.04 0.02 0.06 0.04 0.19 0.14 0.04 0.33
2002 0.13 0.09 0.02 0.07 0.06 0.07 0.04 0.19 0.10 0.06 0.22
2003 0.16 0.12 0.02 0.11 0.05 0.05 0.05 0.16 0.08 0.49 0.26
2004 0.13 0.10 0.02 0.05 0.03 0.05 0.05 0.20 0.07 0.18 0.19
2005 0.15 0.13 0.02 0.11 0.14 0.16 0.06 0.14 0.49 0.11 0.19
2006 0.22 0.10 0.02 0.11 0.11 0.21 0.04 0.12 0.27 0.10 0.44
2007 0.16 0.09 0.02 0.05 0.13 0.08 0.04 0.10 0.27 0.10 0.30
2008 0.15 0.10 0.02 0.04 0.09 0.05 0.04 0.13 0.41 0.07 0.27
2009 0.12 0.06 0.02 0.07 0.03 0.05 0.04 0.09 0.04 0.06 0.25
2010 0.15 0.09 0.02 0.05 0.03 0.05 0.05 0.13 0.11 0.23 0.26
Table 10. Herfindahl index, total
18
Table 12 examines the fragmentation issue from a different angle. It first offers
statistics on the average number of recipients per donor, which increased continually from
10.5 in 2000 through 12.4 in 2005 to 13.5 in 2010 (considering only EU 15 donors). The
number of EU darlings, defined as countries with more than fourteen active EU donors,
also rose from 3 in 2000 to 35 in 2010. On a more positive note, the number of developing
countries where fewer than three EU donors are actively engaged decreased from 16 in
2005 to 12 in 2010.
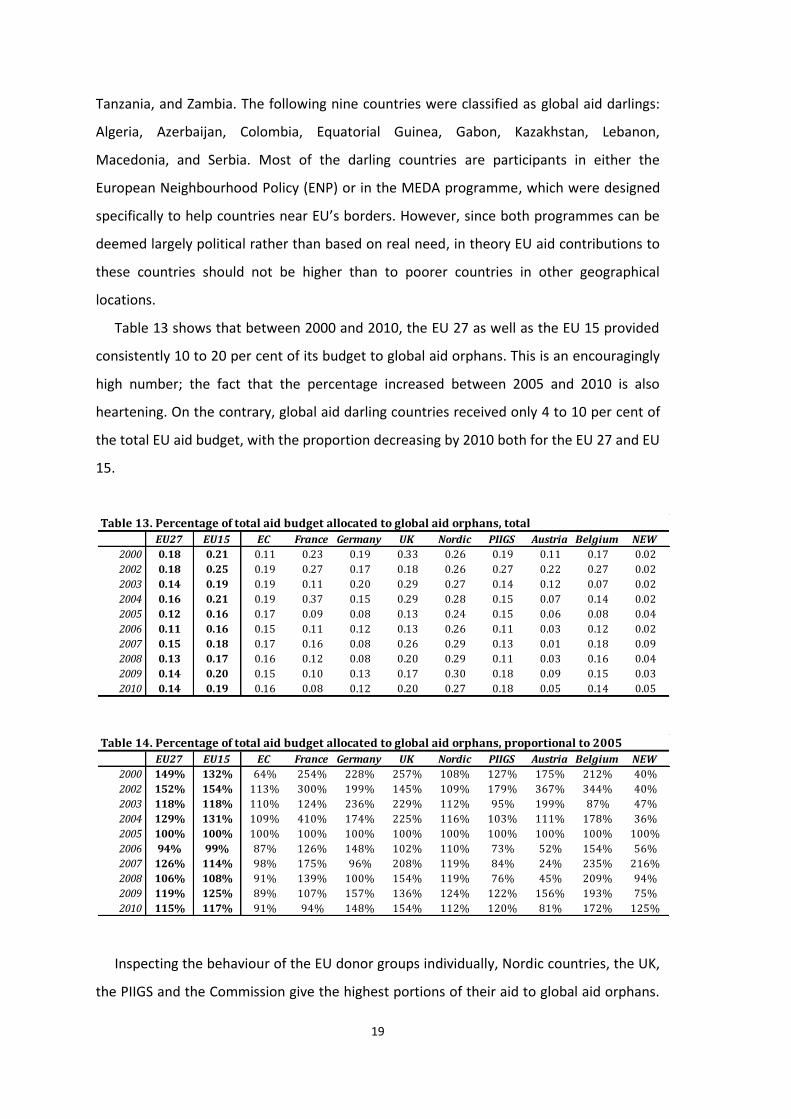
The proportional amount of aid allocated by EU donors to global aid darlings and
orphans is displayed in Tables 13 to 16. Fifteen countries were consistently identified as
global aid orphans from 2000 to 2010: Benin, Burkina Faso, the Gambia, Ghana, Kyrgyz
Republic, Lesotho, Madagascar, Malawi, Mali, Mozambique, Nepal, Senegal, Sierra Leone,
EU27 EU15 EC France Germany UK Nordic PIIGS Austria Belgium NEW
2000 68% 66% 171% 39% 20% 31% 72% 126% 10% 34% 100%
2001 89% 73% 158% 40% 15% 36% 65% 136% 30% 39% 177%
2002 86% 75% 97% 68% 42% 42% 64% 134% 20% 56% 121%
2003 107% 93% 108% 105% 39% 34% 84% 116% 16% 434% 140%
2004 88% 83% 102% 44% 24% 30% 84% 146% 15% 158% 103%
2005 100% 100% 100% 100% 100% 100% 100% 100% 100% 100% 100%
2006 148% 82% 100% 105% 78% 132% 73% 88% 55% 85% 237%
2007 108% 69% 103% 50% 92% 51% 74% 74% 55% 87% 163%
2008 106% 76% 99% 35% 62% 33% 68% 93% 85% 58% 147%
2009 84% 46% 104% 69% 18% 31% 69% 64% 8% 55% 137%
2010 103% 69% 83% 45% 23% 32% 79% 96% 23% 204% 141%
Table 11. Herfindahl index, proportional to 2005
No of
Recipients
EU
Darlings*
EU
Orphans
No of
Recipients
EU
Darlings
EU
Orphans
2000 10.46 3 16 84% 19% 100%
2001 10.81 12 17 87% 75% 106%
2002 11.33 6 14 91% 38% 88%
2003 11.56 11 18 93% 69% 113%
2004 12.07 16 20 97% 100% 125%
2005 12.40 16 16 100% 100% 100%
2006 12.74 17 11 103% 106% 69%
2007 13.14 24 12 106% 150% 75%
2008 13.47 33 12 109% 206% 75%
2009 13.39 40 13 108% 250% 81%
2010 13.54 35 12 109% 219% 75%
*more than 14 EU donors until 1998, more than 16 until 2002, after that more than 18
Table 12. Average number of recipients per EU donor, EU darlings, and EU
orphans; total and proportional to 2005
19
Tanzania, and Zambia. The following nine countries were classified as global aid darlings:
Algeria, Azerbaijan, Colombia, Equatorial Guinea, Gabon, Kazakhstan, Lebanon,
Macedonia, and Serbia. Most of the darling countries are participants in either the
European Neighbourhood Policy (ENP) or in the MEDA programme, which were designed
specifically to help countries near EU’s borders. However, since both programmes can be
deemed largely political rather than based on real need, in theory EU aid contributions to
these countries should not be higher than to poorer countries in other geographical
locations.
Table 13 shows that between 2000 and 2010, the EU 27 as well as the EU 15 provided
consistently 10 to 20 per cent of its budget to global aid orphans. This is an encouragingly
high number; the fact that the percentage increased between 2005 and 2010 is also
heartening. On the contrary, global aid darling countries received only 4 to 10 per cent of
the total EU aid budget, with the proportion decreasing by 2010 both for the EU 27 and EU
15.
Inspecting the behaviour of the EU donor groups individually, Nordic countries, the UK,
the PIIGS and the Commission give the highest portions of their aid to global aid orphans.
EU27 EU15 EC France Germany UK Nordic PIIGS Austria Belgium NEW
2000 0.18 0.21 0.11 0.23 0.19 0.33 0.26 0.19 0.11 0.17 0.02
2002 0.18 0.25 0.19 0.27 0.17 0.18 0.26 0.27 0.22 0.27 0.02
2003 0.14 0.19 0.19 0.11 0.20 0.29 0.27 0.14 0.12 0.07 0.02
2004 0.16 0.21 0.19 0.37 0.15 0.29 0.28 0.15 0.07 0.14 0.02
2005 0.12 0.16 0.17 0.09 0.08 0.13 0.24 0.15 0.06 0.08 0.04
2006 0.11 0.16 0.15 0.11 0.12 0.13 0.26 0.11 0.03 0.12 0.02
2007 0.15 0.18 0.17 0.16 0.08 0.26 0.29 0.13 0.01 0.18 0.09
2008 0.13 0.17 0.16 0.12 0.08 0.20 0.29 0.11 0.03 0.16 0.04
2009 0.14 0.20 0.15 0.10 0.13 0.17 0.30 0.18 0.09 0.15 0.03
2010 0.14 0.19 0.16 0.08 0.12 0.20 0.27 0.18 0.05 0.14 0.05
Table 13. Percentage of total aid budget allocated to global aid orphans, total
EU27 EU15 EC France Germany UK Nordic PIIGS Austria Belgium NEW
2000 149% 132% 64% 254% 228% 257% 108% 127% 175% 212% 40%
2002 152% 154% 113% 300% 199% 145% 109% 179% 367% 344% 40%
2003 118% 118% 110% 124% 236% 229% 112% 95% 199% 87% 47%
2004 129% 131% 109% 410% 174% 225% 116% 103% 111% 178% 36%
2005 100% 100% 100% 100% 100% 100% 100% 100% 100% 100% 100%
2006 94% 99% 87% 126% 148% 102% 110% 73% 52% 154% 56%
2007 126% 114% 98% 175% 96% 208% 119% 84% 24% 235% 216%
2008 106% 108% 91% 139% 100% 154% 119% 76% 45% 209% 94%
2009 119% 125% 89% 107% 157% 136% 124% 122% 156% 193% 75%
2010 115% 117% 91% 94% 148% 154% 112% 120% 81% 172% 125%
Table 14. Percentage of total aid budget allocated to global aid orphans, proportional to 2005
20
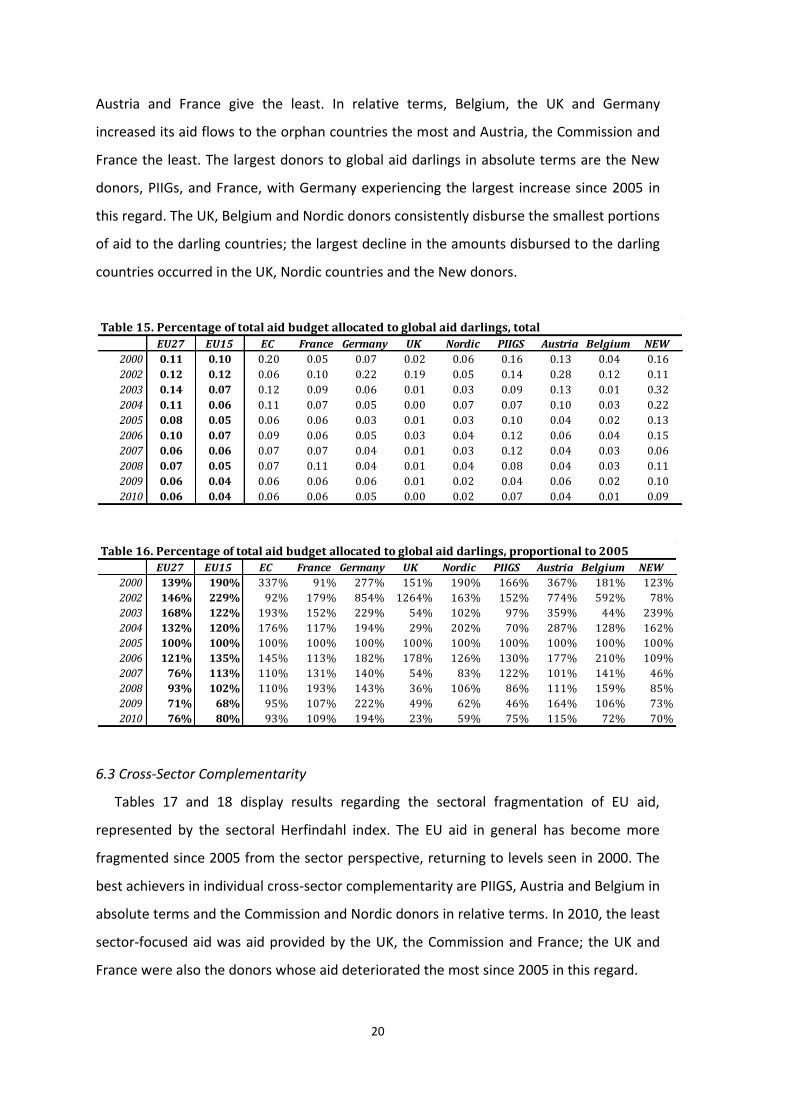
Austria and France give the least. In relative terms, Belgium, the UK and Germany
increased its aid flows to the orphan countries the most and Austria, the Commission and
France the least. The largest donors to global aid darlings in absolute terms are the New
donors, PIIGs, and France, with Germany experiencing the largest increase since 2005 in
this regard. The UK, Belgium and Nordic donors consistently disburse the smallest portions
of aid to the darling countries; the largest decline in the amounts disbursed to the darling
countries occurred in the UK, Nordic countries and the New donors.
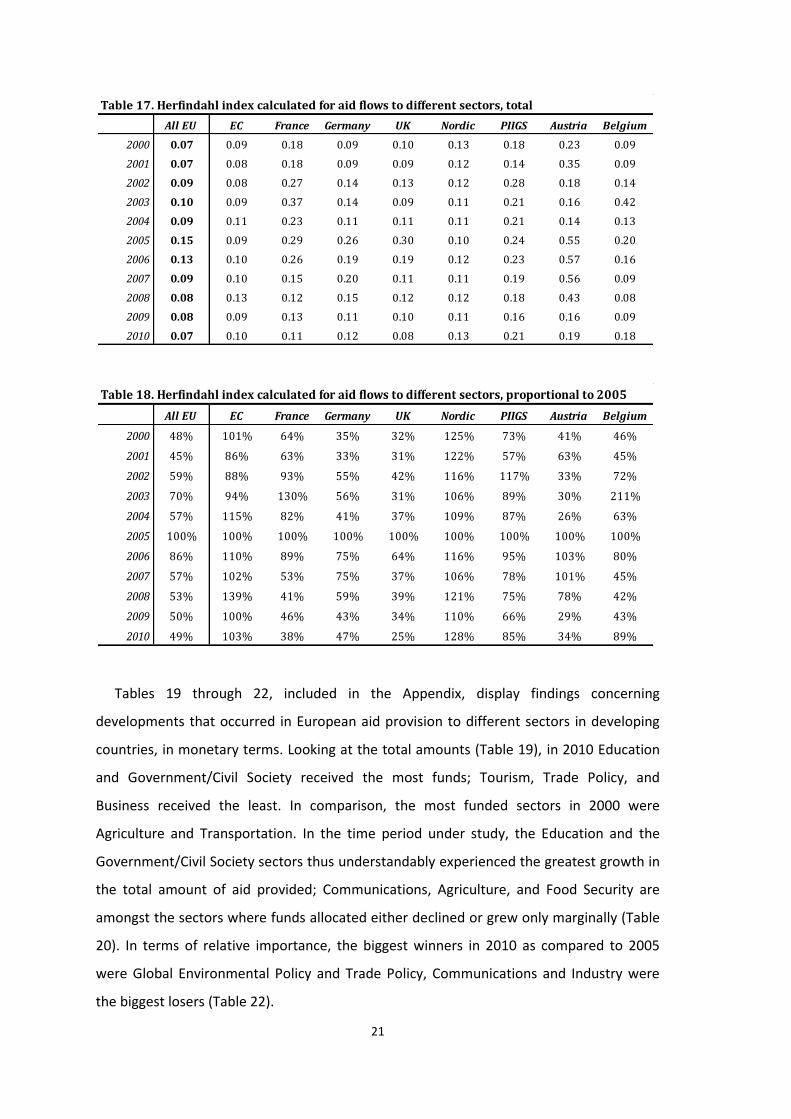
6.3 Cross-Sector Complementarity
Tables 17 and 18 display results regarding the sectoral fragmentation of EU aid,
represented by the sectoral Herfindahl index. The EU aid in general has become more
fragmented since 2005 from the sector perspective, returning to levels seen in 2000. The
best achievers in individual cross-sector complementarity are PIIGS, Austria and Belgium in
absolute terms and the Commission and Nordic donors in relative terms. In 2010, the least
sector-focused aid was aid provided by the UK, the Commission and France; the UK and
France were also the donors whose aid deteriorated the most since 2005 in this regard.
EU27 EU15 EC France Germany UK Nordic PIIGS Austria Belgium NEW
2000 0.11 0.10 0.20 0.05 0.07 0.02 0.06 0.16 0.13 0.04 0.16
2002 0.12 0.12 0.06 0.10 0.22 0.19 0.05 0.14 0.28 0.12 0.11
2003 0.14 0.07 0.12 0.09 0.06 0.01 0.03 0.09 0.13 0.01 0.32
2004 0.11 0.06 0.11 0.07 0.05 0.00 0.07 0.07 0.10 0.03 0.22
2005 0.08 0.05 0.06 0.06 0.03 0.01 0.03 0.10 0.04 0.02 0.13
2006 0.10 0.07 0.09 0.06 0.05 0.03 0.04 0.12 0.06 0.04 0.15
2007 0.06 0.06 0.07 0.07 0.04 0.01 0.03 0.12 0.04 0.03 0.06
2008 0.07 0.05 0.07 0.11 0.04 0.01 0.04 0.08 0.04 0.03 0.11
2009 0.06 0.04 0.06 0.06 0.06 0.01 0.02 0.04 0.06 0.02 0.10
2010 0.06 0.04 0.06 0.06 0.05 0.00 0.02 0.07 0.04 0.01 0.09
Table 15. Percentage of total aid budget allocated to global aid darlings, total
EU27 EU15 EC France Germany UK Nordic PIIGS Austria Belgium NEW
2000 139% 190% 337% 91% 277% 151% 190% 166% 367% 181% 123%
2002 146% 229% 92% 179% 854% 1264% 163% 152% 774% 592% 78%
2003 168% 122% 193% 152% 229% 54% 102% 97% 359% 44% 239%
2004 132% 120% 176% 117% 194% 29% 202% 70% 287% 128% 162%
2005 100% 100% 100% 100% 100% 100% 100% 100% 100% 100% 100%
2006 121% 135% 145% 113% 182% 178% 126% 130% 177% 210% 109%
2007 76% 113% 110% 131% 140% 54% 83% 122% 101% 141% 46%
2008 93% 102% 110% 193% 143% 36% 106% 86% 111% 159% 85%
2009 71% 68% 95% 107% 222% 49% 62% 46% 164% 106% 73%
2010 76% 80% 93% 109% 194% 23% 59% 75% 115% 72% 70%
Table 16. Percentage of total aid budget allocated to global aid darlings, proportional to 2005
21
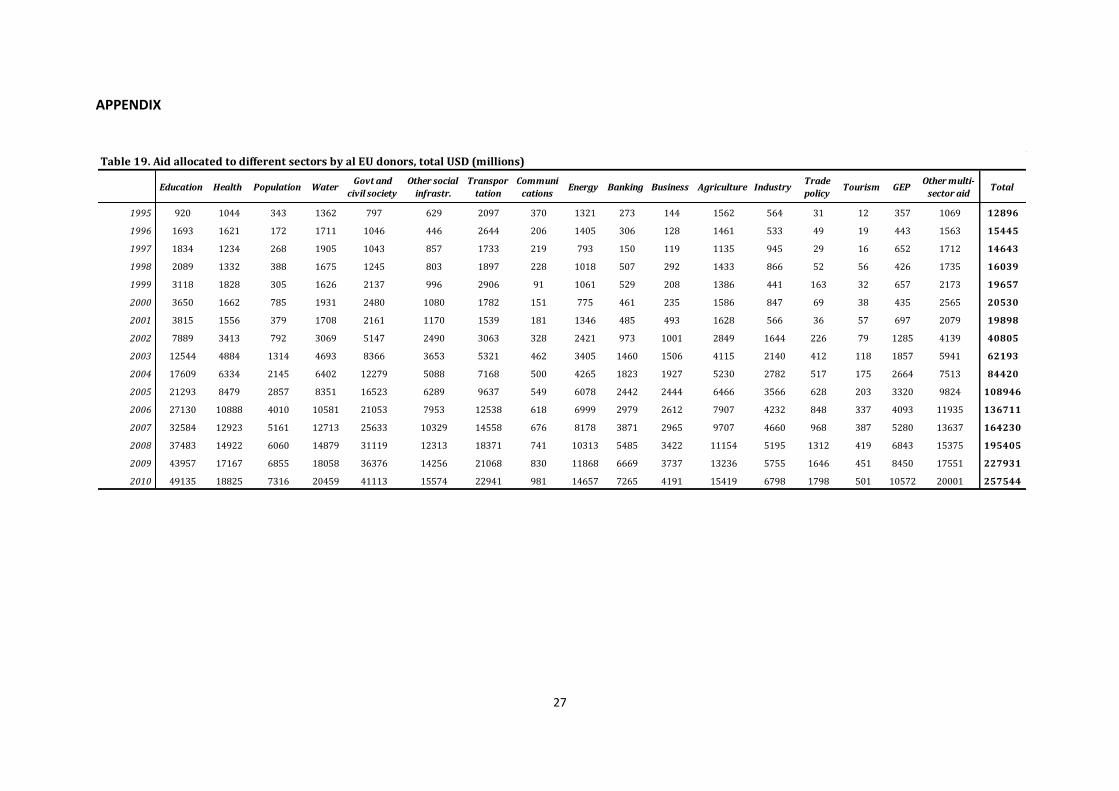
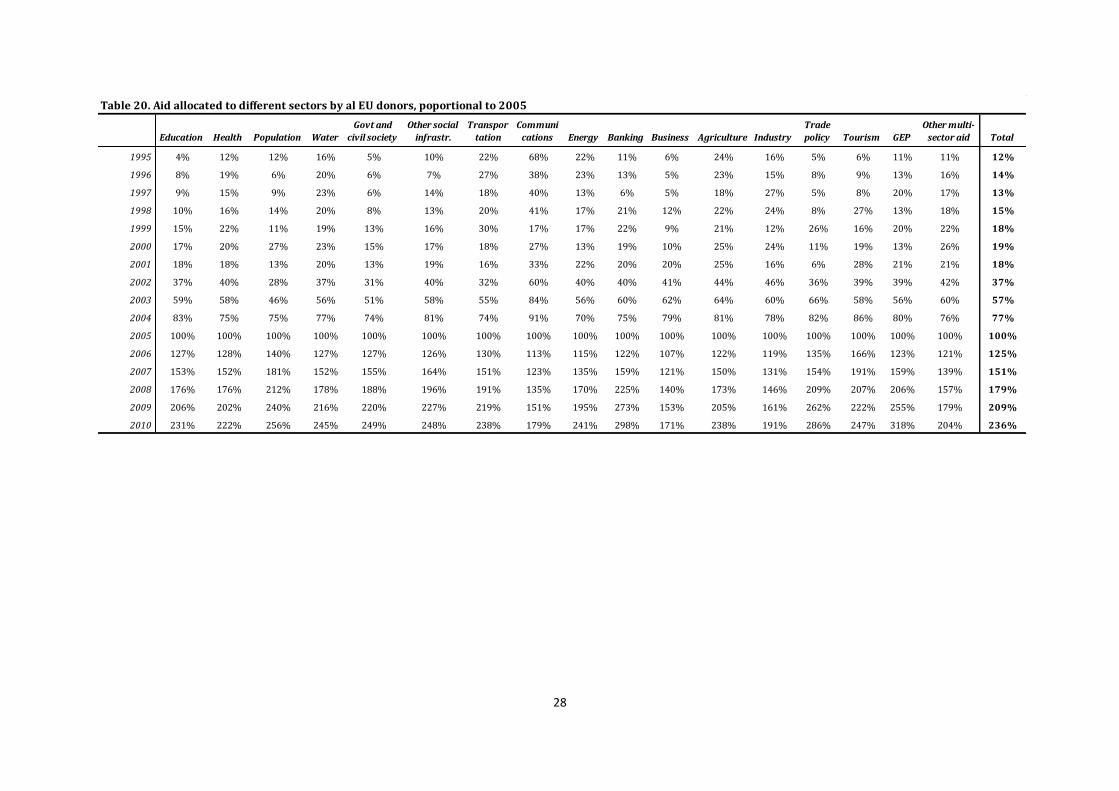
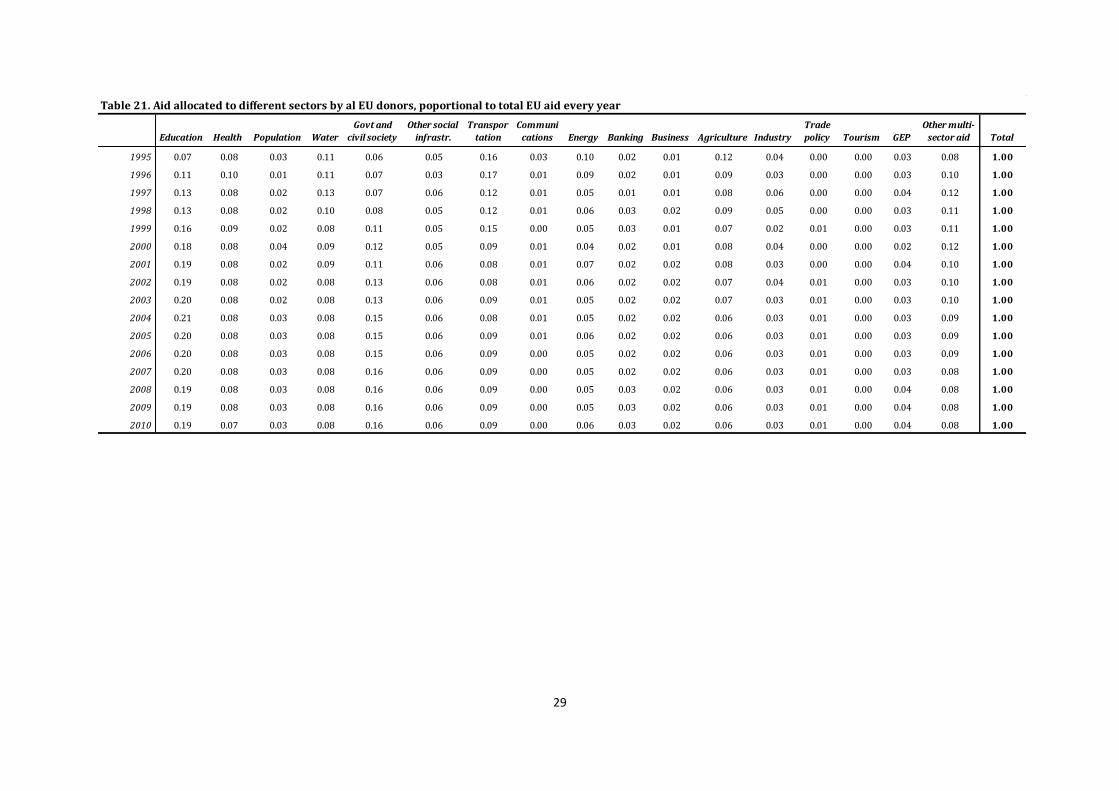
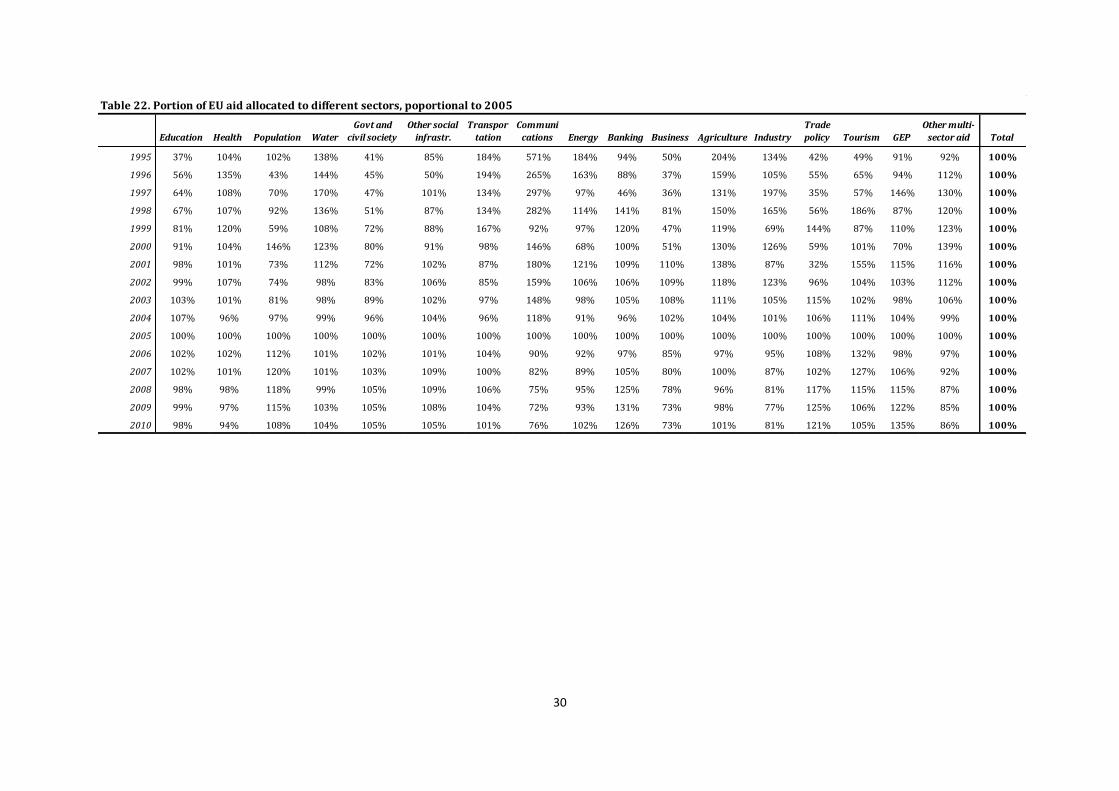
Tables 19 through 22, included in the Appendix, display findings concerning
developments that occurred in European aid provision to different sectors in developing
countries, in monetary terms. Looking at the total amounts (Table 19), in 2010 Education
and Government/Civil Society received the most funds; Tourism, Trade Policy, and
Business received the least. In comparison, the most funded sectors in 2000 were
Agriculture and Transportation. In the time period under study, the Education and the
Government/Civil Society sectors thus understandably experienced the greatest growth in
the total amount of aid provided; Communications, Agriculture, and Food Security are
amongst the sectors where funds allocated either declined or grew only marginally (Table
20). In terms of relative importance, the biggest winners in 2010 as compared to 2005
were Global Environmental Policy and Trade Policy, Communications and Industry were
the biggest losers (Table 22).
All EU EC France Germany UK Nordic PIIGS Austria Belgium
2000 0.07 0.09 0.18 0.09 0.10 0.13 0.18 0.23 0.09
2001 0.07 0.08 0.18 0.09 0.09 0.12 0.14 0.35 0.09
2002 0.09 0.08 0.27 0.14 0.13 0.12 0.28 0.18 0.14
2003 0.10 0.09 0.37 0.14 0.09 0.11 0.21 0.16 0.42
2004 0.09 0.11 0.23 0.11 0.11 0.11 0.21 0.14 0.13
2005 0.15 0.09 0.29 0.26 0.30 0.10 0.24 0.55 0.20
2006 0.13 0.10 0.26 0.19 0.19 0.12 0.23 0.57 0.16
2007 0.09 0.10 0.15 0.20 0.11 0.11 0.19 0.56 0.09
2008 0.08 0.13 0.12 0.15 0.12 0.12 0.18 0.43 0.08
2009 0.08 0.09 0.13 0.11 0.10 0.11 0.16 0.16 0.09
2010 0.07 0.10 0.11 0.12 0.08 0.13 0.21 0.19 0.18
Table 17. Herfindahl index calculated for aid flows to different sectors, total
All EU EC France Germany UK Nordic PIIGS Austria Belgium
2000 48% 101% 64% 35% 32% 125% 73% 41% 46%
2001 45% 86% 63% 33% 31% 122% 57% 63% 45%
2002 59% 88% 93% 55% 42% 116% 117% 33% 72%
2003 70% 94% 130% 56% 31% 106% 89% 30% 211%
2004 57% 115% 82% 41% 37% 109% 87% 26% 63%
2005 100% 100% 100% 100% 100% 100% 100% 100% 100%
2006 86% 110% 89% 75% 64% 116% 95% 103% 80%
2007 57% 102% 53% 75% 37% 106% 78% 101% 45%
2008 53% 139% 41% 59% 39% 121% 75% 78% 42%
2009 50% 100% 46% 43% 34% 110% 66% 29% 43%
2010 49% 103% 38% 47% 25% 128% 85% 34% 89%
Table 18. Herfindahl index calculated for aid flows to different sectors, proportional to 2005
22
7. Discussion
This section sums up the results presented in the previous section in a more
understandable manner. Regarding the EU as a whole, the findings suggest that contrary
to my expectations, in most aspects the EU’s division of labour deteriorated relative to
2005 (signing of the Paris Declaration) as well as relative to 2007 (signing of the Code of
Conduct). Particularly, in-country complementarity and cross-sector complementarity
worsened, with EU donors active in increasingly more sectors, more EU donors per every
sector, more darling sectors and a higher degree of sectoral fragmentation. Performance
in cross-country complementarity has been also quite dismal, with a worsening Herfindahl
index, a higher average number of development partners per EU donors but a lower
average amount disbursed to recipients.
There are, however, several areas, where the performance of EU as a whole improved.
A decline occurred both in the number of orphan sectors (any sector in a developing
country where no EU donor is working) and in the number of EU orphan countries (any
developing country where fewer than three EU donors are active). Moreover, EU donors
consistently allocated large portions of their total aid to global aid orphans and by 2010
significantly decreased the amount disbursed to global aid darlings. These advances are,
however, not likely to be a result of any conscious effort toward a better division of labour
in EU’s development policy. Rather, they probably constitute an unintended consequence
of a generally increasing aid flow on one hand and a changing character of aid13 on the
other hand.
When looking at the different groups of European donors, however, some donors seem
to have made significantly greater strides towards achieving the goals specified in the
Code of Conduct (2007) than others. The European Commission is the one donor that
most consistently appears to have improved in its aid giving, despite the fact that as the
largest European donor it is encouraged to provide aid to as many recipients as possible.
Acting on its comparative advantage, the Commission decreased its average number of
active sectors per recipient as well as the number of recipients in which it is active in more
than two sectors. Through this pathway, the EC also reduced its sectoral fragmentation.
Finally, the Commission gives a consistently high portion of its development funds to
global aid orphans and an ever decreasing amount to global aid darlings. Other donors
that seem to have intentionally advanced towards fulfilment of the Code of Conduct’s
13 It is possible that EU aid is becoming targeted less on the basis of political interests and more on the basis of actual need
23
goals include the Nordic donors –in all three types of complementarity– and Belgium –
particularly in in-country and in cross-country complementarity.
Conversely, the donors that have performed the worst include particularly France, the
UK and Germany. All three donors increased the number of active recipients as well as of
active sectors per recipient, while simultaneously reducing the average amount of aid per
recipient. France and the UK also experienced deterioration within their sector
fragmentation; France moreover gives large portions of its aid to aid darlings and small
portions to aid orphans. This finding is somewhat surprising as the existing literature
suggested that Southern donors, not the large bilateral donors, were traditionally the least
interested in aid effectiveness out of all EU donors. One reason underlying the depressing
performance of France, of the UK and to a lesser extent of Germany could be the large
scale of their bilateral aid programs that might make them more likely to be used as
political tools of foreign policy rather than mere charitable instruments. It is improbable
that any of the three countries are deliberately developing their aid programs contrary to
the goals agreed to in the Code of Conduct (2007), but it equally does not seem likely that
they are making any conscious effort to fulfil them. The PIIGS donors have performed
neither spectacularly bad nor very good. The most notable about their aid programs is the
significant downscaling in recent years, an expected result of the financial and fiscal
problems with which they have been dealing ever since 2008.
8. Conclusion
Despite the multitude of documents and initiatives adopted by EU donors in an effort
to improve their mutual coordination and hence in turn their division of labour, the
analysis of the latest empirical data in this paper indicates that very little progress has
been achieved thus far. In fact, in quite a few areas the division of labour actually suffered
a setback. One could hope that since some donors such as the EC or the group of Nordic
countries made some progress, others will also eventually. Nevertheless, for many
countries - especially for the large bilateral donors such as France, the UK and Germany –
development aid constitutes amongst other things, if not foremost, an important tool of
attaining strategic political interests. Consequently, as the results also insinuate, most EU
donors are not likely to make any changes towards a better division of labour unless
mandated to do so by a more binding document than the Code of Conduct (2007) or the
Operational Framework on Aid Effectiveness (2010). Thus, in a firm belief that more
24
coordinated European aid would also be more effective, I add my voice to those who
advocate for an overhaul of EU’s development aid architecture.
25
References
Accra Agenda for Action (2008).
Acharya, A.; de Lima, A. F.; and Moore, M. (2003). The Proliferators: Transactions Costs and the
Value of Aid. Institute of Development Studies.
Alesina, A. and Dollar, D. (2000) Who Gives Foreign Aid to Whom and Why? Journal of Economic
Growth, 5(1): 33-63.
Bigsten, A. (2006). Donor coordination and the uses of aid. Working Papers in Economics, (196).
Cohen, D. and Jacquet, P. (2008) EU Development Policies at crossroads. Presented at the
Ermonville Seminar on “European Aid Architecture: Opening the Debate;” December 18-19.
DCD-DAC (2012). European Union, DAC Peer Review: Main Findings and Recommendations.
European Commission (2008) An EU Aid Effectiveness Roadmap to Accra and beyond: From
rhetoric to action, hastening the pace of reforms. Commission Staff Working Paper.
European Commission (2011) EU Accountability Report 2011 on Financing for Development.
Commission Staff Working Paper.
European Commission (2009) Aid Effectiveness after Accra: Where Does the EU Stand and What
More Do We Need to Do? Commission Staff Working Paper.
European Council (2007) EU Code of Conduct on Complementarity and Division of Labour in
Development Policy.
European Council (2008) Third High-Level Forum on Aid Effectiveness – Accra (Ghana), 2 to 4
September, 2008 – Guidelines for the Participation of the European Union.
Frot, E. and Santiso, J. (2009). Crushed aid: fragmentation in sectoral aid. OECD Working Paper,
(284).
Gates, S. and Hoeffler, A. (2004). Global Aid Allocation: Are Nordic Donors Different?
Grimm, S. (2008). Reforms in the EU’s aid architecture and management: The Commission is no
longer the key problem: Let’s turn to the system.
Knack, A. and Rahman, A. (2004) Donor Fragmentation and Bureaucratic Quality in Aid
Recipients. Background Paper to World Development Report 2004, Washington DC.
Lawson, M. L. (2010). Foreign Aid Reform: Agency Coordination. DIANE Publishing.
Lehtinen, T. (2003). The Coordination of European Development Cooperation in the Field: Myth
or Reality? European centre for development policy management (ECDPM).
Morss, E. R. (1984). Institutional destruction resulting from donor and project proliferation in
Sub-Saharan African countries. World Development, 12(4), 465-470.
26
Mürle, H. (2007). Towards a division of labour in European development cooperation:
Operational options. Deutsches Institut für Entwicklungspolitik.
Paris Declaration on Aid Effectiveness (2005).
Petrikova, I. (2007) Too Many Cooks Spoiling the Broth: The Effectiveness of NGOs in Addressing
Child Labour in El Salvador. BA Thesis.
Petrikova, I. and Chadha, D. (2011) More Power to the Commission? Comparison of the
European Commission’s and EU Member States’ Adherence to Recommended Practices in
Aid Provision. Paper presented at the Annual DSA Conference, York, UK.
Roeske, K. (2007) The Code of Conduct for a better division of labour in the development policy
– is it a real milestone? Friedrich Ebert Stiftung.
Roodman, D. (2006). Aid project proliferation and absorptive capacity. Center for Global
development Working paper, (75).
Selbervik, H. and Nygaard, K. (2006). Nordic Exeptionalism in Development Assistance? Aid
Policies and the Major Donors: The Nordic Countries. Chr. Michelsen Institute.
Thiele, R.; Nunnenkamp, P.; and Dreher, A. (2007). Do donors target aid in line with the
Millennium Development Goals? A sector perspective of aid allocation.Review of World
Economics, 143(4), 596-630.
Utz, R. (2010) Will countries that receive insufficient aid please stand up. Paper for CFP research
program on the International Aid Architecture, World Bank, Washington DC.
Wanlin, A. (2007). What future for EU development policy? Centre for European Reform.
27
APPENDIX
Education Health Population WaterGovt and
civil society
Other social
infrastr.
Transpor
tation
Communi
cationsEnergy Banking Business Agriculture Industry
Trade
policyTourism GEP
Other multi-
sector aidTotal
1995 920 1044 343 1362 797 629 2097 370 1321 273 144 1562 564 31 12 357 1069 12896
1996 1693 1621 172 1711 1046 446 2644 206 1405 306 128 1461 533 49 19 443 1563 15445
1997 1834 1234 268 1905 1043 857 1733 219 793 150 119 1135 945 29 16 652 1712 14643
1998 2089 1332 388 1675 1245 803 1897 228 1018 507 292 1433 866 52 56 426 1735 16039
1999 3118 1828 305 1626 2137 996 2906 91 1061 529 208 1386 441 163 32 657 2173 19657
2000 3650 1662 785 1931 2480 1080 1782 151 775 461 235 1586 847 69 38 435 2565 20530
2001 3815 1556 379 1708 2161 1170 1539 181 1346 485 493 1628 566 36 57 697 2079 19898
2002 7889 3413 792 3069 5147 2490 3063 328 2421 973 1001 2849 1644 226 79 1285 4139 40805
2003 12544 4884 1314 4693 8366 3653 5321 462 3405 1460 1506 4115 2140 412 118 1857 5941 62193
2004 17609 6334 2145 6402 12279 5088 7168 500 4265 1823 1927 5230 2782 517 175 2664 7513 84420
2005 21293 8479 2857 8351 16523 6289 9637 549 6078 2442 2444 6466 3566 628 203 3320 9824 108946
2006 27130 10888 4010 10581 21053 7953 12538 618 6999 2979 2612 7907 4232 848 337 4093 11935 136711
2007 32584 12923 5161 12713 25633 10329 14558 676 8178 3871 2965 9707 4660 968 387 5280 13637 164230
2008 37483 14922 6060 14879 31119 12313 18371 741 10313 5485 3422 11154 5195 1312 419 6843 15375 195405
2009 43957 17167 6855 18058 36376 14256 21068 830 11868 6669 3737 13236 5755 1646 451 8450 17551 227931
2010 49135 18825 7316 20459 41113 15574 22941 981 14657 7265 4191 15419 6798 1798 501 10572 20001 257544
Table 19. Aid allocated to different sectors by al EU donors, total USD (millions)
28
Education Health Population Water
Govt and
civil society
Other social
infrastr.
Transpor
tation
Communi
cations Energy Banking Business Agriculture Industry
Trade
policy Tourism GEP
Other multi-
sector aid Total
1995 4% 12% 12% 16% 5% 10% 22% 68% 22% 11% 6% 24% 16% 5% 6% 11% 11% 12%
1996 8% 19% 6% 20% 6% 7% 27% 38% 23% 13% 5% 23% 15% 8% 9% 13% 16% 14%
1997 9% 15% 9% 23% 6% 14% 18% 40% 13% 6% 5% 18% 27% 5% 8% 20% 17% 13%
1998 10% 16% 14% 20% 8% 13% 20% 41% 17% 21% 12% 22% 24% 8% 27% 13% 18% 15%
1999 15% 22% 11% 19% 13% 16% 30% 17% 17% 22% 9% 21% 12% 26% 16% 20% 22% 18%
2000 17% 20% 27% 23% 15% 17% 18% 27% 13% 19% 10% 25% 24% 11% 19% 13% 26% 19%
2001 18% 18% 13% 20% 13% 19% 16% 33% 22% 20% 20% 25% 16% 6% 28% 21% 21% 18%
2002 37% 40% 28% 37% 31% 40% 32% 60% 40% 40% 41% 44% 46% 36% 39% 39% 42% 37%
2003 59% 58% 46% 56% 51% 58% 55% 84% 56% 60% 62% 64% 60% 66% 58% 56% 60% 57%
2004 83% 75% 75% 77% 74% 81% 74% 91% 70% 75% 79% 81% 78% 82% 86% 80% 76% 77%
2005 100% 100% 100% 100% 100% 100% 100% 100% 100% 100% 100% 100% 100% 100% 100% 100% 100% 100%
2006 127% 128% 140% 127% 127% 126% 130% 113% 115% 122% 107% 122% 119% 135% 166% 123% 121% 125%
2007 153% 152% 181% 152% 155% 164% 151% 123% 135% 159% 121% 150% 131% 154% 191% 159% 139% 151%
2008 176% 176% 212% 178% 188% 196% 191% 135% 170% 225% 140% 173% 146% 209% 207% 206% 157% 179%
2009 206% 202% 240% 216% 220% 227% 219% 151% 195% 273% 153% 205% 161% 262% 222% 255% 179% 209%
2010 231% 222% 256% 245% 249% 248% 238% 179% 241% 298% 171% 238% 191% 286% 247% 318% 204% 236%
Table 20. Aid allocated to different sectors by al EU donors, poportional to 2005
29
Education Health Population Water
Govt and
civil society
Other social
infrastr.
Transpor
tation
Communi
cations Energy Banking Business Agriculture Industry
Trade
policy Tourism GEP
Other multi-
sector aid Total
1995 0.07 0.08 0.03 0.11 0.06 0.05 0.16 0.03 0.10 0.02 0.01 0.12 0.04 0.00 0.00 0.03 0.08 1.00
1996 0.11 0.10 0.01 0.11 0.07 0.03 0.17 0.01 0.09 0.02 0.01 0.09 0.03 0.00 0.00 0.03 0.10 1.00
1997 0.13 0.08 0.02 0.13 0.07 0.06 0.12 0.01 0.05 0.01 0.01 0.08 0.06 0.00 0.00 0.04 0.12 1.00
1998 0.13 0.08 0.02 0.10 0.08 0.05 0.12 0.01 0.06 0.03 0.02 0.09 0.05 0.00 0.00 0.03 0.11 1.00
1999 0.16 0.09 0.02 0.08 0.11 0.05 0.15 0.00 0.05 0.03 0.01 0.07 0.02 0.01 0.00 0.03 0.11 1.00
2000 0.18 0.08 0.04 0.09 0.12 0.05 0.09 0.01 0.04 0.02 0.01 0.08 0.04 0.00 0.00 0.02 0.12 1.00
2001 0.19 0.08 0.02 0.09 0.11 0.06 0.08 0.01 0.07 0.02 0.02 0.08 0.03 0.00 0.00 0.04 0.10 1.00
2002 0.19 0.08 0.02 0.08 0.13 0.06 0.08 0.01 0.06 0.02 0.02 0.07 0.04 0.01 0.00 0.03 0.10 1.00
2003 0.20 0.08 0.02 0.08 0.13 0.06 0.09 0.01 0.05 0.02 0.02 0.07 0.03 0.01 0.00 0.03 0.10 1.00
2004 0.21 0.08 0.03 0.08 0.15 0.06 0.08 0.01 0.05 0.02 0.02 0.06 0.03 0.01 0.00 0.03 0.09 1.00
2005 0.20 0.08 0.03 0.08 0.15 0.06 0.09 0.01 0.06 0.02 0.02 0.06 0.03 0.01 0.00 0.03 0.09 1.00
2006 0.20 0.08 0.03 0.08 0.15 0.06 0.09 0.00 0.05 0.02 0.02 0.06 0.03 0.01 0.00 0.03 0.09 1.00
2007 0.20 0.08 0.03 0.08 0.16 0.06 0.09 0.00 0.05 0.02 0.02 0.06 0.03 0.01 0.00 0.03 0.08 1.00
2008 0.19 0.08 0.03 0.08 0.16 0.06 0.09 0.00 0.05 0.03 0.02 0.06 0.03 0.01 0.00 0.04 0.08 1.00
2009 0.19 0.08 0.03 0.08 0.16 0.06 0.09 0.00 0.05 0.03 0.02 0.06 0.03 0.01 0.00 0.04 0.08 1.00
2010 0.19 0.07 0.03 0.08 0.16 0.06 0.09 0.00 0.06 0.03 0.02 0.06 0.03 0.01 0.00 0.04 0.08 1.00
Table 21. Aid allocated to different sectors by al EU donors, poportional to total EU aid every year
30
Education Health Population Water
Govt and
civil society
Other social
infrastr.
Transpor
tation
Communi
cations Energy Banking Business Agriculture Industry
Trade
policy Tourism GEP
Other multi-
sector aid Total
1995 37% 104% 102% 138% 41% 85% 184% 571% 184% 94% 50% 204% 134% 42% 49% 91% 92% 100%
1996 56% 135% 43% 144% 45% 50% 194% 265% 163% 88% 37% 159% 105% 55% 65% 94% 112% 100%
1997 64% 108% 70% 170% 47% 101% 134% 297% 97% 46% 36% 131% 197% 35% 57% 146% 130% 100%
1998 67% 107% 92% 136% 51% 87% 134% 282% 114% 141% 81% 150% 165% 56% 186% 87% 120% 100%
1999 81% 120% 59% 108% 72% 88% 167% 92% 97% 120% 47% 119% 69% 144% 87% 110% 123% 100%
2000 91% 104% 146% 123% 80% 91% 98% 146% 68% 100% 51% 130% 126% 59% 101% 70% 139% 100%
2001 98% 101% 73% 112% 72% 102% 87% 180% 121% 109% 110% 138% 87% 32% 155% 115% 116% 100%
2002 99% 107% 74% 98% 83% 106% 85% 159% 106% 106% 109% 118% 123% 96% 104% 103% 112% 100%
2003 103% 101% 81% 98% 89% 102% 97% 148% 98% 105% 108% 111% 105% 115% 102% 98% 106% 100%
2004 107% 96% 97% 99% 96% 104% 96% 118% 91% 96% 102% 104% 101% 106% 111% 104% 99% 100%
2005 100% 100% 100% 100% 100% 100% 100% 100% 100% 100% 100% 100% 100% 100% 100% 100% 100% 100%
2006 102% 102% 112% 101% 102% 101% 104% 90% 92% 97% 85% 97% 95% 108% 132% 98% 97% 100%
2007 102% 101% 120% 101% 103% 109% 100% 82% 89% 105% 80% 100% 87% 102% 127% 106% 92% 100%
2008 98% 98% 118% 99% 105% 109% 106% 75% 95% 125% 78% 96% 81% 117% 115% 115% 87% 100%
2009 99% 97% 115% 103% 105% 108% 104% 72% 93% 131% 73% 98% 77% 125% 106% 122% 85% 100%
2010 98% 94% 108% 104% 105% 105% 101% 76% 102% 126% 73% 101% 81% 121% 105% 135% 86% 100%
Table 22. Portion of EU aid allocated to different sectors, poportional to 2005