Nonlinear dynamical system identification with dynamic noise and observational noise
Upload
khangminh22Category
view
2download
0
Is All That Talk Just Noise? The Information
Content of Internet Stock Message Boards
Werner Antweiler and Murray Z. Frank∗
First version: March 2001
This version: January 28, 2002
Abstract
Financial press reports claim that the millions of messages posted on internet stockmessage boards can move markets. We studied message posting on Yahoo! Finance andRaging Bull for 45 new-economy and old-economy companies. We measure the bullishnessof the messages using computational linguistics methods. Even after controlling for newsin print media, we find evidence that the message boards reflect the views of day traders.At daily frequency an increase in the number of messages predicts a subsequent increasein trading volume and volatility; particularly marked is the surge in small size trades. Wealso find that trades increase with the bullishness of posted messages, while trades decreasewith greater agreement among message posters. (JEL: G12, G14)
Keywords: Volatility, Trading Volume, Internet Message Boards
∗Both authors are at the Faculty of Commerce and Business Administration, University of British Columbia,2053 Main Mall, Vancouver BC V6T 1Z2, Canada. E-mail correspondence can be sent to the correspondingauthor at [email protected]. We would like to thank Richard Arnott, Elizabeth Demers, AlanKraus, John Ries, Jacob Sagi,the seminar audiences at UBC, and at the 2002 American Finance Associationannual meetings for helpful comments. The second author thanks the B.I. Ghert Family Foundation for financialsupport. All errors are ours.

Is All That Talk Just Noise? The Information
Content of Internet Stock Message Boards
First version: March 2001
This version: January 28, 2002
Abstract
Financial press reports claim that the millions of messages posted on internet stockmessage boards can move markets. We studied message posting on Yahoo! Finance andRaging Bull for 45 new-economy and old-economy companies. We measure the bullishnessof the messages using computational linguistics methods. Even after controlling for newsin print media, we find evidence that the message boards reflect the views of day traders.At daily frequency an increase in the number of messages predicts a subsequent increasein trading volume and volatility; particularly marked is the surge in small size trades. Wealso find that trades increase with the bullishness of posted messages, while trades decreasewith greater agreement among message posters. (JEL: G12, G14)
Keywords:
Volatility, Trading Volume, Internet Message Boards
0

“Internet message boards have come of age. [...] even investment pros are watching themessage boards closely and profiting from it. With “posts” running in the millions, Internetmessage boards have become an essential part of the savvy investor’s arsenal. [...] Internetmessages really do move markets, for better or worse.” (Weiss, 2000)
1 Introduction
Many people are devoting a considerable amount of time and effort to create and to read
the messages posted on internet stock message boards. News stories report that the message
boards are having a significant impact. The Securities Exchange Commission has prosecuted
people for internet messages. All this attention to internet stock messages caused us to wonder
whether these messages actually contain financially relevant information.
This paper studies the information content of postings on the Yahoo! Finance and Raging
Bull stock message boards during the year 2000. These are two of the largest and most promi-
nent message boards. The sample of stocks are the 45 firms that together made up the Dow
Jones Industrial Average (DIA), and the Dow Jones Internet Commerce Index (XLK). These
firms were fairly large and well known.
Our focus is on the issue of whether internet messages really do move markets. We study
the informativeness of both the observed message board activity levels, and the contents of
the messages. A key issue is whether the markets tend to move first, or whether the message
boards tend to move first. To the extent that the message boards move first they can be helpful
in forecasting.
What patterns did we expect to find? There are plausible arguments in both directions.
Many messages discuss recent events. Therefore it seems reasonable to expect that when
unusual activity takes place in the market, people will post messages about what just happened.
This is similar in spirit to ordinary news reports of unusual stock market activity. For this
reason we expected to find significant effects from the stock market to the message boards.
Many messages assert that a particular stock is either a good buy or a bad buy. If the
people posting messages are better informed than the marginal trader, there is the possibility
of predictive content for returns. Assertions of predictive content have been made in the
business press. Finance economists are likely to view such claims with skepticism.
Perhaps more interesting is a broader hypothesis. People think before they trade. Many
people like to discuss their ideas. Suppose that they also post messages while they think about
1

trading. This opens up the possibility that posting activity might lead trading volume. It is
well known that volume and volatility often move together. This also opens the possibility that
the messages could help forecast volatility.
In the business press day traders have been described as being active participants on internet
stock message boards. This suggests that the message boards might reflect the views of day
traders rather than being an unbiased sample of all traders. If this is true, then the message
board postings should have greater predictive content for small trades than for large trades.
This prediction matches the evidence nicely in a number of tests.
Due to the nature of the data, we employ well established methods from computational
linguistics. The reason is that our message board data contains more than 1.5 million text
messages – far too many to interpret manually. We therefore use computer algorithms to
interpret the messages. The oldest algorithm used to interpret text is called Naive Bayes.
Another algorithm called Support Vector Machine has become very popular for use in many
classification problems, including text classification. Both algorithms are used to code the
individual messages as bullish, bearish, or neither. We then aggregate the codings into indices
that measure the bullishness of each stock message board during each time period.
As might have been anticipated, the messages do not have any special forecasting ability for
excess stock returns. The messages are remarkably bullish despite poor market performance for
most of the firms in our sample. During the year 2000 the DIA declined by about 5% while the
XLK declined by more than 40%. Yet right through the year the messages were more bullish
regarding the average XLK firm than about the average DIA firm.
There is much more to financial markets than just excess stock returns. We examine the
ability of the message boards to forecast market volatility, trading volume, and spreads. The
message boards might particularly reflect the behavior of day traders rather than other market
participants such as institutional investors. If this clientele hypothesis is true then the message
boards ought to do a better job forecasting small sized trades rather than large size trades.
This turns out to be quite a robust feature of the data.
More messages are posted during periods when market trading is also particularly active.
When above average numbers of messages are posted, we also find that subsequent trading
volume tends to be high, even after controlling for autocorrelation. These forces are stronger
on small trades than on large trades. As conjectured, we also find that an above average
number of messages forecasts high subsequent volatility.
2

A skeptic might hypothesize that the internet messages would merely rehash what was
reported that morning in the Wall Street Journal or similar media. This raises the important
issue of whether the message boards play an independent role. Given the large number of
sources of real world information, this is a difficult challenge to meet fully. We have collected
all articles published in the Wall Street Journal about the firms in our sample during the year
2000. We have checked the days surrounding the news stories, both for unusual market activity
and for unusual message board activity.
The message boards have predictive content even controlling for the presence of articles
in the Wall Street Journal. The message boards do not merely rehash the morning’s news.
The day before a story is published proves to be a more important date than the day of the
publication. Presumably this reflects the fact that many stories are reported on the internet
and on news wires the day before the published version. There is some evidence of unusual
stock market behavior two days before Wall Street Journal news stories. However there is no
evidence that this is reflected on the message boards.
We are familiar with a small number of closely related previous studies. Bagnoli, Beneish
and Watts (1999) compared the First Call analyst earning forecasts to unofficial “whispers.”
The whispers were collected from a number of sources including Internet web pages and news
stories that reported the whisper forecasts. The analysts from First Call tended to underes-
timate corporate earnings announcements, while the “whispers” tended to be more accurate.
Dewally (2000) collected stock recommendations from two newsgroups (misc.invest.stocks and
alt.invest.penny-stocks). He found that there was not much predictive content in the forecasts
on these newsgroups. The recommended stocks typically had strong prior performance.
Wysocki (1999) measured the cumulative message postings on Yahoo! Finance to July 1,
1998. He studied the cross sectional differences between firms in order to determine which firms
had a large number of messages posted. In contrast to our paper, he did not attempt to assess
the content of the messages. The firms with high posting activity were characterized by: high
market valuation relative to fundamentals; high short seller activity; high trading volume; and
high analyst following but low institutional holdings.
Tumarkin and Whitelaw (2001) study the effect of messages posted on Raging Bull. Their
focus is quite different from the current paper. The current paper focuses on the information
content of the message boards and how they affect heavily-traded stocks. We also provide
evidence on the hypothesis that the message boards provide a window into a particular market
3

clientele – day traders. Our paper does not study market manipulation or the inherent rational-
ity of market valuations. Tumarkin and Whitelaw (2001) are interested in whether valuations
are rational in the internet service sector. They examine the message boards in order to see
whether message posting is leading to market manipulation and to irrational valuations. They
study messages for which the person posting the message revealed their position in the stock.
As pointed out by Das and Chen (2001), this is a sample that only includes roughly 10% of
the messages actually posted. By limiting the analysis to daily data, they restrict their ability
to recognize the role being played by day traders.
Consistent with our results Tumarkin and Whitelaw (2001) find that at daily frequency
market activity does help predict message posting levels, and that message posting does not
help predict stock returns. Unlike the current paper they did not study market volatility,
spreads, or trades of different sizes. We find that the message boards do help to predict trading
volume and volatility. The message boards are not informative about subsequent spreads.
Because—unlike Tumarkin and Whitelaw (2001)—we are interested in the potential role of day
traders, we study intra-day data and also consider differential effects of the message boards on
trades of different sizes. The evidence is consistent with the day trader hypothesis.
Das and Chen (2001) is a paper devoted to the development of a new natural language
algorithm to classify stock messages. They illustrate its application to 9 firms on particular days
during the last quarter of 2000. Consistent with our paper they find that the stock messages
reflect information rapidly, but they do not forecast stock returns. Das and Chen (2001)
are focused on developing a new algorithm rather than focusing on financial market behavior
directly. As a result they do not have results about trading volume, market volatility, trades
of differing sizes, or bid-ask spreads. Since our paper is not about devising new computational
linguistic algorithms, we use established algorithms for which there is an analytical basis, and
a track record of previous applications. Lewis (1998), Vapnik (2000) and Hastie, Tibshirani
and Friedman (2001) provide more information about the algorithms that we use.
The rest of the paper is organized as follows. Section (2) explains the reasoning behind a
number of the decisions we made in designing the study. Section (3) discusses the messages
and how we extracted information from the texts. In section (4) we describe a number of the
basic features of the data. Section (5) provides the results of tests for temporal sequencing
between the message boards and the financial market features. We conclude in section (6).
4

2 Defining the Scope of the Study
The first issue we face is the decision of which firms to study. We are interested in the infor-
mation content, but not in market manipulation. There are many reports of attempted, and
sometimes successful, market manipulation using the stock message boards. In one highly pub-
licized case a 15-year old is reported to have made a fair bit of money using a rather traditional
“pump and dump” approach. He apparently focused on small stocks using Yahoo! Finance.1
Penny stocks are reported to be susceptible to such behavior. While market manipulation is
an important topic, it is not our focus in this paper. We are interested in the simpler issue of
information revelation for heavily traded securities.
Popular discussions of financial markets during the period studied often distinguished “old
economy” and “new economy” firms. It seemed plausible that these firms might have been
affected differently by the messages. To represent the “old economy” we use the 30 firms that
are in the Dow Jones Industrial Average (DIA). To represent the “new economy” we use the 15
firms that are included in the Dow Jones Internet Index (XLK). This gives us a sample of 45
large firms. To represent movements in the overall market we used the exchange traded fund
that mimics the S&P 500 (SPY).
The second issue is the time period to study. News stories suggest that the importance of
the message boards is growing. So we decided to study the year 2000 – the most recent year
for which full data was available.
The third issue is the time frequency to use. Day traders have attracted considerable recent
attention. News reports suggest that day traders are particularly involved with the internet
stock message boards. It seems likely that their responses to postings might be observed
1“After he had picked and bought his stock, he would write a single message about it and stick it up in asmany places on Yahoo Finance as he could between 5 and 8 in the morning, when he left home for school. Therewere no explicit rules on Yahoo Finance, but there were constraints. The first was that Yahoo limited the numberof messages he could post using one e-mail address. He would click onto Yahoo and open an account with one ofhis four AOL screen names; a few minutes later, Yahoo, mysteriously, would tell him that his messages could nolonger be delivered. Eventually, he figured out that they must have some limit that they weren’t telling peopleabout. He got around it by grabbing another of his four AOL screen names and creating another Yahoo account.By rotating his four AOL screen names, he found he could get his message onto maybe 200 Yahoo messageboards before school. He also found that when he went to do it the next time, with a different stock, Yahoowould no longer accept messages from his AOL screen names. So he was forced to create four more screen namesand start over again. Yahoo never told him he shouldn’t do this. “The account would be just, like, deleted,” hesaid. “Yahoo never had a policy; it’s just what I figured out.” The S.E.C. accused Jonathan of trying to seemlike more than one person when he promoted his stocks, but when you see how and why he did what he did,that is clearly false. (For instance, he ignored the feature on Yahoo that enables users to employ up to sevendifferent “fictitious names” for each e-mail address.) It’s more true to say that he was trying to simulate anappearance on CNBC.” (“Jonathan Lebed: Stock Manipulator, S.E.C. Nemesis – and 15” By Michael Lewis,New York Times, February 25, 2001.)
5
within the trading day. Therefore we decided to use high frequency data provided by the TAQ
database rather than relying on the daily data from CRSP.
The fourth issue is the choice of message boards. There are many message boards on the
internet. We use data from Yahoo! Finance because it is reported to have the highest volume
of posting activity. In order to ensure that our results are not unduly limited we also use data
from Raging Bull, which is another of the popular message boards. Since different message
boards may attract different people, there is no guarantee that the results will be the same on
both sets of message boards. In fact the results did turn out to be quite similar.
Our data set includes more than 1.5 million messages about the 45 companies in our sam-
ple. Because this makes manual classification impractical, we turned to the use of computer
algorithms to classify the messages.
3 Message Board Data and Classification
Messages were downloaded from the Yahoo! Finance (YF) and Raging Bull (RB) message
boards using specialized software written by the authors. Messages were stored in a simple
plain-text database format, one file per day per company. Each message is uniquely identified
by the bulletin board code (YF or RB), the company’s ticker symbol, and the message board
sequence number. The file contents were then summarized in an index file which also lists the
date and time of posting, the message’s length in words, and the screen name of the originator
of the message.
To understand the nature of the postings it is helpful to look at examples. Figure (1)
provides two fairly typical examples of messages in the database format. Each message is dated
and timed to the minute, has a title, and has a text. The text very often contains a predicted
price change and at least some explanation for the prediction. Most of the explanations are
fairly short. Table (1) shows that the number of words in a message is most frequently between
20 and 50. Relatively few messages have more than about 200 words.2 It is fairly rare for a
message to have more than 500 words. More than 40% of the messages are posted by people
who post only a single message.3 However, there are some people who are very active and
2Many of the messages are rude and/or off-topic, and such messages are often long. On the other hand, areasonable proportion, while perhaps speculative, at least provided some discussion and a discernible predictionfor the firm in question.
3We only observe the chosen screen name rather than the author’s actual name. Therefore if one authorposts messages using more than one screen name we will count these as if they were separate authors.
6

account for more than 50 messages each.
We use two methods for classifying the messages: Naive Bayes (NB) and Support Vector
(SV). We started by using a training data set of 1,000 messages that we classified manually.
We then filtered our entire sample of 1,559,621 messages through the classification software to
obtain buy, hold, or sell signals for each message. These were in turn aggregated into time
periods of 15-minutes, 1 hour and 1 day.
While stock prices maybe set efficiently, there is no economic force that would cause mes-
sages posted on internet stock message boards to be efficient. Accordingly, we did not expect
the messages to provide unbiased forecasts. There are at least two aspects, a clientele issue
and an institutional issue.
A simple categorization of stock market participants includes market makers, institutional
investors, day traders, and ordinary private investors. It seems unlikely that either market
makers or institutional investors would do much posting on internet stock message boards.
Ordinary private investors are a very large and very diverse group, and so we expected the
message boards to reflect activity from this group. Potentially most important however are the
day traders. While their absolute number may be fairly small relative to ordinary investors,
press reports suggest that many of them are extremely active on the stock message boards.
Putting these groups together implies that we did not expect the message boards to reflect the
views of a random sample of all traders.
There is an institutional aspect that may also be important. People who hold either a long
position or a short position are likely to be particularly interested in a given stock. They need
to decide whether to enhance their exposure, or to unwind it. People who hold a zero position
may be less likely to pay attention to a particular message board. Current institutions make it
much easier for a small trader to hold a long position than a short position. Thus we expected
to find a bullish tone on average.
For these reasons we approach the data knowing that while market prices reflect all market
participants, what we observe on the boards probably will not. The message boards probably
reflect a particular segment of the market. As will be shown, this perspective does seem to
help account for several features of the data.
7

3.1 Naive Bayes Message Coding
The Naive Bayes algorithm is the oldest of the algorithms used to classify documents. Lewis
(1998) provides a perspective of the history of the algorithm. It continues to attract interest and
further refinement. Recent related papers include McCallum and Nigam (1998) and McCallum,
Nigam, Rennie and Seymore (2000). Beyond the fact that Naive Bayes has a long and rather
successful track record in text classification, there is another reasons for our attention to this
approach. Using Bayes rule in this manner has a natural attraction given the wide use of
Bayesian methods in financial econometrics.
For Naive Bayes text classification we have employed the Rainbow package developed by
McCallum (1996).4 The key assumption underlying the NB classification method is that oc-
currences of words are independent of each other. The assumption of independence among
words is the reason that the algorithm is referred to as “naive”. Even though this is a highly
unrealistic assumption, NB performs rather well in practice.5
In the context of text classification, Naive Bayes can be understood most easily as a straight-
forward mechanism of updating odds ratios. Consider a stream of words Wi that are found
either in a message of type T or its anti-type T . Let m be the number of occurrences of
this word in type T , and let m be the number of occurrences in anti-type T . Further let n
and n denote the total number of words in classes T and T , respectively. For words found
in messages from the training set we observe the conditional probabilities P (Wi|T ) = mi/ni
and P (Wi|T ) = mi/ni. Now consider Bayes’ rule, updating our prior P (T |Wi−1) to posterior
P (T |Wi) when we observe word Wi and thus P (Wi|T ) and P (Wi|T ):
P (T |Wi) =P (T |Wi−1)P (Wi|T )
P (T |Wi−1)P (Wi|T ) + (1− P (T |Wi−1))P (Wi|T ). (1)
That is easily rewritten in odds-ratios form as
P (T |Wi)1− P (T |Wi)
=P (T |Wi−1)
1− P (T |Wi−1)· P (Wi|T )P (Wi|T )
(2)
with P (T |W0) ≡ P (T ). Classifying a document thus amounts to multiplying odds ratios when
4This software can be downloaded freely for academic purposes from the web at http://www.cs.cmu.edu/-˜mccallum/bow/.
5This approach is an example of a “bag of words” approach to text classification. This approach makes nodirect use of the grammatical structure. As an empirical matter it has been found that a surprisingly smallamount is gained at substantial cost by attempting to exploit grammatical structure in the algorithms. For ahelpful discussion of the various approaches to analyzing text see Manning and Schutze (1999).
8

processing the document word by word.
For reasons of computational accuracy, it is however common practice to add up logs of
odds ratios
P (T |WN ) = P (T ) exp
[N∑i=1
log(P (Wi|T )P (Wi|T )
)](3)
where N is the number of words in a given document. Adding logs of odds ratios avoids the
problem of computational “underflow” or “overflow” errors, which could easily arise when odds
ratios are multiplied directly in a long message. The prior P (T ) is based on the document
frequencies for each of our three classes. The problem with equation (1) is that either P (Wi|T )
or its anti-class counterpart may be zero. In this case, a method known as Laplace smoothing is
applied to replace the zero-value with estimates E(P (Wi|T )) = (1 +mi)/(1 + ni), and likewise
for P (Wi|T ).
Usage of the Rainbow software package proceeded in three steps. First we split the 1,000
messages into buy, sell, and hold messages stored in individual directories. In the second
step we run the rainbow utility to process the messages in the training data set using the
--method=naivebayes and --prune-vocab-by-infogain=1000 options. The latter restricts
the number of words in the vocabulary to the top 1,000 words as ranked by the average mutual
information with the class variable.6 After training is complete, rainbow is put into server
mode and individual messages k containing words W k are sent from a client program to the
server for evaluation. The server returns three probabilities P (c|W kN ) for each of the three
categories c ∈ {B,H, S} (buy, hold, and sell), and we choose the classification with the highest
probability according to arg maxc P (c|W kN ).
At this stage each individual message has been classified. Before turning to the aggregation
step, we discuss the Support Vector Machine coding.
3.2 Support Vector Message Coding
The Support Vector Machine (SVM) approach stems from the work on statistical learning and
computer classification problems. This method has been applied successfully to a broad range
of classification problems. It has been successfully used for text classification by academic
scholars such as Joachims (1999), as well as by scholars at Microsoft Research, see Dumais,
Platt, Heckerman, and Sahami (1998). Given the reports of successful use of this method
6See Cover and Thomas (1991) for details.
9

in text classification, we employ SVM as a second classification method. Using two different
methods for text classification also helps to ensure that our results are “robust” with respect
to the choice of classification method. For SVM text classification we use software by Joachims
(1998).7
Both Naive Bayes and SVM can be represented and analyzed algebraically. Both Naive
Bayes and SVM have a track record of previous successful application to text classification
problems. While a complete discussion of SVM lies beyond the scope of this paper, we point
out the basic idea.
SVM transforms texts into “feature vectors,” where each feature corresponds to a word in
the text to be classified, along with an attribute that describes the word’s importance.8 It
is customary to reduce the feature space to avoid “overfitting” of the data. We only include
words that occur in at least 1,000 of our 1.5 million messages. The words are ranked by what is
known as a minimum information criterion, and we choose only the top 1,000 words from this
list to form our feature space. The SVM algorithm is then optimizing an objective function to
calculate the hyperplane that optimally separates the feature space (words) into a class and its
anti-class.9
SVM classification delivers values rk(B) and rk(S) for each message k and signals buy (B)
and sell (S), where positive and negative numbers indicate whether or not the message belongs
in a given class. To aggregate these two numbers into a unique classification for each message,
we choose B when rk(B) > rk(S) ≥ 0, we choose S when rk(S) > rk(B) ≥ 0, and we choose
hold (H) for all other cases.
Table (2) shows the classification accuracy of the Naive Bayes and Support Vector methods.
Our training data set of 1,000 messages contains 25.2% buy signals, 5.5% sell signals, and 69.3%
hold signals. The in-sample accuracy is very high with both classification methods. Out-of-
sample Naive Bayes found a slightly smaller number of sell messages than did the Support
Vector method.
7This software is freely available on the internet for academic purposes and can be downloaded fromhttp://ais.gmd.de/˝thorsten/svm light/.
8In the context of our study, the attribute that corresponds to each word i is the normalized inverse document
frequency IDFi = log(M/mi)[∑N
j=1 log(M/mj)]−1/2
, where M is the number of messages to be classified, mi
is the number of documents in which word i occurs, and N is the dimension of the word space.9In detail, we split our training sample into buy and sell messages and create appropriate dictionary files in
which words are coded as numbers. These two dictionary files are used to train the classification system alongwith a data file which describes the words attributes. We have used the default parameters of Joachim’s SVMsystem except for the choice of kernel function, where we have opted for a polynomial kernel function instead ofa linear kernel function.
10

3.3 Aggregation of the Coded Messages
For each of the two classification methods we aggregate the message classifications xi in order to
obtain a bullishness signal θt for each of our time intervals t. Let M ct ≡
∑i∈D(t)wix
ci denote the
weighted sum of messages of type c ∈ {B,H, S} in time interval D(t), where xci is an indicator
variable which is 1 if when message i is of type c and zero otherwise, and wi is the weight of
the message. When the weights are all equal to one, M ct is simply the number of messages of
type c in the given time interval. Furthermore, let mt ≡ MBt + MS
t be the total number of
“relevant” messages, and let bt ≡MBt /M
St be the ratio of bullish to bearish messages.
There are many different ways that MBt , MH
t , and MSt can be aggregated into a single
measure of “bullishness.” We have considered the empirical performance of a number of alter-
natives. These definitions implicitly differ in what they mean by the term bullish. Should this
measure represent an average sentiment of those posting messages? Should it vary with the
number of traders expressing the sentiment?
Another way to think about the question is to ask, what is the degree of homogeneity that
we should choose for the aggregation function? Our first measure is defined as
θt ≡MBt −MS
t
MBt +MS
t
=bt − 1bt + 1
. (4)
It is homogenous of degree zero and thus independent of the overall number of messages mt;
multiplying MBt and MH
t by any constant will leave θt unchanged. Furthermore, θt is bounded
by –1 and +1. We investigated this measure extensively in an earlier draft of this paper. While
all our key results can be obtained with this measure, we prefer the following second approach
to defining bullishness:
θ∗t ≡ ln[
1 +MBt
1 +MSt
]= ln
[1 + bt(1 +mt)
1 + bt +mt
]= ln
[2 +mt(1 + θt)2 +mt(1− θt)
]≈ θt ln(1 +mt) (5)
This measure takes into account the number of traders expressing a particular sentiment.
This aggregation function is homogenous of a degree between zero and one. We have also
systematically investigated a third aggregation function
θ∗∗t ≡MBt −MS
t = mt
[bt − 1bt + 1
]= mtθt, (6)
which is homogenous of degree one. The last two measures both increase with the number
11

of messages mt as well as the ratio of bullish to bearish messages. However, the logarithmic
transformation in our “intermediate” measure θ∗ discounts excessively large ratios or message
numbers. Our measure θ∗ appears to outperform both alternatives and so we use it in all
reported tables.10
In the reported tables we focus on the case in which each message is weighted equally
(wi = 1). In addition to equal weighting, we considered two unequal weighting schemes.
Because longer messages might be more important than short ones, we tried weighting the
messages by their length (wi = Li). Some people post many very similar messages. Because
repeated messages by the same author may have diminishing impact, we also tried weighting
each message by the inverse of the total number of messages posted the the author of the
particular message (wi = Ai). These alternative weighting schemes had very small effects.
We also considered using weights based on the citation frequency of individual messages.
This information is available for messages on the Yahoo! Finance boards, where messages may
contain a single citation of a previous message. We do not employ such a weighting system
in our analysis because citation weights are only determined ex-post. The number of citations
that a particular message will receive is unknown at the time it is posted. This would cause
serious problems for our time sequencing analysis. Another concern is that citations may not be
genuine citations of an earlier message. This happens because some message board contributors
find it more convenient to use an e-mail system’s “reply” function instead of the “new message”
function. As a result the number of citations can be a distorted measure.
The treatment of periods during which no messages are posted is a potential source of
concern. If no new messages are posted does this mean that everyone agrees with the last
message? Or does it simply mean that nobody has anything that they wish to say? In the
reported results we assume that an absence of postings is a zero.11
Potentially interesting is the extent of disagreement among the messages posted. Disagree-
ment can induce trading in some settings.12 To measure agreement we proceeded as follows.
10In none of our three measures do we use the number of “hold” messages. This group contains both “noise”as well as neutral (hold) opinions. The amount of “noise” dominates. Thus the inclusion of MH
t would lead tonoisier and perhaps distorted bullishness signals.
11Another possibility is to maintain the previous value instead of using a value of zero during a period withoutmessages. We did some experiments with such a procedure. These indices are biased in the bullish direction.The empirical results obtained using this approach are considerably noisier.
12Harris and Raviv (1993) provide a model of such trading. The hypothesis that disagreement induces tradingis often invoked in theory such as Allen and Gale (1999) and Daniel, Hirshleifer and Subrahmanyam (2001).In a standard rational expectations model however, there can be “no trade” theorems such as in the analysisof Milgrom and Stokey (1982). Related empirical evidence is provided by Kandel and Pearson (1995) and
12

First we define xi ≡ xBi − xSi ∈ {−1,+1}. Again all hold messages are ignored. The variance
of θi during time interval t corresponding to (4) can then be calculated as
σ2t ≡
∑i∈D(t)wi(xi − θt)2∑
i∈D(t)wi=∑
iwix2i∑
iwi− θ2
t = 1− θ2t (7)
In the last simplification step observe that ∀i : x2i = 1, because xi is either +1 or –1. This
permits us to measure the prevailing level of agreement among message board contributors as
an “agreement index”
ηt ≡ 1−√
1− θ2t ∈ [0, 1] (8)
If disagreement produces trading, then ηt should be negatively correlated with measures of
trading volume.
To illustrate the properties of the agreement index η, consider the case where there are three
messages in a particular time interval. First, assume that all three are bullish (xi = +1). Then
it is easily verified that η = 1. The same result emerges when all three messages are bearish
(xi = −1). Second, consider the case where two messages are bullish, and one is bearish. In
this case θ = 1/3, and therefore η = 1−√
1− (1/3)2 = 0.057, so agreement is low. Third, if we
have one buy, one sell, and one hold message, the agreement index will be zero. Finally, what
happens to the agreement index if we do not observe any messages in a given time period?
In these periods we assume that our bullishness index is neutral (θ = 0), and therefore the
agreement index is calculated as zero as well. Intuitively, periods without information may be
viewed as latent disagreement.
4 Basic Features of the Data
4.1 Messages
More messages are posted on Yahoo! Finance than on Raging Bull. Firms that are listed on
NASDAQ and included in the XLK index generate more messages than do firms listed on the
NYSE and included in the DIA. Intel and Microsoft are the only firms in our sample that are
listed on NASDAQ and included in DIA. Many messages are posted about both of these firms.
Figure (2) shows the weekly level of message posting over the full year 2000. News reports
in the earlier part of the year 2000 suggested that posting activity was increasing at a dramatic
Bessembinder, Chan and Seguin (1996).
13

rate, and news reports in the later parts of the year 2000 suggested that posting activity
was falling off dramatically. Neither of these match what we observed for our sample of firms.
There was some decline in activity during the late spring and the summer months, but otherwise
message posting activity was reasonably stable over the year for our sample of firms.
Within the trading week there is a very strong weekend effect. Many fewer messages are
posted during weekends.
4.2 Financial Data
Financial data are from the TAQ database for the 45 stocks and for the exchange traded fund
that serves as our proxy for the market (SPY). We extracted and then aggregated the following
information: a bid-ask midpoint at the end of each 15-minute time interval, the corresponding
bid-ask spread at that point, the volume-weighted average trading price for that 15-minute
interval, the corresponding volume-weighted volatility, the number of shares traded, and the
number of transactions in each of three transaction value categories (below $100,000, between
$100,000 and under $1,000,000, and $1,000,000 or above).
In scanning through the TAQ trades file we ignore information from exchanges other than
NASDAQ or NYSE, we ignore trades or quotes with sequence numbers that are “out of se-
quence,” we ignore trades which are marked as irregular, and we ignore opening and closing
quotes. In addition, we filter out spreads that are negative or in excess of 40% of the bid-ask
midpoint, and we filter out trades with prices in excess of 100% of the bid-ask midpoint for the
relevant time period.
Our measure of the stock market index is the exchange traded fund that mimics the S&P
500 (ticker symbol SPY). This is a market factor that traders can buy and sell easily with
low transaction costs. It also has the further advantage that we can observe its market price
directly at the same frequency as the rest of the financial data.
As can be seen in Figure (3) there was a decline in the volume of stock trading over the
year for our sample of firms. Comparison of Figure (2) with Figure (3) suggests that trading
volume is often elevated during the same weeks that message posting is elevated.
4.3 Wall Street Journal
Using Lexis-Nexis we collected all articles about our 45 firms that appeared in the Wall Street
Journal during the year 2000. As shown in Table (3), there are no news stories about most
14

firms on most days, while the occasional firm has more than a single news story on a given
day. The main firm that had multiple news stories on the same date is Microsoft, which was
involved in a controversial antitrust trial during the year. Table (3) also shows that while the
message board postings are very heavy for the internet firms, the Wall Street Journal provides
much more coverage for the typical Dow Jones Industrial Average firm. In other words there
is a difference in emphasis between these two sources.
The Wall Street Journal is usually taken to be the statement of record and it is published
each business day morning. Investors, however, commonly obtain information from news wire
sources directly or from a range of sources that post news on the internet – including the web
page of the Wall Street Journal. This kind of information commonly becomes available during
the day before it is published in the Wall Street Journal. Therefore it is important to also
examine the days surrounding the day that a story appears in the Wall Street Journal. We
consider two days prior and one day subsequent to a news story day.
4.4 Time
The NYSE and NASDAQ are only open from 9:30 AM to 4:00 PM Eastern time. As is well
known, the behavior at the market open and at the close of trading have somewhat different
properties than during the rest of the day. In particular, as shown in Figure (4), trading volume
tends to be lower during the middle of the day. As explained by Bacidore and Lipson (2001)
the opening and closing procedures on the NYSE are different from trading during most of the
day. The opening auction can take up to a half hour.
In addition to the different trading institutions there are also potentially different trader
motivations to consider. Many small traders think about their portfolios during the evening
when they are home from work. They may call their brokers or place automated trades through
discount brokers before they start work in the morning. This will result in many trades at the
market open. Near the end of the day institutional traders may wish to close out a position in
order to avoid overnight risk. Managers of mutual funds may wish to prepare their portfolio for
the end of the day valuation. These arguments are consistent with what is observed in Figure
(4).
One might have imagined that a high proportion of the messages would be posted in the
evening, after dinner. However, this is not the dominant pattern. Figure (5) shows that
message posting is concentrated during working hours, while the stock markets are open. This
15

is suggestive of day trader activity, but it could also reflect people posting messages from their
jobs.
Both the messages and the stock data are time stamped by the minute. This suggests using
one minute as the time period. However, with this time period definition there will be no
messages posted for most periods, and in many cases relatively few stocks traded. This large
number of zeros can create a misleading impression. If one increases the amount of time in
each time interval, several effects take place. First, there are fewer empty cells. Second, there
are many fewer time periods and hence reduced “sample size.” Third, with longer time periods
some of the information that is included in a given period may become more stale since it is
less recent. Fourth, the numbers within each time period are based on more evidence.
There is no clear best balance among these factors. Some traders really do follow the
market on a minute by minute basis. Other investors may check the market daily, or even
less frequently. With a market composed of a mixture of such people it is quite possible that
different relationships could be revealed on different time scales. In the market microstructure
literature many papers, such as Hasbrouck (1999) and Hasbrouck and Seppi (2001), use a 15
minute time period. Of course other papers define time units at different levels. With these
considerations in mind we carried out tests using 15 minute, 1 hour, and 1 day time periods.
The results from 1 hour do not add much further information, and so we report the results
based on 15 minute and 1 day time period definitions.
There is another time problem to be considered. The markets are only open for part of
the day, while the stock message boards are open 24 hours a day. Thus the two classes of
data have different natural calendars. We have employed three strategies for dealing with
this in our empirical analysis. First, much of our analysis focuses only on the time during
which the markets are open. Second, we use time-of-day dummy variables throughout the
analysis in an effort to control for deterministic time patterns. Third, we have carried out a
number of additional tests to see if the messages posted while the markets were shut predict the
market opening excess stock returns. We found no evidence that the opening excess returns are
forecastable using the message board information, and so we do not report these test results
in detail.
Figure (6) depicts the market performance of our versions of the DIA and XLK indices.13
13The figure depicts the prices of the exchange-trade tracking funds, with prices standardized at 100 at thebeginning of the year 2000. The XLK fund imposes an upper limit of 10 percent on the weight of a particularstock. If market-cap weights had been used, the decline of the internet commerce stocks would have been more
16
The DIA declined by about 5%, while the XLK declined by more than 40%. The decline in
the XLK reflects what is often described as the end of the internet bubble. Two of the firms
in the XLK ceased trading during October due to mergers.
Figure (7) depicts movement of the bullishness signals for the DIA and XLK indices. Weekly
average values are shown because the daily, and higher frequency, values are much more volatile.
The bullishness signals for the XLK held up remarkably strongly. Gradual decline was observed
during the year.
A popular aphorism during the so-called internet bubble was “buy on the dips.” There were
many reports in the business press that at least some investors believed that following a “buy
on the dips” strategy would be key to building long term wealth. Of course, this saying does
not specify a particular definition of a dip, nor does it specify how much to buy. Nonetheless
it may help explain the degree to which bullishness held up in the face of declining markets.
Comparison between Figures (6) and (7) is interesting. One might imagine that stock price
declines would be matched by declines in bullishness. There were two very sharp declines in
XLK, one from late March to late May, and one from early September through the end of
year. There is no simple tight connection between the declining stock prices and the associated
bullishness indices that is apparent in these Figures. There does seem to have been a decline
in bullishness during the fall relative to the earlier part of the year.
4.5 Descriptive Statistics
Table (3) reports a number of descriptive statistics for the companies in our sample. Comparing
Yahoo! Finance to Raging Bull, we find that more messages are posted for all firms, and the
messages are often more bullish. The average message is longer on Raging Bull. In comparison
to the XLK firms, the DIA firms have lower losses, lower volatility, lower activity levels on the
stock message boards, and less bullishness expressed on the stock message boards.
The coverage of our sample of firms in the Wall Street Journal is not all that highly cor-
related with message posting. The XLK firms generate a great deal of message posting, but a
much lower level of coverage by the Wall Street Journal.
Tables (4)-(6) provide a number of descriptive statistics. Price can be measured as either
the average price at which shares actually traded during a time interval, or it can be measured
as the midpoint of the bid-ask spread. Jones, Kaul and Lipson (1994) argue that the midpoint
dramatic due to the steep declines of the two largest stocks.
17

of the bid-ask spread is preferable because it avoids the bid-ask bounce. We follow their
recommendation. Empirically the two are very highly correlated. The average price (midpoint
of the bid and ask) at which our sample of stocks traded during the period under study was
$58.25. The highest price observed in the data was $496.03 and the lowest price observed was
$0.17. This seems a remarkable range for firms that are all large enough to be included in
major stock indices.
Table (5) provides a number of alternative time aggregations for the Yahoo! Finance mes-
sage boards. ‘No lag’ refers to data constructed strictly within a 15 minute time interval. A
‘1 hour lag’ means that the data is aggregated over the previous hour. Similarly, ‘4 hour’ and
‘1 day’ lags report longer time aggregations. Of course the number of words and the number
of messages increase as longer periods of time are included. On average 3.365 messages are
posted every hour for each stock in our sample over the entire year on Yahoo! Finance. This
is a fair bit higher than the 0.58 messages per hour on Raging Bull.
The bullishness measures increase as the length of time included in the measure increases.
This effect is simply an artifact of the manner in which the indices are constructed. When no
messages are posted in a period, neither a buy nor a sell is recorded for that period. When
only a single message is recorded in a period, and that message is neither a buy nor a sell, then
a value of zero is recorded. As the length of the time period increases, less weight is given to
such “accidental holds.” Since there are more buy messages than sells as more messages are
added, the mean tends to rise.14
In order to compute elasticities and to control for scaling, a number of the key variables are
log transformed. In particular variables related to trading volume and to number of messages
posted are calculated as log(1 + x) in order to avoid taking the log of zero when x is zero.
4.6 Correlations
The correlation patterns in the data provide evidence of relevant information. Tables (7) and
(8) report the correlations that are significantly different from zero at a 99% confidence level.
Correlations for Yahoo! Finance and Raging Bull are reported separately, and they prove to
be quite similar.
14As already mentioned, we experimented with constructing bullishness indicators in which the missing valueswere replaced with lagged values. These versions of the indices do not have the time lengthening artifact shownin Tables (5) and (6). However the indices constructed in this manner were much noisier and did not performas well empirically.
18
The correlations reported at the top of Table (7) are among the financial measures. These
generally reproduce results that are already well-known from studies of earlier time periods.
Volume is positively correlated with volatility, and negatively correlated with the spread. There
is greater trading volume near the start of the trading day, and near the end of the trading
day. In the middle of the day volume is lower. Despite the greater trading volume, the spread
is wider at the start of the trading day.
Two aspects of the financial correlations seemed noteworthy. First, there is a positive return
during the first 15 minutes of the day followed by a negative return over the subsequent 45
minutes. Second, the spread is negatively correlated with small trades, but positively correlated
with medium and large trades. It seems easy to imagine that market makers worry more
about the adverse selection issue associated with larger trades. For a helpful discussion of
adverse selection effects in market microstructure, see Campbell, Lo and MacKinlay (1997)
and Madhavan (2000).
The correlations between the stock market features and the message board features are
large. In many cases these correlations are larger than heavily-studied correlations between
different stock market features. For instance, the heavily-studied correlation between trading
volume and volatility is 0.063 in our sample. The correlation between trading volume and
the number of messages is 0.322, while the correlation between the number of messages and
volatility is 0.132. In other words, the magnitudes of the relationships between stock market
attributes and message board measures are not trivial.
Trading volume is positively correlated with the number of messages posted. Small-sized
trades are more closely correlated with posting activity than are large-sized trades. Bullishness
is also much more strongly correlated with small trades than with large ones. These results
are consistent with the idea that the posting activity reflects day traders and not institutional
investors. However, the correlations are not zero with respect to the larger trades. So there
must be other aspects at work as well.
There are a number of distinct approaches to measuring volatility. We have tried a number
of methods, but for simplicity we report results from the use of a particularly simple method.
We calculate the standard deviation of actual trading prices within each 15 minute time interval.
We take the measured standard deviation as our definition of volatility. This approach is similar
in spirit to Schwert (1990) and French, Schwert and Stambaugh (1987).15
15In some results not reported here we have experimented with the estimation of EGARCH and GJR models,
19

Volatility is positively correlated with message posting activity and, perhaps surprisingly,
with the measures of bullishness. This effect is quite robust. Even more surprising is the fact
that volatility is positively correlated with agreement among the messages. In light of the fact
that some financial theories imply that disagreement induces trading, we had expected to find
the reverse correlation. As will be shown in Table (9) this correlation does not hold up once
we condition on other factors.
Stock returns are almost uncorrelated with the number of messages, the bullishness of the
postings, and agreement amongst the posted messages. This reflects the well known difficulty
predicting stock returns. Some minor negative correlations are observed.
Many significant correlations between the stock market measures and the message board
activity measures are found. The similarity between the patterns found on Yahoo! Finance
and Raging Bull is marked and encouraging. In summary, Tables (7) and (8) show that there is
information content on the stock message boards. The rest of the paper focuses on obtaining a
clearer understanding of the form of the connection between the message boards and the stock
markets.
4.7 Simple Contemporaneous Regressions
The correlations reported in Tables (7) and (8) cannot address the question of the independence
of the relationships. To address the independence issue Table (9) reports results from a number
of simple regressions. Each of the financial variables is treated as a dependent variable, and is
regressed on a set of company dummies and three variables from the message boards: the log
number of messages, the bullishness index θ∗, and the agreement index η. We also employ a
stock market index in the regressions.
In the regressions that explain stock returns both theory and evidence show that it is the
difference of log SPY (i.e. return) that belongs in the regression, and so we do that. In the
other regressions it is less clear whether to include the log SPY or the difference of the log SPY.
Prior literature does not provide clear guidance on this issue. Empirically log SPY performs
see Bollerslev, Engle and Nelson (1994) and Glosten, Jagganathan and Runkle (1993). In each case we findthat the residuals are forecastable using stock message board information. We also find that if we tried directlyentering message board variables as explanatory factors and model the error as EGARCH, GJR, or relatedprocess, then the message board variables are statistically significant. However, we also find that these modelstake a remarkably long number of iterations to converge. Schwert (1990), Jones, Kaul, and Lipson (1994) andChan and Fong (2000) fit time series models to returns and then use the absolute values of the residuals fromthese equations as the measure of volatility. We have also used this approach. The results are similar to thosereported. In order to save space we omit these tables.
20

markedly better in these regressions, and so we report these results.16 The results concerning
the effects of the message boards do not depend on which approach is taken.
Because our contemporaneous regressions employ logarithmic transformations, we can con-
veniently interpret several of our estimates as elasticities. For example, in our very first regres-
sion in Table (9) an increase in posting activity by 10% is associated with an increase in trading
volume by less than 3%. At the same time, a 10% increase in the market index is associated
with a 24% decrease in trading volume. Scanning through the column with estimates relating
to posting activity, it is apparent that the magnitudes of all of these estimates are empirically
relevant, with the exception of the estimates relating to returns. Particularly noteworthy is
that posting activity is associated with a much larger response on small trades than on large
trades. The elasticity of the number of small trades with respect to message posting activity
is almost three times as large as the corresponding elasticity for large trades.
The contemporaneous effects from the bullishness index on trading activity also emphasize
the potential role of day traders on the message boards. We again find that changes in the
bullishness index coincide with larger increases in the number of small trades compared to
large trades. Because our bullishness index θ∗ is in logarithmic form, we can again interpret
the estimates as elasticities. Based on our Naive Bayes estimates, A 10% increase in bullishness
coincides with an increase of just under 2% in the number of small trades as well as the overall
trading volume. We also find a positive and significant contemporaneous link between our
bullishness index and returns on the Yahoo! message board, but this should not be interpreted
as a causal link.17 Similar to the pattern found for both the posting activity and bullishness
index, the magnitude of the negative link between the agreement index and the number of
trades is stronger for small trades than large trades.
The results in Table (9) show that when the market as a whole increases in value, the
number of trades drop. This effect is strongest among smaller trades. Volatility also drops
when there is an increase in the market index. The effect on the spread is much smaller in
magnitude and in statistical significance.
16For our purposes this is a side issue. However it is actually an issue that might merit further study in itsown right. It is not obvious to us why the market index performs better in log form rather than in the differenceof log form.
17The bullishness and agreement indices are contemporaneous with the financial variables in Table (9). Analternative approach is to use the 1-hour, 4-hour, and 1-day lagged aggregates of these indices. When thisapproach is taken the magnitude and significance of the coefficients on bullishness and agreement increase.Perhaps more interestingly, the observation that the coefficient on bullishness declines with increasing trade sizebecomes more pronounced. This would reinforce the hypothesis that day traders play a particularly significantrole on the message boards.
21

The results on both Yahoo! Finance and on Raging Bull confirm that log messages has a
strong role in accounting for log trading volume. This is stronger for small size trades than for
large trades. This is consistent with the hypothesis that the stock message boards reflect day
traders rather than with institutional investors.
The bullishness indices play a significant role explaining the number of trades even after
we control for the other factors. This is true for all three weighting versions of the bullishness
index that we have considered. To save space only the unweighted indices are reported. The
results are true both for Yahoo! Finance and Raging Bull.
On Yahoo! Finance the Naive Bayes bullishness indices help to account for price volatility.
However, this finding is weaker when we use the Support Vector versions of the bullishness
indices.
Recall that the simple correlations between agreement and number of trades is positive.
However, in Table (9) we find that once we control for a number of other factors, the sign
on the agreement indices reverse. In Table (9) the sign on agreement is consistent with the
theoretical expectations such as in Harris and Raviv (1993).
5 Time Sequencing Tests
A great many messages assert that a particular stock is a good buy, or that it is a bad buy.
The time horizon of such forecasts is rarely specified. How accurate are such claims? Since
contemporaneous regressions cannot address this issue, we study short horizon assessments.
To extract the time sequencing information we take a simple approach based on a version of
the Granger causality test, see Hamilton (1994). We study the time sequencing effects relating
market features to message board features on a pairwise basis. The market features are returns,
trading volume, volatility and spreads. The message board features are the number of messages,
number of words, bullishness, and agreement.
There is an important question of what other effects need to be controlled for. Table (3)
demonstrates that there are significant differences in the cross sectional levels of message posting
activity. Thus we include firm fixed effects. Table (7) demonstrates that there are time-of-day
effects. Thus we also use time period dummy variables. As in the simple regressions, we include
a proxy for the market factor.
It is well known that the first trading day after a weekend tends to have negative returns.
There does not seem to be a consensus interpretation of this fact. When studying daily data
22

we include a dummy variable for the first trading day of the week.
The role of news stories is potentially very important. Do the message boards simply reflect
what was published in the Wall Street Journal? Or, do they have more of an effect? In the
daily frequency tests we used count variables to control for this issue.
There are a number of closely related approaches to testing for time sequencing. We take
a particularly simple approach. Let xt be some financial measure at time t, let yt be some
message board measure at time t. Let Di represent a time of day dummy for time period i,
and let p be the number of time lags (4 in the case of the 15-minute regressions, and 2 in the
case of the 1-day regressions). Then estimate the following equations,
xt =26∑i=1
α1iDi +
p∑i=1
β1i xt−i +
p∑i=1
γ1i yt−i + u1
t (9)
xt =26∑i=1
α0iDi +
p∑i=1
β0i xt−i + u0
t (10)
To test for significance one can either perform an F test or a χ2 test. Let,
RSS1 =T∑t=1
(u1t )
2, and RSS0 =T∑t=1
(u0t )
2. (11)
Then the test statistic
S =T (RSS0 −RSS1)
RSS1(12)
follows a χ2 distribution with p degrees of freedom. We use this simple approach to testing.
We also reverse the position of the xt and the yt terms to test for the reverse time sequencing.
These are essentially linear tests of independence. Of course being linear tests, they may
not pick up nonlinear relationships. Adding nonlinear terms would increase the flexibility,
but at the same time increase the risk of overfitting the data. We did not experiment with
any nonlinear specifications. Omitted variables are always an issue with causality tests. If an
omitted variable is truly significant, and it is correlated with an included variable, then the
included variable will end up appearing to be “Granger-causal.”
Our main focus is on panel regressions in which we pool the 45 companies in our sample
and introduce both company and time period fixed effects into equations (9) and (10).18 We
18Equations (11) and (12) are suitably modified by replacing T with the total number of observations in thepanel.
23

also tried performing these tests on a firm by firm basis, applying (9) and (10) directly.
5.1 Impulse Responses
When testing for Granger causality we are estimating both directions of causality. This esti-
mation procedure is equivalent to estimating a vector autoregression (VAR) model with two
variables (one message board variable and one market variable). When doing this kind of anal-
ysis it is often helpful to illustrate how the estimated system of equations responds to a unit
shock. We provide impulse response plots to show how the variables respond to a one standard
deviation shock. To save space we only provide the plots for daily frequency data and only for
the messages from Yahoo! Finance.
Let xt denote the vector composed of these two variable so that
xt = µ+p∑j=1
∆jxt−j + vt (13)
where ∆j is a 2×2 matrix of parameters to be estimated, and v is a vector of i.i.d. disturbances.
In our 1-day model, we use p = 2 lags, while in our other models we use p = 4 lags. Equation
(13) can be augmented by p− 1 identities yt−j = yt−j . All p equations can then be stacked as
follows to obtain a more convenient VAR(1) representation
Xt ≡
xt
xt−1
=
µ0
+
∆1 ∆2
I 0
xt−1
xt−2
+
vt
0
≡ M + ∆ (L)Xt + Vt
(14)
where we introduce the lag operator (L). If the system is dynamically stable,19 it has an
equilibrium value of
X = (I−∆)−1M +∞∑s=0
∆sVt−s (15)
An innovation of size dvjt to variable xjt will thus have an effect on variable xit after s periods
that will lead to a deviation from the equilibrium value equal to xi,t+s − xi = (∆s)ijdvjt. The
impulse dissipates over time and the system returns to equilibrium. By definition (∆0)ii = 1,
and ∀i 6= j : (∆0)ij = 0. We use this procedure to plot impulse response functions for a key
set of VARs corresponding to Table (12), i.e.Yahoo! Finance measured in daily time periods.
19See Greene (1997, ch. 17) for details. The modulus of the roots of the characteristic polynomial of ∆ mustall be less than one. The modulus of a complex number is the sum of squares of its real and imaginary part.
24

5.2 Results: 15 minute data
Results for Yahoo! Finance and Raging Bull are reported separately. Tables (10) and (11)
provide results using a 15 minute time period definition. Many significant predictive effects are
found in both directions. The stronger effects are typically from the market to the number of
messages, rather than the reverse direction. Agreement and bullishness both have predictive
ability for financial markets that are similar in magnitude to the predictability from the financial
markets on these variables.
Start with trades. Stock trading volume has a more significant predictive effect on mes-
sage posting than is true in the reverse direction, but in both cases the effect is significant.
The largest impact is on the small size trades. There is a strong effect from trading volume
to reported bullishness that builds over about an hour. After that there is a gradual decline
in bullishness back to normal levels. There is not much connection between bullishness and
returns, nor between bullishness and volatility. The effect of volatility on the number of mes-
sages is significant but short-lived. The effect in the reverse direction is statistically significant,
but quite small in magnitude. The χ2 tests suggest that there is some predictability for stock
returns, but the effects are again very small. It is hard to imagine using such small magnitudes
to earn excess returns. Similarly, the results for the prediction of the spreads are statistically
significant but quite minor in magnitude. An increase in agreement predicts an increase in
trading volume over the next hour. This effect is strongest in the small trades and it is found
both for Yahoo! Finance and for Raging Bull. Comparison between Tables (10) and (11) show
that generally similar results are obtained from Yahoo! Finance and from Raging Bull.
The evidence is consistent with small traders first making a trade, and then almost imme-
diately posting messages to tell others what they have just done. The effect is both strong and
very short-lived. If this were reflecting a “pump and dump” market manipulation strategy,
then it would be surprising that the effect dissipates so rapidly. The example cited in footnote
(1) describes about 3 hours of active message posting.
5.3 Results: daily data
Tables (12) and (13) report results using a one day time period definition. At daily frequency
there is more time for contemplation by traders. Also there is more information from the
message boards within each time period.
The trading volume results are quite interesting and stand in contrast to the 15-minute
25

results. At daily frequency there is considerable evidence that the message boards help to fore-
cast financial market developments. The number of messages posted predicts trading volume
better than trading volume predicts the number of messages. This can also be seen clearly in
Figure (8) Panel A. A one standard deviation positive shock to the number of messages in day
0 results in a 0.16 standard deviation increase in the trading volume during day 1 and about
0.11 standard deviation increase in day 2. In contrast, a one standard deviation increase in the
trading volume actually predicts a slight drop in day 1 messages followed by a rebound in day
2. As can be seen in panels (B), (C) and (D), these trading volume effects appear to mainly
reflect small trades.
At daily frequency we reject both the hypothesis of returns predictability and of spread
predictability in most tests. The lack of ability to forecast returns can be seen in Figure (8)
panels (E), (K), and (Q). Figure (8) panel (F) shows that a positive shock to the number of
messages does predict an increase in the next day volatility. The effects of bullishness and
agreement on volatility are fairly small, as can be seen in panels (L) and (R) of Figure (8).
When there is an increase in trading volume, particularly in the number of small trades,
there is a subsequent increase in measured bullishness. This is easily observed in panels (G)-(J)
of Table (8). Much the same kind of thing happens to the agreement index, as depicted in panels
(M)-(P) of Table 8. Again this evidence is consistent with the hypothesis that immediately
after buying, small traders get on the message board to explain what a wonderful purchase
they just made.
In the daily data we are able to include two more types of control variables: a dummy for
the first day of a new trading week (NWK), and variables for the days surrounding an article in
the Wall Street Journal (WSJt). The WSJt variables are count variables that simply tabulate
the number of stories about the firm in question that were published in the Wall Street Journal
on the date in question.
On the first day of the new week there is a dramatic drop in the number of messages posted,
and in the length of the messages. Many people are presumably more busy doing other things.
One interpretation that has been occasionally offered for the Monday effect is psychological:
people are more depressed when they return to work after the weekend. Consistent with this,
the sign on bullishness is negative at the start of the new week. In sharp contrast to the activity
effects, however, this bullishness effect is statistically insignificant and small in magnitude.
Lakonishok and Maberly (1990) found a reduction in trades by institutional investors and
26

an increase in trades by small investors at the start of the week. If we interpret large trades as
being institutional trades, then we also find a big drop in such trades at the start of the week.
However, we also find more minor drops in the medium and small trades at the start of the
new week – not increases. Apparently, small investor behavior has changed over time in this
respect.
An important question is the extent to which the stock message boards merely repeat what
was already known from press reports. In order to get at this issue we have count variables that
tabulate the number of news stories about a firm on a given day in the Wall Street Journal.
The variable for the day that the story appears is denoted WSJ0. We also include variables for
the two prior dates (WSJ−2,WSJ−1) and for one subsequent date (WSJ+1).
The most important point is that the significance of the message board activity for pre-
dicting financial market behavior survive the inclusion of these variables. This means that
there is information on the message boards beyond that contained in the Wall Street Journal.
Coinciding with the publication day (day 0) there is an increase in the word count, but less of
an increase in the number of messages. On average the messages tend to be longer on these
days. There is a stronger day zero effect on Raging Bull than on Yahoo! Finance. The day –1
effect is larger than the day 0 effect. On day –1 more messages are posted and they are a bit
more bullish. On Raging Bull the messages get longer on day –1. The greater importance of
day –1 is also found in the financial markets. On day –1 more trades take place, particularly
large trades. The fact that so much of the effect is found on day –1 suggests that wire services
and the internet may be very significant sources of information for traders.
Day –2 shows some elevated activity on the stock markets, but almost none on the message
boards. If people are trading on inside information, they are not being so kind as to advertise
the fact on the message boards. Very little of note takes place on date +1. The message boards
exhibit no unusual activity. The stock markets register a slight decline in trading volume,
which is mainly found among the largest trades.
Table (14) asks a somewhat different question about the role of the Wall Street Journal.
This table reports our tests for whether the stock message board activity can be used to
predict the occurrence of news stories in the Wall Street Journal. For this purpose we use a
logit regression where the binary variable is based on whether or not a WSJ article appears
on the following day (or the day thereafter). The regressors in this model are based on 1-day
time-period definitions.
27

We test for predictability one day before the story appears (top two panels in Table 14),
and also two days before the story appears (bottom two panels in Table 14). The results are
quite clear. One day before a story appears there is substantial evidence of elevated posting
activity and increased bullishness. Two days before a story appears neither of these are found.
Nothing unusual is taking place in the stock message boards. The inference is that the message
boards appear to reflect news stories very rapidly. But they do not appear helpful in predicting
news stories. The results in Table (15) are very consistent with the results in Table (12) and
(13). The message boards reflect public information very rapidly.
The business press itself has been making use of the fact that the message boards react to
news so rapidly. It is not uncommon for stories about corporate events to include references to
discussion on the message boards. Colorful quotes from posted messages sometimes find their
way into news stories. On other occasions the message boards are used to identify when an
idea about a firm became public information.20
We were concerned about the extent to which our results might have been affected by
sparseness of message postings. To address this concern we repeated the daily level tests
for the sample of 10 firms with the greatest posting levels.21 While some minor changes are
observed, the basic patterns are very similar. To save space we do not report the results.
6 Conclusions
Casual reading of the internet stock messages might easily lead one to believe that it is all just
noise. Indeed that was our first reaction to reading such messages. But there is more to it than
that. There really is information that can be used to predict trading volume and volatility.
Not all market participants participate actively on the stock message boards. In this paper
we have examined implication of the hypothesis that the message board postings are particu-
larly reflective of day traders. This hypothesis is consistent with many elements of the evidence
20To find current examples, go to the Wall Street Journal’s web page and then search for “message board”.Typical recent examples include: “Speculation on Flooz’s fate first popped up in online message boards, includingdot-com rumor site F dcompany.com and a shopping board run by Anandtech.com.” (“Flooz.com Says It IsSeeking Merger, But Service Remain Offline for Now,” by Stephanie Miles, Wall Street Journal, August 10,2001.) and “Since mid-July, when rumors started to spread on Internet message boards that Fidelity was sellingmost of its 7% stake, the stock had dropped more than 25%.” (“Skechers USA Up 9%; Buyers Step In AfterFMR Gets Out,” by Victoria Marcinkowski, Dow Jones News Wires, August 14, 2001.)
21The top 10 firms are listed in order followed by ticker, number of messages posted (YF+RB) and numberof words posted (YF + RB): 1. Microsoft 197530 12301312, 2. E*Trade 161649 8576062, 3. Amazon 1205748154611, 4. Intel 94347 5356805, 5. Philip Morris 84198 6491652, 6. Yahoo 78008 3465359, 7. AT&T 767694394984, 8. Verticalnet 64293 3449676, 9. Priceline 61397 3052542, 10. Boeing 56279 4593476.
28

that we have found. The idea that asset market prices reflect trading decisions of a variety
of clienteles is not new. What we believe to be new is the ability to identify the popularly
discussed group of small, active market participants, commonly known as day traders.
As might have been expected, there is little evidence that the stock message boards success-
fully predict stock returns. However there is useful information present on the stock message
boards. The magnitudes of some of the observed predictive effects are quite large relative to
other features of stock markets that have attracted attention in the finance literature.
• Message posting and trading volume are positively related. This is true in simple cor-
relations, in contemporaneous regressions, and in tests of predictability. At 15-minute
frequency, the effect from trading volume to the number of messages posted is more sig-
nificant than the reverse. At daily frequency the effect from message posting activity
to trading volume is the more significant predictive direction. The number of messages
posted are more closely connected to small trades than to large trades, as suggested by
the day trader hypothesis.
• Message posting and volatility are also positively related. Again, this effect is found in
simple correlations as well as in the regression context. In the daily data message posting
always has greater predictive ability for market volatility than market volatility has for
message posting.
• Bullishness indices were constructed using the Naive Bayes and Support Vector Machine
algorithms. The two approaches typically gave very similar results. The overall tone on
the message boards was bullish. This bullishness is particularly impressive given the large
decline in stock market value of the firms during the period under study. The bullishness
indices were positively related to trading volume. The more bullish the posted messages
during a time period, the more trades take place in the stock market during that same
time period. Bullishness also exhibits some predictive ability. However the reverse effect
was much stronger. When there is an increase in trading volume, then there is typically
a surge in the bullish tone to the messages posted. Greater agreement is also observed
at that point. This result is particularly true for the smaller-sized trades. While this
might be interpreted as attempted market manipulation strategies, it is also consistent
with small traders simply wishing to talk about the wonderful purchases that they have
just made.
29

• The reported effects survive even when we take into account the presence of news stories
in the Wall Street Journal. The message boards provide a source of financially relevant
information beyond that already present in the Wall Street Journal. Indeed, not infre-
quently the Wall Street Journal itself reports what has been posted on message boards.
Message postings are particularly elevated one day before a story appears in the Wall
Street Journal. This presumably reflects the use of news wires and internet news sources.
There is no evidence of anomalous posting behavior two days prior to a Wall Street Jour-
nal story. In contrast, there is some evidence of anomalous trading activity two days
prior to a story. There is no evidence that the message boards are able to predict the
news stories earlier than the day before.
We also find some evidence related to the well known Monday effect. Consistent with
Lakonishok and Maberly (1990) we find a reduction in the number of large trades at the start
of the week. In contrast to their findings we also find some drop in the number of small trades
at the start of the week. There is a large reduction in message posting activity on the first
trading day of the week. Consistent with the “Monday blues” hypothesis we observe a negative
effect on bullishness on the first trading day of the week. But, in contrast to the activity level
effects, it is a small effect and not statistically significant.
Our findings have potentially important implications for studies in which it is important to
know what information is public at a particular moment in time. This is of interest in studies of
insider trading, and in many event studies. The messages reflect news very rapidly, suggesting
that the message boards can be used to determine when particular information in fact became
public. Our findings are also potentially interesting for those who study stock market volatility,
as well as for those who study trading volume. The message boards provide information that
seems to be helpful for forecasting purposes. Given that the messages contain explanations, it
might be possible to identify different classes of events that have different stock market effects.
Our use of computational linguistics methods may also prove helpful in other ways. A great
deal of text-based information is becoming available to scholars through the internet. There
may be research benefits from extracting the information from such sources. In such studies
the Naive Bayes and the Support Vector Machine algorithms provide natural starting points.
News wire reports would be an interesting target for such a study. After gathering a large
number of news stories, one could try to determine which classes of events have particularly
large effects for stock returns and for volatility.
30

The evidence clearly rejects the hypothesis that the stock message boards are merely noise.
There is financially relevant information present. The information is particularly pertinent for
trading volume and for volatility. The information seems to reflect the views of a particular
clientele—day traders. In contrast to the Business Week story that motivated our study, we
did not find any simple predictability of stock returns using this information.
References
[1] Allen, Franklin, and Douglas Gale, 1999, “Diversity of Opinion and Financing of New
Technology,” Journal of Financial Intermediation, 8, 68-89.
[2] Bacidore, Jeffrey Michael, and Marc L. Lipson, 2001, “The Effects of Opening and Closing
Procedures on the NYSE and Nasdaq,” Working paper.
[3] Bessembinder, Hendrik, Kalok Chan, and Paul J. Seguin, 1996, “An Empirical Examina-
tion of Information, Differences of Opinion, and Trading Activity,” Journal of Financial
Economics, 40, 105-134.
[4] Bollerslev, Tim, Robert F. Engle, and Daniel B. Nelson, 1994, “ARCH Models,” chapter
49 in R. F. Engle and D. L. McFadden (eds.) Handbook of Econometrics, Volume IV,
Elsevier Science.
[5] Campbell, John Y., Andrew W. Lo, and A. Craig MacKinlay, 1997, The Econometrics of
Financial Markets, Princeton University Press, Princeton N. J.
[6] Chan, Kalok and Wai-Ming Fong, 2000, “Trade Size, Order Imbalance, and the Volatility-
Volume Relation,” Journal of Financial Economics, 57, 247-273.
[7] Cover, T. M., and J. A. Thomas, 1991, Elements of Information Theory, Wiley, New York.
[8] Daniel, Kent D., David Hirshleifer and Avanidhar Subrahmanyam, 2001, “Overconfidence,
Arbitrage, and Equilibrium Asset Pricing,” Journal of Finance, 56, 921-965.
[9] Das, Sanjiv Ranjan and Mike Chen, 2001, “Yahoo! for Amazon: Sentiment Parsing from
Small Talk on the Web,” Working Paper, Santa Clara University.
[10] Dewally, Michael, 2000, “Internet Investment Advice: Investing with a Rock of Salt,”
Working Paper, University of Oklahoma.
[11] Dumais, Susan T., J. Platt, D. Heckerman and M. Sahami, 1998, “Inductive Learning Al-
gorithms and Representations for Text Categorization,” in Proceedings of ACM-CIKM98,
November, 148-155, ACM Press.
31

[12] French, K. R., G. W. Schwert, and R. F. Stambaugh, 1987, “Expected Stock Returns and
Volatility,” Journal of Financial Economics, 19, 3-29.
[13] Glosten, L. R., Ravi Jagannathan, and David Runkle, 1993, “On the Relation Between
the Expected Value and the Volatility of the Nominal Excess Return on Stocks,” Journal
of Finance, 48, 1779-1801.
[14] Greene, William H., 1997, Econometric Analysis, 3rd edition, Prentice Hall, Upper Saddle
River.
[15] Hamilton, James D., 1994, Time Series Analysis, Princeton University Press, Princeton
N.J.
[16] Harris, Milton, and Artur Raviv, 1993, “Differences of Opinion Make a Horse Race,”
Review of Financial Studies, 6, 473-506.
[17] Hasbrouck, Joel, 1999, “The Dynamics of Discrete Bid and Ask Quotes,” Journal of
Finance, 54, 2109-2142.
[18] Hasbrouck, Joel, and Duane J. Seppi, 2001, “Common Factors in Pricing, Order Flows
and Liquidity,” Journal of Financial Economics, 59, 383-411.
[19] Hastie, Trevor, Robert Tibshirani, and Jerome Friedman, 2001, The Elements of Statistical
Learning, Springer, New York.
[20] Joachims, Thorsten, 1998, “Text Categorization with Support Vector Machines: Learning
with Many Relevant Features,” in Proceedings of the 10th European Conference on Machine
Learning (ECML), 137-142, Springer-Verlag, New York.
[21] Joachims, Thorsten, 1999, “Making large-Scale SVM Learning Practical,” in B. Scholkopf
and C. Burges and A. Smola (eds.) Advances in Kernel Methods - Support Vector Learning,
MIT Press, Cambridge, MA.
[22] Jones, Charles M., Gautam Kaul, and Marc L. Lipson, 1994, “Transactions, Volume, and
Volatility,” Review of Financial Studies, 7, 4, 631-651.
[23] Kandel, Eugene and N. D. Pearson, 1995, “Differential Interpretation of Public Signals
and Trade in Speculative Markets,” Journal of Political Economy, 103, 831-872.
[24] Lakonishok, Josef, and Edwin Maberly, 1990, “The Weekend Effect: Trading Patterns of
Individual and Institutional Investors,” Journal of Finance, 40, 231-243.
[25] Lewis, David D., 1998, “Naive (Bayes) at Forty: The Independence Assumption in Infor-
mation Retrieval, in Proceedings of the 10th European Conference on Machine Learning
(ECML), Springer-Verlag, New York.
32

[26] Madhavan, Anath, 2000, “Market Microstructure: A Survey,” Journal Of Financial Mar-
kets, 3, 205-258.
[27] Manning, Christopher D., and Hinrich Schutze, 1999, Foundations of Statistical Natural
Language Processing, MIT Press, Cambridge Mass.
[28] McCallum, Andrew, 1996, “Bow: A Toolkit for Statistical Language Modeling, Text Re-
trieval, Classification and Clustering,” School of Computer Science, Carnegie-Mellon Uni-
versity.
[29] McCallum, Andrew and Kamal Nigam, 1998, “A Comparison of Event Models for Naive
Bayes Text Classification,” in AAAI/ICML-98 Workshop on Learning for Text Catego-
rization, pp. 41-48. Technical Report WS-98-05. AAAI Press.
[30] McCallum, Andrew, Kamal Nigam, Jason Rennie, and Kristie Seymore, 2000, “Automat-
ing the Construction of Internet Portals with Machine Learning,” Information Retrieval
Journal, 3, 127-163.
[31] Milgrom, Paul, and Nancy Stokey, 1982, “Information, Trade and Common Knowledge,”
Journal of Economic Theory, 26, 17-27.
[32] Schwert, G. W., 1990, “Stock Volatility and the Crash of ’87,” Review of Financial Studies,
3, 77-102.
[33] Tumarkin, Robert, and Robert F. Whitelaw, 2001, “News or Noise? Internet Message
Board Activity and Stock Prices,” Financial Analysts Journal, 57, 41-51.
[34] Vapnik, Vladimir N., 2000, The Nature of Statistical Learning (Second Edition), Springer,
New York.
[35] Weiss, Gary, 2000, “Where Everyone Is an Expert,” BusinessWeek, May 22.
[36] Wysocki, Peter D., 1999, “Cheap Talk on the Web: The Determinants of Postings on
Stock Message Boards,” Working Paper, November, University of Michigan.
[37] Yang, Yiming, 1999, “An Evaluation of Statistical Approaches to Text Categorization,”
Journal of Information Retrieval, Vol. 1, No. 1/2, 67–88.
33

Figures
Figure 1: Samples of Bulletin Board Messages
---------------------FROM YFCOMP ETYSMGID 13639NAME CaptainLihaiLINK 1DATE 2000/01/25 04:11SKIPTITL ETYS will surprise all pt IISKIPTEXT ETYS will surprise all when it drops to below 15$ a pop, and even thenTEXT it will be too expensive.TEXTTEXT If the DOJ report is real, there will definately be a backlash againstTEXT the stock. Watch your asses. Get out while you can.---------------------FROM YFCOMP IBMMGID 43653NAME plainfielderLINK 1DATE 2000/03/29 11:39SKIPTITL BUY ON DIPS - This is the opportunitySKIPTEXT to make $$$ when IBM will be going up again following this profit takingTEXT bout by Abbey Cohen and her brokerage firm.TEXTTEXT IBM shall go up again after today.-----------------
A-1

Figure 2: Weekly Message Board Activity
Week (Wednesdays)
Num
ber
of M
essa
ges
[Tho
usan
ds]
01/05 01/26 02/16 03/08 03/29 04/19 05/10 05/31 06/21 07/12 08/02 08/23 09/13 10/04 10/25 11/15 12/06 12/270
5
10
15
20
25
30
35
40
45
Note: Posting activity of 45 companies in DIA and XLK combined
Figure 3: Weekly Trading Volume
Week (Wednesdays)
Tur
nove
r [b
illio
n U
S D
olla
rs]
01/05 01/26 02/16 03/08 03/29 04/19 05/10 05/31 06/21 07/12 08/02 08/23 09/13 10/04 10/25 11/15 12/06 12/270
10
20
30
40
50
60
70
80
90
100
110
120
Note: Turnover of 45 companies in ECM and DJX combined
A-2

Figure 4: Hourly Distribution of Stock Trades
Hour of Day (Eastern Time)
Num
ber
of T
rade
s (r
egar
dles
s of
siz
e)
09c
09d
10a
10b
10c
10d
11a
11b
11c
11d
12a
12b
12c
12d
13a
13b
13c
13d
14a
14b
14c
14d
15a
15b
15c
15d
0
50
100
150
200
250
300
350
400
450
Note: Number of trades of all 45 companies in DIA and XLK combined. The letters a–don the right side of an hour indicate fifteen minute intervals within each hour.
Figure 5: Hourly Distribution of Message Board Activity
Hour of Day (Eastern Time)
Perc
enta
ge o
f al
l Con
trib
utio
ns
00
01
02
03
04
05
06
07
08
09
10
11
12
13
14
15
16
17
18
19
20
21
22
23
0.0
0.5
1.0
1.5
2.0
2.5
3.0
3.5
4.0
4.5
5.0
5.5
6.0
6.5
7.0
7.5
8.0
8.5
9.0
Raging Bull
Yahoo!
Note: Percentage of postings of 45 companies in DIA and XLK combined
A-3

Figure 6: Stock Index Performance
50
60
70
80
90
100
110
120
Jan Feb Mar Apr May Jun Jul Aug Sep Oct Nov Dec
DIAXLK
Note: Daily indices for DIA and XLK were computed by using the prices of the corre-sponding tracking funds. The indices were set to 100.0 for the first trading day of 2000.The composition of the XLK index was adjusted when stocks ceased trading: Go2net onOctober 13; and Lycos on October 30.
Figure 7: Message Board Bullishness Indicator
0.15
0.20
0.25
0.30
0.35
0.40
0.45
0.50
0.55
0.60
Jan Feb Mar Apr May Jun Jul Aug Sep Oct Nov Dec
DIAXLK
Note: The (unweighted) bullishness signal is based on the Yahoo!-Finance message boardonly. Due to the high intra-week volatility of the bullishness signal, the above chart de-picts weekly averages corresponding to the DIA and XLK indices. Unlike figure 6, fixedmarket-cap weights were used in constructing the indices.
A-4

Figure 8: Impulse Response Functions (1-day VAR model, Yahoo! Finance)
Messages / VolumeA
Days after Impulse
Res
pons
e
0 1 2 3 4 5 6 7 8 9 10 11 12 13 14−0.14−0.12−0.10−0.08−0.06−0.04−0.02
0.000.020.040.060.080.100.120.140.16
Messages / Small TradesB
Days after Impulse
Res
pons
e
0 1 2 3 4 5 6 7 8 9 10 11 12 13 14−0.14−0.12−0.10−0.08−0.06−0.04−0.02
0.000.020.040.060.080.100.120.14
Messages / Medium TradesC
Days after Impulse
Res
pons
e
0 1 2 3 4 5 6 7 8 9 10 11 12 13 14−0.14−0.12−0.10−0.08−0.06−0.04−0.02
0.000.020.040.060.080.100.120.14
Messages / Large TradesD
Days after Impulse
Res
pons
e
0 1 2 3 4 5 6 7 8 9 10 11 12 13 14−0.14−0.12−0.10−0.08−0.06−0.04−0.02
0.000.020.040.060.080.100.120.14
Messages / ReturnsE
Days after Impulse
Res
pons
e
0 1 2 3 4 5 6 7 8 9 10 11 12 13 14−0.14−0.12−0.10−0.08−0.06−0.04−0.02
0.000.020.040.060.080.100.120.14
Messages / VolatilityF
Days after Impulse
Res
pons
e
0 1 2 3 4 5 6 7 8 9 10 11 12 13 14−0.14−0.12−0.10−0.08−0.06−0.04−0.02
0.000.020.040.060.080.100.120.14
Note: The solid line shows the response of the market variable to a one-standard-deviation increase inthe message-board variable. The dotted line shows the response of the message board variable to a one-standard-deviation increase in the market variable. The vertical axis is measuring the response in fractionsof a standard deviation of the dependent variable. Standard deviations are based on the full data set.
A-5

Bullishness / VolumeG
Days after Impulse
Res
pons
e
0 1 2 3 4 5 6 7 8 9 10 11 12 13 14−0.14−0.12−0.10−0.08−0.06−0.04−0.02
0.000.020.040.060.080.100.120.14
Bullishness / Small TradesH
Days after Impulse
Res
pons
e
0 1 2 3 4 5 6 7 8 9 10 11 12 13 14−0.14−0.12−0.10−0.08−0.06−0.04−0.02
0.000.020.040.060.080.100.120.140.160.18
Bullishness / Medium TradesI
Days after Impulse
Res
pons
e
0 1 2 3 4 5 6 7 8 9 10 11 12 13 14−0.14−0.12−0.10−0.08−0.06−0.04−0.02
0.000.020.040.060.080.100.120.14
Bullishness / Large TradesJ
Days after Impulse
Res
pons
e
0 1 2 3 4 5 6 7 8 9 10 11 12 13 14−0.14−0.12−0.10−0.08−0.06−0.04−0.02
0.000.020.040.060.080.100.120.14
Bullishness / ReturnsK
Days after Impulse
Res
pons
e
0 1 2 3 4 5 6 7 8 9 10 11 12 13 14−0.14−0.12−0.10−0.08−0.06−0.04−0.02
0.000.020.040.060.080.100.120.14
Bullishness / VolatilityL
Days after Impulse
Res
pons
e
0 1 2 3 4 5 6 7 8 9 10 11 12 13 14−0.14−0.12−0.10−0.08−0.06−0.04−0.02
0.000.020.040.060.080.100.120.14
A-6

Agreement / VolumeM
Days after Impulse
Res
pons
e
0 1 2 3 4 5 6 7 8 9 10 11 12 13 14−0.14−0.12−0.10−0.08−0.06−0.04−0.02
0.000.020.040.060.080.100.120.14
Agreement / Small TradesN
Days after Impulse
Res
pons
e
0 1 2 3 4 5 6 7 8 9 10 11 12 13 14−0.14−0.12−0.10−0.08−0.06−0.04−0.02
0.000.020.040.060.080.100.120.140.160.18
Agreement / Medium TradesO
Days after Impulse
Res
pons
e
0 1 2 3 4 5 6 7 8 9 10 11 12 13 14−0.14−0.12−0.10−0.08−0.06−0.04−0.02
0.000.020.040.060.080.100.120.14
Agreement / Large TradesP
Days after Impulse
Res
pons
e
0 1 2 3 4 5 6 7 8 9 10 11 12 13 14−0.14−0.12−0.10−0.08−0.06−0.04−0.02
0.000.020.040.060.080.100.120.14
Agreement / ReturnsQ
Days after Impulse
Res
pons
e
0 1 2 3 4 5 6 7 8 9 10 11 12 13 14−0.14−0.12−0.10−0.08−0.06−0.04−0.02
0.000.020.040.060.080.100.120.14
Agreement / VolatilityR
Days after Impulse
Res
pons
e
0 1 2 3 4 5 6 7 8 9 10 11 12 13 14−0.14−0.12−0.10−0.08−0.06−0.04−0.02
0.000.020.040.060.080.100.120.14
A-7

TablesTable 1: Frequency Distribution of Bulletin Board Contributors and Contributions
Postings per Word Count Percentage ofContributor Percentage Contributors
RB YF RB YF1 3.81 3.10 43.59 40.582 3.00 2.45 15.77 15.493–4 4.40 3.88 13.55 14.185–9 6.90 6.63 11.88 12.7010–19 8.47 8.23 7.04 7.8520–49 13.40 12.76 4.80 5.4650+ 60.01 62.96 3.38 3.74
Words in % of PostingsMessage RB YF1–9 15.55 21.3110–19 16.03 15.6420–49 28.67 28.1450–99 19.81 18.88100–199 11.65 10.36200–499 5.74 4.84500–999 1.84 0.831000+ 0.71 0.00
Note: The column ‘Word Count Percentage’ shows the fraction of the total words postedthat were contributed by authors with the number of postings shown in the first column.The column ‘Percentage of Contributors’ shows the fraction of authors who contributedthe number of messages indicated in the first column. RB and YF indicate the RagingBull and Yahoo! Finance message boards. The second part of the table (‘Words in Mes-sage’) shows the length distribution of messages on the two message boards.
Table 2: Classification Accuracy Within Sample and Overall Classification Distribution
NB SV% B H S B H S
Correct B 25.2 18.1 7.1 0.0 20.4 4.8 0.0Correct H 69.3 3.4 65.9 0.0 0.2 69.1 0.0Correct S 5.5 0.2 1.2 4.1 0.0 1.3 4.21,000 messages1 21.7 74.2 4.1 20.6 75.2 4.2All Messages2 20.0 78.8 1.3 20.3 77.0 2.7
Note: The classification methods are Naive Bayes (NB) and Sup-port Vector (SV). The first %-column shows the actual shares of1,000 hand-coded messages that were classified as ’buy’ (B), ’hold’(H), or ’sell’ (S). The B/H/S matrix entries show the in-sampleprediction accuracy of the classification engine with respect tothe learned samples. — 1 Because the SV method uses an infor-mation gain criterion to select words (‘features’) for its dictionary,some messages in the training data set do not contain any of thesewords. The percentage figures for SV are based on 755 of the 1,000messages which included at least one such ‘feature.’ — 2 This lineprovides summary statistics for the out-of-sample classification ofall 1,559,621 messages.
A-8

Table 3: Summary Statistics By CompanyBullishness1 Activity3 Intensity4 Return5 Vola.6 WSJ
Company Name YF2 RB2 YF2 RB2 YF2 RB2 [%] [%] [#]Philip Morris 0.597 0.325 78.4 5.8 74 115 86.5 0.24 45Intel 0.632 0.300 80.2 14.1 52 85 -64.2 0.33 96Microsoft 0.550 0.234 159.3 38.3 56 90 -63.0 0.25 397General Electric 0.529 0.298 40.1 15.8 72 90 -68.7 0.18 96AT&T 0.494 0.259 64.9 11.9 53 78 -66.5 0.23 189Citigroup 0.251 0.407 4.4 2.5 60 97 -7.6 0.22 80Wal Mart 0.309 0.334 20.5 3.2 82 79 -22.5 0.23 55Hewlett Packard 0.313 0.238 16.0 0.8 63 125 -72.4 0.28 36Honeywell 0.307 0.256 12.1 0.7 76 81 -18.3 0.22 27Johnson&Johnson 0.302 0.298 2.9 0.4 70 72 12.7 0.15 31Walt Disney 0.296 0.313 18.3 2.0 71 96 -0.9 0.20 83Procter&Gamble 0.324 0.161 19.1 2.3 55 95 -27.2 0.23 54Home Depot 0.265 0.372 17.6 3.0 54 81 -33.5 0.22 26IBM 0.282 0.249 24.5 2.6 66 98 -24.6 0.22 108SBC Communications 0.287 0.193 16.6 1.5 65 88 -1.9 0.19 44United Technologies 0.259 0.289 2.0 0.1 79 70 20.9 0.19 18Intn’l Paper 0.254 0.259 8.9 0.3 75 69 -28.4 0.24 19Boeing 0.242 0.093 54.8 1.5 81 90 58.9 0.19 123McDonalds 0.241 0.195 4.3 0.6 67 63 -15.0 0.20 32Eastman Kodak 0.242 0.193 2.7 0.2 72 129 -41.1 0.20 18JP Morgan 0.228 0.241 1.4 0.1 59 127 30.9 0.22 58Alcoa 0.210 0.183 5.0 0.2 56 38 -59.3 0.22 26American Express 0.201 0.284 3.4 0.2 58 70 -66.6 0.21 44Minnesota Mining 0.184 0.287 1.5 0.2 66 101 25.6 0.18 6Coca Cola 0.188 0.181 9.8 0.5 98 94 6.1 0.18 106Du Pont 0.177 0.155 6.7 0.3 72 74 -26.8 0.21 0Merck 0.169 0.131 8.8 0.5 75 87 36.8 0.17 8Caterpillar 0.133 0.218 1.4 0.2 65 60 -3.8 0.20 8General Motors 0.136 0.154 6.6 0.6 85 96 -31.3 0.17 181Exxon 0.113 0.158 7.6 0.6 78 69 8.6 0.14 6E*Trade 1.250 0.782 140.6 21.0 47 91 -72.4 0.48 8Verticalnet 0.941 0.635 57.3 7.0 52 66 -96.3 0.81 3Ameritrade 0.791 0.490 45.5 7.9 50 72 -68.7 0.54 0Yahoo! 0.730 0.401 63.8 14.2 41 60 -93.2 0.51 28Healtheon 0.593 0.446 40.5 6.6 58 83 -79.0 0.63 1Etoys 0.610 0.435 32.4 8.9 58 79 -99.3 1.93 14Lycos 0.609 0.468 13.5 5.8 49 96 -49.4 0.51 19Priceline 0.565 0.337 48.5 12.9 46 65 -97.5 0.72 21Ticketmaster 0.377 0.466 4.7 0.7 80 115 -79.6 0.56 4Amazon 0.401 0.247 103.8 16.8 66 76 -81.1 0.55 37Go2net 0.366 0.409 4.8 0.9 49 76 -63.1 0.53 3CNet 0.370 0.339 12.3 3.7 49 73 -74.8 0.54 10Webvan Group 0.319 0.303 20.2 3.1 84 96 -97.2 1.59 8E-Bay 0.245 0.155 28.3 3.9 49 62 -74.5 0.54 63MP3.com 0.142 0.056 14.4 5.4 68 128 -89.8 1.17 22
Note: The table is sorted by company group (DIA, XLK) and within each group by descend-ing bullishness index averaged across the two bulletin boards. 1 Bullishness refers to the un-weighted Naive Bayes classification. 2 RB and YF indicate Raging Bull and Yahoo Finance! 3
Activity is measured in thousands of messages. 4 Intensity is measured as the average numberof words per message. 5 Return is the change in price between the first and the last trading dayof the year. Lycos and Go2net stopped trading in late October. 6 Volatility is measures as theaverage daily standard deviation divided by price, expressed in percent.
A-9
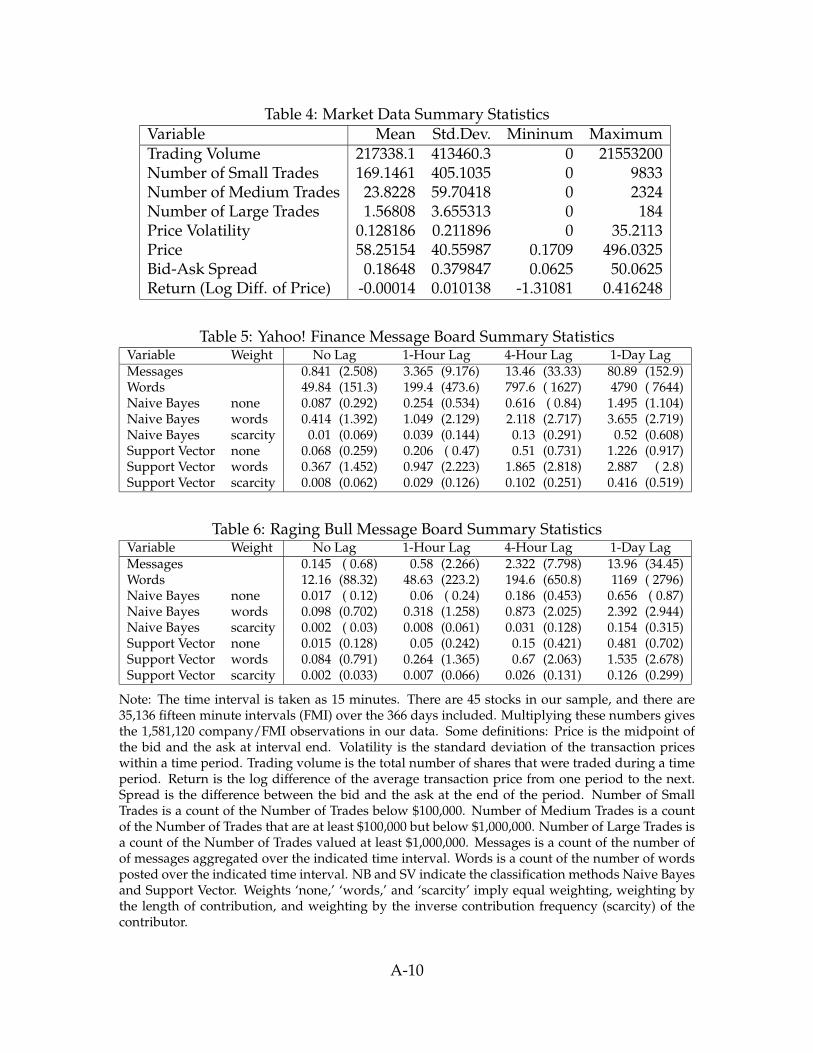
Table 4: Market Data Summary StatisticsVariable Mean Std.Dev. Mininum MaximumTrading Volume 217338.1 413460.3 0 21553200Number of Small Trades 169.1461 405.1035 0 9833Number of Medium Trades 23.8228 59.70418 0 2324Number of Large Trades 1.56808 3.655313 0 184Price Volatility 0.128186 0.211896 0 35.2113Price 58.25154 40.55987 0.1709 496.0325Bid-Ask Spread 0.18648 0.379847 0.0625 50.0625Return (Log Diff. of Price) -0.00014 0.010138 -1.31081 0.416248
Table 5: Yahoo! Finance Message Board Summary StatisticsVariable Weight No Lag 1-Hour Lag 4-Hour Lag 1-Day LagMessages 0.841 (2.508) 3.365 (9.176) 13.46 (33.33) 80.89 (152.9)Words 49.84 (151.3) 199.4 (473.6) 797.6 ( 1627) 4790 ( 7644)Naive Bayes none 0.087 (0.292) 0.254 (0.534) 0.616 ( 0.84) 1.495 (1.104)Naive Bayes words 0.414 (1.392) 1.049 (2.129) 2.118 (2.717) 3.655 (2.719)Naive Bayes scarcity 0.01 (0.069) 0.039 (0.144) 0.13 (0.291) 0.52 (0.608)Support Vector none 0.068 (0.259) 0.206 ( 0.47) 0.51 (0.731) 1.226 (0.917)Support Vector words 0.367 (1.452) 0.947 (2.223) 1.865 (2.818) 2.887 ( 2.8)Support Vector scarcity 0.008 (0.062) 0.029 (0.126) 0.102 (0.251) 0.416 (0.519)
Table 6: Raging Bull Message Board Summary StatisticsVariable Weight No Lag 1-Hour Lag 4-Hour Lag 1-Day LagMessages 0.145 ( 0.68) 0.58 (2.266) 2.322 (7.798) 13.96 (34.45)Words 12.16 (88.32) 48.63 (223.2) 194.6 (650.8) 1169 ( 2796)Naive Bayes none 0.017 ( 0.12) 0.06 ( 0.24) 0.186 (0.453) 0.656 ( 0.87)Naive Bayes words 0.098 (0.702) 0.318 (1.258) 0.873 (2.025) 2.392 (2.944)Naive Bayes scarcity 0.002 ( 0.03) 0.008 (0.061) 0.031 (0.128) 0.154 (0.315)Support Vector none 0.015 (0.128) 0.05 (0.242) 0.15 (0.421) 0.481 (0.702)Support Vector words 0.084 (0.791) 0.264 (1.365) 0.67 (2.063) 1.535 (2.678)Support Vector scarcity 0.002 (0.033) 0.007 (0.066) 0.026 (0.131) 0.126 (0.299)
Note: The time interval is taken as 15 minutes. There are 45 stocks in our sample, and there are35,136 fifteen minute intervals (FMI) over the 366 days included. Multiplying these numbers givesthe 1,581,120 company/FMI observations in our data. Some definitions: Price is the midpoint ofthe bid and the ask at interval end. Volatility is the standard deviation of the transaction priceswithin a time period. Trading volume is the total number of shares that were traded during a timeperiod. Return is the log difference of the average transaction price from one period to the next.Spread is the difference between the bid and the ask at the end of the period. Number of SmallTrades is a count of the Number of Trades below $100,000. Number of Medium Trades is a countof the Number of Trades that are at least $100,000 but below $1,000,000. Number of Large Trades isa count of the Number of Trades valued at least $1,000,000. Messages is a count of the number ofof messages aggregated over the indicated time interval. Words is a count of the number of wordsposted over the indicated time interval. NB and SV indicate the classification methods Naive Bayesand Support Vector. Weights ‘none,’ ‘words,’ and ‘scarcity’ imply equal weighting, weighting bythe length of contribution, and weighting by the inverse contribution frequency (scarcity) of thecontributor.
A-10

Table 7: Pairwise Correlations for TAQ and Yahoo! FinanceVolume Small Medium Large Volatility Return Spread
Small Trades 0.750Medium Trades 0.741 0.544Large Trades 0.654 0.421 0.677Volatility 0.063 0.218 -0.183 -0.093Return 0.016 0.008 0.023 0.016 -0.019Spread -0.031 -0.086 0.063 0.043 -0.03509:30 Dummy 0.140 0.121 0.060 0.104 0.119 0.011 0.03709:45 Dummy 0.075 0.061 0.065 0.048 0.071 -0.010 0.01110:00 Dummy 0.067 0.052 0.058 0.043 0.046 -0.008 0.00710:15 Dummy 0.047 0.038 0.041 0.027 0.026 -0.00615:00 Dummy 0.007 0.012 0.00915:15 Dummy 0.023 0.023 0.021 0.00915:30 Dummy 0.047 0.041 0.040 0.020 0.01615:45 Dummy 0.096 0.076 0.079 0.058 0.031Messages, no lag 0.322 0.484 0.146 0.173 0.132 -0.008 -0.069Messages, 1h lag 0.325 0.500 0.142 0.171 0.122 -0.012 -0.072Messages, 4h lag 0.300 0.474 0.124 0.155 0.097 -0.007 -0.072Messages, 1d lag 0.351 0.518 0.179 0.211 0.108 -0.008 -0.074Words, no lag 0.252 0.346 0.116 0.146 0.076 -0.007 -0.054Words, 1h lag 0.301 0.420 0.136 0.169 0.090 -0.010 -0.067Words, 4h lag 0.303 0.431 0.134 0.169 0.077 -0.007 -0.071Words, 1d lag 0.372 0.507 0.191 0.224 0.097 -0.008 -0.078NB simple, no lag 0.192 0.333 0.024 0.060 0.124 -0.052NB simple, 1h lag 0.237 0.414 0.029 0.082 0.146 -0.007 -0.067NB simple, 4h lag 0.238 0.418 0.028 0.090 0.132 -0.007 -0.072NB simple, 1d lag 0.252 0.405 0.036 0.104 0.147 -0.063NB length, no lag 0.167 0.283 0.021 0.057 0.101 -0.046NB length, 1h lag 0.196 0.323 0.030 0.081 0.114 -0.006 -0.054NB length, 4h lag 0.167 0.262 0.029 0.077 0.085 -0.047NB length, 1d lag 0.057 0.086 -0.011 0.019 0.041 -0.013NB scarce, no lag 0.132 0.207 0.065 0.077 0.070 -0.022NB scarce, 1h lag 0.202 0.324 0.095 0.118 0.097 -0.010 -0.036NB scarce, 4h lag 0.247 0.405 0.114 0.146 0.099 -0.008 -0.051NB scarce, 1d lag 0.329 0.511 0.155 0.199 0.141 -0.007 -0.063SV simple, no lag 0.175 0.302 0.050 0.071 0.088 -0.041SV simple, 1h lag 0.229 0.398 0.064 0.098 0.115 -0.059SV simple, 4h lag 0.235 0.412 0.060 0.106 0.115 -0.064SV simple, 1d lag 0.248 0.398 0.059 0.115 0.138 -0.058Agreement, no lag 0.190 0.326 0.034 0.073 0.118 -0.053Agreement, 1h lag 0.196 0.325 0.042 0.091 0.116 -0.052Agreement, 4h lag 0.136 0.200 0.034 0.071 0.066 -0.034Agreement, 1d lag -0.005 -0.025 -0.023
Note: Only correlations that are significantly different from zero at the 99% confidence levelare reported. Missing values are deleted on a case by case basis rather than for the entiredata set. The time dummies for the first and last hour are reported. Midday time dummiestended to be insignificant and economically small. The time preiod length is 15 minutes.
A-11

Table 8: Pairwise Correlations for Raging BullVolume Small Medium Large Volatility Return Spread
Messages, no lag 0.249 0.383 0.157 0.179 0.109 -0.050Messages, 1h lag 0.275 0.433 0.170 0.193 0.108 -0.011 -0.060Messages, 4h lag 0.272 0.436 0.162 0.189 0.092 -0.007 -0.066Messages, 1d lag 0.311 0.482 0.203 0.233 0.104 -0.007 -0.069Words, no lag 0.143 0.214 0.087 0.107 0.048 -0.032Words, 1h lag 0.210 0.314 0.125 0.154 0.065 -0.005 -0.049Words, 4h lag 0.246 0.373 0.144 0.181 0.066 -0.063Words, 1d lag 0.308 0.465 0.194 0.238 0.088 -0.005 -0.074NB simple, no lag 0.123 0.213 0.044 0.062 0.079 -0.030NB simple, 1h lag 0.181 0.323 0.055 0.088 0.108 -0.008 -0.052NB simple, 4h lag 0.218 0.400 0.055 0.103 0.122 -0.005 -0.070NB simple, 1d lag 0.282 0.505 0.079 0.141 0.172 -0.006 -0.082NB length, no lag 0.114 0.195 0.037 0.056 0.069 -0.030NB length, 1h lag 0.166 0.292 0.044 0.080 0.096 -0.007 -0.049NB length, 4h lag 0.191 0.346 0.039 0.090 0.110 -0.065NB length, 1d lag 0.216 0.386 0.042 0.105 0.148 -0.066NB scarce, no lag 0.070 0.111 0.040 0.050 0.040NB scarce, 1h lag 0.120 0.194 0.062 0.078 0.067 -0.008 -0.022NB scarce, 4h lag 0.171 0.286 0.086 0.108 0.084 -0.007 -0.032NB scarce, 1d lag 0.260 0.427 0.138 0.168 0.130 -0.007 -0.046SV simple, no lag 0.113 0.178 0.067 0.077 0.047 -0.023SV simple, 1h lag 0.169 0.276 0.090 0.109 0.071 -0.007 -0.036SV simple, 4h lag 0.202 0.341 0.092 0.123 0.086 -0.049SV simple, 1d lag 0.252 0.417 0.107 0.147 0.121 -0.061Agreement, no lag 0.131 0.227 0.048 0.068 0.081 -0.032Agreement, 1h lag 0.178 0.322 0.054 0.091 0.106 -0.006 -0.053Agreement, 4h lag 0.191 0.361 0.044 0.097 0.118 -0.067Agreement, 1d lag 0.189 0.351 0.036 0.101 0.144 -0.058
Note: See table 7 for explanations.
A-12

Table 9: Contemporaneous RegressionsLog of Bullishness Agreement Market
Messages Index Index Index1 R2
Yahoo! Finance, Naive Bayes, UnweightedLog Trading Volume 0.259c (81.97) 0.170c (23.7) −0.109c (15.7) −2.398c (60.88) 0.995Log Small Trades 0.225c (101.5) 0.180c (35.8) −0.123c (25.18) −1.522c (55.06) 0.984Log Medium Trades 0.118c (42.8) 0.162c (25.92) −0.097c (15.95) −0.450c (13.11) 0.931Log Large Trades 0.081c (36.7) 0.053c (10.59) −0.022c (4.462) −0.213c (7.762) 0.642Return −0.205 (0.843) 1.729b (3.127) −0.348 (0.649) 0.797c (136.6) 0.063Price Volatililty 0.040c (35) 0.033c (12.71) −0.029c (11.36) −1.171c (81.45) 0.538Spread 0.001 (0.618) 0.009b (2.897) −0.004 (1.389) −0.046b (2.658) 0.244
Yahoo! Finance, Support Vector, UnweightedLog Trading Volume 0.280c (93.25) 0.096c (13.25) −0.088c (12.9) −2.380c (60.43) 0.995Log Small Trades 0.244c (115.8) 0.103c (20.15) −0.091c (19.04) −1.506c (54.42) 0.984Log Medium Trades 0.134c (51.19) 0.122c (19.23) −0.086c (14.55) −0.434c (12.66) 0.931Log Large Trades 0.089c (42.36) 0.042c (8.314) −0.028c (5.91) −0.206c (7.503) 0.642Return −0.063 (0.275) 2.058c (3.679) −0.663 (1.27) 0.797c (136.6) 0.063Price Volatililty 0.045c (40.84) 0.003 (1.236) −0.013c (5.395) −1.168c (81.27) 0.537Spread 0.000 (0.191) 0.008b (2.596) 0.001 (0.379) −0.045b (2.637) 0.244
Raging Bull, Naive Bayes, UnweightedLog Trading Volume 0.344c (67.84) 0.140c (7.323) −0.059c (3.791) −2.519c (63.53) 0.995Log Small Trades 0.306c (85.58) 0.166c (12.3) −0.081c (7.389) −1.626c (58.2) 0.983Log Medium Trades 0.238c (54.46) 0.205c (12.41) −0.085c (6.329) −0.497c (14.54) 0.931Log Large Trades 0.140c (39.87) 0.081c (6.107) −0.039c (3.65) −0.248c (9.049) 0.642Return 0.679 (1.753) −0.490 (0.335) 1.095 (0.922) 0.797c (136.6) 0.063Price Volatililty 0.055c (30.07) 0.038c (5.402) −0.029c (5.146) −1.190c (82.74) 0.536Spread 0.005a (2.369) −0.010 (1.16) 0.009 (1.376) −0.045b (2.647) 0.244
Raging Bull, Support Vector, UnweightedLog Trading Volume 0.366c (72.01) 0.055c (5.092) −0.051c (5.35) −2.516c (63.47) 0.995Log Small Trades 0.328c (91.49) 0.051c (6.626) −0.050c (7.447) −1.624c (58.1) 0.983Log Medium Trades 0.259c (59.08) 0.076c (8.04) −0.037c (4.479) −0.495c (14.45) 0.931Log Large Trades 0.150c (42.66) 0.054c (7.149) −0.040c (6.041) −0.248c (9.02) 0.642Return 0.434 (1.118) 0.415 (0.498) 1.162 (1.594) 0.797c (136.6) 0.063Price Volatililty 0.059c (31.91) 0.009a (2.227) −0.015c (4.467) −1.189c (82.73) 0.536Spread 0.006b (2.761) 0.005 (1.089) −0.004 (0.966) −0.045b (2.645) 0.244
Note: All regressions use company fixed effects. A coefficient that is signficant at 95% level is indicated witha, while b and c denote significance at the 99% level and 99.9% level, respectively. T-statistics are shown inparentheses. 1 Market index denotes the log of the SPY price except in the case of the ‘Return’ regressionswhere it denotes the return (difference of the log price) of the SPY.
A-13

Table 10: Time Sequencing Tests — Yahoo! Finance (15 minutes)X Y X ⇒ Y Y ⇒ X
X−1 X−2 X−3 X−4 SPY χ2 Y−1 Y−2 Y−3 Y−4 SPY χ2
messages volume 0.025c 0.024c 0.005a 0.000 -0.666c 614.c 0.147c 0.007a -0.017c -0.023c -0.016 5855.c
messages small 0.003a 0.010c 0.003a 0.003a -0.312c 153.c 0.231c 0.012a -0.027c -0.031c -0.021 6818.c
messages medium 0.035c 0.016c -0.007c -0.014c -0.059 1048.c 0.165c -0.005 -0.038c -0.047c -0.277c 4448.c
messages large 0.020c 0.013c 0.002 -0.004a -0.068a 491.c 0.097c -0.001 -0.012c -0.014c -0.278c 1300.c
messages return -0.002a -0.001 -0.000 -0.000 21.390c 21.0b -0.004 -0.023c -0.019b -0.026c -0.231 60.8c
messages volatility 0.013c 0.002b -0.003c -0.003c -0.381c 416.c 0.073c 0.006 -0.016a -0.009 -0.220c 248.c
messages spread 0.004c 0.002 0.001 0.002 -0.009 52.0c 0.011a -0.007 -0.003 -0.001 -0.286c 10.9words volume 0.007c 0.007c 0.002a 0.001 -0.658c 398.c 0.276c 0.021a -0.019a -0.020b -0.047 3313.c
words small 0.001b 0.003c 0.001a 0.001a -0.309c 137.c 0.409c 0.026 -0.025 -0.023 -0.096 3588.c
words medium 0.009c 0.004c -0.001a -0.003c -0.063a 545.c 0.309c -0.008 -0.064c -0.070c -0.655c 2177.c
words large 0.005c 0.003c 0.000 -0.000 -0.074a 240.c 0.187c 0.014 -0.016 -0.004 -0.659c 752.c
words return -0.000 -0.001 0.000 -0.000 21.395c 11.2 -0.020 -0.041a -0.042a -0.047b 2.367 31.7c
words volatility 0.003c 0.001b -0.001 -0.000 -0.381c 220.c 0.122c 0.022 0.002 0.010 -0.494c 144.c
words spread 0.001b 0.000 0.000 0.001a -0.010 41.7c 0.015 -0.014 -0.002 0.016 -0.686c 5.56bullishness volume 0.041c 0.038c 0.030c 0.034c -0.698c 719.c 0.024c 0.007c 0.006c 0.006c 0.169c 2356.c
bullishness small 0.029c 0.022c 0.018c 0.024c -0.338c 736.c 0.043c 0.011c 0.009c 0.009c 0.174c 3465.c
bullishness medium 0.027c 0.019c 0.012c 0.012c -0.083b 277.c 0.022c 0.005b 0.003a 0.004a 0.059b 1166.c
bullishness large 0.021c 0.016c 0.016c 0.017c -0.092c 295.c 0.017c 0.009c 0.006c 0.006c 0.057b 659.c
bullishness return -0.001 -0.001 -0.000 -0.000 21.391c 1.45 0.002 -0.008b -0.009b -0.010c 0.635a 48.0c
bullishness volatility 0.009c 0.008c 0.003 0.004a -0.388c 122.c 0.025c 0.006 0.009b 0.008a 0.108c 400.c
bullishness spread 0.006a 0.007b 0.001 0.002 -0.015 33.5c 0.001 0.003 0.002 0.002 0.048a 6.32agreement volume 0.034c 0.034c 0.033c 0.036c -0.683c 575.c 0.015c 0.008c 0.009c 0.009c 0.165c 1848.c
agreement small 0.027c 0.022c 0.018c 0.023c -0.328c 635.c 0.026c 0.012c 0.012c 0.014c 0.163c 2489.c
agreement medium 0.015c 0.011c 0.016c 0.015c -0.080a 151.c 0.009c 0.006c 0.006c 0.006c 0.060b 637.c
agreement large 0.014c 0.014c 0.015c 0.019c -0.089b 207.c 0.012c 0.009c 0.009c 0.008c 0.061b 584.c
agreement return 0.002 -0.001 0.002 -0.001 21.391c 5.08 0.004 -0.001 -0.004 -0.008a 0.517 16.3a
agreement volatility 0.005b 0.006c 0.005b 0.004a -0.385c 74.2c 0.018c 0.005 0.011c 0.011c 0.109c 313.c
agreement spread 0.004 0.005a 0.002 0.003 -0.015 21.8b 0.002 0.002 0.002 0.006a 0.052a 13.8a
Note: The direction of Granger causality is indicated as follows: X ⇒ Y indicates X Granger-causes Y , and Y ⇒ X indicates YGranger-causes X . The regressors Xi and Yi are subscripted by their lags. SPY is a variable with the log of the price of the Standard& Poors Depositary Receipt S&P 500 Tracking Fund, except in the ’Return’ regressions where this variable is the time-differencedlog of the price. A coefficient that is signficant at the 99% level is indicated with a, while b and c denote significance at a 99.9% leveland a 99.99% level, respectively.
A-14

Table 11: Time Sequencing Tests — Raging Bull (15 minutes)X Y X ⇒ Y Y ⇒ X
X−1 X−2 X−3 X−4 SPY χ2 Y−1 Y−2 Y−3 Y−4 SPY χ2
messages volume 0.036c 0.026c 0.004 0.000 -0.676c 391.c 0.075c 0.006c -0.006c -0.009c 0.149c 4261.c
messages small 0.003 0.009c -0.000 0.004 -0.313c 53.6c 0.125c 0.008a -0.015c -0.013c 0.151c 5362.c
messages medium 0.045c 0.022c -0.004 -0.010c -0.074a 682.c 0.088c 0.006a -0.012c -0.018c -0.007 3833.c
messages large 0.036c 0.021c 0.005 -0.004 -0.083b 613.c 0.055c 0.004 0.001 -0.001 -0.012 1290.c
messages return -0.005c -0.002 -0.001 -0.000 21.389c 46.4c 0.001 -0.008 -0.008 -0.014c -0.784a 31.6c
messages volatility 0.017c 0.001 -0.004c -0.002 -0.385c 270.c 0.046c 0.003 -0.018c -0.000 0.015 242.c
messages spread 0.004a 0.001 0.001 0.003 -0.014 19.9b 0.007a 0.001 0.002 0.001 -0.024 9.89words volume 0.008c 0.007c 0.002 0.001 -0.675c 304.c 0.211c 0.023c -0.010 -0.010 0.613c 3388.c
words small 0.001 0.003c 0.000 0.002c -0.315c 74.5c 0.339c 0.037c -0.036c -0.009 0.597c 4111.c
words medium 0.010c 0.006c -0.000 -0.002a -0.077a 466.c 0.238c 0.019a -0.022b -0.037c 0.092 2675.c
words large 0.008c 0.005c 0.001 -0.000 -0.086b 368.c 0.157c 0.011 0.013 0.009 0.075 1004.c
words return -0.001a -0.001 -0.000 -0.000 21.393c 18.7b -0.008 -0.027 -0.025 -0.041b 0.700 25.7c
words volatility 0.004c 0.000 -0.001b 0.000 -0.385c 164.c 0.129c 0.026 -0.046b 0.016 0.192 208.c
words spread 0.001 0.001 0.000 0.001 -0.014 17.0a 0.032b 0.006 -0.000 -0.001 0.033 14.4a
bullishness volume 0.064c 0.051c 0.031c 0.035c -0.673c 269.c 0.012c 0.004c 0.001 0.003c 0.077c 1878.c
bullishness small 0.027c 0.028c 0.015b 0.030c -0.320c 202.c 0.022c 0.006c 0.001 0.004c 0.078c 2717.c
bullishness medium 0.062c 0.039c 0.018b 0.015a -0.080a 257.c 0.013c 0.005c 0.002 0.002a 0.029b 1614.c
bullishness large 0.047c 0.038c 0.024c 0.019b -0.089b 241.c 0.009c 0.004c 0.003c 0.003c 0.027a 689.c
bullishness return -0.009b -0.004 0.004 -0.011c 21.393c 36.7c -0.000 -0.002 -0.005b -0.003a 0.150 26.8c
bullishness volatility 0.017c 0.002 0.001 0.009a -0.385c 57.5c 0.009c 0.006c 0.001 0.003 0.046c 220.c
bullishness spread 0.009 0.000 0.002 0.005 -0.015 9.96 0.002 0.002 0.001 0.002 0.022a 13.3a
agreement volume 0.049c 0.045c 0.030c 0.036c -0.671c 295.c 0.011c 0.005c 0.003c 0.005c 0.092c 1730.c
agreement small 0.029c 0.025c 0.018c 0.028c -0.320c 290.c 0.020c 0.008c 0.002 0.008c 0.092c 2438.c
agreement medium 0.038c 0.028c 0.021c 0.020c -0.079a 205.c 0.011c 0.006c 0.003c 0.004c 0.033a 1293.c
agreement large 0.033c 0.031c 0.020c 0.018c -0.088b 208.c 0.009c 0.006c 0.005c 0.005c 0.031a 655.c
agreement return -0.004 -0.002 -0.001 -0.009c 21.390c 23.0b -0.005a -0.001 -0.005a -0.003 0.189 23.8c
agreement volatility 0.010c 0.004 0.007a 0.007a -0.385c 57.9c 0.010c 0.008c -0.000 0.006c 0.056c 245.c
agreement spread 0.007 0.002 0.001 0.002 -0.014 6.74 0.002 0.002 0.001 0.003a 0.025 15.7a
Note: See table 10 for explanations.
A-15

Table 12: Time Sequencing Tests — Yahoo! Finance (1 day)X Y X ⇒ Y Y ⇒ X
X−1 X−2 WSJ−2 WSJ−1 WSJ0 WSJ1 NWK SPY χ2 Y−1 Y−2 WSJ−2 WSJ−1 WSJ0 WSJ1 NWK SPY χ2
messages volume 0.108c -0.031c 0.029a 0.076c 0.024a -0.025a -0.164c -0.983c 268.c -0.025 0.056b -0.011 0.043b 0.027 -0.001 -0.540c -0.011 14.9b
messages small 0.072c -0.028c 0.028b 0.051c 0.016 -0.016 -0.049c -0.495c 190.c -0.051a 0.094c -0.011 0.043b 0.027 -0.001 -0.543c -0.027 25.0c
messages medium 0.048c -0.053c 0.032a 0.062c 0.008 -0.027a -0.109c 0.220 57.8c -0.027 0.009 -0.013 0.042b 0.027 0.001 -0.539c -0.062 6.41messages large 0.094c -0.067c 0.039a 0.086c 0.035a -0.043a -0.215c 0.052 88.1c -0.023 0.011 -0.013 0.042b 0.027 0.002 -0.537c -0.076 6.21messages return -0.001 0.001 0.001 -0.002 0.000 -0.001 -0.004a 1.257c 1.89 -0.098 0.135 -0.012 0.042b 0.026 0.001 -0.534c 0.924 2.10messages volatility 0.016c -0.012b 0.005 0.013a 0.002 0.001 -0.012 -0.561c 26.5c -0.039 0.055 -0.012 0.042b 0.027 0.001 -0.535c -0.058 3.89messages spread 0.002 -0.002 0.003 0.004 0.000 0.001 0.000 -0.041 2.00 -0.030 -0.041 -0.013 0.042b 0.027 0.001 -0.534c -0.075 1.06words volume 0.043c -0.006 0.029a 0.079c 0.031b -0.025a -0.133c -0.945c 114.c 0.038 0.083b -0.027 0.034 0.065b 0.009 -0.600c -0.227 33.8c
words small 0.025c -0.007 0.027b 0.053c 0.021b -0.016 -0.024a -0.484c 61.4c 0.010 0.126c -0.028 0.034 0.067b 0.010 -0.600c -0.322 35.1c
words medium 0.017b -0.020c 0.030a 0.062c 0.011 -0.029a -0.092c 0.213 20.8c -0.015 0.016 -0.029 0.034 0.070b 0.016 -0.604c -0.484 0.79words large 0.035c -0.023b 0.037 0.088c 0.041a -0.045b -0.186c 0.035 30.8c 0.001 0.013 -0.029 0.034 0.069b 0.015 -0.602c -0.483 1.38words return -0.001 0.000 0.001 -0.002 0.000 -0.001 -0.004a 1.260c 1.28 -0.297 0.212 -0.030 0.033 0.068b 0.017 -0.600c 0.281 4.01words volatility 0.005a -0.003 0.005 0.013a 0.003 0.000 -0.007 -0.563c 7.18 -0.000 0.065 -0.029 0.034 0.069b 0.016 -0.602c -0.403 3.09words spread 0.001 -0.000 0.003 0.004 0.001 0.001 0.001 -0.041 0.36 -0.012 -0.020 -0.029 0.034 0.069b 0.016 -0.601c -0.484 0.09bullishness volume 0.170c -0.052 0.030a 0.080c 0.032c -0.023a -0.094c -1.014c 70.1c 0.027c 0.006 0.015b 0.045c 0.011a 0.005 -0.010 0.286c 63.9c
bullishness small 0.125c -0.068c 0.027b 0.053c 0.021b -0.015 0.001 -0.522c 68.9c 0.049c 0.003 0.014a 0.044c 0.011a 0.005 -0.007 0.289c 121.c
bullishness medium 0.107c -0.148c 0.030a 0.062c 0.011 -0.027a -0.071c 0.224 48.1c 0.016c 0.000 0.015b 0.045c 0.012a 0.006 -0.009 0.194c 36.4c
bullishness large 0.195c -0.083a 0.036 0.086c 0.039a -0.046b -0.150c -0.029 40.6c 0.006 0.007 0.015b 0.045c 0.012a 0.006 -0.011 0.204c 19.9c
bullishness return -0.002 -0.002 0.001 -0.002 0.000 -0.001 -0.004b 1.264c 1.22 -0.017 0.039 0.015b 0.045c 0.012a 0.007 -0.010 -0.064 1.35bullishness volatility 0.036b -0.029a 0.005 0.013a 0.003 0.001 -0.000 -0.568c 17.0b 0.017 0.006 0.014a 0.045c 0.013a 0.006 -0.010 0.230c 7.55bullishness spread 0.015a -0.001 0.003 0.004 -0.000 0.000 0.002 -0.046 9.51a 0.015 0.020 0.014a 0.045c 0.013a 0.006 -0.010 0.198c 2.62agreement volume 0.129c -0.062 0.030a 0.081c 0.036c -0.022 -0.095c -0.963c 18.2b 0.012c 0.004 0.005 0.019c 0.005 0.004 0.004 0.195c 37.9c
agreement small 0.081a -0.056 0.027b 0.054c 0.023b -0.014 -0.001 -0.500c 14.1b 0.025c 0.003 0.005 0.019c 0.004 0.004 0.005 0.200c 89.8c
agreement medium 0.095 -0.141b 0.029a 0.062c 0.011 -0.029a -0.073c 0.217 18.3b 0.009b 0.003 0.005 0.019c 0.006 0.005 0.004 0.151c 47.3c
agreement large 0.216c -0.060 0.036 0.088c 0.042b -0.045b -0.152c -0.025 19.8c 0.003 0.005a 0.005 0.019c 0.005 0.005 0.003 0.159c 23.3c
agreement return -0.002 -0.004 0.001 -0.002 0.000 -0.001 -0.004b 1.263c 1.65 -0.001 0.026 0.005 0.019c 0.006 0.005 0.003 0.066 1.40agreement volatility 0.023 -0.026 0.005 0.013a 0.003 0.001 -0.001 -0.565c 4.39 0.012 -0.001 0.005 0.019c 0.006 0.005 0.004 0.171c 5.79agreement spread 0.027b -0.002 0.003 0.004 0.000 0.000 0.002 -0.047 12.2a 0.014 0.031a 0.005 0.019c 0.006 0.005 0.003 0.155c 11.1a
Note: See table 10 for explanations. In addition, variables WSJ−2, WSJ−1, WSJ0, WSJ+1 indicate how many stories were released in the Wall Street Journal on a given day: two days after, oneday after, on the same day, an the day before the current day, respectively. NWK is an indicator variable for a day being the first trading day after a weekend or holiday.
A-16

Table 13: Time Sequencing Tests — Raging Bull (1 day)X Y X ⇒ Y Y ⇒ X
X−1 X−2 WSJ−2 WSJ−1 WSJ0 WSJ1 NWK SPY χ2 Y−1 Y−2 WSJ−2 WSJ−1 WSJ0 WSJ1 NWK SPY χ2
messages volume 0.070c -0.018a 0.029a 0.079c 0.030b -0.023a -0.129c -1.050c 148.c 0.072c 0.033 -0.013 0.067c 0.040a -0.016 -0.354c 0.713c 43.5c
messages small 0.043c -0.011 0.027b 0.053c 0.019a -0.015 -0.023a -0.546c 92.7c 0.091c 0.071a -0.015 0.066c 0.041a -0.016 -0.348c 0.697c 71.0c
messages medium 0.042c -0.042c 0.030a 0.062c 0.009 -0.028a -0.097c 0.210 54.4c 0.018 0.025 -0.014 0.068c 0.044a -0.012 -0.359c 0.432a 17.2b
messages large 0.073c -0.039c 0.036 0.086c 0.037a -0.045b -0.188c -0.008 68.7c 0.039b 0.003 -0.013 0.067c 0.042a -0.013 -0.357c 0.465a 20.5c
messages return -0.000 0.001 0.001 -0.002 0.000 -0.001 -0.004b 1.261c 1.51 -0.126 0.081 -0.014 0.067c 0.043a -0.011 -0.360c 1.005 1.30messages volatility 0.012c -0.008a 0.005 0.013a 0.002 0.000 -0.007 -0.570c 18.0b -0.019 0.098a -0.016 0.067c 0.044a -0.012 -0.361c 0.555a 10.9a
messages spread 0.005a -0.002 0.003 0.004 -0.000 0.000 -0.000 -0.043 11.0a 0.171a -0.011 -0.016 0.066c 0.043a -0.012 -0.362c 0.454a 7.44words volume 0.015c -0.001 0.029a 0.081c 0.034c -0.023a -0.112c -1.003c 53.4c 0.268c 0.114a -0.037 0.145b 0.125b -0.050 -0.555c 2.029c 91.9c
words small 0.008c -0.000 0.026b 0.054c 0.022b -0.015 -0.011 -0.520c 27.4c 0.303c 0.199b -0.044 0.141b 0.129b -0.049 -0.542c 1.830c 111.c
words medium 0.008b -0.008a 0.029a 0.062c 0.011 -0.030a -0.085c 0.208 16.1b 0.066 0.062 -0.041 0.151b 0.146c -0.029 -0.566c 1.013 22.4c
words large 0.014c -0.006 0.035 0.088c 0.042b -0.045b -0.169c -0.004 18.1b 0.152c 0.003 -0.036 0.148b 0.139b -0.036 -0.564c 1.124 42.4c
words return 0.000 0.000 0.001 -0.002 0.000 -0.001 -0.004b 1.263c 0.60 -0.659 -0.014 -0.041 0.149b 0.146c -0.025 -0.568c 1.726 3.86words volatility 0.001 -0.000 0.005 0.013a 0.003 0.000 -0.003 -0.570c 2.21 0.119 0.175 -0.044 0.148b 0.146c -0.029 -0.569c 1.467a 13.2a
words spread 0.002b -0.000 0.003 0.004 0.000 0.000 -0.000 -0.044 13.7a 0.386 0.024 -0.045 0.147b 0.145c -0.027 -0.575c 1.079 5.52bullishness volume 0.080c -0.024 0.029a 0.082c 0.036c -0.022 -0.100c -0.966c 20.5c 0.024c 0.006 0.003 0.017b 0.003 -0.000 -0.010 0.276c 45.5c
bullishness small 0.064c -0.023 0.026b 0.054c 0.024b -0.014 -0.004 -0.508c 23.0c 0.039c 0.006 0.002 0.017b 0.003 -0.001 -0.008 0.270c 74.2c
bullishness medium 0.078b -0.056a 0.028 0.062c 0.011 -0.030a -0.078c 0.204 19.1c 0.015b 0.006 0.003 0.018c 0.005 0.001 -0.010 0.193b 46.8c
bullishness large 0.092b -0.018 0.035 0.088c 0.044b -0.045b -0.158c -0.011 11.1a 0.015c 0.002 0.003 0.018c 0.004 0.001 -0.011 0.208c 33.7c
bullishness return 0.002 -0.001 0.001 -0.002 0.000 -0.001 -0.004b 1.263c 0.79 0.001 0.016 0.003 0.018c 0.005 0.002 -0.011 0.283 0.16bullishness volatility 0.003 -0.003 0.005 0.013a 0.004 0.000 -0.002 -0.566c 0.25 0.009 0.013 0.002 0.018c 0.005 0.002 -0.011 0.231c 5.49bullishness spread 0.011 -0.002 0.003 0.004 0.000 0.001 0.001 -0.044 6.10 0.024 0.018 0.002 0.018c 0.005 0.002 -0.011 0.202c 2.92agreement volume 0.028 -0.023 0.030a 0.082c 0.037c -0.021 -0.099c -0.945c 3.74 0.008 -0.001 -0.001 0.007 0.001 0.001 -0.002 0.202b 3.79agreement small 0.028 -0.016 0.026b 0.054c 0.024b -0.014 -0.003 -0.496c 5.08 0.013 -0.001 -0.001 0.007 0.001 0.001 -0.002 0.202c 6.26agreement medium 0.049 -0.027 0.029a 0.062c 0.012 -0.030a -0.077c 0.204 6.74 0.008 0.001 -0.001 0.007 0.002 0.002 -0.002 0.180b 8.15agreement large 0.022 -0.004 0.035 0.089c 0.045b -0.045b -0.157c 0.004 0.63 0.009a -0.001 -0.001 0.007 0.002 0.001 -0.002 0.186b 9.25a
agreement return 0.002 0.000 0.001 -0.002 0.000 -0.001 -0.004b 1.263c 0.87 0.017 0.015 -0.001 0.007 0.002 0.002 -0.003 0.163 0.36agreement volatility -0.003 0.000 0.005 0.013a 0.004 0.000 -0.002 -0.565c 0.12 0.002 -0.002 -0.001 0.007 0.002 0.002 -0.003 0.184b 0.05agreement spread 0.008 -0.003 0.003 0.004 0.001 0.001 0.001 -0.043 3.40 -0.001 0.003 -0.001 0.007 0.002 0.002 -0.003 0.184b 0.03
Note: See table 12 for explanations.
A-17

Table 14: Does Posting Activity Predict News Releases in the Wall Street Journal?
Yahoo! Finance, 1 day lag(1) (2) (3) (4) (5)
Log Messages 0.532c (177) 0.5c (139)Log Words 0.312c (94.4) 0.372c (144) 0.276c (70.7)Bullishness 0.52c (13) 1.051c (14.9) 0.832c (37.5) 1.8c (47)Agreement −1.04a (5.18) 0.486a (5.22) −1.94c (17.6)Log Likelihood −4399 −4397 −4440 −4457 −4430Observations 14235 14235 14235 14235 14235Companies 39 39 39 39 39
Raging Bull, 1 day lag(1) (2) (3) (4) (5)
Log Messages 0.432c (163) 0.431c (148)Log Words 0.149c (97.6) 0.159c (119) 0.144c (90.5)Bullishness 0.255 (3.59) 0.28 (1.43) 0.241 (3.29) 0.828c (12.3)Agreement −0.03 (0.02) −0.06 (0.23) −0.71b (9.24)Log Likelihood −4452 −4452 −4485 −4486 −4480Observations 14235 14235 14235 14235 14235Companies 39 39 39 39 39
Yahoo! Finance, 2 day lag(1) (2) (3) (4) (5)
Log Messages 0.045 (1.52) 0.031 (0.63)Log Words 0.044 (2.92) 0.045 (3.38) 0.038 (2.13)Bullishness −0.05 (0.12) 0.205 (0.68) −0.06 (0.18) 0.18 (0.6)Agreement −0.5 (1.6) −0.26 (1.29) −0.49 (1.66)Log Likelihood −4545 −4544 −4544 −4543 −4543Observations 14196 14196 14196 14196 14196Companies 39 39 39 39 39
Raging Bull, 2 day lag(1) (2) (3) (4) (5)
Log Messages 0.012 (0.12) 0.023 (0.43)Log Words 0.017 (1.42) 0.012 (0.79) 0.018 (1.56)Bullishness −0.1 (0.5) −0.32 (2.05) −0.14 (1) −0.33 (2.43)Agreement 0.268 (1.57) −0 (0) 0.244 (1.4)Log Likelihood −4545 −4544 −4544 −4545 −4544Observations 14196 14196 14196 14196 14196Companies 39 39 39 39 39
Note: Estimates are obtained from logit regressions with company fixed effects where the dependent variable is abinary response variable which is 1 when the Wall Street Journal has published an article on a particular companyon a given day, and 0 otherwise. The first two panels predict today’s news release based on yesterday’s postingactivity, while the last two panels predict today’s news release based on the posting activity on the day beforeyesterday. Companies which zero or fewer than 5 WSJ releases were dropped from this analysis. A coefficientthat is signficant at 95% level is indicated with a, while b and c denote significance at a 99% level and a 99.9% levelrespectively. Numbers in parentheses provide the Wald χ2 statistics on which the significance determination wasbased.
A-18
Copyright © 2022 FDOKUMEN