Blood Oxygen Level-Dependent Signal Variability Is More than Just Noise
8
Behavioral/Systems/Cognitive Blood Oxygen Level-Dependent Signal Variability Is More than Just Noise Douglas D. Garrett, 1,2 Natasa Kovacevic, 1 Anthony R. McIntosh, 1,2 and Cheryl L. Grady 1,2,3 1 Rotman Research Institute, Baycrest, Toronto, Ontario M6A 2E1, Canada, 2 Department of Psychology, University of Toronto, Toronto, Ontario M5S 3G3, Canada, and 3 Department of Psychiatry, University of Toronto, Toronto, Ontario M5T 1R8, Canada Functional magnetic resonance imaging (fMRI) research often attributes blood oxygen level-dependent (BOLD) signal variance to measurement-related confounds. However, what is typically considered “noise” variance in data may be a vital feature of brain function. We examined fMRI signal variability during fixation baseline periods, and then compared SD- and mean-based spatial patterns and their relations with chronological age (20 – 85 years). We found that not only was the SD-based pattern robust, it differed greatly, both spatially and statistically, from the mean-based pattern. Notably, the unique age-predictive power of the SD-based pattern was more than five times that of the mean-based pattern. This reliable SD-based pattern of activity highlights an important “signal” within what is often considered measurement-related “noise.” We suggest that examination of BOLD signal variability may reveal a host of novel brain-related effects not previously considered in neuroimaging research. Introduction Within functional magnetic resonance imaging (fMRI) research, much of what we understand about brain function is based on average brain activation patterns. Researchers typically compute within-subject average signals across a given time course to cap- ture what is conceived as the most relevant brain activity (see “Mean” in Fig. 1). This approach is steeped in statistical and scientific traditions, in which a primary assumption is that central tendency reflects the most representative value in a distribution, and thus, “signal” within distributional “noise.” However, no matter how the brain is measured, it is obvious that the brain’s natural state is inherently variable (see “Vari- ance” in Fig. 1) (Arieli et al., 1996; Miller et al., 2002; Laskaris et al., 2003; Neumann et al., 2003; Huettel et al., 2004; Faisal et al., 2008; McIntosh et al., 2008). Current evidence suggests substantial intrasubject variability in the blood oxygen level- dependent (BOLD) signal within and across testing sessions, but BOLD signal variance is often discounted as merely re- flecting issues with task, image acquisition and preprocessing, statistical power, reliability, or other nuisance effects (Aguirre et al., 1998; Miller et al., 2002; Neumann et al., 2003; Huettel et al., 2004; Smith et al., 2005; Andrews-Hanna et al., 2007; Jones et al., 2008). However, several other areas of research have examined di- rectly the properties and unique functionality of variance, and suggest that by considering rather than ignoring variance, our ability to understand and predict several important phenomena can improve dramatically (Stein et al., 2005; MacDonald et al., 2006; Faisal et al., 2008). For example, recent EEG work shows that greater brain signal variability may indicate a more sophisti- cated neural system that can explore multiple functional states, yields more stable behavioral performance, and may be an im- portant index of the cognitive capacity of the human brain (Ghosh et al., 2008; McIntosh et al., 2008). Although the concept of variability has not completely eluded fMRI research, no study to date has considered BOLD variance as a within-person mea- sure with intrinsic theoretical and predictive meaning. Among the myriad contexts where one could investigate the effect and function of variability in BOLD signals, normal human aging is an appropriate starting point. In many respects, aging has be- come a model for examining generalized “noise” in both brain and behavior (Li et al., 2006; MacDonald et al., 2006, 2009; Hultsch et al., 2008). With regard to fMRI, however, age-related BOLD variability requires exploration. In the current study, we characterized BOLD variability with several novel questions in mind: (1) Can we find spatial patterns of BOLD variability, sug- gesting that this variability is more than just “noise” in the brain? If so, are older or younger brains more variable, or does the answer depend on brain region? (2) What are the similarities and differences between mean- and variability-based spatial patterns with age? (3) Does either BOLD mean or variability do a better job of predicting age? (4) Can we determine whether variability effects are due simply to confounds that influence the BOLD signal? Received Oct. 16, 2009; revised Jan. 13, 2010; accepted Feb. 12, 2010. D.D.G. was supported by a doctoral Canada Graduate Scholarship from the Natural Sciences and Engineering Research Council of Canada, the Sir James Lougheed Award of Distinction from Alberta Scholarship Programs, the Naomi Grigg Fellowship for Postgraduate Studies in Gerontology from Soroptimist International of Toronto, and the Men’s Service Group Graduate Student Fellowship from the Rotman Research Institute, Baycrest. This work was supported by a Canadian Institutes of Health Research grant to C.L.G. (MOP14036) and A.R.M. (MOP13026), and a James S. McDonnell Foundation grant to A.R.M. C.L.G. was supported also by the Canada Research Chairs program, the Ontario Research Fund, and the Canadian Foundation for Innovation. We thank Laura Garrett for her helpful editorial suggestions, and Stephen Strother for insightful comments and expertise. D.D.G., N.K., A.R.M., and C.L.G. wrote the manuscript. D.D.G. and N.K. performed the analyses. D.D.G., N.K., A.R.M., and C.L.G. designed the study. A.R.M. and C.L.G. designed the task. Correspondence should be addressed to Douglas D. Garrett, Rotman Research Institute, Baycrest, 3560 Bathurst Street, Toronto, Ontario M6A 2E1, Canada. E-mail: [email protected]. DOI:10.1523/JNEUROSCI.5166-09.2010 Copyright © 2010 the authors 0270-6474/10/304914-08$15.00/0 4914 • The Journal of Neuroscience, April 7, 2010 • 30(14):4914 – 4921
-
Upload
independent -
Category
Documents
-
view
0 -
download
0
Transcript of Blood Oxygen Level-Dependent Signal Variability Is More than Just Noise
Behavioral/Systems/Cognitive
Blood Oxygen Level-Dependent Signal Variability Is Morethan Just Noise
Douglas D. Garrett,1,2 Natasa Kovacevic,1 Anthony R. McIntosh,1,2 and Cheryl L. Grady1,2,3
1Rotman Research Institute, Baycrest, Toronto, Ontario M6A 2E1, Canada, 2Department of Psychology, University of Toronto, Toronto, Ontario M5S 3G3,Canada, and 3Department of Psychiatry, University of Toronto, Toronto, Ontario M5T 1R8, Canada
Functional magnetic resonance imaging (fMRI) research often attributes blood oxygen level-dependent (BOLD) signal variance tomeasurement-related confounds. However, what is typically considered “noise” variance in data may be a vital feature of brainfunction. We examined fMRI signal variability during fixation baseline periods, and then compared SD- and mean-based spatialpatterns and their relations with chronological age (20 – 85 years). We found that not only was the SD-based pattern robust, itdiffered greatly, both spatially and statistically, from the mean-based pattern. Notably, the unique age-predictive power of theSD-based pattern was more than five times that of the mean-based pattern. This reliable SD-based pattern of activity highlights animportant “signal” within what is often considered measurement-related “noise.” We suggest that examination of BOLD signalvariability may reveal a host of novel brain-related effects not previously considered in neuroimaging research.
IntroductionWithin functional magnetic resonance imaging (fMRI) research,much of what we understand about brain function is based onaverage brain activation patterns. Researchers typically computewithin-subject average signals across a given time course to cap-ture what is conceived as the most relevant brain activity (see“Mean” in Fig. 1). This approach is steeped in statistical andscientific traditions, in which a primary assumption is thatcentral tendency reflects the most representative value in adistribution, and thus, “signal” within distributional “noise.”However, no matter how the brain is measured, it is obviousthat the brain’s natural state is inherently variable (see “Vari-ance” in Fig. 1) (Arieli et al., 1996; Miller et al., 2002; Laskariset al., 2003; Neumann et al., 2003; Huettel et al., 2004; Faisal etal., 2008; McIntosh et al., 2008). Current evidence suggestssubstantial intrasubject variability in the blood oxygen level-dependent (BOLD) signal within and across testing sessions,but BOLD signal variance is often discounted as merely re-flecting issues with task, image acquisition and preprocessing,statistical power, reliability, or other nuisance effects (Aguirre
et al., 1998; Miller et al., 2002; Neumann et al., 2003; Huettel etal., 2004; Smith et al., 2005; Andrews-Hanna et al., 2007; Joneset al., 2008).
However, several other areas of research have examined di-rectly the properties and unique functionality of variance, andsuggest that by considering rather than ignoring variance, ourability to understand and predict several important phenomenacan improve dramatically (Stein et al., 2005; MacDonald et al.,2006; Faisal et al., 2008). For example, recent EEG work showsthat greater brain signal variability may indicate a more sophisti-cated neural system that can explore multiple functional states,yields more stable behavioral performance, and may be an im-portant index of the cognitive capacity of the human brain(Ghosh et al., 2008; McIntosh et al., 2008). Although the conceptof variability has not completely eluded fMRI research, no studyto date has considered BOLD variance as a within-person mea-sure with intrinsic theoretical and predictive meaning. Amongthe myriad contexts where one could investigate the effect andfunction of variability in BOLD signals, normal human aging isan appropriate starting point. In many respects, aging has be-come a model for examining generalized “noise” in both brainand behavior (Li et al., 2006; MacDonald et al., 2006, 2009;Hultsch et al., 2008). With regard to fMRI, however, age-relatedBOLD variability requires exploration. In the current study, wecharacterized BOLD variability with several novel questions inmind: (1) Can we find spatial patterns of BOLD variability, sug-gesting that this variability is more than just “noise” in the brain?If so, are older or younger brains more variable, or does theanswer depend on brain region? (2) What are the similarities anddifferences between mean- and variability-based spatial patternswith age? (3) Does either BOLD mean or variability do a betterjob of predicting age? (4) Can we determine whether variabilityeffects are due simply to confounds that influence the BOLDsignal?
Received Oct. 16, 2009; revised Jan. 13, 2010; accepted Feb. 12, 2010.D.D.G. was supported by a doctoral Canada Graduate Scholarship from the Natural Sciences and Engineering
Research Council of Canada, the Sir James Lougheed Award of Distinction from Alberta Scholarship Programs, theNaomi Grigg Fellowship for Postgraduate Studies in Gerontology from Soroptimist International of Toronto, and theMen’s Service Group Graduate Student Fellowship from the Rotman Research Institute, Baycrest. This work wassupported by a Canadian Institutes of Health Research grant to C.L.G. (MOP14036) and A.R.M. (MOP13026), and aJames S. McDonnell Foundation grant to A.R.M. C.L.G. was supported also by the Canada Research Chairs program,the Ontario Research Fund, and the Canadian Foundation for Innovation. We thank Laura Garrett for her helpfuleditorial suggestions, and Stephen Strother for insightful comments and expertise. D.D.G., N.K., A.R.M., and C.L.G.wrote the manuscript. D.D.G. and N.K. performed the analyses. D.D.G., N.K., A.R.M., and C.L.G. designed the study.A.R.M. and C.L.G. designed the task.
Correspondence should be addressed to Douglas D. Garrett, Rotman Research Institute, Baycrest, 3560 BathurstStreet, Toronto, Ontario M6A 2E1, Canada. E-mail: [email protected].
DOI:10.1523/JNEUROSCI.5166-09.2010Copyright © 2010 the authors 0270-6474/10/304914-08$15.00/0
4914 • The Journal of Neuroscience, April 7, 2010 • 30(14):4914 – 4921

Materials and MethodsSampleOur sample consisted of 19 young adults (mean age � 25.79 � 3.28 years,range 20 –30 years, 10 women) and 28 older adults (mean age � 66.46 �8.25 years, range 56 – 85 years, 14 women). Most participants were righthanded (3 in each group were left handed), and all were screened using adetailed health questionnaire to exclude health problems and/or medi-cations that might affect cognitive function and brain activity, includingstrokes and cardiovascular disease. Structural MRIs also were inspectedto rule out severe white matter changes or other abnormalities. Theyoung adults had significantly more years of education than did the olderadults (young adults � 18.00 � 2.10 years; older adults � 15.70 � 3.10years; t(46) � 2.80, p � 0.01). There was no age difference in mean scores(mean scores for both groups � 29) on a test of mental status (Folstein etal., 1975). The present experiment was approved by the Research Eth-ics Board at Baycrest, and all participants gave informed consent fortheir participation (following the guidelines of the Research EthicsBoard at Baycrest and the University of Toronto) and were paid fortheir participation.
Data of interest: fixation blocksTo maintain a simple model structure throughout, all mean and SDanalyses were performed using only volumes acquired during fixationblocks from a broader study that also included several cognitive taskblocks randomly interspersed (Grady et al., 2010). Participants viewed afixation cross for the entirety of each block. On average, there were 32fixation blocks per subject, with 10 volumes per block. This amounted toa total average of 320 volumes per subject (640 s of fixation) at a TR �2000 ms.
fMRI scanningWe acquired images with a Siemens Trio 3T magnet. We first obtained aT1-weighted anatomical volume using SPGR (TE � 2.6 ms, TR � 2000ms, FOV � 256 mm, slice thickness � 1 mm) for coregistration with thefunctional images and to ensure that there were no significant brainabnormalities in any participants. T2* functional images (TE � 30 ms,TR � 2000 ms, flip angle � 70°, FOV � 200 mm) were obtained usingEPI acquisition. Each functional sequence consisted of twenty-eight5-mm-thick axial slices, positioned to image the whole brain.
Data preprocessingCommon Template. For the purpose of creating an unbiased commonanatomical template for a large age range (20 – 85 years), we first dividedsubjects into three age groups: 20 –30, 55– 65, and 66 – 85. For each of thethree age groups, we created an unbiased nonlinear group average ana-tomical image (Kovacevic et al., 2005; Chen et al., 2006; Levine et al.,2008). Starting with the three group-specific average images, we thenapplied the same algorithm to create a common anatomical image, whichwe refer to as the Common Template. The rationale behind this two-
stage derivation of a Common Template was to accommodate large agedifferences across subjects. Brain anatomy changes significantly duringnormal aging (e.g., atrophy) (Ezekiel et al., 2004), and we assume that anyindividual subject registers better with subjects within the same generalage group than with subjects from other groups. On the other hand, thethree age-specific group average images are sufficiently blurry to alloweasy coregistration. The transforms obtained from the two stages wereconcatenated to produce a single nonlinear transform from each subjectinto the Common Template space.
Functional data. Functional data were slice-time corrected using AFNI(http://afni.nimh.nih.gov/afni) and motion corrected using AIR(http://bishopw.loni.ucla.edu/AIR5/) by registering all functional vol-umes to the 100th volume within run. By averaging all functional vol-umes within a motion-corrected run, we calculated mean functionalvolumes. For each run, mean functional volume was registered with eachsubject’s structural volume using a rigid body transformation model.After appropriate transform concatenations, from initial volume to the100th volume within run, from mean run volume to structural volume,and from structural volume into the Common Template space, we ob-tained a direct nonlinear transform from each initial fMRI volume intothe Common Template space. We then applied the FSL/FNIRT registra-tion algorithm to find a nonlinear transform between our anatomicalCommon Template and MNI 152_T1 provided with FSL software (www.fmrib.ox.ac.uk/fsl). Data were smoothed using an 8 mm Gaussian kernel.The steps outlined above comprised our “basic” preprocessing steps (i.e.,slice timing and motion correction, spatial normalization, and smooth-ing) (Table 1).
We performed several additional preprocessing steps aimed at reduc-ing data artifacts (termed “extended” preprocessing in Table 1). Func-tional volumes in the Common Template space were first corrected forartifacts via independent component analysis (ICA) within separateruns, as implemented in FSL/Melodic (Beckmann and Smith, 2004).Voxel time series were further adjusted by regressing out motion correc-tion parameters, white matter (WM), and CSF time series. For WM andCSF regression, we extracted time series from unsmoothed data withinsmall ROIs in the corpus callosum and ventricles of the Common Tem-plate, respectively. ROIs were selected such that they were deep within theeach structure of interest (corpus callosum and ventricles) to avoid signalcontamination from external tissues due to misregistration. The ratio-nale for using small ROIs and unsmoothed data was to ensure that theROIs would not contain any signal of interest (i.e., gray matter signal) forany of the subjects. The choice of a single 4 mm 3 voxel within corpuscallosum for WM and a same-size voxel within one lateral ventricle forCSF was based on our experience in having excellent registration of thesestructures across all ages. With a large age span in our data, it would beeasy to introduce age-related bias if larger ROIs or smoothed data wereused. Spatial smoothing mixes signals from neighboring voxels on onehand, and registration errors during spatial normalization on the other;both factors can contaminate WM and CSF time series due to the closeproximity of gray matter voxels. Although we used nonlinear registrationto adjust for age related differences in anatomy (atrophy, in particular), itis still likely that residual differences remained such that, e.g., larger CSFROIs would have residual small, yet biased, age-dependent contributionsfrom GM signal.
To localize regions from our functional output, we submitted MNIcoordinates to the Anatomy Toolbox in SPM8, which applies probabilis-tic algorithms to determine the cytoarchitectonic labeling of MNI coor-
Figure 1. Conceptual comparison between fMRI signal mean and variability for a randombrain voxel.
Table 1. Effects of preprocessing on BOLD signal variance and age prediction
Level ofpreprocessing Voxel SDs
R 2 between SDbrain and age
R 2 between meanbrain and age
Basic 0.72 (0.48) 0.39 0.60Extended 0.36 (0.20) 0.81 0.59
�Basic� preprocessing includes typical preprocessing steps (i.e., slice timing, motion correction, and spatial normal-ization and smoothing). �Extended� preprocessing includes independent components analysis, motion correction/white matter/cerebrospinal fluid parameter regression, and block normalization (see Materials and Methods). Wecalculated SDs over fixation blocks, and averaged them over brain and subjects. Between-subjects standard devia-tion of voxel SDs is given in parentheses. R 2 values represent proportion of variance accounted for in models whereage was predicted separately by SD-based and mean-based brain scores.
Garrett et al. • BOLD Variability Is More than Just Noise J. Neurosci., April 7, 2010 • 30(14):4914 – 4921 • 4915
dinates (Eickhoff et al., 2005, 2007). Regions not labeled using thismethod were located manually using the Atlas of the Human Brain (Maiet al., 2008) after transforming MNI coordinates to Talairach space withthe Nonlinear Yale MNI to Talairach Conversion Algorithm (Lacadie etal., 2008) and associated online Java-based applet. Supplemental Tables 1and 2 (available at www.jneurosci.org as supplemental material) containpeaks of activation for SD- and mean-based measures for clusters com-prised of at least 10 contiguous voxels, and associated peak bootstrapratios of 3.00 or greater (for details, see Data analysis, Partial least-squares analysis of relations between BOLD SD and age, and BOLD meanand age).
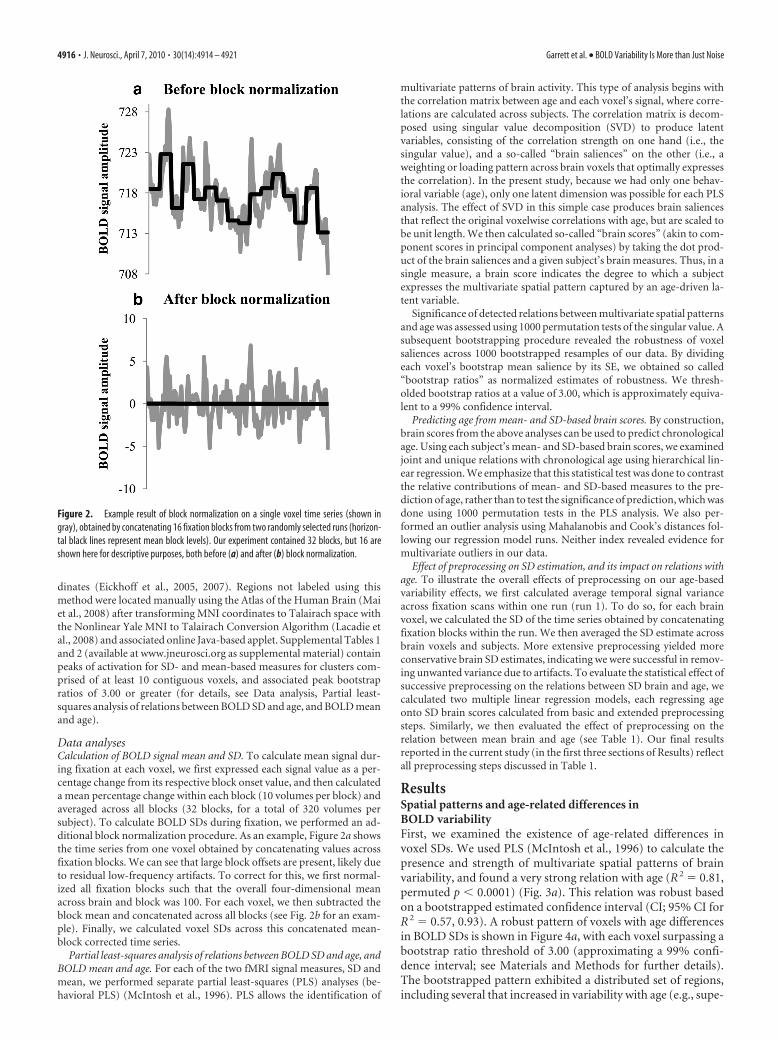
Data analysesCalculation of BOLD signal mean and SD. To calculate mean signal dur-ing fixation at each voxel, we first expressed each signal value as a per-centage change from its respective block onset value, and then calculateda mean percentage change within each block (10 volumes per block) andaveraged across all blocks (32 blocks, for a total of 320 volumes persubject). To calculate BOLD SDs during fixation, we performed an ad-ditional block normalization procedure. As an example, Figure 2a showsthe time series from one voxel obtained by concatenating values acrossfixation blocks. We can see that large block offsets are present, likely dueto residual low-frequency artifacts. To correct for this, we first normal-ized all fixation blocks such that the overall four-dimensional meanacross brain and block was 100. For each voxel, we then subtracted theblock mean and concatenated across all blocks (see Fig. 2b for an exam-ple). Finally, we calculated voxel SDs across this concatenated mean-block corrected time series.
Partial least-squares analysis of relations between BOLD SD and age, andBOLD mean and age. For each of the two fMRI signal measures, SD andmean, we performed separate partial least-squares (PLS) analyses (be-havioral PLS) (McIntosh et al., 1996). PLS allows the identification of
multivariate patterns of brain activity. This type of analysis begins withthe correlation matrix between age and each voxel’s signal, where corre-lations are calculated across subjects. The correlation matrix is decom-posed using singular value decomposition (SVD) to produce latentvariables, consisting of the correlation strength on one hand (i.e., thesingular value), and a so-called “brain saliences” on the other (i.e., aweighting or loading pattern across brain voxels that optimally expressesthe correlation). In the present study, because we had only one behav-ioral variable (age), only one latent dimension was possible for each PLSanalysis. The effect of SVD in this simple case produces brain saliencesthat reflect the original voxelwise correlations with age, but are scaled tobe unit length. We then calculated so-called “brain scores” (akin to com-ponent scores in principal component analyses) by taking the dot prod-uct of the brain saliences and a given subject’s brain measures. Thus, in asingle measure, a brain score indicates the degree to which a subjectexpresses the multivariate spatial pattern captured by an age-driven la-tent variable.
Significance of detected relations between multivariate spatial patternsand age was assessed using 1000 permutation tests of the singular value. Asubsequent bootstrapping procedure revealed the robustness of voxelsaliences across 1000 bootstrapped resamples of our data. By dividingeach voxel’s bootstrap mean salience by its SE, we obtained so called“bootstrap ratios” as normalized estimates of robustness. We thresh-olded bootstrap ratios at a value of 3.00, which is approximately equiva-lent to a 99% confidence interval.
Predicting age from mean- and SD-based brain scores. By construction,brain scores from the above analyses can be used to predict chronologicalage. Using each subject’s mean- and SD-based brain scores, we examinedjoint and unique relations with chronological age using hierarchical lin-ear regression. We emphasize that this statistical test was done to contrastthe relative contributions of mean- and SD-based measures to the pre-diction of age, rather than to test the significance of prediction, which wasdone using 1000 permutation tests in the PLS analysis. We also per-formed an outlier analysis using Mahalanobis and Cook’s distances fol-lowing our regression model runs. Neither index revealed evidence formultivariate outliers in our data.
Effect of preprocessing on SD estimation, and its impact on relations withage. To illustrate the overall effects of preprocessing on our age-basedvariability effects, we first calculated average temporal signal varianceacross fixation scans within one run (run 1). To do so, for each brainvoxel, we calculated the SD of the time series obtained by concatenatingfixation blocks within the run. We then averaged the SD estimate acrossbrain voxels and subjects. More extensive preprocessing yielded moreconservative brain SD estimates, indicating we were successful in remov-ing unwanted variance due to artifacts. To evaluate the statistical effect ofsuccessive preprocessing on the relations between SD brain and age, wecalculated two multiple linear regression models, each regressing ageonto SD brain scores calculated from basic and extended preprocessingsteps. Similarly, we then evaluated the effect of preprocessing on therelation between mean brain and age (see Table 1). Our final resultsreported in the current study (in the first three sections of Results) reflectall preprocessing steps discussed in Table 1.
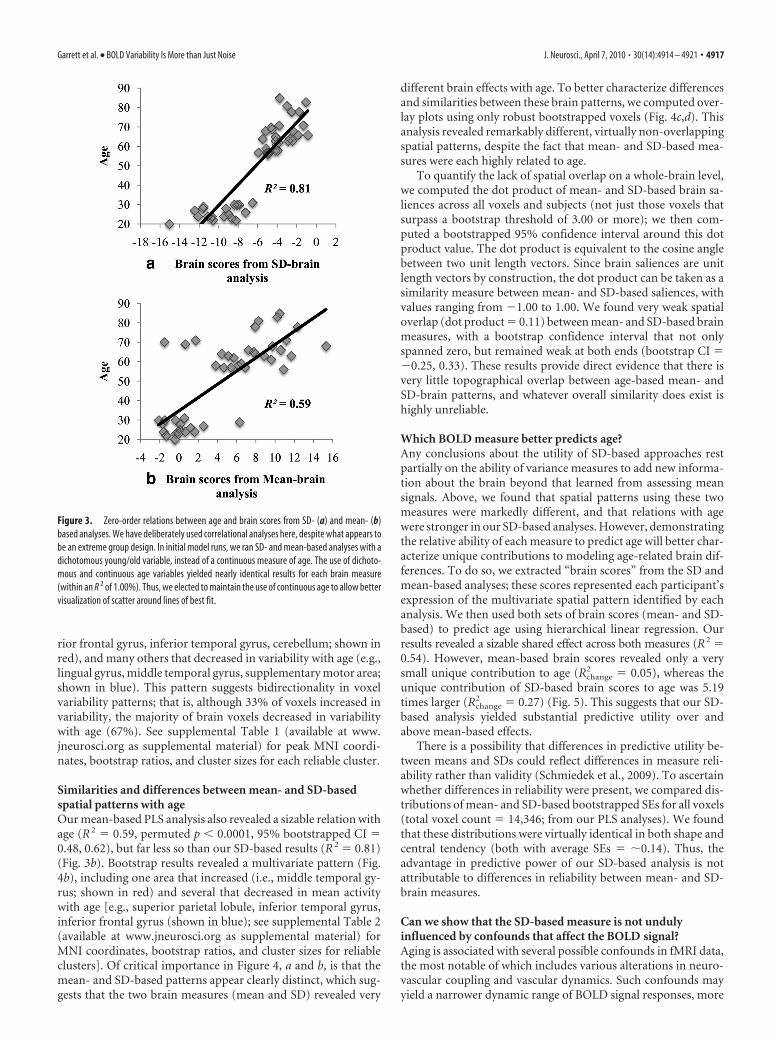
ResultsSpatial patterns and age-related differences inBOLD variabilityFirst, we examined the existence of age-related differences invoxel SDs. We used PLS (McIntosh et al., 1996) to calculate thepresence and strength of multivariate spatial patterns of brainvariability, and found a very strong relation with age (R 2 � 0.81,permuted p � 0.0001) (Fig. 3a). This relation was robust basedon a bootstrapped estimated confidence interval (CI; 95% CI forR 2 � 0.57, 0.93). A robust pattern of voxels with age differencesin BOLD SDs is shown in Figure 4a, with each voxel surpassing abootstrap ratio threshold of 3.00 (approximating a 99% confi-dence interval; see Materials and Methods for further details).The bootstrapped pattern exhibited a distributed set of regions,including several that increased in variability with age (e.g., supe-
Figure 2. Example result of block normalization on a single voxel time series (shown ingray), obtained by concatenating 16 fixation blocks from two randomly selected runs (horizon-tal black lines represent mean block levels). Our experiment contained 32 blocks, but 16 areshown here for descriptive purposes, both before (a) and after (b) block normalization.
4916 • J. Neurosci., April 7, 2010 • 30(14):4914 – 4921 Garrett et al. • BOLD Variability Is More than Just Noise
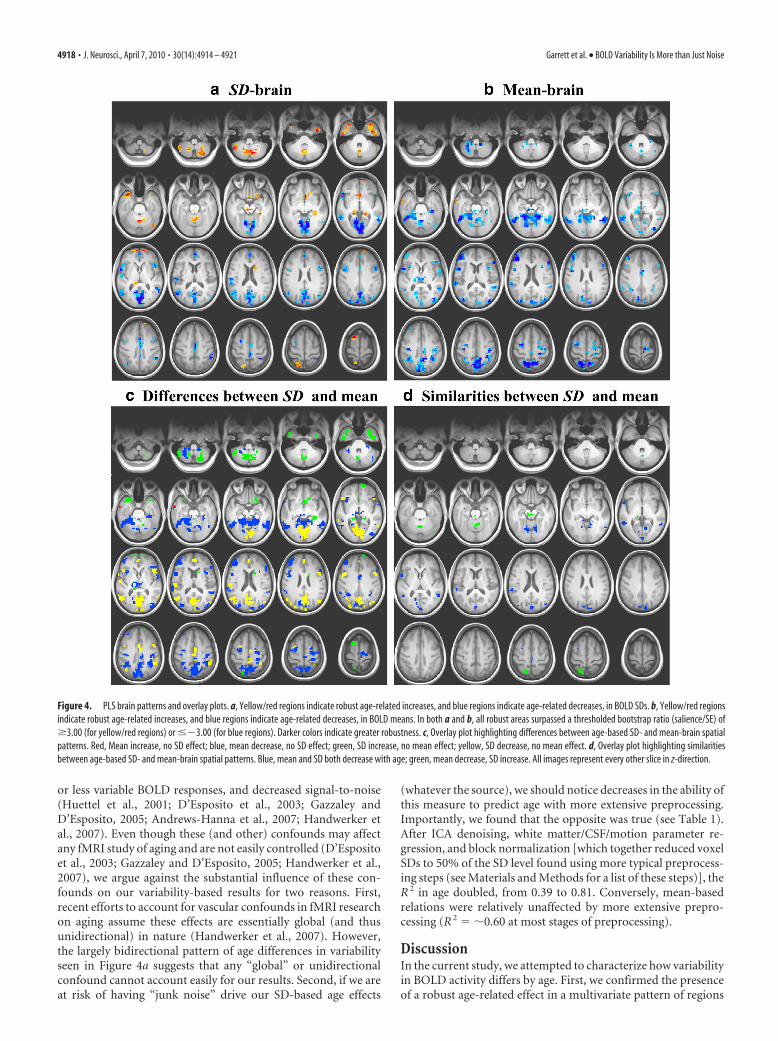
rior frontal gyrus, inferior temporal gyrus, cerebellum; shown inred), and many others that decreased in variability with age (e.g.,lingual gyrus, middle temporal gyrus, supplementary motor area;shown in blue). This pattern suggests bidirectionality in voxelvariability patterns; that is, although 33% of voxels increased invariability, the majority of brain voxels decreased in variabilitywith age (67%). See supplemental Table 1 (available at www.jneurosci.org as supplemental material) for peak MNI coordi-nates, bootstrap ratios, and cluster sizes for each reliable cluster.
Similarities and differences between mean- and SD-basedspatial patterns with ageOur mean-based PLS analysis also revealed a sizable relation withage (R 2 � 0.59, permuted p � 0.0001, 95% bootstrapped CI �0.48, 0.62), but far less so than our SD-based results (R 2 � 0.81)(Fig. 3b). Bootstrap results revealed a multivariate pattern (Fig.4b), including one area that increased (i.e., middle temporal gy-rus; shown in red) and several that decreased in mean activitywith age [e.g., superior parietal lobule, inferior temporal gyrus,inferior frontal gyrus (shown in blue); see supplemental Table 2(available at www.jneurosci.org as supplemental material) forMNI coordinates, bootstrap ratios, and cluster sizes for reliableclusters]. Of critical importance in Figure 4, a and b, is that themean- and SD-based patterns appear clearly distinct, which sug-gests that the two brain measures (mean and SD) revealed very
different brain effects with age. To better characterize differencesand similarities between these brain patterns, we computed over-lay plots using only robust bootstrapped voxels (Fig. 4c,d). Thisanalysis revealed remarkably different, virtually non-overlappingspatial patterns, despite the fact that mean- and SD-based mea-sures were each highly related to age.
To quantify the lack of spatial overlap on a whole-brain level,we computed the dot product of mean- and SD-based brain sa-liences across all voxels and subjects (not just those voxels thatsurpass a bootstrap threshold of 3.00 or more); we then com-puted a bootstrapped 95% confidence interval around this dotproduct value. The dot product is equivalent to the cosine anglebetween two unit length vectors. Since brain saliences are unitlength vectors by construction, the dot product can be taken as asimilarity measure between mean- and SD-based saliences, withvalues ranging from �1.00 to 1.00. We found very weak spatialoverlap (dot product � 0.11) between mean- and SD-based brainmeasures, with a bootstrap confidence interval that not onlyspanned zero, but remained weak at both ends (bootstrap CI ��0.25, 0.33). These results provide direct evidence that there isvery little topographical overlap between age-based mean- andSD-brain patterns, and whatever overall similarity does exist ishighly unreliable.
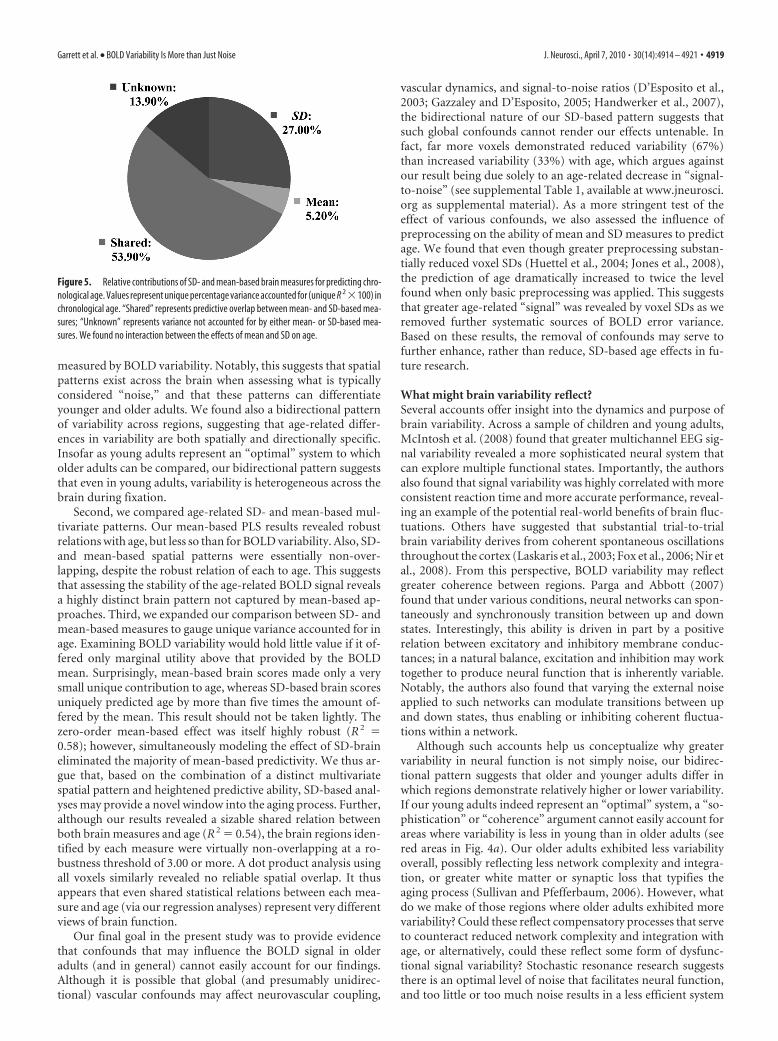
Which BOLD measure better predicts age?Any conclusions about the utility of SD-based approaches restpartially on the ability of variance measures to add new informa-tion about the brain beyond that learned from assessing meansignals. Above, we found that spatial patterns using these twomeasures were markedly different, and that relations with agewere stronger in our SD-based analyses. However, demonstratingthe relative ability of each measure to predict age will better char-acterize unique contributions to modeling age-related brain dif-ferences. To do so, we extracted “brain scores” from the SD andmean-based analyses; these scores represented each participant’sexpression of the multivariate spatial pattern identified by eachanalysis. We then used both sets of brain scores (mean- and SD-based) to predict age using hierarchical linear regression. Ourresults revealed a sizable shared effect across both measures (R2 �0.54). However, mean-based brain scores revealed only a verysmall unique contribution to age (Rchange
2 � 0.05), whereas theunique contribution of SD-based brain scores to age was 5.19times larger (Rchange
2 � 0.27) (Fig. 5). This suggests that our SD-based analysis yielded substantial predictive utility over andabove mean-based effects.
There is a possibility that differences in predictive utility be-tween means and SDs could reflect differences in measure reli-ability rather than validity (Schmiedek et al., 2009). To ascertainwhether differences in reliability were present, we compared dis-tributions of mean- and SD-based bootstrapped SEs for all voxels(total voxel count � 14,346; from our PLS analyses). We foundthat these distributions were virtually identical in both shape andcentral tendency (both with average SEs � �0.14). Thus, theadvantage in predictive power of our SD-based analysis is notattributable to differences in reliability between mean- and SD-brain measures.
Can we show that the SD-based measure is not undulyinfluenced by confounds that affect the BOLD signal?Aging is associated with several possible confounds in fMRI data,the most notable of which includes various alterations in neuro-vascular coupling and vascular dynamics. Such confounds mayyield a narrower dynamic range of BOLD signal responses, more
Figure 3. Zero-order relations between age and brain scores from SD- (a) and mean- (b)based analyses. We have deliberately used correlational analyses here, despite what appears tobe an extreme group design. In initial model runs, we ran SD- and mean-based analyses with adichotomous young/old variable, instead of a continuous measure of age. The use of dichoto-mous and continuous age variables yielded nearly identical results for each brain measure(within an R 2 of 1.00%). Thus, we elected to maintain the use of continuous age to allow bettervisualization of scatter around lines of best fit.
Garrett et al. • BOLD Variability Is More than Just Noise J. Neurosci., April 7, 2010 • 30(14):4914 – 4921 • 4917
or less variable BOLD responses, and decreased signal-to-noise(Huettel et al., 2001; D’Esposito et al., 2003; Gazzaley andD’Esposito, 2005; Andrews-Hanna et al., 2007; Handwerker etal., 2007). Even though these (and other) confounds may affectany fMRI study of aging and are not easily controlled (D’Espositoet al., 2003; Gazzaley and D’Esposito, 2005; Handwerker et al.,2007), we argue against the substantial influence of these con-founds on our variability-based results for two reasons. First,recent efforts to account for vascular confounds in fMRI researchon aging assume these effects are essentially global (and thusunidirectional) in nature (Handwerker et al., 2007). However,the largely bidirectional pattern of age differences in variabilityseen in Figure 4a suggests that any “global” or unidirectionalconfound cannot account easily for our results. Second, if we areat risk of having “junk noise” drive our SD-based age effects
(whatever the source), we should notice decreases in the ability ofthis measure to predict age with more extensive preprocessing.Importantly, we found that the opposite was true (see Table 1).After ICA denoising, white matter/CSF/motion parameter re-gression, and block normalization [which together reduced voxelSDs to 50% of the SD level found using more typical preprocess-ing steps (see Materials and Methods for a list of these steps)], theR 2 in age doubled, from 0.39 to 0.81. Conversely, mean-basedrelations were relatively unaffected by more extensive prepro-cessing (R 2 � �0.60 at most stages of preprocessing).
DiscussionIn the current study, we attempted to characterize how variabilityin BOLD activity differs by age. First, we confirmed the presenceof a robust age-related effect in a multivariate pattern of regions
Figure 4. PLS brain patterns and overlay plots. a, Yellow/red regions indicate robust age-related increases, and blue regions indicate age-related decreases, in BOLD SDs. b, Yellow/red regionsindicate robust age-related increases, and blue regions indicate age-related decreases, in BOLD means. In both a and b, all robust areas surpassed a thresholded bootstrap ratio (salience/SE) of�3.00 (for yellow/red regions) or ��3.00 (for blue regions). Darker colors indicate greater robustness. c, Overlay plot highlighting differences between age-based SD- and mean-brain spatialpatterns. Red, Mean increase, no SD effect; blue, mean decrease, no SD effect; green, SD increase, no mean effect; yellow, SD decrease, no mean effect. d, Overlay plot highlighting similaritiesbetween age-based SD- and mean-brain spatial patterns. Blue, mean and SD both decrease with age; green, mean decrease, SD increase. All images represent every other slice in z-direction.
4918 • J. Neurosci., April 7, 2010 • 30(14):4914 – 4921 Garrett et al. • BOLD Variability Is More than Just Noise
measured by BOLD variability. Notably, this suggests that spatialpatterns exist across the brain when assessing what is typicallyconsidered “noise,” and that these patterns can differentiateyounger and older adults. We found also a bidirectional patternof variability across regions, suggesting that age-related differ-ences in variability are both spatially and directionally specific.Insofar as young adults represent an “optimal” system to whicholder adults can be compared, our bidirectional pattern suggeststhat even in young adults, variability is heterogeneous across thebrain during fixation.
Second, we compared age-related SD- and mean-based mul-tivariate patterns. Our mean-based PLS results revealed robustrelations with age, but less so than for BOLD variability. Also, SD-and mean-based spatial patterns were essentially non-over-lapping, despite the robust relation of each to age. This suggeststhat assessing the stability of the age-related BOLD signal revealsa highly distinct brain pattern not captured by mean-based ap-proaches. Third, we expanded our comparison between SD- andmean-based measures to gauge unique variance accounted for inage. Examining BOLD variability would hold little value if it of-fered only marginal utility above that provided by the BOLDmean. Surprisingly, mean-based brain scores made only a verysmall unique contribution to age, whereas SD-based brain scoresuniquely predicted age by more than five times the amount of-fered by the mean. This result should not be taken lightly. Thezero-order mean-based effect was itself highly robust (R 2 �0.58); however, simultaneously modeling the effect of SD-braineliminated the majority of mean-based predictivity. We thus ar-gue that, based on the combination of a distinct multivariatespatial pattern and heightened predictive ability, SD-based anal-yses may provide a novel window into the aging process. Further,although our results revealed a sizable shared relation betweenboth brain measures and age (R 2 � 0.54), the brain regions iden-tified by each measure were virtually non-overlapping at a ro-bustness threshold of 3.00 or more. A dot product analysis usingall voxels similarly revealed no reliable spatial overlap. It thusappears that even shared statistical relations between each mea-sure and age (via our regression analyses) represent very differentviews of brain function.
Our final goal in the present study was to provide evidencethat confounds that may influence the BOLD signal in olderadults (and in general) cannot easily account for our findings.Although it is possible that global (and presumably unidirec-tional) vascular confounds may affect neurovascular coupling,
vascular dynamics, and signal-to-noise ratios (D’Esposito et al.,2003; Gazzaley and D’Esposito, 2005; Handwerker et al., 2007),the bidirectional nature of our SD-based pattern suggests thatsuch global confounds cannot render our effects untenable. Infact, far more voxels demonstrated reduced variability (67%)than increased variability (33%) with age, which argues againstour result being due solely to an age-related decrease in “signal-to-noise” (see supplemental Table 1, available at www.jneurosci.org as supplemental material). As a more stringent test of theeffect of various confounds, we also assessed the influence ofpreprocessing on the ability of mean and SD measures to predictage. We found that even though greater preprocessing substan-tially reduced voxel SDs (Huettel et al., 2004; Jones et al., 2008),the prediction of age dramatically increased to twice the levelfound when only basic preprocessing was applied. This suggeststhat greater age-related “signal” was revealed by voxel SDs as weremoved further systematic sources of BOLD error variance.Based on these results, the removal of confounds may serve tofurther enhance, rather than reduce, SD-based age effects in fu-ture research.
What might brain variability reflect?Several accounts offer insight into the dynamics and purpose ofbrain variability. Across a sample of children and young adults,McIntosh et al. (2008) found that greater multichannel EEG sig-nal variability revealed a more sophisticated neural system thatcan explore multiple functional states. Importantly, the authorsalso found that signal variability was highly correlated with moreconsistent reaction time and more accurate performance, reveal-ing an example of the potential real-world benefits of brain fluc-tuations. Others have suggested that substantial trial-to-trialbrain variability derives from coherent spontaneous oscillationsthroughout the cortex (Laskaris et al., 2003; Fox et al., 2006; Nir etal., 2008). From this perspective, BOLD variability may reflectgreater coherence between regions. Parga and Abbott (2007)found that under various conditions, neural networks can spon-taneously and synchronously transition between up and downstates. Interestingly, this ability is driven in part by a positiverelation between excitatory and inhibitory membrane conduc-tances; in a natural balance, excitation and inhibition may worktogether to produce neural function that is inherently variable.Notably, the authors also found that varying the external noiseapplied to such networks can modulate transitions between upand down states, thus enabling or inhibiting coherent fluctua-tions within a network.
Although such accounts help us conceptualize why greatervariability in neural function is not simply noise, our bidirec-tional pattern suggests that older and younger adults differ inwhich regions demonstrate relatively higher or lower variability.If our young adults indeed represent an “optimal” system, a “so-phistication” or “coherence” argument cannot easily account forareas where variability is less in young than in older adults (seered areas in Fig. 4a). Our older adults exhibited less variabilityoverall, possibly reflecting less network complexity and integra-tion, or greater white matter or synaptic loss that typifies theaging process (Sullivan and Pfefferbaum, 2006). However, whatdo we make of those regions where older adults exhibited morevariability? Could these reflect compensatory processes that serveto counteract reduced network complexity and integration withage, or alternatively, could these reflect some form of dysfunc-tional signal variability? Stochastic resonance research suggeststhere is an optimal level of noise that facilitates neural function,and too little or too much noise results in a less efficient system
Figure 5. Relative contributions of SD- and mean-based brain measures for predicting chro-nological age. Values represent unique percentage variance accounted for (unique R 2 �100) inchronological age. “Shared” represents predictive overlap between mean- and SD-based mea-sures; “Unknown” represents variance not accounted for by either mean- or SD-based mea-sures. We found no interaction between the effects of mean and SD on age.
Garrett et al. • BOLD Variability Is More than Just Noise J. Neurosci., April 7, 2010 • 30(14):4914 – 4921 • 4919
(Laurienti et al., 2006; Li et al., 2006; Parga and Abbott, 2007;Lugo et al., 2008; McDonnell and Abbott, 2009). Future workcould address precisely to what “optimal” refers in an agingcontext.
Relatedly, another interesting computational account reflectsexchanges between noise and neuronal output with age. Li et al.(2006) suggest that aging neurons produce less output per unit ofinput (so-called “gain”), and even the presence of ideal noiselevels (yielding the benefits of stochastic resonance on signal de-tection) is not enough to overcome this neural inefficiency. Themodel of Li et al. (2006) also demonstrates that younger neuronsrequire less noise to produce peak neural output, revealing amore efficient system. However, the authors used an externalnoise source to model the effects of SR with age. To the extent thatinternal noise sources may operate in a similar manner (i.e., pro-ducing the benefits of SR), their findings suggest that older neu-rons may benefit to some extent from internal variability, but notnearly to the same extent that young systems can. Should regionsthat show age-related increases in brain variability reflect a com-pensatory mechanism to counteract reduced neural efficiencywith age, this may represent systemic efforts to induce SR-typebenefits in the presence of neural inefficiency. Areas that showage-related decreases in BOLD SDs may then represent reduc-tions in optimal variability levels with age (Fig. 4a).
Finally, it may simply be that greater variability is requirednaturally in some neural regions for optimal function, but not inothers. Other researchers controlling for BOLD variability (as aconfound) revealed that some regions show greater variability,some regions show reduced variability, and other regions showno difference across age groups (Andrews-Hanna et al., 2007).Perhaps spatially distinct variability is itself a proxy for the func-tional substrate of an “optimal” system, and only when optimalvariability patterns are disrupted can age-related effects becomeevident.
ConclusionBOLD variability exhibits a spatially coherent pattern, highly dif-ferentiates from the BOLD mean, and robustly relates to age.Representing a more dynamic view of brain function, examiningBOLD variability is a novel approach that can be easily integratedinto any fMRI research design. Given our results, we find noreason to simply consider BOLD variability as “noise.” As Faisalet al. (2008) appropriately state, “. . . to understand the nervoussystem we have to distinguish variability from noise by account-ing for its sources and appreciate the way in which it influencesthe brain’s structure and function” (p. 300). Variance-basedmeasures may in fact reveal a host of novel brain-related effectsnot previously considered in fMRI research, while simulta-neously bridging to other research areas in which neural variabil-ity is expected and even functional (Stein et al., 2005; Faisal et al.,2008; McIntosh et al., 2008). Indeed, it seems that BOLD variabil-ity provides a new “signal” that deserves careful consideration.
ReferencesAguirre GK, Zarahn E, D’Esposito M (1998) The variability of human,
BOLD hemodynamic responses. Neuroimage 8:360 –369.Andrews-Hanna JR, Snyder AZ, Vincent JL, Lustig C, Head D, Raichle ME,
Buckner RL (2007) Disruption of large-scale brain systems in advancedaging. Neuron 56:924 –935.
Arieli A, Sterkin A, Grinvald A, Aertsen A (1996) Dynamics of ongoingactivity: explanation of the large variability in evoked cortical responses.Science 273:1868 –1871.
Beckmann CF, Smith SM (2004) Probabilistic independent componentanalysis for functional magnetic resonance imaging. IEEE Trans MedImaging 23:137–152.
Chen XJ, Kovacevic N, Lobaugh NJ, Sled JG, Henkelman RM, Henderson JT(2006) Neuroanatomical differences between mouse strains as shown byhigh-resolution 3D MRI. Neuroimage 29:99 –105.
D’Esposito M, Deouell LY, Gazzaley A (2003) Alterations in the BOLDfMRI signal with ageing and disease: a challenge for neuroimaging. NatRev Neurosci 4:863– 872.
Eickhoff SB, Stephan KE, Mohlberg H, Grefkes C, Fink GR, Amunts K, ZillesK (2005) A new SPM toolbox for combining probabilistic cytoarchitec-tonic maps and functional imaging data. Neuroimage 25:1325–1335.
Eickhoff SB, Paus T, Caspers S, Grosbras MH, Evans AC, Zilles K, Amunts K(2007) Assignment of functional activations to probabilistic cytoarchi-tectonic areas revisited. Neuroimage 36:511–521.
Ezekiel F, Chao L, Kornak J, Du AT, Cardenas V, Truran D, Jagust W, Chui H,Miller B, Yaffe K, Schuff N, Weiner M (2004) Comparisons betweenglobal and focal brain atrophy rates in normal aging and Alzheimer dis-ease: boundary shift integral versus tracing of the entorhinal cortex andhippocampus. Alzheimer Dis Assoc Disord 18:196 –201.
Faisal AA, Selen LP, Wolpert DM (2008) Noise in the nervous system. NatRev Neurosci 9:292–303.
Folstein MF, Folstein SE, McHugh PR (1975) “Mini-mental state.” A prac-tical method for grading the cognitive state of patients for the clinician.J Psychiatr Res 12:189 –198.
Fox MD, Snyder AZ, Zacks JM, Raichle ME (2006) Coherent spontaneousactivity accounts for trial-to-trial variability in human evoked brain re-sponses. Nat Neurosci 9:23–25.
Gazzaley A, D’Esposito M (2005) BOLD functional MRI and cognitive ag-ing. In: Cognitive neuroscience of aging (Cabeza R, Nyberg L, Park D,eds), pp 107–131. New York: Oxford UP.
Ghosh A, Rho Y, McIntosh AR, Kotter R, Jirsa VK (2008) Noise during restenables the exploration of the brain’s dynamic repertoire. PLoS ComputBiol 4:e1000196.
Grady CL, Protzner AB, Kovacevic N, Strother SC, Afshin-Pour B, WojtowiczMA, Anderson JAE, Churchill N, McIntosh AR (2010) A multivariateanalysis of age-related differences in default mode and task positive net-works across multiple cognitive domains. Cereb Cortex. Advance onlinepublication. doi:10.1093/cercor/bhp207.
Handwerker DA, Gazzaley A, Inglis BA, D’Esposito M (2007) Reducing vas-cular variability of fMRI data across aging populations using a breath-holding task. Hum Brain Mapp 28:846 – 859.
Huettel SA, Singerman JD, McCarthy G (2001) The effects of aging uponthe hemodynamic response measured by functional MRI. Neuroimage13:161–175.
Huettel SA, Song AW, McCarthy G (2004) Functional magnetic resonanceimaging. Sunderland, MA: Sinauer Associates.
Hultsch DF, Strauss E, Hunter MA, MacDonald SWS (2008) Intraindi-vidual variability, cognition, and aging. In: The handbook of aging andcognition, Ed 3 (Craik FIM, Salthouse TA, eds), pp 2491–2556. New York:Psychology.
Jones TB, Bandettini PA, Birn RM (2008) Integration of motion correctionand physiological noise regression in fMRI. Neuroimage 42:582–590.
Kovacevic N, Henderson JT, Chan E, Lifshitz N, Bishop J, Evans AC,Henkelman RM, Chen XJ (2005) A three-dimensional MRI atlas of themouse brain with estimates of the average and variability. Cereb Cortex15:639 – 645.
Lacadie CM, Fulbright RK, Rajeevan N, Constable RT, Papademetris X(2008) More accurate Talairach coordinates for neuroimaging usingnon-linear registration. Neuroimage 42:717–725.
Laskaris NA, Liu LC, Ioannides AA (2003) Single-trial variability in earlyvisual neuromagnetic responses: an explorative study based on the re-gional activation contributing to the N70m peak. Neuroimage20:765–783.
Laurienti PJ, Burdette JH, Maldjian JA, Wallace MT (2006) Enhanced mul-tisensory integration in older adults. Neurobiol Aging 27:1155–1163.
Levine B, Kovacevic N, Nica EI, Cheung G, Gao F, Schwartz ML, Black SE(2008) The Toronto traumatic brain injury study: injury severity andquantified MRI. Neurology 70:771–778.
Li S-C, Van Oertzen T, Lindenberger U (2006) A neurocomputationalmodel of stochastic resonance and aging. Neurocomputing 69:1553–1560.
Lugo E, Doti R, Faubert J (2008) Ubiquitous crossmodal stochastic reso-nance in humans: auditory noise facilitates tactile, visual and propriocep-tive sensations. PLoS ONE 3:e2860.
4920 • J. Neurosci., April 7, 2010 • 30(14):4914 – 4921 Garrett et al. • BOLD Variability Is More than Just Noise

MacDonald SWS, Nyberg L, Backman L (2006) Intra-individual variabilityin behavior: links to brain structure, neurotransmission and neuronalactivity. Trends Neurosci 29:474 – 480.
MacDonald SWS, Li S-C, Backman L (2009) Neural underpinnings of within-person variability in cognitive functioning. Psychol Aging 24:792–808.
Mai JK, Paxinos G, Voss T (2008) Atlas of the human brain, Ed 3. New York:Elsevier.
McDonnell MD, Abbott D (2009) What is stochastic resonance? Defini-tions, misconceptions, debates, and its relevance to biology. PLoS Com-put Biol 5:e1000348.
McIntosh AR, Bookstein FL, Haxby JV, Grady CL (1996) Spatial patternanalysis of functional brain images using partial least squares. Neuroim-age 3:143–157.
McIntosh AR, Kovacevic N, Itier RJ (2008) Increased brain signal variabilityaccompanies lower behavioral variability in development. PLoS ComputBiol 4:e1000106.
Miller MB, Van Horn JD, Wolford GL, Handy TC, Valsangkar-Smyth M,Inati S, Grafton S, Gazzaniga MS (2002) Extensive individual differ-ences in brain activations associated with episodic retrieval are reliableover time. J Cogn Neurosci 14:1200 –1214.
Neumann J, Lohmann G, Zysset S, von Cramon DY (2003) Within-subjectvariability of BOLD response dynamics. Neuroimage 19:784 –796.
Nir Y, Mukamel R, Dinstein I, Privman E, Harel M, Fisch L, Gelbard-Sagiv H,Kipervasser S, Andelman F, Neufeld MY, Kramer U, Arieli A, Fried I,Malach R (2008) Interhemispheric correlations of slow spontaneousneuronal fluctuations revealed in human sensory cortex. Nat Neurosci11:1100 –1108.
Parga N, Abbott LF (2007) Network model of spontaneous activity exhibitingsynchronous transitions between up and down states. Front Neurosci1:57–66.
Schmiedek F, Lovden M, Lindenberger U (2009) On the relation of meanreaction time and intraindividual reaction time variability. Psychol Aging24:841– 857.
Smith SM, Beckmann CF, Ramnani N, Woolrich MW, Bannister PR, JenkinsonM, Matthews PM, McGonigle DJ (2005) Variability in fMRI: a re-examination of inter-session differences. Hum Brain Mapp 24:248–257.
Stein RB, Gossen ER, Jones KE (2005) Neuronal variability: noise or part ofthe signal? Nat Rev Neurosci 6:389 –397.
Sullivan EV, Pfefferbaum A (2006) Diffusion tensor imaging and aging.Neurosci Biobehav Rev 30:749 –761.
Garrett et al. • BOLD Variability Is More than Just Noise J. Neurosci., April 7, 2010 • 30(14):4914 – 4921 • 4921