
Iris liveness detection methods in Mobile Applications
12
Iris liveness detection methods in Mobile Applications Ana F. Sequeira 1,2 , Juliano Murari 3 and Jaime S. Cardoso 1,2 1 INESC TEC (formerly INESC Porto), Porto, Portugal 2 Faculdade de Engenharia, Universidade doPorto, Porto, Portugal 3 Universidade Federal de S. Paulo, S˜ ao Paulo, Brazil {ana.filipa.sequeira, jaime.cardoso}@fe.up.pt, juliano.murari@[email protected] Keywords: Biometrics, Iris, Liveness Detection, Fake Database, Handheld Device Abstract: Biometric systems are vulnerable to different kinds of attacks. Particularly, the systems based on iris are vul- nerable to direct attacks consisting on the presentation of a fake iris to the sensor trying to access the system as it was from a legitimate user. The analysis of some countermeasures against this type of attacking scheme is the problem addressed in the present paper. Several state-of-the-art methods were implemented and included in a feature selection framework so as to determine the best cardinality and the best subset that conducts to the highest classification rate. Three different classifiers were used: Discriminant analysis, K nearest neighbours and Support Vector Machines. The implemented methods were tested in existing databases for iris liveness purposes (Biosec and Clarkson) and in a new fake database which was constructed for evaluation of iris live- ness detection methods in the mobile scenario. The results suggest that this new database is more challenging than the others. Therefore, improvements are required in this line of research to achieve good performance in real world mobile applications. 1 INTRODUCTION Biometric systems can offer several advantages over classical security methods as they rather identify an individual by what he is instead of based on some- thing he knows or possesses. However, in spite of its advantages, biometric systems have some draw- backs, including: i) the lack of secrecy (e.g. every- body knows our face or could get our fingerprints), and ii) the fact that a biometric trait cannot be replaced (no new iris can be generated if an impostor “steals” it). Furthermore, biometric systems are vulnerable to external attacks which could decrease their level of security. Concerning these vulnerabilities we find in the literature (Galbally et al., 2007) an analysis of the eight different points of attack on biometric recogni- tion systems previously identified (Ratha et al., 2001). These points are illustrated in Fig. 1. These attacks are divided into two main groups: direct and indirect attacks. • Direct attacks: the first vulnerability point in a biometric security system is the possibility to gen- erate synthetic biometric samples (for instance, speech, fingerprints or face images) in order to fraudulently access a system. These attacks at Figure 1: Architecture of an automated biometric verifica- tion system. Possible attack points are numbered from 1 to 8, from (Galbally et al., 2007) the sensor level are referred to as direct attacks. It is worth noting that in this type of attacks no specific knowledge about the system operation is needed (matching algorithm used, feature extrac- tion, feature vector format, etc). Furthermore, the attack is carried out in the analogue domain, out- side the digital limits of the system, so the digital protection mechanisms (digital signature, water- marking, etc.) can not be used. • Indirect attacks: this group includes all the re- maining seven points of attack. Attacks 3 and 5 might be carried out using a Trojan Horse that bypasses the feature extractor, and the matcher respectively. In attack 6 the system database is manipulated (a template is changed, added or deleted) in order to gain access to the applica-
Transcript of Iris liveness detection methods in Mobile Applications

Iris liveness detection methods in Mobile Applications
Ana F. Sequeira1,2, Juliano Murari3 and Jaime S. Cardoso1,2
1INESC TEC (formerly INESC Porto), Porto, Portugal2Faculdade de Engenharia, Universidade do Porto, Porto, Portugal
3Universidade Federal de S. Paulo, Sao Paulo, Brazil{ana.filipa.sequeira, jaime.cardoso}@fe.up.pt, juliano.murari@[email protected]
Keywords: Biometrics, Iris, Liveness Detection, Fake Database, Handheld Device
Abstract: Biometric systems are vulnerable to different kinds of attacks. Particularly, the systems based on iris are vul-nerable to direct attacks consisting on the presentation of a fake iris to the sensor trying to access the system asit was from a legitimate user. The analysis of some countermeasures against this type of attacking scheme isthe problem addressed in the present paper. Several state-of-the-art methods were implemented and includedin a feature selection framework so as to determine the best cardinality and the best subset that conducts to thehighest classification rate. Three different classifiers were used: Discriminant analysis, K nearest neighboursand Support Vector Machines. The implemented methods were tested in existing databases for iris livenesspurposes (Biosec and Clarkson) and in a new fake database which was constructed for evaluation of iris live-ness detection methods in the mobile scenario. The results suggest that this new database is more challengingthan the others. Therefore, improvements are required in this line of research to achieve good performance inreal world mobile applications.
1 INTRODUCTION
Biometric systems can offer several advantages overclassical security methods as they rather identify anindividual by what he is instead of based on some-thing he knows or possesses. However, in spite ofits advantages, biometric systems have some draw-backs, including: i) the lack of secrecy (e.g. every-body knows our face or could get our fingerprints),and ii) the fact that a biometric trait cannot be replaced(no new iris can be generated if an impostor “steals”it). Furthermore, biometric systems are vulnerable toexternal attacks which could decrease their level ofsecurity. Concerning these vulnerabilities we find inthe literature (Galbally et al., 2007) an analysis of theeight different points of attack on biometric recogni-tion systems previously identified (Ratha et al., 2001).These points are illustrated in Fig. 1.
These attacks are divided into two main groups:direct and indirect attacks.
• Direct attacks: the first vulnerability point in abiometric security system is the possibility to gen-erate synthetic biometric samples (for instance,speech, fingerprints or face images) in order tofraudulently access a system. These attacks at
Figure 1: Architecture of an automated biometric verifica-tion system. Possible attack points are numbered from 1 to8, from (Galbally et al., 2007)
the sensor level are referred to as direct attacks.It is worth noting that in this type of attacks nospecific knowledge about the system operation isneeded (matching algorithm used, feature extrac-tion, feature vector format, etc). Furthermore, theattack is carried out in the analogue domain, out-side the digital limits of the system, so the digitalprotection mechanisms (digital signature, water-marking, etc.) can not be used.
• Indirect attacks: this group includes all the re-maining seven points of attack. Attacks 3 and 5might be carried out using a Trojan Horse thatbypasses the feature extractor, and the matcherrespectively. In attack 6 the system databaseis manipulated (a template is changed, added ordeleted) in order to gain access to the applica-

tion. The remaining points of attack (2, 4, 7 and 8)are thought to exploit possible weak points in thecommunication channels of the system, extract-ing, adding or changing information from them.In opposition to direct attacks, in this case the in-truder needs to have some information about theinner working of the recognition system and, inmost cases, physical access to some of the ap-plication components (feature extractor, matcher,database, etc.) is required.
Among the different existing biometric traits, irishas been traditionally regarded as one of the most re-liable and accurate. This fact has led researchers topay special attention to its vulnerabilities and in par-ticular to analyze to what extent their security levelmay be compromised by spoofing attacks. These at-tacks may consist on presenting a synthetically gen-erated iris to the sensor so that it is recognized as thelegitimate user and access is granted. The most com-mon and simple approaches are those carried out withhigh quality iris printed images (Ruiz-Albacete et al.,2008). However, other more sophisticated threatshave also been reported in the literature such as theuse of contact lenses (Wei et al., 2008).
The development of iris liveness detection tech-niques is crucial for the deployment of iris biometricapplications in daily life. The evolution in the useof mobile devices in our society also raises the urgefor liveness solutions in the mobile biometric field.To pursue this goal there is also a need for suitabledatabases in which new methods can be tested.
In this work we implemented state-of-the-artmethods conceived to deal with spoofing attacks iniris recognition, in particular, the use of printed im-ages and contact lenses. The proposed method com-prises a feature selection method, in order to deter-mine the best cardinalities and respective subset offeatures, with the use of state-of-the-art classifiers.This framework intended to achieve the best classifi-cation rates with only the “necessary” number of fea-tures Two existing databases were tested, one com-prising samples of printed iris images and anothercomprising images of eyes with contact lenses. Tak-ing in account the results obtained and the character-istics of the databases available and the new trend ofperforming biometric recognition in mobile scenar-ios, we constructed a new fake iris database. Thisdatabase comprises printed copies of the original im-ages (after being printed, the images were acquiredwith the same device and in similar conditions as theoriginal ones). We found this new database to be morechallenging than the others.
This paper is organized as follows. In section 2the concept of liveness detection in an iris recogni-
tion system is presented. In section 3, we explainthe algorithms implemented. In section 4 is presentedthe database constructed with fake printed images fortesting liveness detection methods in iris recognition.In section 5, the dataset of images is presented in 5.1,the methodology used is presented in 5.2 and the re-sults and their discussion are presented in 5.3. Finally,in section 6 we draw some conclusions and sketchsome ideas for future works.
2 IRIS LIVENESS DETECTION
The problem of liveness detection of a biometrictrait can be seen as a two class classification problemwhere an input trait sample has to be assigned to oneof two classes: real or fake. The key point of the pro-cess is to find a set of discriminant features which per-mits to build an appropriate classifier which gives theprobability of the sample vitality given the extractedset of features (Galbally et al., 2012b).
Biometric recognition systems are vulnerable tobe spoofed by fake copies (Daugman, 2004), for in-stance, fake finger tips made of commonly availablematerials such as clay and gelatine. Iris is no excep-tion. There are potential threats for iris-based sys-tems, the main are (He et al., 2009):
• Eye image: Screen image, Photograph, Paperprint, Video signal.
• Artificial eye: Glass/plastic etc.
• Natural eye (user): Forced use.
• Capture/replay attacks: Eye image, IrisCode tem-plate.
• Natural eye (impostor): Eye removed from body,Printed contact lens.
The feasibility of some attacks have been reportedby some researchers (Daugman, 1998; Daugman,2004; Lee et al., 2005) who showed that it is actuallypossible to spoof some iris recognition systems withprinted iris and well-made colour iris lens. Therefore,it is important to detect the fake iris as much as possi-ble (He et al., 2009).
Several liveness detection methods have been pre-sented through the past recent years. In fact, anti-spoofing techniques were presented that use physio-logical properties to distinguish between real and fakebiometric traits. This is done in order to improve therobustness of the system against direct attacks and toincrease the security level offered to the final user. Irisliveness detection approaches can broadly be dividedinto: i)software-based techniques, in which the fakeirises are detected once the sample has been acquired

with a standard sensor (i.e., features used to distin-guish between real and fake eyes are extracted fromthe iris image, and not from the eye itself), and ii)hardware-based techniques, in which some specificdevice is added to the sensor in order to detect partic-ular properties of a living iris such as the eye hippus(which is the permanent oscillation that the eye pupilpresents even under uniform lighting conditions) orthe pupil response to a sudden lighting event (e.g.,switching on a diode) (Galbally et al., 2012b). Ac-cording to this author, even though hardware-basedapproaches usually present a higher detection rate, thesoftware-based techniques have the advantage of be-ing less expensive (as no extra device in needed), andless intrusive for the user (very important character-istic for a practical liveness detection solution). Ingeneral, a combination of both type of anti-spoofingschemes would be the most desirable approach to in-crease the security level of biometric systems. (Gal-bally et al., 2012b)
In this work we focus on software based tech-niques since these are more easily and affordable ap-plicable in real-world applications.
In the literature we found that the methods of live-ness detection may be classified into four categoriesbased on the physical features of biometric and live-ness data and the timing of measurement (Une andTamura, 2006). In this framework, the biometric dataare used in the iris recognition and the liveness dataare used in the liveness detection. We can itemize thefour categories:
• Perfect matching model: Both biometric and live-ness data are simultaneously obtained from thesame physical feature.
• Simultaneous measuring model: Biometric andliveness data are simultaneously obtained fromdifferent physical features.
• Same biometric measuring model: Biometric andliveness data are obtained from the same physicalfeature with different timings.
• Independent measuring model: Biometric andliveness data are obtained from different featureswith different timings.
The ideal configuration of liveness detection for bio-metrics recognition is represented by the perfectmatching model with the highest ability to distinguishbetween live and fake irises (Kanematsu et al., 2007).
The potential of quality assessment to identify realand fake iris samples acquired from a high qualityprinted image has previously been explored as a wayto detect spoofing attacks (Galbally et al., 2012b).Some quality based features have been used individu-ally for liveness detection in traits such as iris (Kane-
matsu et al., 2007; Wei et al., 2008) or face (Li et al.,2004). A strategy based on the combination of sev-eral quality related features has also been used forspoofing detection in fingerprint based recognitionsystems (Galbally et al., 2012a) as well as in iris live-ness detection (Galbally et al., 2012b). In this latterwork, a set of quality measures are used as iris live-ness detection features to aid the classification of fakeor real iris images included in a framework of featureselection. We find in literature that works concerningthe quality of iris images are often the starting point toiris liveness detection techniques. One example is theassessment of the iris image quality based on mea-sures like occlusion, contrast, focus and angular de-formation (Abhyankar and Schuckers, 2009), other isthe use of texture analysis of the iris (He et al., 2007),among others like, for example, the analysis of fre-quency distribution rates of some specific regions ofiris (Ma et al., 2003).
The way forward seems to be the development oftechniques for iris liveness detection that work wellindependently of the particular characteristics of thedatabases available nowadays. It is required to de-velop and improve methods as well as to constructnew databases in less constrained conditions.
3 IMPLEMENTED METHODS
Some of the measures are obtained from the entireeye image but others are extracted only from the irisregion, therefore a segmentation step is required. Wechoose to make the segmentation process manually, inorder to ensure reasonable accuracy. The manual seg-mentation is done by marking three differents pointsin the image. The first point is the eye centre, i.e., weconsider a single centre for both pupil and iris. Thesecond point is marked in the pupil border and thethird in the iris border. With these points is possibleto determine the iris and pupil radius and then approx-imate the contours as two concentric circles. Withthe manual segmentation’s information we are able tomap the regions of interest which will be eventuallyused by the liveness detection algorithms.
3.1 Algorithm 1 - High FrequencyPower
The High Frequency Power algorithm, which pro-vides feature 1, works on the whole image and mea-sures the energy concentration in the high frequencycomponents of the spectrum using a high pass con-volution kernel of 8x8. The application of this con-volution is a good Fourier Transform approximation

and works as high frequency spectral analysis, whichcan be considered an estimator of focus (Daugman,2002). The focus of a real iris, as it is a 3D volume,is different from a fake iris focus, which has a 2D sur-face. For more details on the method see (Galballyet al., 2012b).
3.2 Algorithm 2 - Local Contrast
The Local Contrast algorithm, which provides fea-ture 2, is based on bounding box that involves theiris and the pupil. The bounding box is divided inblocks of P×P and for each block it is applied theFast Fourier Transform (FFT) algorithm to extract themedium power frequencies, which better representsthe contrast. The final value is given by the num-ber of blocks with medium values (between 20 and60) divided by the total number of blocks. This al-gorithm was inspired in an occlusion estimation tech-nique (Abhyankar and Schuckers, 2009) and it wasadapted for contrast estimation for iris liveness detec-tion in (Galbally et al., 2012b) where more details canbe found.
3.3 Algorithm 3 - Global Contrast
The Global Contrast algorithm, which provides fea-ture 3, explores the fact that parts extremely bright ordark of the image are not useful and can be consid-ered as noise. Thus, pixels near medium value (128in 8-bit image) are considered of best contrast (Ab-hyankar and Schuckers, 2009). In order to quantifythe contrast, the original pixels values are normalizedbetween 0 and 25 (Figure 2). Original pixels nearmedium value will get higher values in the normalizedscale, as well as very low and very high values (< 10and > 245) are normalized to 0. This measure waspresented in (Abhyankar and Schuckers, 2009) andit was adapted for global contrast estimation for irisliveness detection in (Galbally et al., 2012b) wheremore details can be found.
Figure 2: Normalization function of the algorithm 3.
3.4 Algorithm 4 - FrequencyDistribution Rates
The Frequency Distribution Rates algorithm consistsin different mathematical combinations of three dif-ferent parameters which consider respectively thepower of the low (F1), medium (F2), and high (F3)frequencies (computed according to the 2D FourierSpectrum) from two iris subregions in the horizontaldirection. This subregions are illustrated in Figure 3.Each subregion is subdivided in three circular concen-tric region, which determine the three different fre-quencies, i.e, for the first subregion, F1
1 refers to thecentral circle, F1
2 refers to the middle circular ring andF1
3 refers to the outer circular ring, as depicted in Fig-ure 4. The final F1 is given by the average between the
two regions: F1 =F1
1 +F21
2 . The same is done to F2 andF3. More details on the method can be found in (Maet al., 2003; Galbally et al., 2012b).
Figure 3: Example of the subregions used in the algorithm4 (Galbally et al., 2012b).
Figure 4: One of the regions of interest subdivided to cal-culate the frequencies (Galbally et al., 2012b).
With the three final frequencies we extract sevendifferent combinations, represented in Table 1 (Maet al., 2003; Galbally et al., 2012b).
3.5 Algorithm 5 - Statistical TextureAnalysis
The Statistical Texture Analysis algorithm was devel-oped as a contact lens countermeasure. The outer por-

Table 1: Extracted measures from the final frequencies.
Features no. Combination4 F1 +F2 +F35 F2/(F1 +F3)6 F37 F28 F19 (F1 +F2)/F3
10 (F1 ∗F2)/F3
tion of the colour contact lens (corresponding to re-gions closer to outer circle) provides the most usefultexture information for fake iris detection since thissection of the fake iris is insensitive to the pupil di-lation (He et al., 2007). The region of interest is thelower part of the iris in order to minimize the occlu-sion by the eyelashes and eyelids, which in generaloccurs in the upper iris portion. In order to achieveinvariance to translation and scale, the region of inter-est is further normalized to a rectangular block of afixed size W ×H (Figure 5).
(a) Original (b) Normalized
Figure 5: Region of interest used in the algoritm 5 (He et al.,2007).
After the normalization, the GLCM (Gray LevelCo-occurence Matrix), one of the most proeminentapproaches used to extract textural features (Haral-ick et al., 1973), is calculated. Four measures areextracted: the mean (µ) and standard deviation (σ),direct from the normalized region of interest, and thecontrast (con) and the energy (e) from the GLCM ma-trix. These measures will provide features 11 to 14and its values are given, respectively, by the equationsbelow:
µ =1
W ∗H
H
∑i=1
W
∑j=1
I(i, j) (1)
σ =
√√√√ 1W ∗H
H
∑i=1
W
∑j=1
(I(i, j)−µ)2 (2)
con =N
∑i=1
N
∑j=1
(i− j)2P(i, j) (3)
e =N
∑i=1
N
∑j=1
P(i, j)2 (4)
Where I denotes the normalized iris image, Wis the width of the normalized iris image, H is theheight of the normalized iris image. P is the co-occurrence matrix and N denotes the dimension of theco-occurrence matrix. For more details on the methodsee (He et al., 2007).
3.6 Feature Selection
The algorithms implemented originated 14 differentfeatures. Due to this dimensionality it is possible thatthe best classification results are not obtained using allthe features, but a subset of them. It is convenient tosearch for the optimum number and set of features.To exhaustively test all possibilities is not feasible.Therefore we use the “Sequential Forward FloatingSelection” (SFFS) (Pudil et al., 1994) to perform fea-ture selection. The SFFS is basically a combinationof search methods such as “Plus-l-Minus-r” (Stearns,1976) and Sequential Forward Search (SFS) (Whit-ney, 1971). The appearance of “floating” comes fromthe fact that the values l and r are not fixed, i.e., theycan “float”. Another aspect is the dominant directionof search, including (forward) or excluding (back-ward) characteristics (Pudil et al., 1994). We usethe Mahalanobis distance as criterion function. TheSFFS has shown to be competitive when compared toother selection techniques (Jain and Zongker, 1997).
3.7 Classification
The classification results were obtained using threeclassification methods: Discriminant Analysis (DA),k-Nearest Neighbour (kNN) and Support Vector Ma-chine (SVM).
4 MobBIOfake: IRIS IMAGESCAPTURED WITH AHANDHELD DEVICE
The MobBIOfake database was constructed upon theMobBIO Multimodal Database (Blind Ref, 2013).The MobBIO Multimodal Database comprises thebiometric data from 105 volunteers. Each individ-ual provided samples of face, iris and voice. Theequipment used for the samples acquisition was anAsus Transformer Pad TF 300T, with Android ver-sion 4.1.1. The device has two cameras, one frontaland one back camera. The camera used was the backcamera, version TF300T-000128, with 8 MP of reso-lution and autofocus.

The iris images were captured in two differentlighting conditions, in a room with both natural andartificial sources of light, with variable eye orienta-tions and occlusion levels, so as to comprise a largervariability of unconstrained scenarios. Each volun-teer contributed with 16 images (8 of each eye) with a300× 200 resolution. Some examples of iris imagesare depicted in Figure 6.
(a) (b) (c) (d)
(e) (f) (g) (h)Figure 6: Iris images from MobBIO database illustratingdifferent kinds of noise: a) Heavily occluded; b) Heavilypigmented; c) Glasses reflection; d) Glasses occlusion; e)Off-angle; f) Partial eye; g) Reflection occlusion and h)Normal.
MobBIOfake
The MobBIOfake is composed by a subset of 800iris images from MobBIO and its corresponding fakecopies, in a total of 1600 iris images. The fake sam-ples were obtained from printed images of the originalones captured with the same handheld device and insimilar conditions. From the original dataset of im-ages
The aim of constructing such a database is, on onehand, to fulfil the necessity of databases and, on theother hand to broad the acquisition conditions of theimages. The number and variety of databases for irisliveness detection is somewhat limited so the fact thatthese images were captured with a portable device andare RGB images come as a novelty and makes it possi-ble to evaluate liveness methods in this new upcomingscenario.
The construction of the MobBIOfake upon theMobBIO iris images subset comprised several steps.The images of each volunteer were joined in a singleimage, as shown in Figure 7.
A preprocessing (contrast enhancement) was ap-plied using GIMP software (GIMP, 2008) to the im-age. This enhancement is believed to improve thequality of the fake sample (Ruiz-Albacete et al.,2008). After this, the images were printed in a profes-sional printer using high quality photographic paper.At this point we were able to capture the images. Each
Figure 7: MobBIOfake construction: joint images of onevolunteer.
individual image (a image of one single eye) was ac-quired using the same portable device and in similarlighting conditions as the original ones were captured,as illustrated in Figure 8.
Figure 8: MobBIOfake construction: fake samples acquisi-tion.
Finally, the individual eye images were croppedand resized to fix dimensions. An example of a realimage and its copy is depicted in Figure 9.
(a) Real image (b) Fake imageFigure 9: Corresponding real and fake images of MobBIO.

5 EXPERIMENTAL SETUP
5.1 Datasets
The implemented methods were tested in threedatasets. One was a database constructed within ourwork, the MobBIOfake, comprised of 800 iris imagesand its corresponding fake copies, captured with thesame portable device and in similar conditions as theoriginal ones. The description of the construction ofthis dataset was detailed in section 4.
The other two databases, described below, are theBiosec database (Fierrez et al., 2007), composed byreal iris images and the corresponding fake printedimages; and the Clarkson database (S. Schuckers andYambay, 2013) comprising real iris images and fakeones obtained by the use of contact lenses.
Biosec
The Biosec database was created at the Polytech-nic University of Madrid (UPM) and the UniversitatPolitecnica de Catalunya (UPC). The images were ac-quired in an office room with a large table for hard-ware of biometric recognition system and two chairs,one for the donor and one for the supervisor of the ac-quisition process. Environmental conditions such aslighting and noise, were not controlled to simulate areal situation (Fierrez et al., 2007). To construct thefalse database original images are pre-processed andprinted on paper using a commercial printer. Then theprinted images were presented to the iris sensor, ob-taining the fake copy. This study considered differentcombinations of pre-processing, printing equipmentand paper type (Ruiz-Albacete et al., 2008). There-fore, the database used consists of real and fake irisimages and follows the same structure as the originaldatabase. Biosec dataset comprises a total of 1600images: 800 real images and its corresponding 800fake samples. All images are in greyscale and its di-mensions are 640×480 (Galbally et al., 2012b). Thetwo eyes of the same individual are considered as dif-ferent users. The acquisition of both real and fakesamples were made using the sensor LG IrisAccessEOU3000 (Ruiz-Albacete et al., 2008).
Clarkson
The subset of Clarkson database that we used wasmade available under request and contains 270 realiris images and 400 fake iris images. The fake sam-ples are images of eyes with contact lenses compris-ing 14 models of contact lenses. There are two differ-
ent lighting conditions in the database, which was ac-quired by video (capturing 100 frames and with vari-ation of focus). The Clarkson database was madeavailable to participants of the LivDet-2013 compe-tition (S. Schuckers and Yambay, 2013) .
5.2 Methodology
The proposed method is depicted in Figure 10.
Figure 10: Steps of the proposed method
The first step of the method is the segmentation, inthis case it was made manually so as to purge our re-sults from the errors associated with automatic meth-ods of iris segmentation. Although it has to be notedthat in a real world application this step needs to benecessarily automatized.
The second step was the feature extraction. Thiscomprises the application of the methods described insubsections 3.1, 3.2, 3.3, 3.4 and 3.5.
Next step was the feature selection. This com-prises the application of the method Sequential For-ward Floating Search, described in subsection 3, be-fore applying the classifiers to evaluate the proposedmethods. We ran the SFFS to obtain the best subsetfor each cardinality from ℵ = 2 to ℵ = 12 features.This range is defined by the selection method whenconsidering a set amount of 14 features.
The last step was the classification. We usedthree state-of-the-art classifiers: Discriminant Anal-ysis (DA), k-Nearest Neighbours (kNN) and Sup-port Vector Machines (SVM). For each cardinality,(ℵ = 2, ...,12), the results of classification were ob-tained calculating the average of the results of 50 runsfor classification of the images based on the corre-sponding best ℵ features. The results were obtainedby randomly dividing, in each run, the 1600 samplesin two sets: 1000 samples for training and 600 fortesting. The parameter k in kNN was optimized usingcross-validation, and tested in the interval [1,20] bysteps of 1. For the SVM, we used a polynomial ker-nel and also used cross-validation for optimization ofthe parameters. It was performing a ”grid-search” onthe parameters of the models. Exponentially growing
sequences of C were tested: C = 2N with N varyingbetween −1 and 15. For the polynomial degree, d,values tested were: d = 1,2,3,4,5.
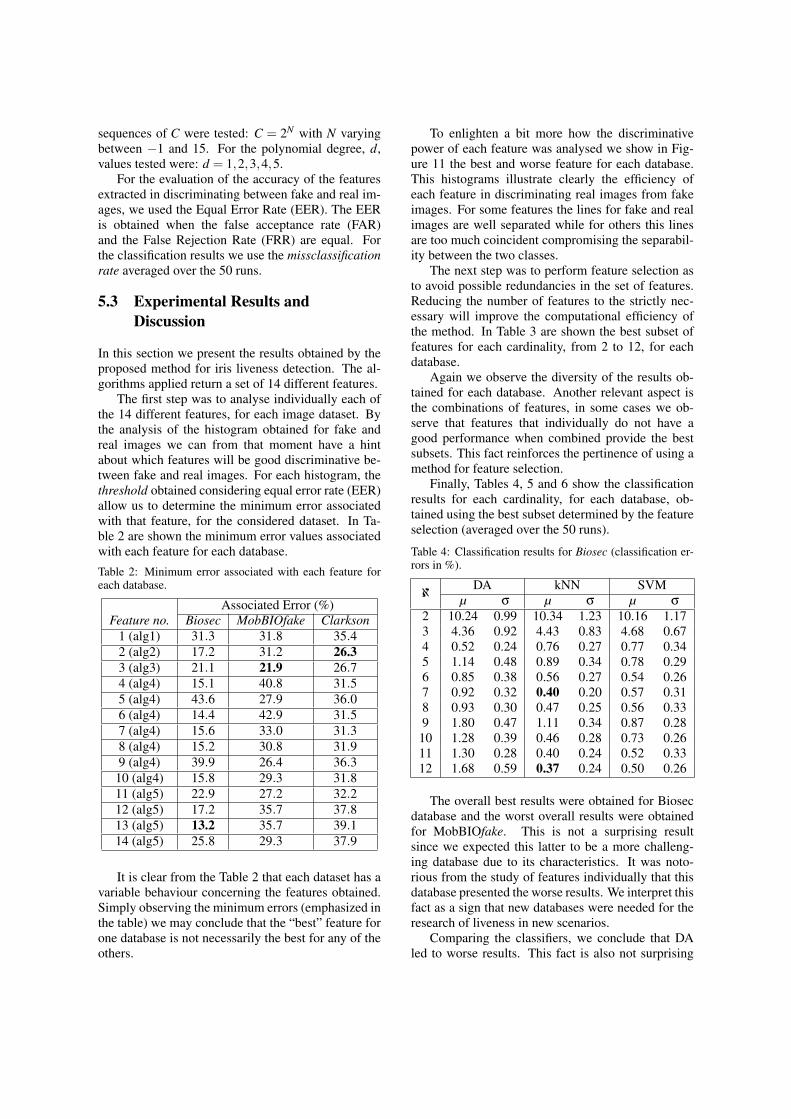
For the evaluation of the accuracy of the featuresextracted in discriminating between fake and real im-ages, we used the Equal Error Rate (EER). The EERis obtained when the false acceptance rate (FAR)and the False Rejection Rate (FRR) are equal. Forthe classification results we use the missclassificationrate averaged over the 50 runs.
5.3 Experimental Results andDiscussion
In this section we present the results obtained by theproposed method for iris liveness detection. The al-gorithms applied return a set of 14 different features.
The first step was to analyse individually each ofthe 14 different features, for each image dataset. Bythe analysis of the histogram obtained for fake andreal images we can from that moment have a hintabout which features will be good discriminative be-tween fake and real images. For each histogram, thethreshold obtained considering equal error rate (EER)allow us to determine the minimum error associatedwith that feature, for the considered dataset. In Ta-ble 2 are shown the minimum error values associatedwith each feature for each database.
Table 2: Minimum error associated with each feature foreach database.
Associated Error (%)Feature no. Biosec MobBIOfake Clarkson
1 (alg1) 31.3 31.8 35.42 (alg2) 17.2 31.2 26.33 (alg3) 21.1 21.9 26.74 (alg4) 15.1 40.8 31.55 (alg4) 43.6 27.9 36.06 (alg4) 14.4 42.9 31.57 (alg4) 15.6 33.0 31.38 (alg4) 15.2 30.8 31.99 (alg4) 39.9 26.4 36.310 (alg4) 15.8 29.3 31.811 (alg5) 22.9 27.2 32.212 (alg5) 17.2 35.7 37.813 (alg5) 13.2 35.7 39.114 (alg5) 25.8 29.3 37.9
It is clear from the Table 2 that each dataset has avariable behaviour concerning the features obtained.Simply observing the minimum errors (emphasized inthe table) we may conclude that the “best” feature forone database is not necessarily the best for any of theothers.
To enlighten a bit more how the discriminativepower of each feature was analysed we show in Fig-ure 11 the best and worse feature for each database.This histograms illustrate clearly the efficiency ofeach feature in discriminating real images from fakeimages. For some features the lines for fake and realimages are well separated while for others this linesare too much coincident compromising the separabil-ity between the two classes.
The next step was to perform feature selection asto avoid possible redundancies in the set of features.Reducing the number of features to the strictly nec-essary will improve the computational efficiency ofthe method. In Table 3 are shown the best subset offeatures for each cardinality, from 2 to 12, for eachdatabase.
Again we observe the diversity of the results ob-tained for each database. Another relevant aspect isthe combinations of features, in some cases we ob-serve that features that individually do not have agood performance when combined provide the bestsubsets. This fact reinforces the pertinence of using amethod for feature selection.
Finally, Tables 4, 5 and 6 show the classificationresults for each cardinality, for each database, ob-tained using the best subset determined by the featureselection (averaged over the 50 runs).
Table 4: Classification results for Biosec (classification er-rors in %).
ℵDA kNN SVM
µ σ µ σ µ σ
2 10.24 0.99 10.34 1.23 10.16 1.173 4.36 0.92 4.43 0.83 4.68 0.674 0.52 0.24 0.76 0.27 0.77 0.345 1.14 0.48 0.89 0.34 0.78 0.296 0.85 0.38 0.56 0.27 0.54 0.267 0.92 0.32 0.40 0.20 0.57 0.318 0.93 0.30 0.47 0.25 0.56 0.339 1.80 0.47 1.11 0.34 0.87 0.2810 1.28 0.39 0.46 0.28 0.73 0.2611 1.30 0.28 0.40 0.24 0.52 0.3312 1.68 0.59 0.37 0.24 0.50 0.26
The overall best results were obtained for Biosecdatabase and the worst overall results were obtainedfor MobBIOfake. This is not a surprising resultsince we expected this latter to be a more challeng-ing database due to its characteristics. It was noto-rious from the study of features individually that thisdatabase presented the worse results. We interpret thisfact as a sign that new databases were needed for theresearch of liveness in new scenarios.
Comparing the classifiers, we conclude that DAled to worse results. This fact is also not surprising

(a) Biosec - Feature 13 (best result). (b) Biosec - Feature 5 (worse result).
(c) MobBIOfake - Feature 3 (best result). (d) MobBIOfake - Feature 6 (worse result).
(e) Clarkson - Feature 2 (best result). (f) Clarkson - Feature 13 (worse result).
Figure 11: Histograms for the best result/smallest minimum error (left) and worse result/biggest minimum error (right) foreach database.
since this classifier may be considered simpler thanthe others. The kNN achieved the overall best results.
Now, analysing each database per se, we observefor the Biosec database that the best average classi-fication rate was obtained with kNN. In terms of thecardinality of features, we note that the best averageresult, 0.37%, obtained with a subset of 12 features, is
followed closely by the value 0.4% with only a cardi-nality of 7. And this again encourages the use of fea-ture selection since the computational time and com-plexity is lowered if we lower the number of features.
Concerning the MobBIOfake, undoubtedly theclassification errors obtained are higher than the otherdatabases, what is not unexpected as we already re-
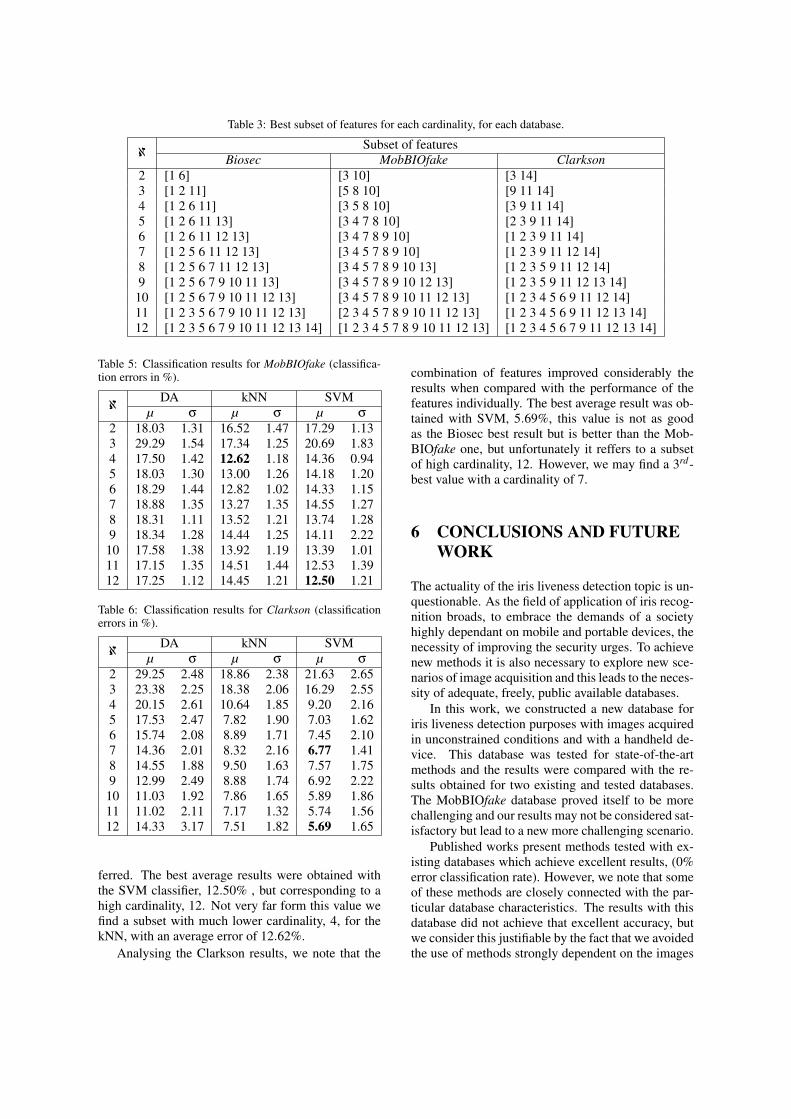
Table 3: Best subset of features for each cardinality, for each database.
ℵSubset of features
Biosec MobBIOfake Clarkson2 [1 6] [3 10] [3 14]3 [1 2 11] [5 8 10] [9 11 14]4 [1 2 6 11] [3 5 8 10] [3 9 11 14]5 [1 2 6 11 13] [3 4 7 8 10] [2 3 9 11 14]6 [1 2 6 11 12 13] [3 4 7 8 9 10] [1 2 3 9 11 14]7 [1 2 5 6 11 12 13] [3 4 5 7 8 9 10] [1 2 3 9 11 12 14]8 [1 2 5 6 7 11 12 13] [3 4 5 7 8 9 10 13] [1 2 3 5 9 11 12 14]9 [1 2 5 6 7 9 10 11 13] [3 4 5 7 8 9 10 12 13] [1 2 3 5 9 11 12 13 14]10 [1 2 5 6 7 9 10 11 12 13] [3 4 5 7 8 9 10 11 12 13] [1 2 3 4 5 6 9 11 12 14]11 [1 2 3 5 6 7 9 10 11 12 13] [2 3 4 5 7 8 9 10 11 12 13] [1 2 3 4 5 6 9 11 12 13 14]12 [1 2 3 5 6 7 9 10 11 12 13 14] [1 2 3 4 5 7 8 9 10 11 12 13] [1 2 3 4 5 6 7 9 11 12 13 14]
Table 5: Classification results for MobBIOfake (classifica-tion errors in %).
ℵDA kNN SVM
µ σ µ σ µ σ
2 18.03 1.31 16.52 1.47 17.29 1.133 29.29 1.54 17.34 1.25 20.69 1.834 17.50 1.42 12.62 1.18 14.36 0.945 18.03 1.30 13.00 1.26 14.18 1.206 18.29 1.44 12.82 1.02 14.33 1.157 18.88 1.35 13.27 1.35 14.55 1.278 18.31 1.11 13.52 1.21 13.74 1.289 18.34 1.28 14.44 1.25 14.11 2.22
10 17.58 1.38 13.92 1.19 13.39 1.0111 17.15 1.35 14.51 1.44 12.53 1.3912 17.25 1.12 14.45 1.21 12.50 1.21
Table 6: Classification results for Clarkson (classificationerrors in %).
ℵDA kNN SVM
µ σ µ σ µ σ
2 29.25 2.48 18.86 2.38 21.63 2.653 23.38 2.25 18.38 2.06 16.29 2.554 20.15 2.61 10.64 1.85 9.20 2.165 17.53 2.47 7.82 1.90 7.03 1.626 15.74 2.08 8.89 1.71 7.45 2.107 14.36 2.01 8.32 2.16 6.77 1.418 14.55 1.88 9.50 1.63 7.57 1.759 12.99 2.49 8.88 1.74 6.92 2.22
10 11.03 1.92 7.86 1.65 5.89 1.8611 11.02 2.11 7.17 1.32 5.74 1.5612 14.33 3.17 7.51 1.82 5.69 1.65
ferred. The best average results were obtained withthe SVM classifier, 12.50% , but corresponding to ahigh cardinality, 12. Not very far form this value wefind a subset with much lower cardinality, 4, for thekNN, with an average error of 12.62%.
Analysing the Clarkson results, we note that the
combination of features improved considerably theresults when compared with the performance of thefeatures individually. The best average result was ob-tained with SVM, 5.69%, this value is not as goodas the Biosec best result but is better than the Mob-BIOfake one, but unfortunately it reffers to a subsetof high cardinality, 12. However, we may find a 3rd-best value with a cardinality of 7.
6 CONCLUSIONS AND FUTUREWORK
The actuality of the iris liveness detection topic is un-questionable. As the field of application of iris recog-nition broads, to embrace the demands of a societyhighly dependant on mobile and portable devices, thenecessity of improving the security urges. To achievenew methods it is also necessary to explore new sce-narios of image acquisition and this leads to the neces-sity of adequate, freely, public available databases.
In this work, we constructed a new database foriris liveness detection purposes with images acquiredin unconstrained conditions and with a handheld de-vice. This database was tested for state-of-the-artmethods and the results were compared with the re-sults obtained for two existing and tested databases.The MobBIOfake database proved itself to be morechallenging and our results may not be considered sat-isfactory but lead to a new more challenging scenario.
Published works present methods tested with ex-isting databases which achieve excellent results, (0%error classification rate). However, we note that someof these methods are closely connected with the par-ticular database characteristics. The results with thisdatabase did not achieve that excellent accuracy, butwe consider this justifiable by the fact that we avoidedthe use of methods strongly dependent on the images

used, such as ratios of iris and pupil radius or areas,among others.
For future work, we foresee the necessity of im-proving the existing methods and develop new onesmore suitable to the new imaging scenarios. Anotheraspect to invest is the segmentation step which prefer-ably should be automatic, however, the iris segmenta-tion problem constitutes by itself a whole new set ofchallenges.
We participated in an iris liveness competition, the“LivDet Competition 2013” (Clarkson University andof Technology, 2013a), held as part of the IEEE BTAS20131. We applied this methodology combined withan automatic segmentation method (Monteiro et al.,2013; Monteiro et al., 2014) and achieved the firstplace2.
ACKNOWLEDGEMENTS
The first author would like to thank the Fundacaopara a Ciencia e Tecnologia (FCT) - Portugal for thefinancial support for the PhD grant with referenceSFRH/BD/74263/2010. The second author wouldlike to thank the National Council for Scientific andTechnological Development (CNPq) - Brazil.
1http://www.btas2013.org/2http://people.clarkson.edu/projects/biosal/iris/results.php
REFERENCES
Abhyankar, A. and Schuckers, S. (2009). Iris quality assess-ment and bi-orthogonal wavelet based encoding forrecognition. Pattern Recognition, 42(9):1878 – 1894.
Blind Ref, B. R. (2013). Reference removed for blind re-view.
Clarkson University, N. D. U. and of Technol-ogy, W. U. (2013a). Liveness Detection-iris competition 2013. IEEE BTAS 2013.http://people.clarkson.edu/projects/biosal/iris/.
Clarkson University, N. D. U. and of Technol-ogy, W. U. (2013b). Liveness Detection-iris competition 2013. IEEE BTAS 2013.http://people.clarkson.edu/projects/biosal/iris/results.php.
Daugman, J. (1998). Recognizing people by their irispatterns. Information Security Technical Report,3(1):33–39.
Daugman, J. (2002). How iris recognition works. In Inter-national Conference on Image Processing, volume 1,pages I–33 – I–36.
Daugman, J. (2004). Iris recognition and anti-spoofingcountermeasures. In 7-th International Biometricsconference.
Fierrez, J., Ortega-Garcia, J., Torre Toledano, D., andGonzalez-Rodriguez, J. (2007). Biosec baseline cor-pus: A multimodal biometric database. PatternRecognition, 40(4):1389–1392.
Galbally, J., Alonso-Fernandez, F., Fierrez, J., and Ortega-Garcia, J. (2012a). A high performance finger-print liveness detection method based on quality re-lated features. Future Generation Computer Systems,28(1):311–321.
Galbally, J., Fierrez, J., and Ortega-Garcia, J. (2007). Vul-nerabilities in biometric systems: attacks and recentadvances in liveness detection. DATABASE, 1(3):4.
Galbally, J., Ortiz-Lopez, J., Fierrez, J., and Ortega-Garcia,J. (2012b). Iris liveness detection based on qualityrelated features. In 5th IAPR International Conferenceon Biometrics (ICB), pages 271–276. IEEE.
GIMP, G. (2008). Image manipulation program. User Man-ual, Edge-Detect Filters, Sobel, The GIMP Documen-tation Team.
Haralick, R. M., Shanmugam, K., and Dinstein, I. H.(1973). Textural features for image classification.Systems, Man and Cybernetics, IEEE Transactions,(6):610–621.
He, X., An, S., and Shi, P. (2007). Statistical textureanalysis-based approach for fake iris detection usingsupport vector machines. In Advances in Biometrics,pages 540–546. Springer.
He, X., Lu, Y., and Shi, P. (2009). A new fake iris detec-tion method. In Advances in Biometrics, pages 1132–1139. Springer.
Jain, A. and Zongker, D. (1997). Feature selection: Evalua-tion, application, and small sample performance. Pat-tern Analysis and Machine Intelligence, IEEE Trans-actions, 19(2):153–158.
Kanematsu, M., Takano, H., and Nakamura, K. (2007).Highly reliable liveness detection method for iris

recognition. In SICE, 2007 Annual Conference, pages361–364. IEEE.
Lee, E., Park, K., and Kim, J. (2005). Fake iris detectionby using purkinje image. In Advances in Biometrics,volume 3832 of Lecture Notes in Computer Science,pages 397–403. Springer Berlin / Heidelberg.
Li, J., Wang, Y., Tan, T., and Jain, A. K. (2004). Live facedetection based on the analysis of fourier spectra. InDefense and Security, pages 296–303. InternationalSociety for Optics and Photonics.
Ma, L., Tan, T., Wang, Y., and Zhang, D. (2003). Per-sonal identification based on iris texture analysis. Pat-tern Analysis and Machine Intelligence, IEEE Trans-actions, 25(12):1519–1533.
Monteiro, J. C., Oliveira, H. P., Sequeira, A. F., and Car-doso, J. S. (2013). Robust iris segmentation under un-constrained settings. In Proceedings of InternationalConference on Computer Vision Theory and Applica-tions (VISAPP), pages 180–190.
Monteiro, J. C., Sequeira, A. F., Oliveira, H. P., and Car-doso, J. S. (2014). Robust iris localisation in challeng-ing scenarios. In CCIS Communications in Computerand Information Science. Springer-Verlag.
Pudil, P., Novovicova, J., and Kittler, J. (1994). Floatingsearch methods in feature selection. Pattern recogni-tion letters, 15(11):1119–1125.
Ratha, N. K., Connell, J. H., and Bolle, R. M. (2001). Ananalysis of minutiae matching strength. In Audio-andVideo-Based Biometric Person Authentication, pages223–228. Springer.
Ruiz-Albacete, V., Tome-Gonzalez, P., Alonso-Fernandez,F., Galbally, J., Fierrez, J., and Ortega-Garcia, J.(2008). Direct attacks using fake images in iris verifi-cation. In Biometrics and Identity Management, pages181–190. Springer.
S. Schuckers, K. Bowyer, A. C. and Yambay, D.(2013). Liviness Detection - Iris Competition 2013.http://people.clarkson.edu/projects/biosal/iris/.
Stearns, S. D. (1976). On selecting features for pattern clas-sifiers. In Proceedings of the 3rd International JointConference on Pattern Recognition, pages 71–75.
Une, M. and Tamura, Y. (2006). liveness detection tech-niques. IPSJ Magazine, 47(6):605–608.
Wei, Z., Qiu, X., Sun, Z., and Tan, T. (2008). Counterfeitiris detection based on texture analysis. In ICPR 2008.19th International Conference on Pattern Recogni-tion., pages 1–4. IEEE.
Whitney, A. W. (1971). A direct method of nonparametricmeasurement selection. Computers, IEEE Transac-tions, 100(9):1100–1103.