
Exploring Employment Opportunities for Tunisians - IOM Tunisia
Upload
khangminh22Category
view
0download
0
IOMMONITORING
AND EVALUATION GUIDELINES
International Organization for Migration (IOM)17 route des Morillons, P.O. Box 17, 1211 Geneva 19, Switzerland
Tel.: +41 22 717 9111 • Fax: +41 22 798 6150 • Email: [email protected] • Website: www.iom.int

The opinions expressed in the report are those of the authors and do not necessarily reflect the views of the International Organization for Migration (IOM). The designations employed and the presentation of material throughout the report do not imply expression of any opinion whatsoever on the part of IOM concerning the legal status of any country, territory, city or area, or of its authorities, or concerning its frontiers or boundaries.
IOM is committed to the principle that humane and orderly migration benefits migrants and society. As an intergovernmental organization, IOM acts with its partners in the international community to: assist in meeting the operational challenges of migration; advance understanding of migration issues; encourage social and economic development through migration; and uphold the human dignity and well-being of migrants.
_____________________________
Publisher: International Organization for Migration 17 route des Morillons P.O. Box 17 1211 Geneva 19 Switzerland Tel.: +41 22 717 9111 Fax: +41 22 798 6150 Email: [email protected] Website: www.iom.int
Required citation: International Organization for Migration (IOM), 2020. IOM Monitoring and Evaluation Guidelines. IOM. Geneva.
_____________________________
ISBN 978-92-9268-016-9 (PDF)
© IOM 2021
Some rights reserved. This work is made available under the Creative Commons Attribution-NonCommercial-NoDerivs 3.0 IGO License (CC BY-NC-ND 3.0 IGO).*
For further specifications please see the Copyright and Terms of Use.
This publication should not be used, published or redistributed for purposes primarily intended for or directed towards commercial advantage or monetary compensation, with the exception of educational purposes e.g. to be included in textbooks.
Permissions: Requests for commercial use or further rights and licensing should be submitted to [email protected].
* https://creativecommons.org/licenses/by-nc-nd/3.0/igo/legalcode
PUB2020/022/EL

IOMMONITORING
AND EVALUATION GUIDELINES


IOM MONITORING AND EVALUATION GUIDELINESiii
Foreword
Over the past decade, there have been substantive changes in the way countries and the international community approach and accomplish socioeconomic development, culminating with the adoption of the 2030 Agenda for Sustainable Development in 2015, as well as in the way they provide humanitarian assistance during emergencies and post-emergencies following the organization of the World Humanitarian Summit of 2016. Migration and movement of people were not left aside and considered as a cross-cutting theme that can be addressed in several of the Sustainable Development Goals (SDGs) and being at the centre of humanitarian action with displaced populations and forced migration.
The adoption of the Global Compact for Safe, Orderly and Regular Migration in 2018 further highlighted the role that migration can play in the socioeconomic development of countries and how migration should be managed for the benefit of all, including the migrants themselves. By becoming an agency of the UN System in 2016, IOM has reinforced its role as the agency specializing in migration. IOM’s mandate as the Secretariat of the United Nations Migration Network created in the framework of the Global Compact for Migration reflects the UN recognition of its comparative advantages and expertise as a leading agency and voice on migration policy and practice.
In this context, IOM has developed a Strategic Vision in 2019 to guide the Organization in meeting the expectation of its global role in addressing the needs and challenges of a complex migration context. A core principle of the Strategic Vision is that IOM becomes a learning organization, drawing on expertise and success from its diverse programming. Monitoring and evaluation (M&E) play an important institutional role in fostering a robust learning culture and capacities to capture, distill and share evidence and knowledge from IOM interventions for informed decision-making and accountability at the country, regional and global levels. M&E is also a potent mechanism through which agencies can reach their target populations and understand the activities that can make a real and lasting difference for them, with no one left behind.
IOM’s core institutional and operational strengths and prominence on the international scene also call for a more rigorous results system closely linked to the Organization’s strategic vision and requiring a revised operating model developed through the Internal Governance Framework (IGF). The IGF states that “through a results-based approach, the Organization will be well placed to achieve its strategic objectives, measure such achievement, identify lessons learned and use such information to inform the next phase of strategic planning”. A robust M&E system contributes to this effort and provides government officials, IOM managers, partners, donors, civil society and beneficiaries with better means for decision-making, accountability and learning.
In an effort to support these initiatives, the Office of the Inspector General’s Central Evaluation function (OIG/Evaluation) has developed the first of its kind IOM Monitoring and Evaluation Guidelines, ensuring that IOM staff, consultants and implementing partners have access to complementary and more technical support that builds on the M&E foundation provided in the IOM Project Handbook. The IOM Monitoring and Evaluation Guidelines recognizes that M&E is a professional field in its own right and aims to provide the key concepts, methodologies and the practical details needed to make M&E work effectively. It has been developed based on the principles set out in the IOM Evaluation Policy and IOM Monitoring Policy, building on international M&E standards and practice and incorporating new international M&E trends, for instance on the Theory of Change. It is also designed taking into account the IOM facilitator-led M&E e-learning course developed by OIG/Evaluation in 2018, which staff is encouraged to consider taking.

ivForeword
The IOM Monitoring and Evaluation Guidelines were developed through a consultative process, with an M&E needs assessment conducted with 107 IOM staff members globally to obtain a better overview of IOM’s existing level of M&E knowledge. Furthermore, a task force consisting of IOM technical experts from country and regional offices, relevant Headquarters departments, as well as regional M&E officers was created to help review the content.
António VitorinoDirector GeneralInternational Organization for Migration

IOM MONITORING AND EVALUATION GUIDELINESv
Acknowledgements
The Office of the Inspector General would like to thank those who contributed to the IOM Monitoring and Evaluation Guidelines, including the 57 colleagues worldwide who partook in the initial monitoring and evaluation (M&E) needs assessment to inform the scope and content of this initiative.
We would like to especially thank the regional M&E officers for their support with the shaping of the content, as well as their technical reviews: Maite De Muller Barbat, Ludvik Girard, Sarah Lynn Harris, Rogers Mutie, Theogene Nshimiyimana, Jhonn Rey, Kim Sokleang, Vanesa Vaca and Angeline Wambanda.
We are also pleased to thank the other colleagues who were members of the initial task force who helped further review the content: Alessia Castelfranco, Jennifer Hollings, Sarah Lotfi, Kerry Maze, Nazanine Nozarian and Carol San Miguel.
This initiative would not have been possible without the support of the Inspector General, as well as the financial contributions of IOM’s unearmarked funding. We are also thankful to the various thematic departments for their technical input. Lastly, we would like to thank the Publications Unit for their availability and guidance.
Authors
The IOM Monitoring and Evaluation Guidelines were written by Katia Barrech, with valuable contributions from Diana Cartier, Christophe Franzetti, Anca Paducel and editing support by Myra Albu.


IOM MONITORING AND EVALUATION GUIDELINESvii
ContentsForeword ............................................................................................................................................................... iii
Acknowledgements ........................................................................................................................................... v
How is the IOM Monitoring and Evaluation Guidelines structured? .................................................x
How to use the IOM Monitoring and Evaluation Guidelines ...............................................................xi
INTRODUCTION TO MONITORING AND EVALUATION ..........................................................................................................................2
List of abbreviations and acronyms .............................................................................................................3
Chapter 1: Introduction to monitoring and evaluation ......................................................................41.1. Overview ....................................................................................................................................................41.2. Results-based management commitment at IOM ....................................................................51.3. The M in M&E: Understanding monitoring ...............................................................................71.4. The E in M&E: Understanding evaluation ................................................................................. 101.5. Monitoring versus evaluation ......................................................................................................... 111.6. Strategic orientation at IOM ........................................................................................................... 14
NORMS, STANDARDS AND MANAGEMENT FOR MONITORING AND EVALUATION ...................................................................... 22
List of abbreviations and acronyms .......................................................................................................... 23
Chapter 2: Norms, standards and management for monitoring and evaluation .................. 242.1. Professional norms and standards in monitoring and evaluation ................................... 242.2. Monitoring and evaluation management: Roles and responsibilities .............................. 30
Annexes ................................................................................................................................................................ 40
MONITORING AT IOM ........................................................................................................................... 42
List of abbreviations and acronyms .......................................................................................................... 43
Chapter 3: Monitoring at IOM ................................................................................................................... 443.1. An overview of how to monitor ................................................................................................. 443.2. Programme theory .............................................................................................................................. 443.3. Theory of Change .............................................................................................................................. 453.4. IOM Results Matrix ......................................................................................................................... 563.5. Types of monitoring: An overview ............................................................................................... 753.6. Remote management, monitoring and third-party monitoring ....................................... 803.7. Pulling it all together: Monitoring and evaluation plan ......................................................... 893.8. Monitoring and reporting on results ........................................................................................... 95

viii
METHODOLOGIES FOR DATA COLLECTION AND ANALYSIS FOR MONITORING AND EVALUATION ....................................................................106
List of abbreviations and acronyms ........................................................................................................107
Chapter 4: Methodologies for data collection and analysis for monitoring and evaluation .............................................................................................................108
4.1. An overview of chapter 4 ..............................................................................................................1084.2. Professional standards and ethical guidelines .........................................................................1094.3. Planning and designing data collection tools ..........................................................................1114.4. Methods, approaches and tools for monitoring and evaluation ....................................1294.5. Collecting and managing data ......................................................................................................1414.6. Analysing data ......................................................................................................................................1484.7. Presenting findings .............................................................................................................................155
Annex 4.1. IOM migration data governance and monitoring and evaluation ................157Annex 4.2. How to conduct a desk review ..................................................................................157Annex 4.3. Types of bias .......................................................................................................................158Annex 4.4. Applying types of sampling ...........................................................................................160Annex 4.5. Survey design and implementation ...........................................................................165Annex 4.6. Survey example .................................................................................................................172Annex 4.7. Interview structure and questions ............................................................................173Annex 4.8. Interview example ...........................................................................................................176Annex 4.9. Preparing, conducting and moderating a focus group ......................................177Annex 4.10. IOM example – Focus group discussion guide ....................................................181Annex 4.11. Examples of observations and planning
and conducting observations ......................................................................................182Annex 4.12. Steps for analysing qualitative data ...........................................................................184Annex 4.13. Calculating descriptive statistics .................................................................................187Annex 4.14. Types of visualizations.....................................................................................................190
EVALUATION ...............................................................................................................................................202
List of abbreviations and acronyms ........................................................................................................203
Chapter 5: Evaluation ...................................................................................................................................2045.1. Evaluation overview ..........................................................................................................................2045.2. Planning for evaluation .....................................................................................................................2085.3. Undertaking evaluation ....................................................................................................................2345.4. Follow-up and using evaluation ....................................................................................................2425.5. Accountability and learning from evaluation ..........................................................................245
Annex 5.1. Budgeting for evaluation ................................................................................................253Annex 5.2. Expanded list of evaluation types by specificities and scope .........................253Annex 5.3. Incorporating cross-cutting themes at IOM .........................................................255Annex 5.4. Evaluation terms of reference template .................................................................269Annex 5.5. IOM sample evaluation matrices for a development-oriented
project and a humanitarian project ..........................................................................269

IOM MONITORING AND EVALUATION GUIDELINESix
Annex 5.6. IOM scorecard for assessment of applications for evaluations commissioning evaluator(s) (individual consultant or consulting firm) ......270
Annex 5.7. IOM inception report template ................................................................................270Annex 5.8. IOM evaluation report components template ....................................................270Annex 5.9. IOM final evaluation report template ......................................................................270Annex 5.10. Evaluation brief template and guidance ..................................................................270Annex 5.11. Evaluative approaches: Most significant change ...................................................270Annex 5.12. Request for Proposals (RFP) template ....................................................................271

x
How is the IOM Monitoring and Evaluation Guidelines structured?
The IOM Monitoring and Evaluation Guidelines is structured around five chapters, each of which covers theoretical and practical concepts of monitoring and evaluation (M&E): (1) introduction to monitoring and evaluation; (2) norms, standards and management for monitoring and evaluation; (3) monitoring at IOM; (4) methodologies for data collection and analysis for monitoring and evaluation; and (5) evaluation.
(1) Introduction to monitoring and evaluationThis chapter discusses the main concepts and benefits of monitoring and evaluation. It also focuses on the difference between monitoring and evaluation, and explains the strategic orientation at IOM.
(2) Norms, standards and management for monitoring and evaluationChapter 2 describes the norms and standards for conducting monitoring and evaluation, and highlights the main roles and responsibilities related to management of M&E.
(3) Monitoring at IOMThis chapter provides a step-by-step explanation of how to develop a Results Matrix, as well as a Results Monitoring Framework. The chapter also introduces the Theory of Change and looks into various types and levels of monitoring used in IOM.
(4) Methodologies for data collection and analysis for monitoring and evaluationThis chapter outlines the methodologies, tools and approaches required to design data collection tools, conduct data analysis and include measures of quality control.
(5) EvaluationChapter 5 explains the different steps required for planning, undertaking and following up and using evaluations. It also looks into accountability and learning from evaluation.

IOM MONITORING AND EVALUATION GUIDELINESxi
How to use the IOM Monitoring and Evaluation GuidelinesThe IOM Monitoring and Evaluation Guidelines provides a comprehensive overview of both monitoring and evaluation at IOM. It is recommended that users read through the IOM Monitoring and Evaluation Guidelines sequentially as this will give them a good understanding of the overall concepts of M&E, with each stage leading to the next. Once users are familiar with the contents, they can refer to specific chapters or sections within the chapters as the need arises.
Next to the main text, the IOM Monitoring and Evaluation Guidelines have been graphically marked to alert the reader to key pieces of information as follows:
Blue text boxes highlight key information or provide additional information to complement the ideas and content in the main body of the text.
Yellow text boxes provide good practices and/or tips that relate to the discussion in the main body of the text.
Orange boxes contain either additional information and/or resources pertaining to the specific topic mentioned above the box.
Burgundy text boxes provide examples to concepts discussed in the main body of the text.
The IOM Monitoring and Evaluation Guidelines contain links to resources relevant to the content presented. Some resources presented are internal to IOM staff only and can be accessed only by those with IOM login credentials. These resources will be updated on a regular basis. To see the updated resources, kindly follow this link.
INFO
RMATION
RESOURCES
EXAMPLE
TIP


CHAPTER 1
Introduction to monitoring and evaluation

2 CHAPTER 1 Introduction to monitoring and evaluation
INTRODUCTION TO MONITORING AND EVALUATION
1The following chapter contains links to resources relevant to the content presented. Some resources presented are internal to IOM staff only and can be accessed only by those with IOM login credentials. These resources will be updated on a regular basis. To see the updated resources, kindly follow this link.
List of abbreviations and acronyms ............................................................................................. 3
1.1. Overview ................................................................................................................................... 4
1.2. Results-based management commitment at IOM ............................................................ 51.2.1. What is results-based management? ....................................................................................................51.2.2. Results-based management and monitoring and evaluation ......................................................6
1.3. The M in M&E: Understanding monitoring ........................................................................ 71.3.1. What is monitoring? ....................................................................................................................................71.3.2. Why monitor? ................................................................................................................................................81.3.3. When to monitor? .......................................................................................................................................8
1.4. The E in M&E: Understanding evaluation ......................................................................... 101.4.1. What is evaluation? ................................................................................................................................... 101.4.2. Why evaluate? ............................................................................................................................................. 101.4.3. When is it done? ........................................................................................................................................ 10
1.5. Monitoring versus evaluation .............................................................................................. 11
1.6. Strategic orientation at IOM ............................................................................................... 141.6.1. IOM Strategic Vision................................................................................................................................. 141.6.2. Migration Governance Framework .................................................................................................... 151.6.3. Sustainable Development Goals ........................................................................................................ 161.6.4. United Nations Sustainable Development Cooperation Framework ................................ 181.6.5. Migration Crisis Operational Framework ....................................................................................... 191.6.6. Global Compact for Safe, Orderly and Regular Migration ...................................................... 20

IOM MONITORING AND EVALUATION GUIDELINES3
List of abbreviations and acronymsCCA Common Country Analysis
IFRC International Federation of Red Cross and Red Crescent Societies
IOM International Organization for Migration
M&E monitoring and evaluation
MCOF Migration Crisis Operational Framework
MiGOF Migration Governance Framework
OECD Organisation for Economic Co-operation and Development
OECD-DAC Organisation for Economic Co-operation and Development – Development Assistance Committee
OIG/Evaluation Office of the Inspector General’s Central Evaluation function
RBM results-based management
SDG Sustainable Development Goal
SRF Strategic Results Framework
UNCT United Nations Country Team
UNDAF United Nations Development Assistance Framework
UNDG United Nations Development Group
UNEG United Nations Evaluation Group
UNSDCF United Nations Sustainable Development Cooperation Framework
UNSDG United Nations Sustainable Development Group

4 CHAPTER 1 Introduction to monitoring and evaluation
Chapter 1 | Introduction to monitoring and evaluation
1.1. OverviewIOM is considered an efficient organization with extensive field presence, implementing its many interventions through a large and decentralized network of regional offices and country offices.1 IOM puts a strong focus on results-based management (RBM), which is promoted to strengthen organizational effectiveness and move towards evidence-based and results-focused programming. A results-based approach requires robust monitoring and evaluation (M&E) systems that provide government officials, IOM staff, partners, donors and civil society with better means to the following:
• Inform decision-making by providing timely feedback to management on intervention context, risks, challenges, results, as well as successful approaches;
• Meet accountability obligations by informing donors, beneficiaries and other stakeholders on IOM’s performance, progress made in the achievement of results and the utilization of resources;2
• Draw lessons learned from experience to provide feedback into the planning, design and implementation of future interventions and improve service delivery.
M&E, at times, may seem challenging in the context of IOM’s interventions, where project duration may not be “long enough” to incorporate strong M&E, or where security, time pressure, funding and/or capacity constraints may hinder the rigorous implementation of M&E. For the same reasons, the benefits of M&E may go unrecognized already in the proposal writing stage, resulting in insufficient attention given to it. The IOM Monitoring and Evaluation Guidelines is a good opportunity to correct those impressions and put M&E at the centre of sound performance and fulfilling the duty of accountability.
As IOM’s global role in addressing migration-related challenges has diversified and expanded, new political and organizational realities have demanded a different conceptualization of M&E, as well as reframed organizational thinking about what it constitutes and its application. These realities include the numerous operational demands, limited resources, accelerated speed of expected response and immediate visibility for impact and accountability, as well as the expected rapid integration of new organizational concepts, such as “value for money” and Theory of Change into daily work. Learning and information-sharing also channel a number of key messages and recommendations to be considered.
IOM’s internal and external environments have also undergone significant changes in recent years, with an increased focus on migration worldwide. As a United Nations-related agency, IOM is a main reference on migration, supporting the attainment of migration-related commitments of the 2030 Agenda for Sustainable Development (Sustainable Development Goals or SDGs) and contributing to the implementation of the Global Compact for Safe, Orderly and Regular Migration. IOM is also an increasingly important contributor to migration data and analysis on a global scale, including for the implementation of the 2030 Agenda, and is praised for its operational and pragmatic approach to managing migration, in line with its mandate and the Migration Governance Framework (MiGOF). Furthermore, IOM is internally guided by
1 For the purpose of the IOM Monitoring and Evaluation Guidelines, the term intervention is used interchangeably for either a project, programme, strategy or a policy.
2 For the purpose of the IOM Monitoring and Evaluation Guidelines, IOM uses the OECD/DAC definition of beneficiary/ies or people that the Organization seeks to assist as “the individuals, groups, or organisations, whether targeted or not, that benefit directly or indirectly, from the development intervention. Other terms, such as rights holders or affected people, may also be used.” See OECD, 2019, p. 7. The term beneficiary/ies or people that IOM seeks to assist, will intermittently be used throughout the IOM Monitoring and Evaluation Guidelines, and refers to the definition given above, including when discussing humanitarian context.

IOM MONITORING AND EVALUATION GUIDELINES5
the Strategic Vision, which does not supersede IOM’s existing MIGOF. But while MIGOF sets out a set of objectives and principles, it does not set out a focused direction of travel. The Strategic Vision is intended to do this. The Strategic Vision also intends to strengthen IOM’s capacity to contribute to the SDGs or the Global Compact for Migration, as well as other existing cooperative frameworks. This chapter will provide an overview of both monitoring and evaluation as key components and an overview of RBM at IOM; it will also outline the differences between monitoring and evaluation and explain how M&E together are relevant to IOM’s strategic approach and objectives.
1.2. Results-based management commitment at IOM1.2.1. What is results-based management?
Over the last 15 years, international actors have increasingly shifted to RBM. RBM supports better performance and greater accountability by applying a clear plan to manage and measure an intervention, with a focus on the results to be achieved.3 By identifying, in advance, the intended results of an intervention and how its progress can be measured, managing an intervention and determining whether a difference has genuinely been made for the people concerned becomes better understood and easier to implement.
The IOM definition of results-based management
At IOM, RBM is defined as a management strategy that sets out clear objectives and outcomes to define the way forward, and uses specific indicators to verify the progress made. RBM encompasses the whole project cycle: planning, managing implementation, monitoring, reporting and evaluation.4
The aim of RBM is to provide valuable information for decision-making and lessons learned for the future, which includes the following:
• Planning, setting the vision and defining a results framework; • Implementing interventions to achieve the results; • Monitoring to ensure results are being achieved; • Encouraging learning through reporting and evaluation.
Among other aspects, an RBM approach requires strong M&E, as well as knowledge management.
In 2011, IOM adopted a conscious RBM approach at the project level as seen in the first edition of the IOM Project Handbook. The 2017 version of the IOM Project Handbook provides yet more detailed guidance on RBM and has made the use of a results matrix a requirement to improve IOM’s work.5
At a corporate level, IOM has identified a set of global results that it wants to achieve by 2023, using its MiGOF as the basis for the Organization’s work and the Strategic Vision as a “direction of travel”. This is condensed in the Strategic Results Framework (SRF). This framework specifies the highest level of desired change IOM would like to achieve. The RBM approach builds a bridge between the framework and IOM’s traditional programmes. This allows IOM to report on the results it has collectively achieved, rather than on the activities performed.
3 UNEG, 2007.4 IOM, 2018a (Internal link only).5 See IOM, 2017 (Internal link only).
INFO
RMATION

6 CHAPTER 1 Introduction to monitoring and evaluation
1.2.2. Results-based management and monitoring and evaluation
Monitoring and evaluation are important parts of RBM, based on clearly defined and measurable results, processes, methodologies and tools to achieve results. M&E can be viewed as providing a set of tools to enable RBM, helping decision makers track progress and demonstrate an intervention’s higher-level results.6
Results-based M&E moves from a focus on the immediate results, such as the successful implementation of activities and production of outputs, to the higher-level results, looking at the achievement of outcomes and impacts. Figure 1.1 shows RBM as a “life cycle approach” within which M&E are incorporated.
Figure 1.1. Results-based management life cycle
Source: Adapted from United Nations Development Programme, 2009, p. 10.
A summary of results-based management
Definition Results-based management at IOM What it means for M&E
A management strategy that sets out clear objectives and outcomes to define the way forward, and uses specific indicators to verify the progress made. RBM is seen as taking a life cycle approach, including planning, managing, monitoring, reporting and evaluating.
RBM at IOM is a means to further strengthen IOM’s interventions. RBM encourages project developers and managers to clearly articulate an intervention’s objective, the desired change it aims to achieve, what is required to achieve such change, whether the desired change is achieved and how ongoing or future performance can further improve through learning.
In essence, M&E supports RBM through monitoring and measuring intervention progress towards predetermined targets, refining implementation, and evaluating changes and results to further improve future interventions.
6 Kusek and Rist, 2004. See also UNDG, 2011.
INFO
RMATION

IOM MONITORING AND EVALUATION GUIDELINES7
IOM resources2017 IOM Project Handbook. Second edition. Geneva (Internal link only).
2018a Results-based management in IOM (Internal link only).
2020a RBM Results Based Management SharePoint (Internal link only).
Other resources Kusek, J.Z. and R. Rist
2004 Ten Steps to a Results-Based Monitoring and Evaluation System: A Handbook for Development Practitioners. World Bank, Washington, D.C.
Organisation for Economic Co-operation and Development (OECD)2019 Better Criteria for Better Evaluation: Revised Evaluation Criteria Definitions and Principles for Use.
OECD/Development Assistance Committee (DAC) Network on Development Evaluation.
United Nations Development Group (UNDG)2011 Results-Based Management Handbook: Harmonizing RBM concepts and approaches for improved
development results at country level.
United Nations Development Programme (UNDP)2009 Handbook on Planning, Monitoring and Evaluating for Development Results. New York.
United Nations Evaluation Group (UNEG)2007 The Role of Evaluation in Results-based Management. Reference document, UNEG/REF(2007)1.
1.3. The M in M&E: Understanding monitoring 1.3.1. What is monitoring?
Given IOM’s broad thematic portfolio and the decentralized nature of the Organization, it is important, when implementing an intervention, to provide justification for the implementation, articulate what changes are expected to occur and, moreover, how these are expected to occur. Monitoring helps do just that.
Monitoring can often be confused with reporting, which is one of the components of monitoring. While reporting only refers to the compilation, transfer and distribution of information, monitoring focuses on the collection and analysis, on a regular basis, of the information required for reporting. Therefore, monitoring encompasses the planning, designing, selecting of methods and systematic gathering and analysis of the content, while reporting summarizes that content with the purpose of delivering the relevant information.
IOM defines monitoring as an established practice of internal oversight that provides management with an early indication of progress, or lack thereof, in the achievement of results, in both operational and financial activities.7 Monitoring can take various shapes, vary in the frequency of its conduct and be tailored to a specific context, which is usually dependent on the intervention’s objectives. In an IOM intervention, there are four key areas for monitoring: activity monitoring, results monitoring, financial monitoring and risk monitoring.8
7 IOM, 2018b, p. 2. 8 Modules 2 and 4 of IOM Project Handbook. Further information can be found in chapter 3 of the IOM Monitoring and Evaluation Guidelines.
RESOURCES

8 CHAPTER 1 Introduction to monitoring and evaluation
Figure 1.2. Scope of monitoring – Four key monitoring areas
Activities Outputs Outcomes Objectives
Monitoring activities
Monitoring budget and expenditures
Monitoring risks
Monitoring results
Source:AdaptedfromIOMRegionalOfficePretoria M&EpresentationonScopeofMonitoring(2017).
While these are the four essential areas to monitor at IOM, additional types of monitoring are outlined in chapter 3 of the IOM Monitoring and Evaluation Guidelines.
In order to standardize its approach to monitoring, IOM has developed relevant standardized tools: (a) IOM Results Matrix; and (b) Results Monitoring Framework.9 Despite this, it may still be a challenge for IOM staff to tailor these tools and adapt them to the monitoring needs of the diverse portfolio of context-specific interventions it implements and migration needs. Therefore, how to monitor within IOM largely depends on how IOM responds to particular migration-related needs within an intervention. Monitoring should be sufficiently flexible to then allow for an assessment of whether interventions respond to emerging needs.
1.3.2. Why monitor?
Monitoring is necessary, because it continuously generates the information needed to measure progress towards results throughout implementation and enables timely decision-making. Monitoring helps decision makers be anticipatory and proactive, rather than reactive, in situations that may become challenging to control. It can bring key elements of strategic foresight to IOM interventions.
1.3.3. When to monitor?
Monitoring is undertaken on an ongoing basis during the implementation of an intervention. Where possible, it is essential to ask relevant “monitoring questions” regularly.
Monitoring helps identify whether:
• Planned activities are actually taking place (within the given time frame);• There are gaps in the implementation;• Resources have been/are being used efficiently;• The intervention’s operating context has changed.
9 See the IOM Results Matrix section of chapter 3 for a detailed description of each of these tools.
TIP

IOM MONITORING AND EVALUATION GUIDELINES9
Monitoring questions
While implementing activities: • What activities are being implemented? • Are they being implemented as planned? • What is the current budget burn rate? • Have any new risks been identified? • Are intended target groups being reached?
When measuring results: • Are results being achieved? • Is progress shown against indicators? • Are targets being met? • Are target groups satisfied with the services?
A summary of monitoring
Definition Monitoring at IOM How to apply It
Monitoring is an established practice of internal oversight that provides management with an early indication of progress, or lack thereof, in the achievement of results, in both operational and financial activities.10
Monitoring at IOM is a routine – but important – process of data collection and analysis, as well as an assessment of progress towards intervention objectives. In other words, it allows for the frequent assessment of the implementation process within IOM interventions.
Due to the different thematic areas and diverse approaches to responding to country, regional or global needs and expectations, a standardized approach to monitoring IOM interventions remains challenging. Monitoring needs to be flexible enough to assess whether and how IOM’s interventions are responding to emerging needs. Chapters 2, 3 and 4 of the IOM Monitoring and Evaluation Guidelines will provide more details on how monitoring achieves this.
IOM resources2017 Module 2 and Module 4. In: IOM Project Handbook. Second edition. Geneva (Internal link only).2018b Monitoring Policy. IN/31. 27 September.
Other resources International Federation of Red Cross and Red Crescent Societies (IFRC)
2011 Project/Programme Monitoring and Evaluation (M&E) Guide. Geneva.
10 IOM, 2018b, p. 2.
EXAMPLEIN
FORMATION
RESOURCES

10 CHAPTER 1 Introduction to monitoring and evaluation
1.4. The E in M&E: Understanding evaluation1.4.1. What is evaluation?
While monitoring may ask the questions, “What is the current status of implementation? What has been achieved so far? How has it been achieved? When has it been achieved?”, evaluation helps, in addition, to understand why and how well something was achieved, and gives judgement on the worth and merit of an intervention. Evaluation allows for a more rigorous analysis of the implementation of an intervention, also looking at why one effort worked better than another. Evaluation enriches learning processes and improves services and decision-making capability for those involved in an intervention. It also provides information not readily available from monitoring, which can be derived from the use of evaluation criteria, such as in-depth consideration for impact, relevance, efficiency, effectiveness, coverage, coordination, sustainability, connectedness and coherence.
IOM defines evaluation as the systematic and objective assessment of an ongoing or completed intervention, including a project, programme, strategy or policy, its design, implementation and results.
1.4.2. Why evaluate?
Evaluation can be considered a means to discuss causality. While monitoring may show whether indicators have progressed, it remains limited in explaining, in detail, why a change occurred. Evaluation, on the other hand, looks at the question of what difference the implementation of an activity and/or intervention has made. It helps answer this question by assessing monitoring data that reflects what has happened and how, to identify why it happened. Evaluation provides practitioners with the required in-depth and evidence-based data for decision-making purposes, as it can assess whether, how, why and what type of change has occurred during an intervention.
Evaluation is also critical to assess the relevance and performance of the means and progress towards achieving change. Effective conduct and the use of credible evaluations go hand in hand with a culture of results-oriented, evidence-driven learning and decision-making. When evaluations are used, they contribute not only to accountability, but also to creating space for reflection, learning and the sharing of findings, innovations and experiences. They are a source of reliable information to help improve IOM’s service provision to beneficiaries, migrants, Member States and donors. Findings, lessons learned and best practices from previous evaluations can also help enhance an intervention design and enrich the formulation of results and the results framework. Evaluations have their own methodological and analytical rigour, determined at the planning stage and depending on their intention and scope.
1.4.3. When is it done?
An evaluation can be conducted at every stage of the intervention cycle, depending on the type of evaluation being implemented. For example, an ex-ante evaluation conducted during the conceptualization phase of an intervention can set a strong foundation for a successful implementation. Evaluations conducted during implementation (for instance, real-time and midterm evaluations) are good sources for providing feedback on the status and progress, strengths or weaknesses of implementation.11, 12 In this sense, evaluations provide decision makers with timely information to make adjustments, as required.
11 An ex-ante evaluation assesses the validity of the design, target populations and objectives of an evaluation. For more information, see the section “Types of evaluation” in chapter 5.
12 A real-time evaluation provides instant feedback to intervention managers about an ongoing evaluation. A midterm evaluation is carried out for the purpose of improving intervention performance or, in some cases, to amend an intervention’s objective. For more information, see also the section “Types of evaluation” in chapter 5.

IOM MONITORING AND EVALUATION GUIDELINES11
Evaluation versus other review and assessment types
Evaluation should not be confused with concepts, such as review, assessment, needs assessments/appraisals or audit. Refer to the following definitions:13
Review According to the OECD/DAC glossary, a review is “an assessment of the performance of an intervention, periodically or on an ad hoc basis”. A review is more extensive than monitoring but less than evaluation.14
Assessment An assessment can commonly be defined as the action of estimating the nature, ability or quality of something. In the context of development interventions, it is often associated with another term to focus on what will be assessed, such as needs assessment, skills assessment, context assessment and results-based assessment. It can take place prior, during or after an intervention and may be used in an evaluative context.
Needs assessments and appraisals
Needs assessments and appraisals are tools enabling decision makers to choose and decide between optional activities, as well as refine the final design of a project or programme.
Audit Audit as an activity of supervision verifying whether the existing policies, norms and instruments are being applied and used adequately. Audit also examines the adequacy of organizational structures and systems and performs risk assessments. The audit focuses on the accountability and control of the efficient use of resources.
IOM resources2018c IOM Evaluation Policy. Office of the Inspector General. September.
Other resources Organisation for Economic Co-operation and Development (OECD)
2010 Glossary of Key Terms in Evaluation and Results Based Management. OECD/DAC, Paris.
1.5. Monitoring versus evaluation
Although often grouped together, M&E are two distinct but related functions. Recognizing the difference between monitoring and evaluation helps those implementing interventions understand that the two are indeed complimentary, as well as mutually beneficial functions. The main difference between them is their focus of assessment, as well as the timing in which each is conducted.
Monitoring, on the one hand, focuses on whether the implementation is on track to achieving its intended results and objectives, in line with established benchmarks. Evaluation, on the other hand, can provide evidence on whether the intervention and its approach to implementation is the right one, and if so, how and why changes are taking place. Evaluation also highlights the strengths and weaknesses of the design of the intervention. In other words, while monitoring can provide information on how the implementation is doing, evaluation can go a step further and demonstrate whether the expected change has been attained, whether the intervention contributed to that change (impact analysis/evaluation) and whether the intervention itself and its approach were the most suited to address the given problem.
13 Adapted from IOM, 2018c.14 Adapted from OECD, 2010, p. 34.
RESOURCES
INFO
RMATION

12 CHAPTER 1 Introduction to monitoring and evaluation
In terms of timing, while monitoring tracks an intervention’s progress and achievement of results on an ongoing basis, throughout implementation, evaluation is usually a one-off activity, undertaken at different points of an intervention’s life cycle.
Monitoring and evaluation and vertical logic
Keeping the vertical logic in mind when monitoring an intervention is useful, as it can help understand the specific level of result, which is being monitored, and, moreover, how individual results contribute to the overall implementation objectives.15 In this sense, monitoring can function as a tool that can help review the management objectives. Similarly, when evaluating an intervention, it is important to consider its vertical logic to enable a more holistic approach to evaluation.
The following two diagrams show monitoring and evaluation in relation to the vertical logic. Chapter 3 of the IOM Monitoring and Evaluation Guidelines will further elaborate the vertical logic. Note that the two diagrams include indicative questions that pertain to monitoring and evaluation, and that there may be many other questions applicable in the context of vertical logic that are not included in the following figures.
Figure 1.3. Monitoring and vertical logic
Are activities being implemented on scheduleand within budget?
Are activities leading to the expected outputs?
Are outputs leading to achievementof the outcomes? What is causing
delays or unexpectedresults?
Is there anythinghappening that shouldlead management tomodify the operation’simplementation plan?
Measuring changes at goal-level requires a longer time frame,and is therefore dealt with by evaluation
How do beneficiaries feel about the work?Outputs
Activities
Objectives
Outcomes
Monitoring and the vertical logic
15 Vertical logic refers to the means–end relationship between activities and results, as well as the relationship between the results and their contribution to the broader objective (Module 2 of IOM Project Handbook, p. 122) (Internal link only). For more information on vertical logic, see the section, “The IOM Results Matrix” in chapter 3 of the IOM Monitoring and Evaluation Guidelines.
INFO
RMATION

IOM MONITORING AND EVALUATION GUIDELINES13
Figure 1.4. Evaluation and vertical logicEvaluation and the vertical logic
E�ectiveness
• Is the intervention achieving its objectives?
• To which extent has or is the interventionexpected to achieve its results, includingany di�erential results across groups?
Impact
• What di�erence does the intervention make?
• To which extent has the intervention,or is expected to generate signi�cantpositive or negative, intended orunintended, higher-level e�ects?
Efficiency
• How well were resources used?
• To which extent has, or is the interventionlikely to deliver results in an economic and timely way?
Sustainability•
•
Will the bene�t last?
To which extent will the bene�tsof the intervention continue, or are likely to continue?
Relevance• Is the intervention doing the right thing?
• To which extent are the intervention’sobjectives and design responding tobene�ciaries’, global, country and partner/institution needs, policies and priorities, and continue to do so ifcircumstances change?
Coherence• How well does the intervention �t?
• How compatible is the intervention with other interventions in a country,sector or institution?
Outputs
Activities
Objectives
Outcomes
Source: Adapted from IFRC, 2011. See also OECD, n.d.
Key differences between monitoring and evaluation
Monitoring Evaluation
Monitoring is the continuous, systematic collection of data/information throughout the implementation of an intervention as part of intervention management. It focuses on the implementation of an intervention, comparing what is delivered to what was planned.
Evaluation is a scheduled, periodic and in-depth assessment at specific points in time (before, during, at the end of or after an intervention). It is a specific process that assess this success of an intervention against an established set of evaluation criteria.
It is usually conducted by people directly involved in implementing the intervention.
It is usually conducted by people not having directly participated in the intervention.
It routinely collects data against indicators and compares achieved results with targets.
It assesses causal contributions of interventions to results and explores unintended results.
It focuses on tracking the progress of regular or day-to-day activities during implementation.
It assesses whether, why and how well change has occurred and whether the change can be attributed to the intervention.
It looks at production of results at the output and outcome level.
It looks at performance and achievement of results at the output, outcome, as well as the objective level.
It concentrates on planned intervention elements.It assesses planned elements and looks for unplanned change, searches for causes, challenges, risks, assumptions and sustainability.
INFO
RMATION

14 CHAPTER 1 Introduction to monitoring and evaluation
Other resourcesInternational Federation of Red Cross and Red Crescent Societies (IFRC)
2011 Project/Programme Monitoring and Evaluation (M&E) Guide. Geneva.
Organisation for Economic Co-operation and Development (OECD)n.d. OECD DAC Criteria for Evaluating Development Assistance.
1.6. Strategic orientation at IOM16
This section focuses on the strategic orientation at IOM and how it relates to M&E.
1.6.1. IOM Strategic Vision
What it states
The Strategic Vision spans 2019–2023 and is the Director General’s articulation of how IOM as an organization needs to develop over a five-year period in order to meet new and emerging responsibilities at the global, regional, country and project levels. The Strategic Vision will guide the Organization into the future and turn IOM’s aspirations into reality.
It has a number of different components, including the following: • Strategic goals, outlining what IOM should be in 2023;• Strategic priorities, based on a landscape assessment of what the next decade will bring, according to
three main pillars of work: resilience, mobility and governance (more detailed in the SRF); • Drivers for success, outlining areas of institutional development that will be needed to fully realize
the goals of the Organization.
The Strategic Vision is operationalized through the SRF, which defines four overarching global objectives for the Organization, accompanied by a limited number of long-term and short-term outcomes and outputs that articulate how these highest-level objectives will be reached. These high-level results and the key performance indicators that help measure them can and should be used within projects and programmes to ensure alignment with the Strategic Vision and other key global frameworks like the SDGs and the Global Compact for Migration.
• Internally, the Strategic Vision strengthens corporate identity at a critical moment, offering a common narrative about what is important about IOM’s work, issues in which the Organization expects to engage further, and how it wishes to strengthen as an organization. All staff, and particularly chiefs of mission, play a crucial role in understanding and embodying the vision at the country level.
• Externally, this document offers staff a framework for engaging in strategic discussion with Member States and other stakeholders and aims to bring coherence to IOM’s external brand.
Here are some ways on how to use the Strategic Vision and the related Strategic Results Framework
(a) Be familiar with the Strategic Vision and the institutional results framework.(b) Where possible, projects should be aligned to the SRF at the outcome or output levels.(c) Regional and country offices should align any future country or regional strategies with the Strategic
Vision and the SRF, although they still have flexibility to adjust for local needs.
16 The following information regarding strategic orientation is partially based on IOM, 2016a (Internal link only).
RESOURCES

IOM MONITORING AND EVALUATION GUIDELINES15
1.6.2. Migration Governance Framework17
What it states
MiGOF was endorsed by IOM Member States at the IOM Council in 2015. MiGOF is now the overarching framework for all of the Organization’s work. MiGOF is linked to the SDGs and represents an ideal for migration governance to which States can aspire.
MiGOF Principles and ObjectivesPr
inci
ples
O
bjectives1. Advance the
socioeconomic well-being of migrants and society.
1. Adherence to international
migrants’ rights.
2. Effectively address the mobility dimensions of crises.
2. Formulating policy using evidence and a “whole-of-government” approach.
3. Ensure that migration takes place in a safe, orderly
3. Engagement with partners to address migration and related issues.
The three principles propose the necessary
represent the means through which a State will ensure that the systemic requirements for good need to consider mobile categories of people and
address their needs for assistance in the event of an emergency, building resilience of individuals and
the economic and social health of the State.
PUB2020/009/L
MiGRATIONGOVERNANCEFRAMEWORK
MiGOF
Source: IOM, 2016b.
MiGOF is a migration system that promotes human mobility, which benefits migrants and society, when it:• Adheres to international standards and fulfils migrants’ rights;• Formulates policy using evidence and a “whole-of-government” approach; • Engages with partners to address migration and related issues.
The system also seeks to: • Advance the socioeconomic well-being of migrants and society;• Effectively address the mobility dimensions of crises; • Ensure that migration takes place in a safe, orderly and dignified manner.
17 For more information, see IOM, 2016b.
The essential elements for facilitatingorderly, safe, regular and responsible migration
and mobility of people through plannedand well-managed migration policies.
MiGRATIONGOVERNANCEFRAMEWORK

16 CHAPTER 1 Introduction to monitoring and evaluation
1.6.3. Sustainable Development Goals18
What it states
The SDGs were adopted by the United Nations General Assembly in September 2015. With the SDGs, migration has, for the first time, been inserted into mainstream development policy. The central reference to migration in the 2030 Agenda is Target 10.7 under the goal “Reduce inequality in and among countries”. It is a call to “facilitate orderly, safe, regular and responsible migration and mobility of people, including through the implementation of planned and well-managed migration policies”. However, migration and migrants are directly relevant to the implementation of all the SDGs and many of their targets. The SDGs, and the commitment to leave no one behind and to reach the furthest behind, will not be achieved without due consideration of migration. IOM’s Migration and the 2030 Agenda: A Guide for Practitioners outlines these interlinkages in detail.
IOM has helped the international community implement and monitor progress on the 2030 Agenda through the following:
• Establishing IOM’s Institutional Strategy on Migration and Sustainable Development, which is guiding IOM in the necessary steps to ensure that migration governance can contribute to achieving the 2030 Agenda;
• Supporting United Nations Country Team (UNCT) and Member States integrate migration considerations into Common Country Analysis (CCAs) and United Nations Sustainable Development Cooperation Framework (UNSDCF);
• Supporting Member States to measure and report on migration governance within Voluntary National Reviews for the High-Level Political Forum dedicated to reviewing progress on the 2030 Agenda;
• Implementing joint programming with other UN agencies and actors to ensure development actions are coherent with and complementary to efforts to ensure good migration governance;
• Providing development actors and donors with the tools and support to integrate migration into development cooperation efforts for enhanced aid effectiveness;
• Supporting Member States to mainstream migration into policy planning and programming across sectors and general development planning for enhanced development impact;
• Furthering global dialogue and exchange on migration and sustainable development by supporting fora and platforms such as the Global Forum on Migration and Development;
• Developing tools to analyse gaps in migration governance such as the Migration Governance Indicators;
• Developing tools and providing technical assistance within the context of the UN Network on Migration to help governments and UNCTs leverage the implementation of the Global Compact for Migration for sustainable development outcomes.
18 IOM, 2018d.

IOM MONITORING AND EVALUATION GUIDELINES17
What do the Sustainable Development Goals mean for IOM’s work and monitoring and evaluation?
Within IOM’s institutional strategy on migration and sustainable development, IOM has committed to three main outcomes: (a) human mobility is increasingly a choice; (b) migrants and their families are empowered; and (c) migration is increasingly well-governed. To achieve these outcomes, IOM has committed to four institutional outputs: (a) improved policy capacity on migration and sustainable development through a more robust evidence base and enhanced knowledge management; (b) stronger partnerships across the United Nations development system and beyond that harness the different expertise and capabilities of relevant actors on migration and sustainable development; (c) increased capacity to integrate migration in the planning, implementation, monitoring and reporting of the 2030 Agenda; and (d) high-quality migration programming that contributes to positive development outcomes.
In relation to output (a), having a stronger evidence base on migration and sustainable development is crucial if the development potential of migration will be capitalized. Enhancing IOM’s capacity to apply quality M&E in its programming from a development perspective will be crucial in this regard. This will also help enhance IOM’s capacity to showcase how its work supports the achievement of the 2030 Agenda through high-quality programming that contributes to development outcome, as outlined in output (d). IOM also has the responsibility to support its Member States achieve the same and ensure that monitoring, evaluation and reporting on migration governance efforts is aligned with and contribute to their efforts to achieve the 2030 Agenda. Thus, output (b) on building stronger partnerships across the United Nations development system and beyond will be crucial to ensure that migration is firmly featured in UNSDCF and other development agendas, as well as national and local policies and programming. IOM’s role as coordinator of the United Nations Network on Migration will allow the Organization to achieve this within UNCTs. IOM has developed an action plan to achieve all of this and which is driven by IOM’s Migration and Sustainable Development Unit and overseen by IOM’s organization-wide Working Group on the SDGs.
As part of IOM’s effort to track progress on the migration aspects of the SDGs, IOM and the Economist Intelligence Unit published a Migration Governance Index in 2016. Based on MiGOF categories, the Index, which is the first of its kind, provides a framework for countries to measure their progress towards better migration governance at the policy level.
INFO
RMATION

18 CHAPTER 1 Introduction to monitoring and evaluation
1.6.4. United Nations Sustainable Development Cooperation Framework19
What it states
The UNSDCF (formerly the United Nations Development Assistance Framework or UNDAF) is now “the most important instrument for planning and implementation of the United Nations development activities at country level in support of the implementation of the 2030 Agenda for Sustainable Development”.20
It is a strategic medium-term results framework that represents the commitment of the UNCT of a particular country to supporting that country’s longer-term achievement of the SDGs. Furthermore, it is intended as an instrument that drives strategic planning, funding, implementation, monitoring, learning, reporting and evaluation for the United Nations, in partnership with host governments and other entities.
The UNSDCF explicitly seeks to ensure that government expectations of the United Nations development system will drive its contributions at the country level and that these contributions emerge from an analysis of the national landscape vis-à-vis SDG priorities. It is therefore “the central framework for joint monitoring, review, reporting and evaluation of the United Nations development system’s impact in a country achieving the 2030 Agenda [for Sustainable Development]”.21
Ä For more information regarding the UNSDCF, see The Cooperation Framework.
Key recommendations to include migration in the United Nations Sustainable Development Cooperation Framework • Establish working relations with the resident coordinator and ensure they are up to date on IOM
work.• IOM should engage fully with the new generation of UNCTs to ensure that migration issues,
including displacement and other effects of crisis, are reflected in CCAs, cooperation frameworks and broader UNCT priorities.
• IOM should participate in – and where possible lead – any country-level inter-agency coordination forums around the UNSDCF to facilitate the inclusion of the perspectives of migrants and migration-affected communities in all development processes.
• Introduce IOM strategies and work in countries with cooperation frameworks, aligning outcomes, outputs and indicators. This will also facilitate country-level reporting in UN Info.
19 UNSDG, 2019.20 Ibid.21 Ibid., p. 8.

IOM MONITORING AND EVALUATION GUIDELINES19
1.6.5. Migration Crisis Operational Framework22
What it states
The Migration Crisis Operational Framework (MCOF) was approved by IOM Council in 2012 and combines humanitarian activities and migration management services. Some of the key features of MCOF are as follows:
• It is based on international humanitarian and human rights law and humanitarian principles.
• It combines 15 sectors of assistance related to humanitarian activities and migration management services.
• It covers pre-crisis preparedness, emergency response and post-crisis recovery.
• It complements existing international systems (such as cluster approach) and builds on IOM’s partnerships.
MCOF helps crisis-affected populations, including displaced persons and international migrants stranded in crisis situations in their destination/transit countries, to better access their fundamental rights to protection and assistance.
What does Migration Crisis Operational Framework mean for IOM’s work and monitoring and evaluation?
MCOF should be adapted to each context and can be used for analysing the migration patterns in a country and developing a strategic direction of a country together with MiGOF. Projects and programmes should be aligned to MCOF, and MCOF strategy progress should be monitored through specific and measurable results.
22 IOM, 2012.

20 CHAPTER 1 Introduction to monitoring and evaluation
1.6.6. Global Compact for Safe, Orderly and Regular Migration
What it states
The Global Compact for Migration is the first intergovernmentally negotiated agreement, prepared under the auspices of the United Nations, covering all dimensions of international migration in a holistic and comprehensive manner. It is a non-binding document that respects States’ sovereign right to determine who enters and stays in their territory and demonstrates commitment to international cooperation on migration. It presents a significant opportunity to improve the governance of migration to address the challenges associated with today’s migration, as well as strengthen the contribution of migrants and migration to sustainable development. The Global Compact for Migration is framed in a way consistent with Target 10.7 of the 2030 Agenda in which Member States commit to cooperate internationally to facilitate safe, orderly and regular migration. The Global Compact for Migration is designed to:
• Support international cooperation on the governance of international migration;• Provide a comprehensive menu of options for States from which they can select policy options to
address some of the most pressing issues around international migration; • Give States the space and flexibility to pursue implementation based on their own migration realities
and capacities.
The Global Compact for Migration contains 23 objectives for improving migration management at all levels of government. The 23 objectives can be found in paragraph 16 of the United Nations General Assembly Resolution adopting the Global Compact for Safe, Orderly and Regular Migration.23
23 United Nations, 2018b.
IOM resources2012 Resolution No. 1243 on Migration Crisis Operational Framework. Adopted on 27 November.
2016a IOM Chiefs of Mission Handbook 2016. Geneva (Internal link only).
2016b Migration Governance Framework. Brochure. Geneva.
2018d Migration and the 2030 Agenda: A Guide for Practitioners. Geneva.
2020b Strategic Vision: Setting a Course for IOM. Geneva.
Other resources United Nations
2018a United Nations General Assembly Resolution 72/279 on Repositioning of the United Nations development system in the context of the quadrennial comprehensive policy review of operational activities for development of the United Nations System. Adopted on 31 May (A/RES/72/279).
2018b United Nations General Assembly Resolution 73/195 on the Global Compact for Safe, Orderly and Regular Migration. Adopted on 19 December (A/RES/73/195).
n.d. United Nations Sustainable Development Goals.
United Nations Sustainable Development Group (UNSDG)2019 United Nations Sustainable Development Cooperation Framework – Internal Guidance.
RESOURCES

CHAPTER 2
Norms, standards and management for
monitoring and evaluation

22 CHAPTER 2 Norms, standards and management for monitoring and evaluation
NORMS, STANDARDS AND MANAGEMENT FOR MONITORING AND EVALUATION
2The following chapter contains links to resources relevant to the content presented. Some resources presented are internal to IOM staff only and can be accessed only by those with IOM login credentials. These resources will be updated on a regular basis. To see the updated resources, kindly follow this link.
List of abbreviations and acronyms ........................................................................................... 23
2.1. Professional norms and standards in monitoring and evaluation ............................... 242.1.1. Professionalism and integrity in monitoring and evaluation .................................................. 272.1.2. Informed consent ..................................................................................................................................... 29
2.2. Monitoring and evaluation management: Roles and responsibilities .......................... 302.2.1. Evaluation ...................................................................................................................................................... 312.2.2. Monitoring ................................................................................................................................................... 332.2.3. Budgeting for monitoring, as well as for evaluation ................................................................... 37
Annexes ........................................................................................................................................... 40

IOM MONITORING AND EVALUATION GUIDELINES23
List of abbreviations and acronyms
ALNAP Active Learning Network for Accountability and Performance
AOAC Audit and Oversight Advisory Committee
CoM chief of mission
IFRC International Federation of Red Cross and Red Crescent Societies
M&E monitoring and evaluation
ODI Overseas Development Institute
OECD Organisation for Economic Co-operation and Development
OECD-DAC Organisation for Economic Co-operation and Development – Development Assistance Committee
OIG Office of the Inspector General
OIG/Evaluation Office of the Inspector General’s Central Evaluation function
PRIMA Project Information and Management Application
ToR terms of reference
UNEG United Nations Evaluation Group

24 CHAPTER 2 Norms, standards and management for monitoring and evaluation
Chapter 2 | Norms, standards and management for monitoring and evaluationProfessional norms and standards for monitoring and evaluation (M&E) serve as a framework to contribute to the improvement of IOM’s M&E functions, as well as to the greater effectiveness of its interventions. This chapter will first explain the norms and standards related to M&E. It will then look at key components of managing M&E, including related roles and responsibilities in the IOM context, as well as budgeting requirements for M&E.
2.1. Professional norms and standards in monitoring and evaluationAs a member of the United Nations Evaluation Group (UNEG), IOM operates under the UNEG Norms and Standards for Evaluation.1 At IOM, it is the Office of the Inspector General’s Central Evaluation function (OIG/Evaluation) that is responsible for promoting these norms and standards and ensuring that they are implemented and respected.
The information in this chapter of the IOM Monitoring and Evaluation Guidelines derives from both the IOM Evaluation and Monitoring Policies. Together, the policies define IOM’s position on, and provide instruction related to, the purpose of M&E within the Organization, the norms and standards adopted, as well as the M&E criteria to be used, M&E-related roles and responsibilities and budgeting requirements.
This chapter, as well as the evaluation and monitoring policies, specifically mention some of the key UNEG norms and standards frequently used and/or that can be applied institutionally within the context of IOM .
The table below provides a summary of the guiding norms and standards. While there are no UNEG norms and standards for monitoring, the IOM Monitoring Policy adapted the evaluation norms and standards as “principles for monitoring”; these are listed below followed by the evaluation norms and standards:
Guiding monitoring principles and evaluation norms and standards
Monitoring
Principles
Impartiality Mitigating the presence of bias applies to any monitoring actions and reporting.
Utility Monitoring must serve the information needs of the intended users for a maximum benefit. Monitors shall ensure that the work is well informed, relevant, timely and clearly and concisely presented. Monitoring reports should present evidence, progress, issues and recommendations in a comprehensive and balanced way. Reports should be both results and action oriented.
Transparency All stages of the monitoring processes should be transparent; consultation with major stakeholders is essential and involves clear and regular communication, including the scheduling and scope of specific monitoring missions and activities. Documentation resulting from monitoring should be easily consultable and readable to guarantee transparency and legitimacy.
1 See UNEG, 2016a; see also the IOM Evaluation web page for a full listing of the norms and standards and further relevant references.

IOM MONITORING AND EVALUATION GUIDELINES25
CredibilityMonitoring shall be based on data and observations using systems and tools that can guarantee quality and reliability. Monitoring reports shall reflect consistency and dependability in data, findings, judgements and lessons learned.
Disclosure The reporting and lessons from monitoring shall be disseminated by establishing effective feedback loops to relevant departments, operational staff and, when relevant, to beneficiaries and other stakeholders.2
Participation Whenever relevant, IOM monitoring activities shall be carried out with the participation of relevant stakeholders, such as affected populations or beneficiaries, donors, national and international government agencies, non-governmental organizations, civil society organizations, the private sector and/or representatives of local communities.
Evaluation
Norms
Intentionality and utilityIn the context of limited resources, evaluations must be selected and undertaken with a clear intention of use and in a timely manner for decision-making with relevant and useful information.
Impartiality This is mitigating the presence of bias at all stages of the evaluation process, including planning an evaluation, formulating the mandate and scope, selecting the evaluation team, providing access to stakeholders, conducting the evaluation with the necessary methodological rigour and presentation of key findings, recommendations and challenges. It provides legitimacy to evaluation and reduces the potential for conflict of interest.
Independence The evaluation function should be independent from other management functions so that it is free from undue influence. It needs to have full discretion in directly submitting its reports for consideration at the appropriate level of decision-making. To avoid conflict of interest and undue pressure, evaluators need to be independent and must not have been directly responsible for the policy setting, design or overall management of the subject of evaluation. They must have no vested interest and have the full freedom to impartially conduct their evaluative work. They must be able to express their opinion in a free manner, without potential negative effects on their professional status or career development. Independence of the evaluation function should not impinge the access of evaluators to information about the evaluation.
Transparency and consultation These are essential features in all stages of the evaluation process, particularly with the major stakeholders, as they establish trust, build confidence, enhance ownerships and increase accountability. They also guarantee credibility (another UNEG norm) and quality of the evaluation and facilitate consensus-building and ownership of the findings, conclusions and recommendations.
2 For the purpose of the IOM Monitoring and Evaluation Guidelines, IOM uses the OECD/DAC definition of beneficiary/ies or people that the Organization seeks to assist as “the individuals, groups, or organisations, whether targeted or not, that benefit directly or indirectly, from the development intervention. Other terms, such as rights holders or affected people, may also be used.” See OECD, 2019, p. 7. The term beneficiary/ies or people that IOM seeks to assist, will intermittently be used throughout the IOM Monitoring and Evaluation Guidelines, and refers to the definition given above, including when discussing humanitarian context.

26 CHAPTER 2 Norms, standards and management for monitoring and evaluation
Standards
Disclosure policy All evaluations are expected to be publicly available and listed on the IOM Evaluation web page and under other specific web pages as deemed necessary, with due regard to IOM’s Data Protection Principles (IN/00138). All additional evaluation products (such as annual reports, evaluation plans, terms of reference (ToR), evaluation management responses and evaluation briefs) should also be shared when requested.
Competencies Evaluation competencies refer to the qualifications, skills, experience, educational background and attributes required to carry out roles and responsibilities within an evaluation process, as well as ensure the credibility and quality of the evaluation process. All those engaged in promoting, designing, conducting and managing evaluation activities should aspire to promote and conduct high-quality work, guided by professional standards and ethical evaluation principles. Some of these elements are also included in the professionalism norm, which should be supported by an enabling environment, institutional structures and adequate resources. Internal and external evaluators should also abide by these principles and show sufficient professional competencies to conduct evaluations.
Management response and follow-up In addition to the comments on the draft report that are requested from stakeholders, including managers (programme managers, chiefs of mission (CoMs), directors of department), evaluations may also require an explicit response by the management to endorse or challenge the report and its recommendations. This may take the form of a management response, an action plan on the follow-up of recommendations and/or an agreement on the assignment of responsibilities and accountabilities. A periodic report on the status of the implementation of the evaluation recommendations may be asked of the office/manager, particularly when addressing sensitive reports that require close follow-up.
Evaluability Before undertaking complex evaluations requiring a significant investment, it may be useful to conduct an evaluability assessment to examine the scope and financial implications of the evaluation, fine-tune methodological approaches, such as for data collection and availability analysis, and decide on the evaluation criteria. It may be necessary to conduct preliminary surveys or focus groups to ensure that the evaluation will provide timely and credible information for decision-making and guarantee an impartial evaluation process.
Conduct of evaluations Each evaluation should use design, planning and implementation processes that are inherently quality oriented, covering appropriate methodologies for data collection, analysis and interpretation. All evaluations must first be framed and prepared through ToR, providing the evaluation objective(s), scope, methodology, resources required and implementation workplan. Evaluators should be required to develop an evaluation matrix or inception report clearly showing how they understand the scope and approach to the evaluation. Evaluation reports must present, in a complete and balanced way, the evidence, findings, conclusions and recommendations. They must be brief, to the point and easy to understand.3
Quality control and assurance4
Quality control and assurance mechanisms should be put in place at each stage of the evaluation process. OIG can provide such services, in line with UNEG guidelines, and for decentralized evaluations, the regional M&E officers can be consulted.
3 For more information on the conduct of evaluations, see chapter 5 of the IOM Monitoring and Evaluation Guidelines. 4 For more information on quality control and assurance, see chapter 5 of the IOM Monitoring and Evaluation Guidelines.

IOM MONITORING AND EVALUATION GUIDELINES27
The evaluation norm and standard, and monitoring principle of ethics
M&E practitioners must have personal and professional integrity, and evaluations or monitoring activities should not reflect personal or sectoral interests.5 They must respect the right of institutions and individuals to provide information in confidence, take care that those involved have a chance to examine the statements made and ensure that sensitive data cannot be traced to its source. Evaluators and monitors must be sensitive to the beliefs, manners and customs of the social and cultural environments in which they work and must address issues of discrimination and gender inequality. They may sometimes uncover evidence of wrongdoing, which must be reported to the appropriate investigative body with the required confidentiality. Evaluators are not expected to evaluate the personal performance of individuals, but rather must balance an evaluation of management functions with due consideration for this principle.
M&E practitioners should be aware of and act in accordance with the UNEG Ethical Guidelines for Evaluation (2020).6
2.1.1. Professionalism and integrity in monitoring and evaluation
M&E practitioners should not violate ethical principles or compromise their independence when collecting and analysing M&E data.
Practices that may violate monitoring and evaluation ethical principles
Although there are many more ways in which this can happen, here are some common examples:
• Altering and producing positive findings due to a conflict of interest, other pay-offs or to avoidpenalties
• Allowing unsubstantiated opinions to influence the monitoring and/or evaluation activities as a resultof sloppy, unreliable or unprofessional evaluation or monitoring practices
• Allowing personal bias to influence findings• Making promises to beneficiaries or participants that cannot be kept in order to induce them to
cooperate• Failing to honour commitments that should have been honoured7
In addition, having a misunderstanding of their responsibilities may also lead M&E practitioners to violate ethical principles. This may result in faulty reasoning, including in overgeneralizing findings from data, drawing conclusions based on too little data or allowing their own prejudice to cloud their objectivity during data collection and analysis. Ethical problems may arise at any point during data collection and analysis process.
5
6
7
For the purpose of the IOM Monitoring and Evaluation Guidelines, the term M&E practitioner refers to any IOM staff who is involved in M&E activities. See also the IOM Evaluation web page for more information on UNEG Ethical Guidelines for Evaluation. Worthen et al., 2004.
INFO
RMATION
EXAMPLE

28 CHAPTER 2 Norms, standards and management for monitoring and evaluation
Practices that may result in faulty reasoning
The following are a few examples of some misunderstandings that M&E practitioners may encounter during either monitoring or evaluation exercises.
Commissioning entity
• Decides on the findings before the M&E exercise takes place• Uses the findings in an unethical or questionable fashion, such as violating confidentiality• Declares certain research questions are off limits, despite their relevance• Modifies findings before they are made public • Pressures the evaluator or monitor to alter the presentation of findings • Suppresses or ignores findings8
• Seeks to influence how data will be gathered by potentially limiting access to some sources of data
Monitoring and evaluation practitioner
• Discovers illegal, unethical or dangerous behaviour during the monitoring and/or evaluation process and decides not to inform the relevant stakeholders
• Is reluctant to present findings fully, for unspecified reasons• Reports certain findings that could violate confidentiality• Uses findings as evidence against someone9 • Involves participants in data collection processes that lead to reigniting pre-existing tensions or
traumas within the enumerated communities
Participants and other stakeholders
• Expect that their participation will lead to personal benefits
Negative consequences could arise from unethical behaviours that could have an impact on ongoing and/or future programming.
Preventive measures to address ethical concerns
While the ethical problems that M&E practitioners encounter are vast and vary by context, the following are some preventive measures that can be taken to address situations presented above:
• Have a clear understanding of the goals and objectives of the monitoring and/or evaluation exercise and the different roles of all actors involved.
• Inform and ensure common understanding of methodologies and approaches.• Share evaluation findings with the client and key stakeholders.• Collaborate with key stakeholders in a participatory manner.• Discuss the possibility of obtaining negative findings at the outset so that they can be used for
improvements and lessons learned.• Emphasize the M&E staff’s independence and their responsibility to stand by the data and findings. • Be aware of power dynamics within a team and within the community/groups.
8 Morris and Cohn, 1993.9 Ibid.
EXAMPLE

IOM MONITORING AND EVALUATION GUIDELINES29
• Involve multiple stakeholders including vulnerable groups and women• Prioritize safety over data collection needs; do not conduct interviews where it may compromise the
safety of the interviewee; ensure participants understand their rights and give their informed consent• Ensure that interviews are trauma-informed to avoid re-traumatizing participants
Ä Note: If traumatized participants cannot be linked to relevant services, do not ask questions that may trigger a trauma response. Be sure to seek guidance from relevant thematic specialists or experts when monitoring or evaluation requires direct contact with affected populations at high risk of trauma.
Where there is a breakdown in social relations, ask trusted members of the community to introduce the monitoring and/or evaluation process.
Ä Note: Be transparent. Explain the purpose, constraints and for what purpose and how the data will be used and stored.10
Throughout the development and implementation of M&E activities, practitioners must adhere to common ethical principles in order to guarantee that the information gathered is accurate, relevant, timely and used in a responsible manner. An ethical monitoring and/or evaluation checklist, found in Annex 2.1, may be used in order to ensure that norms and standards, including ethical principles, inform all stages of data collection, analysis and reporting.
2.1.2. Informed consent
In order to satisfy the key ethical considerations outlined above, it is critical to obtain informed consent from the individuals from whom that data is collected. Informed consent is the permission granted by a person to have their personal data collected and analysed upon having understood and agreed to the following:
(a) Purpose of the collection, processing and sharing of their personal data;(b) Data users; (c) Any risks associated with the collection, processing or sharing of the data.
Sufficient information should be provided to the participant so that they may have the ability to independently judge and decide on whether or not to grant their consent to participate in the interview or research. Although informed consent may be obtained in writing or through a verbal statement by participants, it is advised to obtain it in writing, circumstances permitting (see IOM Informed Consent Template).11 A checklist to help support the process of attaining informed consent is available in Annex 2.2. Informed consent checklist.
10 Buchanan-Smith et al., 2016. 11 Available internally to IOM staff via the IOM intranet.

30 CHAPTER 2 Norms, standards and management for monitoring and evaluation
IOM resources 2018a IOM Evaluation Policy. Office of the Inspector General (OIG), September.
2018b Monitoring Policy. IN/31. 27 September.
External resourcesBuchanan-Smith, M., J. Cosgrave and A. Warner
2016 Evaluation of Humanitarian Action Guide. Active Learning Network for Accountability and Performance/Overseas Development Institute (ALNAP/ODI) London.
Morris, M. and R. Cohn1993 Program evaluators and ethical challenges: A national survey. Evaluation Review, 17(6):621–642.
Organisation for Economic Co-operation and Development (OECD)2019 Better Criteria for Better Evaluation: Revised Evaluation Criteria Definitions and Principles for Use.
OECD/Development Assistance Committee (DAC) Network on Development Evaluation.
United Nations Evaluation Group (UNEG)2016a Norms and Standards for Evaluation. New York.
2020 UNEG Ethical Guidelines for Evaluation.
Worthen, B.R., J.R. Sanders and J.L. Fitzpatrick 2004 Program Evaluation: Alternative Approaches and Practical Guidelines. Third edition. Pearson Education
Inc., Boston.
2.2. Monitoring and evaluation management: Roles and responsibilitiesThe IOM Project Handbook states that the responsibility for monitoring interventions and planning for and managing evaluation falls on the manager responsible for the intervention (strategy, project or programme). However, the manager can, and should, be supported by other IOM staff to ensure proper M&E efforts are put in place. This will depend largely on budget and resources allocated.
RESOURCES

IOM MONITORING AND EVALUATION GUIDELINES31
Frequently, there is a wide range of people with some related M&E responsibilities within their ToR. Therefore, it is essential to clearly identify a staff member that others can turn to for M&E guidance and accountability. This person should oversee the coordination and supervision of M&E functions, as well as highlight and report any potential challenges that may arise.
The following sections provide a brief overview of some of the competencies required, and challenges faced, when managing and conducting monitoring, as well as evaluation, in an intervention.
2.2.1. Evaluation
Evaluation at IOM works at two different levels: a central evaluation function overseen by the OIG and at a decentralized level, which includes all evaluation activities and matters that are managed and overseen by other departments and offices at IOM. For more information on decentralized evaluation, see chapter 5.
OIG/Evaluation aims to contribute actively to the oversight, accountability, transparency, strategic guidance and organizational leadership and learning of the Organization. This includes providing technical guidance and support to IOM departments and offices and contributing to the set-up of decentralized evaluation systems.
In this regard, roles and responsibilities related to evaluation rest with different entities at IOM, namely the Director General, the Inspector General, IOM Audit and Oversight Advisory Committee, OIG/Evaluation Unit, directors of regional offices and departments, regional M&E officers, CoMs/heads of offices, project or programme managers and M&E staff in country offices as summarized below. A full and detailed list of responsibilities is found within the IOM Evaluation Policy.12
Director General Responsible for guaranteeing that attention is given to evaluation within IOM, including by allocating relevant resources. The Director General endorses the OIG/Evaluation Unit workplan and supports OIG-implemented evaluations.
Inspector General
Holds an oversight function by approaching policies, guidelines and strategies related to evaluation, as well as approving the OIG biannual workplan for further submission to the Director General. The Inspector General also promotes evaluation across the Organization as a mechanism for corporate learning and accountability.
IOM Audit and Oversight Advisory Committee (AOAC)
Reviews the functioning, operational independence and effectiveness of OIG, including its evaluation function, as well as provides advice on the status of evaluation at IOM.
12 IOM, 2018a.

32 CHAPTER 2 Norms, standards and management for monitoring and evaluation
OIG/Evaluation
Responsible for actively contributing to the oversight, accountability, transparency, strategic guidance and organizational leadership and learning of IOM. It sets norms and standards for evaluation in IOM, preparing relevant institutional policies and instructions, harmonizing procedures, as well as providing technical guidance and support to IOM departments and offices.
Among its prescribed tasks, OIG/Evaluation:
• Contributes to the set-up of decentralized evaluation systems and guarantees their quality;
• Conducts central and corporate evaluations, as well as specific evidence-based assessments and independent reviews;
• Contributes to policy and decision-making; • Establishes the framework that provides overall guidance, quality assurance and
technical assistance and capacity-building for evaluation, as well as supports professionalization;
• Promotes an evaluation culture and the use of evaluation inside IOM; • Participates in evaluation networks with regional and international organizations,
the United Nations, Member States and donors.
Directors of regional offices and departments
At an institutional level, directors of IOM regional offices and of departments in IOM are responsible for the following: (a) contributing to the development of the workplan for central evaluations conducted by OIG/Evaluation; (b) promoting the use of evaluation as strategic tools and facilitating the conduct of evaluation; (c) ensuring that relevant staff/offices support the conduct of evaluation; and (d) where relevant, ensure that a management response and follow-up is provided.
For decentralized evaluation, directors are responsible for identifying and planning evaluations, such as making resources available and ensuring conformity to IOM’s mandatory policy of including evaluation in all projects.
Regional M&E officers
Responsible for preparing evaluation workplans for their respective regions; preparing and/or undertaking evaluations of IOM interventions within their region; promoting the use of evaluation; providing technical support and capacity-building for the planning and conduct of quality evaluation.
Regional M&E officers also contribute to the development of evaluation guidelines and methods for evaluation under OIG/Evaluation guidance. They promote and ensure the application of the IOM Evaluation Policy and guidelines; reinforce partnership with, and participation in, regional evaluation networks; and inform and consult with OIG/Evaluation on technical support and quality assurance matters.
CoMs
For all evaluations within their country office (central and decentralized), CoMs are responsible for facilitating the conduct of evaluations. This includes ensuring the involvement of relevant staff/sub-offices and the provision of timely feedback. CoMs ensure a management response is provided and steps are taken to implement and support follow-up actions on agreed evaluation recommendations.
For decentralized evaluations within their country office, CoMs are responsible for the following: (a) identifying and planning evaluations, including making appropriate resources available; (b) ensuring that evaluations implemented conform with the IOM Evaluation Policy; and (c) informing and consulting with regional M&E officers and OIG/Evaluation for technical support and quality assurance, when required.

IOM MONITORING AND EVALUATION GUIDELINES33
Project/Programme managers and M&E staff in country offices
For project/programme evaluation, M&E staff can help develop plans, including evaluation ToR, although the programme or project manager remains responsible for understanding and approving all plans. M&E staff and focal points within country offices may be expected to play a role in evaluation by organizing and/leading self-evaluation.
For all evaluations (centralized and decentralized) of their intervention(s), managers and M&E staff in country offices facilitate the conduct of the evaluation, ensure relevant staff and other offices are involved and provide timely feedback and guarantee that a management response is provided and followed up.
For decentralized evaluations, intervention managers and M&E staff identify and plan evaluations, including by making resources available in line with intervention budgets and evaluation scope, principles, norms and quality provisions. Managers and M&E staff ensure that evaluation is included for all IOM projects or provide a justification for when it is not included, as well as assess the possibility for including evaluation at a later stage of implementation.
Managers and M&E staff should inform and consult with their respective regional M&E officer and/or OIG/Evaluation for technical support and quality assurance when required.
Roles and responsibilities in evaluating a strategy or policy
In the case of a strategy that is owned at the country level, such as a country strategy, the entity responsible for its development and implementation should also be responsible for evaluating it, as required, and ensuring that relevant programmatic evaluations also take it into consideration.
2.2.2. Monitoring
As previously mentioned, in a programme or project, the ultimate responsibility for monitoring rests with the appropriate programme or project manager. For strategies and policies, the responsible owner of the intervention is responsible for monitoring the progress of that strategy or policy. When possible, it is recommended that IOM offices hire dedicated M&E officers to conduct M&E of relevant interventions and provide the required monitoring support to CoMs, managers or other administrative and operational staff in the office. The recruitment of dedicated M&E officers is also adapted to complex working environments, involving multiple implementing partners, locations, restricted areas and large budgets.
INFO
RMATION

34 CHAPTER 2 Norms, standards and management for monitoring and evaluation
Overall monitoring responsibilities
Intervention Responsibility for monitoring
Organization-wide strategies or policies
Relevant Headquarters departments/divisions (such as the Human Resources Strategy by Human Resources Management, the IT Strategy by Information and Communications Technology Unit, the Migration Crisis Operational Framework by the Department of Operations and Emergencies and the Gender Policy by Gender Coordination Unit).
Regional strategies Regional directors, in coordination with the senior regional advisors.
Country strategies CoMs, in coordination with the regional directors.
Programmes and projects
CoMs are responsible for ensuring that programme and project managers are monitoring or integrating monitoring systems in their projects/programmes. Managers are responsible for monitoring their own programmes or projects.
Key roles and responsibilities of monitoring across the various levels within IOM13
Responsible unit Summary description of key monitoring-related responsibilities
OIG/Evaluation
Specific responsibilities include the following:
• Developing and/or assisting in the development of monitoring policies and guidance materials for the Organization to facilitate the implementation of effective monitoring, in coordination with relevant departments;
• Providing training on monitoring, in coordination with relevant departments and regional offices;
• Managing a community of practice on M&E;• Providing technical support on monitoring upon request and often in coordination
with the regional M&E officers.
Headquarters departments, divisions and units, and regional thematic specialists
Provide monitoring guidance and instructions within their area of technical expertise (such as Migration Health Division for health projects). They are also responsible for monitoring their own relevant policies and strategies, ensuring that project monitoring systems are linked to the strategic objectives and assisting offices in finding timely solutions to problems through effective monitoring.
Regional directorsEnsure collaboration for monitoring the implementation of regional policies and strategies and instruct the endorsement of projects in the region to ensure the relevant inclusion of monitoring systems.
Regional M&E officers
Regional M&E officers responsibilities include the following:
• Develop/adapt tools, methods and workplans for monitoring at the regional office level, in coordination with the regional director, country offices and OIG, based on assessed needs and priorities in the region;
• Provide technical support and capacity-building on monitoring to offices and projects in the region, including liaising with relevant partners/stakeholders;
• Conduct monitoring visits of high-profile or high-risk projects requiring independent monitoring or urgent technical guidance, considering regional offices M&E annual workplans.
13 The full list of roles and responsibilities for monitoring across various levels within the Organization can be found in IOM, 2018b, pp. 5–6.

IOM MONITORING AND EVALUATION GUIDELINES35
Responsible unit Summary description of key monitoring-related responsibilities
Regional resources management officers
Provide support to country offices’ finance staff in monitoring financial expenditure and budgets.
CoMs
Ensure that all projects in the country office have sound monitoring mechanisms and tools in place and that the regional office is kept informed. Furthermore, if the country office has a strategy, the CoM should ensure that its implementation is being monitored.
Programme/Project managers
Programme/Project managers have the primary responsibility for monitoring progress of the project/programme, in both operational and financial terms, including what resources go into the project (inputs), what is carried out (activities) and what results come out (outputs and outcomes). Specifically, programme/project managers ensure that effective monitoring and control mechanisms are in place to gain assurance that items obtained under the project reach the targeted beneficiaries and to prevent fraud. They regularly monitor and measure progress, identifying and communicating any deviations or risks to relevant stakeholders and promptly taking corrective actions as necessary (such as requesting project implementation period extension or seeking donor approval to amend/revise the project activities, risk plan, results or budget).
In collaboration with finance staff, managers regularly review financial results, including line item reports, to minimize incidences of under/overspending, and where necessary, explain material under-over-spends and/or correct errors.
Country office M&E staff
M&E officers develop associated M&E tools and workplans at the country office level, including for implementing partners, in coordination with the CoM/head of office and the regional office, and based on a risks assessment of the projects being implemented within the country.
They also provide associated technical support and capacity-building to the office/projects on monitoring (input at project development, implementation and reporting levels) and conduct monitoring visits in accordance with project/programme workplans, including activities undertaken by implementing partners. M&E officers are also responsible for preparing relevant reports.
Note: Several country offices have M&E focal points. Focal points may not be able to conduct all these monitoring activities but can use the responsibilities as guidance for their role.
Country office resource management staff
Country office resource management staff assist managers in monitoring financial expenditure and ensure adherence with contractual requirements to donors and IOM procedures.
Monitoring and evaluation competencies
When thinking of M&E roles and responsibilities, it is useful to consider essential competencies for such roles. Competencies are a combination of knowledge and skills required for practitioners to execute complex tasks in their professional environment. Despite the wide diversity of contexts within which M&E is conducted, the complexity of M&E systems and the fact that competencies may vary to some degree at different levels, the following are considered to be applicable for M&E staff.14
14 Adapted from UNAIDS, 2010.

36 CHAPTER 2 Norms, standards and management for monitoring and evaluation
Figure 2.1. Essential competencies for monitoring and evaluation staff
Essential monitoring and evaluation competencies
General management competencies
Ability to:
• Make sound decisions and lead a team to achieve results;• Identify gaps in monitoring policies, procedures and systems; • Provide pragmatic recommendations for improvement;• Negotiate effectively to achieve agreement and commitment;• Clearly articulate and communicate key messages;• Respond appropriately to communications from internal and external stakeholders.
Professional monitoring and evaluation staff competencies
Ability to:
• Develop and communicate a clear and convincing vision and mission for M&E;• Manage development strategies and M&E plans for implementation, including long- and short-term objectives,
risk assessments and resource implications;• Develop, regularly update, harmonize and communicate M&E plans, including identified data needs, indicators,
data collection procedures, methods, roles and responsibilities and budgets for implementing a functional M&E system;
• Manage planning and implementation of activities to build M&E capacity at individual, organizational and system levels;
• Develop programme M&E plans in coordination with programme management;• Ensure M&E arrangements comply with donor agreements and programme requirements;• Oversee IOM’s M&E teams effectively to ensure comprehensive and detailed coverage of projects; • Provide relevant information for performance management and evaluation of programme activities.

IOM MONITORING AND EVALUATION GUIDELINES37
Data collection, data management, data analysis, dissemination and use competencies
Ability to:
• Manage the implementation of procedures for routine monitoring, including reporting and data use for programme management and improvement;
• Manage population-based surveillance and/or surveys, including identification of data needs, data collection planning (including budgeting) and implementation, data analysis, report writing, dissemination, feedback and data use;
• Manage the implementation of data quality assurance policies and procedures appropriate to the type of data and data sources, including supportive supervision and data auditing;
• Manage the implementation of data management and data-sharing procedures;• Manage the dissemination of information in a targeted and timely manner;• Identify, articulate and support strategic use of data for programme management and improvement;• Guide the regular sharing of M&E findings with relevant stakeholders and ensure that monitoring data is
discussed in the appropriate forums in a timely manner.
When assessing M&E capacity, it is helpful to consider the following:15
Entry/Novice Proficient/Skilled Mastery/Expert
• Developing awareness/building knowledge
• Limited understanding of M&E• Limited experience• Unaware of potential problems• Unaware of questions to ask
• Applying knowledge routinely• Basic understanding of M&E• Moderate amount of experience• Solves problems as they arise• Aware of questions to ask and able
to access resources to answer the questions
• Using knowledge fluently and effectively• Advanced understanding of M&E• Extensive experience• Anticipates problems before they arise• Poses questions to the field• Sought out for input
2.2.3. Budgeting for monitoring, as well as for evaluation
As M&E are mandatory parts of any IOM intervention, related costs must be included in their respective budgets during the intervention development phase. Detailed guidance on budgeting for projects and programmes, including the incorporation of monitoring evaluation costs is available in the IOM Project Handbook, while specific guidance on budgeting for evaluation is presented in Annex 5.1 of chapter 5 in the IOM Monitoring and Evaluation Guidelines.16 For a strategy or policy, the department or office in charge of drafting should also set aside a budget for the M&E of this type of intervention during the development phase.
15 Ibid. 16 See IOM, 2017, pp. 155–158, 167, 169, 170 and 178 (Internal link only).

38 CHAPTER 2 Norms, standards and management for monitoring and evaluation
Budgeting for monitoring and evaluation during intervention development
Budgeting for an intervention is now done through IOM’s Project Information and Management Application (PRIMA).17 Budgets developed through PRIMA include lines specific for M&E costs, under the Operational Costs section of the budget template. How to incorporate M&E costs into a budget within PRIMA is described in the PRIMA User Guide (Internal link only).
M&E-related staff costs should be clearly mentioned under the Staff Costs section of the IOM Project Budget template in PRIMA. Similarly, specific costs related to M&E, such as conducting baseline assessments, post-intervention surveys and conducting evaluations, should be clearly mentioned in the designated M&E lines under the Operational Costs section of the IOM Project Budget in PRIMA.
Costs, such as for corresponding staff time and travel, are typically incorporated into the Staff and Office Costs section of the IOM Project Budget, unless subcontracted or performed by a partner or consultant, in which case these costs should be listed under the Operational Costs section either in the separate budget lines for Monitoring and Evaluation, as indicated in the budget template in PRIMA, or under the costs for the partner.
Figure 2.2. Budgeting for monitoring and evaluation
Evaluation 2–4%
Monitoring 3–6%
Total budget
M&E allocation5–10%
IOM recommends the same range for M&E as recommended by the wider evaluation community: 5–10 per cent of the total budget, with 2–4 per cent for evaluation and 3–6 per cent for monitoring. However, this cost breakdown is purely indicative and, whatever the size of the intervention, the amount allocated for an evaluation in IOM ranges from USD 3,000 to USD 30,000, taking into consideration that internal evaluations conducted by IOM staff are less expensive than external evaluations. For complex evaluations that may require more resources, specific discussions can take place with the donor(s) regarding higher budgeted amounts; for instance, impact evaluations may require an investment of at least of USD 70,000 and can easily reach a cost of USD 500,000.
Identifying the data source and collection methods required for M&E early in intervention development allows for the best estimation of the financial needs. The following highlights key considerations for planning the project/programme M&E budget.18
17 PRIMA is an institutional project information management solution. It is available internally to IOM staff via the IOM intranet.18 Adapted from IFRC, 2011.
INFO
RMATION

IOM MONITORING AND EVALUATION GUIDELINES39
Key considerations for planning an intervention monitoring and evaluation budget
• Incorporate regular costs related to M&E, such as field visits for data collection and/or conducting evaluations.
• Consider itemizing costs related to M&E by differentiating between human resources, such as hiring new staff and capital expenses, such as computer software, travelling and accommodation, conducting trainings, resources required for setting up an M&E system, developing new data collection tools and piloting tools.
• Using narrative descriptions of itemized requirements can clarify M&E requirements that may help encourage funding for M&E.
• Clearly highlighting M&E related costs will better reflect the true cost of an intervention.
• Stating clear M&E costs may help demonstrate institutional professionalism and commitment towards achieving results.
OIG/Evaluation has developed a sample M&E Budget Calculator, including example calculations depending on specific M&E needs.
IOM resources2010 IOM Data Protection Manual. Geneva.
2017 IOM Project Handbook. Second edition. Geneva (Internal link only).
2018a IOM Evaluation Policy. OIG, September.
2018b Monitoring Policy. IN/31. 27 September.
n.d.a OIG/Evaluation Strategy 2021–2023. OIG/Evaluation.
n.d.b IOM Informed Consent Form (Internal link only).
n.d.c PRIMA for All (Internal link only).
n.d.d OIG/Evaluation M&E Budget Calculator (Internal link only).
External resourcesBarnett, C. and L. Camfield
2016 Ethics in evaluation. Journal of Development Effectiveness, 8(4):528–534.
Buchanan-Smith, M., J. Cosgrave and A. Warner 2016 Evaluation of Humanitarian Action Guide. ALNAP/ODI, London.
International Federation of Red Cross and Red Crescent Societies (IFRC)2011 Project/Programme Monitoring and Evaluation (M&E) Guide. Geneva.
Morra-Imas, L.G. and R.C. Rist 2009 The Road to Results: Designing and Conducting Effective Development Evaluations. World Bank,
Washington, D.C.
RESOURCES
M&E
INFO
RMATION

40 CHAPTER 2 Norms, standards and management for monitoring and evaluation
Morris, M. 2003 Ethical considerations in evaluation. In: International Handbook of Educational Evaluation, Part 1.
Springer International Handbooks of Education (T. Kellaghan, D. Stufflebeam and L. Wingate, eds.). Kluwer Academic Publishers, Dordrecht, pp. 303–327.
2015a Professional judgment and ethics. In: Community Psychology: Foundations for Practice (V. Scott and S.M. Wolfe, eds.). SAGE Publications, pp. 132–156.
2015b Research on evaluation ethics: Reflections and an agenda. In: Research on Evaluation: New Directions for Evaluation, 2015(148):31–42.
Morris, M. and R. Cohn1993 Program evaluators and ethical challenges: A national survey. Evaluation Review, 17(6):621–642.
Organisation for Economic Co-operation and Development (OECD)2019 Better Criteria for Better Evaluation: Revised Evaluation Criteria Definitions and Principles for Use.
OECD/DAC Network on Development for Evaluation.
Prom-Jackson, S. and G. Bartsiotas 2014 Analysis of the Evaluation Function in the United Nations System . JIU/REP/2014/6. Joint Inspection
Unit of the United Nations, Geneva.
Thomson, S., A. Ansoms and J. Murison (eds.) 2013 Emotional and Ethical Challenges for Field Research in Africa: The Story Behind the Findings. Palgrave
Macmillan, Hampshire.
United Nations Evaluation Group (UNEG)2016a Norms and Standards for Evaluation. New York.
2016b Evaluation Competency Framework. New York.
2020 UNEG Ethical Guidelines for Evaluation.
UNAIDS 2010 Standards for a Competency-based Approach to Monitoring and Evaluation Curricula and
Trainings. Monitoring and Evaluation Reference Group, Geneva.
Worthen, B.R., J.R. Sanders and J.L. Fitzpatrick 2004 Program Evaluation: Alternative Approaches and Practical Guidelines. Third edition. Pearson Education
Inc., Boston.
Annexes
Annex 2.1. Ethical monitoring and/or evaluation checklist (Internal link only)
Annex 2.2. Informed consent checklist (Internal link only)

CHAPTER 3
Monitoring at IOM

42 CHAPTER 3 Monitoring at IOM
MONITORING AT IOM
3The following chapter contains links to resources relevant to the content presented. Some resources presented are internal to IOM staff only and can be accessed only by those with IOM login credentials. These resources will be updated on a regular basis. To see the updated resources, kindly follow this link.
List of abbreviations and acronyms ........................................................................................... 43
3.1. An overview of how to monitor ........................................................................................ 44
3.2. Programme theory ................................................................................................................ 44
3.3. Theory of Change .................................................................................................................. 453.3.1. What is the Theory of Change? .......................................................................................................... 453.3.2. When to use a ToC .................................................................................................................................. 463.3.3. How to develop a ToC ........................................................................................................................... 463.3.4. How to develop a Theory of Change using the if-then-because formula ........................ 513.3.5. How to review a Theory of Change that applies the if-then-because formula .............. 53
3.4. IOM Results Matrix ............................................................................................................... 563.4.1. The difference between the Theory of Change and a logical framework ........................ 573.4.2. Developing an IOM Results Matrix .................................................................................................. 593.4.3. Results Matrix terminology ................................................................................................................... 613.4.4. Results Monitoring Framework .......................................................................................................... 71
3.5. Types of monitoring: An overview ..................................................................................... 753.5.1. Types of monitoring .................................................................................................................................. 763.5.2. Strategy- and policy-level monitoring .............................................................................................. 78
3.6. Remote management, monitoring and third-party monitoring .................................. 803.6.1. Remote management ............................................................................................................................... 803.6.2. Remote monitoring .................................................................................................................................. 823.6.3. Third-party monitoring ........................................................................................................................... 86
3.7. Pulling it all together: Monitoring and evaluation plan .................................................. 89
3.8. Monitoring and reporting on results ................................................................................. 953.8.1. Reporting on results ................................................................................................................................. 953.8.2. Reporting in a narrative donor report ...........................................................................................1003.8.3. Reporting and learning ..........................................................................................................................102

IOM MONITORING AND EVALUATION GUIDELINES43
List of abbreviations and acronyms
AAP accountability to affected populations CDC Centers for Disease Control and ProtectionCIDA Canadian International Development AgencyCoM chief of missionFCDO Foreign, Commonwealth and Development Office, United Kingdom (formerly
Department for International Development (DFID)IFRC International Federation of Red Cross and Red Crescent Societies INL US Bureau of International Narcotics and Law Enforcement AffairsIOM International Organization for MigrationIRC International Rescue Committee
JSRP Justice and Security Research ProgrammeLEG Office of Legal AffairsM&E monitoring and evaluationMiGOF Migration Governance FrameworkMIS management information systemMoV means of verification NGO non-governmental organizationOECD Organisation for Economic Co-operation and DevelopmentOECD/DAC Organisation for Economic Co-operation and Development/
Development Assistance CommitteeOIG/Evaluation Office of the Inspector General’s Central Evaluation functionPPR project performance reviewPRIMA Project Information and Management ApplicationPRISM Process and Resource Integrated Systems ManagementQQT quantity, quality and timeRBA rights-based approachRMF Results Monitoring FrameworkSDG Sustainable Development GoalSMART specific, measurable, achievable, relevant and time-boundSoV source of verification ToC Theory of Change ToR terms of referenceTPM third-party monitoringTRD Transition and Recovery DivisionUNDAF United Nations Development Assistance Framework UNSD United Nations Statistics DivisionUNSDCF United Nations Sustainable Development Cooperation FrameworkUSAID United States Agency for International Development

44 CHAPTER 3 Monitoring at IOM
Chapter 3 | Monitoring at IOMThis chapter looks at the essentials for monitoring an intervention (a project/programme and/or a strategy or policy). It introduces the Theory of Change (ToC) and the IOM Results Matrix, and describes the basic types of monitoring, including activity, results, financial and risk monitoring, as well as other types of monitoring. This chapter also focuses on remote management and monitoring, third-party monitoring (TPM), and explains how different monitoring elements come together to form an overall M&E plan, and finally, looks at monitoring and reporting on results.
3.1. An overview of how to monitor A strong project design is the foundation for successful monitoring. The proposal development stage clearly articulates the desired results an intervention aims to achieve, how it achieves them and stipulates how progress towards these results will be measured. Modules 1 (Conceptualization), 2 (Proposal design) and 4 (Project management and monitoring) of the IOM Project Handbook provide an overview of this process and show how the foundations for successful monitoring are laid.
This chapter builds on the main points mentioned in the IOM Project Handbook and provides further technical guidance, as well as expands on new concepts such as ToC. It primarily focuses on monitoring a project or programme and also shows that the principles of monitoring a project or programme are also applicable to monitoring a strategy and/or policy. While many concepts covered in this chapter are important for both monitoring and evaluation (M&E) – such as the development of a ToC, the IOM Results Matrix, IOM Cross-Cutting Themes, remote management and the development of an M&E plan – guidance for conducting evaluation in IOM is covered in detail in chapter 5 of the IOM Monitoring and Evaluation Guidelines. IOM focuses on four key areas for monitoring: (a) activities; (b) results; (c) budget and expenditure; and (d) risk.
3.2. Programme theoryWhile various definitions exist of the programme theory, this section focuses on approaches most suited for the IOM operational context.1 Programme theory is a key aspect of implementation design and explains how an intervention (project/programme, strategy and policy) is expected to contribute to a chain of results.2 It is a representation of all the building blocks that are required to bring about a higher-level change or results. It is usually formulated at the proposal development stage.3
Programme theory is a logical thinking process on how to address a situation and respond to it through an intervention. It can therefore be useful in providing a conceptual framework for monitoring, as well as for evaluation.
Various labels for programme theory exist, including logic model, intervention logic, causal model, results chain and ToC. Two complimentary approaches, which are pertinent for IOM interventions, are further elaborated in this chapter: (a) ToC; and (b) logical framework, which is represented by the Results Matrix at IOM.
While both approaches map out how an intervention leads to results, each has a slightly different purpose.
1 This chapter, inter alia, draws on definitions and concepts as shared by BetterEvaluation, n.d., which are considered to be most suited for the IOM context.
2 Adapted from Rogers, n.d.3 Ibid.

IOM MONITORING AND EVALUATION GUIDELINES45
BetterEvaluationn.d. Home page.
Rogers, P.n.d. Develop programme theory/theory of change. BetterEvaluation.
3.3. Theory of Change
3.3.1. What is the Theory of Change?
Clearly articulating the expected results or desired change of an intervention is the foundation for M&E. It is necessary to identify what requires change, what expected change looks like and, finally, how such change can be achieved through IOM interventions. This is where ToC comes in handy. While there are many different definitions of ToC, this section focuses on approaches relevant to the IOM context.4
A ToC may be viewed as a tool or methodology to map out the logical sequence of an intervention from activities to results, showing multiple pathways that may lead to change, including pathways not related to the planned intervention. It may also be viewed as a deeper reflective process and dialogue among staff and stakeholders, reflecting the values and philosophy of change that make more explicit the underlying assumptions of how and why change may occur as a result of an intervention. At its best, a ToC is a combination of these two views.
It is most often defined as illustrating a link between activities, outputs, outcomes and objectives, creating a chain of results, referred to as the pathway of change or the causal pathway.5 It is essentially a comprehensive articulation of how and why desired change will occur within a specific context.6 Some basic components of a ToC often include a big picture analysis of how change is expected to occur in relation to a specific thematic area, an articulation of a specific pathway in relation to this and an assessment framework that is designed to test both the pathway and the assumptions made about how change happens.7
What is a Theory of Change?8
Theory of Change is a comprehensive description and explanation of how and why a desired change is expected to happen in a particular context.
Specifically, it focuses on mapping out what an intervention or change initiative does (its activities) and how these lead to achievement of the objective through results (outputs, outcomes, objectives).
In this way, a ToC articulates hypotheses about how change happens by explaining the connection between an intervention and its effect. It does so by surfacing the logic and rationale for an intervention and articulating the assumptions inherent in the approach (multiple pathways).
4 See examples of different shapes of ToCs at Center for Theory of Change, n.d.a. 5 A causal pathway is the process of step-by-step mapping through which all the required preconditions necessary to reach a desired change
are determined. 6 Center for Theory of Change, n.d.b. 7 Stein and Valters, 2012. 8 This definition is adapted by IOM from Center for Theory of Change, n.d.c.
RESOURCES

46 CHAPTER 3 Monitoring at IOM
A ToC can be viewed as a product of a series of critical thinking exercises that provide a comprehensive picture of the different levels of change expected to occur due to an intervention, at the stage of its development, during its implementation, as well as following its completion.
Center for Theory of Changen.d.a Theory of Change examples.
n.d.b What is theory of change?
n.d.c Home page.
Stein, D. and C. Valters 2012 Understanding theory of change in international development. Justice and Security Research
Programme (JSRP) Paper 1. JSRP and The Asia Foundation.
3.3.2. When to use a Theory of Change
The use of a ToC is more and more common and developed for all types of interventions. It can be applied to design, monitor, as well as evaluate different types of interventions and is best used to measure the complexity of transformation and change. Because a ToC acknowledges that change is not linear, but dynamic and complex, it often seeks to articulate social, political and community-based change(s) or empowerment initiatives. A ToC is a process-oriented approach that can be used to analyse the interrelations and/or interactions in complex systems in which IOM, partners and allies work. Such a process helps navigate in unpredictable and complex environments and helps track and assess change in the system to which an intervention may contribute.
3.3.3. How to develop a Theory of Change
It is important to note that different terminologies may be applicable when defining the multiple pathways of change, such as: (a) objectives, outcomes and outputs; (b) long-term, intermediate and short-term outcomes; or (c) outcomes and pre-conditions. This section uses the terms objectives, outcomes, outputs and activities to align with IOM’s M&E terminology and either develop or supplement IOM results matrices.
ToC is a guiding framework for all stages of thinking, action and sense-making for interventions involved with social and/or political change processes.
Graphic depiction
When graphically depicting a ToC, diagrams can be generally flexible in format and may be simple or complex. They can be vertical, horizontal or circular.
RESOURCES

IOM MONITORING AND EVALUATION GUIDELINES47
Figure 3.1. Graphic depiction of a Theory of Change diagram
The graphic depiction of a ToC can help with mapping out multiple causal pathways to identify the most feasible one for a given intervention. Another advantage of graphically depicting a ToC is that it makes possible causal links more understandable and immediately visible. It enables comparisons between different pathways and can help identify implicit assumptions.9
Participatory approach
The process of developing a ToC should be participatory and collaborative, and include key stakeholders, as well as the beneficiaries, or people that the Organization seeks to assist, and/or affected populations, who can offer their different perspectives to define what an expected change within a specific thematic field may look like.10 Their participation can also help identify underlying assumptions that are inherent to explaining why a particular change is expected to occur.
Multiple pathways of change
A ToC acknowledges that change is dynamic and complex and can show different possible pathways that might lead to change (see Figure 3.2 where each colour of the arrows represent a different pathway). The process of developing a ToC helps discover these multiple pathways of change.
9 See examples of different shapes of ToCs in Figure 3.1, as well as at Center for Theory of Change, n.d.a.10 For the purpose of the IOM Monitoring and Evaluation Guidelines, IOM uses the OECD/DAC definition of beneficiary/ies or people that the
Organization seeks to assist as “the individuals, groups, or organisations, whether targeted or not, that benefit directly or indirectly, from the development intervention. Other terms, such as rights holders or affected people, may also be used.” See OECD, 2019, p. 7. The term beneficiary/ies or people that IOM seeks to assist, will intermittently be used throughout the IOM Monitoring and Evaluation Guidelines, and refers to the definition given above, including when discussing humanitarian context.

48 CHAPTER 3 Monitoring at IOM
Figure 3.2. Chain of results/Causal pathways
Theory of Change (ToC)
Illustrating a link between activities and results, creating a chain of results, referred to as the pathway of change, or the causal pathway.
Chain of results / Causal pathway
Objective
Activity Activity Activity Activity Activity
Output Output OutputOutput
OutcomeOutcomeOutcome
VO updatedModule 3: Monitoring at IOM
How to develop a ToC?
A common challenge when using the ToC is the lack of a “theory” and/or using a weak theory. For instance, weak theories do not explain how change is expected to occur or do not state/establish assumptions clearly. It is important to ensure that the ToC actually articulates a logical theory, which makes the implicit causal mechanisms explicit and supplements the graphical representation.
By developing a valid and relevant ToC, implementers can ensure that their interventions will be delivering the appropriate activities for desired and realistic results. It ensures that interventions are easier to monitor and evaluate, bring to scale, as well as sustain, as each step – from the ideas and assumptions behind it, to the results it hopes to achieve and resources required – are clearly articulated within the theory. A well-articulated ToC can also promote a common understanding of the intervention for all actors involved in implementation, thereby facilitating a cohesive and common approach.
The process of developing a ToC can help identify whether, and at which stage or level, assumptions, logical jumps or missing key steps in the change process are taking place. Developing a ToC is a good way to raise further questions such as the following:
(a) Why is a particular change expected to happen?(b) What evidence is available to support that expected change will/has occur/red?(c) What logical jumps are made?(d) What assumptions are made?
When developing a ToC, it is important to understand its purpose. ToCs can be applied at different levels, ranging from world views, strategies and policies, to the project or programme level and all the way down to activity level. For instance, world views can help clarify social and political theories that inform one’s thinking. Organizational ToCs can help inform the vision, mission and values that the organization requires to contribute to social change. For policy ToCs, it can help identify how an organization expects change to evolve in a specific sector and how it contributes to it.
Scholars have not reached agreement on an overall definition of, and methodology for, developing a ToC, and donors may follow different approaches to drafting a ToC. For instance, the approach by the United Kingdom Foreign, Commonwealth and Development Office (FCDO) to drafting a ToC largely differs from that of the United States Agency for International Development (USAID) or that of the European Union.11 While FCDO’s approach still contains strong elements of a logical-framework approach (looking at inputs, outputs, outcomes and impact), USAID emphasizes the possibility of multiple pathways that may lead to change, while highlighting the importance of underlying assumptions throughout the process. The following depict these two different approaches:
11 FCDO is formerly the Department for International Development (DFID).

IOM MONITORING AND EVALUATION GUIDELINES49
Figure 3.3. FCDO’s Theory of Change approach
13
Annex3
GBP £6m (included in the overall financial component)
Management Agency SIDBI: PMU at New Delhi with Gender specialist
FCDO: Task Team Leader (0.5 FTE); Economists (0.1 FTE); SD Advisor (0.5 FTE); Governance Advisor (02 FTE); Programme Officer-A2L (0.5 FTE)
Research/studies: FINSCOPE Survey; Cost benefit data/ Sectoral studies; Product development
Financial products - savings, insurance, pension - developed, piloted and rolled out based on women’s needs; capacity of partners enhanced
70% of the clients will be poor or borderline poor (below USD2 a day) especially women
Financial services targeted at women and six specific products rolled out
Inputs
Outputs 4: Women’s capacities to tackle gender constraints relating to business and the household enhanced Activities Participation
Outcomes Short Long
Grant support to MFIs/SHPIs / NGOs/ training institutions through NABARD, SFMC/similar institutions - Providing access to financial
products and services - Integrating gender issues in
their microfinance programmes,
- facilitate structured monthly discussions among the clientson social, gender and health issues
- Financial literacy
0.3 mn women clients trained/ made aware of their rights, including as consumers of financial services on a) Financial literacy and b) Social, health and genderissues
Assumptions and External Factors - Low cost approaches to building capacities of
women on financial and gender issues will be explored during the operational phase
- Partner MFIs/SHPIs show commitment and willingness to take forward the issue; go beyond the assumption that simply organizing women into client groups addresses gender issues
- Women are able/willing to determine and prioritize social/ gender issues and needs
EVIDENCE Linking: Activities to short/ medium Outcome: Medium • ‘Littlefield, Elizabeth, Jonathan Murdoch, and Syed Hashemi, “Is microfinance an effective
strategy to reach the millennium development goals?” Focus Note 24, Washington, D.C.: CGAP, 2003; Vaill, S., 2003, ‘More than Money: Strategies to Build Women’s Economic Power, Impact Report No. 1: Economic Opportunity Initiative, The Global Fund for Women,San Francisco
• Pitt, M., Khandker, S. and Cartwright, J., 2006, ‘Empowering Women with Micro Finance:Evidence from Bangladesh’, Economic Development and Cultural Change, University of Chicago; Microfinance Programme Impact Assessment 2003, United Nations Capital Development Fund Based on Case Studies in Haiti, Kenya, Malawi and Nigeria:
Outcome to Long-term Outcome/ Impact: Medium • Kim, J. C. et al., 2007, ‘Understanding the Impact of a Microfinance-Based Intervention on
Women’s Empowerment and the Reduction of Intimate Partner Violence in South Africa’, American Journal of Public Health, vol. 97, no. 10, pp. 1794-1802 ; O'Rourke K, et.al., “Impact of community organization of women on perinatal outcomes in rural Bolivia.” Rev Panam Salud Publica 1998 3(1): 9-14.
• Manandhar DS, Osrin D, Shrestha BP, et al. “Eff ect of a participatory intervention with women’s groups on birth outcomes in Nepal: cluster-randomised controlled trial.” Lancet2004; 364: 970–79. Prasanta Tripathy, et al., “Effect of a participatory intervention with women's groups on birth outcomes and maternal depression in Jharkhand and Orissa, India: a cluster-randomised controlled trial”; Lancet 2010: 375; Syed Hashemi, Sidney Schuler, and Ann Riley, “Rural Credit Programs and Women’s Empowerment in Bangladesh,” World Development 24, no. 4 (1996): 635-53.
Increased decision making by women clients
Poor and vulnerable people, especially women, benefit from economic growth in poorest states, India
Women able to travel outside place of residence without male escort (50% increase over control groups)
35% decrease malnourishment rate amongst children below 5 years over control groups
Impact
Women gain self-esteem and self- confidence
Source: Vogel and Stephenson, 2012.Note: FCDO is formerly the Department for International Development (DFID).

50 CHAPTER 3 Monitoring at IOM
Figure 3.4. USAID’s Theory of Change approach
Source: Kedzia, 2018.
Irrespective of how different stakeholders approach a ToC, they all have one commonality: they enable the articulation of how, why and under what conditions a change is expected to occur within a specific context. While there is no one standard approach to developing a ToC, the following section illustrates a formula that can be applicable in most contexts and is commonly used by USAID to measure social and behavioural change.
Center for Theory of Change n.d.a. TOC examples.
Kedzia, K.2018 Theory of change: It’s easier than you think. USAID Learning Lab, 13 March.
Organisation for Economic Co-operation and Development (OECD)2019 Better Criteria for Better Evaluation: Revised Evaluation Criteria Definitions and Principles for Use.
OECD/Development Assistance Committee (DAC) Network on Development Evaluation.
Vogel, I. and Z. Stephenson2012 Appendix 3: Examples of theories of change. FCDO, London.
RESOURCES

IOM MONITORING AND EVALUATION GUIDELINES51
3.3.4. How to develop a Theory of Change using the if-then-because formula
While ToCs can be illustrated in different ways, the logic of the chain of results, or causal pathway, can be tested using if-then-because statements. In other words, it helps reveal assumptions that are “tested” through actions/activities, while assumptions play a central role in developing the ToC.
Every step taken, from the overall objective of the intervention to each of its activities, has a ToC behind it that can explain and articulate the logical connections (or the different pathways) between the lower-level results, such as between outputs and outcomes, as well as between the higher-level results, such as the outcomes and objectives.
A common challenge when designing an intervention are logical leaps and gaps. There may be a disconnect between strong problem analysis and seemingly unrelated activities, with weak links and/or assumptions between objectives, outcomes, outputs and activities. Through surfacing underlying assumptions, the ToC may provide a bridge between analysis and programming.
Generally, a ToC can be articulated using the “if X, then Y, because of Z” formula. That is, “if X action/activity occurs, then Y result will occur, because of Z assumption(s)”. The process of surfacing such underlying assumptions can help identify where logical jumps are made or helps identify missing key steps in the change process.
Figure 3.5. If-then-because formula
The following section will focus on one of the many possible pathways illustrating the application of the if-then-because formula, noting that this exercise can be repeated for many different pathways for different levels.

52 CHAPTER 3 Monitoring at IOM
Figure 3.6. Example of the if-then-because formula
The following elaborates on the example, identifying assumptions potentially surfaced through this process for this one particular pathway down to the output level. As many different pathways can exist for each level, this exercise can be done for each possible pathway.
Ä Multiple pathways: During the process of identifying multiple pathways, it is important to note that not all pathways may be implemented by IOM, and that some of them can be implemented by actors other than IOM, and out of IOM’s control.
Objectives: Contribute to stability and security, and build a foundation for political and social development in conflict-prone communities of country X.
Objective-level Theory of Change
If relationships between the local authorities and conflict-prone communities in area Y of country X are strengthened, then stability and security, and building foundations for political and social development in conflict-prone communities of country X will be supported, because
• The relationship between the local authorities and conflict-prone communities is weak;• The lack of attention from the local authorities towards the needs of conflict-prone communities has
affected the relationship between them;• The weakened relationship between the local authorities and the conflict-prone communities may be
one of the causes for conflict;• The lack of attention from the local authorities to the needs of conflict-prone communities is one
of the causes of instability and poor security, which impedes sociopolitical development in the area;• Others.
Ä Multiple pathways: With each result articulated at the outcome level, an if-then-because statement is articulated, and the assumptions surfaced at the objective-level ToC.
EXAMPLE
IF relationships between the local authorities and conflict-prone communities in area Y of country X are strengthened, THEN stability and security, and building foundations for political and social development in conflict-prone communities of country X will be supported, because (assumptions):
IF access to livelihoods opportunities for conflict-prone communities of country X are increased, THEN relationships between the local authorities and communities in area Y of country X are strengthened, because (assumptions):
IF vocational skills among beneficiaries in conflict-prone communities of country X are developed/enhanced, THEN their access to livelihood opportunities will increase, because

IOM MONITORING AND EVALUATION GUIDELINES53
Outcome-level Theory of Change
If access to livelihood opportunities for conflict-prone communities of country X is increased, then relationships between the local authorities and communities in area Y of country X are strengthened, because
• People consider the government responsive for meeting their needs;• Targeted areas lack quality services from government; • Target areas have historically been neglected;• If people are grateful and appreciate the local, then they are more likely to perceive the authorities’
service delivery more positively, which may lead to improving their mutual relationship;• Others.
Ä Multiple pathways: With each result articulated at the output level, an if-then-because statement is articulated, and the assumptions surfaced at the outcome-level ToC.
Output-level Theory of Change
If vocational skills among beneficiaries in conflict-prone communities of country X are developed/enhanced, then their access to livelihood opportunities will increase, because
• Improved vocational skills may increase the chance for beneficiaries to find a job;• Capacities are relevant to the opportunities in the target areas;• Opportunities exist in the area;• Local government and line departments continue to provide support; • Local government and line departments take ownership of the activity and provide follow-up support
to beneficiaries; • Others.
Ä Multiple pathways: With each result articulated at the activity level, an if-then-because statement is articulated, and the assumptions surfaced at the output-level ToC.
Additional examples of ToCs surfacing assumptions for multiple pathways can be found in the resources listed at the end of this section.
3.3.5. How to review a Theory of Change that applies the if-then-because formula
When reviewing a ToC, one may want to focus on the links a ToC is trying to make. The following checklist consists of five simple questions that may help with the review process:
(a) Are both the action (X) and the result (Y) clearly formulated? Is it clear what approach is being utilized? When considering the result, ensure that terms being used are clear. Ask whether the results are measurable, and if so, what would be a good source of verification for this. How would this be monitored and how would can sources of verification for this result be attained?
(b) Is the result realistic and achievable given the scale of action, resources and time frame? Try to assess whether the results are proportional to the scale and scope of action. Is the result observable? Is it immediate, intermediate or long term? How will the result be measured? Are there any logical jumps and/or gaps between a modest action and an ambitious result?
(c) Do the assumptions explain why the approach is suitable? A strong assumption is able to articulate why the chosen approach should produce the expected change/result. This reflects the intervention’s problem analysis.

54 CHAPTER 3 Monitoring at IOM
(d) Are the relevant preconditions that are necessary for success included in the assumptions? Assumptions targeting necessary preconditions mostly reflect conditions beyond the intervention’s control that are believed to be necessary to attain results, but do not explain why/how change will occur. This may also be viewed as being linked to thinking about risk. To identify such assumptions, it is helpful to ask one’s self that if the intervention were to fail, what may have gone wrong.
(e) Does the ToC make sense if it is reversed?
Earlier, it was shown that ToCs can be applied to an activity, project, programme, strategy or policy. The following shows how to review a ToC at all the levels by applying the “if X, then Y, because Z” formula to each one. In cases where the “if X, then Y, because Z” formula is applied, the higher-level ToC’s “if” statement becomes the lower-level ToC’s “then” statement, meaning that for each statement, the action/intervention of higher-level ToC should correspond with the result/desired change of the lower-level ToC.
Figure 3.7. If-then-because formula linkages
Figure 3.8 applies this method of ToC review to the above example:
Figure 3.8. Example of if-then-because formula linkages
EXAMPLE
IF relationships between the local authorities and conflict-prone communities in area Y of country X are strengthened, THEN stability and security, and building foundations for political and social development in conflict-prone communities of country X will be supported, because (assumptions):
IF access to livelihoods opportunities for conflict-prone communities of country X are increased, THEN relationships between the local authorities and communities in area Y of country X are strengthened, because (assumptions):
IF vocational skills among beneficiaries in conflict-prone communities of country X are developed/enhanced, THEN their access to livelihood opportunities will increase, because

IOM MONITORING AND EVALUATION GUIDELINES55
How to monitor an if-then-because Theory of Change
Monitoring the IF statements: Include questions into the data collection tools that directly relate to the if statement.
Example of output-level ToC: • If access to livelihood opportunities for conflict-prone communities of country X are increased
– Was there an increase of knowledge and vocational skills? (Assess whether there was an increase in knowledge through the training pre/post-test; beneficiary feedback);
– Are beneficiaries using attained knowledge and vocational skills? If yes, how so; if no, why not (draft lesson learned)?
Monitoring the THEN statements: Include questions into your data collection tools that directly relate to the then statement.
Example of output-level ToC: • Then their access to livelihood opportunities will increase
– Have livelihood opportunities for target beneficiaries increased? – If yes, was it due to the intervention; if no, why not (draft a lesson learned)?
Monitoring the BECAUSE statements: Include questions into your data collection tools that directly relate to the because statement.
Examples of output-level ToC:• Because improved vocational skills may increase the chance for beneficiaries to find a job
– Were beneficiaries unemployed prior to training? – Did they find a (better) job due to increased skills (beneficiary feedback)?
• Because capacities are relevant to the opportunities in the target areas – Ask beneficiaries if this is accurate.
• Opportunities exist in the area – Conduct context analysis.
Other resourcesAnderson, A.A.
2006 The Community Builder’s Approach to Theory of Change: A Practical Guide to Theory Development. The Aspen Institute, New York.
BetterEvaluation n.d. Home page.
Brown, A.-M. 2016 What is this thing called ‘Theory of Change’? USAID Learning Lab, 18 March.
Davies, R. 2018 Representing theories of change: Technical challenges with evaluation consequences. Centre of
Excellence for Development Impact and Learning Inception Paper 15, London.
Hivos 2015 Hivos ToC Guidelines: Theory of Change Thinking in Practice. The Hague.
Lysy, C.2018 Illustrating models and theories of change. BetterEvaluation, 10 January.
RESOURCES
INFO
RMATION

56 CHAPTER 3 Monitoring at IOM
Rogers, P. 2014 Theory of Change. Methodological Briefs: Impact Evaluation No. 2. UNICEF Office of Research,
Florence.
2017a Using logic models and theories of change better in evaluation. BetterEvaluation, 19 May.
2017b BetterEvaluation FAQ: How do you use program theory for evaluating systems? BetterEvaluation, 21 June.
Valters, C. 2015 Theories of Change: Time for a radical approach to learning in development. Overseas Development
Institute, London.
Vogel, I. 2012 Review of the use of ‘Theory of Change’ in international development. Review report. FCDO.
Graphical representation toolsEvaluation Toolbox
n.d. Problem Tree/Solution Tree Analysis.
Microsoftn.d. Microsoft Visio.
Theorymaker n.d. Home page.
3.4. IOM Results Matrix
As previously mentioned, also belonging to programme theory is the logical framework, which helps identify an intervention’s operational design and is a foundation for M&E. It is an overview of an intervention’s intended approach to attain results, based on the situation and problem analysis undertaken during the conceptualization stage. Specifically, it uses a matrix to summarize the logical sequence in which an intervention aims to achieve desired results, the activities required to attain these results and the indicators and sources of verification that help measure progress towards achieving results.
Within IOM, the Results Matrix included in the IOM Project Proposal Template, also known as the results framework, bears the closest resemblance to the logical framework. Module 2 of the IOM Project Handbook provides detailed guidance on the development, drafting and design of the Results Matrix. The IOM Project Handbook identifies the Results Matrix as a strategic management tool that facilitates the “planning, monitoring, evaluating and reporting on the implementation of a project and progress towards achieving its results.”12 Other organizations, agencies and donors may use different terminology to express similar processes of logical construction.13
IOM’s Project Information and Management Application (PRIMA) captures project-related data. All project-related documents required to track a project are available on PRIMA. This includes the proposal, the IOM Results Matrix and budget-related documents. A PRIMA User Guide is available internally on IOM’s intranet.14
12 Module 2 of IOM Project Handbook, p. 119 (Internal link only).13 Ibid., p. 120.14 PRIMA is an institutional project information management solution. It is available internally to IOM staff via the IOM intranet.
INFO
RMATION

IOM MONITORING AND EVALUATION GUIDELINES57
IOM resources2017a Module 2. In: IOM Project Handbook. Second edition. Geneva (Internal link only).
2019a PRIMA User Guide. MA/00651 (Internal link only).
3.4.1. The difference between the Theory of Change and a logical framework
Separating the ToC from the logical framework is challenging, because they both stem from the same family of approaches related to programme theory. A ToC, as described in the previous section, starts from the premise that the process of social change is complex, taking into account different perspectives and analysing the underlying assumptions of an intervention’s design. In contrast, a logical framework offers a more simplified picture of intervention logic, not considering all the underlying assumptions and related causal links, but rather only those related to the particular intervention and selected during the project’s initial conceptualization. A logical framework can be viewed as a more rigid and linear way of thinking about change.
Originally, logical frameworks were intended to summarize complex stakeholder discussions about the objectives and results that an intervention would reach and contribute to, as is also the case with the ToC rationale. The intention was to analyse internal and external dependencies that would influence the intervention’s effectiveness, including direct assumptions that require to be taken into consideration in the analysis.15 However, the logical framework insufficiently reveals all the pathways that can influence or lead to change. ToC thinking helps bridge this gap, by showing multiple inter-connected causal pathways and by making explicit the assumptions that explain how and why change is expected to occur. Table 3.1 summarizes some of the aspects of a logical framework as compared to a ToC.
Table 3.1. Comparing and contrasting Theory of Change and logical framework
Theory of Change Logical framework
• Based on the underlying network of processes driving change.
• Explanatory: Articulates and explains the “what”, “how” and “why” of the intended change process. “If we do X, then Y will change because…”.
• Unlimited pathways of change: Articulates assumptions and causal effects, and also drivers and all immediate states/steps in the critical pathway of change.
• Critical thinking, room for complexity and deep questioning. Shows all the different possible pathways that might lead to change, even those pathways that are not directly related to the intervention (a network).
• Articulates assumptions underlying the strategic thinking of a strategy, programme or project.
• Generally based on the practical achievements that the project is expected to deliver.
• Descriptive: Largely shows what is thought will happen/will be achieved.
• Three result levels (outputs, outcomes, objective). Mostly looks at assumptions that have to hold for the next-level result to be realized.
• Linear representation of change simplifies reality. Describes how logically programme activities will lead to the immediate outputs, and how these will lead to the outcomes and goal (linear, vertical).
• Focuses on assumptions about external conditions.
Source: Adapted from Hivos, 2015, p. 15.
15 Vogel, 2012.
RESOURCES

58 CHAPTER 3 Monitoring at IOM
While assumptions play a critical role in the development of both a ToC and the IOM Results Matrix, there is a clear distinction between assumptions as they are used in the ToC and as elaborated in the IOM Results Matrix. The most important distinctions can be summarized as follows:
Assumptions: ToC versus IOM Results Matrix
Assumptions in the ToC Assumptions in the IOM Results Matrix
ToC assumptions help to articulate the logical connection/causal pathway between lower- and higher-level results.
• Expresses the strategic thinking about how change happens.
• Believed to already exist/be in place prior to implementation.
• Inherent to the approach. • Identified using the if-then-because
formula (see above section, How to develop a ToC using the if-then-because formula).
Assumptions within the IOM Results Matrix are the pre-conditions (necessary and positive) on which the success of a higher-level result depends.
• Completes the intervention logic and places it in the implementation context.
• A condition or resource that must be in place for a result to be achieved.
• Generally, outside the control of the organization (external condition).
• Built into the horizontal logic of an intervention using the “[lower-level result] + [assumption] is likely to result in [higher-level result]” formula (see Module 2).
A further explanation of logical framework assumptions as used within the IOM Results Matrix is provided further down in this section.
Despite these differences, a ToC and logical framework remain complementary, can be used together, and ToC thinking can be applied to the process of drafting the IOM Results Matrix. This encourages intervention developers to make explicit the ToC assumptions about how desired change will occur, highlighting the change process and related causal pathways between expected results. These also can then be articulated when addressing the “why” and “how” within the rationale section of the Project Proposal Template, more specifically, providing the strategic thinking that informs the “assumptions and hypotheses underlying the causal relationships between activities, outputs and outcomes”.16
IOM resources2017a Module 1 and Module 2. In: IOM Project Handbook. Second edition. Geneva (Internal link only).
Other resourcesHivos
2015 Hivos ToC Guidelines: Theory of Change Thinking in Practice. The Hague.
Vogel, I. 2012 Review of the use of ‘Theory of Change’ in international development. Review report. FCDO.
16 The IOM Project Proposal template is available in Module 2 of IOM Project Handbook, pp. 182–183 (Internal link only).
RESOURCES
INFO
RMATION

IOM MONITORING AND EVALUATION GUIDELINES59
3.4.2. Developing an IOM Results Matrix Developing an IOM Results Matrix is one of the foundations for monitoring an intervention at IOM. It provides an overview of the parameters for the measurement of intervention results. The Results Matrix, mandatory for all IOM project proposals and available in the IOM Project Handbook, can also be used for the implementation of a strategy or policy and is drafted during the initial development stage.17
Understanding how a results matrix is developed can contribute to improving general understanding of how to monitor intervention progress and results effectively. The following sections will illustrate the various steps involved in developing a Results Matrix.
Development of the Results Matrix should build on the analysis carried out in the conceptualization phase. In particular, the problem tree and solution tree, if developed when conducting the situation analysis, may already map out the various causal pathways.18 The scoping analysis (selecting which part of the problem and solution trees to focus on) then identifies the changes that can be achieved in a particular intervention.19
2 121IOM PROJECT HANDBOOK
Tool 2.1: Results Matrix
Indicators Data source and Baseline Target
This is the most
goal to which the project can contribute. It seeks to align to a broader, longer-term strategy, whether internal or external.
These are
factors or variables to measure achievement or to
changes. Data is disaggregated by
(e.g. age, sex), wherever relevant.
Data source and
indicate from where and how
be gathered for the purposes of measuring the indicator.
Baseline measurement establishes the value of the indicator at the beginning of the project planning period. Baseline data is disaggregated by
(e.g. age, sex), wherever relevant.
Target describes the expected value of the indicator
of the result. Target data is disaggregated by
(e.g. age, sex), wherever relevant.
Outcomes:These are the intended changes
performance, individual or group behaviour
economic, or social
These are
factors or variables to measure achievement or to
changes. Data is disaggregated by
(e.g. age, sex), wherever relevant.
Data source and
indicate from where and how
be gathered for the purposes of measuring the indicator.
Baseline measurement establishes the value of the indicator at the beginning of the project planning period. Baseline data is disaggregated by
(e.g. age, sex), wherever relevant.
Target describes the expected value of the indicator
of the result. Target data is disaggregated by
(e.g. age, sex), wherever relevant.
This part includes
necessary for the outcomes to contribute to the achievement of the
Outputs:These include the intended changes in the skills or
the availability of new products or services as a result of project
These are the
factors or variables to measure achievement or to
changes. Data is disaggregated by
(e.g. age, sex), wherever relevant.
Data source and
indicate from where and how
be gathered for the purposes of measuring the indicator.
Baseline measurement establishes the value of the indicator at the beginning of the project planning period. Baseline data is disaggregated by
(e.g. age, sex), wherever relevant.
Target describes the expected value of the indicator
of the result. Target data is disaggregated by
(e.g. age, sex), wherever relevant.
This part includes
necessary for the outputs to
delivery of the outcomes.
are organized and executed under the project.
This part is for
necessary for the
the outputs.
be completed in the manner described in Figure 2.1. Refer to the
Module 1.
collec�on method
Note: Visualization of an IOM Results Matrix located in Module 2 of IOM Project Handbook, p. 121.
17 Module 2 of IOM Project Handbook, p. 119 (Internal link only).18 A problem tree and solution tree are both part of conducting a situation analysis, which is done to obtain a better understanding of a
situation or context in which a project is implemented prior to its development. Information regarding their development and conduct of a situation analysis is available in Module 1 of IOM Project Handbook, pp. 11–26 (Internal link only).
19 Analysing project scope, including conducting a scoping analysis, is addressed in more detail in Module 1 of IOM Project Handbook, pp. 27–29 (Internal link only).
Ä Headings are interactive and will direct to the specific section on this chapter.
TIP

60 CHAPTER 3 Monitoring at IOM
Vertical logic
The term vertical logic refers to the “means-end relationshipbetween activities and the results”, as well as the relationship between “the results and their contribution to the broader objective”.20
The IOM Results Matrix uses the terms “objective”, “outcome”, “output” and “activity” to demonstrate vertical logic. The diagram below provides a visual representation of the vertical logic (as well as horizontal logic) within a results matrix.21
Figure 3.9. Vertical logic
Results Indicators Data source and collec�on
method
Baseline Target Assump�ons
Objec�ve
Outcome
Output
Ac�vi�es
i
ii
iii
iv
Ver�
cal L
ogic
Source: Adapted from Module 2 of IOM Project Handbook, p. 122 (Internal link only).
Vertical logic focuses on the results at each level. It is the process of taking the logical steps from the objectives down to the activities, with the aim of linking and demonstrating how the results at each level contribute to the next. Results that are properly linked demonstrate the causal connection from one result level to the next, forming a causal pathway or results chain.
Engaging in a participatory approach to the development of a results matrix, ideally including the views of key stakeholders, such as beneficiaries, or people that IOM seeks to assist, will lead to better formulated results and indicators. This is essential for successful monitoring once the intervention has begun.
Performing a stakeholder analysis during the conceptualization phase of an intervention identifies relevant stakeholders, assesses their interests, the ways these interests are likely to affect the intervention, as well as the level of their involvement. This process can support the identification of key stakeholders for involvement in the development process.22 A stakeholder analysis can also inform the manner and level of stakeholder involvement in M&E processes.
20 The means-end relationship is defined in IOM Project Handbook, p. 25 (Internal link only).21 Module 2 of IOM Project Handbook, p. 122 (Internal link only).22 The stakeholder analysis process is described in Module 1 of IOM Project Handbook, pp. 13–22 (Internal link only). The IOM Project Handbook
provides tools to support this process including a stakeholder matrix (Tool 1.2, p. 15), a stakeholder importance and influence matrix (Tool 1.3, p. 17) and a stakeholder participation matrix (Tool 1.4, p. 21).
INFO
RMATION

IOM MONITORING AND EVALUATION GUIDELINES61
Horizontal logic
Horizontal logic “defines how each of the levels in the vertical logic will be measured and the assumptions that are required for the means-end relationship to hold true”.23
Figure 3.10. Horizontal logic
Source: Adapted from Module 2 of IOM Project Handbook, p. 122 (Internal link only).
Horizontal logic completes the Results Matrix by identifying what assumptions are required for the results to occur and how progress on each of the results will be measured.
IOM resources2017a Module 1 and Module 2. In: IOM Project Handbook. Second edition. Geneva (Internal link only).
3.4.3. Results Matrix terminology
When it comes to expressing results within a results matrix, there is diversity of terminology used by different organizations and agencies. However, the underlying logic for the development of the Results Matrix is similar, allowing for alignment of concepts and related reporting, as well as M&E processes. The following chart provides examples of the Result Matrix terminology IOM has used in the past, as well as the terminology IOM currently uses and compares these with the terminology used by several other key development entities. Careful consideration should be given to ensuring that the results at each level of the vertical logic line-up when transferring interventions between donor/partner formats and IOM templates.24
23 Module 2 of IOM Project Handbook, p. 123 (Internal link only).24 Additional information on the use of different terminologies can be found in Church and Rogers, 2006.
RESOURCES

62 CHAPTER 3 Monitoring at IOM
IOM works with a number of different donors and other development actors. Familiarizing one’s self with the terminology used by these actors and how they are related to the IOM terminology allows for more accurate and effective monitoring and reporting of intervention results.
Figure 3.11. Results terminologies
Source: IOM Project Development Training, 2018.Note: FCDO is formerly the Department for International Development (DFID).
Applying vertical logic
IOM currently uses the terms objective, outcome, output and activity to demonstrate vertical logic, while indicator, assumption, data source and collection method, target and baseline help to elaborate the horizontal logic. The following is a summary of those definitions:25
Vertical logic definitions26
Objective
The objective is the most significant, realistic goal to which the intervention can contribute. It seeks to align a broader, long-term strategy, whether internal or external.
• Seeks to align to a broader, longer-term strategy, whether internal or external.
• Beyond direct control of the intervention. • Addresses the political, economic or social conditions
of the society, at the national or international level. • Usually attainable only in the long term and with
involvement of other stakeholders.
Outcomes
An outcome is the intended change in institutional performance, individual or group behaviour or attitudes, or the political, economic or social position of the beneficiaries, or people that IOM seeks to assist.
• Results that the intervention can influence. • The intervention may not have full control
over outcomes and cannot fully guarantee their achievement.
• Achieved by the institution/group – not by the intervention alone – but with the help of the intervention.
• Reasonably expected to occur in the medium term after implementation.
• This component refers to the application of the newly acquired skill, product or service.
25 For more details on each component, see Module 2 of IOM Project Handbook (Internal link only).26 Adapted from Table 2.3 of IOM Project Handbook, p. 135 (Internal link only).
TIP

IOM MONITORING AND EVALUATION GUIDELINES63
Outputs
An output is the intended change in the skills or abilities of beneficiaries, or people IOM seeks to assist, or the availability of new products or services as a result of intervention activities.
• Results that the intervention can control. • The intervention guarantees delivery. • Achieved within the time frame and resources of
the intervention. • This component refers to the acquisition of a new
skill, product or service.
Activities
Activities include coordination, technical assistance, training, production, delivery, transpor-tation and any other tasks or-ganized and executed under the intervention.
• Actions done to deliver the tangible products and services of the output.
• Sample verbs used: build, engage, train, facilitate, distribute, assist, conduct, organize.
IOM resources2017a IOM Project Handbook. Second edition. Geneva (Internal link only).
Other resourcesChurch, C. and M. Rogers
2006 Designing for Results: Integrating Monitoring and Evaluation in Conflict Transformation Programs. Search for Common Ground, Washington, D.C.
Tool to create results matricesn.d. Microsoft Visio.
Applying horizontal logic
The following sections provide more detail on how horizontal logic is applied to the Results Matrix. The components of horizontal logic are assumptions, indicators, baseline, targets and data source and collection methods. The horizontal logic connects the measurement of results (through indicators) with the assumptions behind how the results are expected to occur.
Assumptions
Please refer to the visualization of the IOM Results Matrix above to identify the Assumptions column in the Results Matrix.
“Assumptions are the necessary and positive conditions that allow for a successful means–end relationship between the different levels of results.”27
Assumptions help complete the intervention logic by placing the intervention in the specific context in which it will be implemented. Assumptions also help identify important conditions on which the success of the intervention depends and that lie outside IOM’s line of control. In this sense, assumptions identify the required preconditions for results to occur.28
27 Module 2 of IOM Project Handbook, p. 137 (Internal link only).28 An assumption checklist and examples of writing assumptions can be found in IOM Project Handbook, pp. 137–140 (Internal link only).
RESOURCES

64 CHAPTER 3 Monitoring at IOM
An assumption checklist is provided as a tool within the IOM Project Handbook.29 This tool can also be useful for monitoring purposes and understanding the intervention.
Examples of well-written assumptions are available in Module 2 of the IOM Project Handbook, pp. 137–140.
Indicators
Please refer the visualization of the IOM Results Matrix above to identify the Indicators column in the Results Matrix.
After having set up achievable and well-defined results and having identified related assumptions, the next step in developing a Results Matrix is to select indicators to monitor progress towards achieving those results. Indicators consist of information that signals change.
Indicators can be defined as “the quantitative or qualitative factors or variables to measure achievement or to reflect expected changes”.30 Indicators can either be qualitative, quantitative, binary or proxy indicators. Indicators help indicate change towards an intended result and demonstrate whether an intervention is on or off track.
Indicators are not intended to demonstrate why the intervention has made a difference; this is inter alia covered by evaluation. Similarly, they do not demonstrate how change occurs, which is, inter alia, covered by the ToC or by evaluation. They help understand whether change has occurred.
There is no specific rule on the ideal number of indicators for any one result, but they should be able to measure whether the result has been achieved.
Components of an indicator
What is to be measured Unit of measurement Target population Direction of change
Qualitative Quantitative
• Used to measure things that are subjective in nature, such as experience, opinions, perception and the quality and mastery of a new skills.
• Can be expressed through changes in perception, experience, attitudes, awareness and others.
• Can also be numerical.
Examples include the following: • Improved public perception of parliamentary
effectiveness;• Percentage of households who state that they have
changed their hygiene practices as a result of the training/information received.
• Used to measure things inherently objective and quantifiable, such as how many, how often, how much or how long.
• Can be expressed in absolute figure, percentage, rate or ratio.
Examples include the following: • The number of persons with access to
each water point.• Percentage of surveyed citizens who say
that they have access to a court system to resolve disputes.
29 Module 2 of IOM Project Handbook, p. 140 (Internal link only).30 Ibid.; see also OECD, 2010.
EXAMPLE
TIP

IOM MONITORING AND EVALUATION GUIDELINES65
Binary indicator (can be qualitative or quantitative)
• Indicates whether tangible variable exists.• Used to measure existence of tangible variable.• Can be expressed through yes or no answers.• Generally used at the output level.
Examples include the following:• Migration policy drafted;• Task force put in place.
Proxy indicator
• Acts as a stand-in indicator for one that is difficult to measure directly.31 • Measures changes not directly related, yet closely associated with the issue.
Example includes: • Increase in the number of political parties and voter turnout (as a proxy indicator for
improved governance).
Table 3.2 summarizes the use of indicators at the different levels of results.
Table 3.2. Levels of intervention control
Result level Indicator description Level of intervention control
Objective
• Measures progress made in achieving the specific objective.
Helps confirm changes to the following: – Political, economic and/or social conditions of
beneficiaries.
• Intervention can contribute to
Outcome
• Measures progress made in achieving the specific outcome.
Helps confirm intended change in the following: – Institutional performance; – Individual and/or group behaviour and attitudes; – Immediate political, economic and/or social positions of
beneficiaries.
• Intervention can influence
Output
• Measures progress made in achieving the specific output.
Helps confirm the intended change in the following: – Skills and/or abilities of beneficiaries; – Availability of new products or services.
• Intervention has direct control over
To ensure the measurement of the effects of an intervention on different intended or unintended target populations, it is important to disaggregate indicators by age, gender, migration status and any other identifiers relevant to the intervention.
31 Module 2 of IOM Project Handbook, p. 142 (Internal link only).
INFO
RMATION

66 CHAPTER 3 Monitoring at IOM
Achieving outcomes
It is important to think about how to achieve outcomes within the time frame of the intervention or with an understanding of how to measure their achievement after the intervention concludes already at the development stage of an intervention. There can be short- or medium-term outcomes, depending also on the nature and duration of the project.
How to formulate an outcome to ensure that indicators can be measured within the implementation period or with mechanisms in place for measurement shortly after its completion will greatly depend on the following:
(a) Type and complexity of intervention; (b) Type of results the intervention aims to achieve; (c) Duration of the intervention; (d) Resources available for verification.
A capacity-building intervention, which includes a training activity for officials from a government institution, would want to measure institutional change through the application of knowledge acquired. Depending on the topic and the local context, this may be measurable only three to six months after the training has taken place. Therefore, developers, M&E officers and intervention managers should consider when the training can take place within the project timeline to allow sufficient time to collect data on the short- and medium-term outcome-level results.
Although indicators need to be tailored to results of an individual intervention, it can be useful to look at the successful indicators of other interventions and modify them as needed. In some cases, standard indicators have been developed within specific thematic areas and may act as a guide to help measure results vis-à-vis certain international norms and standards; hence, they may require further adaptation.
It is also recommended to align indicators with existing country-level, regional, thematic and global strategies and policies. Examples of this can be to cross-check indicators to ensure their alignment with indicators in a country-level United Nations Sustainable Development Cooperation Framework (UNSDCF), a government strategy or national action plan to address a particular thematic area or topic, indicators established as a part of the Sustainable Development Goals (SDGs).32
PRIMA helps monitor project progress through the Results Matrix and project indicators.
When creating an IOM Results Matrix in PRIMA, users will be asked to enter indicators for the objective and for each results statement. For each indicator, PRIMA requires entry of an indicator type, which allows for two options: numeric or text. For a numeric indicator, intervention developers will only enter numeric data for this indicator. A text-type indicator will allow users to report using text-based data.
32 For additional information, please refer to the UNSD, 2020.
EXAMPLE
INFO
RMATION
TIP

IOM MONITORING AND EVALUATION GUIDELINES67
In the case of a numeric indicator type, users are asked to identify an indicator category, which provides three options: beneficiary, service or item. If beneficiary is selected, additional fields will be displayed for completion, including beneficiary category, unit of measure (individual, household or community), beneficiary type, as well as allowing for a multiplier or targeting individual or unique beneficiaries.33, 34, 35 Users will also be asked to assign an Indicator Service Code, which allows IOM to collect numeric data across different projects on the numeric indicator type categories, namely items and services delivered, as well as beneficiaries assisted. Finally, when entering targets, users can select to disaggregate data further by age, sex and vulnerability characteristic. Indicator banks will be made available through PRIMA for All. These may be helpful to guide development, while keeping in mind that the completion and quality control of indicators to take into account an intervention’s specific circumstances must be done by developers, managers and those reviewing proposals.
For more information on entering indicators into an IOM Results Matrix in PRIMA, see the PRIMA End User Training Guide: PD Creates Project Proposal (IOM Template) for internal IOM users only through the IOM intranet here.
While developing indicators, the following considerations should be taken into account:
» Indicator overload: Too many indicators, often overlapping and measuring the same thing. One to three indicators for a results statement may suffice.
» Output fixation: Indicators that are focused on counting outputs only. » Indicator imprecision: Indicators that are unclear and may measure results at a too high or too low
level. » Excessive complexity: Indicators that are not clear and are very difficult to understand.
It is also important to keep in mind the specific, measurable, achievable, relevant and time-bound (SMART) criteria used to develop indicators:
2 147IOM PROJECT HANDBOOK
Tool 2.5: How to Select SMART Indicators
If the baseline measurement is zero (e.g. none of the participants passed a pretraining assessment that was conducted to measure the baseline) or is not applicable (i.e. because there was no training conducted and therefore no participants to measure the baseline), then only the target should be included when completing the IOM Results Matrix. Refer to the section on needs assessment in Module 1 for a discussion on what to do when baseline information cannot be obtained during project development.
Indicators should be “SMART”, but no single indicator is likely to satisfy all the SMART criteria equally.6 It is important, however, to always pay close attention to whether an indicator is achievable and whether it is relevant. An achievable indicator is one that requires no more than a reasonable amount of time, effort, and money to gather and analyse the necessary data. Assessing if an indicator is achievable requires identifying the data source (also known as the means of verification), ensuring that the data can be accessed when necessary, and understanding the cost implications, methods, software, and hardware requirements for proper analysis of the data (see Module 4 for more information). A relevant indicator is one that is as directly related to the result as possible.
Specific: Does the indicator capture the essence of the desired result?
Measurable: Are changes verifiable? Is the indicator a reliable and clear measurement of the results?
Achievable: Will the indicator require no more than a reasonable amount of time, effort, and money to gather and analyse the necessary data?
Relevant: Is the indicator plausibly associated with the result?
Time-bound: Does the indicator reflect a time frame for measurement?
6 Note that some donors require that the SMART criteria be applied to the results instead of, or in addition to, indicators.
Source: Module 2 of IOM Project Handbook, p. 147 (Internal link only).
33 Beneficiary category allows users to identify whether the beneficiary of the intended result is direct or indirect.34 This allows users to specify the average number of individuals in the household or community and is only displayed if the beneficiary
indicator category is selected and the unit of measure is indicated as either “household” or “community” (IOM, 2019b) (Internal link only).35 While the “target individual beneficiaries” field is populated with the number specified in the indicator target, the “target unique beneficiaries”
field allows users to specify the number of beneficiaries that have not been counted in any previous indicator.
TIP

68 CHAPTER 3 Monitoring at IOM
An indicator must also be both relevant (directly related to the result) and achievable (requires a reasonable amount of time and resources to gather and analyse data). Assessing whether an indicator is achievable requires assessing the data source/means of verification (MoV).
Another useful approach to drafting indicators is to apply QQT targeting, which ensures that each indicator is measurable in terms of quantity, quality and time (QQT).36
An indicator can define the how many, how often, how much, how long or a mixture of it as illustrated in the example below:
Step 1: Basic indicator % of participants trained that report using the information gained
Step 2: Add quality (What kind of change)
% of border management officials of country X trained that report using the tools and knowledge provided in their work
Step 3: Add quantity(How much)
% of border management officials of country X trained that report using the tools and knowledge provided in their work on a regular basis
Step 4: Add time(By when)
% of border management officials of country X trained that report using the tools and knowledge provided in their work on a regular basis six months after the training
IOM resources2017a IOM Project Handbook. Second edition. Geneva (Internal link only).
2019b PD creates Project Proposal – IOM Template, Results Matrix. IOM PRIMA End-User Training Guide (Internal link only).
n.d.a IOM PRIMA for All User Guide (Internal link only).
Other resourcesOrganisation for Economic Co-operation and Development (OECD)
2010 Glossary of Key Terms in Evaluation and Results Based Management. Paris.
People in Needn.d. IndiKit: Guidance on SMART Indicators for Relief and Development Projects.
United Nations Statistics Division (UNSD)2020 E-Handbook on the Sustainable Development Goals.
World Bank2010 Constructing and targeting indicators using QQT. In: The LogFrame Handbook: A Logical Approach
to Project Cycle Management. Washington, D.C., pp. 38–47.
Tool to support indicator development n.d. Microsoft Visio.
36 World Bank, 2010.
TIP
RESOURCES

IOM MONITORING AND EVALUATION GUIDELINES69
Data sources and data collection method
Please refer to the visualization of the IOM Results Matrix above to identify the data sources and data collection methods in the Results Matrix.
In order to monitor indicators, a source of information to verify each indicator is required. Within IOM, these sources of information are referred to data sources, defined as “identify[ing] where and how the information will be gathered for the purposes of measurement of specific indicators.”37 In addition to data sources, other commonly used terms include MoV or source of verification (SoV).
Data sources should identify what information to collect, how to collect that information and in what form (collection method) and with what frequency. Data sources can include documents (such as reports, government publications and records), data sets (such as national census data and project monitoring data sets), records (such as training attendance sheets and beneficiary case files) and people (such as beneficiaries and/or affected populations, stakeholders, project staff and government officials).
Indicator Data source Collection method
Percentage of households earning more cash after project People in households Household survey
Data sources can be primary or secondary. Primary data is collected by the implementing organization and may include personnel, budget, administrative data, surveys, interviews and direct observations. Secondary data is collected by others outside the implementing organization.
When selecting a data source, the following should be considered:
• Will there be access to the information? • Where will the information be attained from?• Can the data source provide quality data?• How will the information be attained given limited resources?• How costly and feasible is collecting the information?
It is required that each known data source collection method be specified in the initial Results Matrix, as time, capacity and budget must be built into the intervention in order to successfully implement them. Available resources and frequency of collection should also be identified during the development phase of an intervention. This is particularly important for M&E purposes, as it can also have specific budgetary implications.
It is equally important to collect only the data required for measurement of the indicators and data that is intended for further use. Collecting other additional information may result in added cost and time. Chapter 4 will provide further information on data collection methods and tools.
37 Module 2 of IOM Project Handbook, p. 143 (Internal link only).
EXAMPLE
TIP

70 CHAPTER 3 Monitoring at IOM
Baseline and targets
Please refer to the visualization of the IOM Results Matrix above to identify the baseline and target columns in the Results Matrix.
Baseline data and targets can be defined as follows: “Baseline data provides a foundation against which to measure change over time, while targets establish precisely the mark the project intends to hit.”38
Figure 3.12. Data baseline, milestone and target
500
250
1001 2 3 4 5 6
Year
baseline
milestones
target
Baseline data can be considered as the starting point, depicting the initial conditions before the implementation of an intervention. The baseline provides the first measurement of an indicator. It sets the current condition against which future change will be measured.
Key considerations in setting indicator baselines
Depending on the context and nature of an intervention, baseline data may not always be available during its development phase. In such cases, it may be appropriate to propose collecting baseline data (and subsequently the targets) once the intervention begins, in agreement with other key counterparts and donors.
In some cases, a baseline study or assessment may be required to identify the appropriate baseline data, if a budget is available for it, as it may have costly implications. For instance, in cases where changes to the general population are of interest, a census can be used as a baseline; however, this may not always be available, and it would be costly to conduct one related to the intervention. In other scenarios, it may not be possible to conduct a needed baseline study due to security restrictions or other reasons outside of IOM’s control. In such cases, data collected during the first monitoring visit, when a specific indicator is measured for the first time, can be considered a baseline for that indicator.
In other cases, particularly in multiphase programmes, baseline data may be available through other previously implemented interventions. However, in all cases, it is critical to be consistent in the way data is presented within the intervention, at the development phase and throughout reporting, as well as to always have a solid understanding and justification for why baseline data is presented in a particular way.
38 Module 2 of IOM Project Handbook, p. 145 (Internal link only).
INFO
RMATION

IOM MONITORING AND EVALUATION GUIDELINES71
Establishing targets sets the threshold for a particular indicator; it establishes what the intervention hopes to achieve, measured against a baseline. If targets are met for all of a result’s indicators, the intervention can be considered as having successfully achieved its result. The target set for a particular indicator should be appropriate within a given context or location, keeping in mind that an appropriate target in one scenario, location or context, may not be appropriate for another context. Key considerations to establishing a target may include budget considerations (what is the maximum that can be accomplished with the available resources), donor or key counterpart priorities (what is the intervention being asked to achieve) and contextual limitations (what is feasible given the environment in which the intervention is implemented). Setting targets for some results may be straightforward, while for others, it can be quite complex.39
IOM resources2017a Preparing the Results Matrix, Module 2. In: IOM Project Handbook. Second edition. Geneva,
pp. 123–152 (Internal link only).
n.d.b Samples of Completed IOM Results Matrices. Monitoring and Evaluation Sharepoint folder (Internal link only).
3.4.4. Results Monitoring Framework
Once the Results Matrix is developed and finalized, it can be converted into a monitoring tool that can be used during the implementation of an intervention: the Results Monitoring Framework (RMF). The RMF is developed at the start of the implementation, after a project has been funded and activated. The RMF is the primary tool to monitor the results of any intervention. It enables all members of the implementing team, as well as stakeholders, to track the progress being made towards achieving intended results. By specifying the data collection method, the RMF also highlights the requirements to obtain high-quality data. The RMF can be used alongside the detailed workplan for monitoring activities, financial reporting tools for monitoring budget compliance and the risk management plan for monitoring risks, to ensure a holistic monitoring approach.
39 Examples of baseline data and targets set at different result levels can be found in Module 2 of IOM Project Handbook, pp. 145, 146, 148–151 (Internal link only).
RESOURCES

72 CHAPTER 3 Monitoring at IOM
Results Monitoring Framework
2624
MO
DU
LE
4Pro
ject M
anagem
ent a
nd M
onito
ring
Tool 4.2: Results Monitoring Framework
Results Indicators
Data Source and Collection Method
Data Analysis Frequency Responsible Person Baseline Target Achieved Progress
Objective: Obtained from the Results Matrix.
Obtained from the Results Matrix.
Obtained from the Results Matrix.
Indicates how performance data will be analysed.
Indicates how often data will be collected.
Indicates who will be responsible for organizing data collection, data verification and data storage.
Obtained from the Results Matrix.
Obtained from the Results Matrix.
Indicates current status of progress towards reaching the target.
Analyses the extent of progress towards reaching the target.
Outcome 1: Obtained from the Results Matrix.
Output 1.1: Obtained from the Results Matrix.
Output 1.2: Obtained from the Results Matrix.
Source: Module 4 of IOM Project Handbook, p. 262 (Internal link only).
The RMF reflects much of the same information contained in the Result Matrix, but it contains five additional columns: data analysis, frequency, responsible person, achieved and progress. The RMF additionally removes the assumptions column from the Results Matrix.40 The following shows the distinction between the two tools.
Figure 3.13. Results Matrix and Results Monitoring Framework comparison
Results Matrix
Results Indicators Data source and collection method Baseline Target Assumptions
Objective
Outcome
Output
Results Monitoring Framework
Results IndicatorsData source
and collection method41
Data analysis Frequency Responsible
person Baseline Target Achieved Progress
Objective
Outcome
Output
40 See the proposed template in Module 4 of IOM Project Handbook, p. 263 (Internal link only).41 Data collection methods and analysis will be discussed in further detail in chapter 4 of the IOM Monitoring and Evaluation Guidelines.

IOM MONITORING AND EVALUATION GUIDELINES73
The five new columns are completed as follows:
Data analysis
This column is to be filled with a description of how the data collected will be analysed. The main categories of analysis are qualitative and quantitative.
For example, if the indicator is “presence of legislation that reflects international best practice”, the data source would be where the information (data) comes from (copy of the legislation), while the data collection method would be a document review (review of the legislation). Data analysis would be qualitative in nature, for instance, if an expert would assess the degree to which the legislation is in line with international best practices.
If the indicator was “percentage of households earning more cash after the intervention”, then the data source would be the people in the households, the data collection method would be a household survey, and the data analysis method would be mainly quantitative, that is, a calculation of the percentage of households that reported higher earnings.42
Ä Some qualitative and/or higher-level indicators may require a more specialized type of analysis or more resource- and time-intensive data collection than the immediate intervention team is able to provide. In such cases, a good practice is to incorporate this data analysis into scheduled evaluations, where expertise and resources external to the team can be recruited.
Frequency
Frequency refers to how often data will be collected (such as weekly, monthly, annually, quarterly, one-off and end of intervention). Frequency should correspond to the activities and indicators.
For example, if one training is to be held, and the indicator being measured is “percentage of trainees, by sex, who pass the post-training test”, then the measurement would be taken once (one-off) following the completion of the training and the test.
If an ongoing activity is being monitored, for example “transport assistance to refugees during a protracted crisis”, then it would make sense to monitor the number of persons being transported on a regular basis (such as weekly or even daily).43
Responsible person
This column indicates the name of the person from the intervention team who will be responsible for organizing data collection, data analysis and data storage in line with the IOM Data Protection Manual.
In cases where personal data is involved, the person specified in this column is the data controller, as per IOM Data Protection Manual.44
42 Module 4 of IOM Project Handbook, p. 259 (Internal link only).43 Ibid., p. 260.44 Ibid.

74 CHAPTER 3 Monitoring at IOM
Achieved
This column is to be filled with information, periodically or as it becomes available, which indicates the progress being made towards reaching the target. For example, if the target is to train 100 humanitarian workers on preventing human trafficking in emergencies, and 75 workers have been trained, enter 75 [out of a target of 100].45
Ä When required, it is good practice to break down this column into several periods (such as by month, quarter or year) to enable the tracking of progress over time. Ideally, this should align with the intervention’s reporting periods to simplify both tracking and reporting.
Progress
This column is to be filled with information, periodically or as it becomes available, which analyses the extent of the progress towards reaching the target. If appropriate, this can be expressed as a percentage (such as if 75 out of 100 humanitarian workers have been trained, the progress towards the target is 75%).
In some cases, a narrative description of progress towards the target may be more appropriate, particularly for qualitative indicators. For example, if the target indicator is “presence of legislation that reflects international best practice”, the confirmation of the existence of the legislation only partially reflects international best practice, then a brief description of how it reflects best practices and what gaps still remain would be most appropriate.46
Ä Note that the progress column should not be used for describing the activities carried out. It should only describe information related to the achievement of results, specifically related to the measurement of the specific indicator.
While the RMF is the main tool that can be used to keep track of the information required to monitor an intervention, additional tools to facilitate the collection of data may be needed for each indicator, depending on the specified data collection method. Examples of relevant data collection tools, such as surveys, focus group discussions, key informant interviews and others are further provided in chapter 4 of the IOM Monitoring and Evaluation Guidelines.
IOM resources2010 IOM Data Protection Manual. Geneva.
2017 Module 2 and Module 4. In: IOM Project Handbook. Second edition. Geneva (Internal link only).
45 Ibid.46 Ibid., p. 261.
INFO
RMATION
RESOURCES

IOM MONITORING AND EVALUATION GUIDELINES75
3.5. Types of monitoring: An overviewWhen monitoring an IOM intervention, four essential areas to monitor and the key tools associated with each area are considered.
ActivitiesKey monitoring tool: Detailed workplan
ResultsKey design tools:
ToC, Results MatrixKey monitoring tool: RMF
Budget and expendituresKey monitoring tool: Process
and Resource Integrated Systems Management (PRISM) financial reports
and PRIMA for All
RisksKey monitoring tool:
Risk Management Plan
Rights-based approach (RBA)
Gender mainstreaming
Environmental sensitivity and sustainability
Protection mainstreaming
Process monitoring
Compliance monitoring
Context monitoring
Beneficiary monitoring
Remote monitoringAccountability to affected
populations (AAP)
Additional types of monitoring
Incorporating cross-cutting themes
A variety of elements can be monitored in an intervention and what to monitor will depend on the specific information needs of an intervention.
In addition to monitoring budget and expenditures, PRIMA may be used as a tool to monitor results; it can specifically be used to report on a Results Matrix and RMF as these can be tracked using the system, as well as provide useful dashboard results.
Results monitoring in PRIMA is a two-step approach: (a) planning the monitoring of project results; and (b) updating/monitoring the project results by measuring progress against the indicators established in the Results Matrix. Using the Plan tab within the Results Monitoring Module, managers are able to enter information into additional columns that are added to the original Results Matrix to create RMF: (a) Data analysis (including options for data disaggregation); (b) Frequency; and (c) Person responsible. The additional two columns of the RMF – Achieved (indicated as Cumulative progress in PRIMA) and Progress – are updated using the Indicator Results tab in the Results Monitoring PRIMA Module. Once complete, the data entered into the RMF in PRIMA can also be exported into PRIMA-generated donor reports.
For more information on how to use PRIMA to monitor results, see PRIMA User Guide – Results Monitoring.
INFO
RMATION

76 CHAPTER 3 Monitoring at IOM
3.5.1. Types of monitoring
The following table looks closer at the different types of monitoring and outlines the tools most useful in conducting each type of monitoring.
Table 3.3. IOM’s four types of monitoring47
Monitoring type Description Tool/s to use
Activity monitoring
Activity monitoring tracks progress, gaps and delays in activities against a detailed workplan.
A manager should already have a basic workplan from the intervention proposal. At the start of implementation, this basic workplan should be further developed into a detailed workplan. The detailed workplan includes the activities and tasks identified within the Results Matrix, along with all other activities and tasks related to implementation. It includes, for example, a section for ongoing monitoring, evaluation and reporting activities.Ideally, the development of the detailed workplan should be undertaken by the intervention team, under the overall leadership of the manager.
IOM Workplan Templates (Module 4 of IOM Project Handbook, p. 293) (Internal link only).
The workplan helps to plan and monitor the implementation of activities, clearly distribute tasks among the intervention team and helps to ensure that the outputs are delivered within the time frame and budget available.
Results monitoring
Results monitoring tracks results. This type of monitoring is used to determine whether an intervention is on or off track towards its intended results (outputs, outcomes, objective). It is also recommended to reflect on and identify any unintended positive or negative effect. An example of this could be if training participants independently created a working group and continued to meet beyond the time frame of that training.
The previous sections have shown how to monitor for results in great detail using the IOM Results Monitoring Framework and/or the Results Matrix.
IOM Results Monitoring Framework Template (Module 4 of IOM Project Handbook, p. 262) (Internal link only).
The RMF should always reflect the most recent agreed-upon version of the Results Matrix and should be reviewed regularly.
Various data collection tools are mentioned in chapter 4.
Financial (Budget and expenditure) monitoring
Financial monitoring tracks costs by input against the planned expenditures as per the approved budget.48 It is often done in conjunction with compliance and process monitoring (described below).
When reporting, PRIMA is used to create interim and final financial reports and can, therefore, be a resource for financial monitoring.
PRISM financial reports (see Module 4 of IOM Project Handbook, pp. 301–307) (Internal link only).49
PRIMA
47 Adapted from IFRC, 2011.48 See Module 4 of IOM Project Handbook, pp. 263–269 (Internal link only).49 PRISM is IOM’s resource planning solution built on SAP (IOM’s enterprise software).

IOM MONITORING AND EVALUATION GUIDELINES77
Risk monitoring
Risk monitoring tracks whether previously identified risks are still pertinent, if new risk has emerged and assesses whether the likelihood and timeline of previously identified risks remain accurate.
Risk monitoring also entails identifying and assigning risk treatment actions, which is part of setting up a risk management plan. Risk monitoring is often conducted in conjunction with context monitoring.50 Also see an example of a risk register in Module 1 of the IOM Project Handbook (p. 32) for further information.
IOM Risk Management Plan (Module 4 of IOM Project Handbook, p. 308) (Internal link only).
PRIMA includes a Risk Management module for managing risk. For more information, see the PRIMA User Guide, available internally to IOM staff via the IOM intranet.
Additional types of monitoring to consider
Process monitoring
Process monitoring tracks the use of inputs and other resources, the progress of an intervention’s activities and the delivery of outputs. It assesses how activities are delivered. This type of monitoring is often conducted in combination with compliance monitoring (defined below). Process monitoring tools could be checklists to ensure that processes are undertaken; registration forms and tracking forms could also be tools used for process monitoring.
Compliance monitoring
Compliance monitoring ensures compliance with organizational and donor regulations and the expected results of the intervention, as well as with local governmental regulations and laws, contractual requirements and established ethical standards. One example of a compliance monitoring tool is a checklist.
Context monitoring
Context monitoring tracks the situation in which the intervention operates and focuses on identifying risks and assumptions, taking into account any unexpected considerations that may arise. In this way, context monitoring is closely linked to risk monitoring. Context monitoring covers the direct area of operation, as well as the larger institutional, political, funding and policy context that affect the implementation of an intervention. IOM tools that may be used for context monitoring include the above-mentioned risk management plan.
Beneficiary monitoring
Beneficiary monitoring tracks beneficiary perceptions of an ongoing or completed intervention. This type of monitoring encourages beneficiary participation and assesses beneficiary satisfaction or complaints, the level of their participation/inclusion, their access to resources, how they were treated within the intervention and their overall experience of change. Survey and questionnaire are examples of tools that can be used for beneficiary monitoring.
50 See Module 4 of IOM Project Handbook for further guidance (Internal link only).
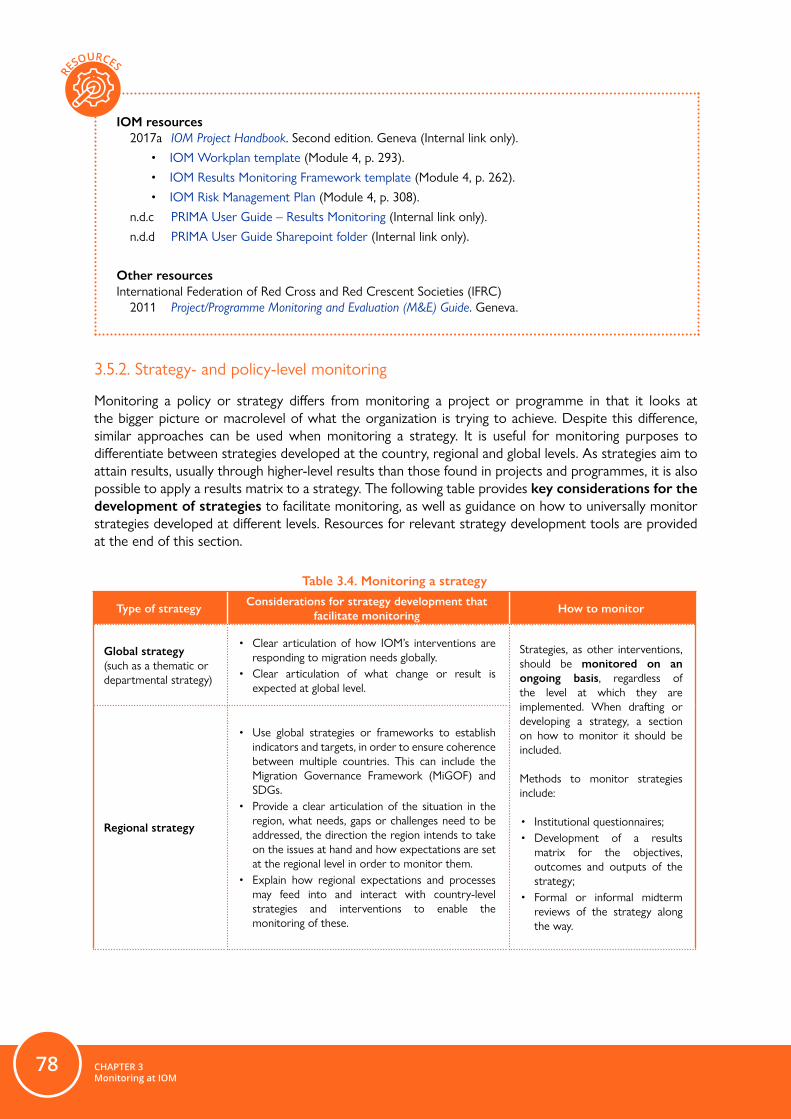
78 CHAPTER 3 Monitoring at IOM
IOM resources2017a IOM Project Handbook. Second edition. Geneva (Internal link only).
• IOM Workplan template (Module 4, p. 293).• IOM Results Monitoring Framework template (Module 4, p. 262). • IOM Risk Management Plan (Module 4, p. 308).
n.d.c PRIMA User Guide – Results Monitoring (Internal link only).n.d.d PRIMA User Guide Sharepoint folder (Internal link only).
Other resourcesInternational Federation of Red Cross and Red Crescent Societies (IFRC)
2011 Project/Programme Monitoring and Evaluation (M&E) Guide. Geneva.
3.5.2. Strategy- and policy-level monitoring
Monitoring a policy or strategy differs from monitoring a project or programme in that it looks at the bigger picture or macrolevel of what the organization is trying to achieve. Despite this difference, similar approaches can be used when monitoring a strategy. It is useful for monitoring purposes to differentiate between strategies developed at the country, regional and global levels. As strategies aim to attain results, usually through higher-level results than those found in projects and programmes, it is also possible to apply a results matrix to a strategy. The following table provides key considerations for the development of strategies to facilitate monitoring, as well as guidance on how to universally monitor strategies developed at different levels. Resources for relevant strategy development tools are provided at the end of this section.
Table 3.4. Monitoring a strategy
Type of strategy Considerations for strategy development that facilitate monitoring How to monitor
Global strategy(such as a thematic or departmental strategy)
• Clear articulation of how IOM’s interventions are responding to migration needs globally.
• Clear articulation of what change or result is expected at global level.
Strategies, as other interventions, should be monitored on an ongoing basis, regardless of the level at which they are implemented. When drafting or developing a strategy, a section on how to monitor it should be included.
Methods to monitor strategies include:
• Institutional questionnaires; • Development of a results
matrix for the objectives, outcomes and outputs of the strategy;
• Formal or informal midterm reviews of the strategy along the way.
Regional strategy
• Use global strategies or frameworks to establish indicators and targets, in order to ensure coherence between multiple countries. This can include the Migration Governance Framework (MiGOF) and SDGs.
• Provide a clear articulation of the situation in the region, what needs, gaps or challenges need to be addressed, the direction the region intends to take on the issues at hand and how expectations are set at the regional level in order to monitor them.
• Explain how regional expectations and processes may feed into and interact with country-level strategies and interventions to enable the monitoring of these.
RESOURCES

IOM MONITORING AND EVALUATION GUIDELINES79
Country strategy
• Provide a clear articulation of what the situation in the country is to inform the selection and development of any proposed results, indicators and targets to be monitored.
• Use global and regional strategies or frameworks to ensure coherence (including the SDGs and the UNSDCF for the country).
• During development, clearly link ongoing interventions to established results to show how IOM is responding to country-specific needs.
• Reporting (formal and informal, external and internal) on the strategy implementation on a regular basis;
• Regular monitoring should ensure that ongoing and newly developed interventions are clearly linked to relevant strategy results.
Monitoring policy
Policies are often developed at the system, institutional and organizational levels and can facilitate efforts to address complex challenges. However, having sound and evidence-based policies is needed to address those challenges and achieve longer-term institutional and organizational goals. Therefore, it is critical to build M&E into the policy cycle, for many of the same reasons as in project-, programme- and strategy-level interventions, including to promote accountability and learning. With this in mind, many of the same considerations that promote the successful monitoring of a strategy can also facilitate the monitoring of a policy. Similarly, tools, such as the development and use of a results matrix, can be applied to policy monitoring.
For more resources on monitoring (and evaluating) a policy, see the Resources section below.
Where a Results Matrix or RMF has not been developed for a particular strategy or policy, it is still possible to monitor the intervention through frequent strategic reviews and reporting, in ways that may be more qualitative in nature. Tools that may support this include the following: (a) action plan; (b) midterm strategy review; (c) regular meetings of key strategy stakeholders on the strategic direction; and (d) linking specific projects to the strategy to identify potential implementation and/or funding gaps.
Example of developing a monitoring plan for a strategy
IOM Thailand’s country strategy provides a good example of how to develop a plan to monitor a strategy. It shows how project/programme-level monitoring essentials, such as the Results Matrix, is applied at the strategy level. Furthermore, it shows multiple results matrices, covering different thematic areas that respond to the country-specific migration needs, and indicates how they are linked to other global frameworks such as the SDGs.
IOM resources 2017b IOM Thailand Internal National Strategy 2017–2020. N.p. Monitoring and Evaluation Sharepoint
folder (Internal link only).
2018a IOM Country Strategy Draft Outline. Internal template on Monitoring and Evaluation Sharepoint folder (Internal link only).
2018b IOM Country Strategy – Quick Guide. Internal template on Monitoring and Evaluation Sharepoint folder (Internal link only).
INFO
RMATION
RESOURCES
EXAMPLE
TIP

80 CHAPTER 3 Monitoring at IOM
Other resourcesNational Center for Injury Prevention and Control
2013 Step by step – Evaluating violence and injury prevention policies, Brief 1: Overview of policy evaluation. Centers for Disease Control and Protection (CDC), Atlanta.
Organisation for Economic Co-operation and Development (OECD)n.d. Policy monitoring and evaluation.
3.6. Remote management, monitoring and third-party monitoringThis section focuses on operating and monitoring in environments where reaching vulnerable populations is a challenge, including in contexts with medium to high insecurity, while maintaining the security of the organization’s personnel. It also addresses cases of large and complex programmes, some with wide coverage, including those implemented with the use of TPM. Remote management and monitoring strategies and TPM can help mitigate the challenges inherent to such situations and support IOM to continuously provide targeted assistance, while reducing risk to staff.
A management structure, which may have been set up as a temporary mode of operation, can rapidly become a semi- and/or permanent approach to implementation in countries with deteriorating security. While the proliferation of remote management approaches may have offered a number of recommendations to practitioners to improve their results in hard-to-reach areas, it has also revealed its limitations, including those related to intervention monitoring and AAP. This section will cover remote management, remote monitoring, as well as TPM of interventions.
3.6.1. Remote management
Remote management approaches have substantial implications for monitoring and accountability practices, as well as the ability of the implementing organization to provide assurance of reaching project/programme results. Where situations may restrict staff members from meeting with beneficiaries or monitoring activities directly, they must rely on other staffing approaches or external partners. Remote management approaches are required in circumstances where management may not have physical presence and hence limited technical oversight, monitoring and accountability, as well as in situations with an increased risk of fraud and corruption occurring. The following are some of the common situations in which remote management approaches can be adopted.
(a) IOM is directly operational, but with limited, or reduced, staff based on the ground.
In this situation, while still being able to reach target beneficiaries, management is often under the full responsibility of the limited IOM staff who are on the ground.
(b) IOM works with an international partner organization, managing interventions from different locations.
This is often the case when the United Nations imposes security restrictions, while other actors, such as international non-governmental organizations (NGOs), are not subject to the same constraints. Here, IOM manages the intervention but implements activities through the partner organization.

IOM MONITORING AND EVALUATION GUIDELINES81
(c) IOM works with a local partner, managing the intervention from different locations.
In this case, IOM retains management but implements the activities through a local partner on the ground. This approach may be particularly cost effective and beneficial, as it facilitates access to target beneficiaries, while simultaneously building the capacity of the local partner.
(d) Implementing organization fully outsources implementation to another partner.
In this scenario, IOM does not retain immediate management of the outsourced intervention. If this is the only option, it is highly recommended to closely manage this relationship to ensure a high degree of accountability. This is recommended to include strong and regular M&E-related communication mechanisms, remote monitoring mechanisms, as well as clearly defined mechanisms for quality assurance. Examples of all three of these mechanisms to mitigate the challenges that arise when implementation is fully outsourced to another organization are further elaborated.
Special circumstances
The COVID-19 pandemic in 2020 led to further challenges in managing and implementing interventions, as well as, relatedly, all subsequent M&E efforts. It presented yet another remote management scenario, where most activities and movements were severely restricted for all actors. These conditions further reinforce the need for having strong and flexible monitoring systems in place to support the implementation of interventions. In response to the challenges brought by the COVID-19 pandemic, IOM developed a guidance document, Continuity of Monitoring and Evaluation Interventions during COVID-19, which includes data collection alternatives that are equally helpful in remote management and monitoring scenarios.
In general, remote management, including remote monitoring and some aspects of TPM, can be a temporary or a more permanent response to security and logistical challenges in the direct implementation of programmes.51 Depending on the degree of remoteness, different strategies may need to be applied. The office managing the intervention must identify a set of general parameters and thresholds that define when direct implementation is no longer possible or advisable (such as what are the risks the organization is willing to take). If required, mission staff can seek assistance to set parameters and thresholds from their respective regional office and/or the Office of the Inspector General’s Central Evaluation function (OIG/Evaluation) at Headquarters.
Considerations include the following: (a) Physical security/operating environment – An elaborated risk and security assessment should
include the following:(i) A solid context and security environment analysis, including dynamics of conflict (United
Nations Risk Management Unit), distance to project sites, transport types, availability and constraints and infrastructure;
(ii) Security risk levels analysis (low/medium/high);(iii) Access to project sites analysis: None/irregular/regular but limited.
(b) Cost analysis of options – A cost analysis should include the following:(i) How much can be invested for delegating responsibility in the implementation and having
the least impact to programme quality; this may require analysing other cost-effective or cost-saving options;
51 This section is based on IOM's TRD and OIG/Evaluation feedback collected on TPM in 2018.
INFO
RMATION

82 CHAPTER 3 Monitoring at IOM
(ii) Possibilities of monitoring/conducting field visits, given the circumstances (security environment, remoteness and other factors affecting risk); availability of information systems; identification of efficient implementing partners; guaranteeing capacity-building of local partners; how to maintain effective relationship with beneficiaries, for instance through community networking systems; possibilities to assess the impact of the programme through remote management.
(c) Exit strategy – As remote management systems are often more expensive and less reliable than direct management, where applicable, an exit strategy to transition from remote to direct management should be considered and regularly reviewed to inform relevant implementation-related decisions.
An IOM managing mission, in consultation with relevant regional offices and Headquarters decision makers, should also consider who makes the decision to engage in remote programming and what processes forms the basis for that decision, including the legal framework.
3.6.2. Remote monitoring
Remote management may have significant implications for the organizational set-up, accountability, monitoring and assurance of the quality of interventions. When a situation calls for remote management, the set-up and use of monitoring approaches require more attention. Due to logistical difficulties in conducting the monitoring in complex and remote environments, the need for additional training and contractual arrangements with additional reporting lines may arise. Strong remote monitoring approaches become key to supporting and contributing to remote management.
A common challenge of remote monitoring is the allocation of sufficient resources for planning and budgeting the set-up of rigorous and effective monitoring systems. It is therefore important to identify operational constraints and budgeting limitations encountered in those fragile and complex environments. This ultimately may also prevent abusive use of no-cost extensions. Considering such constraints and limitations in the monitoring section of each project proposal may also reassure the donor that attention is paid to monitoring in order to guarantee the overall quality of an intervention.
Through the use of specific remote management approaches, monitoring of implementation can still continue. The following table outlines key challenges in the context of remote monitoring and possible solutions to address them.
INFO
RMATION

IOM MONITORING AND EVALUATION GUIDELINES83
Table 3.5. Remote monitoring: Key challenges and possible solutions
Challenge Explanation Suggested solutions
Potential deterioration in programme quality
Ensuring high quality in programming may be especially challenging when projects are technically complex.
Where/if possible:
• Preventive measures should include a clear and strong performance framework, including a solid communication plan and quality assurance mechanisms.
• Break down complexity into simple, digestible components, including easy-to-follow standard operating procedures for technically complex projects.
• Schedule regular and reoccurring meetings with the project/programme team; train staff, including implementing partners, and refresh their understanding of the subject matter, as well as conduct cross-checks and provide ongoing supervision and technical guidance on the subject matter.
• Increase monitoring visits, where possible, as this can contribute to remote supervision, technical guidance and the cross-checking of data.
Weak monitoring and control mechanisms
Rigorous monitoring may be neglected when a project is already facing competing priorities and deadlines or budgetary constraints. The lack of staff capacity, standardized approaches and monitoring tools, infrequent monitoring visits, low quality of collected data and the lack of information triangulation are factors that can weaken monitoring and result in poor decision-making, potential deterioration in programme quality and corruption.
Where/if possible:
• Ensure dedicated monitoring capacity both at the programme/project development and implementation levels.
• Develop an M&E plan, outlining the overall strategy for monitoring, its standardized approaches, sources, timing and management processes and procedures.
• Provide standardized monitoring tools that are regularly reviewed and updated.
• Regularly conduct capacity-building of monitoring staff.
• Introduce controls in the monitoring process, where required.
• Increase triangulation of information and integrate a monitoring culture among different implementing staff, beneficiaries and stakeholders.
• Enable real-time communication and information-sharing mechanisms.
• Implement strict financial tracking systems to mitigate corruption.

84 CHAPTER 3 Monitoring at IOM
Insufficient and/or inaccurate data and reporting
Low quality of data can affect the quality of reporting. It can be related to limited staff capacity and/or time spent in the field due to security concerns while collecting data.
Where/if possible:
• Set up easy-to-use data collection tools, as well as field data collection plans with options showing plan A and B in line with the identified possible challenges.
• Set up an effective data quality control mechanism at the end of every day of data collection, as well as during data entry and submission.
• Plan enough time for training and piloting of tools. – Avoid complex or lengthy tools and focus on
collecting only the most critical information. • Throughout the data collection process, call the field
focal person daily to receive updates or troubleshoot challenges. This will ensure everything is on track and can be particularly useful when working with partners.
• Conduct frequent data triangulation.• Introduce data reporting systems that are accessible
online or through cell phones and in which it is possible to provide real-time feedback to bridge the physical distance.
Reduced number of visits and access to implementation sites
Monitoring visits to implementation sites or field offices can, at times, be challenging. This can result in poor communication, lack of information-sharing and lack of control of information, which can ultimately negatively affect the quality of implementation.
Where/if possible:
• Identify a monitoring team not affected by security limitations to conduct field visits on behalf of the implementing team (ensure prior training if it is an external team).
• Ensure consistent information flow by establishing mechanisms that provide real-time collaboration spaces, enable greater data security, seamless coordination, and improved management and control mechanisms.
• Ensure monitoring visits take place regularly, whenever possible. Note that the regularity and frequency of monitoring visits can often be related to the frequency of information needs, which can be assessed through RMF.
• Favour online monitoring mechanisms as mentioned above including also receiving photographs and GPS tracking devices for distribution of goods.
• Consider the use of a third party to conduct monitoring visits of IOM’s work. These would be entities that have more access or may be less impacted by security constraints.
Limited staff/partner capacity
The most common limitations are related to management, data analysis and reporting skills, as well as having a good understanding of concepts such as M&E, humanitarian action and beneficiary accountability.
Where/if possible:
• Introduce these concepts at the start of an intervention, during staff capacity-building to ensure common understanding of requirements and expectations.
• Consider developing a regular internal training schedule, invest in collaborative training events with local or international actors, promote good practice presentations and use systematized tools and templates.

IOM MONITORING AND EVALUATION GUIDELINES85
Weak technical oversight of implementation
Providing adequate technical support through remote management can prove to be more challenging.
Where/If possible:
• Consider identifying a technical M&E expert within the team (field or country office). If not available, consider reaching out to relevant regional offices or colleagues at Headquarters to request for assistance.
Potential weak communication between the main country office or delocalized main office and sub-offices in the field
Communication may suffer in remote management contexts.
Where/if possible:
• Bring staff from head and field offices or partners together for regular meetings, either in person or for time-effective virtual communication to address the weak connections.
• Use reporting templates and real-time document-sharing through online platforms, as it can support improving communication, increase accountability, follow-up and information-sharing.
• Introduce communication protocols.
Increased risk of fraud and corruption
The risks of fraud and corruption are present throughout the implementation of an intervention and may arise in remote management settings, where monitoring is more difficult. Fraud or corruption can occur at various levels: at the organizational level with own staff, at the beneficiary level or at an implementing partner level. Certain socioeconomic and political factors can lead to increased likelihood of fraud and corruption.
Where/if possible:
• Take relevant contextual factors into consideration when setting up rigorous control, monitoring and supervisory systems.
• Incorporate sufficient checks and control mechanisms tailored to the intervention’s individual procedures and processes.
Remote monitoring systems
Insofar as it is possible, remote monitoring systems should allow for real-time feedback. Such systems have multiple benefits: they can enable a real-time and/or close to real-time two-way communication in remote environments; thereby serving not only as a management tool, but also as a check and quality assurance mechanism. By receiving near to real-time information/data, IOM staff is able to identify and respond to challenges through corrective efforts much faster.
INFO
RMATION

86 CHAPTER 3 Monitoring at IOM
Microsoft Office 365 is available to all IOM staff members and contains tools that can be used for (remote) monitoring. Some of the useful tools are as follows:
Real-time collaboration/sharing Collaboration spaces/platforms
• OneDrive• MS Forms (for data collection; also mobile
friendly)• Word (for sharing documents for real-time
collaboration)• MS Excel (for sharing documents for real-
time collaboration)• MS Planner
• SharePoint• MS Teams• Yammer
Virtual calls
• Skype for Business
• MS Teams
IOM resources 2020 Continuity of Monitoring and Evaluation Interventions during COVID-19. Version 8 April. OIG/
Evaluation.
Other resources International Rescue Committee (IRC)
2016 IRC – Syria, Remote Management Guidelines. Last updated August 2016.
Norman, B.2012 Monitoring and Accountability Practices for Remotely Managed Projects Implemented in Volatile
Operating Environments. Tearfund, Teddington, United Kingdom.
Price, R. 2018 Approaches to remote monitoring in fragile states. GSDRC Helpdesk Research Report. University
of Birmingham.
Ä Resources primarily linked to COVID19 that can also be applied to other contexts
Kopper, S. and A. Sautmann 2020 Best practices for conducting phone surveys. Abdul Latif Jameel Poverty Action Lab (J-Pal),
20 March.
3.6.3. Third-party monitoring
TPM is the system of contracting third parties to conduct the monitoring, and/or cover monitoring functions, such as collecting (and at times verifying) data, on behalf of the implementing instance or donor. However, the definition can further be contextualized, and TPM modalities can take various shapes, especially in non-permissive environments. Therefore, when speaking of TPM, it is important to clarify which of the following possible situations is being discussed.
(a) IOM uses TPM – IOM, as the managing entity, uses TPM to monitor its interventions: IOM hires an external monitoring team to conduct the monitoring of its own and/or of its implementing partners’ performance.
RESOURCES
TIP

IOM MONITORING AND EVALUATION GUIDELINES87
(b) IOM is the third-party monitor – Another managing entity uses IOM to monitor its interventions: IOM is the TPM entity and conducts monitoring of non-IOM interventions.
(c) IOM is the subject of TPM by another entity – An entity (usually a donor agency) uses external TPM entities to monitor IOM’s performance: An IOM-managed intervention is being monitored by a TPM entity, working directly for the intervention donor.
IOM has experience in all three situations as elaborated in the following examples from IOM Pakistan:
(a) IOM uses TPM – IOM uses TPM to monitor the implementation of its own intervention and/or the work of implementing partners (such as local NGOs): At a large-scale USAID-funded community stabilization programme, the security situation and security protocols restrict IOM staff’s access to field activities. The programme, therefore, hired field staff through third-party contracts to conduct the monitoring of ongoing projects in the zones with restricted access. The staff was trained and supervised by IOM M&E staff through remote management and monitoring, using a M&E management information system (MIS) designed for this programme to enable real-time monitoring.
(b) IOM is the TPM – Another entity uses IOM as the third-party monitor to monitor its interventions: IOM is the TPM of an INL-implemented project, using a specific monitoring system.52 IOM is not involved in the implementation of the project in any shape or form and is merely monitoring project performance as a TPM.
(c) IOM is being TPMed – A donor agency uses TPM to monitor IOM’s performance: IOM activities were monitored by a third party, funded by USAID. The TPM reported directly to USAID. Any challenges that were flagged by the TPM to USAID were then forwarded to IOM for response. In case of conflicting findings, IOM was requested to provided evidence-based monitoring reports to the donor.
TPM is not only used in emergency situations; it can also be used in large-scale programmes, for instance within the United States Refugee Admissions Program, which uses TPM to monitor its activities implemented around the world by different agencies, or the European Union Trust Fund programme with IOM’s performance being monitored by another entity.
Key considerations for third-party monitoring agreements
It is important when engaging in a TPM scenario to ensure that the parties involved have clear and realistic expectations. Contractual agreements define the parameters and conditions for any TPM scenario, including the obligations and requirements of the different entities involved. When entering into an agreement with a third party for the purpose of monitoring, in any of the three TPM scenarios outlined above, several key considerations should be kept in mind:
(a) Roles and responsibilities: Ensure that the roles and responsibilities within the scenario are clearly outlined for each party, including frequency of monitoring and reporting, lines of reporting, lines and means of communication between parties, staffing required for implementation, deliverables and division of work between the parties. Other important obligations may be identified and included depending on the context.
(b) Data protection: Identify potential data protection issues and address them directly within the agreement and at the outset of monitoring implementation. While IOM makes a commitment to being transparent with TPM partners, agreements must be in line with IOM Data Protection Principles, following the guidance provided by the IOM Data Protection Manual, and following guidance from the Office of Legal Affairs (LEG) regarding confidentiality-related language within contractual agreements.
52 INL is the acronym for the US Bureau of International Narcotics and Law Enforcement Affairs.
INFO
RMATION
EXAMPLE

88 CHAPTER 3 Monitoring at IOM
Ä To reinforce IOM’s commitment to transparency, consider outlining any specific foreseen limitations on the sharing of data from the outset of a TPM arrangement, ideally during the initial negotiations between TPM agreement parties.
(c) Indicators: It is important to agree upon what is being monitored and how results are measured at the outset. Adding or altering indicators, beyond what was originally contractually agreed upon with the donor, and without agreement of all parties, may complicate or hinder accurate reporting of results, and, in some situations, significantly complicate established data collection mechanisms.
(d) Multiple agreements: In nearly all situations, a TPM agreement will be concluded within the context of an existing project or programme. In such cases, a donor agreement will already exist. It is therefore essential that all TPM agreements align with the obligations outlined for IOM in the original donor agreement. Where possible, if a TPM scenario is required by a donor, try to agree upon the parameters, including IOM’s ethical considerations related to data protection, as well as roles and responsibilities of all parties prior to the conclusion of the initial donor agreement.
Ä Finally, where there are questions or disagreements related to TPM agreements and the language used therein, remember to utilize LEG as a resource. For further guidance on procurement matters related to TPM, please see IN/284.
Challenges and risks of third-party monitoring53
While TPM allows for the indirect tracking, verification, validation, real-time collection of data and course correction of IOM interventions, it also has some limitations. Such limitations can include poor-quality reporting of monitoring visits conducted, unexpected costs (inter alia, related to improving the quality), lack of transparency and difficulty using TPM to collect outcome-level data. Many of the risks inherent in remote management are also true for TPM.
Additional potential risks associated with third-party monitoring
Prog
ram
mat
ic
• Inadequate design: Budget does not include air travel, proper M&E system or trainings, for example.
• Implementation/technical oversight: Supervision only from a distance.• Poor feedback and participation: If no direct and regular feedback is available for monitoring (for
instance due to reduced regularity of visits to projects or inadequate M&E frameworks), the performance of the programme may be at risk, such as risk of corruption and recruitment of inadequate skills or mismanagement.
• Communication: Inaccurate/inconsistent/untimely data collection and reporting; triangulation of data is very difficult; weak communication with staff in the field and head offices.
• Limited relationship with the community/acceptance and participation.
Inst
itut
iona
l • Financial: If a TPM system is weak due to limited funding, monitoring and reporting may be affected and weaken the value of the use of TPM.
• Reputational: Third-party monitors need to be selected with due consideration to ethical behaviours, professionalism, cultural sensitivities and reputation. A bad selection can affect the reputation of the organization using TPM.
Oth
er • Conflict of interest at the TPM level with biased monitoring for its benefits and other contractual opportunities.
53 The following sections are drawn from information compiled by TRD, developed in consultation with OIG/Evaluation in 2018.

IOM MONITORING AND EVALUATION GUIDELINES89
Key lessons learned from IOM experience with third-party monitoring implementation
(a) Allocate sufficient resources for the capacity-building of TPM staff to ensure a high quality of work throughout monitoring processes. Using manuals, handbooks, guidance notes and various templates for such remote monitoring systems are highly recommended. It is important to abide by IOM standards such as IOM Data Protection Principles to ensure compliance.
(b) It is important to agree at the outset of a TPM arrangement, whether in the agreement itself or an annexed or accompanying document, on the parameters related to the ethical collection, management and use of data, including linking TPM efforts to the IOM Accountability to Affected Populations Framework (see chapter 5 on IOM Cross-Cutting Themes: AAP).
(c) When clarifying roles and responsibilities in a TPM agreement, ensure that all parties have a realistic understanding of the human and other resources required to facilitate all TPM activities. Whether IOM is engaged in TPM or being TPMed, data collection requirements, such as the facilitation of monitoring visits or drafting of reports, should not limit the capacity of the implementing organization to implement the intervention.
The resources referenced above for remote management and monitoring can also be considered, depending on the situation, for TPM.
IOM resources2010a IOM Data Protection Manual. Geneva.
2010b Annex X: IOM Data Protection Principles (Internal link only).
2021 Changes to Procurement, Implementing Partners Selection and Related Contracting Procedures (IN/284) (Internal link only).
3.7. Pulling it all together: Monitoring and evaluation planThis chapter has so far introduced various types of monitoring, including the four essential areas to monitor: results, activities, budget and expenditure and risk.
As noted in the Types of monitoring section of this chapter, PRIMA may also be used as a tool to monitor results, using the Results Matrix and RMF.
For additional information on how to use PRIMA to monitor results, see the PRIMA User Guide, Annex 5: Results Monitoring (Internal link only).
Taken together, these constitute the main elements that should be used in planning and carrying out the monitoring of projects, programmes, strategies and policies. Together with planning evaluation, covered in chapter 5 of the IOM Monitoring and Evaluation Guidelines, these elements constitute the M&E plan. The M&E plan outlines the overall plan for M&E across the entire intervention. It should specify the monitoring strategy, approaches, any studies, reviews or evaluations to be conducted, detailing data sources, timing, management processes, as well as summarize the overall programme theory, including ToC or Results Matrix.
INFO
RMATION
RESOURCES
INFO
RMATION

90 CHAPTER 3 Monitoring at IOM
While various definitions exist, the terms “M&E plan” and “M&E framework” are often used interchangeably. However, while both seem identical, they refer to two different concepts. Table 3.6 shows some of the key elements.
Table 3.6. Key elements compared: Monitoring and evaluation plan and monitoring and evaluation framework
Monitoring and evaluation plan Monitoring and evaluation framework
In some cases, a detailed description of project logic, envisioned evaluations and monitoring activities, as well as M&E tools, may be required. Cases where this might be required include when the success of a very large or complex project needs to be measured, when a variety of partners will be involved in M&E activities or when the donor specifically requires a more detailed plan on how M&E will be enabled at the start of the intervention.
This more detailed version would be called an M&E plan and would cover all planned M&E activities. It can also cover additional areas, such as learning and reporting.
The most common definition of an M&E framework is a table that lists all indicators (and their brief definition), along with data source, baseline, target, how often it will be measured, data collection methods and tools, as well as who is responsible for measuring results. For IOM, the closest concept to an M&E framework is RMF. In many cases, RMF may be sufficient for monitoring the results of an intervention at IOM, along with the plans described in the M&E sections of the project document.
An M&E plan should ideally be done at the initial (inception) phase of a project, before starting implementation and should be reviewed periodically to reflect changes in the implementation context, or after major project design changes are made.
The M&E framework is also developed at the start of the project. It may also need to be reviewed periodically to reflect the changes in implementation.
The M&E framework can be a component of, and included in, the M&E plan.
While the two concepts are presented as distinct here, it is always advised to seek clarity from a particular donor or partner to ensure a common understanding of the terminology and associated expectations.
An M&E plan helps tie together all the M&E components, such as field visit plans, the RMF, data collection and analysis and use requirements, learning and reflection activities and other information. In some instances, an M&E plan may also contain detailed descriptions of the intervention indicators. It is useful to compile all the different elements that enable M&E within an intervention into one document or folder in order to better manage M&E processes, promote access to all documents and a common understanding among the project team, as well as facilitate eventual reviews and evaluations.
Although there are various templates for M&E plans, the following outlines the main components of a basic and an advanced M&E plan.
INFO
RMATION

IOM MONITORING AND EVALUATION GUIDELINES91
Basic monitoring and evaluation plan template
(a) Results Monitoring Framework Include a copy of the developed RMF in the document. Its final columns – Achieved and Progress – can be left blank. A separate copy of the RMF can be kept in order to track progress.
(b) Planning for monitoring of activities, financials and risksSometimes the monitoring of activities, financials and risks are not considered part of the M&E plan, but rather as a separate part of project management. However, the M&E plan can include a reference to how those elements are being monitored.
For IOM, the main tools referenced in the IOM Project Handbook are the detailed workplan, PRISM reports and/or tailor-made tools and the Risk Management Plan. Tools for data collection should also be referenced in this section of an M&E plan. For more information related to data collection tools, see chapter 4 of the IOM Monitoring and Evaluation Guidelines.
(c) Detailed workplanThe M&E plan should be fully linked to the detailed workplan, including ensuring that M&E activities are included in the overall workplan. A detailed workplan is comprehensive and realistic, with the right people assigned to each task, and takes into account workflows and potential scheduling problems right from the start of the project. It can also help to find synergies between operational and M&E activities, for example by timing monitoring visits in relation to other planned intervention activities. The project manager can use the detailed workplan to keep everyone informed of implementation progress, including the project team, the chief of mission (CoM) and the donor (see Module 4 of the IOM Project Handbook for further details).
(d) Planning for review and evaluationBuilding on the information in the project proposal, further details can be provided on evaluation plans, including type, estimated date, intended use/users, methodologies, data collection tools, internal or external evaluations and budget. Details can also be included on any planned review exercises (project performance reviews (PPR), for instance), considered as a form of monitoring.
Advanced monitoring and evaluation plan template
(a) Overview and backgroundDescribe context and background of the project and provide a brief description of the project.
(b) Description of the Theory of ChangeAnother element that could be developed as part of the M&E plan is a ToC. Based on what is in the project document, the ToC can be expanded by adding a narrative description and/or a visual depiction of the intended changes and the assumptions/hypotheses underlying causal relationships between activities, outputs and outcomes. It is important to recall that the ToC goes beyond the IOM Results Matrix, providing a picture of how change happens, including results pathways that may not be in the control of the intervention at hand. For more information regarding the ToC, please see the section of this chapter Theory of Change.
(c) Results Monitoring Framework Include a copy of the RMF in the document. The final columns — Achieved and Progress — can be left blank, and a separate copy of the RMF can be kept in order to track progress.

92 CHAPTER 3 Monitoring at IOM
(d) Planning for monitoring of resultsBuilding on the plans in the RMF, further details can be provided on the methodologies, approaches and related tools, including data collection tools, to be used for monitoring indicators, as well as monitoring other areas, such as the intervention context and needs and beneficiary satisfaction.
(e) Planning of monitoring of activities, financials and risksSometimes, the monitoring of activities, financials and risks are not considered part of the M&E plan, but rather as a separate part of project management. However, the M&E plan can include a reference to how those elements are being monitored.
For IOM, the main tools referenced in the IOM Project Handbook are the detailed workplan, PRISM reports and/or tailor-made tools, and the Risk Management Plan.54 Tools for data collection should also be referenced in this section of an M&E plan. For more information related to data collection tools, see chapter 4 of the IOM Monitoring and Evaluation Guidelines.
(f) Detailed workplanThe M&E plan should be fully linked to the detailed workplan, including ensuring that M&E activities are included in the overall workplan. A detailed workplan is comprehensive and realistic, with the right people assigned to each task, and takes into account workflows and potential scheduling problems right from the start of the project. It can also help to find synergies between operational and M&E activities, for example by timing monitoring visits in relation to other planned intervention activities. The project manager can use the detailed workplan to keep everyone informed of implementation progress, including the project team, the CoM, and the donor (see Module 4 of IOM Project Handbook for further details).
(g) Data: Management, roles and responsibilitiesDescribe how monitoring data will be gathered, stored (including entry into data management systems such as PRIMA) and managed. This should be done not only for data used to report on indicators, but also any data collected to monitor other areas as well. This section can include potential limitations or challenges, information about data disaggregation and plans to share and review data with internal or external partners. Data privacy should also be considered, including by referencing the intervention’s alignment to the IOM Data Protection Policy. Standards and plans for ensuring data quality can also be described. Finally, roles and responsibilities for each project team related to data collection and analysis can be laid out here.
(h) Planning for monitoring visits by programme staffGuidance can be provided on how to conduct monitoring visits, along with references to the standardized forms to be used in order to gather data on activities, results or other areas to monitor, as well as how to document/report on monitoring visits.
(i) Plans for working with implementing partners on monitoring and evaluationA section can also be added to describe plans for ensuring that implementing partners have strong monitoring systems in place to regularly provide IOM with accurate data and information on the progress and efficiency of their implemented activities. This can include description of data collection, including frequency, standardized forms to be used or trainings to be provided to implementing partners. This can be particularly useful in remote management situations.
54 For additional information on developing tools to monitor activities, results, budget and expenditure, and risks, see Module 4 of IOM Project Handbook, pp. 254–258 (Internal link only).

IOM MONITORING AND EVALUATION GUIDELINES93
(j) Planning for reporting This could include reference to donor reporting dates and related templates, or for joint reporting mechanisms. Reporting plans can also include internal monitoring reports, as well as any regular reporting that is required of the mission, such as reports to Headquarters, regional offices or the UN Country Team. It could also include plans for sharing and using reports. Graphics could also be added to illustrate how the various data collected will feed into the various reports. For more details on reporting, refer to the next section of this chapter.
(k) Planning for review and evaluationBuilding on the information in the project proposal, further details can be provided on the evaluation plans including type, estimated date, intended use/users, methodologies, data collection tools internal or external evaluation, and budget. A draft of evaluation terms of reference (ToR) could also be annexed or referenced and saved to the project files once available. Details can also be included on any planned review exercises, such as PPRs or after-action reviews (see chapter 5 for more information about these exercises).
(l) Planning for reflection and learningA section could also be considered in the advanced M&E plan to describe any other mechanisms for reflection and learning from the M&E findings, including any recommendations from reviews and evaluations. This can include references to project coordination mechanisms, such as project team meetings and project steering committees, as well as other formal and informal ways to facilitate learning, whether internally among the project team or externally with partners, such as annual review workshops or lessons learned workshops. Plans should also be made for when and how the M&E plan itself will be reviewed and updated, as needed.
(m) Resources for monitoring and evaluation Finally, the M&E plan could provide information on the M&E total budget, including a breakdown of the budget in case there are various budget related to M&E activities, as well as outline other resources required for implementation of M&E functions, such as human resources and materials/equipment. This section should elaborate on the financial resources, human resources and materials available for M&E.

94 CHAPTER 3 Monitoring at IOM
The following chart provides a graphic overview of an M&E plan, including how it builds on the project development and helps to ensure accountability and learning.
Figure 3.14. Monitoring and evaluation plan overview
Note: Modified based on a graphic developed by IOM Regional Office Vienna (2017).
Results matrix
Results Monitoring Framework
Monitoring reports Management response plans to follow-up on recommendations
Detailed workplan
Risk management plan
PRIMA for All
PRISM reports and tailor-made tools
Monitoring section
Evaluation section
Budget
Workplan
Risk assessment plan
PRIMA for All
Donor reports
Theory of Change*
Data collection
Data analysis
Evaluation report
PPR report
Evaluation ToR
PRIMA for All
Results achievedActivities implemented
On budgetRisks managed
Monitoring
Donor reportingLearning
Mon
itor
ing
and
ev
alua
tion
pla
n
Evaluation
EXAMPLE

IOM MONITORING AND EVALUATION GUIDELINES95
3.8. Monitoring and reporting on resultsReporting on intervention results is an essential component of ensuring compliance with a results-based approach. It is undertaken at different intervals throughout the life cycle of an intervention. Based on operational knowledge and best practices, reporting also contributes to the expansion of IOM’s institutional knowledge. It is a means of communicating information on intervention progress, achieved results, lessons learned, constraints encountered, the steps taken to overcome and address challenges and good practices identified during implementation.
Reporting is a mandatory component of intervention management. Informing donors, member States and other stakeholders regularly on the status of an intervention helps demonstrate transparency and accountability, as well as ensures compliance with contractual engagements. Internal reporting, such as through monitoring reports, reports from implementing partners, meeting minutes and lessons learned logs, is another important element of project management that can also facilitate eventual external reporting. Reporting requires maintaining a record of all actions taken during implementation; it is therefore also an important source of information for auditors and evaluators in assessing whether an intervention has been successfully implemented, in line with IOM rules and regulations, as well as with the donor’s agreement.55
Implementing a reporting plan
IOM offices should consider developing a reporting plan to anticipate reporting needs and ensure that sufficient time is allowed for the collection of data and the preparation of reports. This could be included as part of an M&E plan (see the previous section, Pulling it all together: Monitoring and evaluation plan) or it could be developed as a stand-alone plan.
A reporting plan can cover reporting roles (who is responsible for reporting), the types of reports required, how frequently a report is to be produced, procedures for report review and who is to receive the report.56 Reporting plans can include intervention-specific reports, as well as any regular reporting that is required of the mission, such as reports to Headquarters, regional offices or the UN Country Team.
Module 5 of the IOM Project Handbook provides a detailed guide on donor reporting and its three main phases: (a) preparation; (b) review and approval; and (c) submission. This section focuses on how to report on results using monitoring findings, the specific sections of the narrative donor report to enhance results reporting and how reporting can contribute to institutional learning.
3.8.1. Reporting on results
Report writing is about communicating results.
55 Module 5 of IOM Project Handbook, p. 356 (Internal link only).56 Adapted from UNICEF, 2017, p. 161 (Internal link only).
INFO
RMATION
TIP

96 CHAPTER 3 Monitoring at IOM
Reporting is a critical component of M&E, as it enables the presentation of collected data and findings generated for key stakeholder use and overall performance. Reporting on results provides evidence and feedback to decision makers to inform their decision-making processes. Internal monitoring reports and external donor reports can serve several purposes, depending on an intervention’s information needs, as well as the information derived from M&E, which can be put to different uses. M&E information can serve to:57
Demonstrate accountability
Delivering according to engagements taken with different stakeholders.
Convince
Using evidence from findings.
Educate
Reporting findings to help organizational learning.
Learn
Seeing what works, what does not and why.
Document
Recording and creating institutional memory.
Involve
Engaging stakeholders through a participatory process.
Gain support
Demonstrating results to help gain support among stakeholders.
Decision-making
Providing feedback to decision makers.
Collecting data for a results-based report
The data necessary to report on progress in achieving the targets set for indicators should be collected throughout the implementation of an intervention and compiled and analysed prior to reporting. This includes data needed from project stakeholders and implementing partners. Therefore, it is important to establish why, when and how data needed for reporting will be collected.
The Results Matrix as well as the RMF collects key information and can therefore be used as resource for results-based reporting.58
57 Adapted from Kusek and Rist, 2004.58 For more detailed information regarding the RMF, please refer to the Results Monitoring Framework section of this chapter.

IOM MONITORING AND EVALUATION GUIDELINES97
Collecting data to ensure results-oriented reporting versus activity-based reporting
In the case of a capacity-building-related result, if the focus is on the knowledge attained, with an indicator that measures the percentage of participants who increased knowledge or the percentage who reported being able to apply knowledge gained, then once this data is collected, reporting will also be able to focus on this information and demonstrate a change in capacity through increased knowledge.
On the other hand, if the indicator is not used and the data is not collected, then the report would only be able to state how many people were trained or how many trainings were implemented, which would be insufficient information to demonstrate a change, that is, the training provided achieved a change and the intended result of the capacity-building activity was reached.
Irrespective of how well data is collected and analysed, data must also be well presented, with the target audience in mind. If poorly presented, reporting becomes less useful, which wastes resources and time. When identifying the purpose of data collection, it is important to plan for strong reporting structures from the very beginning. The chart below provides a picture of the cycle of data collection and analysis, reporting and use:
Figure 3.15. Cycle of data collection, analysis, reporting and use
Identify information needs and resources
Collect data
Analysedata
Report conclusions
Design/ modify
response
Writing a results-based report
When looking at reporting from an M&E perspective, some additional practices can be used to ensure results-based reporting.59 It is important to emphasize active language that captures the process of change, by explaining measurable, visible and concrete change in a given context. Language used in the report should focus on what is different as a result of the intervention, rather than what is implemented to create that change.
59 The IOM Project Handbook provides information about the content of reporting, including general report writing tips in Module 5 at pp. 367, 387–393 (Internal link only).
EXAMPLE

98 CHAPTER 3 Monitoring at IOM
In the past, reporting often focused too much on the activities implemented and not on results at the output and outcome level, nor on the impact of the intervention towards achieving an intervention objective. Reporting should:
• Tell the story of implementation, moving from the activities to the results and demonstrating how resources were used to achieve those results;
• This story should provide an overview of the quantitative and qualitative data that demonstrates achievement towards results;
• Underscore the challenges encountered by the project or programme and where improvements might be needed.60
In addition, there are other recommended tips for writing results-based reports that adequately capture change.
Additional tips for writing to capture change61
• When reporting on completed activities, make sure to analyse and report on their effects. The focus should be on reporting on results rather than presenting detailed descriptions of activities, which could rather be provided in separate annexes.
• Present evidence of change and analyse progress by using indicators, baselines and targets in narrative report writing. Evidence of change may be presented in form of human-interest stories, personal testimonies, case studies, independent verifications or research, photos or statistical analyses, among others.
• Provide context for the progress and changes achieved, also referring to the ToC.• Incorporate lessons learned and successful practices at all levels of reporting. • Highlight how challenges and bottlenecks were overcome. • Think critically about the contribution of the project activities towards the results, and about which
other factors could be contributing to results.
Examples of results-based language could be as follows:
Activity Results-based reporting
IOM procured and installed 20 winterized containers at the border area.
By December, there was a 25 per cent increase in the number of migrants who slept in winterized accommodation in the country.
IOM registered and provided transportation for migrant children to local schools in the area of the accommodation centre.
In 2021, the enrolment in schools of migrant children residing in migrant accommodation centers increased from 30 per cent to 90 per cent.
For more examples and information, refer to Module 5 of the IOM Project Handbook.
60 Chapter 6 of UNICEF, 2017, pp. 146–148.61 Adapted from UNICEF, 2017, p. 150.
EXAMPLE

IOM MONITORING AND EVALUATION GUIDELINES99
A good balance needs also to be kept between descriptive writing and analytical writing throughout. Descriptive writing helps to describe what has occurred, while analytical writing supplements this by adding analysis that may help explain why these things happened, what they have achieved (beyond the activities and the immediate outputs) and what implications this may have.
Descriptive writing Analytical writing
States what happened Identifies the significance of the findings
States the order in which things happened Evaluates strengths and weaknesses
Explains how something works Makes reasoned judgements
Lists details Gives reasons for each selected option
In addition to being results-based and incorporating both descriptive and analytical writing, there are other considerations that strengthen the quality of reporting. Effective reporting is relevant, timely, complete, accurate, concise and user-friendly, consistent and cost effective. It also presents good or high-quality data. The following chart provides a list of questions to help identify whether reporting meets these criteria:62
Relevant • Which specific use or purpose is the report serving?• Is excessive, unnecessary reporting avoided?
Timely • Is the report timely for its intended use?
Complete • Does the report provide a sufficient amount of information for its intended use?
Accurate • Does the report provide adequate facts and figures?
Concise and user-friendly
• Is the report writing appropriate for its intended audience? • Is the language clear, concise and easy to understand?
Consistent • Does the report use units and formats that are available and comparable over time to allow for tracking of progress against?
Cost-effective • Have the devoted time and resources been balanced out against the report’s relevance and use?
Strong reporting can satisfy IOM’s relationships with donors, improve donor support and facilitate the monitoring of a project. Weak reporting can be an indication of a lack of accountability and transparency mechanisms, with possible consequences for the relationship with a donor or other stakeholders.63
Planning for effective reporting can be used to identify specific reporting needs and information needs of the target audience early in the process. Information can also be for a particular purpose, such as strategic planning, ongoing project implementation, compliance with donor requirements, evaluation or organizational learning. Utilization-focused reporting, that is reporting information according to information needs that will be utilized, helps optimize the use of report findings and avoids unnecessary reporting.
When preparing for reporting, it is useful to know who will receive what information, in which format, in what frequency, and identify who will prepare and deliver the information.
62 Adapted from IFRC, 2011.63 For examples of these consequences, see Module 5 of IOM Project Handbook, p. 356 (Internal link only).
TIP

100 CHAPTER 3 Monitoring at IOM
3.8.2. Reporting in a narrative donor report
The project manager is responsible for drafting, preparing and coordinating the donor reports in a timely manner.64 Within IOM, there are two main types of donor reports according to frequency, namely interim and final reports. Module 5 of the IOM Project Handbook lays out, in detail, the steps required to draft and prepare a narrative donor report.65 In summary, these steps are as follows:
• Review project documents (originals and any subsequent revisions) to ensure that the most up-to-date information is presented in the report; specifically, the most recent agreed-upon version of the Results Matrix, reporting requirements and deadlines.
• Review previous interim reports to ensure consistency of information and provide updates on any previous challenges raised in prior reports.
• Review donor agreement and amendments to confirm key reporting requirements stipulated in the agreement, in particular, the frequency of reporting, format and reporting language. If these are not stipulated in the agreement, the IOM Project Handbook provides additional instructions on how to proceed at p. 261.
In reviewing project documents, be sure to also refer to the Results Matrix and any corresponding ToC, the RMF, as well as the M&E plan for key inputs (if developed). If a reporting plan exists, refer to timelines and any already established reporting formats. The exact wording of the objective, expected results (outcome and output), as well as of the indicators, baselines and targets, reflected in the Results Matrix should be included the narrative part of the report to emphasize the reporting of results. Carefully reviewing these documents also facilitates the identification of unexpected results, which should also be included in any reporting.
IOM reporting template section II (Progress made towards realizing outcomes and outputs)66
Section two of the reporting template describes results (outcomes and outputs) and related activities of the implementation during the reporting period. If the intervention has conducted frequent monitoring, information pertaining to results, such as outcomes and outputs, can be derived from its monitoring reports, its Results Matrix and/or its RMF. Progress made towards incorporating the cross-cutting themes should also be mentioned in this section of the report.67
IOM reporting template section III (Progress achieved compared with the indicators in the Results Matrix)68
The third section of the reporting template focuses on reporting on progress against the indicators of the Results Matrix, with detailed information on how to complete each cell.
64 Module 5 of IOM Project Handbook, p. 358 (Internal link only).65 See Module 5 of IOM Project Handbook, pp. 260–361 (Internal link only).66 Ibid., p. 364.67 Guiding questions for incorporating cross-cutting themes into donor reporting can be found in the annex of chapter 5 of the IOM Monitoring
and Evaluation Guidelines.68 Module 5 of IOM Project Handbook, pp. 365–366 (Internal link only).
TIP

IOM MONITORING AND EVALUATION GUIDELINES101
IOM Results Matrix in the reporting template
Results Indicators Baseline Target Progress made during the reporting period
Cumulative project progress
ObjectiveInsert the objective as stated in the project document.
Insert the indicator as established in the Results Matrix.
Insert the baseline data relevant to the objective.
Insert the target set for the objective, as stated in the project document and Results Matrix.
Report the progress made within the current reporting period towards contributing to the realization of the objective as measured by the objective indicator against the defined target.
Indicate the total cumulative progress from the beginning of the project to the current reporting period as measured by the baseline versus the target of the outcome indicator.
No entry will be made in this column for the first report.
Outcome 1Insert the (first) outcome as stated in the project document.
Insert the indicators as established in the Results Matrix for Outcome 1. Be sure to add any new indicators that have been established subsequently.
Insert the baseline data relevant toOutcome 1.
Insert the target for Outcome 1, as stated in the project document and Results Matrix.
Report the progress made within the current reporting period towards influencing the realization of the outcome as measured by the outcome indicator against the defined target.
Indicate the total cumulative progress from the beginning of the project to the current reporting period as measured by the baseline versus the target of the outcome indicator.
No entry will be made in this column for the first report.
Output 1.1Insert the (first) output as stated in the project document.
Insert theindicators as established in the Results Matrix for Output 1.1. Be sure to add any new indicators that have been established subsequently.
Insert the baselinedata relevant to .Output 1.1.
Insert the target set for Output 1.1,as stated in the project documentand ResultsMatrix.
Report the progress made within the current reporting period towards the realization of the output as measured by the output indicator against the defined target.
Example of a project with a 12-month duration:In interim report 1 (Jan.–Mar. period): 500 border officials, disaggregated by sex, trained on the identification of falsified travel documents.
In the final report (Oct.–Dec. period): 350 border officials, disaggregated by sex, trained on the identification of falsified travel documents.
Indicate the total progress from the beginning of the project to the current reporting period as measured by the baseline versus the target of the output indicator.
Example of a project with a 12-month duration:In interim report 1 (Jan.–Mar. period): No entry will be made in this column for the first interimreport.
ActivitiesList the activities accomplished during the reporting period towards the realization of Output 1.1 based on the initial activities in the results framework.
Progress towards the realization of the objective, outcomes and outputs is recorded concisely in the column “Progress made during the period” while the progress made towards the results for the duration of the intervention is included in the column “Cumulative progress”.

102 CHAPTER 3 Monitoring at IOM
A well-designed Results Matrix, and related RMF, with detailed indicators and data sources, can outline how data can be monitored at each results level – output, outcome and objective. Following the above, the data from monitoring findings is then recorded by being entered into the column “Achieved” of the RMF and, when reporting, into the column “Progress made during reporting period” for each level (output, outcome or objective – see above). As implementation progresses, monitoring reports and progress tracked over time in the RMF will show how progress on the indicators slowly lead to overall results at different levels that will inform reporting.
IOM reporting template section IV (Challenges encountered and actions taken)69
This section of the reporting template is an important part of reporting on results, as it provides a space to explain how results were affected by unintended consequences during implementation. The section describes and analyses significant difficulties or delays faced during project implementation and summarizes the corrective measures that have been taken or are being planned to address and rectify the situation. An analysis of the impact of any assumption in the Results Matrix, which did not hold true, or any risk realized during the reporting period must also be included in this section. The effect of the unrealized assumption or realized risk on the delivery of specific results and the impact of the overall project implementation should be regularly monitored to diminish any negative effects. Monitoring can also contribute to the assessment of whether the issue was outside of IOM’s control, such as in the case of a political event or a natural disaster. If the problem was due to a flaw or oversight in project design or due to insufficient mitigation measures in the risk management plan, this should also be mentioned. Finally, it is important to describe the measures or treatment plans that have either been planned or have been taken to address the situation and how it will be monitored. A table is provided within the reporting template to guide users to match each challenge with actions taken.70 Reporting on those issues is also an important element for future evaluations. This is also be a good time to update the risk management plan, if needed.
IOM reporting template section V (Conclusion)71
In this section, a brief summary of the key achievements realized during the reporting period should be provided, as well as the next steps in the project’s implementation outlined. In the case of an interim report, briefly reiterate if there are any significant or persistent challenges anticipated for the upcoming period. It can be helpful to show how these future key activities are envisioned to lead to further results. For final reports, good practices and/or lessons learned during implementation should also be highlighted. To capture lessons learned, it is important to identify the exact challenges and remedial actions that were taken that lead to achieving positive results in subsequent activities. If they exist, lessons learned logs can be useful for this section of the report. Evaluations can also contribute to the lessons learned process and complement the final report.
3.8.3. Reporting and learning
As stated above, reporting based on M&E findings and data can contribute to organizational learning and help improve the quality of interventions overall. While chapter 5 of the IOM Monitoring and Evaluation Guidelines provides more detail on learning through evaluation, this section highlights the link between reporting and learning with a focus on reporting based on findings and data from M&E activities.
69 Module 5 of IOM Project Handbook, p. 367 (Internal link only).70 Ibid.71 Ibid.

IOM MONITORING AND EVALUATION GUIDELINES103
Results-based reporting is crucial for decision-making and planning during the implementation of an intervention, as it can provide the information necessary for evidence-based decision-making. The findings and data generated through M&E activities provide crucial input for project management and informs decision-making. Furthermore, reflecting on findings from M&E allows for learning from day-to-day activities. In turn, the lessons learned from daily activities help to improve the quality of both ongoing and future activities, as well as for future programmes.
Reporting, reflecting and learning should occur throughout the intervention life cycle. While at the conceptualization stage, findings and lessons learned can be incorporated from previous evaluations; at the implementation stage, monitoring and/or a midterm evaluation can provide information to help decision-making to improve performance and impact and contribute to learning. Finally, at the completion stage, project/programme staff can reflect on the intervention to prepare for donor reporting and an evaluation facilitates the collection of higher-level lessons learned.
IOM resources2017a Module 5. In: IOM Project Handbook. Second edition. Geneva, pp. 355–416 (Internal link only).
Other resourcesInternational Federation of Red Cross and Red Crescent Societies (IFRC)
2011 Project/Programme Monitoring and Evaluation (M&E) Guide. Geneva.
Kusek, J.Z. and R. Rist2004 Ten Steps to Monitoring and Evaluation System: A Handbook for Development Practitioners. World
Bank, Washington, D.C.
UNICEF 2017 Results-Based Management Handbook: Working together for children. New York.
RESOURCES


CHAPTER 4
Methodologies for data collection and analysis for monitoring and evaluation

106 CHAPTER 4 Methodologies for data collection and analysis for monitoring and evaluation
METHODOLOGIES FOR DATA COLLECTION AND ANALYSIS FOR MONITORING AND EVALUATION
4The following chapter contains links to resources relevant to the content presented. Some resources presented are internal to IOM staff only and can be accessed only by those with IOM login credentials. These resources will be updated on a regular basis. To see the updated resources, kindly follow this link.
List of abbreviations and acronyms .........................................................................................1074.1. An overview of chapter 4 ..................................................................................................1084.2. Professional standards and ethical guidelines ................................................................109
4.2.1. Ethical behaviour ......................................................................................................................................1094.2.2. Evaluation and politics ...........................................................................................................................109
4.3. Planning and designing data collection tools .................................................................1114.3.1. Planning for data collection ................................................................................................................1124.3.2. Sources of data ........................................................................................................................................1154.3.3. Desk review ...............................................................................................................................................1154.3.4. Type of measurement ............................................................................................................................1164.3.5. Measurement quality ..............................................................................................................................1174.3.6. Levels of measurement .........................................................................................................................1184.3.7. Sampling .......................................................................................................................................................1214.3.8. Determining sample size .......................................................................................................................127
4.4. Methods, approaches and tools for monitoring and evaluation ................................1294.4.1. Surveys .........................................................................................................................................................1314.4.2. Interviews ....................................................................................................................................................1324.4.3. Focus group discussions ........................................................................................................................1334.4.4. Case study ..................................................................................................................................................1344.4.5. Observation ..............................................................................................................................................1354.4.6. Additional methods for data collection for monitoring and evaluation ..........................136
4.5. Collecting and managing data ...........................................................................................1414.5.1. Data collection..........................................................................................................................................1414.5.2. Data entry...................................................................................................................................................1424.5.3. Data clean-up ............................................................................................................................................1434.5.4. Diagnosis .....................................................................................................................................................1444.5.5. Treatment ..................................................................................................................................................1454.5.6. Missing data ................................................................................................................................................1454.5.7. Recoding and creating new variables ..............................................................................................1474.5.8. Documenting change .............................................................................................................................148
4.6. Analysing data ......................................................................................................................1484.6.1. Qualitative data analysis ........................................................................................................................1484.6.2. Quantitative data analysis .....................................................................................................................1514.6.3. Analysis of numerical variables ..........................................................................................................1524.6.4. Triangulation of data sources..............................................................................................................154
4.7. Presenting findings...............................................................................................................1554.7.1. How to visualize findings ......................................................................................................................155
Annexes .........................................................................................................................................157

IOM MONITORING AND EVALUATION GUIDELINES107
List of abbreviations and acronyms
ALNAP/ODI Active Learning Network for Accountability and Performance/ Overseas Development Institute
CDC Centers for Disease Control and ProtectionDR/V dreams realized or visioningGIS geographic information systemIDP internally displaced personIFAD International Fund for Agricultural DevelopmentIFRC International Federation of Red Cross and Red Crescent Societies IOM International Organization for Migration
IPDET International Program for Development Evaluation Training
M&E monitoring and evaluationNFI non-food itemOECD Organisation for Economic Co-operation and Development
OECD/DAC Organisation for Economic Co-operation and Development/ Development Assistance Committee
OIG/Evaluation Office of the Inspector General’s Central Evaluation functionSWOT Strengths, weaknesses, opportunities and threatsToC Theory of Change ToR terms of referenceUNEG United Nations Evaluation GroupUNHCR United Nations High Commissioner for Refugees

108 CHAPTER 4 Methodologies for data collection and analysis for monitoring and evaluation
Chapter 4 | Methodologies for data collection and analysis for monitoring and evaluation
The quality and utility of data derived from either monitoring or evaluation in an IOM intervention depends on the data collection planning, design, implementation, management and analysis stages of these respective processes. Understanding each stage, and the linkages between them, is important for collecting relevant, high-quality data that can inform evidence-based decision-making and learning. The following chapter will look at methodologies for planning, designing and using various data collection tools for both monitoring and evaluation (M&E) purposes. This chapter also focuses on managing and analysing the collected data and, finally, how to present findings.
4.1. An overview of chapter 4
This chapter presents methodological fundamentals required for data collection and analysis. Specific issues and considerations for variation between methodologies are covered throughout the chapter. Awareness of methodological fundamentals helps set standards and ensure consistency in methodology, quality of data and reporting across the Organization. It enhances the robustness and rigour of IOM M&E products and facilitates the comparison of results and their aggregation.
While obtaining data is required for both M&E, it is important to note that the methodologies may vary according to respective information needs.1 This may subsequently shape the purpose of the data collection, which is guided by the availability of data, local context, resources and time, as well as other variables.
The scope of this chapter is limited to concepts that will enable users to acquire a broad understanding of methodologies for collecting and analysing M&E data, and links to additional resources are available at the end of each section.
M&E practitioners will have an understanding of methodologies for M&E, specifically of how to select, design and implement methods relevant to their work and have a knowledgeable background to make informed choices.
1 See chapter 1 on M&E related functions and their distinctness.
Professional standards and ethical
guidelines for monitoring
and evaluation
Methods, approaches
and tools for monitoring
and evaluation
Analysing data
Planning and designing data collection
tools
Collecting and managing
data
Presenting findings

IOM MONITORING AND EVALUATION GUIDELINES109
4.2. Professional standards and ethical guidelinesDuring the different stages of monitoring or evaluation, including for the collection and use of data, M&E practitioners are required to adopt ethical behaviours that prevent them from being influenced by internal and external pressures that may try to change the findings before they are released or to use them in an inappropriate way.2
4.2.1. Ethical behaviour
Ethics are a set of values and beliefs that are based on a person’s view of what is right, wrong, good and bad and that influence the decisions people make. They can be dictated by the organization and also by laws in the country in which the M&E practitioners work and what people consider to be ethical in that context.
M&E practitioners must also act in accordance with the following sources:
IOM resource 2014 IOM Standards of Conduct. IN/15 Rev. 1 (Internal link only).
Other resource United Nations Evaluation Group (UNEG)
2016 Norms and Standards for Evaluation. New York.3
Ä For more information related to how professional norms and standards in M&E, including ethics and guide IOM’s M&E work, see chapter 2: Norms, standards and management for monitoring and evaluation.
4.2.2. Evaluation and politics
The gathered data provide an important source of information to decision makers about the intervention being monitored and/or evaluated. While positive evaluations can help secure more funds, expand a pilot project or enhance reputations, the identification of serious problems can lead to difficult situations where the credibility of the work done is at stake. Understanding and managing political situations and influence is crucial for maintaining the integrity of the monitoring and evaluation work and well defined and robust methodologies for the data collection and analysis play a critical role.4
Ethical guidelines and principles
When planning, designing, implementing, managing and reporting on M&E activities, M&E practitioners should ensure that their actions are informed by ethical guidelines, particularly those outlined below:
• IOM Evaluation Policy and Monitoring Policy (September 2018);
• IOM Data Protection Principles (IN/00138) (May 2009) (Internal link only);
• IOM Standards of Conduct (IN/15 Rev.1) (Internal link only);
• UNEG Ethical Guidelines for Evaluation (March 2008, revised 2020).
2 Also see chapter 2, Norms, standards and management for monitoring and evaluation.3 IOM is a member of UNEG, and this must operate in accordance with the established professional norms and standards and ethical
guidelines.4 Morra Imas and Rist, 2009. Please also see chapter 2 on norms, standards and management for monitoring and evaluation.
RESOURCES

110 CHAPTER 4 Methodologies for data collection and analysis for monitoring and evaluation
Some of the common ethical principles presented in the above documents “should be applied in full respect of human rights, data protection and confidentiality, gender considerations, ethnicity, age, sexual orientation, language, disability, and other considerations when designing and implementing the evaluation”.5 They can be summarized as follows:
Figure 4.1. Monitoring and evaluation ethical principles
Plan• Utility• Necessity• Conflict(s) of
interest• Transparency and
consultation
Design• Rights of
participants• Confidentiality• Transparency and
consultation
Implement and manage• Informed consent• Confidentiality• Rights of
participants
Analyse and report• Impartiality• Credibility• Accountability• Transparency and
consultation• Accuracy,
completeness and reliability
Must be considered at each monitoring and/or evaluation stage
• Independence• Honesty and integrity• Respect for dignity and diversity of participants• Avoidance of harm• Accuracy, completeness and reliabilty• Transparency and consultation
!Adhering to common ethical principles also contributes guaranteeing that the information gathered is accurate, relevant, timely and used in a responsible manner (see chapter 2, as well as Annex 2.1. Ethical monitoring and/or evaluation checklist).
Ä Independence also means avoiding conflicts of interest and being able to retain independence of judgement and not be influenced by pressure from any party to modify evaluation findings.
IOM resource2017b IOM Project Handbook. Second edition. Geneva (Internal link only).
Other resourcesBuchanan-Smith, M., J. Cosgrave and A. Warner
2016 Evaluation of Humanitarian Action Guide. Active Learning Network for Accountability and Performance/Overseas Development Institute (ALNAP/ODI), London.
Fitzpatrick, J.L., J.R. Sanders and B.R. Worthen2004 Programme Evaluation: Alternative Approaches and Practical Guidelines. Third edition. Pearson
Education Inc., New York.
5 IOM, 2017b, p. 438.
RESOURCES

IOM MONITORING AND EVALUATION GUIDELINES111
House, E.R. 1995 Principled evaluation: A critique of the AEA Guiding Principles. New Directions for Programme
Evaluation, 66:27–34.
Morra Imas, L.G. and R.C. Rist 2009 The Road to Results: Designing and Conducting Effective Development Evaluations. World Bank,
Washington, D.C.
Morris, M. and R. Cohn 1993 Programme evaluators and ethical challenges: A national survey. Evaluation Review, 17:621–642.
Thomson, S., A. Ansoms and J. Murison (eds.) 2013 Emotional and Ethical Challenges for Field Research in Africa: The Story behind the Findings. Palgrave
Macmillan, Chippenham and Eastbourne.
4.3. Planning and designing data collection toolsRigorous planning and designing for data collection can improve the quality of the approach and methods of data collection and, therefore, the quality of collected data. It is imperative to identify the approach intended for use to monitor or evaluate an intervention, and then to establish a data collection plan. Selecting an appropriate approach will also allow a relevant assessment of the monitoring or evaluation questions guiding any review, taking into account the specific context, existing constraints, access, timing, budget and availability of data.
IOM migration data governance
What is it?
Data governance represents the framework used by IOM to manage the organizational structures, policies, fundamentals and quality that ensures accurate and risk-free migration data and information. It establishes standards, accountability and responsibilities and ensures that migration data and information use are of maximum value to IOM, while managing the cost and quality of handling the information. Data governance enforces the consistent, integrated and disciplined use of migration data by IOM.
How is it relevant to IOM’s work?
Data governance allows IOM to view data as an asset in every IOM intervention and, most importantly, it is the foundation upon which all IOM initiatives can rest. It is important to keep in mind the migration data life cycle throughout the whole project cycle. This includes the planning and designing, capturing and developing, organizing, storing and protecting, using, monitoring and reviewing, and eventually improving, the data or disposing of it.
Key concepts to look out for: • Data steward• Roles and responsibilities• Data quality• Data classification for security and privacy• Data processing, including collection and use
Ä For an elaboration on the information presented on IOM migration data governance, see Annex 4.1. IOM migration data governance and monitoring and evaluation.
INFO
RMATION

112 CHAPTER 4 Methodologies for data collection and analysis for monitoring and evaluation
IOM resources2009 IOM Data Protection Principles. IN/00138 (Internal link only).
2010 IOM Data Protection Manual. Geneva.
2017a Migration Data Governance Policy. IN/253 (Internal link only).
2020a IOM Migration Data Strategy: Informing Policy and Action on Migration, Mobility and Displacement 2020–2025.
n.d. Data Protection FAQs (Internal link only).
4.3.1. Planning for data collection
When planning for data collection, basic considerations ensure that the data to be collected and analysed is valid and reliable: purpose for data collection, methodology for data collection, resources for data collection and timing for data collection. Qualitative, quantitative or mixed methods approach to collect data can be considered in that respect.
Figure 4.2. Key considerations when planning for data collection
Purpose for data collection
Some questions to ask: • Is the data collected for the purpose of monitoring or evaluation?• What are the main information needs? • What are the objectives, outcomes, outputs and activities being monitored or
evaluated? • What are the expected results (intermediate and long term)?• Which stakeholder’s information needs will the data address?
RESOURCES
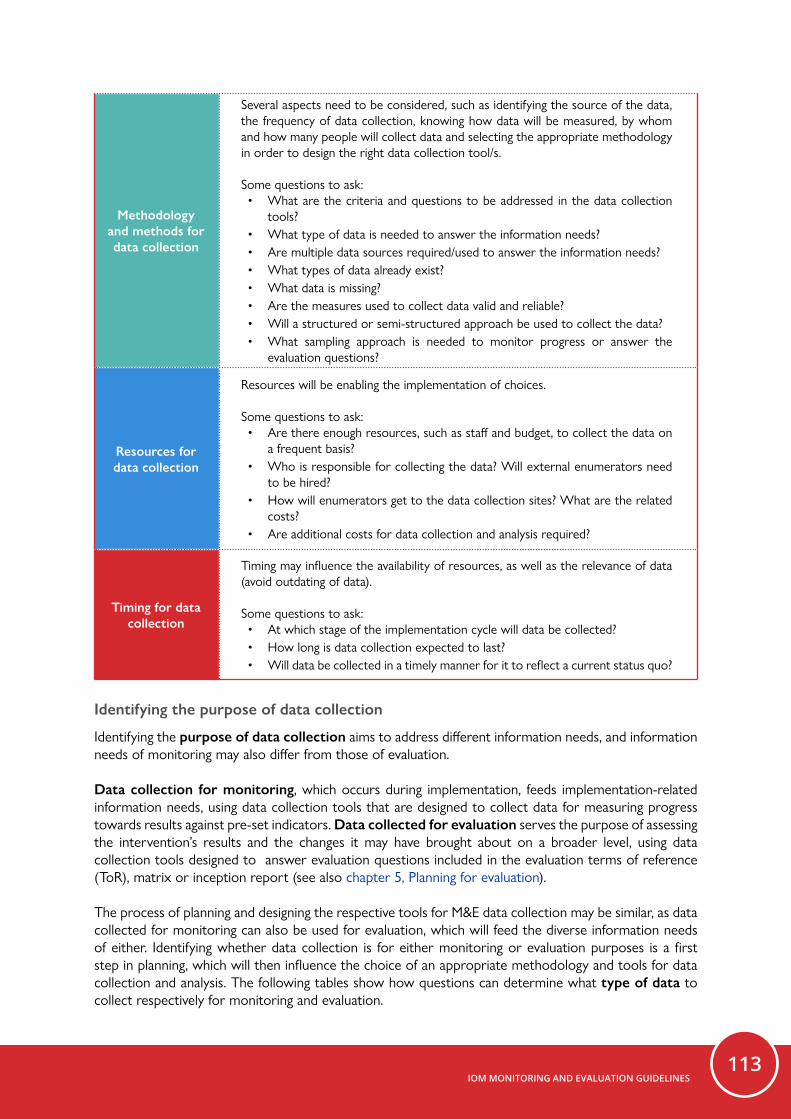
IOM MONITORING AND EVALUATION GUIDELINES113
Methodology and methods for data collection
Several aspects need to be considered, such as identifying the source of the data, the frequency of data collection, knowing how data will be measured, by whom and how many people will collect data and selecting the appropriate methodology in order to design the right data collection tool/s.
Some questions to ask: • What are the criteria and questions to be addressed in the data collection
tools?• What type of data is needed to answer the information needs? • Are multiple data sources required/used to answer the information needs? • What types of data already exist? • What data is missing? • Are the measures used to collect data valid and reliable? • Will a structured or semi-structured approach be used to collect the data? • What sampling approach is needed to monitor progress or answer the
evaluation questions?
Resources for data collection
Resources will be enabling the implementation of choices.
Some questions to ask: • Are there enough resources, such as staff and budget, to collect the data on
a frequent basis? • Who is responsible for collecting the data? Will external enumerators need
to be hired?• How will enumerators get to the data collection sites? What are the related
costs?• Are additional costs for data collection and analysis required?
Timing for data collection
Timing may influence the availability of resources, as well as the relevance of data (avoid outdating of data).
Some questions to ask: • At which stage of the implementation cycle will data be collected? • How long is data collection expected to last? • Will data be collected in a timely manner for it to reflect a current status quo?
Identifying the purpose of data collection
Identifying the purpose of data collection aims to address different information needs, and information needs of monitoring may also differ from those of evaluation.
Data collection for monitoring, which occurs during implementation, feeds implementation-related information needs, using data collection tools that are designed to collect data for measuring progress towards results against pre-set indicators. Data collected for evaluation serves the purpose of assessing the intervention’s results and the changes it may have brought about on a broader level, using data collection tools designed to answer evaluation questions included in the evaluation terms of reference (ToR), matrix or inception report (see also chapter 5, Planning for evaluation).
The process of planning and designing the respective tools for M&E data collection may be similar, as data collected for monitoring can also be used for evaluation, which will feed the diverse information needs of either. Identifying whether data collection is for either monitoring or evaluation purposes is a first step in planning, which will then influence the choice of an appropriate methodology and tools for data collection and analysis. The following tables show how questions can determine what type of data to collect respectively for monitoring and evaluation.

114 CHAPTER 4 Methodologies for data collection and analysis for monitoring and evaluation
Figure 4.3. Monitoring and vertical logic
Are activities being implemented on scheduleand within budget?
Are activities leading to the expected outputs?
Are outputs leading to achievementof the outcomes? What is causing
delays or unexpectedresults?
Is there anythinghappening that shouldlead management tomodify the operation’simplementation plan?
Measuring changes at goal-level requires a longer time frame,and is therefore dealt with by evaluation
How do beneficiaries feel about the work?Outputs
Activities
Objectives
Outcomes
Monitoring and the vertical logic
Source: Adapted from International Federation of Red Cross and Red Crescent Societies (IFRC), 2011.
Figure 4.4. Evaluation and vertical logic
Evaluation and the vertical logic
E�ectiveness
• Is the intervention achieving its objectives?
• To which extent has or is the interventionexpected to achieve its results, includingany di�erential results across groups?
Impact
• What di�erence does the intervention make?
• To which extent has the intervention,or is expected to generate signi�cantpositive or negative, intended orunintended, higher-level e�ects?
Efficiency
• How well were resources used?
• To which extent has, or is the interventionlikely to deliver results in an economic and timely way?
Sustainability•
•
Will the bene�t last?
To which extent will the bene�tsof the intervention continue, or are likely to continue?
Relevance• Is the intervention doing the right thing?
• To which extent are the intervention’sobjectives and design responding tobene�ciaries’, global, country and partner/institution needs, policies and priorities, and continue to do so ifcircumstances change?
Coherence• How well does the intervention �t?
• How compatible is the intervention with other interventions in a country,sector or institution?
Outputs
Activities
Objectives
Outcomes
Source: Adapted from IFRC, 2011.
International Federation of Red Cross and Red Crescent Societies (IFRC) 2011 Project/Programme Monitoring and Evaluation (M&E) Guide. Geneva.
RESOURCES

IOM MONITORING AND EVALUATION GUIDELINES115
4.3.2. Sources of data
The IOM Project Handbook defines data sources as identifying where and how the information will be gathered for the purpose of measuring the specified indicators.6
In general, there are two sources of data that can be drawn upon for monitoring and/or evaluation purposes:
(a) Primary data, which is the data that M&E practitioners collect themselves using various instruments, such as key informant interviews, surveys, focus group discussions and observations.
(b) Secondary data, which is data obtained from other pre-existing sources, such as a country census or survey data from partners, donors or government.
Ä Note that in cases where IOM works with implementing partners that are directly managed by IOM, the data collected is still considered primary data collected by IOM.
Availability and quality of secondary data
It is important to assess the availability and quality of secondary data, as this enables M&E practitioners to target efforts towards the collection of additional data. For instance, it is important to ascertain whether baseline data (such as census data) are available, and, if so, to determine its quality. Where this is not the case or where the quality of the data is poor, M&E practitioners are required to plan for the collection of baseline data.
4.3.3. Desk review
When choosing sources of data, it is helpful to start with a desk review to better assess what type of data to use. For monitoring, this corresponds to the information included under the column “Data source and collection method” of the IOM Results Matrix and Results Monitoring Framework (see chapter 3). For evaluation, the type of data will be clarified in the evaluation ToR, inception report and/or evaluation matrix and can also include data derived from monitoring.
A desk review usually focuses on analysing existing relevant primary and secondary data sources and can be either structured or unstructured. Structured desk reviews use a formal structure for document analysis, whereas unstructured reviews are background reading. For detailed guidance on conducting a desk review, see Annex 4.2. How to conduct a desk review.
6 Module 2 of IOM Project Handbook, p. 143.
INFO
RMATION
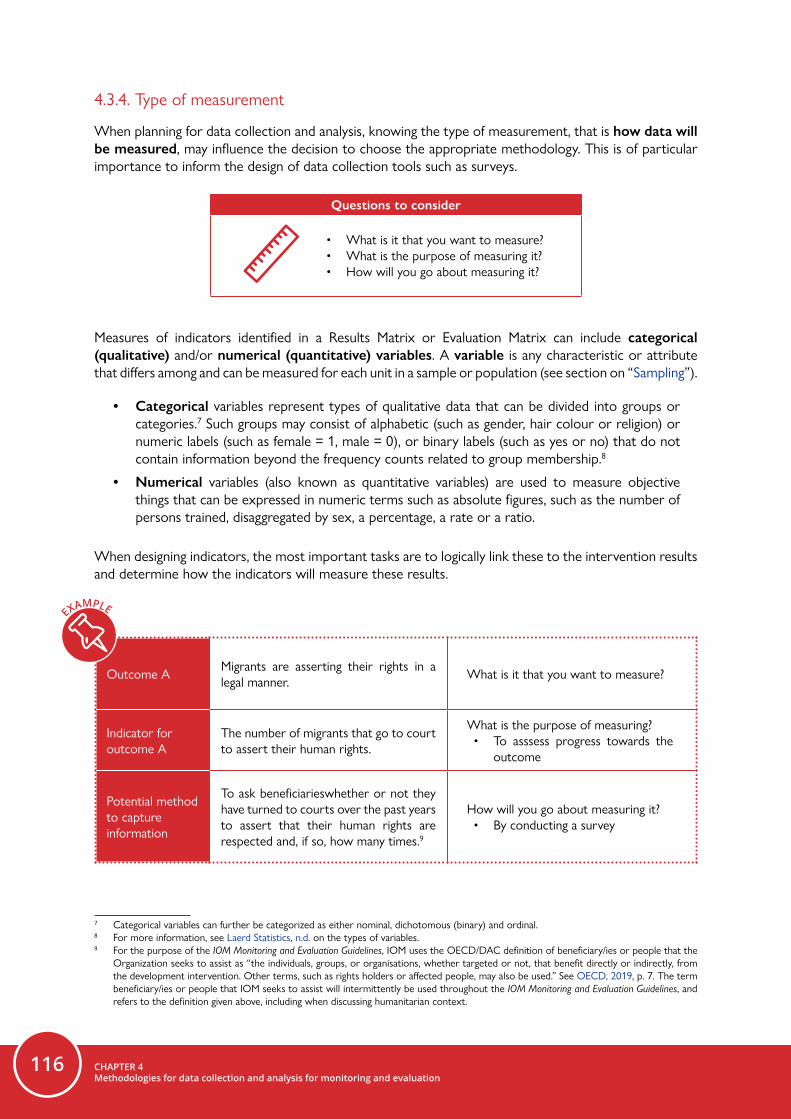
116 CHAPTER 4 Methodologies for data collection and analysis for monitoring and evaluation
4.3.4. Type of measurement
When planning for data collection and analysis, knowing the type of measurement, that is how data will be measured, may influence the decision to choose the appropriate methodology. This is of particular importance to inform the design of data collection tools such as surveys.
Questions to consider
• What is it that you want to measure? • What is the purpose of measuring it? • How will you go about measuring it?
Measures of indicators identified in a Results Matrix or Evaluation Matrix can include categorical (qualitative) and/or numerical (quantitative) variables. A variable is any characteristic or attribute that differs among and can be measured for each unit in a sample or population (see section on “Sampling”).
• Categorical variables represent types of qualitative data that can be divided into groups or categories.7 Such groups may consist of alphabetic (such as gender, hair colour or religion) or numeric labels (such as female = 1, male = 0), or binary labels (such as yes or no) that do not contain information beyond the frequency counts related to group membership.8
• Numerical variables (also known as quantitative variables) are used to measure objective things that can be expressed in numeric terms such as absolute figures, such as the number of persons trained, disaggregated by sex, a percentage, a rate or a ratio.
When designing indicators, the most important tasks are to logically link these to the intervention results and determine how the indicators will measure these results.
Outcome A Migrants are asserting their rights in a legal manner. What is it that you want to measure?
Indicator for outcome A
The number of migrants that go to court to assert their human rights.
What is the purpose of measuring?• To asssess progress towards the
outcome
Potential method to capture information
To ask beneficiarieswhether or not they have turned to courts over the past years to assert that their human rights are respected and, if so, how many times.9
How will you go about measuring it?• By conducting a survey
7 Categorical variables can further be categorized as either nominal, dichotomous (binary) and ordinal.8 For more information, see Laerd Statistics, n.d. on the types of variables. 9 For the purpose of the IOM Monitoring and Evaluation Guidelines, IOM uses the OECD/DAC definition of beneficiary/ies or people that the
Organization seeks to assist as “the individuals, groups, or organisations, whether targeted or not, that benefit directly or indirectly, from the development intervention. Other terms, such as rights holders or affected people, may also be used.” See OECD, 2019, p. 7. The term beneficiary/ies or people that IOM seeks to assist will intermittently be used throughout the IOM Monitoring and Evaluation Guidelines, and refers to the definition given above, including when discussing humanitarian context.
EXAMPLE
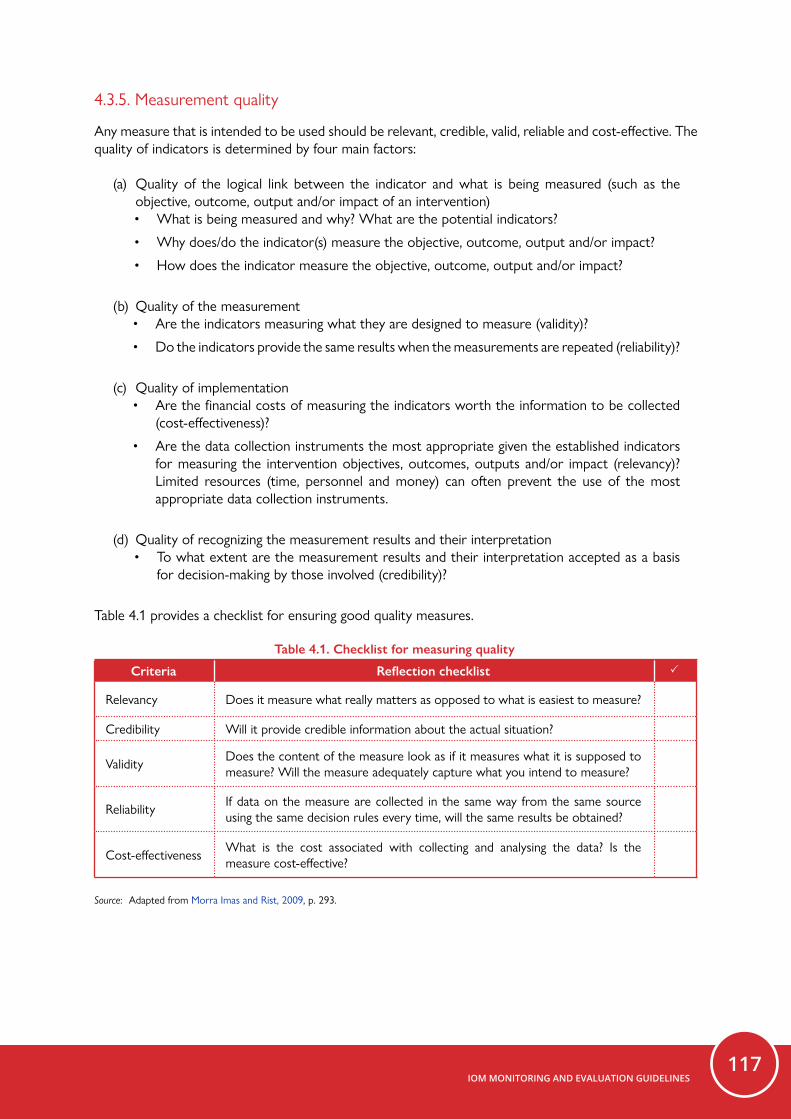
IOM MONITORING AND EVALUATION GUIDELINES117
4.3.5. Measurement quality
Any measure that is intended to be used should be relevant, credible, valid, reliable and cost-effective. The quality of indicators is determined by four main factors:
(a) Quality of the logical link between the indicator and what is being measured (such as the objective, outcome, output and/or impact of an intervention) • What is being measured and why? What are the potential indicators?
• Why does/do the indicator(s) measure the objective, outcome, output and/or impact?
• How does the indicator measure the objective, outcome, output and/or impact?
(b) Quality of the measurement • Are the indicators measuring what they are designed to measure (validity)?
• Do the indicators provide the same results when the measurements are repeated (reliability)?
(c) Quality of implementation• Are the financial costs of measuring the indicators worth the information to be collected
(cost-effectiveness)?
• Are the data collection instruments the most appropriate given the established indicators for measuring the intervention objectives, outcomes, outputs and/or impact (relevancy)? Limited resources (time, personnel and money) can often prevent the use of the most appropriate data collection instruments.
(d) Quality of recognizing the measurement results and their interpretation• To what extent are the measurement results and their interpretation accepted as a basis
for decision-making by those involved (credibility)?
Table 4.1 provides a checklist for ensuring good quality measures.
Table 4.1. Checklist for measuring quality
Criteria Reflection checklist
Relevancy Does it measure what really matters as opposed to what is easiest to measure?
Credibility Will it provide credible information about the actual situation?
Validity Does the content of the measure look as if it measures what it is supposed to measure? Will the measure adequately capture what you intend to measure?
Reliability If data on the measure are collected in the same way from the same source using the same decision rules every time, will the same results be obtained?
Cost-effectiveness What is the cost associated with collecting and analysing the data? Is the measure cost-effective?
Source: Adapted from Morra Imas and Rist, 2009, p. 293.

118 CHAPTER 4 Methodologies for data collection and analysis for monitoring and evaluation
IOM resources2017b IOM Project Handbook. Second edition. Geneva (Internal link only).
Other resourcesLaerd Statistics
n.d. Types of variable.
Organisation for Economic Co-operation and Development (OECD)2019 Better Criteria for Better Evaluation: Revised Evaluation Criteria Definitions and Principles for Use.
OECD/Development Assistance Committee (DAC) Network on Development Evaluation.
Stockmann, R. (ed.) 2011 A Practitioner Handbook on Evaluation. Edward Elgar, Cheltenham and Northampton.
4.3.6. Levels of measurement
The values that a variable takes form a measurement scale, which is used to categorize and/or quantify indicators. They can be nominal, ordinal, interval or ratio scales. The levels of measurement used will determine the kind of data analysis techniques that can or cannot be used.
Levels of measurement
Nominal scales
Interval scales
Levels ofmeasurement Ordinal scalesRatio scales
Nominal scales
Nominal scales consist of assigning unranked categories that represent more of quality than quantity. Any values that may be assigned to categories only represent a descriptive category (they have no inherent numerical value in terms of magnitude). The measurement from a nominal scale can help determine whether the units under observation are different but cannot identify the direction or size of this difference. A nominal scale is used for classification/grouping purposes.
RESOURCES

IOM MONITORING AND EVALUATION GUIDELINES119
Question
Site type(Select one option)
(a) Host communities (b) Collective settlement/centre(c) Transitional centre(d) Camp/Site(e) Others (specify):_____________________
Ordinal scales
Ordinal scales are an ordered form of measurement, consisting of ranked categories. However, the differences between the categories are not meaningful. Each value on the ordinal scale has a unique meaning, and it has an ordered relationship to every other value on the scale. The measurement from an ordinal scale can help determine whether the units under observation are different from each other and the direction of this difference. An ordinal scale is used for comparison/sorting purposes.
Question
How often do you interact with local people?
(a) Every day (5)(b) A few times per week (4)(c) A few times per month (3) (d) A few times per year (2) (e) Not at all (1)
Since ordinal scales closely resemble interval scales, numerical scores (as illustrated in the above example) are often assigned to the categories. The assignment of numerical scores makes it possible to use more powerful quantitative data analysis techniques than would otherwise be possible with non-numerical data.
Interval scales
Interval scales consist of numerical data that have no true zero point with the differences between each interval being the same regardless of where it is located on the scale. The measurement from an interval scale can help determine both the size and the direction of the difference between units. However, since there is no true zero point, it is not possible to make statements about how many times higher one score is than another (for example, a rating of 8 on the scale below is not two times a rating of 4). Thus, an interval scale is used to assess the degree of difference between values.
Question
Compared to your financial situation before leaving, how would you rate your current financial situation?
____________________________________________________________1 2 3 4 5 6 7 8 9 10
Poor Good
EXAMPLE
EXAMPLE
EXAMPLE

120 CHAPTER 4 Methodologies for data collection and analysis for monitoring and evaluation
Ratio scales
Ratio scales consist of numerical data with a true zero point that is meaningful (that is, something does not exist), and there are no negative numbers on this scale. Like interval scales, ratio scales determine both the absolute size (that is, measure distance from the true zero point) and the direction of the difference between units. This measurement also allows to describe the difference between units in terms of ratios, which is not possible with interval scales. Thus, a ratio scale is used to assess the absolute amount of a variable and compare measurements in terms of a ratio.
Question
What was your income last month? _________________
Ä Note: An annual income of USD 20,000 is 4 times as large as an annual income of USD 5,000.
Table 4.2. Summary of measurement scales
Scale Values Type What it provides Examples
Nominal Discrete Categorical• Values have no order• Frequency• Mode
• Gender: Male (1); Female (2)
• Marital status: Married (4); Single (3); Divorced (2); Widowed (1)
Ordinal Discrete Categorical
• Order of values is known• Frequency of distribution• Mode• Media• Mean*
• The assistance received was appropriate and timely.
• Entirely agree (4); Agree (3); Disagree (2); Entirely disagree (1)
Interval Continuous Numerical
• Order of values is known• Frequency of distribution• Mode• Media• Mean• Quantify difference between
each value• Can add or subtract values• No true zero point
• Mental health score• Political orientation
Ratio Continuous Numerical
• Order of values is known• Frequency of distribution• Mode• Media• Mean• Quantify difference between
each value• Can add or subtract values• Can multiply and divide
values• Has a true zero point
• The distance travelled from point of origin to destination
• Income
* Ordinal scales are often treated in a quantitative manner by assigning scores to the categories and then using numerical summaries, such as the mean and standard deviation.
EXAMPLE

IOM MONITORING AND EVALUATION GUIDELINES121
The most important task of any indicator is to ensure the best possible allocation of the characteristics being measured to the measurement scale. This segregation of the characteristics “and their measurable statistical dispersion (variance) on the scale are the main insights gained because of the indicator (the variables)”.10
4.3.7. Sampling
When planning for data collection and thinking of the type of data that will be collected, it is important to assess the target audience from which the data will be collected. A crucial consideration that may influence decision-making is to determine the sample size and sampling strategy to select a representative sample of respondents, as this has budgetary implications.
While at times it may be feasible to include the entire population in the data collection process, at other times, this may not be necessary nor feasible due to time, resource and context-specific constraints, so a sample is selected.
A population, commonly denoted by the letter N, is comprised of members of a specified group. For example, in order to learn about the average age of internally displaced persons (IDPs) living in an IDP camp in city X, all IDPs living in that IDP camp would be the population.
Because available resources may not allow for the gathering of information from all IDPs living in the IDP camp in city X, a sample of this population will need to be selected. This is commonly denoted by the lowercase letter n. A sample refers to a set of observations drawn from a population. It is a part of the population that is used to make inference about/is representative for the whole population.
Figure 4.5. Illustration of population (N) versus sample (n)
Sampling is the process of selecting units from a population (that is, a sample) to describe or make inferences about that population (that is, estimate what the population is like based on the sample results).
10 Stockmann, A Practitioner Handbook on Evaluation, p. 204.
INFO
RMATION

122 CHAPTER 4 Methodologies for data collection and analysis for monitoring and evaluation
Questions to ask when sampling
• Who will be the respondents for data collection? • How many people will data be collected from? • Why is it better to collect data from group A rather than group B? • How many responses will need to be collected to make the findings
reliable, valid and representative of a larger population or group?• How much data will need to be collected to enable an in-depth
analysis?• Will it be enough to speak to just a few beneficiaries about the
results of a particular activity, or will the entire target population be needed?
• What is the ideal balance between information participants can provide and the number of participants required until the information needed is acquired?
Sampling applies to both qualitative and quantitative monitoring/evaluation methods. Whereas random sampling (also referred to as probability sampling) is often applied when primarily quantitative data collection tools are used for monitoring/evaluation purposes, non-random sampling (also referred to as non-probability or purposeful sampling) tends to be applied to monitoring/evaluation work that relies largely upon qualitative data.11
Properly selecting a sample, ideally at random, can reduce the chances of introducing bias in the data, thereby enhancing the extent to which the gathered data reflects the status quo of an intervention. Bias is any process at any stage in the design, planning, implementation, analysis and reporting of data that produces results or conclusions that differ systematically from the truth.12 For more information on the types of bias, see Annex 4.3. Types of bias.
Country Y has a site hosting 1,536 IDPs; this is the entire population (N).
IOM is implementing several activities, alongside other humanitarian actors, to address the needs of the IDPs sheltering at this site. You are interested in monitoring/evaluating these activities. In particular, you are trying to capture the views of an average person benefiting from this intervention.
Due to time and budget constraints, it is impossible to survey every IDP benefiting from IOM services. Therefore, you pick a sample (n) that represents the overall view of the 1,536 IDPs benefiting from the intervention. Given the available resources, the representative sample for the target population in this case was chosen to be 300.
11 Adapted from Trochim, 2020a and Lærd Dissertation, n.d.12 Adapted from Sackett, 1979.
EXAMPLE

IOM MONITORING AND EVALUATION GUIDELINES123
Figure 4.6. Illustration of example
1,500 IDPs
Site X (Country Y)
300 IDPs
Popula�on Sample
Random sampling
Random sampling is an approach to sampling used when a large number of respondents is required and where the sample results are used to generalize about an entire target population. In other words, to ensure that the sample really represents the larger target population and that not only reflecting the views of a very small group within the sample, representative individuals are randomly chosen. Random sampling is an effective method to avoid sampling bias.
True random sampling requires a sampling frame, which is a list of the whole target population from which the sample can be selected. This is often difficult to apply. As a result, other random sampling techniques exist that do not require a full sampling frame (systematic, stratified and clustered random sampling).
Table 4.3. Summary of types of random sampling
Types of random sampling
Definition Purpose Advantages Disadvantages
Sim
ple
rand
om
sam
plin
g
Simple random sampling is a technique where each member of the population has an equal chance of being selected as subject.
When the target population is small, homogeneous and easily accessible
High degree of representativeness of the target population
• Time consuming and expensive
• Requires a sampling frame
• Results can vary considerably if target population is very heterogeneous
• Difficult to do for large/dispersed populations
• Small subpopulations of interest may not be present in the sample in sufficient numbers
Syst
emat
ic r
ando
m s
ampl
ing
Systematic random sampling is a technique that randomly selects a number near the beginning of the sampling frame list, skips several numbers, and selects another number, skips several more numbers, and selects the next name, and so on. The number of names skipped at each stage depends on the desired sample size.

124 CHAPTER 4 Methodologies for data collection and analysis for monitoring and evaluation
Stra
tifie
d ra
ndom
sam
plin
g Stratified random sampling divides the sampling frame in two or more strata (subpopulations) according to meaningful characteristics, such as type of migrant or gender from which participants are then randomly selected.
When the population is heterogeneous and contains several different subpopulations, some of which are of interest for the monitoring/ evaluation exercise
High degree of representativeness of the subpopulations in the target population
• Time consuming and expensive
• More complex than simple and systematic random sampling
• Strata must be carefully defined
Clu
ster
ran
dom
sa
mpl
ing
Cluster random sampling divides the population into many clusters (such as neighbourhoods in a city) and then takes a simple random sample of the clusters. The units in each cluster constitute the sample.
When both the target population and the desired sample size are large
• Easy and convenient
• Can select a random sample when the target population sampling frames are very localized
• Clusters may not be representative of the target population
• Important subpopulations may be left out
• Statistical analysis more complicated
Mul
tist
age
rand
om
sam
plin
g
Multistage random sampling combines two or more of the random sampling techniques sequentially (such as starting with a cluster random sample, followed by a simple random sample or a stratified random sample).
When a sampling frame does not exist and is inappropriate
• Multiple randomizations
• Can select a random sample when the target population lists are very localized
• Can be less expensive, but more complex than cluster sampling
Non-random/Purposeful sampling
Figure 4.7. Non-random sample
V
Popula�on N Non-random sample
Non-random sampling is used where:
• Large number of respondents are not required;
• The research is exploratory;• Qualitative methods are used;• Access is difficult;• The population is highly
dispersed.
Source: OIG/Evaluation.
Non-random/purposeful sampling is appropriate when there is a small “n” study, the research is exploratory, qualitative methods are used, access is difficult or the population is highly dispersed. For further information as to when it is appropriate to use non-random sampling, see Patton (2015) and Daniel (2012). The chosen sampling technique will depend on the information needs, the methodology (quantitative or qualitative) and the data collection tools that will be required.

IOM MONITORING AND EVALUATION GUIDELINES125
Table 4.4. Summary of most common types of non-random/purposeful sampling techniques
Types of non-random
samplingDefinition Purpose Advantages Disadvantages
Purposeful sampling
Purposeful sampling selects individuals from the target population according to a set of criteria.
When the sample needs to fulfil a purpose
• Ensures balance of group sizes when multiple groups are to be selected
• Sample guaranteed to meet specific criteria
• Sample not easily defensible as being representative of the target population due to potential researcher bias
Snowball sampling
Snowball sampling makes contact with an individual from the target population, who then gives names of further relevant persons to contact from the target population.
When individuals from the target population are difficult to get in contact with
• Possible to include individuals of groups for which no sampling frame or identifiable clusters exist
• Difficult to know whether the sample is representative of the target population
Quota sampling
Quota sampling selects individuals from categories or subpopulations in direct proportion to their existence in the target population.
When strata are present in the target population, but stratified sampling is not possible
• Ensures selection of adequate numbers of individuals from the target population with the appropriate characteristics
• Need a good understanding of the target population
• Quota sample may be unrepresentative
Convenience sampling
Convenience sampling asks a set of individuals from the target population who just happen to be available.
When individuals of the target population are convenient to sample
• Easy and inexpensive way to ensure sufficient numbers for a monitoring/ evaluation exercise
• Likely unrepresentative sample
• Cannot generalize to target population
Note: While the table shows the most common types of non-random/purposeful sampling, further types of non-random/purposeful sampling can be found in Patton, 2015.
Limitations of non-random/purposeful sampling
There are several limitations when using non-random/purposeful samples, especially convenience and snowball samples. First, generalizations to the entire target population cannot be made. Second, statistical tests for making inferences cannot be applied to quantitative data. Finally, non-random samples can be subject to various biases that are reduced when the sample is selected at random. If using a non-random sample, M&E practitioners should ask the following: “Is there something about this particular sample that might be different from the population as a whole?” If the answer is affirmative, the sample may lack representation from some groups in the population. Presenting demographic characteristics of the sample can provide insight as to how representative it is of the target population from which the sample was drawn.

126 CHAPTER 4 Methodologies for data collection and analysis for monitoring and evaluation
Table 4.5. Non-random/Purposeful versus random sampling
Non-random/Probability sampling Random sampling
• Sample selection is based on the subjective judgement of the researcher • Sample is selected at random
• Subjective method • Objective method
• Analytical inference • Statistical inference
• Not everyone from the population has an equal chance of getting selected
• Everyone in the population has an equal chance of getting selected
• Sampling bias may not be considered • Useful to reduce sampling bias
• Useful when the population has similar traits • Useful when the population is diverse
• Sample does not accurately represent the population • Useful to create an accurate sample
• Finding the right respondents is easy • Finding the right respondents can prove challenging
• Exploratory findings • Conclusive findings
Source: Adapted from Sheppard, 2020.
Regardless of which sampling approach and technique you decide to use, it is important that you are clear about your sample selection criteria, procedures and limitations.
Resources for random sampling and non-random/purposeful sampling are provided in Annex 4.4. Applying types of sampling.
Daniel, J. 2012 Sampling Essentials: Practical Guidelines for Making Sampling Choices. SAGE Publications, Thousand
Oaks.
Lærd Dissertationn.d. Purposive sampling.
Patton, M.Q.2015 Qualitative Research and Evaluation Methods. Fourth edition. SAGE Publications, Thousand Oaks.
Sackett, D.L. 1979 Bias in analytic research. Journal of Chronic Diseases, 32:51–63.
Sheppard, V.2020 Chapter 7: Sampling techniques. In: Research Methods for Social Sciences: An Introduction.
Pressbooks.
Stockmann, R. (ed.) 2011 A Practitioner Handbook on Evaluation. Edward Elgar, Cheltenham and Northampton.
Trochim, W.M.K.2020a Nonprobability sampling. Research Methods Knowledge Base.
2020b Probability sampling. Research Methods Knowledge Base.
RESOURCES
TIP

IOM MONITORING AND EVALUATION GUIDELINES127
4.3.8. Determining sample size
The size of the sample will be determined by what will be measured, for what purpose and how it will be measured. The size of the sample will also need to ensure, with the maximum level of confidence possible, that an observed change or difference between groups is the result of the intervention, rather than a product of chance. However, this may not always be the case for non-random/purposeful sampling.
Determining sample size: Random sampling
When a large number of respondents is required, the appropriate sample size is decided by considering the confidence level and the sampling error.
Table 4.6. Confidence level and sampling error
Confidence level Sampling error
How confident should the person collecting data be in the sample results and their accuracy in reflecting the entire population?
Generally, the confidence level is set at 95 per cent, that is, there is a 5 per cent chance that the results will not accurately reflect the entire population.
In other words, if a survey is conducted and it is repeated multiple times, the results would match those from the actual population 95 per cent of the time.
Ä In order to be 99 per cent confident, the sample size must be larger than it would need to be to achieve a 90 per cent confidence level.
Increasing the confidence level requires increasing the sample size.
It is important to determine how precise estimates should be for the purpose of data collection. This is the sampling error or margin of error.
The sampling error or margin of error is the estimate of error that arises when data is gathered on a sample rather than the entire population.
A sampling error or margin of error occurs when a sample is selected that does not represent the entire population.

128 CHAPTER 4 Methodologies for data collection and analysis for monitoring and evaluation
Confidence level and sampling errorConfidence level and sampling error
IOM is currently implementing a livelihoods project in region M of country Y. A poll is taken in region M, which reveals that 62 per cent of the people are satisfied with the activities organized through the livelihoods project and 38 per cent of those surveyed are not satisfied with the assistance received.
The M&E officer responsible for data collection in this case has decided that the sampling error for the poll is +/- 3 per cent points. This means that if everyone in region M were surveyed, between 59 (62 -3) and 65 (62 +3) per cent would be satisfied and between 35 (38 -3) and 41 (38 +3) per cent would not be satisfied with the assistance received at the 95 per cent confidence level. The plus or minus 3 per cent points is called the confidence interval, which is the range within which the true population value lies with a given probability (that is, 95% confidence level). In other words, the +/- 3 per cent points is the confidence interval and represents the width of confidence level, which tells more about uncertain or certain we are about the true figure in the population. When the confidence interval and confidence level are put together, a spread of a percentage results.
Online sample size calculator
A number of tools are available online to help calculate the sample size needed for a given confidence level and margin of error. One useful tool is the Survey System Sample Size Calculator as well as the Population Proportion – Sample Size Calculator.
How to calculate the sample size using an online calculatorHow to calculate the sample size using an online calculator
At the IDP site in country Y, there are 1,536 IDPs. You would like to make sure that the sample you select is adequate. You decide that having 95 per cent confidence in the sample results with a margin of error of 5 per cent is acceptable. The accuracy and precision for the population of interest tells you that you need a sample size of 307 IDPs to be able to generalize the entire population of IDPs at the site.
Ä For a study that requires a small number of participants, selecting small random samples can give highly misleading estimates of the target population. Therefore, non-random sampling is more appropriate.
EXAMPLERE
SOURCESEXAMPLE

IOM MONITORING AND EVALUATION GUIDELINES129
Determining sample size: Non-random/purposeful sampling
For non-random/purposeful sampling, an indication of whether an adequate sample has been reached or not is data saturation. Once this point is reached, no more data needs to be collected. However, due to little guidance on how many interviews are needed to reach saturation, this can be sometimes difficult to identify.
The following questions can help determine how many people to include in the sample achieving both data saturation and credibility:
• Should all population segments be included in the sample?
• Should people with diverse perspectives be included in the sample?
• Should the findings be triangulated (see section on “Triangulation”)?
4.4. Methods, approaches and tools for monitoring and evaluation Once data collection has been planned and data sources and sampling have been established, it is time to focus on approaches and methods for designing the data collection tools. The indicators in the Results Matrix, as well as the evaluation criteria and related questions, will determine the approach and tools that will be used to collect the necessary data for monitoring progress/evaluating the intervention.
Time and budget constraints, as well as ethical or logistical challenges, will inform the data collection approach and tools used. The use of multiple tools for gathering information, also known as the triangulation of sources, can increase the accuracy of the information collected about the intervention. For instance, if the intervention is managed remotely due to lack of access to the field and relies upon data collection teams, triangulating the information remotely is a crucial quality check mechanism.
While triangulation is ideal, it can also be very expensive. In general, M&E practitioners use a combination of surveys, interviews, focus groups and/or observations. Studies that use only one tool are more vulnerable to biases linked to that particular method.
Methods for and approaches to data collection are systematic procedures and useful to support the process of designing data collection tools. Generally, a mixture of qualitative and quantitative methods and approaches to data collection are used for M&E. Although there are multiple definitions for these concepts, quantitative methods and approaches can be viewed as being based on numerical data that can be analysed using statistics. They focus on pinpointing what, where, when, how often and how long something occurs and can provide objective, hard facts, but cannot explain why something occurs. Qualitative methods and approaches for data collection are based on data that are descriptive in nature, rather than data that can be measured or counted. Qualitative research methods can use descriptive words that can be examined for patterns or meaning and, therefore, focus on why or how something occurs.

130 CHAPTER 4 Methodologies for data collection and analysis for monitoring and evaluation
The following provides an overview of when a quantitative and/or qualitative approach, and corresponding tools for collecting monitoring and/or evaluation data should be used:
Table 4.7. Quantitative versus qualitative approaches for monitoring and evaluation
Quantitative approach Qualitative approach
What
• Structured • Emphasizes reliability • Harder to develop • Easier to analyse
• Less structured • Emphasizes validity • Easier to develop • Can provide “rich data” but is more
labour intensive to collect and analyse
Why
• Want to count things to explain what is observed
• Want to generalize to entire target population
• Want to make predictions/provide causal explanations
• Know what you want to measure
• Want complete, detailed description of what is observed
• Want to understand what is observed • Want narrative or in-depth information • Not sure what you are able to measure • Want to attain a more in-depth
understanding or insight
Tools
• Surveys • Interviews • Observations
• Surveys • Interviews • Focus group discussions • Case studies• Observations
Sample
• Large-n (sample) that is representative of the target population
• Respondents selected using some form of random sampling
• Small-n (sample) that is unrepresentative of the target population
• Respondents usually selected according to their experience
Output Numerical data Words and pictures
Analysis Statistical Interpretive
Source: Adapted from Morra-Imas and Rist, 2009.
The following graphic provides an overview of data collection methods for both monitoring and evaluation.
Frequently used data collection methods
Surveys Interviews Focus group discussions
Case studies Observation
Additional data collection methods
BrainstormingStrengths, weaknesses,
opportunities and threats (SWOT)
Dreams realized or visioning (DR/V)
Drama and role plays
Photos and videos
Geographic information system
(GIS) mapping

IOM MONITORING AND EVALUATION GUIDELINES131
4.4.1. Surveys
Surveys are a common technique for collecting data. Surveys can collect focused, targeted information about a sample taken from the target population for a project, programme or policy, especially data about perceptions, opinions and ideas. While surveys can also be used to measure intended behaviour, there is always room for interpretation, and any data gathered may be less “factual” as what people say they (intend to) do may not reflect what they in fact do in reality.
Generally, a survey is conducted with a relatively large sample that is randomly selected so that the results reflect the larger target population (see section on Sampling). The format of the survey can be structured or semi-structured, depending on the purpose of the data collection (see Table 4.8) and be implemented on a one-time basis (cross-sectional) or over a period of time (longitudinal).
Cross-sectional surveys are used to gather information on the target population at a single point in time, such as at the end of a project. This survey format can be used to determine the relationship between two factors, for example, the impact of a livelihoods project on the respondent’s level of knowledge for establishing an income-generating activity.
Longitudinal surveys gather data over a period of time, allowing for an analysis of changes in the target population over time, as well as the relationship between factors over time. There are different types of longitudinal surveys, such as panel and cohort studies.13
Table 4.8. Structured versus semi-structured surveys
Structured Semi-structured
Content• Closed-ended questions with a
predetermined set of response options. • Each respondent is asked the same questions
in the same way and is given the same response options.
Content• A mixture of closed- and open-ended questions
with some predetermined set of response options. • Each respondent is asked the same questions in
the same way; however, for open-ended questions, they are not provided with a predetermined set of response options.
PurposeAggregate and make comparisons between groups, and/or across time, on issues about which there is already a thorough understanding.
PurposeAcquire an in-depth understanding of the issues that are being monitored and/or evaluated.
13 Both panel and cohort studies are approaches to the design of longitudinal studies. Cohort studies follow people identified by specific characteristics in a defined time period, whereas panel studies aim to cover the whole population (Lugtig and Smith, 2019).

132 CHAPTER 4 Methodologies for data collection and analysis for monitoring and evaluation
For more information about the different types, design and implementation of longitudinal surveys, see the following:
IOM resource2019a Post training completion evaluation form (Internal link only).
Other resoucesLugtig, P. and P.A. Smith
2019 The choice between a panel and cohort study design.
Lynn, P. (ed.)2009 Methodology of Longitudinal Surveys. Wiley, West Sussex.
Morra-Imas, L.G. and R.C. Rist 2009 The Road to Results: Designing and Conducting Effective Development Evaluations. World Bank,
Washington, D.C.
(Kindly note that this can further be adapted as needed.)
Surveys can be administered in different ways, such as in-person interviews, phone interviews or as paper or online questionnaires that require participants to write their answers.
For more information on how to design and implement a survey, see Annex 4.5. Survey design and implementation and Annex 4.6. Survey example.
4.4.2. Interviews
Interviews are a qualitative research technique used to shed light on subjectively lived experiences of, and viewpoints from, the respondents’ perspective on a given issue, or sets of issues, that are being monitored or evaluated for a given intervention. Interviews provide opportunities for mutual discovery, understanding, reflection and explanation. Interviews are of three types: (a) structured; (b) semi-structured; and (c) unstructured. Table 4.9 provides an overview of each interview approach, when to use it and some examples.
RESOURCES

IOM MONITORING AND EVALUATION GUIDELINES133
Table 4.9. Types of interviews
Structured Semi-structured Unstructured
What is it?
• Mostly closed-endedquestions.
• All respondents are askedthe same questions in thesame order.
• No probing beyond theset of questions.
• A mixture of closed- andopen-ended questions.
• Can leave certain questionsout, mix the order ofquestions or ask certainstandard questions indifferent ways depending onthe context.
• Allows for probes andclarifications beyond theinitial pre-established set ofquestions.
• No predeterminedquestions andresponse options.
• Open conversationguided by a centraltopic area or theme(such as respondent’slife) and lets therespondent guide theinterview.
• Allows for probes andclarifications.
When to use it?
• When there is already athorough understandingabout one or morecomplex issues beingmonitored/evaluated.
• When comparable data isdesired/needed.
• To obtain an in-depth understanding about one or morecomplex issues being monitored and/or evaluated.
• When there is less need for comparable data.
Formulating interview questions
Good-quality interview questions should have the following characteristics:
• Simple and clear and do not use acronyms, abbreviations or jargon;• Not double barreled, such that it touch on more than one subject, while allowing for only one answer;• Favour open-ended and elaborate answers. If including yes/no questions, these should be followed by
requests for further explanations, “Why?”, “In what ways?”, or they should be reworded to encouragea more fine-grained answer.
• Straightforward (no double negatives), neutral and non-leading;• Non-threatening and non-embarrassing to the interviewee;• Accompanied by appropriate probes.14
To know more about interviews, examples of interview structure and probing, see Annex 4.7. Interview structure and questions (examples provided throughout the annex) and Annex 4.8. Interview example.
4.4.3. Focus group discussions
A focus group is another qualitative research technique in the form of a planned group discussion among a limited number of people, with a moderator and if possible, note takers, as well as observers if also using observations.15 The purpose of a focus group is to attain diverse ideas and perceptions on a topic of interest in a relaxed, permissive environment that allows the expression of different points of view, with
14 Probes are responsive questions asked to clarify what has been raised by the respondent. The aim is to obtain more clarity, detail or in-depth understanding from the respondent on the issue(s) being monitored/evaluated. For more information, see Annex 4.7. Interview structure and questions.
15 Usually, focus group discussions should not exceed 15 participants. For more participants, community group interview techniques may be used.
INFO
RMATION

134 CHAPTER 4 Methodologies for data collection and analysis for monitoring and evaluation
no pressure for consensus. Focus groups are also used to acquire an in-depth understanding about a topic or issue, which is generally not possible using a survey. For instance, a survey can tell you that 63 per cent of the population prefers activity Y, but a focus group can reveal the reasons behind this preference. Focus groups can also help check for social desirability bias, which is the tendency among survey respondents to answer what they think the enumerator wants to hear, rather than their actual opinions. For example, during the focus group discussion, one may discover that the actual preference of the participants is activity Z, not activity Y, as per their responses to the survey. However, focus groups provide less of an opportunity to generate detailed individual accounts on the topic or issue being explored. If this type of data is required, one should use interviews instead. If someone is answering too often, it is important to identify if this behaviour intimidates other participants and moderate the discussions inviting others to contribute. It is also important to understand who that person is, for instance, a political leader trying to impose answers to the group.
To know more about focus group discussions, see Annex 4.9. Preparing, conducting and moderating a focus group and Annex 4.10. IOM example of a focus group discussion guide.
4.4.4. Case study
A case study is a qualitative data collection method that is used to examine real-life situations and if the findings of the case can illustrate aspects of the intervention being monitored and/or evaluated. It is a comprehensive examination of cases to obtain in-depth information, with the goal of understanding the operational dynamics, activities, outputs, outcomes and interactions of an intervention.
Case studies involve a detailed contextual analysis of a limited number of events or conditions and their relationships. It provides the basis for the application of ideas and extension of methods. Data collected using a case study can help understand a complex issue or object and add strength to what is already known.
A case study is useful to explore the factors that contribute to outputs and outcomes. However, this method of data collection may require considerable time and resources, and information obtained from case studies can be complex to analyse and extrapolate.
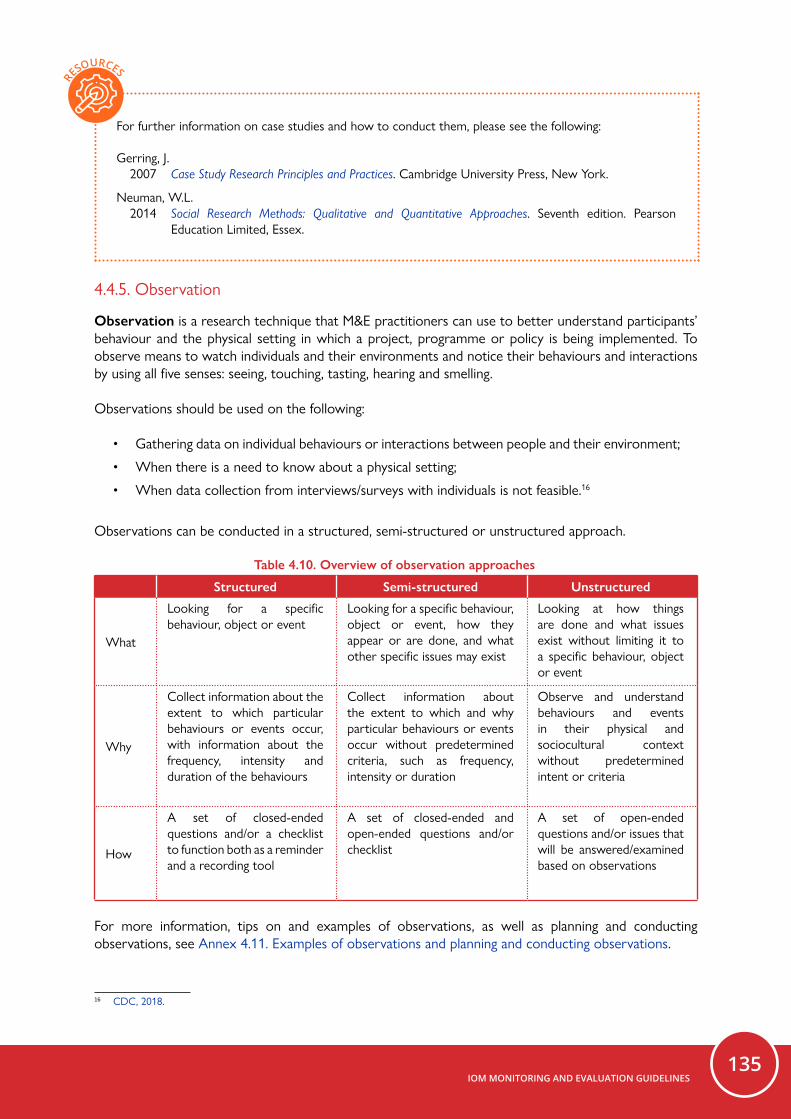
IOM MONITORING AND EVALUATION GUIDELINES135
For further information on case studies and how to conduct them, please see the following:
Gerring, J. 2007 Case Study Research Principles and Practices. Cambridge University Press, New York.
Neuman, W.L. 2014 Social Research Methods: Qualitative and Quantitative Approaches. Seventh edition. Pearson
Education Limited, Essex.
4.4.5. Observation
Observation is a research technique that M&E practitioners can use to better understand participants’ behaviour and the physical setting in which a project, programme or policy is being implemented. To observe means to watch individuals and their environments and notice their behaviours and interactions by using all five senses: seeing, touching, tasting, hearing and smelling.
Observations should be used on the following:
• Gathering data on individual behaviours or interactions between people and their environment;
• When there is a need to know about a physical setting;
• When data collection from interviews/surveys with individuals is not feasible.16
Observations can be conducted in a structured, semi-structured or unstructured approach.
Table 4.10. Overview of observation approaches
Structured Semi-structured Unstructured
What
Looking for a specific behaviour, object or event
Looking for a specific behaviour, object or event, how they appear or are done, and what other specific issues may exist
Looking at how things are done and what issues exist without limiting it to a specific behaviour, object or event
Why
Collect information about the extent to which particular behaviours or events occur, with information about the frequency, intensity and duration of the behaviours
Collect information about the extent to which and why particular behaviours or events occur without predetermined criteria, such as frequency, intensity or duration
Observe and understand behaviours and events in their physical and sociocultural context without predetermined intent or criteria
How
A set of closed-ended questions and/or a checklist to function both as a reminder and a recording tool
A set of closed-ended and open-ended questions and/or checklist
A set of open-ended questions and/or issues that will be answered/examined based on observations
For more information, tips on and examples of observations, as well as planning and conducting observations, see Annex 4.11. Examples of observations and planning and conducting observations.
16 CDC, 2018.
RESOURCES

136 CHAPTER 4 Methodologies for data collection and analysis for monitoring and evaluation
4.4.6. Additional methods for data collection for monitoring and evaluation
Additional data collection methods17
Method Definition
Brainstorming
Brainstorming means to gain many ideas quickly from a group without delving into a deeper and more detailed discussion. It encourages critical and creative thinking, rather than simply generating a list of options, answers or interests. From an M&E perspective, this method is often a first step in a discussion that is followed by other methods.
Drama and role plays
Drama and role plays are used to encourage groups of people to enact scenes from their lives concerning perceptions, issues and problems that have emerged relating to a project intervention, which can then be discussed. Drama can also help a group to identify what indicators would be useful for monitoring or evaluation and identify changes emerging from a project intervention.
DR/V
DR/V serves the purpose of understanding people’s dreams or shared visions for the future of an intervention by means of a focused discussion. This is a good method for identifying indicators, understanding if primary stakeholders feel that their well-being is increasing or not and helping stakeholders reflect on the relevance of the intervention based on people’s visions for development.
GIS mapping
Using computer-based GIS that represents geographic coordinates in a very precise map can help present information relating to changes in geographical, social or developmental indicators. From an M&E perspective, GIS can help to analyse complex data collected, as the various thematic layers of spatial information can be overlaid for easy examination of relationships between the different themes.
Photographs and videos
This data collection method helps track changes across a series of sequenced photographs or videos. From an M&E perspective, it helps focus on specific indicators or performance questions, or can be more open-ended if needed; for instance, when asking stakeholders to document/assess change from their perspective.
SWOT analysis
The purpose of a SWOT analysis is to identify the strengths, weaknesses, opportunities and threats in relation to an intervention or group, and how such an assessment may change over time. This method is useful for qualitative assessments, such as the services provided by the implementation and relationships between relevant stakeholders involved.
17 The following information is adapted from IFAD, 2002.

IOM MONITORING AND EVALUATION GUIDELINES137
Methods for impact evaluations
Impact evaluations aim to identify a proper counterfactual and whether impact can be confidently attributed to an intervention.18 Specifically, this may be done by assessing the situation of the beneficiaries “before and after” and “with or without” the intervention. By comparing the before and after and/or with or without scenarios, any differences/changes observed can be attributed to the intervention, with some reservations as it is not always straightforward and attribution may be more complex to assess than by answering the above scenarios.
A common first step in impact evaluation is to determine the sample size and sampling strategy to select a representative sample from both the treatment group (participating in the intervention) and comparison group (not participating in the intervention). The calculation of a robust and representative sample depends on various factors.
While there is a range of impact evaluation designs, there is also a range of methods that are applicable within these designs.19 To answer the specific evaluation questions, methods are flexible and can be used in different combinations within impact evaluation designs. Experimental, quasi-experimental and non-experimental are three types of impact evaluation design.
Experimental methods
Experimental methods, also called randomized control trials, use randomization techniques at the outset of the intervention to sample both intervention and comparison groups.20 While there are different methods to randomize a population, a general requirement is that the two groups remain as similar as possible in terms of socioeconomic characteristics and that their size should be broadly equivalent. Ensuring these makes them comparable and maximizes the statistical degree of precision of the impact on the target group.21
Given the rigourous approach to selecting treatment and control groups, as well as the frequency of primary data collection for generating the required data sets, experimental methods are considered the most robust for assessing and attributing impact to an intervention. However, they have cost and time implications, and might raise ethical considerations (given the purposive exclusion of a group of people from project benefits) that need to be dealt with upfront. Methods of fairly selecting participants include using a lottery, phasing in an intervention and rotating participants through the intervention to ensure that everyone benefits.
Quasi-experimental methods
Quasi-experimental designs identify a comparison group that is as similar as possible to the intervention group in terms of pre-intervention characteristics; with the key difference that quasi-experimental design lacks random assignment.22 The main quasi-experimental approaches are pre-post, simple difference, double difference (difference-in-differences), multivariate regression, propensity score matching and regression discontinuity design (see Table 4.10 for definitions).23
18 The following information is adapted from IFAD, 2015 and from BetterEvaluation, n.d.19 UNEG, 2013.20 A randomized controlled trial is an experimental form of impact evaluation in which the population receiving the intervention (intervention
group) is chosen at random from the eligible population, and a control group (not receiving intervention) is also chosen at random from the same eligible population. Both groups are chosen randomly and have equal chance of participation (see White et al., 2014).
21 IFAD, 2002.22 White and Sabarwal, 2014.23 White and Raitzer, 2017.
INFO
RMATION

138 CHAPTER 4 Methodologies for data collection and analysis for monitoring and evaluation
Non-experimental methods
In non-experimental methods used in ex-post-impact evaluations, the participants as well as the comparison groups are not selected randomly prior to the intervention, but the comparison group is reconstructed ex post, that is, at the time of the evaluation. To determine ex-post changes that may have occurred as a result of the intervention, impact evaluations using non-experimental methods conduct at least two complimentary analyses: “before and after” and “with or without”.
Non-experimental methods are often considered if the decision to do an impact evaluation is taken after the intervention has taken place.24
A variety of methods are used in non-experimental design to ensure that they are as similar as possible and to minimize selection bias. This can include (propensity) score matching, regression discontinuity design, difference-in-differences and instrumental variables.25 A description of the different techniques are found in the following table.
Table 4.11. Quasi and non-experimental methods
Methodology DescriptionWho is in the comparison
group?
Required assumptions
Required data
Pre-
post
Measure how programme participants improved (or changed) over time.
Programme participants themselves – before participating in the programme.
The programme was the only factor influencing any changes in the measured outcome over time.
Before and after data for programme participants.
Sim
ple
diffe
renc
e
Measure difference between programme participants and non-participants after the programme is completed.
Individuals who didn’t participate in the programme (for any reason), but for whom data were collected after the programme.
Non-participants are identical to participants except for programme participation, and were equally likely to enter the programme before it started.
“After” data of the before-and- after scenario for programme participants and non-participants.
Diff
eren
ce-i
n-di
ffere
nces
Measure improvement (change) over time of programme participants relative to the improvement (change) of non-participants.
Individuals who didn’t participate in the programme (for any reason), but for whom data were collected both before and after the programme.
If the programme didn’t exist, the two groups would have had identical trajectories over this period.
Before and after data for both participants and non-participants.
24 Ibid.25 Gertler et al. (2011) provide an exhaustive description of non-experimental methods.

IOM MONITORING AND EVALUATION GUIDELINES139
Mul
tiva
riat
e re
gres
sion
Individuals who received treatment are compared with those who did not, and other factors that might explain differences in the outcomes are “controlled” for.
Individuals who didn’t participate in the programme (for any reason), but for whom data were collected both before and after the programme. In this case, data is not comprised of just indicators of outcomes, but other “explanatory” variables as well.
The factors that were excluded (because they are unobservable and/or have been not been measured) do not bias results because they are either uncorrelated with the outcome or do not differ between participants and non-participants.
Outcomes as well as “control variables” for both participants and non-participants.
Stat
isti
cal m
atch
ing
Individuals in control group are compared to similar individuals in experimental group.
Exact matching: For each participant, at least one non-participant who is identical on selected characteristics Propensity score matching: Non-participants who have a mix of characteristics, which predict that they would be as likely to participate as participants.
The factors that were excluded (because they are unobservable and/or have been not been measured) do not bias results, because they are either uncorrelated with the outcome or do not differ between participants and non-participants.
Outcomes, as well as “variables for matching” for both participants and non-participants.
Reg
ress
ion
disc
onti
nuit
y de
sign
Individuals are ranked based on specific, measurable criteria. There is some cut-off that determines whether an individual is eligible to participate. Participants are then compared to non-participants and the eligibility criterion is controlled for.
Individuals who are close to the cut-off, but fall on the “wrong” side of that cut-off, and therefore do not get the programme.
After controlling for the criteria (and other measures of choice), the remaining differences between individuals directly below and directly above the cut-off score are not statistically significant and will not bias the results. A necessary but sufficient requirement for this to hold is that the cut-off criteria are strictly adhered to.
Outcomes, as well as measures on criteria (and any other controls).
Inst
rum
enta
l var
iabl
es
Participation can be predicted by an incidental (almost random) factor, or “instrumental” variable, that is uncorrelated with the outcome, other than the fact that it predicts participation (and participation affects the outcome).
Individuals who, because of this close to random factor, are predicted not to participate and (possibly as a result) did not participate.
If it weren’t for the instrumental variable’s ability to predict participation, this “instrument” would otherwise have no effect on or be uncorrelated with the outcome.
Outcomes, the “instrument,” and other control variables.

140 CHAPTER 4 Methodologies for data collection and analysis for monitoring and evaluation
Ran
dom
ized
ev
alua
tion
Experimental method for measuring a causal relationship between two variables.
Participants are randomly assigned to the control groups.
Randomization “worked.” That is, the two groups are statistically identical (on observed and unobserved factors).
Outcome data for control and experimental groups; control variables can help absorb variance and improve “power”.
Source: IFAD, 2015.
Ä For more information related to impact evaluation, see also chapter 5, Types of evaluation – Key considerations regarding impact evaluations.
BetterEvaluationn.d. Compare results to the counterfactual.
Gertler, P.J., S. Martinez, P. Premand, L.B. Rawlings and C.M.J. Vermeersch 2011 Impact Evaluation in Practice. World Bank, Washington, D.C.
International Fund for Agricultural Development (IFAD)2002 Annex D: Methods for monitoring and evaluation. In: Managing for Impact in Rural Development:
A Guide for Project M&E. Rome.
2014 Republic of India, Impact Evaluation of Jharjkhand – Chhattisgarh Tribal Development Programme (JCTDP). Approach Paper. Independent Office of Evaluation.
2015 Evaluation Manual. Second edition. Independent Office of Evaluation of IFAD, Rome.
Leeuw, F. and J. Vaessen 2009 Impact Evaluations and Development: NONIE Guidance on Impact Evaluation. World Bank,
Washington, D.C.
United Nations Evaluation Group (UNEG)2013 Impact Evaluation in UN Agency Evaluation Systems: Guidance on Selection, Planning and
Management. Guidance document.
US Department of Health and Human Services, Centers for Disease Control and Prevention (CDC)2018 Data collection methods for program evaluation: Observation. Evaluation Brief no. 16.
White, H. and D. Raitzer 2017 Impact Evaluation of Development Interventions: A Practical Guide. Asian Development Bank, Metro
Manila.
White, H. and S. Sabarwal 2014 Quasi-experimental design and methods. Methodological Briefs, Impact Evaluation No. 8.
UNICEF, Florence.
White, H., S. Sabarwal and T. de Hoop2014 Randomized controlled trials (RCTs). Methodological Briefs, Impact Evaluation No. 7. UNICEF,
Florence.
RESOURCES

IOM MONITORING AND EVALUATION GUIDELINES141
4.5. Collecting and managing data 4.5.1. Data collection
Once the M&E design has been identified and the method(s) and tools have been developed, the data collection can start. It is also recommended to organize a training with the data collection team(s) on the methodology. The training should cover in detail each data collection tool that will be used and include practical exercises of how to implement them.
Developing a data collection guide with clear instructions for the enumerators is a useful reference tool, both during the training and after, for the actual data collection; see the example provided below for an excerpt from a survey included in a data collection guide. Taking these steps will ensure that the collected data will be accurate with a minimum amount of error. In certain cases, however, conducting a full training is not feasible due to time and resource constraints, and having a data collection guide can be an important reference.
Excerpt from a data collection guide
Section 1: Economic situationThis section looks at the economic/financial situation of the respondent.
1. Do you have a regular source of income? Yes No
Objective: To find out whether or not the respondent has a regular supply of money. Possible sources of income include employment, small business and participation in a credit and savings group.
Instructions: First read out the question and response options and then circle the respondent's answer (yes or no).
a) (If # 1 YES) What has been your average monthly income over the past six months? ____________________________
Instructions: First read out the question and then insert the average monthly income of the respondent in the space provided beside the question. This question is to be asked only if the respondent answered "Yes" to question # 1.
b) (If # 1 NO) What was your income last month? _________________________________
Instructions: First read out the question and then insert the income amount of the respondent in the space provided beside the question. This question is to be asked only if the respondent answered ''No " to question #1.
2. How often do you receive financial support from a third party? Always Very
often Rarely Never
Objective: To find out how regularly the respondent is receiving financial support from a third party which can be a person or an organization.
Instructions: First read out the question and response options and then circle the respondent's answer (one of the four options listed beside the question).
EXAMPLE

142 CHAPTER 4 Methodologies for data collection and analysis for monitoring and evaluation
Each data collection team should have a supervisor who can oversee the data collection and check for any errors. During the data collection, it is imperative that the supervisor of the data collection team regularly checks for the following:
• Are there any forms missing? • Are there any double forms for a respondent? • Are there any answer boxes or options left blank? • Are there more than one option selected for closed-ended questions with single-option responses? • Are correct values filled out in the wrong boxes? • Are the answers readable? • Are there any writing errors? • Are there any answers that are out of the expected range (outliers)?
Doing these checks will help reduce the amount of error in the data collected.
4.5.2. Data entry
The data collected needs then to be transferred onto a computer application, such as Microsoft Word or Excel. Having the data in an electronic format will facilitate the data clean-up and data analysis. For quantitative data, the first step in data entry is to create the data file(s) to achieve a smooth transfer between a spreadsheet and a statistical programme package, such as SPSS and Stata for conducting statistical analyses.
How to structure a data spreadsheet
• Data structure for cross-sectional data: A table of numbers and text in which each row corresponds to an individual subject (or unit of analysis) and each column corresponds to a different variable or measurement. There is one record (row) per subject.
• Data structure for longitudinal data: The data can be structured in a wide data file format or a long data file format. In the wide format (see Table 4.12), a subject’s repeated responses will be in a single row, and each response is in a separate column. In the long format (see Table 4.13), each row is one time point per subject; so each subject (county) will have data in multiple rows. Any variables that don’t change across time will have the same value in all the rows.
Table 4.12. Wide format data file example
ID Age Income 2015 Income 2016 Income 2017
1 067 43 30 000 30 000 32 000
2 135 37 28 000 31 000 30 000
Table 4.13. Long format data file example
ID Age Income Year
1 067 43 30 000 2015
2 067 43 30 000 2016
3 067 43 32 000 2017
4 135 37 28 000 2015
5 135 37 31 000 2016
6 135 37 30 000 2017

IOM MONITORING AND EVALUATION GUIDELINES143
For qualitative data, the first step in the data entry process is transferring all the interview, focus group and observation notes to a Word document for conducting content analysis using qualitative data programme packages, such as NVivo or MAXQDA.
Another component of the data entry is assigning each subject (or unit of analysis) a unique identifier (ID) (for example: 01, 02, 03 and so on), unless this is done directly during the data collection process. To do this, a separate file should be created that matches the identifying information for each subject (unit of analysis) with their unique ID. Assigning a unique identifier to each respondent ensures that the data cannot be traced back to them if the data is disclosed to other parties.
4.5.3. Data clean-up
Once the data has been transferred from the medium used to record the information to a computer application (Word or Excel), it needs to be screened for errors. Following this, any errors need to be diagnosed and treated.
Data errors can occur at different stages of the design, implementation and analysis of data (see Figure 4.8):
• When designing the data collection instruments (such as improper sampling strategies, invalid measures, bias and others);
• When collecting or entering data;
• When transforming/extracting/transferring data;
• When exploring or analysing data;
• When submitting the draft report for peer review.26
Figure 4.8. Sources of error
26 UNHCR, 2015.
Data entry Processing
Data integrationMeasurement
Sources of error

144 CHAPTER 4 Methodologies for data collection and analysis for monitoring and evaluation
Key errors to look for when screening dataKey errors to look for when screening data2727
• Spelling and formatting irregularities: Are categorical variables written incorrectly? Are date formats consistent?
• Lack of data: Do some questions have fewer answers than surrounding questions? • Excessive data: Are there duplicate entries? Are there more answers than originally allowed? • Outliers/inconsistencies: Are there values that are so far beyond the typical distribution that they
seem potentially erroneous? • Strange patterns: Are there patterns that suggest cheating rather than honest answers (that is,
several questionnaires with the exact same answers)? • Suspect analysis results: Do the answers to some questions seem counter-intuitive or extremely
unlikely?
Table 4.14. Selected data screening method
Quantitative data Qualitative data
• Browse data tables after sorting • Calculate summary statistics • When time allows, validate data entry • Create frequency distributions and cross-tabulations • Graphically explore data distributions using box plots,
histograms and scatter plots with the help of visual analysis software such as Tableau desktop
• Detect outliers*
• Check for spelling errors • Compare data with assumptions or
criteria • Take counts of words and phrases • Create frequency distributions and
cross-tabulations
Depending on the number of data collection tools used and amount of data collected, data entry agents may need to be recruited and trained to do the data entry (and data clean-up).
* United Nations High Commissioner for Refugees (UNHCR), 2015.
4.5.4. Diagnosis
Once the suspect data has been identified, the next step is to review all the respondent’s answers to determine if the data makes sense given the context in which it was collected. Following this review, there are several possible diagnoses for each suspect data point identified:
• The data point is missing. Missing data can be a result of omitted answers by the respondents (no response), questions that are skipped over by the enumerator (erroneous entry or skip pattern) or the data entry agents, or there are dropouts (for longitudinal research).
• The data point is a true extreme value. True extreme values are answers that seem high but can be justified by other answers.
• The data point is a true normal value. True normal values are valid answers.
• The data point is an error. Errors can be either typos or inappropriate answers (questions asked were misunderstood by the respondents). Sometimes, errors can be rapidly identified when there are pre-defined cut-offs because the values are logically or biologically impossible. For example, the sample comprises only of respondents between the ages of 18 and 35; however, on the survey, a respondent is listed as being 80 years old, which is not possible.28
27 Ibid.28 Ibid.

IOM MONITORING AND EVALUATION GUIDELINES145
4.5.5. Treatment
Once the problematic observations have been identified, these need to be treated before the data can be analysed. The following are some of the key approaches to dealing with data errors:
• Leave the data unchanged. This approach is the most conservative as it entails accepting the erroneous data as valid response(s) and making no changes. For large-n studies, leaving one erroneous response may not affect the analysis. However, for small-n studies, the decision of leaving the data unchanged may be more problematic.
• Correct the data, however without modification of the intention of or meaning given by the respondent.
• Delete the data. It is important to remember that leaving out data can make it seem as if the data is being “cherry-picked” to obtain the desired results. Alternatively, a binary variable can be created (1 = suspicious record; 0 = not so) and use this new variable as a record filter in Pivot tables or in-table filtering to understand the impact of potentially erroneous data in the final results.
• Re-measure the suspect or erroneous values, if time and resources permit.29
General decision-making rules:30
• If the person doing the data entry has entered values different from the ones in the survey, the value should be changed to what was recorded in the survey form.
• When variable values do not make sense and there is no data entry error nor notes to determine where the error comes from, the value should be left as it is. Any changes will bias the data.
• When blank cases are present for questions that required an answer, or if erroneous values cannot be corrected, these may be deleted from the data file.
• When there are still suspect and true extreme values after the diagnostic phase, it is necessary to next examine the influence of these data points, both individually and as a group, on the results before deciding whether or not to leave the data unchanged.
• Any data points taken out of the data set should be reported as “excluded from analysis” in the methodology chapter of the final report.
4.5.6. Missing data
Missing values require attention because they cannot be simply ignored. The first step is to decide which blank cells need to be filled with zeros (because they represent negative observation; for example “no”, “not present” and “option not taken”) and which to leave blank (if using blanks to indicate missing or not applicable). Blank cells can also be replaced with missing value codes; for example, 96 (I don’t know), 97 (refused to answer), 98 (skip question/not applicable) and 99 (blank/missing).
If the proportion of missing or incomplete cases is substantial for a category of cases, this will be a major M&E concern. Once a set of data is known to be missing, it is important to determine whether the missing data are random or whether they vary in a systematic fashion, and also the extent to which the problem exists. Random missing values may occur because the subject inadvertently did not answer some questions. The assessment may be overly complex and/or long, or the enumerator may be tired and/or not paying attention, thereby missing the question. Random missing values may also occur through
29 Ibid.30 Ibid.

146 CHAPTER 4 Methodologies for data collection and analysis for monitoring and evaluation
data entry mistakes. If there are only a small number of missing values in the data set (typically, less than 5%), then it is extremely likely to be random. Non-random missing values may occur because the key informant purposefully did not answer some questions (confusing or sensitive question, no appropriate choices such as “no opinion” or “not applicable”).
The default option for handling missing data is filtering and excluding them from the analysis:
(a) Listwise/casewise deletion: Cases that have missing values on the variable(s) under analysis are excluded. If only analysing one variable, then listwise deletion is simply analysing the existing data. If analysing multiple variables, then listwise deletion removes cases if there is a missing value on any of the variables. The disadvantage is a loss of data, because all data from cases who may have answered some of the questions, but not others (such as the missing data), are removed.
(b) Pairwise deletion: All available data is included. Unlike listwise deletion, which removes cases (subjects) that have missing values on any of the variables under analysis, pairwise deletion only removes the specific missing values from the analysis (not the entire case). In other words, all available data is included. If conducting a correlation on multiple variables, this technique allows to conduct the bivariate correlation between all available data points and ignore only those missing values if they exist on some variables. In this case, pairwise deletion will result in different sample sizes for each correlation. Pairwise deletion is useful when the sample size is small or missing values are large, because there are not many values to begin with, so why omit even more with listwise deletion.
Ä Note: Deletion means exclusion within a statistical procedure, not deletion (of variables or cases) from the data set.
(c) Deletion of all cases with missing values: Only those cases with complete data are retained. This approach reduces the sample size of the data, resulting in a loss of power and increased error in estimation (wider confidence intervals). While this may not be a problem for large data sets, it is a big disadvantage for small ones. Results may also be biased if subjects with missing values are different from the subjects without missing values (that is, non-random) resulting in a non-representative sample.
(d) Imputation (replace the missing values): All cases are preserved by replacing the missing data with a probable value based on other available information (such as the mean or median of the observations for the variable for which the value is missing). Once all missing values have been imputed, the data set can then be analysed using standard techniques for complete data. More sophisticated imputation methods, involving equations that attempt to predict the values of the missing data based on a number of variables for which data are available, exist. Each imputation method can result in biased estimates. Detailing the technicalities, appropriateness and validity of each technique goes beyond the scope of this document. Ultimately, choosing the right technique depends on the following: (i) how much data are missing (and why); (ii) patterns, randomness and distribution of missing values; and (iii) effects of the missing data and how the data will be used in the analysis. It is strongly recommended to refer to a statistician if M&E practitioners are faced with a small data set with large quantities of missing values.
In practice, for M&E purposes with few statistical resources, creating a copy of the variable and replacing missing values with the mean or median may often be enough and preferable to losing cases through deletion methods.

IOM MONITORING AND EVALUATION GUIDELINES147
4.5.7. Recoding and creating new variables
During the data clean-up process, certain variables may need to be recoded and new variables created to meet the analytic needs for the M&E exercise. Variables may be recoded in various scenarios, including the following:
• Formatting: Date (day, month and year), pre-fixes to create better sorting in tables and rounding (in continuous variables).
• Syntax: Translation, language style and simplification. • Recoding a categorical variable (such as ethnicity, occupation, an “other” category and spelling
corrections). • Recoding a continuous variable (such as age) into a categorical variable (such as age group). • Combining the values of a variable into fewer categories (such as grouping all problems caused
by access issues). • Combining several variables to create a new variable (such as building an index based on a set
of variables). • Defining a condition based on certain cut-off values (such as “at risk” versus “at acute risk”
population). • Changing a level of measurement (such as from interval to ordinal scale). • A distinction is needed between values (conceptually).
Categorical variables can be recoded in three ways:
(a) Collapse a categorical variable into fewer categories by combining categories that logically go together or eliminate categories that have small numbers of observations;
(b) Break a categorical variable up into several variables with fewer categories; (c) Combine several categorical variables into fewer variables with more categories.
Guidelines for collapsing data
• Ordinal variables need to be collapsed in a way that preserves the order of the categories. • Combine only those categories that go together. • The way in which categories are collapsed can easily affect the significance level of statistical tests.
Categories should be collapsed a priori to avoid the criticism that the data were manipulated to obtain a certain result.
• Do not oversimplify the data. The unnecessary reduction in the number of categories can reduce statistical power and make relationships in the data ambiguous. Generally, any categories that include 10 per cent or more of the data (or 5 cases for very small samples) should be kept intact.
Tips for effective recoding
• Use distinct and easy-to-remember variable names. • Pay attention to missing values. When recoding is done, the number of cases with missing data should
be the same as before recoding. • Use graphs to check the accuracy of recoding. • Use variable codes consistently. For example, with dichotomous “yes/no” variables, always use 0 = no
and 1 = yes. For a variable that can have more than one value, always make 0 the reference category. • Keep a permanent record of all the recoding.
TIP

148 CHAPTER 4 Methodologies for data collection and analysis for monitoring and evaluation
4.5.8. Documenting change
Two good data management practices are transparency and the proper documentation of all the procedures followed, including the data cleaning process.
Documenting errors, changes and additions is essential to the following:
• Determining and maintaining data quality; • Avoiding duplication of error checking by different data entry staff; • Knowing what and by whom data quality checks have been carried out; • Recovering data cleaning errors; • Informing data users of the changes made to the last version of the data accessed.
To keep track of all the changes made to the data, a change log can be created. By keeping track of all the modifications made, it will be possible to roll back to the original values, when necessary. The following are some of the fields that are included in a change log:
• Table (if using multiple tables) • Column, row • Date changed • Changed by • Old value • New value • Comments
Ruel, E., W.E. Wagner III and B.J. Gillespie2016a Chapter 12: Data entry. In: The Practice of Survey Research: Theory and Applications. SAGE
Publications, Thousand Oaks, California, pp. 195–207.
2016b Chapter 13: Data cleaning. In: The Practice of Survey Research: Theory and Applications. SAGE Publications, Thousand Oaks, California, pp. 208–237.
United Nations High Commissioner for Refugees (UNHCR) 2015 Dealing with messy data. Coordination Toolkit.
4.6. Analysing dataOnce the data has been collected and cleaned, these are ready to be analysed. Data analysis makes it possible to assess whether, how and why the intervention being monitored and/or evaluated is on track towards achieving, or has achieved, the established objectives. This part of the chapter will discuss and provide examples of how to analyse qualitative and quantitative M&E data, as well as the triangulation of data sources.
4.6.1. Qualitative data analysis
Qualitative data analysis is a process aimed at reducing and making sense of vast amounts of qualitative information – very often from multiple sources, such as focus group discussion notes, individual interview notes and observations – in order to deduce relevant themes and patterns that address the M&E questions posed. When analysing qualitative data, the focus is on the words spoken by the respondents, the context
RESOURCES

IOM MONITORING AND EVALUATION GUIDELINES149
in which the data was collected, the consistency and contradictions of respondents’ views, the frequency and intensity of participants’ comments, their specificity and emerging themes and patterns. For example, as part of monitoring an ongoing project, it is decided to conduct 10 focus groups with a select number of beneficiaries. What should be done once all the discussion notes are collected? Should the data be analysed in an ad hoc or systematic fashion, that is, highlight the relevant information or code it?
Codes are words or short phrases that capture a “summative, salient, essence-capturing, and/or evocative attribute for […] language-based or visual data”.31 Coding is the process of labelling as “belonging to” or representing some type of phenomenon that can be a concept, belief, action, theme, cultural practice or relationship. Coding can be accomplished manually, using paper and highlighters, or by a computer in a Word document, an Excel spreadsheet or a qualitative data analysis software like NVivo.
To begin coding the data manually, gather the hard copies of all the data; mark up the text with pens, pencils, highlighters and markers; and finally cut, paste, hole-punch, pile and string together the data. It is preferable to leave wide margins and lots of white space for the markings.
Figure 4.9. Example of manual coding and marginal remarks
4
may suggest new interpretations, as well as connections with other data. Moreover, if you are mindful of what is growing out of the data, your notes will usually point toward questions and issues for you to look into as you code and collect more data.
Illustration of Coding and Marginal Remarks
Figure 1 is an example of the initial coding and marginal remarks on a hard copy of interview transcripts. Typically, in an interview transcript like the one shown (Figure 1), you will read the entire interview from start to finish without coding. On the second read, you will want to jot down both codes and remarks on a hardcopy as you read it. As mentioned previously, the codes will derive from both those created prior to data collection (“pre-set codes,” also referred to as “a priori codes”), as well as those that are created as data are collected and transcripts are reviewed (referred to as “emergent codes”).
Source: Center for Evaluation and Research, n.d.
31 Saldana, 2009, p. 3.
EXAMPLE

150 CHAPTER 4 Methodologies for data collection and analysis for monitoring and evaluation
As most M&E practitioners have access to word-processing and spreadsheet programs, these are quite popular in qualitative data analysis (see Figure 4.10 illustrating coding in a Word document).
Figure 4.10. Example of coding in Word document
https://slideplayer.com/slide/4633924/ Source: Ng, n.d.
Figure 4.11. Example of coding in a spreadsheet
Source: AccountingWEB, 2017.
EXAMPLE

IOM MONITORING AND EVALUATION GUIDELINES151
For large amounts of data, such as 20 or more interview transcripts, a license for an existing qualitative data analysis software package like NVivo can be purchased. For an introduction to NVivo and an introductory guide to setting up and coding with this software, please see QSR International’s (2014) Getting Started Guide.
For guidelines on how to analyse qualitative data, see Annex 4.12. Steps for analysing qualitative data.
4.6.2. Quantitative data analysis
Once the quantitative data has been entered in a spreadsheet, it is ready to be used for creating information to answer the monitoring or evaluation questions posed. Statistics help transform quantitative data into useful information to help with decision-making, such as summarizing data and describing patterns, relationships and connections. Statistics can be descriptive or inferential. As its name already reveals, descriptive statistics give information that help describe data and help to summarize it. Other methods of descriptive statistics are graphical representations in form of histograms, pie charts and bar charts, to name a few. This provides a quick method of making comparisons between different sets of data and spotting smallest and largest values, trends or changes over a period of time. Inferential statistics use data drawn from a sample of the population to make generalizations about populations.
As most statistics used in M&E exercises are descriptive, the following discussion will provide tools and examples on how to calculate these types of statistics.
As already mentioned in the measurement section, data is collected from units, which can be individuals, households, schools, communities and others. The different measurements, questions or pieces of information that are collected from/about these units are the variables. There are two types of variables, quantitative numerical (quantitative) and categorical. Whereas categorical variables are made up of a group of categories (such as sex, male/female), numerical variables are numbers such as the number of participants at a training.
Figure 4.12. Two types of variables
Categorical data groups are all units in distinct categories, which can be summarized by determining how many times a category occurs. For example, the number of females in a community, which can be described as the frequency of females in the community. This information is presented using a frequency table. The frequency table shows how many individuals in the community fall into each category (male/female). This can also then be represented as a percentage or proportion of the total.

152 CHAPTER 4 Methodologies for data collection and analysis for monitoring and evaluation
Frequency tables can be used to present findings in a report or can be converted into a graph for a more visual presentation. A proportion describes the relative frequency of each category and is calculated by dividing each frequency by the total number.
Percentages are calculated by multiplying the proportion by 100. Proportions and percentages can be easier to understand and interpret than examining raw frequency data and are often added into a frequency table (see Table 4.15).
Table 4.15. Frequency table
Question 32. Percentage of parents who registered their children’s birth with the birth and death registry
Response Frequency Proportion Percentage
Registered their children before the project 32 0.25 25%
Registered their children after the project 2 0.02 1.6%
Did not have children or did not respond 94 0.73 73.4%
Total 128 1.00 100%
Source: IOM’s internal evaluation of the project titled Technical Support to the Government of Ghana to Address Child Trafficking and Other Child Protection Abuses in the Ketu South, North and South Tongu Districts of the Volta Region.
4.6.3. Analysis of numerical variables
The centre and the spread of the data are two commonly used descriptive statistics. Whereas the centre describes a typical value, the spread describes the distance of a data point from the centre of the data.
The most common statistics used to describe the center are the mean (that is, the average) and the median. The median is the middle value in a data set; half the data are greater than the median and half are less. The mean is calculated by adding up all the values and then dividing by the total number of values.
EXAMPLE

IOM MONITORING AND EVALUATION GUIDELINES153
A survey is conducted of 25 youth (between the ages of 18 and 25), who are participating in a project that is being monitored. Among other things, their age is recorded. Each number is the age of an individual with the ages being arranged in order.
The mean and the median would be different for this data set. To calculate the median, arrange the youth in order of age and then find the midway point. In this example, 21 is the median age of the youth; 12 youth are below the age of 21 and 11 children are above the age of 21. To calculate the mean, add up all the ages and then divide by the number of youth. In this example, 21 years is also the mean age of the youth interviewed. The range of the example data would be 7 years (minimum = 18, maximum = 25).
Other statistics describing spread are the interquartile range and standard deviation.
Ä The interquartile range is the difference between the upper quartile and lower quartile of the data. A quarter (or 25%) of the data lie above the upper quartile and a quarter of the data lie below the lower quartile.
Ä The standard deviation shows the average difference between each individual data point (or age of youth in the above example) and the mean age. If all data points are close to the mean, then the standard deviation is low, showing that there is little difference between values. A large standard deviation shows that there is a larger spread of data.
For information on how to calculate descriptive statistics using Microsoft Excel, see Annex 4.13. Calculating descriptive statistics.
EXAMPLE

154 CHAPTER 4 Methodologies for data collection and analysis for monitoring and evaluation
4.6.4. Triangulation of data sources
Triangulation is the process of comparing several different data sources and methods to corroborate findings and compensate for any weaknesses in the data by the strengths of other data.
Triangulation can enhance the validity and reliability of existing observations about a given issue. The ability to compare and contrast different findings and perspectives on the same situation and/or phenomenon is an effective way to find inconsistencies in data and identify areas for further investigation. When findings converge, this can lead to new, credible findings about an issue and create new ways of looking at it.
Although there are no fixed rules for analysing data for triangulation, there are several activities at the heart of the process:
• Critically assess the data. For example, prioritize those findings that are most relevant to the goal(s) of triangulation, identify ways the findings from different sources relate to one another and highlight any gaps in the data.
• Identify any trends and whether they are drawn from a single or from multiple data sources.
• Develop working hypotheses related to the goal(s) of data triangulation. For example, if the goal is to understand if certain behaviours are changing among beneficiaries and whether any changes can be linked directly to the intervention, hypotheses from the available data that are linked to this goal should be developed. Hypotheses can be in support of the goal; for example, a supportive hypothesis could be “providing psychosocial support has reduced signs of post-traumatic stress disorder (PTSD) symptoms among beneficiaries”.
• Confirm or refute hypotheses. This is a critical point in triangulation when new ideas, perspectives and explanations are likely to emerge. It is also a point when gaps in data are identified, which could lead to a search for additional data. If no additional data is available, a hypothesis may need to be modified or dropped. Any modified hypotheses should then be reconfirmed.
• Use the convergence of data supporting or not supporting the hypothesis to draw reasoned conclusions from the triangulation exercise. The conclusions should be linked as closely as possible to the stated goal(s) of triangulation. The key to this process is to make the strongest case for a hypothesis/ goal given the evidence. Questions that may be helpful to consider during the process include the following:
– Which hypotheses are supported by the most rigourous data? – Which hypotheses are supported by independent sources? – Which hypotheses are supported by both quantitative and qualitative data? – Are there important biases or limitations in the available data? – Are there any other possible explanations not covered by the hypotheses? – How confident are you in the conclusion? – Is the conclusion actionable (that is, does it lead to a specific improvement in the
response)? • Carefully and thoroughly document conclusions before disseminating them.

IOM MONITORING AND EVALUATION GUIDELINES155
AccountingWEB2017 Open-ended survey text analysis in Excel. 24 August.
Bazeley, P. and K. Jackson 2013 Qualitative Data Analysis with NVivo. SAGE Publications Ltd., London.
Center for Evaluation and Researchn.d. Tips and tools #18: Coding qualitative data. Impact.
Ng, Y.-L.n.d. A brief introduction to NVivo. Workshop document. Hong Kong Baptist University Library.
QSR International 2014 NVivo for Windows 10 Getting Started Guide.
Saldana, J.2009 The Coding Manual for Qualitative Researchers. SAGE Publications, Thousand Oaks.
Tracy, S.2013 Qualitative Research Methods: Collecting Evidence, Crafting Analysis, Communicating Impact. Wiley-
Blackwell, West Sussex.
4.7. Presenting findingsM&E efforts aim to generate, and make available, relevant information for decision-making and the management of the intervention being monitored or evaluated. All data visualizations should summarize the collected data and communicate the findings obtained in a simple and intuitive way for the reader. This final part of this chapter will discuss and provide examples of the different types of techniques and tools available for visualizing data, depending on what it demonstrates and what is the aim of conveying it to the reader.
4.7.1. How to visualize findings
Step 1: Identify the data visualization goal Before M&E practitioners start designing any data visualization, the following questions should be asked:
• What is the data trying to communicate? • How will it engage or persuade the audience to act upon the information being presented? • What is the takeaway message the audience should be left with?
It is important to be clear about the goal(s) of presenting data visually in order to design it correctly. Defining the message is a crucial step in the process, and the graphic should reinforce who the organization or intervention is and what it does.
Step 2: Know the audience Knowing the audience means asking what the audience already knows, what additional information they wish to have to learn and how much detail they require to understand the message being conveyed.
Step 3: Think about how to visualize the story Once the data collected is cleaned and has been analysed, a more precise idea about what findings to present should emerge. Table 4.15 provides an overview of the key visualization techniques to use depending on what the data reveals.
RESOURCES

156 CHAPTER 4 Methodologies for data collection and analysis for monitoring and evaluation
Table 4.15. Summary of different visualization techniques and what they can be used for
What the data shows Appropriate visualization technique use
Summary Summary table
Facts and figures Icons and images draw attention to the data values
Comparison, rank and distribution
Bar charts and heat maps using shapes and colours represent numerical values
Proportion or part-to-whole
Pie charts, donuts, stacked bar charts, tree maps show distribution within a group
Change over time Line graphs for time-series analyses with optional trend lines
Relationships and trends Scatter plot and bubble graphs can help show correlation
Text analysis Word clouds to visually display the most common words in a qualitative data set
Source: Carrington and Handley, 2017.
For additional information regarding each type of visualization, see Annex 4.14. Types of visualizations.
Carrington, O. and S. Handley2017 Data visualization: What’s it all about? New Philanthropy Capital (NPC) Briefing, August. London.
RESOURCES

IOM MONITORING AND EVALUATION GUIDELINES157
Annexes
Annex 4.1. IOM migration data governance and monitoring and evaluation
What is it?Data governance represents the framework used by IOM to manage the organizational structures, policies, fundamentals and quality that will ensure access to accurate information. It establishes standards, accountabilities and responsibilities and ensures that migration data and information usage achieves maximum value to IOM, while managing the cost and quality of information handling. Data governance enforces the consistent, integrated and disciplined use of migration data by IOM.
How is it relevant to IOM work?Data governance allows to view data as an asset in every IOM intervention and, most importantly, it is the foundation upon which all IOM initiatives can rest. Evidence-based programming only becomes a reality when data can prove what the problem is and how to solve it. This means being able to measure what is not known and knowing what is available and what is possible to work with.
The migration data life cycle throughout the whole project cycle includes planning and designing, capturing and developing, organizing, storing and protecting, using, monitoring and reviewing and eventually improving the data or disposing it.
Things to look out for:
(a) Data steward: At the intervention implementation phase, the data to collect has a clear data steward. If the intervention is a project implemented at the mission level, the chief of mission will be the data steward. If it includes more than one country, the data steward is most likely to be the regional director. If it is a global project, it should be ascertained which thematic area the project belongs to and, as such, the division head would be the data steward. Where the data is cross-cutting, it is likely that the data steward would be the department head.
(b) Roles and responsibilities: All project staff should be aware of their roles and responsibilities regarding the data and only have access to the data that they need to do their work.
(c) Data quality: Data needs to be accurate, valid, reliable, timely, relevant and complete.(d) Data classification for security and privacy: The level of risk for the collection of data
should be determined and classified accordingly, so that it can be stored with accurate access controls.
(e) Data processing including collection and use: Tools that allow to collect only the data needed for the purpose of its use should be developed.
Ä For a list of relevant resources, please refer to the text box IOM migration data governance in this chapter.
Annex 4.2. How to conduct a desk reviewSteps to conduct a desk review
Step 1: Identify all possible sources.Step 2: Categorize documents.Because some documents will be more pertinent than others, not all documents should be given equal weight or attention. To facilitate the desk review, available documents can be categorized into tiers:
• Tier I are documents specifically on the subject of the monitoring/evaluation exercise, such as situation, progress and monitoring reports and project proposals;

158 CHAPTER 4 Methodologies for data collection and analysis for monitoring and evaluation
• Tier II are background documents such as media coverage and other agency reports;
• Tier III are non-project-related documents.
Step 3: Decide on the approach (Structured/Unstructured).Often times, due to time constraints, monitoring and evaluation activities limit themselves to first-tier and partially second-tier documents for which an unstructured approach is suitable. To include a full second- and third-tiers documents in the desk review, a structured approach will be required, such as the following:
• Structured review form to record comments read through the documents;
• Rubric to rate parts of the documents, for example, using a four-point scale to divide documents into the following:
– Those that do not address the topic at all. – Those that address the topic in a minor way. – Those that address the topic in some significant way. – Those focused principally on the topic.
• Indexing and searching documents for content analysis.
Additional information and practical examples of how to conduct a desk review
Buchanan-Smith, M., J. Cosgrave and A. Warner 2016 Evaluation of Humanitarian Action Guide. ALNAP/ODI, London.
Annex 4.3. Types of biasThe accuracy of the collected data and conclusion drawn depend on the M&E practitioner and the respondents and how they address and comply with the different steps in the data collection, analysis and reporting processes. No study is ever entirely free from bias. Therefore, it is important to be transparent about any bias in the data collected in monitoring/evaluation reports. A statement relating to the potential biases and the steps that were taken to control such biases should be included in all monitoring/evaluation reports.
Respondent bias
Non-response bias: This bias occurs when individuals selected refuse to, or are unable to, participate in the survey. As a result, the data that is collected will differ in meaningful ways from the target population. To avoid this, M&E practitioners should ensure that the selected sample is representative of the target population or adjust the sample if this bias is becoming too important.
Acquiescence bias: Acquiescence bias occurs when a respondent tends to agree with and be positive about whatever the interviewer asks. To avoid this, questions that suggest such an answer should be revised to gage the respondent’s true point of view on the issue(s) of interest.32
32 Sarniak, 2015.
RESOURCES

IOM MONITORING AND EVALUATION GUIDELINES159
Social desirability bias: This bias involves respondents answering questions in a way that they think will lead to being accepted and liked. To avoid this, indirect questioning may be used, which entails asking about what a third party thinks, feels and how they will behave. Such approaches allow respondents to project their own feelings onto others, while still providing honest, representative answers.33
Habituation bias: For habituation bias, the respondent provides the same answer to all those questions that are worded in similar ways. To avoid this, questions should be worded/reworded differently and have varying response options.34
Sponsor bias: As respondents generally know who is the organization funding the intervention, their feelings and opinions about that organization may bias their answers. For instance, respondents may present a dire situation in the hope of obtaining additional or future funding from the organization. This bias may be more difficult to address, but the same approach for acquiescence bias may be used.35
Attrition/Mortality bias: When respondents drop out of the study, the sample selected may no longer be representative of the target population. The sample needs to be adjusted.
Selection bias: Selection bias is the distortion of the data because of the way in which it was collected. Self-selection is one common form of selection bias whereby people volunteer to participate in the study. The source of bias here is that the participants may respond differently from those who do not volunteer to participate in the study.
Recall bias: This bias arises when the respondents have difficulties remembering certain information resulting in the collection of inaccurate information. One way to minimize this bias is to anchor questions to key events that respondents are familiar with that can help them recall the relevant information. Evaluator/Researcher bias
Confirmation bias: This type of bias occurs when an M&E practitioner forms a hypothesis or belief about the intervention being monitored/evaluated and uses respondents’ information to confirm that hypothesis or belief. Confirmation bias can also extend into the analysis stage, with evaluators/researchers tending to remember points that support their hypothesis and points that disprove other hypotheses. To minimize confirmation bias, M&E practitioners should regularly re-evaluate impressions of respondents and challenge pre-existing assumptions and hypotheses.
Question-order bias: This bias arises when one question influences respondents’ answers to subsequent questions. The words and ideas presented in questions prime respondents, thereby impacting their thoughts, feelings and attitudes on subsequent questions. While this type of bias is sometimes unavoidable, it can be reduced by asking general questions before specific, unaided before aided and positive before negative.
Leading questions and wording bias: This type of bias arises when M&E practitioners elaborate on a respondent’s answer in an effort to confirm a hypothesis, build rapport or overestimate their understanding of the respondent. To minimize this bias, practitioners should ask questions that use the respondents’ language and avoid summarizing what the respondents said in their own words.
Publication bias: This bias occurs when negative results are less likely to be submitted and/or published than positive ones. “Most evaluations are commissioned by agencies or donors with a vested interest in
33 Ibid.34 Ibid.35 Ibid.

160 CHAPTER 4 Methodologies for data collection and analysis for monitoring and evaluation
the result, so it is possible that the incentive structure tends toward more positive findings even when external consultants are hired to carry out the evaluation.”36
References and further reading on bias
Bernard, H.R.2012 Social Research Methods: Qualitative and Quantitative Approaches. Second edition. SAGE
Publications, Thousand Oaks.
Creswell, J.W. 2014 Research Design: Qualitative, Quantitative, and Mixed Methods Approaches. Fourth edition. SAGE
Publications, Thousand Oaks.
Hunter, J.E. and F.L. Schmidt 2004 Methods of Meta-Analysis: Correcting Error and Bias in Research Findings. Second edition. SAGE
Publications, Thousand Oaks.
Keppel, G. 1991 Design and Analysis: A Researcher's Handbook. Third edition. Prentice-Hall, Inc., New York.
Neuman, W.L. 2006 Social Research Methods: Qualitative and Quantitative Approaches. Sixth edition. Pearson/Allyn and
Bacon, Boston.
Punch, K.F. 2013 Introduction to Social Research: Quantitative and Qualitative Approaches. SAGE Publications, London.
Sarniak, R. 2015 9 types of research bias and how to avoid them. Quirk’s Media, August.
Annex 4.4. Applying types of samplingRandom sampling
Simple random sampling
Random samples are samples in which each unit in the target population for the monitoring/evaluation exercise has an equal chance of being selected. This approach is fair and reduces selection bias, which undermines the accuracy of the predictions being made about the target population (see section on “Bias”).
Ideally, a sample should be representative of the entire target population. In order to select a random sample, a sampling frame is required. Each unit is assigned a unique identification number and then using a random number table or generator, a certain number of units is randomly selected.
Example: At site X in country Y, there is a total of 1,536 IDPs, and 1,536 is a four-digit number, so every individual in the population is assigned a four-digit number beginning with 0001, 0002, 0003, 0004 and so on. Then, starting at any point in the random number table, choose successive four-digit numbers until 300 distinct numbers between 0001 and 1,536 are obtained or generate 300 random numbers between 0001 and 1,536 using a software such as Microsoft Excel (see example below).
36 Ibid.
RESOURCES

IOM MONITORING AND EVALUATION GUIDELINES161
How to select a random sample of 300 IDPs from a total population of 1,536 IDPs using Microsoft Excel
Step 1: Click on cell A1 and type RANDBETWEEN(0001,1536) and press Enter.
Step 2: To generate, for example, a list of 300 random numbers, select cell A1, click on the lower right corner of cell A1 and drag it down to cell A300.

162 CHAPTER 4 Methodologies for data collection and analysis for monitoring and evaluation
Systematic random sampling
Systematic random sampling is a technique that randomly selects a number near the beginning of the sampling frame list, skips several numbers, and selects another number, skips several more numbers, and selects the next name and so forth. The number of names skipped at each stage depends on the desired sample size.
How to select a systematic random samplingStep 1: Estimate the number of units in the population (for example, 1,536 IDPs at site X).Step 2: Determine the sample size (for example, 300 IDPs).Step 3: Divide step 1 by step 2 (k=N/n) to get the skip number. Example: k = 1,536/300 = 5.12
Step 4: Select a subject at random from the first Kth number in the sampling frame (for example, fifth number).
Step 5: Select every Kth number listed after that one until the required sample is selected.
Because of the luck of the draw using simple random sampling, a good representation of subgroups in a population may not be obtained. Several other random sampling techniques exist to address this issue.
Stratified random sampling
Stratified random sampling, also referred to as proportional or quota random sampling, is a technique that divides the sampling frame in two or more strata (subpopulations) according to meaningful characteristics, such as type of migrant or gender from which participants are then randomly selected. Then, a simple random sample from each strata is taken. When using the same sampling fraction within the strata, proportionate stratified random sampling is conducted. When using different sampling fractions in the strata, disproportionate stratified random sampling is used. This technique is useful when the project, programme or policy is targeting several groups to compare.
Example: Among the people at the IDP site in country Y, how many are children, youth, young adults, adults and some elderly? If children, youth and elderly represent only a small proportion of the total IDP site population, a simple random sample may not include enough of them to allow for a meaningful analysis to be conducted.
How to select a stratified random sampleStep 1: Divide the population into the strata of interest. For example, of the 1,536 IDPs, there are
142 children (0–12), 157 youth (13–25), 413 young adults (26–34), 701 adults (35–60) and 123 elderly (60+).
Step 2: Select a simple random sample from each stratum. Example: 142/1,536 = .092 * 142 = 13.12
Select a simple random sample of 13 from the children stratum.
Ä Note: The number of units that is selected from each stratum should be equivalent to the stratum’s proportion of the total population.
Simple, systematic and stratified random sampling techniques require a sampling frame, which is very difficult to have for individuals or families. When a sampling frame is not available or the units on the list are so widely dispersed that it would be too time-consuming and expensive to conduct a simple random sample, cluster sampling is a useful alternative.

IOM MONITORING AND EVALUATION GUIDELINES163
Cluster random sampling
Cluster random sampling divides the population into several clusters and then a simple random sample is selected from the clusters. The units in the selected clusters constitute the sample. Unlike stratified random sampling, cluster random sampling uses the clusters to identify units not to compare them. A drawback of this approach is that the clusters may differ in important characteristics from the ones not included in the sample, thereby biasing the accuracy of the inferences made to the target population.
How to select a cluster random sampleStep 1: Identify the population of interest (for example, 1,536 IDPs at site X in country Y).Step 2: Divide the population into a large number of clusters (there are 10 zones in the IDP camp
of approximately 150 IDPs each, of which two are randomly sampled).Step 3: Select a simple random sample of the clusters (for example, randomly sample 2 of the 10
zones, yielding a total sample of about 300).
Multistage random sampling
Multistage random sampling is a technique that combines two or more random sampling methods sequentially. The process usually begins by taking a cluster random sample, followed by a simple random sample or a stratified random sample. Multistage random sampling can also combine random and non-random sampling techniques.
Example: In country Z, there are 7 IDP sites. In order to assess the support being provided by IOM to the IDP populations in these locations, purposefully select 2 of the 7 sites according to a set of criteria. Within each of the two sites, there are 8 zones with about 60 IDPs each. Randomly select 2 zones from each of the two IDP sites, yielding a total sample of 240 IDPs.
Non-random sampling
Purposeful sampling
Purposeful sampling is when a sample is selected according to set of predetermined criteria that are believed to provide the data necessary for monitoring/evaluating the project, programme or policy under review. Unlike random sampling, this sampling technique is mainly used with a limited number of persons with the required information and limited time and resources to collect it. In emergency settings such as conflict-affected societies, this approach may also be more appropriate, as taking a random sample may face the risk of aggravating tensions.
Unlike random sampling, purposeful sampling is deliberately biased in order to select the most appropriate cases for the monitoring/evaluation questions posed. Thus, if this sampling technique is used, it is necessary to be transparent and rigourous when selecting a sample to control for and identify any potential bias in the data that need to be considered in the interpretation of results. For a discussion on how to select purposeful samples, see Buchanan-Smith et al.'s Evaluation of Humanitarian Action Guide (2016).
Snowball sampling
A snowball sample is another form of purposeful sampling that is used when it is not known who, what or how many perspectives to include. Begin with an interview and then ask the interviewee to identify other potential additional respondents to talk to. This process is continued until having reached a point of saturation. Saturation is the point in the data collection process where no new or relevant information emerges that addressed the monitoring/evaluation questions proposed. Snowball sampling is particularly useful when trying to reach populations that are inaccessible or difficult to locate.

164 CHAPTER 4 Methodologies for data collection and analysis for monitoring and evaluation
When using purposive sampling, a variety of different perspectives should be included in the sample to ensure the credibility of the findings, that is, data source triangulation. For instance, accounting for roles, gender, ethnicity, religion, geographic location and other factors important to the problem being addressed by the project, programme or policy under review should be done to capture diverse perspectives in the sample. When this is not possible, it is required to be transparent about the perspectives included and those that were not in the monitoring/evaluation report.
Quota sampling
Quota sampling, also a purposeful sampling technique, consists of selecting a specific number of different types of units from a population non-randomly according to some fixed quota. The quota sampling can be proportional (to represent the major characteristics of the target population by sampling a proportional amount of each) or non-proportional (to specify the minimum number of sampled units in each category without considerations for having numbers that match the proportions in the target population). For example, in the IDP site, it is possible to select 150 women and 150 men to interview (n = 300, proportional) or 200 IDPs, 50 returnees and 50 refugees (n = 300, non-proportional).
Convenience sampling
Convenience samples are selected based on the availability or self-selection of participants (that is, volunteers) and/or the researcher’s convenience. While this technique is neither purposeful nor strategic, it remains widely used because it is inexpensive, simple and convenient. For instance, arriving in a project target location and interviewing the project staff available on the day of the visit and beneficiaries that are encountered while walking through different parts of the location. However, this sampling technique is also the least reliable of the non-random sampling approaches presented above, as those most available are over-represented, thereby underestimating the variability that exists within the target population. If this technique is used, using quotas can help ensure that the sample is more inclusive. For instance, ensure sampling an equal number of men and women, and every second interview can be conducted with a female.
References and further reading on sampling
Buchanan-Smith, M., J. Cosgrave and A. Warner 2016 Evaluation of Humanitarian Action Guide. ALNAP/ODI, London.
Daniel, J. 2012 Sampling Essentials: Practical Guidelines for Making Sampling Choices. SAGE Publications, Thousand
Oaks.
Hand, D.J. 2008 Statistics: A Very Short Introduction. Oxford University Press, New York.
Magnani, R. 1999 Sampling Guide. Food Security and Nutrition Monitoring (IMPACT) Project, International Science
and Technology Institute for the U.S. Agency for International Development. Arlington, Virginia, January.
Morra-Imas, L.G. and R.C. Rist 2009 The Road to Results: Designing and Conducting Effective Development Evaluations. World Bank,
Washington, D.C.
National Audit Office, United Kingdom 2000 A Practical Guide to Sampling. Statistical and Technical Team.
RESOURCES

IOM MONITORING AND EVALUATION GUIDELINES165
Sackett, D.L. 1979 Bias in analytic research. Journal of Chronic Diseases, 32:51–63.
Stockmann, R. (ed.)2011 A Practitioner Handbook on Evaluation. Edward Elgar, Cheltenham and Northampton.
Trochim, W.M.K.2020a Probability sampling. Research Methods Knowledge Base.
2020b Nonprobability sampling. Research Methods Knowledge Base.
Wholey, J.S., H.P. Hatry and K.E. Newcomer (eds.)2010 Handbook of Practical Program Evaluation. Third edition. Jossey-Bass, San Francisco, California.
Annex 4.5. Survey design and implementationQuestion format, types and response options
The format of survey questions can be closed-ended or open-ended. Many surveys tend to include a mixture of both. Closed-ended questions can be answered with a simple response or a selection of response options. Common formats for close-ended questions include response options that are:
• Dichotomous Example: Do your children go to school? □ Yes □ No
• Ordered Example: What is the frequency of food (or cash/vouchers) distribution at the site?
□ Every day □ Twice a week □ Once a week □ Every two weeks □ Once a month □ Irregular □ Never □ Unknown □ No answer, why? _______________
• Unordered Example: Reason for displacement
□ Conflict □ Flood □ Fire □ Drought □ Landslide □ Other
• Fill in the blank Example: How much money do you earn per day? ____
For more information and examples on the different formats for closed-ended questions, see David and Sutton’s chapter on “Survey design” in Social Research (2011).
In contrast, open-ended questions enable respondents to answer in their own words. For example, “Why did you specifically choose this destination country?”
There are six different types of questions that can be used to design a survey.37
(a) Behaviour/experience questions explore what the respondents do/aim to do, how they behave/act, what they experience/encounter, how they respond or just what happens or occurs in the context in which the project, programme or policy is being implemented. Example: Do you intend to move to a different location?
(b) Opinion/value questions explore the respondents’ thoughts, reactions, impressions, attitudes and outlook on the activities/issues being monitored/evaluated.
37 Patton, 1987. There are other types/categories of questions that are used for interviews and that are further developed in Annex 4.7.

166 CHAPTER 4 Methodologies for data collection and analysis for monitoring and evaluation
Example: How would you describe your household’s access to public services, such as education, shelter, health and other services in the area in which you currently reside?
□ Excellent: We experience no problems whatsoever. □ Good: Access is good but we experience minor delays. □ Neutral. □ Bad: We experience delays and problems. □ Very bad: There are delays and denial of access from local community and authorities.
(d) Feeling questions explore the respondents’ emotions or emotional reactions about a particular experience, thought or issue. Example: Do you consider yourself locally integrated?
□ Yes □ Partially integrated □ No □ I do not know
(e) Knowledge questions inquire about the respondent’s knowledge about a particular issue. Example: How many members of your household suffer from a chronic illness?
(d) Sensory questions explore what the respondent sees, hears, touches, tastes and smells. Examples: Is there enough lighting in the site at night?
(e) Background/demographic questions elicit biographical or historical information from the respondents. Example: Sex: □ Male □ Female
When developing survey questions, it is important to avoid making them ambiguous, doubled barreled, leading and with double negatives. An ambiguous question is when the respondent can interpret the question in several different ways because it uses a vague term(s) or phrase. A double-barreled question is when you ask about two different issues at the same time. A question that contains “and” or “or” is an indication that the question may be double barreled. A leading question is when you suggest to the respondent a certain answer. Double negatives in a question introduces unnecessary confusion, thereby increasing the risk of gathering unreliable data. By avoiding these mistakes, it is ensured that the data collected is valid and reliable.
Example of ambiguous questions:
(a) Poor: Would you be willing to relocate? □ Yes □ No
Good: Would you be willing to relocate (select one option): □ Within the same state □ Out of the state (specify):__________ □ Within the same country □ Out of the country (specify):________ □ No relocation □ Don’t know
(b) Poor: How did you hear about the project? (Double-barreled: Provides two answer options in one)□ A friend or relative □ A newspaper □ Television or radio □ Your spouse □ Work

IOM MONITORING AND EVALUATION GUIDELINES167
Good: How did you hear about the project? □ A friend □ A relative □ A media source
Example of double-barreled questions:
Poor: In your opinion, how would you rate the health and education services available at the site? □ Excellent □ Good □ Fair □ Poor
Good: In your opinion, how would you rate the health services available at the site? □ Excellent □ Good □ Fair □ Poor
In your opinion, how would you rate the education services available at the site? □ Excellent □ Good □ Fair □ Poor
Example of leading questions:
Poor: More people have participated in activity X than any other project activity. Have you participated in this activity? □ Yes □ No
Good: Have you participated in activity X? □ Yes □ No
Example of double negatives questions:
Poor: How do you feel about the following statement? “We should not reduce military spending.” □ Strongly agree □ Agree □ Disagree □ Strongly disagree
Good: How do you feel about the following statement? “We should reduce military spending.” □ Strongly agree □ Agree □ Disagree □ Strongly disagree

168 CHAPTER 4 Methodologies for data collection and analysis for monitoring and evaluation
Sequencing questions
The order in which the survey questions are asked can affect the quality of the responses received, as well as whether or not the survey will be completed by the respondents. For example, if a survey is started with highly sensitive questions, the participants may provide inaccurate information, may skip the questions or drop out of the survey altogether. The following are a few tips on sequencing survey questions:
• Begin with questions that are of interest to the respondents.
• Ask questions about the present before questions about the past or future.
• Spread out fact-based questions throughout the survey, as these tend to disengage respondents.
• Begin with easier questions and place more difficult or sensitive questions near the end.
• Place personal/demographic questions at the end, as some respondents may feel uncomfortable continuing with the survey if they are asked certain background questions in the beginning.
• Group similar or related questions together.
• Ensure there is a logical flow to the questions.
• Ask the most important questions by two thirds of the way through.
• Prioritize questions, dropping those which are of low priority.
References and further reading on survey question format, types and response options
Bradburn, N.M., B. Wansink and S. Sudman 2004 Asking Questions: The Definitive Guide to Questionnaire Design – For Market Research, Political Polls,
and Social and Health Questionnaires. Revised edition. Jossey-Bass, San Francisco, California.
Cowles, E.L. and E. Nelson2015 An Introduction to Survey Research. Business Expert Press, New York.
David, M. and C.D. Sutton2011 Survey design. In: Social Research: An Introduction. Second edition. SAGE Publications, London, pp.
239–270.
Fowler Jr., F.J. 2006 Improving Survey Questions: Design and Evaluation. SAGE Publications, Thousand Oaks.
International Program for Development Evaluation Training (IPDET), World Bank and Carleton University2013 IPDET Handbook.
Morra-Imas, L.G. and R.C. Rist2009 The Road to Results: Designing and Conducting Effective Development Evaluations. World Bank,
Washington, D.C.
Patton, M.Q. 1987 How to Use Qualitative Methods in Evaluation. SAGE Publications, California.
RESOURCES

IOM MONITORING AND EVALUATION GUIDELINES169
Layout
Similar to the sequencing of survey questions, the layout of the survey is also important for gathering high-quality data (especially for self-administered surveys). The following are some of the main points to include in a survey:
• Title, date and respondent identification number;
• Contact and return information;
• Introductory statement/cover letter that indicates the purpose of the survey and explains how it will be used;
• Limit the number of headings for the topics being covered;
• Keep questions simple, short and concise;
• Questions and response choices should be formatted and worded consistently;
• Each question should be numbered;
• Provide instructions on how to answer each question (for example, choose one or all options that apply, tick a box, circle the answer or write a short answer);
• Order responses from a lower level to a higher level, moving from left to right (for example, 1 – Not at all; 2 – Sometimes; 3 – Often; 4 – Always).
Introductory statement/cover letter
The introductory statement/cover letter should be brief and easy to understand. The following are the main points that are generally included:
• Purpose and importance of the survey;
• Identification of the organization conducting the survey;
• Importance of the respondent’s participation;
• Explanation of why the respondent was selected to participate in the survey;
• Approximate time it will take to complete the survey;
• Assurance that the information will remain anonymous and confidential;
• Appreciation for the respondent’s time and effort;
• A person’s name and contact details for further enquiries;
• An offer for feedback of the survey results.
Building rapport
At the beginning of a survey (or an interview, see section on Interviews), it is important to establish a good rapport with the respondent. Rapport is the ability to relate to the respondent in a way that creates a level of trust and understanding. How to build good rapport with your respondent?
(a) Make a good first impression.
Upon arriving at the meeting place to carry out the survey, do the best to make the respondent feel at ease. With a few well-chosen words, it is possible to put the respondent in the right frame of mind for

170 CHAPTER 4 Methodologies for data collection and analysis for monitoring and evaluation
participating in the survey. Begin with a smile and greeting such as “Good morning” or “Good afternoon” and then proceed with the introduction.
(b) Obtain the respondent’s consent. (c) Answer any of the respondent’s questions frankly. (d) Assure anonymity and confidentiality of responses.
If the respondent is hesitant about responding to a question or asks what the data will be used for, explain that the information collected will remain confidential, no individual names will be used for any purpose, and all information will be grouped together when writing any reports. Also, it is advisable not to mention other surveys conducted or show completed survey forms to other enumerators in front of a respondent or any other person.
(e) Always have a positive approach. (f) Interview the respondent alone.
The presence of a third person during the survey can avoid obtaining frank, honest answers from the respondent. Therefore, it is very important that the survey be conducted privately and that all questions be answered by the respondent.
If other people are present, explain to the respondent that some of the questions are private and ask to interview the person in the best place for talking alone. Sometimes, asking for privacy will make others more curious, so they will want to listen. Establishing privacy from the beginning will allow the respondent to be franker and more attentive to questions.
If it is impossible to get privacy, it is possible to carry out the interview with the other people present. In this case, separate the respondent from the others as much as possible.
(g) Use participants as experts.
Individuals are invited to participate in a study because they are viewed as possessing important knowledge required for monitoring/evaluating a specific project, programme or policy. In that case, it is advised to let participants know that the survey will learn from them. Expressing this to participants helps to establish a respectful appreciation for valuable contributions that they will make to the monitoring/evaluation exercise.
References and further reading on survey layout
King, N. and C. Horrocks 2018 Interviews in Qualitative Research. SAGE Publications, London.
Mack, N., C. Woodsong, K.M. MacQueen, G. Guest and E. Namey 2005 Qualitative Research Methods: A Data Collector's Field Guide. Family Health International, North
Carolina.
RESOURCES

IOM MONITORING AND EVALUATION GUIDELINES171
Reviewing, translating, pretesting and piloting the survey
Once the initial version of a survey is drafted, it is recommended to engage the key stakeholders and local experts in reviewing the draft closely and amend it based on the feedback received. This process may have to be repeated several times before the survey is ready for pretesting. If the survey will be conducted in the local language, the survey needs to be translated prior to the pretest. The translator(s) should be fluent in both languages and, to the extent possible, be familiar with the issues being covered in the survey. Once the survey is translated into the local language, a second translator should translate it back into the original language. This process ensures an accurate translation. Any gaps or misunderstanding need to be addressed before the survey can be pretested.
When conducting a pretest, it is important to test the survey among a group of people from diverse backgrounds relevant to the issues being monitored/evaluated. The goal of a pretest is to ensure that the survey is collecting the information it is aimed to collect. A good pretest should look at the survey at three levels:
• As a whole: Are all sections of the survey consistent? Are there any sections that ask the same question?
• Each section: If the survey has more than one section, does each section collect the intended information? Are all major activities/issues being monitored/evaluated accounted for? Are there any questions that are not relevant?
• Individual questions: Is the wording clear? Is the translation correct? Does the question allow ambiguous responses? Are there alternative interpretations?
One approach to assessing the survey on these three levels is to sit down with a small number of respondents as they complete the survey and ask them to reason aloud as they fill it out. This process, although time intensive, can yield important insights about how potential respondents will interpret the questions being asked. Any question that is misunderstood should be revised and tested again. This process may need to be repeated several times, especially if the survey has been translated into another language, which can result in gaps or misunderstandings regarding the accurate translation.
Once the survey has been finalized, it should be piloted with an appropriate sample of potential respondents to participate in the survey. This will provide a good indication of the validity and reliability of the questions in the survey. The pilot is also an opportunity to practice implementing the survey, which can help identify any potential challenges that may be encountered during the actual data collection.
References and further reading on reviewing, pretesting and piloting the survey
Morra-Imas, L.G. and R.C. Rist2009 The Road to Results: Designing and Conducting Effective Development Evaluations. World Bank,
Washington, D.C.
International Program for Development Evaluation Training (IPDET), World Bank and Carleton University2013 IPDET Handbook.
tools4devn.d. How to pretest and pilot a survey questionnaire.
RESOURCES

172 CHAPTER 4 Methodologies for data collection and analysis for monitoring and evaluation
Annex 4.6. Survey exampleExcerpts from the IOM South Sudan post-distribution monitoring of non-food items, Wau, September 2017
A mobile phone-based post-distribution monitoring household questionnaire was used to carry out household data collection and included visual observation and recording (photos) of the usage and state of distributed items. From 3,507 households, an initial sample size of 88 households was calculated using the sample size calculator referred to in the South Sudan Shelter-Non-food Item (S-NFI) Cluster Guidelines. Moreover, as per recommendation stipulated in the guidelines, 20 per cent of the initial sample size was added to account for any spoiled surveys or improper data entry. Therefore, 19 households (20% of the initial sample size) was added, totaling a target sample size of 105 households. Confidence was 96 per cent with 10 per cent margin of error. With three days to survey households, each enumerator collected data from seven households per day over three days. One enumerator interviewed an additional two households, resulting in a total sample size of 107 households.
Introduction
• Please introduce yourself and the purpose of the visit to the interviewee clearly.
• Please confirm the interviewee did receive the shelter and NFI items (blankets, mosquito nets, collapsible jerrycans and kangas) in the IOM distribution in May 2017.
• Please seek the consent of the interviewee before proceeding with the questionnaire, telling him/her that the interview will take about 30 minutes of their time.
• Please explain that you are not going to provide any additional items but that the information provided is only to help improve distributions in the future.
• Please try to keep the interview as confidential as possible to avoid bias. This may mean asking bystanders politely to move away, and/or finding a space where people are not able to overhear.
• Please confirm that the head of household and/or the individual who was registered and who collected the items at distribution time is the person you are interviewing.
The following are many possible examples and show only a short segment of a survey.
Did you receive NFI from IOM distribution during May 2017? □ Yes □ No 1a. Select the State: □ Abyei Administrative Area □ Central Equatoria
□ Eastern Equatoria □ Jonglei 1b. Location of interview: ____________________________ 2. Name of enumerator: ___________________________ 3a. Name of respondent (Beneficiary name):___________________ 3b. Please mark sex of the respondent: □ Male □ Female 3c. What is your household size?
□ 1 □ 2 □ 3 □ 4 □ 5 □ 6 □ 7 □ 8 □ 9 □ More than 10 4a. Did you feel you received the items in time to respond to your needs? □ Yes, timely □ Delayed □ Too late 4b. What was the quality of the sleeping mat? □ Good □ Average □ Not good 4c. Was the distribution well organized? □ Excellent □ Good □ Averagely organized □ Poorly organized □ Badly organized 4d. What changes have you experienced since the items were distributed to you?
(that is, protection from malaria, more comfortable sleep)

IOM MONITORING AND EVALUATION GUIDELINES173
Annex 4.7. Interview structure and questionsParts of the interview and types of questions
Table A4.1. Overview of interview structure and types of questions
Opening Body Closing
Building rapport questions Generative questions Directive questions Wrap-up questions
• Open-ended experience • Factual questions
• Tour • Hypothetical • Behaviour and action • Compare–contrast • Motives
• Closed-ended • Typology • Member reflection • Potentially
threatening
• Catch-all • Identity-enhancing • Demographic
Informed consent Informed consent
The opening
During the first few minutes of an interview, it is advisable to inform the participant about the interview by using an introductory statement similar to that for a survey. The length of the interview can be confirmed by saying something like this:
Ä The interview should last about an hour. Does that still work for you? While I will encourage you to elaborate on your answers to the questions that I will ask, there may be times when I redirect, so that we may be sure to cover all the issues within the hour.
The first questions should then focus on building rapport, helping the participants feel comfortable and knowledgeable. Therefore, questions should be non-intimidating, open-ended, easy and inviting, such as open-ended experience questions that will prompt the respondents to tell stories (for example, “What can you tell me about Project X?”) or factual questions about the issues being monitored/evaluated (for example, “What basic services are available in your community?”).
The body
After the opening, you can begin to ask generative questions, which are non-directive, non-intimidating questions aimed at generating frameworks for talk. Tour questions ask the interviewee to share familiar descriptive knowledge or memories about an activity or event; for example, “Can you describe a typical day for me?” Tour questions can be followed with probes by asking for examples or timeline questions; for example, “What were the events that led up to you leaving your home?” Hypothetical questions ask interviewees to imagine their behaviours, actions, feelings or thoughts in certain situations; for example, “Imagine you receive X amount of money; how would you use it?” Behaviour and action questions can also be asked, as well as compare–contrast questions; for example, “How is your daily routine similar to or different from the daily routine you had before leaving your home?” Finally, questions can be about motives (of the interviewee and/or those of another person). Such questions include asking about feelings, actions or behaviours, worded in the format of “why” or “how” questions. After asking about past and present experiences, future prediction questions can be asked to obtain further related information, for example, “Where do you see yourself living in the near future?”
To obtain specific information, directive questions are used. The simplest type of directive question is the closed-ended question, which has predetermined single, dichotomous or multiple response options. There are also typology questions where respondents are asked to organize their knowledge into different types or categories; for example, “What types of recreational activities do you engage in

174 CHAPTER 4 Methodologies for data collection and analysis for monitoring and evaluation
on a regular basis?” Prompts can be used to encourage participants to articulate a range of categories or types. If interested to ask the participant to comment on the data collected thus far, member reflection questions can be used; for example, “On the basis of my fieldwork so far, it seems that one reason for … is … What do you think about my interpretation here?” If potentially threatening/intimidating questions need to be asked (such as personal or political), these should be left for the end of the interview as these may be less problematic if good rapport is already built with the participants.
The closing
Several types of questions exist for closing an interview. Catch-all questions can be used to capture and tie together loose ends or unfinished stories; for example, “What question did I not ask that you think I should have asked?” The end of an interview is also the time to ask identity-enhancing questions, which encourage the interviewee to leave the discussion feeling appreciated and an expert. For instance, “What did you feel was the most important thing we talked about today and why?” Answers to these questions can also guide future interviews. For demographic questions, when and how to ask them remains debated. Whereas some researchers and practitioners believe they should be asked at the beginning, in case the participant terminates the interview prematurely, others find they can interfere with building rapport. At the end of the interview, remember to thank the interviewees and reassure them of anonymity and confidentiality.
References and further reading on interview structure and types of questions
Tracy, S. 2013 Qualitative Research Methods: Collecting Evidence, Crafting Analysis, Communicating Impact. Wiley-
Blackwell, West Sussex.
Formulating interview questions
Good quality interview questions should have the following characteristics:
• Simple and clear (no acronyms, abbreviations or jargon);
• Not double barreled;
• Promote open-ended and elaborate answers;
• Note: If it is decided to include yes/no questions, these should be followed by “Why?” or “In what ways?” or they should be reworded to encourage a more fine-grained answer (for example, “To what extent is…”).
• Straightforward (no double negatives), neutral and non-leading;
• Non-threatening to the interviewee;
• Accompanied by appropriate probes.
Probes
Probes are responsive questions asked to clarify what has been raised by the respondent. The aim is to obtain more clarity, detail or in-depth understanding from the respondent on the issue(s) being monitored/evaluated.
RESOURCES

IOM MONITORING AND EVALUATION GUIDELINES175
Examples of clarifying probes:• Did I understand you correctly that…?
• When you say … what exactly do you mean?
Examples of detail probes:• How did you deal with …?
• Can you tell me more about …?
Examples of analytical probes:• How would you characterize …?
• What is/was important about …?
Examples of variations and counterfactual probes:• Would you deal with X in the same way the next time?
• Some of the people I have talked to said that … What is your take on this?
Reviewing, translating, pretesting and piloting the interview
Similar to surveys, interviews too should be reviewed, translated (if necessary), pretested and piloted. For a review on how to proceed, refer to the subsection and annex on “Surveys”.
Tips for conducting interviews
• Let the interviewee know about the purpose and timing of the interview, the reason for being interviewed, how they were selected, how the data will be used (anonymity and confidentiality), how long the interview will take, whether they will receive a copy of the report, and that summary notes of the interview will be available if desired.
• Pick a time and location that is safe, easily accessible, quiet and free from distractions.
• Have a note-taker and/or record the interview, when feasible.
• If taking notes, make sure not to be distracted from the conversation:
– Maintain eye contact as much as possible; – Write key words and phrases (not verbatim); – To capture a certain response, ask the interviewee to repeat to have sufficient time to
capture it; – For important responses, ask the interviewee if their exact words can be used/quoted.
• Stick to the selected interview approach (structured, semi-structured, unstructured).
• Establish rapport and avoid asking sensitive questions until the interviewee appears comfortable.
• Give the interviewee sufficient time to respond.
• Be aware of cultural norms with eye contact, gender issues and asking direct questions.
• Write up the interview notes as soon as possible after the interview.

176 CHAPTER 4 Methodologies for data collection and analysis for monitoring and evaluation
References and further reading on reviewing, translating, pretesting and piloting the interview
Kvale S. 1996 InterViews: An Introduction to Qualitative Research Interviewing. SAGE Publications, Thousand Oaks.
Oxfam2019 Conducting semi-structured interviews. Oxford.
Rubin, H.J. and I.S. Rubin 1995 Qualitative Interviewing: The Art of Hearing Data. SAGE Publications, Thousand Oaks.
Spradley, J.P. 1979 The Ethnographic Interview. Holt, Rinehart and Winston, New York.
Annex 4.8. Interview exampleEvaluation: IOM Timor-Leste Counter Trafficking Project – Interview protocol for stakeholders and project
Relevant questions were drawn from the comprehensive list below, depending on the respondent’s role (such as project implementer or stakeholder) and areas of competency.
I have been requested to conduct an evaluation of the IOM project titled “Strengthening government and service provider responses to human trafficking in Timor-Leste: A capacity-building initiative”. The objectives of the evaluation are as follows: (a) measure the progress made by the project; (b) identify any challenges faced in the implementation of this project; and (c) identify lessons learned, best practices and potential areas for future project design and implementation. The evaluation focuses on the activities conducted under this project specifically, and not on IOM’s entire programme of activities in the country. The key respondents in this evaluation are IOM staff involved in project implementation, IOM’s implementing partner organizations, beneficiaries of the project’s activities, and government and civil society stakeholders. Individual responses will be kept confidential, and we will only share generalized findings and anonymous comments.
Thank you for your time and cooperation in this process!
Background information
(a) What is your title, role and your responsibilities in relation to the IOM project?(b) How long have you been in this position?
Relevance
(c) To your knowledge, what does the IOM project aim to achieve?(d) To what extent are the objectives of the programme still valid?(e) To your knowledge, what are the main activities and outputs of the programme?(f) Are the activities and outputs of the programme consistent with the outcomes and attainment
of its objective?(g) In your view, what are the assumptions linking the activities, outputs, outcomes and objectives?
RESOURCES

IOM MONITORING AND EVALUATION GUIDELINES177
Effectiveness
(h) Has your organization been involved in the implementation of any of the activities of this project?(i) If yes, which ones?(ii) If no, have you heard anything about the implementation of these activities? If yes, which
ones?(iii) What have been key achievements of these activities?(iv) In your experience, what types of activities have been most of least successful? Why?(v) What have been the key factors that have positively or negatively affected your work (or
other’s work) in this project?
Sustainability
(i) What factors will contribute to or impede the continuation of the project’s achievements after the end of the project?
(j) To what extent have project outputs been institutionalized? For example, have any guidelines, terms of reference, policy documents, legislation or other items been adopted by national institutions?
Project progress (for implementers)
(k) What do you consider as the project’s key achievements to date?(l) What have been key disappointments?(m) To what extent is the project’s implementation on schedule? Why?(n) What have been strengths and weakness in the implementation of the pilot initiative? (such as
in terms of timeliness, managing risks, partners and resource allocation)(o) What key lessons have been learned to date from implementing the pilot initiative? What
recommendations or suggestions can you make with regard to the remaining implementation period of the project? Beyond the project?
Annex 4.9. Preparing, conducting and moderating a focus groupPreparing for a focus group discussion
An average focus group discussion involves 6 to 8 people and a maximum of 15 and lasts between one to two hours. When selecting the participants for a focus group discussion, it is important that the group is homogeneous so that participants feel more comfortable expressing their opinions. To select homogenous groups of participants, consider, among other things, the following:
• Gender: Will men and women feel comfortable discussing this topic in a mixed-gender group? For example, women might feel uncomfortable discussing issue X if men are in the group.
• Age: Will age affect the way that people react to this topic? For example, a young person might feel uncomfortable talking about issue X if older people from his community are in the group.
• Hierarchy: Will people of different hierarchical positions be able to discuss this topic equally? For example, a resident from village A might feel uncomfortable discussing issue X if the local administrator is in the group.38
38 Humans of Data, 2017.

178 CHAPTER 4 Methodologies for data collection and analysis for monitoring and evaluation
Other considerations can also include the participation of officials of the government among participants who may influence the answers or cultural differences that may affect the answers (mixing participation of indigenous people with other non-indigenous communities).
References and further reading on preparing for a focus group discussion
Humans of Data2017 How to conduct a successful focus group discussion. 11 September.
Once the participants are selected, obtaining their informed consent is required, verbally or on a written form. For the location, it is important to select a quiet and secure place, and easily accessible by all the participants. If not doing any survey and collecting demographic data is needed, a short form can be designed and administered to the participants at the end of the focus group discussion.
How to conduct a focus group discussion
Introduction
At the start of the focus group, the moderator should present the aim of the discussion and an overview of the topics that will be covered, assure participants that their responses will remain confidential and anonymous, and lay down the ground rules. The following is an example of an introduction to read at the outset of the focus group to all the participants:
"Thank you for agreeing to participate in this focus group discussion. We will discuss … Let me remind you that the information given will be treated confidentially and that you may refuse to answer any of the questions and end your participation in the discussion at any time.
For the group discussion to proceed smoothly and respectfully for all participants, the following ground rules should be respected at all times by everyone:
• One person speaks at a time.
• What is shared in the room stays in the room.
• Everyone has a chance to share their ideas, experience and opinions.
• There are no right or wrong answers.
• Everyone actively listens to and respects each other.
In addition to these ground rules, I would like to ask you if you have any other ground rules that you would like to add to the list.”
Warm-up
Before starting with the focus group questionnaire or topic guide, a warm-up time can be spent to make the participants feel comfortable around each other and safe to open up and share their ideas, experience and opinions. To do so, begin the discussion by asking the participants to introduce themselves (for example: “First, I’d like everyone to introduce themselves. Can you tell us your name?”) or conduct an icebreaker exercise (see Example box).
RESOURCES

IOM MONITORING AND EVALUATION GUIDELINES179
Icebreaker example
One-worders: This icebreaker allows the group to be familiar with one another by sharing their thoughts on a common topic. First, divide the participants into subgroups of four or five people by having them number off. This allows participants to get acclimated to the others in the group. Mention to the groups that their assignment is to think of one word that describes X; give the groups a minute to generate a word. After, the group shares the one word that describes X with the entire group of participants. For example, in a session about mobile usability testing, request the group to think about their smartphone and come up with one word to describe it.
Source: eVOC Insights, 2013.
Questionnaire/Topic guide
Similar to interviews, focus groups will vary in the extent to which discussions are structured. If having a strong sense of the issues to be explored, consider developing a questionnaire (the number of questions will depend on the length and number of participants, but should not exceed 10 questions). If not having a thorough understanding of the issue(s) to be explored, consider developing a topic guide that will allow the group itself to shape the agenda and the flow of the discussion.
Wrap-up
– “What is one thing that you heard here that you thought was really important?”
– “Thank you for your time and participation. This has been a very successful discussion.”
– “Your opinions will be a valuable asset to… We hope you have found the discussion interesting.”
After the focus group discussion
If the discussion is recorded, having specified it at the beginning, transcribe the conversation as soon as possible, so the specific nuances of the dialogue are not lost.
Tips for moderating a focus group discussion
(a) Actively listen to the participants and remain neutral.Active listening involves hearing what each person is saying and observing the body posture and facial gestures, which can provide insights regarding the appropriate ways to engage participants. It is important to remain as impartial as possible, even if having a strong opinion about something. If participants sense about you having an opinion, they may want to change their responses so that they will seem more socially desirable, rather than reflect what they truly believe or feel about a topic.
(b) Show the participants that they are listened to what they are saying. Some of the common signs that indicate about paying attention include leaning forward slightly, looking directly at the participants while they are speaking and nodding at appropriate times. Frequently looking away and/or at a watch, or even worse yawning, can risk making participants feel that they are not listened to or boring, which can result in them becoming disengaged from the discussion.
EXAMPLE

180 CHAPTER 4 Methodologies for data collection and analysis for monitoring and evaluation
(c) Use silence to encourage elaboration. Allowing silence at times during the discussion can encourage participants to elaborate upon what they are saying.
(d) Use probes.When participants give incomplete or irrelevant answers, it is possible to probe for more developed, clearer responses. Some suggested probing techniques are as follows:
• Repeat the question;
• Pause for the answer;
• Repeat the reply;
• Ask when, what, where, which and how questions;
• Use neutral comments such as “Anything else?”
Example of a good probe:“Could you explain what you mean by…”
Example of a bad probe:“So you’re telling me that …. Right?”
Using probes for clarification also reinforces the impression that the participants have expert knowledge, based on their direct experiences with the topic(s) or issue(s) being monitored/evaluated. Good probes let the participants know that they are listened to and that it is worth to know more about what they have to say. It is important to avoid asking leading questions, as these can convey to participants an opinion and that it is not about learning from them as an unbiased listener. This type of questioning can also lead participants to answer questions in a socially desirable manner.
(e) Keep the participants talking.To avoid possibly interrupting the participants if there is a need to follow-up with something, make a mental note of it and ask them about it once they have finished their thought.
(f) Keep track of time. Some individuals have a tendency to talk at length about their ideas, experience and opinions. The moderator has to structure the focus group discussion in such a way that it is possible to elicit complete responses from the participants without rushing them, while still respecting the time constraints.
(g) Keep the discussion moving.When the participants are sharing less pertinent or off-topic information, it is possible to politely move the focus group discussions forward, for instance by highlighting something that the respondent talks about that is relevant to another question or set of questions prepared for the discussion. Another way is to acknowledge that time together is waning, and there are some other aspects to have time to discuss, and for this reason, invite to move on.
(h) Reduce the pressure to conform to a dominant point of view.When an idea is being adopted without any general discussion or disagreement, it is likely that group pressure to conform to a dominant viewpoint has occurred. To minimize this group dynamic, it is suggested to probe for alternative views; for example, “We have had an interesting discussion, but let’s explore other ideas or points of view. Has anyone had a different idea/experience/idea that they wish to share?”
EXAMPLE

IOM MONITORING AND EVALUATION GUIDELINES181
(i) Note-taking.Handwritten notes should be extensive and accurately reflect the content of the focus group discussion, as well as any salient observations of nonverbal behaviour, such as facial expressions, hand movements and group dynamics.
References and further reading on preparing for a focus group discussion
eVOC Insights 2013 Focus group icebreakers. 5 September.
Humans of Data2017 How to conduct a successful focus group discussion. 11 September.
Annex 4.10. IOM example – Focus group discussion guideFocus group discussion guide: Excerpts from the IOM South Sudan post-distribution monitoring of non-food items (Wau, September 2017)
Two focus group discussion were carried out, one with women (11 participants) and one with men (9 participants). Community mobilizers assisted in gathering the participants. One local interpreter was present to facilitate discussions from Wau Arabic to English and vice versa.
Effectiveness• What items did you receive?• How did you hear about the registration taking place?
Protection• Have you seen changes after receiving the shelter/NFIs? (Specify changes in their relationship
with the community, family and others. Did jealousy arise? Did this have any implications on their sense of security? Were there thieves?)
Appropriateness (items)• Did the items you receive meet your needs? (Can you rank the items that you needed the most
at the time of distribution?)
Coverage• Were all those displaced registered?
Quality of intervention (services provided by the organization)• Were the community, local authorities and beneficiaries involved in the criteria and needs
identification of the NFI materials?
Accountability• Was there a complaint desk?
RESOURCES

182 CHAPTER 4 Methodologies for data collection and analysis for monitoring and evaluation
Annex 4.11. Examples of observations and planning and conducting observations
Examples of observations
Structured observations are conducted using a recording sheet or checklist to list targeted observations.
Table A4.2. Example of structured observations during a focus group discussion
Overall self-expression of participants
Resist sharing of thoughts and feelings.
Struggle to share thoughts and feelings.
Express thoughts and feelings during safe conversation topics.
Express thoughts and feelings during difficult conversation topics.
Overall listening of participants
Ignore input from others.
Listen to in-group members but ignore outgroup members.
Listen carefully to input from others.
Question others to get other viewpoints.
Semi-structured observations can be conducted using observation guides.
Table A4.3. Example of semi-structured observations during a focus group discussion
Verbal behaviour and interactions
• Who is speaking to whom and for how long? • Who initiates interaction? • What is the tone of voice of participants? • Do participants wait for their turn to speak? • Is the language used by the participants tolerant?
Physical behaviour gestures
• What are participants doing during the focus group discussion?
• Who is interacting with whom? • Who is not interacting? • What are the reactions of participants during
the discussion; for examples, laughing (about what), surprised (about what), disagree (about what), upset (about what)?
Unstructured observations are usually conducted when en route to or while walking around the observation site (see example in Table A4.4).
EXAMPLE
EXAMPLE

IOM MONITORING AND EVALUATION GUIDELINES183
Table A4.4. Example of unstructured observationsThe following are the indicators the researchers should use to guide their daily observations when in the field.
Governance/Political situation in the community
• Is the language used by the participants tolerant? (Visibility of local public services, such as health clinics, schools and different political associations)
• Local offices of human rights organizations or “community-building” initiatives (such as promotion of women’s rights and educational and health projects)
• Functionality of local authorities (visibility, accessibility by the public and possible personal experiences)
• Presence of police or the military on the streets • Visible signs of politics in the community (presence of political parties, campaign posters) • Level of (dis)trust encountered in personal experiences with local persons • General atmosphere in the locality (sense of optimism/pessimism)
Socioeconomic situation in the community
• State of local infrastructure (road, public services) • Presence of construction activities (roads, official buildings and private houses) • Presence of (international or local) development agencies/non-governmental organizations
Planning for observations
When planning for observations, it is advised to consider the following steps:
Step 1: Determine what is being monitored/evaluated, that is, identify the indicators being monitored, evaluation criteria and questions being explored.
Step 2: Determine the specific items for which to collect data on and how to collect the information needed (recording sheets and checklists, observation guides and/or field notes).
Step 3: Select the sites for conducting the observations.Step 4: Select and train the observers. Step 5: Pilot observation data collection procedure(s).Step 6: Schedule observations appropriately to ensure observing the components of the activity
that will answer the evaluation questions.39
The observation data collection procedure should be piloted before it is used for monitoring/evaluation. To do this, a minimum of two observers should go to the same location and complete the observation sheet. Once completed, the sheets should be compared. If there are large differences in terms of the observations made, the observers may require more training and clarification. If there is little difference, the procedure can be used for monitoring/evaluation.
Tips for conducting observations
Do (a) Enter the observation process without preconceived notions and fixed expectations. (b) Note observations made and information volunteered that are related to subjects beyond
formal assessment concerns.
39 CDC, 2018.
EXAMPLE
184 CHAPTER 4 Methodologies for data collection and analysis for monitoring and evaluation
(c) Record information that is contradictory or surprising to expectations. (d) Stay focused to make useful comparisons. (e) Be active and curious in the observation process, which is about seeing, hearing, smelling,
tasting, feeling and touching. (f) Be aware of what was not seen, such as the absence of people, services and infrastructure. (g) Respect the local culture.
Do not (a) Begin the observation process with a set of expectations or seek to record data primarily to
prove a pre-existing hypothesis. (b) Rely on remembering information. Record observations on the observation sheet. (c) Focus solely on misery and destitution. Be aware of capacities, opportunities and social capital
within the affected community. (d) Be intrusive. Take steps to be as sensitive and respectful as possible. (e) Take a photograph without asking prior permission.
References and further reading on observations
US Department of Health and Human Services, Centers for Disease Control and Prevention (CDC) 2018 Data collection methods for program evaluation: Observation. Evaluation Brief no. 16.
Annex 4.12. Steps for analysing qualitative dataStep 1: Get to know the data
Before beginning to analyse the data, M&E practitioners need to familiarize themselves with them. This process requires reading and rereading the notes taken (the data) in their entirety. As they go through the data, it is important to take notes of any thoughts that come to mind and summarize each transcript and piece of data that will be analysed. The goal at this stage is to absorb and think about the data that has been collected, jotting down reflections and hunches but reserving judgement. Some open-ended questions that can be asked include: “What is happening here?” or “What strikes you?”40
Step 2: Initial round of coding
Once the content of the data is known, practitioners can begin coding the material to condense the information into key themes and topics that can help answer the M&E questions posed.
There are two main approaches to coding qualitative data. The first approach consists of creating a framework that reflects the monitoring or evaluation aims and objectives, which is then used to assess the data gathered. This is a deductive approach, as the concepts and issues of interest are first identified, which allows one to focus on particular answers of respondents and disregard the rest.
The initial round of coding begins with an examination of the data and assignment of words or phrases that capture their essence. Those who use a manual approach could write the code in the margin, and those who use a word-processing software could type the code in the Comment function or in another column.
40 Tracy, 2013.
RESOURCES

IOM MONITORING AND EVALUATION GUIDELINES185
The codes assigned in this first round of coding are usually, but not always, also first-level codes. First-level codes focus on “what” is present in the data. They are descriptive, showing the basic activities and processes in the data such as LAUGHING), thereby requiring little interpretation, which is done in the second round of coding.
Throughout the coding process, it is important to continuously compare the data applicable to each code and modify the code definitions to fit new data (or the codes and create a new code). Both lumping data into large bins and fracturing them into smaller slices have advantages and disadvantages.41 Those who first fracture the data into small pieces, each with its own code, usually connect these bits into larger categories during later coding cycles. In contrast, those who lump first usually make finer distinctions later.
What data should be coded first? Many qualitative experts suggest first coding the data that are typical or interesting in some way, and then moving on to contrastive data. The initial data texts coded will influence the resulting coding scheme, so it is advised to choose texts in these early stages that represent a range of the data available. Also, an iterative approach does not require that the entire corpus of data be put through a fractured and detailed primary coding cycle. After having read through all the data a few times, and having conducted line-by-line initial coding on a portion, it is possible to consider some focusing activities.
As practitioners engage in the initial round of coding, it is helpful to create a list of codes and a brief definition or representative example of each, especially if the codes are not self-explanatory. As the coding becomes more focused, it is wise to develop a systematic codebook – a data display that lists key codes, definitions and examples that are going to be used in the analysis. Codebooks are like “legends” for the data, helping to meet the challenge of going through pages of transcripts, highlighting and scrawling.
A codebook can include the following:42
• Short description of code; • Detailed description of code; • Inclusion criteria (features that must be present to include data with this code); • Exclusion criteria (features that would automatically exclude data from this code); • Typical exemplars (obvious examples of this code); • Atypical exemplars (surprising examples of this code); • “Close but no” exemplars (examples that may seem like the code but are not).43
In addition to creating a codebook, it is important to frequently return to the monitoring or evaluation questions posed. As most M&E practitioners face various time and resource constrains, many pursue analysis directions that align not only with themes emerging in the initial coding, but also with ones that mesh well with monitoring/evaluation goals, experience and deadlines.
Throughout the analysis, revisiting research questions and other sensitizing concepts helps to ensure they are still relevant and interesting. Original interests are merely points of departure, and other more salient issues may emerge in the data analysis.
41 Bazeley and Jackson, 2013.42 Bernard and Ryan, 2010, p. 99. 43 Tracy, 2013.
EXAMPLE

186 CHAPTER 4 Methodologies for data collection and analysis for monitoring and evaluation
Step 3: Second round of coding
The second round of coding is about beginning to critically examine the codes identified in the initial round of coding and organize, synthesize and categorize them into interpretive concepts. This second round aims to explain, theorize and synthesize the codes from the first round by identifying patterns, rules or cause–effect progressions and making interpretations.
For instance, if codes that continually reappear in the data are identified, M&E practitioners may decide to link them together in a specific way that responds to the monitoring/evaluation question posed.
Accordingly, at this point, a better understanding of which data will be most important for the analysis will emerge. Certain data, even if they are already collected, may only tangentially relate to the questions being explored, and therefore, they will not be included in the analysis at hand. It is also at this point that M&E practitioners will see whether additional data needs to be collected to flesh out an emerging code or explanation of what is being observed in the data collected. One way to identify whether additional data is required is to ask this question: “Does the emerging analysis address the monitoring/evaluation question posed in an interesting and significant way?” If not, this may suggest the need for more data. It might also suggest the need for additional synthesizing activities.
Throughout the coding process, it is important to record the emerging thoughts and ideas systematically. First, create a document that records all the analysis activities chronologically (date and discussion of what was accomplished in terms of analysis). Second, write analytic memos, both as a part of the analysis process and as an analysis outcome. Analytic memos are sites of conversation with oneself about our data. Analytic memos help M&E practitioners figure out the fundamental stories in the data and serve as a key intermediary step between coding and writing a draft of the analysis. Although they can take many forms, analytic memos are often characterized by one or more of the following features:
• Define the code as carefully as possible;
• Explicate its properties;
• Provide examples of raw data that illustrate the code;
• Specify conditions under which it arises, is maintained and changes;
• Describe its consequences;
• Show how it relates to other codes;
• Develop hypotheses about the code.44
Ä Analytic memos are very helpful for thinking through how codes relate to each other.
Practitioners should also play devil’s advocate with themselves through the process of negative case analysis. Such a practice asks them to actively seek out deviant data that do not appear to support the emerging hypothesis, and then revise arguments so that they better fit all the emerging data. Negative-case analysis discourages the practice of cherry-picking data examples that only fit early explanations and ignoring discrepant evidence. As such, negative case analysis helps to ensure the fidelity and credibility of emerging explanations.
44 Tracy, 2013.

IOM MONITORING AND EVALUATION GUIDELINES187
In addition to the analytic memos, M&E practitioners should create a loose analysis outline that notes the questions posed and the potential ways the emerging codes are attending to them.
Once the data is coded, it is time to abstract themes from the codes. At this stage, practitioners must review the codes and group them together to represent common, salient and significant themes. A useful way of doing this is to write the code headings on small pieces of paper and spread them out on a table; this process will give an overview of the various codes and also allow them to be moved around and clustered together into themes. Look for underlying patterns and structures – including differences between types of respondents (such as adults versus children and men versus women) if analysed together. Label these clusters of codes (and perhaps even single codes) with a more interpretative and “basic theme”. Take a new piece of paper, write the basic theme label and place it next to the cluster of codes. In the final step, examine the basic themes and cluster them together into higher order and more interpretative “organizing themes”.
Bazeley, P. and K. Jackson 2013 Qualitative Data Analysis with NVivo. SAGE Publications Ltd., London.
Bernard, H.R. and G.W. Ryan 2010 Analyzing Qualitative Data: Systematic Approaches. SAGE Publications, California.
Tracy, S. 2013 Qualitative Research Methods: Collecting Evidence, Crafting Analysis, Communicating Impact. Wiley-
Blackwell, West Sussex.
Annex 4.13. Calculating descriptive statisticsCalculating these descriptive statistics can be easily done with Microsoft Excel. To do this, install the Data Analysis Tool pack. Open Excel, go to FILE | OPTION| ADD INS and add the Analysis Tool. Once this is done, Data Analysis should appear on the far right of the tool bar. The advantage of the data analysis tool is that it can do several things at once. If a quick overview of the data is needed, it will provide a list of descriptive statistics that explain your data.
RESOURCES
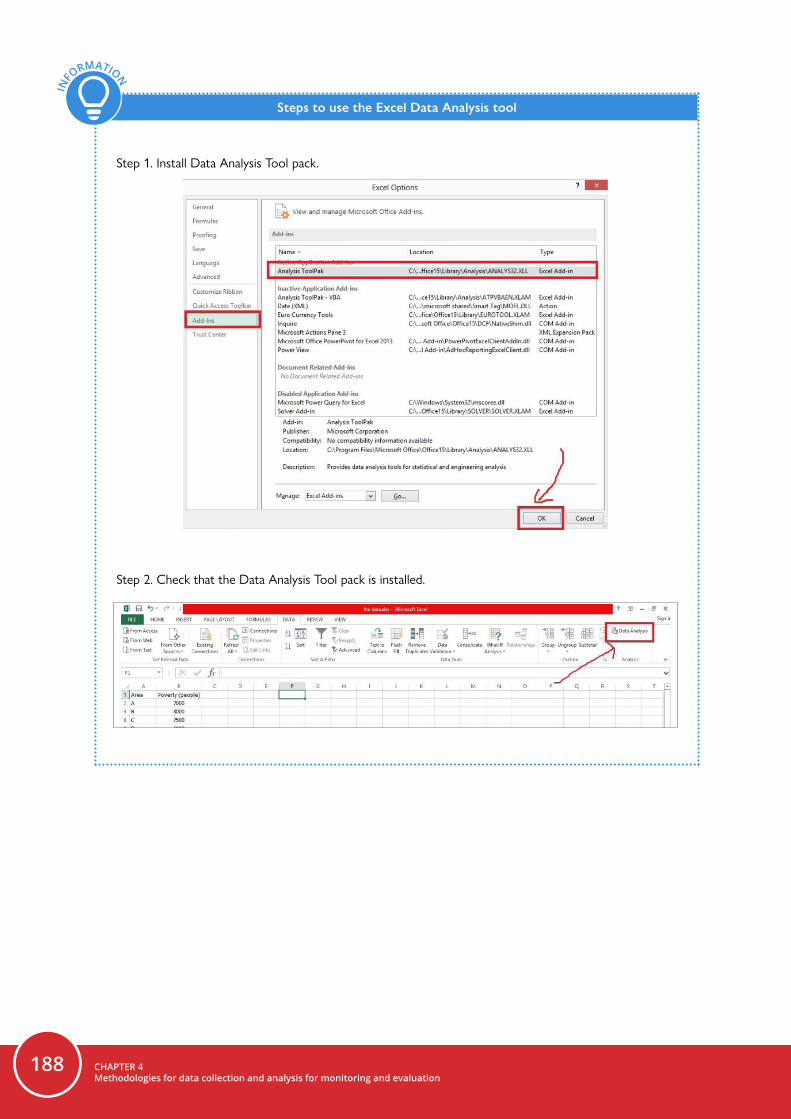
188 CHAPTER 4 Methodologies for data collection and analysis for monitoring and evaluation
Steps to use the Excel Data Analysis tool
Step 1. Install Data Analysis Tool pack.
Step 2. Check that the Data Analysis Tool pack is installed.
INFO
RMATION

IOM MONITORING AND EVALUATION GUIDELINES189
Step 3. Open the Data Analysis Tool.
Step 4. Conduct data analysis.

190 CHAPTER 4 Methodologies for data collection and analysis for monitoring and evaluation
Step 5. Interpret descriptive statistics.
Source: World Sustainable, 2020.
World Sustainable2020 Easy descriptive statistics with Excel. 3 June.
Annex 4.14. Types of visualizations There are multiple ways and tool for visualization of data, and here are some of the most common samples and types.
Summary table
Summary tables are useful for displaying data in simple, digestible ways. The use of a summary table allows the reader to assess data and note significant values or relationships. Figure A4.1 depicts a summary table of the types of sites as hosting IDPs displaced due to the ongoing conflict in South Sudan.
RESOURCES
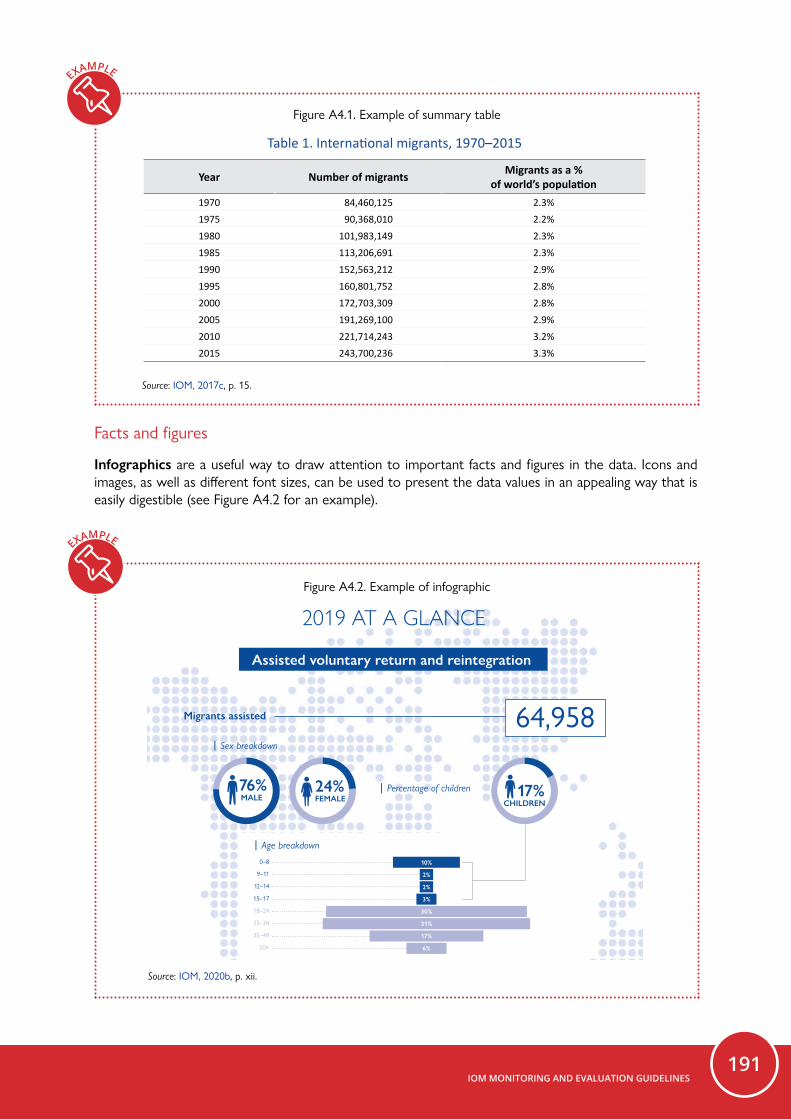
IOM MONITORING AND EVALUATION GUIDELINES191
Figure A4.1. Example of summary table
15WORLD MIGRATION REPORT 2018
International migrants: numbers and trends
UN DESA produces estimates of the number of international migrants globally. The following discussion draws on its estimates, which are based on data provided by States.26
The United Nations Recommendations on Statistics of International Migration defines an international migrant as any person who has changed his or her country of usual residence, distinguishing between “short-term migrants” (those who have changed their country of usual residence for at least three months, but less than one year) and “long-term migrants” (those who have done so for at least one year). However, not all countries use this definition in practice.27 Some countries use different criteria to identify international migrants by, for example, applying different minimum durations of residence. Differences in concepts and definitions, as well as data collection methodologies between countries, hinder full comparability of national statistics on international migrants.
Overall, the estimated number of international migrants has increased over the past four-and-a-half decades. The total estimated 244 million people living in a country other than their country of birth in 2015 is almost 100 million more than in 1990 (when it was 153 million), and over three times the estimated number in 1970 (84 million; see table 1).28 While the proportion of international migrants globally has increased over this period, it is evident that the vast majority of people continue to live in the country in which they were born. Most international migrants in 2015 (around 72%) were of working age (20 to 64 years of age), with a slight decrease in migrants aged less than 20 between 2000 and 2015 (17% to 15%), and a constant share (around 12%) of international migrants aged 65 years or more since 2000.
Table1.Internationalmigrants,1970–2015
Year Number of migrants Migrants as a % of world’s population
1970 84,460,125 2.3%1975 90,368,010 2.2%1980 101,983,149 2.3%1985 113,206,691 2.3%1990 152,563,212 2.9%1995 160,801,752 2.8%2000 172,703,309 2.8%2005 191,269,100 2.9%2010 221,714,243 3.2%2015 243,700,236 3.3%
Source:UNDESA,2008and2015a.
Note: Thenumberofentities(suchasStates,territoriesandadministrativeregions)forwhichdataweremadeavailableinthe2015UNDESARevision of International Migrant Stockwas213.In1970,thenumberofentitieswas135.
26 Data are also provided to UNDESA by territories and administrative units. For a summary on UNDESA stock data sources,methodologyandcaveats,pleaseseeUNDESA,2015b.
27 UNDESA,1998.28 UNDESA,2008.
Source: IOM, 2017c, p. 15.
Facts and figures
Infographics are a useful way to draw attention to important facts and figures in the data. Icons and images, as well as different font sizes, can be used to present the data values in an appealing way that is easily digestible (see Figure A4.2 for an example).
Figure A4.2. Example of infographic
xii Introduction and key concepts
2019 AT A GLANCE
Assisted voluntary return and reintegration
Migrants assisted
Migrants in vulnerable situations
136 164 123
123
Number of host countries Number of countries of origin Number of countries that are both host countries and countries of origin
64,958
4,943
19% 21%60%Migrants with
health-related needs Identi�ed victims
of trackingUnaccompanied and separated children
24%FEMALE
17%CHILDREN
0–8
9–11
12–14
15–17
18–24
25–34
35–49
50+
76%MALE
10%
2%
2%
3%
30%
31%
17%
6%
│ Age breakdown
│ Percentage of children
│ Sex breakdown
Source: IOM, 2020b, p. xii.
EXAMPLE
EXAMPLE

192 CHAPTER 4 Methodologies for data collection and analysis for monitoring and evaluation
IOM resources2017c World Migration Report 2018. Geneva.
2020b 2019 Return and Reintegration Key Highlights. Geneva.
Online toolsNoun Project provides access to free icons and images to download and use. Canva and Piktochart provide free and easy-to-use templates for infographics.
Comparison, rank and distribution
Bar charts and heat maps can be used to compare, rank and show the distribution of data values. Bar charts use a horizontal (X) axis and a vertical (Y) axis to plot categorical data or longitudinal data. Bar charts compare or rank variables by grouping data by bars. The lengths of the bars are proportional to the values the group represents. Bar charts can be plotted vertically or horizontally. In the vertical column chart, the categories being compared are on the horizontal axis, and on the horizontal bar chart (see Figure A4.3), the countries being compared are on the vertical axis. Bar charts are useful for ranking categorical data by examining how two or more values or groups compare to each other in relative magnitude at a given point in time.
Figure A4.3. Example of a horizontal bar chart
25WORLD MIGRATION REPORT 2020
in some European countries due, for example, to declining birth rates.11 By comparison, Africa underwent the most significant change, with its population growing by nearly 30 per cent over this period, due to high fertility rates and increasing lifespans.12 This growth has nevertheless been softened by emigration from Africa to other regions (namely Europe and Asia – see chapter 3 of this report for discussion).
Figure2.Proportionalpopulationchangebyregion,2009–2019
0 2 4 6 8 10 12 14
Europe
Northern America
Asia
LatinAmericaandtheCaribbean
Oceania
Africa
Per cent change 2009–2014 Per cent change 2014–2019
Source: UNDESA,2019c.
Note: CategorizationbasedonUNDESAgeographic regions (see chapter3, appendixA fordetails), not implyingofficialendorsementoracceptancebyIOM.
While population growth over the decade may be most pronounced for Africa, in 2019 more than half the world’s total population resided in just one region: Asia (4.6 billion people). From 2009 to 2019, the population in Asia grew by nearly 440 million (from 4.16 billion to 4.6 billion), compared with just under 300 million in Africa (from 1.01 billion to 1.31 billion).13 Five of the world’s top 10 most populous countries are in Asia (China, India, Indonesia, Pakistan and Bangladesh).14
The United States of America has been the main country of destination for international migrants since 1970.15 Since then, the number of foreign-born people residing in the country has more than quadrupled – from less than 12 million in 1970, to close to 51 million in 2019. Germany, the second top destination for migrants, has also observed an increase over the years, from 8.9 million in 2000 to 13.1 million in 2019. A list of the top 20 destination countries of international migrants is provided in the left column of figure 3.
11 UNDESA,2019c. See chapter3of this report (figure14) showing countrieswith the largestproportional population change inEurope.
12 UNDESA,2019c.Seechapter3ofthisreport(figure2)showingcountrieswiththelargestproportionalpopulationchangeinAfrica.13 UNDESA,2019c.14 Ibid.15 UNDESA,2008,2019a.
Source: IOM, 2019b, p. 25.
EXAMPLE
RESOURCES

IOM MONITORING AND EVALUATION GUIDELINES193
Histograms are a graphical representation of the distribution and frequency of numerical data. They show how often each different value occurs in a quantitative, continuous data set. Histograms group data into bins or ranges to show the distribution and frequency of each value.
Figure A4.4 shows the proportion of survey respondents reporting exploitation for any type of the Central Mediterranean route by age group. Here, the age of the respondents are grouped into “bins”, rather than displaying each individual age.
Figure A4.4. Example of a histogram
22 Migration and migrants: A global overview
Snapshot of international migrants
Theinternationalmigrantpopulationgloballyhasincreasedinsizebutremained relativelystableasaproportionoftheworld’spopulation
272Million258
Million249Million221
Million192Million
174Million
1995 2000 2005 2010 2015 2019
2.8% 2.9% 3.2% 3.4% 3.4% 3.5%
2.7%3.6%
4.8%5.5%
7.5%8.8%
10.0%11.0%
11.2%10.1%
7.1%4.3%
3.4%3.3%
2.8%
3.4%4.3%
5.3%5.6%
7.2%8.2%
9.2%10.1%
10.4%9.6%
6.9%4.4%
3.5%3.3%
2.8%
70–7465–6960–6455–5950–5445–4940–4435–3930–2425–2920–2415–1910–14
5–90–4
52% ofinternationalmigrantsare male, 48% are female
Mostinternationalmigrants(74%)areofworkingage(20–64years)
*Age groups above 75 years were omitted (male 4%, female 6%).
Source: IOM, 2019b, p. 22.
Another approach to visualize the distribution of the data is to use heat maps. Figure A4.5 shows the concentration of returnees from Pakistan and Islamic Republic of Iran to three provinces in Afghanistan (Laghman, Nangarhar and Kunar).
EXAMPLE

194 CHAPTER 4 Methodologies for data collection and analysis for monitoring and evaluation
Figure A4.5. Example of a heat map
BURKINA FASO790,959
Displaced Individuals
(64%)
MALI219,414
Displaced Individuals
(18%)
NIGER162,401
Displaced Individuals
(13%)
MAURITANIA58,831
Displaced Individuals
(5%)
▪ 765,517 IDPs▪ 25,442 Refugees
▪ 209,933 IDPs▪ 9,481 Refugees
▪ 104,565 IDPs▪ 57,836 Refugees ▪ 58,831 Refugees
DISPLACEMENT TRACKING MATRIX (DTM) 13 March 2020 CENTRAL SAHEL & LIPTAKO GOURMA CRISIS – MONTHLY DASHBOARD #3
INTERNATIONAL ORGANIZATION FOR MIGRATION (IOM)Contact: [email protected] https://displacement.iom.int https://dtm.iom.int http://rodakar.iom.int
When quoting, paraphrasing or in any way using the information mentioned in this report, the source needs to be stated appropriately as follows: “Source: International Organization for Migration (IOM), (Feb, 2020), Displacement Tracking Matrix (DTM)”.
18MAffected
Individuals
1,080,015IDPs(88%)
151,590Refugees
(12%)
Context: The Central Sahel area, and in particular the Liptako Gourmaregion, which borders Burkina Faso, Mali and Niger, is affected by acomplex crisis involving growing competition over dwindlingresources; climatic variability; demographic pressure; high levels ofpoverty; disaffection and a lack of livelihood opportunities; communaltensions; the absence of state institutions and basic services; and
violence related to organized crime and Non-State Armed Groups. Thecrisis has led to the death of an estimated 4,000 people and triggeredsignificant displacement of populations in the three affected countries.As of 13 March 2020, 1,231,605 individuals have been displaced,including 1,080,015 Internally Displaced Persons (88% of the displacedpopulation) and 151,590 Refugees (12% of the displaced population).
Sixty-four per cent of the affected population (790,959 individuals)were located in Burkina Faso, while 18 per cent resided in Mali(219,414 individuals), 13 per cent in Niger (162,401 individuals) and 5per cent in Mauritania (58,831 individuals).NB: Displacements may also be linked to the crisis affecting Northern Mali since 2012
This map is for illustration purpose only. Names and boundaries on this map do not imply official endorsement or acceptance by IOM.
Sources: ACLED (Oct 2019), ACAPS (Nov 2019) DTM Mali, Commission de mouvements de populations(CMP) (Jan 2019), UNHCR Mali (31 Dec 2019), DTM Niger (28 Dec 2019), UNHCR Niger (31 Aug2019), CONASUR Burkina Faso/OCHA (14 Feb 2020), UNHCR Burkina Faso (31 Jan 2019), UNHCRMauritania (29 Feb 2020).
Source: IOM, 2020c.
Note: This map is for illustration purposes only. The boundaries and names shown and the designations used on this map do not imply official endorsement or acceptance by the International Organization for Migration.
IOM resources2019b World Migration Report 2020. Geneva.
2020c DTM – Central Sahel and Liptako Gourma Crisis. Monthly Dashboard #3. 13 March.
Online toolsCarto allows to present data on geographic maps.
Proportion or part-to-whole
Pie charts or donuts are circular charts divided into slices, with the size of each slice showing the relative value, typically out of 100 per cent. Pie charts and donuts are useful for providing an overview of categories at a single point in time (see Figures A4.6 and A4.7).
If deciding to use a pie chart, make sure to limit the number of pie slices to five, as too many risk distracting the reader from the main point. Also, it can happen that the value of some of the slices are relatively the same, which makes it hard to compare their contribution to relate to one another. In this case, a horizontal bar chart may be more appropriate if the values of the slices are relatively the same to clearly see the difference between them.
EXAMPLERE
SOURCES

IOM MONITORING AND EVALUATION GUIDELINES195
Figure A4.6. Example of a pie chart
Reporting Period : 13 - 19 Dec 2020 Published on: 20 December 2020
IDP HH who left displaced location within the week
13 to 19 Dec
[email protected] https://dtm.iom.int/yemen +967 730 551177
Al Maharah 0 0 580
Total 206 1 28,436
Hajjah N/A N/A N/A
Al Dhale'e 15
Taizz
Al Mahwit N/A N/A N/A
Socotra 0 0 26
Al Jawf 0 0 1,591
Raymah N/A N/A N/A
Hadramaut 11 0 1,155
Al Bayda 0 0 138
Abyan 5 0 830
Dhamar N/A N/A N/A
Aden 0 1 166
Sa'ada N/A N/A N/A
Shabwah 0 0 699
Lahj 0 0 898
N/A
Sana'a N/A N/A N/A
Ibb N/A N/A N/A
Marib 35 0 12,800
Amran N/A N/A
Between 13 and 19 December, newlydisplaced households were recordedin Taizz (74 HH), Al Hudaydah (66HH), and Marib (35 HH). Most ofthese displacements were the result ofincreased fighting in Al Hudaydah (81HH), Taizz (49 HH) and Marib (38HH).
RAPID DISPLACEMENT TRACKING (RDT)
Displaced Households by District of Displacement and Origin
Number of Displaced Households (IDP HHs) per Governorate
Governorate of Displacement
IDP HH Displaced during the week
Total IDP HH
13 to 19 Dec 01 Jan to 19 Dec
74 0 2,783
Amanat Al Asimah N/A N/A N/A
0 2,861
Al Hudaydah 66 0 3,909
35%
27%
13%
24%
1%In Settlements (Grouped of Families) Urban andRural
In Rented Accommodation
In Isolated/dispersed settlements (detached froma location)
With Host Families who are Relatives (no rentalfee)
With Host Families who are not Relatives (norental fee)
DISPLACEMENT TRACKING
0
500
1,000
1,500
2,000
2,500
3,000
Janu
ary/
04
Janu
ary/
18
Febr
uary
/01
Febr
uary
/15
Febr
uary
/29
Mar
ch/1
4
Mar
ch/2
8
Apr
il/11
Apr
il/25
May
/09
May
/23
June
/06
June
/20
July
/04
July
/18
Aug
ust/
01
Aug
ust/
15
Aug
ust/
29
Sept
embe
r/12
Sept
embe
r/26
Oct
ober
/10
Oct
ober
/24
Nov
embe
r/07
Nov
embe
r/21
Dec
embe
r/05
Dec
embe
r/19
Weekly Displacement Trends (# of HHs) IDPs Shelter Types
IOM YEMEN
WEEKLY UPDATE Displaced People
Returned People
Jan 01 - Dec 19, 2020*Reported during
Jan 01 - Dec 19, 2020*Reported during
*Based on data collected during 13 - 19 Dec, 2020
DTM’s Rapid Displacement Tracking (RDT)tool collects and reports on numbers ofhouseholds forced to flee on a daily basis,allowing for regular reporting of newdisplacements in terms of numbers, geographyand needs. In the first eleven months of 2020,conflict (82%) and natural disasters (13%) haveresulted most of displacements, particularly inMarib, Al Hudaydah, Al Dhale'e, Tiaz, Al Jawf,and Hadramaut governorates. Economicconditions, Health, COVID-19 and otherfactors caused rest of 5% displacements.
IDP HH WHO LEFT DISPLACED LOCATIONS
2020, and have been added in the total households.
displaced between Dec 06 - Dec 12,23 HHs wereUPDATE: Additional
1,321Since the beginning of 2020, DTMalso identified other
previously displaced householdswho left the displaced location andmoved to either their place oforigion or some other displacedlocation.
1,767 Households10,602 Individuals
28,436 Households170,616 Individuals
Source: IOM, 2020d.
Figure A4.7. Example of donuts
4 Chapter 1: Assisted voluntary return and reintegration overview 2019
│ Host regions
Top 10 host/transit countries for assisted voluntary return and reintegration, 2019
Top 10 countries of origin for assisted voluntary return and reintegration, 2019
│ Regions of origin
Dialogue and/or capacity-building activities on return management
Fifty-eight IOM country offices facilitated dialogue and/or capacity-building activities on return management. These activities focused, among others, on legislative review, adoption of guidelines, set-up of interministerial committees, establishment of a referral mechanism, and capacity-building on return assistance and returnees’ vulnerabilities and needs.
17% ▼19% ▲17% ▲38% ▲35% ▲29% ▼16% ▲
240% ▲2% ▲
71% ▼17% ▲31% ▼33% ▲15% ▼1.5% ▼61% ▲
125% ▲0.3% ▼
European Economic Area West and Central Africa Middle East and North Africa East and Horn of Africa South-Eastern Europe, Eastern Europe and Central Asia Asia and the Paci�cSouthern Africa Central and North AmericaSouth America
43.5% 35.6%
8.7%
11.1%
23.0%
13.6%
3.8%
1.6%2.1%
0.5%
29.2%
6.2%
9.0%
5.1%
1.9%
1.4% 3.7%
0.1%
58
Host and origin regions for assisted voluntary return and reintegration, 2019
Mali
Belgium
Mexico
Turkey
Austria
Netherlands
Greece
Djibouti
Germany
Niger 16,414
13,053
4,220
3,854
3,035
2,840
2,533
2,244
2,183
1,429
10% ▲
18% ▼
24% ▲
22% ▼
41% ▲
18% ▼
70% ▲
334% ▲
21% ▼
1,686% ▲ Sierra Leone
Honduras
Nigeria
Côte d'Ivoire
Georgia
Pakistan
Iraq
Guinea
Mali
Ethiopia 6,098
5,576
4,458
3,995
2,888
2,603
2,057
1,914
1,870
1,777
27% ▲
38% ▲
12% ▼
29% ▼
59% ▲
3% ▼
12% ▲
29% ▲
365% ▲
114% ▲
Source: IOM, 2020b, p. 4.
Change over time
Bar charts can also be used to represent longitudinal data repeated over time to help identify temporal trends and patterns (see Figure A4.8). Similarly, line charts are another great way for displaying trends (see Figure A4.9).
EXAMPLE

196 CHAPTER 4 Methodologies for data collection and analysis for monitoring and evaluation
Figure A4.8. Example of a bar chart237WORLD MIGRATION REPORT 2020
Figure2.Shareofglobalmigrantsunder20yearsofage
0%
5%
10%
15%
20%
19901995
20002005
20102015
2019
18.6
17.2
16.015.6
14.513.9 13.9
Perc
enta
ge o
f mig
rant
s und
er 2
0
Source: UNDESA,2019a.
Concerns about the inadequacy of data – lack of sources and deficits in reliable, up-to-date and disaggregated data – are not peculiar to the child migration context; they exist for the migration field as a whole, and are referenced throughout this report. But the data deficiencies regarding child migrants are of particular concern, because they hamper timely and adequate protection and care for a group of migrants that may be especially vulnerable and dependent on government support. Remarkably, only 56 per cent of refugee-related data and 20 per cent of internally displaced person (IDP)-related data include age-disaggregated information; even migrant stock data include information about age in only 80 per cent of countries.27 The absence of age disaggregation is not the only concern. Others include broad gaps in data on gender, problems relating to the double-counting of children who move between and within countries, and deficient methods for ascertaining age.28
The most recent global estimate for the total number of child migrants is approximately 31 million.29 This is a “stock” figure, one that represents the total number of people under 18 born in a country other than the one where they are living. Though it gives a snapshot of the magnitude of the issue, it is of limited accuracy and use, because it does not describe which country the migrant children have come from, what their legal status is, how long they have been where they are or what the children’s date of birth is.
27 UNICEFetal.,2018;UNDESA,2019b.28 IOM,2016.29 UNICEF,2018b.
Source: IOM, 2019b, p. 237.
Figure A4.9. Example of a line chart
142 Migration research and analysis: Growth, reach and recent contributions
has also increased. One indicator – though extensively criticized – in academic publishing is a journal’s Impact Factor.32 However, Impact Factors were available for only three of the selected journals (International Migration, International Migration Review and Migration Studies). Taking into consideration these three journals, together with those examined in the World Migration Report 2018, there appears to have been an increase (see figure 4). The recent average Impact Factor increase suggests that the articles published in these journals are receiving more attention: citing a paper reasonably implies that it has been read, and that some of its content was helpful in adding to the evidence base and/or generating debates, building knowledge, or informing migration policy and practice.
Figure4.ImpactFactorofselectedjournals
0.0
0.5
1.0
1.5
2.0
2.5
Average
MigrationStudies
InternationalMigrationReview
InternationalMigration
PopulationSpaceandPlace
Mobilities
JournalofRefugeeStudies
AsianandPacificMigrationJournal
JournalofEthnicandMigrationStudies
201820172016201520142013201220112010
Impa
ctFactor
Source: https://jcr.incites.thomsonreuters.com/ (accessed21June2019).
Note: International Journal of Migration and Border Studies,Journal of Immigrant and Refugee Studies,Journal on Migration and Human Security, Refugee Survey QuarterlyandRevue européenne des migrations internationaleswerenotindexedbyInCitesatthetimeofwriting(June2019),whileMigration Studiesstartedtobeindexedin InCites in2017.TheImpactFactoristheratioofcitationstopublications.
Publication metrics based on citation counts (including the Impact Factor) clearly have various limitations and downsides.33 First, citations tend to accumulate slowly, given academic publishing timelines and the time it takes to compile/release statistics. Second, citations are a matter almost solely within the academic context, which is one reason alternative measures (discussed below) have been developed. Third, citations do not measure quality of material, but are a way of quantifying impact (see the discussion on this point in
32 TheImpactFactorisacitations–publicationsratio.Foragivenyear,ittakesintoaccountcitationsandpublicationsfromtheprecedingtwoyears.Formoreinformation,pleaseseetheexampleinappendixA.
33 ForarecentoverviewofImpactFactorlimitations,seeWilliamsandPadula,2015.ForabroaderaccountofImpactFactormisuse,seeThePLoSMedicineEditors,2006.
Source: IOM, 2019b, p. 142.
EXAMPLE

IOM MONITORING AND EVALUATION GUIDELINES197
Relationships and trends
Scatter charts are commonly used to show the relationship among the variables where both the horizontal and vertical axes are value axes, not categorical axes. For instance, the United Nations has released a new study that finds a causal relation between long-lasting droughts in El Salvador, Guatemala and Honduras and the increase in irregular migration from these countries to the United States. “Members of families affected by the drought are 1.5 per cent more likely to emigrate than similar households elsewhere. Although this is a low value, the significance lies in the fact that the correlation between drought occurrence and emigration is positive and the probability of emigrating is higher than that of families who are not from the Dry Corridor”.45 The scatter plot can be used to illustrate this positive relationship (as the length of drought increase, irregular migration increases). In Figure A4.10, the scatter plot demonstrates a positive relationship between the number of units sold by product family and revenue. The more units sold, the greater the revenue.
A bubble chart is a variation of a scatter chart in which the data points are replaced with bubbles, and an additional dimension of the data is represented in the size of the bubbles. Just like a scatter chart, a bubble chart does not use a category axis; both horizontal and vertical axes are value axes.
Figure A4.10. Example of a scatter chart
Strong correlations are similarly evident between a broader set of development indicators and existing displacement 263 Here again, we are unable to infer causality, but they highlight areas that likely both generate displacement risk and are affected by displace-ment triggers such as conflict or disasters The number of new displacements associated with conflict is higher in countries where fewer girls are enrolled in primary school and where infants are more likely to die (see figure 13) The quality of education and healthcare, represented through proxies of pupil-teacher ratios and the number of hospital beds per head of population, correlate strongly with disaster displacement
In some countries this correlation may be as much a reflection of impact as of risk Low health and educa-tion levels can be a driver of vulnerability, but also a direct impact of conflict and disaster Infrastructure quality can also be both a determinant of displacement risk and a consequence of destruction by a hazardous event or war New displacements associated with conflict are more common in countries where there is less internet access, where electricity consumption is lower and ports are less developed in the first place, but conflict also impedes infrastructure development In
and Syria have been studied, but it is not possible to infer direct causality 261 More research is required to unpack how these factors determine displacement dynamics 262
Comparisons with UNDP’s Human Development Index show that low levels of human development correlate strongly with disaster displacement risk A number of countries with high human development face both high economic loss risk – a reflection of significant exposure of physical assets – as well as high displacement risk Most of the countries with high levels of displacement risk, however, are those with low levels of human devel-opment, highlighting the role of vulnerability and expo-sure of populations to disaster (see figure 12)
figure 12: correlation between human development, disaster displacement risk and economic loss risk
High developmentLow development
Ave
rag
e an
nu
al lo
sses
in m
illio
ns
USD
(per
100
,000
peo
ple
)
Average Annual Displacement (per 100,000 people)
figure 13: conflict and disaster displacement relative to selected education and health indicators
New
dis
pla
cem
ents
(co
nfl
ict)
New
dis
plac
emen
ts (d
isas
ter)
New
dis
pla
cem
ents
(co
nfl
ict)
New
dis
plac
emen
ts (d
isas
ter)
School enrollment, pre-primary, female (% gross)
Pupil-teacher ratio, upper secondary
Mortality rate, neonatal (per 1,000 live births)
Hospital beds (per 1,000 people)
1M
1,000
0
1 10 100
1M
1,000
05 10 50
1M
1,000
0
1 10 50
1M
1,000
00.1 1 10
Yemen
DRC
Bangladesh
Ethiopia
Philippines
Madagascar
UkraineLebanon
Sudan
Cameroon
Sudan
Mexico
61
Off th
e griD
Source: IDMC, 2018, p. 61.
45 World Food Programme, 2017, p. 16.
EXAMPLE

198 CHAPTER 4 Methodologies for data collection and analysis for monitoring and evaluation
Text analysis
Text analysis refers to various processes by which qualitative data can be modified so that they can be organized and described in a clear and intuitive manner. To summarize text gathered such as focus group discussion notes, basic text summaries and analyses can be conducted. Some of the most common ways of achieving this is using word frequencies (lists of words and their frequencies) and word clouds (see Figure A4.11).
Figure A4.11. Example of word clouds
106 Migration research and analysis: Growth, reach and recent contributions
Moreover, the remaining geographical terms among the 75 that form the word cloud are Africa, Australia, Canada, China, England, the Netherlands and the Republic of Korea: the large majority are immigration – rather than emigration – countries or regions.
Figure2.Wordcloudfromthetitlesof538academicarticlespublishedin sevenacademicjournalsin2015–2016
Note: Createdusingwww.wordclouds.comandwww.wordle.net.
Asian and Pacific Migration Journal
…articlespublishedbyAPMJaregenerallyindicativeofthemigrationscenariointheAsia-Pacificandareareflectionofthestateofresearch,policydiscussions,andadvocacyissues.…Thearticlespublishedin2015and2016includedmanyarticlesonSouthKoreaandChina,butoverall,thelasttwoyearspointtodiversityinthetypesofmigrants,originsanddestinationscovered.Articlesonstudentmigration,forexample,pertainedtoChineseandIndianstudents,incidentallythetoptwogroupsofinternationalstudentmigrants.ArticlesaboutunaccompaniedadolescentKoreanstudentsintheUS…,thereturnofChinesestudents,andsomefocusonJapanesestudentmigrationhaveexpandedthediscussiononthetopic.ArticlesaboutFilipinoteachersinIndonesia,ChineseimmigrantentrepreneursinSingaporeandAfghan-nativefertilitydifferentialsinIranaresomeexamplesofarticlesthatrevealrelativelylessknownaspectsaboutintra-regionalmigrationwhilethearticlesaboutVietnameseinPolandprovideanupdateontheoldmigrationandcharacteristicsofnewVietnamesemigrationtoPoland…Overall,thearticlespublishedin2015–2016areacombinationofoldorpersistingissuesandneworhithertounder-researchedquestions.
Source:MarujaAsis,Co-editor.ThefullsubmissionisinappendixB.
Source: IOM, 2017c, p. 106.
IOM resources2017c World Migration Report 2018. Geneva.
2019b World Migration Report 2020. Geneva.
2020b 2019 Return and Reintegration Key Highlights. Geneva.
2020d Yemen – Rapid Displacement Tracking Update. 13–19 December.
Other resourcesInternal Displacement Monitoring Centre
2018 Global Report on Internal Displacement. Geneva.
Online toolsVisage tools – how to design scatter plotsVoyant tools – word frequencies, concordance, word clouds and visualizations Netlytic – summarize and discover social networks from online conversations on social media sites Wordclouds WordleWord tree
RESOURCES
EXAMPLE

IOM MONITORING AND EVALUATION GUIDELINES199
What to remember when creating data visuals
• To create good graphics, use only a few contrasting but compatible colours that are also suitable for People with colour blindness and reprinting in black and white.
• Order the data in graphs in a logical sequence, with appropriate data ranges to help viewers easily interpret the data (such as from greatest to least or by time period).
• Take care when using 3D charts because these can often be difficult to read and can hide or distort data.
• Keep graphs and charts simple. Avoid including different variables on different scales in the chart or overloading with decoration, gridlines or unnecessary information. If there is no purpose for something, leave it out.
• If creating truly powerful data visualizations, adding some context in the form of text is one of the most effective ways to communicate the data. Yuk and Diamond (2014) identify five main rules for adding text to data visualizations:
– Use text that is complementary; – Use simple words; – Keep it short; – Avoid using random colours to make text stand out against visuals; – Ensure text applies to every scenario of the data being displayed.
Table A4.5. Evaluating data visuals checklist
Items to consider
1 Did I eliminate all non-essential information?
2 Am I overwhelming the reader by the quantity of data?
3 Does the chart choice enhance or obscure the story the data is telling?
4 Is it clear to the reader when and from where you obtained the data?
5 Are you consistent with the colours chosen?
6 Do I effectively use white space to separate the graphical areas and text?
7 Is the layout easy to digest and does not crowd any of the information presented?
8 Is the choice of chart suitable for the purpose of the visual?
9 Do icons really help emphasize the important information?
10 Do I avoid duplicating information and charts?
11 Do I use clear sections to make it easy for users to view the visualizations?
12 Is the text size appropriate (not too small but also not too large)?
13 Are labels clear?
14 Is the style of different labels consistent?
15 Is all the text visible (that is, it is not cut off)?
For more information and examples of the points items listed in the checklist for evaluating the data visuals (Figure A4.2), see chapter 13: Evaluating real data visualizations in Data Visualization for Dummies by Yuk and Diamond (2014).
TIP

200 CHAPTER 4 Methodologies for data collection and analysis for monitoring and evaluation
References and further readingCarrington, O. and S. Handley
2017 Data visualization: What’s it all about? New Philanthropy Capital (NPC) Briefing, August. London.
Hewitt, M. 2016 11 design tips for visualizing survey results. Visage, 1 December.
World Food Programme 2017 Food Security and Emigration: Why people flee and the impact on family members left behind in El
Salvador, Guatemala and Honduras. Research report. Clayton.
Yuk, M. and S. Diamond 2014 Data Visualization for Dummies. John Wiley and Sons, New Jersey.
Additional online data visualization tools A wide array of data visualization tools exists online, many of which are accessible for free. Also remember that Microsoft Excel is the most common tool for data visualization and can create many good charts and graphs. To access free tutorials, discussions and best practices for creating data visualizations in Microsoft Excel, see the Excel Charts blog. In addition to Excel, the following are some additional free online tools for creating charts:
• ChartGo
• ChartGizmo
• Online Chart Tool
• Datawrapper
• amCharts
• Highcharts
• Tableau
RESOURCES

CHAPTER 5
Evaluation

202 CHAPTER 5 Evaluation
EVALUATION
5The following chapter contains links to resources relevant to the content presented. Some resources presented are internal to IOM staff only and can be accessed only by those with IOM login credentials. These resources will be updated on a regular basis. To see the updated resources, kindly follow this link.
List of abbreviations and acronyms .........................................................................................203
5.1. Evaluation overview ............................................................................................................2045.1.1. Roles in evaluation ...................................................................................................................................2065.1.2. Evaluation stages ......................................................................................................................................207
5.2. Planning for evaluation .......................................................................................................2085.2.1. Define the purpose and evaluability of evaluation ....................................................................2105.2.2. Prepare evaluation terms of reference ...........................................................................................2275.2.3. Select evaluator(s)....................................................................................................................................230
5.3. Undertaking evaluation ......................................................................................................2345.3.1. Supervise evaluation implementation and workplan ................................................................2345.3.2. Evaluation deliverables ...........................................................................................................................2365.3.3. Provide feedback on all phases of the evaluation ......................................................................2385.3.4. Ensure evaluation quality ......................................................................................................................240
5.4. Follow-up and using evaluation .........................................................................................2425.4.1. Follow-up on implementation of recommendations and use of the report..................2425.4.2. Using and disseminating the evaluation ..........................................................................................243
5.5. Accountability and learning from evaluation .................................................................2455.5.1. Generating knowledge and learning through evaluation ........................................................246
Annexes .........................................................................................................................................253

IOM MONITORING AND EVALUATION GUIDELINES203
List of abbreviations and acronyms
AAP accountability to affected populations
ALNAP/ODI Active Learning Network for Accountability and Performance/Overseas Development Institute
ASQ American Society for QualityAAR after-action reviewALNAP Active Learning Network for Accountability and PerformanceCoM chief of missionCRPD Convention of the Rights of Persons with DisabilitiesGAO General Accounting Office (United States)IASC Inter-Agency Standing CommitteeILO International Labour OrganizationIOM International Organization for Migration
LGBTI lesbian, gay, bisexual, transgender and/or intersex
MCOF Migration Crisis Operational FrameworkM&E monitoring and evaluationMSC Most significant changeNGO non-governmental organizationOECD Organisation for Economic Co-operation and Development
OECD/DAC Organisation for Economic Co-operation and Development/ Development Assistance Committee
OIG/Evaluation Office of the Inspector General’s Central Evaluation functionOPD organization of persons with disabilitiesPPR project performance reviewPRIMA Project Information and Management ApplicationRBA rights-based approachSEA sexual exploitation and abuseToC Theory of Change ToR terms of referenceUNDP United Nations Development ProgrammeUNDIS United Nations Disability Inclusion StrategyUNEG United Nations Evaluation GroupU-FE utilization-focused evaluationUSAID United States Agency for International Development

204 CHAPTER 5 Evaluation
Chapter 5 | EvaluationThis chapter provides an overview of managing evaluations, specifically planning, undertaking, following-up and using evaluation, as well as the benefits of learning and accountability derived from evaluation. It outlines the responsibilities and steps required to commission and manage an evaluation, how to differentiate between different types of evaluation, use evaluation criteria and identify and promote learning approaches. This chapter does not cover how to conduct an evaluation as an evaluator. IOM staff interested in developing their evaluation skills further in order to join the roster of internal IOM evaluators can participate in the IOM Internal Evaluator training, which covers this topic.
5.1. Evaluation overviewEvaluation is defined as the systematic and objective assessment of an ongoing or completed intervention, including a project, programme, strategy or policy, its design, implementation and results. Evaluation is about accountability and learning by informing stakeholders on the extent to which resources have been used efficiently and effectively to achieve results, and providing empirical knowledge about which elements of an intervention worked or did not work and why.1 Evaluation can be used to improve IOM’s work through evidence-based decision-making as a promotion tool for IOM activities and as a tool for fundraising and visibility.
By contributing to knowledge and providing information on the performance and achievement of activities, evaluations enable informed decision-making for policymakers, programme managers and other key stakeholders. Since 2011, IOM has made it mandatory to consider the inclusion of evaluations in its project proposals.2
The accountability dimension is usually addressed to donors and other stakeholders, including beneficiaries, by demonstrating whether work has been carried out as agreed and intended results achieved, and in compliance with established standards.3 To gain the full benefit of learning and to ensure that the organization continues to build on its recognized strengths of flexibility, reliability and creativity, a strong evaluation culture is required and encouraged.
1 When accountability and learning is discussed, the acronym MEAL is often used for monitoring, evaluation, accountability and learning, instead of using the concept of M&E only. However, it is important to note that evaluation itself includes accountability and learning.
2 For further information, see IOM, 2018a.3 For the purpose of the IOM Monitoring and Evaluation Guidelines, IOM uses the OECD/DAC definition of beneficiary/ies or people that the
Organization seeks to assist as “the individuals, groups, or organisations, whether targeted or not, that benefit directly or indirectly, from the development intervention. Other terms, such as rights holders or affected people, may also be used.” See OECD, 2019, p. 7. The term beneficiary/ies or people that IOM seeks to assist, will intermittently be used throughout the IOM Monitoring and Evaluation Guidelines, and refers to the definition given above, including when discussing humanitarian context.

IOM MONITORING AND EVALUATION GUIDELINES205
In addition to accountability, learning, decision-making and promotion, other possible purposes for evaluation can include steering, fundraising and visibility.
To foster an evaluation culture at IOM, it is important to consider multiple aspects that help shape the way evaluation is thought of within the Organization. This includes building the evaluation culture itself. This can be done by clarifying what evaluation is, encouraging the planning, management and conduct of evaluations, and paying close attention to the utilization of evaluation.
IOM’s evaluation efforts are largely decentralized as specified in the IOM Evaluation Policy.4
IOM proposes the following definition for decentralized evaluation: “Decentralized evaluations are evaluations commissioned and managed outside the IOM central evaluation office (OIG/Evaluation) – by Headquarters Departments, Regional Offices and Country Offices – focusing on activities, themes, operational areas, policies, strategies and projects falling under their respective areas of work.”5
As per its mandate, the Office of the Inspector General’s Central Evaluation function (OIG)/Evaluation) is responsible for providing guidance on the implementation of decentralized evaluation approaches.6 Some features of decentralized evaluation at IOM are as follows:
• Decentralized evaluations are conducted by independent internal or external evaluators, and managed by IOM country offices, regional offices and Headquarters departments, which fund them through their projects and activities.
• Decentralized evaluations more often relate to projects and programmes, or operational areas at the global, regional and country levels, and can also focus on thematic areas and strategies of national or regional importance.7
4 IOM, 2018a.5 Ibid., p. 4.6 IOM, 2015a.7 IOM, 2018a, pp. 4–5.
INFO
RMATION
INFO
RMATION

206 CHAPTER 5 Evaluation
5.1.1. Roles in evaluation
There are four important roles to distinguish within the evaluation process: (a) the evaluation commissioner; (b) the evaluation manager; (c) the evaluator; and (d) the evaluation user.
The evaluation commissioner is the party or stakeholder who decides that an evaluation should take place. This could be the IOM programme manager, relevant IOM chief of mission (CoM), a thematic specialist or unit(s) from Headquarters and/or from a regional/country office, the donor or any combination of these stakeholders.
The evaluation manager is the person who is in charge of managing the evaluation. It is possible that the evaluation manager is from the same entity or office that commissioned the evaluation. Most often in IOM, the evaluation manager is the programme or project manager.
It is important to note that, at times, several stakeholders may be part of an evaluation management committee, overseeing the evaluation process together.
An evaluator is charged with conducting the evaluation. Evaluators can be external consultants, IOM staff or evaluators recruited by IOM, donors, partner organizations and governments.
The evaluation users are key players for guaranteeing the full utilization and benefits of evaluation. They can be direct users, who are, for instance, directly concerned with the implementation of the recommendations and accountability purposes, as well as indirect users that can be more interested with the learning dimension of the evaluation.
In addition to these roles, there are other stakeholder engagement and reference groups that play an important role, for instance in terms of quality assurance. For further information on reference groups, see Information box.
The United Nations Evaluation Group’s (UNEG) Norms and Standards for Evaluation (2016) further elaborates on stakeholder engagement and reference groups.8 Specifically, the document states that “inclusive and diverse stakeholder engagement in the planning, design, conduct and follow-up of evaluations is critical to ensure ownership, relevance, credibility and the use of evaluation. Reference groups and other stakeholder engagement mechanisms should be designed for such purpose.”9
Stakeholder engagement and reference groups are recommended for complex evaluations, multi-country and multiprogramme with a wide range of stakeholders. In these cases, such groups may be particularly useful and can ensure a more participatory approach throughout the evaluation.
8 UNEG, 2016.9 Ibid., p. 24.

IOM MONITORING AND EVALUATION GUIDELINES207
The UNEG Norms and Standards for Evaluation define the various groups as follows:10
Reference groups: Reference groups are composed of core groups of stakeholders of the evaluation subject who can provide different perspectives and knowledge on the subject. The reference groups should be consulted on the following: (a) evaluation design to enhance its relevance; (b) preliminary findings to enhance their validity; (c) recommendations to enhance their feasibility, acceptability and ownership; and (d) at any point during the evaluation process when needed. The use of reference groups enhances the relevance, quality and credibility of evaluation processes.
Learning groups: Learning groups could be established with stakeholders to focus on the use of evaluation. Learning groups generally have a smaller role in quality enhancement or validation of findings than reference groups.
Steering groups: When appropriate, some key stakeholders could be given a stronger role as members of the steering group to ensure better ownership. Steering groups not only advise, but also provide guidance to evaluations.
Advisory groups: Advisory groups are composed of experts on evaluation or the subject matter. Because group members generally do not have a direct stake in the subject matter to be evaluated, they can provide objective advice to evaluations. Using these groups can enhance the relevance, quality and credibility of evaluation processes through guidance, advice, validation of findings and use of the knowledge.
5.1.2. Evaluation stages
Module 6 of the IOM Project Handbook, published in 2017, outlined three phases for the evaluation process: (a) planning evaluations; (b) managing evaluations; and (c) using evaluations.11 The IOM Monitoring and Evaluation Guidelines, however, proposes a three-stage process including the following stages: (a) planning for evaluation; (b) undertaking evaluation; and (c) follow-up and using evaluation. These three stages of evaluation are as follows:12
• Define the purpose and evaluability of evaluation• Prepare evaluation terms of reference (ToR)• Select evaluator(s)
• Supervise evaluation implementation and workplan• Evaluation deliverables• Provide feedback on all phases of the evaluation• Ensure evaluation quality
• Follow-up on the implementation of recommendations and use of the report
• Using and disseminating the evaluation
Planning for evaluation
Undertaking evaluation
Follow-up and using evaluation
10 Ibid., pp. 24–25.11 Module 6 of IOM Project Handbook, p. 422 (Internal link only).12 Adapted from World Bank, 2015.
INFO
RMATION

208 CHAPTER 5 Evaluation
IOM resources2015 Resolution No. 1309 on IOM–UN relations, adopted on 24 November 2015 (C/106/RES/1309).
2017 Module 6. In: IOM Project Handbook. Second edition. Geneva (Internal link only).
2018a IOM Evaluation Policy. Office of the Inspector General (OIG), September.
External resourcesOrganisation for Economic Co-operation and Development (OECD)
2019 Better Criteria for Better Evaluation: Revised Evaluation Criteria Definitions and Principles for Use. OECD/Development Assistance Committee (DAC) Network on Development for Evaluation.
United Nations Evaluation Group (UNEG)2016 Norms and Standards for Evaluation. New York.
World Bank 2015 Managing Evaluations: A How-to Guide for Managers and Commissioners of Evaluations. Independent
Evaluation Group, The World Bank Group, Washington, D.C.
5.2. Planning for evaluation
• Define the purpose and evaluability of evaluation• Prepare evaluation terms of reference (ToR)• Select evaluator(s)
Planning for evaluation
IOM strongly recommends conducting evaluations, and an effective use of evaluation starts with sound planning. The IOM Project Handbook (IN/250) requires that all proposals consider the inclusion of an evaluation within the project; hence, the first step of planning happens during project development.13
Project developers provide a brief description of the evaluation, including its purpose, timing, intended use and methodology. The cost of evaluation must also be included in the budget at the planning stage.14
If no evaluation of the project is foreseen at the project development stage, an appropriate justification must be provided. Reasons for this may include the following:
(a) The expected donor has indicated, prior to the submission of the proposal, that it will not fund an evaluation;
(b) The donor plans to conduct its own evaluation, outside of the IOM implementation cycle;(c) Other evaluative approaches have been agreed upon with the donor, such as project
performance reviews (PPR) or after-action reviews (AAR).
13 Module 6 of IOM Project Handbook, p. 423 (Internal link only).14 For more information on budgeting, please see the section in this chapter of the IOM Monitoring and Evaluation Guidelines on preparing
evaluation ToR.
RESOURCES

IOM MONITORING AND EVALUATION GUIDELINES209
While other possible exceptions may exist, note that the following are not considered valid or sufficient justifications for excluding evaluation from project design: “The project is doing alright without an evaluation”; “The project will examine the validity of an evaluation later”; “The project can spend that money in a better way”; “The donor does not want an evaluation”, without negotiating further with the donor. The examples given also reflect a weak evaluation culture and failure to understand and duly promote the benefits of evaluation.
If a full-fledged evaluation is not possible due to funding and/or resource constraints or the short duration of implementation, there may still be possibilities to conduct other evaluative approaches.15 For instance, an internal review and other evaluative assessments such as lessons learned workshops, AARs or PPRs can be done. These evaluative approaches will be explained later in the chapter. However, these other learning and/or evaluative approaches are not as extensive as an evaluation and do not replace it. Other evaluative approaches could be viewed rather as complementary to evaluation, even when evaluation is planned.
In contrast to other evaluative approaches, the benefit of conducting evaluation lies in its more robust and rigorous methodology. Evaluation allows for a detailed analysis through a predefined and logical framework, the participation of a wider range of stakeholders and supports a strong evidence-based approach to document overall performance and change brought about by an intervention, which is measured against a widely accepted and tested set of evaluation criteria.
In Project Information and Management Application (PRIMA),as before, project developers are expected to provide minimum information on planned evaluations within the Evaluation Module when creating project proposal in the platform.16 The Evaluation Module populates the Evaluation section of the IOM Proposal Template. The information requested while completing this module includes whether or not an evaluation is planned, including a justification if no evaluation is planned; the purpose of the evaluation (intended use and users); the type (by time and who conducts the evaluation); suggested criteria to be addressed by the evaluation; and the proposed methodology. Furthermore, project developers will also be required to provide a budget for any planned evaluations when building a budget in PRIMA.
For more information regarding planning for evaluation during project development in PRIMA, see the Create Proposal (IOM Template) section of the internal IOM PRIMA User Guide.
During implementation, planning for the evaluation typically occurs a few months before the evaluation takes place and involves three main components: (a) defining the purpose and evaluability of the evaluation; (b) preparing the evaluation terms of reference (ToR); and (c) selecting the evaluators.
15 For more information on these, please see the section of this chapter of the IOM Monitoring and Evaluation Guidelines on Generating knowledge and learning through evaluation.
16 PRIMA for All is an institutional project information management solution. It is available internally to IOM staff via the IOM intranet. For more on PRIMA, see chapter 3 of the IOM Monitoring and Evaluation Guidelines.
INFO
RMATION

210 CHAPTER 5 Evaluation
5.2.1. Define the purpose and evaluability of evaluation
• Define the purpose and evaluability of evaluation• Prepare evaluation terms of reference (ToR)• Select evaluator(s)
Planning for evaluation
The first step in planning for an evaluation is defining the purpose and evaluability of an evaluation. The evaluation purpose describes the overall reason why the evaluation is being conducted and its expected results. Agencies and organizations may use different terminology, and IOM is open to accept such terminology when preparing the evaluation ToR.
Agencies, organizations and resource materials also refer to evaluation objectives, and, respectively, to specific objectives. The definition of evaluation objective is similar to the one for the evaluation purpose, which is the overall reason the evaluation is being conducted, while evaluation-specific objectives typically make reference to the criteria being addressed by the project or scope of the evaluation.17
Some guiding questions that can be used to frame the purpose of an evaluation are as follows:
Guiding questions to define evaluation purpose
• Who are the intended users of the evaluation?• What does the evaluation strive to assess (the intervention, specific thematic components, a strategy,
collaboration)? • What are the priority evaluation aspects to analyse, considering that not necessarily all evaluation
criteria need to be covered (such as relevance, performance and implementation processes, impact, coherence and sustainability)?
• What is the expected result (such as to draw any specific recommendations, identify challenges and lessons learned, gather good practices and inform next phases of implementation)?
Identify and engage relevant stakeholders early in the planning process through a participatory approach. This can provide opportunities to clarify key aspects of the evaluation and help reach an agreement on key evaluation questions and scope.
17 Module 6 of IOM Project Handbook, p. 423 (Internal link only).
INFO
RMATION
TIP

IOM MONITORING AND EVALUATION GUIDELINES211
Assessing the evaluability – in other words feasibility – of an evaluation is an essential part of the evaluation planning process, increasing the likelihood that the evaluation will be able to produce credible information in a timely manner or by limiting its scope.18 It encourages evaluation managers to set realistic expectations of an evaluation on the basis of the contextual realities on the ground, including financial realities and timing, as well as on the monitoring and data collection mechanisms already in place.
It is important to review relevant project documents or strategies to identify what has already been agreed upon with the donor or at the institutional and governmental levels. As some time may have passed since the start of the planning for the intervention to be evaluated, it is also important to review the choices made so far in the intervention to ensure that earlier decisions taken still hold when the evaluation takes place. The programme manager may need to discuss any planned changes with the donor.
The process of planning an evaluation involves trade-off decisions, as the evaluation manager will have to weigh the cost and feasibility of various evaluation designs, as well as the benefits of the evaluation (operational, institutional and strategic).
To define the purpose and assess the evaluability of an evaluation, managers must be aware of the common types of evaluations, methodologies, and evaluation criteria. Understanding these concepts and technical requirements and specificities can also help evaluation managers to manage their evaluations more effectively. Types of evaluation
Evaluation types can be defined according to the following elements, and evaluations can be a combination of the different categories:
Figure 5.1. Types of evaluation
Timing
Scope andtechnical
specificities of evaluation
Purpose
Who conducts it
18 UNEG, 2016.

212 CHAPTER 5 Evaluation
Evaluation type according to timing
Figure 5.2. Evaluation according to timing
Timing
Scope andtechnical
specificities of evaluation
Purpose
Who conducts it
One distinction is made on the basis of the timing of the evaluation exercise; in other words, when in the intervention life cycle, the evaluation is conducted.
Figure 5.3. Evaluation types by timing
Ex-ante Real-time
Mostly used in
emergencies
Midterm Final Ex-post

IOM MONITORING AND EVALUATION GUIDELINES213
Ex-ante evaluation
An ex-ante evaluation is performed before the implementation of an intervention to assess the validity of the design, target populations and objectives. An ex-ante evaluation includes criteria and analysis that are not covered by needs assessments, appraisals or feasibility studies.
Real-time evaluation
Real-time evaluations are mostly used in emergencies, at the early stages of implementation, to provide instant feedback to intervention managers about an ongoing operation.19
Midterm evaluation
A midterm evaluation is carried out during an intervention’s implementation and for the purpose of improving its performance or, in some cases, to amend its objective, if it has become unrealistic due to unexpected factors or implementation challenges.
Final evaluation
A final, or terminal, evaluation is undertaken at the end, or close to the end, of an intervention to examine the overall performance and achievement of results, also for the benefit of stakeholders not directly involved in the management and implementation of the intervention (such as donors and governmental entities).
Ex-post evaluation
The ex-post evaluation is implemented some months after the end of an intervention to assess the immediate and medium-term outcomes and sustainability of results. It includes the extent to which the intervention has contributed to direct or indirect changes; however, it is not as robust as an impact evaluation.
Evaluation types according to purpose
Figure 5.4. Evaluation according to purpose
Timing
Scope andtechnical
specificities of evaluation
Purpose
Who conducts it
Evaluations defined by their purpose can be formative or summative. Formative evaluation is conducted during implementation for the purposes of improving performance. It is intended to assist managers adjust and improve project, programme and strategy implementation based on findings, as well as stakeholders’
19 Cosgrave et al., 2009.

214 CHAPTER 5 Evaluation
suggestions and needs. A summative evaluation is conducted at the end of an intervention time frame and also for the benefit of stakeholders not directly involved in the management of the implementation such as donors. It provides insights about the effectiveness of the intervention and gives then the opportunity to use best practices identified during the evaluation. A summative evaluation can inform higher-level decision-making, for instance to scale up an intervention, consolidate it or continue funding follow-up phases.
Based on the purpose of the evaluation
Formative evaluation
• Conducted during implementation
• Intended for managers and direct actors
• Redresses and improves the project or programme
Summative evaluation
• Conducted at the end of a project or programme
• Intended for those not directly involved in management
• Provides insights about the effectiveness of the project
• Gives the opportunity to use best practices identified during the evaluation
• Informs higher-level decision-making for follow-up actions
Evaluation types according to who conducts it
Figure 5.5. Evaluation according to who conducts it
Timing
Scope andtechnical
specificities of evaluation
Purpose
Who conducts it
A third distinction is made according to the person(s) who conduct(s) the evaluation exercise. There are three types of evaluation based on who conducts the evaluation: (a) internal; (b) external; and (c) mixed.

IOM MONITORING AND EVALUATION GUIDELINES215
Internal evaluation
• An internal evaluation is conducted by an IOM unit, an individual staff member or a team composed of IOM staff.
• An independent internal evaluation is conducted by someone who did not directly participate in the conceptualization, development and/or implementation of the intervention to be evaluated. Within IOM, internal independent evaluations are conducted by OIG/Evaluation, regional M&E officers and trained staff on the IOM Internal Evaluation roster. Evaluations of interventions conducted by staff members from the implementing office are also considered independent internal evaluations, as long as the evaluators were not involved in its development and implementation.
• A self-evaluation is an internal evaluation done by those who are or were entrusted with the development and/or delivery of the project or programme.20
External evaluation
• An external evaluation is conducted by someone recruited externally, mainly by the implementing organization and/or the donor.
• These are often considered independent evaluations, with reservations expressed by some organizations given the interference of management in the recruitment.21
Mixed evaluation• Mixed evaluations include both internal and external evaluators who
conduct the evaluation together. Each evaluator may have her/his own specific role within the team.
Joint evaluation
Joint evaluations are conducted by a group of agencies, including perhaps with the participation of donors. There are “various degrees of ‘jointness’ depending on the extent to which individual partners cooperate in the evaluation process, merge their evaluation resources and combine their evaluation reporting.”22 An agency can participate as a lead agency for conducting the joint evaluation or it can act simply as a participant in the joint exercise. A group of agencies can also lead the process, and the various roles and responsibilities can be defined during the planning stage.
Ä While joint evaluations are very useful and encouraged, the organization of joint evaluations is more demanding than a single external or internal evaluation due to the coordination required between participating parties for the planning, establishment of ToR and financing of the exercise.
The cost and logistical implications of each type of evaluation will also vary based on who will conduct it. If an external evaluator (or an evaluation firm) or evaluators are contracted to conduct the evaluation, they will charge fees for this service. The fees for evaluators will vary depending on their experience, qualifications and location (locally recruited evaluators with the same level of experience may often be less expensive than internationally recruited evaluators), and evaluators may charge different fees depending on the complexity and difficulty of the assignment. Additional fees may also be charged for travel to insecure locations. The amount to budget for evaluator fees also depends on whether the evaluation is to be conducted by a single evaluator or an evaluation team.
20 Some define self-evaluations as being all evaluations conducted in an organization, including those conducted by external consultants, that are not falling under the responsibility and management of independent central evaluation offices, funded by independent mechanisms and budget.
21 Ibid.22 OECD, 2010, p. 26.
INFO
RMATION

216 CHAPTER 5 Evaluation
For further information on the decision to select a single evaluator or evaluators, see the subsection, Select evaluator(s) of this chapter.
Considering the cost of an external evaluation when developing projects
When in the development phase of the project cycle, project developers should consult with procurement and human resource officers to estimate the standard market rates for each projected evaluation team member and, if necessary, seek advice from OIG/Evaluation.
Project developers will also need to estimate the duration of the evaluation based on its objective and scope to anticipate the potential cost of the evaluation. The evaluator fees are often calculated using a daily rate, and project developers should estimate how many days are required for each of the following:23
• Initial document and literature review; • Travel (if relevant); • Preparation of the inception report;• Data collection and analysis; • Presentation of initial findings;• Preparation of the draft report; • Revisions and finalization of the evaluation report.
In IOM, the number of days of work for conducting an evaluation is usually between 20 and 40 days in a period ranging from 1 to 3 months.
If an IOM staff member from a different IOM office, which is not involved in the project, will conduct an internal evaluation, the cost for the time spent in-country to conduct the evaluation needs to be considered as travel duty (TDY). For an internal self-evaluation, or evaluations conducted by a staff member from the implementing office, there are normally no fees associated, except for those that would relate to data collection and analysis (for example, in the case of surveys with enumerators or for field visits).
Rosters of internal and external evaluators are managed by OIG/Evaluation and the regional M&E officers. Internal evaluators have usually been trained through the internal evaluator training managed by OIG and the regional M&E officers, who can assist offices to identify internal and external evaluators as required.
Ä For further information on budgeting for evaluation within an IOM intervention, see Annex 5.1. Budgeting for evaluation.
23 Ibid.
INFO
RMATION
INFO
RMATION
TIP

IOM MONITORING AND EVALUATION GUIDELINES217
Evaluation types according to technical specificities and scope
Figure 5.6. Evaluation according to technical specificities and scope
Timing
Scope andtechnical
specificities of evaluation
Purpose
Who conducts it
The fourth group of evaluation types is defined according to technical specificities and scope. This group is the most diversified, and the most common types of evaluation are presented here, with additional references provided in the Resources box and within the annexes. The scope of an evaluation allows the understanding of what will be covered and what type of evaluation may be conducted.
IOM usually conducts programme and project evaluations that examine respectively a set of activities brought together to attain specific global, regional, country or sector assistance objectives, and an individual activity designed to achieve specific objectives within a given budget and time period. IOM may also conduct evaluations of a strategy or policy. These may use similar approaches as for programme or project evaluations. In addition, IOM conducts thematic evaluations that examine selected aspects or cross-cutting issues in different types of assistance (such as poverty, environment and gender).
The following evaluation types are relatively common within the IOM context, as well as in international cooperation activities and deserve to be mentioned. A process evaluation examines the internal dynamics of implementing organizations, their policy instruments, their service delivery mechanisms, their management practices and the linkages among these. A country-programme or country-assistance evaluation is more common in United Nations agencies and bilateral assistance that use country programming approaches and defined as an evaluation of one or more donor or agency’s portfolio of development.
Furthermore, IOM also conducts meta-evaluations, which aim to judge the quality, merit, worth and significance of an evaluation or several evaluations.24 Synthesis evaluations are also encouraged as they provide the opportunity to identify patterns and define commonalities.25
24 A meta-evaluation is an instrument used to aggregate findings from a series of evaluations. It also involves an evaluation of the quality of this series of evaluations and its adherence to established good practice in evaluation. See Ministry of Foreigner Affairs (Denmark), 2004.
25 A synthesis evaluation is “a systematic procedure for organizing findings from several disparate evaluation studies, which enables evaluators to gather results from different evaluation reports and to ask questions about the group of reports”. See General Accounting Office, 1992 (name was changed to Government Accountability Office in 2004), The Evaluation Synthesis.

218 CHAPTER 5 Evaluation
Evaluations may also be defined by their technical specificity and the approach that will be used during the evaluation, for instance, a participatory evaluation, which may be defined as an evaluation method in which representatives of agencies and stakeholders (including beneficiaries) work together in designing, carrying out and interpreting an evaluation. The collaborative effort deserves to be underlined, but it also brings organizational constraints that render the exercise relatively complex. A distinction should be made here as well between participatory evaluation and participatory techniques. The latter consist, for instance, of focus group discussions or preparatory meetings and can be included as an evaluation approach irrespective of other types of evaluation selected.
Ä For further information regarding types of evaluations based on scope and technical specifies, as well as additional evaluation types within this category, see Annex 5.2. Expanded list of evaluation types by specificities and scope.
IOM resources2017a Module 6. In: IOM Project Handbook. Second edition. Geneva (Internal link only).
2018a IOM Evaluation Policy. OIG, September.
External resourcesAubel, J.
1999 Participatory Program Evaluation Manual: Involving Program Stakeholders in the Evaluation Process. Child Survival Technical Support Project and Catholic Relief Services, Maryland.
Cosgrave, J., B. Ramalingam and T. Beck 2009 Real-time Evaluations of Humanitarian Action – An ALNAP Guide. Active Learning Network for
Accountability and Performance (ALNAP).
Ministry of Foreigner Affairs (Denmark), Danida 2004 Meta-Evaluation: Private and Business Sector Development Interventions. Copenhagen.
Organisation for Economic Co-operation and Development (OECD)2010 Glossary of Key Terms in Evaluation and Results Based Management. OECD/DAC, Paris.
United Nations Evaluation Group (UNEG)2016a Norms and Standards for Evaluation. New York.
United States General Accounting Office (GAO)1992 The Evaluation Synthesis. GAO/PEMD 10.1.2. Revised March 1992.
An impact evaluation attempts to determine the entire range of long-term change deriving from the intervention, including the positive and negative, primary and secondary, long-term change produced by the intervention, whether directly or indirectly, intended or unintended.
RESOURCES

IOM MONITORING AND EVALUATION GUIDELINES219
Key considerations regarding impact evaluations
As noted above, an impact evaluation specifically attempts to determine the entire range of effects deriving from an intervention, including the positive and negative, primary and secondary, long-term effects and changes produced by the project, directly or indirectly, intended or unintended.
Such evaluations also attempt to establish the amount of identified change that is attributable to the intervention. Impact evaluations are often conducted sometime after the end of the intervention.
Impact evaluations require specific methodologies and precise and systematic technical steps in order to elaborate valid and verified conclusions and recommendations. The budget for conducting an impact evaluation can also be high, requiring detailed surveys on broad population samples and control groups, and the exercise can also be time-consuming. It is important to make a clear distinction between an impact analysis or expected impact analysis, which can be found in several types of evaluations that are using the evaluation criteria of impact, and an impact evaluation or rigorous impact evaluation that call for relevant and strict methodologies and statistical approaches to measure them.26
Ä A basic principle to apply before choosing an impact evaluation is that the benefits of the evaluation should outweigh their costs and limitations.
External resources International Fund for Agricultural Development (IFAD)
2015 Chapter 8: Impact evaluation. In: Evaluation Manual. Second edition. Rome, pp. 96–100.
Public Health England, Government of the United Kingdom2018 Guidance: Outcome Evaluation. 7 August.
Rogers, P. 2014 Overview of impact evaluation. Methodological Briefs: Impact Evaluation 1. UNICEF, Florence.
United Nations Evaluation Group (UNEG)2013 Impact Evaluation in UN Agency Evaluation Systems: Guidance on Selection, Planning and
Management. Guidance Document.
For more information regarding data collection methodology and analysis for impact evaluation, see Chapter 4: Methodologies for data collection and analysis for monitoring and evaluation.
26 The term rigorous evaluation was used by impact evaluation specialists who considered that the impact evaluation methodologies commonly used are not sufficiently rigorous and started to call for such a distinction.
INFO
RMATION
RESOURCES

220 CHAPTER 5 Evaluation
Utilization-focused evaluation
One approach to evaluation is the utilization-focused evaluation (U-FE), developed by Michael Q. Patton. The approach does not advocate for any particular type of evaluation or evaluation methodology, but rather can be applied regardless of the type or methods selected for the evaluation.
The U-FE “begins with the premise that evaluations should be judged by their utility and actual use; therefore, evaluators should facilitate the evaluation process and design any evaluation with careful consideration of how everything that is done, from beginning to end, will affect use…Therefore, the focus in utilization-focused evaluation is on intended use by intended users”.27
In other words, how useful the evaluation will be to those who will use it. U-FE encourages evaluators to design and conduct evaluations with this core principle in mind, ensuring that each decision and action is taken in a way that encourages use. It involves the intended evaluation users throughout, requiring a close collaborative relationship between the evaluator, evaluation manager and the intended evaluation users, based on the premise that “intended users are more likely to use evaluations if they understand and feel ownership over the evaluation process and findings.”28
Ä A 17-step checklist has been developed in order to facilitate the implementation of U-FE.
Patton, M.Q.2008 Utilization-Focused Evaluation. Fourth edition. SAGE Publications, Thousand
Oaks.
2012 Essentials of Utilization-Focused Evaluation. First edition. SAGE Publications, Thousand Oaks.
2015 Evaluation in the field: The need for site visit standards. American Journal of Evaluation, 36(4):444–460.
Ramírez, R. and D. Brodhead2013 Utilization Focused Evaluation: A primer for evaluators. Southbound, Penang.
Evaluation criteria
Evaluation uses a set of criteria for the assessment of an intervention. Evaluation criteria are standards by which an intervention can be addressed. While several criteria exist, IOM primarily uses two established references for evaluation criteria: (a) the OECD/DAC criteria, which had originally been developed for development-orientated interventions and were adjusted in December 2019 to also be relevant for humanitarian interventions; and (b) the Active Learning Network for Accountability and Performance (ALNAP) criteria, which were developed for humanitarian interventions.
27 Patton, 2008, p. 37. 28 Ibid., p. 211.
INFO
RMATION
RESOURCES

IOM MONITORING AND EVALUATION GUIDELINES221
Table 5.1. Selecting evaluation criteria
Type of intervention Development intervention Humanitarian intervention
Description
Development interventions focus on responding to ongoing structural issues, particularly systemic poverty, that may hinder socioeconomic and institutional development in a given context.29
Humanitarian interventions focus on saving lives, alleviating suffering and maintaining human dignity during and after human-induced crises and natural disasters, as well as preventing and preparing for them.30
Evaluation criteria
OECD/DAC criteria
Ä ALNAP criteria may also be applied to development interventions, where appropriate.
ALNAP criteria
Ä The revised OECD/DAC criteria may also be applied to humanitarian interventions, where appropriate.
• Relevance• Coherence31 • Efficiency • Effectiveness• Impact • Sustainability
• Appropriateness• Effectiveness• Efficiency• Impact• Coherence• Coverage• Coordination• Connectedness
Evaluation criteria are used to help identify key questions that should be answered during the evaluation. Evaluation questions should be targeted to what is needed and relevant to the evaluation commissioner’s requirements.
The OECD/DAC criteria are commonly used in the evaluation community and were updated and adjusted in 2019, including the addition of a new criterion, “Coherence”. A table reflecting those changes is provided.
The OECD/DAC underscores that the criteria it outlines, and their respective definitions, should be understood within a broader context and be read together with its own, as well as other standards and guidelines for conducting evaluation.
The OECD/DAC prefaces its criteria with the following two principles of use.
29 Humanitarian Coalition, n.d.; Module 6 of IOM Project Handbook, p. 434 (Internal link only).30 Ibid.31 The OECD/DAC adopted revised criteria on 10 December 2019, incorporating one new criterion, “coherence”. The revised criteria and an
explanatory brochure can be found at OECD, n.d.
INFO
RMATION
INFO
RMATION

222 CHAPTER 5 Evaluation
Principle one The criteria should be applied thoughtfully to support high-quality, useful evaluation. They should be contextualized – understood in the context of the individual evaluation, the intervention being evaluated and the stakeholders involved. The evaluation questions (what you are trying to find out) and what you intend to do with the answers should inform how the criteria are specifically interpreted and analysed.
Principle two Use of the criteria depends on the purpose of the evaluation. The criteria should not be applied mechanistically. Instead, they should be covered according to the needs of the relevant stakeholders and the context of the evaluation. More or less time and resources may be devoted to the evaluative analysis for each criterion depending on the evaluation purpose. Data availability, resource constraints, timing and methodological considerations may also influence how (and whether) a particular criterion is covered.32
In addition to the updated definitions, sample evaluation questions related to each criterion are also included.
OECD/DAC and ALNAP evaluation criteria
Criteria Definition Sample evaluation questions
Rel
evan
ce(O
ECD
/DA
C)
Relevance is “[t]he extent to which the intervention objectives and design respond to beneficiaries, global, country, and partner/institution needs, policies, and priorities; and continue to do so if circumstances change.
Note: “Respond to” means that the objectives and design of the intervention are sensitive to the economic, environmental, equity, social, political economy and capacity conditions in which it takes place. “Partner/institution” includes government (national, regional, local), civil society organizations, private entities and international bodies involved in funding, implementing and/or overseeing the intervention. Relevance assessment involves looking at differences and trade-offs between different priorities or needs. It requires analysing any changes in the context to assess the extent to which the intervention can be (or has been) adapted to remain relevant.”33
• Do the intervention’s expected outcomes and outputs remain valid and pertinent either as originally planned or as subsequently modified?
• Are the project activities and outputs consistent with the intended outcomes and objective?
• Do the project activities and outputs take into account relevant policies, guidelines and beneficiary needs?
• Does the project still respond to the needs of the other target groups/stakeholders?
• Is the intervention well-designed (results matrix, Theory of Change (ToC) and risk analysis in particular) to address needs and priorities?
• Is the project aligned with and supportive of IOM national, regional and/or global strategies?
• Is the project aligned with and supportive of national strategies?
• Is the project in line with donor priorities?
32 OECD, 2019, p. 6.33 Ibid., p. 7.

IOM MONITORING AND EVALUATION GUIDELINES223
App
ropr
iate
ness
(ALN
AP)
The analysis of appropriateness examines “[t]he extent to which humanitarian activities are tailored to local needs, increasing ownership, accountability and cost-effectiveness accordingly.”34
• To what extent were tools and technologies used adapted to the local context?
• To what extent were local stakeholders and beneficiaries consulted and involved in the implementation of activities?
• To what extent were the delivered supplies adapted to local needs?
Coh
eren
ce(O
ECD
/DA
C, n
ewly
add
ed in
201
9 an
d A
LNA
P)
Within OECD/DAC, coherence looks at “[t]he compatibility of the intervention with other interventions in a country, sector or institution.
Note: The extent to which other interventions (particularly policies) support or undermine the intervention, and vice versa. Includes internal coherence and external coherence: Internal coherence addresses the synergies and interlinkages between the intervention and other interventions carried out by the same institution/government, as well as the consistency of the intervention with the relevant international norms and standards to which that institution/government adheres. External coherence considers the consistency of the intervention with other actors’ interventions in the same context. This includes complementarity, harmonization and coordination with others, and the extent to which the intervention is adding value while avoiding duplication of effort.”35
ALNAP also uses the criterion of “coherence”.
Within ALNAP, coherence in this context refers to “[t]he extent to which security, developmental, trade and military policies as well as humanitarian policies, are consistent and take into account humanitarian and human rights considerations”.36
• Do synergies exist with other interventions carried out by IOM as well as intervention partners?
• To what extent do the other implemented interventions support or undermine the intervention?
• To what extent is the intervention consistent with international norms and standards to be applied to the existing context?
• To what extent is the intervention consistent with other actors’ interventions in the same context?
• To what extent does the intervention add value/avoid duplication in the given context?
• Are security, developmental, trade and military policies including humanitarian components consistent?
• To what extent are these policies concretely applied during interventions, taking into account humanitarian and human rights considerations?
34 Buchanan-Smith et al., 2016, p. 113.35 OECD, 2019, p. 8.36 Buchanan-Smith et al., 2016, p. 114.

224 CHAPTER 5 Evaluation
Effec
tive
ness
(OEC
D/D
AC
and
ALN
AP)
In the OECD/DAC, effectiveness considers “[t]he extent to which the intervention achieved, or is expected to achieve, its objectives, and its results, including any differential results across groups.
Note: Analysis of effectiveness involves taking account of the relative importance of the objectives or results.”37
ALNAP also uses this criterion similarly. ALNAP defines effectiveness as “[t]he extent to which an activity achieves its purpose, or whether this can be expected to happen on the basis of the outputs.”38
• To what extent did the intervention achieve its objectives, including the timely delivery of relief assistance?
• Have the outputs and outcomes been achieved in accordance with the stated plans?
• Are the target beneficiaries being reached as expected?
• Are the target beneficiaries satisfied with the services provided?
• What are the major factors influencing the achievement of the intervention’s desired outcomes?
• To what extent has the project adapted or is able to adapt to changing external conditions in order to ensure project outcomes?
Cov
erag
e (A
LNA
P)
Coverage is defined as “[t]he extent to which major population groups facing life-threatening suffering were reached by humanitarian action”.39
Ä Coverage can often be included in the analysis of effectiveness.
• Who were the major groups in need of humanitarian assistance? Of these groups, who were provided with humanitarian assistance?
• Is the assistance and protection proportionate to their needs and devoid of extraneous political agendas?
Coo
rdin
atio
n(A
LNA
P)
Coordination is “[t]he extent to which the interventions of different actors are harmonised with each other, promote synergy, avoid prevent gaps, duplication and resource conflicts”.40
Ä Coordination can often be included in the analysis of effectiveness.
• Are the different actors involved in an emergency response coordination?
• Are the point of views from other actors of the overall system taken into account in the intervention strategy?
37 OECD, 2019, p. 9.38 Buchanan-Smith et al., 2016, p. 113. 39 Ibid., p. 114.40 Ibid.

IOM MONITORING AND EVALUATION GUIDELINES225
Effici
ency
(O
ECD
/DA
C a
nd A
LNA
P)
Efficiency within the OECD/DAC considers “[t]he extent to which the intervention delivers, or is likely to deliver, results in an economic and timely way.
Note: “Economic” is the conversion of inputs (funds, expertise, natural resources, time, etc.) into outputs, outcomes and impacts, in the most cost-effective way possible, as compared to feasible alternatives in the context. “Timely” delivery is within the intended time frame, or a time frame reasonably adjusted to the demands of the evolving context. This may include assessing operational efficiency (how well the intervention was managed).”41
ALNAP also includes the criterion of efficiency and considers it to look at “[t]he outputs – qualitative and quantitative – achieved as a result of inputs”.42
• Were the project activities undertaken and were the outputs delivered on time?
• Was the project implemented in the most efficient way compared to alternative means of implementation?
• How well are the resources (funds, expertise and time) being converted into results?
• To what extent are disbursements/provision of inputs for activities implemented as scheduled?
Impa
ct(O
ECD
/DA
C a
nd A
LNA
P)
Impact within OECD/DAC looks at “the extent to which the intervention has generated or is expected to generate significant positive or negative, intended or unintended, higher-level effects.
Note: Impact addresses the ultimate significance and potentially transformative effects of the intervention. It seeks to identify social, environmental and economic effects of the intervention that are longer term or broader in scope than those already captured under the effectiveness criterion. Beyond the immediate results, this criterion seeks to capture the indirect, secondary and potential consequences of the intervention. It does so by examining the holistic and enduring changes in systems or norms, and potential effects on people’s well-being, human rights, gender equality, and the environment.”43
The ALNAP criterion of impact looks at “the wider effects of the project – social, economic, technical and environmental – on individuals, gender and age groups, communities and institutions.” Similar to the OECD/DAC criterion, “[i]mpacts can be intended and unintended, positive and negative, macro (sector) and micro (household).”44
• What significant change(s) does the intervention bring or is expected to bring, whether positive or negative, intended or unintended?
• Does the impact come from the intervention, from external factors or from both?
• Did the intervention take timely measures for mitigating any unplanned negative impacts?
41 OECD, 2019, p. 10. 42 Buchanan-Smith et al., 2016, p. 113. 43 OECD, 2019, p. 11.44 Buchanan-Smith et al., 2016, p. 113.

226 CHAPTER 5 Evaluation
Sust
aina
bilit
y(O
ECD
/DA
C)
Sustainability refers to “the extent to which the net benefits of the intervention continue, or are likely to continue.
Note: Includes an examination of the financial, economic, social, environmental, and institutional capacities of the systems needed to sustain net benefits over time. Involves analyses of resilience, risks and potential trade-offs. Depending on the timing of the evaluation, this may involve analysing the actual flow of net benefits or estimating the likelihood of net benefits continuing over the medium and long-term.”45
• Are structures, resources and processes in place to ensure the benefits generated by the project are continued after the external support ceases?
• Is the project supported by local institutions and well-integrated into local social and cultural structures?
• Do the partners benefiting from the intervention have adequate capacities (technical, financial, managerial) for ensuring that the benefits are retained in the long run, and are they committed to do so?
• To what extent have target groups, and possibly other relevant interest groups and stakeholders, been involved in discussions about sustainability?
• Do the target groups have any plans to continue making use of the services/products produced?
Con
nect
edne
ss(A
LNA
P)
Connectedness looks at “[t]he extent to which activities of a short-term emergency nature are carried out in a context that takes longer-term and interconnected problems into account”.46
Ä Adds a humanitarian dimension to sustainability.
• To what extent are the project activities connected to longer-term development concerns?
• What steps have been taken to promote retention of gains from these interventions?
The focus on given criteria may change at different stages of the intervention life cycle. In an ex-ante evaluation, the focus could be on relevance, while for a midterm evaluation, it could shift towards effectiveness and efficiency so that recommendations for improvement can be made during implementation. By the end of the life cycle, final and ex-post evaluations are better able to assess the overall performance, sustainability and impact of the intervention. However, the evaluation criteria must always take account of the specific requirements of the evaluation and the interest of end users of the evaluation and of other stakeholders.
The evaluation commissioner and/or manager, in consultation with relevant stakeholders, select the evaluation criteria to be used and the questions to be answered. The criteria selected must clearly be spelled out in the ToR and properly reflect the purpose and scope of the evaluation.
Buchanan-Smith, M., J. Cosgrave and A. Warner 2016 Evaluation of Humanitarian Action Guide. Active Learning Network for Accountability and
Performance/Overseas Development Institute (ALNAP/ODI), London.
Humanitarian Coalition n.d. From humanitarian to development aid.
45 OECD, 2019, p. 12.46 Buchanan-Smith et al., 2016, p. 114.
RESOURCES

IOM MONITORING AND EVALUATION GUIDELINES227
Organisation for Economic Co-operation and Development (OECD)2019 Better Criteria for Better Evaluation: Revised Evaluation Criteria Definitions and Principles for Use.
OECD/DAC Network on Development for Evaluation.
2021 Applying Evaluation Criteria Thoughtfully. OECD Publishing, Paris.
n.d. Evaluation criteria. OECD/DAC criteria for evaluating development assistance.
5.2.2. Prepare evaluation terms of reference
• Define the purpose and evaluability of evaluation• Prepare evaluation terms of reference (ToR)• Select evaluator(s)
Planning for evaluation
The evaluation ToR are a key framing and planning tool for managing an evaluation, as this provides clear and detailed specifications on the objectives and scope of the evaluation, as well as the roles and responsibilities of the parties involved, such as the evaluation manager, the evaluator(s) the evaluation users and/or possible partners. They also provide information on the timing, methodology and budget of the evaluation. Poorly developed ToR can cause confusion and result in expectations, and focus, that may differ between the involved parties. Having a clear understanding of the different evaluation types and criteria outlined in the previous sections will help formulate the evaluation ToR. The ToR are part of the contractual agreement between IOM and contacted evaluators, as they outline evaluator obligations at all stages of the process, as well as the evaluation commissioner and/or manager expectations.
In IOM, it is almost always the organization itself that commissions the evaluation, but sometimes donors may stipulate that they will conduct an evaluation at their level. The entity responsible for commissioning the evaluation is usually responsible for preparing the evaluation ToR. In the case of jointly commissioned evaluations, such responsibilities can be shared between participating entities. In all cases, IOM, its partners, when relevant, and the donor should review and agree on the ToR prior to their finalization.
Figure 5.7. Overview of key components of terms of reference
INFO
RMATION
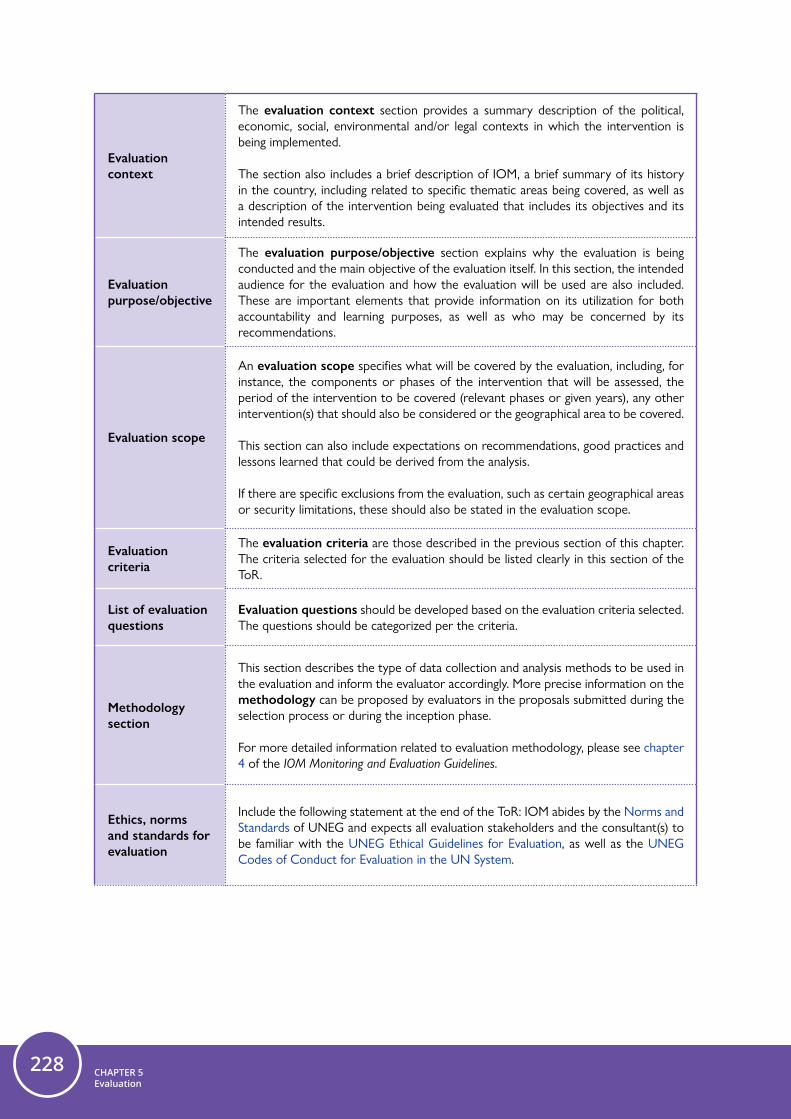
228 CHAPTER 5 Evaluation
Evaluation context
The evaluation context section provides a summary description of the political, economic, social, environmental and/or legal contexts in which the intervention is being implemented.
The section also includes a brief description of IOM, a brief summary of its history in the country, including related to specific thematic areas being covered, as well as a description of the intervention being evaluated that includes its objectives and its intended results.
Evaluation purpose/objective
The evaluation purpose/objective section explains why the evaluation is being conducted and the main objective of the evaluation itself. In this section, the intended audience for the evaluation and how the evaluation will be used are also included. These are important elements that provide information on its utilization for both accountability and learning purposes, as well as who may be concerned by its recommendations.
Evaluation scope
An evaluation scope specifies what will be covered by the evaluation, including, for instance, the components or phases of the intervention that will be assessed, the period of the intervention to be covered (relevant phases or given years), any other intervention(s) that should also be considered or the geographical area to be covered.
This section can also include expectations on recommendations, good practices and lessons learned that could be derived from the analysis.
If there are specific exclusions from the evaluation, such as certain geographical areas or security limitations, these should also be stated in the evaluation scope.
Evaluation criteria
The evaluation criteria are those described in the previous section of this chapter. The criteria selected for the evaluation should be listed clearly in this section of the ToR.
List of evaluation questions
Evaluation questions should be developed based on the evaluation criteria selected. The questions should be categorized per the criteria.
Methodology section
This section describes the type of data collection and analysis methods to be used in the evaluation and inform the evaluator accordingly. More precise information on the methodology can be proposed by evaluators in the proposals submitted during the selection process or during the inception phase.
For more detailed information related to evaluation methodology, please see chapter 4 of the IOM Monitoring and Evaluation Guidelines.
Ethics, norms and standards for evaluation
Include the following statement at the end of the ToR: IOM abides by the Norms and Standards of UNEG and expects all evaluation stakeholders and the consultant(s) to be familiar with the UNEG Ethical Guidelines for Evaluation, as well as the UNEG Codes of Conduct for Evaluation in the UN System.

IOM MONITORING AND EVALUATION GUIDELINES229
Cross-cutting themes
The coverage of cross-cutting themes should be explained in the ToR within the evaluation scope section, as well as in a specific subsection to the evaluation questions listed or through specific questions under the relevant criteria. In addition, in the evaluation methodology, evaluators could be asked to consider evaluation approaches and methods that properly address cross-cutting issues (for instance, in the collection of data and presenting data disaggregated by sex, geographic location and income).
Evaluation ToR should attempt to cover all cross-cutting themes (in IOM mainly gender, human rights, environment, accountability to affected populations in emergencies) or explain if certain themes may not be covered.
Annex 5.3. Incorporating cross-cutting themes at IOM provides a detailed description of the cross-cutting themes used in IOM, as well as guiding questions for incorporating cross-cutting themes into M&E.
Budget
This section specifies the resources that are available to conduct an evaluation, including in-kind support provided by IOM, such as transportation and translation.
The section also outlines which costs related to the evaluation will be covered by IOM and which are to be covered by the consultant or service provider. These include the consultancy fee, travel, daily subsistence allowance, as well as any data collection or technical costs to be considered.
For more information regarding budgeting for evaluation, see Annex 5.1. Budgeting for evaluation.
Specification of roles
This section specifies the roles of those involved in the evaluation to inform all parties of the tasks they need to accomplish and what is expected of them. Examples of this include providing general information about project management and relevant focal points, such as those tasked with facilitating access to project-related documentation or setting up meetings and collecting data from project partners.
An evaluation could require the set-up of a committee, such as a reference group, a management committee or a learning group. If this takes place, it would need to be highlighted here. These are particularly useful, and recommended, for complex evaluations (multi-country, multiprogramme), with multiple stakeholders, and can ensure a participatory approach throughout the evaluation.
Time schedule
An indicative time schedule sets out, in chronological order, the dates by when tasks need to be accomplished or products handed over, the amount of time allocated for the completion of tasks and products and who is responsible for the completion of each task or product. It can also include the dates of field visits or surveys to be conducted.
Deliverable section
The section specifies the products to be generated at various stages of the evaluation process, as well as who will be responsible for each deliverable (considering, however, that it will be mainly related to the work of the evaluator).
The list of deliverables is likely to include the evaluation matrix (see Information box for more details) and/or inception report, the draft evaluation report to be submitted for comments and the final evaluation report and evaluation brief. It can also include information on an initial presentation of findings or workshop for presenting the final report to main stakeholders. For further information, please see subsection on Evaluation deliverables.

230 CHAPTER 5 Evaluation
ToRs can be shared with the regional M&E officers or OIG for quality checking prior to being finalized.
IOM resourcesn.d.a IOM Checklist - Evaluation ToR (Internal link only).
Annex 5.4. Evaluation terms of reference template (Internal link only).
Annex 5.5. Sample evaluation matrices for a development-oriented project and a humanitarian project (Internal link only).
5.2.3. Select evaluator(s)
• Define the purpose and evaluability of evaluation• Prepare evaluation terms of reference (ToR)• Select evaluator(s)
Planning for evaluation
As part of the planning phase, once the purpose and evaluability of a planned evaluation have been defined and the ToR for the evaluation has been elaborated, a selection process for evaluator(s) must take place, in line with what has already been agreed in the project proposal and/or ToR.
Internal versus external evaluators
The following table provides some tips on the benefits of using internal or external evaluator(s):
Internal evaluator(s) External evaluator(s)
• Familiar with the context and object of the study.
• May lead to greater acceptability of the findings by IOM colleagues.
• Less expensive.• Well placed to understand IOM, its mandate
and operations. • Can continue building on the evaluation over
time with the utilization of evaluation results.• Can learn from the evaluation experience and
apply it to one’s own work.
• Could ensure the inclusion of independent and external views in the analysis.
• Can bring new perspectives and lessons learned from similar non-IOM projects that has been evaluated.
• Generally perceived to be unbiased, as not influenced by internal factors, and with relevant evaluation expertise.
• Could be more familiar with ethical and independence principles to be applied for the conduct of an evaluation.
Note: Adapted from Module 6 of IOM Project Handbook, p. 440 (Internal link ony).
RESOURCES
TIP

IOM MONITORING AND EVALUATION GUIDELINES231
A meta-evaluation covering IOM evaluations conducted from 2017 to 2019 indicated that the level of quality of the evaluation did not differ between internal and external evaluations.
A mixed team of internal and external evaluators can be used, with the roles and responsibilities defined by their strengths highlighted above. An external evaluator could, for instance, benefit from the knowledge of the organization of the internal evaluator to prepare the inception report and focus on methodology given her/his evaluation expertise.
Considerations for selecting an internal versus external evaluator
Based on the benefits listed above, the following considerations are useful for selecting an internal evaluator versus an external evaluator:
• Budget availability; • Understanding of the thematic area and context; • Technical competencies required; • Existing workload of the IOM staff to be approached as internal evaluator; • Expertise in data collection and analysis methodology.
The expected duration, timing and complexity of the evaluation may also impact the choice. An evaluation may require significant time and travel to various locations; this may have implications for using an internal evaluator, who would still need to perform the regular tasks when conducting the evaluation and may only be available for a shorter field visit. The supervisor of the internal evaluator may also object to release the staff for a longer duration and absence. To complete their evaluation, internal evaluators may need to work on an evaluation report over the course of an average period of three months, while fulfilling the responsibilities of their full-time position.
The question of timing and constraints related to the selection of an evaluator, therefore, needs to be considered and the recruitment process initiated well in advance of the planned start date of the evaluation exercise by the evaluator(s). Recruiting an external evaluator requires IOM to issue a call for evaluator(s) to organize a selection process and have the contract approved and signed according to relevant procedures, which may also take some time. Such procedures are not needed for an internal evaluator, but the availability of an internal evaluator needs to be negotiated with the potential evaluator’s supervisor within IOM, and more time may be required to complete the exercise given the internal staff’s ongoing tasks, as specified above.
Selecting evaluator(s)
In parallel to the decision to select an internal or external evaluator, the use of multiple evaluators instead of a single evaluator can also be considered. For instance, a team may be required if specific expertise is required to analyse the performance of an intervention (such as an engineer to review a construction-related programme component or a health expert to review the response to a specific disease within a programme) or if additional national evaluators can bring an added value to the exercise (such as in case of complex interventions that require good knowledge of national context, stakeholders or politics). The evaluation commissioner, the evaluation manager or management committee can determine which option is best suited to the task, include it in the ToR and adjust the selection process accordingly.
INFO
RMATION

232 CHAPTER 5 Evaluation
The main points for consideration in the choice between a single evaluator or a team can be summarized as follows:
(a) Complexity of the evaluation: Should the evaluation require significant data collection, in-depth and multiple field visits, have a multi-country scope, a combination of specific evaluation methods, involve multiple languages or require a national evaluator perspective, an evaluation team may be best suited to conduct the evaluation.
(b) Duration of the evaluation: If the evaluation time frame is short, it may be better to consider a team, where the members can work together and complete the evaluation within a shorter time frame.
(c) Multiple areas of expertise: If an evaluation requires different areas of very specific expertise that may not be found within one evaluator, it may be necessary to consider selecting an evaluation team that can meet the requirements through its various members.
Selection process
The following section discusses the selection process for hiring an external evaluator or evaluators; this can be done mainly by applying the following: (a) recruitment of an individual consultant; or (b) engagement of a consulting firm or service provider. This process applies to external evaluator(s) only, as internal evaluators in IOM have been pre-identified at the global and regional levels and may be engaged through direct negotiation with the identified evaluator(s) supervisor.
Looking for an internal evaluator
IOM offices who are interested in an internal evaluation should contact their designated regional M&E officer after developing the ToR for the evaluation. The regional M&E officer will help to identify an available evaluator based on the existing global or regional roster.
Selecting individual consultants
For the recruitment of a single evaluator, a call for evaluator(s) is issued, including the evaluation ToR (see Annex 5.4. Evaluation terms of reference template) and the following additional elements:
• Requirements: This is the list of competencies required for the individual;
• Instructions for the submission of the application: This should include what additional documents are expected to be submitted as part of the application, such as previous evaluation reports. It should also include the deadline for the submission of the application and the contact details for the person to whom the application should be sent.
TIP

IOM MONITORING AND EVALUATION GUIDELINES233
OIG/Evaluation and IOM regional M&E officers maintain a roster of external consultants and service providers (Internal link only) with detailed information on the expertise, languages, specializations and others.47 The call for evaluator(s) can be shared via internal IOM SharePoint to pass on or through existing listservs, such as MandENews, UNEG, XCeval, International Program for Development Evaluation Training and ALNAP. These can be accessed publicly, through the regional M&E officers or OIG. Selected evaluators from the roster based on the needs can also be contacted for submitting a proposal if interested.
Once the applications are received, the evaluation manager/committee assesses them and shortlists applicants. IOM has developed a scorecard for the assessment of applications (see Annex 5.6) for evaluations, which is a helpful tool in the selection process. Once the selection is completed, the evaluation manager and/or programme manager prepare a contract, in accordance with IOM instructions on hiring consultant(s) (IN/84 Guidelines for Selection and Employment of Consultants (Internal link only)).
Selecting a consulting firm
For the selection of an evaluation team, a request for proposal is issued in accordance with IOM procurement instructions as per the IOM Procurement Manual (Internal link only). A template for the Request for Proposal (RFP) for evaluations is available here in the event that a consulting firm is needed (Internal link only).
IOM staff are strongly encouraged to determine in advance whether a single evaluator or a team may be required for an evaluation. In the event that this cannot be done in advance, then staff should reach out to their respective regional M&E officer or OIG/Evaluation for further information on selecting evaluators and processes that could help them.
Annexes• Annex 5.4. Evaluation terms of reference template (Internal link only).• Annex 5.6. IOM scorecard for assessment of applications for evaluations commissioning evaluators
(Internal link only).• Annex 5.12. Request for Proposals (RFP) template
IOM resources2006 Guidelines to the Differences between Individual and Service Provider Contracts (IN/73)
(Internal link only).
2007 Guidance for Selection and Employment of Consultants (IN/84) (Internal link only).
2016a IOM Procurement Manual: Procurement of Goods, Works and Services (IN/168 rev. 2) (Internal link only).
2021 Changes to Procurement, Implementing Partners Selection and Related Contracting Procedures (IN/284) (Internal link only).
n.d.b Evaluation and Monitoting Portal (Internal link only).
Ä Ensure that clauses related to data protection and confidentiality, as well as PSEA are included incontracts.
47 Evaluation and Monitoring Portal, available internally to IOM staff via the IOM intranet.
INFO
RMATION
INFO
RMATION
RESOURCES

234 CHAPTER 5 Evaluation
Attention should also be drawn, and the documents provided to consultants if necessary, to the following:
IOM resource2010 IOM Data Protection Manual. Geneva.
Other resourcesUnited Nations Evaluation Group (UNEG)
2010a UNEG Quality Checklist for Evaluation Terms of Reference and Inception Reports. Guidance Document, UNEG/G/(2010)1.
2008 UNEG Code of Conduct for Evaluation in the UN System. Foundation Document, UNEG/FN/CoC(2008).
2016 Norms and Standards for Evaluation. New York.
2020 UNEG Ethical Guidelines for Evaluation.
5.3. Undertaking evaluation• Supervise evaluation implementation and workplan• Evaluation deliverables• Provide feedback on all phases of the evaluation• Ensure evaluation quality
Undertaking evaluation
Once the evaluator(s) is/are commissioned, the evaluation work itself can start and the evaluation manager has three main tasks to perform:
(a) Supervising the evaluation implementation and workplan. (b) Providing feedback on the activities conducted for the development of the report and on the
draft report itself.(c) Ensuring quality requirements are understood and quality review is monitored.
The evaluator(s) will complete the evaluation during this phase. This section of the chapter, therefore, also provides information on the expected deliverables that the evaluator(s) should complete during the course of the evaluation. This is summarized in the section of this chapter, Evaluation deliverables.
5.3.1. Supervise evaluation implementation and workplan
• Supervise evaluation implementation and workplan• Evaluation deliverables• Provide feedback on all phases of the evaluation• Ensure evaluation quality
Undertaking evaluation
The process of overseeing the implementation of the evaluation implies not only supervising the evaluator(s), but also managing and organizing the collection of documents and other materials for the evaluation, organizing the field visits, interviews and written surveys, as well as maintaining communication with key stakeholders.

IOM MONITORING AND EVALUATION GUIDELINES235
When organizing evaluation activities, evaluation managers should keep in mind the demands made of stakeholders, beneficiaries and affected populations with regard to the time, resources and effort that they must invest to provide evaluation-related data. In addition to obtaining informed consent (see chapter 2: Norms, standards and management for monitoring and evaluation), be sure to inform all relevant parties from whom data will be collected of what will be asked of them in advance and in an organized manner. Keep in mind other ongoing monitoring and implementation-related activities that may make similar demands to avoid overburdening key stakeholders.
At the outset of this phase, the evaluation manager, evaluation commissioner, evaluation management committee (if present) and selected evaluator(s) should jointly review the ToR to ensure that there are no comments, questions or key points that need to be renegotiated. It is also standard practice to have a management meeting at the beginning of the evaluation process to ensure that the evaluation manager, evaluator(s) and stakeholders (if relevant) all share a common understanding of the evaluation process and various roles and responsibilities. Furthermore, evaluators should be requested to develop an inception report. This will provide insight into their understanding of the evaluation ToR, as well as useful information on the way they will conduct the evaluation (for further information on the inception report, see the section, Evaluation deliverables). Any changes that result from reviewing the inception report should be well documented and reflected in the relevant documents and/or ToR. At this stage, the evaluation manager should have already provided the evaluator(s) with the key documents to start the evaluation, and additional resources can be shared when the final agreement on the work to complete is reached.
In addition to intervention-specific documents, in order to support evaluators in their process and ensure that they abide by the expectations for all IOM evaluations, evaluation managers should provide certain key documents:
(a) IOM Guidance for Addressing Gender in Evaluations: This document provides practical guidance for ensuring that gender is properly addressed in evaluation;
(b) IOM Gender and Evaluation Tip Sheet: This tip sheet provides a short guide to help staff involved in managing and conducting evaluations develop gender-sensitive M&E scope of work, methodologies and findings. For more detailed guidance, including examples of gender-sensitive criteria, indicators and findings.
(c) A copy of this chapter (chapter 5) of the IOM Monitoring and Evaluation Guidelines, with a particular emphasis on the Evaluation deliverables section, so that they understand the components expected;
(d) A copy of the IOM templates for Inception reports, Evaluation matrix and Evaluation reports that can serve as a guide;
(e) Links to the quality checklist tools from UNEG (and IOM), so that they understand how evaluations will be reviewed;
(f) Annex 5.10. Evaluation brief template and guidance.
The clear definition of the roles and responsibilities of all parties directly involved in the evaluation is also essential for a sound implementation, with each individual having tasks to complete and deadlines to respect in order to ensure quality.
INFO
RMATION
TIP

236 CHAPTER 5 Evaluation
5.3.2. Evaluation deliverables
• Supervise evaluation implementation and workplan• Evaluation deliverables• Provide feedback on all phases of the evaluation• Ensure evaluation quality
Undertaking evaluation
Evaluators are expected to provide several key deliverables, which should be clearly stated in the ToR. Each of these deliverables are outlined below, with key information concerning their content and potential structure.
Inception report
The inception report is the first main deliverable that is provided by the evaluator. This report should be written following an initial document review and meetings with the evaluation manager or management committee. This document reveals the evaluator(s)’ understanding of the evaluation exercise, how each evaluation question will be answered and the intended data collection methods. The Inception report template is available in Annex 5.7.
Inception reports should always be requested in an evaluation ToR for external consultants. In the case of an internal evaluation, an evaluation matrix will be sufficient as it will help to frame the understanding of the exercise by the internal evaluator.
One key element of the inception report is the evaluation matrix. An evaluation matrix is a tool for guiding the evaluation by specifying the following: (a) criteria being assessed by the evaluation; (b) questions and subquestions that will be answered to assess each criterion; (c) indicators to be used to guide the assessment; (d) sources of data; and I data collection tools. It can clearly represent how the evaluation will be conducted, although it does not replace the need for a full inception report. For examples of evaluation matrices for a development and humanitarian project, see Annex 5.5. IOM sample evaluation matrices for a development-oriented project and a humanitarian project.
Progress reports
It is encouraged that evaluator(s) regularly report on the progress made while conducting the evaluation, so the evaluation manager or committee can periodically monitor how well data collection is going and if the methodologies selected for the evaluation are being properly used. The purpose of this is to ensure that when problems are encountered in the data collection process that could adversely affect the quality of the evaluation (such as the cancellation of scheduled meetings, unmet target numbers of interview or survey respondents or basic documents not properly reviewed), corrective measures can be introduced in a timely manner. Progress reports do not need to be lengthy and can be provided in an email or during regular meetings. Furthermore, the need for progress reports may vary depending on the duration and complexity of the evaluation.
The evaluation management should ensure that suitable logistical arrangements are made for data collection. If circumstances outside of IOM or the evaluator’s control occur (such as weather, social or political events that prevent some site visits), the evaluator(s) and the evaluation management should examine whether these circumstances will affect the quality and credibility of the exercise and in case, discuss relevant methodological and practical alternatives.

IOM MONITORING AND EVALUATION GUIDELINES237
Debrief of initial findings
Initial findings should be presented at the end of the field visit or the data collection phase, providing an opportunity for relevant parties – such as government stakeholders, donors, beneficiaries or implementing partners – to identify any misinterpretation or factual mistake at an early stage before report writing. This can be done in the form of a PowerPoint or short report; it should be added as a deliverable if expected.
Evaluation report
The evaluation report should first be provided in draft format to allow stakeholders to provide comments (see section, Provide feedback on all phases of the evaluation). After the evaluator receives the consolidated feedback, he/she should revise the report as necessary and submit the final version.
Ä Final evaluation reports are to be written in one of IOM’s official languages. If not possible, a summary of the findings and recommendations should be prepared in one of IOM’s official languages.
Although IOM does not oblige all evaluators to use the same reporting format, evaluator(s) are expected to address all the following components:
• Title page, including the title of the evaluation, date of completion (such as the date that the draft report is submitted) and the name of the evaluator(s) or evaluation firm(s);
• Executive summary, including an explanation of the project background, overview of evaluation background, concise description of the evaluation methodology, summary of all evaluation findings, summary of all conclusions, summary of all lessons learned and good practices and a summary of all recommendations;
• Project background, including a brief overview of contextual factors, clear and relevant description of key stakeholders, description of intervention logic and funding arrangements;
• Evaluation background, including an explanation of the purpose of the evaluation, description of evaluation scope and list of evaluation clients and main audience for the report;
• Evaluation approach and methodology, including a statement of the evaluation approach, evaluation questions and criteria (providing a justification for their use or lack thereof), methodology used, inclusion of cross-cutting themes, stakeholder participation, limitations of the evaluation and description of evaluation norms and standards;
• Evaluation findings per criteria that are complete (all questions are addressed and findings aligned with purpose, questions and approach), robust (findings are justified by evidence and data disaggregated by key variables), identify causal factors that led to accomplishments and failures and adequately address IOM cross-cutting themes;
• Conclusions that are based on and clearly linked to the evidence presented in the Evaluation findings section and that are, to the extent possible, objective and clearly justified;
• Recommendations that are clear and concise, based on findings and/or conclusions of the report are relevant, identify the person responsible for their implementation and that are actionable;
• Lessons learned that are relevant, specific to the context, targeting specific users and applicable; • Good practices that concisely capture the context from which they are derived and specify target
users, are applicable and replicable and demonstrate a link to specific impacts that are realistic.
It is on the basis of the report that quality assessment/assurance/control will take place (see this chapter’s section on how to ensure evaluation quality).
Ä More detailed guidance for each evaluation report component is provided in Annex 5.8. IOM evaluation report components template. A template for reporting is provided in Annex 5.9. IOM final evaluation report template.

238 CHAPTER 5 Evaluation
Evaluation brief
An evaluation brief should be developed by the evaluators after the final report has been completed. A template for this will be provided for by IOM developed on Microsoft Publisher. The brief provides a short overivew of the evaluation, ensuring that conclusions, recommendations, lessons learned and good practices are provided. Guidance for the evaluation brief is provided in Annex 5.10. Evaluation brief template and guidance.
Final presentation of the evaluation
A final presentation of the evaluation may be expected for some evaluations that would once again provide an overview of the key elements of the evaluation with a strong focus on the findings, conclusions and recommendations. Other deliverables presenting the evaluation, such as a PowerPoint presentation or infographic, may also be requested from the evaluator. In the event this kind of deliverable is anticipated, it should be clearly stated within the deliverable section of the evaluation ToR.
Preliminary management response matrix
Evaluator(s) should prepare a draft management response matrix by inserting the recommendations, as well as indicative time frame or deadline for implementation. This draft matrix will then be shared with the evaluation manager, who will then liaise with relevant IOM management and staff to complete the matrix. If a draft management response matrix is expected from the evaluator(s), its preparation should be agreed upon at the start of the evaluation as a part of the evaluator’s deliverables.48
For more information regarding the management response matrix, see this chapter’s section on Follow-up and using evaluation. A management response matrix template is available in the OIG/Evaluation publication, Management Response and Follow-up on IOM Evaluation Recommendations.
5.3.3. Provide feedback on all phases of the evaluation
• Supervise evaluation implementation and workplan• Evaluation deliverables• Provide feedback on all phases of the evaluation• Ensure evaluation quality
Undertaking evaluation
Reviewing and providing feedback to the draft evaluation report is a critical step in the evaluation process. Involving the evaluation commissioner, manager (or management committee), as well as other key stakeholders in the process also ensures that all the intended evaluation users will receive the information that they need. If this is not undertaken properly, there is a risk that the evaluation may be discredited by its users once it is published. This step allows for a transparent and open process to review the evaluation prior to finalization.
48 IOM, 2019.

IOM MONITORING AND EVALUATION GUIDELINES239
Involving key stakeholders in providing feedback
Key stakeholders should have an opportunity to comment on the report, which is common with participatory approaches. If a reference group or other stakeholder engagement mechanism has been established for the purpose of the evaluation, their involvement in this process can guarantee broader participation in the feedback loop. External stakeholders can include partners, donors and beneficiaries. Internal IOM stakeholders can include CoMs, regional thematic specialists and other staff who have contributed to implementation (for instance, from other programmes that have influenced the implementation of the programme evaluated).
When the draft report is provided by the evaluator(s), the evaluation manager should coordinate the comments and responses and consolidate all feedback to present it back to the evaluator(s) without delay. Feedback should focus on the technical aspects of the evaluation and factual evidence. Bear in mind that the evaluator is required to make factual corrections but is not required (and should not be requested) to revise findings, conclusions or recommendations in a manner not consistent with presented evidence, as this contravenes evaluation ethics.
In case significant issues surface in the final stage of reporting, the evaluator and manager should reassess the process and develop a plan to address those identified issues. The challenges should be thoroughly assessed to determine if mistakes have been made and whether they can be corrected. All parties can also ensure that the recommendations in the report are acceptable and actionable.
If the evaluation manager and evaluator(s) do not reach an agreement on the interpretation of data and/or on the conclusions and recommendations that flow from that interpretation, the evaluation manager can prepare a management opinion, highlighting the disagreements with justifications.49
In general, the final report review process should not be another opportunity to provide new information for the evaluation, as relevant information should have been provided during the data collection and analysis phases. However, if new relevant information has just become available, or a recent or concurrent event has had an impact on the analysis or recommendations (as it has happened with the COVID-19 unexpected crisis), the evaluation manager should discuss it with the evaluator, and additional time can be allocated to incorporate the new data and information into the report or into an addendum (for instance, examining how COVID-19 affects the recommendations already made).
Regional M&E officers and/or OIG/Evaluation can assist if there is a disagreement on the findings, conclusions and recommendations of an evaluation report.
After the evaluator receives the consolidated feedback, she/he should revise the report as necessary, and submit the finalized version.
49 For further reference, see IOM, 2019, p. 5.
INFO
RMATION
INFO
RMATION

240 CHAPTER 5 Evaluation
5.3.4. Ensure evaluation quality
• Supervise evaluation implementation and workplan• Evaluation deliverables• Provide feedback on all phases of the evaluation• Ensure evaluation quality
Undertaking evaluation
Communication on the progress of the evaluation is key for guaranteeing quality and relevant reporting, and each party has a role to play, in particular at the level of the evaluation management and the evaluator(s). Maintaining quality standards for an evaluation is particularly important, as it also enhances the credibility and objectivity of the exercise. Quality standards ensure that evaluations are conducted in line with the procedural and technical requirements, as well as with the evaluation norms and standards, applied in the organization.50 They also contribute to the provision of accurate and useful information and to regularly monitor the quality of the evaluations.
Each evaluation actor can contribute to achieving quality standards by providing relevant inputs. Quality control is the primary responsibility of the evaluation manager, who should ensure that an evaluation is conducted in line with the IOM Evaluation Policy and Guidance, as well as any requirements and standards agreed upon with other stakeholders, for instance the intervention donor.51 The evaluation manager and evaluator(s) have the responsibility to guarantee conformity with established quality standards in the carrying out of activities at all stages of the evaluation process.
Key roles and activities to ensure a high-quality evaluation52
The evaluation manager should:
• Ensure that the evaluation objectives are clear and that the methodologies and activities implemented by the evaluator(s) will contribute to reaching them;
• Maintain ownership of the evaluation by ensuring that the decision-making responsibility is retained and that decisions are made in a timely manner;
• Monitor the progress of the evaluation and provide relevant and timely feedback and guidance to the evaluator(s);
• Consider and discuss suggestions from evaluators of possible solutions, if problems arise; • Discuss and ensure agreement on communication protocols, from the beginning, with all evaluation
actors; • Ensure evaluators, the evaluation commissioner and evaluation committees have full access to
information from the beginning; • Meet with evaluators, the evaluation steering committee and stakeholders to discuss draft reports
and revisions;• Approve the final report and organize a presentation of the evaluation findings for stakeholders; • Provide a management response that responds to all recommendations for follow-up.
50 For its quality standards, IOM uses the UNEG Norms and Standards for Evaluation of June 2016. For more information, see chapter 2, Norms, standards and management for monitoring and evaluation.
51 Quality control is defined as “part of quality management focused on fulfilling quality requirements”. It is one activity related to quality assurance, which is “part of quality management focused on providing confidence that quality requirements will be fulfilled”. Quality control efforts should be done at the level of evaluation management, and quality assurance is the responsibility of the centralized evaluation function within an organization. See definitions from ISO 9000:2015: Quality management systems on ASQ, n.d.
52 Adapted from World Bank, 2015.

IOM MONITORING AND EVALUATION GUIDELINES241
The evaluator(s) should:
• Conduct the evaluation within the allotted time frame and budget;• Ensure implementation of proper methodologies for conducting surveys and analysis of data/results; • Provide regular progress reports to the evaluation manager/committee and communicate problems
that require their attention in a timely manner; • Ensure that the process of commenting on the draft report is well organized and includes feedback
on the corrections and clarifications on misinterpretations; • When requested, make a presentation of the initial findings during the conduct of the evaluation (if
possible, for beneficiaries as well).
OIG recommends using the UNEG quality checklists for reviewing adherence to quality standards. Two different lists have been developed in line with the UNEG Norms and Standards: (a) UNEG Quality Checklist for Evaluation Terms of Reference and Inception Reports; and (b) UNEG Quality Checklist for Evaluation Reports.
IOM plans to publish its own quality control/assurance tool to be used by evaluation managers when reviewing reports.53
The UNEG analytical frameworks for assessing the evaluation quality (see Resources section) should be provided to evaluators to ensure that they have good understanding of IOM’s expectations for the quality of the evaluation. The same can also be used by evaluation managers and regional M&E officers during the drafting of ToR and inception reports, as well as in the review of the evaluation report.
If engaged evaluator(s) produce a poor-quality inception report, evaluation management should offer the opportunity to the evaluator(s) to amend the inception report until a consensus is reached on its quality. If the inception report continues to be unsatisfactory and is included in the key deliverables, consideration should be given to terminate the contract, instead of taking the risk of receiving a final product of poor quality. The regional M&E officers and/or OIG/Evaluation can also be contacted to provide advice on the negotiation process with the evaluator(s) and on the decision to terminate the contract.
It is important that the contract with the evaluator(s) is structured in such a way that enables evaluation management to respond appropriately, by including a clause that states that IOM reserves the right to withhold payment, in full or in part, if the services are not provided in full or are inadequate. The same can be applied for finalization of the draft evaluation report, allowing for the final payment to be withheld if quality is not met after several attempts to correct it.
Ä Regional M&E officers and/or OIG/Evaluation are available to assist in quality settings and, in coordination with IOM Office of Legal Affairs, if contractual measures need to be taken in cases where quality standards are not met.
53 The forthcoming tool will be used as a checklist and guide for quality control, undertaken by the evaluation manager, and will be expanded upon, as with ratings for quality assurance purposes. The same tool will be used to develop a quality assurance mechanism, which will allow for the systematic assessment of evaluation reports to ensure that quality standards are maintained.
INFO
RMATION
TIP

242 CHAPTER 5 Evaluation
IOM resource2019 Management Response and Follow-Up on IOM Evaluation Recommendations. OIG/Evaluation.
(Internal link only).
Other resourcesAmerican Society for Quality (ASQ)
n.d. Quality assurance and quality control.
World Bank2015 Managing Evaluations: A How-To Guide for Managers and Commissioners of Evaluations. Washington,
D.C.
ToolsUnited Nations Evaluation Group (UNEG)
2010a UNEG Quality Checklist for Evaluation Terms of Reference and Inception Reports. Guidance Document, UNEG/G(2010)1.
2010b UNEG Quality Checklist for Evaluation Reports. Guidance Document, UNEG/G(2010)/2.
5.4. Follow-up and using evaluation
• Follow-up on the implementation of recommendations and use of the report
• Using and disseminating the evaluationFollow-up and using evaluation
A common misconception about managing an evaluation is that the evaluation process is considered finished once the final report is submitted and approved. In fact, the conduct and then approval of the report represent the first two thirds of the process, but the main raison d’être and benefit of an evaluation lies within the final third of the process, namely the use of the report, its findings and recommendations.
The final third
• Use and follow-up of evaluation findings and recommendations.• Internal and external promotion for replication and learning.• Use for other purposes, such as synthesis evaluations or meta evaluations.
5.4.1. Follow-up on implementation of recommendations and use of the report
• Follow-up on the implementation of recommendations and use of the report
• Using and disseminating the evaluationFollow-up and using evaluation
RESOURCES

IOM MONITORING AND EVALUATION GUIDELINES243
After the final report is approved, the evaluation commissioner or manager should work on the follow-up to the evaluation recommendations, in coordination with senior management and the project stakeholders, as appropriate. The evaluation commissioner and manager should consider and discuss with relevant entities how the findings of the report will be communicated to a broader audience as well. The evaluation manager will then finalize the management response matrix drafted by the evaluator, in line with the instructions provided in the IOM publication, Management Response and Follow-Up on IOM Evaluation Recommendations.
The management response matrix is a tool to:
• Indicate if the evaluation recommendations are accepted, partially accepted or rejected. • Describe the follow-up actions to be taken to address the recommendations. • Indicate the deadline for follow-up actions taken and who is responsible for each action. • Monitor the implementation of the follow-up action. • Facilitate integration of accepted evaluation recommendations into future actions.
It is a monitoring tool that must be referred to on a regular basis until all the follow-up actions have been implemented or are no longer applicable. The relevant use of evaluations as an accountability tool should be done in a timely manner; therefore, it is recommended to complete follow-up actions and the review process within 18 months of the evaluation’s final submission, even when not all follow-up actions have been finalized. The monitoring of the implementation of the management response matrix can be assigned to specific staff within the office. Progress on the follow-up actions included in the matrix should be shared with relevant entities, as well as with the regional M&E officers and OIG/Evaluation for their records.
The management response matrix can either be filled out directly in PRIMA or the Word version can be uploaded directly to PRIMA. Programme and project managers will receive a reminder to fill out the management response matrix, and 12 months after the evaluation report has been completed, another reminder will be sent to update on the status of the recommendations.
5.4.2. Using and disseminating the evaluation
• Follow-up on the implementation of recommendations and use of the report
• Using and disseminating the evaluationFollow-up and using evaluation
INFO
RMATION

244 CHAPTER 5 Evaluation
Sharing and publicizing evaluation reports are important steps for guaranteeing the relevant use of evaluation. Evaluation managers and/or commissioners may want to discuss and prepare a communication and dissemination strategy, which will require deliberate action and analysis to reach the right audience. The following points may be considered:
• How will the evaluation be used and disseminated?
• How will the findings in the evaluation report be shared with various groups of stakeholders who may have diverging points of view?
• When is the best time to disseminate the evaluation to ensure its optimal use?
Disseminating evaluations contributes to fulfilling their purpose of learning, by ensuring that the knowledge gained through evaluation can be widely used to improve the quality of new interventions, as well as implementation methods. It is recommended to think about how evaluations will be shared, and with whom, early in the planning phase. These decisions should also take into consideration the specific needs when deciding to share evaluations internally within IOM or externally.
Utilization-focused evaluation and disseminating evaluation
The U-FE approach can provide useful insight when planning evaluation dissemination and/or preparing a communication and dissemination strategy. For more information, see the information box Utilization-focused evaluation.
The IOM Evaluation Policy specifies that all evaluation reports are to be made public, but the “sharing strategy” can vary. In the case of an externally shared evaluation – for example, an evaluation of an IOM strategy (corporate, regional or country) or policy (usually corporate) – it could be of interest to all IOM Member States and possibly some donors, while for project evaluations, external interest may be limited to the local government(s) and the specific donor(s) who funded the project. However, in the case of projects, external distribution can also include implementing partners, collaborating non-governmental organizations (NGOs) and/or beneficiaries, which may not be the case for an evaluation of an IOM strategy.
For reports shared internally, a similar distinction applies, as with external reports. While the evaluation of a policy may be shared more often at the departmental level, evaluations of projects, programmes, as well as local or regional strategies, are more valuable for the field offices concerned and relevant thematic specialists at the regional and departmental levels. If the policy evaluation’s dissemination is mainly at the department level for the purpose of organizing the follow-up or lessons learning, it can also be shared more broadly, including to all IOM offices worldwide, given their possible interest on a corporate policy. Some cases are also very specific; for instance, the regional M&E officers and OIG/Evaluation need to be kept informed of the publication of evaluations to add them to its central repository of evaluation reports and/or on the IOM Evaluation web page.
Generally, it is recommended to have just one version of a report that can be shared both externally and internally and that serves all stakeholders with varied points of view. It has happened, in a limited number of cases, that two versions of an evaluation report – one for limited distribution and internal use and the other for external consumption – were produced; for instance, when the report contains some sections covering confidential or sensitive issues related to demobilization activities. If uncertain about the dissemination of an evaluation report, the evaluation manager should consult with the CoM for country-level interventions, regional directors for regional or cross-regional interventions and/or the regional M&E officer or OIG/Evaluation.
INFO
RMATION

IOM MONITORING AND EVALUATION GUIDELINES245
Evaluation reports, when cleared, are to be shared with OIG/Evaluation, who will include them in the central repository and on the IOM Evaluation web page.
As stated in the Evaluation deliverables section of this chapter, a separate summary or evaluation brief is also required. The brief should be developed by the evaluator to provide a shorter, succinct report on key elements. Guidance on developing an evaluation brief, which is mandatory, as well as an evaluation brief template, are available in Annex 5.10. Evaluation brief template and guidance.
Ways of sharing evaluations
It is also important to consider different ways of sharing evaluations in a strategic and systematic manner to ensure that lessons can be extracted by key users and that others can benefit from the evaluation based on their needs and interest. Some examples of different ways are as follows:
• Communication strategy using various communication platforms, such as Yammer (internal), Facebook, Twitter and websites;
• Webinar conducted for relevant stakeholders;• Video presentation of the evaluation and the response from IOM;• Workshop to discuss findings and agree on the way forward.
IOM resources2019 Management Response and Follow-Up on IOM Evaluation Recommendations. OIG/Evaluation
(Internal link only).
n.d.c IOM Evaluation repository.
n.d.d IOM Evaluation website.
5.5. Accountability and learning from evaluationThe benefits of using information derived from evaluations are numerous. Practitioners must effectively apply this information to enhance accountability, improve performance, as well as strengthen decision-making through learning. Accountability can be defined as “the obligation to demonstrate that work has been conducted in compliance with agreed rules and standards or to report fairly and accurately on performance results vis-à-vis mandated roles and/or plans. This may require a careful, even a legally sound, demonstration that the work is consistent with the contract terms”.54 Learning, on the other hand, is the process by which individuals or organizations acquire and use skills and knowledge. This section will address the various ways of learning through evaluation and other evaluative approaches and, while the requirements related to accountability in sharing an evaluation report are covered in the previous section, this section will also include accountability considerations for the other evaluative approaches that are discussed.
54 OECD, 2010, p. 15.
INFO
RMATION
RESOURCES

246 CHAPTER 5 Evaluation
One way to use information gained from evaluation is to share it at the organizational level, thereby generating knowledge for ongoing and future planning and implementation, as well as fostering a culture of learning and knowledge in the organization and supporting its overall accountability. Knowledge gained from evaluations also provides the organization with evidence-based information. Learning must be incorporated into the core element of an evaluation, including effective information-sharing and learning systems.
Organisation for Economic Co-operation and Development (OECD) 2010 Glossary of Key Terms in Evaluation and Results Based Management. OECD/DAC, Paris.
5.5.1. Generating knowledge and learning through evaluation
Knowledge and learning derived from evaluation can feed back into the organizational learning and planning processes through regular reflection, accessibility to the evaluation reports and regular exchange of information through learning sessions. This can be visualized as follows:
Figure 5.8. Generating knowledge and learning through evaluation
Regularreflection
Accessibility and regular exchange of information
Reporting
Information
Exchange of knowledge
products and learning sessions
Organizational learning and
planning process
In addition to evaluation, other processes can enhance learning from interventions. The following are three examples of evaluative approaches that can also incorporate learning in addition to accountability, and also used for monitoring purposes:
(a) Lessons learned;(b) Project performance review (PPR); and(c) After-action review (AAR).
RESOURCES

IOM MONITORING AND EVALUATION GUIDELINES247
Lessons learned and lessons learning
Lessons learned can be understood as generalizations based on evaluation experiences with projects, programmes, strategies or policies that abstract from the specific circumstances to broader situations. Frequently, lessons highlight strengths or weaknesses in preparation, design and implementation that affect performance, outcome and impact. In other words, they are intended to describe the knowledge gained from experiences in well-defined situations. Documenting lessons learned and incorporating them into other interventions can lead to improving the quality of service delivery. In particular, they can help to avoid practices that may regularly fail to produce results or other common mistakes.
The following graphic provides an overview of the process of how lessons learned are identified (through implementation and evaluating implementation), how they are developed and, finally, incorporated and used to improve implementation.
Figure 5.9. Lessons learned – Improving implementation
Implementation1
Evaluatingimplementation
2
Collect and analyse data
Modify/adjust intervention as needed
Drafting and sharing lessons learned
3
Incorporating lessons learned and improving
implementation4
While lessons learned are generally surfaced through conducting evaluation, lessons learned can also be captured through specific lessons-learning workshops, which bring together various stakeholders to brainstorm on performance and identify the lessons learned from an intervention. This approach can be used as well for interventions at the policy or strategic levels, where stakeholders may be asked to reflect on their approaches to a particular topic or thematic area over time.
Another similar concept, in terms of generating knowledge from an evaluation, is the notion of good practices, which can be seen as the identification of a procedure that has proven to produce results in a satisfactory way and that is proposed as a “standard” practice suitable for widespread adoption. A lesson learned with an identified practice that produces such satisfactory results is identified to be worthy of replicating and possibly upscaling, may, over time, become an “emerging good practice”.55
55 ILO, 2014, p. 2.

248 CHAPTER 5 Evaluation
While lessons learning is noted here as one of several evaluative approaches, it is important to underline that evaluators are generally expected to incorporate lessons learned into the report. See the section, Planning for evaluation: Prepare evaluation terms of reference (Evaluation scope).
In general, disseminating lessons learned can take place as a part of, or in a similar manner to, disseminating a final evaluation report. In particular, they can be incorporated into any evaluation summary documents made available to relevant users. The Evaluation brief template and guidance (Annex 5.10) contains a specific section for the presentation of lessons learned, when required.
In some cases, lessons learned may be of particular interest to relevant thematic specialists for their further dissemination and applicability to other similar interventions. The “use” of lessons learned is particularly critical in the development of new interventions, at the project or programme level, as well as in the development of strong strategic and policy guidance to a particular area of IOM’s work. Therefore, evaluation managers should carefully consider with whom to share lessons learned and identified good practices, in order to best incorporate them into future and planned IOM interventions.
International Labour Organization (ILO)2014 Evaluation Lessons Learned and Emerging Good Practices. Guidance Note 3, 25 April.
Project performance review
IOM has developed a PPR tool, which is an assessment that focuses primarily on the performance of a project or programme using OECD/DAC criteria, with a focus on effectiveness and efficiency. The objective of a PPR is to support field offices in assessing the performance of their interventions, using a constructive, participatory and coordinated approach. The exercise usually takes place during implementation, so that corrective measures can be taken if necessary. The criteria of relevance, impact and sustainability are briefly analysed through the PPR, and it may also look at the extent to which the outcomes of an intervention are being achieved or may be achieved due to the activities, as well as outputs completed.
A PPR also looks at cross-cutting issues, analysing the level of accountability to beneficiaries and affected populations, particularly in emergency context, as well as assessing the intervention’s link to global, regional or country strategies.
INFO
RMATION
RESOURCES

IOM MONITORING AND EVALUATION GUIDELINES249
It is important to note that a PPR is not an evaluation, as it is less comprehensive than an evaluation. An evaluation takes more time and preparation, covers issues in greater detail and is able to produce more evidence-based analysis and findings. Further differences between a review and an evaluation can be summarized as follows:
Evaluation Review
• Is a systematic and objective assessment of an ongoing or completed intervention, and its design, implementation and results;
• Aims to determine the relevance and fulfilment of objectives, and development of efficiency, effectiveness, impact and sustainability;
• More solid evidence base for accountability and learning.
• Is an assessment of the performance of an intervention on a periodic or ad hoc basis;
• Reviews are usually less comprehensive and/or in-depth than evaluations;
• Tends to emphasize operational aspects.
IOM resources2018b Planning, Conducting and Using Project Performance Reviews (PPR). OIG/Evaluation, June
(Internal link only).
• PPR Tool Template
• PPR Report Template
• Reader for PPR Reporting
• Preparing for PPRs
• Action Plan on PPR Recommendations
After-action review
An AAR is a structural discussion about an intervention that enables a team to consider and reflect on what happened, why it has happened and how to sustain strengths and improve weaknesses.56 It is a facilitated process involving key actors, in which the general principle is to be neutral and objective to ensure that the discussions stay focused on challenges, remain positive and do not evolve into self-justification. Essentially, the review should focus on questions, such as the following: “What was expected versus what actually happen(ed)?”, “What went well and why?” and What could have gone better and why?”.
56 Adapted from Buchanan-Smith et al., 2016.
RESOURCES

250 CHAPTER 5 Evaluation
An AAR involves the following steps:
Figure 5.10. After-action review steps
Identify• What went well and why?• What could have gone
better and why?
Asked to vote• The three most important
lessons
Summarize conclusions into lessons learned
• What could be done better next time?
Brainstorm understanding• Objective• Intent
Reconstruct timeline• Timelines of key events• Changes over time
Source: Adapted from Buchanan-Smith et al., 2016 and USAID, 2006.
As a first step, participants brainstorm on their understanding of the objective(s) or intent of the action and then develop a timeline of what actually happened and has changed over time. The next step is more focused on an analytical approach, as they identify what went well and why, and what could have gone better and why. At the end of the process, conclusions of what could be done better next time are summarized into lessons learned. Participants may be asked to vote for what they regard as the three most important lessons in case of multiple considerations. An AAR discussion is a facilitated process and may not last more than half a day or a day. Depending on the resources and time available, it can either be formal, with additional preparatory work, or informal as detailed in the box below.
Key features of after-action review
Formal reviews• Are facilitated by an objective outsider• Take more time• Use more complex review techniques and tools• Are scheduled beforehand• Are conducted in meetings or other “formal”
settings• Require a more standard and thorough report
Informal reviews• Are conducted by those closest to the activity• Take less time• Use simple review techniques and tools• Are conducted when needed• Are held at the event’s site• Can be covered by a less-comprehensive
report
Source: Adapted from USAID, 2006.

IOM MONITORING AND EVALUATION GUIDELINES251
Buchanan-Smith, M., J. Cosgrave and A. Warner 2016 Evaluation of Humanitarian Action Guide. ALNAP/ODI, London.
USAID2006 After-Action Review: Technical Guidance. PN-ADF-360. Washington, D.C.
Other examples of evaluative approaches and tools are summarized as follows:
Additional approaches and resources
Mos
t si
gnifi
cant
cha
nge
What is it?
A most significant change (MSC) is a type of participatory tool that requires gathering personal accounts of perceived change(s) and determining which of these accounts is the most significant and why.
A more detailed explanation of the MSC approach is elaborated in Annex 5.11. Evaluative approaches: Most significant change.
MSC toolkits and guidesAsadullah, S. and S. Muñiz
2015 Participatory Video and the Most Significant Change: A guide for facilitators. InsightShare, Oxford.
BetterEvaluation n.d. Most significant change. Online resource.
Davies, R. and J. Dart2005 The ‘Most Significant Change’ Technique – A Guide to Its Use.
International Development Research Centre’s Pan Asia Networking 2008 Jess Dart – Most significant change, part I. Video.
Kir
kpat
rick
mod
el
What is it?
The Kirkpatrick model is a four-level training evaluation model developed to evaluate trainings. The four levels are as follows: (a) reaction; (b) learning; (c) behaviour; and (d) results. This is a commonly used method for assessing the results acquired from a training. A generic post-training completion evaluation form has been developed that can be easily modified as required by interested parties.
IOM2017b Reaching results through training. Webinar video, 25 July (Internal
link only)
MindTools n.d. Kirkpatrick’s four-level training evaluation model: Analyzing learning
effectiveness.
RESOURCES
RESOURCES
RESOURCES

252 CHAPTER 5 Evaluation
Peer
rev
iew
What is it?
Peer review is a process that can help advise on quality issues and compliance to standards, usually conducted by other specialists from the same field, who are chosen for their knowledge of the subject matter. This process has been used in IOM, for instance, for the review of implementation of the United Nations System-wide Action Plan (UN-SWAP) for gender equality and the empowerment of women, with the participation of two to three other agencies being mutually reviewed. A peer review mechanism has also been developed by UNEG in partnership with OECD/DAC to review the evaluation policy of UNEG members.
United Nations Evaluation Group (UNEG)2011a UNEG Framework for Professional Peer Reviews of the Evaluation
Function on UN Organizations. Reference document, UNEG/REF(2011)1.
2018a Background note on the UNEG peer review mechanism. Working paper.
2018b Modalities for evaluating, reviewing or assessing an evaluation function. Working paper.
n.d. Integrating gender equality and human rights in evaluation – UN-SWAP guidance, analysis and good practices.
Out
com
e ha
rves
ting
57
What is it?
Outcome harvesting is an evaluative approach that can be used to collect data on interventions. As its name suggests, outcome harvesting collects (“harvests”) evidence of occurred changes (outcomes). Once changes are identified, it works backwards to determine whether and how these changes are linked to your intervention.
Outcome Harvestingn.d. Homepage.
Outcome Mapping2014 What is outcome harvesting? Video, 15 January.
Wilson-Grau, R. 2015 Outcome harvesting. BetterEvaluation.
57 Adapted from Wilson-Grau, 2015.
RESOURCES
RESOURCES

IOM MONITORING AND EVALUATION GUIDELINES253
Annexes
Annex 5.1. Budgeting for evaluationAdapted from Module 6 of IOM Project Handbook, pp. 423–431 (Internal link only).
Annex 5.2. Expanded list of evaluation types by specificities and scopeAdapted from OIG/Evaluation, IOM Evaluation Guidelines (January 2006), Annex 2.
Cluster evaluation: An evaluation that analyses a set of related activities, projects or programmes to identify common threads and themes.
Country-programme/Country-assistance evaluation: An evaluation of one more or more donor or agency’s portfolios of development.
Cross-section evaluation: A systematic evaluation of various evaluation reports on a specific project type, on projects involving one particular sector, or on one particular instrument or theme, designed to review and possibly update existing development policy directives.
Democratic evaluation: An evaluation approach that addresses critical evaluation issues, such as dealing with power relations among stakeholders, including stakeholders’ perspectives, and providing useful information to programmes. Power redistribution is accomplished by “democratizing knowledge” and holding all groups, including the client, mutually accountable.
Empowerment evaluation: An evaluation promoting close involvement between the evaluator and the project/programme participants to produce more meaningful and useful evaluation results. Empowerment evaluation is necessarily a collaborative group activity, not an individual pursuit.
In-depth evaluation: An approach that consists of focusing evaluation or a part of an evaluation precisely on a category of outputs, or on a group or category of impacts.
Incorporated/built-in evaluation: An approach to implementation that involves fairly continuous self-evaluation by principal actors and participants, according to pre-established criteria related to the purpose and goal of the assistance.
Meta-evaluation: An evaluation that aims to judge the quality, merit, work and significances of an evaluation or several evaluations.
Partial system evaluation: An evaluation also used in emergency situations, which covers only a part of the system. It can be related to thematic or sector evaluations.
Participatory evaluation: An evaluation method in which representatives of agencies and stakeholders (including beneficiaries) work together in designing, carrying out and interpreting an evaluation.
Process evaluation: An evaluation that examines the internal dynamics of implementing organizations, their policy instructions, their service delivery mechanisms, their management practices and the linkages among these.

254 CHAPTER 5 Evaluation
Quasi-experimental impact evaluation: An evaluation that compares different groups before and after programme implementation to assess the programme impact and value added of further investments. It uses rapid and economical studies that combine exploitation of existing data sets with rapid sample surveys, tracer studies, interviews and others.
Real-time evaluation: An evaluation implemented in emergency situations that aims to provide a rapid feedback on humanitarian operations and be an immediate catalyst for improvements in organizational and operational performance. The methodology cannot be rigid, and flexibility and adaptability are required, although it must guarantee quality.
Sector evaluation: An evaluation of a variety of aid actions, all of which are located in the same sector, either in one country or cross-country. A sector covers a specific area of activities, such as health, industry, education, transport or agriculture.
Single-agency response evaluation: Also in emergency situations, an evaluation that covers the overall response by a particular agency.
Single-agency/Single-project evaluation: An evaluation that covers a single project undertaken by a single agency in an emergency situation.
Stakeholder evaluation: An evaluation that involves agencies, organizations, groups or individuals who have a direct or indirect interest in the development assistance, or who affect or are positively or negatively affected by the implementation and outcome of it. Stakeholders work together to develop and finalize instruments and procedures, produce recommendations, and make decisions throughout the evaluation process (related term: Participatory evaluation, which focuses on methodology).
Strategic evaluation: An evaluation of a particular issue aiming to advance a deeper understanding of the issue, reduce the range of uncertainties associated with the different options for addressing it and help to reach an acceptable working agreement among the parties concerned. It is usually adapted when urgency of the issue poses high risks to stakeholders and has generated conflicting views.
Synthesis evaluation: “[A] systematic procedure for organizing findings from several disparate evaluation studies, which enables evaluators to gather results from different evaluation reports and to ask questions about the group of reports.”58
System-wide evaluation: An evaluation used in emergency situations that covers the response by the whole system to a particular disaster or emergency.
Theory-based evaluation: An evaluation that focuses on an in-depth understanding of the workings of a programme or activity, the programme theory or logic. It needs not assume simple linear cause-and-effect relationships, but maps out the determining or causal factors judged important for success and how they might interact.
58 GAO, 1992.

IOM MONITORING AND EVALUATION GUIDELINES255
United States General Accounting Office (GAO)1992 The Evaluation Synthesis. GAO/PEMD 10.1.2. Revised March 1992.
Annex 5.3. Incorporating cross-cutting themes at IOM Cross-cutting themes can be defined as additional considerations or areas that intersect with an intervention, or that can be easily integrated into it, without losing focus on the main goals of the intervention. Mainstreaming a cross-cutting theme is generally understood as a strategy to make the specific theme, given its importance, an integral dimension of the organization’s design, implementation and M&E of policies and interventions. The inclusion of themes can evolve over time and new themes can be added; they are not necessarily the same for all organizations and not all may be relevant to be considered in an intervention.
This section will cover the following themes: (a) rights-based approach (RBA); (b) protection mainstreaming; (c) disability inclusion; (d) gender mainstreaming; (e) environmental sensitivity and sustainability; and (f) accountability to affected populations (AAP). It is important to note that this annex treats the M&E of cross-cutting issues only. In the event that these thematic areas become the main focus of an intervention, it is no longer to be considered as a cross-cutting theme.
Ä Evaluation terms of reference (ToR) should ensure that questions pertaining to the in-tegration of relevant cross-cutting themes are reflected inside a specific section or un-der relevant criteria, specifying that it will be examined as a cross-cutting theme.
Rights-based approach
What is it?
RBA is a conceptual framework and methodological tool for developing policies and practices. RBA is the conscious and systematic integration of rights, norms and standards derived from international law into programming, with a main focus on migration in the case of IOM. An RBA to migration programming aims to empower rights holders and strengthen the capacity of duty bearers to fulfil their obligations to protect rights holders.
Although there is no universal understanding of how to apply an RBA to interventions in practice, it generally includes the following attributes that can be applied to IOM’s migration context:
• Identification of the rights holders, their entitlements, and duty bearers’ obligations to respect, protect and fulfil those entitlements;
• Assessment of whether rights are being respected, protected and fulfilled and, if they are not, an analysis of the underlying causes and a strategy for correcting;
• Capacity-building for rights holders to be aware of and enjoy their rights and of duty bearers to meet their obligations;
• Ensuring that rights principles (such as non-discrimination, participation and accountability) are integrated into the project, strategy and policy developed and during the implementation process.
How to monitor and evaluate rights-based approach
When considered as a cross-cutting theme, an RBA would require measuring the process of programming and its adherence to rights principles. These principles can be incorporated into a results matrix and monitored accordingly, or they can be measured without being set out in the matrix by using a monitoring tool. Lastly, RBA can and should be included in an evaluation; an evaluation should assess rights issues even if the projects themselves do not have a specific rights-based objective or outcome.
RESOURCES

256 CHAPTER 5 Evaluation
Individuals engaged in monitoring the RBA within an intervention can also refer to IOM’s RBA manual titled Rights-based Approach to Programming, which includes a section on M&E and presents a monitoring tool in Annex IV.59
The following are some questions that can be asked during both monitoring and evaluation processes to ensure that an RBA perspective is covered:
Participation• Have the various stakeholders (including both rights holders and duty bearers) been involved in
planning and designing the M&E of the project and determining the type of data to collect? • Are other individuals or groups, such as local civil society groups or NGOs, involved? • Are key groups, particularly the most marginalized groups of rights holders, included and/or involved
in the M&E process?
Equality and non-discrimination • Is the M&E process explicitly designed to detect or measure discrimination against particular groups
throughout its objectives and outcomes? • Is the data collected appropriately disaggregated, such as by age, disability, ethnicity, sex, nationality and
migration status, to track any gaps in considering equality and discrimination throughout intervention outputs and outcomes?
Accountability, transparency and rule of law• Are the M&E processes directly linked to any rights such as measuring the realization of specific rights? • Do the M&E processes account for any form of complaint mechanisms and how are received
complaints dealt with? • Are the findings from the M&E shared publicly in a transparent manner? • Are the findings from the M&E used to promote changes in law or policy of the State?
During the evaluation, the evaluator should also consider the following tips for ensuring that RBA is integrated in the evaluation process:
(a) Include mechanisms to ensure that the most marginalized groups of rights holders are/were involved in the evaluation.
(b) As an evaluator, ask yourself: Were all stakeholders included and how will the evaluation explicitly detect or measure discrimination against particular groups? For example, the evaluation may be designed to detect any form of discriminatory practices that may have occurred during the implementation of the project or as a result of the project.
(c) Identify channels to field any form of complaints that may be received during the evaluation.
59 Annex IV of IOM, 2015b, p. 144.
INFO
RMATION

IOM MONITORING AND EVALUATION GUIDELINES257
IOM resources 2015b Annex IV: Rights-based monitoring tool. In: Rights-based Approach to
Programming. Geneva, p. 144.
2017a Annex 4.2: Guiding questions for incorporating cross-cutting themes into the project management and monitoring phase of the IOM project cycle (Module 4). In: IOM Project Handbook. Second edition. Geneva, pp. 344–346 (Internal link only).
Protection mainstreaming
What is it?
Protection mainstreaming is defined as “the inclusion of humanitarian protection principles into the crisis response by ensuring that any response is provided in a way that avoids any unintended negative effects (do no harm), is delivered according to needs, prioritizes safety and dignity, is grounded on participation and empowerment of local capacities and ultimately holds humanitarian actors accountable vis-à-vis affected individuals and communities”.60
IOM is committed to mainstreaming protection across all of its humanitarian programming, as this aims to ensure safe programming. IOM incorporates the following four protection mainstreaming principles, which are fundamental to crisis and post-crisis response:
(a) Prioritize safety and dignity and avoid causing harm;(b) Secure meaningful access;(c) Ensure accountability;(d) Ensure participation and empowerment.
Adhering to the Inter-Agency Standing Committee’s (IASC) Statement on the Centrality of Protection in Humanitarian Action, IOM reaffirms that the protection of all affected and at-risk individuals and communities must be at the heart of humanitarian decision-making and response before, during and after a crisis strikes.61 IOM ensures that service and assistance delivery preserves the physical integrity of individuals and communities, and their dignity is culturally appropriate and minimizes any harmful and unintended negative consequences. Assistance and ser-vices are provided according to needs and not on the basis of age, sex, gender identity, national-ity, race or ethnic allegiance. Services and assistance are provided in good quantity, within safe and easy-to-reach locations, are known by the affected individuals and accessible by all various groups, including medical cases, disabled individuals and discriminated against groups. Affected individuals and communities play an active role in the measurement of the quality of interventions that affect them and put in place effective and easily accessible mechanisms for suggestions and complaints from the population, and, in so doing, increase accountability. Inclusive participation to decision-making processes is fostered to support the development of self-protection capacities and assist people to claim their rights and empower themselves.
60 Please note that this section is based primarily on the guidance from 2016 for protection mainstreaming within MCOF. This will be further updated upon availability of new guidance on protection (IOM, n.d.f, p. 4).
61 IASC, 2013.
RESOURCES

258 CHAPTER 5 Evaluation
The mobility dimensions of humanitarian crises often include complex and large-scale migration flows and mobility patterns that typically involve significant and diverse vulnerabilities for affected individuals and communities. For interventions developed within the framework of the IOM Migration Crisis Operational Framework (MCOF) sectors of assistance,62 appropriate consideration must be given to ensuring appropriate protection of affected persons, including migrants (displaced persons, refugees, asylum seekers, stateless persons and others) and crisis-affected communities that produce and/or host migrants. The Guidance Note on how to mainstream protection across IOM crisis response (IN/232) (Internal link only) also provides a step-by-step approach on how to integrate protection mainstreaming principles into both crisis response planning and the various phases of the project life cycle. The note also provides several tools such as situation and vulnerability analysis that could be relevant.
Protection in humanitarian action can be through three main interventions:
(a) Mainstreaming of humanitarian protection principles; (b) Protection integration; (c) Specialized protection activities.
Projects using the first approach, mainstreaming protection, ensure that any response is provided in a way that complies with each protection mainstreaming principle within the intervention itself. Protection mainstreaming is the responsibility of all actors.
Protection integration “involves incorporating protection objectives into the programming of other sector-specific responses […] to achieve protection outcomes.”63
Specialized protection activities “directly aim to prevent or respond to human rights and humanitarian law violations, or to restore the rights of individuals who are particularly vul-nerable to or at risk of neglect, discrimination, abuse and exploitation. Stand-alone protection activities can include activities aimed at preventing or responding to specific protection risks […] violations and needs […] including for specific groups such as women, children, persons with disabilities, older persons, displaced persons and migrants.”64
How to monitor and evaluate protection mainstreaming
As per the Guidance Note on Protection Mainstreaming, relevant interventions should monitor to what extent protection mainstreaming was effectively integrated during implementation. Furthermore, evaluations should be conducted through a participatory and inclusive approach to integrate protection mainstreaming considerations. Examples include sex and age diversity during consultations and not exclusively relying on community leaders to identify respondents such as marginalized groups.
Individuals may wish to consult the Guidance Note on Protection Mainstreaming, which includes a tool for M&E in its Annex 3.
62 IOM MCOF specifies the following 15 sectors of assistance: (a) camp management and displacement tracking; (b) shelter and non-food items; (c) transport assistance for affected populations; (d) health support; (e) psychosocial support; (f) (re)integration assistance; (g) activities to support community stabilization and transition; (h) disaster risk reduction and resilience building; (i) land and property support; (j) counter-trafficking and protection of vulnerable migrants; (k) technical assistance for humanitarian border management; (l) emergency consular assistance; (m) diaspora and human resource mobilization; (n) migration policy and legislation support; and (o) humanitarian communications (IOM, 2012).
63 IOM, 2018c, p. 16; see also IASC, 2016.64 Ibid.
INFO
RMATION

IOM MONITORING AND EVALUATION GUIDELINES259
The following are some questions that can be considered for both the monitoring and evaluation of protection as a cross-cutting theme and to ensure adherence to the protection principles:
• Are monitoring processes designed to ensure that access to humanitarian assistance by all groups is being regularly monitored?
• Are procedures in place to mitigate risks resulting from unintended consequences of IOM activities on protection issues?
• While providing assistance, is the safety and security of beneficiaries taken into consideration? If barriers to services and assistance are identified, are measures being taken to mitigate these barriers?
• Have procedures for informed consent been established and are they being used appropriately?• Are all affected population and beneficiary groups and subgroups (such as boys, girls, men and women,
abled and disabled, marginalized) being involved in monitoring and/or the evaluation processes?• Is specific attention being given to access services by different beneficiary groups and subgroups and
in different project locations?• Are referral pathways for protection incidents established and in use?• Is sensitive data being managed appropriately and in line with the IOM Data Protection Principles?• Is feedback from affected populations and beneficiaries regularly collected and used to improve
programming to better suit their needs?• Are self-protection capacities being utilized within the framework of the project?• Are State and local actors regularly consulted and involved in the implementation of protection
measures?• What impact has been achieved after the introduction of protection mainstreaming considerations
during the project design, implementation and monitoring?
Below are some key tips for including protection mainstreaming into evaluation:
• Consider a participatory evaluation approach to ensure inclusion of all beneficiary groups. • Consider how evaluation findings could be used to improve future actions, propose course correctors
and ensure that findings that are deemed to be of interest to the larger community are shared.• Consider to which extent and how protection should be further integrated into intervention activities
as a cross-cutting issue.
IOM resources2012 IOM Migration Crisis Operational Framework, MC/2355.
2016b Guidance Note on how to mainstream protection across IOM crisis response (or the Migration Crisis Operational Framework sectors of assistance). IN/232.
2017a Annex 4.2: Guiding questions for incorporating cross-cutting themes into the project management and monitoring phase of the IOM project cycle (Module 4). In: IOM Project Handbook. Second edition. Geneva, p. 350 (Internal link only).
2018c Institutional Framework for Addressing Gender-Based Violence in Crises. Geneva.
n.d.e Protection mainstreaming in IOM crisis response.
n.d.f Guidance Note on Protection Mainstreaming – Annex 3 (Internal link only).
RESOURCES

260 CHAPTER 5 Evaluation
Other resourcesInter-Agency Standing Committee (IASC)
2013 The Centrality of Protection in Humanitarian Action: Statement by the Inter-Agency Standing Committee (IASC) Principals.
2016 IASC Policy on Protection in Humanitarian Action.
Disability inclusion
Disability inclusion in IOM interventions has gained importance in recent years in line with initiatives promoted by the United Nations. Disability inclusion requires specific attention to be fully integrated as a cross-cutting issue into M&E efforts.
What is it?
Persons with disabilities are estimated to represent 15 per cent of the world’s population. In specific humanitarian contexts, they may form a much higher percentage and can be among the most marginalized people in crisis-affected communities. Persons with disabilities may face multiple forms of discrimination and be at heightened risk of violence and abuse, also often linked to their social conditions and other intersecting identities (such as gender, age, race and indigenous groups).
The Convention of the Rights of Persons with Disabilities (CRPD) affirms that States Parties must protect and promote the rights of persons with disabilities in their laws, policies and practices; and must also comply with the treaty’s standards when they engage in international cooperation. The CRPD, along with the Sustainable Development Goals and the Sendai Framework for Disaster Risk Reduction, set out other standards that protect persons with disabilities.
In addition to legal frameworks, IOM’s work on disability inclusion is also guided by the United Nations Disability Inclusion Strategy (UNDIS) that was launched in 2019, as well as IASC’s Guidelines on the Inclusion of Persons with Disabilities in Humanitarian Action. IOM’s commitments made at the Global Disability Summit in 2018 are also important in disability inclusive programming.
CRPD defines persons with disabilities as those who have long-term sensory, physical, psychosocial, intellectual or other impairments that, in interaction with various barriers, may hinder their full and effective participation in society on an equal basis with others.
IOM interventions must ensure that their activities address the barriers that prevent persons with disabilities in all their diversity from participating in, or having access to services and/or protection, in line with CRPD.
Both the UNDIS strategy and the IASC Guidance recommend taking a twin-track approach, which combines inclusive mainstream programmes with targeted interventions for persons with disabilities.
RESOURCES
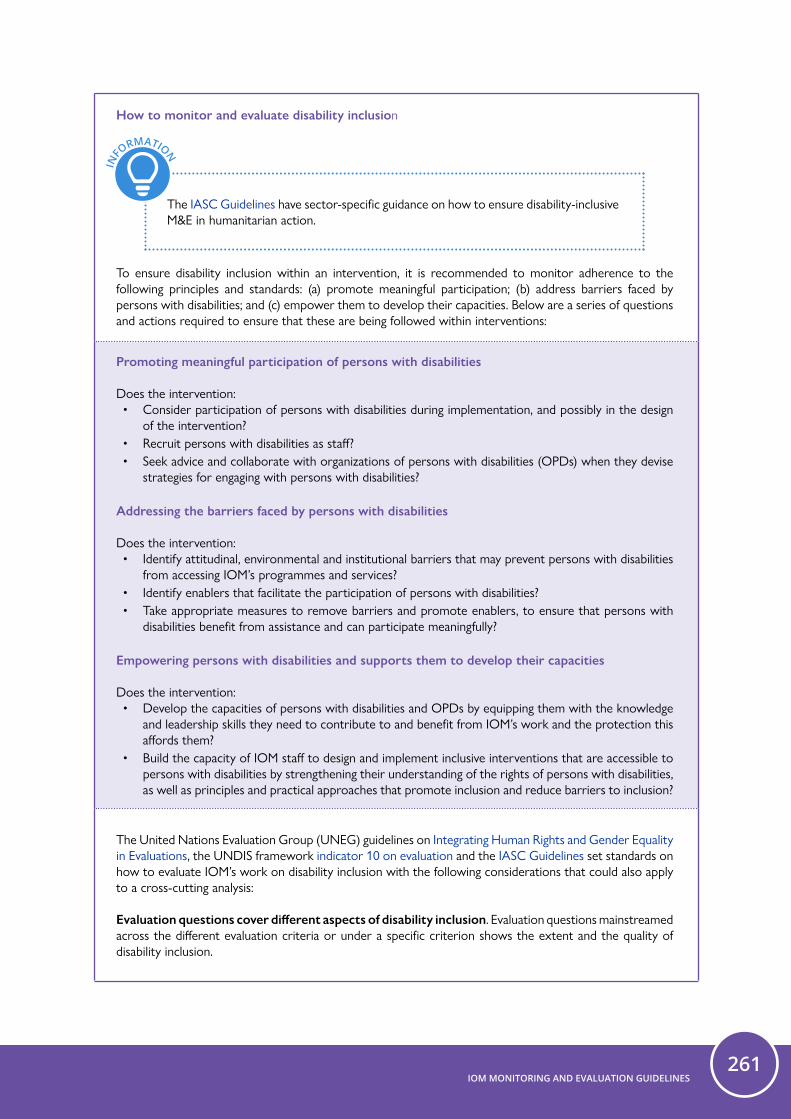
IOM MONITORING AND EVALUATION GUIDELINES261
How to monitor and evaluate disability inclusion
The IASC Guidelines have sector-specific guidance on how to ensure disability-inclusive M&E in humanitarian action.
To ensure disability inclusion within an intervention, it is recommended to monitor adherence to the following principles and standards: (a) promote meaningful participation; (b) address barriers faced by persons with disabilities; and (c) empower them to develop their capacities. Below are a series of questions and actions required to ensure that these are being followed within interventions:
Promoting meaningful participation of persons with disabilities
Does the intervention: • Consider participation of persons with disabilities during implementation, and possibly in the design
of the intervention?• Recruit persons with disabilities as staff?• Seek advice and collaborate with organizations of persons with disabilities (OPDs) when they devise
strategies for engaging with persons with disabilities?
Addressing the barriers faced by persons with disabilities
Does the intervention: • Identify attitudinal, environmental and institutional barriers that may prevent persons with disabilities
from accessing IOM’s programmes and services? • Identify enablers that facilitate the participation of persons with disabilities? • Take appropriate measures to remove barriers and promote enablers, to ensure that persons with
disabilities benefit from assistance and can participate meaningfully?
Empowering persons with disabilities and supports them to develop their capacities Does the intervention: • Develop the capacities of persons with disabilities and OPDs by equipping them with the knowledge
and leadership skills they need to contribute to and benefit from IOM’s work and the protection this affords them?
• Build the capacity of IOM staff to design and implement inclusive interventions that are accessible to persons with disabilities by strengthening their understanding of the rights of persons with disabilities, as well as principles and practical approaches that promote inclusion and reduce barriers to inclusion?
The United Nations Evaluation Group (UNEG) guidelines on Integrating Human Rights and Gender Equality in Evaluations, the UNDIS framework indicator 10 on evaluation and the IASC Guidelines set standards on how to evaluate IOM’s work on disability inclusion with the following considerations that could also apply to a cross-cutting analysis:
Evaluation questions cover different aspects of disability inclusion. Evaluation questions mainstreamed across the different evaluation criteria or under a specific criterion shows the extent and the quality of disability inclusion.
INFO
RMATION

262 CHAPTER 5 Evaluation
Evaluation stakeholder mapping and data collection methods involve persons with disabilities and their representative organizations. Persons with disabilities and OPDs can enrich evaluation by providing first-hand information on their situation and experience.
Evaluation examines if barriers have been removed to allow full participation of persons with disabilities. It can also include long-term impact analysis on the lives of persons with disabilities and the recognition of their rights according to international standards.
IOM resourcesn.d.e Protection mainstreaming in IOM crisis response.
n.d.g Disability inclusion SharePoint (Internal link only).
Other resourcesGovernment of the United Kingdom
n.d. IOM’s commitments made at the Global Disability Summit in 2018.
Inter-Agency Standing Committee (IASC)2019 Guidelines on the Inclusion of Persons with Disabilities in Humanitarian
Action.
United Nations n.d.a Indicator 10: Evaluation. In: Entity Accountability Framework. Technical notes.
n.d.b United Nations Disability Inclusion Strategy (UNDIS).
United Nations Evaluation Group (UNEG) 2011b Integrating Human Rights and Gender Equality in Evaluation – Towards
UNEG Guidance. Guidance document, UNEG/G(2011)2.
Gender mainstreaming
What is it?
IOM has been working actively to mainstream gender throughout all of its interventions. Numerous policy and guidance documents are available to support this commitment (see the Resources box). IOM’s Gender Coordination Unit is in charge of the promotion of gender equality in IOM and proposes the following considerations and definitions of the notion of gender, gender analysis and gender mainstreaming:
Gender: The social attributes and opportunities associated with one’s sex and the relationships between people of different gender and age groups (such as women, men, girls and boys), as well as the relations between people of the same gender group. These attributes, opportunities and relationships are socially constructed and learned through socialization processes. They are context- and time-specific and changeable. Gender determines what is expected, allowed and valued in people based on their sex in a given context. In most societies, there are differences and inequalities between people of different gender groups in terms of responsibilities assigned, activities undertaken, access to and control over resources, as well as decision-making opportunities. Gender is part of the broader sociocultural context.
Gender analysis: A critical examination of how differences in gender roles, experiences, needs, opportunities and priorities affect people of different gender and age groups in a certain situation or context. A gender analysis should be integrated into all sector assessments and situation analyses, starting with the needs assessment.
RESOURCES

IOM MONITORING AND EVALUATION GUIDELINES263
Gender mainstreaming: The process of assessing the implications of any planned action, including legislation, policies or programmes, for people of different gender groups, in all areas and at all levels. It is an approach for making everyone’s concerns and experiences an integral dimension of the design, implementation, M&E of interventions in all political, economic and societal spheres so that all gender groups benefit equally and inequality is not perpetuated. The ultimate goal is to achieve gender equality.
How to monitor and evaluate gender mainstreaming
Throughout its interventions, IOM aims to promote gender equality and ensure that all of its beneficiaries and populations assisted are receiving the services and support they need, taking into consideration their gender-specific experiences so that interventions do not perpetuate gender inequalities.
The following are a few simple points to ensure gender mainstreaming and to monitor it within an intervention as a cross-cutting theme:
• Ensure that interventions address all the different needs (and capacities) of a diverse beneficiary population, with an aim to eliminate gender disparities and contribute to gender equality.
• Assesses how well an intervention captures gender perspectives. This includes using gender-sensitive indicators, which are disaggregated by sex, as well as indicators that measure gender-specific changes, such as prevalence of gender-based violence or perceptions of gender norms, roles and relations.
• Ensure that progress on gender-sensitive indicators is monitored regularly and adapted, as needed, to ensure that all intended beneficiaries are covered.
• Ensure that all gender and age groups are consulted when monitoring an intervention, to better inform progress on indicators and ensure that no one is left behind or discriminated because of gender considerations.
Gender marker: The IOM Gender Marker is a tool that assesses how well interventions integrate gender considerations. It establishes a clear set of minimum standards for incorporating gender considerations and sets out a coding system based on how many minimum standards are met. It allows IOM to track the percentage of its interventions and financial allocations that are designed to contribute to gender equality. The Gender Marker aims at improving the quality of IOM interventions by emphasizing the importance of addressing the specific needs and concerns of women, girls, boys and men, inclusive of those identifying as lesbian, gay, bisexual, transgender and/or intersex (LGBTI), and of different ages, so that everyone benefits in an appropriate way.
Evaluation can ensure that adequate attention is paid to the above points (and any other gender-related issues) that they are properly reflected in the evaluation methodology, findings/results, challenges and lessons learned. IOM has developed the Guidance for Addressing Gender in Evaluations, which are available in the Resources box and can be used for examining gender as a cross-cutting element of the intervention.
During the evaluation, the evaluator should also consider the following tips for ensuring that gender mainstreaming is integrated in the evaluation.
(a) Ensure that gender issues are specifically addressed in the evaluation ToR.
(b) During data collection, ensure that the persons being interviewed or surveyed are diverse and gender-representative of all concerned project partners and beneficiaries.
(c) Surveys, interview questions and other data collection instruments should include gender issues.
(d) Evaluation reports should include a gender perspective, such as analysis of sex-disaggregated data.

264 CHAPTER 5 Evaluation
Evaluations should include questions to determine this during the process, such as the following:
• Are/were male and female beneficiaries able to participate meaningfully in the project? • What are/were some of the barriers to meaningful participation and what has been or will be done
to address these barriers? • Are/Were men’s and women’s needs and skills adequately addressed and incorporated? • Are/Were men and women satisfied with the project’s activities?
(e) Include gender perspective when analysing the successes and challenges, actions taken, lessons learned and best practices during the evaluation process.
IOM intranet (available internally to IOM staff) and IOM website (publicly available) contain numerous references that are useful for monitoring the inclusion of gender in IOM interventions, including as cross-cutting issue, and in particular the IOM Gender Marker which should be considered in all interventions. The United Nations System-wide Action Plan on Gender Equality and the Empowerment of Women (UN-SWAP) is also an important resource for the inclusion of gender.
IOM resources2018d Guidance for Addressing Gender in Evaluations. OIG.
n.d.h IOM Gender and Evaluation Tip Sheet.
n.d.i IOM Gender Marker (Internal link only).
n.d.j Gender and migration.
Other resourcesUN-Women
n.d. Promoting UN accountability (UN-SWAP and UNCT-SWAP).
Environmental sensitivity and sustainability
What is it?
Environmental sensitivity must be addressed by all IOM interventions that should safeguard the environment. No IOM intervention should have a direct negative impact on the environment, and all possible measures should be taken to prevent harm to biodiversity and ecosystems, such as the destruction or contamination of natural resources.
Environmental sustainability is about addressing human needs without jeopardizing the ability of future generations to meet their needs and preventing irreversible damage to the world. Where sufficient resources and expertise are available, IOM projects should strive towards environmental sustainability.65
65 See IOM, 2017a, p. 50 (Internal link only).
RESOURCES

IOM MONITORING AND EVALUATION GUIDELINES265
Ä Environmental issues should be identified and analysed throughout the intervention as part of the initial risk analysis, as well as addressed as a part of the risk management plan where environmental risks are inevitable.66
Mainstreaming environmental sustainability “requires integrating the principles of sustainable management, protection, conservation, maintenance and rehabilitation of natural habitats and their associated biodiversity and ecosystem functions.”67
How to monitor and evaluate environmental considerations
When interventions are not specifically designed to address environmental issues – such as IOM programmes addressing disaster preparedness and disaster risk reduction to prevent forced migration that results from environmental factors, or those for relocation of populations from zones affected by environmental degradations – there are various elements that can be taken into account for monitoring and evaluating the inclusion of environmental sensibility and sustainability as a cross-cutting issue.
In its 2018 document titled IOM’s engagement in migration environment and climate change, IOM suggests the following considerations for understanding the migration and environment nexus; further suggestions are provided as to when this could be included and how it could be monitored within an intervention as a cross-cutting theme:
Considerations Monitoring or evaluating in the context of an intervention
Environmental factors have always been a cause of migration.
Ensure that environmental factors are included in the rationales of interventions whenever relevant and how the intervention mitigates this.
It is often difficult to isolate the environmental and climatic factors from socioeconomic factors, but an increasing number of studies show that environmental challenges are clearly a factor that impact the decision to move or to stay.
When relevant and feasible, these factors should be identified and how the intervention indirectly address them as a cross-cutting theme. The linkage of these factors may often be explained in a ToC.
Climate change is expected to have major impacts on human mobility as the movement of people is and will continue to be affected by natural disasters and environmental degradation.
As a cross-cutting theme in interventions dealing with mobility, the role and impact of the environment should be identified, if not specifically addressed by an objective and outcome.
Environmental migration may take many complex forms: forced and voluntary, temporary and permanent, internal and international.
When examining the role and impact of the environment on IOM interventions dealing with migration, it could be relevant to identify if it can be categorized as “environmental migration” and if the intervention addresses it properly.
66 Ibid., p. 51.67 Ibid., citing UNDP, 2014.

266 CHAPTER 5 Evaluation
The concept of “vulnerability” needs to be put at the centre of current and future responses to environmental migration. The most vulnerable may be those who are unable to or do not move (trapped populations).
The disaggregation of different groups will be necessary to ensure that interventions are monitored accordingly.
Environmental migration should not be understood as a wholly negative or positive outcome – migration can amplify existing vulnerabilities and can also allow people to build resilience. For example, temporary migration and remittances can open up alternative sources of income and reduce reliance on the environment for subsistence.
An evaluation of an intervention could assess the positive and negative effects of environmental migration and how the intervention contributed to this if relevant to be considered as a cross-cutting theme.
The following are a series of questions that could be included in the evaluation ToR to ensure that environmental sensitivity and sustainability were properly integrated.
• Would it have been relevant to conduct an environmental impact assessment for this intervention? • Was the project successfully implemented without any negative impact on the environment that could
have affected human well-being? • Has environmental damage been caused or likely to be caused by the project? What kind of
environmental impact mitigation measures have been taken?• Were appropriate environmental practices followed in project implementation? • Does the project respect successful environmental practices identified in IOM? • What are the existing capacities (within project, project partners and project context) dealing with
critical risks that could affect project effectiveness such as climate risks or risks of natural disasters? • Will the achievement of project results and objectives likely to generate increased pressure on fragile
ecosystems (such as natural forests, wetlands, coral reefs and mangroves) and scarce natural resources (such as surface and groundwater, timber and soil)?
• Did the intervention bring relevant benefits and innovation for environmental sensitivity and sustainability?
IOM resources 2017a Annex 4.2: Guiding questions for incorporating cross-cutting themes into the
project management and monitoring phase of the IOM project cycle (Module 4). In: IOM Project Handbook. Second edition. Geneva, p. 344 (Internal link only).
2018e IOM’s engagement in migration environment and climate change. Infosheet.
n.d.k Migration, environment and climate change. IOM intranet (Internal link only).
n.d.l Environmental Migration Portal web site.
Other resourcesUnited Nations Development Programme (UNDP)
2014 Social and Environmental Standards. New York.
RESOURCES

IOM MONITORING AND EVALUATION GUIDELINES267
Accountability to affected populations
What is it?
AAP is an active commitment by humanitarian actors to use power responsibly by taking account of, giving account to, and being held to account by the people they seek to assist. AAP has featured on the humanitarian agenda for over two decades, initially known as “accountability to beneficiaries”. The shift to “accountability to affected populations” takes into account that assistance not only affects the aid recipients, but also the wider community. It aims to see affected populations as partners rather than as passive beneficiaries, recognizing their dignity and capacities and empowering them in the efforts that matter to them.
AAP takes accountability beyond the limited practice of accountability to identified “beneficiaries”, as it reaches out to people unintentionally excluded from receiving assistance that often happens to marginalized groups including people with disabilities, older persons and LGBTI groups. Moreover, the commitment to AAP differs from the traditional accountability to donors only. It requires humanitarian actors to place people at the core of the response, fostering their right to be involved in the decision-making processes that affect them and inform programming to be appropriate and responsive to their needs.
AAP gained particular prominence through the Transformative Agenda (2011) and the World Humanitarian Summit (2016) commitments, including the Grand Bargain (2016). These initiatives helped develop a shared understanding of AAP within the international community and resulted in a range of collective, as well as individual institutional commitments that aim to include people receiving aid in making the decisions that affect their lives, foster meaningful collaboration with local stakeholders and prevent sexual exploitation and abuse (SEA).
The Accountability to Affected Populations (AAP) Framework establishes IOM’s common approach for implementing and mainstreaming AAP throughout its crisis-related work, as contained in its MCOF. It helps the Organization ensure quality and responsive programming in line with the evolving needs of affected populations and communities and enforce the Organization’s zero tolerance against SEA and other misconduct. The commitments of this framework were developed in line with the IASC commitments to AAP and adapted to meet IOM’s operational realities.
Adherence to the framework’s principles and achieving its commitments and objectives are mandatory. There are many ways to implement and mainstream AAP, and such efforts need to be contextually relevant. Therefore, the framework is to be read in conjunction with the guiding IOM Accountability to affected populations collaboration space (Internal link only), which aims to help IOM staff identify and tailor AAP interventions.
AAP is founded on two operational principles in humanitarian programming: (a) rights-based approach; and (b) aid effectiveness.
Being accountable to affected people reaffirms IOM’s obligation to respect, fulfil and protect human rights and dignity, and achieving the commitments is essential for quality programming.

268 CHAPTER 5 Evaluation
IOM is committed to providing humanitarian assistance in a manner that respects and fosters the rights of beneficiaries. IOM recognizes that there is often an inherent and important power differential in the interactions between IOM staff members and beneficiaries. As AAP is an active commitment by IOM, the Organization understands AAP more concretely as follows:
• Taking account of their views, which means giving them a meaningful influence over decision-making about projects and programmes in a way that is inclusive, gender-sensitive, non-discriminatory, does not harm, is conflict sensitive and accounts for the diversity of people in the affected community. IOM ensures that informed consent, protection and safety concerns are key considerations in its response. The Organization places high value on incorporating the feedback from migrants and affected populations into its projects, strategies, as well as in its collective response. While IOM has started to put in place individual feedback, complaints and response mechanisms in its interventions, the Organization is also involved in innovative approaches to joint feedback mechanisms that can reinforce transparency, mutual accountability and have a positive impact.
• Giving account by sharing of information in an effective and transparent way across all the thematic areas of work and to all communities with whom IOM works. This includes information about IOM and its mission, about projects/programmes and how to access them, timelines, entitlements related to IOM projects and selection criteria for taking part in the project and reasons for any changes that may be needed, as well as the staff code of conduct and information on how to provide feedback or how to raise complaints. IOM has the responsibility to share information in an appropriate and timely way, depending on the context, to ensure that affected populations can understand that information can be empowered by it, and become active participants in the IOM response. IOM also works with Humanitarian Country Teams and other key inter-agency fora and actors to agree on a strategy to share information to streamline communication and ensure coherence of messaging.
• Being held to account by the affected populations it serves, which means that IOM ensures affected communities and individuals have the opportunity to assess and, where feasible, inform modifications/adjustments to its actions. Being accountable involves consulting affected communities and individuals on what they think about the quality of IOM response – at the country, regional and organizational levels – and act upon the feedback or provide an appropriate explanation on why such action cannot be taken. Particular emphasis needs to be placed on accountability to those left furthest behind, including extremely vulnerable women, adolescent girls, people with disabilities, the elderly and people identifying as LGBTI. IOM has in place a “zero tolerance” policy on fraud, corruption and SEA by staff and contractors, as this constitutes a breach of and very serious violation of the rights of the concerned persons.68 Populations should know about the code of conduct and be able to raise complaints and call for appropriate protection measures against such abuse, as well as be informed in general terms of the results of investigations on these complaints.
How to monitor and evaluate AAP mainstreaming
It is then also vital that communities being assisted are involved in the monitoring and the evaluation of IOM interventions and that their points of view on the success and failures, as well as the impact of the intervention, are considered for improving practice and future response. Accountability has always been embedded in the organizational structure of IOM and its operational policies and procedures. Monitoring AAP is also necessary for addressing the relationship between beneficiaries and IOM, and ensuring that the populations’ needs are met and that they are participating in the intervention at the planning, design, implementation and M&E stage. The Accountability to Affected Populations Framework can be considered as reference for related monitoring activities.
68 IOM, 2016c (Internal link only).

IOM MONITORING AND EVALUATION GUIDELINES269
Through its interventions, IOM aims to ensure that all its beneficiaries and affected populations assisted are receiving the services and support they need. The following M&E questions can be asked when examining AAP as a cross-cutting issue.
(a) Does/Did the intervention use participatory methodologies in design, decision-making, implementation and monitoring of interventions to ensure the affected communities are involved from the initial stages of planning to identify their own needs, capacities, traditional and cultural divisions, and the strategies that are best suited to address these?
(b) Does/Did the intervention involve affected populations to ensure that their views are captured and influence further programming? For instance, this can be done by adding questions in data collection tools for monitoring and/or evaluation purposes that collect beneficiary feedback.
(c) Does/Did the intervention integrate indicators reflecting AAP efforts to ensure understanding the quality of IOM’s service provision and assist in identifying strengths and weaknesses in AAP related implementation?
(d) Does/Did the intervention conduct reviews for high-profile and high-risk interventions to identify AAP practices or provide recommendations on how to improve it?
(e) Does/Did the intervention learn from, document and share good practice on AAP as a cross-cutting theme to assist in institutionalizing AAP practice across interventions, across countries and regions?
Questions identified in previous cross-cutting themes such as rights-based approach, protection or gender can also properly cover elements related to AAP.
IOM resources 2016c Policy and Procedures for Preventing and Responding to Sexual Exploitation and
Abuse. IN/234 (Internal link only).
2020 Accountability to Affected Populations Framework. Geneva.
n.d.m Accountability to affected populations SharePoint (Internal link only).
Annex 5.4. Evaluation terms of reference template
United Nations Evaluation Group (UNEG)2008 UNEG Code of Conduct for Evaluation in the UN System. Foundation Document, UNEG/FN/
CoC(2008).
2016 Norms and Standards for Evaluation. New York.
2020 UNEG Ethical Guidelines for Evaluation.
Annex 5.5. IOM sample evaluation matrices for a development-oriented project and a humanitarian project
Module 6 of IOM Project Handbook (Internal link only)
RESOURCES
RESOURCES

270 CHAPTER 5 Evaluation
Annex 5.6. IOM scorecard for assessment of applications for evaluations commissioning evaluator(s) (individual consultant or consulting firm) (Internal link only)
Annex 5.7. IOM inception report template Module 6 of IOM Project Handbook, pp. 474–475 (Internal link only)
Annex 5.8. IOM evaluation report components template
Annex 5.9. IOM final evaluation report template
Annex 5.10. Evaluation brief template and guidance
Annex 5.11. Evaluative approaches: Most significant change
What it is
A most significant change (MSC) is a type of participatory monitoring and evaluation.69 It involves gathering personal account of change and determining which of these accounts is the most significant and why. It is participatory because it involves multiple stakeholders in deciding what type of change to record and analyse. It is also a form of monitoring, because gathering of data occurs throughout the implementation cycle and provides information for decision makers. Finally, MSC is a form of evaluation, because it provides information on higher-level results, such as outcomes and impact, which can be useful to assess implementation performance as a whole.
When to use it
MSC had different names, one of which is “monitoring-without-indicators” or “story approach”, as it does not make use of performance indicators and the answer to how change occurred is formulated in a story. In this sense, MSC is very helpful instrument in explaining how and when change comes about, which makes it useful to support the development of a Theory of Change.
How it is done
• Scholars may disagree on the number of steps in using MSC, but in essence, these can be summarized into three basic steps:
• Panels of key stakeholders at different hierarchical levels (such as field staff, programme staff, managers and donors) decide together on what type of significant change accounts/stories should be collected. As these stories come from the field, key stakeholders identify general domains of change and the frequency to be monitored, such as changes in people’s lives for example.
69 Adapted from ODI, 2009.

IOM MONITORING AND EVALUATION GUIDELINES271
• After analysing the collected stories, they are filtered up through the levels of authority typically found within an organization, where at each level along with a detailed explanation of the selection criteria, a most significant change is identified.
• The stories are shared and the values and selection criteria are discussed with stakeholders and in this way contribute to learning.
Strengths and limitations
MSC not only supports the process of learning from the stories, as it provides information about un/intended impact, but also helps clarify the values held by different stakeholders in terms of identifying what success looks like. Note that MSC by itself is not sufficient for impact analysis, as it does not sufficiently explain why change happens and provides information about the extremes, rather than the usual experience. One of its limitations is that it is time consuming and requires thorough follow-up and multiple stakeholder meetings.
Asadullah, S. and S. Muñiz 2015 Participatory Video and the Most Significant Change: A guide for facilitators. InsightShare, Oxford.
Davies, R. and J. Dart2005 The ‘Most Significant Change’ Technique – A Guide to Its Use.
International Development Research Centre’s Pan Asia Networking 2008 Jess Dart – Most significant change, part I. Video.
Overseas Development Institute (ODI) 2009 Strategy Development: Most Significant Change. Toolkit.
Annex 5.12. Request for Proposals (RFP) template
RESOURCES

IOMMONITORING
AND EVALUATION GUIDELINES
International Organization for Migration (IOM)17 route des Morillons, P.O. Box 17, 1211 Geneva 19, Switzerland
Tel.: +41 22 717 9111 • Fax: +41 22 798 6150 • Email: [email protected] • Website: www.iom.int
Copyright © 2022 FDOKUMEN