INVESTMENT UPDATE - SBI Mutual Fund
96
Report as on 31 August 2022 st INVESTMENT UPDATE
-
Upload
khangminh22 -
Category
Documents
-
view
2 -
download
0
Transcript of INVESTMENT UPDATE - SBI Mutual Fund

Report as on 31 August 2022st
INVESTMENT UPDATE

INDEX
......................................................................................................................................................................
......................................................................................................................................................................
......................................................................................................................................................................
......................................................................................................................................................................
......................................................................................................................................................................
......................................................................................................................................................................
......................................................................................................................................................................
......................................................................................................................................................................
......................................................................................................................................................................
......................................................................................................................................................................
......................................................................................................................................................................
......................................................................................................................................................................
......................................................................................................................................................................
......................................................................................................................................................................
......................................................................................................................................................................
......................................................................................................................................................................
......................................................................................................................................................................
......................................................................................................................................................................
......................................................................................................................................................................
......................................................................................................................................................................
......................................................................................................................................................................
......................................................................................................................................................................
......................................................................................................................................................................
......................................................................................................................................................................
......................................................................................................................................................................
......................................................................................................................................................................
......................................................................................................................................................................
......................................................................................................................................................................
......................................................................................................................................................................
Content Category No.
From the MD & CEO’s Desk
Market Overview
From the DMD & CBO's Desk
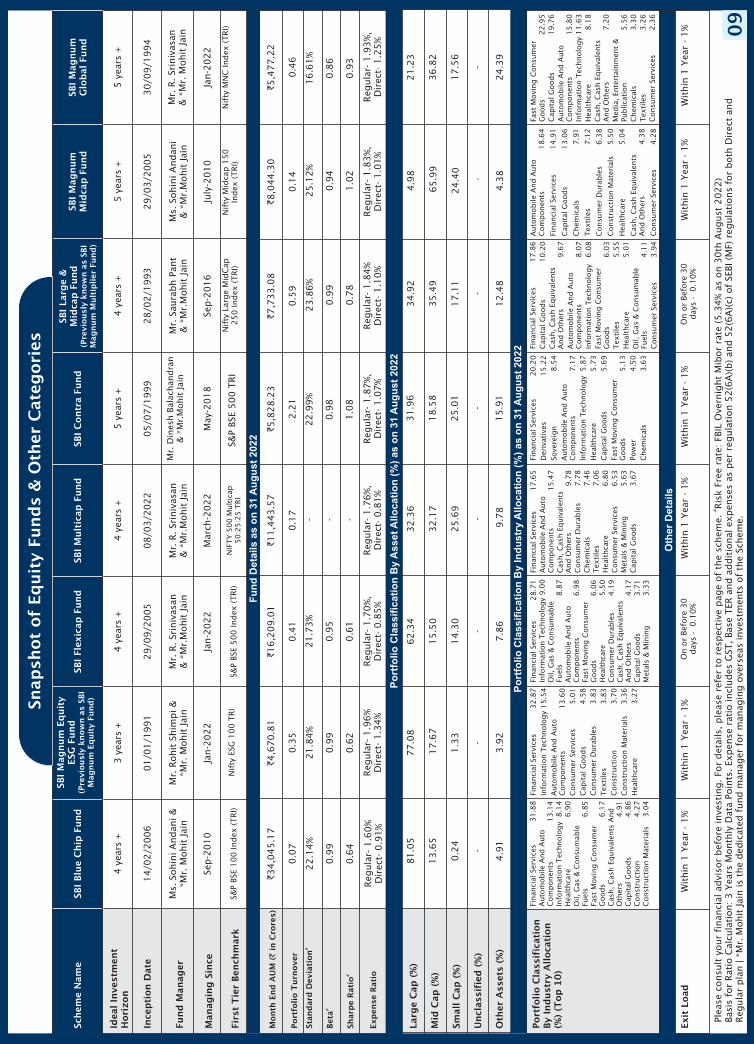
Snapshot of Equity Funds & Other Categories
Snapshot of Hybrid Funds & Solution Oriented Scheme
SBI Blue Chip Fund Equity - Large Cap
SBI Magnum Equity ESG Fund(Previously known as SBI Magnum Equity Fund) Equity - Thematic Fund
SBI Flexicap Fund(Previously known as SBI Magnum Multicap Fund) Equity - Flexicap Fund
SBI Multicap Fund Equity - Multicap Fund
SBI Contra Fund Equity - Contra Fund
SBI Large & Midcap Fund(Previously known as SBI Magnum Multiplier Fund) Equity - Large & Mid Cap Fund
SBI Focused Equity Fund(Previously known as SBI Emerging Businesses Fund) Equity - Focused Fund
SBI Magnum MidCap Fund Equity - Mid Cap Fund
SBI Magnum Global Fund Equity - Thematic Fund
SBI Small Cap Fund(Previously known as SBI Small & Midcap Fund) Equity - Small Cap Fund
SBI Long Term Equity Fund(Previously known as SBI Magnum Taxgain Scheme) Equity - ELSS
SBI Healthcare Opportunities Fund(Previously known as SBI Pharma Fund) Equity - Sectoral Fund
SBI Banking And Financial Services Fund Equity - Sectoral Fund
SBI PSU Fund Equity - Sectoral Fund
SBI Magnum Comma Fund Equity - Sectoral Fund
SBI Infrastructure Fund Equity - Sectoral Fund
SBI Consumption Opportunities Fund(Previously known as SBI FMCG Fund) Equity - Thematic
SBI Technology Opportunities Fund(Previously known as SBI IT Fund) Equity - Sectoral Fund
SBI Equity Minimum Variance Fund Equity - Thematic
SBI Gold Fund Fund of Funds
SBI International Access - US Equity FoF Fund of Funds
SBI Nifty Index Fund Index Fund
SBI Equity Hybrid Fund(Previously known as SBI Magnum Balanced Fund) Hybrid - Aggressive Hybrid Fund
SBI Conservative Hybrid Fund(Previously known as SBI Debt Hybrid Fund) Hybrid - Conservative Hybrid Fund
SBI Multi Asset Allocation Fund(Previously known as SBI Magnum MonthlyIncome Plan - Floater) Hybrid - Multi Asset Allocation Fund
SBI Magnum Children's Benefit Fund - Savings Plan(Previously known as SBI Magnum Children's Benefit Fund) Solutions Oriented Scheme - Children’s Fund
04
05
08
09
12
13
14
16
15
17
18
19
20
21
22
23
24
25
26
27
28
29
30
31
32
33
34
36
37
38
39
......................................................................................................................................................................

......................................................................................................................................................................
......................................................................................................................................................................
......................................................................................................................................................................
......................................................................................................................................................................
......................................................................................................................................................................
......................................................................................................................................................................
........................................................................................................................................................................
INDEXContent Category No.
SBI Equity Savings Fund Hybrid - Equity Savings Fund
SBI Arbitrage Opportunities Fund Hybrid - Arbitrage Fund
SBI Balanced Advantage Fund Hybrid - Balanced Advantage Fund
SBI Magnum Children’s Benefit Fund – Investment Plan Solutions Oriented Scheme - Children’s Fund
SBI Retirement Benefit Fund – Aggressive Plan Solutions Oriented Scheme - Retirement Fund
SBI Retirement Benefit Fund – Aggressive Hybrid Plan Solutions Oriented Scheme - Retirement Fund
SBI Retirement Benefit Fund – Conservative Hybrid Plan Solutions Oriented Scheme - Retirement Fund
SBI Retirement Benefit Fund – Conservative Plan Solutions Oriented Scheme - Retirement Fund
SBI Magnum Gilt Fund(Previously known as SBI Magnum Gilt Fund - Long Term Plan) Debt - Gilt Fund
SBI Magnum Income Fund Debt - Medium To Long Duration Fund
SBI Dynamic Bond Fund Debt - Dynamic Bond Fund
SBI Corporate Bond Fund Debt - Corporate Bond Fund
SBI Credit Risk Fund(Previously known as SBI Corporate Bond Fund) Debt - Credit Risk Fund
SBI Magnum Medium Duration Fund(Previously known as SBI Regular Savings Fund) Debt - Medium Duration Fund
SBI Short Term Debt Fund Debt - Short Duration Fund
SBI Magnum Constant Maturity Fund(Previously known as SBI Magnum Gilt Fund - Short Term Plan) Debt - Gilt Fund With 10 Year Constant Duration
SBI Magnum Low Duration Fund(Previously known as SBI Ultra Short Term Debt Fund) Debt - Low Duration Fund
SBI Savings Fund Debt - Money Market Fund
SBI Banking and PSU Fund(Previously known as SBI Treasury Advantage Fund) Debt - Banking And PSU Fund
SBI Liquid Fund(Previously known as SBI Premier Liquid Fund) Debt - Liquid Fund
SBI Magnum Ultra Short Duration Fund(Previously known as SBI Magnum InstaCash Fund) Debt - Ultra Short Duration Fund
SBI Floating Rate Debt Fund Debt – Floater Fund
SBI Overnight Fund(Previously known as SBI Magnum InstaCash Fund -Liquid Floater) Debt - Overnight Fund
Snapshot of Debt Funds & Other Categories
Comparative Performance for all Schemes
Systematic Investment Plan (SIP)
Total Expense Ratios
IDCW History Of Debt & Hybrid Funds
Benchmark Riskometer
Potential Risk Class (PRC) Matrix
Disclaimer
SBI Funds Management limited Branches
How to read the Factsheet
40
41
42
43
44
45
46
47
48
51
50
52
53
54
55
56
57
58
59
60
61
62
63
64
84
65
78
85
88
90
94
93
95
......................................................................................................................................................................
......................................................................................................................................................................
......................................................................................................................................................................
......................................................................................................................................................................
......................................................................................................................................................................
......................................................................................................................................................................
......................................................................................................................................................................
......................................................................................................................................................................
......................................................................................................................................................................
......................................................................................................................................................................
......................................................................................................................................................................
......................................................................................................................................................................
......................................................................................................................................................................
......................................................................................................................................................................
......................................................................................................................................................................
......................................................................................................................................................................
......................................................................................................................................................................
......................................................................................................................................................................
......................................................................................................................................................................
......................................................................................................................................................................
......................................................................................................................................................................
......................................................................................................................................................................
......................................................................................................................................................................
......................................................................................................................................................................
......................................................................................................................................................................

From the MD & CEO Desk’s
Dear Investors,
Warm Regards,
Vinay M. Tonse
MD & CEO
August was an eventful month. After some stressful period till June, the Indian equity markets rallied for the second
consecutive month in August, with the Nifty and Sensex gaining 3.5%* and 3.4%*, respectively. This also resulted in the Indian
equity benchmark indices getting into positive territory for calendar year 2022, so far. This was a strong outperformance
compared to other emerging-market economies and the US market.
Another noteworthy development in the last few days has been leading global central bankers stating that fighting price rise
would be a top priority in the near future. This would mean higher interest rates for a period longer than what was anticipated
previously. The news that flowed in from the meeting of central bankers at Jackson Hole in the US, saw markets reacting
negatively.
Then there was a crucial data release on economic activity and growth in the country. The data now suggests that the Indian
economy grew by 13.5% (Source- CMIE Economic Outlook) in the April-June period this year. Such high growth is rarely seen,
but this time around, the expectation was even higher.
In effect, all such developments have resulted in significant volatility in recent times. As an investor, the volatility in the
markets can be an unpleasant experience, especially if you have started your investment journey only recently, or if you have
not been through a complete market cycle.
Hence, right at the beginning, it is crucial to accept the reality that volatility is an essential part of this investment journey in
the short term. I would also like to draw your attention to another reality. Time and again, long-term investments have stood
tall against all odds, aiding disciplined investors in reaching their financial goals.
Trusting the process is the key to achieving your financial goals and wealth creation. In addition to sticking to your
investments in a disciplined manner, you should also review the risk appetite and resultant asset allocation from time to time.
As mentioned above, the economic growth in April-June period was below expectations. One of the reasons for this was the
underwhelming performance of the manufacturing sector. The services sector pushed the Indian economy’s growth in
Q1FY23 to double-digit, despite an unimpressive performance by manufacturing sector. This is a good example to
understand how one of your asset classes can act as a hedge against another asset class being in a difficult situation.
The lesson here is that different solutions are needed for different situations, but maintaining a healthy combination is also
necessary. Invest in equity funds for long-term financial goals like retirement planning or children’s education. For short-term
goals like a vacation in summer next year, you can opt for other suitable mutual fund schemes.
You can choose from the bouquet of our offerings for different financial goals. I would also encourage you to consult your
financial advisor to better understand what suits your needs best. Your asset allocation should ideally be tailor-made to your
risk appetite.
Going forward too there can be ups and downs, in the economy and in the markets. However, the Indian economy seems
poised for growth with investments expected to come in from the government as well as the private sector. This is a time, you
as an investor, cannot miss being invested. At our end, it is our constant endeavor to offer the best-in-class investment
solutions that can suit the different risk appetite and financial goals you have.
Wishing the best of the ongoing festive season to you and your loved ones!
*Source: NSE, BSE04

Market Overview
05
" Higher for a bit longer" on policy rates was the hard, though obvious message that came out of the much awaited Jackson Hole Symposium speech by the US FED Chairman. Ever
since the initiation of QE post the 2008 Financial crisis, financial markets have been conditioned to factor in weaker economic data as " Good data" for asset prices given the
disposition of Central Banks, especially the US FED to provide backstop support. Whether this points to excess financialisation or the overreliance on softer interest rates, the fact
remains that Central bank policy actions continue to remain a key factor in the evolution of market trends. At the same time, given the recent policy failures it is quite likely that as
the dust settles, policy mandates, operating frameworks as well as the broader topics of central bank independence and accountability mechanisms would undergo a relook. This
has already been set in motion at an operational level with most central banks eschewing the practice of giving specific forward guidance . The decision of the Australian
Government in July 22 to review the role of Reserve Bank of Australia's Monetary Policy framework and operations could well be the first among many other similar steps in other
jurisdictions in the developed world.
With the FED promising to " be at it until the job is done on inflation" , financial markets have repriced expectations on the peak FED rates back higher. The expectation of modest
easing towards the end of CY23 still remains difficult to fathom in the current circumstances. At the same time, bond yields across most of the developed markets have
substantially retraced the easing seen since July22, in a flattening trend. The key recession indicator , i.e the steepness of the 2/10Y US treasury yield curve still remains inverted at
around -23 bps.
Source: Bloomberg, SBIMF Research
Indian equities continued with the up move off their June lows with the Nifty and the Sensex gaining 3.7% and 3.6% respectively for the month of August. This was a strong
outperformance to the rest of Emerging Market (EM) complex that was broadly flat for the month as well as to the US market with the S&P500 declining 4% for the month. On a YTD
basis, India has outperformed EMs by over 14% in 2022 after already outperforming strongly in CY21. Since the beginning of 2021, Indian equities have outperformed the EM index
by over 38%. This has in turn led to India's valuation premium to EMs swelling to near historical highs. While this may be reflective of India's rising prominence in the global
economy, from a near term standpoint it could also mean that further upsides may be capped till the valuation argument improves.
Equity Markets

06
India's valuation premium to Emerging Markets near historic highs
Equity valuations expensive versus bonds
Equity market sentiment has cooled off over the past few months
Fixed Income:
Source: Bloomberg, SBIFM Research
Source: Bloomberg, FactSet, SBIFM Research
Source: Bloomberg, FactSet, SBIFM Research
On a standalone basis too, Indian equity valuations are on the expensive side, as measured by our preferred valuation gauge- yield spread of earnings yield over bond yields (please
refer the chart below- the lower this spread, the more expensive equities are versus bonds).
Valuations are expensive at a time when global macro uncertainties continue to persist. Even as inflation may be peaking for good, headwinds on global growth stay. With the Fed
chair having decisively declared fighting inflation as the priority even if it comes at the expense of growth, China continuing to struggle and Europe potentially staring at an energy
crisis in the winters, we believe we may still not be out of woods. For valuations to support further upsides, either a meaningful decline in bond yields must materialize, or else
markets need to consolidate till earnings catch-up.
Beyond the headline index however we find decent dispersion in stock valuations and hence stock specific opportunities. Our measure of market sentiment has turned neutral over
the past few months after pointing to euphoria in second half of 2021. This is suggestive of the froth in broader markets having been cleared thanks to the price action of the past
many months. This in turn has opened bottom-up, stock specific opportunities.
We therefore stay bottom-up and stock specific. On the other side of the potential near term turbulence however, we stay optimistic on the prospects of a manufacturing and
investment activity driven earnings expansion over the next few years.
The domestic bond markets have surprisingly remained insulated from the repricing of overseas yields and expectations. Stable currency and softness in crude prices alongside
newsflow pertaining to inclusion in the JP Morgan Bond Index led to a softening trend in yields. Crude prices have remained lower than the RBI estimate of USD 105/barrel , but

07
prone to swings based on newsflow including China lockdowns, Iran nuclear deal resolution as well as demand data. This is likely to sustain in coming months as the war in Europe
drags on even as other sanctions on Russian oil take effect alongside the scheduled end for the Strategic reserve drawdowns which have been supplying additional barrels of oil to
the markets so far.
The issue of Index Inclusion has been triggered by the routine review expected around September and certain research reports and news stories surrounding it. While the same was
considered imminent around the Union Budget, this has been on the backburner for a while as the Government remains unwilling to provide preferential taxation benefits or
enable overseas clearing. The immediate trigger seems to be the exclusion of Russia from the indices and the concern of Index trackers on increasing concentration within the
index. Alongside similar worries around China, the issue of non-inclusion of a large market like India has been raised again in the routine investor feedback reviews. While we
believe that a policy decision to be part of indices has been taken with a more open framework for debt flows such as the Fully Accessible Route (FAR securities), there is no
evidence so far of any additional measures to immediately accelerate the process. Hence, we remain sceptical of any immediate inclusion, though the same can be accelerated if
the Index providers climb down in their preconditions to accommodate the second largest EM Debt market within Asia. At the same time, index inclusion announcement in the
current year would be sentimentally positive and less likely to result in any large flows given the global backdrop as well as the process of staggered inclusion that the indices
follow.
The resilience of markets also should be seen in the context of reasonable appetite and probably space available in Bank Held to Maturity Book for sovereign securities. In the
current FY till date (Aug 12, 2022), scheduled bank's incremental investments in SLR securities have remained robust at Rs 3.43 trillion as against Rs 1.50 trillion in the
corresponding period in the previous FY. Alongside healthy investor demand from long term investors and lower issuances of SDL as against the calendar, SLR securities have
remained well bid so far. SDL issuances in this FY till end August have been around 67% of the indicated calendar for the same period. At the same time, as second half supply meets
the reality of better credit growth as well as less favourable domestic liquidity and overseas cues, we could witness episodes of volatility in yields.
Corporate Bonds continue to be supported by pending demand for mandated investment quotas, despite glaring disconnect in valuations. AAA PSU/PFI bonds continue to trade
lower than SDL's and almost in line with Government securities across most tenors. Spreads on liquid AAA PSU/PFI bonds over government securities range from zero to 17bps
across various benchmark tenors. These spreads provide no compensation for either credit or liquidity/ impact cost. Similarly, other credits priced over an overvalued AAA curve
remain an equally non attractive proposition on a relative basis. A gradual unwinding of excess liquidity and repricing of the existing favourable terms on External benchmark
linked Bank loans should set the stage for a gradual unwinding of the excesses seen in credit spread pricing. Sovereign securities provide the best space currently to position for a
medium-term positive view on the interest rate cycle.
From a monetary policy perspective, while India seems to be in a much better shape as compared to developed economies, the influence of a strong dollar would continue to
impact outcomes. Effectively, EM central banks getting complete "operational independence from the policies of the FED", would remain a challenge given the dynamics of capital
flows. However, we expect that the RBI could well resort to smaller adjustments incrementally in the Repo rate in the journey towards a near term pause zone of between 6.00% -
6.25%. The path towards this potential end point is unlikely to be smooth and unidirectional as seen in recent weeks.
Source: Bloomberg, SBIMF Research
Source- SBIFM research, Bloomberg. As on 06 September, 2022
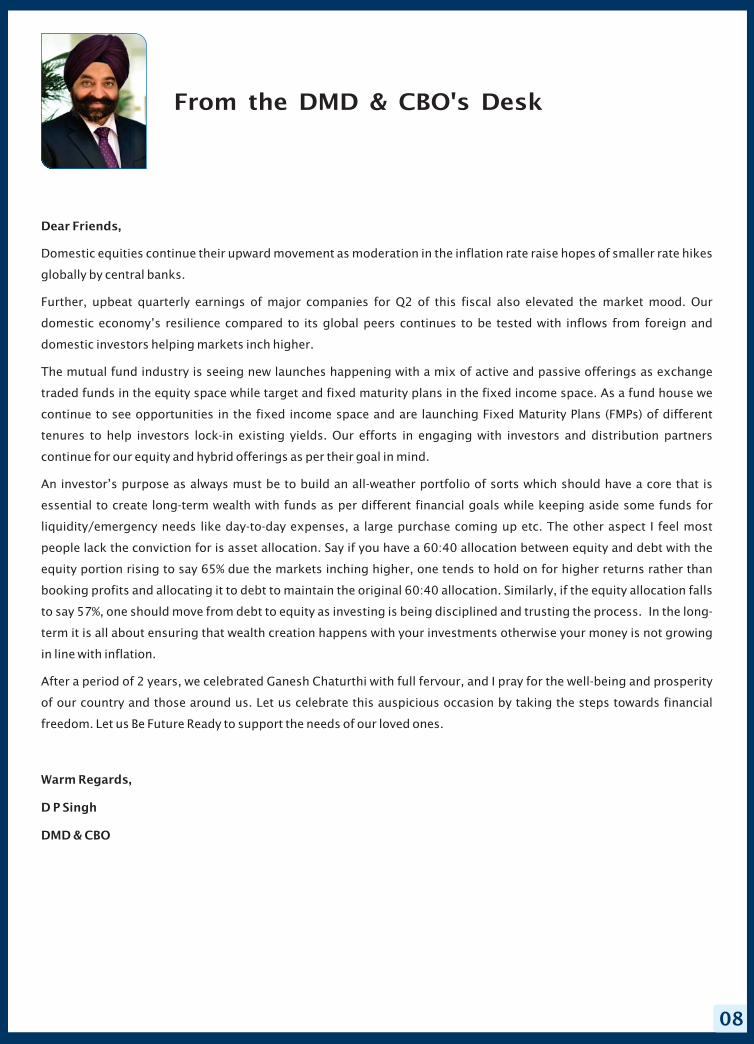
Dear Friends,
Warm Regards,
D P Singh
DMD & CBO
Domestic equities continue their upward movement as moderation in the inflation rate raise hopes of smaller rate hikes
globally by central banks.
Further, upbeat quarterly earnings of major companies for Q2 of this fiscal also elevated the market mood. Our
domestic economy’s resilience compared to its global peers continues to be tested with inflows from foreign and
domestic investors helping markets inch higher.
The mutual fund industry is seeing new launches happening with a mix of active and passive offerings as exchange
traded funds in the equity space while target and fixed maturity plans in the fixed income space. As a fund house we
continue to see opportunities in the fixed income space and are launching Fixed Maturity Plans (FMPs) of different
tenures to help investors lock-in existing yields. Our efforts in engaging with investors and distribution partners
continue for our equity and hybrid offerings as per their goal in mind.
An investor’s purpose as always must be to build an all-weather portfolio of sorts which should have a core that is
essential to create long-term wealth with funds as per different financial goals while keeping aside some funds for
liquidity/emergency needs like day-to-day expenses, a large purchase coming up etc. The other aspect I feel most
people lack the conviction for is asset allocation. Say if you have a 60:40 allocation between equity and debt with the
equity portion rising to say 65% due the markets inching higher, one tends to hold on for higher returns rather than
booking profits and allocating it to debt to maintain the original 60:40 allocation. Similarly, if the equity allocation falls
to say 57%, one should move from debt to equity as investing is being disciplined and trusting the process. In the long-
term it is all about ensuring that wealth creation happens with your investments otherwise your money is not growing
in line with inflation.
After a period of 2 years, we celebrated Ganesh Chaturthi with full fervour, and I pray for the well-being and prosperity
of our country and those around us. Let us celebrate this auspicious occasion by taking the steps towards financial
freedom. Let us Be Future Ready to support the needs of our loved ones.
08
From the DMD & CBO's Desk
Po
rtfo
lio
Cla
ssif
icati
on
By In
du
str
yA
llo
cati
on
(%
) as o
n 3
1A
ug
ust
2022
Port
folio C
lass
ific
ati
on
By
Ind
ust
ry A
lloca
tion
(%)
(Top
10)
Oth
er
Deta
ils
Exit
Load
Wit
hin
1 Y
ear
- 1%
Wit
hin
1 Y
ear
- 1%
On o
r Be
fore
30
day
s -
0.1
0%
Wit
hin
1 Y
ear
- 1%
Wit
hin
1 Y
ear
- 1%
On o
r Be
fore
30
day
s -
0.1
0%
Wit
hin
1 Y
ear
- 1%
Wit
hin
1 Y
ear
- 1%
Finan
cial
Ser
vice
s31.8
8A
uto
mobile
And A
uto
Com
ponen
ts13.1
4In
form
atio
n T
echnolo
gy
8.1
4H
ealt
hca
re6.9
0O
il, G
as &
Consu
mab
leFu
els
6.8
5Fa
st M
ovi
ng C
onsu
mer
Goods
6.1
7C
ash,
Cas
h E
quiv
alen
ts A
nd
Oth
ers
4.9
1C
apit
al G
oods
4.8
6C
onst
ruct
ion
4.2
7C
onst
ruct
ion M
ater
ials
3.0
4
Finan
cial
Ser
vice
s3
2.8
7In
form
atio
n T
echnolo
gy
15
.54
Auto
mobile
And A
uto
Com
ponen
ts1
3.6
0C
onsu
mer
Ser
vice
s5
.01
Cap
ital
Goods
4.5
8C
onsu
mer
Dura
ble
s3
.83
Tex
tile
s3
.83
Const
ruct
ion
3.7
0C
onst
ruct
ion M
ater
ials
3.3
6H
ealt
hca
re3
.27
Finan
cial
Ser
vice
s2
8.7
1In
form
atio
n T
echnolo
gy
9.0
0O
il, G
as &
Consu
mab
leFu
els
8.8
7A
uto
mobile
And A
uto
Com
ponen
ts6
.98
Fast
Movi
ng C
onsu
mer
Goods
6.0
6H
ealt
hca
re5
.50
Consu
mer
Dura
ble
s4
.19
Cas
h,
Cas
h E
quiv
alen
tsA
nd O
ther
s4
.17
Cap
ital
Goods
3.7
1M
etal
s &
Min
ing
3.3
3
Finan
cial
Ser
vice
s1
7.6
5A
uto
mobile
And A
uto
Com
ponen
ts1
5.4
7C
ash,
Cas
h E
quiv
alen
tsA
nd O
ther
s9
.78
Consu
mer
Dura
ble
s7
.78
Chem
ical
s7
.46
Tex
tile
s7
.06
Hea
lthca
re6
.80
Consu
mer
Ser
vice
s6
.53
Met
als
& M
inin
g5
.63
Cap
ital
Goods
3.6
7
Finan
cial
Ser
vice
s2
0.2
0D
eriv
ativ
es1
5.2
2So
vere
ign
8.5
4A
uto
mobile
And A
uto
Com
ponen
ts7
.17
Info
rmat
ion T
echnolo
gy
5.8
7H
ealt
hca
re5
.73
Cap
ital
Goods
5.6
9Fa
st M
ovi
ng C
onsu
mer
Goods
5.1
3Po
wer
4.5
0C
hem
ical
s3
.63
Finan
cial
Ser
vice
s1
7.8
6C
apit
al G
oods
10
.20
Cas
h, C
ash E
quiv
alen
tsA
nd O
ther
s9
.67
Auto
mobile
And A
uto
Com
ponen
ts8
.07
Info
rmat
ion T
echnolo
gy
6.0
8Fa
st M
ovi
ng C
onsu
mer
Goods
6.0
3T
exti
les
5.5
5H
ealt
hca
re5
.01
Oil,
Gas
& C
onsu
mab
leFu
els
4.1
1C
onsu
mer
Ser
vice
s3.9
4
Fast
Movi
ng C
onsu
mer
Goods
22
.95
Cap
ital
Goods
19
.76
Auto
mobile
And A
uto
Com
ponen
ts1
5.8
0In
form
atio
n T
echnolo
gy
11
.63
Hea
lthca
re8
.18
Cas
h, C
ash E
quiv
alen
tsA
nd O
ther
s7
.20
Med
ia,
Ente
rtai
nm
ent
&Pu
blic
atio
n5
.56
Chem
ical
s3
.30
Tex
tile
s3
.26
Consu
mer
Ser
vice
s2
.36
Fu
nd
Deta
ils a
s o
n 3
1A
ug
ust
2022
Month
End
AU
M (
in C
rore
s)`
`34,0
45.1
7`4,6
70.8
1`16,2
09.0
1`11,4
43.5
7`5,8
28.2
3`7,7
33.0
8`8,0
44.3
0`5,4
77.2
2
Port
folio T
urn
over
0.0
70.3
50.4
10.1
72.2
10.5
90.1
40.4
6
Exp
ense
Rati
oReg
ula
r- 1
.60%
Dir
ect-
0.9
1%
Reg
ula
r- 1
.96%
Dir
ect-
1.3
4%
Reg
ula
r- 1
.70%
,D
irec
t- 0
.85%
Reg
ula
r- 1
.76%
,D
irec
t- 0
.81%
Reg
ula
r- 1
.87%
,D
irec
t- 1
.07%
Reg
ula
r- 1
.84%
Dir
ect-
1.1
0%
Reg
ula
r- 1
.83%
,D
irec
t- 1
.01%
Reg
ula
r- 1
.93%
,D
irec
t- 1
.25%
Stand
ard
Dev
iati
on
Bet
a
#
#
#Sh
arp
e R
ati
o
22.1
4%
0.9
9
0.6
4
21.8
4%
0.9
9
0.6
2
21.7
3%
0.9
5
0.6
1
- - -
22.9
9%
0.9
8
1.0
8
23.8
6%
0.9
9
0.7
8
25.1
2%
0.9
4
1.0
2
16.6
1%
0.8
6
0.9
3
Schem
e N
am
eSB
I Blu
e C
hip
Fund
SBI
Flex
icap
Fund
SBI
Mult
icap
Fund
SBI
Contr
a F
und
SBI
Magnum
Mid
cap
Fund
SBI
Magnum
Glo
bal Fu
nd
Idea
l In
ves
tmen
tH
ori
zon
4ye
ars
+3
year
s+
4ye
ars
+4
year
s+
5ye
ars
+4
year
s+
5ye
ars
+5
year
s+
Ince
pti
on D
ate
14/0
2/2
006
01/0
1/1
991
29/0
9/2
005
08/0
3/2
022
05/0
7/1
999
28/0
2/1
993
29/0
3/2
005
30/0
9/1
994
Fund
Manager
Ms.
Sohin
i A
ndan
i &
*Mr.
Mohit
Jai
nM
r. R
ohit
Shim
pi &
*Mr.
Mohit
Jai
nM
r. R
. Sr
iniv
asan
& *
Mr.
Mohit
Jai
nM
r. R
. Sr
iniv
asan
& *
Mr.
Mohit
Jai
nM
r. S
aura
bh P
ant
& *
Mr.
Mohit
Jai
nM
s. S
ohin
i A
ndan
i&
*M
r.M
ohit
Jai
n
Managin
g S
ince
Sep-2
010
Jan-2
022
Jan-2
022
Mar
ch-2
022
May
-2018
Sep-2
016
July
-2010
Jan-2
022
Firs
t T
ier
Ben
chm
ark
S&P
BSE
10
0 Index
(T
RI)
S&P
BSE
500 Index
(TRI)
NIF
TY 5
00
Mult
icap
50
:25
:25
TR
I
Po
rtfo
lio
Cla
ssif
icati
on
By
Asset
Allo
cati
on
(%
) as o
n 3
1A
ug
ust
2022
Larg
e C
ap
(%
)
Mid
Cap
(%
)
Small C
ap
(%
)
Uncl
ass
ifie
d (
%)
Oth
er A
sset
s (%
)
81.0
5
13.6
5
0.2
4
-
4.9
1
77.0
8
17.6
7
1.3
3
-
3.9
2
62.3
4
15.5
0
14.3
0
-
7.8
6
32.3
6
32.1
7
25.6
9
-
9.7
8
31.9
6
18.5
8
25.0
1
-
15.9
1
34.9
2
35.4
9
17.1
1
-
12.4
8
4.9
8
65.9
9
24.4
0
-
4.3
8
21.2
3
36.8
2
17.5
6
-
24.3
9
Snap
shot
of
Eq
uit
y Fu
nd
s &
Oth
er
Cate
gori
es
Plea
se c
onsu
lt y
our
finan
cial
advi
sor
bef
ore
inve
stin
g. Fo
r det
ails
, ple
ase
refe
r to
res
pec
tive
pag
e of
the
schem
e.#R
isk
Free
rat
e: F
BIL
Ove
rnig
ht
Mib
or
rate
(5
.34
% a
s on 3
0th
August
20
22
)Ba
sis
for
Rat
io C
alcu
lati
on:
3 Y
ears
Month
ly D
ata
Poin
ts.
Expen
se r
atio
incl
udes
GST
, Ba
se T
ER a
nd a
ddit
ional
expen
ses
as p
er r
egula
tion 5
2(6
A)(
b)
and 5
2(6
A)(
c) o
f SE
BI (
MF)
reg
ula
tions
for
both
Dir
ect
and
Reg
ula
r pla
n |
*Mr.
Mohit
Jai
n is
the
ded
icat
ed f
und m
anag
er f
or
man
agin
g o
vers
eas
inve
stm
ents
of
the
Schem
e.
SBI
Larg
e &
Mid
cap
Fund
(Pre
vio
usl
y know
n a
s SB
IM
ag
num
Mult
iplier
Fund
)
SBI
Magnum
Eq
uit
yESG
Fund
(Pre
vio
usl
y know
n a
s SB
IM
ag
num
Eq
uit
y Fu
nd
)
Mr.
Din
esh B
alac
han
dra
n&
*M
r.M
ohit
Ja i
nM
r. R
. Sr
iniv
asan
& *
Mr.
Mohit
Ja i
n
Nif
ty M
NC
Index
(TRI)
Nif
ty L
arge
Mid
Cap
250 Index
(TRI)
S&P
BSE
500 T
RI
Nif
ty M
idca
p 1
50
Index
(TRI)
Nif
ty E
SG 1
00 T
RI
05
09
Auto
mobile
And A
uto
Com
ponen
ts1
8.6
4
Finan
cial
Ser
vice
s1
4.9
1
Cap
ital
Goods
13
.06
Chem
ical
s7
.91
Tex
tile
s7
.12
Consu
mer
Dura
ble
s6
.38
Const
ruct
ion M
ater
ials
5.5
0
Hea
lthca
re5
.04
Cas
h, C
ash E
quiv
alen
tsA
nd O
ther
s4
.38
Consu
mer
Ser
vice
s4
.28

Po
rtfo
lio
Cla
ssif
icati
on
By In
du
str
yA
llo
cati
on
(%
) as o
n 3
1A
ug
ust
2022
Port
folio C
lass
ific
ati
on B
y In
dust
ryA
lloca
tion (
%)
(Top
10)
Finan
cial
Ser
vice
s3
6.0
8H
ealt
hca
re8
.43
Fast
Movi
ng C
onsu
mer
Goods
7.3
3T
elec
om
munic
atio
n7
.17
Cas
h, C
ash E
quiv
alen
tsA
nd O
ther
s6
.96
Auto
mobile
And A
uto
Com
ponen
ts5
.87
Pow
er4
.90
Info
rmat
ion T
echnolo
gy
4.7
7C
hem
ical
s4
.01
Tex
tile
s3
.46
Cap
ital
Goods
21.0
5C
onsu
mer
Dura
ble
s14.6
3C
onsu
mer
Ser
vice
s12.1
9C
ash, C
ash E
quiv
alen
tsA
nd O
ther
s8.7
4C
hem
ical
s7.7
7D
eriv
ativ
es7.5
0C
onst
ruct
ion
6.7
5Fa
st M
ovi
ng C
onsu
mer
Goods
5.0
8A
uto
mobile
And A
uto
Com
ponen
ts4.8
0Fi
nan
cial
Ser
vice
s2.5
9
Finan
cial
Ser
vice
s27.6
1C
ash, C
ash E
quiv
alen
tsA
nd O
ther
s9.3
4C
apit
al G
oods
9.0
9In
form
atio
nTec
hnolo
gy
8.5
7A
uto
mobile
And A
uto
Com
ponen
ts8.2
1O
il, G
as &
Consu
mab
leFu
els
7.8
9H
ealt
hca
re6.4
9C
onst
ruct
ion
4.8
2Tel
ecom
munic
atio
n2.7
9R
ealt
y2
.65
Hea
lthca
re87.9
9
Chem
ical
s5.6
5
Consu
mer
Ser
vice
s4.0
0
Cas
h, C
ash E
quiv
alen
tsA
nd O
ther
s1.9
6
Cap
ital
Goods
0.4
0
Finan
cial
Ser
vice
s94.5
0C
ash, C
ash E
quiv
alen
tsA
nd O
ther
s5.1
5D
eriv
ativ
es0.3
5
Finan
cial
Ser
vice
s36.7
9
Pow
er16.9
4
Cap
ital
Goods
15.4
1
Oil,
Gas
& C
onsu
mab
leFu
els
12.6
1
Met
als
& M
inin
g9.2
4
Cas
h, C
ash E
quiv
alen
tsA
nd O
ther
s4.8
8
Serv
ices
4.1
3
Chem
ical
s18.5
7O
il, G
as &
Consu
mab
leFu
els
15.3
7Po
wer
15.3
7C
onst
ruct
ion
Mat
eria
ls1
4.7
6M
etal
s &
Min
ing
11.1
8C
ash, C
ash E
quiv
alen
tsA
nd O
ther
s9.2
4Fa
st M
ovi
ng C
onsu
mer
Goods
4.3
6U
tilit
ies
4.2
9Fo
rest
Mat
eria
ls3.6
8Tex
tile
s3.1
8
Fu
nd
Deta
ils a
s o
n 3
1A
ug
ust
2022
Month
End
AU
M (
Rs.
in C
rore
s)`27,4
52.3
0`14,0
44.4
6`11,2
04.8
6`1,6
75.5
5`3,7
20.8
9`463.4
9`468.0
0
Port
folio T
urn
over
0.3
40.3
10.1
50.2
71.1
20.4
70.5
6
Exp
ense
Rati
oReg
ula
r- 1
.62%
Dir
ect-
0.7
1%
Reg
ula
r- 1
.70%
Dir
ect-
0.7
2%
Reg
ula
r- 1
.74%
,D
irec
t- 1
.16%
Reg
ula
r- 2
.12%
,D
irec
t- 1
.06%
Reg
ula
r- 1
.91%
Dir
ect-
0.7
9%
Reg
ula
r- 2
.49%
,D
irec
t- 1
.45%
Reg
ula
r- 2
.57%
,D
irec
t- 2
.03%
Stand
ard
Dev
iati
on
Bet
a
#
#
#Sh
arp
e R
ati
o
21.2
1%
0.8
6
0.7
1
23.6
3%
0.7
7
1.0
9
21.6
3%
0.9
5
0.7
3
20.1
3%
0.8
8
0.9
3
30.1
2%
0.9
6
0.4
3
23.9
1%
0.7
9
0.5
0
25.5
1%
0.9
3
0.8
7
Schem
e N
am
e
SBI
Focu
sed
Eq
uit
yFu
nd
(Pre
vio
usl
y know
nas
SBI
Em
erg
ing
Busi
nes
ses
Fund
)
SBI
Small C
ap
Fund
(Pre
vio
usl
y know
n a
s SB
ISm
all &
Mid
cap
Fund
)
SBI
Long T
erm
Eq
uit
y Fu
nd
(Pre
vio
usl
y know
n a
s SB
IM
agnum
Taxgain
Sch
eme)
SBI
Hea
lthca
reO
pp
ort
unit
ies
Fund
(Pre
vio
usl
y know
n a
s SB
IPharm
a F
und
)
SBI
Bankin
g &
Financi
al Se
rvic
esFu
nd
SBI
PSU
Fund
SBI
Magnum
CO
MM
A F
und
Idea
l In
ves
tmen
t H
ori
zon
5ye
ars
+5
year
s+
3ye
ars
+T
acti
cal
Tac
tica
lT
acti
cal
Tac
tica
l
Ince
pti
on D
ate
17/0
9/2
004
09/0
9/2
009
31/0
3/1
993
05/0
7/1
999
26/0
2/2
015
07/0
7/2
010
08/0
8/2
005
Fund
Manager
Mr.
R. Sr
iniv
asan
& *
Mr.
Mohit
Ja i
nM
r. R
. Sr
iniv
asan
& *
Mr.
Mohit
Ja i
nM
r. D
ines
hBa
lach
andra
nM
r. T
anm
aya
Des
ai&
*M
r.M
ohit
Ja i
nM
r. M
ilind A
gra
wal
& *
Mr.
Mohit
Ja i
nM
r. R
ichar
d D
'souza
Mr.
Ric
har
d D
'souza
& *
Mr.
Mohit
Ja i
n
Managin
g S
ince
May
-20
09
Nov
- 2013
Sep-2
016
Jun-2
011
Aug -
2019
Aug-2
014
Aug-2
014
Firs
t T
ier
Ben
chm
ark
S&P
BSE
500 Index
(TRI)
S&P
BSE
250 S
mal
l C
apIn
dex
TRI
S&P
BSE
HEA
LTH
CA
RE
Index
(TRI)
S&P
BSE
PSU
IN
DEX
(TRI)
Nif
ty C
om
modit
ies
Index
(TRI)
Po
rtfo
lio
Cla
ssif
icati
on
By
Asset
Allo
cati
on
(%
) as o
n 3
1A
ug
ust
2022
Larg
e C
ap
(%
)
Mid
Cap
(%
)
Small C
ap
(%
)
Uncl
ass
ifie
d (
%)
Oth
er A
sset
s (%
)
51.4
5
28.2
0
4.6
7
-
14.9
7
-
11.9
1
71.7
3
-
16.3
6
57.9
4
21.3
5
11.3
7
-
9.3
4
54.8
8
19.8
6
22.9
0
-
2.3
6
80.0
2
4.2
7
10.2
1
-
5.5
0
62.9
6
16.9
9
15.1
7
-
4.8
8
42.1
5
13.9
0
34.7
1
-
9.2
4
Oth
er
Deta
ils
Exit
Load
Wit
hin
1 Y
ear
- 1%
Wit
hin
1 Y
ear
- 1%
NIL
Wit
hin
15 D
ays
- 0.5
0%
Wit
hin
30 d
ays
- 0.5
0%
Wit
hin
30 d
ays
- 0.5
0%
Wit
hin
30 d
ays
- 0.5
0%
Snap
shot
of
Eq
uit
y Fu
nd
s &
Oth
er
Cate
gori
es
Plea
se c
onsu
lt y
our
finan
cial
advi
sor
bef
ore
inve
stin
g. Fo
r det
ails
, ple
ase
refe
r to
res
pec
tive
pag
e of
the
schem
e.*M
r. M
ohit
Jai
n is
the
ded
icat
ed f
und m
anag
er f
or
man
agin
g o
vers
eas
inve
stm
ents
of
the
Schem
e.
#R
isk
Free
rat
e: F
BIL
Ove
rnig
ht
Mib
or
rate
(5
.34
% a
s on 3
0th
August
20
22
) Ba
sis
for
Rat
io C
alcu
lati
on:
3 Y
ears
Month
ly D
ata
Poin
ts. Ex
pen
sera
tio incl
udes
GST
, Ba
se T
ER a
nd a
ddit
ional
expen
ses
as p
er r
egula
tion 5
2(6
A)(
b)
and 5
2(6
A)(
c) o
f SE
BI (
MF)
reg
ula
tions
for
both
Dir
ect
and R
egula
r pla
n |
Nif
ty F
inan
cial
Ser
vice
sIn
dex
(TRI)
S&P
BSE
500 Index
(TRI)
10

Plea
se c
onsu
lt y
our
finan
cial
advi
sor
bef
ore
inve
stin
g. Fo
r det
ails
, ple
ase
refe
r to
res
pec
tive
pag
e of
the
schem
e.*M
r. M
ohit
Jai
n is
the
ded
icat
ed f
und m
anag
er f
or
man
agin
g o
vers
eas
inve
stm
ents
of
the
Schem
e.
#R
isk
Free
rat
e: F
BIL
Ove
rnig
ht
Mib
or
rate
(5
.34
% a
s on 3
0th
August
20
22
) Ba
sis
for
Rat
io C
alcu
lati
on:
3 Y
ears
Month
ly D
ata
Poin
ts. Ex
pen
sera
tio incl
udes
GST
, Ba
se T
ER a
nd a
ddit
ional
expen
ses
as p
er r
egula
tion 5
2(6
A)(
b)
and 5
2(6
A)(
c) o
f SE
BI (
MF)
reg
ula
tions
for
both
Dir
ect
and R
egula
r pla
n |
Po
rtfo
lio
Cla
ssif
icati
on
By In
du
str
yA
llo
cati
on
(%
)as o
n 3
1A
ug
ust
2022
Port
folio C
lass
ific
ati
on
By
Ind
ust
ry A
lloca
tion
(%)
(Top
10)
Cap
ital
Goods
23
.56
Const
ruct
ion
Mat
eria
ls1
2.2
8O
il, G
as &
Consu
mab
leFu
els
11
.81
Const
ruct
ion
10
.92
Cas
h, C
ash E
quiv
alen
tsA
nd O
ther
s8
.81
Tel
ecom
munic
atio
n5
.96
Pow
er4
.86
Finan
cial
Ser
vice
s4
.58
Auto
mobile
And A
uto
Com
ponen
ts4
.08
Met
als
& M
inin
g3
.39
Fast
Movi
ng C
onsu
mer
Goods
32.0
3C
onsu
mer
Ser
vice
s19.4
7C
onsu
mer
Dura
ble
s15.7
4C
ash, C
ash E
quiv
alen
tsA
nd O
ther
s9.5
6Tex
tile
s8.6
9Tel
ecom
munic
atio
n8.1
9A
uto
mobile
And A
uto
Com
ponen
ts6.9
6M
edia
, En
tert
ainm
ent
&Pu
blic
atio
n1.8
6D
eriv
ativ
es-2
.50
Info
rmat
ion
Tec
hnolo
gy
70.9
0
Cas
h, C
ash E
quiv
alen
tsA
nd O
ther
s10.0
0
Tel
ecom
munic
atio
n9.5
7
Med
ia,
Ente
rtai
nm
ent
&Pu
blic
atio
n7.2
9
Serv
ices
1.6
9
Finan
cial
Ser
vice
s0.5
5
Fast
Movi
ng C
onsu
mer
Goods
26.1
6H
ealt
hca
re15.9
6Fi
nan
cial
Ser
vice
s12.4
6In
form
atio
nTec
hnolo
gy
10.4
9Po
wer
9.0
4A
uto
mobile
And A
uto
Com
ponen
ts6.0
3O
il, G
as &
Consu
mab
leFu
els
3.9
8M
etal
s &
Min
ing
3.2
9C
onst
ruct
ion M
ater
ials
3.1
9Tel
ecom
munic
atio
n3.0
7
Mutu
al F
und
100.1
4C
ash, C
ash E
quiv
alen
tsA
nd O
ther
s-0
.14
Mutu
al F
und
99.6
9C
ash, C
ash E
quiv
alen
tsA
nd O
ther
s0.3
1
Finan
cial
Ser
vice
s36.8
9In
form
atio
nTec
hnolo
gy
14.1
8O
il, G
as &
Consu
mab
leFu
els
13.3
8Fa
st M
ovi
ng C
onsu
mer
Goods
8.7
3A
uto
mobile
And A
uto
Com
ponen
ts5.9
9H
ealt
hca
re3.7
8C
onsu
mer
Dura
ble
s3.3
5C
onst
ruct
ion
2.9
8M
etal
s &
Min
ing
2.7
7Tel
ecom
munic
atio
n2.2
5
Fu
nd
Deta
ils
as o
n 3
1A
ug
ust
2022
Schem
e N
am
eSB
I In
frast
ruct
ure
Fund
SBI
Gold
Fund
SBI
Inte
rnati
onal
Acc
ess
- U
S Eq
uit
y Fo
FSB
I N
ifty
Ind
ex F
und
Idea
l In
ves
tmen
t H
ori
zon
Tac
tica
lT
acti
cal
Tac
tica
l5
year
s+
Tac
tica
lN
A3
year
s+
Ince
pti
on D
ate
06/0
7/2
007
05/0
7/1
999
05/0
7/1
999
02/0
3/2
019
12/0
9/2
011
22/0
3/2
021
17/0
1/2
002
Fund
Manager
Mr.
Bhav
in V
ithla
ni
& *
Mr.
Mohit
Ja i
nM
r. S
aura
bh P
ant
& *
Mr.
Mohit
Ja i
nM
r. S
aura
bh P
ant
& *
Mr.
Mohit
Ja i
nM
r. R
avip
raka
sh S
har
ma
Mr.
Rav
ipra
kash
Shar
ma
& *
Mr.
Mohit
Ja i
n
Managin
g S
ince
Jan-2
022
Jun-2
011
Jan-2
022
Mar
-20
19
Sep-2
011
Mar
ch-2
02
1Fe
b-2
011
Firs
t T
ier
Ben
chm
ark
Nif
ty Infr
astr
uct
ure
Index
(TRI)
Pric
e of
Phys
ical
Gold
S&P
500 Index
, a f
ter
conve
rtin
g it
to India
n R
upee
Nif
ty 5
0 Index
(TRI)
Po
rtfo
lio
Cla
ssif
icati
on
By
Asset
Allo
cati
on
(%
) as o
n 3
1A
ug
ust
2022
Larg
e C
ap
(In
%)
Mid
Cap
(In
%)
Small C
ap
(In
%)
Uncl
ass
ifie
d (
%)
Oth
er A
sset
s (I
n %
)
40.2
2
14.4
9
36.4
8
-
8.8
1
36.5
9
27.3
0
27.1
9
-
8.9
2
62.6
2
2.2
8
4.7
3
-
30.3
7
- -
ETF:
100.1
4
-
-0.1
4
- -
Ove
rsea
s M
utu
al F
und:
99.6
9
-
0.3
1
99.2
2
- - -
0.7
8
99.8
0
- - -
0.1
3
Oth
er
Deta
ils
Exit
Load
Wit
hin
30 d
ays
- 0.5
0%
On o
r Be
fore
30
day
s -
0.1
0%
Wit
hin
15 D
ays
- 0.5
0%
For
exit
on o
r bef
ore
15 d
ays
from
the
da t
e of
allo
tmen
t–
0.5
%Fo
r ex
it a
fter
15 d
ays
from
the
dat
e of
allo
tmen
t -
Nil
On o
r bef
ore
15 d
ays
- 1%
For
exit
on o
r bef
ore
1 y
ear
from
the
da t
e of
allo
tmen
t–
1.0
0%
For
exit
aft
er 1
yea
r fr
om
the
dat
e of
allo
tmen
t–
Nil
For
exit
on o
r bef
ore
15
day
sfr
om
the
da t
e of
allo
tmen
t–
0.5
%Fo
r ex
it a
fter
15
day
s fr
om
the
dat
e of
allo
tmen
t -
Ni l
Snap
shot
of
Eq
uit
y Fu
nd
s &
Oth
er C
ate
gori
esSB
I C
onsu
mp
tion
Op
port
unit
ies
Fund
(Pre
vio
usl
y know
n a
s SB
IFM
CG
Fund
)
SBI
Tec
hnolo
gy
Op
port
unit
ies
Fund
(Pre
vio
usl
y know
n a
s SB
IIT
Fund
)
SBI
Eq
uit
y M
inim
um
Vari
ance
Fund
Nif
ty India
Consu
mpti
on
Index
(TRI)
S&P
BSE
Tec
k In
dex
(TRI
Nif
ty 5
0 Index
(TRI)
Month
End
AU
M (
Rs.
in C
rore
s)`906.4
0`1,0
60.0
9`2,5
34.6
1`132.3
5`1,1
63.5
1`930.4
1`2,8
54.3
5
Port
folio T
urn
over
0.6
00.6
20.3
70.4
7-
-0.1
9
- - -
Exp
ense
Rati
oReg
ula
r- 2
.35%
Dir
ect-
1.9
4%
Reg
ula
r- 2
.26%
Dir
ect-
1.2
6%
Reg
ula
r- 2
.01%
Dir
ect-
0.9
2%
Reg
ula
r- 0
.75%
Dir
ect-
0.4
3%
Reg
ula
r- 0
.42%
,D
irec
t- 0
.10%
Reg
ula
r- 1
.63%
,D
irec
t- 0
.93%
Reg
ula
r- 0
.50%
,D
irec
t- 0
.18%
Stand
ard
Dev
iati
on
Bet
a
#
#
#Sh
arp
e R
ati
o
23.6
3%
1.0
3
0.7
8
23.4
6%
1.0
9
0.8
0
21.7
2%
0.9
2
0.9
2
18.7
5%
0.8
1
0.7
7
- - -
- - -
Mr.
Rav
ipra
kash
Shar
ma
& *
Mr.
Mohit
Ja i
nM
r. M
ohit
Ja i
n
11

12
EQUITY-LARGE CAP
Option NAV ( )`
NET ASSET VALUE
Record Date IDCW NAV ( )`(in /Unit)`
LAST IDCW
•
•
Long term capital appreciation.Investment in equity and equity-related instruments of large capcompanies.
SBI Blue Chip FundThis product is suitable for investors who are seeking^:
Face value: 10`
Investment Objective
Quantitative Data
To provide investors with opportunitiesfor long-term growth in capital throughan active management of investments in adiversified basket of large cap equitystocks (as specified by SEBI/AMFI fromtime to time).
Fund Details
Standard DeviationBetaSharpe RatioPortfolio Turnover*
#
#
#
: 22.14%: 0.99: 0.64
Equity Turnover : 0.07Total Turnover : 0.07Total Turnover = Equity + Debt + Derivatives#
S o u r c e : C R I S I L F u n d A n a l y s e r*Portfolio Turnover = lower of total sale or totalpurchase for the last 12 months (including equityderivatives) upon Avg. AUM of trailing twelve months.
Risk Free rate: FBIL Overnight Mibor rate (5.34% as on30th August 2022) Basis for Ratio Calculation: 3 YearsMonthly Data Points
Ratios are computed using Total Return Index (TRI) asper SEBI Circular dated Jan 4, 2018
PORTFOLIO CLASSIFICATION BY(%)ASSET ALLOCATION
•
•
•
•
•
•
•
•
•
•
•
•
•
•
Type of Scheme
Date of Allotment:Report As On:AAUM for the Month of August 2022
AUM as on August 31, 2022
Fund Manager:
Managing Since:
Total Experience:First Tier Benchmark:Exit Load:
Entry Load:Plans Available:Options:SIP
Minimum Investment
Additional Investment
An open-ended Equity Schemepredominantly investing in large cap stocks.
14/02/2006
33,583.80 Crores
34,045.17 CroresMs. Sohini Andani &
*Mr.Mohit Jain
Ms. Sohini Andani Sep-2010Mr. Mohit Jain Nov-2017
Over 27 yearsS&P BSE 100 Index (TRI)
For exit within 1 year from the date of allotment -1 %; For exit after 1 year from the date ofallotment - Nil
N.A.Regular, Direct
Growth, IDCW
Any Day SIP’ Facility - is available for Monthly,Quarterly, Semi-Annual and Annual frequenciesthrough electronic mode like OTM / DebitMandate. Default SIP date will be 10th. In case theSIP due date is a Non Business Day, then theimmediate following Business Day will beconsidered for SIP processing.Daily - Minimum 500 & in multiples of 1 thereafterfor a minimum of 12 instalments. (Kindly refernotice cum addendum dated June 02, 2020 forfurther details)Weekly - Minimum 1000 & in multiples of 1thereafter for a minimum of 6 instalments. (or)Minimum 500 & in multiples of 1 thereafter for aminimum of 12 instalments.Monthly - Minimum 1000 & in multiples of 1thereafter for minimum six months (or) minimum
500 & in multiples of 1 thereafter forminimum one year.Quarterly - Minimum 1500 & in multiples of 1thereafter for minimum one year.Semi Annual - Minimum 3000 & in multiples of1 thereafter for a minimum of 4 installments.Annual - Minimum 5000 & in multiples of 1thereafter for a minimum of 4 installments.
5000 & in multiples of 1
1000 & in multiples of 1
31/08/2022
`
`
` `
` `
` `
` `
` `
` `
` `
` `
PORTFOLIO CLASSIFICATION BYINDUSTRY ALLOCATION (%)
PORTFOLIO
Pursuant to payment of IDCW, the NAV of IDCW Option of scheme/planswould fall to the extent of payout and statutory levy, if applicable.
^Investors should consult their financial advisers if in doubt aboutwhether the product is suitable for them.
Reg-Plan-IDCW 35.6470
Reg-Plan-Growth 62.6616
Dir-Plan-IDCW 44.1485
Dir-Plan-Growth 68.0260
23-Sep-16 (Reg Plan) 1.00 18.596423-Sep-16 (Dir Plan) 1.20 21.856917-Jul-15 (Reg Plan) 2.50 17.688017-Jul-15 (Dir Plan) 2.90 20.539521- Mar-14 (Reg Plan) 1.80 12.7618
Financial Services 31.88Automobile And Auto Components 13.14Information Technology 8.14Healthcare 6.90Oil, Gas & Consumable Fuels 6.85Fast Moving Consumer Goods 6.17Capital Goods 4.86Construction 4.27Construction Materials 3.04Realty 2.28Telecommunication 2.00Textiles 1.95Metals & Mining 1.67Consumer Services 0.75Chemicals 0.61Consumer Durables 0.43Sovereign 0.15Cash, Cash Equivalents And Others 4.91
Investors understand that their principal
will be at Very High risk
Large Cap MidcapSmallcap
Cash, Cash Equivalents, And Others
*Mr. Mohit Jain is the dedicated fund manager for managing overseas investments of the Scheme.
Equity SharesICICI Bank Ltd. 7.93HDFC Bank Ltd. 7.90Infosys Ltd. 4.88Reliance Industries Ltd. 4.86ITC Ltd. 4.41Larsen & Toubro Ltd. 4.27Housing Development Finance Corporation Ltd. 3.59HCL Technologies Ltd. 3.07State Bank Of India 2.86Mahindra & Mahindra Ltd. 2.86Divi'S Laboratories Ltd. 2.66Eicher Motors Ltd. 2.28Axis Bank Ltd. 2.27Bharti Airtel Ltd. 2.00Page Industries Ltd. 1.95Shree Cement Ltd. 1.78Britannia Industries Ltd. 1.76Hindalco Industries Ltd. 1.67Sona Blw Precision Forgings Ltd. 1.64ICICI Prudential Life Insurance Company Ltd. 1.63Cummins India Ltd. 1.54Cholamandalam Investment & Finance Co. Ltd. 1.47Cipla Ltd. 1.43HDFC Life Insurance Company Ltd. 1.38Sun Pharmaceutical Industries Ltd. 1.28DLF Ltd. 1.27Ultratech Cement Ltd. 1.26Max Healthcare Institute Ltd. 1.23Bharat Electronics Ltd. 1.17Thermax Ltd. 1.16
Stock Name (%) Of Total AUM Stock Name (%) Of Total AUMICICI Lombard General Insurance Company Ltd. 1.15Samvardhana Motherson International Ltd. 1.14Bajaj Auto Ltd. 1.07Godrej Properties Ltd. 1.01SKF India Ltd. 0.99Hero Motocorp Ltd. 0.94Maruti Suzuki India Ltd. 0.90Schaeffler India Ltd. 0.88Kotak Mahindra Bank Ltd. 0.84Motherson Sumi Wiring India Ltd. 0.75TVS Motor Company Ltd. 0.68PI Industries Ltd. 0.61Coal India Ltd. 0.59Avenue Supermarts Ltd. 0.58Indian Oil Corporation Ltd. 0.51Hindustan Petroleum Corporation Ltd. 0.48Crompton Greaves Consumer Electricals Ltd. 0.43Bharat Petroleum Corporation Ltd. 0.41Life Insurance Corporation Of India 0.40Aurobindo Pharma Ltd. 0.30Shriram City Union Finance Ltd. 0.24Tata Consultancy Services Ltd. 0.19Zomato Ltd. 0.17
HDFC Ltd.(Warrants) 0.22
91 Day T-Bill 27.10.22 0.15
Total
Total 0.22
Total 0.15
94.72Warrants
Treasury Bills
Cash, Cash Equivalents And Others 4.91
Grand Total 100.00
81.05
13.65
0.24 4.91

13
EQUITY- THEMATIC FUND
Option NAV ( )`
NET ASSET VALUE
Record Date IDCW NAV ( )`(in /Unit)`
LAST IDCW
•
•
Long term capital appreciation.Investments in companies following the ESG theme.
SBI Magnum Equity ESG FundThis product is suitable for investors who are seeking^:
Face value: 10`
Investment Objective
Quantitative Data
The objective of the scheme is to provide investors with opportunities forlong-term growth in capital through an active management ofinvestments in a diversified basket of companies followingEnvironmental, Social and Governance (ESG) criteria.The Fund aims at achieving its objectives by aligning itself to itsResponsible Investment Policy and using ESG assessments of constituentcompanies to minimise risks arising from ESG factors and deliver risk-adjusted returns to the investors. The fund uses negative screening, ESGintegration and best-in-class approaches for stock selection.However, there is no guarantee or assurance that the investment objectiveof the scheme will be achieved.
Fund Details
Standard DeviationBetaSharpe RatioPortfolio Turnover*
#
#
#
: 21.84%: 0.99: 0.62
Equity Turnover : 0.32Total Turnover : 0.35Total Turnover = Equity + Debt + Derivatives#
S o u r c e : C R I S I L F u n d A n a l y s e r*Portfolio Turnover = lower of total sale or totalpurchase for the last 12 months (including equityderivatives) upon Avg. AUM of trailing twelve months.Risk Free rate: FBIL Overnight Mibor rate (5.34% as on30th August 2022) Basis for Ratio Calculation: 3 YearsMonthly Data PointsRatios are computed using Total Return Index (TRI) asper SEBI Circular dated Jan 4, 2018
PORTFOLIO CLASSIFICATION BY(%)ASSET ALLOCATION
Pursuant to payment of IDCW, the NAV of IDCW Option of scheme/planswould fall to the extent of payout and statutory levy, if applicable.
•
•
•
•
•
•
•
•
•
•
•
•
•
•
•
Type of Scheme
Date of Allotment:Report As On:AAUM for the August 2022
AUM as on August 31, 2022
Fund Manager:
Managing Since:
Total Experience:First Tier Benchmark:Exit Load:
Entry Load:Plans Available:Options:SIP
Minimum Investment
Additional Investment
An open-ended Equity Scheme investing incompanies following the ESG theme.
01/01/199131/08/2022
4,620.13 Crores
4,670.81 CroresMr. Rohit Shimpi &
*Mr. Mohit Jain
Mr. Rohit Shimpi Jan-2022Mr. Mohit Jain Nov-2017
Over 16 yearsNifty ESG 100 TRI
For exit within 1 year from the date of allotment- 1 %;For exit after 1 year from the date of allotment -Nil
N.A.Regular, Direct
Growth, IDCW
Any Day SIP’ Facility - is available for Monthly,Quarterly, Semi-Annual and Annual frequenciesthrough electronic mode like OTM / DebitMandate. Default SIP date will be 10th. In casethe SIP due date is a Non Business Day, then theimmediate following Business Day will beconsidered for SIP processing.Daily - Minimum 500 & in multiples of 1thereafter for a minimum of 12 instalments.(Kindly refer notice cum addendum dated June02, 2020 for further details)Weekly - Minimum 1000 & in multiples of 1thereafter for a minimum of 6 instalments. (or)Minimum 500 & in multiples of 1 thereafter fora minimum of 12 instalments.Monthly - Minimum 1000 & in multiples of 1thereafter for minimum six months (or)minimum 500 & in multiples of 1 thereafterfor minimum one year.Quarterly - Minimum 1500 & in multiples of1 thereafter for minimum one year.Semi Annual - Minimum 3000 & in multiples of
1 thereafter for a minimum of 4 installments.Annual - Minimum 5000 & in multiples of 1thereafter for a minimum of 4 installments.
1000 & in multiples of 1
1000 & in multiples of 1
Month of`
`
` `
` `
` `
` `
`
`
` `
` `
` `
PORTFOLIO CLASSIFICATION BYINDUSTRY ALLOCATION (%)
PORTFOLIO
^Investors should consult their financial advisers if indoubt about whether the product is suitable for them.
(Previously known as SBI Magnum Equity Fund)
Reg-Plan-IDCW 51.9512
Reg-Plan-Growth 166.1123
Dir-Plan-IDCW 64.1782
Dir-Plan-Growth 178.7692
16-Mar-18 (Reg Plan) 3.40 29.085716-Mar-18 (Dir Plan) 4.00 34.635630-May-17 (Reg Plan) 2.00 30.8936
(Dir Plan) 2.50 36.502730-May-1729-Apr-16 (Reg Plan) 4.50 27.489329-Apr-16 (Dir Plan) 5.00 32.324024-Apr-15 (Reg Plan) 6.00 31.747924-Apr-15 (Dir Plan) 7.00 36.7592
Financial Services 32.87Information Technology 15.54Automobile And Auto Components 13.60Consumer Services 5.01Capital Goods 4.58Consumer Durables 3.83Textiles 3.83Construction 3.70Construction Materials 3.36Healthcare 3.27Fast Moving Consumer Goods 2.57Oil, Gas & Consumable Fuels 1.81Metals & Mining 1.79Media, Entertainment & Publication 1.33Services 1.25Cash, Cash Equivalents And Others 1.66
Investors understand that their principal
will be at Very High risk
Large Cap Midcap Foreign Equity sharesSmallcap
Cash, Cash Equivalents, And Others
*Mr. Mohit Jain is the dedicated fund manager for managing overseas investments of the Scheme.
Equity Shares
Infosys Ltd. 6.49
Housing Development Finance Corporation Ltd. 6.08
ICICI Bank Ltd. 6.04
HDFC Bank Ltd. 4.58
Axis Bank Ltd. 3.93
Page Industries Ltd. 3.83
Larsen & Toubro Ltd. 3.70
Ultratech Cement Ltd. 3.36
Mahindra & Mahindra Ltd. 3.17
Maruti Suzuki India Ltd. 3.15
Kotak Mahindra Bank Ltd. 3.14
Eicher Motors Ltd. 2.95
ABB India Ltd. 2.79
State Bank Of India 2.73
Tata Consultancy Services Ltd. 2.72
Britannia Industries Ltd. 2.57
Wipro Ltd. 2.48
TVS Motor Company Ltd. 2.32
FSN E-Commerce Ventures Ltd. 2.24
Titan Company Ltd. 2.01
Sona Blw Precision Forgings Ltd. 2.01
Stock Name (%) Of Total AUM Stock Name (%) Of Total AUMSBI Life Insurance Company Ltd. 1.99
Divi'S Laboratories Ltd. 1.94
Cholamandalam Investment & Finance Co. Ltd. 1.86
Asian Paints Ltd. 1.82
Reliance Industries Ltd. 1.81
Jubilant Foodworks Ltd. 1.79
Hindalco Industries Ltd. 1.79
Cummins India Ltd. 1.79
L&T Technology Services Ltd. 1.59
HDFC Asset Management Company Ltd. 1.55
PVR Ltd. 1.33
Cipla Ltd. 1.33
InterGlobe Aviation Ltd. 1.25
Info Edge (India) Ltd. 0.98
ICICI Lombard General Insurance Company Ltd. 0.97
Microsoft Corporation 2.26
Total 96.08
Total 2.26
Foreign Equity Shares
Cash, Cash Equivalents And Others 1.66
Grand Total 100.00
77.08
17.67
1.332.26
1.66

14
EQUITY-FLEXICAP FUND
Option NAV ( )`
NET ASSET VALUE
Record Date IDCW NAV ( )`(in /Unit)`
09-Mar-18 (Reg Plan) 1.90 20.5230
09-Mar-18 (Dir Plan) 2.20 23.9106
29-Dec-17 ( Plan) 2.90 27.6830
29-Dec-17 (Reg Plan) 2.50 23.8257
Dir
30-Dec-16 (Reg Plan) 1.90 19.2173
30-Dec-16 (Dir Plan) 2.20 22.0670
LAST IDCW
•
•
Long term capital appreciation.Investments in a diversified basket of equity stocks spanning theentire market capitalization spectrum to provide both long-termgrowth opportunities and liquidity
SBI Flexicap FundThis product is suitable for investors who are seeking^:
Face value: 10`
Investment Objective
Quantitative Data
To provide investors with opportunities for long-term growth in capital along with the liquidity of anopen-ended scheme through an active managementof investments in a diversified basket of equitystocks spanning the entire market capitalizationspectrum and in debt and money marketinstruments. However, there is no guarantee orassurance that the investment objective of thescheme will be achieved.
Fund Details
Standard DeviationBetaSharpe RatioPortfolio Turnover*
#
#
#
: 21.73%: 0.95: 0.61
Equity Turnover : 0.41Total Turnover : 0.41Total Turnover = Equity + Debt + Derivatives#
S o u r c e : C R I S I L F u n d A n a l y s e r
*Portfolio Turnover = lower of total sale or total
purchase for the last 12 months (including equity
derivatives) upon Avg. AUM of trailing twelve months.Risk Free rate: FBIL Overnight Mibor rate (5.34% as on
30th August 2022) Basis for Ratio Calculation: 3 Years
Monthly Data PointsRatios are computed using Total Return Index (TRI) as
per SEBI Circular dated Jan 4, 2018
PORTFOLIO CLASSIFICATION BY(%)ASSET ALLOCATION
Pursuant to payment of IDCW, the NAV of IDCW Option of scheme/planswould fall to the extent of payout and statutory levy, if applicable.
•
•
•
•
•
•
•
•
•
•
•
•
•
•
Type of Scheme
Date of Allotment:Report As On:AAUM for the August 2022
AUM as on August 31, 2022
Fund Manager:
Managing Since:
Total Experience:First Tier Benchmark:Exit Load:
Entry Load:Plans Available:Options:SIP
Minimum Investment
Additional Investment
An open-ended Dynamic Equity Scheme investingacross large cap, mid cap, small cap stocks.
29/09/200531/08/2022
16,041.48 Crores
16,209.01 Crores
Mr. R. Srinivasan &*Mr. Mohit Jain
Mr. R. Srinivasan Jan-2022Mr. Mohit Jain Nov-2017
Over 30 yearsS&P BSE 500 Index (TRI)
For exit on or before 30 days from thedate of allotment - 0.10%For exit after 30 days from the date of allotment-Nil
N.A.Regular, Direct
Growth, IDCW
Any Day SIP’ Facility - is available for Monthly,Quarterly, Semi-Annual and Annual frequenciesthrough electronic mode like OTM / DebitMandate. Default SIP date will be 10th. In case theSIP due date is a Non Business Day, then theimmediate following Business Day will beconsidered for SIP processing.Daily - Minimum 500 & in multiples of 1 thereafterfor a minimum of 12 instalments. (Kindly refernotice cum addendum dated June 02, 2020 forfurther details)Weekly - Minimum 1000 & in multiples of 1thereafter for a minimum of 6 instalments. (or)Minimum 500 & in multiples of 1 thereafter for aminimum of 12 instalments.Monthly - Minimum 1000 & in multiples of 1thereafter for minimum six months (or) minimum
500 & in multiples of 1 thereafter for minimumone year.Quarterly - Minimum 1500 & in multiples of 1thereafter for minimum one year.Semi Annual - Minimum 3000 & in multiples of1 thereafter for a minimum of 4 installments.Annual - Minimum 5000 & in multiples of 1thereafter for a minimum of 4 installments.
1000 & in multiples of 1
1000 & in multiples of 1
Month of`
`
` `
` `
` `
` `
` `
` `
` `
` `
PORTFOLIO CLASSIFICATION BYINDUSTRY ALLOCATION (%)
PORTFOLIO
^Investors should consult their financial advisers if in doubtabout whether the product is suitable for them.
Reg-Plan-IDCW 34.1616
Reg-Plan-Growth 76.2917
Dir-Plan-IDCW 41.5591
Dir-Plan-Growth 83.1464
Financial Services 28.71Information Technology 9.00Oil, Gas & Consumable Fuels 8.87Automobile And Auto Components 6.98Fast Moving Consumer Goods 6.06Healthcare 5.50Consumer Durables 4.19Capital Goods 3.71Metals & Mining 3.33Chemicals 2.78Textiles 2.76Construction 2.49Services 2.34Consumer Services 2.10Telecommunication 2.02Power 1.99Construction Materials 1.92Media, Entertainment & Publication 1.08Cash, Cash Equivalents And Others 4.17 Cash, Cash Equivalents, And Others
Investors understand that their principal
will be at Very High risk
Equity Shares
ICICI Bank Ltd. 8.70ITC Ltd. 5.46State Bank Of India 5.38HDFC Bank Ltd. 5.06Reliance Industries Ltd. 4.60Infosys Ltd. 3.33Axis Bank Ltd. 3.01Larsen & Toubro Ltd. 2.49Hindalco Industries Ltd. 2.22The Indian Hotels Company Ltd. 2.10Bharti Airtel Ltd. 2.02Gail (India) Ltd. 1.91Page Industries Ltd. 1.76Cipla Ltd. 1.73Carborundum Universal Ltd. 1.68Max Healthcare Institute Ltd. 1.44Container Corporation Of India Ltd. 1.40Nuvoco Vistas Corporation Ltd. 1.34Divi'S Laboratories Ltd. 1.34Cholamandalam Investment & Finance Co. Ltd. 1.32Maruti Suzuki India Ltd. 1.29Sheela Foam Ltd. 1.25Bharat Petroleum Corporation Ltd. 1.24Sona Blw Precision Forgings Ltd. 1.20Bandhan Bank Ltd. 1.20Mahindra & Mahindra Ltd. 1.19TVS Motor Company Ltd. 1.16ZF Commercial Vehicle Control Systems India Ltd. 1.13TTK Prestige Ltd. 1.13ICICI Lombard General Insurance Company Ltd. 1.13
Stock Name (%) Of Total AUM Stock Name (%) Of Total AUMOil & Natural Gas Corporation Ltd. 1.12Tata Steel Ltd. 1.11SRF Ltd. 1.10PVR Ltd. 1.08ICICI Prudential Life Insurance Company Ltd. 1.06AIA Engineering Ltd. 1.04CESC Ltd. 1.02Uno Minda Ltd. 1.01Tech Mahindra Ltd. 1.00Rossari Biotech Ltd. 1.00K.P.R. Mill Ltd. 1.00Narayana Hrudayalaya Ltd. 0.99Bharat Forge Ltd. 0.99V-Guard Industries Ltd. 0.98HCL Technologies Ltd. 0.98Torrent Power Ltd. 0.97Interglobe Aviation Ltd. 0.94Credit Access Grameen Ltd. 0.92Relaxo Footwears Ltd. 0.83Camlin Fine Sciences Ltd. 0.68United Breweries Ltd. 0.60Star Cement Ltd. 0.58Manappuram Finance Ltd. 0.52Life Insurance Corporation Of India 0.41
Alphabet Inc. 2.69Microsoft Corporation 1.00
Total 92.14
Total 3.69
Foreign Equity Shares
Cash, Cash Equivalents And Others 4.17
Grand Total 100.00
Foreign Equity sharesLarge Cap MidcapSmallcap
*Mr. Mohit Jain is the dedicated fund manager for managing overseas investments of the Scheme.
62.3415.50
14.30
3.69 4.17

15
EQUITY-MULTICAP FUND
Option NAV ( )`
NET ASSET VALUE
•
•
Long term wealth creationInvestment predominantly in equity and equity related securitiesacross market capitalisation
SBI MultiCap FundThis product is suitable for investors who are seeking^:
Investment Objective
The investment objective of the scheme is toprovide investors with opportunities for long termgrowth in capital from a diversified portfolio ofequity and equity related instruments across marketcapitalization.
However, there can be no assurance that theinvestment objective of the Scheme will be realized.
Fund Details
PORTFOLIO CLASSIFICATION BY(%)ASSET ALLOCATION
Pursuant to payment of IDCW, the NAV of IDCW Option of scheme/planswould fall to the extent of payout and statutory levy, if applicable.
•
•
•
•
•
•
•
•
•
•
•
•
•
•
Type of Scheme
Date of Allotment:Report As On:AAUM for the August 2022
AUM as on August 31, 2022
Fund Manager:
Managing Since:
Total Experience:First Tier Benchmark:
Exit Load:
Entry Load:Plans Available:Options:SIP
Minimum Investment
Additional Investment
An open ended equity scheme investing acrosslarge cap, mid cap, small cap stocks
08/03/202231/08/2022
11,133.67 Crores
11,443.57 CroresMr. R. Srinivasan &
*Mr. Mohit Jain
Mr. R. Srinivasan March-2022Mr. Mohit Jain March 2022
Over 30 years
NIFTY 500 Multicap 50:25:25 TRINIL - If units purchased or switched in
from another scheme of the Fund are redeemedor switched out upto 10% of the units (the limit)purchased or switched on or before 1 year fromthe date of allotment.1% of the applicable NAV - If units purchased orswitched in from another scheme of the Fundare redeemed or switched out in excess of thelimit on or before 1 year from the date ofallotmentNIL - If units purchased or switched in fromanother scheme of the Fund are redeemed orswitched out after 1 year from the date ofallotment
N.A.Regular, Direct
Growth, IDCW
Daily – Minimum 500 & in multiples of Re. 1thereafter for minimum 12 instalmentsWeekly – Minimum 1000 & in multiples of Re. 1thereafter for minimum of six installments orminimum 500 & in multiples of Re. 1 thereafterfor minimum 12 installments.Monthly – Minimum 1000 & in multiples of Re.1 thereafter for minimum 6 months (or)minimum500 & in multiples of Re. 1 thereafter for
minimum 12 monthsQuarterly – Minimum 1500 & in multiples of Re.1 thereafter for minimum one yearSemi-Annual - Minimum 3000 & in multiples ofRe. 1 thereafter for minimum of 4 instalments.Annual - Minimum 5000 & in multiples of Re. 1thereafter for minimum of 4 instalments.
5000 & in multiples of 1
1000 & in multiples of 1
Month of`
`
`
`
`
`
`
`
`
`
` `
` `
PORTFOLIO CLASSIFICATION BYINDUSTRY ALLOCATION (%)
PORTFOLIO
^Investors should consult their financial advisers if in doubtabout whether the product is suitable for them.
Reg-Plan-IDCW 10.7850
Reg-Plan-Growth 10.7840
Dir-Plan-IDCW 10.8489
Dir-Plan-Growth 10.8493
Financial Services 17.65Automobile And Auto Components 15.47Consumer Durables 7.78Chemicals 7.46Textiles 7.06Healthcare 6.80Consumer Services 6.53Metals & Mining 5.63Capital Goods 3.67Construction 3.29Media, Entertainment & Publication 3.22Fast Moving Consumer Goods 2.79Services 1.86Power 1.01Cash, Cash Equivalents And Others 9.78
Cash, Cash Equivalents, And Others
Large Cap MidcapSmallcap
*Mr. Mohit Jain is the dedicated fund manager for managing overseas investments of the Scheme.
Investors understand that their principal
will be at Very High risk
32.36
32.17
25.69
9.78
Equity Shares
TVS Motor Company Ltd. 6.03
ICICI Bank Ltd. 5.43
State Bank Of India 5.11
Divi'S Laboratories Ltd. 4.12
Endurance Technologies Ltd. 4.06
TTK Prestige Ltd. 3.85
K.P.R. Mill Ltd. 3.62
Hindalco Industries Ltd. 3.45
Page Industries Ltd. 3.44
ICICI Prudential Life Insurance Company Ltd. 3.43
PVR Ltd. 3.22
Maruti Suzuki India Ltd. 3.10
Max Healthcare Institute Ltd. 2.68
Carborundum Universal Ltd. 2.58
V-Mart Retail Ltd. 2.55
Deepak Nitrite Ltd. 2.42
Sona Blw Precision Forgings Ltd. 2.28
Navin Fluorine International Ltd. 2.27
Paradeep Phosphates Ltd. 2.26
GR Infra Projects Ltd. 2.26
Go Fashion (India) Ltd. 2.21
Life Insurance Corporation Of India 2.19
Tata Steel Ltd. 2.18
Interglobe Aviation Ltd. 1.86
V-Guard Industries Ltd. 1.81
Vedant Fashions Ltd. 1.77
United Breweries Ltd. 1.72
Stock Name (%) Of Total AUM Stock Name (%) Of Total AUMBandhan Bank Ltd. 1.49
Blue Star Ltd. 1.25
Timken India Ltd. 1.09
Mrs. Bectors Food Specialities Ltd. 1.07
Kalpataru Power Transmission Ltd. 1.03
NHPC Ltd. 1.01
Relaxo Footwears Ltd. 0.87
Aether Industries Ltd. 0.51
Total 90.22
Cash, Cash Equivalents And Others 9.78
Grand Total 100.00
Quantitative Data
Portfolio Turnover*Equity Turnover : 0.11Total Turnover : 0.17*Portfolio Turnover = lower of total sale or total purchasefor the last 12 months (including equity derivatives) uponAvg. AUM of trailing twelve months. Tracking Error iscomputed for the 3 Year Period ending 30th August 2022,based on month-end NAV. Ratios are computed using TotalReturn Index (TRI) as per SEBI Circular dated Jan 4, 2018

16
EQUITY-CONTRA FUND
Option NAV ( )`
NET ASSET VALUE
•
•
Long term capital appreciation.Investments in a diversified portfolio of equity and equityrelated securities following a contrarian investment strategy.
SBI Contra FundThis product is suitable for investors who are seeking^:
Investment Objective
Quantitative Data
To provide the investor with theopportunity of long-term capitalappreciation by investing in a diversifiedportfolio of equity and equity relatedsecurities following a contrarianinvestment strategy.
Standard DeviationBetaSharpe RatioPortfolio Turnover*
#
#
#
: 22.99%: 0.98: 1.08
Equity Turnover : 0.51Total Turnover : 2.21Total Turnover = Equity + Debt + Derivatives#
S o u r c e : C R I S I L F u n d A n a l y s e r*Portfolio Turnover = lower of total sale or totalpurchase for the last 12 months (including equityderivatives) upon Avg. AUM of trailing twelve months.
Risk Free rate: FBIL Overnight Mibor rate (5.34% as on30th August 2022) Basis for Ratio Calculation: 3 YearsMonthly Data Points
Ratios are computed using Total Return Index (TRI) asper SEBI Circular dated Jan 4, 2018
PORTFOLIO CLASSIFICATION BY(%)ASSET ALLOCATION
Fund Details
•
•
•
•
•
•
•
•
•
•
•
•
•
•
Type of Scheme
Date of Allotment:Report As On:AAUM for the August 2022
AUM as on August 31, 2022
Fund Manager:
Managing Since:
Total Experience:First Tier Benchmark:Exit Load:
Entry Load:Plans Available:Options:SIP
Minimum Investment
An open-ended Equity Scheme followingcontrarian investment strategy.
05/07/199931/08/2022
5,578.95 Crores
5,828.23 CroresMr. Dinesh Balachandran &
*Mr. Mohit Jain
Mr. Dinesh May-2018Mr. Mohit Jain Nov-2017
Over 21 YearsS&P BSE 500 TRI
For exit within 1 year from the date of allotment- 1 %;For exit after 1 year from the date of allotment -Nil.
N.A.Regular, Direct
Growth, IDCW
Any Day SIP’ Facility - is available for Monthly,Quarterly, Semi-Annual and Annual frequenciesthrough electronic mode like OTM / DebitMandate. Default SIP date will be 10th. In casethe SIP due date is a Non Business Day, then theimmediate following Business Day will beconsidered for SIP processing.Daily - Minimum 500 & in multiples of 1thereafter for a minimum of 12 instalments.(Kindly refer notice cum addendum dated June02, 2020 for further details)Weekly - Minimum 1000 & in multiples of 1thereafter for a minimum of 6 instalments. (or)Minimum 500 & in multiples of 1 thereafter fora minimum of 12 instalments.Monthly - Minimum 1000 & in multiples of 1thereafter for minimum six months (or)minimum 500 & in multiples of 1 thereafterfor minimum one year.Quarterly - Minimum 1500 & in multiples of1 thereafter for minimum one year.Semi Annual - Minimum 3000 & in multiplesof 1 thereafter for a minimum of 4installments.Annual - Minimum 5000 & in multiples of 1thereafter for a minimum of 4 installments.
5000 & in multiples of 1Additional Investment
1000 & in multiples of 1
Month of`
`
` `
` `
` `
` `
``
` `
` `
` `
PORTFOLIO CLASSIFICATION BYINDUSTRY ALLOCATION (%)
PORTFOLIO
^Investors should consult their financial advisers if in doubtabout whether the product is suitable for them.
Record Date IDCW NAV ( )`(in /Unit)`
09-Mar-18 (Dir Plan) 2.90 24.7907
09-Mar-18 (Reg Plan) 2.30 19.7427
26-Feb-16 (Dir Plan) 2.30 20.0765
26-Feb-16 (Reg Plan) 2.00 16.1649
23-Jun-17 (Dir Plan) 2.90 25.7138
23-Jun-17 (Reg Plan) 2.30 20.5531
LAST IDCW Face value: 10`
Pursuant to payment of IDCW, the NAV of IDCW Option of scheme/planswould fall to the extent of payout and statutory levy, if applicable.
Reg-Plan-IDCW 37.8599
Reg-Plan-Growth 218.3329
Dir-Plan-IDCW 49.0109
Dir-Plan-Growth 232.2296
Financial Services 20.20Sovereign 8.54Automobile And Auto Components 7.17Information Technology 5.87Healthcare 5.73Capital Goods 5.69Fast Moving Consumer Goods 5.13Power 4.50Chemicals 3.63Construction Materials 3.22Consumer Durables 2.90Oil, Gas & Consumable Fuels 2.44Realty 2.16Metals & Mining 1.56Construction 1.49Media, Entertainment & Publication 1.26Telecommunication 1.08Services 0.93Textiles 0.79Consumer Services 0.61Forest Materials 0.45Derivatives 15.22Cash, Cash Equivalents And Others -0.57
Investors understand that their principal
will be at Very High risk
Foreign Equity Shares
Large Cap MidcapSmallcap
Cash, Cash Equivalents, And Others Derivatives
Equity SharesICICI Bank Ltd. 4.02 - 4.02HDFC Bank Ltd. 3.68 - 3.68Tube Investments Of India Ltd. 2.95 - 2.95HCL Technologies Ltd. 2.69 - 2.69State Bank Of India 2.37 - 2.37Aster Dm Healthcare Ltd. 2.03 - 2.03Tech Mahindra Ltd. 2.01 - 2.01ITC Ltd. 2.01 - 2.01CESC Ltd. 2.01 - 2.01Mahindra & Mahindra Financial Services Ltd. 2.00 - 2.00Gail (India) Ltd. 1.93 - 1.93HDFC Ltd. 1.85 - 1.85Equitas Holdings Ltd. 1.82 - 1.82Axis Bank Ltd. 1.79 - 1.79Mahindra & Mahindra Ltd. 1.77 -1.78 -0.01United Spirits Ltd. 1.74 - 1.74NHPC Ltd. 1.69 - 1.69Sanofi India Ltd. 1.54 - 1.54Neogen Chemicals Ltd. 1.50 - 1.50Wendt (India) Ltd. 1.37 - 1.37NMDC Ltd. 1.30 - 1.30Carborundum Universal Ltd. 1.30 - 1.30The Ramco Cements Ltd. 1.20 - 1.20Infosys Ltd. 1.17 - 1.17Disa India Ltd. 1.15 - 1.15Aether Industries Ltd. 1.14 - 1.14Kajaria Ceramics Ltd. 1.09 - 1.09Bharti Airtel Ltd. 1.08 - 1.08Bank Of Baroda 1.08 - 1.08V-Guard Industries Ltd. 1.06 - 1.06Prism Johnson Ltd. 1.04 - 1.04Ashiana Housing Ltd. 1.02 - 1.02Rallis India Ltd. 0.99 - 0.99Colgate Palmolive (India) Ltd. 0.98 - 0.98ACC Ltd. 0.98 - 0.98Indian Bank 0.94 - 0.94Gateway Distriparks Ltd. 0.93 - 0.93Kalpataru Power Transmission Ltd. 0.87 - 0.87Dr. Reddy'S Laboratories Ltd. 0.87 - 0.87Esab India Ltd. 0.84 - 0.84
Torrent Power Ltd. 0.80 - 0.80The Phoenix Mills Ltd. 0.79 - 0.79K.P.R. Mill Ltd. 0.79 - 0.79Ingersoll Rand (India) Ltd. 0.78 - 0.78Motherson Sumi Wiring India Ltd. 0.71 - 0.71Automotive Axles Ltd. 0.66 - 0.66ICICI Prudential Life Insurance Company Ltd. 0.65 - 0.65Greenply Industries Ltd. 0.63 - 0.63Westlife Development Ltd. 0.61 - 0.61Bosch Ltd. 0.60 - 0.60Lupin Ltd. 0.57 - 0.57JMC Projects (India) Ltd. 0.53 - 0.53Bharat Petroleum Corporation Ltd. 0.51 - 0.51Hero Motocorp Ltd. 0.48 - 0.48Aurobindo Pharma Ltd. 0.48 - 0.48Andhra Paper Ltd. 0.45 - 0.45Prataap Snacks Ltd. 0.40 - 0.40Prestige Estates Projects Ltd. 0.35 - 0.35Tata Steel Ltd. 0.26 - 0.26Mazagon Dock Shipbuilders Ltd. 0.25 - 0.25Biocon Ltd. 0.24 - 0.24Dixon Technologies (India) Ltd. 0.12 -0.12 -Sadbhav Engineering Ltd. 0.09 - 0.09National Stock Exchange Of India Ltd.-29-Sep-22 - 14.28 14.28Wipro Ltd.-29-Sep-22 - 0.82 0.82Ashok Leyland Ltd.-29-Sep-22 - 1.00 1.00Alkem Laboratories Ltd.-29-Sep-22 - 1.02 1.02
NETFlix Inc 1.26 - -
91 Day T-Bill 22.09.22 2.57 - -91 Day T-Bill 03.11.22 2.55 - -182 Day T-Bill 01.09.22 1.72 - -91 Day T-Bill 13.10.22 0.85 - -364 Day T-Bill 02.11.22 0.85 - -
Total 75.55 15.22 90.77
Total 1.26 - -
Total 8.54 - -
Foreign Equity Shares
Treasury Bills
Cash, Cash Equivalents And Others -0.57 - -
Grand Total 100.00
(%) Of TotalAUM
(%) Of TotalAUM
Stock Name Stock Name% of AUMDerivatives
% of AUMDerivatives
Diff in %of AUM
Diff in %of AUM
*Mr. Mohit Jain is the dedicated fund manager for managing overseas investments of the Scheme.
31.96
18.58
25.01
1.26
15.22-0.57

17
EQUITY-LARGE & MID CAPFUND
Option NAV ( )`
NET ASSET VALUE
Record Date IDCW NAV ( )`(in /Unit)`
09-Mar-18 (Reg-plan) 11.00 94.110609-Mar-18 (Dir-plan) 13.00 111.106227-Feb-17 (Reg-plan) 7.80 89.654627-Feb-17 (Dir-plan) 9.20 105.206412-Sep-14 (Reg-plan) 11.50 74.9641
LAST IDCW
•
•
Long term capital appreciation.Investments in a diversified portfolio oflarge and midcap companies.
SBI Large & Midcap FundThis product is suitable for investors who are seeking^:
Face value: 10`
Investment Objective
Quantitative Data
To provide the investor with theopportunity of long-term capitalappreciation by investing in diversifiedportfolio comprising predominantly largecap and mid cap companies.
Fund Details
Standard DeviationBetaSharpe RatioPortfolio Turnover*
#
#
#
: 23.86%: 0.99: 0.78
Equity Turnover : 0.38Total Turnover : 0.59Total Turnover = Equity + Debt + Derivatives#
S o u r c e : C R I S I L F u n d A n a l y s e r*Portfolio Turnover = lower of total sale or totalpurchase for the last 12 months (including equityderivatives) upon Avg. AUM of trailing twelve months.
Risk Free rate: FBIL Overnight Mibor rate (5.34% as on30th August 2022) Basis for Ratio Calculation: 3 YearsMonthly Data Points
Ratios are computed using Total Return Index (TRI) asper SEBI Circular dated Jan 4, 2018
PORTFOLIO CLASSIFICATION BY(%)ASSET ALLOCATION
Pursuant to payment of IDCW, the NAV of IDCW Option ofscheme/plans would fall to the extent of payout and statutory levy, ifapplicable.
•
•
•
•
•
•
•
•
•
•
•
•
•
•
Type of Scheme
Date of Allotment:Report As On:AAUM for the August 2022
AUM as on August 31, 2022
Fund Manager:
Managing Since:
First Tier Benchmark:
Exit Load:
Entry Load:Plans Available:Options:SIP
Minimum Investment
Additional Investment
An open-ended Equity Scheme investing in bothlarge cap and mid cap stocks.
28/02/199331/08/2022
7,482.20 Crores
7,733.08 CroresMr. Saurabh Pant &
*Mr. Mohit Jain
Mr. Saurabh Pant Sep-2016Mr. Mohit Jain Nov-2017Total Experience Over 15 years
For exit on or before 30 days from the date ofallotment - 0.10%For exit after 30 days from the date ofallotment- Nil
N.A.Regular, Direct
Growth, IDCW
Any Day SIP’ Facility - is available for Monthly,Quarterly, Semi-Annual and Annual frequenciesthrough electronic mode like OTM / DebitMandate. Default SIP date will be 10th. In casethe SIP due date is a Non Business Day, then theimmediate following Business Day will beconsidered for SIP processing.Daily - Minimum 500 & in multiples of 1thereafter for a minimum of 12 instalments.(Kindly refer notice cum addendum dated June02, 2020 for further details)Weekly - Minimum 1000 & in multiples of 1thereafter for a minimum of 6 instalments. (or)Minimum 500 & in multiples of 1 thereafter fora minimum of 12 instalments.Monthly - Minimum 1000 & in multiples of 1thereafter for minimum six months (or)minimum 500 & in multiples of 1 thereafterfor minimum one year.Quarterly - Minimum 1500 & in multiples of1 thereafter for minimum one year.
5000 & in multiples of 1
1000 & in multiples of 1
Month of`
`
` `
` `
` `
` `
Semi Annual - Minimum ` 3000 & in multiples
of ` 1 thereafter for a minimum of 4
installments.
Annual - Minimum ` 5000 & in multiples of ` 1
thereafter for a minimum of 4 installments.
` `
` `
NIFTY LargeMidCap 250 Index (TRI)
PORTFOLIO CLASSIFICATION BYINDUSTRY ALLOCATION (%)
PORTFOLIO
(Previously known as SBI Magnum Multiplier Fund)
^Investors should consult their financial advisers if in doubtabout whether the product is suitable for them.
Reg-Plan-IDCW 173.9771
Reg-Plan-Growth 385.0925
Dir-Plan-IDCW 212.3485
Dir-Plan-Growth 407.4081
Financial Services 17.86Capital Goods 10.20Automobile And Auto Components 8.07Information Technology 6.08Fast Moving Consumer Goods 6.03Textiles 5.55Healthcare 5.01Oil, Gas & Consumable Fuels 4.11Consumer Services 3.94Metals & Mining 3.45Construction Materials 3.27Consumer Durables 2.87Telecommunication 2.73Chemicals 2.55Power 1.85Services 1.80Media, Entertainment & Publication 1.51Forest Materials 1.09Construction 1.06Derivatives 1.30Cash, Cash Equivalents And Others 9.67
Investors understand that their principal
will be at Very High risk
Large Cap Midcap Small Cap
Foreign Equity Shares Derivatives
Cash, Cash Equivalents, And Others
Equity Shares
ICICI Bank Ltd. 6.20 - 6.20Page Industries Ltd. 4.77 - 4.77Infosys Ltd. 3.86 - 3.86HDFC Bank Ltd. 3.84 - 3.84Reliance Industries Ltd. 3.75 - 3.75The Indian Hotels Company Ltd. 3.04 - 3.04Bharti Airtel Ltd. 2.73 - 2.73ITC Ltd. 2.69 - 2.69Uno Minda Ltd. 2.62 - 2.62State Bank Of India 2.61 - 2.61Emami Ltd. 2.38 - 2.38AIA Engineering Ltd. 2.31 - 2.31Ingersoll Rand (India) Ltd. 2.23 - 2.23Nuvoco Vistas Corporation Ltd. 2.19 - 2.19Ashok Leyland Ltd. 2.19 - 2.19Max Healthcare Institute Ltd. 1.85 - 1.85Container Corporation Of India Ltd. 1.80 - 1.80ZF Commercial Vehicle Control SystemsIndia Ltd. 1.74 - 1.74Tube Investments Of India Ltd. 1.64 - 1.64Sun Pharmaceutical Industries Ltd. 1.62 - 1.62Sheela Foam Ltd. 1.58 - 1.58Fortis Healthcare Ltd. 1.54 - 1.54Muthoot Finance Ltd. 1.50 - 1.50Bharat Forge Ltd. 1.44 - 1.44Torrent Power Ltd. 1.43 - 1.43Relaxo Footwears Ltd. 1.29 - 1.29Neogen Chemicals Ltd. 1.22 - 1.22NMDC Ltd. 1.17 - 1.17Axis Bank Ltd. 1.17 - 1.17Tata Steel Ltd. 1.16 - 1.16ICICI Prudential Life Insurance Company Ltd. 1.15 - 1.15HCL Technologies Ltd. 1.14 - 1.14Jindal Steel & Power Ltd. 1.12 - 1.12Sona Blw Precision Forgings Ltd. 1.10 - 1.10Andhra Paper Ltd. 1.09 - 1.09The Ramco Cements Ltd. 1.08 - 1.08Tega Industries Ltd. 1.07 - 1.07G R Infra Projects Ltd. 1.06 - 1.06Privi Speciality Chemicals Ltd. 1.02 - 1.02
Motherson Sumi Wiring India Ltd. 0.97 - 0.97United Breweries Ltd. 0.96 - 0.96Triveni Turbine Ltd. 0.96 - 0.96Lemon Tree Hotels Ltd. 0.90 - 0.90Ganesha Ecosphere Ltd. 0.78 - 0.78Bandhan Bank Ltd. 0.72 - 0.72Equitas Small Finance Bank Ltd. 0.67 - 0.67Control Print Ltd. 0.59 - 0.59Persistent Systems Ltd. 0.49 - 0.49NTPC Ltd. 0.42 - 0.42Oil & Natural Gas Corporation Ltd. 0.36 - 0.36Solar Industries India Ltd. 0.30 - 0.30Gayatri Bioorganics Ltd. 0.01 - 0.01National Stock Exchange Of India Ltd.-29-Sep-22 - 0.75 0.75Hindalco Industries Ltd.-29-Sep-22 - 0.55 0.55
Netflix Inc 1.51 - -
Total 87.52 1.30 88.82
Total 1.51 - -
Foreign Equity Shares
Cash, Cash Equivalents And Others 9.67 - -
Grand Total 100.00
(%) Of TotalAUM
(%) Of TotalAUM
Stock Name Stock Name% of AUMDerivatives
% of AUMDerivatives
Diff in %of AUM
Diff in %of AUM
*Mr. Mohit Jain is the dedicated fund manager for managing overseas investments of the Scheme.
34.92
35.49
17.11
1.511.30
9.67

18
EQUITY-FOCUSED FUND
Option NAV ( )`
NET ASSET VALUE
Record Date IDCW NAV ( )`(in /Unit)`
09-Mar-18 (Reg Plan) 2.70 23.758309-Mar-18 (Dir Plan) 3.70 33.067228-Apr-17 (Reg Plan) 2.20 22.1892
(Dir Plan) 3.00 30.590528-Apr-1707-Apr-16 (Reg Plan) 2.00 20.111907-Apr-16 (Dir Plan) 2.50 27.4503
LAST IDCW
•
•
Long term capital appreciation.Investment in equity and equity related instrumentswith maximum 30 stocks across multicap space
SBI Focused Equity FundThis product is suitable for investors who are seeking^:
Face value: 10`
Investment Objective
Quantitative Data
To provide the investor with theopportunity of long-term capitalappreciat ion by invest ing in aconcentrated portfolio of equity andequity related securities.
Fund Details
Standard DeviationBetaSharpe RatioPortfolio Turnover*
#
#
#
: 21.21%: 0.86: 0.71
Equity Turnover : 0.29Total Turnover : 0.34Total Turnover = Equity + Debt + Derivatives#
S o u r c e : C R I S I L F u n d A n a l y s e r*Portfolio Turnover = lower of total sale or totalpurchase for the last 12 months (including equityderivatives) upon Avg. AUM of trailing twelve months.
Risk Free rate: FBIL Overnight Mibor rate (5.34% as on30th August 2022) Basis for Ratio Calculation: 3 YearsMonthly Data Points
Ratios are computed using Total Return Index (TRI) asper SEBI Circular dated Jan 4, 2018
PORTFOLIO CLASSIFICATION BY(%)ASSET ALLOCATION
Pursuant to payment of IDCW, the NAV of IDCW Option of scheme/planswould fall to the extent of payout and statutory levy, if applicable.
•
•
•
•
•
•
•
•
•
•
•
•
•
•
•
Type of Scheme
Date of Allotment:Report As On:AAUM for the August 2022
AUM as on August 31, 2022
Fund Manager:
Managing Since:
Total Experience:First Tier Benchmark:Exit Load:
Entry Load:Plans Available:Options:SIP
Minimum Investment
Additional Investment
An open-ended Equity Scheme investing inmaximum 30 stocks across multicap space.
17/09/200431/08/2022
27,122.41 Crores
27,452.30 CroresMr. R. Srinivasan &
*Mr. Mohit Jain
Mr. R. Srinivasan May-2009Mr. Mohit Jain Nov-2017
Over 30 yearsS&P BSE 500 Index (TRI)
For exit within 1 year from the date of allotment- 1 %;For exit after 1 year from the date of allotment -Nil.
N.A.Regular, Direct
Growth, IDCW
Any Day SIP’ Facility - is available for Monthly,Quarterly, Semi-Annual and Annual frequenciesthrough electronic mode like OTM / DebitMandate. Default SIP date will be 10th. In casethe SIP due date is a Non Business Day, then theimmediate following Business Day will beconsidered for SIP processing.Daily - Minimum 500 & in multiples of 1thereafter for a minimum of 12 instalments.(Kindly refer notice cum addendum dated June02, 2020 for further details)Weekly - Minimum 1000 & in multiples of 1thereafter for a minimum of 6 instalments. (or)Minimum 500 & in multiples of 1 thereafter for aminimum of 12 instalments.Monthly - Minimum 1000 & in multiples of 1thereafter for minimum six months (or)minimum 500 & in multiples of 1 thereafterfor minimum one year.Quarterly - Minimum 1500 & in multiples of 1thereafter for minimum one year.Semi Annual - Minimum 3000 & in multiples of
1 thereafter for a minimum of 4 installments.Annual - Minimum 5000 & in multiples of 1thereafter for a minimum of 4 installments.
5000 & in multiples of 1
1000 & in multiples of 1
Month of`
`
` `
` `
` `
` `
`
`
` `
` `
` `
PORTFOLIO CLASSIFICATION BYINDUSTRY ALLOCATION (%)
PORTFOLIO
(Previously known as SBI Emerging Businesses Fund)
^Investors should consult their financial advisers if in doubtabout whether the product is suitable for them.
Financial Services 36.08Healthcare 8.43Fast Moving Consumer Goods 7.33Telecommunication 7.17Automobile And Auto Components 5.87Power 4.90Information Technology 4.77Chemicals 4.01Textiles 3.46Media, Entertainment & Publication 3.20Services 2.70Consumer Durables 2.26Consumer Services 2.11Sovereign 0.71Derivatives 0.04Cash, Cash Equivalents And Others 6.96
Reg-Plan-IDCW 42.3687
Reg-Plan-Growth 231.6405
Dir-Plan-IDCW 61.8121
Dir-Plan-Growth 253.6466
Investors understand that their principal
will be at Very High risk
*Mr. Mohit Jain is the dedicated fund manager for managing overseas investments of the Scheme.
Large Cap Midcap Small Cap
Cash, Cash Equivalents, And Others
51.45
28.20
4.67
7.970.04
6.96
Equity Shares
ICICI Bank Ltd. 7.76 - 7.76
Bharti Airtel Ltd. 7.17 - 7.17
State Bank Of India 5.23 - 5.23
Muthoot Finance Ltd. 4.94 0.04 4.98
Divi's Laboratories Ltd. 4.89 - 4.89
Kotak Mahindra Bank Ltd. 4.88 - 4.88
HDFC Bank Ltd. 4.87 - 4.87
Bajaj Finance Ltd. 4.61 - 4.61
Procter & Gamble Hygiene And
Health Care Ltd. 4.59 - 4.59
Solar Industries India Ltd. 4.01 - 4.01
ICICI Lombard General Insurance
Company Ltd. 3.79 - 3.79
Max Healthcare Institute Ltd. 3.54 - 3.54
Page Industries Ltd. 3.46 - 3.46
Maruti Suzuki India Ltd. 3.31 - 3.31
NHPC Ltd. 2.99 - 2.99
Hatsun Agro Product Ltd. 2.74 - 2.74
Delhivery Ltd. 2.70 - 2.70
ZF Commercial Vehicle Control
Systems India Ltd. 2.56 - 2.56
Relaxo Footwears Ltd. 2.26 - 2.26
Medplus Health Services Ltd. 2.11 - 2.11
Torrent Power Ltd. 1.91 - 1.91
Alphabet Inc. 4.77 - -
NETFlix Inc 3.20 - -
182 Day T-Bill 03.11.22 0.71 - -
Total 84.32 0.04 84.36
Total 7.97 - -
Total 0.71 - -
Foreign Equity Shares
Treasury Bills
Cash, Cash Equivalents
And Others 6.96 - -
Grand Total 100.00
(%) Of TotalAUM
(%) Of TotalAUM
Stock Name Stock Name% of AUMDerivatives
% of AUMDerivatives
Diff in %of AUM
Diff in %of AUM
Foreign Equity Shares Derivatives

19
EQUITY-MID CAP FUND
Option NAV ( )`
NET ASSET VALUE
Record Date IDCW NAV ( )`(in /Unit)`
16-Mar-18 (Reg-Plan) 1.80 32.659516-Mar-18 (Dir-Plan) 2.60 47.551330-Jun-16 (Reg-Plan) 2.50 28.244530-Jun-16 (Dir-Plan) 3.50 40.305020-Mar-15 (Reg-Plan) 4.80 26.661920-Mar-15 (Dir-Plan) 6.80 37.4040
LAST IDCW
•
•
Long term capital appreciation.Investments predominantly in a well diversified equitystocks of midcap companies.
SBI Magnum Midcap FundThis product is suitable for investors who are seeking^:
Face value: 10`
Investment Objective
Quantitative Data
To provide investors with opportunitiesfor long-term growth in capital along withthe liquidity of an open-ended scheme byinvesting predominantly in a welldiversified basket of equity stocks ofMidcap companies.
Fund Details
Standard DeviationBetaSharpe RatioPortfolio Turnover*
#
#
#
: 25.12%: 0.94: 1.02
Equity Turnover : 0.14Total Turnover : 0.14Total Turnover = Equity + Debt + Derivatives#
S o u r c e : C R I S I L F u n d A n a l y s e r*Portfolio Turnover = lower of total sale or totalpurchase for the last 12 months (including equityderivatives) upon Avg. AUM of trailing twelve months.Risk Free rate: FBIL Overnight Mibor rate (5.34% as on30th August 2022) Basis for Ratio Calculation: 3 YearsMonthly Data PointsRatios are computed using Total Return Index (TRI) asper SEBI Circular dated Jan 4, 2018
PORTFOLIO CLASSIFICATION BY(%)ASSET ALLOCATION
Pursuant to payment of IDCW, the NAV of IDCW Option of scheme/planswould fall to the extent of payout and statutory levy, if applicable.
•
•
•
•
•
•
•
•
•
•
•
•
•
•
Type of Scheme
Date of Allotment:Report As On:AAUM for the August 2022
AUM as on August 31, 2022
Fund Manager:
Managing Since:
Total Experience:FirstTierBenchmark:Exit Load:
Entry Load:Plans Available:Options:SIP
Minimum Investment
Additional Investment
An open-ended Equity Scheme predominantlyinvesting in mid cap stocks.
29/03/200531/08/2022
7,793.69 Crores
8,044.30 CroresMs. Sohini Andani &
*Mr. Mohit Jain
Ms. Sohini Andani July-2010Mr. Mohit Jain Nov-2017
Over 27 yearsNiftyMidcap150Index(TRI)
For exit within 1 year from the dateof allotment - 1 %;For exit after 1 year from the date of allotment -Nil
N.A.Regular, Direct
Growth, IDCW
Any Day SIP’ Facility - is available for Monthly,Quarterly, Semi-Annual and Annual frequenciesthrough electronic mode like OTM / DebitMandate. Default SIP date will be 10th. In casethe SIP due date is a Non Business Day, then theimmediate following Business Day will beconsidered for SIP processing.Daily - Minimum 500 & in multiples of 1thereafter for a minimum of 12 instalments.(Kindly refer notice cum addendum dated June02, 2020 for further details)Weekly - Minimum 1000 & in multiples of 1thereafter for a minimum of 6 instalments. (or)Minimum 500 & in multiples of 1 thereafter for aminimum of 12 instalments.Monthly - Minimum 1000 & in multiples of 1thereafter for minimum six months (or)minimum 500 & in multiples of 1 thereafterfor minimum one year.Quarterly - Minimum 1500 & in multiples of1 thereafter for minimum one year.Semi Annual - Minimum 3000 & in multiplesof 1 thereafter for a minimum of 4installments.Annual - Minimum 5000 & in multiples of 1thereafter for a minimum of 4 installments.
5000 & in multiples of 1
1000 & in multiples of 1
Month of`
`
` `
` `
` `
` `
`
`
` `
` `
` `
PORTFOLIO CLASSIFICATION BYINDUSTRY ALLOCATION (%)
PORTFOLIO
^Investors should consult their financial advisers if indoubt about whether the product is suitable for them.
Reg-Plan-IDCW 61.2052
Reg-Plan-Growth 149.7908
Dir-Plan-IDCW 92.8228
Dir-Plan-Growth 163.7270
Automobile And Auto Components 18.64Financial Services 14.91Capital Goods 13.06Chemicals 7.91Textiles 7.12Consumer Durables 6.38Construction Materials 5.50Healthcare 5.04Consumer Services 4.28Realty 4.26Fast Moving Consumer Goods 3.10Oil, Gas & Consumable Fuels 2.00Power 2.00Metals & Mining 0.68Construction 0.30Sovereign 0.25Information Technology 0.19Cash, Cash Equivalents And Others 4.38
Large Cap MidcapSmallcap
Cash, Cash Equivalents, And Others
Equity Shares
Page Industries Ltd. 5.71Tube Investments Of India Ltd. 5.20Sheela Foam Ltd. 4.82Schaeffler India Ltd. 4.54CRISIL Ltd. 4.49Thermax Ltd. 3.79Cholamandalam Investment & Finance Co. Ltd. 3.34Carborundum Universal Ltd. 3.25The Indian Hotels Company Ltd. 2.90Max Healthcare Institute Ltd. 2.67Sona Blw Precision Forgings Ltd. 2.63Coromandel International Ltd. 2.62Jk Cement Ltd. 2.41Procter & Gamble Hygiene And Health Care Ltd. 2.26SKF India Ltd. 2.12TVS Motor Company Ltd. 2.08Torrent Power Ltd. 2.00Tatva Chintan Pharma Chem Ltd. 1.97The Phoenix Mills Ltd. 1.95Gujarat State Petronet Ltd. 1.86Bharat Forge Ltd. 1.84PI Industries Ltd. 1.71Endurance Technologies Ltd. 1.68The Ramco Cements Ltd. 1.63Godrej Properties Ltd. 1.58ABB India Ltd. 1.53Mahindra & Mahindra Financial Services Ltd. 1.43ZF Commercial Vehicle Control Systems India Ltd. 1.41Gokaldas Exports Ltd. 1.41The Federal Bank Ltd. 1.37Crompton Greaves Consumer Electricals Ltd. 1.37HDFC Bank Ltd. 1.29
Stock Name (%) Of Total AUM Stock Name (%) Of Total AUMUno Minda Ltd. 1.10City Union Bank Ltd. 1.06Medplus Health Services Ltd. 1.03Aether Industries Ltd. 1.03Pfizer Ltd. 0.83Sanofi India Ltd. 0.78Oberoi Realty Ltd. 0.73Shriram City Union Finance Ltd. 0.70National Aluminium Company Ltd. 0.68Prism Johnson Ltd. 0.62Chemplast Sanmar Ltd. 0.58Natco Pharma Ltd. 0.57Nuvoco Vistas Corporation Ltd. 0.54Dodla Dairy Ltd. 0.52Indian Bank 0.49Housing And Urban Development Corporation Ltd. 0.44Info Edge (India) Ltd. 0.35Hatsun Agro Product Ltd. 0.32Swaraj Engines Ltd. 0.31NCC Ltd. 0.30Mangalam Cement Ltd. 0.30Computer Age Management Services Ltd. 0.30NRB Bearings Ltd. 0.22Indigo Paints Ltd. 0.19Happiest Minds Technologies Ltd. 0.19Glaxosmithkline Pharmaceuticals Ltd. 0.19Oil India Ltd. 0.14
91 Day T-Bill 27.10.22 0.25
Total 95.37
Treasury Bills
Total 0.25
Cash, Cash Equivalents And Others 4.38
Grand Total 100.00
Investors understand that their principal
will be at Very High risk
*Mr. Mohit Jain is the dedicated fund manager for managing overseas investments of the Scheme.
4.98
65.99
24.40
4.38
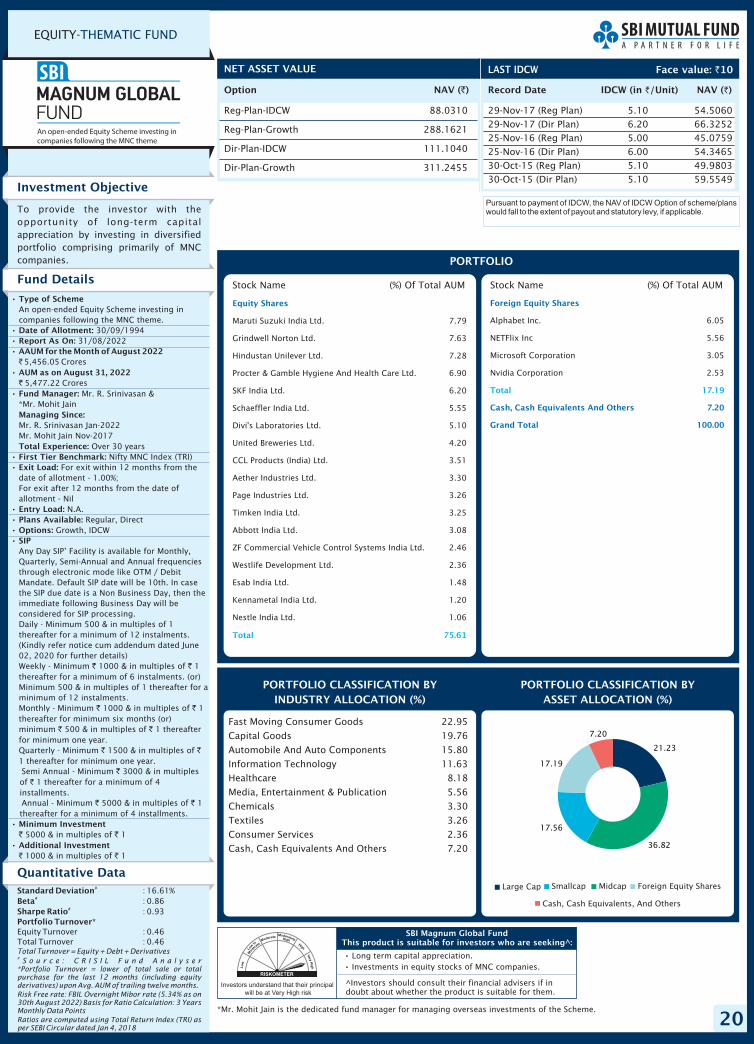
20
EQUITY-THEMATIC FUND
Option NAV ( )`
NET ASSET VALUE
•
•
Long term capital appreciation.Investments in equity stocks of MNC companies.
SBI Magnum Global FundThis product is suitable for investors who are seeking^:
Investment Objective
Quantitative Data
To provide the investor with theopportunity of long-term capitalappreciation by investing in diversifiedportfolio comprising primarily of MNCcompanies.
Fund Details
Standard DeviationBetaSharpe RatioPortfolio Turnover*
#
#
#
: 16.61%: 0.86: 0.93
Equity Turnover : 0.46Total Turnover : 0.46Total Turnover = Equity + Debt + Derivatives
S o u r c e : C#
R I S I L F u n d A n a l y s e r*Portfolio Turnover = lower of total sale or totalpurchase for the last 12 months (including equityderivatives) upon Avg. AUM of trailing twelve months.
Risk Free rate: FBIL Overnight Mibor rate (5.34% as on30th August 2022) Basis for Ratio Calculation: 3 YearsMonthly Data Points
Ratios are computed using Total Return Index (TRI) asper SEBI Circular dated Jan 4, 2018
PORTFOLIO CLASSIFICATION BY(%)ASSET ALLOCATION
•
•
•
•
•
•
•
•
•
•
•
•
•
•
Type of Scheme
Date of Allotment:Report As On:AAUM for the August 2022
AUM as on August 31, 2022
Fund Manager:
Managing Since:
Total Experience:First Tier Benchmark:Exit Load:
Entry Load:Plans Available:Options:SIP
Minimum Investment
Additional Investment
An open-ended Equity Scheme investing incompanies following the MNC theme.
30/09/199431/08/2022
5,456.05 Crores
5,477.22 CroresMr. R. Srinivasan &
*Mr. Mohit Jain
Mr. R. Srinivasan Jan-2022Mr. Mohit Jain Nov-2017
Over 30 yearsNifty MNC Index (TRI)
For exit within 12 months from thedate of allotment - 1.00%;For exit after 12 months from the date ofallotment - Nil
N.A.Regular, Direct
Growth, IDCW
Any Day SIP’ Facility is available for Monthly,Quarterly, Semi-Annual and Annual frequenciesthrough electronic mode like OTM / DebitMandate. Default SIP date will be 10th. In casethe SIP due date is a Non Business Day, then theimmediate following Business Day will beconsidered for SIP processing.Daily - Minimum 500 & in multiples of 1thereafter for a minimum of 12 instalments.(Kindly refer notice cum addendum dated June02, 2020 for further details)Weekly - Minimum 1000 & in multiples of 1thereafter for a minimum of 6 instalments. (or)Minimum 500 & in multiples of 1 thereafter for aminimum of 12 instalments.Monthly - Minimum 1000 & in multiples of 1thereafter for minimum six months (or)minimum 500 & in multiples of 1 thereafterfor minimum one year.Quarterly - Minimum 1500 & in multiples of1 thereafter for minimum one year.Semi Annual - Minimum 3000 & in multiplesof 1 thereafter for a minimum of 4installments.Annual - Minimum 5000 & in multiples of 1thereafter for a minimum of 4 installments.
5000 & in multiples of 1
1000 & in multiples of 1
Month of`
`
` `
` `
` `
` `
`
`
` `
` `
` `
PORTFOLIO CLASSIFICATION BYINDUSTRY ALLOCATION (%)
PORTFOLIO
^Investors should consult their financial advisers if indoubt about whether the product is suitable for them.
Record Date IDCW NAV ( )`(in /Unit)`
29-Nov-17 (Reg Plan) 5.10 54.506029-Nov-17 (Dir Plan) 6.20 66.325225-Nov-16 (Reg Plan) 5.00 45.075925-Nov-16 (Dir Plan) 6.00 54.346530-Oct-15 (Reg Plan) 5.10 49.980330-Oct-15 (Dir Plan) 5.10 59.5549
LAST IDCW Face value: 10`
Pursuant to payment of IDCW, the NAV of IDCW Option of scheme/planswould fall to the extent of payout and statutory levy, if applicable.
Reg-Plan-IDCW 88.0310
Reg-Plan-Growth 288.1621
Dir-Plan-IDCW 111.1040
Dir-Plan-Growth 311.2455
Fast Moving Consumer Goods 22.95
Capital Goods 19.76
Automobile And Auto Components 15.80
Information Technology 11.63
Healthcare 8.18
Media, Entertainment & Publication 5.56
Chemicals 3.30
Textiles 3.26
Consumer Services 2.36
Cash, Cash Equivalents And Others 7.20
Cash, Cash Equivalents, And Others
Large Cap Midcap Foreign Equity SharesSmallcap
Equity Shares
Maruti Suzuki India Ltd. 7.79
Grindwell Norton Ltd. 7.63
Hindustan Unilever Ltd. 7.28
Procter & Gamble Hygiene And Health Care Ltd. 6.90
SKF India Ltd. 6.20
Schaeffler India Ltd. 5.55
Divi's Laboratories Ltd. 5.10
United Breweries Ltd. 4.20
CCL Products (India) Ltd. 3.51
Aether Industries Ltd. 3.30
Page Industries Ltd. 3.26
Timken India Ltd. 3.25
Abbott India Ltd. 3.08
ZF Commercial Vehicle Control Systems India Ltd. 2.46
Westlife Development Ltd. 2.36
Esab India Ltd. 1.48
Kennametal India Ltd. 1.20
Nestle India Ltd. 1.06
Total 75.61
Stock Name (%) Of Total AUM Stock Name (%) Of Total AUM
Foreign Equity Shares
Cash, Cash Equivalents And Others 7.20
Grand Total 100.00
Alphabet Inc. 6.05
NETFlix Inc 5.56
Microsoft Corporation 3.05
Nvidia Corporation 2.53
Total 17.19
Investors understand that their principal
will be at Very High risk
*Mr. Mohit Jain is the dedicated fund manager for managing overseas investments of the Scheme.
21.23
36.82
17.56
17.19
7.20

21
EQUITY-SMALL CAP FUND
Option NAV ( )`
NET ASSET VALUE
Record Date IDCW NAV ( )`(in /Unit)`
09-Mar-18 (Reg Plan) 9.10 33.338309-Mar-18 (Dir Plan) 11.10 40.713728-Aug-15 (Reg Plan) 3.60 23.523628-Aug-15 (Dir Plan) 4.30 27.863030-Jan-15 (Reg Plan) 4.00 26.0785
LAST IDCW
•
•
Long term capital appreciationInvestment in equity and equity-related securitiespredominantly of small cap companies.
SBI Small Cap FundThis product is suitable for investors who are seeking^:
Face value: 10`
Investment Objective
Quantitative Data
To provide investors with opportunitiesfor long-term growth in capital along withthe liquidity of an open-ended scheme byinvesting predominantly in a welldiversified basket of equity stocks ofsmall cap companies.
Fund Details
Standard DeviationBetaSharpe RatioPortfolio Turnover*
#
#
#
: 23.63%: 0.77: 1.09
Equity Turnover : 0.15Total Turnover : 0.31
Total Turnover = Equity + Debt + Derivatives#
S o u r c e : C R I S I L F u n d A n a l y s e r*Portfolio Turnover = lower of total sale or totalpurchase for the last 12 months (including equityderivatives) upon Avg. AUM of trailing twelve months.
Risk Free rate: FBIL Overnight Mibor rate (5.34% as on30th August 2022) Basis for Ratio Calculation: 3 YearsMonthly Data Points
Ratios are computed using Total Return Index (TRI) asper SEBI Circular dated Jan 4, 2018
PORTFOLIO CLASSIFICATION BY(%)ASSET ALLOCATION
Pursuant to payment of IDCW, the NAV of IDCW Option of scheme/planswould fall to the extent of payout and statutory levy, if applicable.
•
•
•
•
•
•
•
•
•
•
•
•
•
Type of Scheme
Date of Allotment:
Report As On:
AAUM for the August 2022
AUM as on August 31, 2022
Fund Manager:Managing Since:
Total Experience:
First Tier Benchmark:
Exit Load:
Entry Load:
Plans Available:
Options:
SIP
Minimum Investment and AdditionalInvestment:
An open-ended Equity Scheme predominantlyinvesting in small cap stocks.
09/09/2009
31/08/2022
13,623.24 Crores
14,044.46 Crores
Mr. R. Srinivasan & *Mr. Mohit Jain
Mr. R. Srinivasan Nov - 2013Mr. Mohit Jain Nov - 2017
Over 30 years
S&P BSE 250 Small Cap Index TRI
For exit within one year from the dateof allotment -1%For exit after one year from the date of allotment– Nil
N.A.
Regular, Direct
Growth, IDCW
Fresh registration through SIP/STP-in on or afterFebruary 04, 2021 in the Scheme will be cappedat 25,000 per month per PAN (firstholder/guardian PAN) for daily, weekly, monthlyand quarterly frequencies. The caps for variousfrequencies will be as under:Daily SIP/STP-in: 250,Weekly SIP/STP-in: 6,250,Monthly SIP/STP-in: 5,000,Quarterly SIP/STP-in: 75,000All other terms and conditions pertaining toSIPs/STPs remain unchanged under the Scheme.Kindly refer notice cum addendum dated February03, 2021 for further details.
Fresh subscriptions through lumpsum investment(including additional investments / Switch in) inthe Scheme is discontinued till further notice interms of notice cum addendum dated September04, 2020.
Month of`
`
`
`1,
`
`2
`
PORTFOLIO CLASSIFICATION BYINDUSTRY ALLOCATION (%)
PORTFOLIO
^Investors should consult their financial advisers if indoubt about whether the product is suitable for them.
(Previously known as SBI Small & Midcap Fund)
Reg-Plan-IDCW 66.2044
Reg-Plan-Growth 112.0638
Dir-Plan-IDCW 85.1202
Dir-Plan-Growth 124.7130
Cash, Cash Equivalents, And Others
Mid Cap Smallcap
Capital Goods 21.05Consumer Durables 14.63Consumer Services 12.19Chemicals 7.77Construction 6.75Fast Moving Consumer Goods 5.08Automobile And Auto Components 4.80Financial Services 2.59Healthcare 2.19Construction Materials 1.80Media, Entertainment & Publication 1.53Services 1.53Realty 1.33Textiles 0.52Derivatives 7.50Cash, Cash Equivalents And Others 8.74
Investors understand that their principal
will be at Very High risk
Non-convertible Preference SharesDerivatives
Equity Shares
ELGI Equipments Ltd. 4.79 - 4.79
Vedant Fashions Ltd. 4.15 - 4.15
Sheela Foam Ltd. 3.33 - 3.33
Blue Star Ltd. 3.29 - 3.29
Fine Organic Industries Ltd. 3.08 - 3.08
Rajratan Global Wire Ltd. 3.02 - 3.02
Carborundum Universal Ltd. 2.97 - 2.97
V-Guard Industries Ltd. 2.75 - 2.75
Timken India Ltd. 2.55 - 2.55
Lemon Tree Hotels Ltd. 2.49 - 2.49
Grindwell Norton Ltd. 2.26 - 2.26
Triveni Turbine Ltd. 2.25 - 2.25
Chalet Hotels Ltd. 2.23 - 2.23
Narayana Hrudayalaya Ltd. 2.19 - 2.19
Navin Fluorine International Ltd. 2.13 - 2.13
Hatsun Agro Product Ltd. 2.09 - 2.09
Finolex Industries Ltd. 2.09 - 2.09
Esab India Ltd. 2.08 - 2.08
TTK Prestige Ltd. 1.99 - 1.99
Kalpataru Power Transmission Ltd. 1.99 - 1.99
ZF Commercial Vehicle Control
Systems India Ltd. 1.78 - 1.78
V-Mart Retail Ltd. 1.56 - 1.56
PVR Ltd. 1.53 - 1.53
Hawkins Cookers Ltd. 1.53 - 1.53
Cms Infosystems Ltd. 1.53 - 1.53
Vst Industries Ltd. 1.43 - 1.43
KNR Constructions Ltd. 1.43 - 1.43
Rossari Biotech Ltd. 1.41 - 1.41
City Union Bank Ltd. 1.41 - 1.41
Ahluwalia Contracts (India) Ltd. 1.40 - 1.40
G R Infra Projects Ltd. 1.36 - 1.36
Dodla Dairy Ltd. 1.34 - 1.34
Go Fashion (India) Ltd. 1.33 - 1.33
Relaxo Footwears Ltd. 1.28 - 1.28
Chemplast Sanmar Ltd. 1.15 - 1.15
Ratnamani Metals & Tubes Ltd. 1.13 - 1.13
Star Cement Ltd. 0.95 - 0.95
Nuvoco Vistas Corporation Ltd. 0.85 - 0.85
CSB Bank Ltd. 0.85 - 0.85
GE T&D India Ltd. 0.81 - 0.81
Brigade Enterprises Ltd. 0.81 - 0.81
Engineers India Ltd. 0.57 - 0.57
Garware Technical Fibres Ltd. 0.52 - 0.52
Alembic Ltd. 0.52 - 0.52
Thangamayil Jewellery Ltd. 0.46 - 0.46
Westlife Development Ltd. 0.43 - 0.43
Anand Rathi Wealth Ltd. 0.33 - 0.33
Zydus Wellness Ltd. 0.22 - 0.22
National Stock Exchange Of India Ltd.
-29-Sep-22 - 7.50 7.50
Shreno Ltd. 0.12 - -
Total 83.64 7.50 91.14
Total 0.12 - -
Non-Convertible Preference Shares
Cash, Cash Equivalents And Others 8.74 - -
Grand Total 100.00
(%) Of TotalAUM
(%) Of TotalAUM
Stock Name Stock Name% of AUMDerivatives
% of AUMDerivatives
Diff in %of AUM
Diff in %of AUM
*Mr. Mohit Jain is the dedicated fund manager for managing overseas investments of the Scheme.
11.91
71.73
0.12
7.50
8.74
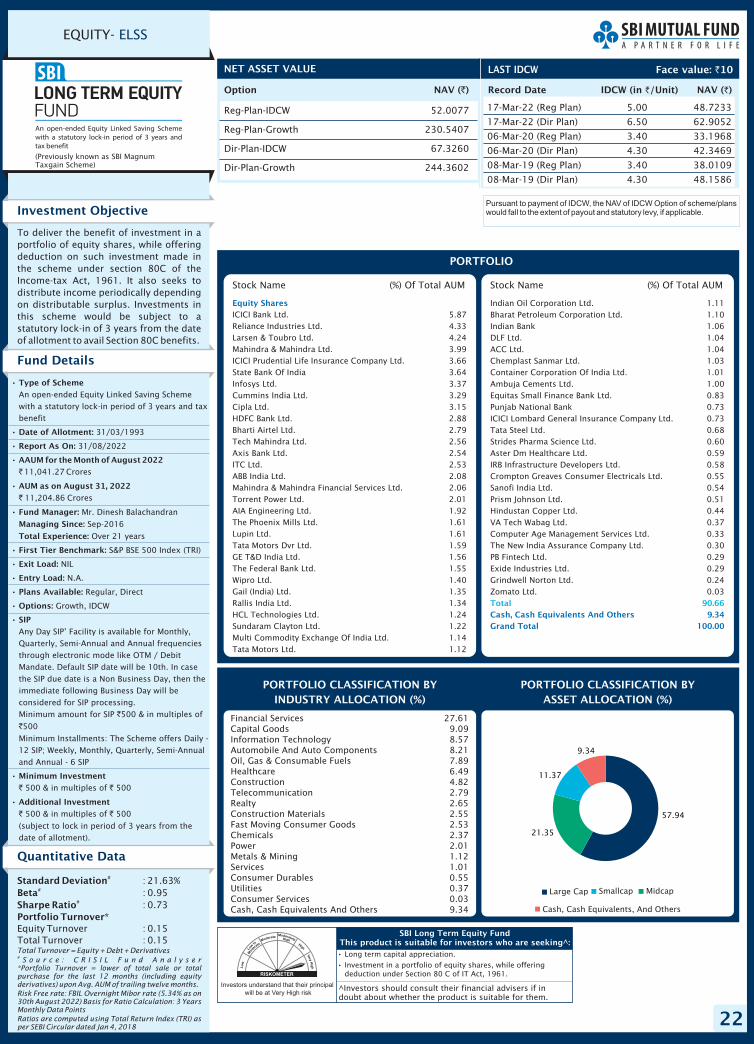
22
EQUITY- ELSS
Option NAV ( )`
NET ASSET VALUE
Record Date IDCW NAV ( )`(in /Unit)`
LAST IDCW
•
•
Long term capital appreciation.Investment in a portfolio of equity shares, while offeringdeduction under Section 80 C of IT Act, 1961.
SBI Long Term Equity FundThis product is suitable for investors who are seeking^:
Face value: 10`
Investment Objective
Quantitative Data
To deliver the benefit of investment in aportfolio of equity shares, while offeringdeduction on such investment made inthe scheme under section 80C of theIncome-tax Act, 1961. It also seeks todistribute income periodically dependingon distributable surplus. Investments inthis scheme would be subject to astatutory lock-in of 3 years from the dateof allotment to avail Section 80C benefits.
Fund Details
Standard DeviationBetaSharpe RatioPortfolio Turnover*
#
#
#
: 21.63%: 0.95: 0.73
Equity Turnover : 0.15Total Turnover : 0.15Total Turnover = Equity + Debt + Derivatives#
S o u r c e : C R I S I L F u n d A n a l y s e r*Portfolio Turnover = lower of total sale or totalpurchase for the last 12 months (including equityderivatives) upon Avg. AUM of trailing twelve months.
Risk Free rate: FBIL Overnight Mibor rate (5.34% as on30th August 2022) Basis for Ratio Calculation: 3 YearsMonthly Data Points
Ratios are computed using Total Return Index (TRI) asper SEBI Circular dated Jan 4, 2018
PORTFOLIO CLASSIFICATION BY(%)ASSET ALLOCATION
Pursuant to payment of IDCW, the NAV of IDCW Option of scheme/planswould fall to the extent of payout and statutory levy, if applicable.
•
•
•
•
•
•
•
•
•
•
•
•
•
•
Type of Scheme
Date of Allotment:
Report As On:
AAUM for the August 2022
AUM as on August 31, 2022
Fund Manager:
Managing Since:
Total Experience:
First Tier Benchmark:
Exit Load:
Entry Load:
Plans Available:
Options:
SIP
Minimum Investment
Additional Investment
An open-ended Equity Linked Saving Schemewith a statutory lock-in period of 3 years and taxbenefit
31/03/1993
31/08/2022
11,041.27 Crores
11,204.86 Crores
Mr. Dinesh Balachandran
Sep-2016
Over 21 years
S&P BSE 500 Index (TRI)
NIL
N.A.
Regular, Direct
Growth, IDCW
Any Day SIP’ Facility is available for Monthly,Quarterly, Semi-Annual and Annual frequenciesthrough electronic mode like OTM / DebitMandate. Default SIP date will be 10th. In casethe SIP due date is a Non Business Day, then theimmediate following Business Day will beconsidered for SIP processing.Minimum amount for SIP 500 & in multiples of
500
Minimum Installments: The Scheme offers Daily -12 SIP; Weekly, Monthly, Quarterly, Semi-Annualand Annual - 6 SIP
500 & in multiples of 500
500 & in multiples of 500
(subject to lock in period of 3 years from thedate of allotment).
Month of
`
`
`
`
` `
` `
PORTFOLIO CLASSIFICATION BYINDUSTRY ALLOCATION (%)
PORTFOLIO
Equity Shares
ICICI Bank Ltd. 5.87Reliance Industries Ltd. 4.33Larsen & Toubro Ltd. 4.24Mahindra & Mahindra Ltd. 3.99ICICI Prudential Life Insurance Company Ltd. 3.66State Bank Of India 3.64Infosys Ltd. 3.37Cummins India Ltd. 3.29Cipla Ltd. 3.15HDFC Bank Ltd. 2.88Bharti Airtel Ltd. 2.79Tech Mahindra Ltd. 2.56Axis Bank Ltd. 2.54ITC Ltd. 2.53ABB India Ltd. 2.08Mahindra & Mahindra Financial Services Ltd. 2.06Torrent Power Ltd. 2.01AIA Engineering Ltd. 1.92The Phoenix Mills Ltd. 1.61Lupin Ltd. 1.61Tata Motors Dvr Ltd. 1.59GE T&D India Ltd. 1.56The Federal Bank Ltd. 1.55Wipro Ltd. 1.40Gail (India) Ltd. 1.35Rallis India Ltd. 1.34HCL Technologies Ltd. 1.24Sundaram Clayton Ltd. 1.22Multi Commodity Exchange Of India Ltd. 1.14Tata Motors Ltd. 1.12
Stock Name (%) Of Total AUM Stock Name (%) Of Total AUM
Indian Oil Corporation Ltd. 1.11Bharat Petroleum Corporation Ltd. 1.10Indian Bank 1.06DLF Ltd. 1.04ACC Ltd. 1.04Chemplast Sanmar Ltd. 1.03Container Corporation Of India Ltd. 1.01Ambuja Cements Ltd. 1.00Equitas Small Finance Bank Ltd. 0.83Punjab National Bank 0.73ICICI Lombard General Insurance Company Ltd. 0.73Tata Steel Ltd. 0.68Strides Pharma Science Ltd. 0.60Aster Dm Healthcare Ltd. 0.59IRB Infrastructure Developers Ltd. 0.58Crompton Greaves Consumer Electricals Ltd. 0.55Sanofi India Ltd. 0.54Prism Johnson Ltd. 0.51Hindustan Copper Ltd. 0.44VA Tech Wabag Ltd. 0.37Computer Age Management Services Ltd. 0.33The New India Assurance Company Ltd. 0.30PB Fintech Ltd. 0.29Exide Industries Ltd. 0.29Grindwell Norton Ltd. 0.24Zomato Ltd. 0.03Total 90.66
Cash, Cash Equivalents And Others 9.34
Grand Total 100.00
^Investors should consult their financial advisers if indoubt about whether the product is suitable for them.
17-Mar-22 (Reg Plan) 5.00 48.7233
17-Mar-22 (Dir Plan) 6.50 62.9052
06-Mar-20 (Reg Plan) 3.40 33.1968
06-Mar-20 (Dir Plan) 4.30 42.3469
08-Mar-19 (Reg Plan) 3.40 38.0109
08-Mar-19 (Dir Plan) 4.30 48.1586
Reg-Plan-IDCW 52.0077
Reg-Plan-Growth 230.5407
Dir-Plan-IDCW 67.3260
Dir-Plan-Growth 244.3602
Financial Services 27.61Capital Goods 9.09Information Technology 8.57Automobile And Auto Components 8.21Oil, Gas & Consumable Fuels 7.89Healthcare 6.49Construction 4.82Telecommunication 2.79Realty 2.65Construction Materials 2.55Fast Moving Consumer Goods 2.53Chemicals 2.37Power 2.01Metals & Mining 1.12Services 1.01Consumer Durables 0.55Utilities 0.37Consumer Services 0.03Cash, Cash Equivalents And Others 9.34
(Previously known as SBI MagnumTaxgain Scheme)
Investors understand that their principal
will be at Very High risk
Cash, Cash Equivalents, And Others
Large Cap MidcapSmallcap
57.94
21.35
11.37
9.34

23
EQUITY- SECTORAL FUND
Option NAV ( )`
NET ASSET VALUE
Record Date IDCW NAV ( )`(in /Unit)`
16-Mar-18 (Reg Plan) 14.10 75.912716-Mar-18 (Dir Plan) 16.40 88.598630-Jan-15 (Reg Plan) 10.00 93.5001
LAST IDCW
•
•
Long term capital appreciation.Equity investments in stocks of companies in the healthcare sector.
SBI Healthcare Opportunities FundThis product is suitable for investors who are seeking^:
Face value: 10`
Investment Objective
Quantitative Data
To provide the investors with theopportunity of long-term capitalappreciation by investing in a diversifiedportfolio of equity and equity relatedsecurities in Healthcare space.
Fund Details
Standard DeviationBetaSharpe RatioPortfolio Turnover*
#
#
#
: 20.13%: 0.88: 0.93
Equity Turnover : 0.27Total Turnover : 0.27Total Turnover = Equity + Debt + Derivatives
S o u r c e : C R I S I L F u n d A n a l y s e r*Portfolio Turnover = lower of total sale or totalpurchase for the last 12 months (including equityderivatives) upon Avg. AUM of trailing twelvemonths.Risk Free rate: FBIL Overnight Mibor rate (5.34% ason 30th August 2022) Basis for Ratio Calculation: 3Years Monthly Data PointsRatios are computed using Total Return Index (TRI) asper SEBI Circular dated Jan 4, 2018
#
PORTFOLIO CLASSIFICATION BY(%)ASSET ALLOCATION
Pursuant to payment of IDCW, the NAV of IDCW Option ofscheme/plans would fall to the extent of payout and statutory levy, ifapplicable.
•
•
•
•
•
•
•
•
•
•
•
•
•
•
Type of Scheme
Date of Allotment:Report As On:AAUM for the August 2022
AUM as on August 31, 2022
Fund Manager:
Managing Since:
Total Experience:First Tier Benchmark:
Exit Load:
Entry Load:Plans Available:Options:SIP
Minimum Investment
Additional Investment
An open-ended Equity Scheme investing inhealthcare sector.
05/07/199931/08/2022
1,671.31 Crores
1,675.55 CroresMr. Tanmaya Desai &
*Mr. Mohit Jain
Mr. Tanmaya Desai Jun-2011Mr. Mohit Jain Nov-2017
Over 14 years
S&P BSE HEALTHCARE Index (TRI)For exit within 15 Days from the date
of allotment - 0.50%;For exit after 15 Days from the date ofallotment - Nil.
N.A.Regular, Direct
Growth, IDCW
Any Day SIP’ Facility is available for Monthly,Quarterly, Semi-Annual and Annual frequenciesthrough electronic mode like OTM / DebitMandate. Default SIP date will be 10th. In casethe SIP due date is a Non Business Day, then theimmediate following Business Day will beconsidered for SIP processing.Daily - Minimum 500 & in multiples of 1thereafter for a minimum of 12 instalments.(Kindly refer notice cum addendum dated June02, 2020 for further details)Weekly - Minimum 1000 & in multiples of 1thereafter for a minimum of 6 instalments. (or)Minimum 500 & in multiples of 1 thereafter fora minimum of 12 instalments.Monthly - Minimum 1000 & in multiples of 1thereafter for minimum six months (or)minimum 500 & in multiples of 1 thereafterfor minimum one year.Quarterly - Minimum 1500 & in multiples of1 thereafter for minimum one year.Semi Annual - Minimum 3000 & in multiplesof 1 thereafter for a minimum of 4installments.Annual - Minimum 5000 & in multiples of 1thereafter for a minimum of 4 installments.
5000 & in multiples of 1
1000 & in multiples of
Month of`
`
` `
` `
` `
` `
`
`
` `
` `
` ` 1
PORTFOLIO CLASSIFICATION BYINDUSTRY ALLOCATION (%)
PORTFOLIO
Equity Shares
Sun Pharmaceutical Industries Ltd. 15.24
Cipla Ltd. 9.92
Max Healthcare Institute Ltd. 8.82
Dr. Reddy's Laboratories Ltd. 8.11
Apollo Hospitals Enterprise Ltd. 7.74
Divi'S Laboratories Ltd. 5.84
Aether Industries Ltd. 5.65
Rainbow Children'S Medicare Ltd. 4.16
Torrent Pharmaceuticals Ltd. 4.07
Medplus Health Services Ltd. 4.00
Gland Pharma Ltd. 3.96
Jb Chemicals & Pharmaceuticals Ltd. 3.72
Alkem Laboratories Ltd. 3.55
Fortis Healthcare Ltd. 3.51
Abbott India Ltd. 3.36
Narayana Hrudayalaya Ltd. 2.51
AMI Organics Ltd. 1.60
Gufic Biosciences Ltd. 1.26
Aurobindo Pharma Ltd. 0.62
Total 97.64
Stock Name (%) Of Total AUM Stock Name (%) Of Total AUM
Non-Convertible Preference Shares
Cash, Cash Equivalents And Others 1.96
Grand Total 100.00
Shreno Ltd. 0.40
Total 0.40
(Previously known as SBI Pharma Fund)
^Investors should consult their financial advisers if indoubt about whether the product is suitable for them.
Reg-Plan-IDCW 134.3461
Reg-Plan-Growth 213.2669
Dir-Plan-IDCW 164.5718
Dir-Plan-Growth 236.8714
Healthcare 87.99
Chemicals 5.65
Consumer Services 4.00
Capital Goods 0.40
Cash, Cash Equivalents And Others 1.96
Cash, Cash Equivalents, And Others
Non-convertible Preference Shares
Large Cap MidcapSmallcap
Investors understand that their principal
will be at Very High risk
*Mr. Mohit Jain is the dedicated fund manager for managing overseas investments of the Scheme.
54.88
19.86
22.90
0.401.96
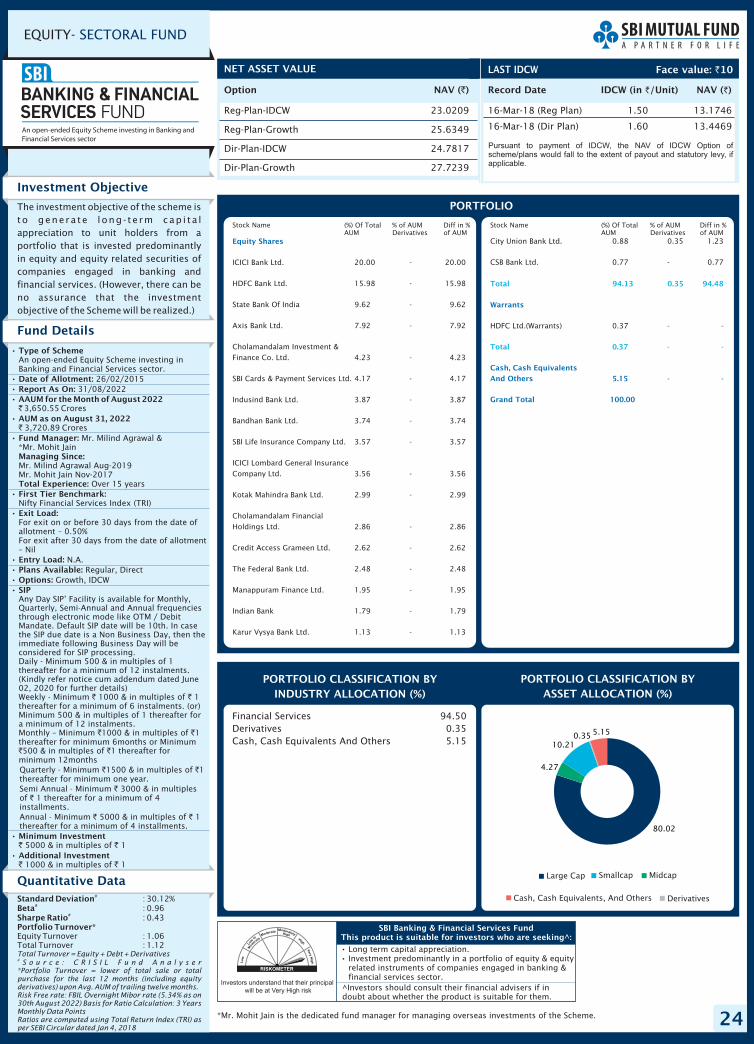
24
EQUITY- SECTORAL FUND
Option NAV ( )`
NET ASSET VALUE
•
•
Long term capital appreciation.Investment predominantly in a portfolio of equity & equityrelated instruments of companies engaged in banking &financial services sector.
SBI Banking & Financial Services FundThis product is suitable for investors who are seeking^:
Investment Objective
The investment objective of the scheme isto gene ra te long - t e rm cap i t a lappreciation to unit holders from aportfolio that is invested predominantlyin equity and equity related securities ofcompanies engaged in banking andfinancial services. (However, there can beno assurance that the investmentobjective of the Scheme will be realized.)
Fund Details
PORTFOLIO CLASSIFICATION BY(%)ASSET ALLOCATION
•
•
•
•
•
•
•
•
•
•
•
•
•
•
Type of Scheme
Date of Allotment:Report As On:AAUM for the August 2022
AUM as on August 31, 2022
Fund Manager:
Managing Since:
Total Experience:First Tier Benchmark:
Exit Load:
Entry Load:Plans Available:Options:SIP
Minimum Investment
Additional Investment
An open-ended Equity Scheme investing inBanking and Financial Services sector.
26/02/201531/08/2022
3,650.55 Crores
3,720.89 CroresMr. Milind Agrawal &
*Mr. Mohit Jain
Mr. Milind Agrawal Aug-2019Mr. Mohit Jain Nov-2017
Over 15 years
Nifty Financial Services Index (TRI)
For exit on or before 30 days from the date ofallotment – 0.50%For exit after 30 days from the date of allotment– Nil
N.A.Regular, Direct
Growth, IDCW
Any Day SIP’ Facility is available for Monthly,Quarterly, Semi-Annual and Annual frequenciesthrough electronic mode like OTM / DebitMandate. Default SIP date will be 10th. In casethe SIP due date is a Non Business Day, then theimmediate following Business Day will beconsidered for SIP processing.Daily - Minimum 500 & in multiples of 1thereafter for a minimum of 12 instalments.(Kindly refer notice cum addendum dated June02, 2020 for further details)Weekly - Minimum 1000 & in multiples of 1thereafter for a minimum of 6 instalments. (or)Minimum 500 & in multiples of 1 thereafter fora minimum of 12 instalments.Monthly – Minimum 1000 & in multiples of 1thereafter for minimum 6months or Minimum500 & in multiples of 1 thereafter for
minimum 12monthsQuarterly - Minimum 1500 & in multiples of 1thereafter for minimum one year.Semi Annual - Minimum 3000 & in multiplesof 1 thereafter for a minimum of 4installments.Annual - Minimum 5000 & in multiples of 1thereafter for a minimum of 4 installments.
5000 & in multiples of 1
1000 & in multiples of 1
Month of`
`
` `
` `
` `
` `
``
` `
` `
` `
PORTFOLIO CLASSIFICATION BYINDUSTRY ALLOCATION (%)
^Investors should consult their financial advisers if indoubt about whether the product is suitable for them.
PORTFOLIO
Quantitative DataStandard DeviationBetaSharpe RatioPortfolio Turnover*
#
#
#
: 30.12%: 0.96: 0.43
Equity Turnover : 1.06Total Turnover : 1.12Total Turnover = Equity + Debt + Derivatives#
S o u r c e : C R I S I L F u n d A n a l y s e r*Portfolio Turnover = lower of total sale or totalpurchase for the last 12 months (including equityderivatives) upon Avg. AUM of trailing twelve months.Risk Free rate: FBIL Overnight Mibor rate (5.34% as on30th August 2022) Basis for Ratio Calculation: 3 YearsMonthly Data PointsRatios are computed using Total Return Index (TRI) asper SEBI Circular dated Jan 4, 2018
Record Date IDCW NAV ( )`(in /Unit)`
16-Mar-18 (Reg Plan) 1.50 13.1746
16-Mar-18 (Dir Plan) 1.60 13.4469
LAST IDCW Face value: 10`
Pursuant to payment of IDCW, the NAV of IDCW Option ofscheme/plans would fall to the extent of payout and statutory levy, ifapplicable.
Reg-Plan-IDCW 23.0209
Reg-Plan-Growth 25.6349
Dir-Plan-IDCW 24.7817
Dir-Plan-Growth 27.7239
Financial Services 94.50Derivatives 0.35Cash, Cash Equivalents And Others 5.15
Large Cap MidcapSmallcap
Investors understand that their principal
will be at Very High risk
*Mr. Mohit Jain is the dedicated fund manager for managing overseas investments of the Scheme.
80.02
4.27
10.210.35 5.15
Equity Shares
ICICI Bank Ltd. 20.00 - 20.00
HDFC Bank Ltd. 15.98 - 15.98
State Bank Of India 9.62 - 9.62
Axis Bank Ltd. 7.92 - 7.92
Cholamandalam Investment &Finance Co. Ltd. 4.23 - 4.23
SBI Cards & Payment Services Ltd. 4.17 - 4.17
Indusind Bank Ltd. 3.87 - 3.87
Bandhan Bank Ltd. 3.74 - 3.74
SBI Life Insurance Company Ltd. 3.57 - 3.57
ICICI Lombard General InsuranceCompany Ltd. 3.56 - 3.56
Kotak Mahindra Bank Ltd. 2.99 - 2.99
Cholamandalam FinancialHoldings Ltd. 2.86 - 2.86
Credit Access Grameen Ltd. 2.62 - 2.62
The Federal Bank Ltd. 2.48 - 2.48
Manappuram Finance Ltd. 1.95 - 1.95
Indian Bank 1.79 - 1.79
Karur Vysya Bank Ltd. 1.13 - 1.13
City Union Bank Ltd. 0.88 0.35 1.23
CSB Bank Ltd. 0.77 - 0.77
HDFC Ltd.(Warrants) 0.37 - -
Total 94.13 0.35 94.48
Total 0.37 - -
Warrants
Cash, Cash Equivalents
And Others 5.15 - -
Grand Total 100.00
(%) Of TotalAUM
(%) Of TotalAUM
Stock Name Stock Name% of AUMDerivatives
% of AUMDerivatives
Diff in %of AUM
Diff in %of AUM
Cash, Cash Equivalents, And Others Derivatives

25
EQUITY- SECTORAL FUND
Option NAV ( )`
NET ASSET VALUE
•
•
Long term capital appreciation.Investments in diversified basket of equity stocks ofdomestic Public Sector Undertakings and their subsidiaries.
SBI PSU FundThis product is suitable for investors who are seeking^:
Investment Objective
Quantitative Data
To provide investors with opportunitiesfor long-term growth in capital along withthe liquidity of an open-ended schemethrough an active management ofinvestments in a diversified basket ofequity stocks of domestic Public SectorUndertakings (and their subsidiaries) andin debt and money market instrumentsissued by PSUs and others.
Fund Details
Standard DeviationBetaSharpe RatioPortfolio Turnover*
#
#
#
: 23.91%: 0.79: 0.50
Equity Turnover : 0.47Total Turnover : 0.47Total Turnover = Equity + Debt + Derivatives#
S o u r c e : C R I S I L F u n d A n a l y s e r*Portfolio Turnover = lower of total sale or totalpurchase for the last 12 months (including equityderivatives) upon Avg. AUM of trailing twelve months.
Risk Free rate: FBIL Overnight Mibor rate (5.34% as on30th August 2022) Basis for Ratio Calculation: 3 YearsMonthly Data Points
Ratios are computed using Total Return Index (TRI) asper SEBI Circular dated Jan 4, 2018
PORTFOLIO CLASSIFICATION BY(%)ASSET ALLOCATION
•
•
•
•
•
•
•
•
•
•
•
•
•
•
Type of Scheme
Date of Allotment:Report As On:AAUM for the August 2022
AUM as on August 31, 2022
Fund Manager:
Total Experience:First Tier Benchmark:Exit Load:
Entry Load:Plans Available:Options:SIP
Minimum Investment
Additional Investment
An open-ended Equity Scheme investing inPSU/PSU subsidiaries sector.
07/07/201031/08/2022
460.84 Crores
463.49 CroresMr. Richard D'souza
Managing Since: Aug 2014Over 30 years
S&P BSE PSU INDEX (TRI)
For exit on or before 30 days from the date ofallotment – 0.50%For exit after 30 days from the date of allotment- Nil
N.A.Regular, Direct
Growth, IDCW
Any Day SIP’ Facility is available for Monthly,Quarterly, Semi-Annual and Annual frequenciesthrough electronic mode like OTM / DebitMandate. Default SIP date will be 10th. In casethe SIP due date is a Non Business Day, then theimmediate following Business Day will beconsidered for SIP processing.Daily - Minimum 500 & in multiples of 1thereafter for a minimum of 12 instalments.(Kindly refer notice cum addendum dated June02, 2020 for further details)Weekly - Minimum 1000 & in multiples of 1thereafter for a minimum of 6 instalments. (or)Minimum 500 & in multiples of 1 thereafter fora minimum of 12 instalments.Monthly - Minimum 1000 & in multiples of 1thereafter for minimum six months (or)minimum 500 & in multiples of 1 thereafterfor minimum one year.Quarterly - Minimum 1500 & in multiples of1 thereafter for minimum one year.Semi Annual - Minimum 3000 & in multiplesof 1 thereafter for a minimum of 4installments.Annual - Minimum 5000 & in multiples of 1thereafter for a minimum of 4 installments.
5000 & in multiples of 1
1000 & in multiples of 1
Month of`
`
` `
` `
` `
` `
``
` `
` `
` `
PORTFOLIO CLASSIFICATION BYINDUSTRY ALLOCATION (%)
PORTFOLIO
Equity Shares
State Bank Of India 15.39
Power Grid Corporation Of India Ltd. 8.93
NTPC Ltd. 8.01
Bharat Electronics Ltd. 5.56
Mazagon Dock Shipbuilders Ltd. 5.24
Indian Bank 5.15
Hindustan Aeronautics Ltd. 4.61
Bank Of Baroda 4.59
SBI Life Insurance Company Ltd. 4.49
Can Fin Homes Ltd. 4.37
Hindustan Copper Ltd. 4.33
Container Corporation Of India Ltd. 4.13
Coal India Ltd. 3.29
Gail (India) Ltd. 3.12
Oil & Natural Gas Corporation Ltd. 2.99
Punjab National Bank 2.80
National Aluminium Company Ltd. 2.54
Stock Name (%) Of Total AUM Stock Name (%) Of Total AUM
Steel Authority Of India Ltd. 2.37
Indian Oil Corporation Ltd. 1.98
Chennai Petroleum Corporation Ltd. 1.23
Total 95.12
Cash, Cash Equivalents And Others 4.88
Grand Total 100.00
^Investors should consult their financial advisers if indoubt about whether the product is suitable for them.
Reg-Plan-IDCW 14.3425
Reg-Plan-Growth 14.3442
Dir-Plan-IDCW 15.2791
Dir-Plan-Growth 15.3000
Financial Services 36.79
Power 16.94
Capital Goods 15.41
Oil, Gas & Consumable Fuels 12.61
Metals & Mining 9.24
Services 4.13
Cash, Cash Equivalents And Others 4.88
Cash, Cash Equivalents, And Others
Large Cap MidcapSmallcap
LAST IDCW Face value: 10`
Record Date IDCW NAV ( )`(in /Unit)`
16-Mar-18 (Reg Plan) 4.20 22.0929
16-Mar-18 (Dir Plan) 4.30 22.8433
15-Mar-10 3.00 16.0100
25-Jul-08 2.00 17.1400
Investors understand that their principal
will be at Very High risk
62.9616.99
15.17
4.88

26
EQUITY- SECTORAL FUND
Option NAV ( )`
NET ASSET VALUE
Record Date IDCW NAV ( )`(in /Unit)`
16-Mar-18 (Reg Plan) 4.20 22.0929
16-Mar-18 (Dir Plan) 4.30 22.8433
15-Mar-10 3.00 16.0100
25-Jul-08 2.00 17.1400
LAST IDCW
•
•
Long term capital appreciation.Equity investments in a portfolio of stocks of companiesin the commodity and commodity related sectors.
SBI Magnum Comma FundThis product is suitable for investors who are seeking^:
Face value: 10`
Investment Objective
Quantitative Data
To generate opportunities for growthalong with possibility of consistentreturns by investing predominantly in aportfolio of stocks of companies engagedin the commodity and commodity relatedbusinesses.
Fund Details
Standard DeviationBetaSharpe RatioPortfolio Turnover*
#
#
#
: 25.51%: 0.93: 0.87
Equity Turnover : 0.56Total Turnover : 0.56Total Turnover = Equity + Debt + Derivatives#
S o u r c e : C R I S I L F u n d A n a l y s e r*Portfolio Turnover = lower of total sale or totalpurchase for the last 12 months (including equityderivatives) upon Avg. AUM of trailing twelve months.
Risk Free rate: FBIL Overnight Mibor rate (5.34% as on30th August 2022) Basis for Ratio Calculation: 3 YearsMonthly Data Points
Ratios are computed using Total Return Index (TRI) asper SEBI Circular dated Jan 4, 2018
PORTFOLIO CLASSIFICATION BY(%)ASSET ALLOCATION
Pursuant to payment of IDCW, the NAV of IDCW Option ofscheme/plans would fall to the extent of payout and statutory levy, ifapplicable.
•
•
•
•
•
•
•
•
•
•
•
•
•
•
Type of Scheme
Date of Allotment:Report As On:AAUM for the August 2022
AUM as on August 31, 2022
Fund Manager:
Managing Since:
Total Experience:First Tier Benchmark:
Exit Load:
Entry Load:Plans Available:Options:SIP
Minimum Investment
Additional Investment
An open-ended Equity Scheme investing incommodity and commodity related sectors.
08/08/200531/08/2022
454.47 Crores
468.00 CroresMr. Richard D'souza &
*Mr. Mohit Jain
Mr. Richard D'souza Aug-2014Mr. Mohit Jain Nov-2017
Over 30 years
Nifty Commodities Index (TRI)
For exit on or before 30 days from the date ofallotment – 0.50%For exit after 30 days from the date of allotment– Nil
N.A.Regular, Direct
Growth, IDCW
Any Day SIP’ Facility is available for Monthly,Quarterly, Semi-Annual and Annual frequenciesthrough electronic mode like OTM / DebitMandate. Default SIP date will be 10th. In casethe SIP due date is a Non Business Day, then theimmediate following Business Day will beconsidered for SIP processing.Daily - Minimum 500 & in multiples of 1thereafter for a minimum of 12 instalments.(Kindly refer notice cum addendum dated June02, 2020 for further details)Weekly - Minimum 1000 & in multiples of 1thereafter for a minimum of 6 instalments. (or)Minimum 500 & in multiples of 1 thereafter for aminimum of 12 instalments.Monthly - Minimum 1000 & in multiples of 1thereafter for minimum six months (or)minimum 500 & in multiples of 1 thereafterfor minimum one year.Quarterly - Minimum 1500 & in multiples of 1thereafter for minimum one year.Semi Annual - Minimum 3000 & in multiples of
1 thereafter for a minimum of 4 installments.Annual - Minimum 5000 & in multiples of 1thereafter for a minimum of 4 installments.
5000 & in multiples of 1
1000 & in multiples of 1
Month of`
`
` `
` `
` `
` `
``
` `
` `
` `
PORTFOLIO CLASSIFICATION BYINDUSTRY ALLOCATION (%)
PORTFOLIO
Equity Shares
NTPC Ltd. 7.02
Reliance Industries Ltd. 5.66
Power Grid Corporation Of India Ltd. 5.64
Neogen Chemicals Ltd. 5.19
ACC Ltd. 4.91
Coal India Ltd. 4.89
Ultratech Cement Ltd. 4.85
CCL Products (India) Ltd. 4.36
Antony Waste Handling Cell Ltd. 4.29
Paradeep Phosphates Ltd. 3.81
Andhra Paper Ltd. 3.68
Tata Steel Ltd. 3.65
The India Cements Ltd. 3.33
Clean Science & Technology Ltd. 3.23
K.P.R. Mill Ltd. 3.18
Rossari Biotech Ltd. 3.17
Indian Oil Corporation Ltd. 3.04
Hindalco Industries Ltd. 2.91
Aether Industries Ltd. 2.81
Stock Name (%) Of Total AUM Stock Name (%) Of Total AUM
Tata Power Company Ltd. 2.71
National Aluminium Company Ltd. 2.58
Hindustan Copper Ltd. 2.04
Oil & Natural Gas Corporation Ltd. 1.78
Sagar Cements Ltd. 1.67
India Pesticide Ltd. 0.36
Total 90.76
Cash, Cash Equivalents And Others 9.24
Grand Total 100.00
^Investors should consult their financial advisers if indoubt about whether the product is suitable for them.
An open-ended Equity Scheme investing in commodityand commodity related sectors.
Reg-Plan-IDCW 38.8271
Reg-Plan-Growth 68.4042
Dir-Plan-IDCW 41.4028
Dir-Plan-Growth 72.7577
Chemicals 18.57
Oil, Gas & Consumable Fuels 15.37
Power 15.37
Construction Materials 14.76
Metals & Mining 11.18
Fast Moving Consumer Goods 4.36
Utilities 4.29
Forest Materials 3.68
Textiles 3.18
Cash, Cash Equivalents And Others 9.24
Investors understand that their principal
will be at Very High risk
Cash, Cash Equivalents, And Others
Large Cap MidcapSmallcap
*Mr. Mohit Jain is the dedicated fund manager for managing overseas investments of the Scheme.
42.15
13.90
34.71
9.24

27
EQUITY- SECTORAL FUND
Option NAV ( )`
NET ASSET VALUE
•
•
Long term capital appreciation.Equity investments in stocks of companies directly or indirectlyinvolved in the infrastructure growth of the Indian economy.
SBI Infrastructure FundThis product is suitable for investors who are seeking^:
Investment Objective
Quantitative Data
To provide investors with opportunitiesfor long-term growth in capital throughan active management of investments in adiversified basket of equity stocks ofcompanies directly or indirectly involvedin the infrastructure growth in the Indianeconomy and in debt & money marketinstruments.
Fund Details
Standard DeviationBetaSharpe RatioPortfolio Turnover*
#
#
#
: 23.63%: 1.03: 0.78
Equity Turnover : 0.60Total Turnover : 0.60Total Turnover = Equity + Debt + Derivatives#
S o u r c e : C R I S I L F u n d A n a l y s e r*Portfolio Turnover = lower of total sale or totalpurchase for the last 12 months (including equityderivatives) upon Avg. AUM of trailing twelve months.Risk Free rate: FBIL Overnight Mibor rate (5.34% as on30th August 2022) Basis for Ratio Calculation: 3 YearsMonthly Data PointsRatios are computed using Total Return Index (TRI) asper SEBI Circular dated Jan 4, 2018
•
•
•
•
•
•
•
•
•
•
•
•
•
•
Type of Scheme
Date of Allotment:Report As On:AAUM for the August 2022
AUM as on August 31, 2022
Fund Manager:
Managing Since:
Total Experience:First Tier Benchmark:
Exit Load:
Entry Load:Plans Available:Options:SIP
Minimum Investment
Additional Investment
An open-ended Equity Scheme investing ininfrastructure and allied sectors.
06/07/200731/08/2022
886.47 Crores
906.40 CroresMr. Bhavin Vithlani &
*Mr. Mohit Jain
Mr. Bhavin Vithlani Jan-2022Mr. Mohit Jain Nov-2017
Over 19 years
Nifty Infrastructure Index (TRI)
For exit on or before 30 days from the date ofallotment – 0.50%For exit after 30 days from the date of allotment- Nil
N.A.Regular, Direct
Growth, IDCW
Any Day SIP’ Facility is available for Monthly,Quarterly, Semi-Annual and Annual frequenciesthrough electronic mode like OTM / DebitMandate. Default SIP date will be 10th. In casethe SIP due date is a Non Business Day, then theimmediate following Business Day will beconsidered for SIP processing.Daily - Minimum 500 & in multiples of 1thereafter for a minimum of 12 instalments.(Kindly refer notice cum addendum dated June02, 2020 for further details)Weekly - Minimum 1000 & in multiples of 1thereafter for a minimum of 6 instalments. (or)Minimum 500 & in multiples of 1 thereafter fora minimum of 12 instalments.Monthly - Minimum 1000 & in multiples of 1thereafter for minimum six months (or)minimum 500 & in multiples of 1 thereafterfor minimum one year.Quarterly - Minimum 1500 & in multiples of1 thereafter for minimum one year.Semi Annual - Minimum 3000 & in multiplesof 1 thereafter for a minimum of 4installments.Annual - Minimum 5000 & in multiples of 1thereafter for a minimum of 4 installments.
5000 & in multiples of 1
1000 & in multiples of 1
Month of`
`
` `
` `
` `
` `
``
` `
` `
` `
PORTFOLIO CLASSIFICATION BYINDUSTRY ALLOCATION (%)
PORTFOLIO
^Investors should consult their financial advisers if indoubt about whether the product is suitable for them.
Record Date IDCW NAV ( )`(in /Unit)`
16-Mar-18 (Reg Plan) 1.70 13.6863
16-Mar-18 (Dir Plan) 1.80 14.0096
LAST IDCW Face value: 10`
Pursuant to payment of IDCW, the NAV of IDCW Option ofscheme/plans would fall to the extent of payout and statutory levy, ifapplicable.
Reg-Plan-IDCW 23.8413
Reg-Plan-Growth 26.8008
Dir-Plan-IDCW 25.1304
Dir-Plan-Growth 28.3952
Capital Goods 23.56Construction Materials 12.28Oil, Gas & Consumable Fuels 11.81Construction 10.92Telecommunication 5.96Power 4.86Financial Services 4.58Automobile And Auto Components 4.08Metals & Mining 3.39Services 3.00Consumer Services 2.49Healthcare 2.15Realty 2.11Cash, Cash Equivalents And Others 8.81
Equity Shares
Reliance Industries Ltd. 7.86
Bharti Airtel Ltd. 5.96
Larsen & Toubro Ltd. 5.30
Ultratech Cement Ltd. 4.14
Shree Cement Ltd. 3.65
Carborundum Universal Ltd. 3.49
Tega Industries Ltd. 3.04
Ingersoll Rand (India) Ltd. 2.84
Nuvoco Vistas Corporation Ltd. 2.78
ICICI Bank Ltd. 2.69
Torrent Power Ltd. 2.61
Disa India Ltd. 2.57
Chalet Hotels Ltd. 2.49
Grindwell Norton Ltd. 2.43
CESC Ltd. 2.25
MRF Ltd. 2.17
Ahluwalia Contracts (India) Ltd. 2.17
Max Healthcare Institute Ltd. 2.15
Kennametal India Ltd. 2.15
Gail (India) Ltd. 2.14
Stock Name (%) Of Total AUM Stock Name (%) Of Total AUM
Brigade Enterprises Ltd. 2.11
ZF Commercial Vehicle Control Systems India Ltd. 1.91
HDFC Bank Ltd. 1.89
GE T&D India Ltd. 1.84
JMC Projects (India) Ltd. 1.83
Bharat Petroleum Corporation Ltd. 1.81
AIA Engineering Ltd. 1.81
Tata Steel Ltd. 1.79
The Ramco Cements Ltd. 1.71
Kalpataru Power Transmission Ltd. 1.62
Delhivery Ltd. 1.61
Hindalco Industries Ltd. 1.60
Adani Ports And Special Economic Zone Ltd. 1.39
Esab India Ltd. 1.38
Triveni Turbine Ltd. 1.10
Wendt (India) Ltd. 0.91
Total 91.19
Cash, Cash Equivalents And Others 8.81
Grand Total 100.00
Cash, Cash Equivalents, And Others
Large Cap MidcapSmallcap
Investors understand that their principal
will be at Very High risk
PORTFOLIO CLASSIFICATION BY(%)ASSET ALLOCATION
*Mr. Mohit Jain is the dedicated fund manager for managing overseas investments of the Scheme.
40.22
14.49
36.48
8.81

28
EQUITY-THEMATIC
Option NAV ( )`
NET ASSET VALUE
Record Date IDCW NAV ( )`(in /Unit)`
16-Mar-18 (Reg Plan) 12.70 69.821016-Mar-18 (Dir Plan) 15.60 85.932429-May-15 (Reg Plan) 10.00 51.325729-May-15 (Dir Plan) 12.00 61.486217-May-13 (Reg Plan) 8.00 46.0416
LAST IDCW
•
•
Long term capital appreciation.Equity investments in stock of companies following consumption theme.
SBI Consumption Opportunities FundThis product is suitable for investors who are seeking^:
Face value: 10`
Investment Objective
Quantitative Data
To provide the investor with theopportunity of long-term capitalappreciation by investing in a diversifiedportfolio of equity and equity relatedsecurities in Consumption space.
Fund Details
Standard DeviationBetaSharpe RatioPortfolio Turnover*
#
#
#
: 23.46%: 1.09: 0.80
Equity Turnover : 0.54Total Turnover : 0.62Total Turnover = Equity + Debt + Derivatives#
S o u r c e : C R I S I L F u n d A n a l y s e r*Portfolio Turnover = lower of total sale or totalpurchase for the last 12 months (including equityderivatives) upon Avg. AUM of trailing twelve months.
Risk Free rate: FBIL Overnight Mibor rate (5.34% as on30th August 2022) Basis for Ratio Calculation: 3 YearsMonthly Data Points
Ratios are computed using Total Return Index (TRI) asper SEBI Circular dated Jan 4, 2018
PORTFOLIO CLASSIFICATION BY(%)ASSET ALLOCATION
•
•
•
•
•
•
•
•
•
•
•
•
•
•
Type of Scheme
Date of Allotment:Report As On:AAUM for the August 2022
AUM as on August 31, 2022
Fund Manager:
Managing Since:
Total Experience:First Tier Benchmark:
Exit Load:
Entry Load:Plans Available:Options:SIP
Minimum Investment
Additional Investment
An open-ended Equity Scheme followingconsumption theme.
05/07/199931/08/2022
1,034.15 Crores
1,060.09 CroresMr. Saurabh Pant &
*Mr. Mohit Jain
Mr. Saurabh Pant Jun-2011Mr. Mohit Jain Nov-2017
Over 15 years
Nifty India Consumption Index (TRI)
For exit on or before 30 days from the date ofallotment - 0.10%For exit after 30 days from the date ofallotment- Nil
NilRegular, Direct
Growth, IDCW
Any Day SIP’ Facility is available for Monthly,Quarterly, Semi-Annual and Annual frequenciesthrough electronic mode like OTM / DebitMandate. Default SIP date will be 10th. In casethe SIP due date is a Non Business Day, thenthe immediate following Business Day will beconsidered for SIP processing.Daily - Minimum 500 & in multiples of 1thereafter for a minimum of 12 instalments.(Kindly refer notice cum addendum dated June02, 2020 for further details)Weekly - Minimum 1000 & in multiples of 1thereafter for a minimum of 6 instalments. (or)Minimum 500 & in multiples of 1 thereafter fora minimum of 12 instalments.Monthly - Minimum 1000 & in multiples of 1thereafter for minimum six months (or)minimum 500 & in multiples of 1 thereafterfor minimum one yearQuarterly - Minimum 1500 & in multiples of1 thereafter for minimum one year.Semi Annual - Minimum 3000 & in multiplesof 1 thereafter for a minimum of 4installments.Annual - Minimum 5000 & in multiples of 1thereafter for a minimum of 4 installments.
5000 & in multiples of 1
1000 & in multiples of 1
Month of`
`
` `
` `
` `
` `
``
` `
` `
` `
PORTFOLIO CLASSIFICATION BYINDUSTRY ALLOCATION (%)
PORTFOLIO
^Investors should consult their financial advisers if indoubt about whether the product is suitable for them.
Pursuant to payment of IDCW, the NAV of IDCW Option of scheme/planswould fall to the extent of payout and statutory levy, if applicable.
(Previously known as SBI FMCG Fund)
Reg-Plan-IDCW 120.5743
Reg-Plan-Growth 200.2682
Dir-Plan-IDCW 155.9420
Dir-Plan-Growth 221.5141
Fast Moving Consumer Goods 32.03
Consumer Services 19.47
Consumer Durables 15.74
Textiles 8.69
Telecommunication 8.19
Automobile And Auto Components 6.96
Media, Entertainment & Publication 1.86
Derivatives -2.50
Cash, Cash Equivalents And Others 9.56
Cash, Cash Equivalents, And Others Foreign Equity Shares
Investors understand that their principal
will be at Very High risk
Large Cap Midcap DerivativesSmallcap
*Mr. Mohit Jain is the dedicated fund manager for managing overseas investments of the Scheme.
Equity Shares
ITC Ltd. 9.21 - 9.21
Hindustan Unilever Ltd. 8.41 - 8.41
Bharti Airtel Ltd. 8.19 - 8.19
Page Industries Ltd. 6.26 - 6.26
The Indian Hotels Company Ltd. 5.98 - 5.98
Go Fashion (India) Ltd. 4.38 - 4.38
Chalet Hotels Ltd. 4.26 - 4.26
Procter & Gamble Hygiene AndHealth Care Ltd. 3.83 - 3.83
Sheela Foam Ltd. 3.74 - 3.74
Vedant Fashions Ltd. 3.63 - 3.63
Emami Ltd. 3.52 - 3.52
Hero Motocorp Ltd. 2.94 - 2.94
Hawkins Cookers Ltd. 2.55 - 2.55
Maruti Suzuki India Ltd. 2.48 -2.50 -0.02
Blue Star Ltd. 2.39 - 2.39
Mrs. Bectors FoodSpecialities Ltd. 2.14 - 2.14
Relaxo Footwears Ltd. 2.11 - 2.11
Britannia Industries Ltd. 1.98 - 1.98
Berger Paints India Ltd. 1.84 - 1.84
Greenpanel Industries Ltd. 1.61 - 1.61
Ganesha Ecosphere Ltd. 1.58 - 1.58
Mahindra & Mahindra Ltd. 1.54 - 1.54
V-Guard Industries Ltd. 1.50 - 1.50
Westlife Development Ltd. 1.22 - 1.22
United Breweries Ltd. 1.07 - 1.07
Dodla Dairy Ltd. 0.97 - 0.97
Hatsun Agro Product Ltd. 0.90 - 0.90
Gokaldas Exports Ltd. 0.85 - 0.85
Netflix Inc 1.86 - -
Total 91.08 -2.50 88.58
Total 1.86 - -
Foreign Equity Shares
Cash, Cash Equivalents
And Others 9.56 - -
Grand Total 100.00
(%) Of TotalAUM
(%) Of TotalAUM
Stock Name Stock Name% of AUMDerivatives
% of AUMDerivatives
Diff in %of AUM
Diff in %of AUM
36.59
27.30
27.19
1.86-2.50
9.56

29
EQUITY- SECTORAL FUND
Option NAV ( )`
NET ASSET VALUE
Record Date IDCW NAV ( )`(in /Unit)`
16-Mar-18 (Reg Plan) 5.90 33.851016-Mar-18 (Dir Plan) 7.30 41.914226-Jun-15 (Reg Plan) 6.00 31.839026-Jun-15(Dir Plan) 7.00 38.697608-Aug-13 (Reg Plan) 4.50 28.6220
LAST IDCW
•
•
Long term capital appreciation.Equity investments in stock of companies in thetechnology and technology related sectors.
SBI Technology Opportunities FundThis product is suitable for investors who are seeking^:
Face value: 10`
Investment Objective
Quantitative Data
To provide the investor with theopportunity of long-term capitalappreciation by investing in a diversifiedportfolio of equity and equity relatedsecurities in technology and technologyrelated companies.
Standard DeviationBetaSharpe RatioPortfolio Turnover*
#
#
#
: 21.72%: 0.92: 0.92
Equity Turnover : 0.37Total Turnover : 0.37Total Turnover = Equity + Debt + Derivatives#
S o u r c e : C R I S I L F u n d A n a l y s e r*Portfolio Turnover = lower of total sale or totalpurchase for the last 12 months (including equityderivatives) upon Avg. AUM of trailing twelve months.
Risk Free rate: FBIL Overnight Mibor rate (5.34% as on30th August 2022) Basis for Ratio Calculation: 3 YearsMonthly Data Points
Note: Fund Manager for Foreign Securities Mr.MohitJain w.e.f. Nov 28, 2017. Exp. Over 5years
Ratios are computed using Total Return Index (TRI) asper SEBI Circular dated Jan 4, 2018
PORTFOLIO CLASSIFICATION BY(%)ASSET ALLOCATION
Pursuant to payment of IDCW, the NAV of IDCW Option of scheme/planswould fall to the extent of payout and statutory levy, if applicable.
Fund Details•
•
•
•
•
•
•
•
•
•
•
•
•
•
Type of Scheme
Date of Allotment:
Report As On:
AAUM for the August 2022
AUM as on August 31, 2022
Fund Manager:
Managing Since:
Total Experience:
First Tier Benchmark:
Exit Load:
Entry Load:
Plans Available:
Options:
SIP
Minimum Investment
Additional Investment
An open-ended Equity Scheme investing intechnology and technology related sectors.
05/07/1999
31/08/2022
2,610.55 Crores
2,534.61 Crores
Mr. Saurabh Pant &*Mr. Mohit Jain
Mr. Saurabh Pant Jan-2022Mr. Mohit Jain Nov-2017
Over 15 years
S&P BSE Teck Index (TRI)
For exit within 15 days from the dateof allotment - 0.50%;For exit after 15 days from the date of allotment- Nil.
N.A.
Regular, Direct
Growth, IDCW
Any Day SIP’ Facility is available for Monthly,Quarterly, Semi-Annual and Annual frequenciesthrough electronic mode like OTM / DebitMandate. Default SIP date will be 10th. In casethe SIP due date is a Non Business Day, then theimmediate following Business Day will beconsidered for SIP processing.Daily - Minimum 500 & in multiples of 1thereafter for a minimum of 12 instalments.(Kindly refer notice cum addendum dated June02, 2020 for further details)Weekly - Minimum 1000 & in multiples of 1thereafter for a minimum of 6 instalments. (or)Minimum 500 & in multiples of 1 thereafter for aminimum of 12 instalments.Monthly - Minimum 1000 & in multiples of 1thereafter for minimum six months (or)minimum 500 & in multiples of 1 thereafterfor minimum one year.Quarterly - Minimum 1500 & in multiples of1 thereafter for minimum one year.Semi Annual - Minimum 3000 & in multiples of
1 thereafter for a minimum of 4 installments.
Annual - Minimum 5000 & in multiples of 1thereafter for a minimum of 4 installments.
5000 & in multiples of 1
1000 & in multiples of 1
Month of`
`
` `
` `
` `
` `
``
` `
` `
` `
PORTFOLIO CLASSIFICATION BYINDUSTRY ALLOCATION (%)
PORTFOLIO
Equity SharesInfosys Ltd. 26.10Tata Consultancy Services Ltd. 12.10Bharti Airtel Ltd. 9.57HCL Technologies Ltd. 6.30Wipro Ltd. 5.03Tech Mahindra Ltd. 3.52Oracle Financial Services Software Ltd. 1.78Eclerx Services Ltd. 1.69Emudhra Ltd. 1.41PVR Ltd. 0.79Computer Age Management Services Ltd. 0.55Persistent Systems Ltd. 0.50Newgen Software Technologies Ltd. 0.29
Microsoft Corporation 7.68NETFlix Inc 6.50Alphabet Inc. 3.85Nvidia Corporation 2.34
Total 69.63
Total 20.37
Foreign Equity Shares
Cash, Cash Equivalents And Others 10.00
Grand Total 100.00
Stock Name (%) Of Total AUM
(Previously known as SBI IT Fund)
^Investors should consult their financial advisers if indoubt about whether the product is suitable for them.
Reg-Plan-IDCW 79.9360
Reg-Plan-Growth 132.7440
Dir-Plan-IDCW 104.0623
Dir-Plan-Growth 146.5113
Information Technology 70.90
Telecommunication 9.57
Media, Entertainment & Publication 7.29
Services 1.69
Financial Services 0.55
Cash, Cash Equivalents And Others 10.00
Cash, Cash Equivalents, And Others
Foreign Equity Shares
Large Cap Small CapMid Cap
Investors understand that their principal
will be at Very High risk
*Mr. Mohit Jain is the dedicated fund manager for managing overseas investments of the Scheme.
62.62
2.28
4.73
20.37
10.00

30
EQUITY-THEMATIC
Option NAV ( )`
NET ASSET VALUE
•
•
Long term Capital appreciation.To generate income by investing in a diversified basket ofcompanies in Nifty 50 Index while aiming for minimizingthe portfolio volatility.
SBI Equity Minimum Variance FundThis product is suitable for investors who are seeking^:
Investment Objective
Quantitative Data
The investment objective of the scheme is toprovide long term capital appreciation byinvesting in a diversified basket of companies inNifty 50 Index while aiming for minimizing theportfolio volatility. However, there is noguarantee or assurance that the investmentobjective of the scheme will be achieved.
Standard DeviationBetaSharpe RatioPortfolio Turnover*
#
#
#
: 18.75%: 0.81: 0.77
Equity Turnover : 0.40Total Turnover : 0.47Total Turnover = Equity + Debt + Derivatives
*Portfolio Turnover = lower of total sale or total purchasefor the last 12 months (including equity derivatives) uponAvg. AUM of trailing twelve months.
Risk Free rate: FBIL Overnight Mibor rate (5.34% as on30th August 2022) Basis for Ratio Calculation: 3 YearsMonthly Data Points
Ratios are computed using Total Return Index (TRI) as perSEBI Circular dated Jan 4, 2018
PORTFOLIO CLASSIFICATION BY(%)ASSET ALLOCATION
Fund Details•
•
•
•
•
•
•
•
•
•
•
•
•
•
Type of Scheme
Date of Allotment:Report As On:AAUM for the August 2022
AUM as on August 31, 2022
Fund Manager:
First Tier Benchmark:Exit Load:
Entry Load:Plans Available:Options:SIP
Minimum Investment
Additional Investment
An Open Ended Equity Scheme followingminimum variance theme
02/03/201931/08/2022
130.65 Crores
132.35 CroresMr. Raviprakash Sharma &
*Mr. Mohit JainManaging Since:Mr. Raviprakash March-2019Mr. Mohit Jain March-2019Total Experience: Over 22 years
Nifty 50 Index (TRI)For exit on or before 15 days from
the date of allotment – 0.5%For exit after 15 days from the date of allotment- Nil
N.A.Regular, Direct
Growth, IDCW
Any Day SIP’ Facility is available for Monthly,Quarterly, Semi-Annual and Annual frequenciesthrough electronic mode like OTM / DebitMandate. Default SIP date will be 10th. In casethe SIP due date is a Non Business Day, then theimmediate following Business Day will beconsidered for SIP processing.Daily - Minimum 500 & in multiples of 1thereafter for a minimum of 12 instalments.(Kindly refer notice cum addendum dated June02, 2020 for further details)Weekly - Minimum 1000 & in multiples of Re. 1thereafter for minimum of six installments. (or)Minimum 500 & in multiples of 1 thereafter for aminimum of 12 instalments.Monthly - Minimum 1000 & in multiples of Re.1 thereafter for minimum six months (or)minimum 500 & in multiples of Re. 1 thereafterfor minimum one yearQuarterly - Minimum 1500 & in multiples of Re.1 thereafter for minimum one yearSemi-Annual - Minimum amount of investmentwill be 3,000 and in multiples of Re.1thereafter for minimum 4 number ofinstallmentsAnnual - Minimum amount of investment will be5,000 and in multiples of Re.1 thereafter for
minimum 4 number of installments
5000 & in multiples of 1
1000 & in multiples of 1
Month of`
`
`
`
`
`
`
`
` `
` `
PORTFOLIO CLASSIFICATION BYINDUSTRY ALLOCATION (%)
^Investors should consult their financial advisers if indoubt about whether the product is suitable for them.
PORTFOLIO
Equity Shares
Hindustan Unilever Ltd. 8.31 - 8.31
Nestle India Ltd. 7.98 - 7.98
Power Grid Corporation Of India Ltd. 7.90 - 7.90
Cipla Ltd. 7.80 - 7.80
Britannia Industries Ltd. 7.46 - 7.46
Tata Consultancy Services Ltd. 6.91 - 6.91
Sun Pharmaceutical Industries Ltd. 3.88 - 3.88
Bharti Airtel Ltd. 3.07 - 3.07
Dr. Reddy's Laboratories Ltd. 2.36 - 2.36
SBI Life Insurance Company Ltd. 1.67 - 1.67
ITC Ltd. 1.41 - 1.41
Bajaj Finserv Ltd. 1.34 - 1.34
Indusind Bank Ltd. 1.22 - 1.22
Titan Company Ltd. 1.19 - 1.19
Bajaj Finance Ltd. 1.16 - 1.16
Hindalco Industries Ltd. 1.15 - 1.15
NTPC Ltd. 1.14 - 1.14
Coal India Ltd. 1.14 - 1.14
ICICI Bank Ltd. 1.12 - 1.12
Tata Steel Ltd. 1.11 - 1.11
Grasim Industries Ltd. 1.11 - 1.11
Adani Ports And Special EconomicZone Ltd. 1.11 - 1.11
Larsen & Toubro Ltd. 1.09 - 1.09
Asian Paints Ltd. 1.09 - 1.09
Eicher Motors Ltd. 1.08 - 1.08
UPL Ltd. 1.07 - 1.07
Ultratech Cement Ltd. 1.05 - 1.05
Mahindra & Mahindra Ltd. 1.05 - 1.05
Axis Bank Ltd. 1.04 - 1.04
Shree Cement Ltd. 1.03 - 1.03
JSW Steel Ltd. 1.03 - 1.03
Apollo Hospitals Enterprise Ltd. 1.03 - 1.03
Tata Motors Ltd. 1.02 - 1.02
Kotak Mahindra Bank Ltd. 1.02 - 1.02
State Bank Of India 1.01 - 1.01
Tata Consumer Products Ltd. 1.00 - 1.00
Bajaj Auto Ltd. 1.00 - 1.00
HDFC Ltd. 0.99 - 0.99
Reliance Industries Ltd. 0.98 - 0.98
HDFC Bank Ltd. 0.98 - 0.98
Maruti Suzuki India Ltd. 0.96 - 0.96
Tech Mahindra Ltd. 0.95 - 0.95
Oil & Natural Gas Corporation Ltd. 0.94 - 0.94
Hero Motocorp Ltd. 0.92 - 0.92
Bharat Petroleum Corporation Ltd. 0.92 - 0.92
HDFC Life Insurance Company Ltd. 0.91 - 0.91
Infosys Ltd. 0.90 - 0.90
Divi's Laboratories Ltd. 0.89 - 0.89
Wipro Ltd. 0.87 - 0.87
HCL Technologies Ltd. 0.86 - 0.86
National Stock Exchange Of India Ltd.-29-Sep-22 - 0.74 0.74
Total 99.22 0.74 99.96
Cash, Cash Equivalents And Others 0.04 - -
Grand Total 100.00
Reg-Plan-IDCW 16.4791
Reg-Plan-Growth 16.4751
Dir-Plan-IDCW 16.7003
Dir-Plan-Growth 16.7013
Fast Moving Consumer Goods 26.16Healthcare 15.96Financial Services 12.46Information Technology 10.49Power 9.04Automobile And Auto Components 6.03Oil, Gas & Consumable Fuels 3.98Metals & Mining 3.29Construction Materials 3.19Telecommunication 3.07Consumer Durables 2.28Services 1.11Construction 1.09Chemicals 1.07Derivatives 0.74Cash, Cash Equivalents And Others 0.04
DerivativesLarge Cap
Investors understand that their principal
will be at Very High risk
(%) Of TotalAUM
(%) Of TotalAUM
Stock Name Stock Name% of AUMDerivatives
% of AUMDerivatives
Diff in %of AUM
Diff in %of AUM
*Mr. Mohit Jain is the dedicated fund manager for managing overseas investments of the Scheme.
99.22
0.740.04
Cash, Cash Equivalents, And Others

31
Option NAV ( )`
NET ASSET VALUE
•
•
Long term capital appreciation.Investment in SBI - ETF Gold.
SBI Gold FundThis product is suitable for investors who are seeking^:
Investment Objective
The scheme seeks to provide returns thatclosely correspond to returns provided bySBI - ETF Gold (erstwhile known as SBIGold Exchange Traded Scheme).
Fund Details
•
•
•
•
•
•
•
•
•
•
•
•
•
•
•
Type of Scheme
Date of Allotment:
Report As On:
AAUM for the August 2022
AUM as on August 31, 2022
Fund Manager:
Managing Since:
Total Experience:
First Tier Benchmark:
Exit Load:
Entry Load:
Plans Available:
Options:
SIP
Minimum Investment
Additional Investment
An open-ended Fund of Fund Scheme investingin SBI-ETF Gold
12/09/2011
31/08/2022
1,190.43 Crores
1,163.51 Crores
Mr. Raviprakash Sharma
Sep-2011
Over 22 years
Price of Physical Gold
For exit on or before 15 days fromthe date of allotment – 1%For exit after 15 days from the date ofallotment - Nil (w.e.f. 8 September 2020)
N.A.
Regular, Direct
Growth, IDCW
Any Day SIP’ Facility is available for Monthly,Quarterly, Semi-Annual and Annual frequenciesthrough electronic mode like OTM / DebitMandate. Default SIP date will be 10th. In casethe SIP due date is a Non Business Day, then theimmediate following Business Day will beconsidered for SIP processing.Daily - Minimum 500 & in multiples of 1thereafter for a minimum of 12 instalments.(Kindly refer notice cum addendum dated June02, 2020 for further details)Weekly - Minimum 1000 & in multiples of 1
thereafter for a minimum of 6 instalments. (or)Minimum 500 & in multiples of 1 thereafter fora minimum of 12 instalments.Monthly - Minimum 1000 & in multiples of 1
thereafter for minimum six months (or)minimum 500 & in multiples of 1 thereafter
for minimum one year.Quarterly - Minimum 1500 & in multiples of
1 thereafter for minimum one year.
Semi Annual - Minimum 3000 & in multiples
of 1 thereafter for a minimum of 4
installments.
Annual - Minimum 5000 & in multiples of 1
thereafter for a minimum of 4 installments.
5000 & in multiples of 1
1000 & in multiples of 1
Month of
`
`
` `
` `
` `
` `
`
`
` `
` `
` `
PORTFOLIO
Exchange Traded Funds
Cash, Cash Equivalents And Others -0.14
Grand Total 100.00
SBI Gold ETF 100.14
Total 100.14
Mutual Fund Units (%) Of Total AUM
^Investors should consult their financial advisers if indoubt about whether the product is suitable for them.
Note: The investors are bearing the recurring expenses of the scheme,in addition to the expenses of other schemes in which SBI Gold Fundmakes investments
FUND OF FUND
Reg-Plan-IDCW 15.5261
Reg-Plan-Growth 15.5219
Dir-Plan-IDCW 16.1141
Dir-Plan-Growth 16.1373
Mutual Fund Units Cash, Cash Equivalents And Others
PORTFOLIO CLASSIFICATION BY (%)ASSET ALLOCATION
100.14
-0.14
Investors understand that their principal
will be at Very High risk

32
Option NAV ( )`
NET ASSET VALUE
•
•
Long term capital appreciation.Investments in units of a US focused equity fund
SBI International Access - US Equity FoFThis product is suitable for investors who are seeking^:
Investment Objective
The scheme seeks to provide long termcapital appreciation by investing in unitsof one or more mutual fund schemes /ETF, which are domiciled overseas andpredominantly invest in US markets.However, there can be no assurance thatthe investment objective of the schemewould be achieved.
Fund Details
PORTFOLIO CLASSIFICATION BY (%)ASSET ALLOCATION
•
•
•
•
•
•
•
•
•
•
•
•
•
•
Type of Scheme
Date of Allotment:
Report As On:
AAUM for the August 2022
AUM as on August 31, 2022
Fund Manager:Managing Since:Total Experience:
First Tier Benchmark:
Entry Load:
Exit Load:
Plans Available:
Options:
SIP
Minimum Investment
Additional Investment
An open-ended fund of funds scheme investing inmutual fund scheme/ETFs that invest in US markets
22/03/2021
31/08/2022
984.49 Crores
930.41 Crores
Mr. Mohit JainMarch 2021Over 10 years
S&P 500 Index, afterconverting it to Indian Rupee
N.A
For exit on or before 1 year from the dateof allotment – 1.00%For exit after 1 year from the date of allotment – Nil
Regular, Direct
Growth, IDCW
Daily – Minimum 500 & in multiples of 1 thereafterfor minimum 12 Instalments.Weekly - Minimum 1000 & in multiples of 1thereafter for minimum of six installments orminimum 500 & in multiples of 1 thereafter forminimum 12 installments.Monthly - Minimum 1000 & in multiples of 1thereafter for minimum six months (or) minimum500 & in multiples of 1 thereafter for minimum
one year.Quarterly - Minimum 1500 & in multiples of 1thereafter for minimum one year.Semi-Annual - Minimum amount of investment willbe 3,000 and in multiples of 1 thereafter forminimum 4 number of installments.Annual - Minimum amount of investment will be5,000 and in multiples of 1 thereafter for
minimum 4 number of installments.
5000/- and in multiples of 1 thereafter
1000/- and in multiples of 1 thereafterSubscriptions through lumpsum investment(including additional purchases / Switch in) andfresh registrations through Systematic InvestmentPlan (SIP) / Systematic Transfer Plan (STP) / Transferof IDCW-ins in SBI International Access – US EquityFoF (the Scheme) has been discontinued with effectfrom February 4, 2022 i.e. post cut-off timing ofFebruary 3, 2022, till further noticeExisting systematic registrations like SIPs/ STPs/Transfer of IDCW-ins etc. in the Scheme shall remaincontinue under the Scheme till further notice.
Month of`
`
` `
` `
` `
` `
` `
` `
` `
` `
` `
` `
PORTFOLIO
Overseas Mutual Fund
Cash, Cash Equivalents And Others 0.31
Grand Total 100.00
Amundi Funds Us Pioneer Fund -I15 Usd Cap 99.69
Total 99.69
Mutual Fund Units (%) Of Total AUM
^Investors should consult their financial advisers if indoubt about whether the product is suitable for them.
Note: The investors are bearing the recurring expenses of the scheme,in addition to the expenses of other schemes in which SBI InternationalAccess - US Equity FoF makes investments
FUND OF FUND
Reg-Plan-IDCW 10.5490
Reg-Plan-Growth 10.5487
Dir-Plan-IDCW 10.6789
Dir-Plan-Growth 10.6786
Overseas Mutual Fund Cash, Cash Equivalents, And Others
Investors understand that their principal
will be at Very High risk
99.69
0.31

33
INDEX FUND
Option NAV ( )`
NET ASSET VALUE
•
•
Long term capital appreciation.Passive Investment in stocks comprising the Nifty 50 Indexin the same proportion as in the index to achieve returnsequivalent to the Total returns Index of Nifty 50 Index.
SBI Nifty Index FundThis product is suitable for investors who are seeking^:
Investment Objective
Quantitative Data
The scheme will adopt a passive investmentstrategy. The scheme will invest in stockscomprising the Nifty 50 Index in the sameproportion as in the index with the objectiveof achieving returns equivalent to the TotalReturns Index of Nifty 50 Index byminimizing the performance differencebetween the benchmark index and thescheme. The Total Returns Index is an indexthat reflects the returns on the index fromindex gain/loss plus IDCW payments by theconstituent stocks. However, there can be noassurance that the investment objective ofthe scheme will be achieved.
Fund Details
Portfolio Turnover*Equity Turnover : 0.13Total Turnover : 0.19
Tracking Error : 0.23%Total Turnover = Equity + Debt + Derivatives
*Portfolio Turnover = lower of total sale or totalpurchase for the last 12 months (including equityderivatives) upon Avg. AUM of trailing twelve months.Tracking Error is computed for the 3 Year Periodending 30th August 2022, based on month-end NAV.Tracking Error is computed using Total Returns Index.Ratios are computed using Total Return Index (TRI) asper SEBI Circular dated Jan 4, 2018
PORTFOLIO CLASSIFICATION BY(%)ASSET ALLOCATION
•
•
•
•
•
•
•
•
•
•
•
•
•
•
Type of Scheme
Date of Allotment:Report As On:AAUM for the August 2022
AUM as on August 31, 2022
Fund Manager:
Managing Since:
Total Experience:
First Tier Benchmark:Exit Load:
Entry Load:Plans Available:Options:SIP
Minimum Investment
Additional Investment
An open-ended Scheme tracking Nifty 50 Index.17/01/2002
31/08/2022
2,821.66 Crores
2,854.35 CroresMr. Raviprakash Sharma &
*Mr. Mohit Jain
Mr. Ravi Feb-2011*Mr. Mohit Jain Nov-2017
Mr. Ravi Over 22 yearsMr. Mohit Jain Over 10 years
Nifty 50 Index (TRI)For exit within 15 days from the date of
allotment - 0.20%For exit on or after 15 days from the date ofallotment - Nil
N.A.Regular, Direct
Growth, IDCW
Any Day SIP’ Facility is available for Monthly,Quarterly, Semi-Annual and Annual frequenciesthrough electronic mode like OTM / DebitMandate. Default SIP date will be 10th. In casethe SIP due date is a Non Business Day, then theimmediate following Business Day will beconsidered for SIP processing.Daily - Minimum 500 & in multiples of 1thereafter for a minimum of 12 instalments.(Kindly refer notice cum addendum dated June02, 2020 for further details)Weekly - Minimum 1000 & in multiples of 1thereafter for a minimum of 6 instalments. (or)Minimum 500 & in multiples of 1 thereafter for aminimum of 12 instalments.Monthly - Minimum 1000 & in multiples of 1thereafter for minimum six months (or)minimum 500 & in multiples of 1 thereafterfor minimum one year.Quarterly - Minimum 1500 & in multiples of1 thereafter for minimum one year.Semi Annual - Minimum 3000 & in multiplesof 1 thereafter for a minimum of 4installments.Annual - Minimum 5000 & in multiples of 1thereafter for a minimum of 4 installments.
5000 & in multiples of 1
1000 & in multiples of 1
Month of`
`
` `
` `
` `
` `
``
` `
` `
` `
PORTFOLIO CLASSIFICATION BYINDUSTRY ALLOCATION (%)
PORTFOLIO
^Investors should consult their financial advisers if indoubt about whether the product is suitable for them.
Record Date IDCW NAV ( )`(in /Unit)`
23-Mar-06 3.30 14.5541
28-Mar-05 3.80 15.0818
LAST IDCW Face value: 10`
Pursuant to payment of IDCW, the NAV of IDCW Option ofscheme/plans would fall to the extent of payout and statutory levy, ifapplicable.
Equity Shares
Reliance Industries Ltd. 11.66 - 11.66
HDFC Bank Ltd. 8.36 - 8.36
ICICI Bank Ltd. 7.91 - 7.91
Infosys Ltd. 7.00 - 7.00
HDFC Ltd. 5.68 - 5.68
Tata Consultancy Services Ltd. 4.26 - 4.26
Kotak Mahindra Bank Ltd. 3.61 - 3.61
ITC Ltd. 3.59 - 3.59
Hindustan Unilever Ltd. 3.04 - 3.04
Larsen & Toubro Ltd. 2.98 - 2.98
State Bank Of India 2.61 - 2.61
Axis Bank Ltd. 2.54 - 2.54
Bajaj Finance Ltd. 2.49 - 2.49
Bharti Airtel Ltd. 2.25 - 2.25
Asian Paints Ltd. 1.96 - 1.96
Mahindra & Mahindra Ltd. 1.61 - 1.61
Maruti Suzuki India Ltd. 1.55 - 1.55
Titan Company Ltd. 1.39 - 1.39
Bajaj Finserv Ltd. 1.31 - 1.31
HCL Technologies Ltd. 1.27 - 1.27
Sun Pharmaceutical Industries Ltd. 1.24 - 1.24
Tata Steel Ltd. 1.12 - 1.12
Tata Motors Ltd. 1.08 - 1.08
Power Grid Corporation Of India Ltd. 1.01 - 1.01
NTPC Ltd. 1.00 - 1.00
Ultratech Cement Ltd. 0.99 - 0.99
Indusind Bank Ltd. 0.92 - 0.92
Nestle India Ltd. 0.91 - 0.91
Tech Mahindra Ltd. 0.87 - 0.87
JSW Steel Ltd. 0.83 - 0.83
Hindalco Industries Ltd. 0.82 - 0.82
Grasim Industries Ltd. 0.81 - 0.81
Wipro Ltd. 0.78 - 0.78
Adani Ports And Special EconomicZone Ltd. 0.78 - 0.78
SBI Life Insurance Company Ltd. 0.77 - 0.77
Cipla Ltd. 0.72 - 0.72
Oil & Natural Gas Corporation Ltd. 0.69 - 0.69
HDFC Life Insurance Company Ltd. 0.69 - 0.69
Bajaj Auto Ltd. 0.68 - 0.68
Dr. Reddy'S Laboratories Ltd. 0.66 - 0.66
Coal India Ltd. 0.63 - 0.63
Tata Consumer Products Ltd. 0.62 - 0.62
Eicher Motors Ltd. 0.60 - 0.60
Divi's Laboratories Ltd. 0.59 - 0.59
Britannia Industries Ltd. 0.57 - 0.57
Apollo Hospitals Enterprise Ltd. 0.57 - 0.57
UPL Ltd. 0.53 - 0.53
Hero Motocorp Ltd. 0.47 - 0.47
Bharat Petroleum Corporation Ltd. 0.40 - 0.40
Shree Cement Ltd. 0.38 - 0.38
National Stock Exchange Of India Ltd.-29-Sep-22 - 0.19 0.19
182 Day T-Bill 03.11.22 0.07 - -
Total 99.80 0.19 99.99
Total 0.07 - -
Treasury Bills
Cash, Cash Equivalents And Others -0.06 - -
Grand Total 100.00
Reg-Plan-IDCW 79.1213
Reg-Plan-Growth 154.2162
Dir-Plan-IDCW 82.3960
Dir-Plan-Growth 160.4164
Financial Services 36.89Information Technology 14.18Oil, Gas & Consumable Fuels 13.38Fast Moving Consumer Goods 8.73Automobile And Auto Components 5.99Healthcare 3.78Consumer Durables 3.35Construction 2.98Metals & Mining 2.77Telecommunication 2.25Construction Materials 2.18Power 2.01Services 0.78Chemicals 0.53Sovereign 0.07Derivatives 0.19Cash, Cash Equivalents And Others -0.06
DerivativesLarge Cap
Cash, Cash Equivalents, And Others
Investors understand that their principal
will be at Very High risk
(%) Of TotalAUM
(%) Of TotalAUM
Stock Name Stock Name% of AUMDerivatives
% of AUMDerivatives
Diff in %of AUM
Diff in %of AUM
*Mr. Mohit Jain is the dedicated fund manager for managing overseas investments of the Scheme.
99.80
0.19-0.06

Plea
se c
onsu
lt y
our
finan
cial
advi
sor
bef
ore
inve
stin
g.
For
det
ails
, ple
ase
refe
r to
res
pec
tive
pag
e of
the
schem
e. S
ourc
e: C
RIS
IL F
und A
nal
yser
Ris
k Fr
ee r
ate:
FBI
L O
vern
ight
Mib
or
rate
()
Basi
s fo
r R
atio
Cal
cula
tion:
3 Y
ears
Month
ly D
ata
Poin
ts E
xpen
se r
atio
incl
udes
GST
, Ba
se T
ER a
nd
addit
ional
expen
ses
as p
er r
egula
tion 5
2(6
A)(
b)
and 5
2(6
A)(
c) o
f SE
BI (
MF)
reg
ula
tions
for
both
Dir
ect
and R
egula
r pla
n.
Mr
Gau
rav
Meh
tahas
bee
n r
epla
ced w
ith M
r R
ohit
Shim
pi (
w.e
.f O
ctober
1,
20
21
) | *
Mr.
Mohit
Jai
n is
the
ded
icat
ed f
und m
anag
er f
or
man
agin
g o
vers
eas
inve
stm
ents
of
the
Schem
e.
#5
.34
% a
s on 3
0th
August
20
22
Snap
shot
of
Hyb
rid
Fund
s &
Solu
tion O
riente
d F
und
s
Fu
nd
Deta
ils a
s o
n 3
1A
ug
ust
2022
Schem
eSB
I Eq
uit
ySa
vin
gs
Fund
SBI
Arb
itra
ge
Op
port
unit
ies
Fund
SBI
Bala
nce
dA
dvanta
ge
Fund
SBI
Mag
num
Child
ren's
Ben
efit
Fund
–In
ves
tmen
t Pla
n
Idea
l In
ves
tmen
t H
ori
zon
3ye
ars
+2
year
s+
2ye
ars
+5
year
s+
1ye
ar3
month
s3
year
s+
5ye
ars
+
Ince
pti
on D
ate
09/1
0/1
995
09/0
4/2
001
21/1
2/2
005
21/0
2/2
002
27/0
5/2
015
03/1
1/2
006
31/0
8/2
021
29/0
9/2
020
Fund
Manager
Mr.
R.
Srin
ivas
an -
Equit
yM
r. D
ines
h A
huja
- D
ebt
*Mr.
Mohit
Jai
n
Mr.
Sau
rabh P
ant
-Equit
yM
s. M
ansi
Saj
eja
-Deb
t*M
r. M
ohit
Jai
n
Mr.
Din
esh
Bala
chan
dra
nM
r. R
aj G
andhi
(for
ETC
Ds)
&*M
r. M
ohit
Jai
n
Mr.
R S
riniv
asan
- E
quit
yM
r. R
ajee
vRad
hak
rish
nan
- D
ebt
Ms.
Nid
hi C
haw
la(E
quit
y Po
rtio
n)
Ms.
Man
si S
ajej
a(D
ebt
Port
ion)
Mr.
Nee
raj K
um
ar(A
rbit
rage
Port
ion)
Mr.
Aru
n R
.(D
ebt
Port
ion)
Mr.
Nee
raj K
um
ar(E
quit
y Po
rtio
n)
Mr.
Din
esh B
alac
han
dra
n(E
quit
y Po
rtio
n)
Mr.
Din
esh A
huja
(D
ebt
Port
ion)
*Mr.
Mohit
Jai
n
Mr.
R S
riniv
asan
- E
quit
yPo
rtio
n; M
r. D
ines
hA
huja
- D
ebt
Port
ion
*Mr.
Mohit
Jai
n
Managin
g S
ince
Jan-2
01
2 &
Nov-
20
17
Saura
bh-J
an-2
022 &
Man
si-J
une-
2021
Mohit
-Jan
-2020
Din
esh-
Oct
2021-
Raj
- Fe
b 2
020
Mohit
-Nov-
2017
Jun-2
008
Nid
hi-Ja
n-2
022 M
ansi
-June-
2021 N
eera
j-M
ay-2
015
Oct
2012 -
Nee
raj K
um
arJu
ne
2021 -
Aru
n R
Aug-2
021
Sep 2
020
Firs
t T
ier
Ben
chm
ark
CRIS
IL H
ybri
d 3
5+65 -
Aggre
ssiv
e In
dex
NIF
TY 5
0 H
ybri
dC
om
posi
te D
ebt
15:8
5In
dex
SBI
Eq
uit
y H
ybri
d F
und
(Pre
viousl
y kn
ow
n a
s SB
IM
agnum
Bal
ance
d F
und)
Month
End
AU
M (
Rs.
in C
rore
s)`55,2
74.2
6`6,5
61.4
2`528.9
1`88.0
9`2,4
43.5
4`6,0
01.2
8`24,7
35.0
5`580.9
7
- - - -
Stand
ard
Dev
iati
on
#0.7
6%
Bet
a#
0.6
9
Sharp
e R
ati
o#
-2.0
7
Exp
ense
Rati
oReg
ula
r-1.4
7%
Dir
ect-
0.8
1%
Reg
ula
r- 1
.11%
Dir
ect-
0.5
7%
Reg
ula
r- 1
.77%
Dir
ect-
0.8
7%
Reg
ula
r- 1
.21%
Dir
ect-
0.8
6%
Reg
ula
r- 1
.18%
Dir
ect-
0.6
6%
Reg
ula
r- 0
.82%
Dir
ect-
0.3
6%
Reg
ula
r- 1
.62%
Dir
ect-
0.5
7%
Reg
ula
r- 2
.36%
Dir
ect-
1.1
6%
5.5
6
8.6
7
5.7
9
7.2
8
5.0
6
7.4
4
5.2
5
7.1
1
16.0
4%
1.0
7
0.6
6
- - -
- - -
- - -
- - -
- - -
2.8
7
4.1
9
3.0
1
7.0
1
- - - -
1.4
3
1.6
5
1.4
9
6.4
9
2.0
4
3.0
2
2.1
5
6.6
8
65
.10
48.9
121.9
5
16.1
65.9
5
3.7
340.6
8
--
--
--
8.9
410.1
8
5.0
1-
17.2
521.2
4
Exit
Load
For
exit
wit
hin
12
month
s fr
om
the
dat
e of
allo
tmen
t: F
or
10
%of
inve
stm
ent
- N
il Fo
rre
mai
nin
g inve
stm
ents
- 1
.00
%;
For
exit
aft
er 1
2 m
onth
s fr
om
the
dat
e of
allo
tmen
t -
Nil
For10%
ofth
ein
vest
men
tsw
ithin
1Yea
r–
Nil;
Forth
ere
mai
nin
gin
vest
men
ts-1
.00%
For
10%
of
the
inve
stm
ents
wit
hin
1 Y
ear
–N
il; F
or
the
rem
ainin
g inve
stm
ents
-1.0
0%
Wit
hre
spec
tto
unit
snot
subje
ctto
lock
-inper
iod
and
the
hold
ing
per
iod
isle
ssth
an3
year
s:3%
for
redem
pti
on/s
wit
chout
bef
ore
1ye
arfr
om
the
dat
eof
allo
tmen
t;2%
for
redem
pti
on/s
wit
chout
afte
r1
year
and
up
to2
year
sfr
om
the
dat
eof
allo
tmen
t;1%
for
redem
pti
on/s
wit
chout
afte
r2
year
san
dup
to3
year
sfr
om
the
dat
eof
allo
tmen
t;N
ilfo
rre
dem
pti
on
or
swit
ch-o
ut
afte
r3
year
sfr
om
the
dat
eof
allo
tmen
t
For
exit
on
or
bef
ore
15
day
sfr
om
the
dat
eof
allo
tmen
t–
0.1
0%
For
exit
afte
r15
day
sfr
om
the
dat
eof
allo
tmen
t–
Nil
For
exit
on
or
bef
ore
1m
onth
from
the
dat
eof
allo
tmen
t–0
.25%
For
exit
afte
r1
month
from
the
dat
eof
allo
tmen
t–
Nil
NIL
-If
unit
spurc
has
edor
swit
ched
infr
om
anoth
ersc
hem
eof
the
Fund
are
redee
med
or
swit
ched
out
upto
10%
of
the
unit
s(t
he
limit
)purc
has
edor
swit
ched
on
or
bef
ore
1ye
arfr
om
the
dat
eof
allo
tmen
t.1%
of
the
applic
able
NA
V-If
unit
spurc
has
edor
swit
ched
infr
om
anoth
ersc
hem
eof
the
Fund
are
redee
med
or
swit
ched
out
inex
cess
of
the
limit
on
or
bef
ore
1ye
arfr
om
the
dat
eof
allo
tmen
tN
IL-If
unit
spurc
has
edor
swit
ched
infr
om
anoth
ersc
hem
eof
the
Fund
are
redee
med
or
swit
ched
out
afte
r1
year
from
the
dat
eof
allo
tmen
t
For
alli
nve
stm
ents
wit
hre
spec
tto
unit
snot
subje
ctto
lock
-inper
iod
and
the
hold
ing
per
iod
isle
ssth
an3
year
s:3%
for
redem
pti
on/s
wit
chout
on
or
bef
ore
1ye
arfr
om
the
dat
eof
allo
tmen
t,2%
for
redem
pti
on/s
wit
chout
afte
r1
year
and
up
to2
year
sfr
om
the
dat
eof
allo
tmen
t,1%
for
redem
pti
on/s
wit
chout
afte
r2
year
san
dup
to3
year
sfr
om
the
dat
eof
allo
tmen
t,N
ilfo
rre
dem
pti
on
or
swit
ch-o
ut
afte
r3
year
sfr
om
the
dat
eof
allo
tmen
t.
Larg
e C
ap
Mid
Cap
Small C
ap
Uncl
ass
ifie
d
AA
, AA
+, A
AA
And
EQ
UIV
ALE
NT
Bel
ow
AA
Sover
eig
n
Bel
ow
A1
+, A
1+
Cash
, Cash
Eq
uiv
ale
nts
,D
eriv
ati
ves
and
Oth
ers
Oth
er
Deta
ils
Eq
uit
y Sh
are
s
Corp
ora
te D
ebt
Gilts
Money
Mark
et I
nst
rum
ents
Oth
er A
sset
s
66.2
0
6.8
7
16.2
5
0.4
9
10.1
9
21.5
2
29.9
2
17.8
6
4.8
8
25.8
2
49.1
9
-
24.1
1
-
26.7
0
22.1
5
11.8
6
5.2
3
-
60.7
6
70.1
3
9.8
7
9.0
7
5.9
7
4.9
6
68.9
1
1.1
4
16.7
0
0.4
0
12.8
5
68.8
0
-
1.4
4
12.5
1
17.2
5
50
.26
13
.78
2.1
6
-
5.8
7
1.0
0
17
.61
0.4
9
8.8
3
8.5
5
6.4
4
6.5
3
-
29
.30
0.6
2
34
.53
4.8
8
9.1
5
18
.99
12
.14
18
.06
- - -
24
.11
-
Oth
ers
15
.04
,1
1.6
6ET
F
4.2
8
4.9
1
11
.67
-
11
.86
-
36
.96
-
30
.32
41.2
3
16.2
5
12.6
5
-
7.2
7
2.6
0
17.6
6
-
2.3
4
57.3
0
8.4
6
2.3
7
-
1.1
4
-
20.3
8
-
10.3
5
Mod
ifie
d D
ura
tion (
Aver
age
Matu
rity
Maca
ula
y D
ura
tion (
years
)
Yie
ld t
o M
atu
rity
(%
)years
)
(yea
rs)
Nifty
Equi
tySa
ving
sN
ifty
50 A
rbit
rage
Nif
ty 5
0 H
ybri
dC
om
posi
te D
ebt
50:5
0 Index
CRIS
IL H
ybri
d 3
5+65
-Aggre
ssiv
e In
dex
SBI
Mag
num
Child
ren's
Ben
efit
Fund
-Sa
vin
gs
Pla
n(P
revi
ousl
y kn
ow
n a
sSB
I M
agnum
Child
ren's
Benef
it F
und)
SBI
Conse
rvati
ve
Hyb
rid
Fund
(Pre
viousl
y kn
ow
nas
SBI
Deb
t H
ybri
d F
und)
SBI
Mult
i A
sset
Alloca
tion
Fund (
Prev
iousl
y kn
ow
n a
sSB
I M
agnum
Month
lyIn
com
e Pl
an -
Flo
ater
)
45%
CRIS
IL 1
0 y
ear
Gilt
Index
+40%
NIF
TY 5
0TRI+
15%
Pri
ce o
f G
old
(w.e
.f N
ove
mber
6, 2020)
NIF
TY 5
0 H
ybri
dC
om
posi
te D
ebt
15:8
5 Index
Co
mp
osit
ion
by
Assets
as o
n31
Au
gu
st
2022
Co
mp
osit
ion
by R
ati
ng
s &
Assets
as o
n31
Au
gu
st
2022
5.4
4
7.5
6
5.6
4
7.0
9
- - -
81.7
9
-
10.1
8
-
8.0
3
34

Plea
se c
onsu
lt y
our
finan
cial
advi
sor
bef
ore
inve
stin
g.
For
det
ails
, ple
ase
refe
r to
res
pec
tive
pag
e of
the
schem
e. S
ourc
e: C
RIS
IL F
und A
nal
yser
Ris
k Fr
ee r
ate:
FBI
L O
vern
ight
Mib
or
rate
()
Basi
s fo
r R
atio
Cal
cula
tion:
3 Y
ears
Month
ly D
ata
Poin
ts E
xpen
se r
atio
incl
udes
GST
, Ba
se T
ERan
d a
ddit
ional
expen
ses
as p
er r
egula
tion 5
2(6
A)(
b)
and 5
2(6
A)(
c) o
f SE
BI (
MF)
reg
ula
tions
for
both
Dir
ect
and R
egula
r pla
n.
Mr
Gau
rav
Meh
tahas
bee
n r
epla
ced w
ith M
r R
ohit
Shim
pi (
w.e
.f O
ctober
1,
20
21
) | *
Mr.
Mohit
Jai
n is
the
ded
icat
ed f
und m
anag
er f
or
man
agin
g o
vers
eas
inve
stm
ents
of
the
Schem
e.
#5
.34
% a
s on 3
0th
August
20
22
Snap
shot
of
Hyb
rid
Fund
s &
Solu
tion O
riente
d F
und
s
Fu
nd
Deta
ils a
s o
n31
Au
gu
st
2022
Schem
eSB
I R
etir
emen
t Ben
efit
Fund
–A
ggre
ssiv
eH
ybri
d P
lan
Idea
l In
ves
tmen
t H
ori
zon
5ye
ars
+5
year
s+
5ye
ars
+5
year
s+
Ince
pti
on D
ate
10/0
2/2
021
10/0
2/2
021
10/0
2/2
021
10/0
2/2
021
Fund
Manager
Mr.
Din
esh A
huja
and M
r. A
rdhen
du
Bhat
tach
arya
(C
o-f
und m
anag
er)
(Deb
tport
ion)
along w
ith M
r. R
ohit
Shim
pi (E
quit
yport
ion);
Mr.
Mohit
Jai
n -
Ove
rsea
sIn
vest
men
ts
Mr.
Din
esh A
huja
and M
r. A
rdhen
du
Bhat
tach
arya
(C
o-f
und m
anag
er)
(Deb
t port
ion)
along w
ith M
r. R
ohit
Shim
pi (E
quit
y port
ion);
Mr.
Mohit
Jai
n -
Ove
rsea
s In
vest
men
ts
Mr.
Din
esh A
huja
and M
r. A
rdhen
du
Bhat
tach
arya
(C
o-f
und m
anag
er)
(Deb
tport
ion)
along w
ith M
r. R
ohit
Shim
pi (E
quit
yport
ion);
Mr.
Mohit
Jai
n -
Ove
rsea
sIn
vest
men
ts
Mr.
Din
esh A
huja
and M
r. A
rdhen
du
Bhat
tach
arya
(C
o-f
und m
anag
er)
(Deb
tport
ion)
along w
ith M
r. R
ohit
Shim
pi (E
quit
yport
ion);
Mr.
Mohit
Jai
n -
Ove
rsea
sIn
vest
men
ts
Managin
g S
ince
Din
esh : F
eb -
2021 A
rdhen
du: Ju
ne
- 2021
Rohit
: O
ct -
2021
Din
esh : F
eb -
2021 A
rdhen
du: Ju
ne
- 2021
Rohit
: O
ct -
2021
Din
esh : F
eb -
2021 A
rdhen
du: Ju
ne
- 2021
Rohit
: O
ct -
2021
Din
esh : F
eb -
2021 A
rdhen
du: Ju
ne
- 2021
Rohit
: O
ct -
2021
Firs
t T
ier
Ben
chm
ark
S&P
BSE
500 T
RI
CRIS
IL H
ybri
d 3
5+65 -
Aggre
ssiv
e In
dex
CRIS
IL H
ybri
d 6
5+35 -
Conse
rvat
ive
Index
SBI
Ret
irem
ent
Ben
efit
Fund
–A
ggre
ssiv
e Pla
n
Month
End
AU
M (
Rs.
in C
rore
s)`949.7
2`736.0
1`195.6
3`148.4
9
Stand
ard
Dev
iati
on
#
Bet
a#
Sharp
e R
ati
o#
Exp
ense
Rati
oReg
ula
r-2.2
2%
Dir
ect-
1.0
3%
Reg
ula
r- 2
.35%
Dir
ect-
1.2
6%
Reg
ula
r- 1
.66%
Dir
ect-
1.1
2%
Reg
ula
r- 1
.37%
Dir
ect-
0.8
9%
2.8
3
3.1
8
2.9
3
6.8
4
- - -
- - -
- - -
- - -
2.7
7
3.1
6
2.8
7
6.8
6
6.2
1
9.9
5
6.4
8
7.4
9
6.2
9
10.5
4
6.5
9
7.3
9
Exit
Load
Nil
Nil
Nil
Nil
Larg
e C
ap
Mid
Cap
Small C
ap
Uncl
ass
ifie
d
AA
, AA
+, A
AA
And
EQ
UIV
ALE
NT
Bel
ow
AA
Sover
eig
n
Bel
ow
A1
+, A
1+
Cash
, Cash
Eq
uiv
ale
nts
,D
eriv
ati
ves
and
Oth
ers
Oth
er
Deta
ils
Eq
uit
y Sh
are
s
Corp
ora
te D
ebt
Gilts
Money
Mark
et I
nst
rum
ents
Oth
er A
sset
s
93.9
5
-
1.5
0
-
4.5
5
74.9
2
-
11.3
3
-
13.7
5
38.1
3
17.6
0
31.1
6
-
13.1
1
18.8
8
27.9
1
41.0
3
-
12.1
8
56
.09
23
.51
14
.35
- - -
1.5
0
-
4.5
5
41
.98
19
.35
13
.59
- - -
12
.02
-
13
.06
21.9
4
9.5
4
6.6
5
-
17.6
0
-
36.2
7
-
8.0
0
10
.89
4.7
8
3.2
1
-
27
.91
-
43
.33
-
9.8
8
Mod
ifie
d D
ura
tion (
Aver
age
Matu
rity
Maca
ula
y D
ura
tion (
years
)
Yie
ld t
o M
atu
rity
(%
)years
)
(yea
rs)
SBI
Ret
irem
ent
Ben
efit
Fund
–C
onse
rvati
ve
Hyb
rid
Pla
nSB
I R
etir
emen
t Ben
efit
Fund
–C
onse
rvati
ve
Pla
n
NIF
TY C
om
posi
te D
ebt
Index
Co
mp
osit
ion
by
Assets
as o
n31
Au
gu
st
2022
Co
mp
osit
ion
by R
ati
ng
s &
Assets
as o
n31
Au
gu
st
2022
35

36
HYBRID - AGGRESSIVEHYBRID FUND
Option NAV ( )`
NET ASSET VALUE
Record Date IDCW Nav ( )`(in /Unit)`
10-Feb-20 (Reg Plan) 0.97 31.847210-Feb-20 (Dir Plan) 1.43 46.812910-Feb-20 (Reg Plan) 0.97 31.943510-Feb-20 (Dir Plan) 1.43 48.953107-Feb-19 (Reg Plan) 0.20 27.755107-Feb-19 (Dir Plan) 0.30 40.538328-Sep-18 (Reg Plan) 0.29 27.346828-Sep-18 (Dir Plan) 0.42 39.8354
LAST IDCW
•
•
Long term capital appreciation.Investments primarily in equity and equity relatedinstruments, with exposure in debt and money market instruments.
SBI Equity Hybrid FundThis product is suitable for investors who are seeking^:
Face value: 10`
Investment Objective
Quantitative Data
To provide investors long-term capitalappreciation along with the liquidity of anopen-ended scheme by investing in a mixof debt and equity. However, there can beno assurance that the investmentobjective of the scheme will be achieved.Please check investment objective for allschemes
Fund Details
Standard Deviation :Beta :Sharpe Ratio :
Yield to Maturity :Portfolio Turnover*
#
#
#
16.04%1.070.665.56
years7.28%
Equity Turnover : 2.32Total Turnover : 13.03
Modified Duration :Average Maturity :Macaulay Duration :
years8.67 years5.79
*Total Turnover = Equity + Debt + DerivativesSource: CRISIL Fund Analyser Risk Free rate: FBIL Overnight Mibor
rate (5.34% as on 30th August 2022) Basis for Ratio Calculation: 3Years Monthly Data Points
#
PORTFOLIO
PORTFOLIO CLASSIFICATION BYASSET CLASS / RATING CLASS (%)
Pursuant to payment of IDCW, the NAV of IDCW Option of scheme/planswould fall to the extent of payout and statutory levy, if applicable.
•
•
•
•
•
•
•
•
•
•
•
•
•
•
Type of Scheme
Date of Allotment:Report As On:AAUM for the August 2022
AUM as on August 31, 2022
Fund Managers:Mr. R. Srinivasan -EquityMr. Dinesh Ahuja -Debt*Mr. Mohit Jain -Managing Since:
Total Experience:Mr. R. Srinivasan -Mr. Dinesh Ahuja -Mr. Mohit Jain -First Tier Benchmark:
Exit Load:
Entry Load:Plans Available:Options:SIP
Minimum Investment
Additional Investment
An open-ended Hybrid Scheme investingpredominantly in equity and equity relatedinstruments.
09/10/199531/08/2022
54,370.10 Crores
55,274.26 Crores
Mr. R. Srinivasan Jan-2012Mr. Dinesh Ahuja Jan-2012Mohit Jain Nov-2017
Over 30 yearsOver 24 years
Over 10 yearsCRISIL Hybrid 35+65 -
Aggressive Index
For exit within 12 months from the date ofallotment:For 10% of investment - NilFor remaining investments - 1.00%;For exit after 12 months from the date ofallotment - Nil.
N.A.Regular, Direct
Growth, IDCW
‘Any Day SIP’ Facility is available for Monthly,Quarterly, Semi-Annual and Annual frequenciesthrough electronic mode like OTM / DebitMandate. Default SIP date will be 10th. In case theSIP due date is a Non Business Day, then theimmediate following Business Day will beconsidered for SIP processing.Daily - Minimum 500 & in multiples of 1thereafter for a minimum of 12 instalments.(Kindly refer notice cum addendum dated June02, 2020 for further details)Weekly - Minimum 1000 & in multiples of 1thereafter for a minimum of 6 instalments. (or)Minimum 500 & in multiples of 1 thereafter for aminimum of 12 instalments.Monthly - Minimum 1000 & in multiples of 1thereafter for minimum six months (or) minimum
500 & in multiples of 1 thereafter forminimum one yearQuarterly - Minimum 1500 & in multiples of 1thereafter for minimum one year.Semi Annual - Minimum 3000 & in multiples of
1 thereafter for a minimum of 4 installments.Annual - Minimum 5000 & in multiples of 1thereafter for a minimum of 4 installments.
1000 & in multiples of 1
1000 & in multiples of 1
Month of`
`
` `
` `
` `
` `
``
` `
` `
` `
PORTFOLIO CLASSIFICATION BYINDUSTRY ALLOCATION (%)
^Investors should consult their financial advisers if indoubt about whether the product is suitable for them.
(Previously known as SBI Magnum Balanced Fund)
Large Cap Midcap Small Cap A1+
Below AA AA+ AAAAA and Equivalent Sovereign
Reg-Plan-IDCW 43.6790
Reg-Plan-Growth 206.1267
Dir-Plan-IDCW 65.3443
Dir-Plan-Growth 223.3071
Financial Services 27.36Sovereign 17.61Healthcare 7.43Automobile And Auto Components 4.40Consumer Services 4.04Services 3.88Chemicals 3.80Oil, Gas & Consumable Fuels 3.79Information Technology 3.78Metals & Mining 3.28Construction 2.79Telecommunication 2.57Construction Materials 1.83Capital Goods 1.48Textiles 1.18Power 0.81Fast Moving Consumer Goods 0.68Consumer Durables 0.46Derivatives 0.16Cash, Cash Equivalents And Others 8.67
Investors understand that their principal
will be at Very High risk
*Mr. Mohit Jain is the dedicated fund manager for managing overseas investments of the Scheme.
50.26
13.78
2.163.41
0.761.701.00
17.61
0.490.16 8.67
Cash, Cash Equivalents And Others Derivatives
Equity Shares
Commercial Papers
Certificate Of Deposits
Non Convertible Debentures
ICICI Bank Ltd. 6.43 - 6.43HDFC Bank Ltd. 4.03 - 4.03Infosys Ltd. 3.78 - 3.78Reliance Industries Ltd. 3.34 - 3.34Kotak Mahindra Bank Ltd. 3.04 - 3.04Bajaj Finance Ltd. 3.03 - 3.03MRF Ltd. 3.02 - 3.02Divi's Laboratories Ltd. 2.62 - 2.62State Bank Of India 2.60 - 2.60Bharti Airtel Ltd. 2.57 - 2.57Avenue Supermarts Ltd. 2.35 - 2.35Delhivery Ltd. 2.27 - 2.27Larsen & Toubro Ltd. 2.05 - 2.05Hindalco Industries Ltd. 1.91 - 1.91Solar Industries India Ltd. 1.85 - 1.85Cipla Ltd. 1.71 - 1.71Sun Pharmaceutical Industries Ltd. 1.62 - 1.62Max Healthcare Institute Ltd. 1.48 - 1.48AIA Engineering Ltd. 1.48 - 1.48Maruti Suzuki India Ltd. 1.38 - 1.38Tata Steel Ltd. 1.37 - 1.37Muthoot Finance Ltd. 1.34 - 1.34Shree Cement Ltd. 1.30 0.16 1.46ICICI Lombard General Insurance Company Ltd. 1.24 - 1.24Page Industries Ltd. 1.18 - 1.18SRF Ltd. 1.08 - 1.08Westlife Development Ltd. 0.86 - 0.86Vedant Fashions Ltd. 0.83 - 0.83Procter & Gamble Hygiene And Health Care Ltd. 0.68 - 0.68Life Insurance Corporation Of India 0.67 - 0.67The Ramco Cements Ltd. 0.53 - 0.53Chemplast Sanmar Ltd. 0.53 - 0.53Relaxo Footwears Ltd. 0.46 - 0.46Indian Oil Corporation Ltd. 0.45 - 0.45Sjvn Ltd. 0.43 - 0.43InterGlobe Aviation Ltd. 0.35 - 0.35Galaxy Surfactants Ltd. 0.34 - 0.34
L&T Metro Rail (Hyderabad) Ltd. CRISIL A1+ 0.27 - -
HDFC Bank Ltd. IND A1+ 0.22 - -
Mahindra & MahindraFinancial Services Ltd. IND AAA 0.79 - -Indian Bank
Total 66.20 0.16 66.36
Total 0.27 - -
Total 0.22 - -
(Tier Ii Bond Under Basel III) CRISIL AAA 0.73 - -LIC Housing Finance Ltd. CRISIL AAA 0.58 - -Union Bank Of India(At1 Bond Under Basel III) CRISIL AA 0.52 - -KNR Tirumala Infra Pvt. Ltd. CRISIL AAA 0.51 - -Tata Motors FinanceSolutions Ltd. CARE AA- 0.45 - -Tata International Ltd.(Perpetual Bond) CARE A+ 0.42 - -Manappuram Finance Ltd. CRISIL AA 0.39 - -Tata Power Company Ltd. IND AA 0.38 - -Cholamandalam Investment &Finance Co. Ltd. [ICRA]AA+ 0.36 - -L&T Metro Rail (Hyderabad) Ltd.[Guaranteed By Larsen &Toubro Limited] CRISIL AAA(CE) 0.35 - -Indian Bank(Tier Ii Bond Under Basel III) IND AA+ 0.26 - -Tata Realty AndInfrastructure Ltd. [ICRA]AA 0.23 - -Indinfravit Trust CRISIL AAA 0.22 - -Aadhar Housing Finance Ltd. CARE AA 0.18 - -Tata Capital HousingFinance Ltd. CRISIL AAA 0.15 - -Punjab National Bank(Tier II Bond Under Basel III) CRISIL AA+ 0.14 - -State Bank Of India(Tier II Bond Under Basel III) CRISIL AAA 0.04 - -Export-Import Bank Of India CRISIL AAA 0.04 - -
Tata Motor FinanceHoldings Ltd. [ICRA]AA- 0.13 - -
Government Of India SOVEREIGN 16.25 - -
State Government OfAndhra Pradesh SOVEREIGN 0.65 - -State Government OfWest Bengal SOVEREIGN 0.33 - -State Government Of Rajasthan SOVEREIGN 0.26 - -State Government Of Gujarat SOVEREIGN 0.06 - -State Government Of Haryana SOVEREIGN 0.05 - -State Government OfTamil Nadu SOVEREIGN 0.01 - -
Government Of India SOVEREIGN - - -
Total 6.74 - -
Total 0.13 - -
Total 16.25 - -
Total 1.36 - -
Zero Coupon Bonds
Government Securities
State Development Loans
Cash, Cash Equivalents And Others 8.67 - -Grand Total 100.00
Issuer Name Rating (%) Of Total % of AUM Derivatives Diff in % of AUM Issuer Name Rating (%) Of Total % of AUM Derivatives Diff in % of AUM

37
HYBRID - CONSERVATIVEHYBRID FUND
Option NAV ( )` Option NAV ( )`
NET ASSET VALUE
•
•
Regular income and capital growth.Investment primarily in Debt and Money marketinstruments and secondarily in equity and equity related instruments.
SBI Conservative Hybrid FundThis product is suitable for investors who are seeking^:
Investment Objective
Quantitative Data
To provide the investors an opportunityto invest primarily in Debt and Moneymarket instruments and secondarily inequity and equity related instruments.
Fund Details
Modified Duration :Average Maturity :Macaulay Duration :Yield to Maturity :
2.874.19 years3.01 years7.01%
years
PORTFOLIO CLASSIFICATION BYASSET CLASS / RATING CLASS (%)
•
•
•
•
•
•
•
•
•
•
•
•
•
•
•
Type of Scheme
Date of Allotment:Report As On:AAUM for the August 2022
AUM as on August 31, 2022
Fund Managers:Mr. Saurabh PantMs. Mansi SajejaMr. Mohit Jain
Managing Since:Mr. Saurabh PantMs. Mansi SajejaMr. Mohit Jain -Total ExperienceMr. Saurabh PantMs. Mansi SajejaMr. Mohit JainFirst Tier Benchmark:
Exit Load:
Entry Load:Plans Available:Options:SIP
Minimum Investment
Additional Investment
An open-ended Hybrid Scheme investingpredominantly in debt instruments.
09/04/200131/08/2022
6,437.48 Crores
6,561.42 Crores
- (Equity Portion)- (Debt Portion)
* - Investments in foreignsecurities portion
- January 2022- June 2021
January 2020
- Over 15 years- Over 16 years
- Over 10 years
NIFTY 50 Hybrid Composite Debt 15:85 IndexFor exit within 1 year from the date
of allotment For 10% of investment : NilFor remaining investment: 1.00%For exit after one year from the date ofallotment – Nil
N.A.Regular, Direct
Growth, IDCW
Any Day SIP’ Facility is available for Monthly,Quarterly, Semi-Annual and Annual frequenciesthrough electronic mode like OTM / DebitMandate. Default SIP date will be 10th. In casethe SIP due date is a Non Business Day, then theimmediate following Business Day will beconsidered for SIP processing.Daily - Minimum 500 & in multiples of 1thereafter for a minimum of 12 instalments.(Kindly refer notice cum addendum dated June02, 2020 for further details)Weekly - Minimum 1000 & in multiples of 1thereafter for a minimum of 6 instalments. (or)Minimum 500 & in multiples of 1 thereafter fora minimum of 12 instalments.Monthly - Minimum 1000 & in multiples of 1thereafter for minimum six months (or)minimum 500 & in multiples of 1 thereafterfor minimum one yearQuarterly - Minimum 1500 & in multiples of1 thereafter for minimum one year.Semi Annual - Minimum 3000 & in multiplesof 1 thereafter for a minimum of 4installments.Annual - Minimum 5000 & in multiples of 1thereafter for a minimum of 4 installments.
5,000 & in multiples of 1
1,000 & in multiples of 1
Month of`
`
` `
` `
` `
` `
`
`
` `
` `
` `
PORTFOLIO CLASSIFICATION BYINDUSTRY ALLOCATION (%)
PORTFOLIO
^Investors should consult their financial advisers if indoubt about whether the product is suitable for them.
(Previously known as SBI Debt Hybrid Fund)
AAA and Equivalent Sovereign Below AA AA AA+Cash, Cash Equivalents, And Others A1+
Reg-Plan-Growth 54.8306
Reg-Plan-Monthly IDCW 16.8424
Reg-Plan-Quarterly IDCW 15.8136
Reg-Plan-Annual IDCW 19.3406
Dir-Plan-Growth 59.0461
Dir-Plan-Monthly IDCW 21.6143
Dir-Plan-Quarterly IDCW 18.0410
Dir-Plan-Annual IDCW 23.5466
Sovereign 34.53Financial Services 23.39Services 6.91Consumer Durables 4.25Telecommunication 3.98Automobile And Auto Components 3.46Construction 2.69Power 2.25Information Technology 2.01Consumer Services 1.66Capital Goods 1.62Textiles 1.24Fast Moving Consumer Goods 1.07Chemicals 0.67Construction Materials 0.58Healthcare 0.54Derivatives -0.70Cash, Cash Equivalents And Others 9.85
Investors understand that their principal
will be at Moderately High risk
*Mr. Mohit Jain is the dedicated fund manager for managing overseas investments of the Scheme.
Equity Shares
Commercial Papers
Non Convertible Debentures
Infosys Ltd. 1.68 - 1.68
ICICI Bank Ltd. 1.49 - 1.49
Vedant Fashions Ltd. 1.28 - 1.28
Page Industries Ltd. 1.24 - 1.24
Bharti Airtel Ltd. 1.02 - 1.02
Procter & Gamble Hygiene And Health Care Ltd. 0.85 - 0.85
TVS Motor Company Ltd. 0.84 - 0.84
Sona Blw Precision Forgings Ltd. 0.71 - 0.71
Axis Bank Ltd. 0.71 - 0.71
ZF Commercial Vehicle Control SystemsIndia Ltd. 0.69 - 0.69
Maruti Suzuki India Ltd. 0.69 -0.70 -0.01
Carborundum Universal Ltd. 0.67 - 0.67
Bandhan Bank Ltd. 0.64 - 0.64
HDFC Bank Ltd. 0.59 - 0.59
JK Cement Ltd. 0.58 - 0.58
Sheela Foam Ltd. 0.57 - 0.57
ICICI Lombard General Insurance Company Ltd. 0.55 - 0.55
Max Healthcare Institute Ltd. 0.54 - 0.54
Apollo Tyres Ltd. 0.53 - 0.53
Blue Star Ltd. 0.50 - 0.50
Aether Industries Ltd. 0.50 - 0.50
V-Guard Industries Ltd. 0.48 - 0.48
SBI Life Insurance Company Ltd. 0.47 - 0.47
Kalpataru Power Transmission Ltd. 0.44 - 0.44
Thangamayil Jewellery Ltd. 0.43 - 0.43
Tega Industries Ltd. 0.42 - 0.42
Container Corporation Of India Ltd. 0.40 - 0.40
State Bank Of India 0.38 - 0.38
Lemon Tree Hotels Ltd. 0.38 - 0.38
Tech Mahindra Ltd. 0.33 - 0.33
Ge T&D India Ltd. 0.33 - 0.33
Avanti Feeds Ltd. 0.22 - 0.22
ESAB India Ltd. 0.20 - 0.20
Chemplast Sanmar Ltd. 0.17 - 0.17
L&T Metro Rail (Hyderabad) Ltd. CRISIL A1+ 2.28 - -
Tata Motors Finance Ltd. CRISIL A1+ 1.10 - -
NABHA Power Ltd. CRISIL A1+ 0.76 - -
Crompton Greaves ConsumerElectricals Ltd. CRISIL A1+ 0.74 - -
HDFC Ltd. CRISIL AAA 3.22 - -
Muthoot Finance Ltd. CRISIL AA+ 2.81 - -
Total 21.52 -0.70 20.82
Total 4.88 - -
L&T Metro Rail (Hyderabad) Ltd.[Guaranteed By Larsen &Toubro Limited] CRISIL AAA(CE) 2.59 - -
Union Bank Of India(At1 Bond Under Basel III) CRISIL AA 2.30 - -
Punjab National Bank(At1 Bond Under Basel III) CRISIL AA 2.30 - -
Power Finance Corporation Ltd. CRISIL AAA 2.23 - -
Summit Digitel InfrastructurePvt. Ltd. CRISIL AAA 2.21 - -
Tata Capital HousingFinance Ltd. CRISIL AAA 2.16 - -
KNR Tirumala Infra Pvt. Ltd. CRISIL AAA 1.87 - -
Indinfravit Trust CRISIL AAA 1.64 - -
Crompton GreavesConsumer Electricals Ltd. CRISIL AA+ 1.53 - -
India Grid Trust [ICRA]AAA 1.49 - -
Mahindra Rural HousingFinance Ltd. IND AA+ 0.99 - -
Bharti Hexacom Ltd. CRISIL AA+ 0.75 - -
Manappuram Finance Ltd. CRISIL AA 0.46 - -
Tata Realty AndInfrastructure Ltd. [ICRA]AA 0.38 - -
Bajaj Housing Finance Ltd. CRISIL AAA 0.37 - -
Tata Motor FinanceHoldings Ltd. [ICRA]AA- 0.62 - -
Government Of India SOVEREIGN 17.86 - -
State Government OfMaharashtra SOVEREIGN 6.04 - -
State Government Of Karnataka SOVEREIGN 2.56 - -
State Government Of Gujarat SOVEREIGN 1.90 - -
State Government OfAndhra Pradesh SOVEREIGN 1.58 - -
State Government Of Bihar SOVEREIGN 0.87 - -
State Government Of Rajasthan SOVEREIGN 0.79 - -
State Government Of Haryana SOVEREIGN 0.79 - -
State Government OfMadhya Pradesh SOVEREIGN 0.76 - -
State Government Of Kerala SOVEREIGN 0.75 - -
State Government Of Jharkhand SOVEREIGN 0.63 - -
Total 29.30 - -
Total 0.62 - -
Total 17.86 - -
Total 16.67 - -
Zero Coupon Bonds
Government Securities
State Development Loans
Cash, Cash Equivalents And Others 9.85 - -
Grand Total 100.00
Issuer Name Rating (%) Of Total % of AUM Derivatives Diff in % of AUM Issuer Name Rating (%) Of Total % of AUM Derivatives Diff in % of AUM
Large Cap Midcap Small Cap Derivatives
8.55
6.44
6.53
17.78
6.085.440.62
34.53
4.88-0.70
9.85

38
HYBRID - MULTI ASSETALLOCATION FUND
Option NAV ( )` Option NAV ( )`
NET ASSET VALUE
•
•
Long term capital growth with potential for regular incomeInvestment in a diversified portfolio of equity, fixed income andgold and gold related instruments including domestic and overseasETFs; with a minimum allocation of 10% in each of the asset class andunits of REITs and InvITs with an allocation of up to 10%.
SBI Multi Asset Allocation FundThis product is suitable for investors who are seeking^:
Investment Objective
To provide the investors an opportunityto invest in an actively managed portfolioof multiple asset classes.
Fund Details
PORTFOLIO CLASSIFICATION BYASSET CLASS / RATING CLASS (%)
PORTFOLIO CLASSIFICATION BYINDUSTRY ALLOCATION (%)
PORTFOLIO
^Investors should consult their financial advisers if indoubt about whether the product is suitable for them.
(Previously known as SBI Magnum MonthlyIncome Plan - Floater)
Cash, Cash Equivalents, Derivative Margin And Others
Small CapLarge Cap Midcap
Sovereign DerivativesOverseas ETF ETF
Reg-Plan-Growth 38.4726
Reg-Plan-Monthly IDCW 17.2027
Reg-Plan-Quarterly IDCW 17.1862
Reg-Plan-Annual IDCW 21.7519
Dir-Plan-Growth 41.5638
Dir-Plan-Monthly IDCW 18.6636
Dir-Plan-Quarterly IDCW 19.7425
Dir-Plan-Annual IDCW 23.6814
Sovereign 24.11Financial Services 10.65Exchange Traded Funds 10.10Fast Moving Consumer Goods 4.99Capital Goods 4.46Healthcare 4.40Oil, Gas & Consumable Fuels 4.35Metals & Mining 3.38Consumer Durables 2.97Construction Materials 2.81Power 2.77Chemicals 2.35Realty 2.27Consumer Services 1.86Mutual Fund 1.56Textiles 0.72Services 0.34Information Technology 0.33Telecommunication 0.28Automobile And Auto Components 0.26Derivatives -2.09Cash, Cash Equivalents And Others 17.13
•
•
•
•
•
•
•
•
•
•
•
•
•
•
Type of Scheme
Date of Allotment:
Report As On:
AAUM for the August 2022
AUM as on August 31, 2022
Fund Manager: Mr. Dinesh Balachandran &Mr. Raj Gandhi (for ETCDs) & *Mr. Mohit JainManaging Since:Mr. Dinesh BalachandranMr. Raj GandhiMr. Mohit JainTotal Experience:Mr. Dinesh BalachandranMr. Raj GandhiMr. Mohit Jain -
First Tier Benchmark:
Exit Load:
Entry Load:
Plans Available:
Options:
SIP
Minimum Investment
Additional Investment
An open-ended Scheme investing in equity, debtand gold and gold related instruments includingETFs and such other asset classes as SEBI mayprescribe from time to time.
21/12/2005
31/08/2022
581.77 Crores
528.91 Crores
- Oct 2021- Feb 27, 2020
- Nov 2017
– over 21 years- over 17 years
Over 8 Years
45% CRISIL 10 year Gilt Index +40%NIFTY 50TRI+15% Price of Gold
For exit within 12 months from thedate of allotmentFor 10% of investments : NilFor remaining investment: 1.00%For exit after 12 months from the date ofallotment – Nil
N.A.
Regular, Direct
Growth, IDCW
Any Day SIP’ Facility is available for Monthly,Quarterly, Semi-Annual and Annual frequenciesthrough electronic mode like OTM / DebitMandate. Default SIP date will be 10th. In casethe SIP due date is a Non Business Day, then theimmediate following Business Day will beconsidered for SIP processing.Daily - Minimum 500 & in multiples of 1thereafter for a minimum of 12 instalments.(Kindly refer notice cum addendum dated June02, 2020 for further details)Weekly - Minimum 1000 & in multiples of 1thereafter for a minimum of 6 instalments. (or)Minimum 500 & in multiples of 1 thereafter for aminimum of 12 instalments.Monthly - Minimum 1000 & in multiples of 1thereafter for minimum six months (or)minimum 500 & in multiples of 1 thereafterfor minimum one year.Quarterly - Minimum 1500 & in multiples of 1thereafter for minimum one year.
Semi Annual - Minimum 3000 & in
multiples of 1 thereafter for a minimumof 4installments.
Annual - Minimum 5000 & in multiples
of 1 thereafter for a minimum of 4
installments.
5,000 & in multiples of 1
1,000 & in multiples of 1
Month of`
`
` `
` `
` `
` `
` `
` ` *Mr. Mohit Jain is the dedicated fund manager for managing overseas investments of the Scheme.
18.99
12.14
18.06
10.101.56
24.11
-2.09
17.13
Equity Shares
GAIL (India) Ltd. 3.77 - 3.77
ICICI Bank Ltd. 3.02 - 3.02
CESC Ltd. 2.77 - 2.77
AIA Engineering Ltd. 2.59 - 2.59
Equitas Holdings Ltd. 2.55 - 2.55
Mrs. Bectors Food Specialities Ltd. 2.37 - 2.37
Aster Dm Healthcare Ltd. 2.35 - 2.35
ACC Ltd. 2.29 - 2.29
Dixon Technologies (India) Ltd. 2.09 -2.09 -
Hindustan Copper Ltd. 2.02 - 2.02
Ashiana Housing Ltd. 1.85 - 1.85
Manappuram Finance Ltd. 1.53 - 1.53
Rallis India Ltd. 1.20 - 1.20
Ingersoll Rand (India) Ltd. 1.01 - 1.01
Avenue Supermarts Ltd. 0.86 - 0.86
Vedanta Ltd. 0.73 - 0.73
Pidilite Industries Ltd. 0.72 - 0.72
Page Industries Ltd. 0.72 - 0.72
Apollo Hospitals Enterprise Ltd. 0.69 - 0.69
Godrej Consumer Products Ltd. 0.61 - 0.61
Havells India Ltd. 0.60 - 0.60
Info Edge (India) Ltd. 0.59 - 0.59
Dabur India Ltd. 0.57 - 0.57
Ambuja Cements Ltd. 0.52 - 0.52
ICICI Lombard General Insurance Company Ltd. 0.50 - 0.50
Cholamandalam Investment & Finance Co. Ltd. 0.50 - 0.50
Marico Ltd. 0.47 - 0.47
Siemens Ltd. 0.45 - 0.45
PI Industries Ltd. 0.43 - 0.43
United Spirits Ltd. 0.42 - 0.42
DLF Ltd. 0.42 - 0.42
Jubilant Foodworks Ltd. 0.41 - 0.41
ICICI Prudential Life Insurance Company Ltd. 0.41 - 0.41
Ge T&D India Ltd. 0.41 - 0.41
Colgate Palmolive (India) Ltd. 0.39 - 0.39
Bank Of Baroda 0.38 - 0.38
InterGlobe Aviation Ltd. 0.34 - 0.34
Bajaj Holdings & Investment Ltd. 0.34 - 0.34
Larsen & Toubro Infotech Ltd. 0.33 - 0.33
Hindustan Petroleum Corporation Ltd. 0.33 - 0.33
Bandhan Bank Ltd. 0.33 - 0.33
Lupin Ltd. 0.28 - 0.28
Indus Towers Ltd. 0.28 - 0.28
Berger Paints India Ltd. 0.28 - 0.28
Jindal Steel & Power Ltd. 0.27 - 0.27
Aurobindo Pharma Ltd. 0.27 - 0.27
Yes Bank Ltd. 0.26 - 0.26
Torrent Pharmaceuticals Ltd. 0.26 - 0.26
SBI Cards & Payment Services Ltd. 0.26 - 0.26
Bosch Ltd. 0.26 - 0.26
Indraprastha Gas Ltd. 0.25 - 0.25
Biocon Ltd. 0.24 - 0.24
Muthoot Finance Ltd. 0.20 - 0.20
HDFC Asset Management Company Ltd. 0.20 - 0.20
Steel Authority Of India Ltd. 0.18 - 0.18
NMDC Ltd. 0.18 - 0.18
Zydus Lifesciences Ltd. 0.17 - 0.17
Punjab National Bank 0.17 - 0.17
Procter & Gamble Hygiene And Health Care Ltd. 0.16 - 0.16
Gland Pharma Ltd. 0.14 - 0.14
SPDR Gold Trust 1.56 - -
Government Of India SOVEREIGN 24.11 - -
SBI Gold ETF 10.10 - -
Total 49.19 -2.09 47.10
Total 1.56 - -
Total 24.11 - -
Total 10.10 - -
Overseas ETF
Government Securities
Exchange Traded Funds
Cash, Cash Equivalents And Others 17.13 - -
Grand Total 100.00
Issuer Name Rating (%) Of Total % of AUM Derivatives Diff in % of AUM Issuer Name Rating (%) Of Total % of AUM Derivatives Diff in % of AUM
Investors understand that their principal
will be at Very High risk

39
SOLUTIONS ORIENTEDSCHEME-CHILDREN’SFUND
Option NAV ( )`
NET ASSET VALUE
Investment Objective
Quantitative Data
To provide the investors an opportunity to earnregular income predominantly throughinvestment in debt and money marketinstruments and capital appreciation throughan actively managed equity portfolio.
Fund Details
Modified Duration :Average Maturity :Macaulay Duration :Yield to Maturity :
1.431.65 years1.49 years6.49%
years
PORTFOLIO CLASSIFICATION BYASSET CLASS / RATING CLASS (%)
•
•
•
•
•
•
•
•
•
•
•
•
•
•
Type of Scheme
Date of Allotment:Report As On:AAUM for the August 2022
AUM as on August 31, 2022
Fund Manager:Mr. R Srinivasan - EquityMr. Rajeev Radhakrishnan - DebtMr. Mohit Jain - Foreign Securities Portion
Managing since:Mr. R SrinivasanMr. Rajeev RadhakrishnanMr. Mohit JainTotal Experience:Mr. R SrinivasanMr. Rajeev RadhakrishnanMr. Mohit JainFirst Tier Benchmark:
Exit Load:
Entry Load:Plans Available:Options:SIP
Minimum Investment
Additional Investment
An open-ended fund for investment for childrenhaving a lock-in for at least 5 years or till the childattains age of majority (whichever is earlier).
21/02/200231/08/2022
87.90 Crores
88.09 Crores
*
January 13, 2021Jun-2008
Nov-2017
-Over 30 years-Over 21 years
-Over 10 Years
NIFTY 50 Hybrid Composite Debt 15:85 Index
With respect to units not subject to lock-in periodand the holding period is less than 3 years: 3% forredemption/switch out before 1 year from the dateof allotment; 2% for redemption/switch out after 1year and up to 2 years from the date of allotment;1% for redemption/switch out after 2 years and upto 3 years from the date of allotment; Nil forredemption or switch-out after 3 years from thedate of allotment
N.ARegular, Direct
Growth,
Any Day SIP’ Facility is available for Monthly,Quarterly, Semi-Annual and Annual frequenciesthrough electronic mode like OTM / Debit Mandate.Default SIP date will be 10th. In case the SIP duedate is a Non Business Day, then the immediatefollowing Business Day will be considered for SIPprocessing.Daily - Minimum 500 & in multiples of 1 thereafterfor a minimum of 12 instalments. (Kindly refernotice cum addendum dated June 02, 2020 forfurther details)Weekly - Minimum 1000 & in multiples of 1thereafter for a minimum of 6 instalments. (or)Minimum 500 & in multiples of 1 thereafter for aminimum of 12 instalments.Monthly - Minimum 1000 & in multiples of 1thereafter for minimum six months (or) minimum500 & in multiples of 1 thereafter for minimumone yearQuarterly - Minimum 1500 & in multiples of 1thereafter for minimum one year.Semi Annual - Minimum 3000 & in multiples of 1thereafter for a minimum of 4 installments.Annual - Minimum 5000 & in multiples of 1thereafter for a minimum of 4 installments.
5,000 & in multiples of 1
1,000 & in multiples of 1
Month of`
`
` `
` `
`
`
` `
` `
` `
` `
` `
PORTFOLIO CLASSIFICATION BYINDUSTRY ALLOCATION (%)
PORTFOLIO
Equity Shares
Garware Technical Fibres Ltd. 1.46
Gokaldas Exports Ltd. 1.44
Hawkins Cookers Ltd. 1.39
Vedant Fashions Ltd. 1.32
Muthoot Finance Ltd. 1.32
Bajaj Finance Ltd. 1.24
JMC Projects (India) Ltd. 1.21
Go Fashion (India) Ltd. 1.19
Max Healthcare Institute Ltd. 1.10
Aether Industries Ltd. 1.08
ICICI Lombard General Insurance Company Ltd. 1.02
Dodla Dairy Ltd. 0.99
Hatsun Agro Product Ltd. 0.90
Delhivery Ltd. 0.84
Rossari Biotech Ltd. 0.78
G R Infra Projects Ltd. 0.77
K.P.R. Mill Ltd. 0.75
CSB Bank Ltd. 0.72
Divi's Laboratories Ltd. 0.70
Thangamayil Jewellery Ltd. 0.64
Total 20.86
Issuer Name Rating (%) Of TotalAUM
Issuer Name Rating (%) Of TotalAUM
Foreign Equity Shares
Non Convertible Debentures
Government Securities
State Development Loans
Alphabet Inc. 1.29
Indinfravit Trust CRISIL AAA 3.88
DBL Mangloor HighwaysPvt. Ltd. IND AAA 3.34
Indian Bank(Tier II Bond Under Basel III) IND AA+ 2.35
Tata Power Company Ltd. IND AA 2.29
Government Of India SOVEREIGN 5.23
State Government OfMadhya Pradesh SOVEREIGN 16.94
State Government OfUttar Pradesh SOVEREIGN 11.64
Government Of India SOVEREIGN 3.15
Total 1.29
Total 11.86
Total 5.23
Total 28.58
Total 3.15
Strips
Cash, Cash Equivalents And Others 29.03
Grand Total 100.00
(Previously known as SBI Magnum Children'sBenefit Fund)
•
•
Regular income and capital appreciation.Investment primarily in debt and money market instruments andsecondarily in actively managed equity and equity related instruments.
SBI Magnum Children's Benefit Fund - Savings PlanThis product is suitable for investors who are seeking^:
^Investors should consult their financial advisers if indoubt about whether the product is suitable for them.
Reg-Plan-Growth 77.0707
Dir-Plan-Growth 83.1748
Sovereign 36.96Services 8.06Financial Services 6.65Textiles 3.65Consumer Services 2.51Power 2.29Consumer Durables 2.03Construction 1.98Fast Moving Consumer Goods 1.89Chemicals 1.86Healthcare 1.80Information Technology 1.29Cash, Cash Equivalents And Others 29.03
Cash, Cash Equivalents, And Others
AAA and Equivalent AA+AASovereign
Large Cap Midcap Small Cap
Investors understand that their principal
will be at Moderately High risk
*Mr. Mohit Jain is the dedicated fund manager for managing overseas investments of the Scheme.
Foreign Equity Shares
4.28 4.91
11.67
1.29
7.22
2.352.29
36.96
29.03
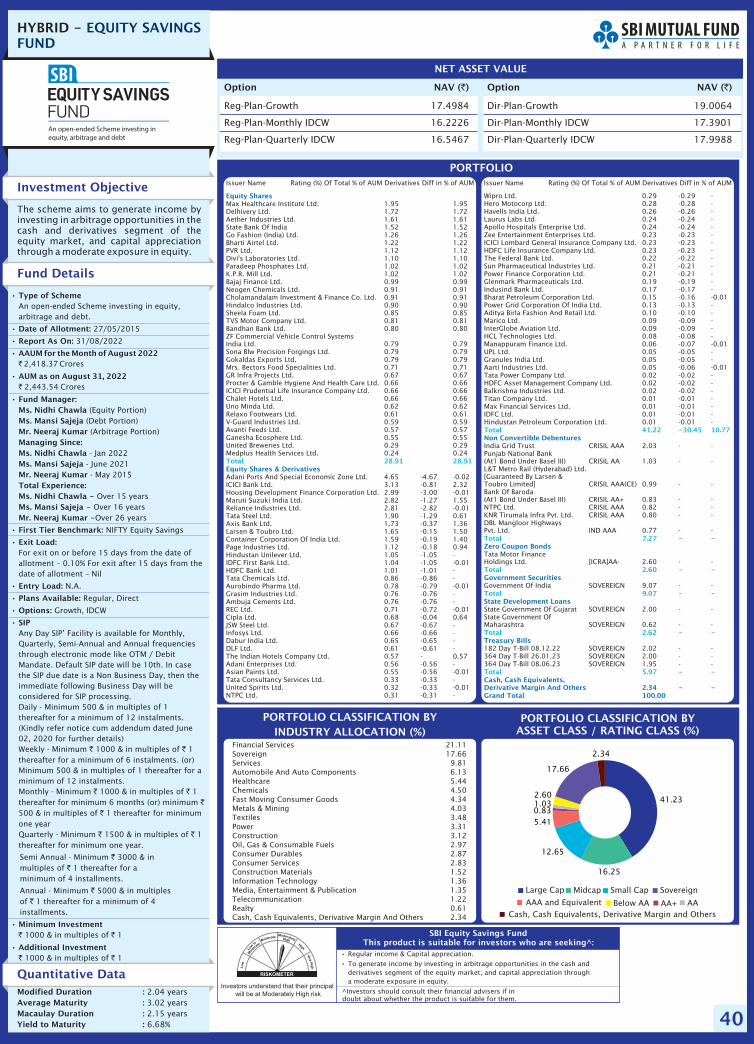
40
HYBRID - EQUITY SAVINGSFUND
•
•
Regular income & Capital appreciation.To generate income by investing in arbitrage opportunities in the cash andderivatives segment of the equity market, and capital appreciation througha moderate exposure in equity.
SBI Equity Savings FundThis product is suitable for investors who are seeking^:
Investment Objective
The scheme aims to generate income byinvesting in arbitrage opportunities in thecash and derivatives segment of theequity market, and capital appreciationthrough a moderate exposure in equity.
Fund Details
PORTFOLIO CLASSIFICATION BYASSET CLASS / RATING CLASS (%)
PORTFOLIO CLASSIFICATION BYINDUSTRY ALLOCATION (%)
PORTFOLIO
Option NAV ( )` Option NAV ( )`
NET ASSET VALUE
^Investors should consult their financial advisers if indoubt about whether the product is suitable for them.
Cash, Cash Equivalents, Derivative Margin and Others
Large Cap Midcap Small Cap Sovereign
Equity Shares
Equity Shares & Derivatives
Max Healthcare Institute Ltd. 1.95 1.95Delhivery Ltd. 1.72 1.72Aether Industries Ltd. 1.61 1.61State Bank Of India 1.52 1.52Go Fashion (India) Ltd. 1.26 1.26Bharti Airtel Ltd. 1.22 1.22PVR Ltd. 1.12 1.12Divi's Laboratories Ltd. 1.10 1.10Paradeep Phosphates Ltd. 1.02 1.02K.P.R. Mill Ltd. 1.02 1.02Bajaj Finance Ltd. 0.99 0.99Neogen Chemicals Ltd. 0.91 0.91Cholamandalam Investment & Finance Co. Ltd. 0.91 0.91Hindalco Industries Ltd. 0.90 0.90Sheela Foam Ltd. 0.85 0.85TVS Motor Company Ltd. 0.81 0.81Bandhan Bank Ltd. 0.80 0.80ZF Commercial Vehicle Control SystemsIndia Ltd. 0.79 0.79Sona Blw Precision Forgings Ltd. 0.79 0.79Gokaldas Exports Ltd. 0.79 0.79Mrs. Bectors Food Specialities Ltd. 0.71 0.71GR Infra Projects Ltd. 0.67 0.67Procter & Gamble Hygiene And Health Care Ltd. 0.66 0.66ICICI Prudential Life Insurance Company Ltd. 0.66 0.66Chalet Hotels Ltd. 0.66 0.66Uno Minda Ltd. 0.62 0.62Relaxo Footwears Ltd. 0.61 0.61V-Guard Industries Ltd. 0.59 0.59Avanti Feeds Ltd. 0.57 0.57Ganesha Ecosphere Ltd. 0.55 0.55United Breweries Ltd. 0.29 0.29Medplus Health Services Ltd. 0.24 0.24
Adani Ports And Special Economic Zone Ltd. 4.65 -4.67 -0.02ICICI Bank Ltd. 3.13 -0.81 2.32Housing Development Finance Corporation Ltd. 2.99 -3.00 -0.01Maruti Suzuki India Ltd. 2.82 -1.27 1.55Reliance Industries Ltd. 2.81 -2.82 -0.01Tata Steel Ltd. 1.90 -1.29 0.61Axis Bank Ltd. 1.73 -0.37 1.36Larsen & Toubro Ltd. 1.65 -0.15 1.50Container Corporation Of India Ltd. 1.59 -0.19 1.40Page Industries Ltd. 1.12 -0.18 0.94Hindustan Unilever Ltd. 1.05 -1.05 -IDFC First Bank Ltd. 1.04 -1.05 -0.01HDFC Bank Ltd. 1.01 -1.01 -Tata Chemicals Ltd. 0.86 -0.86 -Aurobindo Pharma Ltd. 0.78 -0.79 -0.01Grasim Industries Ltd. 0.76 -0.76 -Ambuja Cements Ltd. 0.76 -0.76 -REC Ltd. 0.71 -0.72 -0.01Cipla Ltd. 0.68 -0.04 0.64JSW Steel Ltd. 0.67 -0.67 -Infosys Ltd. 0.66 -0.66 -Dabur India Ltd. 0.65 -0.65 -DLF Ltd. 0.61 -0.61 -The Indian Hotels Company Ltd. 0.57 - 0.57Adani Enterprises Ltd. 0.56 -0.56 -Asian Paints Ltd. 0.55 -0.56 -0.01Tata Consultancy Services Ltd. 0.33 -0.33 -United Spirits Ltd. 0.32 -0.33 -0.01NTPC Ltd. 0.31 -0.31 -
Total 28.91 28.91
Wipro Ltd. 0.29 -0.29 -Hero Motocorp Ltd. 0.28 -0.28 -Havells India Ltd. 0.26 -0.26 -Laurus Labs Ltd. 0.24 -0.24 -Apollo Hospitals Enterprise Ltd. 0.24 -0.24 -Zee Entertainment Enterprises Ltd. 0.23 -0.23 -ICICI Lombard General Insurance Company Ltd. 0.23 -0.23 -HDFC Life Insurance Company Ltd. 0.23 -0.23 -The Federal Bank Ltd. 0.22 -0.22 -Sun Pharmaceutical Industries Ltd. 0.21 -0.21 -Power Finance Corporation Ltd. 0.21 -0.21 -Glenmark Pharmaceuticals Ltd. 0.19 -0.19 -Indusind Bank Ltd. 0.17 -0.17 -Bharat Petroleum Corporation Ltd. 0.15 -0.16 -0.01Power Grid Corporation Of India Ltd. 0.13 -0.13 -Aditya Birla Fashion And Retail Ltd. 0.10 -0.10 -Marico Ltd. 0.09 -0.09 -InterGlobe Aviation Ltd. 0.09 -0.09 -HCL Technologies Ltd. 0.08 -0.08 -Manappuram Finance Ltd. 0.06 -0.07 -0.01UPL Ltd. 0.05 -0.05 -Granules India Ltd. 0.05 -0.05 -Aarti Industries Ltd. 0.05 -0.06 -0.01Tata Power Company Ltd. 0.02 -0.02 -HDFC Asset Management Company Ltd. 0.02 -0.02 -Balkrishna Industries Ltd. 0.02 -0.02 -Titan Company Ltd. 0.01 -0.01 -Max Financial Services Ltd. 0.01 -0.01 -IDFC Ltd. 0.01 -0.01 -Hindustan Petroleum Corporation Ltd. 0.01 -0.01 -
India Grid Trust CRISIL AAA 2.03 - -Punjab National Bank(At1 Bond Under Basel III) CRISIL AA 1.03 - -L&T Metro Rail (Hyderabad) Ltd.[Guaranteed By Larsen &Toubro Limited] CRISIL AAA(CE) 0.99 - -Bank Of Baroda(At1 Bond Under Basel III) CRISIL AA+ 0.83 - -NTPC Ltd. CRISIL AAA 0.82 - -KNR Tirumala Infra Pvt. Ltd. CRISIL AAA 0.80 - -DBL Mangloor HighwaysPvt. Ltd. IND AAA 0.77 - -
Tata Motor FinanceHoldings Ltd. [ICRA]AA- 2.60 - -
Government Of India SOVEREIGN 9.07 - -
State Government Of Gujarat SOVEREIGN 2.00 - -State Government OfMaharashtra SOVEREIGN 0.62 - -
182 Day T-Bill 08.12.22 SOVEREIGN 2.02 - -364 Day T-Bill 26.01.23 SOVEREIGN 2.00 - -364 Day T-Bill 08.06.23 SOVEREIGN 1.95 - -
Total 41.22 -30.45 10.77
Total 7.27 - -
Total 2.60 - -
Total 9.07 - -
Total 2.62 - -
Total 5.97 - -
Non Convertible Debentures
Zero Coupon Bonds
Government Securities
State Development Loans
Treasury Bills
Cash, Cash Equivalents,Derivative Margin And Others 2.34 - -Grand Total 100.00
Issuer Name Rating (%) Of Total % of AUM Derivatives Diff in % of AUM Issuer Name Rating (%) Of Total % of AUM Derivatives Diff in % of AUM
Financial Services 21.11Sovereign 17.66Services 9.81Automobile And Auto Components 6.13Healthcare 5.44Chemicals 4.50Fast Moving Consumer Goods 4.34Metals & Mining 4.03Textiles 3.48Power 3.31Construction 3.12Oil, Gas & Consumable Fuels 2.97Consumer Durables 2.87Consumer Services 2.83Construction Materials 1.52Information Technology 1.36Media, Entertainment & Publication 1.35Telecommunication 1.22Realty 0.61Cash, Cash Equivalents, Derivative Margin And Others 2.34
Reg-Plan-Growth 17.4984
Reg-Plan-Monthly IDCW 16.2226
Reg-Plan-Quarterly IDCW 16.5467
Dir-Plan-Growth 19.0064
Dir-Plan-Monthly IDCW 17.3901
Dir-Plan-Quarterly IDCW 17.9988
Quantitative DataModified Duration :Average Maturity :Macaulay Duration :Yield to Maturity :
2.043.02 years2.15 years6.68%
years
•
•
•
•
•
•
•
•
•
•
•
•
•
•
Type of Scheme
Date of Allotment:
Report As On:
AAUM for the August 2022
AUM as on August 31, 2022
Fund Manager:Ms. Nidhi ChawlaMs. Mansi SajejaMr. Neeraj KumarManaging Since:Ms. Nidhi ChawlaMs. Mansi SajejaMr. Neeraj KumarTotal Experience:Ms. Nidhi Chawla -Ms. Mansi Sajeja -Mr. Neeraj Kumar -
First Tier Benchmark:
Exit Load:
Entry Load:
Plans Available:
Options:
SIP
Minimum Investment
Additional Investment
An open-ended Scheme investing in equity,arbitrage and debt.
27/05/2015
31/08/2022
2,418.37 Crores
2,443.54 Crores
(Equity Portion)(Debt Portion)(Arbitrage Portion)
- Jan 2022- June 2021- May 2015
Over 15 yearsOver 16 yearsOver 26 years
NIFTY Equity Savings
For exit on or before 15 days from the date ofallotment – 0.10% For exit after 15 days from thedate of allotment – Nil
N.A.
Regular, Direct
Growth, IDCW
Any Day SIP’ Facility is available for Monthly,Quarterly, Semi-Annual and Annual frequenciesthrough electronic mode like OTM / DebitMandate. Default SIP date will be 10th. In casethe SIP due date is a Non Business Day, then theimmediate following Business Day will beconsidered for SIP processing.Daily - Minimum 500 & in multiples of 1thereafter for a minimum of 12 instalments.(Kindly refer notice cum addendum dated June02, 2020 for further details)Weekly - Minimum 1000 & in multiples of 1thereafter for a minimum of 6 instalments. (or)Minimum 500 & in multiples of 1 thereafter for aminimum of 12 instalments.Monthly - Minimum 1000 & in multiples of 1thereafter for minimum 6 months (or) minimum500 & in multiples of 1 thereafter for minimumone yearQuarterly - Minimum 1500 & in multiples of 1thereafter for minimum one year.
Semi Annual - Minimum 3000 & inmultiples of 1 thereafter for aminimum of 4 installments.
Annual - Minimum 5000 & in multiplesof 1 thereafter for a minimum of 4installments.
1000 & in multiples of 1
1000 & in multiples of 1
Month of`
`
` `
` `
`
`
` `
`
`
`
`
` `
` `
Investors understand that their principal
will be at Moderately High risk
AA+AAA and Equivalent Below AA AA
41.23
16.25
12.65
5.410.831.032.60
17.66
2.34

41
HYBRID - ARBITRAGE FUND
Option NAV ( )`
NET ASSET VALUE
Record Date IDCW NAV ( )`(in /Unit)`
LAST IDCW
•
•
Short term investment.Investments to exploit profitable arbitrage opportunities between the spot andderivative market segments to provide capital appreciation and regular income.
SBI Arbitrage Opportunities FundThis product is suitable for investors who are seeking^:
Face value: 10`
Investment Objective
Quantitative Data
To provide capital appreciation and regular incomefor unit holders by identifying profitable arbitrageopportunities between the spot and derivativemarket segments as also through investment ofsurplus cash in debt and money marketinstruments.
Fund Details
Standard Deviation :Beta :Sharpe Ratio :Portfolio Turnover*
#
#
#
0.76%0.69-2.07
Equity Turnover : 2.32Total Turnover : 13.03Total Turnover = Equity + Debt + Derivatives#
S o u r c e : C R I S I L F u n d A n a l y s e r*Portfolio Turnover = lower of total sale or totalpurchase for the last 12 months (including equityderivatives) upon Avg. AUM of trailing twelve months.Risk Free rate: FBIL Overnight Mibor rate (5.34% as on30th August 2022) Basis for Ratio Calculation: 3 YearsMonthly Data Points
PORTFOLIO CLASSIFICATION BY(%)ASSET ALLOCATION
•
•
•
•
•
•
•
•
•
•
•
•
•
•
Type of Scheme
Date of Allotment:Report As On:AAUM for the August 2022
AUM as on August 31, 2022
Fund Manager:Mr. Neeraj Kumar -Mr. Arun R. -Managing Since:Mr. Neeraj Kumar -Mr. Arun R. -Total Experience:Mr. Neeraj Kumar -Mr. R. Arun -First Tier Benchmark:Exit Load:
Entry Load:Plans Available:Option:SIP
Minimum Investment
Additional Investment
An open-ended Scheme investing inarbitrage opportunities.
03/11/200631/08/2022
7,171.34 Crores
6,001.28 Crores
Equity PortionDebt Portion
Oct 2012June 2021
Over 26 yearsOver 16 years
NIFTY 50 ArbitrageFor exit on or before 1 month from
the date of allotment – 0.25% For exit after 1month from the date of allotment – Nil
N.A.Regular, Direct
Growth, IDCW
Any Day SIP’ Facility is available for Monthly,Quarterly, Semi-Annual and Annual frequenciesthrough electronic mode like OTM / DebitMandate. Default SIP date will be 10th. In casethe SIP due date is a Non Business Day, then theimmediate following Business Day will beconsidered for SIP processing.Daily - Minimum 500 & in multiples of 1thereafter for a minimum of 12 instalments.(Kindly refer notice cum addendum dated June02, 2020 for further details)Weekly - Minimum 1000 & in multiples of 1thereafter for a minimum of 6 instalments. (or)Minimum 500 & in multiples of 1 thereafter for aminimum of 12 instalments.Monthly - Minimum 1000 & in multiples of 1thereafter for minimum six months (or) minimum
500 & in multiples of 1 thereafter forminimum one year.Quarterly - Minimum 1500 & in multiples of 1thereafter for minimum one year.Semi Annual - Minimum 3000 & in multiples of
1 thereafter for a minimum of 4 installments.Annual - Minimum 5000 & in multiples of1thereafter for a minimum of 4 installments.
5000 & in multiples of 1
1000 & in multiples of 1
Month of`
`
` `
` `
` `
` `
`
`
` `
` `
` `
PORTFOLIO CLASSIFICATION BYINDUSTRY ALLOCATION (%)
PORTFOLIO
^Investors should consult their financial advisers if indoubt about whether the product is suitable for them.
Cash, Cash Equivalents, Derivative Margin and Others
A1+Large Cap Midcap Small Cap Sovereign
Reg-Plan-IDCW 14.5779
Reg-Plan-Growth 27.7207
Dir-Plan-IDCW 15.6950
Dir-Plan-Growth 29.0481
27-Mar-20 (Reg Plan) 0.07 13.398927-Mar-20 (Dir Plan) 0.07 14.269028-Feb-20 (Reg Plan) 0.07 13.463428-Feb-20 (Dir Plan) 0.07 14.328131-Jan-20 (Reg Plan) 0.07 13.423831-Jan-20 (Dir Plan) 0.07 14.2766
Financial Services 20.82Services 9.17Sovereign 8.94Metals & Mining 8.78Power 5.01Construction Materials 4.03Information Technology 3.04Oil, Gas & Consumable Fuels 3.02Media, Entertainment & Publication 2.61Healthcare 2.32Fast Moving Consumer Goods 2.27Consumer Durables 2.19Consumer Services 2.09Chemicals 2.00Automobile And Auto Components 1.88Telecommunication 1.57Capital Goods 1.53Realty 1.15Textiles 0.22Construction 0.11Cash, Cash Equivalents, Derivative Margin And Others 17.25
Investors understand that their principal
will be at Low risk
Pursuant to payment of IDCW, the NAV of IDCW Option of scheme/plans would fall to the extent of payout and statutory levy, if applicable.
Equity SharesAdani Ports And Special Economic Zone Ltd. 7.23 -7.27 -0.04Adani Enterprises Ltd. 4.57 -4.58 -0.01HDFC Bank Ltd. 2.83 -2.84 -0.01Ambuja Cements Ltd. 2.41 -2.42 -0.01Zee Entertainment Enterprises Ltd. 2.38 -2.37 0.01Tata Power Company Ltd. 2.25 -2.26 -0.01Bajaj Finance Ltd. 2.08 -2.08 -Housing Development Finance Corporation Ltd. 1.83 -1.84 -0.01ICICI Bank Ltd. 1.42 -1.43 -0.01Axis Bank Ltd. 1.42 -1.42 -Asian Paints Ltd. 1.37 -1.37 -Reliance Industries Ltd. 1.34 -1.35 -0.01HCL Technologies Ltd. 1.33 -1.34 -0.01Grasim Industries Ltd. 1.25 -1.26 -0.01Bandhan Bank Ltd. 1.10 -1.11 -0.01Vedanta Ltd. 1.07 -1.07 -JSW Steel Ltd. 0.99 -0.99 -Vodafone Idea Ltd. 0.96 -0.98 -0.02Power Grid Corporation Of India Ltd. 0.94 -0.95 -0.01IDFC Ltd. 0.89 -0.89 -Trent Ltd. 0.81 -0.82 -0.01The Indian Hotels Company Ltd. 0.80 -0.81 -0.01UPL Ltd. 0.79 -0.79 -Indian Oil Corporation Ltd. 0.74 -0.75 -0.01Maruti Suzuki India Ltd. 0.73 -0.73 -Tata Steel Ltd. 0.72 -0.73 -0.01Power Finance Corporation Ltd. 0.70 -0.69 0.01Bank Of Baroda 0.69 -0.69 -National Aluminium Company Ltd. 0.68 -0.67 0.01Sun Pharmaceutical Industries Ltd. 0.65 -0.65 -Manappuram Finance Ltd. 0.63 -0.63 -Larsen & Toubro Infotech Ltd. 0.63 -0.63 -Biocon Ltd. 0.63 -0.63 -Godrej Properties Ltd. 0.60 -0.61 -0.01Punjab National Bank 0.59 -0.59 -ITC Ltd. 0.57 -0.57 -Samvardhana Motherson International Ltd. 0.54 -0.55 -0.01Oberoi Realty Ltd. 0.53 -0.54 -0.01Tata Chemicals Ltd. 0.48 -0.48 -The Federal Bank Ltd. 0.47 -0.47 -HDFC Life Insurance Company Ltd. 0.47 -0.47 -Tata Communications Ltd. 0.45 -0.45 -Piramal Enterprises Ltd. 0.45 -0.46 -0.01Mindtree Ltd. 0.45 -0.46 -0.01Bharat Heavy Electricals Ltd. 0.45 -0.45 -Ashok Leyland Ltd. 0.45 -0.46 -0.01Bharat Electronics Ltd. 0.43 -0.43 -Godrej Consumer Products Ltd. 0.42 -0.42 -Havells India Ltd. 0.40 -0.40 -NTPC Ltd. 0.39 -0.39 -InterGlobe Aviation Ltd. 0.39 -0.39 -LIC Housing Finance Ltd. 0.37 -0.37 -Shriram Transport Finance Company Ltd. 0.35 -0.35 -NMDC Ltd. 0.35 -0.35 -United Spirits Ltd. 0.32 -0.32 -Tata Consumer Products Ltd. 0.31 -0.31 -Marico Ltd. 0.31 -0.31 -Oil & Natural Gas Corporation Ltd. 0.30 -0.30 -L&T Finance Holdings Ltd. 0.30 -0.31 -0.01Glenmark Pharmaceuticals Ltd. 0.29 -0.29 -Aditya Birla Fashion And Retail Ltd. 0.29 -0.29 -Gujarat Narmada Valley Fertilizers & Chemicals Ltd. 0.27 -0.27 -Rbl Bank Ltd. 0.25 -0.25 -Kotak Mahindra Bank Ltd. 0.25 -0.25 -Bata India Ltd. 0.25 -0.25 -Page Industries Ltd. 0.22 -0.22 -Bajaj Finserv Ltd. 0.22 -0.22 -Mphasis Ltd. 0.21 -0.21 -ICICI Lombard General Insurance Company Ltd. 0.21 -0.21 -ACC Ltd. 0.21 -0.22 -0.01Zydus Lifesciences Ltd. 0.20 -0.20 -Indiabulls Housing Finance Ltd. 0.20 -0.20 -Indraprastha Gas Ltd. 0.19 -0.19 -Delta Corp Ltd. 0.19 -0.19 -Aditya Birla Capital Ltd. 0.19 -0.19 -Steel Authority Of India Ltd. 0.17 -0.17 -Exide Industries Ltd. 0.17 -0.17 -Rain Industries Ltd. 0.16 -0.16 -Persistent Systems Ltd. 0.16 -0.16 -Indus Towers Ltd. 0.16 -0.16 -Canara Bank 0.16 -0.16 -
Balrampur Chini Mills Ltd. 0.16 -0.16 -Hindustan Petroleum Corporation Ltd. 0.15 -0.15 -Hindalco Industries Ltd. 0.15 -0.15 -Hero Motocorp Ltd. 0.15 -0.15 -Torrent Pharmaceuticals Ltd. 0.14 -0.14 -Sun Tv Network Ltd. 0.13 -0.13 -Mahindra & Mahindra Ltd. 0.13 -0.13 -Mahanagar Gas Ltd. 0.13 -0.13 -Gail (India) Ltd. 0.13 -0.13 -Cummins India Ltd. 0.13 -0.13 -REC Ltd. 0.12 -0.13 -0.01PI Industries Ltd. 0.12 -0.12 -Indian Energy Exchange Ltd. 0.12 -0.12 -Nestle India Ltd. 0.11 -0.11 -Metropolis Healthcare Ltd. 0.11 -0.11 -Larsen & Toubro Ltd. 0.11 -0.11 -IDFC First Bank Ltd. 0.11 -0.11 -PVR Ltd. 0.10 -0.10 -HDFC Asset Management Company Ltd. 0.10 -0.10 -SRF Ltd. 0.09 -0.09 -GMR Infrastructure Ltd. 0.09 -0.09 -Divi's Laboratories Ltd. 0.09 -0.09 -Tech Mahindra Ltd. 0.08 -0.08 -Jindal Steel & Power Ltd. 0.08 -0.08 -L&T Technology Services Ltd. 0.07 -0.08 -0.01Dalmia Bharat Ltd. 0.07 -0.07 -Cholamandalam Investment & Finance Co. Ltd. 0.07 -0.07 -Titan Company Ltd. 0.06 -0.06 -Siemens Ltd. 0.06 -0.06 -Berger Paints India Ltd. 0.06 -0.06 -Apollo Hospitals Enterprise Ltd. 0.06 -0.06 -Voltas Ltd. 0.05 -0.05 -Ultratech Cement Ltd. 0.05 -0.05 -Chambal Fertilisers And Chemicals Ltd. 0.05 -0.05 -Britannia Industries Ltd. 0.05 -0.05 -Balkrishna Industries Ltd. 0.05 -0.05 -Aurobindo Pharma Ltd. 0.05 -0.05 -Abbott India Ltd. 0.05 -0.05 -The India Cements Ltd. 0.04 -0.04 -Tata Consultancy Services Ltd. 0.04 -0.04 -Amara Raja Batteries Ltd. 0.04 -0.04 -Tata Motors Ltd. 0.03 -0.03 -Petronet LNG Ltd. 0.03 -0.03 -Multi Commodity Exchange Of India Ltd. 0.03 -0.03 -Intellect Design Arena Ltd. 0.03 -0.03 -Container Corporation Of India Ltd. 0.03 -0.03 -Can Fin Homes Ltd. 0.03 -0.03 -Bosch Ltd. 0.03 -0.03 -Alkem Laboratories Ltd. 0.03 -0.03 -Wipro Ltd. 0.02 -0.02 -Mahindra & Mahindra Financial Services Ltd. 0.02 -0.02 -Lupin Ltd. 0.02 -0.02 -DLF Ltd. 0.02 -0.02 -Deepak Nitrite Ltd. 0.02 -0.02 -Colgate Palmolive (India) Ltd. 0.02 -0.02 -Pidilite Industries Ltd. 0.01 -0.01 -Oracle Financial Services Software Ltd. 0.01 -0.01 -Firstsource Solutions Ltd. 0.01 -0.01 -Eicher Motors Ltd. 0.01 -0.01 -Coromandel International Ltd. 0.01 -0.01 -Bharat Petroleum Corporation Ltd. 0.01 -0.01 -Bharat Forge Ltd. 0.01 -0.01 -
Motilal Oswal Finvest Ltd. CRISIL A1+ 2.15 - -Nabha Power Ltd. CRISIL A1+ 1.43 - -L&T Metro Rail (Hyderabad) Ltd. CRISIL A1+ 1.43 - -
Government Of India SOVEREIGN 1.44 - -
91 Day T-Bill 08.09.22 SOVEREIGN 2.51 - -182 Day T-Bill 29.09.22 SOVEREIGN 1.43 - -91 Day T-Bill 03.11.22 SOVEREIGN 1.42 - -182 Day T-Bill 08.09.22 SOVEREIGN 0.72 - -91 Day T-Bill 24.11.22 SOVEREIGN 0.71 - -364 Day T-Bill 24.11.22 SOVEREIGN 0.71 - -
Total 68.80 -69.08 -0.28
Total 5.01 - -
Total 1.44 - -
Total 7.50 - -
Commercial Papers
Government Securities
Treasury Bills
Grand Total 100.00Cash, Cash Equivalents, Derivative Margin And Others 17.25 - -
Issuer Name Rating (%) Of Total % of AUM Derivatives Diff in % of AUM Issuer Name Rating (%) Of Total % of AUM Derivatives Diff in % of AUM
48.91
16.16
3.73
8.94
5.01
17.25

42
HYBRID - BALANCEDADVANTAGE FUND
•
•
Long term capital appreciation.Dynamic asset allocation between equity and equity relatedinstruments including derivatives and fixed income instruments.
SBI Balanced Advantage FundThis product is suitable for investors who are seeking^:
Investment Objective
Quantitative Data
To provide long term capital appreciation/ income from a dynamic mix of equityand debt investments. However, therecan be no assurance that the investmentobjective of the Scheme will be realized.
Fund Details
PORTFOLIO CLASSIFICATION BY(%)ASSET ALLOCATION
•
•
•
•
•
•
•
•
•
•
•
•
•
•
Type of Scheme
Date of Allotment:
Report As On:
AAUM for the August 2022
AUM as on August 31, 2022
Fund Manager:
Mr. Dinesh Balachandran -
Mr. Dinesh Ahuja -
Mr. Mohit Jain
Managing Since:
Mr. Dinesh Balachandran -
Mr. Dinesh Ahuja -
Mr. Mohit Jain -
Total Experience:
Mr. Dinesh Balachandran -
Mr. Dinesh Ahuja -
Mr. Mohit Jain -
First Tier Benchmark:
Exit Load:
Entry Load:
Plans Available:
Option:
SIP
Minimum Investment
Additional Investment
An open-ended dynamic asset allocation fund.
31/08/2021
31/08/2022
24,529.64 Crores
24,735.05 Crores
Equity Portion
Debt Portion
* shall manage investments in foreignsecurities of the Scheme
August 2021
August 2021
August 2021
Over 21 years
Over 24 years
Over 10 years
Nifty 50 Hybrid Composite Debt 50:50 Index
NIL - If units purchased or switched infrom another scheme of the Fund are redeemed orswitched out upto 10% of the units (the limit)purchased or switched on or before 1 year fromthe date of allotment. 1% of the applicable NAV - Ifunits purchased or switched in from anotherscheme of the Fund are redeemed or switched outin excess of the limit on or before 1 year from thedate of allotment NIL - If units purchased orswitched in from another scheme of the Fund areredeemed or switched out after 1 year from thedate of allotment
N.A.
Regular, Direct
Growth, IDCW
Daily - Minimum 500 & in multiples of 1thereafter
for minimum of twelve installments. Weekly -Minimum 1000 & in multiples of 1 thereafter for
minimum of six installments or Minimum 500 & in
multiples of 1 thereafter for minimum of twelve
installments. Monthly - Minimum 1000 & in
multiples of 1 thereafter for minimum six months
(or) minimum 500 & in multiples of 1 thereafter
for minimum one year. Quarterly - Minimum 1500
& in multiples of 1 thereafter for minimum one
year. Semi-Annual - Minimum amount of investmentwill be 3,000 and in multiples of 1 thereafter for
minimum 4 number of installments.
Annual - Minimum amount of investment will be5,000 and in multiples of 1 thereafter for
minimum 4 number of installments.
5000 & in multiples of 1
1000 & in multiples of 1
Month of
`
`
` `
` `
`
`
`
`
` `
`
`
` `
` `
` `
` `
PORTFOLIO CLASSIFICATION BYINDUSTRY ALLOCATION (%)
PORTFOLIO
^Investors should consult their financial advisers if indoubt about whether the product is suitable for them.
Cash, Cash Equivalents, Derivative Margin and OthersInfrastructure Investment Trust Foreign Equity Shares
Large Cap Midcap Small Cap Sovereign
Option NAV ( )` Option NAV ( )`
NET ASSET VALUE
Reg-Plan-IDCW 10.5000
Reg-Plan-Growth 10.5002
Dir-Plan-IDCW 10.6292
Dir-Plan-Growth 10.6286
Financial Services 20.47Sovereign 20.38Information Technology 7.83Services 4.99Fast Moving Consumer Goods 4.97Healthcare 4.72Oil, Gas & Consumable Fuels 4.57Automobile And Auto Components 4.49Metals & Mining 4.43Capital Goods 3.95Power 2.97Construction 2.15Construction Materials 1.82Telecommunication 1.71Realty 1.28Consumer Durables 0.90Chemicals 0.59Consumer Services 0.39Media, Entertainment & Publication 0.28Cash, Cash Equivalents, Derivative Margin And Others 7.11
Modified Duration :Average Maturity :Macaulay Duration :Yield to Maturity :
5.067.44 years5.25 years7.11%
yearsInvestors understand that their principal
will be at Moderately High risk
Equity Shares
Equity Shares & Derivatives
State Bank Of India 1.75 - 1.75Bharti Airtel Ltd. 1.67 - 1.67Mahindra & Mahindra Ltd. 1.56 - 1.56Gail (India) Ltd. 1.39 - 1.39NHPC Ltd. 1.25 - 1.25Ashok Leyland Ltd. 1.14 - 1.14Cipla Ltd. 1.10 - 1.10ICICI Prudential Life Insurance Company Ltd. 1.02 - 1.02Cummins India Ltd. 0.96 - 0.96Max Healthcare Institute Ltd. 0.93 - 0.93Sona Blw Precision Forgings Ltd. 0.82 - 0.82Bharat Forge Ltd. 0.72 - 0.72Life Insurance Corporation Of India 0.66 - 0.66Indian Oil Corporation Ltd. 0.63 - 0.63Gateway Distriparks Ltd. 0.54 - 0.54Carborundum Universal Ltd. 0.54 - 0.54Wipro Ltd. 0.49 - 0.49Bharat Petroleum Corporation Ltd. 0.49 - 0.49ICICI Lombard General Insurance Company Ltd. 0.43 - 0.43Blue Star Ltd. 0.41 - 0.41Go Fashion (India) Ltd. 0.39 - 0.39CESC Ltd. 0.34 - 0.34ACC Ltd. 0.30 - 0.30Dr. Reddy's Laboratories Ltd. 0.29 - 0.29Crompton Greaves Consumer Electricals Ltd. 0.10 - 0.10Bajaj Finserv Ltd. 0.06 - 0.06
ICICI Bank Ltd. 3.79 -1.22 2.57ITC Ltd. 3.15 -0.04 3.11Axis Bank Ltd. 3.09 -1.21 1.88Housing Development Finance Corporation Ltd. 2.85 -1.58 1.27HDFC Bank Ltd. 2.74 -0.43 2.31Larsen & Toubro Ltd. 2.15 -0.10 2.05Tech Mahindra Ltd. 1.98 -0.11 1.87Reliance Industries Ltd. 1.92 -1.17 0.75Infosys Ltd. 1.86 -1.53 0.33Adani Enterprises Ltd. 1.84 -1.85 -0.01HCL Technologies Ltd. 1.56 -0.02 1.54Tata Steel Ltd. 1.39 -0.62 0.77Tata Consultancy Services Ltd. 1.30 -1.15 0.15DLF Ltd. 1.28 -0.37 0.91Sun Pharmaceutical Industries Ltd. 1.17 -0.47 0.70SBI Life Insurance Company Ltd. 1.13 -1.13 -Power Grid Corporation Of India Ltd. 1.10 -1.11 -0.01Maruti Suzuki India Ltd. 1.00 -1.00 -Tata Motors Ltd. 0.88 -0.03 0.85Adani Ports And Special Economic Zone Ltd. 0.87 -0.88 -0.01Kotak Mahindra Bank Ltd. 0.86 -0.86 -Ambuja Cements Ltd. 0.85 -0.85 -Hindustan Unilever Ltd. 0.80 -0.81 -0.01Divi's Laboratories Ltd. 0.77 -0.78 -0.01ABB India Ltd. 0.59 -0.60 -0.01Britannia Industries Ltd. 0.58 -0.12 0.46Bajaj Finance Ltd. 0.56 -0.44 0.12Grasim Industries Ltd. 0.47 -0.47 -Hindalco Industries Ltd. 0.45 -0.45 -JSW Steel Ltd. 0.42 -0.42 -SBI Cards & Payment Services Ltd. 0.40 -0.40 -United Spirits Ltd. 0.35 -0.01 0.34
Total 19.98 - 19.98
Container Corporation Of India Ltd. 0.34 -0.02 0.32HDFC Life Insurance Company Ltd. 0.32 -0.32 -Asian Paints Ltd. 0.29 -0.29 -Apollo Hospitals Enterprise Ltd. 0.29 -0.29 -Tata Power Company Ltd. 0.28 -0.28 -Jindal Steel & Power Ltd. 0.24 -0.24 -Canara Bank 0.24 -0.24 -Shree Cement Ltd. 0.20 0.01 0.21Tata Chemicals Ltd. 0.19 -0.20 -0.01Lupin Ltd. 0.17 -0.17 -UPL Ltd. 0.15 -0.16 -0.01Hero Motocorp Ltd. 0.15 -0.15 -Hindustan Petroleum Corporation Ltd. 0.13 -0.13 -Pidilite Industries Ltd. 0.11 -0.11 -Titan Company Ltd. 0.10 -0.10 -SRF Ltd. 0.10 -0.10 -Indian Energy Exchange Ltd. 0.09 -0.09 -Zee Entertainment Enterprises Ltd. 0.08 -0.08 -Exide Industries Ltd. 0.08 -0.08 -Tata Consumer Products Ltd. 0.07 -0.07 -National Aluminium Company Ltd. 0.07 -0.07 -Can Fin Homes Ltd. 0.07 -0.07 -Mindtree Ltd. 0.06 -0.06 -Indusind Bank Ltd. 0.05 -0.05 -Tata Communications Ltd. 0.04 -0.04 -Coromandel International Ltd. 0.04 -0.04 -Steel Authority Of India Ltd. 0.02 -0.02 -Dabur India Ltd. 0.02 -0.02 -Oil & Natural Gas Corporation Ltd. 0.01 -0.01 -National Stock Exchange Of India Ltd.-29-Sep-22 - 3.16 3.16
Cognizant Technology Solutions Corporation 0.58 - -NETFlix Inc 0.20 - -
L&T Metro Rail (Hyderabad) Ltd.[Guaranteed By Larsen &Toubro Limited] CRISIL AAA(CE) 0.78 - -LIC Housing Finance Ltd. CRISIL AAA 0.36 - -
Government Of India SOVEREIGN 16.70 - -
State Government OfAndhra Pradesh SOVEREIGN 1.83 - -State Government OfTelangana SOVEREIGN 0.99 - -State Government OfWest Bengal SOVEREIGN 0.46
364 Day T-Bill 24.11.22 SOVEREIGN 0.40 - -
National Highways Infra Trust 2.46 - -
Total 48.15 -22.56 25.59
Total 0.78 - -
Total 1.14 - -
Total 16.70 - -
Total 3.28 - -
Total 0.40 - -
Total 2.46 - -
Foreign Equity Shares
Non Convertible Debentures
Government Securities
State Development Loans
- -
Treasury Bills
Infrastructure Investment Trust
Cash, Cash Equivalents,Derivative Margin And Others 7.11 - -Grand Total 100.00
Issuer Name Rating (%) Of Total % of AUM Derivatives Diff in % of AUM Issuer Name Rating (%) Of Total % of AUM Derivatives Diff in % of AUM
AAA and Equivalent
*Mr. Mohit Jain is the dedicated fund manager for managing overseas investments of the Scheme.
57.30
8.46
2.372.460.781.14
20.38
7.11

43
SOLUTIONS ORIENTEDSCHEME-CHILDREN'S FUND
Option NAV ( )`
NET ASSET VALUE
•
•
Long term capital appreciationInvestment primarily in actively managed equity and equity relatedinstruments and secondarily in debt and money market securities.
SBI Magnum Children's Benefit Fund – Investment PlanThis product is suitable for investors who are seeking^:
Investment Objective
The investment objective of the scheme is to generatelong term capital appreciation by investingpredominantly in equity and equity related securities ofcompanies across sectors and market capitalizations.The scheme will also invest in debt and money marketinstruments with an endeavour to generate income.However, there is no guarantee or assurance that theinvestment objective of the scheme will be achieved.
Fund Details
PORTFOLIO CLASSIFICATION BY(%)ASSET ALLOCATION
•
•
•
•
•
•
•
•
•
•
•
•
•
•
Type of Scheme
Date of Allotment:
Report As On:
AAUM for the August 2022
AUM as on August 31, 2022
Fund Manager:
Mr. R Srinivasan -Mr. Dinesh Ahuja -Mr. Mohit Jain
Managing since:Total Experience:Mr. R. Srinivasan -Mr. Dinesh Ahuja -Mr. Mohit Jain -
First Tier Benchmark:
Exit Load:
Entry Load:
Plans Available:
Option:
SIP
Minimum Investment
Additional Investment
An open-ended fund for investment for childrenhaving a lock-in for at least 5 years or till the childattains age of majority (whichever is earlier)
29/ 09/2020
31/08/2022
568.52 Crores
580.97 Crores
Equity PortionDebt Portion
* shall manage investments inforeign securities of the Scheme
September 29, 2020
Over 30 yearsOver 20 years
Over 10 years
CRISIL Hybrid 35+65 -Aggressive Index
For all investments with respect to units notsubject to lock-in period and the holding periodis less than 3 years:3% for redemption/switch out on or before 1year from the date of allotment2% for redemption/switch out after 1 year andup to 2 years from the date of allotment1% for redemption/switch out after 2 years andup to 3 years from the date of allotmentNil for redemption or switch-out after 3 yearsfrom the date of allotment.
NA
Regular, Direct
Growth
Daily - Minimum 500 & in multiples of Re. 1thereafter for minimum of twelve installmentsWeekly - Minimum 1000 & in multiples of Re. 1thereafter for minimum of six installments orMinimum 500 & in multiples of Re. 1 thereafterfor minimum of twelve installments.Monthly -Minimum 1000 & in multiples of Re. 1 thereafterfor minimum six months (or) minimum 500 & inmultiples of Re. 1 thereafter for minimum oneyear Quarterly - Minimum 1500 & in multiples ofRe. 1 thereafter for minimum one yearSemi-Annual - Minimum amount of investmentwill be 3,000 and in multiples of Re.1 thereafterfor minimum 4 number of installmentsAnnual - Minimum amount of investment will be
5,000 and in multiples of Re.1 thereafter forminimum 4 number of installments.
5000 & in multiples of 1
1000 & in multiples of 1
Month of
`
`
`
`
`
`
`
`
`
`
` `
` `
PORTFOLIO CLASSIFICATION BYINDUSTRY ALLOCATION (%)
PORTFOLIO
^Investors should consult their financial advisers if indoubt about whether the product is suitable for them.
Cash, Cash Equivalents, Derivative Margin and OthersForeign Equity Shares
SovereignLarge Cap Midcap Small Cap
Reg-Plan-Growth 23.5401
Dir-Plan-Growth 24.2214
Financial Services 22.21Fast Moving Consumer Goods 10.57Sovereign 10.18Chemicals 8.27Information Technology 7.35Textiles 7.07Media, Entertainment & Publication 5.86Healthcare 4.68Consumer Durables 4.58Capital Goods 3.46Construction 3.28Telecommunication 3.00Consumer Services 1.46Cash, Cash Equivalents And Others 8.03
Equity Shares
Dodla Dairy Ltd. 6.18
Bajaj Finance Ltd. 5.54
ICICI Bank Ltd. 5.20
Max Healthcare Institute Ltd. 4.68
Aether Industries Ltd. 4.65
Gokaldas Exports Ltd. 4.43
State Bank Of India 3.93
GR Infra Projects Ltd. 3.28
Hawkins Cookers Ltd. 3.27
CSB Bank Ltd. 3.26
Avanti Feeds Ltd. 3.12
Bharti Airtel Ltd. 3.00
Disa India Ltd. 2.76
Muthoot Finance Ltd. 2.73
Neogen Chemicals Ltd. 2.66
Garware Technical Fibres Ltd. 2.64
ICICI Lombard General Insurance Company Ltd. 1.55
Medplus Health Services Ltd. 1.46
Thangamayil Jewellery Ltd. 1.31
Hatsun Agro Product Ltd. 1.27
Privi Speciality Chemicals Ltd. 0.96
Ratnamani Metals & Tubes Ltd. 0.70
Issuer Name Rating (%) Of TotalAUM
Issuer Name Rating (%) Of TotalAUM
Total 68.58
Total 13.21
Total 10.18
Foreign Equity Shares
Government Securities
Cash, Cash Equivalents And Others 8.03
Grand Total 100.00
NETFlix Inc 5.86
Alphabet Inc. 4.96
Nvidia Corporation 2.39
Government Of India SOVEREIGN 10.18
Quantitative DataModified Duration :Average Maturity :Macaulay Duration :Yield to Maturity :
5.44 years7.56 years5.64 years7.09%
Investors understand that their principal
will be at Very High risk
*Mr. Mohit Jain is the dedicated fund manager for managing overseas investments of the Scheme.
21.95
5.95
40.68
13.21
10.18
8.03

44
SOLUTIONS ORIENTEDSCHEME-RETIREMENT FUND
Option NAV ( )` Option NAV ( )`
NET ASSET VALUE NET ASSET VALUE
•
•
Long term capital appreciationInvestment predominantly in equity and equity related instruments
SBI Retirement Benefit Fund – Aggressive PlanThis product is suitable for investors who are seeking^:
Investment Objective
The investment objective of the scheme is to provide acomprehensive retirement saving solution that servesthe variable needs of the investors through long termdiversified investments in major asset classes.However, there can be no assurance that theinvestment objective of the Scheme will be realized.
Fund Details
PORTFOLIO CLASSIFICATION BY(%)ASSET ALLOCATION
•
•
•
•
•
•
•
•
•
•
•
•
•
•
Type of Scheme
Date of Allotment:
Report As On:
AAUM for the August 2022
AUM as on August 31, 2022
Fund Manager:
Mr. Rohit Shimpi -
Mr. Dinesh Ahuja and Mr. Ardhendu
Bhattacharya
Mr. Mohit Jain
Managing since:
Dinesh Ahuja:
Rohit Shimpi:
Ardhendu Bhattacharya:
Total Experience:
Mr. Rohit Shimpi -
Mr. Dinesh Ahuja -
Mr. Mohit Jain -
Mr. Ardhendu Bhattacharya
First Tier Benchmark:
Exit Load:
Entry Load:
Plans Available:
Option:
SIP
Minimum Investment
Additional Investment
An open-ended retirement solution-orientedscheme having a lock-in of 5 years or tillretirement age (whichever is earlier)
10/02/2021
31/08/2022
922.62 Crores
949.72 Crores
Equity Portion
(Co-fund manager) -Debt portion
* Overseas investments
Feb - 2021
Oct - 2021
June - 2021
Over 16 years
Over 24 years
Over 10 years
- Over 12 years
S&P BSE 500 TRI
Nil
N.A.
Regular, Direct
Growth, IDCW
Daily - Minimum 500 & in multiples of 1thereafter for minimum of twelve installments.Weekly - Minimum 1000 & in multiples of1 thereafter for minimum of six installments
or Minimum 500 & in multiples of 1thereafter for minimum of twelve installments.Monthly - Minimum 1000 & in multiples of1 thereafter for minimum six months (or)
minimum 500 & in multiples of 1thereafter for minimum one year.Quarterly - Minimum 1500 & in multiples of1 thereafter for minimum one year.
Semi-Annual - Minimum amount of investmentwill be 3,000 and in multiples of 1thereafter for minimum 4 number ofinstallments.Annual - Minimum amount of investment will be5,000 and in multiples of 1 thereafter for
minimum 4 number of installments.
5000 & in multiples of 1
1000 & in multiples of 1
Month of
`
`
` `
` `
` `
`
`
` `
`
`
` `
`
`
` `
` `
PORTFOLIO CLASSIFICATION BYINDUSTRY ALLOCATION (%)
PORTFOLIO
^Investors should consult their financial advisers if indoubt about whether the product is suitable for them.
Reg-Plan-IDCW 13.8063
Reg-Plan-Growth 13.8054
Direct Plan-IDCW 14.1272
Dir-Plan-Growth 14.1344
Financial Services 31.29Capital Goods 15.11Automobile And Auto Components 10.89Information Technology 7.13Consumer Services 7.02Construction Materials 4.72Construction 3.79Healthcare 3.54Realty 3.36Consumer Durables 2.81Metals & Mining 2.20Textiles 2.09Sovereign 1.50Cash, Cash Equivalents And Others 4.55
Equity Shares
HDFC Bank Ltd. 7.18
ICICI Bank Ltd. 6.58
Infosys Ltd. 5.58
Maruti Suzuki India Ltd. 5.10
Housing Development Finance Corporation Ltd. 4.43
Grindwell Norton Ltd. 3.91
Larsen & Toubro Ltd. 3.79
State Bank Of India 3.74
Ultratech Cement Ltd. 3.73
ABB India Ltd. 3.50
The Indian Hotels Company Ltd. 3.28
Axis Bank Ltd. 3.20
Timken India Ltd. 2.60
Chalet Hotels Ltd. 2.59
Cholamandalam Investment & Finance Co. Ltd. 2.52
TVS Motor Company Ltd. 2.38
Hindalco Industries Ltd. 2.20
Page Industries Ltd. 2.09
HDFC Asset Management Company Ltd. 2.08
Cipla Ltd. 2.08
ZF Commercial Vehicle Control Systems India Ltd. 1.99
Carborundum Universal Ltd. 1.87
Issuer Name Rating (%) Of TotalAUM
Issuer Name Rating (%) Of TotalAUM
AIA Engineering Ltd. 1.73
DLF Ltd. 1.70
The Phoenix Mills Ltd. 1.66
V-Guard Industries Ltd. 1.63
ICICI Lombard General Insurance Company Ltd. 1.56
Wipro Ltd. 1.55
Esab India Ltd. 1.50
Abbott India Ltd. 1.46
Sona Blw Precision Forgings Ltd. 1.42
Hawkins Cookers Ltd. 1.18
FSN E-Commerce Ventures Ltd. 1.15
Nuvoco Vistas Corporation Ltd. 0.99
Government Of India SOVEREIGN 1.50
Total 93.95
Total 1.50
Government Securities
Cash, Cash Equivalents And Others 4.55
Grand Total 100.00
Investors understand that their principal
will be at Very High risk
Quantitative DataModified Duration :Average Maturity :Macaulay Duration :
years3.18 years2.93
2.83
years6.84%Yield to Maturity :
Cash, Cash Equivalents, Derivative Margin and Others
SovereignLarge Cap Midcap Small Cap
*Mr. Mohit Jain is the dedicated fund manager for managing overseas investments of the Scheme.
56.09
23.51
14.35
1.50 4.55
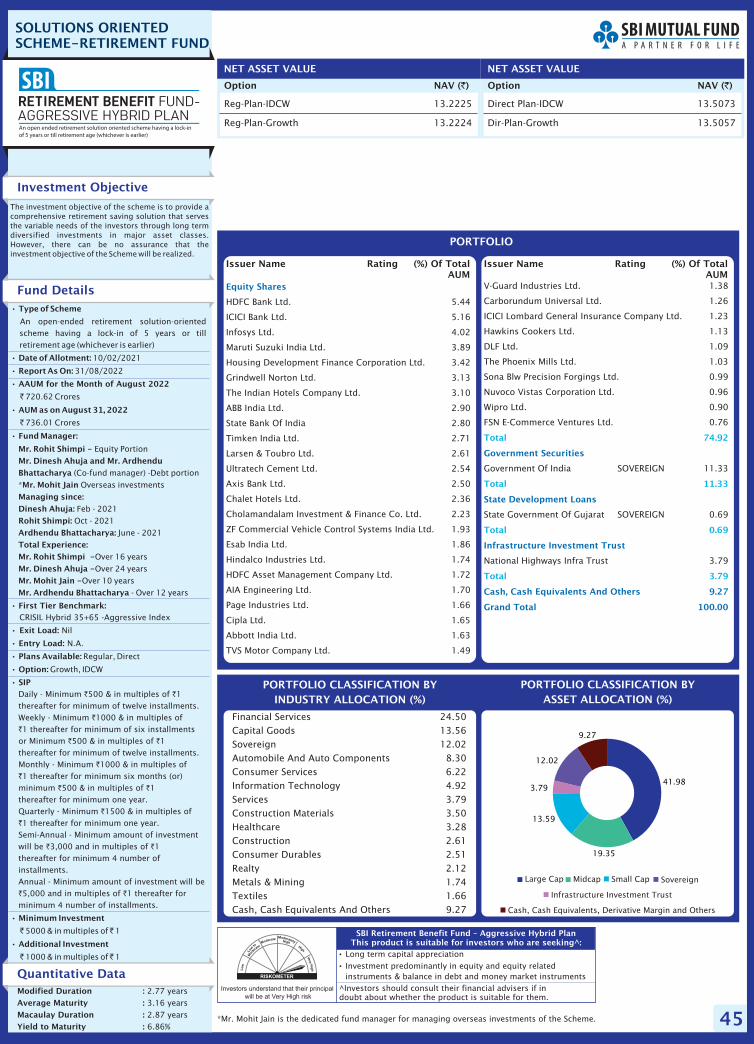
45
SOLUTIONS ORIENTEDSCHEME-RETIREMENT FUND
•
•
Long term capital appreciationInvestment predominantly in equity and equity relatedinstruments & balance in debt and money market instruments
SBI Retirement Benefit Fund – Aggressive Hybrid PlanThis product is suitable for investors who are seeking^:
Investment Objective
The investment objective of the scheme is to provide acomprehensive retirement saving solution that servesthe variable needs of the investors through long termdiversified investments in major asset classes.However, there can be no assurance that theinvestment objective of the Scheme will be realized.
Fund Details
PORTFOLIO CLASSIFICATION BY(%)ASSET ALLOCATION
•
•
•
•
•
•
•
•
•
•
•
•
•
•
Type of Scheme
Date of Allotment:
Report As On:
AAUM for the August 2022
AUM as on August 31, 2022
Fund Manager:
Mr. Rohit Shimpi -
Mr. Dinesh Ahuja and Mr. Ardhendu
Bhattacharya
Mr. Mohit Jain
Managing since:
Dinesh Ahuja:
Rohit Shimpi:
Ardhendu Bhattacharya:
Total Experience:
Mr. Rohit Shimpi -
Mr. Dinesh Ahuja -
Mr. Mohit Jain -
Mr. Ardhendu Bhattacharya
First Tier Benchmark:
Exit Load:
Entry Load:
Plans Available:
Option:
SIP
Minimum Investment
Additional Investment
An open-ended retirement solution-orientedscheme having a lock-in of 5 years or tillretirement age (whichever is earlier)
10/02/2021
31/08/2022
720.62 Crores
736.01 Crores
Equity Portion
(Co-fund manager) -Debt portion
* Overseas investments
Feb - 2021
Oct - 2021
June - 2021
Over 16 years
Over 24 years
Over 10 years
- Over 12 years
CRISIL Hybrid 35+65 -Aggressive Index
Nil
N.A.
Regular, Direct
Growth, IDCW
Daily - Minimum 500 & in multiples of 1thereafter for minimum of twelve installments.Weekly - Minimum 1000 & in multiples of1 thereafter for minimum of six installments
or Minimum 500 & in multiples of 1thereafter for minimum of twelve installments.Monthly - Minimum 1000 & in multiples of1 thereafter for minimum six months (or)
minimum 500 & in multiples of 1thereafter for minimum one year.Quarterly - Minimum 1500 & in multiples of1 thereafter for minimum one year.
Semi-Annual - Minimum amount of investmentwill be 3,000 and in multiples of 1thereafter for minimum 4 number ofinstallments.Annual - Minimum amount of investment will be5,000 and in multiples of 1 thereafter for
minimum 4 number of installments.
5000 & in multiples of 1
1000 & in multiples of 1
Month of
`
`
` `
` `
` `
`
`
` `
`
`
` `
`
`
` `
` `
PORTFOLIO CLASSIFICATION BYINDUSTRY ALLOCATION (%)
PORTFOLIO
^Investors should consult their financial advisers if indoubt about whether the product is suitable for them.
Financial Services 24.50Capital Goods 13.56Sovereign 12.02Automobile And Auto Components 8.30Consumer Services 6.22Information Technology 4.92Services 3.79Construction Materials 3.50Healthcare 3.28Construction 2.61Consumer Durables 2.51Realty 2.12Metals & Mining 1.74Textiles 1.66Cash, Cash Equivalents And Others 9.27
Equity Shares
HDFC Bank Ltd. 5.44
ICICI Bank Ltd. 5.16
Infosys Ltd. 4.02
Maruti Suzuki India Ltd. 3.89
Housing Development Finance Corporation Ltd. 3.42
Grindwell Norton Ltd. 3.13
The Indian Hotels Company Ltd. 3.10
ABB India Ltd. 2.90
State Bank Of India 2.80
Timken India Ltd. 2.71
Larsen & Toubro Ltd. 2.61
Ultratech Cement Ltd. 2.54
Axis Bank Ltd. 2.50
Chalet Hotels Ltd. 2.36
Cholamandalam Investment & Finance Co. Ltd. 2.23
ZF Commercial Vehicle Control Systems India Ltd. 1.93
Esab India Ltd. 1.86
Hindalco Industries Ltd. 1.74
HDFC Asset Management Company Ltd. 1.72
AIA Engineering Ltd. 1.70
Page Industries Ltd. 1.66
Cipla Ltd. 1.65
Abbott India Ltd. 1.63
TVS Motor Company Ltd. 1.49
Issuer Name Rating (%) Of TotalAUM
Issuer Name Rating (%) Of TotalAUM
V-Guard Industries Ltd. 1.38
Carborundum Universal Ltd. 1.26
ICICI Lombard General Insurance Company Ltd. 1.23
Hawkins Cookers Ltd. 1.13
DLF Ltd. 1.09
The Phoenix Mills Ltd. 1.03
Sona Blw Precision Forgings Ltd. 0.99
Nuvoco Vistas Corporation Ltd. 0.96
Wipro Ltd. 0.90
FSN E-Commerce Ventures Ltd. 0.76
Government Of India SOVEREIGN 11.33
State Government Of Gujarat SOVEREIGN 0.69
National Highways Infra Trust 3.79
Total 74.92
Total 11.33
Total 0.69
Total 3.79
Government Securities
State Development Loans
Infrastructure Investment Trust
Cash, Cash Equivalents And Others 9.27
Grand Total 100.00
Investors understand that their principal
will be at Very High risk
Quantitative DataModified Duration :
Average Maturity :
Macaulay Duration :
years
3.16 years
2.87
2.77
years
6.86%Yield to Maturity :
Option NAV ( )` Option NAV ( )`
NET ASSET VALUE NET ASSET VALUE
Reg-Plan-IDCW 13.2225
Reg-Plan-Growth 13.2224
Direct Plan-IDCW 13.5073
Dir-Plan-Growth 13.5057
Cash, Cash Equivalents, Derivative Margin and Others
Infrastructure Investment Trust
SovereignLarge Cap Midcap Small Cap
*Mr. Mohit Jain is the dedicated fund manager for managing overseas investments of the Scheme.
41.98
19.35
13.59
3.79
12.02
9.27

46
SOLUTIONS ORIENTEDSCHEME-RETIREMENT FUND
•
•
Long term capital appreciationInvestment predominantly in debt and money marketinstruments & balance in equity and equity related instruments
SBI Retirement Benefit Fund – Conservative Hybrid PlanThis product is suitable for investors who are seeking^:
Investment Objective
The investment objective of the scheme is to provide acomprehensive retirement saving solution that servesthe variable needs of the investors through long termdiversified investments in major asset classes.However, there can be no assurance that theinvestment objective of the Scheme will be realized.
Fund Details
PORTFOLIO CLASSIFICATION BY(%)ASSET ALLOCATION
•
•
•
•
•
•
•
•
•
•
•
•
•
•
Type of Scheme
Date of Allotment:
Report As On:
AAUM for the August 2022
AUM as on August 31, 2022
Fund Manager:
Mr. Rohit Shimpi -
Mr. Dinesh Ahuja and Mr. Ardhendu
Bhattacharya
Mr. Mohit Jain
Managing since:
Dinesh Ahuja:
Rohit Shimpi:
Ardhendu Bhattacharya:
Total Experience:
Mr. Rohit Shimpi -
Mr. Dinesh Ahuja -
Mr. Mohit Jain -
Mr. Ardhendu Bhattacharya
First Tier Benchmark:
Exit Load:
Entry Load:
Plans Available:
Option:
SIP
Minimum Investment
Additional Investment
An open-ended retirement solution-orientedscheme having a lock-in of 5 years or tillretirement age (whichever is earlier)
10/02/2021
31/08/2022
193.13 Crores
195.63 Crores
Equity Portion
(Co-fund manager) -Debt portion
* Overseas investments
Feb - 2021
Oct - 2021
June - 2021
Over 16 years
Over 24 years
Over 10 years
- Over 12 years
CRISIL Hybrid 65+35 - Conservative Index
Nil
N.A.
Regular, Direct
Growth, IDCW
Daily - Minimum 500 & in multiples of 1thereafter for minimum of twelve installments.Weekly - Minimum 1000 & in multiples of1 thereafter for minimum of six installments
or Minimum 500 & in multiples of 1thereafter for minimum of twelve installments.Monthly - Minimum 1000 & in multiples of1 thereafter for minimum six months (or)
minimum 500 & in multiples of 1thereafter for minimum one year.Quarterly - Minimum 1500 & in multiples of1 thereafter for minimum one year.
Semi-Annual - Minimum amount of investmentwill be 3,000 and in multiples of 1thereafter for minimum 4 number ofinstallments.Annual - Minimum amount of investment will be5,000 and in multiples of 1 thereafter for
minimum 4 number of installments.
5000 & in multiples of 1
1000 & in multiples of 1
Month of
`
`
` `
` `
` `
`
`
` `
`
`
` `
`
`
` `
` `
PORTFOLIO CLASSIFICATION BYINDUSTRY ALLOCATION (%)
PORTFOLIO
^Investors should consult their financial advisers if indoubt about whether the product is suitable for them.
Sovereign 36.27Financial Services 26.67Capital Goods 6.71Automobile And Auto Components 4.16Telecommunication 3.72Consumer Services 2.93Information Technology 2.51Construction Materials 1.86Healthcare 1.58Consumer Durables 1.36Construction 1.33Realty 1.19Metals & Mining 0.87Textiles 0.84Cash, Cash Equivalents And Others 8.00
Equity Shares
HDFC Bank Ltd. 2.95
ICICI Bank Ltd. 2.84
Infosys Ltd. 2.02
Maruti Suzuki India Ltd. 2.01
Housing Development Finance Corporation Ltd. 1.81
Grindwell Norton Ltd. 1.62
ABB India Ltd. 1.50
The Indian Hotels Company Ltd. 1.41
Ultratech Cement Ltd. 1.33
Larsen & Toubro Ltd. 1.33
Axis Bank Ltd. 1.28
State Bank Of India 1.26
Timken India Ltd. 1.15
Cholamandalam Investment & Finance Co. Ltd. 1.13
Chalet Hotels Ltd. 1.04
ZF Commercial Vehicle Control Systems India Ltd. 0.96
Cipla Ltd. 0.91
HDFC Asset Management Company Ltd. 0.90
ESAB India Ltd. 0.88
Hindalco Industries Ltd. 0.87
Page Industries Ltd. 0.84
AIA Engineering Ltd. 0.83
Carborundum Universal Ltd. 0.73
V-Guard Industries Ltd. 0.71
Abbott India Ltd. 0.67
TVS Motor Company Ltd. 0.65
Hawkins Cookers Ltd. 0.65
Issuer Name Rating (%) Of TotalAUM
Issuer Name Rating (%) Of TotalAUM
ICICI Lombard General Insurance Company Ltd. 0.62
DLF Ltd. 0.61
The Phoenix Mills Ltd. 0.58
Sona Blw Precision Forgings Ltd. 0.54
Nuvoco Vistas Corporation Ltd. 0.53
Wipro Ltd. 0.49
Fsn E-Commerce Ventures Ltd. 0.48
Mahindra Rural HousingFinance Ltd. IND AA+ 5.12
HDFC Ltd. CRISIL AAA 3.89
LIC Housing Finance Ltd. CRISIL AAA 3.84
Summit Digitel InfrastructurePvt. Ltd. CRISIL AAA 3.72
Union Bank Of India(At1 Bond Under Basel III) CRISIL AA 1.03
Government Of India SOVEREIGN 31.16
State Government OfChhattisgarh SOVEREIGN 4.41
State Government Of Karnataka SOVEREIGN 0.70
Total 38.13
Total 17.60
Total 31.16
Total 5.11
Non Convertible Debentures
Government Securities
State Development Loans
Cash, Cash Equivalents And Others 8.00
Grand Total 100.00
Quantitative DataModified Duration :Average Maturity :Macaulay Duration :Yield to Maturity :
6.21 years9.95 years6.48 years7.49%
Option NAV ( )` Option NAV ( )`
NET ASSET VALUE NET ASSET VALUE
Reg-Plan-IDCW 11.7638
Reg-Plan-Growth 11.7619
Direct Plan-IDCW 11.9061
Dir-Plan-Growth 11.9075
Investors understand that their principal
will be at High risk
*Mr. Mohit Jain is the dedicated fund manager for managing overseas investments of the Scheme.
Cash, Cash Equivalents, Derivative Margin and Others
Large Cap Midcap Small Cap Sovereign
AA+AAA and Equivalent Below AA AA
21.94
9.54
6.65
11.455.121.03
36.27
8.00

47
SOLUTIONS ORIENTEDSCHEME-RETIREMENT FUND
•
•
Long term capital appreciationInvestment predominantly in debt and money marketinstruments & remaining in equity and equity related instruments
SBI Retirement Benefit Fund – Conservative PlanThis product is suitable for investors who are seeking^:
Investment Objective
The investment objective of the scheme is to provide acomprehensive retirement saving solution that servesthe variable needs of the investors through long termdiversified investments in major asset classes.However, there can be no assurance that theinvestment objective of the Scheme will be realized.
Fund Details
PORTFOLIO CLASSIFICATION BY(%)ASSET ALLOCATION
•
•
•
•
•
•
•
•
•
•
•
•
•
•
Type of Scheme
Date of Allotment:
Report As On:
AAUM for the August 2022
AUM as on August 31, 2022
Fund Manager:
Mr. Rohit Shimpi -
Mr. Dinesh Ahuja and Mr. Ardhendu
Bhattacharya
Mr. Mohit Jain
Managing since:
Dinesh Ahuja:
Rohit Shimpi:
Ardhendu Bhattacharya:
Total Experience:
Mr. Rohit Shimpi -
Mr. Dinesh Ahuja -
Mr. Mohit Jain -
Mr. Ardhendu Bhattacharya
First Tier Benchmark:
Exit Load:
Entry Load:
Plans Available:
Option:
SIP
Minimum Investment
Additional Investment
An open-ended retirement solution-oriented
scheme having a lock-in of 5 years or till
retirement age (whichever is earlier)
10/02/2021
31/08/2022
147.18 Crores
148.49 Crores
Equity Portion
(Co-fund manager) -Debt portion
* Overseas investments
Feb - 2021
Oct - 2021
June - 2021
Over 16 years
Over 24 years
Over 10 years
- Over 12 years
NIFTY Composite Debt Index
Nil
N.A.
Regular, Direct
Growth, IDCW
Daily - Minimum 500 & in multiples of 1
thereafter for minimum of twelve installments.
Weekly - Minimum 1000 & in multiples of
1 thereafter for minimum of six installments
or Minimum 500 & in multiples of 1
thereafter for minimum of twelve installments.
Monthly - Minimum 1000 & in multiples of
1 thereafter for minimum six months (or)
minimum 500 & in multiples of 1
thereafter for minimum one year.
Quarterly - Minimum 1500 & in multiples of
1 thereafter for minimum one year.
Semi-Annual - Minimum amount of investment
will be 3,000 and in multiples of 1
thereafter for minimum 4 number of
installments.
Annual - Minimum amount of investment will be
5,000 and in multiples of 1 thereafter for
minimum 4 number of installments.
5000 & in multiples of 1
1000 & in multiples of 1
Month of
`
`
` `
` `
` `
`
`
` `
`
`
` `
`
`
` `
` `
PORTFOLIO CLASSIFICATION BYINDUSTRY ALLOCATION (%)
PORTFOLIO
^Investors should consult their financial advisers if indoubt about whether the product is suitable for them.
Sovereign 43.33Financial Services 29.38Telecommunication 4.89Capital Goods 3.35Automobile And Auto Components 2.07Consumer Services 1.38Information Technology 1.27Construction Materials 0.87Healthcare 0.76Consumer Durables 0.67Construction 0.63Realty 0.61Metals & Mining 0.48Textiles 0.43Cash, Cash Equivalents And Others 9.88
Equity Shares
HDFC Bank Ltd. 1.48
ICICI Bank Ltd. 1.38
Infosys Ltd. 1.05
Maruti Suzuki India Ltd. 0.99
Housing Development Finance Corporation Ltd. 0.92
Grindwell Norton Ltd. 0.80
ABB India Ltd. 0.71
State Bank Of India 0.68
The Indian Hotels Company Ltd. 0.67
Ultratech Cement Ltd. 0.64
Larsen & Toubro Ltd. 0.63
Timken India Ltd. 0.61
Axis Bank Ltd. 0.61
Cholamandalam Investment & Finance Co. Ltd. 0.56
Chalet Hotels Ltd. 0.50
Hindalco Industries Ltd. 0.48
AIA Engineering Ltd. 0.47
ZF Commercial Vehicle Control Systems India Ltd. 0.44
HDFC Asset Management Company Ltd. 0.44
ESAB India Ltd. 0.44
Page Industries Ltd. 0.43
Cipla Ltd. 0.42
TVS Motor Company Ltd. 0.40
V-Guard Industries Ltd. 0.35
Abbott India Ltd. 0.34
DLF Ltd. 0.33
Hawkins Cookers Ltd. 0.32
Issuer Name Rating (%) Of TotalAUM
Issuer Name Rating (%) Of TotalAUM
Carborundum Universal Ltd. 0.32
ICICI Lombard General Insurance Company Ltd. 0.29
The Phoenix Mills Ltd. 0.28
Sona Blw Precision Forgings Ltd. 0.24
Nuvoco Vistas Corporation Ltd. 0.23
Wipro Ltd. 0.22
Fsn E-Commerce Ventures Ltd. 0.21
Mahindra Rural HousingFinance Ltd. IND AA+ 6.74
HDFC Ltd. CRISIL AAA 5.12
LIC Housing Finance Ltd. CRISIL AAA 5.06
Summit Digitel InfrastructurePvt. Ltd. CRISIL AAA 4.89
Union Bank Of India(At1 Bond Under Basel III) CRISIL AA 3.38
Bank Of Baroda(At1 Bond Under Basel III) CRISIL AA+ 2.72
Government Of India SOVEREIGN 41.03
State Government Of Rajasthan SOVEREIGN 2.30
Total 18.88
Total 27.91
Total 41.03
Total 2.30
Non Convertible Debentures
Government Securities
State Development Loans
Cash, Cash Equivalents And Others 9.88
Grand Total 100.00
Quantitative DataModified Duration :Average Maturity :Macaulay Duration :Yield to Maturity :
6.29 years10.54 years6.59 years7.39%
Option NAV ( )` Option NAV ( )`
NET ASSET VALUE NET ASSET VALUE
Reg-Plan-IDCW 11.1565
Reg-Plan-Growth 11.1565
Direct Plan-IDCW 11.2499
Dir-Plan-Growth 11.2516
Investors understand that their principal
will be at Moderately High risk
*Mr. Mohit Jain is the dedicated fund manager for managing overseas investments of the Scheme.
Cash, Cash Equivalents, Derivative Margin and Others
Large Cap Midcap Small Cap Sovereign
AAA and Equivalent AA+ AA
10.89
4.78
3.21
15.07
9.46
3.38
43.33
9.88

Exit
Load
NIL
NIL
NIL
Month
End
AU
M (
Rs.
in C
rore
s)`3,6
73.6
6`1,5
39.2
6`2,3
75.1
1`16,2
01.5
4`2,9
51.3
0`9,2
43.3
8`13,4
66.1
2`815.7
8
Exp
ense
Rati
oReg
ula
r- 0
.94%
Dir
ect-
0.4
6%
Reg
ula
r- 1
.46%
Dir
ect-
0.8
0%
Reg
ula
r- 1
.64%
Dir
ect-
0.8
7%
Reg
ula
r- 0
.79%
Dir
ect-
0.3
4%
Reg
ula
r- 1
.55%
Dir
ect-
0.9
2%
Reg
ula
r- 1
.22%
Dir
ect-
0.6
9%
Reg
ula
r- 0
.85%
Dir
ect-
0.3
5%
Reg
ula
r- 0
.64%
Dir
ect-
0.3
3%
Snap
shot
of
Fund
sD
ebt
Eq
uit
y Sh
are
s
Corp
ora
te D
ebt
Gilts
Money
Mark
et I
nst
rum
ents
Oth
er A
sset
s
- -
94.3
2
0.2
7
5.4
1
-
34.4
0
63.4
2
-
2.1
8
- -
94.3
4
0.0
0
5.6
6
-
61.7
8
10.2
9
18.2
4
9.6
9
-
54.5
4
41.4
8
0.2
2
3.7
6
-
47.2
8
19.9
8
7.1
3
25.6
1
- -
92.5
8
-
7.4
2
For
10%
of
the
inve
stm
ents
wit
hin
1Yea
r–
Nil;
For
the
rem
ainin
gin
vest
men
ts -
1.0
0%
For
10%
of
the
inve
stm
ents
1 m
onth
–N
il;Fo
r th
e re
mai
nin
gin
vest
men
ts -
0.2
5%
wit
hin
For
exit
wit
hin
12 m
onth
s
from
the
da t
e of
allo
tmen
t:
- Fo
r 8%
of
inve
stm
ent
- N
il -
For
rem
ainin
g inve
stm
ents
-
1.5
0%
For
8%
of
the
inve
stm
ents
1 Y
ear
–N
il; F
or
the
rem
ainin
g inve
stm
ents
- 3
.00%
For
8%
of
the
inve
stm
ents
aft
er1 Y
ear
to 2
Yea
rs–
Nil;
For
the
rem
ainin
g inve
stm
ents
- 1
.50%
For
8%
of
the
inve
stm
ents
aft
er2 Y
ear
to 3
Yea
rs–
Nil;
For
the
rem
ainin
g inve
stm
ents
- 0
.75%
wit
hin
Schem
e N
am
eSB
I M
agnum
Gilt
Fund
(Pre
viousl
y kn
ow
n a
s SB
IM
agnum
Gilt
Fund -
Long
Ter
m P
lan)
SBI
Magnum
Inco
me
Fund
SBI
Dyn
am
ic B
ond
Fund
SBI
Corp
ora
te B
ond
Fund
SBI
Cre
dit
Ris
k F
und
(Pre
viousl
y kn
ow
n a
s SB
IC
orp
ora
te B
ond F
und)
SBI
Magnum
Med
ium
Dura
tion F
und
(Pre
viousl
y kn
ow
n a
s SB
IReg
ula
r Sa
vings
Fund)
SBI
Short
Ter
m D
ebt
Fund
Idea
l In
ves
tmen
t H
ori
zon
3ye
ars
+3
year
s+
3ye
ars
+3
year
s+
3ye
ars
+2
year
s+
1ye
ar+
1ye
ar+
Ince
pti
on D
ate
30/1
2/2
000
25/1
1/1
998
09/0
2/2
004
16/
01/2
019
17/0
7/2
014
12/1
1/2
003
27/7
/2007
30/1
2/2
000
Fund
Manager
Mr.
Din
esh A
huja
Mr.
Din
esh A
huja
& *
Mr.
Mohit
Ja i
nM
r. D
ines
h A
huja
& *
Mr.
Mohit
Ja i
nM
r. R
ajee
vR
adhak
rish
na n
& *
Mr.
Mohit
Ja i
nM
r. L
oke
sh M
ally
a*M
r. M
ohit
Ja i
nM
r. D
ines
h A
huja
*Mr.
Mohit
Ja i
nM
r. R
ajee
vR
adhak
rish
na n
&*M
r. M
ohit
Ja i
nM
r. D
ines
h A
huja
(w.e
.f. Ja
n 2
7, 2020)
Managin
g S
ince
Jan-2
011
Jan-2
011 -
Nov-
2017
Jan-2
011-N
ov-
2017
Jan-2
019-F
eb-2
019
Feb-2
017-
Nov-
2017
July
-2011-
Nov-
2017
Jun-2
008 -
Nov-
2017
Jan -
2020
Firs
t T
ier
Ben
chm
ark
NIF
TY C
orp
ora
te B
ond
Index
B-III
NIF
TY C
redit
Ris
kBo
nd Index
C-II
CRIS
IL S
hort
Dura
tion
Fund A
II In
dex
Plea
se c
onsu
lt y
our
finan
cial
advi
sor
bef
ore
inve
stin
g.
For
det
ails
, ple
ase
refe
r to
res
pec
tive
pag
e of
the
schem
e. E
xpen
se r
atio
incl
udes
GST
, Ba
se T
ER a
nd a
ddit
ional
expen
ses
as p
er r
egula
tion
52
(6A
)(b)
and 5
2(6
A)(
c) o
f SE
BI (
MF)
reg
ula
tions
for
both
Dir
ect
and R
egula
r pla
n.
| *M
r. M
ohit
Jai
n is
the
ded
icat
ed f
und m
anag
er f
or
man
agin
g o
vers
eas
inve
stm
ents
of
the
Schem
e.
SBI
Magnum
Const
ant
Matu
rity
Fund
(Pre
viousl
ykn
ow
n a
s SB
I M
agnum
Gilt
Fund -
Short
Ter
m P
lan)
Nif
ty A
ll D
ura
tion G
-Sec
Index
CRIS
IL M
ediu
m t
oLo
ng D
ura
tion F
und
BIII
Index
CRIS
IL D
ynam
ic B
ond
Fund A
III Index
NIF
TY M
ediu
mD
ura
tion D
ebt
Index
C-III
Nif
ty 1
0 y
r Be
nch
mar
kG
-Sec
Oth
er
Deta
ils
-
73.4
2
15.1
3
0.2
0
11.2
5
Nil
Co
mp
osit
ion
by R
ati
ng
s a
s o
n31
Au
gu
st
2022
Co
mp
os
itio
n b
yA
ss
ets
as
on
31
Au
gu
st
2022
AA
, AA
+, A
AA
And
EQ
UIV
ALE
NT
Bel
ow
AA
Sover
eign
Bel
ow
A1+
, A1+
Cash
, Cash
Eq
uiv
ale
nts
,D
eriv
ati
ves
and
Oth
ers
- -
96.4
9
-
3.5
1
28.5
8
5.8
2
63.4
2
-
2.1
8
- -
97.3
6
0.0
0
2.6
4
45.1
2
16.6
6
12.7
9
15.7
4
9.6
9
46.0
9
8.4
5
42.2
9
0.2
2
2.9
5
47.2
8
-
27.8
2
7.1
3
17.7
7
- -
96.3
5
-
3.6
5
73.4
2
-
16.9
4
0.2
0
9.4
4
Mod
ifie
d D
ura
tion (
Aver
age
Matu
rity
)
Maca
ula
y D
ura
tion (
years
years
)
(yea
rs
)
Yie
ld t
o M
atu
rity
(%
)
6.8
5
10.4
3
7.1
0
7.2
0
5.3
1
7.7
0
5.5
3
7.3
2
7.1
5
10.9
7
7.4
1
7.2
4
1.6
2
2.6
5
1.7
3
7.5
7
3.7
6
5.2
0
3.9
3
7.4
4
1.4
1
1.7
7
1.4
8
6.6
4
6.8
8
9.6
6
7.1
3
7.1
6
1.4
5
1.7
9
1.5
4
6.7
4
Fu
nd
Deta
ils a
s o
n31
Au
gu
st
2022
48

1day
+
01/1
0/2
002
Mr.
R. A
run
Apr-
2012
1day
+
01/1
0/2
002
Mr.
R. A
run
Apr-
2012
1day
+
01/1
0/2
002
Mr.
R. A
run
Apr-
2012
Co
mp
osit
ion
by R
ati
ng
s a
s o
n31
Au
gu
st
2022
Exit
Load
NIL
Wit
hin
3 b
usi
nes
sday
s-
0.1
0%
NIL
NIL
AA
, AA
+, A
AA
And
EQ
UIV
ALE
NT
Bel
ow
AA
Sover
eign
Bel
ow
A1+
, A1+
Cash
, Cash
Eq
uiv
ale
nts
,D
eriv
ati
ves
and
Oth
ers
Oth
er
Deta
ils
Fu
nd
Deta
ils a
s o
n31
Au
gu
st
2022
Month
End
AU
M (
Rs.
in C
rore
s)`8,9
57.1
7`20,4
97.8
9`5,7
34.3
8`64,9
72.3
3`11,9
93.8
1`2,4
93.2
0`14,0
05.6
3
Exp
ense
Rati
oReg
ula
r- 0
.96%
Dir
ect-
0.4
0%
Reg
ula
r- 0
.76%
Dir
ect-
0.2
3%
Reg
ula
r- 0
.81%
Dir
ect-
0.3
4%
Reg
ula
r0.2
8%
Dir
ect-
0.1
8%
-Reg
ula
r- 0
.47%
Dir
ect-
0.2
9%
Reg
ula
r- 0
.46%
Dir
ect-
0.2
6%
Reg
ula
r- 0
.18%
Dir
ect-
0.1
0%
Mod
ifie
d D
ura
tion (
Aver
age
Matu
rity
Maca
ula
y D
ura
tion (
years
)
Yie
ld t
o M
atu
rity
years
)
(yea
rs)
(%)
0.5
8
0.6
5
0.6
1
6.4
9
0.2
6
0.2
8
0.2
8
6.1
6
1.3
5
1.6
1
1.4
3
6.6
6
0.1
1
0.1
2
0.1
1
5.6
7
0.3
3
0.3
8
0.3
5
6.0
8
1 D
ay
1 D
ay
1 D
ay
5.3
8
Eq
uit
y Sh
are
s
Corp
ora
te D
ebt
Gilts
Money
Mark
et I
nst
rum
ents
Oth
er A
sset
s
Co
mp
osit
ion
by
Assets
as o
n31
Au
gu
st
2022
-
36.3
8
9.0
5
41.9
1
12.6
6
- - -
89.3
4
10.6
6
-
65.0
2
8.4
0
12.5
0
14.0
8
-
0.2
3
-
94.9
8
4.7
9
-
9.3
4
4.0
0
71.4
8
15.1
8
-
58.6
2
18.0
8
1.3
4
21.9
6
- - -
5.0
3
94.9
7
36.3
8
-
20.4
0
36.5
5
6.6
7
- -
20.4
8
71.9
0
7.6
2
65.0
2
-
11.1
5
12.5
0
11.3
3
0.2
3
-
34.3
5
61.6
4
3.7
8
9.3
4
-
21.7
1
58.0
1
10.9
4
55.6
9
-
34.7
4
1.3
4
8.2
3
- -
5.0
3
-
94.9
7
Snap
shot
of
Deb
t Fu
nd
s
Plea
se c
onsu
lt y
our
finan
cial
advi
sor
bef
ore
inve
stin
g.
For
det
ails
, ple
ase
refe
r to
res
pec
tive
pag
e of
the
schem
e. E
xpen
se r
atio
incl
udes
GST
, Ba
se T
ER a
nd a
ddit
ional
expen
ses
as p
er r
egula
tion
52
(6A
)(b)
and 5
2(6
A)(
c) o
f SE
BI (
MF)
reg
ula
tions
for
both
Dir
ect
and R
egula
r pla
n.
|*M
r. M
ohit
Jai
n is
the
ded
icat
ed f
und m
anag
er f
or
man
agin
g o
vers
eas
inve
stm
ents
of
the
Schem
e.
Schem
e N
am
eSB
I Sa
vin
gs
Fund
SBI
Bankin
g a
nd
PSU
Fund
(Pre
viousl
y kn
ow
n a
s SB
ITre
asury
Adva
nta
ge
Fund)
SBI
Liq
uid
Fund
(Pre
viousl
y kn
ow
n a
s SB
IPr
emie
r Li
quid
Fund)
Idea
l In
ves
tmen
t H
ori
zon
3m
onth
s+
3m
onth
s+
3ye
ars
+7day
+1
day
+3
year
s+
1day
+
Ince
pti
on D
ate
27/7
/2007
19/0
7/2
004
09/1
0/2
009
24/1
1/2
003
21/0
5/1
999
27/1
0/2
020
01/1
0/2
002
Fund
Manager
Mr.
Raj
eev
Rad
hak
rish
nan
& *
Mr.
Mohit
Jai
nM
r. R
. A
run
& *
Mr.
Mohit
Jai
n
Mr.
Raj
eev
Rad
hak
rish
nan
Mr.
Mohit
Jain
-in
vest
men
tsin
fore
ign
secu
riti
esof
the
Schem
e(w
.e.f
.Ja
n2
2,
2020)
Mr.
R. A
run
Mr.
R. A
run
& *
Mr.
Mohit
Jai
n
Mr.
Raj
eev
Rad
hak
rish
nan
and M
r.A
rdhen
du B
hat
tach
arya
(Co-f
und m
anag
er)
& *
Mr.
Mohit
Jai
n
Mr.
R. A
run
Managin
g S
ince
Jun-2
008-
Nov-
2017
Apr-
2012-
Nov-
2017
Nov-
20
13
- Jan
-20
20
May
-2018
June
2021 -
Nov
2017
Mohit
& R
ajee
v -
Oct
2020
Ard
hen
du -
June
2021
Apr-
2012
Firs
t T
ier
Ben
chm
ark
CRIS
IL M
oney
Mar
ket
Fund B
I In
dex
NIF
TY L
iquid
Index
B-I
SBI
Over
nig
ht
Fund
(Pre
viousl
y kn
ow
n a
sSB
IM
agnum
Inst
aCas
h F
und -
Liquid
Flo
ater
)
SBI
Floati
ng
Rate
Deb
tFu
nd
SBI
Magnum
Ult
raSh
ort
Dura
tion
Fund
(Pre
viousl
y kn
ow
n a
sSB
IM
agnum
Inst
aCas
h F
und)
SBI
Magnum
Low
Dura
tion
Fund
(Pre
viousl
y kn
ow
n a
sSB
IU
ltra
Short
Ter
mD
ebt
Fund)
CRIS
IL O
vern
ight
Fund
AIIn
dex
Nif
ty S
hort
Dura
tion
Deb
t In
dex
CRIS
IL U
ltra
Short
Dura
tion F
und B
IIn
dex
NIF
TY B
anki
ng a
nd
PSU
Deb
t In
dex
CRIS
IL L
ow
Dura
tion
Fund B
IIn
dex
NIL
For
exit
wit
hin
3 d
ays
from
the
dat
e of
allo
tmen
t: 0
.10
%,
For
exit
on o
r af
ter
3 d
ays
from
the
dat
e of
allo
tmen
t: N
il
Inve
stor
exit
upon
subsc
ripti
on /
swit
ch -
in
Exit
Load
as
a%
of
redem
pti
on
pro
ceed
s
Day 1
0.0
070%
Day 2
0.0
065%
Day 3
0.0
060%
Day 4
0.0
055%
Day 5
0.0
050%
Day 6
0.0
045%
Day 7
0.0
000%
49
1.1
4
1.3
1
1.2
1
6.7
0

50
DEBT- GILT FUND
Investment Objective
Quantitative Data
To provide returns to the investors generatedthrough investments in Government securitiesissued by the Central Government and/or StateGovernment(s).
Fund Details
Modified Duration :
Average Maturity :
Macaulay Duration :
Yield to Maturity :
6.8510.43 years7.10 years7.20%
years
•
•
•
•
•
•
•
•
•
•
•
•
•
•
Type of Scheme
Date of Allotment:
Report As On:
AAUM for the August 2022
AUM as on August 31, 2022
Fund Manager: Mr. Dinesh Ahuja
Managing Since:
Total Experience:
First Tier Benchmark:
Exit Load:
Entry Load:
Plans Available:
Options:
Minimum Investment
Additional Investment
An open ended Debt Scheme investing in
government securities across maturity. A
relatively high interest rate risk and relatively
low credit risk
30/12/2000
31/08/2022
3,589.40 Crores
3,673.66 Crores
Jan-2011
Over 24 years
Nifty All Duration G-Sec Index
NIL
N.A.
Regular, Direct
Growth, IDCW
Any Day SIP’ Facility is available for Monthly,
Quarterly, Semi-Annual and Annual frequencies
through electronic mode like OTM / Debit
Mandate. Default SIP date will be 10th. In case
the SIP due date is a Non Business Day, then
the immediate following Business Day will be
considered for SIP processing.
Daily - Minimum 500 & in multiples of 1
thereafter for a minimum of 12 instalments.
(Kindly refer notice cum addendum dated June
02, 2020 for further details)
Weekly - Minimum 1000 & in multiples of 1
thereafter for a minimum of 6 instalments. (or)
Minimum 500 & in multiples of 1 thereafter for
a minimum of 12 instalments.
Monthly - Minimum 1000 & in multiples of 1
thereafter for minimum six months (or)
minimum 500 & in multiples of 1 thereafter
for minimum one year
Quarterly - Minimum 1500 & in multiples of 1
thereafter for minimum one year.
Semi Annual - Minimum 3000 & in multiples
of 1 thereafter for a minimum of 4
installments.
Annual - Minimum 5000 & in multiples of 1
thereafter for a minimum of 4 installments.
5,000 & in multiples of 1
1,000 & in multiples of 1
Month of
`
`
` `
` `
` `
` `
`
`
` `
` `
` `
SIP
Option NAV ( )`
NET ASSET VALUE
Option NAV ( )`
PORTFOLIO CLASSIFICATION BYRATING CLASS (%)
PORTFOLIO CLASSIFICATION BYASSET ALLOCATION (%)
•
•
Regular income and capital growth for medium to long-term
Investment in government securities.
SBI Magnum Gilt FundThis product is suitable for investors who are seeking^:
^Investors should consult their financial advisers if indoubt about whether the product is suitable for them.
PORTFOLIO
Government Securities
State Development Loans
Government Of India SOVEREIGN 94.32
State Government Of Andhra Pradesh SOVEREIGN 1.82
State Government Of West Bengal SOVEREIGN 0.08
182 Day T-Bill 29.09.22 SOVEREIGN 0.27
Total 94.32
Total 1.90
Total 0.27
Treasury Bills
Cash, Cash Equivalents And Others 3.51
Grand Total 100.00
Issuer Name Rating (%) Of TotalAUM
PF-Fixed Period-1 Year-IDCW 16.3530
PF-Fixed Period-2 Year-IDCW 16.5496
PF-Fixed Period-3 Year-IDCW 16.0461
PF-Regular IDCW 17.1024
PF-Fixed Period-3 Year-Growth 31.7507
PF-Regular Growth 33.9825
Reg-Plan-IDCW 16.2772
Reg-Plan-Growth 52.9345
Dir-Plan-IDCW 17.6512
Dir-Plan-Growth 55.3062
Government Securities 94.32
State Development Loans 1.90
Treasury Bills 0.27
Cash, Cash Equivalents And Others 3.51
Sovereign
Cash, Cash Equivalents, And Others
96.49
3.51
Investors understand that their principal
will be at Moderate risk

51
DEBT-MEDIUM TO LONGDURATION FUND
Option NAV ( )`
NET ASSET VALUE
Option NAV ( )`
•
•
Regular income for medium to long-term
Investment in Debt and Money Market Instruments.
SBI Magnum Income FundThis product is suitable for investors who are seeking^:
Investment Objective
Quantitative Data
To provide investors an opportunity to generateregular income through investments in debt andmoney market instruments such that theMacaulay duration of the portfolio is between 4years and 7 years. However, there is noguarantee or assurance that the investmentobjective of the scheme will be achieved. Thescheme doesn’t assure or guarantee any returns.
Fund Details
Modified Duration :Average Maturity :Macaulay Duration :Yield to Maturity :
5.317.70 years5.53 years7.32%
years
PORTFOLIO CLASSIFICATION BYRATING CLASS (%)
•
•
•
•
•
•
•
•
•
•
•
•
•
•
Type of Scheme
Date of Allotment:Report As On:AAUM for the August 2022
AUM as on August 31, 2022
Fund Manager: Mr. Dinesh Ahuja &*Mr. Mohit JainManaging Since:Mr. Dinesh AhujaMr. Mohit JainTotal Experience:Mr. Dinesh AhujaMr. Mohit JainFirst Tier Benchmark:
Exit Load:
Entry Load:Plans Available:Options:SIP
Minimum Investment
Additional Investment
An open-ended medium to long term Debtscheme investing in instruments such that theMacaulay Duration of the portfolio is between 4years to 7 years (Please refer to the page no. 26of SID for details on Macaulay's Duration).A relatively high interest rate risk and relativelyhigh credit risk
25/11/199831/08/2022
1,533.74 Crores
1,539.26 Crores
Jan-2011Nov-2017
Over 24 yearsOver 10 years
CRISIL Medium to LongDuration Fund BIII Index
For exit within 1 year from the dateof allotment.For 10% of investment : NilFor remaining investment: 1.00%For exit after one year from the date ofallotment – Nil
N.A.Regular, Direct
Growth, IDCW
Any Day SIP’ Facility is available for Monthly,Quarterly, Semi-Annual and Annual frequenciesthrough electronic mode like OTM / DebitMandate. Default SIP date will be 10th. In casethe SIP due date is a Non Business Day, then theimmediate following Business Day will beconsidered for SIP processing.Daily - Minimum 500 & in multiples of 1thereafter for a minimum of 12 instalments.(Kindly refer notice cum addendum dated June02, 2020 for further details)Weekly - Minimum 1000 & in multiples of 1thereafter for a minimum of 6 instalments. (or)Minimum 500 & in multiples of 1 thereafter for aminimum of 12 instalments.Monthly - Minimum 1000 & in multiples of 1thereafter for minimum six months (or)minimum 500 & in multiples of 1 thereafterfor minimum one yearQuarterly - Minimum 1500 & in multiples of 1.Semi Annual - Minimum 3000 & in multiples of1 thereafter for a minimum of 4 installments.
Annual - Minimum 5000 & in multiples of 1thereafter for a minimum of 4 installments.
5,000 & in multiples of 1
1,000 & in multiples of 1
Month of`
`
` `
` `
` `
` `
`
`
` `
` `
` `
PORTFOLIO CLASSIFICATION BYASSET ALLOCATION (%)
^Investors should consult their financial advisers if indoubt about whether the product is suitable for them.
PORTFOLIO
Non Convertible Debentures
Zero Coupon Bonds
Tata Realty And Infrastructure Ltd. [ICRA]AA 4.50Tata Power Company Ltd. IND AA 4.27Mahindra Rural Housing Finance Ltd. IND AA+ 3.90Indinfravit Trust CRISIL AAA 3.82Aadhar Housing Finance Ltd. CARE AA 3.25State Bank Of India (Tier II Bond Under Basel III) CRISIL AAA 3.11Indian Bank (Tier II Bond Under Basel III) CRISIL AAA 3.10Jindal Stainless Ltd. CRISIL AA- 2.84Muthoot Finance Ltd. CRISIL AA+ 1.62Indian Bank (Tier II Bond Under Basel III) IND AA+ 1.01
Tata Motor Finance Holdings Ltd. [ICRA]AA- 2.98
Government Of India SOVEREIGN 63.42
Total 31.42
Total 2.98
Total 63.42
Government Securities
Cash, Cash Equivalents And Others 2.18
Grand Total 100.00
Issuer Name Rating (%) Of Total AUM
Reg-Plan-Bonus 34.8182
Reg-Plan-Growth 57.4644
Reg-Plan-Half Yearly IDCW 15.0298
Reg-Plan-Quarterly IDCW 16.1831
Government Securities 63.42
Non Convertible Debentures 31.42
Zero Coupon Bonds 2.98
Cash, Cash Equivalents And Others 2.18
Dir-Plan-Bonus 36.9193
Dir-Plan-Growth 60.8315
Dir-Plan-Half Yearly IDCW 17.2594
Dir-Plan-Quarterly IDCW 17.6695
AAA and Equivalent Below AA AA+AA Sovereign
Cash, Cash Equivalents, And Others
Investors understand that their principal
will be at Moderately High risk
*Mr. Mohit Jain is the dedicated fund manager for managing overseas investments of the Scheme.
10.03
6.53
12.02
5.8263.42
2.18

52
DEBT- DYNAMIC BOND FUND
Option NAV ( )`
NET ASSET VALUE
•
•
Regular income for medium to long-term
Investment in high quality debt securities of varying maturities.
SBI Dynamic Bond FundThis product is suitable for investors who are seeking^:
Investment Objective
Quantitative Data
To provide investors attractive returnsthrough investment in an activelymanaged portfolio of high quality debtsecurities of varying maturities.
Fund Details
Modified Duration :Average Maturity :Macaulay Duration :Yield to Maturity :
7.15 years10.97 years7.41 years7.24%
PORTFOLIO CLASSIFICATION BYRATING CLASS (%)
•
•
•
•
•
•
•
•
•
•
•
•
•
•
Type of Scheme
Date of Allotment:Report As On:AAUM for the August 2022
AUM as on August 31, 2022
Fund Manager: Mr. Dinesh Ahuja &
*Mr. Mohit Jain
Managing Since:
Mr. Dinesh Ahuja
Mr. Mohit Jain
Total Experience:
Mr. Dinesh Ahuja
Mr. Mohit JainFirst Tier Benchmark:
Exit Load:
Entry Load:Plans Available:Options:SIP
Minimum Investment
Additional Investment
An open ended dynamic debt scheme investingacross duration A relatively high interest raterisk and relatively low credit risk
09/02/200431/08/2022
2,346.64 Crores
2,375.11 Crores
Jan-2011
Nov-2017
Over 24 years
Over 10 Years
CRISIL Dynamic Bond Fund AIII Index
For exit within 1 month from the date ofallotmentFor 10% of investment : NilFor remaining investment: 0.25%For exit after one month from the date ofallotment – Nil
N.A.Regular, Direct
Growth, IDCW
Any Day SIP’ Facility is available for Monthly,Quarterly, Semi-Annual and Annual frequenciesthrough electronic mode like OTM / DebitMandate. Default SIP date will be 10th. In casethe SIP due date is a Non Business Day, then theimmediate following Business Day will beconsidered for SIP processing.Daily - Minimum 500 & in multiples of 1thereafter for a minimum of 12 instalments.(Kindly refer notice cum addendum dated June02, 2020 for further details)Weekly - Minimum 1000 & in multiples of 1
thereafter for a minimum of 6 instalments. (or)Minimum 500 & in multiples of 1 thereafter for aminimum of 12 instalments.Monthly - Minimum 1000 & in multiples of 1
thereafter for minimum six months (or)minimum 500 & in multiples of 1 thereafter
for minimum one yearQuarterly - Minimum 1500 & in multiples of 1
thereafter for minimum one year.Semi Annual - Minimum 3000 & in multiples of
1 thereafter for a minimum of 4 installments.Annual - Minimum 5000 & in multiples of 1
thereafter for a minimum of 4 installments.
5,000 & in multiples of 1
1,000 & in multiples of 1
Month of
`
`
` `
` `
` `
` `
`
`
` `
` `
` `
PORTFOLIO CLASSIFICATION BYASSET ALLOCATION (%)
^Investors should consult their financial advisers if indoubt about whether the product is suitable for them.
PORTFOLIO
Government Securities
Government Of India SOVEREIGN 94.34
State Government Of Andhra Pradesh SOVEREIGN 3.02
Total 94.34
Total 3.02
State Development Loans
Cash, Cash Equivalents And Others 2.64
Grand Total 100.00
Issuer Name Rating (%) Of TotalAUM
Reg-Plan-IDCW 15.0824
Reg-Plan-Growth 28.7694
Dir-Plan-IDCW 17.1860
Dir-Plan-Growth 30.7684
Government Securities 94.34
State Development Loans 3.02
Cash, Cash Equivalents And Others 2.64
Cash, Cash Equivalents, And Others
Sovereign
*Mr. Mohit Jain is the dedicated fund manager for managing overseas investments of the Scheme.
97.36
2.64
Investors understand that their principal
will be at Moderate risk
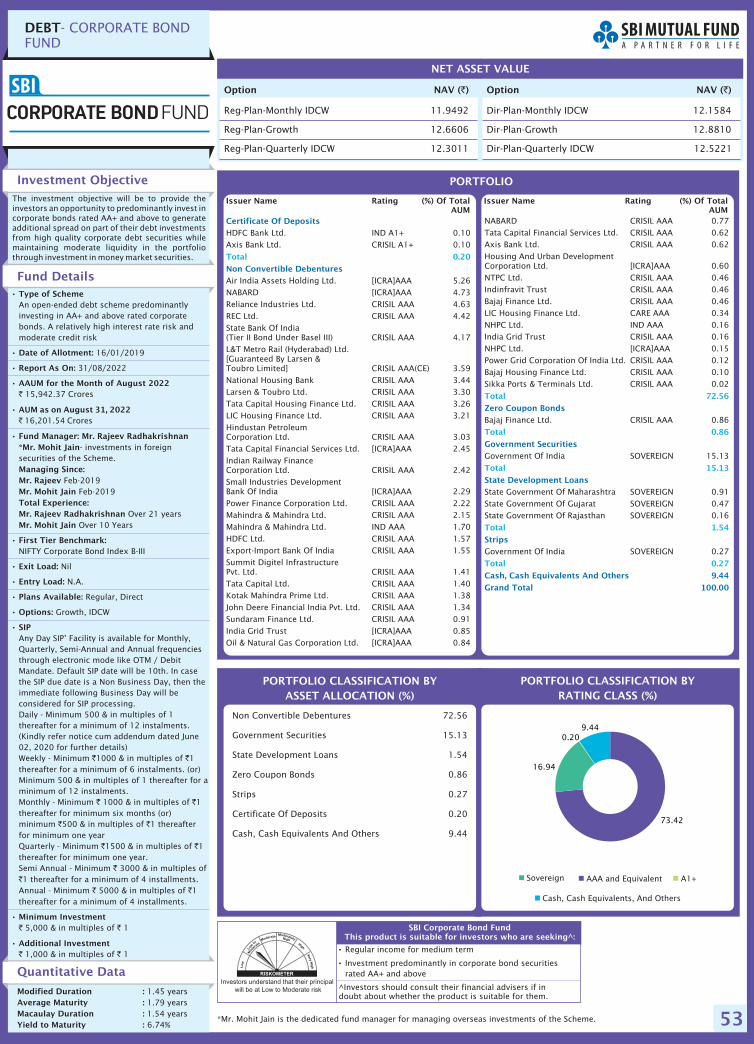
53
DEBT- CORPORATE BONDFUND
Option NAV ( )` Option NAV ( )`
NET ASSET VALUE
•
•
Regular income for medium term
Investment predominantly in corporate bond securitiesrated AA+ and above
SBI Corporate Bond FundThis product is suitable for investors who are seeking^:
Investment Objective
Quantitative Data
The investment objective will be to provide theinvestors an opportunity to predominantly invest incorporate bonds rated AA+ and above to generateadditional spread on part of their debt investmentsfrom high quality corporate debt securities whilemaintaining moderate liquidity in the portfoliothrough investment in money market securities.
Fund Details
Modified Duration :Average Maturity :Macaulay Duration :Yield to Maturity :
1.45 years1.79 years1.54 years6.74%
PORTFOLIO CLASSIFICATION BYRATING CLASS (%)
•
•
•
•
•
•
•
•
•
•
•
•
•
•
Type of Scheme
Date of Allotment:
Report As On:
AAUM for the August 2022
AUM as on August 31, 2022
Fund Manager: Mr. Rajeev Radhakrishnan*Mr. Mohit Jain
Managing Since:Mr. RajeevMr. Mohit JainTotal Experience:Mr. Rajeev RadhakrishnanMr. Mohit Jain
First Tier Benchmark:
Exit Load:
Entry Load:
Plans Available:
Options:
SIP
Minimum Investment
Additional Investment
An open-ended debt scheme predominantlyinvesting in AA+ and above rated corporatebonds. A relatively high interest rate risk andmoderate credit risk
16/01/2019
31/08/2022
15,942.37 Crores
16,201.54 Crores
- investments in foreignsecurities of the Scheme.
Feb-2019Feb-2019
Over 21 yearsOver 10 Years
NIFTY Corporate Bond Index B-III
Nil
N.A.
Regular, Direct
Growth, IDCW
Any Day SIP’ Facility is available for Monthly,Quarterly, Semi-Annual and Annual frequenciesthrough electronic mode like OTM / DebitMandate. Default SIP date will be 10th. In casethe SIP due date is a Non Business Day, then theimmediate following Business Day will beconsidered for SIP processing.Daily - Minimum 500 & in multiples of 1thereafter for a minimum of 12 instalments.(Kindly refer notice cum addendum dated June02, 2020 for further details)Weekly - Minimum 1000 & in multiples of 1thereafter for a minimum of 6 instalments. (or)Minimum 500 & in multiples of 1 thereafter for aminimum of 12 instalments.Monthly - Minimum 1000 & in multiples of 1thereafter for minimum six months (or)minimum 500 & in multiples of 1 thereafterfor minimum one yearQuarterly - Minimum 1500 & in multiples of 1thereafter for minimum one year.Semi Annual - Minimum 3000 & in multiples of1 thereafter for a minimum of 4 installments.
Annual - Minimum 5000 & in multiples of 1thereafter for a minimum of 4 installments.
5,000 & in multiples of 1
1,000 & in multiples of 1
Month of`
`
` `
` `
` `
` `
`
`
` `
` `
` `
PORTFOLIO CLASSIFICATION BYASSET ALLOCATION (%)
^Investors should consult their financial advisers if indoubt about whether the product is suitable for them.
Reg-Plan-Monthly IDCW
Reg-Plan-Growth
Reg Quarterly IDCW
11.9492
12.6606
-Plan- 12.3011
Dir-Plan- 12.1584
12.8810
Dir-Plan-Quarterly IDCW 12.5221
Monthly IDCW
Dir-Plan-Growth
Non Convertible Debentures 72.56
Government Securities 15.13
State Development Loans 1.54
Zero Coupon Bonds 0.86
Strips 0.27
Certificate Of Deposits 0.20
Cash, Cash Equivalents And Others 9.44
Cash, Cash Equivalents, And Others
AAA and Equivalent A1+Sovereign
PORTFOLIO
Issuer Name Rating (%) Of TotalAUM
Issuer Name Rating (%) Of TotalAUM
Certificate Of Deposits
Non Convertible Debentures
HDFC Bank Ltd. IND A1+ 0.10Axis Bank Ltd. CRISIL A1+ 0.10
Air India Assets Holding Ltd. [ICRA]AAA 5.26NABARD [ICRA]AAA 4.73Reliance Industries Ltd. CRISIL AAA 4.63REC Ltd. CRISIL AAA 4.42State Bank Of India(Tier II Bond Under Basel III) CRISIL AAA 4.17L&T Metro Rail (Hyderabad) Ltd.[Guaranteed By Larsen &Toubro Limited] CRISIL AAA(CE) 3.59National Housing Bank CRISIL AAA 3.44Larsen & Toubro Ltd. CRISIL AAA 3.30Tata Capital Housing Finance Ltd. CRISIL AAA 3.26LIC Housing Finance Ltd. CRISIL AAA 3.21Hindustan PetroleumCorporation Ltd. CRISIL AAA 3.03Tata Capital Financial Services Ltd. [ICRA]AAA 2.45Indian Railway FinanceCorporation Ltd. CRISIL AAA 2.42Small Industries DevelopmentBank Of India [ICRA]AAA 2.29Power Finance Corporation Ltd. CRISIL AAA 2.22Mahindra & Mahindra Ltd. CRISIL AAA 2.15Mahindra & Mahindra Ltd. IND AAA 1.70HDFC Ltd. CRISIL AAA 1.57Export-Import Bank Of India CRISIL AAA 1.55Summit Digitel InfrastructurePvt. Ltd. CRISIL AAA 1.41Tata Capital Ltd. CRISIL AAA 1.40Kotak Mahindra Prime Ltd. CRISIL AAA 1.38John Deere Financial India Pvt. Ltd. CRISIL AAA 1.34Sundaram Finance Ltd. CRISIL AAA 0.91India Grid Trust [ICRA]AAA 0.85Oil & Natural Gas Corporation Ltd. [ICRA]AAA 0.84
Total 0.20
NABARD CRISIL AAA 0.77Tata Capital Financial Services Ltd. CRISIL AAA 0.62Axis Bank Ltd. CRISIL AAA 0.62Housing And Urban DevelopmentCorporation Ltd. [ICRA]AAA 0.60NTPC Ltd. CRISIL AAA 0.46Indinfravit Trust CRISIL AAA 0.46Bajaj Finance Ltd. CRISIL AAA 0.46LIC Housing Finance Ltd. CARE AAA 0.34NHPC Ltd. IND AAA 0.16India Grid Trust CRISIL AAA 0.16NHPC Ltd. [ICRA]AAA 0.15Power Grid Corporation Of India Ltd. CRISIL AAA 0.12Bajaj Housing Finance Ltd. CRISIL AAA 0.10Sikka Ports & Terminals Ltd. CRISIL AAA 0.02
Bajaj Finance Ltd. CRISIL AAA 0.86
Government Of India SOVEREIGN 15.13
State Government Of Maharashtra SOVEREIGN 0.91State Government Of Gujarat SOVEREIGN 0.47State Government Of Rajasthan SOVEREIGN 0.16
Government Of India SOVEREIGN 0.27
Total 72.56
Total 0.86
Total 15.13
Total 1.54
Total 0.27
Zero Coupon Bonds
Government Securities
State Development Loans
Strips
Cash, Cash Equivalents And Others 9.44
Grand Total 100.00
Investors understand that their principal
will be at Low to Moderate risk
*Mr. Mohit Jain is the dedicated fund manager for managing overseas investments of the Scheme.
73.42
16.94
0.209.44

54
DEBT- CREDIT RISKFUND
Option NAV ( )`
NET ASSET VALUE
Option NAV ( )`
•
•
Regular income for medium term
Predominantly investment in corporate debt securitiesrated AA and below.
SBI Credit Risk FundThis product is suitable for investors who are seeking^:
Investment Objective
Quantitative Data
To provide the investors an opportunity topredominantly invest in corporate bonds ratedAA and below(excluding AA+ rated corporatebonds) so as to generate attractive returns whilemaintaining moderate liquidity in the portfoliothrough investment in money market securities.
Fund Details
Modified Duration :
Average Maturity :
Macaulay Duration :
Yield to Maturity :
1.62 years
2.65 years
1.73 years
7.57%$per investor per day across all subscriptiontransactions (i.e. fresh purchases, additionalpurchases, switch-in and trigger transactionssuch as SIP, STP and RSP trigger), as availableunder the scheme.
PORTFOLIO CLASSIFICATION BYRATING CLASS (%)
•
•
•
•
•
•
•
•
•
•
•
•
•
•
Type of Scheme
Date of Allotment:Report As On:AAUM for the August 2022
AUM as on August 31, 2022
Fund Manager: Mr. Lokesh Mallya &*Mr. Mohit JainManaging Since:Mr. Lokesh MallyaMr. Mohit JainTotal Experience:Mr. Lokesh MallyaMr. Mohit JainFirst Tier Benchmark:
Exit Load
Entry Load:Plans Available:Options:SIP
Minimum Investment$
Additional Investment
An open-ended debt scheme predominantlyinvesting in AA and below rated corporate bonds(excluding AA+ rated corporate bonds). A relativelyhigh interest rate risk and relatively high credit risk
17/07/201431/08/2022
2,959.27 Crores
2,951.30 Crores
Feb-2017Nov-2017
Over 16 yearsOver 10 years
NIFTY Credit Risk Bond Index C-II
For exit within 12 months from the date ofallotment: For 8% of the investment – Nil For theremaining investment - 3% For exit after 12 monthsbut within 24 months from the date of allotment:For 8% of the investment – Nil For the remaininginvestment -1.5% For exit after 24 months butwithin 36 months from the date of allotment: For8% of the investment – Nil For the remaininginvestment -0.75%; For exit after 36 months fromthe date of allotment – Nil
N.A.Regular, Direct
Growth, IDCW
Any Day SIP’ Facility is available for Monthly,Quarterly, Semi-Annual and Annual frequenciesthrough electronic mode like OTM / Debit Mandate.Default SIP date will be 10th. In case the SIP duedate is a Non Business Day, then the immediatefollowing Business Day will be considered for SIPprocessing.Daily - Minimum 500 & in multiples of 1 thereafterfor a minimum of 12 instalments. (Kindly refernotice cum addendum dated June 02, 2020 forfurther details)Weekly - Minimum 1000 & in multiples of 1thereafter for a minimum of 6 instalments. (or)Minimum 500 & in multiples of 1 thereafter for aminimum of 12 instalments.Monthly - Minimum 1000 & in multiples of 1thereafter for minimum six months (or) minimum500 & in multiples of 1 thereafter for minimumone yearQuarterly - Minimum 1500 & in multiples of 1thereafter for minimum one year.Semi Annual - Minimum 3000 & in multiples of 1thereafter for a minimum of 4 installments.Annual - Minimum 5000 & in multiples of 1thereafter for a minimum of 4 installments.
5000 & in multiples of 1 (Restrict investment inthe scheme to a maximum limit of 10 Cr. perinvestor across all folios on cumulative investment)
1,000 & in multiples of 1
Month of`
`
` `
` `
`
`
` `
` `
` `
` `
` `
PORTFOLIO CLASSIFICATION BYASSET ALLOCATION (%)
PORTFOLIO
Issuer Name Rating (%) Of TotalAUM
Issuer Name Rating (%) Of TotalAUM
^Investors should consult their financial advisers if indoubt about whether the product is suitable for them.
Commercial Papers
Non Convertible Debentures
Tata Projects Ltd. CRISIL A1+ 3.60
L&T Metro Rail (Hyderabad) Ltd. CRISIL A1+ 3.36
Godrej Properties Ltd. CRISIL A1+ 2.54
Kirloskar Ferrous Industries Ltd. [ICRA]A1+ 1.69
Chambal Fertilisers And Chemicals Ltd. CRISIL A1+ 1.69
Asirvad Microfinance Ltd. CRISIL A1+ 1.68
Indostar Capital Finance Ltd. CRISIL A1+ 1.18
Tata International Ltd.(Perpetual Bond) CARE A+ 5.07
Indinfravit Trust CRISIL AAA 4.98
Flometallic India Pvt. Ltd. CRISIL AA+ 4.75
Godrej Industries Ltd. CRISIL AA 4.68
Tata Power Company Ltd. IND AA 3.43
Aadhar Housing Finance Ltd. CARE AA 3.42
Avanse Financial Services Ltd. CARE A+ 3.17
Jindal Stainless Ltd. CRISIL AA- 2.96
Tata Realty And Infrastructure Ltd. [ICRA]AA 2.86
AU Small Finance Bank Ltd.(Tier II Bond Under Basel III) CRISIL AA 2.65
Manappuram Finance Ltd. CRISIL AA 2.57
Union Bank Of India(At1 Bond Under Basel III) IND AA 2.56
Punjab National Bank(At1 Bond Under Basel III) CRISIL AA 2.56
Nuvoco Vistas Corporation Ltd. CRISIL AA 2.54
Pune Solapur Expressways Pvt. Ltd.(A Tata Realty And InfrastructureLimited Jv) [ICRA]AA- 2.04
Union Bank Of India(At1 Bond Under Basel III) CRISIL AA 1.85
Tata Motors Ltd. [ICRA]AA- 1.77
Mahindra Rural Housing Finance Ltd. IND AA+ 1.69
Total 15.74
Latur Renewable Pvt. Ltd. CRISIL AA+(CE) 1.68
Prestige Projects Pvt. Ltd. [ICRA]A+(CE) 1.65
Small Industries DevelopmentBank Of India CARE AAA 1.64
Crompton Greaves ConsumerElectricals Ltd. CRISIL AA+ 0.85
Indian Bank(At1 Bond Under Basel III) CRISIL AA+ 0.41
Government Of India SOVEREIGN 10.29
182 Day T-Bill 22.12.22 SOVEREIGN 2.50
Total 61.78
Total 10.29
Total 2.50
Government Securities
Treasury Bills
Cash, Cash Equivalents And Others 9.69
Grand Total 100.00
Reg-Plan-IDCW 16.5610
Reg-Plan-Daily IDCW 12.1247
Reg-Plan-Growth 36.6330
Non Convertible Debentures 61.78
Commercial Papers 15.74
Government Securities 10.29
Treasury Bills 2.50
Cash, Cash Equivalents And Others 9.69
Dir-Plan-IDCW 18.0761
Dir-Plan-Daily IDCW 12.3237
Dir-Plan-Growth 38.8425
AAA and Equivalent Below AA AA+ AA A1+
Cash, Cash Equivalents, And Others Sovereign
Investors understand that their principal
will be at High risk
*Mr. Mohit Jain is the dedicated fund manager for managing overseas investments of the Scheme.
6.62
9.38
29.12
16.66
12.79
15.74
9.69

55
DEBT- MEDIUM DURATIONFUND
Option NAV ( )`
NET ASSET VALUE
•
•
Regular income for medium term
Investment in Debt and Money Market securities.
SBI Magnum Medium Duration FundThis product is suitable for investors who are seeking^:
Investment Objective
Quantitative Data
To provide investors an opportunity togenerate attractive returns with moderatedegree of liquidity through investmentsin debt and money market instrumentssuch that the Macaulay duration of theportfolio is between 3 years – 4 years.However, there is no guarantee orassurance that the investment objectiveof the scheme will be achieved. Thescheme doesn’t assure or guarantee anyreturns.
Fund Details
Modified Duration :Average Maturity :Macaulay Duration :Yield to Maturity :
3.765.20 years3.93 years7.44%
years
PORTFOLIO CLASSIFICATION BYRATING CLASS (%)
•
•
•
•
•
•
•
•
•
•
•
•
•
•
Type of Scheme
Date of Allotment:Report As On:AAUM for the August 2022
AUM as on August 31, 2022
Fund Managers: Mr. Dinesh Ahuja &*Mr. Mohit JainManaging Since:Mr. Dinesh AhujaMr. Mohit JainTotal Experience:Mr. Dinesh AhujaMr. Mohit JainFirst Tier Benchmark:
Exit Load:
Entry Load:Plans Available:Options:SIP
Minimum Investment
Additional Investment
An open ended medium term debt schemeinvesting in instruments such that the MacaulayDuration of the portfolio is between 3 years and4 years. (Please refer to the page no. 24 of SIDfor details on Macaulay’s Duration). A relativelyhigh interest rate risk and relatively high creditrisk
12/11/200331/08/2022
9,262.92 Crores
9,243.38 Crores
July-2011Nov-2017
Over 24 yearsOver 10 years
NIFTY Medium Duration Debt Index C-III
For exit within 12 months from the date ofallotment: - For 8% of investment - Nil Forremaining investments - 1.50%;For exit after 12 months from the date ofallotment: Nil
N.A.Regular, Direct
Growth, IDCW
Any Day SIP’ Facility is available for Monthly,Quarterly, Semi-Annual and Annual frequenciesthrough electronic mode like OTM / DebitMandate. Default SIP date will be 10th. In casethe SIP due date is a Non Business Day, then theimmediate following Business Day will beconsidered for SIP processing.Daily - Minimum 500 & in multiples of 1thereafter for a minimum of 12 instalments.(Kindly refer notice cum addendum dated June02, 2020 for further details)Weekly - Minimum 1000 & in multiples of 1thereafter for a minimum of 6 instalments. (or)Minimum 500 & in multiples of 1 thereafter for aminimum of 12 instalments.Monthly - Minimum 1000 & in multiples of 1thereafter for minimum six months (or) minimum
500 & in multiples of 1 thereafter forminimum one yearQuarterly - Minimum 1500 & in multiples of 1thereafter for minimum one year.Semi Annual - Minimum 3000 & in multiples of1 thereafter for a minimum of 4 installments.
Annual - Minimum 5000 & in multiples of 1thereafter for a minimum of 4 installments.
5,000 & in multiples of 1
1,000 & in multiples of 1
Month of`
`
` `
` `
` `
` `
``
` `
` `
` `
PORTFOLIO CLASSIFICATION BYASSET ALLOCATION (%)
PORTFOLIO
Commercial Papers
Non Convertible Debentures
Indostar Capital Finance Ltd. CRISIL A1+ 0.22
State Bank Of India(Tier II Bond Under Basel III) CRISIL AAA 4.78
Mahindra Rural Housing Finance Ltd. IND AA+ 4.70
Indinfravit Trust CRISIL AAA 4.67
Torrent Power Ltd. CRISIL AA+ 3.50
Indian Bank(Tier II Bond Under Basel III) CRISIL AAA 3.46
Muthoot Finance Ltd. CRISIL AA+ 3.44
Tata Power Company Ltd. IND AA 2.96
Avanse Financial Services Ltd. CARE A+ 2.66
Latur Renewable Pvt. Ltd. CRISIL AA+(CE) 2.63
Jindal Stainless Ltd. CRISIL AA- 2.52
Da Toll Road Pvt. Ltd. IND AA+ 2.21
Sundaram Home Finance Ltd. CARE AA+ 2.04
India Grid Trust CRISIL AAA 1.92
Aadhar Housing Finance Ltd. CARE AA 1.90
Tata Realty And Infrastructure Ltd. [ICRA]AA 1.71
Tata Motors Finance Solutions Ltd. CARE AA- 1.62
Punjab National Bank(Tier II Bond Under Basel III) CRISIL AA+ 1.60
Bharti Hexacom Ltd. CRISIL AA+ 1.60
Mahindra & Mahindra FinancialServices Ltd. IND AAA 1.24
Pune Solapur Expressways Pvt. Ltd.(A Tata Realty And InfrastructureLimited Jv) [ICRA]AA- 0.93
Tata Capital Housing Finance Ltd. CRISIL AAA 0.92
Manappuram Finance Ltd. CRISIL AA 0.81
Tata International Ltd.
Total 0.22
(Perpetual Bond) CARE A+ 0.54
Tata Motor Finance Holdings Ltd. [ICRA]AA- 0.18
Government Of India SOVEREIGN 41.48
State Government Of Maharashtra SOVEREIGN 0.81
Total 54.36
Total 0.18
Total 41.48
Total 0.81
Zero Coupon Bonds
Government Securities
State Development Loans
Cash, Cash Equivalents And Others 2.95
Grand Total 100.00
Issuer Name Rating (%) Of TotalAUM
Issuer Name Rating (%) Of TotalAUM
^Investors should consult their financial advisers if indoubt about whether the product is suitable for them.
Reg-Plan-IDCW 16.1050
Reg-Plan-Growth 41.5487
Dir-Plan-IDCW 17.1981
Dir-Plan-Growth 44.2432
Non Convertible Debentures 54.36
Government Securities 41.48
State Development Loans 0.81
Commercial Papers 0.22
Zero Coupon Bonds 0.18
Cash, Cash Equivalents And Others 2.95
AAA and Equivalent Below AA AA+AA Sovereign
A1+Cash, Cash Equivalents, And Others
Investors understand that their principal
will be at Moderately High risk
*Mr. Mohit Jain is the dedicated fund manager for managing overseas investments of the Scheme.
16.99
21.72
7.388.45
42.29
0.222.95

56
DEBT- SHORT DURATIONFUND
•
•
Regular income for short term
Investment in Debt and Money Market securities.
SBI Short Term Debt FundThis product is suitable for investors who are seeking^:
Investment Objective
Quantitative Data
To provide investors an opportunity togenerate regular income throughinvestments in a portfolio comprisingpredominantly of debt instruments whichare rated not below investment grade andmoney market instruments such that theMacaulay duration of the portfolio isbetween 1 year and 3 years.
Fund Details
Modified Duration :
Average Maturity :
Macaulay Duration :
Yield to Maturity :
1.41
1.77 years
1.48 years
6.64%
years
PORTFOLIO CLASSIFICATION BYRATING CLASS (%)
•
•
•
•
•
•
•
•
•
•
•
•
•
•
Type of Scheme
Date of Allotment:Report As On:AAUM for the August 2022
AUM as on August 31, 2022
Fund Manager:Mr. Rajeev Radhakrishnan & *Mr. Mohit JainManaging Since:Mr. RajeevMr. Mohit JainTotal Experience:Mr. RajeevMr. Mohit JainFirst Tier Benchmark:
Exit Load:Entry Load:Plans Available:Options:SIP
Minimum Investment
Additional Investment
An open ended short-term debt schemeinvesting in instruments such that the MacaulayDuration of the portfolio is between 1 year and3 years. (Please refer to the page no. 26 of SIDfor details on Macaulay’s Duration). A moderateinterest rate risk and relatively low credit risk
27/7/200731/08/2022
12,366.51 Crores
13,466.12 Crores
Jun-2008Nov-2017
Over 21 yearsOver 10 years
CRISIL Short Duration Fund AII IndexNil
N.A.Regular, Direct
Growth, IDCW
Any Day SIP’ Facility is available for Monthly,Quarterly, Semi-Annual and Annual frequenciesthrough electronic mode like OTM / DebitMandate. Default SIP date will be 10th. In casethe SIP due date is a Non Business Day, thenthe immediate following Business Day will beconsidered for SIP processing.Daily - Minimum 500 & in multiples of 1thereafter for a minimum of 12 instalments.(Kindly refer notice cum addendum dated June02, 2020 for further details)Weekly - Minimum 1000 & in multiples of 1thereafter for a minimum of 6 instalments. (or)Minimum 500 & in multiples of 1 thereafter fora minimum of 12 instalments.Monthly - Minimum 1000 & in multiples of 1thereafter for minimum six months (or)minimum 500 & in multiples of 1 thereafterfor minimum one yearQuarterly - Minimum 1500 & in multiples of1 thereafter for minimum one year.Semi Annual - Minimum 3000 & in multiplesof 1 thereafter for a minimum of 4installments.Annual - Minimum 5000 & in multiples of 1thereafter for a minimum of 4 installments.
5,000 & in multiples of 1
1,000 & in multiples of 1
Month of`
`
` `
` `
` `
` `
`
`
` `
` `
` `
PORTFOLIO CLASSIFICATION BYASSET ALLOCATION (%)
Option NAV ( )`
NET ASSET VALUE
Option NAV ( )`
PORTFOLIO
Commercial Papers
Certificate Of Deposits
Non Convertible Debentures
Tata Capital Financial Services Ltd. CRISIL A1+ 1.48Small Industries DevelopmentBank Of India CRISIL A1+ 1.44Axis Finance Ltd. CRISIL A1+ 0.92
HDFC Bank Ltd. IND A1+ 1.81Axis Bank Ltd. CRISIL A1+ 1.48
Reliance Industries Ltd. CRISIL AAA 5.02HDFC Ltd. CRISIL AAA 3.58L&T Metro Rail (Hyderabad) Ltd.[Guaranteed By Larsen &Toubro Limited] CRISIL AAA(CE) 3.23Mahindra & Mahindra FinancialServices Ltd. IND AAA 3.03Air India Assets Holding Ltd. [ICRA]AAA 2.54NABARD [ICRA]AAA 2.21India Grid Trust CRISIL AAA 1.90Can Fin Homes Ltd. [ICRA]AA+ 1.86L&T Finance Ltd. CRISIL AAA 1.85Bajaj Finance Ltd. CRISIL AAA 1.84State Bank Of India(Tier II Bond Under Basel III) CRISIL AAA 1.70Summit Digitel Infrastructure Pvt. Ltd. CRISIL AAA 1.62Mahindra Rural Housing Finance Ltd. IND AA+ 1.59NABHA Power Ltd. [ICRA]AAA(CE) 1.49Crompton Greaves ConsumerElectricals Ltd. CRISIL AA+ 1.49LIC Housing Finance Ltd. CARE AAA 1.48Tata Cleantech Capital Ltd. CRISIL AAA 1.46Sikka Ports & Terminals Ltd. CRISIL AAA 1.01Housing And Urban DevelopmentCorporation Ltd. [ICRA]AAA 0.97Small Industries DevelopmentBank Of India [ICRA]AAA 0.91REC Ltd. CRISIL AAA 0.87Indian Railway FinanceCorporation Ltd. CRISIL AAA 0.86
Total 3.84
Total 3.29
Tata Capital Ltd. CRISIL AAA 0.74Bank Of Baroda(Tier II Bond Under Basel III) IND AAA 0.68Cholamandalam Investment &Finance Co. Ltd. [ICRA]AA+ 0.48Torrent Power Ltd. CRISIL AA+ 0.42Power Grid Corporation Of India Ltd. CRISIL AAA 0.42NABARD CRISIL AAA 0.42National Housing Bank CRISIL AAA 0.37NTPC Ltd. CRISIL AAA 0.30Power Finance Corporation Ltd. CRISIL AAA 0.29LIC Housing Finance Ltd. CRISIL AAA 0.19Indian Oil Corporation Ltd. CRISIL AAA 0.18Small Industries DevelopmentBank Of India CARE AAA 0.12Bharti Hexacom Ltd. CRISIL AA+ 0.11
Axis Finance Ltd. CRISIL AAA 0.05
Government Of India SOVEREIGN 19.98
State Government Of Gujarat SOVEREIGN 2.99State Government Of Rajasthan SOVEREIGN 0.93State Government Of Haryana SOVEREIGN 0.92State Government Of Madhya Pradesh SOVEREIGN 0.74State Government Of Uttar Pradesh SOVEREIGN 0.63State Government OfHimachal Pradesh SOVEREIGN 0.51State Government Of Karnataka SOVEREIGN 0.39State Government Of Tamil Nadu SOVEREIGN 0.24
Government Of India SOVEREIGN 0.49
Total 47.23
Total 0.05
Total 19.98
Total 7.35
Total 0.49
Zero Coupon Bonds
Government Securities
State Development Loans
Strips
Cash, Cash Equivalents And Others 17.77Grand Total 100.00
Issuer Name Rating (%) Of TotalAUM
Issuer Name Rating (%) Of TotalAUM
^Investors should consult their financial advisers if indoubt about whether the product is suitable for them.
Non Convertible Debentures 47.23
Government Securities 19.98
State Development Loans 7.35
Commercial Papers 3.84
Certificate Of Deposits 3.29
Strips 0.49
Zero Coupon Bonds 0.05
Cash, Cash Equivalents And Others 17.77
Retail-Plan-Fortnightly IDCW 12.3437
Retail-Plan-Growth 29.7119
Retail-Plan-Monthly IDCW 13.6087
Retail-Plan-Weekly IDCW 12.3250
Reg-Plan-Fortnightly IDCW 11.8950
Reg-Plan-Growth 26.2607
Reg-Plan-Monthly IDCW 14.5187
Reg-Plan-Weekly IDCW 11.9068
Dir-Plan-Fortnightly IDCW 18.5305
Dir-Plan-Growth 27.5115
Dir-Plan-Monthly IDCW 15.3749
Dir-Plan-Weekly IDCW 12.0508
AAA and Equivalent
Cash, Cash Equivalents, And Others
AA+ SovereignA1+
Investors understand that their principal
will be at Low to Moderate risk
*Mr. Mohit Jain is the dedicated fund manager for managing overseas investments of the Scheme.
41.33
5.9527.82
7.13
17.77

57
Option NAV ( )`
NET ASSET VALUE
•
•
Regular income and capital growth for medium to long-term
Investment in government securities having a constantmaturity of around 10 years.
SBI Magnum Constant Maturity FundThis product is suitable for investors who are seeking^:
Investment Objective
Quantitative Data
To provide returns to the investorsgenerated through investmentspredominantly in Government securitiesissued by the Central Government and/orState Government such that the AverageMaturity of the portfolio is around 10years.
Fund Details
Modified Duration :
Average Maturity :
Macaulay Duration :
Yield to Maturity :
6.88
9.66 years
7.13 years
7.16%
years
PORTFOLIO CLASSIFICATION BYRATING CLASS (%)
•
•
•
•
•
•
•
•
•
•
•
•
•
•
Type of Scheme
Date of Allotment:
Report As On:
AAUM for the August 2022
AUM as on August 31, 2022
Fund Manager: Mr. Dinesh Ahuja
Managing Since:
Total Experience:
First Tier Benchmark:
Exit Load:
Entry Load:
Plans Available:
Options:
SIP
Minimum Investment
Additional Investment
An open-ended Debt Scheme investing ingovernment securities having a constantmaturity of around 10 years. A relatively highinterest rate risk and relatively low credit risk
30/12/2000
31/08/2022
792.43 Crores
815.78 Crores
Jan - 2020
Over 24 years
Nifty 10 yr Benchmark G-Sec
NIL
N.A.
Regular, Direct
Growth, IDCW
Any Day SIP’ Facility is available for Monthly,Quarterly, Semi-Annual and Annual frequenciesthrough electronic mode like OTM / DebitMandate. Default SIP date will be 10th. In casethe SIP due date is a Non Business Day, then theimmediate following Business Day will beconsidered for SIP processing.Daily - Minimum 500 & in multiples of 1thereafter for a minimum of 12 instalments.(Kindly refer notice cum addendum dated June02, 2020 for further details)Weekly - Minimum 1000 & in multiples of 1
thereafter for a minimum of 6 instalments. (or)Minimum 500 & in multiples of 1 thereafter for aminimum of 12 instalments.Monthly - Minimum 1000 & in multiples of 1
thereafter for minimum six months (or)minimum 500 & in multiples of 1 thereafter for
minimum one yearQuarterly - Minimum 1500 & in multiples of 1
thereafter for minimum one year.
Semi Annual - Minimum 3000 & in multiples of
1 thereafter for a minimum of 4 installments.
Annual - Minimum 5000 & in multiples of 1
thereafter for a minimum of 4 installments.
5,000 & in multiples of 1
1,000 & in multiples of 1
Month of
`
`
` `
` `
` `
` `
`
`
` `
` `
` `
PORTFOLIO CLASSIFICATION BYASSET ALLOCATION (%)
DEBT-GILT FUND WITH 10YEAR CONSTANT DURATION
PORTFOLIO
Government Securities
Government Of India SOVEREIGN 92.58
Government Of India SOVEREIGN 3.77
Total 92.58
Total 3.77
Strips
Cash, Cash Equivalents And Others 3.65
Grand Total 100.00
Issuer Name Rating (%) Of TotalAUM
^Investors should consult their financial advisers if indoubt about whether the product is suitable for them.
Reg-Plan-IDCW 16.6632
Reg-Plan-Growth 51.2346
Dir-Plan-IDCW 17.1711
Dir-Plan-Growth 52.7883
Government Securities 92.58
Strips 3.77
Cash, Cash Equivalents And Others 3.65
SovereignCash, Cash Equivalents, And Others
Investors understand that their principal
will be at Moderate risk
96.35
3.65
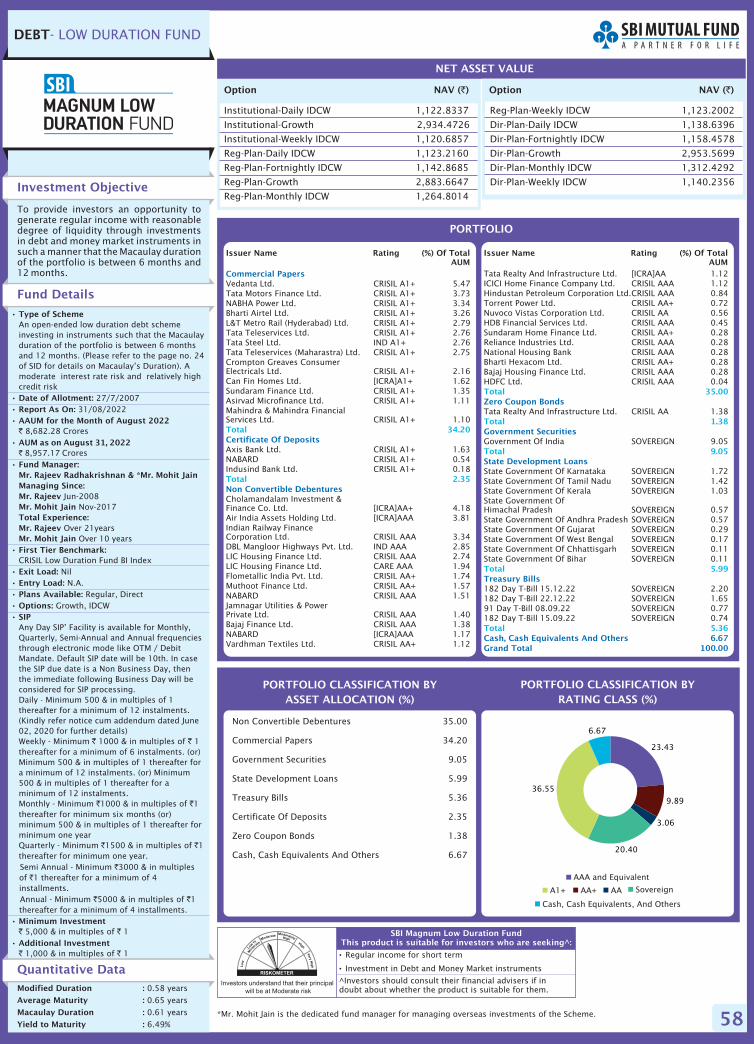
58
Option NAV ( )`
NET ASSET VALUE
Option NAV ( )`
•
•
Regular income for short term
Investment in Debt and Money Market instruments
SBI Magnum Low Duration FundThis product is suitable for investors who are seeking^:
Investment Objective
Quantitative Data
To provide investors an opportunity togenerate regular income with reasonabledegree of liquidity through investmentsin debt and money market instruments insuch a manner that the Macaulay durationof the portfolio is between 6 months and12 months.
Modified Duration :
Average Maturity :
Macaulay Duration :
Yield to Maturity :
0.58
0.65 years
0.61 years
6.49%
years
Fund Details
PORTFOLIO CLASSIFICATION BYRATING CLASS (%)
•
•
•
•
•
•
•
•
•
•
•
•
•
•
Type of Scheme
Date of Allotment:Report As On:AAUM for the August 2022
AUM as on August 31, 2022
Fund Manager:Mr. Rajeev Radhakrishnan & *Mr. Mohit JainManaging Since:Mr. RajeevMr. Mohit JainTotal Experience:Mr. RajeevMr. Mohit JainFirst Tier Benchmark:
Exit Load:Entry Load:Plans Available:Options:SIP
Minimum Investment
Additional Investment
An open-ended low duration debt schemeinvesting in instruments such that the Macaulayduration of the portfolio is between 6 monthsand 12 months. (Please refer to the page no. 24of SID for details on Macaulay’s Duration). Amoderate interest rate risk and relatively highcredit risk
27/7/200731/08/2022
8,682.28 Crores
8,957.17 Crores
Jun-2008Nov-2017
Over 21yearsOver 10 years
CRISIL Low Duration Fund BI IndexNil
N.A.Regular, Direct
Growth, IDCW
Any Day SIP’ Facility is available for Monthly,Quarterly, Semi-Annual and Annual frequenciesthrough electronic mode like OTM / DebitMandate. Default SIP date will be 10th. In casethe SIP due date is a Non Business Day, thenthe immediate following Business Day will beconsidered for SIP processing.Daily - Minimum 500 & in multiples of 1thereafter for a minimum of 12 instalments.(Kindly refer notice cum addendum dated June02, 2020 for further details)Weekly - Minimum 1000 & in multiples of 1thereafter for a minimum of 6 instalments. (or)Minimum 500 & in multiples of 1 thereafter fora minimum of 12 instalments. (or) Minimum500 & in multiples of 1 thereafter for aminimum of 12 instalments.Monthly - Minimum 1000 & in multiples of 1thereafter for minimum six months (or)minimum 500 & in multiples of 1 thereafter forminimum one yearQuarterly - Minimum 1500 & in multiples of 1thereafter for minimum one year.Semi Annual - Minimum 3000 & in multiplesof 1 thereafter for a minimum of 4installments.Annual - Minimum 5000 & in multiples of 1thereafter for a minimum of 4 installments.
5,000 & in multiples of 1
1,000 & in multiples of 1
Month of`
`
` `
` `
` `
`
`
` `
` `
` `
PORTFOLIO CLASSIFICATION BYASSET ALLOCATION (%)
DEBT- LOW DURATION FUND
PORTFOLIO
Commercial Papers
Certificate Of Deposits
Non Convertible Debentures
Vedanta Ltd. CRISIL A1+ 5.47Tata Motors Finance Ltd. CRISIL A1+ 3.73NABHA Power Ltd. CRISIL A1+ 3.34Bharti Airtel Ltd. CRISIL A1+ 3.26L&T Metro Rail (Hyderabad) Ltd. CRISIL A1+ 2.79Tata Teleservices Ltd. CRISIL A1+ 2.76Tata Steel Ltd. IND A1+ 2.76Tata Teleservices (Maharastra) Ltd. CRISIL A1+ 2.75Crompton Greaves ConsumerElectricals Ltd. CRISIL A1+ 2.16Can Fin Homes Ltd. [ICRA]A1+ 1.62Sundaram Finance Ltd. CRISIL A1+ 1.35Asirvad Microfinance Ltd. CRISIL A1+ 1.11Mahindra & Mahindra FinancialServices Ltd. CRISIL A1+ 1.10
Axis Bank Ltd. CRISIL A1+ 1.63NABARD CRISIL A1+ 0.54Indusind Bank Ltd. CRISIL A1+ 0.18
Cholamandalam Investment &Finance Co. Ltd. [ICRA]AA+ 4.18Air India Assets Holding Ltd. [ICRA]AAA 3.81Indian Railway FinanceCorporation Ltd. CRISIL AAA 3.34DBL Mangloor Highways Pvt. Ltd. IND AAA 2.85LIC Housing Finance Ltd. CRISIL AAA 2.74LIC Housing Finance Ltd. CARE AAA 1.94Flometallic India Pvt. Ltd. CRISIL AA+ 1.74Muthoot Finance Ltd. CRISIL AA+ 1.57NABARD CRISIL AAA 1.51Jamnagar Utilities & PowerPrivate Ltd. CRISIL AAA 1.40Bajaj Finance Ltd. CRISIL AAA 1.38NABARD [ICRA]AAA 1.17Vardhman Textiles Ltd. CRISIL AA+ 1.12
Total 34.20
Total 2.35
Tata Realty And Infrastructure Ltd. [ICRA]AA 1.12ICICI Home Finance Company Ltd. CRISIL AAA 1.12Hindustan Petroleum Corporation Ltd.CRISIL AAA 0.84Torrent Power Ltd. CRISIL AA+ 0.72Nuvoco Vistas Corporation Ltd. CRISIL AA 0.56HDB Financial Services Ltd. CRISIL AAA 0.45Sundaram Home Finance Ltd. CRISIL AA+ 0.28Reliance Industries Ltd. CRISIL AAA 0.28National Housing Bank CRISIL AAA 0.28Bharti Hexacom Ltd. CRISIL AA+ 0.28Bajaj Housing Finance Ltd. CRISIL AAA 0.28HDFC Ltd. CRISIL AAA 0.04
Tata Realty And Infrastructure Ltd. CRISIL AA 1.38
Government Of India SOVEREIGN 9.05
State Government Of Karnataka SOVEREIGN 1.72State Government Of Tamil Nadu SOVEREIGN 1.42State Government Of Kerala SOVEREIGN 1.03State Government OfHimachal Pradesh SOVEREIGN 0.57State Government Of Andhra Pradesh SOVEREIGN 0.57State Government Of Gujarat SOVEREIGN 0.29State Government Of West Bengal SOVEREIGN 0.17State Government Of Chhattisgarh SOVEREIGN 0.11State Government Of Bihar SOVEREIGN 0.11
182 Day T-Bill 15.12.22 SOVEREIGN 2.20182 Day T-Bill 22.12.22 SOVEREIGN 1.6591 Day T-Bill 08.09.22 SOVEREIGN 0.77182 Day T-Bill 15.09.22 SOVEREIGN 0.74
Total 35.00
Total 1.38
Total 9.05
Total 5.99
Total 5.36
Zero Coupon Bonds
Government Securities
State Development Loans
Treasury Bills
Cash, Cash Equivalents And Others 6.67Grand Total 100.00
Issuer Name Rating (%) Of TotalAUM
Issuer Name Rating (%) Of TotalAUM
^Investors should consult their financial advisers if indoubt about whether the product is suitable for them.
Institutional-Daily IDCW 1,122.8337
Institutional-Growth 2,934.4726
Institutional-Weekly IDCW 1,120.6857
Reg-Plan-Daily IDCW 1,123.2160
Reg-Plan-Fortnightly IDCW 1,142.8685
Reg-Plan-Growth 2,883.6647
Reg-Plan-Monthly IDCW 1,264.8014
Non Convertible Debentures 35.00
Commercial Papers 34.20
Government Securities 9.05
State Development Loans 5.99
Treasury Bills 5.36
Certificate Of Deposits 2.35
Zero Coupon Bonds 1.38
Cash, Cash Equivalents And Others 6.67
Reg-Plan-Weekly IDCW 1,123.2002
Dir-Plan-Daily IDCW 1,138.6396
Dir-Plan-Fortnightly IDCW 1,158.4578
Dir-Plan-Growth 2,953.5699
Dir-Plan-Monthly IDCW 1,312.4292
Dir-Plan-Weekly IDCW 1,140.2356
Investors understand that their principal
will be at Moderate risk
AAA and Equivalent
Cash, Cash Equivalents, And Others
AA+ AA SovereignA1+
*Mr. Mohit Jain is the dedicated fund manager for managing overseas investments of the Scheme.
23.43
9.89
3.06
20.40
36.55
6.67

59
Option NAV ( )`
NET ASSET VALUE
Option NAV ( )`
•
•
Regular income for short-term
Investment in money market instruments.
SBI Savings FundThis product is suitable for investors who are seeking^:
Investment Objective
Quantitative Data
To provide the investors an opportunityto invest in money market instruments.
Fund Details
Modified Duration :
Average Maturity :
Macaulay Duration :
Yield to Maturity :
0.26
0.28 years
0.28 years
6.16%
years
PORTFOLIO CLASSIFICATION BYRATING CLASS (%)
•
•
•
•
•
•
•
•
•
•
•
•
•
•
Type of Scheme
Date of Allotment:
Report As On:
AAUM for the August 2022
AUM as on August 31, 2022
Fund Manager: Mr. R. Arun & *Mr. Mohit Jain
Managing Since:
Mr. R. Arun
Mr. Mohit Jain
Total Experience:
Mr. R. Arun
Mr. Mohit Jain
First Tier Benchmark:
Exit Load:
Entry Load:
Plans Available:
Options:
SIP
Minimum Investment
Additional Investment
An open-ended debt scheme investing in moneymarket instruments. A relatively low interestrate risk and moderate credit risk
19/07/2004
31/08/2022
19,978.04 Crores
20,497.89 Crores
Apr-2012
Nov-2017
Over 16 years
Over 10 years
CRISIL Money Market Fund BI Index
For exit within 3 business days from the date ofallotment - 0.10%For exit after 3 business days from the date ofallotment - Nil
N.A.
Regular, Direct
Growth, IDCW
Any Day SIP’ Facility is available for Monthly,Quarterly, Semi-Annual and Annual frequenciesthrough electronic mode like OTM / DebitMandate. Default SIP date will be 10th. In casethe SIP due date is a Non Business Day, then theimmediate following Business Day will beconsidered for SIP processing.Daily - Minimum 500 & in multiples of 1thereafter for a minimum of 12 instalments.(Kindly refer notice cum addendum dated June02, 2020 for further details)Weekly - Minimum 1000 & in multiples of 1
thereafter for a minimum of 6 instalments. (or)Minimum 500 & in multiples of 1 thereafter fora minimum of 12 instalments.Monthly - Minimum 1000 & in multiples of 1
thereafter for minimum six months (or)minimum 500 & in multiples of 1 thereafter forminimum one yearQuarterly - Minimum 1500 & in multiples of 1
thereafter for minimum one year.
Semi Annual - Minimum 3000 & in multiples of
1 thereafter for a minimum of 4 installments.
Annual - Minimum 5000 & in multiples of 1
thereafter for a minimum of 4 installments.
500 & in multiples of 1
500 & in multiples of 1
Month of
`
`
` `
` `
` `
`
`
` `
` `
` `
PORTFOLIO CLASSIFICATION BYASSET ALLOCATION (%)
DEBT- MONEY MARKET FUND
PORTFOLIO
Commercial Papers
Certificate Of Deposits
HDFC Ltd. CRISIL A1+ 7.56
Cholamandalam Investment &Finance Co. Ltd. CRISIL A1+ 4.39
Small Industries DevelopmentBank Of India CRISIL A1+ 3.55
Tata Power Company Ltd. CRISIL A1+ 3.36
L&T Metro Rail (Hyderabad) Ltd. CRISIL A1+ 3.16
Tata Motors Finance Ltd. CRISIL A1+ 3.08
Motilal Oswal Finvest Ltd. CRISIL A1+ 2.92
Bharti Airtel Ltd. CRISIL A1+ 2.84
Vedanta Ltd. CRISIL A1+ 2.42
Tata Steel Ltd. IND A1+ 1.92
LIC Housing Finance Ltd. CRISIL A1+ 1.91
Can Fin Homes Ltd. [ICRA]A1+ 1.54
NABHA Power Ltd. CRISIL A1+ 1.46
Larsen & Toubro Ltd. CRISIL A1+ 1.45
Mahindra & Mahindra FinancialServices Ltd. CRISIL A1+ 1.32
Birla Group Holding Pvt. Ltd. CRISIL A1+ 1.21
L&T Finance Ltd. CRISIL A1+ 1.17
JM Financial Asset ReconstructionCompany Ltd. CRISIL A1+ 1.03
Network18 Media & Investments Ltd. [ICRA]A1+ 0.84
JM Financial Products Ltd. CRISIL A1+ 0.70
Sundaram Finance Ltd. CRISIL A1+ 0.59
Kotak Mahindra Prime Ltd. CRISIL A1+ 0.59
Tv18 Broadcast Ltd. [ICRA]A1+ 0.24
Manappuram Home Finance Ltd. CRISIL A1+ 0.12
HDFC Bank Ltd. IND A1+ 7.92
Axis Bank Ltd. CRISIL A1+ 4.55
Total 49.37
Indusind Bank Ltd. CRISIL A1+ 3.69
Small Industries DevelopmentBank Of India CRISIL A1+ 3.34
Bank Of Baroda IND A1+ 2.32
NABARD CRISIL A1+ 0.71
State Government Of Gujarat SOVEREIGN 1.65
State Government Of Karnataka SOVEREIGN 0.88
State Government Of Tamil Nadu SOVEREIGN 0.51
182 Day T-Bill 29.09.22 SOVEREIGN 6.03
91 Day T-Bill 10.11.22 SOVEREIGN 3.14
182 Day T-Bill 17.11.22 SOVEREIGN 2.66
182 Day T-Bill 02.03.23 SOVEREIGN 1.42
91 Day T-Bill 01.09.22 SOVEREIGN 1.22
182 Day T-Bill 22.12.22 SOVEREIGN 1.20
364 Day T-Bill 19.01.23 SOVEREIGN 0.96
182 Day T-Bill 24.11.22 SOVEREIGN 0.72
364 Day T-Bill 06.07.23 SOVEREIGN 0.09
Total 22.53
Total 3.04
Total 17.44
State Development Loans
Treasury Bills
Cash, Cash Equivalents And Others 7.62
Grand Total 100.00
Issuer Name Rating (%) Of TotalAUM
Issuer Name Rating (%) Of TotalAUM
^Investors should consult their financial advisers if indoubt about whether the product is suitable for them.
Reg-Plan-Daily IDCW 11.1446
Reg-Plan-Growth 34.1898
Reg-Plan-Monthly IDCW 13.4816
Reg-Plan-Weekly IDCW 12.7227
Commercial Papers 49.37
Certificate Of Deposits 22.53
Treasury Bills 17.44
State Development Loans 3.04
Cash, Cash Equivalents And Others 7.62
Dir-Plan-Daily IDCW
Dir-Plan-Growth 36.1655
Dir-Plan-Monthly IDCW 14.3348
Dir-Plan-Weekly IDCW 12.9891
11.2928
Cash, Cash Equivalents, And Others
A1+ Sovereign
Investors understand that their principal
will be at Moderate risk
*Mr. Mohit Jain is the dedicated fund manager for managing overseas investments of the Scheme.
20.48
71.90
7.62

60
Option NAV ( )`
NET ASSET VALUE
Option NAV ( )`
•
•
Regular income over medium term
Investment in Debt instruments predominantly issued byBanks PSUs, PFIs and Municipal bodies.
SBI Banking & PSU FundThis product is suitable for investors who are seeking^:
Investment Objective
Quantitative Data
The scheme seeks to generate regularincome through a judicious mix ofportfolio comprising predominantly debtand money market securities of Banks,Public Sector Undertakings, PublicFinancial Institutions and Municipalbodies.
Fund Details
Modified Duration :
Average Maturity :
Macaulay Duration :
Yield to Maturity :
1.35
1.61 years
1.43 years
6.66%
years
PORTFOLIO CLASSIFICATION BYRATING CLASS (%)
•
•
•
•
•
•
•
•
•
•
•
•
•
•
Type of Scheme
Date of Allotment:
Report As On:
AAUM for the August 2022
AUM as on August 31, 2022
Fund Manager:Mr. Rajeev Radhakrishnan
Mr. Mohit Jain -
Total Experience:Mr. Rajeev Radhakrishnan –Mr. Mohit Jain –
First Tier Benchmark:
Exit Load:
Entry Load:
Plans Available:
Options:
SIP
Minimum Investment
Additional Investment
An open-ended debt scheme predominantlyinvesting in debt instruments of banks, PublicSector Undertakings, Public Financial Institutionsand Municipal Bodies. A relatively high interestrate risk and moderate credit risk
09/10/2009
31/08/2022
5,738.55 Crores
5,734.38 Crores
(Managing Since:Nov 2013)
Investments in foreignsecurities of the Scheme (w.e.f. Jan 22, 2020)
Over 21 yearsOver 10 years
NIFTY Banking and PSU Debt Index
Nil
N.A.
Regular, Direct
Growth, IDCW
Any Day SIP’ Facility is available for Monthly,Quarterly, Semi-Annual and Annual frequenciesthrough electronic mode like OTM / DebitMandate. Default SIP date will be 10th. In casethe SIP due date is a Non Business Day, then theimmediate following Business Day will beconsidered for SIP processing.Daily - Minimum 500 & in multiples of 1thereafter for a minimum of 12 instalments.(Kindly refer notice cum addendum dated June02, 2020 for further details)Weekly - Minimum 1000 & in multiples of 1thereafter for a minimum of 6 instalments. (or)Minimum 500 & in multiples of 1 thereafter for aminimum of 12 instalments.Monthly - Minimum 1000 & in multiples of 1thereafter for minimum six months (or)minimum 500 & in multiples of 1 thereafterfor minimum one year.Quarterly - Minimum 1500 & in multiples of 1thereafter for minimum one year.
Semi Annual - Minimum 3000 & in multiples of1 thereafter for a minimum of 4 installments.
Annual - Minimum 5000 & in multiples of 1thereafter for a minimum of 4 installments.
5,000 & in multiples of 1
1,000 & in multiples of 1
Month of`
`
` `
` `
` `
` `
`
`
` `
` `
` `
PORTFOLIO CLASSIFICATION BYASSET ALLOCATION (%)
DEBT- BANKING AND PSUFUND
^Investors should consult their financial advisers if indoubt about whether the product is suitable for them.
Reg-Plan-Daily IDCW 1,166.2820
Reg-Plan-Growth 2,556.4157
Reg-Plan-Monthly IDCW 1,094.2614
Reg-Plan-Weekly IDCW 1,166.0641
Non Convertible Debentures 65.02
Government Securities 8.40
Certificate Of Deposits 8.22
Commercial Papers 4.28
State Development Loans 2.75
Cash, Cash Equivalents And Others 11.33
Dir-Plan-Daily IDCW 1,181.2316
Dir-Plan-Growth 2,681.7378
Dir-Plan-Monthly IDCW 1,146.0922
Dir-Plan-Weekly IDCW 1,178.6074
Cash, Cash Equivalents, And Others
AAA and Equivalent A1+ AA+ Sovereign
PORTFOLIO
Commercial Papers
Certificate Of Deposits
Non Convertible Debentures
Small Industries DevelopmentBank Of India CRISIL A1+ 2.54
Bharat Petroleum Corporation Ltd. CRISIL A1+ 1.74
HDFC Bank Ltd. IND A1+ 4.12
Bank Of Baroda IND A1+ 4.10
Air India Assets Holding Ltd. [ICRA]AAA 6.12
Power Finance Corporation Ltd. CRISIL AAA 5.15
Hindustan Petroleum Corporation Ltd. CRISIL AAA 5.06
National Housing Bank CRISIL AAA 4.77
Rec Ltd. CRISIL AAA 4.58
Indian Railway Finance Corporation Ltd.CRISIL AAA 4.48
Axis Bank Ltd. CRISIL AAA 4.46
State Bank Of India(Tier II Bond Under Basel III) CRISIL AAA 4.43
Oil & Natural Gas Corporation Ltd. [ICRA]AAA 4.31
NTPC Ltd. CRISIL AAA 2.97
Power Grid Corporation Of India Ltd. CRISIL AAA 2.74
NABARD [ICRA]AAA 2.66
Small Industries DevelopmentBank Of India [ICRA]AAA 2.19
NABARD CRISIL AAA 2.17
Small Industries DevelopmentBank Of India CARE AAA 1.60
Export-Import Bank Of India CRISIL AAA 1.56
Indian Oil Corporation Ltd. CRISIL AAA 1.31
Indian Bank
Total 4.28
Total 8.22
(Tier II Bond Under Basel III) IND AA+ 0.90
HDFC Bank Ltd. CRISIL AAA 0.89
Punjab National Bank(Tier II Bond Under Basel III) CRISIL AA+ 0.88
Nuclear Power Corporation Of India Ltd.CRISIL AAA 0.84
Punjab National Bank CRISIL AA+ 0.53
Housing And Urban DevelopmentCorporation Ltd. [ICRA]AAA 0.39
NHPC Ltd. [ICRA]AAA 0.03
Government Of India SOVEREIGN 8.40
State Government Of Gujarat SOVEREIGN 1.79
State Government Of Madhya Pradesh SOVEREIGN 0.87
State Government Of Maharashtra SOVEREIGN 0.09
Total 65.02
Total 8.40
Total 2.75
Government Securities
State Development Loans
Cash, Cash Equivalents And Others 11.33
Grand Total 100.00
Issuer Name Rating (%) Of TotalAUM
Issuer Name Rating (%) Of TotalAUM
Investors understand that their principal
will be at Low to Moderate risk
*Mr. Mohit Jain is the dedicated fund manager for managing overseas investments of the Scheme.
62.71
2.31
11.15
12.50
11.33

61
DEBT- LIQUID FUND
•
•
Regular income for short termInvestment in Debt and Money Market securities with residualmaturity upto 91 days only.
SBI Liquid FundThis product is suitable for investors who are seeking^:
Investment Objective
Quantitative Data
To provide the investors an opportunityto invest in the entire range of debt andmoney market securities with residualmaturity upto 91 days only.
Fund Details
Modified Duration :
Average Maturity :
Macaulay Duration :
Yield to Maturity :
0.11
0.12 years
0.11 years
5.67%
years
PORTFOLIO CLASSIFICATION BYRATING CLASS (%)
•
•
•
•
•
•
•
•
•
•
•
•
•
•
Type of Scheme
Date of Allotment:
Report As On:
AAUM for the August 2022
AUM as on August 31, 2022
Fund Manager: Mr. R. ArunManaging Since:Total Experience:
First Tier Benchmark:
Exit Load:
Entry Load:
Plans Available:
Options:
SIP:
Minimum Investment
Additional Investment
An open-ended Liquid Scheme. A relativelylow interest rate risk and moderate creditrisk
24/11/2003
31/08/2022
64,831.13 Crores
64,972.33 Crores
May-2018Over 16 years
NIFTY Liquid Index B-I
N.A.
Regular, Direct
Growth, IDCW
For Growth option only: Weekly/Monthlyfrequency – 500 and in multiples of 1 forminimum 12 instalments or 1000 and inmultiples of 1 for minimum 6 instalments.(w.e.f. March 03, 2021)Quarterly – 6,000 and 2 installments; Semi-Annual and Annual – 12,000 and 2installments
Growth Option: 500 & in multiples of 1Other options except Growth option:5000 & in multiples of 1/-
Growth Option: 500 & in multiples of 1Other options except Growth option:5000 & in multiples of 1/-
Month of`
`
`
`
` `
` `
` `
` `
` `
`
`
PORTFOLIO CLASSIFICATION BYASSET ALLOCATION (%)
Option NAV ( )`
NET ASSET VALUE
Option NAV ( )`
PORTFOLIO
Commercial Papers
Certificate Of Deposits
Reliance Retail Ventures Ltd. CRISIL A1+ 6.24
Indian Oil Corporation Ltd. [ICRA]A1+ 5.41
Small Industries Development
Bank Of India CRISIL A1+ 4.55
HDFC Ltd. CRISIL A1+ 4.55
Reliance Jio Infocomm Ltd. CRISIL A1+ 3.81
Larsen & Toubro Ltd. CRISIL A1+ 3.68
Bharat Petroleum Corporation Ltd. CRISIL A1+ 2.28
Adani Ports And Special Economic
Zone Ltd. [ICRA]A1+ 2.28
ICICI Securities Ltd. CRISIL A1+ 2.20
Sikka Ports & Terminals Ltd. CRISIL A1+ 1.83
Jamnagar Utilities & Power Private Ltd. CRISIL A1+ 1.52
L&T Finance Ltd. CRISIL A1+ 1.51
Bajaj Finance Ltd. CRISIL A1+ 1.50
Tata Power Renewable Energy Ltd. CRISIL A1+ 1.47
Tata Capital Financial Services Ltd. CRISIL A1+ 1.44
Tata Capital Housing Finance Ltd. CRISIL A1+ 0.76
Kotak Securities Ltd. CRISIL A1+ 0.76
Aditya Birla Finance Ltd. [ICRA]A1+ 0.76
Hindustan Petroleum Corporation Ltd. CRISIL A1+ 0.61
Chambal Fertilisers And Chemicals Ltd. CRISIL A1+ 0.61
Tata Steel Ltd. IND A1+ 0.38
NTPC Ltd. CRISIL A1+ 0.30
HDFC Credila Financial Services
Pvt. Ltd. CRISIL A1+ 0.30
Axis Finance Ltd. CRISIL A1+ 0.27
Cholamandalam Investment &
Finance Co. Ltd. CRISIL A1+ 0.15
Canara Bank CRISIL A1+ 4.56
HDFC Bank Ltd. IND A1+ 3.05
Total 49.17
Indian Bank CRISIL A1+ 3.04
Punjab National Bank CRISIL A1+ 1.82
Power Finance Corporation Ltd. CRISIL AAA 0.23
State Government Of Andhra Pradesh SOVEREIGN 0.24
State Government Of Karnataka SOVEREIGN 0.23
State Government Of Haryana SOVEREIGN 0.19
State Government Of Uttar Pradesh SOVEREIGN 0.11
State Government Of Gujarat SOVEREIGN 0.10
State Government Of Tamil Nadu SOVEREIGN 0.07
State Government Of Kerala SOVEREIGN 0.07
91 Day T-Bill 01.12.22 SOVEREIGN 6.65
91 Day T-Bill 24.11.22 SOVEREIGN 5.64
91 Day T-Bill 10.11.22 SOVEREIGN 3.91
91 Day T-Bill 03.11.22 SOVEREIGN 3.03
91 Day T-Bill 15.09.22 SOVEREIGN 2.84
91 Day T-Bill 27.10.22 SOVEREIGN 2.42
182 Day T-Bill 01.09.22 SOVEREIGN 2.42
91 Day T-Bill 08.09.22 SOVEREIGN 2.32
91 Day T-Bill 01.09.22 SOVEREIGN 2.14
91 Day T-Bill 20.10.22 SOVEREIGN 0.76
91 Day T-Bill 17.11.22 SOVEREIGN 0.60
364 Day T-Bill 13.10.22 SOVEREIGN 0.30
182 Day T-Bill 24.11.22 SOVEREIGN 0.23
182 Day T-Bill 27.10.22 SOVEREIGN 0.08
Total 12.47
Total 0.23
Total 1.01
Total 33.34
Non Convertible Debentures
State Development Loans
Treasury Bills
Cash, Cash Equivalents And Others 3.78
Grand Total 100.00
Issuer Name Rating (%) Of TotalAUM
Issuer Name Rating (%) Of TotalAUM
^Investors should consult their financial advisers if indoubt about whether the product is suitable for them.
lnvestor exit uponsubscription / switch-In
Day 1 0.0070%
Day 2 0.0065%
Day 3 0.0060%
Day 4 0.0055%
Day 5 0.0050%
Day 6 0.0045%
Day 7 onwards 0.0000%
Exit Load as a % ofredemption Proceeds
Commercial Papers 49.17
Treasury Bills 33.34
Certificate Of Deposits 12.47
State Development Loans 1.01
Non Convertible Debentures 0.23
Cash, Cash Equivalents And Others 3.78
Institutional-Daily IDCW 1,093.1817Institutional-Fortnightly IDCW 1,118.6029Institutional-Growth 3,402.7788Reg-Plan-Daily IDCW 1,093.1776Reg-Plan-Fortnightly IDCW 1,106.2703Reg-Plan-Growth 3,370.9212
Reg-Plan-Weekly IDCW 1,157.0286Dir-Plan-Daily IDCW 1,095.5611Dir-Plan-Fortnightly IDCW 1,108.6676Dir-Plan-Growth 3,395.0898Dir-Plan-Weekly IDCW 1,159.5552
Cash, Cash Equivalents, And Others
0.23
34.35
61.64
3.78
Sovereign A1+ AAA and Equivalent
Investors understand that their principal
will be at Low to Moderate risk

62
•
•
Regular income for short term
Investment in Debt and Money Market instruments.
SBI Magnum Ultra Short Duration FundThis product is suitable for investors who are seeking^:
PORTFOLIO CLASSIFICATION BYRATING CLASS (%)
PORTFOLIO CLASSIFICATION BYASSET ALLOCATION (%)
DEBT- ULTRA SHORTDURATION FUND
Option NAV ( )`
NET ASSET VALUE
Option NAV ( )`
PORTFOLIO
Commercial Papers
Certificate Of Deposits
Non Convertible Debentures
Small Industries DevelopmentBank Of India CRISIL A1+ 6.47
HDFC Ltd. CRISIL A1+ 6.20
Export-Import Bank Of India CRISIL A1+ 5.92
Larsen & Toubro Ltd. CRISIL A1+ 5.37
Tata Motors Finance Ltd. CRISIL A1+ 3.19
L&T Finance Ltd. CRISIL A1+ 3.19
Cholamandalam Investment &Finance Co. Ltd. CRISIL A1+ 2.85
Tata Power Company Ltd. CRISIL A1+ 2.46
Mahindra & Mahindra FinancialServices Ltd. CRISIL A1+ 2.26
Bharti Airtel Ltd. CRISIL A1+ 1.62
HDB Financial Services Ltd. CRISIL A1+ 1.61
Tata Steel Ltd. IND A1+ 1.24
Can Fin Homes Ltd. [ICRA]A1+ 1.02
LIC Housing Finance Ltd. CRISIL A1+ 0.83
Fullerton India Credit Company Ltd. CRISIL A1+ 0.81
HDFC Bank Ltd. IND A1+ 3.79
Indusind Bank Ltd. CRISIL A1+ 3.65
Indian Bank CRISIL A1+ 2.45
Bank Of Baroda IND A1+ 1.98
Axis Bank Ltd. CRISIL A1+ 1.10
NABARD CRISIL AAA 3.36
REC Ltd. CRISIL AAA 1.76
Power Finance Corporation Ltd. CRISIL AAA 1.71
Tata Capital Financial Services Ltd. CRISIL AAA 1.05
Total 45.04
Total 12.97
LIC Housing Finance Ltd. CARE AAA 0.83
Hindustan PetroleumCorporation Ltd. CRISIL AAA 0.42
Indian Railway FinanceCorporation Ltd. CRISIL AAA 0.21
Government Of India SOVEREIGN 4.00
State Government Of Tamil Nadu SOVEREIGN 1.45
State Government Of Haryana SOVEREIGN 0.85
State Government Of Maharashtra SOVEREIGN 0.63
State Government OfAndhra Pradesh SOVEREIGN 0.41
State Government Of Gujarat SOVEREIGN 0.39
State Government Of Punjab SOVEREIGN 0.34
State Government Of Rajasthan SOVEREIGN 0.17
182 Day T-Bill 29.09.22 SOVEREIGN 5.82
182 Day T-Bill 22.12.22 SOVEREIGN 2.46
182 Day T-Bill 03.11.22 SOVEREIGN 2.07
182 Day T-Bill 15.12.22 SOVEREIGN 1.64
182 Day T-Bill 24.11.22 SOVEREIGN 1.24
364 Day T-Bill 06.07.23 SOVEREIGN 0.24
Total 9.34
Total 4.00
Total 4.24
Total 13.47
Government Securities
State Development Loans
Treasury Bills
Cash, Cash Equivalents And Others 10.94
Grand Total 100.00
Issuer Name Rating (%) Of TotalAUM
Issuer Name Rating (%) Of TotalAUM
^Investors should consult their financial advisers if indoubt about whether the product is suitable for them.
Investment Objective
Quantitative Data
To provide investors with an opportunityto generate regular income with highdegree of liquidity through investmentsin a portfolio comprising predominantlyof debt and money market instruments.
Fund Details
Modified Duration :
Average Maturity :
Macaulay Duration :
Yield to Maturity :
0.33
0.38 years
0.35 years
6.08%
years
•
•
•
•
•
•
•
•
•
•
•
•
•
•
Type of Scheme
Date of Allotment:
Report As On:
AAUM for the August 2022
AUM as on August 31, 2022
Fund Manager: Mr. R. Arun & *Mr. Mohit JainManaging Since:Mr. R. ArunMr. Mohit JainTotal Experience:Mr. R. ArunMr. Mohit Jain
First Tier Benchmark:
Exit Load:
Entry Load:
Plans Available:
Options:
SIP:
Minimum Investment
Additional Investment
An open ended ultra-short term debt schemeinvesting in instruments such that the MacaulayDuration of the portfolio is between 3 months to6 months (Please refer to the page no. 22 of SIDfor details on Macaulay’s Duration). A relativelylow interest rate risk and moderate credit risk
21/05/1999
31/08/2022
11,884.66 Crores
11,993.81 Crores
June-2021Nov-2017
Over 16 yearsOver 10 years
CRISIL Ultra Short Duration Fund BI Index
Nil
N.A.
Regular, Direct
Growth, IDCW
(w.e.f. June 04, 2020)Any Day SIP' Facility is available forMonthly, Quarterly, Semi-Annual andAnnual frequencies through electronic mode likeOTM / Debit Mandate. Default SIP date will be10th. In case the SIP due date is a Non BusinessDay, then the immediate following Business Daywill be considered for SIP processing.Daily - Minimum 500 & in multiples of 1 thereafterfor a minimum of 12 installments. (Kindly refernotice cum addendum dated June 02, 2020 forfurther details)Weekly - Minimum 1000 & in multiples of 1thereafter for a minimum of 6 installments. (or)Minimum 500 & in multiples of 1 thereafter for aminimum of 12 installments.Monthly - Minimum 1000 & in multiples of 1thereafter for minimum six months (or) minimum500 & in multiples of 1 thereafter for minimum
one yearQuarterly - Minimum 1500 & in multiples of 1thereafter for minimum one year.Semi Annual - Minimum 3000 & in multiples of 1thereafter for a minimum of 4 installments.Annual - Minimum 5000 & in multiples of 1thereafter for a minimum of 4 installments.
5,000 & in multiples of 1
1,000 & in multiples of 1
Month of`
`
` `
` `
` `
` `
`
` `
` `
` `
Commercial Papers 45.04
Treasury Bills 13.47
Certificate Of Deposits 12.97
Non Convertible Debentures 9.34
State Development Loans 4.24
Government Securities 4.00
Cash, Cash Equivalents And Others 10.94
Reg-Plan-Cash Option 4,918.6599
Reg-Plan-Daily IDCW 1,852.2157
Reg-Plan-Weekly IDCW 1,192.1160
Dir-Plan- 4,974.6155
Dir-Plan-Daily IDCW 1,860.1337
Dir-Plan-Weekly IDCW 1,197.3432
Cash
AAA and Equivalent A1+
Cash, Cash Equivalents, And Others Sovereign
Investors understand that their principal
will be at Low to Moderate risk
*Mr. Mohit Jain is the dedicated fund manager for managing overseas investments of the Scheme.
9.34
21.71
58.01
10.94

63
•
•
To generate reasonable returnsTo invest in a portfolio of floating rate instruments(including fixed rate instruments converted for floatingrate exposures using swaps / derivatives)
SBI Floating Rate Debt FundThis product is suitable for investors who are seeking^:
PORTFOLIO CLASSIFICATION BYRATING CLASS (%)
PORTFOLIO CLASSIFICATION BYASSET ALLOCATION (%)
DEBT- FLOATER FUND
Option NAV ( )`
NET ASSET VALUE
Option NAV ( )`
^Investors should consult their financial advisers if indoubt about whether the product is suitable for them.
Investment Objective
Quantitative Data
The investment objective of the scheme is togenerate regular income through investment ina portfolio comprising substantially of floatingrate debt instruments. The scheme may invest aportion of its net assets in fixed rate debtsecurities swapped for floating rate returns andmoney market instruments. However, there is noguarantee or assurance that the investmentobjective of the scheme will be achieved. Thescheme doesn’t assure or guarantee any returns.
Fund Details
Modified Duration :
Average Maturity :
Macaulay Duration :
Yield to Maturity :
1.14
1.31 years
1.21 years
6.70%
years
•
•
•
•
•
•
•
•
•
•
•
•
•
•
Type of Scheme
Date of Allotment:Report As On:AAUM for the August 2022
AUM as on August 31, 2022
Fund Manager:Mr. Rajeev Radhakrishnan and Mr. ArdhenduBhattacharya & *Mr. Mohit JainManaging Since:Rajeev RadhakrishnanArdhendu BhattacharyaMr. Mohit JainTotal Experience:Mr. Rajeev Radhakrishnan: -Mr. Ardhendu Bhattacharya: -Mr. Mohit Jain: -First Tier Benchmark:
Exit Load:
Entry Load:Plans Available:Options:SIP:
Minimum Investment
Additional Investment
An open-ended debt scheme investingpredominantly in floating rate instruments (includingfixed rate instruments converted to floating rateexposures using swaps / derivatives). A moderateinterest rate risk and relatively low credit risk
27/10/202031/08/2022
2,339.87 Crores
2,493.20 Crores
(Co-fund manager)
- Oct 2020- June 2021
-October 2020
21 years12 years
10 years
Nifty Short Duration Debt IndexFor exit within 3 days from the date of
allotment: 0.10%,For exit on or after 3 days from the date ofallotment: Nil
N.A.Regular, Direct
Growth, IDCW
Any Day SIP’ Facility is available for Monthly,Quarterly, Semi-Annual and Annual frequenciesthrough electronic mode like OTM / Debit Mandate.Default SIP date will be 10th. In case the SIP due dateis a Non Business Day, then the immediate followingBusiness Day will be considered for SIP processing.Daily - Minimum 500 & in multiples of 1 thereafterfor a minimum of 12 instalments. (Kindly refer noticecum addendum dated June 02, 2020 for furtherdetails)Weekly - Minimum 1000 & in multiples of 1thereafter for a minimum of 6 instalments. (or)Minimum 500 & in multiples of 1 thereafter for aminimum of 12 instalments.Monthly - Minimum 1000 & in multiples of 1thereafter for minimum six months (or) minimum500 & in multiples of 1 thereafter for minimum
one year.Quarterly - Minimum 1500 & in multiples of 1thereafter for minimum one year. Semi Annual -Minimum 3000 & in multiples of 1 thereafter for aminimum of 4 installments.Annual - Minimum 5000 & in multiples of 1thereafter for a minimum of 4 installments.
5,000 & in multiples of 1
1,000 & in multiples of 1
Month of`
`
` `
` `
` `
` `
` `
` `
` `
` `
Non Convertible Debentures 55.69
Government Securities 18.08
State Development Loans 13.73
Strips 2.93
Certificate Of Deposits 1.34
Cash, Cash Equivalents And Others 8.23
Reg-Plan-Monthly 10.7881
Reg-Plan-Growth 10.7875
Reg-Plan-Quarterly IDCW 10.7883
IDCW Dir-Plan- 10.8274
Dir-Plan- 10.8281
Dir-Plan-Quarterly IDCW 10.8282
Monthly IDCW
Growth
AAA and Equivalent AA+ A1+
Cash, Cash Equivalents, And Others Sovereign
PORTFOLIO
Certificate Of Deposits
Non Convertible Debentures
Government Securities
State Development Loans
HDFC Bank Ltd. IND A1+ 1.34
Export-Import Bank Of India CRISIL AAA 7.85Summit Digitel Infrastructure Pvt. Ltd. CRISIL AAA 6.81Embassy Office Parks Reit CRISIL AAA 5.93LIC Housing Finance Ltd. CARE AAA 5.92REC Ltd. CRISIL AAA 5.36Housing Development Finance Corporation Ltd. CRISIL AAA 5.03Tata Capital Housing Finance Ltd. CRISIL AAA 4.55National Bank For Agriculture And Rural Development [ICRA]AAA 3.35Hindustan Petroleum Corporation Ltd. CRISIL AAA 3.02Air India Assets Holding Ltd. [ICRA]AAA 2.21Power Finance Corporation Ltd. CRISIL AAA 1.98State Bank Of India( Tier II Bond Under Basel III ) CRISIL AAA 1.02Small Industries Development Bank Of India [ICRA]AAA 1.00Torrent Power Ltd. CRISIL AA+ 0.41Sundaram Home Finance Ltd. CARE AA+ 0.41Flometallic India Pvt. Ltd. CRISIL AA+ 0.40Tata Cleantech Capital Ltd. CRISIL AAA 0.20Mahindra Rural Housing Finance Ltd. IND AA+ 0.20Jamnagar Utilities & Power Private Ltd. CRISIL AAA 0.04
Government Of India SOVEREIGN 18.08
State Government Of Rajasthan SOVEREIGN 4.90State Government Of Andhra Pradesh SOVEREIGN 3.84State Government Of West Bengal SOVEREIGN 1.60State Government Of Haryana SOVEREIGN 1.02State Government Of Tamil Nadu SOVEREIGN 0.82State Government Of Bihar SOVEREIGN 0.79State Government Of Jharkhand SOVEREIGN 0.42State Government Of Punjab SOVEREIGN 0.21State Government Of Gujarat SOVEREIGN 0.13
Government Of India SOVEREIGN 2.93
Total 1.34
Total 55.69
Total 18.08
Total 13.73
Total 2.93
Strips
Cash, Cash Equivalents And Others 8.23Grand Total 100.00
Issuer Name (%) Of Total AUMRating
Investors understand that their principal
will be at Low to Moderate risk
*Mr. Mohit Jain is the dedicated fund manager for managing overseas investments of the Scheme.
54.27
1.42
34.74
1.348.23

64
•
•
Regular income for short term
Investment in overnight securities.
SBI Overnight FundThis product is suitable for investors who are seeking^:
PORTFOLIO CLASSIFICATION BYRATING CLASS (%)
Treasury Bills 5.03
Cash, Cash Equivalents And Others 94.97
Investment Objective
Quantitative Data
To provide the investors an opportunityto invest in overnight securities maturingon the next business day.
Fund Details
Modified Duration :
Average Maturity :
Macaulay Duration :
Yield to Maturity :
1 day
1 day
1 day
5.38%
•
•
•
•
•
•
•
•
•
•
•
•
•
Type of Scheme
Date of Allotment:
Report As On:
AAUM for the Month of August 2022
AUM as on August 31, 2022
Fund Manager: Mr. R. ArunManaging Since:Total Experience:
First Tier Benchmark:
Exit Load:Entry Load:
Plans Available:
Options:
SIP:
Minimum Investment
Additional Investment
An open-ended debt scheme investing inovernight securities. A relatively low interestrate risk and relatively low credit risk
01/10/2002
31/08/2022
25,607.08 Crores
14,005.63 Crores
Apr-2012Over 16 years
CRISIL Overnight Fund AI Index
NILN.A.
Regular, Direct
Growth, IDCW
For Growth option only:Weekly/Monthly frequency – 2,000 and 6installments;Quarterly – 6,000 and 2 installments;Semi-Annual and Annual – 12,000 and 2installments
5,000 & in multiples of 1
1,000 & in multiples of 1
`
`
`
`
`
` `
` `
PORTFOLIO CLASSIFICATION BYASSET ALLOCATION (%)
DEBT- OVERNIGHT FUND
Option NAV ( )`
NET ASSET VALUE
Option NAV ( )`
PORTFOLIO
Treasury Bills
Cash, Cash Equivalents And Others 94.97
Grand Total 100.00
91 Day T-Bill 01.09.22 SOVEREIGN 2.8891 Day T-Bill 22.09.22 SOVEREIGN 1.43182 Day T-Bill 08.09.22 SOVEREIGN 0.72
Total 5.03
Issuer Name (%) Of TotalAUM
Rating
^Investors should consult their financial advisers if indoubt about whether the product is suitable for them.
Cash, Cash Equivalents, And Others
Sovereign
Reg-Plan-Daily IDCW 1,092.1494
Reg-Plan-Growth 3,487.0878
Reg-Plan-Weekly IDCW 1,115.2389
Dir-Plan-Daily IDCW 1,094.1108
Dir-Plan-Growth 3,524.9924
Dir-Plan-Weekly IDCW 1,117.2469
Investors understand that their principal
will be at Low risk
5.03
94.97

65
Comparative Performance for all Schemes -Regular Plan
Note: Wherever NAV/Benchmark Index value is not available for start/end date for concerned period, the previous business day value of NAV/Benchmark Index is considered for return computation.
Notes:
a.
c. Past performance may or may not be sustained in future and the same may not necessarily provide the basis for comparison with other investment.
d. Load is not considered for computation of returns.
e. Period for which scheme’s performance has been provided is computed basis last day of the month-end preceding the date of advertisement. In case, the start/end date of the concerned period is a non-business day, the NAV of the
previous date is considered for computation of returns.
The details of the period since the Fund Manager is managing the scheme(s) & inception date provided alongside of the table. The total no of schemes managed by Mr. R. Srinivasan is 6 (2 schemes are jointly managed by Mr. Dinesh Ahuja & Mr. Mohit Jain - Investments in foreign securities portion). The total no. of
schemes managed by Mr. DineshAhuja is 13 (2 schemes are jointly managed by Mr. R. Srinivasan). The Scheme count of Mr. DineshAhuja includes an ETF managed by him. The total no of schemes managed by Mr. Rohit Shimpi is 1 (2 schemes are jointly managed by Ms. Mansi Sajeja and 1 scheme is jointly managed
with Mr. Neeraj Kumar) The total no of schemes managed by Mansi Sajeja is 2 (1 schemes are jointly managed with Mr. Saurabh Pant and 1 scheme is jointly managed with Mr. Neeraj Kumar & Nidhi Chawla)
b. Different plans shall have a different expense structure. Performance for all scheme(s) are of Regular growth option. In case of SBI Magnum Equity ESG Fund growth option was introduced later on 27-Nov-2006 and SBI Equity Hybrid Fund growth option was introduced later on 19-Jan-2005, hence for the
purpose of calculation of since inception returns, all IDCW declared prior to the splitting of the scheme into IDCW & Growth Options are assumed to be reinvested in the units of the scheme at the then prevailing NAV (ex-IDCW NAV).
h. SBI Equity Hybrid Fund, SBI Conservative Hybrid Fund, SBI Magnum Equity ESG Fund: As the scheme was launched before the launch of the benchmark index, benchmark index figures since inception or the required period are not available.
i. SBI Equity Hybrid Fund: As scheme additional benchmark TRI data is not available since inception of the scheme, additional benchmark performance is calculated using composite CAGR of S&P BSE Sensex PRI values from 9-Oct-95 to 18-Aug-96 and TRI values since 19-Aug-96.
j. SBI Magnum Gilt Fund, SBI Magnum Income Fund, SBI Conservative Hybrid Fund: As the scheme was launched before the launch of the additional benchmark index, additional benchmark index figures since inception or the required period are not available.
k.
f. Scheme count for the total schemes managed by the Fund Managers does not include close ended Scheme.
g. SBI Focused Equity Fund: As scheme benchmark TRI data is not available since inception of the scheme, benchmark performance is calculated using composite CAGR of S&P BSE 500 PRI values from 17-Sep-04 to 31-Jul-06 and TRI values since 01-Aug-06.
The performance of the schemes is benchmarked to the Total Return variant of the Index.
l. The debt portion of SBI Conservative Hybrid Fund was managed by Mr. Dinesh Ahuja till 29th June 2021. Ms. Mansi Sajeja is managing debt portion of SBI Conservative Hybrid Fund w.e.f. June 30, 2021. Mr. Saurabh Pant is managing (Equity) portion of SBI Conservative Hybrid Fund w.e.f. January 1, 2022
m. SBI Balanced Advantage Fund Scheme are jointly managed by Mr. Dinesh Balachandran, Mr. Dinesh Ahuja and Mr. Mohit (w.e.f. 31st August 2021).
n. *Mr. Mohit Jain is the dedicated fund manager for managing overseas investments of the Scheme, The total no. of schemes managed by Mr. Mohit Jain is 40.
Managing Since
Jan-11
Inception Date
09-02-2004
Managing Since
Jan-11
Inception Date
25-11-1998
Managing Since
Jul-11
Managing Since
Jan-11
Inception Date
30-12-2000
Inception Date
12-11-2003
Inception Date
09-10-1995
Inception Date
09-04-2001
Inception Date
01-01-1991
Inception Date
29-09-2020
Managing Since
Jan-12
Managing SinceMansi - Jul-11
Saurabh - Jan-22Mohit - Jan-20
Managing Since
Jan-22
Managing Since
Sep-20
Funds Managed by Dinesh Ahuja & *Mr. Mohit Jain is the dedicated fund manager for overseas securities
Funds Managed by Dinesh Ahuja
Fund Managed by Rohit Shimpi & *Mohit Jain (investments in foreign securities portion)
Fund Jointly Managed by R. Srinivasan (Equity portion), Dinesh Ahuja (Debt portion) & *Mohit Jain (investments in foreign securities portion)
SBI Conservative Hybrid Fund
First Tier Scheme Benchmark: - NIFTY 50 HybridComposite Debt 15:85 Index
Additional Benchmark: - CRISIL 10 Year Gilt Index
SBI Equity Hybrid Fund
First Tier Scheme Benchmark: - CRISIL Hybrid 35+65 -Aggressive Index
Additional Benchmark: - S&P BSE Sensex (TRI)
SBI Dynamic Bond Fund
SBI Magnum Income Fund
SBI Magnum Medium Duration Fund
First Tier Scheme Benchmark: - CRISIL Dynamic Bond Fund AIIIIndex
Additional Benchmark: - CRISIL 10 Year Gilt Index
First Tier Scheme Benchmark: - CRISIL Medium to Long DurationFund BIII Index
Additional Benchmark: - CRISIL 10 Year Gilt Index
First Tier Scheme Benchmark: - NIFTY Medium Duration DebtIndex C-III
Additional Benchmark: - CRISIL 10 Year Gilt Index
SBI Magnum Gilt Fund
First Tier Scheme Benchmark: - Nifty All Duration G-Sec Index
Additional Benchmark: - CRISIL 10 Year Gilt Index
SBI Magnum Equity ESG Fund
First Tier Scheme Benchmark: - Nifty ESG 100 TRI
Additional Benchmark: - S&P BSE Sensex (TRI)
SBI Magnum Children’s Benefit Fund- Investment Plan
First Tier Scheme Benchmark: - CRISIL Hybrid 35+65 -Aggressive Index
Additional Benchmark: - S&P BSE Sensex TRI
2.55 10,255 5.30 11,678 6.03 13,400 5.86 28,768
1.83 10,183 6.33 12,025 6.54 13,728 7.40 37,672
-0.33 9,967 3.61 11,123 4.54 12,486 5.48 26,934
2.07 10,207 6.73 12,162 6.48 13,690 7.60 57,119
3.92 10,392 8.34 12,719 7.32 14,236 10.10 98,639
-0.33 9,967 3.61 11,123 4.54 12,486 N.A. N.A.
2.80 10,280 6.95 12,235 7.10 14,090 7.85 41,453
5.16 10,516 7.83 12,542 7.24 14,187 7.91 41,889
-0.33 9,967 3.61 11,123 4.54 12,486 5.43 27,036
3.83 10,383 15.61 15,459 11.81 17,471 15.40 4,72,250
5.65 10,565 16.23 15,708 11.83 17,493 N.A. N.A.
4.82 10,482 18.16 16,504 14.75 19,899 12.72 2,50,715
6.78 10,678 11.27 13,782 7.57 14,403 8.26 54,699
3.06 10,306 8.65 12,830 8.03 14,717 N.A. N.A.
-0.33 9,967 3.61 11,123 4.54 12,486 N.A. N.A.
2.93 10,293 6.00 11,912 6.51 13,705 7.99 52,921
2.04 10,204 5.42 11,718 6.41 13,643 N.A. N.A.
-0.33 9,967 3.61 11,123 4.54 12,486 N.A. N.A.
3.10 10,310 17.59 16,269 12.54 18,056 14.43 7,16,484
1.06 10,106 20.67 17,579 15.22 20,303 N.A. N.A.
4.82 10,482 18.16 16,504 14.75 19,899 15.26 8,98,953
17.96 11,796 N.A. N.A. N.A. N.A. 56.27 23,541
5.65 10,565 N.A. N.A. N.A. N.A. 21.09 14,443
4.82 10,482 N.A. N.A. N.A. N.A. 27.96 16,046
Fund Jointly Managed by Mansi Sajeja (Debt portion), Saurabh Pant (Equity portion) & *Mohit Jain (investments in foreign securities portion)
Fund Jointly Managed by R. Srinivasan (Equity portion), Dinesh Ahuja (Debt portion) & *Mohit Jain (investments in foreign securities portion)
Managing Since
Feb-17
Managing Since
August - 2021
Inception Date
17-07-2014
Inception Date
31-08-2021
Funds Managed by Lokesh Mallya & *Mr. Mohit Jain is the dedicated fund manager for overseas securities
Fund managed by Mr. Dinesh Balachandran (Equity Portion) Mr. Dinesh Ahuja (Debt Portion) *Mr. Mohit Jain (investments in foreign securities portion)
3.64 10,364 6.44 12,060 6.15 13,476 7.65 18,201
5.51 10,551 7.94 12,577 8.00 14,697 8.83 19,893
-0.33 9,967 3.61 11,123 4.54 12,486 6.93 17,242
5.02 10,500 N.A. N.A. N.A. N.A. 5.02 10,500
4.06 10,406 N.A. N.A. N.A. N.A. 4.06 10,406
-0.33 9,967 N.A. N.A. N.A. N.A. -0.33 9,967
CAGR %
Point-to-Point
returns on Standard
Investment of
Rs. 10,000/-
CAGR %
Point-to-Point
returns on Standard
Investment of
Rs. 10,000/-
CAGR %
Point-to-Point
returns on Standard
Investment of
Rs. 10,000/-
3 Years 5 Years
CAGR %
Point-to-Point
returns on Standard
Investment of
Rs. 10,000/-
Since Inception
Inception Date &
Managing Since
1 Year
SBI Credit Risk Fund
First Tier Scheme Benchmark: -NIFTY Credit Risk Bond Index C-II
Additional Benchmark: - CRISIL 10 Year Gilt Index
SBI Balanced Advantage Fund
FirstTierSchemeBenchmark: -NIFTY50HybridCompositeDebt50:50 Index
Additional Benchmark: - Crisil 10 Yr Gilt Index

66
Comparative Performance for all Schemes -Regular Plan
Notes:
a.
b.
c. Past performance may or may not be sustained in future and the same may not necessarily provide the basis for comparison with other investment.
d. Load is not considered for computation of returns.
e. Period for which scheme’s performance has been provided is computed basis last day of the month-end preceding the date of advertisement. In case, the start/end date of the concerned period is a non-business day, the NAV of the previous date is
considered for computation of returns.
f. Scheme count for the total schemes managed by the Fund Managers does not include ended Scheme.
The details of the period since the Fund Manager is managing the scheme(s) & inception date provided alongside of the table. The total no of schemes managed by Mr. Neeraj Kumar is 2 (1 scheme is jointly managed by Ms. Nidhi Chawla & Mansi Sajeja
and 1 scheme is jointly managed by Mr. Arun R.) The total no of schemes managed by Mr. R. Srinivasan is 4. The total no of schemes jointly managed by Mr. Lokesh Mallya is 1.The total no of schemes managed by Mansi Sajeja is 1 (2 schemes are jointly
managed with Mr Saurabh Pant & Mr. Mohit Jain - Investments in foreign securities portion and 1 scheme is jointly managed with Mr Neeraj Kumar & Ms. Nidhi Chawla)
Different plans shall have a different expense structure. Performance for all scheme(s) are of Regular growth option. In case of SBI Magnum Global Fund regular growth option was introduced later on 27-Jun-2005 and SBI Technology Opportunities Fund
regular growth option was introduced later on 01-Jan-2013, hence for the purpose of calculation of since inception returns, all IDCW declared prior to the splitting of the scheme into IDCW & Growth Options are assumed to be reinvested in the units of the
scheme at the then prevailing NAV (ex-IDCW NAV).
close
g. SBI Flexicap Fund: As scheme benchmark TRI data is not available since inception of the scheme, benchmark performance is calculated using composite CAGR of S&P BSE 500 PRI values from 29-Sep-05 to 31-Jul-06 and TRI values since 01-Aug-06.
h. SBI Magnum Global Fund: As scheme additional benchmark TRI data is not available since inception of the scheme, additional benchmark performance is calculated using composite CAGR of S&P BSE Sensex PRI values 30-Sep-94 to 18-Aug-96 and TRI
values since 19-Aug-96.
i. SBI Arbitrage Opportunities Fund, SBI Technology Opportunities Fund & SBI Magnum Global Fund : As the scheme was launched before the launch of the benchmark index, benchmark index figures since inception or the required period are not available.
j. The performance of the schemes is benchmarked to the Total Return variant of the Index.
k. SBI Arbitrage Opportunities Fund: Debt portion of the scheme was managed by Mr. Rajeev Radhakrishnan till June 29, 2021. Mr. Arun R. is managing SBI Arbitrage Opportunities Fund w.e.f. June 30, 2021
l. The Debt portion of SBI Equity Savings Fund was managed by Mr. Ruchit Mehta till 29th June 2021. The Debt portion of SBI Equity Savings Fund is managed by Ms. Mansi Sajeja w.e.f. 30th June 2021.
m. Ms. Nidhi Chawla is managing (Equity) portion of SBI Equity Savings Fund w.e.f. January 1, 2022
n. SBI Multicap Fund Scheme are jointly managed by Mr. R. Srinivasan & *Mr. Mohit Jain (w.e.f. 8th March 2022). *Mr. Mohit Jain is the dedicated fund manager for managing overseas investments of the Scheme.
o. *Mr. Mohit Jain is the dedicated fund manager for managing overseas investments of the Scheme, The total no. of schemes managed by Mr. Mohit Jain is 40.
CAGR %
Point-to-Point
returns on Standard
Investment of
Rs. 10,000/-
CAGR %
Point-to-Point
returns on Standard
Investment of
Rs. 10,000/-
CAGR %
Point-to-Point
returns on Standard
Investment of
Rs. 10,000/-
3 Years 5 Years
CAGR %
Point-to-Point
returns on Standard
Investment of
Rs. 10,000/-
Since Inception
Inception Date &
Managing Since
Managing Since
Oct-12
Inception Date
03-11-2006
SBI Arbitrage Opportunities Fund
SBI Equity Savings Fund
First Tier Scheme Benchmark: - Nifty 50 Arbitrage
Additional Benchmark: - Crisil 1 Yr T-Bill Index
First Tier Scheme Benchmark: - Nifty Equity Savings
Additional Benchmark: - Crisil 10 Yr Gilt Index
1 Year
Managing Since
Neeraj - May-15
Mansi - June-21
Nidhi - Jan-22
Inception Date
27-05-2015
Fund Jointly Managed by Neeraj Kumar (Equity portion) & Arun R. (Debt portion)
Notes:
a. The details of the period since the Fund Manager is managing the scheme(s) & inception date provided alongside of the table. The total number of schemes managed by Mr. Bhavin Vithlani is 1.
b. Past performance may or may not be sustained in future and the same may not necessarily provide the basis for comparison with other investment.
c. Load is not considered for computation of returns.
d. Period for which scheme's performance has been provided is computed basis last day of the month-end preceding the date of advertisement. In case, the start/end date of the concerned period is a non-business day, the NAV of the previous date
is considered for computation of returns.
e. Different plans shall have a different expense structure. The performance details provided herein are of Growth Option - Regular Plan.
f. Scheme count for the total schemes managed by the Fund Managers does not include close ended Scheme.
g. The data of the last working day has been considered for the calculation of performance.
h.The performance of the schemes is benchmarked to the Total Return variant of the Index.
j.*Mr. Mohit Jain is the dedicated fund manager for managing overseas investments of the Scheme, The total no. of schemes managed by Mr. Mohit Jain is 40.
3.85 10,385 3.83 11,194 4.83 12,661 6.65 27,721
3.41 10,341 3.52 11,095 4.31 12,348 N.A. N.A.
3.18 10,318 4.62 11,451 5.59 13,126 6.12 25,600
3.06 10,306 10.66 13,555 7.61 14,427 8.00 17,498
4.09 10,409 10.31 13,428 8.87 15,302 8.67 18,300
-0.33 9,967 3.61 11,123 4.54 12,486 6.15 15,436
CAGR %
Point-to-Point
returns on Standard
Investment of
Rs. 10,000/-
CAGR %
Point-to-Point
returns on Standard
Investment of
Rs. 10,000/-
CAGR %
Point-to-Point
returns on Standard
Investment of
Rs. 10,000/-
3 Years 5 Years
CAGR %
Point-to-Point
returns on Standard
Investment of
Rs. 10,000/-
Since Inception
Inception Date &
Managing Since
1 Year
Funds Managed by Bhavin Vithlani & *Mohit Jain (investments in foreign securities portion)
Funds Managed by R. Srinivasan & *Mohit Jain (investments in foreign securities portion)
SBI Infrastructure Fund
First Tier Scheme Benchmark: - Nifty Infrastructure (TRI)
Additional Benchmark: - S&P BSE Sensex (TRI)
Inception Date
06-07-2007
Managing Since
Jan - 2022
12.82 11,282 22.99 18,617 12.61 18,111 6.72 26,802
11.06 11,106 21.50 17,947 11.03 16,873 3.19 16,106
4.82 10,482 18.16 16,504 14.75 19,899 11.03 48,846
Fund jointly managed by Mansi Sajeja (Debt Portion), Nidhi Chawla (Equity Portion) and Neeraj Kumar (Arbitrage Portion)
CAGR %
Point-to-Point
returns on Standard
Investment of
Rs. 10,000/-
CAGR %
Point-to-Point
returns on Standard
Investment of
Rs. 10,000/-
CAGR %
Point-to-Point
returns on Standard
Investment of
Rs. 10,000/-
3 Years 5 Years
CAGR %
Point-to-Point
returns on Standard
Investment of
Rs. 10,000/-
Since Inception
Inception Date &
Managing Since
Managing Since
May-09
Inception Date
17-09-2004
1 Year
Managing Since
Nov-13
Inception Date
09-09-2009
Funds Managed by R. Srinivasan & *Mohit Jain (investments in foreign securities portion)
0.15 10,015 19.67 17,148 14.35 19,555 19.12 2,31,648
7.01 10,701 21.24 17,832 13.59 18,907 15.59 1,34,906
4.82 10,482 18.16 16,504 14.75 19,899 15.68 1,36,843
16.92 11,692 32.03 23,032 19.11 23,977 20.46 1,12,067
6.81 10,681 28.20 21,085 10.08 16,164 10.14 35,034
4.82 10,482 18.16 16,504 14.75 19,899 12.08 43,959
2.57 10,257 17.34 16,163 11.24 17,037 12.75 76,295
7.01 10,701 21.24 17,832 13.59 18,907 13.55 85,899
4.82 10,482 18.16 16,504 14.75 19,899 13.59 86,465
3.71 10,371 21.18 17,805 13.22 18,608 14.60 4,50,344
7.45 10,745 18.64 16,709 10.17 16,232 N.A. N.A.
4.82 10,482 18.16 16,504 14.75 19,899 11.51 2,09,831
SBI Small Cap Fund
First Tier Scheme Benchmark: - S&P BSE 250 Small Cap IndexTRI
Additional Benchmark: - S&P BSE Sensex (TRI)
SBI Focused Equity Fund
First Tier Scheme Benchmark: - S&P BSE 500 (TRI)
Additional Benchmark: - S&P BSE Sensex (TRI)
SBI Flexicap Fund
SBI Magnum Global Fund
First Tier Scheme Benchmark: - S&P BSE 500 (TRI)
Additional Benchmark: - S&P BSE Sensex (TRI)
First Tier Scheme Benchmark: - Nifty MNC (TRI)
Additional Benchmark: - S&P BSE Sensex (TRI)
Managing Since
Jan-2022
Inception Date
29-09-2005
Managing Since
Jan-2022
Inception Date
30-09-1994

67
Comparative Performance for all Schemes -Regular Plan
Notes:
a.
b.
c. Past performance may or may not be sustained in future and the same may not necessarily provide the basis for comparison with other investment.
d. Load is not considered for computation of returns.
e. Period for which scheme’s performance has been provided is computed basis last day of the month-end preceding the date of advertisement. In case, the start/end date of the concerned period is a non-business day, the NAV of the
previous date is considered for computation of returns.
f. Scheme count for the total schemes managed by the Fund Managers does not include ended Scheme.
The details of the period since the Fund Manager is managing the scheme(s) & inception date provided alongside of the table. The total no of schemes managed by Mr. Saurabh Pant is 3. The total no of schemes managed by
Mr.Tanmaya Desai is 1.
Different plans shall have a different expense structure. Performance for all scheme(s) are of Regular growth option. In case of SBI Consumption Opportunities Fund growth option was introduced later on 01-Jan-2013, SBI Large &
Midcap Fund growth option was introduced later on 25-May-2005 and SBI Healthcare Opportunities Fund growth option was introduced later on 31-Dec-2004. Hence for the purpose of calculation of since inception returns, all IDCW
declared prior to the splitting of the scheme into IDCW & Growth Options are assumed to be reinvested in the units of the scheme at the then prevailing NAV (ex-IDCW NAV).
close
g. SBI Consumption Opportunities Fund & SBI Large & Midcap Fund : As the scheme was launched before the launch of the benchmark index, benchmark index figures since inception or the required period are not available.
h. SBI Large & Midcap Fund: As scheme benchmark TRI data is not available since inception of the scheme, additional benchmark performance is calculated using composite CAGR of S&P BSE Sensex PRI values from 28-Feb-93 to 18
-Aug-96 and TRI values since 19-Aug-96.
i. SBI Healthcare Opportunities Fund: As TRI data is not available since inception of SBI Healthcare Opportunities Fund, benchmark performance is calculated using composite CAGR of S&P BSE Health Care PRI values from 05-Jul-99
to 30-Dec-07 and TRI values since 31-Dec-07.
j. The performance of the schemes is benchmarked to the Total Return variant of the Index.
k. The Benchmark of SBI Large & Midcap Fund has been changed to NIFTY LargeMidcap 250 w.e.f. 25th February 2019.
l. *Mr. Mohit Jain is the dedicated fund manager for managing overseas investments of the Scheme, The total no. of schemes managed by Mr. Mohit Jain is 40.
CAGR %
Point-to-Point
returns on Standard
Investment of
Rs. 10,000/-
CAGR %
Point-to-Point
returns on Standard
Investment of
Rs. 10,000/-
CAGR %
Point-to-Point
returns on Standard
Investment of
Rs. 10,000/-
3 Years 5 Years
CAGR %
Point-to-Point
returns on Standard
Investment of
Rs. 10,000/-
Since Inception
Inception Date &
Managing Since
Managing Since
Jun-11
Inception Date
05-07-1999
Managing Since
Sep-16
Inception Date
28-02-1993
1 Year
Funds Managed by Saurabh Pant & *Mohit Jain (investments in foreign securities portion)
Funds Managed by Saurabh Pant & *Mohit Jain (investments in foreign securities portion)
Managing Since
Jun-11
Inception Date
05-07-1999
SBI Healthcare Opportunities Fund
First Tier Scheme Benchmark: - S&P BSE Health Care (TRI)
Additional Benchmark: - S&P BSE Sensex (TRI)
Funds Managed by Tanmaya Desai & *Mohit Jain (investments in foreign securities portion)
Notes:
a. Ms. SohiniAndani has been managing SBI Blue Chip Fund since September 2010 and SBI Magnum Midcap Fund
since July 2010 The total number of schemes managed by Ms. SohiniAndani is 2. Mr. MilindAgrawal has been managing SBI Banking & Financial Services Fund since August 2019. The total number of schemes managed by Mr. MilindAgrawal
is 1. SBI Banking & Financial Services Fund was managed by Ms. Sohini Andani till 31st July 2019.
b. Past performance may or may not be sustained in future and the same may not necessarily provide the basis for comparison with other investment.
c. Load is not considered for computation of returns.
d. Period for which scheme’s performance has been provided is computed basis last day of the month-end preceding the date of advertisement. In case, the start/end date of the concerned period is a non-business day, the NAV of the previous date
is considered for computation of returns.
e. Different plans shall have a different expense structure. The performance details provided herein are of Growth Option - Regular Plan. Performance for Schemes not having Growth Option has been calculated considering the IDCW Option
and is Net of IDCW distribution tax, if any.
f. Scheme count for the total schemes managed by the Fund Managers does not include Scheme.close ended
g. SBI Blue Chip Fund: As scheme benchmark TRI data is not available since inception of the scheme, benchmark performance is calculated using composite CAGR of S&P BSE 100 PRI values from 14-Feb-06 to 31-Jul-06 and TRI
values since 01-Aug-06.
h. SBI Magnum Midcap Fund: As the scheme was launched before the launch of the benchmark index, benchmark index figures since inception or the required period are not available.
I. The performance of the schemes is benchmarked to the Total Return variant of the Index.
The details of the period since the Fund Manager is managing the scheme(s) & inception date provided alongside of the table.
CAGR %
Point-to-Point
returns on Standard
Investment of
Rs. 10,000/-
CAGR %
Point-to-Point
returns on Standard
Investment of
Rs. 10,000/-
CAGR %
Point-to-Point
returns on Standard
Investment of
Rs. 10,000/-
3 Years 5 Years
CAGR %
Point-to-Point
returns on Standard
Investment of
Rs. 10,000/-
Since Inception
Inception Date &
Managing Since
Managing Since
July-10
Inception Date
29-03-2005
SBI Magnum MidCap Fund
SBI Blue Chip Fund
First Tier Scheme Benchmark: - Nifty Midcap 150 (TRI)
Additional Benchmark: - S&P BSE Sensex (TRI)
First Tier Scheme Benchmark: - S&P BSE 100 (TRI)
Additional Benchmark: - S&P BSE Sensex (TRI)
1 Year
Managing Since
Sep-10
Inception Date
14-02-2006
Funds Managed by Sohini Andani & *Mohit Jain (investments in foreign securities portion)
SBI Banking & Financial Services Fund
First Tier Scheme Benchmark: - Nifty Financial Services (TRI)
Additional Benchmark: - S&P BSE Sensex (TRI)Managing Since
Aug-19
Inception Date
26-02-2015
Fund Managed by Milind Agrawal & *Mohit Jain (investments in foreign securities portion)
24.54 12,454 23.35 18,777 14.64 19,805 15.35 2,73,474
16.73 11,673 20.82 17,647 13.36 18,719 N.A. N.A.
4.82 10,482 18.16 16,504 14.75 19,899 13.75 1,97,873
11.85 11,185 23.01 18,626 13.92 19,187 14.72 5,75,640
8.81 10,881 23.84 19,004 14.22 19,437 N.A. N.A.
4.82 10,482 18.16 16,504 14.75 19,899 12.67 3,38,670
-10.41 8,959 25.60 19,825 24.67 30,116 14.94 2,51,690
-9.82 9,018 21.05 17,746 20.41 25,313 N.A. N.A.
4.82 10,482 18.16 16,504 14.75 19,899 13.75 1,97,873
-8.96 9,104 24.52 19,319 12.20 17,779 15.40 2,76,263
-12.82 8,718 22.15 18,233 12.62 18,119 13.82 2,00,546
4.82 10,482 18.16 16,504 14.75 19,899 13.75 1,97,873
16.82 11,682 31.42 22,715 14.43 19,617 16.80 1,49,797
11.85 11,185 28.75 21,357 14.86 19,993 N.A. N.A.
4.82 10,482 18.16 16,504 14.75 19,899 15.28 1,19,275
5.15 10,515 18.29 16,560 11.38 17,141 11.73 62,664
6.50 10,650 19.35 17,009 13.53 18,862 12.80 73,414
4.82 10,482 18.16 16,504 14.75 19,899 12.86 74,058
3.03 10,303 14.17 14,886 11.63 17,334 13.35 25,636
1.81 10,181 14.28 14,929 13.20 18,590 13.01 25,071
4.82 10,482 18.16 16,504 14.75 19,899 11.63 22,847
SBI Consumption Opportunities Fund
SBI Large & Midcap Fund
First Tier Scheme Benchmark: - Nifty India Consumption (TRI)
Additional Benchmark: - S&P BSE Sensex (TRI)
First Tier Scheme Benchmark: - NIFTY LargeMidcap 250 (TRI)
Additional Benchmark: - S&P BSE Sensex (TRI)
SBI Technology Opportunities Fund
First Tier Scheme Benchmark: - S&P BSE Teck (TRI)
Additional Benchmark: - S&P BSE Sensex (TRI)Managing Since
Jun-11
Inception Date
05-07-1999

68
Comparative Performance for all Schemes -Regular Plan
Notes:
a.
c. Past performance may or may not be sustained in future and the same may not necessarily provide the basis for comparison with other investment.
d. Load is not considered for computation of returns.
e. Period for which scheme’s performance has been provided is computed basis last day of the month-end preceding the date of advertisement. In case, the start/end date of the concerned period is a non-business day, the NAV of the previous date is considered for computation of returns.
f. Scheme count for the total schemes managed by the Fund Managers does not include ended Schemes.close
g. SBI Long Term Equity Fund: As the scheme was launched before the launch of the benchmark index, benchmark index figures since inception or the required period are not available.
h. SBI Long Term Equity Fund:As scheme benchmark TRI data is not available since inception of the scheme, additional benchmark performance is calculated using composite CAGR of S&P BSE Sensex PRI values 31-Mar-93 to 18-Aug-96 and TRI values since 19-Aug-96.
I. SBI Contra Fund: As scheme benchmark TRI data is not available since inception of the scheme, benchmark performance is calculated using composite CAGR of S&P BSE 500 PRI values from 05-Jul-99 to 31-Jul-06 and TRI values since 01-Aug-06.
.
.
The details of the period since the Fund Manager is managing the scheme(s) & inception date provided alongside of the table. Mr. Dinesh Balachandran has been managing SBI Long Term Equity Fund (previously known as SBI Magnum Taxgain Scheme) since September 2016. The total number of schemes managed by Mr. Dinesh Balachandran is 4 (3 schemes are jointly
managed by Mr. Mohit Jain). SBI Contra Fund was managed by Mr. R. Srinivasan till May 04, 2018. The total no. of schemes managed by Mr. Mohit Jain is 40(He is the dedicated Fund Manager for managing overseas investments of the Schemes of SBI Mutual Fund which have a mandate to invest in overseas securities)
b. Different plans shall have a different expense structure. Performance for all scheme(s) are of Regular growth option. In case of SBI Long Term Equity Fund growth Option was introduced later on 07-May-2007 and SBI Contra Fund growth option was introduced later on 06-May-2005, hence for the purpose of calculation of since inception returns, all IDCW declared prior to the splitting of
the scheme into IDCW & Growth Options are assumed to be reinvested in the units of the scheme at the then prevailing NAV (ex-IDCW NAV).
j SBI Muti Asset Allocation Fund - Mr. Raj Gandhi is appointed as fund manager for managing investments in ETCDs w.e.f. February 27, 2020.
k SBI Muti Asset Allocation Fund: Benchmark of the scheme is changed to 45% CRISIL 10 Year Gilt Index + 40% NIFTY 50 TRI + 15% Price of Gold w.e.f. November 06, 2020
l. SBI Multi Asset Allocation Fund: Mr. Dinesh Balachandran is appointed fund manager w.e.f October 1, 2021. Mr Gaurav Mehta was the fund manager till 30th September, 2021.
m. SBI International Access - US Equity FoF: S&P 500 benchmark performance is calculated using INR equivalent closing prices. (source: Bloomberg)
n. *Mr. Mohit Jain is the dedicated fund manager for managing overseas investments of the Scheme, The total no. of schemes managed by Mr. Mohit Jain is 40.
Inception Date &
Managing Since
Inception Date
31-03-1993
Inception Date
05-07-1999
Managing Since
Sep-16
Managing Since
May-18
Notes:
a.
The performance of the schemes is benchmarked to the Total Return variant of the Index.
The details of the period since the Fund Manager is managing the scheme(s) & inception date provided alongside of the table. Mr. Raviprakash Sharma has been managing SBI GOLD Fund since September 2011, SBI Nifty Index Fund since February 2011 and SBI Equity Minimum Variance Fund since March 2019. The total number of schemes managed by Mr.
Raviprakash Sharma is 4.
b. Past performance may or may not be sustained in future and the same may not necessarily provide the basis for comparison with other investment.
c. Load is not considered for computation of returns.
d. Period for which scheme’s performance has been provided is computed basis last day of the month-end preceding the date of advertisement. In case, the start/end date of the concerned period is a non-business day, the NAV of the previous date is considered for computation of returns.
e. Different plans shall have a different expense structure. The performance provided for SBI Gold Fund, are of Regular Plan - IDCW Option and is Net of IDCW distribution tax, if any. The performance details provided for SBI Nifty Index Fund are of Growth Option-Regular Plan.
f. Scheme count for the total schemes managed by the Fund Managers does not include ETF’s managed by Mr. Raviprakash Sharma.
g. The data of the last working day has been considered for the calculation of performance.
h.
Inception Date
16-05-2018
Managing Since
Feb-19
Funds Managed by Dinesh Balachandran & Mr. Raj Gandhi (for ETCDs) & *Mohit Jain (investments in foreign securities portion)
SBI Multi Asset Allocation Fund
First Tier Scheme Benchmark: - 45% CRISIL 10 Year Gilt Index+ 40% NIFTY 50 TRI + 15% Price of Gold
Additional Benchmark: - S&P BSE Sensex TRI
5.60 10,560 11.44 13,844 N.A. N.A. 9.50 14,764
3.72 10,372 11.10 13,717 N.A. N.A. 11.12 15,725
4.82 10,482 18.16 16,504 N.A. N.A. 14.33 17,773
SBI Long Term Equity Fund
First Tier Scheme Benchmark: - S&P BSE 500 (TRI)
Additional Benchmark: - S&P BSE Sensex (TRI)
SBI Contra Fund
First Tier Scheme Benchmark: - S&P BSE 500 TRI
Additional Benchmark: - S&P BSE Sensex (TRI)
Funds Managed by Dinesh Balachandran
Fund Jointly Managed by Dinesh Balachandran and *Mohit Jain (investments in foreign securities portion)
7.18 10,718 20.45 17,485 10.91 16,779 15.61 7,15,897
7.01 10,701 21.24 17,832 13.59 18,907 N.A. N.A.
4.82 10,482 18.16 16,504 14.75 19,899 13.29 3,93,896
18.45 11,845 31.16 22,581 14.89 20,020 18.90 5,52,485
7.01 10,701 21.24 17,832 13.59 18,907 15.50 2,81,618
4.82 10,482 18.16 16,504 14.75 19,899 13.75 1,97,873
CAGR %
Point-to-Point
returns on Standard
Investment of
Rs. 10,000/-
CAGR %
Point-to-Point
returns on Standard
Investment of
Rs. 10,000/-
CAGR %
Point-to-Point
returns on Standard
Investment of
Rs. 10,000/-
3 Years 5 Years
CAGR %
Point-to-Point
returns on Standard
Investment of
Rs. 10,000/-
Since Inception1 Year
Inception Date &
Managing Since
Inception Date &
Managing Since
CAGR %
CAGR %
Point-to-Point
returns on Standard
Investment of
Rs. 10,000/-
Point-to-Point
returns on Standard
Investment of
Rs. 10,000/-
CAGR %
CAGR %
Point-to-Point
returns on Standard
Investment of
Rs. 10,000/-
Point-to-Point
returns on Standard
Investment of
Rs. 10,000/-
CAGR %
CAGR %
Point-to-Point
returns on Standard
Investment of
Rs. 10,000/-
Point-to-Point
returns on Standard
Investment of
Rs. 10,000/-
3 Years
3 Years
5 Years
5 Years
CAGR %
CAGR %
Point-to-Point
returns on Standard
Investment of
Rs. 10,000/-
Point-to-Point
returns on Standard
Investment of
Rs. 10,000/-
Since Inception
Since Inception
1 Year
1 Year
Inception Date
22-03-2021
Inception Date
19-05-2021
Managing Since
Mar - 2021
Managing Since
May - 2021
Fund managed by Mr. Mohit Jain
SBI International Access - US Equity FoF
First Tier Scheme Benchmark: - S&P 500
Additional Benchmark: - S&P BSE Sensex TRI
SBI Nifty Next 50 Index Fund
First Tier Scheme Benchmark: - Nifty Next 50 TRI
Additional Benchmark: - S&P BSE Sensex TRI
-6.55 9,345 N.A. N.A. N.A. N.A. 4.34 10,631
-4.60 9,540 N.A. N.A. N.A. N.A. 7.10 11,041
4.82 10,482 N.A. N.A. N.A. N.A. 14.77 12,197
5.60 10,560 N.A. N.A. N.A. N.A. 14.29 11,868
6.50 10,650 N.A. N.A. N.A. N.A. 15.34 12,008
4.82 10,482 N.A. N.A. N.A. N.A. 16.50 12,162
CAGR %
Point-to-Point
returns on Standard
Investment of
Rs. 10,000/-
CAGR %
Point-to-Point
returns on Standard
Investment of
Rs. 10,000/-
CAGR %
Point-to-Point
returns on Standard
Investment of
Rs. 10,000/-
3 Years 5 Years
CAGR %
Point-to-Point
returns on Standard
Investment of
Rs. 10,000/-
Since Inception
Inception Date &
Managing Since
Managing Since
Sep-11
Inception Date
12-09-2011
SBI Gold Fund
SBI Nifty Index Fund
First Tier Scheme Benchmark: - The Morning Fixing of Gold byLondon Bullion Market Association (LBMA)
Additional Benchmark: - S&P BSE Sensex (TRI)
First Tier Scheme Benchmark: - Nifty 50 (TRI)
Additional Benchmark: - S&P BSE Sensex (TRI)
1 Year
Managing Since
Feb-11
Inception Date
17-01-2002
Funds Managed by Raviprakash Sharma
7.00 10,700 8.76 12,869 10.24 16,284 4.09 15,522
8.83 10,883 8.86 12,904 11.54 17,271 5.56 18,101
4.82 10,482 18.16 16,504 14.75 19,899 13.94 41,857
4.54 10,454 17.54 16,245 12.80 18,263 14.18 1,54,218
5.16 10,516 18.63 16,701 13.78 19,071 16.01 2,14,029
4.82 10,482 18.16 16,504 14.75 19,899 16.63 2,38,949
Managing Since
Mar-19
Inception Date
31-03-2019
Funds Managed by Raviprakash Sharma & *Mohit Jain (investments in foreign securities portion)
5.13 10,513 19.48 17,067 N.A. N.A. 15.56 16,475
5.16 10,516 18.63 16,701 N.A. N.A. 14.80 16,102
4.82 10,482 18.16 16,504 N.A. N.A. 14.99 16,197
SBI Equity Minimum Variance Fund
First Tier Scheme Benchmark: - Nifty 50 TRI
Additional Benchmark: - S&P BSE Sensex TRI
Funds Managed by Raviprakash Sharma & *Mohit Jain (investments in foreign securities portion)

69
Comparative Performance for all Schemes -Regular Plan
Notes:
a. The total number of schemes managed by Mr. Richard D’souza is 2.b. Past performance may or may not be sustained in future and the same may not necessarily provide the basis for comparison with other investment.c. Load is not considered for computation of returns.d. Period for which scheme’s performance has been provided is computed basis last day of the month-end preceding the date of advertisement. In case, the start/end date of the concerned period is a non-business day, the NAV of the previous date
is considered for computation of returns.e. Different plans shall have a different expense structure. The performance details provided herein are of Growth Option - Regular Plan. Performance for Schemes not having Growth Option has been calculated considering the IDCW Option
and is Net of IDCW distribution tax, if any.f. Scheme count for the total schemes managed by the Fund Managers does not include ended Scheme.closeg. The data of the last working day has been considered for the calculation of performance.h. SBI Magnum Comma Fund: As TRI data is not available since inception of SBI Magnum Comma Fund, benchmark performance is calculated using composite CAGR of Nifty Commodities PRI values from 08-Aug-05 to 13-Feb-12 and TRI
values since 14-Feb-12.. The performance of the schemes is benchmarked to the Total Return variant of the Index.
The details of the period since the Fund Manager is managing the scheme(s) & inception date provided alongside of the table.
Notes:
a.
b. Past performance may or may not be sustained in future and the same may not necessarily provide the basis for comparison with other investment.c. Load is not considered for computation of returns.d. Period for which scheme’s performance has been provided is computed basis last day of the month-end preceding the date of advertisement. In case, the start/end date of the concerned period is a non-business day, the NAV of the previous date
is considered for computation of returns.e. Different plans shall have a different expense structure. The performance details provided herein are of Growth Option - Regular Plan. Performance for Schemes not having Growth Option has been calculated considering the IDCW Option
and is Net of IDCW distribution tax, if any.f. Scheme count for the total schemes managed by the Fund Managers does not include close ended Scheme & ETF.
g. The performance of the schemes is benchmarked to the Total Return variant of the Index.h. As the scheme was launched before the launch of the benchmark index, benchmark index figures since inception or the required period are not available.I. *Mr. Mohit Jain is the dedicated fund manager for managing overseas investments of the Scheme, The total no. of schemes managed by Mr. Mohit Jain is 40.
The details of the period since the Fund Manager is managing the scheme(s) &inception date provided alongside of the table. The total no. of schemes managed by Mr. DineshAhuja is 13. The Scheme count of Mr. DineshAhuja includes an ETFmanaged by him. SBI Retirement Benefit Fund is jointly managed by Mr. DineshAhuja and Mr.Ardhendu Bhattacharya (Co-fund manager) (Debt Portion) and Mr. Gaurav Mehta (Equity Portion).
CAGR %
Point-to-Point
returns on Standard
Investment of
Rs. 10,000/-
CAGR %
Point-to-Point
returns on Standard
Investment of
Rs. 10,000/-
CAGR %
Point-to-Point
returns on Standard
Investment of
Rs. 10,000/-
3 Years 5 Years
CAGR %
Point-to-Point
returns on Standard
Investment of
Rs. 10,000/-
Since Inception
Inception Date &
Managing Since
Managing Since
Aug-14
Inception Date
08-08-2005
1 Year
Funds Managed by Richard D'souza & *Mohit Jain (investments in foreign securities portion)
Funds Managed by Richard D'souza
Managing Since
Aug-14
Inception Date
07-07-2010
Notes:
a. The total number of schemes managed by Mr. R.Arun is 5 (1 scheme is jointly managed with Mr Neeraj Kumar)
b. Past performance may or may not be sustained in future and the same may not necessarily provide the basis for comparison with other investment.
c. Load is not considered for computation of returns.
d. Period for which scheme’s performance has been provided is computed basis last day of the month-end preceding the date of advertisement. In case, the start/end date of the concerned period is a non-business day, the NAV of the previous date
is considered for computation of returns.
e. Different plans shall have a different expense structure. The performance details provided herein are of Growth Option - Regular Plan. Performance for Schemes not having Growth Option has been calculated considering the IDCW Option
and is Net of IDCW distribution tax, if any.
f. Scheme count for the total schemes managed by the Fund Managers does not include ended Scheme.close
g. SBI Overnight Fund : As the scheme was launched before the launch of the benchmark index, benchmark index figures since inception or the required period are not available.
The details of the period since the Fund Manager is managing the scheme(s) & inception date provided alongside of the table.
CAGR %
Point-to-Point
returns on Standard
Investment of
Rs. 10,000/-
CAGR %
Point-to-Point
returns on Standard
Investment of
Rs. 10,000/-
CAGR %
Point-to-Point
returns on Standard
Investment of
Rs. 10,000/-
3 Years 5 Years
CAGR %
Point-to-Point
returns on Standard
Investment of
Rs. 10,000/-
Since Inception
Inception Date &
Managing Since
Managing Since
Jan 27, 2020
Inception Date
30-12-2000
1 Year
1.17 10,117 5.14 11,624 7.31 14,229 7.82 51,021
-0.23 9,977 3.36 11,044 4.25 12,315 N.A. N.A.
3.18 10,318 4.62 11,451 5.59 13,126 6.13 36,234
Funds Managed by Dinesh Ahuja
SBI Magnum Constant Maturity Fund
First Tier Scheme Benchmark: - Nifty 10 yr Benchmark G-Sec
Additional Benchmark: - CRISIL 1 Year T-Bill Index
Annualized
%
Annualized
%
Annualized
%
CAGR
%
CAGR
%
CAGR
%
CAGR
%
Point-to-Point
returns on
Standard
Investment
of Rs. 10,000/-
Point-to-Point
returns on
Standard
Investment
of Rs. 10,000/-
Point-to-Point
returns on
Standard
Investment
of Rs. 10,000/-
Point-to-Point
returns on
Standard
Investment
of Rs. 10,000/-
Point-to-Point
returns on
Standard
Investment
of Rs. 10,000/-
Point-to-Point
returns on
Standard
Investment
of Rs. 10,000/-
Point-to-Point
returns on
Standard
Investment
of Rs. 10,000/-
Inception
Date &
Managing
Since
7 Days 15 Days 1 Month 1 Year 3 Year 5 Year Since Inception
5.12 10,010 5.06 10,021 4.96 10,042 3.71 10,371 3.56 11,109 4.55 12,490 6.46 34,825
5.31 10,010 5.24 10,022 5.17 10,044 3.90 10,390 3.72 11,158 4.66 12,559 N.A. N.A.
3.63 10,007 4.37 10,018 5.88 10,050 3.18 10,318 4.62 11,451 5.59 13,126 5.86 31,097
5.20 10,010 5.35 10,022 5.40 10,046 3.82 10,382 3.99 11,246 5.21 12,894 6.90 28,041
5.65 10,011 5.76 10,024 5.84 10,050 4.05 10,405 4.16 11,303 5.32 12,959 7.26 29,539
3.63 10,007 4.37 10,018 5.88 10,050 3.18 10,318 4.62 11,451 5.59 13,126 6.17 25,226
4.43 10,007 5.08 10,025 5.37 10,047 3.46 10,346 4.53 11,423 5.56 13,105 7.01 34,163
5.37 10,010 5.75 10,024 5.97 10,051 4.20 10,420 4.70 11,480 5.78 13,244 6.95 33,816
3.63 10,007 4.37 10,018 5.88 10,050 3.18 10,318 4.62 11,451 5.59 13,126 5.92 28,368
Inception
Date
01-10-2002
Managing
Since
Apr-12
Inception
Date
19-07-2004
Managing
Since
Apr-12
Inception
Date
24-11-2003
SBI Overnight Fund
SBI Liquid Fund
First Tier Scheme Benchmark:-CRISILOvernight Fund AI Index
Additional Benchmark: - CRISIL 1 YearT-Bill Index
First Tier Scheme Benchmark:-NIFTYLiquid Index B-I
Additional Benchmark: - CRISIL 1 YearT-Bill Index
SBI Savings Fund
First Tier Scheme Benchmark:-CRISIL
Money Market Fund Bl Index
Additional Benchmark: - CRISIL 1 Year
T-Bill Index
Funds Managed by R. Arun
Funds Managed by R. Arun & *Mohit Jain (investments in foreign securities portion)
SBI PSU Fund
First Tier Scheme Benchmark: - S&P BSE PSU (TRI)
Additional Benchmark: - S&P BSE Sensex (TRI)
SBI Magnum Comma Fund
First Tier Scheme Benchmark: - Nifty Commodities (TRI)
Additional Benchmark: - S&P BSE Sensex (TRI)
17.91 11,791 15.39 15,369 3.17 11,690 3.01 14,345
23.91 12,391 17.63 16,285 4.96 12,737 2.65 13,745
4.82 10,482 18.16 16,504 14.75 19,899 12.14 40,249
-1.75 9,825 27.25 20,621 12.98 18,408 11.92 68,408
9.89 10,989 26.22 20,122 11.38 17,139 11.60 65,121
4.82 10,482 18.16 16,504 14.75 19,899 14.34 98,518
Managing
Since May-18
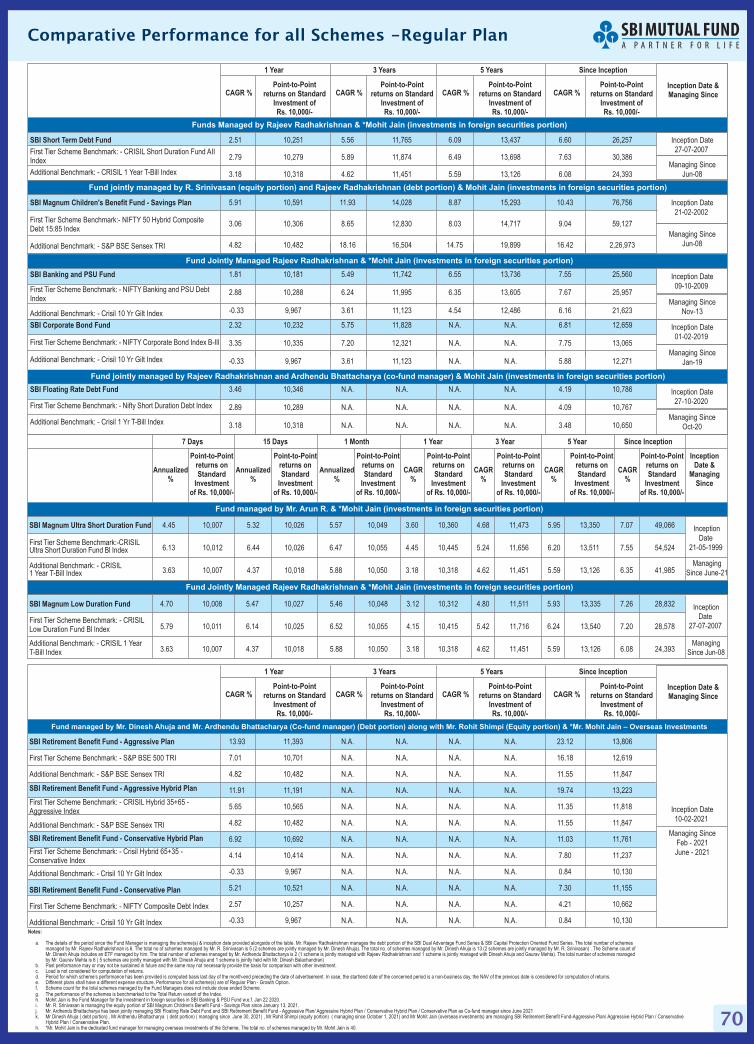
70
Comparative Performance for all Schemes -Regular Plan
CAGR %
CAGR %
Point-to-Point
returns on Standard
Investment of
Rs. 10,000/-
Point-to-Point
returns on Standard
Investment of
Rs. 10,000/-
CAGR %
CAGR %
Point-to-Point
returns on Standard
Investment of
Rs. 10,000/-
Point-to-Point
returns on Standard
Investment of
Rs. 10,000/-
CAGR %
CAGR %
Point-to-Point
returns on Standard
Investment of
Rs. 10,000/-
Point-to-Point
returns on Standard
Investment of
Rs. 10,000/-
3 Years
3 Years
5 Years
5 Years
CAGR %
CAGR %
Point-to-Point
returns on Standard
Investment of
Rs. 10,000/-
Point-to-Point
returns on Standard
Investment of
Rs. 10,000/-
Since Inception
Since Inception
Inception Date &
Managing Since
Inception Date &
Managing Since
1 Year
1 Year
Managing Since
Jun-08
Inception Date
27-07-2007
Inception Date
09-10-2009
Inception Date
01-02-2019
Managing Since
Nov-13
Managing Since
Jan-19
2.51 10,251 5.56 11,765 6.09 13,437 6.60 26,257
2.79 10,279 5.89 11,874 6.49 13,698 7.63 30,386
3.18 10,318 4.62 11,451 5.59 13,126 6.08 24,393
13.93 11,393 N.A. N.A. N.A. N.A. 23.12 13,806
7.01 10,701 N.A. N.A. N.A. N.A. 16.18 12,619
4.82 10,482 N.A. N.A. N.A. N.A. 11.55 11,847
11.91 11,191 N.A. N.A. N.A. N.A. 19.74 13,223
5.65 10,565 N.A. N.A. N.A. N.A. 11.35 11,818
4.82 10,482 N.A. N.A. N.A. N.A. 11.55 11,847
6.92 10,692 N.A. N.A. N.A. N.A. 11.03 11,761
4.14 10,414 N.A. N.A. N.A. N.A. 7.80 11,237
-0.33 9,967 N.A. N.A. N.A. N.A. 0.84 10,130
5.21 10,521 N.A. N.A. N.A. N.A. 7.30 11,155
2.57 10,257 N.A. N.A. N.A. N.A. 4.21 10,662
-0.33 9,967 N.A. N.A. N.A. N.A. 0.84 10,130
1.81 10,181 5.49 11,742 6.55 13,736 7.55 25,560
2.88 10,288 6.24 11,995 6.35 13,605 7.67 25,957
-0.33 9,967 3.61 11,123 4.54 12,486 6.16 21,623
Funds Managed by Rajeev Radhakrishnan & *Mohit Jain (investments in foreign securities portion)
Fund managed by Mr. Dinesh Ahuja and Mr. Ardhendu Bhattacharya (Co-fund manager) (Debt portion) along with Mr. Rohit Shimpi (Equity portion) & *Mr. Mohit Jain – Overseas Investments
SBI Short Term Debt Fund
First Tier Scheme Benchmark: - CRISIL Short Duration Fund AIIIndex
Additional Benchmark: - CRISIL 1 Year T-Bill Index
SBI Banking and PSU Fund
First Tier Scheme Benchmark: - NIFTY Banking and PSU DebtIndex
Additional Benchmark: - Crisil 10 Yr Gilt Index
SBI Magnum Low Duration Fund
First Tier Scheme Benchmark: - CRISILLow Duration Fund Bl lndex
Additional Benchmark: - CRISIL 1 YearT-Bill Index
4.70 10,008 5.47 10,027 5.46 10,048 3.12 10,312 4.80 11,511 5.93 13,335 7.26 28,832
5.79 10,011 6.14 10,025 6.52 10,055 4.15 10,415 5.42 11,716 6.24 13,540 7.20 28,578
3.63 10,007 4.37 10,018 5.88 10,050 3.18 10,318 4.62 11,451 5.59 13,126 6.08 24,393Managing
Since Jun-08
Inception
Date
27-07-2007
Managing
Since June-21
Inception
Date
21-05-1999
Annualized
%
Annualized
%
Annualized
%
CAGR
%
CAGR
%
CAGR
%
CAGR
%
Point-to-Point
returns on
Standard
Investment
of Rs. 10,000/-
Point-to-Point
returns on
Standard
Investment
of Rs. 10,000/-
Point-to-Point
returns on
Standard
Investment
of Rs. 10,000/-
Point-to-Point
returns on
Standard
Investment
of Rs. 10,000/-
Point-to-Point
returns on
Standard
Investment
of Rs. 10,000/-
Point-to-Point
returns on
Standard
Investment
of Rs. 10,000/-
Point-to-Point
returns on
Standard
Investment
of Rs. 10,000/-
Inception
Date &
Managing
Since
7 Days 15 Days 1 Month 1 Year 3 Year 5 Year Since Inception
SBI Magnum Ultra Short Duration Fund
First Tier Scheme Benchmark:-CRISILUltra Short Duration Fund Bl Index
Additional Benchmark: - CRISIL1 Year T-Bill Index
4.45 10,007 5.32 10,026 5.57 10,049 3.60 10,360 4.68 11,473 5.95 13,350 7.07 49,066
6.13 10,012 6.44 10,026 6.47 10,055 4.45 10,445 5.24 11,656 6.20 13,511 7.55 54,524
3.63 10,007 4.37 10,018 5.88 10,050 3.18 10,318 4.62 11,451 5.59 13,126 6.35 41,985
Fund Jointly Managed Rajeev Radhakrishnan & *Mohit Jain (investments in foreign securities portion)
Fund Jointly Managed Rajeev Radhakrishnan & *Mohit Jain (investments in foreign securities portion)
Fund managed by Mr. Arun R. & *Mohit Jain (investments in foreign securities portion)
Managing Since
Jun-08
Inception Date
21-02-2002
5.91 10,591 11.93 14,028 8.87 15,293 10.43 76,756
3.06 10,306 8.65 12,830 8.03 14,717 9.04 59,127
4.82 10,482 18.16 16,504 14.75 19,899 16.42 2,26,973
Fund jointly managed by R. Srinivasan (equity portion) and Rajeev Radhakrishnan (debt portion) & Mohit Jain (investments in foreign securities portion)
SBI Magnum Children's Benefit Fund - Savings Plan
First Tier Scheme Benchmark:- NIFTY 50 Hybrid CompositeDebt 15:85 Index
Additional Benchmark: - S&P BSE Sensex TRI
Inception Date
27-10-2020
Managing Since
Oct-20
Inception Date
10-02-2021
Managing Since
Feb - 2021
June - 2021
Fund jointly managed by Rajeev Radhakrishnan and Ardhendu Bhattacharya (co-fund manager) & Mohit Jain (investments in foreign securities portion)
SBI Retirement Benefit Fund - Aggressive Plan
SBI Retirement Benefit Fund - Aggressive Hybrid Plan
SBI Retirement Benefit Fund - Conservative Hybrid Plan
SBI Retirement Benefit Fund - Conservative Plan
First Tier Scheme Benchmark: - S&P BSE 500 TRI
Additional Benchmark: - S&P BSE Sensex TRI
First Tier Scheme Benchmark: - CRISIL Hybrid 35+65 -Aggressive Index
Additional Benchmark: - S&P BSE Sensex TRI
First Tier Scheme Benchmark: - Crisil Hybrid 65+35 -Conservative Index
Additional Benchmark: - Crisil 10 Yr Gilt Index
First Tier Scheme Benchmark: - NIFTY Composite Debt Index
Additional Benchmark: - Crisil 10 Yr Gilt IndexNotes:
a.
b. Past performance may or may not be sustained in future and the same may not necessarily provide the basis for comparison with other investment.c. Load is not considered for computation of returns.d. Period for which scheme’s performance has been provided is computed basis last day of the month-end preceding the date of advertisement. In case, the start/end date of the concerned period is a non-business day, the NAV of the previous date is considered for computation of returns.e. Different plans shall have a different expense structure. Performance for all scheme(s) are of Regular Plan - Growth Option.f. Scheme count for the total schemes managed by the Fund Managers does not include .close ended Schemeg. The performance of the schemes is benchmarked to the Total Return variant of the Index.h. Mohit Jain is the Fund Manager for the investment in foreign securities in SBI Banking & PSU Fund w.e.f. Jan 22 2020.i. Mr. R. Srinivasan is managing the equity portion of SBI Magnum Children's Benefit Fund - Savings Plan since January 13, 2021.j. Mr. Ardhendu Bhattacharya has been jointly managing SBI Floating Rate Debt Fund and SBI Retirement Benefit Fund - Aggressive Plan/ Aggressive Hybrid Plan / Conservative Hybrid Plan / Conservative Plan as Co-fund manager since June 2021k. Mr Dinesh Ahuja ( debt portion) , Mr Ardhendu Bhattacharya ( debt portion) ( managing since June 30, 2021) , Mr Rohit Shimpi (equity portion) ( managing since October 1, 2021) and Mr Mohit Jain (overseas investments) are managing SBI Retirement Benefit Fund-Aggressive Plan/ Aggressive Hybrid Plan / Conservative
Hybrid Plan / Conservative Plan.h. *Mr. Mohit Jain is the dedicated fund manager for managing overseas investments of the Scheme, The total no. of schemes managed by Mr. Mohit Jain is 40.
The details of the period since the Fund Manager is managing the scheme(s) & inception date provided alongside of the table. Mr. Rajeev Radhakrishnan manages the debt portion of the SBI Dual Advantage Fund Series & SBI Capital Protection Oriented Fund Series. The total number of schemesmanaged by Mr. Rajeev Radhakrishnan is 6. The total no of schemes managed by Mr. R. Srinivasan is 5 (2 schemes are jointly managed by Mr. Dinesh Ahuja). The total no. of schemes managed by Mr. Dinesh Ahuja is 13 (2 schemes are jointly managed by Mr. R. Srinivasan) . The Scheme count ofMr. Dinesh Ahuja includes an ETF managed by him. The total number of schemes managed by Mr. Ardhendu Bhattacharya is 2 (1 scheme is jointly managed with Rajeev Radhakrishnan and 1 scheme is jointly managed with Dinesh Ahuja and Gaurav Mehta). The total number of schemes managedby Mr. Gaurav Mehta is 6 ( 5 schemes are jointly managed with Mr. Dinesh Ahuja and 1 scheme is jointly held with Mr. Dinesh Balachandran)
2.32 10,232 5.75 11,828 N.A. N.A. 6.81 12,659
3.35 10,335 7.20 12,321 N.A. N.A. 7.75 13,065
-0.33 9,967 3.61 11,123 N.A. N.A. 5.88 12,271
3.46 10,346 N.A. N.A. N.A. N.A. 4.19 10,786
2.89 10,289 N.A. N.A. N.A. N.A. 4.09 10,767
3.18 10,318 N.A. N.A. N.A. N.A. 3.48 10,650
SBI Corporate Bond Fund
First Tier Scheme Benchmark: - NIFTY Corporate Bond Index B-Ill
Additional Benchmark: - Crisil 10 Yr Gilt Index
SBI Floating Rate Debt Fund
First Tier Scheme Benchmark: - Nifty Short Duration Debt Index
Additional Benchmark: - Crisil 1 Yr T-Bill Index

71
Advising Since
Nov-2018
Inception Date
1-Nov-2018
Advising Since
Dec-2018
Inception Date
3-Dec-2018
Advising Since
Jul-2019
Inception Date
1-Jul-2019
Advising Since
Jul-2019
Inception Date
1-Jul-2019
Advising Since
Jul-2019
Inception Date
1-Jul-2019
Comparative Performance of Permitted Category FPI Portfolio
CAGR %
CAGR %
CAGR %
Point-to-Point
returns on Standard
Investment of
Rs. 10,000/-
Point-to-Point
returns on Standard
Investment of
Rs. 10,000/-
Point-to-Point
returns on Standard
Investment of
Rs. 10,000/-
CAGR %
CAGR %
CAGR %
Point-to-Point
returns on Standard
Investment of
Rs. 10,000/-
Point-to-Point
returns on Standard
Investment of
Rs. 10,000/-
Point-to-Point
returns on Standard
Investment of
Rs. 10,000/-
CAGR %
CAGR %
CAGR %
Point-to-Point
returns on Standard
Investment of
Rs. 10,000/-
Point-to-Point
returns on Standard
Investment of
Rs. 10,000/-
Point-to-Point
returns on Standard
Investment of
Rs. 10,000/-
3 Years
3 Years
3 Years
5 Years
5 Years
5 Years
CAGR %
Absolute/
CAGR %
CAGR %
Point-to-Point
returns on Standard
Investment of
Rs. 10,000/-
Point-to-Point
returns on Standard
Investment of
Rs. 10,000/-
Point-to-Point
returns on Standard
Investment of
Rs. 10,000/-
Since Inception
Since Inception
Since Inception
Advising Since
Jun - 21
Advising Since
Dec-18
Inception Date
17-06-2021
Inception Date
03-12-2018
0.54 10,054 N.A. N.A. N.A. N.A. 1.37 10,137
2.10 10,210 N.A. N.A. N.A. N.A. 3.21 10,321
-0.35 9,965 N.A. N.A. N.A. N.A. -0.80 9,920
-0.13 9,987 15.65 11,565 N.A. N.A. 13.41 11,341
15.00 11,500 24.18 12,418 N.A. N.A. 19.74 11,974
4.82 10,482 18.16 11,816 N.A. N.A. 15.55 11,555
Inception Date &
Advising Since
Inception Date &
Advising Since
Inception Date &
Advising Since
1 Year
1 Year
1 Year
Notes:
a.
c. For calculation of scheme performance, NAV is converted into INR using currency conversion rate i.e. USDINR rate. (Source: Bloomberg Closing Price)d. Benchmark return is based on INR value (Source: Bloomberg)
The above Performance returns are calculated and compared from the date of inception of category II- FPI Portfolio i.e. June 17, 2021.b. Returns less than 1 year period are absolute and returns greater than 1 year period are compounded annualised (CAGR).
Notes:
a.
c. For calculation of scheme performance, NAV is converted into INR using currency conversion rate i.e. USDINR rate. (Source: Bloomberg Closing Price)d. The performance is benchmarked to the Total Return Variant of the index.e. Benchmark return is based on INR value (Source: Bloomberg)f. For Permitted Category - FPI Portfolio 7 date of inception taken from date of FM taking over asAdvisor.g. For Permitted Category - FPI Portfolio 6, and 8 to 10, though SBI FM advises a portion of the Fund, the entire NAV as received from Client is taken for Comparative performance.h. For Permitted Category - FPI Portfolio Nos.8 to 10, comparative returns of benchmark relevant extracts from Bloomberg are taken
The above Performance returns are calculated and compared from the date of inception of respective Permitted Category - FPI Portfolios.b. Returns less than 1 year period are absolute and returns greater than 1 year period are compounded annualised (CAGR).
Performance of Permitted Category FPI Portfolio (advised by Mr. Rajeev Radhakrishnan)
Performance of Permitted Category FPI Portfolio (advised by Mr. Rohit Shimpi)
Performance of Permitted Category FPI Portfolio (advised by Mr. R. Shimpi #)
Past performance may or may not be sustained in the future. Inception date is June 17, 2021. The performance is not comparable with the performance of the scheme(s) of SBI Mutual Fund due to differing investment objective/s and fundamental differences in asset allocation, investmentstrategy and the regulatory environment. The said disclosure is pursuant to SEBI Circular No. Cir/IMD/DF/F/2012 dated February 28, 2012 pertaining to Regulation 24(b) of SEBI (Mutual Funds) Regulations, 1996. FPI – Foreign Portfolio Investor.
Past performance may or may not be sustained in the future. The performance is not comparable with the performance of the scheme(s) of SBI Mutual Fund due to differing investment objective/s and fundamental differences in asset allocation, investment strategy and the regulatoryenvironment. The said disclosure is pursuant to SEBI Circular No. Cir/IMD/DF/F/2012 dated February 28, 2012 pertaining to Regulation 24(b) of SEBI (Mutual Funds) Regulations, 1996. FPI – Foreign Portfolio Investor
Advising Since
Nov-2018
Inception Date
1-Nov-2018
Permitted Category FPI Portfolio 11
First Tier Benchmark: - JP MORGAN GBI-EM BROAD INDIA
Additional Benchmark: - CRISIL 10 Year Gilt Index
Permitted Category - FPI Portfolio 2
Additional Benchmark: S&P BSE SENSEX TRI
Additional Benchmark: S&P BSE SENSEX TRI
Additional Benchmark: S&P BSE SENSEX TRI
Additional Benchmark: S&P BSE SENSEX TRI
First Tier Benchmark: - BSE 100
Additional Benchmark: S&P BSE SENSEX TRI
First Tier Benchmark: - MSCI INDIA
Additional Benchmark: S&P BSE SENSEX TRI
First Tier Benchmark: - MSCI Emerging Markets Index
Additional Benchmark: S&P BSE SENSEX TRI
First Tier Benchmark: - MSCI Emerging Markets Free Index
Additional Benchmark: S&P BSE SENSEX TRI
First Tier Benchmark: - MSCI AC Asia ex Japan Index
Additional Benchmark: S&P BSE SENSEX TRI
Permitted Category - FPI Portfolio 3
Permitted Category - FPI Portfolio 4
Permitted Category - FPI Portfolio 5
Permitted Category - FPI Portfolio 6
Permitted Category - FPI Portfolio 7
Permitted Category - FPI Portfolio 8
Permitted Category - FPI Portfolio 9
Permitted Category - FPI Portfolio 10
Permitted Category FPI Portfolio 1
First Tier Benchmark: - MSCI INDIA 10/40 TRI
Additional Benchmark: - S&P BSE Sensex (TRI)
Advising Since
Dec-2018
Inception Date
21-Dec-2018
Advising Since
Apr-2019
Inception Date
22-Apr-2019
Advising Since
Apr-2019
Inception Date
22-Apr-2019
# From 16th April,2019, Rohit Shimpi is added as Deputy Adviser.
11.52 11,152 21.85 12,185 N.A. N.A. 19.60 11,960
4.82 10,482 18.16 11,816 N.A. N.A. 16.75 11,675
6.13 10,613 16.61 11,661 N.A. N.A. 14.15 11,415
4.82 10,482 18.16 11,816 N.A. N.A. 16.21 11,621
6.35 10,635 16.46 11,646 N.A. N.A. 13.46 11,346
4.82 10,482 18.16 11,816 N.A. N.A. 15.18 11,518
7.10 10,710 22.49 12,249 N.A. N.A. 16.95 11,695
4.82 10,482 18.16 11,816 N.A. N.A. 15.18 11,518
-7.11 9,289 16.60 11,660 N.A. N.A. 11.32 11,132
4.89 10,489 17.81 11,781 N.A. N.A. 15.02 11,502
4.82 10,482 18.16 11,816 N.A. N.A. 16.75 11,675
6.76 10,676 17.33 11,733 N.A. N.A. 14.60 11,460
4.24 10,424 18.05 11,805 N.A. N.A. 14.25 11,425
4.82 10,482 18.16 11,816 N.A. N.A. 15.55 11,555
-17.15 8,285 6.60 10,660 N.A. N.A. 5.04 10,504
-14.51 8,549 6.75 10,675 N.A. N.A. 5.28 10,528
4.82 10,482 18.16 11,816 N.A. N.A. 15.05 11,505
-14.37 8,563 6.25 10,625 N.A. N.A. 4.80 10,480
-14.51 8,549 6.75 10,675 N.A. N.A. 5.28 10,528
4.82 10,482 18.16 11,816 N.A. N.A. 15.05 11,505
-17.53 8,247 6.95 10,695 N.A. N.A. 5.49 10,549
-14.84 8,516 7.71 10,771 N.A. N.A. 6.20 10,620
4.82 10,482 18.16 11,816 N.A. N.A. 15.05 11,505

72
Comparative Performance for all Schemes -Direct Plan
Note: Wherever NAV/Benchmark Index value is not available for start/end date for concerned period, the previous business day value of NAV/Benchmark Index is considered for return computation.
Notes:
a.
c. Past performance may or may not be sustained in future and the same may not necessarily provide the basis for comparison with other investment.
d. Load is not considered for computation of returns.
e. Period for which scheme’s performance has been provided is computed basis last day of the month-end preceding the date of advertisement. In case, the start/end date of the concerned period is a non-business day, the NAV of theprevious date is considered for computation of returns.
The details of the period since the Fund Manager is managing the scheme(s) & inception date provided alongside of the table. The total no of schemes managed by Mr. R. Srinivasan is 6 (2 schemes are jointly managed by Mr. Dinesh Ahuja & Mohit Jain (investments in foreign securitiesportion). The total no. of schemes managed by Mr. Dinesh Ahuja is 13 (2 schemes are jointly managed by Mr. R. Srinivasan). The Scheme count of Mr. Dinesh Ahuja includes an ETF managed by him. The total no of schemes managed by Mr. Saurabh Pant is 3 (2 schemes are jointlymanaged by Ms.Mansi Sajeja and 1 scheme is jointly managed with Mr. Neeraj Kumar) The total no of schemes managed by Mansi Sajeja is 1 (2 schemes are jointly managed with Mr. Saurabh Pant and 1 scheme is jointly managed with Mr. Neeraj Kumar & Nidhi Chawla)
b. Different plans shall have a different expense structure. Performance for all scheme(s) are of Direct Plan - Growth Option.
g.
f. Scheme count for the total schemes managed by the Fund Managers does not include close ended Scheme.
The performance of the schemes is benchmarked to the Total Return variant of the Index.
h. The debt portion of SBI Conservative Hybrid Fund was managed by Mr. Dinesh Ahuja till 29th June 2021. Ms. Mansi Sajeja is managing debt portion of SBI Conservative Hybrid Fund w.e.f. June 30, 2021
I. SBI International Access - US Equity FoF: S&P 500 benchmark performance is calculated using INR equivalent closing prices. (source: Bloomberg)
j. SBI Multicap Fund Scheme are jointly managed by Mr. R. Srinivasan & *Mr. Mohit Jain (w.e.f. 8th March 2022). *Mr. Mohit Jain is the dedicated fund manager for managing overseas investments of the Scheme.
k. *Mr. Mohit Jain is the dedicated fund manager for managing overseas investments of the Scheme, The total no. of schemes managed by Mr. Mohit Jain is 40.
Inception Date
01-01-2013
Inception Date
07-01-2013
Inception Date
01-01-2013
Managing Since
Jan-13
Managing Since
Jan-13
Managing Since
May-18
SBI Magnum Equity ESG Fund
First Tier Scheme Benchmark: - Nifty ESG 100 TRI
Additional Benchmark: - S&P BSE Sensex (TRI)
4.57 10,457 16.40 15,778 12.66 18,145 15.23 39,368
5.65 10,565 16.23 15,708 11.83 17,493 12.45 31,091
4.82 10,482 18.16 16,504 14.75 19,899 13.70 34,602
7.36 10,736 11.92 14,025 8.31 14,904 9.85 24,752
3.06 10,306 8.65 12,830 8.03 14,717 8.85 22,667
-0.33 9,967 3.61 11,123 4.54 12,486 6.18 17,835
3.84 10,384 18.50 16,646 13.47 18,814 14.52 37,067
1.06 10,106 20.67 17,579 15.22 20,303 14.97 38,519
4.82 10,482 18.16 16,504 14.75 19,899 13.70 34,602
Fund Jointly Managed by Mansi Sajeja (Debt portion), Saurabh Pant (Equity portion) & *Mohit Jain (investments in foreign securities portion)
Fund Jointly Managed by R. Srinivasan (Equity portion), Dinesh Ahuja (Debt portion) & *Mohit Jain (investments in foreign securities portion)
Inception Date
29-09-2020
Managing Since
Sep-20
Fund Jointly Managed by R. Srinivasan (Equity portion), Dinesh Ahuja (Debt portion) & *Mohit Jain (investments in foreign securities portion)
SBI Magnum Children’s Benefit Fund- Investment Plan
First Tier Scheme Benchmark: - CRISIL Hybrid 35+65 -Aggressive Index
Additional Benchmark: - S&P BSE Sensex TRI
19.63 11,963 N.A. N.A. N.A. N.A. 58.61 24,221
5.65 10,565 N.A. N.A. N.A. N.A. 21.09 14,443
4.82 10,482 N.A. N.A. N.A. N.A. 27.96 16,046
Fund Managed by Rohit Shimpi & *Mohit Jain (investments in foreign securities portion)
Managing Since
Jan-13
Inception Date
01-01-2013
Managing Since
Nov-13
Inception Date
02-01-2013
Funds Managed by R. Srinivasan & *Mohit Jain (investments in foreign securities portion)
Funds Managed by R. Srinivasan & *Mohit Jain (investments in foreign securities portion)
1.21 10,121 20.94 17,700 15.54 20,588 15.80 41,270
7.01 10,701 21.24 17,832 13.59 18,907 14.28 36,347
4.82 10,482 18.16 16,504 14.75 19,899 13.70 34,602
18.13 11,813 33.50 23,811 20.47 25,375 26.49 96,902
6.81 10,681 28.20 21,085 10.08 16,164 12.49 31,187
4.82 10,482 18.16 16,504 14.75 19,899 13.63 34,368
3.52 10,352 18.46 16,630 12.35 17,899 16.50 43,716
7.01 10,701 21.24 17,832 13.59 18,907 14.16 35,916
4.82 10,482 18.16 16,504 14.75 19,899 13.59 34,247
4.46 10,446 22.11 18,216 14.11 19,347 16.95 45,425
7.45 10,745 18.64 16,709 10.17 16,232 15.05 38,787
4.82 10,482 18.16 16,504 14.75 19,899 13.70 34,602
SBI Focused Equity Fund
SBI Small Cap Fund
First Tier Scheme Benchmark: - S&P BSE 500 (TRI)
Additional Benchmark: - S&P BSE Sensex (TRI)
First Tier Scheme Benchmark: - S&P BSE 250 Small Cap IndexTRI
Additional Benchmark: - S&P BSE Sensex (TRI)
SBI Flexicap Fund
SBI Magnum Global Fund
First Tier Scheme Benchmark: - S&P BSE 500 (TRI)
Additional Benchmark: - S&P BSE Sensex (TRI)
First Tier Scheme Benchmark: - Nifty MNC (TRI)
Additional Benchmark: - S&P BSE Sensex (TRI)
Managing Since
Jan-2022
Inception Date
04-01-2013
Managing Since
Jan-2022
Inception Date
01-01-2013
Managing Since
Jan-13
Inception Date
01-01-2013
Managing Since
Jan-13
Inception Date
01-01-2013
Managing Since
Jan-13
Managing Since
Jan-13
Inception Date
02-01-2013
Inception Date
28-01-2013
Funds Managed by Dinesh Ahuja & *Mr. Mohit Jain is the dedicated fund manager for overseas securities
Funds Managed by Dinesh Ahuja
SBI Dynamic Bond Fund
SBI Magnum Income Fund
SBI Magnum Medium Duration Fund
First Tier Scheme Benchmark: - CRISIL Dynamic Bond Fund AIII Index
Additional Benchmark: - CRISIL 10 Year Gilt Index
First Tier Scheme Benchmark: - CRISIL Medium to Long Duration FundBIII Index
Additional Benchmark: - CRISIL 10 Year Gilt Index
First Tier Scheme Benchmark: - NIFTY Medium Duration Debt IndexC-III
Additional Benchmark: - CRISIL 10 Year Gilt Index
SBI Magnum Gilt Fund
First Tier Scheme Benchmark: - Nifty All Duration G-Sec Index
Additional Benchmark: - CRISIL 10 Year Gilt Index
3.34 10,334 6.06 11,934 6.82 13,910 8.20 21,415
1.83 10,183 6.33 12,025 6.54 13,728 8.01 21,064
-0.33 9,967 3.61 11,123 4.54 12,486 6.25 17,968
2.74 10,274 7.41 12,396 7.24 14,181 8.20 21,420
3.92 10,392 8.34 12,719 7.32 14,236 8.76 22,517
-0.33 9,967 3.61 11,123 4.54 12,486 6.25 17,968
3.34 10,334 7.48 12,417 7.72 14,507 9.25 23,360
5.16 10,516 7.83 12,542 7.24 14,187 8.51 21,899
-0.33 9,967 3.61 11,123 4.54 12,486 6.14 17,713
3.42 10,342 6.50 12,082 7.05 14,055 9.44 23,914
2.04 10,204 5.42 11,718 6.41 13,643 7.24 19,657
-0.33 9,967 3.61 11,123 4.54 12,486 6.25 17,963
CAGR %
Point-to-Point
returns on Standard
Investment of
Rs. 10,000/-
CAGR %
Point-to-Point
returns on Standard
Investment of
Rs. 10,000/-
CAGR %
Point-to-Point
returns on Standard
Investment of
Rs. 10,000/-
3 Years 5 Years
CAGR %
Point-to-Point
returns on Standard
Investment of
Rs. 10,000/-
Since Inception
Inception Date &
Managing Since
1 Year
SBI Equity Hybrid Fund
First Tier Scheme Benchmark: - CRISIL Hybrid 35+65 -Aggressive Index
Additional Benchmark: - S&P BSE Sensex (TRI)
SBI Conservative Hybrid Fund
First Tier Scheme Benchmark: - NIFTY 50 HybridComposite Debt 15:85 Index
Additional Benchmark: - CRISIL 10 Year Gilt Index

73
Comparative Performance for all Schemes -Direct Plan
Notes:
a.
b.
c. Past performance may or may not be sustained in future and the same may not necessarily provide the basis for comparison with other investment.
d. Load is not considered for computation of returns.
e. Period for which scheme’s performance has been provided is computed basis last day of the month-end preceding the date of advertisement. In case, the start/end date of the concerned period is a non-business day, the NAV of the
previous date is considered for computation of returns.
f. Scheme count for the total schemes managed by the Fund Managers does not include ended Scheme.
The details of the period since the Fund Manager is managing the scheme(s) & inception date provided alongside of the table. The total no of schemes managed by Mr. Neeraj Kumar is 2 (1 scheme is jointly managed by Mr. Ruchit
Mehta & Mansi Sajeja and 1 scheme is jointly managed by Mr. Arun R.) The total no of schemes jointly managed by Mr. Lokesh Mallya is 1.The total no of schemes managed by Mansi Sajeja is 2 (2 schemes are jointly managed with Mr
Ruchit Mehta and 1 scheme is jointly managed with Mr Neeraj Kumar)
Different plans shall have a different expense structure. Performance for all scheme(s) are of Direct Plan - Growth Option.
close
g. SBI Arbitrage Opportunities Fund: Debt portion of the scheme was managed by Mr. Rajeev Radhakrishnan till June 29, 2021. Mr. Arun R. is managing SBI Arbitrage Opportunities Fund w.e.f. June 30, 2021
h. The Debt portion of SBI Equity Savings Fund was managed by Mr. Ruchit Mehta till 29th June 2021. The Debt portion of SBI Equity Savings Fund is managed by Ms. Mansi Sajeja w.e.f. 30th June 2021.
CAGR %
Point-to-Point
returns on Standard
Investment of
Rs. 10,000/-
CAGR %
Point-to-Point
returns on Standard
Investment of
Rs. 10,000/-
CAGR %
Point-to-Point
returns on Standard
Investment of
Rs. 10,000/-
3 Years 5 Years
CAGR %
Point-to-Point
returns on Standard
Investment of
Rs. 10,000/-
Since Inception
Inception Date &
Managing Since
Managing Since
Jan-13
Inception Date
11-01-2013
1 Year
Managing Since
Neeraj-May-15
Mansi-June-21
Nidhi-Jan-22
Inception Date
27-05-2015
Fund Jointly Managed by Neeraj Kumar (Equity portion) & Arun R. (Debt portion)
Managing Since
Feb-17
Inception Date
02-01-2013
Funds Managed by Lokesh Mallya & *Mohit Jain (investments in foreign securities portion)
Notes:
a. The details of the period since the Fund Manager is managing the scheme(s) & inception date provided alongside of the table. The total number of schemes managed by Mrs. Bhavin Vithlani is 1.
b. Past performance may or may not be sustained in future and the same may not necessarily provide the basis for comparison with other investment.
c. Load is not considered for computation of returns.
d. Period for which scheme's performance has been provided is computed basis last day of the month-end preceding the date of advertisement. In case, the start/end date of the concerned period is a non-business day, the NAV of the previous date
is considered for computation of returns.
e. Different plans shall have a different expense structure. Performance for all scheme(s) are of Direct Plan - Growth Option.
f. Scheme count for the total schemes managed by the Fund Managers does not include close ended Scheme.
g.The performance of the schemes is benchmarked to the Total Return variant of the Index.
h.SBI BalancedAdvantage Fund Scheme are jointly managed by Mr. Dinesh Balachandran, Mr. DineshAhuja and Mr. Mohit Jain (w.e.f. 31stAugust 2021).
I.*Mr. Mohit Jain is the dedicated fund manager for managing overseas investments of the Scheme, The total no. of schemes managed by Mr. Mohit Jain is 40.
4.32 10,432 4.30 11,347 5.36 12,982 6.59 18,493
3.41 10,341 3.52 11,095 4.31 12,348 5.70 17,067
3.18 10,318 4.62 11,451 5.59 13,126 6.35 18,111
3.63 10,363 11.35 13,809 8.62 15,120 9.24 19,006
4.09 10,409 10.31 13,428 8.87 15,302 8.67 18,300
-0.33 9,967 3.61 11,123 4.54 12,486 6.15 15,436
4.28 10,428 7.10 12,288 6.87 13,940 8.35 19,187
5.51 10,551 7.94 12,577 8.00 14,697 8.83 19,893
-0.33 9,967 3.61 11,123 4.54 12,486 6.93 17,242
CAGR %
CAGR %
Point-to-Point
returns on Standard
Investment of
Rs. 10,000/-
Point-to-Point
returns on Standard
Investment of
Rs. 10,000/-
CAGR %
CAGR %
Point-to-Point
returns on Standard
Investment of
Rs. 10,000/-
Point-to-Point
returns on Standard
Investment of
Rs. 10,000/-
CAGR %
CAGR %
Point-to-Point
returns on Standard
Investment of
Rs. 10,000/-
Point-to-Point
returns on Standard
Investment of
Rs. 10,000/-
3 Years
3 Years
5 Years
5 Years
CAGR %
CAGR %
Point-to-Point
returns on Standard
Investment of
Rs. 10,000/-
Point-to-Point
returns on Standard
Investment of
Rs. 10,000/-
Since Inception
Since Inception
Inception Date &
Managing Since
Inception Date &
Managing Since
1 Year
1 Year
Funds Managed by Bhavin Vithlani & *Mohit Jain (investments in foreign securities portion)
Funds Managed by Bhavin Vithlani & *Mohit Jain (investments in foreign securities portion)
SBI Infrastructure Fund
First Tier Scheme Benchmark: - Nifty Infrastructure (TRI)
Additional Benchmark: - S&P BSE Sensex (TRI)
SBI Balanced Advantage Fund
First Tier Scheme Benchmark: - NIFTY 50 Hybrid CompositeDebt 50:50 Index
Additional Benchmark: - Crisil 10 Yr Gilt Index
Inception Date
02-01-2013
Inception Date
31-08-2021
Managing Since
Nov-18
Managing Since
August - 2021
13.40 11,340 23.68 18,930 13.36 18,720 13.10 32,866
11.06 11,106 21.50 17,947 11.03 16,873 8.83 22,643
4.82 10,482 18.16 16,504 14.75 19,899 13.63 34,368
6.30 10,628 N.A. N.A. N.A. N.A. 6.30 10,628
4.06 10,406 N.A. N.A. N.A. N.A. 4.06 10,406
-0.33 9,967 N.A. N.A. N.A. N.A. -0.33 9,967
Note: Wherever NAV/Benchmark Index value is not available for start/end date for concerned period, the previous business day value of NAV/Benchmark Index is considered for return computation.
Fund jointly managed by Mansi Sajeja (Debt Portion), Nidhi Chawla (Equity Portion) and Neeraj Kumar (Arbitrage Portion)
SBI Arbitrage Opportunities Fund
SBI Equity Savings Fund
First Tier Scheme Benchmark: - Nifty 50 Arbitrage
Additional Benchmark: - Crisil 1 Yr T-Bill Index
First Tier Scheme Benchmark: - Nifty Equity Savings
Additional Benchmark: - Crisil 10 Yr Gilt Index
SBI Credit Risk Fund
First Tier Scheme Benchmark: - NIFTY Credit Risk Bond IndexC-II
Additional Benchmark: - CRISIL 10 Year Gilt Index
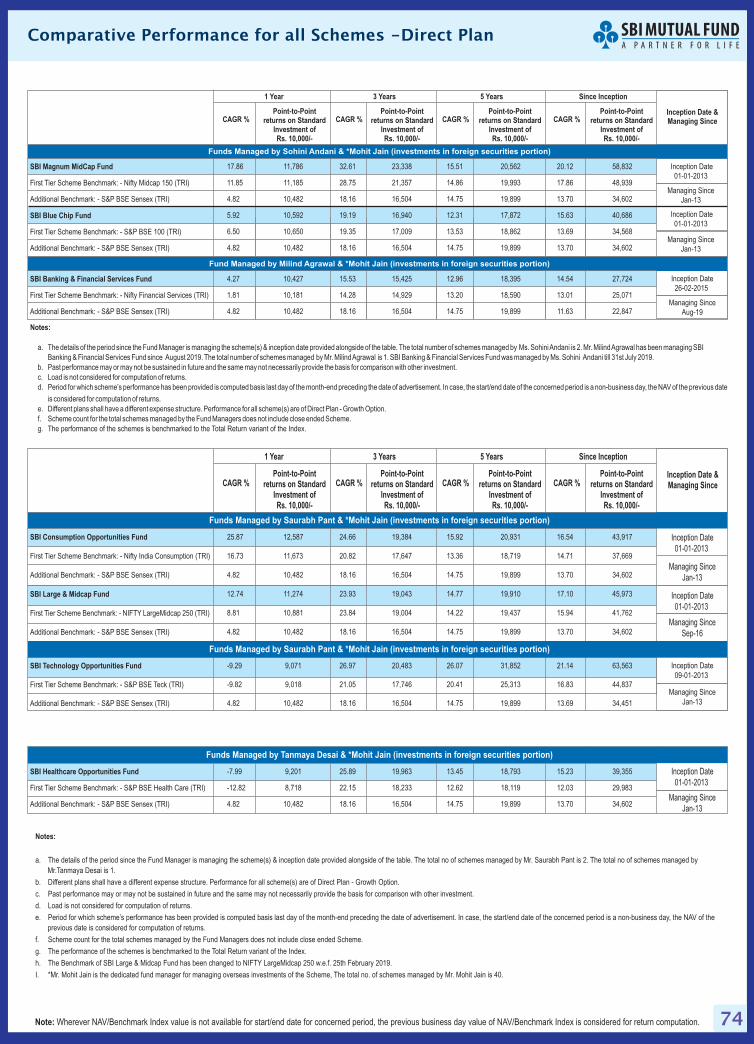
74
Comparative Performance for all Schemes -Direct Plan
Notes:
a.
b.
c. Past performance may or may not be sustained in future and the same may not necessarily provide the basis for comparison with other investment.
d. Load is not considered for computation of returns.
e. Period for which scheme’s performance has been provided is computed basis last day of the month-end preceding the date of advertisement. In case, the start/end date of the concerned period is a non-business day, the NAV of the
previous date is considered for computation of returns.
f. Scheme count for the total schemes managed by the Fund Managers does not include ended Scheme.
The details of the period since the Fund Manager is managing the scheme(s) & inception date provided alongside of the table. The total no of schemes managed by Mr. Saurabh Pant is 2. The total no of schemes managed by
Mr.Tanmaya Desai is 1.
Different plans shall have a different expense structure. Performance for all scheme(s) are of Direct Plan - Growth Option.
close
g. The performance of the schemes is benchmarked to the Total Return variant of the Index.
h. The Benchmark of SBI Large & Midcap Fund has been changed to NIFTY LargeMidcap 250 w.e.f. 25th February 2019.
I. *Mr. Mohit Jain is the dedicated fund manager for managing overseas investments of the Scheme, The total no. of schemes managed by Mr. Mohit Jain is 40.
Notes:
a. The total number of schemes managed by Ms. SohiniAndani is 2. Mr. MilindAgrawal has been managing SBI
Banking & Financial Services Fund since August 2019. The total number of schemes managed by Mr. MilindAgrawal is 1. SBI Banking & Financial Services Fund was managed by Ms. Sohini Andani till 31st July 2019.
b. Past performance may or may not be sustained in future and the same may not necessarily provide the basis for comparison with other investment.
c. Load is not considered for computation of returns.
d. Period for which scheme’s performance has been provided is computed basis last day of the month-end preceding the date of advertisement. In case, the start/end date of the concerned period is a non-business day, the NAV of the previous date
is considered for computation of returns.
e. Different plans shall have a different expense structure. Performance for all scheme(s) are of Direct Plan - Growth Option.
f. Scheme count for the total schemes managed by the Fund Managers does not include Scheme.close ended
g. The performance of the schemes is benchmarked to the Total Return variant of the Index.
The details of the period since the Fund Manager is managing the scheme(s) & inception date provided alongside of the table.
CAGR %
Point-to-Point
returns on Standard
Investment of
Rs. 10,000/-
CAGR %
Point-to-Point
returns on Standard
Investment of
Rs. 10,000/-
CAGR %
Point-to-Point
returns on Standard
Investment of
Rs. 10,000/-
3 Years 5 Years
CAGR %
Point-to-Point
returns on Standard
Investment of
Rs. 10,000/-
Since Inception
Inception Date &
Managing Since
Managing Since
Jan-13
Inception Date
01-01-2013
SBI Magnum MidCap Fund
SBI Blue Chip Fund
First Tier Scheme Benchmark: - Nifty Midcap 150 (TRI)
Additional Benchmark: - S&P BSE Sensex (TRI)
First Tier Scheme Benchmark: - S&P BSE 100 (TRI)
Additional Benchmark: - S&P BSE Sensex (TRI)
1 Year
Managing Since
Jan-13
Inception Date
01-01-2013
Funds Managed by Sohini Andani & *Mohit Jain (investments in foreign securities portion)
SBI Banking & Financial Services Fund
First Tier Scheme Benchmark: - Nifty Financial Services (TRI)
Additional Benchmark: - S&P BSE Sensex (TRI)Managing Since
Aug-19
Inception Date
26-02-2015
Fund Managed by Milind Agrawal & *Mohit Jain (investments in foreign securities portion)
Managing Since
Jan-13
Inception Date
01-01-2013
SBI Healthcare Opportunities Fund
First Tier Scheme Benchmark: - S&P BSE Health Care (TRI)
Additional Benchmark: - S&P BSE Sensex (TRI)
Funds Managed by Tanmaya Desai & *Mohit Jain (investments in foreign securities portion)
-7.99 9,201 25.89 19,963 13.45 18,793 15.23 39,355
-12.82 8,718 22.15 18,233 12.62 18,119 12.03 29,983
4.82 10,482 18.16 16,504 14.75 19,899 13.70 34,602
17.86 11,786 32.61 23,338 15.51 20,562 20.12 58,832
11.85 11,185 28.75 21,357 14.86 19,993 17.86 48,939
4.82 10,482 18.16 16,504 14.75 19,899 13.70 34,602
5.92 10,592 19.19 16,940 12.31 17,872 15.63 40,686
6.50 10,650 19.35 17,009 13.53 18,862 13.69 34,568
4.82 10,482 18.16 16,504 14.75 19,899 13.70 34,602
4.27 10,427 15.53 15,425 12.96 18,395 14.54 27,724
1.81 10,181 14.28 14,929 13.20 18,590 13.01 25,071
4.82 10,482 18.16 16,504 14.75 19,899 11.63 22,847
Note: Wherever NAV/Benchmark Index value is not available for start/end date for concerned period, the previous business day value of NAV/Benchmark Index is considered for return computation.
CAGR %
Point-to-Point
returns on Standard
Investment of
Rs. 10,000/-
CAGR %
Point-to-Point
returns on Standard
Investment of
Rs. 10,000/-
CAGR %
Point-to-Point
returns on Standard
Investment of
Rs. 10,000/-
3 Years 5 Years
CAGR %
Point-to-Point
returns on Standard
Investment of
Rs. 10,000/-
Since Inception
Inception Date &
Managing Since
Managing Since
Jan-13
Inception Date
01-01-2013
Managing Since
Sep-16
Inception Date
01-01-2013
1 Year
Funds Managed by Saurabh Pant & *Mohit Jain (investments in foreign securities portion)
Funds Managed by Saurabh Pant & *Mohit Jain (investments in foreign securities portion)
25.87 12,587 24.66 19,384 15.92 20,931 16.54 43,917
16.73 11,673 20.82 17,647 13.36 18,719 14.71 37,669
4.82 10,482 18.16 16,504 14.75 19,899 13.70 34,602
12.74 11,274 23.93 19,043 14.77 19,910 17.10 45,973
8.81 10,881 23.84 19,004 14.22 19,437 15.94 41,762
4.82 10,482 18.16 16,504 14.75 19,899 13.70 34,602
-9.29 9,071 26.97 20,483 26.07 31,852 21.14 63,563
-9.82 9,018 21.05 17,746 20.41 25,313 16.83 44,837
4.82 10,482 18.16 16,504 14.75 19,899 13.69 34,451
SBI Consumption Opportunities Fund
SBI Large & Midcap Fund
First Tier Scheme Benchmark: - Nifty India Consumption (TRI)
Additional Benchmark: - S&P BSE Sensex (TRI)
First Tier Scheme Benchmark: - NIFTY LargeMidcap 250 (TRI)
Additional Benchmark: - S&P BSE Sensex (TRI)
SBI Technology Opportunities Fund
First Tier Scheme Benchmark: - S&P BSE Teck (TRI)
Additional Benchmark: - S&P BSE Sensex (TRI)
Managing Since
Jan-13
Inception Date
09-01-2013

75
Comparative Performance for all Schemes -Direct Plan
Notes:
a. Mr. Dinesh Balachandran has been managing SBI Long Term Equity Fund (previously known as SBI Magnum Taxgain Scheme) since September 2016. The
total number of schemes managed by Mr. Dinesh Balachandran is 4 (3 schemes are jointly managed by Mr. Mohit Jain).
c. Past performance may or may not be sustained in future and the same may not necessarily provide the basis for comparison with other investment.
d. Load is not considered for computation of returns.
e. Period for which scheme’s performance has been provided is computed basis last day of the month-end preceding the date of advertisement. In case, the start/end date of the concerned period is a non-business day, the NAV of the previous date is considered for computation of returns.
f. Scheme count for the total schemes managed by the Fund Managers does not include ended Schemes.
SBI Contra Fund was managed by Mr. R. Srinivasan till May 04, 2018. The total no. of schemes managed by Mr.Mohit Jain is 40(He is the dedicated Fund Manager
for managing overseas investments of the Schemes of SBI Mutual Fund which have a mandate to invest in overseas securities)
close
.
.
The details of the period since the Fund Manager is managing the scheme(s) & inception date provided alongside of the table.
b. Different plans shall have a different expense structure. Performance for all scheme(s) are of Direct Plan - Growth Option.
g SBI Muti Asset Allocation Fund - Mr. Raj Gandhi is appointed as fund manager for managing investments in ETCDs w.e.f. February 27, 2020.
h SBI Muti Asset Allocation Fund: Benchmark of the scheme is changed to 45% CRISIL 10 Year Gilt Index + 40% NIFTY 50 TRI + 15% Price of Gold w.e.f. November 06, 2020
I. The performance of the schemes is benchmarked to the Total Return variant of the Index.
j. SBI Multi Asset Allocation Fund: Mr. Dinesh Balachandran is appointed fund manager w.e.f October 1, 2021. Mr Gaurav Mehta was the fund manager till 30th September, 2021.
k. SBI International Access - US Equity FoF: S&P 500 benchmark performance is calculated using INR equivalent closing prices. (source: Bloomberg)
l. *Mr. Mohit Jain is the dedicated fund manager for managing overseas investments of the Scheme, The total no. of schemes managed by Mr. Mohit Jain is 40.
Inception Date &
Managing Since
Inception Date
01-01-2013
Inception Date
01-01-2013
Managing Since
Sep-16
Managing Since
May-18
Notes:
a.
The performance of the schemes is benchmarked to the Total Return variant of the Index.
The details of the period since the Fund Manager is managing the scheme(s) & inception date provided alongside of the table. The total number of schemes managed by Mr. Raviprakash Sharma is 4.
b. Past performance may or may not be sustained in future and the same may not necessarily provide the basis for comparison with other investment.
c. Load is not considered for computation of returns.
d. Period for which scheme’s performance has been provided is computed basis last day of the month-end preceding the date of advertisement. In case, the start/end date of the concerned period is a non-business day, the NAV of the previous date is considered for computation of returns.
e. Different plans shall have a different expense structure. The performance provided for SBI Gold Fund, are of Direct Plan - IDCW Option and is Net of IDCW distribution tax, if any. The performance details provided for and SBI Equity Minimum Variance Fund are of Growth Option - Direct Plan.
f. Scheme count for the total schemes managed by the Fund Managers does not include ETF’s managed by Mr. Raviprakash Sharma.
g.
CAGR %
Point-to-Point
returns on Standard
Investment of
Rs. 10,000/-
CAGR %
Point-to-Point
returns on Standard
Investment of
Rs. 10,000/-
CAGR %
Point-to-Point
returns on Standard
Investment of
Rs. 10,000/-
3 Years 5 Years
CAGR %
Point-to-Point
returns on Standard
Investment of
Rs. 10,000/-
Since Inception
Inception Date &
Managing Since
Managing Since
Jan-13
Inception Date
01-01-2013
SBI Gold Fund
SBI Nifty Index Fund
First Tier Scheme Benchmark: - The Morning Fixing of Goldby London Bullion Market Association (LBMA)
Additional Benchmark: - S&P BSE Sensex (TRI)
First Tier Scheme Benchmark: - Nifty 50 (TRI)
Additional Benchmark: - S&P BSE Sensex (TRI)
1 Year
Managing Since
Jan-13
Inception Date
01-01-2013
Funds Managed by Raviprakash Sharma
Inception Date
15-03-2013
Managing Since
Feb-19
Funds Managed by Dinesh Balachandran & Mr. Raj Gandhi (for ETCDs) & *Mohit Jain (investments in foreign securities portion)
SBI Multi Asset Allocation Fund
First Tier Scheme Benchmark: - 45% CRISIL 10 Year Gilt Index +40% NIFTY 50 TRI + 15% Price of Gold
Additional Benchmark: - S&P BSE Sensex TRI
6.56 10,656 12.29 14,163 N.A. N.A. 10.41 15,296
3.72 10,372 11.10 13,717 N.A. N.A. 11.12 15,725
4.82 10,482 18.16 16,504 N.A. N.A. 14.33 17,773
SBI Long Term Equity Fund
First Tier Scheme Benchmark: - S&P BSE 500 (TRI)
Additional Benchmark: - S&P BSE Sensex (TRI)
SBI Contra Fund
First Tier Scheme Benchmark: - S&P BSE 500 TRI
Additional Benchmark: - S&P BSE Sensex (TRI)
Funds Managed by Dinesh Balachandran
Fund Jointly Managed by Dinesh Balachandran and *Mohit Jain (investments in foreign securities portion)
7.84 10,784 21.20 17,814 11.62 17,328 14.23 36,170
7.01 10,701 21.24 17,832 13.59 18,907 14.28 36,347
4.82 10,482 18.16 16,504 14.75 19,899 13.70 34,602
19.33 11,933 32.03 23,035 15.67 20,703 15.21 39,301
7.01 10,701 21.24 17,832 13.59 18,907 14.28 36,347
4.82 10,482 18.16 16,504 14.75 19,899 13.70 34,602
CAGR %
Point-to-Point
returns on Standard
Investment of
Rs. 10,000/-
CAGR %
Point-to-Point
returns on Standard
Investment of
Rs. 10,000/-
CAGR %
Point-to-Point
returns on Standard
Investment of
Rs. 10,000/-
3 Years 5 Years
CAGR %
Point-to-Point
returns on Standard
Investment of
Rs. 10,000/-
Since Inception1 Year
Note: Wherever NAV/Benchmark Index value is not available for start/end date for concerned period, the previous business day value of NAV/Benchmark Index is considered for return computation.
Inception Date &
Managing Since
CAGR %
Point-to-Point
returns on Standard
Investment of
Rs. 10,000/-
CAGR %
Point-to-Point
returns on Standard
Investment of
Rs. 10,000/-
CAGR %
Point-to-Point
returns on Standard
Investment of
Rs. 10,000/-
3 Years 5 Years
CAGR %
Point-to-Point
returns on Standard
Investment of
Rs. 10,000/-
Since Inception1 Year
Inception Date
22-03-2021
Managing Since
Mar - 2021
Fund managed by Mr. Mohit Jain
SBI International Access - US Equity FoF
First Tier Scheme Benchmark: - S&P 500
Additional Benchmark: - S&P BSE Sensex TRI
-5.81 9,419 N.A. N.A. N.A. N.A. 5.22 10,762
-4.60 9,540 N.A. N.A. N.A. N.A. 7.10 11,041
4.82 10,482 N.A. N.A. N.A. N.A. 14.77 12,197
7.39 10,739 9.18 13,017 10.68 16,610 4.28 15,000
8.83 10,883 8.86 12,904 11.54 17,271 5.42 16,654
4.82 10,482 18.16 16,504 14.75 19,899 13.70 34,602
4.88 10,488 17.98 16,428 13.24 18,620 12.60 31,481
5.16 10,516 18.63 16,701 13.78 19,071 13.39 33,704
4.82 10,482 18.16 16,504 14.75 19,899 13.70 34,602
Managing Since
Mar-19
Inception Date
19-03-2019
Funds Managed by Raviprakash Sharma & *Mohit Jain (investments in foreign securities portion)
5.51 10,551 19.96 17,270 N.A. N.A. 16.02 16,702
5.16 10,516 18.63 16,701 N.A. N.A. 14.80 16,102
4.82 10,482 18.16 16,504 N.A. N.A. 14.99 16,197
SBI Equity Minimum Variance Fund
First Tier Scheme Benchmark: - Nifty 50 TRI
Additional Benchmark: - S&P BSE Sensex TRI
Funds Managed by Raviprakash Sharma & *Mohit Jain (investments in foreign securities portion)
Inception Date &
Managing Since
CAGR %
Point-to-Point
returns on Standard
Investment of
Rs. 10,000/-
CAGR %
Point-to-Point
returns on Standard
Investment of
Rs. 10,000/-
CAGR %
Point-to-Point
returns on Standard
Investment of
Rs. 10,000/-
3 Years 5 Years
CAGR %
Point-to-Point
returns on Standard
Investment of
Rs. 10,000/-
Since Inception1 Year
Inception Date
19-05-2021
Managing Since
May - 2021
SBI Nifty Next 50 Index Fund
First Tier Scheme Benchmark: - Nifty Next 50 TRI
Additional Benchmark: - S&P BSE Sensex TRI
6.13 10,613 N.A. N.A. N.A. N.A. 14.87 11,945
6.50 10,650 N.A. N.A. N.A. N.A. 15.34 12,008
4.82 10,482 N.A. N.A. N.A. N.A. 16.50 12,162

76
Comparative Performance for all Schemes -Direct Plan
Notes:
a. The total number of schemes managed by Mr. Richard D’souza is 2.b. Past performance may or may not be sustained in future and the same may not necessarily provide the basis for comparison with other investment.c. Load is not considered for computation of returns.d. Period for which scheme’s performance has been provided is computed basis last day of the month-end preceding the date of advertisement. In case, the start/end date of the concerned period is a non-business day, the NAV of the previous date
is considered for computation of returns.e. Different plans shall have a different expense structure. Performance for all scheme(s) are of Direct Plan - Growth Option.f. Scheme count for the total schemes managed by the Fund Managers does not include ended Scheme.closeg. The performance of the schemes is benchmarked to the Total Return variant of the Index.
The details of the period since the Fund Manager is managing the scheme(s) & inception date provided alongside of the table.
Notes:
a.
b. Past performance may or may not be sustained in future and the same may not necessarily provide the basis for comparison with other investment.c. Load is not considered for computation of returns.d. Period for which scheme’s performance has been provided is computed basis last day of the month-end preceding the date of advertisement. In case, the start/end date of the concerned period is a non-business day, the NAV of the previous date
is considered for computation of returns.e. Different plans shall have a different expense structure. Performance for all scheme(s) are of Direct Plan - Growth Option.f. Scheme count for the total schemes managed by the Fund Managers does not include close ended Scheme & ETF.
g. The performance of the schemes is benchmarked to the Total Return variant of the Index.h. *Mr. Mohit Jain is the dedicated fund manager for managing overseas investments of the Scheme, The total no. of schemes managed by Mr. Mohit Jain is 40.
The details of the period since the Fund Manager is managing the scheme(s) &inception date provided alongside of the table. The total no. of schemes managed by Mr. DineshAhuja is 13. The Scheme count of Mr. DineshAhuja includes an ETFmanaged by him.
Notes:
a. The total number of schemes managed by Mr. R.Arun is 5 (1 scheme is jointly managed with Mr Neeraj Kumar)
b. Past performance may or may not be sustained in future and the same may not necessarily provide the basis for comparison with other investment.
c. Load is not considered for computation of returns.
d. Period for which scheme’s performance has been provided is computed basis last day of the month-end preceding the date of advertisement. In case, the start/end date of the concerned period is a non-business day, the NAV of the previous date
is considered for computation of returns.
e. Different plans shall have a different expense structure. Performance for all scheme(s) are of Direct Plan - Growth Option.
f. Scheme count for the total schemes managed by the Fund Managers does not include ended Scheme.
g. The performance of the schemes is benchmarked to the Total Return variant of the Index.
close
The details of the period since the Fund Manager is managing the scheme(s) & inception date provided alongside of the table.
CAGR %
Point-to-Point
returns on Standard
Investment of
Rs. 10,000/-
CAGR %
Point-to-Point
returns on Standard
Investment of
Rs. 10,000/-
CAGR %
Point-to-Point
returns on Standard
Investment of
Rs. 10,000/-
3 Years 5 Years
CAGR %
Point-to-Point
returns on Standard
Investment of
Rs. 10,000/-
Since Inception
Inception Date &
Managing Since
Managing Since
Jan-20
Inception Date
02-01-2013
1 Year
1.48 10,148 5.46 11,731 7.65 14,458 9.10 23,208
-0.23 9,977 3.36 11,044 4.25 12,315 6.16 17,823
3.18 10,318 4.62 11,451 5.59 13,126 6.37 18,173
Funds Managed by Dinesh Ahuja
SBI Magnum Constant Maturity Fund
First Tier Scheme Benchmark: - Nifty 10 yr Benchmark G-Sec
Additional Benchmark: - CRISIL 1 Year T-Bill Index
Note: Wherever NAV/Benchmark Index value is not available for start/end date for concerned period, the previous business day value of NAV/Benchmark Index is considered for return computation.
CAGR %
Point-to-Point
returns on Standard
Investment of
Rs. 10,000/-
CAGR %
Point-to-Point
returns on Standard
Investment of
Rs. 10,000/-
CAGR %
Point-to-Point
returns on Standard
Investment of
Rs. 10,000/-
3 Years 5 Years
CAGR %
Point-to-Point
returns on Standard
Investment of
Rs. 10,000/-
Since Inception
Inception Date &
Managing Since
Managing Since
Aug-14
Inception Date
04-01-2013
1 Year
Funds Managed by Richard D'souza & *Mohit Jain (investments in foreign securities portion)
Funds Managed by Richard D'souza
Managing Since
Aug-14
Inception Date
01-01-2013SBI PSU Fund
First Tier Scheme Benchmark: - S&P BSE PSU (TRI)
Additional Benchmark: - S&P BSE Sensex (TRI)
SBI Magnum Comma Fund
First Tier Scheme Benchmark: - Nifty Commodities (TRI)
Additional Benchmark: - S&P BSE Sensex (TRI)
19.21 11,921 16.37 15,764 4.05 12,198 6.43 18,259
23.91 12,391 17.63 16,285 4.96 12,737 5.52 16,803
4.82 10,482 18.16 16,504 14.75 19,899 13.70 34,602
-1.21 9,879 27.98 20,976 13.77 19,059 13.34 33,499
9.89 10,989 26.22 20,122 11.38 17,139 11.28 28,067
4.82 10,482 18.16 16,504 14.75 19,899 13.59 34,247
Annualized
%
Annualized
%
Annualized
%
CAGR
%
CAGR
%
CAGR
%
CAGR
%
Point-to-Point
returns on
Standard
Investment
of Rs. 10,000/-
Point-to-Point
returns on
Standard
Investment
of Rs. 10,000/-
Point-to-Point
returns on
Standard
Investment
of Rs. 10,000/-
Point-to-Point
returns on
Standard
Investment
of Rs. 10,000/-
Point-to-Point
returns on
Standard
Investment
of Rs. 10,000/-
Point-to-Point
returns on
Standard
Investment
of Rs. 10,000/-
Point-to-Point
returns on
Standard
Investment
of Rs. 10,000/-
Inception
Date &
Managing
Since
7 Days 15 Days 1 Month 1 Year 3 Year 5 Year Since Inception
5.20 10,010 5.14 10,021 5.04 10,043 3.80 10,380 3.64 11,134 4.62 12,536 6.18 17,855
5.31 10,010 5.24 10,022 5.17 10,044 3.90 10,390 3.72 11,158 4.66 12,559 6.00 17,565
3.63 10,007 4.37 10,018 5.88 10,050 3.18 10,318 4.62 11,451 5.59 13,126 6.38 18,189
5.30 10,010 5.45 10,022 5.50 10,047 3.93 10,393 4.08 11,276 5.30 12,950 6.75 18,800
5.65 10,011 5.76 10,024 5.84 10,050 4.05 10,405 4.16 11,303 5.32 12,959 6.75 18,812
3.63 10,007 4.37 10,018 5.88 10,050 3.18 10,318 4.62 11,451 5.59 13,126 6.38 18,189
4.95 10,008 5.61 10,028 5.90 10,052 4.01 10,401 5.10 11,610 6.18 13,499 7.57 20,240
5.37 10,010 5.75 10,024 5.97 10,051 4.20 10,420 4.70 11,480 5.78 13,244 7.00 19,227
3.63 10,007 4.37 10,018 5.88 10,050 3.18 10,318 4.62 11,451 5.59 13,126 6.38 18,189
Inception
Date
01-01-2013
Managing
Since
Jan-13
Inception
Date
01-01-2013
Managing
Since
Jan-13
Inception
Date
01-01-2013
SBI Overnight Fund
SBI Liquid Fund
First Tier Scheme Benchmark:-CRISILOvernight Fund AI Index
Additional Benchmark: - CRISIL 1 YearT-Bill Index
First Tier Scheme Benchmark:-NIFTYLiquid Index B-I
Additional Benchmark: - CRISIL 1 YearT-Bill Index
SBI Savings Fund
First Tier Scheme Benchmark:-CRISILMoney Market Fund Bl Index
Additional Benchmark: - CRISIL 1 Year
T-Bill Index
Funds Managed by R. Arun
Funds Managed by R. Arun & *Mohit Jain (investments in foreign securities portion)
Managing
Since May-18

77
Comparative Performance for all Schemes -Direct Plan
CAGR %
Point-to-Point
returns on Standard
Investment of
Rs. 10,000/-
CAGR %
Point-to-Point
returns on Standard
Investment of
Rs. 10,000/-
CAGR %
Point-to-Point
returns on Standard
Investment of
Rs. 10,000/-
3 Years 5 Years
CAGR %
Point-to-Point
returns on Standard
Investment of
Rs. 10,000/-
Since Inception
Inception Date &
Managing Since
1 Year
Managing Since
Jan-13
Inception Date
01-01-2013
Inception Date
07-01-2013
Inception Date
01-02-2019
Managing Since
Nov-13
Managing Since
Feb-19
3.03 10,303 6.09 11,943 6.65 13,800 7.88 20,819
2.79 10,279 5.89 11,874 6.49 13,698 7.73 20,544
3.18 10,318 4.62 11,451 5.59 13,126 6.38 18,189
2.29 10,229 5.99 11,908 7.07 14,070 8.06 21,133
2.88 10,288 6.24 11,995 6.35 13,605 7.60 20,281
-0.33 9,967 3.61 11,123 4.54 12,486 6.18 17,835
2.77 10,277 6.25 11,998 N.A. N.A. 7.33 12,879
3.35 10,335 7.20 12,321 N.A. N.A. 7.75 13,065
-0.33 9,967 3.61 11,123 N.A. N.A. 5.88 12,271
Funds Managed by Rajeev Radhakrishnan & *Mohit Jain (investments in foreign securities portion)
SBI Banking and PSU Fund
First Tier Scheme Benchmark: - NIFTY Banking and PSU DebtIndex
Additional Benchmark: - Crisil 10 Yr Gilt Index
SBI Corporate Bond Fund
First Tier Scheme Benchmark: - NIFTY Corporate Bond Index B-III
Additional Benchmark: - Crisil 10 Yr Gilt Index
Managing
Since Jan-13
Inception
Date
01-01-2013
Managing
Since Jun-21
Inception
Date
01-01-2013
Annualized
%
Annualized
%
Annualized
%
CAGR
%
CAGR
%
CAGR
%
CAGR
%
Point-to-Point
returns on
Standard
Investment
of Rs. 10,000/-
Point-to-Point
returns on
Standard
Investment
of Rs. 10,000/-
Point-to-Point
returns on
Standard
Investment
of Rs. 10,000/-
Point-to-Point
returns on
Standard
Investment
of Rs. 10,000/-
Point-to-Point
returns on
Standard
Investment
of Rs. 10,000/-
Point-to-Point
returns on
Standard
Investment
of Rs. 10,000/-
Point-to-Point
returns on
Standard
Investment
of Rs. 10,000/-
Inception
Date &
Managing
Since
7 Days 15 Days 1 Month 1 Year 3 Year 5 Year Since Inception
SBI Magnum Ultra Short Duration Fund
First Tier Scheme Benchmark: - CRISILUltra Short Duration Fund BI Index
Additional Benchmark: - CRISIL1 Year T-Bill Index
4.63 10,008 5.50 10,027 5.75 10,050 3.79 10,379 4.86 11,533 6.11 13,453 7.20 19,587
6.13 10,012 6.44 10,026 6.47 10,055 4.45 10,445 5.24 11,656 6.20 13,511 7.30 19,772
3.63 10,007 4.37 10,018 5.88 10,050 3.18 10,318 4.62 11,451 5.59 13,126 6.38 18,189
Fund Jointly Managed Rajeev Radhakrishnan & Mohit Jain (investments in foreign securities portion)
Fund Jointly Managed Rajeev Radhakrishnan & *Mohit Jain (investments in foreign securities portion)
Fund managed by Mr. Arun R. & *Mohit Jain (investments in foreign securities portion)
6.36 10,636 12.61 14,287 9.71 15,891 12.11 30,152
3.06 10,306 8.65 12,830 8.03 14,717 8.85 22,679
4.82 10,482 18.16 16,504 14.75 19,899 13.59 34,247
Fund jointly managed by R. Srinivasan (equity portion) and Rajeev Radhakrishnan (debt portion) & *Mohit Jain (investments in foreign securities portion)
SBI Magnum Children's Benefit Fund - Savings Plan
First Tier Scheme Benchmark:- NIFTY 50 Hybrid CompositeDebt 15:85 Index
Additional Benchmark: - S&P BSE Sensex TRI
Note: Wherever NAV/Benchmark Index value is not available for start/end date for concerned period, the previous business day value of NAV/Benchmark Index is considered for return computation.
Notes:
a.
b. Past performance may or may not be sustained in future and the same may not necessarily provide the basis for comparison with other investment.c. Load is not considered for computation of returns.d. Period for which scheme’s performance has been provided is computed basis last day of the month-end preceding the date of advertisement. In case, the start/end date of the concerned period is a non-business day, the NAV of the previous date is considered for computation of returns.e. Different plans shall have a different expense structure. Performance for all scheme(s) are of Direct Plan - Growth Option.f. Scheme count for the total schemes managed by the Fund Managers does not include .close ended Schemeg. The performance of the schemes is benchmarked to the Total Return variant of the Index.h. Mohit Jain is the Fund Manager for the investment in foreign securities in SBI Banking & PSU Fund w.e.f. Jan 22 2020.i. Mr. R. Srinivasan is managing the equity portion of SBI Magnum Children's Benefit Fund - Savings Plan since January 13, 2021.j. Mr. Ardhendu Bhattacharya has been jointly managing SBI Floating Rate Debt Fund and SBI Retirement Benefit Fund - Aggressive Plan/ Aggressive Hybrid Plan / Conservative Hybrid Plan / Conservative Plan as Co-fund manager since June 2021k. Mr Dinesh Ahuja (debt portion), Mr Ardhendu Bhattacharya (debt portion) (managing since June 30, 2021), Mr Rohit Shimpi (equity portion) (managing since October 1, 2021) and Mr Mohit Jain (overseas investments) are managing SBI Retirement Benefit Fund-Aggressive Plan/ Aggressive Hybrid Plan / Conservative Hybrid Plan /
Conservative Plan.l. *Mr. Mohit Jain is the dedicated fund manager for managing overseas investments of the Scheme, The total no. of schemes managed by Mr. Mohit Jain is 40.
The details of the period since the Fund Manager is managing the scheme(s) & inception date provided alongside of the table. Mr. Rajeev Radhakrishnan manages the debt portion of the SBI Dual Advantage Fund Series & SBI Capital Protection Oriented Fund Series. The total number of schemesmanaged by Mr. Rajeev Radhakrishnan is 6. The total no of schemes managed by Mr. R. Srinivasan is 5 (2 schemes are jointly managed by Mr. Dinesh Ahuja). The total no. of schemes managed by Mr. Dinesh Ahuja is 13 (2 schemes are jointly managed by Mr. R. Srinivasan) . The Scheme count ofMr. Dinesh Ahuja includes an ETF managed by him. The total number of schemes managed by Mr. Ardhendu Bhattacharya is 2 (1 scheme is jointly managed with Rajeev Radhakrishnan and 1 scheme is jointly managed with Dinesh Ahuja and Gaurav Mehta). The total number of schemes managedby Mr. Gaurav Mehta is 6 ( 5 schemes are jointly managed with Mr. Dinesh Ahuja and 1 scheme is jointly held with Mr. Dinesh Balachandran)
Inception Date
27-10-2020
Managing Since
Oct-20
Fund jointly managed by Rajeev Radhakrishnan and Ardhendu Bhattacharya (co-fund manager) & *Mohit Jain (investments in foreign securities portion)
3.67 10,367 N.A. N.A. N.A. N.A. 4.41 10,826
2.89 10,289 N.A. N.A. N.A. N.A. 4.09 10,767
3.18 10,318 N.A. N.A. N.A. N.A. 3.48 10,650
SBI Floating Rate Debt Fund
First Tier Scheme Benchmark: - Nifty Short Duration Debt Index
Additional Benchmark: - Crisil 1 Yr T-Bill Index
SBI Magnum Low Duration Fund
First Tier Scheme Benchmark: - CRISILLow Duration Fund BI Index
Additional Benchmark: - CRISIL 1 YearT-Bill Index
5.26 10,009 6.03 10,030 6.02 10,053 3.67 10,367 5.38 11,705 6.35 13,604 7.44 20,018
5.79 10,011 6.14 10,025 6.52 10,055 4.15 10,415 5.42 11,716 6.24 13,540 7.55 20,206
3.63 10,007 4.37 10,018 5.88 10,050 3.18 10,318 4.62 11,451 5.59 13,126 6.38 18,189
CAGR %
Point-to-Point
returns on Standard
Investment of
Rs. 10,000/-
CAGR %
Point-to-Point
returns on Standard
Investment of
Rs. 10,000/-
CAGR %
Point-to-Point
returns on Standard
Investment of
Rs. 10,000/-
3 Years 5 Years
CAGR %
Point-to-Point
returns on Standard
Investment of
Rs. 10,000/-
Since Inception
Inception Date &
Managing Since
1 Year
15.60 11,560 N.A. N.A. N.A. N.A. 25.00 14,135
7.01 10,701 N.A. N.A. N.A. N.A. 16.18 12,619
4.82 10,482 N.A. N.A. N.A. N.A. 11.55 11,847
13.37 11,337 N.A. N.A. N.A. N.A. 21.39 13,506
5.65 10,565 N.A. N.A. N.A. N.A. 11.35 11,818
4.82 10,482 N.A. N.A. N.A. N.A. 11.55 11,847
7.73 10,773 N.A. N.A. N.A. N.A. 11.91 11,906
4.14 10,414 N.A. N.A. N.A. N.A. 7.80 11,237
-0.33 9,967 N.A. N.A. N.A. N.A. 0.84 10,130
5.74 10,574 N.A. N.A. N.A. N.A. 7.89 11,250
2.57 10,257 N.A. N.A. N.A. N.A. 4.21 10,662
-0.33 9,967 N.A. N.A. N.A. N.A. 0.84 10,130
Fund managed by Mr. Dinesh Ahuja and Mr. Ardhendu Bhattacharya (Co-fund manager) (Debt portion) along with Mr. Rohit Shimpi (Equity portion) & *Mr. Mohit Jain – Overseas Investments
Inception Date
10-02-2021
Managing Since
Feb - 2021
June - 2021
SBI Retirement Benefit Fund - Aggressive Plan
SBI Retirement Benefit Fund - Aggressive Hybrid Plan
SBI Retirement Benefit Fund - Conservative Hybrid Plan
SBI Retirement Benefit Fund - Conservative Plan
First Tier Scheme Benchmark: - S&P BSE 500 TRI
Additional Benchmark: - S&P BSE Sensex TRI
First Tier Scheme Benchmark: - CRISIL Hybrid 35+65 -Aggressive Index
Additional Benchmark: - S&P BSE Sensex TRI
First Tier Scheme Benchmark: - Crisil Hybrid 65+35 -Conservative Index
Additional Benchmark: - Crisil 10 Yr Gilt Index
First Tier Scheme Benchmark: - NIFTY Composite Debt Index
Additional Benchmark: - Crisil 10 Yr Gilt Index
SBI Short Term Debt Fund
First Tier Scheme Benchmark: - CRISIL Short Duration FundAII Index
Additional Benchmark: - CRISIL 1 Year T-Bill Index
Managing Since
Jun-08
Inception Date
21-02-2002

78
The Fund offers flexible and convenient Systematic Investment Plan (SIP) facility. To illustrate the advantages of SIP investments, this is how your investments would have grown if you hadinvested say 10,000 systematically on the first Business Day of every month over a period of time in the Respective Scheme by using XIRR approach. XIRR helps in calculating return oninvestments given an initial and final value and a series of cash inflows and outflows with the correct allowance for the time impact of the transactions. Data as on August 31, 2022.
1.Periodical SIP Performances (1Yr, 3Yrs, 5Yrs, 10 Yrs & 15 Yrs) are computed considering SIP Investment on 1st business day of every month.
2."Since Inception SIP" performance are computed considering 1st instalment on allotment date and thereafter on 1st business day of every subsequent month.
`
Investors are advised to refer to the performance summary table on page 64 -76. Returns are calculated for the Regular plan.Disclaimer: The above investment simulation is for illustrative purposes only and should not be construed as a promise on minimum returns and safeguard of capital. TheAMC / Mutual Fund is not guaranteeing or promising or forecasting any returns. Investors are advised to consult their financial advisor/consultant before taking anyinvestment decision. SIP does not assure a profit or guarantee protection against a loss in a declining market. Please refer SID of the respective Schemes before investing.The performance of the schemes is benchmarked to the Total Return variant of the Index.*Mr. Mohit Jain is the dedicated fund manager for managing overseas investments of the Scheme, The total no. of schemes managed by Mr. Mohit Jain is 40.
Source: ICRA Online
Benefits of Systematic Investment Plan (SIP)SIP Performance of Select Schemes - Fund Manager-wise
38,00,000 18,00,000 12,00,000 6,00,000 3,60,000 1,20,0006,26,81,297 53,28,867 24,71,553 8,84,628 4,79,420 1,23,665
14.41 13.32 13.84 15.54 19.56 5.74N.A. N.A. 15.58 17.51 21.53 4.13N.A. 13.16 14.37 16.55 20.47 8.64
Total Amount Invested ( )Mkt Value as on August 31, 2022 ( )
First Tier Benchmark Returns (Annualised) (%) (TRI) #Additional Benchmark Returns (Annualised) (TRI) (%) ##
`
`
Returns (Annualised) (%)
SIP Investments
Past performance may or may not be sustained in the future. # Nifty ESG 100 TRI, ## S&P BSE SENSEX, Inception Date: January 01, 1991
Returns are calculated for Regular Plan IDCW Option. The calculation is derived by IDCW reinvested at the prevailing NAV.For calculation of Scheme returns , where the NAV is not declared for SIP date due to SEBI regulation related to frequency of NAV declaration applicable onthat time, returns are computed considering the declared NAV of next business day.
SBI Magnum Equity ESG Fund FUND MANAGER -ROHIT SHIMPI & *MOHIT JAIN
27,80,000 18,00,000 12,00,000 6,00,000 3,60,000 1,20,0004,14,26,865 56,55,780 28,64,029 10,77,494 6,02,184 1,31,649
19.50 14.01 16.59 23.66 36.53 18.5815.45 13.77 15.18 17.61 23.97 10.7414.99 13.16 14.37 16.55 20.47 8.64
Total Amount Invested ( )Mkt Value as on August 31, 2022 ( )
First Tier Benchmark Returns (Annualised) (TRI) (%) #Additional Benchmark Returns (Annualised) (TRI) (%) ##
`
`
Returns (Annualised) (%)
SIP Investments
Past performance may or may not be sustained in the future. # S&P BSE 500 TRI, ## S&P BSE SENSEX, Inception Date: July 05, 1999
Returns are calculated for Regular Plan IDCW Option. The calculation is derived by IDCW reinvested at the prevailing NAV.
SBI Contra Fund FUND MANAGER -DINESH BALACHANDRAN & *MOHIT JAIN
19,90,000 18,00,000 12,00,000 6,00,000 3,60,000 1,20,00066,65,548 55,76,959 25,26,197 8,82,359 4,86,761 1,25,623
13.25 13.85 14.25 15.44 20.66 8.8512.96 13.27 14.49 16.79 22.20 10.4812.82 13.16 14.37 16.55 20.47 8.64
Total Amount Invested ( )Mkt Value as on August 31, 2022 ( )
First Tier Benchmark Returns (Annualised) ( (%)#AdditionalBenchmarkReturns(Annualised)(TRI)(%)##
`
`
Returns (Annualised) (%)TRI)
SIP Investments
Past performance may or may not be sustained in the future. # S&P BSE 100, ## S&P BSE SENSEX, Inception Date: February 14, 2006
Returns are calculated for Regular Plan Growth Option
SBI Blue Chip Fund FUND MANAGER -SOHINI ANDANI & *MOHIT JAIN
35,50,000 18,00,000 12,00,000 6,00,000 3,60,000 1,20,0006,70,02,590 63,42,641 28,39,288 9,58,710 5,26,066 1,28,637
16.18 15.33 16.43 18.83 26.32 13.69N.A. 15.29 16.75 18.96 26.46 12.23
13.73 13.16 14.37 16.55 20.47 8.64
20,90,000 18,00,000 12,00,000 6,00,000 3,60,000 1,20,0001,04,76,929 78,15,372 32,33,497 10,71,637 5,92,153 1,31,723
16.47 17.72 18.84 23.43 35.23 18.7116.35 17.19 18.92 21.37 31.36 14.5313.11 13.16 14.37 16.55 20.47 8.64
Total Amount Invested ( )Mkt Value as on August 31, 2022 ( )
First Tier Benchmark Returns (Annualised) (TRI) (%) #Additional Benchmark Returns (Annualised) (TRI) (%) ##
`
`
Returns (Annualised) (%)
SIP Investments
Past performance may or may not be sustained in the future. # NIFTY Large Midcap 250, ## S&P BSE SENSEX, Inception Date: February 28, 1993
Returns are calculated for Regular Plan IDCW Option. The calculation is derived by IDCW reinvested at the prevailing NAV.
SBI Large & Midcap Fund FUND MANAGER -SAURABH PANT & *MOHIT JAIN
Total Amount Invested ( )Mkt Value as on August 31, 2022 ( )
First Tier Benchmark Returns (Annualised) (TRI) (%) #Additional Benchmark Returns (Annualised) (TRI) (%) ##
`
`
Returns (Annualised) (%)
SIP Investments
Past performance may or may not be sustained in the future. # Nifty Midcap 150, ## S&P BSE SENSEX, Inception Date: March 29, 2005
Returns are calculated for Regular Plan Growth Option
SBI Magnum MidCap Fund FUND MANAGER -SOHINI ANDANI & *MOHIT JAIN
Since InceptionSIP
15 YearsSIP
10 YearsSIP
5 YearsSIP
3 YearsSIP
1 YearSIP
Since InceptionSIP
15 YearsSIP
10 YearsSIP
5 YearsSIP
3 YearsSIP
1 YearSIP
Since InceptionSIP
15 YearsSIP
10 YearsSIP
5 YearsSIP
3 YearsSIP
1 YearSIP
Since InceptionSIP
15 YearsSIP
10 YearsSIP
5 YearsSIP
3 YearsSIP
1 YearSIP
Since InceptionSIP
15 YearsSIP
10 YearsSIP
5 YearsSIP
3 YearsSIP
1 YearSIP

79
The Fund offers flexible and convenient Systematic Investment Plan (SIP) facility. To illustrate the advantages of SIP investments, this is how your investments would have grown if you hadinvested say 10,000 systematically on the first Business Day of every month over a period of time in the Respective Scheme by using XIRR approach. XIRR helps in calculating return oninvestments given an initial and final value and a series of cash inflows and outflows with the correct allowance for the time impact of the transactions. Data as on August 31, 2022.
1.Periodical SIP Performances (1Yr, 3Yrs, 5Yrs, 10 Yrs & 15 Yrs) are computed considering SIP Investment on 1st business day of every month.
2."Since Inception SIP" performance are computed considering 1st instalment on allotment date and thereafter on 1st business day of every subsequent month.
`
Investors are advised to refer to the performance summary table on page 64 -76. Returns are calculated for the Regular plan.Disclaimer: The above investment simulation is for illustrative purposes only and should not be construed as a promise on minimum returns and safeguard of capital. The AMC /Mutual Fund is not guaranteeing or promising or forecasting any returns. Investors are advised to consult their financial advisor/consultant before taking any investmentdecision. SIP does not assure a profit or guarantee protection against a loss in a declining market. Please refer SID of the respective Schemes before investing.The performance of the schemes is benchmarked to the Total Return variant of the Index.*Mr. Mohit Jain is the dedicated fund manager for managing overseas investments of the Scheme, The total no. of schemes managed by Mr. Mohit Jain is 40.
Benefits of Systematic Investment Plan (SIP)SIP Performance of Select Schemes - Fund Manager-wise
32,00,000 18,00,000 12,00,000 6,00,000 3,60,000 1,20,0003,99,00,190 53,32,364 24,37,900 8,44,809 4,56,926 1,23,478
15.73 13.33 13.59 13.67 16.15 5.45N.A. 12.08 12.92 14.13 16.82 8.60
14.46 13.16 14.37 16.55 20.47 8.64
Total Amount Invested ( )Mkt Value as on August 31, 2022 ( )
First Tier Benchmark Returns (Annualised) (%) #Additional Benchmark Returns (Annualised) (TRI) (%) ##
`
`
Returns (Annualised) (%)
SIP Investments
Past performance may or may not be sustained in the future. # Scheme Benchmark: - CRISIL Hybrid 35+65 - Aggressive Index, ## S&P BSE SENSEX,Inception Date: October 09, 1995
Returns are calculated for Regular Plan IDCW Option. The calculation is derived by IDCW reinvested at the prevailing NAV.
SBI Equity Hybrid Fund FUND MANAGER -R. SRINIVASAN (Equity) & DINESH AHUJA (Debt) *MOHIT JAIN
35,40,000 18,00,000 12,00,000 6,00,000 3,60,000 1,20,0008,12,24,468 51,53,625 24,24,509 8,95,229 5,01,367 1,26,853
17.20 12.93 13.48 16.03 22.79 10.82N.A. 13.77 15.18 17.61 23.97 10.74
13.78 13.16 14.37 16.55 20.47 8.64
Total Amount Invested ( )Mkt Value as on August 31, 2022 ( )
First Tier Benchmark Returns (Annualised) (TRI) (%) #Additional Benchmark Returns (Annualised) (TRI) (%) ##
`
`
Returns (Annualised) (%)
SIP Investments
Past performance may or may not be sustained in the future. # S&P BSE 500, ## S&P BSE SENSEX, Inception Date: March 31, 1993
Returns are calculated for Regular Plan IDCW Option. The calculation is derived by IDCW reinvested at the prevailing NAV.
SBI Long Term Equity Fund FUND MANAGER -DINESH BALACHANDRAN
33,60,000 18,00,000 12,00,000 6,00,000 3,60,000 1,20,0007,50,33,259 66,37,491 26,60,816 8,99,150 4,88,034 1,25,551
18.07 15.85 15.22 16.21 20.84 8.74N.A. 14.92 14.46 13.55 18.69 12.99
14.16 13.16 14.37 16.55 20.47 8.64
Total Amount Invested ( )Mkt Value as on August 31, 2022 ( )
First Tier Benchmark Returns (Annualised) (TRI) (%) #Additional Benchmark Returns (Annualised) (TRI) (%) ##
`
`
Returns (Annualised) (%)
Since InceptionSIP
15 YearsSIP
10 YearsSIP
5 YearsSIP
3 YearsSIP
1 YearSIPSIP Investments
Past performance may or may not be sustained in the future. # Nifty MNC, ## S&P BSE SENSEX, Inception Date: September 30, 1994
Returns are calculated for Regular Plan IDCW Option. The calculation is derived by IDCW reinvested at the prevailing NAV.
SBI Magnum Global Fund FUND MANAGER -R. SRINIVASAN & *MOHIT JAIN
21,50,000 18,00,000 12,00,000 6,00,000 3,60,000 1,20,0001,12,31,029 72,48,462 27,59,046 8,93,086 4,74,919 1,19,344
16.35 16.86 15.90 15.93 18.89 -1.0213.66 13.77 15.18 17.61 23.97 10.7413.33 13.16 14.37 16.55 20.47 8.64
Total Amount Invested ( )Mkt Value as on August 31, 2022 ( )
First Tier Benchmark Returns (Annualised) (TRI) (%) #Additional Benchmark Returns (Annualised) (TRI) (%) ##
`
`
Returns (Annualised) (%)
Since InceptionSIP
15 YearsSIP
10 YearsSIP
5 YearsSIP
3 YearsSIP
1 YearSIPSIP Investments
Past performance may or may not be sustained in the future. # S&P BSE 500, ## S&P BSE SENSEX, Inception Date: September 17, 2004
Returns are calculated for Regular Growth
SBI Focused Equity Fund FUND MANAGER -R. SRINIVASAN & *MOHIT JAIN
15,60,000 N.A. 12,00,000 6,00,000 3,60,000 1,20,00080,58,430 N.A. 43,55,455 10,96,091 5,85,278 1,31,557
23.03 N.A. 24.35 24.37 34.34 18.4312.73 N.A. 14.91 19.24 31.94 5.3813.44 N.A. 14.37 16.55 20.47 8.64
Total Amount Invested ( )Mkt Value as on August 31, 2022 ( )
First Tier Benchmark Returns (Annualised) (TRI) (%) #Additional Benchmark Returns (Annualised) (TRI) (%) ##
`
`
Returns (Annualised) (%)
SIP Investments
Past performance may or may not be sustained in the future. # S&P BSE 250 Small Cap Index TRI, ## S&P BSE SENSEX, Inception Date: September 09, 2009
Returns are calculated for Regular Plan Growth Option
SBI Small Cap Fund FUND MANAGER -R. SRINIVASAN & *MOHIT JAIN
Since InceptionSIP
15 YearsSIP
10 YearsSIP
5 YearsSIP
3 YearsSIP
1 YearSIP
Since InceptionSIP
15 YearsSIP
10 YearsSIP
5 YearsSIP
3 YearsSIP
1 YearSIP
Since InceptionSIP
15 YearsSIP
10 YearsSIP
5 YearsSIP
3 YearsSIP
1 YearSIP

80
The Fund offers flexible and convenient Systematic Investment Plan (SIP) facility. To illustrate the advantages of SIP investments, this is how your investments would have grown if you hadinvested say 10,000 systematically on the first Business Day of every month over a period of time in the Respective Scheme by using XIRR approach. XIRR helps in calculating return oninvestments given an initial and final value and a series of cash inflows and outflows with the correct allowance for the time impact of the transactions. Data as on August 31, 2022.
1.Periodical SIP Performances (1Yr, 3Yrs, 5Yrs, 10 Yrs & 15 Yrs) are computed considering SIP Investment on 1st business day of every month.
2."Since Inception SIP" performance are computed considering 1st instalment on allotment date and thereafter on 1st business day of every subsequent month.
`
Investors are advised to refer to the performance summary table on page 64 -76. Returns are calculated for the Regular plan.Disclaimer: The above investment simulation is for illustrative purposes only and should not be construed as a promise on minimum returns and safeguard of capital. The AMC /Mutual Fund is not guaranteeing or promising or forecasting any returns. Investors are advised to consult their financial advisor/consultant before taking any investmentdecision. SIP does not assure a profit or guarantee protection against a loss in a declining market. Please refer SID of the respective Schemes before investing.The performance of the schemes is benchmarked to the Total Return variant of the Index.*Mr. Mohit Jain is the dedicated fund manager for managing overseas investments of the Scheme, The total no. of schemes managed by Mr. Mohit Jain is 40.
Benefits of Systematic Investment Plan (SIP)SIP Performance of Select Schemes - Fund Manager-wise
20,30,000 18,00,000 12,00,000 6,00,000 3,60,000 1,20,00069,14,119 56,04,216 26,40,531 8,70,199 4,80,724 1,22,925
13.15 13.90 15.08 14.87 19.76 4.5813.39 13.77 15.18 17.61 23.97 10.7412.89 13.16 14.37 16.55 20.47 8.64
Total Amount Invested ( )Mkt Value as on August 31, 2022 ( )
First Tier Benchmark Returns (Annualised) (TRI) (%) #Additional Benchmark Returns (Annualised) (TRI) (%) ##
`
`
Returns (Annualised) (%)
Since InceptionSIP
15 YearsSIP
10 YearsSIP
5 YearsSIP
3 YearsSIP
1 YearSIPSIP Investments
Past performance may or may not be sustained in the future. # S&P BSE 500, ## S&P BSE SENSEX, Inception Date: September 29, 2005
Returns are calculated for Regular Plan Growth Option
SBI Flexicap Fund FUND MANAGER -R. SRINIVASAN & *MOHIT JAIN
Total Amount Invested ( )Mkt Value as on August 31, 2022 ( )
First Tier Benchmark Returns (Annualised) (TRI) (%) #Additional Benchmark Returns (Annualised) (TRI) (%) ##
`
`
Returns (Annualised) (%)
Total Amount Invested ( )Mkt Value as on August 31, 2022 ( )
First Tier Benchmark Returns (Annualised) (TRI) (%) #Additional Benchmark Returns (Annualised) (TRI) (%) ##
`
`
Returns (Annualised) (%)
Total Amount Invested ( )Mkt Value as on August 31, 2022 ( )
First Tier Benchmark Returns (Annualised) (TRI) (%) #Additional Benchmark Returns (Annualised) (TRI) (%) ##
`
`
Returns (Annualised) (%)
Total Amount Invested ( )Mkt Value as on August 31, 2022 ( )
First Tier Benchmark Returns (Annualised) (TRI) (%) #Additional Benchmark Returns (Annualised) (TRI) (%) ##
`
`
Returns (Annualised) (%)
Since InceptionSIP
Since InceptionSIP
Since InceptionSIP
Since InceptionSIP
15 YearsSIP
15 YearsSIP
15 YearsSIP
15 YearsSIP
10 YearsSIP
10 YearsSIP
10 YearsSIP
10 YearsSIP
5 YearsSIP
5 YearsSIP
5 YearsSIP
5 YearsSIP
3 YearsSIP
3 YearsSIP
3 YearsSIP
3 YearsSIP
1 YearSIP
1 YearSIP
1 YearSIP
1 YearSIP
SIP Investments
SIP Investments
SIP Investments
SIP Investments
Past performance may or may not be sustained in the future. # S&P BSE Teck, ## S&P BSE SENSEX, Inception Date: July 05, 1999
Past performance may or may not be sustained in the future. # Nifty India Consumption, ## S&P BSE SENSEX, Inception Date: July 05, 1999
Past performance may or may not be sustained in the future. # Nifty Financial Services Index, ## S&P BSE SENSEX, Inception Date: February 26, 2015
Past performance may or may not be sustained in the future. # NIFTY Banking and PSU Debt Index, ## Crisil 10 Yr Gilt Index, Inception Date: October 09, 2009
Returns are calculated for Regular Plan IDCW Option. The calculation is derived by IDCW reinvested at the prevailing NAV.
Returns are calculated for Regular Plan IDCW Option. The calculation is derived by IDCW reinvested at the prevailing NAV.
Returns are calculated for Regular Plan IDCW Option. It is assumed that IDCW declared under the scheme have been reinvested at the prevailing NAV.
Returns are calculated for Regular Plan IDCW Option. It is assumed that IDCW declared under the scheme have been reinvested at the prevailing NAV.
SBI Technology Opportunities Fund
SBI Consumption Opportunities Fund
SBI Banking & Financial Services Fund
SBI Banking and PSU Fund
FUND MANAGER -SAURABH PANT & *MOHIT JAIN
FUND MANAGER -SAURABH PANT & *MOHIT JAIN
FUND MANAGER -MILIND AGRAWAL & *MOHIT JAIN
FUND MANAGER -RAJEEV RADHAKRISHNAN & *MOHIT JAIN
27,80,000 18,00,000 12,00,000 6,00,000 3,60,000 1,20,0002,42,37,125 77,88,090 32,34,570 10,64,786 5,14,270 1,09,495
15.92 17.68 18.85 23.17 24.65 -15.89N.A. 14.59 15.99 19.24 19.51 -17.20
14.99 13.16 14.37 16.55 20.47 8.64
27,80,000 18,00,000 12,00,000 6,00,000 3,60,000 1,20,0003,70,64,129 87,63,045 28,10,795 9,72,725 5,50,960 1,33,278
18.76 19.02 16.24 19.43 29.76 21.26N.A. 15.22 15.24 17.60 24.82 27.89
14.99 13.16 14.37 16.55 20.47 8.64
9,10,000 N.A. N.A. 6,00,000 3,60,000 1,20,00015,99,416 N.A. N.A. 8,44,528 4,62,801 1,27,154
14.55 N.A. N.A. 13.66 17.05 11.3015.27 N.A. N.A. 14.85 18.08 10.6015.05 N.A. N.A. 16.55 20.47 8.64
15,50,000 N.A. 12,00,000 6,00,000 3,60,000 1,20,00025,29,990 N.A. 17,09,223 6,91,608 3,81,553 1,21,284
7.27 N.A. 6.88 5.63 3.82 2.007.44 N.A. 7.08 6.15 4.78 3.216.09 N.A. 5.84 4.45 1.99 1.53
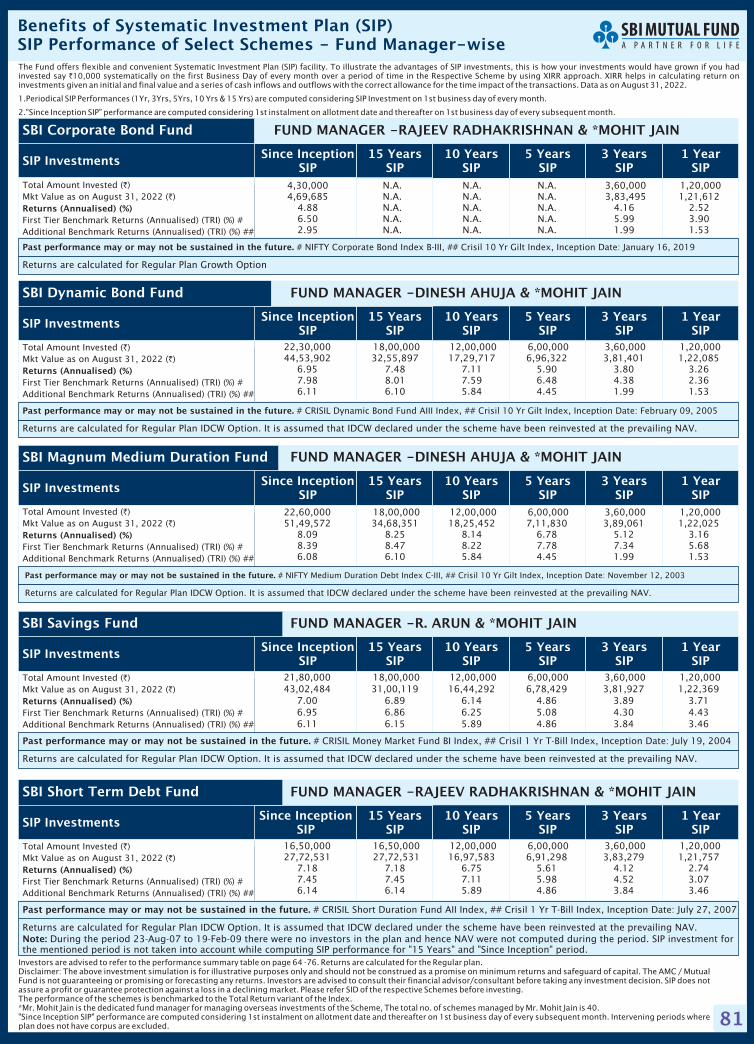
81
Investors are advised to refer to the performance summary table on page 64 -76. Returns are calculated for the Regular plan.Disclaimer: The above investment simulation is for illustrative purposes only and should not be construed as a promise on minimum returns and safeguard of capital. The AMC / MutualFund is not guaranteeing or promising or forecasting any returns. Investors are advised to consult their financial advisor/consultant before taking any investment decision. SIP does notassure a profit or guarantee protection against a loss in a declining market. Please refer SID of the respective Schemes before investing.The performance of the schemes is benchmarked to the Total Return variant of the Index.*Mr. Mohit Jain is the dedicated fund manager for managing overseas investments of the Scheme, The total no. of schemes managed by Mr. Mohit Jain is 40."Since Inception SIP" performance are computed considering 1st instalment on allotment date and thereafter on 1st business day of every subsequent month. Intervening periods whereplan does not have corpus are excluded.
Benefits of Systematic Investment Plan (SIP)SIP Performance of Select Schemes - Fund Manager-wise
4,30,000 N.A. N.A. N.A. 3,60,000 1,20,0004,69,685 N.A. N.A. N.A. 3,83,495 1,21,612
4.88 N.A. N.A. N.A. 4.16 2.526.50 N.A. N.A. N.A. 5.99 3.902.95 N.A. N.A. N.A. 1.99 1.53
Total Amount Invested ( )Mkt Value as on August 31, 2022 ( )
First Tier Benchmark Returns (Annualised) (TRI) (%) #Additional Benchmark Returns (Annualised) (TRI) (%) ##
`
`
Returns (Annualised) (%)
Since InceptionSIP
15 YearsSIP
10 YearsSIP
5 YearsSIP
3 YearsSIP
1 YearSIPSIP Investments
Past performance may or may not be sustained in the future. # NIFTY Corporate Bond Index B-III, ## Crisil 10 Yr Gilt Index, Inception Date: January 16, 2019
Returns are calculated for Regular Plan Growth Option
SBI Corporate Bond Fund FUND MANAGER -RAJEEV RADHAKRISHNAN & *MOHIT JAIN
Total Amount Invested ( )Mkt Value as on August 31, 2022 ( )
First Tier Benchmark Returns (Annualised) (TRI) (%) #Additional Benchmark Returns (Annualised) (TRI) (%) ##
`
`
Returns (Annualised) (%)
Total Amount Invested ( )Mkt Value as on August 31, 2022 ( )
First Tier Benchmark Returns (Annualised) (TRI) (%) #Additional Benchmark Returns (Annualised) (TRI) (%) ##
`
`
Returns (Annualised) (%)
Total Amount Invested ( )Mkt Value as on August 31, 2022 ( )
First Tier Benchmark Returns (Annualised) (TRI) (%) #Additional Benchmark Returns (Annualised) (TRI) (%) ##
`
`
Returns (Annualised) (%)
Total Amount Invested ( )Mkt Value as on August 31, 2022 ( )
First Tier Benchmark Returns (Annualised) (TRI) (%) #Additional Benchmark Returns (Annualised) (TRI) (%) ##
`
`
Returns (Annualised) (%)
Since InceptionSIP
Since InceptionSIP
Since InceptionSIP
Since InceptionSIP
15 YearsSIP
15 YearsSIP
15 YearsSIP
15 YearsSIP
10 YearsSIP
10 YearsSIP
10 YearsSIP
10 YearsSIP
5 YearsSIP
5 YearsSIP
5 YearsSIP
5 YearsSIP
3 YearsSIP
3 YearsSIP
3 YearsSIP
3 YearsSIP
1 YearSIP
1 YearSIP
1 YearSIP
1 YearSIP
SIP Investments
SIP Investments
SIP Investments
SIP Investments
Past performance may or may not be sustained in the future. # CRISIL Dynamic Bond Fund AIII Index, ## Crisil 10 Yr Gilt Index, Inception Date: February 09, 2005
Past performance may or may not be sustained in the future. # NIFTY Medium Duration Debt Index C-III, ## Crisil 10 Yr Gilt Index, Inception Date: November 12, 2003
Past performance may or may not be sustained in the future. # CRISIL Money Market Fund BI Index, ## Crisil 1 Yr T-Bill Index, Inception Date: July 19, 2004
Past performance may or may not be sustained in the future. # CRISIL Short Duration Fund AII Index, ## Crisil 1 Yr T-Bill Index, Inception Date: July 27, 2007
Returns are calculated for Regular Plan IDCW Option. It is assumed that IDCW declared under the scheme have been reinvested at the prevailing NAV.
Returns are calculated for Regular Plan IDCW Option. It is assumed that IDCW declared under the scheme have been reinvested at the prevailing NAV.
Returns are calculated for Regular Plan IDCW Option. It is assumed that IDCW declared under the scheme have been reinvested at the prevailing NAV.
Returns are calculated for Regular Plan IDCW Option. It is assumed that IDCW declared under the scheme have been reinvested at the prevailing NAV.Note: During the period 23-Aug-07 to 19-Feb-09 there were no investors in the plan and hence NAV were not computed during the period. SIP investment forthe mentioned period is not taken into account while computing SIP performance for "15 Years" and "Since Inception" period.
SBI Dynamic Bond Fund
SBI Magnum Medium Duration Fund
SBI Savings Fund
SBI Short Term Debt Fund
FUND MANAGER -DINESH AHUJA & *MOHIT JAIN
FUND MANAGER -DINESH AHUJA & *MOHIT JAIN
FUND MANAGER -R. ARUN & *MOHIT JAIN
FUND MANAGER -RAJEEV RADHAKRISHNAN & *MOHIT JAIN
22,30,000 18,00,000 12,00,000 6,00,000 3,60,000 1,20,00044,53,902 32,55,897 17,29,717 6,96,322 3,81,401 1,22,085
6.95 7.48 7.11 5.90 3.80 3.267.98 8.01 7.59 6.48 4.38 2.366.11 6.10 5.84 4.45 1.99 1.53
22,60,000 18,00,000 12,00,000 6,00,000 3,60,000 1,20,00051,49,572 34,68,351 18,25,452 7,11,830 3,89,061 1,22,025
8.09 8.25 8.14 6.78 5.12 3.168.39 8.47 8.22 7.78 7.34 5.686.08 6.10 5.84 4.45 1.99 1.53
21,80,000 18,00,000 12,00,000 6,00,000 3,60,000 1,20,00043,02,484 31,00,119 16,44,292 6,78,429 3,81,927 1,22,369
7.00 6.89 6.14 4.86 3.89 3.716.95 6.86 6.25 5.08 4.30 4.436.11 6.15 5.89 4.86 3.84 3.46
16,50,000 16,50,000 12,00,000 6,00,000 3,60,000 1,20,00027,72,531 27,72,531 16,97,583 6,91,298 3,83,279 1,21,757
7.18 7.18 6.75 5.61 4.12 2.747.45 7.45 7.11 5.98 4.52 3.076.14 6.14 5.89 4.86 3.84 3.46
The Fund offers flexible and convenient Systematic Investment Plan (SIP) facility. To illustrate the advantages of SIP investments, this is how your investments would have grown if you hadinvested say 10,000 systematically on the first Business Day of every month over a period of time in the Respective Scheme by using XIRR approach. XIRR helps in calculating return oninvestments given an initial and final value and a series of cash inflows and outflows with the correct allowance for the time impact of the transactions. Data as on August 31, 2022.
1.Periodical SIP Performances (1Yr, 3Yrs, 5Yrs, 10 Yrs & 15 Yrs) are computed considering SIP Investment on 1st business day of every month.
2."Since Inception SIP" performance are computed considering 1st instalment on allotment date and thereafter on 1st business day of every subsequent month.
`
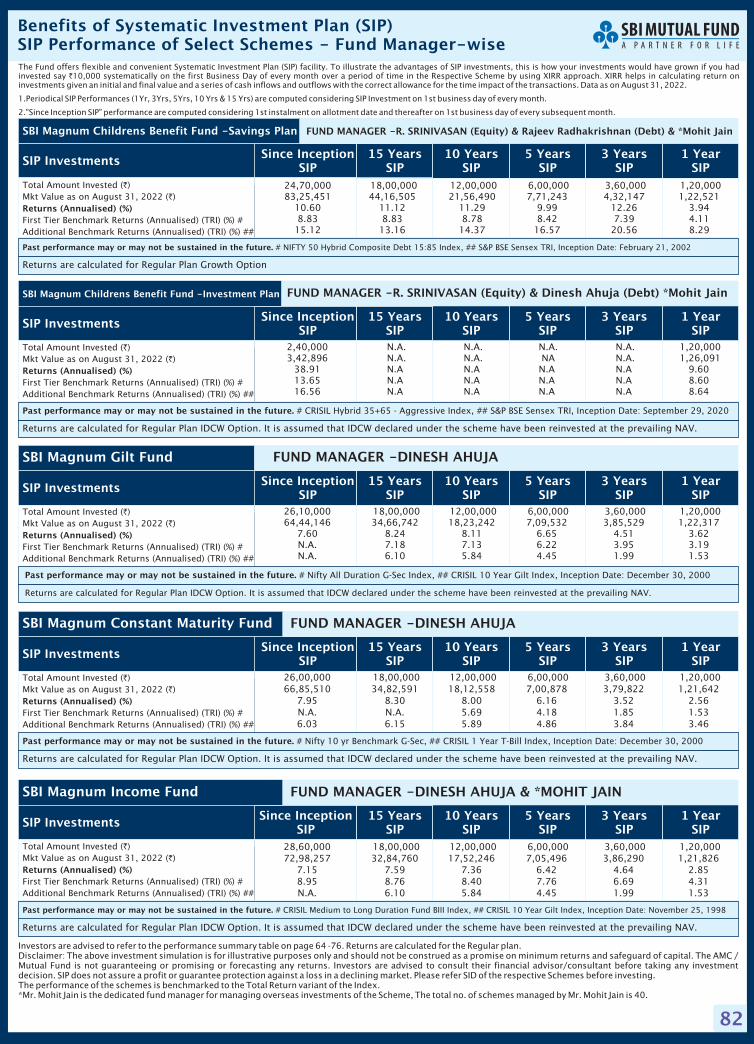
82
Investors are advised to refer to the performance summary table on page 64 -76. Returns are calculated for the Regular plan.Disclaimer: The above investment simulation is for illustrative purposes only and should not be construed as a promise on minimum returns and safeguard of capital. The AMC /Mutual Fund is not guaranteeing or promising or forecasting any returns. Investors are advised to consult their financial advisor/consultant before taking any investmentdecision. SIP does not assure a profit or guarantee protection against a loss in a declining market. Please refer SID of the respective Schemes before investing.The performance of the schemes is benchmarked to the Total Return variant of the Index.*Mr. Mohit Jain is the dedicated fund manager for managing overseas investments of the Scheme, The total no. of schemes managed by Mr. Mohit Jain is 40.
Benefits of Systematic Investment Plan (SIP)SIP Performance of Select Schemes - Fund Manager-wise
24,70,000 18,00,000 12,00,000 6,00,000 3,60,000 1,20,00083,25,451 44,16,505 21,56,490 7,71,243 4,32,147 1,22,521
10.60 11.12 11.29 9.99 12.26 3.948.83 8.83 8.78 8.42 7.39 4.11
15.12 13.16 14.37 16.57 20.56 8.29
Total Amount Invested ( )Mkt Value as on August 31, 2022 ( )
First Tier Benchmark Returns (Annualised) (TRI) (%) #Additional Benchmark Returns (Annualised) (TRI) (%) ##
`
`
Returns (Annualised) (%)
Since InceptionSIP
15 YearsSIP
10 YearsSIP
5 YearsSIP
3 YearsSIP
1 YearSIPSIP Investments
Past performance may or may not be sustained in the future. # NIFTY 50 Hybrid Composite Debt 15:85 Index, ## S&P BSE Sensex TRI, Inception Date: February 21, 2002
Returns are calculated for Regular Plan Growth Option
SBI Magnum Childrens Benefit Fund -Savings Plan
Total Amount Invested ( )Mkt Value as on August 31, 2022 ( )
First Tier Benchmark Returns (Annualised) (TRI) (%) #Additional Benchmark Returns (Annualised) (TRI) (%) ##
`
`
Returns (Annualised) (%)
Total Amount Invested ( )Mkt Value as on August 31, 2022 ( )
First Tier Benchmark Returns (Annualised) (TRI) (%) #Additional Benchmark Returns (Annualised) (TRI) (%) ##
`
`
Returns (Annualised) (%)
Total Amount Invested ( )Mkt Value as on August 31, 2022 ( )
First Tier Benchmark Returns (Annualised) (TRI) (%) #Additional Benchmark Returns (Annualised) (TRI) (%) ##
`
`
Returns (Annualised) (%)
Total Amount Invested ( )Mkt Value as on August 31, 2022 ( )
First Tier Benchmark Returns (Annualised) (TRI) (%) #Additional Benchmark Returns (Annualised) (TRI) (%) ##
`
`
Returns (Annualised) (%)
Since InceptionSIP
Since InceptionSIP
Since InceptionSIP
Since InceptionSIP
15 YearsSIP
15 YearsSIP
15 YearsSIP
15 YearsSIP
10 YearsSIP
10 YearsSIP
10 YearsSIP
10 YearsSIP
5 YearsSIP
5 YearsSIP
5 YearsSIP
5 YearsSIP
3 YearsSIP
3 YearsSIP
3 YearsSIP
3 YearsSIP
1 YearSIP
1 YearSIP
1 YearSIP
1 YearSIP
SIP Investments
SIP Investments
SIP Investments
SIP Investments
Past performance may or may not be sustained in the future. # CRISIL Hybrid 35+65 - Aggressive Index, ## S&P BSE Sensex TRI, Inception Date: September 29, 2020
Past performance may or may not be sustained in the future. # Nifty All Duration G-Sec Index, ## CRISIL 10 Year Gilt Index, Inception Date: December 30, 2000
Past performance may or may not be sustained in the future. # Nifty 10 yr Benchmark G-Sec, ## CRISIL 1 Year T-Bill Index, Inception Date: December 30, 2000
Past performance may or may not be sustained in the future. # CRISIL Medium to Long Duration Fund BIII Index, ## CRISIL 10 Year Gilt Index, Inception Date: November 25, 1998
Returns are calculated for Regular Plan IDCW Option. It is assumed that IDCW declared under the scheme have been reinvested at the prevailing NAV.
Returns are calculated for Regular Plan IDCW Option. It is assumed that IDCW declared under the scheme have been reinvested at the prevailing NAV.
Returns are calculated for Regular Plan IDCW Option. It is assumed that IDCW declared under the scheme have been reinvested at the prevailing NAV.
Returns are calculated for Regular Plan IDCW Option. It is assumed that IDCW declared under the scheme have been reinvested at the prevailing NAV.
SBI Magnum Childrens Benefit Fund -Investment Plan
SBI Magnum Gilt Fund
SBI Magnum Constant Maturity Fund
SBI Magnum Income Fund
FUND MANAGER -DINESH AHUJA
FUND MANAGER -DINESH AHUJA
FUND MANAGER -DINESH AHUJA & *MOHIT JAIN
2,40,000 N.A. N.A. N.A. N.A. 1,20,0003,42,896 N.A. N.A. NA N.A. 1,26,091
38.91 N.A N.A N.A N.A 9.6013.65 N.A N.A N.A N.A 8.6016.56 N.A N.A N.A N.A 8.64
26,10,000 18,00,000 12,00,000 6,00,000 3,60,000 1,20,00064,44,146 34,66,742 18,23,242 7,09,532 3,85,529 1,22,317
7.60 8.24 8.11 6.65 4.51 3.62N.A. 7.18 7.13 6.22 3.95 3.19N.A. 6.10 5.84 4.45 1.99 1.53
26,00,000 18,00,000 12,00,000 6,00,000 3,60,000 1,20,00066,85,510 34,82,591 18,12,558 7,00,878 3,79,822 1,21,642
7.95 8.30 8.00 6.16 3.52 2.56N.A. N.A. 5.69 4.18 1.85 1.536.03 6.15 5.89 4.86 3.84 3.46
28,60,000 18,00,000 12,00,000 6,00,000 3,60,000 1,20,00072,98,257 32,84,760 17,52,246 7,05,496 3,86,290 1,21,826
7.15 7.59 7.36 6.42 4.64 2.858.95 8.76 8.40 7.76 6.69 4.31N.A. 6.10 5.84 4.45 1.99 1.53
FUND MANAGER -R. SRINIVASAN (Equity) & Rajeev Radhakrishnan (Debt) & *Mohit Jain
FUND MANAGER -R. SRINIVASAN (Equity) & Dinesh Ahuja (Debt) *Mohit Jain
The Fund offers flexible and convenient Systematic Investment Plan (SIP) facility. To illustrate the advantages of SIP investments, this is how your investments would have grown if you hadinvested say 10,000 systematically on the first Business Day of every month over a period of time in the Respective Scheme by using XIRR approach. XIRR helps in calculating return oninvestments given an initial and final value and a series of cash inflows and outflows with the correct allowance for the time impact of the transactions. Data as on August 31, 2022.
1.Periodical SIP Performances (1Yr, 3Yrs, 5Yrs, 10 Yrs & 15 Yrs) are computed considering SIP Investment on 1st business day of every month.
2."Since Inception SIP" performance are computed considering 1st instalment on allotment date and thereafter on 1st business day of every subsequent month.
`

83
Investors are advised to refer to the performance summary table on page 64 -76. Returns are calculated for the Regular plan.Disclaimer: The above investment simulation is for illustrative purposes only and should not be construed as a promise on minimum returns and safeguard of capital. The AMC /Mutual Fund is not guaranteeing or promising or forecasting any returns. Investors are advised to consult their financial advisor/consultant before taking any investmentdecision. SIP does not assure a profit or guarantee protection against a loss in a declining market. Please refer SID of the respective Schemes before investing.The performance of the schemes is benchmarked to the Total Return variant of the Index.*Mr. Mohit Jain is the dedicated fund manager for managing overseas investments of the Scheme, The total no. of schemes managed by Mr. Mohit Jain is 40.
Note: SBI Multi Asset Allocation Fund: Mr. Dinesh Balachandran is appointed fund manager w.e.f October 1, 2021. Mr Gaurav Mehta was the fund manager till 30thSeptember, 2021.
Benefits of Systematic Investment Plan (SIP)SIP Performance of Select Schemes - Fund Manager-wise
8,80,000 N.A. N.A. 6,00,000 3,60,000 1,20,00012,08,602 N.A. N.A. 7,54,069 4,20,631 1,22,163
8.51 N.A. N.A. 9.09 10.40 3.389.32 N.A. N.A. 9.55 10.28 5.595.07 N.A. N.A. 4.45 1.97 1.45
Total Amount Invested ( )Mkt Value as on August 31, 2022 ( )
First Tier Benchmark Returns (Annualised) (TRI) (%) #Additional Benchmark Returns (Annualised) (TRI) (%) ##
`
`
Returns (Annualised) (%)
Since InceptionSIP
15 YearsSIP
10 YearsSIP
5 YearsSIP
3 YearsSIP
1 YearSIPSIP Investments
Past performance may or may not be sustained in the future. # Nifty Equity Savings Index, ## Crisil 10 Yr Gilt Index, Inception Date: May 27, 2015
Returns are calculated for Regular Plan Growth Option
SBI Equity Savings Fund FUND MANAGER -Mansi Sajeja (Debt) & Nidhi Chawla (Equity) Neeraj Kumar (Arbitrage)
Total Amount Invested ( )Mkt Value as on August 31, 2022 ( )
First Tier Benchmark Returns (Annualised) (TRI) (%) #Additional Benchmark Returns (Annualised) (TRI) (%) ##
`
`
Returns (Annualised) (%)
Total Amount Invested ( )Mkt Value as on August 31, 2022 ( )
First Tier Benchmark Returns (Annualised) (TRI) (%) #Additional Benchmark Returns (Annualised) (TRI) (%) ##
`
`
Returns (Annualised) (%)
Total Amount Invested ( )Mkt Value as on August 31, 2022 ( )
First Tier Benchmark Returns (Annualised) (TRI) (%) #Additional Benchmark Returns (Annualised) (TRI) (%) ##
`
`
Returns (Annualised) (%)
Since InceptionSIP
Since InceptionSIP
Since InceptionSIP
15 YearsSIP
15 YearsSIP
15 YearsSIP
10 YearsSIP
10 YearsSIP
10 YearsSIP
5 YearsSIP
5 YearsSIP
5 YearsSIP
3 YearsSIP
3 YearsSIP
3 YearsSIP
1 YearSIP
1 YearSIP
1 YearSIP
SIP Investments
SIP Investments
SIP Investments
Past performance may or may not be sustained in the future. # NIFTY 50 Hybrid Composite Debt 15:85 Index, ## CRISIL 10 Year Gilt Index, Inception Date: September 04, 2001
Past performance may or may not be sustained in the future. # NIFTY Credit Risk Bond Index C-II, ## CRISIL 10 Year Gilt Index, Inception Date: January 02, 2014
Past performance may or may not be sustained in the future. # 45% CRISIL 10 Year Gilt Index + 40% NIFTY 50 TRI + 15% Price of Gold, ## S&P BSE Sensex TRI, Inception Date: May 16, 2018
Returns are calculated for Regular Plan IDCW Option. It is assumed that IDCW declared under the scheme have been reinvested at the prevailing NAV.
Returns are calculated for Regular Plan IDCW Option. It is assumed that IDCW declared under the scheme have been reinvested at the prevailing NAV.
Returns are calculated for Regular Plan IDCW Option. It is assumed that IDCW declared under the scheme have been reinvested at the prevailing NAV.
SBI Conservative Hybrid Fund
SBI Credit Risk Fund
SBI Multi Asset Allocation Fund
FUND MANAGER -Saurabh Pant (Equity) & Mansi Sajeja (Debt) & *Mohit Jain
FUND MANAGER -LOKESH MALLYA & *MOHIT JAIN
FUND MANAGER -Dinesh Balachandran & Raj Gandhi (for ETCDs) & *Mohit Jain
25,70,000 18,00,000 12,00,000 6,00,000 3,60,000 1,20,00068,56,634 36,58,229 19,25,502 7,69,374 4,25,969 1,24,169
8.34 8.89 9.15 9.90 11.27 6.55N.A. 8.83 8.78 8.42 7.39 4.11N.A. 6.10 5.84 4.45 1.99 1.53
9,80,000 N.A. N.A. 6,00,000 3,60,000 1,20,00012,96,691 N.A. N.A. 6,99,984 3,91,229 1,22,448
6.73 N.A. N.A. 6.11 5.49 3.838.30 N.A. N.A. 7.93 7.26 5.915.40 N.A. N.A. 4.45 1.99 1.53
5,20,000 N.A. N.A. N.A. 3,60,000 1,20,0006,62,665 N.A. N.A. N.A. 4,27,577 1,24,430
11.19 N.A. N.A. N.A. 11.53 6.9611.00 N.A. N.A. N.A. 10.48 5.5517.42 N.A. N.A. N.A. 20.56 8.29
The Fund offers flexible and convenient Systematic Investment Plan (SIP) facility. To illustrate the advantages of SIP investments, this is how your investments would have grown if you hadinvested say 10,000 systematically on the first Business Day of every month over a period of time in the Respective Scheme by using XIRR approach. XIRR helps in calculating return oninvestments given an initial and final value and a series of cash inflows and outflows with the correct allowance for the time impact of the transactions. Data as on August 31, 2022.
1.Periodical SIP Performances (1Yr, 3Yrs, 5Yrs, 10 Yrs & 15 Yrs) are computed considering SIP Investment on 1st business day of every month.
2."Since Inception SIP" performance are computed considering 1st instalment on allotment date and thereafter on 1st business day of every subsequent month.
`
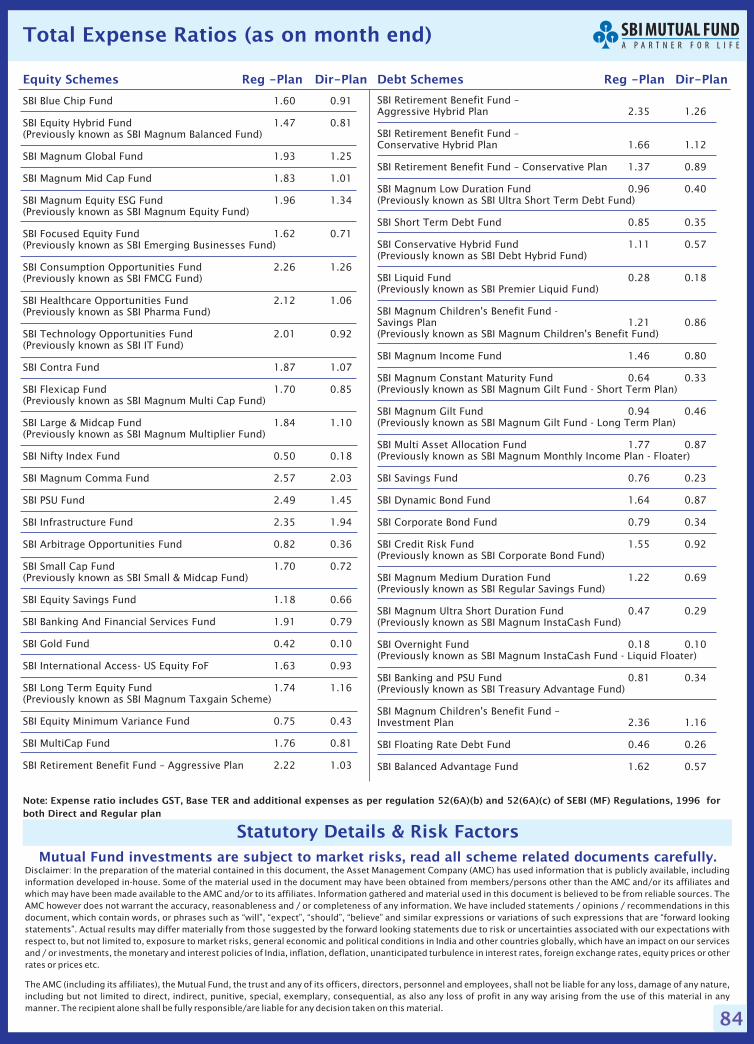
84
Statutory Details & Risk FactorsMutual Fund investments are subject to market risks, read all scheme related documents carefully.
Disclaimer: In the preparation of the material contained in this document, the Asset Management Company (AMC) has used information that is publicly available, includinginformation developed in-house. Some of the material used in the document may have been obtained from members/persons other than the AMC and/or its affiliates andwhich may have been made available to the AMC and/or to its affiliates. Information gathered and material used in this document is believed to be from reliable sources. TheAMC however does not warrant the accuracy, reasonableness and / or completeness of any information. We have included statements / opinions / recommendations in thisdocument, which contain words, or phrases such as “will”, “expect”, “should”, “believe” and similar expressions or variations of such expressions that are “forward lookingstatements”. Actual results may differ materially from those suggested by the forward looking statements due to risk or uncertainties associated with our expectations withrespect to, but not limited to, exposure to market risks, general economic and political conditions in India and other countries globally, which have an impact on our servicesand / or investments, the monetary and interest policies of India, inflation, deflation, unanticipated turbulence in interest rates, foreign exchange rates, equity prices or otherrates or prices etc.
The AMC (including its affiliates), the Mutual Fund, the trust and any of its officers, directors, personnel and employees, shall not be liable for any loss, damage of any nature,including but not limited to direct, indirect, punitive, special, exemplary, consequential, as also any loss of profit in any way arising from the use of this material in anymanner. The recipient alone shall be fully responsible/are liable for any decision taken on this material.
SBI Blue Chip Fund 1.60 0.91
SBI Equity Hybrid Fund 1.47 0.81(Previously known as SBI Magnum Balanced Fund)
SBI Magnum Global Fund 1.93 1.25
SBI Magnum Mid Cap Fund 1.83 1.01
SBI Magnum Equity ESG Fund 1.96 1.34(Previously known as SBI Magnum Equity Fund)
SBI Focused Equity Fund 1.62 0.71(Previously known as SBI Emerging Businesses Fund)
SBI Consumption Opportunities Fund 2.26 1.26(Previously known as SBI FMCG Fund)
SBI Healthcare Opportunities Fund 2.12 1.06(Previously known as SBI Pharma Fund)
SBI Technology Opportunities Fund 2.01 0.92(Previously known as SBI IT Fund)
SBI Contra Fund 1.87 1.07
SBI Flexicap Fund 1.70 0.85(Previously known as SBI Magnum Multi Cap Fund)
SBI Large & Midcap Fund 1.84 1.10(Previously known as SBI Magnum Multiplier Fund)
SBI Nifty Index Fund 0.50 0.18
SBI Magnum Comma Fund 2.57 2.03
SBI PSU Fund 2.49 1.45
SBI Infrastructure Fund 2.35 1.94
SBI Arbitrage Opportunities Fund 0.82 0.36
SBI Small Cap Fund 1.70 0.72(Previously known as SBI Small & Midcap Fund)
SBI Equity Savings Fund 1.18 0.66
SBI Banking And Financial Services Fund 1.91 0.79
SBI Gold Fund 0.42 0.10
SBI International Access- US Equity FoF 1.63 0.93
SBI Long Term Equity Fund 1.74 1.16(Previously known as SBI Magnum Taxgain Scheme)
SBI Equity Minimum Variance Fund 0.75 0.43
SBI MultiCap Fund 1.76 0.81
SBI Retirement Benefit Fund – Aggressive Plan 2.22 1.03
SBI Retirement Benefit Fund –Aggressive Hybrid Plan 2.35 1.26
SBI Retirement Benefit Fund –Conservative Hybrid Plan 1.66 1.12
SBI Retirement Benefit Fund – Conservative Plan 1.37 0.89
SBI Magnum Low Duration Fund 0.96 0.40(Previously known as SBI Ultra Short Term Debt Fund)
SBI Short Term Debt Fund 0.85 0.35
SBI Conservative Hybrid Fund 1.11 0.57(Previously known as SBI Debt Hybrid Fund)
SBI Liquid Fund 0.28 0.18(Previously known as SBI Premier Liquid Fund)
SBI Magnum Children's Benefit Fund -Savings Plan 1.21 0.86(Previously known as SBI Magnum Children's Benefit Fund)
SBI Magnum Income Fund 1.46 0.80
SBI Magnum Constant Maturity Fund 0.64 0.33(Previously known as SBI Magnum Gilt Fund - Short Term Plan)
SBI Magnum Gilt Fund 0.94 0.46(Previously known as SBI Magnum Gilt Fund - Long Term Plan)
SBI Multi Asset Allocation Fund 1.77 0.87(Previously known as SBI Magnum Monthly Income Plan - Floater)
SBI Savings Fund 0.76 0.23
SBI Dynamic Bond Fund 1.64 0.87
SBI Corporate Bond Fund 0.79 0.34
SBI Credit Risk Fund 1.55 0.92(Previously known as SBI Corporate Bond Fund)
SBI Magnum Medium Duration Fund 1.22 0.69(Previously known as SBI Regular Savings Fund)
SBI Magnum Ultra Short Duration Fund 0.47 0.29(Previously known as SBI Magnum InstaCash Fund)
SBI Overnight Fund 0.18 0.10(Previously known as SBI Magnum InstaCash Fund - Liquid Floater)
SBI Banking and PSU Fund 0.81 0.34(Previously known as SBI Treasury Advantage Fund)
SBI Magnum Children's Benefit Fund –Investment Plan 2.36 1.16
SBI Floating Rate Debt Fund 0.46 0.26
SBI Balanced Advantage Fund 1.62 0.57
Equity Schemes Reg -Plan Dir-Plan Debt Schemes Reg -Plan Dir-Plan
Note: Expense ratio includes GST, Base TER and additional expenses as per regulation 52(6A)(b) and 52(6A)(c) of SEBI (MF) Regulations, 1996 forboth Direct and Regular plan
Total Expense Ratios (as on month end)

85
SBI Conservative Hybrid Fund - Quarterly IDCW
Scheme Name Record Date IDCW NAV
(in Rs./Unit) ( )`
Regular Plan - Qtr IDCW
Direct Plan - Qtr IDCW
Regular Plan - Qtr IDCW
Direct Plan - Qtr IDCW
Regular Plan - Qtr IDCW
Direct Plan - Qtr IDCW
Face value: 10`
28-Jun-19 0.2000 11.8695
28-Jun-19 0.2200 13.2913
27-Sep-19 0.2000 11.8903
27-Sep-19 0.2200 13.3387
27-Dec-19 0.1800 11.9186
27-Dec-19 0.2050 13.3878
SBI Multi Asset Allocation Fund - Monthly IDCW
27-Dec-19 0.0500 12.9939
27-Dec-19 0.0500 13.8000
31-Jan-20 0.0500 13.0258
31-Jan-20 0.0500 13.8459
28-Feb-20 0.0500 12.7450
28-Feb-20 0.0500 13.5572
Scheme Name Record Date IDCW NAV
(in Rs./Unit) ( )`
Reg. Plan - Monthly IDCW
Direct Plan - Monthly IDCW
Reg. Plan - Monthly IDCW
Direct Plan - Monthly IDCW
Reg. Plan - Monthly IDCW
Direct Plan - Monthly IDCW
Face value: 10`
Pursuant to payment of IDCW, the NAV of IDCW Option of schemes/plans would fall to the extent of payout and statutory levy, if applicable.Existing plans under the scheme are named Regular w.e.f. 01/01/2013
IDCW History Of Debt & Hybrid Funds
SBI Magnum Gilt Fund PF Fixed 1 Year - IDCW
28-Jun-19 0.2000 13.6834
27-Sep-19 0.2000 13.8546
27-Dec-19 0.2100 13.9694
Scheme Name Record Date IDCW NAV
(in Rs./Unit) ( )`
IDCW - PF Fixed 1 Year
IDCW - PF Fixed 1 Year
IDCW - PF Fixed 1 Year
Face value: 10`
SBI Magnum Gilt Fund PF Regular - IDCW
28-Jun-19 0.2000 14.3123
27-Sep-19 0.2100 14.4904
27-Dec-19 0.2200 14.6101
Scheme Name Record Date IDCW NAV
(in Rs./Unit) ( )`
IDCW - PF Regular
IDCW - PF Regular
IDCW - PF Regular
Face value: 10`
28-Jun-19 0.2000 13.8489
27-Sep-19 0.2000 14.0244
27-Dec-19 0.2150 14.1381
Scheme Name Record Date IDCW NAV
(in Rs./Unit) ( )`
IDCW-PF Fixed 2 Years
IDCW-PF Fixed 2 Years
IDCW-PF Fixed 2 Years
SBI Magnum Gilt Fund PF Fixed 2 Years - IDCW
Face value: 10`
SBI Magnum Gilt Fund IDCWPF Fixed 3 Years -
28-Jun-19 0.2000 13.4302
27-Sep-19 0.2000 13.5943
27-Dec-19 0.2050 13.7079
Scheme Name Record Date IDCW NAV
(in Rs./Unit) ( )`
IDCW-PF Fixed 3 Years
IDCW-PF Fixed 3 Years
IDCW-PF Fixed 3 Years
Face value: 10`
SBI Conservative Hybrid Fund - Annual IDCW
24-Mar-17 0.8000 14.2182
24-Mar-17 0.8000 16.3740
23-Mar-18 0.8000 14.0798
23-Mar-18 0.8000 16.4921
29-Mar-19 0.8000 13.9783
29-Mar-19 0.8000 16.6829
Scheme Name Record Date IDCW NAV
(in Rs./Unit) ( )`
Regular Plan - Annual IDCW
Direct Plan - Annual IDCW
Regular Plan - Annual IDCW
Direct Plan - Annual IDCW
Regular Plan - Annual IDCW
Direct Plan - Annual IDCW
Face value: 10`
SBI Conservative Hybrid Fund - Monthly IDCW
27-Dec-19 0.0500 16.1384
27-Dec-19 0.0500 12.7925
31-Jan-20 0.0500 16.2508
31-Jan-20 0.0500 12.8634
28-Feb-20 0.0500 16.1993
28-Feb-20 0.0500 12.8064
Scheme Name Record Date IDCW NAV
(in Rs./Unit) ( )`
Direct Plan - Mthly IDCW
Regular Plan - Mthly IDCW
Direct Plan - Mthly IDCW
Regular Plan - Mthly IDCW
Regular Plan - Mthly IDCW
Direct Plan - Mthly IDCW
Face value: 10`
SBI Multi Asset Allocation Fund - Annual IDCW
24-Mar-17 0.8000 15.0660
24-Mar-17 0.8000 15.5711
23-Mar-18 0.8000 15.2971
23-Mar-18 0.8000 15.9910
29-Mar-19 0.8000 15.0775
29-Mar-19 0.8000 16.0175
Scheme Name Record Date IDCW NAV
(in Rs./Unit) ( )`
Regular Plan - Annual IDCW
Direct Plan - Annual IDCW
Regular Plan - Annual IDCW
Direct Plan - Annual IDCW
Regular Plan - Annual IDCW
Direct Plan - Annual IDCW
Face value: 10`
SBI Multi Asset Allocation Fund - Quarterly IDCW
28-Jun-19 0.2000 12.5479
28-Jun-19 0.2000 14.0457
27-Sep-19 0.2000 12.8404
27-Sep-19 0.2000 14.4187
27-Dec-19 0.1950 12.8814
27-Dec-19 0.2150 14.4924
Scheme Name Record Date IDCW NAV
(in Rs./Unit) ( )`
Regular Plan - Qtr IDCW
Direct Plan - Qtr IDCW
Regular Plan - Qtr IDCW
Direct Plan - Qtr IDCW
Regular Plan - Qtr IDCW
Direct Plan - Qtr IDCW
Face value: 10`
SBI Magnum Gilt Fund - QuarterlyIDCW
Scheme Name Record Date IDCW NAV
(in Rs./Unit) ( )`
27-Sep-19 0.2100 14.2970
27-Sep-19 0.2250 15.2465
27-Dec-19 0.2200 14.4121
27-Dec-19 0.2300 15.3912
31-Jan-22 0.5800 16.5691
31-Jan-22 0.5800 17.8701
Face value: 10`
Regular Plan - IDCW
Direct Plan - IDCW
Regular Plan - IDCW
Direct Plan - IDCW
Regular Plan - IDCW
Direct Plan - IDCW
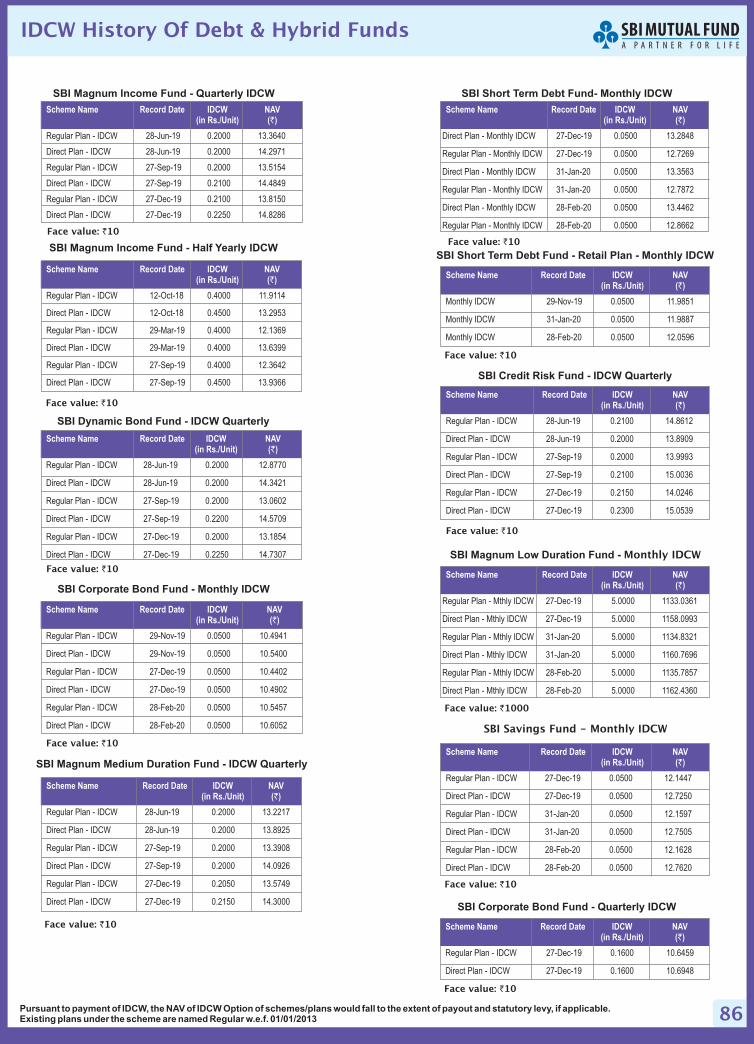
86Pursuant to payment of IDCW, the NAV of IDCW Option of schemes/plans would fall to the extent of payout and statutory levy, if applicable.Existing plans under the scheme are named Regular w.e.f. 01/01/2013
SBI Magnum Income Fund - Quarterly IDCW
28-Jun-19 0.2000 13.3640
28-Jun-19 0.2000 14.2971
27-Sep-19 0.2000 13.5154
27-Sep-19 0.2100 14.4849
27-Dec-19 0.2100 13.8150
27-Dec-19 0.2250 14.8286
Scheme Name Record Date IDCW NAV
(in Rs./Unit) ( )`
Regular Plan - IDCW
Direct Plan - IDCW
Regular Plan - IDCW
Direct Plan - IDCW
Regular Plan - IDCW
Direct Plan - IDCW
Face value: 10`
SBI Magnum Income Fund - Half Yearly IDCW
12-Oct-18 0.4000 11.9114
12-Oct-18 0.4500 13.2953
29-Mar-19 0.4000 12.1369
29-Mar-19 0.4000 13.6399
27-Sep-19 0.4000 12.3642
27-Sep-19 0.4500 13.9366
Scheme Name Record Date IDCW NAV
(in Rs./Unit) ( )`
Regular Plan - IDCW
Direct Plan - IDCW
Regular Plan - IDCW
Direct Plan - IDCW
Regular Plan - IDCW
Direct Plan - IDCW
Face value: 10`
28-Jun-19 0.2000 12.8770
28-Jun-19 0.2000 14.3421
27-Sep-19 0.2000 13.0602
27-Sep-19 0.2200 14.5709
27-Dec-19 0.2000 13.1854
27-Dec-19 0.2250 14.7307
Scheme Name Record Date IDCW NAV
(in Rs./Unit) ( )`
Regular Plan - IDCW
Direct Plan - IDCW
Regular Plan - IDCW
Direct Plan - IDCW
Regular Plan - IDCW
Direct Plan - IDCW
SBI Dynamic Bond Fund - IDCW Quarterly
Face value: 10`
SBI Short Term Debt Fund- Monthly IDCW
27-Dec-19 0.0500 13.2848
27-Dec-19 0.0500 12.7269
31-Jan-20 0.0500 13.3563
31-Jan-20 0.0500 12.7872
28-Feb-20 0.0500 13.4462
28-Feb-20 0.0500 12.8662
Scheme Name Record Date IDCW NAV
(in Rs./Unit) ( )`
Direct Plan - Monthly IDCW
Regular Plan - Monthly IDCW
Direct Plan - Monthly IDCW
Regular Plan - Monthly IDCW
Direct Plan - Monthly IDCW
Regular Plan - Monthly IDCW
Face value: 10`
SBI Short Term Debt Fund - Retail Plan - Monthly IDCW
29-Nov-19 0.0500 11.9851
31-Jan-20 0.0500 11.9887
28-Feb-20 0.0500 12.0596
Scheme Name Record Date IDCW NAV
(in Rs./Unit) ( )`
Monthly IDCW
Monthly IDCW
Monthly IDCW
Face value: 10`
28-Jun-19 0.2100 14.8612
28-Jun-19 0.2000 13.8909
27-Sep-19 0.2000 13.9993
27-Sep-19 0.2100 15.0036
27-Dec-19 0.2150 14.0246
27-Dec-19 0.2300 15.0539
Scheme Name Record Date IDCW NAV
(in Rs./Unit) ( )`
Regular Plan - IDCW
Direct Plan - IDCW
Regular Plan - IDCW
Direct Plan - IDCW
Regular Plan - IDCW
Direct Plan - IDCW
SBI Credit Risk Fund - IDCW Quarterly
Face value: 10`
IDCW History Of Debt & Hybrid Funds
Face value: 10`
SBI Corporate Bond Fund - Monthly IDCW
29-Nov-19 0.0500 10.4941
29-Nov-19 0.0500 10.5400
27-Dec-19 0.0500 10.4402
27-Dec-19 0.0500 10.4902
28-Feb-20 0.0500 10.5457
28-Feb-20 0.0500 10.6052
Scheme Name Record Date IDCW NAV
(in Rs./Unit) ( )`
Regular Plan - IDCW
Direct Plan - IDCW
Regular Plan - IDCW
Direct Plan - IDCW
Regular Plan - IDCW
Direct Plan - IDCW
27-Dec-19 5.0000 1133.0361
27-Dec-19 5.0000 1158.0993
31-Jan-20 5.0000 1134.8321
31-Jan-20 5.0000 1160.7696
28-Feb-20 5.0000 1135.7857
28-Feb-20 5.0000 1162.4360
Scheme Name Record Date IDCW NAV
(in Rs./Unit) ( )`
Regular Plan - Mthly IDCW
Direct Plan - Mthly IDCW
Regular Plan - Mthly IDCW
Direct Plan - Mthly IDCW
Mthly IDCW
Mthly IDCW
Regular Plan -
Direct Plan -
SBI Magnum Low Duration Fund - Monthly IDCW
Face value: 1000`
SBI Magnum Medium Duration Fund - IDCW Quarterly
Scheme Name Record Date IDCW NAV
(in Rs./Unit) ( )`
28-Jun-19 0.2000 13.2217
28-Jun-19 0.2000 13.8925
27-Sep-19 0.2000 13.3908
27-Sep-19 0.2000 14.0926
27-Dec-19 0.2050 13.5749
27-Dec-19 0.2150 14.3000
Face value: 10`
Regular Plan - IDCW
Direct Plan - IDCW
Regular Plan - IDCW
Direct Plan - IDCW
Regular Plan - IDCW
Direct Plan - IDCW
SBI Savings Fund - Monthly IDCW
27-Dec-19 0.0500 12.1447
27-Dec-19 0.0500 12.7250
31-Jan-20 0.0500 12.1597
31-Jan-20 0.0500 12.7505
28-Feb-20 0.0500 12.1628
28-Feb-20 0.0500 12.7620
Scheme Name Record Date IDCW NAV
(in Rs./Unit) ( )`
Regular Plan - IDCW
Direct Plan - IDCW
Regular Plan - IDCW
Direct Plan - IDCW
Regular Plan - IDCW
Direct Plan - IDCW
Face value: 10`
SBI Corporate Bond Fund - Quarterly IDCW
27-Dec-19 0.1600 10.6459
27-Dec-19 0.1600 10.6948
Scheme Name Record Date IDCW NAV
(in Rs./Unit) ( )`
Regular Plan - IDCW
Direct Plan - IDCW
Face value: 10`
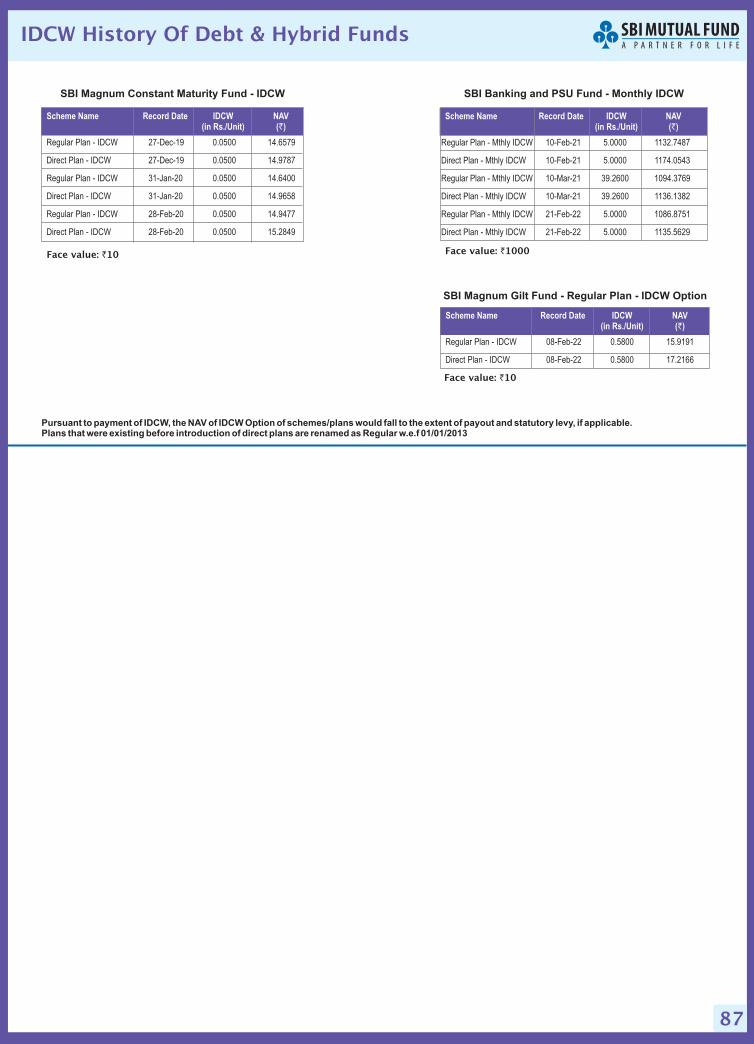
87
SBI Banking and PSU Fund - Monthly IDCW
10-Feb-21 5.0000 1132.7487
10-Feb-21 5.0000 1174.0543
10-Mar-21 39.2600 1094.3769
10-Mar-21 39.2600 1136.1382
21-Feb-22 5.0000 1086.8751
21-Feb-22 5.0000 1135.5629
Scheme Name Record Date IDCW NAV
(in Rs./Unit) ( )`
Regular Plan - Mthly IDCW
Direct Plan - Mthly IDCW
Regular Plan - Mthly IDCW
Direct Plan - Mthly IDCW
Regular Plan - Mthly IDCW
Direct Plan - Mthly IDCW
Face value: 1000`
SBI Magnum Constant Maturity Fund - IDCW
27-Dec-19 0.0500 14.6579
27-Dec-19 0.0500 14.9787
31-Jan-20 0.0500 14.6400
31-Jan-20 0.0500 14.9658
28-Feb-20 0.0500 14.9477
28-Feb-20 0.0500 15.2849
Scheme Name Record Date IDCW NAV
(in Rs./Unit) ( )`
Regular Plan - IDCW
Direct Plan - IDCW
Regular Plan - IDCW
Direct Plan - IDCW
Regular Plan - IDCW
Direct Plan - IDCW
Face value: 10`
IDCW History Of Debt & Hybrid Funds
Pursuant to payment of IDCW, the NAV of IDCW Option of schemes/plans would fall to the extent of payout and statutory levy, if applicable.Plans that were existing before introduction of direct plans are renamed as Regular w.e.f 01/01/2013
SBI Magnum Gilt Fund - Regular Plan - IDCW Option
08-Feb-22 0.5800 15.9191
08-Feb-22 0.5800 17.2166
Scheme Name Record Date IDCW NAV
(in Rs./Unit) ( )`
Regular Plan - IDCW
Direct Plan - IDCW
Face value: 10`

88
SR No. Scheme Name First Tier Scheme Benchmark NameFirst Tier Scheme
Benchmark Riskometer
1 SBI Magnum Equity ESG Fund NIFTY100 ESG TRI
2 SBI Large and Midcap Fund NIFTY Large Midcap 250 TRI
3 SBI Long Term Equity Fund S&P BSE 500 TRI
4 SBI Magnum Global Fund Nifty MNC TRI
5 SBI Equity Hybrid Fund CRISIL Hybrid 35+65 - Aggressive Index
6 SBI Consumption Opportunities Fund Nifty India Consumption TRI
7 SBI Technology Opportunities Fund S&P BSE Teck TRI
8 SBI Healthcare Opportunities Fund S&P BSE HC TRI
9 SBI Contra Fund S&P BSE 500 TRI
10 SBI Nifty Index Fund Nifty 50 TRI
11 SBI Focused Equity Fund S&P BSE 500 TRI
12 SBI Magnum Midcap Fund Nifty Midcap 150 TRI
13 SBI Magnum Comma Fund Nifty Commodities TRI
14 SBI Flexicap Fund S&P BSE 500 TRI
15 SBI Blue Chip Fund S&P BSE 100 TRI
16 SBI Infrastructure Fund Nifty Infrastructure TRI
17 SBI PSU Fund S&P BSE PSU TRI
18 SBI Smallcap Fund S&P BSE 250 Small Cap TRI
19 SBI Banking And Financial Services Fund Nifty Financial Services TRI
20 SBI Magnum Children's Benefit Fund- Investment Plan CRISIL Hybrid 35+65 - Aggressive Index
21 Retirement Benefit Fund - Aggressive Plan S&P BSE 500 TRI
22 Retirement Benefit Fund - Aggressive Hybrid Plan CRISIL Hybrid 35+65 - Aggressive Index
23 SBI International Access- US Equity FoF S&P 500
24 SBI Equity Minimum Variance Fund Nifty 50 TRI
SBI
SBI
25 SBI MultiCap Fund Nifty 500 Multicap 50:25:25 TRI
26 SBI Nifty Next 50 Index Fund Nifty Next 50 TRI
1 SBI Balanced Advantage Fund NIFTY 50 Hybrid Composite Debt 50:50 Index
2 SBI Magnum Medium Duration Fund NIFTY Medium Duration Debt Index C-III
3 SBI Credit Risk Fund NIFTY Credit Risk Bond Index C-II
4 SBI Multi Asset Allocation Fund 45% CRISIL 10 year Gilt Index +40%NIFTY 50
TRI+15% Price of Gold
5 SBI Gold Fund Price of Gold
6 SBI Retirement Benefit Fund - Conservative Hybrid Plan CRISIL Hybrid 65+35 - Conservative Index
1 SBI Magnum Children's Benefit Fund - Savings Plan NIFTY 50 Hybrid Composite Debt 15:85 Index
2 SBI Conservative Hybrid Fund NIFTY 50 Hybrid Composite Debt 15:85 Index
3 SBI Magnum Income Fund CRISIL Medium to Long Duration Fund BIII Index
Investors understand that the
scheme benchmark riskometer
is at Very High risk
Investors understand that the
scheme benchmark riskometer
is at High risk
Investors understand that the
scheme benchmark riskometer
is at Moderately High risk
Benchmark Riskometer As on 31 August, 2022

89
Benchmark Riskometer As on 31 August, 2022
SR No. Scheme Name
1 SBI Magnum Low Duration Fund CRISIL Low Duration Fund BI Index
2 SBI Short Term Debt Fund CRISIL Short Duration Fund AII Index
3 SBI Banking & PSU Fund Nifty Banking & PSU Debt Index
4 SBI Magnum Ultra Short Duration Fund CRISIL Ultra Short Duration Fund BI Index
5 SBI Floating Rate Debt Fund Nifty Short Duration Debt Index
6 SBI Dynamic Bond Fund CRISIL Dynamic Bond Fund AIII Index
7 SBI Magnum Gilt Fund Nifty All Duration G-Sec Index
8 SBI Equity Savings Fund NIFTY Equity Savings Index
9 SBI Corporate Bond Fund NIFTY Corporate Bond Index B-III
10 SBI Retirement Benefit Fund - Conservative Plan NIFTY Composite Debt Index
11 SBI Liquid Fund NIFTY Liquid Index B-I
12 SBI Magnum Constant Maturity Fund Nifty 10 yr Benchmark G-Sec
1 SBI Overnight Fund CRISIL Overnight Fund AI Index
2 SBI Arbitrage Opportunities Fund Nifty 50 Arbitrage Index
1 SBI Savings Fund CRISIL Money Market Fund BI Index
Investors understand that the
scheme benchmark riskometer
is at Moderate risk
Investors understand that the
scheme benchmark riskometer
is at Low risk
Note - Pursuant to SEBI Circular no. SEBI/HO/IMD/IMD-II DOF3/P/CIR/2021/573,benchmark of above schemes is termed as
First Tier benchmark.
Also Investor are requested to refer the addendum issued on April 4, 2022 for revised First Tier benchmark for open ended
debt schemes as per PRC Matrix.
First Tier Scheme Benchmark NameFirst Tier Scheme
Benchmark Riskometer
Investors understand that the
scheme benchmark riskometer
is at Low to Moderate risk

90
Credit Risk
Credit Risk
Interest RateRisk
Interest RateRisk
Relatively Low(Class I)
Relatively Low(Class I)
Moderate(Class II)
Moderate(Class II)
RelativelyHigh (Class III)
RelativelyHigh (Class III)
Relatively Low(Class A)
Relatively Low(Class A)
Moderate(Class B)
Moderate(Class B)
Relatively High(Class C)
Relatively High(Class C)
Potential Risk Class
Potential Risk Class
A-I
A-II
Disclosure of Potential Risk Class (PRC) matrix
SBI Overnight Fund
SBI Short Term Debt Fund | SBI Floating Rate Debt Fund
Potential Risk Class Matrix for debt schemes based onInterest Rate Risk and Credit Risk
Credit Risk
Interest RateRisk
Relatively Low(Class I)
Moderate(Class II)
RelativelyHigh (Class III)
Relatively Low(Class A)
Moderate(Class B)
Relatively High(Class C)
Potential Risk Class
A-III
SBI Magnum Constant Maturity Fund | SBI Dynamic Bond Fund | SBI Magnum Gilt Fund

91
Disclosure of Potential Risk Class (PRC) matrix
Credit Risk
Interest RateRisk
Relatively Low(Class I)
Moderate(Class II)
RelativelyHigh (Class III)
Relatively Low(Class A)
Moderate(Class B)
Relatively High(Class C)
Potential Risk Class
B-I
SBI Savings Fund | SBI Magnum Ultra Short Duration Fund | SBI Liquid Fund
Potential Risk Class Matrix for debt schemes based onInterest Rate Risk and Credit Risk
Credit Risk
Interest RateRisk
Relatively Low(Class I)
Moderate(Class II)
RelativelyHigh (Class III)
Relatively Low(Class A)
Moderate(Class B)
Relatively High(Class C)
Potential Risk Class
B-III
SBI Banking & PSU Fund | SBI Corporate Bond Fund

92
Potential Risk Class Matrix for debt schemes based onInterest Rate Risk and Credit Risk
Disclosure of Potential Risk Class (PRC) matrix
Credit Risk
Credit Risk
Interest RateRisk
Interest RateRisk
Relatively Low(Class I)
Relatively Low(Class I)
Moderate(Class II)
Moderate(Class II)
RelativelyHigh (Class III)
RelativelyHigh (Class III)
Relatively Low(Class A)
Relatively Low(Class A)
Moderate(Class B)
Moderate(Class B)
Relatively High(Class C)
Relatively High(Class C)
Potential Risk Class
Potential Risk Class
C-II
C-III
SBI Magnum Low Duration Fund
SBI Magnum Income Fund | SBI Magnum Medium Duration Fund | SBI Credit Risk Fund

93
Disclaimer for data from CRISIL'S FUND ANALYSER:
Disclaimer:
Disclaimer of SBI Nifty Index Fund:
Disclaimer for SBI Nifty Next 50 Index Fund:
Mutual Fund Investments are subject to market risks, read all scheme related documents carefully.
Asset Management Company:
,Trus tee :
Regd Office
CRISIL has taken due care and caution in compilation of the Data
contained in the CRISIL'S FUND ANALYSER. The Data in the CRISIL'S FUND ANALYSER has been obtained by CRISIL
from sources, which it considers reliable. However, CRISIL does not guarantee the accuracy, adequacy or completeness of
any Data in the CRISIL'S FUNDANALYSER and is not responsible for any errors or omissions or for the results obtained from
the use of such Data. CRISIL especially states that it has no financial liability whatsoever to the users of CRISIL'S FUND
ANALYSER. CRISIL or any of its directors/ employees/ representatives does not accept any liability for any direct or
consequential loss arising from the use of the Data contained in the CRISIL'S FUNDANALYSER or any data generated from
the CRISIL'S FUNDANALYSER.
This investment update is for information purpose only and is not an offer to sell or a solicitation to buy any
mutual fund units/securities. These views alone are not sufficient and should not be used for the development or
implementation of an investment strategy. It should not be construed as investment will give advice to any party. All opinions
and estimates included in this schemes guide constitute our view as of this date and are subject to change without notice.
Neither SBI Funds Management Limited, nor any person connected with it, accepts any liability arising from the use of this
information. The recipient of this material should rely on their own investigations and take professional advice on their own.
In the preparation of the material contained in this document, the AMC has used information that is publicly available,
including information developed in-house. Information gathered and material used in this document is believed to be from
reliable sources published by third parties. While such publications are believed to be reliable, however, neither the AMC, its
officers, the trustees, the Fund nor any of their affiliates or representatives assume any responsibility of the accuracy,
reasonableness and/or completeness of any information. For data referred to of any third party in this material no such party
will assume any liability for the same. Further, all opinion included in this newsletter are as of date and are subject to change
without any notice. All recipients of this material should seek appropriate professional advice and carefully read the scheme
information document/ statement of additional information and before dealing and or transacting in any of the products
referred to in this material make their own investigation. The Fund, the AMC and Trustees and any of its directors, officers,
employees and other personnel shall not liable for any loss, damage of any nature, including but not limited to direct, indirect,
punitive, special, exemplary, consequential, as also any loss of profit in any way arising from the use of this material in any
manner whatsoever. The recipient alone shall be fully responsible/are liable for any decision taken on the basis of this
material.
The SBI Nifty Index Fund (the Scheme) offered by SBI Mutual Fund is not sponsored,
endorsed, sold or promoted by NSE INDICES LIMITED (formerly known as India Index Services & Products Limited (IISL)).
NSE INDICES LIMITED does not make any representation or warranty, express or implied (including warranties of
merchantability or fitness for particular purpose or use) and disclaims all liability to the owners of “the Scheme” or any
member of the public regarding the advisability of investing in securities generally or in “the Scheme” linked to Nifty 50 Index
or particularly in the ability of the NIFTY 50 Index to track general stock market performance in India. Please read the full
Disclaimers in relation to the NIFTY 50 Index in the Offer Document / Prospectus /Information Statement.
SBI Nifty Next 50 Index Fund (the Scheme) offered by SBI Mutual Fund is not
sponsored, endorsed, sold or promoted by NSE INDICES LIMITED (formerly known as India Index Services & Products
Limited (IISL)). NSE INDICES LIMITED does not make any representation or warranty, express or implied (including
warranties of merchantability or fitness for particular purpose or use) and disclaims all liability to the owners of “the Scheme”
or any member of the public regarding the advisability of investing in securities generally or in the “the Scheme” linked to Nifty
Next 50 Index or particularly in the ability of Nifty Next 50 Index to track general stock market performance in India. Please
read the full Disclaimers in relation to the Nifty Next 50 Index in the Offer Document / Prospectus / Information Statement.
SBI Funds Management Limited (A Joint Venture between SBI & AMUNDI) (CIN:
U65990MH1992PLC065289 ) SB I Mu tua l Fund Trus tee Company Pv t . L td . (C IN :
U65991MH2003PTC138496),Sponsor: State Bank of India. - 9th Floor, Crescenzo, C– 38 & 39, G Block,
Bandra-Kurla Complex, Bandra (East), Mumbai - 400051 Tel: 91-022-61793000 Fax : 91-022-67425687, E-mail :
[email protected] • www.sbimf.com
Disclaimer

94
NORTH
SOUTH
EAST
WEST
Rajasthan:
Delhi:
Uttar Pradesh:
Uttarakhand:
Punjab:
Jammu and Kashmir: Himachal Pradesh:
Haryana:
Chandigarh:
Kerala:
Andaman and Nicobar Islands: Arunachal Pradesh: Assam:
Bihar:
Jharkhand:
Meghalaya:
Nagaland: Orissa:
SIKKIM: Tripura: WestBengal:
Chhattisgarh:
Goa: Gujarat:
Madhya Pradesh:
Maharashtra:
AJMER: 0145-2426284 ALWAR: 0144-4023133 BHILWARA: 01482-235144 Bikaner: 0151-2943080 JAIPUR: 0141-
4144100/0141-4144101 JODHPUR: 0291-2611929/ 28 KOTA: 0744-2360631 SRIGANGANAGAR: 0154- 2940384 UDAIPUR:
0294-2413717 Janakpuri: 011-42638016/22500097 Nehru Place: 011-45708803/41045628 New Delhi: 011-23466601-620
Nirman Vihar/ Laxmi Nagar: 011-43550360/46011830 Pitampura: 011-27351974 Gurgaon: 0124-4083769/4200828
Agra: 0562-2850239/2850237 Aligarh: 0571-2402017 Meerut: 0121-2667877 Saharanpur: 0132-2720789 Ghaziabad: 0120-
4217338 Noida: 0120-4232214/4287400 Allahabad: 0532-2261028 Bareilly: 7379335566 Faizabad:9554165444 Gorakhpur: 0551-
2203378 Jhansi: 0510-2330298 Kanpur: 9793599935 / 9793599931 Lucknow: 0522-2286742 Moradabad: 0591 -
2411411Raebareli0535 - 2975087RenukootNAVaranasi0542 - 2222492BASTI0554-2297888ETAWAH0535-2975087
Dehradun: 0135-2741719, 2749913 Haldwani: 0594-6220526/6222925 Roorkee: 8954890226 Amritsar: 0183-2221755
Bhatinda: 0164-2218415 Ferozepur: 01632-236167 Hoshiarpur: 01882-228415 Jalandhar: 0181-2238415 Ludhiana: 0161-5058415
Mohali: 0172-5053380 pathankot: 9888828415 Patiala: 0175-2300058 Sangrur: 01672-500020 Yamunanagar: 0173-295044
Jammu: 0191-2955736 srinagar: 0194-2474864 Baddi: 0179-5244415 Dharmashala:
01892-225814 Hamirpur: 0197-2224799 Mandi: 0190-5223833 Shimla: 0177-2807608 Faridabad: 0129-4030661
Ambala: 0171-2653400 Hissar: 01662-238415 Panchkula: 0172-2580136 Panipat: 0180-2648415, 0180-4078415 Rohtak: 01262-
258415 Chandigarh: 0172-2703380, 2703381
Alappuzha 0477-2970516
PORTBLAIR03192-239552 Itanagar: 0360-2292416 Bongaigaon:
6000905499 / 9864073173 Guwahati: 0361-2463747 / 2463704 Jorhat: 8811081942 Silchar: 0384-2221109 Tezpur: 9435019671
/7002711578 Tinsukia:8135847027 Bhagalpur: 0641-2420661 Biharsharif: 9931092379 Darbhanga: 06272-245004 Gaya:
0631-2222405 Muzaffarpur: 0621-2283014 Patna: 9262699197, 9262699198 Purnea: 9709343555 Siwan: 7545040123
BOKARO: 0654-2232561 Daltonganj: 9798614664 Deoghar:9570378333 DHANBAD: 0326-2301545 HAZARIBAGH:
0654-6270415 JAMSHEDPUR: 657-2320447 RANCHI: 0651-2331466 Giridih: 06532-296009 Shillong: 7002996893
Dimapur: 0386-2224287 Angul: 06764-234201 BALASORE: 0678-2262646 BHUBANESWAR: 0674-
2392401/2392501 CUTTACK: 0671-2422792 ROURKELA: 0661-2522999 SAMBALPUR: 0663-2410001 BERHAMPUR: 0680-
2222792 GANGTOK: 9073387377 Agartala: 0381-2324107 ASANSOL: 8170037270 Bankura:
9830648090 Barasat: 9830979009 Berhampore: 9933625826 Bindhannagar:8274004546 Bolpur: 9233179907 BURDWAN:
9933035302 Cooch behar: 083178 35401 DALHOUSIE: 033-40082726 DURGAPUR: 0343-2544191 Garia 9874772626 Haldia:
9073641484 KALYANI: 033-25827700 KHARAGPUR: 03222-225592 KOLKATA: 033-40924800 Krishnanagar: 9073340410
MALDA: 03512-266128 SILIGURI: 0353-2537065/2461703 Sreerampur: 033-26520011 Arambagh: 7604027781 Behala:
9883283489 Bashirhat: 8945895144
Bhilai: 0788 - 4010955, 2292099 Bilaspur: 07752 - 415300 Korba: 07759 - 246777 Raigarh: 07762 - 296946 Raipur:
0771 - 2543355, 4056808 Margao: 0832 - 2725233/34Panjim: 0832 - 2235283, 2421806 Vasco: 0832 - 2500626/36
Ahmedabad - Law Garden: 079 - 26423060/70 Ahmedabad - Maninagar: 079 - 48442929 Ahmedabad - S.G. Highway Branch: 079-
40299122 Anand: 02692 - 246210 Bharuch: 02642 - 247550 Bhavnagar: 0278 - 2523788 Bhuj: 02832 - 250900 Gandhidham: 02836
- 233615 Gandhinagar: 079 - 29750620 Jamangar: 0288 - 2660104 Junagadh: 0285 - 2670350 Mehsana: 02762 - 233872 Nadiad:
0268 - 2560110 Navsari: 02637 - 242266 Rajkot: 0281 - 2466740/41 Surat: 0261 - 2462763/64 Vadodara: 0265 - 2323010 Valsad:
02632 - 245440 Vapi: 0260 - 2400480 BHOPAL: 0755 - 2557341 GWALIOR: 0751 - 2447272: Indore: 0731 -
4991080-83 / 4045944 JABALPUR: 0761 - 2410042 Ratlam: 07412 - 409492 SAGAR: 07582 - 241367 Ujjain: 0734 - 2536140/41
Ahmednagar: 0241 - 2354555 Akola: 0724 - 2457222 Amravati: 0721 - 2560291 AURANGABAD: 0240 - 2351460
CHINCHWAD 020 - 27355721 Dhule: 0256 - 2237253 JALGAON: 0257-2223450 KOLHAPUR: 0231 - 2680880 Mumbai - Alibag:
02141 - 225555 Mumbai - Andheri: 022 - 26200231 Mumbai - BKC: 022 - 61793000 Mumbai - Borivali: 022 - 28922741, 28927551
Mumbai - Chembur: 7045353653 Mumbai - Dadar: 022 - 24322446/47 Mumbai - Ghatkopar: 022 - 25012228 Mumbai - Kalyan: 0251 -
2311980 Mumbai - Kharghar: 022 - 27740359/69 Mumbai - Nariman Point: 022 - 66532800 Mumbai - Thane: 022 - 25414594 Mumbai
- Vashi: 022 - 27801018/16 Mumbai - Versova: 022 - 26300155/56 Nagpur: 0712 - 6621479, 6659601 Nanded: 02462 - 244144
NASHIK: 0253 - 2232553 PUNE: 020 - 25670961, 25653398/99 Pune - CAMP: 9850815152 RATNAGIRI: 7506868073 Sangli: 0233 -
2970379 Satara: 02162 - 298732 SOLAPUR: 0217 - 2315292
• • • •
• • • •
• • •
• •
• • • •
• • • • •
• • • •
• • •
• • • •
• • • • •
• •
• • • •
• • • •
• Calicut: 0495-2768270, 4020079 • Ernakulam: 0484-4011605 / 06
• Thirvananthapuram: 0471-4011590 / 91 • Kannur: 0474-2752760 / 2752860 • Kollam: 0474-2752760 / 2752860
• Kottayam: 0481-2570816-17 • Palakkad: 0491-2971899 • Thiruvalla: 0469-2971155 • Thrissur: 0487-2445700
Anna Nagar: 044 48626775 • Chennai: 044 28543382 /3383 • Coimbatore: 0422 2541666 • Madurai: 0452 4374242 •
Pondicherry: 0413 2222266 • Salem: 0427 4552289 • Tirunelveli: 0462 4220023 • Tirupur: 0421 2234001 • Trichy: 0431 4000667 •
Kumbakonam: 0435-2427426 • Vellore: 0416 2225005 • Tuticorin: 0461 2334400 Hyderabad: 040 23391901 / 23391902 •
KUKATPALLY: 040 29569882 • Madhapur: 040-23119010 • Dilsukhnagar: 040-29311875 • Nalgonda: 08682 221999 • Nizamabad
8462234001 Secunderabad: 040 48544611 / 711 • Warangal: 0870-2430307 • Srikakulam: 08942-220533 • Vizayanagarm: 8922275439 •
Vishakapatnam: 0891-2511853 • Kakinada: 0884-2356767 • Rajamundry: 0883-2434002/2432306 • Guntur: 0863-2211022 • Nellore:
0861-2338688 • Kurnool: 08518-227776 • Tirupathi: 0877-2280208 •Ananthapur: 08554-294489 • Kadapa: 08652-355418
•
• • • •
• • • •
• • • •
• • • •
• • •
• •
• • • •
•
• • • • •
• • • • • •
• • • • •
• • • •
•
• • • •
•
• •
• • • • •
• • • • •
• • • • •
• •
• • • •
• • • •
• • • • •
• • • •
• • •
• • • •
• • • •
• • • •
• •
Tamil Nadu:
Telangana:
SBI Funds Management Limited Branches

95
Fund Manager :
Application Amount for Fresh Subscription :
Minimum Additional Amount :
Yield to Maturity :
SIP :
NAV :
First Tier Benchmark :
Entry Load :
Note:
Exit Load :
Modified Duration :
Standard Deviation :
Sharpe Ratio :
Beta :
AUM :
Holdings :
Nature of Scheme :
Rating Profile :
Tracking Error :
An employee of the asset management company such as a mutual fund or life insurer, who managesinvestments of the scheme. He is usually part of a larger team of fund managers and research analysts.
This is the minimum investment amount for a new investor in a mutual fundscheme.
This is the minimum investment amount for an existing investor in a mutual fund scheme.
The Yield to Maturity or the YTM is the rate of return anticipated on a bond if held until maturity. YTM isexpressed as an annual rate. The YTM factors in the bond's current market price, par value, coupon interest rate and time tomaturity.
SIP or systematic investment plan works on the principle of making periodic investments of a fixed sum. It works similarto a recurring bank deposit. For instance, an investor may opt for an SIP that invests 500 every 15th of the month in an equityfund for a period of three years.
The NAV or the net asset value is the total asset value per unit of the mutual fund after deducting all related andpermissible expenses. The NAV is calculated at the end of every business day. It is the value at which the investor enters orexits the mutual fund.
A group of securities, usually a market index, whose performance is used as a standard or benchmarkto measure investment performance of mutual funds, among other investments. Some typical benchmarks include the Nifty50, S&P BSE Sensex, BSE 200, BSE 500, 10-Year Gsec.
A mutual fund may have a sales charge or load at the time of entry and/or exit to compensate thedistributor/agent. Entry load is charged at the time an investor purchases the units of a mutual fund. The entry load is added tothe prevailing NAV at the time of investment. For instance, if the NAV is 100 and the entry load is 1%, the investor will enter thefund at 101.
SEBI, vide circular dated June 30, 2009 has abolished entry load and mandated that the upfront commission todistributors will be paid by the investor directly to the distributor, based on his assessment of various factors including theservice rendered by the distributor
Exit load is charged at the time an investor redeems the units of a mutual fund. The exit load is deducted from theprevailing NAV at the time of redemption. For instance, if the NAV is 100 and the exit load is 1%, the redemption price wouldbe 99 Per Unit.
Modified duration is the price sensitivity and the percentage change in price for a unit change in yield
Standard deviation is a statistical measure of the range of an investment's performance. When a mutualfund has a high standard deviation, its means its range of performance is wide, implying greater volatility.
The Sharpe Ratio, named after its founder, the Nobel Laureate William Sharpe, is a measure of risk-adjustedreturns. It is calculated using standard deviation and excess return to determine reward per unit of risk.
Beta is a measure of an investment's volatility vis-à-vis the market. Beta of less than 1 means that the security will be lessvolatile than the market. A beta of greater than 1 implies that the security's price will be more volatile than the market.
AUM or assets under management refers to the recent / updated cumulative market value of investments managed by amutual fund or any investment firm.
The holdings or the portfolio is a mutual fund's latest or updated reported statement of investments/securities.These are usually displayed in terms of percentage to net assets or the rupee value or both. The objective is to give investors anidea of where their money is being invested by the fund manager.
The investment objective and underlying investments determine the nature of the mutual fund scheme.For instance, a mutual fund that aims at generating capital appreciation by investing in stock markets is an equity fund orgrowth fund. Likewise, a mutual fund that aims at capital preservation by investing in debt markets is a debt fund or incomefund. Each of these categories may have sub-categories.
Mutual funds invest in securities after evaluating their creditworthiness as disclosed by the ratings. Adepiction of the mutual fund in various investments based on their ratings becomes the rating profile of the fund. Typically,this is a feature of debt funds.
Measure that indicates how closely the portfolio return tracks the benchmark return. Tracking error is thestandard deviation of the difference of returns between a portfolio and the benchmark over a specified holding period.
`
S&P S&P
IDCW stands for ‘Income Distribution cum Capital Withdrawal option’. The amounts can be distributed out of investors’capital (Equalization Reserve), which is part of the sale price that represents realized gains.
- For details on IDCW, please refer notice cum addendum dated March 27, 2021. In line with SEBI Circular no.SEBI/HO/IMD/DF3/CIR/P/2020/194 dated October 5, 2020, nomenclature of Dividend plans / options has been rephrasedw.e.f April 1, 2021.
`
`
`
`
IDCW :
Note
How to read the Factsheet?