Opportunities for Impact Investment in Coastal and Water ...
Upload
khangminh22Category
view
4download
0
Investment Opportunities in the Rwandan Energy Sector
TRAIDE Rwanda
Evelien Lambooij, Thijs Rutgers, Emily ter Steeg and Marie Fidele Umutoniwase Ndahimana
May 2020

ContentsFACT SHEET RWANDAN ENERGY SECTOR 3BUSINESS OPPORTUNITIES 4Abbreviations 5
1. INTRODUCTION 5Rwandancontext 5Rwandanenergysector 6
2. STAKEHOLDERS AND ENABLING ENVIRONMENT 8NationalElectrificationPlan 8Publicsector 9IndependentPowerProducers 9Consumers 9
3. MAJOR TRENDS IN ON-GRID ELECTRIFICATION 11Hydroelectricpower 11Thermalpower 12Methanegas 12Peat 13Solar 13Energyimports 14Transmissionofenergy 14Distributionofenergy 14Fundingmechanisms 14Gridconnectionfees 15
4. OPPORTUNITIES IN ON-GRID ELECTRIFICATION 165. MAJOR TRENDS IN OFF-GRID ELECTRIFICATION 17SolarHomeSystems 17Mini-grids 19
6. OPPORTUNITIES IN OFF-GRID ELECTRIFICATION 21SolarHomeSystems 21Mini-grids 22
7. MAJOR TRENDS IN CLEAN COOKING 238. OPPORTUNITIES IN CLEAN COOKING 27ANNEXE 1 28ANNEXE 2 29REFERENCES 30

Fact sheet Rwandan energy sector
ACCESS TO ENERGY
CAPACITY
INEFFICIENT COOKING SOLUTIONS
INSTALLED CAPACITY
ENERGY CONSUMPTION
38% access to a grid connection line
/ aimed 52%
14% connected to an off-grid line1
1HeadofInfrastructureSectionLénaïcGeorgelin,2020;WhenapplyingIEAstandards,thispercentageis49.1.2ThesepercentagesarelowerwhentakingintoaccounttheWorldBankstandardthatelectricityshouldbeavailableforatleastfourhoursduringthedayandonehouratnight.Applyingthesestandards,only26.8percentwasconnectedin2020.3MinInfra,2018;REG,2019.4REG,2019.5USAID,2019;RDB,2017.6REG,2019.7Inefficientfuelsforcookingarewood,charcoal,coalandkerosene(CleanCookingAlliance,n.d.);MinInfra:BiomassStrategy,2019.8Extensiveresearchwasconductedforthe‘RwandaBeyondConnections’reportbasedonthemulti-tierframework(WorldBankincooperationwithAfDBandUN)tostudyelectricityconsumption,affordabilityandwillingnesstopayin2017.9WorldBank,2018.
governmental aim by
20242020
202020192010
2023-24includes a reserve margin of 15%
aim for 20247 42% 2020 98%
Rural 9.9 kWh
2000 RWF/month~ 2.15 USD
4700 RWF/month~ 5.05 USD9
Urban8 29.2 kWh
Average 20.8 kWh/month
2015 … 2017 2018 … 2020 … 2024
72.7 MW
218 MW
556 MW5
224.6 MW + 19.95 MW4
24% 32% 34.5% 38%2
11% 14%3
0%
48%
52%
2015 … … 2018 … 2020 … 2024
12.9 million
13.9 million(3.7 m households)
import fromDemocratic Republic of the Congo and Uganda6
methane gas
diesel peathydro solar
/ aimed 48%
101.
07
MW
45%27%14% 5.5 7% 1.5
60
.64
MW
31.
44
MW
12.3
5 M
W
15.7
2 M
W
3.3
7 M
W
Investment Opportunities in the Rwandan Energy Sector 4
Business opportunitiesON-GRID ELECTRIFICATION
• Rwandan government has awarded nine large-scale (>5MW) projects
andtwelvesmall-scale(<5MW)projectstoincreasetheMWgeneration
capacity inRwanda.Twolarge-scaleprojectsareregionalprojects, in-
volvingotherEast-Africancountries.
• Atthemoment,therearenoopentenders.Suppliersmightbeableto
provideservicesorinputsforprojectssuchasequipment,consultancies
andtraining.
• There areover seventeenprojects ongoing aiming toupgradeandex-
pandthetransmissionlinenetwork.Severaloftheseprojectsstillrequire
funding.Opportunitiesexistinrealisingtheinfrastructuredevelopment,
providingequipment,technicalsupport,projectsdesignandtrainingof
technicians.
OFF-GRID ELECTRIFICATION
Solar Home Systems
Product development
• ExploreopportunitiestocreateSolarHomeSystemsthatcanbeshared
bymultiplehouseholdsintermsofdesignandbusinessmodel.In2016,
55.5percentof theRwandanpopulationwas livingbelow thepoverty
rateearning57–59USDpermonth.Meanwhile,thepricerangefora
medium-sizeSolarHomeSystemsoldonthelocalmarketwas50–100USD.
Most households donot have themeans to purchase their own Solar
HomeSystem.
• DevelopstrongerSolarHomeSystemproducts.Therearesafety issues
withaffordableSolarHomeSystemkitsonthemarket:strongerequip-
mentandwiresareneededtoimprovethequalityofsystems.
Local production
• ExploreopportunitiestoassembleorproduceSolarHomeSystemkits
locallyandobtain investment incentives.MostSolarHomeSystemkits
are sourced fromChina, but one company is currently investigating
optionsforlocalproduction.
Financial model
• Benefit fromfinancial supportprovided toSolarHomeSystemcompa-
nies and consumers. The Scaling up Renewable Energy Program fund
andUbudehesubsidieswillbelaunchedsoonprovidingfundstoreach
low-incomehouseholds.
Mini-grids
Product development
• Benefit from falling internationalmarketpricesof solarPVpanels. Im-
provedcost-efficiencythankstoreducedcostsofequipmentgenerates
opportunities.
Financial model
• Tapintoblendedfinancetofundmini-griddevelopmentengagingdonors,
publicandprivateactors.Financial support forSHScompanieswillbe-
come available via the Scaling Up Renewable Energy Program fund,
whichisexpectedtobelaunchedin2021.Theprogramwillfundamaxi-
mumof37percentoftotalfinancingcosts.
Clean cooking
Product development
• Developaffordable,safeproductsforlow-incomehouseholdsfocusingon
tier0,1,2and3ImprovedCookingStoves.Forexample,companiescan
addinsulationtothestovetoincreaseheatefficiency.
Local production
• Investigatethepossibilitytoproducepelletsandbriquetteslocally,tore-
duceusagecostsoftier4–5stoves.Thegovernmentiswillingtofacilitate
accesstorawmaterialsforfactories(e.g.providingforestconcessionsto
pelletsmakers).
Awareness
• Contextualisesalesstrategiesandawarenesscampaignstolocalvalues.
Cookingpracticesarelinkedtostrongculturalandbehaviouralvaluesin
Rwanda.Consequently,it isdifficulttoconvincepeopletochangetheir
behaviourinbothurbanandruralareas.
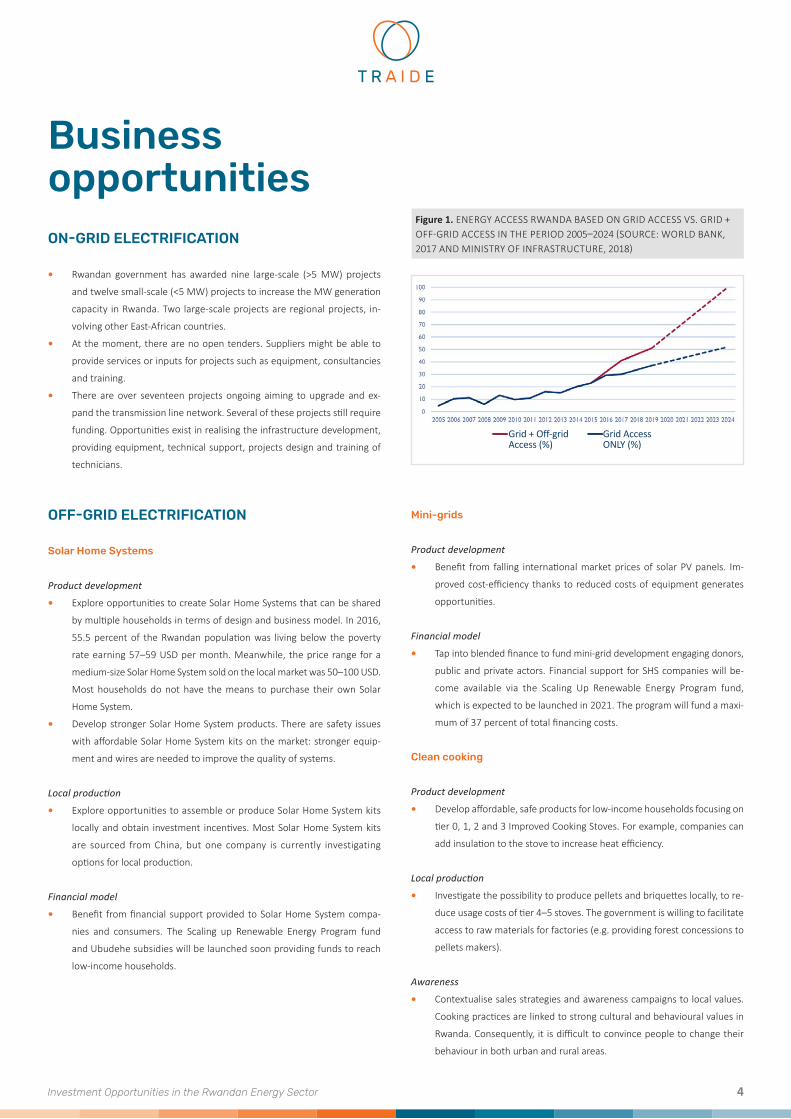
Figure 1.ENERGYACCESSRWANDABASEDONGRIDACCESSVS.GRID+OFF-GRIDACCESSINTHEPERIOD2005–2024(SOURCE:WORLDBANK,2017ANDMINISTRYOFINFRASTRUCTURE,2018)
Grid + Off-grid Access (%)
Grid AccessONLY (%)

Investment Opportunities in the Rwandan Energy Sector 5
1. IntroductionThis report will explore investment opportunities for Dutch and other
local or foreign businesses in the energy sector. Sustainable Development
Goal (SDG) 7: ‘Ensure access to affordable, reliable, sustainable and
modern energy for all’ is a top priority for the Rwandan government. The
Rwandan government aims to reach universal access to electricity for
the population by 2024. This agenda offers opportunities for the private
sector. Rwanda is moving through a phase of transition. The country
seeks to develop equitable relationships with other countries moving
from aid to trade. This report seeks to evaluate investment opportuni-
ties along the aid and trade spectrum: some of these business models
can be market-driven whilst others will require subsidies. Many energy
projects depend on external funding, and low-income rural households
often need funding mechanisms in order to afford the basic electricity
services offered by private energy businesses. Therefore, close collab-
oration between public and private stakeholders is very important.
RWANDAN CONTEXT
Rwanda is one of the smallest, most densely populated countries on the
Africancontinent.Around12.5millionpeopleliveinanareaof26,338square
kilometres.10EightypercentoftheRwandanpopulationlivesinremote,rural
areas.Therefore,itisdifficultandexpensivetoconnectthemtothenational
grid.Also,purchasingpoweroftheRwandanpopulationremainslow.In2016,
55.5percentof theRwandanpopulationwas livingbelowthepovertyrate
earning 57–59 USD per month. Meanwhile, the price range for a medi-
um-sizeSolarHomeSystem(SHS)soldonthelocalmarketwas50–100USD.
ABBREVIATIONS
ADF AfricanDevelopmentFundAfDB AfricanDevelopmentBankDRC DemocraticRepublicofCongoEARP EnergyAccessRoll-outProgrammeEDCL EnergyDevelopmentCorporationLimitedESSP EnergySectorStrategicPlanEU EuropeanUnionEUCL EnergyUtilityCorporationLimitedGACC GlobalAllianceforCleanCookstovesGDP GrossDomesticProductICS ImprovedCookstoveIEC InternationalElectrotechnicalCommissionIEA InternationalEnergyAgencyIPP IndependentPowerProducerJICA JapanInternationalCooperationAgencyKV KilovoltKW KilowattKWh KilowatthourLCPDP LeastCostPowerDevelopmentPlanLPG LiquefiedPetroleumGasLV LowVoltageMinEcoFin MinistryofFinanceandEconomicPlanningMinInfra MinistryofInfrastructureRwandaMoMo MobileMoneyMV MediumVoltageMW MegawattNELSAP NileEquatorialLakesSubsidiaryActionProgramNEP NationalElectrificationPlanPAYG PayAsYouGoPV PhotovoltaicRBF Results-BasedFinancingREG RwandaEnergyGroupRES RuralElectrificationStrategyRURA RwandaUtilitiesRegulatoryAuthorityRWF RwandanFrancSACCO SavingsandCreditCooperativeOrganizationSDG SustainableDevelopmentGoalSHS SolarHomeSystemSLS SolarLightingSystemSREP ScalingUpRenewableEnergyProgramUSD UnitedStatesDollarW WattWHO WorldHealthOrganizationWTP WillingnesstoPay
10Kooetal.:RwandaBeyondBorders,2018.

Investment Opportunities in the Rwandan Energy Sector 6
The Rwandan Gross Domestic Product (GDP) has experienced an average
growth rate of 7.5 percent since 2000. In 2019, economic growth even
exceededtenpercent.Priortotheglobalpandemic,growthratesofapproxi-
matelyeightpercentwereprojecteduntil2022.11Disruptionsofinternational
tradeandtravelarelikelytosuppressgrowthrates.Moreover,publicinvest-
ments supporting the expansion of (energy) infrastructure such as power
plantshavebeenamajordriverofgrowth.12Stableenergysupplycansupport
industrydevelopmentandsmallbusinesses.Atthemoment,72percentof
productiveusersinRwandahasaccesstoenergy.13Consideringrecentdevelop-
ments,delaysintheexecutionofenergygenerationprojectscanbeexpected.
RWANDAN ENERGY SECTOR
In 2020, the RwandanMinistry of Infrastructure (MinInfra) estimates that
52.2percentoftheRwandanpopulationhasaccesstoenergy.38percentofthe
Rwandanpopulationhasaccessviaagridconnectionandfourteenpercentis
connectedtoanoff-gridline.14Thispercentagemightbeslightlylowerwhen
applyingthestandardsoftheInternationalEnergyAgency(IEA)accordingto
which49percentoftheRwandanpopulationhadaccesstobasicelectricity
in 2019.15 The Rwandan government aims to reach universal access for the
populationtoelectricityby2024.Atthemoment,consumerelectricitydemand
is rather low because most households still use biomass for cooking, and
keroseneforlights.Around98percentofthetotalRwandanpopulationuses
biomassascookingfuel,whichmakesthehealthburdenofindoorairpollution
exposureoneofthelargestintheworld.16Thegovernmentaimstoreducethe
numberhouseholdsusingbiomassforcookingfrom98to42percentby2024.
The Ministry of Infrastructure (MinInfra) has set ambitious targets in the
Energy Sector Strategic Plan (ESSP) for 2018/2019–2023/2024.17 It distin-
guished between three subsectors: electricity, biomass and petroleum.18
Whereas, electricity and biomass are prioritised, petroleum is not. All
petroleum (including LPG) is imported from neighbouring countries and
so far, there is no evidence Rwanda has its own source. Rwanda’s ESSP
main target is reaching universal access to energy by 2024. Approximately
52 percent of energy generation should come from renewable energy
sources. The projected division between on-grid and off-grid access is 52
percent versus 48percent. Figure 4 shows that on-grid targets for the year
2018/19weremet.However,targetswerenotmetforoff-gridaccess,which
is fourteen percent at the moment instead of the projected 23 percent.
The main challenge is to reach low-income households in remote areas.
Figure 2.ACCESSTOELECTRICITYTOTALPOPULATION(SOURCE:POWERAFRICA,2019)
Figure 3.ENERGYCONSUMPTIONBYCONSUMERSINRWANDA(2016)
BIOMASS 85%
PETROLEUM 13%
ELECTRICITY 2%
11MinInfra:ESSP,2018.12AfricanDevelopmentBankGroup:AfricaEconomicOutlook,2020;WorldBank2020.13Productiveusersutiliseenergyforactivitiesthatenhanceincomeandwelfare.Examplesofproductiveusersarehealthandeducationfacilities,publicinfrastructure,andindustries(MinInfra:ESSP,2018).14HeadofInfrastructureSectionLénaïcGeorgelin,2020.15IEA(2019,p.36)definesaccesstoenergyforhouseholdswhen‘thehouseholdhasreliableandaffordableaccesstoelectricity(andcleancookingfacilities),whichisenoughtosupplyabasicbundleofenergyservices,andwiththelevelofservicecapableofgrowingovertime.Basicelectricityservicesaredefinedasowningasetofseverallightbulbs,phonecharging,aradioandpotentiallyafanortelevision.16IEA,2019.17MinInfra:ESSP,2018.18MinInfra:ESSP,2018.

Investment Opportunities in the Rwandan Energy Sector 7
In2020,Rwandahasan installedon-gridenergycapacityof224.6mega-
watt(MW)plusan installedoff-gridcapacityof19.95MW(mostly from
SHS).19 By 2023/24, the combined on-grid and off-grid capacity should
reach 556 MW, which includes a reserve margin of fifteen percent.20
The Rwandan on-grid generation capacity has tripled since 2010.
The current installed capacity of 224.6 megawatt comes from five
energy sources: 101 MW installed hydroelectric capacity, 60 MW
capacity from diesel resources, 31 MW from methane gas resources,
15.5 MW from peat resources and 12.5 MW from solar resources.
An additional 3.5 megawatt is imported from DRC and Uganda.21
Installed off-grid capacity is much lower than grid capacity. Off-grid elec-
tricity inRwanda is generated through SHS andmini-grids. The latter type
generates energy through solar PV or hydropower. In 2018, there were
27 companies distributing SHS and nine companies installing mini-grids.
Overall,theinstalledmini-grids(bothhydroandsolar)haveatotalcapacity
of250kilowatt (KW).22 The installed capacityof SHS,basedonanaverage
of 50 Watt (W) SHS is 12.7 MW. This is based on numbers from 2019.
Most investment opportunities for the private sector seem to exist in the
off-grid electrification. The Rwandan government is investing in on-grid
projects to raise the electrification rate. In remote, rural areas, it is too
expensive to establish grid connections and hence, innovative solutions
are required. The government has called upon the private sector to help
provide energy access for all Rwandan residents and businesses.23 Busi-
nesses can develop technologies and business models suited for these
challenging target groups in the electricity and biomass subsector.
Figure 4.PLANNEDCHANGESINON-ANDOFF-GRIDCONNECTIONS2018–2024(SOURCE:ESSP,2017)
%
%
%
0102030405060708090
100
0102030405060708090
100
0102030405060708090
100
New on-grid connectionsand share of on-grid access
2018/19
163,914
283,507
1.5
2018/19
2019/20
148,201
220,262
1.8
2019/20
2020/21
160,466
271,266
2.3
2020/21
2021/22
173,624
255,706
2.7
2021/22
2022/23
187,472
274,286
3.2
2022/23
2023/24
202,734
293,938
3.7
2023/24
New off-grid connectionsand share of off-grid access
Households connected (million) and share (%)
224.6 MW
101.07 MW 60.64 MW 31.44 MW 15.72 12.35
3.37DRC & Uganda
19REG,2019.20RDB,2017;USAID,2019.21REG,2019.22REG,2019.23MinInfra:ESSP,2018.24ThewebsiteofREG(2020)statesthe‘availablecapacity’(ratherthantheinstalledcapacity)iscurrently:88.41MWhydro(39%),43.07MWthermal(diesel)(19%),56.68MWmethanegas(25%),24.94MWimport(11%),4.53MWsolar(2%),9,07MWpeat(4%).ThedataregardinginstalledcapacitywascollectedduringaninterviewwithREG.
INSTALLED CAPACITY24

Investment Opportunities in the Rwandan Energy Sector 8
2. Stakeholders and enabling environment Three types of stakeholders can be distinguished in the energy sector,
namely:publicsector,independentpowerproducers(IPPs)andconsumers.
On-grid projects are generally large-scale investments managed by the
government(incollaborationwithaforeignIPP)andfundedthroughloans.
Theseprojectsincludetheconstructionofnewplantsaswellastheupgrading
of existingplants and transmission lines.Off-grid projects tend to be small-
scaleandarefrequentlyaid-basedimplementedbyIPPsinrural,remoteareas.
Please reviewAnnexe1 foranoverviewofcategorizeddonors foroff-grid,
on-grid and clean cooking. Please review Annexe 2 for an overview
of development organisations supporting energy projects in Rwanda.
NATIONAL ELECTRIFICATION PLAN
Thedivisionofgridandoff-gridconnectionsinRwandaisstrictlyregulated
by theNational Electrification Plan (NEP). TheNEP determines in a highly
detailed manner where grid connection lines have been and should be
installed.ThePlanshowsgrid linesarealreadypresentorplannedinmost
areas. By contrast, off-grid areas are scattered; mini-grid areas are also
scarcebecause thenumberofpermits is limited. In ‘gridextensionzones,’
investorsmust refrain from the instalment of off-grid connections.Hence,
the NEP clarifies in which areas IPPs can and in which areas they cannot
target potential customers. The NEP only distinguishes between grid and
off-gridareas.Hence, the typeofoff-grid source, amini-gridor SHS,does
notmatter.25 Thismeans thatoff-gridenergy suppliers ‘share’ theseareas.
25PersonalcommunicationGIZ,2020.26REG,2019.27REG,2019.
Figure 5.NATIONALELECTRIFICATIONPLAN2018
LEGENDUmuwalimu SACCO
Existing and ongoing MV
NEP Category
Crossed by MV
Grid Extension
Off-grid
Administratives
Waterbodies
National Park
District boundary
Sector boundary
20
19C
ON
NE
CT
ED
HO
US
EH
OL
DS
Southern Province26,27 31% + 16%
District of Kigali 65% + 2.7%

Investment Opportunities in the Rwandan Energy Sector 9
PUBLIC SECTOR
ThepublicsectoractorsaretheMinistryofFinanceandEconomicPlanning
(MinEcoFin)andMinInfra;policymakersshapingtheenablingenvironment.
MinEcoFin allocates the budget for energy investments and operations.
MinInfradevelopsenergypoliciesandtargets,whichmustbealignedwith
theSDGs.Subsequently,projectsareexecutedbytheRwandaEnergyGroup
(REG). REG is the national utility company in Rwanda and owned by the
government.REG is divided into twodepartments: EnergyUtilityCorpora-
tion Limited (EUCL) and Energy Development Corporation Limited (EDCL).
EUCLisresponsiblefortheoperationalisationandmaintenanceofgridconnec-
tion lines in Rwanda. They generate, transmit, and distribute energy to
customers.EDCLisinchargeofpublicinvestmentsinnewenergygeneration
projects. EDCL is themain contact forprivateenergy investors thatwant to
operateinthefieldofenergy,bothon-grid/off-gridandcleancooking.Rwanda
UtilitiesRegulatoryAuthority(RURA)setsthetariffsforenergypricesinRwanda.
Furthermore,EDCLdevelops theEnergyAccessRoll-outProgramme (EARP),
inwhichtheexpansionofaccesstoelectricityinRwandaisplanned.TheEARP
isfundedbytheRwandangovernmentanddevelopmentpartnerslikeAfrican
DevelopmentBank(AfDB)andtheEuropeanUnion(EU).Thereareadditional
non-governmentalfundssuppliedbygrantsorloansfromindependentdonors.28
INDEPENDENT POWER PRODUCERS
IPPsareofcrucialimportancetotheRwandangovernmentinhelpingto
achieveits2024goals.Thereareon-gridandoff-gridproducers.Thereare
only a couple of on-grid IPPs; foreign companies facilitating large-scale
grid investments. IPPshavesupportedthedevelopmentofthemethane
gasgenerationfacilityatLakeKivuaswellaslargesolarandpeatgeneration
sites.Bycontrast,off-gridelectrificationisdoneviaseveralsmallerprojects
scattered throughout the country by a variety of companies. Off-grid
IPPs aremostly involved in renewable energy projects: solar and hydro
power. There are also several IPPs involved in the clean cooking sector.
CONSUMERS
ConsumergroupsinRwandaarehighlydiverseintermsofconsumption
rates.Thisisthereasonwhytherearefixedelectricitytariffsfordifferent
consumergroups.Adistinctionismadebetweenresidential,non-residen-
tial(publicinstitutions,officesandhospitals)andindustrialconsumers.A
secondcategorisationismadewithinthethreeconsumergroupsonthe
basisofmonthlyconsumptionrates.Majordifferencesexistbetweenthe
charged tariffs for the low-income, low-demand households versus the
high-income,high-demandhouseholds.Moreover,small industrialusers
pay ahigherprice than large industrial users; businesses receivemajor
discountsonenergytariffsasaninvestmentincentive.29In2016,house-
holdsaccountedfor82percentoftotalenergyconsumptioninRwanda.
Figure 6.OPERATIONALFRAMEWORKENERGYSECTORRWANDA
Figure 7.ELECTRICITYTARIFFSFORDIFFERENTCONSUMERGROUPSIN2018–19AND2020(PRICEPERkWhinRWF)(SOURCE:REG,2020)
ECONOMIC CLUSTER
MINECOFINMinistry of Economics and Finance
MININFRAMinistry of Infrastructure
RURARwanda Utilities
Regulatory Agency
REGRwanda Energy Group
EUCLEnergy Utility
Corporation Limited
IPPsPrivate sector power
suppliers
CONSUM-ERS
EDCLEnergy Development Corporation Limited
BudgetTransferstoREGforinvestmentandoperations
Payments(Capacity+EnergyCharges)
Paymentviabilling
RegulatedbyRURA
Assets(Genertation,T&D)
Electricity Electricity
Small<22.000 kWh/year
INDUSTRIAL
NON-RESIDENTIAL
RESIDENTIAL
0–100 kWh
110134
87103
8094
204227
222225
8989
182212
210249
2018–19 2020
0–15 kWh
Medium22.000–660.000 kWh/year
Large>660.000 kWh/year
>100 kWh
15–50 kWh
>50 kWh
28MinInfra,2018.29Thesepricesarebasedonindustrialuserswithasmartmeter.Withoutasmartmeter,aflatrateischargedwhichincreasescostsperkWhwithapproximatelyfifteenpercent,2020.

Investment Opportunities in the Rwandan Energy Sector 10
Categorisation of residential consumers is based on their energy consump-
tion rates as well as the national social stratification system: ‘Ubudehe
categories.’ Ubudehe means ‘collective action and mutual support to solve
problems within a community.’ In the tier system, Rwandans are catego-
risedon thebasisof their socioeconomic status;one’s categorydetermines
the levelof supportprovidedby thegovernment.32Thereare fourUbudehe
categories; the first category includes the poorest people in society while
the fourth category is for the wealthiest members of society. Electricity
consumption rates are linked to the Ubudehe category: people in tier
four have the highest consumption rates (�load’) and use most appliances.
Table 1.LOADLEVELS,INDICATIVEELECTRICAPPLIANCESANDASSOCIATED
CAPACITYTIERS(SOURCE:RWANDABEYONDCONNECTIONS,2018)
Loadlevel IndicativeelectricappliancesCapacitytiertipicallyneeded
topowertheload
3–49 WTask lighting, phone charging, radio
50–199 WMultipoint general lighting, television, computer, printer, fan
200–799 WAir cooler, refrigerator, freezer, food processor, water pump, rice cooker
800–1999 WWashing machine, iron, hair dryer, toaster, microwave
2000 Wor more
Air conditioner, space heater, vacuum cleaner, water heater, electric cookstove
Average20.8 kWh/month30
URBAN29.2 kWh/month
RURAL9.9 kWh/month
2000 RWF~ 2.15 USD 4700 RWF
~ 5.05 USD31
Very low load
Highload
Low load
Very high load
Medium load
TIER 1
TIER 4
TIER 2
TIER 5
TIER 3
30Forthe‘RwandaBeyondConnections’reportbasedonthemulti-tierframework(WorldBankincooperationwithAfDBandUN),extensiveresearchwasdoneonelectricityconsumption,affordabilityandwillingnesstopayin2017.31WorldBank,2018.32GovernmentofRwanda,n.d.33LocalAdministrativeEntitiesDevelopmentAgency,2020.
1,902,800people
489,700households
People with no means to own or rent homes of their own and can hardly put food on the table.
4,721,000people
1,198,600households
People who have part time small jobs and either own cheap houses or are able to pay rent.
5,410,200people
1,187,700households
People who do not need help from the government for survival. They include farmers, professionals, and business owners.
152,700people
66,400households
People deemed to be rich such as government officials from the level of director upwards, and large business owners.
THE FOUR UBUDEHE CATEGORIES33
12 3 4
ENERGY CONSUMPTION

Investment Opportunities in the Rwandan Energy Sector 11
3. Major trends in on-grid electrifi-cation In 2020, Rwanda has an installed on-grid energy capacity of 224.6MW.34
Rwandan on-grid energy capacity has tripled since 2010. 52.5 percent
comes from renewable energy sources. The government expects on-grid
energy demand to peak around 2024, reaching 282–376 MW.35 Around
this time, the government expect on-grid capacity to be around 290MW
(52percentof thetotalcapacityof560MW). In2019,REGdevelopedthe
Least Cost Power Development Plan (LCPDP), which defines the genera-
tion extensionplans for 2019–2025. There are ongoing projects forwhich
construction has started.Most projects are still in the pipeline and some
projects are on hold because the funding phase has not been completed.
HYDROELECTRIC POWER
The total current installed capacity of all hydroelectric power plants in
Rwanda is 98.5 MW. About 45 percent of on-grid energy in Rwanda is
generatedbyhydroelectricpower.36Therearefive largeoperationalpower
plantswithatotalcapacityofaround73MW.Thelargepowerplantsarenot
workingonfullcapacityduetoseveralreasonssuchasweatherconditions
influencingwaterlevels.Thelargehydropowerplantsaregeneratingpower
from river runs and lakes, and their details are visible in themap below:
HYDROELECTRIC POWER
Figure 8.ON-GRIDGENERATIONMIXRWANDA2019(SOURCE:REG,2019)
Figure 9.INSTALLEDCAPACITYNATIONALGRID2009–2017(SOURCE:MININFRA,2018)
0
50
100
150
200
250
201720162015201420132012201120102009
MW
86 96 101112
131
164 164192
218
HYDROPOWER 45%
DIESEL 27%
METHANE 14%
PEAT 7%
SOLAR 5.5%
IMPORT 1.5%
Mukungwa I Power Station (Lake Ruhondo, Northern Province)
Coordinates:CM93+8XNyakinama,RwandaInstalledcapacity:12MWOperationalcapacity:6MWDateofinstallation:1982MAXOP
Ntakura Power Station (Lake Burera, Northern Province)
Coordinates:GQF2+34Ruhondo,RwandaInstalledcapacity:11.5MWOperationalcapacity:2.6MWDateofinstallation:1959MAXOP
Nyabarongo I Power Station (Nyabarongo River, Southern Province)
Coordinates:2J6M+G7Bulinga,RwandaInstalledcapacity:28MWOperationalcapacity:13.5MWDateofinstallation:2014MAXOP
Ruzizi II Power Plant (Ruzizi river, border Rwanda-DRC)
Coordinates:FVRG+73Bukavu,DemocraticRepublicoftheCongoInstalledcapacityforRwanda:12MW(43.8MWtotal)Operationalcapacity:10.7MWDateofinstallation:2017MAXOP
Rukarara Hydroelectric Power Station Coordinates:GHJ3+M8Kabacuzi,RwandaInstalledcapacity:9.5MWOperationalcapacity:3.8MWDateofinstallation:2011MAXOP
34REG,2019.35MinInfra,2018.36MinInfra,2018.

Investment Opportunities in the Rwandan Energy Sector 12
TotalRwandanpotential forhydropowerhasbeenestimatedat400MW.
Thedomesticpotentialis250MWandthereisanadditionalregionalpotential
of 150MWwhen the use of shared water resources is optimised. In the
coming five years, full domestic capacity of 250 MW should be realised
following thedevelopmentof newandmoreefficienthydroelectric power
plants. These projects will raise hydropower generation by 173 percent.
In the LCPDP, five large hydroelectric power plant projects arementioned
to be developed with a total MW capacity of 137.5 MW: Nyabarongo II
(43.5MW),RuziziIII(48.33MW),GiciyeIII(7.2MW),RukararaVI(6.7MW),
Rusumo(26.7MW)andBihongore(5.4MW).37,38Thefirstfourprojectsare
extensionsofcurrent installedplants.Additionally,31MWwillbe installed
through eighteen smaller and micro hydro projects; of which 7 MW will
be installed by IPPs in 2020.39Moreover, the LCPDP states existing power
hydro-plantswillremainoperational.However,thereisnoindicationinthe
planwhetherthegovernment isplanningto improvetheircapacityornot.
THERMAL POWER
Thermalpoweraccountsfor27percentoftotalenergycapacityinRwanda.40
Diesel is themainsourceused tomeetdemandduringpeakhours.Diesel
is relatively expensive because it is imported and inefficient,whichmakes
the generation of electricity costly. Industrial users are charged slightly
higher prices during peak hours. Improved affordability is expected when
extra supply is provided during peak hours following the completion of
new hydro and peat projects (rather than diesel). There are five thermal
powerplantsusingdiesel. The two largestplants are Jabana (phase1and2)
andSO-Energy,whicharebothsituatedinthedistrictofKigali.41Theyhave
an installed capacity of 27.8 and 30 MW respectively. No new projects
will be developed in the future. The Rwandan government is focusing
on renewable energy and moving away from diesel-generated power.
METHANE GAS
Rwanda has a unique source of energy: Lake Kivu where methane gas is
extractedtogenerateenergy.LakeKivuissituatedbetweenRwandaandthe
DemocraticRepublicofCongo(DRC)andconsideredasharedenergysource.
There is no other lake in theworld that containsmethane gas in the same
proportions. The high levels of methane are caused by the surrounding
active volcanic region. The total lake contains 60 billion m3 of methane
and it is estimated that a total of 700MW of electricity can be generated
over a period of 55 years.42 The total potential for Rwanda is 350 MW.
At the moment, there is one power plant on Lake Kivu located in the
Rwandan part of the lake. Kivuwatt is owned by a British company called
Contour Global and has been operational since 2015. The plant produces
26 MW over a period of 25 years, supplying the national grid of Rwanda.
The plant is running at full capacity. The construction of two additional
plants is planned raising total capacity of Kivuwatt to 75 MW.43 This
project is still in the pipeline. A second project is under construction at
Lake Kivu. Symbion, an American-based energy company, is constructing
a plant with a generation capacity of 56 MW over a period of 25 years.44
37REG,2019.38Twolargeplants,RusumoandRuziziIII,areregionalprojectsandthenumberofMWinbracketsisthecapacityassignedtoRwanda.39REG,2019.40REG,2019.41REG,2019.42DLAPiperAfrica,n.d.43ContourGlobal,n.d.44Symbion,n.d.

Investment Opportunities in the Rwandan Energy Sector 13
PEAT
Seven percent of energy is generated using peat. The first peat power
plant in Rwanda was completed in 2017; it was a pilot project and the
first of its kind in Africa. The plant is located in Gishoma, South-West
Rwanda and generates 15 MW electricity supplying the national grid.
A second, larger plant with a capacity of 72 MW is currently under
construction. The new power plant is located in Gisagara, Southern
Province and owned by Turkish Mining and Electricity company Hakan.
SOLAR
Only5.5percentofon-gridelectricityinRwandaisgeneratedbysolarpower.
Theinstalledcapacityforthegenerationofsolarpowerislow.Therearethree
powerplants:Jali(0.25MW),GigaWatt(8.5MW)andNashoSolarPP(3.3MW).
Thetotalinstalledcapacityisaround12MW.However,capacityonlyreaches
twentypercentonaverage,sincetherearenoenergystoragefacilities.Most
energy is needed during evening peak hours when there is no sunlight.
However,duetothelackofstoragesurplusenergycollectedduringthedayis
lost.Thegovernment-ownedNashoplantisasolar-poweredirrigationproject.
The largest plant, GigaWatt is running at the lowest capacity of 14 percent.
REG has announced the development of a new solar plant including
a storage facility, generating 30 MW of electricity. At the moment,
feasibility studies are being conducted. Moreover, REG acknowl-
edges the high potential of solar PV in Rwanda. Nonetheless, the focus
areas of the Rwandan government are hydro, methane and peat,
which can be explained by the short lifespan of solar infrastructure.
SOLAR POWER
PEAT POWER
Rwamagana Solar Power Station (GigaWatt)
Coordinates:X9FG+HVCollineNawe,RwandaInstalledcapacity:8.5MWOperationalcapacity:1.19MWDateofinstallation:2013MAXOP
Jali Solar Energy Plant Coordinates:4288+6GJali,Kigali,RwandaInstalledcapacity:0.25MWOperationalcapacity:0.04MWDateofinstallation:2007
MAXOP
Gishoma Peat to Power Plant (Western Province)
Coordinates:9WJP+RCGishoma,RwandaInstalledcapacity:15MWOperationalcapacity:14.25MWDateofinstallation:2017MAXOP
Hakan Peat to Power Plant (Southern Province)
Coordinates:GXG3+GXMuyaga,RwandaInstalledcapacity:72MWOperationalcapacity:68.4MWDateofinstallation:2020(planned)MAXOP
Nasho Solar PP
Coordinates:WP3R+9XMurundi,RwandaInstalledcapacity:3.3MWOperationalcapacity:0.66MWDateofinstallation:2017MAXOP

Investment Opportunities in the Rwandan Energy Sector 14
ENERGY IMPORTS
Energy imports are very small with 1.6 percent of the on-grid electricity
being imported fromUgandaandDRC.452MWofelectricity is importedvia
the Kawanda-Birembo High Voltage Power Transmission Line. This project
is part of the Nile Equatorial Lakes Subsidiary Action Program (NELSAP) of
East-African countries. The power line starts in Kawanda, Uganda and ends
inGasabodistrictinKigali.46ThisprojectisfinancedbyAfDBandJapanInter-
nationalCooperationAgency(JICA).3.5MWelectricity is importedfromthe
Ruzizi I power plant in DRC. This plant can generate 30 MW of electricity
andhasbeenoperational since1957.Theaimof theRwandangovernment
istophaseoutimportsfromDRC.Rwandadoesnotseektoincreaseenergy
importsinthefuturewiththeexceptionoftheregionalprojectsoftheNELSAP.
TRANSMISSION OF ENERGY
The transmission network transports generated electricity from the main
source to sub-stations, after which electricity is distributed to end-users.
ExistingtransmissionlinesinRwandaaremainly110kilovolt(kV)and220kV
andnewtransmissionlineswillsupportthesamevoltage.Between2010and
2017, the lengthof transmission lines inRwanda increased from462km to
744km.Moreover,therearesixteenplannedprojectstofurtherexpandthe
transmissionnetwork,forwhichfundinghasalreadybeensecured.Addition-
ally,therearetwentyprojectsinthepipeline,forwhichfundinghasnotbeen
secured. Theseprojects supportexpansionof transmission lines throughout
the entire country but the Kigali ring has been prioritised since 2016.
Transmission and distribution lines are not fully efficient: in 2018, capacity
losses were estimated to be around 22 percent. Goal is to reduce this to
fifteenpercentby2024.Tocompare:capacity losses intransmission lines in
theNetherlandswere4.8percentin2014,andglobalaverageis8.5percent.47
Annually,approximately22percentoftransmissionsarelost.Thefinancialcosts
arecurrentlyestimatedat28millionUSDandcan increase to102millionUSD
considering rapidly growing energy production and consumption rates.48
Losses are mainly caused by technical problems. Many transmission lines
consist of long medium voltage (MV) feeders, low voltage (LV) lines and
inefficient single-phase lines.49 Moreover, deficient planning results in
the incompatibility of lines or inefficient connections. Finally, poor work-
manship and old equipment are considered as major cause of technical
losses. Furthermore, there are also commercial losses resulting from faulty
accounting and record-keeping, theft and non-payment by customers.
Especially, non-payment by large customers causes major financial losses.
DISTRIBUTION OF ENERGY
Thewiringof theenergydistributionnetwork inRwanda is16,000km long,
of which 35 percent is covered by MV lines and 65 percent by LV lines.50
Currently, the distribution network has a suboptimal performance demon-
strated by the number of power outages each year. In 2016–2017, REG
customersfacedpoweroutagesfor36hoursonaverage.Theaimistoreduce
this number to fourteen hours by 2024.51 91.7 percent of grid-connected
householdsexperiencemorethanfourinterruptionsinelectricitysupplyeach
week.52Thisnumber includesbothurbanandruralareas,butoutagesseem
tooccurmoreoften inurbanareasbecauseof thegrid-connectiondensity.
The government has launched various projects to reduce power outages.
Several rehabilitation and expansion projects of the LV and MV networks
have started. 350 km of wiring will be added to the distribution network.
Thegovernmentisalsoupgradingsubstationslinkingtransmissionanddistri-
bution networks. Electricity connections for non-residential and industrial
users (public,commercialcentres, factories,hotelsandoffices)areprioritised
becausethemarginalcostsarerelativelylowincomparisontohouseholdsin
scattered,remoteareas.Moreover,residentialusersconsumealowamountof
electricity,whichreducestheincentivetotargetthisgroup.Thegovernment
aimstoconnectallproductiveusersby2022.Also,thedistrictsofHuyeand
Gisagarahaveahighprioritysinceaccesstoelectricityisverylowintheseareas.
FUNDING MECHANISMS
Thegovernmentmostly usesmixed fundingmechanismsblending govern-
ment, development partners and private investors resources to finance
transmission and distribution projects. The projects require large capital
investments, for which the government wants to involve development
partners and the private sector as well. Transmission projects are mainly
funded by the Rwandan government, AfDB and African Development
Fund (ADF). The biggest challenge is to mobilise funds for new trans-
mission projects. No funding has been secured for the 2020 projects
and this can result in severe delays; especially considering the impact
of the COVID-19 pandemic on economic growth around the world.
45REG,2019.46UETCL,2019.47WorldBank,2018.48MinInfra,2018.49MinInfra,2018.50REG,2019.51Thisnumberonlyconcernsofficiallyregisteredlong-lastingoutages.Additionally,manyRwandansexperience(short)outagesinrainyperiods.52RwandaBeyondConnections,WorldBank,2018.

Investment Opportunities in the Rwandan Energy Sector 15
GRID CONNECTION FEES
Consumption rates of both urban and rural households are insufficient
to publicly fund the cost of a grid connection. An average monthly
electricity consumption between 130–140 kWh is needed to break-
even.53 However, these high connection fees are also a major obstacle
for consumers. At themoment, thewillingness to pay (WTP) of uncon-
nected households is low, especially in rural areas (see figure below).
In 2017, connection fees were roughly 56,000 RWF (nearly 59 USD).
48 percent of customerswere notwilling to pay because the costs are
simply too high; connections fees are higher for consumers located
further away from the grid. The Rwandan government acknowledges
that the fees are a barrier to the target to quickly expand grid-access.
ELECTRIFIED HOUSEHOLDS
ELECTRICITY SERVICE
CONNECTION TO THE GRID:
ELECTRICITY USAGE:
AVERAGE MONTHLY CONSUMPTION IS 20.8 KWH
URBAN29.2 kWh/month
URBAN77.4%
RURAL9.9 kWh/month
81.3% of electrified households have
at least 8 HOURS of electricity supply a day,
at least 3 HOURS in the evening
49.6% receive electricity
23 HOURS a day, 7 DAYS a week
66.8% very low–load appliances
20.9% face VOLTAGE ISSUES(such as low or fluctuating voltage)
91.7%
more than FOUR electricity
DISRUPTIONS a week
RURAL15.6%
48.3%
2.4%
34.8%
14.4%
54.7%
36.5%
2.4% 2.0% 1.6% 2.8%
Figure 10.WILLINGNESSTOPAYFORAGRIDCONNECTIONINCREASESWHENPAYMENTISSPREADOVERTIME(SOURCE:RWANDABEYONDCONNECTIONS,2018)
Figure 11.OVERHALFOFUNCONNECTEDHOUSEHOLDSARENOTCONNECTEDTOTHEGRIDBECAUSEOFHIGHCONNECTIONCOST(SOURCE:RWANDABEYONDCONNECTIONS,2018)
willingtopay56,000RWFupfront
Connectioncostistooexpensive
Gridistoofar
Rent/landlord'sdecisionMonthlyfeeisexpensive
Other
Applicationsubmitted,waitingforconnection
willingtopay28,000RWFupfront
notwillingtopayatgiventerms
willingtopay56,000RWF(15,000–41,000over24months)
VOLT
53RuralElectrificationStrategy,MinInfra,2016.

Investment Opportunities in the Rwandan Energy Sector 16
4. Opportunities in on-grid electri-ficationInthepastyears,on-gridelectrificationhasbeenthemainfocusinRwanda
whereas the off-grid and clean cooking sector are still in the early stages
of development. Consequently, the on-grid sector has matured, energy
supply isplentifuland investmentopportunitiesare limited:manyprojects
are planned or ongoing. The installed capacity of MW will provide an
energy surplus following the completion of multiple large-scale national
and regional projects. Rwanda follows the regional trend of oversupply.
At this point, the government is not approving new projects nor signing
new contracts. The main challenge is the financing of the planned (and
ongoing) hydro and peat projects, which are at risk of being delayed.
Thereareopportunities in termsof improvingand layingout transmission
lines.REGisworkingontheimprovementoftransmissionlinesbutisinneed
ofinvestorsand/orinternationaldonorstoexpanditsoperations.Therefore,
opportunities exist related to infrastructure development and equipment.
Also, opportunities exist with regard to technical support, projects design
andtrainingoftechnicians.TheRwandangovernmenthascurrentlysixteen
transmission projects ongoing, which are partly funded by AfDB, EU and
theGermanNationalDevelopmentBank KfW.54 Transmissionprojectswith
anapproximatevalueof50millionareinthepipelineandrequirefunding.
Large-scale grid projects
• Atthemoment,therearenoopentenders.Suppliersmightbeableto
provideservicesorinputsforprojectssuchasequipment,consultancies
andtraining.Rwandangovernmenthasawardedninelarge-scale(>5MW)
projects and twelve small-scale (<5MW)projects to increase theMW
generation capacity in Rwanda. Two large-scale projects are regional
projectscollaboratingwithotherEast-Africancountries.
Transmission lines
• Thereareoverseventeenprojectsongoingaimingtoupgradeandexpand
the transmission line network. Several of these projects still require
funding.Opportunitiesexistinrealizingtheinfrastructuredevelopment,
providingequipment,technicalsupport,projectsdesignandtrainingof
technicians.
• Transmission network requires general improvement.MV and LV lines
needtobeshortenedtoreduceinefficiencyandlosses.
Substations
• Mostoperationalsubstationsareoutdatedandcausebadconnections.
Thenumberofoutages (which currently runat 36hours a year) can
bereducedthroughtheupgradingofsubstationsandimprovinglinkages
withthetransmissionnetwork.
• In remote areaswithpoor grid connections, productiveusers andor
public institutions could serve as substations. This would allow for
connectingcurrentlyoff-gridhouseholdsandimprovetheconnectedness
ofalreadyon-gridhouseholds.
Smart Meters
• Non-paymentratesofcustomersareratherhigh.Anopportunityliesinthe
distributionofsmartmeterstoavoidnon-paymentbylarge(r)customers.
• Accountingandrecord-keepingareaburdensometaskandtheprocesses
arepronetomistakes.Smartmeterscanreducefinancialerrorsresulting
frommiscalculations.
Awareness
• 6.5percentofelectricitygenerationislostduetocommerciallosses.
A large share of these losses is caused by illegally tapping electricity
fromthenationalnet.Companiescancollaboratewiththegovernment
toraiseawarenessontherisksofenergytheft. Illegallytappingenergy
canbeextremelydangerous,especiallywhenelectricityisdrainedfrom
MVorHVlines.
54Forthedistributionprojects,1,5milionUSDisprovidedbyMinEcoFin(Rwanda),73millionUSDbyAfDB,3.4millionbytheWorldBank,11millionbyEnabel.About46.4millionUSDstillneedstoberaised.

Investment Opportunities in the Rwandan Energy Sector 17
5. Major trends in off-grid electrifi-cationThe off-grid sector in Rwanda is developing but progress has not been
made as fast as in the on-grid sector. The off-grid sector should target
rural areas because of the low connection rates and high connec-
tion fees. Moreover, off-grid electrification is supposed to target
households rather than productive users. Only productive users located
800 meters or further from a grid infrastructure can be connected
to an off-grid source. The assigned areas for off-grid expansion are
visible in the NEP, which defines the target areas for off-grid sources.
Moreover, the Rural Electrification Strategy (RES) and NEP have
delegated the responsibility for off-grid development to IPPs.
The RES extensively describes the role of the private sector as
a key player and the possibilities to obtain financial support
from the government. The RES is divided into four programmes:
• Establishmentofamechanismtoallowlow-incomehouseholdstoac-
cessmodernenergyservicesthroughbasicsolarsystems;
• Establishmentofarisk-mitigationfacilityfortheprivatesectortomake
suresolarproductsareavailableonanaffordabletariffforthetarget
group;
• Developmentofmini-gridsbytheprivatesectorwithastrictoverviewof
thegovernment,whoidentifiessitesforthegrids,anddevelopmentof
financialframeworks;
• GovernmentcontinuestofocusonEARP.
After the launch of the RES and NEP, there was an impressive increase
in households, mainly rural, being connected to off-grid sources. This
rapid increase was mostly realised through SHS and to a lesser extent
by the more recent development of mini-grids. The government recog-
nises the high costs of off-grid electrification remain problem since most
target groups are low-income households with low consumption rates.
Looking at the existing policies and future plans, main focus is on the
development of SHS and more specifically, stand-alone solar systems.
SOLAR HOME SYSTEMS
The climate in Rwanda is suitable for SHS with slight seasonal variation:
daily solar irradiation ranges from 4 kWh/m2 in the north to 5.4 kWh/m2
in the south of the country.56 The Eastern and Southern Province have
the highest potential for solar power. There are different types of SHS
ranging from Solar Lighting System (SLS) powering two or more light
bulbs and have a phone charging capability, to SHS powering two or
more light bulbs and appliances such as a television, iron, microwave,
or refrigerator.57 Most Rwandans with an off-grid electricity connection
use a stand-alone SHS; there is no connection to the grid whatsoever.
CONNECTION TO AN OFF-GRID SOURCE55
BEFORE 20150%
201811%
201914%
55MinInfra,2018;REG,2019.56Get.Invest,n.d.57RwandaBeyondConnections,2018.

Investment Opportunities in the Rwandan Energy Sector 18
Businesses looking to enter the Rwandan market for SHS, should
follow strict governmental guidelines. All SHS on the Rwandan market
are required to meet certain minimum standards. Businesses need to
make sure their SHS product meets these criteria, which define ‘basic
access to energy.’ Otherwise, their product does not enable Rwanda
to achieve SDG 7. Systems which do not meet these standards cannot
be imported. A few examples of requirements are specified below:
• Quality of the system: systemsneed a proof of conformity recognized
under the International Electrotechnical Commission (IEC) Conformity
Assessmentand/orLightingGlobal;
• Technicalspecificationoflamps58,solarPVpanels59,andbatteries60;
• Warranty:productsbelowtier1(basicSLS)requireatleastone-yearwar-
ranty,tier1hasaminimumoftwo-yearwarranty(basicSHS),andtier2
andabovehasaminimumofthree-yearwarranty(moreadvancedSHS);
• Agreementbetweenpurchaserandsupplier:itneedstocoverresponsi-
bilitiesofbothparties,resolution/complainthandling,aftersalesservices
andatimeline.
The private sector has introduced innovative businessmodels to improve
financialaccessofhouseholdstoSHS.Servicemodelsseektoremovehigh
upfront costs for customers. In 2016, 55.5 percent of the Rwandan popu-
lation was living below the poverty rate earning 57–59 USD per month.
Meanwhile, the price range for amedium-size SHSwas 50–100USD. The
mainbusinessmodel isPayAsYouGo (PAYG): thismodality isused for96
percent of off-grid SHS sales.61 PAYG requires customers to make daily or
weekly instalment payments (usually) through Mobile Money (MoMo).
The SHS company has the ability to disable the system if the required
amount has not been paid.62 The PAYG system is designed to mitigate
risks associated with giving loans to customers with no credit history;
the prepaid system takes away the risk of non-payment of high costs.63
Nonetheless, it seems difficult to keep default rates and non-payment
low when households with lower and irregular incomes are reached.64
At the moment, SHS are distributed by both local and foreign private
sector investors.65 Many SHS companies are from Europe and North
America. Most SHS kits are produced in China. A Dutch company, NOTS,
is planning on moving assembly activities and subsequently, produc-
tion of SHS to Rwanda.66 Often these companies have received grants or
lenient loans from development organisations, larger private companies
or universities. Furthermore, the Rwandan government is developing
two financial schemes to raise household access to SHS: a subsidy
scheme targeting consumers and a support scheme targeting producers.
The SHS subsidy scheme for consumers is based on the Ubudehe cate-
gories. It targets households in tier 1, 2 and 3; no subsidies are provided
tohouseholds intier4and5.Most supportwill beavailable for themost
affordable SHS products developed for households in the lowest tier. The
supportplanswereannouncedin2019buthavenotbeenimplementedyet.
In addition to the subsidy scheme for consumers, the government
has developed financial support system for investors (IPPs) called the
Scaling up Renewable Energy Program (SREP) fund. This programme
has not yet been launched. It will offer the following ways of support67:
• Companies have access to riskmitigation facilities for SHSboughtby
householdsandproductiveusersinUbudehetiers2,3and4.68
• CompaniesinvestinginSHScanacquireloanstoinvestintheirSHSbusiness.
• HouseholdsinUbudehetiers2,3and4cangetaloanfromtheSavings
andCreditCooperatives(SACCO)tobuyaSHS.Loansarealreadybeing
provided.69
Figure 12.SOLARLIGHTINGPRODUCTSALESBYPAYMENTMODALITY(SOURCE:ENDEV,2018)
PAYGO 96%
UPFRONT SALES 4%
Figure 13.PLANNEDTARGETEDSUBSIDIESTOINCREASETHEAFFORD-ABILITYOFSOLARHOMESYSTEMS(SOURCE:MININFRA,2019)
UBUDEHE 3
UBUDEHE 2
UBUDEHE 180–90%
55–65%
30–40%
Range of subsidy level
58LED,>120lumens,2Wpowerconsumptionand>20,000lifetimehours.59CrystallineorPolySi,12/24/48Vandminimum12-WattPeak.60Deepcycle,maintenancefree,storagecapacityof60Whanddepthofdischargeof80percent.61EnDev,2018.62PowerAfrica,2019.63PowerAfrica,2019.64EnDev,2018.65ThefollowingSHScompaniesareactiveinRwanda:AptechAfrica(UG),Ared(IT/RW),Azuri(UK),BBOXX(UK),DASSYEnterprise(RW),DavisandShirtliff(RW),GreatLakesEnergy(RW),Ignite(UK/US),Mobisol(DE),Munyax(BE),NOTSsolarlamps(NL),RENERG(DE),ServeandSmileLTD(RW)andZola(US).66NOTS,2020.67MinInfra,2019.68Facilitieswillbe(partly)fundedbytheSREP.SREPhasatotalbudgetof50millionUSDfundassignedtoruralelectricityaccessexpansion.69ItisexpectedhouseholdsinUbudehetier2and3willnolongerneedloansoncethesubsidyschemeisintroduced.HouseholdsinUbudehetier4cannotmakeuseofthesubsidyschemeandcancontinuetoaccessloans.

Investment Opportunities in the Rwandan Energy Sector 19
An upcomingway by companies to finance off-grid electrification projects
is international crowdfunding. In this way, companies raise the initial
funds required to produce a high number of SHS systems, which can be
donatedtolowincomehouseholds.Thistrendhasbeenvisiblethroughout
East Africa. In 2018, 19 USDmillion of funding for SHS in East Africawas
supplied through crowdfunding, compared to 2.5 USD million in 2017.70
The main issues that arise with SHS are the limited purchasing power,
customers’ lack of understanding of the credit system, remaining uncer-
taintyamongthepopulationwithregardtothepotentialconstructionofgrid
connections, and increasing competition enabling customers to switch to
cheaper alternatives.71 These issuesmake it difficult for companies in SHS
tobecomeprofitable.ThefirstSHScompaniesenteredtheRwandanmarket
in 2014 and only recently in 2019–2020, some managed to break even.
MINI-GRIDS
There are three types of mini-grids: solar power, hydropower and
diesel. The latter is the least popular because of the limited supply of
diesel in remote areas, high operational costs and fossil fuel emissions.
Therefore, theRwandan government encourages private sector investors
to develop hydro and solar mini-grids. Mini-grids are considered a
potential source of energy for households and businesses located in
the most remote areas. These consumers are highly unlikely to get a
grid connection. Companies needed to wait for the finalisation of the
NEP, in which the zones for mini-grid development were determined.
Nowadays, mini-grid permits are still limited and expensive.72 It is obliga-
tory for companies to do extensive market research to assess potential
customers’ electricity demand prior to the installment of a mini-grid.
Themarketofmini-gridsupplyinRwandaisstillintheearlystagesofdevel-
opment. Thereare currently six companiesoperating inRwanda (Table2).
Mini-grid development requires a high initial investment and seemsmore
financially challenging in comparison to SHS in Rwanda. Installment and
material costs are high, whilst energy consumption rates and number of
customersare low.Thepriceof amini-gridproducingone kW range from
4,000–7,000 USD (including installment and transportation) and costs
per customer range from 250–650 USD.73 Some companies manage to
reduce costs per consumer connecting more households to a mini-grid;
MeshPower has connected on average 35 households to one mini-grid.
Table 2.MINI-GRIDCOMPANIESOPERATINGINRWANDA(SOURCE:ENDEV,2018)
Company Technology Location SizeNo of households connected
Grant support Headquarter locations
Neseltec Solar Kirehedistrict 30kW 183 EEP Rwanda
ECOS Hydro Muhangadistrict 11kW 303 EnDev Rwanda
RENERG Solar Nyamashekedistrict 30kW 121 USADF Germany
MeshPower SolarMultipleinBugeseraandNgomadistricts
1kWeach,57sites
2,046 EEP&EnDev USA
MeshPower Solar Bugeseradistrict 4kWAC/DC 78 None USA
Absolute Energy Solar Gatsibodistrict 50kW 505 EnDev UK
ARC Power Solar Nyamata,Bugeseradistrict 20kW 200RenewableEnergyPerformancePlatform(REPP)
UK/Rwanda
ARC Power Solar Nyamata,Bugeseradistrict 40kW 290RenewableEnergyPerformancePlatform(REPP)
UK/Rwanda
70PowerAfrica,2019.71EnDev,2018.72RURA,2015.73EnDev,2018.Thisnumberisbasedonanaveragemonthlyconsumptionof1kWhperruralhouseholdinRwanda.

Investment Opportunities in the Rwandan Energy Sector 20
Nonetheless, it seems unlikely mini-grid electricity will be affordable for
low-income households in the absence of government subsidy schemes
or other (donor) financing systems. The two main mechanisms used to
finance mini-grid development in Rwanda are grants and debt financing.
Most companies finance their operations through grants, which cover
40-70 percent of the investment costs. Grants are a type of results-
based financing (RBF) creating an initial risk for mini-grid developers.
Furthermore,theRwandangovernmenthasdesignedasubsidyandfinancial
support system formini-grids in the RES. The systemwould provide risk
mitigationfacilitiesformini-gridinvestors,targetinglow-incomehouseholds
andproductiveusers.74Companieswillhavethepossibilitytoacquireloans
toinvestintheirmini-gridbusiness.Whenamini-gridprojectisunsuccessful,
the government shares the risk of failure with private investors (IPPs).75
For example, amini-grid projectmight fail due to environmental reasons:
the source of a mini-hydro source can run dry following changing rain
patterns.Thissubsidyandfinancialsupportsystemhasyettobelaunched.
Solar mini-grids and nano-grids are ‘standalone’ energy distribution
networks powered by solar panels. Standalone means they are not
connected to the national grid.76 A major advantage of solar mini-grid
systems is the flexibility: they can be installed anywhere with suffi-
cient solar potential. The greatest disadvantage is the short lifespan of
solar panels, which need to be replaced approximately every ten years.
Currently, there are six sites with solarmini-grids and 57 sites with nano
mini-grids.77 In total, these mini-grids connect 3,726 households. 1 kW
nano-grid systems can supply an average of 35 households. Full potential
of 1 kW per hour (kWh) can be reached under optimal circumstances.
Hydro mini-grids or pico-hydro78 grids are powered by a source of water
withasufficient,constantflowofwater.Atthemoment,thereisoneopera-
tionalhydromini-gridinRwandaconnecting303households.Theadvantage
of hydromini-grids is the long life-span and lowmaintenance. The disad-
vantages are the dependence on high material costs, logistics and water
(rainfall). The latter disadvantage is most problematic: climate change
seems to result in shorter, more intense intervals of rainfall in Rwanda.
74MinInfra,2019.75Facilitieswillbe(partly)fundedbytheScalingUpRenewableEnergyPrograminLowIncomeCountries(SREP).SREPhasatotalbudgetof50millionUSDfundassignedtoruralelectricityaccessexpansion.76Nano-gridscangenerate1kWorless,andmini-gridsgenerateabove1kWelectricity.77All57nano-gridsweredevelopedbyMeshPower.78Pico-hydrogridsarethosemini-gridswithapoweroflessthan5kW.

Investment Opportunities in the Rwandan Energy Sector 21
6. Opportunities in off-grid electri-ficationThere aremajormarket opportunities in off-grid electrification in Rwanda
considering the urgent need to connect a high number of remote house-
holds: so far only fourteen percent of the Rwandan population has been
connectedtoanoff-gridsource,meaninganother34percent(approximately
1.2million households) still need to be connected by 2024. Furthermore,
the government has put the private sector in the driving seat to realise
quick expansion. Nonetheless, it remains a challenge to provide low-in-
come households in remote, rural areas with access to energy. Themain
issues hampering the rapid distribution of SHS andmini-grids are the low
purchasing power and energy consumption rates of Rwandan customers.
Eventual returns on investment remain unclear. Some SHS companies
have managed to break-even after 5–6 years of operations in Rwanda.
Allmini-grid companies are still dependent on loans and grants.However,
there are planned and ongoing government and donor programmes to
provide low-income households with access to energy via SHS or mini-
grids. Off-grid electrification is a domain of aid and trade solutions.
Innovative concepts are needed taking a multi-stakeholder approach
engaging the private sector, government and development organizations.
SOLAR HOME SYSTEMS
Product development
• In2016,55.5percentoftheRwandanpopulationwas livingbelowthe
povertyrateearning57-59USDpermonth.Meanwhile,thepricerange
foramedium-sizeSHSsoldonthelocalmarketwas50–100USD.
ͷ Improvethecost-efficiencyofSHSproductsandespecially,reduce
operatingexpensestoincreaseaffordability.
• MosthouseholdsareunabletoaffordtheirownSHS,buttheymightbe
abletoshareone.
ͷ ExploreopportunitiestocreateSHSthatcanbesharedbymultiple
householdsintermsofdesignandbusinessmodel.
• Thereareproductiveusers(suchasshopsandsmallfactories)whocan
purchasehigherelectricitygeneratingSHSkits.Theseuserscouldserve
asahostandprovidesurroundinghouseholdswithelectricityservices.
ͷ Identifyunconnectedproductiveusers,whocouldbecomehosts
forsurroundinghouseholds.
Local production
• MostSHSkitsarecurrentlybeingsourcedfromChina.Onecompanyis
investigating the option to set up a local assembly or production line.
Preferencefor ‘madeinRwanda’productscanprovidecompanieswith
accesstoinvestmentincentives.
ͷ ExploreopportunitiestoassembleorproduceSHSkitslocally.
• TherearesafetyissueswithaffordableSHSkitsonthemarket:stronger
equipmentandwiresareneededtoimprovethequalityofsystems.
ͷ DevelopstrongerSHSproductsfocusingonwiring.
Electricity Storage
• Mosthouseholdsdonothaveaccess toenergystorage facilities,while
energyconsumptionratespeakatnight.
ͷ Explorewaystoimprovestoragecapacityandtoenablethesharing
ofstoragecapacityamongneighborsorproductiveusersnearby.

Investment Opportunities in the Rwandan Energy Sector 22
Payment method
• WTPforSHSincreaseswhenhouseholdsareallowedtopayininstallments.
ͷ UseinnovativebusinessmodelsbasedonaPAYGsystemorprovide
micro-loanstohouseholds.
• Customerloyaltyislimited,whichresultsinhightransactioncosts.
ͷ Improvecontractsandcustomerrelationstoavoidcustomersfrom
switchingtocompetitorswithoutnotice.
Financial model
• Householdsareunable topay theactualpriceofSHSand thegovern-
menthaslimitedoptionsofsupport.Start-upandoperationalcostscan
potentially be coveredbydonors, private investors, universities. These
actorshaveprovedareliablesourceofincomeforothercompanies.
ͷ Tapintoalternativefinancialflowstosupportthebusinessmodel.
• Crowdfunding is an upcoming financing source, which has recently
gainedpopularity.Companiesraisetheinitialfundsrequiredtoproduce
ahighnumberofSHSsystems,whicharesubsequentlydonatedtolow
incomehouseholds.
ͷ Launchacrowdfundinginitiativetoscaleupabusiness.
• SREPfundandUbudehesubsidieswillbelaunchedsoonprovidingfunds
toreachlow-incomehouseholds.
ͷ Benefit from financial support provided to SHS companies and
consumers.
MINI-GRIDS
Product development
• InternationalmarketpricesofsolarPVpanelsarefalling.Opportunities
inthemini-gridsectoraregrowingforcompaniesthatmanagetoreduce
theirproductioncosts.
ͷ Improvecost-efficiencythankstoreducedcostsofinputs.
• Developpartnershipstrategiesbetweencompaniestolowerthecostof
mini-griddevelopment.
Production and installation
• Productioncostsformini-gridsarecurrentlyveryhigh.
ͷ Exploreopportunities for producing kits andmini-grids locally to
reducecosts.
• Installationandmaintenancecostscanbereduced followingthe in-
creasingavailabilityofskilledtechniciansinRwanda.
ͷ Providetrainingtoincreasethenumberofqualifiedtechnicians.
Payment method
• Themostsuitablepaymentmethodsforhouseholdsconnectedtoamini-
gridarePAYGandpaymentsininstallments.
ͷ Introduceflexibletariffsthatallowcustomerstoswitchtohigher
orlowertariffswhenevernecessarytoreducenon-paymentrates.
Financial model
• Financingofmini-gridswilllikelyrequireblendedpublic,donorandpri-
vatefunds.Closecollaborationwithgovernmentinstitutionsanddonors
isneededtodesignsuitableblendedfinancemechanismsandmitigate
investment risks. The Rwandan government iswilling to guarantee for
around50percentoftheinvestmentincaseoffailure.
ͷ Tapintoblendedfinancetofundmini-griddevelopmentengaging
donors,publicandprivateactors.
• Today’s competitivemarketmakes it difficult to generate investments.
Hence,itisnecessarytolookintoalternativefinancingmechanisms.
ͷ Usecrowdfundingtoraisethefinanceforthemini-grid.
• Mosthouseholdscannotaffordthehighenergyprices.Financialsupport
forSHScompanieswillbecomeavailableviatheSREPfund(expected
in2021)andcanreducecostsforhouseholds.SREPwillfundamaximum
of37percentoftotalfinancingcosts.
ͷ Benefit frompublicfinancial supportprovided toSHScompanies
andconsumers.

Investment Opportunities in the Rwandan Energy Sector 23
7. Major trends in clean cookingSDG7 ‘access to affordable, reliable, sustainable and modern energy’ also
includes access to clean cooking facilities. The transition to clean cooking
is important because traditional cooking has a severe negative impact on
thenaturalenvironmentandpublichealth.Traditionalcookingrequiresthe
use of biomass,mostly firewood and charcoal, of which the sourcing is a
majorcauseofdeforestation.79Also,biomass isahighlypollutingand inef-
ficient energy source causingup to 25percent of black carbon emissions.
Moreover,traditionalstovescausehouseholdairpollutionandposesecurity
risks;especiallyforwomenwhopreparethefamilymeals.Cookingfacilities
are qualified as ‘clean’ on the basis ofWorld Health Organization (WHO)
standardsforhouseholdairpollutionlevelsbasedontheemissionlevelsof
particulatematterandcarbonmonoxide.Availableoptionsforcleancooking
includeelectricity,gas,ethanol, solarandhighperformingbiomassstoves.
Traditionally, Rwandans only used wood as their cooking fuel. Between
1990 and 2005, the use of wood was 60 percent.80 Moreover, Rwandans
consume a high amount of beans,which have a long cooking time. There
isstill littleawarenesswithregardtothehealthproblemscausedbytradi-
tionalcookingpractices.Nowadays,eventhoughalternatives likeLiquefied
Petroleum Gas (LPG) are available on the market, people still prefer to
use wood because of tradition. This is especially the case in rural areas.
At thismoment,98percentof theRwandanpopulationstillusesbiomass for
cooking:wood,charcoalanddung.8191percentofhouseholdsstillrelyonthe
most inefficient type of biomass: firewood, which households collect every
day for 40-80 minutes. On average, households consume around 1.8 tons
offirewoodperyear.82Thetotalvalueofwoodusedforcooking isdifficult to
measurebecauseitisgatheredratherthanbought.80percentoftheRwandan
populationusescharcoalascookingfuel.Themarketofcharcoal(about150.000
tons)accountsfortwopercentofGDP,withatotalvalueof50millionUSD.83The
Rwandangovernmentaimstoreducenumberofhouseholdsdependentontradi-
tionalcookingtechnologiesbyfiftypercentby2024.84Furthermore,MinInfrahas
developedtheBiomassEnergyStrategytoreducetheamountofbiomassused
inRwanda.Thestrategyfocusesontheimprovedmanagementofwoodbiomass
resources, promotion of alternative fuels and efficiency of biomass usage.
79InRwanda,deforestationcauseserosion,landslidesandfloods.80NationalTreeFoundation,n.d.81FAO,2019.82FAO,2019.83GlobalAllianceforCleanCookstovesRwandaMarketAssessmentSectorMapping,2012.84MinInfra,2018.
Figure 14.CHANGESINBIOMASSUSEANDALTERNATIVEFUELACCESS2018–2024(ESSP,2017)
0
20
40
60
80
100
500000
1000000
1500000
2000000
2500000
100000
200000
300000
400000
2018/19 2019/20 2020/21 2021/22 2022/23 2023/24
2018/19 2019/20 2020/21 2021/22 2022/23 2023/24
Householdsusing firewood
Householdsusing alterna-tive fuels
Householdsmoved offfirewood

Investment Opportunities in the Rwandan Energy Sector 24
TherearemanytypesofImprovedCookstoves(ICS)ofvaryingqualityinterms
ofhealthandsafetystandards.TheGlobalAllianceforCleanCookstoves(GACC)
hasdefinedtiers(0-5)torankthequalityofstovesbasedontheWHOguide-
lines. Tier0 stovesareof the lowestquality includingfirewood stoves. Tier5
stovesarethehighestqualityincludingLPG,solarandelectricstoves.Improved
biomasscookingstovesbelongintier4:onlytier5stovesareconsideredclean
onthebasisofWHOguidelines.Nonetheless,tier4stovescanbeusedastran-
sitionalsolutionsbeingmuchsaferthantraditionalstoves.85Thereplacementof
biomasswithalternativecleancookingfuels(LPGandelectricity)isusuallytoo
expensiveforthelow-incomegroups.Only6.5percentoftheRwandanpopu-
lationcurrentlyusesdifferent typesofstovesmixingbiomassandclean fuels.
In Kenya, the uptake of ICS has beenmuch faster (Figure 16). This increase
can be explained by the fact that Kenya is a LPG-producing country, which
makes LPG distribution cheaper and widely available. Moreover, the usage
ofPay-As-You-Goand smartmeters for LPG is widespread,whichmakes this
fuelmoreaffordable for low-incomegroups.Kenyaalsohasmultiple factories
where ICS are being produced. Also, there is an ICS testing centre in Kenya
where official certificates are obtained for produced cookstoves. Rwandan
producers have to send stoves to Kenya for testing to obtain certification.
Figure 16.ACCESSTOCLEANFUELSANDTECHNOLOGIESFORCOOKING(%OFPOPULATION)(SOURCE:WORLDBANK,2019)
Figure 15.SEGMENTATIONOFANNUALCHARCOALMARKETVALUEIN2008(MILLIONUSD)
Retail6.6 million USD
Transport19.7 million USD
Remains in rural areas26.3 million USD
85GACC,2019.
Above: Firewood-based ICS from BURN Kuniokoa (Kenya, USA) on the left; Charcoal-based ICS from Ecozoom (Kenya, USA) on the right.Below: Charcoal-based ICS from GGS (Geni Green Solutions, Rwanda)

Investment Opportunities in the Rwandan Energy Sector 25
ATTRIBUTES TIER 0 TIER 1 TIER 2 TIER 3 TIER 4 TIER 5
COOKING EXPOSURE
Emission: Fuel Firewood,dung,twigs,leaves,ricehusks,processedbiomasspelletsorbriquette,charcoal,kerosene
Biogas,ethanol,highqualityprocessedbio-masspelletsorbriquettes
Electricity,solar,LPG
Emission: Stove design
Three-stonefire,tripod,flatmudring,traditionalcharcoalstove
ConventionaloroldgenerationICS
ICS+chimney,rocketstoveorICS+insulation
Rocketstovewithhighinsulationorwithchimney,ad-vancedinsulationcharcoalstoves
Rocketstovewithchimney(wellsealed),rocketstovegasifier,advancedsecondaryaircharcoalstove,forcedair
Ventilation: Volume of kitchen
Lessthan5m3 Morethan5m3 Morethan10m3 Morethan20m3 Morethan40m3 Openair
Ventilation: Structure
Noopeningexceptforthedoor
1windowMorethan1window
Significantopenings(largeopeningsbeloworaboveheightofthedoor)
Verandaorahoodisusedtoextractthesmoke
Openair
Ventilation level Bad Average Good
Contact time
Morethan7.5hours
Lessthan7.5hours
Lessthan6hoursLessthan4.5hours
Lessthan3hoursLessthan1.5hours
Bad Average Good
COOKSTOVE EFFICIENCY
ISO's voluntary performance targets (TBC)
Lessthan10% Morethan10% Morethan20% Morethan30% Morethan40% Morethan50%
CONVENIENCE
Fuel acquisition (through collec-tion or purchase) and preparation time (hours per week)
Morethan7hours Lessthan7hours Lessthan3hoursLessthan1.5hours
Lessthan0.5hour
Stove preparation time (minutes per meal)
Morethan15minutesLessthan15minutes
Lessthan10minutes
Lessthan5minutes
Lessthan2minutes
SAFETY OF PRIMARY COOKSTOVE
Seriousaccidentsoverthepast12monthsNoseriousaccidentsoverthepastyear
AFFORDABILITY Levelizedcostofcookingsolution(fuel)morethan5%ofhouseholdincomeLevelizedcostofcookingsolution(fuel)lessthan5%ofhouseholdincome
FUEL AVAILABILITY Primaryfuelavailablelessthan80%oftheyear
Primaryfuelisreadilyavailable80%oftheyear
Primaryfuelisreadilyavailablethroughouttheyear
Figure 17.MULTI-TIERFRAMEWORKFORICSANDCLEANCOOKINGALTERNATIVES(SOURCE:RWANDABEYONDCONNECTIONS,2018)

Investment Opportunities in the Rwandan Energy Sector 26
Table 3.TIERPERFORMANCETARGETSFORCOOKSTOVES(SOURCE:GACC,N.D.)
TierThermal Efficiency
(%)
Carbon Monoxide Emissions
(gram/megajoule delivered)
Fine Particu-late Matter Emissions
(milligram/megajoule delivered)
Safety(score)
Durability(score)
5 ≥ 50 ≤ 3.0 ≤ 5 ≥ 95 < 10
4 ≥ 40 ≤ 4.4 ≤ 62 ≥ 86 < 15
3 ≥ 30 ≤ 7.2 ≤ 218 ≥ 77 < 20
2 ≥ 20 ≤ 11.5 ≤ 481 ≥ 68 < 25
1 ≥ 10 ≤ 18.3 ≤ 1031 ≥ 60 < 35
0 < 10 > 18.3 > 1031 < 60 > 35
Rwanda already has a group of ICS suppliers.86 The government works with
several supplierswhose product quality ranges from tier 1 to 5.87 Businesses
arerequiredtopresentacertificatestatingthequalityofthestoves.88Themain
targetof thegovernment is to reduce thenumberofhouseholdsusing tradi-
tionalcookingstoveswhilstraisingthenumberofhouseholdsusinganimproved
biomasscookstove.Improvedbiomasscookstovesaremoreenergyefficientand
producinglessemissions.Thegovernmentappealstotheprivatesectorforthe
distributionof ICS recognising themajor role of businesses to reachbiomass
reductiontargets.TheobjectiveofRwandaistodistribute300,000ICSperyear.
Themainissueforthedistributionistheaffordabilityofthestoves.Businesses
shouldcarefullyconsidertheaffordabilityoftheirproduct(stove)andcooking
fuel.Householdsspendingthemosttimecollectingcookingfuelsaweek(around
130minutes)aremostwillingtopayforabiomass-basedimprovedcookstove.89
However, households are only able to spend approximately 3,000 RWF
(3.20USD).90Moreover,companiesneedtodevelopalternativebusinessmodels
or acquire external financial support because most households are unable/
unwilling topayupfront. Thereare severaloptions: installmentpaymentsare
themost common.Companieshavealsoexperimentedwithfixedpurchasing
agreementsofinputs;pelletsorbriquettes.CompaniessellingICSusingpellets
orbriquetteswill likelyneedtosetupafactorytoproducethesethemselves.
Consideringthesechallenges,thedistributionofICSwillrequireclosecollaboration
betweenthegovernment,developmentpartnersandprivatesector.Theobjective
oftheRwandangovernmentistodistribute300,000ICSperyear.Itappealsto
theprivatesectorforthedistributionofICSrecognisingthemajorroleofbusi-
nessestoreachitsbiomassreductiontargets.Hence,thegovernmentislooking
intooptionstoprovide(financial)supporttocustomersand/orsuppliers.Future
supportwill likelybeprovidedonthebasisofthetargetgroupandassociated
Ubudehecategories.Also,thegovernmentdesignsincentivesforthosecompanies
willingtoproducelocallyorthatarewillingtomoveitsheadquarterstoRwanda.
Table 4.NUMBEROFINCREASEINICSEACHYEAR(2017/18ISBASEYEAR)(SOURCE:MININFRA,2018)
Year ICS
2017/18 1,839,684ICSdisseminated
2018/19 137,219ICSdisseminated
2019/20 293,191ICSdisseminated
2020/21 315,490ICSdisseminated
2021/22 339,127ICSdisseminated
2022/23 364,112ICSdisseminated
2023/24 390,544ICSdisseminated
86Twocompanies,IgniteandGeniGreenSolutions,areoperatinginRwanda(anduntilrecentlyInyenyeri).Thereareseveralothercompanies,whicharestillintheir‘initiation’phase.87Nofurtherinformationonthesesuppliersisavailablewhenwritingthisreport.However,twoinvestors,GGSandSNVwereinterviewed.SNVisaDutchNGOexploringopportunitiesintheICSsector.GeniGreenSolutionsisaKigali-basedcompanysellingtier1–2ICSespeciallyinGasabodistrictinKigali,witharound6000customersatthemoment.88LocallyproducedstovesneedtobetransportedtoKenyasincethisisthenearestplacefortestingthequalityofstovesandacquiringacertificate.89Surveyincluded45householdslivinginKigali.90RwandaBeyondConnections,WorldBank,2017.

Investment Opportunities in the Rwandan Energy Sector 27
8. Opportunities in clean cooking
Product development
• ManyICScompaniestargettheuppermarketsegment,whilst,low-income
householdsareunabletoaffordtier4and5stoves.Amarketentrywith
analternative,improvedtier0–3cookingstoveprovidesalargercon-
sumerbase.Thesestovescanofferatransitionalsolution.
ͷ Developnewaffordableproductsforlow-incomehouseholds.
ͷ Upgradeexistingproductswithinsulationtoincreaseheatefficiency.
ͷ Sellsecond-handproducts.
• ExistingICSarestillproducedathighcostperunit.Themostcost-efficient
productscancountonthehighestsubsidiesfromtheRwandangovernment.
ͷ Attempt to reduceproductioncostsusingsecond-handmaterials
andfocusingonhighvolumesproducinginbulk.
• Companiescanfocusonsellinglessefficientstoves(WHOtier1–3).
Alternative cooking fuels
• Availabilityofpelletsandbriquettesislimited,andthesefuelsaresome-
timesimported.Companiesshouldconsidersettinguptheirownproduc-
tionfacility.Thegovernmentiswillingtofacilitateaccesstorawmaterials
forfactories(e.g.providingforestconcessionstopelletsmakers).
ͷ Investigatethepossibilitytoproducefuelslocallytoreduceusage
costsoftier4–5stoves.
ͷ Investmentinthecontrolledandsustainableproductionofbiomass
andcleanfuels.
• MostRwandansstillusewoodorcharcoalwhichharmsournaturalen-
vironment because the costs of clean cooking fuels are still too high.
Businessmightenablecustomerstoexchangerawbiomassforpelletsor
briquettes.Alternatively,theycanobtaindiscountswhenprovidingraw
biomass.
ͷ Developaninclusivebusinessmodelwithsolutionsforlow-income
households.
“The private sector will play a prominent role in delivering access
to clean cooking technologies. Government will engage with the
private sector and promote investments through establishing an
appropriate enabling environment. Barriers to entry and bottlenecks
will be identified and reduced or removed, resulting in competition
and innovation in both technologies and business models.” (ESSP)
Financial model
• Low-incomehouseholdsareunabletopaythefullpriceofanICSatonce.
Theintroductionofinnovativeandalternativepaymentmethodssuchas
PAYGcouldprovideaviablebusinessmodel.
• GovernmentsupportisprovidedtoachieveothergoalsrelatedtoSDG7
‘accesstoenergy’ improvingthefinancialaccessof low-incomehouse-
holds. InitiativeswillbelaunchedtosupportSHSandmini-gridcompa-
niesandconsumers.
ͷ Advocate for a subsidy system based on Ubudehe categories
tomake payment of ICS feasible focusing on rural areas and fe-
male-headedhouseholds.
• Producersofcookingstovesareconfrontedwithhighstart-upcostsand
workingcapitalneeds.
ͷ Provide financial support (grants or subsidies) to manufacturers
anddistributors(e.g.byestablishingworkingcapitalfacilities).
Awareness
• Cookingpracticesare linkedtostrongculturalandbehavioralvalues in
Rwanda.Consequently,it isdifficulttoconvincepeopletochangetheir
waysintroducingnewtechnologiesinbothurbanandruralareas.
ͷ Contextualise sales strategies and awareness campaigns to local
values.

Investment Opportunities in the Rwandan Energy Sector 28
Thesecompanies/organisationsarecurrentlyproviding(financial)supportto
programsinRwandaorusedtosupportprojectsinthepast.
ON-GRIDELECTRIFICATION
AfDBArabBankforEconomicDevelopmentinAfrica(BADEA)ChinaEximBankDevelopmentBankofRwanda(BRD)EmergingAfricaInfrastructureFundEnabelEnergyandEnvironmentPartnershipsTrustFund(EEPAfrica)EuropeanUnion(EUExternalAction)FinnfundFMOJICAKFWEntwicklungsbankNorfundSTEGInternationalUSAID/PowerAfrica
WorldBank
OFF-GRIDELECTRIFICATION
AcumenCapitalPartnersAfricaEnterpriseChallengeFundDevelopmentBankofRwanda(BRD)DFIDEnergiseAfricaEnergisingDevelopment(EnDev)EnergyAccessVenturesEnergyandEnvironmentPartnershipsTrustFund(EEPAfrica)FonerwaGIZKawiSafiShellFoundationStichtingDOENUNIDOUSAID/PowerAfrica
WorldBank
CLEANCOOKING
AcumenCapitalPartnersAfricaEnterpriseChallengeFundEnergisingDevelopment(EnDev)EnergyandEnvironmentPartnershipsTrustFund(EEPAfrica)EUExternalActionFonerwaOspreyFoundation
WorldBank(CarbonInitiativeforDevelopment)
Annexe 1 | Overview of categorized donors for off-grid electrification, on-grid electrification and clean cooking

Investment Opportunities in the Rwandan Energy Sector 29
ENERGISINGDEVELOPMENTPARTNERSHIP(EnDev)OFI.A.,GIZ,DUTCHMINISTRYOFFOREIGNAFFAIRSANDUKaid
TheEnDevpartnershiphastwophases:thefirstphasewasoperationalbetweenMay2006andSeptember2009.ThecurrentsecondphaseisfromOctober2009toDecember2020.Thetotalbudgetofthisprojectis19.4millionUSD.Theobjectiveofthisprojectistosupply1,021,430peoplewithenergyforlightingandelectricalappliancesand20,544peoplewithcookingenergy.ThisprojectwasfundedbyorganisationsincludingGIZ,theMinistryofForeignAffairsoftheNetherlandsandUKaid.
EUROPEANUNION(EU)
In2014 thegovernmentofRwandaandEuropeanUnionsignedafinancialagreementof23millioneurostoupgradeRwanda’selectricitynetworksystemstoreducelossesofalreadyscarcepowerproduced.AnexampleofaprojectdoneincooperationwiththeEU,istheJabanaPowerSubstationatGasabo.EUgranted6millioneurostoMobisolforprepaidEnergy‘Renttoown’solarHomesystems(offgrid)project.Thegoaloftheprojectistoprovidesolarpowersystemstomorethan70,000households,and100schoolsinruralareas.
AFRICANDEVELOPMENTBANK(AFDB)
In2018 AfDBsignedaloancontractof229.2millioneurostosupportelectricitysupplyandaccesstoelectricity.Thisloanincluded181millionUSDofloansfromAfDBand70millionUSDfromtheAfricanDevelopmentFund.ThisisaspecialfundwithintheAfDBBankGroupfocusedoneconomicandsocialdevelopmentinleastdevelopedAfricancountries.Theprogramwillenableconnectionsto193,000householdson-gridand124,000off-grid.
In2015 RwandasignedaloancontractwithAfDBof138millionUSDfortheregionalRuziziIIIhydropowerplantproject.ThisprojectispartoftheProgramforInfrastructureDevelopmentinAfrica(PIDA)andinvolvesotherEACcountrieslikeBurundiandDRC.
In2011 AfDBprovidedaloanworth25millionUSDforthedevelopmentofthemethanegason-gridpowerplantKivuWattphaseone.
FMO
In2011 FMOprovidedaloanworth31.5millionUSDforthedevelopmentofthemethanegason-gridpowerplantKivuWattphaseone.
In2014 FMOfundedroughly10.6millionUSDforthedevelopmentoftheon-gridsolarplantAgahozo-ShalomownedbyGigawattGlobalRwandaLtd.
RWANDARENEWABLEENERGYFUNDOFTHEWORLDBANK
TheREFplanstohelp1.8millionpeopletoaccesselectricityoffgridthroughitssupporttogovernmentprojectswithintheRES.Theprojectsstartedin2017afterthegovernmentofRwandaandtheWorldBanksignedthe48.9millionUSDSREPfund.
POWERAFRICAOFUSAID
PowerAfricamainlyprovidesthedevelopmentofon-gridprojectsdonebyitspartners.TheorganisationsupportsinterestedprivateinvestorslinkedtoPowerAfricaanddevelopmentbankswillingtoprovideloansorgrants.ExamplesofdevelopedprojectsaretheHakanpeattopower(on-gridpowerplant,80MW),SoEnergydieselgenerationplantandtheAgahozo-Shalomon-gridsolarplant.
Annexe 2 | Development organisations supporting ongoing energy projects in Rwanda

Investment Opportunities in the Rwandan Energy Sector 30
REFERENCES
AfricanDevelopmentBankGroup.(2020).AfricanEconomicOutlook:Devel-opingAfrica’sWorkforcefortheFuture.Retrievedfromhttps://www.afdb.org/en/documents/african-economic-outlook-2020
ContourGlobal.(n.d.).InnovativeTechnologies.Retrievedfromhttps://www.contourglobal.com/innovative-technologies
Cooke,P.&Wilkinson,C.(2020).Interviewonoff-gridelectrification.
DLAPiperGlobalLawFirm.(n.d.).Rwanda’sLakeKivu:Electricitygenerationthroughmethanegas.Retrievedfromhttps://www.dlapiper.com/en/moroc-co/insights/publications/2019/11/africa-connected-issue-3/electricity-genera-tion-through-methane-gas-in-rwanda/
Dushimimana,M.A.(2019)Ubudehecategoriestobereviewed.Retrievedfrom:https://www.newtimes.co.rw/news/ubudehe-categories-be-reviewed
EnergisingDevelopment(EnDev).(2019).Rwanda–OffGridSectorStatusReport.Retrievedfromhttps://www.urwegobank.com/wp-content/up-loads/2019/09/EnDev_Off-Grid-Sector-Status-Report_2018.pdf
FoodandAgricultureOrganization.(2019,May27).Rwandaenvisagestoreducehouseholdrelianceonwoodfuel.Retrievedfromhttp://www.fao.org/africa/news/detail-news/en/c/1195960/
Georgelin,L.(2020).InterviewonEnergysector.
GET.invest.(n.d.).RenewableEnergyPotentialRwanda.Retrievedfromhttps://www.get-invest.eu/market-information/rwanda/renewable-energy-po-tential/
GlobalAllianceforCleanCookstoves.(n.d.).ImpactAreas.Retrievedfromhttps://www.cleancookingalliance.org/home/index.html
GlobalAllianceforCleanCookstoves.(2012).RwandaMarketAssessment–SectorMapping[Slides].Retrievedfromhttps://www.cleancookingalliance.org/binary-data/RESOURCE/file/000/000/170-1.pdf
InternationalEnergyAgency.(2019a).AfricaEnergyOutlook.Retrievedfromhttps://www.iea.org/reports/africa-energy-outlook-2019
InternationalEnergyAgency.(2019b).SDG7:DataandProjections–Accesstoaffordable,reliable,sustainableandmodernenergyforall[Accesstoelectricity].Retrievedfromhttps://www.iea.org/reports/sdg7-data-and-projections/ac-cess-to-electricity
InternationalTreeFoundation.(n.d.).ITFHome.Retrievedfromhttps://inter-nationaltreefoundation.org
Lempp,P.&Kesrelioglu,S.(2020).Interviewonoff-gridenergysector.
MinistryofInfrastructure.(2016).RuralElectrificationStrategy.Retrievedfromhttps://www.mininfra.gov.rw/fileadmin/user_upload/aircraft/Rural_Elec-trification_Strategy.pdf
MinistryofInfrastructure.(2018a).BiomassEnergyStrategy.Retrievedfromhttps://www.mininfra.gov.rw/index.php?id=311
MinistryofInfrastructure.(2018b).EnergySectorStrategicPlan2018/19–2023/24.Retrievedfromhttp://www.reg.rw/fileadmin/user_upload/Fi-nal_ESSP.pdf
MinistryofInfrastructure,&RwandaEnergyGroup.(2019).OffGridElectricityAccessExpansionProgramsinRwanda[Slides].Retrievedfromhttps://atain-sights.com/wp-content/uploads/2019/06/9.-Uwera-Rwanda-Energy-Group.pdf
Munyehirwe,A.(2020).Interviewoncleancookingsector.
Ndahimana,A.(2020)Interviewonoff-gridenergysector.
Ngizwenayo,D.(2020)Interviewontheenergysector.
Rwagaju,L.(2020).Interviewonoff-gridelectrification.
RwandaDevelopmentBoard.(2017).Energy.Retrievedfromhttps://rdb.rw/investment-opportunities/energy/
RwandaEnergyGroup.(2019a).Off-gridelectrification.Retrievedfromhttps://www.reg.rw/what-we-do/access/offgrid/
RwandaEnergyGroup.(2019b).On-gridelectrification.Retrievedfromhttps://www.reg.rw/what-we-do/access/ongrid/
RwandaEnergyGroup.(2019c).PoliciesandRegulations.Retrievedfromhttps://www.reg.rw/public-information/policies-regulations/?itemPerP-age=30&cHash=bbcd8c8df2734436c5e43ceae9c27b6e
RwandaEnergyGroup.(2020).Tariffs.Retrievedfromhttps://www.reg.rw/customer-service/tariffs/
RwandaGovernanceBoard.(n.d.).Ubudehe.Retrievedfromhttp://www.rgb.rw/index.php?id=35
RwandaUtilitiesRegulatoryAuthority.(2015).GoverningtheSimplifiedLi-censingFrameworkforRuralElectrificationinRwanda.Retrievedfromhttps://www.reg.rw/fileadmin/user_upload/RURA-Simplified_Licensing_Regulations_FINAL_APPROVED.pdf
SymbionPower.(n.d.).InvestinginAfrica’sEnergy.Retrievedfromhttps://www.symbion-power.com
UgandaElectricityTransmissionCompany.(n.d.).Information.Retrievedfromhttps://www.uetcl.com
USAID,&PowerAfrica.(2019).Off-gridsolarmarketassessment.Retrievedfromhttps://sun-connect-news.org/fileadmin/DATEIEN/Dateien/New/PA-OP-Rwanda-MarketAssessment-Final_508.pdf
WorldBankGroup.(2018).RwandaBeyondConnections:EnergyAccessDiagnosticReportBasedontheMulti-TierFramework.Retrievedfromhttp://documents.worldbank.org/curated/en/406341533065364544/Rwanda-Be-yond-connections-energy-access-diagnostic-report-based-on-the-multi-ti-er-framework
WorldBankGroup.(2019).Rwanda[Data].Retrievedfromhttps://data.world-bank.org/country/rwanda

Copyright © 2022 FDOKUMEN