inveSTMent Grade Energy Audit report - Nagar Nigam ...
145
INVESTMENT GRADE ENERGY AUDIT REPORT Nagar Nigam Mathura- Vrindavan, Uttar Pradesh Submitted by Energy Efficiency Services Limited Submitted To Nagar Nigam Mathura- Vrindavan September, 2017
-
Upload
khangminh22 -
Category
Documents
-
view
0 -
download
0
Transcript of inveSTMent Grade Energy Audit report - Nagar Nigam ...

INVESTMENT GRADE ENERGY AUDIT REPORT
Nagar Nigam Mathura- Vrindavan, Uttar Pradesh
Submitted by
Energy Efficiency Services Limited
Submitted To
Nagar Nigam Mathura- Vrindavan
September, 2017

ACKNOWLEDGMENT We are sincerely thankful to the Ministry of Urban Development, Government of India for including energy
audits to achieve energy efficiency under the reforms of Atal Mission for Rejuvenation and Urban
Transformation (AMRUT). We are also extremely thankful to the “Department of Urban Development
(DUD) Uttar Pradesh” for taking up the reform on priority basis with Energy Efficiency Services Limited
(EESL) and signing the agreement on 09th Feb 2017 for preparation of Investment Grade Energy Audit
(IGEA) reports for its AMRUT Mission and Smart Mission for Cities & Towns. We acknowledge the
support and guidance provided by the following Central and State Government officials:
Shri Durga Shankar Mishra, Secretary (Urban Development, AMRUT), Ministry of Urban
Development, Govt. of India
Shri. Shiv Das Meena, Joint Secretary (AMRUT) Ministry of Urban Development, Govt. of India
Shri G. Ravinder, Deputy Secretary, Ministry of Urban Development, Govt. of India
Shri R K Mishra, Director of Urban Local Bodies, Department of Urban Development (DUD), Govt.
of Uttar Pradesh, Lucknow
Vishal Bhardwaj, Additional Director. Directorate of Urban Local Bodies, Govt. of Uttar Pradesh
We would also like to thank the officials of the “Nagar Nigam Mathura- Vrindavan” for their support during
the field studies and preparation of the Investment Grade Energy Audit (IGEA) Report. We acknowledge the
support and guidance provided by the following officials of Nagar Nigam Mathura- Vrindavan during the
survey and detailed energy audit.
Shri Ashish Kumar Yadav, JE, Water Works Department, Mathura
Shri Kuwarpal Singh, JE, Water Works Department, Mathura
Shri Chhatrapal Singh, JE, Water Works Department, Mathura
We are also thankful to the officers, engineers, operators, technicians and other personnel for their
continuous support and guidance in undertaking this exhaustive task of detailed energy audit. The field study
would not have been completed on time without their interaction and timely support. We are grateful for
their co-operation during the entire process.
We would also like to thank the officials of “URS Verification Pvt Ltd” for carrying out the energy audit and
preparation of the IGEA report. We acknowledge the efforts put in by the following officials of URS during
the energy audit.
Shri Rakesh Sharma, Energy Auditor (EA-10080)
Shri Pushpendra Yadav, Team Member
Shri Mukesh Kumar Bharti, Team Member
On Behalf of Energy Efficiency Services Limited
Mr. Tarun Tayal, Regional Manager, EESL – Uttar Pradesh

Executive Summary Background of the Project
The Atal Mission for Rejuvenation and Urban Transformation (AMRUT) was launched by Prime Minister of
India in June 2015 with the objective of providing basic services (e.g. water supply, sewerage, urban
transport) to households and build amenities in cities which will improve the quality of life for all.
To facilitate market transformation and replicate Municipal Energy Efficiency Programme on a large scale in
India, Ministry of Urban Development (MoUD), Government of India signed a Memorandum of
Understanding (MoU) with Energy Efficiency Services Limited (EESL), a joint venture under Ministry of
Power, Government of India on 28th September 2016 under AMRUT. This will enable replacement of
inefficient pump sets in Public Water Works & Sewerage Systems (PWW&SS) with energy efficient pump
sets with no upfront cost to the Municipal Bodies. The investment will be recovered in form of fixed annuity.
Energy audit and optimizing energy consumption are mandatory reforms under AMRUT. EESL and
Department of Urban Development (DUD), Government of Uttar Pradesh have jointly entered into an
agreement on 9th February, 2017 in order to provide an overarching framework to facilitate engagement
between State Government and various ULBs (covered under AMRUT) of Uttar Pradesh. Under this
agreement, EESL is undertaking the project to replace old inefficient pump sets by energy efficient pump
sets in Mathura, city of Uttar Pradesh.
Description of Facilities
Mathura is a city in the North Indian state of Uttar Pradesh. It is located approximately 50 kilometres north
of Agra, and 145 kilometres south-east of Delhi; about 11 kilometres from the town of Vrindavan, and 22
kilometres from Govardhan. It is the administrative centre of Mathura District of Uttar Pradesh. The 2011
census of India estimated the population of Mathura to be 441,894.
Main source of water for the city of Mathura is ground water. There are 1411 Nos. of pumps installed to cater
the water needs of Mathura City. These 141 nos. of submersible pumps are used to supply water directly to
the users. Out of 141 Nos. of water supply pumps, 121 Nos. were in operation during energy audit and 20
Nos. of pumps were under maintenance. Apart from water distribution pump sets, 35 Nos. of pump sets are
also installed in the sewage water pumping system to transfer the sewage water to the sewage treatment
plant. Out of 35 Nos. of pump, 21 Nos. of pumps were in operation during energy audit and 14 Nos. of Pump
sets were under maintenance.
1 As per LOA, there were 143 pumps (water), however in LOA list, there was repetition of two pump sets. Therefore, total pump at Mathura, in IGEA, is considered as 141.

Description of facility and water storage capacity
S. No
Facility Name & Location
Source of water
Number of
pumps MLD Capacity
Type of Storage
Number of/ Reservoir/Cl
arifier
No. of OHT
1 Bhuteshwar Campus TW No.2
Ground Water
1 0.20 Direct User
No Reservoirs
No OHTs
2 Bhuteshwar Campus TW No.5
Ground Water
1 0.06 Direct User
No Reservoirs
No OHTs
3 Bhuteshwar Campus TW No.7
Ground Water
1 0.24 Direct User
No Reservoirs
No OHTs
4 Nagar Palika TW No.15 Ground Water
1 0.34 Direct User
No Reservoirs
No OHTs
5 Bangali Ghat TW No.16 Ground Water
1 0.32 Direct User
No Reservoirs
No OHTs
6 Police Line TW No.25 Ground Water
1 0.71 Direct User
No Reservoirs
No OHTs
7 Bhuteshwar Campus TW No.27
Ground Water
1 0.08 Direct User
No Reservoirs
No OHTs
8 District Jail TW No.29 Ground Water
1 0.46 Direct User
No Reservoirs
No OHTs
9 Govind Nagar Sec. A Ground Water
1 0.36 Direct User
No Reservoirs
No OHTs
10 Kushak Gali-1 Ground Water
1 0.32 Direct User
No Reservoirs
No OHTs
11 Shyam Ghat Ground Water
1 0.14 Direct User
No Reservoirs
No OHTs
12 Vishram Ghat Ground Water
1 0.41 Direct User
No Reservoirs
No OHTs
13 Chatta Bazar Ground Water
1 0.58 Direct User
No Reservoirs
No OHTs
14 Rampal Gali Ground Water
1 0.28 Direct User
No Reservoirs
No OHTs
15 Vrindavan Gate Ground Water
1 0.42 Direct User
No Reservoirs
No OHTs
16 Theknarnol Ground Water
1 0.30 Direct User
No Reservoirs
No OHTs
17 Dwarkeshpuri Ground Water
1 0.06 Direct User
No Reservoirs
No OHTs
18 Unth Gali Ground Water
1 0.17 Direct User
No Reservoirs
No OHTs
19 Naya Nagla Gali No.8 Ground Water
1 0.08 Direct User
No Reservoirs
No OHTs
20 Chah Kathoti Ground Water
1 0.17 Direct User
No Reservoirs
No OHTs
21 Agra Hotel Ground Water
1 0.56 Direct User
No Reservoirs
No OHTs
22 Dhruv Ghat Ground Water
1 0.56 Direct User
No Reservoirs
No OHTs
23 Maholi Ki Paur Ground Water
1 0.31 Direct User
No Reservoirs
No OHTs
24 Gaja Paysa Ground 1 0.25 Direct No No

S. No
Facility Name & Location
Source of water
Number of
pumps MLD Capacity
Type of Storage
Number of/ Reservoir/Cl
arifier
No. of OHT
Water User Reservoirs OHTs
25 Radhika Vihar Ground Water
1 0.20 Direct User
No Reservoirs
No OHTs
26 Dholi Pyau Ground Water
1 0.30 Direct User
No Reservoirs
No OHTs
27 Thateran Gali Ground Water
1 0.21 Direct User
No Reservoirs
No OHTs
28 Tulsi Chabutra Ground Water
1 0.23 Direct User
No Reservoirs
No OHTs
29 Bairag puri Ground Water
1 0.11 Direct User
No Reservoirs
No OHTs
30 Bhargva Gali Ground Water
1 0.71 Direct User
No Reservoirs
No OHTs
31 Gandhi Park Pump-1 Ground Water
1 0.20 Direct User
No Reservoirs
No OHTs
32 Megha Gali Ground Water
1 0.03 Direct User
No Reservoirs
No OHTs
33 Bhadurpura Ground Water
1 0.12 Direct User
No Reservoirs
No OHTs
34 Chaganpura Ground Water
1 0.10 Direct User
No Reservoirs
No OHTs
35 Krishna Vihar NH-2 Ground Water
1 0.09 Direct User
No Reservoirs
No OHTs
36 Askunda Ground Water
1 0.49 Direct User
No Reservoirs
No OHTs
37 Mahavidya Face-2 Ground Water
1 0.28 Direct User
No Reservoirs
No OHTs
38 Dalpat Khidki Ground Water
1 0.16 Direct User
No Reservoirs
No OHTs
39 Gopalpura Ground Water
1 0.13 Direct User
No Reservoirs
No OHTs
40 Shanti Nagar Ground Water
1 0.36 Direct User
No Reservoirs
No OHTs
41 Laxmi Nagar-1 Ground Water
1 0.53 Direct User
No Reservoirs
No OHTs
42 Laxmi Nagar-2 Ground Water
1 0.32 Direct User
No Reservoirs
No OHTs
43 Laxmi Nagar-4 Ground Water
1 0.31 Direct User
No Reservoirs
No OHTs
44 Naya Nagla, Koyla Gali Ground Water
1 0.21 Direct User
No Reservoirs
No OHTs
45 Maholi Yojna-1 Ground Water
1 0.22 Direct User
No Reservoirs
No OHTs
46 Maholi Yojna-3 Ground Water
1 0.30 Direct User
No Reservoirs
No OHTs
47 Sheetla Ghati Ground Water
1 0.20 Direct User
No Reservoirs
No OHTs
48 Manas Nagar Ground Water
1 0.26 Direct User
No Reservoirs
No OHTs

S. No
Facility Name & Location
Source of water
Number of
pumps MLD Capacity
Type of Storage
Number of/ Reservoir/Cl
arifier
No. of OHT
49 Ratan Kund Ground Water
1 0.17 Direct User
No Reservoirs
No OHTs
50 Gau Ghat Ground Water
1 0.26 Direct User
No Reservoirs
No OHTs
51 Arjunpura Ground Water
1 0.06 Direct User
No Reservoirs
No OHTs
52 Officer Colony Ground Water
1 0.23 Direct User
No Reservoirs
No OHTs
53 Badpura Colony Ground Water
1 0.50 Direct User
No Reservoirs
No OHTs
54 Narayan Puri Ground Water
1 0.58 Direct User
No Reservoirs
No OHTs
55 Jhigurpura Ground Water
1 0.19 Direct User
No Reservoirs
No OHTs
56 Raigarpura Ground Water
1 0.40 Direct User
No Reservoirs
No OHTs
57 Gupta Kunj Ground Water
1 0.14 Direct User
No Reservoirs
No OHTs
58 Radha Nagar Ground Water
1 0.26 Direct User
No Reservoirs
No OHTs
59 Manoharpura Ground Water
1 0.07 Direct User
No Reservoirs
No OHTs
60 Krishna Nagar Ground Water
1 0.14 Direct User
No Reservoirs
No OHTs
61 Heja Hospital Ground Water
1 0.10 Direct User
No Reservoirs
No OHTs
62 Laxmi Nagar Ground Water
1 0.24 Direct User
No Reservoirs
No OHTs
63 Maholi Yojna-2 Ground Water
1 0.23 Direct User
No Reservoirs
No OHTs
64 Antapada Ground Water
1 0.32 Direct User
No Reservoirs
No OHTs
65 Rani Mandi Ground Water
1 0.14 Direct User
No Reservoirs
No OHTs
66 Kutta Paysa Ground Water
1 0.20 Direct User
No Reservoirs
No OHTs
67 Gali Ravaliya Ground Water
1 0.20 Direct User
No Reservoirs
No OHTs
68 Gali Rajkumar Ground Water
1 0.35 Direct User
No Reservoirs
No OHTs
69 Gandhi Park-2 Ground Water
1 0.21 Direct User
No Reservoirs
No OHTs
70 Arjunpura-2 Ground Water
1 0.09 Direct User
No Reservoirs
No OHTs
71 Theknarnol-2 Ground Water
1 0.31 Direct User
No Reservoirs
No OHTs
72 Madhav Puri Ground Water
1 0.24 Direct User
No Reservoirs
No OHTs
73 Dholi Pyau Tiraha-New Ground 1 0.40 Direct No No

S. No
Facility Name & Location
Source of water
Number of
pumps MLD Capacity
Type of Storage
Number of/ Reservoir/Cl
arifier
No. of OHT
Construction Water User Reservoirs OHTs
74 Ahilyabai Park Dampier Nagar MVDA
Ground Water
1 0.30 Direct User
No Reservoirs
No OHTs
75 Ramlila Ground Krishna Nagar MVDA
Ground Water
1 0.11 Direct User
No Reservoirs
No OHTs
76 Kankali Temple Dwarikapuri MVDA
Ground Water
1 0.21 Direct User
No Reservoirs
No OHTs
77 Machli Mandi Bharatpur Gate
Ground Water
1 0.37 Direct User
No Reservoirs
No OHTs
78 Nai Basti W.No. Ground Water
1 0.22 Direct User
No Reservoirs
No OHTs
79 Andi Kuiya Ground Water
1 0.47 Direct User
No Reservoirs
No OHTs
80 Kathoti Kua Chaupal Ground Water
1 0.18 Direct User
No Reservoirs
No OHTs
81 Kathoti Kua Masjid Ground Water
1 0.09 Direct User
No Reservoirs
No OHTs
82 Gupta Kunk WNo.7 Ground Water
1 0.20 Direct User
No Reservoirs
No OHTs
83 Sadar Dhobi Pada W.No8
Ground Water
1 0.55 Direct User
No Reservoirs
No OHTs
84 Gandhi Nagar W.No. 9 Ground Water
1 0.10 Direct User
No Reservoirs
No OHTs
85 Laxmi Nagar W.No. 9 Ground Water
1 0.24 Direct User
No Reservoirs
No OHTs
86 Bains Bhora Kotwali W.No.14
Ground Water
1 0.22 Direct User
No Reservoirs
No OHTs
87 Radhey Shyam Ashram W.No.16
Ground Water
1 0.28 Direct User
No Reservoirs
No OHTs
88 Om Nagar W.No.17 Ground Water
1 0.26 Direct User
No Reservoirs
No OHTs
89 Om Nagar-2 W.No.17 Ground Water
1 0.31 Direct User
No Reservoirs
No OHTs
90 Antapara behind Gurudwara W.No.18
Ground Water
1 0.21 Direct User
No Reservoirs
No OHTs
91 Jogi Gali Antapada W.No.18
Ground Water
1 0.14 Direct User
No Reservoirs
No OHTs
92 Khateek Mohalla Balmiki Basti W.No.19
Ground Water
1 0.28 Direct User
No Reservoirs
No OHTs
93 Guru Nanak Nagar W.No.19
Ground Water
1 0.05 Direct User
No Reservoirs
No OHTs
94 Krishnapuram-1 Ward-24
Ground Water
1 0.11 Direct User
No Reservoirs
No OHTs
95 Krishnapuram-2 Ward-24
Ground Water
1 0.12 Direct User
No Reservoirs
No OHTs
96 Balmiki Basti Dholi Pyau Ward-27
Ground Water
1 0.17 Direct User
No Reservoirs
No OHTs
97 Mahavidya Park Ward-28
Ground Water
1 0.26 Direct User
No Reservoirs
No OHTs

S. No
Facility Name & Location
Source of water
Number of
pumps MLD Capacity
Type of Storage
Number of/ Reservoir/Cl
arifier
No. of OHT
98 Hanuman Teela Ward-33
Ground Water
1 0.07 Direct User
No Reservoirs
No OHTs
99 Kashmiri Gali Ward-34 Ground Water
1 0.18 Direct User
No Reservoirs
No OHTs
100 Mission Teela Sadar Bazar Ward-35
Ground Water
1 0.41 Direct User
No Reservoirs
No OHTs
101 Matia Gate Ward-37 Ground Water
1 0.32 Direct User
No Reservoirs
No OHTs
102 Subhash Nagar Nala Ward-38
Ground Water
1 0.15 Direct User
No Reservoirs
No OHTs
103 Manshapuri Ward-39 Ground Water
1 0.12 Direct User
No Reservoirs
No OHTs
104 Rampal Gali Ward-40 Ground Water
1 0.22 Direct User
No Reservoirs
No OHTs
105 Theknarnol Ward-40 Ground Water
1 0.31 Direct User
No Reservoirs
No OHTs
106 Lala Ganj Ward-42 Ground Water
1 0.14 Direct User
No Reservoirs
No OHTs
107 Kashiram Yojna-3 Ground Water
1 0.15 Direct User
No Reservoirs
No OHTs
108 Kashiram Yojna-4 Ground Water
1 0.21 Direct User
No Reservoirs
No OHTs
109 Satrangi Garden Ward-8 Ground Water
1 0.48 Direct User
No Reservoirs
No OHTs
110 Ambedkar Pratima Ward-10
Ground Water
1 0.21 Direct User
No Reservoirs
No OHTs
111 Naya Nagla Ward-11 Ground Water
1 0.27 Direct User
No Reservoirs
No OHTs
112 Ambedkar Nagar Ward-12
Ground Water
1 0.16 Direct User
No Reservoirs
No OHTs
113 Mali Mohalla Sadar Ward-13
Ground Water
1 0.24 Direct User
No Reservoirs
No OHTs
114 Naya Bans Ward-15 Ground Water
1 0.08 Direct User
No Reservoirs
No OHTs
115 Machli Gate Ward-19 Ground Water
1 0.05 Direct User
No Reservoirs
No OHTs
116 Bhim Nagar S.B.I. Ward-27
Ground Water
1 0.29 Direct User
No Reservoirs
No OHTs
117 Motikunj Extension Ground Water
1 0.33 Direct User
No Reservoirs
No OHTs
118 Rani Mandi Balmiki Basti Ward-6
Ground Water
1 0.24 Direct User
No Reservoirs
No OHTs
119 Matia Gate Joshiyan Garden
Ground Water
1 0.30 Direct User
No Reservoirs
No OHTs
120 Sanjay Nagar Nala Ground Water
1 0.30 Direct User
No Reservoirs
No OHTs
121 Balmiki Basti Ward-1 Ground Water
1 0.22 Direct User
No Reservoirs
No OHTs
122 Bhuteshwar Campus Ground 1 Under Direct No No

S. No
Facility Name & Location
Source of water
Number of
pumps MLD Capacity
Type of Storage
Number of/ Reservoir/Cl
arifier
No. of OHT
TW No.20 Water Maintenance User Reservoirs OHTs
123 Bhuteshwar Campus Ground Water
1 Under
Maintenance Direct User
No Reservoirs
No OHTs
124 Bhuteshwar Campus TW No.24
Ground Water
1 Under
Maintenance Direct User
No Reservoirs
No OHTs
125 Bhuteshwar Campus TW No.26
Ground Water
1 Under
Maintenance Direct User
No Reservoirs
No OHTs
126 Goalpada Ground Water
1 Under
Maintenance Direct User
No Reservoirs
No OHTs
127 Gujrana Gali Ground Water
1 Under
Maintenance Direct User
No Reservoirs
No OHTs
128 Halan Ganj Ground Water
1 Under
Maintenance Direct User
No Reservoirs
No OHTs
129 Chaubachcha Ground Water
1 Under
Maintenance Direct User
No Reservoirs
No OHTs
130 Radhey Shyam Ashram Ground Water
1 Under
Maintenance Direct User
No Reservoirs
No OHTs
131 State Bank TW No.19 Ground Water
1 Under
Maintenance Direct User
No Reservoirs
No OHTs
132 Gopalpura-2 Ground Water
1 Under
Maintenance Direct User
No Reservoirs
No OHTs
133 Kucha Sunaran Ward-38
Ground Water
1 Under
Maintenance Direct User
No Reservoirs
No OHTs
134 Radha Nagar-2 Ground Water
1 Under
Maintenance Direct User
No Reservoirs
No OHTs
135 Shamshan Ghat MVDA Ground Water
1 Under
Maintenance Direct User
No Reservoirs
No OHTs
136 Bhuteshwar Garden W.No.20
Ground Water
1 Under
Maintenance Direct User
No Reservoirs
No OHTs
137 Patiram Gali Ward-40 Ground Water
1 Under
Maintenance Direct User
No Reservoirs
No OHTs
138 Satgada Ward-45 Ground Water
1 Under
Maintenance Direct User
No Reservoirs
No OHTs
139 General Ganj Ward-16 Ground Water
1 Under
Maintenance Direct User
No Reservoirs
No OHTs
140 Ambakhar Ground Water
1 Under
Maintenance Direct User
No Reservoirs
No OHTs
141 Pani Ki Tanki Ward-17 Ground Water
1 Under
Maintenance Direct User
No Reservoirs
No OHTs
Total (Water Supply Pumps)
141

Description of Sewage Pumping Stations
S. No
Facility Name & Location
Source of water
Number of
pumps
MLD Capacity
Type of Storage
Number of/ Reservoir/Cl
arifier
No. of OHT
1 Diary Farm SPS Municipal Water
6 16.00 Sump No
Reservoirs No OHTs
2 Masani Nala SPS Municipal Water
5 13.59 Sump No
Reservoirs No OHTs
3 Bangali Ghat SPS Municipal Water
5 14.50 Sump No
Reservoirs No OHTs
4 Cantt. Nala SPS Municipal Water
5 NA Sump No
Reservoirs No OHTs
5 Vrindavan Gate SPS Municipal Water
4 NA Sump No
Reservoirs No OHTs
6 Krishna Ganga SPS Municipal Water
3 NA Sump No
Reservoirs No OHTs
7 Swami Ghat SPS Municipal Water
3 NA Sump No
Reservoirs No OHTs
8 Chinta Haran SPS Municipal Water
3 NA Sump No
Reservoirs No OHTs
9 Dhruv Ghat SPS Municipal Water
1 NA Sump No
Reservoirs No OHTs
Total 35
Summary of Performance Evaluation of Pump sets
Based on the measurement and analysis carried out during the energy audit, the pump and pump set
efficiencies for all pumping stations have been estimated. The summary of results is provided in the table
below.
Pump Range and Efficiency Evaluation Matrix
S. No. Pump Type Pump
No Pump Capacity
Range (kW)
Weighted Average Pump Efficiency (%)
Weighted Average Pump Set
Efficiency (%)
Water Supply
1 Submersible 15 3.34 kW – 6.97 kW 44.6 37.9
2 Submersible 75 7 kW – 10 kW 39.6 33.7
3 Submersible 31 10 kW – 13 kW 33.7 28.6
Sewage
4 Non Clog Submersible 7 10 kW - 24 kW 29.1 26.2
5 Non Clog Submersible 5 36 kW – 46 kW 37.5 33.8
6 Non Clog Submersible 5 67 kW – 80.4 kW 36.0 32.4
7 VT 4 8.9 kW – 87.9 kW 16.2 14.6

Performance Indicators
Along with estimation of efficiency of pump sets, performance indicators such as specific energy consumption was also evaluated for pump of Nagar Nigam
Mathura- Vrindavan. Details of performance indicators and other operating parameters are provided in the tables below:
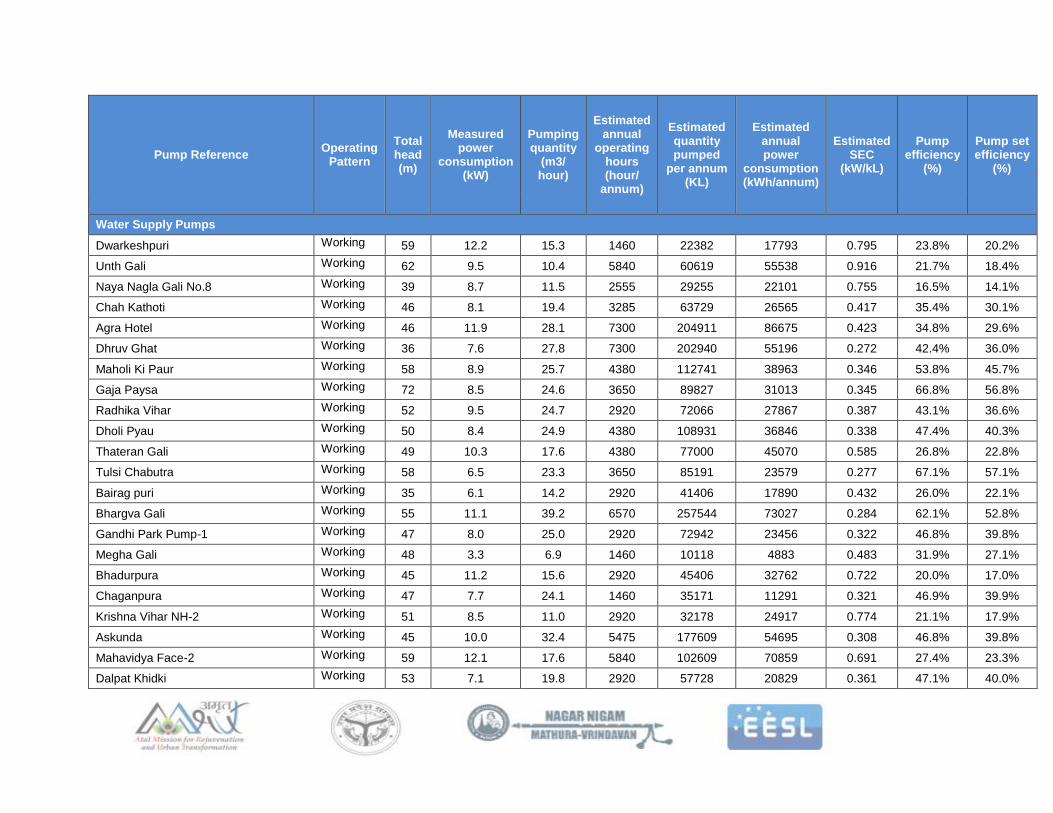
Performance Indicators for Mathura Water Supply Pumps
Pump Reference Operating
Pattern
Total head (m)
Measured power
consumption (kW)
Pumping quantity
(m3/ hour)
Estimated annual
operating hours (hour/
annum)
Estimated quantity pumped
per annum (KL)
Estimated annual power
consumption (kWh/annum)
Estimated SEC
(kW/kL)
Pump efficiency
(%)
Pump set efficiency
(%)
Water Supply Pumps
Bhuteshwar Campus TW No.2 Working 50 8.6 24.7 2920 72124 25200 0.349 45.8% 39.0%
Bhuteshwar Campus TW No.5 Working 56 11.5 28.2 730 20593 8406 0.408 44.0% 37.4%
Bhuteshwar Campus TW No.7 Working 50 8.9 27.1 3285 88859 29094 0.327 48.9% 41.6%
Nagar Palika TW No.15 Working 44 9.6 17.2 7300 125852 70177 0.558 25.3% 21.5%
Bangali Ghat TW No.16 Working 37 7.5 16.1 7300 117749 54799 0.465 25.5% 21.7%
Police Line TW No.25 Working 42 13.1 35.4 7300 258566 95387 0.369 36.5% 31.0%
Bhuteshwar Campus TW No.27 Working 61 9.6 10.2 2920 29842 27935 0.936 20.9% 17.7%
District Jail TW No.29 Working 30 12.8 33.0 5110 168528 65459 0.388 24.7% 21.0%
Govind Nagar Sec. A Working 52 10.1 33.1 4015 132696 40601 0.306 54.5% 46.3%
Kushak Gali-1 Working 27 11.7 22.5 5110 115077 59821 0.520 16.6% 14.1%
Shyam Ghat Working 48 6.1 8.9 5840 51801 35819 0.691 22.2% 18.9%
Vishram Ghat Working 39 12.1 34.3 4380 150234 53042 0.353 35.4% 30.1%
Chatta Bazar Working 46 12.5 36.4 5840 212634 72766 0.342 43.1% 36.6%
Rampal Gali Working 53 8.8 23.0 4380 100609 38756 0.385 44.1% 37.5%
Vrindavan Gate Working 46 11.1 26.0 5840 151606 64882 0.428 34.4% 29.3%
Theknarnol Working 70 12.4 21.4 5110 109405 63415 0.580 38.7% 32.9%
Pump Reference Operating
Pattern
Total head (m)
Measured power
consumption (kW)
Pumping quantity
(m3/ hour)
Estimated annual
operating hours (hour/
annum)
Estimated quantity pumped
per annum (KL)
Estimated annual power
consumption (kWh/annum)
Estimated SEC
(kW/kL)
Pump efficiency
(%)
Pump set efficiency
(%)
Water Supply Pumps
Dwarkeshpuri Working 59 12.2 15.3 1460 22382 17793 0.795 23.8% 20.2%
Unth Gali Working 62 9.5 10.4 5840 60619 55538 0.916 21.7% 18.4%
Naya Nagla Gali No.8 Working 39 8.7 11.5 2555 29255 22101 0.755 16.5% 14.1%
Chah Kathoti Working 46 8.1 19.4 3285 63729 26565 0.417 35.4% 30.1%
Agra Hotel Working 46 11.9 28.1 7300 204911 86675 0.423 34.8% 29.6%
Dhruv Ghat Working 36 7.6 27.8 7300 202940 55196 0.272 42.4% 36.0%
Maholi Ki Paur Working 58 8.9 25.7 4380 112741 38963 0.346 53.8% 45.7%
Gaja Paysa Working 72 8.5 24.6 3650 89827 31013 0.345 66.8% 56.8%
Radhika Vihar Working 52 9.5 24.7 2920 72066 27867 0.387 43.1% 36.6%
Dholi Pyau Working 50 8.4 24.9 4380 108931 36846 0.338 47.4% 40.3%
Thateran Gali Working 49 10.3 17.6 4380 77000 45070 0.585 26.8% 22.8%
Tulsi Chabutra Working 58 6.5 23.3 3650 85191 23579 0.277 67.1% 57.1%
Bairag puri Working 35 6.1 14.2 2920 41406 17890 0.432 26.0% 22.1%
Bhargva Gali Working 55 11.1 39.2 6570 257544 73027 0.284 62.1% 52.8%
Gandhi Park Pump-1 Working 47 8.0 25.0 2920 72942 23456 0.322 46.8% 39.8%
Megha Gali Working 48 3.3 6.9 1460 10118 4883 0.483 31.9% 27.1%
Bhadurpura Working 45 11.2 15.6 2920 45406 32762 0.722 20.0% 17.0%
Chaganpura Working 47 7.7 24.1 1460 35171 11291 0.321 46.9% 39.9%
Krishna Vihar NH-2 Working 51 8.5 11.0 2920 32178 24917 0.774 21.1% 17.9%
Askunda Working 45 10.0 32.4 5475 177609 54695 0.308 46.8% 39.8%
Mahavidya Face-2 Working 59 12.1 17.6 5840 102609 70859 0.691 27.4% 23.3%
Dalpat Khidki Working 53 7.1 19.8 2920 57728 20829 0.361 47.1% 40.0%

Pump Reference Operating
Pattern
Total head (m)
Measured power
consumption (kW)
Pumping quantity
(m3/ hour)
Estimated annual
operating hours (hour/
annum)
Estimated quantity pumped
per annum (KL)
Estimated annual power
consumption (kWh/annum)
Estimated SEC
(kW/kL)
Pump efficiency
(%)
Pump set efficiency
(%)
Water Supply Pumps
Gopalpura Working 59 12.8 18.2 2555 46475 32593 0.701 27.0% 22.9%
Shanti Nagar Working 57 9.3 33.1 4015 133057 37299 0.280 65.1% 55.4%
Laxmi Nagar-1 Working 23 6.9 29.4 6570 193289 45289 0.234 31.4% 26.7%
Laxmi Nagar-2 Working 42 8.9 31.8 3650 116216 32449 0.279 48.2% 41.0%
Laxmi Nagar-4 Working 26.5 7.0 39.2 2920 114552 20352 0.178 47.8% 40.6%
Naya Nagla, Koyla Gali Working 47 7.0 20.9 3650 76395 25667 0.336 44.8% 38.1%
Maholi Yojna-1 Working 46 8.8 27.0 2920 78928 25550 0.324 45.5% 38.7%
Maholi Yojna-3 Working 49 10.0 36.9 2920 107748 29103 0.270 58.1% 49.4%
Sheetla Ghati Working 70 6.0 14.1 5110 71847 30830 0.429 52.3% 44.4%
Manas Nagar Working 47 6.2 23.5 4015 94393 24948 0.264 57.0% 48.4%
Ratan Kund Working 59 5.5 11.9 5110 60809 28139 0.463 40.8% 34.7%
Gau Ghat Working 39 7.7 23.3 4015 93389 30768 0.329 37.9% 32.2%
Arjunpura Working 61 9.5 12.3 1825 22484 17350 0.772 25.3% 21.5%
Officer Colony Working 23 9.1 19.1 4380 83789 40070 0.478 15.4% 13.1%
Badpura Colony Working 39 9.0 33.3 5475 182318 49147 0.270 46.4% 39.4%
Narayan Puri Working 46 12.0 29.0 7300 211919 87843 0.415 35.6% 30.2%
Jhigurpura Working 49 7.9 15.8 4380 69073 34777 0.503 31.2% 26.5%
Raigarpura Working 43 9.1 33.0 4380 144452 40004 0.277 49.7% 42.3%
Gupta Kunj Working 49 7.6 17.9 2920 52180 22314 0.428 36.7% 31.2%
Radha Nagar Working 46 9.0 20.1 4745 95375 42863 0.449 32.8% 27.9%
Manoharpura Working 78 8.1 14.2 1825 25897 14752 0.570 43.9% 37.3%
Krishna Nagar Working 52 8.6 18.0 2920 52472 25135 0.479 34.8% 29.6%

Pump Reference Operating
Pattern
Total head (m)
Measured power
consumption (kW)
Pumping quantity
(m3/ hour)
Estimated annual
operating hours (hour/
annum)
Estimated quantity pumped
per annum (KL)
Estimated annual power
consumption (kWh/annum)
Estimated SEC
(kW/kL)
Pump efficiency
(%)
Pump set efficiency
(%)
Water Supply Pumps
Heja Hospital Working 61 8.3 16.8 2190 36704 18082 0.493 39.7% 33.7%
Laxmi Nagar Working 25 9.5 19.9 4380 87031 41614 0.478 16.8% 14.2%
Maholi Yojna-2 Working 50 9.7 28.6 2920 83512 28207 0.338 47.4% 40.3%
Antapada Working 37 9.5 26.4 4380 115763 41698 0.360 32.9% 28.0%
Rani Mandi Working 44 11.7 17.7 2920 51626 34261 0.664 21.2% 18.1%
Kutta Paysa Working 54 9.7 19.9 3650 72745 35466 0.488 35.5% 30.2%
Gali Ravaliya Working 51 6.3 20.1 3650 73292 23092 0.315 51.9% 44.1%
Gali Rajkumar Working 63 12.6 29.4 4380 128816 55130 0.428 47.2% 40.1%
Gandhi Park-2 Working 42 8.9 17.9 4380 78183 38821 0.497 27.1% 23.0%
Arjunpura-2 Working 55 8.6 15.4 2190 33770 18878 0.559 31.5% 26.8%
Theknarnol-2 Working 60 8.8 25.5 4380 111734 38427 0.344 55.9% 47.5%
Madhav Puri Working 51 8.1 21.6 4015 86604 32366 0.374 43.7% 37.2%
Dholi Pyau Tiraha-New Construction Working 54 11.9 20.1 7300 147022 87113 0.593 29.2% 24.8%
Ahilyabai Park Dampier Nagar MVDA Working 43 9.9 24.7 4380 108186 43570 0.403 34.2% 29.1%
Ramlila Ground Krishna Nagar MVDA Working 41 9.9 18.6 2190 40690 21608 0.531 24.7% 21.0%
Kankali Temple Dwarikapuri MVDA Working 50 7.6 18.7 4015 74960 30403 0.406 39.5% 33.6%
Machli Mandi Bharatpur Gate Working 59 8.8 30.6 4380 133809 38602 0.288 65.5% 55.7%
Nai Basti W.No. Working 50 10.6 27.9 2920 81351 30835 0.379 42.3% 35.9%
Andi Kuiya Working 54 10.6 31.2 5475 171039 58181 0.340 50.9% 43.2%
Kathoti Kua Chaupal Working 50 9.4 18.5 3650 67416 34188 0.507 31.6% 26.9%
Kathoti Kua Masjid Working 56 12.9 18.6 1825 33890 23470 0.693 25.9% 22.0%
Gupta Kunk WNo.7 Working 49 7.3 22.6 3285 74241 23976 0.323 48.6% 41.3%

Pump Reference Operating
Pattern
Total head (m)
Measured power
consumption (kW)
Pumping quantity
(m3/ hour)
Estimated annual
operating hours (hour/
annum)
Estimated quantity pumped
per annum (KL)
Estimated annual power
consumption (kWh/annum)
Estimated SEC
(kW/kL)
Pump efficiency
(%)
Pump set efficiency
(%)
Water Supply Pumps
Sadar Dhobi Pada W.No8 Working 25 10.3 39.2 5110 200057 52429 0.262 30.6% 26.0%
Gandhi Nagar W.No. 9 Working 45 8.2 16.7 2190 36551 18031 0.493 29.2% 24.8%
Laxmi Nagar W.No. 9 Working 50 9.6 17.2 5110 88045 48869 0.555 28.9% 24.5%
Bains Bhora Kotwali W.No.14 Working 53 9.1 27.6 2920 80650 26437 0.328 51.8% 44.0%
Radhey Shyam Ashram W.No.16 Working 42 11.9 17.5 5840 102142 69710 0.682 19.7% 16.8%
Om Nagar W.No.17 Working 45 9.2 21.6 4380 94564 40426 0.427 33.7% 28.7%
Om Nagar-2 W.No.17 Working 50 8.5 17.1 6570 112281 55714 0.496 32.3% 27.4%
Antapara behind Gurudwara W.No.18 Working 43 7.8 35.0 2190 76562 17065 0.223 61.8% 52.5%
Jogi Gali Antapada W.No.18 Working 44 8.5 23.1 2190 50545 18699 0.370 38.1% 32.4%
Khateek Mohalla Balmiki Basti W.No.19 Working 53 9.1 20.1 5110 102864 46369 0.451 37.7% 32.0%
Guru Nanak Nagar W.No.19 Working 46 8.0 9.5 2007.5 19031 16060 0.844 17.5% 14.8%
Krishnapuram-1 Ward-24 Working 39 10.7 28.4 1460 41508 15648 0.377 33.1% 28.2%
Krishnapuram-2 Ward-24 Working 43 10.2 29.3 1460 42705 14879 0.348 39.5% 33.6%
Balmiki Basti Dholi Pyau Ward-27 Working 50 9.0 13.4 4745 63346 42863 0.677 23.7% 20.1%
Mahavidya Park Ward-28 Working 54 6.5 21.8 4380 95353 28676 0.301 57.5% 48.9%
Hanuman Teela Ward-33 Working 54 7.5 17.9 1460 26090 10909 0.418 41.4% 35.2%
Kashmiri Gali Ward-34 Working 37 7.0 18.3 3650 66905 25428 0.380 31.2% 26.5%
Mission Teela Sadar Bazar Ward-35 Working 38 10.9 29.3 5110 149774 55495 0.371 32.9% 27.9%
Matia Gate Ward-37 Working 64 9.0 22.8 5110 116661 45915 0.394 52.1% 44.3%
Subhash Nagar Nala Ward-38 Working 49 11.4 18.2 2920 53173 33385 0.628 25.0% 21.3%
Manshapuri Ward-39 Working 47 9.4 15.3 2920 44588 27583 0.619 24.3% 20.7%
Rampal Gali Ward-40 Working 49 6.9 24.4 3285 80055 22557 0.282 55.7% 47.4%

Pump Reference Operating
Pattern
Total head (m)
Measured power
consumption (kW)
Pumping quantity
(m3/ hour)
Estimated annual
operating hours (hour/
annum)
Estimated quantity pumped
per annum (KL)
Estimated annual power
consumption (kWh/annum)
Estimated SEC
(kW/kL)
Pump efficiency
(%)
Pump set efficiency
(%)
Water Supply Pumps
Theknarnol Ward-40 Working 53 7.5 21.8 5110 111551 38146 0.342 49.7% 42.2%
Lala Ganj Ward-42 Working 62 7.8 17.0 2920 49698 22763 0.458 43.4% 36.9%
Kashiram Yojna-3 Working 48 7.0 14.7 3650 53473 25550 0.478 32.2% 27.4%
Kashiram Yojna-4 Working 53 11.3 20.6 3650 75227 41245 0.548 31.0% 26.3%
Satrangi Garden Ward-8 Working 21 6.9 31.8 5475 174324 37978 0.218 30.9% 26.3%
Ambedkar Pratima Ward-10 Working 47 9.1 35.7 2190 78117 19912 0.255 59.1% 50.2%
Naya Nagla Ward-11 Working 44 7.9 22.5 4380 98419 34435 0.350 40.3% 34.2%
Ambedkar Nagar Ward-12 Working 49 8.8 32.7 1825 59732 15974 0.267 58.7% 49.9%
Mali Mohalla Sadar Ward-13 Working 50 10.8 24.2 3650 88184 39483 0.448 35.8% 30.4%
Naya Bans Ward-15 Working 62 7.9 16.5 1825 30094 14472 0.481 41.3% 35.1%
Machli Gate Ward-19 Working 50 7.6 10.7 1825 19601 13809 0.705 22.7% 19.3%
Bhim Nagar S.B.I. Ward-27 Working 50 6.6 24.4 4380 106741 28774 0.270 59.4% 50.5%
Motikunj Extension Working 47 8.6 27.4 4380 120143 37722 0.314 48.0% 40.8%
Rani Mandi Balmiki Basti Ward-6 Working 49 9.6 24.5 3650 89316 34990 0.392 40.1% 34.1%
Matia Gate Joshiyan Garden Working 59 9.1 25.3 4380 110989 39954 0.360 52.5% 44.6%
Sanjay Nagar Nala Working 48 8.1 25.2 4380 110245 35469 0.322 47.8% 40.6%
Balmiki Basti Ward-1 Working 52 9.4 18.2 4380 79585 41085 0.516 32.3% 27.4%
Sub Total (A) 1100.9 2745.6 476508 11,086,806 4,397,513

Performance Indicators for Mathura Sewage Pumping station Pumps
Pump Reference Operating Pattern Total head (m)
Measured power
consumption (kW)
Pumping quantity
(m3/ hour)
Estimated annual
operating hours (hour/
annum)
Estimated quantity
pumped per annum (KL)
Estimated annual power consumption
(kWh/ annum)
Estimated SEC
(kW/kL)
Pump efficiency
(%)
Pump set efficiency
(%)
Sewage Pumping Stations
Masani Nala SPS Pump 1
Five Pumps, one pump is operating at a time on rotational basis
25 39.3 236.7 1460 345533 57310 0.166 49.1% 41.7%
Masani Nala SPS Pump 2 31 45.9 262.1 1460 382666 67018 0.175 58.4% 49.7%
Masani Nala SPS Pump 3 27 67.5 398.7 1460 582053 98588 0.169 52.6% 44.7%
Masani Nala SPS Pump 4 33 45.3 215.2 1460 314197 66165 0.211 51.7% 44.0%
Masani Nala SPS Pump 5 26 68.6 389.0 1460 567891 100111 0.176 48.7% 41.4%
Krishna Ganga SPS Pump 2 Three Pumps, 2W + 1 NW, pump operated on rotational basis
22 10.4 52.3 1825 95508 19037 0.199 48.0% 40.8%
Krishna Ganga SPS Pump 3 24 10.4 54.3 1825 99158 19037 0.192 42.0% 35.7%
Chinta Haran SPS Pump 1 Three Pumps, 2W + 1 NW, pump operated on rotational basis
25 13.0 66.4 1095 72712 14288 0.196 42.0% 35.7%
Chinta Haran SPS Pump 3 24 13.8 66.1 1095 72328 15082 0.209 38.0% 32.3%
Swami Ghat SPS Pump 1 Three Pumps, 2W + 1 NW, pump operated on rotational basis
12 12.5 122.8 3650 448342 45713 0.102 37.2% 31.6%
Swami Ghat SPS Pump 2 11 12.4 119.5 3650 436053 45285 0.104 33.4% 28.4%
Cantt. Nala SPS Pump 1 Five Pumps, 1W + 4NW
25 23.9 39.9 4380 174908 104726 0.599 13.8% 11.7%
Dairy Farm SPS Pump 1
Six Pumps, 5W + 1 NW, one pump is operating at a time on rotational basis
26 80.4 293.7 1460 428851 117373 0.274 31.3% 26.6%
Dairy Farm SPS Pump 2 18 36.4 110.3 1460 160970 53211 0.331 18.0% 15.3%
Dairy Farm SPS Pump 3 26 78.2 302.9 1460 442283 114169 0.258 32.8% 27.9%
Dairy Farm SPS Pump 4 19 36.1 111.2 1460 162333 52708 0.325 19.3% 16.4%
Dairy Farm SPS Pump 5 25 76.2 312.3 1460 455909 111252 0.244 33.8% 28.7%
Vrindavan Gate SPS Pump 1 Three Pumps, 2W + 1 5 9.1 55.1 1825 100618 16632 0.165 10.6% 8.5%

Pump Reference Operating Pattern Total head (m)
Measured power
consumption (kW)
Pumping quantity
(m3/ hour)
Estimated annual
operating hours (hour/
annum)
Estimated quantity
pumped per annum (KL)
Estimated annual power consumption
(kWh/ annum)
Estimated SEC
(kW/kL)
Pump efficiency
(%)
Pump set efficiency
(%)
Sewage Pumping Stations
Vrindavan Gate SPS Pump 2 NW, pump operated on rotational basis
8 9.0 51.8 1825 94462 16368 0.173 16.2% 13.0%
Bangali Ghat SPS Pump 1 Five Pumps, 2W + 3 NW, pump operated on rotational basis
20 41.3 212.9 1825 388451 75304 0.194 36.2% 28.9%
Bangali Ghat SPS Pump 5 22 44.0 236.8 1825 432160 80243 0.186 41.5% 33.2%
Sub Total (B) 773.7 3709.9 39420 6,257,387 1,289,619
Total (A+B) 1874.6 6455.5 515928 17,344,193 5,687,132
Summary of Project Cost Benefit Analysis
The energy saving has been calculated on the basis of energy audit activity conducted at Mathura. Consequently, feasibility of individual projects has been
discussed with ULB officials and different pump manufactures. The energy saving of this project has been calculated on the basis of the technical information
shared by the manufacturers (for the recommended equipment) and operating information shared by pumping station personnel. The estimated energy saving is
provided in the table below:
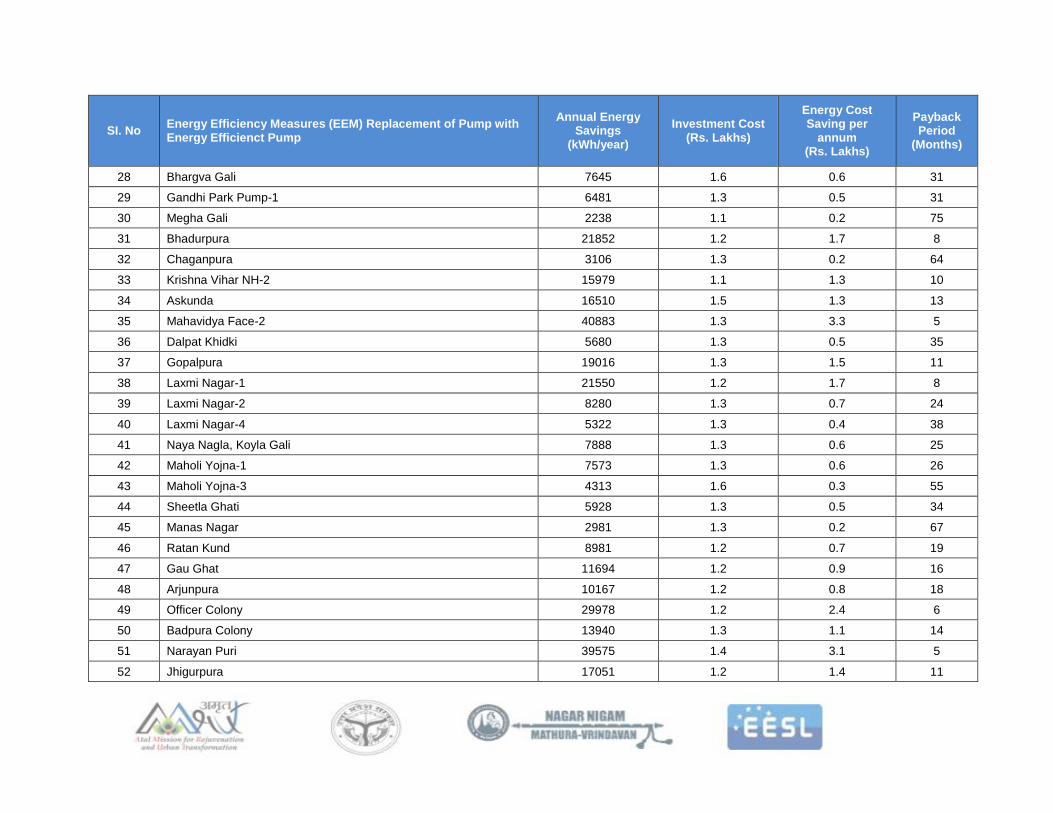
Summary of Energy Saving Measures Identified During the Audit
SI. No Energy Efficiency Measures (EEM) Replacement of Pump with Energy Efficienct Pump
Annual Energy Savings
(kWh/year)
Investment Cost (Rs. Lakhs)
Energy Cost Saving per
annum (Rs. Lakhs)
Payback Period
(Months)
Water Supply Pumps
1 Bhuteshwar Campus TW No.2 7344 1.3 0.6 27
2 Bhuteshwar Campus TW No.5 2896 1.5 0.2 77

SI. No Energy Efficiency Measures (EEM) Replacement of Pump with Energy Efficienct Pump
Annual Energy Savings
(kWh/year)
Investment Cost (Rs. Lakhs)
Energy Cost Saving per
annum (Rs. Lakhs)
Payback Period
(Months)
3 Bhuteshwar Campus TW No.7 7095 1.3 0.6 28
4 Nagar Palika TW No.15 41177 1.2 3.3 4
5 Bangali Ghat TW No.16 31535 1.2 2.5 6
6 Police Line TW No.25 43502 1.5 3.5 5
7 Bhuteshwar Campus TW No.27 18214 1.2 1.4 10
8 District Jail TW No.29 40425 1.3 3.2 5
9 Govind Nagar Sec. A 7633 1.5 0.6 29
10 Kushak Gali-1 43230 1.2 3.4 4
11 Shyam Ghat 22276 1.1 1.8 8
12 Vishram Ghat 25048 1.5 2.0 9
13 Chatta Bazar 26034 1.5 2.1 9
14 Rampal Gali 12354 1.3 1.0 16
15 Vrindavan Gate 30351 1.3 2.4 7
16 Theknarnol 26825 1.5 2.1 8
17 Dwarkeshpuri 10877 1.2 0.9 17
18 Unth Gali 35469 1.2 2.8 5
19 Naya Nagla Gali No.8 15887 1.1 1.3 11
20 Chah Kathoti 11212 1.2 0.9 16
21 Agra Hotel 40003 1.4 3.2 5
22 Dhruv Ghat 19022 1.3 1.5 11
23 Maholi Ki Paur 7721 1.5 0.6 29
24 Radhika Vihar 9311 1.3 0.7 21
25 Dholi Pyau 9877 1.3 0.8 20
26 Thateran Gali 25310 1.2 2.0 7
27 Bairag puri 9997 1.1 0.8 17
SI. No Energy Efficiency Measures (EEM) Replacement of Pump with Energy Efficienct Pump
Annual Energy Savings
(kWh/year)
Investment Cost (Rs. Lakhs)
Energy Cost Saving per
annum (Rs. Lakhs)
Payback Period
(Months)
28 Bhargva Gali 7645 1.6 0.6 31
29 Gandhi Park Pump-1 6481 1.3 0.5 31
30 Megha Gali 2238 1.1 0.2 75
31 Bhadurpura 21852 1.2 1.7 8
32 Chaganpura 3106 1.3 0.2 64
33 Krishna Vihar NH-2 15979 1.1 1.3 10
34 Askunda 16510 1.5 1.3 13
35 Mahavidya Face-2 40883 1.3 3.3 5
36 Dalpat Khidki 5680 1.3 0.5 35
37 Gopalpura 19016 1.3 1.5 11
38 Laxmi Nagar-1 21550 1.2 1.7 8
39 Laxmi Nagar-2 8280 1.3 0.7 24
40 Laxmi Nagar-4 5322 1.3 0.4 38
41 Naya Nagla, Koyla Gali 7888 1.3 0.6 25
42 Maholi Yojna-1 7573 1.3 0.6 26
43 Maholi Yojna-3 4313 1.6 0.3 55
44 Sheetla Ghati 5928 1.3 0.5 34
45 Manas Nagar 2981 1.3 0.2 67
46 Ratan Kund 8981 1.2 0.7 19
47 Gau Ghat 11694 1.2 0.9 16
48 Arjunpura 10167 1.2 0.8 18
49 Officer Colony 29978 1.2 2.4 6
50 Badpura Colony 13940 1.3 1.1 14
51 Narayan Puri 39575 1.4 3.1 5
52 Jhigurpura 17051 1.2 1.4 11

SI. No Energy Efficiency Measures (EEM) Replacement of Pump with Energy Efficienct Pump
Annual Energy Savings
(kWh/year)
Investment Cost (Rs. Lakhs)
Energy Cost Saving per
annum (Rs. Lakhs)
Payback Period
(Months)
53 Raigarpura 10327 1.5 0.8 22
54 Gupta Kunj 8923 1.2 0.7 20
55 Radha Nagar 19887 1.2 1.6 9
56 Manoharpura 4750 1.3 0.4 42
57 Krishna Nagar 10845 1.2 0.9 17
58 Heja Hospital 6996 1.3 0.6 29
59 Laxmi Nagar 29763 1.1 2.4 6
60 Maholi Yojna-2 8257 1.5 0.7 27
61 Antapada 20489 1.3 1.6 10
62 Rani Mandi 22365 1.2 1.8 8
63 Kutta Paysa 16015 1.3 1.3 12
64 Gali Ravaliya 4584 1.3 0.4 44
65 Gali Rajkumar 17025 1.6 1.4 14
66 Gandhi Park-2 21624 1.2 1.7 8
67 Arjunpura-2 9151 1.2 0.7 20
68 Theknarnol-2 6397 1.5 0.5 35
69 Madhav Puri 10496 1.3 0.8 19
70 Dholi Pyau Tiraha-New Construction 47803 1.4 3.8 4
71 Ahilyabai Park Dampier Nagar MVDA 20536 1.3 1.6 10
72 Ramlila Ground Krishna Nagar MVDA 12871 1.2 1.0 14
73 Kankali Temple Dwarikapuri MVDA 10774 1.2 0.9 17
74 Nai Basti W.No. 11401 1.5 0.9 20
75 Andi Kuiya 14053 1.5 1.1 16
76 Kathoti Kua Chaupal 16535 1.2 1.3 11
77 Kathoti Kua Masjid 14072 1.3 1.1 14

SI. No Energy Efficiency Measures (EEM) Replacement of Pump with Energy Efficienct Pump
Annual Energy Savings
(kWh/year)
Investment Cost (Rs. Lakhs)
Energy Cost Saving per
annum (Rs. Lakhs)
Payback Period
(Months)
78 Gupta Kunk WNo.7 5964 1.3 0.5 34
79 Sadar Dhobi Pada W.No8 27664 1.3 2.2 7
80 Gandhi Nagar W.No. 9 9417 1.2 0.7 19
81 Laxmi Nagar W.No. 9 25813 1.2 2.1 7
82 Bains Bhora Kotwali W.No.14 6015 1.5 0.5 37
83 Radhey Shyam Ashram W.No.16 47243 1.2 3.8 4
84 Om Nagar W.No.17 19355 1.3 1.5 10
85 Om Nagar-2 W.No.17 26312 1.2 2.1 7
86 Jogi Gali Antapada W.No.18 7687 1.3 0.6 26
87 Khateek Mohalla Balmiki Basti W.No.19 19374 1.3 1.5 10
88 Guru Nanak Nagar W.No.19 11292 1.1 0.9 15
89 Krishnapuram-1 Ward-24 7633 1.3 0.6 26
90 Krishnapuram-2 Ward-24 5786 1.3 0.5 35
91 Balmiki Basti Dholi Pyau Ward-27 25950 1.2 2.1 7
92 Mahavidya Park Ward-28 3181 1.3 0.3 63
93 Hanuman Teela Ward-33 3933 1.3 0.3 51
94 Kashmiri Gali Ward-34 12210 1.2 1.0 14
95 Mission Teela Sadar Bazar Ward-35 27314 1.3 2.2 7
96 Matia Gate Ward-37 10243 1.5 0.8 22
97 Subhash Nagar Nala Ward-38 19740 1.2 1.6 9
98 Manshapuri Ward-39 16393 1.2 1.3 11
99 Rampal Gali Ward-40 3134 1.3 0.2 64
100 Theknarnol Ward-40 8872 1.3 0.7 23
101 Lala Ganj Ward-42 7506 1.3 0.6 27
102 Kashiram Yojna-3 11844 1.2 0.9 15

SI. No Energy Efficiency Measures (EEM) Replacement of Pump with Energy Efficienct Pump
Annual Energy Savings
(kWh/year)
Investment Cost (Rs. Lakhs)
Energy Cost Saving per
annum (Rs. Lakhs)
Payback Period
(Months)
103 Kashiram Yojna-4 21503 1.3 1.7 9
104 Satrangi Garden Ward-8 18430 1.2 1.5 9
105 Naya Nagla Ward-11 12993 1.3 1.0 15
106 Mali Mohalla Sadar Ward-13 17651 1.3 1.4 11
107 Naya Bans Ward-15 5234 1.3 0.4 38
108 Machli Gate Ward-19 8471 1.1 0.7 20
109 Motikunj Extension 9762 1.3 0.8 21
110 Rani Mandi Balmiki Basti Ward-6 13320 1.3 1.1 15
111 Matia Gate Joshiyan Garden 8668 1.5 0.7 26
112 Sanjay Nagar Nala 9267 1.3 0.7 22
113 Balmiki Basti Ward-1 19412 1.2 1.5 9
Sub- Total (A) 1,805,761 147 144 12
Sewage Pumping Station
114 Masani Nala SPS Pump 1 20759 5.3 1.7 39
115 Masani Nala SPS Pump 2 14790 5.4 1.2 55
116 Masani Nala SPS Pump 3 25499 7.1 2.0 42
117 Masani Nala SPS Pump 4 21116 5.4 1.7 38
118 Masani Nala SPS Pump 5 40653 7.0 3.2 26
119 Krishna Ganga SPS Pump 2 4582 2.2 0.4 73
120 Chinta Haran SPS Pump 1 4284 2.2 0.3 78
121 Chinta Haran SPS Pump 3 5200 2.2 0.4 64
122 Swami Ghat SPS Pump 1 21039 2.1 1.7 15
123 Swami Ghat SPS Pump 2 23374 2.1 1.9 14
124 Cantt. Nala SPS Pump 1 68629 2.7 5.5 6
125 Dairy Farm SPS Pump 1 67619 6.6 5.4 15

SI. No Energy Efficiency Measures (EEM) Replacement of Pump with Energy Efficienct Pump
Annual Energy Savings
(kWh/year)
Investment Cost (Rs. Lakhs)
Energy Cost Saving per
annum (Rs. Lakhs)
Payback Period
(Months)
126 Dairy Farm SPS Pump 2 38931 3.6 3.1 14
127 Dairy Farm SPS Pump 3 64189 6.6 5.1 16
128 Dairy Farm SPS Pump 4 36281 3.4 2.9 14
129 Dairy Farm SPS Pump 5 61731 6.6 4.9 16
130 Bangali Ghat SPS Pump 1 41099 9.2 3.3 34
131 Bangali Ghat SPS Pump 5 38383 9.2 3.1 36
Sub- Total (B) 598,158 89 47.6 22.5
Net Total (A+B) 2,403,919 236 191 15
Under maintenance pump sets, which were not repaired during energy audit period, were not taken up for measurement, analysis and subsequent
implementation in this report.
Implementation of the energy efficiency measures on pumping system may result in annual energy savings of 2,403,919 kWh per year which is 44.33% of the
existing electricity consumption. This energy saving is equivalent to 206.7 toe and results in reduction 1,971 tCO22 per year.
2 Estimated using average grid emission factor provided in Central electricity authority report titled “CO2 Baseline Database for the Indian Power Sector” version 11.

Project Financials and proposed Business Model Total Project cost (CAPEX) The following are the key components considered while arriving at the total project cost:
i. Cost of pump, motor and other accessories (like NRV and gate valve), discovered through a
transparent bidding process;
ii. Cost of dismantling, installation and commissioning including testing charges, discovered through a
transparent bidding process;
iii. Project Establishment and Supervision charges of EESL at 5% of total cost of equipment including
installation;
iv. Cost of preparation of IGEA, as per actual tendered cost, plus EESL’s service charge at 15%;
v. All applicable goods and services tax as on actual basis; and
vi. Capitalized interest during the Project Implementation Period.
Details of project capital cost is provided in the table below:
Project Capital Cost
Capital Cost Related assumption Unit Value
Number of Pumps No. 131
Total Cost of Equipment including installation, commissioning and testing INR lakhs 235.55
Cost of pump including motor INR lakhs 125.17
Cost of NRV INR lakhs 39.04
Cost of Gate valve INR lakhs 50.72
Cost of Web based dashboard INR lakhs 10.06
Installation and Commissioning Cost including testing charges INR lakhs 10.55
EESL's administrative and establishment charge % 5
Cost of preparation of IGEA report including EESL service charges and applicable
GST
INR lakhs 10.49
Total Project Cost w/o Capitalized interest INR lakhs 257.82
Commissioning Details
Total Months for Commissioning months 9
Capitalized interest INR lakhs 14.45
Total Project Cost INR lakhs 272.27
Operating Costs (OPEX) The following are the key components considered while arriving at the operating cost for the project
i. Project Establishment and Supervision charges of EESL at 4% of total project cost, with annual
escalation of 5%; and
ii. Actual incurred Repair & Maintenance charges, discovered through a transparent bidding process.
Details about project operating cost is provided in the table below.

Project Operating Cost
Operational Details Unit Value
EESL's administrative and establishment charges % 4%
Financing Terms and other tax related assumptions The following are the key financial assumptions used in developing the model. Financing terms and tax
related assumptions are provided in the table below:
Financing terms and tax related assumptions
Parameters Unit Value
Term of the project Years 7
Financing Details
Debt Percentage % 70%
Cost of Debt % 11%
Equity Percentage % 30%
Cost of Equity (post- tax) % 16%
Tax Details
Corporate Tax % 34.61%
Goods and Services Tax % 18%
Output - Annuity Payment to EESL Based on the cost parameters and assumptions mentioned above, the annuity payment to EESL was
computed. Details of annuity payment to EESL are provided in the table below.
Annuity Payment to EESL
Year
1 2 3 4 5 6 7 Total
Calculations of annuity payment
Total Debt to be repaid INR lakh 47.07 44.07 41.08 38.08 35.09 32.09 29.10 266.59
Principal Repayment INR lakh 27.23 27.23 27.23 27.23 27.23 27.23 27.23 190.59
Interest INR lakh 19.84 16.85 13.85 10.86 7.86 4.87 1.87 76.00
Total Equity Repayments INR lakh 30.58 27.73 24.87 22.02 19.16 16.31 13.45 154.13
Recovery of equity investment INR lakh 11.67 11.67 11.67 11.67 11.67 11.67 11.67 81.68
Return on equity INR lakh 18.91 16.06 13.20 10.35 7.49 4.64 1.78 72.45
R&M Charges INR lakh 0.00 5.89 17.67 22.38 27.09 35.33 42.40 150.75
EESL's administrative and establishment charge
INR lakh 10.89 11.44 12.01 12.61 13.24 13.90 14.59 88.67
Annuity Payment to EESL INR lakh 88.54 89.13 95.62 95.09 94.58 97.63 99.54 660.13
Goods and Services Tax on annuity payment
INR lakh 15.94 16.04 17.21 17.12 17.02 17.57 17.92 118.82
Annuity Payment to EESL incl. all applicable taxes
INR lakh 104.48 105.17 112.84 112.20 111.60 115.21 117.5 778.96

Year
1 2 3 4 5 6 7 Total
ULB Savings
Total Savings INR lakh 191.11 195.52 199.79 203.88 207.74 211.35 214.7 1424.1
Profit to ULB INR lakh 86.63 90.36 86.95 91.67 96.14 96.15 97.20 645.10
% of savings with ULBs % 45.3%
Sensitivity analysis The sensitivity analysis has been conducted to determine the impact of change in capital cost and change in
savings on the percentage of monetary share of accrued savings retained by the ULB. Project sensitivity
analysis is provided in the table below.
Project sensitivity analysis
Change in Capital Cost % of savings retained by the utility
-10% 49.52%
-5% 47.41%
0% 45.30%
5% 43.19%
10% 41.08%
Change in Interest (ROE, Interest, D/E ratio) % of savings retained by the utility
-10% 39.22%
-5% 42.42%
0% 45.30%
5% 47.90%
10% 50.27%

Key facts of IGEA
Key facts of the project are as follows:
Particular Unit Value
Total number of pump sets as per LOA Nos. 176
Total number of pump sets under maintenance Nos. 30
Total number of pump sets where measurement was not possible Nos. 4
Total number of pump sets audited Nos. 142
Total numbers of pumps sets considered for replacement Nos. 131
Estimated present annual energy consumption (for 131 pump sets) kWh 5,422,877
Estimated annual energy consumption with proposed EEPS
(for 131 pump sets) kWh 3,018,958
Percentage energy saving potential % 44.33
Total project cost (including IGEA cost and capitalized interest) Rs. Lakhs 272.27
Pre – implementation annual energy consumption (baseline) and post implementation annual energy
consumption will be estimated based proposed Measurement and Verification (M & V methodology).
Rated and operating parameters of pump sets to be installed under this project along with other accessories
are provided in the table below:

Key Facts of the Pumps to Be Replaced
Pump Identification Rated parameters Operating parameters (individual operation) Accessories to be installed
Pump Reference Flow (m3/ hour)
Head (m)
Motor rating (kW)
Flow (m3/hour)
Total head (m)
Actual power consumption
(kW)
Pump set efficiency
(%)
NRV to be
installed (Yes/No)
Gate valve to
be installed (Yes/No)
Apparatus for Web based
dashboard (Yes/No)
Water Supply Pump
Bhuteshwar Campus TW No.2 36 65 9.3 24.7 50 8.6 45.85% Yes Yes Yes
Bhuteshwar Campus TW No.5 - 65 9.3 28.2 56 11.5 43.96% Yes Yes Yes
Bhuteshwar Campus TW No.7 30 65 9.3 27.1 50 8.9 48.93% Yes Yes Yes
Nagar Palika TW No.15 - 65 9.3 17.2 44 9.6 25.28% Yes Yes Yes
Bangali Ghat TW No.16 24 65 9.3 16.1 37 7.5 25.47% Yes Yes Yes
Police Line TW No.25 36 65 9.3 35.4 42 13.1 36.48% Yes Yes Yes
Bhuteshwar Campus TW No.27 36 65 9.3 10.2 61 9.6 20.88% Yes Yes Yes
District Jail TW No.29 24 65 9.3 33.0 30 12.8 24.75% Yes Yes Yes
Govind Nagar Sec. A 36 65 9.3 33.1 52 10.1 54.45% Yes Yes Yes
Kushak Gali-1 30 65 9.3 22.5 27 11.7 16.64% Yes Yes Yes
Shyam Ghat 18 65 7.5 8.9 48 6.1 22.24% Yes Yes Yes
Vishram Ghat 18 65 9.3 34.3 39 12.1 35.39% Yes Yes Yes
Chatta Bazar 18 65 9.3 36.4 46 12.5 43.07% Yes Yes Yes
Rampal Gali 18 65 9.3 23.0 53 8.8 44.08% Yes Yes Yes
Vrindavan Gate 18 65 9.3 26.0 46 11.1 34.44% Yes Yes Yes
Theknarnol 18 65 9.3 21.4 70 12.4 38.69% Yes Yes Yes
Dwarkeshpuri 18 65 9.3 15.3 59 12.2 23.78% Yes Yes Yes
Unth Gali 18 65 9.3 10.4 62 9.5 21.68% Yes Yes Yes
Naya Nagla Gali No.8 18 65 7.5 11.5 39 8.7 16.54% Yes Yes Yes
Chah Kathoti 15 65 7.5 19.4 46 8.1 35.36% Yes Yes Yes
Agra Hotel 18 65 9.3 28.1 46 11.9 34.84% Yes Yes Yes
Dhruv Ghat 24 65 9.3 27.8 36 7.6 42.41% Yes Yes Yes

Pump Identification Rated parameters Operating parameters (individual operation) Accessories to be installed
Pump Reference Flow (m3/ hour)
Head (m)
Motor rating (kW)
Flow (m3/hour)
Total head (m)
Actual power consumption
(kW)
Pump set efficiency
(%)
NRV to be
installed (Yes/No)
Gate valve to
be installed (Yes/No)
Apparatus for Web based
dashboard (Yes/No)
Maholi Ki Paur 24 65 9.3 25.7 58 8.9 53.77% Yes Yes Yes
Radhika Vihar 24 65 9.3 24.7 52 9.5 43.09% Yes Yes Yes
Dholi Pyau 24 65 9.3 24.9 50 8.4 47.36% Yes Yes Yes
Thateran Gali 21 65 9.3 17.6 49 10.3 26.82% Yes Yes Yes
Bairag puri 24 65 9.3 14.2 35 6.1 25.95% Yes Yes Yes
Bhargva Gali 18 65 9.3 39.2 55 11.1 62.15% Yes Yes Yes
Gandhi Park Pump-1 18 65 7.5 25.0 47 8.0 46.83% Yes Yes Yes
Megha Gali 15 65 4.5 6.9 48 3.3 31.86% Yes Yes Yes
Bhadurpura 18 65 9.3 15.6 45 11.2 19.98% Yes Yes Yes
Chaganpura 18 65 7.5 24.1 47 7.7 46.91% Yes Yes Yes
Krishna Vihar NH-2 24 65 9.3 11.0 51 8.5 21.10% Yes Yes Yes
Askunda 18 65 7.5 32.4 45 10.0 46.82% Yes Yes Yes
Mahavidya Face-2 18 65 9.3 17.6 59 12.1 27.37% Yes Yes Yes
Dalpat Khidki 18 65 7.5 19.8 53 7.1 47.06% Yes Yes Yes
Gopalpura 15 65 9.3 18.2 59 12.8 26.95% Yes Yes Yes
Laxmi Nagar-1 18 65 9.3 29.4 23 6.9 31.45% Yes Yes Yes
Laxmi Nagar-2 18 65 9.3 31.8 42 8.9 48.19% Yes Yes Yes
Laxmi Nagar-4 18 65 7.5 39.2 26.5 7.0 47.79% Yes Yes Yes
Naya Nagla, Koyla Gali 18 65 7.5 20.9 47 7.0 44.82% Yes Yes Yes
Maholi Yojna-1 24 65 9.3 27.0 46 8.8 45.53% Yes Yes Yes
Maholi Yojna-3 24 65 9.3 36.9 49 10.0 58.12% Yes Yes Yes
Sheetla Ghati 18 65 7.5 14.1 70 6.0 52.26% Yes Yes Yes
Manas Nagar 18 65 7.5 23.5 47 6.2 56.97% Yes Yes Yes

Pump Identification Rated parameters Operating parameters (individual operation) Accessories to be installed
Pump Reference Flow (m3/ hour)
Head (m)
Motor rating (kW)
Flow (m3/hour)
Total head (m)
Actual power consumption
(kW)
Pump set efficiency
(%)
NRV to be
installed (Yes/No)
Gate valve to
be installed (Yes/No)
Apparatus for Web based
dashboard (Yes/No)
Ratan Kund 18 65 7.5 11.9 59 5.5 40.85% Yes Yes Yes
Gau Ghat 18 65 7.5 23.3 39 7.7 37.93% Yes Yes Yes
Arjunpura 18 65 9.3 12.3 61 9.5 25.33% Yes Yes Yes
Officer Colony 18 65 9.3 19.1 23 9.1 15.41% Yes Yes Yes
Badpura Colony 15 65 9.3 33.3 39 9.0 46.35% Yes Yes Yes
Narayan Puri 30 65 9.3 29.0 46 12.0 35.55% Yes Yes Yes
Jhigurpura 18 65 7.5 15.8 49 7.9 31.18% Yes Yes Yes
Raigarpura 15 65 9.3 33.0 43 9.1 49.75% Yes Yes Yes
Gupta Kunj 18 65 7.5 17.9 49 7.6 36.71% Yes Yes Yes
Radha Nagar 24 65 9.3 20.1 46 9.0 32.79% Yes Yes Yes
Manoharpura 24 65 9.3 14.2 78 8.1 43.87% Yes Yes Yes
Krishna Nagar 24 65 9.3 18.0 52 8.6 34.78% Yes Yes Yes
Heja Hospital 24 65 9.3 16.8 61 8.3 39.67% Yes Yes Yes
Laxmi Nagar 18 65 9.3 19.9 25 9.5 16.75% Yes Yes Yes
Maholi Yojna-2 18 65 9.3 28.6 50 9.7 47.43% Yes Yes Yes
Antapada 24 65 9.3 26.4 37 9.5 32.91% Yes Yes Yes
Rani Mandi 24 65 9.3 17.7 44 11.7 21.24% Yes Yes Yes
Kutta Paysa 24 65 9.3 19.9 54 9.7 35.49% Yes Yes Yes
Gali Ravaliya 24 65 9.3 20.1 51 6.3 51.86% Yes Yes Yes
Gali Rajkumar 24 65 9.3 29.4 63 12.6 47.16% Yes Yes Yes
Gandhi Park-2 24 65 9.3 17.9 42 8.9 27.10% Yes Yes Yes
Arjunpura-2 24 65 9.3 15.4 55 8.6 31.52% Yes Yes Yes
Theknarnol-2 24 65 9.3 25.5 60 8.8 55.90% Yes Yes Yes

Pump Identification Rated parameters Operating parameters (individual operation) Accessories to be installed
Pump Reference Flow (m3/ hour)
Head (m)
Motor rating (kW)
Flow (m3/hour)
Total head (m)
Actual power consumption
(kW)
Pump set efficiency
(%)
NRV to be
installed (Yes/No)
Gate valve to
be installed (Yes/No)
Apparatus for Web based
dashboard (Yes/No)
Madhav Puri 21 65 9.3 21.6 51 8.1 43.72% Yes Yes Yes
Dholi Pyau Tiraha-New Construction 24 65 9.3 20.1 54 11.9 29.20% Yes Yes Yes
Ahilyabai Park Dampier Nagar MVDA 27 65 9.3 24.7 43 9.9 34.21% Yes Yes Yes
Ramlila Ground Krishna Nagar MVDA 18 65 9.3 18.6 41 9.9 24.74% Yes Yes Yes
Kankali Temple Dwarikapuri MVDA 18 65 7.5 18.7 50 7.6 39.50% Yes Yes Yes
Nai Basti W.No. 18 65 9.3 27.9 50 10.6 42.26% Yes Yes Yes
Andi Kuiya 18 65 9.3 31.2 54 10.6 50.86% Yes Yes Yes
Kathoti Kua Chaupal 18 65 9.3 18.5 50 9.4 31.59% Yes Yes Yes
Kathoti Kua Masjid 18 65 9.3 18.6 56 12.9 25.91% Yes Yes Yes
Gupta Kunk WNo.7 18 65 9.3 22.6 49 7.3 48.61% Yes Yes Yes
Sadar Dhobi Pada W.No8 18 65 9.3 39.2 25 10.3 30.56% Yes Yes Yes
Gandhi Nagar W.No. 9 18 65 9.3 16.7 45 8.2 29.23% Yes Yes Yes
Laxmi Nagar W.No. 9 18 65 9.3 17.2 50 9.6 28.86% Yes Yes Yes
Bains Bhora Kotwali W.No.14 18 65 9.3 27.6 53 9.1 51.80% Yes Yes Yes
Radhey Shyam Ashram W.No.16 18 65 9.3 17.5 42 11.9 19.72% Yes Yes Yes
Om Nagar W.No.17 18 65 9.3 21.6 45 9.2 33.73% Yes Yes Yes
Om Nagar-2 W.No.17 18 65 9.3 17.1 50 8.5 32.28% Yes Yes Yes
Jogi Gali Antapada W.No.18 18 65 9.3 23.1 44 8.5 38.11% Yes Yes Yes
Khateek Mohalla Balmiki Basti W.No.19 18 65 9.3 20.1 53 9.1 37.67% Yes Yes Yes
Guru Nanak Nagar W.No.19 18 65 9.3 9.5 46 8.0 17.46% Yes Yes Yes
Krishnapuram-1 Ward-24 18 65 9.3 28.4 39 10.7 33.14% Yes Yes Yes
Krishnapuram-2 Ward-24 18 65 9.3 29.3 43 10.2 39.54% Yes Yes Yes
Balmiki Basti Dholi Pyau Ward-27 18 65 9.3 13.4 50 9.0 23.67% Yes Yes Yes

Pump Identification Rated parameters Operating parameters (individual operation) Accessories to be installed
Pump Reference Flow (m3/ hour)
Head (m)
Motor rating (kW)
Flow (m3/hour)
Total head (m)
Actual power consumption
(kW)
Pump set efficiency
(%)
NRV to be
installed (Yes/No)
Gate valve to
be installed (Yes/No)
Apparatus for Web based
dashboard (Yes/No)
Mahavidya Park Ward-28 18 65 9.3 21.8 54 6.5 57.53% Yes Yes Yes
Hanuman Teela Ward-33 18 65 9.3 17.9 54 7.5 41.38% Yes Yes Yes
Kashmiri Gali Ward-34 18 65 9.3 18.3 37 7.0 31.19% Yes Yes Yes
Mission Teela Sadar Bazar Ward-35 18 65 9.3 29.3 38 10.9 32.86% Yes Yes Yes
Matia Gate Ward-37 18 65 9.3 22.8 64 9.0 52.10% Yes Yes Yes
Subhash Nagar Nala Ward-38 18 65 9.3 18.2 49 11.4 25.00% Yes Yes Yes
Manshapuri Ward-39 18 65 9.3 15.3 47 9.4 24.34% Yes Yes Yes
Rampal Gali Ward-40 18 65 9.3 24.4 49 6.9 55.72% Yes Yes Yes
Theknarnol Ward-40 18 65 9.3 21.8 53 7.5 49.66% Yes Yes Yes
Lala Ganj Ward-42 18 65 9.3 17.0 62 7.8 43.37% Yes Yes Yes
Kashiram Yojna-3 18 65 9.3 14.7 48 7.0 32.19% Yes Yes Yes
Kashiram Yojna-4 18 65 9.3 20.6 53 11.3 30.97% Yes Yes Yes
Satrangi Garden Ward-8 18 65 9.3 31.8 21 6.9 30.88% Yes Yes Yes
Naya Nagla Ward-11 18 65 9.3 22.5 44 7.9 40.29% Yes Yes Yes
Mali Mohalla Sadar Ward-13 18 65 9.3 24.2 50 10.8 35.78% Yes Yes Yes
Naya Bans Ward-15 18 65 9.3 16.5 62 7.9 41.31% Yes Yes Yes
Machli Gate Ward-19 18 65 9.3 10.7 50 7.6 22.74% Yes Yes Yes
Motikunj Extension 18 65 9.3 27.4 47 8.6 47.96% Yes Yes Yes
Rani Mandi Balmiki Basti Ward-6 18 65 9.3 24.5 49 9.6 40.07% Yes Yes Yes
Matia Gate Joshiyan Garden 18 65 9.3 25.3 59 9.1 52.51% Yes Yes Yes
Sanjay Nagar Nala 18 65 9.3 25.2 48 8.1 47.80% Yes Yes Yes
Balmiki Basti Ward-1 18 65 9.3 18.2 52 9.4 32.27% Yes Yes Yes
Sewage Pumping Station

Pump Identification Rated parameters Operating parameters (individual operation) Accessories to be installed
Pump Reference Flow (m3/ hour)
Head (m)
Motor rating (kW)
Flow (m3/hour)
Total head (m)
Actual power consumption
(kW)
Pump set efficiency
(%)
NRV to be
installed (Yes/No)
Gate valve to
be installed (Yes/No)
Apparatus for Web based
dashboard (Yes/No)
Masani Nala SPS Pump 1 270 36 30 236.7 25 39.3 49.1% Yes Yes Yes
Masani Nala SPS Pump 2 270 36 30 262.1 31 45.9 58.4% Yes Yes Yes
Masani Nala SPS Pump 3 540 36 90 398.7 27 67.5 52.6% Yes Yes Yes
Masani Nala SPS Pump 4 270 36 30 215.2 33 45.3 51.7% Yes Yes Yes
Masani Nala SPS Pump 5 540 36 90 389.0 26 68.6 48.7% Yes Yes Yes
Krishna Ganga SPS Pump 2 108 20 11 52.3 22 10.4 36.4% Yes Yes Yes
Chinta Haran SPS Pump 1 270 20.5 19 66.4 25 13.0 42.0% Yes Yes Yes
Chinta Haran SPS Pump 3 270 20.5 19 66.1 24 13.8 38.0% Yes Yes Yes
Swami Ghat SPS Pump 1 - - 7 122.8 12 12.5 37.2% Yes Yes Yes
Swami Ghat SPS Pump 2 - - 7 119.5 11 12.4 33.4% Yes Yes Yes
Cantt. Nala SPS Pump 1 72 25 19 39.9 25 23.9 13.8% Yes Yes Yes
Dairy Farm SPS Pump 1 338.4 35 75 293.7 26 80.4 31.3% Yes Yes Yes
Dairy Farm SPS Pump 2 165.6 28 30 110.3 18 36.4 18.0% Yes Yes Yes
Dairy Farm SPS Pump 3 338.4 35 75 302.9 26 78.2 32.8% Yes Yes Yes
Dairy Farm SPS Pump 4 165.6 28 30 111.2 19 36.1 19.3% Yes Yes Yes
Dairy Farm SPS Pump 5 338.4 35 75 312.3 25 76.2 33.8% Yes Yes Yes
Bangali Ghat SPS Pump 1 349.2 24 45 212.9 20 41.3 36.2% Yes Yes Yes
Bangali Ghat SPS Pump 5 349.2 24 45 236.8 22 44.0 41.5% Yes Yes Yes
Total 6055.6 1780.7

Table of Contents Executive Summary ........................................................................................................................................ iii
Background of the Project ............................................................................................................................ iii
Description of Facilities ................................................................................................................................ iii
Summary of Performance Evaluation of Pump sets ...................................................................................... x
Performance Indicators ................................................................................................................................. xi
Summary of Project Cost Benefit Analysis .............................................................................................. xviii
Project Financials and proposed Business Model ...................................................................................... xxv
Total Project cost (CAPEX) ....................................................................................................................... xxv
Operating Costs (OPEX) ............................................................................................................................ xxv
Financing Terms and other tax related assumptions ................................................................................. xxvi
Output - Annuity Payment to EESL ......................................................................................................... xxvi
Sensitivity analysis ................................................................................................................................... xxvii
Key facts of IGEA .................................................................................................................................. xxviii
1 Introduction ...................................................................................................................................... 1
1.1 Background of the Project.................................................................................................................. 1
1.2 Stakeholders Involved ........................................................................................................................ 2
1.3 Objective of the IGEA ....................................................................................................................... 3
1.4 Methodology adopted for Energy Audit ............................................................................................ 5
2 Interaction with Facilities/ Key Personnel ..................................................................................... 7
2.1 Interaction with Pump Manufacturers ................................................................................................ 7
3 Project area and Facility description ............................................................................................. 8
3.1 General information about the city .................................................................................................... 8
3.2 Accessibility to city from Metro cities & State capital ...................................................................... 8
3.3 Pumping Stations in the Mathura ....................................................................................................... 9
3.4 Historical Water Pumped and Energy Consumption Analysis ....................................................... 14
3.5 Power Failure Data .......................................................................................................................... 15
3.6 Rainfall and Climate data ................................................................................................................. 15
3.7 Ground Water Profile ....................................................................................................................... 15
3.8 Reservoir Levels at Different Seasons ............................................................................................. 15
3.9 Water Cost Estimation ..................................................................................................................... 16
4 Pumping Stations Performance Evaluation................................................................................. 17
4.1 Connected load at pumping stations ................................................................................................ 17
4.2 Mathura Pumping Station ................................................................................................................ 23
5 Baseline Assessment ....................................................................................................................... 52

5.1 Definition of possible and operating combinations ......................................................................... 52
5.2 Key measurements for determining baseline or pre implementation level ...................................... 52
5.3 Baseline ............................................................................................................................................ 54
6 Energy Efficiency Measures .......................................................................................................... 61
6.1 Summary of Energy Efficiency Measures ....................................................................................... 61
6.2 Detailed Energy Efficiency Measures .................................................................................................... 67
7 Repair & Maintenance Measures ................................................................................................. 88
7.1 Present R&M and O&M expenses ................................................................................................... 88
8 Project Financials and Business model ........................................................................................ 89
8.1 Total Project cost (CAPEX) ............................................................................................................. 89
8.2 Operating Costs (OPEX) .................................................................................................................. 90
8.3 Financing Terms and other tax related assumptions ........................................................................ 91
8.4 Output - Annuity Payment to EESL ................................................................................................ 91
8.5 Sensitivity analysis ........................................................................................................................... 92
8.6 Payment Security Mechanism .......................................................................................................... 92
9 Key Observations and Suggestions ............................................................................................... 94
9.1 Observation ...................................................................................................................................... 94
9.2 Recommendations ............................................................................................................................ 94
10 Measurement and Verification (M&V) ........................................................................................ 95
10.1 Definition of possible and operating combinations ......................................................................... 95
10.2 Flow of activities under M & V process .......................................................................................... 95
10.3 Pre and post implementation assessment ......................................................................................... 96
10.4 Correction Factors and adjustments ................................................................................................. 97
10.5 Determination of Savings................................................................................................................. 98
11 Risk Responsibility Matrix & Risk Mitigation ............................................................................ 99
12 Project Implementation Schedule ............................................................................................... 104
12.1 Execution Strategy ......................................................................................................................... 104
12.2 Proposed schedule .......................................................................................................................... 104
13 Annexures ..................................................................................................................................... 106
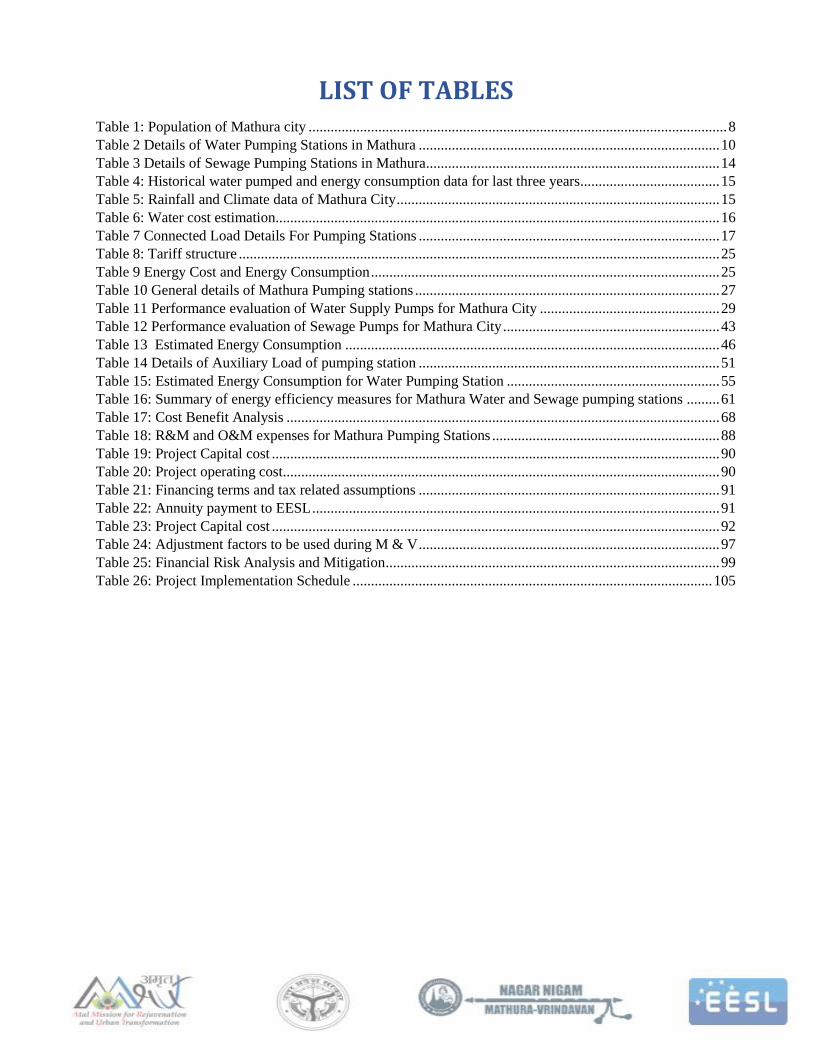
LIST OF TABLES Table 1: Population of Mathura city .................................................................................................................. 8
Table 2 Details of Water Pumping Stations in Mathura .................................................................................. 10
Table 3 Details of Sewage Pumping Stations in Mathura ................................................................................ 14
Table 4: Historical water pumped and energy consumption data for last three years...................................... 15
Table 5: Rainfall and Climate data of Mathura City ........................................................................................ 15
Table 6: Water cost estimation......................................................................................................................... 16
Table 7 Connected Load Details For Pumping Stations .................................................................................. 17
Table 8: Tariff structure ................................................................................................................................... 25
Table 9 Energy Cost and Energy Consumption ............................................................................................... 25
Table 10 General details of Mathura Pumping stations ................................................................................... 27
Table 11 Performance evaluation of Water Supply Pumps for Mathura City ................................................. 29
Table 12 Performance evaluation of Sewage Pumps for Mathura City ........................................................... 43
Table 13 Estimated Energy Consumption ...................................................................................................... 46
Table 14 Details of Auxiliary Load of pumping station .................................................................................. 51
Table 15: Estimated Energy Consumption for Water Pumping Station .......................................................... 55
Table 16: Summary of energy efficiency measures for Mathura Water and Sewage pumping stations ......... 61
Table 17: Cost Benefit Analysis ...................................................................................................................... 68
Table 18: R&M and O&M expenses for Mathura Pumping Stations .............................................................. 88
Table 19: Project Capital cost .......................................................................................................................... 90
Table 20: Project operating cost....................................................................................................................... 90
Table 21: Financing terms and tax related assumptions .................................................................................. 91
Table 22: Annuity payment to EESL ............................................................................................................... 91
Table 23: Project Capital cost .......................................................................................................................... 92
Table 24: Adjustment factors to be used during M & V .................................................................................. 97
Table 25: Financial Risk Analysis and Mitigation ........................................................................................... 99
Table 26: Project Implementation Schedule .................................................................................................. 105

LIST OF FIGURES Figure 1 Mathura Water Distribution System Overview ................................................................................... 9
Figure 2 Mathura Sewage Pumping System overview ...................................................................................... 9
Figure 3 Generic layout diagram of Water Supply Pumping Stations ............................................................. 23
Figure 4 Generic layout diagram of Sewage Pumping Stations ...................................................................... 24
Figure 5 SLD of Pumping Station of Mathura City ......................................................................................... 24
Figure 6 P&ID diagram of all water supply pumping stations ........................................................................ 26
Figure 7 P&ID diagram of all sewage Pumping station .................................................................................. 27
Figure 8 Photographs of pumping station site ................................................................................................. 28
Figure 9 Schematic of business model of the project ...................................................................................... 89

ABBREVIATIONS AMRUT Atal Mission Rejuvenation and Urban Transformation
APFC Automatic Power Factor Control
BEP Best Efficiency Points
BPS Booster Pumping Stations
CEA Certified Energy Auditor
DUD Department of Urban Development
EC Energy Conservation
EE Energy Efficiency
EEM Energy Efficiency Measure
EESL Energy Efficiency Services Limited
FY Financial Year
GST Goods and Services Tax
HT High Tension
HSC Horizontal Split Casing
IGEA Investment Grade Energy Audit
kVA Kilo Volt Ampere
kW Kilowatt
kWh kilowatt Hour
LED Light Emitting Diode
LT Low Tension
MEEP Municipal Energy Efficiency Programme
MoUD Ministry of Urban Development
MoU Memorandum of Understanding
OHT Over Head Tank
O&M Operation and Maintenance
PF Power Factor
PS Pumping Station
PWW&SS Public Water Works & Sewerage Systems
RPM Rotations Per Minute
R&M Repair & Maintenance
ROE Return on Equity
SEC Specific Energy Consumption
SHPSC State level High Powered Steering Committee
SLTC State Level Technical Committee
SPS Sewerage Pumping Station
STP Sewerage Treatment Plant
DUD Department of Urban Development
TOE Tonne of oil equivalent
ULB Urban Local Body
UM Under Maintenance
VFD Variable Frequency Drive
WTP Water Treatment Plant
WDS Water Distribution Station

1
1 Introduction
1.1 Background of the Project
The Atal Mission for Rejuvenation and Urban Transformation (AMRUT) was launched by Prime Minister of
India in June 2015 with the objective of providing basic services (e.g. water supply, sewerage, urban
transport) to households and build amenities in cities which will improve the quality of life for all.
To facilitate market transformation and replicate Municipal Energy Efficiency Programme on a large scale in
India, MoUD, Government of India signed a MoU with Energy Efficiency Services Limited (EESL), a joint
venture under Ministry of Power, Government of India on 28th September, 2016 under AMRUT. This will
enable replacement of inefficient Pump sets in Public Water Works & Sewerage Water Systems with energy
efficient Pump sets at no upfront cost to the Municipal Bodies. The investment will be recovered in form of
fixed annuity.
Energy audit and optimizing energy consumption are mandatory reforms under AMRUT. EESL and
Department of Urban Development (DUD), Government of Uttar Pradesh have jointly entered into an
agreement on 9th February, 2017 in order to provide an overarching framework to facilitate engagement
between the state government and various ULBs (covered under AMRUT) of Uttar Pradesh. Under this
agreement, EESL is undertaking the project to replace old inefficient Pump sets by energy efficient Pump
sets in Mathura City of Uttar Pradesh.

According to MoUD, energy audit for improving energy use is one of the mandated reforms under the
AMRUT and this initiative would help the cities significantly. “This will substantially reduce costs of
operation of water supply schemes and public lighting that will ultimately benefit the citizens. EESL will be
promoting use of energy efficiency programmes across the country and will ensure supply of latest
technologies under these municipal programmes".
Energy cost accounts for 40 to 60 % of cost only for water supply in urban areas and energy efficiency
interventions can reduce this cost by 20 to 40 %, depending on the type and age of pump sets being used for
bulk water supply. By becoming energy efficient, ULB’s can reap annually up to 4,800 MU and Rs.3,200
Crores besides avoiding the need for 3,300 MW of power.
Necessary interventions would be undertaken by EESL without any financial burden on ULB as cost of the
proposed Municipal Energy Efficiency Programmes would be borne out of annuity. MoU states that
performance contracting offers a mechanism for ULB to finance these projects without upfront investment.
As per the MoU, EESL will develop overall strategy for taking up energy efficiency projects in urban areas
by implementation of energy efficient Pump sets in public water works and sewage systems.
EESL will provide or arrange project funding for implementation as required and will procure energy
efficient equipment and materials in a transparent manner besides ensuring repair and maintenance services
for the goods replaced and installed by it. EESL is in the process of implementing energy efficient pumps for
500 cities under AMRUT scheme of Government of India. After the agreement between DUD and EESL
was signed successfully on 09th February 2017, EESL initiated an open tendering process for hiring Energy
Auditing Agency through competitive bidding. Based on the bidding evaluation, URS Verification was
selected for doing the energy audit for Mathura Town. EESL has engaged URS for preparation of (IGEA)
reports for Public Water Works and Sewerage Systems (PWW&SS) with an objective to replace inefficient
pump sets with efficient ones vide its work order Ref LoA No: EESL/06/2016-17/Energy Audit/Uttar
Pradesh /41-61/LOA-1617393 Dated: 28th March 2017
1.2 Stakeholders Involved
There are many stakeholders involved in AMRUT. Their roles and responsibilities are already defined by the
MoUD and other technical committee. Generally, the MoUD, EESL, ULB and Department of Urban
Development (DUD) have major role to execute under AMRUT.
MoUD: The MoUD committee may co-opt any representative from any Government Department or
organization as Member or invite any expert to participate in its deliberations. Key roles of MoUD include:
i. Allocation and release of funds to the States/UTs/Mission Directorate.
ii. Overall monitoring and supervision of the Mission.
iii. Advise to the State/UT/implementing agencies on innovative ways for resource mobilization,
private financing and land leveraging.
iv. Confirm appointment of organizations, institutions or agencies for third party monitoring.

DUD: Department of Urban Development (DUD) was setup to ensure the proper implementation and
monitoring of the centrally assisted programme. DUD provides technical support to districts/towns to
achieve their targets and also help in monitoring the state training plan. They also provide guidance and
supervise the programme implementation through visits to the project sites.
ULB: At the City level, the ULB will be responsible for implementation of the Mission. The Municipal
Commissioner will ensure timely preparation of all the required documents. The ULBs will ensure city level
approvals of IGEA and bid documents and forward these to the State level Technical Committee (SLTC)/
State level High Powered Steering committee (SHPSC) for approvals. The ULB will also be responsible for
building coordination and collaboration among stakeholders for timely completion of projects without
escalation of project cost.
SLTC: SLTC may co-opt member(s) from other State Government Departments/Government organizations
and may also invite experts in the field to participate in its deliberations.
EESL: Ministry of Power has set up Energy Efficiency Services Limited (EESL), a Joint Venture of NTPC
Limited, PFC, REC and POWERGRID to facilitate implementation of energy efficiency projects. It will
promote energy efficiency programmes across the country and will ensure supply of energy efficient
equipment under this municipal programme. Necessary interventions would be undertaken by EESL without
any financial burden on ULBs as cost of the proposed Municipal Energy Efficiency Programmes would be
borne out of annuity payments. EESL has been doing various Energy Efficient Programmes, list of same is
provided below:
1. Domestic Appliances Programme (LED Bulbs, LED Tube lights, Fans, etc.)
2. Street Lighting National Programme
3. Agricultural Demand Side Management
4. Municipal Energy Efficiency Programme
5. Atal Jyoti Yojana (Solar LED Street Lights)
Energy Auditing Agency - URS: EESL has engaged URS Verification Pvt Ltd. for preparation of IGEA
reports for public water works in Mathura, UP with an objective to replace inefficient pump sets with energy
efficient ones. URS Verification had conducted energy audit activity at Mathura and had made IGEA with
financial projections for Mathura ULB.
Pump Suppliers and Manufacturers: EESL has selectively taken on-board range of pump manufacturers
and enquired with them regarding the necessary specifications of the products which can be used in line with
the defined criteria according to EESL. All these manufacturers are rated manufacturers and comply with the
quality and standards of their products.
1.3 Objective of the IGEA
Energy costs account for 40 to 60% of cost for water supply in urban areas and energy efficiency
interventions can reduce this cost by 20 to 40%, depending on the type and age of pump sets being used for
Public Water Works and Sewerage Systems (PWW&SS). The MoUD with support from EESL has designed
framework project for Energy Efficiency in cities of India while giving priority to AMRUT and smart cities.
The objective of this project and IGEA report is to provide maximum information for creating baseline and
analysis of current energy and utilization of Public water works systems.
This project is to be co-implemented by EESL and the objectives of this project are as under:
To create increased demand for EE investments by adopting a ULB approach to facilitate the
development of customized EE products and financing solutions in ULB.
To raise the quality of EE investment proposals from a technical and commercial perspective.
To expand the use of existing guarantees mechanisms for better risk management by EESL to
catalyze additional commercial finance for energy efficiency.
To establish a monitoring and evaluation system for the targeted ULB.
Scope of Work of Detailed Energy Audit
The general scope of work for detailed energy audits under IGEA as per Schedule ‘A’ is as follows:
Discussion with Key personnel and Site visits of the facility
o Initial discussions with Key personnel such as Commissioner, Chief Officer,
Electrical/Mechanical engineer and pump operators to explain the objectives of the project,
benefits of energy efficiency, and the approach that will be followed in Energy Audit.
o Purpose of this discussion will be to ensure that key personnel of ULB have adequate
understanding of the project.
o Visiting all the facilities within the scope of project by identified agency to ascertain the
availability of data and system complexity.
o Identified agency will formulate a data collection strategy.
Data Collection
o Current energy usage (month wise) for all forms of energy for the last three years (quantity
and cost)
o Mapping of process
o ULB and pumping station profile including name of station, years in operation, total water
quantity pumped in last three years
o List of major pumping equipment and specifications
Analysis
o Energy cost and trend analysis
o Energy quantities and trend analysis
o Specific consumption and trend analysis
o Pumping costs trend analysis
o Scope and potential for improvement in energy efficiency
Detailed process mapping to identify major areas of energy use
To identify all areas for energy saving (with or without investment) in the following areas:
o Electrical: Power factor management, transformer loading, power quality tests, motor load
studies, lighting load, electrical metering, monitoring and control system

o Water usage and pumping efficiencies (including water receipt, storage, distribution,
utilization, etc.), pump specifications, break down maintenance
Classify parameters related to EE Enhancements such as estimated quantum of energy saving,
investment required, time frame for implementation, payback period and to classify the same in
order of priority
Undertake detailed financial analysis of the investments required for EE enhancements
Design “Energy Monitoring System” for effective monitoring and analysis of energy consumption,
energy efficiency.
Correlate monthly pumping quantity data with electricity consumption for a period of last three years
of normal operation for individual sections of the overall pumping station
Recommend a time bound action plan for implementation
The broad content of the IGEA report should be as follows:
o Executive summary: Provides brief description of the facilities covered, measures
evaluated, analysis methodology, results and a summary table presenting the cost and
savings estimates for each recommended measure. It also includes a summary of the
recommended measures and costs as well as the financial indicators of the Project.
o Background: Background about the ULB and the project.
o Facility Description: Details of the existing facilities targeted, such as water treatment &
supply systems, sewage treatment and handling systems.
o Energy Scenario: Energy consumption details of all facilities included in the audit and their
energy sources.
o Baseline parameters and Adjustments: Methodology followed in establishing the baseline
parameters and criteria.
o Data Collection: List the various types of data collected and their sources.
o System mapping: Describe the methodology followed for system mapping and include the
maps and process flow diagrams in the report.
o List of Potential EEMs: A list of all identified measures with estimates of the savings and
payback periods on investments, and a summary of the selected EEMs chosen for further
development.
1.4 Methodology adopted for Energy Audit
A detailed energy audit was conducted at all the pumping stations falling under Nagar Nigam Mathura-
vrindavan from 24th April, 2017 to 11th August, 2017. The energy audit team of URS comprised of BEE
certified energy auditors/managers and pump experts. During the field visit, adequate numbers of portable
energy audit instruments were used to carry out measurements of pump sets efficiency parameters. In
addition to this, design and operational data was collected from logbooks, equipment manuals and pump
manufacturers. Discussions were held with various technical and operating staffs of the ULB to understand
the system and pump sets operations and requirements completely. The energy audit study mainly focused
on the evaluation of operational efficiency/performance of the pump sets already installed in the premise
from the energy conservation point of view.
The methodology planned for accomplishing the above scope of work was divided into three phases as
detailed below:

Phase 1: Inception
Conduct kick-off meeting
Pilot visit to a few sites to ascertain the availability of data, measurements points and system
complexity
Discussed and finalized the methodology for data collection as per job card.
Phase 2: Detailed energy audit
Initial meeting with concerned staff of ULB at each site to brief them regarding the project
Walk-through of the site along with pumping station/site personnel to understand the site conditions
and equipment involved
Assessment of data availability (historical data/technical data sheets of major
equipment/maintenance practices/cost details/electricity bills, etc.) and placing request for required
data
Finalization of measurement points and support required from ULB staff
Conducting measurements and data collection with support from ULB staff
o Energy auditing instruments used during project are listed below:
Power analyser: For electrical parameters(V, A, kW, kVA, kWh, kVAh, PF, Hz and
THD)
Ultrasonic flow meter: For water flow measurement
Ultrasonic thickness gauge: For pipeline thickness measurement
Digital pressure gauges: For suction and discharge pressure measurement
Lux meter: For lighting intensity measurement
o Filling& signing of job cards
o Parallel activities of noting observations on the following:
SLD (Site Layout Diagram) & PID
Operation &Maintenance practices
Instrumentation in place and
Existing practices to monitor energy consumption.
Phase 3: Analysis and IGEA report preparation
Compilation and analysis of data collected from site
Performance assessment of the equipment
Conceptualization and development of energy cost reduction projects
Cost benefit analysis
Review of adequacy of instrumentation for energy efficiency monitoring and
Submission of IGEA report to ULB/ SLTC for approval.

7
2 Interaction with Facilities/ Key Personnel
The energy auditing team interacted for work proceeding and reporting with stakeholders for efficient
information exchange. The kick-off meeting was held under the Junior Engineer, Water Works Department
on 10th April, 2017 for discussing the data/information required, methodology to be followed and support
required from the ULB. The ULB appointed its staff to provide support and information during energy audit.
URS has provided day wise reporting to appointed staff of ULB regarding work status. Based on the work
experience with ULB, inception report was submitted to EESL.
During the kick-off meeting at Mathura on 10th April 2017 following points were discussed:
Support from the ULB will be given to the URS team for conducting energy audit
Energy audit will be conducted by URS team in presence of EESL personnel and nodal official of
ULB.
Observations will be discussed with the appointed official of ULB and EESL
URS can communicate with ULB official regarding scheduling of sites for audit
Support will be provided by ULB to obtain various data to create baseline of energy consumption,
quantity of water pumped etc.
The letter of site activity conducted should be collected by URS after finishing the site work
URS will regularly report the ULB official by informing the status of work and work schedule
The site work completion letter should contain the information of pumps measured and those under
maintenance
URS will report the status of work on a daily basis to project-coordinator of EESL
URS will submit the job card to EESL after completion of site work
Signature of authorized personnel should be obtained on the job card in case of non-availability of
data
EESL also appointed their staff to monitor audit works and to provide support and guidance for better quality
of work flow. The appointed Staff from EESL have been trained for the information exchange and to provide
maximum support for the site to be ready for energy audit. The appointed staff of EESL held periodic
discussion with URS team members regarding the observation of energy audit and feasibility of EE projects
at ULB.
2.1 Interaction with Pump Manufacturers
Some of the reputed pump manufacturers were selectively contacted regarding the costing and feasibility of
different pump sets. The discussion with pump set manufacturers included the following points:
Technical Feasibility of the suggested energy efficiency measures were discussed with the vendors.
Commercial terms of EEM such as cost of equipment, auxiliary systems, and installation cost etc.
were discussed with the vendors for assessing financial viability of EEM.

8
3 Project area and Facility description 3.1 General information about the city
Mathura is a city in the North Indian state of Uttar Pradesh. It is located approximately 50 kilometres north
of Agra, and 145 kilometres south-east of Delhi; about 11 kilometres from the town of Vrindavan, and 22
kilometres from Govardhan. It is the administrative centre of Mathura District of Uttar Pradesh. Mathura is
the birthplace of Krishna at the centre of Braj or Brij-bhoomi, called Shri Krishna Janma-Bhoomi. It is one
of the seven cities (Sapta Puri) considered holy by Hindus.
Mathura has been chosen as one of the heritage cities for HRIDAY - Heritage City Development and
Augmentation Yojana scheme of Government of India. Details about city population is provided in table 1.
Table 1: Population of Mathura city3
Census Year Population (Nos.)
2001 2,074,516
2011 2,547,184
3.2 Accessibility to city from Metro cities & State capital
Air
The nearest international airport to Mathura is located in Delhi, at a distance of 147 km while the closest
domestic airport is Kheria airport, Agra, located at a distance of 49 km.
Train
Mathura has its own Railway Station which lies in Jhansi railway division of the North Central Railway
Zone. Mathura is a major railway junction, which is connected by many trains operating on routes between
Delhi and Agra on regular basis.
Road
Mathura has good road network and is connected to all the areas of the Mathura city. Mathura is also well-
linked with New Delhi through Noida-Agra express way.
3 Source: http://www.census2011.co.in/census/district/516-mathura.html

3.3 Pumping Stations in the Mathura
Main source of water for the city of Mathura is ground water. There are 1414 Nos. of pumps installed to cater
the water needs of Mathura City. These 141 nos. of submersible pumps are used to supply water directly to
the users. Out of 141 Nos. of water supply pumps, 121 Nos. were in operation during energy audit and 20
Nos. of pumps were under maintenance. The pictorial representation of the entire pumping station supply
water to the user is shown in Figure 1.
Figure 1 Mathura Water Distribution System Overview
Waste water from the household etc. is collected directly at sewage pumping stations. Further the waste
water supplied to the sewage treatment plant through the 3 Nos. of MPS pumping stations. 35 Nos. of pumps
are installed in sewage pumping system of Mathura to transfer the sewage water to the sewage treatment
plant. Out of 35 Nos. of pump, 21 Nos. of pumps were in operation during energy audit and 14 Nos. of Pump
sets were under maintenance. The pictorial representation of the entire sewage pumping station is shown in
Figure 2.
Figure 2 Mathura Sewage Pumping System overview
4 As per LOA, there were 143 pumps (water), however in LOA list, there was repetition of two pump sets. Therefore, total pump at Mathura, in IGEA, is considered as 141.
Borewell Pump
Ground Water
User
Municipality
sewage water
Bypass line to Yamuna River
Sewage Sump
Sewage Pump (Submersible Non Clog pump/VT
Sewage Treatment Plant

The details of the water pumping stations are provided in the table 2.
Table 2 Details of Water Pumping Stations in Mathura
S. No
Facility Name & Location MLD Capacity Type of
the facility Source of
water Distribution/Delivery Area
1 Bhuteshwar Campus TW No.2 0.20 Raw Water Ground Water User
2 Bhuteshwar Campus TW No.5 0.06 Raw Water Ground Water User
3 Bhuteshwar Campus TW No.7 0.24 Raw Water Ground Water User
4 Nagar Palika TW No.15 0.34 Raw Water Ground Water User
5 Bangali Ghat TW No.16 0.32 Raw Water Ground Water User
6 Police Line TW No.25 0.71 Raw Water Ground Water User
7 Bhuteshwar Campus TW No.27 0.08 Raw Water Ground Water User
8 District Jail TW No.29 0.46 Raw Water Ground Water User
9 Govind Nagar Sec. A 0.36 Raw Water Ground Water User
10 Kushak Gali-1 0.32 Raw Water Ground Water User
11 Shyam Ghat 0.14 Raw Water Ground Water User
12 Vishram Ghat 0.41 Raw Water Ground Water User
13 Chatta Bazar 0.58 Raw Water Ground Water User
14 Rampal Gali 0.28 Raw Water Ground Water User
15 Vrindavan Gate 0.42 Raw Water Ground Water User
16 Theknarnol 0.30 Raw Water Ground Water User
17 Dwarkeshpuri 0.06 Raw Water Ground Water User
18 Unth Gali 0.17 Raw Water Ground Water User
19 Naya Nagla Gali No.8 0.08 Raw Water Ground Water User
20 Chah Kathoti 0.17 Raw Water Ground Water User
21 Agra Hotel 0.56 Raw Water Ground Water User
22 Dhruv Ghat 0.56 Raw Water Ground Water User
23 Maholi Ki Paur 0.31 Raw Water Ground Water User
24 Gaja Paysa 0.25 Raw Water Ground Water User
25 Radhika Vihar 0.20 Raw Water Ground Water User
26 Dholi Pyau 0.30 Raw Water Ground Water User
27 Thateran Gali 0.21 Raw Water Ground Water User
28 Tulsi Chabutra 0.23 Raw Water Ground Water User
29 Bairag puri 0.11 Raw Water Ground Water User
30 Bhargva Gali 0.71 Raw Water Ground Water User
31 Gandhi Park Pump-1 0.20 Raw Water Ground Water User
32 Megha Gali 0.03 Raw Water Ground Water User
33 Bhadurpura 0.12 Raw Water Ground Water User

S. No
Facility Name & Location MLD Capacity Type of
the facility Source of
water Distribution/Delivery Area
34 Chaganpura 0.10 Raw Water Ground Water User
35 Krishna Vihar NH-2 0.09 Raw Water Ground Water User
36 Askunda 0.49 Raw Water Ground Water User
37 Mahavidya Face-2 0.28 Raw Water Ground Water User
38 Dalpat Khidki 0.16 Raw Water Ground Water User
39 Gopalpura 0.13 Raw Water Ground Water User
40 Shanti Nagar 0.36 Raw Water Ground Water User
41 Laxmi Nagar-1 0.53 Raw Water Ground Water User
42 Laxmi Nagar-2 0.32 Raw Water Ground Water User
43 Laxmi Nagar-4 0.31 Raw Water Ground Water User
44 Naya Nagla, Koyla Gali 0.21 Raw Water Ground Water User
45 Maholi Yojna-1 0.22 Raw Water Ground Water User
46 Maholi Yojna-3 0.30 Raw Water Ground Water User
47 Sheetla Ghati 0.20 Raw Water Ground Water User
48 Manas Nagar 0.26 Raw Water Ground Water User
49 Ratan Kund 0.17 Raw Water Ground Water User
50 Gau Ghat 0.26 Raw Water Ground Water User
51 Arjunpura 0.06 Raw Water Ground Water User
52 Officer Colony 0.23 Raw Water Ground Water User
53 Badpura Colony 0.50 Raw Water Ground Water User
54 Narayan Puri 0.58 Raw Water Ground Water User
55 Jhigurpura 0.19 Raw Water Ground Water User
56 Raigarpura 0.40 Raw Water Ground Water User
57 Gupta Kunj 0.14 Raw Water Ground Water User
58 Radha Nagar 0.26 Raw Water Ground Water User
59 Manoharpura 0.07 Raw Water Ground Water User
60 Krishna Nagar 0.14 Raw Water Ground Water User
61 Heja Hospital 0.10 Raw Water Ground Water User
62 Laxmi Nagar 0.24 Raw Water Ground Water User
63 Maholi Yojna-2 0.23 Raw Water Ground Water User
64 Antapada 0.32 Raw Water Ground Water User
65 Rani Mandi 0.14 Raw Water Ground Water User
66 Kutta Paysa 0.20 Raw Water Ground Water User
67 Gali Ravaliya 0.20 Raw Water Ground Water User
68 Gali Rajkumar 0.35 Raw Water Ground Water User
69 Gandhi Park-2 0.21 Raw Water Ground Water User

S. No
Facility Name & Location MLD Capacity Type of
the facility Source of
water Distribution/Delivery Area
70 Arjunpura-2 0.09 Raw Water Ground Water User
71 Theknarnol-2 0.31 Raw Water Ground Water User
72 Madhav Puri 0.24 Raw Water Ground Water User
73 Dholi Pyau Tiraha-New Construction
0.40 Raw Water Ground Water User
74 Ahilyabai Park Dampier Nagar MVDA
0.30 Raw Water Ground Water User
75 Ramlila Ground Krishna Nagar MVDA
0.11 Raw Water Ground Water User
76 Kankali Temple Dwarikapuri MVDA
0.21 Raw Water Ground Water User
77 Machli Mandi Bharatpur Gate 0.37 Raw Water Ground Water User
78 Nai Basti W.No. 0.22 Raw Water Ground Water User
79 Andi Kuiya 0.47 Raw Water Ground Water User
80 Kathoti Kua Chaupal 0.18 Raw Water Ground Water User
81 Kathoti Kua Masjid 0.09 Raw Water Ground Water User
82 Gupta Kunk WNo.7 0.20 Raw Water Ground Water User
83 Sadar Dhobi Pada W.No8 0.55 Raw Water Ground Water User
84 Gandhi Nagar W.No. 9 0.10 Raw Water Ground Water User
85 Laxmi Nagar W.No. 9 0.24 Raw Water Ground Water User
86 Bains Bhora Kotwali W.No.14 0.22 Raw Water Ground Water User
87 Radhey Shyam Ashram W.No.16 0.28 Raw Water Ground Water User
88 Om Nagar W.No.17 0.26 Raw Water Ground Water User
89 Om Nagar-2 W.No.17 0.31 Raw Water Ground Water User
90 Antapara behind Gurudwara W.No.18
0.21 Raw Water Ground Water User
91 Jogi Gali Antapada W.No.18 0.14 Raw Water Ground Water User
92 Khateek Mohalla Balmiki Basti W.No.19
0.28 Raw Water Ground Water User
93 Guru Nanak Nagar W.No.19 0.05 Raw Water Ground Water User
94 Krishnapuram-1 Ward-24 0.11 Raw Water Ground Water User
95 Krishnapuram-2 Ward-24 0.12 Raw Water Ground Water User
96 Balmiki Basti Dholi Pyau Ward-27 0.17 Raw Water Ground Water User
97 Mahavidya Park Ward-28 0.26 Raw Water Ground Water User
98 Hanuman Teela Ward-33 0.07 Raw Water Ground Water User
99 Kashmiri Gali Ward-34 0.18 Raw Water Ground Water User
100 Mission Teela Sadar Bazar Ward-35
0.41 Raw Water Ground Water User
101 Matia Gate Ward-37 0.32 Raw Water Ground Water User
102 Subhash Nagar Nala Ward-38 0.15 Raw Water Ground Water User
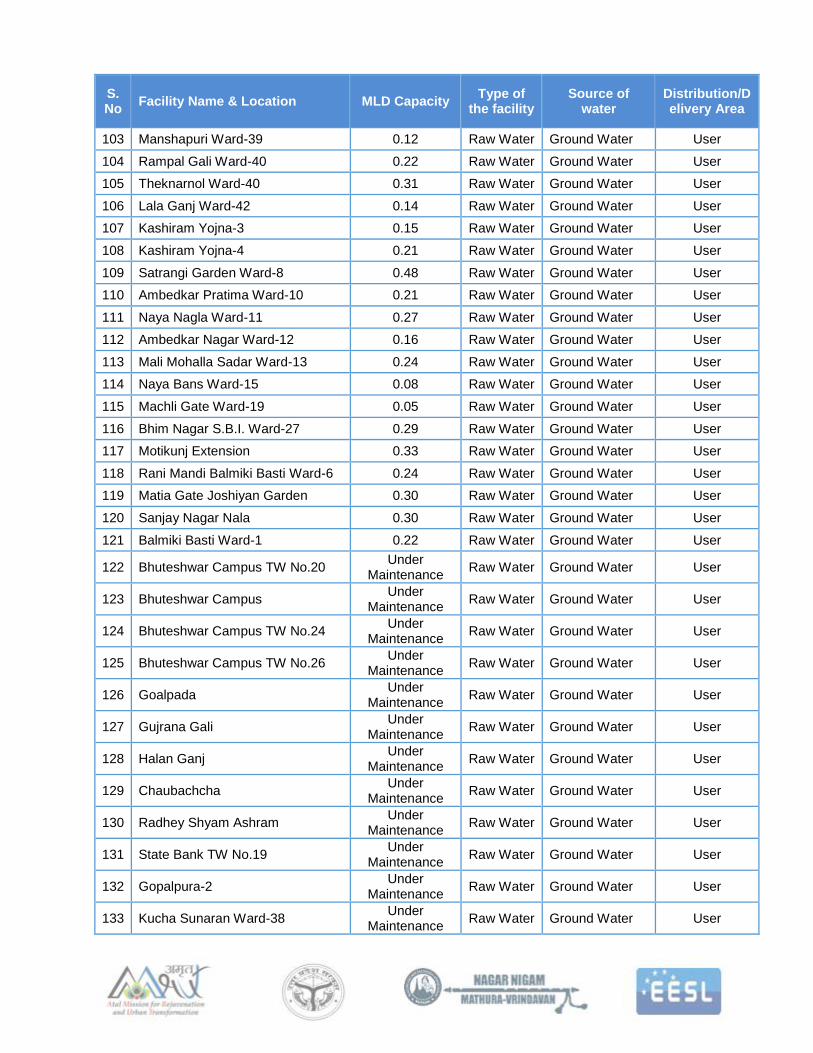
S. No
Facility Name & Location MLD Capacity Type of
the facility Source of
water Distribution/Delivery Area
103 Manshapuri Ward-39 0.12 Raw Water Ground Water User
104 Rampal Gali Ward-40 0.22 Raw Water Ground Water User
105 Theknarnol Ward-40 0.31 Raw Water Ground Water User
106 Lala Ganj Ward-42 0.14 Raw Water Ground Water User
107 Kashiram Yojna-3 0.15 Raw Water Ground Water User
108 Kashiram Yojna-4 0.21 Raw Water Ground Water User
109 Satrangi Garden Ward-8 0.48 Raw Water Ground Water User
110 Ambedkar Pratima Ward-10 0.21 Raw Water Ground Water User
111 Naya Nagla Ward-11 0.27 Raw Water Ground Water User
112 Ambedkar Nagar Ward-12 0.16 Raw Water Ground Water User
113 Mali Mohalla Sadar Ward-13 0.24 Raw Water Ground Water User
114 Naya Bans Ward-15 0.08 Raw Water Ground Water User
115 Machli Gate Ward-19 0.05 Raw Water Ground Water User
116 Bhim Nagar S.B.I. Ward-27 0.29 Raw Water Ground Water User
117 Motikunj Extension 0.33 Raw Water Ground Water User
118 Rani Mandi Balmiki Basti Ward-6 0.24 Raw Water Ground Water User
119 Matia Gate Joshiyan Garden 0.30 Raw Water Ground Water User
120 Sanjay Nagar Nala 0.30 Raw Water Ground Water User
121 Balmiki Basti Ward-1 0.22 Raw Water Ground Water User
122 Bhuteshwar Campus TW No.20 Under
Maintenance Raw Water Ground Water User
123 Bhuteshwar Campus Under
Maintenance Raw Water Ground Water User
124 Bhuteshwar Campus TW No.24 Under
Maintenance Raw Water Ground Water User
125 Bhuteshwar Campus TW No.26 Under
Maintenance Raw Water Ground Water User
126 Goalpada Under
Maintenance Raw Water Ground Water User
127 Gujrana Gali Under
Maintenance Raw Water Ground Water User
128 Halan Ganj Under
Maintenance Raw Water Ground Water User
129 Chaubachcha Under
Maintenance Raw Water Ground Water User
130 Radhey Shyam Ashram Under
Maintenance Raw Water Ground Water User
131 State Bank TW No.19 Under
Maintenance Raw Water Ground Water User
132 Gopalpura-2 Under
Maintenance Raw Water Ground Water User
133 Kucha Sunaran Ward-38 Under
Maintenance Raw Water Ground Water User

S. No
Facility Name & Location MLD Capacity Type of
the facility Source of
water Distribution/Delivery Area
134 Radha Nagar-2 Under
Maintenance Raw Water Ground Water User
135 Shamshan Ghat MVDA Under
Maintenance Raw Water Ground Water User
136 Bhuteshwar Garden W.No.20 Under
Maintenance Raw Water Ground Water User
137 Patiram Gali Ward-40 Under
Maintenance Raw Water Ground Water User
138 Satgada Ward-45 Under
Maintenance Raw Water Ground Water User
139 General Ganj Ward-16 Under
Maintenance Raw Water Ground Water User
140 Ambakhar Under
Maintenance Raw Water Ground Water User
141 Pani Ki Tanki Ward-17 Under
Maintenance Raw Water Ground Water User
Table 3 Details of Sewage Pumping Stations in Mathura
S. No
Facility Name & Location
MLD Capacity
Type of the facility Source of
water Distribution/Delivery Area
1 Diary Farm SPS 16.00 Sewage Pumping Station Municipal Water Sewage Treatment Plant
2 Masani Nala SPS 13.59 Sewage Pumping Station Municipal Water Sewage Treatment Plant
3 Bangali Ghat SPS 14.50 Sewage Pumping Station Municipal Water Sewage Treatment Plant
4 Cantt. Nala SPS NA Sewage Pumping Station Municipal Water Sewage Treatment Plant
5 Vrindavan Gate SPS NA Sewage Pumping Station Municipal Water Sewage Treatment Plant
6 Krishna Ganga SPS NA Sewage Pumping Station Municipal Water Sewage Treatment Plant
7 Swami Ghat SPS NA Sewage Pumping Station Municipal Water Sewage Treatment Plant
8 Chinta Haran SPS NA Sewage Pumping Station Municipal Water Sewage Treatment Plant
9 Dhruv Ghat SPS NA Sewage Pumping Station Municipal Water Sewage Treatment Plant
3.4 Historical Water Pumped and Energy Consumption Analysis
Historical data about water pumped and energy consumption of Nagar Nigam Mathura- Vrindavan is
provided in the table below.

Table 4: Historical water pumped and energy consumption data for last three years5
Description Water flow (kL /Annum)
Energy consumption (kWh/Annum)
Specific energy consumption (kWh/kL)
Jan-14 to Dec-14 Not available 2,430,016 Not available
Jan-15 to Dec-15 Not available 2,406,705 Not available
Jan-16 to Dec-16 Not available 2,923,171 Not available
3.5 Power Failure Data
Power failure data is not available with Nagar Nigam Mathura- Vrindavan.
3.6 Rainfall and Climate data
Rainfall and climate data of Mathura is provided in table 5.
Table 5: Rainfall and Climate data of Mathura City6
Month Jan Feb Mar Apr May Jun Jul Aug Sept Oct Nov Dec
Min. Temp (°C) 7.4 10.1 15.5 21.5 26.7 29.1 27 25.8 24.5 19 12 8.1
Max. Temp (°C) 22.1 25.3 31.5 37.7 41.5 40.4 35.1 33.1 33.6 33.6 29.3 23.9
Avg. Temp (°C) 14.7 17.7 23.5 29.6 34.1 34.7 31 29.4 29 26.3 20.6 16
Precipitation /
Rainfall (mm) 14 6 12 2 6 28 202 271 125 31 5 5
3.7 Ground Water Profile Water source in the city is primarily ground water that is pumped out with the help of bore wells. The water
level below ground remains in range from 9 m to 55 m, as informed by the ULB personals. The pumping
stations installed in Mathura city are having a bore length in the range of 55 m – 107 m.
3.8 Reservoir Levels at Different Seasons
Mathura depends totally on ground water from bore wells and there are no reservoirs. Yamuna River flows
by the city but the water from this river is not used as water source in existing water distribution system.
5 Electricity bills were not provided for all pumping stations. In some pumping stations, electricity bills were available
only for few months. Values provided in above table were based on available electricity bills 6 Source: https://en.climate-data.org/location/4880/

3.9 Water Cost Estimation
During energy audit, data regarding various operation and maintenance expenses borne by ULB was
collected for estimating water cost. Details of expenditure by ULB during last year and estimated water cost
are provided in the table 6.
Table 6: Water cost estimation
Particular Units Values
Energy cost (Electricity) Rs. Lakhs 281.7
Repair & Maintenance Rs. Lakhs 209.2
Operation (man power & raw material) Rs. Lakhs 789.68
Miscellaneous cost (Cost of major replacement) Rs. Lakhs 273.42
Total cost Rs. Lakhs 1554
Annual water pumped to City (estimated) kL 11,086,806
Water cost Rs./kL 14.0

4 Pumping Stations Performance Evaluation
Mathura City is getting the drinking water supply from ground water through bore wells. Waster/sewage
water from the households is collected at the sump. Further these sewage water transfers to the sewage
treatment plant through the pumps installed at the MPS/IPS. Details of connected load at the pumping
stations, layout and results of performance assessment are provided in subsequent sections of this chapter.
4.1 Connected load at pumping stations
Based on the data collected for the pumping station from Nagar Nigam Mathura- Vrindavan, details of
connected load of Water Supply pumping stations is provided in the table 7.
Table 7 Connected Load Details For Pumping Stations
S. No Pump Reference Pump type Rated
Power (kW)
Water Supply Pump Sets
1 Bhuteshwar Campus TW No.2 Submersible 9.3
2 Bhuteshwar Campus TW No.5 Submersible 9.3
3 Bhuteshwar Campus TW No.7 Submersible 9.3
4 Nagar Palika TW No.15 Submersible 9.3
5 Bangali Ghat TW No.16 Submersible 9.3
6 Police Line TW No.25 Submersible 9.3
7 Bhuteshwar Campus TW No.27 Submersible 9.3
8 District Jail TW No.29 Submersible 9.3
9 Govind Nagar Sec. A Submersible 9.3
10 Kushak Gali-1 Submersible 9.3
11 Shyam Ghat Submersible 7.5
12 Vishram Ghat Submersible 9.3
13 Chatta Bazar Submersible 9.3
14 Rampal Gali Submersible 9.3
15 Vrindavan Gate Submersible 9.3
16 Theknarnol Submersible 9.3
17 Dwarkeshpuri Submersible 9.3
18 Unth Gali Submersible 9.3
19 Naya Nagla Gali No.8 Submersible 7.5
20 Chah Kathoti Submersible 7.5
21 Agra Hotel Submersible 9.3
22 Dhruv Ghat Submersible 9.3
23 Maholi Ki Paur Submersible 9.3
24 Gaja Paysa Submersible 7.5

S. No Pump Reference Pump type Rated
Power (kW)
25 Radhika Vihar Submersible 9.3
26 Dholi Pyau Submersible 9.3
27 Thateran Gali Submersible 9.3
28 Tulsi Chabutra Submersible 7.5
29 Bairag puri Submersible 9.3
30 Bhargva Gali Submersible 9.3
31 Gandhi Park Pump-1 Submersible 7.5
32 Megha Gali Submersible 4.5
33 Bhadurpura Submersible 9.3
34 Chaganpura Submersible 7.5
35 Krishna Vihar NH-2 Submersible 9.3
36 Askunda Submersible 7.5
37 Mahavidya Face-2 Submersible 9.3
38 Dalpat Khidki Submersible 7.5
39 Gopalpura Submersible 9.3
40 Shanti Nagar Submersible 9.3
41 Laxmi Nagar-1 Submersible 9.3
42 Laxmi Nagar-2 Submersible 9.3
43 Laxmi Nagar-4 Submersible 7.5
44 Naya Nagla, Koyla Gali Submersible 7.5
45 Maholi Yojna-1 Submersible 9.3
46 Maholi Yojna-3 Submersible 9.3
47 Sheetla Ghati Submersible 7.5
48 Manas Nagar Submersible 7.5
49 Ratan Kund Submersible 7.5
50 Gau Ghat Submersible 7.5
51 Arjunpura Submersible 9.3
52 Officer Colony Submersible 9.3
53 Badpura Colony Submersible 9.3
54 Narayan Puri Submersible 9.3
55 Jhigurpura Submersible 7.5
56 Raigarpura Submersible 9.3
57 Gupta Kunj Submersible 7.5
58 Radha Nagar Submersible 9.3
59 Manoharpura Submersible 9.3
60 Krishna Nagar Submersible 9.3

S. No Pump Reference Pump type Rated
Power (kW)
61 Heja Hospital Submersible 9.3
62 Laxmi Nagar Submersible 9.3
63 Maholi Yojna-2 Submersible 9.3
64 Antapada Submersible 9.3
65 Rani Mandi Submersible 9.3
66 Kutta Paysa Submersible 9.3
67 Gali Ravaliya Submersible 9.3
68 Gali Rajkumar Submersible 9.3
69 Gandhi Park-2 Submersible 9.3
70 Arjunpura-2 Submersible 9.3
71 Theknarnol-2 Submersible 9.3
72 Madhav Puri Submersible 9.3
73 Dholi Pyau Tiraha-New Construction Submersible 9.3
74 Ahilyabai Park Dampier Nagar MVDA Submersible 9.3
75 Ramlila Ground Krishna Nagar MVDA Submersible 9.3
76 Kankali Temple Dwarikapuri MVDA Submersible 7.5
77 Machli Mandi Bharatpur Gate Submersible 9.3
78 Nai Basti W.No. Submersible 9.3
79 Andi Kuiya Submersible 9.3
80 Kathoti Kua Chaupal Submersible 9.3
81 Kathoti Kua Masjid Submersible 9.3
82 Gupta Kunk WNo.7 Submersible 9.3
83 Sadar Dhobi Pada W.No8 Submersible 9.3
84 Gandhi Nagar W.No. 9 Submersible 9.3
85 Laxmi Nagar W.No. 9 Submersible 9.3
86 Bains Bhora Kotwali W.No.14 Submersible 9.3
87 Radhey Shyam Ashram W.No.16 Submersible 9.3
88 Om Nagar W.No.17 Submersible 9.3
89 Om Nagar-2 W.No.17 Submersible 9.3
90 Antapara behind Gurudwara W.No.18 Submersible 9.3
91 Jogi Gali Antapada W.No.18 Submersible 9.3
92 Khateek Mohalla Balmiki Basti W.No.19 Submersible 9.3
93 Guru Nanak Nagar W.No.19 Submersible 9.3
94 Krishnapuram-1 Ward-24 Submersible 9.3
95 Krishnapuram-2 Ward-24 Submersible 9.3
96 Balmiki Basti Dholi Pyau Ward-27 Submersible 9.3

S. No Pump Reference Pump type Rated
Power (kW)
97 Mahavidya Park Ward-28 Submersible 9.3
98 Hanuman Teela Ward-33 Submersible 9.3
99 Kashmiri Gali Ward-34 Submersible 9.3
100 Mission Teela Sadar Bazar Ward-35 Submersible 9.3
101 Matia Gate Ward-37 Submersible 9.3
102 Subhash Nagar Nala Ward-38 Submersible 9.3
103 Manshapuri Ward-39 Submersible 9.3
104 Rampal Gali Ward-40 Submersible 9.3
105 Theknarnol Ward-40 Submersible 9.3
106 Lala Ganj Ward-42 Submersible 9.3
107 Kashiram Yojna-3 Submersible 9.3
108 Kashiram Yojna-4 Submersible 9.3
109 Satrangi Garden Ward-8 Submersible 9.3
110 Ambedkar Pratima Ward-10 Submersible 9.3
111 Naya Nagla Ward-11 Submersible 9.3
112 Ambedkar Nagar Ward-12 Submersible 9.3
113 Mali Mohalla Sadar Ward-13 Submersible 9.3
114 Naya Bans Ward-15 Submersible 9.3
115 Machli Gate Ward-19 Submersible 9.3
116 Bhim Nagar S.B.I. Ward-27 Submersible 9.3
117 Motikunj Extension Submersible 9.3
118 Rani Mandi Balmiki Basti Ward-6 Submersible 9.3
119 Matia Gate Joshiyan Garden Submersible 9.3
120 Sanjay Nagar Nala Submersible 9.3
121 Balmiki Basti Ward-1 Submersible 9.3
122 Bhuteshwar Campus TW No.20 Submersible 9.3
123 Bhuteshwar Campus Submersible 9.3
124 Bhuteshwar Campus TW No.24 Submersible 9.3
125 Bhuteshwar Campus TW No.26 Submersible 9.3
126 Goalpada Submersible 9.3
127 Gujrana Gali Submersible 5.6
128 Halan Ganj Submersible 7.5
129 Chaubachcha Submersible 7.5
130 Radhey Shyam Ashram Submersible 7.5
131 State Bank TW No.19 Submersible 9.3
132 Gopalpura-2 Submersible 9.3

S. No Pump Reference Pump type Rated
Power (kW)
133 Kucha Sunaran Ward-38 Submersible 9.3
134 Radha Nagar-2 Submersible 9.3
135 Shamshan Ghat MVDA Submersible 9.3
136 Bhuteshwar Garden W.No.20 Submersible 9.3
137 Patiram Gali Ward-40 Submersible 9.3
138 Satgada Ward-45 Submersible 9.3
139 General Ganj Ward-16 Submersible 9.3
140 Ambakhar Submersible 9.3
141 Pani Ki Tanki Ward-17 Submersible 9.3
Sub Total (A) 1267
1 Dairy Farm Submersible Non Clog 75
2 Dairy Farm Submersible Non Clog 30
3 Dairy Farm Submersible Non Clog 75
4 Dairy Farm Submersible Non Clog 30
5 Dairy Farm Submersible Non Clog 75
6 Dairy Farm Submersible Non Clog 30
7 Masani Nala Submersible Non Clog 90
8 Masani Nala Submersible Non Clog 30
9 Masani Nala Submersible Non Clog 90
10 Masani Nala Submersible Non Clog 30
11 Masani Nala Submersible Non Clog 90
12 Bangali Ghat VT 45
13 Bangali Ghat VT 45
14 Bangali Ghat VT 45
15 Bangali Ghat VT 22
16 Bangali Ghat VT 45
17 Cantt Sewage Submersible Non Clog 19
18 Cantt Sewage Submersible Non Clog 5
19 Cantt Sewage Submersible Non Clog 19
20 Cantt Sewage Submersible Non Clog 5
21 Cantt Sewage Submersible Non Clog 19
22 Vrindavan Gate VT 8
23 Vrindavan Gate VT 8
24 Vrindavan Gate VT 8
25 Vrindavan Gate VT 4
26 Kishan Ganga Submersible Non Clog 11

S. No Pump Reference Pump type Rated
Power (kW)
27 Kishan Ganga Submersible Non Clog 11
28 Kishan Ganga Submersible Non Clog 11
29 Swami Ghat Submersible Non Clog 8
30 Swami Ghat Submersible Non Clog 8
31 Swami Ghat Submersible Non Clog 8
32 Chintaharan Submersible Non Clog 19
33 Chintaharan Submersible Non Clog 19
34 Chintaharan Submersible Non Clog 19
35 Dhruv Ghat Submersible Non Clog 4
Sub Total (B) 1051
C= A+B 2318
Pumps Name
Bulb (100W)
Bulb (60W)
LED (9W)
LED (50W)
LED (40W)
FTL (40W)
Fan (70W)
Cooler fan
(120W)
Exhaust Fan
(150W)
Exhaust Fan (250W)
Table Fan
(35W)
HPSV
(250)
HPSV
(150)
Cantt. Nala SPS
1 1 1 1 1
Dairy Farm SPS
1 1 2 2 1 3 2
Vrindavan Gate SPS
1 1 1 1 1
Bengali Ghat SPS
3 2
Masani Nala SPS
1 1 2 1 1
Swami Ghat SPS
1 1 1 1 1 1
Krishna Ganga SPS
1 2 1
Chinta Haran SPS
1 1 1
Total Nos. 7 5 7 5 1 3 2 1 4 2 3 4 2
Total Connected Load (D)
0.7 0.3 0.06 0.25 0.04 0.12 0.14 0.12 0.6 0.5 0.105 1 0.3
Auxiliary Load for Water Supply Pumps (kW) (E) 4
Total Auxiliary Connected Load (kW) (F) 8
Net Total Connected Load (kW), G= C+F 2327

4.2 Mathura Pumping Station
4.2.1 Overview of Existing System
Main source of water for the city of Mathura is ground water. There are 1417 Nos. of pumps installed to cater
the water needs of Mathura City. These 141 nos. of submersible pumps are used to supply water directly to
the users. Out of 141 Nos. of water supply pumps, 121 Nos. were in operation during energy audit and 20
Nos. of pumps were under maintenance. The Bore depth of pump at Mathura Ranges from 55 - 107 m while
the water level found to be present in the range of 9 m -55 m. The generic layout diagram of water supply
pumping station is shown in Figure 3.
Figure 3 Generic layout diagram of Water Supply Pumping Stations
Waste water from the household etc. is collected directly at sewage pumping stations. Further the waste
water supplied to the sewage treatment plant through the 3 Nos. of MPS pumping stations. 35 Nos. of pumps
are installed in sewage pumping system of Mathura to transfer the sewage water to the sewage treatment
plant. Out of 35 Nos. of pump, 21 Nos. of pumps were in operation during energy audit and 14 Nos. of Pump
sets were under maintenance. The pictorial representation of the sewage pumping station is shown in Figure
4.
7 As per LOA, there were 143 pumps (water), however in LOA list, there was repetition of two pump sets. Therefore, total pump at Mathura, in IGEA, is considered as 141.

Figure 4 Generic layout diagram of Sewage Pumping Stations
4.2.2 Electricity Supply
Nagar Nigam Mathura- Vrindavan is getting the electricity from Dakshinanchal Vidyut Vitaran Nigam Ltd
(DVVNL). All Water Pumping installations have low tension (LT) supply at 415V, 50Hz from DVVNL
under LMV-7 is applicable to the Public water works, sewage treatment plants and sewage pumping stations
functioning under Jal Sansthan, Jal Nigam or other local bodies.
MPS pumping station of sewage is having the dedicated transformer is getting the supply from DVVNL at
11 kV and stepped down to 415 V. No Energy Meter has been installed in the pumping stations. The SLD of
the pumping system is shown in figure 5.
Figure 5 SLD of Pumping Station of Mathura City
Main Header Gate Valve
To Sewage Treatment Plant
Gate Valve Gate Valve Gate Valve
NRV NRV NRV

4.2.3 Tariff Structure
The tariff for LMV-7, as per UPERC Tariff orders is provided in table 8.
Table 8: Tariff structure
Item 2016-17 2015-16 2014-15
Rate of energy charge per KWh 7.95 7.10 6.80
Rate of fixed charge per KW 290 230 230
4.2.4 Electricity Bill Analysis
The bills for the last three year have been taken from the Nagar Nigam Mathura- Vrindavan. Summary of
same has been tabulated in the table 9.
Table 9 Energy Cost and Energy Consumption8
Period of energy bill
Energy consumption kwh/Annum
Percentage Increase of energy consumption over
previous year (%)
Energy cost Rs/Annum
Jan-14 to Dec-14 2430016 NA 11642152
Jan-15 to Dec-15 2406705 NA 17087604
Jan-16 to Dec-17 2923171 NA 27323719
Note: The details of electricity bill analysis is provided in Annexure IV
4.2.5 Energy Consumption Pattern at Pumping Station
During energy audit, three phase power analyzer was installed at main incomer of Main pumping station
(MPS) for recording variations of electrical parameters, key findings of analysis or recorded data is as
follows is tabulate in below table:
Particulars Unit Sewage Pumping station Water Supply Pumps
Voltagemax V 441.46 449.44
Voltagemin V 365.21 334.22
Voltageavg V 414.58 397.73
Currentmax A 122.7 23.0
Currentmin A 17.1 7.6
Currentavg A 59.7 16.3
PFmax
0.931 0.974
PFmin
0.770 0.466
PFavg
0.840 0.801
Powermax kW 80.39 13.07
8 Electricity bills were not provided for all pumping stations. In some pumping stations, electricity bills were available
only for few months. Values provided in above table were based on available electricity bills

Particulars Unit Sewage Pumping station Water Supply Pumps
Powermin kW 8.97 3.34
Poweravg kW 36.85 9.10
Voltage THD % 1.19 1.25
Current THD % 2.28 3.5
* During log period frequency was found to be varying from 49.9 Hz to 50.1 Hz, whereas average frequency
was recorded as 50 Hz.
4.2.6 Pumping Station System Mapping
P & ID station for all Water supply pumping stations are similar. Generic P & ID is shown in the figure 6.
Figure 6 P&ID diagram of all water supply pumping stations
P & ID station for all Sewage Pumping stations are similar. Generic P & ID is shown in the figure 7.
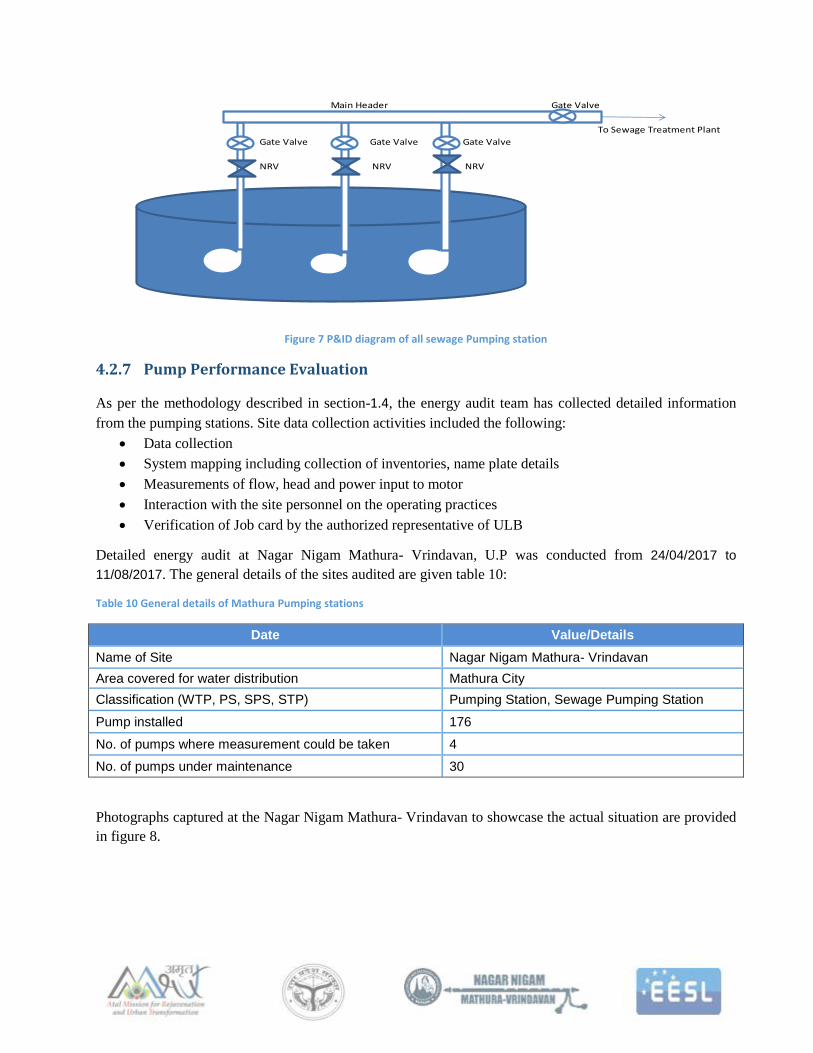
Figure 7 P&ID diagram of all sewage Pumping station
4.2.7 Pump Performance Evaluation
As per the methodology described in section-1.4, the energy audit team has collected detailed information
from the pumping stations. Site data collection activities included the following:
Data collection
System mapping including collection of inventories, name plate details
Measurements of flow, head and power input to motor
Interaction with the site personnel on the operating practices
Verification of Job card by the authorized representative of ULB
Detailed energy audit at Nagar Nigam Mathura- Vrindavan, U.P was conducted from 24/04/2017 to
11/08/2017. The general details of the sites audited are given table 10:
Table 10 General details of Mathura Pumping stations
Date Value/Details
Name of Site Nagar Nigam Mathura- Vrindavan
Area covered for water distribution Mathura City
Classification (WTP, PS, SPS, STP) Pumping Station, Sewage Pumping Station
Pump installed 176
No. of pumps where measurement could be taken 4
No. of pumps under maintenance 30
Photographs captured at the Nagar Nigam Mathura- Vrindavan to showcase the actual situation are provided
in figure 8.
Main Header Gate Valve
To Sewage Treatment Plant
Gate Valve Gate Valve Gate Valve
NRV NRV NRV

Figure 8 Photographs of pumping station site

29
The performance evaluation of the pumps was done based on the measurement done during energy audit. Results of performance evaluation of pumps are
provided in table11:
Table 11 Performance evaluation of Water Supply Pumps for Mathura City
Parameters Unit
Bhuteshwar
Campus TW
No.2
Bhuteshwar
Campus TW
No.5
Bhuteshwar
Campus TW
No.7
Nagar Palika
TW No.15
Bangali
Ghat TW
No.16
Police Line
TW No.25
Bhuteshwar
Campus TW
No.27
District Jail
TW No.29
Govind
Nagar Sec.
A
Kushak
Gali-1
Rated Parameters
Pump Type Submersible Submersible Submersible Submersible Submersible Submersible Submersible Submersible Submersible Submersible
Rated Head m 65 65 65 65 65 65 65 65 65 65
Rated Flow M3/hr 36 - 30 - 24 36 36 24 36 30
Rated Power HP 12.5 12.5 12.5 12.5 12.5 12.5 12.5 12.5 12.5 12.5
Rated Power kW 9.325 9.325 9.325 9.325 9.325 9.325 9.325 9.325 9.325 9.325
Parameters Measured
Measured Flow m3/hr 24.7 28.21 27.05 17.24 16.13 35.42 10.22 32.98 33.05 22.52
Measured
Discharge
Pressure (A)
kg/cm2 1.1 1.8 1.2 1.3 1.8 1.7 2.2 0.8 1.1 0.8
Total Bore length Ft. 230 350 230 230 230 230 230 230 230 230
Water Level Below
Ground (B) m 38 37 37 30 18 24 38 21 40 18
Height above
Surface to
Measured Gauge
Pressure, if any (C)
m 1 1 1 1 1 1 1 1 1 1
Static Discharge
Head (D= B+C) m 39 38 38 31 19 25 39 22 41 19
Performance Evaluation
Total Head
(=(AX10)+(D) m 50 56 50 44 37 42 61 30 52 27
Average kW kW 8.63 11.51 8.86 9.61 7.51 13.07 9.57 12.81 10.11 11.71
Hydraulic Power kW 3.36 4.30 3.68 2.07 1.63 4.05 1.70 2.69 4.68 1.66
Motor Efficiency % 85% 85% 85% 85% 85% 85% 85% 85% 85% 85%
Pump Shaft Power kW 7.34 9.79 7.53 8.17 6.38 11.11 8.13 10.89 8.60 9.95

Parameters Unit
Bhuteshwar
Campus TW
No.2
Bhuteshwar
Campus TW
No.5
Bhuteshwar
Campus TW
No.7
Nagar Palika
TW No.15
Bangali
Ghat TW
No.16
Police Line
TW No.25
Bhuteshwar
Campus TW
No.27
District Jail
TW No.29
Govind
Nagar Sec.
A
Kushak
Gali-1
Pump Efficiency % 45.8% 44.0% 48.9% 25.3% 25.5% 36.5% 20.9% 24.7% 54.5% 16.6%
Overall (Pump set)
Efficiency % 39.0% 37.4% 41.6% 21.5% 21.7% 31.0% 17.7% 21.0% 46.3% 14.1%
Specific Energy
Consumption kW/m3 0.349 0.408 0.327 0.558 0.465 0.369 0.936 0.388 0.306 0.520
Parameters Unit Shyam Ghat Vishram
Ghat
Chatta
Bazar Rampal Gali
Vrindavan
Gate Theknarnol Dwarkeshpuri Unth Gali
Naya Nagla
Gali No.8
Chah
Kathoti
Rated Parameters
Pump Make Submersible Submersible Submersible Submersible Submersible Submersible Submersible Submersible Submersible Submersible
Rated Head m 65 65 65 65 65 65 65 65 65 65
Rated Flow m3/hr 18 18 18 18 18 18 18 18 18 15
Rated Power HP 10 12.5 12.5 12.5 12.5 12.5 12.5 12.5 10 10
Rated Power kW 7.46 9.325 9.325 9.325 9.325 9.325 9.325 9.325 7.46 7.46
Parameters
Measured
Measured Flow m3/hr 8.87 34.3 36.41 22.97 25.96 21.41 15.33 10.38 11.45 19.4
Measured
Discharge Pressure
(A)
kg/cm2 3.8 2.9 1.5 1.2 3 2.3 2.4 1.8 0.4 1.1
Total Bore length Ft. 180 - 230 - 230 250 180 230 230 230
Water Level Below
Ground (B) m 9 9 30 40 15 46 34 43 34 34
Height above
Surface to
Measured Gauge
Pressure, if any (C)
m 1 1 1 1 1 1 1 1 1 1
Static Discharge
Head (D= B+C) m 10 10 31 41 16 47 35 44 35 35
Performance
Evaluation
Total Head
(=(AX10)+(D) m 48 39 46 53 46 70 59 62 39 46
Average kW kW 6.133 12.11 12.46 8.85 11.11 12.41 12.19 9.51 8.65 8.09

Parameters Unit Shyam Ghat Vishram
Ghat
Chatta
Bazar Rampal Gali
Vrindavan
Gate Theknarnol Dwarkeshpuri Unth Gali
Naya Nagla
Gali No.8
Chah
Kathoti
Hydraulic Power kW 1.16 3.64 4.56 3.32 3.25 4.08 2.46 1.75 1.22 2.43
Motor Efficiency % 85% 85% 85% 85% 85% 85% 85% 85% 85% 85%
Pump Shaft Power kW 5.21 10.29 10.59 7.52 9.44 10.55 10.36 8.08 7.35 6.87
Pump Efficiency % 22.2% 35.4% 43.1% 44.1% 34.4% 38.7% 23.8% 21.7% 16.5% 35.4%
Overall (Pump set)
Efficiency % 18.9% 30.1% 36.6% 37.5% 29.3% 32.9% 20.2% 18.4% 14.1% 30.1%
Specific Energy
Consumption kW/m3 0.691 0.353 0.342 0.385 0.428 0.580 0.795 0.916 0.755 0.417
Parameters Unit Agra Hotel Dhruv Ghat Maholi Ki
Paur
Radhika
Vihar Dholi Pyau
Thateran
Gali Bairag puri
Bhargva
Gali
Gandhi Park
Pump-1 Megha Gali
Rated Parameters
Pump Type Submersible Submersible Submersible Submersible Submersible Submersible Submersible Submersible Submersible Submersible
Rated Head m 65 65 65 65 65 65 65 65 65 65
Rated Flow m3/hr 18 24 24 24 24 21 24 18 18 15
Rated Power HP 12.5 12.5 12.5 12.5 12.5 12.5 12.5 12.5 10 6
Rated Power kW 9.325 9.325 9.325 9.325 9.325 9.325 9.325 9.325 7.46 4.476
Parameters
Measured
Measured Flow m3/hr 28.07 27.8 25.74 24.68 24.87 17.58 14.18 39.20 24.98 6.93
Measured
Discharge Pressure
(A)
kg/cm2 3.6 2.3 0.8 1.1 1.2 0.8 1 1.1 1.9 1.7
Total Bore length Ft. 230 230 230 230 230 230 230 230 180 180
Water Level Below
Ground (B) m 9 12 49 40 37 40 24 43 27 30
Height above
Surface to
Measured Guage
Pressure, if any (C)
m 1 1 1 1 1 1 1 1 1 1
Static Discharge
Head (D= B+C) m 10 13 50 41 38 41 25 44 28 31
Performance
Evaluation
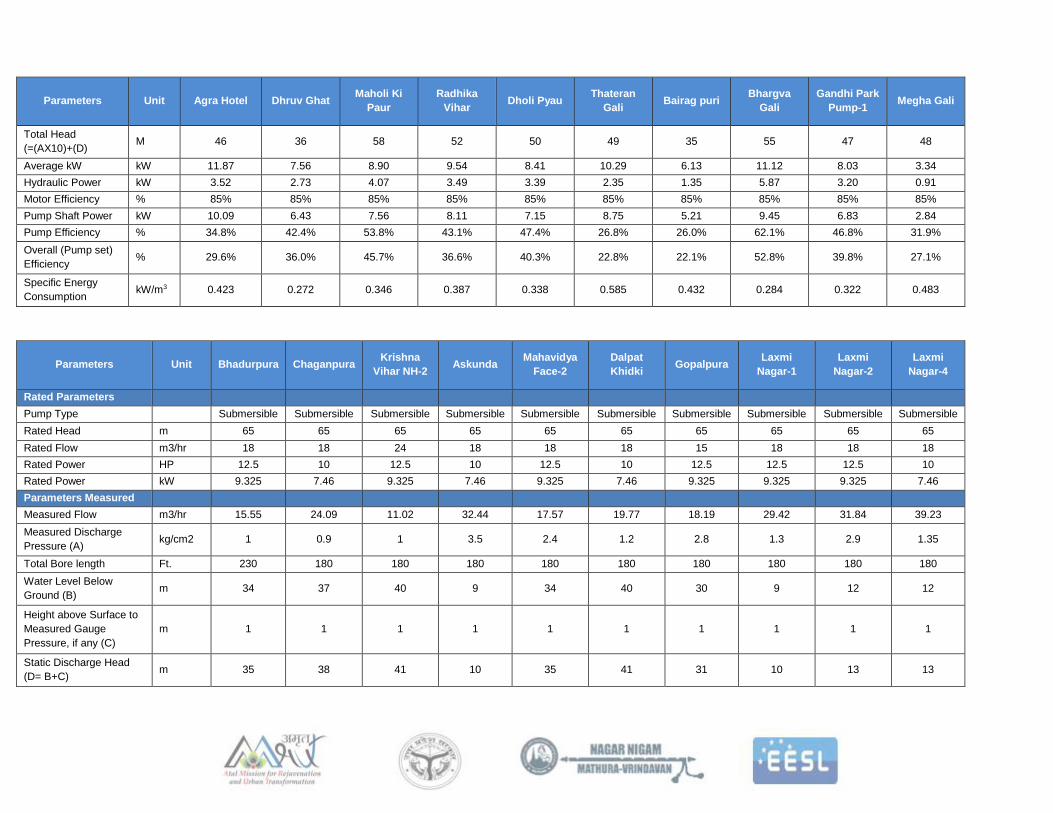
Parameters Unit Agra Hotel Dhruv Ghat Maholi Ki
Paur
Radhika
Vihar Dholi Pyau
Thateran
Gali Bairag puri
Bhargva
Gali
Gandhi Park
Pump-1 Megha Gali
Total Head
(=(AX10)+(D) M 46 36 58 52 50 49 35 55 47 48
Average kW kW 11.87 7.56 8.90 9.54 8.41 10.29 6.13 11.12 8.03 3.34
Hydraulic Power kW 3.52 2.73 4.07 3.49 3.39 2.35 1.35 5.87 3.20 0.91
Motor Efficiency % 85% 85% 85% 85% 85% 85% 85% 85% 85% 85%
Pump Shaft Power kW 10.09 6.43 7.56 8.11 7.15 8.75 5.21 9.45 6.83 2.84
Pump Efficiency % 34.8% 42.4% 53.8% 43.1% 47.4% 26.8% 26.0% 62.1% 46.8% 31.9%
Overall (Pump set)
Efficiency % 29.6% 36.0% 45.7% 36.6% 40.3% 22.8% 22.1% 52.8% 39.8% 27.1%
Specific Energy
Consumption kW/m3 0.423 0.272 0.346 0.387 0.338 0.585 0.432 0.284 0.322 0.483
Parameters Unit Bhadurpura Chaganpura Krishna
Vihar NH-2 Askunda
Mahavidya
Face-2
Dalpat
Khidki Gopalpura
Laxmi
Nagar-1
Laxmi
Nagar-2
Laxmi
Nagar-4
Rated Parameters
Pump Type Submersible Submersible Submersible Submersible Submersible Submersible Submersible Submersible Submersible Submersible
Rated Head m 65 65 65 65 65 65 65 65 65 65
Rated Flow m3/hr 18 18 24 18 18 18 15 18 18 18
Rated Power HP 12.5 10 12.5 10 12.5 10 12.5 12.5 12.5 10
Rated Power kW 9.325 7.46 9.325 7.46 9.325 7.46 9.325 9.325 9.325 7.46
Parameters Measured
Measured Flow m3/hr 15.55 24.09 11.02 32.44 17.57 19.77 18.19 29.42 31.84 39.23
Measured Discharge
Pressure (A) kg/cm2 1 0.9 1 3.5 2.4 1.2 2.8 1.3 2.9 1.35
Total Bore length Ft. 230 180 180 180 180 180 180 180 180 180
Water Level Below
Ground (B) m 34 37 40 9 34 40 30 9 12 12
Height above Surface to
Measured Gauge
Pressure, if any (C)
m 1 1 1 1 1 1 1 1 1 1
Static Discharge Head
(D= B+C) m 35 38 41 10 35 41 31 10 13 13

Parameters Unit Bhadurpura Chaganpura Krishna
Vihar NH-2 Askunda
Mahavidya
Face-2
Dalpat
Khidki Gopalpura
Laxmi
Nagar-1
Laxmi
Nagar-2
Laxmi
Nagar-4
Performance
Evaluation
Total Head (=(AX10)+(D) m 45 47 51 45 59 53 59 23 42 26.5
Average kW kW 11.22 7.73 8.53 9.99 12.13 7.13 12.76 6.89 8.89 6.97
Hydraulic Power kW 1.91 3.08 1.53 3.98 2.82 2.85 2.92 1.84 3.64 2.83
Motor Efficiency % 85% 85% 85% 85% 85% 85% 85% 85% 85% 85%
Pump Shaft Power kW 9.54 6.57 7.25 8.49 10.31 6.06 10.84 5.86 7.56 5.92
Pump Efficiency % 20.0% 46.9% 21.1% 46.8% 27.4% 47.1% 27.0% 31.4% 48.2% 47.8%
Overall (Pump set)
Efficiency % 17.0% 39.9% 17.9% 39.8% 23.3% 40.0% 22.9% 26.7% 41.0% 40.6%
Specific Energy
Consumption kW/m3 0.722 0.321 0.774 0.308 0.691 0.361 0.701 0.234 0.279 0.178
Parameters Unit Naya Nagla,
Koyla Gali
Maholi
Yojna-1
Maholi
Yojna-3
Sheetla
Ghati
Manas
Nagar
Ratan
Kund Gau Ghat Arjunpura
Officer
Colony
Rated Parameters
Pump Type Submersible Submersible Submersible Submersible Submersible Submersible Submersible Submersible Submersible
Rated Head M 65 65 65 65 65 65 65 65 65
Rated Flow m3/hr 18 24 24 18 18 18 18 18 18
Rated Power HP 10 12.5 12.5 10 10 10 10 12.5 12.5
Rated Power kW 7.46 9.325 9.325 7.46 7.46 7.46 7.46 9.325 9.325
Parameters Measured
Measured Flow m3/hr 20.93 27.03 36.9 14.06 23.51 11.9 23.26 12.32 19.13
Measured Discharge Pressure
(A) kg/cm2 1.2 1 1.1 1.4 0.9 0.9 1.1 2 0.7
Total Bore length Ft. 180 180 180 230 180 230 180 180 180
Water Level Below Ground (B) M 34 35 37 55 37 49 27 40 15
Height above Surface to
Measured Guage Pressure, if
any (C)
M 1 1 1 1 1 1 1 1 1

Parameters Unit Naya Nagla,
Koyla Gali
Maholi
Yojna-1
Maholi
Yojna-3
Sheetla
Ghati
Manas
Nagar
Ratan
Kund Gau Ghat Arjunpura
Officer
Colony
Static Discharge Head (D=
B+C) M 35 36 38 56 38 50 28 41 16
Performance Evaluation
Total Head (=(AX10)+(D) M 47 46 49 70 47 59 39 61 23
Average kW kW 7.03 8.75 9.97 6.03 6.21 5.51 7.66 9.51 9.15
Hydraulic Power kW 2.68 3.39 4.92 2.68 3.01 1.91 2.47 2.05 1.20
Motor Efficiency % 85% 85% 85% 85% 85% 85% 85% 85% 85%
Pump Shaft Power kW 5.98 7.44 8.47 5.13 5.28 4.68 6.51 8.08 7.78
Pump Efficiency % 44.8% 45.5% 58.1% 52.3% 57.0% 40.8% 37.9% 25.3% 15.4%
Overall (Pump set) Efficiency % 38.1% 38.7% 49.4% 44.4% 48.4% 34.7% 32.2% 21.5% 13.1%
Specific Energy Consumption kW/m3 0.336 0.324 0.270 0.429 0.264 0.463 0.329 0.772 0.478
Parameters Unit Badpura Colony Narayan Puri Jhigurpura Raigarpura Gupta Kunj Radha Nagar Manoharpura Krishna
Nagar
Rated Parameters
Pump Type Submersible Submersible Submersible Submersible Submersible Submersible Submersible Submersible
Rated Head M 65 65 65 65 65 65 65 65
Rated Flow m3/hr 15 30 18 15 18 24 24 24
Rated Power HP 12.5 12.5 10 12.5 10 12.5 12.5 12.5
Rated Power kW 9.325 9.325 7.46 9.325 7.46 9.325 9.325 9.325
Parameters Measured
Measured Flow m3/hr 33.3 29.03 15.77 32.98 17.87 20.1 14.19 17.97
Measured Discharge Pressure
(A) kg/cm2 0.8 0.8 1.1 1.5 0.8 0.5 2.2 1.4
Total Bore length Ft. 180 180 230 180 180 180 280 180
Water Level Below Ground (B) M 30 37 37 27 40 40 55 37

Parameters Unit Badpura Colony Narayan Puri Jhigurpura Raigarpura Gupta Kunj Radha Nagar Manoharpura Krishna
Nagar
Height above Surface to
Measured Gauge Pressure, if
any (C)
M 1 1 1 1 1 1 1 1
Static Discharge Head (D=
B+C) M 31 38 38 28 41 41 56 38
Performance Evaluation
Total Head (=(AX10)+(D) M 39 46 49 43 49 46 78 52
Average kW kW 8.98 12.03 7.94 9.13 7.64 9.03 8.08 8.61
Hydraulic Power kW 3.54 3.64 2.10 3.86 2.38 2.52 3.01 2.54
Motor Efficiency % 85% 85% 85% 85% 85% 85% 85% 85%
Pump Shaft Power kW 7.63 10.23 6.75 7.76 6.50 7.68 6.87 7.32
Pump Efficiency % 46.4% 35.6% 31.2% 49.7% 36.7% 32.8% 43.9% 34.8%
Overall (Pump set) Efficiency % 39.4% 30.2% 26.5% 42.3% 31.2% 27.9% 37.3% 29.6%
Specific Energy Consumption kW/m3 0.270 0.415 0.503 0.277 0.428 0.449 0.570 0.479
Parameters Unit Heja
Hospital
Laxmi
Nagar
Maholi
Yojna-2 Antapada Rani Mandi
Kutta
Paysa
Gali
Ravaliya
Gali
Rajkumar
Gandhi
Park-2
Arjunpura-
2
Rated Parameters
Pump Type Submersible Submersible Submersible Submersible Submersible Submersible Submersible Submersible Submersible Submersible
Rated Head M 65 65 65 65 65 65 65 65 65 65
Rated Flow m3/hr 24 18 18 24 24 24 24 24 24 24
Rated Power HP 12.5 12.5 12.5 12.5 12.5 12.5 12.5 12.5 12.5 12.5
Rated Power kW 9.325 9.325 9.325 9.325 9.325 9.325 9.325 9.325 9.325 9.325
Parameters Measured

Parameters Unit Heja
Hospital
Laxmi
Nagar
Maholi
Yojna-2 Antapada Rani Mandi
Kutta
Paysa
Gali
Ravaliya
Gali
Rajkumar
Gandhi
Park-2
Arjunpura-
2
Measured Flow m3/hr 16.76 19.87 28.6 26.43 17.68 19.93 20.08 29.41 17.85 15.42
Measured Discharge
Pressure (A) kg/cm2 1.4 1.2 1.2 1.2 1.3 1 1.2 1.6 1.4 1.1
Total Bore length Ft. 230 180 180 180 180 230 180 230 180 230
Water Level Below Ground
(B) M 46 12 37 24 30 43 38 46 27 43
Height above Surface to
Measured Gauge Pressure, if
any (C)
M 1 1 1 1 1 1 1 1 1 1
Static Discharge Head (D=
B+C) M 47 13 38 25 31 44 39 47 28 44
Performance Evaluation
Total Head (=(AX10)+(D) M 61 25 50 37 44 54 51 63 42 55
Average kW kW 8.26 9.50 9.66 9.52 11.73 9.72 6.33 12.59 8.86 8.62
Hydraulic Power kW 2.78 1.35 3.89 2.66 2.12 2.93 2.79 5.05 2.04 2.31
Motor Efficiency % 85% 85% 85% 85% 85% 85% 85% 85% 85% 85%
Pump Shaft Power kW 7.02 8.08 8.21 8.09 9.97 8.26 5.38 10.70 7.53 7.33
Pump Efficiency % 39.7% 16.8% 47.4% 32.9% 21.2% 35.5% 51.9% 47.2% 27.1% 31.5%
Overall (Pump set) Efficiency % 33.7% 14.2% 40.3% 28.0% 18.1% 30.2% 44.1% 40.1% 23.0% 26.8%
Specific Energy Consumption kW/m3 0.493 0.478 0.338 0.360 0.664 0.488 0.315 0.428 0.497 0.559

Parameters Unit Theknarnol-
2
Madhav
Puri
Dholi Pyau
Tiraha-New
Construction
Ahilyabai
Park
Dampier
Nagar
MVDA
Ramlila
Ground
Krishna
Nagar
MVDA
Kankali
Temple
Dwarikapuri
MVDA
Nai Basti
W.No. Andi Kuiya
Kathoti
Kua
Chaupal
Kathoti
Kua Masjid
Rated Parameters
Pump Type Submersible Submersible Submersible Submersible Submersible Submersible Submersible Submersible Submersible Submersible
Rated Head m 65 65 65 65 65 65 65 65 65 65
Rated Flow m3/hr 24 21 24 27 18 18 18 18 18 18
Rated Power HP 12.5 12.5 12.5 12.5 12.5 10 12.5 12.5 12.5 12.5
Rated Power kW 9.325 9.325 9.325 9.325 9.325 7.46 9.325 9.325 9.325 9.325
Parameters Measured
Measured Flow m3/hr 25.51 21.57 20.14 24.7 18.58 18.67 27.86 31.24 18.47 18.57
Measured Discharge
Pressure (A) kg/cm2 1.3 1.3 1.6 1.2 1.6 1.2 0.9 0.7 1.2 2.1
Total Bore length Ft. 230 180 180 230 180 180 230 230 180 180
Water Level Below Ground
(B) m 46 37 37 30 24 37 40 46 37 34
Height above Surface to
Measured Gauge Pressure,
if any (C)
m 1 1 1 1 1 1 1 1 1 1
Static Discharge Head (D=
B+C) m 47 38 38 31 25 38 41 47 38 35
Performance Evaluation
Total Head (=(AX10)+(D) m 60 51 54 43 41 50 50 54 50 56
Average Voltage V 406.92 411.64 404.29 408.79 365.12 397.78 399.33 412.19 399.01 385.18
Average Current A 14.21 14.63 20.63 16.78 19.19 14.93 16.97 18.99 16.48 22.01
Average PF pf 0.87 0.77 0.84 0.87 0.81 0.74 0.91 0.78 0.82 0.88
Average kW kW 8.77 8.06 11.93 9.95 9.87 7.57 10.56 10.63 9.37 12.86
Hydraulic Power kW 4.17 3.00 2.96 2.89 2.07 2.54 3.79 4.59 2.51 2.83
Motor Efficiency % 85% 85% 85% 85% 85% 85% 85% 85% 85% 85%
Pump Shaft Power kW 7.46 6.85 10.14 8.46 8.39 6.44 8.98 9.03 7.96 10.93

Parameters Unit Theknarnol-
2
Madhav
Puri
Dholi Pyau
Tiraha-New
Construction
Ahilyabai
Park
Dampier
Nagar
MVDA
Ramlila
Ground
Krishna
Nagar
MVDA
Kankali
Temple
Dwarikapuri
MVDA
Nai Basti
W.No. Andi Kuiya
Kathoti
Kua
Chaupal
Kathoti
Kua Masjid
Pump Efficiency % 55.9% 43.7% 29.2% 34.2% 24.7% 39.5% 42.3% 50.9% 31.6% 25.9%
Overall (Pump set) Efficiency % 47.5% 37.2% 24.8% 29.1% 21.0% 33.6% 35.9% 43.2% 26.9% 22.0%
Specific Energy
Consumption kW/m3 0.344 0.374 0.593 0.403 0.531 0.406 0.379 0.340 0.507 0.693
Parameters Unit
Gupta
Kunk
WNo.7
Sadar
Dhobi Pada
W.No8
Gandhi
Nagar
W.No. 9
Laxmi
Nagar
W.No. 9
Bains
Bhora
Kotwali
W.No.14
Radhey
Shyam
Ashram
W.No.16
Om Nagar
W.No.17
Om Nagar-
2 W.No.17
Jogi Gali
Antapada
W.No.18
Khateek
Mohalla
Balmiki
Basti
W.No.19
Rated Parameters
Pump Type Submersible Submersible Submersible Submersible Submersible Submersible Submersible Submersible Submersible Submersible
Rated Head m 65 65 65 65 65 65 65 65 65 65
Rated Flow m3/hr 18 18 18 18 18 18 18 18 18 18
Rated Power HP 12.5 12.5 12.5 12.5 12.5 12.5 12.5 12.5 12.5 12.5
Rated Power kW 9.325 9.325 9.325 9.325 9.325 9.325 9.325 9.325 9.325 9.325
Parameters Measured
Measured Flow m3/hr 22.6 39.15 16.69 17.23 27.62 17.49 21.59 17.09 23.08 20.13
Measured Discharge
Pressure (A) kg/cm2 1.1 0.6 1 1.2 1.2 2.6 1 1.2 0.9 1.2
Total Bore length Ft. 180 180 180 180 180 180 180 230 180 230
Water Level Below Ground
(B) m 37 18 34 37 40 15 34 37 34 40
Height above Surface to
Measured Guage Pressure, if
any (C)
m 1 1 1 1 1 1 1 1 1 1

Parameters Unit
Gupta
Kunk
WNo.7
Sadar
Dhobi Pada
W.No8
Gandhi
Nagar
W.No. 9
Laxmi
Nagar
W.No. 9
Bains
Bhora
Kotwali
W.No.14
Radhey
Shyam
Ashram
W.No.16
Om Nagar
W.No.17
Om Nagar-
2 W.No.17
Jogi Gali
Antapada
W.No.18
Khateek
Mohalla
Balmiki
Basti
W.No.19
Static Discharge Head (D=
B+C) m 38 19 35 38 41 16 35 38 35 41
Performance Evaluation
Total Head (=(AX10)+(D) m 49 25 45 50 53 42 45 50 44 53
Average kW kW 7.30 10.26 8.23 9.56 9.05 11.94 9.23 8.48 8.54 9.07
Hydraulic Power kW 3.02 2.67 2.05 2.35 3.99 2.00 2.65 2.33 2.77 2.91
Motor Efficiency % 85% 85% 85% 85% 85% 85% 85% 85% 85% 85%
Pump Shaft Power kW 6.20 8.72 7.00 8.13 7.70 10.15 7.85 7.21 7.26 7.71
Pump Efficiency % 48.6% 30.6% 29.2% 28.9% 51.8% 19.7% 33.7% 32.3% 38.1% 37.7%
Overall (Pump set) Efficiency % 41.3% 26.0% 24.8% 24.5% 44.0% 16.8% 28.7% 27.4% 32.4% 32.0%
Specific Energy Consumption kW/m3 0.323 0.262 0.493 0.555 0.328 0.682 0.427 0.496 0.370 0.451
Parameters Unit
Guru Nanak
Nagar
W.No.19
Krishnapuram-
1 Ward-24
Krishnapuram-
2 Ward-24
Balmiki
Basti Dholi
Pyau Ward-
27
Mahavidya
Park Ward-
28
Hanuman
Teela Ward-
33
Kashmiri
Gali Ward-
34
Mission
Teela Sadar
Bazar
Ward-35
Matia Gate
Ward-37
Subhash
Nagar Nala
Ward-38
Rated Parameters
Pump Type Submersible Submersible Submersible Submersible Submersible Submersible Submersible Submersible Submersible Submersible
Rated Head m 65 65 65 65 65 65 65 65 65 65
Rated Flow m3/hr 18 18 18 18 18 18 18 18 18 18
Rated Power HP 12.5 12.5 12.5 12.5 12.5 12.5 12.5 12.5 12.5 12.5
Rated Power kW 9.325 9.325 9.325 9.325 9.325 9.325 9.325 9.325 9.325 9.325
Parameters
Measured
Measured Flow m3/hr 9.48 28.43 29.25 13.35 21.77 17.87 18.33 29.31 22.83 18.21

Parameters Unit
Guru Nanak
Nagar
W.No.19
Krishnapuram-
1 Ward-24
Krishnapuram-
2 Ward-24
Balmiki
Basti Dholi
Pyau Ward-
27
Mahavidya
Park Ward-
28
Hanuman
Teela Ward-
33
Kashmiri
Gali Ward-
34
Mission
Teela Sadar
Bazar
Ward-35
Matia Gate
Ward-37
Subhash
Nagar Nala
Ward-38
Measured
Discharge Pressure
(A)
kg/cm2 0.8 0.8 1.2 1.2 1.6 1.9 2.1 0.7 1.7 1.4
Total Bore length Ft. 180 230 230 180 180 180 180 180 230 180
Water Level Below
Ground (B) m 37 30 30 37 37 34 15 30 46 34
Height above
Surface to
Measured Guage
Pressure, if any (C)
m 1 1 1 1 1 1 1 1 1 1
Static Discharge
Head (D= B+C) m 38 31 31 38 38 35 16 31 47 35
Performance
Evaluation
Total Head
(=(AX10)+(D) m 46 39 43 50 54 54 37 38 64 49
Average kW kW 8.00 10.72 10.19 9.03 6.55 7.47 6.97 10.86 8.99 11.43
Hydraulic Power kW 1.19 3.02 3.43 1.82 3.20 2.63 1.85 3.03 3.98 2.43
Motor Efficiency % 85% 85% 85% 85% 85% 85% 85% 85% 85% 85%
Pump Shaft Power kW 6.80 9.11 8.66 7.68 5.57 6.35 5.92 9.23 7.64 9.72
Pump Efficiency % 17.5% 33.1% 39.5% 23.7% 57.5% 41.4% 31.2% 32.9% 52.1% 25.0%
Overall (Pump set)
Efficiency % 14.8% 28.2% 33.6% 20.1% 48.9% 35.2% 26.5% 27.9% 44.3% 21.3%
Specific Energy
Consumption kW/m3 0.844 0.377 0.348 0.677 0.301 0.418 0.380 0.371 0.394 0.628
Parameters Unit Manshapuri
Ward-39
Rampal Gali
Ward-40
Theknarnol
Ward-40
Lala Ganj
Ward-42
Kashiram
Yojna-3
Kashiram
Yojna-4
Satrangi
Garden Ward-
8
Naya Nagla
Ward-11
Rated Parameters
Pump Type Submersible Submersible Submersible Submersible Submersible Submersible Submersible Submersible

Parameters Unit Manshapuri
Ward-39
Rampal Gali
Ward-40
Theknarnol
Ward-40
Lala Ganj
Ward-42
Kashiram
Yojna-3
Kashiram
Yojna-4
Satrangi
Garden Ward-
8
Naya Nagla
Ward-11
Rated Head m 65 65 65 65 65 65 65 65
Rated Flow m3/hr 18 18 18 18 18 18 18 18
Rated Power HP 12.5 12.5 12.5 12.5 12.5 12.5 12.5 12.5
Rated Power kW 9.325 9.325 9.325 9.325 9.325 9.325 9.325 9.325
Parameters Measured
Measured Flow m3/hr 15.27 24.37 21.83 17.02 14.65 20.61 31.84 22.47
Measured Discharge Pressure (A) kg/cm2 1.2 1.1 1.2 1.5 3.5 4 0.8 0.9
Total Bore length Ft. 180 180 180 230 180 180 180 180
Water Level Below Ground (B) m 34 37 40 46 12 12 12 34
Height above Surface to Measured
Gauge Pressure, if any (C) m 1 1 1 1 1 1 1 1
Static Discharge Head (D= B+C) m 35 38 41 47 13 13 13 35
Performance Evaluation
Total Head (=(AX10)+(D) m 47 49 53 62 48 53 21 44
Average kW kW 9.45 6.87 7.46 7.80 7.00 11.30 6.94 7.86
Hydraulic Power kW 1.95 3.25 3.15 2.87 1.92 2.97 1.82 2.69
Motor Efficiency % 85% 85% 85% 85% 85% 85% 85% 85%
Pump Shaft Power kW 8.03 5.84 6.35 6.63 5.95 9.61 5.90 6.68
Pump Efficiency % 24.3% 55.7% 49.7% 43.4% 32.2% 31.0% 30.9% 40.3%
Overall (Pump set) Efficiency % 20.7% 47.4% 42.2% 36.9% 27.4% 26.3% 26.3% 34.2%
Specific Energy Consumption kW/m3 0.619 0.282 0.342 0.458 0.478 0.548 0.218 0.350
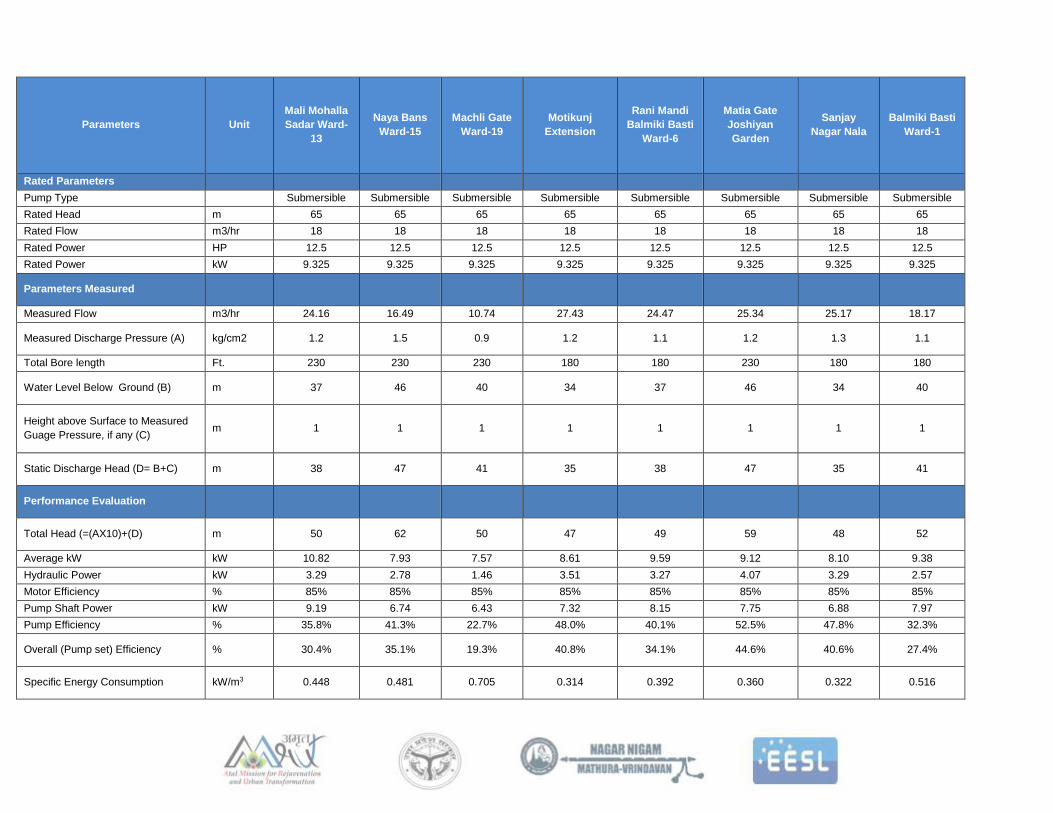
Parameters Unit
Mali Mohalla
Sadar Ward-
13
Naya Bans
Ward-15
Machli Gate
Ward-19
Motikunj
Extension
Rani Mandi
Balmiki Basti
Ward-6
Matia Gate
Joshiyan
Garden
Sanjay
Nagar Nala
Balmiki Basti
Ward-1
Rated Parameters
Pump Type Submersible Submersible Submersible Submersible Submersible Submersible Submersible Submersible
Rated Head m 65 65 65 65 65 65 65 65
Rated Flow m3/hr 18 18 18 18 18 18 18 18
Rated Power HP 12.5 12.5 12.5 12.5 12.5 12.5 12.5 12.5
Rated Power kW 9.325 9.325 9.325 9.325 9.325 9.325 9.325 9.325
Parameters Measured
Measured Flow m3/hr 24.16 16.49 10.74 27.43 24.47 25.34 25.17 18.17
Measured Discharge Pressure (A) kg/cm2 1.2 1.5 0.9 1.2 1.1 1.2 1.3 1.1
Total Bore length Ft. 230 230 230 180 180 230 180 180
Water Level Below Ground (B) m 37 46 40 34 37 46 34 40
Height above Surface to Measured
Guage Pressure, if any (C) m 1 1 1 1 1 1 1 1
Static Discharge Head (D= B+C) m 38 47 41 35 38 47 35 41
Performance Evaluation
Total Head (=(AX10)+(D) m 50 62 50 47 49 59 48 52
Average kW kW 10.82 7.93 7.57 8.61 9.59 9.12 8.10 9.38
Hydraulic Power kW 3.29 2.78 1.46 3.51 3.27 4.07 3.29 2.57
Motor Efficiency % 85% 85% 85% 85% 85% 85% 85% 85%
Pump Shaft Power kW 9.19 6.74 6.43 7.32 8.15 7.75 6.88 7.97
Pump Efficiency % 35.8% 41.3% 22.7% 48.0% 40.1% 52.5% 47.8% 32.3%
Overall (Pump set) Efficiency % 30.4% 35.1% 19.3% 40.8% 34.1% 44.6% 40.6% 27.4%
Specific Energy Consumption kW/m3 0.448 0.481 0.705 0.314 0.392 0.360 0.322 0.516

Table 12 Performance evaluation of Sewage Pumps for Mathura City
Parameters Unit Masani Nala
SPS Pump 1
Masani Nala
SPS Pump 2
Masani Nala SPS
Pump 3
Masani Nala SPS
Pump 4
Masani Nala SPS
Pump 5
Krishna Ganga
SPS Pump 2
Chinta Haran
SPS Pump 1
Chinta Haran
SPS Pump 3
Rated Parameters
Pump Type Non Clog
Submersible
Non Clog
Submersible
Non Clog
Submersible
Non Clog
Submersible
Non Clog
Submersible
Non Clog
Submersible
Non Clog
Submersible
Non Clog
Submersible
Rated Head m 36 36 36 36 36 20 20.5 20.5
Rated Flow M3/hr 270 270 540 270 540 108 270 270
Rated Power HP 40 40 120 40 120 15 25 25
Rated Power kW 30 30 90 30 90 11 19 19
Parameters
Measured
Measured Flow m3/hr 236.7 262.1 398.7 215.2 389.0 52.3 66.4 66.1
Measured
Discharge Pressure
(A)
kg/c
m2 2.0 2.6 2.2 2.8 2.1 1.9 2.2 2.1
Total Bore length Ft. 34 34 34 34 34 20 21 21
Sewage Level
Below Measured
Gauge Pressure
(B)
m 5 5 5 5 5 3 3 3
Performance
Evaluation
Total Head
(=(AX10)+(D) m 25 31 27 33 26 22 25 24
Average kW kW 39.25 45.90 67.53 45.32 68.57 10.43 13.05 13.77
Hydraulic Power kW 16.38 22.79 30.19 19.92 28.37 3.23 4.66 4.45
MotorEfficiency % 85% 85% 85% 85% 85% 85% 85% 85%
Pump Shaft Power kW 33.37 39.02 57.40 38.52 58.28 8.87 11.09 11.71
Pump Efficiency % 49.1% 58.4% 52.6% 51.7% 48.7% 36.4% 42.0% 38.0%
Overall (Pump set)
Efficiency % 41.7% 49.7% 44.7% 44.0% 41.4% 31.0% 35.7% 32.3%
Specific Energy
Consumption
kW/m3
0.166 0.175 0.169 0.211 0.176 0.199 0.196 0.209

Parameters Unit Swami Ghat SPS Pump 1
Swami Ghat SPS Pump 2
Parallel Operation
Swami Ghat SPS Pump 1 &
2
Cantt. Nala SPS Pump 1
Dairy Farm SPS Pump 1
Dairy Farm SPS Pump 2
Dairy Farm SPS Pump 3
Dairy Farm SPS Pump 4
Dairy Farm SPS Pump 5
Rated Parameters
Pump Type Non Clog
Submersible Non Clog
Submersible Non Clog
Submersible Non Clog
Submersible Non Clog
Submersible Non Clog
Submersible Non Clog
Submersible Non Clog
Submersible Non Clog
Submersible
Rated Head m 25 35 28 35 28 35
Rated Flow M3/hr 72 338.4 165.6 338.4 165.6 338.4
Rated Power HP 10 10 20 25 100 40 100 40 100
Rated Power kW 7.5 7.5 14.9 19 75 30 75 30 75
Parameters Measured
Measured Flow m3/hr 122.8 119.5 215.0 39.9 293.7 110.3 302.9 111.2 312.3
Measured Discharge Pressure (A)
kg/cm2
0.8 0.7 0.8 1.9 2.0 1.2 2.0 1.3 1.9
Total Bore length Ft. 20 20 20 40 34 34 34 34 34
Sewage Level Below Measured Gauge Pressure (B)
m 3.5 3.5 3.5 6 6 6 6 6 6
Performance Evaluation
Total Head (=(AX10)+(D)
m 12 11 12 25 26 18 26 19 25
Average kW kW 12.52 12.41 26.40 23.91 80.39 36.45 78.20 36.10 76.20
Hydraulic Power kW 3.96 3.52 6.94 2.80 21.42 5.57 21.81 5.93 21.90
Motor Efficiency % 85% 85% 85% 85% 85% 85% 85% 85% 85%
Pump Shaft kW 10.65 10.55 22.44 20.32 68.33 30.98 66.47 30.69 64.77
Pump Efficiency % 37.2% 33.4% 30.9% 13.8% 31.3% 18.0% 32.8% 19.3% 33.8%
Overall (Pump set) Efficiency
% 31.6% 28.4% 26.3% 11.7% 26.6% 15.3% 27.9% 16.4% 28.7%
Specific Energy Consumption
kW/m3
0.102 0.104 0.123 0.599 0.274 0.331 0.258 0.325 0.244

Parameters Unit Vrindavan Gate
SPS Pump 1 Vrindavan Gate
SPS Pump 2 Bangali Ghat SPS
Pump 1 Bangali Ghat SPS
Pump 5 Parallel Operation of Bangali Ghat SPS Pump 1 & Pump 5
Rated Parametres
Pump Type VT VT VT VT VT
Rated Head M 13.5 13.5 24 24 --
Rated Flow M3/hr 90 90 349.2 349.2 -
Rated Power kW 7.5 7.5 44.8 44.8 -
Parameters Measured
Measured Flow m3/hr 55.1 51.8 212.9 236.8 438.0
Measured Discharge Pressure (A) kg/cm2 0.6 0.9 2.1 2.3 2.3
Total Bore length Ft. 31 31 21 21 21
Suction Head (B) M 1 1 1 1 1
Performance Evaluation
Total Head (=(AX10)-B M 5 8 20 22 22
Average Voltage V 365.21 369.23 418.43 424.89 417.53
Average Current A 18.08 17.91 67.58 64.14 135.13
Average PF Pf 0.796 0.782 0.821 0.931 0.800
Average kW kW 9.11 8.97 41.26 43.97 75.13
Hydraulic Power kW 0.77 1.16 11.94 14.61 27.03
Motor Efficiency % 80% 80% 80% 80% 80%
Pump Shaft Power kW 7.29 7.17 33.01 35.17 60.10
Pump Efficiency % 10.6% 16.2% 36.2% 41.5% 45.0%
Overall (Pump set) Efficiency % 8.5% 13.0% 28.9% 33.2% 36.0%
Specific Energy Consumption kW/m3 0.165 0.173 0.194 0.186 0.172
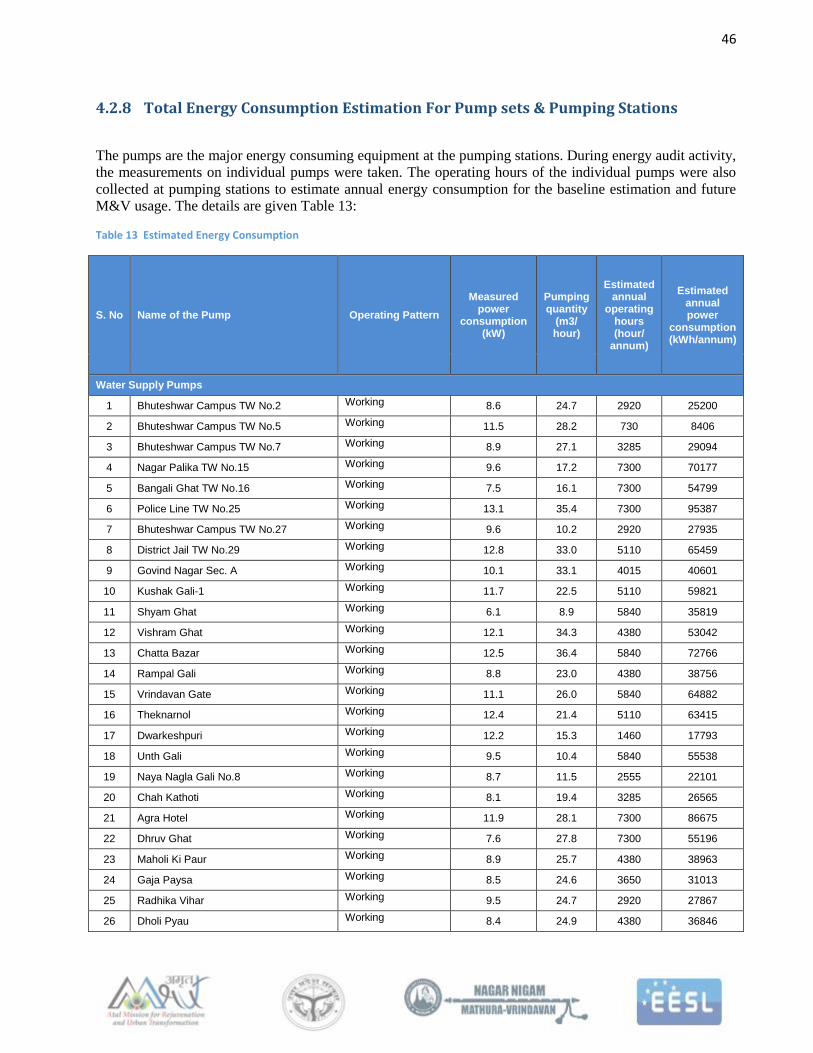
46
4.2.8 Total Energy Consumption Estimation For Pump sets & Pumping Stations
The pumps are the major energy consuming equipment at the pumping stations. During energy audit activity,
the measurements on individual pumps were taken. The operating hours of the individual pumps were also
collected at pumping stations to estimate annual energy consumption for the baseline estimation and future
M&V usage. The details are given Table 13:
Table 13 Estimated Energy Consumption
S. No Name of the Pump Operating Pattern
Measured power
consumption (kW)
Pumping quantity
(m3/ hour)
Estimated annual
operating hours (hour/
annum)
Estimated annual power
consumption (kWh/annum)
Water Supply Pumps
1 Bhuteshwar Campus TW No.2 Working 8.6 24.7 2920 25200
2 Bhuteshwar Campus TW No.5 Working 11.5 28.2 730 8406
3 Bhuteshwar Campus TW No.7 Working 8.9 27.1 3285 29094
4 Nagar Palika TW No.15 Working 9.6 17.2 7300 70177
5 Bangali Ghat TW No.16 Working 7.5 16.1 7300 54799
6 Police Line TW No.25 Working 13.1 35.4 7300 95387
7 Bhuteshwar Campus TW No.27 Working 9.6 10.2 2920 27935
8 District Jail TW No.29 Working 12.8 33.0 5110 65459
9 Govind Nagar Sec. A Working 10.1 33.1 4015 40601
10 Kushak Gali-1 Working 11.7 22.5 5110 59821
11 Shyam Ghat Working 6.1 8.9 5840 35819
12 Vishram Ghat Working 12.1 34.3 4380 53042
13 Chatta Bazar Working 12.5 36.4 5840 72766
14 Rampal Gali Working 8.8 23.0 4380 38756
15 Vrindavan Gate Working 11.1 26.0 5840 64882
16 Theknarnol Working 12.4 21.4 5110 63415
17 Dwarkeshpuri Working 12.2 15.3 1460 17793
18 Unth Gali Working 9.5 10.4 5840 55538
19 Naya Nagla Gali No.8 Working 8.7 11.5 2555 22101
20 Chah Kathoti Working 8.1 19.4 3285 26565
21 Agra Hotel Working 11.9 28.1 7300 86675
22 Dhruv Ghat Working 7.6 27.8 7300 55196
23 Maholi Ki Paur Working 8.9 25.7 4380 38963
24 Gaja Paysa Working 8.5 24.6 3650 31013
25 Radhika Vihar Working 9.5 24.7 2920 27867
26 Dholi Pyau Working 8.4 24.9 4380 36846

47
S. No Name of the Pump Operating Pattern
Measured power
consumption (kW)
Pumping quantity
(m3/ hour)
Estimated annual
operating hours (hour/
annum)
Estimated annual power
consumption (kWh/annum)
27 Thateran Gali Working 10.3 17.6 4380 45070
28 Tulsi Chabutra Working 6.5 23.3 3650 23579
29 Bairag puri Working 6.1 14.2 2920 17890
30 Bhargva Gali Working 11.1 39.2 6570 73027
31 Gandhi Park Pump-1 Working 8.0 25.0 2920 23456
32 Megha Gali Working 3.3 6.9 1460 4883
33 Bhadurpura Working 11.2 15.6 2920 32762
34 Chaganpura Working 7.7 24.1 1460 11291
35 Krishna Vihar NH-2 Working 8.5 11.0 2920 24917
36 Askunda Working 10.0 32.4 5475 54695
37 Mahavidya Face-2 Working 12.1 17.6 5840 70859
38 Dalpat Khidki Working 7.1 19.8 2920 20829
39 Gopalpura Working 12.8 18.2 2555 32593
40 Shanti Nagar Working 9.3 33.1 4015 37299
41 Laxmi Nagar-1 Working 6.9 29.4 6570 45289
42 Laxmi Nagar-2 Working 8.9 31.8 3650 32449
43 Laxmi Nagar-4 Working 7.0 39.2 2920 20352
44 Naya Nagla, Koyla Gali Working 7.0 20.9 3650 25667
45 Maholi Yojna-1 Working 8.8 27.0 2920 25550
46 Maholi Yojna-3 Working 10.0 36.9 2920 29103
47 Sheetla Ghati Working 6.0 14.1 5110 30830
48 Manas Nagar Working 6.2 23.5 4015 24948
49 Ratan Kund Working 5.5 11.9 5110 28139
50 Gau Ghat Working 7.7 23.3 4015 30768
51 Arjunpura Working 9.5 12.3 1825 17350
52 Officer Colony Working 9.1 19.1 4380 40070
53 Badpura Colony Working 9.0 33.3 5475 49147
54 Narayan Puri Working 12.0 29.0 7300 87843
55 Jhigurpura Working 7.9 15.8 4380 34777
56 Raigarpura Working 9.1 33.0 4380 40004
57 Gupta Kunj Working 7.6 17.9 2920 22314
58 Radha Nagar Working 9.0 20.1 4745 42863
59 Manoharpura Working 8.1 14.2 1825 14752
60 Krishna Nagar Working 8.6 18.0 2920 25135
61 Heja Hospital Working 8.3 16.8 2190 18082
62 Laxmi Nagar Working 9.5 19.9 4380 41614
63 Maholi Yojna-2 Working 9.7 28.6 2920 28207

48
S. No Name of the Pump Operating Pattern
Measured power
consumption (kW)
Pumping quantity
(m3/ hour)
Estimated annual
operating hours (hour/
annum)
Estimated annual power
consumption (kWh/annum)
64 Antapada Working 9.5 26.4 4380 41698
65 Rani Mandi Working 11.7 17.7 2920 34261
66 Kutta Paysa Working 9.7 19.9 3650 35466
67 Gali Ravaliya Working 6.3 20.1 3650 23092
68 Gali Rajkumar Working 12.6 29.4 4380 55130
69 Gandhi Park-2 Working 8.9 17.9 4380 38821
70 Arjunpura-2 Working 8.6 15.4 2190 18878
71 Theknarnol-2 Working 8.8 25.5 4380 38427
72 Madhav Puri Working 8.1 21.6 4015 32366
73 Dholi Pyau Tiraha-New Construction Working 11.9 20.1 7300 87113
74 Ahilyabai Park Dampier Nagar MVDA Working 9.9 24.7 4380 43570
75 Ramlila Ground Krishna Nagar MVDA Working 9.9 18.6 2190 21608
76 Kankali Temple Dwarikapuri MVDA Working 7.6 18.7 4015 30403
77 Machli Mandi Bharatpur Gate Working 8.8 30.6 4380 38602
78 Nai Basti W.No. Working 10.6 27.9 2920 30835
79 Andi Kuiya Working 10.6 31.2 5475 58181
80 Kathoti Kua Chaupal Working 9.4 18.5 3650 34188
81 Kathoti Kua Masjid Working 12.9 18.6 1825 23470
82 Gupta Kunk WNo.7 Working 7.3 22.6 3285 23976
83 Sadar Dhobi Pada W.No8 Working 10.3 39.2 5110 52429
84 Gandhi Nagar W.No. 9 Working 8.2 16.7 2190 18031
85 Laxmi Nagar W.No. 9 Working 9.6 17.2 5110 48869
86 Bains Bhora Kotwali W.No.14 Working 9.1 27.6 2920 26437
87 Radhey Shyam Ashram W.No.16 Working 11.9 17.5 5840 69710
88 Om Nagar W.No.17 Working 9.2 21.6 4380 40426
89 Om Nagar-2 W.No.17 Working 8.5 17.1 6570 55714
90 Antapara behind Gurudwara W.No.18 Working 7.8 35.0 2190 17065
91 Jogi Gali Antapada W.No.18 Working 8.5 23.1 2190 18699
92 Khateek Mohalla Balmiki Basti W.No.19 Working 9.1 20.1 5110 46369
93 Guru Nanak Nagar W.No.19 Working 8.0 9.5 2007.5 16060
94 Krishnapuram-1 Ward-24 Working 10.7 28.4 1460 15648
95 Krishnapuram-2 Ward-24 Working 10.2 29.3 1460 14879
96 Balmiki Basti Dholi Ward-27 Working 9.0 13.4 4745 42863
97 Mahavidya Park Ward-28 Working 6.5 21.8 4380 28676
98 Hanuman Teela Ward-33 Working 7.5 17.9 1460 10909
99 Kashmiri Gali Ward-34 Working 7.0 18.3 3650 25428
100 Mission Teela Sadar Bazar Ward-35 Working 10.9 29.3 5110 55495

49
S. No Name of the Pump Operating Pattern
Measured power
consumption (kW)
Pumping quantity
(m3/ hour)
Estimated annual
operating hours (hour/
annum)
Estimated annual power
consumption (kWh/annum)
101 Matia Gate Ward-37 Working 9.0 22.8 5110 45915
102 Subhash Nagar Nala Ward-38 Working 11.4 18.2 2920 33385
103 Manshapuri Ward-39 Working 9.4 15.3 2920 27583
104 Rampal Gali Ward-40 Working 6.9 24.4 3285 22557
105 Theknarnol Ward-40 Working 7.5 21.8 5110 38146
106 Lala Ganj Ward-42 Working 7.8 17.0 2920 22763
107 Kashiram Yojna-3 Working 7.0 14.7 3650 25550
108 Kashiram Yojna-4 Working 11.3 20.6 3650 41245
109 Satrangi Garden Ward-8 Working 6.9 31.8 5475 37978
110 Ambedkar Pratima Ward-10 Working 9.1 35.7 2190 19912
111 Naya Nagla Ward-11 Working 7.9 22.5 4380 34435
112 Ambedkar Nagar Ward-12 Working 8.8 32.7 1825 15974
113 Mali Mohalla Sadar Ward-13 Working 10.8 24.2 3650 39483
114 Naya Bans Ward-15 Working 7.9 16.5 1825 14472
115 Machli Gate Ward-19 Working 7.6 10.7 1825 13809
116 Bhim Nagar S.B.I. Ward-27 Working 6.6 24.4 4380 28774
117 Motikunj Extension Working 8.6 27.4 4380 37722
118 Rani Mandi Balmiki Basti Ward-6 Working 9.6 24.5 3650 34990
119 Matia Gate Joshiyan Garden Working 9.1 25.3 4380 39954
120 Sanjay Nagar Nala Working 8.1 25.2 4380 35469
121 Balmiki Basti Ward-1 Working 9.4 18.2 4380 41085
Sub-Total (A) 1101 2746 476508 4397513
Sewage Water Pumping Stations
122 Masani Nala SPS Pump 1
Five Pumps, one pump is operating at a time on rotational basis
39.3 236.7 1460 57310
123 Masani Nala SPS Pump 2 45.9 262.1 1460 67018
124 Masani Nala SPS Pump 3 67.5 398.7 1460 98588
125 Masani Nala SPS Pump 4 45.3 215.2 1460 66165
126 Masani Nala SPS Pump 5 68.6 389.0 1460 100111
127 Krishna Ganga SPS Pump 2 Three Pumps, 2W + 1 NW, pump operated on rotational basis
10.4 52.3 1460 19037
128 Krishna Ganga SPS Pump 3 10.4 54.3 1460 19037
129 Chinta Haran SPS Pump 1 Three Pumps, 2W + 1 NW, pump operated on rotational basis
13.0 66.4 1095 14288
130 Chinta Haran SPS Pump 3 13.8 66.1 1095 15082
131 Swami Ghat SPS Pump 1 Three Pumps, 2W + 1 NW, pump operated on rotational basis
12.5 122.8 3650 45713
132 Swami Ghat SPS Pump 2 12.4 119.5 3650 45285
133 Cantt. Nala SPS Pump 1 Five Pumps, 1W + 4NW 23.9 39.9 4380 104726

50
S. No Name of the Pump Operating Pattern
Measured power
consumption (kW)
Pumping quantity
(m3/ hour)
Estimated annual
operating hours (hour/
annum)
Estimated annual power
consumption (kWh/annum)
134 Dairy Farm SPS Pump 1
Six Pumps, 5W + 1 NW, one pump is operating at a tome on rotational basis
80.4 293.7 1460 117373
135 Dairy Farm SPS Pump 2 36.4 110.3 1460 53211
136 Dairy Farm SPS Pump 3 78.2 302.9 1460 114169
137 Dairy Farm SPS Pump 4 36.1 111.2 1460 52708
138 Dairy Farm SPS Pump 5 76.2 312.3 1460 111252
139 Vrindavan Gate SPS Pump 1 Three Pumps, 2W + 1 NW, pump operated on rotational basis
9.1 55.1 1825 16632
140 Vrindavan Gate SPS Pump 2 9.0 51.8 1825 16368
141 Bangali Ghat SPS Pump 1 Five Pumps, 2W + 3 NW, pump operated on rotational basis
41.3 212.9 1825 75304
142 Bangali Ghat SPS Pump 5 44.0 236.8 1825 80243
Sub-Total (B) 774 3710 38690 1289619
Net Total 1875 6456 515198 5687132

51
4.2.9 Auxiliaries in Pumping Stations
During the energy audit, auxiliary electrical load of pumping station were also studied and details of same is
provided in table 14.
Table 14 Details of Auxiliary Load of pumping station
Pumps Name
Bulb (100W)
Bulb
(60W)
LED (9W)
LED (50W)
LED (40W)
FTL (40W)
Fan (70W)
Cooler fan (120W)
Exhaust Fan (150W
)
Exhaust Fan (250W
)
Table
Fan (35W)
HPSV
(250)
HPSV
(150)
Cantt. Nala SPS
1 1 1 1 1
Dairy Farm SPS
1 1 2 2 1 3 2
Vrindavan Gate SPS
1 1 1 1 1
Bengali Ghat SPS
3 2
Masani Nala SPS
1 1 2 1 1
Swami Ghat SPS
1 1 1 1 1 1
Krishna Ganga SPS
1 2 1
Chinta Haran SPS
1 1 1
Total Nos.
7 5 7 5 1 3 2 1 4 2 3 4 2
Total Connected Load (A)
0.7 0.3 0.06
0.25 0.04 0.12 0.14 0.12 0.6 0.5 0.10
5 1 0.3
Auxiliary Load for Water Supply Pumps (kW) (B) 4
Total Connected Load (kW) (A+B) 8

52
5 Baseline Assessment
Estimation of baseline is the key element in design and development of any energy efficiency project. It play
an important role in determining the savings associated with the implementation of energy efficiency
measure (EEM) and determining the techno-financial feasibility of the EEM. In case of Municipal Energy
Efficiency Programme (MEEP), the baseline is affected by many parameters including the changes in the
system due to addition of command area, seasonal variations, increase in population which affect the
required flow (Q) and the head (H).
Measurement and Verification (M&V) is the term given to the process for quantifying savings delivered by
an Energy Efficiency Measure (EEM). It includes energy saving verification process involving
measurements and reporting methodology. M & V methodology followed in this project includes following
measurement schedule
a. Measurement of parameters pre EEM implementation (just before installation of EEPS) for all
operating combinations using portable instruments
b. Measurement of parameters post EEM implementation for all operating combinations using
portable instruments.
Energy savings are calculated as the difference in power drawn (in pre and post implementation scenario)
multiplied by the operating hours mentioned in this report.
Baseline of this project will be estimated based on pre EEM implementation measurements, conducted just
before installation of new EEPS at pumping station
5.1 Definition of possible and operating combinations
In ULBs, especially in case of pumping stations, where the pumps are connected in parallel, the pump
operated in various combinations. For the purpose of this document, these combinations are defined as
possible combinations. For example, for if 3 pumps are connected in parallel, there are 7 possible
combinations considering three different pumps i.e.
Pump 1 Pump 1+ Pump 2
Pump 2 Pump 2+ Pump 3 Pump 1+Pump 2+Pump 3
Pump 3 Pump 3 +Pump 1
However, the ULB might be operating the pumps only in three combination, depending on the flow
requirement, from the one discussed above. For the purpose of this document, these combinations are
defined as operating combinations.
Operating Combination 1 Operating Combination 2 Operating Combination 3
Pump 1 Pump 1+ Pump 2 Pump 1+Pump 2+Pump 3
5.2 Key measurements for determining baseline or pre implementation
level
To determine baseline, the following parameters would be measured during pre-implementation period
(just before installation of new energy efficient pumps) for each operating combination.
i. Power Consumption, voltage, frequency (kW, Volt, hz)

53
Data Unit kW, Volt, hz
Description Voltage, frequency and power consumption of all operating
combinations at site (pre and post implementation)
Source of Data On site measurement using calibrated portable instrument (power
analyzer)
Description of measurement
methods and procedures to
be applied
Instantaneous onsite measurement using portable power analyzer
QA/QC procedures to be
applied
Calibrated instrument from a NABL accredited laboratory
ii. Flow rate (m3/hr)
Data Unit m
3
/hr.
Description Flow rate delivered for all operating combinations at site (pre and post implementation)
Source of Data On site measurement using calibrated portable instruments (flow meter)
Description of measurement
methods and procedures to
be applied
Instantaneous onsite measurement using portable flow meter
QA/QC procedures to be
applied
Calibrated instrument from a NABL accredited laboratory
iii. Head (m)
Data Unit meters (m)
Description Average head delivered for all operating combinations at site (pre and post implementation)
Source of Data On site measurement using calibrated instruments
Description of measurement
methods and procedures to
be applied
Instantaneous onsite measurement using pressure gauge installed at both the suction and discharge side of the pump
QA/QC procedures to be
applied
Calibrated instrument from a NABL accredited laboratory
54
5.3 Baseline
The baselines energy consumption measurement for existing water pumping station will be established using
pre implementation (just before installation of new pumps) measurements on existing pumps. Most of the
electric parameters would be measured instantaneously using portable instruments, while operating hours
would be provided by this report.
The baseline would be:
𝐵𝑎𝑠𝑒𝑙𝑖𝑛𝑒 𝐸𝑛𝑒𝑟𝑔𝑦 𝐶𝑜𝑛𝑠𝑢𝑚𝑝𝑡𝑖𝑜𝑛 𝑜𝑓 𝑎 𝑝𝑢𝑚𝑝 (𝑘𝑊ℎ)
= 𝑘𝑊1 × ℎ𝑜𝑢𝑟𝑠 𝑜𝑓 𝑜𝑝𝑒𝑟𝑎𝑡𝑖𝑜𝑛1 + 𝑘𝑊2 × ℎ𝑜𝑢𝑟𝑠 𝑜𝑓 𝑜𝑝𝑒𝑟𝑎𝑡𝑖𝑜𝑛2 + ⋯.
Where, 1, 2…. represent operating combination of pump
𝐵𝑎𝑠𝑒𝑙𝑖𝑛𝑒 𝐸𝑛𝑒𝑟𝑔𝑦 𝐶𝑜𝑛𝑠𝑢𝑚𝑝𝑡𝑖𝑜𝑛 𝑜𝑓 𝑎 𝑈𝐿𝐵 (𝑘𝑊ℎ) = 𝐵𝑎𝑠𝑒𝑙𝑖𝑛𝑒 𝑜𝑓 𝑝𝑢𝑚𝑝1 + 𝐵𝑎𝑠𝑒𝑙𝑖𝑛𝑒 𝑜𝑓 𝑝𝑢𝑚𝑝2 + ⋯.
Where 1, 2 … represent baseline energy consumption of pumps of ULB
Baseline of this project will be estimated based on pre-implementation measurements, conducted just before
installation of new EEPS at pumping station. Table 15 provides estimated present energy consumption of
pumps operating at Mathura pumping station based on data provided in this report.

55
Table 15: Estimated Energy Consumption for Water Pumping Station
S. No Pump Name
Measured Power Consumption
Flow Rate Frequency Head Voltage Hours
Baseline Baseline Energy
Consumption
kW m3/hr. Hz m V Hours kWh
Water Supply Pumps
1 Bhuteshwar Campus TW No.2 8.6 24.7 50 50 390.5 2920 25200
2 Bhuteshwar Campus TW No.5 11.5 28.2 50 56 357.9 730 8406
3 Bhuteshwar Campus TW No.7 8.9 27.1 50 50 381.8 3285 29094
4 Nagar Palika TW No.15 9.6 17.2 50 44 398.3 7300 70177
5 Bangali Ghat TW No.16 7.5 16.1 50 37 394.0 7300 54799
6 Police Line TW No.25 13.1 35.4 50 42 402.2 7300 95387
7 Bhuteshwar Campus TW No.27 9.6 10.2 50 61 380.0 2920 27935
8 District Jail TW No.29 12.8 33.0 50 30 413.0 5110 65459
9 Govind Nagar Sec. A 10.1 33.1 50 52 405.7 4015 40601
10 Kushak Gali-1 11.7 22.5 50 27 382.1 5110 59821
11 Shyam Ghat 6.1 8.9 50 48 390.4 5840 35819
12 Vishram Ghat 12.1 34.3 50 39 390.0 4380 53042
13 Chatta Bazar 12.5 36.4 50 46 449.4 5840 72766
14 Rampal Gali 8.8 23.0 50 53 399.2 4380 38756
15 Vrindavan Gate 11.1 26.0 50 46 380.3 5840 64882
16 Theknarnol 12.4 21.4 50 70 396.7 5110 63415
17 Dwarkeshpuri 12.2 15.3 50 59 398.1 1460 17793
18 Unth Gali 9.5 10.4 50 62 401.8 5840 55538
19 Naya Nagla Gali No.8 8.7 11.5 50 39 380.5 2555 22101
20 Chah Kathoti 8.1 19.4 50 46 421.6 3285 26565
21 Agra Hotel 11.9 28.1 50 46 391.8 7300 86675
22 Dhruv Ghat 7.6 27.8 50 36 389.2 7300 55196
23 Maholi Ki Paur 8.9 25.7 50 58 366.2 4380 38963

56
S. No Pump Name
Measured Power Consumption
Flow Rate Frequency Head Voltage Hours
Baseline Baseline Energy
Consumption
kW m3/hr. Hz m V Hours kWh
24 Radhika Vihar 9.5 24.7 50 52 375.0 2920 27867
25 Dholi Pyau 8.4 24.9 50 50 401.6 4380 36846
26 Thateran Gali 10.3 17.6 50 49 361.5 4380 45070
27 Bairag puri 6.1 14.2 50 35 391.0 2920 17890
28 Bhargva Gali 11.1 39.2 50 55 388.1 6570 73027
29 Gandhi Park Pump-1 8.0 25.0 50 47 390.0 2920 23456
30 Megha Gali 3.3 6.9 50 48 368.3 1460 4883
31 Bhadurpura 11.2 15.6 50 45 389.0 2920 32762
32 Chaganpura 7.7 24.1 50 47 389.0 1460 11291
33 Krishna Vihar NH-2 8.5 11.0 50 51 414.3 2920 24917
34 Askunda 10.0 32.4 50 45 401.4 5475 54695
35 Mahavidya Face-2 12.1 17.6 50 59 408.9 5840 70859
36 Dalpat Khidki 7.1 19.8 50 53 389.4 2920 20829
37 Gopalpura 12.8 18.2 50 59 418.7 2555 32593
38 Laxmi Nagar-1 6.9 29.4 50 23 415.6 6570 45289
39 Laxmi Nagar-2 8.9 31.8 50 42 412.6 3650 32449
40 Laxmi Nagar-4 7.0 39.2 50 26.5 412.9 2920 20352
41 Naya Nagla, Koyla Gali 7.0 20.9 50 47 411.4 3650 25667
42 Maholi Yojna-1 8.8 27.0 50 46 404.4 2920 25550
43 Maholi Yojna-3 10.0 36.9 50 49 428.6 2920 29103
44 Sheetla Ghati 6.0 14.1 50 70 395.0 5110 30830
45 Manas Nagar 6.2 23.5 50 47 334.9 4015 24948
46 Ratan Kund 5.5 11.9 50 59 371.5 5110 28139
47 Gau Ghat 7.7 23.3 50 39 395.3 4015 30768
48 Arjunpura 9.5 12.3 50 61 381.8 1825 17350
49 Officer Colony 9.1 19.1 50 23 395.2 4380 40070

57
S. No Pump Name
Measured Power Consumption
Flow Rate Frequency Head Voltage Hours
Baseline Baseline Energy
Consumption
kW m3/hr. Hz m V Hours kWh
50 Badpura Colony 9.0 33.3 50 39 398.9 5475 49147
51 Narayan Puri 12.0 29.0 50 46 396.9 7300 87843
52 Jhigurpura 7.9 15.8 50 49 400.4 4380 34777
53 Raigarpura 9.1 33.0 50 43 392.9 4380 40004
54 Gupta Kunj 7.6 17.9 50 49 384.8 2920 22314
55 Radha Nagar 9.0 20.1 50 46 380.5 4745 42863
56 Manoharpura 8.1 14.2 50 78 381.5 1825 14752
57 Krishna Nagar 8.6 18.0 50 52 392.3 2920 25135
58 Heja Hospital 8.3 16.8 50 61 407.6 2190 18082
59 Laxmi Nagar 9.5 19.9 50 25 434.8 4380 41614
60 Maholi Yojna-2 9.7 28.6 50 50 387.4 2920 28207
61 Antapada 9.5 26.4 50 37 408.2 4380 41698
62 Rani Mandi 11.7 17.7 50 44 433.4 2920 34261
63 Kutta Paysa 9.7 19.9 50 54 382.0 3650 35466
64 Gali Ravaliya 6.3 20.1 50 51 368.2 3650 23092
65 Gali Rajkumar 12.6 29.4 50 63 417.4 4380 55130
66 Gandhi Park-2 8.9 17.9 50 42 408.4 4380 38821
67 Arjunpura-2 8.6 15.4 50 55 339.0 2190 18878
68 Theknarnol-2 8.8 25.5 50 60 406.9 4380 38427
69 Madhav Puri 8.1 21.6 50 51 411.6 4015 32366
70 Dholi Pyau Tiraha-New Construction 11.9 20.1 50 54 404.3 7300 87113
71 Ahilyabai Park Dampier Nagar MVDA 9.9 24.7 50 43 408.8 4380 43570
72 Ramlila Ground Krishna Nagar MVDA 9.9 18.6 50 41 365.1 2190 21608
73 Kankali Temple Dwarikapuri MVDA 7.6 18.7 50 50 397.8 4015 30403
74 Nai Basti W.No. 10.6 27.9 50 50 399.3 2920 30835
75 Andi Kuiya 10.6 31.2 50 54 412.2 5475 58181

58
S. No Pump Name
Measured Power Consumption
Flow Rate Frequency Head Voltage Hours
Baseline Baseline Energy
Consumption
kW m3/hr. Hz m V Hours kWh
76 Kathoti Kua Chaupal 9.4 18.5 50 50 399.0 3650 34188
77 Kathoti Kua Masjid 12.9 18.6 50 56 385.2 1825 23470
78 Gupta Kunk WNo.7 7.3 22.6 50 49 428.5 3285 23976
79 Sadar Dhobi Pada W.No8 10.3 39.2 50 25 387.1 5110 52429
80 Gandhi Nagar W.No. 9 8.2 16.7 50 45 334.2 2190 18031
81 Laxmi Nagar W.No. 9 9.6 17.2 50 50 400.6 5110 48869
82 Bains Bhora Kotwali W.No.14 9.1 27.6 50 53 407.1 2920 26437
83 Radhey Shyam Ashram W.No.16 11.9 17.5 50 42 398.2 5840 69710
84 Om Nagar W.No.17 9.2 21.6 50 45 418.2 4380 40426
85 Om Nagar-2 W.No.17 8.5 17.1 50 50 418.1 6570 55714
86 Jogi Gali Antapada W.No.18 8.5 23.1 50 44 382.7 2190 18699
87 Khateek Mohalla Balmiki Basti W.No.19 9.1 20.1 50 53 381.8 5110 46369
88 Guru Nanak Nagar W.No.19 8.0 9.5 50 46 395.8 2007.5 16060
89 Krishnapuram-1 Ward-24 10.7 28.4 50 39 405.2 1460 15648
90 Krishnapuram-2 Ward-24 10.2 29.3 50 43 387.4 1460 14879
91 Balmiki Basti Dholi Pyau Ward-27 9.0 13.4 50 50 382.4 4745 42863
92 Mahavidya Park Ward-28 6.5 21.8 50 54 397.0 4380 28676
93 Hanuman Teela Ward-33 7.5 17.9 50 54 370.5 1460 10909
94 Kashmiri Gali Ward-34 7.0 18.3 50 37 373.9 3650 25428
95 Mission Teela Sadar Bazar Ward-35 10.9 29.3 50 38 440.9 5110 55495
96 Matia Gate Ward-37 9.0 22.8 50 64 423.1 5110 45915
97 Subhash Nagar Nala Ward-38 11.4 18.2 50 49 398.0 2920 33385
98 Manshapuri Ward-39 9.4 15.3 50 47 432.8 2920 27583
99 Rampal Gali Ward-40 6.9 24.4 50 49 413.2 3285 22557
100 Theknarnol Ward-40 7.5 21.8 50 53 406.8 5110 38146
101 Lala Ganj Ward-42 7.8 17.0 50 62 379.5 2920 22763

59
S. No Pump Name
Measured Power Consumption
Flow Rate Frequency Head Voltage Hours
Baseline Baseline Energy
Consumption
kW m3/hr. Hz m V Hours kWh
102 Kashiram Yojna-3 7.0 14.7 50 48 382.3 3650 25550
103 Kashiram Yojna-4 11.3 20.6 50 53 403.2 3650 41245
104 Satrangi Garden Ward-8 6.9 31.8 50 21 399.7 5475 37978
105 Naya Nagla Ward-11 7.9 22.5 50 44 419.4 4380 34435
106 Mali Mohalla Sadar Ward-13 10.8 24.2 50 50 426.1 3650 39483
107 Naya Bans Ward-15 7.9 16.5 50 62 438.6 1825 14472
108 Machli Gate Ward-19 7.6 10.7 50 50 380.2 1825 13809
109 Motikunj Extension 8.6 27.4 50 47 382.4 4380 37722
110 Rani Mandi Balmiki Basti Ward-6 9.6 24.5 50 49 409.3 3650 34990
111 Matia Gate Joshiyan Garden 9.1 25.3 50 59 442.9 4380 39954
112 Sanjay Nagar Nala 8.1 25.2 50 48 409.0 4380 35469
113 Balmiki Basti Ward-1 9.4 18.2 50 52 413.0 4380 41085
Sewage Water Pumping Stations
114 Masani Nala SPS Pump 1 39.3 236.7 50 25 410.4 1460 57310
115 Masani Nala SPS Pump 2 45.9 262.1 50 31 407.8 1460 67018
116 Masani Nala SPS Pump 3 67.5 398.7 50 27 412.8 1460 98588
117 Masani Nala SPS Pump 4 45.3 215.2 50 33 414.3 1460 66165
118 Masani Nala SPS Pump 5 68.6 389.0 50 26 420.3 1460 100111
119 Krishna Ganga SPS Pump 2 10.4 52.3 50 22 431.5 1460 19037
120 Chinta Haran SPS Pump 1 13.0 66.4 50 25 423.1 1095 14288
121 Chinta Haran SPS Pump 3 13.8 66.1 50 24 413.1 1095 15082
122 Swami Ghat SPS Pump 1 12.5 122.8 50 12 433.9 3650 45713
123 Swami Ghat SPS Pump 2 12.4 119.5 50 11 436.3 3650 45285
124 Cantt. Nala SPS Pump 1 23.9 39.9 50 25 382.6 4380 104726
125 Dairy Farm SPS Pump 1 80.4 293.7 50 26 434.0 1460 117373
126 Dairy Farm SPS Pump 2 36.4 110.3 50 18 409.8 1460 53211

60
S. No Pump Name
Measured Power Consumption
Flow Rate Frequency Head Voltage Hours
Baseline Baseline Energy
Consumption
kW m3/hr. Hz m V Hours kWh
127 Dairy Farm SPS Pump 3 78.2 302.9 50 26 411.1 1460 114169
128 Dairy Farm SPS Pump 4 36.1 111.2 50 19 414.7 1460 52708
129 Dairy Farm SPS Pump 5 76.2 312.3 50 25 441.5 1460 111252
130 Bangali Ghat SPS Pump 1 41.3 212.9 50 20 418.4 1825 75304
131 Bangali Ghat SPS Pump 5 44.0 236.8 50 22 424.9 1825 80243
Total 1780.7 6055.6 5422877

61
6 Energy Efficiency Measures
6.1 Summary of Energy Efficiency Measures
A summary of the proposed energy efficiency measures for water pumping stations and sewage pumping stations are provided in Table 16.
Table 16: Summary of energy efficiency measures for Mathura Water and Sewage pumping stations
SI. No Energy Efficiency Measures (EEM) Replacement of Pump with Energy Efficienct Pump
Present Annual Energy Consumption (kWh/year)
Annual Energy Savings
(kWh/year)
Investment Cost (Rs. Lakhs)
Energy Cost Saving per annum (Rs.
Lakhs)
Payback Period
(Months)
Percentage of Energy Saving
(%)
Water Supply Pumps
1 Bhuteshwar Campus TW No.2 25200 7344 1.3 0.6 27 29.14%
2 Bhuteshwar Campus TW No.5 8406 2896 1.5 0.2 77 34.45%
3 Bhuteshwar Campus TW No.7 29094 7095 1.3 0.6 28 24.39%
4 Nagar Palika TW No.15 70177 41177 1.2 3.3 4 58.68%
5 Bangali Ghat TW No.16 54799 31535 1.2 2.5 6 57.55%
6 Police Line TW No.25 95387 43502 1.5 3.5 5 45.61%
7 Bhuteshwar Campus TW No.27 27935 18214 1.2 1.4 10 65.20%
8 District Jail TW No.29 65459 40425 1.3 3.2 5 61.76%
9 Govind Nagar Sec. A 40601 7633 1.5 0.6 29 18.80%
10 Kushak Gali-1 59821 43230 1.2 3.4 4 72.27%
11 Shyam Ghat 35819 22276 1.1 1.8 8 62.19%
12 Vishram Ghat 53042 25048 1.5 2.0 9 47.22%
13 Chatta Bazar 72766 26034 1.5 2.1 9 35.78%
14 Rampal Gali 38756 12354 1.3 1.0 16 31.88%
15 Vrindavan Gate 64882 30351 1.3 2.4 7 46.78%
16 Theknarnol 63415 26825 1.5 2.1 8 42.30%

62
SI. No Energy Efficiency Measures (EEM) Replacement of Pump with Energy Efficienct Pump
Present Annual Energy Consumption (kWh/year)
Annual Energy Savings
(kWh/year)
Investment Cost (Rs. Lakhs)
Energy Cost Saving per annum (Rs.
Lakhs)
Payback Period
(Months)
Percentage of Energy Saving
(%)
17 Dwarkeshpuri 17793 10877 1.2 0.9 17 61.13%
18 Unth Gali 55538 35469 1.2 2.8 5 63.86%
19 Naya Nagla Gali No.8 22101 15887 1.1 1.3 11 71.88%
20 Chah Kathoti 26565 11212 1.2 0.9 16 42.21%
21 Agra Hotel 86675 40003 1.4 3.2 5 46.15%
22 Dhruv Ghat 55196 19022 1.3 1.5 11 34.46%
23 Maholi Ki Paur 38963 7721 1.5 0.6 29 19.82%
24 Radhika Vihar 27867 9311 1.3 0.7 21 33.41%
25 Dholi Pyau 36846 9877 1.3 0.8 20 26.81%
26 Thateran Gali 45070 25310 1.2 2.0 7 56.16%
27 Bairag puri 17890 9997 1.1 0.8 17 55.88%
28 Bhargva Gali 73027 7645 1.6 0.6 31 10.47%
29 Gandhi Park Pump-1 23456 6481 1.3 0.5 31 27.63%
30 Megha Gali 4883 2238 1.1 0.2 75 45.83%
31 Bhadurpura 32762 21852 1.2 1.7 8 66.70%
32 Chaganpura 11291 3106 1.3 0.2 64 27.51%
33 Krishna Vihar NH-2 24917 15979 1.1 1.3 10 64.13%
34 Askunda 54695 16510 1.5 1.3 13 30.18%
35 Mahavidya Face-2 70859 40883 1.3 3.3 5 57.70%
36 Dalpat Khidki 20829 5680 1.3 0.5 35 27.27%
37 Gopalpura 32593 19016 1.3 1.5 11 58.34%
38 Laxmi Nagar-1 45289 21550 1.2 1.7 8 47.58%
39 Laxmi Nagar-2 32449 8280 1.3 0.7 24 25.52%
40 Laxmi Nagar-4 20352 5322 1.3 0.4 38 26.15%
41 Naya Nagla, Koyla Gali 25667 7888 1.3 0.6 25 30.73%
42 Maholi Yojna-1 25550 7573 1.3 0.6 26 29.64%

63
SI. No Energy Efficiency Measures (EEM) Replacement of Pump with Energy Efficienct Pump
Present Annual Energy Consumption (kWh/year)
Annual Energy Savings
(kWh/year)
Investment Cost (Rs. Lakhs)
Energy Cost Saving per annum (Rs.
Lakhs)
Payback Period
(Months)
Percentage of Energy Saving
(%)
43 Maholi Yojna-3 29103 4313 1.6 0.3 55 14.82%
44 Sheetla Ghati 30830 5928 1.3 0.5 34 19.23%
45 Manas Nagar 24948 2981 1.3 0.2 67 11.95%
46 Ratan Kund 28139 8981 1.2 0.7 19 31.92%
47 Gau Ghat 30768 11694 1.2 0.9 16 38.01%
48 Arjunpura 17350 10167 1.2 0.8 18 58.60%
49 Officer Colony 40070 29978 1.2 2.4 6 74.81%
50 Badpura Colony 49147 13940 1.3 1.1 14 28.36%
51 Narayan Puri 87843 39575 1.4 3.1 5 45.05%
52 Jhigurpura 34777 17051 1.2 1.4 11 49.03%
53 Raigarpura 40004 10327 1.5 0.8 22 25.82%
54 Gupta Kunj 22314 8923 1.2 0.7 20 39.99%
55 Radha Nagar 42863 19887 1.2 1.6 9 46.40%
56 Manoharpura 14752 4750 1.3 0.4 42 32.20%
57 Krishna Nagar 25135 10845 1.2 0.9 17 43.15%
58 Heja Hospital 18082 6996 1.3 0.6 29 38.69%
59 Laxmi Nagar 41614 29763 1.1 2.4 6 71.52%
60 Maholi Yojna-2 28207 8257 1.5 0.7 27 29.27%
61 Antapada 41698 20489 1.3 1.6 10 49.14%
62 Rani Mandi 34261 22365 1.2 1.8 8 65.28%
63 Kutta Paysa 35466 16015 1.3 1.3 12 45.16%
64 Gali Ravaliya 23092 4584 1.3 0.4 44 19.85%
65 Gali Rajkumar 55130 17025 1.6 1.4 14 30.88%
66 Gandhi Park-2 38821 21624 1.2 1.7 8 55.70%
67 Arjunpura-2 18878 9151 1.2 0.7 20 48.47%
68 Theknarnol-2 38427 6397 1.5 0.5 35 16.65%

64
SI. No Energy Efficiency Measures (EEM) Replacement of Pump with Energy Efficienct Pump
Present Annual Energy Consumption (kWh/year)
Annual Energy Savings
(kWh/year)
Investment Cost (Rs. Lakhs)
Energy Cost Saving per annum (Rs.
Lakhs)
Payback Period
(Months)
Percentage of Energy Saving
(%)
69 Madhav Puri 32366 10496 1.3 0.8 19 32.43%
70 Dholi Pyau Tiraha-New Construction 87113 47803 1.4 3.8 4 54.87%
71 Ahilyabai Park Dampier Nagar MVDA 43570 20536 1.3 1.6 10 47.13%
72 Ramlila Ground Krishna Nagar MVDA 21608 12871 1.2 1.0 14 59.57%
73 Kankali Temple Dwarikapuri MVDA 30403 10774 1.2 0.9 17 35.44%
74 Nai Basti W.No. 30835 11401 1.5 0.9 20 36.98%
75 Andi Kuiya 58181 14053 1.5 1.1 16 24.15%
76 Kathoti Kua Chaupal 34188 16535 1.2 1.3 11 48.36%
77 Kathoti Kua Masjid 23470 14072 1.3 1.1 14 59.96%
78 Gupta Kunk WNo.7 23976 5964 1.3 0.5 34 24.87%
79 Sadar Dhobi Pada W.No8 52429 27664 1.3 2.2 7 52.77%
80 Gandhi Nagar W.No. 9 18031 9417 1.2 0.7 19 52.23%
81 Laxmi Nagar W.No. 9 48869 25813 1.2 2.1 7 52.82%
82 Bains Bhora Kotwali W.No.14 26437 6015 1.5 0.5 37 22.75%
83 Radhey Shyam Ashram W.No.16 69710 47243 1.2 3.8 4 67.77%
84 Om Nagar W.No.17 40426 19355 1.3 1.5 10 47.88%
85 Om Nagar-2 W.No.17 55714 26312 1.2 2.1 7 47.23%
86 Jogi Gali Antapada W.No.18 18699 7687 1.3 0.6 26 41.11%
87 Khateek Mohalla Balmiki Basti W.No.19 46369 19374 1.3 1.5 10 41.78%
88 Guru Nanak Nagar W.No.19 16060 11292 1.1 0.9 15 70.31%
89 Krishnapuram-1 Ward-24 15648 7633 1.3 0.6 26 48.78%
90 Krishnapuram-2 Ward-24 14879 5786 1.3 0.5 35 38.89%
91 Balmiki Basti Dholi Pyau Ward-27 42863 25950 1.2 2.1 7 60.54%
92 Mahavidya Park Ward-28 28676 3181 1.3 0.3 63 11.09%
93 Hanuman Teela Ward-33 10909 3933 1.3 0.3 51 36.05%
94 Kashmiri Gali Ward-34 25428 12210 1.2 1.0 14 48.02%

65
SI. No Energy Efficiency Measures (EEM) Replacement of Pump with Energy Efficienct Pump
Present Annual Energy Consumption (kWh/year)
Annual Energy Savings
(kWh/year)
Investment Cost (Rs. Lakhs)
Energy Cost Saving per annum (Rs.
Lakhs)
Payback Period
(Months)
Percentage of Energy Saving
(%)
95 Mission Teela Sadar Bazar Ward-35 55495 27314 1.3 2.2 7 49.22%
96 Matia Gate Ward-37 45915 10243 1.5 0.8 22 22.31%
97 Subhash Nagar Nala Ward-38 33385 19740 1.2 1.6 9 59.13%
98 Manshapuri Ward-39 27583 16393 1.2 1.3 11 59.43%
99 Rampal Gali Ward-40 22557 3134 1.3 0.2 64 13.89%
100 Theknarnol Ward-40 38146 8872 1.3 0.7 23 23.26%
101 Lala Ganj Ward-42 22763 7506 1.3 0.6 27 32.97%
102 Kashiram Yojna-3 25550 11844 1.2 0.9 15 46.36%
103 Kashiram Yojna-4 41245 21503 1.3 1.7 9 52.14%
104 Satrangi Garden Ward-8 37978 18430 1.2 1.5 9 48.53%
105 Naya Nagla Ward-11 34435 12993 1.3 1.0 15 37.73%
106 Mali Mohalla Sadar Ward-13 39483 17651 1.3 1.4 11 44.70%
107 Naya Bans Ward-15 14472 5234 1.3 0.4 38 36.16%
108 Machli Gate Ward-19 13809 8471 1.1 0.7 20 61.35%
109 Motikunj Extension 37722 9762 1.3 0.8 21 25.88%
110 Rani Mandi Balmiki Basti Ward-6 34990 13320 1.3 1.1 15 38.07%
111 Matia Gate Joshiyan Garden 39954 8668 1.5 0.7 26 21.69%
112 Sanjay Nagar Nala 35469 9267 1.3 0.7 22 26.13%
113 Balmiki Basti Ward-1 41085 19412 1.2 1.5 9 47.25%
Sub- Total (A) 4185294 1805761 147 144 12 43.15%
Sewage Pumping Station
114 Masani Nala SPS Pump 1 57310 20759 5.3 1.7 39 36.22%
115 Masani Nala SPS Pump 2 67018 14790 5.4 1.2 55 22.07%
116 Masani Nala SPS Pump 3 98588 25499 7.1 2.0 42 25.86%
117 Masani Nala SPS Pump 4 66165 21116 5.4 1.7 38 31.91%
118 Masani Nala SPS Pump 5 100111 40653 7.0 3.2 26 40.61%

66
SI. No Energy Efficiency Measures (EEM) Replacement of Pump with Energy Efficienct Pump
Present Annual Energy Consumption (kWh/year)
Annual Energy Savings
(kWh/year)
Investment Cost (Rs. Lakhs)
Energy Cost Saving per annum (Rs.
Lakhs)
Payback Period
(Months)
Percentage of Energy Saving
(%)
119 Krishna Ganga SPS Pump 2 19037 4582 2.2 0.4 73 24.07%
120 Chinta Haran SPS Pump 1 14288 4284 2.2 0.3 78 29.98%
121 Chinta Haran SPS Pump 3 15082 5200 2.2 0.4 64 34.47%
122 Swami Ghat SPS Pump 1 45713 21039 2.1 1.7 15 46.02%
123 Swami Ghat SPS Pump 2 45285 23374 2.1 1.9 14 51.62%
124 Cantt. Nala SPS Pump 1 104726 68629 2.7 5.5 6 65.53%
125 Dairy Farm SPS Pump 1 117373 67619 6.6 5.4 15 57.61%
126 Dairy Farm SPS Pump 2 53211 38931 3.6 3.1 14 73.16%
127 Dairy Farm SPS Pump 3 114169 64189 6.6 5.1 16 56.22%
128 Dairy Farm SPS Pump 4 52708 36281 3.4 2.9 14 68.83%
129 Dairy Farm SPS Pump 5 111252 61731 6.6 4.9 16 55.49%
130 Bangali Ghat SPS Pump 1 75304 41099 9.2 3.3 34 54.58%
131 Bangali Ghat SPS Pump 5 80243 38383 9.2 3.1 36 47.83%
Sub- Total (B) 1237583 598158 89 48 22 48.33%
Net Total (A+B) 5422877 2403919 236 191 15 44.33%

67
6.2 Detailed Energy Efficiency Measures
Opportunity of energy saving identified of Mathura Water and Sewage pumping stations are discussed
below:
6.2.1 EEM 1: Replacement of existing pump inefficient pump with energy efficient pump
Existing operating conditions: Main source of water for the city of Mathura is ground water. There are
1419 Nos. of pumps installed to cater the water needs of Mathura City. These 141 nos. of submersible pumps
are used to supply water directly to the users. Out of 141 Nos. of water supply pumps, 121 Nos. were in
operation during energy audit and 20 Nos. of pumps were under maintenance. Apart from water distribution
pump sets, 35 Nos. of pump sets are also installed in the sewage water pumping system to transfer the
sewage water to the sewage treatment plant. Out of 35 Nos. of pump, 21 Nos. of pumps were in operation
during energy audit and 14 Nos. of Pump sets were under maintenance.
Recommendations: The present operating pumps’ efficiencies for water supply pumps are in range of
15.4% to 62.1% and for sewage pumps is 13.8% to 58.4%. The efficiency of the pump is low mainly due to
pump operating far away from the Best Efficiency Point (BEP). Therefore, it is suggested to replace existing
pump with energy efficient pump to reduce the energy consumption.
Cost benefit analysis: Expected savings from replacement of pump is about 2,403,919 kWh per year, which
would result in a cost benefit of about Rs.191 Lakh per year. Estimated investment for implementation of
this measure is about Rs.236 Lakh, which basically includes cost of pump set, installation cost and cost of
Web based dashboard. Simple payback period is estimated to be about 15 months. Cost benefit analysis of
recommendation is provided in table 17.
9 As per LOA, there were 143 pumps (water), however in LOA list, there was repetition of two pump sets. Therefore, total pump at Mathura, in IGEA, is considered as 141.

68
Table 17: Cost Benefit Analysis
Parameters Unit Bhuteshwar
Campus TW No.2
Bhuteshwar Campus TW No.5
Bhuteshwar Campus TW No.7
Nagar Palika TW
No.15
Bangali Ghat TW
No.16
Police Line TW No.25
Bhuteshwar Campus
TW No.27
District Jail TW No.29
Govind Nagar Sec.
A
Kushak Gali-1
Rated Parameters
Pump Type Submersible Submersible Submersible Submersible Submersible Submersible Submersible Submersible Submersible Submersible
Rated Head m 65 65 65 65 65 65 65 65 65 65
Rated Flow m3/hr 36 - 30 - 24 36 36 24 36 30
Rated Power kW 9.325 9.325 9.325 9.325 9.325 9.325 9.325 9.325 9.325 9.325
Parameters Measured
Flow Delivered m3/hr 24.7 28.21 27.05 17.24 16.13 35.42 10.22 32.98 33.05 22.52
Head of the Pump m 50 56 50 44 37 42 61 30 52 27
Motor Power Consumption
kW 8.63 11.51 8.86 9.61 7.51 13.07 9.57 12.81 10.11 11.71
Calculated Efficiency of the Pump set
% 39.0% 37.4% 41.6% 21.5% 21.7% 31.0% 17.7% 21.0% 46.3% 14.1%
Proposed Pump
Head of the Pump M 50 56 50 44 37 42 61 30 52 27
Flow of the Pump m3/hr 24.7 28.21 27.05 17.24 16.13 35.42 10.22 32.98 33.05 22.52
Power of the motor on existing duty point
kW 6.12 7.55 6.70 3.97 3.19 7.11 3.33 4.90 8.21 3.25
Proposed efficiency of pump set on existing duty point
% 55% 57% 55% 52.0% 51% 57% 51% 55% 57% 51%
Operating Hours hours 2920 730 3285 7300 7300 7300 2920 5100 4015 5100
Annual energy saving kWh/annum 7344 2896 7095 41177 31535 43502 18214 40425 7633 43230
Electricity Rate Rs/kWh 7.95 7.95 7.95 7.95 7.95 7.95 7.95 7.95 7.95 7.95
Annual cost saving Rs in lakhs/annum
0.6 0.2 0.6 3.3 2.5 3.5 1.4 3.2 0.6 3.4
Investment towards new Pump set including GST
Rs in Lakhs 0.679 0.816 0.679 0.566 0.522 0.816 0.522 0.679 0.816 0.522
Investment towards NRV replacement including GST
Rs in Lakhs 0.215 0.215 0.215 0.215 0.215 0.215 0.215 0.215 0.215 0.215
Investment towards gate valve replacement including GST
Rs in Lakhs 0.299 0.299 0.299 0.299 0.299 0.299 0.299 0.299 0.299 0.299
Investment towards Web based dashboard including GST
Rs in Lakhs 0.077 0.077 0.077 0.077 0.077 0.077 0.077 0.077 0.077 0.077

69
Parameters Unit Bhuteshwar
Campus TW No.2
Bhuteshwar Campus TW No.5
Bhuteshwar Campus TW No.7
Nagar Palika TW
No.15
Bangali Ghat TW
No.16
Police Line TW No.25
Bhuteshwar Campus
TW No.27
District Jail TW No.29
Govind Nagar Sec.
A
Kushak Gali-1
Investment towards Installation & Commissioning including GST
Rs in Lakhs 0.057 0.069 0.057 0.048 0.044 0.069 0.044 0.057 0.069 0.044
Total Cost Rs in Lakhs 1.326 1.476 1.326 1.204 1.156 1.476 1.156 1.326 1.476 1.156
Payback Period months 27 77 28 4 6 5 10 5 29 4
Parameters Unit Shyam Ghat
Vishram Ghat
Chatta Bazar
Rampal Gali
Vrindavan Gate
Theknarnol Dwarkeshpur
i Unth Gali
Naya Nagla Gali No.8
Chah Kathoti
Rated Parameters
Pump Type Submersibl
e Submersibl
e Submersibl
e Submersibl
e Submersibl
e Submersibl
e Submersible
Submersible
Submersible
Submersible
Rated Head m 65 65 65 65 65 65 65 65 65 65
Rated Flow m3/hr 18 18 18 18 18 18 18 18 18 15
Rated Power kW 7.46 9.325 9.325 9.325 9.325 9.325 9.325 9.325 7.46 7.46
Parameters Measured
Flow Delivered m3/hr 8.87 34.3 36.41 22.97 25.96 21.41 15.33 10.38 11.45 19.4
Head of the Pump m 48 39 46 53 46 70 59 62 39 46
Motor Power Consumption
kW 6.133 12.11 12.46 8.85 11.11 12.41 12.19 9.51 8.65 8.09
Calculated Efficiency of the Pump set
% 18.9% 30.1% 36.6% 37.5% 29.3% 32.9% 20.2% 18.4% 14.1% 30.1%
Proposed Pump
Head of the Pump m 48 39 46 53 46 70 59 62 39 46
Flow of the Pump m3/hr 8.87 34.3 36.41 22.97 25.96 21.41 15.33 10.38 11.45 19.4
Power of the motor on existing duty point
kW 2.32 6.39 8.00 6.03 5.91 7.16 4.74 3.44 2.43 4.67
Overall Efficiency % 50% 57% 57% 55% 55% 57% 52% 51% 50% 52%
Operating Hours hours 5840 4380 5840 4380 5840 5110 1460 5840 2555 3285
Annual Present Energy Consumption
kWh/annum 35819 53042 72766 38756 64882 63415 17793 55538 22101 26565
Annual energy saving kWh/annum 22276 25048 26034 12354 30351 26825 10877 35469 15887 11212
Electricity Rate Rs/kWh 7.95 7.95 7.95 7.95 7.95 7.95 7.95 7.95 7.95 7.95
Annual cost saving Rs in lakhs/annum
1.8 2.0 2.1 1.0 2.4 2.1 0.9 2.8 1.3 0.9

70
Parameters Unit Shyam Ghat
Vishram Ghat
Chatta Bazar
Rampal Gali
Vrindavan Gate
Theknarnol Dwarkeshpur
i Unth Gali
Naya Nagla Gali No.8
Chah Kathoti
Investment towards new Pump set including GST
Rs in Lakhs 0.478 0.816 0.816 0.679 0.679 0.816 0.566 0.522 0.478 0.566
Investment towards NRV replacement including GST
Rs in Lakhs 0.215 0.215 0.215 0.215 0.215 0.215 0.215 0.215 0.215 0.215
Investment towards gate valve replacement including GST
Rs in Lakhs 0.299 0.299 0.299 0.299 0.299 0.299 0.299 0.299 0.299 0.299
Investment towards Web based dashboard including GST
Rs in Lakhs 0.077 0.077 0.077 0.077 0.077 0.077 0.077 0.077 0.077 0.077
Investment towards Installation & Commissioning including GST
Rs in Lakhs 0.040 0.069 0.069 0.057 0.057 0.069 0.048 0.044 0.040 0.048
Total Cost Rs in Lakhs 1.108 1.476 1.476 1.326 1.326 1.476 1.204 1.156 1.108 1.204
Payback Period months 8 9 9 16 7 8 17 5 11 16
Parameters Unit Agra Hotel Dhruv Ghat Maholi Ki
Paur
Radhika
Vihar Dholi Pyau Thateran Gali Bairag puri Bhargva Gali
Gandhi Park
Pump-1 Megha Gali
Rated Parameters
Pump Make Submersible Submersible Submersible Submersible Submersible Submersible Submersible Submersible Submersible Submersible
Rated Head m 65 65 65 65 65 65 65 65 65 65
Rated Flow m3/hr 18 24 24 24 24 21 24 18 18 15
Rated Power kW 9.325 9.325 9.325 9.325 9.325 9.325 9.325 9.325 7.46 4.476
Parameters Measured
Flow Delivered m3/hr 28.07 27.8 25.74 24.68 24.87 17.58 14.18 39.20 24.98 6.93
Head of the Pump m 46 36 58 52 50 49 35 55 47 48
Motor Power Consumption kW 11.87 7.56 8.90 9.54 8.41 10.29 6.13 11.12 8.03 3.34
Calculated Efficiency of the
Pump set % 29.6% 36.0% 45.7% 36.6% 40.3% 22.8% 22.1% 52.8% 39.8% 27.1%
Proposed Pump
Head of the Pump m 46 36 58 52 50 49 35 55 47 48
Flow of the Pump m3/hr 28.07 27.8 25.74 24.68 24.87 17.58 14.18 39.2 24.98 6.93

71
Parameters Unit Agra Hotel Dhruv Ghat Maholi Ki
Paur
Radhika
Vihar Dholi Pyau Thateran Gali Bairag puri Bhargva Gali
Gandhi Park
Pump-1 Megha Gali
Power of the motor on existing
duty point kW 6.39 4.96 7.13 6.35 6.16 4.51 2.70 9.95 5.81 1.81
Overall Efficiency % 55% 55% 57% 55% 55% 52% 50% 59% 55% 50%
Operating Hours hours 7300 7300 4380 2920 4380 4380 2920 6570 2920 1460
Annual energy saving kWh/annum 40003 19022 7721 9311 9877 25310 9997 7645 6481 2238
Electricity Rate Rs/kWh 7.95 7.95 7.95 7.95 7.95 7.95 7.95 7.95 7.95 7.95
Annual cost saving Rs in
lakhs/annum 3.2 1.5 0.6 0.7 0.8 2.0 0.8 0.6 0.5 0.2
Investment towards new Pump
set including GST Rs in Lakhs 0.679 0.679 0.816 0.679 0.679 0.566 0.478 0.920 0.679 0.478
Investment towards NRV
replacement including GST Rs in Lakhs 0.229 0.215 0.215 0.215 0.215 0.215 0.215 0.215 0.215 0.215
Investment towards gate valve
replacement including GST Rs in Lakhs 0.312 0.299 0.299 0.299 0.299 0.299 0.299 0.299 0.299 0.299
Investment towards Web
based dashboard including
GST
Rs in Lakhs 0.077 0.077 0.077 0.077 0.077 0.077 0.077 0.077 0.077 0.077
Investment towards Installation
& Commissioning including
GST
Rs in Lakhs 0.057 0.057 0.069 0.057 0.057 0.048 0.040 0.078 0.057 0.040
Total Cost Rs in Lakhs 1.354 1.326 1.476 1.326 1.326 1.204 1.108 1.588 1.326 1.108
Payback Period months 5 11 29 21 20 7 17 31 31 75
Parameters Unit Bhadurpur
a Chaganpur
a Krishna
Vihar NH-2 Askunda
Mahavidya Face-2
Dalpat Khidki
Gopalpura Laxmi
Nagar-1 Laxmi
Nagar-2 Laxmi
Nagar-4
Rated Parameters
Pump Make Submersible Submersible Submersibl
e Submersibl
e Submersibl
e Submersibl
e Submersibl
e Submersibl
e Submersibl
e Submersibl
e
Rated Head m 65 65 65 65 65 65 65 65 65 65
Rated Flow m3/hr 18 18 24 18 18 18 15 18 18 18
Rated Power kW 9.325 7.46 9.325 7.46 9.325 7.46 9.325 9.325 9.325 7.46
Parameters Measured
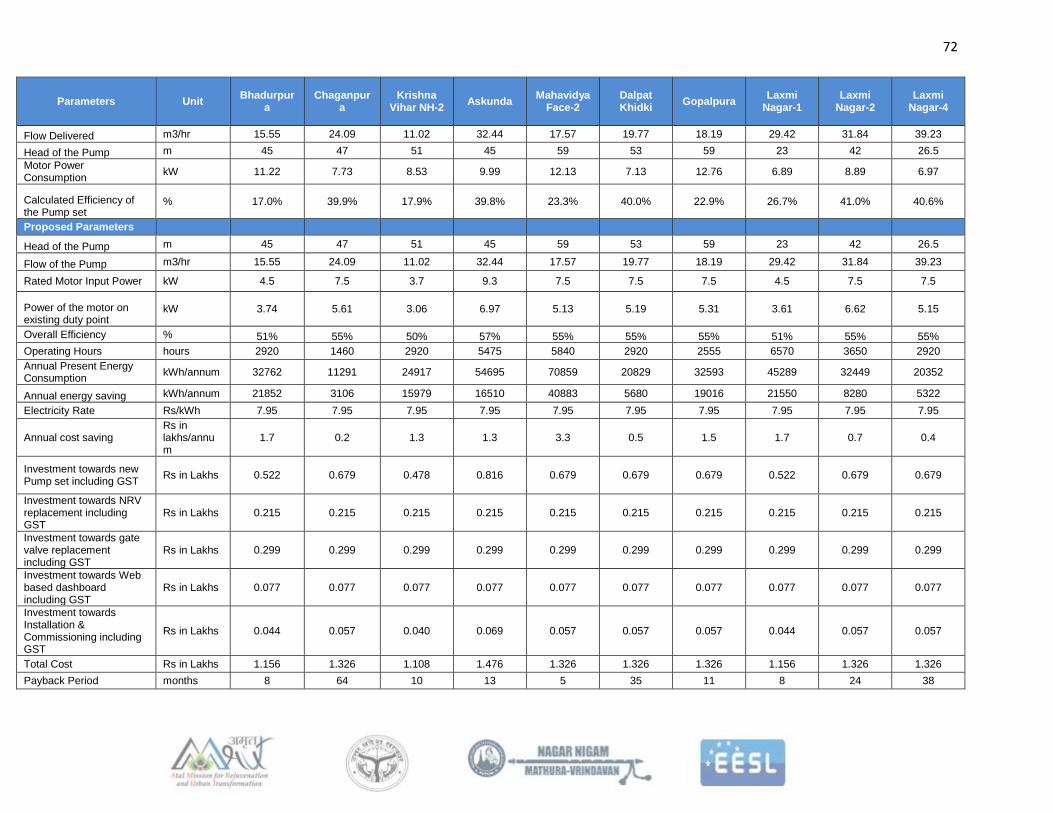
72
Parameters Unit Bhadurpur
a Chaganpur
a Krishna
Vihar NH-2 Askunda
Mahavidya Face-2
Dalpat Khidki
Gopalpura Laxmi
Nagar-1 Laxmi
Nagar-2 Laxmi
Nagar-4
Flow Delivered m3/hr 15.55 24.09 11.02 32.44 17.57 19.77 18.19 29.42 31.84 39.23
Head of the Pump m 45 47 51 45 59 53 59 23 42 26.5
Motor Power Consumption
kW 11.22 7.73 8.53 9.99 12.13 7.13 12.76 6.89 8.89 6.97
Calculated Efficiency of the Pump set
% 17.0% 39.9% 17.9% 39.8% 23.3% 40.0% 22.9% 26.7% 41.0% 40.6%
Proposed Parameters
Head of the Pump m 45 47 51 45 59 53 59 23 42 26.5
Flow of the Pump m3/hr 15.55 24.09 11.02 32.44 17.57 19.77 18.19 29.42 31.84 39.23
Rated Motor Input Power kW 4.5 7.5 3.7 9.3 7.5 7.5 7.5 4.5 7.5 7.5
Power of the motor on existing duty point
kW 3.74 5.61 3.06 6.97 5.13 5.19 5.31 3.61 6.62 5.15
Overall Efficiency % 51% 55% 50% 57% 55% 55% 55% 51% 55% 55%
Operating Hours hours 2920 1460 2920 5475 5840 2920 2555 6570 3650 2920
Annual Present Energy Consumption
kWh/annum 32762 11291 24917 54695 70859 20829 32593 45289 32449 20352
Annual energy saving kWh/annum 21852 3106 15979 16510 40883 5680 19016 21550 8280 5322
Electricity Rate Rs/kWh 7.95 7.95 7.95 7.95 7.95 7.95 7.95 7.95 7.95 7.95
Annual cost saving Rs in lakhs/annum
1.7 0.2 1.3 1.3 3.3 0.5 1.5 1.7 0.7 0.4
Investment towards new Pump set including GST
Rs in Lakhs 0.522 0.679 0.478 0.816 0.679 0.679 0.679 0.522 0.679 0.679
Investment towards NRV replacement including GST
Rs in Lakhs 0.215 0.215 0.215 0.215 0.215 0.215 0.215 0.215 0.215 0.215
Investment towards gate valve replacement including GST
Rs in Lakhs 0.299 0.299 0.299 0.299 0.299 0.299 0.299 0.299 0.299 0.299
Investment towards Web based dashboard including GST
Rs in Lakhs 0.077 0.077 0.077 0.077 0.077 0.077 0.077 0.077 0.077 0.077
Investment towards Installation & Commissioning including GST
Rs in Lakhs 0.044 0.057 0.040 0.069 0.057 0.057 0.057 0.044 0.057 0.057
Total Cost Rs in Lakhs 1.156 1.326 1.108 1.476 1.326 1.326 1.326 1.156 1.326 1.326
Payback Period months 8 64 10 13 5 35 11 8 24 38

73
Parameters Unit Naya Nagla, Koyla Gali
Maholi Yojna-1
Maholi Yojna-3
Sheetla Ghati
Manas Nagar
Ratan Kund Gau Ghat Arjunpura Officer Colony
Rated Parameters
Pump Make Submersible Submersible Submersible Submersible Submersible Submersible Submersible Submersible Submersible
Rated Head m 65 65 65 65 65 65 65 65 65
Rated Flow m3/hr 18 24 24 18 18 18 18 18 18
Rated Power kW 7.46 9.325 9.325 7.46 7.46 7.46 7.46 9.325 9.325
Parameters Measured
Flow Delivered m3/hr 20.93 27.03 36.9 14.06 23.51 11.9 23.26 12.32 19.13
Head of the Pump m 47 46 49 70 47 59 39 61 23
Motor Power Consumption kW 7.03 8.75 9.97 6.03 6.21 5.51 7.66 9.51 9.15
Calculated Efficiency of the Pump set
% 38.1% 38.7% 49.4% 44.4% 48.4% 34.7% 32.2% 21.5% 13.1%
Proposed Parameters
Head of the Pump m 47 46 49 70 47 59 39 61 23
Flow of the Pump m3/hr 20.93 27.03 36.9 14.06 23.51 11.9 23.26 12.32 19.13
Rated Motor Input Power kW 7.5 7.5 11.2 7.5 7.5 4.5 5.6 5.6 5.6
Power of the motor on existing duty point
kW 4.87 6.16 8.49 4.87 5.47 3.75 4.75 3.94 2.30
Overall Efficiency % 55% 55% 58% 55% 55% 51% 52% 52% 52%
Operating Hours hours 3650 2920 2920 5110 4015 5110 4015 1825 4380
Annual energy saving kWh/annum 7888 7573 4313 5928 2981 8981 11694 10167 29978
Electricity Rate Rs/kWh 7.95 7.95 7.95 7.95 7.95 7.95 7.95 7.95 7.95
Annual cost saving Rs in lakhs/annum
0.6 0.6 0.3 0.5 0.2 0.7 0.9 0.8 2.4
Investment towards new Pump set including GST
Rs in Lakhs 0.679 0.679 0.917 0.679 0.679 0.522 0.566 0.566 0.566
Investment towards NRV replacement including GST
Rs in Lakhs 0.215 0.215 0.215 0.215 0.215 0.215 0.215 0.215 0.215
Investment towards gate valve replacement including GST
Rs in Lakhs 0.299 0.299 0.299 0.299 0.299 0.299 0.299 0.299 0.299
Investment towards Web based dashboard including GST
Rs in Lakhs 0.077 0.077 0.077 0.077 0.077 0.077 0.077 0.077 0.077
Investment towards Installation & Commissioning including GST
Rs in Lakhs 0.057 0.057 0.077 0.057 0.057 0.044 0.048 0.048 0.048
Total Cost Rs in Lakhs 1.326 1.326 1.584 1.326 1.326 1.156 1.204 1.204 1.204

74
Parameters Unit Naya Nagla, Koyla Gali
Maholi Yojna-1
Maholi Yojna-3
Sheetla Ghati
Manas Nagar
Ratan Kund Gau Ghat Arjunpura Officer Colony
Payback Period months 25 26 55 34 67 19 16 18 6
Parameters Unit Badpura Colony
Narayan Puri Jhigurpura Raigarpura Gupta Kunj Radha Nagar Manoharpura Krishna Nagar
Rated Parameters
Pump Make Submersible Submersible Submersible Submersible Submersible Submersible Submersible Submersible
Rated Head m 65 65 65 65 65 65 65 65
Rated Flow m3/hr 15 30 18 15 18 24 24 24
Rated Power kW 9.325 9.325 7.46 9.325 7.46 9.325 9.325 9.325
Parameters Measured
Flow Delivered m3/hr 33.3 29.03 15.77 32.98 17.87 20.1 14.19 17.97
Head of the Pump m 39 46 49 43 49 46 78 52
Motor Power Consumption kW 8.98 12.03 7.94 9.13 7.64 9.03 8.08 8.61
Hydraulic Power kW 3.54 3.64 2.10 3.86 2.38 2.52 3.01 2.54
Motor Efficiency % 85% 85% 85% 85% 85% 85% 85% 85%
Pump Shaft Power kW 7.63 10.23 6.75 7.76 6.50 7.68 6.87 7.32
Pump Efficiency % 46.4% 35.6% 31.2% 49.7% 36.7% 32.8% 43.9% 34.8%
Calculated Efficiency of the Pump set
% 39.4% 30.2% 26.5% 42.3% 31.2% 27.9% 37.3% 29.6%
Proposed Parameters
Head of the Pump m 39 46 49 43 49 46 78 52
Flow of the Pump m3/hr 33.3 29.03 15.77 32.98 17.87 20.1 14.19 17.97
Rated Motor Input Power kW 7.5 7.5 5.6 9.3 5.6 5.6 7.5 5.6
Power of the motor on existing duty point
kW 6.43 6.61 4.05 6.78 4.59 4.84 5.48 4.89
Overall Efficiency % 55% 55% 52% 57% 52% 52% 55% 52%
Operating Hours hours 5475 7320 4380 4380 2920 4745 1825 2920
Annual energy saving kWh/annum 13940 39575 17051 10327 8923 19887 4750 10845
Electricity Rate Rs/kWh 7.95 7.95 7.95 7.95 7.95 7.95 7.95 7.95
Annual cost saving Rs in lakhs/annum
1.1 3.1 1.4 0.8 0.7 1.6 0.4 0.9
Investment towards new Pump set including GST
Rs in Lakhs 0.679 0.679 0.566 0.816 0.566 0.566 0.679 0.566

75
Parameters Unit Badpura Colony
Narayan Puri Jhigurpura Raigarpura Gupta Kunj Radha Nagar Manoharpura Krishna Nagar
Investment towards NRV replacement including GST
Rs in Lakhs 0.215 0.229 0.215 0.215 0.215 0.215 0.215 0.215
Investment towards gate valve replacement including GST
Rs in Lakhs 0.299 0.312 0.299 0.299 0.299 0.299 0.299 0.299
Investment towards Web based dashboard including GST
Rs in Lakhs 0.077 0.077 0.077 0.077 0.077 0.077 0.077 0.077
Investment towards Installation & Commissioning including GST
Rs in Lakhs 0.057 0.057 0.048 0.069 0.048 0.048 0.057 0.048
Total Cost Rs in Lakhs 1.326 1.354 1.204 1.476 1.204 1.204 1.326 1.204
Payback Period months 14 5 11 22 20 9 42 17
Parameters Unit Heja
Hospital Laxmi Nagar
Maholi Yojna-2
Antapada Rani Mandi Kutta Paysa
Gali Ravaliya
Gali Rajkumar
Gandhi Park-2
Arjunpura-2
Rated Parameters
Pump Make Submersibl
e Submersibl
e Submersibl
e Submersibl
e Submersibl
e Submersibl
e Submersibl
e Submersibl
e Submersibl
e Submersibl
e
Rated Head M 65 65 65 65 65 65 65 65 65 65
Rated Flow m3/hr 24 18 18 24 24 24 24 24 24 24
Rated Power HP 12.5 12.5 12.5 12.5 12.5 12.5 12.5 12.5 12.5 12.5
Rated Power kW 9.325 9.325 9.325 9.325 9.325 9.325 9.325 9.325 9.325 9.325
Parameters Measured
Flow Delivered m3/hr 16.76 19.87 28.6 26.43 17.68 19.93 20.08 29.41 17.85 15.42
Head of the Pump m 61 25 50 37 44 54 51 63 42 55
Motor Power Consumption
kW 8.26 9.50 9.66 9.52 11.73 9.72 6.33 12.59 8.86 8.62
Hydraulic Power kW 2.78 1.35 3.89 2.66 2.12 2.93 2.79 5.05 2.04 2.31
Motor Efficiency % 85% 85% 85% 85% 85% 85% 85% 85% 85% 85%
Pump Shaft Power kW 7.02 8.08 8.21 8.09 9.97 8.26 5.38 10.70 7.53 7.33
Pump Efficiency % 39.7% 16.8% 47.4% 32.9% 21.2% 35.5% 51.9% 47.2% 27.1% 31.5%
Calculated Efficiency of the Pump set
% 33.7% 14.2% 40.3% 28.0% 18.1% 30.2% 44.1% 40.1% 23.0% 26.8%
Proposed Parameters
Head of the Pump m 61 25 50 37 44 54 51 63 42 55
Flow of the Pump m3/hr 16.76 19.87 28.6 26.43 17.68 19.93 20.08 29.41 17.85 15.42

76
Parameters Unit Heja
Hospital Laxmi Nagar
Maholi Yojna-2
Antapada Rani Mandi Kutta Paysa
Gali Ravaliya
Gali Rajkumar
Gandhi Park-2
Arjunpura-2
Rated Motor Input Power kW 7.5 3.7 9.3 7.5 5.6 7.5 7.5 11.2 5.6 5.6
Power of the motor on existing duty point
kW 5.06 2.71 6.83 4.84 4.07 5.33 5.07 8.70 3.93 4.44
Overall Efficiency % 55% 50% 57% 55% 52% 55% 55% 58% 52% 52%
Operating Hours hours 2190 4380 2920 4380 2920 3650 3650 4380 4380 2190
Annual energy saving kWh/annum 6996 29763 8257 20489 22365 16015 4584 17025 21624 9151
Electricity Rate Rs/kWh 7.95 7.95 7.95 7.95 7.95 7.95 7.95 7.95 7.95 7.95
Annual cost saving Rs in lakhs/annum
0.6 2.4 0.7 1.6 1.8 1.3 0.4 1.4 1.7 0.7
Investment towards new Pump set including GST
Rs in Lakhs 0.679 0.478 0.816 0.679 0.566 0.679 0.679 0.917 0.566 0.566
Investment towards NRV replacement including GST
Rs in Lakhs 0.215 0.215 0.215 0.215 0.215 0.215 0.215 0.215 0.215 0.215
Investment towards gate valve replacement including GST
Rs in Lakhs 0.299 0.299 0.299 0.299 0.299 0.299 0.299 0.299 0.299 0.299
Investment towards Web based dashboard including GST
Rs in Lakhs 0.077 0.077 0.077 0.077 0.077 0.077 0.077 0.077 0.077 0.077
Investment towards Installation & Commissioning including GST
Rs in Lakhs 0.057 0.040 0.069 0.057 0.048 0.057 0.057 0.077 0.048 0.048
Total Cost Rs in Lakhs 1.326 1.108 1.476 1.326 1.204 1.326 1.326 1.584 1.204 1.204
Payback Period months 29 6 27 10 8 12 44 14 8 20
Parameters Unit Theknarnol-2 Madhav Puri
Dholi Pyau
Tiraha-New
Construction
Ahilyabai
Park
Dampier
Nagar MVDA
Ramlila
Ground
Krishna
Nagar MVDA
Kankali
Temple
Dwarikapuri
MVDA
Nai Basti
W.No. Andi Kuiya
Kathoti Kua
Chaupal
Kathoti Kua
Masjid
Rated Parameters
Pump Make Submersible Submersible Submersible Submersible Submersible Submersible Submersible Submersible Submersible Submersible
Rated Head m 65 65 65 65 65 65 65 65 65 65
Rated Flow m3/hr 24 21 24 27 18 18 18 18 18 18

77
Parameters Unit Theknarnol-2 Madhav Puri
Dholi Pyau
Tiraha-New
Construction
Ahilyabai
Park
Dampier
Nagar MVDA
Ramlila
Ground
Krishna
Nagar MVDA
Kankali
Temple
Dwarikapuri
MVDA
Nai Basti
W.No. Andi Kuiya
Kathoti Kua
Chaupal
Kathoti Kua
Masjid
Rated Power HP 12.5 12.5 12.5 12.5 12.5 10 12.5 12.5 12.5 12.5
Rated Power kW 9.325 9.325 9.325 9.325 9.325 7.46 9.325 9.325 9.325 9.325
Parameters Measured
Flow Delivered m3/hr 25.51 21.57 20.14 24.7 18.58 18.67 27.86 31.24 18.47 18.57
Head of the Pump m 60 51 54 43 41 50 50 54 50 56
Motor Power Consumption kW 8.77 8.06 11.93 9.95 9.87 7.57 10.56 10.63 9.37 12.86
Hydraulic Power kW 4.17 3.00 2.96 2.89 2.07 2.54 3.79 4.59 2.51 2.83
Motor Efficiency % 85% 85% 85% 85% 85% 85% 85% 85% 85% 85%
Pump Shaft Power kW 7.46 6.85 10.14 8.46 8.39 6.44 8.98 9.03 7.96 10.93
Pump Efficiency % 55.9% 43.7% 29.2% 34.2% 24.7% 39.5% 42.3% 50.9% 31.6% 25.9%
Calculated Efficiency of the
Pump set % 47.5% 37.2% 24.8% 29.1% 21.0% 33.6% 35.9% 43.2% 26.9% 22.0%
Proposed Parameters
Head of the Pump m 60 51 54 43 41 50 50 54 50 56
Flow of the Pump m3/hr 25.51 21.57 20.14 24.7 18.58 18.67 27.86 31.24 18.47 18.57
Rated Motor Input Power kW 9.3 7.5 7.5 7.5 5.6 5.6 9.3 9.3 5.6 7.5
Power of the motor on existing
duty point kW 7.31 5.45 5.39 5.26 3.99 4.89 6.66 8.06 4.84 5.15
Overall Efficiency % 57% 55% 55% 55% 52% 52% 57% 57% 52% 55%
Operating Hours hours 4380 4015 7300 4380 2190 4015 2920 5475 3650 1825
Annual energy saving kWh/annum 6397 10496 47803 20536 12871 10774 11401 14053 16535 14072
Electricity Rate Rs/kWh 7.95 7.95 7.95 7.95 7.95 7.95 7.95 7.95 7.95 7.95
Annual cost saving Rs in
lakhs/annum 0.5 0.8 3.8 1.6 1.0 0.9 0.9 1.1 1.3 1.1
Investment towards new Pump
set including GST Rs in Lakhs 0.816 0.679 0.679 0.679 0.566 0.566 0.816 0.816 0.566 0.679
Investment towards NRV
replacement including GST Rs in Lakhs 0.215 0.215 0.229 0.215 0.215 0.215 0.215 0.215 0.215 0.215
Investment towards gate valve
replacement including GST Rs in Lakhs 0.299 0.299 0.312 0.299 0.299 0.299 0.299 0.299 0.299 0.299
Investment towards Web
based dashboard including Rs in Lakhs 0.077 0.077 0.077 0.077 0.077 0.077 0.077 0.077 0.077 0.077

78
Parameters Unit Theknarnol-2 Madhav Puri
Dholi Pyau
Tiraha-New
Construction
Ahilyabai
Park
Dampier
Nagar MVDA
Ramlila
Ground
Krishna
Nagar MVDA
Kankali
Temple
Dwarikapuri
MVDA
Nai Basti
W.No. Andi Kuiya
Kathoti Kua
Chaupal
Kathoti Kua
Masjid
GST
Investment towards
Installation & Commissioning
including GST
Rs in Lakhs 0.069 0.057 0.057 0.057 0.048 0.048 0.069 0.069 0.048 0.057
Total Cost Rs in Lakhs 1.476 1.326 1.354 1.326 1.204 1.204 1.476 1.476 1.204 1.326
Payback Period months 35 19 4 10 14 17 20 16 11 14
Parameters Unit Gupta Kunk
WNo.7
Sadar
Dhobi Pada
W.No8
Gandhi
Nagar W.No.
9
Laxmi
Nagar
W.No. 9
Bains
Bhora
Kotwali
W.No.14
Radhey
Shyam
Ashram
W.No.16
Om Nagar
W.No.17
Om Nagar-
2 W.No.17
Jogi Gali
Antapada
W.No.18
Khateek
Mohalla
Balmiki
Basti
W.No.19
Rated Parameters
Pump Make Submersible Submersible Submersible Submersible Submersible Submersible Submersible Submersible Submersible Submersible
Rated Head m 65 65 65 65 65 65 65 65 65 65
Rated Flow m3/hr 18 18 18 18 18 18 18 18 18 18
Rated Power kW 9.325 9.325 9.325 9.325 9.325 9.325 9.325 9.325 9.325 9.325
Parameters Measured
Flow Delivered m3/hr 22.6 39.15 16.69 17.23 27.62 17.49 21.59 17.09 23.08 20.13
Head of the Pump m 49 25 45 50 53 42 45 50 44 53
Motor Power Consumption kW 7.30 10.26 8.23 9.56 9.05 11.94 9.23 8.48 8.54 9.07
Hydraulic Power kW 3.02 2.67 2.05 2.35 3.99 2.00 2.65 2.33 2.77 2.91
Motor Efficiency % 85% 85% 85% 85% 85% 85% 85% 85% 85% 85%
Pump Shaft Power kW 6.20 8.72 7.00 8.13 7.70 10.15 7.85 7.21 7.26 7.71
Pump Efficiency % 48.6% 30.6% 29.2% 28.9% 51.8% 19.7% 33.7% 32.3% 38.1% 37.7%
Calculated Efficiency of the Pump set % 41.3% 26.0% 24.8% 24.5% 44.0% 16.8% 28.7% 27.4% 32.4% 32.0%
Proposed Parameters
Head of the Pump m 49 25 45 50 53 42 45 50 44 53
Flow of the Pump m3/hr 22.6 39.15 16.69 17.23 27.62 17.49 21.59 17.09 23.08 20.13

79
Parameters Unit Gupta Kunk
WNo.7
Sadar
Dhobi Pada
W.No8
Gandhi
Nagar W.No.
9
Laxmi
Nagar
W.No. 9
Bains
Bhora
Kotwali
W.No.14
Radhey
Shyam
Ashram
W.No.16
Om Nagar
W.No.17
Om Nagar-
2 W.No.17
Jogi Gali
Antapada
W.No.18
Khateek
Mohalla
Balmiki
Basti
W.No.19
Rated Motor Input Power kW 7.5 7.5 5.6 5.6 9.3 5.6 7.5 5.6 7.5 7.5
Power of the motor on existing duty point kW 5.48 4.85 3.93 4.51 6.99 3.85 4.81 4.48 5.03 5.28
Overall Efficiency % 55% 55% 52% 52% 57% 52% 55% 52% 55% 55%
Operating Hours hours 3285 5110 2190 5110 2920 5840 4380 6570 2190 5110
Annual energy saving kWh/annum 5964 27664 9417 25813 6015 47243 19355 26312 7687 19374
Electricity Rate Rs/kWh 7.95 7.95 7.95 7.95 7.95 7.95 7.95 7.95 7.95 7.95
Annual cost saving Rs in
lakhs/annum 0.5 2.2 0.7 2.1 0.5 3.8 1.5 2.1 0.6 1.5
Investment towards new Pump set including
GST Rs in Lakhs 0.679 0.679 0.566 0.566 0.816 0.566 0.679 0.566 0.679 0.679
Investment towards NRV replacement
including GST Rs in Lakhs 0.215 0.215 0.215 0.215 0.215 0.215 0.215 0.215 0.215 0.215
Investment towards gate valve replacement
including GST Rs in Lakhs 0.299 0.299 0.299 0.299 0.299 0.299 0.299 0.299 0.299 0.299
Investment towards Web based dashboard
including GST Rs in Lakhs 0.077 0.077 0.077 0.077 0.077 0.077 0.077 0.077 0.077 0.077
Investment towards Installation &
Commissioning including GST Rs in Lakhs 0.057 0.057 0.048 0.048 0.069 0.048 0.057 0.048 0.057 0.057
Total Cost Rs in Lakhs 1.326 1.326 1.204 1.204 1.476 1.204 1.326 1.204 1.326 1.326
Payback Period months 34 7 19 7 37 4 10 7 26 10
Parameters Unit
Guru Nanak Nagar
W.No.19
Krishnapuram-1 Ward-24
Krishnapuram-2 Ward-24
Balmiki Basti Dholi
Pyau Ward-27
Mahavidya Park Ward-
28
Hanuman Teela
Ward-33
Kashmiri Gali Ward-
34
Mission Teela Sadar Bazar
Ward-35
Matia Gate Ward-37
Subhash Nagar Nala
Ward-38
Rated Parameters
Pump Make Submersibl
e Submersible Submersible
Submersible
Submersible
Submersible
Submersible
Submersible
Submersible
Submersible
Rated Head m 65 65 65 65 65 65 65 65 65 65
Rated Flow m3/hr 18 18 18 18 18 18 18 18 18 18

80
Parameters Unit
Guru Nanak Nagar
W.No.19
Krishnapuram-1 Ward-24
Krishnapuram-2 Ward-24
Balmiki Basti Dholi
Pyau Ward-27
Mahavidya Park Ward-
28
Hanuman Teela
Ward-33
Kashmiri Gali Ward-
34
Mission Teela Sadar Bazar
Ward-35
Matia Gate Ward-37
Subhash Nagar Nala
Ward-38
Rated Power kW 9.325 9.325 9.325 9.325 9.325 9.325 9.325 9.325 9.325 9.325
Parameters Measured
Flow Delivered m3/hr 9.48 28.43 29.25 13.35 21.77 17.87 18.33 29.31 22.83 18.21
Head of the Pump m 46 39 43 50 54 54 37 38 64 49
Motor Power Consumption
kW 8.00 10.72 10.19 9.03 6.55 7.47 6.97 10.86 8.99 11.43
Hydraulic Power kW 1.19 3.02 3.43 1.82 3.20 2.63 1.85 3.03 3.98 2.43
Motor Efficiency % 85% 85% 85% 85% 85% 85% 85% 85% 85% 85%
Pump Shaft Power kW 6.80 9.11 8.66 7.68 5.57 6.35 5.92 9.23 7.64 9.72
Pump Efficiency % 17.5% 33.1% 39.5% 23.7% 57.5% 41.4% 31.2% 32.9% 52.1% 25.0%
Calculated Efficiency of the Pump set
% 14.8% 28.2% 33.6% 20.1% 48.9% 35.2% 26.5% 27.9% 44.3% 21.3%
Proposed Parameters
Head of the Pump m 46 39 43 50 54 54 37 38 64 49
Flow of the Pump m3/hr 9.48 28.43 29.25 13.35 21.77 17.87 18.33 29.31 22.83 18.21
Rated Motor Input Power kW 3.7 7.5 7.5 4.5 7.5 7.5 4.5 7.5 9.3 5.6
Power of the motor on existing duty point
kW 2.38 5.49 6.23 3.56 5.82 4.78 3.62 5.51 6.98 4.67
Overall Efficiency % 50% 55% 55% 51% 55% 55% 51% 55% 57% 52%
Operating Hrs hours 2007 1460 1460 4745 4380 1460 3650 5110 5110 2920
Annual energy saving kWh/annum 11292 7633 5786 25950 3181 3933 12210 27314 10243 19740
Electricity Rate Rs/kWh 7.95 7.95 7.95 7.95 7.95 7.95 7.95 7.95 7.95 7.95
Annual cost saving Rs in lakhs/annum
0.9 0.6 0.5 2.1 0.3 0.3 1.0 2.2 0.8 1.6
Investment towards new Pump set including GST
Rs in Lakhs 0.478 0.679 0.679 0.522 0.679 0.679 0.522 0.679 0.816 0.566
Investment towards NRV replacement including GST
Rs in Lakhs 0.215 0.215 0.215 0.215 0.215 0.215 0.215 0.215 0.215 0.215
Investment towards gate valve replacement including GST
Rs in Lakhs 0.299 0.299 0.299 0.299 0.299 0.299 0.299 0.299 0.299 0.299
Investment towards Web based dashboard
Rs in Lakhs 0.077 0.077 0.077 0.077 0.077 0.077 0.077 0.077 0.077 0.077

81
Parameters Unit
Guru Nanak Nagar
W.No.19
Krishnapuram-1 Ward-24
Krishnapuram-2 Ward-24
Balmiki Basti Dholi
Pyau Ward-27
Mahavidya Park Ward-
28
Hanuman Teela
Ward-33
Kashmiri Gali Ward-
34
Mission Teela Sadar Bazar
Ward-35
Matia Gate Ward-37
Subhash Nagar Nala
Ward-38
including GST
Investment towards Installation & Commissioning including GST
Rs in Lakhs 0.040 0.057 0.057 0.044 0.057 0.057 0.044 0.057 0.069 0.048
Total Cost Rs in Lakhs 1.108 1.326 1.326 1.156 1.326 1.326 1.156 1.326 1.476 1.204
Payback Period months 15 26 35 7 63 51 14 7 22 9
Parameters Unit Manshapuri
Ward-39 Rampal Gali
Ward-40 Theknarnol
Ward-40 Lala Ganj Ward-42
Kashiram Yojna-3
Kashiram Yojna-4
Satrangi Garden Ward-8
Naya Nagla Ward-11
Rated Parameters
Pump Make Submersible Submersible Submersible Submersible Submersible Submersible Submersible Submersible
Rated Head m 65 65 65 65 65 65 65 65
Rated Flow m3/hr 18 18 18 18 18 18 18 18
Rated Power kW 9.325 9.325 9.325 9.325 9.325 9.325 9.325 9.325
Parameters Measured
Flow Delivered m3/hr 15.27 24.37 21.83 17.02 14.65 20.61 31.84 22.47
Head of the Pump m 47 49 53 62 48 53 21 44
Motor Power Consumption kW 9.45 6.87 7.46 7.80 7.00 11.30 6.94 7.86
Calculated Efficiency of the Pump set % 20.7% 47.4% 42.2% 36.9% 27.4% 26.3% 26.3% 34.2%
Proposed Parameters
Head of the Pump m 47 49 53 62 48 53 21 44
Flow of the Pump m3/hr 15.27 24.37 21.83 17.02 14.65 20.61 31.84 22.47
Rated Motor Input Power kW 4.5 7.5 7.5 7.5 4.5 7.5 4.5 7.5
Power of the motor on existing duty point kW 3.83 5.91 5.73 5.22 3.75 5.41 3.57 4.90
Overall Efficiency % 51% 55% 55% 55% 51% 55% 51% 55%
Operating Hrs hours 2920 3285 5110 2920 3650 3650 5475 4380
Annual energy saving kWh/annum 16393 3134 8872 7506 11844 21503 18430 12993

82
Parameters Unit Manshapuri
Ward-39 Rampal Gali
Ward-40 Theknarnol
Ward-40 Lala Ganj Ward-42
Kashiram Yojna-3
Kashiram Yojna-4
Satrangi Garden Ward-8
Naya Nagla Ward-11
Electricity Rate Rs/kWh 7.95 7.95 7.95 7.95 7.95 7.95 7.95 7.95
Annual cost saving Rs in lakhs/annum
1.3 0.2 0.7 0.6 0.9 1.7 1.5 1.0
Investment towards new Pump set including GST
Rs in Lakhs 0.522 0.679 0.679 0.679 0.522 0.679 0.522 0.679
Investment towards NRV replacement including GST
Rs in Lakhs 0.215 0.215 0.215 0.215 0.215 0.215 0.215 0.215
Investment towards gate valve replacement including GST
Rs in Lakhs 0.299 0.299 0.299 0.299 0.299 0.299 0.299 0.299
Investment towards Web based dashboard including GST
Rs in Lakhs 0.077 0.077 0.077 0.077 0.077 0.077 0.077 0.077
Investment towards Installation & Commissioning including GST
Rs in Lakhs 0.044 0.057 0.057 0.057 0.044 0.057 0.044 0.057
Total Cost Rs in Lakhs 1.156 1.326 1.326 1.326 1.156 1.326 1.156 1.326
Payback Period months 11 64 23 27 15 9 9 15
Parameters Unit
Mali Mohalla Sadar
Ward-13
Naya Bans Ward-15
Machli Gate Ward-
19
Motikunj Extension
Rani Mandi Balmiki Basti
Ward-6
Matia Gate Joshiyan Garden
Sanjay Nagar Nala
Balmiki Basti Ward-
1
Rated Parameters
Pump Make Submersible Submersible Submersible Submersible Submersible Submersible Submersible Submersible
Rated Head m 65 65 65 65 65 65 65 65
Rated Flow m3/hr 18 18 18 18 18 18 18 18
Rated Power kW 9.325 9.325 9.325 9.325 9.325 9.325 9.325 9.325
Parameters Measured
Flow Delivered m3/hr 24.16 16.49 10.74 27.43 24.47 25.34 25.17 18.17
Head of the Pump m 50 62 50 47 49 59 48 52
Motor Power Consumption kW 10.82 7.93 7.57 8.61 9.59 9.12 8.10 9.38
Calculated Efficiency of the Pump set % 30.4% 35.1% 19.3% 40.8% 34.1% 44.6% 40.6% 27.4%
Proposed Parameters

83
Parameters Unit
Mali Mohalla Sadar
Ward-13
Naya Bans Ward-15
Machli Gate Ward-
19
Motikunj Extension
Rani Mandi Balmiki Basti
Ward-6
Matia Gate Joshiyan Garden
Sanjay Nagar Nala
Balmiki Basti Ward-
1
Head of the Pump m 50 62 50 47 49 59 48 52
Flow of the Pump m3/hr 24.16 16.49 10.74 27.43 24.47 25.34 25.17 18.17
Rated Motor Input Power kW 7.5 7.5 3.7 7.5 7.5 9.3 7.5 5.6
Power of the motor on existing duty point kW 5.98 5.06 2.92 6.38 5.94 7.14 5.98 4.95
Overall Efficiency % 55% 55% 50% 55% 55% 57% 55% 52%
Operating Hours hours 3650 1825 1825 4380 3650 4380 4380 4380
Annual energy saving kWh/annum 17651 5234 8471 9762 13320 8668 9267 19412
Electricity Rate Rs/kWh 7.95 7.95 7.95 7.95 7.95 7.95 7.95 7.95
Annual cost saving Rs in lakhs/annum
1.4 0.4 0.7 0.8 1.1 0.7 0.7 1.5
Investment towards new Pump set including GST Rs in Lakhs 0.679 0.679 0.478 0.679 0.679 0.816 0.679 0.566
Investment towards NRV replacement including GST
Rs in Lakhs 0.215 0.215 0.215 0.215 0.215 0.215 0.215 0.215
Investment towards gate valve replacement including GST
Rs in Lakhs 0.299 0.299 0.299 0.299 0.299 0.299 0.299 0.299
Investment towards Web based dashboard including GST
Rs in Lakhs 0.077 0.077 0.077 0.077 0.077 0.077 0.077 0.077
Investment towards Installation & Commissioning including GST
Rs in Lakhs 0.057 0.057 0.040 0.057 0.057 0.069 0.057 0.048
Total Cost Rs in Lakhs 1.326 1.326 1.108 1.326 1.326 1.476 1.326 1.204
Payback Period months 11 38 20 21 15 26 22 9
Parameters Unit Masani Nala SPS Pump 1
Masani Nala SPS Pump 2
Masani Nala SPS Pump 3
Masani Nala SPS Pump 4
Masani Nala SPS Pump 5
Krishna Ganga SPS Pump 2
Chinta Haran SPS Pump 1
Chinta Haran SPS Pump 3
Rated Parameters
Pump Type Non Clog
Submersible Non Clog
Submersible Non Clog
Submersible Non Clog
Submersible Non Clog
Submersible Non Clog
Submersible Non Clog
Submersible Non Clog
Submersible
Rated Head m 36 36 36 36 36 20 20.5 20.5
Rated Flow M3/hr 270 270 540 270 540 108 270 270
Rated Power kW 30 30 90 30 90 11 19 19
Parameters Measured
Flow Delivered m3/hr 236.7 262.1 398.7 215.2 389.0 52.3 66.4 66.1

84
Parameters Unit Masani Nala SPS Pump 1
Masani Nala SPS Pump 2
Masani Nala SPS Pump 3
Masani Nala SPS Pump 4
Masani Nala SPS Pump 5
Krishna Ganga SPS Pump 2
Chinta Haran SPS Pump 1
Chinta Haran SPS Pump 3
Head of the Pump m 25 31 27 33 26 22 25 24
Motor Power Consumption
kW 39.25 45.90 67.53 45.32 68.57 10.43 13.05 13.77
Calculated Efficiency of the Pump set
% 41.7% 49.7% 44.7% 44.0% 41.4% 31.0% 35.7% 32.3%
Proposed Parameters
Head of the Pump m 25 31 27 33 26 22 25 24
Flow of the Pump m3/hr 237 262 399 215 389 52 66 66
Rated Motor Input Power
kW 26.25 33.75 52.5 33.75 45 9 9 9
Power of the motor on existing duty point
kW 25.03 35.77 50.06 30.86 40.72 7.92 9.14 9.03
Pump Efficiency % 77% 75% 71% 76.0% 82% 48% 60% 58%
Overall Efficiency % 65% 64% 60% 65% 70% 41% 51% 49%
Operating Hrs hours 1460 1460 1460 1460 1460 1825 1095 1095
Annual energy saving
kWh/annum
20759 14790 25499 21116 40653 4582 4284 5200
Electricity Rate Rs/kWh 7.95 7.95 7.95 7.95 7.95 7.95 7.95 7.95
Annual cost saving Rs in lakhs/annum
1.7 1.2 2.0 1.7 3.2 0.4 0.3 0.4
Investment towards new Pump set including GST
Rs in Lakhs
2.768 3.733 4.414 3.733 4.343 1.427 1.427 1.427
Investment towards NRV replacement including GST
Rs in Lakhs
1.055 0.588 1.055 0.588 1.055 0.245 0.245 0.245
Investment towards gate valve replacement including GST
Rs in Lakhs
1.181 0.658 1.181 0.658 1.181 0.338 0.338 0.338
Investment towards Web based dashboard including GST
Rs in Lakhs
0.077 0.077 0.077 0.077 0.077 0.077 0.077 0.077
Investment towards Installation & Commissioning including GST
Rs in Lakhs
0.233 0.315 0.372 0.315 0.366 0.120 0.120 0.120
Total Cost Rs in Lakhs
5.315 5.371 7.100 5.371 7.022 2.208 2.208 2.208

85
Parameters Unit Masani Nala SPS Pump 1
Masani Nala SPS Pump 2
Masani Nala SPS Pump 3
Masani Nala SPS Pump 4
Masani Nala SPS Pump 5
Krishna Ganga SPS Pump 2
Chinta Haran SPS Pump 1
Chinta Haran SPS Pump 3
Payback Period months 39 55 42 38 26 73 78 64
Parameters Unit Swami Ghat SPS Pump 1
Swami Ghat SPS Pump 2
Cantt. Nala SPS Pump 1
Dairy Farm SPS Pump 1
Dairy Farm SPS Pump 2
Dairy Farm SPS Pump 3
Dairy Farm SPS Pump 4
Dairy Farm SPS Pump 5
Rated Parameters
Pump Type Non Clog
Submersible Non Clog
Submersible Non Clog
Submersible Non Clog
Submersible Non Clog
Submersible Non Clog
Submersible Non Clog
Submersible Non Clog
Submersible
Rated Head m - - 25 35 28 35 28 35
Rated Flow M3/hr - - 72 338.4 165.6 338.4 165.6 338.4
Rated Power kW 7.5 7.5 19 75 30 75 30 75
Parameters Measured
Flow Delivered m3/hr 122.8 119.5 39.9 293.7 110.3 302.9 111.2 312.3
Head of the Pump m 12 11 25 26 18 26 19 25
Motor Power Consumption
kW 12.52 12.41 23.91 80.39 36.45 78.20 36.10 76.20
Calculated Efficiency of the Pump set
% 31.6% 28.4% 11.7% 26.6% 15.3% 27.9% 16.4% 28.7%
Proposed Parameters
Head of the Pump m 12 11 25 26 18 26 19 25
Flow of the Pump m3/hr 123 119 40 294 110 303 111 312
Rated Motor Input Power
kW 7.5 7.5 11.25 37.5 11.25 37.5 15 37.5
Power of the motor on existing duty point
kW 6.76 6.00 8.24 34.08 9.78 34.23 11.25 33.92
Pump Efficiency % 69% 69% 40% 74% 67% 75% 62% 76%
Overall Efficiency % 59% 59% 34% 63% 57% 64% 53% 65%
Operating Hrs hours 3650 3650 4380 1460 1460 1460 1460 1460
Annual energy saving
kWh/annum
21039 23374 68629 67619 38931 64189 36281 61731
Electricity Rate Rs/kWh 7.95 7.95 7.95 7.95 7.95 7.95 7.95 7.95
Annual cost saving Rs in lakhs/annum
1.7 1.9 5.5 5.4 3.1 5.1 2.9 4.9

86
Parameters Unit Swami Ghat SPS Pump 1
Swami Ghat SPS Pump 2
Cantt. Nala SPS Pump 1
Dairy Farm SPS Pump 1
Dairy Farm SPS Pump 2
Dairy Farm SPS Pump 3
Dairy Farm SPS Pump 4
Dairy Farm SPS Pump 5
Investment towards new Pump set including GST
Rs in Lakhs
1.321 1.321 1.844 3.962 2.142 3.962 1.899 3.962
Investment towards NRV replacement including GST
Rs in Lakhs
0.245 0.245 0.270 1.055 0.588 1.055 0.588 1.055
Investment towards gate valve replacement including GST
Rs in Lakhs
0.338 0.338 0.354 1.181 0.658 1.181 0.658 1.181
Investment towards Web based dashboard including GST
Rs in Lakhs
0.077 0.077 0.077 0.077 0.077 0.077 0.077 0.077
Investment towards Installation & Commissioning including GST
Rs in Lakhs
0.111 0.111 0.155 0.334 0.181 0.334 0.160 0.334
Total Cost Rs in Lakhs
2.093 2.093 2.700 6.610 3.645 6.610 3.382 6.610
Payback Period months 15 14 6 15 14 16 14 16
Parameters Unit Bangali Ghat SPS Pump 1 Bangali Ghat SPS Pump 5
Rated Parameters
Pump Type VT VT
Rated Head m 24 24
Rated Flow M3/hr 349.2 349.2
Rated Power kW 44.8 44.8
Parameters Measured
Measured Flow m3/hr 212.9 236.8
Head of the Pump m 20 22
Motor Power Consumption kW 41.26 43.97
Calculated Efficiency of the Pump set % 28.9% 33.2%
Proposed Parameters
Head of the Pump m 20 22
Flow of the Pump m3/hr 213 237
Rated Motor Input Power kW 37.3 37.3
Power of the motor on existing duty point kW 18.74 22.94

87
Parameters Unit Bangali Ghat SPS Pump 1 Bangali Ghat SPS Pump 5
Pump Efficiency % 75% 75%
Overall Efficiency % 64% 64%
Operating Hours hours 1825 1825
Annual energy saving kWh/annum 41099 38383
Electricity Rate Rs/kWh 7.95 7.95
Annual cost saving Rs in lakhs/annum 3.3 3.1
Investment towards new Pump set including GST Rs in Lakhs 3.979 3.979
Investment towards NRV replacement including GST Rs in Lakhs 2.290 2.290
Investment towards gate valve replacement including GST Rs in Lakhs 2.563 2.563
Investment towards Web based dashboard including GST Rs in Lakhs 0.077 0.077
Investment towards Installation & Commissioning including GST Rs in Lakhs 0.335 0.335
Total Cost Rs in Lakhs 9.245 9.245
Payback Period months 34 36

88
7 Repair & Maintenance Measures
7.1 Present R&M and O&M expenses
Pump sets requires periodic repair and maintenance to keep themin running condition and each R & M
activity has a cost associated with it. During energy audit, it was observed that need of repair and
maintenance arises generally for replacement of consumables and for addressing wear and tears of
components of pump set. During energy audit, data regarding repair and maintenance cost was requested to
municipality official but partial data of R& M is received from him. Details of R & M and other cost
associated with pumping stations are provided in table 18:
Table 18: R&M and O&M expenses for Mathura Pumping Stations
Financial Data Units Values
Cost of Repair & Maintenance in FY2014 - 2015 Rs. Lakh 147.1
Cost of Repair & Maintenance in FY2015 - 2016 Rs. Lakh 129.2
Cost of Repair & Maintenance in FY2016- 2017 Rs. Lakh 209.2
Cost of Operation in FY2014 -2015 Rs. Lakh 641.73
Cost of Operation in FY2015-2016 Rs. Lakh 669.28
Cost of Operation in FY2016-2017 Rs. Lakh 789.68
Cost of Purchase of new pump/motors/accessories in FY2014-2015 Rs. Lakh 22.18
Cost of Purchase of new pump/motors/accessories in FY2015- 2016 Rs. Lakh 220.88
Cost of Purchase of new pump/motors/accessories in FY2016 -2017 Rs. Lakh 273.42
In above tables, cost of operations includes jal kal staff cost, jal kal sewage , Borewell, Sewage Contractor,
labor cost on daily basis.
In proposed scenario, repair and maintenance cost for the pump sets reduces most of old and inefficient
pumps will be replaced by new energy efficient pumps. Along with this, during project period, repair and
maintenance of new pumps will be done by EESL selected manufacturer.

89
8 Project Financials and Business model
An IGEA Report is the process of conducting an energy audit to identify efficiency improvement
opportunities, and translating the technical findings into financial terms to present it as a bankable project
capable of securing a loan. Therefore it is important to conduct a detailed financial analysis for the project to
ascertain the financial viability of the project.
This project would be implemented in Annuity Mode. In this mode, EESL will invest all the capital
investment required for implementation of the Energy Efficiency Project. EESL will assure a minimum
energy savings of approx. 20% as compared to the existing energy consumption. Payments would not
be affected if savings are higher than 20%. Further EESL would provide Repair & Maintenance (R&M)
for the replaced pump sets during the project period. The repayment to EESL (in the form of annuity) would
be determined on cost plus ROE basis. Schematic of business model of this project is provided in figure 9.
Figure 9 Schematic of business model of the project
8.1 Total Project cost (CAPEX)
The following are the key components considered while arriving at the total project cost:
i. Cost of pump, motor and other accessories (like NRV and gate valve), discovered through a
transparent bidding process;

90
ii. Cost of dismantling, installation and commissioning including testing charges, discovered through a
transparent bidding process;
iii. Project Establishment and Supervision charges of EESL at 5 % of total cost of equipment including
installation;
iv. Cost of preparation of IGEA, as per actual tendered cost, plus EESL’s service charge at 15%;
v. All applicable goods and services taxes on actual basis; and
vi. Capitalized interest during the Project Implementation Period.
Details of project capital cost is provided in table 19.
Table 19: Project Capital cost
Capital Cost Related assumption Unit Value
Number of Pumps No. 131
Total Cost of Equipment including installation, commissioning and testing INR lakhs 235.55
Cost of pump including motor INR lakhs 125.17
Cost of NRV INR lakhs 39.04
Cost of Gate valve INR lakhs 50.72
Cost of Web based dashboard INR lakhs 10.06
Installation and Commissioning Cost including testing charges INR lakhs 10.55
EESL's administrative and establishment charge % 5
Cost of preparation of IGEA report including EESL service charges and applicable
GST
INR lakhs 10.49
Total Project Cost w/o Capitalized interest INR lakhs 257.82
Commissioning Details
Total Months for Commissioning months 9
Capitalized interest INR lakhs 14.45
Total Project Cost INR lakhs 272.27
8.2 Operating Costs (OPEX)
The following are the key components considered while arriving at the operating cost for the project
i. Project Establishment and Supervision charges of EESL at 4% of total project cost, with annual
escalation of 5%; and
ii. Actual incurred Repair & Maintenance charges, discovered through a transparent bidding process.
Details of operating cost is provided in table 20.
Table 20: Project operating cost
Operational Details Unit Value
EESL's administrative and establishment charges % 4%

91
8.3 Financing Terms and other tax related assumptions
The following are the key financial assumptions used in developing the model. Details of financing terms
and tax related assumptions are provided in table 21.
Table 21: Financing terms and tax related assumptions
Parameters Unit Value
Term of the project years 7
Financing Details
Debt Percentage % 70
Cost of Debt % 11
Equity Percentage % 30
Cost of Equity (post- tax) % 16
Tax Details
Corporate Tax % 34.61
Goods and Services Tax % 18
8.4 Output - Annuity Payment to EESL
Based on the cost parameters and assumptions mentioned above, the annuity payment to EESL was
computed. Details of annuity payment to EESL is provided in table 22.
Table 22: Annuity payment to EESL
Year 1 2 3 4 5 6 7 Total
Calculations of annuity payment
Total Debt to be repaid INR lakh 47.07 44.07 41.08 38.08 35.09 32.09 29.10 266.59
Principal Repayment INR lakh 27.23 27.23 27.23 27.23 27.23 27.23 27.23 190.59
Interest INR lakh 19.84 16.85 13.85 10.86 7.86 4.87 1.87 76.00
Total Equity Repayments INR lakh 30.58 27.73 24.87 22.02 19.16 16.31 13.45 154.13
Recovery of equity investment INR lakh 11.67 11.67 11.67 11.67 11.67 11.67 11.67 81.68
Return on equity INR lakh 18.91 16.06 13.20 10.35 7.49 4.64 1.78 72.45
R&M Charges INR lakh 0.00 5.89 17.67 22.38 27.09 35.33 42.40 150.75
EESL's administrative and establishment charge
INR lakh 10.89 11.44 12.01 12.61 13.24 13.90 14.59 88.67
Annuity Payment to EESL INR lakh 88.54 89.13 95.62 95.09 94.58 97.63 99.54 660.13
Goods and Services Tax on annuity payment
INR lakh 15.94 16.04 17.21 17.12 17.02 17.57 17.92 118.82
Annuity Payment to EESL incl. all applicable taxes
INR lakh 104.48 105.17 112.84 112.20 111.60 115.21 117.5 778.96
ULB Savings
Total Savings INR lakh 191.11 195.52 199.79 203.88 207.74 211.35 214.7 1424.1
Profit to ULB INR lakh 86.63 90.36 86.95 91.67 96.14 96.15 97.20 645.10
% of savings with ULBs % 45.3%

92
8.5 Sensitivity analysis
The sensitivity analysis has been conducted to determine the impact of change in capital cost and change in
savings on the percentage of monetary share of accrued savings retained by the ULB. Details of project
sensitivity analysis is provided below
Table 23: Project Capital cost
Change in Capital Cost % of savings retained by the utility
-10% 49.52%
-5% 47.41%
0% 45.30%
5% 43.19%
10% 41.08%
Change in Interest(ROE, Interest, D/E ratio) % of savings retained by the utility
-10% 39.22%
-5% 42.42%
0% 45.30%
5% 47.90%
10% 50.27%
8.6 Payment Security Mechanism
Payment default by the borrower is perceived as one of the most important risks. For projects based on
ESCO model, wherein ESCO or financial institution pays the upfront capital for project implementation, the
regular payment to the ESCO/financial institution is crucial to maintain a positive cash flow. There are
difficulties associated with measuring energy performance accurately and equitably, and therefore the actual
energy savings may be disputable, especially in circumstances where the energy baseline and stipulated
factors are not well established at the pre-project stage. Apart from possible dispute on actual savings, host’s
bankruptcy and dismissal of a management body could also be possible reasons for non-payment. Payment
security mechanism is necessary to ensure confidence of investors in an ESCO projects. The mechanism
should be structured in a way which would be acceptable to ESCO/financial institution. The payment
security mechanism maybe in form of irrevocable bank guarantees or letter of credit (LOC) furnished by the
ESCO/financial institution.
Letter of credit
Letter of credit (LC) is the obligation taken by the bank to make the payment once certain criteria are met.
Whereas, bank guarantee (BG) is a promise made by a bank that the liabilities of the debtor will be met in
event the energy user fails to make the payment. The major difference between bank guarantee (BG) and
letter of credit (LC) is that BG reduces the loss in the transaction if transaction doesn’t go as planned while
letter of credit ensures that transaction proceeds as planned. As the ultimate objective of the program is to
improve the energy efficiency in water supply and sewage system and ensuring the success of the project,
letter of credit would be preferred payment security mechanism.

93
Letter of credits processes payment on receipt of required documents from the service provider. Major
challenges associated with letter of credit are enlisted below:
Letter of credits are usually irrevocable agreement and hence any changes in terms of contract will
be difficult to address in letter of credit.
Getting letter of credit is difficult considering the stringent qualification criteria. Letter of credit is
usually issued to companies and organization that have cash flow, asset and good credit score.
Usually line of credit are issued with terms for paying it back, herein energy user will be using the
line of credit to pay the service provider for its services. In case of energy savings line of credit
could be used as an guarantee in case of default by the government entity
In the case of the AMRUT program, the state government play a critical role in implementation of the
project would sign the tri partite agreement for implementation of the project. The state government shall
provide an unconditional, revolving and irrevocable Letter of Credit from a scheduled and nationalized bank
(other than co-operative banks) at its own cost for the entire contract period. The amount of letter of credit
shall be equivalent to 2 times the quarterly invoice. The LC may then be drawn upon by EESL for recovery
of the eligible payments, in case of defaults.

94
9 Key Observations and Suggestions
To achieve optimum performance and reliability, a pump must be operated close to its best efficiency point
(BEP). At the BEP, the hydrodynamic unbalanced load of the pump is at its minimum. Basically, when a
pump operates at a point that is far away from the actual BEP, it results in an overall increase in
hydrodynamic unbalanced load. This in turn affects the performance, reliability and efficiency of the pump.
Main source of water for the city of Mathura is ground water. There are 14110 Nos. of pumps installed to
cater the water needs of Mathura City. These 141 nos. of submersible pumps are used to supply water
directly to the users. Out of 141 Nos. of water supply pumps, 121 Nos. were in operation during energy audit
and 20 Nos. of pumps were under maintenance. Apart from water distribution pump sets, 35 Nos. of pump
sets are also installed in the sewage water pumping system to transfer the sewage water to the sewage
treatment plant. Out of 35 Nos. of pump, 21 Nos. of pumps were in operation during energy audit and 14
Nos. of Pump sets were under maintenance.
The present operating pumps’ efficiencies for water supply pumps are in range of 15.4% to 62.1% and for
sewage pumps is 13.8% to 58.4%. The efficiency of the pump is low mainly due to pump operating far away
from the Best Efficiency Point (BEP).
9.1 Observation Main header pipeline of the sewage MPS station is old and rusted. Therefore, only one Pump is
operating at at time.
Pressure gauge is installed at the Dairy farm sewage pumping station but none was operating during
the audit.
Screen installed to the sewage pumping station but not working properly.
In some of the pumping stations the NRV and gate valve is not functioning properly.
There is no monitoring of discharge pressure and flow throughout the system.
9.2 Recommendations Energy meters have to be installed to all pumping stations.
Screen has to be checked and install new system to prevent heavy solid particles entering to the
system.
Monitoring of discharge pressure and flow.
10 As per LOA, there were 143 pumps (water), however in LOA list, there was repetition of two pump sets. Therefore, total pump at Mathura, in IGEA, is considered as 141.

95
10 Measurement and Verification (M&V)
Measurement and Verification (M&V) is the term given to the process for quantifying savings delivered by
an Energy Efficiency Measure (EEM). It includes energy saving verification process involving
measurements and reporting methodology. M & V methodology followed in this project includes following
measurement schedule
a. Measurement of parameters pre EEM implementation (just before installation of EEPS) for all
operating combinations using portable instruments
b. Measurement of parameters post EEM implementation for all operating combinations using portable
instruments.
Energy savings are calculated as the difference in power drawn (in pre and post implementation scenario)
multiplied by the operating hours mentioned in IGEA.
These energy savings shall be verified in accordance with M&V plan presented in the final report by EESL
and as agreed upon by the ULB. The energy savings will be determined and signed by EESL, Pump Supplier
and the ULB. EESL shall submit a report as per the reporting template attached to this agreement verifying
the savings mentioned in the agreement.
The report shall be submitted by EESL to all the ULB within 15 days of the completion of the verification
10.1 Definition of possible and operating combinations
In ULBs, especially in case of pumping stations, where the pumps are connected in parallel, the pump
operated in various combinations. For the purpose of this document, these combinations are defined as
possible combinations. For example, for if 3 pumps are connected in parallel, there are 7 possible
combinations considering three different pumps i.e.
Pump 1 Pump 1+ Pump 2
Pump 2 Pump 2+ Pump 3 Pump 1+Pump 2+Pump 3
Pump 3 Pump 3 +Pump 1
However, the ULB might be operating the pumps only in three combination, depending on the flow
requirement, from the one discussed above. For the purpose of this document, these combinations are
defined as operating combinations.
Operating Combination 1 Operating Combination 2 Operating Combination 3
Pump 1 Pump 1+ Pump 2 Pump 1+Pump 2+Pump 3
10.2 Flow of activities under M & V process First, measurements of old pump would be carried out by the supplier when new pump is ready to be
installed at ULB.
Instantaneous measurement of parameters like flow, head (both at suction and discharge) and power
of old pump would be carried out for all operating combinations after stabilisation using portable
meters. These parameters will be called pre implementation parameters
Pre implementation parameters will be verified by EESL, ULB and Supplier.

96
Then, old pump will be replaced by new pump and instantaneous measurements of parameters
mentioned above will be carried out on new pump after stabilisation for same operating
combinations. These parameters will be called post implementation parameters.
Energy savings of a pump for each combination would be determined by multiplying the difference
in instantaneous power consumption in pre and post EEM implementation scenario with
corresponding operating hours mentioned in IGEA. Total savings of a pump will be the summation
of energy savings in each operating combination (i.e. weighted average savings of a pump would be
estimated)
The flow and head of new pump i.e. post implementation parameters should match pre
implementation parameters.
Post implementation parameters will be verified by EESL, ULB and supplier.
Penalty would be imposed on pump supplier if energy savings, at ULB level, are less than 20% of
existing energy consumption
10.3 Pre and post implementation assessment
To determine savings, the following parameters would be measured during pre and post implementation for
each operating combination,
i. Power Consumption, voltage, frequency (kW, Volt, hz)
Data Unit kW, Volt, hz
Description Voltage, frequency and power consumption of all operating combinations (pre and post implementation)
Source of Data On site measurement using calibrated portable instrument (power analyzer)
Description of measurement methods and procedures to be applied
Instantaneous onsite measurement using portable power analyzer
QA/QC procedures to be applied
Calibrated instrument from a NABL accredited laboratory
ii. Flow rate (m3/hr)
Data Unit m
3
/hr
Description Flow rate delivered for all operating combinations (pre and post implementation)
Source of Data On site measurement using calibrated portable instruments (flow meter)
Description of measurement
methods and procedures to
be applied
Instantaneous onsite measurement using portable flow meter
QA/QC procedures to be
applied
Calibrated instrument from a NABL accredited laboratory

97
iii. Head (m)
Data Unit meters (m)
Description Average head delivered for all operating combinations (pre and post implementation)
Source of Data On site measurement using calibrated instruments
Description of measurement
methods and procedures to
be applied
Instantaneous onsite measurement using pressure gauge installed at both the suction and discharge side of the pump
QA/QC procedures to be
applied
Calibrated instrument from a NABL accredited laboratory
10.4 Correction Factors and adjustments
In case of deviation in frequency and voltage at the time of post implementation parameter measurements,
following correction factors would be applied on parameters of new pump to determine actual. Adjustments
factors to be used during M&V are provided in table 24.
Table 24: Adjustment factors to be used during M & V
Factor Affecting Rationale for adjustment Adjustment to be made
Variation in supply frequency As per pump affinity law 𝑄1
𝑄2
=𝑁1
𝑁2
𝑃1
𝑃2
= (𝑁1
𝑁2
)3
Where,
Q is the flow of the meter
N is the speed of the shaft
P is the power drawn
Voltage Variation As per BEE guidelines If the post implementation voltage is 10% higher than pre implementation voltage, power consumption will increases by 0.75%
If the post implementation voltage is 10% lower than pre implementation voltage, power consumption will increase by 2%

98
10.5 Determination of Savings
Based on this data, the energy savings would be calculated as given below:
% 𝑠𝑎𝑣𝑖𝑛𝑔𝑠 (𝑠1) =((𝑘𝑊𝑝𝑟𝑒1 − 𝑘𝑊𝑝𝑜𝑠𝑡1) 𝑋 ℎ1) + ((𝑘𝑊𝑝𝑟𝑒2 − 𝑘𝑊𝑝𝑜𝑠𝑡2) 𝑋 ℎ2) + … … .
(𝑘𝑊𝑝𝑟𝑒1 𝑋 ℎ1) + (𝑘𝑊𝑝𝑟𝑒2 𝑋 ℎ2) + ⋯ …
• Where, 1, 2…. represents parameter for different operating combinations of a pump
• h1, h2 represents annual operating hours of a pump in different combinations
• kWpre – Instantaneous power consumption of old pump in a particular combination
• kWpost – Instantaneous power consumption of new pump in a particular combination
• s1 represents percentage savings of a pump
Further, aggregate savings at a ULB level would be determined based on weighted average savings
of all pumps:
The aggregate percentage savings at ULB would be
𝑎𝑔𝑔𝑟𝑒𝑔𝑎𝑡𝑒 % 𝑠𝑎𝑣𝑖𝑛𝑔𝑠 𝑎𝑡 𝑈𝐿𝐵 =𝑠1 × 𝑒1 + 𝑠2 × 𝑒2 + 𝑠3 × 𝑒3 … … … .
𝑒1 + 𝑒2 + 𝑒3 … …
• Where, e represents energy consumption of one pump in all combination
𝑒1 = 𝑘𝑊𝑝𝑟𝑒1 𝑋 ℎ𝑜𝑢𝑟1 + 𝑘𝑊𝑝𝑟𝑒2 𝑋 ℎ𝑜𝑢𝑟2 + ⋯ … … …
• s1, s2, s3, s4, s5........ are percentage savings for individual pumps replaced at ULB
• e1, e2, e3, e4, e5........ are annual energy consumption of each pump

99
11 Risk Responsibility Matrix & Risk Mitigation
To develop an effective business model, it is necessary to identify clear roles and responsibilities and the
risks associated with the project development. This is useful to develop appropriate structure and plan for
project financing and risk mitigation mechanism for ring fencing the risks of project investors. Some of the
major risks and their mitigation mechanisms are discussed below.As established in the previous sections, the
preferred mode for implementation of this project is annuity mode. Therefore the responsibility matrix has
been prepared considering the preferred implementing mode. Details of financial risk and associated
mitigation measures table 25.
Table 25: Financial Risk Analysis and Mitigation
Risk Key Incidence of risk
Description Mitigation Measure
Operational Risk: Usage risks are usually a direct consequence of use of equipment by the end users. These risks are usually beyond the control of the ESCO
Inaccurate Baseline ULB Baseline for any ESCO based project is usually defined in terms of energy consumption and the performance level of the equipment. In case of pumping stations, when pumps are connected in parallel, few pumps might not be operational during baseline determination. Also, an increase or decrease in operating hours can show up as corresponding increase or decrease in “savings” unless adequate adjustments are applied
The design of the M&V protocol would include sufficient measures in form of engineering formula for baseline correction to sufficiently mitigate this risk
Operational change in the facility
ULB Operational changes can be in terms of change in usage hours. Further in case of pumping system, the operational changes can be a result of use of higher size of pumps, increase in number of pumps connected in a parallel system, increase in required flow among others.
Market Risk: Market risks arise due to uncertainty of market conditions. These risks can be attributed to
various stakeholders and factors including suppliers of technology, maturity of technology and consumers
among others.
Availability of suppliers
EESL Availability of suppliers and the
technology are keys to development of
any ESCO project. Competition in
market leads to market forces
optimizing the cost. This also leads to
new technology innovations and
product differentiation. Dependence on
a single supplier also increase the
project risk, where the project is
dependent on capability of single
vendor to supply quality products in
required quantity in a pre-determined
EESL is mitigating the risk by ensuring the involvement of manufacturers and suppliers throughout the project lifecycle including taking inputs during IGEA preparation. Further pumping is a matured industry with many suppliers

100
Risk Key Incidence of risk
Description Mitigation Measure
time frame. Ineffective competition
may lead to installation of inferior
quality product and also cause delay in
implementation.
Age of the technology
EESL Mature technology are by nature stable
and more dependable than new
technology. The performance
standards for mature technologies are
also well defined. There are many
inherent risks associated with new
technology, these include price
fluctuations, rapid technology
improvements (which could lead to
project being more effective later i.e.
early adopters curse11), lesser
awareness about technology
shortcomings and effects.
Pumping is a matured technology with key technical parameters and fundamentals remaining relatively constant during the past century.
Financial Risk: The financial risk mainly deals with the cost escalations associated with the project. These risks if not mitigated properly affect the profitability and feasibility of the project
Equipment Cost Escalation
ULB The increase in equipment cost could be
due to various factors including increase
in cost of raw materials, changed
policies and regulations. The escalated
cost could result in reducing the project
profitability and in worst scenarios
making the project unviable.
In the annuity mode, the equipment cost considered is the cost discovered in competitive bidding. This will ensure the best possible cost for the ULB. Further, manufacturer’s budgetary quotations are taken while developing the IGEA.
Installation and annual maintenance cost Escalation
ULB (before bidding) Technology supplier (post bidding)
Installation cost is the function of
manpower cost, cost of carrying
inventory and material required for
installation. For a project with longer
execution cycle, managing installation
and annual maintenance cost can be
key to success of the project.
In addition to factor affecting increase in
manpower cost (change in labor laws
etc.), the reasons for installation and
annual maintenance cost are similar to
equipment cost escalation. As the
selected technology supplier is
contractually responsible for installation
For the ULB the mitigation measures are same above
11 The new technology turns old very quickly. Also rapid improvements lead to reduction in cost in near future. For example early adopters of solar technology had to pay a higher feed in tariff as compared to later adopters

101
Risk Key Incidence of risk
Description Mitigation Measure
and annual maintenance at the rate
mentioned in its bids. The risk is
transferred to the technology provider
post bidder selection.
M&V Costs EESL M&V costs tend to vary significantly
depending on the extent of
measurements, involvement of technical
manpower, and automation required in
the M&V methods and protocols
adopted
M&V mechanism will be clearly defined, agreed and incorporated into project financials prior to project implementation
Time and Budget Overruns
EESL Failure to implement a viable project in a
timely manner can add costs
To be addressed by closely monitoring progress with unit
Design and construction risk: Improper design and delays in constructions are a significant risk to ESCO project.
Delays in procurement, installation and commissioning
All stakeholders
Delay in procurement, installation and commissioning could drive up project cost. Longer project durations could also increase the probability of other regulatory and policy related risks. It is important to plan the project efficiently to minimize these risks. Projects undertaken by EESL usually require procurement of large quantity of a single product
Standardization of bidding and other contractual documents is key to minimize this risk. Additionally all the stakeholders including ULBs, state government, manufacturers and energy auditors need to be engaged since project inception
Improper selection of energy efficiency solution and integration of energy efficient solution
All stakeholders
The aim of an ESCO project is reduce energy consumption while maintaining or improving performance of the equipment. Proper selection of solution is important to achieve these objectives. Improper selection of solution could lead to non-achievement of savings as estimated. It could also lead to not meeting the performance parameters from the baseline scenario
The manufacturers and technology suppliers are engaged since the project inception including overseeing energy audit activities and selection of technology. Further the manufacturers should be encouraged to visit the facility before bidding for the project.
Performance risks: related to performance of energy efficient equipment post implementation. Poor performance could lead to reduced savings from the ESCO project. This may result in poor financial returns for the project
Equipment performance depreciation
EESL /Technology Supplier
In many conditions the equipment
performance deteriorates over the life of
the project. The derating of the
equipment needs to be properly
modelled in the business model for the
project. Incorrect assumptions could
lead to severe financial implication of the
project. There are two key reasons for
the equipment performance
Derating of equipment has been appropriately modelled in the financial model. The values of derating have been finalized after consultation with manufacturers. Proper quality control

102
Risk Key Incidence of risk
Description Mitigation Measure
depreciation.
• Quality of equipment:
Equipment installed as a part of
the project does not conform to
quality standards set. It is also
possible that the vendor
supplies equipment which do
not meet the technical
specification set out in the
bidding document.
• External conditions: These
conditions include various
external parameters including
power quality and operating
condition (flow output and pump
submergence) deviating from
the design parameters
action plan needs to be developed as part of the bidding documents and contract. Capacity building of pump operators in proper operations of the new pumps installed
Repair/maintenance and warranty risks
EESL /Technology Supplier
Repair/maintenance and warranty risks
relate to faulty equipment risks. The risk
also arises due to different agencies
being responsible for operations and
repair/maintenance. In case of this
project, operation would be managed by
urban utility, whereas EESL and in turn
technology supplier would be
responsible for the repair and
maintenance. A dispute also might arise
related to deviation from warranty
conditions which are also not under
EESL/technology supplier control. EESL
offers extended warranty up to the life of
the project under most of its projects.
The payment to EESL is also linked to
satisfactory replacement of faulty
equipment and timely repairs.
Capacity building of pump operators will be taken up to facilitate proper operations and routine preventive maintenance of the new pumps installed EESL will define Comprehensive repair and maintenance requirements including spares and components inventory, as well as appropriate systems (e.g. for registering complaints and turn-around times) and will make the equipment suppliers contractually responsible for preventive maintenance requirements.
Environmental and Legal Risk
Reduction of water level
ULB, state government and general population
In areas where ground water is supplied through submersible pumps, another important risk is reduction of water level due to over drawl of water by the farmers because of more efficient high discharge new pumps. This could result in many short and long term environmental effects. If the water table is not recharged consistently if might
Change in operation guidelines, i.e. reduction if water supply hours if the flow is increased

103
Risk Key Incidence of risk
Description Mitigation Measure
result in other long term effects including desertification.
Utilization of old inventory in other areas
ULB and EESL
If the collected inefficient pumps are not destroyed they could be used again. This would defeat the purpose of the project and lead to over-estimation of environmental benefits associated with the project.
Proper destruction of old inventory
Health, Safety and Social risk
Health Safety and Social risk
ULB and EESL
As principal employer EESL is responsible for these risks including:
Nonpayment of minimum wages
Child labor
Insurance for workers
Emergency preparedness, fire & electrical safety
Safety of tools and equipment used
EESL should contractually make the technology supplier and contractor adequately responsible for this risk. As principal employer of all the people working under this project, EESL should collect proper documentation.

104
12 Project Implementation Schedule
12.1 Execution Strategy
EESL and other stakeholders need to pay attention to project execution in order to deliver impactful projects.
The efforts and money on a project that is poorly executed do not produce results on the expected lines.
Following are the project execution strategies to keep projects running efficiently and on schedule:
Define specific and measurable objectives: The well-executed project is seen as one that achieves its
desired results. Those specifics should include:
The timeline for the project- Identify milestones and deadlines that are needed to accomplish
incremental progress.
The staff and infrastructure resources necessary to complete the project. This would include full-time
employees, outside contractors, part-time staff or specialized freelance support to properly execute
the project.
The cost of the project- Be sure to take into account human resources and material costs, including
hardware and software or consulting fees, travel or other incremental expenses.
Plan for the unexpected: The project managers should take into account that not everything will go as
planned. Being prepared for changes also means standing behind a project’s goals on a broad level. As the
project is being executed, project leaders should be able to explain and support what has happened in the
project to date, along with: current status, what the results thus far mean to the project and its objectives, and
what specific impact these results will have on the project in terms of cost reduction, broader opportunities,
etc.
Measure progress through project waypoints: The process to improvement must invariably include
measurement; and not just on a one-and-done basis. The different stakeholders need to measure progress
along the way to see an updated view of the project so that they can respond immediately if (and when)
project parameters need to be re-calibrated or changed. Measurement should be happening organically so
that project leaders have visibility into the time commitment of project participants and the cost of materials
and infrastructure.
12.2 Proposed schedule
The total implementation period of the EEM’s as per the schedule provided by the pumping station is given
in table 26.

105
Table 26: Project Implementation Schedule
T0: Date of signing of MoU between State Government and EESL
Sr. No
Activity T0 T0 +
30 days
T0 +
90 days
T0 +
105 days
T0 +
135 days
1 Signing of MoU between State Government and EESL
2 Inviting tenders for hiring of agency to prepare IGEA Report
3 Preparation of IGEA and submission to ULB
4 Submission of IGEA to SLTC by ULB
5 SLTC approval on IGEA
T1: Date of signing tripartite agreement between State Government, ULB and EESL, known as effective
date
Sr. No
Activity T1 T1 +
30 days
T1 +
90 days
T1 +
255 days
T1 +
270 days
1 Signing of tripartite agreement between State Government, ULB and EESL
2 Inviting tenders for selection of pump supplier
3 Selection of pump supplier
4 Installation of energy efficient pump sets at ULB
5 Submission of M & V report to ULB by EESL
Since the ULB has water supplying priorities; the implementation is proposed to be carried out in such a way
that the operation of pumping station is not impacted.

106
Annexures
The Annexures have been compiled as a separate document.
List of Annexures:
1. Energy Auditor/Manager Certificate
2. Verified Job Cards
3. Calibration Certificates of Instruments
4. Electricity Bills
5. Budgetary Quotations from Pump Manufacturers