Farmers Participatory Evaluations and Selection of Bread ...
Upload
independentCategory
view
7download
0
ORIGINAL PAPER
Investigation of the salt tolerance of new Polish bread and durumwheat cultivars
Agnieszka Pła _zek • Maria Tatrzanska • Maciej Maciejewski •
Janusz Koscielniak • Krzysztof Gondek • Jarosław Bojarczuk •
Franciszek Dubert
Received: 8 January 2013 / Revised: 17 April 2013 / Accepted: 18 April 2013 / Published online: 30 April 2013
� The Author(s) 2013. This article is published with open access at Springerlink.com
Abstract In some regions of the world, low annual pre-
cipitation necessitates irrigation of crop plants which usu-
ally leads to soil salinity. Due to climatic changes this
effect is also expected in the countries of Central Europe,
and so in Poland. The aim of the study was (1) to compare
tolerance to salt stress of Polish Triticum aestivum cvs.
‘Bogatka’ and ‘Banderola’ with T. durum cv. ‘Komnata’
and breeding line 121, and (2) to indicate the physiological
parameter/parameters most suitable for such comparison.
The investigation was performed in two experiments. In the
first one, the germination ability of caryopses and coleop-
tiles’ growth were estimated at 0–250 mM of NaCl. The
second experiment was conducted on plants grown in
a glasshouse in saline soil at 0–150 mM of NaCl
for 6 weeks. Salt tolerance was evaluated on the basis
of following parameters: chlorophyll fluorescence, net
photosynthesis rate (PN), transpiration rate (E), stomatal
conductance (gs), cell membrane permeability (EL), pro-
line content, fresh weight (FW), dry weight (DW), and
relative water content (RWC). Highest germination of
caryopses of durum cultivars was recorded at all the
salinity levels; however, their coleoptiles were shorter than
coleoptiles of bread wheat cultivars. Analysis of chloro-
phyll fluorescence showed that applied salt doses did not
disturb the light phase of photosynthesis in all cultivars
under study. Plants of durum wheat showed the higher
dissipation of energy excess at the level of the antenna
chlorophyll (DIo/CSm) under salinity as compared to
plants of bread wheat. Both ‘Komnata’ and line 121
showed stronger PN reduction as an effect of salinity. A
decline of PN was closely connected with a decrease in gs.
The PN correlated with a decrease in DW in all studied
cultivars except ‘Bogatka’. Control plants of ‘Komnata’
and line 121 were characterized by higher EL and proline
level than bread wheat cultivars. An increasing cell mem-
brane permeability correlated with a decrease of RWC in
‘Banderola’ and ‘Komnata’. The content of proline under
the increasing salinity correlated with changes of RWC in
‘Banderola’, ‘Komnata’ and line 121, which indicate pro-
tectoral role of proline against dehydration of tissue. Dry
weight and RWC seem to be the parameters most useful in
the salt-tolerance estimation of wheat plants. Taking into
account the studied parameters ‘Banderola’ could be rec-
ognized as more salt tolerant, the degree of salinity toler-
ance of ‘Bogatka’ is the same as line 121, while ‘Komnata’
seems to be the most salt sensitive. The salt tolerance of
T. aestivum and T. durum depends on the cultivar rather
than the wheat species.
Keywords Chlorophyll fluorescence � Photosynthesis �Proline � Salt stress � Triticum aestivum � Triticum durum
Communicated by W. Filek.
A. Pła _zek (&) � J. Koscielniak
Department of Plant Physiology, Faculty of Agriculture
and Economics, University of Agriculture, Podłu _zna 3,
30-239 Krakow, Poland
e-mail: [email protected]
M. Tatrzanska � M. Maciejewski � F. Dubert
F. Gorski Institute of Plant Physiology, Polish Academy
of Sciences, Niezapominajek 21, 30-239 Krakow, Poland
K. Gondek
Department of Agricultural and Environmental Chemistry,
Faculty of Agriculture and Economics, University
of Agriculture, Mickiewicza 21, 31-120 Krakow, Poland
J. Bojarczuk
Plant Breeding Smolice, Plant Breeding and Acclimatization
Institute Group, 63-740 Kobylin, Smolice 146, Poland
123
Acta Physiol Plant (2013) 35:2513–2523
DOI 10.1007/s11738-013-1287-9

Abbreviations
ABS/CSm Light energy absorbed by leaf cross-section
(CS)
DIo/CSm Dissipation of energy flux at the level of the
antenna chlorophylls
DW Dry weight
E Transpiration rate
EL Electrolyte leakage
ETo/CSm Quantum yield of photosynthetic electron
transport chain after QA per cross-section
(CS)
Fv/Fm Potential photochemical PSII efficiency
FW Fresh weight
gs Stomatal conductivity
OEC The fraction of O2 evolving centres PSII in
comparison with the control sample
PI(CSm) The performance index defined on a cross-
section (CS) basis and calculated as:
PI(ABS) 9 ABS/CSm where: PI(ABS) - (RC/
ABS) 9 (uPo/(1 - uPo)) 9 (wo/(1 - wo))
RC is for reaction centre ABS is for
absorption flux, uPo is for maximum
quantum yield for primary photochemistry,
and wo is for the quantum yield for electron
transport
PN Net photosynthesis rate
PSII Photosystem II
SSI Salt susceptibility index
QA The first stable electron quinone acceptor in
PSII
TRo/CSm Trapped energy flux per cross-section (CS),
quantum yield of primary photochemistry
(from RC to QA) per CS
RWC Relative water content
Introduction
The area affected by salinity in the world amounts to more
than 800 million hectares of land, so salinity is becoming a
serious problem for crop productivity (Munns and Tester
2008). Apart from natural soil salinity it is also evoked by
such agronomic practices, such as improper irrigation and
fertilization. In some regions of the world, low annual
precipitation necessitates irrigation of crop plants with
water which sometimes could not be completely desalted.
However, in most cases soil salinity is an effect of salt
accumulation over long cultivation periods and deforesta-
tion (Brini et al. 2009). In Poland, located in Central
Europe, the progressive reduction of the groundwater level
and more frequent periods of drought cause 30 % losses of
grain yield, which results in the need for plant watering
(Schar et al. 2004; Martyniak et al. 2007; Walter et al.
2011). It can, therefore, be expected that soil salinity will
also affect regions that have not yet experienced such
important problem with this environmental stress.
Salinity may cause osmotic stress and ion toxicity stress
due to Na? and Cl-. Osmotic stress has an immediate
effect on plant growth and stronger influence growth rates
than ionic stress (Munns and Tester 2008). A high con-
centration of sodium ions disturbs the osmotic balance and
results in physiological drought-inhibiting water uptake by
the plant. The toxic influence of Na? may be manifested by
the premature death of leaves, degradation of the cell
membranes, inhibition of many enzymes, as well as dam-
ages of photosynthetic apparatus (Mitsuya et al. 2003). The
biochemical strategies of plants within defence response to
salinity are, among others: selective build-up or exclusion
of salt ions, control uptake of ions by roots and transport
into leaves, ion compartmentation, synthesis of osmolytes,
changes in membrane structure, as well as activation of
antioxidant defence system (Munns and Tester 2008). The
threshold level of salt stress for most plants is approxi-
mately 40 mM NaCl, which is equivalent to 4 dS m-1,
while 50–100 mM NaCl is recognized as moderate salinity
(Munns and James 2003). The latter authors maintain that
only salinity over 200 mM of NaCl identifies more salt
tolerant genotypes of such plant species as wheat. How-
ever, Rawat et al. (2011) stated that 1.5 dS m-1 injures
most plants. Most of the crops respond to salinity as typical
glycophytes and demonstrate differentiated tolerance levels
to this stress. According to Munns and Tester (2008),
barley can be recognized as the most salt-tolerant cereal,
while rice as the most sensitive one.
The most considerable criterion of salt tolerance is a
production of biomass, which is significantly declined due
to soil salinity. In cereals, the major effect of salinity is a
reduction of the number of tillers (Munns and James 2003).
According to Ashraf and Ali (2008), the selection of spe-
cies sensitive to environmental stresses have been based on
such parameters as relative growth and relative growth
reduction. Reduced leaf development results in a build-up
of unused photosynthate and may generate feedback sig-
nals to downregulate photosynthesis (Munns et al. 2000;
Paul and Foyer 2001). Salt stress causes stomatal closure,
which limits CO2 fixation. Lower rate of photosynthesis
stimulates the generation of reactive oxygen species
(ROS), which disturb the photochemical processes in thy-
lakoids and can evoke strong photoinhibition (Sairam and
Tyagi 2004).
The degree of salt and drought tolerance is often esti-
mated on the basis of ion leakage (EL) from leaves as a
parameter of cell membrane permeability (Munns and
James 2003; Hura et al. 2007; Filek et al. 2012). These
authors have stated that membrane permeability is affected
2514 Acta Physiol Plant (2013) 35:2513–2523
123

by both osmotic and ion toxic stresses. Damage of mem-
brane structure as a result of salinity can be due to toxic
influence of Na? ions which cause strong membrane
depolarization and the consequent effect of lipid peroxi-
dation (Yasar et al. 2006).
Plant response to salinity is an accumulation of osmo-
protectant proline. It provides membrane stability and
alleviates cell membrane destruction caused by a high salt
concentration. Moreover, proline may contribute to the
osmotic regulation that maintains water content in leaves
(Mansour 1998).
Bread wheat (Triticum aestivum L.) is the main cereal
cultivated in Poland and in most countries around the
world. Although cultivation of T. durum Desf. has not been
yet popular in Poland, in recent years several new Polish
spring and winter cultivars of this cereal have been bred.
Triticum durum is the second most important wheat in
Southern Europe and the Middle East. In addition, it is
often cultivated on soils affected by salinity although,
according to some reports, durum wheat is less salt tolerant
compared to bread wheat (Noori and McNeilly 2000;
Munns and James 2003). Greenway and Munns (1980)
have stated that the growth and photosynthetic efficiency in
wheat may be reduced by salinity even at a low salt con-
centration. Munns and James (2003) maintain additionally
that the plant resistance degree to salinity depends on stress
duration, so screening of plant resistance to salt should last
at least 2–3 weeks.
The aim of the presented work was to evaluate if new
Polish cultivars of T. durum are less tolerant to salinity than
cultivars of T. aestivum. The response of plants of both
wheat species to salinity was estimated on the basis of the
parameters most often described in the literature. The study
was performed on germinating caryopses at 0–250 mM
NaCl level and plants grown at 0–150 mM NaCl. The
caryopses germination ability in different salt concentra-
tions, chlorophyll fluorescence, photosynthesis and tran-
spiration rate, stomatal conductance, ion leakage from
leaves, proline content, as well as fresh and dry weight of
plants grown under salt stress were evaluated. On the basis
of results obtained in two independent experiments per-
formed in the controlled conditions, the parameters most
useful in the screening of plant salt tolerance were chosen.
Materials and methods
Plant material
The study was performed on T. aestivum winter cultivars
‘Bogatka’ and ‘Banderola’, and T. durum winter cultivar
‘Komnata’ and line 121. Caryopses of T. aestivum were
obtained from the Department of Cereal Plants of the Plant
Breeding and Acclimatization Institute in Krakow
(Poland), while T. durum from Plant Breeding Smolice,
Plant Breeding and Acclimatization Institute Group
(Poland).
Germination of caryopses and coleoptiles length
Caryopses were sterilized in 0.5 % NaOCl for 15 min, then
washed three times with sterile distilled water and placed
on Petri dishes (Ø = 10 cm) with filter paper wetted with
NaCl solutions of the following concentrations: 0 (control),
20, 40, 70, 100, 150, 200, and 250 mM. Fifteen caryopses
were put on each dish. The evaluation was conducted in
five replicates (five dishes for each salt concentration).
Caryopses were germinated in the dark at 25 �C for 6 days.
After this time, a percentage of germinated caryopses was
calculated for each dish, while the length of coleoptiles was
measured individually for 20 seedlings grown at each salt
treatment. The influence of salinity was expressed as salt
susceptibility index (SSI) calculated as below:
SSI = (1 - G1/G2) 9 100, where: G1 grain germina-
tion in salt solution, G2 grain germination in pure water
(control). Analogically, SSI for coleoptiles length was
calculated. The presented results are the means of two
independent experiments.
Plant cultivation and salt treatments
Pots (4 dm3) were filled with commercial substrate (pH 6)
and watered with solutions of the following NaCl con-
centrations: 0 (control), 20, 40, 70, 100, 125, and 150 mM.
The applied salt concentrations were chosen on the basis of
results relating to germination ability of seeds, obtained in
the first stage of the investigation. To state the real salt
content in the soil, the conductivity of soil solution was
estimated for each NaCl treatment. Soil was air-dried at
70 �C for 2 days, mixed with the water in a ratio of 1:5 and
conductivity of the soil solution was analyzed using a
conductometer (CI 317, Elmetron, Poland). The results of
the conductivity test for studied NaCl concentration are
presented in Table 1.
Table 1 Conductivity of commercial soil watered with NaCl solu-
tions of 0, 20, 40, 70, 100, 125, and 150 mM
NaCl (mM) dS m-1 s-1
0 1.695
20 2.675
40 5.005
70 8.365
100 11.250
125 13.750
150 17.200
Acta Physiol Plant (2013) 35:2513–2523 2515
123
Seeds, sterilized as described above, were sown in pots
and nine plants per pot were maintained. The plants were
grown for 6 weeks under glasshouse conditions at 22 �C,
in daylight (April–May) supplemented with the light of
400 lmol m-2 s-2 PPFD (AGRO Philips sodium lamps)
up to a 16-h photoperiod. The plants were watered with
NaCl solutions of the same volume, and once a week with
Hoagland’s medium (Hoagland and Arnon 1938) was
added to the salt solutions to obtain NaCl concentration as
above. The described plant growth conditions were the
same in two independent experiments. All analyses were
performed after a 6-week cultivation of plants under salt
stress. Similarly as in the case of evaluation of seed ger-
mination capacity, the presented results are the means of
both experiments.
Chlorophyll fluorescence
Chlorophyll fluorescence was measured in the third upper
well-developed leaf using the Plant Efficiency Analyser
(PEA) (Hansatech Ltd., Kings Lynn, UK). Before mea-
surements, the LED—light source of the fluorometer was
calibrated using an SQS light meter (Hansatech Ltd., Kings
Lynn, UK). The excitation irradiance had an intensity of
3,000 lmol m-2 s-2 (peak at 650 nm). Measurements
were taken after 30 min of leaf adaptation to darkness
(clips with a 4-mm diameter hole). Fluorescence intensity
was measured with a PIN-photodiode after being passed
through a long-pass filter. Changes in fluorescence were
registered during irradiation between 10 ls and 1 s. During
the initial 2 ms, the data were collected every 10 ls with
12-bit resolution. After this period, the frequency of mea-
surements was reduced automatically. On the basis of these
measurements, the following parameters (per excited leaf
cross-section, CS) were calculated based on the theory of
energy flow in PSII and using the JIP test as has been
described elsewhere (Lazar 1999; Strasser et al. 2000):
ABS/CSm, TRo/CSm, ETo/CSm, DIo/CSm, PI(CSm), OEC,
Fv/Fm. The measurements were performed in 15 replicates.
Gas exchange
Net photosynthetic (PN), transpiration (E) rates and sto-
matal conductance (gs) of plants in the stage of the fifth leaf
were measured by means of an infrared gas analyzer
(Ciras-1, Hansatech Ltd., Kings Lynn, UK) with a Par-
kinson leaf chamber (PLC6) automatically controlling the
measurement conditions. The irradiation system consisted
of halogen lamps. The leaf chamber was fastened on the
middle part of the fourth leaf. The flow rate of air with
constant CO2 concentration [400 lmol(CO2) mol-1(air)]
through the assimilation chamber was 300 cm-3 min-1.
The temperature of the leaves was 25 �C, the air humidity
40 %, and the irradiance 800 lmol(photon) m-2 s-1. The
measurements were performed in 15 replicates.
Electrolyte leakage
Ion leakage determining the plasma membrane’s integrity
was measured in the fourth upper, well-expanded leaves.
Leaf discs (Ø = 1 cm) were washed in distilled water, put
into plastic vials containing 10 cm3 deionised water and
shaken for 24 h (50 rpm) at 20 �C. Next, ion conductivity
was measured (EL1) using a conductometer (CI 317,
Elmetron, Poland). Then the samples were frozen at
-40 �C for 24 h after thawing they were shaken again for
24 h and, next, total ion leakage (EL2) was measured.
Membrane permeability was expressed as a percentage of
total electrolyte leakage (EL1 9 100/EL2). The measure-
ments were done in ten replicates for each NaCl treatment.
Proline content
The content of free proline in wheat leaves was deter-
mined as described by Bates et al. (1973). Samples were
homogenized in 3 % (w/v) sulfosalicylic acid to precipi-
tate protein, and centrifuged at 14,0009g for 10 min. The
reaction mixture contained 2 cm3 glacial acetic acid,
2 cm3 ninhydrin reagent (2.50 % w/v ninhydrin in 60 %
v/v 6 M phosphoric acid) and 2 cm3 of supernatant. The
incubation lasted for 1 h at 90 �C then, after stopping the
reaction with ice, 4 cm3 of toluene was added and mixed
by vortex. The upper toluene phase was decanted into a
glass cuvette and absorbance was measured at
k = 520 nm. The concentration was assayed using proline
as the calibration standard. Each assay was performed in
seven replicates representing seven leaves from different
plants for each treatment. The content of proline was
expressed as mg g-1 of DW.
Fresh and dry weight and relative water content
Fresh weight (FW) of the above ground part of the plants
was weighed, next their dry weight (DW) was estimated
after 48-h drying at 70 �C. RWC in leaves was calculated
according to the formula: (FW - DW)/DW. The RWC
parameter means number of grams of water needed to
hydrate 1 g of plant dry weigh. Analyses were done in 15
replicates.
Statistical analyses
All data were analyzed with Statistica 9.0 software (Stat-
soft, Tulsa, OK, USA) using a one-way ANOVA. The
differences between means were analyzed according to
multiple range Duncan’s test at p \ 0.05.
2516 Acta Physiol Plant (2013) 35:2513–2523
123

Results
Germination of caryopses
The percentage of germinated grains of ‘Bogatka’ was similar
in NaCl concentrations of 0–150 mM, only higher salt levels
(200 and 250 mM of NaCl) significantly decreased its cary-
opses germination ability (Table 2). In ‘Banderola’, a signif-
icant reduction of germination was noted already at 20 mM of
NaCl. This cultivar was also characterized by the highest salt
susceptibility amongst all the studied cultivars (SSI at 250 mM
of NaCl amounted to 33.6, 16.2, 2.2, and 0.7 % for ‘Bande-
rola’, ‘Bogatka’, line 121 and ‘Komnata’, respectively). Both
cultivars of durum wheat demonstrated non-significant salin-
ity influence on the number of germinated grains.
Salt stress affected stronger coleoptiles’ growth than seed
germination (Table 3). In control combination coleoptiles of
durum wheat were shorter as compared to coleoptiles of
bread wheat. ‘Bogatka’ showed considerable reduction of its
coleoptiles’ length already at 20-mM concentration, while
‘Banderola’ at 70 mM and higher. The pattern of salt
influence on coleoptiles’ length noted for ‘Banderola’ was
similar as in both durum cultivars. The values of SSI showed
that the coleoptiles of both bread wheat cultivars were less
sensitive to salinity than the durum wheat ones: SSI for
‘Bogatka’ and ‘Banderola’ at 250 mM amounted to 84.3 and
83.7 %, respectively, while for line 121 and ‘Komnata’ it
amounted to 87.9 and 89.3 %, respectively.
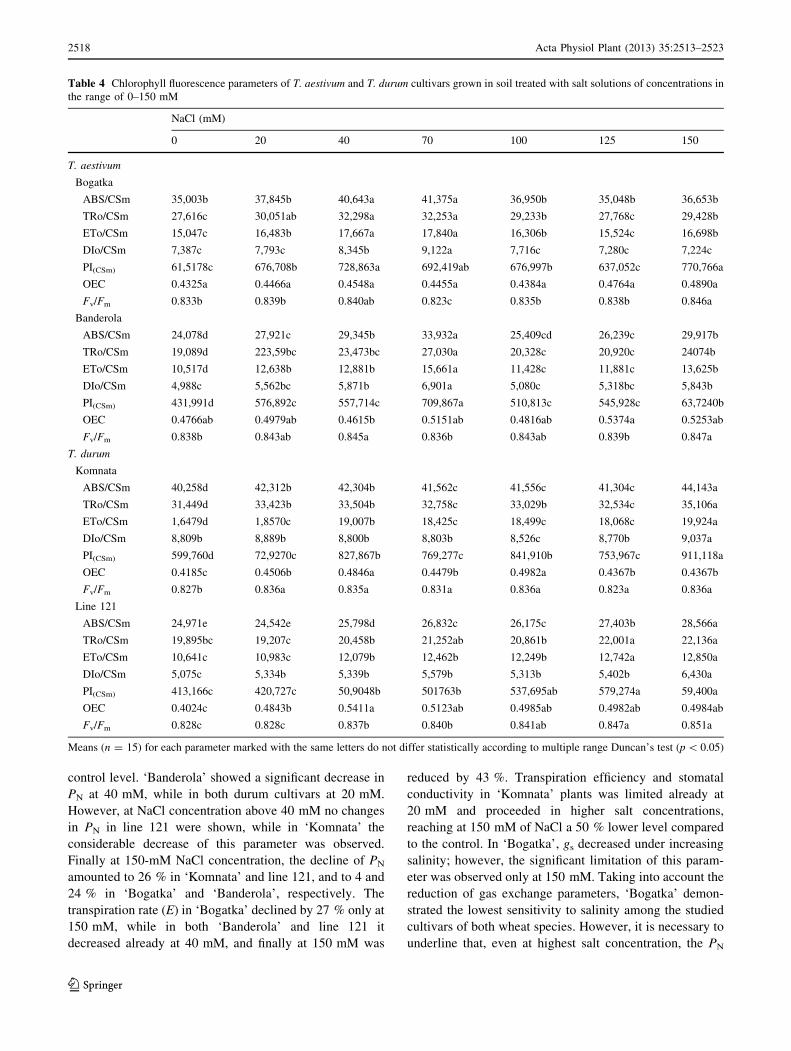
Chlorophyll fluorescence
Analysis of chlorophyll fluorescence clearly divided the
plant response to salt stress into two groups: bread wheat
and durum wheat cultivars. In the case of ‘Bogatka’, most
studied parameters reached the highest values in NaCl
concentration of 40 and 70 mM (Table 4). Salt concen-
tration of 100–150 mM decreased the values of such
parameters as ABS/CSm, TRo/CSm, ETo/CSm and DIo/
CSm, while Fv/Fm and PICSm reached the highest level in
plants grown at 150 mM. Efficiency of OEC did not
change under rising salinity. ‘Banderola’ also showed the
highest efficiency of photosynthetic apparatus at 70 mM of
NaCl. Only Fv/Fm reached the highest level at 150 mM,
while the OEC parameter—similarly as in ‘Bogatka’—was
generally not sensitive to salt stress. Likewise as in ‘Bog-
atka’, DIo/CSm (energy dissipation) reached the maximal
values at 70 mM, while a higher salt concentration caused
its decrease.
Both cultivars of T. durum demonstrated the highest
efficiency of photosynthetic apparatus in plants grown at
125 and 150 mM of NaCl. In the case of ‘Komnata’, OEC
reached the highest values in plants grown at 40 and
100 mM, while in line 121 it increased at 40 mM and at
higher salt levels. Potential photochemical efficiency
(Fv/Fm) did not change in ‘Komnata’, while it increased
gradually in higher salt concentrations. In both durum
cultivars DIo/CSm was maximal at the highest salt
concentration.
Gas exchange
All the studied cultivars, with the exception of ‘Bogatka’,
showed a decrease in PN under rising soil salinity
(Table 5). ‘Bogatka’ reached the highest PN rate at
125 mM of NaCl, while at 150 mM it declined up to the
Table 2 Germination of caryopses of T. aestivum and T. durum
cultivars treated with salt solutions of concentrations in the range of
0–250 mM
NaCl
(mM)
T. aestivum T. durum
Bogatka Banderola Komnata Line 121
% SSI % SSI % SSI % SSI
0 94.5a 0 100a 0 97.2a 0 97.6a 0
20 91.8a 2.9 94.0b 6.0 97.2a 0 96.6a 2.0
40 94.5a 0 94.0b 6.0 97.2a 0 97.7a 0
70 94.5a 0 94.0b 6.0 97.2a 0 93.3a 4.4
100 91.8a 2.9 91.9b 8.1 90.6a 6.8 96.1a 1.5
150 84.6ab 10.5 79.1bc 20.9 97.1a 0.1 96.7a 1.0
200 81.1b 14.2 72.6 c 27.4 95.8a 0.9 97.6a 0
250 79.2b 16.2 66.4c 33.6 96.5a 0.7 95.5a 2.2
Left column: percentage of germinating grains, right column: values
of SSI coefficient (%). Means (n = 5) within each column marked
with the same letters do not differ statistically according to multiple
range Duncan’s test (p \ 0.05)
Table 3 Length of the coleoptiles of T. aestivum and T. durum cul-
tivars germinating in salt solutions of concentrations in the range of
0–250 mM
NaCl
(mM)
T. aestivum T. durum
Bogatka Banderola Komnata Line 121
mm SSI mm SSI mm SSI mm SSI
0 61.0a 0 64.3a 0 55.1a 0 48.6a 0
20 47.7b 21.8 63.4a 1.4 49.2a 10.7 46.6a 4.1
40 34.5c 43.4 60.5a 5.9 48.2a 12.5 42.4a 12.8
70 27.2cd 55.4 40.3b 37.3 26.9b 51.2 28.7b 40.9
100 23.5d 61.5 27.7c 56.9 23.6b 57.2 26.6b 45.3
150 23.0d 62.3 25.9c 59.7 18.0bc 67.3 15.1c 68.9
200 18.0de 70.5 23.5c 63.5 9.6c 82.6 10.4c 78.4
250 9.6e 84.3 10.5d 83.7 5.9c 89.3 5.9d 87.9
Left column: length of the coleoptiles (mm) 6 days after germination,
right column: values of SSI coefficient (%). Means (n = 20) marked
within each column with the same letters do not differ statistically
according to multiple range Duncan’s test (p \ 0.05)
Acta Physiol Plant (2013) 35:2513–2523 2517
123
control level. ‘Banderola’ showed a significant decrease in
PN at 40 mM, while in both durum cultivars at 20 mM.
However, at NaCl concentration above 40 mM no changes
in PN in line 121 were shown, while in ‘Komnata’ the
considerable decrease of this parameter was observed.
Finally at 150-mM NaCl concentration, the decline of PN
amounted to 26 % in ‘Komnata’ and line 121, and to 4 and
24 % in ‘Bogatka’ and ‘Banderola’, respectively. The
transpiration rate (E) in ‘Bogatka’ declined by 27 % only at
150 mM, while in both ‘Banderola’ and line 121 it
decreased already at 40 mM, and finally at 150 mM was
reduced by 43 %. Transpiration efficiency and stomatal
conductivity in ‘Komnata’ plants was limited already at
20 mM and proceeded in higher salt concentrations,
reaching at 150 mM of NaCl a 50 % lower level compared
to the control. In ‘Bogatka’, gs decreased under increasing
salinity; however, the significant limitation of this param-
eter was observed only at 150 mM. Taking into account the
reduction of gas exchange parameters, ‘Bogatka’ demon-
strated the lowest sensitivity to salinity among the studied
cultivars of both wheat species. However, it is necessary to
underline that, even at highest salt concentration, the PN
Table 4 Chlorophyll fluorescence parameters of T. aestivum and T. durum cultivars grown in soil treated with salt solutions of concentrations in
the range of 0–150 mM
NaCl (mM)
0 20 40 70 100 125 150
T. aestivum
Bogatka
ABS/CSm 35,003b 37,845b 40,643a 41,375a 36,950b 35,048b 36,653b
TRo/CSm 27,616c 30,051ab 32,298a 32,253a 29,233b 27,768c 29,428b
ETo/CSm 15,047c 16,483b 17,667a 17,840a 16,306b 15,524c 16,698b
DIo/CSm 7,387c 7,793c 8,345b 9,122a 7,716c 7,280c 7,224c
PI(CSm) 61,5178c 676,708b 728,863a 692,419ab 676,997b 637,052c 770,766a
OEC 0.4325a 0.4466a 0.4548a 0.4455a 0.4384a 0.4764a 0.4890a
Fv/Fm 0.833b 0.839b 0.840ab 0.823c 0.835b 0.838b 0.846a
Banderola
ABS/CSm 24,078d 27,921c 29,345b 33,932a 25,409cd 26,239c 29,917b
TRo/CSm 19,089d 223,59bc 23,473bc 27,030a 20,328c 20,920c 24074b
ETo/CSm 10,517d 12,638b 12,881b 15,661a 11,428c 11,881c 13,625b
DIo/CSm 4,988c 5,562bc 5,871b 6,901a 5,080c 5,318bc 5,843b
PI(CSm) 431,991d 576,892c 557,714c 709,867a 510,813c 545,928c 63,7240b
OEC 0.4766ab 0.4979ab 0.4615b 0.5151ab 0.4816ab 0.5374a 0.5253ab
Fv/Fm 0.838b 0.843ab 0.845a 0.836b 0.843ab 0.839b 0.847a
T. durum
Komnata
ABS/CSm 40,258d 42,312b 42,304b 41,562c 41,556c 41,304c 44,143a
TRo/CSm 31,449d 33,423b 33,504b 32,758c 33,029b 32,534c 35,106a
ETo/CSm 1,6479d 1,8570c 19,007b 18,425c 18,499c 18,068c 19,924a
DIo/CSm 8,809b 8,889b 8,800b 8,803b 8,526c 8,770b 9,037a
PI(CSm) 599,760d 72,9270c 827,867b 769,277c 841,910b 753,967c 911,118a
OEC 0.4185c 0.4506b 0.4846a 0.4479b 0.4982a 0.4367b 0.4367b
Fv/Fm 0.827b 0.836a 0.835a 0.831a 0.836a 0.823a 0.836a
Line 121
ABS/CSm 24,971e 24,542e 25,798d 26,832c 26,175c 27,403b 28,566a
TRo/CSm 19,895bc 19,207c 20,458b 21,252ab 20,861b 22,001a 22,136a
ETo/CSm 10,641c 10,983c 12,079b 12,462b 12,249b 12,742a 12,850a
DIo/CSm 5,075c 5,334b 5,339b 5,579b 5,313b 5,402b 6,430a
PI(CSm) 413,166c 420,727c 50,9048b 501763b 537,695ab 579,274a 59,400a
OEC 0.4024c 0.4843b 0.5411a 0.5123ab 0.4985ab 0.4982ab 0.4984ab
Fv/Fm 0.828c 0.828c 0.837b 0.840b 0.841ab 0.847a 0.851a
Means (n = 15) for each parameter marked with the same letters do not differ statistically according to multiple range Duncan’s test (p \ 0.05)
2518 Acta Physiol Plant (2013) 35:2513–2523
123

rate in leaves of both durum cultivars was the same as in
leaves of ‘Bogatka’ and higher than in ‘Banderola’. Prob-
ably the reason for this is the fact that in both T. durum
cultivars photosynthetic apparatus was less injured by salt
stress (which was documented by some chlorophyll fluo-
rescence parameters), and natural PN level in the control
plants was higher than in T. aestivum cultivars.
Electrolyte leakage
The control plants of both species differed significantly in
their natural cell membrane permeability (Table 6). Durum
cultivars demonstrated a 2–3times higher electrolyte leak-
age from leaves than both bread wheat cultivars. Salinity
increased EL in all plants under study. In ‘Banderola’, the
highest ion leakage was observed at 100 and 125 mM of
NaCl (an increase by 45 % in relation to the control), while
in ‘Bogatka’ it was observed at 125 mM (57 %). In the
case of ‘Komnata’, an increasing ion leakage under a rising
salt concentration was observed, and finally at 150 mM of
NaCl it was twofold higher than in the control. Line 121
demonstrated the highest cell membrane permeability at 70
and 100 mM of NaCl (an increase in relation to the control
amounted to 22 and 12 %, respectively). In all cultivars,
with the exception of ‘Komnata’, the highest ion leakage
was observed not only in the highest applied salt doses but
in concentrations in the range of 70–125 mM. In ‘Bande-
rola’ and ‘Komnata’, a negative correlation between EL
and RWC was found (r = -0.77 and r = -0.76; p \ 0.05,
respectively), what means that an increase in cell mem-
brane permeability caused a decrease in water content
calculated per g of DW. A negative influence of an increase
in EL on FW was proved only for ‘Komnata’ plants (r =
-0.76; p \ 0.05).
Proline content
Control plants of both durum cultivars contained about a
2–2.5 times greater proline amount than the studied culti-
vars of bread wheat (Table 7). In the case of ‘Bogatka’, the
highest amount of this amino acid was observed in a
salinity of 125 mM, while in ‘Banderola’ it was only at
20 mM of NaCl. ‘Komnata’ plants contained the highest
level of proline at 70 mM, while plants of line 121 at 125,
and 150 mM of NaCl. In summary, the pattern of proline
amount change under salinity was similar for both ‘Bog-
atka’ and line 121, and for both ‘Banderola’ and ‘Kom-
nata’. This result suggests that proline accumulation as a
defence response to salt stress is specific for the cultivar,
not for wheat species. Only in the ‘Bogatka’ plants, a
positive correlation between proline content and PN was
found (r = 0.88; p \ 0.05). The proline content in tissue
correlated with RWC in ‘Banderola’, ‘Komnata’ and line
Table 5 Net photosynthesis rate (lmol CO2 m-2 s-1), transpiration efficiency (mmol H2O m-2 s-1), and stomatal conductance (mmol
H2O m-2 s-1) of seedlings of T. aestivum and T. durum cultivars grown in soil treated with salt solutions of concentrations in the range of
0–150 mM
NaCl (mM) T. aestivum T. durum
Bogatka Banderola Komnata Line 121
PN E gs PN E gs PN E gs PN E gs
0 11.3cd 2.2ab 77ab 11.4a 2.1a 77a 13.5a 2.8a 107a 14.3.0a 2.8a 120a
20 11.7bc 2.1ab 77ab 11.6a 2.0a 75a 12.9b 2.3b 89b 13.0b 2.6a 105a
40 11.8bc 2.0ab 75ab 9.8b 1.6b 60b 13.0ab 2.2c 84b 10.9c 2.0b 88b
70 11.4c 1.9b 68b 8.6d 1.3cd 46cd 11.8c 1.6d 60c 10.5c 1.6cd 61c
100 12.2b 2.2a 82a 8.2d 1.2d 42d 8.3f 1.2f 42e 11.1c 1.8bc 70c
125 13.3a 2.0ab 76ab 9.4bc 1.4c 49c 10.8d 1.4e 52d 10.7c 1.5d 58c
150 10.9d 1.4c 52c 8.7cd 1.2d 44cd 10.01e 1.4e 51d 10.5c 1.6d 56c
Means (n = 15) within each column marked with the same letters do not differ statistically according to multiple range Duncan’s test (p \ 0.05)
PN net photosynthesis rate, E transpiration efficiency, gs stomatal conductance
Table 6 Percentage of electrolyte leakage from leaf cells of T. aes-
tivum and T. durum cultivars grown in soil treated with salt solutions
of concentrations in the range of 0–150 mM
NaCl (mM) T. aestivum T. durum
Bogatka Banderola Komnata Line 121
0 6.24 b 6.73 bc 12.62 d 18.87 b
20 4.72 b 4.14 c 18.31 c 17.33 b
40 6.66 b 5.50 bc 22.65 ab 18.07 b
70 7.05 b 4.31 c 20.51 b 24.09 a
100 6.61 b 12.46 a 19.35 bc 21.34 ab
125 14.24 a 11.90 a 24.40 ab 18.23 b
150 8.28 b 7.94 b 25.22 a 17.75 b
Means (n = 10) within each column marked with the same letters do
not differ statistically according to multiple range Duncan’s test
(p \ 0.05)
Acta Physiol Plant (2013) 35:2513–2523 2519
123

121 (r coefficient amounted to 0.79, 0.76 and 0.87 at
p \ 0.05, respectively). These results evident confirm
protection role of this osmolyte against tissue dehydration
in most wheat plant grown in saline soil.
Fresh and dry mass and relative water content
Salinity stress decreased FW in all the studied cultivars
(Table 8). In ‘Bogatka’ and ‘Banderola’, the reduction of
FW was observed at 70 mM and at higher concentrations
of NaCl. Fresh mass decreased in ‘Komnata’ at 100 mM,
while in line 121 gradually from 20 mM. A salt concen-
tration of 150 mM caused a decline of FW amounting to
50, 36, 48, and 66 % in the ‘Bogatka’, ‘Banderola’,
‘Komnata’ and line 121, respectively. A considerable
decrease in DW was closely associated with the decrease in
FW in the case of all plants. Salt concentration of 150 mM
caused the strongest DW reduction in line 121 (it amounted
to 38 %), while the lowest DW lost was noted in the case
of ‘Banderola’ (13 %). Plants of ‘Bogatka’ and ‘Komnata’
showed a decline of this parameter amounting to about
30 %. In the case of all studied cultivars except ‘Bogatka’,
a reduction of DW correlated significantly with PN limi-
tation (r = 0.33, 0.38 and 0.34 at p \ 0.05 for ‘Banderola’,
‘Komnata’ and line 121, respectively). It is worth to add,
that only for line 121 a correlation between energy dissi-
pation in PSII (DIo/CSm) and FW (r = -0.52; p \ 0.05)
and DW (r = -0.47; p \ 0.05) was found.
Relative water content declined under increasing salinity
in all the cultivars (Table 8). The reduction of this
parameter at 150 mM in ‘Banderola’, ‘Komnata’ and line
121 amounted to 30 %, whereas in ‘Bogatka’ to 40 %. In
the case of the latter, the first symptoms of water loss were
already observed at 20 mM, while in ‘Banderola’ at
100 mM, in ‘Komnata’ at 70 mM, and in line 121 at
40 mM. Taking into account the changes in DW and RWC,
‘Banderola’ differs significantly from the other cultivars
under study and seems to be more salt tolerant.
Discussion
Caryopses of both durum cultivars were germinated in the
NaCl solutions of 0–250 mM. The ‘Banderola’ cultivar of
T. aestivum showed a little (however statistically signifi-
cant) decrease in caryopses germination already at 20 mM,
whereas ‘Bogatka’ only at 200 and 250 mM of NaCl. Thus,
germination ability under salt stress depends on cultivar
specificity and not plant species. This conclusion confirms
the earlier results of Noori and McNeilly (2000) who found
that reduction of root and shoot length of T. durum plants
under 100 mM NaCl depended on genotype. Rawat et al.
(2011) observed a decrease in the germination rate of
T. aestivum caryopses in soil with a salt concentration of
0–60 mM, while Hu et al. (2012) noted this effect at
Table 7 Proline content (mg g-1 DW) in the leaves of T. aestivum
and T. durum cultivars grown in soil treated with salt solutions of
concentrations in the range of 0–150 mM
NaCl (mM) T. aestivum T. durum
Bogatka Banderola Komnata Strain 121
0 2.07 b 1.98 b 4.20 bc 5.55 a
20 2.62 ab 3.15 a 5.36 b 3.41 b
40 2.56 ab 1.59 bc 3.40 c 2.90 b
70 1.99 b 2.02 b 6.03 a 1.83 d
100 2.47 ab 1.82 b 2.71 c 2.34 bc
125 3.22 a 1.32 c 2.83 c 5.43 a
150 2.23 b 1.55 bc 2.86 c 5.17 a
Means (n = 7) within each column marked with the same letters do
not differ statistically according to multiple range Duncan’s test
(p \ 0.05)
Table 8 Fresh (g) and dry (g) weight and relative water content (g H2O g-1 of DW) of seedlings of T. aestivum and T. durum cultivars grown in
soil treated with salt solutions of concentrations in the range of 0–150 mM
NaCl (mM) T. aestivum T. durum
Bogatka Banderola Komnata Line 121
FW DW RWC FW DW RWC FW DW RWC FW DW RWC
0 10.40a 1,13a 8.20a 11.4a 1.23a 8.27a 9.71a 1.10a 7.83a 11.5a 1.18a 8.75a
20 10.20a 1.10a 7.35b 12.0a 1.36a 7.82a 8.69a 1.01a 7.60a 8.84b 0.96ab 8.21ab
40 9.44a 1.20a 6.87c 9.92ab 1.20a 7.27ab 7.74ab 0.98a 6.90ab 7.78bc 0.94ab 7.28b
70 5.98b 0.79b 6.57c 7.27b 0.88b 7.26ab 6.79ab 0.95a 6.15b 5.33c 0.65b 7.20b
100 5.96b 0.86b 5.93cd 8.39ab 1.19a 6.05b 5.02b 0.76b 5.61b 4.99c 0.68b 6.34c
125 5.56b 0.81b 5.62d 7.68b 1.09a 5.97b 5.01b 0.76b 5.58b 5.01c 0.71b 6.15c
150 5.27b 0.79b 4.98d 7.36b 1.07a 5.88b 5.04b 0.78b 5.46b 5.03c 0.73b 5.89c
Means (n = 15) within each column marked with the same letters do not differ statistically according to multiple range Duncan’s test (p \ 0.05)
FW fresh weight, DW dry weight, RWC relative water content
2520 Acta Physiol Plant (2013) 35:2513–2523
123

0–200 mM of NaCl. Brini et al. (2009) found a significant
decrease of caryopses germination of durum wheat under
200 mM of NaCl treatment. It is very interesting that
germination ability in salt solutions is negatively correlated
with seedling growth. Coleoptile length of both durum
cultivars was the most reduced compared to both studied
cultivars of bread wheat. So, durum cultivars are more
tolerant to salinity at the germinating stage, while bread
wheat ones are more salt tolerant in the seedling stage. This
effect could be explained by stronger selection seeds of
bread wheat, resulted in development of seedlings with
higher vigour compared to durum ones.
In general, salinity levels applied in our work did not
evoke a disturbance of PSII efficiency. The cultivars of
T. aestivum showed the highest values of the most studied
parameters of chlorophyll fluorescence at 70 mM of NaCl,
while cultivars of T. durum at a much higher level i.e.,
150 mM. Moradi and Ismail (2007) have stated that plant
tolerance to salinity may be demonstrated by a higher
dissipation of excess energy. The T. durum plants showed a
greater ability for excess energy dissipation as a response
to salinity than the T. aestivum ones; however, in line 121 a
negative correlation between fresh weight, dry weight and
DIo/CSm was found, which means that the changes in plant
mass did not depend on high excess of energy. An increase
in dissipation of excess energy could also indicate damage
to the photosynthetic apparatus, and therefore the inter-
pretation of changes in the values of this parameter is
ambiguous (Kalaji et al. 2011). Analysis of chlorophyll
fluorescence parameters, especially of PI(CSm) and Fv/Fm in
both studied wheat species suggests that the light phase of
photosynthesis was not disturb under salinity. The results
obtained in the presented study have found that this phase
is more salt resistant than the subsequent stages of photo-
synthesis as well as transport and deposition of assimilates,
which decide about plant mass production. This means,
that under salt stress some processes of the light phase
protect photosystems against excess of unused light.
A decrease of PN in both bread and durum wheat under
salt stress was closely connected with stomata closure. The
decline in PN under salinity proceeded in all the studied
cultivars, but the reduction was the most visible in
T. durum plants. Plants of ‘Bogatka’ demonstrated only
4 % reduction of PN rate with simultaneously the lowest
reduction of E and gs compared to other cultivars under
study. It is worth to mark that in ‘Bogatka’ no correlation
between DW and PN, E and gs was found, while plants of
other cultivars demonstrated significant association
between DW and PN rate. ‘Banderola’ showed the lowest
DW reduction under salinity compared to the another.
Sharma et al. (2005) observed a decrease of PN, E and gs in
wheat genotypes under the influence of NaCl applied in the
concentration adequate to 4–8 dS m-1. These authors
stated that a reduction in the above-mentioned parameters
was higher in salt sensitive genotype than in salt tolerant
ones. Muranaka et al. (2002) observed that 100 mM NaCl
inhibited the growth of T. aestivum plants, and this phe-
nomenon was connected with a decrease in PN and was
evoked by a water deficit rather than the toxic influence of
ions.
Stomata closure is a part of a plant’s defence mechanism
against salinity stress. A decrease in transpiration rate can
help to conserve water and limit salt loading in the plant
(Romero-Aranda et al. 2001). In our study, durum cultivars
demonstrated a stronger reduction in E and gs compared to
bread wheat plants, which may indicate that the durum
cultivars cope better under drought conditions. On the other
hand, these cultivars demonstrated a greater limitation in
PN than the bread wheat ones. The lowest limitation of PN
under 150 mM NaCl was observed in ‘Bogatka’, showing
simultaneously the lowest decline in E and the highest
water loss, which suggests inhibition of water uptake by the
root system. Hence, DW and RWC seem to be the most
important parameters indicating a degree of plant sensi-
tivity to salinity. Taking this into account, ‘Banderola’
could be recognized as more salt resistant compared to the
other cultivars under study.
To the physiological parameters measured during salt
stress belongs electrolyte leakage from the leaf cells as an
indicator of cell membrane permeability (Ashraf and Harris
2004; Sairam and Tyagi 2004). Khatkar and Kuhad (2000)
observed a gradual increase in the EL from bread wheat
leaves under influence of NaCl applied in the range of
0–200 mM. In the studied wheat plants any serious damage
of membrane structures based on the ion leakage mea-
surements was observed. The significant increase in
membrane permeability was found at different salt levels
for each cultivar. It is interesting that the NaCl concen-
tration of 150 mM, caused a similar ion leakage from leaf
cells as in the control plants. Percentage electrolyte leakage
correlated with RWC in ‘Banderola’ and ‘Komnata’, what
means that in these both cultivars an increase in membrane
permeability decreased tissue hydration. In addition, in
‘Komnata’, a negative influence of rising ion leakage on
fresh mass production was found.
To the compounds most commonly accumulated under
osmotic stresses belongs proline (Flowers et al. 1977).
Khatkar and Kuhad (2000) as well as Khan et al. (2009)
observed a strong increase in proline content in wheat
plants grown at moderate salinity. In the present investi-
gation, control plants of durum cultivars were characterized
by a twofold higher proline content compared to the bread
wheat ones. The proline level in the leaves of both wheat
species changed non-specifically. However, it is interesting
that the pattern of proline changes under salinity was
similar for the cultivars rather than for particular species.
Acta Physiol Plant (2013) 35:2513–2523 2521
123

The content of proline under the increasing salinity corre-
lated with changes of RWC in ‘Banderola’, ‘Komnata’ and
line 121. This result may imply protective role of proline
against tissue dehydration in most wheat plants under salt
stress.
Conclusion
Collating all the results obtained, we can state that the
differences between genotypes can dominate over the dif-
ferences between both analyzed species. In our opinion, the
common statement that durum cultivars are more sensitive
to salinity than bread wheat ones, is not quite right. A
choice of one or two parameters, which clearly could be
used for selection of salt tolerant plants is problematic. The
ability to germinate in saline soil is a fundamental feature
deciding salt tolerance. Percentage of germinated seeds and
coleoptile growth are the indicators at the first stage of
plant development. In the further stage, an increase in dry
weight of plants seems to be the most important, so in our
opinion these parameters should be used for plant selection.
Taking into account the changes of DW and RWC under
rising salinity, bread wheat cultivar ‘Banderola’ could be
recognized as more salt tolerant. The degree of salinity
tolerance of bread wheat ‘Bogatka’ is the same as durum
line 121, while durum ‘Komnata’ is the most salt sensitive.
Author Contribution Agnieszka Pła _zek was the main
contractor of the experiments, wrote the manuscript and
interpreted data; Maria Tatrzanska, Maciej Maciejewski,
Janusz Koscielniak, and Krzysztof Gondek performed
analyses, Jarosław Bojarczuk is a breeder and author of
used durum wheat cultivars; Franciszek Dubert designed
and coordinated the study.
Acknowledgments The study was supported by the Polish Ministry
of Science and Higher Education. No. 813/N-COST/2010/0 (within
COST Action FA0901).
Open Access This article is distributed under the terms of the
Creative Commons Attribution License which permits any use, dis-
tribution, and reproduction in any medium, provided the original
author(s) and the source are credited.
References
Ashraf M, Ali Q (2008) Relative membrane permeability and
activities of some antioxidant enzymes as the key determinants
of salt tolerance in canola (Brassica napus L.). Environ Exp Bot
63:266–273
Ashraf M, Harris PJC (2004) Potential biochemical indicators of
salinity tolerance in plants. Plant Sci 166:3–16
Bates LE, Waldren RP, Teare ID (1973) Rapid determination of free
proline for water stress studies. Plant Soil 39:205–207
Brini F, Amara I, Feki K, Hanin M, Khoudi H, Masmoudi K (2009)
Physiological and molecular analyses of seedlings of two
Tunisian durum wheat (Triticum turgidum L. subsp. Durum
[Desf.] varieties showing contrasting tolerance to salt stress.
Acta Physiol Plant 31:145–154
Filek M, Walas S, Mrowiec H, Rudolphy-Skorska E, Sieprawska A,
Biesaga-Koscielniak J (2012) Membrane permeability and
micro- and macroelement accumulation in spring wheat cultivars
during the short-term effect of salinity- and PEG-induced water
stress. Acta Physiol Plant 34:985–995
Flowers TJ, Troke PF, Yeo AR (1977) The mechanism of salt
tolerance in halophytes. Annu Rev Plant Physiol 28:89–121
Greenway H, Munns R (1980) Mechanism of salt tolerance in non
halophytes. Annu Rev Plant Physiol 31:149–190
Hoagland DR, Arnon DI (1938) The water-culture method for plants
without soil. University of California Agricultural Experiment
Station Circular 347:29–32
Hu M, Shi Z, Zhang Z (2012) Effects of exogenous glucose on seed
germination and antioxidant capacity in wheat seedlings under
salt stress. Plant Growth Regul 68:177–188
Hura T, Hura K, Grzesiak M (2007) Effect of long-term drought stress
on leaf gas exchange and fluorescence parameters in C3 and C4
plants. Acta Physiol Plant 29:103–113
Kalaji HM, Govindjee, Bosa K, Koscielniak J, _Zuk-Gołaszewska K
(2011) Effects of salt stress on photosystem II efficiency and
CO2 assimilation of two Syrian barley landraces. Environ Exp
Bot 73:64–72
Khan MA, Shirazi MU, Khan MA, Mujtaba SM, Islam E, Mumtaz S,
Shereen AR, Ansari U, Ashraf MY (2009) Role of proline, K/Na
ratio and chlorophyll content in salt tolerance of wheat (Triticum
aestivum L.). Pak J Bot 41:633–638
Khatkar D, Kuhad MS (2000) Short-term salinity induced changes in
two wheat cultivars at different growth stages. Biol Plant
43:629–632
Lazar D (1999) Chlorophyll a fluorescence induction. BBA
1412:1–28
Mansour MMF (1998) Protection of plasma membrane of onion
epidermal cells by glycinebataine and proline against NaCl
stress. Plant Physiol Biochem 36:767–772
Martyniak L, Dabrowska-Zielinska K, Szymczyk R, Gruszczynska M
(2007) Validation of satellite-derived soil-vegetation indices for
prognosis of spring cereals yield reduction under drought
conditions—case study from central-western Poland. Adv Space
Res 39:67–72
Mitsuya S, Kawasaki M, Taniguchi M, Miyake H (2003) Light
dependency of salinity-induced chloroplast degradation. Plant
Prod Sci 6:219–223
Moradi F, Ismail AM (2007) Responses of photosynthesis, chloro-
phyll fluorescence and ROS-Scavenging system to salt stress
during seedling and reproductive stages in rice. Ann Bot
99:1161–1173
Munns R, James R (2003) Screening methods for salinity tolerance: a
case study with tetraploid wheat. Plant Soil 253:201–218
Munns R, Tester M (2008) Mechanism of salinity tolerance. Annu
Rev Plant Biol 59:651–681
Munns R, Guo J, Passioura JB, Cramer GR (2000) Leaf water status
controls daytime but not daily rates of leaf expansion in salt-
treated barley. Aust J Plant Physiol 27:949–957
Muranaka S, Shimizu K, Kato M (2002) Ionic and osmotic effects of
salinity on single-leaf photosynthesis in tow wheat cultivars with
different drought tolerance. Photosynthetica 40:201–207
Noori SAS, McNeilly T (2000) Assessment of variability in salt
tolerance based on seedling growth in Triticum durum Desf.
Genet Res Crop Evol 47:285–291
Paul MJ, Foyer CH (2001) Sink regulation of photosynthesis. J Exp
Bot 52:1383–1400
2522 Acta Physiol Plant (2013) 35:2513–2523
123

Rawat L, Singh Y, Shukla N, Kumar J (2011) Alleviation of the
adverse effects of salinity stress in wheat (Triticum aestivum L.)
by seed biopriming with salinity tolerant isolates of Trichoderma
harzianum. Plant Soil 347:387–400
Romero-Aranda R, Soria T, Cuartero J (2001) Tomato plant-water
uptake and plant-water relationships under saline growth condi-
tions. Plant Sci 160:265–272
Sairam RK, Tyagi A (2004) Physiology and molecular biology of
salinity stres tolerance in plants. Curr Sci 86:407–421
Schar C, Vidale PL, Luthi D, Frei C, Haberli C, Liniger MA,
Appenenzeller C (2004) The role of increasing temperature
variability in European summer heatwaves. Nature 427:332–336
Sharma N, Gupta NK, Gupta S, Hasegawa H (2005) Effect of NaCl
salinity on photosynthesis rate, transpiration rate, and oxidative
stress tolerance in contrasting wheat genotypes. Photosynthetica
43:609–613
Strasser RJ, Srivatava A, Tsimilli-Michael M (2000) The fluorescence
transient as a tool to characterize and screen photosynthetics
samples. In: Yunus M, Pathre U, Mohanty P (eds) Probing
photosynthesis: mechanism, regulation and adaptation. Taylor
and Francis, Bristol, pp 45–483
Walter J, Nagy L, Hein R, Rascher U, Beierkuhnlein C, Willner E,
Jentsch A (2011) Do plants remember drought? Hints towards a
drought-memory in grasses. Environ Exp Bot 71:34–40
Yasar F, Ellialtioglu S, Kusvuran S (2006) Ion and lipid peroxide
content in sensitive and tolerant eggplant callus cultured under
salt stress. Eur J Hortic Sci 71:169–172
Acta Physiol Plant (2013) 35:2513–2523 2523
123
Copyright © 2022 FDOKUMEN